An Andy Williams Interview Arranger profile of Eddie Durham ...
Upload
khangminh22Category
view
0download
0
ED 429 837
AUTHOR
TITLE
INSTITUTION
SPONS AGENCY
ISBNPUB DATENOTECONTRACTAVAILABLE FROM
PUB TYPEEDRS PRICEDESCRIPTORS
IDENTIFIERS
ABSTRACT
DOCUMENT RESUME
SE 062 411
Bates, Peggy; Greiner, Elizabeth; Hampshire, Jane; Jolly,Sylvia; Keel, Eddie; Lancaster, Edith; Leake, Cindy; Locum,Jennifer; Moore, Vanessa; Morton, Sherry; Moser, Sue;Peterson, Bonnie; Simmons, Jo Ann; Stewart, RonGraphing Calculators in Mathematics Grades 7-12: A ResourceGuide for the Classroom and for Preservice/InserviceTraining.Tennessee Univ., Martin. Center of Excellence for Scienceand Mathematics Education.; Eisenhower Regional Consortiumfor Mathematics and Science Education, Charleston, WV.;Appalachia Educational Lab., Charleston, WV.Office of Educational Research and Improvement (ED),Washington, DC.ISBN-1-891677-02-01998-00-00234p.R168R5009Appalachia Educational Laboratory, P.O. Box 1348,Charleston, WV 25325-1348; Tel: 800-624-9120 (Toll Free);e-mail: [email protected]; Web site: http://www.ael.orgGuides Classroom Teacher (052)
MF01/PC10 Plus Postage.*Academic Standards; Educational Technology; *GraphingCalculators; Inservice Teacher Education; Lesson Plans;Mathematics Activities; *Mathematics Instruction; PreserviceTeacher Education; *Problem Solving; ProfessionalDevelopment; Relevance (Education); Seccr7 Education;*Secondary School MathematicsCalculator Based Laboratories
Technology has revolutionized the way mathematics andscience are taught and few innovations in mathematics education have had asmuch impact as the graphing calculator. Fourteen classroom teachers werebrought together during the summer of 1997 and during a week-long workshop,the teachers collaborated to develop a resource guide for integratinggraphing calculators into the mathematics curriculum for grades 7-12. Thisbook provides those lessons that cover a wide variety of mathematicalconcepts and topics and are intended to facilitate the use of the graphing
calculator in the classroom. Designed to be consistent with nationalstandards and state frameworks for mathematics, the lessons emphasizehands-on, problem solving approaches and connections to science and the realworld. Some lessons also incorporate other forms of technology such ascalculator-based laboratories. (ASK)
*************************
Reproductions
*************************
*******************************************************
supplied by EDRS are the best that can be madefrom the original document.
************************************************

U.S. DEPARTMENT OF EDUCATIONOffice of Educational Research end Improvement
E UCATIONAL RESOURCES INFORMATIONCENTER (ERIC)
document has been reproduced asreceived from the person or organizationoriginating R.
O Minor changes have been made toimprove reproduction quality.
Points of view or opinions stated in thisdocument do not necessarily representofficial OERI position or policy.
...,:. , ..., ,.Y
A .,.; Vs. 5 ;
.'", '-".\ ''' .,
'WIP
,VF4,4 i El S ? I
A
itAAA.,,,A .'
Yaffiro=h4p:M.P1410.1004111.1W`rsiWrI4 'W:4'` 1Rke,OftWd:*.Ar:11:A4
A Resource Guide for the Classroomand for Preservice/Inservice Training
thematics
2

Graphing Calculators
in
Mathematics Grades 7 12
A Resource Guide for the Classroom
and for Preservice/Inservice Training
Developed by
the Center of Excellence for
Science and Mathematics Education (CESME)
at
The University of Tennessee at Martin
In Collaboration with
the Eisenhower Regional Consortium for
Mathematics and Science Education
at
Appalachia Educational Laboratory, Inc.

Graphing Calculators in Mathematics Grades 7 12A Resource Guide for the Classroom and for Preservice/Inservice Training
Developed by
the Center of Excellence for Science and Mathematics Education (CESME) at
The University of Tennessee at Martin
In Collaboration with
the Eisenhower Regional Consortium for Mathematics and Science
Education at Appalachia Educational Laboratory, Inc.
ISBN-1-891677-02-0
Iris B. Hubbard, Project DirectorCenter of Excellence for Science and Mathematics Education (CESME)
145 Gooch Hall
The University of Tennessee at Martin
Martin, Tennessee 38238
901/587-7207
Fax 901/587-7206
Authors
Peggy Bates
Elizabeth Greiner
Jane Hampshire
Sylvia Jolly
Eddie Keel
Edith Lancaster
Cindy Leake
Jennifer Locum
Vanessa Moore
Sherry Morton
Sue Moser
Bonnie Peterson
Jo Ann Simmons
Ron Stewart
Sandi Bigharn, CESME, Layout and Design
Michelle Dotson, CESME, Graduate Research Associate
1998
COPY AVAILABLE
4

Graphing Calculators in Mathematics Grades 7-12
About the CESME
The mission of the CESME is the improvement of teaching and learning in science andmathematics in Tennessee and nationally through research, development, and training. Focusareas are:
improvement of science and mathematics education in the rural school communityeffective use of appropriate educational technology in science and mathematicseducationreducing underrepresentation of women and minorities in science and mathematics
The CESME conducts workshops for K-12 math and science teachers that emphasize strate-gies of teaching that meet national standards and are aligned with state curriculum frame-works. One area of professional development is the coordination of workshops in whichteachers expand and utilize their expertise to develop innovative resources that can be usedby other teachers throughout the state and beyond.
For information about other CESME projects and educational resources, contact the CESME.
J.P. Prather, DirectorCenter of Excellence for Science and Mathematics Education (CESME)
145 Gooch HallThe University of Tennessee at Martin
Martin, Tennessee 38238901/587-7166
Fax 901/587-7206http://cesme.utm.edu
The CESME/UT Martin is an Equal Opportunity/Affirmative Action Employer.
5
iv

Graphing Calculators in Mathematics Grades 7-12
About AEL
AEL's mission is to link the knowledge from research with the wisdom from practice toimprove teaching and learning. AEL serves as the Regional Educational Laboratory forKentucky, Tennessee, Virginia, and West Virginia. For these same four states, it operatesboth a Regional Technology in Education Consortium and the Eisenhower Regional Consor-tium for Mathematics and Science Education. In addition, it serves as the Region IV Com-prehensive Technical Assistance Center and operates the ERIC Clearinghouse on RuralEducation and Small Schools.
The Eisenhower Regional Consortium for Mathematics and Science Education collaborateswith educators to improve mathematics and science education. Specifically, the Consortiumidentifies and shares exemplary mathematics and science instructional materials and providestechnical assistance to help teachers, administrators, and college faculty use new teachingmethods and assessment strategies.
Information about AEL projects, programs, and services is available by writing or calling AEL.
FL,Appalachia Educational Laboratory
Post Office Box 1348Charleston, West Virginia 25325-1348
304/347-0400800/624-9120
[email protected]://www.ael.org
Eisenhower Regional Consortium for Mathematics and Science EducationPam Buckley, Director
AEL Arlington1700 North Moore Street, Suite 1275
Arlington, Virginia 22209703/276-0200
Fax 703/276-0266
This publication is based on work sponsored wholly or in part by the Office of EducationalResearch and Improvement, U.S. Department of Education, under grant number R168R5009.Its contents do not necessarily reflect the views of OERI, the Department, or any otheragency of the U.S. Government.
AEL is an Equal Opportunity/Affirmative Action Employer.

Graphing Calculators in Mathematics Grades 7-12
Table of Contents
Preface ix
Important Information
Concept-Based Lessons
Lesson 1 Fun with Function Families 1
Transformation of Graphs when Parameters of Equations are Changed
Lesson 2 Putting Inequalities to the Test 15
Solving One-Variable Linear Inequalities, Including Applications
Lesson 3 Solving Inequalities on the TI-83 29Solving and Graphing Linear Inequalities in One and Two Variables,Absolute Value Inequalities, and Compound Inequalities
Lesson 4 Starting with Stats 41
Collecting, Organizing, and Analyzing Real-World Data
Lesson 5 Investigating Slope 55Slope Y-Intercept Form of Equations vs. Rise/Run
Lesson 6 Connecting Measurement 69
Lesson 7 Constructing Trigonometric Concepts 79
Lesson 8 Graph Interpretation 93Interpreting, Extending, and Creating a Variety of Graphs
Problem-Based Lessons
Lesson 9 SpeedingA Study in Linear Functions 107
Lesson 10 Traveling Through the Solar System An Exploration of Mass vsWeight 125
Lesson 11 Alien AttackAn Investigation of Quadratic and HigherEquations 137
Lesson 12 A Sick Astronaut 155
Measures of Central Tendency and Line of Best Fit
Lesson 13 Topographic Maps and Whitewater Rivers 167
Rates of Change
Lesson 14 We've Got the SpiritA Variety of Techniques for SolvingLinear Systems 181
vii

Graphing Calculators in Mathematics Grades 7-12
Table ol Contents
Activity Packets
Packet 1 Basic Calculus on the Graphing Calculator 197
Finding the Numerical Derivative of a Function at a PointGraphing the Derivative of a FunctionFinding the Roots of a DerivativeFinding Solutions of EquationsSolving Equations Involving DerivativesFinding the Definite Integral of a Function
Packet 2 Calculator-Based Lab Activities 213
Graphing the Time vs. Height Curve for a Bouncing BallGraphing the Movement of a PendulumPressure vs. Depth Curve for a Swimming Pool
8

Graphing Calculators in Mathematics Grades 7-12
Preface
echnology has revolutionized the way mathematics and science are taught,and few innovations in mathematics education have had as much impact as thegraphing calculator. Perhaps the only instruments more important in developing
sound mathematical foundations are our students' minds. Armed with the ability toeffectively use technology, students have the potential to accelerate their mastery ofmathematical principles and techniques, and to affect their world in meaningful ways.Our challenge as teachers is to harness and exploit the graphing calculator as a tool toenhance learning.
Many of us have struggled with the role that graphing calculators should play inour classrooms. Assimilating this new educational tool into our teaching styles has notbeen easy for many of us who have been accustomed to teaching in more traditionalways. Yet, time and again, we see what can result from placing hand-held calculators inthe hands of our students. Our reluctance to embrace the graphing calculator technol-ogy is not that we need to be convinced of its usefulness, but that we need to knowmore ways to use it effectively. Learning how to use the graphing calculator, in con-junction with other forms of technology and in substantial ways, is as important forteachers as it is for students. Our goal as educators is for students to learn to use tech-nology to develop thinking skills, not merely to punch buttons to obtain meaninglessnumbers and pictures. We want graphing calculators to enhance students' abilities tosolve problems in multiple ways, to visualize mathematical concepts, and to findexcitement in the learning process.
It was with these thoughts in mind that fourteen classroom teachers werebrought together during the summer of 1997 as part of a collaborative project of theCESME and the Eisenhower Regional Consortium for Mathematics and Science Educa-tion at AEL. During a weeklong workshop, the teachers collaborated to develop aresource guide for integrating graphing calculators into the mathematics curriculum,grades 7-12. The resulting lessons cover a wide variety of mathematical concepts andtopics and are intended to facilitate the use of the graphing calculator in the classroom.The lessons were planned for teachers with no experience with graphing calculators aswell as for teachers who have been using graphing calculators as long as they havebeen available. Designed to be consistent with national standards and state frameworksfor mathematics, the lessons emphasize hands-on, problem-solving approaches, andconnections to science and the real world. Some incorporate other forms of technologysuch as the Calculator Based Lab (CBL).
Like you, we are teachers dedicated to instilling a desire to learn within ourstudents and to structuring successful learning environments. Our hope is that you willbe able to use this guide in productive ways in the classroom, in your personal profes-sional development, and/or in conducting inservice or preservice training for othermathematics educators.
Ron Stewart for the Authors
Eisenhower Regional Consortium for Mathematics and Science Education at AEL ix

Graphing Calculators in Mathematics Grades 7-12
important information
Notation
Keystrokes are indicated by bold lettering enclosed in < >. For example, <ZOOM>.
An equivalent menu is enclosed in parentheses following the keystrokes. For example,<2nd> <STAT> (LIST) indicates pressing the key labeled 2nd and the key labeled STATfor the LIST menu.
Appropriate student classes are indicated on the tops of the sheets by the followingsymbols:
Audience SymbolArithmetic
Middle Grades IIIMath Tech I
Math Tech II
Pre-AlgebraAlgebra I
Algebra IIGeometry
Probability and StatisticsIII
Advanced AlgebraPre-Calculus
Calculus
Note: Although TI-82 and TI-83 keystrokes are given, the lessons could easily be modi-fied for any graphing calculator. Many hours have been spent developing and editingand checking keystrokes; however, the graphing calculator manual can always beconsulted for additional help or information.
10
Center of Excellence for Science and Mathematics Education at UT Martin

Graphing Calculators in Mathematics Grades 7-12
Authors* Edith Lancaster, Central HS, Bruceton, TN* Jo Ann Simmons, Peabody HS, Trenton, TN
Lesson 1: Fun With Function Families
F.(
AApproximate Time Needed for Lesson
Two to three 90-minute periods; four tradi-tional class periods
Content Area
Patterns, Functions, and Algebraic Thinking
Process Standards
Problem Solving, Reasoning, Communication
Goals for Students
To identify fundamental "head of family" equations and graphsTo draw the graph given a "head of family" equationTo write the equation given a "head of family" graphTo use transformations to draw the graph of an equationTo identify the transformations of a graph and write the corresponding equation
Description or Summary of Lesson
S tudents in Math Tech I, Algebra I, and/or Algebra II are the intended audience.Students will work individually or in small groups. The students will develop
tables of functional values for four fundamental equations and plot points on coordi-nate grids. Students will use the TI-81, TI-82, or TI-83 for the tables and for graph-ing. Students will recognize and use translation, reflection, and size transformationsof the graphs for four fundamental equations.
Background Information
This lesson is introductory material in preparation for transformations and practicematerial for transformations on "head of family" functions. Prior to this lesson
students should be able to do coordinate graphing and should have basic keystrokeskills on a TI-81, TI-82, or TI-83.
Materials and Equipment
View screen with graphing calculatorOverhead projector, overhead graph grid, transparency sheet, overhead pensEach student will need:4 2 sheets of graph paper, one cut into four 4" x 5" pieces4 1 sheet of transparency paper about 4" x 5"4 access to 1 overhead penNi damp paper towel4 access to a TI-81, TI-82, or TI-83 graphing calculator4 handouts
Eisenhower Regional Consortium for Mathematics and Science Education at AEL
11Lesson 1 /1

Graphing Calculators in Mathematics Grades 7-12
I f r .1 rActivity One: Four mead or ramily runctions
Teacher Notes
Outline:cg> Review table building and coordinate graphing.
cg> Build tables for y = x Y = lxk y = x2 , and y = .
cg> On graph paper, graph the points from the tables.cg> Enter the function y = x into the <Y=> menu on graphing calculator.cg> Set window on calculator using the <Zoom> <6> command.cg> Graph the function. Repeat the above steps for the other three functions.cg> Practice shapes of fundamental graphs using "mathercise" (see below).
y = x Y = Ix y = x2 y =
Note: Teachers will want to form the graphs so they look correct to the students. Thepictures above are correct to the ones forming the graphs.
The domain and range of each function should be discussed so that the students canchoose appropriate values of "x" to place in a t-table. Suggested domain values to choose
for y = x would be integers between -10 and 10; for y = Ix would be integers between
-10 and 10; for y = x2 would be integers between -4 and 4; and for y = would be
(0, 1, 4, 9, 161.
<ZOOM> <5> (ZSquare) sets the window of the calculator in the ratio of about 3:2 andsince the screen is in that ratio the vertical scale and horizontal scale are the same size.This will allow the calculator graph to look like the student's graph and not appear dis-torted.
12
2 / Lesson 1 Center of Excellence for Science and Mathematics Education at UT Martin

Graphing Calculators in Mathematics Grades 7-12
AActivity One Handout
1. Fill in the following t-tables using appropriate values of x and graph each function ongraph paper.
y = x
x yY=
x y
y = x2
X y
y = AFX
x y
2. Using the graphing calculator (in function mode), press the <Y=> key. Enter Y, = x .
Press <ZOOM>, press <6> to set the window to a standard grid. Press <GRAPH> to seethe graph. Compare the shape of this graph to your graph of y = x
TI-82 and TI-83 users: Make a table of values for the function placed in Y, = by pressing<2nd> <WINDOW> (TBLSET). Set TBLSTART = at -10 and the ATbl = to 1. Inde-pendent and Dependent should be on Auto. Press <2nd> <GRAPH> (TABLE) andcompare the t-table you made with the table in the calculator.
TI-81 users: Set the <RANGE> at Xmin = -9.6, Xmax = 9.4, xscale = 1, Ymin = -6.6,Ymax = 6.4, Yscale = 1. Press the <TRACE> key and compare the (x,y) values shownon the screen with those in your table.
3. Press the <Y=> key and enter Y, = lx1 using the following key strokes:
TI-81/82: 1 = <2nd> < x 1 > (ABS) <X,T, 0 >
TI-83: = <MATH> < I> > (NUM) <ENTER> [1:abs( ] <X,T, ,n>Press <ZOOM> <5> (Zsquare). Press <GRAPH>.
Compare the shape of this graph to your graph of y =
Press <2nd> <GRAPH> (TABLE) and compare the t-table you made with the table inthe calculator.
Note: Since you changed the function in Y, = the values in the table have changed tomatch the new function.
4. Repeat Step 3 using y = x2 and y = .
5. Mathercise: Practice the shape of the fundamental equations using arm movements.Stand and demonstrate the shape of the graph when your teacher calls out an equation.Remember the shapes of the four graphs because your teacher will be calling themrandomly and rapidly.
Eisenhower Regional Consortium for Mathematics and Science Education at AEL Lesson 1/3
13

Graphing Calculators in Mathematics Grades 7-12
Activity Two: Transformations of the "Head of Family"
Functions Using the Graphing Calculator
Teacher Notes
Outline:()1> Clear the <Y=> menu. Use a table (Activity Two, Handout 1) to record the results of
your observations. They will include, for each pair of equations, the graphs and any
conclusions that can be made. Graph the "head of family" function in Y1 = , and the
transformed graph in K = . Start with Y1 = x and 1/2 = x . Record the results.
Clear the <Y=> menu. Next use = ixl and Y2 = lxi . Third use Y1 = x2 and
Y2 = x2 and last use Y1 = -N5 , and Y2 = . Fill in the charts each time new
equations are used and answer questions at bottom of chart.
cg" Clear the <Y=> menu. Use a table (Activity Two, Handout 2) to record your obser-
vations. This time, place the "head of family" graph in Y1 = and twice the function
in Y2 = ( 2x , 2lxl , 2x2 , and 2A5 respectively).
x IA x2cg° Repeat using Y2 = -2 , 2 , , 2 ) and recording in Activity Two, Handout 3.
cg' Repeat using Y2 = ( x + 2 , xl + 2 , x2 + 2 , Ji + 2 ) and recording in Activity Two,
Handout 4.
cg> Repeat using Y2 = ( x 2 , lxl 2 , x2 2 , 2 ) and recording in Activity
Two, Handout 5.
Complete Activity Two, Handout 6, and draw conclusions in paragraph form.
Note: For Activity Two, Handout 1, you may want to emphasize that the line of reflection isthe x-axis.
4 / Lesson 1 Center of Excellence for Science and Mathematics Education at UT Martin
1 4

Graphing Calculators in Mathematics Grades 7-12
Activity Two, Handout 1
AUsing your graphing calculator (in function mode, sequential mode) press <Y=>. = x
Enter Y2 = X . Press <ZOOM>, press <4>. Press <GRAPH>. Enter resulting informa-
tion in table below as #1.
Go back to <Y=>. Clear Y1 = and enter = Ix1 as yi = abs (x). Clear 1'2 = and enter
Y2 = aS Y2 = abs(x). Press <GRAPH>. Enter resulting information in table below
as #2.
Go back to <Y=> . Clear Y1 and enter Y, = x2 . Clear Y2 = and enter Y2 = X2 . Press
<GRAPH>. Enter resulting information in table below as #3.
Go back to <Y=>. Clear Y, = and enter Y, = . Clear 112 = and enter Y, = . Press
<GRAPH>. Enter resulting information in table below as #4.
Sketch and LabelBoth GraphsY1 Equation Y2 Equation
How is 1'2 Differentfrom Y, ?
1 .
2.
3.
4.
What effect does replacing the function with the opposite of the function have on the graph?
Would this transformation be called a translation, a reflection, or a vertical compression/stretch?
Eisenhower Regional Consortium for Mathematics and Science Education at AEL
15Lesson 1 /5

Graphing Calculators in Mathematics Grades 7-12
Activity Two, Handout 2
Repeat instructions given in Activity Two, Handout 1, using Y2= 2x, 214 2x2 , and 2VX .
1; Equation Y2 EquationSketch and Label
Both GraphsHow is Y2 Different
from Y1 ?
2.
3.
4.
What effect does replacing the function with twice the function have on the graph?
6 /Lesson 1 Center of Excellence fo1 S6ence and Mathematics Education at UT Martin

Graphing Calculators in Mathematics Grades 7-12
Activity Two, Handout 3
X [XI X2
Repeat instructions given in Activity Two, Handout 1, using Y2 = -2 ' 2 ' ' and2
Y1 Equation Y2 Equation
Sketch and Label
Both Graphs
How is 1'2 Different
from I; ?
1.
2.
3.
4.
What effect does replacing the function with "the function divided by 2" have on thegraph?
Would you call the transformations in #2 and #3 translations, reflections, or verticalcompressions/stretches?
Eisenhower Regional Consortium for Mathematics and Science Education at AEL
1 7Lesson 1 /7
Graphing Calculators in Mathematics Grades 7-12
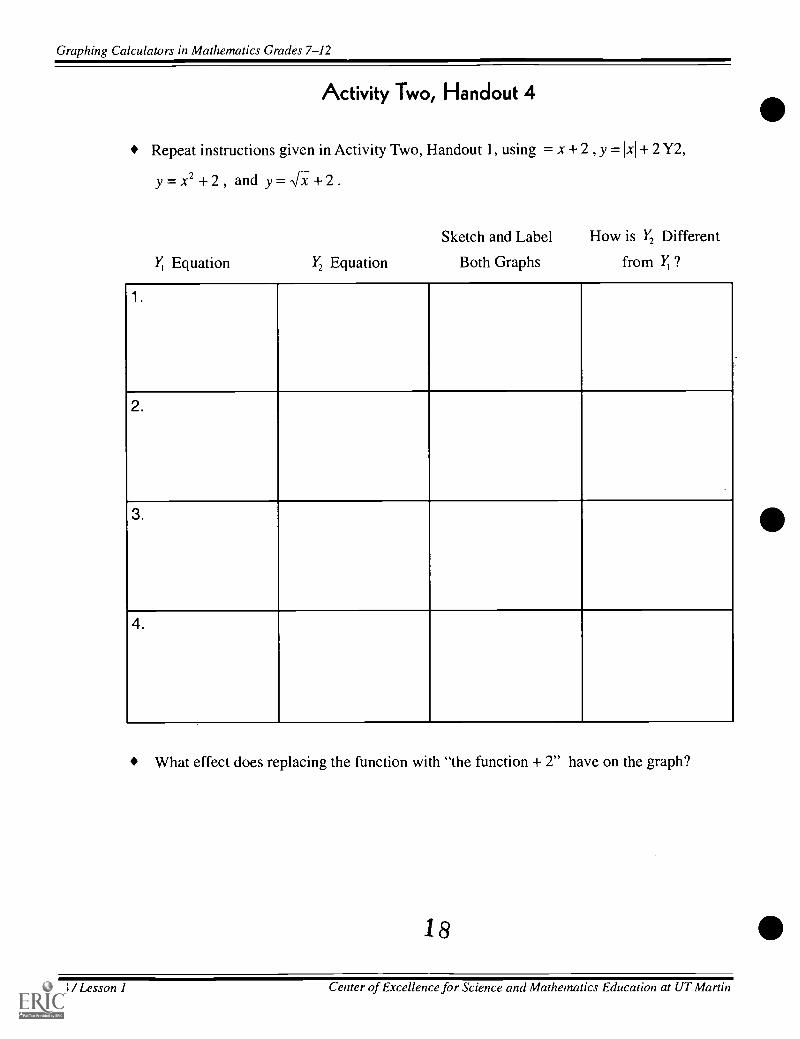
Activity Two, Handout 4
Repeat instructions given in Activity Two, Handout 1, using = x + 2 , y = lxI + 2 Y2,
y = x2 + 2 , and y = + 2 .
I; Equation Y2 Equation
Sketch and Label
Both Graphs
How is Y2 Different
from /11 ?
1 .
2.
3.
4.
What effect does replacing the function with "the function + 2" have on the graph?
18
8 / Lesson 1 Center of Excellence for Science and Mathematics Education at UT Martin
Graphing Calculators in Mathematics Grades 7-12
Activity Two, Handout 5
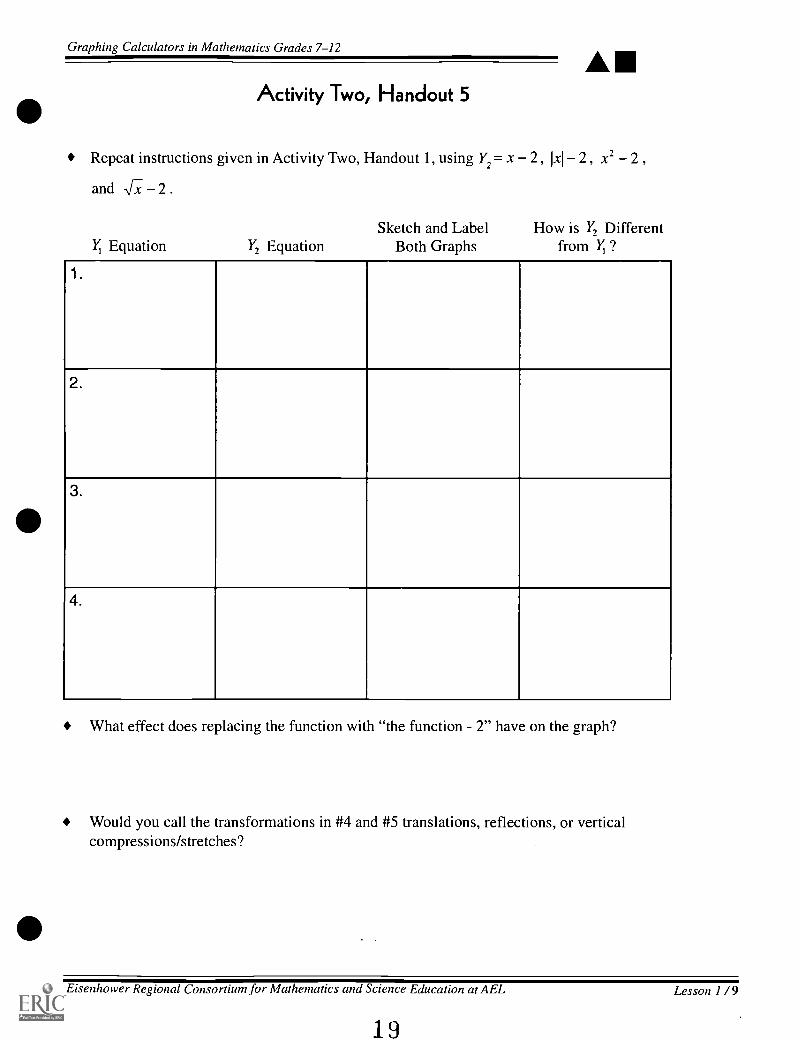
Repeat instructions given in Activity Two, Handout 1, using Y2 = X 2 , Ix 2 , x2 2 ,
and -rx 2 .
11 Equation Y2 EquationSketch and Label How is Y2 Different
Both Graphs from Y1 ?
1.
2.
3.
4.
What effect does replacing the function with "the function 2" have on the graph?
Would you call the transformations in #4 and #5 translations, reflections, or verticalcompressions/stretches?
Eisenhower Regional Consortium for Mathematics and Science Education at AEL
19
Lesson 1 /9

Graphing Calculators in Mathematics Grades 7-12
Activity Two, Handout 6
Explorations and Conclusions:
Choose the "head of family" graph for each of the following equations. How does thegraph of each of the 10 equations below differ from its "head of family" graph? Make a
conjecture for each equation and check with your calculator.
1. y = 5x
2. y=5x+6
3. y=x+9
4. y=lxI-3
5. y=J+4
6. y=2x2 1
7. y.x2 +3
8. y =
9. = 31x1+ 2
10. y = 3x2
Conjecture Actual
What conclusions can you make? Write your conclusions in paragraph form.
20
10 / Lesson 1 Center of Excellence for Science and Mathematics Education at UT Martin

Graphing Calculators in Mathematics Grades 7-12
Activity Three: "Hands on" Transformations
Prerequisites:
Students must have completed Activity 1 and Activity 2.
Instructions For Teacher:
Instruct students to take one piece of the graph paper and draw an x-axis and y-axis withthe origin at the center of the paper. Illustrate, using the overhead projector. Have them
draw one of the "head of family" graphs on this coordinate axis with a pen or pencilthe
graph of y = lx1 is suggested. Let them place the transparency sheet over this graph and trace
the "V" on the transparency sheet with an overhead pen. Have the students move the trans-parency sheet to show the location of the following graphs:
1. y = 1x1
2. y = + 3
3- = 1
4. y = ixi 2
5- = 4
Have student-volunteer locate the new graph on the overhead while teacher walks aroundthe room to see if the students are making the proper "flips" and "slides."
Slide and/or flip the transparency on the overhead to some location on the grid and havestudents write the equation. Let one student write an equation and place the transparencyat the proper location on the overhead. Have the other students write the equation.Check to see that the equations are alike. Repeat with other students selecting the equa-tion and location.
Let the students erase their transparency with the damp paper towel. Place the transpar-
ency over the "head of family" graph and, using the overhead pen, graph y = 21x1 on the
transparency. Have the students move the transparency to show the location of each ofthe following graphs:
1. y = 21x1 3. y = 21x1 1
2. y = 21x1 + 3 4. y = 21x1+2
Repeat the exercise of placing the transparency at a particular location and letting thestudents write the equations.
Eisenhower Regional Consortium for Mathematics and Science Education at AEL
2 1Lesson 1 /11
Graphing Calculators in Mathematics Grades 7-12
Select another "head of the family" graph. Use a second piece of graph paper to draw itsgraph. Repeat the exercises, first giving the equation and locating the graph, then locat-ing the graph and writing the equation.
12 / Lesson 1 Center of Excellence for Science and Mathematics Education at UT Martin

Graphing Calculators in Mathematics Grades 7-12 AAdaptations:
These exercises could be used in Algebra II and upper level courses by adding other
functions such as y = x3; y = 2' or other exponential functions; y = [x], the step func-
tion; y = log x or other logarithmic functions; and y = sin x or other trigonometricfunctions.
Horizontal translations of the form y = f (x + h) and y = f (x h) can be added to the
vertical translations of the form y = f (x) + k and y = f (x) k .
Reflections in the y-axis of the form y = f ( x) could be added.
A different approach would be to have a "station activity" for the graph-to-equationactivity. Set up 10-12 stations around the classroom and have a graph at each station thatwill illustrate the transformations on the parent graphs. Let each student have 15-30seconds at each station to write the correct equation.
Within the resources listed are real-world problems related to function transformations.
If a Calculator Based Lab and motion detector are available, students might enjoy walk-ing in front of the motion detector to create each "head of family" graph.
Suggested Teacher Resources:
CBL-Explorations in Algebra for TI-82 and TI-83, by Stephen D. Nichols, MeridianCreative Group, 1996.
Graphing Calculator Activities, by Edwin Andersen and Charles Lund, Addison-WesleyPublishing, 1992.
Transforming Functions to Fit Data, by Ronald J. Carlson and Mary Jean Winter, KeyCurriculum Press, 1998.
TI-83 or TI-82 Mini-Labs: Algebraic Investigations, by Phil DeMarois, Mathware, 1996.
2 3
Eisenhower Regional Consortium for Mathematics and Science Education at AEL Lesson 1 /13

Graphing Calculators in Mathematics Grades 7-12
Authors:* Vanessa Moore
Germantown HS, Germantown, TN
* Sherry MortonGermantown HS, Germantown, TN
Lesson 2: Putting Inequalities to the Test
Approximate Time Needed for Lesson:
One traditional class period
in*
Content Area:
Patterns, Functions, and Algebraic Thinking
Process Standards:
Problem Solving, Connections
Goals for Students
To solve linear inequalities using both calculator and non-calculator methods.To apply inequalities in solving real-world problems.
Description or Summa'ry of Lesson
S tudents in Algebra I, Algebra II, and Pre-calculus are the intended audience. The firstactivity uses a sample problem to illustrate a calculator method for graphic solutions
to linear inequalities. The second activity includes applying this method of solvinginequalities in a real-world problem situation and relates algebraic and graphic solutionsof linear inequalities.
Background Information
FT his lesson is introductory material with several suggestions for using advancedtopics, enrichment, and discussion. Prior to this lesson students should have studied
graphing lines, solving linear inequalities, and basic keystrokes on a TI-81, TI-82, or TI-83.
Materials and Equipment
View screen with graphing calculatorOverhead projector, overhead graph grid, transparency sheet, overhead pensEach student will need:4 access to a TI-82 or TI-83 graphing calculator4 graph paper4 handouts
2 4
Eisenhower Regional Consortium for Mathematics and Science Education at AEL Lesson 2 /15

Graphing Calculators in Mathematics Grades 7-12
Activity One: The Graphing Calculator as a Tool for
Solving One-Variable Inequalities
Teacher Notes
Outline:
cg> Review graphing linear inequalities.cg> Review solving inequalities in one variable.cg> Use the graphing calculator to see a graphic interpretation of the solution set of a
one-variable inequality.
11-82 Keystrokes
Note: The x stored value must not be zero.The inequality expression must be entered in three parts on the <Y=> screen.
Press <Y=>.
1; = type the left side of the expression.
Y2 = type the right side of the expression.
Y3 = put the cursor on (this is where the inequality will be written in terms of 1; and 172).
YiS5X+7Y2133X-3Y3=1Y4=Ys=Yfi=Y7=Ye=
unction_Parametric_
3:Polar_4:5ecluence_5:0n/Off_
Press <2nd> <VARS>. Highlight 1: Function. Press <ENTER>. Highlight 1: /I Press<ENTER>.
1.
I UR1
Y23:%."
4:Y45:Ys6:Ys74,Y?
YiE54+7Y2S3X-3Y30Y1Y4YsYfiY7Ye-
2516 /Lesson 2 Center of Excellence for Science and Mathematics Education at UT Martin

Graphing Calculators in Mathematics Grades 7-12
y 85X+7Y2133X-3Y3E1Y1YYs=Y6YB=
Press <2nd> <MATH> (Test) Cursor down to the desired symbol. Then press<ENTER>.
yggki LOGIC_--2: 03: >!g>ST<6:
YiE15X+7YaEl3X-3Y3EIY1 >
YsYs=Y7YEI=
*
Press <2nd> <VARS>. Highlight 1 Function Press <ENTER>. Highlight 2: Y2 andpress <ENTER>.
0.11110 le Z
1: Y1alY23: Y3
Y45: Ys6: y67 I. Y ?
YiE15X+7Y EI3X-3Y313Y1?.Y2YYs=Y6=Y7=Ye
Now is a good time to discuss domain and range in order to set the axis on the graph
screen to achieve an adequate picture of the expressions in the Y, and Y,. Look at the Y,
and Y2 and discuss what would be appropriate x and y maximums and minimums.
Graphing calculator users can graph one, some, or all of the expressions on the Y= screen.On the Y= screen, if the = sign is highlighted, then the calculator will graph the expres-sion. The expression is said to be "turned on." All three expressions in the above rightscreen are "turned on." To turn an expression off, move the cursor, by using the bluearrows, to the = sign of the expression desired, and press <ENTER>.
2 6
Eisenhower Regional Consortium for Mathematics and Science Education at AEL Lesson 2 /17

Graphing Calculators in Mathematics Grades 7-12
Turn the Y3 expression off in order to view the graph of the other two expressions.
Set the viewing window in order to achieve the desired graph.Press <WINDOW>.Xmin (whatever desired) <ENTER>.Xmax (whatever desired) <ENTER>.Xscl (for a large screen may use a scl of 0) <ENTER>.Ymin (whatever desired) <ENTER>.Ymax (whatever desired) <ENTER>.Yscl (for a large screen, one may use a scl of 0, or the same scl as X, or different)<ENTER>.
PUIuIiJl _FORMATmin
Xmax 10Xsc.1 1Ymin -25Ymax 10Yscl 0
Now press <GRAPH> to see the graph of Y1 and Y2 .
Discussion:At this point the instructor may want to spend some time discussing the graph of the twoexpressions and what may occur with the inequality.
Turn off the expressions Y1 and Y2 (use the method previously described).
Turn on the expression 13.
Press <GRAPH>. Depending on the inequality the user may need to reset the window.
2718 / Lesson 2 Center' of Excellence for Science and Mathematics Education at UT Martin

Graphing Calculators in Mathematics Grades 7-12
Y1-5X+7Y2=3X-3Y30Y1>Y2Y4Ys-Yfi
Y7Ye
To Run the Actual Test Feature:
FORMATpun -10
Xmax 10Xscl-1Ymin=-2Ymax=2Ysc1=0
*
Press <TRACE>. Move the cursor left and right. Notice the Y= value is either 0 or 1. IfY = 0 then the x-value does not satisfy the inequality; if Y= 1 then the x-value does satisfythe inequality.
Since the Y= value must be 0 or 1, the Y maximum and minimum range must in-clude 0 and 1. This will be an important factor to remember not only in the every-day use of this feature but also in the application problem to be explored.
1111, ANIS
N=1.0631329B
3
iii=1
The screen on the left is the graph of the inequality before the trace key is pressed. No-tice in the upper right corner of the right screen the number 3. This number tells the user
the calculator is graphing the Y3 expression. Since the Y = value in the right screen is 1,
the x-value makes the inequality true and is, therefore, in the solution set.
Take time with the class to trace along the graph and make some generalizations aboutthe values of x and y for the inequality.
TI-83 Keystrokes
The keystrokes are the same as the TI-82 except in the <Y-VARS> section. Repeat the
steps from the TI-82 in order to enter the expressions into Y, and Y, .
To write Y3 in terms of Y, and Y2, press <Y=> and put the cursor on 13. Press <VARS>
and move the cursor to highlight Y-VARS (left screen). Press <ENTER>.
2 3
Eisenhower Regional Consortium for Mathematics and Science Education at AEL Lesson 2 / 19

Graphing Calculators in Mathematics Grades 7-12
VARSOBRA-FR!2:Parametric_3:Polar_4:0n/Off_
1 :
I. ONY2
3:Y34:Y45:Ys6:Y674,Y7
Notice the 1 is highlighted for 11 . Press <ENTER>.
P101 P1ot2 P103W iE5X+7W 21:13X-3W AY.'
W s-
W 7-
Press <2nd> <MATH> (TEST). Highlight the desired sign (left screen), press<ENTER> (right screen).
LJ LOGIC-
2:030
P1101 P1102
W iEN+7W 2O3X-3W AVViL-W 4=
WfiN.Y7
29
20 /Lesson 2 Center of Excellence for Science and Mathematics Education at UT Martin

Graphing Calculators in Mathematics Grades 7-12
Press <VARS>, highlight Y-VARS. Press <ENTER>.
1: Function is highlighted (as before) shown on the left screen.Press <ENTER>.
Highlight the Y2 as shown on the right screen.
VMSWunTali!2:Parametric_3:Polar_4:0n/Off_
ORMWMAZ
WY23:Y34:YLI5:Ys6:Y674,Y7
Press <ENTER> to complete the inequality in the Y3 expression.
Ploti P102 P103W iED4+7\Y21213X-3W AY1L-Y2M\YL1\Ys\Y6\Y7
*
To finish the testing on the TI-83 follow the same method as with the TI-82. The TI-83has the same capability of turning an expression on or off to graph it. The three expres-
sions in the screen above are all on.
The TI-83 has a distinct property that the TI-82 does not allow. Once in the trace mode, theuser can put any desired value in for x and it will calculate the y. Take a few moments afterrunning the testing feature and try substituting values for x, then evaluate the y. This can bedone repeatedly. This also allows the user to experiment with the method of Guess and Test.
30
Eisenhower Regional Consortium for Mathematics and Science Education at AEL Lesson 2 / 21

Graphing Calculators in Mathematics Grades 7-12
Activity Two: Application of Inequalities
Teacher Notes
Outline:
Give students Handout 1 to complete the application problem below.(:1> Give students Handout 2 to complete the application problem below.
Application Problem:
You have been nominated to plan your senior class trip.
The class decided to take a cruise to the Bahamas OH YEAH ,i 1, and only two cruiselines offer group packages.
The Party Line has a flat fee of $25,000 and an additional $175.00 per person, with aminimum of 250 people and a maximum of 500 people.
(68,750 < 25,000 + 175.00X < 112,500)
The Sun Ship has a flat fee of $2350 and an additional $225.00 per person, with a mini-mum of 300 people and a maximum of 750.
(69,850 < 2350.00 + 225.00X < 171,100)
Questions:
1. How many people would make the Party Line package the better offer?
2. How many people would make the Sun Ship package the better offer?
3. How many people would make the two packages equal?
22 / Lesson 2 Center of Excellence for Science and Mathematics Education at UT Martin

Graphing Calculators in Mathematics Grades 7-12
The following screens are from the TI-83, which can be used to explore the problem.
Enter the two expressions into the Y = screen.
For Question 1:
Enter 113 as Y1"
Plokl P102 F1ot3
W 1 E125000+175X\YA2350+225X1\ Y3\YLI
Ws=\ Y7
(left screen). Turn off /1, and Y2 (right screen)
Ploti P102 P103'N1 l:125000+175XW 2132350+225XW AY1<Y2\YLI\Ys%NG\Y7
11.-
P101 P102 P1ot3\Y1=25000+175X\Y2=2350+225XWAYi<Y2\YL1
\Yfi\Y7
Before graphing the inequality, CHECK THE VIEW WINDOW. Remember the Y =value on the Test feature must be inclusive of 0 and 1. A sample window is on the leftbelow.
Press <GRAPH> (the screen on the right shows the graph before <TRACE> is pressed).
wINpowXrinIXmax 800Xscl 0Ymin -1Ymax 2Ysc1-0Xres=1
3 ?
Eisenhower Regional Consortium for Mathematics and Science Education at AEL Lesson 2 / 23
Graphing Calculators in Mathematics Grades 7-12
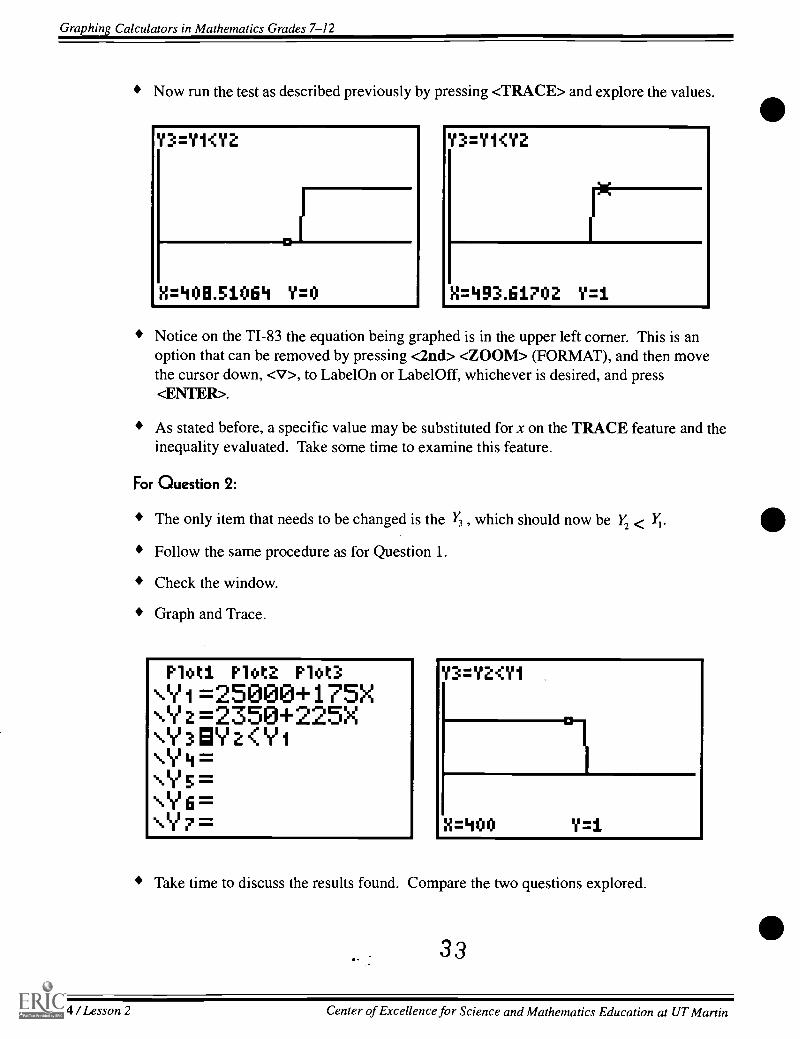
Now run the test as described previously by pressing <TRACE> and explore the values.
Y3=Yi<Y2
H=493.61702 Y=1
Notice on the TI-83 the equation being graphed is in the upper left corner. This is anoption that can be removed by pressing <2nd> <ZOOM> (FORMAT), and then movethe cursor down, <V>, to LabelOn or LabelOff, whichever is desired, and press<ENTER>.
As stated before, a specific value may be substituted for x on the TRACE feature and theinequality evaluated. Take some time to examine this feature.
For Question 2:
The only item that needs to be changed is the Y3 , which should now be
Follow the same procedure as for Question 1.
Check the window.
Graph and Trace.
P101 P102 P103W 1 =25000+175XW 2=2350+225XWAY2<Y1\Y 4N.Y5=
W 7
y2 < yi. e
Take time to discuss the results found. Compare the two questions explored.
33
24 /Lesson 2 Center of Excellence for Science and Mathematics Education at UT Martin

Graphing Calculators in Mathematics Grades 7-12 *Question 3:
Replace Y3 with Y1 = Y2 This can be done by following the procedure previously discussed.
Since the equality would be only one point, the graphing method of testing will not be aworking method. At this time it would be better to use the Table feature. As done previ-
ously, turn off yi and y2 and turn on Y3
P101 P1ot2 P103\Y1=25000+175X\ Y2=2350+225XW AY2 Yl\YLI-W s=
\ Y7=
Since the inequalities have been discussed the students have an idea of the values that willsatisfy the equation.
To use the Table feature: Press <2nd> <WINDOW> (TBLSET ) Press <ENTER>.
Set TBLStart =450 and A Tbl= 1
X Y3450 0451 0
Lii11. 2454 0455 0456 0
X=453
Press <2nd> <GRAPH> (TABLE).
TABLE SETUPTb1Start=450ATb1=1Indpnt: Hu c AskDepend: Aut Ask
Eisenhower Regional Consortium for Mathematics and Science Education at AEL Lesson 2 / 25

Graphing Calculators in Mathematics Grades 7-12
Notice all of the values have a Y value of 0 except 453. The Y value for 453 is1, therefore 453 is the number of people that will make the equation true.
At this time the user should be able to apply the information of this activity tosolve any inequality.
Have students complete the Activity Two Handout.
35
26 /Lesson 2 Center of Excellence for Science and Mathematics Education at UT Martin

Graphing Calculators in Mathematics Grades 7-12
Activity Two Handout
Application Problem:
You have been nominated to plan your Senior Class Trip. YEA 9
The class decided to take a cruise to the Bahamas ellil UlEAlifivo 29 and only two cruiselines offer group packages.
The Party Line has a flat fee of $25,000 and an additional $175.00 per person,with a minimum of 250 people and a maximum of 500 people.
1. Write an inequality to represent this fee structure.
*
The Sun Ship has a flat fee of $2350 and an additional $225.00 per person, with a mini-mum of 300 people and a maximum of 750.
2. Write an inequality to represent this fee structure.
3. Use your graphing calculator to answer the following questions:
a. How many people would make the Party Line package the better offer?
b. How many people would make the Sun Ship package the better offer?
c. How many people would make the two packages equal?
33
Eisenhower Regional Consortium for Mathematics and Science Education at AEL Lesson 2 / 27
Graphing Calculators in Mathematics Grades 7-12
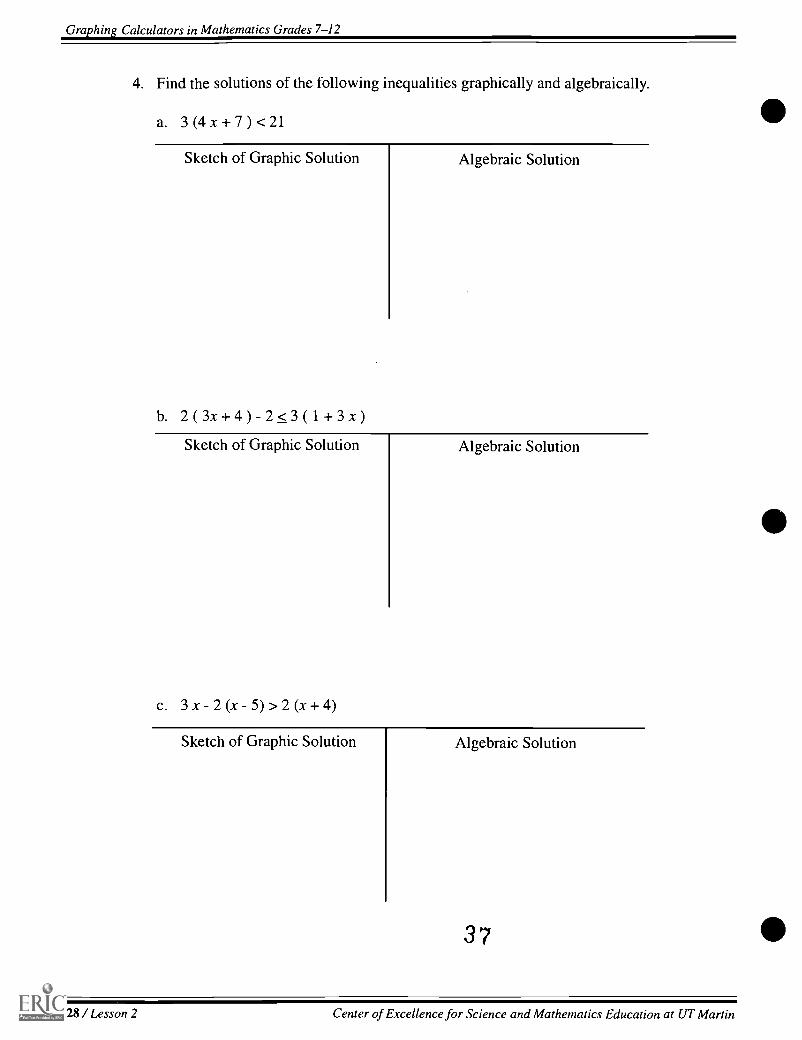
4. Find the solutions of the following inequalities graphically and algebraically.
a. 3(4x+7)<21
Sketch of Graphic Solution
b. 2(3x+4)-2<3(1+3x)
Algebraic Solution
Sketch of Graphic Solution
c. 3x-2(x-5)>2(x+4)
Algebraic Solution
Sketch of Graphic Solution Algebraic Solution
3 7
28 /Lesson 2 Center of Excellence for Science and Mathematics Education at UT Martin
Graphing Calculators in Mathematics Grades 7-12
Lesson 3: Solving Inequalities on the TI-83
"
Authors
* Cindy Leake, Hunters Lane HSNashville, TN
* Sue Moser , Hunters Lane HS
Nashville, TN
Approximate Time Needed For LessonOne to two traditional class periods or one90-minute period
Content AreaPatterns, Functions, and Algebraic Thinking
Process StandardsReasoning and Connections withinMathematics
Goals for Students
To solve inequalities graphicallyTo algebraically interpret graphic solutions of inequalities
Description or Summary of Lesson
Students in Algebra I or Algebra II are the intended audience. The lesson consists offour activities that, depending upon the students' calculator mastery, may be teacher
directed or structured for cooperative groups. The first activity focuses on single-variableinequalities, the second on absolute value inequalities, and the final two extend to two-variable and compound inequalities. The activities include examples as well as practiceexercises.
Background Information
This lesson is an introduction to solving inequalities on the TI-83 graphing calculator.Prior to the lesson, students should already have studied the algebraic solution of
simple inequalities.
Materials and Equipment
TI-83 graphing calculator with view screenOverhead projectorEach student will need:4 access to a TI-83 graphing calculator"V handouts
3 9
Eisenhower Regional Consortium for Mathematics and Science Education at AEL Lesson 3 /29

Graphing Calculators in Mathematics Grades 7-12
Activities One to Four
Teacher Notes
Outline:ot. Teacher leads students through the example in Activity One: Single-Variable
Inequalities Handout.ag> Working in cooperative groups, students complete Activity One Handout.cg> Teacher leads students through the example in Activity Two: Absolute Value
Inequalities Handout.cg> Working in cooperative groups, students complete Activity Two Handout.cg> Teacher leads students through the example in Activity Three: Graphing Inequali-
ties in Two Variables Handout.cg> Working in cooperative groups, students complete Activity Three Handout.eg> Teacher leads students through the example in Activity Four: Compound Inequali-
ties Handout.cg> Working in cooperative groups, students complete Activity Four Handout.
3 9
30 /Lesson 3 Center of Excellence for Science and Mathematics Education at UT Martin

Graphing Calculators in Mathematics Grades 7-12
Activity One Handout: Single-Variable Inequalities
Example:
x 5 < 12
In function mode (<MODE> and highlight FUNC), press <Y=> and enter the left side ofthe inequality in Yi , the right side in Y2. Set an appropriate <WINDOW> so that anypoint(s) of intersection show and press <GRAPH>.
Note: Be sure plots are turned off by <2nd> <STAT PLOT> <4>.
KW/ MU mu
W 21312
W s-
\Y7
WINDOWXmin=-10Xmax=20Xsc1=1Ymin=-10Ymax-15Yscl 1
Xres 1I
Find the point of intersection of the two lines by pressing <2nd> <TRACE> (Calc) <5>(Intersect) and then <ENTER>, <ENTER>, <ENTER>. Note: For Guess? have thecursor near the point of intersection.
WMANWIlm1:value2:zer93:minlmum4:maximumalintersect6:eN/dx7:Jrf(x)dx
Eisenhower Regional Consortium for Mathematics and Science Education at AEL Lesson 3 /31
4 0

Graphing Calculators in Mathematics Grades 7-12
Observe that the graph of y = x 5 is below (less than) that of the graph of y = 12 for all
values of x to the left of (less than) 17. Therefore, the solution is x < 17.
Excercises
a. Graph each of the following on your calculator, then sketch the graph on the grid pro-vided.
b. Indicate the solution set with a statement of inequality.
1. x-4 <3
MEMMII11111111111111111.11111111M111111111=11111
1111111111111111I4 1
2. 2x+6 > 411111111111MINEMM....1111111111M11111111111.M1111111111111111MENNEMM=111111111MMIIIIIIIIIMMEMNI1111111111MENNEIIIIIIIMMM1111111111IMMEMIMMIIIIMEMIIIIMI1 =MENEM
MENEM=
32 / Lesson 3 Center of Excellence for Science and Mathematics Education at UT Martin

Graphing Calculators in Mathematics Grades 7-12
Activity Two Handout: Absolute Value Inequalities
Example:
lx+21>5
Again, use the graphing technique. Note: abs( is found at MATH, NUM, 1:.
Plot/ P1ot2 P1ot3\ Y1 Dabs (X+2)\Y2135\Y 3
Y\ Y 5
Y\Y
WINDOWXmin= -10Xmax=10Xsc1=1Ymin= -10Ymax=10Yscl 11Xres 1
First curye?N=1.914E1936 Y=3.914E1936
2
Guess?X=2.9787234 Y=5
42
Eisenhower Regional Consortium for Mathematics and Science Education at AEL Lesson 3 /33

Graphing Calculators in Mathematics Grades 7-12
Repeat the above procedure.
Note: The calculation for intersection must be applied twice in order to find both points. Thefirst time move the cursor close to one intersection point for Guess?; the second time, movethe cursor over to the other point of intersection for Guess? before pressing the third<ENTER>.
We may write our solution to the inequality by noting that the absolute value graph hasvalues greater than the line y = 5 when it is above it. That occurs for values of x that areto the left of -7 or to the right of 3. Thus the solution is the union of the two sets,x < 7 or x > 3 -
4 3
34 / Lesson 3 Center of Excellence for Science and Mathematics Education at UT Martin

Graphing Calculators in Mathematics Grades 7-12
Exercises:
a. Graph each of the following on your calculator, then sketch the graph on the grid pro-vided.
b. Indicate the solution set with a statement of inequality.
1. 1 2x-31 >57
x
2. 1 3x 4 1 < 7 .7
Eisenhower Regional Consortium for Mathematics and Science Education at AEL Lesson 3 /35

Graphing Calculators in Mathematics Grades 7-12
Activity Three Handout: Graphing Inequalities in Two Variables
Example:yx 3
Entering x 3 in l'i will graph the line y = x 3. To graph the inequality, we need allpoints above the line where y = x 3 as well as those on the line. To accomplish this, use<4 > to move the cursor to the left of Yi . Press <ENTER> until shading is shown abovethe slanted line to the left of 11. (See left screen below.) Pressing <GRAPH> in anappropriate window gives the desired solution.
P1011 P102 P1031Y1EX 3\Y2 I\Y3\Y4W 5=W SW 7
Note: The graph of y > x 3 must be graphed in the same manner. When transferring thegraph to paper, the difference is noted by a solid line when equality is included; a broken ordashed line when it is not.
For y < 2x + 1, the area below the slanted line on the <Y=> screen should be shaded.
P1011 P1012 P103ILY1M2X+1N.Y2=1W Y3N.Y4\Y5W fiW 7
4 5
36 /Lesson 3 Center of Excellence for Science and Mathematics Education at UT Martin
Graphing Calculators in Mathematics Grades 7-12
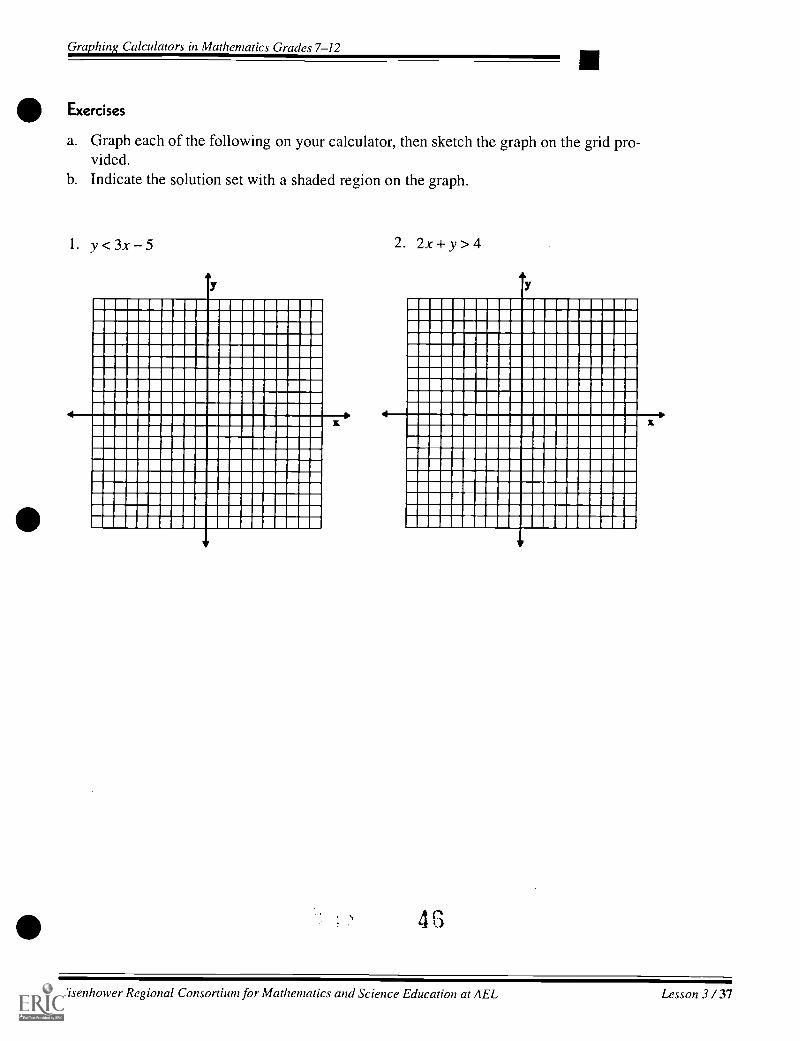
Exercises
a. Graph each of the following on your calculator, then sketch the graph on the grid pro-vided.
b. Indicate the solution set with a shaded region on the graph.
1. y<3x-5
4
2. 2x+y>4
4G
Eisenhower Regional Consortium for Mathematics and Science Education at AEL Lesson 3 /37

Graphing C'alculators in Mathematics Grades 7-12
Activity Four Handout: Compound Inequalities
Example:
x + y <1
y x 1
First solve for y in x + y < 1: y < 1 x.
Enter these in the <Y=> menu including appropriate shading as in Activity Three.
P101 P102 P1ot3L Y11:11 X' AX 1N.Y3
Ws=WfiN.Y7
The area where the shading overlaps is the solution set.
For inequalities involving x as the only variable, the <WINDOW> is the best method ofisolating the given area.
Example:
x > 0y< x+ 3
WINDOWXmin=0Xmax=10Xsc1=1Ymin=-10Ymax=10Ysc1=1Xres=1
P101 Plota P1ot3LY1EX+3W 2=1
W s=W fi=\Y?
4 7
38 / Lesson 3 Center of Excellence for Science and Mathematics Education at UT Martin
Graphing Calculators in Mathematics Grades 7-12
4 3
Eisenhower Regional Consortium for Mathematics and Science Education at AEL Lesson 3 /39

Graphing Calculators in Mathematics Grades 7-12
Exercises
Graph the following system of inequalities on the calculator, and sketch it on the gridprovided.
x < 3y < 6
y?.x+11111111111111=11111111111MIIMMIII1111111111MIN11111IMIIIIMI1111111111111111MINMM11111111111111111111=1111fflIMMIIIIIIIM1111111111=1111111M11111110111111.1111111111.1111111.-1111=11111111.MMIIMINIIIIMIIIIIMIIMINMEM111011111111MII111111M111111111=11111=1111111111111ifinIMIN1111111111.01.111.1111E1111111111=1111MINIIIIMIIIIIMMIIMIMIMIIIN11111111M1111111=11111M11111111111111111111111111WIlli1111111111111111IIIIMIIIIMIIIMIIIIIIMINIMININIIII
Is the given point a solution to this system of inequalities? Justify each algebraically aswell as graphically.
4 9
40 / Lesson 3 Center of Excellence for Science and Mathematics Education at UT Martin

Graphing Calculators in Mathematics Grades 7-12
Authors* Edith Lancaster
Central HS, Bruceton, TN* Jo Ann Simmons
Peabody HS, Trenton, TN
Lesson 4: Starting With Stats
Approximate Time Needed For Lesson:Two traditional class periods
Content AreaStatistics and Probability
Process Standards
Problem Solving, Reasoning, Connections,Communication
All
Goals for Students
To collect and organize data from various sourcesTo find measures of central tendencyTo choose, construct, and analyze the appropriate graphical representation for a dataset using both calculator and non-calculator methods
Description or Summary of Lesson
rr he intended audience would include students in middle grades (7-8), Pre-Algebra,Math Tech I, Algebra I, and/or Probability and Statistics. Students will work indi-
vidually or in small groups. The students will collect real-world data for one-variablestatistical data analysis using both non-calculator and calculator activities.
Background Information
S tudents should have basic keystroke skills on a TI-82 or TI-83 and have studied basicstatistics prior to this lesson.
Materials and Equipment
View screen with graphing calculatorOverhead projectorOne TI-82 or TI-83 for every two studentsResources for data: almanacs, Internet (such as the variety of government statisticsfound at <http://www.lib.utk.edu/gpo/fedstats.html>), magazines, encyclopedias,Book of Facts, etc.Each student will need:
graph paperhandouts
5 0
Eisenhower Regional Consortium for Mathematics and Science Education at AEL Lesson 4 /41
Graphing Calculators in Mathematics Grades 7-12
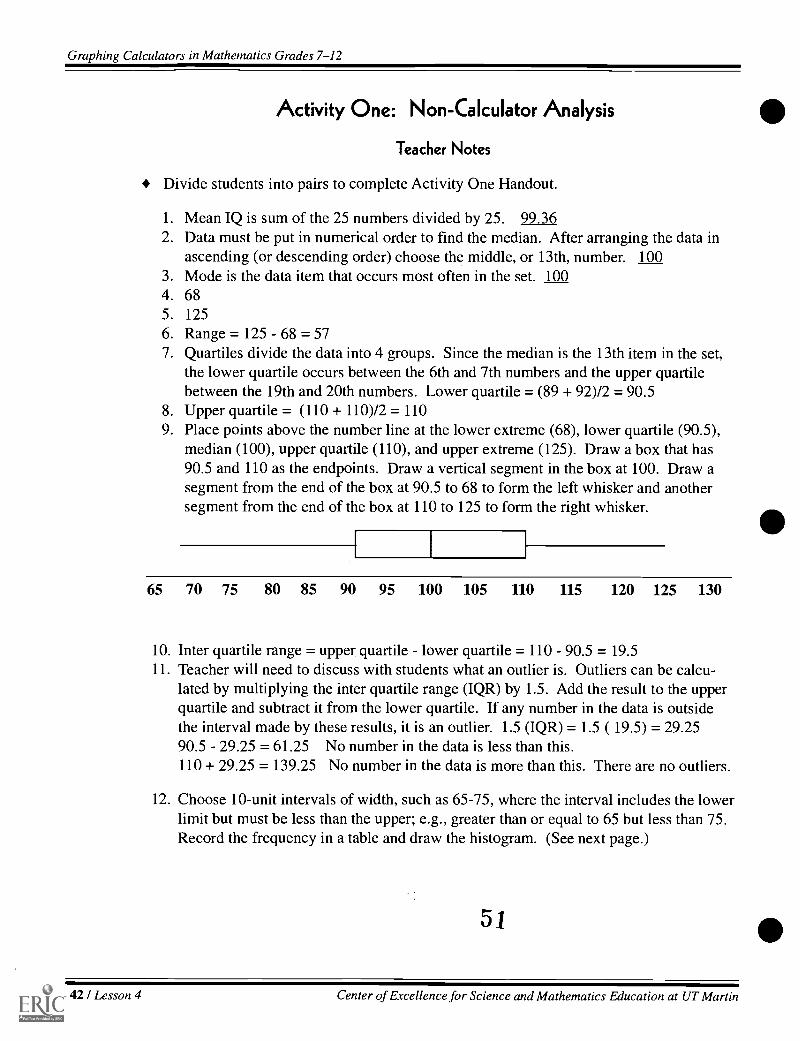
Activity One: Non-Calculator Analysis
Teacher Notes
Divide students into pairs to complete Activity One Handout.
1. Mean IQ is sum of the 25 numbers divided by 25. 99.362. Data must be put in numerical order to find the median. After arranging the data in
ascending (or descending order) choose the middle, or 13th, number. 1003. Mode is the data item that occurs most often in the set. 1004. 685. 1256. Range = 125 68 = 577. Quartiles divide the data into 4 groups. Since the median is the 13th item in the set,
the lower quartile occurs between the 6th and 7th numbers and the upper quartilebetween the 19th and 20th numbers. Lower quartile = (89 + 92)/2 = 90.5
8. Upper quartile = (110 + 110)/2 = 1109. Place points above the number line at the lower extreme (68), lower quartile (90.5),
median (100), upper quartile (110), and upper extreme (125). Draw a box that has90.5 and 110 as the endpoints. Draw a vertical segment in the box at 100. Draw asegment from the end of the box at 90.5 to 68 to form the left whisker and anothersegment from the end of the box at 110 to 125 to form the right whisker.
65 70 75 80 85 90 95 100 105 110 115 120 125 130
10. Inter quartile range = upper quartile lower quartile = 110 90.5 = 19.511. Teacher will need to discuss with students what an outlier is. Outliers can be calcu-
lated by multiplying the inter quartile range (IQR) by 1.5. Add the result to the upperquartile and subtract it from the lower quartile. If any number in the data is outsidethe interval made by these results, it is an outlier. 1.5 (IQR) = 1.5 ( 19.5) = 29.2590.5 29.25 = 61.25 No number in the data is less than this.110 + 29.25 = 139.25 No number in the data is more than this. There are no outliers.
12. Choose 10-unit intervals of width, such as 65-75, where the interval includes the lowerlimit but must be less than the upper; e.g., greater than or equal to 65 but less than 75.Record the frequency in a table and draw the histogram. (See next page.)
51
42 / Lesson 4 Center of Excellence for Science and Mathematics Education at UT Martin

Graphing Calculators in Mathematics Grades 7-12 A
Interval Frequency65-75 1
75-85 1
85-95 6
95-105 10
105-115 4115-125 2 1 I
65 75 85 95 105 115 125
13. Before the writing assignment you might want to discuss normal distribution, middlehalf of data being in the inter quartiles (the box in the box and whisker plot), length ofwhiskers representing the "spread" of the data, etc. After each student writes his analy-sis, switch partners and discuss the findings.
Eisenhower Regional Consortiuni for Mathematics and Science Education at AEL Lesson 4 / 43
Graphing Calculators in Mathematics Grades 7-12
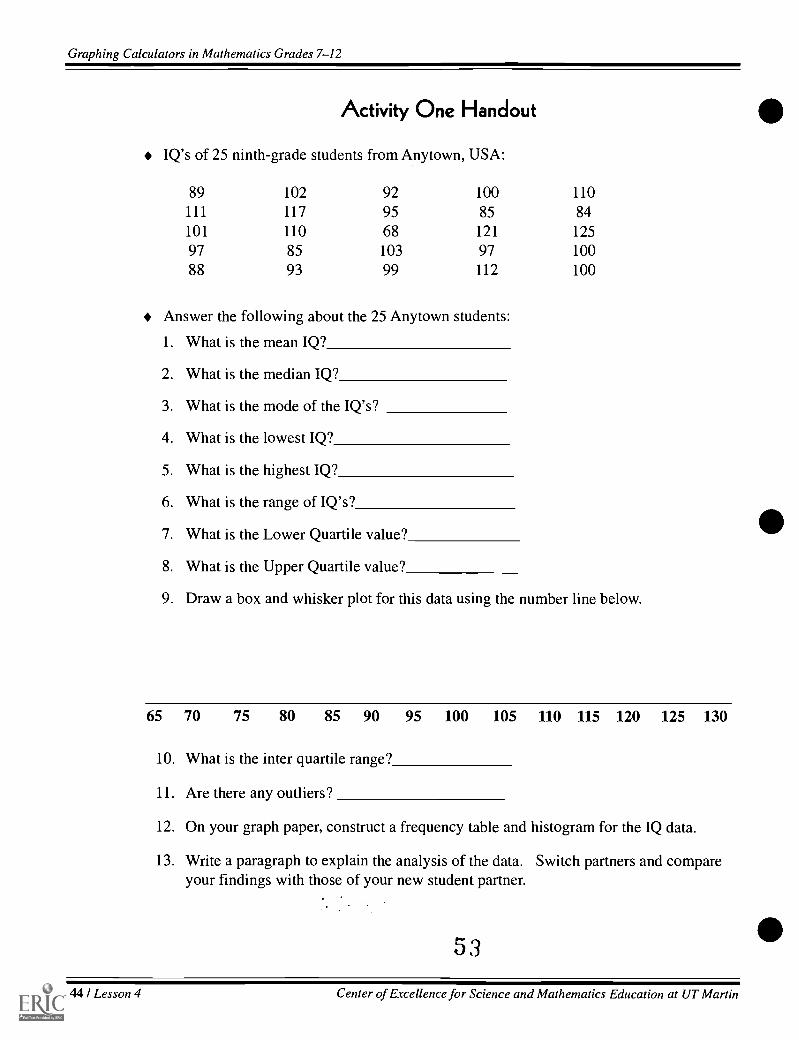
Activity One Handout
IQ's of 25 ninth-grade students from Anytown, USA:
89 102 92 100 110111 117 95 85 84101 110 68 121 12597 85 103 97 10088 93 99 112 100
Answer the following about the 25 Anytown students:
1. What is the mean IQ?
2. What is the median IQ?
3. What is the mode of the IQ's?
4. What is the lowest IQ?
5. What is the highest IQ?
6. What is the range of IQ's?
7. What is the Lower Quartile value?
8. What is the Upper Quartile value?
9. Draw a box and whisker plot for this data using the number line below.
65 70 75 80 85 90 95 100 105 110 115 120 125 130
10. What is the inter quartile range?
11. Are there any outliers?
12. On your graph paper, construct a frequency table and histogram for the IQ data.
13. Write a paragraph to explain the analysis of the data. Switch partners and compareyour findings with those of your new student partner.
53
44 / Lesson 4 Center of Excellence for Science and Mathematics Education at UT Martin

Graphing Calculators in Mathematics Grades 7-12
AActivity Two: TI-82 or TI-83 Calculator Analysis
Teacher Notes
The teacher will guide the students through this exercise using the Activity Two Handout.This activity is designed to prepare the students to analyze the data they collect in
Activity Three.
r 4
Eisenhower Regional Consortium for Mathematics and Science Education at AEL Lesson 4 / 45

Graphing Calculators in Mathematics Grades 7-12
Activity Two Handout
1. Enter the data from Activity 1 into your calculator by pressing <STAT> <1> (Edit).
CALC TESTSit_
SortA(3:SortD(4:ClrList5:SetUpEditor
TI-83
CALCit_
SortA(3:SortD(4:ClrList
TI-82
2. If the lists have data already entered in the columns, use the up arrow to highlight Ll,press the <CLEAR> key and the <ENTER> key. This should clear the data from thatcolumn. You may clear each of the columns this way.
3. You may also go back to the screen above by pressing <STAT> and <4> followed by thelists you want to clear separated by commas and then <ENTER>. L1 is above the 1 key(<2nd> <1>), L2 above the 2 key, etc. This will clear all the lists at once.
4. When the lists have been cleared, press <STAT> <1> (Edit). The displays for TI-82 andTI-83 are similar.
5. Enter data by typing 89, press <ENTER>; 111, <ENTER>; 101, <ENTER>,etc., until allthe data has been entered.
Li L2 L3 1
0911110197GB
Ll(7)= 1 17
Li L2 L3 1
11211004125
AMLi(25) =11313
5546 / Lesson 4 Center o Excellence for Science and Mathematics Education at UT Martin

Graphing Calculators in Mathematics Grades 7-12 A1. Construct a box and whisker plot for the data by pressing <2nd> <Y => (STAT PLOT).
fLE, L1 La a
2:Plot2...OffI41.1 L2 .
3:Plot3...OffLi La a
4W1otsOff
2. Choose 1: by pressing <ENTER>
oti Plota 1)103In UftType: un Ah
FL14..
Xlist:LiYlist:L2Mark:
TI-83
Plot1OnTYAINN LL dbbX1 i st 130 La L3 1.4 LS L6Yli St : Li gigi L3 1.4 LS L6Mark: CI +
TI-82
3. Press <ENTER> to turn the plot on. <N, > one time and then <I.> to the box and whis-ker plot. The TI-83 will have 6 choices for Typechoose the 5th one. The TI-82 willhave four choiceschoose the 3rd one. Press <ENTER>.
4. <y > one time. If Xlist is not set at Li, do this by pressing <2nd> <I>. The Frequencyshould be set at 1.
10u.
JrP1ot2 P1ot3
Offype:L L Mb
0. i'dg;
FrecOM
TI-83
Plot1giti OffTYPe:117.EZithbX1 i St 1313 La L3 1.4 LS L6Fred: 13 Li L2 L3 LS L6
TI-82
5. Set the viewing window by pressing <WINDOW> and making the following entries:Xmin = 60, Xmax= 130, Xscl = 10, Ymin = -2, Ymax = 4, Yscl = 1
WINDOWXmin=60Xmax=130Xsc1=10Ymin=-2Ymax=4Ysc1=1Xres=1
:JU
Eisenhower Regional Consortium for Mathematics and Science Education at AEL Lesson 4 / 47

Graphing Calculators in Mathematics Grades 7-12
6. Press <GRAPH> to see the box and whisker plot. Press <TRACE>.
TI-83
Pi
Med=100
TI-82
7. Notice the <TRACE> key is showing the median IQ. Press <I.> once to see the UpperQuartile(Q3) and press again to see the Upper Extreme. By pressing the <4 > you canfind the Lower Quartile (Q1) and the Lower Extreme.
8. To find the mean IQ using the calculator press <2nd> <STAT> and then press <1.> tohighlight MATH. Choose 3: (mean). Press <ENTER>.
9. Mean will appear on the home screen. Press <2nd> <1> and then < ) > to name Ll asthe argument of the function. Press <ENTER> and the answer appears.
NAMES OPS mum1:min(2:max(Egemean(4:median(5:sum(6:prod(nstdDev(
mean(L1)99.36
TI-83
OPS amma1:min(2:max(Namean(4:median(5:sum6:prod
mean(L1)99.36
TI-82
5 7
48 / Lesson 4 Center of Excellence for Science and Mathematics Education at UT Martin

Graphing Calculators in Mathematics Grades 7-12
A10. To find the mode of the data, the data should be placed in numerical order. This can be
done by pressing <STAT> and choosing 2 SortA(.
11. Press <ENTER> and press <2nd> <1> < ) > to enter L1 as the argument.
12. Press <ENTER> to arrange the data in numerical order.
13. Press <STAT> and choose Edit, press <ENTER> to see the sorted data. Choose themode from the sorted data.
mean(Li )99.36
SortA(Li)Done
Li L2 13 1
fiBEl'iBSBS
q92
Li (fi)=89
Li L2 L3 1
99100100100101
A=Luis) =103
14. To see the histogram return to the STAT PLOT menu by pressing <2nd> <Y =>.Change the Type from the box and whisker plot to the histogram.
[
P1ot2 P1ot3Off
ype: I. Lc !CP
Xlist:L1FrecoM
"10
TI-83
plot1a Offi ype: I. Pc1}4!0
>41 i st : El La L31.4 LS LfiFreci: NI Li 12 L3 Lli LS Lfi
5 3
TI-82
Eisenhower Regional Consortium for Mathematics and Science Education at AEL Lesson 4 / 49

Graphing Calculators in Mathematics Grades 7-12
15. Press <WINDOW> and set Xmin = 65, Xmax = 125, Xscl = 10, Ymin = -3, Ymax = 12,and Yscl = 1. Press <GRAPH> to see the histogram.
FORMAT14M65Xmax=125Xsc1=10%in= -3Ymax=12Ysol=1
16. You will want to do exploration using the <TRACE> key.
59
50 / Lesson 4 Center of Excellence for Science and Mathematics Education at UT Martin

Graphing Calculators in Mathematics Grades 7-12
Activity Three: Analysis of Real-World Data
Teacher Notes
Outline:
Topics should be discussed with class and selection made to avoid duplication of data.Some suggestions for topics would be salaries of tennis players, height of teammembers on a professional basketball team, weight of team members from schoolfootball program, maximum speeds of animals, number of consonants in names ofclass members, grades on quiz, or similar one-variable data.
1°I)' Students should be given 2-3 days to collect data. Any library source, Internet source,or personal collection of data should be allowed.
cg> This activity would be be done as a project.
0=1' Assessment should be based on originality of data, completion of project on time,neatness, organization of data, and quality of analysis.
0
Eisenhower Regional Consortium for Mathematics and Science Education at AEL Lesson 4 /51

Graphing Calculators in Mathematics Grades 7-12
Activity Three Handout
1. Choose a topic to research.
2. Collect data that has at least 10 items. Sources for data research:4 Magazines, especially sports topics4 Almanacs, e.g., Information Please Almanac, The World Almanac
Book of FactsAl Encyclopedias4 Internet sources, e. g., <http://www.lib.utk.edu/gpo/fedstats.html> has a wealth of a
variety of government statistics including Census data, economic, agricultural, etc.
3. Source of Data (title of publication or URL for Internet data)
4. Using Activity Two as a guide, analyze the data. If a box and whisker plot or histogramdoes not best represent your data, try some other graphing representation. Sketch a graphof your data below and answer the following questions:
What is the mean for your data ?
What is the median of your data?
What is the mode?
What is the lowest
What is the highest
What is the range of
What is the Lower Quartile value?
What is the Upper Quartile value?
Are there any outliers?
52 / Lesson 4 Center of Excellence for Science and Mathematics Education at UT Martin

Graphing Calculators in Mathematics Grades 7-12
5. Write a paragraph to explain the analysis of the data.
r.)
A
Eisenhower Regional Consortium for Mathematics and Science Education at AEL Lesson 4 / 53

Graphing Calculators in Mathematics Grades 7-12
Adaptations:
For upper-level mathematics courses, include longer data sets, standard deviation, vari-ability, frequency distribution, normal distribution with probability.
Other types of graphical representation such as stem and leaf plots or scatter plots andprediction equations could be included.
Comparisons of two sets of data with two box and whisker plots or stem and leaf plotscould be made.
Suggested Teacher Resource:
Investigating Probability and Statistics, Using the TI-82 Graphics Calculator byGraham A. Jones, Beverly S. Rich, Carol A Thornton, and Roger Day, Addison-WesleyPublishing Company, 1996. (Student Edition and Teacher Guide)
6 3
54 / Lesson 4 Center of Excellence for Science and Mathematics Education at UT Martin

Graphing Calculators in Mathematics Grades 7-12
Lesson 5: Investigating Slope
Author* Sylvia James
Brighton HS, Brighton, TN
Approximate Time Needed for Lesson
Two traditional class periods or one 90-minuteclass period
Content Area
Patterns, Functions, and Algebraic Thinking;Spatial Sense and Geometric Concepts
Process Standards
Connections, Problem Solving, and Communication
Goals for Students
To graph linear functionsTo determine the slope of a line given any two points on the lineTo articulate the relationship between the calculated slope of a line and its equationTo compare the slopes of parallel lines and perpendicular linesTo determine sets of parallel or perpendicular lines from their equationsTo use slope as rate of change to interpret and construct graphs in real-world situa-tions
IDDescription or Summary of LessonQtudents in Pre-Algebra, Algebra I, or Algebra II are the intended audience. In the
first activity, students will work individually or in pairs to explore the relationshipbetween slope and linear equations and to compare the slopes of parallel or perpendicu-lar lines. In the second activity students apply the concept of slope to describe a real-world situation. The graphing calculator will be used to enhance the investigations.
Background Information
This is a short, exploratory lesson that connects algebra and geometry and the realworld. It could serve as an introduction to a study of function families and "head of
family" functions. Prior to this lesson, students should be able to solve a linear equationfor y in terms of x and to use the formula to calculate slope. They should also be able todo coordinate graphing and have familiarity with basic keystrokes on a graphing calculator.
Materials and Equipment
Graphing calculator with view acreen, if availableOverhead projectorEach student will need:
access to a graphing calculator.1-2 sheets of graph paper 6 4red and black markershandouts
Eisenhower Regional Consortium for Mathematics and Science Education at AEL Lesson 5 / 55

Graphing Calculators in Mathematics Grades 7-12
Activity One
Teacher Notes
Outline:
'31> Review solving equations for y in terms of x and the slope formula.cg> Review geometric concepts: parallel lines and perpendicular lines'cl> Students complete Activity One Handout
Instructions For the Graphing Calculator:
Note: Press <2nd> <Y=> (STAT PLOT) <4> <ENTER> to turn all the stat plots off beforebeginning this activity.
After algebraically solving an equation for y in terms of x, enter an equation into thecalculator, by pressing the <Y=> key and the keyboard to enter each equation.
Y1132X1YA2X+3YAX/3Y4M-3X+2YA-X/2+1YAX/3-4YA-2X+1Yee-3X+1/2
Graph one equation at a time for this activity to be most effective. To deactivate anequation, use the arrow key and move the cursor onto the = sign in the <Y=> page. Press<ENTER>. The = key should no longer be highlighted. Set an appropriate window bypressing < ZOOM> <6>. The graph will appear on the screen. (See below.)
YlE2XY2=2X+3Y3=X/3Y4=-3X+2Ys=-X/2+1YG=X/3-4Y7=-2X+1Ye -3X+1/2
MUM FORMATXmin=-10Xmax=10Xsc1=1Ymin=-10Ymax=10Ys01-1
65
56 / Lesson 5 Center of Excellence for Science and Mathematics Education at UT Martin

Graphing Calculators in Mathematics Grades 7-12
Repeat the above procedure for the other seven equations.
To graph more than one equation, use the arrow key and the enter key to activatethe needed equations. For example, it is interesting to graph Y, , Y2, and Y5 at the same
time or perhaps Y4, n, and Y8.
, Y,, and 1, Y4 , n, and Y8
Find coordinates for two points by pressing <2nd> <Graph> (TABLE) and entering anytwo values for x in the X . The corresponding y-coordinates will apprear in the Y column(On the TI-83 press <ENTER> in the Y column for each coordinate to appear afterentering an x.)
X Yi2 45 10-3 -65 109 le11
Yi =2. .
Note: <TRACE> and 4.> will proviae coordinates of points on the graph, but the valuesmay be unnecessarily difficult to use. 66
Eisenhower Regional Consortium for Mathematics and Science Education at AEL Lesson 5 /57
Graphing Calculators in Mathematics Grades 7-12
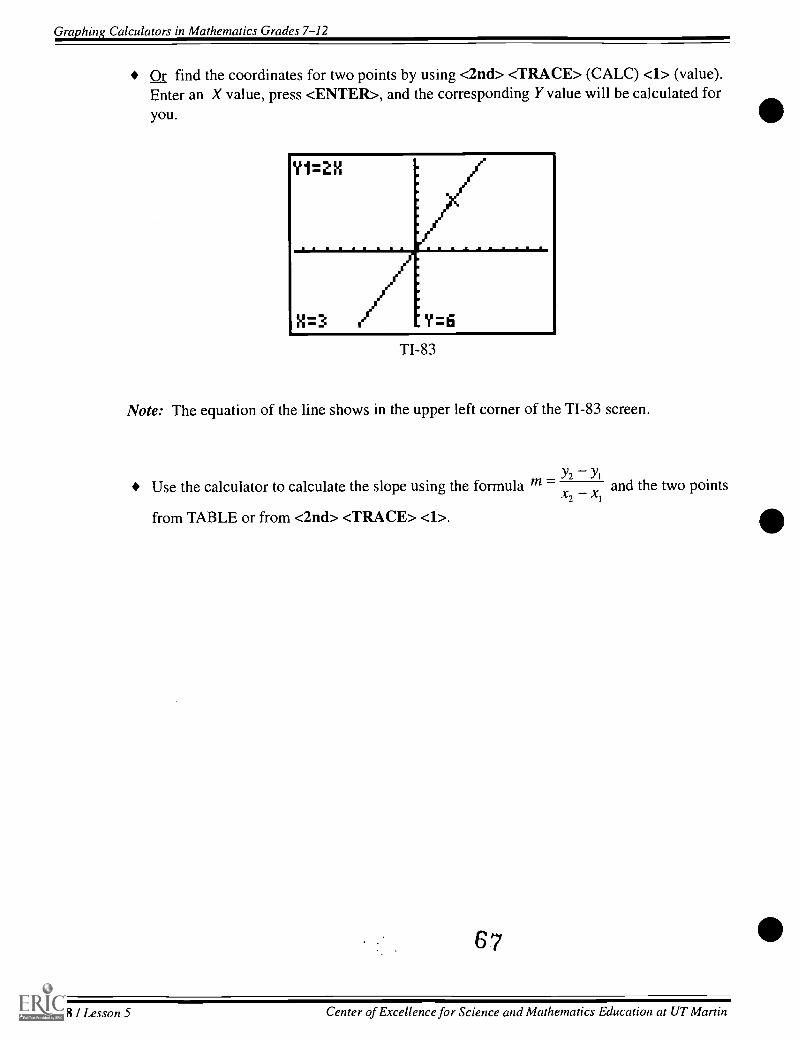
Or find the coordinates for two points by using <2nd> <TRACE> (CALC) <1> (value).Enter an X value, press <ENTER>, and the corresponding Y value will be calculated foryou.
TI-83
Note: The equation of the line shows in the upper left corner of the TI-83 screen.
2Y
Use the calculator to calculate the slope using the formula m and the two pointsx2
1
from TABLE or from <2nd> <TRACE> <1>.
6 7
58 / Lesson 5 Center of Excellence for Science and Mathematics Education at UT Martin

Graphing Calculators in Mathematics Grades 7-12
Activity 1 Handout
1-8. Solve each equation in the following chart for y in terms of x. Graph each equationusing the graphing calculator. Using <2nd> <TRACE> (CALC) <1> (value), findthe coordinates for 2 points on each line. Using the graphing calculator and the slopeformula, calculate the slope of each line. Complete the chart and use the informationto answer the questions that follow.
Functions y = Coefficienctof x,
2 Ordered Pairs CalculatedSlope
1 L' = x2
2 -2x+y=3
3 3y = x
4 y + 3x =2
5 2y =-x,+2
6 3y = x -12
7 y+2x =1
8 2y +6x -1 = 0
9. What do you notice about the coefficients of x and the calculated slope?
10. How do the slopes of functions 1, 2, and 5 compare?
63
Eisenhower Regional Consortium for Mathematics and Science Education at AEL Lesson 5/59
Graphing Calculators in Mathematics Grades 7-12
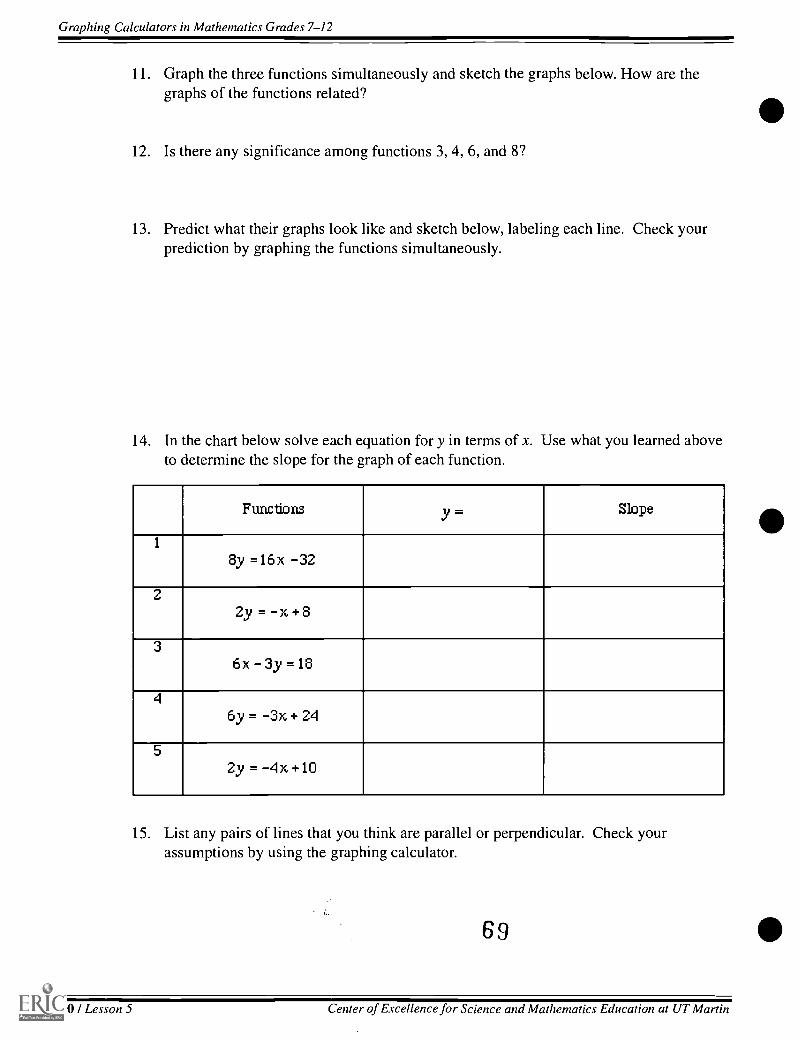
11. Graph the three functions simultaneously and sketch the graphs below. How are thegraphs of the functions related?
12. Is there any significance among functions 3, 4, 6, and 8?
13. Predict what their graphs look like and sketch below, labeling each line. Check yourprediction by graphing the functions simultaneously.
14. In the chart below solve each equation for y in terms of x. Use what you learned aboveto determine the slope for the graph of each function.
Functions y = Slope
1
8y =16x -32
22y = -x- + 8
36x -3y =18
46y = -3x + 24
52y = -4x.+10
15. List any pairs of lines that you think are parallel or perpendicular. Check yourassumptions by using the graphing calculator.
6 9
60 / Lesson 5 Center of Excellence for Science and Mathematics Education at UT Martin

Graphing Calculators in Mathematics Grades 7-12
16. Write a paragraph describing your conclusions from this investigation.
7 0
Eisenhower Regional Consortium for Mathematics and Science Education at AEL Lesson 5 / 61

Graphing Calculators in Mathematics Grades 7-12
Activity Two
Teacher Notes
Outline:
Review how to calculate slope. Students complete #1-#6 on the Activity Two Hand-out.
Students use graph paper to plot the ordered pairs at specific points of the path of aroller coaster.
Students complete Activity Two Handout.
Teacher and students discuss what appears to be happening between various points onthe curve. (Lead the student to discover positive slope, negative slope, same slope,zero slope, etc.)
cg> Students enter data into calculator to verify their graph.
Students calculate the slopes to test their assumptions.
Answers for Activity Two Handout:
Part I.
1. 1/2 2. -2
3. 1 4. 1/2
5. Yes, #1 and #4 have the same slope.
6. No, they could be collinear. However, from the graphs, they are parallel.
Part II.
1. Positive Slope
Example: (0,0) and (20,5)
Slope: 1/4
2. Negative Slope
Example: (120,130) and (140,120)
Slope = -1/2
71
62 / Lesson 5 Center of Excellence for Science and Mathematics Education at UT Martin
Graphing Calculators in Mathematics Grades 7-12
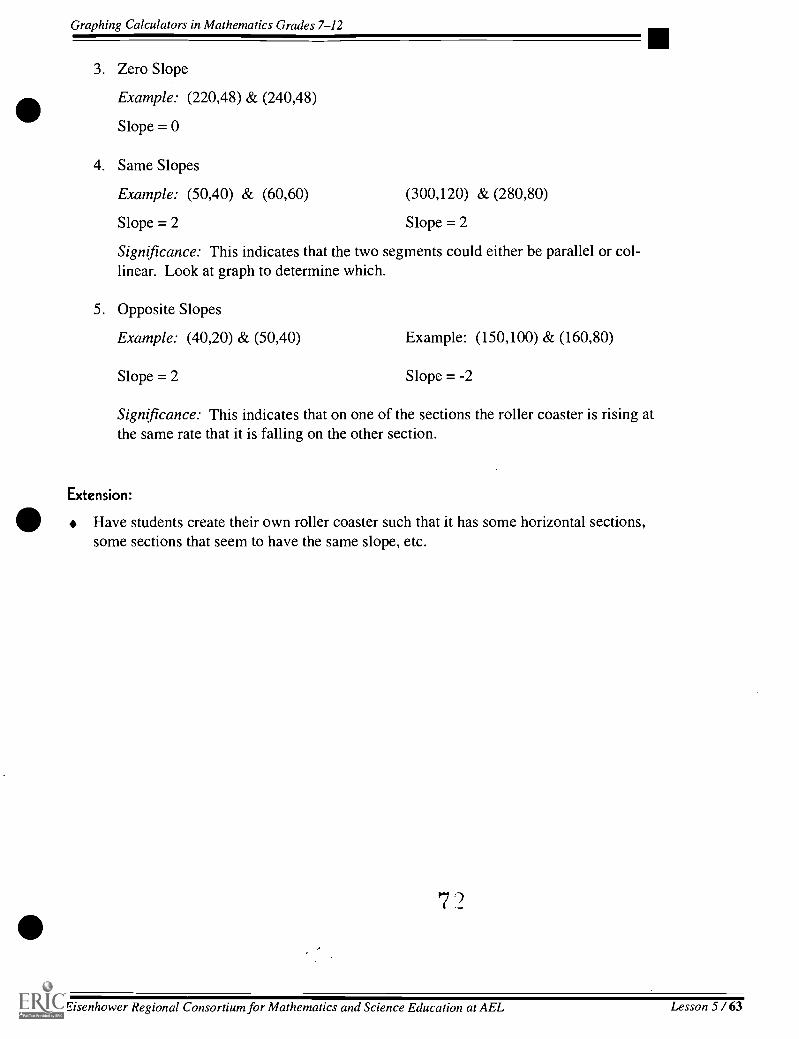
3. Zero Slope
Example: (220,48) & (240,48)
Slope = 0
4. Same Slopes
Example: (50,40) & (60,60) (300,120) & (280,80)
Slope = 2 Slope = 2
Significance: This indicates that the two segments could either be parallel or col-linear. Look at graph to determine which.
5. Opposite Slopes
Example: (40,20) & (50,40) Example: (150,100) & (160,80)
Slope = 2 Slope = -2
Significance: This indicates that on one of the sections the roller coaster is rising atthe same rate that it is falling on the other section.
Extension:
Have students create their own roller coaster such that it has some horizontal sections,some sections that seem to have the same slope, etc.
Eisenhower Regional Consortium for Mathematics and Science Education at AEL Lesson 5 /63

Graphing Calculators in Mathematics Grades 7-12
Activity Two Handout
-Part I.
Find the slope of the line segments connecting each pair of points below:
1. (0,4)(4,6)
2. (3,-5)(5,-9)
3. (3,6) 4. (8,6)(6,9) (12,8)
5. Do any of the line segments have the same slope?
6. If you answered yes in #5, does this mean that the segments connecting the points areparallel? To test your assumption plot the line segments below. Hint: Put a sheet ofgraph paper behind this handout to help with your graphs.
Part II. Graphing the path of the roller coaster
Problem: Graph the ordered pairs below on a sheet of graph paper with an appropriatescale. For a more realistic roller coaster graph, connect the points using smooth curvesinstead of jagged line segments. Assume the roller coaster starts at (0,0).
(0,0) (20,5) (40,20) (50,40) (60,60) (70,80) (80,100) (100,120)
(120,130) (140,120) (150,100) (160,80) (180,62.5) (200,47)
(220,48) (240,48) (260,58) (280,80) (300,120)
73
64 / Lesson 5 Center of Excellence for Science and Mathematics Education at UT Martin
Graphing Calculators in Mathematics Grades 7-12
1. Mark with a heavier black marker sections of the graph where the roller coaster is going
up.
2. Mark with a red marker sections of the graph where the roller coaster is going down.
3. Compute the slopes between the pairs of points for the black sections.
4. Compute the slopes between the pairs of points for the red sections.
5. What do you notice about the slopes in #3 and #4?
6. Are there any segments where the roller coaster appears to be traveling horizontally?Calculate the slope of any such segments.
7-8. For #7 and #8, pick pairs of segments that appear to fit the following conditions.Calculate the slope to test your assumptions.
7. Same slope (What is the significance of having the same slope?)
8. Slopes that are opposite (What is the significance of having an opposite slope?)
9. Enter the data into the Graphing Calculator TI-82 or TI-83:
Press <STAT> <1> (Edit).
TI-82: Enter the x-coordinates into the Li column and the y-coordinates into the 1,2column. The screen should appear like the following screen shot.
7 4
Eisenhower Regional Consortium for Mathematics and Science Education at AEL Lesson 5 / 65

Graphing Calculators in Mathematics Grades 7-12
L1 L2 VI s
0204050GO70BO
052040GOBO100
L3
Set an appropriate window such as the one below.
WINDOWMin=0Xmax=350Xsc1=20Ymin=0Ymax=140Ysc1=20Xres 1
Press <2nd> <Y=> (STAT PLOT) and <1>.
P102 Pkit3Off
Ellhaical
Xlist:L1Ylist:L2Mark: +
To enter Li for Xlist, press the <2nd> <1> ( LI). To enter 1,2 for YList, press the <2nd>
TI-83: Enter the x-coordinates into the X column and the y-coordinates into the Y column.
The screen should appear like the following.
X Y 114 3
0 020 540 2050 40GO GO70 BOBO 100
12 - 75
66 / Lesson 5 Center of Excellence for Science and Mathematics Education at UT Martin
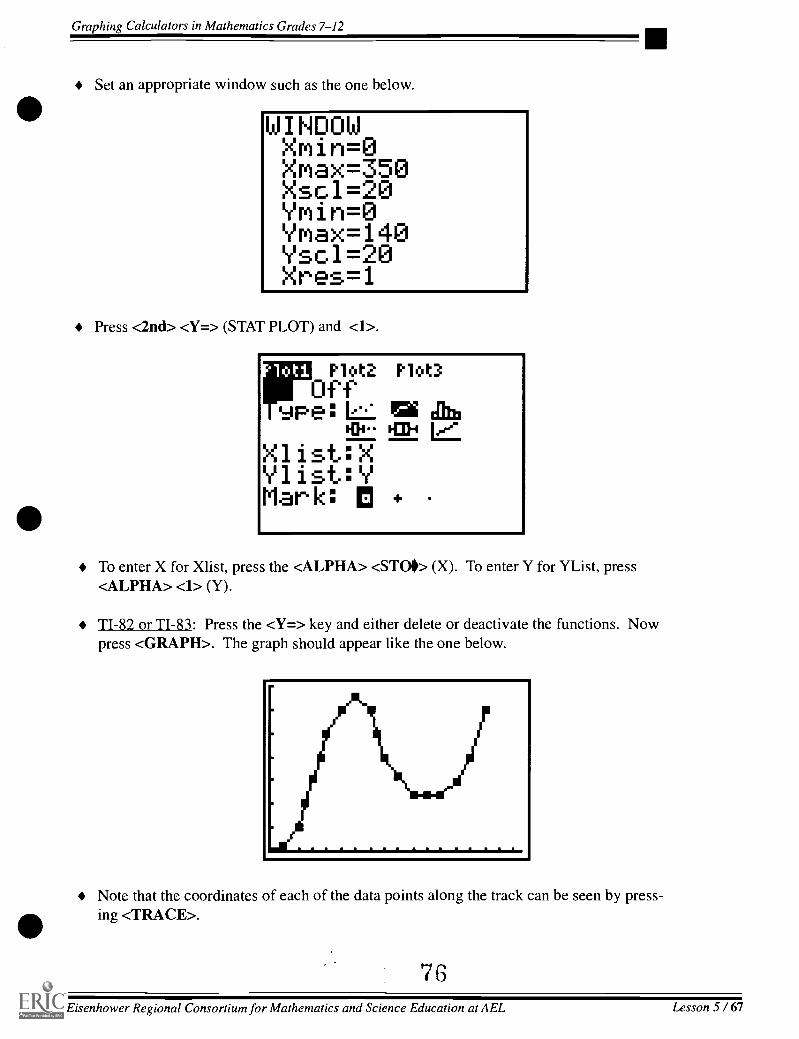
Graphing Calculators in Mathematics Grades 7-12
Set an appropriate window such as the one below.
WINDOWXmin=0Xmax=350Xsc1=20Ymin=0Ymax=140Yscl 20Xres 1
Press <2nd> <Y=> (STAT PLOT) and <1>.
wo.rfs,..t2 mot3
r...e:. sii Clhb
Xlist:XYlist:YMark: In 4.
To enter X for Xlist, press the <ALPHA> <STOO> (X). To enter Y for YList, press<ALPHA> <1> (Y).
TI-82 or TI-83: Press the <Y=> key and either delete or deactivate the functions. Nowpress <GRAPH>. The graph should appear like the one below.
Note that the coordinates of each of the data points along the track can be seen by press-ing <TRACE>.
713
Eisenhower Regional Consortium for Mathematics and Science Education at AEL Lesson 5 / 67

Graphing Calculators in Mathematics Grades 7-12
I
Authors* Peggy Bates,
Bledsoe County HS, Pikeville, TN
* Jennifer LocumEagleville School, Eagleville, TN
Lesson 6: Connecting Measurement
A
Approximate Time Needed for LessonOne 90-minute class period or two traditionalclass periods
Content AreaEstimation, Measurement, and Computation;Statistics and Probability; Spatial Sense andGeometric Concepts; Patterns, Functions, andAlgebraic Concepts
Process Standards
Connections, Problem Solving, and Reasoning
Goals for Students
To collect and summarize dataTo describe data with measures of central tendency and dispersion such as mean,median, quartiles, and extremesTo use formulas to derive measurements for volume and surface area in problem-solving situationsTo measure to the nearest inch and quarter inchTo express measurements in different waysTo use trial and error and successive approximations to derive missing values in aformula
Description or Summary of Lesson
S tudents in middle grades, Math Tech I, Pre-Algebra, or Algebra I are the intendedaudience. This lesson includes activities that connect measurement to geometry,
statistics, estimation, and the real world. Students may work individually or in pairs.
Background Information
P rior to this lesson students should have had experience with measuring length; boxand whisker plots; measures of dispersion and central tendency including mean,
median, quartiles, and extremes; and formulas for area and volume of simple geometricfigures. Some prior experience with calculators would be helpful but is not required.
Materials and Equipment
View screen with TI-82 or TI-83 graphing calculatorOverhead projector, if availableAssortment of cylindrical and rectangular solidsRulers in inches and/or centimetersEach pair of students will need:\I access to a TI-83 or TI-83 graphing calculator\I handouts
77Eisenhower Regional Consortium for Mathematics and Science Education at AEL Lesson 6 / 69

Graphing Calculators in Mathematics Grades 7-12
Activity One: Connecting Measurement to Statistics and Surface Area
Teacher Notes
Outline:
(71> Teacher discusses non-standard and standard units of measurement and history of someof our common units of measurement.
(g4> Students complete the data collection and use a graphing calculator to describe the data asdetailed in Activity One, Handout 1.
c:1> 3tudents convert cubits to feet and apply a formula for surface area of a rectangular solidin the problem-solving situation described in Activity One, Handout 2.
()=> Students convert cubits to feet and apply a formula for surface area of a rectangular solidin the problem-solving situation described in Activity One, Handout 3.
Traditionally measurements for ancient structures were in cubits, a measurement oflength equal to the length from the elbow to the fingertips. A cubit, however, would vary
from individual to individual. Determine the length the class might use as a measurement forthe cubit.
Note: Although the dictionary says a cubit is sometimes represented by 18 inches or as muchas 22 inches, it is more interesting to use a measure of central tendency such as the mean ormedian to describe or define or "standardize" a cubit.
Each student measures from his or her elbow to the tip of the middle finger. The infor-mation is recorded in the individual's journal and also on the chalkboard or a chart. Eachstudent or pair of students enters the data from the board into the graphing calculator as alist (as detailed in Activity One, Handout 1) and develops a box and whisker plot usingthe TI-82 or TI-83 in order to describe the data with the mean, median, quartiles, andextremes.
Each student will discuss with his or her partner or neighbor whether the median or themean would be the most appropriate estimation of cubit. The teacher will discuss thefindings and class consensus for the size of a cubit in contemporary units.
Note: When completing Handout 2, 2*L*W should be omitted since the roof and floorwould not be painted. When completing Handout 3, be sure students use the calculator keysfor it (<2nd> <A> on the TI-82 and TI-83).
The area of each Norman window would be 8 +1
x r2 sq. ft., which is approximately2
9.57 sq. ft. since the radius is 1.
78
70 / Lesson 6 Center of Excellence for Science and Mathematics Education at UT Martin

Graphing Calculators in Mathematics Grades 7-12
Activity One, Handout 1
AUse a TI-82 or TI-83 to graph the class measurements for a cubit, and describe a cubit asthe mean or median of the data collected. Enter the data for the class into your graphing
calculator as follows.
Press <STAT> <1>. If numbers are already in the first list ( LI or X for example) clear byhighlighting the heading and pressing <CLEAR> and <ENTER>.
< v >. Enter information in the first list (I or X) by entering each student's measure-ment for a cubit then press <ENTER> until all the data is in the list.
Next press <Y=> and either clear each Y or make sure no = sign is highlighted.
Then press <2nd> <Y=> (STAT PLOT) <1>.
Select ON by using <ENTER> and < > (Type).TI-82: <Is> to the third graph (box and whisker) and press <ENTER>.TI-83: <Is> to the fifth graph (box and whisker) and press <ENTER>.
<7> to Xlist and over to the list that contains your info (see screens below), <ENTER>.Leave or set Freq: 1.
Plot1a OffI vpe: rilbXlist: gigl La L3 L5 LfiFrei 121 Li L2 L3 L'i L5 Lfi
TI-82
woRt2pe:LLJhb.... .
Xlist:XFre9:1
TI-83
Set an appropriate window by pressing <WINDOW> so that Xmax and Ymax willincorporate your data. See the following sample windows:
7 9
Eisenhower Regional Consortium for Mathematics and Science Education at AEL Lesson 6 /71

Graphing Calculators in Mathematics Grades 7-12
WINDOWXmin=I2Xmax=35Xsc1=1Ymin=13Ymax=10Ysc1=1Xres=1
TI-82
nifg12Xmax=35Xsc1=1Ymin=0Ymax=10Yscl 1
FORMAT
TI-83
To see the box and whiskers graph of the class data, press <GRAPH>.
H
TI-82
Sketch your graph below.
I
TI-83
Press <TRACE> to move the cursor along the plot to obtain data such as the median,extremes, and quartiles.
To find the mean, press <2nd> <STAT> (LIST) andTI-82: <is> (Math).TI-83: <4> (Math).
Then press <3> (mean( ).80
72 / Lesson 6 Center of Excellence for Science and Mathematics Education at UT Martin

Graphing Calculators in Mathematics Grades 7-12
OPS aum1:minc2:max(giamean(4:median(5:sum6:prod
NAMES OPS alma1:mint2:max(gamean(4:median(5:sum(6:prod(nstdDev(
Enter the name of your list using the keyboard. For example, to find the mean of Li on
the TI-82, press <2nd> <1> ( Li ) and <)> <ENTER>.
Median
Q1
Min X
Mean
Q3
Max X
Do you think the mean or the median best describes a cubit? Why?
A
81
Eisenhower Regional Consortium for Mathematics and Science Education at AEL Lesson 6 /73

Graphing Calculators in Mathematics Grades 7-12
Activity One, Handout 2
Problem:
Afour-year institution in Dayton, TN, built its administrative wing using the dimensionsof an ancient boat. Suppose this vessel were 300 cubits long, 50 cubits wide, and 30
cubits tall. Using the class consensus for cubit from Handout One, convert these dimensionsto feet.
Use these conversions to calculate the surface area of the building. Recall that surfacearea for a rectangular solid is 2(LW) + 2 (WH) + 2(LH). However, do not paint the roofor the floor of the building. Disregarding windows, determine how much paint would beneeded to paint the building if a gallon of paint covers 350 square feet.
Hint: You can use your calculator to store the values needed to find the surface area byomitting the part of the formula that applies to the roof and the flooring. Store values byusing the following procedure.
TI-82 Enter length in feet and press <ST00.--> <ALPHA> <L> <2nd> < > ( : ).
Enter width in feet and press <STON.--> <ALPHA> <W> <2nd> < . > ( : ).
Enter height in feet and press <STOD--> <ALPHA> <H> <2nd> <. > ( : ).
TI-83 Enter length in feet and press <STOI> <ALPHA> <L> <ALPHA> < > ( : ).
Enter width in feet and press <STOO> <ALPHA> <W> <ALPHA> < . > ( : ).Enter height in feet and press <STOO> <ALPHA> <H> <ALPHA> < . > ( : ).
Then use similar keys as needed to enter the portion of the formula that you will be usingand complete the calculation for the total square feet to paint. From this answer calculatethe gallons of paint.
Formula you used:
Total square feet:
Gallons of paint needed:
74 / Lesson 6 Center of Excellence for Science and Mathematics Education at UT Martin

Graphing Calculators in Mathematics Grades 7-12
Activity One, Handout 3
Problem:
A II
If we suppose the administration building from Handout 2 has 40 Norman windows suchas the one pictured below, use your graphing calculator to find the amount of paintneeded.
Hint: Use keys similar to the ones you used in Handout 2.
4 feet
2 feet
Area of each window:
Total area of windows:
Total area to paint:
Number of gallons of paint needed:
8 3
Eisenhower Regional Consortium for Mathematics and Science Education at AEL Lesson 6 / 75

Graphing Calculators in Mathematics Grades 7-12
Activity Two:
Connecting Measurement to Estimation and Volume
Teacher Notes
Outline:(Et> Teacher reviews formulas for finding the volume of rectangular prisms and cylinders.
Working in pairs, students complete Handout 1.(1=1> Teacher reviews trial-and-error method of problem solving and method of successive
approximations.'Et> Working in pairs, students complete Handout 2.
A variety of rectangular prisms and cylinders are needed for this activity. The teachermay ask the students to collect and bring to class during the two or three weeks before theactivity.
For any of the calculations involving pi, students should use <2nd> <A> (7E) rather thanthe approximation 3.14.
The linear measurements may be done in inches or in centimeters. Cubic centimeters ormilliliters may be easier to estimate than cubic inches. Students may need encourage-ment to estimate the volumes.
Handout 2 key for missing values to two decimal places; the teacher may want to havethe estimates just to one decimal place or to the nearest unit.
Cylinder Radius Height CalculatedVolume
1 12 units 1.04 units 470 cubicunits
2 4.9 units 13 units 980 cubicunits
3 71 units 4.75 wits 75,224 cubicunits
4 20 units 5 units 6283 cubicunits
8 4
76 / Lesson 6 Center of Excellence for Science and Mathematics Education at UT Martin

Graphing Calculators in Mathematics Grades 7-12
Activity Two, Handout 1
ADirections:
Complete the chart below for three rectangular prisms. Use the calculator to find thevolume for the first prism. Before finding the volume of the second prism, write anestimate based on the calculated volume of the first prism. Before calculating the volumeof the third prism, write an estimate based on the calculated volume of the first two.
RectangularPrism
Length Width Height EstimatedVolume
CalculatedVolume
1
2
3
Complete the chart below for three cylinders. Use the calculator to find the volume forthe first cylinder. Before finding the volume of the second cylinder write an estimatebased on the calculated volume of the first prism. Before calculating the volume of thethird cylinder, write an estimate based on the calculated volume of the first two.
Cylinder Radius Height EstimatedVolume
CalculatedVolume
1
2
3
8 5
Eisenhower Regional Consortium for Mathematics and Science Education at AEL Lesson 6 / 77
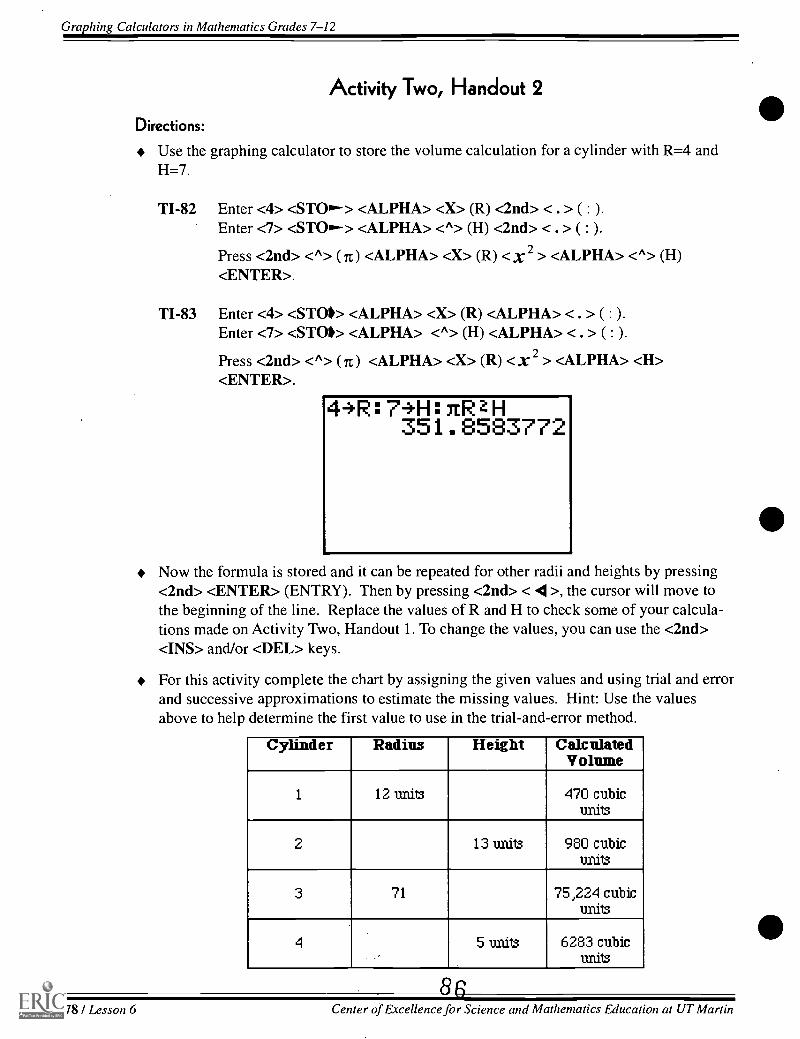
Graphing Calculators in Mathematics Grades 7-12
Activity Two, Handout 2
Directions:
Use the graphing calculator to store the volume calculation for a cylinder with R=4 andH=7.
TI-82 Enter <4> <STON--> <ALPHA> <X> (R) <2nd> < . > ( : ).
Enter <7> <ST01,--> <ALPHA> <A> (H) <2nd> < . > ( : ).
Press <2nd> <A> ( it) <ALPHA> <X> (R) <X 2 > <ALPHA> <A> (H)<ENTER>.
TI-83 Enter <4> <STOI> <ALPHA> <X> (R) <ALPHA> < . > ( : ).
Enter <7> <ST011> <ALPHA> <A> (H) <ALPHA> < . > ( : ).
Press <2nd> <A> (7E) <ALPHA> <X> (R) < x2 > <ALPHA> <H><ENTER>.
44R:741-1:7(RaH351.8583772
Now the formula is stored and it can be repeated for other radii and heights by pressing<2nd> <ENTER> (ENTRY). Then by pressing <2nd> < >, the cursor will move tothe beginning of the line. Replace the values of R and H to check some of your calcula-tions made on Activity Two, Handout 1. To change the values, you can use the <2nd>
<INS> and/or <DEL> keys.
For this activity complete the chart by assigning the given values and using trial and errorand successive approximations to estimate the missing values. Hint: Use the valuesabove to help determine the first value to use in the trial-and-error method.
Cylinder Radius Height CalculatedVolume
1 12 units 470 cubicunits
2 13 units 980 cubicunits
3 71 75,224 cubicunits
el 5 units 6283 cubicmits
78 /Lesson 6 Cemer o8
Excellence for Science and Mathematics Education at UT Martin
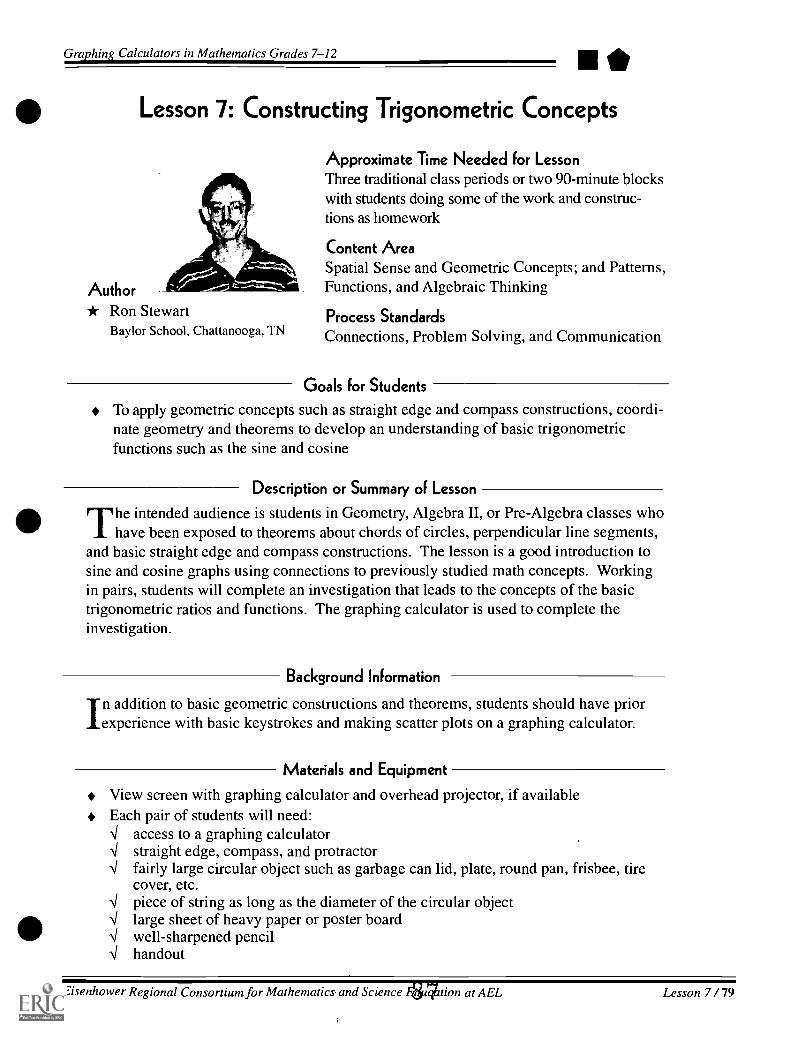
Graphing Calculators in Mathematics Grades 7-12
Author* Ron Stewart
Baylor School, Chattanooga, TN
Lesson 7: Constructing Trigonometric Concepts
AegMtki
Approximate Time Needed for LessonThree traditional class periods or two 90-minute blockswith students doing some of the work and construc-tions as homework
Content AreaSpatial Sense and Geometric Concepts; and Patterns,Functions, and Algebraic Thinking
Process StandardsConnections, Problem Solving, and Communication
Goals for Students
To apply geometric concepts such as straight edge and compass constructions, coordi-nate geometry and theorems to develop an understanding of basic trigonometricfunctions such as the sine and cosine
Description or Summary of Lesson
rr he intended audience is students in Geometry, Algebra II, or Pre-Algebra classes whohave been exposed to theorems about chords of circles, perpendicular line segments,
and basic straight edge and compass constructions. The lesson is a good introduction tosine and cosine graphs using connections to previously studied math concepts. Workingin pairs, students will complete an investigation that leads to the concepts of the basictrigonometric ratios and functions. The graphing calculator is used to complete theinvestigation.
Background Information
In addition to basic geometric constructions and theorems, students should have priorexperience with basic keystrokes and making scatter plots on a graphing calculator.
Materials and Equipment
* View screen with graphing calculator and overhead projector, if availableEach pair of students will need:-V access to a graphing calculator
straight edge, compass, and protractor4 fairly large circular object such as garbage can lid, plate, round pan, frisbee, tire
cover, etc.4 piece of string as long as the diameter of the circular object4 large sheet of heavy paper or poster board4 well-sharpened pencil
handout
Eisenhower Regional Consortium for Mathematics and Science 471tion at AEL Lesson 7 / 79
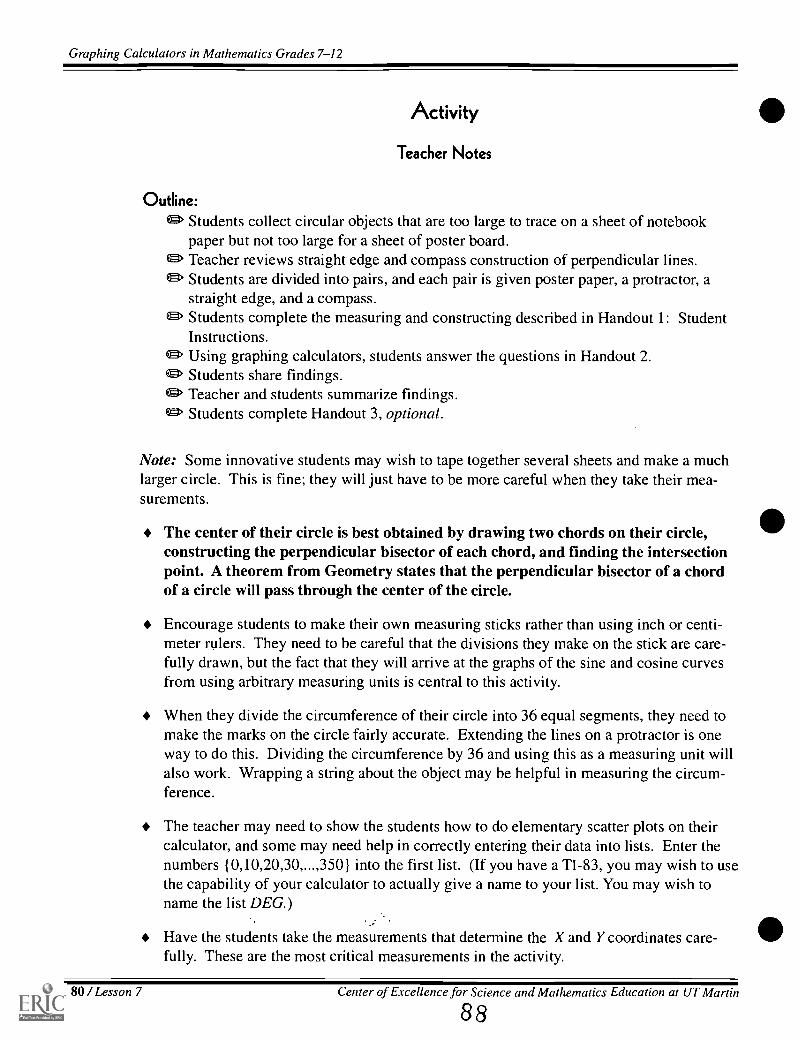
Graphing Calculators in Mathematics Grades 7-12
Activity
Teacher Notes
Outline:ogt. Students collect circular objects that are too large to trace on a sheet of notebook
paper but not too large for a sheet of poster board.Eg> Teacher reviews straight edge and compass construction of perpendicular lines.
Students are divided into pairs, and each pair is given poster paper, a protractor, astraight edge, and a compass.
Eg> Students complete the measuring and constructing described in Handout 1: StudentInstructions.
0=t' Using graphing calculators, students answer the questions in Handout 2.Students share findings.
(Et> Teacher and students summarize findings.Eg> Students complete Handout 3, optional.
Note: Some innovative students may wish to tape together several sheets and make a muchlarger circle. This is fine; they will just have to be more careful when they take their mea-surements.
The center of their circle is best obtained by drawing two chords on their circle,constructing the perpendicular bisector of each chord, and finding the intersectionpoint. A theorem from Geometry states that the perpendicular bisector of a chordof a circle will pass through the center of the circle.
Encourage students to make their own measuring sticks rather than using inch or centi-meter rulers. They need to be careful that the divisions they make on the stick are care-fully drawn, but the fact that they will arrive at the graphs of the sine and cosine curvesfrom using arbitrary measuring units is central to this activity.
When they divide the circumference of their circle into 36 equal segments, they need tomake the marks on the circle fairly accurate. Extending the lines on a protractor is oneway to do this. Dividing the circumference by 36 and using this as a measuring unit willalso work. Wrapping a string about the object may be helpful in measuring the circum-ference.
The teacher may need to show the students how to do elementary scatter plots on theircalculator, and some may need help in correctly entering their data into lists. Enter thenumbers R10,20,30,...,3501 into the first list. (If you have a TI-83, you may wish to usethe capability of your calculator to actually give a name to your list. You may wish toname the list DEG.)
Have the students take the measurements that determine the X and Y coordinates care-fully. These are the most critical measurements in the activity.
80 / Lesson 7 Center of Excellence for Science and Mathematics Education at UT Martin
88

Graphing Calculators in Mathematics Grades 7-12
The X values are recorded in L2, and the Y coordinates in L3 . If you have a TI-83,these lists may be named X and Y.
Here is an example of what the edit screens may look like:
1g1 L2,L3 1
0 15 010 14.772 2.604720 /4.095 5.130330 12.99 7.540 11.491 9.64iS50 9.641S 11.491SO 7.5 12.99
Li ={07 10,207307...TI-82 or TI-83
DEG :.: Y 3
0 15 A
10 14.772 2.604720 14.095 5.130330 12.99 7.540 11.491 9.641S50 9.641S 11.49160 7.5 12.99
Y(1) =0
TI-83 with Named Lists
If .we imagine a unit length named the farka, and a circle with a radius of 15 farkas, thenwe will get a set of values that can be used as a check on the student's values.
(These were generated by using the standard Sin and Cos functions, but they give an ideaof what some student values may look like if done correctly.)
After highlighting L4 and entering L2 (or list X ) divided by the radius (using the new
units), a new set of numbers appears in L4. After highlighting L5 and entering L3 (list Y )divided by the radius, a new set of numbers appears in this list.
An ideal scatter plot of Let (X/R) vs L (DEG) would look similar to this:
BEST COPY AVAILABLE
8 9
Eisenhower Regional Consortium for Mathematics and Science Education at AEL Lesson 7 /81

Graphing Calculators in Mathematics Grades 7-12
An ideal scatter plot of L5 (Y/R) vs LI (DEG) would look like this:
Selected Answers and Comments For Handout One, Student Instructions:
3. Perpendicular bisectors of two chords of a circle will intersect at the center of the circle.
5. The center of the circle is the midpoint for each diameter.
6. Quadrants should be labeled in the standard way, with I, II, III, IV listed in a counter-clockwise direction.
7. This will obviously depend on what value that the students choose for their unit length.
8. 10 degrees
9. 36 elements, representing angles in degrees, spaced at 10-degree intervals.360 degrees is not needed since it is located in the same position as the 0 degree mark.
11. The dimension of each list is 36
The questions at the end of the assignment ask students to recognize that the sin and cosgraphs represent ratios of numbers, and that even though different groups had differentsizes of circles, and measured with different measuring scales, the ratios of the X and Ycoordinates to the radius of their particular circle were the same as the ratios for all of theother circles. In all circles, the ratio of the circumference to the diameter is a constant,namely, pi.
Suggested Extensions:
1. It is productive to have the groups repeat the activity using standard meter or yard sticks.They should be encouraged to talk about why they will get the same graphs, no matterwhat measuring standard they used to take measurements.
2. More advanced classes can explore the reciprocal trig functions (csc, sec and cot) bytaking the reciprocals of their lists and forming the appropriate scatter plots.
9 0
82 /Lesson 7 Center of Excellence for Science and Mathematics Education at UT Martin

Graphing Calculators in Mathematics Grades 7-12
3. Once students recognize that cosine values are obtained from the scatter plot of their ListL2 /R, which is now contained in L4, and that the sine values are contained in list L5 they
can begin to explore some elementary trigonometric identities such as:
sin20 + cos20 = 1
sin 0= tan 0
cos 0
They should use the values in their own lists, or values from their graphs, instead ofcalculator values or values from tables.
4. Students with a TI-83 can try the SinReg regression option in the Stat Calc menu (#C inthe menu).
Suggestions For ASSESSMENT
1. Constructions
50 pointsstudents should be rewarded for the time and effort they put into gatheringthe data
25 pointssuccessfully completing the activity and producing a graph, even if it iswrong
15 pointsgeometric constructions using straight edge and compass
10 pointscooperative work with a partner
5 points bonusmaking an accurate, non-standard measuring stick
2. Data collection and analysis
50 pointsaccuracy, as entering data correctly is an important part of the activity
15 pointsaccurate measurements of X and Y coordinates
15 pointscorrectly entering values in lists and determining how to get the rest of thedata in later lists
15 pointswell constructed and correct scatter plots
5 pointslabeling axes and giving a scale on final sketches of graphs
9 1
Eisenhower Regional Consortium for Mathematics and Science Education at AEL Lesson 7 / 83

Graphing Calculators in Mathematics Grades 7-12
Answers to Handout 2
1. The X and Y coordinates of a point on a circle must be less than or equal to the length ofthe radius. Thus the ratios X/R and Y/R will be < 1. The coordinates are + or -, depend-ing on which quadrant the coordinate is located in.
Thus, the cos and sin functions can be at most +1, and no less than -1.
2. L4 will be + when the points are in Quadrants I and IV (where the X coordinates are +since R is always +).
3. L5 will be + when the points are located in Quadrants I and II (where the Y coordinatesare + since R is always +).
4. Draw a smooth curve between the points on the scatter plot and estimate the values forthe sin and cos from the y coordinates of points on the smooth curve through the scatterplot.
The sin and cos will have the same value when the angle is 45 degrees, and again whenthe angle is 225 degrees. The graphs intersect at these points.
5. Estimate these values, using your graphs: (all angles are in degrees)Values should be approximately:
sin(35) = .57 cos(45) = .71
cos(55) = .57 sin(90) = 1.0
sin(135) = .71 cos(135) = .71
cos(225) = -.71 sin(225) = -.71
sin(305) = -.82 cos(325) = .82
Essay:
This is one of the most important parts of the activity, as it asks the students to understandwhy they are getting the same numbers and graphs from circles and measuring sticks thatare so vastly different. Be sure to clearly explain the underlying principle that ratiosbetween coordinate values and the radius of the circle are the same, no matter what sizethe circle is, or what is used to measure it.
84 /Lesson 7 Center of Excellence for Science and Mathematics Education at UT Martin

Graphing Calculators in Mathematics Grades 7-12
This may be a difficult idea for students to verbalize. As stated in the earlier comments,the sin and cos graphs represent ratios of numbers, and even though differentgroups had circles with different sizes, and measured with different measuringscales, the ratios of the X and Y coordinates to the radius of their particular circlewas the same as the ratios for all of the other circles. In all circles, the ratio of thecircumference to the diameter is a constant, namely, pi.
Answers to Activity Handout 3
1. Students should be getting a scatter plot of the tangent graph. To get around the problemof division by 0, which is what happens at the 90- and 270-degree angles, tell students toreplace 0 with a very small number like .0001. The results, as far as the graph goes, willbe about the same.
Using the previous lists (in terms of our imaginary farkas):
sin 0The graph of L5/ L4 will look the same since tanO =
cos 0
2. The graphs will be the same as the csc 0 and sec 0 graphs.
sec 0
9 3
Eisenhower Regional Consortium for Mathematics and Science Education at AEL Lesson 7 / 85

Graphing Calculators in Mathematics Grades 7-12
Handout 1: Student Instructions
Note: You will be asked to submit your work, so be sure you retain important measurementsand data.
1. Your first task is to bring an object that can be used to trace the outline of a circle. Youmay not use a compass or a method such as a pencil attached to a length of string. Gar-bage can lids, frisbees, hoola hoops, round pots and pans, and siinilar objects work fine.Your object should make a circle too big to fit on a normal sheet of paper, but not so bigthat it won't fit on a sheet of poster paper.
2. Carefully trace the outline of your object on a sheet of poster paper. Use a pencil for yourfirst outline in case you make a mistake. After you have drawn a good circle, you cantrace over your drawing using a pen or fine-tipped marker.
3. Using a straight edge and a compass, find the center of your circle. Draw your lineslightly, as you will be taking measurements from your circle a bit later in this activity.(Hint: what theorems do you know about chords of circles that may help you?)
4. Draw a diameter of your circle.
5. Construct another diameter for your circle, perpendicular to the one you drew in #4. Thetwo diameters intersect at the center of the circle, which is also thefor each of the diameters.
6. Extend the two diameters beyond the circle. In effect, you have constructed two coordi-nate axes. Label one of them the X axis, and the other the Y axis, and decide where thepositive X axis is located. Lightly label each of the four quadrants (I, II, III, IV) on yourposter paper.
7. Use a measuring stick if you must, but it may be more interesting to take a straight edge(be sure it is longer than the radius of your circle) and make a set of equally spaced markson it. In effect, you are making a measuring stick with a new set of units. Make up somename for your units. For example, let one unit be 1 farka. You'll now be measuringlengths in terms of farkas, instead of inches or centimeters. Of course, you can useinches or centimeters if you wish.
What is the radius of your circle in terms of your new unit?
What is the equation of your circle in terms of your new unit?
4
86 /Lesson 7 Center of Excellence for Science and Mathematics Education at UT Martin

Graphing Calculators in Mathematics Grades 7-12
8. Decide on a method that will divide the circumference of your circle into 36 equallyspaced segments (called arcs). You may use a protractor and your new measuring stick todo this.
What is the measure of each of the central angles that have been formed by these arcs?. Mark each of these dividing points.
9. Press <STAT> <1> (Edit) on your calculator. Enter the numbers {0,10,20,30,...,350}into the first list. (If you have a TI-83, you may wish to use the capability of your calcu-lator to actually give a name to your list. You may wish to name the list DEG.)
How many numbers will you enter into this list?
What do you think that these numbers represent?
Why was 360 not entered into the list?
10. Determine the X and Y coordinates of each point you marked in #8 in terms of your newunits. This may take a while, and can become tedious, but be as accurate as you can, asthis is one of the most crucial aspects of this activity. Record the X values in L2, and
the Y coordinates in L3. If you have a TI-83, you may wish to name these lists X and Y.
11. The number of elements in each list is called the dimension of the list. Check to see thateach list has the same dimension.
12. Highlight L4, and enter L2 (or list X ) divided by your radius (use your new units). You
should see a new set of numbers appear in L4. Highlight L5, and enter L3 (list Y )divided by your radius. You should see a different set of numbers appear in this list.
13. You are now ready to construct a scatter plot of your data. In the <2nd> <Y=> (STATPLOT) menu, turn on Plot 1, and at Type select scatter plot. In the Xlist enter L, (list
DEG ), and in the Ylist enter L2 (list x). Choose the dot as the mark.
WIWI, FORMATMin= -5Xmax=365Xsc1=20Ymin= -1.2Ymax=1.2',so =1
TI-829 5
WINDOWXmin= -5Xmax=365Xsc1=20Ymin= -1.2Ymax=1.2Ysc1=1Xres=1
TI-83
Eisenhower Regional Consortium for Mathematics and Science Education at AEL Lesson 7 /87

Graphing Calculators in Mathematics Grades 7-12
14. Set your window as follows:
15. Turn off any equations that you may have on the <Y= >screen. (You can highlight the=, and press <ENTER> to turn off the graphs of these functions without having to getrid of them entirely.)
16. Press <GRAPH> to view your scatter plot. Sketch your graph, indicating units on bothsets of axes. If you have access to a Graph Link, you can get a printout of your graph.
17. Turn off Plot 1, turn on Plot 2, and repeat procedures 13-16, using 1,3 (list Y) in place of
L, (list x).
18. Turn on both Plot 1 and Plot 2, and describe how the two graphs compare.
19. Compare your lists and scatter plots with another group's. What lists do your groups havein common and which are different? Did your groups have similar-looking graphs?
20. Post your graphs in a place where other groups can compare their graphs to yours.
Note: The first scatter plot you made is called a cosine graph, and is the graph of a functionthat relates the angles you listed in Li to the ratio of the X coordinates of your points over theradius of your circle, which are found in 4. It is usually written as
y = cos0
where 0 is the angle that you listed in Li.
The second scatter plot that you made is called a sine graph, and is usually written as
y = sines .
These two graphs and their corresponding functions are two very important concepts inmathematics. You will encounter them often.
Please answer the questions on the accompanying sheet (Handout 2).
9 6
88 / Lesson 7 Center of Excellence for Science and Mathematics Education at UT Martin

Graphing Calculators in Mathematics Grades 7-12
Handout 2
Write in complete sentences, using good grammar and correct spelling. Be sure to indicatehow you arrived at any of your calculated values.
1. Why were the values in lists L4 and L5 between 1 and -1?
Could they ever be larger than 1, or smaller than -1? Why?
2. In which quadrants were the values in 1,4 positive , and
negative ? Why was this the case?
3. Answer question #2 for L5 .
4. How could you use your scatter plots to estimate values for the sine and cosine of anglesthat are not among those listed in L, (List DEG)? List any angles for which the sin andthe cos of the angle are the same.
5. Estimate these values, using your graphs: (all angles are in degrees)
sin(35) = cos(45) = cos(225) =
cos(55) = sin(90) = sin(305) =
sin(135) = cos(135) = sin(225) =9 7
cos(325) =
Eisenhower Regional Consortium for Mathematics and Science Education at AEL Lesson 7 / 89
Graphing Calculators in Mathematics Grades 7-12
Essay:
The most amazing thing about this activity is that, even though several of the groups hadcircles of different sizes, all of the groups arrived at about the same numbers in Lists L4
and L5 and they had similar graphs for the sine and cosine curves. This is a very impor-tant property of a group of equations known as trigonometric equations or functions.
An equally important factor was that you arrived at the same graphs, even though differ-ent groups were using different measuring standards.
Think about why this is, and write a paragraph or two explaining why you think thishappened.
9 8
90 / Lesson 7 Center of Excellence for Science and Mathematics Education at UT Martin

Graphing Calculators in Mathematics Grades 7-12
Handout 3: Further Excursions in Trigonometry
1. In L6 enter the values obtained by dividing L3 by L2 (List Y divided by List X). Make a
scatter plot with Li (the angles) on the X axis, and L6 on the Y axis. Sketch the resultinggraph on another sheet of paper, being sure to state the window values that you used.What happens at the 90-degree and the 270-degree marks? Why does this happen?
Suppose that you made a scatter plot with L on the X axis, and the list made by calculat-
ing the L5I L4 values placed on the Y axis. Compare this graph with the one you made atthe beginning of this question. Explain the relationship between the graphs.
2. Explore the following scatter plots. Comment on their most important features. The list(List DEG) will always be on the X axis of the scatter plot. Make scatter plots with
the following lists on the Y axis:
a. Radius/ 4 (the reciprocal of L4, or Radius/List X)
b. Radius/ L3 (the reciprocal of L5 , or Radius/List Y)
9 9
Eisenhower Regional Consortium for Mathematics and Science Education at AEL Lesson 7 /91

Graphing Calculators in Mathematics Grades 7-12
r-
Authors* Peggy Bates
Bledsoe County HS, Pikeville, TN
* Jennifer LocumEagleville School, Eagleville, TN
Lesson 8: Graph Interpretation
Approximate Time Needed for LessonThree traditional class periods or two 90-minuteperiods if all of the activities are selected
Content AreaProbability and Statistics
Process Standards
Communication, Problem Solving, Connections,and Reasoning
Goal for Students
To describe, extend, interpret, and create a variety of graphs using appropriatematerials
Description or Summary of Lesson
S tudents in middle grades or Pre-Algebra are the intended audience. The lesson is1.3 composed of five short activities designed to introduce students to a variety ofgraphs and possible interpretations in different learning contexts. The activities can beused together or selected ones used in combination with textbook or other graphingactivities.
Background Information
This is an introductory lesson that is expandable to more complex mathematics.Prior to this lesson students need only very minimal graphing skills and basic famil-
iarity with a graphing calculator.
Materials and Equipment
View screen with graphing calculatorOverhead projectorYard sticksNewspaperPost-it notesEach pair of students will need:4 access to a graphing calculator-4 access to a calculator-based lab (CBL)4 access to a motion detector
access to GraphLinkgraph paperhandouts 10 0
Eisenhower Regional Consortium for Mathematics and Science Education at AEL Lesson 8 / 93
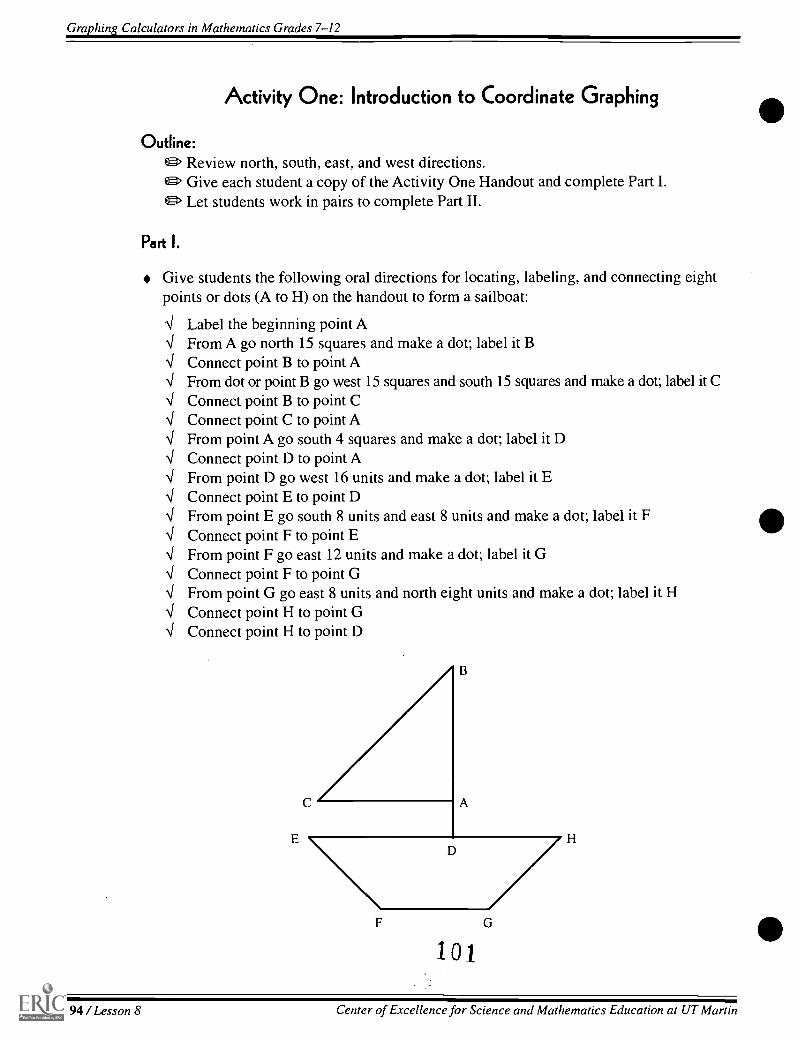
Graphing Calculators in Mathematics Grades 7-12
Activity One: Introduction to Coordinate Graphing
Outline:ct> Review north, south, east, and west directions.el:. Give each student a copy of the Activity One Handout and complete Part I.
Let students work in pairs to complete Part II.
Part I.
Give students the following oral directions for locating, labeling, and connecting eightpoints or dots (A to H) on the handout to form a sailboat:
4 Label the beginning point A4 From A go north 15 squares and make a dot; label it B4 Connect point B to point A4 From dot or point B go west 15 squares and south 15 squares and make a dot; label it C4 Connect point B to point C4 Connect point C to point A4 From point A go south 4 squares and make a dot; label it D4 Connect point D to point A4 From point D go west 16 units and make a dot; label it E4 Connect point E to point D4 From point E go south 8 units and east 8 units and make a dot; label it F4 Connect point F to point E4 From point F go east 12 units and make a dot; label it G4 Connect point F to point G4 From point G go east 8 units and north eight units and make a dot; label it H4 Connect point H to point G4 Connect point H to point D
F
101G
94 / Lesson 8 Center of Excellence for Science and Mathematics Education at UT Martin

Graphing Calculators in Mathematics Grades 7-12
Ask students to relabel the points as ordered pairs where the first member is a numberthat represents the distance east or west from point A, and the second member is a num-ber that represents the distance north or south from point A. Agree to use positivenumbers for east and north and negative numbers for south and west.
A = (0, 0) B = (0, 15)C = (-16, 0) D = (0, -4)E = (-15, -4) F = (-8, -12)G = (4, -12) H = (12, -4)
Part II.
Give each pair of students a city map that uses blocks. A Yahoo search on the Internet forcity maps will produce a wide variety of maps. For example, the Waterfront and HistoricPark in Philadelphia is currently located at the following address: <http://www.libertynet.org/mmp/maps/historic.html>. (Since web addresses occasionallychange, a new Internet search for the Waterfront and Historic Park in Philadelphia mayneed to be conducted.)
Have students write directions for how to get from one point to another. Ask students touse the directions in the sailboat activity, i.e., E or W and N or S to go to another locationon the chosen map. For example, if students are using the map of Philadelphia, theycould be asked to travel from the Vietnam War Memorial to the Liberty Bell with as fewturns as possible, going E or W first, then N or S. In all cases build understanding of theCartesian Coordinate system by leading to the (x-coordinate, y-coordinate) labeling ofpoints.
Suggestions For Assessment:
Ask students to write or give oral answers to questions such as those below:
1. Suppose I were a pizza delivery driver at the corner of Street andStreet, and I had to make a delivery at the corner of Street and
Street. Write instructions in terms of E, W, N, S for the best way to go.
Rewrite your answer as an ordered pair that is equivalent to your written instructions.
2. Suppose I were a cab driver trying to run up the fare of a passenger I picked up at thecorner of Street and Street with a given destination. Writeinstructions in terms of E, W, N, S for the "best" route.
Rewrite your answer as an ordered pair that is equivalent to your written instructions.
102Eisenhower Regional Consortium for Mathematics and Science Education at AEL Lesson 8 / 95
Graphing Calculators in Mathematics Grades 7-12
Extension:
Have students use the ordered pairs of the segment endpoints in Part I to determine theequation of each corresponding line and then graph on calculator using the <y= > screen.Graph Link could allow printing of the graphs. Students could then outline or highlightthe line segments of the picture from Part I.
103
96 /Lesson 8 Center of Excellence for Science and Mathematics Education at UT Martin
Graphing Calculators in Mathematics Grades 7-12
Activity One Handout
i
H
.4
4. _1-,
4--
,
4.-
,
-t
*
1
4"
-1 ;
4.
1 4
. I.- - 4 -
* t
T i___
t 1 -
1
1 ±1 -I--
1 1___
_
1
I I-
1
I-.
7-
--p--
4 .._
-4-I* *
f 1---i- J-4
1,--1 I- 1 I
ti 1
1 t_._
.. i__..,.,
,
1
.L
I-...
1L i-i- -r--
f -1-
r _I- '-,
4_
H-1
,__
,
I
4 I_..i
: 4.-
"."4"
.
...,.......t. ....4-.1 i
1
1 1
I
-,----4- , -.. -.1- I-
1- 1
4-- ..-!
L._
1 1
1 j 4---1
1
.-- -
+--H--,
i------
I1
'
4-1 t I
-i1 I
1- -----,r
1
-----,
rj.
4_
+
+1
_ _;-- -
,..
+.- .'
.,
1___
1
__,__.__
--- -
-i -}
.
_
+ --4.-
_ 4-__ I__ __1
,
4. 4
4--.
4_
, -_,._
_1_
; --.I
.,____.t
_
_-
1' -i--
T-
::---1 1
4- i
f---._ _--.--
;
.
.._ .-- -4-- - - - --,--
t .
I. 4.
*4.
'-i-
1
+-
1-
- - .-,
_... ,
-.---t
- .---
-.
...-
i--
4
..
.---
- ....-....-
.._____
.
*
1
1
-.-+ . --.--..-
4
t
--.- ---4- I--
i
.,-
...--
.__
f
t
'''-I--,
r_ -I--. 4
±1
4
.
f1 -1-
--I--
i
I!-
I ' 1
4
T---- 't"---41--1.-
-4- ,-- t-
;
--. +-.1--4-
. +
t
-1.- ,
-I-- -4-i
14.
. i
I -.I-- t 1- 4- }- -'4 , f ,_
t4 l
-r-
4
4-
.
.1t.
4
-1.
,
...__
4
_
104
Eisenhower Regional Consortium for Mathematics and Science Education at AEL Lesson 8 / 97

Graphing Calculators in Mathematics Grades 7-12
Activity Two: Scatter Plots
Teacher Notes
Outline:
cg> Introduce the terms "increasing" and "decreasing."
Effi> Students measure and record height (x) in inches and shoe size (y) on Post-it note. ,
Then each student will place his or her Post-it appropriately on a graph drawn on thechalkboard.
ct> Students record what this graph represents and use descriptive words to describe therelationship. For example, "as the height increases, the shoe size increases" or "tallerpeople tend to have bigger feet."
cg> Students work in pairs to enter the class's data into a graphing calculator and com-plete the Activity Two Handout.
Suggestions For Assessment:
Pairs of students brainstorm several situations that may result in a decreasing graph.Then each person will create a set of data and enter it into the calculator to graph as ascatter plot. Students will then explain in journals the trends in the scatter plot.
Extensions and Adaptations:
Divide the class according to gender and graph the data again. Is there a noticeabledifference? What explanation could you offer for the variations?
Students may benefit from collecting their own data. For example, have students use theclassified section of the newspaper to record information about used car prices of aparticular make, but using different models. Construct a scatter plot using the car pricesand the age of the cars in list one and list two. Before graphing, remember to change theWINDOW to show values comparable to the prices gathered. Is the resulting plot linear?Increasing? Decreasing? Why are there some points that seem to be out of line with theothers? What factors might cause differences in used car prices of the same model?From this information can you determine a line of best fit? Launch into a discussion ofslope, which should give students an estimate of how much a car could depreciate fromyear to year. Based on this calculation, estimate the price of a car for an age that is notlisted. Using the same estimate how could the students determine what a new car mightcost in 5 years? 10 years?
I 03
98 / Lesson 8 Center of Excellence for Science and Mathematics Education at UT Martin

Graphing Calculators in Mathematics Grades 7-12
Activity Two Handout
Technology Activity:
Using information gathered in your class, create a scatter plot using the TI-82. Forexample:
Shoe Height5 608 639 688 70
To enter the data, press <STAT> <1> (Edit).
Note: If numbers are already in any of the lists, clear by highlighting the heading, i.e., Li,etc., by pressing <CLEAR>.
Then <Down Arrow> under L and enter each height. For example,<6> <0> <ENTER><6> <3> <ENTER><6> <8> <ENTER><7> <0> <ENTER>
<Right Arrow> to the next list, L2 , and enter the shoe sizes.
Press <Y=> and delete any information in any of the Y's.
Then use the following keystrokes to create a scatter plot in the calculator:<2nd> <STAT PLOT> <1> <ENTER><Left Arrow> (On) <ENTER><Down Arrow> (Type ) and highlight the scatter graph.Press <ENTER>Arrow to Xlist and select Li
Arrow to Ylist and select L2
Note: On the TI-83, to enter 4, for Xlist press <2nd> <1> ( 4). Similarly, to enter L2 for
the Ylist, press <2nd> <2> ( L2).
Plot1gm Off-Nipe: L Hai dhbX1 st : 1313 L2 L3 L'i LS LtiY 1 ist: L1IL3LLIL5L ti
Mark: a +
TI-82
riouOff
X 1 i st : LiYlMark: a +
Plot3
dhbFEEH
10,6 TI-83
Eisenhower Regional Consortium for Mathematics and Science Education at AEL Lesson 8 /99
Graphing Calculators in Mathematics Grades 7-12
Set an appropriate window by pressing <WINDOW>. For Xmax, enter a number slightlygreater than the tallest person; for Xmin, enter a number slightly smaller than the shortestperson. Likewise, change Ymax to slightly more than largest shoe size and Xmin toslightly smaller than the smallest shoe size. Likewise, set appropriate Xscl and Yscldepending upon the ranges for height and shoe size. An appropriate Xscl might be 5 or10.and an appropriate Yscl might be 1 or 2.
To see the scatter plot of the data, press <GRAPH>. Compare and contrast your graphwith the class graph on the board. Discuss what would happen if different values weresubstituted in the lists.
107
100 / Lesson 8 Center of Excellence for Science and Mathematics Education at UT Martin

Graphing Calculators in Mathematics Grades 7-12
Activity Three: Graph Interpretation
Teacher Notes
Encourage students to use the terms "increasing" and "decreasing" in their descriptions ofthe two problems in the handout. Explain what might create a change represented byeach rising, falling, and no-change section for both graphs in the handout. Many possiblescenarios would be correct for each one.
Suggestions for Assessment:
Students work in pairs to draw a line graph explaining a real-world phenomenon, thenpresent and explain the completed graph to the class. A partial listing of possibilitiescould be given, such as number of customers at a department store, points scored in afootball game, time spent on homework throughout the year, attendance at sportingevents, yearly chocolate sales, annual flower sales. Compare data for each topic to timeof day, time of month, or time of year, depending on which is most relevant.
108
Eisenhower Regional Consortium for Mathematics and Science Education at AEL Lesson.8 /101

Graphing Calculators in Mathematics Grades 7-12
Activity Three Handout
A Bathtub Problem:
Use your imagination to create a possible scenario depicted by the graph below:
Depthof
Water
Time
A Drink Machine Problem:
Use the graph above to create a story describing the situation at the beverage dispensingmachine below.
Numberof
Drinks
Time
102 / Lesson 8 Center of Excellence for Science and Mathematics Education at UT Martin

Graphing Calculators in Mathematics Grades 7-12
Activity Four: Match It Graph ItTeacher Notes
Real World Math With the CBL System by Chris Brueningsen, et al., Texas Instru-ments, Inc., 1994, pp. 101-105.
This is a wonderful Texas Instruments CBL activity. Students will transfer the programinto the graphing calculator using Graph Link. The activity itself may be used at multiplelevels by dividing it into sections. Basically it gives a graph and asks students to emulatethe graph using the motion detector.
110
Eisenhower Regional Consortium for Mathematics and Science Education at AEL Lesson 8 /103

Graphing Calculators in Mathematics Grades 7-12
Activity Five: Creating a Pie Chart on the TI-82
Teacher Notes
The program PIECHART for the TI-82 can be entered into the graphing calculator fromthe following resource: TI-82 Graphing Calculator Activities for Middle School Math.Lund, Charles. MathWare, P.O. Box 3025, Urbana, IL 61801
Since pie charts provide an immediate sense of equal or unequal distribution, studentsoften like the result, if not the means needed to achieve it. Using the PIECHART pro-gram, teachers can simplify the process and keep interest in the information to be gainedfrom this format.
Sample Problem:
Ask students which months they were born. Tally the results by months. Transfer data tolist one by pressing <STAT> <1> (EDIT) and then typing data into the first list. Thenuse the PRGM key to select the PIECHART program. Select the data display that corre-sponds to your information, since the program allows for percentages or raw data.
Adaptations:
Students create a budget for a family for one month including, but not limited to, food,clothing, mortgage, rent, car, miscellaneous, utilities, insurance, phone. The monthly carand rent payments can be taken from a newspaper. Some might prefer to actually call cardealerships or real estate brokers. Looking at the pie graph, students can answer suchquestions as "Which category consumes most of the budget?" Students could also trans-fer the pie chart to a coordinate axis. Using each quadrant as 90 degrees, estimate per-centages for each part of your budget. Given various annual incomes, students could alsoestimate a monthly budget.
104 /Lesson 8 Center of Excellence for Science and Mathematics Education at UT Martin

Graphing Calculators in Mathematics Grades 7-12
Suggestions for Staff Development:Welcome and brief overview of workshop (5-10 minutes)
Engage participants in the shoe size activity and give instructions for entering informationinto lists and forming a scatter plot in the TI-82 (20-30 minutes)
Activities (Teachers will be divided into three groups) (30-45 minutes)4 All groups will be given copies of Activities One, Three, and FourNI Groups will be given the necessary materials and equipment and instructed to return
in 45 minutes for discussion.
Answer the following questions in a discussion format. (15-20 minutes)1. How did the knowledge that you needed to present influence your thinking?2. How do you think students would relate to these activities?3. What are the benefits of the different activities?4. What is the value of having students use paper and pencil as well as the
calculator in considering graphs?
Break (10-15 minutes)
Groups adapt the scatter plot activity to show how activities can be used at higher levels.(15-20 minutes)
Total Group Discussion of Assessment (10-15 minutes)NI How do you assess a student's work?
What are some characteristics of "good" problems?How would you have students demonstrate interpretive skills using technology?
Al How do you create a problem that piques the interest of students?
If time permits, complete Activity Five with the total group. (15 minutes)
Closure (5-10 minutes)Sample discussion questions:-\,/ Which of the Standards are we addressing with problems of graph interpretation?-4 What training do you need to pursue this technological focus?
Eisenhower Regional Consortium for Mathematics and Science Education at AEL Lesson 8 / 105

Graphing Calculators in Mathematics Grades 7-12 *Lesson 9: SpeedingA Study in Linear Functions
S: 5110
Approximate Time Needed For LessonOne to five traditional class periods, de-pending on how many activities in thelesson are completed
Authors Content Area
* Bonnie PetersonHendersonville HS, Hendersonville, TN
* Eddie Keel , Haywood HS, Brownsville, TN
Patterns, Functions, and Algebraic Thinking
Process StandardsProblem Solving, Connections
Goals for StudentsTo perform a linear regression to describe a functional relationshipTo apply skills involving linear functions to analyze and describe real-world situa-tions
Description or Summary of Lesson
S tudents in Math Tech II, Algebra I, Algebra II, and Advanced Algebra are theintended audience. It is assumed that students can calculate slope, graph a linear
function, and write an equation for a linear function. Prerequisite skills will be reviewedin a handout, and this activity also will teach students how to perform the graphingcalculator skills needed to complete this activity. Through the use of several activities,students will learn and apply basic knowledge of linear functions to a problem involvingspeeding tickets.
Background Information
This lesson involves applying earlier concepts related to linear functions to areal-world situation that is of high interest to secondary students. Some or all of the
activities may be used, depending on the math background of the students. Extensionsare included, which make it also appropriate for more advanced students.
Equipment and Materials
View screen with graphing calculatorOverhead projectorEach student will need:
access to a TI-82 or TI-83 graphing calculatorseveral sheets of graph paper and a straight edge
\I handouts
113
BESTCOPY AVAILABLE
Eisenhower Regional Consortium for Mathematics and Science Education at AEL Lesson 9 / 107

Graphing Calculators in Mathematics Grades 7-12
Activity One: Prerequisite Review
Teacher Notes
TI-82 Instructions
Skill One: Graphing Lines (see problem 6 on the Activity One Handout).Press the <Y=> key.Type the equation. Use the < > key for any variables used. Be sure to placeparentheses around any fractions.
Push the <ZOOM> key.Press <6> (ZStandard).If the graph on your calculator is not acceptable or does not show up, press the<WINDOW> key and change the Xmin, Xmax, Ymin, and Ymax settings.
Yi=Y2=Y3=Y4=Ys=Ys=Y7=Ye=
Y10(2/3)X4-111Ya=Y3=Y4=Ys=Ys=Y7=Ye=
8MEMORYox
2:Zoom In3:Zoom Out4:ZDecimal5:ZScluareNIZStandard742Trig
Skill Two: Regression (see problem #9 on the Activity One Handout).Press the <STAT > key.Press <1> (Edit).If there are numbers in the table already, you will need to erase them. Use the <A> keyand highlight the LI. Press the <CLEAR> key. Then, press the <ENTER> key. Thiswill erase everything in this column. If there is data in the other column, press the <1.>key to get to the next column and repeat the procedure.Go to the L1 column using the r>, 4. A, or y arrow keys. Type the first x-coordinate.Then, press <ENTER>. Type the 2nd x-coordinate and press <ENTER>. Repeat theprocedure.When you have finished typing your x-coordinates in the L1 column, press the < > keyto go to the L2 column. Type the 1st y-coordinate and press <ENTER> key. Type the2nd y-coordinate and press <ENTER> key. Repeat the procedure.(Note: Be sure that the L1 and L2 columns are the same length.)When you are finished typing your y-coordinates, press the <2nd> < MODE> (QUIT)keys.Press the <STAT> key.Press the <is> key to go to the CALC menu.Press <5> for "LinReg( ax+b)" to find the linear regression equation. LinReg( ax+b) willappear on the calculator screen. Press <ENTER>.The answer will now appear on the screen.(Note: If you get an error message that says/ 'FIR: DIM MISMATCH," your L1 and L2columns are not the same length.)
108 /Lesson 9 Unter of Excellence for Science and Mathematics Education at UT Martin

Graphing Cakulators in Mathematics Grades 7-12
C
PLit_ALC
R(3:SortD(4:ClrList
CALCit_
:SortA(3:SortD(4:C1rList
EDIT1:1Alltats2:2liar Stets3:SetUp_4:MedMedaLinReg(ax+b)6:QuadReg74-Cub1 cReg
A. *Li L2 L3-1 -31a
1a
elm n
1_1()=
LinReg(ax+b) I LinRegv=ax+ba=2b=-1r=1
Skill 3: Make a chart (see problem #10 on the Activity One Handout).Press the <Y=> key.Type the equation that you wish to use.Press <2nd> <GRAPH> (TABLE).If your table does not start with the number you desire OR the x-value of the chart doesnot increase in the increments you want, press the <2nd> key. Then, press the <WIN-DOW> key (TblSet).You will see a TABLE SETUP menu.TblMin is the number where your table willstart. Type the number where you want the table to begin and press <ENTER>. 6,Thl isthe amount of change from one x-value to the next. (In other words, it is how much thevalues in the x column go up or down.) Type the number that you want for ATbl andpress <ENTER>.Press <2nd> <GRAPH> to see your new table.Press the <A> key or the <v> key to see more entries in the table.
TABLE SETUPTb1Min=1ATb1=3
Indpnt:Depend:
Hu ,cAut;-
AskAsk
TABLE SETUPTb1Min=0aTb1=1Indpnt:DePend:
HuAutc
AskAsk
YiEIX2+5X^6Y2=Y 3 =YLI=Ys=Ys=Y7=Ye=
X YiMOM 01 62 324a 3654
204965 781506 233316
X=0
X YI1. 64 204967 58829'i10 5E613 2.41E716 8.39E719 2.35E8
X=1 BEST COPY AVAILABLE
1I-83 Instructions
Skill One: Graphing lines (See Problem # 6 on the Prerequisite worksheet).Press the <Y=> key.Type the equation in }Y]=. Use the < X,T,0,11> key for any variables used. Be sure toplace parentheses around any fractions.Push the <ZOOM> key.Press <6> for ZStandard.If the graph on your calculator is dt kceptable or does not show up, press the <WIN-DOW> key and change the Xmin, Xmax, Ymin, and Ymax settings.
Eisenhower Regional Consortium for Mathematics and at AEL Lesson 9 / 109

Graphing Calculators in Mathematics Grades 7-12
Yi=Yz=Y3=Y4=Ys=Ys=Y7=Ye=
YiE1(2/3)X+1MY2=Y3=Y4=Ys=Ys=Y7=Ye=
nMEMORYo>:
2:Zoom In3:Zoom Out4:ZDecimal5:ZSguareMIZStandard74ZTrig
Skill Two: Regression (see problem # 9 on the Activity One Handout).Press <STAT>.
Press <1> for Edit.
If the names for the columns are Li, L2, and L3 go to Step 4.
Otherwise, press the <STAT> key. Press <5> for SetUpEditor. Then, press <ENTER>.Press the <STAT> key and then press <ENTER>.
If there are numbers in the table already, you will need to erase them. Use the <A> keyand highlight the LI. Press the <CLEAR> key. Then, press <ENTER>. This will eraseeverything in this column. If there is data in the other column, press the <I>> key to getto the next column and repeat the procedure.Go to the LI column using the arrow keys. Type the first x-coordinate. Then, press<ENTER>. Type the 2nd x-coordinate and press<ENTER>. Repeat the procedure.
When you have finished typing your x-coordinates in theL1 column, press the 4.> keyto go to the L2 column. Type the 1st y-coordinate and press <ENTER>. Type the 2ndy-coordinate and press <ENTER>. Repeat the procedure.
Note: Be sure that the L1 and L2 columns are the same length.
When you are finished typing your y-coordinates, press <2nd> <MODE> (QUIT)
Press <STAT>.
Press the <0.> key to go to the CALC menu.
Press <4> for "LinReg( ax+b)" to find the linear regression. LinReg( ax+b) will appearon the calculator screen. Press <ENTER>.
The answer will now appear on the screen.
Note: If you get an error message that says "ERR: DIM MISMATCH", your L1 and L2columns are not the same length.
Sometimes, the r and r2 value will not appear on the screen. If you want to see thesecorrelation coefficients, press the <2nd> key and then press the <0> (CATALOG). Pressthe <IS> key until you get to DiagnosticOn.Press <ENTER> when this is highlighted. Press <ENTER> again. Now press <STAT>,<y> to CALC, and <4> for LinReg(ax + b). The r and r2 values should now appear.
CALCit_
:SortA(3:SortD(4:ClrList
CALCit_
:SortA(3:SortD(4:ClrList
EDIT IggiNg TESTS1:1Var Stats2:2Var Stats3:MedMedEULinReg(ax+b)5:QuadReg6:CubicReg74,QuartReg
Li Lz L3-1 -31 12 3Aim 23
L1(5)=
LinReg(ax+b) M
116
LinReg,J=ax+ba=2b=-1r2=1r=1
110 / Lesson 9 Center of Excellence for Science and Mathematics Education at UT Martin

Graphing Calculators in Mathematics Grades 7-12 A *Skill 3: Make a Chart (see problem # 10 on the Activity One Handout).
Press the <Y=> key.Type the equation you wish to use.Press <2nd> <GRAPH>(TABLE).If your table does not start with the number you desire OR the x-value of the chart doesnot increase in the increments you want, press the <2nd> key. Then, press <WINDOW>(Tb1Set)You will see a TABLE SETUP menu. TblMin is the number where your table will start.
Type the number where you want the table to begin and press <ENTER>. ATbl is theamount of change from one x-value to the next. (In other words, it is how much thevalues in the x-column go up or down.) Type the number you want for ATbl and press<ENTER>.6. Press <2nd> <GRAPH> (Table) to see your new table.7. Press <A> or <v> to see more entries in the table.
YleX2+5X^E.Y2=Y3=Y4=Ys=Ye=Y7=Ye=
X YiFI1 64 204967 5E1929410 5E613 2.41E716 9.39E719 2.35E9
X=1
TABLE SETUPTb1Min=0ATb1=1IndPnt:Depend:
HuAutc
AskAsk
TABLE SETUPTb1Min=11ATb1=3Indpnt:Depend:
HuA u
AskAsk
X YiMEM1
o6
2 32'i3 36544 204965 781506 233316
X=e1
BEST COPY AVAILABLE
1 1 7
Eisenhower Regional Consortium for Mathematics and Science Education at AEL Lesson 9 /111

Graphing Calculators in Mathematics Grades 7-12
Activity One Handout: Prerequisite Review
1. Plot the following points: A(2,5), B(-1,3), C(0,2), and D(4,-3).
1111.1111.11111=111EM11111111EllEMEME111.11111111111=11111111111=1011=111.11111.1111M111.111=111=1111111111M1111=1111111111.11111.1111=1
2. Calculate the slope of the line through the points (4,-5) and (1,3) algebraically.
3. Using your graphing calculator, compute the slope of the line through the points (-2,5)and (-4,0).
4. Calculate the slopes of these two lines using rri =
a. b.
ri serun
112 /Lesson 9 Center of Excellence for Science and Mathematics Education at UT Martin
118

Graphing Calculators in Mathematics Grades 7-12 *0 5. Graph the following lines: a. y = 2x -F 3, b. y = x A-19 and c. 2x -1-- 3y = 6
11111111111111IMMIIIIIIIMEMMIIIIIIIMIIMIIIMMEM11111111111
MIIIIIIMIIMMEMMIIMIIMMIIIIIIIIIIMIIIMIIIIMIIMIIMIIIIIIIIIIIMMEMIIIIIMMEMIIIMM
6. Using a graphing calculator, sketch the following lines:
a. y = 3x - 4 and b. y = lx -F 2 .
a. b.
7. Write the equation of the line through the points (1,5) and (9, 2).
MIIIIIMIIIIIIIIMMIIIIIIIIIIIIIMIllMMIIIIIIIIIIIIIIIIIIII11111111IMMIIMMEMIIIIIMIIMMEMMINMMIIIIIIIMIIIIIIIIIIMIIIIIIIIIIIIIIIIIIII1111111MMIMMMMMIIIIIIIIIIIIIIIIMMMIIIIIIIIIIIIIIIII
8. Find the equation of the line in the following graph using the slope and the y-intercept ofthe line.
9. Using your graphing calculator, find the equation of the line through the following pointsusing linear regression: (-1,-3), (1,1), (2,3), and (12,23).
119
Eisenhower Regional Consortium for Mathematics and Science Education at AEL Lesson 9 / 113

Graphing Calculators in Mathematics Grades 7-12
10. Using your graphing calculator, complete the table for f(x) x2 5x6
x Y
01
2345678
114 /Lesson 9 Center of Excellence for Science and Mathematics Education at UT Martin

Graphing Calculators in Mathematics Grades 7-12 *Activity Two Handout: An Introduction to Speeding Tickets
Vou are traveling on 1-40 in Tennessee and you are stopped by a state trooper. To your.1 horror, you are given a speeding ticket. In Tennessee, the cost of your ticket is deter-
mined by the city and/or county in which the ticket is issued.
Suppose you are stopped for speeding in the Tennessee city of Petersburg. The Peters-burg City Council has decided the cost of a speeding ticket on the interstate (with a speedlimit of 65) will be determined using the following function:
7- = 80 -i- 1(s 65)
S is the speed you are traveling in miles per hour (mph) and T is the cost of the ticket.
1. What would be the cost of your speeding ticket if you are traveling 72 mph? Explainhow you arrived at your answer.
2. Find T if S = 55.
3. Explain why you would not get a traffic ticket if you are traveling 55 mph, even thoughthe answer in #2 indicates your speeding ticket is a certain amount.
4. For what values of S would you not use this formula? Why?
5. Your teacher received a $100 speeding ticket in Petersburg. flow fast was he or shegoing? Explain how you arrived at your answer.
121
Eisenhower Regional Consortium for Mathematics and Science Education at AEL Lesson 9 / 115

Graphing Calculators in Mathematics Grades 7-12
6. The city of Petersburg has hired you to establish a way for city officials to quicklydetermine the cost of a traffic ticket. You determine that a chart would be the solutionto this problem. Using your graphing calculator, make a speeding ticket chart for speedsbetween 66 mph and 90 mph.
Speed (mph) Cost of Ticket66676869707172737475767778798081828384858687888990
7. Look at the chart above and the function T = 80 + 1(S 65). Why do you think thenumber 1 is included in the function?
8. All other streets in Petersburg have a speed limit of 45 mph. Suppose you have beenhired as a consultant by the City Council to establish a formula that determines the costof a speeding ticket on these streets. They have given you this stipulation:
The minimum ticket should be $30.
Create a fair and reasonable function using S and T. Explain how you arrived at yourfunction, and explain why it is fair and reargable.
2
116 / Lesson 9 Center of Excellence for Science and Mathematics Education at UT Martin

Graphing Calculators in Mathematics Grades 7-12 A*Activity Three Handout: When is a Ticket the Same?
Edithtown and Keelston, two fictional cities in Tennessee, use the following functions todetermine the cost of speeding tickets:
Edithtown: T = 66 + 2(S 65) Keelston: T = 10 + 10(S 65)
1. Using a graphing calculator, create a chart that lists the cost of speeding tickets inEdithtown and Keelston for speeds between 66 and 90. At what speed is the cost of aspeeding ticket the same in both cities? Circle this speed on the chart you create.
Edithtown
Speed (mph) Cost of Ticket66676869707172737475767778798081828384858687888990
Keelston
Speed (mph) Cost of Ticket66676869707172737475767778798081828384858687888990
2. For every additional mph you go over the speed limit in Edithtown, what happens to thecost of the speeding ticket? (flint: use the chart in #1)
3. Write T = 66 + 2(S 65) in slope-intercept form (y = mx + b). What is the slope of theequation? What does the slope mean? What are its units?
123Eisenhower Regional Consortiutn for Mathematics and Science Education at AEL Lesson 9 /117

Graphing Calculators in Mathematics Grades 7-12
4. For every additional mph you go over the speed limit in Edithtown, what happens to thecost of the speeding ticket?
5. Write T= 10 + 10(S 65) in slope-intercept form. What is the slope of the equation?What does the slope mean? What are its units?
6. Explain how slope and the change in the cost of the speeding ticket are related.
7. Using a graphing calculator, sketch the speeding ticket functions. Describe the windowthat you used.
Edithtown Keelston Both cities on the same axis
8. Describe how the graphs are similar. Why do you think they are similar?
9. Describe how the graphs are different. Why do you think they are different?
1 4
118 / Lesson 9 Center of Excellence for Science and Mathematics Education at UT Martin

Graphing Calculators in Mathematics Grades 7-12
10. An interesting situation occurs when you look at the speeding ticket functions for thesetwo cities. There is only one speed that you could travel in either city and get a ticketthat costs the same amount in both cities. There are at least three ways to attack thisproblem.
a. Algebraic Solution: Solve the system of equations for the two cities of Edithtownand Keelston. Show all work.
b. Graphical Solution: Graph the two functions on your graphing calculator. When dothey intersect? Justify your answer (i.e., show the graphs, the point of intersection,and the window).
c. Numerical method: You did this already in problem #1.
d. Can you think of another way to solve this problem?
125
Eisenhower Regional Consortium for Mathematics and Science Education at AEL Lesson 9 / 119

Graphing Calculators in Mathematics Grades 7-12
Activity Four: Piecewise and Other Functions
Note: The data used in this section were obtained from police departments in July 1997.
Though some real towns and cities in Tennessee actually use linear functions to determinethe cost of speeding tickets, this is not always the case.
* For example, the city of Martin uses the following schedule:
Traffic Offense CostSpeeding (Simple) $56.00Speeding (Radar-Limit + 15 mph) $56.50Speeding (Radar-Limit + 20 mph) $61.50Speeding (Radar-Limit + 25 mph) $66.50Speeding (Radar-Limit + 30 mph) $71.50
This is a stepwise function.
1. Make a graph that represents the speeding fines in Martin, Tennessee.
2. What would be the cost of a speeding ticket in Martin if your speed in a 55 mph zone is72 mph? 80 mph? 85 mph? 92 mph? Explain how youarrived at these answers.
3. Develop a piecewise function for this schedule.
126
120 / Lesson 9 Center of Excellence for Science and Mathematics Education at UT Martin

Graphing Calculators in Mathematics Grades 7-12 A*Another example of speeding fines in a 55 mph speed limit zone is given below in theinformation from Weak ley County, Tennessee.
Speed (mph) Ticket Cost60-64 7165-70 12071-75 12576-80 130over 80 155
This is another piecewise function.
4. Explain the pattern for speeds 65 mph through 80 mph?
5. Why do you think the $71 fine does not fit the pattern?
6. Why does the $155 fine not fit the pattern?
7. Why do you think there is no listing for speeds from 56 to 59 mph?
127
Eisenhower Regional Consortium for Mathematics and Science Education at AEL Lesson 9 / 121

Graphing Calculators in Mathematics Grades 7-12
I f a Tennessee state trooper issues a speeding ticket to a motorist, the exact amount of thethe ticket is determined by the county in which the ticket is issued. Some of the factors
used to determine the value of a speeding ticket include the following: state litigation tax,county clerk fee, local county tax, law library fee, and an officer or trooper fee.
If you are ticketed by a police officer in Metropolitan Nashville/Davidson County, thecost of a speeding ticket is simply $78.50 for exceeding the speed limit on the interstate. Atthe discretion of the police officer, a fine for reckless driving may be issued with a maximumvalue of $500 for traveling 15 mph over the speed limit.
However, if a speeding ticket is issued by a state trooper, the amounts are $69 for speedsof 74 mph or less and $113.50 for speeds of 75 mph or more. These interstate fines are thesame whether the speed limit is 55 mph or 65 mph.
8. For what speeds is a ticket more costly if you are stopped by a police officer, and forwhat speeds is it more costly if you are stopped by a trooper?
9. Do you think this ticketing schedule is fair? Explain your answer.
Some similar functions are used to determine fees for postal rates, package deliveryservices, car rentals, and cellular phone charges. Can you think of other examples?
10. Further investigate one of the ideas in #9.
12 8
122 /Lesson 9 Center of Excellence for Science and Mathematics Education at UT Martin

Graphing Calculators in Mathematics Grades 7-12
Activity Five: Speeding Ticket Projects
Select one of the following projects to complete. You may work with a partner
A 11 *
1. Contact city, county, or state police departments in your area. Find out how the cost of aspeeding ticket is determined in at least 3 different governmental entities. Write a paperon the fairness of these fines.
2. You have been hired by a city that wants to deter people from speeding. You have beenasked to create a function that is not linear and would deter motorists from speeding.Create a function and explain why your function would accomplish this goal. Use chartsand graphs to support your claim.
3. Conduct and report research on the correlation between speeding and vehicular accidents.
4. Conduct and report research on speed limits in neighboring states.
5. Contact city, county, or state police departments in your area. Determine their definitionof "reckless driving." How is this determined and what is this fine?
129
Eisenhower Regional Consortium for Mathematics and Science Education at AEL Lesson 9 / 123

Graphing Calculators in Mathematics Grades 7-12
Assessment and Inservice Suggestions
Assessment:Handouts provided in this lesson can be graded by the teacher.Teacher can observe learning while students are working.Students could be asked to write a paper describing what they have learned in this lesson.Students could complete a project as suggested in the extensions.
Inservice:
Teachers can get graphing calculator experience by completing the handouts in thisactivity as part of an inservice program.The TI-82 and TI-83 instructional sheets will be extremely valuable for teacher with littleor no graphing calculator experience.Teachers should get the "hands-on" experience of calling police departments to researchthe cost of speeding tickets in their area.Teachers should get an opportunity to brainstorm to consider other ways to enhance thisactivity. For example, one discussion among teachers produced an idea to invite a policeofficer to speak in a class.
130
124 /Lesson 9 Center of Excellence for Science and Mathematics Education at UT Martin

Graphing Calculators in Mathematics Grades 7-12
Lesson 10: Traveling Through the Solar System
An Exploration of Mass vs. Weight
Authors
* Jane Hampshire, St. Agnes Academy,Memphis, TN
* Elizabeth Greiner, Frayser HS, Memphis, TN
Approximate Time Needed for Lesson
One to two traditional class periodsor one 90-minute period
Content Area
Statistics and Probability
Process Standards
Problem Solving, Communication,and Connections
Goals for Students
To use calculator and non-calculator methods for analyzing dataTo apply data collection and analysis in a study of mass and weightTo use the concept of line of best fit to calculate weight (mass) when given mass(weight)
Description or Summary of Lesson
S tudents in Arithmetic, Pre-Algebra, General Science, and Physical Science are theintended audience. Using appropriate technology and working in small groups,
the students collect data by measuring the mass of various objects, calculating theweights, and representing the data in various ways. Using calculator and non-calcula-tor methods, the students will analyze the data to determine relationships, makepredictions using a line of best fit, and formulate written conclusions.
Background Information
?This is an introductory lesson intended for students in grades 7-9.Students are assumed to have mastered graphing in a plane, be familiar with
slope and y-intercept, and be familiar with basic graphing calculator keys. There arereferences for extending and connecting to Algebra 1, Algebra 2, Pre-Calculus, andCalculus.
Materials and Equipment
Balance scale RaisinsA few uncooked spaghetti noodles Graph paperCenticubes or other gram weights Construction paperGlueOverhead projector and calculator, with view screen if possibleEach student will need:
notebook paper and pencil 1 3 14 access to a TI-81, TI-82, or TI-83 graphing calculator4 handouts
Eisenhower Regional Consortium for Mathematics and Science Education at AEL Lesson 10 /125

Graphing Calculators in Mathematics Grades 7-12
Activity One: RaisinsCollecting Data to Explore Mass
Teacher Notes
Outline:(El> Students measure the mass of different amounts of raisins.
Students use Activity One Handout to record and graph the results by hand and withthe calculator.
Eg> Students analyze the data and complete the handout.Students are given a homework assignment to name five other situations that makea linear relationship besides the number of items vs. mass.
or" Students complete the following evaluation problem:Use your calculator to make a scatter plot and line of regression for the followingdata:
number of paper clips weight
20 2230 3040 4650 5460 67
Show your graph as your final answer.
Extensions:
A more advanced class could compute the line of regression and determine the corre-lation coefficient.You can repeat the above using Tootsie Rolls, paper clips, or similar objects.The following books will help you use a CBL to measure and form the lists for suchan experiment. The specific activities listed all use a force sensor. The first refer-ence is very similar to the raisin activity; the others are designed for more advancedplaces in the curriculum.
Activity #2 "Making Cents of Math" in Real Word Math with the CBL System byChris Brueninger, Bill Bower, Linda Antinone, Elisa Bruening, copyright 1994 by TexasInstruments.
Activity #6 "Exploring Linear Equations II" in CBL Explorations in Algebra,* theTI-82 and TI-83, copyright 1996 by The Meridian Creative Group
Activities #12 "Modeling Geometric Sequences II" and #17 "Modeling Vector Addi-tion" in CBL Explorations in Pre-Calculus for the TI-82, copyright 1995 by The MeridianCreative Group
Activities #11 "Vector Analysis of Forces" and #14 "Moments about a Fixed Point" inCBL Explorations in Calculus for the TI-82, copyright 1995 by The Meridian CreativeGroup
1 32
126 / Lesson 10 Center of Excellence for Science and Mathematics Education at UT Martin

Graphing Calculators in Mathematics Grades 7-12
Activity One Handout: Raisins
1. Find the measures of the following using a balance scale. Place the given number ofraisins on one side of the balance. Place centicubes (or other gram weights) on the otherside of the balance until both sides are the same. The raisins weigh the number ofcenticubes. Remember 1 centicube has a mass of 1 gram. Write the results in the table.
Number of raisins Mass in grams1 02 02 53 04 0
2. What is the independent variable?
3. What is the dependent variable?
4. Are these variables related? How?
5. On graph paper, graph the number of raisins vs. the corresponding mass. Choose anappropriate scale.
6. Do the data points show any relationship? What is that relationship?
7. Is there a positive correlation (that is, does the dependent variable increase/decrease whenthe independent variable increases/decreases) or negative correlation (that is, does thedependent variable increase/decrease when the independent variable decreases/increases)or no correlation (no consistent relationship)?
8. Even though the data points may not be in exactly one straight line, there may be a linethat is close to most, if not all, points. This is called the line of best fit. Use the spaghettito find this line of best fit. Does the spaghetti intersect with every point, come close tomost points, or not intersect any point?
9. What does the slope represent in this problem?
133Eisenhower Regional Consortium for Mathematks and Science Education at AEL Lesson 10 /127

Graphing Calculators in Mathematics Grades 7-12
10. What number value is the slope? To find the slope, choose any two of the data points
y2that fall on or very close to the spaghetti and use the slope formula in
Slope =
11. According to the data, what should be the y-intercept?
12. What is the y-intercept according to the line of best fit (spaghetti)?
13. Is the value of #11 different from the value of #12? Why/Why not?
14. Write an equation for the line made by the spaghetti in the form y = mx + b where m isthe slope and b is the y-intercept.
15. Predict the missing values in the table by using the linear equation you found in #14.
Number of raisins Mass in grams1 000
4
1 69 5
16. Make a real-life graph. On a piece of heavier paper (construction paper, poster board),create an appropriate title for this graph. Draw axes for the first quadrant. Draw thehash marks along the axes and choose an appropriate scale. Glue the raisin pieces atthe data points from Question 1. Glue on spaghetti as the line of best fit. Label theline of best fit with the equation from Question 14.
17. Turn on the graphing calculator.
Press <2nd> < Y=> (Stat Plot).
Press <4> (Plotsoff). This returns the cursor to the home screen.
Press <ENTER>. This will turn all of the stat plots off.
Press <Y=>. If any of the = signs are highlighted, move the cursor on top of the =
and press <ENTER>. Doing this will make the graph of this equation invisible.
OR if you do not want that equation anymore, keep the cursor on top of the equa-
tion and press <CLEAR>. Do one of these two things for any equation that is in
any Y.3 1
128 / Lesson 10 Center of Excellence for Science and Mathematics Education at UT Martin

Graphing Calculators in Mathematics Grades 7-12
Press <STAT>. Press <ENTER> for the Edit menu. In the first list or column of the
table ( L, on the TI-82 or X on the TI-83) enter the data for the number of raisins that are
weighed. After each entry, press <ENTER>. Arrow to the right to the second list, 4. If
it is not named, name it L2 by typing <2nd> <2> ( L2). Enter the data that was collected
for mass in grams for each amount of raisins.
Press <2nd> <Y=> (Stat Plot) and then <ENTER> with the cursor on Plot 1. Press
<ENTER> while the cursor is flashing on top of the ON.
Press <y> once. Move the cursor on top of the scatter plot. Press <ENTER> to select
this type of graph. Arrow down once to Xlist.
TI-82: Press <2nd> <1> ( Li). Press <y> and select L2 for Ylist.
TI-83: Enter X for Xlist. Press <y> and <2nd> <2> ( L2) for Ylist.
Press <y> and choose the type of mark you want to represent your data.
Press the <WINDOW> key. The window sets up the view screen where the graph will
appear. Be sure to use numbers that include all data points. Buffer these points on all
sides in order to see a complete graph . Xmin is the smallest value for the viewscreen.
Use 0 for the Xmin in order to see the y-axis.
Press the <y>. The Xmax is the largest number of raisins. Since the largest number of
raisins on the table is 40, buffer this by 20 and type in 60.
Press the <y>. The Xscl (x-axis scale) sets the tic marks on the axis. Press < 5>.
Press the <y>. The Ymin is the smallest value of the masses. In order to see the x-axis,
type in 0. <y>. The Ymax is the highest value of the masses. Using a buffer again, type
in 20 higher than the highest mass value. <y>. Determine the Yscl (y-axis scale) by
dividing the largest mass value by how many tic marks you want to see. (Suggestion:
type in 5)
Press <GRAPH>. To look at the values of the points, press <TRACE>. A flashing
cursor will appear on top of the first data point. At the bottom of the screen, X= and Y=
will appear. To see the rest of the data points, press the <0.> key.
To find the line of best fit, press the <STAT> key. To calculate this equation, arrow once
to the right to CALC. The equation forms a line, so press <4> (LinReg (ax+b)), which is
a linear regression. LinReg(ax+b) abpears on the home screen. Press <ENTER>.
Eisenhower Regional Consortium for Mathematics and Science Education at AEL Lesson 10 /129
Q

Graphing Calculators in Mathematics Grades 7-12
18. The calculator finds the value of the slope (a) and y-intercept (b). (Round to the
hundredths place)
Slope=
Y-intercept=
One equation for a line is y = mx + b (m=slope and b=y-intercept)
19. What is the equation of this line?(Hint: use substitution)
20. To look at this graph, press <Y=>. Type in the equation that you wrote above. Thewindow still contains the data points from above. Press <GRAPH>.
21. How do the calculator slope and y-intercept compare with the slope and y-intercept
from the spaghetti and pencil and paper calculations?
22. Name 5 new concepts that you learned from the experiment and/or 5 things that you
now understand better because of the experiment.
23. Write a journal entry that includes the answers to the following questions.
a. Summarize the experiment.b. What relationship did the centicubes have with the mass?c. What conclusions can be made about the number of raisins and their mass?d. What did the line of best fit (spaghetti) tell about this relationship?e. How would someone find the mass of 100 raisins?f. How would someone find out how many.raisins are in 200 grams?
1 3
130 /Lesson 10 Center of Excellence for Science and Mathematics Education at UT Martin

Graphing Calculators in Mathematics Grades 7-12
Activity Two: Weight Through the Solar System
Teacher Notes
Outline:cg> Teacher and students agree on formula: weight = mass x gravity.
The teacher will choose a celebrity and guide all students through an example usingthe steps on the student handout.
(1=4> Using the handout, small groups perform same calculations for a second celebrity.cg> Homework assignment: Have students find their own weight on all planets and graph
resulting data.
Extension:Given that the moon's gravitational pull is 1/6 that of the earth, have students find thecelebrity's weight on the moon. Is this comparable to any planet? Who would use thisinformation?
Hopefully, your students will identify with, or at least readily recognize, the people yousend through the solar system in the last activity. You may wish to choose important
people in your school or community. We have included many athletes since their weights arereadily available on the Internet (just search for a name you wish to include). Following is asample list of people whose weights were found on the internet:
Lisa LeslieRebecca LoboBrett FavreJohn StocktonJackie Joyner-KerseeOprah WinfreyAnfernee Penny Hardaway
Suggestions for assessment:
Journal entriesGraphsTablesParticipation in class discussionOral group summariesHomework assignmentA quiz
165 pounds185 pounds225 pounds175 pounds154 pounds150 pounds210 pounds
137
Eisenhower Regional Consortium for Mathematics and Science Education at AEL Lesson 10 /131

Graphing Calculators in Mathematics Grades 7-12
Activity Two Handout
1. Choose a celebrity from the list to discover his/her weights on other planets.
2. On which planet would you expect the celebrity you choose to weigh the most?
3. On which planet would you expect the celebrity you choose to weigh the least?
4. Calculate the values for the following table. The following formula will be useful:
Planets Mass of Person Gravity Mass*Gravity WeightMercury 0.38Venus 0.91Earth 1
Mars 0.38Jupiter 2.54Saturn 0.93Uranus 0.8Neptune 1.2Pluto 0.06
(Assume that gravity values are in terms of Earth = 1)
5. a. Create a bar graph using the results of the data showing the weight of the person oneach planet.
b. Give the bar graph a title. Label the x-axis as the planets and the y-axis as the weightof the person. Choose an appropriate scale.
13 3
132 / Lesson 10 Center of Excellence for Science and Mathematics Education at UT Martin

Graphing Calculators in Mathematics Grades 7-12
6. Turn on the graphing calculator. Make a bar graph on the calculator using the same data.Use the following steps to create this bar graph. All bold type words are keys on thecalculator.
Press the <STAT> key. With EDIT highlighted, and press <1> (Edit) and<ENTER>.
In the first column or list in the table ( Li on the TI-82 and X on the TI-83) list the
numbers from 1-9. After each number that is typed into the Li or X list, press
<ENTER>. These numbers represent the planets, where 1 is Mercury and 9 is Pluto.
Press the right arrow key once and the cursor should now be under L2 .List the
weights of the person in the chart above in the same order as the nine planets.
Press <Y=> and clear any Y= that is not clear. Press <2nd> <Y=> (STAT PLOT).
In the STAT PLOT menu, with PLOT 1 highlighted, press <ENTER>. Turn the stat
plot on by pressing <ENTER> while the cursor is flashing on top of ON. Press <y>
once. Highlight the bar graph and press <ENTER>.
Press the <y> once. The Xlist is the horizontal axis, which will be the planets. Make
sure that List 1( Li on the TI-82 or X on the TI-83) is placed in this spot. IfL1 or X is
not present, place the cursor on top of what is there and press <2nd> <1> ( Li) or on
the TI-83, press <x,tn>.
0Press the <y> once. The Freq (frequency) is the vertical axis, which will represent
the weight of the person on the given planet. Make sure that L2 (List 2) is placed in
that spot. If L2 is not present, place the cursor on top of what is there and press
<2nd> <2> ( L2).
Press <WINDOW> to set the viewscreen where the graph will appear. Be sure to use
numbers that include all of the data points. Buffer these points on all sides in order to
see the complete graph. Xmin is the smallest value for the viewscreen. Use 0 for the
Xmin in order to see the y-axis.
Press the <y> once. The Xmax is the highest value for the planet number. Since
there are nine planets, and in order to see complete bars, type in 10.
Press the <y>. Xscl (x-axis scale) sets the tic marks on the axis. Type in <1> be-
cause the planets are labeled by the whole numbers 1-9.
139Eisenhower Regional Consortium for Mathematics and Science Education at AEL Lesson 10 /133
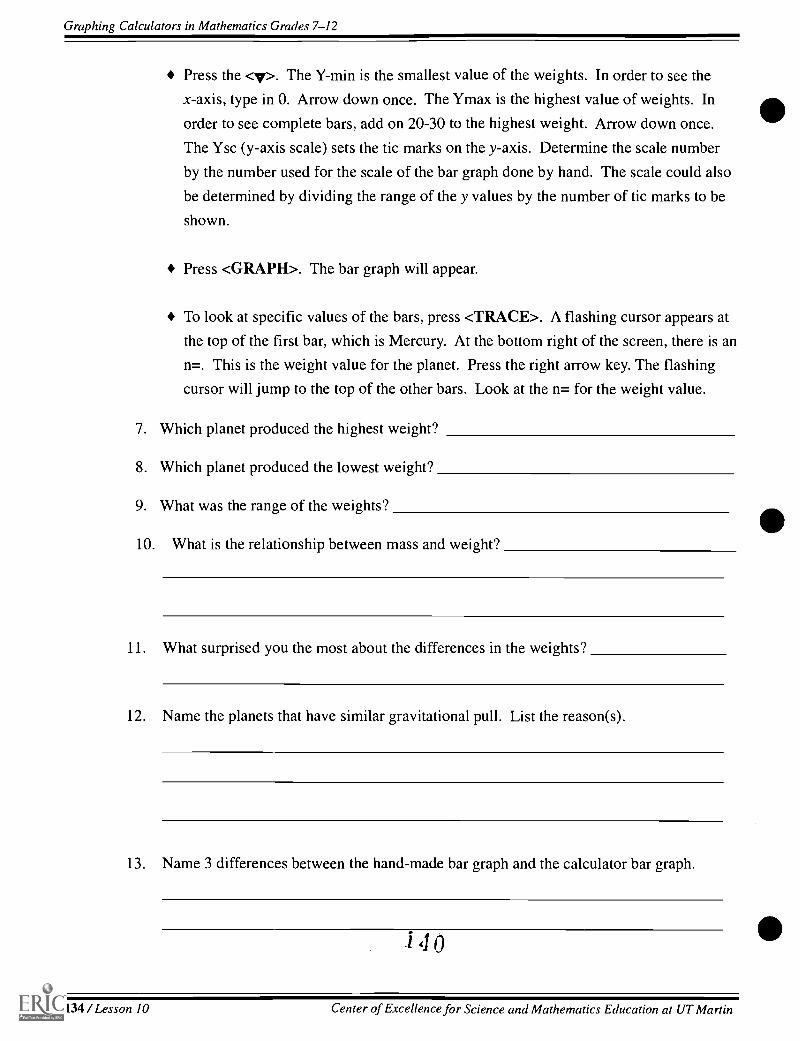
Graphing Calculators in Mathematics Grades 7-12
Press the <y>. The Y-min is the smallest value of the weights. In order to see the
x-axis, type in 0. Arrow down once. The Ymax is the highest value of weights. In
order to see complete bars, add on 20-30 to the highest weight. Arrow down once.
The Ysc (y-axis scale) sets the tic marks on the y-axis. Determine the scale number
by the number used for the scale of the bar graph done by hand. The scale could also
be determined by dividing the range of the y values by the number of tic marks to be
shown.
Press <GRAPH>. The bar graph will appear.
To look at specific values of the bars, press <TRACE>. A flashing cursor appears at
the top of the first bar, which is Mercury. At the bottom right of the screen, there is an
n=. This is the weight value for the planet. Press the right arrow key. The flashing
cursor will jump to the top of the other bars. Look at the n= for the weight value.
7. Which planet produced the highest weight?
8. Which planet produced the lowest weight?
9. What was the range of the weights?
10. What is the relationship between mass and weight?
11. What surprised you the most about the differences in the weights?
12. Name the planets that have similar gravitational pull. List the reason(s).
13. Name 3 differences between the hand-made bar graph and the calculator bar graph.
1 4 0
134 /Lesson 10 Center of Excellence for Science and Mathematics Education at UT Martin

Graphing Calculators in Mathematics Grades 7-12
14. Name 3 similarities in making a hand-made bar graph and the calculator bar graph.
15. Why would you want to know what you weigh on different planets?
16. On graph paper, make a scatter plot using the same data where the independent variableis the planets and the dependent variable is the weight. Give the scatter plot a title andlabel the axes.
17. Turn on the calculator. Press <2nd> <y=> (STAT PLOT). Press <4> (Plotsoff). This
returns the cursor to the home screen. Press <ENTER>. This will turn all of the stat
plots off. Press <Y=>. If any of the = signs are highlighted, move the cursor on top of
the = and press <ENTER>. Doing this will make the graph of that equation invisible.
OR If you do not want that equation anymore, keep the cursor on top of the equation
and press <CLEAR>. Do one of these two things for any equation that is in any Y=.
Press <2nd> <Y=> (STAT PLOT). Press <ENTER>. Press <ENTER> while the
flashing cursor is on top of the ON. Arrow down, highlight the scatter plot , and press
<ENTER>.
Arrow down to Xlist and type in Li (<2nd> <1>). Remember Li is the list with the
number of planets 1-9. Arrow down to Ylist and type in L2 (<2nd> <2>). Remember
L2 is the list with your celebrity's weight on the different planets. Arrow down and
press <ENTER> on top of the type of mark you want to represent the data.
Earlier, the window was set for the data. Since the data has not changed, leave the
window the same.
Press <GRAPH>. The scatter plot will appear. To look at specific point values, press
<TRACE>. At the bottom of the screen, X= and Y= appear. Use the right arrow to
move to points on the right and the left arrow to go back toward the first point.
1 4 1
Eisenhower Regional Consortium for Mathematics and Science Education at AEL Lesson 10 /135

Graphing Calculators in Mathematics Grades 7-12
18. What connection do you see between the bar graph and the scatter plot?
19. Which graph better represents the data? Why?
20. Are there outliers? If so, identify them.
21. Does there seem to be a relationship between a person's weight on a planet and thedistance the planets are from the sun? What seems to occur?
22. If you know that, on Saturn, Joe weighs 200 lbs, what does he weigh on Mercury?
Joe's weight on Mercury=
23. Write a journal entry that answers the following:a. Summarize the experiment.b. What is the relationship between mass and weight?c. How does gravitational pull affect weight?d. Which type of graph better represents the data? Why?e. When are the mass and weight the same (if they ever are)?f. When you step on the scale, what are you measuring?g. If you could choose any planet to live on, which planet would you choose
now that you know your weight will change? Why?
1 4
136 /Lesson 10 Center of Excellence for Science and Mathematics Education at UT Martin
Graphing Calculators in Mathematics Grades 7-12 *Lesson 11: Alien AttackAn Investigation
of Quadratic and Higher Equations
Authors
* Vanessa MooreGermantown HS, Germantown, TN
* Sherry MortonGermantown HS, Germantown, TN
Approximate Time Needed for Lesson
One to two traditional class periods or one90-minute period
Content AreaPatterns, Functions, and Algebraic Thinking
Process Standards
Problem Solving and Connections
Goals for Students
To explore a variety of calculator methods for solving quadratic and higher degreeequationsTo apply solving quadratic equations in a problem-solving situation
Description or Summary of Lesson
S tudents in Algebra I, Algebra II, and Pre-Calculus are the intended audience.1.3 After a teacher-led discussion of a futuristic problem and graphing calculatormethods of solution, the students will apply the methods to solve variations of theproblem. They will work in pairs or in groups of three. Also, the same methods willbe applied to higher degree equations.
Background Information
T his lesson is introductory material with several suggestions for using advancedtopics, enrichment, and discussion. Prior to the lesson, students should be able to
identify a quadratic, cubic, or quartic equation.
Materials and Equipment
Graphing calculator (TI-81, TI-82, TI-83, TI-85)View screen, if available, and an overhead projectorEach student will need:Al access to a graphing calculatorAI one sheet of graph paper
four copies of Handout 1Al Handout 2
Note: The screens used in this lesson are from the TI-82. The TI-83 would use thesame procedure. The TI-81 and TI-85 do not have a table method, but the problemcan be solved graphically on both and on,the TI-85 by using solver.
143Eisenhower Regional Consortium for Mathematics and Science Education at AEL Lesson 11 / 137

Graphing Calculators in Mathematics Grades 7-12
Activity One: Alien Attack
Teacher Notes
Outline:
(Et> The teacher will work through the futuristic problem with students using the Tableand Intersect methods on the graphing calculator and one copy of Handout 1.
1> Students work the practice problems using the additional copies of Handout 1 andusing both methods.
effi> Students complete Handout 2.
Note: This lesson may be kept very basic or may be expanded to encompass physics andwriting. An element of creativity was used to interest the students and relate the problem to
current events.
Teacher Notes For Handout 1
Science Connection:When an object is propelled upwards, gravity pulls it back to Earth. The graph of timevs. height is a parabolic curve even in a world in which the only force working on the
object is gravity, and the path of the object is straight up and down. The relationship of theobject and gravity can be expressed by the formula:
s = h,+ v,t 0.5g12, where s is the distance above the starting point, h, is the starting
height, v, is the initial velocity, t is time elapsed, and g is the acceleration of gravity.
The acceleration of gravity is 9.8 meters/ sec2. With the application of this information,alternative methods of solving quadratics will be developed and practiced.
Problem:n alien ship is hovering above Washington, D.C. at a height of just 100 meters. Agiant slime blob is housed in a missile-like container. The alien ship fires the
container up into the air at a velocity of 500 meters per second and sets its warp speedto fly away.
1. Let time be represented by x and substitute the given information into the equation. Thenchange the equation into the form of y =. This must occur with any equation to besolved on the graphing calculator.
2. Enter in the equation y =100 + 500x .5(9.8)x2.
Press <Y=> and enter Yi = 100 + 500x .5(9.8)x2
144138 /Lesson 11 Center of Excellence for Science and Mathematics Education at UT Martin

Graphing Calculators in Mathematics Grades 7-12
Yal100+500X .5(9.8)X2Y21:101Y3Y4-fsY6Y7
*
3. The first approach to be used for solving this problem will be the table feature.
Press <2nd> <WINDOW> (TBLSET )Set Tb1Min=0A Tbl = 1 (This assigns the increments to be used for the x-values of the table.)
TABLE SETUPTb1Min=0ATb1=1Indpnt:Depend:
Hu cAutc
AskAsk
4. Look at the table by pressing <2nd> <GRAPH> (TABLE).
X YiA 1001 595.12 10E10.43 1555.94 2021.65 2477.56 2923.6
X 0 _
5. Begin the investigation.
14'5
Eisenhower Regional Consortium for Mathematics and Science Education at AEL Lesson 11 / 139
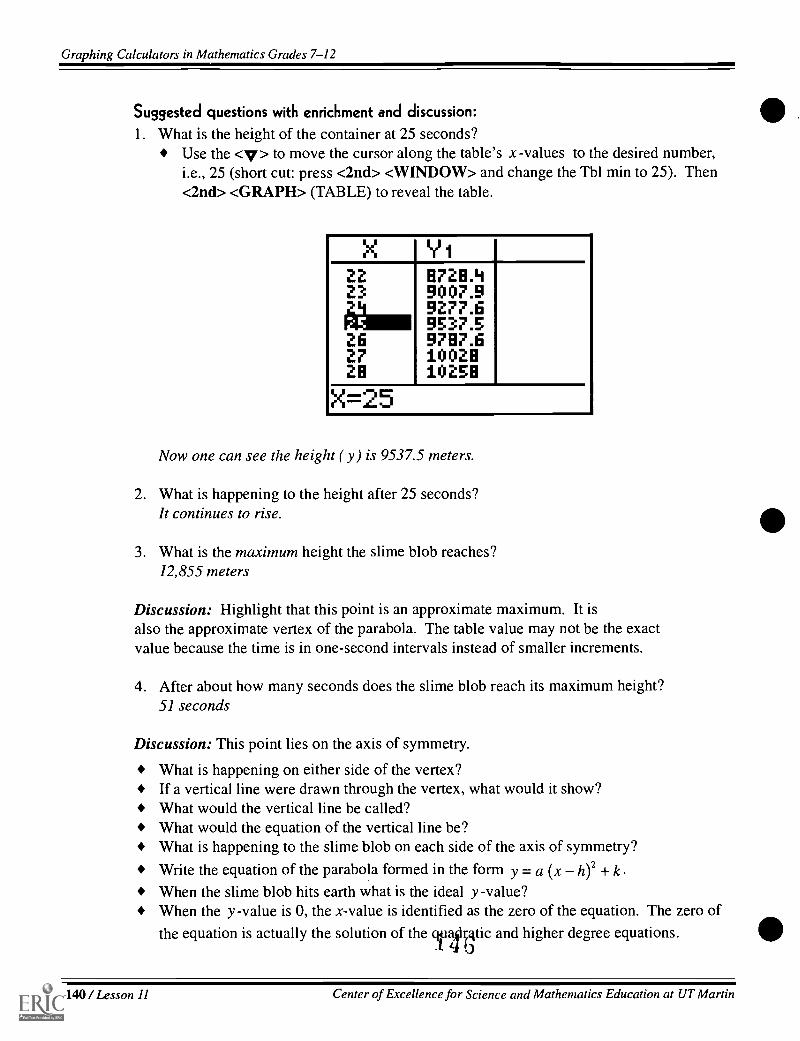
Graphing Calculators in Mathematics Grades 7-12
Suggested questions with enrichment and discussion:
1. What is the height of the container at 25 seconds?Use the <y> to move the cursor along the table's x-values to the desired number,i.e., 25 (short cut: press <2nd> <WINDOW> and change the Tbl min to 25). Then<2nd> <GRAPH> (TABLE) to reveal the table.
X Yi22 9729.423 9007.9iiil 9277.6
9537.526 9797.627 1002929 10259
X 25
Now one can see the height ( y ) is 9537.5 meters.
2. What is happening to the height after 25 seconds?It continues to rise.
3. What is the maximum height the slime blob reaches?12,855 meters
Discussion: Highlight that this point is an approximate maximum. It isalso the approximate vertex of the parabola. The table value may not be the exactvalue because the time is in one-second intervals instead of smaller increments.
4. After about how many seconds does the slime blob reach its maximum height?51 seconds
Discussion: This point lies on the axis of symmetry.
What is happening on either side of the vertex?If a vertical line were drawn through the vertex, what would it show?What would the vertical line be called?What would the equation of the vertical line be?What is happening to the slime blob on each side of the axis of symmetry?
Write the equation of the parabola formed in the form y = a (x h)2 + k .
When the slime blob hits earth what is the ideal y-value?When the y-value is 0, the x-value is identified as the zero of the equation. The zero ofthe equation is actually the solution of the quailicgtic and higher degree equations.
I 44 ij
140 /Lesson 11 Center of Excellence for Science and Mathematics Education at UT Martin

Graphing Calculators in Mathematics Grades 7-12
X Vi49 12835
Num.1285012855
52 1285053 1283654 1281255 1277B
X=51
5. After how many seconds would the blob slime Washington, D.C.?approximately 102.24043
6. What is the height ( y) when the slime blob is on the ground?approximately .08325
7. How close is .08325 to 0? (Ideally the y value should be 0).
X 'YiDo ummil.s15.1120.4103 -384.1104 -898.4105 -1423106 -1956
X-102
-*
Discussion: Notice in the screen above at 102 seconds the height is positive, and at 103seconds the height is negative. Therefore the slime blob hits between 102 and 103 secondsafter it is hurled into the air.
The <2nd> <WINDOW> (Tb1Set) allows us to change the increments of the table. Changethe Tb1Min to 102 and A Tbl to 0.1. (See table on the left). You can continue to make adjust-ments until you find zero for the y value. Thus the height is approximately 0 (.08325) after102.24 seconds. This value was found with Tb1Min at 102.24 and A Tbl .0001 (see thefollowing screens).
147
Eisenhower Regional Consortium for Mathematics and Science Education at AEL Lesson 11 /141

Graphing Calculators in Mathematics Grades 7-12
X Vi102 120.4
ialia70.39120.2134
102.3 -29.92102.4 -90.22102.5 -130.6102.6 -191.1
X=102.2
X 11) 1
102.24 .2939610224 2137910224 .1635610224 .11337ie3wigi .06317
.0129910224 -.0372
X-102.2404
Enrichment:
Make a graph with paper and pencil using the coordinates given on the table with respectto time ( x) and height ( y).What shape does the graph form? parabolaWhy, if the container is shot straight up and supposedly comes straight down, does thegraph form this shape? The graph represents time vs. height and is not the path of thecontainerWhat is the maximum amount of time our superhero has to save the country?102 secondsHave the students take one approach or the othereither the container is intercepted ornotand write a conclusion to the scenario.Using the tables allows the students to see the x values with the corresponding y values;and with the tables, an understanding of the increasing and decreasing of the equation canbe developed. However, although this is a good visual method of exploring the equation,finding exact values may be tedious, as in the case of finding the exact time the slimeblob landed on Washington, D.C. Therefore, the problem will be solved by using thegraphs of the quadratic, the zoom feature, and a system of equations approach to exploresolutions.
Using the problem y =100 + 500x .5(9.8)x2, enter this into the <Y=> screen as done inthe previous example.
Discussion: Once the equation is in place the x and y axis must be established to give anaccurate picture of the graph. Do this by pressing <WINDOW>.
What would be suitable for a minimum and maximum x?What would be suitable for a minimum and maximum y ?Note: when using a large axis, it may be easier to set the x and y scale at 0.
1 4 9
142 /Lesson 11 Center of Excellence for Science and Mathematics Education at UT Martin

Graphing C'alculators in Mathematics Grades 7-12
FORMATm n-0
Xmax=150Xsc1=0YpiinOYmax=14000Ysc1=0
*
Now the equation is entered and the window is set. Press <GRAPH> and the equation
will be graphed. The student can use <TRACE>, which would give an approximate
maximum height, an approximate landing time, and approximate heights at different
times. The <ZOOM> feature can be used to better pinpoint the maximum height and
landing position (zero of the equation).
The 1 in the top right corner represents the Y, equation. The X = and Y = represent the x
and y coordinates at the starred point.
Finding the zero using the intersect method.
The following approach is a more efficient method of finding the zero of an equation.
To find the zeros of an equation, whether quadratic or of higher degree, the equation can be
set up as a system, and use a feature of intersection or root.
The zero of an equation is where the graph crosses the x-axis ( y = 0).
Therefore, the system that will be used is where Y, = current equation and Y, = 0.
For example, with the equation Y=100 + 500x .5(9.8)x2, enter in <Y=> as shown in thenext illustration.
149
Eisenhower Regional Consortium for Mathematics and Science Education at AEL Lesson 11 / 143

Graphing Calculators in Mathematics Grades 7-12
Ya1100+500X .5(9
Y2Y3Y4YsYs-Y7
Use the discussion from the previous problem to set the viewing window after pressing
<WINDOW>.
To find the zero:
Press <GRAPH> to see the two equations graphed, then <2nd> <TRACE> and high-
light the fifth option, which is intersect (Left screen). Then press <ENTER> (right
screen below).
1:value2:root3:minimum4:maximumgUintersect6:&J/dx7:Sf(x)dx
The screen will display First curve?, which means the cursor is moving along the y,
equation. Use the arrow keys to move the cursor as close as possible to the intersection
point (where Y = 0). Press <ENTER>.
Second curue? 4.X=913.9361.7 111=9.n.44
144 / Lesson 11 Center of Excellence for Science and Mathematics Education at UT Martin

Graphing Calculators in Mathematics Grades 7-12 *The screen displays Second curve?, which means the cursor is moving along Y2 equa-
tion. Use the blue arrows to move the cursor as close as possible to the intersection point.
Press <ENTER>.
The screen displays Guess?, making the feature resemble a video game.Press <ENTER>.
IntersectionX=10224043 _?=0
Notice when Y = 0, the X-value is 102.24043. This is a zero. If there is more than one
zero, repeat the process beginning with <2nd> <TRACE>. When finding the other
zeros, use the arrow keys to move your cursor to the next intersection point, and continue
the process.
Some of the stumbling blocks that could occur are discussed below.
Stumbling Block ResolutionCalculator Freezes (will not proceed tosecond curve, guess, or intersection)
Press 2nd QUIT (above MODE) andstart the process over
Y.-- may be in scientific notation Press 2nd QUIT (above MODE) andstart the process over or use theteachable moment and discuss notation
Eisenhower Regional Consortium for Mathematics and Science Education at AEL Lesson 11 / 145

Graphing Calculators in Mathematics Grades 7-12
Practice problems
Change the initial velocity on Handout 1 to:
1. 1500 meters per second
2. 3000 meters per second
3. 5000 meters per second
What effects does this have on maximum, minimum, and the times explored in the previ-
ous questions.
Enrichment
Compare and contrast the solutions. Discuss the variations and have students write a
synopsis of the activity.
Teacher Notes for Handout 2
Find the zeros of the following equations (include sketches of the graphs from yourcalculator).
a. 35x3 +16x2 = 12x
Intersect Method
One approach is to enter the left side of the above equation as 171, the right side of the
equation as Y2, and use <2nd> <TRACE> (CALC) to find the points of intersection (inthis case, there are 3 points of intersection), which will find the values of x, which are thesolutions of the equation.
FORMAT4AlrliM -3
Xmax=3Xsc 1=0Ymin -15Ymax 15Ysc 1 0
146 /Lesson 11 Center of Excellence for Science and Mathematics Education at UT Martin

Graphing Calculators in Mathematics Grades 7-12 *
.
lir.
Intersection:4=.4 I?
Intersect nX=-.E1571429 Yr.-10.213571
The table can be checked to verify that these three values of x are zeros or approximatevalues for the zeros.
These solutions are consistent with a graph of the original equation (rewritten with theright side equal to 0) and its intersection with y = 0 . Then, with the left side as I', and 0as Y2, the same zeros (0, .4, and -.8571429 [approximately]) can be found using <2nd><TRACE> (CALC) three times with the cursor close, in turn, to each of the points ofintersection.
153
Eisenhower Regional Consortium for Mathematics and Science Education at AEL Lesson 11 /147

-
Graphing Calculators in Mathematics Grades 7-12
b. 18x3 +16x = 34x2
Intersect Method
One approach is to enter the left side of the above equation as Yi , the right side of the
equation as Y2, and use <2nd> <TRACE> (CALC) to find the two points of intersection,which will find the values of x, which are the solutions of the equation.
FORMATVE9-2Xmax=2Xsc1=0Ymin=-20Ymax=20Ys01-0
Therefore, 0 and 1 are zeros of the original equation.
Press <2nd> <TABLE> to check using the table method.
Note: These solutions are consistent with a graph of the original equation as shownbelow, rewritten with the right side equal to 0 and its intersection with y = 0 . Then with
the left side as Yi and 0 as Y the same zeros can be found.
148 /Lesson 11 Center of Excellence for Science and Mathematics Education at UT Martin
15 4
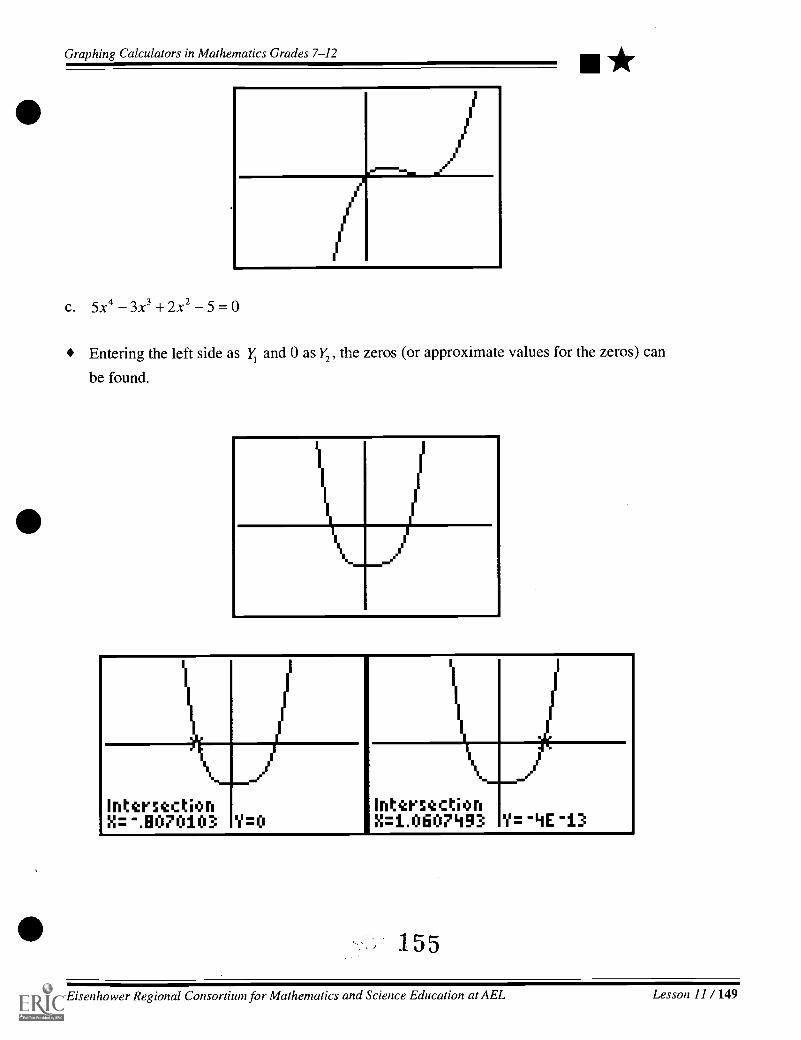
Graphing Calculators in Mathematics Grades 7-12
c. 5x4 3x2 + 2x2 5 = 0
*
Entering the left side as 1 and 0 as y2 , the zeros (or approximate values for the zeros) can
be found.
lirIntersectionX= -.B070103 '?=0
IntersectionN=1.0607493 le=-LIE-13
155
Eisenhower Regional Consortium for Mathematics and Science Education at AEL Lesson 11 / 149

Graphing Calculators in Mathematics Grades 7-12
Adaptations:
Have students create an equation with one real zero, two real zeros, or even four real
zeros.
What if the graph does not cross the x axis? What does this imply?
150 /Lesson 11 Center of Excellence for Science and Mathematics Education at UT Martin

Graphing Calculators in Mathematics Grades 7-12
Activity One, Handout 1: Alien Attack
*
When an object is propelled upward, gravity pulls it back to Earth. The graph of timevs. height is a parabolic curve even though in a world in which the only force working
on the object is gravity, the path of the object is straight up and down. The relationship of theobject and gravity can be expressed by the formula:
s = h,+vi t 0.5gt2, where s is the distance above the starting point, h, is the starting
height, v, is the initial velocity, t is time elapsed, and g is the acceleration of gravity.The acceleration of gravity is 9.8 meters/sec2. Using this information, alternative methodsof solving quadratics will be developed and practiced.
Problem:An alien ship is hovering above Washington, D.C. at a height of 100 meters. A giantslime blob is housed in a missile-like container. The alien ship fires the container upinto the air at a velocity of meters per second, and sets their warpspeed to fly away.
I. What is the height of the container at 25 seconds?
2. What is happening to the height after 25 seconds?
3. What is the maximum height the slime blob reaches?
4. After how many seconds does the slime blob reach its maximum height?
5. What is happening on either side of the vertex?
6. If a vertical line were drawn through the vertex what would it show?
7. What would be the equation of the vertical line?
8. What is happening to the slime blob on each side of the axis of symmetry?
Eisenhower Regional Consortium for Mathematics and Science Education at AEL Lesson 11 / 151
157

Graphing Calculators in Mathematics Grades 7-12
9. Write the equation of the parabola formed in the form of y = a(x h)2 + k.
10. When the slime blob hits earth what is the ideal y -value?
11. After how many seconds would the slime blob slime Washington, D.C.?
12. What is the height when the slime blob is on the ground?
13. How close is .08325 to 0?
14. Make a graph with paper and pencil using the coordinates given on the table withrespect to time ( x) and height ( y ).
15. What shape does the graph form?
16. Why, if the container is shot straight up and supposedly comes straight down, doesthe graph form this shape?
17. What is the maximum amount of time a superhero has to save the country?
18. Decide whether the superhero saves the country, and create a conclusion to ourscenario.
153
152 /Lesson 11 Center of Excellence for Science and Mathematics Education at UT Martin

Graphing Calculators in Mathematics Grades 7-12
Activity One, Handout 2
-*
Find the zero's of the following equations (include sketches of the graphs from yourcalculator).
a. 35x3 +16x2 = 12x
b. 18x3 +16x = 34x2
C. 5x4 3x3 + 2x2 5 = 0
1 59
Eisenhower Regional Consortium for Mathematics and Science Education at AEL,
Lesson 11 / 153
Graphing Calculators in Mathematics Grades 7-12
Inservice Suggestions:
An inservice plan would be for the participants to perform as a class of high school
students, following along with the instructor. The instructor's presentation would be
greatly enhanced by using the view screen to illustrate the activities of the calculator.
1 G 0
154 /Lesson 11 Center of Excellence for Science and Mathematics Education at UT Martin
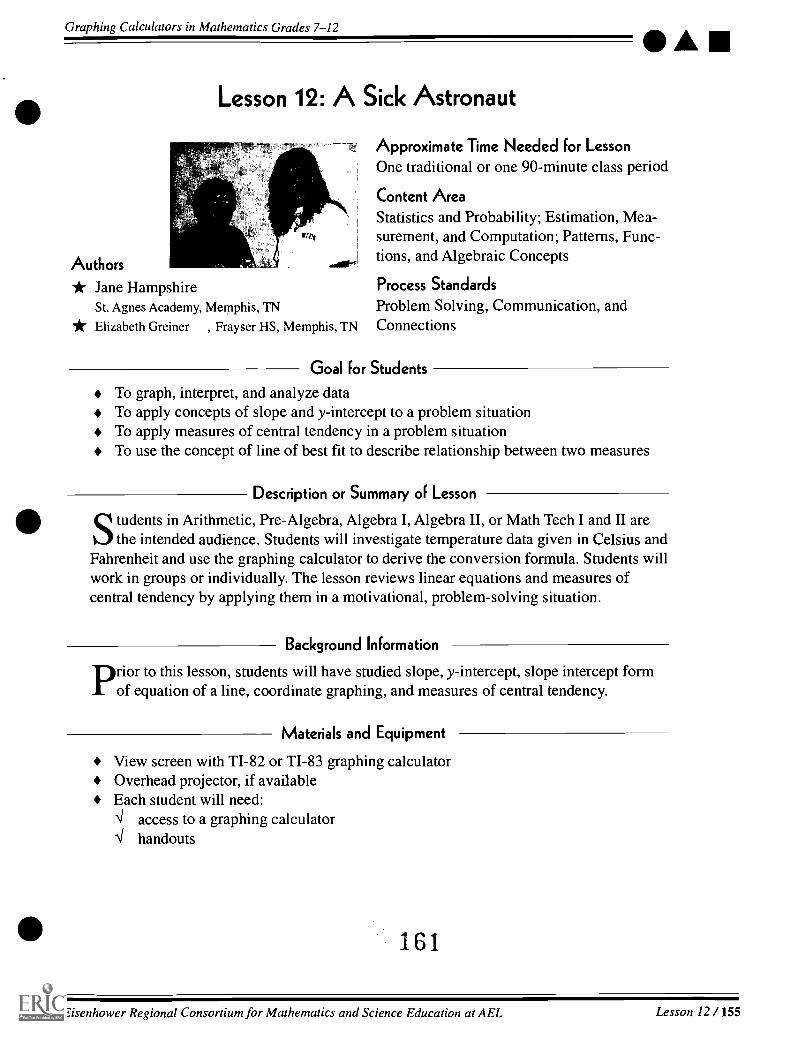
Graphing Calculators in Mathematics Grades 7-12
Lesson 12: A Sick Astronaut
Authors
* Jane Hampshire Process Standards
St. Agnes Academy, Memphis, TN Problem Solving, Communication, and* Elizabeth Greiner , Frayser HS, Memphis, TN Connections
A
Approximate Time Needed for LessonOne traditional or one 90-minute class period
Content AreaStatistics and Probability; Estimation, Mea-surement, and Computation; Patterns, Func-tions, and Algebraic Concepts
Goal for Students
To graph, interpret, and analyze dataTo apply concepts of slope and y-intercept to a problem situationTo apply measures of central tendency in a problem situationTo use the concept of line of best fit to describe relationship between two measures
Description or Summary of Lesson
S tudents in Arithmetic, Pre-Algebra, Algebra I, Algebra II, or Math Tech I and II are1.3 the intended audience. Students will investigate temperature data given in Celsius andFahrenheit and use the graphing calculator to derive the conversion formula. Students willwork in groups or individually. The lesson reviews linear equations and measures ofcentral tendency by applying them in a motivational, problem-solving situation.
Background Information
p rior to this lesson, students will have studied slope, y-intercept, slope intercept formof equation of a line, coordinate graphing, and measures of central tendency.
Materials and Equipment
View screen with TI-82 or TI-83 graphing calculatorOverhead projector, if availableEach student will need:4 access to a graphing calculator4 handouts
161
Eisenhower Regional Consortium for Mathematics and Science Education at AEL Lesson 12 / 155
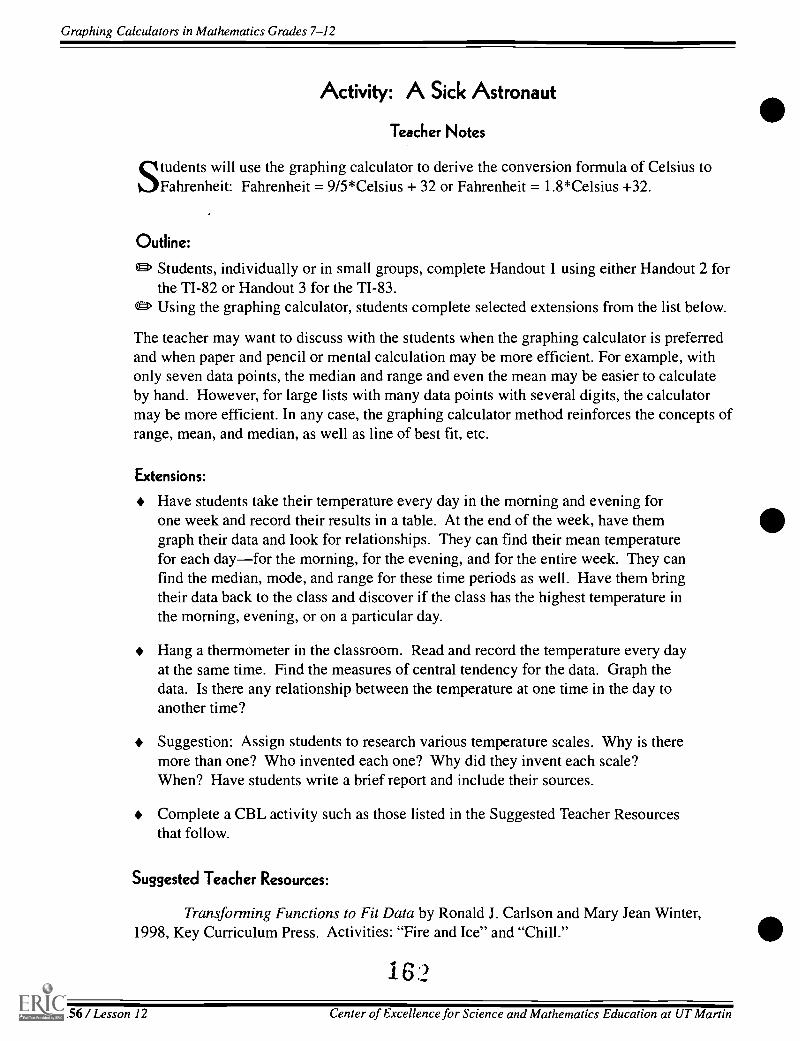
Graphing Calculators in Mathematics Grades 7-12
Activity: A Sick Astronaut
Teacher Notes
Students will use the graphing calculator to derive the conversion formula of Celsius toFahrenheit: Fahrenheit = 9/5*Celsius + 32 or Fahrenheit = 1.8*Celsius +32.
Outline:
tEr. Students, individually or in small groups, complete Handout 1 using either Handout 2 forthe TI-82 or Handout 3 for the TI-83.
ig> Using the graphing calculator, students complete selected extensions from the list below.
The teacher may want to discuss with the students when the graphing calculator is preferredand when paper and pencil or mental calculation may be more efficient. For example, withonly seven data points, the median and range and even the mean may be easier to calculateby hand. However, for large lists with many data points with several digits, the calculatormay be more efficient. In any case, the graphing calculator method reinforces the concepts ofrange, mean, and median, as well as line of best fit, etc.
Extensions:
Have students take their temperature every day in the morning and evening forone week and record their results in a table. At the end of the week, have themgraph their data and look for relationships. They can find their mean temperaturefor each dayfor the morning, for the evening, and for the entire week. They canfind the median, mode, and range for these time periods as well. Have them bringtheir data back to the class and discover if the class has the highest temperature inthe morning, evening, or on a particular day.
Hang a thermometer in the classroom. Read and record the temperature every dayat the same time. Find the measures of central tendency for the data. Graph thedata. Is there any relationship between the temperature at one time in the day toanother time?
Suggestion: Assign students to research various temperature scales. Why is theremore than one? Who invented each one? Why did they invent each scale?When? Have students write a brief report and include their sources.
Complete a CBL activity such as those listed in the Suggested Teacher Resourcesthat follow.
Suggested Teacher Resources:
Transforming Functions to Fit Data by Ronald J. Carlson and Mary Jean Winter,1998, Key Curriculum Press. Activities: "Fire and Ice" and "Chill."
16?
156 / Lesson 12 Center of Excellence for Science and Mathematics Education at UT Martin

Graphing Calculators in Mathematics Grades 7-12 AReal-World Math with the CBL System by Chris Brueningsen, Bill Bower, Linda
Antinone, And Elisa Brueningsen, 1994, Texas Instruments. Activities: "Chill Out," "Mix ItUp," and "And Now, the Weather."
CBL Explorations in Algebra for the TI-82 and TI-83 by the Meridian Group, 1996.Activities: "Exploring Statistics," "Exploring Exponential Equations," and "ExploringScatter Plots."
CBL Explorations in Pre-calculus for the TI-82 by Meridian Creative Group, 1995.Activity: "Modeling Exponential Functions."
CBL Explorations in Calculus for the TI-82 by the Meridian Creative Group, 1995.Activity: "Newton's Law of Cooling."
Physical Science with the CBL by Donald L. Volz and Sandy Sapatka, 1997, VernierSoftware. Activities: "Temperature Probe Response Time," "Boiling Temperature of Water,""Freezing and Melting of Water," "Evaporation of Alcohols," "Endothermic and ExothermicReactions," "Neutralization Reactions," "Mixing Warm and Cold Water," "Heat of Fusion,""Energy Content of Fuels," "Energy Content of Foods," "Absorption of Radiant Energy,""An Insulated Coke Bottle," "A Good Sock," "Insulation Angle," and "Solar Homes and HeatSinks. If
Biology with CBL by Scott Holman and David Masterman, 1997, Vernier Software.Activities: "Energy in Food," "Biodiversity and Ecosystems," "Dissolved Oxygen in Water,""Watershed Testing," and "Physical Profile of a Lake."
TI-82 and CBL Lab Applications in Biology and Chemistry by Penny Sconzo andChris Harrow, 1995, Kendall/Hunt Publishing Company. Activities: "Temperature vs. Vol-ume of Gas," "Boiling Point Elevation," "Heat of Formation of Magnesium Oxide," and"Food Calorimetry."
163
Eisenhower Regional Consortium for Mathematics and Science Education at AEL Lesson 12 / 157
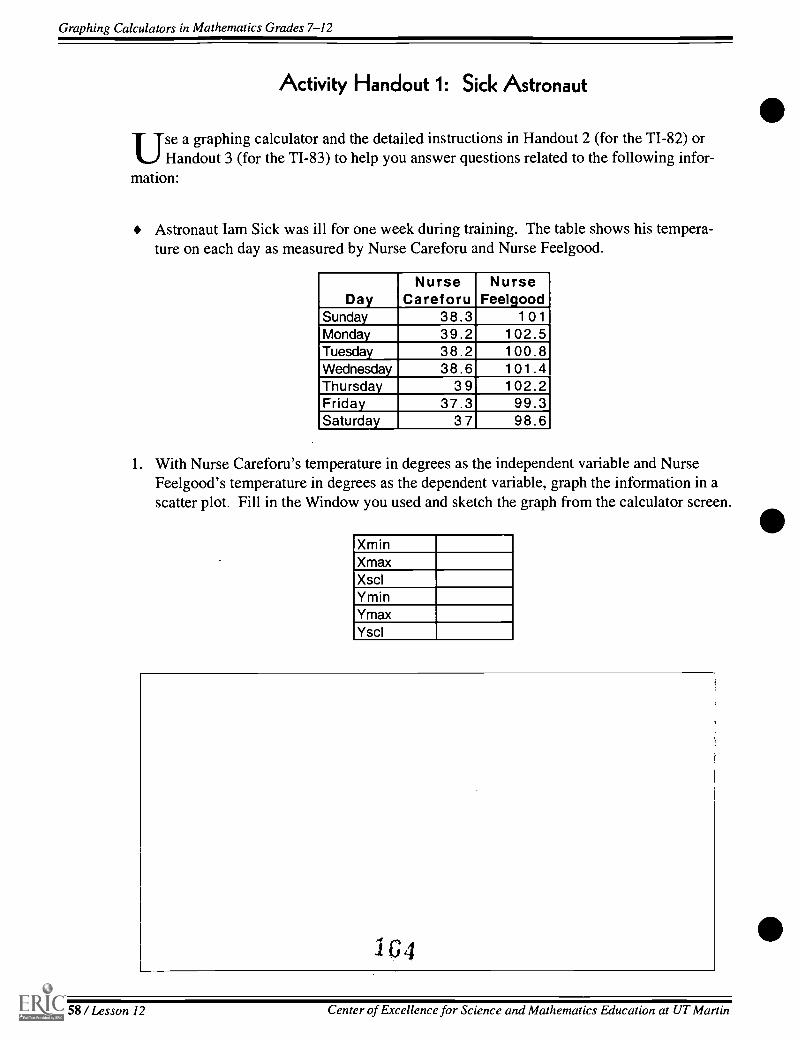
Graphing Calculators in Mathematics Grades 7-12
Activity Handout 1: Sick Astronaut
Use a graphing calculator and the detailed instructions in Handout 2 (for the TI-82) orHandout 3 (for the TI-83) to help you answer questions related to the following infor-
mation:
* Astronaut Iam Sick was ill for one week during training. The table shows his tempera-ture on each day as measured by Nurse Careforu and Nurse Feelgood.
DayNurse
CareforuNurse
FeelgoodSunday 38.3 101Monday 39.2 102.5Tuesday 38.2 100.8Wednesday 38.6 101.4Thursday 3 9 102.2Friday 37.3 99.3Saturday 3 7 98.6
1. With Nurse Careforu's temperature in degrees as the independent variable and NurseFeelgood's temperature in degrees as the dependent variable, graph the information in ascatter plot. Fill in the Window you used and sketch the graph from the calculator screen.
XminXmaxXsclYminYmaxYscl
1 G4
158 / Lesson 12 Center of Excellence for Science and Mathematics Education at UT Martin

Graphing Calculators in Mathematics Grades 7-12
a. The equation of the line of best fit is
b. The slope is . Write the slope as a fraction.
A
c. The y-intercept is ; thus, the point where theline intersects the y-axis is
d. Interpret this point for Iam
e. Interpret it for the rest of the real world
f. Do you think there is a reason for the name of the nurses? If yes, explain. If not,reconsider what the nurses did in this situation.
g. What is the standard formula for the relationship between degrees Celsius and Fahr-enheit? Where did you find this information orhow did you calculate it?
h. How does the slope on the line of best fit and the y-intercept compare to the standardformula?
2. a. What was the range of Iam's temperature according to Nurse Careforu?
b. What was Iam's mean temperature for the week according to Nurse Careforu?On which day(s) did this occur?
c. What was Iam's median temperature for the week according to Nurse Careforu?On which day(s) did this occur?
d. What was the mode of Iam's temperature according to NurseCareforu? On which day(s) did this occur?
3. a. What was the range of Iam's temperature according to Nurse Feelgood?
b. What was Iam's mean temperature for the week according to Nurse Feelgood?On which day(s) did this occur?
c. What was Iam's median temperature for the week according to Nurse Feelgood?On which day(s) did this occur?
d. What was the mode of Iam's temperature according to NurseFeelgood? On which days did this occur?
165
Eisenhower Regional Consortium for Mathematics and Science Education at AEL Lesson 12 / 159
Graphing Calculators in Mathematics Grades 7-12
4. Compare the results in #2 and #3. Explain what you just found.
1 66
160 /Lesson 12 Center of Excellence for Science and Mathematics Education at UT Martin

Graphing Calculators in Mathematics Grades 7-12
Activity Handout 2: Sick Astronaut
11-82 Instructions
Turn the calculator on. Press <2nd> <Y= > (STAT PLOT). Press <4> (Plots Off). Thisreturns the cursor to the home screen.
Press <ENTER>. This will turn all the stat plots off. Press <Y=>. If any of the = signsare highlighted, move the cursor on top of the = and press <ENTER>. Doing this willmake the graph of that equation invisible. Or if you do not want that equation anymore,keep the cursor on top of the equation and press <CLEAR>. Do one of these two thingsfor any equation that is in <Y=>.
Press <STAT>. <ENTER> (Edit).
In LI (List 1), list the temperatures taken by Nurse Careforu. After each number that istyped into the list, press <ENTER>. Press <i>> once.
The cursor should now be under L2 (List 2). Type the Temperatures taken by NurseFeelgood into this list.
Press <2nd> <Y=> (STAT PLOT) and <ENTER> (Plot 1). Turn the stat plot on bypressing <ENTER> while the cursor is flashing on top of On. Press <y> once. High-light the scatter plot and press <ENTER>. Press <y> for Xlist and select ( L1).
Note: Remember L, is the list with temperatures taken by Nurse Careforu.
Arrow down once to Ylist and select L, .
Note: Remember that L, is the list of temperatures taken by Nurse Feelgood.
Arrow down once and press <ENTER> with the cursor on the type of mark you want torepresent the data.
Press <WINDOW> to set up the view screen where the graph will appear. Be sure to usenumbers that include all of the data points. Buffer these points on all sides in order to seethe complete graph.
Xmin is the smallest value for the view screen horizontally. Use 35 for the Xmin. Arrowdown once. The Xmax is the highest horizontal value for the viewscreen. Use 40 as theXmax. Arrow down once. Xscl (x-axis scale) sets the tic marks on the axis. Type in 1for Xscl because the range of the data is small. Arrow down once.
The Ymin is the smallest vertical value of the viewscreen. Type in 96 for Ymin. Arrowdown once. The Ymax is the highest vertical value of the viewscreen. Type in 104 forYmax. Arrow down once. The Yscl (y-axis scale) sets the tic marks on the y-axis. Deter-mine the scale number by the number used for the scale of the bar graph done by hand.The scale could also be determined by dividing the range of the y values by how many ticmarks to be shown. Use 1 for the Yscl.
1 6 7Eisenhower Regional Consortium for Mathematics and Science Education at AEL Lesson 12 / 161

Graphing Calculators in Mathematics Grades 7-12
FORMATAM4535Xmax=40Xsc1=1Ymin=96Ymax=104Yscl 1
Press <GRAPH>. The scatter plot will appear. (It should look similar to the scatter plotbelow.) To look at specific values, press <TRACE>. At the bottom of the screen, X=and Y= appear. Use the right arrow to move to points on the right and the left arrow to goback toward the first point.
aa
cPa
a a
To establish a line of best fit, press <STAT>. To calculate the equation of the line, press<1*>(CALC) <5> (LinReg(ax+b)). This will give the slope and y-intercept for the equa-tion of the line of best fit. LinReg(ax+b) appears on the home screen. Press <ENTER>.Three values appear.
The value for a is the slope and b is the y-intercept. The r value is called the correlationcoefficient. The closer the line comes to hitting all of the points, the closer this numberapproaches 1. This r indicates a good fit of the line and the data points.
Press <Y=>. To put this exact equation into the <Y=> menu, press <VARS>. Theequation is coming from data, so press <5>. Then press <Is> .(1.>, (EQ [equation]).Press <7> (RegEQ) to paste the equation into the <Y=>.
Zap Pun mot3WiM1.7424242424243X+34.21818181
W2=11W3=Ws=
/
16162 / Lesson 12 Center of Excellence for Science and Mathematics Education at UT Martin
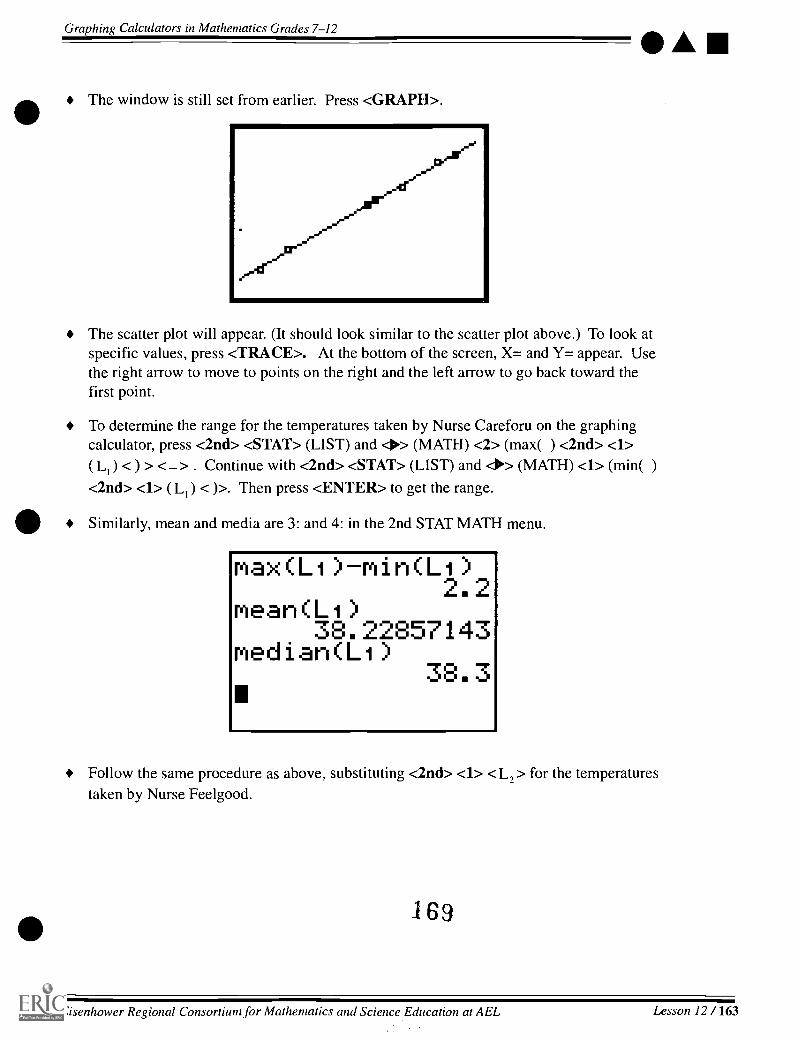
Graphing Calculators in Mathematics Grades 7-12
The window is still set from earlier. Press <GRAPH>.
A
The scatter plot will appear. (It should look similar to the scatter plot above.) To look atspecific values, press <TRACE>. At the bottom of the screen, X= and Y= appear. Usethe right arrow to move to points on the right and the left arrow to go back toward thefirst point.
To determine the range for the temperatures taken by Nurse Careforu on the graphingcalculator, press <2nd> <STAT> (LIST) and <Is> (MATH) <2> (max( ) <2nd> <1>(L1) < ) > <_> . Continue with <2nd> <STAT> (LIST) and do> (MATH) <1> (min( )<2nd> <1> ( Li ) < )>. Then press <ENTER> to get the range.
Similarly, mean and media are 3: and 4: in the 2nd STAT MATH menu.
max(LO-min(Li)2.2
mean(Li)38.22857143
median(LO38.3
Follow the same procedure as above, substituting <2nd> <1> <L2 > for the temperaturestaken by Nurse Feelgood.
169
Eisenhower Regional Consortium for Mathematics and Science Education at AEL Lesson 12 / 163

Graphing Calculators in Mathematics Grades 7-12
Handout 3
11-83 Instructions1. Enter each list of temperatures in a list labeled with the nurse's name, NRC or NRF,by pressing <STAT> <1> (Edit) and with the cursor on the top of a column, use <2nd>< DEL> (INS) and <2nd> <ALPHA> (A-Lock) and the keyboard to name a new list.Then arrow down to enter values.
rim BRF 1-1 2
3B.3 Mr=39.2 102.538.2 100.838.6 101.439 102237.3 99.337 98.8
BRFC'D =101
Use <2nd> <Y=> (STAT PLOT) <1> <ENTER> and with On highlighted press<ENTER> and <Down Arrow> to select the scatter plot. Then <Down Arrow> andwith <2nd> <ALPHA> (A-Lock) and the keyboard enter NRC for the Xlist and NRF forthe Ylist. Also chose the first mark. Press <WINDOW> <ZOOM> <9> (ZoomStat) tosee a graph of the data.
WINDOWXmin=16.78Xmax=39.42Xsc1=5Ymin=97.937Ymax=103.163Ysc1=20Xres=1
Or press <WINDOW> to determine an appropriate window.
FORMAT2LIMIT=35
Xmax=40Xsc1-1Ymin 96Ymax 104Yscl 1
170
a
a°
164 /Lesson 12 Center of Excellence for Science and Mathematics Education at UT Martin
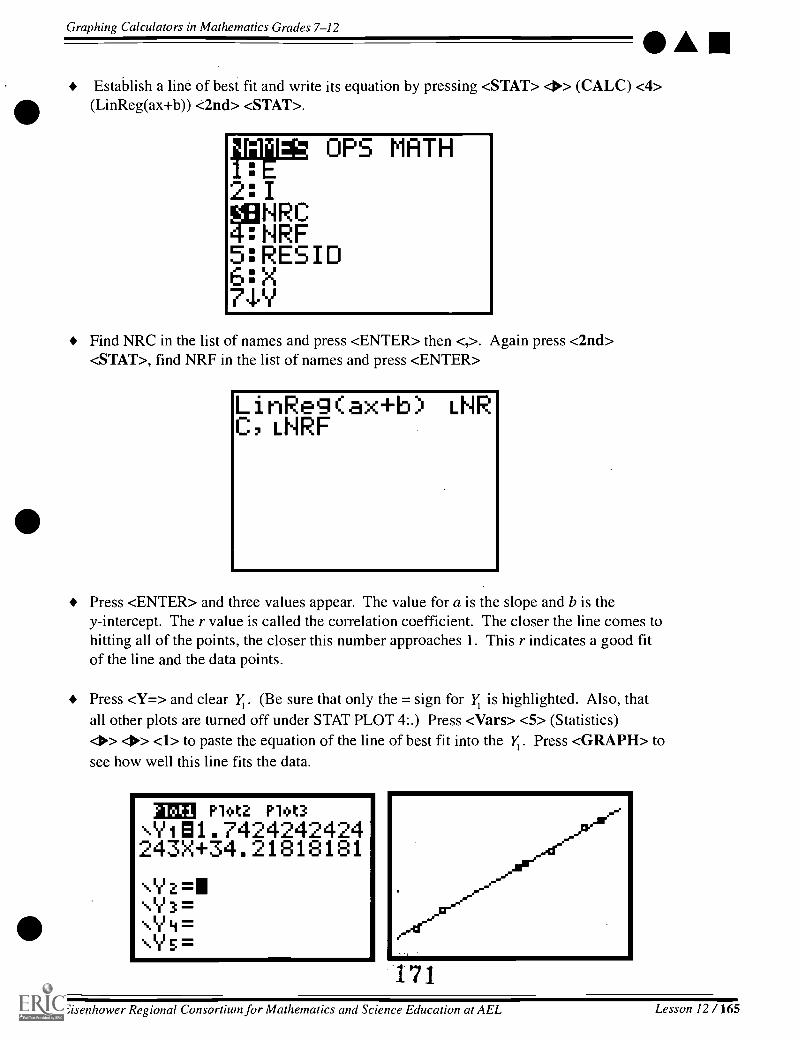
Graphing Calculators in Mathematics Grades 7-12
AEstablish a line of best fit and write its equation by pressing <STAT> <Is> (CALC) <4>(LinReg(ax+b)) <2nd> <STAT>.
r511r; OPS MATH
2:1
VIZ5:RESID6:XTIN
Find NRC in the list of names and press <ENTER> then <,>. Again press <2nd><STAT>, find NRF in the list of names and press <ENTER>
LinReg(ax+b) LNRC7LNRF
Press <ENTER> and three values appear. The value for a is the slope and b is they-intercept. The r value is called the correlation coefficient. The closer the line comes tohitting all of the points, the closer this number approaches 1. This r indicates a good fitof the line and the data points.
Press <Y=> and clear Yi . (Be sure that only the = sign for Y1 is highlighted. Also, thatall other plots are turned off under STAT PLOT 4:.) Press <Vars> <5> (Statistics)> <I*> <1> to paste the equation of the line of best fit into the Yi . Press <GRAPH> tosee how well this line fits the data.
IME P102 piot3\Y1 e 1 . 7424242424243X+34.21818181
171Eisenhower Regional Consortium for Mathematics and Science Education at AEL Lesson 12 / 165

Graphing Calculators in Mathematics Grades 7-12
To use the graphing calculator to determine range, press <2nd> <STAT> (LIST) <4<2> (max( ), <2nd> <STAT> (LIST), highlight NRC, and press <ENTER> <)> <_>.
Next press <2nd> <STAT> (LIST) (Left Arrow> <1> (min( ), <2nd> <STAT> (LIST),highlight NRC, and press <ENTER>.
This gives the range.
Similarly, determine mean and median in turn using 3: and 4: in the 2nd STAT MATHmenu.
max(LNRC) min(04RC)
2.2mean(LNRC)
38.22857143median(LNRC)
38.3M
Repeat the above procedure with LNRC replaced by LNRF.
172
166 /Lesson 12 Center of Excellence for Science and Mathematics Education at UT Martin

Graphing Calculators in Mathematics Grades 7-12 *Lesson 13: Topographic Maps and Whitewater Rivers
Approximate Time Needed for LessonTwo to five traditional class periods; also works well in90-minute blocks; lesson also assumes that some ofthe work is completed outside of class as homework
AIM Content AreaAuthor Estimation, Measurement, and Computation; Prob-* Ron Stewart ability and Statistics; and Patterns, Functions, and
Baylor School, Chattanooga, TN Algebraic Thinking
Process StandardsConnections and Problem Solving
Goals for StudentsTo gather and analyze data from a real-world phenomenon that can be modeled graphicallyTo apply the concept of slope as a rate of change to a real-world situation
Description or Summary of Lesson
Advanced students in Algebra, Pre-Calculus, or Calculus are the intended audience. In thislesson, students work in groups of two or three to measure distances between contour
lines on a topographic map, following the course of a river as it winds through a mountainousregion. By converting these measurements to standard units such as feet, meters, or miles, andby using the elevation intervals between contour lines, students enter their data into lists thatcan be graphed as a scatter plot to depict the gradient profile of the river. In Algebra classesthis information can enhance the concept of slope, and in more advanced classes the lessoncan be used to lay the foundation for the concept of a derivative. The included sample datafrom a topographic map containing a steep creek can be used throughout this lesson; however,the lesson can be enhanced by using a topographical map of the local area.
Background Information
T his lesson is an enrichment-level lesson or student project that allows students to applypreviously learned concepts of measurement and slope in a real-world situation. The
application can enhance their understanding of the concept of slope as rate of change. Thislesson assumes prior lessons have given students experience in using the graphing calculatorto analyze data in addition to proficiency with basic keystrokes.
Materials and EquipmentView screen with graphing calculator and overhead projector, if availableEach group of students will need:
4 access to a graphing calculator a ruler4 a local area topographic map I handouts
a length of dental floss or fishing line BESTCOPYAVAILABLE
Eisenhower Regional Consortium for Mathematics and Science Education at AEL Lesson 13 /167
173

Graphing Calculators in Mathematics Grades 7-12
Activity One
Teacher Notes
Note: Though the Bear Creek data included in this activity can be used, teachers likely willfind it more worthwhile to use topographic maps of local rivers and streams. Thesecan generally be purchased inexpensively from outdoor shops and some businesses.In this case, students will need rulers that can measure or estimate lengths down to1/10 or 1/16 of an inch. The transparent, flexible types are particularly useful. Also,the teacher will need to give some initial explanation as to how to read data fromtopographical maps.
If students are using the sample data included, skip Section I below and go to SectionII of the teacher notes.
Section I: Reading Topographic Maps and Entering Data
1f students are able to obtain actual topographic maps, select a stream or river that hasseveral contour lines crossing it. Contour lines are shown as thin, brown lines thatfollow a wavy path or occur in groups and look like parallel bands or concentric
patterns.Contour lines will always close on themselves if traced with a pencil, even if you have to
connect adjoining maps together to continue the line. Generally, the steeper streams andrivers give data that is easier to work with. Streams and rivers appear as blue lines on a map.Twenty to 50 contour lines give enough points. The spaces between the lines representconstant elevation changes. This separation distance is known as the contour interval, andwill generally be given in 10-, 20-, or 40-foot intervals. The exact value for a particular mapcan be found at the bottom of the map.
The map will also have a scale that can be used to convert distances measured on the mapto feet, meters, or miles. Many of the most common maps are of the 1:24,000 series. Forexample, 1/4 of an inch on the map corresponds to 24,000 x (1/4) inches on land, which is6,000 inches or approximately .095 miles.
As mentioned earlier, topographic maps such as the one being used in this activity can bepurchased for a moderate price from various outdoor shops and topographic agencies. BearCreek is a particularly steep stream and is popular among expert kayakers and canoeists forits big drops and difficult rapids.
Students should select a convenient starting point on their stream and determine theelevation of that point. Selecting a point on the stream near a contour line makes it easier tofind such a point. The task of data collection is described below.
Students should measure, as accurately as possible, distances between suc-cessive contour lines as they cross the stream, putting these values in a list.If a TI-83 is being used, then students can give meaningful names to their
168 /Lesson 13 Center of Excellence for Science and Mathematics Education at UT Martin
174
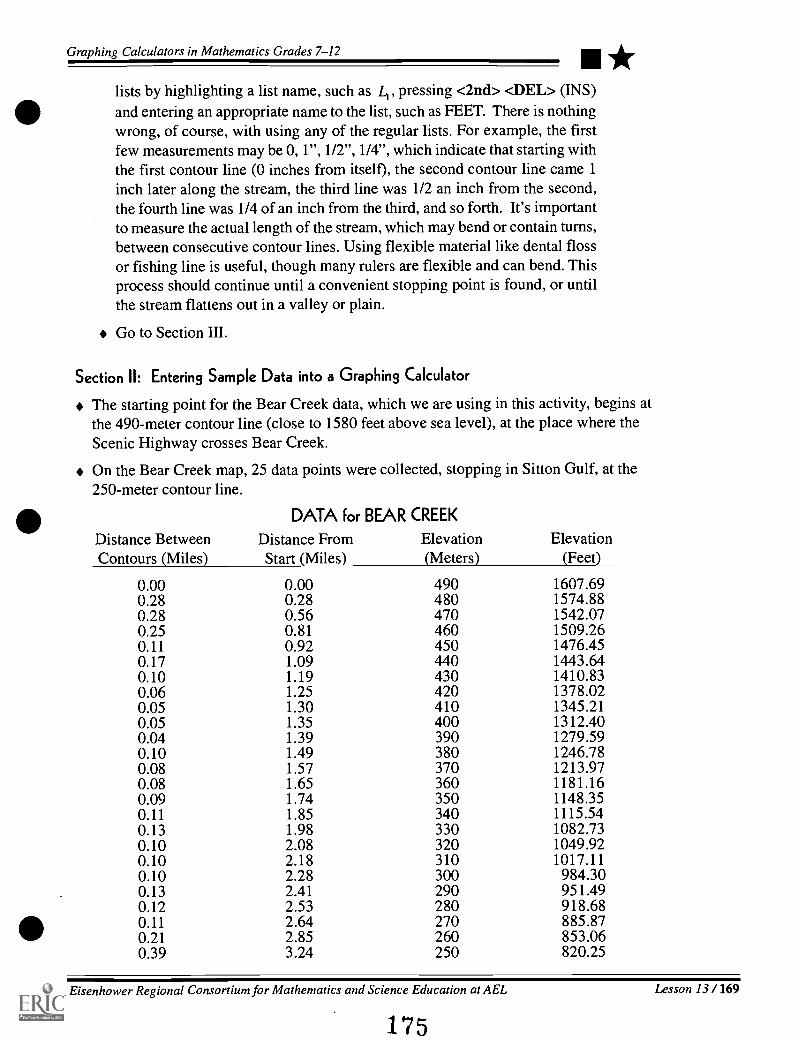
Graphing Calculators in Mathematics Grades 7-12 *lists by highlighting a list name, such as 4, pressing <2nd> <DEL> (INS)and entering an appropriate name to the list, such as FEET. There is nothingwrong, of course, with using any of the regular lists. For example, the firstfew measurements may be 0, 1", 1/2", 1/4", which indicate that starting withthe first contour line (0 inches from itself), the second contour line came 1inch later along the stream, the third line was 1/2 an inch from the second,the fourth line was 1/4 of an inch from the third, and so forth. It's importantto measure the actual length of the stream, which may bend or contain turns,between consecutive contour lines. Using flexible material like dental flossor fishing line is useful, though many rulers are flexible and can bend. Thisprocess should continue until a convenient stopping point is found, or untilthe stream flattens out in a valley or plain.
Go to Section III.
Section II: Entering Sample Data into a Graphing Calculator
The starting point for the Bear Creek data, which we are using in this activity, begins atthe 490-meter contour line (close to 1580 feet above sea level), at the place where theScenic Highway crosses Bear Creek.
On the Bear Creek map, 25 data points were collected, stopping in Sitton Gulf, at the250-meter contour line.
Distance BetweenContours (Miles)
DATA for BEAR CREEK
Distance From ElevationStart (Miles) (Meters)
Elevation(Feet)
0.00 0.00 490 1607.690.28 0.28 480 1574.880.28 0.56 470 1542.070.25 0.81 460 1509.260.11 0.92 450 1476.450.17 1.09 440 1443.640.10 1.19 430 1410.830.06 1.25 420 1378.020.05 1.30 410 1345.210.05 1.35 400 1312.400.04 1.39 390 1279.590.10 1.49 380 1246.780.08 1.57 370 1213.970.08 1.65 360 1181.160.09 1.74 350 1148.350.11 1.85 340 1115.540.13 1.98 330 1082.730.10 2.08 320 1049.920.10 2.18 310 1017.110.10 2.28 300 984.300.13 2.41 290 951.490.12 2.53 280 918.680.110.21
2.642.85
270260
885.87853.06
0.39 3.24 250 820.25
Eisenhower Regional Consortium for Mathematics and Science Education at AEL Lesson 13 /169
1 75

Graphing Calculators in Mathematics Grades 7-12
If a TI-83 is being used, then students can give meaningful names to their lists by high-lighting a List name, pressing <2nd> <DEL> (INS) and giving an appropriate name tothe list. There is nothing wrong, of course, with using any of the regular lists.
Enter the Distance Between Contours data into Li or an otherwise named list.
Continue with Section III.
Section III: Constructing the Scatter Plot:
The next task is to get a cumulative sum of the distances, so that one knows the distancesof consecutive contour lines from the starting point. Students will discover all kinds ofclever ways to accomplish this.
One way to do this on the TI-83 if the original data was listed in 4, is to highlight L2,and press <2nd> <STAT> (LIST) <1*> (OPS) <6> (cumSum( ) and then press <2nd>
The accumulated distances will be recorded in L2. It may be useful to name this list DISTif you are using a TI-83. These distances should then be converted to miles, or km.Remember that each inch corresponds to 24,000 inches, (2,000 ft.), if you are using oneof the standard 24 000 series topographic maps. Highlight L2 (or DIST) and then multiplyby 24,000/(12 x 5280) to convert inches to miles on these maps.
L2=24000* L2 at the bottom of the screen and <ENTER> will place the appropriatecalculations in L2. Similar calculations can be made if metric units are being used.
The final step in preparing the scatter plot is to associate each of these accumulateddistances with the elevation of that contour. Again, allow students to devise ways to dothis on their own. Some will no doubt just laboriously enter each of the values in L3 (orELEV), but others will recognize that since the contour lines occur at regular intervals(say 20 feet or 10 meters), a sequence can be used to quickly list the values. The particu-lar map which we are using in this activity uses 10-meter contour intervals. The follow-ing sequence can be used to enter the values.
Highlight 1.3 (or label a list as ELEV), and press <2nd> <STAT> (LIST) and with OPShighlighted press <5> (seq( ) and then complete seq(490 X, X, 0, 240, 10). Othersequences can also be used.
Students are now ready to construct a scatter plot of their data. For the data collected inSection I or the Bear Creek data in Section II, Plot 1 is turned on, using the second of theType options (which draws a line segment between consecutive data points), with DISTor L2 in Xlist, and ELEV or L3 in Ylist.
170 / Lesson 13 Center of Excellence for Science and Mathematics Education at UT Martin
1 7' -

Graphing Calculators in Mathematics Grades 7-12 *Off
vpe:
Xlist:DISTYlist:ELEVMark: C +
TI-83
Plot1On
abbX1 ist: L1ffilL3 L'i L5 LfiYlist: L±LLLILL 6Mark: +
TI-82
It is probably more useful to have students set their own windows by observing the valuesthey recorded than to allow them to simply use the <ZOOM> <9> (ZoomStat) option.
In this way, they will realize that the Xmin and Xmax are associated with distances alongthe stream from the starting point, and that the Ymin and Ymax values are associatedwith the ending and starting elevations. The Xscl and Yscl can be set as desired. On theBear Creek data, Xscl was set at .5 miles and the Yscl at 20 meters.
INDOWXmin=0Xmax=3.5Xsc1=.5Ymin=225Ymax=500Ysc1=20Xres=1
A graph similar to the following should be seen.
TI-82
BEST COPY AVAILABLE
TI-83
Eisenhower Regional Consortium for Mathematics and Science Education at AEL Lesson 13 / 171
177
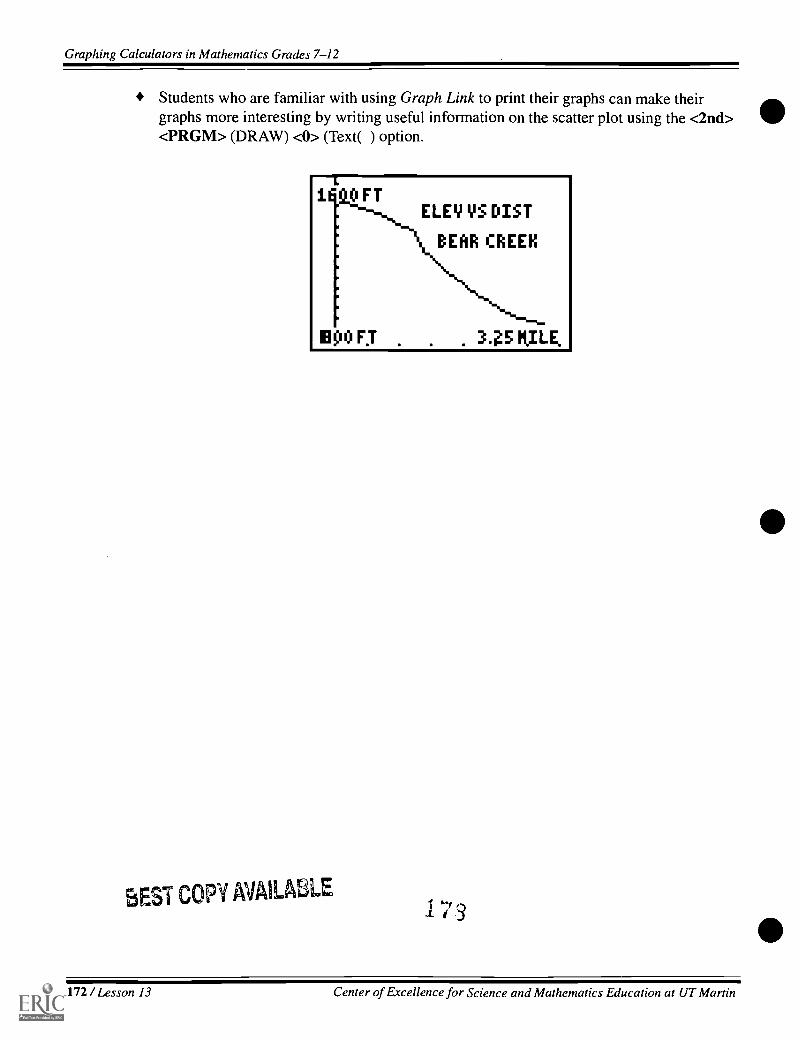
Graphing Calculators in Mathematics Grades 7-12
Students who are familiar with using Graph Link to print their graphs can make theirgraphs more interesting by writing useful information on the scatter plot using the <2nd><PRGM> (DRAW) <0> (Text( ) option.
BEST COPY MALAWI1 73
172 / Lesson 13 Center of Excellence for Science and Mathematics Education at UT Martin

Graphing Calculators in Mathematics Grades 7-12 *Handout Two Answers (For Bear Creek)
1. The average gradient is -243.04 foot/mile, or about -45.93 m/km, which means that thecreek is dropping, on the average, about 243.04 feet for every mile it travels. The nega-tive sign reflects the fact that rivers run down hill. If the entire river were tilted down at aconstant level of 243.04 vertical feet for each horizontal mile traveled, then the gradientwould be constant. Of course, most rivers contain bends, rapids, fast and slow places, soa constant gradient is not very realistic.
2. The gradient is a measure of vertical drop in a river over a horizontal distance, which canbe expressed as the basic definition of the slope of a line between two points.
Gradient = change in elevation / elapsed distance.Calculus students may recognize that if these difference quotients were calculated oversmaller and smaller distances, then they would be finding approximations for the exactrate at which the river is changing at that point, which is related to the concept of thederivative.
3/4. The river is steepest where the gradient is the largest, which occurs in the middle ofBear Creek. Between the 1.2 and 1.65 mile marks, Bear Creek is dropping at an incred-ible rate of just over 500 ft. per mile. Expert kayakers call this section the Cosmic Mile,as it contains some of the steepest and most intense whitewater rapids in the country.
5. The riverbed is likely to be the most resistant to change at the beginning and end of BearCreek, as the harder rock strata in these places are not as easily cut away by the movingwater. As a result the gradient is less, and the scatter plot is flatter, in these areas.
Extra Credit: This is primarily for more advanced students. Those students who are familiarwith various curve fitting, or regression techniques, will find that a cubic or a logistic func-tion will fit the data well, though it is useful for students who know how to do so, to checkthe residuals of their equations
CubicReg,d=ax3+bx2+0x+da=17.20b=-83.650=18.26d=487.52R2=1.00
1
Logistic,J=c/(1+ae."(-bxlia=.31b=-.580=669.34
Eisenhower Regional Consortium for Mathematics and Science Education at AEL Lesson 13 /173
179
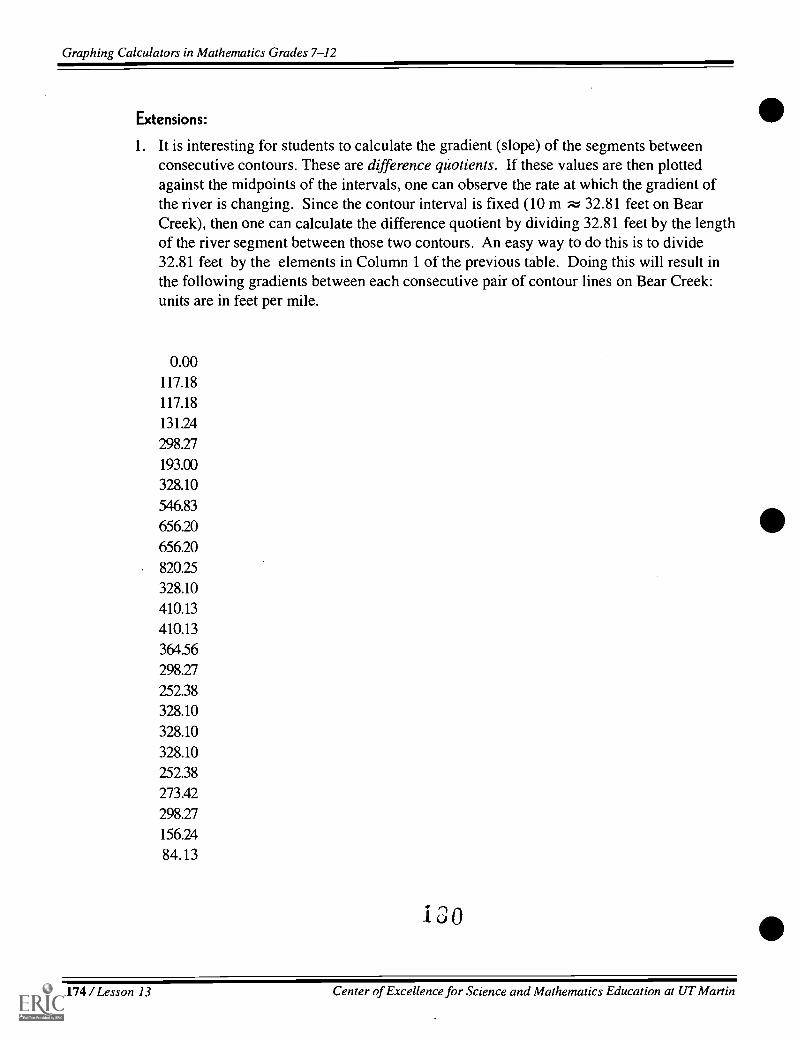
Graphing Calculators in Mathematics Grades 7-12
Extensions:
1. It is interesting for students to calculate the gradient (slope) of the segments betweenconsecutive contours. These are difference quotients. If these values are then plottedagainst the midpoints of the intervals, one can observe the rate at which the gradient ofthe river is changing. Since the contour interval is fixed (10 m P.-; 32.81 feet on BearCreek), then one can calculate the difference quotient by dividing 32.81 feet by the lengthof the river segment between those two contours. An easy way to do this is to divide32.81 feet by the elements in Column 1 of the previous table. Doing this will result inthe following gradients between each consecutive pair of contour lines on Bear Creek:units are in feet per mile.
0.00117.18
117.18
131.24
298.27
193.00
328.10
546.83
656.20
656.20
820.25
328.10
410.13
410.13
364.56
298.27
252.38
328.10
328.10
328.10
252.38
273.42
298.27
156.24
84.13
174 /Lesson 13 Center of Excellence for Science and Mathematics Education at UT Martin

Graphing Calculators in Mathematics Grades 7-12 *2. A scatter plot of the rates of change calculated in the previous activity vs. distance gives
the graph below. Note that students may wish to use the midpoint of the segments be-tween contours, or work with one of the end points of the segment. Calculation of the
1ST CHILES)
midpoints is a good exercise in its own right. This graph uses the right end points.Question: What do the spikes on this graph indicate?
Answer: The spikes represent particularly steep sections on the river, where large dropsand rapids are likely to be found. The particularly big spike in this graph occurs on asection of the river that includes a large, 65-foot, 3-tiered waterfall known by expertkayakers as Stairway to Heaven.
3. If possible, have your students hike along segments of their river or stream, so that theycan see what the river is actually like, and compare what they see to what they predicted.
4. Using highways instead of rivers gives an opportunity to have both increasing and de-creasing components on the scatter plot, since roads go both up- and downhill.
5. Another extension is to have students create a topographic map with specified features,which in turn they can analyze. An example follows. Several solutions are possible. It isproductive to have the students work in groups and discuss their maps with the rest of theclass.
Create a map of a river on a 1:24 000 scale, using 20-foot contour lines, with the follow-ing characteristics:
1. The river is 100,000 feet long.
2. The river begins on a relatively flat plateau, falls through a relatively mild canyon, entersan area where the rock is hard and the river doesn't cut through the ground as fast as inthe canyon. It then enters a deep gorge where the river drops at a relatively fast rate untilit finally enters a valley where it slows before emptying into a large lake.
3. The river drops 1,000 vertical feet in elevation.
4. Sketch the river as realistically as you can, including contour lines that cut across the pathof the river.
Eisenhower Regional Consortium for Mathematics and Science Education at AEL Lesson 13 /175
lOi

Graphing Calculators in Mathematics Grades 7-12
Suggestions For Assessment:
Each of these categories will be assigned points deemed appropriate by the instructor.Points can vary within each subcategory, depending on the instructor's discretion.
A paper discussing the group's findings and a group presentation to the rest of the classare important parts of the activity. The following is a sample of one assessment rubric.
1. Remember that a significant amount of time is used by the students in gathering data.20 points:
up to 10 points for participating in the data collection and supporting a collabora-tive effortup to 5 additional points for collecting the necessary data
4 up to 5 additional points for accuracy and clarity
2. Report on the activity50 points:4 10 points: Explanation of the various procedures used in the data collection, and
analysis. Attention should be paid to how well students explained how they usedtechnology in their work.10 points: correctly entering data into tables and lists10 points: obtaining good scatter plots20 points: Discussion of the analytical features, using tables and graphs to illus-trate their conclusions. Students should be encouraged to use Graph Link print-outs.
3. Class Presentation20 points:4 5 points for being prepared and ready to present on time4 10 points for a clear explanation of their findings4 5 points for participation by all group members
4. Activity Handout Two10 points:4 5 points for correctness4 5 points for contributions by all group members
13 ?
176 / Lesson 13 Center of Excellence for Science and Mathematics Education at UT Martin

Graphing Calculators in Mathematics Grades 7-12
Handout 1
Student Instructions:
You will be assigned partners by your instructor and will be working with your group forseveral sessions. You need to bring your graphing calculator, a ruler, pencil and paper,and a small length of dental floss or fishing line to the sessions.
Your group is to decide on a stream or river you would like to study. For the purposes ofthis activity, a steep stream or river works best. Your group will procure a topographicmap that includes the river you wish to study. Your instructor can suggest places whereyou can find topographic maps, and give you some basic instructions on how to gatherinformation from your map.
You are now ready to begin work.
1. Select a convenient starting and stopping place on your river. Select segments of yourriver that are crossed by 20 to 50 contour lines.
2. Record the elevation of your starting and ending locations. Be sure to include the correctunits.
3. This is the most tedious part of the project, but the most critical part for accuracy. It'seasy to get lost in regions of tightly packed contour lines, so be careful not to lose yourplace.
Beginning at your starting point, measure the distance to the next contour line that crossesthe stream in fractions of an inch or centimeter, and record this value. From this secondcontour line, measure the distance to the next contour line. Continue in this fashion,recording each successive distance. In some places your river may bend or contain turns.Use the dental floss to help you measure these distances.
4. Using the scale at the bottom of your map, convert the distances in #3 to miles (or km).Enter these values in a list on your calculator.
5. Use the values in #4 to find how far each successive contour line is from the startingpoint. If you are using a TI-83, you can use the cumSum( feature to help you find thesevalues. If you are using a TI-82, you can add each successive number to the previoussum. Enter these values in 1,2 . If you are using a TI-83, you may wish to name your listDIST .
6. Remembering that the contour lines are separated by a fixed value (the contour interval),you can determine the elevation of each of the contour lines that you measured. Recordthese elevations in 1,3 , or name it ELEV.
Eisenhower Regional Consortium for Mathematics and Science Education at AEL Lesson 13 / 177
1 R q
Graphing Calculators in Mathematics Grades 7-12
7. You are now ready to set up your scatter plot of L3 vs. L2 (ELEV vs. DIST). Set anappropriate window based on the values you have recorded in the two lists. It will beuseful to use the connected type of scatter plot.
8. Answer the questions on Handout Two.
9. Submit a well-written paper that discusses your work and your results on this project.Explain what you did to collect your data and how you analyzed your results. Clearlyexplain how you arrived at any calculated values. Graphs, tables, and data should all bepresented in a satisfactory manner. Explain how you used technology in your work.What have you discovered about the nature of the stream you chose? As always, you areexpected to use complete sentences with good grammatical form and pay attention tospelling.
10. Your group should prepare a 10- to 15-minute presentation of your findings for theclass. Each person in your group must participate in the presentation.
Extra credit:
Additional information about your stream can be learned by calculating the slopes be-tween consecutive contour lines and constructing a scatter plot of these values on the y-axis, and their distances from the starting point on the x-axis. You may wish to find themidpoints of the segments between the contour lines, or use right or left end points.
Explain what you did and tell what additional information this gives you about yourstream.
181
178 /Lesson 13 Center of Excellence for Science and Mathematics Education at UT Martin

Graphing Calculators in Mathematics Grades 7-12 *Handout 2
Using the data in Handout 3, answer the following questions as completely as possible.Write in complete sentences and pay attention to good gramthatical construction andcorrect spelling. Show how you arrived at any of your calculated values.
1. The gradient of a section of river can be thought of as the slope of the line between thestarting and ending points for that segment of the river. What is the average gradient ofyour stream? What does the sign of this number mean? What do your units mean? Whatwould your river look like if the gradient were constant over its entire length? Is thisrealistic?
2. Explain in words how the gradient is a rate of change. Express this as a mathematicalformula.
3. Over which sections is your river the steepest? How steep is the river at these places?
4. Where do you expect to find the most severe rapids or falls in your stream? Why?
5. Where on your river will the riverbed contain material that is most resistant to change?
Extra Credit:
Can you find an equation, or mathematical function, that approximates the gradientprofile of your river?
Eisenhower Regional Consortium for Mathematics and Science Education at AEL Lesson 13 / 179
185

Graphing Calculators in Mathematics Grades 7-12
Handout 3
DATA For BEAR CREEK
Distance BetweenContours (Miles)
Distance FromStart (Miles)
Elevation(Meters)
Elevation(Feet)
0.00 0.00 490 1607.690.28 0.28 480 1574.880.28 0.56 470 1542.070.25 0.81 460 1509.260.11 0.92 450 1476.450.17 1.09 440 1443.640.10 1.19 430 1410.830.06 1.25 420 1378.020.05 1.30 410 1345.210.05 1.35 400 1312.400.04 1.39 390 1279.590.10 1.49 380 1246.780.08 1.57 370 1213.970.08 1.65 360 1181.160.09 1.74 350 1148.350.11 1.85 340 1115.540.13 1.98 330 1082.730.10 2.08 320 1049.920.10 2.18 310 1017.110.10 2.28 300 984.300.13 2.41 290 951.490.12 2.53 280 918.680.11 2.64 270 885.870.21 2.85 260 853.060.39 3.24 250 820.25
186
180 /Lesson 13 Center of Excellence for Science and Mathematics Education at UT Martin
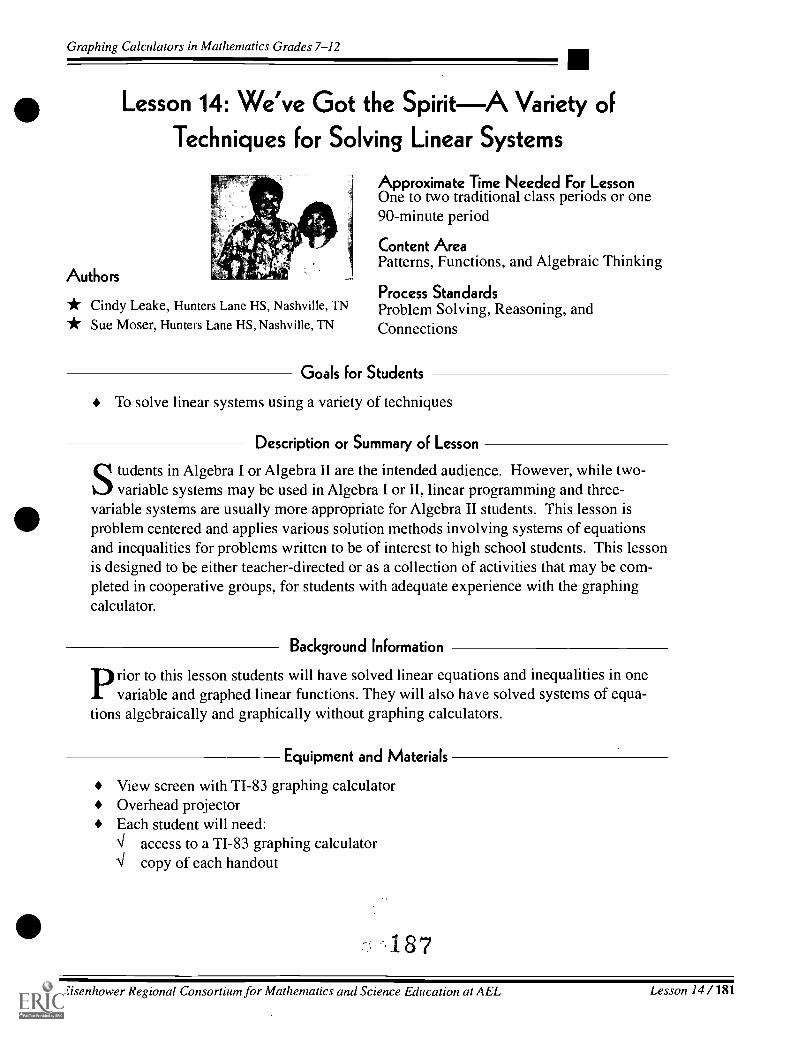
Graphing Calculators in Mathematics Grades 7-12
Lesson 14: We've Got the SpiritA Variety ofTechniques for Solving Linear Systems
Authors
* Cindy Leake, Hunters Lane HS, Nashville, TN* Sue Moser, Hunters Lane HS, Nashville, TN
Approximate Time Needed For LessonOne to two traditional class periods or one90-minute period
Content AreaPatterns, Functions, and Algebraic Thinking
Process StandardsProblem Solving, Reasoning, andConnections
Goals for Students
To solve linear systems using a variety of techniques
Description or Summary of Lesson
S tudents in Algebra I or Algebra II are the intended audience. However, while two-variable systems may be used in Algebra I or II, linear programming and three-
variable systems are usually more appropriate for Algebra II students. This lesson isproblem centered and applies various solution methods involving systems of equationsand inequalities for problems written to be of interest to high school students. This lessonis designed to be either teacher-directed or as a collection of activities that may be com-pleted in cooperative groups, for students with adequate experience with the graphingcalculator.
Background Information
P rior to this lesson students will have solved linear equations and inequalities in onevariable and graphed linear functions. They will also have solved systems of equa-
tions algebraically and graphically without graphing calculators.
Equipment and Materials
View screen with TI-83 graphing calculatorOverhead projectorEach student will need:Al access to a TI-83 graphing calculator
copy of each handout
487
Eisenhower Regional Consortium for Mathematics and Science Education at AEL Lesson 14 / 181

Graphing Calculators in Mathematics Grades 7-12
Activity One: A Homecoming Promotion I
Teacher Notes
Using an appropriate domain needs to be emphasized in every problem. When using thecalculator for graphical solutions, students become frustrated when they do not see the
expected graph in the viewing window. In each problem it is always important to emphasizechecking for the reasonableness of answers given the "real-world" situation. Students shouldbe able to justify rounding or not according to the situation. Variables must always be clearlyidentified by the students at the outset and in each succeeding problem or extension.
Two-Variable Systems
The Spirit Club has $200 to spend on souvenir items to be given away at "Homecoming."They would like to buy enough items so the first 500 fans who arrive receive either afootball or a spirit ribbon. The footballs, which are more popular, cost 60 cents each; thespirit ribbons, 25 cents each. Keeping all of these facts in mind, how many of each canthey buy and get as close as possible to $200 without going over?
Algebraic Solution
Let x = number of footballs; y= number of ribbons
x+y = 500.6x +.25y = 200
y= 500 x
.6x +.25(500 x) = 200
.6x +125 .25x = 200
.35x = 75x= 214.3
y= 500 214.3
y= 285.7
Therefore, the students should purchase 214 footballs and 286 ribbons at a cost of$199.90.
Graphical Solution
Enter each equation into the Y= menu after pressing <Y=>. Use <left arrow> and<ENTER> keys to set one line to be thin and one to be thick.
Press <WINDOW> and determine an appropriate viewing window and scale. Becausethe students are purchasing items for 500 fans, both x and y will be between 0 and 500.
109
182 / Lesson 14 Center of Excellence for Science and Mathematics Education at UT Martin

Graphing Calculators in Mathematics Grades 7-12
P11t1 Plo12 P103\Y1E500 XW213800 2.4X\ I'? 3\ Y 4
WINDOWXm i n=0Xmax=500Xsc1-50YminYmaxYsclXres
0500501
To calculate the point of intersection, press <GRAPH> and then <2nd> <TRACE>(CALC).Next press <5> (intersect) and then <ENTER> < ENTER> < ENTER>.
Inkkrskction 1.N=21428571 A1=285.71429 .
Therefore, the students should purchase 214 footballs and 286 ribbons at a cost of$199.90.
Numerical Solution
Using the functions in the <Y=> menu, examine the table of values in order to find thevalue of x (the number of footballs) for which y (the number of ribbons) is the same inboth 171 and Y2. <2nd> <WINDOW> (TBLSET) allows us to enter a starting value for xof 0 and an increment of 20. <2nd> <GRAPH> (TABLE) allows us to view values of xand y for each of the functions.
TABLE SETUPTb1Start=0ATb1=20
I ndpnt :Depend:
Hu cAutc
AskAsk
X Vi Y2f2040GOBO100120
SOO4804B0440420400380
BOO752704GSBBOBHO512
X=0
Eisenhower Regional Consortium for Mathematics and Science Education at AEL
189
Lesson 14 /183

Graphing Calculators in Mathematics Grades 7-12
Scroll through x values until the difference in Yland Y2 is the smallest.
X Y 2
160nYi
340 416180 320 368
ANSE280 iqno 260 224260 240 176280 220 128
X 220
Then press <2nd> <WINDOW > (TBLSET) and adjust TABLE SETUP accordingly.
TABLE SETUPTb15tart 210ATb1=1IndPnt: Hu c AskDepend: Autr Ask
X Yi Y2210 290 296211 289 293.6212 2E18 291.2
we.. iE in:Pi215 285 284216 284 281.6
X 214
The values of y are closest when x = 214; therefore, the students should buy 214 footballsand 286 ribbons at a cost of $199.90.
Extensions
A. Due to inflation the price of ribbons skyrocketed to 30 cents. How many of each shouldthey buy now?
Solving the adjusted system of equations, y =166.666... and x = 333.333... However,167 of the footballs and 333 of the ribbons would total $200.10. If going over $200 is notallowed and if the Spirit Club must have 500 items, the 166 footballs and 334 ribbonsshould be purchased for $199.80.
B. A $10 rebate is given for every 200 footballs purchased. Using the inflated price forribbons and keeping the total items to 500, how many of the popular footballs can now bepurchased?
200 footballs and 300 ribbons could be purchased for $210.00 (includes the $10.00rebate) for purchasing 200 footballs. This keeps the total items to give out at 500 butincreases the number of the more popular footballs. The class could discuss other param-eters and the corresponding solutions. 1 3 0
184 /Lesson 14 Center of Excellence for Science and Mathematics Education at UT Martin

Graphing Calculators in Mathematics Grades 7-12
Activity One Handout
The Spirit Club has $200 to spend on souvenir items to be given away at "Homecoming."They would like to buy enough items so the first 500 fans who arrive receive either afootball or a spirit ribbon. The footballs, which are more popular, cost 60 cents each; thespirit ribbons, 25 cents each. How many of each can they buy and get as close as possibleto $200 without going over?
1. Solve algebraically below using a system of two equations with two variables each.
2. Follow the instructions below to solve graphically using your graphing calculator.
Enter each equation into the Y. menu after pressing <Y=>. Use <left arrow> and<ENTER> keys to set one line to be thin and one to be thick.
Press <WINDOW> and determine an appropriate viewing window and scale. Becausethe students are purchasing items for 500 fans, both x and y will be between 0 and 500.
191
Eisenhower Regional Consortium for Mathematics and Science Education at AEL Lesson 14 /185

Graphing Calculators in Mathematics Grades 7-12
Ploti Plot2 P103\YI 0500 XNY21:1800 2.4X\Y\ITI\Y\ 6\Y
WINDOWi n=0
Xmax=500Xsc1=50YIN) i n=e1'Max 500Yscl 50Xres 1
To calculate the point of intersection, press <GRAPH> and then <2nd> <TRACE>(CALC).Next press <5> (intersect) and then <ENTER> < ENTER> < ENTER>.
The point of intersection is
Therefore, the club should purchase footballs and ribbons at a cost of
3. Using the functions in the Y= menu, examine the table of values in order to find the valueof x (the number of footballs) for which y (the number of ribbons) is the same in both Y1and Y2. <2nd> <WINDOW> (TABLSET) allows us to enter a starting value for x of 0and an increment of 20. <2nd><GRAPH> (TABLE) allows us to view values of x and yfor each of the functions.
186 /Lesson 14 Center of Excellence for Science and Mathematics Education at UT Martin

Graphing Calculators in Mathematics Grades 7-12
TABLE SETUPTb1Start=0ATb1=20Indpnt:Depend:
HuAutc
AskAsk
X Yi Y2A 500 BOO20 480 75240 460 70460 440 65680 420 608100 400 560120 380 512
X-13
Scroll through x values until the difference in Y1 and Y2 is the smallest.
X Yi Y2160 340 416180 320 36B
iii$6_ iC iq240 260 224260 240 176280 220 128
X-220
Then press <2nd> <WINDOW> and adjust TABLE SETUP accordingly.
TABLE SETUPTb15tart=210ATb1=1Indpnt: Hu..11: AskDepend: RAI- Ask
The values of y are chosen when x = ; therefore, the club should buyfootballs
and ribbons at a cost of $
BEST COPY MPLAULE 193
Eisenhower Regional Consortium for Mathematics and Science Education at AEL Lesson 14 /187

Graphing Calculators in Mathematics Grades 7-12
Extensions:
A. Due to inflation the price of ribbons skyrocketed to 30 cents. How many of each shouldthey buy now? Determine and write below the appropriate system of equations. Thensolve graphically on the graphing calculator and sketch the graph below. Finally, solvenumerically using the table method and draw the final table screen below.
B. A $10 rebate is given for every 200 footballs purchased. Using the inflated price forribbons and keeping the total items to 500, how many of the popular footballs can now bepurchased?
1 4
188 / Lesson 14 Center of Excellence for Science and Mathematics Education at UT Martin

Graphing Calculators in Mathematics Grades 7-12
Activity Two: A Homecoming Promotion II
Teacher Notes
Linear Programming
Using the basic problem from Activity One, suppose the students want to distribute atleast 175 footballs. How many footballs and ribbons should be purchased to stay within
the budget and still accommodate at least as many fans as before?
Linear Programming Solution
Write the constraints for the system.
x > 175 (y > 0)y > 500 x
y < 800 2.4x
Enter the equations into the <Y=> menu, select style, and determine an appropriateviewing window and scale. (Review Activity One for the steps.)
P1oti P102 P1031Y1M500 XIIIN213800 2.4X
Ws=We\Y7
II II NIL-
WINDOWXmin=175Xmax=5001Xsc1=50Ymin-0Ymax 500Yscl 50Xres 1
Identify the feasible region and its corner points. To calculate the intersection of Yi and
Y2 press <GRAPH> and then <2nd> <TRACE> (CALC).
Next press <5> (intersect) and then <ENTER> < ENTER> < ENTER>.
195
Eisenhower Regional Consortium for Mathematics and Science Education at AEL Lesson 14 / 189

Graphing Calculators in Mathematics Grades 7-12
IntQrsi2ction:I:214.21157i ...?=2135.71,129
The intersection of the two Y functions with the line x = 175 must be done by pressing<2nd> <TRACE> (CALC) <1> (value). Then type 175 and press <ENTER>.
<V> will give the second equation intersection.
Thus, the corner points of the feasible region are (175,325), (175,380), and (214,285).
Minimize the cost.C(x , y) = .6x + .25yC(175,325) = .6(175) + .25(325) = $186.25 *C(175,380) = .6(175) + .25(380) = $200.00C(214,285) = .6(214) + .25(285) = $199.65
Maximize the sN(x , y)
ervice.= x + y
N(175,325) = 175 + 325 = 500N(175,380) = 175 + 380 = 555 *N(214,285) = 214 + 285 = 499
Therefore, to minimize cost, students should buy 175 footballs and 325 ribbons.maximize service, students should buy.17t5Aorotballs and 380 ribbons.
J
To
190 /Lesson 14 Center of Excellence for Science and Mathematics Education at UT Martin
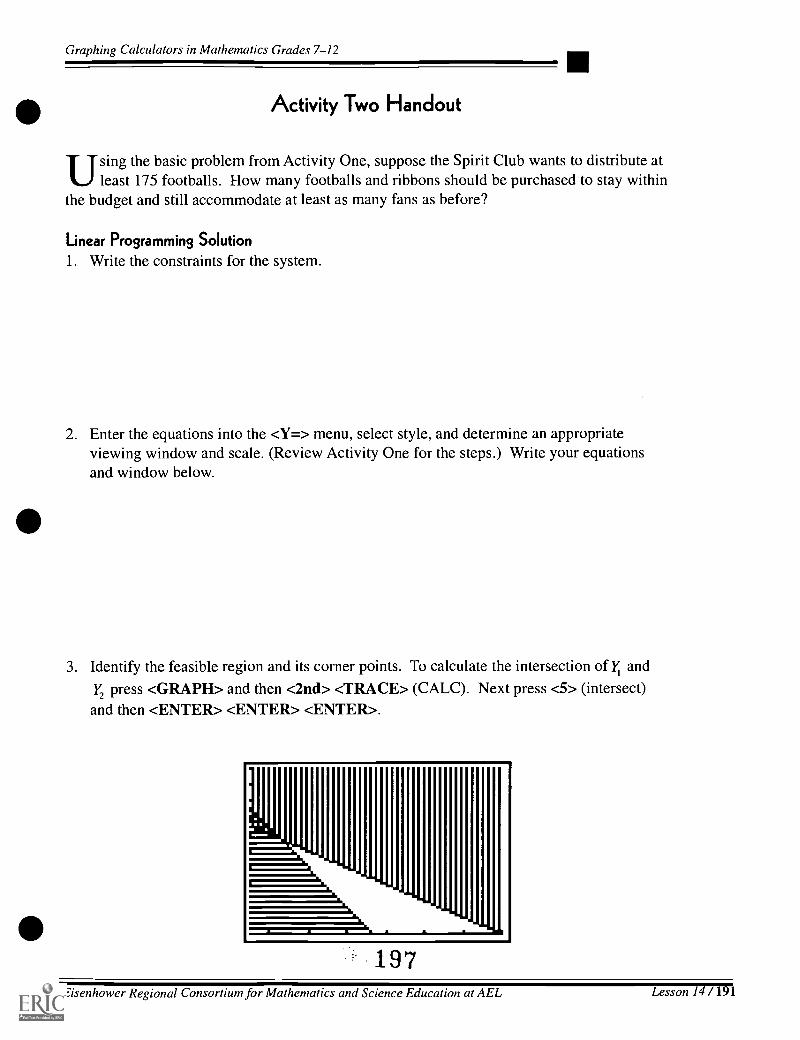
Graphing Calculators in Mathematics Grades 7-12
Activity Two Handout
Using the basic problem from Activity One, suppose the Spirit Club wants to distribute atleast 175 footballs. How many footballs and ribbons should be purchased to stay within
the budget and still accommodate at least as many fans as before?
Linear Programming Solution1. Write the constraints for the system.
2. Enter the equations into the <Y=> menu, select style, and determine an appropriateviewing window and scale. (Review Activity One for the steps.) Write your equationsand window below.
3. Identify the feasible region and its corner points. To calculate the intersection of l andY2 press <GRAPH> and then <2nd> <TRACE> (CALC). Next press <5> (intersect)and then <ENTER> <ENTER> <ENTER>.
197Eisenhower Regional Consortium for Mathematics and Science Education at AEL Lesson 14 /191

Graphing Calculators in Mathematics Grades 7-12
The intersection of the two Y functions with the line x = 175 must be done by pressing<2nd> <TRACE> (CALC) <1> (value). Then type 175 and press <ENTER>.
<v> will give the second equation intersection.
Thus, the corner points of the feasible region are
, and
Minimize the cost:
C(x, y) = .6x + .25y
C( ) = .6( )+ .25( ) = $
C( ) = .6( )+ .25( ) = $
C( ) = .6( )+ .25( ) = $
Maximize the service:
N(x, y) = x + y
N(
N(
N(
Therefore, to minimize cost, students should buy footballs andribbons.
To maximize service, students should buy footballs and ribbons.
133
192 /Lesson 14 Center of Excellence for Science and Mathematics Education at UT Martin

Graphing Calculators in Mathematics Grades 7-12
Activity Three: Three-Variable Systems
Teacher Notes
T he Spirit Club has $200 to spend on souvenir items to be given away at "Home-coming." They would like to buy enough items so the first 500 fans who arrive receive
a football, a spirit ribbon, or a button. The footballs, which are more popular, cost 60 centseach; the spirit ribbons, 25 cents each; and the buttons are 40 cents each. They have decidedon an equal number of buttons and ribbons. How many of each should they buy? A checkshould be made to ensure that the correct number of items have been distributed within thebudget.
Matrix Solution
Let x = number of footballs, y = number of ribbons, and z = number of buttons.
.6x + .25y + .4z = 200x+ y+ z=500
y z = 0
.6 .25 .4 x_ 2001 1 1 5000 1 1 0
To enter the coefficient as MATRIX [A], press <MATRIX> <0.> <O.> (EDIT)<ENTER> and change to a 3 x 3 matrix. Then enter the values.
Press <2nd> <QUIT> to exit and save MATRIX [A].
Then in a similar way enter the constant matrix as MATRIX [B]. Press <2nd> <QUIT>to exit and save MATRIX [13].
MATRIX [R] 3 x3I .6 .25 .11
[ 1[0 1
MATRIX [13] 3 xl
3 7 i
199Eisenhower Regional Consortium for Mathematics and Science Education at AEL Lesson 14 /193
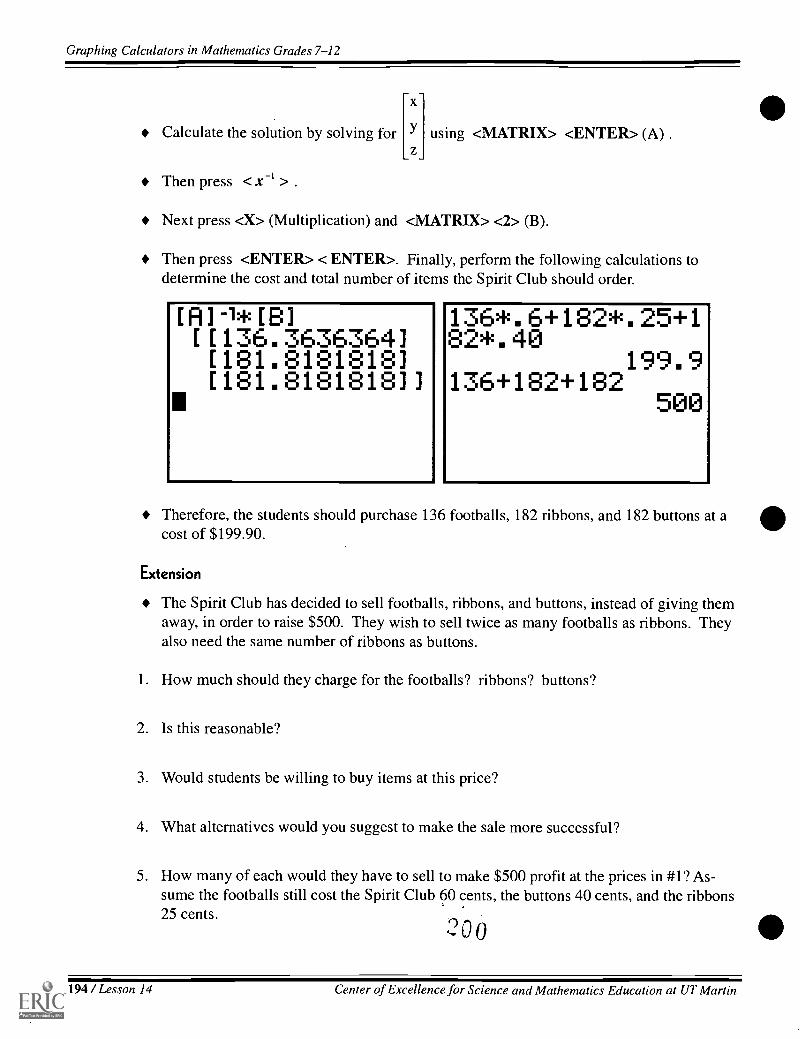
Graphing Calculators in Mathematics Grades 7-12
Calculate the solution by solving for
Then press
using <MATRIX> <ENTER> (A) .
Next press <X> (Multiplication) and <MATRIX> <2> (B).
Then press <ENTER> < ENTER>. Finally, perform the following calculations todetermine the cost and total number of items the Spirit Club should order.
[A]-1*[13][ [136.3636364][181.8181818][181.8181818] ]
136*. 6+182*82*. 40136+182+182
.25+1
199.9500
Therefore, the students should purchase 136 footballs, 182 ribbons, and 182 buttons at acost of $199.90.
Extension
The Spirit Club has decided to sell footballs, ribbons, and buttons, instead of giving themaway, in order to raise $500. They wish to sell twice as many footballs as ribbons. Theyalso need the same number of ribbons as buttons.
1. How much should they charge for the footballs? ribbons? buttons?
2. Is this reasonable?
3. Would students be willing to buy items at this price?
4. What alternatives would you suggest to make the sale more successful?
5. How many of each would they have to sell to make $500 profit at the prices in #1? As-sume the footballs still cost the Spirit Club 60 cents, the buttons 40 cents, and the ribbons25 cents.
200
194 / Lesson 14 Center of Excellence for Science and Mathematics Education at UT Martin

Graphing Calculators in Mathematics Grades 7-12
Activity Three Handout
FT he Spirit Club has $200 to spend on souvenir items to be given away at "Home-coming." They would like to buy enough items so the first 500 fans who arrive receive a
football, a spirit ribbon, or a button. The footballs, which are more popular, cost 60 centseach; the spirit ribbons, 25 cents each; and the buttons are 40 cents each. They have decidedon an equal number of buttons and ribbons. How many of each should they buy? A checkshould be made to ensure that the correct number of items have been distributed within thebudget.
Matrix Solution
Let x = number of footballs, y = number of ribbons, and z = number of buttons.
1. Write three equations in three unknowns to express algebraically the problem information.
2. Write the coefficient and constant matrices in below.
To enter the coefficient as MATRIX [A], press <MATRIX> <i>> <I>> (EDIT)<ENTER> and change to a 3 x 3 matrix. Then enter the values. Press <2nd> <QUIT>to exit and save MATRIX [A].
Then in a similar way enter the constant matrix as MATRIX [B] Press <2nd> <QUIT>
to exit and save MATRIX [13].
201
Eisenhower Regional Consortium for Mathematics and Science Education at AEL Lesson 14 / 195

Graphing Calculators in Mathematics Grades 7-12
Calculate the solution by solving for using <MATRIX> <ENTER> (A).
Then press
Next press <X> (Multiplication) and <MATRIX> <2> (B).
Then press <ENTER> < ENTER>. Finally, perform the calculations to determine thecost and total number of items the Spirit Club should order.
Therefore, the students should purchasebuttons at a cost of $
Extension
footballs, ribbons, and
The Spirit Club has decided to sell footballs, ribbons, and buttons instead of giving themaway in order to raise $500. They wish to sell twice as many footballs as ribbons. Theyalso need the same number of ribbons as buttons.
1. How much should they charge for the footballs? ribbons? buttons?
2. Is this reasonable?
3. Would students be willing to buy items at this price?
4. What alternatives would you suggest to make the sale more successful?
5. How many of each would they have to sell to make $500 profit at the prices in #1?Assume the footballs still cost the Spirit Club 60 cents, the buttons 40 cents, and theribbons 25 cents.
2 0 2
196 / Lesson 14 Center of Excellence for Science and Mathematics Education at UT Martin

Graphing Calculators in Mathematics Grades 7-12
Packet One: Basic Calculus on the Graphing Calculator
Author* Eddie Keel, Haywood HS
Brownsville, TN
Approximate Time Needed for PacketApproximately 20-30 minutes for each ofthe activities.
Content AreaPatterns, Functions, and Algebraic Thinking
Process Standards
Connections within Mathematics
Goals for Students
To find the numerical derivative of a function at a pointTo graph a derivativeTo find the roots of a derivativeTo find solutions of equationsTo solve equations involving derivativesTo find the definite integral of a given function
Description or Summary of Activity Packet
S tudents in calculus are the intended audience. Students will work individuallyand use the TI-82 or TI-83 to reinforce and enhance basic calculus concepts. This
packet comprises six separate activities to enhance each of the concepts as it is studiedduring the calculus course. The activities teach familiarity with using the graphingcalculator to perform the above calculations and to find the graphic solution to enhancethe algebraic solution. The packet may also be used to review some of the key conceptsof calculus.
Background Information
prior to the included activities, students will have studied basic material for each ofthe concepts and will have mastered substitution, graphing, and solving equations.
Also, students will have knowledge of basic keystrokes on the graphing calculator.
Materials and Equipment
View screen with graphing calulatorOverhead projectorEach student will need:
access to a TI-82 or TI-83 graphing calculator\I several sheets of graph paper and a straight edge\I handouts
203Eisenhower Regional Consortium for Mathematics and Science Education at AEL Packet 1 / 197

Graphing Calculators in Mathematics Grades 7-12
Activities One through Six
Teacher Notes
As each activity is used in the packet, the teacher will demonstrate the graphing calculatorkeystrokes and procedures as described in the example. Then the students will work
individually with the graphing calculator to complete the appropriate handout.
Activity One:Finding the Numerical Derivative of a Function at a PointActivity One Handout
Activity Two:Graphing the Derivative of a FunctionActivity Two Handout
Activity Three:
Finding the Roots of a DerivativeActivity Three Handout
Activity Four:
Finding Solutions of EquationsActivity Four Handout
Activity Five:
Solving Equations Involving DerivativesActivity Five Handout
Activity Six:Finding the Definite Integral of a Given FunctionActivity Six Handout
198 / Packet 1 Celiter of Excellence for Science and Mathematics Education at UT Martin

Graphing Calculators in Mathematics Grades 7-12
Activity One HandoutFinding the Numerical Derivative of a Function at a Point
I. TI Commands
If f (x) = x2 , find f '(3)
On the TI-82 or TI-83, you will want to write this as nDeriv (x3 x2, x, 3). " x3 _ x2 "
refers to the function whose derivative you want to find. x is the variable that you areusing in the equation. 3 is the x-value of the point where you want to find the derivative.
Note: This is not correct calculus notation! This is simply the command you must type inthe calculator at the appropriate screen (see below) to get the answer.
Complete the following. Pay attention to parentheses in #3 and #4.
1. What command will you use to tell the TI-82 or TI-83 to calculate f'(2) if f (x) = 5x + 3 ?
2. What command will you use to tell the TI-82 or TI-83 to calculate f'(-1) if f (x) = x5 ?
3. What command will you use to tell the TI-82 or TI-83 to calculate f'(5) if f (x) = 43x 5 ?
44. What command will you use to tell the TI-82 or TI-83 to calculate f'(-2.25) if f (x) = 3x
II. Keystrokes
Once you know what command to type on your graphing calculator, you must learn howto type the command.
1. Push the <MATH> key.2. Press the < V> key until you get to 8 for nDeriv( .
Press <ENTER>.(Shortcut: Press <8> to get nDeriv( , and you will not have to scroll down with thedown arrow key). .
3. Type the rest of the nDeriv( command (that is in the parenthesis).4. Press <ENTER>. The answer should appear on the screen.
205Eisenhower Regional Consortium for Mathematics and Science Education at AEL Packet 1 / 199

Graphing Calculators in Mathematics Grades 7-12
Try this procedure with the following example.
Ill. Examplef'(2) iff(x)= x2 + x3
NUM HYP PRBrac
Dec3:34:3T5:xT6:fMin(74,fMax(
nDeriv(
IV. Problems
Vall NUM HYP PRB271,Uec3:34:3T
6:fMin(7:fMax(gUnDeriv(
nDeriv(Xa+X^37X,2)
16.000001
In the following problems, find the numerical derivative at the point provided. In addi-tion, write the command that you typed on your graphing calculator.
1. f'(1) iff(x) = x4 + x2
(a) command (b) solution
2. f'(-1) iff(x) = x 4x'2
(a) command (b) solution
3. f(5) iff(x) = Ji
(a) command (b) solution
3x2 54. f'(-2.25) iff(x) =x 3
(a) command (b) solution
5. c(-132.856) iff(x)= 006(a) command (b) solution
200 / Packet 1 Center of Excellence for Science and Mathematics Education at UT Martin

Graphing Calculators in Mathematics Grades 7-12
Activity Two HandoutGraphing the Derivative of a Function
I. Procedure
1. Press the <Y=> key.2. Press <MATH> <8> to get nDeriv(.3. Type the function, x, and x. Use commas to separate these expressions and close the
parentheses.4. Graph the function using any method you prefer. <ZOOM> <6> (Standard) will work on
many problems. However, the window may need adjusting on some problems.
II. Example
Use the procedure above to Sketch the derivative off (x) = x2 + 5x .
Moti Plota P103W1EnDeriv(Xz+5X7X,X)Wa=\Y3=W4=NhYs=Ws=
Ill. Exercises
Using your graphing calculator, sketch the derivatives of the functions below.
1. Sketch the derivative off (x) = 2x .
2. Sketch the derivative off (x) = 2x + 4 .
3. Sketch the derivative off (x) = 9 x2 .
207
Eisenhower Regional Consortium for Mathematics and Science Education at AEL Packet 1 /201

Graphing Calculators in Mathematics Grades 7-12
4. Sketch the derivative off (x) = x3 4x .
5. Sketch the derivative off (x) = x4 5x3 .
IV. For Further Thought
6. Sketch the derivative off(x) =2,x 3
x` 16
7. Describe the appearance of this graph. Why does it look this way?
8. Calculate the derivative algebraically. See if this answer matches your answers in#6 and #7.
2 0 8
202 / Packet 1 Center of Excellence for Science and Mathematics Education at UT Martin
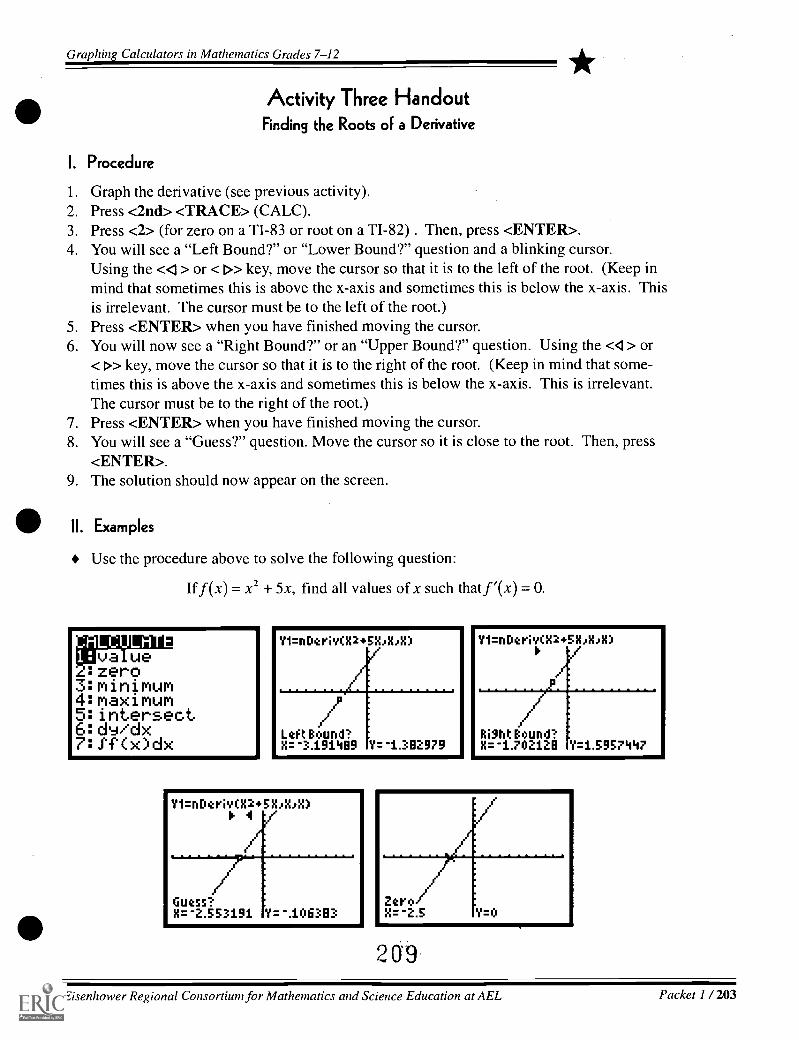
Graphing Calculators in Mathematics Grades 7-12
Activity Three HandoutFinding the Roots of a Derivative
I. Procedure
1. Graph the derivative (see previous activity).2. Press <2nd> <TRACE> (CALC).3. Press <2> (for zero on a TI-83 or root on a TI-82) . Then, press <ENTER>.4. You will see a "Left Bound?" or "Lower Bound?" question and a blinking cursor.
Using the <4 > or < l>> key, move the cursor so that it is to the left of the root. (Keep inmind that sometimes this is above the x-axis and sometimes this is below the x-axis. Thisis irrelevant. The cursor must be to the left of the root.)
5. Press <ENTER> when you have finished moving the cursor.6. You will now see a "Right Bound?" or an "Upper Bound?" question. Using the <4 > or
< r» key, move the cursor so that it is to the right of the root. (Keep in mind that some-times this is above the x-axis and sometimes this is below the x-axis. This is irrelevant.The cursor must be to the right of the root.)
7. Press <ENTER> when you have finished moving the cursor.8. You will see a "Guess?" question. Move the cursor so it is close to the root. Then, press
<ENTER>.9. The solution should now appear on the screen.
II. Examples
Use the procedure above to solve the following question:
If f (x) = x2 + 5x, find all values of x such that f (x) = 0.
ztroX= -2.5
2G9
Eisenhower Regional Consortium for Mathematics and Science Education at AEL Packet 1 / 203

Graphing Calculators in Mathematics Grades 7-12
Some derivatives do not have roots. Look at the graph of the derivative of
f (x) = x3 + 2x . Why doesn't it have any roots?
P1oti P1ota Plot3W1 SIDeriv04^3+2>40400W2=W 3=\YLI=\Ys=W fi=
Some derivatives have more than one root. Look at the derivative of f (x)The graph of the derivative crosses the x-axis at two different points. Youperform the procedure twice to find both roots. Find the left root first andright root. The two solutions should be x is approximately ± 0.816.
P14:41 P1ot2 Plot3WiOnDeriv(X^3-2>40.404)W2W3=\YLI=\Ys=Wfi=
III. Exercises
= x3 2x .
will have tothen find the
+1. If f (x) = 5 x2 + 8, then find all values x such that f '(x) = 0.
2. If f (x) = x3 10x2, then find all values x such that f ' (x) = 0.
210
204 /Packet 1 Center of Excellence for Science and Mathematics Education at UT Martin

Graphing Calculators in Mathematics Grades 7-12
3. If f (x) = x3 + 8x, then find all values x such that f' (x) = 0.
4. Iff(x) = x3 8x, then find all values x such that f'(x) = 0.
5. Iff(x) = 9x3 8x2 7 x, then find all values x such that f'(x) = 0.
211
Eisenhower Regional Consortiunz for Mathematics and Science Education at AEL Packet 1 / 205
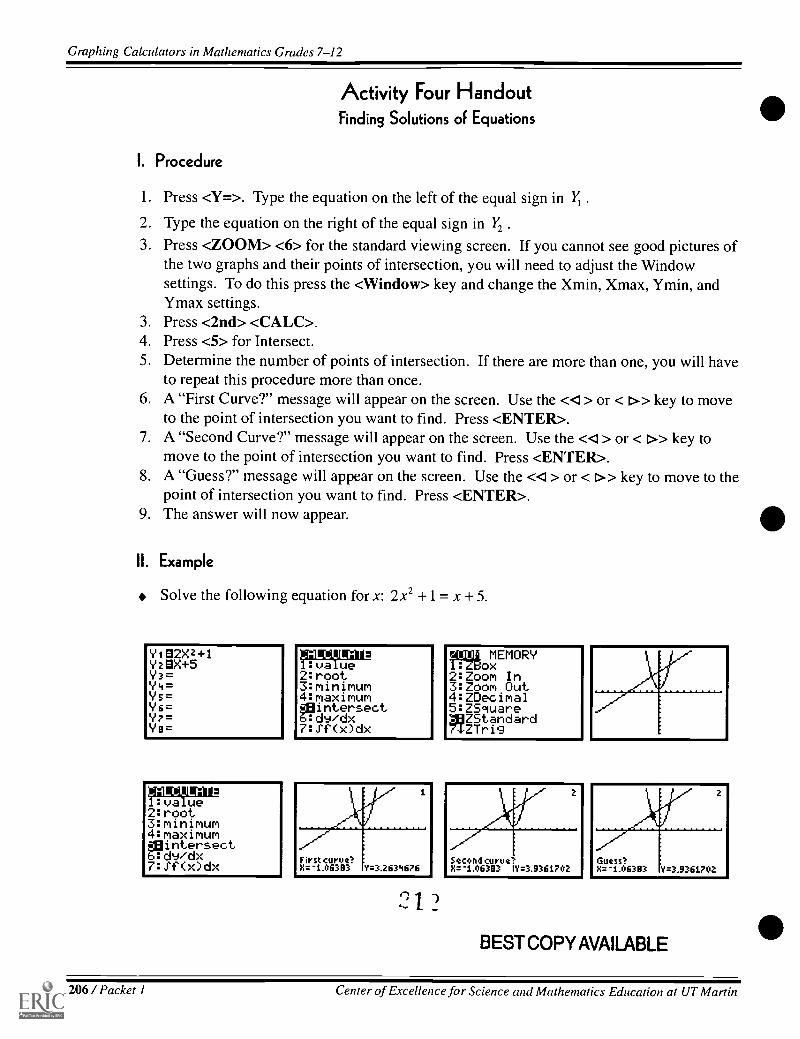
Graphing Calculators in Mathematics Grades 7-12
Activity Four HandoutFinding Solutions of Equations
I. Procedure
1. Press <Y=>. Type the equation on the left of the equal sign in Y1 .
2. Type the equation on the right of the equal sign in Y, .
3. Press <ZOOM> <6> for the standard viewing screen. If you cannot see good pictures ofthe two graphs and their points of intersection, you will need to adjust the Windowsettings. To do this press the <Window> key and change the Xmin, Xmax, Ymin, andYmax settings.
3. Press <2nd> <CALC>.4. Press <5> for Intersect.5. Determine the number of points of intersection. If there are more than one, you will have
to repeat this procedure more than once.6. A "First Curve?" message will appear on the screen. Use the <4 > or < D> key to move
to the point of intersection you want to find. Press <ENTER>.7. A "Second Curve?" message will appear on the screen. Use the <4 > or < D> key to
move to the point of intersection you want to find. Press <ENTER>.8. A "Guess?" message will appear on the screen. Use the <<i> or < t» key to move to the
point of intersection you want to find. Press <ENTER>.9. The answer will now appear.
II. Example
Solve the following equation for x: 2x2 + 1 = x + 5.
Yie2X2+1Ya105Y3=Y4=Ys=Yfi=Y7=Yo=
01141011VM2I:value2:root3:mimmum4:maximumgaintersect6:d9/dx7:Sf(x)dx
NiIMIC012value
2:root3:minimum4:maximumgaintersect6:dv/dx7:Sf(x)dx
+lirstcurve?-1.05393 V=3.263406
MitAEMORY
2:Zoom In3:Zoom Out4:ZDecimal5:ZSaluaregaZStandard742Trig
Second curve?X= -1.06383 W=3.9361702
-4111112Guess?x= -1.063E13 Y=3.9361702
BESTCOPYAVAILABLE
206 / Packet 1 Center of Excellence for Science and Mathematics Education at UT Martin
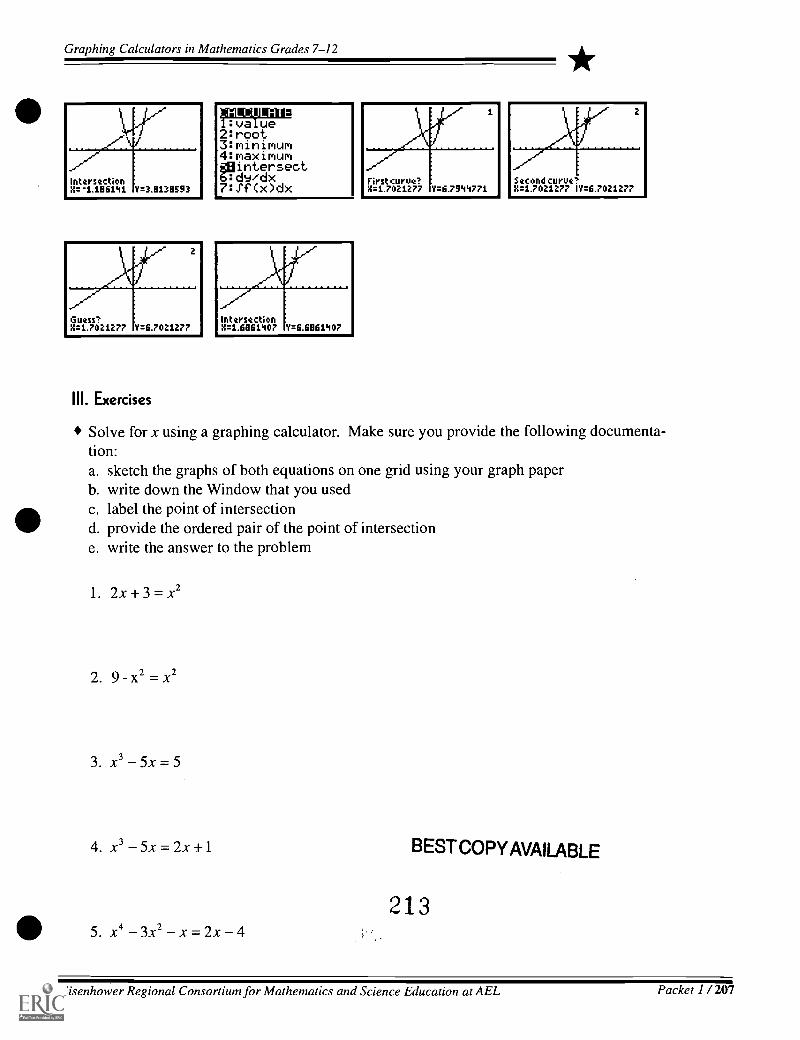
Graphing Calculators in Mathematics Grades 7-12
2
Msg21277 Y=6.7021277
HI. Exercises
:va ue2:root3:minimum4:r9aximumainterseotb:dv/dx7:Sf(x)dx
IntersectionX=1.6861407 Y=4.6861407
Firstcurut?x=1.7021277 Y=6.7944771
Sacand curve?X=11021277 IV:6.7021277
Solve for x using a graphing calculator. Make sure you provide the following documenta-tion:a. sketch the graphs of both equations on one grid using your graph paperb. write down the Window that you usedc. label the point of intersectiond. provide the ordered pair of the point of intersectione. write the answer to the problem
1. 2x + 3 = x2
2. 9 x2 = X2
3. x3 5x = 5
4. x3 5x = 2x +1
5. x4 3x2 x = 2x 4
BESTCOPYAVAILABLE
213
Eisenhower Regional Consortium for Mathematics and Science Education at AEL Packet 1 / 207

Graphing Calculators in Mathematics Grades 7-12
Activity Five HandoutSolving Equations Involving Derivatives
I. Procedure
Most types of algebraic problems in the form f(x) = g(x) that you want to solve for
x given f '(x) = h(x) can be solved using the following procedure on the TI-82 orTI-83.
1. Type nDeriv( g(x), x, x ) in Y1 .
2. Type h(x) in Y2 .
3. Press <ZOOM> <6> for the standard viewing screen. If you cannot see a good picture ofthe two graphs and their points of intersection, you will need to adjust the Windowsettings. To do this, press <WINDOW> and change the Xmin, Xmax, Ymin, and Ymaxsettings.
3. Press <2nd> <TRACE> (CALC).4. Press <5> for Intersect.5. Determine the number of points of intersection. If there are more than one, you will have
to repeat this procedure more than once.6. A "First Curve?" message will appear on the screen. Use the <-1 > or < r>> to move to
the point of intersection you want to find. Press <ENTER>.7. A "Second Curve?" message will appear on the screen. Use the << > or <I>> key to
move to the point of intersection you want to find. Press <ENTER>.8. A "Guess?" message will appear on the screen. Use the <-1 > or < D> key to move to
the point of intersection you want to find. Press <ENTER>.9. The answer will now appear.
II. Example
Let f(x) = x3 2x. Find all values of x such that f '(x) = 3.
Plotl P1ot2 P1ot3W1 OnDeriv(X^3-2>40.400W21:13W3=\YLI=\Ys=Wfi=
2 1
01,01:11:1:value2:zqr93:m1mmum4:r9aximumgOintersect6:dv/dx7:Sf(x)dx
208 /Packet 1 Center of Excellence for Science and Mathematics Education at UT Martin

Graphing Calculators in Mathematics Grades 7-12
/
Second curve?X=1.063929E1 111"7.3
*N
Guess?X=1.0013299 V=3
When you repeat the procedure to get the 2nd intersection point, this is what the proce-dure looks like on a TI-83:
Plod. P1ot2 P1ot3W1 enDeriv(X^3-2X,X,X)W203W3=\YLI=\Ys=Wfi= ÷ :WPM:
value2:zqr93:mimmum4:Inaximumaintersect6:1:1(J/dx7:Sf(x)dx
Guess?X=1.063929E1 11=3
IntersectionX=1.2909943 'l=3
Eisenhower Regional Consortium for Mathematics and Science Education at AEL Packet 1 / 209
21 5BEST COPYAVAILARI r

Graphing Calculators in Mathematics Grades 7-12
III. Exercises
Provide appropriate documentation as in Activity Four.
1. Let f (x) = x2. Find all values of x such that f'(x) = 5.
2. Let f (x) = x3 . Find all values of x such that f '(x) = 2.
3. Let f (x) = x3 5 x2 10x. Find all values of x such that f '(x) = 1.
4. Let f (x) = 9x x3 . Find all values of x such that f'(x) = 3.
5. Let f (x) = x3 2x2. Find all values of x such that f'(x) = x.
r) 14. rJ
210 /Packet 1 Center of Excellence for Science and Mathematics Education at UT Martin

Graphing Calculators in Mathematics Grades 7-12
Activity Six HandoutFinding the De Finite Integral of a Function
I. TI Commands
*
On the TI-82 or TI-83, you will want to write this as fnInt( x^ 4,x,3,5 ) . .04 refers tothe function of which you want to find the integral. x is the variable used in the equation.3 is the lower limit on the integrand and 5 is the upper limit on the integrand.
Note: This is not correct calculus notation! This is simply the command you must type inthe calculator to get the answer.
rl1. What command will you use to tell the TI-82 or TI-83 to calculate j x dx ?
0
3
2. What command will you use to tell the TI-82 or TI-83 to calculate .1 5x2 + 6x)dx ?
r3 x2 9xdx?3. What command will you use to tell the TI-82 or TI-83 to calculate .1-2 2x
2 ,4. What command will you use to tell the TI-82 or TI-83 to calculate 10 'Vxdx ?
II. Keystrokes
Once you know what command to type on your graphing calculator, you must now learnhow to type the command.
1. Push the <MATH> key.2. Press the <y>key until you get to 9 for fnInt(. Press <ENTER>. (Shortcut: Press 9 to
get fnInt( and you will not have to scroll down with the down arrow key.)3. Type the rest of the fnInt( command (as described in Section I above).4. Press <ENTER>. The answer should appear on the screen.
217Eisenhower Regional Consortium for Mathetnatics and Science Education at AEL Packet 1 /211

Graphing Calculators in Mathematics Grades 7-12
Ill. Example
5/ 2N TTry this procedure with the following example: f2kx 3 x px
!pa NUM CPX PRB fnInt(M fnInt(X^3-X2, >4,25)
'fnInt(X^3-X2,X,2'5)
4:3T( 113.255:'T6:fMin(7:fMax(8:nDeriv(gefnInt(
IV. Exercises
In the following problems, find the definite integral. In addition, write the command thatyou typed on your graphing calculator. Keep in mind that these answers are sometimesapproximations.
1.2
oxdx
a. command b. solution
2
2. X2dX
a. command b. solution
3.
f2
x3dx0
a. command b. solution
4.r2(
J 0\x-Fl1
)dx
a. command b. solution
10 x2 -5. L10
dxx2 + 8
a. command b. solution
212 /Packet 1 Center of Excellence for Science and Mathematics Education at UT Martin

Graphing Calculators in Mathematics Grades 7-12
Packet Two: Calculator-Based Lab Activities
Author* Bonnie Peterson
Hendersonville HS, Hendersonville, TN
*
Approximate Time Needed For LessonOne to two traditional class periods or one90-minute period for each of the activities
Content AreaProbability and Statistics and Patterns,Functions, and Algebraic Thinking
Process StandardsProblem Solving and Connections
Goals for Students
To collect and analyze real-world dataTo model real-world phenomena using functions and graphs
Description or Summary of Activity Packet
ctivities One and Three (Bouncing Balls and Swimming Pool) are appropriate forAlgebra I, Math Tech II, and Algebra II students. All three activities are appropriate
for Pre-Calculus Students. Using a Calculator Based Lab (CBL) and probes, students willcollect and analyze real-world data. This packet comprises three separate activities. Onecollects data from a bouncing ball, one collects data from a swinging pendulum, and onecollects data from a "swimming pool." Beginning algebra students will use this data towork with parabolic functions, and more advanced students will work with exponentialfunctions. Work can be accomplished successfully in groups, but entire class demonstra-tions could also be useful. The activities can be completed all together and one at a time,depending upon the mathematical background of the students.
Background Information
p rior to the included activities, the students will have had experience with basic keystrokes and with finding linear and quadratic regression equations on the graphing
calculator. The students will have also studied linear and non-linear functions.
Materials
Graph-LinkGraphing calculator with view screen and projector, if availableEach student will need:4 access to a CBL4 access to a motion detector (Activities One and Two) and a pressure probe
(Activity Three)4 access to a TI-83 graphing calci'llator-with link cable
handoutsAdditional materials listed for each activity 21 9 BEST COPY AVAILABLE
Eisenhower Regional Consortium for Mathematics and Science Education at AEL Packet 2 /213

Graphing Calculators in Mathematics Grades 7-12
Activity One: Graphing the Time vs. Height Curve For a
Bouncing Ball
Teacher Notes
Additional Equipment:Basketball
T his activity requires a graphing calculator program to input the data collected by a CBL.Such a program may be any generic one that collects data from the motion detector for
about 10 seconds or the bounce program that comes with the CBL. Appropriate ones may bedownloaded from the TI web site (http://www.ti.com/calc/docs/cblwb3.htm).
Two good programs are available from the sources listed below.
Real-World Math with the CBL System by Brueningsen, Bower, Antinone, andBrueningsen, published by Texas Instruments, Activity 9: That's the Way the BallBounces
CBL Explorations in Calculus for the TI-82 by Nichols, published by MeridianCreative Group, Activity 8: Analyzing a Bouncing Ball
As technology advances, more calculators will be useful. Certainly, the TI-82 and TI-83are already available. A possible advantage to using a person to hold the motion detec-tor: if the ball does not bounce straight up and down, the person can follow the path ofthe ball, making sure to keep the height of the motion detector constant.
Extension: After Question 4 in Handout 1, the following extension may be assigned.Students repeat the process of finding parabolic functions for each of the parabolicsections. Students can then examine the relationships between these functions. If thisprocess is to be used, care must be taken to preserve all original data.
Handout 1 includes alternate methods for finding the function. It ispossible to challenge students by letting them initially work, using
y = ax2 + bx + c . Helpful ideas are as follows:
c= y-intercept, the sum of the roots =-; , the product of the roots =
Different balls and different initial heights may be used to see how this alters the func-tions. Similar experiments can be performed with other objects such as a yo-yo.
2:10
. 214 / Packet 2 Center of Excellence for Science and Mathematics Education at UT Martin

Graphing Calculators in Mathematics Grades 7-12
Suggestions for Assessment:
Teachers will certainly assess student learning by monitoring student progress while theclass is working in groups to perform the experiment and answer the questions. It isrecommended that students then write and/or orally present this lab report for furtherassessment by the teacher.
Suggestions for Staff Development:
Staff development activities should include hands-on activities so that teachers will trulyexperience these activities. Teachers should be encouraged to interact with one another,assist one another, and share ideas.
221
Eisenhower Regional Consortium for Mathematics and Science Education at AEL Packet 2 / 215

Graphing Calculators in Mathematics Grades 7-12
Activity One, Handout 1
The motion detector must be positioned above the ball. Note: Try various balls to seewhat will yield good data. Balls must be large enough to be clearly picked up by themotion detector. Balls with fuzzy surfaces, such as tennis balls, often do not yield gooddata.
You may attach the motion detector to a stationary support such as a ring stand, or youmay let a person hold the detector at a constant height with the person's arm extended.The ball should be dropped from a position that is at least 18 inches below the motiondetector. Be careful that the person or equipment does not interfere with the path be-tween the motion detector and the ball. Make sure the motion detector is in place facingdown and is connected to the CBL that is connected to the graphing calculator.
1. Begin the program.2. Drop the ball as soon as clicking is heard.3. Check to see that if good results were obtained. (If not, run the experiment again.)
The data should yield agraph similar to this sample.
First, study one parabolic section from your graph. Just select one and read from thegraph, but if a program is available to select one section, use it. The program will prob-ably put the selected data in two particular lists (doing this by hand is tedious), so takenote of which two lists are used.
1. The ball bounced mostly straight up and down. Why does the graph look like it wasbouncing from left to right? What values compose the x-coordinates and the y-coordi-nates?
2. Using trace or the lists, estimate the vertex of the parabola. (Round decimals to hun-dredths.)
0 9 9
216 / Packet 2 Center of Excellence for Science and Mathematics Education at UT Martin

Graphing Calculators in Mathematics Grades 7-12 A*3. The vertex form of a parabolic expression is given by
y = a(x h)2 + k
where a is a constant and the coordinates of the vertex are (h, k). h and k were found inQuestion 2. You will need to make an estimate of the value for a . (Something close to -1is probably a good first choice.) Now use the <Y=> key on your calculator to type in theexpression a(x h)2 + k using the determined values for a, h, and k for Yi. Press<GRAPH>. Make adjustments for the value of a until you obtain a good fit. Write yourequation below.
4. What affect does the sign and magnitude of a have on the graph?
Extension: You may repeat this process with other parabolic sections and examine therelationships between their algebraic functions.
5. Algebraically transform your function in question 3 to the form y = ax2 + bx + c andstate it below.
6. Now use quadratic regression in your calculator on the same parabolic section of yourdata. Write the regression equation below.
7. Are the answers in questions 5 and 6 consistent? Explain.
223
Eisenhower Regional Consortium for Mathematics and Science Education at AEL Packet 2 / 217

Graphing Calculators in Mathematics Grades 7-12
Activity One, Handout 2
1. Perform the experiment as listed in Handout 1 again, or use the data collected in Hand-out 1. Use trace or the lists to find the height in meters at the beginning of the experimentand at the top of the vertex of each parabola. Let the x-coordinates denote the number ofthe bounce with the initial position having an x-coordinate of 0, and the vertex of the firstparabola having an x-coordinate of 1, etc. The y-coordinate will be the height. Enter thisdata in two available lists in your calculator.
2. Use your calculator to construct a scatter plot representing this data. Sketch the plotbelow.
3. Use your calculator to compute a linear regression equation for this data.
4. Type the linear regression equation in <Y= > and graph it. Sketch the graph below.
5. Does this seem to be a reasonable representation of the data? Explain.
2.94
218 /Packet 2 Center of Excellence for Science and Mathematics Education at UT Martin

Graphing Calculators in Mathematics Grades 7-12 A*6. Now use your calculator to compute an exponential regression on this data.
7. Type this regression equation in <Y=> (eliminate or turn off the linear regression) andgraph it.
8. Is this a reasonable representation of this data? Explain.
9. Use your data or graph to find the initial height of the ball and the height reached aftereach bounce to as many bounces as are contained in your data. Then use the regressionequation in Question 7 to compute the height after the next few bounces until you havevalues for the original height and the height reached after the first 10 bounces. (You maywish to round values to hundredths.)
10. How far has the ball traveled from the time it was dropped until it reaches its maximumheight after the tenth bounce?
225
Eisenhower Regional Consortium for Mathematics and Science Education at AEL Packet 2 / 219

Graphing Calculators in Mathematics Grades 7-12
Activity Two: Graphing the Movement of a Pendulum
Teacher Notes
Additional Equipment4 Pendulum bob and string4 Stopwatch\I Meter stick4 Support such as a ring stand to be used to attach pendulum
In this activity students will use a CBL and motion detector to obtain data demonstratingthe movement of a pendulum. Students will then develop a trigonometric function that
approximates this sinusoidal curve. Students will develop this work further to find andexamine graphs for velocity and acceleration using derivatives.
This experiment requires a program for the graphing calculator. Such a program may beany generic one that collects data from the motion detector or the pendulum program thatcomes with the CBL. Appropriate ones may be downloaded from the TI website address:(http://www.ti.com/calc/docs/cblwb3.htm)
Two good programs are available from the sources listed below.
Real-World Math with the CBL System by Brueningsen, Bower, Antinone, andBrueningsen, published by Texas Instruments, Activity 16: Tic, Toc
CBL Explorations in Calculus for the TI-82 by Nichols, published by MeridianCreative Group, Activity 10: Analyzing a Pendulum
Physical measurements are used in appropriate places. Values can also be obtained fromthe graph. The choice is left to the teacher's discretion.
Question 8 allows great opportunity to discuss concepts from calculus such as the deriva-tive of a constant is zero and the chain rule.
Question 10 should allow good discussion of the relationships between the cosine andsine functions in differentiation. Also of importance are the concepts of velocity andacceleration as the pendulum changes position.
220 /Packet 2 Center of Excellence for Science and Mathematics Education at UT Martin

Graphing Calculators in Mathematics Grades 7-12 *Suggestions for Assessment:
Teachers will certainly assess student learning by monitoring student progress while theclass is working in groups to perform the experiment and answer the questions. It isrecommended that students then write and/or orally present this lab report for greaterassessment by the teacher.
Suggestions for Staff Development:
Staff development activities should include hands-on activities so that teachers will trulyexperience these activities. Teachers should be encouraged to interact with one another,assist one another, and share ideas.
227
Eisenhower Regional Consortium for Mathematics and Science Education at AEL Packet 2 / 221
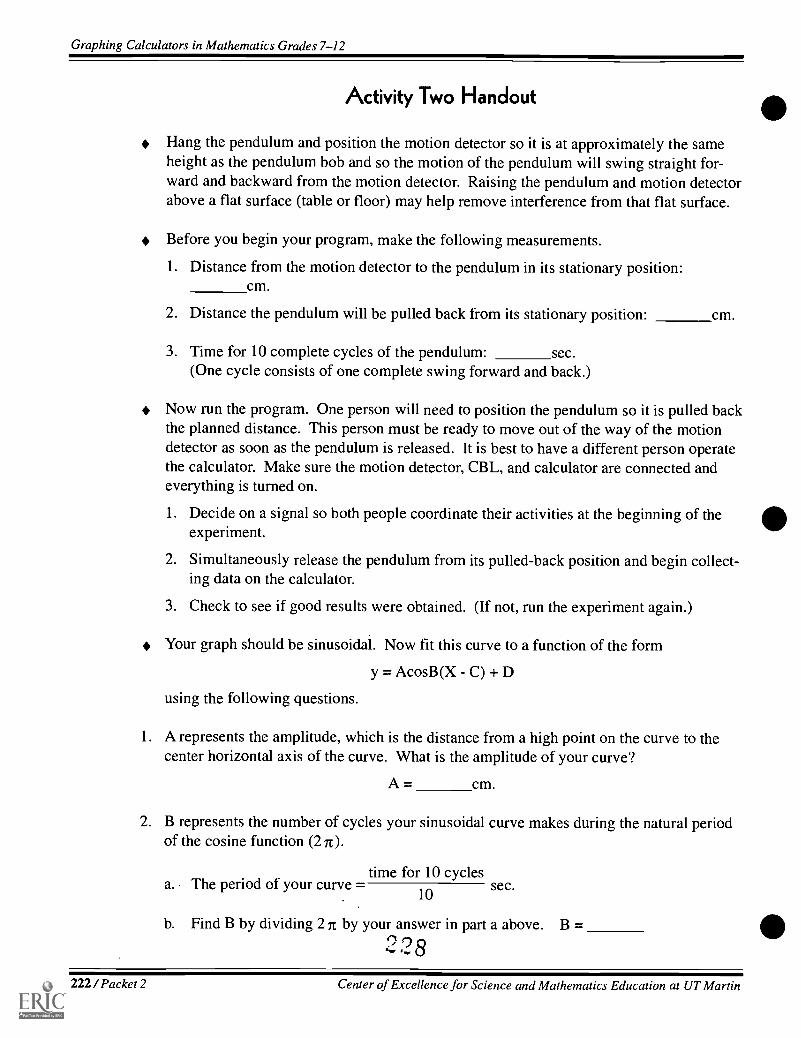
Graphing Calculators in Mathematics Grades 7-12
Activity Two Handout
Hang the pendulum and position the motion detector so it is at approximately the sameheight as the pendulum bob and so the motion of the pendulum will swing straight for-ward and backward from the motion detector. Raising the pendulum and motion detectorabove a flat surface (table or floor) may help remove interference from that flat surface.
Before you begin your program, make the following measurements.
1. Distance from the motion detector to the pendulum in its stationary position:cm.
2. Distance the pendulum will be pulled back from its stationary position: cm.
3. Time for 10 complete cycles of the pendulum: sec.(One cycle consists of one complete swing forward and back.)
Now run the program. One person will need to position the pendulum so it is pulled backthe planned distance. This person must be ready to move out of the way of the motiondetector as soon as the pendulum is released. It is best to have a different person operatethe calculator. Make sure the motion detector, CBL, and calculator are connected andeverything is turned on.
1. Decide on a signal so both people coordinate their activities at the beginning of theexperiment.
2. Simultaneously release the pendulum from its pulled-back position and begin collect-ing data on the calculator.
3. Check to see if good results were obtained. (If not, run the experiment again.)
Your graph should be sinusoidal. Now fit this curve to a function of the form
y = AcosB(X C) + D
using the following questions.
1. A represents the amplitude, which is the distance from a high point on the curve to thecenter horizontal axis of the curve. What is the amplitude of your curve?
A = cm.
2. B represents the number of cycles your sinusoidal curve makes during the natural periodof the cosine function (2 n ).
time for 10 cyclesa. The period of your curve
10sec.
b. Find B by dividing 2 It by your answer in part a above. B =9 0 8
222 /Packet 2 Center of Excellence for Science and Mathematics Education at UT Martin

Graphing Calculators in Mathematics Grades 7-12 A *3. C represents the horizontal shift of your curve. Since the cosine function reaches a
maximum when it intersects the y-axis, use trace with any maximum value of your curveto determine C.
C =
4. D represents the vertical shift of your curve from the x-axis. This is the distance betweenthe stationary pendulum and the motion detector. D = cm.
5. Now using <Y=> type your numbers in the function y = AcosB(X-C) + D for Y1.
6. Graph Y1 simultaneously with your data. Is your equation an acceptable fit to your data?If not, analyze your work and make adjustments. Write your equation that produces agood fit.
Now you can extend your investigation of this data into the area of calculus.
7. Use nDeriv( to graph the first derivative of your function in Y2 .Hint: nDeriv( is found as line 8 in the <MATH> menu.Y, should be typed like the screen below shows. (Of course you will have your functionin 111.) Remember the Y1 names the function to be differentiated, the first x names thevariable, and the second x directs the calculator to differentiate for all values of x.
Yi=YAnDeriv(Y1,X,X
Y3=Y4=Ys=Ys=Y7=
8. Why does the graph of the derivative need such a different window? Why is Y2 so muchlower than Y1? Why is the amplitude so different?
229
Eisenhower Regional Consortium for Mathematics and Science Education at AEL Packet 2 / 223

Graphing Calculators in Mathematics Grades 7-12
9. Use nDeriv( to graph the second derivative of your function in Y1.Hint: 1'3 should be typed like the screen to the right.(Again you will have your function in Y1.)
10. Discuss the relationships between the three functions.What are other names for the derivatives?What do these functions mean concerning the pendulum?
Yi=YainDeriv0,10404
Y39nDeriv(Y2,X,X
Y4=Ys=Ys=
224 /Packet 2 Center of Excellence for Science and Mathematics Education at UT Martin

Graphing Calculators in Mathematics Grades 7-12 A *Activity Three: Pressure vs. Depth Curve for a Swimming Pool
Teacher Notes
Additional Equipment:
Vernier pressure sensorPiece of plastic tubing at least 20 feet long (aquarium air tubing works well)Means of attaching weight (paper clip works well)Weight heavy enough to pull the tubing to the bottom of the water (a large fishing sinkerworks well)
Al Permanent marking penRulerLong pipe to hold waterWater
Students will use a CBL and pressure probe to measure water pressure as depth changes.This experiment will simulate the change in water pressure in a swimming pool as the
depth changes. This experiment will use a tall pipe to simulate the pool. The resultingfunction will be linear.
A convenient way to make the "swimming pool" is to use white plastic pipe that can bepurchased at a hardware store. This pipe can be in sections that screw together. This willmake storage and transport easier. You can also have some fun with your students bymaking it their duty to figure out how to empty the water at the end of the experiment.
In order to perform this experiment the graphing calculator must have a program. If youare very proficient and wish to write your own program, that is fine. Most teachers willprefer to link calculators or use Graph-Link to download someone else's program. Yourprogram must not only measure pressure, but it must also use the trigger on the CBL.One good program that is available is listed below.
Real-World Math with the CBL System by Brueningsen, Bower, Antinone, andBrueningsen, published by Texas Instruments, Activity 3: Pool Plunge
If the pipe is too elaborate, a garden hose will also work. Of course you can always takea field trip to a swimming pool. Hawaii might be fun!
Suggestions For Assessment:
Teachers will certainly assess student learning by monitoring student progress while theclass responds during the experiment and while students answer the questions. Teacherswill have further opportunity to assess student learning if the assignment concludes witha written and/or oral report. This could even include ideas such as a discussion of depthswith pressures that are safe for swimming and the depth at which the Titanic rests.
Eisenhower Regional Consortium for Mathematics and Science Education at AEL Packet 2 / 225
231

Graphing Calculators in Mathematics Grades 7-12
Suggestions for Staff Development:
Staff development should include hands-on activities. Teachers should be encouraged tointeract with one another, assist one another, and share ideas.
226 /Packet 2 Center of Excellence for Science and Mathematics Education at UT Martin
Graphing Calculators in Mathematics Grades 7-12
Activity Three Handout
A*-
When a person dives into a swimming pool, there is a noticeable change in the pressureon the eardrums as the person descends to the bottom of the pool. The purpose of thisexperiment is to develop the mathematical relationship between the depth of the waterand the pressure that is felt. Instead of using a pool, students can produce the same effectby pouring water into a pipe.
This experiment uses plastic pipe that is at least 2 inches in diameter. Make sure the pipeis sealed on the bottom and is as tall as is convenient in your classroom. Pour water intothis pipe to simulate the water in a pool. Now that your "swimming pool" is ready, beginto set up your other equipment. Make a small hole in one end of the plastic tubing andattach the weight. Beginning at that end of the tubing, measure and mark off intervals ofone foot until you have exceeded the depth of the water. Attach the other end of theplastic tubing to the pressure sensor.
4 Measure the initial pressure.4 Your program must be one that is activated by the trigger.4 Start your program.4 Lower the tubing into the water one foot at a time, taking a reading for each foot of
depth.4 Examine your graph to make sure it is acceptable.4 Answer the questions below.
1. Sketch the graph of your data below.
2. Does your data look linear? Use <TRACE> to find the coordinates of two of your datapoints.
3. Find the slope of the line passing through the two points in Question 2.
4. Now, in slope-intercept form, write the equation of the line passing through those points.
2 3 3
Eisenhower Regional C'onsortium for Mathematics and Science Education at AEL Packet 2 / 227

Graphing Calculators in Mathematics Grades 7-12
5. Use your calculator to graph your line on the graph of your data. How good a fit is yourline?
6. Another way to obtain a line representing your data is to use linear regression in yourcalculator. Do this and write the resulting equation below.
7. Do the equations in Question 4 and Question 6 agree? Explain.
8. Now graph the equation in Question 6 on the graph with your data. How well does thisgraph fit your data?
234
228 /Packet 2 Center of Excellence for Science and Mathematics Education at UT Martin

U.S. Department of EducationOffice of Educational Research and Improvement (OERI)
National Library of Education (NLE)Educational Resources Information Center (ERIC)
NOTICE
REPRODUCTION BASIS
®
ERIC
This document is covered by a signed "Reproduction Release(Blanket) form (on file within the ERIC system), encompassing allor classes of documents from its source organization and, therefore,does not require a "Specific Document" Release form.
This document is Federally-funded, or carries its own permission toreproduce, or is otherwise in the public domain and, therefore, maybe reproduced by ERIC without a signed Reproduction Release form(either "Specific Document" or "Blanket").
EFF-089 (9/97)
Copyright © 2022 FDOKUMEN