João Vitor Campos e Silva - Instituto Juruá
216
Manejo Participativo nas Várzeas Amazônicas e seus Efeitos Multi-tróficos João Vitor Campos e Silva Ray Troll
-
Upload
khangminh22 -
Category
Documents
-
view
1 -
download
0
Transcript of João Vitor Campos e Silva - Instituto Juruá
Manejo Participativo nas Várzeas Amazônicas e seus
Efeitos Multi-tróficos
João Vitor Campos e Silva
Ray Troll
i
UNIVERSIDADE FEDERAL DO RIO GRANDE DO NORTE CENTRO DE BIOCIÊNCIAS
PÓS-GRADUAÇÃO EM ECOLOGIA DEPARTAMENTO DE ECOLOGIA
TESE DE DOUTORADO
Manejo participativo nas várzeas amazônicas e seus
efeitos multi-tróficos
João Vitor Campos e Silva
Orientador: Dr. Carlos Augusto da Silva Peres Co-orientador: Dr. Carlos Roberto Sorensen Dutra da Fonseca
Natal, Junho de 2016
ii
Universidade Federal do Rio Grande do Norte - UFRN
Sistema de Bibliotecas - SISBI
Catalogação de Publicação na Fonte. UFRN - Biblioteca Setorial do Centro de Biociências - CB
Campos-Silva, João Vitor.
Manejo participativo nas várzeas amazônicas e seus efeitos
multi-tróficos / João Vitor Campos e Silva. - Natal, 2016. 209 f.: il.
Tese (Doutorado) - Universidade Federal do Rio Grande do Norte.
Centro de Biociências. Programa de Pós-Graduação em Ecologia. Orientador: Prof. Dr. Carlos Augusto da Silva Peres.
Coorientador: Prof. Dr. Carlos Roberto Sorensen Dutra da
Fonseca.
1. Pesca na Amazônia - Tese. 2. Gestão baseada na comunidade -
Tese. 3. Desenvolvimento sustentável - Tese. I. Peres, Carlos Augusto da Silva. II. Fonseca, Carlos Roberto Sorensen Dutra da.
III. Título.
RN/UF/BSE-CB CDU 639.2
iii
“... Os animais são super legais, ganhei um livro da minha mãe que fala que os animais são diferentes em cada lugar. Fico imaginando se os animais da Amazônia são parecidos com os animais daqui. Eu vi a foto de um bicho pequeno, chamado tamanduaí! Eu queria muito criar um desse, mas tenho dó de fazer ele mudar de Estado. Eu rezo todo dia para que eu conheça a Amazônia. Quero trabalhar lá quando eu crescer. Quero andar de barco nos rios, pescar com os pescadores ribeirinhos. Adoro pescar! Tomara que lá as pessoas sejam amigas dos animais. ” João Vitor Campos e Silva, 1992. Redação escolar.

iv
Dedicatória Dedico essa tese ao médico cardiologista Dr. Wlademir dos Santos Junior que com seu dom e técnica fez com que o coração de meu pai não parasse de bater, postergando assim, a felicidade de nossa família.

v
Agradecimentos
Sabe aqueles períodos incríveis da vida? Inundados de descobertas, erros, acertos,
crescimento e felicidade? O doutorado foi exatamente isso. E eu me pergunto: Como
agradecer a oportunidade de vivenciar tudo isso?
Durante a materialização dessa tese tive o prazer de viver de perto a realidade de
pescadores, seringueiros, agricultores e extrativistas do Médio Juruá, um rio lindo, todo
sinuoso que nasce nos Andes e corta o coração da Amazônia. Conheci os causos
inacreditáveis da exploração da seringa, uma página sangrenta da história de nosso
país, repleta de abusos e exploração do Povo humilde da beirada do rio.
Também vi esse mesmo Povo emergir da condição de explorado para se tornar um
exemplo mundial de manejo de recursos naturais e desenvolvimento local. Também
ouvi muitas histórias de heróis ainda vivos, que vivem anonimamente combatendo as
injustiças desse mundão de meu deus. Vi cidadãos, desprovidos de qualquer
oportunidade, desafiarem essa política nefasta ao conduzir seu desenvolvimento com
as próprias mãos cheias de calo.
Aprendi a pescar com rede, nadei no rio com piranha, fugi de jacaré, andei atrás de
passarinho, vi a morte de perto ao naufragar um barco, tirei e bebi açaí, acompanhei
caçadas, tirei leite da seringa, comi arabú, tratei corte de facão com banha de sucuri,
curei dor de barriga com capurana, curei dor de amor com céu estrelado e viola,
pesquei com jaticá, tomei vinho de apuruí, comi muito tambaqui, alaguei canoa, tomei
muita picada de caba, tomei peia de potó.
Me enchi de guereré, caí do assacú e me atolei na lama, contei pirarucu, confundi
bodeco com sulamba, plantei roça, fiz farinha, perdi amigo morto em conflito pesqueiro,
quase perdi amigos com picadas de cobras, morei 15 meses em um barco, compreendi
o que é organização social, aprendi a falar e a ouvir, aprendi a ser flor e espinho com o
mesmo semblante. Aprendi a respeitar, aprendi o que devo ser para obter respeito.
Aprendi que qualquer sociedade tem seus alicerces na relação que estabelece com a
natureza. Fiz tantos amigos na beira desse rio que as lagrimas despencam sem cessar
de tanta saudade.
Não lembro mais quem eu era antes do Médio Juruá. O doutorado acabou e foi um
pequeno detalhe.
Muitas pessoas marcaram esse momento.
Primeiramente, agradeço de coração aos meus pais por terem me ensinado o valor de
sempre lutar pela humildade e honestidade. A grande sorte que dei na vida foi ter
nascido em uma família que me permitiu seguir meus desejos sem a pressão e a
cobrança de um mundo sedento por dinheiro. Meus pais são pessoas incríveis que
abdicaram de seus sonhos para que eu pudesse tentar alcançar os meus. Não quero
desmerecer meus esforços, mas tenho plena consciência que tudo que eu possa
conquistar na vida, terão as marcas suadas das mãos de meus pais, que garantiram a
vi
oportunidade de estudo em um país às avessas. Além de muito amor, tenho por eles a
mais grandiosa gratidão.
Sou muito grato também à algumas pessoas que, lá atrás, me incentivaram a me jogar
em solos amazônicos, como é o caso da querida Dri (Adriane Morais) e do Roberto
Ávila, amigo especial que teve importância fundamental inclusive na minha escolha
pela biologia.
Devo fazer um agradecimento especial à passagem que tive pela secretaria de
desenvolvimento sustentável do Estado, trabalhando especificamente no Programa
participativo de monitoramento da biodiversidade e uso dos recursos naturais nas
Unidades de conservação do Amazonas, o ProBUC. Esse programa mudou minha
vida, pois me lançou na esfera que sempre desejei estar: entre os seres humanos e a
natureza. Ali conheci grandes amigos que me inspiraram na caminhada rumo a um
mundo mais justo e mais harmônico na relação homem/natureza. São eles: Henrique
C. Santiago (Cachaça), Sinomar F. Jr, Davi Teles Vinhas, Marcelo Castro, Polly Lemos
e Wilde Itaborahy. Um abraço no coração de cada um, aprendi muito com vocês.
Agradeço de coração todos os amigos no médio Juruá que possibilitaram essa imersão
que se tatuou para sempre em minha formação como ser humano. Tenho o prazer em
dizer que construí uma família no Médio Juruá passando por todas as comunidades do
Bacaba ao São Sebastião. Impossível citar nomes, é muita gente boa por lá!!!!!!!!!!!!!
Quero agradecer também as instituições responsáveis pelo lindo trabalho que ocorre
por lá – ASPROC, AMARU, DEMUC, ICMBio, IBAMA, Colônia de pescadores e todo o
time de profissionais que que fazem do trabalho uma linda luta.
Agradeço muito ao Carlos Peres, meu orientador, por toda sua dedicação. Um
orientador que incansavelmente me mostrou atalhos para se chegar à ciência de alta
qualidade. Carlos me deu uma oportunidade incrível de coordenar o campo de um
grande projeto, serei sempre muito grato. Carlos também elevou minha referência e me
ensinou que a ciência é muito divertida, quando feita com criatividade, sem amarras e
grandes dogmas.
Agradeço ao governo brasileiro por ter me concedido a oportunidade de pensar um
tema que não gera lucros à grandes empresas. Agradeço à UFRN e seu corpo docente
por todas as oportunidades e por me mostrar que é possível criar um espaço
acadêmico sem vaidade e mesquinharia.
Agradeço imensamente ao meu co-orientador Carlinhos Fonseca, por ser um grande
exemplo de pesquisador, professor, pai, amigo e ser humano. Eita família bonita a
desse cabra! Foi inspirador ter conhecido a forma como ele encara a vida de cientista.
E como é bom discutir ciência com a mesma pessoa que te acompanha no samba,
tocando pandeiro e no ataque das peladas!
Agradeço muito à Priscila Lopes por ser sempre tão solicita, querida, inspiradora e de
esquerda! Ao Coca pelo seu exemplo mostrando que política e ciência fazem parte do
mesmo discurso, e à Adriana Carvalho que contribuiu muito com o desenvolvimento de

vii
minha tese e nunca me recebeu sem um sorriso estampado no rosto! Renato Cintra
com sua positividade impressionante tem um agradecimento especial também!
João Henrique, o minhoca, também foi um grande amigo muito importante no
desenvolvimento desse trabalho. Ele me guiou nas viagens ao fantástico mundo dos
fitoplâncton. Sua paciência, alegria e prontidão para o compartilhamento da cachaça
foram de grande valia!
Joseph Hawes, além de coautor e parceiro profissional, também foi um grande amigo
que ganhei durante o doutorado.
São tantos amigos importantes na caminhada que seria muito arriscado citar nomes
com uma memória avoada como a minha…
Mas alguns tiveram participação decisiva em algum momento dessa tese: Fernanda
Meirelles, Leo Xina, Chimbinha, fumaça, Guiga, Dri, Bernardo, Carol, Helder, Juampy,
Juanka e Eugenia... E a materialização final da tese foi especialmente amparada pela
positividade e no companheirismo compreensivo da Julia!!! Que sorte a minha!
Obrigado também Carolina Freitas por todo o companheirismo profissional em campo!
A Carol foi um baita reforço em nosso projeto e enriqueceu de mais os longos trabalhos
de campo, juntamente com os amigos Hugo Costa, Almir e Thonha!
Foram tão vastas as experiências, são tão intensos os agradecimentos, pena que seja
tão limitado o espaço. Pois aqui não caberia o oceano de gratidão que me lava a alma
nesse momento. Devo me cuidar para não ser piegas e redundante, mas dentre todos
os ensinamentos, o doutorado me mostrou que o crescimento é muito maior quando
nos dedicamos à colaboração e ao altruísmo. De coração, obrigado a todos que de
alguma forma contribuíram com esse período da minha vida.

viii
vii
Sumário
Página
Introdução 1
Estrutura da tese 7
Capítulo 1 (artigo 1)
13 Policy reversals do not bode well for conservation in Brazilian Amazonia
Capítulo 2 (artigo 2)
22
Community-based management induces rapid recovery of a high-value tropical freshwater fishery
Capítulo 3 (artigo 3)
74
Community-based management drives food web structure in Amazon floodplains lakes
Capítulo 4 (artigo 4)
102 Responses of waterbirds to fisheries management on Amazon floodplains
Capítulo 5 (artigo 5)
126
Unintended multi-species co-benefits of community-based fluvial beach protection in lowland Amazonia
Capítulo 6 (artigo 6)
158
Arapaima management as a tool for conservation of Amazon floodplains: Bottlenecks, threats and recommendations
Anexo 1 (Artigos de divulgação)
171 Artigo 7 - Tempos sombrios para a conservação da Amazônia
Artigo 8 - Comunidades ribeirinhas da Amazônia melhoram a qualidade de vida protegendo a biodiversidade 177
Artigo 9 - Espécies guarda-chuva: O manejo da tartaruga da Amazônia garante a conservação de muitas outras espécies
189
Anexo 2
194 Artigo 10 - Brazilian fisheries dipped in a sea of uncertainty
Anexo 3 - Além tese: Ensinamentos caboclos para problemas também existentes na academia
Conto 1: Sobre a solidão 198
Conto 2: Sobre a meritocracia 200
Conto 3: Sobre a aplicabilidade (ou não) da Ciência 202
Conto 4: Sobre bens materiais, dinheiro e felicidade 205
Conto 5: Sobre a alteridade 207
Conto 6: Sobre o tempo 208
Introdução e Estrutura da tese
1
1. Introdução geral
Um dos aspectos mais fascinantes do planeta Terra é a colossal diversidade
biológica que habita seus domínios. Estimativas sugerem que cerca de 9 milhões de
espécies de plantas, fungos, animais e microrganismos dividem espaço com cerca
de 7 bilhões de pessoas. Essa numerosa população humana consome mais de 40%
da produção primária líquida do planeta (Vitousek et al. 1986, Rojstaczer et al.
2001), cerca de 35% da produtividade oceânica (Pauly e Christensen 1995) e cerca
de 60% do fluxo de água doce (Postel et al. 1996). Essa escala de consumo fez
emergir uma crise ambiental sem precedentes, com genes, espécies e grupos
funcionais sendo eliminados em taxas nunca antes observadas na história da
humanidade (Cardinale et al. 2012). Essa dantesca problemática traz um homérico
desafio para as sociedades contemporâneas: usar os recursos naturais de forma
sustentável, sem comprometer os sistemas biológicos.
Atenção especial vem sendo dada aos ambientes de água doce, que representam
apenas 0,8% da superfície terrestre (Gleick 1996). Apesar da pequena
representatividade, esses sistemas foram fundamentais para o desenvolvimento das
sociedades humanas, sustentando as atividades agrícolas e industriais (UNDP,
2006). Com o rápido aumento das populações humanas, particularmente nos
trópicos, esses sistemas de água doce se tornaram os ambientes mais ameaçados,
com taxas de perda de espécies substancialmente mais altas que os ambientes
terrestres ( Dudgeom et al 2005; Sala et al. 2010).
Os grandes rios de água doce e suas planícies de inundação podem ser
caracterizados como complexos sistemas sócio ecológicos, onde as normas sociais,
relações ecológicas e interações biofísicas são dinâmicas, complexas e recíprocas
Introdução e Estrutura da tese
2
(Liu et al. 2009; Ostrom 2009). As comunidades humanas residentes nesses
ambientes de água doce são altamente dependentes dos recursos naturais, como é
o caso do pescado, por exemplo. Nesse caso, a conservação dos estoques é
essencial para a estabilidade econômica e social das comunidades humanas. A
conservação desses ambientes, portanto, pode ser considerada um problema
comum que afeta diferentes escalas e se relaciona com os grandes desafios do
milênio: conservação da biodiversidade, melhoria da qualidade de vida e redução da
pobreza (Sacchs et al. 2009).
A floresta amazônica ilustra bem essa problemática, pois ela representa cerca de
metade de todo remanescente de floresta tropical do mundo (Hansen et al. 2013),
uma grande fração da biodiversidade terrestre e uma diversidade cultural
impressionante. Toda essa riqueza abaixo e a cima do solo representa também uma
incisiva oportunidade de desenvolvimento para todos os países que compartilham
suas fronteiras. Na prática, o destino do bioma depende da habilidade humana de
implementar atividades sustentáveis para o desenvolvimento da região.
As áreas protegidas constituem uma das maiores ferramentas globais de
conservação. São instrumentos governamentais, criados com a grandiosa missão de
preservar e conservar a diversidade biológica e os recursos naturais associados a
ela (UICN 1994). As unidades de desenvolvimento sustentável compõem uma
categoria de área protegida que permite diferentes tipos e intensidades de
manipulação humana. Elas abrigam as chamadas “populações tradicionais” que
ainda mantém uma forte relação com a terra, apresentando, muitas vezes, um
modelo de subsistência, quanto à ocupação do espaço e uso dos recursos naturais.
As áreas protegidas reservadas ao desenvolvimento sustentável correspondem a
61,6% de todas as áreas protegidas do mundo (WDPA 2011). No Brasil, a grande

Introdução e Estrutura da tese
3
maioria das unidades de desenvolvimento sustentável (cerca de 99% em área)
encontra-se na Amazônia (Rylands e Brandom 2005).
Não restam dúvidas quanto à importância das áreas protegidas na conservação
da biodiversidade, contenção de desmatamentos e manutenção de serviços
ambientais (Peres 2005; Nepstad 2006; Malhi et al. 2008). No entanto, a grande
maioria das áreas protegidas criadas foram sedimentadas sobre os alicerces da
ecologia terrestre (Castelo 2013). Além disso, a Amazônia vive atualmente um
período político substancialmente desfavorável à criação e implementação de novas
áreas protegidas (Campos-Silva et al. 2015). Portanto, urge a necessidade de se
pensar estratégias conservacionistas complementares que contemplem os
ambientes aquáticos.
Uma forma alternativa de se pensar a conservação da biodiversidade de forma
integrada com o desenvolvimento das populações tradicionais se sedimenta na
inclusão das populações locais nas tomadas de decisão que regulam o uso de
recursos naturais (Somanatham 2009). Esse manejo colaborativo dos recursos
naturais (também chamados de co-manejo) surgiu cerca de 30 anos atrás como uma
tentativa de descentralizar o uso de recursos naturais, antes centralizado no Estado
(Cleaver 1999). O objetivo do co-manejo é o compartilhamento das tomadas de
decisão que regulam o uso de recursos naturais entre os diferentes usuários, dessa
forma as regras poderiam refletir melhor as peculiaridades de cada local e as
propostas teriam uma maior adesão por parte dos usuários. (Jentoft 2000). Embora
soe convincente, existe uma grande lacuna sobre experiencias empíricas de co-
manejo (Gutierrez et al. 2011; Cinner et al. 2012). Basicamente, a literatura global
carece de estudos que avaliem esses sistemas sob uma perspectiva ecológica.
A presente tese de doutorado se desenvolveu de 2012 a 2016 na região média do
Introdução e Estrutura da tese
4
rio Juruá, um importante afluente do rio Amazonas. Vale ressaltar a grande
organização social observada na região. No último século, a exploração da borracha
foi uma importante atividade econômica no norte do Brasil, no entanto, conduziu
uma grande parcela da população ribeirinha à extrema pobreza, sem suporte
governamental e sob constantes ameaças dos chamados “patrões da borracha”
(Fearnside 1989). Essa situação criou uma grande necessidade de organização
social e culminou com a criação das duas reservas de uso sustentável, a Reserva de
Desenvolvimento Sustentável (RDS) de Uacari e a Reserva Extrativista (RESEX) do
Médio Juruá.
A RESEX do Médio Juruá (5º33’54”S, 67º42’47”W) encontra-se na margem
esquerda do Rio Juruá, dentro dos limites da cidade de Carauari, Amazonas. A
reserva foi criada em 1997 e possui 253.227 hectares. A vegetação é caracterizada
pela predominância de Floresta Ombrófila Densa Aluvial de Terras Baixas e a
Floresta Ombrófila Aberta de Terras Baixas. Na RESEX existem cerca de 13
comunidades, onde residem aproximadamente 700 pessoas.
A RDS de Uacari (5º43'58"S, 67º46'53"W) foi criada em 2005, possui 632.949
hectares e forma, juntamente, com a Terra Indígena Rio Biá e a Reserva de
Desenvolvimento Sustentável Cujubim, um mosaico de áreas protegidas com quase
4,5 milhões de hectares. Dentro dos limites da reserva são encontradas 32
comunidades onde residem 1200 pessoas.
Um aspecto marcante das várzeas amazônicas é o pulso de inundação (Junk
1989). Muitas vezes a diferença entre o período de águas baixas e altas pode atingir
cerca de 12 metros. Esse fenômeno molda todas as comunidades biológicas que
residem na várzea, inclusive os grupos humanos. Na época da seca, os lagos e
corpos d’agua tornam-se unidades discretas na paisagem, permitindo a ordenação

Introdução e Estrutura da tese
5
das atividades pesqueiras. Uma dessas atividades é o manejo do pirarucu, que vem
se difundido por muitas localidades da Amazônia.
O Pirarucu pode ser chamado de gigante vermelho das várzeas. Trata-se do
maior peixe de escamas do mundo, que pode atingir mais de 200 Kg e medir mais
de 3 metros de comprimento. Devi ao alto valor nutricional de sua carne, alinhado ao
alto valor cultural de sua pesca, o pirarucu foi dizimado dos rios amazônicos, sendo
extinto em muitas localidades. O manejo se iniciou por volta de 1999 com o objetivo
de reverter essa tendência de diminuição populacional. Atualmente o manejo ocorre
em mais de 20 localidades e os resultados reportados têm sido surpreendentes. O
manejo ocorre basicamente de forma comunitária, onde as comunidades protegem
os lagos em períodos críticos do ano, solicitam a cota de abate ao governo e, por
fim, realizam a pesca do pirarucu, vendendo-o em escala municipal e estadual.
Na baixada das águas também surgem centenas de praias que funcionam como
sítios reprodutivos de várias espécies de animais, dentre eles a tartaruga da
Amazônia. Assim como o pirarucu, a tartaruga da Amazônia, juntamente com outras
espécies como o tracajá e o iaçá, representam um grupo de altíssimo valor cultural
para a população ribeirinha amazônica, pois sua carne é considerada uma
incomparável iguaria. Essas espécies de quelônios vêm sendo explorados desde
épocas pré-colombianas, consolidando-se como uma importantíssima fonte proteica
para as sociedades ribeirinhas e ameríndias. Além da carne, os ovos possuem um
valor nutricional impressionante e é consumido pela população geralmente
acompanhado de farinha açúcar, quando chamado de arabu. Trata-se de algo
equivalente a gemada, mistura feita com ovos de galinha e açúcar bastante
consumida na cidade.
Introdução e Estrutura da tese
6
Além da alimentação humana os ovos dos quelônios foram amplamente
explorados para iluminação pública e para confecção de manteiga. Estima-se que
milhões de ovos eram utilizados anualmente para iluminação pública das grandes
cidades amazônicas, Belém e Manaus. Diante dessa pressão drástica as
populações de tartaruga da Amazônia declinaram e desapareceram de muitos rios
da Amazônia.
Com o objetivo de reverter esse processo de redução populacional, comunitários
organizados socialmente iniciaram um processo de proteção das praias de desova,
que tem por objetivo garantir a proteção das fêmeas adultas. Essa iniciativa se
espalhou para mais de 100 localidades e hoje se constitui na maior ferramenta de
conservação dos quelônios de água doce da Amazônia.
O Médio Juruá a proteção dos tabuleiros de desova se iniciou ainda nos tempos
dos patões da borracha, que protegiam a praia para ter o recurso em abundância.
Hoje ele ocorre de forma organizada em 14 praias protegidas, dentro de duas
Unidades de conservação, a RESEX Médio Juruá e a RDS Uacari. Basicamente os
protetores das praias, ou monitores como são chamados, passam cerca de cinco
meses por mês em uma casa de madeira em frente à praia afastando qualquer
pessoa que tente coletar os ovos ou as fêmeas. É um trabalho árduo, muitas vezes
perigosos, pois a tartaruga tem um altíssimo valor no comércio ilegal. Uma fêmea
adulta pode ser vendida por até 1000 reais em Manaus. Como benefício cada
monitor recebe uma cesta básica por mês, durante o período que fica protegendo a
praia.
O manejo do pirarucu e a proteção de tabuleiros de desova de quelônios têm
como objetivo a conservação e uso dos recursos mais emblemáticos e importantes
do interior do Amazonas. O objetivo dessa tese é avaliar os efeitos ecológicos,

Introdução e Estrutura da tese
7
econômicos e sociais desses dois sistemas de conservação de base comunitária.
Cada capítulo da tese aborda um tema relacionado a essa problemática.
2. Estrutura da tese:
A presente tese é estruturada em seis capítulos e três anexos. No capítulo 1, faço
uma breve explanação sobre o cenário político da conservação na Amazônia.
Basicamente, a meu ver, é necessário o fortalecimento de outras ferramentas de
conservação que não sejam centralizadas nas instâncias governamentais. Isso é
importante em momentos onde a crise econômica e as prioridades políticas estejam
afastadas das necessidades conservacionistas. Esse capítulo se resume em um
artigo publicado na Natureza & Conservação na forma de Policy essay.
No capítulo 2 apresento um artigo sobre o manejo do pirarucu (Arapaima gigas)
publicado na Scientific Reports, onde avalio os benefícios ecológicos e
socioeconômicos do manejo, concluindo que o manejo do pirarucu é uma grande
janela de oportunidades para a conservação das várzeas amazônicas, pois há
claramente a oportunidade de associar a conservação da biodiversidade aquática
com a melhoria da qualidade de vida das populações ribeirinhas.
No capítulo 3, avalio a relação entre o manejo do pirarucu e a produtividade
primária dos lagos de várzea. Além dos fatores bottom up, amplamente discutidos
nas abordagens limnológicas, encontramos que o manejo comunitário da pesca tem
forte influência na biomassa de fitoplâncton, provavelmente por fenômenos tróficos
induzidos pelas grandes populações de pirarucu residentes em lagos protegidos.
Esse capítulo está em processo de submissão para a Journal of applied Ecology.
No capítulo 4, avalio as respostas das aves aquáticas ao manejo pesqueiro. Para
Introdução e Estrutura da tese
8
algumas guildas de aves, como os mergulhões, garças e socós, o manejo pesqueiro
foi o fator mais forte para explicar a variação no número de indivíduos dessas
espécies. Esse capítulo está em processo de submissão na Ecological applications.
No capítulo 5, avalio os efeitos ecológicos de outro sistema de conservação de base
comunitária, que é a proteção de tabuleiros de desova da tartaruga da Amazônia
(Podocnemis expansa). Analisamos 34 anos de dados e concluímos que os
resultados são fortes e substanciais tanto para a conservação da tartaruga da
Amazônia como para diversos outros grupos taxonomicos que também usam as
praias. Esse artigo está submetido para a PNAS. O capítulo 6 é um artigo escrito em
coautoria com membros da ampla maioria das instituições envolvidas no manejo do
pirarucu na Amazônia. A ideia foi discutir as principais ameaças e entraves ao
manejo do pirarucu sob o ponto de vista de todas as instituições protagonistas:
comunidades, associações locais, ONGs e governo. As recomendações geradas
nesse artigo poderão servir de alicerce para futuros projetos acadêmicos,
governamentais ou do terceiro setor.
No anexo 1 apresentarei todos os resultados dessa tese na forma de artigos de
divulgação científica que serão submetidos à Ciência Hoje e outras revistas
equivalentes. Penso que isso é importante por dois motivos: o primeiro é
disponibilizar os resultados dessa tese na língua portuguesa, o segundo é levar a
informação da tese para outras esferas, além da acadêmica. No anexo 2 apresento
uma breve carta submetida à Fisheries Research, relatando o completo descaso
governamental com a pesca brasileira. Devemos ter em mente que a pesca garante
a captura de cerca de 800.000 toneladas de pescado por ano, garantindo emprego
para mais de 3,5 milhões de pessoas e segurança alimentar e social para milhões de
famílias. No entanto, não temos ideia sobre a condição dos estoques, uma vez que
Introdução e Estrutura da tese
9
não temos estatística pesqueira em vigor. A necessidade de investimento no
monitoramento pesqueiro é algo pulsante no país. Por isso escrevemos essa carta
para tentar chamar um pouco de atenção ao caso.
Por fim, no anexo 3, eu apresento alguns contos escritos com base nos
aprendizados que tive no decorrer dessa tese. Apesar desses contos não se
enquadrarem no espaço convencional de uma tese, devido ao seu caráter livre e
subjetivo, resolvi inseri-los para compartilhar um pouco da sabedoria cabocla com
outros alunos que, por ventura, possam passar pelos mesmos anseios e indagações
que passei nos 15 meses que convivi com a sábia população do rio Juruá.
Referencias
1.Campos-Silva, J. V., da Fonseca Junior, S. F. & da Silva Peres, C. A.2015. Policy
reversals do not bode well for conservation in Brazilian Amazonia. Natureza &
Conservação, 13(2).
2.Cardinale, B.J.; Duffy, J.E. Gonzales, A.; Hooper, D.U.; Perrings, C.; Venail, P.;
Narwani,A.;Mace, G.M.; Tilman, D.; Wardle, D.A.;Kinzing, A.P.; Daily, G.C.;
Loreau,M.; Grace, J.B.; Larigauderie, A.; Srivastava, D.S. and Naeem, S. 2012,
Nature. Biodiversity loss and its impacto n humanity, 486,pp59-67.
3.Cleaver, F., 1999. Paradoxes of participation: questioning participatory approaches
to development. Journal of International Development 11, 597–612.
4.Castello, L.; McGrath, D.G.; Hess, L.L.; Coe, M.T.; Lefebvre, P.A.;Petry, P.; Macedo,
M.N.; Reno, V.F.; and Arantes, C.C.2013. The vulnerability of Amazon freshwater
ecosystems. Conservation Letters 0 (2013) 1–13
5.Cinner. J.E. et al. 2012. Transitions toward co-management: The process of marine
resource management devolution in three east African countries, Global

Introdução e Estrutura da tese
10
Environmental Change 22, 651–658.
6.Dudgeon D, et al. 2006. Freshwater biodiversity: Importance, threats, status and
conservation challenges. Biological Reviews 81: 163–182
7.Fearnside, P. M. 1989. Extractive reserves in Brazilian Amazonia: An opportunity to
maintain tropical rain forest under sustainable use. BioScience 39:387-393.
8.Gleick, P.H., 1996. Basic Water Requirements for Human Activities: Meeting Basic
Needs, 21. Water International (IWRA), pp. 83–92.
9.Hansen, M.C. High-resolution global maps of 21st-century forest cover change
Science, 342 (2013), pp. 850-853.
10.Gutierrez, N.L.; Hilborn, R. and Defeo, O. 2011. Leadership, social capital and
incentives promote successful fisheries
11.IUCN/WCMC. 1994. Guidelines for Protected Area Management
Categories. Gland and Cambridge: IUCN.
12.Jentof, S. 2000, Legitimacy and disappointment in fisheries management, Marine
Policy, 24,pp141-148.
13.Junk. W. J., Bayley, P. B., and Sparks, R. E. 1989. ‘The flood pulse concept in
river-floodplain systems’, Special Publication of the Canadian Journal of Fisheries
and Aquatic Sciences, 106, 1 10-127
14.Liu, J.; Dietz, T.; Carpenter, S.R.;Alberti, M.; Folke, C.; Moran,E.;Pell, A.N.;
Deadman, P.; Kratz, T.; Lubchenco, J.; Ostrom, E.; Ouyang, Z.; Provencher, W.;
Redman, C.; Schneider, SH.; Taylor, W.W. Complexity of Coupled Human and
Natural Systems. Science 2009
15.Malhi, Y. Roberts. J. T. Betts, R. A.; Killen, T.; Li, W.; Nobre, C.2008. Climate
Change, deforestation an the fate of the Amazon, Science Vol 3.
16.Nepstad, D.; Schwartzman, S.; Bamberger, B.; Santilli, M.; Ray, D.; Schlesinger,
P.; Lefebvre, P.; Alencar, A.; Prinz, E.; Fiske, G. and Rolla, A. 2006. Inhibition ao
Amazon Deforestation and Fire by Parks and Indigenous lands, Conservation Bilogy.
Vol 2: N1, 65-73.
17.Ostrom, E. 2009. A general Framework for Analyzing sustainability of Social-
Ecological Systems.Science (325)419-422.
18.Pauly, D. and Christensen, V. (1995) Primary production required to sustain global
fisheries. Nature 374, 255–257
19.Peres, C. 2005. Why we need a megareserves in Amazonia. Conservation
Biology, V:19, N3, P 728-733.
Introdução e Estrutura da tese
11
20.Postel, S.; Daily, G.; Ehrlich, P. Human appropriation of renewable fresh water.
Science, v. 271, n. 5250, p. 785-788, 1996.
21.Rojstaczer, S., Sterling, S. M., & Moore, N. J. (2001). Human appropriation of
photosynthesis products. Science, 294(5551), 2549 – 2552.
22.Rylands, A. Brandon, K.2005. Brazilian Protected Areas. Conservation Biology,
19:3, 612-618.
23.Sachs, J. D.; Baillie, J.E.M.; Sutherland, W.J.; Armsworth, P.R.; Ash, N.;
Beddington, J.; Blacburn, T.M.; Collen, B.; Gardiner,B.; Gaston, K.J.; Godfray, H.C.J.;
Green, R.E.; Harvey, P.H.; House, B.; Knapp, S.; Kumpel, N.F.;Macdonald,D.W.;
Mace. G.M.; Mallet,J.; Matthews, A.; May, R.M.; Petchey, O.; Purvis, A.; Roe, D.; Safi,
K.; Turner, K.; Walpole, M.; Watson, R.; Jones,K.E. 2009. Biodiversity Conservation
and the Millennium Development Goals. Science 325, 1502–1503.
24.Sala, O. E., Chapin, F. S., Armesto, J. J., Berlow, R., Bloomfield, J., Dirzo, R.,
Huber-Sanwald, E., Huenneke, L. F., Jackson, R. B., Kinzing, A., Leemans, R.,
Lodge, D.,
Mooney, H. A., Oesterheld, M., Poff, N. L., Sykes, M. T., Walker, B. H., Walker, M. &
Wall, D. H. 2000. Global biodiversity scenarios for the year 2100. Science, 287,
1770–1774.
25.Somanathan, E., Prabhakar, R. & Mehta, B. S. Decentralization for cost-effective
conservation. Proceedings of the National Academy of Sciences 106, 4143-4147
(2009).
26.UNDP (United Nations Development Programme). Human Development Report
2006. Beyond Scarcity: Power, Poverty and the Global Water Crisis. UNDP, New
York, 422 pp.
27.Vitousek, P.; Erlich, P.; Ehrlich, A.; Matson, P. Human Appropriation of the
Products of Photosynthesis. Bioscience, v. 36, n. 6, p. 368-373, 1986.
28.World database on Protected Area. Disponível em <http.www.wdpa.org>
Acessado em 09/11/2011.
Capítulo 1
Policy reversals do not bode well for conservation in
Brazilian Amazonia
Julia T. Verba
Julia Verba
Capítulo 1
14
Policy reversals do not bode well for conservation in Brazilian Amazonia*
João Vitor Campos-Silva, Sinomar Ferreira da Fonseca Junior, Carlos Augusto da
Silva Peres
*Publicado na Natureza e Conservação 2015; 13:193-5, doi: 10.1016/j.ncon.2015.11.006
The Amazon basin represents nearly half of the world's remaining tropical
forests (Hansen et al. 2013) and a large fraction of the terrestrial biodiversity. Due to
a wealth of increasingly desirable above- and below-ground natural resources, the
Amazon also represents a divisive development opportunity for South American
countries. In practice, however, reconciling the Herculean challenges of implementing
sustainable strategies for biodiversity conservation, poverty alleviation, and economic
growth will determine the ultimate fate of the region. Here, we express concerns over
two successful conservation and development strategies in the Brazilian Amazon over
the last two decades involving the concomitant creation of a comprehensive system
of protected areas and strengthening of the scientific and technical capacity to manage
natural resources.
In 2000, the Brazilian government established the National Protected Areas
System (SNUC), which was enshrined by the new constitution. Currently, SNUC has
consolidated a total of 1940 protected areas containing 1,513,828km2 of tropical
forest, which represents 17.8% of Brazil's entire territory. Of this total, 205 are
managed by municipal county agencies, 781 are protected areas managed by state
government agencies, whereas the remaining 954 are managed by the federal
government (MMA 2015). Since 2006, indigenous and Quilombola (traditional
communities of Afro-Brazilian descendants) territories were included as part of the
National Plan for Protected Areas, which represents about one quarter of the Brazilian

Capítulo 1
15
territory under non-private protection (PNAP 2006). This is an area larger than France,
Spain, Portugal, the United Kingdom, Italy and Germany combined.
This national protected area system represents the key frontline of deterrence
against tropical deforestation, habitat degradation, and biodiversity loss (Bruner et al.
2001; Nepstad et al. 2006; Ricketts et al. 2010), and is often considered as the largest
contributor to recently observed global scale declines in tropical forest loss (Hansen
et al. 2013). The huge advances made over the last 15 years are undeniable, when
Brazil gained a world leadership status in conservation (Ferreira et al. 2014). However,
in the last few years, these hard-won conservation gains have been severely
embattled by central-government environmental policy, particularly in the State of
Amazonas, the largest subnational political unit in Brazil (155.9 million hectares),
where >95% of the total area remains forested, ∼51% of which within formal protected
areas and indigenous territories (IMAZON 2015).
It is widely known that in most cases the mere creation of a protected area on
paper does not in itself ensure its long-term conservation. Most Amazonian protected
areas have yet to be properly implemented through local investments in reserve
personnel, infrastructure and securing land-tenure, so they remain at the mercy of
encroachment by squatters, other economic interests, poaching and deforestation
(Peres and Terborgh 1995; WWF 2012; Ferreira et al. 2013). For instance, 46.4% of
all state protected areas within Amazonas have no management plans, but even if
management plan guidelines are the first precondition to manage a protected area,
they alone cannot ensure legal enforcement of reserve regulations. Moreover, overall
human capacity to implement protected areas is wholly insufficient. Currently, only 27
full- or part-time staff are employed to manage the 42 state protected areas of
Capítulo 1
16
Amazonas, representing only 0.65 employees per reserve, or a mean reserve area of
6966km2 under the watch of each full or part-time reserve manager. This situation is
even worse when reserve personnel who are physically stationed at the state capital,
rather than in situ, are excluded from this workforce. This would equate to only 16
reserve staff, representing only 0.38 employees per reserve or a mean forest reserve
area of 11,756km2 per park manager.
Clearly, despite considerable conservation investments over the last two
decades, Brazil remains at a cross-roads in implementing and consolidating its large
network of protected areas on paper. While further governmental investments in
science, surveillance technology, and human resources could lead low-governance
regions like Amazonia to truly sustainable growth, most of the dividends from
conservation investments over the last four decades could be lost if the current
atmosphere of political neglect persists.
Another component of conservation management investments is scientific
capacity and output. Over the last two decades the number of postgraduate students
who are based at universities and research agencies within Brazilian Amazonia leaped
from 214 to 2159 per year, representing an >1000% increase in capacity throughput.
This is reflected in the growing number of papers published, from 471 to 2776 per year
(SECTI 2015). Sustainable natural resource exploitation and scientific development
are inextricably linked. Moreover, many of these postgraduate students go on to work
in research institutes, government agencies and NGOs, and continue to contribute to
regional scientific development one way or another. Retaining proficient research and
technical staff within Amazonia is critical, so government agencies should think
strategically about continued career opportunities in regional job markets.

Capítulo 1
17
However, all recent hallmarks in government executive orders have rapidly
drifted in the opposite direction, generating alarming concerns over the balance
between conservation and unhinged development, at least in Amazonia. This follows
a series of policy swings, beginning with the controversial overhaul of the well
established Forest Act (Metzger et al. 2010; Michalski et al. 2010). Recently, new
political decisions implemented by the state government of Amazonas severely
threaten the operational viability of the main agencies implementing conservation and
natural resource management. First, the Science, Technology and Innovation Council
(SECTI) was dissolved by the new state governor, which will severely damage
scientific growth, since this agency funds much of the science investment throughout
Amazonas.
Second, the Protected Area Management and Climate Change Agency was
also dissolved under the watch of the State Department of the Environment and
Sustainable Development. This massive cut in human resources can result in the
collapse of the entire state protected area system since most of these PAs depend on
state resources and are far from implemented. If human resources were insufficient
prior to these cuts, they are now virtually non-existent. Overall investments in
environmental management (including funding allocation to protected areas) were
also cut off by 88%, and it is important to emphasize that these budget cuts will impair
not only the upkeep of protected areas but all associated local collaborative
management structures. In a scenario of meager investments becoming even scarcer,
the state government will likely fail to honor collaborative management arrangements
and contracts previously co-signed by conservation NGOs.

Capítulo 1
18
To make matters worse, the current government plans to link what is left of the
conservation departments to the state Production Department. This is a Machiavellian
strategy to eliminate the autonomy of the former, subordinating it to the economic
demands of primary production, which are often diametrically opposite to the interests
of forest and biodiversity conservation. Unfortunately these political blunders do not
stop there. Indigenous reserves – which represent 27.3% of the state area – have also
succumbed to the current wave of government proposals. There are loud rumors that
the State Secretariat for Indigenous Peoples will also become subordinate to another
department, which led to protests by indigenous leaders, due to their sudden loss of
autonomy.
The government's simple justification is the wider context of budget cuts.
However, beyond monetary issues, this reform reflects the operational paradigm of
the Brazilian Federal Government: economic growth at any cost. In March 2015 the
State government passed a new law (PL155/2015) effectively fast-tracking the
licensing of large infrastructure projects without the scrutiny of federal environmental
institutions. These institutions control the approval and installation of new large
development projects, and the new law essentially provides a ‘blank check’ for large
contracts to be rolled out to large construction companies operating in the Amazon.
This is added to the fact that some 277 dams across the entire Brazilian Amazon basin
have been earmarked for construction, which at the very least is highly questionable,
not least because the costs of large dams on biodiversity and livelihoods of traditional
peoples are prohibitive and still difficult to predict and quantify (Gunkel et al. 2003)
given their overall environmental and biodiversity costs (Finer and Jenkins 2012;
Benchimol and Peres 2015). There is also a clear government strategy to invest in
mining exploration in Amazonia, even within protected areas. In 2011, the central

Capítulo 1
19
government created the State Department of Mining, Geodiversity and Water
Resources (SEGEORH), whose main objective is to support the construction of large
infrastructure and mining projects to promote regional economic growth. This is very
alarming, because approximately one fifth of all strictly protected areas and indigenous
reserves overlap officially sanctioned mining claims, representing an area of
315.6km2 under threat (Bernard et al. 2014; de Marques and Peres 2015).
Moreover, if government plans are to cut costs, there is little justification for the
strong increment in staff in the Governor's Office, which now has the highest number
of employees ever recorded. There are more than 70 staff, 34 positions assigned to
the direct assistance of the Office and 40 positions assigned to ceremonial duties
(Diário Oficial 2015). This means that the State of Amazonas has more employees to
organize the annual calendar of solemnities of a single office than to support
conservation and sustainable use of natural resources in the subnational political unit
controlling the largest tropical forest area on Earth.
The government saga to instigate economic exploitation of Amazonian surface
and underground resources, followed by the rapid dismantling of state-level
conservation agencies suggest that Brazil is reaffirming its postmodern colonial
condition, in which natural resources are exploited without proper planning and
environmental restraints, often caving in to external demands, rather than regional
socio-economic needs.
This sea-change in government attitudes to strategic planning has amounted to
serious detrimental effects since 2008. Brazil has lost 12,400km2 of protected areas
to degazetting, and an additional 31,700km2 to downsizing of forest reserves.
Moreover, an additional 21,000km2 could be lost via these processes if new law

Capítulo 1
20
proposals under discussion in the National Congress are sanctioned (Bernard et al.
2014; de Marques and Peres 2015). Moreover, since last year Brazil has seen a 215%
increase in deforestation, which partly reflects both legal and illegal clear-cutting in
private landholdings in the aftermath of the controversial legislative reform to the
Brazilian Forest Code (IMAZON 2015).
Apparently, new governmental development trajectories no longer take into
account the conservation of biological and cultural diversity. Thanks to a series of
unwise policies forcefully fast-tracked by the federal executive under the questionable
watch of President Dilma Rousseff, Brazil once again is entering a gloomy time for
conservation in the Amazon. Active engagement in the political process by both the
science community and civil society is therefore critically needed to veer off course
from the worst collisions steamrolled by wanton disregard for the long term-future of
natural resources, which after all is the bedrock of sustainable development.
References
1.Benchimol, M., C.A. Peres. Widespread forest vertebrate extinctions induced by a
mega hydroelectric dam in lowland Amazonia. PLOS ONE, 10 (2015), pp. 7.
2.Bernard, E.,L.A.O. Pena,E. Araujo. Downgrading, downsizing, degazettement, and
reclassification of protected areas in Brazil. Conserv. Biol., (2014), pp. 1-12.
3.Bruner, A.G. Effectiveness of parks in protecting tropical biodiversity. Science, 291
(2001), pp. 125-127.
4.Marques, A.A.B., C.A. Peres. Pervasive legal threats to protected areas in Brazil
Oryx, 49 (2015), pp. 25-29.
5. Ferreira, A.J.M. Relatório Conclusivo de Auditoria Operacional e Ambiental em
Unidades de Conservação Estaduais do Amazonas. Tribunal de Contas do Estado do
Amazonas (2013).
6. Ferreira, J. Brazil's environmental leadership at risk. Science, 346 (2014), pp. 706-
707.
7. Finer M., C.N. Jenkins. Proliferation of hydroelectric dams in the Andean Amazon
Capítulo 1
21
and implications for Andes-Amazon connectivity PLoS ONE, 7 (2012), pp. e35126.
8. Gunkel G. The environmental and operational impacts of Curuá-Una, a reservoir in
the Amazon region of Pará, Brazil. Lakes Reservoirs Res. Manage., 8 (2003), pp. 201-
216.
9. Hansen, M.C. High-resolution global maps of 21st-century forest cover change
Science, 342 (2013), pp. 850-853.
10. IMAZON – Instituto do Homem e meio ambiente da Amazonia, (2015). Available
from http://imazon.org.br/ (accessed 26.06.15).
11. Metzger J.P. Brazilian law: full speed in reverse? Science, 329 (2010), pp. 276-
277.
12. Michalski, F.,D. Norris,C.A. Peres. No return from biodiversity loss. Science (New
York, NY), 329 (2010), pp. 1282.
13. MMA – Ministério do Meio Ambiente. (2015). Available from
http://www.mma.gov.br/images/arquivo/80112/CNUC_Categoria_Fevereiro_2015.pdf
/(accessed 26.06.15).
14. Nepstad D. Inhibition of Amazon deforestation and fire by parks and indigenous
lands. Conserv. Biol., 20 (2006), pp. 65-73.
15. PNAP - Plano Estratégico Nacional de Áreas Protegidas. Decreto número 5.758
(2006).
16. Peres C.A., J.W. Terborgh. Amazonian nature reserves: an analysis of the
defensibility status of existing conservation units and design criteria for the future.
Conserv. Biol., 9 (1995), pp. 34-46.
17. Ricketts, T.H. Indigenous lands, protected areas, and slowing climate change
PLoS Biol., 8 (2010), pp. 1-4.
18. SECTI – Secretaria do Estado de Ciencia Tecnologia e Inovação, (2015). Available
from http://www.cienciaempauta.am.gov.br/ (accessed 26.06.15).
19. WWF and Instituto Chico Mendes de Conservação da Biordiversidade
Management Effectiveness of Brazilian Federal Protected Areas: Results of 2010
(2012).

22
Capítulo 2
Community-based management induces rapid
recovery of a high-value tropical freshwater
fishery
Carolina Freitas 22
Capítulo 2
23
Community-based management induces rapid recovery of a high-value
tropical freshwater fishery*
João Vitor Campos-Silva and Carlos A. Peres
*Publicado na Nature Scientific Reports 6 (2016), doi:10.1038/srep34745
Abstract
Tropical wetlands are highly threatened socio-ecological systems, where local communities rely heavily on aquatic animal protein, such as fish, to meet food security. Here, we quantify how a ‘win-win’ community-based resource management program induced stock recovery of the world's largest scaled freshwater fish (Arapaima gigas), providing both food and income. We analyzed stock assessment data over eight years and examined the effects of protected areas, community-based management, and landscape and limnological variables across 83 oxbow lakes monitored along a ~500-km section of the Juruá River of Western Brazilian Amazonia. Patterns of community management explained 71.8% of the variation in arapaima population sizes. Annual population counts showed that protected lakes on average contained 304.8 (± 332.5) arapaimas, compared to only 9.2 (± 9.8) in open-access lakes. Protected lakes have become analogous to a high-interest savings account, ensuring an average annual revenue of US$10,601 per community and US$1046.6 per household, greatly improving socioeconomic welfare. Arapaima management is a superb window of opportunity in harmonizing the co-delivery of sustainable resource management and poverty alleviation. We show that arapaima management deserves greater attention from policy makers across Amazonian countries, and highlight the need to include local stakeholders in conservation planning of Amazonian floodplains.
Key words: tropical fisheries, protected areas, stock recovery, wetlands,
floodplains, community-based management
Introduction
Although freshwater ecosystems comprise only 0.8% of Earth’s surface1,
they host one third of all vertebrate species worldwide2, and have always played a
critical role in societal development throughout human history. Currently,
freshwater environments and wetlands are top global scale conservation priorities,
because they are rapidly becoming the most threatened ecosystems, particularly
in the tropics, with rates of species loss substantially higher than those of terrestrial
environments3.

Capítulo 2
24
Many of these overexploited and increasingly degraded freshwater
environments can be described as socio-ecological systems (SES), where social
norms, ecological relationships and biophysical interactions are dynamic, complex
and reciprocal4. Human settlements, for example, are heavily dependent on
freshwater resources such as fish, and the top-down structure of entire fish
communities is often governed by the intensity of human overexploitation5.
Conservation and management of fish stocks are therefore essential to the
economic stability and social wellbeing of floodplain dwellers. Conservation of
freshwater ecosystems is widely considered an intractable problem affected at
different spatial scales, and is inextricably related to the often extolled but rarely
reconciled major challenges for humanity in the new millennium: biodiversity
conservation, improved quality of life, and poverty alleviation6.
Establishing the framework for sustainable resource use in locally co-
managed SESs is often a herculean task. This challenge is particularly difficult
partly because resource populations are affected by both biotic and abiotic factors,
in addition to the landscape dynamics of human exploitation pressure. For
example, marine fisheries respond to large-scale spatial patterns, such as latitude,
elevation, annual precipitation, and ecosystem primary productivity7. At smaller
scales, several other important variables can govern freshwater resource
availability including landscape and habitat heterogeneity8, water chemistry, and
plankton productivity9.
Setting aside and implementing well-managed protected areas is but one way of
achieving sustainable resource use10. For example, effectively established
marine protected areas have resulted in significant seascape-scale increases in
fishery yields11. Moreover, there are contentious discussions that remain
unresolved about the role of sustainable-use protected areas in realistically

Capítulo 2
25
reducing poverty and promoting other social benefits, mainly in developing
countries12. The rationale behind the thorny issue of reconciling biodiversity
conservation with local socioeconomic needs can be mainly justified at two levels.
First, implementation and maintenance of existing protected areas, particularly
large tropical reserves, are rarely effective due to scarce financial and human
resources, and inherent surveillance difficulties in enforcing reserve regulations
against a myriad of increasing external threats13. Therefore, formal alliances with
reserve residents can decentralize resource management, strengthen full-time
surveillance systems, and reduce overall conservation costs14. Secondly,
protected areas can enhance income opportunities, creating direct social and
economic benefits for local people15. For both of these reasons, legally occupied
sustainable-use reserves now exceed people-free strictly-protected reserves in
terms of both numbers and total area throughout the tropics16.
There are good examples of local communities that have been effectively
empowered to manage their own resources. These approaches are often referred
to as Community-Based Management (hereafter, CBM), whereby local people
with a vested interest in sustainable-use activities undergo an empowering
process to gain management control of their local natural resources17. This has
been independently demonstrated to work in different resource management
systems, for example to strengthen the sustainability of coral reef fisheries18,
convert commercial hunters into conservationists in Afrotropical forests19 and
improve conservation outcomes in Himalayan forests14. However, well-grounded
examples of positive ecological outcomes from CBM schemes have been rarely
demonstrated20.
A rare noteworthy example of community empowerment of artisanal
fisheries management has been occurring in lowland Amazonia21. With growing
market demand and technological innovation, large-scale commercial fishing
Capítulo 2
26
pressure on Amazonian fish stocks has been escalating since the early 1960s22.
This fueled the emergence of community-based management initiatives, whereby
fisherfolk began to restrict access by large commercial fishing boats into lakes near
their communities23. These initiatives, whenever they can be formalized, have
been variously referred to as ‘Fishing Accords’ between subsistence and
commercial fishing interests and have had a strong effect on local fisheries
management. In 1993, government agencies legally sanctioned these local
agreements as a formal fisheries management tool, which has since become a
powerful strategy to prevent overexploitation of important fish species24. Since
1999, such fishing accords, based on a strong social organization movement,
paved the way to the development of a promising community-based management
system focused on the exploitation of arapaima or pirarucú (Arapaima gigas,
Arapaimidae), a target species of marked importance in Amazonian history and
prehistory.
Arapaima spp. represents an apex predator in Amazonian fish communities
and Earth’s largest scaled freshwater fish, reaching >3.0m and >220kg
(Supplementary Information, Fig. S1). The alpha taxonomy of this monotypic
genus is poorly understood, and some new Amazonian species may yet be
described25. Adult arapaima exhibit high levels of parental care, protecting its fry
at all times, which contributes to its relatively low fecundity26. Fry-guarding adults
produce a mucous secretion, which flows through the water creating a safety net
that maintains a more cohesive family unit, and reducing natural predation on
young27. Due to its high ecological, economic and cultural value, large body size,
late maturity, and small brood sizes, Arapaima spp. is highly vulnerable to
overexploitation, and has been driven to local extinction at many localities28.
Surprisingly, however, A. gigas is currently listed as ‘data deficient’ in the most
recent IUCN Red List of Threatened Species.

Capítulo 2
27
Here, we provide a quantitative assessment of how CBM can promote the
recovery and conservation of arapaima, one of the most important tropical
freshwater fisheries, while generating both significant income and economic food
security for local livelihoods across Amazonian floodplains. We examine the
effects of different spatial scales of protection (protected lakes within and outside
protected areas), community management regime, distance to nearest markets,
and limnological and landscape-scale variables associated with 80 monitored
lakes spread across a ~600-km section of the Juruá River of western Brazilian
Amazonia. We further identify the patterns of local perception on arapaima
population growth as witnessed across 41 semi-subsistence communities
surveyed over the last 10 years. Finally, we discuss CBM initiatives as a powerful
tool for Amazonian floodplain conservation in decentralizing responsible decision-
making over natural resources, while serving the interests of both biodiversity
conservation and local livelihoods.
Methods
Study Landscape and Social Context
This study was carried out at 80 floodplain lakes inside and outside (upriver
and downriver) of two large contiguous sustainable-use reserves along the middle
section of the Juruá River, the second-largest white-water tributary of the Amazon
River (Fig. 1). The ~14,000-km2 study landscape contains two main forest types:
17.7% of seasonally-flooded (várzea) forest along the wide floodplain and 82.3%
of upland (terra firme) forest which is rarely if ever inundated29. The wet and dry
seasons coincide with periods of high (January – June) and low floodplain water
levels (August – November), with a prolonged flood pulse often exceeding 10 m in
amplitude30.
Capítulo 2
28
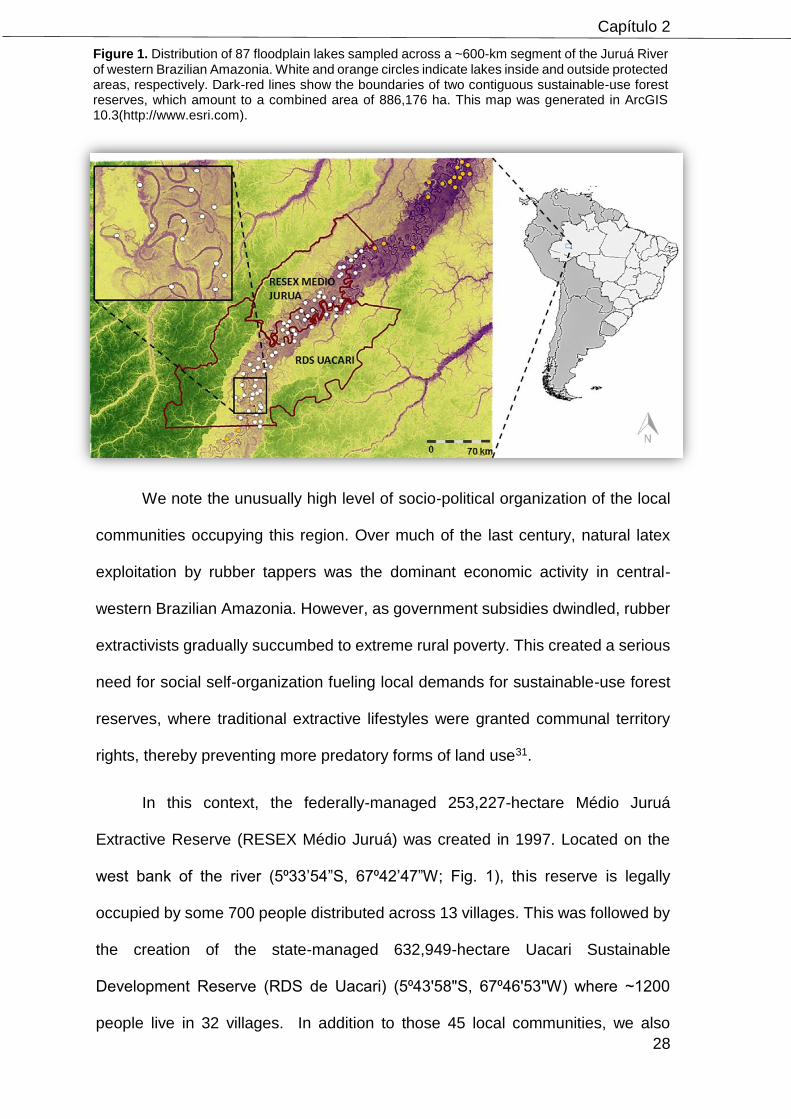
Figure 1. Distribution of 87 floodplain lakes sampled across a ~600-km segment of the Juruá River of western Brazilian Amazonia. White and orange circles indicate lakes inside and outside protected areas, respectively. Dark-red lines show the boundaries of two contiguous sustainable-use forest reserves, which amount to a combined area of 886,176 ha. This map was generated in ArcGIS 10.3(http://www.esri.com).
We note the unusually high level of socio-political organization of the local
communities occupying this region. Over much of the last century, natural latex
exploitation by rubber tappers was the dominant economic activity in central-
western Brazilian Amazonia. However, as government subsidies dwindled, rubber
extractivists gradually succumbed to extreme rural poverty. This created a serious
need for social self-organization fueling local demands for sustainable-use forest
reserves, where traditional extractive lifestyles were granted communal territory
rights, thereby preventing more predatory forms of land use31.
In this context, the federally-managed 253,227-hectare Médio Juruá
Extractive Reserve (RESEX Médio Juruá) was created in 1997. Located on the
west bank of the river (5⁰33’54”S, 67⁰42’47”W; Fig. 1), this reserve is legally
occupied by some 700 people distributed across 13 villages. This was followed by
the creation of the state-managed 632,949-hectare Uacari Sustainable
Development Reserve (RDS de Uacari) (5⁰43'58"S, 67⁰46'53"W) where ~1200
people live in 32 villages. In addition to those 45 local communities, we also
Capítulo 2
29
monitored 14 communities outside these protected areas. The local economy is
sustained by fisheries, slash-and-burn cassava agriculture, and non-timber forest
products such as oil seeds and palm fruits.
‘Fishing Accords’
To ensure food and economic security for rural communities, Fishing
Accords in the mid Juruá region were negotiated between local communities at the
two focal reserves, communities outside those reserves, and the Fishermen
Cooperative of Carauari, the nearest town. However, this is the first attempt to
evaluate the effectiveness of these fishing agreements.
These agreements established three categories of lake resource access
during the dry season, when lakes become discrete geographic features in the
landscape: (1) Open-access lakes contain free-for-all resource pools and remain
available for any fishing interests, including commercial fishing boats; (2)
Subsistence-use lakes are designed to supply local subsistence needs and
restrict access to only subsistence artisanal fishermen from the resident
community responsible for guarding that lake; and (3) Protected lakes are
managed by local communities primarily as stock recovery and arapaima
management sites, and exclude both commercial and subsistence fishing boats.
A floating wooden guard post is usually erected at the main strategic entrance of
the lake, thereby serving as a full-time armed vigilance unit managed by the
resident community (Fig. 2). During the arapaima management season, some of
protected lakes are harvested by the resident community for only a brief dry-
season period of up to 5 days per year, according to a previously set proportional
harvest quota based on the number of adult and juvenile arapaima censused at
that lake in the previous year.

Capítulo 2
30
Figure 2. Section of the Rio Juruá floodplain showing the upland (terra firme) forest (dark
green area) and floodplain várzea forest (light green area), containing oxbow lakes and
levees. Community-based full-time surveillance scheme protecting lakes during the dry
season is made possible by a wooden floating house placed at a strategic access point at
the mouth of the lake (red squares). Different families in each resident community, who
are often armed with a shotgun, take turns guarding the lake against underhand poachers.
Intermediate inset figure shows details of a protected lake; small inset figure shows a
harpoon fisherman in a dugout canoe harvesting arapaimas.
Annual arapaima counts along the mid Juruá started at several lakes in
2005, whereas lake management was implemented in 2010 by a partnership
between local communities, local associations and government agencies.
Arapaima counts take place during the low-water season at each monitored lake
every year, and the census data are forwarded to IBAMA (Brazilian Natural
Resources Agency), which then authorizes a lake-specific harvest quota of up to
30% of all adults (>1.5 m in length) counted, depending on the fish processing
requirements of the resident community and other extenuating factors.
Arapaima counts
Arapaima spp. is an air-breathing fish that is highly adapted to hypoxic and
anoxic environments27, thereby frequently coming to the surface to breathe air,

Capítulo 2
31
which facilitates direct sightings and counts (supplementary video S1). This census
method is highly effective, was developed and repeatedly field-tested in Central
Amazonian floodplains, with the specific objective of quantitatively surveying
arapaima populations (see Ref. 32 for further details). This census method
produces population size estimates that are strongly correlated with those from
mark-recapture abundance estimates32. Along the Juruá, this technique involved
the collaborative participation of up to 20 previously trained and highly experienced
arapaima fishermen per lake, who could detect air-breathing arapaima on the lake
surface through both visual and acoustic cues. During systematic censuses of
each lake, each fisherman working collectively sequentially covered a non-
overlapping lake area ranging from 0.2 to 2.0 ha, depending on local constraints
such as macrophyte coverage and lake area, to avoid double-counts.
During census periods, each observer remained silent on the lake margins
and counted all arapaima detected within each census area over multiple 20-min
periods (coinciding with the mean observed air-breathing interval at which they
become visible), which were synchronized across observers. These counts could
distinguish two main size classes: juveniles (1.0 - 1.5m in length) and adults
(>1.5m in length). In very large lakes, counts were conducted over more than one
census session often taking the whole day, until the entire census had been
completed. To preclude any detectability problems due to background noise,
arapaima counts were restricted to favourable weather conditions, which excluded
rainy days and strong winds.
Arapaima revenues
For each lake and each family household, we estimated the total revenue
derived from sales of legally harvested arapaima for local communities of the Juruá
region. This was based on ~6200 adult arapaima counted in 2015 at 26 protected

Capítulo 2
32
lakes. In doing so, we assumed (i) the maximum legally permitted offtake of 30%
of the recently censused adult population (Sept – Oct 2015) at managed lakes; (ii)
the average dressed weight of butchered and clean carcasses ready to be
commercialized (71.3 kg per adult); (iii) the mean market price in the nearest local
town (R$ 5.5 ≈ US$2.08 per kg), which is a conservative estimate of market value
but more realistically reflects transaction prices actually paid to floodplain dwellers;
and (iv) a mean monetary exchange rate of US$1 = R$2.64 (December 2014). We
include both subsistence and open-access lakes in these calculations for
comparison, but in practice, arapaima catches from these lakes can be consumed
locally or bartered, but cannot be sold to external traders.
Datasets and Variables
To understand the determinants of arapaima population sizes within oxbow
lakes, we examined systematic arapaima census data obtained at 83 lakes located
along a ~500-km fluvial distance along the Rio Juruá (31 protected; 34
subsistence; and 18 open-access lakes; Fig. 1) that had been surveyed at least
once during the dry season of 2013. We also had access to yearly dry-season
arapaima count data (2005 – 2015) from most of these lakes, obtained by a
collaborative institutional partnership, which yielded a total of 269 counts at 77
lakes (mean = 3.49 annual counts per lake).
For the full set of 83 lakes (Dataset 1), we obtained explanatory data on
fisheries management history and a range of landscape variables extracted for
each lake using ArcGIS (version 10.2). Predictors of arapaima stock sizes across
those lakes included: Protection area status: if the lake was inside or outside any
protected area; Lake management category: open-access, subsistence, or
protected; Lake area: including both open-water and macrophyte cover; Distance
to nearest community: the true nonlinear path distance on foot or boat used by

Capítulo 2
33
local users, which was measured using a GPS; Distance to nearest market:
expressed as the nonlinear fluvial travel distance from the lake entrance to the
town of Carauari port; Distance to the river channel: the Euclidean distance
between the lake entrance and the main Juruá river channel; Connectivity:
presence of a perennial levee or secondary channel connecting the lake to any
larger water body; and Water geochemistry: ‘black’ or ‘white’, defined as the locally
perceived amount of suspended alluvial sediments in the lake water column.
Secondly, for a subset of 43 of the 83 lakes (Dataset 2), we quantified
proxies of primary productivity of the lakes and obtained detailed limnological data
based on both field and laboratory measurements of water samples collected
during both the dry (low-water) and wet (high-water) seasons. These included:
Depth: maximum lake depth; Water transparency: estimated using a Secchi disk;
Conductivity: measured in S/cm using a conductivity meter; Macrophyte cover:
initially mapped in the field and then independently measured using 5-m resolution
RapidEye© images, which we purchased for the entire study area; Phytoplancton
biomass: estimated based on both dry- and wet season water samples and
chlorophyll-a measurements using high-performance liquid chromatography
(HPLC); and Total phosphorus and nitrogen: determined using light absorbance at
882 nm. A more detailed description of these variables, measurements and
hypotheses are presented in Supplementary Table S1.
Local perception surveys
We conducted 63 semi-structured interviews at 41 local extractive
communities containing at least six households. A total of 26 and 15 of these
communities were located inside and outside our two focal protected areas,
respectively. Interviewees were selected if they were heads of households who
were both highly experienced arapaima fishermen and had been continuous full-
Capítulo 2
34
time residents at any given community for >10 years. During these interviews, we
objectively asked about the overall perception of the local arapaima population
status (i.e. increasing, decreasing, or stable) in terms of the perceived size of the
present population within one or more lakes that had been frequently visited by
local villagers during the dry season, against perceived background population
trends over the last 10 years. The experienced fishermen have been chosen
according the leadership indication, at least one per community
We also conducted 28 interviews with self-declared formerly illegal
arapaima fishers at 13 communities, 12 of which inside the reserves and one
outside. These experienced fishers had since abandoned illegal fishing practices
and are currently working with the arapaima management program. They also
reported on perceived socio-economic changes since the onset of the
management program. Essentially, we asked about major perceived changes in
local livelihoods after the implementation of CBM. We also assessed the level of
importance of any given response, in terms of its overall relative frequency across
all interviews. Each interview lasted up to 15 min, and was facilitated by the overall
experience of resident fishermen in terms of frequent observational exposure to
arapaima populations at community lakes, and fishing effort over at least a decade
using harpoons, gillnets, or both.
In this study, we adhere to the full set of legislative and ethical specifications
to conduct the research within or outside Brazilian protected areas, including the
way we handled local interviews and conducted arapaima surveys. Our methods
were explicitly carried out in accordance with the formally approved legal
guidelines and licensing requirements as stipulated by the Brazilian Ministry of
Science and the Environment (SISBIO license number 45054). We can confirm
that all sampling protocols were approved by Brazilian law; and that any data

Capítulo 2
35
acquisition activities that may have involved people or third parties were conducted
with their explicit and clear-headed consent, once they had been completely
informed by native Portuguese speakers about the nature and objectives of the
research. We further declare no conflicts of interest in reporting the results of this
research work.
Data Analysis
To understand the local environmental and management determinants of
arapaima population size, we examined Datasets 1 and 2, using the number of
adult and juvenile arapaima estimated from systematic counts at each focal
floodplain lake as response variables. Dataset 3 was then used to examine the
variation in population size and annualized population growth rates from multiple
counts within each lake.
First, we ran generalized linear models (GLMs) to examine the variation in
recent (2013) counts within the full set of 83 lakes (dataset 1) as a function of all
potential predictors. Second, we performed GLMs to examine the variation in
arapaima population size within the subset of 43 lakes for which limnological data,
including proxies of productivity, were available (dataset 2). Our patch metrics, lake
management, and limnological fixed effects are listed above for these datasets.
Although arapaima population sizes should scale to lake area, we opted to retain
this variable as a fixed effect, rather than as an offset measure, because both
census detectability and habitat suitability within lakes were likely highly variable.
However, because ecological studies using count data are often affected by
overdispersion, a quasi-poisson and negative binomial distribution are often used
33. We used the latter because the variance-mean relationship provided a better
fit.
Third, we used generalized linear mixed models (GLMMs) and a negative
binomial error structure to examine variation in all 269 yearly arapaima counts
Capítulo 2
36
(2005 – 2015) considering the same set of predictors, but nesting population
counts within the 77 lakes surveyed at least twice (range = 2 – 8 yearly counts),
with lake identity defined as a random factor. Fourth, we examine the variation in
annualized population growth rates (𝐺𝑁) within and across lakes by calculating
percentage changes in population sizes between any two consecutive dry-season
counts (including both adults and juveniles) within the same lake (𝐺𝑁 =
(𝑌𝑟1 – 𝑌𝑟2)
𝑌𝑟1 ⦁ 100
𝑁𝑦𝑟𝑠), which did not necessarily take place in consecutive years. This
yielded 186 positive or negative GN estimates (% yr‒1) across 71 lakes exploited
by 26 local communities.
We first selected the most parsimonious random intercept structure by
identifying the model with the lowest Akaike Information Criterion corrected for
small sample size (AICc) with all fixed effects added34. AICc is calculated as the
difference between the AICc of each model and the lowest AICc, with AICc < 2
interpreted as substantial support that the model belongs to the set of best models.
Akaike weights give the probability that a model is the best model, given the data
and the set of candidate models 35. Models were fit with lmer in the lme4 package
and every model combination examined with the MuMIn package36 within the R
platform (R Development Core Team 2015). When comparing models that varied
in their random effects but not fixed effects, models were fit using restricted
maximum likelihood (REML). Finally, we calculated the hierarchical partitioning of
each explanatory variable.
Because arapaimas exhibit seasonal movements during the flood pulse
(JVCS and CAP, unpubl. data), it is possible that population sizes could be
homogenized through source-sink dynamics across lakes near one another
regardless of their prevailing local management history. We therefore examined
the spatial structure of the data across all 83 lakes (yielding 3,160 pairwise

Capítulo 2
37
Euclidian distances between any two lakes; mean = 73.6 ± 55.6 km; range = 1.3 –
223.3 km) to investigate the degree to which lakes could be considered as spatially
independent. However, there were no differences in model fits between whether
or not we included the geospatial structure of the data (expressed as the x,y
centroids of lake localities) as additional terms in spatial autoregressive models
explaining arapaima stock sizes within lakes based on key environmental and
management predictors ( 2 likelihood ratio test, P = 0.15). In addition, stock sizes
in open-access lakes were unrelated to physical distances to the nearest protected
lake (R2 < 0.001, P = 0.966). We therefore decided to interpret, rather than formally
incorporate, large-scale spatial effects in any subsequent analyses.
Results
Population responses to community management
There was a dramatic positive response of local arapaima populations to
community-based lake management regime (Fig. 3 and 4). Lake protection status,
as enforced by local communities, explained 71.2% of the variation in population
sizes in dataset 1 and 66.8% in dataset 2.
Population size estimates were significantly different between the three lake
management classes (p<0.001), and averaged over three orders of magnitude
from 304.8 (± 332.46, N = 31) individuals in protected lakes to 34.1 (± 24.4, N =
34) and 9.2 (± 9.8, N = 18) individuals in subsistence and open-access lakes,
respectively (Supplementary Fig. S2). This becomes even more striking
considering that open-access lakes were much larger (222.5 ± 172.1 ha, N = 18)
than protected lakes (126.5 ± 117.4 ha, N = 31), resulting in a mean arapaima
population density 131-fold higher in the latter (open-access lakes: 0.002 ind. ha‒
1; protected lakes: 0.294 ind. ha‒1). Whether or not a lake was formally within or
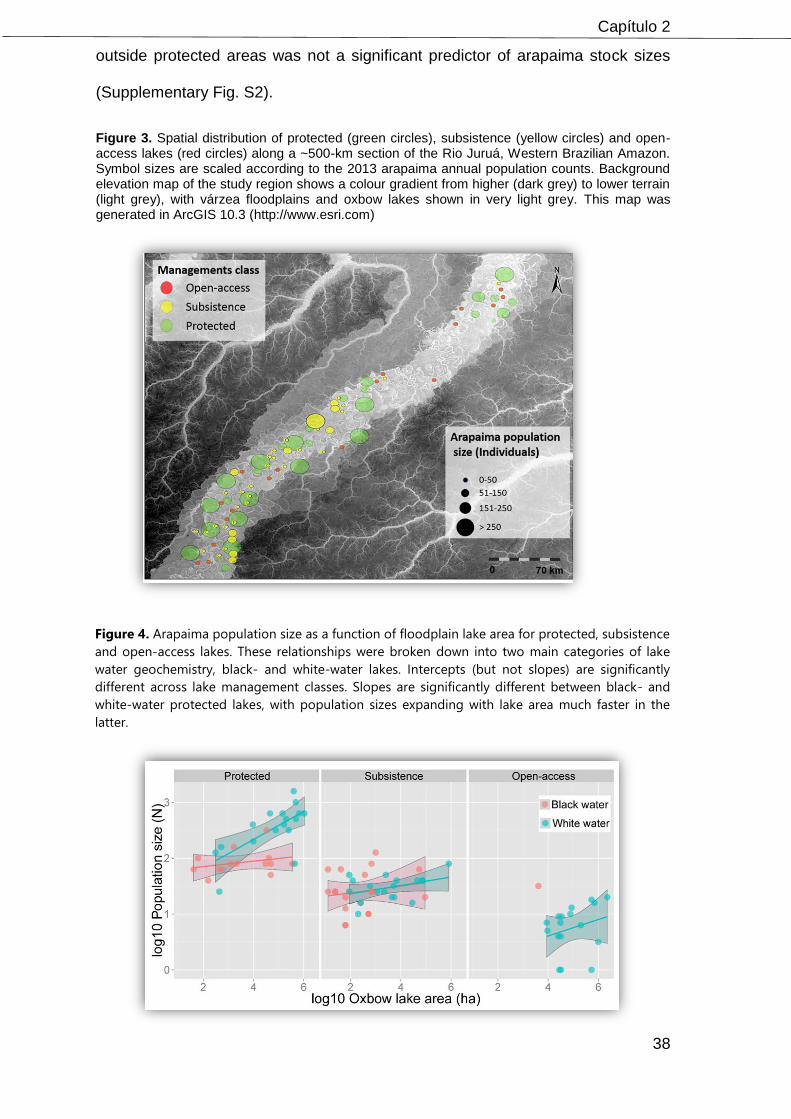
Capítulo 2
38
outside protected areas was not a significant predictor of arapaima stock sizes
(Supplementary Fig. S2).
Figure 3. Spatial distribution of protected (green circles), subsistence (yellow circles) and open-access lakes (red circles) along a ~500-km section of the Rio Juruá, Western Brazilian Amazon. Symbol sizes are scaled according to the 2013 arapaima annual population counts. Background elevation map of the study region shows a colour gradient from higher (dark grey) to lower terrain (light grey), with várzea floodplains and oxbow lakes shown in very light grey. This map was generated in ArcGIS 10.3 (http://www.esri.com)
Figure 4. Arapaima population size as a function of floodplain lake area for protected, subsistence
and open-access lakes. These relationships were broken down into two main categories of lake
water geochemistry, black- and white-water lakes. Intercepts (but not slopes) are significantly
different across lake management classes. Slopes are significantly different between black- and
white-water protected lakes, with population sizes expanding with lake area much faster in the
latter.
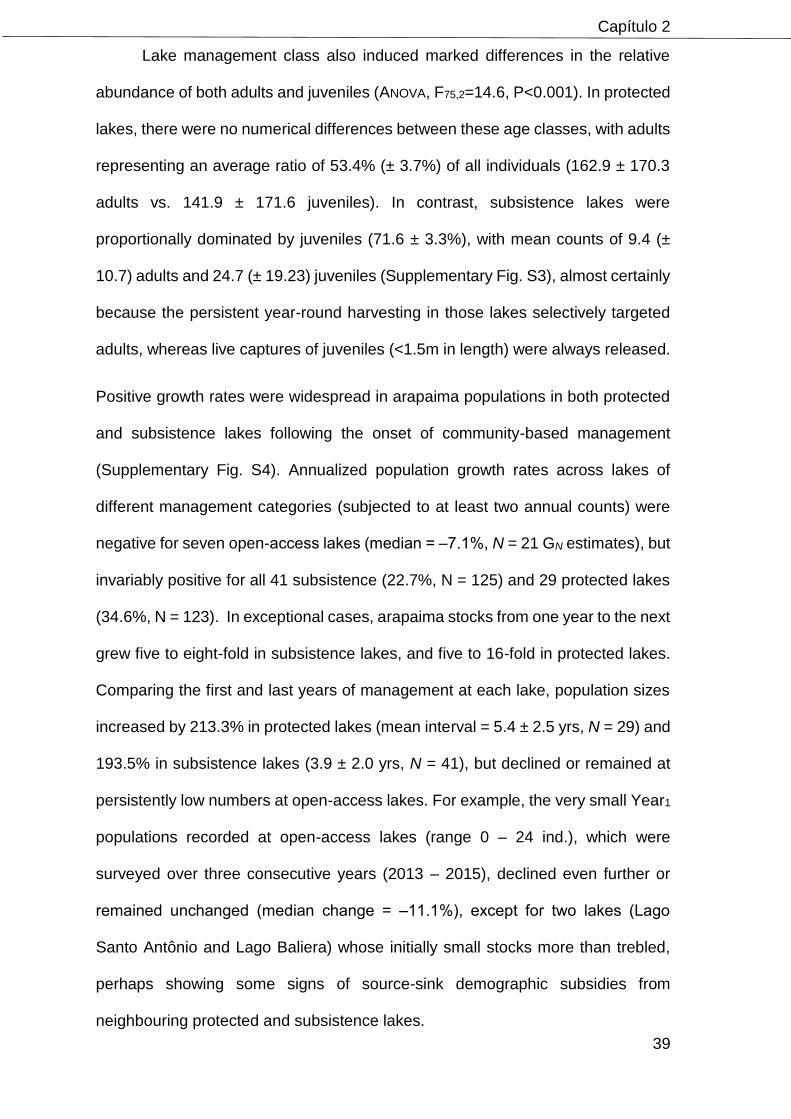
Capítulo 2
39
Lake management class also induced marked differences in the relative
abundance of both adults and juveniles (ANOVA, F75,2=14.6, P<0.001). In protected
lakes, there were no numerical differences between these age classes, with adults
representing an average ratio of 53.4% (± 3.7%) of all individuals (162.9 ± 170.3
adults vs. 141.9 ± 171.6 juveniles). In contrast, subsistence lakes were
proportionally dominated by juveniles (71.6 ± 3.3%), with mean counts of 9.4 (±
10.7) adults and 24.7 (± 19.23) juveniles (Supplementary Fig. S3), almost certainly
because the persistent year-round harvesting in those lakes selectively targeted
adults, whereas live captures of juveniles (<1.5m in length) were always released.
Positive growth rates were widespread in arapaima populations in both protected
and subsistence lakes following the onset of community-based management
(Supplementary Fig. S4). Annualized population growth rates across lakes of
different management categories (subjected to at least two annual counts) were
negative for seven open-access lakes (median = ‒7.1%, N = 21 GN estimates), but
invariably positive for all 41 subsistence (22.7%, N = 125) and 29 protected lakes
(34.6%, N = 123). In exceptional cases, arapaima stocks from one year to the next
grew five to eight-fold in subsistence lakes, and five to 16-fold in protected lakes.
Comparing the first and last years of management at each lake, population sizes
increased by 213.3% in protected lakes (mean interval = 5.4 ± 2.5 yrs, N = 29) and
193.5% in subsistence lakes (3.9 ± 2.0 yrs, N = 41), but declined or remained at
persistently low numbers at open-access lakes. For example, the very small Year1
populations recorded at open-access lakes (range 0 – 24 ind.), which were
surveyed over three consecutive years (2013 – 2015), declined even further or
remained unchanged (median change = ‒11.1%), except for two lakes (Lago
Santo Antônio and Lago Baliera) whose initially small stocks more than trebled,
perhaps showing some signs of source-sink demographic subsidies from
neighbouring protected and subsistence lakes.

Capítulo 2
40
Local management, landscape and limnological effects
Whether we considered (i) all 83 lakes where at least a single arapaima
count was available for the same dry season (2013), (ii) the 77 lakes subjected to
at least two annual counts, or (iii) the smaller subset of 43 lakes for which
limnological data were available, community-enforced mode of lake access always
explained the most amount of variance in stock sizes and population growth rates
(Fig. 5A-C), with protected lakes always containing the largest or fastest growing
populations, followed by subsistence lakes. As expected, although lake area was
a significant positive predictor of stock sizes, its effect was consistently smaller
than that of lake management class. Recovery time (years) was a significant
positive predictor of stock sizes for those lakes counted over more than one year,
with high growth rates for protected lakes showing no evidence of slowing down
(Supplementary Fig. S4). Nonlinear walking distance to the nearest local
community had a significant negative effect on population growth rates (Fig. 5B
and Supplementary Fig. S5), presumably because protection measures were
inherently more effective at lakes in close proximity to a village, provided residents
remained vigilant to enforce widely agreed community rules in light of Fishing
Accords. None of the limnological variables were important predictors of population
descriptors, except for the proportion of macrophyte cover which was negatively
correlated with stock sizes (r = ‒0.41). Further model details can be seen in
Supplementary Table S2).

Capítulo 2
41
Figure 5. Coefficient estimates (± 95% confidence intervals) showing the magnitude and direction of effects of different local and landscape scale variables on arapaima stock sizes and population growth rates within floodplain lakes of Western Brazilian Amazonia. Arapaima stock sizes were modelled with (A) generalized linear models (GLMs) using a set of 83 lakes censused in the dry-season of 2013; (B) GLMs for a subset of 43 lakes where detailed limnological and lake productivity variables were also quantified; and (C) generalized linear mixed models (GLMMs) for a subset of 77 lakes for which 269 annual counts (2005 – 2015) were available. ‘Time’ in panel C interaction terms refers to recovery time or the number of years since the onset of sustainable management at any given lake. Explanatory variables were standardized prior to analyses.
Local perception of stock recovery
Perception surveys with experienced fishermen confirmed the increasingly
evident notion that local arapaima populations have been growing inside but not
outside protected areas. However, at two communities well outside the protected
areas, there was unanimous consensus that arapaima stocks were also increasing
since a community management scheme was established (Fig. 6). This again
lends support to the idea that lake management in itself overrides the wider effects
of protected area status in determining arapaima population trajectories.
Socioeconomic benefits accrued from population recovery, as listed by formerly
illegal fishermen, were in order of importance: generation of local income,
strengthening of cultural values, growing “pride” in the community, and a more
equitable distribution of profits from fisheries (Supplementary Table S3).
Figure 6. Local perceptions on arapaima population trajectories based on semi-structured interviews with experienced arapaima fishermen. Red and green circles indicate communities (and community lakes) for which local informants reported either a decline or an increase in arapaima population sizes over the last decade, respectively. Yellow circles indicate stable populations that have not appreciably changed over time. Yellow lines represent the boundaries of the two

Capítulo 2
42
contiguous sustainable-use forest reserves, which may or may not contain lakes referred to during interviews. This map was generated in ArcGIS 10.3 (http://www.esri.com)
Arapaima revenues
The bulk of local income benefits accrued from fisheries management was
restricted to protected lakes, with subsistence and open-access lakes flat-lined at
virtually zero commercial value (Fig. 7). Protected lakes could derive total fishing
revenues from arapaima stocks averaging US$10,601 [95% CI: US$5,393,
US$15,808] every year, provided that full compliance with management rules
takes place and total allowable catches (TACs) are harvested. However, some
exceptionally large white-water lakes could yield as much as US$52,093 yr‒1 if the
officially sanctioned TAC had been sold. This translates into mean annual
revenues per community household of US$1,046.6 [95% CI, US$497, US$1,596],
considering the 14.4 ± 8.5 families per community (range = 4 – 30) that were
engaged in arapaima management activities. These family revenues were
positively correlated with the number of years since the onset of the CBM program
(r = 0.791, P < 0.001). Arapaima population growth (and potential revenues) scaled

Capítulo 2
43
strongly to lake area in white-water lakes, but not in black-water lakes, which
appear to be intrinsically less productive in terms of carrying capacity and stock
recovery (Fig. 7). White-water lakes on average yielded significantly higher mean
revenues (US$1,662.2 ± 350.6) than black-water lakes (US$449.4 ± 395.2; P =
0.025).
Figure 7. Gross fishing revenues per local community across three classes of lake resource protection through community-based management, which were further broken down into two main lake types in terms of water geochemistry. Slopes for protected lakes are significantly different between black- and white-water lakes, with arapaima populations in increasingly larger lakes accruing much higher revenues.
Finally, we used a predictive model to estimate the average recovery time
to achieve a stock size of 1000 adult arapaimas per lake, which could generate a
reasonable annual income (≈ US$44,491) for the resident community managing
that lake. We used as predictors the size of the lake, the distances to the nearest
local community and to the main river channel, and the nearest market town. This
shows that achieving a stock size of 1000 individuals would take a mean recovery
time of only 7.5 to 8.0 years from the onset of the CBM program for white-water
and black-water lakes, respectively, and at most 14 years considering the upper
95% CI of our estimates (Supplementary Fig. S6).

Capítulo 2
44
Discussion
Even some of the most severely underfunded protected areas can be
powerful instruments of tropical biodiversity conservation37. However, most tropical
protected areas are designed on the basis of known terrestrial ecology guidelines,
even if they contain extensive freshwater ecosystems. In Amazonia, the
overwhelming majority of protected areas are designed to protect forest
biodiversity, whereas increasingly threatened freshwater biotas remain highly
neglected38. This emphasizes the need to rethink how best to protect freshwater
ecosystems, but this is hindered by severe political resistance to create new, or
expand existing, protected areas39. In fact, protected area policy will likely succumb
to serious setbacks in many tropical countries, where existing reserves are being
downgraded, downsized or degazetted40. Given this unfavourable scenario and
government suspension of spawning season closures41, decentralization of
conservation policies and alliances with highly engaged local stakeholders can
become powerful tools14.
Recovery of arapaima fisheries has been suggested within some
Amazonian protected areas21,42. Although our study reinforces these findings, we
further show that CBM initiatives, in which floodplain lakes are the management
unit of interest, can impart even stronger positive outcomes for conservation, even
if implemented outside the boundaries of formally protected areas. Local
stewardship, direct in situ surveillance, full-time presence, and management of
high-value fish stocks were the most important factors in boosting arapaima
population sizes across a wide range of lakes. Proximity to the nearest community
was a key proxy of effective protection, largely because community management
rules and de facto exclusion of competing resource users cannot be easily
Capítulo 2
45
enforced in more remote lakes. Moreover, arapaima represents an umbrella
species in floodplain lakes, so that protecting their stocks brings about collateral
benefits to other important taxonomic groups, such as freshwater turtles43 and
caimans (JVCS and CAP, unpubl. data).
Although arapaima populations in subsistence lakes are not fully protected,
these lakes are in theory closed to commercial fishing boats. This resulted in a
much reduced and more size-selective offtake, with live catches of smaller
individuals released back into the lakes. This explains both the intermediate
arapaima population size compared to either open-access or protected lakes, and
the high number of juveniles. In fact, subsistence lakes likely serve a critical role
in juvenile recruitment, and ensure largely exclusive access to highly-selective
artisanal fisheries targeting large populations of smaller-bodied detritivore and
frugivore fish, which provide the mainstay of animal protein for Amazonian
floodplain dwellers21.
Although protected area context has been shown to be imperative to ensure
arapaima stock recovery elsewhere21,42, and remains an important overarching
scale of protection, we argue that the Juruá sustainable-use reserves were not
only important in protecting harvest-sensitive stocks, but also provided more
favourable conditions for successful CBM establishment. Community-level socio-
political organization and local compliance are critical determinants of successful
resource management44, and these community traits were conspicuously missing
in villages outside protected areas.
Beyond the protected area and CMB effects on arapaima populations,
understanding the environmental factors that govern resource distribution and
abundance is critical to the establishment of resource use guidelines45. First, all
other things being equal, larger lakes should be expected to contain larger
Capítulo 2
46
arapaima populations, and should be prioritized for management (cf. 45).
Distances to the nearest town and to the main river channel could also important
predictors of stock sizes. The mid Juruá town of Carauari serves as a convergence
point for an operational fleet of over 800 variable-sized fishing boats, which largely
supply chilled fish to a few wholesale middlemen who monopolize the regional fish
trade. Therefore, harvesting pressure on fish stocks is substantially higher near
the town than at distant sites up- or down-river, for which travel costs are higher,
as well documented in other CBM schemes46. The floodplain distance effect can
be explained simply in terms of physical access, because more remote (and often
older) floodplain lakes far from the meandering main channel are rarely visited by
commercial fishing boats.
Considering the subset of 43 lakes where detailed limnological variables
were quantified, macrophyte cover was an important yet ambiguous predictor of
arapaima population size. The habitat heterogeneity created by macrophytes
positively affects aquatic species richness47 — providing shelter, refuge and
foraging sites for many species48— but hinders physical access to gillnet and
harpoon fishermen. The macrophyte zone also provides a critical food supply for
juvenile arapaima49, so we expected the coverage of macrophytes and number of
arapaima to covary positively. Surprisingly, however, our data show an inverse
relationship, possibly due to a sampling artifact. High levels of macrophyte cover
impair counts of arapaima whose detectability is associated with surfacing in open-
water32, thereby super-inflating sampling imprecision. In this study, arapaima
population sizes were most likely underestimated in lakes dominated by large
areas of macrophytes.
Water geochemistry also played important roles in arapaima population size as
proxies of primary productivity. Although this effect size was weak, more
Capítulo 2
47
productive white-water lakes with high phytoplankton biomass likely supported
larger numbers of arapaima. In sum, arapaima populations within dry-season lakes
responded strongly to both human exploitation and some biophysical variables.
Therefore, we can identify both top-down and bottom-up factors affecting
populations of an Amazonian harvest-sensitive large-bodied fish, so that large
white-water lakes, particularly those near local communities should be prioritized
for local co-management initiatives both within and outside protected areas.
Arapaima population growth trajectories in protected lakes were a function
of time. This is consistent with the results from Mamirauá Sustainable
Development Reserve, Brazil, where the arapaima population increased nine-fold
in eight years21. We cannot yet estimate the maximum carrying capacity of these
lakes, but all protected subpopulations were still growing, partly fueled by the
annual input of alluvial nutrients brought in by the rising floodwaters, which likely
enhances the resilience of exploited animal populations48. An example worth
highlighting is the Marari Grande lake (Supplementary Table S4), which had been
entirely unprotected and available for professional fisheries until 2008.
Experienced fishers from the nearest community reported that this lake had long
been depleted, and that arapaimas had been locally extirpated. After only 7 years
of protection this lake yielded the largest arapaima population in our study
landscape (~2,020 individuals). Like elsewhere in Amazonia 22, 24, , much of this
depletion process was driven by less selective large-scale commercial fishing
boats, which come from far afield to harvest arapaima and other high-value fish
from unprotected lakes. The rapid reversal in this situation resulted from a local
initiative to guard the Marari Grande and other protected lakes, which suddenly
enforced the exclusion of professional fishing boats from those lakes.
Capítulo 2
48
Throughout our study landscape, experienced fisherfolk have reported that
arapaima stocks gradually dwindled to very low numbers during the heyday of
commercial fishing boats of the 1980s, to the point of perceived local extinction
from most lakes in the region. However, this predicament was only reversed with
the onset of negotiated fishing closures in both protected and subsistence lakes.
This becomes clear when we assessed stock sizes in open-access lakes, which
have been bearing the brunt of overfishing. These free-for-all lakes clearly fall
under a ʻtragedy of the commonsʼ scenario50, whereby scramble competition for
valuable fish resources accelerate overexploitation. During the first years of
exploiting an open-access lake, the benefits are disproportionately concentrated
on the few commercial fishermen harvesting that lake, to the detriment of all local
users. Over time, the pressure on harvest-sensitive resources became
prohibitively high, so the population eventually collapsed. Fishing Accords are thus
a concrete example of positive communal organization, defining boundaries, and
establishing rules of governance that are instrumental in managing common-pool
resources, thereby precluding resource collapse51. Moreover, such local initiatives
can trigger rapid co-benefits in multi-species population recovery in previously
depleted lakes, thus increasing the overall fisheries productivity of both those lakes
and the neighbouring waterscape22.
Although arapaima population growth is restricted to managed lakes, the
map resulting from local perception surveys indicates that the recovery is
widespread throughout the reserves (Fig. 6), whereas arapaima stocks are
perceived to have bottomed out outside protected areas. This clear perception
pattern is largely due to the absence of widely known protected lakes outside
protected areas. However, in the few cases where grassroots management plans
were self-established by communities outside protected areas, the arapaima
population has been clearly showing an early growth trajectory. This can be seen
Capítulo 2
49
at Lago Grande (Supplementary Table S4), a 294-ha lake outside the protected
areas where the arapaima population increased from ~30 to over 1200 individuals
in only 3 years of CBM lake protection.
Yet the degree to which population growth is due to internal recruitment or
immigration remains poorly known. For example, it is inconceivable that a low-
fecundity fish population can increase 3900% in only 3 years, such as in Lago
Grande. Rapid stock recovery must therefore be due to both local reproduction
and lateral migration during the high-water season52, whereby protected lakes
likely function as demographic sources. This is consistent with the long-range
movements exhibited by arapaima during the flood pulse. For example, one of the
juveniles we tracked at RDS Uacari using VHF radio-telemetry moved ~30 km in
a few days (JVCS and CAP, unpubl. data). A better understanding of seasonal
subpopulation movements during floodwaters is critical in designing a landscape-
scale network of protected, semi-protected and unprotected lakes that maximizes
fisheries productivity for all regional stakeholders.
Integrated development strategies that render biodiversity conservation
truly compatible with poverty alleviation are still too rhetorical but often elusive53.
Locally co-managed arapaima fisheries in Amazonian floodplains could become
an important window of opportunity because this can generate income for
thousands of families, apparently without significant wider opportunity costs, for
example, in depressing fish catches for excluded commercial stakeholders.
Indeed, we show that protected lakes have recently become something analogous
to a high-interest savings account, ensuring an average value of nearly
US$10,600, assuming the maximum allowable harvest quota of up to 30% of
adults and an adequate level of communal organization and compliance. This rare
cash-earning opportunity has also improved the socioeconomic welfare of local

Capítulo 2
50
communities, enhancing education and health services. Moreover, resident
communities managing protected lakes can count on an unprecedented annual
windfall payment every year, which enables often prohibitive private or communal
investments, such as house refurbishment and purchase of expensive equipment.
In addition to local income and social welfare, emergency funds can be generated
from arapaima sales, which have covered costs of urgent travel and medical care
at nearby urban centers or the state capital (Manaus) in case of serious illness or
accidents. This form of immediate access to health care, often resulting in life-
saving interventions, is unavailable from state health services. In sum, we show
that arapaima CBM schemes can become a colossal welfare enhancement
opportunity at relatively low costs. For example, covering all additional expenses
for both counting the arapaima population at a large lake (>150 ha) each year, and
enforcing anti-poaching vigilance at that lake costs only US$700 per year.
Socioeconomic benefits listed in our perception surveys with formerly illegal
arapaima fishermen include local income, more equitable distribution of fisheries
profits, and maintenance of cultural integrity. Prior to the management program,
illegal arapaima sales were distributed throughout the annual calendar, rather than
accrued as a lump sum following the collective dry-season offtake. This cash
windfall contributes further administrative benefits in terms of village and
household scale financial organization, enabling local managers to invest, for
example, in community infrastructure. Fisheries CBM has also been instrumental
in propagating traditional knowledge. Children often help during the fish offtake
season, while simultaneously learning about arapaima ecology and capture
techniques. Experienced fishermen also reported that CBM communities now
show a stronger “sense of pride” flowing from the management program, which
has been reinforced by positive media coverage disseminating this success story.
All of these direct and collateral benefits have greatly strengthened local

Capítulo 2
51
empowerment, providing positive feed-back on the emergence of the management
program as a whole54. Finally, local income distribution within villages has become
significantly more egalitarian following arapaima CBM because everyone can
participate, whereas illegal catches were previously oligopolized by a few highly
skilled fishermen.
In recent decades, the Brazilian government, local organizations, local
communities, and conservation NGOs have attempted to develop participatory
management strategies with a broad base of local uptake55. One of the most
important features of arapaima CBM in this study is the robust social organization
of both small and large communities, which ensures the dialogue, articulation and
partnership among stakeholders at different institutional scales, ensuring that the
lake protection system operates properly. The management structure is essentially
communitarian, whereby the resident community coupled with other lake users
define the rules of engagement and use of that environment, so that the spatial
patterns of resource access are defined at both individual and collective levels.
Moreover, CBM becomes more robust with the adhesion of additional partners
because of higher financial benefits, stronger self-monitoring of management
effectiveness, and greater collective vigilance in terms of formal or informal law
compliance. We also note the strong participation of grassroots institutions,
including reserve resident cooperatives and associations of rural producers, which
were erected by community members themselves. This ensures that decision-
making is in fact in the hands of local communities that were hitherto
disenfranchised and had no political voice. This further empowers local resource-
users to co-adapt and fine-tune management guidelines according to local culture,
which is critical to the success of conservation interventions56.
Capítulo 2
52
However, the long-term viability of Arapaima CBM will depend on a number
of externalities. Legal trade of sustainably harvested fish requires producers to
meet a number of sanitary preconditions stipulated by Brazilian health authorities.
This demands minimum processing equipment and infrastructure, which most
local communities do not yet have. These historically deprived communities have
so far been isolated from public policies, so meeting even minimum certification
standards will clearly require catalysis from government subsidies.
But perhaps the most important incidental challenge to be considered is the
likely urban market saturation from many competing arapaima management
initiatives at several Amazonian river basins, which would considerably increase
supply but depress market prices. Moreover, illegal fishing also remains a
significant competitive threat57, because offtakes from unknown sources are
delivered to consumers in large amounts at substantially lower cost. A third
wildcard threat to sustainable arapaima management comes from aquaculture in
that many Amazonian fish farms are now beginning to produce captive-bred
arapaima for local and regional markets58. Understanding these market
bottlenecks will be vital for the continuity of successful community-based wild fish
management. In doing so, government agencies, NGOs and other stakeholders
should consider the nuances of trade chains to enhance market conditions for
novice CBM traders. Managing wild arapaima populations remains a highly
promising conservation opportunity, but maintaining economically viable CBM in
the long term will critically depend on solving these challenges.
Arapaima, a paradigm “fish of change”
Local Fishing Accords are not new, as they have been established at
several Amazonian sites for nearly four decades, although the outcomes have
been elusive59. However, arapaima fisheries have profoundly changed the concept
Capítulo 2
53
of local fishing agreements. This fishery and its associated value reinforces the
justification of protecting lakes, and allocating much community time and endeavor
to this end.
Undoubtedly, arapaima management is a rare window of opportunity to
harmonize the often incompatible goals of sustainable resource management and
poverty alleviation. All similar efforts across the Amazon are also showing positive
results 21,42. This is significant because these local communities rarely have any
alternative cash-earning opportunities. Arapaima management can thus positively
empower local communities, and fishing agreements can be instrumental in the
sustainable management of aquatic resources in tropical floodplains, thereby
serving as an excellent stratagem to recruit allies with full-time physical presence
in protecting these threatened environments. Yet, there is not enough federal and
state government investment in Brazil—in terms of information transfer, technical
input and trade subsidies—to catalyze the initiation and consolidate similar CBM
programs despite widespread popular demand. Finally, we emphasize that fishing
agreements alone are not a panacea and cannot substitute the creation of large
protected areas, because these also ensure the continuity of many complex
ecological processes that sustain baseline resource productivity60.
References
1. Watkins, K. Human Development Report 2006-Beyond scarcity: Power, poverty
and the global water crisis. UNDP Human Development Reports (2006) (2006).
2.Butchart, S. H. et al. Global biodiversity: indicators of recent declines. Science
328, 1164-1168 (2010).
3. Dudgeon, D. et al. Freshwater biodiversity: importance, threats, status and
conservation challenges. Biological reviews 81, 163-182 (2006).
4. Liu, J. et al. Complexity of coupled human and natural systems. science 317,
1513-1516 (2007).

Capítulo 2
54
5. Darimont, C. T., Fox, C. H., Bryan, H. M. & Reimchen, T. E. The unique ecology
of human predators. Science 349, 858-860 (2015).
6. Sachs, J. D. et al. Biodiversity conservation and the millennium development
goals. Science 325, 1502-1503 (2009).
7. Attrill, M. J. & Power, M. Climatic influence on a marine fish assemblage. Nature
417, 275-278 (2002).
8. Richards, C., Johnson, L. B. & Host, G. E. Landscape-scale influences on
stream habitats and biota. canadian Journal of Fisheries and aquatic sciences 53,
295-311 (1996).
9. Dodson, S. I., Arnott, S. E. & Cottingham, K. L. The relationship in lake
communities between primary productivity and species richness. Ecology 81,
2662-2679 (2000).
10. Assessment, M. E. Ecosystems and human well-being. Vol. 5 (Island press
Washington, DC:, 2005).
11. Gell, F. R. & Roberts, C. M. Benefits beyond boundaries: the fishery effects of
marine reserves. Trends in Ecology & Evolution 18, 448-455 (2003).
12. Gurney, G. G. et al. Poverty and protected areas: an evaluation of a marine
integrated conservation and development project in Indonesia. Global
Environmental Change 26, 98-107 (2014).
13. Peres, C. A. & Terborgh, J. W. Amazonian nature reserves: an analysis of the
defensibility status of existing conservation units and design criteria for the future.
Conservation Biology 9, 34-46 (1995).
14.Somanathan, E., Prabhakar, R. & Mehta, B. S. Decentralization for cost-
effective conservation. Proceedings of the National Academy of Sciences 106,
4143-4147 (2009).
15.Wells, M. P. & McShane, T. O. Integrating protected area management with
local needs and aspirations. AMBIO: A Journal of the Human Environment 33, 513-
519 (2004).
16.Peres, C. A. Conservation in Sustainable‐Use Tropical Forest Reserves.
Conservation Biology 25, 1124-1129 (2011).
17.Brosius, J. P., Tsing, A. L. & Zerner, C. Representing communities: Histories
and politics of community‐based natural resource management. Society & Natural
resources: An international Journal 11, 157-168 (1998).
18.Cinner, J. et al. Transitions toward co-management: The process of marine
resource management devolution in three east African countries. Global
Environmental Change 22, 651-658 (2012).
Capítulo 2
55
19.Gibson, C. C. & Marks, S. A. Transforming rural hunters into conservationists:
an assessment of community-based wildlife management programs in Africa.
World Development 23, 941-957 (1995).
20.Evans, L., Cherrett, N. & Pemsl, D. Assessing the impact of fisheries co-
management interventions in developing countries: A meta-analysis. Journal of
Environmental Management 92, 1938-1949 (2011).
21.Castello, L., Viana, J. P., Watkins, G., Pinedo-Vasquez, M. & Luzadis, V. A.
Lessons from integrating fishers of arapaima in small-scale fisheries management
at the Mamirauá Reserve, Amazon. Environmental management 43, 197-209
(2009).
22.McGrath, D. G., De Castro, F., Futemma, C., de Amaral, B. D. & Calabria, J.
Fisheries and the evolution of resource management on the lower Amazon
floodplain. Human ecology 21, 167-195 (1993).
23.De Castro, F. Fishing accords: The political ecology of fishing intensification in
the Amazon. (Indiana University, 2000).
24.McGrath, D. G. Avoiding a tragedy of the commons: recent developments in the
management of Amazonian fisheries. Amazonia at the Crossroads. Institute of
Latin American Studies: London, 171-197 (2000).
25.Stewart, D. J. A New Species of Arapaima (Osteoglossomorpha:
Osteoglossidae) from the Solimões River, Amazonas State, Brazil. Copeia 2013,
470-476 (2013).
26.Godinho, H. P., Santos, J. E., Formagio, P. S. & Guimarães‐Cruz, R. J. Gonadal
morphology and reproductive traits of the Amazonian fish Arapaima gigas (Schinz,
1822). Acta Zoologica 86, 289-294 (2005).
27.Parker, B. H. Arapaima: An Amazonian fish species of immense proportions.
Biodiversity 3, 21-24 (2002).
28.Castello, L., Arantes, C. C., Mcgrath, D. G., Stewart, D. J. & Sousa, F. S. D.
Understanding fishing‐induced extinctions in the Amazon. Aquatic Conservation:
Marine and Freshwater Ecosystems 25, 587-598 (2015).
29.Hawes, J. E., Peres, C. A., Riley, L. B. & Hess, L. L. Landscape-scale variation
in structure and biomass of Amazonian seasonally flooded and unflooded forests.
Forest Ecology and Management 281, 163-176 (2012).
30.Hawes, J. E. & Peres, C. A. Patterns of Plant Phenology in Amazonia
Seasonally Flooded and Unflooded Forests. Biotropica, doi:10.1111/btp.12315
(2016).
Capítulo 2
56
31.Fearnside, P. M. Extractive reserves in Brazilian Amazonia: An opportunity to
maintain tropical rain forest under sustainable use. BioScience 39,387-393
(1989)..
32.Castello, L. A method to count pirarucu Arapaima gigas: fishers, assessment,
and management. North American Journal of Fisheries Management 24, 379-389
(2004).
33.Ver Hoef, J. M. & Boveng, P. L. Quasi-Poisson vs. negative binomial
regression: how should we model overdispersed count data? Ecology 88, 2766-
2772 (2007).
34.Zuur, A., Ieno, E. N., Walker, N., Saveliev, A. A. & Smith, G. M. Mixed Effects
Models and Extensions in Ecology with R. (Springer-Verlag, 2009).
35.Burnham, K. P. & Anderson, D. R. Model selection and multimodel inference: a
practical information-theoretic approach. (Springer Science & Business Media,
2003).
36.Bartoń, K. MuMIn: multi-model inference. R package version 1 (2013).
37.Bruner, A. G., Gullison, R. E., Rice, R. E. & Da Fonseca, G. A. Effectiveness of
parks in protecting tropical biodiversity. Science 291, 125-128 (2001).
38.Castello, L. et al. The vulnerability of Amazon freshwater ecosystems.
Conservation Letters 6, 217-229 (2013).
39.Campos-Silva, J. V., da Fonseca Junior, S. F. & da Silva Peres, C. A. Policy
reversals do not bode well for conservation in Brazilian Amazonia. Natureza &
Conservação (2015).
40.Mascia, M. B. et al. Protected area downgrading, downsizing, and
degazettement (PADDD) in Africa, Asia, and Latin America and the Caribbean,
1900–2010. Biological Conservation 169, 355-361 (2014).
41.Pinheiro, H. T. et al. Brazilian aquatic biodiversity in peril. Science (New York,
NY) 350, 1043 (2015).
42.Petersen, T. A., Brum, S. M., Rossoni, F., Silveira, G. F. V. & Castello, L.
Recovery of Arapaima sp. populations by community-based management in
floodplains of the Purus River, Amazon. Journal of Fish Biology (2016).
43.Miorando, P. S., Rebêlo, G. H., Pignati, M. T. & Brito Pezzuti, J. C. Effects of
community-based management on Amazon river turtles: a case study of
Podocnemis sextuberculata in the lower Amazon floodplain, Pará, Brazil.
Chelonian Conservation and Biology 12, 143-150 (2013).
Capítulo 2
57
44.Pollnac, R. B., Crawford, B. R. & Gorospe, M. L. Discovering factors that
influence the success of community-based marine protected areas in the Visayas,
Philippines. Ocean & Coastal Management 44, 683-710 (2001).
45.Arantes, C. C., Castello, L., Cetra, M. & Schilling, A. Environmental influences
on the distribution of arapaima in Amazon floodplains. Environmental biology of
fishes 96, 1257-1267 (2013).
46.Maire, E. et al. How accessible are coral reefs to people? A global assessment
based on travel time. Ecology letters 19.4, 351-360 (2016).
47.Hercos, A., Sobansky, M., Queiroz, H. & Magurran, A. Local and regional rarity
in a diverse tropical fish assemblage. Proceedings of the Royal Society of London
B: Biological Sciences 280, 20122076 (2013).
48.Junk, W. J., Bayley, P. B. & Sparks, R. E. The flood pulse concept in river-
floodplain systems. Special Publication of the Canadian Journal of Fisheries and
Aquatic Sciences 106, 110-127 (1989).
49.Affonso, A. G., Queiroz, H. & Novo, E. M. L. M. in Biologia, conservação e
manejo participativo de pirarucus na Pan-Amazônia (ed Ellen Silvia Amaral
Figueiredo) 278 (IDSM, 2013).
50.Hardin, G. The tragedy of the commons. science 162, 1243-1248 (1968).
51.Ostrom, E. Tragedy of the commons. The New Palgrave Dictionary of
Economics, 3573-3576 (2008).
52.Castello, L. Lateral migration of Arapaima gigas in floodplains of the Amazon.
Ecology of Freshwater Fish 17, 38-46 (2008).
53.Adams, W. M. et al. Biodiversity conservation and the eradication of poverty.
Science 306, 1146-1149 (2004).
54.Morales, M. C. & Harris, L. M. Using subjectivity and emotion to reconsider
participatory natural resource management. World Development 64, 703-712
(2014).
55.Constantino, P. d. A. L. et al. Empowering local people through community-
based resource monitoring: a comparison of Brazil and Namibia. Ecology and
Society 17, 22 (2012).
56.Waylen, K. A., Fischer, A., McGowan, P. J., Thirgood, S. J. & Milner‐Gulland,
E. Effect of Local Cultural Context on the Success of Community‐Based
Conservation Interventions. Conservation Biology 24, 1119-1129 (2010).
57.Cavole, L. M., Arantes, C. C. & Castello, L. How illegal are tropical small-scale
fisheries? An estimate for arapaima in the Amazon. Fisheries Research 168, 1-5
(2015).

Capítulo 2
58
58.dos Santos, C. H. d. A. Genetic relationships between captive and wild
subpopulations of Arapaima gigas (Schinz, in Cuvier, 1822). International Journal
of Fisheries and Aquaculture 6, 108-123 (2014).
59.Castro, F. d. & McGrath, D. G. Moving toward sustainability in the local
management of floodplain lake fisheries in the Brazilian Amazon. Human
Organization 62, 123-133 (2003).
60.Peres, C. A. Why we need megareserves in Amazonia. Conservation Biology
19, 728-733 (2005).
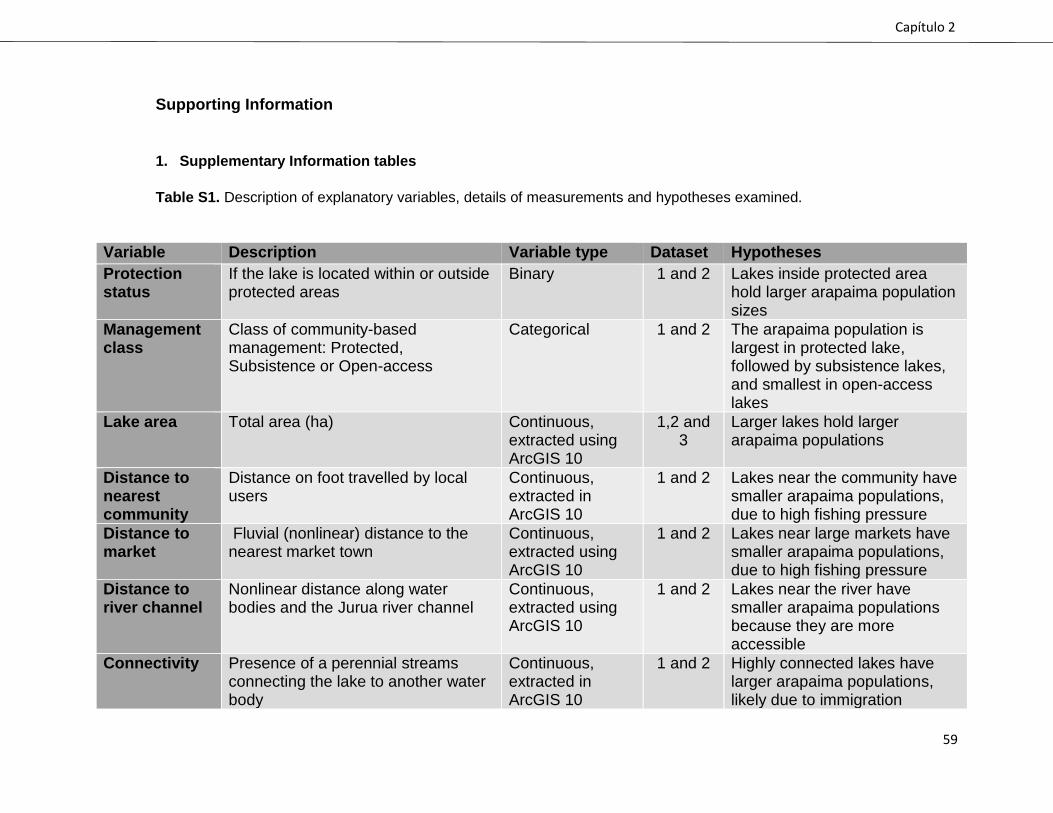
Capítulo 2
59
Supporting Information
1. Supplementary Information tables
Table S1. Description of explanatory variables, details of measurements and hypotheses examined.
Variable Description Variable type Dataset Hypotheses
Protection status
If the lake is located within or outside protected areas
Binary 1 and 2 Lakes inside protected area hold larger arapaima population sizes
Management class
Class of community-based management: Protected, Subsistence or Open-access
Categorical 1 and 2 The arapaima population is largest in protected lake, followed by subsistence lakes, and smallest in open-access lakes
Lake area Total area (ha) Continuous, extracted using ArcGIS 10
1,2 and 3
Larger lakes hold larger arapaima populations
Distance to nearest community
Distance on foot travelled by local users
Continuous, extracted in ArcGIS 10
1 and 2 Lakes near the community have smaller arapaima populations, due to high fishing pressure
Distance to market
Fluvial (nonlinear) distance to the nearest market town
Continuous, extracted using ArcGIS 10
1 and 2 Lakes near large markets have smaller arapaima populations, due to high fishing pressure
Distance to river channel
Nonlinear distance along water bodies and the Jurua river channel
Continuous, extracted using ArcGIS 10
1 and 2 Lakes near the river have smaller arapaima populations because they are more accessible
Connectivity Presence of a perennial streams connecting the lake to another water body
Continuous, extracted in ArcGIS 10
1 and 2 Highly connected lakes have larger arapaima populations, likely due to immigration
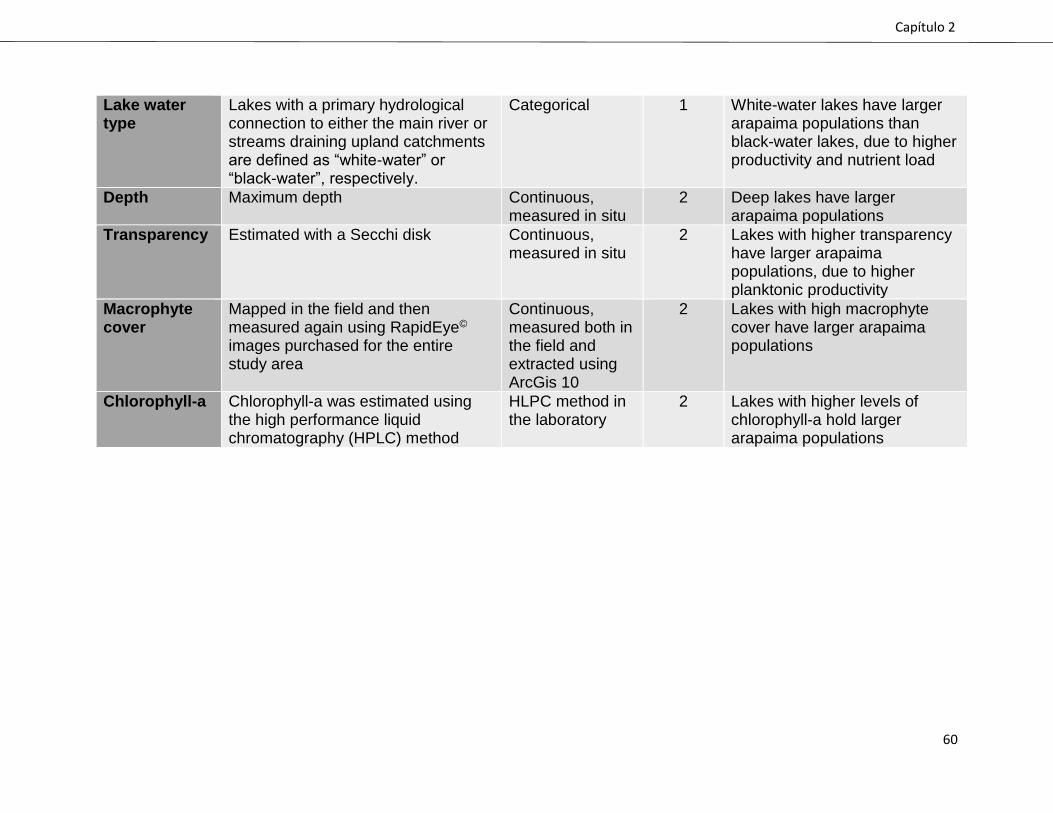
Capítulo 2
60
Lake water type
Lakes with a primary hydrological connection to either the main river or streams draining upland catchments are defined as “white-water” or “black-water”, respectively.
Categorical 1 White-water lakes have larger arapaima populations than black-water lakes, due to higher productivity and nutrient load
Depth Maximum depth Continuous, measured in situ
2 Deep lakes have larger arapaima populations
Transparency Estimated with a Secchi disk Continuous, measured in situ
2 Lakes with higher transparency have larger arapaima populations, due to higher planktonic productivity
Macrophyte cover
Mapped in the field and then measured again using RapidEye© images purchased for the entire study area
Continuous, measured both in the field and extracted using ArcGis 10
2 Lakes with high macrophyte cover have larger arapaima populations
Chlorophyll-a Chlorophyll-a was estimated using the high performance liquid chromatography (HPLC) method
HLPC method in the laboratory
2 Lakes with higher levels of chlorophyll-a hold larger arapaima populations

Capítulo 2
61
Table S2. Human perception of socioeconomic changes following the implementation of Arapaima population
management within lakes guarded by any given local community.
Dataset 1
Model Predictors AICc Δ AICc
Weight
1 Management class + Area + Distance to town 833.3 0.00 0.163
2 Management class + Area 834 0.67 0.117
3 Management class + Area + Distance to community + Distance to river 831.2 0.89 0.105
4 Management class + Area + Distance to community 834.3 1 0.099
5 Management class + Area + Distance to community + Distance to town 834.6 1.26 0.087
6 Management class + Area + Distance to community + Distance to river + Distance to town 835.1 1.73 0.069
7 Management class + Area + Distance to river + Distance to town 835.2 1.86 0.064
Dataset 2
1 Management class + Area + Distance to community + Distance to town 452.5 0.00 0.091
2 Management class + Area + Distance to community + Distance to town + Distance to river 452.8 0.35 0.076
3 Management class + Area + Distance to community + Distance to town + Macrophyte coverage 453.3 0.87 0.059
4 Management class + Area + Distance to town 454.0 1.5 0.043
5 Management class + Area + Distance to community + Distance to town + Depth 454.2 1.71 0.039
6 Management class + Area + Distance to town + transparency 454.3 1.83 0.036
7 Management class + Area + Distance to community + Distance to town + Transparency 454.4 1.95 0.034
Dataset 3
1 Management class + Recovery time + Lake area + Distance to river + Distance to community 637.62 0.00 0.265
2 Management class + Lake area + Recovery time + Distance to river + Management class * Recovery time + Distance to community
638.35
0.73 0.173
Table S3. Local perception of socioeconomic changes following the implementation of Arapaima population
management within lakes guarded by any given local community.

Capítulo 2
62
Table S4. Lake identification, geographic coordinates, and environmental variables associated with each floodplain lake.
Lake: lake identity; Community: identity of nearest village; Protected Area: inside or outside a reserve; Man. Class: class
of management; Lake area: area in ha; Water type: black or white; Per: perimeter of the lake; Dist.Comm.: distance to
nearest community; Geographic coordinates: Latitude and longitude; Lim.var.: availability of limnological data obtained in
situ; Pop. size: arapaima population size (adults and juveniles) based on annual counts.
Benefits Brief explanation Relative importance score (%)
Income generation Fisheries income is accrued by individual households as an annual windfall payment. This substantial amount of money enables several investments that were previously not feasible.
1 (100%)
Cultural maintenance Arapaima fisheries is a deeply entrenched traditional extractive activity. With the establishment of CBM, this activity and traditional knowledge associated with the target species can be learned by adolescents and children, thereby perpetuating this practice.
2 (75%)
Increasing local “pride” Professional fishermen reported an increase in community “pride”. Essentially, arapaima management increases the self-respect, pride and self-esteem of the local community associated with community-based management.
3 (68%)
Enhanced income distribution
Prior to CBM, only experienced families could benefit from the arapaima fishery. Following the implementation of management, all community members can participate.
4 (27.5%)

Capítulo 2
63
Lake Community Protect. Man. Class Lake area
Water type
Per. Dist.comm. Latitude Longitude Lim.var. Pop.size
Acurau Xeruã reserve Subsistence 42 White 4750 3736.8 6° 1'52.12"S 67°47'25.28"W yes 22,000
Anaxiqui Sao José reserve Protected 173 White 2085 67.5 5°43'33.34"S 67°48'24.72"W yes 592,000
Andreza Novo Horizonte reserve Unprotected 90 White 5456 2962.5 5° 5'53.35"S 67° 8'25.27"W yes 4,000
Angelim Nova União reserve Subsistence 7 Black 2790 3451.1 5°22'2.00"S 67°27'15.62"W no 23,000
Aruanã Nova União reserve Protected 16 Black 2823 3491.4 5°20'46.07"S 67°25'27.01"W yes 70,000
Baliera Nova União reserve Subsistence 21 White 5317 3406.9 5°23'5.89"S 67°21'28.72"W yes 24,000
Bauana Bauana reserve Unprotected 93.3 White 7000 1054 5°25'45.11"S 67°18'53.43"W yes 8,000
Bom Fim Bom Fim reserve Protected 220 White 1486 686.4 6° 0'19.82"S 67°52'33.92"W no 345,000
Boto Bom Jesus reserve Protected 92 Black 8814 3378.7 5°23'56.20"S 67°14'54.93"W yes 298,000
Boto Nova União reserve Subsistence 11 Black 3492 4580.4 5°19'43.82"S 67°24'56.91"W no 15,000
Braga Concordia outside Protected 25 Black 5602 2242.1 4°41'2.23"S 66°37'28.54"W yes 176,000
Branco Vista Alegre outside Protected 255 Black 9056 3811 5°11'22.19"S 67°16'38.85"W yes 77,000
Branco Fortuna reserve Protected 15 White 2918 2274.2 4°43'3.43"S 66°39'59.17"W yes 172,000
cameta Boa Vista reserve Subsistence 6 Black 1926 1203.5 4°45'29.79"S 66°43'0.22"W no 7,000
Camponesa Xibauazinho reserve Subsistence 13 Black 3972 3899.5 5°56'15.48"S 67°45'12.77"W no 52,000
Canico Lago Cerrado outside Unprotected 306 White 1717 6540.2 4°47'10.39"S 66°48'30.17"W yes 0,000
Cobras Monte Carmelo reserve Subsistence 4 Black 2213 4511.2 5°24'36.01"S 67°16'57.95"W yes 26,000
Comprido Roque reserve Protected 12 White 3017 3840.4 5° 7'41.20"S 67°12'47.71"W yes 137,000
Curape Lago Cerrado outside UnProtected 573 White 32244 5491 4°42'56.13"S 66°47'26.95"W yes 22,000
Damião São Francisco reserve Subsistence 46 White 3653 1069.7 5°41'12.27"S 67°46'9.55"W no 38,000
Deserto Santo Antonio reserve Subsistence 105 White 20706 4663.6 4°33'34.62"S 66°43'30.51"W yes 37,000
Doca São Raimundo reserve Subsistence 113 Black 7450 5062.9 5°27'51.3"S 67°30'52.3" W no 63,000
Dona_Maria Sao Raimundo reserve Protected 101 Black 9926 137.2 5°25'21.48"S 67°31'17.38"W yes 97,000
Esperança Sao Raimundo reserve Protected 108 Black 6711 6507.1 5°25'12.63"S 67°15'26.63"W no 45,000
Farias Morada Nova reserve Subsistence 16 White 1955 3437.7 5°11'16.22"S 67°18'12.81"W no 29,000
Florenço Morada Nova reserve Subsistence 3 Black 865 3173.1 5°29'21.33"S 67°35'49.46"W no 26,000
Grande Concordia outside Protected 88 Black 5681 102.9 4°34'30.06"S 66°37'47.57"W yes 84,000
Grande Lago Cerrado outside Protected 294 White 2048 137.2 4°44'39.55"S 66°42'54.41"W yes 473,000

Capítulo 2
64
Henrique Fortuna reserve Subsistence 17 Black 5031 7825.2 5°14'6.40"S 67°18'18.24"W no 80,000
Ilha Sao Raimundo reserve Subsistence 3 Black 1368 4662.6 05°28'35,2"S 67°31'43,3" W no 67,000
Istume Fortuna reserve Subsistence 20 Black 3440 6395.1 5°30'15.13"S 67°36'44.81"W no 126,000
Itabaiana Xeruã reserve Protected 28 Black 6408 5747.1 6° 3'9.73"S 67°45'53.56"W yes 82,000
Janiceto Morada Nova reserve Subsistence 6 Black 2562 2447 5°30'9.20"S 67°36'17.74"W yes 13,000
Jiburi Fortuna outside Unprotected 88.8 White 11000 10010 5°13'7.45"S 67°12'28.67"W no 6,000
Limoeiro Morada Nova reserve Subsistence 28 White 2557 3844.2 5°28'46.44"S 67°34'24.72"W no 27,000
Luis_Ceará Fortuna reserve Subsistence 4 Black 1593 7022.3 5°13'36.30"S 67°17'44.90"W no 23,000
Macaco Xibauazinho reserve Protected 53 White 5912 10 5°58'38.99"S 67°46'2.14"W no 429,000
Maia Caroçal reserve Subsistence 15 Black 5187 5736 5°54'14.59"S 67°48'10.04"W no 10,000
Mamuria Concordia outside Unprotected 81 White 5537 4274.4 4°41'55.62"S 66°38'56.30"W yes 4,000
Manaria Sao Raimundo reserve Protected 293 White 2433 121 5°27'58.27"S 67°31'20.15"W yes 1013,000
Mandioca Mandioca reserve Protected 200 White 1372 1443.8 5°52'16.15"S 67°48'19.72"W yes 482,000
Mandioquinha Mandioca reserve Subsistence 129 White 8739 4373.1 5°52'51.23"S 67°49'15.26"W no 37,000
Marari_Grande Xibauazinho reserve Protected 269 White 2040 63 5°56'27.74"S 67°45'58.93"W yes 1509,000
Maravilha Maravilha outside Subsistence 368 White 2344 900 6° 6'6.69"S 67°56'1.34"W yes 71,000
Marinho Concordia outside Subsistence 41 White 3396 1000 4°35'1.30"S 66°37'35.14"W yes 34,000
Maximiano Monte Carmelo reserve Unprotected 51.4 White 3700 5039 5°45'40.09"S 67°48'46.91"W no 5,000
Mutum Vista Alegre outside Protected 22 Black 3833 4640.2 4°43'26.29"S 66°40'43.27"W yes 85,000
Oncas Morada Nova reserve Subsistence 11 White 2614 1393.6 5°32'33.65"S 67°36'8.30"W yes 17,000
Parana_Manariã Sao Raimundo reserve Protected 132 White 23989.9 3499.6 5°27'9.66"S 67°30'34.76"W no 290,000
Patocino Xibauazinho reserve Subsistence 7 White 2787 5060.7 5°53'09.7''S 67°46'23.2''W no 54,000
Pau_Furado Monte Carmelo reserve Subsistence 38 White 2958 4333.9 5°44'39.52"S 67°47'49.44"W no 22,000
Pe_da_Terra Xeruã reserve Protected 5 Black 2172 8245.1 6° 2'38.32"S 67°44'59.58"W no 63,000
Pirapitinga Concordia outside Protected 6 Black 1546 2823.3 4°40'4.89"S 66°37'30.14"W yes 94,000
Ponga Concordia outside Unprotected 132 White 1102 7200 4°39'26.09"S 66°36'24.08"W yes 9,000
Preto Nova Esperança reserve Protected 54 White 5342 183.9 4°37'10.57"S 66°42'45.20"W yes 182,000
Puca Xué reserve Unprotected 85 White 7233 2495.7 5°35'32.12"S 67°33'40.08"W yes 0,000
Pupunha_Baixo Pupunha reserve Unprotected 138.5 White 9929 1500 5°35'36.99"S 67°45'52.18"W no 13,000
Raimundão Vista Alegre outside Protected 14 White 2076 7343.8 4°44'19.73"S 66°40'6.21"W yes 23,000
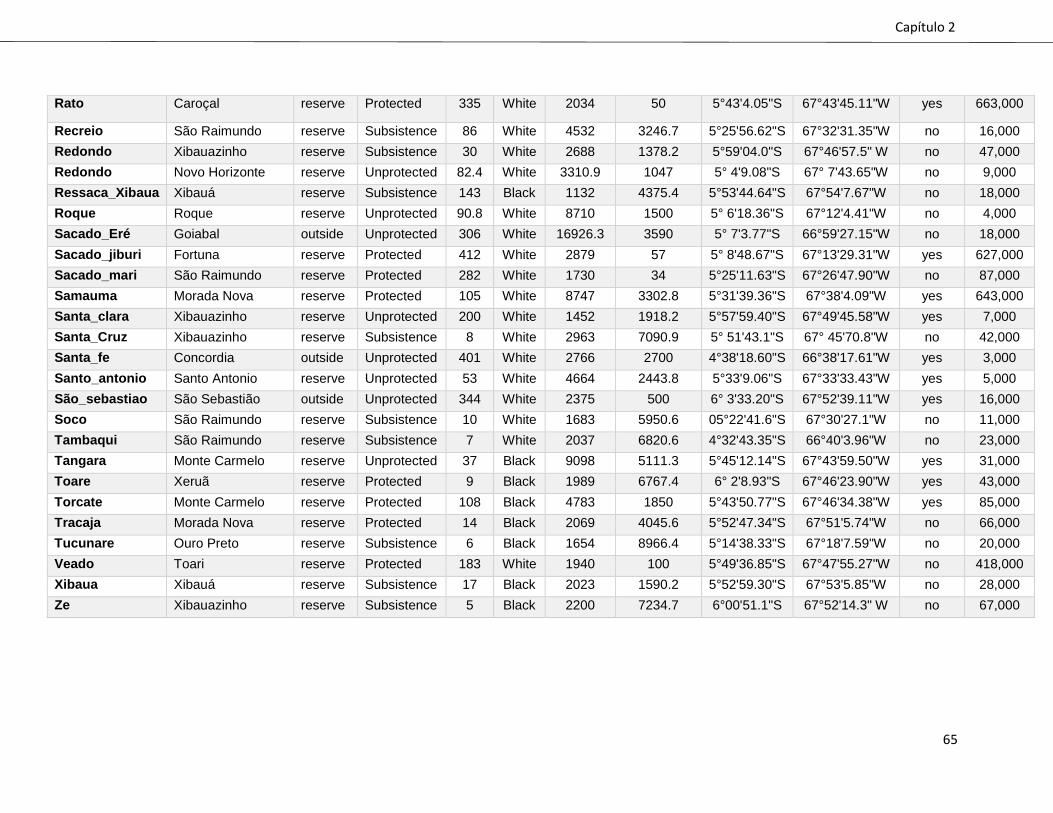
Capítulo 2
65
Rato Caroçal reserve Protected 335 White 2034 50 5°43'4.05"S 67°43'45.11"W yes 663,000
Recreio São Raimundo reserve Subsistence 86 White 4532 3246.7 5°25'56.62"S 67°32'31.35"W no 16,000
Redondo Xibauazinho reserve Subsistence 30 White 2688 1378.2 5°59'04.0"S 67°46'57.5" W no 47,000
Redondo Novo Horizonte reserve Unprotected 82.4 White 3310.9 1047 5° 4'9.08"S 67° 7'43.65"W no 9,000
Ressaca_Xibaua Xibauá reserve Subsistence 143 Black 1132 4375.4 5°53'44.64"S 67°54'7.67"W no 18,000
Roque Roque reserve Unprotected 90.8 White 8710 1500 5° 6'18.36"S 67°12'4.41"W no 4,000
Sacado_Eré Goiabal outside Unprotected 306 White 16926.3 3590 5° 7'3.77"S 66°59'27.15"W no 18,000
Sacado_jiburi Fortuna reserve Protected 412 White 2879 57 5° 8'48.67"S 67°13'29.31"W yes 627,000
Sacado_mari São Raimundo reserve Protected 282 White 1730 34 5°25'11.63"S 67°26'47.90"W no 87,000
Samauma Morada Nova reserve Protected 105 White 8747 3302.8 5°31'39.36"S 67°38'4.09"W yes 643,000
Santa_clara Xibauazinho reserve Unprotected 200 White 1452 1918.2 5°57'59.40"S 67°49'45.58"W yes 7,000
Santa_Cruz Xibauazinho reserve Subsistence 8 White 2963 7090.9 5° 51'43.1"S 67° 45'70.8"W no 42,000
Santa_fe Concordia outside Unprotected 401 White 2766 2700 4°38'18.60"S 66°38'17.61"W yes 3,000
Santo_antonio Santo Antonio reserve Unprotected 53 White 4664 2443.8 5°33'9.06"S 67°33'33.43"W yes 5,000
São_sebastiao São Sebastião outside Unprotected 344 White 2375 500 6° 3'33.20"S 67°52'39.11"W yes 16,000
Soco São Raimundo reserve Subsistence 10 White 1683 5950.6 05°22'41.6"S 67°30'27.1"W no 11,000
Tambaqui São Raimundo reserve Subsistence 7 White 2037 6820.6 4°32'43.35"S 66°40'3.96"W no 23,000
Tangara Monte Carmelo reserve Unprotected 37 Black 9098 5111.3 5°45'12.14"S 67°43'59.50"W yes 31,000
Toare Xeruã reserve Protected 9 Black 1989 6767.4 6° 2'8.93"S 67°46'23.90"W yes 43,000
Torcate Monte Carmelo reserve Protected 108 Black 4783 1850 5°43'50.77"S 67°46'34.38"W yes 85,000
Tracaja Morada Nova reserve Protected 14 Black 2069 4045.6 5°52'47.34"S 67°51'5.74"W no 66,000
Tucunare Ouro Preto reserve Subsistence 6 Black 1654 8966.4 5°14'38.33"S 67°18'7.59"W no 20,000
Veado Toari reserve Protected 183 White 1940 100 5°49'36.85"S 67°47'55.27"W no 418,000
Xibaua Xibauá reserve Subsistence 17 Black 2023 1590.2 5°52'59.30"S 67°53'5.85"W no 28,000
Ze Xibauazinho reserve Subsistence 5 Black 2200 7234.7 6°00'51.1"S 67°52'14.3" W no 67,000

Capítulo 2
66
Supplementary Information figures
Figure S1. Adult arapaima being weighed following a capture from a managed (protected) oxbow lake,
and a local family of arapaima managers.
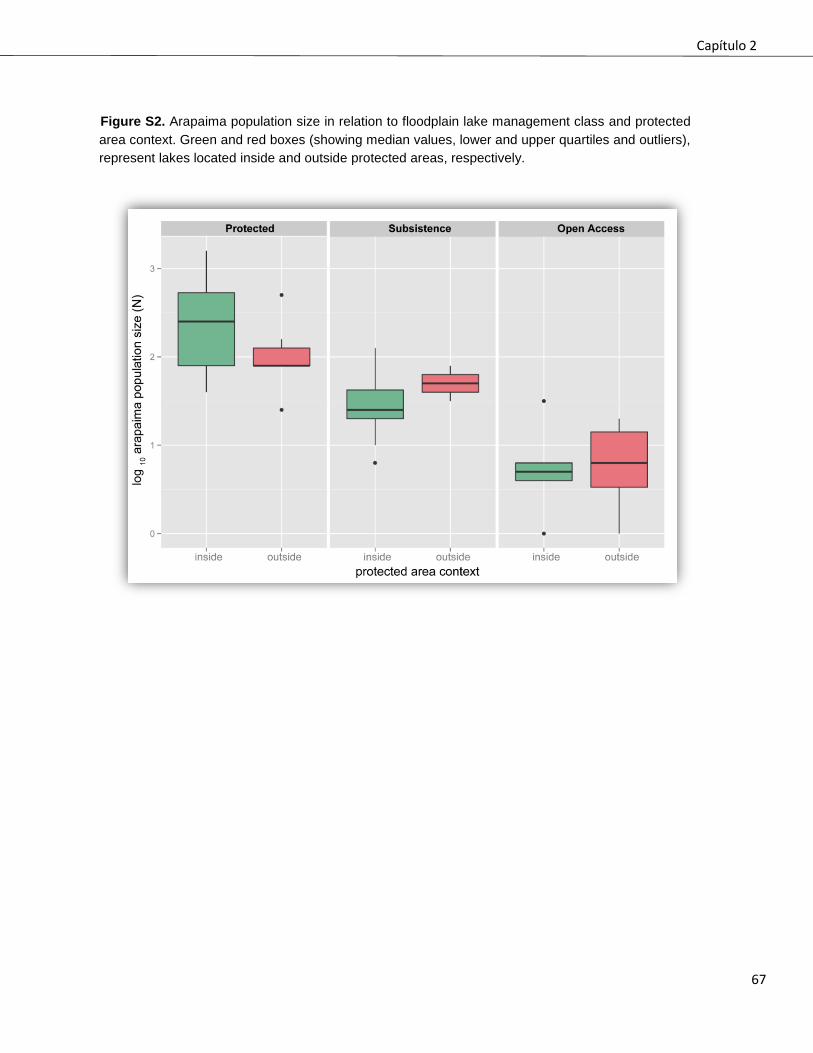
Capítulo 2
67
Figure S2. Arapaima population size in relation to floodplain lake management class and protected
area context. Green and red boxes (showing median values, lower and upper quartiles and outliers),
represent lakes located inside and outside protected areas, respectively.
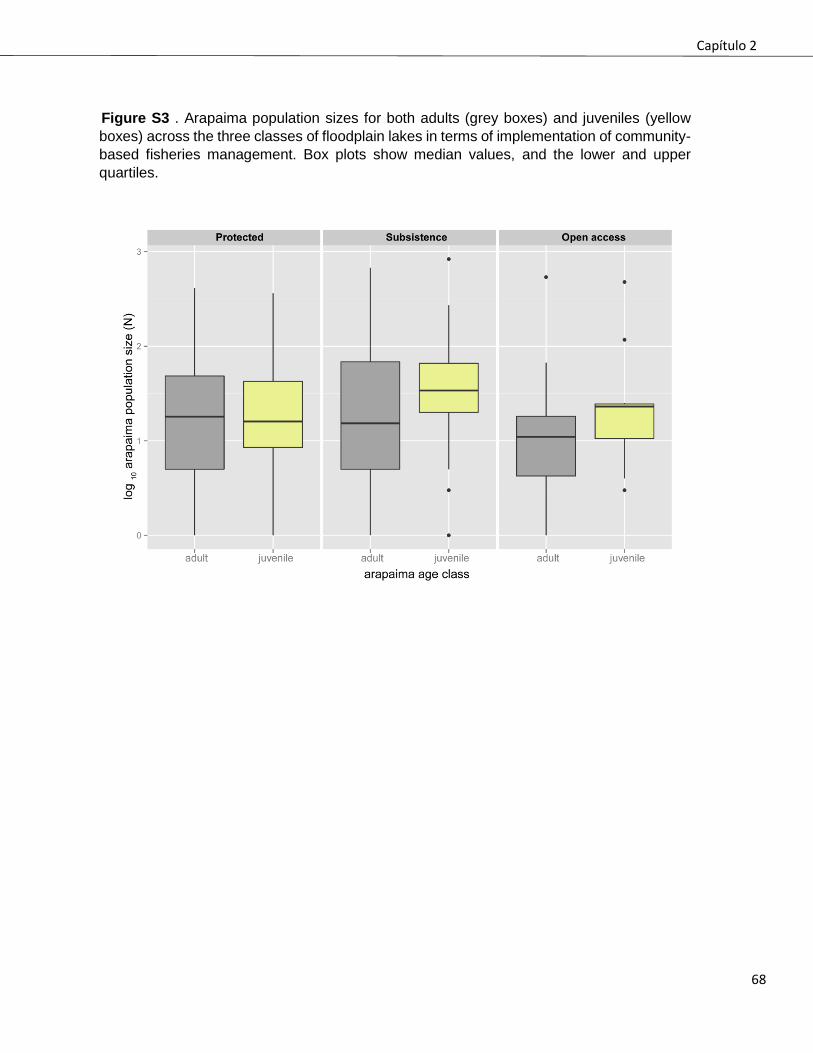
Capítulo 2
68
Figure S3 . Arapaima population sizes for both adults (grey boxes) and juveniles (yellow
boxes) across the three classes of floodplain lakes in terms of implementation of community-
based fisheries management. Box plots show median values, and the lower and upper
quartiles.

Capítulo 2
69
Figure S4. Arapaima population recovery trajectories over time for individual floodplain lakes
for both (A) adults and (B) juveniles (see text). Individual lines represent annual time series
for any given lake for which data from repeated annual counts were available. Blue lines
indicate protected and subsistence lakes; red lines indicate open-access lakes.

Capítulo 2
70
Figure S5. Arapaima population size based on annual counts within floodplain lakes as a
function of physical (nonlinear) distance on foot from the nearest local community

Capítulo 2
71
Figure S6. Model predictions of the time lag (yrs) required to achieve a population recovery
of a local arapaima population size of 1000 individuals, given the rates of population growth
observed in either white-water (blue curve) or black-water protected lakes (red curve),
managed by local communities. Arrows indicate 95% confidence intervals.

74
Capítulo 3
Community-based management drives food web
structure in amazon floodplains lakes
Helder Espírito-Santo
Capítulo 3
75
Community-based management drives food web structure in amazon floodplains
lakes*
João Vitor Campos-Silva, Carlos A. Peres, João H.do Amaral, Hugo Sarmento and Carlos R.S.Fonseca
*Manuscrito a ser submetido para Journal of Applied Ecology
Keywords: phytoplankton, flood pulse, community-based conservation, community-
based management
Summary
A. The drivers of energy sources in freshwater systems is a central topic in environmental sciences. Primary producers are typically controlled by bottom-up factors (nutrients and light), however, the models developed do not fit very well in tropical floodplain environments, which show very high spatio-temporal variation. This high variation on producer’s responses could be result of a lack of integrated approaches, which considers bottom-up and top down forces into the models.
B. Here we quantified the relative effect size of bottom up and top down mechanism
on phytoplankton biomass, controlling the influence of local and landscape heterogeneity for 58 floodplain lakes spread along almost 500 km of an important tributary of the Amazon River. We used as top down forces a surrogate of top predator abundance.
C. We show that the effect of large predators on protected managed lakes is the
strongest factor controlling phytoplankton during the wet season. Our results can help to understand the responses of phytoplankton across different levels of fisheries pressure, beyond the known bottom up variables, in a large scale in tropical floodplain lakes.
D. Synthesis and applications: Our findings highlight the importance of using an
integrated bottom-up and top down approach to predict phytoplankton biomass in amazon environments, furthermore our results point out the need to include the human pressure into an ecosystem perspective in the same assessment. It can provide a powerful tool for fisheries authorities and stakeholders, interested in managing fisheries, according to different levels of productivity.
Capítulo 3
76
1. Introduction
Top down and bottom-up controls of trophic-level biomass have been described in
terrestrial and aquatic environments. Phytoplankton is very important in the dynamics of
aquatic environments, due to its substantial contribution to primary production (Zwart et
al. 2015). In the floodplains of Amazon basin, phytoplankton has a minor contribution to
net ecosystem production - 5% approximately (Black & Forsberg 2001) – but it has a
substantial trophic importance, once sustains a large portion of the fish production,
ensuring food security for millions of families (Araujo-lima 1986; FAO 2014; Mortillaro et
al. 2015). The role of bottom up factors influencing phytoplankton biomass has been
studied for decades, however the solid knowledge comes mostly from studies in the
temperate regions, mainly Europe and North America (Belcon 2012). Such developed
models, do not fit for tropical environments, which show higher spatio-temporal variation
when compared to temperate ones (Huszar et al. 2006; Sarmento 2012). Therefore,
integrated models, evaluating both bottom-up and top down mechanism structuring
phytoplankton biomass for tropical floodplain lakes are warranted.
Phosphorus emerges as a major limiting nutrient into bottom-up approach, explaining
most of phytoplankton biomass variation (Dillon & Rigler 1974; Phillips et al. 2008). Total
nitrogen also appears as an important nutrient, once it is a limiting factor in some tropical
and subtropical systems (Forsberg & Trevisan 2007; Xu et al. 2010). Other bottom up
factors, such as light availability, have considerable effects on phytoplankton dynamics,
since it can limit the photosynthetic process, and population’s growth, interfering in
phytoplankton successional evolution (Huisman 1999; Polimene et al. 2014).
Macrophytes also show a complex interaction with phytoplankton frequently causing

Capítulo 3
77
alternated phases of dominance (Goulder 1969; Asaeda et al. 2001; Van Donk & Van de
Bund 2002) due to asymmetric light inhibition, nutrient competition (Van Donk et al. 1993),
and alteration of the nitrogen availability due to denitrification (Weisner et al. 1994).
Food web structure can be particularly relevant for our understanding of the high
variance in productivity of tropical lakes (Sarmento 2012). The effects of the presence of
top predator on producers have been developed since the second half of last century
(Hodgson 2005). This approach resulted in the trophic cascade hypothesis, which states
that an increase in piscivorous fish decreases the biomass of planktivorous fish, lowering
the consumption of herbivorous zooplankton, and finally reducing the phytoplankton
biomass (Carpenter et al. 1985). Many studies have demonstrated this hypothesis in
enclosure experiments, whole lake experiments and long term studies in the temperate
regions (e.g. Brett & Goldman 1996; Meijer et al. 1999; Mittelbach et al. 1995). However,
to investigate this top down effect in tropical environments, which show high spatio-
temporal variation in nutrients availability, light conditions (particles in suspension),
excretion, food web length, landscape variables, and fisheries pressure, is a huge
challenge. In fact, the complexity of tropical environments can attenuate the magnitude
or even reverse the expected effects of the trophic cascade hypothesis (Hart 2002; Van
Leeuwen et al. 2007).
Landscape and lake morphometric traits can also play a substantial role on
phytoplankton dynamics by affecting both bottom up and top down processes (Søballe &
Kimmel 1987; Prepas et al. 2001; Sheffer & Van Nes, 2007). In freshwater systems
governed the seasonality of the hydrological cycle, such as Amazonian floodplains, this
is particularly important, once the flood pulse controls drastically nutrients cycles (Junk
Capítulo 3
78
1989, 1997). Changes in the spatio-temporal characteristics of water bodies and the
transport of organism and nutrients are severely impacted by the hydrological oscillation
(Thomaz et al. 2007). Therefore, with the constant drying and flooding cycles, where
terrestrial environments become aquatic environments and vice-versa, features of
landscape can regulate the availability and dynamic of nutrients (Junk 1989;
Schonbrunner et al. 2012). Moreover, morphometric traits, such as lake depth and shape
(fetch) can strongly influence ecological process (Hakanson 2005).
Landscape changes during flood pulse, has also the potential to affect top-down
processes via fisheries management. During the dry season lakes become discrete units
on most Amazonian floodplains, providing an attractive ground for fishery. In response to
the uncontrolled large-scale commercial fisheries pressure that was occurring in the
Brazilian Amazon, community-based management emerged (Mcgrath et al. 1993). In
such management systems, natural resources are controlled by local populations,
preventing overexploitation of important fish species (Mcgrath et al. 1993; Castro 1999).
For instance, community-based management of the largest freshwater top predator
scaled fish Arapaima gigas (Schinz, 1822), locally named arapaima, successfully
recovered several populations across the Amazon basin (Castello 2009; Campos-Silva &
Peres in press). Therefore, while populations of arapaima are scarce or absent in open
access lakes due to overexploitation, they show impressive population size in protected
lakes (Campos-Silva & Peres in press). This heterogeneity in food web structures due to
management in very similar lakes creates favourable conditions to test, in a real complex
system, the size effect of food web structure (top down) control versus nutrients and light
(bottom up) limitation on phytoplankton productivity.
Capítulo 3
79
Understanding the drivers of phytoplankton dynamics in Amazonian floodplains can
provide a main contribution not only for ecologists, but also for environmental
stakeholders and fisheries managers. Phytoplankton is the main source of energy for
detritivore fish, one of the most important groups for local fisheries economy and
subsistence of community livelihoods (Araujo-Lima et al. 1986; Forsberg et al. 1993;
Batista et al. 1998; Begossi et al. 1999). Identifying the factors controlling fish production
can subsidize effective management fisheries plans (Forsberg et al. 1993).
Here we aim to quantify the relative effect size of food web structure (top down) control
versus nutrients and light (bottom up) limitation on phytoplankton biomass, controlling the
influence of local and landscape heterogeneity. We sampled 58 lakes spread along 500
km in the Juruá River, during both wet and dry seasons. The bottom up variables were
represented by total phosphorus, total nitrogen, light availability, and macrophyte
coverage, while the top down factor was the distance to the local community, a well-
known proxy of top predator abundance in this Amazon region (Campos-Silva & Peres,
in press). The landscape and lake traits factors included in our models were lake area,
depth, shape, connectivity, distance to main river and distance to head water. We
hypothesise that beside bottom up factors, the landscape will be a strong predictor of
phytoplankton biomass, because phosphate rocks from Andes mountains are the most
important source of nutrients of amazon lowlands (McClain & Naiman, 2008), and lakes
and water bodies nearby the main channel or headwater of river can show a higher
concentration of nutrients. Moreover, due to the importance of the top predator A. gigas
in the ecological network of Amazon lakes, we also expect top-down forces to have a
strong influence in the phytoplankton biomass.

Capítulo 3
80
2. Materials and Methods
Study area
This study was carried out at 58 floodplain lakes within and outside two contiguous
sustainable-use protected area along the Juruá River, a large meandering tributary of the
Amazon River localized in the upper-central portion of the Amazon basin (Fig. 1).
Figure 1. Location of the 58 lakes studied along the Juruá River, Amazon. The red poligons indicate two conservation units of sustainable use. The white circles the lakes studied.
Juruá arises on Andes mountains, the principal supplier of inorganic and organic matter
for the Amazon lowlands (McClain & Naiman 2008). The waters from Juruá are
characteristic to have high suspend sediments load with high turbidity and nutrients,
typical from the so-called “white waters” (Sioli 1986).
Capítulo 3
81
The floodplain of the Juruá is immersed in a drastic flood pulse, which often exceeds
10 m in amplitude (Hawes & Peres, 2016). The wet and dry seasons represent periods
of high (January – June) and low water levels (August – November). We sampled the
lakes during the high water period (march/April 2014) and during the low water period
(August/September 2014). Water dynamics produces a scenario containing 17.7% of
seasonally-flooded (várzea) forest and 82.3% of upland (terra firme) forest which is rarely
if ever inundated (Hawes et al. 2012). There are mainly two types of lakes spread into
landscape, oxbow lakes - formed through complex process of meanders-cut (Stølum
1996), and ria lakes - former, deeply incised river systems, usually nearby upland forest
(Bertani et al. 2015). The average depth of the lakes is around: 11.7 (± 5.4) meters at the
high water period and 4.8 (± 3.4) meters in the low water period. Due the high productivity,
Juruá River has a strong importance as a fish supplier in the Amazon region (Batista &
Petrere Jr, 2003).
Phytoplankton biomass estimates
Phytoplankton biomass was measured in all lakes during the wet and dry season. We
used the Chlorophyll a biomass (chl-a) as a proxy for phytoplankton biomass sampling at
the deepest point of each lake. We first, determined the extent of the euphotic zone, using
the depth of the Secchi disk multiplied by a factor of 2.7 (Cole 1994). Then, we integrate,
the euphotic zone, in a 20 liter bucket using a vertical Van Dorn sampler (3 L). A
subsample (2 L) from the bucket, was transferred to a polyethylene terephthalate (PET)
bottle, stored in insulated boxes for further filtration, to Chl-a determination, and total
phosphorus and nitrogen analysis. For Chl-a, water was filtered through a GF/F glass
fiber filter (Whatman), after a time period which never exceeded 8 hours after the first

Capítulo 3
82
sampling. The concentration of Chl-a (μg l–1, Chla) was determined
spectrophotometrically, after pigment extraction with 90% acetone (10 ml), after two
sonication steps of 15 min separated by an overnight period at 4°C, the Chl-a extracts
were subsequently centrifuged and spectrophotometer readings at 750, 664, 647, 630
nm were performed in a 1 cm glass cuvette (Strickland & Parsons 1968). Filtration was
done in an improvised lab on a riverboat in dim light. Filters were frozen until analysis
(maximum of two months).
Fisheries management and a surrogate for top down forces
During the drying period, lakes become discrete geographic features in the landscape,
enabling a fishery management based on effective protection of some lakes. Basically,
during the low water the local communities can deny to commercial boats the access of
fish stocks of lakes located near the local communities. These agreements ensure a
management composed by three classes of lakes: (1) Open-access lakes which contain
free resource pools, including commercial fishing boats; (2) Subsistence-use lakes that
supply local subsistence needs for the local community; and (3) Protected lakes that
exclude both commercial and subsistence fisheries but allow the sustainable use of
arapaima once a year (see more details in Campos-Silva & Peres in press).
The protected and subsistence class show a variable level of protection: near the
communities the surveillance is enforced and more effective, however in lakes far from
communities the surveillance is often ineffective. These configurations can be used as a
natural experiment, where the top predators are virtually removed from lakes with low
protection and open-access, but has a very high abundance on lakes properly protected,
near the villages. Campos-Silva & Peres (In press) showed that the distance to nearest
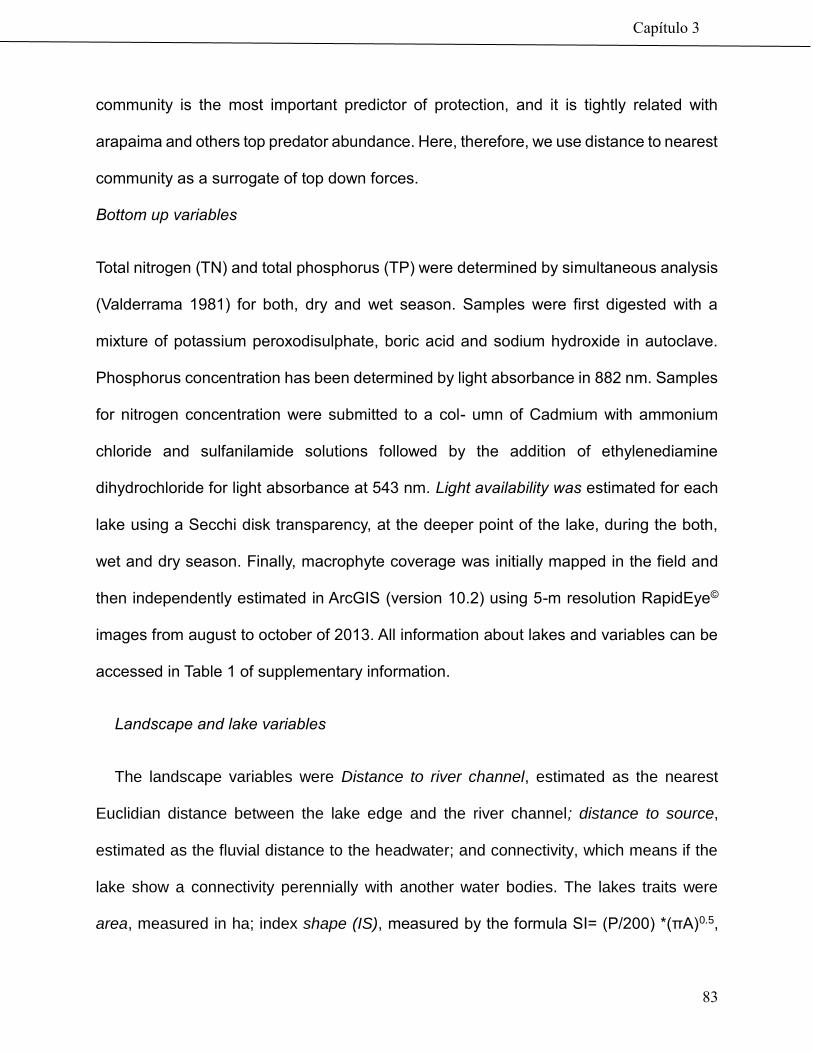
Capítulo 3
83
community is the most important predictor of protection, and it is tightly related with
arapaima and others top predator abundance. Here, therefore, we use distance to nearest
community as a surrogate of top down forces.
Bottom up variables
Total nitrogen (TN) and total phosphorus (TP) were determined by simultaneous analysis
(Valderrama 1981) for both, dry and wet season. Samples were first digested with a
mixture of potassium peroxodisulphate, boric acid and sodium hydroxide in autoclave.
Phosphorus concentration has been determined by light absorbance in 882 nm. Samples
for nitrogen concentration were submitted to a col- umn of Cadmium with ammonium
chloride and sulfanilamide solutions followed by the addition of ethylenediamine
dihydrochloride for light absorbance at 543 nm. Light availability was estimated for each
lake using a Secchi disk transparency, at the deeper point of the lake, during the both,
wet and dry season. Finally, macrophyte coverage was initially mapped in the field and
then independently estimated in ArcGIS (version 10.2) using 5-m resolution RapidEye©
images from august to october of 2013. All information about lakes and variables can be
accessed in Table 1 of supplementary information.
Landscape and lake variables
The landscape variables were Distance to river channel, estimated as the nearest
Euclidian distance between the lake edge and the river channel; distance to source,
estimated as the fluvial distance to the headwater; and connectivity, which means if the
lake show a connectivity perennially with another water bodies. The lakes traits were
area, measured in ha; index shape (IS), measured by the formula SI= (P/200) *(πA)0.5,

Capítulo 3
84
where; P = perimeter of the lake in km; π = 3.1416; A = area of the lake in ha. The shape
index is the deviation from a circle, where a circular lake shows a IS=1 (adapted of Patton
1975). Depth is defined as the maximum lake depth in meters, estimated in the field
during the both, wet and dry season. All spatial measures were done in ArcGIS (version
10.2) using 5-m resolution RapidEye© images from august to october of 2013.
Data analysis
Foremost, we accessed changes on phytoplankton biomass and nutrients
concentration using paired t tests, comparing 41 lakes measured in both, wet and dry
season. Posteriorly, we performed linear models (LMs) to examine variation in
phytoplankton biomass within the full set of 58 lakes (in dry season) and within a subset
of 42 lakes (in wet season) as a function of all potential predictors. We modeled all
possible models, from the constant model (without predictors) to the full model, where
Chl-a ~ Total phosphorus + Total nitrogen + light availability + shape + connectivity +
macrophyte coverage + lake area + distance to main river + distance to nearest
community + distance to headwater. Models were fit with lmer in the lme4 package and
every model combination examined with the MuMIn package (Barton, 2009) within the R
platform (R Development Core Team 2015).
We selected the most parsimonious model with the lowest Akaike Information
Criterion corrected for small sample size (AICc). AICc is calculated as the difference
between each model’s AICc and the lowest AICc, with a AICc < 2 interpreted as
substantial support that the model belongs to the set of best models. Akaike weights give
the probability that a model is the best model, given the data and the set of candidate
models (Burnham and Anderson, 2002). After model selection, we did a model average,
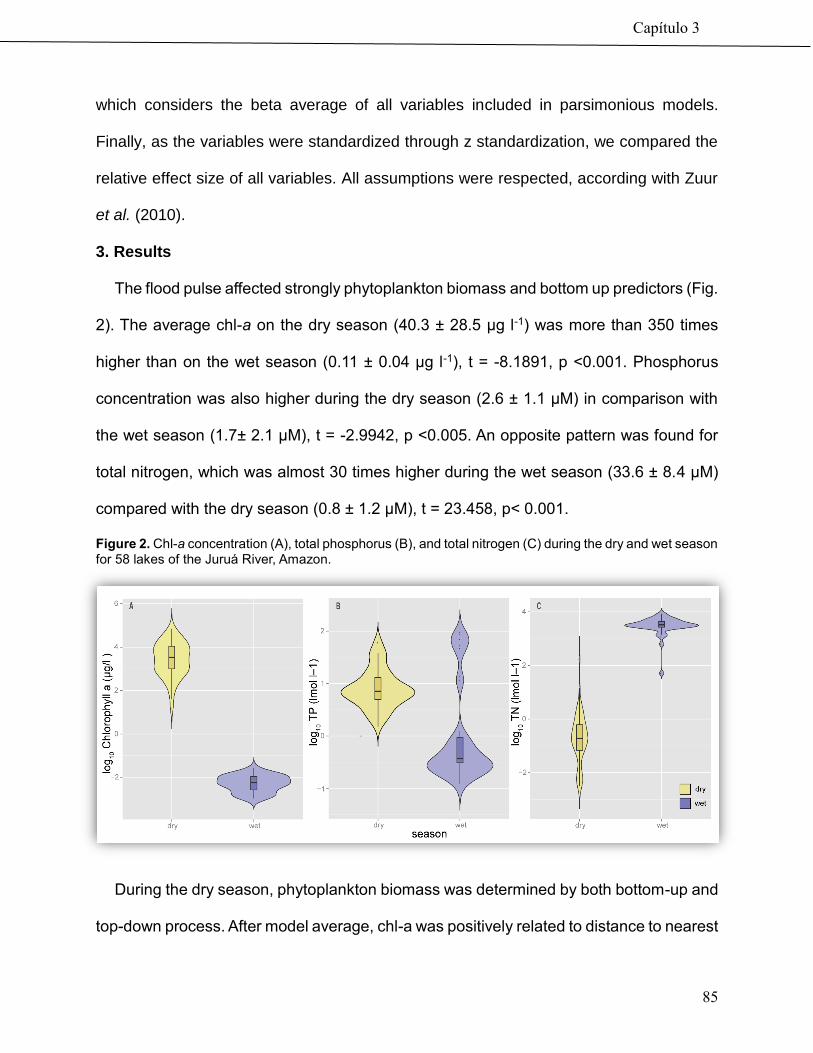
Capítulo 3
85
which considers the beta average of all variables included in parsimonious models.
Finally, as the variables were standardized through z standardization, we compared the
relative effect size of all variables. All assumptions were respected, according with Zuur
et al. (2010).
3. Results
The flood pulse affected strongly phytoplankton biomass and bottom up predictors (Fig.
2). The average chl-a on the dry season (40.3 ± 28.5 µg l-1) was more than 350 times
higher than on the wet season (0.11 ± 0.04 µg l-1), t = -8.1891, p <0.001. Phosphorus
concentration was also higher during the dry season (2.6 ± 1.1 µM) in comparison with
the wet season (1.7± 2.1 µM), t = -2.9942, p <0.005. An opposite pattern was found for
total nitrogen, which was almost 30 times higher during the wet season (33.6 ± 8.4 µM)
compared with the dry season (0.8 ± 1.2 µM), t = 23.458, p< 0.001.
Figure 2. Chl-a concentration (A), total phosphorus (B), and total nitrogen (C) during the dry and wet season for 58 lakes of the Juruá River, Amazon.
During the dry season, phytoplankton biomass was determined by both bottom-up and
top-down process. After model average, chl-a was positively related to distance to nearest
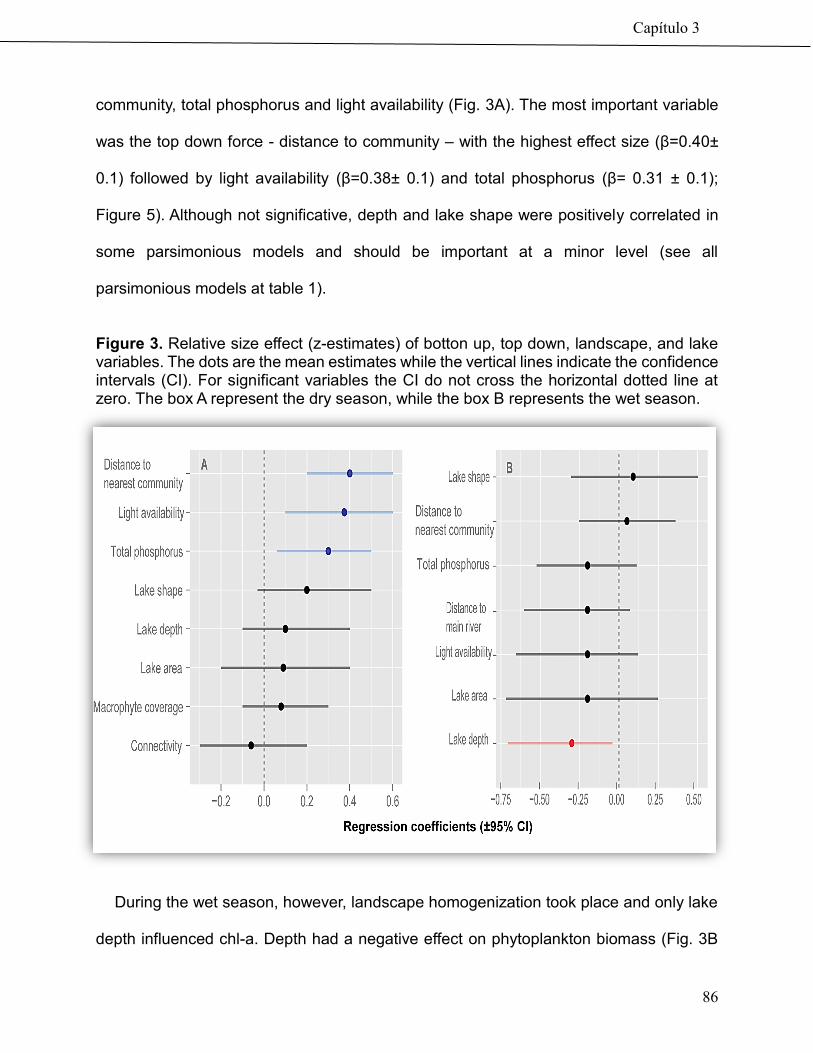
Capítulo 3
86
community, total phosphorus and light availability (Fig. 3A). The most important variable
was the top down force - distance to community – with the highest effect size (β=0.40±
0.1) followed by light availability (β=0.38± 0.1) and total phosphorus (β= 0.31 ± 0.1);
Figure 5). Although not significative, depth and lake shape were positively correlated in
some parsimonious models and should be important at a minor level (see all
parsimonious models at table 1).
Figure 3. Relative size effect (z-estimates) of botton up, top down, landscape, and lake variables. The dots are the mean estimates while the vertical lines indicate the confidence intervals (CI). For significant variables the CI do not cross the horizontal dotted line at zero. The box A represent the dry season, while the box B represents the wet season.
During the wet season, however, landscape homogenization took place and only lake
depth influenced chl-a. Depth had a negative effect on phytoplankton biomass (Fig. 3B
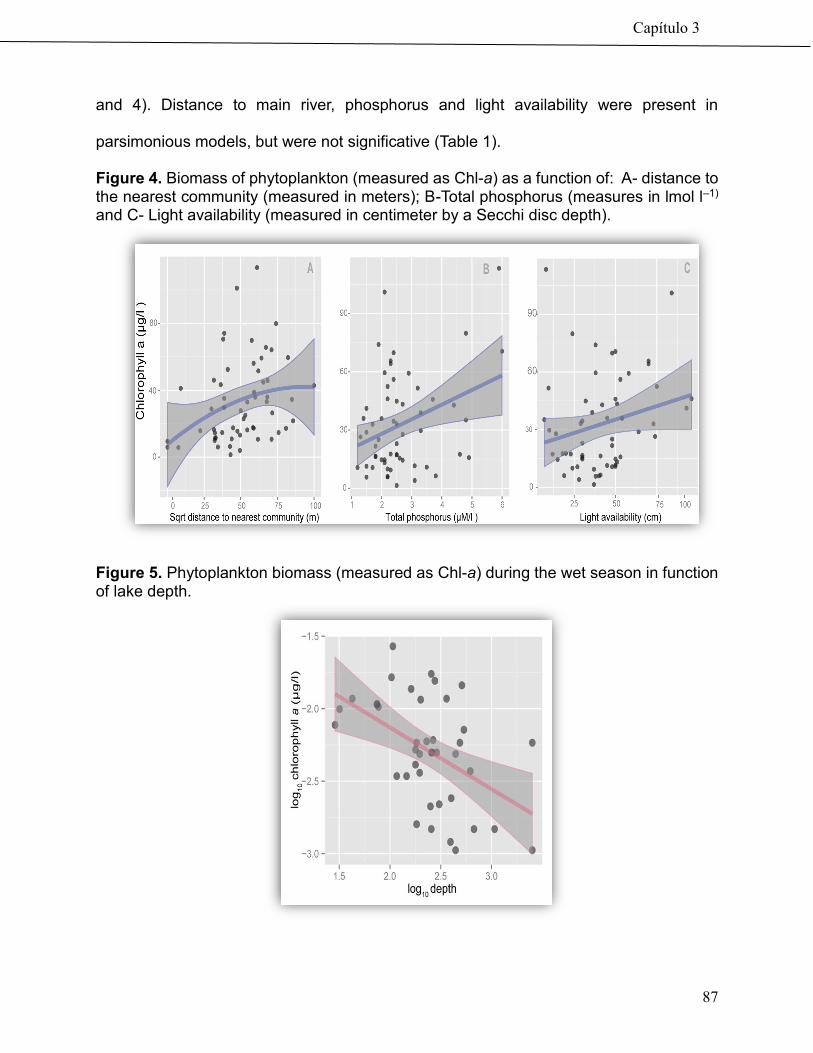
Capítulo 3
87
and 4). Distance to main river, phosphorus and light availability were present in
parsimonious models, but were not significative (Table 1).
Figure 4. Biomass of phytoplankton (measured as Chl-a) as a function of: A- distance to the nearest community (measured in meters); B-Total phosphorus (measures in lmol l–1) and C- Light availability (measured in centimeter by a Secchi disc depth).
Figure 5. Phytoplankton biomass (measured as Chl-a) during the wet season in function of lake depth.
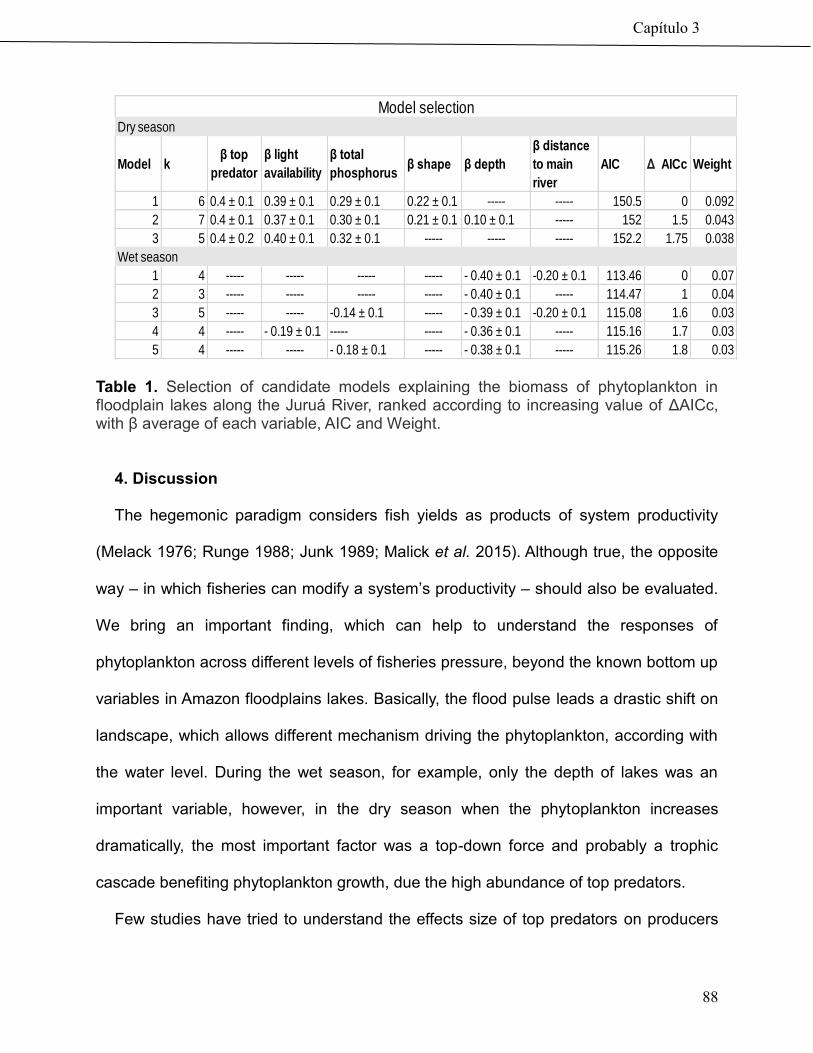
Capítulo 3
88
Table 1. Selection of candidate models explaining the biomass of phytoplankton in floodplain lakes along the Juruá River, ranked according to increasing value of ΔAICc, with β average of each variable, AIC and Weight.
4. Discussion
The hegemonic paradigm considers fish yields as products of system productivity
(Melack 1976; Runge 1988; Junk 1989; Malick et al. 2015). Although true, the opposite
way – in which fisheries can modify a system’s productivity – should also be evaluated.
We bring an important finding, which can help to understand the responses of
phytoplankton across different levels of fisheries pressure, beyond the known bottom up
variables in Amazon floodplains lakes. Basically, the flood pulse leads a drastic shift on
landscape, which allows different mechanism driving the phytoplankton, according with
the water level. During the wet season, for example, only the depth of lakes was an
important variable, however, in the dry season when the phytoplankton increases
dramatically, the most important factor was a top-down force and probably a trophic
cascade benefiting phytoplankton growth, due the high abundance of top predators.
Few studies have tried to understand the effects size of top predators on producers
Model kβ top
predator
β light
availability
β total
phosphorusβ shape β depth
β distance
to main
river
AIC Δ AICc Weight
1 6 0.4 ± 0.1 0.39 ± 0.1 0.29 ± 0.1 0.22 ± 0.1 ----- ----- 150.5 0 0.092
2 7 0.4 ± 0.1 0.37 ± 0.1 0.30 ± 0.1 0.21 ± 0.1 0.10 ± 0.1 ----- 152 1.5 0.043
3 5 0.4 ± 0.2 0.40 ± 0.1 0.32 ± 0.1 ----- ----- ----- 152.2 1.75 0.038
1 4 ----- ----- ----- ----- - 0.40 ± 0.1 -0.20 ± 0.1 113.46 0 0.07
2 3 ----- ----- ----- ----- - 0.40 ± 0.1 ----- 114.47 1 0.04
3 5 ----- ----- -0.14 ± 0.1 ----- - 0.39 ± 0.1 -0.20 ± 0.1 115.08 1.6 0.03
4 4 ----- - 0.19 ± 0.1 ----- ----- - 0.36 ± 0.1 ----- 115.16 1.7 0.03
5 4 ----- ----- - 0.18 ± 0.1 ----- - 0.38 ± 0.1 ----- 115.26 1.8 0.03
Dry season
Wet season
Model selection

Capítulo 3
89
biomass on large scale, especially in tropical environments (Brett & Goldman 1996;
Hodgson 2005; Borer et al. 2005). In part, the little information about tropical systems is
due to their complexity, such as high diversity of habitats, difficult access, spatial
heterogeneity, resources availability and physiology of organisms, and most of these
factors are important to understand the magnitude of top down controls on biomass of
producers (Borer et al. 2005). After the conceptual framework proposed by Carpenter et
al. (1993), several studies have corroborated the trophic cascade hypothesis (Strong
1992; Polis 1994; Flecker & Townsend 1994). The mechanism shows strong variation in
effect size, but it is present in many types of environments (Shurin et al. 2002). In long-
term experiments for example, the reintroduction or eradication of piscivorous fish
induces drastic changes in planktivorous fish abundance, resulting in substantial changes
in lower levels of trophic chain (Mittelbach et al. 1995). Our study reinforces these
findings, showing that the presence of top predators has a high effect size on biomass of
phytoplankton, even in a large scale.
On the other hand, the trophic cascade hypothesis has also been target of some
criticism. Indeed, some approaches showed that changes in food web structure are
accompanied by several compensatory mechanisms, and the trophic cascade hypothesis
would be too simplistic to describe the complexity as a whole in the long run (Person
1999; Hodgson 2005). Manipulation experiments have highlighted that shifts in predator
abundance can modify the herbivory rates or induce changes in nutrients recycling,
through excretion for example, which it has strong influence on producer dynamics (Vanni
& Findlay 1990; Vanni & Layne 1997). Therefore, the details of the mechanism behind
the trophic cascade hypothesis are complex and still not well understood, but it is clear

Capítulo 3
90
that the presence of higher trophic levels strongly influences producers in many
environments, explaining a large part of the variance not explained by bottom up
approach (Hodgson 2005).
There is a vast literature about the bottom up factors controlling phytoplankton
biomass. Phosphorus is often the main limiting factor (Vollenweider 1976; Schindler 1978;
Vollenweider & Kerekes 1980; Tilzer 1990), but nitrogen may play a central role in some
tropical lakes (Thornton 1987; Forsberg & Trevisan 2007; Lewis 2010). Our results
support the findings that phosphorus has a strong effect on phytoplankton biomass, but
only during the dry season. Nitrogen, in its turn, was not important as a driver of
phytoplankton in Juruá sampled lakes, but it can play a mighty role in lakes of different
geological origins, such as ria lakes in central Amazonia (Forsberg & Trevisan 2007).
Besides nutrients, light is another key factor influencing phytoplankton (Havens 1998;
Huisman 1999). We show that light availability should be included as a major driver
controlling chl-a variation in Amazon lakes, probably due to its importance in
photosynthetic process (Eilers & Peeters 1988; Palmer et al. 2013). In sum, large part of
the energy source during the dry season is autochthone, once the discrete features
enable the growing of a large biomass of phytoplankton, through a mix effect of nutrients
supply, top predator presence (and its effects on the food web) and light availability.
During the flooded period however, the flood pulse changes all landscape dynamics,
due the water level oscillation, which can ascend up to 10 meters in amplitude. The large
amount of water discharged into the system leads a huge homogenization of the
landscape. In this scenario, the only important variable influencing the phytoplankton was
the lake depth, which can induce an alternation of a submerged macrophytes phase or a
Capítulo 3
91
turbid phytoplankton dominated state, influencing substantially the lake dynamic
(Hakanson 2005; Sheffer & Van Nes 2007). Moreover, shallow lakes could be affected by
wind, which has a high influence on nutrients resuspension (e.g. Carper & Bachmann
2011). Both mechanisms can change substantially the biomass of phytoplankton.
Nonetheless, the phytoplankton production on wet season is very low, compared with dry
season. We conclude, therefore, that the energy source during wet season is mainly
allochthonous to the extent that the flooded forest is very rich in organic material (Junk
1989), which is evidenced by the high concentration of nitrogen on our sampled lakes.
The flood pulse, due the huge water oscillation, have a strong dilution effect, changing
not only the biomass, but all structure and composition of phytoplankton assemblage
(García de Emiliani 1997; Huszar & Reynolds 1997). Therefore, the flooded period can
be understood as a “reset phenomenon”, which can lead a homogenization of biological
communities. However, after this period, the biological communities are redefined in
discrete units’ lakes, according with a variety of forces. In the case of phytoplankton top
predator abundance, total phosphorus and light availability has the strongest influence on
biomass increasing, undermining all others variables. Future approaches should try to
understand how these mechanism work in the long-term, once the particularities of each
lake are dissolved annually with the flood pulse. Another issue to be discussed is how to
detect phytoplankton responses into the places where the fisheries management is not
explicit. In this case the population size of large predators can vary in function of others
factors, such as distance to market or human density (Cinner et al. 2013), and it should
be clarified and quantified and inserted in the models.
Our study contributes with a better comprehension of the ecology of Amazon
Capítulo 3
92
floodplains lakes, confirming that the variation on phytoplankton biomass in tropical lakes
needs an integrated approach between bottom up and top down factors to be understood.
Phytoplankton is the main important energy source of detritivorous fish, which comprise
a very important group for subsistence and commercial fisheries (Araujo-Lima et al. 1986;
Forsberg et al. 1993). Our findings reinforce the importance of including human activities
and ecosystem perspective in the same ecological assessment, even in remote, low
density populated areas, theoretically low impacted areas such as the upper Amazon. It
can provide a powerful tool for fisheries management and stakeholders, whose are
interested in organize the fisheries, according different levels of productivity.
5. References
1. Araujo-Lima, C. A. R. M., B. R. Forsberg, R. Victoria & L. Martinelli, 1986. Energy
sources for detrivorous fishes in the Amazon. Science 234: 1256–1258
2. Asaeda, T.; Trung, V.K.; Manatunge, J; Van Bon, T. 2001.Modelling macrophyte–
nutrient–phytoplankton interactions in shallow eutrophic lakes and the evaluation of
environmental impacts, Ecological Engineering, 16: 341-357.
3. Batista, V. S., A. J. Inhamuns, C. E. C. Freitas, and D. Freire-Brasil. 1998.
Characterization of the fishery in river communities in the low-Solimões/High-Amazon
region. Fisheries Management & Ecology 5:419-435.
4. Batista, V. S. and Petrere Jr., M. 2003. Characterization of the commercial fish
production landed at Manaus, Amazonas State, Brazil. Acta Amazonica, 33 (1); 53-66 .
2003.
5. Begossi, A.; Silvano, R.A.M.; do Amaral, B.D.; Oyakawa, O.T. 1999. Uses of Fish
and Game by Inhabitants of an Extractive Reserve (Upper Jurua, Acre, Brasil).
Environment, Development and Sustainability, 1:73.
6. Belcon, A.U.2012. Philosophy in Earth and Ocean Sciences in the Graduate
School of Duke University.

Capítulo 3
93
7. Bertani, T.C.; Rosseti, D.F.; Hayakawa, E. H. and Cohen, M.C.L. 2015.
Understanding Amazonian fluvial rias based on a late Pleistocene-Holocene analog,
Earth surface processes and landforms, 40:285-292.
8. Borer, E.T.; Seabloom, E.W., Shurin, J.B., Anderson, K.E., Blanchette, C.A.,
Broitman, B. 2005. What determines the strength of a trophic cascade? Ecology, 86, 528–
537.
9. Brett, M.T.; and Goldman, C.R. 1996. A meta-analysis of the freshwater trophic
cascade Proc. Natl. Acad. Sci. USA, 93:7723-7726.
10. Campos-Silva, J.V. and Peres, C. 2016. Community-based management induces
rapid recovery of a high-value tropical freshwater fisheries
11. Carper, G.L; Bachmann, R.W. 1984. Wind resuspension of sediments in a Prairie
Lake, Canadian Journal of Fisheries and Aquatic Sciences, 41(12),1763-1767
12. Carpenter, S.R.; Kitchell, J.F. and Hodgson, J.R.1985. Cascading Trophic
Interactions and Lake Productivity BioScience, 35: 634-639.
13. Carpenter, S.R. and Kitchell, J.F. (1993) The Trophic Cascade in Lake
Ecosystems, Cambridge University Press.
14. Castello, L.; Viana, J.P.; Watkins, G.; Pinedo-Vasquez, M. and Luzadis, V.A. 2009.
Lessons from Integrating Fishers of Arapaima in Small-Scale Fisheries management
at the Mamiraua Reserve, Amazon. Enviromental Management 43, 197-209.
15. Castro, F. Fishing Accords: the political ecology of fishing intensification in the
Amazon. PhD dissertation - University of Indiana. 1999.
16. Cinner,J.E.;Graham,N.A.J.;Huchery,C.; Macneil,M.A.2013. Global Effects of Local
Human Population Density and Distance to Markets on the Condition of Coral Reef
Fisheries. Conservation Biology 27, 453-458.
17. Cole GA (1994) Textbook of Limnology. Waveland Press Inc, Long, Grove, Illinois
18. Descy J.P; Higgins, H.W., Mackey D.J., Hurley J.P. andFrost T.M. 2000. Pigment
ratios and phytoplankton assessment in northern Wisconsin lakes. Journal of Phycology,
36, 274–286.
19. Dillon, P.J. and Rigler, F.H. 1974. The Phosphorus-Chlorophyll Relationship in
Lakes. Limnology and Oceanography 19(5):767-773.
Capítulo 3
94
20. Eilers, P.H.C.; Peeters, J.C.H. 1988. A model for the relationship between light
intensity and the rate of photosynthesis in phytoplankton, Ecological Modeling, 42:199-
215.
21. FAO, Food and Agriculture Organization of the United Nations. 2014. 243p.
22. Flecker, A.S. and C.R. Townsend. 1994. Community-wide consequences of trout
introduction in New Zealand streams. Ecological Applications 4:798–807.
23. Forsberg, B.R.; Araujo-Lima, C. A. R. M.; Martinelli, L.A; Victoria, R.L. and
Bonassi, J. A. 1993. Autotrophic carbon sources for fish of the central
Amazon, Ecology, 74: 643–652.
24. Forsberg, B. R. and Trevisan, G. V .2007. Relationships among nitrogen and total
phosphorus, algal biomass and zooplankton density in the central Amazonia lakes.
Hydrobiologia, 586:357-365.
25. Goulder, R. 1969. Interactions between the rates of production of a freshwater
macrophyte and phytoplankton is a poun. Oikos, 20:300-309.
26. Hakanson, L. 2005.The Importance of Lake Morphometry for the Structure and
Function of Lakes,Internat. Rev. Hydrobiol. 90 4 433– 461.
27. Hart, D.R.2002. Intraguild predation, invertebrate predators, and trophic cascades
in lakes food webs. Journal of Theoretical Biology, 218:111-128.
28. Hawes, J.E., C.A. Peres, L.B. Riley, and L.L. Hess, 2012. Landscape-scale
variation in structure and biomass of Amazonian seasonally flooded and unflooded
forests. For Ecol Manage 281: 163–176.
29. Hawes, J. E. & Peres, C. A. 2016. Patterns of Plant Phenology in Amazonia
Seasonally Flooded and Unflooded Forests. Biotropica, Online ISSN: 1744-7429.
30. Hodgson, J.Y.S. 2005. The Biologists' Forum: A trophic cascade synthesis: review
of top-down mechanisms regulating lake ecosystems. BIOS, 76(3):137-144.
31. Huot, Y.; Babim, M.; Bruyant, C.; Grob and Twardowski,M.S. 2007. Does
chlorophyll a provide the best index of phytoplankton biomass for primary productivity
studies?. Biogeosciences Discussions, European Geosciences Union, 4: 707-745.
Capítulo 3
95
32. Husman, J.; Jonker, R.R.; Zonneveld, C. and Weissing, F.J. 1999. Competition for
light between phytoplankton species: Experimental tests of mechanistic theory. Ecology,
80: 211-222.
33. Huszar, V.L.M.; Caraco, N.F.; Roland, F. and Cole, J. 2006. Nutrient–chlorophyll
relationships in tropical– subtropical lakes: do temperate models fit? Biogeochemistry,
79: 239–250.
34. Junk, W. J., 1997. General aspects of floodplain ecology with special reference to
Amazonian floodplains. – In: JUNK, W. J. (ed.): The Central Amazon Floodplain: 3–20. –
Ecological Studies, Springer, Berlin.
35. Junk, W. J., Bayley, P. B. and Sparks, R. E., 1989: The flood pulse concept in river-
floodplain systems. – In: DODGE, D. P. (ed.): Proceedings of the International Large
River Symposium. – Can. Publ. Fish. Aquat. Sci. 106: 110–127.
36. Lewis, W. M. J. 2010. Biogeochemistry of tropical lakes. Pages 1595–1603 in J.
Jones, editor. International Association of Theoretical and Applied Limnology, Vol 30, Pt
10, Proceedings.
37. Mcgrath, D.; De Castro, F.; Futemma, C.; Amaral, B.; Calabria, J. 1993. Fisheries
and the evolution of resource management on the Lower Amazon Basin. Journal of
Human Ecology, v. 21, n. 2, p. 167-195.
38. Malick, M.J.; Cox, S.P.; Mueter, F.J. and Peterman, R.M. 2015. Linking
phytoplankton phenology to salmon productivity along a north-south gradient in the
northeast Pacific Ocean, Canadian Journal of Fisheries and Aquatic Sciences, 2015,
72(5): 697-708.
39. Meijer, M.L.; Boois, I.; Scheffer, M.; Portielje, R. and Hosper, H.
1999.Biomanipulation in shallow lakes in The Netherlands: an evaluation of 18 case
studies. Hydrobiologia 408/409: 13–30.
40. Melack, J.M. 1976. Primary productivity and fish yields in tropical lakes.
Transactions of the American fisheries society, 105: 575-580.
41. Mittelbach, G.G., A.M. Turner, D.J. Hall, J.E. Rettig, and
C.W.Osenberg.1995.Perturbation and resilience : a long term, whole-lake study of
predator extinction and reintroduction. Ecology 76:2347–2360.

Capítulo 3
96
42. Mortillaro, J.M; Pouilly, M.; Wach, M.; Freitas. C.E.C.; Abril, G. and Meziane, T.
2015. Trophic opportunism of central amazon floodplain fish. Freshwater biology 60,
1659-1670.
43. Newton, P., A. R. Watkinson, and C. A. Peres. 2011. Determinants of yield in a
non–timber forest product: Copaifera oleoresin in Amazonian extractive reserves. Forest
Ecology and Management 261, 255–264.
44. Palmer, M.A.; Van Dijken, G.L.;Mitchell, B.G.; Seegers, B.J.; Lowry, K.E.; Mills,
M.M. and Arrigo, K.R. 2013. Light and nutrient control of photosynthesis in natural
phytoplankton populations from the Chukchi and Beaufort seas, Arctic Ocean, Limnol.
Oceanogr., 58(6), 2185–2205
45. Patton, D. R. 1975. A diversity index for quantifying habitat edge. Wildlife Society
Bulletin 3: 171-173
46. Persson, L. 1999. Trophic cascades: abiding heterogeneity and the trophic level
concept at the end of the road. Oikos 85:385–397.
47. Phillips G, Pietiläinen OP, Carvalho L, Solimini A, Lyche Solheim A, and Cardoso
A. 2008. Chlorophyll–nutrient relationships of different lake types using a large European
dataset. Aquatic Ecology 42(2):213-226.
48. Polimene, L., Brunet, C., Butenschön, M., Martinez-Vicente, V., Widdicombe, C.,
Torres, R., and Allen, J. I.:2014 Modelling a lightdriven phytoplankton succession, J.
Plankton Res., 36, 214–229.
49. Polis, G.A. 1994. Food webs, trophic cascades and community structure.
Australian Journal of Ecology19:121–136.
50. Prepas, E.E.; Planas, D.; Gibson, J.J.; Vitt, D.H.; Prowse, T.D.; Dinsmore ,W.P.;
Halsey,L.A.; McEachern,P.M.; Paquet, S.; Scrimgeour, G.J.; Tonn, W.M.; Paszkowski,
C.A. and Wolfstein, K. 2001.Landscape variables influencing nutrients and phytoplankton
communities in Boreal Plain lakes of northern Alberta: a comparison of wetlandand
upland-dominated catchments, Can. J. Fish. Aquat. Sci., 58:1286-1299.
51. Runge, J.A. 1988. Should we expect a relationship between primary production
and fisheries? The role of copepod dynamics as a filter of trophic variability.
Hydrobiologia, 167:61-71.
Capítulo 3
97
52. Sarmento, H. 2012. New paradigms in tropical limnology: the importance of the
microbial food web. Hydrobiologia 686:1-14.
53. Schindler, D.W.1978. Factors regulating phytoplankton production and standing
crop in the world’s lakes. Limnology and Oceanography 23:478–486.
54. Scheffer, M. And Van Nes, E. 2007. Shallow lakes theory revisited: various
alternative regimes driven by climate, nutrients, depth and lake size, Hydrobiologia,
584:455-466.
55. Schönbrunner, I.M.; Preiner, S. and Hein, T. 2012. Impact of drying and re-flooding
of sediment on phosphorus dynamics of river–floodplain systems, Sci Total Environ, 432:
329–337.
56. Shurin, J.B., Borer, E.T., Seabloom, E.W., Anderson, K., Blanchette, C.A.,
Broitman, B., Cooper, S.D. & Halpern, S. (2002). A cross-ecosystem comparison of the
strength of trophic cascades. Ecol. Lett., 5, 785–791.
57. Søballe, D. M. and Kimmel, B. L. 1987. A Large-Scale Comparison of Factors
Influencing Phytoplankton Abundance in Rivers, Lakes, and Impoundments. Ecology,
68:1943-1954.
58. Stølum,H.H. 1996. River Meandering as a Self-Organization Process.Science,Vol.
271, No. 5256, pp. 1710-1713.
59. Strong, D.R.1992.Are trophic cascades all wet? Differentiation and donor-control
in speciose ecosystems. Ecology 73:747–754.
60. Thomaz, S. M., Bini, M., and Bozelli, R. L. (2007). Floods increase similarity among
aquatic habitats in river–floodplain systems. Hydrobiologia 579, 1–13.
61. Thornton, J. A. 1987. Aspects of eutrophication management in tropical/subtropical
regions: A review. J. Limnol. Soc S. Afr.,13,25-43.
62. Tilzer, M.M. 1990. Environmental and Physiological Control of Phytoplankton
Productivity in Large Lakes, in Large Lakes, pp 339-367.
63. Vanni, M.J. and Findlay,D.L. 1990. Trophic cascades and phytoplankton
community structure. Ecology 71:921– 937.
64. Vanny, M.J. and Layne, C.D. 1997. Nutrient recycling and herbivory as mechanism
in the “top-down”effect of fish on algae in lakes, Ecology. 78: 21-40.
Capítulo 3
98
65. Van Donk, E., Gulati, R.D., Iedema, A., Meulemans, J., 1993. Macrophyte-related
shifts in the nitrogen and phosphorus contents of the different trophic levels in a
biomanipulated shallow lake. Hydrobiologia 251, 19– 26.
66. Van Donk, E. and Van de Bund, W.J. 2002. Impact of submerged macrophytes
including charophytes on phyto- and zooplankton communities: allelopathy versus other
mechanisms. Aquatic Botany, 72:261–274.
67. Van Leeuwen, E.; Lacerot G.; Van Nes, E.H.; Hemerik L. and Scheffer, M. 2007.
Reduced top–down control of phytoplankton in warmer climates can be explained by
continuous fish reproduction. ecological modelling 206: 205–212.
68. Vollenweider R. A. 1976.Advances in defining critical loading levels for phosphorus
in lake eutrophication. Mem. Ist, Ital Idrobio. 33, 53-83.
69. Vollenweider R. A. & Kerekes J. J.1980.Background and summary results of the
OECD cooperative programme on eutrophication. OECD publication, Paris, France.
70. Weisner, S. E. B., P G. Eriksson, W. Granell & L. Leonardson, 1994. Influence of
macrophytes on nitrate removal in wetlands. Ambio 23: 363–366.
71. Xu, H.; Paerl, H.W.; Quin, B.; Zhu, G. and Gao, G. 2010. Nitrogen and phosphorus
inputs control phytoplankton growth in eutrophic Lake Taihu, China. Limnol. Oceanogr.,
55: 420–432.
72. Zuur, A.F.; Ieno, E.N. and Elphick, C.S. 2010. A protocol for data exploration to
avoid common statistical problems. Methods in Ecology and Evolution 1, 3-14.
73. Zwart, J.A.; Solomon, C.T and Jones, S.E. 2015. Phytoplankton traits predict
ecosystem function in a global set of lakes. Ecology, 96: 2257–2264.
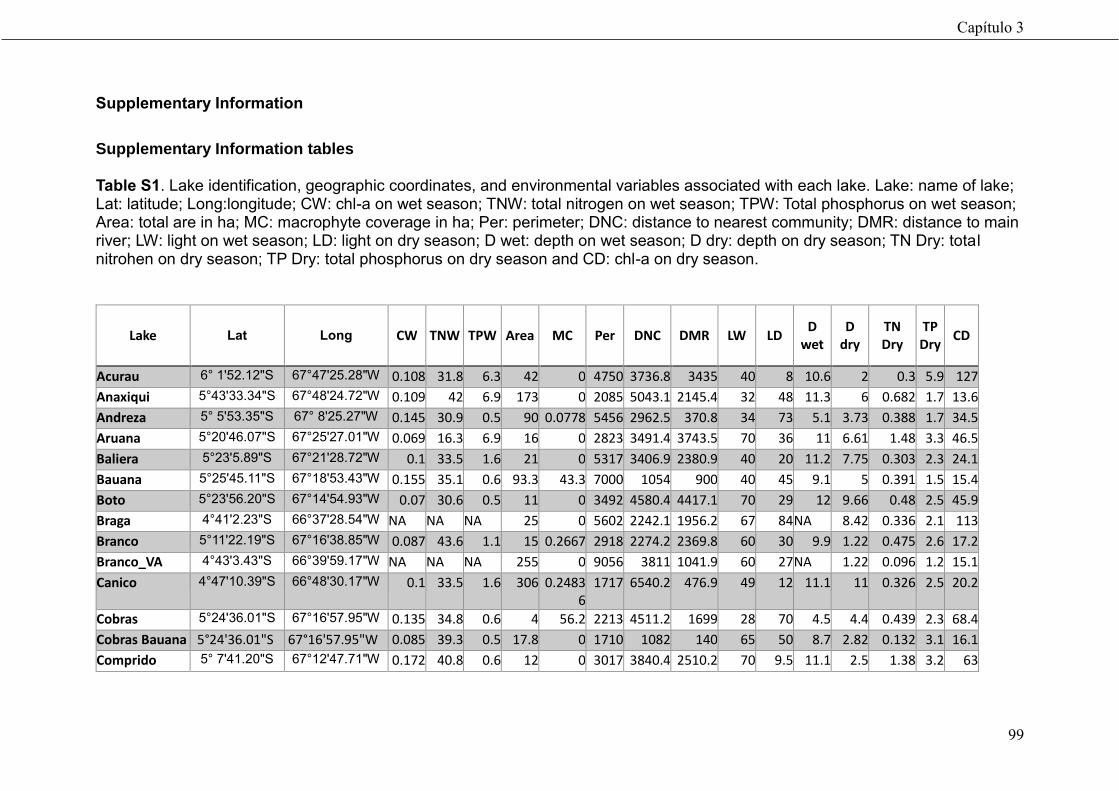
Capítulo 3
99
Supplementary Information
Supplementary Information tables Table S1. Lake identification, geographic coordinates, and environmental variables associated with each lake. Lake: name of lake; Lat: latitude; Long:longitude; CW: chl-a on wet season; TNW: total nitrogen on wet season; TPW: Total phosphorus on wet season; Area: total are in ha; MC: macrophyte coverage in ha; Per: perimeter; DNC: distance to nearest community; DMR: distance to main river; LW: light on wet season; LD: light on dry season; D wet: depth on wet season; D dry: depth on dry season; TN Dry: total nitrohen on dry season; TP Dry: total phosphorus on dry season and CD: chl-a on dry season.
Lake Lat Long CW TNW TPW Area MC Per DNC DMR LW LD D
wet D
dry TN Dry
TP Dry
CD
Acurau 6° 1'52.12"S 67°47'25.28"W 0.108 31.8 6.3 42 0 4750 3736.8 3435 40 8 10.6 2 0.3 5.9 127
Anaxiqui 5°43'33.34"S 67°48'24.72"W 0.109 42 6.9 173 0 2085 5043.1 2145.4 32 48 11.3 6 0.682 1.7 13.6
Andreza 5° 5'53.35"S 67° 8'25.27"W 0.145 30.9 0.5 90 0.0778 5456 2962.5 370.8 34 73 5.1 3.73 0.388 1.7 34.5
Aruana 5°20'46.07"S 67°25'27.01"W 0.069 16.3 6.9 16 0 2823 3491.4 3743.5 70 36 11 6.61 1.48 3.3 46.5
Baliera 5°23'5.89"S 67°21'28.72"W 0.1 33.5 1.6 21 0 5317 3406.9 2380.9 40 20 11.2 7.75 0.303 2.3 24.1
Bauana 5°25'45.11"S 67°18'53.43"W 0.155 35.1 0.6 93.3 43.3 7000 1054 900 40 45 9.1 5 0.391 1.5 15.4
Boto 5°23'56.20"S 67°14'54.93"W 0.07 30.6 0.5 11 0 3492 4580.4 4417.1 70 29 12 9.66 0.48 2.5 45.9
Braga 4°41'2.23"S 66°37'28.54"W NA NA NA 25 0 5602 2242.1 1956.2 67 84 NA 8.42 0.336 2.1 113
Branco 5°11'22.19"S 67°16'38.85"W 0.087 43.6 1.1 15 0.2667 2918 2274.2 2369.8 60 30 9.9 1.22 0.475 2.6 17.2
Branco_VA 4°43'3.43"S 66°39'59.17"W NA NA NA 255 0 9056 3811 1041.9 60 27 NA 1.22 0.096 1.2 15.1
Canico 4°47'10.39"S 66°48'30.17"W 0.1 33.5 1.6 306 0.24836
1717 6540.2 476.9 49 12 11.1 11 0.326 2.5 20.2
Cobras 5°24'36.01"S 67°16'57.95"W 0.135 34.8 0.6 4 56.2 2213 4511.2 1699 28 70 4.5 4.4 0.439 2.3 68.4
Cobras Bauana 5°24'36.01"S 67°16'57.95"W 0.085 39.3 0.5 17.8 0 1710 1082 140 65 50 8.7 2.82 0.132 3.1 16.1
Comprido 5° 7'41.20"S 67°12'47.71"W 0.172 40.8 0.6 12 0 3017 3840.4 2510.2 70 9.5 11.1 2.5 1.38 3.2 63
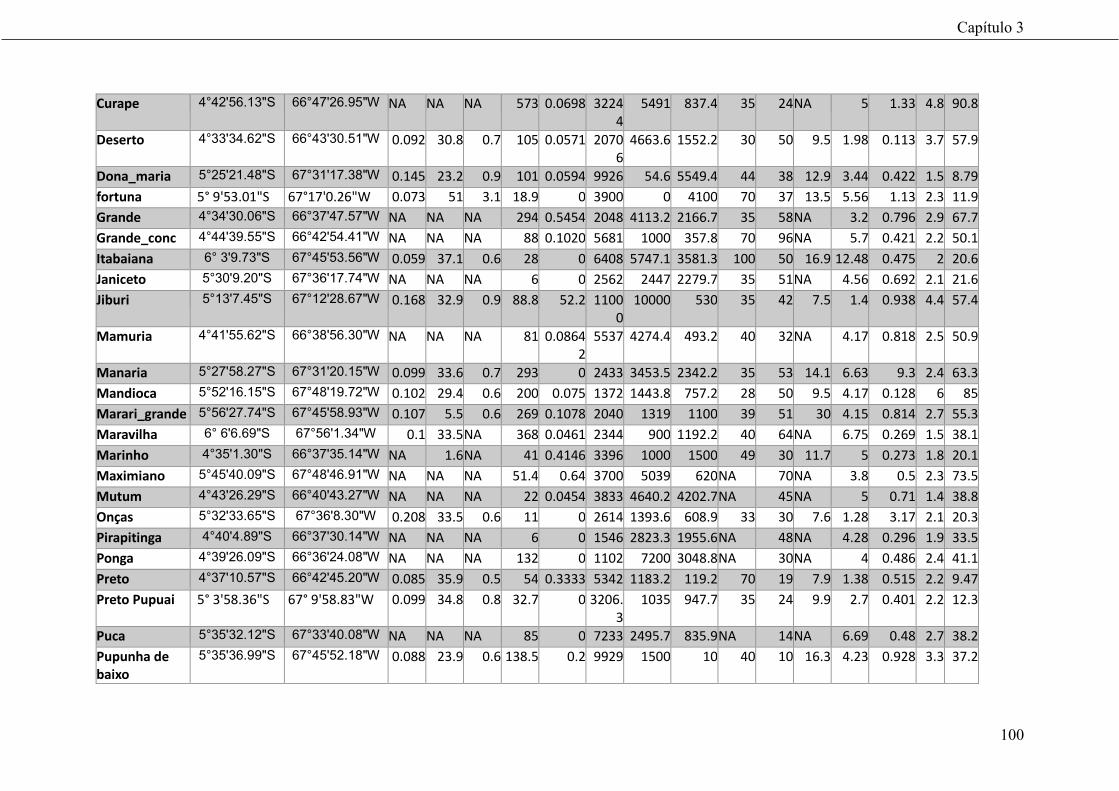
Capítulo 3
100
Curape 4°42'56.13"S 66°47'26.95"W NA NA NA 573 0.0698 32244
5491 837.4 35 24 NA 5 1.33 4.8 90.8
Deserto 4°33'34.62"S 66°43'30.51"W 0.092 30.8 0.7 105 0.0571 20706
4663.6 1552.2 30 50 9.5 1.98 0.113 3.7 57.9
Dona_maria 5°25'21.48"S 67°31'17.38"W 0.145 23.2 0.9 101 0.0594 9926 54.6 5549.4 44 38 12.9 3.44 0.422 1.5 8.79
fortuna 5° 9'53.01"S 67°17'0.26"W 0.073 51 3.1 18.9 0 3900 0 4100 70 37 13.5 5.56 1.13 2.3 11.9
Grande 4°34'30.06"S 66°37'47.57"W NA NA NA 294 0.5454 2048 4113.2 2166.7 35 58 NA 3.2 0.796 2.9 67.7
Grande_conc 4°44'39.55"S 66°42'54.41"W NA NA NA 88 0.1020 5681 1000 357.8 70 96 NA 5.7 0.421 2.2 50.1
Itabaiana 6° 3'9.73"S 67°45'53.56"W 0.059 37.1 0.6 28 0 6408 5747.1 3581.3 100 50 16.9 12.48 0.475 2 20.6
Janiceto 5°30'9.20"S 67°36'17.74"W NA NA NA 6 0 2562 2447 2279.7 35 51 NA 4.56 0.692 2.1 21.6
Jiburi 5°13'7.45"S 67°12'28.67"W 0.168 32.9 0.9 88.8 52.2 11000
10000 530 35 42 7.5 1.4 0.938 4.4 57.4
Mamuria 4°41'55.62"S 66°38'56.30"W NA NA NA 81 0.08642
5537 4274.4 493.2 40 32 NA 4.17 0.818 2.5 50.9
Manaria 5°27'58.27"S 67°31'20.15"W 0.099 33.6 0.7 293 0 2433 3453.5 2342.2 35 53 14.1 6.63 9.3 2.4 63.3
Mandioca 5°52'16.15"S 67°48'19.72"W 0.102 29.4 0.6 200 0.075 1372 1443.8 757.2 28 50 9.5 4.17 0.128 6 85
Marari_grande 5°56'27.74"S 67°45'58.93"W 0.107 5.5 0.6 269 0.1078 2040 1319 1100 39 51 30 4.15 0.814 2.7 55.3
Maravilha 6° 6'6.69"S 67°56'1.34"W 0.1 33.5 NA 368 0.0461 2344 900 1192.2 40 64 NA 6.75 0.269 1.5 38.1
Marinho 4°35'1.30"S 66°37'35.14"W NA 1.6 NA 41 0.4146 3396 1000 1500 49 30 11.7 5 0.273 1.8 20.1
Maximiano 5°45'40.09"S 67°48'46.91"W NA NA NA 51.4 0.64 3700 5039 620 NA 70 NA 3.8 0.5 2.3 73.5
Mutum 4°43'26.29"S 66°40'43.27"W NA NA NA 22 0.0454 3833 4640.2 4202.7 NA 45 NA 5 0.71 1.4 38.8
Onças 5°32'33.65"S 67°36'8.30"W 0.208 33.5 0.6 11 0 2614 1393.6 608.9 33 30 7.6 1.28 3.17 2.1 20.3
Pirapitinga 4°40'4.89"S 66°37'30.14"W NA NA NA 6 0 1546 2823.3 1955.6 NA 48 NA 4.28 0.296 1.9 33.5
Ponga 4°39'26.09"S 66°36'24.08"W NA NA NA 132 0 1102 7200 3048.8 NA 30 NA 4 0.486 2.4 41.1
Preto 4°37'10.57"S 66°42'45.20"W 0.085 35.9 0.5 54 0.3333 5342 1183.2 119.2 70 19 7.9 1.38 0.515 2.2 9.47
Preto Pupuai 5° 3'58.36"S 67° 9'58.83"W 0.099 34.8 0.8 32.7 0 3206.3
1035 947.7 35 24 9.9 2.7 0.401 2.2 12.3
Puca 5°35'32.12"S 67°33'40.08"W NA NA NA 85 0 7233 2495.7 835.9 NA 14 NA 6.69 0.48 2.7 38.2
Pupunha de baixo
5°35'36.99"S 67°45'52.18"W 0.088 23.9 0.6 138.5 0.2 9929 1500 10 40 10 16.3 4.23 0.928 3.3 37.2

Capítulo 3
101
Pupunha de cima
5°35'36.99"S 67°45'52.18"W 0.117 21.4 0.7 162.2 0.2 15540
1500 10 40 7 15.3 1.89 1.056 4.8 49.5
Raimundao 4°44'19.73"S 66°40'6.21"W NA NA NA 14 0 2076 7343.8 3954.3 NA 48 NA 1.53 0.093 1.8 24.3
Recreio 5°25'56.62"S 67°32'31.35"W 0.059 32.9 0.6 25.6 0.0291 3026.1
2000 7545.4 70 18 11.1 1.78 0.598 4.6 24.2
Redondo 5°59'04.0"S 67°46'57.5" W 0.14 44.7 1 82.4 0.0571 3310.9
1047 589.3 45 15 6.5 1.86 0.57 2.7 20.7
Roque 5° 6'18.36"S 67°12'4.41"W 0.159 48.8 0.8 90.8 0.2 8710 1500 0 70 38 15 2.8 0.16 1.9 96.5
Sacado do erê 5° 7'3.77"S 66°59'27.15"W NA NA NA 306 0.0947 16926.3
3590 0 NA 54 NA 2.74 0.766 2 40.1
Sacado_jiburi 5° 8'48.67"S 67°13'29.31"W 0.059 30.1 0.6 412 0.0566 2879 1689.5 0 67 75 20.7 8.62 0.103 2.2 67.6
Samauma 5°31'39.36"S 67°38'4.09"W 0.107 39 0.7 105 0.0697 8747 3302.8 2583.5 32 48 9.6 2.98 1.62 2.4 85.8
Santa_clara 5°57'59.40"S 67°49'45.58"W 0.051 32.9 0.5 200 0 1452 1918.2 1854.4 28 50 14.1 8.3 0.44 3.5 17.6
Santa_fe 4°38'18.60"S 66°38'17.61"W NA NA NA 401 0 2766 2700 0 NA 30 NA 4 0.522 2.5 29.3
Santo_antonio 5°33'9.06"S 67°33'33.43"W NA NA NA 53 0.4074 4664 2443.8 413.2 NA 28 NA 1.76 0.438 3.1 4.92
São_sebastiao 6° 3'33.20"S 67°52'39.11"W 0.107 29.8 5.3 344 53.1 2375 500 0 20 53 14.7 7.38 1.55 4.9 21.4
seco 5° 3'44.13"S 67° 2'52.73"W 0.144 29.8 0.5 83.4 26.7 6972.9
1820 1664.3 32 41 10 6.48 0.736 3.8 13.6
Tabuleiro 5°31'23.30"S 67°40'35.58"W 0.061 33.4 7.2 15.8 38.5 5973.9
0 2357.2 30 40 9.6 15.9 0.083 2.2 7.32
Tangara 5°45'12.14"S 67°43'59.50"W 0.051 38.1 5.6 37 0.49 9098 5111.3 2245.3 80 74 30 17.27 0.61 1.3 29.8
Toare 6° 2'8.93"S 67°46'23.90"W 0.054 31.4 0.9 9 41 1989 6767.4 5972.9 95 38 13.4 4.83 1.47 2.1 84.6
Tocos 5°31'39.80"S 67°41'23.79"W 0.139 34 0.6 6 0 1120 1850 2787.9 100 37 6.5 0.6 1.058 2.5 3.19
Torcate 5°43'50.77"S 67°46'34.38"W 0.121 37.9 0.4 108 33.3 4783 81.7 256 28 93 4.3 2.56 0.101 1.5 46.7
Vera 5°23'13.60"S 67°26'30.93"W 0.164 42.6 2.9 8.3 0.06 3481.9
3460 2494.9 53 23 11.5 4.8 0.76 2.5 24.9
viana 5° 4'19.94"S 67° 3'2.47"W 0.137 33.1 0.5 18.3 0.54 2636.1
2960 2116.2 33 41 6.6 3.28 0.101 1.8 21.1
102
Capítulo 4
Responses of waterbirds to fisheries management
on amazon floodplains
Hugo costa
Hugo Costa
Capítulo 4
103
Responses of waterbirds to fisheries management on amazon floodplains*
João Vitor Campos-Silva, Carlos A. Peres, Carlos R. Fonseca
*Manuscrito a ser submetido à Ecological Applications
Keywords: Birds conservation, piscivorous, egretts, herons, raptors
Abstract
Waterbirds comprise a conspicuous assemblage of species living and depending of the wetlands. The Amazon floodplains are a remarkable example of wetland representing 14% of the Amazon basin, the world’s largest basin. Fisheries management are spread for whole Amazon, and can be an important factor driving the abundance of waterbirds. This study investigates the effects of fisheries management on waterbirds abundance across 31 lakes spread on amazon floodplains. We found that population size of a target apex predator species from fisheries management has a strong negative influence on piscivorous waterbirds guilds. Others important variables were water transparency, depth, area, distance to river channel and macrophyte coverage. For non-piscivorous the fisheries management have no effect, and the important factors were only macrophyte coverage, area and landscape richness. Our findings help us to improve the understanding about the drivers of waterbird abundance in the Amazon floodplains, especially some piscivorous groups, which were strongly influenced by the fisheries activities.
1. Introduction
The wetlands play a fundamental role in a variety of key ecosystem services,
once they strongly influence climate regulation, nutrients recycling and hydrological
cycles (Millennium Ecosystem Assessment, 2005). They are also very rich in species
diversity and endemism (Revenga et al. 2005), hosting one third of all vertebrate
species worldwide (Dudgeom et al. 2006). The waterbirds comprise a conspicuous
assemblage of species living and depending on the wetlands. However, over 50% of
the world’s wetlands were lost in the past century (Fraser and Keddy, 2005), which
has negatively affected waterbirds. For this reason, the maintenance of these aquatic
environments is a central topic in their conservation (Erwin 2002; Ma et al. 2010).

Capítulo 4
104
The Amazon floodplains are a remarkable example of wetland representing
14% of the Amazon basin (Hess et al. 2015), the world’s largest basin. A very peculiar
characteristic of the Amazon floodplain is the yearly flood pulse, which is the strongest
force driving biological communities, source of productivity and landscape features
(Junk 1989, 1997). The flood pulse works as a reset phenomenon, homogenizing the
characteristics of water bodies during the flooded period (Campos-Silva et al in press
1). However, in the dry season, the waterbodies become discrete units, with different
patterns of isolation, productivity, resources availability, prey and predator abundance,
fisheries pressure, and others (Junk, 1997; Robinson et al. 2002; Thomas et al. 2006;
Campos-Silva et al. in press). This high environmental heterogeneity provides habitats
for aquatic bird species of different ecological needs.
The waterbirds are highly mobile organisms able to explore a large area and
different habitats in little time (Kameda et al., 2006; Bauer & Hoye, 2014; Kloskowski
& Trembaczowski, 2015). The decision of where to forage will depend on several
variables. This leads us to a very interesting question: what are the drivers of waterbird
assemblages in complex environments, such as the Amazon floodplains? Ecological
assessments from several studies showed that the richness and community
composition of waterbirds are influenced by local and landscape-scale variables. In
sum, lake morphometry, lake depth, physicochemical attributes, water type and habitat
diversity are important determinants of bird community (Ntiamoa-Baidu et al. 1998;
Cintra et al., 2007a, 2007b, 2015). However, the environmental factors influencing
habitat use will be dependent of the waterbird guild (Tavares et al., 2015), therefore
the direction and size of the effects can be different, according to the behavior and
ecological requirements of each species or guild.
Capítulo 4
105
Fisheries activities are spread through the Amazon, ensuring the livelihoods of
millions of people (Castello, 2009) and also having a great potential as predictor of
waterbird assemblages, due its magnitude. Due to the increase in large-scale
commercial fisheries pressure that has occurred in the Brazilian Amazon, community-
based management was established in many places, where fisheries are controlled by
local populations, avoiding overexploitation of important fish species in lakes nearby
the human settlements (Mcgrath et al., 1993). Beside the fish stock defense, the
protection phenomenon benefits other unintended groups which often use the lake,
such as freshwater turtles and others species of fish (Silvano et al., 2008; Miorando et
al., 2013; Arantes & Freitas, 2016). A notable example of community-based
management on Amazon floodplains is the arapaima exploitation, where local
communities are recovering the populations of the Arapaima gigas (Schinz, 1822), the
largest scaled freshwater fish of the earth (Castello, 2009; Campos-silva & Peres in
press 2). Although never evaluated, fisheries management can be an important factor
driving the abundance of waterbirds in Amazon floodplains. Nonetheless, the effects
of fisheries can be controversial, because several mechanisms are possible: The high
abundance of apex predator, for instance, can increase the pressure on prey
availability, promoting a negative response on waterbirds. On the other hand, the
protection can increase prey availability, affecting positively piscivorous birds. Yet the
protection of waterbodies can positively affect the waterbirds ensuring safe habitat,
once many species are hunted for local subsistence (Gonzales, 1999). All these
possibilities are important to increase the ecological understanding of these groups,
providing subsidies to strengthen conservation frameworks as a whole
Here we aim to quantify the relative effect size of fisheries management on
different waterbird guild abundance, considering the influence of local scale and

Capítulo 4
106
landscape heterogeneity. We sampled 31 lakes immersed in two contiguous protected
areas in the Jurua River. The local scale and landscape variables were represented
by chlorophyll a, macrophyte coverage, water transparency, lake depth, lake area,
shape, landscape heterogeneity, distance to main river and distance to human
settlements. The fisheries management provide lakes with different levels of protection
and arapaima population size (Campos-Silva & Peres, in press 2), which can be a
potential competitor with piscivorous birds. We hypothesize that besides the known
important variables for each guild, fisheries management will be a strong predictor of
piscivorous water birds species abundance. We expect large population size of
arapaima will lead a negative response on piscivorous birds, probably due the
competition. For non-piscivorous species, such as vegetation gleaners and ducks, we
expected no effects of fisheries management.
2. Materials and Methods
Study site
This study was conducted at 31 floodplain lakes within two contiguous
sustainable-use protected areas along the Juruá River, a very productivity tributary of
the Amazon River localized in the upper-central portion of the Amazon basin (Fig. 1).
The floodplain of the Juruá is under a drastic flood pulse, which often exceeds 10 m in
amplitude (Hawes & Peres, 2016). The wet and dry seasons represent periods of high
(January – June) and low water levels (August – November). There are mainly two
types of lakes spread into landscape along the Jurua river basin, oxbow lakes - formed
through complex process of meanders-cut (Stølum, 1996), and ria lakes - former,
deeply incised river systems, usually nearby upland forest (Bertani et al., 2015). The
average depth of the lakes is around: 11.7 (± 5.4) meters at the high water period and
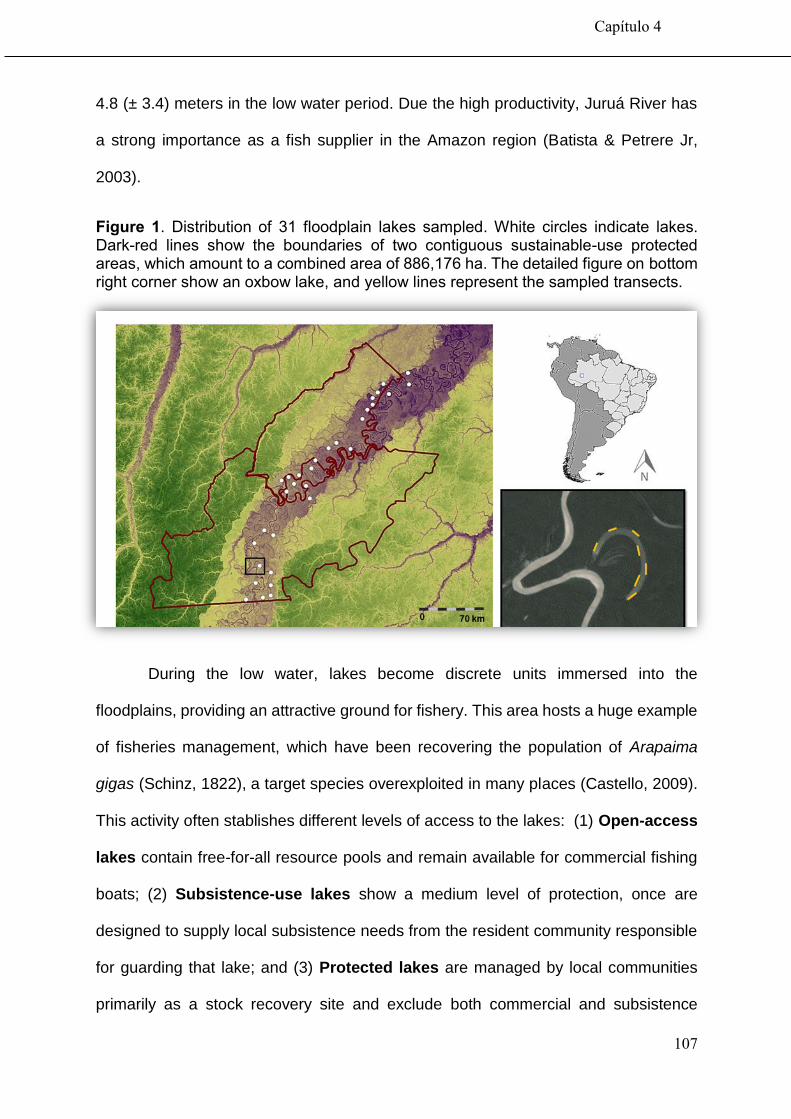
Capítulo 4
107
4.8 (± 3.4) meters in the low water period. Due the high productivity, Juruá River has
a strong importance as a fish supplier in the Amazon region (Batista & Petrere Jr,
2003).
Figure 1. Distribution of 31 floodplain lakes sampled. White circles indicate lakes. Dark-red lines show the boundaries of two contiguous sustainable-use protected areas, which amount to a combined area of 886,176 ha. The detailed figure on bottom right corner show an oxbow lake, and yellow lines represent the sampled transects.
During the low water, lakes become discrete units immersed into the
floodplains, providing an attractive ground for fishery. This area hosts a huge example
of fisheries management, which have been recovering the population of Arapaima
gigas (Schinz, 1822), a target species overexploited in many places (Castello, 2009).
This activity often stablishes different levels of access to the lakes: (1) Open-access
lakes contain free-for-all resource pools and remain available for commercial fishing
boats; (2) Subsistence-use lakes show a medium level of protection, once are
designed to supply local subsistence needs from the resident community responsible
for guarding that lake; and (3) Protected lakes are managed by local communities
primarily as a stock recovery site and exclude both commercial and subsistence

Capítulo 4
108
fishermen. Some protected lakes are managed one time per year, where the arapaima
is caught according with a quota allowed by the government. While populations of
arapaima are scarce or absent in open access lakes due to overexploitation, they show
impressive population size in protected lakes with an average up to 300 individuals per
lake (Campos-Silva & Peres in press 2).
Waterbirds survey
This work was conducted into a participatory perspective. Participatory
monitoring systems have been used successfully in developing countries, where
investments in research are scarce (Vieira et al., 2015). Scientific skills and local
knowledge can be integrated, generating a useful tool for biodiversity monitoring
(Townsend et al., 2005; Marinelli et al., 2007; Constantino et al., 2008). We choose
the participatory approach to cover a large area with repeated sampling. To do it, we
trained 10 experienced hunters, from 10 rural communities. As the motivation of
monitors can ensure the success of the activity (Singh et al., 2014), we provided an
economical reward for each monitor for each sampling event.
We sampled 31 lakes, three times each one, during the dry season, where the
abundance of waterbirds species is higher. We stablished between four and ten
transects in each lake (Fig. 1), and bird surveys were conducted between 6.30–9.00
h. Each transect represent about 400 meters of the lake perimeter, which was
sampled quietly by a canoe in a constant speed (~1 km/h). The number of transect
varies between 4 and 10, according with the lake area. Every individual present in the
transect were counted.
To avoid sampling bias, the observers were trained in exactly same way. We
also compare the perception of the monitors with a specialist ornithologist in a paired
sampling test. The results show no difference in the estimates of richness of species

Capítulo 4
109
(t=0.37; p=0.7) and abundance of individuals (t=1.6 p=0.1). Moreover, we selected a
group of 25 remarkable species, reducing therefore, the risk of false absences.
Waterbirds guilds
We grouped the focal species according with their foraging behaviour, following
Blondel (2003). The guilds were represented by diving species, fishing species, large
waiding birds, small waiding birds, king fishers, ducks and vegetation gleaners. This
approach was successfully used in Tavares (2015). The species from each guild can
be found on table S1 of supplementary material.
Response and explanatory variables
We used as response variable the number of individuals per kilometre, which
represent the f individuals counted into the transects. The response variable was log
transformed. Predictors of waterbirds abundance were Lake management category:
open-access, subsistence, or protected; Distance to human settlements: the true
nonlinear path distance on foot used by local users, which was measured using a GPS;
Distance to the main river: the Euclidean distance between the lake entrance and the
main Juruá river channel; Landscape richness: number of water bodies in a buffer with
5 km radius; Lake area: measured in ha; Lake depth: maximum lake depth; Water
transparency: estimated using a Secchi disk; Macrophyte coverage: initially mapped
in the field and then independently measured using 5-m resolution RapidEye© images,
which we purchased for the entire study area; Primary productivity: phytoplankton
biomass estimated by chlorophyll-a measurements using high-performance liquid
chromatography (HPLC); Arapaima population size: Number of adult arapaima
counted according Castello (2004); Prey availability: Abundance of prey was
measured using data from fisheries made in the lakes. The fisheries were conducted

Capítulo 4
110
by a local residents using one sets of four monofilament gillnets. Each gillnet had a
length of 50 m, with heights around 2m. The mesh sizes had 15,25,35 and 50 mm
between opposite knots. Fish sampling were also conducted during the dry season.
The complete dataset is available on Table S3 of supplementary information.
Statistical analysis
To understand the effects of fisheries management and environmental variables
on waterbirds abundance variation, we performed linear models (LMs) within the full
set of 31 lakes. Foremost, we got the total abundance of piscivorous species and
modeled all possible models combination, from the constant model (without predictors)
to the full model, where piscivorous abundance ~ management class+ distance to
human settlements + distance to main river + landscape richness+ lake area + lake
depth + water transparency + macrophyte coverage + primary productivity + arapaima
population size + prey availability. Models were fit with lmer in the lme4 package and
every model combination examined with the MuMIn package (Barton, 2009) within the
R platform (R Development Core Team 2015). Secondly, we did the same procedures
for all guilds identified.
Posteriorly, we selected the most parsimonious model with the lowest Akaike
Information Criterion corrected for small sample size (AICc). AICc is calculated as
the difference between each model’s AICc and the lowest AICc, with a AICc < 2
interpreted as substantial support that the model belongs to the set of best models.
Akaike weights give the probability that a model is the best model, given the data and
the set of candidate models (Burnham & Anderson, 2002). Finally, we fitted a model
average, considering the beta average of all standardized variables into the
parsimonious models. Thus, we compared the relative effect size of all variables. All
assumptions were respected, according with Zuur et al. (2010).

Capítulo 4
111
3. Results
The piscivorous species represented 75.7% of all 9,660 individuals from 33
species sampled. Analysing the piscivorous group as a whole, we found that the water
transparency was the strongest predictor (β=0.42 ± 0.1) of species abundance,
followed by arapaima population size (β= - 0.31 ± 0.1) and depth (β= - 0.1 ± 0.02; Fig.
2). The model average and estimates can be found on table S3 of supplementary
material.
Figure 2. Schematic figures showing the effect size of the three significative variables on piscivorous total abundance. The red and blue arrow represent a negative and positive effect, respectively. The size of arrow also indicates the magnitude of the effect size.
Looking to the guilds the results vary, as expected (Fig. 3). For diving birds and
large waiding birds the arapaima population size was the strongest predictor, leading
a negative effect on abundance these guilds. Water transparency was the second most
important variable, influencing positively both groups. Large waiding birds are also
influenced positively by the distance of main river channel, and exhibit a higher

Capítulo 4
112
abundance in lakes far from main river channel. Fishing birds responded only to water
transparency, and all others variables had no effects. Small waiding birds exhibited
responses only to the macrophyte coverage. Finally, the king fisher`s followed the
pattern for water transparency, but were also influenced negatively by lake area, lake
depth and macrophyte coverage.
Figure 3. Coefficient estimates (± 95% confidence intervals) showing the magnitude and direction of effects of different variables on piscivorous guilds abundance. Explanatory variables were standardized prior to analyses.

Capítulo 4
113
The non-piscivorous species, represented by ducks and vegetation gleaners,
does not show responses for fisheries managements, as expected (Fig. 4). Vegetation
gleaners were positively influenced by macrophyte coverage, and negatively by area,
while the ducks responded only negatively to landscape richness. All responses can
be checked on figure 1 of supplementary material.
Figure 4. Coefficient estimates (± 95% confidence intervals) showing the magnitude and direction of effects of different variables on non-piscivorous guilds abundance. Explanatory variables were standardized prior to analyses.
4. Discussion
Our findings help us to improve the understanding about the drivers of waterbird
abundance in the Amazon floodplains, especially some piscivorous groups, which
were strongly influenced by the fisheries activities. During the dry season the water
level falls and the lakes become discrete units in the landscape, allowing the action of
several mechanisms which induce changes on primary productivity, availability of prey
and predators and heterogeneity of habitat (Junk, 1989; Campos-Silva et al. in press
Capítulo 4
114
1). Thereby, the responses from each guild of bird vary according to their behavior and
ecological need.
The competition between waterbirds and fishermen could be unclear because
of the difference in composition of harvested species or size of individuals consumed
(Ydelis & Kontautas, 2008). However, there is several ways that fisheries can affect
piscivorous birds. We highlighted the negative influence of fisheries management on
abundance of piscivorous birds through arapaima population size, a strong potential
competitor. Large population of arapaima leads a negative influence on piscivorous
abundance in general, but was the stronger predictor for the abundance of diving birds
and large waiding birds. In fact, due the success of the community-based
managements, population size of arapaima is very large into protected lakes, often
exceeding 1,000 individuals (Campos-Silva & Peres in press 2). As this fish is an apex
predator, large populations can represent a strong competition with piscivorous
waterbirds guilds during the foraging activities, once they often eat a large amount of
fish (Ogden et al. 1976; Fenech et al. 2004).
Piscivorous guilds depends of visual signals to detect prey (Keppeler et al.,
2006). So, the lake selection involves variables which allow prey detectability and the
possibility to catch them (Newbrey et al., 2005). Water transparency has a positive
effect for all piscivorous guilds, except small waiding birds. Fishing species, for
instance, was only influenced by water transparency. We should consider that this guild
can fly over many lakes per day, once they are adapted for long-haul flights
(Strandberg & Alerstam, 2007; Davenport et al., 2016). Thus, they can cover a large
amount of habitat and foraging in places with a high water transparency, which allow
the prey detectability.
Macrophytes coverage shows an ambiguous effect on waterbirds. The

Capítulo 4
115
presence of large banks of macrophytes can hamper the fisheries, once it provides
shelter and food for many species of fish (Casatti et al., 2003). This negative effect
was evidenced by king fishers. However, for small waiding birds the macrophytes
coverage has a positive effect. In fact, small herons, egretts and storks can take
advantage of large banks of floating vegetation, catching the prey that uses the
vegetation as a refuge. The same occurs for vegetation gleaners, a non-piscivorous
group, adapted to use the macrophytes banks for breeding, feeding, and predators
avoiding (Osborne & Bourne, 1977).
Others variables were important predictors of piscivorous birds, such as depth,
which can influence the catchability and prey availability, because shallow lakes may
provide refuge for fishes vulnerable to predation (Paterson and Whitfield, 2000). Large
waiding birds also prefer lakes distant from the main river channel. Probably, it is
related with water level stability, once the water dynamics should be more intense
nearby the main river.
For non-piscivorous guilds the fisheries management was not important, as
expected. For ducks the only important variable was the landscape richness, which
induces a negative effect on their abundance. Although the known importance of
landscape richness on waterbirds community’s parameters (Cintra, 2015), our results
show a different understanding, which can occur due the changes on habitat
availability. High concentrations of waterbodies around the sampled lake, for instance,
means a high concentration of habitat available, which can reduce the abundance of
a determined species into the sampled lake. For vegetation gleaners, beside the
macrophytes coverage, the lake area also has a negative effect on their abundance, it
means that in smaller lakes occurs a densification of these species over the
macrophytes patches available.

Capítulo 4
116
The conservation of wetlands, specially Amazon floodplains, has become a
global aim, once the threats hovering over these environments increased in large
scales (Castello & Macedo, 2015). The understanding of habitat use by waterbirds is
fundamental to establish concrete conservation plans, which can be useful tools to
ensure the conservation of the system as a whole. Our results highlight the importance
to include the fisheries management as a factor influencing the piscivorous guilds.
However, although the arapaima population size leads a negative response of
piscivorous species, the arapaima management does not seem a concern threat,
because the management schemes predicts different levels of lakes protection,
ensuring places where the apex arapaima is virtually non-existent (Campos-Silva &
Peres in press 2), thus these arrangements can provide a compensatory mechanism,
which can also contribute to the waterbirds conservation.
5. References
Arantes, M.L., Freitas, C.E.C., 2016. Effects of fisheries zoning and environmental
characteristics on populations parameters of the tambaqui (Colossoma macropomum)
in managed floodplain lakes in the central Amazon. Fisheries. Manag. Ecol., 23, 133-
143.
Batista, V. S., Petrere Jr., M., 2003. Characterization of the commercial fish production
landed at Manaus, Amazonas State, Brazil. Acta Amaz., 33, 53-66.
Bauer, S., Hoye, B. J., 2014. Migratory animals couple biodiversity and ecosystem
functioning worldwide. Science, 344, 1242552.
Bertani, T. C., Rosseti, D. F., Hayakawa, E. H., Cohen, M. C. L., 2015. Understanding
Amazonian fluvial rias based on a late Pleistocene-Holocene analog, Earth Surf.
Process. Landf., 40, 285-292.
Blondel, J., 2003. Guilds or functional groups: does it matter? Oikos, 100, 223–231.
Burnham, K. P., Anderson, D. R., 2002. Model selection and multimodel inference: a
practical information‐theoretic approach. New York, NY: Springer.
Campos-Silva, J. V., Peres, C. A., Amaral, J. H., Sarmento, H. Beside phosphorus and
Capítulo 4
117
light availability, fisheries drive primary productivity in Amazon floodplains lakes. In
press 1.
Campos-Silva, J. V., Peres, C. A. Community-based management induces rapid
recovery of a high-value tropical freshwater fisheries. In press 2.
Castello, L., 2004. A method to count pirarucu Arapaima gigas: fishers, assessment,
and management. North Am. J. Fish. Mana., 24, 379–389.
Castello, L., Viana,, J. P., Watkins, G., Pinedo-Vasquez,, M. Luzadis, V. A., 2009.
Lessons from Integrating Fishers of Arapaima in Small-Scale Fisheries
management at the Mamiraua Reserve, Amazon. Environ. Manag., 43, 197-209.
Castello, L., Macedo, M. N., 2015. Large-scale degradation of Amazonian freshwater
ecosystems, Glob. Change. Biol., 22,990-1007.
Cintra, R., Sanaiotti, T., Cohn-Haft, M., 2007a. Composition and spatial distribution of
the Anavilhanas Archipelago bird community in the Brazilian Amazon. Biodivers.
Conserv., 16, 313–336.
Cintra, R., Santos, P. M. R. S., Leite, C.B., 2007b. Composition and structure of the
bird communities of seasonally flooded wetlands of western Brazilian Amazonia at high
water. Waterbirds, 30, 521–540.
Cintra, R., 2015. Spatial distribution and composition of waterbirds in relation to
limnological conditions in the Amazon basin. Hydrobiologia, 747, 235-252.
Constantino, P.D.A.L., Carlos H.S.A., Ramalho, E.E., Rostant, L., Marinelli, C.E.,
Teles, D., Valsecchi, J., 2012. Empowering local people through community-based
resource monitoring: a comparison of Brazil and Namibia. Ecol. Soc., 17, 22.
Davenport, L. C., Goodenough, K. S., Haugaasen, T., 2016. Birds of Two Oceans?
TransAndean and Divergent Migration of Black Skimmers (Rynchops niger
cinerascens) from the Peruvian Amazon. PLoS ONE, 11.
Dudgeon, D., Arthington, A. H., Gessner, M. O., Kawabata, Z. I., Knowler, D. J.,
Lévêque, C. et al., 2006. Freshwater biodiversity: importance, threats, status and
conservation challenges. Biol. Rev., 81, 163-182.
Erwin, R. M., 2002. Integrated management of waterbirds: beyond the conventional.
Waterbirds, 25(suppl. 2), 5–12.
Fenech, A.S., Lochmann, E, L., Radomski, A. A., 2004. Seasonal Diets of Male and
Female Double-crested Cormorants from an Oxbow Lake in Arkansas, USA,
Waterbirds, 27, 170-176.
Fraser, L. H., Keddy, P.A., 2005. The world’s largest wetlands: Ecology and

Capítulo 4
118
conservation. Cambridge University Press, Cambridge.
Gonzalez, J. A., 1999. Effects of Harvesting of Waterbirds and Their Eggs by Native
People in the Northeastern Peruvian Amazon. Waterbirds, 22, 217-224.
Hawes, J. E., Peres, C. A., 2016. Patterns of Plant Phenology in Amazonia Seasonally
Flooded and Unflooded Forests. Biotropica, doi:10.1111/btp.12315.
Hess, L. L., Melack, J. M., Affonso, A. G., Barbosa, C., Gastil-Buhl, M., Novo, E. M. ,
2015. Wetlands of Lowland Amazon Basin: Extent, Vegetative Cover, and Dual-season
Inundated Area as Mapped with JERS-1 Synthetic Aperture Radar. Wetlands, 35, 745-
756.
Ma, Z., Cai, Y., Li, B., Chen, J., 2010. Managing Wetland Habitats for Waterbirds: An
International Perspective. Wetlands, 30, 15–27.
Millennium Ecosystem Assessment, 2005. Ecosystems and Human Well-being. Island
Press, Washington, DC, USA.
Newbrey, J. L., Bozek, M. A., Niemuth, N.D., 2005. Effects of lake characteristics and
human disturbance on the presence of piscivorous birds in northern Wisconsin, USA.
Waterbirds, 28,478-486.
Junk. W. J., Bayley, P. B., Sparks, R. E., 1989. ‘The flood pulse concept in river-
floodplain systems’, Special Publication of Canadian Journal of Fisheries and Aquatic
Sciences, 106, 110-127.
Junk, W. J., 1997. General aspects of floodplain ecology with special reference to
Amazonian floodplains. In: JUNK, W. J. (ed.): The Central Amazon Floodplain: 3–20.
Ecological Studies, Springer, Berlin.
Kameda, K., Koba, Hobara, S., Osono, T., Terai, M., 2006. Pattern of natural 15 N
abundance in lakeside forest ecosystem affected by cormorant-derived nitrogen.
Hydrobiologia, 567, 69–86.
Keppeler, F.W., Cruz, D.A., Dalponti, G., Mormul, R.P., 2016. The role of deterministic
factors and stochasticity on the trophic interactions between birds and fish in temporary
floodplain ponds. Hydrobiologia, 773, 225–240.
Kloskowski, J., Trembaczowski, A., 2015. Fish reduce habitat coupling by a waterbird:
evidence from combined stable isotope and conventional dietary approaches. Aquatic.
Ecol., 49, 21–31.
Marinelli, C.E., Carlos, H.S.A. Batista, R.F., Rohe, F., Waldez, F., Kasecker, T.P., Endo,
W., et al. 2007. Programa de Monitoramento da Biodiversidade e do Uso de Recursos
Naturais – ProBUC. Revista Áreas Protegidas da Amazônia, 1, 73-78.
Capítulo 4
119
Miorando, P.S, Rebelo, G.H., Pignati, M.T., Pezzuti, C.B., 2013. Effects of Community-
Based Management on Amazon River Turtles: A Case Study of Podocnemis
sextuberculata in the Lower Amazon Floodplain, Pará, Brazil. Chelonian Conser. Biol.,
12,143-150.
Ntiamoa-Baidu, Y., Piersma, T., Wiersma, P., Bttley, M, Gordon, C., 1998. Water depth
selection, daily feeding routines and diets of waterbirds in coastal lagoons in Ghana.
IBIS, 140, 89-103.
Ogden, J. C, Kushlan, J. A., Tilmant, J.T., 1976. Prey Selectivity by the Wood Stork.
Condor, 78, 324-330.
Osborne, D. R., Bourne, G. R., 1977. Breeding, Behavior and Food Habits of the
Wattled Jacana. Condor, 79, 98-105.
Paterson, A. W., Whitfield, A. K., 2000. Do Shallow-water habitats function as Refugia
for juvenile fishes? Estuar. Coast. Shelf S., 51, 359-364.
Silvano, R. A. M., Ramires, M., Zuanon, J., 2008. Effects of fisheries management on
fish communities in the floodplain lakes of a Brazilian Reserve. Ecol. Freshw. Fish, 4,
1-11.
Singh, N. J., Danell, K., Edenius, L., Ericsson, G., 2014. Tackling the motivation to
monitor: success and sustainability of a participatory monitoring program. Ecol. Soc.,
19, 7.
Strandberg, R., Alerstam, T., 2007. The strategy of fly-and-forage migration, illustrated
for the osprey (Pandion haliaetus). Behav. Ecol. Sociobiol., 61, 1865-1875.
Revenga, C., Campbell, I., Abell, R., Pd, V., Bryer, M., 2005. Prospects for monitoring
freshwater ecosystems towards the 2010 targets. Phil. Trans. R. Soc. B, 360, 397–
413.
Robinson, C. T., Tockner, K., Ward, J. V., 2002. The fauna of dynamic riverine
landscapes. Freshwater Biol, 47, 661-667.
Stølum, H. H., 1996. River Meandering as a Self-Organization Process. Science, 271,
1710-1713.
Tavares, D.C., Guadagnin,D. L., De Moura, F. J., Siciliano, S., Merico, A., 2015.
Environmental and anthropogenic factors structuring waterbird habitats of tropical
coastal lagoons: Implications for management. Biol. Conserv., 186, 12–21.
Thomaz, S. M., Bini, L. M., Bozelli, R. L., 2006. Floods increase similarity among
aquatic habitats in river-floodplain systems. Hydrobiologia, 579, 1-13.
Townsend, W. R., A. R. Borman, E. Yiyoguaje, L. Mendua., 2005. Cofan Indians
Capítulo 4
120
monitoring of freshwater turtles in Zabalo, Ecuador. Biodivers. Conserv., 14, 2743-
2755.
Vieira, M. A. R. M., Von Muhlen, E. M., Sheppard, G. H., 2015. Participatory Monitoring
and Management of Subsistence Hunting in the Piagaçu-Purus Reserve, Brazil.
Conservat. Soc., 13, 254-264.
Casatti, L., Mendes, H. F., Ferreira, K. M., 2003. Aquatic macrophytes as feeding sites
for small fishes in the Rosana Reservoir, Paranapanema River, Southeasrtern, Brazil,
Braz. J. Biol., 63, 213-222.
Ydelis, A., Kontautas A., 2008. Piscivorous birds as top predators and fishery
competitors in the lagoon ecosystem. Hydrobiologia, 611, 45–54
Zuur, A. F., Ieno, E. N., Elphick, C. S., 2010. A protocol for data exploration to avoid
common statistical problems. Methods Ecol, Evol., 1, 3-14.

Capítulo 4
121
Supplementary Information
Supplementary table
S1. Guilds and species sampled in this study
Guild Species
Diving birds Aninhga anhinga
Phalacrocorax brasilianus
Large waiding birds Ardea alba
Ardea cocoi
Mycteria americana
Tigrisoma lineatum
small waiding birds Egretta thula
Butorides striata
Pilherodius pileatus
Cochlearius cochlearius
fishing birds Pandion haliaetus
Busarellus nigricolis
Buteogallus urubitinga
Rynchops niger
Phaetusa simplex
Sternula superciliaris
King fishers Megaceryle torquata
Chloroceryle amazona
Chloroceryle americana
Ducks Cairina moschata
Dendrocigna autumnalis
Neochen jubata
Vegetation gleaners Jacana jacana
Anhima cornuta
Aramus guarauna
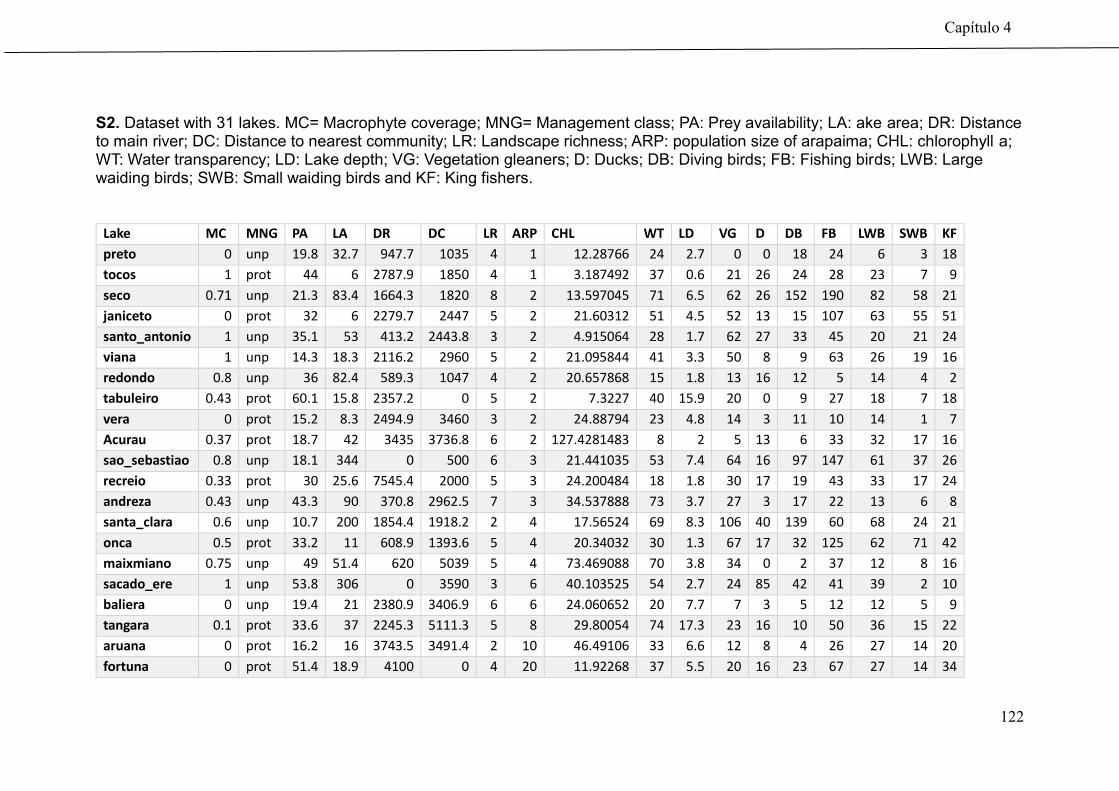
Capítulo 4
122
S2. Dataset with 31 lakes. MC= Macrophyte coverage; MNG= Management class; PA: Prey availability; LA: ake area; DR: Distance to main river; DC: Distance to nearest community; LR: Landscape richness; ARP: population size of arapaima; CHL: chlorophyll a; WT: Water transparency; LD: Lake depth; VG: Vegetation gleaners; D: Ducks; DB: Diving birds; FB: Fishing birds; LWB: Large waiding birds; SWB: Small waiding birds and KF: King fishers.
Lake MC MNG PA LA DR DC LR ARP CHL WT LD VG D DB FB LWB SWB KF
preto 0 unp 19.8 32.7 947.7 1035 4 1 12.28766 24 2.7 0 0 18 24 6 3 18
tocos 1 prot 44 6 2787.9 1850 4 1 3.187492 37 0.6 21 26 24 28 23 7 9
seco 0.71 unp 21.3 83.4 1664.3 1820 8 2 13.597045 71 6.5 62 26 152 190 82 58 21
janiceto 0 prot 32 6 2279.7 2447 5 2 21.60312 51 4.5 52 13 15 107 63 55 51
santo_antonio 1 unp 35.1 53 413.2 2443.8 3 2 4.915064 28 1.7 62 27 33 45 20 21 24
viana 1 unp 14.3 18.3 2116.2 2960 5 2 21.095844 41 3.3 50 8 9 63 26 19 16
redondo 0.8 unp 36 82.4 589.3 1047 4 2 20.657868 15 1.8 13 16 12 5 14 4 2
tabuleiro 0.43 prot 60.1 15.8 2357.2 0 5 2 7.3227 40 15.9 20 0 9 27 18 7 18
vera 0 prot 15.2 8.3 2494.9 3460 3 2 24.88794 23 4.8 14 3 11 10 14 1 7
Acurau 0.37 prot 18.7 42 3435 3736.8 6 2 127.4281483 8 2 5 13 6 33 32 17 16
sao_sebastiao 0.8 unp 18.1 344 0 500 6 3 21.441035 53 7.4 64 16 97 147 61 37 26
recreio 0.33 prot 30 25.6 7545.4 2000 5 3 24.200484 18 1.8 30 17 19 43 33 17 24
andreza 0.43 unp 43.3 90 370.8 2962.5 7 3 34.537888 73 3.7 27 3 17 22 13 6 8
santa_clara 0.6 unp 10.7 200 1854.4 1918.2 2 4 17.56524 69 8.3 106 40 139 60 68 24 21
onca 0.5 prot 33.2 11 608.9 1393.6 5 4 20.34032 30 1.3 67 17 32 125 62 71 42
maixmiano 0.75 unp 49 51.4 620 5039 5 4 73.469088 70 3.8 34 0 2 37 12 8 16
sacado_ere 1 unp 53.8 306 0 3590 3 6 40.103525 54 2.7 24 85 42 41 39 2 10
baliera 0 unp 19.4 21 2380.9 3406.9 6 6 24.060652 20 7.7 7 3 5 12 12 5 9
tangara 0.1 prot 33.6 37 2245.3 5111.3 5 8 29.80054 74 17.3 23 16 10 50 36 15 22
aruana 0 prot 16.2 16 3743.5 3491.4 2 10 46.49106 33 6.6 12 8 4 26 27 14 20
fortuna 0 prot 51.4 18.9 4100 0 4 20 11.92268 37 5.5 20 16 23 67 27 14 34

Capítulo 4
123
itabaiana 0 prot 33.4 28 3581.3 5747.1 4 20 20.603044 50 12.5 0 8 3 50 26 4 31
toare 0 prot 16.7 9 5972.9 6767.4 5 21 84.603596 38 4.8 1 11 12 46 29 16 29
dona_maria 0.43 prot 30 101 5549.4 137.2 3 32 8.785084 38 3.4 48 23 25 92 72 18 39
branco 0.4 prot 47.7 15 2369.8 2274.2 5 51 15.107708 27 1.2 75 15 12 77 17 81 42
torcate 1 prot 30 108 256 81.7 4 67 46.725756 93 2.6 26 4 6 34 17 23 9
samauma 1 prot 40 105 2583.5 3302.8 4 100 85.779848 58 2.9 26 14 15 60 42 22 21
mandioca 1 prot 7.5 200 752.2 1443.8 3 259 84.951328 50 4.1 23 23 6 26 12 23 10
sacado_jiburi 0 prot 52.1 412 0 1689.5 4 357 67.57828 75 8.6 3 16 20 44 16 13 28
manarian 0 prot 30 293 2342.2 3453.5 6 537 63.34328 53 6.6 2 0 14 22 22 14 13
marari 0 prot 5.8 269 1100 1319 5 676 55.346368 51 4.1 0 21 9 68 22 8 30

Capítulo 4
124
S3. Parameters of the Linear models for abundance of total piscivorous as function of fisheries management and others variables on 31 amazon floodplains lakes. Significant variables are marked in bold.
Model average variables β estimates
IC lower IC upper z value p value
Water transparency 0.42164 0.145464 0.69781 2.992 0.00277 Arapaima population size -0.31329 -0.60335 -0.02324 0.14799 0.03426 Lake depth -0.0733 -0.12892 -0.01768 0.02838 0.0098 Distance to main river channel 0.20143 -0.05285 0.45571 0.12974 0.12052 Management class -0.39245 -1.01163 0.22673 1.242 0.21414 Macrophyte coverage -0.69427 -1.46917 0.08062 1.756 0.07908 Prey availability -0.11647 -0.33154 0.09859 1.061 0.28849 Distance to human settlements -0.10672 -0.32883 0.11538 0.942 0.34631 Chlorophyll -0.10941 -0.37185 0.15303 0.817 0.41389 Lake area -0.14521 -0.47262 0.18218 0.869 0.38467 Landscape richness -0.11004 -1.20046 0.98036 0.198 0.8432

Capítulo 4
125
Supplementary Figures Figure 1. Responses of waterbirds guilds abundances to significant explanatory variables.

126
Capítulo 5
Unintended multi-species co-benefits of community-
based fluvial beach protection in lowland Amazonia

Capítulo 5
127
Unintended multi-species co-benefits of community-based fluvial beach
protection in lowland Amazonia*
João V. Campos-Silva, Carlos A. Peres, Joseph E. Hawes & Paulo C. M. Andrade
*Manuscrito a ser submetido à PNAS
Keywords: community conservation, freshwater turtles, management, sustainability
Abstract
Tropical floodplains arguably represent the most threatened freshwater ecosystems
worldwide, and various strategies have been proposed for their conservation. Despite the
increasing threats from large dams, floodplain agriculture, overexploitation of aquatic resources
and global climate change, these environments remain relatively neglected, particularly in the
Amazon. Building a solid conservation programme to address floodplains system is therefore
an intractable but pressing challenge. The protection of fluvial sand beaches, focusing on the
conservation of South American river turtles, effectively represents a successful programme in
reverting population trajectories for overexploited aquatic species. Furthermore, the effects of
beach protection can have positive ripple effects for many other taxa that also use fluvial
beaches and adjacent habitats. Here, we analyzed 34 years of Giant South American Turtle
(Podocnemis expansa) reproductive monitoring, through community-based beach protection,
along the Juruá River of western Brazilian Amazonia. The number of hatchlings released
increased 23 fold and the population recovery is confirmed across 41 human settlements. We
also implemented a multi-taxa approach in evaluating 14 pairs of protected and unprotected
beaches (N = 28) during the dry season of 2013. We sampled caimans, large catfish, other
aquatic megafauna (with sonar), migratory beach-nesting birds, resident birds, lizards and
invertebrates. We found a drastic effect of community-based protection for all taxa sampled.
Moreover, 99% of the P. expansa nests recorded on unprotected beaches were raided by
poachers, compared to just 2.1% on protected beaches. We therefore show that P. expansa
can act as a powerful umbrella species in protecting many other taxa, and that community-
based fluvial beach protection is an efficient conservation strategy that merits greater attention
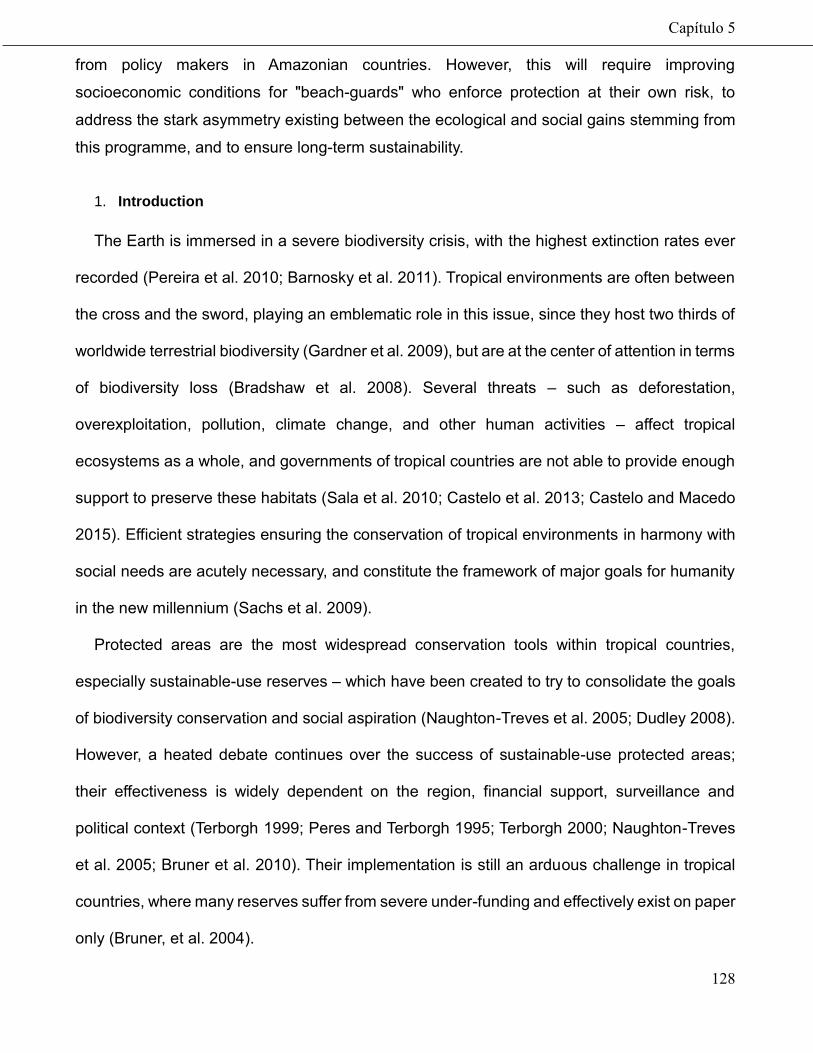
Capítulo 5
128
from policy makers in Amazonian countries. However, this will require improving
socioeconomic conditions for "beach-guards" who enforce protection at their own risk, to
address the stark asymmetry existing between the ecological and social gains stemming from
this programme, and to ensure long-term sustainability.
1. Introduction
The Earth is immersed in a severe biodiversity crisis, with the highest extinction rates ever
recorded (Pereira et al. 2010; Barnosky et al. 2011). Tropical environments are often between
the cross and the sword, playing an emblematic role in this issue, since they host two thirds of
worldwide terrestrial biodiversity (Gardner et al. 2009), but are at the center of attention in terms
of biodiversity loss (Bradshaw et al. 2008). Several threats – such as deforestation,
overexploitation, pollution, climate change, and other human activities – affect tropical
ecosystems as a whole, and governments of tropical countries are not able to provide enough
support to preserve these habitats (Sala et al. 2010; Castelo et al. 2013; Castelo and Macedo
2015). Efficient strategies ensuring the conservation of tropical environments in harmony with
social needs are acutely necessary, and constitute the framework of major goals for humanity
in the new millennium (Sachs et al. 2009).
Protected areas are the most widespread conservation tools within tropical countries,
especially sustainable-use reserves – which have been created to try to consolidate the goals
of biodiversity conservation and social aspiration (Naughton-Treves et al. 2005; Dudley 2008).
However, a heated debate continues over the success of sustainable-use protected areas;
their effectiveness is widely dependent on the region, financial support, surveillance and
political context (Terborgh 1999; Peres and Terborgh 1995; Terborgh 2000; Naughton-Treves
et al. 2005; Bruner et al. 2010). Their implementation is still an arduous challenge in tropical
countries, where many reserves suffer from severe under-funding and effectively exist on paper
only (Bruner, et al. 2004).

Capítulo 5
129
On the other hand, the community-based conservation (CBC) approach – based on various
levels of governance and partnership – shows great potential to comply with both conservation
goals and social demands (Berkes 2007). Some initiatives have contributed to the
conservation of biodiversity and provided good conditions to improve local communities’
welfare (Castello et al. 2009; Cinner et al. 2012a, 2012b; Campos-Silva and Peres, in press),
particularly in socio-ecological systems – where social rules, ecological interactions, policy and
biophysical relations are dynamic and reciprocal (Liu et al. 2009; Ostrom 2009). Moreover, this
approach could become an effective strategy to decentralize resource management and
conservation, strengthen surveillance systems, and reduce costs (Somanatham et al. 2009),
especially in tropical countries, which suffer due to human resources scarcity, lack of financial
support and inoperability of weak institutions (Barret, 2001; Campos-Silva et al. 2015).
Although the CBC approach seems convincing, it is not a panacea, and there remains a
clear lack of outcome evaluation (Barret et al. 2001; Evans et al. 2011). Most evaluations have
been conducted in fisheries activities, and are often measured from a socio-economic
perspective that includes profit distribution, costs and benefits, impact on income and
livelihoods, and optimal rate of use of a specific resource (Pomeroy and Ahmed, 2006; Evans
et al., 2011; Napier et al., 2005). As a result, it is clear that this approach constitutes an
interesting strategy to strengthen the power of communities, to consolidate institutions, and to
enhance social capital, social learning and conflict solving (Berkes, 2009). However, there is
little empirical information on broad ecological effects, and deep impact assessment studies
are still critically necessary (Barret et al. 2001; Evans, et al. 2011; Gutierrez et al. 2011).
Often the main strategy of CBC involves habitat protection of one or a group of species, so
that the benefits from conservation can be extended to other taxa co-occurring in the same
environment as in the umbrella species concept (Roberge and Angelstam, 2004). This
potentially unintended result can strengthen the ecological outputs of CBC, while the

Capítulo 5
130
quantification of collateral ecological benefits could compose a very useful tool for outcome
evaluation.
Here we show a comprehensive example of a CBC project, which has been supporting
population recovery of the threatened giant South American turtle (Podocnemis expansa) for
34 years. The preset study helps to fill a strong gap on CBC ecological effects understanding.
We found that protected areas of sustainable use are not enough to protect the target species,
but the community participation is a very effective tool to avoid poachers. We also showed
precious positive effects on the protection of several unintended groups, such as caimans,
fishes, migratory and resident birds, green iguana (Iguana iguana), terrestrial invertebrates and
others species of turtle. Finally, we achieved the social and economic dividends, which are key
elements for long-term sustainability of this activity. Our results confirm a strong effect of a CBC
initiative on biodiversity conservation. We reinforce the need to include local people on
conservation programs, and also highlight a great window of opportunity, which can help to
ensure an effective large-scale conservation outcome in Amazonian floodplains.
2. Results
Population recovery of target species
After 34 years of programme implementation, the number of hatchlings released increased
26-fold (Figure 2) with an average of 71,087 (± 6,501) hatchlings released every year. Beyond
the clear increase in number of hatchlings released, we can see a strong pattern of population
recovery according to local knowledge or perception. In 38 of 41 communities sampled,
experienced fisherman confirmed the popular notion that the Giant river turtle population
increased in the last 15 years (Figure 3). Even communities far from protected beaches
confirmed this pattern, with the exception of three communities near the urban center, of which
two reported a decreasing and one a stable population.

Capítulo 5
131
Figure 2. Hatchling release trajectories over 34 years (1980 – 2014) of community-based conservation.
Figure 3. Local perceptions of giant South American river turtle population recovery based on semi-structured interviews with experienced fishermen. Red and green circles indicate communities for which local informants reported a decline or increase in population sizes over the last 15 years. Yellow circles indicate stable populations that have not appreciably changed over time. Brown lines represent the boundaries of the two contiguous sustainable-use reserves reserves, and in the upper right is the representation of the location of the nearest market town, Carauari.

Capítulo 5
132
Beyond the clear effect of protection, our model of nest counts also showed others variables
with strong influence on the number of nests. However, only one of all models was
parsimonious, showing a Δ AIC < 2. Three variables were significant, but years of protection
was the most important factor (β = 1.4 ± 0.14), positively influencing our response variable,
followed by declivity (β = -0.71 ± 0.14) and distance to human settlement (β = -0.31 ± 0.13),
which both show a negative relation with the number of nests counted (Figure 4).
Figure 4. Relative size effect (z-estimates) of all predictors of freshwater turtle nests. Dots represent mean estimates while horizontal lines indicate confidence intervals (CI). For significant variables CIs do not cross the vertical dotted line at zero. Estimates colored blue represent a significant positive effect; red estimates represent a significant negative effect.
Collateral benefits for non-target taxa
The protection effect was detected for all sampled groups, –for measures of both abundance
and nest counts (Figure 5 and 6). Surprisingly, even unexpected groups, such as terrestrial
invertebrates, green iguana and resident birds occurred in much higher abundance on
protected beaches (Supplementary Information: Table S1). Model averaging revealed only the

Capítulo 5
133
duration of beach protection as a significant driver of success for these non-target taxa (Figure
S1).
Figure 5. Paired t-test of abundance responses for non-target taxa: (A) continental migrant birds, (B) intra-Amazonia migrant birds, (C) large catfishes, (D) terrestrial invertebrates, (E) aquatic fauna, and (F) caimans. Red and blue circles represent protected and unprotected beaches, respectively.
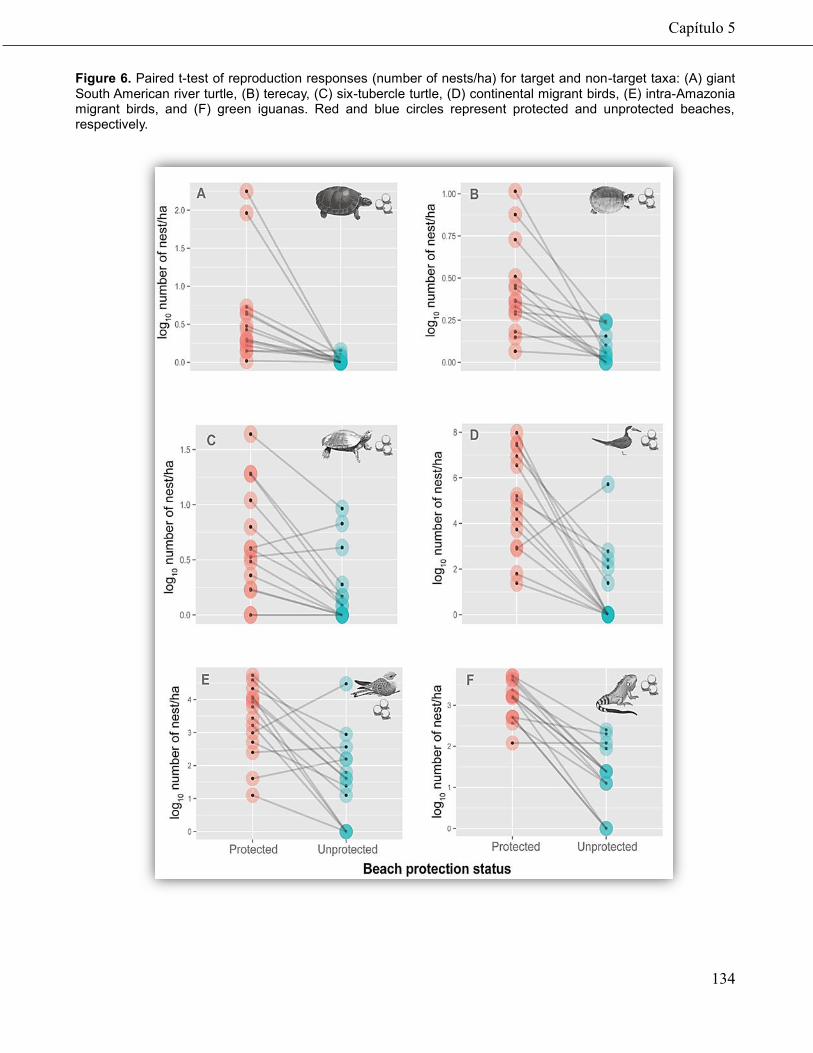
Capítulo 5
134
Figure 6. Paired t-test of reproduction responses (number of nests/ha) for target and non-target taxa: (A) giant South American river turtle, (B) terecay, (C) six-tubercle turtle, (D) continental migrant birds, (E) intra-Amazonia migrant birds, and (F) green iguanas. Red and blue circles represent protected and unprotected beaches, respectively.

Capítulo 5
135
Patterns of abundance
The aquatic biodiversity abundance in general is much higher in front of protected beaches.
The average biomass of large catfishes for example, is six-fold higher for protected (23.4 ±
19.5) than unprotected (3.6 ± 18.9) beaches. Moreover, we found 25 catfish species in
protected beaches, against only eight species in unprotected beaches. Black caimans
(Melanosuchus niger) also occur in higher abundance around protected beaches (PB: 12.1 ±
5.2 individuals/km; UB: 7.4 ± 18.0; t = 4.25, p < 0.05). The same pattern was found with sonar
detections of aquatic megafauna (PB: 0.97 ± 0.5 individuals/m; UB: 0.65 ± 0.5; t = 1.82, p =
0.09), with the protection effect therefore inducing shifts in abundance for most riverine taxa.
The results for terrestrial biodiversity are equally impressive. All groups of birds occur in
much higher number on protected beaches. The migrant Black skimmer (Rynchops niger), for
example, is 80 times more abundant on protected beaches (PB: 3.3 ± 2.4 individuals/ha; UB:
0.04 ± 2.2; t = 5.2, p < 0.05). The same pattern is found for both other migrant species such as
the Large-billed tern (Phaetusa simplex; PB: 5 ± 4.8; UB: 0.17 ± 4.6; t = 4.3, p < 0.05), and
resident species such as the Sand-coloured nighthawk (Chordeiles rupestris; PB: 3.2 ± 2.9;
UB: 0.3 ± 2.7; t = 4.5, p < 0.05. Pitfall traps sampled 4,401 terrestrial invertebrate individuals
from 11 orders, with total abundance almost twice as high on protected beaches. (PB: 196.2 ±
9.86 individuals/trap; UB: 116.6 ± 9.84; N = 14, t = 3.3, p < 0.05). The most abundant order
was Orthoptera with a total of 3,307 individuals (13.1 ± 9.8 individuals/trap), followed by
Coleoptera total = 649; 3.6 ± 9.8 individuals/trap).
Patterns of reproductive activity
We found a strong positive effect of protection for reproductive success in all three
species of freshwater turtle with 1,370 chelonian nests recorded on protected beaches
compared to just 171 on unprotected beaches. There were 58 times more nests of the target

Capítulo 5
136
turtle species (P. expansa) on protected beaches (Table S1), while Terecay turtles (P. unifilis)
and Six-tubercled Amazon river turtles (P. sextuberculata) were also beneficiaries of protection
showing a strong difference between the treatments. This result was mirrored for birds; we
found 8,700 nests of migrant species (Black simmer and large-billed tern) on protected
beaches compared to just 371 nests on unprotected beaches, and almost four times more
nests of the resident sand-collared nighthawk as on protected beaches (Table S1). Finally, the
folivorous green iguana also preferred to build their nests on protected beaches, where the
density of nests was almost seven times higher.
Community-based protection against illegal poaching
We found a drastic effect of protection in reducing poaching activity on the nests of the three
Podocnemis species. On protected beaches, we recorded 521 nests of the Giant South
American river turtle (37.2 ± 52.5 nests/beach, 371 of the Terecay turtle (26.5 ± 21.6), and
1,467 of the Six-tubercled amazon river turtle (104.8 ± 157.8). Of the total of 2,359 sampled
Podocnemis nests, only 2.1 % were raided by poachers. In contrast, we found only four nests
of Giant South American river turtle (0.2 ± 22.5 nests/xxx), 42 nests of Terecay turtle (3.0 ±
20.3), and 156 nests of Six-tubercled amazon river turtle (11.1 ± 55.5) on unprotected beaches,
where 99% of the 202 nests sampled were raided by poachers.
Economic and social dividends
We interviewed all 40 beach-guards involved in the protection of the 14 sampled beaches
spread along more than 300 km of river. The beach-guards interviewed related many positive
outcomes from the beach protection, but also highlighted serious concerns, which threaten the
long-term sustainability of the CBC programme (Table S2). The positive aspects were based
on the population recovery of an important resource, the strengthening of cultural values and
the maintenance of a valued culinary culture. The concerns voiced covered (1) the failure of
the programme to generate a source of local income, (2) the perception of insufficient support

Capítulo 5
137
from the surveillance departments, including a lack of adequate equipment and unsatisfactory
financial reward, and (3) the perception of being undervalued by the government and society
for the considerable time and effort they have invested. Often their primary motivation to
persevere with beach protection is described as a moral obligation to continue the work their
parents and grandparents began.
3.Discussion
The conservation of tropical environments is an enormous challenge, often exacerbated by
the scarcity of human resources and financial support. Thus, new conservation strategies on a
large scale are very welcome, especially those that can be effective through harnessing local
community action and with minimal financial input. We provide strong evidence of positive
ecological outcomes from a multi-level community-based management scheme, which has
released more than 2 million freshwater turtle hatchlings over the last 34 years, driving the
population recovery of a threatened species (Cantarelli et al. 2014).In addition, the scheme is
demonstrated to have had strong collateral benefits for multiple non-target taxa. The broad
attractiveness of this model is further enhanced by the great potential for replication across
threatened Amazonian floodplains, even in communities outside protected areas (Fig. 3).
Freshwater turtles are the most threatened group among vertebrates (Gibbons et al.,2000;
IUCN, 2011). The giant river turtle (and other Podocnemis species), for example, have been
exploited for a long time – from the pre-Columbian indigenous groups up to the contemporary
mixed groups of Brazilian indigenous and European descendants (Peres 2000; Prestes-
Carneiro et al. 2015; Van Vliet et al. 2015). As a result, catastrophic population declines have
been recorded across Amazonia (Thorbjarnarson et al. 1997; Gibbons et al. 2000). In
response, fluvial beach protection has recently been ensuring the vital activity of reproduction,
helping wild populations to recover in many sites. Moreover, the local perception – corroborated
by population recovery findings (Fig. 3) – shows us that community beach protection also
Capítulo 5
138
provides the possibility for preserving local culture , as the Podocnemis genus has a high
importance for rural subsistence (Thorbjarnarson et al., 2000; Prestes-Carneiro et al. 2015).
We considered certain environmental variables, including mineral composition and sediment
grain size, which could influence oviposition in Podocnemis (Milton et al. 1997; Souza and
Vogt, 1994). However, due to their relentless overexploitation, protection has become the
overriding factor driving nest site selection. We showed that the number of nests increases
cumulatively with years of protection, and is negatively influenced by proximity to human
settlements due to increased hunting pressure (Conway-Gomes, 2007). However, beaches
near human settlements are may also be more easily protected because of the high number
of people watching them, as was found for fisheries management in protected lakes, with lakes
nearer settlements showing a higher population size of pirarucu (Arapaima gigas) (Campos-
Silva and Peres, in press). In addition, we also found that slope is an important negative factor,
which can discourage turtles from emerging to oviposit.
Even though large portions of suitable Podocnemis habitat are covered by of sustainable-
use protected areas in Amazonia (Fagundes et al. 2016), the protected area strategy could be
insufficient to ensure their conservation, due to high rates of hunting and egg harvest across
rural communities within extractive reserves (Fachín-Terán et al. 2004; Caputo et al., 2005).
Besides, illegal commerce in small cities within protected areas can place substantial pressure
on turtle populations (Peñaloza et al., 2013). For example, in Carauari – a small town in lowland
Amazonia – the profit generated from the ten largest illegal turtle traders is around U$57K per
year, with the majority of harvested individuals sourced from protected areas (PMJ,
unpublished data). In fact, our findings support the idea that sustainable-use reserves cannot
guarantee the successful freshwater turtle reproduction, since the nest raiding is around 99%
on unprotected beaches within protected areas. Breathtakingly, the CBC approach reduces
poaching to around 2.1%.
Capítulo 5
139
Beyond the strong outputs for target species, the unintended effects of beaches protection
are also overwhelmingly positive for all sampled groups. It is not necessarily novel to detect
positive effects of protection for taxa such as large catfishes, caimans and other species of
turtles, which are commonly harvested within extractive reserves (Peres and Palacios, 2007).
However, that we found similar results for groups that are not exploited by humans shows the
potential of the giant South American river turtle to play a prominent role as an umbrella
species, supporting the conservation of many other species.
Human pressure is known to severely impact wild fish populations (Pauly, et al. 2002;
Woodroffe et al. 2005), which are particularly important in the Amazon for both the local
economy and subsistence (Petrere Jr. et al. 2004). Our results show that protected beaches
function as havens, extending protection from overexploitation to fish and other aquatic species
in the adjacent river. Although it is not possible to reliably differentiate the various taxa detected
by sonar, it is informative to note the higher aquatic biomass in sections of the river alongside
protected beaches. This occurs because uncontrolled commercial fisheries along the main
river channel are permitted even within protected areas, and the pressure is greatest alongside
unprotected beaches.
Caimans too occur in greater abundance near protected beaches, but the explanation is
slightly different. From 1950 to 1965, around 7.5 million caiman skins were harvested for export
(Smith, 1980), leading to a dramatic population decline until the prohibition of wildlife hunting
in 1967 (Da Silveira and Thorbjarnarson, 1999). The current threat to caimans comes not from
harvesting, but principally from conflicts with fishermen who often resort to killing them in
unprotected places (PMJ, unpublished data).
A very attractive result are the responses of groups that are not used by humans. Terrestrial
invertebrates had to develop tolerance to inundation, reproductive strategies and migratory
behavior to live in stressful environments, such as the Amazonian floodplains – which are
Capítulo 5
140
immersed in pronounced seasonal periodicity (Adis and Junk, 2002). Surprisingly, terrestrial
invertebrates were also recorded in higher abundance on protected beaches, contrary to
expectations of top down control of terrestrial invertebrates from the higher abundance of
insectivorous birds. The strong input of nutrients from dead hatchlings, egg remains and
carcasses in general on protected beaches could therefore possibly represent a stronger
bottom-up mechanism. Another surprising example is the green iguana. While the consumption
of green iguana eggs or meat occurs in some Brazilian regions (Alves et al. 2012), it is virtually
non-existent in our study area so the higher abundance of iguana nests in protected beaches
has no relation to variable human exploitation.
Finally, we showed that the community protection of beaches makes a strong contribution
to the conservation of migratory birds. The high concentration of individuals and nests for
migrant black skimmers, long-billed terns and resident sand-coloured nighthawk on protected
beaches suggests that beach protection can provide vital support for the successful
reproduction of these colonial breeding species, which are often under threat from egg
harvesting and other human disturbances (Del Viejo et al. 2004).
Notably, the ecological benefits of beach protection are particularly impressive compared to
the low cost of implementation. This CBC scheme currently costs the Brazilian government
and partners about US$106.40 per beach-guard/month, paid as a monthly basic food basket
throughout the six months of the dry season. This means that each turtle hatchling released
cost just US$0.03 over the last five years. There is a heated discussion about the most
appropriate mechanism of payments for biodiversity conservation in developing countries
(Ferro and Kiss, 2002). Here, we suggest a mixed approach, with the costs supported by
government and local communities, because we understand that rural communities cannot
carry the heavy burden of conservation of biodiversity alone, once biodiversity maintenance is
considered a global objective (Ferraro, 2000). Moreover, there is a clear dissatisfaction with
Capítulo 5
141
current rewards, and beach-guards are increasingly vocal in their claims for a basic salary. We
argue that CBC programmes should strive to generate enough income to ensure their
continuation in the long term. To become less independent on government rewards, the
programme itself could potentially start management schemes, as already occurs in the study
region with Arapaima management (Campos-Silva and Peres in press).
Another fundamental characteristic of this system is the multi-level partnership (Berkes
2007, 2009), where multiple institutions link up effectively to increase the likelihood of success
and reduce the danger of falling into the tragedy of the commons (Hardin, 1968) as exemplified
by the 99% levels of poaching on unprotected beaches. The key is shared responsibility; the
community is responsible for programme activities as a whole, but the government also has a
crucial function in providing financial support and regulating the scheme through data
monitoring.
Our study provides a substantial reflection on the ecological effects of CBC schemes in
tropical environments. Quantifying unintended ecological outputs is crucial for a better
understanding of the broad effects of CBC. Quantifying the ecological co-benefits is also
fundamental for discussing the cost-benefits of implementing this type of programme,
particularly in tropical countries, which are racing against time to develop conservation
strategies that are economically viable and efficient. Community-based fluvial beach protection
is a powerful tool for floodplains conservation, and one that deserves more attention from
government and stakeholders, especially in the Amazon due to the frequent scarcity of financial
support and common bureaucratic difficulties (Cantarelli, 2014; Campos-Silva et al., 2015). The
improvement of beach-guards’ welfare will be essential to ensure the fate of this activity, which
provides a series of positive outcomes for conservation.
4.Materials and methods
Study area
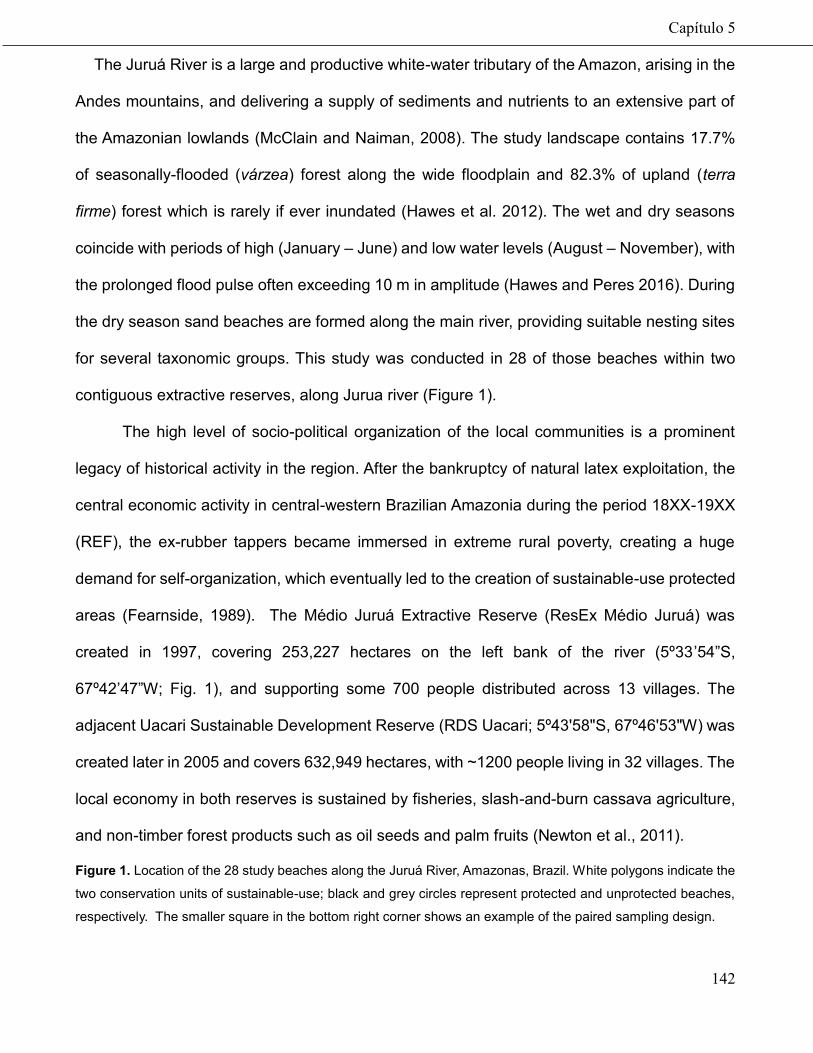
Capítulo 5
142
The Juruá River is a large and productive white-water tributary of the Amazon, arising in the
Andes mountains, and delivering a supply of sediments and nutrients to an extensive part of
the Amazonian lowlands (McClain and Naiman, 2008). The study landscape contains 17.7%
of seasonally-flooded (várzea) forest along the wide floodplain and 82.3% of upland (terra
firme) forest which is rarely if ever inundated (Hawes et al. 2012). The wet and dry seasons
coincide with periods of high (January – June) and low water levels (August – November), with
the prolonged flood pulse often exceeding 10 m in amplitude (Hawes and Peres 2016). During
the dry season sand beaches are formed along the main river, providing suitable nesting sites
for several taxonomic groups. This study was conducted in 28 of those beaches within two
contiguous extractive reserves, along Jurua river (Figure 1).
The high level of socio-political organization of the local communities is a prominent
legacy of historical activity in the region. After the bankruptcy of natural latex exploitation, the
central economic activity in central-western Brazilian Amazonia during the period 18XX-19XX
(REF), the ex-rubber tappers became immersed in extreme rural poverty, creating a huge
demand for self-organization, which eventually led to the creation of sustainable-use protected
areas (Fearnside, 1989). The Médio Juruá Extractive Reserve (ResEx Médio Juruá) was
created in 1997, covering 253,227 hectares on the left bank of the river (5º33’54”S,
67º42’47”W; Fig. 1), and supporting some 700 people distributed across 13 villages. The
adjacent Uacari Sustainable Development Reserve (RDS Uacari; 5º43'58"S, 67º46'53"W) was
created later in 2005 and covers 632,949 hectares, with ~1200 people living in 32 villages. The
local economy in both reserves is sustained by fisheries, slash-and-burn cassava agriculture,
and non-timber forest products such as oil seeds and palm fruits (Newton et al., 2011).
Figure 1. Location of the 28 study beaches along the Juruá River, Amazonas, Brazil. White polygons indicate the
two conservation units of sustainable-use; black and grey circles represent protected and unprotected beaches,
respectively. The smaller square in the bottom right corner shows an example of the paired sampling design.
Capítulo 5
143
Evaluation of target species conservation programme
Ever since the colonization of Brazil, meat and eggs from Amazonian turtle species have
been widely consumed, with steep declines in wild populations, especially for the Giant South
American river turtle (Alho, 1985; Prestes-Carneiro et al. 2015) which, reaching up to 90 Kg in
body mass and 80 cm in carapace length (Pritchard and Trebbau 1984), is the largest
neotropical freshwater turtle. Faced with increasing contemporary threats, and considering
their high cultural importance, several projects were established to protect their nesting sites
(Cantarelli et al. 2014). In our study area, fluvial beach protection was started in the 1990s by
local rubber tappers, to provide meat and eggs for the owners of rubber plantations. With the
demise of the rubber barons, beach protection finally fell into the hands of local communities.
The current project scheme is a mixed approach, where universities, NGOs, government
agencies and local communities are working in partnership to recover wild populations of this
overexploited species.
Within the two study reserves there are currently 14 beaches protected by 42 beach-guards

Capítulo 5
144
(2-4 per beach). For 5-6 months during the dry season, in rotation where possible, beach-
guards occupy a wooden house in front of the beach, maintaining vigilance 24 hours a day,
seven days per week. The pressure from the illegal commerce of freshwater turtles in the
region is substantial, and beach-guards are often the target of threats from poachers attempting
to harvest eggs and females laying eggs on the beach. Beach-guards also monitor nesting
success, recording the number of nests for all three turtle species, any predation or poaching
events and the number of live or dead hatchlings in each nest. From the partnership between
government agencies and university projects, beach-guards receive a total of ~U$107 per
month, in the form of food items.
We analyzed 34 years of data collection (1980 – 2014) to verify the effectiveness of this
community-based conservation model in achieving its aim of ensuring the successful release
of hatchlings. To verify population recovery, we also conducted 63 semi-structured interviews
(Bernard, 1994) at 41 local communities containing at least six households, both within (N=26)
and outside (N=15) protected areas. Interviews were conducted with highly experienced
fishermen who had been continuous full-time residents at the community for >10 years. We
recorded the broad perception of population status (i.e. increasing, decreasing, or neutral) for
the Giant South American turtle at beaches that were frequently visited by local villagers during
the dry season, relative to perceived baseline population status over the last 10 years.
Sample design and multi-taxa approach for non-target species
To understand the unintended benefits of beach protection we sampled, in addition to beach-
guard data on turtle species, multiple non-target taxa, using two approaches: counts of
individuals (abundance approach) and counts of nests (reproduction approach). We sampled
28 beaches (14 protected and 14 unprotected) during the dry season, which is the reproductive
peak for most beach-nesting species. Sampled groups were beach-nesting birds, caimans,
Capítulo 5
145
terrestrial invertebrates, green iguana, large catfishes, and other aquatic fauna (sampled with
sonar). Full methodological details of for each group are available in the supplementary
materials.
Poaching pressure and environmental variables
Poaching pressure was quantified for both protected and unprotected beaches during 45
days, by monitoring the number of nests raided. All beach-guards were highly experienced,
allowing them to detect poaching activity from footprints or other signs around raided nests.
We also established the number of years since the establishment of protection for each
protected beach and extracted two landscape variables related to human pressure using
ArcGIS (version 10.2): the fluvial distances to the nearest local community and to the market
town of Carauari. The crescent area of each beach was calculated by geo-referencing the
peripheral points and measuring the maximum width, we conducted a granulometry analysis,
to provide the percentage of coarse sand, fine sand, clay and silt, and we measured the beach
profile to calculate the gradient within 10 m of the river shore.
Data analyses
We performed general linear models (GLMs) to examine variation in the number of nests of
Giant South American turtles across all 28 beaches (14 protected and 14 unprotected) as a
function of all potential predictors. Because of correlation between granulometry proportions
we included only the percentage of coarse sand in the models. We constructed all possible
models, from the constant model (without predictors) to the full model: Number of nests ~ Years
of protection Distance to nearest community + Distance to nearest town Beach area + Beach
slope + Coarse sand proportion. Models were fitted using the lmer function from the lme4
package and each model combination was examined using the MuMIn package (Barton,
2009). All analyses were conducted in R (R Development Core Team 2015).
Capítulo 5
146
We selected the most parsimonious model with the lowest Akaike Information Criterion
corrected for small sample size (AICc). AICc is calculated as the difference between each
model’s AICc and the lowest AICc, with a AICc < 2 interpreted as substantial support that the
model belongs to the set of best models. Akaike weights give the probability that a model is
the best model, given the data and the set of candidate models (Burnham and Anderson,
2002). After model selection, we calculated a model average, which considers the beta average
of all variables included in parsimonious models. Finally, as the variables were standardized
through z standardization, we compared the relative effect size of all variables.
We tested for differences in abundance or number of nests in all sampled groups using
paired t-tests. Finally, we performed linear models (LMs) and general linear models (GLMs),
according to the error structure, to verify the drivers of abundance or number of nests in our
sampled groups. Model selection procedure followed the same steps described previously.
5.Acknowledgements
This study was funded by a DEFRA Darwin Initiative (UK) grant (Ref. 20-001). We thank the
Secretaria do Estado do Meio Ambiente e Desenvolvimento Sustentável of Amazonas (SDS)
and the Instituto Brasileiro do Meio Ambiente e Recursos Naturais Renováveis
(IBAMA)/Instituto Chico Mendes de Conservação da Biodiversidade (ICMBio) for authorizing
this research. We are grateful for the participation of all beach-guards and the co-operation of
all communities of the Médio Juruá region. XXX assisted identification of terrestrial
invertebrates, and XXX conducted granulometry analyses. We thank XXX for comments on an
earlier version of the manuscript. This is publication no. XX of the Projeto Médio Juruá series
on Resource Management in Amazonian Reserves.
6.References
1. Adis, J., & Junk, W. J. 2002. Terrestrial invertebrates inhabiting lowland river floodplains of
Central Amazonia and Central Europe: a review. Freshwater Biol, 47(4), 711-731.
Capítulo 5
147
2. Alho, C.J.R. 1985. Conservation and management strategies for commonly exploited
Amazonian turtles. Biological Conservation,32,291-298.
3. Alves, R. R. N., Vieira, K. S., Santana, G. G., Vieira, W. L. S., Almeida, W. O., Souto, W. M.
S., ... & Pezzuti, J. C. B. 2012. A review on human attitudes towards reptiles in Brazil. Environ
Monit Assess,184(11), 6877-6901.
4. Barnosky, A. D., Matzke, N., Tomiya, S., Wogan, G. O.U., Swartz, B., Quental, T. B., Marshall,
C.; McGuire, J.L.; Lindsey, E.L.; Maguire, K.C.; Mersey, B. and Ferrer B.A. 2011. Has the
Earth/'s sixth mass extinction already arrived?. Nature, 471(7336), 51-57.
5. Bartón, K. 2009. MuMIn: multi-model inference. R package, version 0.12.2. http://r-forge.r-
project.org/projects/mumin/.
6. Barrett, C. B., Brandon, K., Gibson, C., & Gjertsen, H. 2001. Conserving tropical biodiversity
amid weak institutions. BioScience, 51(6), 497-502.
7. Bernard HR.1994. Research Methods in Anthropology: qualitative and quantitative
approaches. 4th ed. London: Altamira Press.
8. Berkes, F. 2007. Community-based conservation in a globalized world.Proc Natl Acad Sci
USA, 104(39), 15188-15193.
9. Berkes, F. 2009. Evolution of co-management: role of knowledge generation, bridging
organizations and social learning. J Environ Manage, 90(5), 1692-1702.
10. Boswell, K.M.; Wilson, M.P. and Cowan, J.H. 2008. A Semiautomated Approach to Estimating
Fish Size, Abundance, and Behavior from Dual-Frequency Identification Sonar (DIDSON)
Data. North American Journal of Fisheries Management 28:799–807.
11. Bradshow, C.J.A.; Sodhi, N.S. and Brook, B. W. 2008. Tropical turmoil: a biodiversity tragedy
in progress. Frontiers in Ecology and Environment, 7, 79-87.
12. Bruner, A. G., Gullison, R. E., & Balmford, A. 2004. Financial costs and shortfalls of managing
and expanding protected-area systems in developing countries. BioScience, 54(12), 1119-
1126.
13. Bruner, A. G., Gullison, R. E., Rice, R. E., & Da Fonseca, G. A. (2001). Effectiveness of parks
in protecting tropical biodiversity. Science, 291(5501), 125-128.
14. Buckland ST, Anderson DR, Burnham KP, Laake JL, Borchers DL, Thomas L. Introduction to
Distance Sampling. Oxford University Press, Oxford. 2001.
15. Burnham KP, Anderson DR. 2002. Model selection and multimodel inference: a practical
information‐theoretic approach. New York, NY: Springer. p 488.
16. Campos-Silva,J.V.; Fonseca-Junior, S.F., Peres, C.A. 2015. Policy reversals do not bode well
Capítulo 5
148
for conservation in Brazilian Amazonia. Natureza & Conservação, 13:193-195.
17. Cantarelli, V. H., Malvasio, A., & Verdade, L. M. 2014. Brazil's Podocnemis expansa
conservation program: retrospective and future directions. Chelonian Conserv Biol, 13(1), 124-
128.
18. Caputo, F.P.; Canestrlli, D. and Boitani, L. 2005. Conserving the terecay (Podocnemis unifilis,
Testudines: Pelomedusidae) through a community-based sustainable harvest of its eggs.
Biological Conservation,126, 82-92.
19. Castello, L.; Viana, J.P.; Watkins, G.; Pinedo-Vasquez, M. and Luzadis, V.A. 2009. Lessons
from Integrating Fishers of Arapaima in Small-Scale Fisheries management at the
Mamiraua Reserve, Amazon. Enviromental Management 43, 197-209.
20. Castello, L.; McGrath, D.G.; Hess, L.L.; Coe, M.T.; Lefebvre, P.A.; Petry, P.; Macedo, M.N.;
Renós, V. and Arantes, C.C. 2013. The vulnerability of Amazon freshwater ecosystems.
Conservation Letters, 6(4), 217-229.
21. Castello, L., & Macedo, M. N. (2015). Large-scale degradation of Amazonian freshwater
ecosystems. Global Change Biology,22,990-1007.
22. Cinner. J.E. et al. 2012. Transitions toward co-management: The process of marine resource
management devolution in three east African countries, Global Environmental Change 22,
651–658.
23. Cinner. J.E.et al. 2012. Comanagement of coral reef social-ecological systems. Proceedings
of the National Academy of Sciences of the USA 109, 5219–5222.
24. Conway-Gómez, K. 2007. Effects of human settlements on abundance of Podocnemis unifilis
and P. expansa turtles in northeastern Bolivia. Chelonian Conserv Biol, 6(2), 199-205.
25. Da Silveira, R., and Thorbjarnarson, J. B. 1999. Conservation implications of commercial
hunting of black and spectacled caiman in the Mamirauá Sustainable Development Reserve,
Brazil. Biol Conserv, 88(1), 103-109.
26. Da Silveira, R., Magnusson, W. E., & Campos, Z. 1997. Monitoring the distribution, abundance
and breeding areas of Caiman crocodilus crocodilus and Melanosuchus niger in the
Anavilhanas Archipelago, Central Amazonia, Brazil. J Herpetol, 514-520.
27. Davenport, L. C., Goodenough, K. S., & Haugaasen, T. 2016. Birds of Two Oceans? Trans-
Andean and Divergent Migration of Black Skimmers (Rynchops niger cinerascens) from the
Peruvian Amazon. PloS One, 11(1).
28. de Souza, R. R., & Vogt, R. C. 1994. Incubation temperature influences sex and hatchling size
in the neotropical turtle Podocnemis unifilis. J Herpetol, 453-464.
Capítulo 5
149
29. del Viejo, A. M., Vega, X., González, M. A., & Sánchez, J. M. (2004). Disturbance sources,
human predation and reproductive success of seabirds in tropical coastal ecosystems of
Sinaloa State, Mexico. Bird Conserv Int, 14(03), 191-202.
30. Dudley, N.2008. Guidelines for Applying Protected Area Management Categories. Gland,
Switzerland: IUCN. 86pp.
31. Evans, L., Cherrett, N., & Pemsl, D. 2011. Assessing the impact of fisheries co-management
interventions in developing countries: A meta-analysis. J Environ Manage, 92(8), 1938-1949.
32. Fachín-Terán, A., Vogt, R. C., & Thorbjarnarson, J. B. 2004. Patterns of use and hunting of
turtles in the Mamirauá Sustainable Development Reserve, Amazonas, Brazil. People in
Nature: Wildlife Conservation in South and Central America, 1.
33. Fagundes, C. K., Vogt, R. C., & De Marco Júnior, P. 2016. Testing the efficiency of protected
areas in the Amazon for conserving freshwater turtles. Divers Distrib, 22(2), 123-135.
34. Gardner, T. A., Barlow, J., Chazdon, R., Ewers, R. M., Harvey, C. A., Peres, C. A., and Sodhi,
N. S. 2009. Prospects for tropical forest biodiversity in a human‐modified world. Ecol
Lett, 12(6), 561-582.
35. Gerlotto, F.; Soria, M. and Fréon, P. 1999. From two dimensions to three: the use of multibeam
sonar for a new approach in fisheries acoustics. Can. J. Fish. Aquat. Sci. 56: 6–12.
36. Gerlotto, F.; Georgakarakosb, S. and Eriksen, P.K. 2000. The application of multibeam sonar
technology for quantitative estimates of fish density in shallow water acoustic surveys Aquat.
Living Resour. 13, 385−393
37. Gibbons, J. W., et al. 2000. The Global Decline of Reptiles, Déjà Vu Amphibians. BioScience,
50(8), 653-666.
38. Gonzalez-Socoloske, D. and Olivera-Gomez, L.D..2012. Gentle Giants in Dark Waters: Using
Side-Scan Sonar for Manatee Research. The Open Remote Sensing Journal, 5, 1-14
39. Glennie, R., Buckland, S. T., & Thomas, L. 2015. The effect of animal movement on line
transect estimates of abundance. PloS One, 10(3)
40. Greenslade, P. J. M. 1973. Sampling ants with pitfall traps: digging-in effects. Insectes Soc,
20(4), 343-353.
41. Gutierrez, N.L.; Hilborn, R. and Defeo, O. 2011. Leadership, social capital and incentives promote
successful fisheries
42. Hardin, G. 1968. The tragedy of the commons. Science 162,1243–8
43. International Union for Conservation of Nature (IUCN) (2011) 2011 IUCN Red List of

Capítulo 5
150
Threatened Species. Available at: www.iucnredlist.org (accessed 5 January 2015).
44. Liu, J. et al. 2007. Complexity of coupled human and natural systems. Science 317, 1513-
1516.
45. McLaughlin, V. P. 1979. Occurrence of Large-billed Tern (Phaetusa simplex) in Ohio. American
Birds, 33, 727.
46. Milton, S. L., Schulman, A. A., & Lutz, P. L. 1997. The effect of beach nourishment with
aragonite versus silicate sand on beach temperature and loggerhead sea turtle nesting
success. J Coastal Res, 904-915.
47. Napier, V. R., Branch, G. M., & Harris, J. M. 2005. Evaluating conditions for successful co-
management of subsistence fisheries in KwaZulu-Natal, South Africa. Environ Conserv,
32(02), 165-177.
48. Naughton-Treves, L., Holland, M. B., & Brandon, K. 2005. The role of protected areas in
conserving biodiversity and sustaining local livelihoods. Annu. Rev. Environ. Resour., 30, 219-
252.
49. Newton, P., A. R. Watkinson, and C. A. Peres. 2011. Determinants of yield in a non–timber
forest product: Copaifera oleoresin in Amazonian extractive reserves. Forest Ecology and
Management 261, 255–264.
50. Ostrom, E. 2009. A general framework for analyzing sustainability of social-ecological systems.
Science 325, 419-422.
51. Pauly, D., Christensen, V., Guénette, S., Pitcher, T. J., Sumaila, U. R., Walters, C. J., ... &
Zeller, D. 2002. Towards sustainability in world fisheries. Nature, 418(6898), 689-695.
52. Peñaloza, C. L., Hernández, O., Espín, R., Crowder, L. B., & Barreto, G. R. 2013. Harvest of
endangered sideneck river turtles (Podocnemis spp.) in the middle Orinoco, Venezuela.
Copeia, 2013(1), 111-120.
53. Pereira, H. M., et al. (2010). Scenarios for global biodiversity in the 21st century. Science, 330,
1496–1501.
54. Peres, C. A. 2000. Effects of subsistence hunting on vertebrate community structure in
Amazonian forests. Conserv Biol, 14(1), 240-253.
55. Peres, C. A., & Palacios, E. 2007. Basin-Wide Effects of Game Harvest on Vertebrate
Population Densities in Amazonian Forests: Implications for Animal-Mediated Seed Dispersal.
Biotropica, 39(3), 304-315.
56. Peres, C. A., & Terborgh, J. W. 1995. Amazonian nature reserves: an analysis of the
defensibility status of existing conservation units and design criteria for the future. Conserv
Capítulo 5
151
Biol, 9(1), 34-46.
57. Petermann, P. 1997. The birds. In The Central Amazon Floodplain vol 126,pp. 419-452.
Springer Berlin Heidelberg.
58. Petrere Jr, M., Barthem, R. B., Córdoba, E. A., & Gómez, B. C. 2004. Review of the large
catfish fisheries in the upper Amazon and the stock depletion of piraíba (Brachyplatystoma
filamentosum Lichtenstein). Rev Fish Biol Fisher, 14(4), 403-414.
59. Pomeroy, R. S., Pollnac, R. B., Katon, B. M., & Predo, C. D. (1997). Evaluating factors
contributing to the success of community-based coastal resource management: the Central
Visayas Regional Project-1, Philippines. Ocean Coast Manage, 36(1), 97-120.
60. Pomeroy, R.S., and Ahmed, M. 2006. Fisheries and Coastal Resources Co-management in
Asia: Selected Results from a Regional Research Project. WorldFish Center Studies and
Reviews 30, 240p.
61. Prestes-Carneiro, G.; Béarez, P.; Bailon, S.; Py-Daniel, A.R. and Neves, E.G.2015.
Subsistence fishery at Hatahara (750–1230 CE), a pre-Columbian central Amazonian village.
Journal of Archaeological Science: Reports.
62. Pritchard, P.C.H.; Trebbau T. 1984 . The Turtles of Venezuela . Society for the Study of Amph
ibians and Reptiles, Contributions to Herpetology, Vo l . 2 . Ox ford (OH): Miami University
63. Roberge, J.M. and Angelstam, P. 2004. Usefulness of the Umbrella Species Concept as a
Conservation Tool. Conservation Biology,18,76-85.
64. Sachs, J.D. 2009. Biodiversity conservation and the millennium development goals. Science
325, 1502-1503.
65. Sala, O. E., Chapin, F. S.; Armesto, J. J.; Berlow, E.; Bloomfield, J., Dirzo; R.; Huber-Sanwald,
E.; Huenneke, L.F.; Jackson, R.B.; Kinzing, A.; Leemans, R.; Lodge, D.M.; Mooney, H.A.;
Oesterheld, M.; Poff, N.L.; Sykes, M.T.; Walkers, B.H.; Walker, M. andWall, D.H. 2000. Global
biodiversity scenarios for the year 2100. Science, 287(5459), 1770-1774.
66. Somanathan, E.; Prabhakar, R. Mehta, B.S.2009. Decentralization for cost-effective
conservation. Proceedings of the National Academy of Sciences of the USA 106, 4143–4147.
67. Terborgh, J. 1999. Requiem for nature. Island Press.
68. Terborgh, J. 2000. The fate of tropical forests: a matter of stewardship. Conserv Biol, 14(5),
1358-1361.
69. Thorbjarnarson, J. B., Pérez, N., & Escalona, T. 1997. Biology and conservation of aquatic
turtles in the Cinaruco-Capanaparo National Park, Venezuela. In Proceedings, conservation,

Capítulo 5
152
restoration, and management of tortoises and turtles—an international conference. New York
Turtle and Tortoise Society, New York, 109-112.
70. Thorbjarnarson, J., Lagueux, C. J., Bolze, D., Klemens, M. W., & Meylan, A. B. 2000. Human
use of turtles: a worldwide perspective. Turtle Conservation, 33-84.
71. Van Vliet, N.; Cruz, D.; Quiceno-Mesa, M.P.; Neves de Aquino, L.J.; Moreno, J.; Ribeiro,
R.T.; Fa, J.E. 2015. Ride, shoot, and call: wildlife use among contemporary urban hunters in
Três Fronteiras, Brazilian Amazon.Ecology and Society, 20:8.
Capítulo 5
153
Supplementary material
Materials and Methods Migratory birds: We sampled three species of migratory bird, the black skimmer (Rynchops
niger) and the long-billed tern (Phaetusa simplex), which both conduct continent-wide migration
(McLaughlin, 1979; Davenport et al. 2016) and the sand-coloured nighthawk (Chordeiles
rupestris), which conduct intra-Amazonian migration (Peterman, 1997). For the abundance
approach, two observers walked slowly in defined linear transects (Buckland et al. 2001) along
the middle of the beach, starting at 06h30 and counting the number of individuals in each
species. Each observer conducted either (1) counts for half of the beach, which were then
combined (in the case of large beaches) or (2) counts for the whole beach, which were then
compared to reach a consensus (small beaches). Counts were conducted once per beach but
abundances at each beach were observed to be consistent between days. Counts were
facilitated by the lack of vegetation or any other obstructions. Moreover, the birds are
accustomed to human presence, due the monitoring by beach guards, and so we are confident
that their movements were not affected by our presence (Glennie et al. 2015).
Large catfishes: Large catfishes were sampled with two consecutive trawls of 100 m length
and 4 m depth (mesh sizes: 14 and 18 mm) between 10h00 and 12h00. The trawl was pulled
by a metal riverboat from the bank of the beach up to the middle of the river, following the
upstream direction. All individual fish were identified, weighed, and released. All the beaches
were sampled with the same effort.
Aquatic biodiversity abundance: Sonar technology has been satisfactorily used to sample
aquatic fauna, including fishes and manatees (Gerlotto et al. 1999; 2000; Boswell et al. 2000;
Gonzalez-Socoloske and Olivera-Gomez, 2012). We employed a Humminbird® 958c HD

Capítulo 5
154
combo system to survey fish and others vertebrates along transects along each beach and
along the opposite bank of the river. All transect had the same length (400 m) and were covered
by small motor boat a steady slow speed (5 km hr-1). Humminbird® fish finders have a side-
scan sonar with two beams; we used the narrow side beams producing 455 kHz and covering
180°, which is suitable for shallow environments sampling (Gerlotto et al. 2000). The transducer
is attached directly to the boat, and the unit is powered by 12 V batteries. These sonar systems
have a screen to view acoustic images in real time, and the presence of fishes or other aquatic
fauna was detected by a standard alarm. There are three size classes detected but, because
it is not possible to distinguish a small caiman from a medium fish, for example, we included
all classes together to reflect a total abundance index of aquatic vertebrates for each sampled
transect.
Caimans: We sampled caimans using nocturnal surveys (between 19h00 and 23h00) from an
aluminum boat with a 15 HP motor moving between 8 and 10 km/h. Caimans were sampled
by their eyeshine when illuminated with a spotlight (Da Silveira et al., 1997). Spotlight surveys
were made between august and September of 2013, during the wet season. We sampled the
all the beach arch and the bank in front of the beach.
Terrestrial invertebrates: Terrestrial invertebrates were sampled using an array of ten cylindrical
pitfall traps (opening diameter of 75 mm and depth 100 mm) at each beach. Traps filled with
70% ethanol and 5% glycerol were placed 100 m apart along a transect line in the middle of
each beach, parallel to the shoreline, and were retrieved 48 h after installation to avoid any
digging effect (Greenslade 1973). Samples were stored in a solution composed of 70% ethanol
and 30% distilled water. Specimens were identified to the order level with expert taxonomic
assistance from Universidade Federal do Amazonas.
Green iguana, fresh water turtles and bird nests: Nests of the green iguana, freshwater turtles
and birds were sampled by three experienced beach-guards. The whole beach was surveyed

Capítulo 5
155
systematically on a single day during peak nesting activity, counting all nests and identifying
the species by the characteristic tracks and/or egg appearance.
Supplementary figures
Figure S1. Relative size effect (z-estimates) of all predictors of abundance for non-target taxa. Dots represent mean estimates while horizontal lines indicate confidence intervals (CI). For significant variables CIs do not cross the vertical dotted line at zero. Estimates colored blue represent a significant positive effect; red estimates represent a significant negative effect.
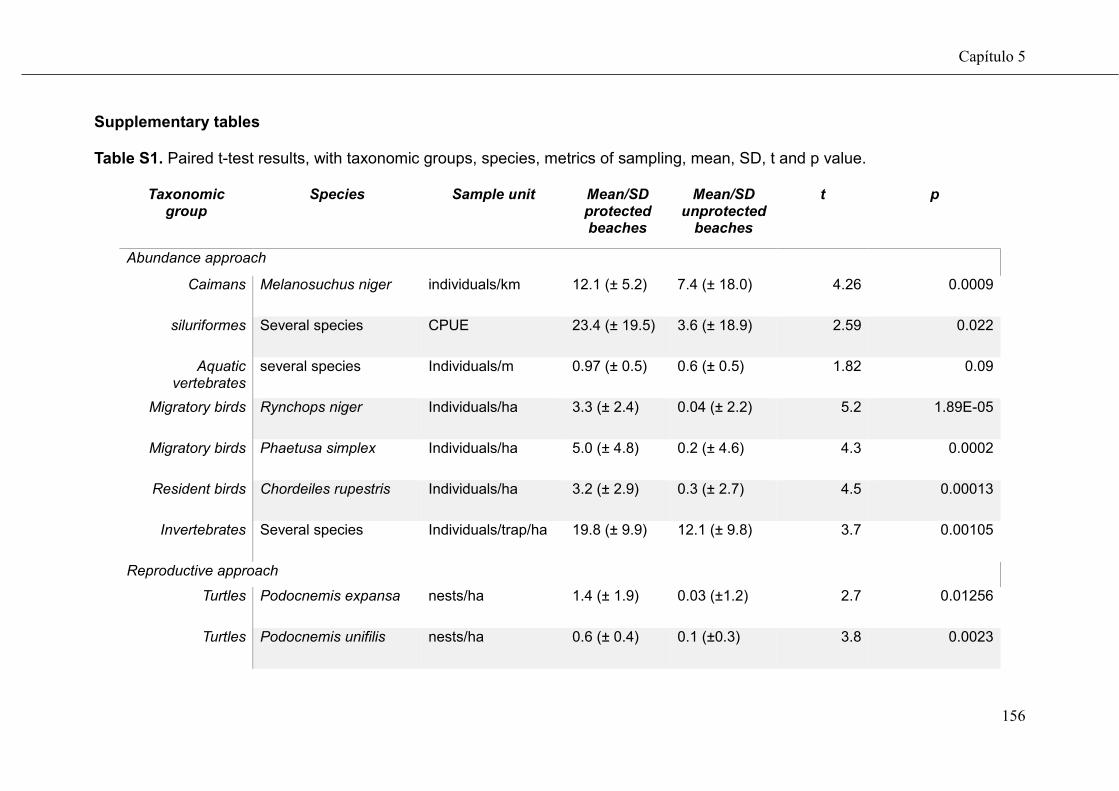
Capítulo 5
156
Supplementary tables
Table S1. Paired t-test results, with taxonomic groups, species, metrics of sampling, mean, SD, t and p value.
Taxonomic group
Species Sample unit Mean/SD protected beaches
Mean/SD unprotected
beaches
t p
Abundance approach
Caimans Melanosuchus niger individuals/km 12.1 (± 5.2) 7.4 (± 18.0) 4.26 0.0009
siluriformes Several species CPUE 23.4 (± 19.5) 3.6 (± 18.9) 2.59 0.022
Aquatic vertebrates
several species Individuals/m 0.97 (± 0.5) 0.6 (± 0.5) 1.82 0.09
Migratory birds Rynchops niger Individuals/ha 3.3 (± 2.4) 0.04 (± 2.2) 5.2 1.89E-05
Migratory birds Phaetusa simplex Individuals/ha 5.0 (± 4.8) 0.2 (± 4.6) 4.3 0.0002
Resident birds Chordeiles rupestris Individuals/ha 3.2 (± 2.9) 0.3 (± 2.7) 4.5 0.00013
Invertebrates Several species Individuals/trap/ha 19.8 (± 9.9) 12.1 (± 9.8) 3.7 0.00105
Reproductive approach
Turtles Podocnemis expansa nests/ha 1.4 (± 1.9) 0.03 (±1.2) 2.7 0.01256
Turtles Podocnemis unifilis nests/ha 0.6 (± 0.4) 0.1 (±0.3) 3.8 0.0023

Capítulo 5
157
Turtles Podocnemis sextuberculata
nests/ha 3.3 (± 2.4) 1.2 (±1.02) 3.1 0.0086
Reptile Iguana iguana nests/ha 0.8 (± 0.5) 0.1 (± 0.5) 8.1 1.08E-08
Migratory birds Rynchops niger nests/ha 5.0 (± 5.1) 0.6 (± 5.1) 2 0.00719
Migratory birds Phaetusa simplex nests/ha 40.1 (± 18.9) 28.5 (± 18.7) 3.2 0.00355
Resident birds Chordeiles rupestris nests/ha 1.4 (± 1.3) 0.4 (± 1.4) 3.1 0.00418
Table S2. Perceptions by 40 beach-guards of the benefits and concerns of community-based beaches protection
Benefits Brief explanation Relative
importance score (%)
Concerns Brief explanation Relative importance score (%)
Population recovery
All beach-guards reported the population increases of the Giant south American river turtle.
1 (100%) Lack of generation of local income/financial reward is not enough
The beach guards claim for a salary.
1 (100%)
Maintenance of an important culinary culture
The turtle meat has a high culinary value.
2 (80%) t Feeling of being under-valued by government and society
They feel part of an undervalued profession.
2 (95%)
Strengthening of cultural values
Turtle hunting and consumption has a high cultural importance.
3 (70%) Lack of surveillance They need more assistance to curb the action of poachers.
3 (90%)
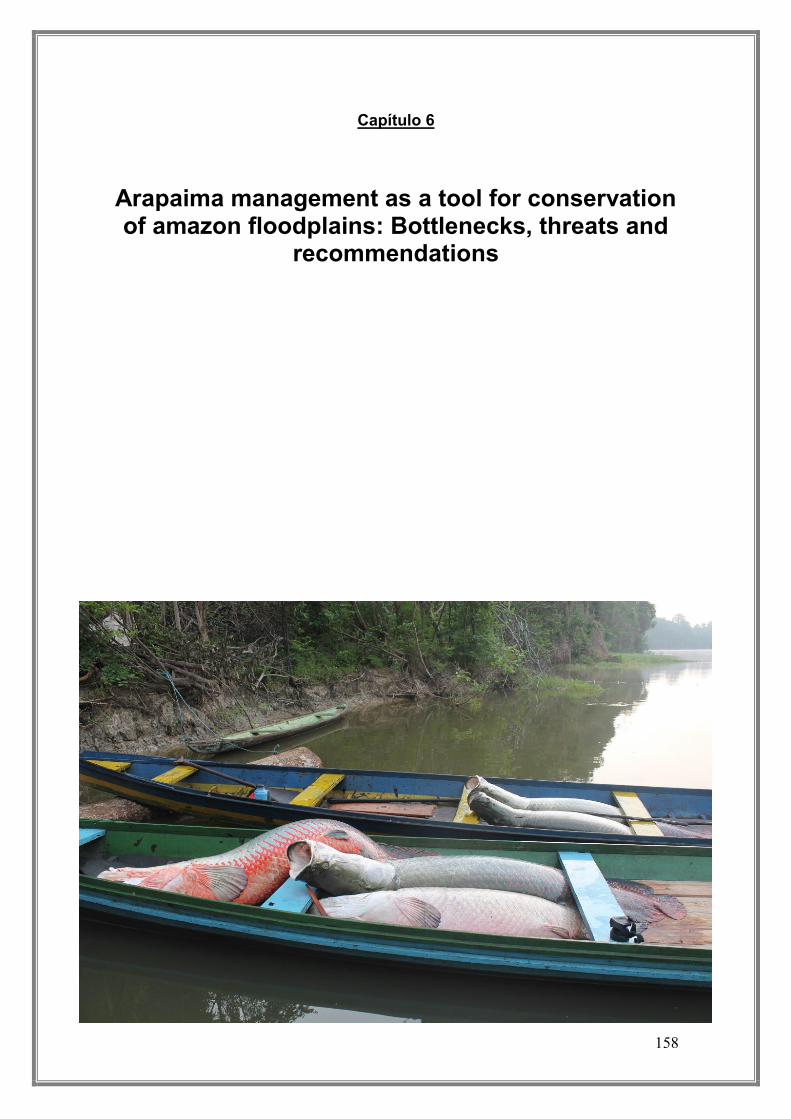
158
Capítulo 6
Arapaima management as a tool for conservation of amazon floodplains: Bottlenecks, threats and
recommendations
Carolina Freitas
Capítulo 6
159
Arapaima management as a tool for conservation of amazon floodplains: Bottlenecks, threats and recommendations*
João Vitor Campos-Silva, Felipe Rossoni, Carolina Freitas, Rosi Batista, Paula
Pinheiro, Adevaldo Dias, Cristina Isis Buck Silva, Flavio Ruben Junior, Marcelo Castro, Leonardo Kurihara e Carlos Peres
*Manuscrito a ser submetido à Fisheries Research
1- Universidade Federal do Rio Grande do Norte- UFRN 2- Instituto Piagaçu Purus - IPI 3- Instituto Chico Mendes de Conservação da Biodiversidade – ICMBio 4- Associação dos produtores rurais de Carauari – ASPROC 5- Instituto Brasileiro de Meio Ambiente e dos Recursos Naturais Renováveis - IBAMA 6- Secretaria do Meio Ambiente do Amazonas - SEMA 7- Fundação Amazonas Sustentável - FAS 8- Operaçao Amazonia Nativa – OPAN 9- University of East Anglia - UEA
Keywords: Amazônia, Amazon protected areas, Community-based-
management, sustainable development, fisheries.
1. Introdução
O pirarucu é o maior peixe de escamas de água doce do mundo, podendo
atingir até três metros de comprimento e pesar cerca de 200 kg. Nativo da Bacia
Amazônica, esse predador de topo sempre foi um importante alvo de pescarias
devido ao seu alto valor cultural e econômico. Ao longo do século XIX e início do
século XX, o pirarucu foi caracterizado como o principal recurso pesqueiro da
Amazônia brasileira (Veríssimo 1895, Santos e Santos 2005), o que indica que
havia uma intensa pressão de exploração sobre a espécie. Com isso, suas
populações logo começaram a apresentar sinais de sobrepesca, expressos
principalmente na diminuição das taxas de captura e do tamanho médio dos
indivíduos (Isaac et al. 1993). O pirarucu deixou de ser encontrado em algumas
partes da Amazônia e passou a existir em baixíssimos números em outras, o que

Capítulo 6
160
gerou preocupação acerca da manutenção da espécie. Atualmente, o status do
pirarucu na Lista Vermelha de Espécies Ameaçadas da IUCN é inconclusivo,
devido à insuficiência de dados (IUCN,2015).
O manejo comunitário do pirarucu teve início há cerca de 15 anos na
Reserva de Desenvolvimento Sustentável Mamirauá. Nesse modelo de manejo,
as comunidades rurais passam a proteger lagos, garantindo a reprodução de
peixes adultos e o crescimento dos filhotes. Esse modelo de manejo recuperou
as populações de pirarucu em Mamirauá (Castello 2009) e vem sendo
estabelecido em diversas outras localidades. De uma forma impressionante, o
padrão de recuperação populacional vem se mantendo o mesmo (Campos-Silva
e Peres in press, Petersen et al. 2016). Além da recuperação populacional do
pirarucu, a proteção dos lagos de manejo também proporciona benefícios
substanciais para outros grupos taxonômicos, como peixes (Silvano et al. 2008;
Arantes 2015) jacarés (Campos-Silva e Peres in press) e quelônios (Miorando
2009).
Além dos benefícios ecológicos, pode-se perceber também expressivos
resultados sociais e econômicos no manejo comunitário do pirarucu. Os lagos
protegidos estão funcionando como uma poupança bancária, assegurando um
lucro anual considerável para muitas famílias da área rural (Castello 2009,
Campos-Silva e Peres in press). Essa rara oportunidade de fonte de renda
alternativa está provendo segurança econômica para muitas comunidades da
Amazônia. Com o dinheiro que adquirem com comercialização da cota de
pirarucu pescada, os ribeirinhos podem investir em melhorias nas suas casas e
comunidades, proporcionando, por exemplo, reformas nas escolas e compra de
motores de luz e equipamentos de trabalho.
Capítulo 6
161
Os benefícios gerados pelo manejo do pirarucu também fazem com que
as comunidades aumentem sua autoestima e sintam orgulho por promover o uso
sustentável de um recurso tão importante que chegou a ser quase extinto. Além
disso, com as práticas do manejo, o conhecimento tradicional relacionado à
biologia, ecologia e pesca do pirarucu está sendo amplamente propagado dentre
os comunitários e compartilhado com os jovens (Campos-Silva e Peres in press).
De uma maneira geral, os comunitários participantes do manejo estão se
mostrando cada vez mais engajados, o que exerce forte influência sobre os
resultados das iniciativas. Ao mesmo tempo, um número cada vez maior de
comunidades tem buscado implementar o manejo do pirarucu, aumentando a
escala dos efeitos dessa atividade na região amazônica.
Assim, este modelo de manejo emerge como uma grande janela de
oportunidades para promover a conservação da biodiversidade aliada à melhoria
da qualidade de vida das comunidades rurais nas áreas de várzea da Amazônia.
Pode-se dizer que a sociedade brasileira se depara com um raro modelo de
conservação, em que os ganhos são substancialmente altos comparados ao
custo relativamente baixo de implementação do modelo.
Atualmente, o manejo do pirarucu ocorre em 24 unidades no estado do
Amazonas, localizadas em 14 municípios (Figura 1). Cerca de 300 comunidades
e mais de 3000 estão envolvidos na pesca de cerca de 100 toneladas de pirarucu
por ano. Vale ressaltar que o número de indivíduos pescados anualmente
corresponde ao máximo de 30% do total de indivíduos adultos contados, pois
esta é a cota anual máxima concedida para cada unidade de manejo pelo
Instituto Brasileiro do Meio Ambiente e dos Recursos Naturais Renováveis
(IBAMA). A porcentagem de cota concedida varia de acordo com uma série de
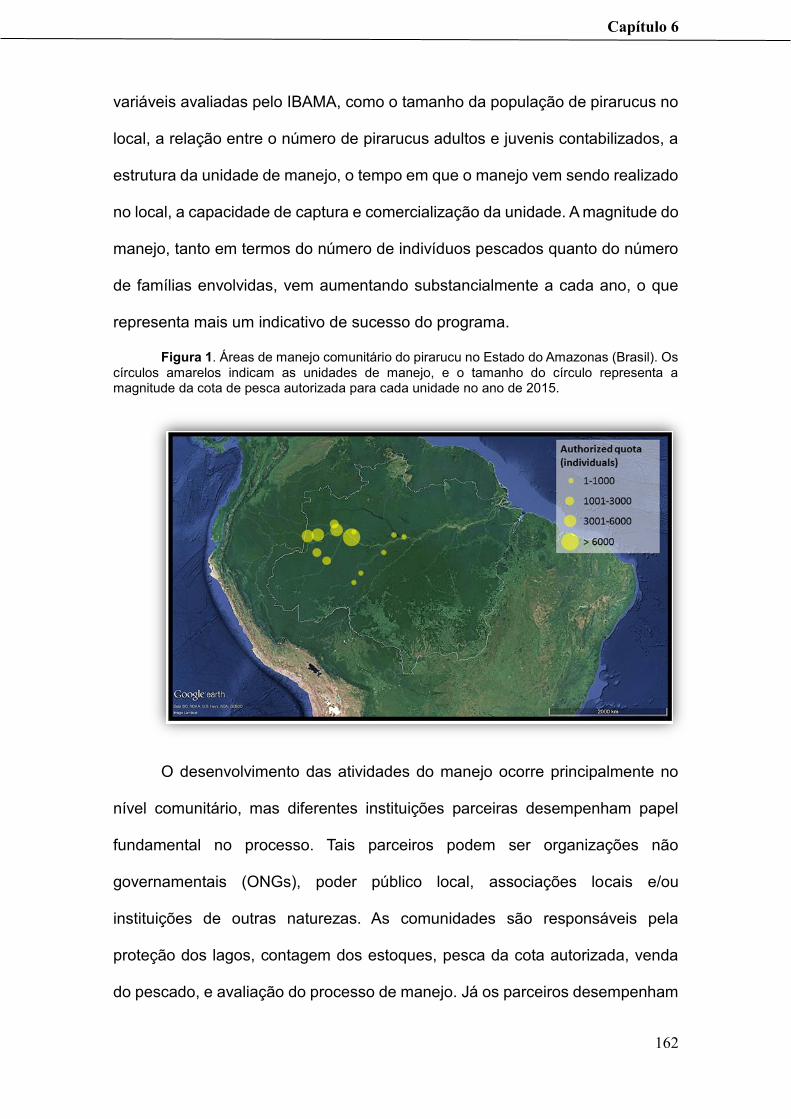
Capítulo 6
162
variáveis avaliadas pelo IBAMA, como o tamanho da população de pirarucus no
local, a relação entre o número de pirarucus adultos e juvenis contabilizados, a
estrutura da unidade de manejo, o tempo em que o manejo vem sendo realizado
no local, a capacidade de captura e comercialização da unidade. A magnitude do
manejo, tanto em termos do número de indivíduos pescados quanto do número
de famílias envolvidas, vem aumentando substancialmente a cada ano, o que
representa mais um indicativo de sucesso do programa.
Figura 1. Áreas de manejo comunitário do pirarucu no Estado do Amazonas (Brasil). Os círculos amarelos indicam as unidades de manejo, e o tamanho do círculo representa a magnitude da cota de pesca autorizada para cada unidade no ano de 2015.
O desenvolvimento das atividades do manejo ocorre principalmente no
nível comunitário, mas diferentes instituições parceiras desempenham papel
fundamental no processo. Tais parceiros podem ser organizações não
governamentais (ONGs), poder público local, associações locais e/ou
instituições de outras naturezas. As comunidades são responsáveis pela
proteção dos lagos, contagem dos estoques, pesca da cota autorizada, venda
do pescado, e avaliação do processo de manejo. Já os parceiros desempenham
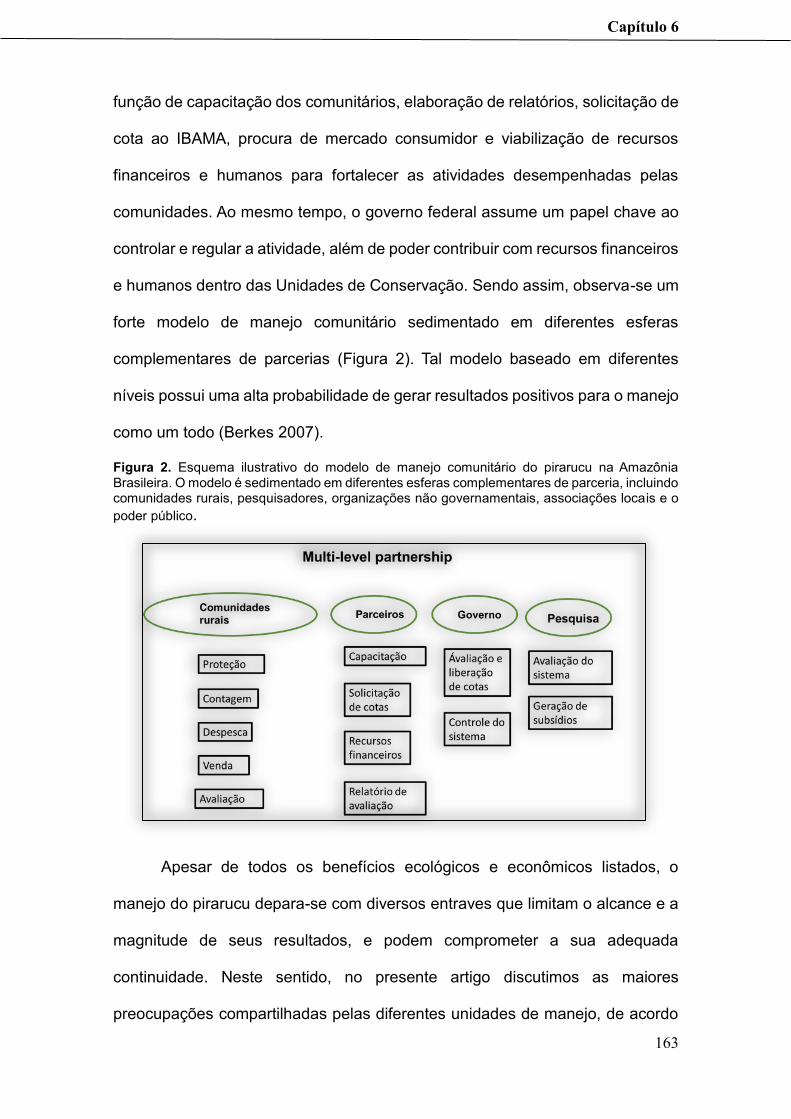
Capítulo 6
163
função de capacitação dos comunitários, elaboração de relatórios, solicitação de
cota ao IBAMA, procura de mercado consumidor e viabilização de recursos
financeiros e humanos para fortalecer as atividades desempenhadas pelas
comunidades. Ao mesmo tempo, o governo federal assume um papel chave ao
controlar e regular a atividade, além de poder contribuir com recursos financeiros
e humanos dentro das Unidades de Conservação. Sendo assim, observa-se um
forte modelo de manejo comunitário sedimentado em diferentes esferas
complementares de parcerias (Figura 2). Tal modelo baseado em diferentes
níveis possui uma alta probabilidade de gerar resultados positivos para o manejo
como um todo (Berkes 2007).
Figura 2. Esquema ilustrativo do modelo de manejo comunitário do pirarucu na Amazônia Brasileira. O modelo é sedimentado em diferentes esferas complementares de parceria, incluindo comunidades rurais, pesquisadores, organizações não governamentais, associações locais e o
poder público.
Apesar de todos os benefícios ecológicos e econômicos listados, o
manejo do pirarucu depara-se com diversos entraves que limitam o alcance e a
magnitude de seus resultados, e podem comprometer a sua adequada
continuidade. Neste sentido, no presente artigo discutimos as maiores
preocupações compartilhadas pelas diferentes unidades de manejo, de acordo
Capítulo 6
164
com a ótica complementar das diversas instituições envolvidas. Expomos
também uma série de recomendações que podem contribuir para futuras ações
governamentais ou do terceiro setor. Nosso principal objetivo é guiar futuros
projetos que possam promover o desenvolvimento dessa promissora atividade
na região amazônica.
2. Gargalos, ameaças e recomendações
1. Dilemas de Mercado
1a. Sazonalidade da produção
Devido ao período reprodutivo do pirarucu e o período sazonal mais adequado
para sua captura, toda a produção pesqueira da espécie ocorre de forma
concentrada em um mesmo período do ano. Com isso, tende a haver uma
grande saturação do mercado e, por conseguinte, uma queda no preço de venda.
A queda do preço compromete a sustentabilidade econômica da atividade e gera
um desestímulo aos comunitários, que sentem que a sua produção não está
sendo valorizada de maneira adequada. Além disso, uma vez que a pesca ilegal
do pirarucu ainda é uma atividade muito comum e difícil de ser fiscalizada na
região, o possível desestímulo gerado pelo baixo preço do pirarucu vendido de
forma legal pode contribuir para um aumento da pesca ilegal.
Recomendações:
I.Viabilização de estrutura frigorífica em cada município onde ocorre o manejo,
para que o pescado possa ser armazenado e vendido ao longo do ano. Desta
forma os pescadores poderão dispor de melhores ofertas pelo produto,
vendendo-o em feiras e mercados do próprio município. Este tipo de venda local
é mais vantajosa para o pescador, pois gera maior valor agregado. Atualmente,
o valor do pirarucu vendido em feiras e mercados locais chega a custar R$

Capítulo 6
165
10,00/kg, enquanto aquele vendido em grandes quantidades para comerciantes
de outras cidades rende cerca de R$ 5,50/kg para os pescadores. A viabilização
de frigoríficos é dependente da articulação política entre as instituições
protagonistas do manejo, como ONGs e associações locais, e o poder público.
Vale ressaltar que tal estrutura frigorífica pode beneficiar outras atividades
importantes para a economia local.
II.O pulso de inundação não ocorre da mesma forma em todas as unidades de
manejo, o que faz com que o período ótimo de captura seja variável de acordo
com a oscilação do nível da água em cada localidade. Assim, a flexibilização do
período permitido para a prática da despesca de acordo com a época de estação
seca de cada localidade seria uma alternativa. Mas para isso, deve-se gerar
informações sobre a dinâmica das águas em cada unidade de manejo.
III.As instituições parceiras que apoiam o desenvolvimento do manejo em cada
local devem estimular constantemente os comunitários a diversificar suas fontes
de renda. O pirarucu deve ser uma fonte de renda complementar, uma vez que
a sua pesca é restrita a um curto período do ano e à uma determinada cota.
1b. Mercado restrito
Embora exista o potencial de exportar o pirarucu para outros Estados e países,
a produção atual está concentrada apenas na região Norte. Isso faz com que o
mercado se sature facilmente, uma vez que anualmente toneladas de pirarucu
são ofertadas na região.
Recomendações
I.Com a assinatura do decreto 36083/2015, que regulamenta a pesca manejada
do pirarucu no estado do Amazonas, espera-se um maior protagonismo do
estado e, por conseguinte, uma maior articulação com o setor empresarial. Tal

Capítulo 6
166
articulação com o setor empresarial poderia resultar em estratégias eficientes de
expansão de mercado. Portanto, é necessário que as diversas entidades
envolvidas com o manejo promovam uma ampla divulgação da oportunidade
econômica que esta atividade representa, despertando o interesse do setor
empresarial em contribuir com a ampliação do mercado.
II.Organização de um seminário estadual para discutir a criação de uma
cooperativa que integre todas as unidades de manejo do Amazonas,
beneficiando, certificando e articulando a venda do pescado em uma escala mais
ampla.
2. Sistema de vigilância ineficaz
A fiscalização na Amazônia é um grande desafio, pois os recursos humanos e
financeiros disponíveis para ações de conservação geralmente são muito
limitados, especialmente considerando-se a ampla escala geográfica da região
e a existência de muitas áreas de difícil acesso. Frente à tal deficiência de
fiscalização tem-se uma forte pressão de pesca ilegal do pirarucu. O peixe ilegal
encontra-se disponível durante todo o ano nas feiras municipais e é vendido por
um valor mais baixo do que o peixe manejado, o que cria um cenário de
competição desigual e gera desestímulo aos pescadores que participam do
manejo comunitário.
Recomendação:
I. Realização de seminários nos municípios onde ocorre o manejo com o objetivo
de sensibilizar a população e articular um sistema de fiscalização local,
envolvendo tanto os próprios comunitários, quanto a colônia de pescadores, a
polícia militar e o ministério público.
3. Exigências sanitárias incompatíveis com a realidade das comunidades rurais.

Capítulo 6
167
As normas sanitárias exigidas atualmente para a produção pesqueira não
contemplam as especificidades das comunidades rurais da Amazônia. É
praticamente inviável para tais comunidades conseguir se adequar às normas
sem receber um forte subsídio externo. Por outro lado, a legislação dificilmente
será flexibilizada, uma vez que essa temática envolve riscos à saúde humana.
Recomendações:
I. Facilitar o transporte do pescado às câmaras frigoríficas, com evisceração
ocorrendo a bordo.
II. Aumentar a proporção de venda de pirarucu seco e salgado, uma vez que
este, além de possuir maior valor agregado, pode ser armazenado por mais
tempo e em condições mais factíveis com a realidade local. Para tanto, seria
necessária a disponibilização de uma salgadeira móvel que contemplasse todas
as comunidades envolvidas. Esta ideia já vem sendo discutida na Agencia de
Defesa Agropecuária e Florestal do Estado do Amazonas, porém ainda não há
decisão final a respeito. Nesse sentido, as instituições envolvidas com o manejo
devem tentar se articular com o governo ou buscar outras formas de
financiamento para viabilizar a salga do pirarucu em maiores proporções dentre
as unidades de manejo.
III. Articular com o governo a criação de créditos rurais específicos e editais
facilitados que ofereçam recursos suficientes para viabilizar a adequação dos
comunitários às normas sanitárias previstas na legislação.
4. Competição com a piscicultura e incentivos desiguais
A piscicultura conta com maiores subsídios governamentais do que a pesca de
pequena escala. Com isso, o preço de venda do pirarucu criado em cativeiro
Capítulo 6
168
pode se tornar mais baixo em comparação ao do peixe manejado, gerando uma
competição desigual e, portanto, desfavorecendo a produção do manejo
comunitário.
Recomendações:
I. Articular com o poder público a disponibilização de maiores incentivos
governamentais à produção do pirarucu manejado. As instituições envolvidas
com o manejo devem se organizar para expor ao governo as demandas desse
mercado, bem como a sua importância ecológica e socioeconômica tanto para a
escala local quanto os efeitos diretos e indiretos em escala regional e nacional.
II. Divulgar para a população de forma sensibilizadora os benefícios ecológicos
e socioeconômicos do manejo comunitário do pirarucu, buscando-se incentivar
uma maior valorização do pescado advindo desta atividade. As insituições
envolvidas com o manejo poderiam se articular com veículos de mídia (formal ou
independente) para elaborar estratégias que pudessem atingir o maior número
de pessoas possível e despertar nas mesmas o interesse em priorizar a compra
do peixe manejado em detrimento do peixe proveniente da piscicultura (ou da
pesca ilegal).
5. O risco de se avaliar os benefícios do manejo apenas sob a perspectiva
econômica
A sustentabilidade econômica do manejo vem sendo bastante discutida. No
entanto, deve-se tomar cuidado com analises superficiais de custo/benefício
uma vez que a vasta maioria dos benefícios sociais e ecológicos ainda não estão
quantificados e valorados. Os grandes benefícios do manejo do pirarucu para a
população local não são apenas econômicos, mas envolvem a dignificação de
uma atividade que antes era ilegal, bem como a manutenção de práticas
Capítulo 6
169
tradicionais e um estímulo a uma maior organização social, empoderamento e
capacitação comunitária, dentre outros possíveis benefícios. Além disso, a
recuperação dos estoques de pirarucu que vem sendo diagnosticada na área
das unidades de manejo é de extrema importância, tanto para a segurança
alimentar das famílias ribeirinhas quanto para a conservação da biodiversidade
no bioma amazônico.
Recomendação: Estimular o desenvolvimento de pesquisas que busquem
quantificar os benefícios advindos do manejo, especialmente os benefícios
sociais, que foram muito pouco estudados de forma sistemática. Avaliações mais
completas sobre os benefícios da atividade possibilitarão um entendimento mais
aprofundado acerca de todas as dimensões que a envolvem.
6. Mudanças climáticas
Ainda não se sabe ao certo até que ponto as mudanças climáticas irão influenciar
a dinâmica das águas na Amazônia. Os povos locais têm observado diversas
alterações nos padrões de vazante e enchente ao longo dos últimos anos, tanto
no que se refere ao nível da água atingido em cada estação quanto ao período
de início e fim da mesma. Vem sendo discutido no universo acadêmico a
possibilidade de tais alterações já serem resultado de processos climáticos de
escala global, o que causa preocupação a respeito das consequências para as
atividades de subsistência dos povos ribeirinhos.
Recomendação: Estimular o desenvolvimento de pesquisas que busquem
inferir sobre as consequências das prováveis mudanças climáticas globais no
desenvolvimento das atividades do manejo, considerando tanto possíveis
mudanças na biologia do pirarucu (ex. taxa de reprodução) quanto mudanças
nos períodos adequados para a despesca.
Capítulo 6
170
3. Referências
1. Berkes F. 2007. Community-based conservation in a globalized world. P
Natl Acad Sci USA 104: 15188–93.
2. Campos-Silva, J.V. and Peres, C. 2016. Community-based management
induces rapid recovery of a high-value tropical freshwater fisheries
3. Isaac, V. J.; Rocha, V. L. C. e Mota, S. “Considerações sobre a legislação
da ‘piracema’ e outras restrições da pesca na região do médio Amazonas”.
Em FURTADO, L.; LEITÃO, W. e MELLO, F. (eds.). Povos das Águas –
realidade e perspectivas na Amazônia. Belém, MCT/ CNPq/ MPEG, 1993,
pp. 188-211, 292 p.
4. IUCN,2015. The IUCN Red List of Threatened Species. Version 2015-4.
<www.iucnredlist.org>. Downloaded on 08 December 2015.
5. Santos, G.M.; Santos, A.C.M. 2005 Sustentabilidadeda pesca na
Amazônia. Estudos Avançados, v. 19; n.54, p.165-182. (Dossiê Amazônia
brasileira II).
6. VERÍSSIMO, J. 1895. A pesca na Amazônia. Livraria Clássica Francisco
Alves. Rio de Janeiro, 206 p.

171
Anexo 1
Divulgação científica
Creio que haverá um avanço muito grande na formação da opinião pública,
quando a divulgação científica tiver a mesma magnitude (e valorização) dos artigos
científicos. Isso implica, obviamente, em um maior compromisso do pesquisador com
esse tipo de produto, para que o conhecimento gerado seja ao menos disponibilizado
na língua local, de uma forma acessível. O presente anexo é composto de três artigos
de divulgação que, de forma singela, tentam resumir os principais resultados dessa
tese, disponibilizando-os para a população em geral.
Anexo 1
172
Artigo 7
Tempos sombrios para a conservação da Amazônia*
João Vitor Campos-Silva, Sinomar F. Fonseca & Carlos Peres
*Artigo de opinião submetido à revista da FAPEAM “Amazônia faz ciência”
A bacia amazônica representa cerca de metade dos remanescentes florestais
do mundo, além de uma grande fração da biodiversidade terrestre. Devido à
grandiosa riqueza de recursos naturais, a Amazônia também significa uma
oportunidade ímpar de desenvolvimento aos países sul americanos. No entanto, o
desafio de implementar estratégias que conciliem o desenvolvimento sustentável, a
redução da pobreza e o crescimento econômico, são tremendos, e de certa forma
irão determinar o destino da região. Nesse texto discutimos duas grandes estratégias
de desenvolvimento que se encontram sob forte ameaça, devido à postura
governamental nos últimos anos.
Em 2000, o governo brasileiro estabeleceu o Sistema Nacional de Áreas
Protegidas (SNUC), que foi incorporado à constituição. Atualmente, o SNUC tem
consolidados 1940 áreas protegidas, contendo cerca de 1,513,828 km2 de floresta
tropical, o que representa 17.8 do território brasileiro. Desse total, 205 são de
responsabilidade dos municípios, 781 dos Estados e 954 do governo federal. Desde
2006 terras indígenas e territórios quilombolas foram inclusos no SNUC, o que
significa dizer que 25% do território brasileiro estaria sob proteção não privada. Trata-
se de uma área maior que a França. Espanha, Portugal, Reino Unido, Alemanha e
Itália juntos.
Anexo 1
173
O SNUC representa uma estratégia chave de defesa contra o desmatamento,
a degradação de habitat e a perda de biodiversidade. Os grandes avanços feitos nos
últimos 15 anos são inegáveis e o Brasil chegou a ganhar a liderança mundial em
conservação da natureza. No entanto, nos últimos anos esses grandes ganhos estão
se desmantelando pela política ambiental brasileira, particularmente no Estado do
Amazonas, o maior Estado brasileiro, com cerca de 155.9 milhões de hectares.
Em primeiro lugar, a mera criação de uma área protegida, ou Unidade de
conservação (UC) como são chamadas, não garante que ela funcione. A maioria das
UCs da Amazônia não estão bem implementadas em termos de infraestrutura,
recursos humanos e investimentos em fiscalização, portanto elas são alvos
constantes de caça ilegal, desmatamento e outros interesses econômicos espúrios.
Cera de 46.4% de todas as UCs do Estado, por exemplo, não possuem plano de
manejo, que é o documento básico para se pensar a gestão da reserva.
Além disso, os recursos humanos necessários para a implementação desse
grande sistema de reservas são absolutamente insuficientes. Atualmente apenas 27
profissionais são responsáveis pela gestão de 42 unidades de conservação,
representando apenas 0.65 funcionários por reserva, ou se preferirem 6966 km2 para
serem geridos e vigiados apenas por um par de olhos. A situação é ainda pior quando
calculamos o número de funcionários que reside de fato nas reservas – apenas 16
funcionários- o que representa 0.38 profissionais por reserva ou 11.756 km2 por
profissional. Nota-se, portanto, que apesar dos grandes investimentos em
conservação nos últimos 20 anos, o Brasil está nitidamente em uma fase de
implementação desse grande sistema de proteção ainda não consolidado.
Outro componente importante para o desenvolvimento sustentável da região
amazônica é o desenvolvimento científico. Nos últimos vinte anos o número de
Anexo 1
174
estudantes de pós-graduação de universidades baseadas na Amazônia saltou de 214
para 2154 por ano, representando mais de 1000% de aumento. Isso reflete também
na produção acadêmica que passou de 471 para 2776 artigos publicados todos os
anos. Indiscutivelmente, a exploração sustentável dos recursos naturais e o
desenvolvimento científico estão substancialmente interligados. Além disso, muitos
desses estudantes acabam ocupando importantes posições em institutos de
pesquisa, ONGs e agências governamentais, contribuindo com o desenvolvimento da
região como um todo. A manutenção e fixação desse distinto recurso humano deveria
ser prioridade em qualquer governo que preze pelo desenvolvimento sustentável.
Entretanto as últimas investidas governamentais têm caminhado para direções
completamente opostas ao desenvolvimento equitativo e sustentável. No Estado do
Amazonas por exemplo, as últimas decisões políticas tem sido catastrófica para a
conservação da biodiversidade e manejo dos recursos naturais. Primeiramente, a
secretaria de ciência, tecnologia e inovação (SECTI) foi dissolvida, prejudicando
severamente o desenvolvimento científico, uma vez que grande parte do
financiamento científico é feito via secretaria. Segundo, o departamento de manejo
de áreas protegidas e mudanças climáticas foi extinta. Esse corte massivo em
recursos financeiros e humanos pode colapsar todo o sistema de gestão das áreas
protegidas, uma vez que essas áreas ainda não estão devidamente implementadas.
Os investimentos em conservação e gestão de áreas protegidas foram cortados em
cerca de 88%, deixando todo o sistema à minguas.
Para piorar a situação, o atual governo planeja ligar o que sobrou do
departamento de gestão de áreas protegidas ao departamento de produção. Essa é
uma estratégia maquiavélica de eliminar a autoridade do setor, subordinando-o às
Anexo 1
175
demandas produtivas do Estado, as quais muitas vezes vão de encontro aos objetivos
conservacionistas.
A justificativa superficial do governo é a redução de custos. No entanto, por
trás das justificativas econômicas, essas reformas refletem o paradigma operacional
do governo federal, que é o crescimento econômico independentemente dos custos
socioambientais. Em março do ano passado o governo estadual materializou uma lei
(PL155/2015) dinamizando o licenciamento de grandes projetos de infraestrutura,
sem considerar as decisões das agencias ambientais que regulamentam esse tipo de
empreendimento. Sem o controle das normas socioambientais, grandes empresas
basicamente têm carata branca para implementar grandes projetos
desenvolvimentistas, sem se preocupar com os custos socioambientais envolvidos.
Isso é muito preocupante em um lugar onde são previstas as construções de 277
hidrelétricas, altamente questionáveis quanto a sua produção em detrimento aos altos
custos em relação à conservação da biodiversidade e bem-estar da população
ribeirinha.
Há também uma nítida investida governamental nos setores de exploração de
minérios, mesmo dentro de áreas protegidas, através da criação do departamento
estadual de mineração, geodiversidade e recursos aquáticos. E é bom ter em mente
que cerca de um quinto das áreas protegidas estabelecidas estão sob solo com alta
riqueza mineral, que já estão na mira das grandes mineradoras.
A ironia do fato é que se o governo planeja conter gastos, basicamente não há
justificativa para o grande incremento no número de funcionários contratados para o
gabinete do governador, o qual já é o maior em todos os tempos. Organizar o
calendário anual do governador do que para pensar o uso sustentável dos recursos
naturais no Estado político que controla a maior floresta tropical do planeta.

Anexo 1
176
A saga governamental em impulsionar a exploração econômica dos recursos
naturais sem o devido planejamento, seguido do rápido desmantelamento das
agências estaduais, sugerem que o brasil está reafirmando sua condição colonial pós-
moderna, onde os recursos naturais são explorados sem nenhuma restrição,
satisfazendo apenas demandas externas que não refletem as verdadeiras demandas
socioambientais.
Aparentemente, as novas trajetórias governamentais não contemplam em
suas metas a manutenção da diversidade cultural e biológica. Graças a uma série de
políticas questionáveis, o Brasil está entrando em tempos sombrios para a
conservação da Amazônia. É necessário que a sociedade se organize para rever o
projeto de país vigente, o qual está amplamente distante das bases do
desenvolvimento sustentável.
Anexo 1
177
Artigo 8
Comunidades ribeirinhas da Amazônia melhoram a qualidade de vida e
protegendo a biodiversidade*
João Vitor Campos-Silva, Carolina Freitas & Carlos A. Peres
*Artigo a ser submetido para Ciência Hoje
As várzeas amazônicas são ambientes fantásticos onde uma diversidade
cultural impressionante divide espaço com uma biodiversidade exuberante. Esses
ambientes são sistemas sócio ecológicos, onde aspectos físicos, biológicos e sociais
interagem de forma complexa. Comunidades humanas, por exemplo, dependem
diretamente dos benefícios ofertados pela natureza, como animais de caça, pescado,
produtos oriundos do extrativismo, dentre outros. Essa dependência atinge várias
esferas, pois além da comida a natureza fornece entretenimento, espiritualidade, cura
para doenças e muitos outros tipos de relações. No entanto, como todos os sistemas
alagáveis de água doce no mundo, as várzeas amazônicas estão imersas em um mar
de ameaças.
Conservar e manejar adequadamente esses ambientes pode contribuir com a
conservação da biodiversidade, melhoria da qualidade de vida dos povos tradicionais
Os ambientes de água doce correspondem à apenas 0.8% da
superfície terrestre. Mesmo com essa baixa
representatividade, foram fundamentais para o
desenvolvimento das grandes sociedades humanas. Com a
população mundial perto de sete bilhões de pessoas, esses
ambientes aquáticos se tornaram os mais ameaçados do
mundo, com taxas de extinção substancialmente maiores
que os ambientes terrestres.

Anexo 1
178
e ainda reduzir a pobreza dessa população, que muitas vezes, estão à margem das
políticas públicas. No entanto, essa não é uma tarefa fácil, uma vez que esses
ambientes são extremamente complexos. Uma das ferramentas amplamente utilizada
é a criação de áreas protegidas.
As áreas protegidas vem sendo uma ferramenta bastante eficaz em muitos
países na contenção de desmatamento, conservação da biodiversidade, manutenção
de serviços ambientais, aumentar a captura de pescado de pescadores artesanais
dentre outros benefícios. No entanto, a ampla maioria das áreas protegidas foram
pensadas para suprir demandas da ecologia terrestre. Os ambientes aquáticos
continuam sendo os mais ameaçados e os mais negligenciados em todo o mundo.
Além disso, o contexto político atual não é propício para a criação de novas
áreas protegidas. Pois, antes de criar novas áreas, deve-se implementar as já
As áreas protegidas foram criadas com a grandiosa missão de
preservar e conservar a diversidade biológica e os recursos naturais
associados a ela. As unidades de desenvolvimento sustentável compõem
uma categoria de área protegida que permite diferentes tipos e
intensidades de manipulação humana. O mapa a baixo mostra as áreas
protegidas existentes na Amazônia brasileira.
Essas reservas abrigam as chamadas “populações tradicionais” que ainda
mantém uma forte relação com a terra, apresentando, muitas vezes, um
modelo de subsistência, quanto à ocupação do espaço e uso dos recursos
naturais.
As áreas
protegidas reservadas ao
desenvolvimento
sustentável correspondem
a 61,6% de todas áreas
protegidas do mundo. No
Brasil, a grande maioria
das Unidades de
desenvolvimento
sustentável (cerca de 99%
em área) encontra-se na
Amazônia.
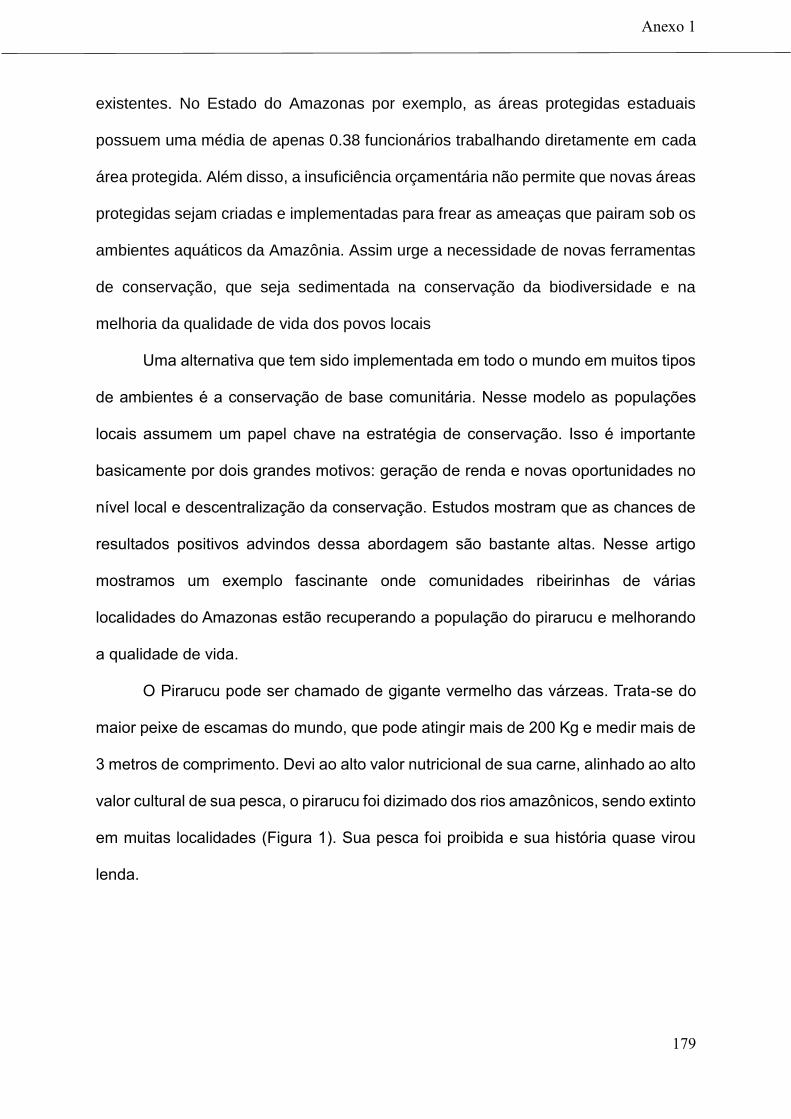
Anexo 1
179
existentes. No Estado do Amazonas por exemplo, as áreas protegidas estaduais
possuem uma média de apenas 0.38 funcionários trabalhando diretamente em cada
área protegida. Além disso, a insuficiência orçamentária não permite que novas áreas
protegidas sejam criadas e implementadas para frear as ameaças que pairam sob os
ambientes aquáticos da Amazônia. Assim urge a necessidade de novas ferramentas
de conservação, que seja sedimentada na conservação da biodiversidade e na
melhoria da qualidade de vida dos povos locais
Uma alternativa que tem sido implementada em todo o mundo em muitos tipos
de ambientes é a conservação de base comunitária. Nesse modelo as populações
locais assumem um papel chave na estratégia de conservação. Isso é importante
basicamente por dois grandes motivos: geração de renda e novas oportunidades no
nível local e descentralização da conservação. Estudos mostram que as chances de
resultados positivos advindos dessa abordagem são bastante altas. Nesse artigo
mostramos um exemplo fascinante onde comunidades ribeirinhas de várias
localidades do Amazonas estão recuperando a população do pirarucu e melhorando
a qualidade de vida.
O Pirarucu pode ser chamado de gigante vermelho das várzeas. Trata-se do
maior peixe de escamas do mundo, que pode atingir mais de 200 Kg e medir mais de
3 metros de comprimento. Devi ao alto valor nutricional de sua carne, alinhado ao alto
valor cultural de sua pesca, o pirarucu foi dizimado dos rios amazônicos, sendo extinto
em muitas localidades (Figura 1). Sua pesca foi proibida e sua história quase virou
lenda.
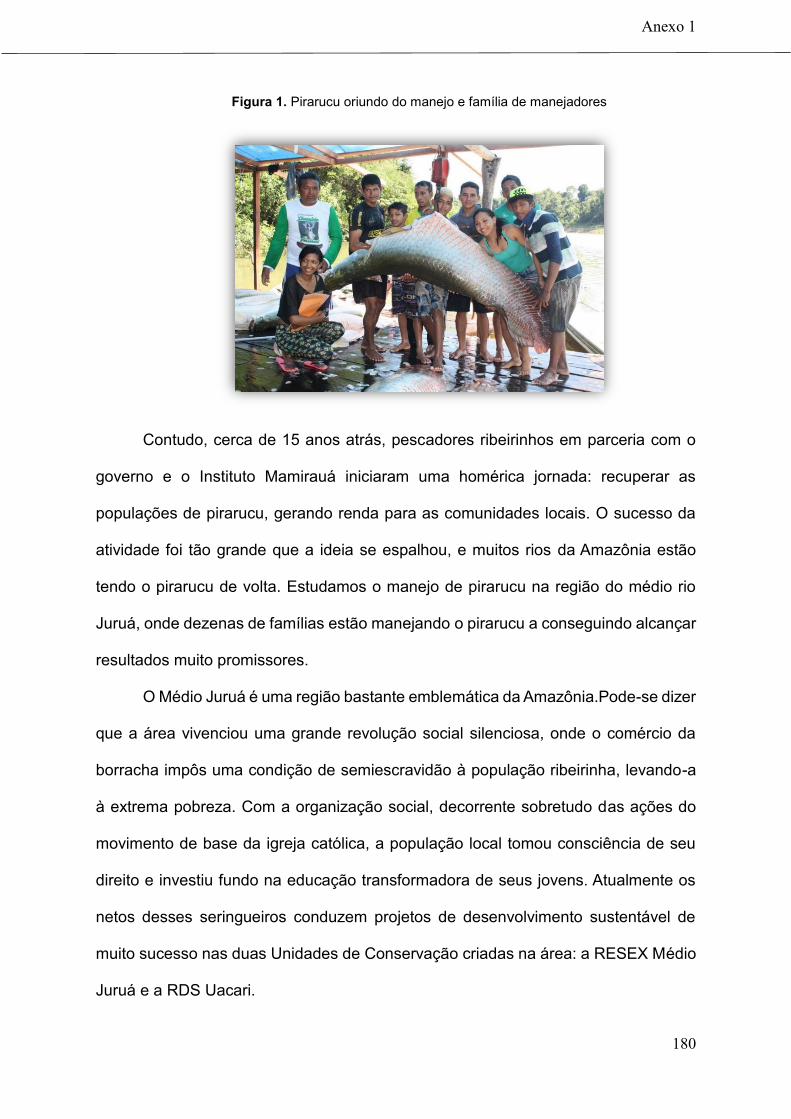
Anexo 1
180
Figura 1. Pirarucu oriundo do manejo e família de manejadores
Contudo, cerca de 15 anos atrás, pescadores ribeirinhos em parceria com o
governo e o Instituto Mamirauá iniciaram uma homérica jornada: recuperar as
populações de pirarucu, gerando renda para as comunidades locais. O sucesso da
atividade foi tão grande que a ideia se espalhou, e muitos rios da Amazônia estão
tendo o pirarucu de volta. Estudamos o manejo de pirarucu na região do médio rio
Juruá, onde dezenas de famílias estão manejando o pirarucu a conseguindo alcançar
resultados muito promissores.
O Médio Juruá é uma região bastante emblemática da Amazônia.Pode-se dizer
que a área vivenciou uma grande revolução social silenciosa, onde o comércio da
borracha impôs uma condição de semiescravidão à população ribeirinha, levando-a
à extrema pobreza. Com a organização social, decorrente sobretudo das ações do
movimento de base da igreja católica, a população local tomou consciência de seu
direito e investiu fundo na educação transformadora de seus jovens. Atualmente os
netos desses seringueiros conduzem projetos de desenvolvimento sustentável de
muito sucesso nas duas Unidades de Conservação criadas na área: a RESEX Médio
Juruá e a RDS Uacari.

Anexo 1
181
Essas comunidades se organizam em um acordo de pesca onde os lagos são
categorizados de acordo com seu nível de exploração: Há os lagos protegidos,
destinados à reprodução das espécies. Nesses lagos não ocorre pesca durante o ano
todo, mas em alguns deles – os chamados lagos de manejo – a pesca do pirarucu
ocorre uma vez por ano. Há também os lagos de subsistência, destinados à
manutenção das comunidades. Nesses lagos, apenas pescadores residentes nas
comunidades podem pescar. Por fim. Os lagos abertos, ou de livre acesso, são
aqueles onde a pesca profissional é permitida.
O efeito da proteção de lagos é impressionante. Em lagos protegidos a média
populacional de pirarucu é de 304 indivíduos, seguidos de 34 em lagos de
subsistência e apenas nove em lagos abertos. O sucesso dos lagos protegidos vem
levando a recuperação dos estoques de pirarucus, como atestam os dados de
contagem analisados desde 2008 e a percepção dos próprios comunitários. A figura
02 mostra as respostas de pescadores experientes, quando questionados se a
população de pirarucu cresceu, diminuiu ou manteve-se estável nos últimos 10 anos.
Mesmo considerando todas as variáveis importantes para o pirarucu a
proteção do lago explica a maior parte na variação da população. Grandes
populações de pirarucu só existem em lagos protegidos (Figura 02).

Anexo 1
182
Figura 2. Mapa esquemático mostrando o tamanho da população de pirarucu em lagos de diferentes classes de manejo
Mas como funciona o manejo?
Para manejar o pirarucu as comunidades devem proteger o lago durante o
período da seca e da vazante das águas. Nessa época é construída uma casa de
madeira na entrada do lago e as famílias revezam a proteção, permanecendo ali
cuidando do lago (Figura 04).
Figura 03. Desenho esquemático do sistema de proteção de lagos
Quando o lago está seco, um grupo de comunitários altamente treinados
realiza a contagem dos pirarucus. Esse método é possível oi os pirarucus,

Anexo 1
183
diferentemente da grande maioria dos peixes, respiram oxigênio. Portanto, ele deve
vir até a superfície do lago para pegar oxigênio. Nesse momento ele é contado (Figura
04)
Figura 04. Momento exato em que um pirarucu vem à superfície para respirar, possibilitando sua contagem.
Após a contagem, uma solicitação de cotas é enviada ao IBAMA que pode
liberar até 30% dos indivíduos adultos contador para o abate. Essa cota varia de
acordo com o tamanho populacional dos pirarucus e também com o nível
organizacional das comunidades. Por fim, com a cota em mãos, as comunidades e
os parceiros realizam a despesca e os pirarucus podem ser vendidos nas cidades
mais próximas e nas grandes cidades.
Efeitos indiretos do manejo do pirarucu
Produtividade primária
O pirarucu adulto se alimenta predominantemente de peixes, exercendo uma
forte pressão em toda a fauna de peixes presente nos lagos. Esse fato pode alterar
toda a dinâmica trófica do sistema.
Analisando lagos protegidos e não protegidos encontramos um resultado
bastante interessante – Em lagos com grandes populações de pirarucu a
Julia Verba
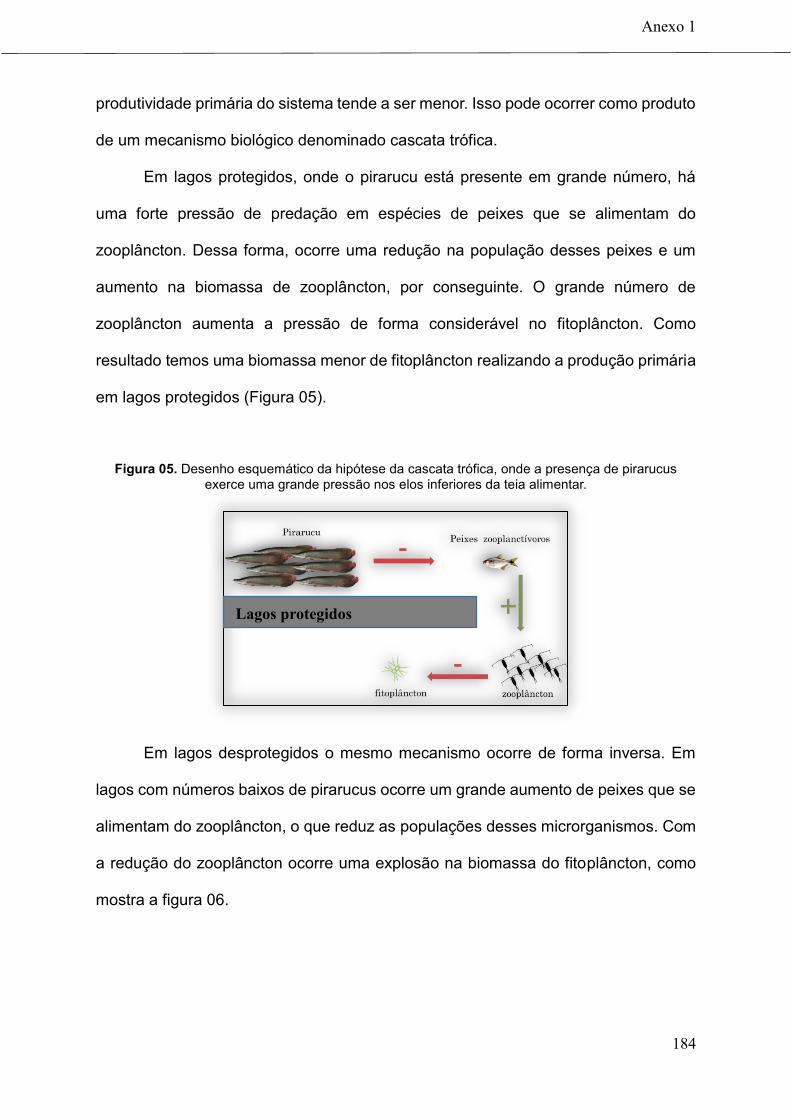
Anexo 1
184
produtividade primária do sistema tende a ser menor. Isso pode ocorrer como produto
de um mecanismo biológico denominado cascata trófica.
Em lagos protegidos, onde o pirarucu está presente em grande número, há
uma forte pressão de predação em espécies de peixes que se alimentam do
zooplâncton. Dessa forma, ocorre uma redução na população desses peixes e um
aumento na biomassa de zooplâncton, por conseguinte. O grande número de
zooplâncton aumenta a pressão de forma considerável no fitoplâncton. Como
resultado temos uma biomassa menor de fitoplâncton realizando a produção primária
em lagos protegidos (Figura 05).
Figura 05. Desenho esquemático da hipótese da cascata trófica, onde a presença de pirarucus exerce uma grande pressão nos elos inferiores da teia alimentar.
Em lagos desprotegidos o mesmo mecanismo ocorre de forma inversa. Em
lagos com números baixos de pirarucus ocorre um grande aumento de peixes que se
alimentam do zooplâncton, o que reduz as populações desses microrganismos. Com
a redução do zooplâncton ocorre uma explosão na biomassa do fitoplâncton, como
mostra a figura 06.
Lagos protegidos
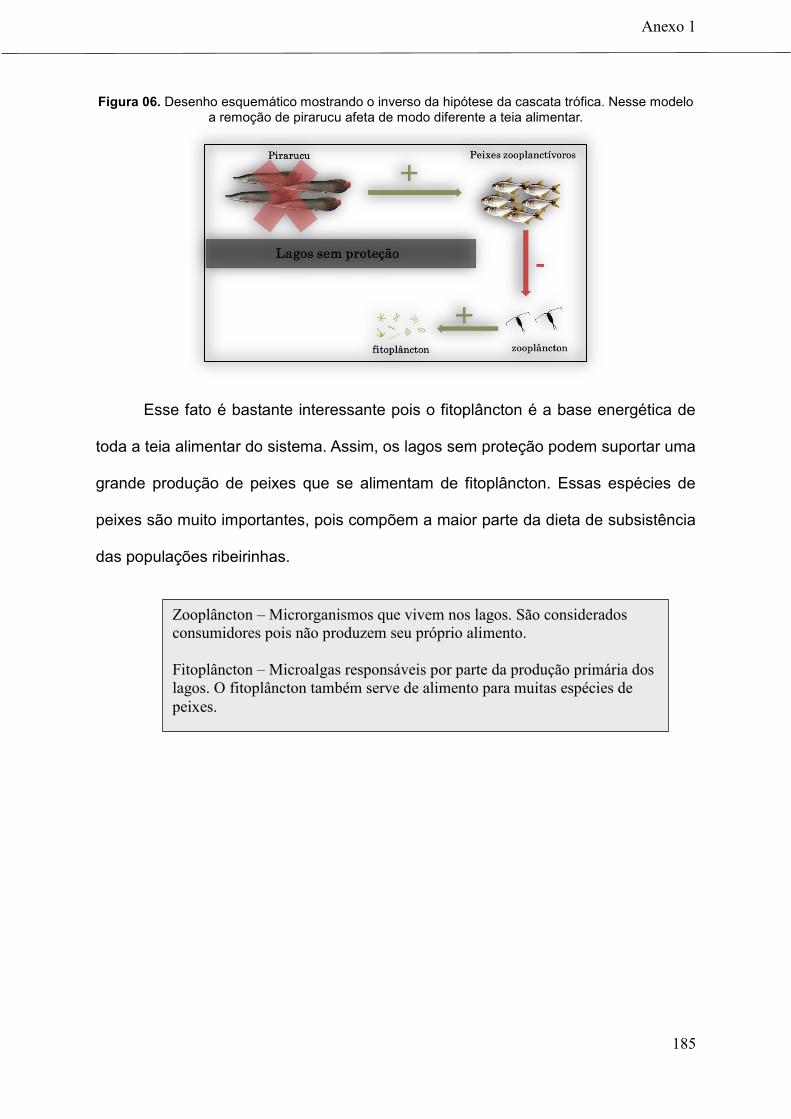
Anexo 1
185
Figura 06. Desenho esquemático mostrando o inverso da hipótese da cascata trófica. Nesse modelo a remoção de pirarucu afeta de modo diferente a teia alimentar.
Esse fato é bastante interessante pois o fitoplâncton é a base energética de
toda a teia alimentar do sistema. Assim, os lagos sem proteção podem suportar uma
grande produção de peixes que se alimentam de fitoplâncton. Essas espécies de
peixes são muito importantes, pois compõem a maior parte da dieta de subsistência
das populações ribeirinhas.
Zooplâncton – Microrganismos que vivem nos lagos. São considerados
consumidores pois não produzem seu próprio alimento.
Fitoplâncton – Microalgas responsáveis por parte da produção primária dos
lagos. O fitoplâncton também serve de alimento para muitas espécies de
peixes.
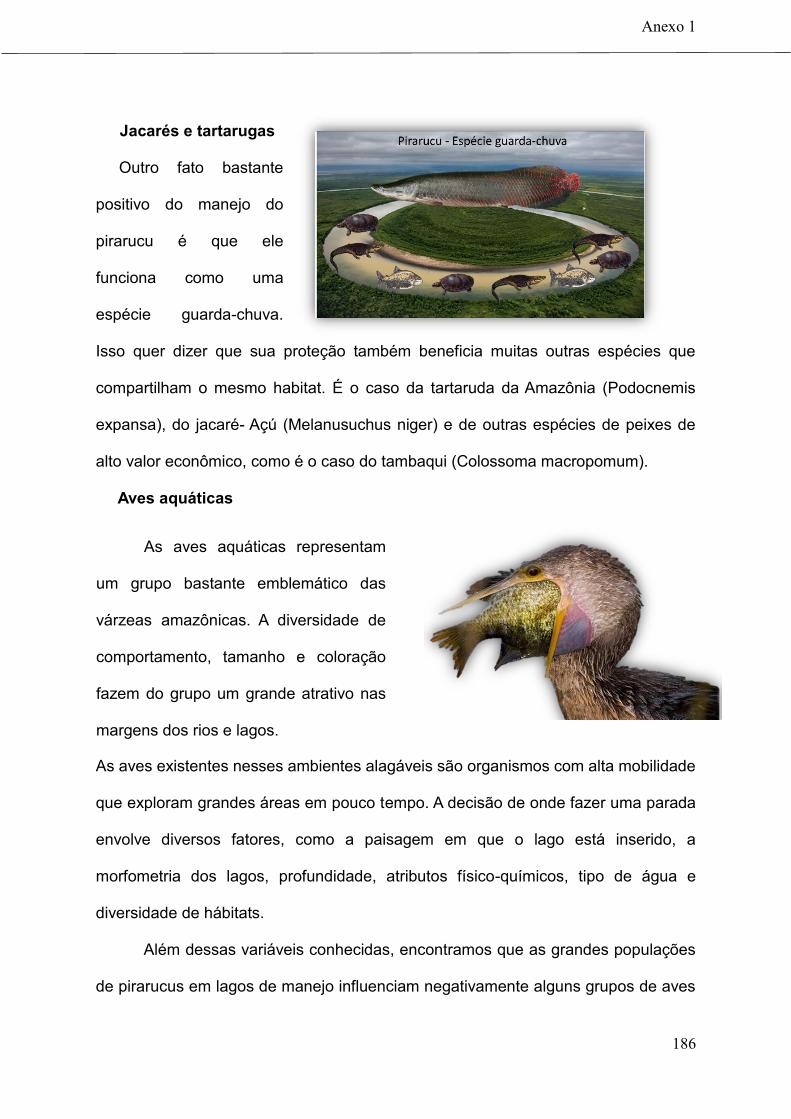
Anexo 1
186
Jacarés e tartarugas
Outro fato bastante
positivo do manejo do
pirarucu é que ele
funciona como uma
espécie guarda-chuva.
Isso quer dizer que sua proteção também beneficia muitas outras espécies que
compartilham o mesmo habitat. É o caso da tartaruda da Amazônia (Podocnemis
expansa), do jacaré- Açú (Melanusuchus niger) e de outras espécies de peixes de
alto valor econômico, como é o caso do tambaqui (Colossoma macropomum).
Aves aquáticas
As aves existentes nesses ambientes alagáveis são organismos com alta mobilidade
que exploram grandes áreas em pouco tempo. A decisão de onde fazer uma parada
envolve diversos fatores, como a paisagem em que o lago está inserido, a
morfometria dos lagos, profundidade, atributos físico-químicos, tipo de água e
diversidade de hábitats.
Além dessas variáveis conhecidas, encontramos que as grandes populações
de pirarucus em lagos de manejo influenciam negativamente alguns grupos de aves
As aves aquáticas representam
um grupo bastante emblemático das
várzeas amazônicas. A diversidade de
comportamento, tamanho e coloração
fazem do grupo um grande atrativo nas
margens dos rios e lagos.
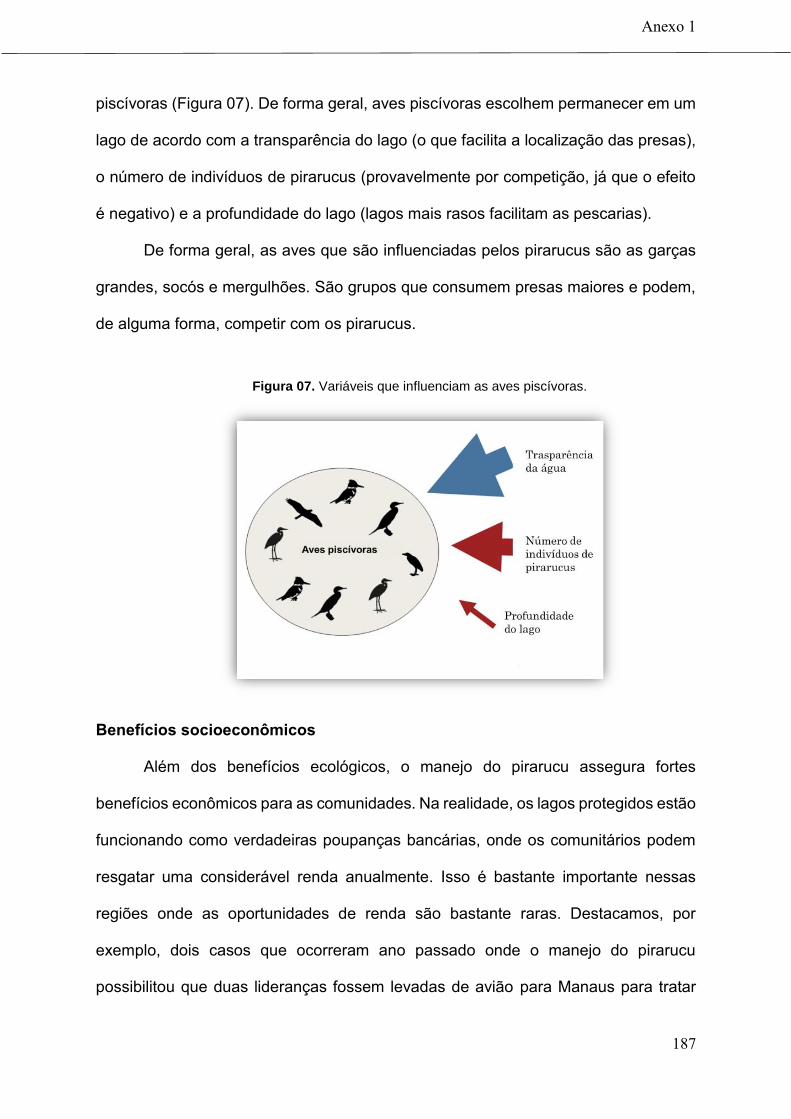
Anexo 1
187
piscívoras (Figura 07). De forma geral, aves piscívoras escolhem permanecer em um
lago de acordo com a transparência do lago (o que facilita a localização das presas),
o número de indivíduos de pirarucus (provavelmente por competição, já que o efeito
é negativo) e a profundidade do lago (lagos mais rasos facilitam as pescarias).
De forma geral, as aves que são influenciadas pelos pirarucus são as garças
grandes, socós e mergulhões. São grupos que consumem presas maiores e podem,
de alguma forma, competir com os pirarucus.
Figura 07. Variáveis que influenciam as aves piscívoras.
Benefícios socioeconômicos
Além dos benefícios ecológicos, o manejo do pirarucu assegura fortes
benefícios econômicos para as comunidades. Na realidade, os lagos protegidos estão
funcionando como verdadeiras poupanças bancárias, onde os comunitários podem
resgatar uma considerável renda anualmente. Isso é bastante importante nessas
regiões onde as oportunidades de renda são bastante raras. Destacamos, por
exemplo, dois casos que ocorreram ano passado onde o manejo do pirarucu
possibilitou que duas lideranças fossem levadas de avião para Manaus para tratar

Anexo 1
188
sérios problemas de saúde. Essa possibilidade era impensável décadas atrás, uma
vez que a população ribeirinha sempre esteve às margens de políticas públicas.
Quando questionados sobre os benefícios que o manejo trouxe, os
manejadores enumeram, além da renda anual, a auto estima, advinda do orgulho de
protagonizar uma atividade econômica em consonância com a legislação; a
possibilidade de manutenção cultural, uma vez que os jovens estão aprendendo com
pais e avôs toda a ciência da pesca do pirarucu; e também a distribuição de renda
mais equitativa, pois antigamente apenas os pescadores especializados no arpão
podiam fazer renda com o pirarucu, e após a implementação do manejo toda a
comunidade pode participar e usufruir da atividade.
Janela de oportunidades
Observamos então, que o manejo do pirarucu surge como uma grande janela
de oportunidades para integrar os dois grandes objetivos do milênio: conservação da
biodiversidade e melhoria da qualidade de vida da população rural. Nossos resultados
mostram que o manejo é uma grande ferramenta para geração de renda e
conservação da biodiversidade. Além disso, trata-se de uma excelente oportunidade
para aumentar o número de pessoas zelando pela biodiversidade amazônica, pois o
envolvimento das pessoas locais faz com que haja um aumento do cuidado com a
natureza, uma vez que os comunitários realmente protegem os lagos contra os
invasores.
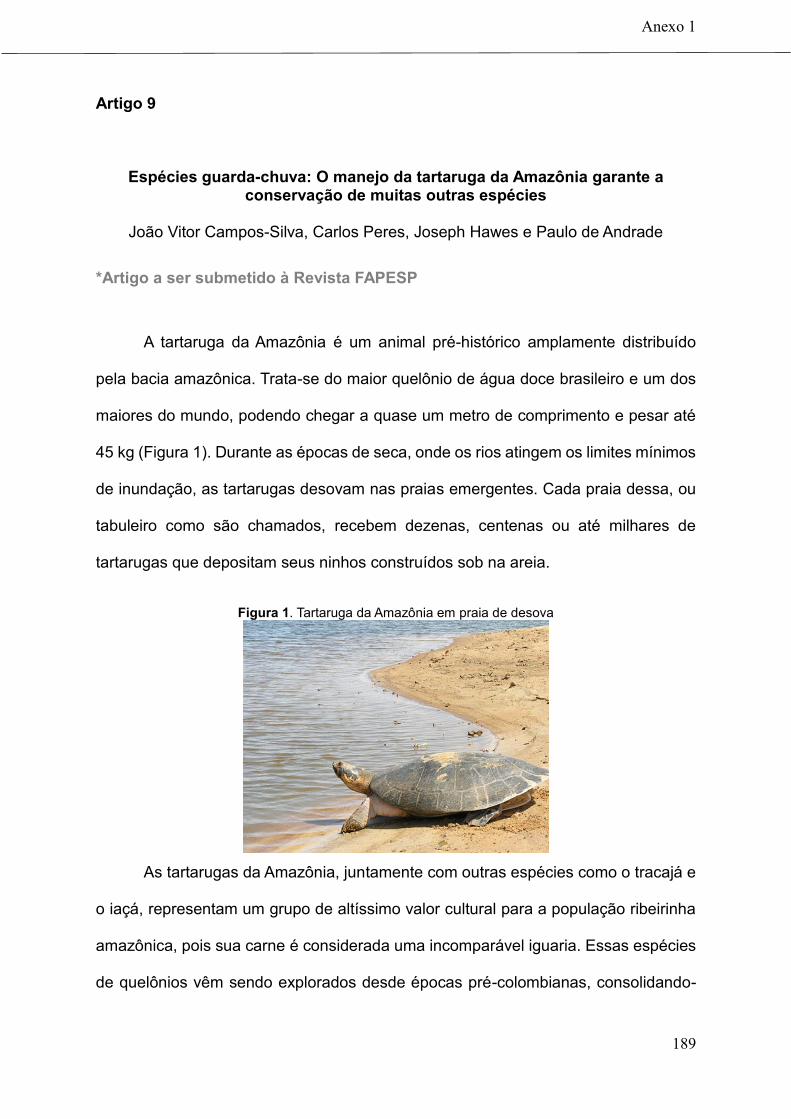
Anexo 1
189
Artigo 9
Espécies guarda-chuva: O manejo da tartaruga da Amazônia garante a conservação de muitas outras espécies
João Vitor Campos-Silva, Carlos Peres, Joseph Hawes e Paulo de Andrade
*Artigo a ser submetido à Revista FAPESP
A tartaruga da Amazônia é um animal pré-histórico amplamente distribuído
pela bacia amazônica. Trata-se do maior quelônio de água doce brasileiro e um dos
maiores do mundo, podendo chegar a quase um metro de comprimento e pesar até
45 kg (Figura 1). Durante as épocas de seca, onde os rios atingem os limites mínimos
de inundação, as tartarugas desovam nas praias emergentes. Cada praia dessa, ou
tabuleiro como são chamados, recebem dezenas, centenas ou até milhares de
tartarugas que depositam seus ninhos construídos sob na areia.
Figura 1. Tartaruga da Amazônia em praia de desova
As tartarugas da Amazônia, juntamente com outras espécies como o tracajá e
o iaçá, representam um grupo de altíssimo valor cultural para a população ribeirinha
amazônica, pois sua carne é considerada uma incomparável iguaria. Essas espécies
de quelônios vêm sendo explorados desde épocas pré-colombianas, consolidando-

Anexo 1
190
se como uma importantíssima fonte proteica para as sociedades ribeirinhas e
ameríndias. Além da carne, os ovos possuem um valor nutricional impressionante e
é consumido pela população geralmente acompanhado de farinha açúcar, quando
chamado de arabu. Trata-se de algo equivalente a gemada, mistura feita com ovos
de galinha e açúcar bastante consumida na cidade.
Além da alimentação humana os ovos dos quelônios foram amplamente
explorados para iluminação pública e para confecção de manteiga. Estima-se que
milhões de ovos eram utilizados anualmente para iluminação pública das grandes
cidades amazônicas, Belém e Manaus. Diante dessa pressão drástica as populações
de tartaruga da Amazônia declinaram e desapareceram de muitos rios da Amazônia.
Com o objetivo de reverter esse processo de redução populacional,
comunitários organizados socialmente iniciaram um processo de proteção das praias
de desova, que tem por objetivo garantir a proteção das fêmeas adultas. Essa
iniciativa se espalhou para mais de 100 localidades e hoje se constitui na maior
ferramenta de conservação dos quelônios de água doce da Amazônia.
O Médio Juruá a proteção dos tabuleiros de desova se iniciou ainda nos
tempos dos patões da borracha, que protegiam a praia para ter o recurso em
abundância. Hoje ele ocorre de forma organizada em 14 praias protegidas, dentro de
duas Unidades de conservação, a RESEX Médio Juruá e a RDS Uacari.
Basicamente os protetores das praias, ou monitores como são chamados,
passam cerca de cinco meses por mês em uma casa de madeira em frente à praia
afastando qualquer pessoa que tente coletar os ovos ou as fêmeas (figura 2). É um
trabalho árduo, muitas vezes perigosos, pois a tartaruga tem um altíssimo valor no
comércio ilegal. Uma fêmea adulta pode ser vendida por até 1000 reais em Manaus.
Como benefício cada monitor recebe uma cesta básica por mês, durante o período
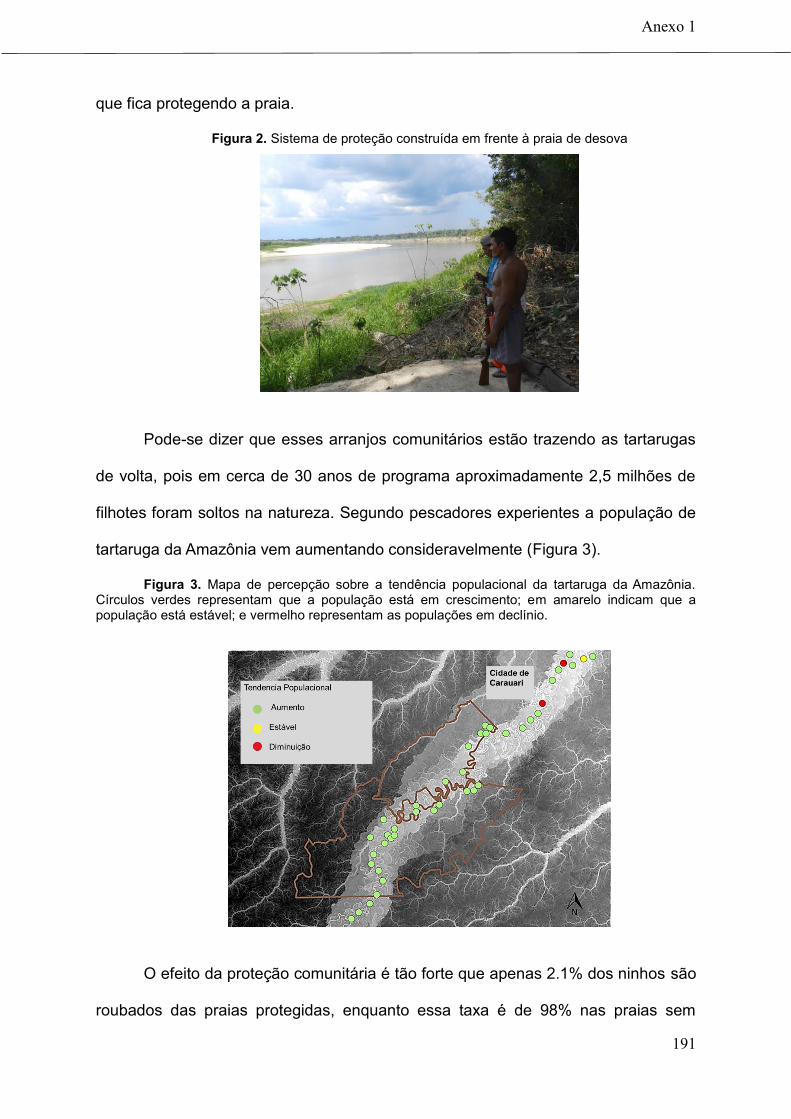
Anexo 1
191
que fica protegendo a praia.
Figura 2. Sistema de proteção construída em frente à praia de desova
Pode-se dizer que esses arranjos comunitários estão trazendo as tartarugas
de volta, pois em cerca de 30 anos de programa aproximadamente 2,5 milhões de
filhotes foram soltos na natureza. Segundo pescadores experientes a população de
tartaruga da Amazônia vem aumentando consideravelmente (Figura 3).
Figura 3. Mapa de percepção sobre a tendência populacional da tartaruga da Amazônia. Círculos verdes representam que a população está em crescimento; em amarelo indicam que a população está estável; e vermelho representam as populações em declínio.
O efeito da proteção comunitária é tão forte que apenas 2.1% dos ninhos são
roubados das praias protegidas, enquanto essa taxa é de 98% nas praias sem
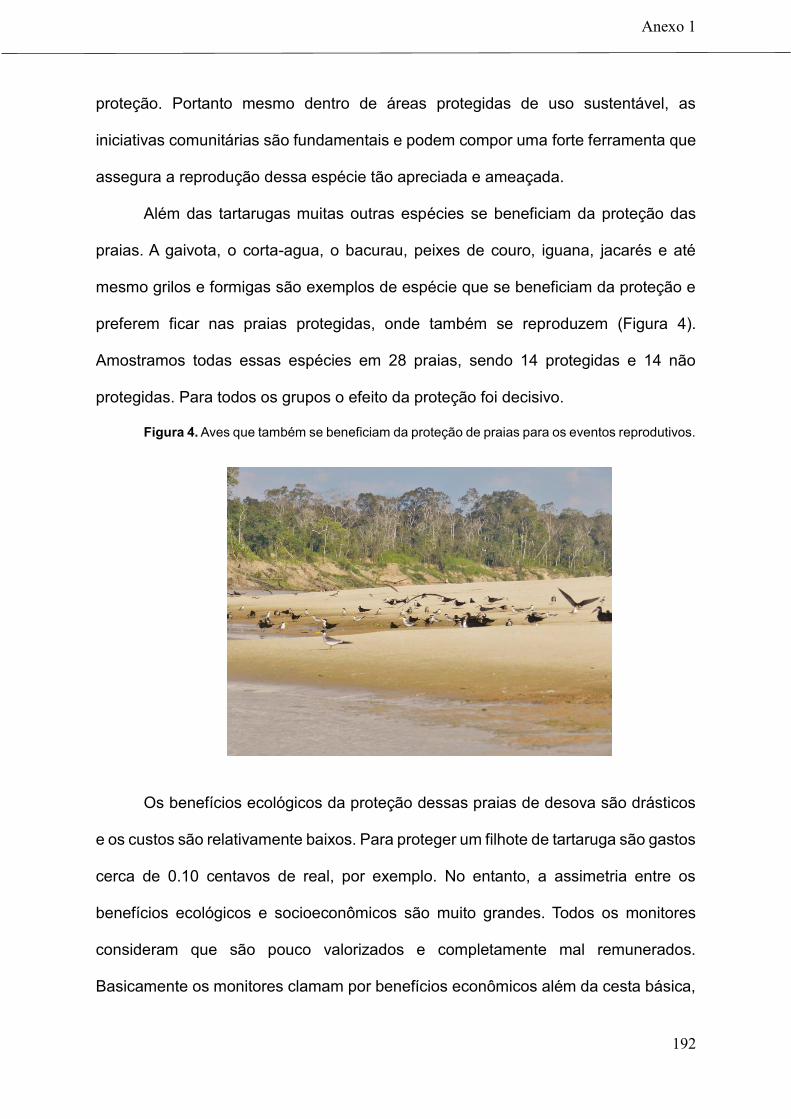
Anexo 1
192
proteção. Portanto mesmo dentro de áreas protegidas de uso sustentável, as
iniciativas comunitárias são fundamentais e podem compor uma forte ferramenta que
assegura a reprodução dessa espécie tão apreciada e ameaçada.
Além das tartarugas muitas outras espécies se beneficiam da proteção das
praias. A gaivota, o corta-agua, o bacurau, peixes de couro, iguana, jacarés e até
mesmo grilos e formigas são exemplos de espécie que se beneficiam da proteção e
preferem ficar nas praias protegidas, onde também se reproduzem (Figura 4).
Amostramos todas essas espécies em 28 praias, sendo 14 protegidas e 14 não
protegidas. Para todos os grupos o efeito da proteção foi decisivo.
Figura 4. Aves que também se beneficiam da proteção de praias para os eventos reprodutivos.
Os benefícios ecológicos da proteção dessas praias de desova são drásticos
e os custos são relativamente baixos. Para proteger um filhote de tartaruga são gastos
cerca de 0.10 centavos de real, por exemplo. No entanto, a assimetria entre os
benefícios ecológicos e socioeconômicos são muito grandes. Todos os monitores
consideram que são pouco valorizados e completamente mal remunerados.
Basicamente os monitores clamam por benefícios econômicos além da cesta básica,
Anexo 1
193
pois segundo eles “um ser humano precisa de outras coisas na vida além de comida”.
Tal fato compromete a sustentabilidade do programa como um todo, pois se não há
um benefício socioeconômico claro o programa fica completamente vulnerável.
Apesar da insatisfação dos monitores em relação à valorização da atividade,
pode-se dizer que o programa é um verdadeiro sucesso em termos ecológicos. Trata-
se na verdade de uma grande janela de oportunidades para conservação da
biodiversidade aquática das várzeas amazônicas, uma vez que o beneficiamento da
proteção é engloba muitos grupos taxonômicos. O grande desafio futuro é beneficiar
economicamente o trabalho dos monitores, pois resolvendo a questão da geração de
renda, através da exploração sustentável ou do próprio pagamento por serviço
ambiental, o programa de proteção das praias de desova de tartarugas pode se tornar
um grande exemplo mundial de manejo de base comunitária.

194
Anexo 2 (Artigo 10)
Brazilian fisheries dipped in a sea of uncertainty*
João V. Campos-Silva, Carolina T. Freitas, Carlos A. Peres, Priscila F. M. Lopes
*Manuscrito a ser submetido à Fish and Fisheries, como uma carta de opinião
Brazil hosts one of the richest fish faunas on Earth, spread along 8400 km of
coastline and vast freshwater drainages. Currently, about 800,000 tons of wild fish are
caught annually in the Brazilian territory, providing high-quality protein for millions of
families, and employing over 3.5 million of people (FAO, 2014). Despite the scale of
this industry, the government is unable to produce reliable fishing statistics and the
official estimates available can be substantially off the mark.
In 2015 the Brazilian Federal Investigation Department (CGU) disclosed an
official report pointing out several irregularities within the Brazilian Ministry of Fisheries
and Aquaculture (MPA), including provision of false fisheries production data to the
Food and Agriculture Organization of the United Nations (FAO) and to the International
Commission for the Conservation of Atlantic Tunas (ICCAT) (CGU, 2015). Such
investigation was launched after a letter written by the MPA technical department,
which claimed the data was unreliable and based on poor technical-scientific
procedures. Such letter did not prevent the Brazilian fisheries statistics from being
generated.
Part of such unreliability is due to a total absence of a national fish landing
statistics program since 2010. Even before this program was put on a halt, there was
plenty of criticism regarding its quality and geographic coverage, punctuated by
numerous interruptions along the way, since it started in 1980. Scientists and
managers alike complained about the lack of training of the personnel working in the
Anexo 2
195
field and of local corruption. Many of the staff was from the places they were sampling,
which gave risen to suspicious that some of them were turning a blind eye on the catch
of certain species, even though the statistics program did not deal with any sort of
enforcement. Moreover, the geographic coverage tended to ignore most of the
artisanal fisheries, due to inaccessibility to many of the places where such fisheries
happen.
Ironically, when we see in retrospective, all such problems look now desirable,
as at least we had some data to criticize. For the last six years, we simply do not know
how much, where or how each fish species is being caught in Brazil. This scenario of
uncertainty does not look any promising, it could result in the collapse of stocks,
biodiversity loss and its associated ecosystem services, followed by a dramatic
dismantlement of local value chains, which is deeply associate to the poor. Some
researches already indicate that some stocks, target or bycatch species, have
collapsed or are on its way.
The Brazilian government urgently needs to get back on track of fisheries
sustainability, if we are to prevent larger losses of biodiversity and ecosystem services,
and their reverberating impacts on food, employment and income for millions of
people. We reinforce the urgent necessity to follow the guidelines present in the open
letter written by Brazilian organizations and fisheries specialists to the president Dilma
Rousseff, which mainly refers to re-establishing an effective fish landing statistics
program, increasing investment in applied research, establishing recovery plans for
overexploited stocks and increasing surveillance against illegal fisheries (Open letter,
2015).

Anexo 2
196
References
1. Food and Agriculture Organization of the United Nations. Fishery and
Aquaculture Country Profiles: The Federative Republic of Brazil.
http://www.fao.org/fishery/facp/BRA/en (2016).
2. Controladoria Geral da União. Relatório de Demandas Externas, número
00190.017846/2014-01. Available online in
http://sistemas2.cgu.gov.br/relats/uploads/6978_%20RDE%2000190.01784
6-2014-01%20-%20Pesca%20e%20Aquicultura%20-%20Bras%C3%ADlia-
DF.pdf ( 2014).
3. Open letter to the Brazilian President. Available online in
http://ciencia.estadao.com.br/blogs/herton-escobar/wp-
content/uploads/sites/81/2015/01/Carta-Aberta-a-presidenta-Ordenamento-
da-Pesca.pdf (2016).
197
Anexo 3
Além tese:
Ensinamentos caboclos para problemas também existentes na academia
O presente anexo é composto de seis pequenos contos sobre algumas
problemáticas que me acompanharam durante os 15 meses que passei em
campo, desenvolvendo esta tese de doutorado. Cada conto representa uma
pequena história, vivenciada com diferentes protagonistas, que com seus
trejeitos, comportamentos e sabedoria popular me ajudaram a refletir sobre
alguns temas inerentes ao ser humano e à nossa sociedade. Resolvi incluir esse
anexo na tese com o objetivo de trazer um pouco do dia a dia do trabalho de
campo para esse documento.
Talvez, também seja uma forma a mais de agradecimento à toda
sabedoria popular compartilhada pelo povo alegre, sofrido e digno da beirada do
rio. Para não citar nomes, chamarei todos os personagens de “Seu Gracias”, em
homenagem ao Gracias Pinto de Lima morador da comunidade do Tabuleiro -um
grande amigo que viveu a degradação humana causada pela exploração da
borracha e o ressurgimento da dignidade advindo do empoderamento das
comunidades tradicionais que povoam o vale desse rio impressionante.
Obrigado amigo Gracias. Seus ensinamentos farão sempre parte de mim.
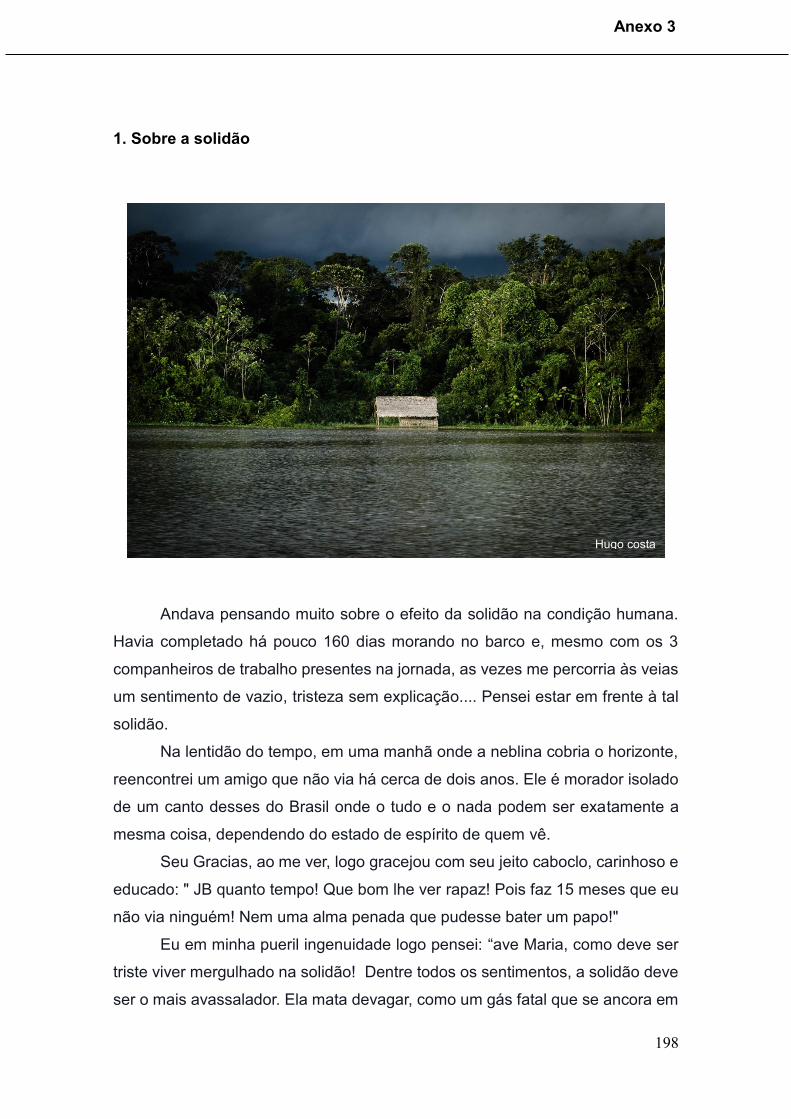
Anexo 3
198
1. Sobre a solidão
Andava pensando muito sobre o efeito da solidão na condição humana.
Havia completado há pouco 160 dias morando no barco e, mesmo com os 3
companheiros de trabalho presentes na jornada, as vezes me percorria às veias
um sentimento de vazio, tristeza sem explicação.... Pensei estar em frente à tal
solidão.
Na lentidão do tempo, em uma manhã onde a neblina cobria o horizonte,
reencontrei um amigo que não via há cerca de dois anos. Ele é morador isolado
de um canto desses do Brasil onde o tudo e o nada podem ser exatamente a
mesma coisa, dependendo do estado de espírito de quem vê.
Seu Gracias, ao me ver, logo gracejou com seu jeito caboclo, carinhoso e
educado: " JB quanto tempo! Que bom lhe ver rapaz! Pois faz 15 meses que eu
não via ninguém! Nem uma alma penada que pudesse bater um papo!"
Eu em minha pueril ingenuidade logo pensei: “ave Maria, como deve ser
triste viver mergulhado na solidão! Dentre todos os sentimentos, a solidão deve
ser o mais avassalador. Ela mata devagar, como um gás fatal que se ancora em
Hugo costa
Anexo 3
199
cada espaço vazio de nossos alvéolos, nos conduzindo à fadiga e agonia”. Com
isso na cabeça, passei a observar a alegria que emanava de seu Gracias ao
contar suas peripécias aos outros companheiros.
Enquanto fitava o sorriso em seu semblante, comecei a pensar melhor as
entrelinhas de seu sorriso. Me lembrei de muitas viagens que fiz para chãos
despovoados, onde muitas pessoas vivem na mais sublime paz, mesmo
distantes de tudo. Percebi então, que na realidade, a solidão nada tem a ver com
reclusão social e falta de pessoas que possam estabelecer laços de amor ou
amizade. A verdadeira solidão ocorre quando nos perdemos de nós mesmo.
Quando nosso "eu" se desencontra o mundo desmorona. Tudo perde o sentido
e o vazio que se aloja no peito tem o peso do mundo.
Qualquer vida deve abarcar um sentido, por mais simples que ele seja.
Se perdermos esse sentido o nosso "eu" também se esvai. Por isso vemos
eremitas vagando em templos, florestas e desertos com o coração
transbordando de alegria e, ao mesmo tempo, vemos grandes legiões de
pessoas em megalópoles com milhares de amigos nas redes sociais, mas
padecendo na mais brutal solidão. Eles estão completamente sós no meio de
milhares.
Por isso, seu Gracias é tão feliz. Mesmo vivendo em reclusão, ele nunca
esteve realmente sozinho, pois o sentido de sua vida e sua própria companhia
sempre foram o bastante. Dar um sentido à vida é blindar-se frente à
solidão! Que tolo era eu ao pensar que a solidão era ausência de algo externo.
Quero mesmo é viver me encontrando para que eu nunca me perca de mim!

Anexo 3
200
2.Sobre a meritocracia
Seu Gracias é o maior pescador de pirarucu da região. Sua veia
naturalista é grandiosa como as grandes cheias que inundam toda a terra que
se pode ver. Seu sonho? Era ser biólogo, hora vejam vocês...
Em um dia chuvoso, estávamos no barco conversando sobre a vida dura
do pescador, quando de repente, ele me desabafa: “Poxa JB... voce é inteligente
né?! Só pode ser muito inteligente quem faz faculdade e depois esses estudo
que faz virá dotô... Queria muito ter nascido inteligente pra ser biólogo também.
Estudar as plantas os animais.....que coisa legal!”
Antes de lhe responder, uma tristeza aguda tomou meu corpo, fruto de
uma lembrança escondida nos recônditos de minha mente. Vou explicar
Hugo costa
Anexo 3
201
brevemente: Ulisses era o garoto mais inteligente de meu colégio e um de meus
melhores amigos. Compartilhávamos dentre tantas coisas, o sonho de ser
biólogo. Ulisses era brilhante e incomparável, não consigo me lembrar sequer
uma prova em que o menino não tivesse tirado nove ou dez. Já eu, com certa
inclinação à preguiça, nunca me afastei da média, nem para baixo nem para
cima. Todas as notas altas que tive não vieram sem as longas horas de bunda
na cadeira.
Mas havia outra diferença entre nós, que nunca foi notada por ser
absolutamente desprezível, mas que o tempo fez ganhar força a ponto de mudar
substancialmente nossos rumos: a mãe de Ulisses era a faxineira da escola,
enquanto a minha era uma comerciante com condições financeiras bem mais
altas. O fato é que Ulisses continuou na mesma (e precarizada escola), enquanto
meus pais, com muito suor, me mandaram para uma das melhores escolas da
região. Na época não haviam políticas sociais que pudessem fazer o menino
deslanchar nos estudos, e com 11 anos Ulisses se tornou um pintor de paredes,
profissão que exerce com muita dignidade e distinção até hoje. O sonho de ser
biólogo foi deixado para trás.
Ulisses era intelectualmente muito superior a mim. Não há como comparar
e não vejo motivos para me envergonhar disso, uma vez que a beleza do mundo
está nos diferentes saberes que cada um carrega consigo. Mas infelizmente,
Ulisses não teve a sorte que tive de nascer em uma família com mais dinheiro.
Não quero em momento algum reduzir os grandes esforços que fiz até hoje para
estar aqui escrevendo esse texto. Mas de fato, os calos nas mãos de meus pais
me abriram muito mais portas que minha parca inteligência.
Lembrar do Ulisses me faz brotar uma imensurável valentia para lutar
nesse mundo para que os Gracias desse país tenham mais oportunidades e
deixem de usar o lenitivo da inteligência para ocultar a brutal desigualdade que
destroça seus sonhos.
Olhando nos olhos do Gracias, olhos que almejam a inteligência (que eu
nunca tive) para se tornar um doutor, findei a conversa abrindo uma lata de
cerveja e brindando: “Que besteira Gracias, queria eu ser inteligente como o
senhor para saber onde jogar o arpão e acertar o lombo de um pirarucu,
garantindo a broca da minha família. Isso é que é ser inteligente rapaz! ”.
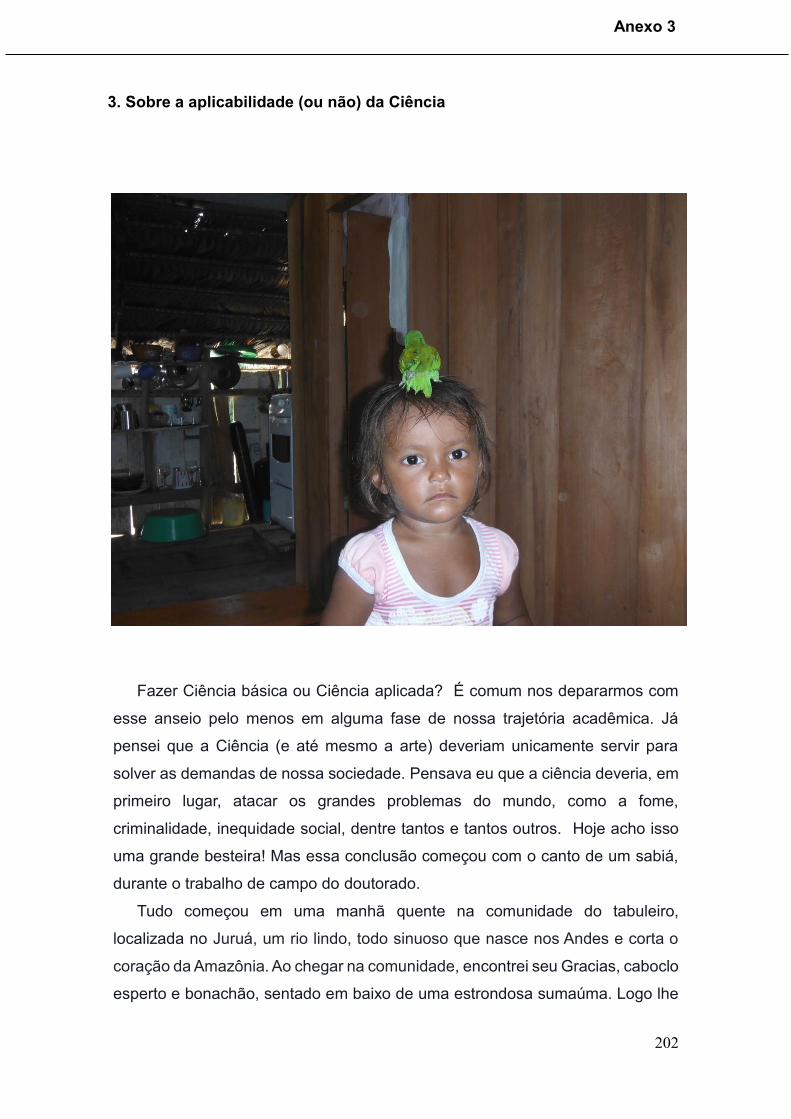
Anexo 3
202
3. Sobre a aplicabilidade (ou não) da Ciência
Fazer Ciência básica ou Ciência aplicada? É comum nos depararmos com
esse anseio pelo menos em alguma fase de nossa trajetória acadêmica. Já
pensei que a Ciência (e até mesmo a arte) deveriam unicamente servir para
solver as demandas de nossa sociedade. Pensava eu que a ciência deveria, em
primeiro lugar, atacar os grandes problemas do mundo, como a fome,
criminalidade, inequidade social, dentre tantos e tantos outros. Hoje acho isso
uma grande besteira! Mas essa conclusão começou com o canto de um sabiá,
durante o trabalho de campo do doutorado.
Tudo começou em uma manhã quente na comunidade do tabuleiro,
localizada no Juruá, um rio lindo, todo sinuoso que nasce nos Andes e corta o
coração da Amazônia. Ao chegar na comunidade, encontrei seu Gracias, caboclo
esperto e bonachão, sentado em baixo de uma estrondosa sumaúma. Logo lhe

Anexo 3
203
indaguei: “Eiii caboclo, que ta fazendo aí parado que nem tracajá? ” Ele com seu
sorriso padrão me replicou “ tô escutando meu amigo, só escutando”. Então ele
apontou para um sabiá que cantava uma melodia tão bonita que me fez sentar
para admira-la por longos 45 minutos. Aprendiz de ornitólogo que sou, logo
comecei a reparar na infinidade de cantos percorrendo os espaços daquela
várzea mansa. Então comecei a refletir sobre a natureza e, invariavelmente,
acabei chegando na ciência. E a “crise” do momento era Ciência básica x Ciência
aplicada.
Assim como a diversidade de cantos embeleza o mundo dos pássaros, a
diversidade de perfis embeleza o mundo dos homens. As pessoas são muito
diferentes, logo a criação humana, seja na arte ou na ciência, também será.
Acontece que muitos cientistas são completamente avessos ao convívio social.
Eles se deliciam na solidão de seus aposentos e suas habilidades são voltadas
unicamente para a produção de conhecimento básico. Sim, eles estão
preocupados com os pormenores das vias da ocitocina; com o tempo que o
elétron leva para mudar de camada; com os pósitrons gerados pela radiação
beta ou pelos íntros que possam interferir na duplicação do DNA. Essas pessoas
não devem carregar o fardo de terem que produzir algo de utilidade imediata
para a sociedade! O conhecimento humano não deve ser suprimido por uma
demanda contemporânea. Muitas vezes, a ciência básica de hoje pode ser a
necessidade do amanhã. Ciência e sociedade nem sempre estão no mesmo
tempo cronológico.
Lembro-me de uma passagem onde um matemático ganhou um alto prêmio
da rainha inglesa, por resolver uma equação que estava há décadas sem
resolução. Na entrega da premiação, a generosa rainha pergunta: "Meu nobre
senhor, acabaste de ganhar uma fortuna por resolver uma equação matemática.
Qual é a importância disso para o mundo?" De forma avassaladora o matemático
responde: "Querida rainha, qual é a importância de um bebê para o mundo?".
Essa resposta não seria tão genial se 20 anos depois essa equação não tivesse
sido fundamental no desenvolvimento do aparelho mais moderno para o
tratamento do câncer. Ora, qual é a importância de um bebe para o mundo? Ele
pode ser uma pessoa comum como nós, um Einstein, um Gandhi, um Mandela
ou um Hittler... Assim também acontece com a ciência básica, uma equação
hoje pode significar muita coisa no futuro.

Anexo 3
204
Já pensaram se Darwin estivesse preocupado em pesquisar algo útil para a
humanidade? Quem financiaria elucubrações de uma mente que buscava um
ancestral comum entre homens e macacos? Por outro lado, a teoria evolucionista
hoje estrutura todo o entendimento que temos da natureza e da vida. Se gostas
e és inclinado a fazer ciência básica, vá em frente! Ela é tão necessária quanto
a compreensão dos efeitos do aquecimento global sobre a produção de
alimentos! Tudo é uma questão de perfil, o que precisamos no fundo é mais
autoconhecimento, assim os espíritos irrequietos com a situação do mundo
poderão compreender os diferentes perfis que existem. É um barato encontrar
aqueles que se preocupam com o salto máximo que a musculatura da perna de
um gafanhoto pode proporcionar. Não há limites para a curiosidade humana!
A ciência deve ser livre! Muitas vezes os caminhos mais fantásticos não se
revelam de uma forma óbvia. As coisas nem sempre precisam de justificativas
para serem bonitas. Isso seu Gracias me mostrou com o canto daquele sabiá...
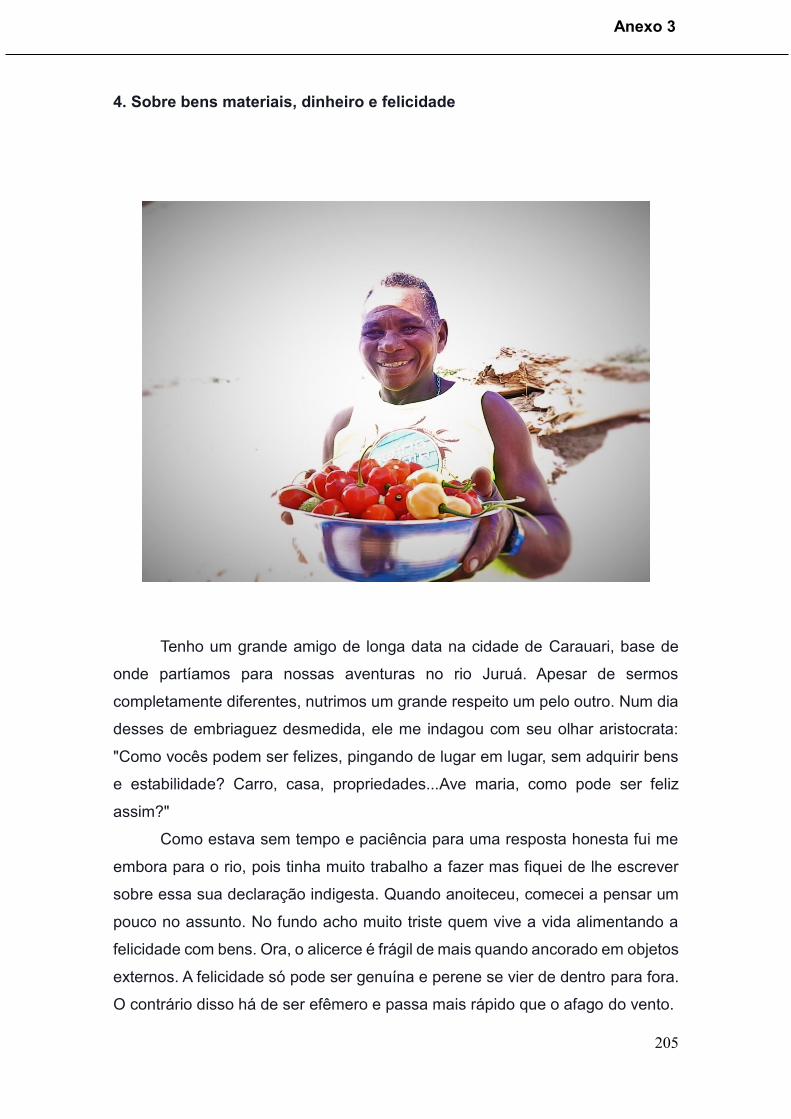
Anexo 3
205
4. Sobre bens materiais, dinheiro e felicidade
Tenho um grande amigo de longa data na cidade de Carauari, base de
onde partíamos para nossas aventuras no rio Juruá. Apesar de sermos
completamente diferentes, nutrimos um grande respeito um pelo outro. Num dia
desses de embriaguez desmedida, ele me indagou com seu olhar aristocrata:
"Como vocês podem ser felizes, pingando de lugar em lugar, sem adquirir bens
e estabilidade? Carro, casa, propriedades...Ave maria, como pode ser feliz
assim?"
Como estava sem tempo e paciência para uma resposta honesta fui me
embora para o rio, pois tinha muito trabalho a fazer mas fiquei de lhe escrever
sobre essa sua declaração indigesta. Quando anoiteceu, comecei a pensar um
pouco no assunto. No fundo acho muito triste quem vive a vida alimentando a
felicidade com bens. Ora, o alicerce é frágil de mais quando ancorado em objetos
externos. A felicidade só pode ser genuína e perene se vier de dentro para fora.
O contrário disso há de ser efêmero e passa mais rápido que o afago do vento.

Anexo 3
206
Esse tema foi discutido extensivamente pela filosofia e é impressionante
como é negligenciado pela maioria. Não se trata de negar o dinheiro, mas de
colocá-lo em seu devido lugar. Sabe como é?
A cada dia nos distanciamos da realidade em busca da externalidade
supérflua. Nesse momento, por exemplo, eu poderia estar imerso em meu laptop
ou celular, mas resolvi vir na proa do barco para sentir a brisa da noite que
refresca meu rosto após um dia de árduo trabalho. Estrelas muito brilhantes
rabiscam um céu negro e vagalumes sobrevoam a agua mansa que nasce na
floresta distante. Já reparou como isso é bonito?
Nas entrelinhas da natureza e dos pequenos acontecimentos diários
estão as respostas para perguntas complexas que acompanham desde sempre
a humanidade. E todo esse universo de reflexão e conhecimento lhe é gratuito.
Isso não te soa interessante?
Nesse instante percorre meu corpo um sentimento de felicidade tão
intenso que me faz pensar: Quanto dinheiro é necessário para isso? Qual a real
necessidade humana? O que realmente devemos buscar nessa vida?
Ora, tudo que acumulamos além do necessário é supérfluo e tem efeito
reverso. O mundo pode sustentar todas as nossas necessidades, mas jamais
poderia suprir toda nossa ambição material e cobiça. O telhado de sapê protege
da mesma forma que o de ouro, e se não proteger deve haver um meio termo
que nos satisfaça.
Obviamente não sou nenhum franciscano pós-moderno que anda pelas
ruas com a roupa do corpo pregando paz e amor. Pelo contrário, usufruo e
dependo do dinheiro. Ganho e gasto bastante. A questão, portanto, não é de
negação e sim de dominação. Quem é dominado por dinheiro padece de tristeza
em algum momento da vida. Exemplos não faltam de pessoas com a conta
bancaria cheia e os olhos vazios de tanta lágrima derramada. Afinal, as coisas
mais valiosas que adquirimos na vida estão muito longe da lógica da pergunta
feita pelo meu amigo. Bom mesmo é gastar nossas economias com o que nos
amplia os horizontes.
Não devemos cair no erro de vincular bens materiais e dinheiro à
felicidade. Corre o risco de chegar ao fim da vida com muitos bens e
pouquíssimas histórias para contar. E acredito que nossos netos irão nos cobrar
mais histórias que dinheiro.... Ninguém toma posse da felicidade. Ela é um
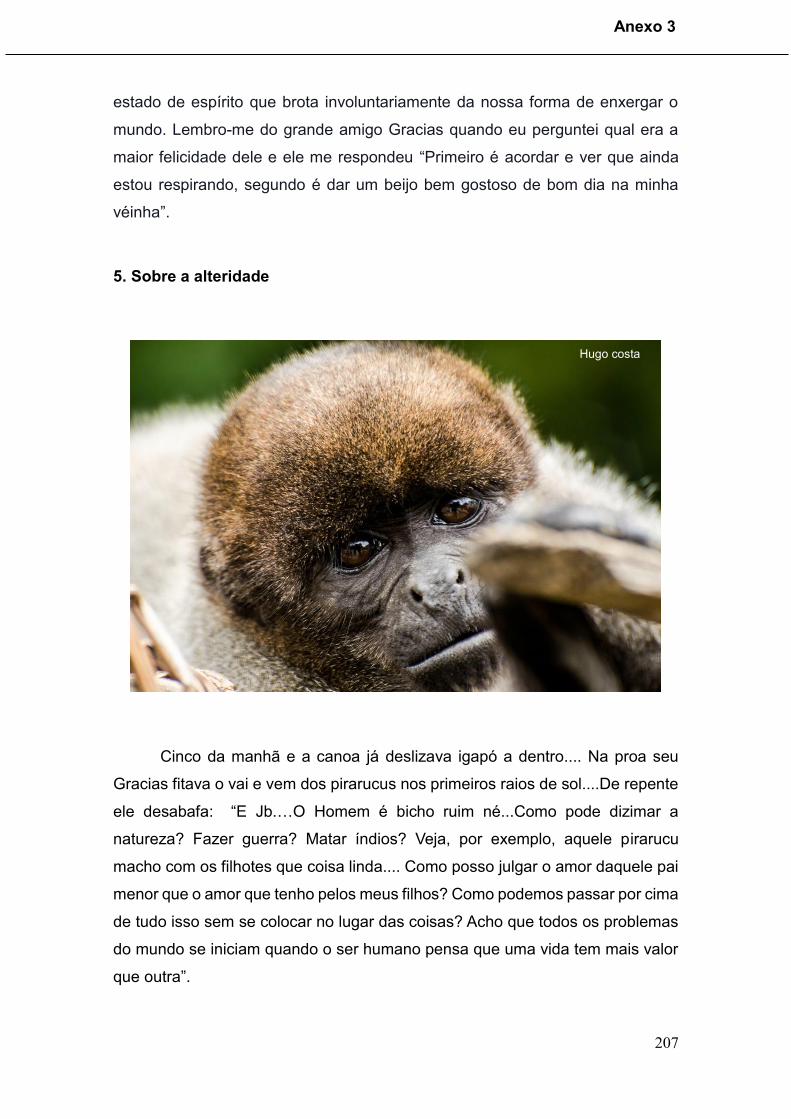
Anexo 3
207
estado de espírito que brota involuntariamente da nossa forma de enxergar o
mundo. Lembro-me do grande amigo Gracias quando eu perguntei qual era a
maior felicidade dele e ele me respondeu “Primeiro é acordar e ver que ainda
estou respirando, segundo é dar um beijo bem gostoso de bom dia na minha
véinha”.
5. Sobre a alteridade
Cinco da manhã e a canoa já deslizava igapó a dentro.... Na proa seu
Gracias fitava o vai e vem dos pirarucus nos primeiros raios de sol....De repente
ele desabafa: “E Jb.…O Homem é bicho ruim né...Como pode dizimar a
natureza? Fazer guerra? Matar índios? Veja, por exemplo, aquele pirarucu
macho com os filhotes que coisa linda.... Como posso julgar o amor daquele pai
menor que o amor que tenho pelos meus filhos? Como podemos passar por cima
de tudo isso sem se colocar no lugar das coisas? Acho que todos os problemas
do mundo se iniciam quando o ser humano pensa que uma vida tem mais valor
que outra”.
Hugo costa

Anexo 3
208
6. Sobre o tempo
Eu andava apressado e cansado na floresta densa enquanto pensava nos
30 anos que acabara de completar. Confesso que estava um pouco em crise
pois sentia que algumas coisas já não eram iguais há pouco tempo atrás...
Seu Gracias vinha vagarosamente atrás observando um grupo de macaco
de cheiro. Eu disse: “Ei seu Gracias você já se incomodou com o tempo? Tenho
a impressão de que ele tem passado rápido de mais...”
Gracias com seu jeito caboclo me responde: “Menino, o tempo é a maior
benção que pode existir...somente com o tempo é que podemos acumular
histórias, e essa é a graça da vida!!” Esbravejei um sorriso com a certeza de que
nesse instante minha relação com o tempo iria de mudar!
Continuou o matuto: “O tempo só é um problema, se passarmos a vida
em branco. Nos momentos finais da nossa existência deve ser agonizante olhar
para trás e não ver nada além de uma imensidão desértica. Aquela vida comum,
movida à trabalho e comida…sem experimentações, sem compartilhar alegrias,
Hugo costa

Anexo 3
209
sem ajudar o próximo, sem música, sem dança, sem amar (na maior concepção
possível de amor). ”
Cabra sábio esse seu Gracias! Quando vivemos acumulando histórias
para contar, construímos nosso navio para navegar em um sublime sentimento
de missão cumprida. Aí não importa se o tempo nos fez calvo, solteiro, fora dos
padrões da moda ou beleza. O importante é que não existe vazio em nosso
passado. Nossa passagem pela terra então, terá sido densa e totalmente
preenchida, com coisas que somente o tempo pode preencher! Realmente o
tempo está do nosso lado, ele é um grande presente absolutamente necessário
para justificarmos a sorte de ter experimentado esse fenômeno raro que é a vida.