JMAP Big Book of Lesson Plans
613
JMAP Big Book of Lesson Plans (This pdf can be navigated using bookmarks in Adobe Reader) About this Book of Lesson Plans: These lesson plans are suitable for use in any state with mathematics curricula aligned to the Common Core. Each lesson plan includes representative questions used by the New York State Education Department (NYSED) to assess high school students during Algebra I (Common Core) Regents mathematics examinations. Teachers are welcome to copy, modify, and use these lesson plans and other JMAP resources for individual and classroom use, but not for profit or republication on the internet. Each lesson plan in this book is available at no cost in manipulable docx format on the JMAP website. Simply Google the name of the lesson plan and the word JMAP. If you find errors in these lesson plans, and there undoubtedly are some errors, or if you have a recommendation for improving these resources, please let us know. Steve and Steve www.jmap.org August, 2018 JMAP is a non-profit initiative working for the benefit of teachers and their students. JMAP provides free resources to teachers and receives no state or local government support. If you wish to support JMAP’s efforts, please consider making a charitable donation through JMAP’s website. While JMAP is not associated with NYSED or the New York City Department of Education (NYCDOE), Steve Sibol (Editor and Publisher) and Steve Watson (Principal and Cofounder) are Brooklyn public high school math teachers. Special appreciation goes to the many math teachers who have shared their ideas about how to improve JMAP.
-
Upload
khangminh22 -
Category
Documents
-
view
8 -
download
0
Transcript of JMAP Big Book of Lesson Plans

JMAP Big Book of Lesson Plans
(This pdf can be navigated using bookmarks in Adobe Reader)
About this Book of Lesson Plans:
These lesson plans are suitable for use in any state with mathematics curricula aligned to the Common Core. Each lesson plan includes representative questions used by the New York State Education Department (NYSED) to assess high school students during Algebra I (Common Core) Regents mathematics examinations.
Teachers are welcome to copy, modify, and use these lesson plans and other JMAP resources for individual and classroom use, but not for profit or republication on the internet. Each lesson plan in this book is available at no cost in manipulable docx format on the JMAP website. Simply Google the name of the lesson plan and the word JMAP.
If you find errors in these lesson plans, and there undoubtedly are some errors, or if you have a recommendation for improving these resources, please let us know.
Steve and Steve www.jmap.org
August, 2018
JMAP is a non-profit initiative working for the benefit of teachers and their students. JMAP provides free resources to teachers and receives no state or local government support. If you wish to support JMAP’s efforts, please consider making a charitable donation through JMAP’s website. While JMAP is not associated with NYSED or the New York City Department of Education (NYCDOE), Steve Sibol (Editor and Publisher) and Steve Watson (Principal and Cofounder) are Brooklyn public high school math teachers. Special appreciation goes to the many math teachers who have shared their ideas about how to improve JMAP.

Bernstein’s Three Pillars of Education
EDUCATION
CURR I CULUM
PEDAGOGY
ASSESSMENT
Basil Bernstein (1924 – 2000)[1] was a British sociologist of education. He posited that there are three pillars of education: 1) curriculum; 2) pedagogy; and 3) assessment; and that all communication involves the transmission of sociolinguistic codes, which are associated with the languages that people use. This book of lesson plans is heavily influenced by Basil Bernstein’s sociolinguistic theory of language codes and seeks to illuminate the hidden codes of the Common Core mathematics curriculum for teachers and students. The methodology focuses on the three pillars of education.
CURRICULUM Curriculum in public education in New York is defined by the state, so each lesson plan begins a crosswalk between New York’s current Common Core State Standards and the revised Next Generation State Standards that will be effective in 2020. These standards constitute New York State’s definition of what is to be taught in Algebra I courses in public schools.
PEDAGOGY Pedagogy in public education is defined by how teachers frame and deliver curriculum to their students. The lesson plans that follow include vocabulary and big ideas associated with the curriculum standards. This information is provided to assist the classroom teacher with ideas and tools that may be useful in the classroom. However, in the final analysis, teachers must adapt any lesson plan to their own teaching styles and to the needs of their students. To facilitate customization, every lesson plan in this book is available in Microsoft Word document format at www.jmap.org for free. Just Google JMAP and the name of the lesson, then customize at will.
ASSESSMENT Assessment of the Algebra I curriculum in New York occurs through the Regents Examination System. Every lesson plan in this book contains every associated Algebra I Regents examination problem administered through June 2018, a total of 504 problems. By studying the entire lesson plan, teachers will gain insights into how the standards are assessed. By aligning curriculum, pedagogy, and assessment practices, teachers will assist their students in their quests to acquire the knowledge required to sustain the examinations. By working the Regents examination problems at the end of each lesson, students will become familiar with Regents assessment practices and become prepared for their own examination.

TABLE OF CONTENTS (This pdf can be navigated using bookmarks in Adobe Reader)
A - Numbers, Operations, and Properties, Lesson 1, Identifying Properties B – Graphs and Statistics, Lesson 1, Central Tendency and Dispersion B – Graphs and Statistics, Lesson 2, Frequency Tables B – Graphs and Statistics, Lesson 3, Frequency Histograms, Box Plots and Dot Plots B – Graphs and Statistics, Lesson 4, Analysis of Data B – Graphs and Statistics, Lesson 5, Regression B – Graphs and Statistics, Lesson 6, Correlation Coefficient B – Graphs and Statistics, Lesson 7, Residuals C – Expressions and Equations, Lesson 1, Dependent and Independent Variables C – Expressions and Equations, Lesson 2, Modeling Expressions C – Expressions and Equations, Lesson 3, Solving Linear Equations C – Expressions and Equations, Lesson 4, Modeling Linear Equations C – Expressions and Equations, Lesson 5, Transforming Formulas D – Rate, Lesson 1, Conversions D – Rate, Lesson 2, Using Rate D – Rate, Lesson 3, Speed D – Rate, Lesson 4, Rate of Change E – Linear Equations, Lesson 1, Modeling Linear Functions E – Linear Equations, Lesson 2, Graphing Linear Functions E – Linear Equations, Lesson 3, Writing Linear Equations F – Inequalities, Lesson 1, Solving Linear Inequalities F – Inequalities, Lesson 2, Interpreting Solutions F – Inequalities, Lesson 3, Modeling Linear Inequalities F – Inequalities, Lesson 4, Graphing Linear Inequalities G – Absolute Value, Lesson 1, Graphing Absolute Value Functions H – Quadratics, Lesson 1, Solving Quadratics H – Quadratics, Lesson 2, Using the Discriminant H – Quadratics, Lesson 3, Modeling Quadratics H – Quadratics, Lesson 4, Geometric Applications of Quadratics H – Quadratics, Lesson 5, Vertex Form of a Quadratic H – Quadratics, Lesson 6, Graphing Quadratic Functions
Every lesson plan in this book is available in Microsoft Word document format at www.jmap.org for free. Just Google JMAP and the name of the lesson, then customize at will.

TABLE OF CONTENTS (cont.) (This pdf can be navigated using bookmarks in Adobe Reader)
I – Systems, Lesson 1, Solving Linear Systems I – Systems, Lesson 2, Modeling Linear Systems I – Systems, Lesson 3, Graphing Linear Systems I – Systems, Lesson 4, Modeling Systems of Linear Inequalities I – Systems, Lesson 5, Graphing Systems of Linear Inequalities I – Systems, Lesson 6, Quadratic-Linear Systems I – Systems, Lesson 7, Other Systems J – Powers, Lesson 1, Modeling Exponential Functions K – Polynomials, Lesson 1, Identifying Solutions K – Polynomials, Lesson 2, Operations with Polynomials K – Polynomials, Lesson 3, Factoring Polynomials K – Polynomials, Lesson 4, Factoring the Difference of Perfect Squares K – Polynomials, Lesson 5, Zeros of Polynomials K – Polynomials, Lesson 6, Graphing Polynomial Functions L – Radicals, Lesson 1, Operations with Radicals L – Radicals, Lesson 2, Graphing Root Functions M – Functions, Lesson 1, Defining Functions M – Functions, Lesson 2, Function Notation, Evaluating Functions M – Functions, Lesson 3, Domain and Range M – Functions, Lesson 4, Operations with Functions M – Functions, Lesson 5, Families of Functions M – Functions, Lesson 6, Transformations with Functions M – Functions, Lesson 7, Comparing Functions M – Functions, Lesson 8, Relating Graphs to Events M – Functions, Lesson 9, Graphing Piecewise-Defined Functions M – Functions, Lesson 10, Graphing Step Functions
N – Sequences and Series, Lesson 1, Sequences
Every lesson plan in this book is available in Microsoft Word document format at www.jmap.org for free. Just Google JMAP and the name of the lesson, then customize at will.

A - Numbers, Operations, and Properties, Lesson 1, Identifying Properties (r. 2018)
NUMBERS, OPERATIONS AND PROPERTIES Identifying Properties
CC Standard
A-REI.1 Explain each step in solving a simple equa-tion as following from the equality of numbers as-serted at the previous step, starting from the assump-tion that the original equation has a solution. Con-struct a viable argument to justify a solution method.
NG Standard
AI-A.REI.1a Explain each step when solving a linear or quadratic equation as following from the equality of numbers asserted at the previous step, starting from the assumption that the original equation has a solution. Con-struct a viable argument to justify a solution method.
Overview of Lesson
Teacher Centered Introduction Overview of Lesson
- activate students’ prior knowledge
- vocabulary
- learning objective(s)
- big ideas: direct instruction
- modeling
Student Centered Activities guided practice Teacher: anticipates, monitors, selects, sequences, and connects student work
- developing essential skills
- Regents exam questions
- formative assessment assignment (exit slip, explain the math, or journal entry)
LEARNING OBJECTIVES
Students will be able to:
1) Use academic language to describe each step in solving an equation.
2) Use a four column strategy to show and explain each step in solving an equation.
VOCABULARY
Commutative Properties of Addition and Multiplication Associative Properties of Addition and Multiplication Distributive Properties of Addition and Multiplication Addition Property of Equality Multiplication Property of Equality Identity Elements of Addition and Multiplication Inverse Properties of Addition and Multiplication
BIG IDEAS PROPERTIES
Commutative Properties of Addition and Multiplication For all real numbers a and b:
Associative Properties of Addition and Multiplication
a b b a+ = + a b b a⋅ = ⋅
Page 1

For all real numbers a, b, and c:
Distributive Properties of Addition and Multiplication
Addition Property of Equality The addition of the same number or expression to both sides of an equation is permitted.
Multiplication Property of Equality The multiplication of both sides of an equation by the same number or expression is permitted.
IDENTITY ELEMENTS Identity Element: The identity element is always associated with an operation. The identity element for a given operation is the element that preserves the identity of other elements under the given operation.
Addition The identity element for addition is the number 0
The number 0 does not change the value of other numbers under addition.
Multiplication
The identity element for multiplication is the number 1
The number 1 does not change the value of other numbers under multiplication.
Inverse Properties of Addition and Multiplication Inverse: The inverse of a number or expression under a given operation will result in the identity element for that operation. Therefore, it is necessary to know what the identity element of an operation is before finding the inverse of a given number or expression.
Addition The additive inverse of a number or expression results in 0 under addition.
Multiplication The multiplicative inverse of a number or expression results in 1 under multiplication.
( ) ( )a b c a b c+ + = + + ( ) ( )a b c a b c⋅ ⋅ = ⋅ ⋅
a b c ab ac( )+ = + ( )a b c ab ac− = −( )b c a ba ca+ = + ( )b c a ba ca− = −
a a and a a+ = + =0 0
a a and a a⋅ = ⋅ =1 1
Page 2

Four Column Strategy The four column strategy focuses on organizing and documenting each step in solving an equation or inequality. Emphasis is given to explaining each step and keeping the equal signs (or inequality signs) aligned in a vertical column. The vertical and horizontal lines are simply scaffolds that can be removed as students acquire understanding and skills in solving equations.
Notes Left Hand Expression Sign Right Hand Expression Given
Add (6) (Addition
Property of Equality)
=
= 8 Divide (2)
(Multiplication Property of Equality)
=
Answer x = 4 Check 2(4) – 6
8-6 2
= = =
2 2 2
DEVELOPING ESSENTIAL SKILLS
Use the four column method with academic language to solve the following equations.
A 2 8 18x + = B 3 7 2
4x − =
C 3 5 2 10x x+ = + D ( )4 5 12 2 4x x+ − = +
REGENTS EXAM QUESTIONS (through June 2018)
A.REI.A.1: Identifying Properties
1) When solving the equation , Emily wrote as her first step. Which
property justifies Emily's first step? 1) addition property of equality 3) multiplication property of equality 2) commutative property of addition 4) distributive property of multiplication over
addition
2) When solving the equation , Evan wrote as his first step. Which property justifies this step? 1) subtraction property of equality 3) associative property of multiplication
2+ 6
82
Page 3

2) multiplication property of equality 4) distributive property of multiplication over subtraction
3) A part of Jennifer's work to solve the equation is shown below. Given: Step 1: Which property justifies her first step? 1) identity property of multiplication 3) commutative property of multiplication 2) multiplication property of equality 4) distributive property of multiplication over
subtraction
SOLUTIONS
1) ANS: 1
Strategy: Identify what changed during Emily’s first step, then identify the property associated with what changed..
Emily moved the term from the left expression of the equation to the right expression of the equation by adding +9 to both the left and right expressions. Adding an equal amount to both sides of an equation is associated with the addition property of equality.
PTS: 2 NAT: A.REI.A.1 TOP: Identifying Properties
2) ANS: 4 Evan’s first step was to remove the parentheses from the right expression.
He removed the parentheses by using the distributive property.
PTS: 2 NAT: A.REI.A.1 TOP: Identifying Properties
3) ANS: 4
This is the distributive property of multiplication over subtraction.
PTS: 2 NAT: A.REI.A.1 TOP: Identifying Properties
Page 4

B – Graphs and Statistics, Lesson 2, Central Tendency and Dispersion (r. 2018)
GRAPHS AND STATISTICS Central Tendency and Dispersion
Common Core Standards
S-ID.A.2 Use statistics appropriate to the shape of the data distribution to compare center (median, mean) and spread (inter-quartile range, standard de-viation) of two or more different data sets. S-ID.A.3 Interpret differences in shape, center, and spread in the context of the data sets, accounting for possible effects of extreme data points (outliers).
Next Generation Standards
AI-S.ID.2 Use statistics appropriate to the shape of the data distribution to compare center (median, mean) and spread (inter-quartile range, sample standard deviation) of two or more different data sets.
Note: Values in the given data sets will represent samples of larger populations. The calculation of standard deviation will be based on the sample standard deviation
formula ( )2
1
x xs
n
−=
− . The sample standard
deviation calculation will be used to make a statement about the population standard deviation from which the sample was drawn.
AI-S.ID.3 Interpret differences in shape, center, and spread in the context of the data sets, accounting for pos-sible effects of extreme data points (outliers).
LEARNING OBJECTIVES
Students will be able to:
1) Calculate measures of central tendency and dispersion for one variable data sets from a graphic representation of the data set, a table, or a context.
2) Compare measures of central tendency and dispersion for two or more one variable data sets.
Overview of Lesson Teacher Centered Introduction
Overview of Lesson
- activate students’ prior knowledge
- vocabulary
- learning objective(s)
- big ideas: direct instruction
- modeling
Student Centered Activities guided practice Teacher: anticipates, monitors, selects, sequences, and connects student work
- developing essential skills
- Regents exam questions
- formative assessment assignment (exit slip, explain the math, or journal entry)
VOCABULARY
Center (measures of central tendency) Mean Median
Mode Spread (measures of dispersion) Interquartile Range
Page 5

Standard Deviation Normal Curve
Outliers (extreme data points)
BIG IDEAS
Measures of Central Tendency
A measure of central tendency is a summary statistic that indicates the typical value or center of an organized data set. The three most common measures of central tendency are the mean, median, and mode. Mean A measure of central tendency denoted by , read “x bar”, that is calculated by adding the data values and then dividing the sum by the number of values. Also known as the arithmetic mean or arithmetic average. The algebraic formula for the mean is:
Median A measure of central tendency that is, or indicates, the middle of a data set when the data values are arranged in ascending or descending order. If there is no middle number, the median is the average of the two middle numbers. Examples: The median of the set of numbers: {2, 4, 5, 6, 7, 10, 13} is 6 The median of the set of numbers: {6, 7, 9, 10, 11, 17} is 9.5 Quartiles: Q1, the first quartile, is the middle of the lower half of the data set. Q2, the second quartile, is also known as the median. Q3, the third quartile, is the middle of the upper half of the data set. NOTE: To computer Q1 and Q2, find the middle numbers in the lower and upper halves of the data set. The median itself is not included in either the upper or the lower halves of the data set. When the data set contains an even number of elements, the median is the average of the two middle numbers and is excluded from the lower and upper halves of the data set. Mode A measure of central tendency that is given by the data value(s) that occur(s) most frequently in the data set. Examples: The mode of the set of numbers {5, 6, 8, 6, 5, 3, 5, 4} is 5. The modes of the set of numbers {4, 6, 7, 4, 3, 7, 9, 1,10} are 4 and 7. The mode of the set of numbers {0, 5, 7, 12, 15, 3} is none or there is no mode.
Measures of Spread
Measures of Spread indicate how the data is spread around the center of the data set. The two most common measures of spread are interquartile range and standard deviation.
x
Mean = =+ + + +Sum of items
Countx x x x
nn1 2 3 ...
Page 6
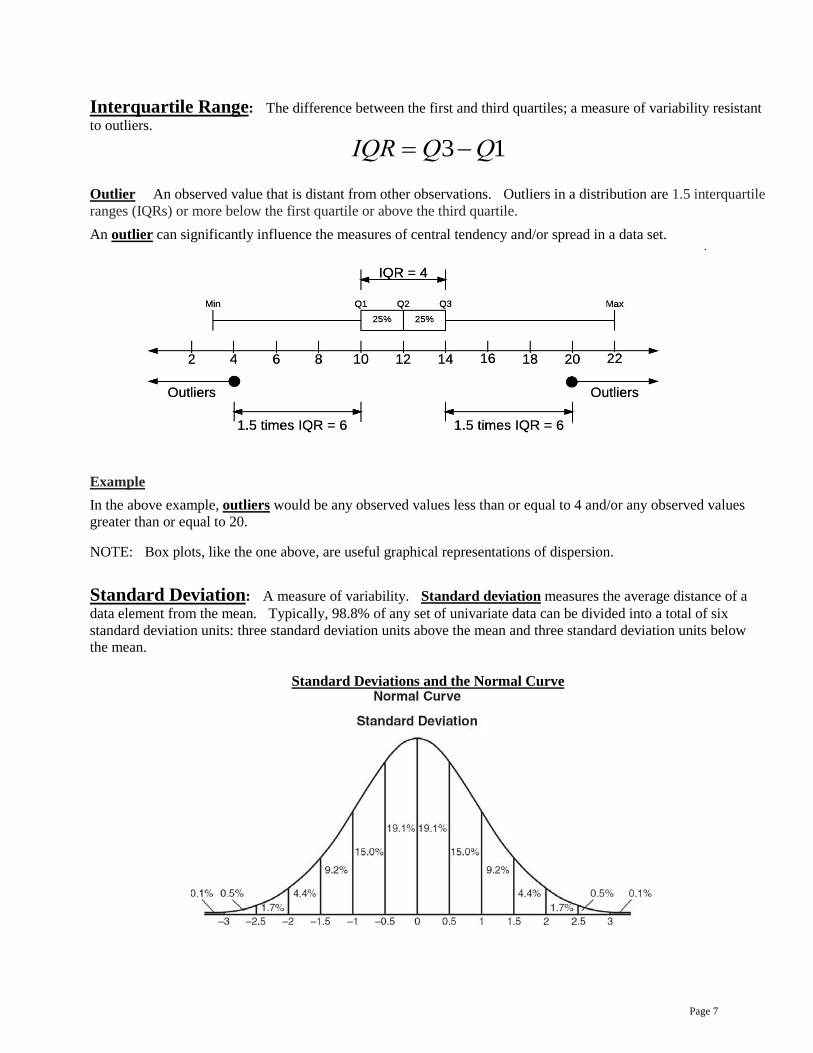
Interquartile Range: The difference between the first and third quartiles; a measure of variability resistant to outliers.
Outlier An observed value that is distant from other observations. Outliers in a distribution are 1.5 interquartile ranges (IQRs) or more below the first quartile or above the third quartile. An outlier can significantly influence the measures of central tendency and/or spread in a data set.
Example In the above example, outliers would be any observed values less than or equal to 4 and/or any observed values greater than or equal to 20.
NOTE: Box plots, like the one above, are useful graphical representations of dispersion. Standard Deviation: A measure of variability. Standard deviation measures the average distance of a data element from the mean. Typically, 98.8% of any set of univariate data can be divided into a total of six standard deviation units: three standard deviation units above the mean and three standard deviation units below the mean.
Standard Deviations and the Normal Curve
3 1IQR Q Q= −
Page 7

• When a data set is normally distributed, there are more elements closer to the mean and fewer elements further away from the mean.
• The normal curve shows the distribution of elements based on their distance from the mean. • Three standard deviation units above the mean and three standard deviation units below the mean
will include approximately 98.8% of all elements in a normally distributed data set. • Each standard deviation above or below the mean corresponds to a specific value in the data set.
o In the above example, the distance associated with each standard deviation unit corresponds
to a distance of approximately units on the scale below the curve.
• Many things in nature, such as height, weight, and intelligence, are normally distributed. There are two types of standard deviations: population and sample.
Population Standard Deviation: If data is taken from the entire population, divide by when averaging the squared deviations. The following is the formula for population standard deviation:
NOTE: Population standard deviation not included in Next Generation Standards.
Sample Standard Deviation: If data is taken from a sample instead of the entire population, divide by when averaging the squared deviations. This results in a larger standard deviation. The following is the formula for sample standard deviation:
Tips for Computing Measures of Central Tendency and Dispersion: Use the STATS function of a graphing calculator to calculate measures of central tendency and dispersion. INPUT VALUES: {4, 8, 5, 12, 3, 9, 5, 2} 1. Use STATS EDIT to input the data set. 2. Use STATS CALC 1-Var Stats to calculate standard deviations.
The outputs include:
, which is the mean (average), , which is the sum of the data set.
223
n
2( )ix xn
σ ∑ −=
1n −
2( )1
ix xsn
∑ −=
−
Page 8

, which is the sum of the squares of the data set.
, which is the sample standard deviation. , which is the population standard deviation.
n, which is the number of elements in the data set
minX, which is the minimum value Q1, which is the first quartile Med, which is the median (second quartile) Q3, which is the third quartile maxX, which is the maximum value
DEVELOPING ESSENTIAL SKILLS
Use a graphing calculator to calculate one variable statistics for the following data sets:
Set A
Set B
Number of Candy Bars Sold 0 35 38 41 43
45 50 53 53 55 68 68 68 72 120
Sets C and D
REGENTS EXAM QUESTIONS
S.ID.A.2-3: Central Tendency and Dispersion
Page 9

4) Christopher looked at his quiz scores shown below for the first and second semester of his Algebra class. Semester 1: 78, 91, 88, 83, 94 Semester 2: 91, 96, 80, 77, 88, 85, 92 Which statement about Christopher's performance is correct? 1) The interquartile range for semester 1 is
greater than the interquartile range for semester 2.
3) The mean score for semester 2 is greater than the mean score for semester 1.
2) The median score for semester 1 is greater than the median score for semester 2.
4) The third quartile for semester 2 is greater than the third quartile for semester 1.
5) Corinne is planning a beach vacation in July and is analyzing the daily high temperatures for her potential destination. She would like to choose a destination with a high median temperature and a small interquartile range. She constructed box plots shown in the diagram below.
Which destination has a median temperature above 80 degrees and the smallest interquartile range? 1) Ocean Beach 3) Serene Shores 2) Whispering Palms 4) Pelican Beach
6) Noah conducted a survey on sports participation. He created the following two dot plots to represent the number of students participating, by age, in soccer and basketball.
Which statement about the given data sets is correct? 1) The data for soccer players are skewed
right. 3) The data for basketball players have the
same median as the data for soccer players.
Page 10

2) The data for soccer players have less spread than the data for basketball players.
4) The data for basketball players have a greater mean than the data for soccer players.
7) The two sets of data below represent the number of runs scored by two different youth baseball teams over the course of a season.
Team A: 4, 8, 5, 12, 3, 9, 5, 2 Team B: 5, 9, 11, 4, 6, 11, 2, 7
Which set of statements about the mean and standard deviation is true? 1) mean A < mean B
standard deviation A > standard deviation B 3) mean A < mean B
standard deviation A < standard deviation B
2) mean A > mean B standard deviation A < standard deviation B
4) mean A > mean B standard deviation A > standard deviation B
8) Isaiah collects data from two different companies, each with four employees. The results of the study, based on each worker’s age and salary, are listed in the tables below.
Which statement is true about these data? 1) The median salaries in both companies are
greater than $37,000. 3) The salary range in company 2 is greater
than the salary range in company 1. 2) The mean salary in company 1 is greater
than the mean salary in company 2. 4) The mean age of workers at company 1 is
greater than the mean age of workers at company 2.
9) The table below shows the annual salaries for the 24 members of a professional sports team in terms of millions of dollars.
Page 11

The team signs an additional player to a contract worth 10 million dollars per year. Which statement about the median and mean is true? 1) Both will increase. 3) Only the mean will increase. 2) Only the median will increase. 4) Neither will change.
10) The heights, in inches, of 12 students are listed below. 61,67,72,62,65,59,60,79,60,61,64,63
Which statement best describes the spread of these data? 1) The set of data is evenly spread. 3) The set of data is skewed because 59 is the
only value below 60. 2) The median of the data is 59.5. 4) 79 is an outlier, which would affect the
standard deviation of these data.
11) The 15 members of the French Club sold candy bars to help fund their trip to Quebec. The table below shows the number of candy bars each member sold.
Number of Candy Bars Sold 0 35 38 41 43
45 50 53 53 55 68 68 68 72 120
When referring to the data, which statement is false? 1) The mode is the best measure of central
tendency for the data. 3) The median is 53.
2) The data have two outliers. 4) The range is 120.
SOLUTIONS
4)ANS: 3
Strategy: Compute the mean, Q1, Q2, Q3, and interquartile range for each semester, then choose the correct answer based on the data.
Mean Q1 Median (Q2) Q3 IQR Semester 1 86.8 80.5 88 92.5 12 Semester 2 87 80 88 92 12
PTS: 2 NAT: S.ID.A.2 TOP: Central Tendency and Dispersion
5) ANS: 4 Strategy: Eliminate wrong answers based on daily high temperatures, then eliminate wrong answers based on size of interquartile ranges. Ocean Breeze and Serene Shores can be eliminated because they do not have median high temperatures above 80 degrees. Whispering Palms and Pelican Beach do have median high temperatures above 80 degrees, so the correct answer must be either Whispering Palms or Pelican Beach.
Page 12
The interquartile range is defined as the difference between the first and third quartiles. Pelican Beach has a much smaller interquartile range than Whispering Palms, so Pelican Beach is the correct choice.
PTS: 2 NAT: S.ID.A.2 TOP: Central Tendency and Dispersion
6) ANS: 4 Strategy: Determine the skew, spread, median, and mean for both data sets, then eliminate wrong answers. Soccer Players Basketball Players
Skew ??? Left Skewed Spread
Median 8.5 10 Mean
a) The data for soccer players are skewed right. Uncertain b) The data for soccer players have less spread than the data for basketball players. Not True. Both data sets have the same spread. c) The data for basketball players have the same median as the data for soccer players. Not True d) The data for basketball players have a greater mean than the data for soccer players. Definitely True
PTS: 2 NAT: S.ID.A.2 TOP: Central Tendency and Dispersion
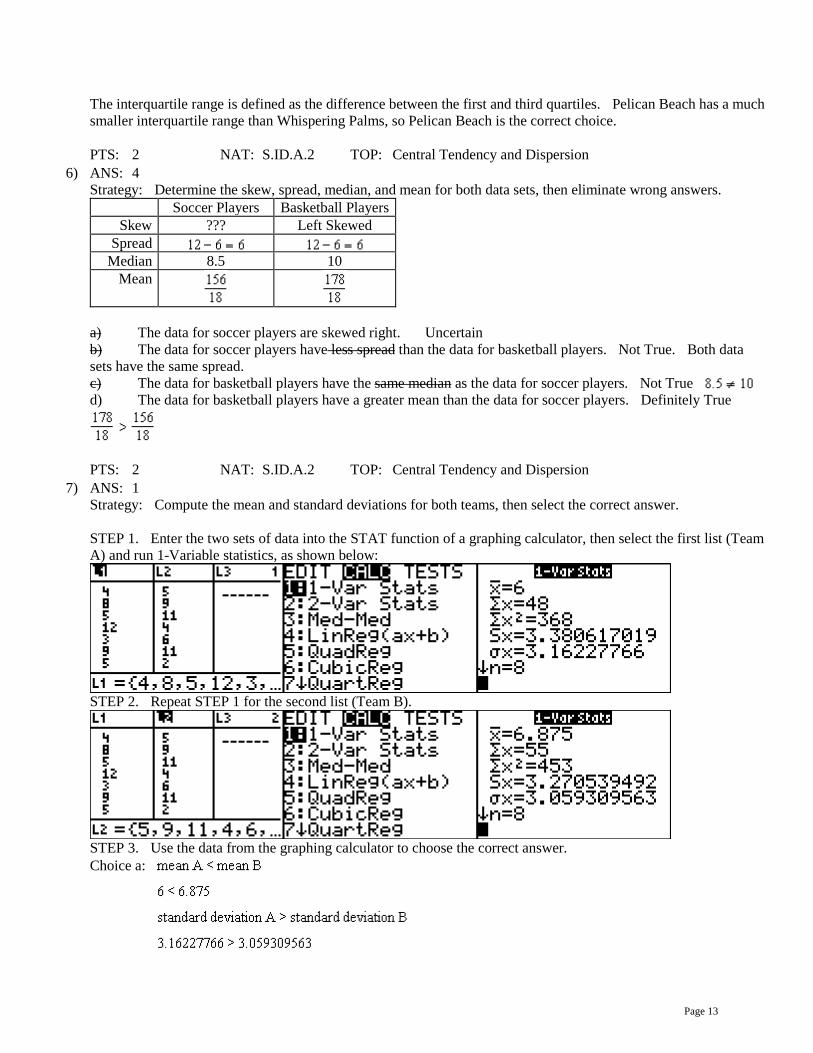
7) ANS: 1 Strategy: Compute the mean and standard deviations for both teams, then select the correct answer. STEP 1. Enter the two sets of data into the STAT function of a graphing calculator, then select the first list (Team A) and run 1-Variable statistics, as shown below:
STEP 2. Repeat STEP 1 for the second list (Team B).
STEP 3. Use the data from the graphing calculator to choose the correct answer. Choice a:
Page 13

Both statements in choice A are true.
PTS: 2 NAT: S.ID.A.2 TOP: Central Tendency and Dispersion
8) ANS: 3 Strategy: Compute the median salary, mean salary, salary range, and mean age of employees for both companies, then select the correct answer.
Company 1 Company 2 1 median salary 33,500 36,250 2 mean salary 33,750 44,125 3 salary range 8,000 36,000 4 mean age 28.25 28.25
PTS: 2 NAT: S.ID.A.2 TOP: Central Tendency and Dispersion
9) ANS: 3 Median remains at 1.4. Strategy: Compare the current median and mean to the new median and mean: STEP 1. Compare the medians: The data are already in ascending order, so the median is the middle number. In this case, the data set contains 24 elements - an even number of elements. This means there are two middle numbers, both of which are 1.4. When the data set contains an even number of elements, the median is the average of the two middle numbers, which in
this case is
The new data set will contain 10 as an additional element, which brings the total number of elements to 25. The new median will be the 13th element, which is 1.4. The current median and the new median are the same, so we can eliminate answer choices a and b. STEP 2. Compare the means: The mean will increase because the additional element (10) is bigger than any current element. It is not necessary to do the calculations. We can eliminate answer choice d. DIMS? Does it make sense that the answer is choice c? Yes. The median will stay and 1.4 and only the mean will increase.
PTS: 2 NAT: S.ID.A.3 TOP: Central Tendency and Dispersion
10) ANS: 4 Input the data in a graphing calculator and obtain single variable statistics, then create a boxplot.
Page 14

(1) The set of data is evenly spread. Wrong. The data is not evenly spread. (2) The median of the data is 59.5. Wrong. The median of the data is 62.5. (3) The set of data is skewed because 59 is the only value below 60. Wrong. The data is skewed, but the reason for skewdness is that the mean does not equal the median. (4) 79 is an outlier, which would affect the standard deviation of these. True. Any value greater than Q3 plus 1.5 times the interquartile range is an outlier.
Page 15
79 is beyond the upper outlier fence.
PTS: 2 NAT: S.ID.A.3 TOP: Central Tendency and Dispersion
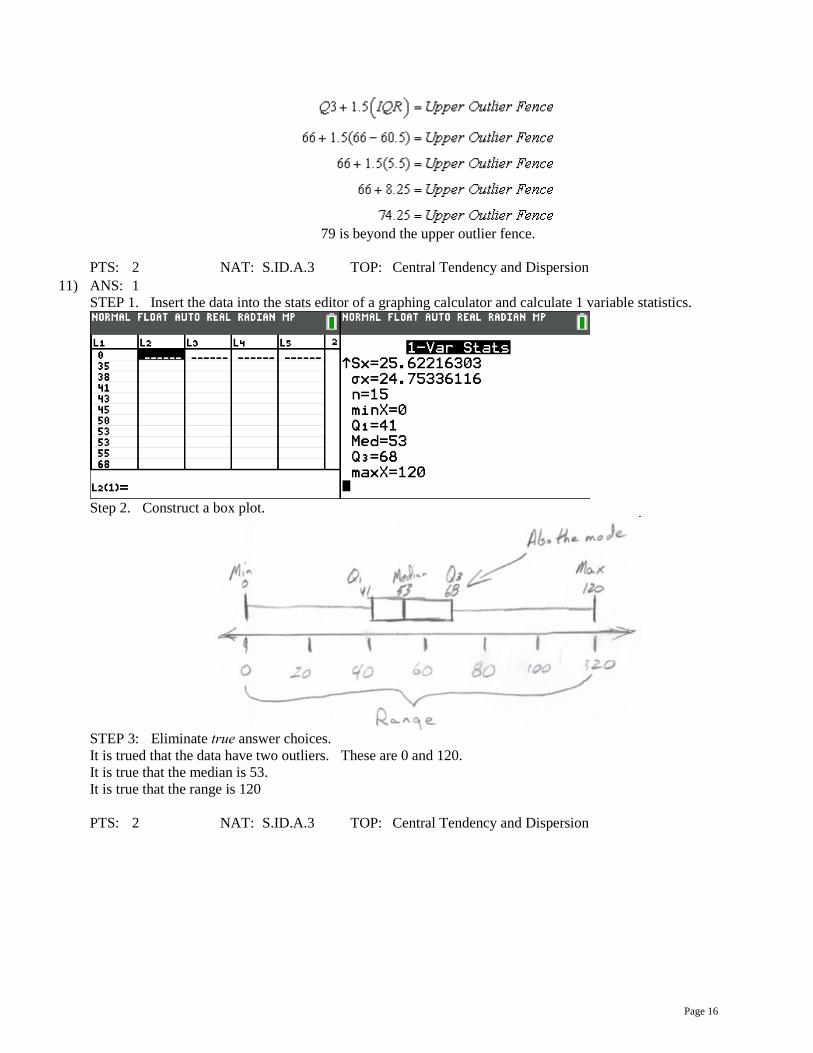
11) ANS: 1 STEP 1. Insert the data into the stats editor of a graphing calculator and calculate 1 variable statistics.
Step 2. Construct a box plot.
STEP 3: Eliminate true answer choices. It is trued that the data have two outliers. These are 0 and 120. It is true that the median is 53. It is true that the range is 120
PTS: 2 NAT: S.ID.A.3 TOP: Central Tendency and Dispersion
Page 16

B – Graphs and Statistics, Lesson 2, Frequency Tables (r. 2018)
GRAPHS AND STATISTICS Frequency Tables
Common Core Standard
S-ID.B.5 Summarize categorical data for two catego-ries in two-way frequency tables. Interpret relative fre-quencies in the context of the data (including joint, marginal, and conditional relative frequencies). Recog-nize possible associations and trends in the data.
Next Generation Standard
AI-S.ID.5 Summarize categorical data for two catego-ries in two-way frequency tables. Interpret relative fre-quencies in the context of the data (including joint, marginal, and conditional relative frequencies). Recog-nize possible associations and trends in the data.
Overview of Lesson
Teacher Centered Introduction Overview of Lesson
- activate students’ prior knowledge
- vocabulary
- learning objective(s)
- big ideas: direct instruction
- modeling
Student Centered Activities guided practice Teacher: anticipates, monitors, selects, sequences, and connects student work
- developing essential skills
- Regents exam questions
- formative assessment assignment (exit slip, explain the math, or journal entry)
LEARNING OBJECTIVES
Students will be able to:
1) Complete a two-way frequency table. 2) Calculate the percentage of data elements in a cell, row, or column of a two-way frequency table.
VOCABULARY
univariate bivariate frequency table
two-way frequency table percentage percent
Page 17

BIG IDEAS
frequency table: A table that shows the observed number or frequency for a single number or range of numbers in a set of univariate data.
Example:
Interval Tally Frequency 1-5
I 6
6-10
II 7
11-15 II 2
two-way frequency table: A table that shows the observed number or frequency for two variables in a set of bivariate data, the rows indicating one category and the columns indicating the other category.
Example:
Calculating Percents
To calculate what percent A is of B, you simply divide A by B, then take that number and move the decimal place two spaces to the right.
Example: To find what percent 3 is of 4, simply divided 3 by 4, then take .75 and move the decimal two spaces to the right. The answer is 75%.
You can also use proportions. To find what percent 3 is of 4, set up the proportion 3 %4 100%
300 4 %75%
x
xx
=
==
DEVELOPING ESSENTIAL SKILLS
1) Organize Data
The senior spirit committee sold hot dogs, pizza, water, and soda at soccer games to raise money for the prom. 400 sales were made. They sold 200 sodas, 150 bottles of water, 158 hot dogs, and 182 pizzas. 50 students who bought hot dogs also bought sodas, and 58 students who bought pizzas also bought bottles of water. 30 students bought soda, but no food; and 46 students bought hot dogs, but no drink. Organize this data in a two-way frequency table.
2) Calculate Percentages
Concession Stand Sales Soda Water No Drink Total
Hot Dog 50 62 46 158 Pizza 120 58 4 182
No Food 30 30 0 60 Total 200 150 50 400
IIII
IIII
Page 18

Calculate the percent of sales in each cell of your two-way frequency table to the nearest tenth of a percent.
REGENTS EXAM QUESTIONS
S.ID.B.5: Frequency Tables
12) The school newspaper surveyed the student body for an article about club membership. The table below shows
the number of students in each grade level who belong to one or more clubs. 1 Club 2 Clubs 3 or More Clubs
9th 90 33 12 10th 125 12 15 11th 87 22 18 12th 75 27 23
If there are 180 students in ninth grade, what percentage of the ninth grade students belong to more than one club?
13) A survey of 100 students was taken. It was found that 60 students watched sports, and 34 of these students did not
like pop music. Of the students who did not watch sports, 70% liked pop music. Complete the two-way frequency table.
Watch Sports Don’t Watch Sports Total
Like Pop
Don’t Like Pop
Total
14) A statistics class surveyed some students during one lunch period to obtain opinions about television programming
preferences. The results of the survey are summarized in the table below.
Based on the sample, predict how many of the school's 351 males would prefer comedy. Justify your answer.
Concession Stand Sales Soda Water No Drink Total
Hot Dog 12.5% 15.5% 11.5% 39.5% Pizza 30% 14.5% 1% 45.5%
No Food 7.5% 7.5% 0% 15% Total 50% 37.5% 12.5% 100%
Page 19

15) A public opinion poll was taken to explore the relationship between age and support for a candidate in an election. The results of the poll are summarized in the table below.
What percent of the 21-40 age group was for the candidate? 1) 15 3) 40 2) 25 4) 60
16) A radio station did a survey to determine what kind of music to play by taking a sample of middle school, high school, and college students. They were asked which of three different types of music they prefer on the radio: hip-hop, alternative, or classic rock. The results are summarized in the table below.
What percentage of college students prefer classic rock? 1) 14% 3) 33% 2) 28% 4) 58%
17) Students were asked to name their favorite sport from a list of basketball, soccer, or tennis. The results are shown in the table below.
Basketball Soccer Tennis Girls 42 58 20 Boys 84 41 5
What percentage of the students chose soccer as their favorite sport? 1) 39.6% 3) 50.4% 2) 41.4% 4) 58.6%
SOLUTIONS
12) ANS: 25% Strategy: Use data from the table and information from the problem to calculate a percentage. STEP 1. Determine the total number of students in the ninth grade who are in 2 or more clubs (33+12). STEP 2. Divide by the total number of students in the ninth grade (180). STEP 3. Convert the decimal to a percentage
Page 20

PTS: 2 NAT: S.ID.B.5 TOP: Frequency Histograms, Bar Graphs and Tables
13) ANS: Step 1. Fill in the known information from the problem.
Watch Sports Dont Watch Sports Total Like Pop
Don’t Like Pop 34 Total 60 100
Step 2. Complete additional cells using given information. Watch Sports Dont Watch Sports Total
Like Pop 26 Don’t Like Pop 34
Total 60 40 100 Step 3. Complete the “Don’t Watch Sports - Like Pop” cell using information from the problem that states “Of the students who did not watch sports, 70% liked pop music.” Compute .
Watch Sports Dont Watch Sports Total Like Pop 26 28
Don’t Like Pop 34 Total 60 40 100
Step 4. Complete the reamining cells. Watch Sports Dont Watch Sports Total
Like Pop 26 28 54 Don’t Like Pop 34 12 46
Total 60 40 100
PTS: 2 NAT: S.ID.B.5 TOP: Frequency Tables
14) ANS: 234 of the school’s 351 males prefer comedy based on the sample. Step 1. Understand that the table is only a sample of the population, and the population of males is 351. Assume that the sample was not biased. Step 2. Strategy. Determine the percent (or fraction) of the males in the sample that prefer comedy, then apply that percent to the total population. Step 3. Execution of strategy.
males were surveyed.
Based on the sample, of the males preferred comedy.
.
Step 4. Does it make sense. Yes, if of the males in the sample prefer comedy, we can predict that of the
males in the population will prefer comedy.
PTS: 2 NAT: S.ID.B.5 TOP: Frequency Tables
15) ANS: 4 Step 1. Understand that the problem is only interested in the percent for the candidate in the 21-40 age group. The bottom two rows of the table are not relevant to the problem.
Page 21

Step 2. Strategy. Determine the total number of poll responses in the 21-40 age group and what percentage of these responses were for the candidate. Step 3. Execute the strategy.
Step 4. Does it make sense? Yes. We know that 30 responses were for the candidate. Choices a), b), and c) are wrong because: a) 15% of 50 is ; b) 25% of 50 is ; and c) 40% of 50 is
. Choice d) is the only correct answer because 60% of 50 is .
PTS: 2 NAT: S.ID.B.5 TOP: Frequency Tables
16) ANS: 2 Understand the Problem: The questions asks what percentage of college students prefer classic rock. The information in the table about middle school and high school students is not important.
The total number of college students is 16 + 20 + 14 = 50. 14 out of 50 college students prefer classic rock.
Strategy: Write and solve a proportion to convert 14 out of 50 to a percentage.
PTS: 2 NAT: S.ID.B.5 TOP: Frequency Tables
17) ANS: 1 Strategy: STEP 1. Find the total numbers of students who like each sport. Basketball: A total of 126 boys and girls chose basketball. Soccer: A total of 99 boys and girls chose soccer. Tennis: A total of 25 boys and girls chose tennis. STEP 2. Find the total number of students in the entire table. Total basketball plus total soccer plus total tennis = 250 STEP 3. Write a proportion to find the percentage of students who chose soccer.
STEP 4. Solve the proportion for x
PTS: 2 NAT: S.ID.B.5 TOP: Frequency Tables
Page 22

B – Graphs and Statistics, Lesson 3, Frequency Histograms, Box Plots and Dot Plots (r. 2018)
GRAPHS AND STATISTICS Frequency Histograms, Box Plots and Dot Plots
Common Core Standard
S-ID.A.1 Represent data with plots on the real number line (dot plots, histograms, and box plots).
Next Generation Standard
AI-S.ID.1 Represent data with plots on the real number line (dot plots, histograms, and box plots).
Overview of Lesson
Teacher Centered Introduction Overview of Lesson
- activate students’ prior knowledge
- vocabulary
- learning objective(s)
- big ideas: direct instruction
- modeling
Student Centered Activities guided practice Teacher: anticipates, monitors, selects, sequences, and connects student work
- developing essential skills
- Regents exam questions
- formative assessment assignment (exit slip, explain the math, or journal entry)
LEARNING OBJECTIVES
Students will be able to:
1) Construct and label dot plots, histograms, and box plots above a number line to represent univariate data sets.
VOCABULARY univariate bivariate dot plot
histogram box plot quartile
BIG IDEAS Dot Plots A dot plot consists of data points plotted on a simple scale. Dot plots are used for continuous, quantitative, univariate data. Data points may be labelled if there are few of them. The horizontal axis is a number line that displays the data in equal intervals. The frequency of each bar is shown by the number of dots on the vertical axis. Example: This dot plot shows how many hours students exercise each week. Fifteen students were asked how many hours they exercise in one week.
Page 23

To create a dot plot, draw and number line, then draw one dot above the number line to represent each value in the data set. Histograms A histogram is a frequency distribution for continuous, quantitative, univariate data. The horizontal axis is a number line that displays the data in equal intervals. The frequency of each bar is shown on the vertical axis. Example: This histogram shows the number of students in Simpson’s class that are in each interval. The students were asked how many hours they spent playing video games in one week.
To create a histogram, first complete a frequency table to show the number of values in intervals of equal size. Then draw a number line with equal intervals. Then, plot the frequency for each interval on the vertical axis.
Box Plots A box plot, also known as a box and whiskers chart, is a visual display of a set of data showing the five number summary: minimum, first quartile, median, third quartile, and maximum. A box plot shows the range of scores within each quarter of the data. It is useful for examining the variation in a set of data and comparing the variation of more than one set of data. Example:
Interval Tally Frequency 0-4
III 8
4.01-8
IIII 4
8.01-12 III 13
12.01-16 I 11
IIII
IIII IIII
IIII IIII
Page 24

To create a box plot, use one-variable stats in a graphing calculator and plot the minimum, Q1, Q2, Q3, and maximum values on a number line. Draw boxes around the middle two quartiles. Connect the boxes to the minimum and maximum using lines.
DEVELOPING ESSENTIAL SKILLS
1. Create a dot plot to represent the following information.
Robert, a sixth grader at Roosevelt Middle School, usually goes to bed around 10:00 p.m. and gets up around 6:00 a.m. to get ready for school. That means he gets about 𝟖𝟖 hours of sleep on a school night. He decided to investigate the statistical question: How many hours per night do sixth graders usually sleep when they have school the next day? Robert took a survey of 𝟐𝟐𝟐𝟐 sixth graders and collected the following data to answer the question.
𝟕𝟕 𝟖𝟖 𝟓𝟓 𝟐𝟐 𝟐𝟐 𝟐𝟐 𝟕𝟕 𝟕𝟕 𝟏𝟏𝟏𝟏 𝟏𝟏𝟏𝟏 𝟏𝟏𝟏𝟏 𝟐𝟐 𝟖𝟖 𝟖𝟖 𝟖𝟖 𝟏𝟏𝟐𝟐 𝟔𝟔 𝟏𝟏𝟏𝟏 𝟏𝟏𝟏𝟏 𝟖𝟖 𝟖𝟖 𝟐𝟐 𝟐𝟐 𝟐𝟐 𝟖𝟖 𝟏𝟏𝟏𝟏 𝟐𝟐 𝟐𝟐 𝟖𝟖 Robert decided to make a dot plot of the data to help him answer his statistical question. Robert first drew a number line and labeled it from 𝟓𝟓 to 𝟏𝟏𝟐𝟐 to match the lowest and highest number of hours slept. Robert’s datum is not included.
SOURCE: Engage New York
2. Create a histogram to represent the following data table.
The Fahrenheit temperature readings on 30 April mornings in Stormville, New York, are shown below.
Page 25

41°, 58°, 61°, 54°, 49°, 46°, 52°, 58°, 67°, 43°, 47°, 60°, 52°, 58°, 48°, 44°, 59°, 66°, 62°, 55°, 44°, 49°, 62°, 61°, 59°, 54°, 57°, 58°, 63°, 60°
Using the data, complete the frequency table below.
On the grid below, construct and label a frequency histogram based on the table.
3. Create a box plot to represent the following data.
The test scores from Mrs. Gray’s math class are shown below. 72, 73, 66, 71, 82, 85, 95, 85, 86, 89, 91, 92
Construct a box-and-whisker plot to display these data.
Page 26

REGENTS EXAM QUESTIONS
S.ID.A.l: Frequency Histograms, Box Plots and Dot Plots
18) The heights, in feet, of former New York Knicks basketball players are listed below.
6.4 6.9 6.3 6.2 6.3 6.0 6.1 6.3 6.8 6.2 6.5 7.1 6.4 6.3 6.5 6.5 6.4 7.0 6.4 6.3 6.2 6.3 7.0 6.4 6.5 6.5 6.5 6.0 6.2
Using the heights given, complete the frequency table below.
Interval Frequency 6.0-6.1 6.2-6.3 6.4-6.5 6.6-6.7 6.8-6.9 7.0-7.1
Based on the frequency table created, draw and label a frequency histogram on the grid below.
Determine and state which interval contains the upper quartile. Justify your response.
19) Robin collected data on the number of hours she watched television on Sunday through Thursday nights for a
period of 3 weeks. The data are shown in the table below.
Page 27

Using an appropriate scale on the number line below, construct a box plot for the 15 values.
20) Which statistic can not be determined from a box plot representing the scores on a math test in Mrs. DeRidder’s
algebra class? 1) the lowest score 3) the highest score 2) the median score 4) the score that occurs most frequently
21) The dot plot shown below represents the number of pets owned by students in a class.
Which statement about the data is not true? 1) The median is 3. 3) The mean is 3. 2) The interquartile range is 2. 4) The data contain no outliers.
22) The box plot below summarizes the data for the average monthly high temperatures in degrees Fahrenheit for Orlando, Florida.
The third quartile is 1) 92 3) 83 2) 90 4) 71
SOLUTIONS
18) ANS:
Page 28

Each quartile contains or 25% of the data values. There are a total of 29 data values in the data set, so
each quartile will contain values. The upper quartile will begin 7.25 values from the
maximum, which places the upper quartile in the 6.4-6.5 interval.
PTS: 4 NAT: S.ID.A.1 TOP: Frequency Histograms KEY: frequency histograms
19) ANS:
Strategy #1: Input all the numbers from the table in a TI 83+ graphing calculator, then calculate 1 variable stats, then use the calculator output to construct the box and whiskers plot. Strategy #2 Follow these step-by-step procedures for creating a box and whiskers plot. STEP 1. Organize the data set in ascending order, as follows. Be sure to include all the data.:
1, 1.5, 1.5, 2, 2, 2.5, 2.5, 3, 3, 3, 3.5, 4, 4, 4.5, 5 STEP 2. Plot a scale on the number line. In this case, the scale is 0 to five in equal intervals of .5 units. STEP 3. Plot the minimum and maximum values: minimum = 1 and maximum = 2. STEP 4. Identify the median. In this problem, there are fifteen numbers and the median is the middle number, which is 3. There are seven numbers to the left of 3 and seven numbers to the right of 3. STEP 5. Plot and label the median = 3 (also known as Q2 or the second quartile). STEP 6. Identify Q1, which is the median of the bottom half of the organized data set. The bottom half of the data includes all numbers below the median, which in this problem, includes the following numbers
1, 1.5, 1.5, 2, 2, 2.5, 2.5 The middle number in an organized list of seven numbers is the fourth number, which in this case is a 2.
Page 29

STEP 7. Plot and label Q1 = 2. STEP 8. Identify Q3, which is the median of the top half of the organized data set. The top half of the data includes all numbers above the median, which in this problem, includes the following numbers
3, 3, 3.5, 4, 4, 4.5, 5 Again, the middle number in an organized list of seven numbers is the fourth number, which in this case is a 4. STEP 9. Plot and label Q3 = 4. STEP 10. Finish the box plot by drawing boxes between the plotted points for Q1, Q2, and Q3.
PTS: 2 NAT: S.ID.A.1 TOP: Box Plots
20) ANS: 4 A box plot is also known as a box and whiskers chart and shows the following five statistics: 1. The minimum score. 2. Q1, which is the top of the first quartile. 3. Q2, which is also the median score and the top of the second quartile. 4. Q3, which is the top of the third quartile. 5. The maximum score. The interquartile range can be determined by subtracting Q1 from Q2.
PTS: 2 NAT: S.ID.A.1
21) ANS: 3 Step 1. Understand that the problem is asking you to apply different statistical measures to the data in the dot plot and find the one answer choice that is not true. Step 2. Strategy: Evaluate each answer choice and eliminate wrong answers. Step 3. Execution of Strategy a) To evaluate this answer choice, the median (middle) of the ordered data elements must be identified. There are 20 dots, so the middle is somewhere between the 10th and 11th dots. Counting 10 dots from either end, the median will occur in the 3 column. The median is 3, so answer a) must be eliminated. b) To evaluate this answer, the interquartile range must be calculated. The interquartile range is defined as the distance between the first and third quartiles in an ordered distribution. The dot plot has 20 dots. Since each quartile contains 25% of the dots, each quartile will contain 25% of 20 dots, which equals 5 dots.
Q1 ends after five dots, so Q1=2. Q2 ends after 10 dots, so Q2=10. Q3 ends after 15 dots, so Q3=4.
The interquartile range is computed as Q3-Q2. In this dot plot, the interquartile range is 2, so answer b) is true and must be eliminated. c) The mean for this data plot can be calculated as follows:
Answer c) is not true, because the mean of this data set is 2.75. Therefore, answer choice c) is the correct answer. d) The data has no outliers. This is true by inspection. All the data is close together and there are no large gaps between the data. Hence, there are no outliers and choice d) must be eliminated.
Page 30

Step 4. Does it make sense? Yes. Three answer choices have been shown to be true and one answer choice has been shown to be false. The statement that is not true is choice c).
, , . An outlier is outside the interval .
PTS: 2 NAT: S.ID.A.1 TOP: Dot Plots
22) ANS: 2 Strategy: Label the five statisitcs shown by a box plot.
PTS: 2 NAT: S.ID.A.1 TOP: Box Plots KEY: interpret
23) ANS: 2 The number of pages a paper will have does not depend on how fast the student types.
PTS: 2 NAT: S.ID.C.9 TOP: Analysis of Data
24) ANS: 2 Strategy: Eliminate wrong answers. Observe: Both variables (numer of pages and amount of ink) increase together, so the correlation is positve. Eliminate answer choices with negative correlation. Reason: Printing causes ink to be used, so the relationship is causal. Eliminate answer choices with non-causal. a) positive correlation, but not causal b) positive correlation, and causal c) negative correlation, but not causal d) negative correlation, and causal
PTS: 2 NAT: S.ID.C.9 TOP: Analysis of Data
Page 31

B – Graphs and Statistics, Lesson 4, Analysis of Data (r. 2018)
GRAPHS AND STATISTICS Analysis of Data
Common Core Standard
S-ID.C.9 Distinguish between correlation and causation.
Next Generation Standard
AI-S.ID.9 Distinguish between correlation and causation.
LEARNING OBJECTIVES
Students will be able to:
1) Distinguish between correlation and causation in context.
Overview of Lesson
Teacher Centered Introduction Overview of Lesson
- activate students’ prior knowledge
- vocabulary
- learning objective(s)
- big ideas: direct instruction
- modeling
Student Centered Activities guided practice Teacher: anticipates, monitors, selects, sequences, and connects student work
- developing essential skills
- Regents exam questions
- formative assessment assignment (exit slip, explain the math, or journal entry)
VOCABULARY
correlation causation
causal relationship
BIG IDEAS
Correlation: Event A is related to, but does not necessarily cause event B. Causation: Event A causes event B.
Example: In the summer, ice cream sales are higher. This is an example of correlation, but not causation. Summer does not cause ice cream sales to be higher. What causes ice cream sales to be higher in the summer is hot weather.
Fallacy of Composition: A fallacy of composition is the erroneous conclusion that: because event B follows event A, event A caused event B. In Latin, a fallacy of composition is known at post hoc, ergo propter hoc, which means “after this, therefore because of this.” Fallacies of composition are usually correlations, not causations.
Page 32

Example of a Fallacy of Composition: Deep in the rain forest, a tribe of indigenous people live. Every year, when the days start getting longer, the shaman of the tribe does a rain dance. Soon, the spring rains come. The people of the village believe the shaman’s dance caused the rain to come. Modern scientists would argue that the rains come every year because of the changing of the seasons, and the village peoples’ belief is a fallacy of composition - the rains were not caused by the shaman’s dance - they were only correlated with the timing of the dance. Such fallacies of composition can be difficult to identify, and it might be even more difficult to convince the village people that the rains are only correlated with, not caused by, the shaman’s rain dance.
DEVELOPING ESSENTIAL SKILLS
Decide whether the relationships between events A and B are correlation or causation.
Event A Causes Event B Which is it? I get in the bathtub. The phone rings. Correlation Attendance at the baseball game goes up.
Ice cream sales increase. Correlation
I wear these socks. We win the soccer game. Correlation I stream more videos on my cell phone.
My cell phone bill goes up. Causation
I eat more food. My weight increases. Uncertain Mankind’s influence on the environment.
Global warming. Causation
I wash my car. It rains. Correlation Smoking cigarettes. Increased chances of getting
lung cancer. Causation
Junk food is sold in school to raise money.
Student obesity increases. Uncertain
I get higher scores on exams. My course grade increases. Causation. I do more homework. My exam scores increase. Correlation
REGENTS EXAM QUESTIONS
S.ID.C.9: Analysis of Data
23) Which situation does not describe a causal relationship?
1) The higher the volume on a radio, the louder the sound will be. 2) The faster a student types a research paper, the more pages the paper will have. 3) The shorter the distance driven, the less gasoline that will be used. 4) The slower the pace of a runner, the longer it will take the runner to finish the race.
24) What type of relationship exists between the number of pages printed on a printer and the amount of ink used by that printer? 1) positive correlation, but not causal 2) positive correlation, and causal 3) negative correlation, but not causal
Page 33

4) negative correlation, and causal
25) Beverly did a study this past spring using data she collected from a cafeteria. She recorded data weekly for ice cream sales and soda sales. Beverly found the line of best fit and the correlation coefficient, as shown in the diagram below.
Given this information, which statement(s) can correctly be concluded? I. Eating more ice cream causes a person to become thirsty. II. Drinking more soda causes a person to become hungry. III. There is a strong correlation between ice cream sales and soda sales. 1) I, only 3) I and III 2) III, only 4) II and III
SOLUTIONS
23) ANS: 2 The number of pages a paper will have does not depend on how fast the student types.
PTS: 2 NAT: S.ID.C.9 TOP: Analysis of Data
24) ANS: 2 Strategy: Eliminate wrong answers. Observe: Both variables (numer of pages and amount of ink) increase together, so the correlation is positve. Eliminate answer choices with negative correlation. Reason: Printing causes ink to be used, so the relationship is causal. Eliminate answer choices with non-causal. a) positive correlation, but not causal b) positive correlation, and causal c) negative correlation, but not causal d) negative correlation, and causal
PTS: 2 NAT: S.ID.C.9 TOP: Analysis of Data
25) ANS: 2 Strategy: Determine the truth value of each statement, then determine which of the four answer choices best matches the truth values of the three statements.
Page 34

STEP 1. Determine the truth values of each statement: Statement I is false. Eating more ice cream does not necessarily cause a person to become thirsty. Statement II is false. Drinking more soda does not necessarily cause a person to become hungry. Statement III is true. There is a strong correlation between ice cream sales and soda sales. STEP 2. Use knowledge of correlation and causation to select the correct answer. Statement III is the only statement than can be correctly concluded. The answer is choice b.
PTS: 2 NAT: S.ID.C.9 TOP: Analysis of Data
Page 35

B – Graphs and Statistics, Lesson 5, Regression (r. 2018)
GRAPHS AND STATISTICS Regression
Common Core Standard
S-ID.B.6 Represent data on two quantitative variables on a scatter plot, and describe how the variables are related.
S-ID.B.6a Fit a function to the data; use func-tions fitted to data to solve problems in the context of the data. Use given functions or choose a function suggested by the context. Emphasize linear, quadratic, and exponential models. PARCC: Tasks have real world context. Exponential func-tions are limited to those with domains in the integers. NYSED: Includes the regression capabilities of the calcu-lator.
Next Generation Standard
AI-S.ID.6 Represent bivariate data on a scatter plot, and describe how the variables’ values are related. Note: It’s important to keep in mind that the data must be linked to the same “subjects,” not just two un-related quantitative variables; being careful not to as-sume a relationship between the actual variables (cor-relation/causation issue). AI-S.ID.6a Fit a function to real-world data; use func-tions fitted to data to solve problems in the context of the data. (Shared standard with Algebra II) Note: Algebra I emphasis is on linear models and in-cludes the regression capabilities of the calculator.
LEARNING OBJECTIVES
Students will be able to:
1) Draw an approximate line of best fit through a scatterplot. 2) Use a graphing calculator to find the equation of the line of best fit for a given set of data. 3) Make a prediction using a linear regression equation.
Overview of Lesson
Teacher Centered Introduction Overview of Lesson
- activate students’ prior knowledge
- vocabulary
- learning objective(s)
- big ideas: direct instruction
- modeling
Student Centered Activities guided practice Teacher: anticipates, monitors, selects, sequences, and connects student work
- developing essential skills
- Regents exam questions
- formative assessment assignment (exit slip, explain the math, or journal entry)
VOCABULARY
Regression Line of Best Fit
Scatterplot Data Cloud
Page 36

BIG IDEAS Regression Model: A function (e.g., linear, exponential, power, logarithmic) that fits a set of paired data. The model may enable other values of the dependent variable to be predicted.
Big Ideas
The individual data points in a scatterplot form data clouds with shapes that suggest relationships between dependent and independent variables. A line of best fit divides the data cloud into two equal parts with about the same number of data points on each side of the line. A line of best fit can be a straight line or a curved line, depending on the shape of the data cloud.
Overview of Regression Using TI 83/83 Family of Graphing Calculators
Calculating Regression Equations. Technology is almost always used to calculate regression equations. . STEP 1. Use STATS EDIT to Input the data into a graphing calculator. STEP 2. Use 2nd STAT PLOT to turn on a data set, then ZOOM 9 to inspect the graph of the data
and determine which regression strategy will best fit the data. STEP 3. Use STAT CALC and the appropriate regression type to obtain the regression equation. STEP 4. Ask the question, “Does it Make Sense (DIMS)?”
DIFFERENT TYPES OF REGRESSION
Page 37

The graphing calculator can calculate numerous types of regression equations, but it must be told which type to calculate. All of the calculator procedures described above can be used with various types of regression. The following screenshots show some of the many regressions that can be calculated on the TI-83/84 family of graphing calculators.
The general purpose of linear regression is to make predictions based on a line of best fit. Choosing the Correct Type of Regression to Calculate There are two general approaches to determining the type of regression to calculate:
• The decision of which type of regression to calculate can be made based on visual examination of the data cloud, or.
• On Regents examinations, the wording of the problem often specifies a particular type of regression to be used.
Using the Data Cloud to Select the Correct Regression Calculation Program
If the data cloud takes the general form of a straight line, use linear regression.
If the data cloud takes the general form of a parabola, use quadratic regression.
If the data cloud takes the general form of an exponential curve, use exponential regression.
Note: The general forms of some data clouds are difficult to interpret. In difficult to interpret cases, the strength of the correlation coefficient can be used to determine which type of regression best fits the data. See lesson for standard S.ID.C.8, Drawing a Line of Best Fit on a Scatterplot A line of best fit may be drawn on a scatterplot of data by using values from the regression equation. STEP 1. Input the regression equation in the y-editor of a graphing calculator STEP2. Use ordered pairs of coordinates from the table of values to plot the line of best fit.
• In linear regression, the line of best fit will always go through the point , where is the
mean of all values of x, and is the mean of all values of y. For example, the line of best fit
for a scatterplot with points (2,5), (4,7) and (8,11) must include the point ,
because these x and y values are the averages of all the x-values and all the y-values.
Page 38

• If the regression equation is linear and in form, the y-intercept and slope can be used to plot the line of best fit.
Making Predictions Based on a Line of Best Fit Predictions may be made based on a line of best fit. STEP 1. Input the regression equation in the y-editor of a graphing calculator STEP2. Use ordered pairs of coordinates from the table of values to identify expected values of the dependent (y) variable for any desired value of the independent (x) variable.
DEVELOPING ESSENTIAL SKILLS – Class Assignment
Nazmun and Daniel came to America from two different parts of the world. Nazmun measures temperature in degrees Celsius, while Daniel measures temperature in degrees Fahrenheit. They want to understand the relation-ship between these two different ways of measuring temperature. They each know the temperature when water freezes, when water boils, the temperature outside today, and the temperature inside their very warm classroom. They record these temperatures in the following table.
Comparison Table Fahrenheit Degrees
Celsius Degrees
Water Freezes 32 0
Water Boils 212 100
Today’s Outdoor Temperature
41 5
Temperature in Classroom
77 25
Use linear regression to find the mathematical relationship between degrees Fahrenheit and degrees Celsius. Then, use your regression equation to add three new rows to the comparison table.
The linear regression equation is .55 17.77
.55 17.77
y x
C F
= −
= − .
This regression equation can be transformed to a more familiar formula as follows:
y mx b= +
Page 39

.55 17.775 7179 95 1609 95 5 99 9
C F
C F
C F
C F
= −
= −
= −
= −
1605 9
( )
5 5 1609 9 55 5 329
239
95
C F
F
C F
C
= − = −
=
−
To add three new rows to the comparison table, input the regression formula into the y-editor of a graphing calcu-lator and use the table of values.
REGENTS EXAM QUESTIONS (through June 2018)
S.ID.B.6: Regression
26) Emma recently purchased a new car. She decided to keep track of how many gallons of gas she used on five of
her business trips. The results are shown in the table below.
Write the linear regression equation for these data where miles driven is the independent variable. (Round all values to the nearest hundredth.)
27) About a year ago, Joey watched an online video of a band and noticed that it had been viewed only 843 times.
One month later, Joey noticed that the band’s video had 1708 views. Joey made the table below to keep track of the cumulative number of views the video was getting online.
Page 40

a) Write a regression equation that best models these data. Round all values to the nearest hundredth. Justify your choice of regression equation. b) As shown in the table, Joey forgot to record the number of views after the second month. Use the equation from part a to estimate the number of full views of the online video that Joey forgot to record.
28) The table below shows the number of grams of carbohydrates, x, and the number of Calories, y, of six different
foods.
Which equation best represents the line of best fit for this set of data? 1) 3) 2) 4)
29) An application developer released a new app to be downloaded. The table below gives the number of downloads for the first four weeks after the launch of the app.
Write an exponential equation that models these data. Use this model to predict how many downloads the developer would expect in the 26th week if this trend continues. Round your answer to the nearest download. Would it be reasonable to use this model to predict the number of downloads past one year? Explain your reasoning.
30) The data table below shows the median diameter of grains of sand and the slope of the beach for 9 naturally
occuring ocean beaches.
Median Diameter of Grains of Sand
in Millimeters (x)
0.17 0.19 0.22 0.235 0.235 0.3 0.35 0.42 0.85
Slope of Beach in Degrees (y)
0.63 0.7 0.82
0.88 1.15 1.5 4.4 7.3 11.3
Page 41

Write the linear regression equation for this set of data, rounding all values to the nearest thousandth. Using this equation, predict the slope of a beach, to the nearest tenth of a dregree, on a beach with grains of sand having a median diameter of 0.65 mm.
31) Omar has a piece of rope. He ties a knot in the rope and measures the new length of the rope. He then repeats
this process several times. Some of the data collected are listed in the table below.
Number of Knots 4 5 6 7 8 Length of Rope (cm) 64 58 49 39 31
State, to the nearest tenth, the linear regression equation that approximates the length, y, of the rope after tying x knots. Explain what the y-intercept means in the context of the problem. Explain what the slope means in the context of the problem.
SOLUTIONS
26) ANS: STEP 1: Input the data in the stats editor of a graphing calculator and calculate linear regression.
PTS: 2 NAT: S.ID.B.6a TOP: Regression
27) ANS: Part a: The data appear to grow at an exponential rate. Part b: Strategy: Input the data into a graphing calculator, inspect the data cloud, and find a regression equation to model the data table, input the regression equation into the y-editor, predict the missing value. STEP 1. Input the data into a graphing calculator or plot the data cloud on a graph, if necessary, so that you can look at the data cloud to see if it has a recognizable shape.
Page 42

STEP 2. Determine which regression strategy will best fit the data. The graph looks like the graph of an exponential function, so choose exponential regression. STEP 3. Execute the appropriate regression strategy in the graphing calculator.
Round all values to the nearest hundredth: STEP 4. Input the regression equation into the y-editor feature of the graphing calculator and view
the associated table of values to find the value of y when x equals 2.
Round 3515.3 to 3515. STEP 4. In Ask the question, “Does it Make Sense (DIMS)?” that the missing total number of views in month 2
would be around 3515 views?
PTS: 4 NAT: S.ID.B.6a TOP: Regression
28) ANS: 4 Strategy: Input the data into a graphing calculator, inspect the data cloud, and find a regression equation to model the data table, input the regression equation into the y-editor, predict the missing value. STEP 1. Input the data into a graphing calculator or plot the data cloud on a graph, if necessary, so that you can look at the data cloud to see if it has a recognizable shape.
STEP 2. Determine which regression strategy will best fit the data. The graph looks like the graph of an linear function, so choose linear regression. STEP 3. Execute the appropriate regression strategy in the graphing calculator.
Page 43

Write the regression equation in a format that can be compared to the answer choices: STEP 4. Compare the answer choices to the regression equation and select choice d.
PTS: 2 NAT: S.ID.B.6a TOP: Regression
29) ANS: a) b) . c) No, because the prediction at is already too large. Strategy: Use data from the table and exponential regression in a graphing calculator. STEP 1: Model the function in a graphing calculator using exponential regression.
The exponential regression equation is STEP 2. Use the equation to predict the number of downloads when .
Rounded to the nearest download, the answer is 3,030,140.
STEP 3. Determine if it would be reasonable to use the model to predict downloads past one year.
Page 44

It would not be reasonable to use this model to make predictions past one year. The number of predicted downloads is more 170 billion downloads, which is more than 20 downloads in one week for every person in the
world.
DIMS? Does It Make Sense? For near term predicitons, yes. For long term predictions, no.
PTS: 4 NAT: S.ID.B.6a TOP: Regression NOT: NYSED classifies this as A.CED.A.2
30) ANS:
y = 17.159x ? . 2.476. y = 17.159(.65) ? . 2.476 ? . 8.7 Strategy: Input the table of values into the stats-editor of a graphing calculator, then use the stats-calc-linear regression with “diagnostics on” to obtain the linear regression equation, then use the linear regression equation to calculate the value of y when .
PTS: 4 NAT: S.ID.B.6
31) ANS: STEP 1. Input values from the table in the stats editor of a graphing calculator, then calculate linear regression.
Regression equation:
STEP 2. Explain what the y-intercept means in this equation. When there are no knots, the rope is 99.2 cm. long.
STEP 3. Explain what the slope means in the context of this problem. The slope is -8.5 and means there is a negative relationship between the number of knots and the length of the rope. Each knot makes the rope 8.5 cm. shorter.
The y-intercept represents the length of the rope without knots. The slope represents the
decrease in the length of the rope for each knot.
PTS: 4 NAT: S.ID.B.6 TOP: Regression KEY: linear
Page 45

B – Graphs and Statistics, Lesson 6, Correlation Coefficient (r. 2018)
GRAPHS AND STATISTICS Correlation Coefficient
Common Core Standard
S-ID.C.8 Compute (using technology) and in-terpret the correlation coefficient of a linear fit.
Next Generation Standard
AI-S.ID.8 Calculate (using technology) and interpret the correlation coefficient of a linear fit.
LEARNING OBJECTIVES
Students will be able to:
1) Calculate the correlation coefficient of a linear fit. 2) Interpret the meaning of a correlation coefficient.
Overview of Lesson
Teacher Centered Introduction Overview of Lesson
- activate students’ prior knowledge
- vocabulary
- learning objective(s)
- big ideas: direct instruction
- modeling
Student Centered Activities guided practice Teacher: anticipates, monitors, selects, sequences, and connects student work
- developing essential skills
- Regents exam questions
- formative assessment assignment (exit slip, explain the math, or journal entry)
VOCABULARY
correlation coefficient A number between -1 and 1 that indicates the strength and direction of the linear relationship between two sets of numbers. The letter “r” is used to represent correlation coefficients. In all cases,
.
1 1r− ≤ ≤
Page 46

BIG IDEAS
SIGNS OF CORRELATIONS The sign of the correlation tells you if two variables increase or decrease together (positive); or if one variable increase when the other variable decreases (negative). The sign of the correlation also provides a general idea of what the graph will look like.
Negative Correlation
In general, one set of data decreases as the other set
increases.
An example of a negative correlation between two variables would be the relationship between
absentiism from school and class grades. As one
variable increases, the other would be expected to
decrease.
No Correlation
Sometimes data sets are not related and there is no
general trend.
A correlation of zero does not always mean that there is no
relationship between the variables. It could mean that the relationship is not linear. For example, the correlation between points on a circle or a regular polygon would be
zero or very close to zero, but the points are very predictably related.
Positive Correlation
In general, both sets of data increase together.
An example of a positive correlation between two variables would be the
relationship between studying for an examination and class
grades. As one variable increases, the other would
also be expected to increase.
• The closer the absolute value of the correlation is to 1, the stronger the correlation between the variables. • The closer the absolute value of the correlation is to zero, the weaker the correlation between the variables. • In a perfect correlation, when 1r = ± , all data points balance the equations and also lie on the graph of the
equation.
Page 47

How to Calculate a Correlation Coefficient Using a Graphing Calculator: STEP 1. Press . STEP 2. Enter bivariate data in the L1 and L2 columns. All the x-values go into L1 column and all the Y values go into L2 column. Press after every data entry.
STEP 3. Turn the diagnostics on by pressing and scrolling down to .
Then, press . The screen should respond with the message . NOTE: If Diagnostics are turned off, the correlation coefficient will not appear beneath the regression equation. Step 4. Press Step 5. The r value that appears at the bottom of the screen is the correlation coefficient.
DEVELOPING ESSENTIAL SKILLS
Interpret the following correlation coefficients:
Correlation Coefficient
Interpretation (must include strength and direction)
r = .5 Moderate Positive r = -.6 Moderate Negative r = -1 Strong Negative (Perfect) r = .7 Strong Positive r = -.9 Strong Negative r = .0 No Correlation r = .2 Weak Positive
REGENTS EXAM QUESTIONS (through June 2018)
S.ID.C.8: Correlation Coefficients
32) The scatterplot below compares the number of bags of popcorn and the number of sodas sold at each performance
of the circus over one week.
STAT EDIT 1:Edit
ENTER
2ND CATALOG DiagnosticsOn
ENTER ENTER Done
STAT CALC 4:4-LinReg (ax+b) ENTER ENTER
Page 48

Which conclusion can be drawn from the scatterplot? 1) There is a negative correlation between
popcorn sales and soda sales. 3) There is no correlation between popcorn
sales and soda sales. 2) There is a positive correlation between
popcorn sales and soda sales. 4) Buying popcorn causes people to buy
soda.
33) What is the correlation coefficient of the linear fit of the data shown below, to the nearest hundredth?
1) 1.00 3) 2) 0.93 4)
34) Analysis of data from a statistical study shows a linear relationship in the data with a correlation coefficient of -0.524. Which statement best summarizes this result? 1) There is a strong positive correlation
between the variables. 3) There is a moderate positive correlation
between the variables. 2) There is a strong negative correlation
between the variables. 4) There is a moderate negative correlation
between the variables.
Page 49

35) Bella recorded data and used her graphing calculator to find the equation for the line of best fit. She then used the correlation coefficient to determine the strength of the linear fit. Which correlation coefficient represents the strongest linear relationship? 1) 0.9 3) -0.3 2) 0.5 4) -0.8
36) The results of a linear regression are shown below.
Which phrase best describes the relationship between x and y? 1) strong negative correlation 3) weak negative correlation 2) strong positive correlation 4) weak positive correlation
37) A nutritionist collected information about different brands of beef hot dogs. She made a table showing the number of Calories and the amount of sodium in each hot dog.
a) Write the correlation coefficient for the line of best fit. Round your answer to the nearest hundredth. b) Explain what the correlation coefficient suggests in the context of this problem.
38) The table below shows 6 students’ overall averages and their averages in their math class.
Overall Student Average 92 98 84 80 75 82 Math Class Average 91 95 85 85 75 78
If a linear model is applied to these data, which statement best describes the correlation coefficient? 1) It is close to -1. 3) It is close to 0. 2) It is close to 1 4) It is close to 0.5.
39) At Mountain Lakes High School, the mathematics and physics scores of nine students were compared as shown in the table below.
Mathematics 55 93 89 60 90 45 64 76 89 Physics 66 89 94 52 84 56 66 73 92
Page 50

State the correlation coefficient, to the nearest hundredth, for the line of best fit for these data. Explain what the correlation coefficient means with regard to the context of this situation.
40) The table below shows the attendance at a museum in select years from 2007 to 2013.
State the linear regression equation represented by the data table when is used to represent the year 2007 and y is used to represent the attendance. Round all values to the nearest hundredth. State the correlation coefficient to the nearest hundredth and determine whether the data suggest a strong or weak association.
41) Erica, the manager at Stellarbeans, collected data on the daily high temperature and revenue from coffee sales.
Data from nine days this past fall are shown in the table below.
State the linear regression function, , that estimates the day's coffee sales with a high temperature of t. Round all values to the nearest integer. State the correlation coefficient, r, of the data to the nearest hundredth. Does r indicate a strong linear relationship between the variables? Explain your reasoning.
42) The percentage of students scoring 85 or better on a mathematics final exam and an English final exam during a
recent school year for seven schools is shown in the table below.
Percentage of Students Scoring 85 or Better
Mathematics, x English, y 27 46 12 28 13 45 10 34 30 56 45 67 20 42
Write the linear regression equation for these data, rounding all values to the nearest hundredth. State the correlation coefficient of the linear regression equation, to the nearest hundredth. Explain the meaning of this value in the context of these data.
SOLUTIONS
32) ANS: 2 Strategy: Eliminate wrong answers.
Page 51

a) Eliminate choice (1) because a negative correlation is a relationship where the dependent (y) values decrease as independent (x) values increase. A graph showing negative correlation would go down from left to right. The graph in this problem does not go down from left to right. b) Select choice (2) because a positive correlation is a relationship where the dependent (y) values increase as independent values (x) increase. A graph showing positive correlation would go up from left to right, like the graph in this problem. c) Eliminate choice (3) because no correlation occurs when there is no relationship between the dependent (y) values and independent (x) values. A graph showing no correlation would not appear to go up or down or have any pattern. d) Eliminate choice (4) because there is no evidence that buying a bag of popcorn causes someone to buy a soda. Causation only occurs when a change in one quantity causes a change in another quantity. For example, doubling the number of cookies baked causes more cookie dough to be used.
PTS: 2 NAT: S.ID.C.8 TOP: Correlation Coefficient
33) ANS: 3 Strategy #1: This problem can be answered by looking at the scatterplot. The slope of the data cloud is negative, so answer choices a and b can be eliminated because both are positive. The data cloud suggests a linear relationship, put the dots are not in a perfect line. A perfect correlation of would show all the dots in a perfect line. Therefore, we can eliminate asnswer choice d. The correct answer is choice c. DIMS: Does it make sense? Yes. The data cloud shows a negative correlation that is strong, but not perfect. Choice c is the best answer. Strategy #2: Input the data from the chart in a graphing calculator and calculate the correlation coeffient using linear regression and the diagnostics on feature. STEP 1. Creat a table of values from the graphing view of the function and input it into the graphing calculator. x y 1 8 2 8 3 5 4 3 5 4 6 1 8 1
STEP 2. Turn diagnostics on using the catalog.
Page 52
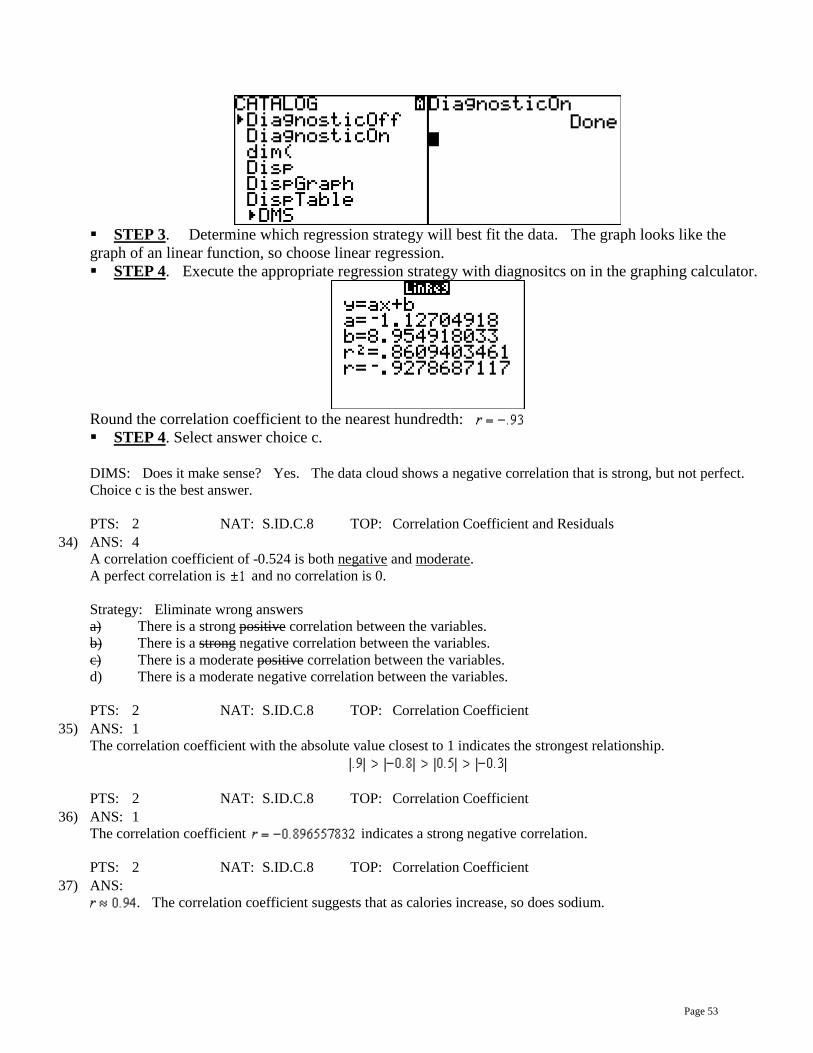
STEP 3. Determine which regression strategy will best fit the data. The graph looks like the graph of an linear function, so choose linear regression. STEP 4. Execute the appropriate regression strategy with diagnositcs on in the graphing calculator.
Round the correlation coefficient to the nearest hundredth: STEP 4. Select answer choice c. DIMS: Does it make sense? Yes. The data cloud shows a negative correlation that is strong, but not perfect. Choice c is the best answer.
PTS: 2 NAT: S.ID.C.8 TOP: Correlation Coefficient and Residuals
34) ANS: 4 A correlation coefficient of -0.524 is both negative and moderate. A perfect correlation is and no correlation is 0. Strategy: Eliminate wrong answers a) There is a strong positive correlation between the variables. b) There is a strong negative correlation between the variables. c) There is a moderate positive correlation between the variables. d) There is a moderate negative correlation between the variables.
PTS: 2 NAT: S.ID.C.8 TOP: Correlation Coefficient
35) ANS: 1 The correlation coefficient with the absolute value closest to 1 indicates the strongest relationship.
PTS: 2 NAT: S.ID.C.8 TOP: Correlation Coefficient
36) ANS: 1 The correlation coefficient indicates a strong negative correlation.
PTS: 2 NAT: S.ID.C.8 TOP: Correlation Coefficient
37) ANS: . The correlation coefficient suggests that as calories increase, so does sodium.
Page 53

Strategy: Use data from the table and a graphing calculator to find both the regression equation and its correlation coefficient. STEP 1. Input the data from the table in a graphing calculator and look at the data cloud.
STEP 2. Turn diagnostics on using the catalog.
STEP 3. Determine which regression strategy will best fit the data. The graph looks like the graph of an linear function, so choose linear regression. STEP 4. Execute the appropriate regression strategy with diagnositcs on in the graphing calculator.
Round the correlation coefficient to the nearest hundredth: DIMS: Does it make sense? Yes. The data cloud and the table show a positive correlation that is strong, but not perfect. A correlation coefficient of .94 is positive, but not a perfectly straight line.
PTS: 4 NAT: S.ID.C.8 TOP: Correlation Coefficient and Residuals
38) ANS: 2 A simple inspection of the table shows that high overall student averages are highly correlated in a positive way with math class averages. The actual correlation coefficient for this table is
PTS: 2 NAT: S.ID.C
39) ANS: .
The correlation coefficient suggests a strong positive correlation between a student’s mathematics and physics scores. Solution Strategy: Input the data into the stats editor of a graphing calculator and calculate linear regression with diagnostics on.
Page 54

PTS: 2 NAT: S.ID.C.8 TOP: Correlation Coefficient
40) ANS: , which suggests a strong association.
Strategy: Convert the table to data that can be input into a graphing calculator, then use the linear regression feature of the graphing calculator to respond to the question. STEP 1. Convert the table for input into the calculator.
Attendance at Museum Year (L1) 0 1 2 4 6
Attendance (L2) 8.3 8.5 8.5 8.8 9.3 STEP 2. Make sure that STAT DIAGNOSTICS is set to “On” in the mode feature of the graphing calculator. Setting STAT DIAGNOSTICS to on causes the correlation coefficient (r) to appear with the linear regression output. STEP 3. Use the linear regression feature of the graphing calculator.
NOTE: Round the graphing calculator output to the nearest hundredth as required in the problem. STEP 4. Record your solution.
PTS: 4 NAT: S.ID.C.8 TOP: Regression KEY: linear NOT: NYSED classifies as S.ID.B.6a
41) ANS:
The correlation coefficient indicates a strong linear relationship because the absolute value of r is close to 1.
Page 55

Strategy: Input the table of values into the stats-editor of a graphing calculator, then use the stats-calc-linear regression with “diagnostics on” to obtain both the linear regression equation and the correlation coeffient (r). The following screenshots illustrate the solution using a TI-84 family graphing calculator.
PTS: 4 NAT: S.ID.C.8 TOP: Regression KEY: linear NOT: NYSED classifies as S.ID.B.6
42) ANS: , 0
A correlation coefficient value of .92 indicates a strong positive correlation between scores 85 or better on the math and English exams for the seven schools. Strategy: Use the linear regression function of a graphing calculator to determine the equation and the correlation coefficient for the data in the table. STEP 1. Input the values from the table into the stats editor of a graphing calculator.
STEP 2. Turn diagnostics on to calculate the correlation coefficient with the regression equation.
STEP 3. Calculate the regression equation and correlation coefficient.
PTS: 4 NAT: S.ID.B.6 TOP: Regression KEY: linear with correlation coefficient
Page 56

B – Graphs and Statistics, Lesson 7, Residuals (r. 2018)
GRAPHS AND STATISTICS Residuals
Common Core Standard
S-ID.B.6b Informally assess the fit of a function by plotting and analyzing residuals.
NYSED: Includes creating residual plots using the capabilities of the calculator (not manually).
S-ID.B.6c Fit a linear function for a scatter plot that suggests a linear association.
NYSED: Both correlation coefficient and residuals will be addressed in this standard.
Next Generation Standard
STANDARD REMOVED STANDARD REMOVED
LEARNING OBJECTIVES
Students will be able to:
1) Understand residuals as the difference between actual and predicted y-values based on a line of best fit.
2) Create residual plots given a table of residual values. 3) Interpret patterns in residual plots as an indication that the regression equation does not fit the
data.
Overview of Lesson
Teacher Centered Introduction Overview of Lesson
- activate students’ prior knowledge
- vocabulary
- learning objective(s)
- big ideas: direct instruction
- modeling
Student Centered Activities guided practice Teacher: anticipates, monitors, selects, sequences, and connects student work
- developing essential skills
- Regents exam questions
- formative assessment assignment (exit slip, explain the math, or journal entry)
VOCABULARY
actual y-value predicted y-value residual residual plot
line of best fit pattern fit the data
BIG IDEAS
A residual is the vertical distance between where a regression equation predicts a point will appear on a graph and the actual location of the point on the graph (scatterplot). If there is no difference between where a regression equation places a point and the actual position of the point, the residual is zero.
Page 57

A residual can also be understood as the difference in predicted and actual y-values (dependent variable values) for a given value of x (the independent variable).
Residual = (actual y-value)-(predicted y-value)
A residual plot is a scatter plot that shows the residuals as points on a vertical axis (y-axis) above corresponding (paired) values of the independent variable on the horizontal axis (x-axis).
Any pattern in a residual plot suggests that the regression equation is not appropriate for the data.
Patterns in residual plots are bad.
Residual plots with patterns indicate the regression equation is not a good fit.
Residual plots without patterns indicate the regression equation is a good fit.
A residual plot without a pattern and with a near equal distribution of points above and below the x-axis suggests that the regression equation is a good fit for the data.
Residuals are automatically stored in graphing calculators when regression equations are calculated. To view a residuals scatterplot in the graphing calculator, you must use 2nd LIST to set the Y list variable to RESID, then use Zoom 9 to plot the residuals.
DEVELOPING ESSENTIAL SKILLS
Calculate the residual values:
x Actual y-value Predicted y-value Residual 0 4 -14 10 1 6 -2 8 2 8 2 6 3 10 4 4 4 12 10 2 5 14 14 0
Page 58

6 16 15 0 7 18 16 2 8 20 15 5 9 22 13 9 10 24 14 10
Plot the residuals and determine if they indicate a good fit or a bad fit.
The residuals form a pattern, so the fit is bad.
REGENTS EXAM QUESTIONS (through June 2018)
S.ID.B.6b: Residuals
43) Use the data below to write the regression equation ( ) for the raw test score based on the hours tutored.
Round all values to the nearest hundredth.
Equation: ___________________________
Page 59

Create a residual plot on the axes below, using the residual scores in the table above.
Based on the residual plot, state whether the equation is a good fit for the data. Justify your answer.
44) Which statistic would indicate that a linear function would not be a good fit to model a data set?
1) 3)
2) 4)
45) After performing analyses on a set of data, Jackie examined the scatter plot of the residual values for each analysis. Which scatter plot indicates the best linear fit for the data?
Page 60

1)
3)
2)
4)
46) The table below represents the residuals for a line of best fit.
Plot these residuals on the set of axes below.
Using the plot, assess the fit of the line for these residuals and justify your answer.
47) The residual plots from two different sets of bivariate data are graphed below.
Explain, using evidence from graph A and graph B, which graph indicates that the model for the data is a good fit.
Page 61

SOLUTIONS
43) ANS:
Based on the residual plot, the equation is a good fit for the data because the residual values are scattered without a pattern and are fairly evenly distributed above and below the x-axis. Strategies: Use linear regression to find a regression equation that fits the first two columns of the table, then create a residuals plot using the first and third columns of the table to see if there is a pattern in the residuals. STEP 1. Input the data from the first two columns of the table into a graphing calculator.
STEP 2. Determine which regression strategy will best fit the data. The problem states that the regression equation should be in the form ( ), which means linear reression. The scatterplot produced by the graphing calculator also suggests linear regression. STEP 3. Execute the lionear regression strategy in the graphing calculator.
Round all values to the nearest hundredth:
Page 62

STEP 4. Plot the residual values on the graph provided using data from the first and third columns of the table. The graph shows a near equal number of points above the line and below the line, and the graph shows no pattern. The regression equation appears to be a good fit.
NOTE: The graphing calculator will also produce a residuals plot.
DIMS: Ask the question, “Does It Make Sense (DIMS)?” Yes. The regression equation produces the
same residuals as shown in the table.
PTS: 4 NAT: S.ID.B.6b TOP: Correlation Coefficient and Residuals
44) ANS: 3 Strategy: Use knowledge of correlation coefficients and residual plots to determine which answer choice is not a good fit to model a data set. STEP 1. A correlation coefficient close to –1 or 1 indicates a good fit, so answer choices a and b can be eliminated. Both suggest a good fit. STEP 2. For a residual plot, there should be no observable pattern and a similar distribution of residuals above and below the x-axis. The residual plot in answer choice d shows a good fit, so answer choice d can be eliminated, leaving answer choice c as the correct answer. DIMS? Does it make sense? Yes. The clear pattern in answer choice c tells us that the linear function is not a good fit to model the data set.
PTS: 2 NAT: S.ID.B.6b TOP: Correlation Coefficient and Residuals
45) ANS: 3 For a residual plot, there should be no observable pattern and about the same number of dots above and below the x axis. Any pattern in a residual plot means that line is not a good fit for the data.
PTS: 2 NAT: S.ID.B.6b TOP: Correlation Coefficient and Residuals
46) ANS:
The line is a poor fit because the residuals form a pattern.
PTS: 2 NAT: S.ID.B.6b TOP: Correlation Coefficient and Residuals
Page 63

47) ANS: Graph A is a good fit because it does not have a clear pattern, whereas Graph B does have a clear pattern..
PTS: 2 NAT: S.ID.6b TOP: Correlation Coefficient and Residuals
Page 64

C – Expressions and Equations, Lesson 1, Dependent and Independent Variables (r. 2018)
EXPRESSIONS AND EQUATIONS Dependent and Independent Variables
Common Core Standards
A-SSE.A.1 Interpret expressions that represent a quantity in terms of its context. A-SSE.A.1a Interpret parts of an expression, such as terms, factors, and coefficients. NYSED: The “such as” listed are not the only parts of an expression students are expected to know; others include, but are not limited to, degree of a polynomial, leading co-efficient, constant term, and the standard form of a poly-nomial (descending exponents). A-SSE.A.1b Interpret complicated expressions by viewing one or more of their parts as a sin-gle entity. For example, interpret ( )1 nP r+ as the product of P and a factor not depending on P.
Next Generation Standards
AI-A.SSE.1 Interpret expressions that represent a quan-tity in terms of its context. AI-A.SSE.1a Write the standard form of a given polyno-mial and identify the terms, coefficients, degree, leading coefficient, and constant term. AI-A.SSE.1b Interpret expressions by viewing one or more of their parts as a single entity.
e.g., Interpret ( )1 nP r+ as the product of P and a fac-tor not depending on P. Note: This standard is a fluency expectation for Algebra I. Fluency in transforming expressions and chunking (see-ing parts of an expression as a single object) is essential in factoring, completing the square, and other mindful al-gebraic calculations.
LEARNING OBJECTIVES
Students will be able to:
1) Identify which terms in a mathematical relationship involving two variables are associated with independent and dependent variables.
Overview of Lesson
Teacher Centered Introduction Overview of Lesson
- activate students’ prior knowledge
- vocabulary
- learning objective(s)
- big ideas: direct instruction
- modeling
Student Centered Activities guided practice Teacher: anticipates, monitors, selects, sequences, and connects student work
- developing essential skills
- Regents exam questions
- formative assessment assignment (exit slip, explain the math, or journal entry)
VOCABULARY
dependent variable independent variable term
variable variable expression
Page 65

BIG IDEAS
Function: A function is a relation that assigns exactly one value of the dependent variable to each value of the independent variable. A function is always a relation.
Example: y=2x
Relation: A relation may produce more than one output for a given input. A relation may or may not be a function.
Example:
This is not a function, because when x=16, there is more than one y-
value. .
The input variable is the independent variable. • It can be any value in the domain of the mathematical relation. • It is plotted on the x-axis in graphs.
The output variable is the dependent variable. • Its value depends upon what is input. • It is plotted on the y-axis.
A term is a number, a variable, or the product of numbers and variables.
• Terms in an expression are always separated by a plus sign or minus sign. • Terms in an expression are always either positive or negative. • Numbers and variables connected by the operations of division and multiplication are parts of the
same term. • Terms, together with their signs, can be moved around within the same expression without
changing the value of the expression. If you move a term from the left expression to the right expression, or from the right expression to the left expression (across the equal sign), the plus or minus sign associated with the term must be changed.
INPUT OUTPUTFUNCTIONMACHINE
INPUT OUTPUTRELATIONMACHINE
2y x
y x
=
=
16 4= ±
Page 66

DEVELOPING ESSENTIAL SKILLS
Identify the dependent and independent variables in the following mathematical relationships.
Mathematical Relationship
Independent Variable
Dependent Variable
2 5y x= + x y 5 ( 32)9
C F= − F C
9 325
C F+ = C F
2A rπ= r A ( ) 2 4 57f t t t= + + t f(t)
REGENTS EXAM QUESTION (through June 2018)
A.SSE.A.1: Dependent and Independent Variables
48) The formula for the surface area of a right rectangular prism is , where l, w, and h represent
the length, width, and height, respectively. Which term of this formula is not dependent on the height? 1) A 3) 2hw 2) 2lw 4) 2lh
SOLUTION
48) ANS: 2 The problem asks “Which term of this formula is not dependent on the height.”
Term #1 Sign Term #2 Term #3 Term #4 A = +2lw +2hw +2lh
This term is the dependent variable in the equation,
which is influenced by the height of the rectangular
prism.
This is the only term that is not dependent on
height.
Height is a variable in this
term.
Height is a variable in this
term.
PTS: 2 NAT: A.SSE.A.1 TOP: Dependent and Independent Variables
Page 67
C – Expressions and Equations, Lesson 2, Modeling Expressions (r. 2018)
EXPRESSIONS AND EQUATIONS Modeling Expressions
Common Core Standards
A-SSE.A.1 Interpret expressions that represent a quantity in terms of its context. A-SSE.A.1a Interpret parts of an expression, such as terms, factors, and coefficients. NYSED: The “such as” listed are not the only parts of an expression students are expected to know; others include, but are not limited to, degree of a polynomial, leading co-efficient, constant term, and the standard form of a poly-nomial (descending exponents). A-SSE.A.1b Interpret complicated expressions by viewing one or more of their parts as a sin-gle entity. For example, interpret P(1+r)n as the product of P and a factor not depending on P.
Next Generation Standards
AI-A.SSE.1 Interpret expressions that represent a quan-tity in terms of its context. AI-A.SSE.1a Write the standard form of a given polyno-mial and identify the terms, coefficients, degree, leading coefficient, and constant term. AI-A.SSE.1b Interpret expressions by viewing one or more of their parts as a single entity. e.g., Interpret P(1 + r)n as the product of P and a factor not depending on P. Note: This standard is a fluency expectation for Alge-bra I. Fluency in transforming expressions and chunking (seeing parts of an expression as a single ob-ject) is essential in factoring, completing the square, and other mindful algebraic calculations.
LEARNING OBJECTIVES
Students will be able to:
1) Use academic language to identify the terms, coefficients, degree, leading coefficient, and constant term of a mathematical statement.
2) Relate parts of equations and expressions to real world contexts.
Overview of Lesson Teacher Centered Introduction
Overview of Lesson
- activate students’ prior knowledge
- vocabulary
- learning objective(s)
- big ideas: direct instruction
- modeling
Student Centered Activities guided practice Teacher: anticipates, monitors, selects, sequences, and connects student work
- developing essential skills
- Regents exam questions
- formative assessment assignment (exit slip, explain the math, or journal entry)
VOCABULARY
coefficient constant degree degree of an equation equation
expression leading coefficient leading term monomial polynomial
standard form term variable variable expression
Page 68

BIG IDEAS Important skills in mathematics involve recognizing and using academic vocabulary to:
1) communicate the structure of mathematics and; 2) relate parts of mathematical equations and expressions to real world contexts.
Equation An equation consists of two expressions connected by an equal sign. The equal sign indicates that both expressions have the same (equal) value. The two expressions in an equation are typically called the left expression and the right expression. Expression An expression is a mathematical statement or phrase consisting of one or more terms. Terms are the building blocks of expressions, similar to the way that letters are the building blocks of words. An expression will always be either a monomial or a polynomial.
• Monomial expressions have only one term. • Polynomial expressions have two or more terms.
Term A term is a number, a variable, or the product of numbers and variables.
• Terms in an expression are always separated by a plus sign or minus sign. • Terms in an expression are always either positive or negative. • Numbers and variables connected by the operations of division and multiplication are parts of the
same term. • Terms, together with their signs, can be moved around within the same expression without
changing the value of the expression. If you move a term from the left expression to the right expression, or from the right expression to the left expression (across the equal sign), the plus or minus sign associated with the term must be changed.
Leading Term: The leading term in a polynomial expression is the highest degree term. Variable A variable is a quantity whose value can change or vary. In algebra, a letter is typically used to represent a variable. The value of the letter can change. The letter x is commonly used to represent a variable, but other letters can also be used. The letters s, o, and sometimes l are avoided by some students because they are easily confused in equations with numbers.
• Independent Variable: Always shown on the x-axis, the independent variable is the input for an equation.
• Dependent Variable: Always shown on the y-axis, the dependent variable is the output of the equation.
• Variable Term: A term than contains at least one variable. • Variable Expression: A mathematical phrase that contains at least one variable.
Example: The equation 2x+3 = 5 contains a left expression and a right expression. The two expressions are connected by an equal sign. The expression on the left is a polynomial variable expression containing two terms, which are +2x and +3. The expression on the right is monomial that contains only one term, which is the constant +5.
Coefficient: A coefficient is the numerical factor of a term in a polynomial. It is typically thought of as the number in front of a variable.
Example: 14 is the coefficient in the term 14x3y.
Page 69

• Leading Coefficient: The leading coefficient of a polynomial is the coefficient of the leading term.
Constant: A constant is a number with a constant value (ie. not a variable). Standard Form of a Polynomial: A polynomial is in standard from when the degrees of its terms are in descending order.
Examples: 3 23 5 7x x x+ + is in standard form. 2 35 3 7x x x+ + is not in standard..
DEVELOPING ESSENTIAL SKILLS
Answer each question about the following mathematical statements:
Mathematical Statements
23 2y x x= + − 4 2 34 6 3 2 2x x x x− + + − 0 4x= +
Is this mathematical statement an expression or an equation?
Equation
Expression
Equation
How many terms are in this mathematical statement?
4 5 3
What is the leading term?
22x− 44x 22x−
What is the degree of this mathematical statement?
Second
Fourth
First
What is the coefficient of the lowest variable term?
1
2
1
What is the constant? 3 -2 0 and 4 Write this mathematical statement in standard form.
22 3y x x= − + +
4 3 24 3 6 2 2x x x x+ − + −
4x = −
REGENTS EXAM QUESTIONS (through June 2018)
A.SSE.A.1: Modeling Expressions
49) To watch a varsity basketball game, spectators must buy a ticket at the door. The cost of an adult ticket is $3.00
and the cost of a student ticket is $1.50. If the number of adult tickets sold is represented by a and student tickets sold by s, which expression represents the amount of money collected at the door from the ticket sales? 1) 3) 2) 4)
Page 70

50) An expression of the fifth degree is written with a leading coefficient of seven and a constant of six. Which expression is correctly written for these conditions? 1) 3) 2) 4)
51) When multiplying polynomials for a math assignment, Pat found the product to be . He then had to state the leading coefficient of this polynomial. Pat wrote down . Do you agree with Pat’s answer? Explain your reasoning.
52) Andy has $310 in his account. Each week, w, he withdraws $30 for his expenses. Which expression could be
used if he wanted to find out how much money he had left after 8 weeks? 1) 3) 2) 4)
53) Konnor wants to burn 250 Calories while exercising for 45 minutes at the gym. On the treadmill, he can burn 6 Cal/min. On the stationary bike, he can burn 5 Cal/min. If t represents the number of minutes on the treadmill and b represents the number of minutes on the stationary bike, which expression represents the number of Calories that Konnor can burn on the stationary bike? 1) 3) 2) 4)
54) Mrs. Allard asked her students to identify which of the polynomials below are in standard form and explain why. I. II. III. Which student's response is correct? 1) Tyler said I and II because the coefficients
are decreasing. 3) Fred said II and III because the exponents
are decreasing. 2) Susan said only II because all the numbers
are decreasing. 4) Alyssa said II and III because they each
have three terms.
SOLUTIONS
49) ANS: 4 Strategy: Translate the words into mathematical expressions.
PTS: 2 NAT: A.SSE.A.1 TOP: Modeling Linear Equations
50) ANS: 4 The degree of a polynomial is determined by the largest exponent of a term within a polynomial. A polynomial expression of the fifth degree can have not exponent larger than 5, so choices b and c can be eliminated.
Page 71

A leading coefficient is the coefficient of the first term of a polynomial written in descending order of exponents. Since the leading coefficient is seven, choices a and c can be eliminated, leaving choice d as the only possible answer. Does it make sense? Yes. has a leading coefficient of seven, is a fifth degree polynomial because 5 is the highest exponent, and a constant term of six.
PTS: 2 NAT: A.SSE.A.1 TOP: Modeling Expressions
51) ANS: I disagree. The leading coefficient of a polynomial is the coefficient of the term with the highest exponent when all of the terms are arranged in descending order by exponents.
Pat should have written that the leading coefficient is .
PTS: 2 NAT: A.SSE.A.1
52) ANS: 4 Strategy: Step 1. Create a table of values by starting at week 0 with $310 dollars. Week $$$ x y 0 310 1 280 2 250 3 220 4 190 5 160 6 130 7 100 8 70
Step 2. Use a graphing calcualtor to determine which expression reproduces the table of values.
PTS: 2 NAT: A.SSE.A.1 TOP: Modeling Expressions
53) ANS: 2 On the stationary bike, Konnor can burn 5 Cal/min. b represents the number of minutes Konnor spends on the stationary bike. 5 times b represents the number of Calories that Konnor can burn on the stationary bike.
PTS: 2 NAT: A.SSE.A.1 TOP: Modeling Expressions
Page 72

54) ANS: 3 Strategy: Find the polynomials that have the exponents decreasing from left to right. This is the definition of standard form. I. is not in standard form because the exponent of the middle term is less than the exponent of the third term. II. is in standard form because the exponents decrease from left to right. III. is in standard form because the exponents decrease from left to right. Fred is correct. II and III are in standard form.
PTS: 2 NAT: A.SSE.A.1 TOP: Modeling Expressions
Page 73
C – Expressions and Equations, Lesson 3, Solving Linear Equations (r. 2018)
EXPRESSIONS AND EQUATIONS Solving Linear Equations
Common Core Standard
A-REI.B.3 Solve linear equations and inequal-ities in one variable, including equations with coefficients represented by letters.
Next Generation Standard
AI-A.REI.3 Solve linear equations and inequalities in one variable, including equations with coefficients repre-sented by letters. Note: Algebra I tasks do not involve solving com-pound inequalities.
LEARNING OBJECTIVES
Students will be able to:
1) Solve one step and multiple step equations. 2) Explain each step involved in solving one step and multiple step equations. 3) Do a check to see if the solution is correct.
Overview of Lesson
Teacher Centered Introduction Overview of Lesson
- activate students’ prior knowledge
- vocabulary
- learning objective(s)
- big ideas: direct instruction
- modeling
Student Centered Activities guided practice Teacher: anticipates, monitors, selects, sequences, and connects student work
- developing essential skills
- Regents exam questions
- formative assessment assignment (exit slip, explain the math, or journal entry)
VOCABULARY balance check common sense DIMS
four column strategy four general rules isolate plug
proper notation substitute
Page 74

BIG IDEAS The Four General Rules
(for solving equations and inequalities)
Isolate the Variable: The goal of solving any equation is to isolate the desired variable in either the left or right expression. Keep It Balanced: During each step of the equation solving process, the left and right expressions must equal one another. Reduce the Number of Terms: Any step that reduces the number of terms in an equation is usually a good step. Use Proper Notation and Do a Check: You check your answers in algebra on two levels: first, you see if the answer actually makes sense, and then you plug your answer back into the problem to see if it works.
• Proper Notation involves making short notes that describe the action taken during each step of solving an equation. Academic language is sometimes required.
• Does It Make Sense (DIMS) The first step in checking a solution is to use “common sense.” For example, if your solu-tion is x = 5, and you are solving for a football player’s weight in pounds, you have proba-bly made a mistake because it does not make sense that a football player weighs only five pounds. On the other hand, if you are solving for the number of pennies in a nickel, it makes perfect sense.
• Plug (substitute) the answer back into the problem to see if it works. The second step in checking a solution is to substitute your solution into the original equa-tion and solve the equation once again with your solution in it. If the left expression is equal to the right expression, the equation balances and your solution is correct.
Isolate theVariable
Reduce the# of Terms
Keep ItBalanced
Ue ProperNotation
Do a CheckEquations
Page 75

The Four Column Strategy The four column strategy focuses on organizing and documenting each step in solving an equation or inequality. Emphasis is given to explaining each step and keeping the equal signs (or inequality signs) aligned in a vertical column. The vertical and horizontal lines are simply scaffolds that can be removed as students acquire understanding and skills in solving equations.
((keep the equation/inequality signs aligned vertically) Notes Left Hand Expression Sign Right Hand Expression Given
Add (6) =
= 8 Divide (2)
=
Answer x = 4 Check 2(4) – 6
8-6 2
= = =
2 2 2
DEVELOPING ESSENTIAL SKILLS
Use the four general rules and the four column strategy to solve the following problems:
If , the value of x is 12
Notes Left Hand Expression Sign Right Hand Expression Given ( )3 2x − = 2 6x +
Distributive Property
3 6x − = 2 6x +
Subtract 2x -2x -2x Simplify x-6 = 6
Add 6 +6 +6 Solution x = 12 Check ( )
( )3 2 2 6
3(12 2) 2 12 63(10) 24 6
30 30
x x− = +
− = +
= +=
What is the value of x in the equation ? 16
Notes Left Hand Expression Sign Right Hand Expression Given 3 2
4x +
= 5 64
x −
Multiply by 4 3 8x + = 5 24x − Subtract 3x 8 = 2 24x −
Add 24 32 = 2x
2+ 6
82
Page 76

Divide by 2 16 = X Check
( ) ( )
3 542 64
3 516 2 16 64 4
48 802 64 412 2 20 6
14 14
x x+ = −
+ = −
+ = −
+ = −=
REGENTS EXAM QUESTIONS (through June 2018)
A.REI.B.3: Solving Linear Equations
55) Which value of x satisfies the equation ?
1) 8.25 3) 19.25 2) 8.89 4) 44.92
56) What is the value of x in the equation ?
1) 4 3) 8 2) 6 4) 11
57) An equation is given below.
The solution to the equation is 1) 8.3 3) 3 2) 8.7 4) -3
58) Which value of x satisfies the equation ?
1) 3) 2) 4)
59) The value of x which makes true is
1) 3) 2) 4)
60) Solve the equation below algebraically for the exact value of x.
SOLUTIONS
55) ANS: 1
Page 77

Strategy: Use the four column method. Notes Left Expression Sign Right Expression Given
=
Divide both
expressions by
(Division property of equality)
=
Cancel and Simplify
=
Subtract from
both expressions (Subtraction property
of equality)
x =
Simplify x =
Simplify x = 8.25 or
Notes Left Expression Sign Right Expression Given
=
Distributive Property
= 20
Cancellation
= 20
Simplification
= 20
Subtract from
both expressions (Subtraction Property
of Equality)
=
Simplification
=
Multiply both expressions by 12
(Multiplication property of equality)
=
Cancel
=
Siomplify = 231 Divide both
expressions by 28 (Division property of
equality)
=
Page 78

Simplify x = 8.25
PTS: 2 NAT: A.REI.B.3 TOP: Solving Linear Equations KEY: fractional expressions
56) ANS: 1 Strategy: Use the four column method.
Notes Left Expression Sign Right Expression Given:
=
Multiply both expressions by 6 (Multiplication
property of equality)
=
Cancel and Simplify
=
Simplify = Add +4 to both
expressions (Addition property of
equality)
=
8
Divide both expressions by 2
(Division property of equality)
x = 4
PTS: 2 NAT: A.REI.B.3 TOP: Solving Linear Equations KEY: fractional expressions
57) ANS: 1
PTS: 2 NAT: A.REI.B.3 TOP: Solving Linear Equations KEY: decimals
58) ANS: 2
Page 79

PTS: 2 NAT: A.REI.B.3 TOP: Solving Linear Equations KEY: fractional expressions
59) ANS: 4 Solve for x:
Multiply by 3 to clear the first fraction.
Multiply by 5 to clear the remaining fraction.
Use distributive property to clear parentheses.
Multiply by 4 to clear fraction.
Transpose and solve for x.
Page 80

PTS: 2 NAT: A.REI.B.3 TOP: Solving Linear Equations KEY: fractional expressions
60) ANS:
Answer:
Strategy: Solve algebraically (without a calculator). Notes Left Expression Sign Right Expression Given
= 4x
Multiply by 3 = 12x Distributive Property = 12x
Add 2x = 14x Simplify 8 = 14x
Divide by 14
= x
Simplify
= x
Check.is Optional Notes Left
Expression Sign Right Expression
Given
= 4x
Evaluate for =
Get a Common Denominator Inside Parentheses
=
Do Addition Inside Parentheses
=
Remove Parentheses Using Multiplication of Fractions
=
Get a Common Denominator
=
Simplify
=
PTS: 3 NAT: A.REI.B.3 TOP: Solving Linear Equations KEY: fractional expressions
Page 81

C – Expressions and Equations, Lesson 4, Modeling Linear Equations (r. 2018)
EXPRESSIONS AND EQUATIONS Modeling Linear Equations
Common Core Standards
A-CED.A.1 Create equations and inequalities in one variable and use them to solve problems. Include equations arising from linear and quadratic func-tions, and simple rational and exponential functions. PARCC: Tasks are limited to linear, quadratic, or exponential equations with integer exponents. A-CED.A.2 Create equations in two or more varia-bles to represent relationships between quantities; graph equations on coordinate axes with labels and scales. A-CED.A.3 Represent constraints by equations or inequalities, and by systems of equations and/or ine-qualities, and interpret solutions as viable or non-vi-able options in a modeling context. For example, represent inequalities describing nutritional and cost constraints on combinations of different foods.
Next Generation Standards
AI-A.CED.1 Create equations and inequalities in one variable to represent a real-world context. (Shared standard with Algebra II) Notes: • This is strictly the development of the model (equa-tion/inequality). • Limit equations to linear, quadratic, and exponen-tials of the form f(x) = a(b)x where a > 0 and b > 0 (b ≠ 1). • Work with geometric sequences may involve an ex-ponential equation/formula of the form an = arn-1, where a is the first term and r is the common ratio. • Inequalities are limited to linear inequalities. • Algebra I tasks do not involve compound inequalities.
AI-A.CED.2 Create equations and linear inequalities in two variables to represent a real-world context. Notes: • This is strictly the development of the model (equa-tion/inequality). • Limit equations to linear, quadratic, and exponen-
tials of the form ( ) ( ) xf x a b= where a > 0 and b > 0 (b ≠ 1).
AI-A.CED.3 Represent constraints by equations or ine-qualities, and by systems of equations and/or inequalities, and interpret solutions as viable or non-viable options in a modeling context.
e.g., Represent inequalities describing nutritional and cost constraints on combinations of different foods.
LEARNING OBJECTIVES
Students will be able to:
1) Model real-world word problems as mathematical expressions and equations.
Page 82

Overview of Lesson Teacher Centered Introduction
Overview of Lesson
- activate students’ prior knowledge
- vocabulary
- learning objective(s)
- big ideas: direct instruction
- modeling
Student Centered Activities guided practice Teacher: anticipates, monitors, selects, sequences, and connects student work
- developing essential skills
- Regents exam questions
- formative assessment assignment (exit slip, explain the math, or journal entry)
VOCABULARY
See key words and their mathematical translations under big ideas.
BIG IDEAS Translating words into mathematical expressions and equations is an important skill. General Approach The general approach is as follows:
1. Read and understand the entire problem. 2. Underline key words, focusing on variables, operations, and equalities or inequalities. 3. Convert the key words to mathematical notation (consider meaningful variable names
other than x and y). 4. Write the final expression or equation. 5. Check the final expression or equation for reasonableness.
Key English Words and Their Mathematical Translations
These English Words Usually Mean Examples: English becomes math
sum, plus, and addition the sum of 5 and x becomes 5 + x minus, less, take away, difference of subtraction 5 minus x becomes 5 – x
the difference of x and 5 becomes x - 5 less than subtraction 3 less than x becomes x - 3
product, times, multiplied by multiplication the product of five times two becomes 5 x 2 x multiplied by 4 becomes 4x
fraction of, percent of multiplication one half of x becomes
12
x
33 percent of y becomes .33y quotient, divided by,
ratio of Division
the quotient of x and y becomes xy
the ratio of two times y and 4 becomes 24y
is, are equals the sum of 5 and x is 20 becomes 5 + x = 20
Page 83

Examples of Modeling Specific Types of Equations Age Problems
Typical Problem in English Mathematical Translation Hints and Strategies Tamara has two sisters. One of the sisters is 7 years older than Tamara. The other sister is 3 years younger than Tamara. The product of Tamara’s sisters' ages is 24. How old is Tamara?
Let x represent Tamara’s age. Let x+7 represent the older sister’s age. Let x-3 represent the younger sister’s age. Write: ( )( )7 7 24x x+ − = Solve for x.
x = 5
Define your variables. Check your answers.
Remember than “is” means =.
Area, Volume and Perimeter Problems
Typical Problem in English Mathematical Translation Hints and Strategies If the length of a rectangular prism is doubled, its width is tripled, and its height remains the same, what is the volume of the new rectangular prism in relation to the volume of the original rectangular prism?
Use the formula V = lwh. Let the volume of the original rectangular prism be represented by lwh. Let the volume of the new rectangular prism be represented by 2 3l w h× × , which simplifies to 6 times lwh. The new rectangular prism has six times the volume of the original rectangular prism.
Use a geometric formula as a guide.
Coin Problems
Typical Problem in English Mathematical Translation Hints and Strategies Byron has 72 coins in his piggy bank. The piggy bank contains only dimes and quarters. If he has $14.70 in his piggy bank, write an equation that can be used to determine q, the number of quarters he has?
The total value of all coins is 1470 cents. Let the number of quarters be represented by q and the value of quarters be represented by 25q. Let the number of dimes be represented by 72 – q and the value of dimes be represented by 10(75 – q) Write: 25 10(72 ) 1470q q+ − = Solve for q.
30q =
Work with cents as units.
Remember that each coin has a specific value in cents
Consecutive Integer Problems
Typical Problem in English Mathematical Translation Hints and Strategies
Page 84

The sum of three consecutive odd integers is 18 less than five times the middle number. Find the three integers. [Only an algebraic solution can receive full credit.]
Let x represent the first integer. Let x + 2 represent the middle integer. Let x + 4 represent the 3rd integer. Write: ( ) ( )2 4 5 2 18x x x x+ + + + = + − Solve for x, x +2, and x + 4.
7, 9, 11
For consecutive integer problems, define your
variables as x, x + 1, and x + 2
For consecutive even or odd integer problems, define your variables as x, x +2, and x + 4.
Missing Number in the Average Problems
Typical Problem in English Mathematical Translation Hints and Strategies TOP Electronics is a small business with five employees. The mean (average) weekly salary for the five employees is $360. If the weekly salaries of four of the employees are $340, $340, $345, and $425, what is the salary of the fifth employee?
Let 5x represent the missing salary Write:
5340 340 345 4253605
x+ + + +=
Solve for 5x .
5 $350x =
Substitute given values into the following formula for
finding the average. 1 2 ... nx x xx
n+ + +
= , then
solve for the missing value.
Number Problems
Typical Problem in English Mathematical Translation Hints and Strategies Twice the larger of two numbers is ten more than five times the smaller, and the sum of four times the larger and three times the smaller is 39. What are the numbers?
Let x represent the larger #. Let y represent the smaller #. Write two equations: 2 10 5x y= + And 4 3 46x y+ = Solve as a system of equations.
x = 10 and y = 2
Define your variables. Check your answers.
Remember that “is” means =.
DEVELOPING ESSENTIAL SKILLS
Write equations or expressions that model each of the following word problems.
1. The length of a rectangular window is 5 feet more than its width, w. The area of the window is 36 square feet. Write an equation that could be used to find the dimensions of the window?
( )5 36w w+ = or
2 5 36 0w w+ − =
2. Rhonda has $1.35 in nickels and dimes in her pocket. If she has six more dimes than nickels, write an equation that can be used to determine x, the number of nickels she has?
0.05 0.10( 6) 1.35x x+ + = or
5 10( 6) 135x x+ + =
3. If h represents a number, write an equation that is a correct translation of "Sixty more than 9 times a number is 375"?
9 60 375h + =
Page 85
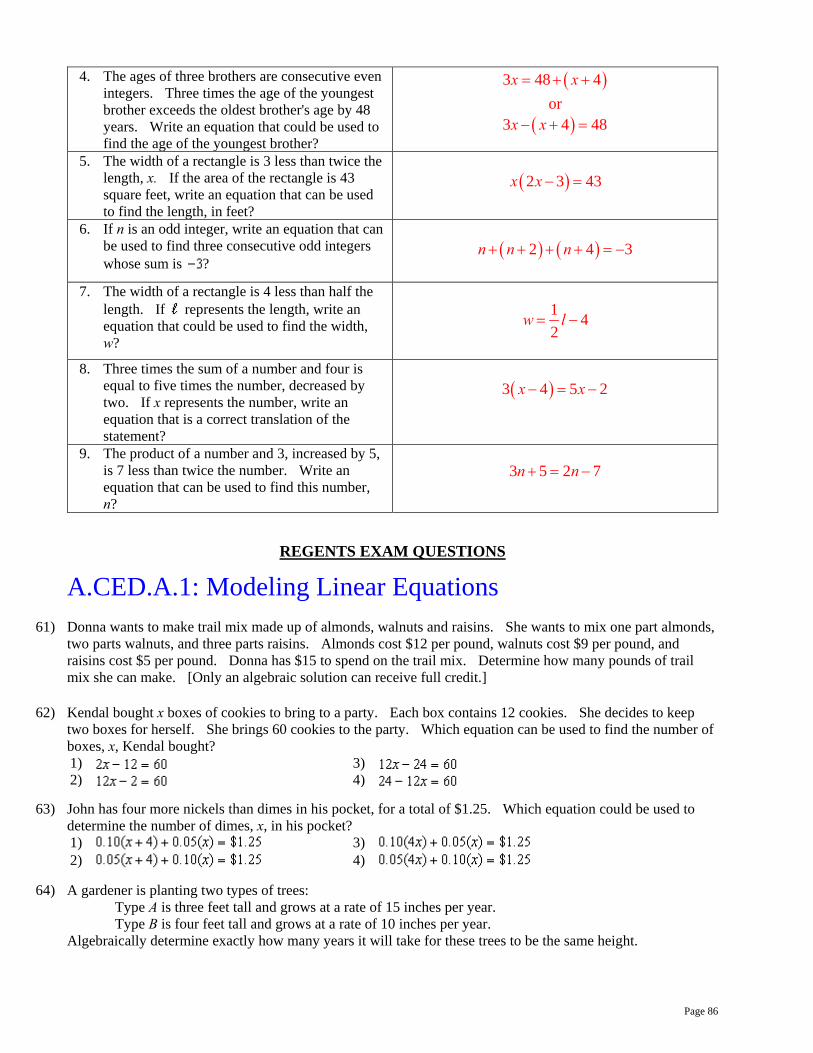
4. The ages of three brothers are consecutive even integers. Three times the age of the youngest brother exceeds the oldest brother's age by 48 years. Write an equation that could be used to find the age of the youngest brother?
( )3 48 4x x= + + or
( )3 4 48x x− + =
5. The width of a rectangle is 3 less than twice the length, x. If the area of the rectangle is 43 square feet, write an equation that can be used to find the length, in feet?
( )2 3 43x x − =
6. If n is an odd integer, write an equation that can
be used to find three consecutive odd integers whose sum is ?
( ) ( )2 4 3n n n+ + + + = −
7. The width of a rectangle is 4 less than half the
length. If represents the length, write an equation that could be used to find the width, w?
1 42
w l= −
8. Three times the sum of a number and four is
equal to five times the number, decreased by two. If x represents the number, write an equation that is a correct translation of the statement?
( )3 4 5 2x x− = −
9. The product of a number and 3, increased by 5, is 7 less than twice the number. Write an equation that can be used to find this number, n?
3 5 2 7n n+ = −
REGENTS EXAM QUESTIONS
A.CED.A.1: Modeling Linear Equations
61) Donna wants to make trail mix made up of almonds, walnuts and raisins. She wants to mix one part almonds,
two parts walnuts, and three parts raisins. Almonds cost $12 per pound, walnuts cost $9 per pound, and raisins cost $5 per pound. Donna has $15 to spend on the trail mix. Determine how many pounds of trail mix she can make. [Only an algebraic solution can receive full credit.]
62) Kendal bought x boxes of cookies to bring to a party. Each box contains 12 cookies. She decides to keep
two boxes for herself. She brings 60 cookies to the party. Which equation can be used to find the number of boxes, x, Kendal bought? 1) 3) 2) 4)
63) John has four more nickels than dimes in his pocket, for a total of $1.25. Which equation could be used to determine the number of dimes, x, in his pocket? 1) 3) 2) 4)
64) A gardener is planting two types of trees: Type A is three feet tall and grows at a rate of 15 inches per year. Type B is four feet tall and grows at a rate of 10 inches per year. Algebraically determine exactly how many years it will take for these trees to be the same height.
Page 86

65) A parking garage charges a base rate of $3.50 for up to two hours, and an hourly rate for each additional hour.
The sign below gives the prices for up to 5 hours of parking.
Which linear equation can be used to find x, the additional hourly parking rate? 1) 3) 2) 4)
66) Sandy programmed a website's checkout process with an equation to calculate the amount customers will be charged when they download songs. The website offers a discount. If one song is bought at the full price of $1.29, then each additional song is $.99. State an equation that represents the cost, C, when s songs are downloaded. Sandy figured she would be charged $52.77 for 52 songs. Is this the correct amount? Justify your answer.
67) A cell phone company charges $60.00 a month for up to 1 gigabyte of data. The cost of additional data is
$0.05 per megabyte. If d represents the number of additional megabytes used and c represents the total charges at the end of the month, which linear equation can be used to determine a user's monthly bill? 1) 3) 2) 4)
68) A typical cell phone plan has a fixed base fee that includes a certain amount of data and an overage charge for data use beyond the plan. A cell phone plan charges a base fee of $62 and an overage charge of $30 per gigabyte of data that exceed 2 gigabytes. If C represents the cost and g represents the total number of gigabytes of data, which equation could represent this plan when more than 2 gigabytes are used? 1) 3) 2) 4)
SOLUTIONS
61) ANS: Donna can make 2 pounds of trail mix. Strategy 1: Determine the costs of six pounds of mix, then scale the amount down to $15 of mix. STEP 1. The mix will have six parts. If each part is 1 pound, the costs of the mix can be determined as follows: $12 for one part almonds @ $12 per pound, $18 for two parts walnuts @ $9 per pound, and $15 for three parts raisins @ $5 per pound. $45 for six pounds of mix. STEP 2: Scale the amount down to $15 of mix
Page 87

Donna can make 2 pounds of trail mix.
DIMS? Does It Make Sense? Yes. If 2 pounds of the mix cost $15, 3 times as much should cost $45. Strategy 2. Write an expression that scales the costs of the mix to $15. Let x represent the scale factor.
Write
The scale factor is . If an entire batch of trail mix contains 6 pounds of ingredients, Donna needs to scale
the recipe down and make only of that amount. In other words, Donna needs to make pounds of
trail mix if she only has $15 to spend.
PTS: 2 NAT: A.CED.A.1 TOP: Modeling Linear Equations
62) ANS: 3 STEP 1. Underline key words. Kendal bought x boxes of cookies to bring to a party. Each box contains 12 cookies. She decides to keep two boxes for herself. She brings 60 cookies to the party. Which equation can be used to find the number of boxes, x, Kendal bought? STEP 2. Define key terms. Let 12 x represent the total number of cookies Kendal Bought. Let 24 represent the total number of cookies Kendal kept for herself. Let 60 represent the total number of cookies Kendal took to school. STEP 3. Write
PTS: 2 NAT: A.CED.A.1
63) ANS: 2
Page 88

Strategy: This is a coin problem, and the value of each coin is important. Let x represent the number of dimes, as required by the problem. Let .10x represent the value of the dimes. (A dime is worth $0.10) The problem says that John has 4 more nickels than dimes. Let represent the number of nickels that John has. Let .05 represent the value of the nickles. (A nickel is worth $0.05) The total amount of money that John has is $1.25. The total amount of money that John has can also be represented by These two expressions are both equal, so write:
This is not an answer choice, but using the commutative property, we can rearrange the order of the terms in the left expression , which is the same as answer choice b. DIMS? Does It Make Sense? Yes. Transform the equation for input into a graphing calculator as follows:
John has 7 dimes and 11 nickles. The dimes are worth 70 cents and the nickels are word 55 cents. In total, John has $1.25.
PTS: 2 NAT: A.CED.A.1 TOP: Modeling Linear Equations
64) ANS: 2.4 years Strategy: Convert all measurements to inches per year, then write two equations, then write and solve a new equation by equating the right expressions of the two equations. STEP 1: Convert all measurements to inches per year. Type A is 36 inches tall and grows at a rate of 15 inches per year. Type B is 48 inches tall and grows at a rate of 10 inches per year. STEP 2: Write 2 equations
STEP 3: Write and solve a break-even equation from the right expressions.
Page 89

DIMS? Does It Make Sense? Yes. After 2.4 years, the type A trees and the type B trees will both be 72 inches tall.
PTS: 2 NAT: A.REI.C.6 TOP: Modeling Linear Equations NOT: NYSED classifies this problem as A.CED.1: Create Inequations and Inequalities
65) ANS: 3
PTS: 2 NAT: A.CED.A.1
66) ANS:
Sandy is not correct. She used the wrong equation.
# Songs (s)
Correct Costs
Sandy’s Costs
1 1.29 2.28 2 2.28 3.27 3 3.27 4.26
---- ---- ---- 52 51.76 52.77
PTS: 2 NAT: A.CED.A.2 TOP: Modeling Linear Equations
67) ANS: 4 Strategy: Translate the words into algebraic terms and expressions. Then eliminate wrong answers.
Page 90

The problem tells us to: Let c represent the total charges at the end of the month. Let 60 represent the cost of 1 gigabyte of data. Let d represent the cost of each megabyte of data after the first gigabyte. The total charges equal 60 plus .05d. Write . This is answer choice d. DIMS? Does It Make Sense? Yes. could be used to represent the user’s monthly bill. First, transpose the formula for input into the graphing calculator:
The table of values shows that the monthly charges increase 5 cents for every additional megabyte of data.
PTS: 2 NAT: A.CED.A.1 TOP: Modeling Linear Equations
68) ANS: 4 Strategy: Translate the words into algebraic terms and expressions. Then eliminate wrong answers. The problem tells us to: Let C represent the total cost. Let g represent the number of gigabytes used. The first sentence, “A typical cell phone plan has a fixed base fee that includes a certain amount of data and an overage charge for data use beyond the plan.” tells us that total cost equals a base fee plus an overage charge. From this, we know that the basic equation will look something like
The second sentence tells us that “A cell phone plan charges a base fee of $62 ....” so we can substitute this specific information into our general equation and we have
We can eliminate answer choices a and b. The correct answer is either c or d.
The second sentence also tells us that the overage charge is “...$30 per gigabyte of data that exceed 2 gigabytes.” We can use this information to choose between answer choices c and d. Answer choice c is . This doesn’t make sense, because the value of the term
becomes negative if the number of gigabytes used is greater than 2, and the total cost becomes negative if the number of gigabytes used is 5 or more. Answer choice c can be eliminated. Answer choice d is the only choice left, and is the correct answer. DIMS? Does It Make Sense? Yes. could represent the plan when more than 2 gigabytes are used, as shown in the following table of values for this function..
Page 91

PTS: 2 NAT: A.CED.A.1 TOP: Modeling Linear Functions
Page 92

C – Expressions and Equations, Lesson 5, Transforming Formulas (r. 2018)
EXPRESSIONS AND EQUATIONS Transforming Formulas
Common Core Standard
A-CED.A.4 Rearrange formulas to highlight a quan-tity of interest, using the same reasoning as in solv-ing equations. For example, rearrange Ohm’s law V=IR to highlight resistance R.
Next Generation Standard
AI-A.CED.4 Rewrite formulas to highlight a quantity of interest, using the same reasoning as in solving equations. e.g., Rearrange Ohm’s law V = IR to highlight resistance R.
LEARNING OBJECTIVES
Students will be able to:
1) rewrite (transform) formulas to isolate specific variables.
Overview of Lesson
Teacher Centered Introduction Overview of Lesson
- activate students’ prior knowledge
- vocabulary
- learning objective(s)
- big ideas: direct instruction
- modeling
Student Centered Activities guided practice Teacher: anticipates, monitors, selects, sequences, and connects student work
- developing essential skills
- Regents exam questions
- formative assessment assignment (exit slip, explain the math, or journal entry)
VOCABULARY
formula transform transformation isolate
BIG IDEAS Properties and operations can be used to transform formulas to isolate different variables in the same ways that equations are manipulated to isolate a variable. Example: The formula can be used to find the perimeter of a rectangle. In English,
translates as “The perimeter equals two times the length plus two times the width.” In the formula , the P variable is already isolated. You can isolate the l variable or the w variables, as follows. (Note that the steps and operations are the same as with regular equations.) To isolate the l variable: Start with the formula:
Move the term 2w to the left expression.
Divide both sides of the equation by 2.
To isolate the w variable: Start with the formula:
Move the term 2l to the left expression.
Divide both sides of the equation by 2.
Page 93

You now have a formula for l in terms of P and w.
You now have a formula for l in terms of P and w.
DEVELOPING ESSENTIAL SKILLS
Isolate each variable in the Volume formula for a rectangular prism V lwh= .
V lwhV lwhV wlhV hlw
=
=
=
=
Isolate each variable in the slope intercept formula of a line y mx b= + .
y mx by b m
xy b x
my mx b
= +−
=
−=
− =
REGENTS EXAM QUESTIONS
A.CED.A.4: Transforming Formulas
69) The formula for the volume of a cone is . The radius, r, of the cone may be expressed as
1)
3)
2)
4)
70) The formula for the area of a trapezoid is . Express in terms of A, h, and . The area of a
trapezoid is 60 square feet, its height is 6 ft, and one base is 12 ft. Find the number of feet in the other base.
71) The equation for the volume of a cylinder is . The positive value of r, in terms of h and V, is
1)
3)
Page 94

2) 4)
72) The distance a free falling object has traveled can be modeled by the equation , where a is acceleration
due to gravity and t is the amount of time the object has fallen. What is t in terms of a and d? 1)
3)
2)
4)
73) The volume of a large can of tuna fish can be calculated using the formula . Write an equation to find the radius, r, in terms of V and h. Determine the diameter, to the nearest inch, of a large can of tuna fish that has a volume of 66 cubic inches and a height of 3.3 inches.
74) Michael borrows money from his uncle, who is charging him simple interest using the formula . To figure
out what the interest rate, r, is, Michael rearranges the formula to find r. His new formula is r equals 1)
3)
2)
4)
75) The formula for the sum of the degree measures of the interior angles of a polygon is . Solve for n, the number of sides of the polygon, in terms of S.
76) Solve the equation below for x in terms of a.
77) Boyle's Law involves the pressure and volume of gas in a container. It can be represented by the formula
. When the formula is solved for , the result is 1) 3)
2)
4)
78) The formula for blood flow rate is given by , where F is the flow rate, the initial pressure, the
final pressure, and r the resistance created by blood vessel size. Which formula can not be derived from the given formula? 1) 3) 2) 4)
79) Using the formula for the volume of a cone, express r in terms of V, h, and .
Page 95

80) The formula calculates the gravitational force between two objects where G is the gravitational
constant, is the mass of one object, is the mass of the other object, and r is the distance between them. Solve for the positive value of r in terms of , G, , and .
81) Students were asked to write a formula for the length of a rectangle by using the formula for its perimeter,
. Three of their responses are shown below.
I.
II.
III.
Which responses are correct? 1) I and II, only 3) I and III, only 2) II and III, only 4) I, II, and III
SOLUTIONS
69) ANS: 1 Strategy: Use the four column method.
Notes Left Expression Sign Right Expression Given
=
Multiply both expressions by 3
=
Divide both expressions by
=
Simplify
=
Take square root of both sides.
=
PTS: 2 NAT: A.CED.A.4 TOP: Transforming Formulas
70) ANS:
a)
b) The other base is 8 feet. Strategy: Use the four column method to isolate and create a new formula, then use it to find the length of the other base.
Notes Left Expression Sign Right Expression
Given
=
Multiply both expressions by 2
=
Page 96

Divide both expressions by h
=
Simplify
=
Subtract from both expressions
=
Substitute the values stated in the problem in the formula.
PTS: 4 NAT: A.CED.A.4 TOP: Transforming Formulas
71) ANS: 1 Strategy: Use the four column method to isolate r.
Notes Left Expression Sign Right Expression Given =
Divide both expressions by
=
Simplify
=
Take square root of both expressions.
=
PTS: 2 NAT: A.CED.A.4 TOP: Transforming Formulas
72) ANS: 2 Strategy: Use the four column method. Isolate t.
Notes Left Expression Sign Right Expression
Given
=
Multiply both expressions by 2
2d
=
Divide both expressions by a
=
Simplify
=
Page 97

Take square root of both expressions
=
t
PTS: 2 NAT: A.CED.A.4 TOP: Transforming Formulas
73) ANS:
a)
b) 5 inches Strategy: Use the four column method to isolate r and create a new formula, then use the new formula to answer the problem.
Notes Left Expression Sign Right Expression Given =
Divide both expressions by
=
Simplify
=
Take square root of both expressions.
=
Substitute the values from the problem into the new equation.
If the radius is approximately 2.5 inches, the diameter is approximately 5 inches.
PTS: 4 NAT: A.CED.A.4 TOP: Transforming Formulas
74) ANS: 3 Strategy: Isolate r, as follows:
PTS: 2 NAT: A.CED.A.4 TOP: Transforming Formulas
75) ANS:
Page 98

PTS: 2 NAT: A.CED.A.4 TOP: Transforming Formulas
76) ANS:
PTS: 2 NAT: A.CED.A.4
77) ANS: 3 Given =
Divide by
=
Simplify
=
PTS: 2 NAT: A.CED.A.4 TOP: Transforming Formulas
78) ANS: 3
Page 99

If , then cannot be true.
PTS: 2 NAT: A.CED.A.4 TOP: Transforming Formulas
79) ANS:
.
PTS: 2 NAT: A.CED.A.4 TOP: Transforming Formulas
80) ANS:
PTS: 2 NAT: A.CED.A.4 TOP: Transforming Formulas
81) ANS: 4 Strategy: Transform the formula to isolate the variable.
This is solution III. NOTE that solution III can also be expressed as:
This is solution II. NOTE also that the distributive property of multiplication can transform solution II into:
Page 100

This is solution I. The correct answer choice is I, II, and III.
PTS: 2 NAT: A.CED.A.4 TOP: Transforming Formulas
S
Page 101

D – Rate, Lesson 1, Conversions (r. 2018)
RATE Conversions
Common Core Standard
N.Q.A.1 Use units as a way to understand problems and to guide the solution of multi-step problems; choose and interpret units consistently in formulas; choose and interpret the scale and the origin in graphs and data displays.
Next Generation Standard
AI-N.Q.1 Select quantities and use units as a way to: i) interpret and guide the solution of multi-step problems; ii) choose and interpret units consistently in formulas; and iii) choose and interpret the scale and the origin in graphs and data displays.
LEARNING OBJECTIVES
Students will be able to:
1) Understand units as essential to understanding and interpreting graphs. 2) Understand units as essential to problem solving. 3) Use and convert units when problem solving.
Overview of Lesson
Teacher Centered Introduction Overview of Lesson
- activate students’ prior knowledge
- vocabulary
- learning objective(s)
- big ideas: direct instruction
- modeling
Student Centered Activities guided practice Teacher: anticipates, monitors, selects, sequences, and connects student work
- developing essential skills
- Regents exam questions
- formative assessment assignment (exit slip, explain the math, or journal entry)
VOCABULARY
cancellation convert / conversion
cross-multiplication denominator
numerator per proportion
rate ratio scale
BIG IDEAS
Big Units - Small Units
As a general rule, big units are used to measure big things and small units are used to measure small things. For example,
• the distance from New York City to San Francisco is a big distance, so it would be measured in big units, like miles or kilometers.
• the distance from a student’s elbow to the tip of his or her finger is a small distance, so it would be measured in small units, like inches or centimeters.
Page 102

Since both big and small units can be used to measure the same thing, it is sometimes desirable to change from one unit of measurement to another. When different size units are used to measure the same thing:
• Changing from a big unit to a small unit involves multiplication. • Changing from a small unit to a big unit involves division.
For example, 1 foot = 12 inches. The following diagram shows the mathematical operations involved in converting feet to inches and inches to feet.
Inches(SmallerUnits)
Feet(Bigger Units)
Multiply by 12
Divide by 12
Ratios, Rates, and Proportions
A ratio is a simple comparison of two numbers, such as 12:1 or 1:12.
A rate is a ratio that includes units, such as 12 inches1 foot
, which is read as “Twelve inches per
foot,” or 1 foot12 inches
, which is read as “One foot per twelve inches.” The vinculum (fraction
bar) is read as the word “per.”
A unit rate is a rate with a denominator of 1 unit. 12 inches1 foot
is a unit rate. 1 foot12 inches
is not a
unit rate. NOTE: When working with problems that involve rates, it is common practice to omit the unit
labels and manipulate ratios instead of rates. While this increases computational
efficiency, it can lead to conceptual errors. While 12 inches1 foot
and 1 foot12 inches
express
the same mathematical relationship between inches and feet, this is because they are
rates – not ratios. When the units are omitted, these rates become the ratios, 121
and
112
, which are not the same mathematical relationship. After a long series of
computations with ratios, it is easy to mislabel the units. Therefore, a good practice is to always make notes about the units.
A proportion is an equation with two ratios and an equal sign between them. For example,1 44 16= is a proportion.
• Every proportion has four parts: two numerators and two denominators.
Page 103

• When three of the four parts in a proportion are given, it is possible to solve for the fourth part using cross-multiplication. An example of using cross-multiplication to solve a proportion in which one part is unknown follows:
Notes Left Expression Sign Right Expression Given 1
4
= 4x
Cross Multiply ( )1 x = ( )4 4 Solution x = 16
• When using proportions to solve unit conversion problems, it is important to label the units to avoid conceptual errors. This is done by simply adding units notation when setting up the proportion. In the following example, the rate of 4 quarts per 1 gallon is used to find the number of quarts in 4 gallons. All the numerators are gallon units and all the denominators are quarts units. Since the x is in a denominator, the answer will be in quarts units.
Notes Left Expression Sign Right Expression Given 1
4gallonsquarts
= 4
x
Cross Multiply ( )1 x = ( )4 4 Solution x = 16 quarts
Cancellation of Units (Factor-Unit Conversion) Cancellation can be used to simplify units within a single expression. The general approach is to consider the units as factors, which can be cancelled using the same rules that are used for cancellation of fractions. In the following example, cancellation is to find the number of seconds in a year. 60 seconds1 minute
60 minutes×1 hour
24 hours×1 day
365 days× 60×60×24×365 seconds 30,536,000 seconds= =
1 year 1 year 1year
Another example of using cancellation is converting 10 miles per hour to meters per second.
10 miles1 hours
1609.344 meters×1 miles
1 hours× 16093.44 miles 4.4704 meters= =3600 seconds 3600 seconds 1 second
Units and Graphs
A graph is one view of the relationship between two variables. The variables are measured in specific units, which are very important to understanding the meaning of the graph. Example: The two graphs below are from different Regents problems. The units for the x-axis both measure time, but the units are different. The units for the y-axis are totally different kinds of measurements. The different units used require different interpretations of the two graphs.
Page 104

Conversions Chart Used in Regents Algebra 1 (Common Core) Exams
DEVELOPING ESSENTIAL SKILLS
Convert the following: Solutions 20 kilometers to feet 1 mile
1.609 kilometers5280 feet×1 mile
20 kilometers× 1×5280×20feet=1 1.609×1×1
105,600feet=1.609
65,630 feet≈
Page 105

30 kilometers per hour to miles per hour
30 kilometers 1 mile×1 hour 1.609 kilometers
30×1 miles=1×1.609 hours
30miles1.609hours18.65 miles
1 hour
=
≈
1 cubic foot to cubic centimeters
1 cubic foot12×12×12 cubic inches
1 cubic inch×
2.54×2.54×2.54 cubic centimeters1×1 cubic foot
12×12×12×2.54×2.54×2.54 cubic centimeters1 cubic foot
28,316.8 cubic centimeters
=
≈
REGENTS EXAM QUESTIONS (through June 2018)
N.Q.A.l: Conversions
82) Peyton is a sprinter who can run the 40-yard dash in 4.5 seconds. He converts his speed into miles per
hour, as shown below.
Which ratio is incorrectly written to convert his speed? 1)
3)
2)
4)
83) Dan took 12.5 seconds to run the 100-meter dash. He calculated the time to be approximately 1) 0.2083 minute 3) 0.2083 hour 2) 750 minutes 4) 0.52083 hour
84) Faith wants to use the formula to convert degrees Fahrenheit, f, to degrees Celsius, .
If Faith calculated , what would her result be? 1) 20° Celsius 3) 154° Celsius 2) 20° Fahrenheit 4) 154° Fahrenheit
85) A typical marathon is 26.2 miles. Allan averages 12 kilometers per hour when running in marathons. Determine how long it would take Allan to complete a marathon, to the nearest tenth of an hour. Justify your answer.
86) A construction worker needs to move 120 ft3 of dirt by using a wheelbarrow. One wheelbarrow load
holds 8 ft3 of dirt and each load takes him 10 minutes to complete. One correct way to figure out the number of hours he would need to complete this job is 1)
3)
Page 106

2)
4)
87) The Utica Boilermaker is a 15-kilometer road race. Sara is signed up to run this race and has done the following training runs: I. 10 miles II. 44,880 feet III. 15,560 yards Which run(s) are at least 15 kilometers? 1) I, only 3) I and III 2) II, only 4) II and III
SOLUTIONS
82) ANS: 2 Strategy: Work through each step of the problem and ask the DIMS question. Does It Make Sense.
STEP 1. This makes sense. The yard units cancel and Peyton’s
speed becomes measured in feet per second instead of yards per second. We take the ratio of
to the next step in our analysis.
STEP 2. . This does not make sense. The speed of a
runner would not be measured in feet per second miles. The problem is that the numerator and
denominator are switched. It should be . When the numerator and denominator are changed,
the problem becomes . The feet units cancel and our
measurement of Peyton’s speed has distance over time, which makes sense. Answer choice b is selected to show that this ratio is incorrectly written. STEP 3. Though we have solved the problem, we can continue our step by step analysis by taking the
ratio of to the next step in our analysis. The problem now becomes
. This makes sense. The seconds
units cancel and we again have distance over miles. We take the ratio to the next step.
STEP 4. miles per hour.
This makes sense. Peyton is a fast sprinter.
PTS: 2 NAT: N.Q.A.1 TOP: Conversions
83) ANS: 1
Page 107

Step 1. Read both the question and the answers. Understand that the problem is asking you to convert seconds into either minutes or hours. The 100 meters is constant, so it is not important to the problem of converting time into minutes or hours. Step 2. Create two proportions using the conversion rates of 1) 60 seconds per minute; and 2) 3600 seconds per hour, to express 12.5 seconds in minutes and hours. Step 3. Execute the strategy.
12.5 second equals how many minutes?
12.5 second equals how many hours?
The correct choice is a), 12.5 seconds equals 0.2083 minutes. 4. Does it make sense? Yes. It is obvious that 12.5 seconds does not equal 750 minutes (choice b) and it is also obvious that 12.5 seconds is not more than half an hour (choice d). The only choice that is less than a minute is choice a), and 12.5 seconds is definitely less than a minute.
PTS: 2 NAT: N.Q.A.1 TOP: Conversions KEY: dimensional analysis
84) ANS: 1
Given
Find
=
Substitute 68 for f
=
Solve inside parentheses
=
Simplify Fraction Using Cancellation
=
Simplify Right Expression
= 20
PTS: 2 NAT: N.Q.A.1 TOP: Conversions KEY: formula
85) ANS: 3.5 hours Note: 1 kilometer = 0.62 miles Step 1. Convert 12 kilometers per hour to miles per hour.
Allan averages 7.44 miles per hour.
Step 2. Use the speed formula to find time.
Page 108
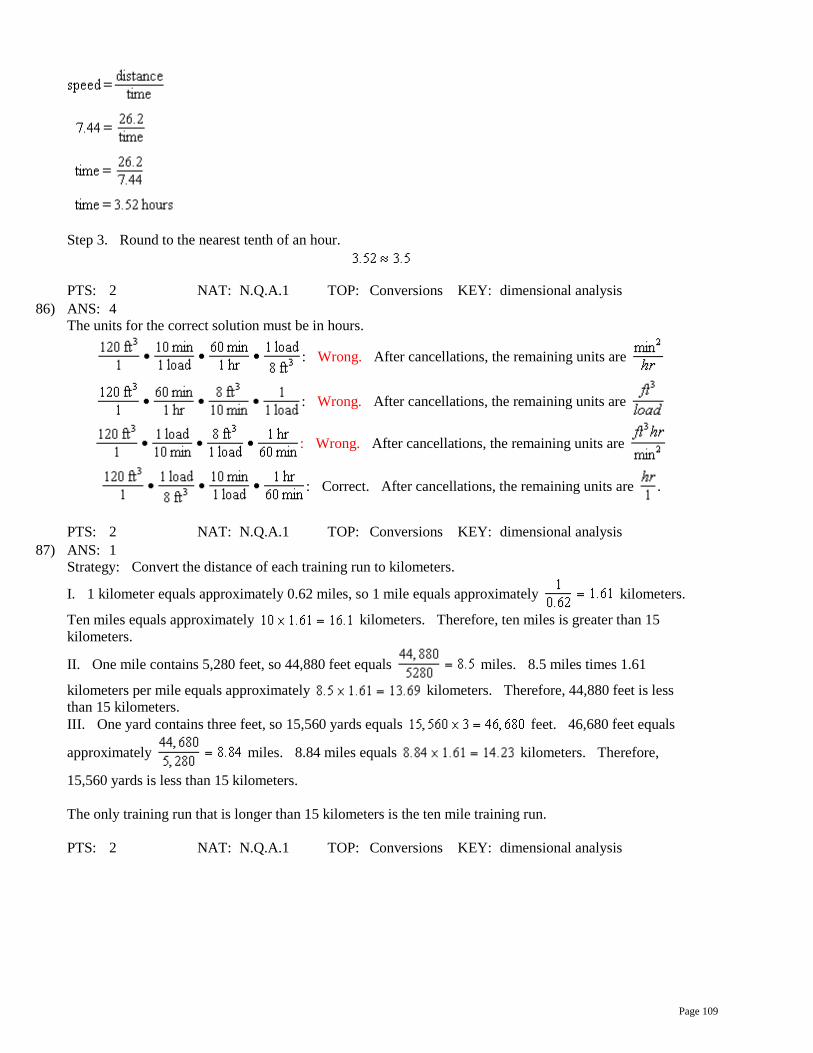
Step 3. Round to the nearest tenth of an hour.
PTS: 2 NAT: N.Q.A.1 TOP: Conversions KEY: dimensional analysis
86) ANS: 4 The units for the correct solution must be in hours.
: Wrong. After cancellations, the remaining units are
: Wrong. After cancellations, the remaining units are
: Wrong. After cancellations, the remaining units are
: Correct. After cancellations, the remaining units are .
PTS: 2 NAT: N.Q.A.1 TOP: Conversions KEY: dimensional analysis
87) ANS: 1 Strategy: Convert the distance of each training run to kilometers.
I. 1 kilometer equals approximately 0.62 miles, so 1 mile equals approximately kilometers.
Ten miles equals approximately kilometers. Therefore, ten miles is greater than 15 kilometers.
II. One mile contains 5,280 feet, so 44,880 feet equals miles. 8.5 miles times 1.61
kilometers per mile equals approximately kilometers. Therefore, 44,880 feet is less than 15 kilometers. III. One yard contains three feet, so 15,560 yards equals feet. 46,680 feet equals
approximately miles. 8.84 miles equals kilometers. Therefore,
15,560 yards is less than 15 kilometers. The only training run that is longer than 15 kilometers is the ten mile training run.
PTS: 2 NAT: N.Q.A.1 TOP: Conversions KEY: dimensional analysis
Page 109

D – Rate, Lesson 2, Using Rate (r. 2018)
RATE Using Rate
Common Core Standard
N-Q.A.2 Define appropriate quantities for the pur-pose of descriptive modeling. PARCC: In Algebra I, this standard will be assessed by ensuring that some modeling tasks (involving Algebra I content or securely held content from grades 6-8) require the student to create a quan-tity of interest in the situation being described. For example, a quantity of interest is not selected for the student by the task. For example, In a situation involving data, the student might autono-mously decide that a measure of center is a key variable in a situ-ation, and then choose to work with the mean.
Next Generation Standard
STANDARD REMOVED
LEARNING OBJECTIVES
Students will be able to:
1) Use conversion rates to solve problems involving scale. 2) Use unit conversion rates and the operations of multiplication and division to convert
units.
Overview of Lesson
Teacher Centered Introduction Overview of Lesson
- activate students’ prior knowledge
- vocabulary
- learning objective(s)
- big ideas: direct instruction
- modeling
Student Centered Activities guided practice Teacher: anticipates, monitors, selects, sequences, and connects student work
- developing essential skills
- Regents exam questions
- formative assessment assignment (exit slip, explain the math, or journal entry)
VOCABULARY
conversion rate proportion scale unit
BIG IDEAS
It is important to understand the units and scales used in mathematical representations. As a general rule, big units should be used to measure big things and small units are used to measure small things. Real world events are often modeled using scaled representations.
A scale is a ratio of the .
Example. A toy car is 1 foot long. The real car it represents is 20 feet long. The scale of the model is:
or 1:20
Page 110

Scales may also be expressed in rates. For example, a map might have a scale expressed as 1 inch5 miles
, or a graph might use scaled intervals of various units on the x-axis and y-axis.
When using scales for representation, it is important to know whether you are going from smaller units to larger units, or from larger units to smaller units, as shown in the following graphic.
Inches(SmallerUnits)
Feet(Bigger Units)
Multiply by 12
Divide by 12
A unit conversion rate because it states the value of 1 unit in terms of another unit. Unit conversion rates are typically used in conversion tables. For example, 1 inch = 2.54 centimeters. Proportions and cross multiplication can be used to convert a unit conversion rate for one unit into to a unit conversion rate for the other unit. For example:
1 x=2.54 1
1 2.541
2.540.39
inchescentimeters
x
x
x
=
=
=
This tells us that 1 centimeter = 0.39 inches.
Page 111

DEVELOPING ESSENTIAL SKILLS
Use the conversion chart to state whether multiplication or division should be used when converting from one unit to the other unit. Specify the multiplicand or divisor for each operation.
Conversions Chart Used in Regents Algebra 1 (Common Core) Exams
From To Operation Used inches centimeters multiply by 2.54
centimeters inches divide by 2.54 meters inches multiply by 39.37 inches meters divide by 39.37 miles feet multiply by 5280 Feet miles divide by 5280 miles kilometers multiply by 0.62
kilometers miles divide by 0.62 pounds ounces multiply by 16 ounces pounds divide by 16 pounds kilograms divide by 2.2 or multiply by 0.454
kilograms pounds multiply by 2.2 ton pound multiply by 2.2
pound ton divide by 2000 cup fluid ounces multiply by 8
fluid ounces cups divide by 8 pint cups multiply by 2 cups pints divide by 2 quart pints multiply by 2 pints quarts divide by 2
gallons quarts multiply by 4 quarts gallons divide by 4 gallons liters multiply by 3.785 liters gallons divide by 3.785 liters cubic centimeters multiply by 1000
centimeters liters divide by 1000
Page 112

REGENTS EXAM QUESTIONS (through June 2018)
N.Q.A.2: Using Rate
88) Patricia is trying to compare the average rainfall of New York to that of Arizona. A comparison between
these two states for the months of July through September would be best measured in
1) feet per hour 3) inches per month 2) inches per hour 4) feet per month
89) A two-inch-long grasshopper can jump a horizontal distance of 40 inches. An athlete, who is five feet nine, wants to cover a distance of one mile by jumping. If this person could jump at the same ratio of body-length to jump-length as the grasshopper, determine, to the nearest jump, how many jumps it would take this athlete to jump one mile.
90) The distance traveled is equal to the rate of speed multiplied by the time traveled. If the distance is
measured in feet and the time is measured in minutes, then the rate of speed is expressed in which units? Explain how you arrived at your answer.
SOLUTIONS
88) ANS: 3 Rainfall is not typically measured in feet, so eliminate choices a and b. An hourly rate would not be meaningful.
PTS: 2 NAT: N.Q.A.1
89) ANS: Strategy 1: Use proportional reasoning and work with inch units. If a 2 inch long grasshopper can jump 40 inches, the grasshopper can jump 20 times its body length. If a 5-feet nine-inch person could jump 20 times his body length, he could jump inches. A mile is 5,280 feet long, or inches.
Strategy 2: Use proportional reasoning and work with feet units
PTS: 2 NAT: N.Q.A.2 TOP: Using Rate
90) ANS: Speed would be measured in feet per minute. Explanation: The problem tells us that distance (d) equals speed (s) multiplied by time (t).
Page 113

Therefore:
and
If distance units are measured in feet and time units are measured in minutes, then:
PTS: 2 NAT: N.Q.A.2 TOP: Using Rate
Page 114

D – Rate, Lesson 3, Speed (r. 2018)
RATE Speed
Common Core Standard
A-CED.A.2 Create equations in two or more varia-bles to represent relationships between quantities; graph equations on coordinate axes with labels and scales.
Next Generation Standard
AI-A.CED.2 Create equations and linear inequalities in two variables to represent a real-world context. Notes: • This is strictly the development of the model (equa-tion/inequality). • Limit equations to linear, quadratic, and exponentials of the form f(x) = a(b)x where a > 0 and b > 0 (b ≠ 1).
LEARNING OBJECTIVES
Students will be able to:
1) Solve problems involving the speed formula: distancespeed =time
Overview of Lesson
Teacher Centered Introduction Overview of Lesson
- activate students’ prior knowledge
- vocabulary
- learning objective(s)
- big ideas: direct instruction
- modeling
Student Centered Activities guided practice Teacher: anticipates, monitors, selects, sequences, and connects student work
- developing essential skills
- Regents exam questions
- formative assessment assignment (exit slip, explain the math, or journal entry)
VOCABULARY
distance speed time
BIG IDEAS
distancespeed =
timedistance = speed time
distancetime =speed
×
dst
d stdts
=
=
=
DEVELOPING ESSENTIAL SKILLS
Page 115

Questions Answers An airplane travels 700 miles in two hours. What
is its average speed? d 700 miless= = =350 miles per hourt 2 hours
A train travel 400 miles in 8 hours. What is its average speed?
d 400 miless= = =50 miles per hourt 8 hours
A car’s average speed is 60 miles per hour. How far has it travelled after 6 hours?
ds = t
st = d
60 miles1 hour
6 hours × = distance1
60 6 miles = distance1 1360 miles = distance
××
A car averages 55 miles per hour. How long will it take to travel 300 miles, to the
hour and nearest minute?
ds = tdt = s
300 milest = 55 miles per hour
t = 5.45 hours
hours 1 0.45 = minutes 60 x
x = 60×0.45x 27 minutes
total time: 5 hours and 27 minutes≈
REGENTS EXAM QUESTIONS
A.CED.A.2: Speed
91) An airplane leaves New York City and heads toward Los Angeles. As it climbs, the plane gradually increases its
speed until it reaches cruising altitude, at which time it maintains a constant speed for several hours as long as it stays at cruising altitude. After flying for 32 minutes, the plane reaches cruising altitude and has flown 192 miles. After flying for a total of 92 minutes, the plane has flown a total of 762 miles. Determine the speed of the plane, at cruising altitude, in miles per minute. Write an equation to represent the number of miles the plane has flown, y, during x minutes at cruising altitude, only. Assuming that the plane maintains its speed at cruising altitude, determine the total number of miles the plane has flown 2 hours into the flight.
Page 116

92) Loretta and her family are going on vacation. Their destination is 610 miles from their home. Loretta is going to share some of the driving with her dad. Her average speed while driving is 55 mph and her dad's average speed while driving is 65 mph. The plan is for Loretta to drive for the first 4 hours of the trip and her dad to drive for the remainder of the trip. Determine the number of hours it will take her family to reach their destination. After Loretta has been driving for 2 hours, she gets tired and asks her dad to take over. Determine, to the nearest tenth of an hour, how much time the family will save by having Loretta's dad drive for the remainder of the trip.
SOLUTIONS
91) ANS: Strategy: Draw a picture to model the problem.
At cruising altitude, the plane is flying at the speed of 9.5 miles per minute. Write an equation to represent the number of miles the plane has flown, y, during x minutes at cruising altitude, only. (NOTE: This is line segment in the above picture.
Assuming that the plane maintains its speed at cruising altitude, determine the total number of miles the plane has flown 2 hours into the flight. Let M represent the total miles flown. Let t represent the number of minutes flown.
2 hours into the flight, the plane has flown 1,028 miles.
PTS: 4 NAT: A.CED.A.2 TOP: Speed
92) ANS: 10 hours and .3 hours.
Page 117

If Loretta drives at an average speed of 55 miles per hour for the first 4 hours of the trip, she will drive
miles. Since the total distance is 610 miles, this leaves miles for her dad to drive.
If her dad drives at an average speed of 65 miles per hour, it will take him hours to drive 390 miles. If
Loretta drives 4 hours and her dad drives 6 hours, the total trip will take 10 hours. If Loretta gets tired after two hours of driving at an average speed of 55 miles per hour, she will have driven
miles, leaving miles for her dad to drive. At an average speed of 65 m iles per hour,
it will take her dad hours to drive 500 miles. The family will save approximately hours
by having Loretta’s dad drive for the remainder of the trip.
PTS: 4 NAT: A.CED.A.2 TOP: Speed
Page 118

D – Rate, Lesson 4, Rate of Change (r. 2018)
RATE Rate of Change
Common Core Standard
F-IF.B.6 Calculate and interpret the average rate of change of a function (presented symbolically or as a table) over a specified interval. Estimate the rate of change from a graph. PARCC: Tasks have a real-world context. Tasks are limited to linear functions, quadratic functions, square root functions, cube root functions, piece-wise defined functions (including step func-tions and absolute value functions) and exponential functions with domains in the integers.
Next Generation Standard
AI-F.IF.6 Calculate and interpret the average rate of change of a function over a specified interval. (Shared standard with Algebra II) Notes: • Functions may be presented by function notation, a ta-ble of values, or graphically. • Algebra I tasks have a real-world context and are lim-ited to the following functions: linear, quadratic, square root, piece-wise defined (including step and absolute value), and exponential functions of the form
( ) ( ) xf x a b= where a > 0 and b > 0, (b ≠ 1).
LEARNING OBJECTIVES
Students will be able to:
1) Calculate and interpret the average rate of change of a function over a specified interval.
Overview of Lesson
Teacher Centered Introduction Overview of Lesson
- activate students’ prior knowledge
- vocabulary
- learning objective(s)
- big ideas: direct instruction
- modeling
Student Centered Activities guided practice Teacher: anticipates, monitors, selects, sequences, and connects student work
- developing essential skills
- Regents exam questions
- formative assessment assignment (exit slip, explain the math, or journal entry)
VOCABULARY
average rate of change coordinate pair interval
rate of change slope slope formula
steepness
Page 119

BIG IDEAS Rate of Change is a measure of how two variables are related to one another. Rate of change can be expressed in many ways:
2 1
2 1
rise change in yrate of change = slope = m = run change in x
y y yx x x− ∆
= = =− ∆
Rate of change can also be found by inspecting a table or graph of a function. Table Graph
By finding the change in y and the change in x between each coordinate pair in a table, you can see if the rate of change is constant or variable. This table shows a linear function because the rate of change is constant.
2 4 3 14 8 6 2= = =
By picking two known points on the graph of a line, you can build a right triangle to find the change in y and the change in x. The rate of change for this linear function is 58
. Always read from left to right when using this method.
• The rate of change in a linear function is constant between any two points anywhere on
the straight line. • The rate of change in a non-linear function varies. • The rate of change can be either positive or negative.
o A positive rate of change indicates that both variables are either increasing together or decreasing together, though not necessarily at the same rate.
o A negative rate of change indicates that one variable increases while the other variable decreases.
• The rate of change in a function can be estimated by the steepness of a graph. Average Rate of Change is used primarily with non-linear functions, since all linear functions have a constant rate of change. Average rate of change can be defined as the slope of the straight line that connects the end points of the interval over which the average rate of change is measured.
Page 120

Example: The graph below records the number of hours and the distance travelled by a family on a trip. The graph is non-linear, so the rate of change is not constant.
To compute the average rate of change for the entire trip, use the end points of the intervals of the graph. Include the origin (0,0) as their starting point. Ten hours later, they had travelled 390 miles (10,390). Their average rate of change for the entire trip is the slope of the line connecting points (0, 0) and (10, 390), which can be calculated as follows:
2 1
2 1
390-0 miles10-0 hours39 miles per hour
y yslopex x
slope
slope
−=
−
=
=
In this example, the average rate of change measures speed, the relationship between distance and time. Notice from the graph that their speed was not constant. Sometimes they went faster than 39 mph and sometimes slower than 39 mph, but their average speed over the entire trip was 39 mph.
Page 121

DEVELOPING ESSENTIAL SKILLS
1. Find the average rate of change between the first and fifth 5 hours.
2 1
2 1
1640-700 850 212.5 Frate of change = 5-1 4 1 hour
y yx x− °
== = =−
2. Use rate of change to determine if the table below represents a linear or a non-linear function. Explain your answer.
Table of Values
Interval x∆
y∆
yx
∆∆
Rate of change between 1898 and 1971
73 5 735
Rate of change between 1971 and 1985
14 8 148
The table is non-linear because the rate of change is not constant.
REGENTS EXAM QUESTIONS (through June 2018)
F.IF.B.6: Rate of Change
93) Given the functions , , and shown below:
Page 122

The correct list of functions ordered from greatest to least by average rate of change over the interval
is 1) , , 3) , , 2) , , 4) , ,
94) An astronaut drops a rock off the edge of a cliff on the Moon. The distance, , in meters, the rock travels after t seconds can be modeled by the function . What is the average speed, in meters per second, of the rock between 5 and 10 seconds after it was dropped? 1) 12 3) 60 2) 20 4) 80
95) The graph below shows the distance in miles, m, hiked from a camp in h hours.
Which hourly interval had the greatest rate of change? 1) hour 0 to hour 1 3) hour 2 to hour 3 2) hour 1 to hour 2 4) hour 3 to hour 4
Page 123

96) The Jamison family kept a log of the distance they traveled during a trip, as represented by the graph below.
During which interval was their average speed the greatest? 1) the first hour to the second hour 3) the sixth hour to the eighth hour 2) the second hour to the fourth hour 4) the eighth hour to the tenth hour
97) The table below shows the average diameter of a pupil in a person’s eye as he or she grows older.
What is the average rate of change, in millimeters per year, of a person’s pupil diameter from age 20 to age 80? 1) 2.4 3) 2) 0.04 4)
98) Joey enlarged a 3-inch by 5-inch photograph on a copy machine. He enlarged it four times. The table below shows the area of the photograph after each enlargement.
What is the average rate of change of the area from the original photograph to the fourth enlargement, to the nearest tenth? 1) 4.3 3) 5.4 2) 4.5 4) 6.0
Page 124

99) Firing a piece of pottery in a kiln takes place at different temperatures for different amounts of time. The graph below shows the temperatures in a kiln while firing a piece of pottery after the kiln is preheated to 200ºF.
During which time interval did the temperature in the kiln show the greatest average rate of change? 1) 0 to 1 hour 3) 2.5 hours to 5 hours 2) 1 hour to 1.5 hours 4) 5 hours to 8 hours
100) The table below shows the cost of mailing a postcard in different years. During which time interval did the cost increase at the greatest average rate?
1) 1898-1971 3) 1985-2006 2) 1971-1985 4) 2006-2012
101) The graph below shows the variation in the average temperature of Earth's surface from 1950-2000, according to one source.
Page 125

During which years did the temperature variation change the most per unit time? Explain how you determined your answer.
102) The table below shows the year and the number of households in a building that had high-speed broadband
internet access.
For which interval of time was the average rate of change the smallest? 1) 2002 - 2004 3) 2004 - 2006 2) 2003 - 2005 4) 2005 - 2007
103) Which function has a constant rate of change equal to -3? 1)
3)
2) {(1,5), (2,2), (3,-5), (4,4)} 4)
104) A graph of average resting heart rates is shown below. The average resting heart rate for adults is 72 beats per minute, but doctors consider resting rates from 60-100 beats per minute within normal range.
Page 126

Which statement about average resting heart rates is not supported by the graph? 1) A 10-year-old has the same average
resting heart rate as a 20-year-old. 3) A 40-year-old may have the same average
resting heart rate for ten years. 2) A 20-year-old has the same average
resting heart rate as a 30-year-old. 4) The average resting heart rate for
teenagers steadily decreases.
105) A family is traveling from their home to a vacation resort hotel. The table below shows their distance from home as a function of time.
Determine the average rate of change between hour 2 and hour 7, including units.
106) The graph below models the height of a remote-control helicopter over 20 seconds during flight.
Over which interval does the helicopter have the slowest average rate of change? 1) 0 to 5 seconds 3) 10 to 15 seconds 2) 5 to 10 seconds 4) 15 to 20 seconds
107) Voting rates in presidential elections from 1996-2012 are modeled below.
Page 127

Which statement does not correctly interpret voting rates by age based on the given graph? 1) For citizens 18-29 years of age, the rate of
change in voting rate was greatest between years 2000-2004.
3) About 70% of people 45 and older voted in the 2004 election.
2) From 1996-2012, the average rate of change was positive for only two age groups.
4) The voting rates of eligible age groups lies between 35 and 75 percent during presidential elections every 4 years from 1996-2012.
108) A manager wanted to analyze the online shoe sales for his business. He collected data for the number of pairs of shoes sold each hour over a 14-hour time period. He created a graph to model the data, as shown below.
The manager believes the set of integers would be the most appropriate domain for this model. Explain why he is incorrect. State the entire interval for which the number of pairs of shoes sold is increasing. Determine the average rate of change between the sixth and fourteenth hours, and explain what it means in the context of the problem.
109) A population of rabbits in a lab, , can be modeled by the function , where x
represents the number of days since the population was first counted. Explain what 20 and 1.014 represent in the context of the problem. Determine, to the nearest tenth, the average rate of change from day 50 to day 100.
Page 128

SOLUTIONS
93) ANS: 4
Over the interval , the average rate of change for , , and
.
PTS: 2 NAT: F.IF.B.6 TOP: Rate of Change
94) ANS: 1
Strategy: Use the formula for speed: and information from the problem to calculate
average speed. STEP 1. Calculate for and .
and
The rock had fallen 20 meters after 5 seconds and 80 meters after 10 seconds. The total distance traveled was 60 meters in 5 seconds. STEP 2: Use the speed formula to find average speed.
Substituting distance and time in the speed formula, .
The rock’s average speed between 5 and 10 seconds after being dropped was 12 meters per second. DIMS? Does it make sense? Yes. The speed formula makes sense and the answer is expressed in meters per second as required by the problem.
PTS: 2 NAT: F.IF.B.6 TOP: Rate of Change
95) ANS: 1 Step 1. Understand that the problem is asking which hourly interval has the greatest rate of change (slope).
Step 2. Strategy: Calculate for each hourly interval and select the largest ratio.
Step3. Execution of Strategy
Page 129

a) between hour 0 and hour 1, .
b) between hour 1 and hour 2, .
c) between hour 2 and hour 3, .
d) between hour 3 and hour 4, .
Answer choice a) has the greatest rate of change. Step 4. Does it make sense? Yes. The graph starts out steep and gradually gets less steep. The steepest part is between hour 0 and hour 1, which corresponds to the calculated rates of change (slopes).
PTS: 2 NAT: F.IF.B.6
96) ANS: 1
Strategy: Equate speed with rate of change.
Make a visual estimate of the steepest line segment on the graph, then use the slope formula to calculate the exact rates of change. STEP 1. The line segment from (1, 40) to (2, 110) appears to be the steepest line segment in the graph. The line segment from (6, 230) to (8, 350) also seems very steep.
STEP 2. Use
The line segment from (1, 40) to (2, 110) has .
The line segment from (6, 230) to (8, 350) has .
PTS: 2 NAT: F.IF.B.6 TOP: Rate of Change
97) ANS: 4 Strategy: Rate of change is the same as slope. Use the slope formula to find the rate of change between (20, 4.7) and (80, 2.3).
Page 130

.
DIMS? Does it make sense? Yes. The average pupil diameter gets smaller very very slowly. Choices a and c are way too big and choices a and b indicate that the average pupil size is getting bigger rather than smaller.
PTS: 2 NAT: F.IF.B.6 TOP: Rate of Change
98) ANS: 3 Strategy: Use the slope formula and data from the table to calculate the exact rate of change over four enlargements.
STEP 1. Use to compute the rate of change between (0, 15) and (4, 36.6).
.
DIMS? Does it make sense? Yes. If you start with 15 and add 5.4 + 5.4 +5.4 + 5.4, you end up with 36.6. There were four enlargements and the average increase of each enlargement was 5.4 square inches.
PTS: 2 NAT: F.IF.B.6 TOP: Rate of Change
99) ANS: 1 Strategy: Equate rate of change with slope. Make a visual estimate of the steepest line segment on the graph, then use the slope formula to calculate the exact rates of change over given intervals. STEP 1. The line segment from (0, 200) to (1, 700) appears to be the steepest line segment in the graph. The line segment from (1, 700) to (1.5, 900) also seems very steep. The rate of change gets slower as the temperature of the kiln gets hotter.
STEP 2. Use
The line segment from (0, 200) to (1, 700) has
.
The line segment from (1, 700) to (1.5, 900) has
The rate of change was greatest in the first hour. DIMS? Does it make sense? Yes. The graph shows that rate of change slows down as time increases, so the first hour would have the greatest rate of change.
PTS: 2 NAT: F.IF.B.6 TOP: Rate of Change
100) ANS: 4
Strategy: Find the average rate of change using the slope formula: .
(a)
Page 131

(b)
(c)
(d)
PTS: 2 NAT: F.IF.B.6 TOP: Rate of Change
101) ANS: During 1960-1965, because the graph has the steepest slope during these years.
PTS: 2 NAT: F.IF.B.6 TOP: Rate of Change
102) ANS: 1 Step 1. Understand the problem as asking for the smallest average rate of change over an interval. The number of households depends on the year, so number of households is the y (dependent) variable and year is the x (independent) variable. Step 2. Strategy. Average rate of change over an interval is found using the end points of the interval and the slope formula. Step 3. Execution.
Average rate of change for choice 1:
Average rate of change for choice 2:
Average rate of change for choice 3:
Average rate of change for choice 4:
Step 4. Does it make sense? Yes. Choice (1) has the smallest average rate of change.
PTS: 2 NAT: F.IF.B.6 TOP: Rate of Change
103) ANS: 4
PTS: 2 NAT: F.LE.A.1
104) ANS: 1 The graph shows that a newborn child has age zero and an average resting heartbeat of 112 (0, 112). A 20 year old has an average resting heartbeat of 72 (20, 72). From birth to age 20, the average resting heartbeat decreases at a constant rate. After age 20, the average resting heartbeat stays the same until age 50 (50, 72). The problem wants to know which answer choice is not supported by the graph. Strategy: Eliminate wrong answers. a) A 10-year-old has the same average resting heart rate as a 20-year-old. This is not supported by the graph. The graph indicates that the average resting heartbeat of a 10-year-old is 92. . This is the correct answer.
Page 132

b) A 20-year-old has the same average resting heart rate as a 30-year-old. This is supported by the graph. , so it is a wrong answer. c) A 40-year-old may have the same average resting heart rate for ten years. This is supported by the graph. , so it is a wrong answer. d) The average resting heart rate for teenagers steadily decreases. This is supported by the graph, so it is a wrong answer. From birth to age 20, the average resting heartbeat decreases at a constant rate.
PTS: 2 NAT: F.IF.B.6 TOP: Rate of Change
105) ANS: 68 miles per hour Strategy: The average rate of change is the slope of the straight line between the two points at the ends of the interval. Find the slope of the straight line between (2, 140) and (7, 480) using the slope formula.
PTS: 2 NAT: F.IF.B.6 TOP: Rate of Change
106) ANS: 2 The average rate of change is slowest between the coordinates (5, 10) and (10, 20), which corresponds to the interval 5 to 10 seconds.
PTS: 2 NAT: F.IF.B.6 TOP: Rate of Change KEY: AI
107) ANS: 2 From 1996-2012, the average rate of change was positive for three age groups.
PTS: 2 NAT: F.IF.B.6 TOP: Rate of Change
108) ANS: PART 1 The set of integers includes negative numbers, so it is not an appropriate domain for time.
PART 2 0 < t < 14
The total number of shoes sold increases every hour that shoes are sold. or
0 < t < 6 The hourly rate of shoe sales increases from 0 hours to 6 hours. PART 3: Calculate the average rate of change and explain what it means.
The average rate of change is -15, which means that, on average, 15 fewer shoes were sold each hour between the sixth and fourteenth hours.
PTS: 4 NAT: F.IF.B.6 TOP: Rate of Change
Page 133

109) ANS: 20 represents the initial number of rabbits. 1.014 represents the rate of population growth. The average rate of change from day 50 to day 100 is 0.8 rabbits per day.
Strategy: Use the slope formula, , to compute the average rate of change between day 50 and
day 100. STEP 1. Input in a graphing calculator. STEP 2. Use the table of values view to afind the number of rabbits on day 50 and dat 100.
Day (x)
Number of Rabbits
50 40.08 100 80.32
STEP 3. Input (50, 40.08) and (100, 80.32) into the slope formula.
PTS: 2 NAT: F.IF.B.6 TOP: Rate of Change
Page 134

E – Linear Equations, Lesson 1, Modeling Linear Functions (r. 2018)
LINEAR EQUATIONS Modeling Linear Equations
Common Core Standards
F-BF.A.1 Write a function that describes a relation-ship between two quantities. F-LE.A.2 Construct linear and exponential func-tions, including arithmetic and geometric sequences, given a graph, a description of a relationship, or two input-output pairs (include reading these from a ta-ble). PARCC: Tasks are limited to constructing linear and exponential functions in simple context (not multi-step).
F-LE.B.5 Interpret the parameters in a linear or ex-ponential function in terms of a context.
PARCC: Tasks have a real-world context. Exponential functions are limited to those with domains in the integers.
S-ID.C.7 Interpret the slope (rate of change) and the intercept (constant term) of a linear model in the context of the data.
Next Generation Standards
F-BF.1 Write a function that describes a relationship be-tween two quantities. AI-F.LE.2 Construct a linear or exponential function symbolically given: i) a graph; ii) a description of the relationship; iii) two input-output pairs (include reading these from a table). (Shared standard with Algebra II)
Note: Tasks are limited to constructing linear and exponential functions in simple context (not multi-step).
AI-F.LE.5 Interpret the parameters in a linear or expo-nential function in terms of a context. (Shared standard with Algebra II) Note: Tasks have a real-world context. Exponential functions are limited to those with domains in the inte-gers and are of the form
( ) ( ) xf x a b= where a > 0 and b > 0 (b ≠ 1). AI-S.ID.7 Interpret the slope (rate of change) and the in-tercept (constant term) of a linear model in the context of the data.
LEARNING OBJECTIVES
Students will be able to:
1)
Overview of Lesson Teacher Centered Introduction
Overview of Lesson
- activate students’ prior knowledge
- vocabulary
- learning objective(s)
- big ideas: direct instruction
- modeling
Student Centered Activities guided practice Teacher: anticipates, monitors, selects, sequences, and connects student work
- developing essential skills
- Regents exam questions
- formative assessment assignment (exit slip, explain the math, or journal entry)
VOCABULARY
BIG IDEAS
Page 135

Linear functions are modelled using the same general approaches used in modelling linear equations (see Expressions and Equations, Lesson 4, Modelling Linear Equations). When modelling linear functions, however, any one of the four views of a function may describe the mathematical relationship between the variables and function notation may be required. There are four views of a function: 1) the function rule; 2) the table of values; 3) the graph; and 4) the narrative or “context” view. All four views can be used to help understand a function, and the ability to move from one view to another is important.
Table View
Context View
Function Rule
Graph View
Four Views of a
Function
NOTE: Graphing calculators will produce table and graph views of a function after inputting the function rule. The context view cannot be modelled with a graphing calculator. Regression can be used to find a function rule from a table or graph (see Graphs and Statistics, Lesson 5, Regression).
Function Notation
Function notation is a language for writing functions. It provides simple, but important information about the mathematical relationship between the variables in a function.
• Function notation identifies the mathematical relationship as a function. o A function has one and only one output (y-value) for each input (x-value). o Function notation should not be used with mathematical relationships that are not
functions. • Function notation identifies both the output (dependent variable) and the intput (independent
variables) in a mathematical relationship • The most common function notation is f(x), which is read as “f of x”.
o f(x) is used to represent the dependent variable (y-value) of the function, and x is used to represent the independent variable (x-value) of the function. In practice, any equation describing a function can be changed to function
notation by substituting f(x) for y. The y-axis of a graph is often labeled f(x) axis. Ordered pairs may be written as ( )( ),x f x
o Other letters besides f and x may be used with function notation. In practice, letters are often chosen to be descriptive of the variables involved.
Page 136

Examples are the function rules for describing how to convert degrees Fahrenheit to degrees Celsius, and back.
Fahrenheit to Celsius Celsius to Fahrenheit
( ) ( )5 329
C f f= − ( ) 9 325
F c c= +
This function rule can be interpreted as “degrees Celsius is a
function of degrees Fahrenheit”.
This function rule can be interpreted as “degrees Fahrenheit is a function of degrees Celsius”.
• Function notation can be used to identify which value of the independent variable is to be used as an input.
o For example, if ( ) 3 7f x x= + , then ( )5 22f =
o (5)f says that the output of the function should be evaluated when the input is x = 5.
( )( )( )( )
5 3 7
5 3 5 7
5 15 7
5 22
f x
f
f
f
= +
= × +
= +
=
Modeling a Sample Function
Context View: The inside of a freezer is kept at a constant temperature of 15 degrees Fahrenheit. When a quart of liquid water is placed in the freezer, its Fahrenheit temperature drops by one-half every 20 minutes until it turns into ice and reaches a constant temperature of 15 degrees. Table View: The tables views below model what the temperatures of two different quarts of water with different initial temperatures would be after m minutes in the freezer.
Initial Temperature = 80 degrees Minutes in Freezer (m)
0 20 40 60 80
Temperature f(m)
80 40 20 15 15
Initial Temperature = 120 degrees Minutes in Freezer (m)
0 20 40 60 80
Temperature f(m)
120 60 30 15 15
Function Rule View The narrative view and the table views suggest that the temperature drops exponentially at first, then stays at a constant temperature of 15 degrees. Exponential growth or decay can be modeled by the function (1 )tA P r− ± , where: A represents the current amount, P represents the starting amount, represents the rate of growth or decay per cycle, and t represents the number of cycles (usually measured as time) The temperature of the water can be modeled using the formula for exponential decay, as follows:
Page 137

time (in minutes)201(1 )
2A P− −
A represents the temperature of the water after m minutes in the freezer.
P represents the initial temperature of the water.
represents the exponential rate of decay. time (in minutes)
20 represents time.
The range of the function would be limited to ( )212 15f m≥ ≥ Check: Input the system of equations in a graphing calculator for a quart of water with an initial temperature of 80 degrees Fahrenheit. The second equation represents the lower limit of 15 degrees.
Graph View
DIMS - Does It Make Sense? Yes, all four views of the function show that the water cools down quickly at first, then more slowly, then reaches a final temperature of 15 degrees. The graph view shows that it would take about 48 minutes for a quart of liquid water with an initial temperature of 80 degrees to reach a frozen temperature of 15 degrees.
DEVELOPING ESSENTIAL SKILLS
The table below represents the number of hours a student worked and the amount of money the student earned.
Page 138

Write a function rule that represents the number of dollars, d, earned in terms of the number of hours, h, worked.
( ) 6.25d h h= Bob sells appliances. He gets paid a fixed salary plus a fee for every appliance he sells. His total weekly compensation in dollars is modelled by the function ( ) 50 250c a a= + . Explain what each of the three terms in this function means in the context of Bob’s compensation.
1. c(a) Bob’s compensation is a function of the number of appliances he sells. 2. 50a Bob gets $50 for every appliance he sells. 3. 250 Bob gets $250 even if he doesn’t sell any appliances.
REGENTS EXAM QUESTIONS (through June 2018)
F.BE.A.1, F.LE.A.2, F.LE.B.5, S.ID.C.7: Modeling Linear Functions
110) Caitlin has a movie rental card worth $175. After she rents the first movie, the card’s value is $172.25.
After she rents the second movie, its value is $169.50. After she rents the third movie, the card is worth $166.75. Assuming the pattern continues, write an equation to define , the amount of money on the rental card after n rentals. Caitlin rents a movie every Friday night. How many weeks in a row can she afford to rent a movie, using her rental card only? Explain how you arrived at your answer.
111) In 2013, the United States Postal Service charged $0.46 to mail a letter weighing up to 1 oz. and $0.20 per
ounce for each additional ounce. Which function would determine the cost, in dollars, , of mailing a letter weighing z ounces where z is an integer greater than 1? 1) 3) 2) 4)
112) Alex is selling tickets to a school play. An adult ticket costs $6.50 and a student ticket costs $4.00. Alex sells x adult tickets and 12 student tickets. Write a function, , to represent how much money Alex collected from selling tickets.
113) Jackson is starting an exercise program. The first day he will spend 30 minutes on a treadmill. He will
increase his time on the treadmill by 2 minutes each day. Write an equation for , the time, in minutes, on the treadmill on day d. Find , the minutes he will spend on the treadmill on day 6.
114) Last weekend, Emma sold lemonade at a yard sale. The function represented the
profit, , Emma earned selling c cups of lemonade. Sales were strong, so she raised the price for this weekend by 25 cents per cup. Which function represents her profit for this weekend? 1) 3) 2) 4)
115) Which chart could represent the function ?
Page 139

1)
3)
2)
4)
116) Jim is a furniture salesman. His weekly pay is $300 plus 3.5% of his total sales for the week. Jim sells x dollars' worth of furniture during the week. Write a function, , which can be used to determine his pay for the week. Use this function to determine Jim's pay to the nearest cent for a week when his sales total is $8250.
117) Each day Toni records the height of a plant for her science lab. Her data are shown in the table below.
The plant continues to grow at a constant daily rate. Write an equation to represent , the height of the plant on the nth day.
118) Tanya is making homemade greeting cards. The data table below represents the amount she spends in
dollars, , in terms of the number of cards she makes, x.
Write a linear function, , that represents the data. Explain what the slope and y-intercept of mean in the given context.
119) A company that manufactures radios first pays a start-up cost, and then spends a certain amount of money
to manufacture each radio. If the cost of manufacturing r radios is given by the function , then the value 5.25 best represents
1) the start-up cost 3) the amount spent to manufacture each radio
2) the profit earned from the sale of one radio 4) the average number of radios manufactured
Page 140

120) A satellite television company charges a one-time installation fee and a monthly service charge. The total cost is modeled by the function . Which statement represents the meaning of each part of the function? 1) y is the total cost, x is the number of
months of service, $90 is the installation fee, and $40 is the service charge per month.
3) x is the total cost, y is the number of months of service, $40 is the installation fee, and $90 is the service charge per month.
2) y is the total cost, x is the number of months of service, $40 is the installation fee, and $90 is the service charge per month.
4) x is the total cost, y is the number of months of service, $90 is the installation fee, and $40 is the service charge per month.
121) The owner of a small computer repair business has one employee, who is paid an hourly rate of $22. The owner estimates his weekly profit using the function . In this function, x represents the number of 1) computers repaired per week 3) customers served per week 2) hours worked per week 4) days worked per week
122) The cost of airing a commercial on television is modeled by the function , where n is the number of times the commercial is aired. Based on this model, which statement is true? 1) The commercial costs $0 to produce and
$110 per airing up to $900. 3) The commercial costs $900 to produce
and $110 each time it is aired. 2) The commercial costs $110 to produce
and $900 each time it is aired. 4) The commercial costs $1010 to produce
and can air an unlimited number of times.
123) The cost of belonging to a gym can be modeled by , where is the total cost for m months of membership. State the meaning of the slope and y-intercept of this function with respect to the costs associated with the gym membership.
124) A car leaves Albany, NY, and travels west toward Buffalo, NY. The equation can be used
to represent the distance, D, from Buffalo after t hours. In this equation, the 59 represents the 1) car's distance from Albany 3) distance between Buffalo and Albany 2) speed of the car 4) number of hours driving
125) A plumber has a set fee for a house call and charges by the hour for repairs. The total cost of her services can be modeled by . Which statements about this function are true? I. A house call fee costs $95. II. The plumber charges $125 per hour. III. The number of hours the job takes is represented by t. 1) I and II, only 3) II and III, only 2) I and III, only 4) I, II, and III
126) A student plotted the data from a sleep study as shown in the graph below.
Page 141

The student used the equation of the line to model the data. What does the rate of change represent in terms of these data? 1) The average number of hours of sleep per
day increases 0.09 hour per year of age. 3) The average number of hours of sleep per
day increases 9.24 hours per year of age. 2) The average number of hours of sleep per
day decreases 0.09 hour per year of age. 4) The average number of hours of sleep per
day decreases 9.24 hours per year of age.
127) During a recent snowstorm in Red Hook, NY, Jaime noted that there were 4 inches of snow on the ground at 3:00 p.m., and there were 6 inches of snow on the ground at 7:00 p.m. If she were to graph these data, what does the slope of the line connecting these two points represent in the context of this problem?
128) The amount Mike gets paid weekly can be represented by the expression , where a is the
number of cell phone accessories he sells that week. What is the constant term in this expression and what does it represent? 1) , the amount he is guaranteed to be
paid each week 3) 290, the amount he is guaranteed to be
paid each week 2) , the amount he earns when he sells a
accessories 4) 290, the amount he earns when he sells a
accessories
SOLUTIONS
110) ANS: 63 weeks Strategy: Model the problem with a linear function.
Each movie rental costs $2.75 Let n represent the number of rentals. Let represent the amount of money on the rental card after n rentals. Caitlin can rent a movie for 63 weeks in a row. Explanation: Caitlin has $175. Each movie rental costs $2.75 $175 divided by $2.75 equals 63.6, so $2.75 times 63.6 equals $175.
Page 142

Caitlin has enough money to rent 63 videos. After 63 weeks, Caitlin will not have enough money to rent another movie.
After 63 weeks, Caitlin will have $1.75 on her rental card, which is not enough to rent another movie. Check using a table of values:
PTS: 4 NAT: F.BF.A.1 TOP: Modeling Linear Equations
111) ANS: 4 Strategy: Eliminate wrong answers. The problem states that there is a flat charge of $0.46 to mail a letter. This flat charge applies regardless of what the letter weighs. Eliminate any answer that multiplies this flat charge by the weight of the letter. Eliminate answer choices a and c. The difference between answer choices b and d is in the terms and , where z represents the weight of the letter in ounces. Choice b charges 20 cents for every ounce. Choice d charges 20 cents for every ounce in excess of the first ounce. Choice d is the correct answer. DIMS? Does It Make Sense? Yes. Transform answer choice c for input into the graphing calculator.
The table shows $0.46 to mail a letter weighing up to 1 oz. and $0.20 per ounce for each additional ounce.
PTS: 2 NAT: A.CED.A.2 TOP: Modeling Linear Equations
112) ANS:
Strategy: Translate the words into math.
$6.50 per adult ticket plus $4.00 per student ticket equals total money collected. $6.50 times x plus $4.00 times 12 students equals total money collected
Page 143

PTS: 2 NAT: F.BF.A.1 TOP: Modeling Linear Equations
113) ANS:
Jackson will spend 40 minutes on the treadmill on day 6. Strategy: Start with a table of values, then write an equation that models both the table view and the narrative view of the function. Then, use the equation to determine the number of minutes Jackson will spend on the treadmill on day 6. STEP 1: Model the narrative view with a table view.
1 2 3 4 5 6 7 8 9 30 32 34 36 38 40 42 44 46
STEP 2: Write an equation.
STEP 3: Use the equation to find the number of minutes Jackson will spend on the treadmill on day 6.
DIMS? Does It Make Sense? Yes. Both the equation and the table of values predict that Jackson will spend 40 minutes on the treadmill on day 6.
PTS: 2 NAT: A.CED.A.1 TOP: Modeling Linear Functions
114) ANS: 4 The problem asks us to change the function to reflect a 25 cents increase in the price for a cup of coffee. To do so, we must understand each part of the equation. represents the total profits. represents the price for each cup of coffee times the numbers of cups sold. represents fixed costs, such as the price of the coffee beans used. If Emma increases the price of coffee by 25 cents, the term .50c will change to .75c. Everything else will stay the same. The new function will be .
PTS: 2 NAT: F.BF.A.1 TOP: Modeling Linear Functions
115) ANS: 4
Page 144

PTS: 2 NAT: F.LE.A.2
116) ANS: STEP 1: Define variables and write a function rule. Let represent Jim’s total pay for a week. Let 300 represent Jim’s fixed pay in dollars. Let .035 represent the additional pay that Jim receives for furniture sales. Let x represent Jims dollars of furniture sales during the week. Write the function rule:
STEP 2: Use the function rule to determine Jim’s pay if he has $8,250 in furniture sales.
$588.75
PTS: 4 NAT: F.BF.A.1 TOP: Modeling Linear Functions
117) ANS:
Strategy 1: The problem states that the plant grows at a constant daily rate, so the rate of change is constant. Use the slope-intercept form of a line, , and data from the table to identify the slope and y-intercept. STEP 1: Extend the table to show the y-intercept, as follows:
Day (n) 0 1 2 3 4 5
Page 145

Height (cm)
1.5 3 4.5 6 7.5 9
The y-intercept is 1.5, so we can write . STEP 2. Use the slope formula and any two pairs of data to find the slope. In the following calculation, the points (1,3) and (5,9) are used.
The slope is 1.5, so we can write DIMS?: See below. Strategy 2: Use linear regression.
The equation is DIMS? Does It Make Sense? Yes. The equation can be used to reproduce the table view, as follows:
PTS: 2 NAT: F.BF.A.1 TOP: Modeling Linear Functions
118) ANS: . Each card costs 75¢ and start-up costs were $4.50.
Strategy: Input the table of values in a graphing calculator and use linear regression to write the function rule.
PTS: 4 NAT: F.BF.A.1 TOP: Modeling Linear Functions
119) ANS: 3
Page 146

Strategy: Interpret the the function in narrative (word) form.
$5.25 for each radio represents the amount spent to manufacture each radio, which is answer choice c.
PTS: 2 NAT: F.LE.B.5 TOP: Modeling Linear Equations
120) ANS: 2 Strategy: Interpret the the function in narrative (word) form.
PTS: 2 NAT: F.LE.B.5 TOP: Modeling Linear Equations
121) ANS: 2 The problem states that the employee is paid an hourly rate of $22. In the equation , the hourly rate of $22 appears next to the letter x, which is a variable representing the number of hours that the employee works. DIMS (Does it Make Sense?) Yes. The equation says that the owner’s profit (P) is a function of how much the employee gets paid. As the value of x increases, the employee gets paid more and the owner’s profits get smaller.
PTS: 2 NAT: A.SSE.A.1 TOP: Modeling Linear Equations
122) ANS: 3 Strategy: Interpret the the function in narrative (word) form, then eliminate wrong answers.
Answer choice a is wrong because the the production costs are not $0. Answer choice b is wrong because the production costs and costs per airing are reversed. Answer choice c is correct. Answer choice d in wrong because it makes no sense.
PTS: 2 NAT: F.LE.B.5 TOP: Modeling Linear Equations
123) ANS:
The slope is 50 and represents the amount paid each month for membewrship in the gym. The y-intercept is 79.50 and represents the initial cost of membership.
PTS: 2 NAT: F.LE.B.5 TOP: Modeling Linear Functions
124) ANS: 2
Page 147

The equation models the distance from Buffalo for a car after t hours. 280 represents the distance in miles from Albany to Buffalo. The car is travelling at an average speed of 59 miles per hour.
The car’s distance from Albany decreases by 59 miles every hour, so 59 represents the speed of the car.
PTS: 2 NAT: F.LE.B.5 TOP: Modeling Linear Functions
125) ANS: 4 The function can be interpreted as follows: Cost is a function of time and is equal to $125 times the number of hours plus a set fee of $95. All three statements are true.
PTS: 2 NAT: F.LE.B.5 TOP: Modeling Linear Functions
126) ANS: 2 The graph shows that the average number of hours of sleep per day decreases as age increases. The correlation is negative. a) The average number of hours of sleep per day increases 0.09 hour per year of age. b) The average number of hours of sleep per day decreases 0.09 hour per year of age. c) The average number of hours of sleep per day increases 9.24 hours per year of age. d) The average number of hours of sleep per day decreases 9.24 hours per year of age.
PTS: 2 NAT: S.ID.C.7 TOP: Modeling Linear Functions
127) ANS:
Page 148

The slope represents the rate of snowfall, which is 2 inches of snow every 4 hours.
PTS: 2 NAT: F.IF.B.6 TOP: Modeling Linear Functions
128) ANS: 3 Strategy: Identify the constant term in the expression , what it means, and eliminate wrong answers.. STEP 1. 2.50a is a variable term and 290 is a constant term. Eliminate the two answer choices that start with 2.50a. STEP 2. The term 290 can represent the amount Mike earns when he sells a accessories, since the term does not contain a. Eliminate this choice. Does It Make Sense? Yes. Mike gets $2.50 for every cell phone accessory he sells plus a constant amount of $290 each week.
PTS: 2 NAT: F.LE.B.5 TOP: Modeling Linear Functions
Page 149

E – Linear Equations, Lesson 2, Graphing Linear Functions (r. 2018)
LINEAR EQUATIONS Graphing Linear Functions
Common Core Standards
A-CED.A.2 Create equations in two or more varia-bles to represent relationships between quantities; graph equations on coordinate axes with labels and scales.
F-IF.B.4 For a function that models a relationship between two quantities, interpret key features of graphs and tables in terms of the quantities, and sketch graphs showing key features given a verbal description of the relationship. Key features include: intercepts; intervals where the function is increas-ing, decreasing, positive, or negative; relative maxi-mums and minimums; symmetries; end behavior; and periodicity. PARCC: Tasks have a real-world context. Tasks are limited to linear functions, quadratic functions, square root functions, cube root functions, piece-wise defined functions (including step functions and absolute value functions) and exponential functions with domains in the integers.
Next Generation Standards
AI-A.CED.2 Create equations and linear inequalities in two variables to represent a real-world context. Notes: • This is strictly the development of the model (equa-tion/inequality). • Limit equations to linear, quadratic, and exponen-
tials of the form ( ) ( ) xf x a b= where a > 0 and b > 0 (b ≠ 1). AI-F.IF.4 For a function that models a relationship be-tween two quantities: i) interpret key features of graphs and tables in terms of the quantities; and ii) sketch graphs showing key features given a verbal de-scription of the relationship. (Shared standard with Algebra II) Notes: • Algebra I key features include the following: intercepts, zeros; intervals where the function is increasing, decreas-ing, positive, or negative; maxima, minima; and symme-tries. • Tasks have a real-world context and are limited to the following functions: linear, quadratic, square root, piece-wise defined (including step and absolute value), and ex-
ponential functions of the form ( ) ( ) xf x a b= where a > 0 and b > 0 (b≠1).
LEARNING OBJECTIVES
Students will be able to:
1) Write function rules that represent table and/or context views of a mathematical relationship between two variables.
2) Graph functions based on function rules, tables, or contexts.
Overview of Lesson Teacher Centered Introduction
Overview of Lesson
- activate students’ prior knowledge
- vocabulary
- learning objective(s)
- big ideas: direct instruction
- modeling
Student Centered Activities guided practice Teacher: anticipates, monitors, selects, sequences, and connects student work
- developing essential skills
- Regents exam questions
- formative assessment assignment (exit slip, explain the math, or journal entry)
Page 150

VOCABULARY context coordinate pair function rule
graph plot point rate of change
table of values x-axis intercept y-axis intercept
BIG IDEAS
Three Facts About Graphs and Their Equations
1. The graph of an equation represents the set of all points that satisfy the equation (make the equation balance).
2. Each and every point on the graph of an equation represents a coordinate pair that can be substituted into the equation to make the equation true.
3. If a point is on the graph of the equation, the point is a solution to the equation.
How to Graph Any Equation:
Table of Values Method: Given a table of values for a function, simply plot each coordinate pair on a coordinate plane, then sketch the line that connects the plotted points. If given a function rule or context view, first create a table of values either manually or using a graphing calculator, then plot enough coordinate pairs to sketch the graph. Minimum Number of Plot Points Required: Equations can be classified as either linear or non-linear. All linear equations, except vertical lines, are functions.
• To graph a linear equation, you need to plot a minimum of two points using either of the following methods: o Two Points Method: If you know two points on the line, simply plot both of them and draw a
straight line passing through the two points. o One Point and the Slope Method: If you know one point on the line and the slope of the line, plot
the point and use the slope to draw a right triangle to find a second point. Then, draw a straight line passing through the two points.
• To graph a non-linear equation, you need a minimum of three plot points. More plot points are better.
How to Find Intercepts of x and y-Axes
The x-axis intercept is the x-value of the point at which the graph of a relation intercepts the x-axis. The ordered pair for any point of the x-axis will always have a value of y = 0.
Example: The equation y = 2x + 8 has an x-intercept of -4. This can be found algebraically by substituting a value of 0 for y.
2 80 2 8
8 28
24
y xx
x
x
x
= += +
− =−
=
− =
The y-axis intercept is the y-value of the point at which a graph of a relation intercepts the y-axis. The ordered pair for this point has a value of x = 0.
Page 151

Example: The equation y = 8 + 2x has a y-intercept of 8. This can be found algebraically by substituting a value of zero for x.
( )2 82 0 80 88
y xyyy
= +
= +
= +=
Rate of Change/Slope
Positive Slope
Goes up from left to right.
Negative Slope. Goes down from left to right.
Zero Slope.
A horizontal line has a slope of zero.
Undefined Slope.
A vertical line has an undefined slope.
DEVELOPING ESSENTIAL SKILLS
Super Painters charges $1.00 per square foot plus an additional fee of $25.00 to paint a living room. If x represents the area of the walls of Francesca's living room, in square feet, and y represents the cost, in dollars, which graph best represents the cost of painting her living room?
a) c)
b) d)
Page 152

Answer: c: This graph has a y-intercept of 25 and a slope of 1. The gas tank in a car holds a total of 16 gallons of gas. The car travels 75 miles on 4 gallons of gas. If the gas tank is full at the beginning of a trip, which graph represents the rate of change in the amount of gas in the tank?
a) c)
b) d)
Answer: b: If the car can travel 75 miles on 4 gallons, it can travel 300 miles on 16 gallons. 744 16
74 16 4300
x
xx
=
× ==
.
REGENTS EXAM QUESTIONS (through June 2018)
A.CED.A.2, F.IF.B.4: Graphing Linear Functions
129) Max purchased a box of green tea mints. The nutrition label on the box stated that a serving of three mints
contains a total of 10 Calories. On the axes below, graph the function, C, where represents the number of Calories in x mints.
Page 153

Write an equation that represents . A full box of mints contains 180 Calories. Use the equation to determine the total number of mints in the box.
130) Which graph shows a line where each value of y is three more than half of x?
1)
3)
2)
4)
131) The graph below was created by an employee at a gas station.
Page 154

Which statement can be justified by using the graph? 1) If 10 gallons of gas was purchased, $35
was paid. 3) For every 2 gallons of gas purchased,
$5.00 was paid. 2) For every gallon of gas purchased, $3.75
was paid. 4) If zero gallons of gas were purchased, zero
miles were driven.
132) The value of the x-intercept for the graph of is 1) 10 3)
2)
4)
133) Which function has the same y-intercept as the graph below?
1)
3)
2) 4)
134) Samantha purchases a package of sugar cookies. The nutrition label states that each serving size of 3 cookies contains 160 Calories. Samantha creates the graph below showing the number of cookies eaten and the number of Calories consumed.
Page 155

Explain why it is appropriate for Samantha to draw a line through the points on the graph.
SOLUTIONS
129) ANS:
a)
b)
c) A full box contains 54 mints. Strategy: Write the equation, then graph the equation, then use the equation and 180 calories to determine the number of mints in a full box. STEP 1. Write the equation.
If 3 mints contain ten calories, then one mint contains calories, and x number of mints contains
calories. Therefore: .
STEP 2: Transform the equation and input the equation into a graphing calculator.
Page 156

STEP 3. Transfer the graph from the calculators table of values to the paper graph and complete the graph. STEP 4. Substitute 180 calories for in the equation and solve for x (the number of mints)
There are 54 mints in a full box.
DIMS: Does It Make Sense? Yes. The table view of the function also shows that 180 calories is paired with 54 mints.
PTS: 4 NAT: A.CED.A.2 TOP: Graphing Linear Functions
130) ANS: 2 Strategy: Convert the narrative view to a function rule, then graph it. STEP 1. Write the function rule.
Page 157

STEP 2. Input the function rule in a graphing calculator and compare the graph view of the function to the answer choices.
Answer choice b is correct. DIMS? Does It Make Sense? Yes. The x and y intercepts are reflected in both the graph and the table of values.
PTS: 2 NAT: A.CED.A.2 TOP: Graphing Linear Functions KEY: bimodalgraph
131) ANS: 2 Strategy #1: Use the slope of the line to determine the cost per gallon of gas. Select any two points that are on intersections of vertical and horizontal gridlines, then substitute them into the slope formula to determine the rate of change, which is the cost per gallon of gas.
or
For every gallon of gas purchased. $3.75 was paid.
Strategy #2. Eliminate wrong answers. Choice (a) is wrong because the chart shows that 10 gallongs of gas costs $37.50, not $35.00. Choice (b) is correct. Choice (c) is wrong because the chart shows that 2 gallons of gas cost $7.50, not $5.00. Choice (d) is wrong because the chart says nothing about the number of miles driven.
PTS: 2 NAT: A.CED.A.2 TOP: Graphing Linear Functions
132) ANS: 1 Strategy: Find the value of x when y equals 0. NOTE: The x-intercept can also be defined as the x-value of the coordinate where the graph intercepts (passes through) the x-axis.
Page 158

The value of the x-intercept is 10.
PTS: 2 NAT: F.IF.C.9 TOP: Graphing Linear Functions
133) ANS: 4 Strategy: Identify the y-intercept in the graph, then test each answer choice to see if it has the same y-intercept. STEP 1. Identify the y-intercept in the graph. The y-intercept is can be defined as the y-value of the coordinate where the graph intercepts (passes through) the y-axis. The graph shows that the function passes through the y-axis at the point , so the value of the y-intercept is -3. STEP 2. Test the other equations to see if the point works. a Does not work c Does not work
b Does not work d works!
PTS: 2 NAT: F.IF.C.9 TOP: Graphing Linear Functions
134) ANS: A line is appropriate because the data is continuous. Samantha could eat any fraction of a cookie and fill in the line between the points for whole cookies.
PTS: 2 NAT: F.IF.B.4 TOP: Graphing Linear Functions
Page 159

E – Linear Equations, Lesson 3, Writing Linear Equations (r. 2018)
LINEAR EQUATIONS Writing Linear Equations
Common Core Standard
A-REI.10 Understand that the graph of an equation in two variables is the set of all its solutions plotted in the coordinate plane, often forming a curve (which could be a line).
Next Generation Standard
AI-A.REI.10 Understand that the graph of an equation in two variables is the set of all its solutions plotted in the coordinate plane. Note: Graphing linear equations is a fluency recom-mendation for Algebra I. Students become fluent in solving characteristic problems involving the analytic geometry of lines, such as writing down the equation of a line given a point and a slope. Such fluency can support them in solving less routine mathematical problems involving linearity; as well as modeling lin-ear phenomena.
LEARNING OBJECTIVES
Students will be able to:
1) Determine if different equations represent the same mathematical relationship between two variables.
2) Write the equation of a line of a line given two points on the line or one point and the slope of the line.
Overview of Lesson
Teacher Centered Introduction Overview of Lesson
- activate students’ prior knowledge
- vocabulary
- learning objective(s)
- big ideas: direct instruction
- modeling
Student Centered Activities guided practice Teacher: anticipates, monitors, selects, sequences, and connects student work
- developing essential skills
- Regents exam questions
- formative assessment assignment (exit slip, explain the math, or journal entry)
VOCABULARY
transform isolate
equivalent y = mx +b form
relationship
BIG IDEAS
Three Facts About Graphs and Their Equations
1. The graph of an equation represents the set of all points that satisfy the equation (make the equation balance).
Page 160

2. Each and every point on the graph of an equation represents a coordinate pair that can be substituted into the equation to make the equation true.
3. If a point is on the graph of the equation, the point is a solution to the equation.
Equivalent Forms of Equations
An equation represents a mathematical relationship between variables. The same relationship between the variables can be represented in many different ways. For example, y = 2x, 2y = 4x, and 3y = 6x all represent the same idea that y is 2 times x.
To determine if different equations represent the same mathematical relationship between variables, use one or more of the following strategies.
• transform the different equations into equivalent forms. If the equations can be transformed into identical forms, the equations represent the same mathematical relationship between the variables.
• isolate the same variable in all the equations and input the equations in a graphing calculator. If the tables of values and graphs are identical, the equations represent the same mathematical relationship between the variables.
Given Two Points on a Line, or One Point and the Slope of a Line, How to Write the Equation of the Line
STEP 1. First, find the slope. If not given, use the slope formula.
2 1
2 1
y ymx x−
=−
STEP 2. Set up and label three columns, as follows:
Write what you are given in this column.
y = m = x = b =
y = mx + b
Substitute the values from the first column into the formula and solve for the unknown b
value in this column.
y = mx + b Use this column to write the fi-nal equation by substituting m
and b in the slope-intercept form.
STEP 3. Complete each column, left to right. The last column will be the equation of the line.
Example: Write the equation of the line that passes through (-5, 6) and (7, 2).
Step 1. Find the slope. 2 1
2 1
2 67 ( 5)
412
13
y ymx x
m
m
m
−=
−−
=− −
−=
= −
Write what you are given in
this column. y = mx + b
y = mx + b
Page 161

y = 2 m = 1
3−
x = 7 b = b
( )12 73723
723143
b
b
b
b
= − +
= − +
+ =
=
1 143 3
y x= +
DEVELOPING ESSENTIAL SKILLS
Which of the following equations represent the same mathematical relationship between the variables? Justify your answer.
3 6y x= +
( )3 2y x= +
– 4 3 2y x= +
1 23
y x= +
All of the equations represent the same mathematical relationship.
3 6y x= +
Use distributive property ( )3 2
3 6
y x
y x
= +
= +
Add 4 to both expressions – 4 3 2
3 6
y x
y x
= +
= +
Multiply both expressions by 3 1 23
3 6
y x
y x
= +
= +
Write the equation of the line that passes through the points (-2, -8) and (6, 16).
Page 162

( )
2 1
2 1
16 86 ( 2)248
3
y ymx x
m
m
m
−=
−
− −=
− −
=
=
Write what you are given in this column.
y = 16 m = 3 x = 6 b = b
y = mx + b ( )16 3 6
16 182
bb
b
= +
= +− =
y = mx + b
3 2y x= −
REGENTS EXAM QUESTIONS (through June 2018)
A.REI.D.10: Writing Linear Equations
135) The graph of a linear equation contains the points and . Which point also lies on the graph?
1) 3) 2) 4)
136) Sue and Kathy were doing their algebra homework. They were asked to write the equation of the line that
passes through the points and . Sue wrote and Kathy wrote .
Justify why both students are correct.
137) How many of the equations listed below represent the line passing through the points and ?
1) 1 3) 3 2) 2 4) 4
SOLUTIONS
135) ANS: 4 Strategy: Find the slope of the line between the two points, then use to find the y-intercept, then write the equation of the line and determine which answer choice is also on the line. STEP 1. Find the slope of the line that passes through the points and .
Page 163
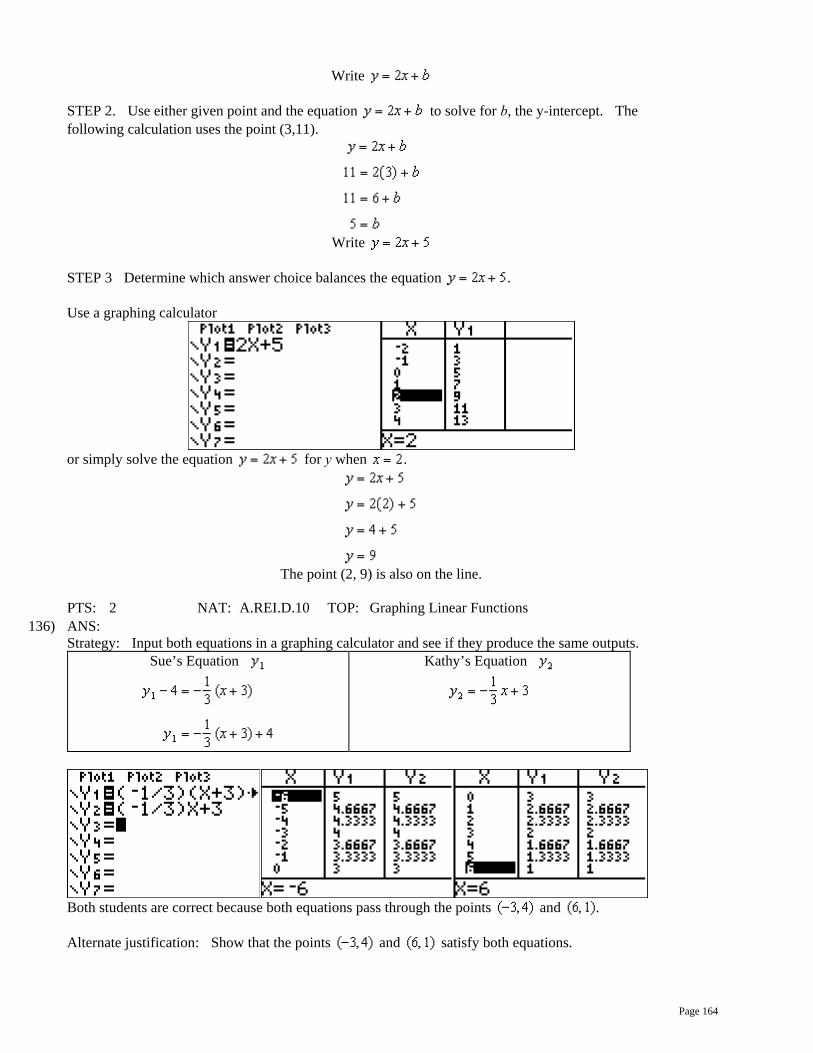
Write
STEP 2. Use either given point and the equation to solve for b, the y-intercept. The following calculation uses the point (3,11).
Write
STEP 3 Determine which answer choice balances the equation . Use a graphing calculator
or simply solve the equation for y when .
The point (2, 9) is also on the line.
PTS: 2 NAT: A.REI.D.10 TOP: Graphing Linear Functions
136) ANS: Strategy: Input both equations in a graphing calculator and see if they produce the same outputs.
Sue’s Equation
Kathy’s Equation
Both students are correct because both equations pass through the points and . Alternate justification: Show that the points and satisfy both equations.
Page 164

Sue’s Equation
Kathy’s Equation
Both students are correct because the points and satisfy both equations.
PTS: 2 NAT: A.REI.D.10 TOP: Writing Linear Equations KEY: other forms
137) ANS: 3 Step 1. Transform each equation for input into a graphing calculator. Original Input in Calculator
Step 2. Input each equation in a graphing calculator and inspect the tables of values for the points and .
Page 165

F – Inequalities, Lesson 1, Solving Linear Inequalities (r. 2018)
INEQUALITIES Solving Linear Inequalities
Common Core Standard
A-REI.B.3 Solve linear equations and inequalities in one variable, including equations with coefficients represented by letters.
Next Generation Standard
AI-A.REI.3 Solve linear equations and inequalities in one variable, including equations with coefficients repre-sented by letters. Note: Algebra I tasks do not involve solving compound inequalities.
NOTE: This lesson is closely related to, and builds upon, Expressions and Equations, Lesson 3, Solving Linear Equations.
LEARNING OBJECTIVES
Students will be able to:
1) Solve one step and multiple step inequalities. 2) Explain each step involved in solving one step and multiple step inequalities. 3) Do a check to see if the solution is correct.
Overview of Lesson
Teacher Centered Introduction Overview of Lesson
- activate students’ prior knowledge
- vocabulary
- learning objective(s)
- big ideas: direct instruction
- modeling
Student Centered Activities guided practice Teacher: anticipates, monitors, selects, sequences, and connects student work
- developing essential skills
- Regents exam questions
- formative assessment assignment (exit slip, explain the math, or journal entry)
VOCABULARY
big rule of inequalities equality four column strategy four general rules
greater than greater than or equal to inequality inequality sign
less than less than or equal to not equal to solution set
BIG IDEAS
The Big Rule for Solving Inequalities:
All the rules for solving equations apply to inequalities – plus one: When an inequality is multiplied or divided by any negative number, the direction of the
inequality sign changes.
Page 166

Inequality Symbols:
The solution of an inequality includes any values that make the inequality true. Solutions to inequalities can be graphed on a number line using open and closed dots.
Checking Solutions to Inequalities To check the solution to an inequality, replace the variable in the inequality with a value in the solution set. If the value selected is a correct solution, the simplified inequality will produce a true statement. NOTE: The value selected must be in the solution set.
DEVELOPING ESSENTIAL SKILLS
Solve for x: 24 35
x x+ > +
Notes Left Hand Expression Sign Right Hand Expression Given 24
5x+
>
3+x
Multiply by 5 20 2x+ > 15 5x+ Subtract 2x 20 > 15+3x Subtract 15 5 > 3x Divide by 3 5
3
> x
Check Select 4
3, which is less than 5
3, to test the solution.
24 35
2 4 44 35 3 3
8 204 315 15
60 8 45 2015 15 15 15
68 6515 15
x x
true
+ > +
+ > +
+ > +
+ > +
>
REGENTS EXAM QUESTIONS (through June 2018)
A.REI.B.3: Solving Linear Inequalities
< >≤ ≥≠
less than greater than less than or equal to greater than or equal tonot equal to
Page 167

138) The inequality is equivalent to
1) 3) 2) 4)
139) Given that , solve for x in terms of a and b:
140) When is solved for x, the solution is
1) 3) 2) 4)
141) What is the solution to ? 1) 3) 2) 4)
142) Solve the inequality below:
143) What is the solution to the inequality ?
1) 3)
2) 4)
144) The solution to is 1) 3) 2) 4) SOLUTIONS
138) ANS: 1
Strategy: Use the four column method for solving and documenting an equation or inequality. Notes Left Expression Sign Right Expression Given: <
Add +8 to both expressions
(Addition property of equality)
<
Add to both
expressions (Addition property of
equality)
<
Simplify <
Page 168

Divide both
expressions by
(Division property of equality)
<
Simplify < Rewrite x > 9
PTS: 2 NAT: A.REI.B.3 TOP: Solving Linear Inequalities
139) ANS:
Strategy: Use the four column method. Remember that . Notes Left Expression Sign Right Expression Given
Distributive Property Transpose
Factor Divide by
x
See NOTE below
NOTE: Since , the expression must be a negative number. When dividing an inequality by a negative number, the direction of the inequality sign must be reversed.
PTS: 2 NAT: A.REI.B.3 TOP: Solving Linear Inequalities
140) ANS: 4
PTS: 2 NAT: A.REI.B.3 TOP: Solving Linear Inequalities
141) ANS: 1
PTS: 2 NAT: A.REI.B.3
142) ANS:
Given
Page 169

Add (2y) + + Simplify 2.2 Subtract (1.8) - - Simplify
Divide (1.6)
Simplify y
PTS: 2 NAT: A.REI.B.3 TOP: Solving Linear Inequalities
143) ANS: 1
Remember to change the direction of the inequality sign when multiplying or dividing by a negative number.
PTS: 2 NAT: A.REI.B.3 TOP: Solving Linear Inequalities
144) ANS: 4 Strategy: Use order of operations.
Notes Left Expression Sign Right Expression Given <
Divide by 2 < Subtract p < 5 Subtract 1 < 4
PTS: 2 NAT: A.REI.B.3 TOP: Solving Linear Inequalities
Page 170

F – Inequalities, Lesson 2, Interpreting Solutions (r. 2018)
INEQUALITIES Interpreting Solutions
Common Core Standard
A-REI.3 Solve linear equations and inequalities in one variable, including equations with coefficients represented by letters.
Next Generation Standard
AI-A.REI.3 Solve linear equations and inequalities in one variable, including equations with coefficients repre-sented by letters. Note: Algebra I tasks do not involve solving com-pound inequalities.
LEARNING OBJECTIVES
Students will be able to:
1) Identify solutions to inequalities as sets of solutions that can be plotted on a number line. 2) Use proper notation to define solution sets. 3) Identify integer values within solution sets. 4) Determine if a specified integer value is within a solution set.
Overview of Lesson Teacher Centered Introduction
Overview of Lesson
- activate students’ prior knowledge
- vocabulary
- learning objective(s)
- big ideas: direct instruction
- modeling
Student Centered Activities guided practice Teacher: anticipates, monitors, selects, sequences, and connects student work
- developing essential skills
- Regents exam questions
- formative assessment assignment (exit slip, explain the math, or journal entry)
VOCABULARY
integer solution set
open dot closed dot
curved parentheses square parentheses
number line
BIG IDEAS
Inequality Symbols:
The solution of an inequality includes any values that make the inequality true. Solutions to inequalities can be graphed on a number line using open and closed dots.
Open Dots v Closed Dots
< >≤ ≥≠
less than greater than less than or equal to greater than or equal tonot equal to
Page 171

Square vs Curved Parentheses When the inequality sign does not contain an equality bar beneath it, the dot is open.
When the inequality sign contains includes an equality bar beneath it, the dot is closed,
or shaded in.
or (1...
means 1 is not included in the solution set.
or [1...
means 1 is included in the solution set
or ...1) means 1 is not included in the solution set
or ...1]
means 1 is included in the solution set
DEVELOPING ESSENTIAL SKILLS
Solve for the smallest integer value of x: 23 4 65
x x+ ≥ −
Notes Left Hand Expression
Sign Right Hand Expression
Given 3 x+ ≥ 4 6x− Add 6x 3+7x ≥ 4
Subtract 3 7x ≥ 1 Divide by 7 x ≥ 1
7
Answer 1 is the smallest integer that is in the solution set. Check
0 is less than 17
and should not
be in the solution set.
( ) ( )3 4 6
3 0 4 6 03 4 true
x x
not
+ ≥ −
+ ≥ −
≥
1 is greater than or equal to 17
and should be in the solution set.
( ) ( )3 4 6
3 1 4 6 14 4 64 2 true
x x+ ≥ −
+ ≥ −
≥ −≥ −
REGENTS EXAM QUESTIONS (through June 2018)
A.REI.B.3: Interpreting Solutions
Graph of 1x >
Lesser Greater
0 1 2 3-1-2-3
Graph of 1x ≥
Lesser Greater
0 1 2 3-1-2-3
Graph of 1x <
Lesser Greater
0 1 2 3-1-2-3
Graph of 1x ≤
Lesser Greater
0 1 2 3-1-2-3
Graph of 1x ≠
Lesser Greater
0 1 2 3-1-2-3
Page 172

145) Given , determine the largest integer value of a when .
146) Solve the inequality below to determine and state the smallest possible value for x in the solution set.
147) Determine the smallest integer that makes true.
148) Solve for x algebraically:
If x is a number in the interval , state all integers that satisfy the given inequality. Explain how you determined these values.
149) Which value would be a solution for x in the inequality ?
1) -13 3) 10 2) -10 4) 11
150) Given the set , what is the solution of ? 1) 3) 2) 1, 2 4)
SOLUTIONS
145) ANS: The largest integer value for a is 2. Strategy: Use the four column method.
Notes Left Expression Sign Right Expression Given >
Substitute -1 for x > Simplify >
Combine like terms > Add +9 to both
expressions (Addition property of
equality)
>
Divide both expressions by
and reverse the sign
a
<
3
The largest integer value that is less the 3 is 2.
PTS: 2 NAT: A.REI.B.3 TOP: Solving Linear Inequalities
146) ANS: 6 is the smallest possible value for x in the solution set. Strategy: Use the four column method.
Notes Left Expression Sign Right Expression Given
Subtract 3x from both expressions
9
Page 173

(Subtraction property of equality)
Add +3 to both expressions
(Addition Property of equality)
12
Divide both expressions by 2
(Division property of equality)
6
Rewrite x 6
PTS: 2 NAT: A.REI.B.3 TOP: Solving Linear Inequalities
147) ANS: 0 is the smallest integer in the solution set. . Strategy: Use the four column method to solve the inequality, then interpret the solution. STEP 1: Solve the inequality.
Notes Left Expression Sign Right Expression Given <
Simplify (Combine like terms)
< 15
Add +8x to both expressions
(Addition Property of Equality)
7
<
8x+15
Subtract 15 from both expressions
(Subtraction Property of Equality)
<
8x
Divide both expressions by +8
(Division property of equality)
<
x
Rewrite x > STEP 2: Interpret the solution set for the smallest integer. The smallest integer greater than -1 is 0.
PTS: 2 NAT: A.REI.B.3 TOP: Solving Linear Inequalities
148) ANS: 6, 7, 8 are the numbers greater than or equal to 6 in the interval. Strategy: Use the four column method to solve the inequality, then interpret the solution. STEP 1: Solve the inequality.
Notes Left Expression Sign Right Expression Given
Clear parentheses
Page 174

(Distributive property) Simplify
(Combine like terms)
Add 5x to both expressions
(Addition property of equality)
24
Subtract 12 from both expressions
(Subtraction property of equality)
12
2x
Divide both expressions by 2
(Division property of equality)
6
x
Rewrite x 6 STEP 2: Interpret the solution set for the interval . The interval contains the integers 4, 5, 6, 7, and 8. If , then the solution set of integers is .
PTS: 4 NAT: A.REI.B.3 TOP: Solving Linear Inequalities
149) ANS: 4
Remember to change the direction of the sign when multiplying or dividing an inequality by a negative number.
11 is the only answer choice that is greater than 10.
PTS: 2 NAT: A.REI.B.3 TOP: Interpreting Solutions
150) ANS: 2 STEP 1: Solve the inequality
STEP 2: Select integers from the interval that satisfy the inequality. The integers in the interval are: {-2, -1, 0, 1, 2}. -2 is not greater than 0 -1 is not greater than 0 0 is not greater than 0 1 is greater than 0 2 is greater than zero.
Page 175

PTS: 2 NAT: A.REI.B.3 TOP: Interpreting Solutions
Page 176

F – Inequalities, Lesson 3, Modeling Linear Inequalities (r. 2018)
INEQUALITIES Modeling Linear Inequalities
Common Core Standards
A-CED.1 Create equations and inequalities in one variable and use them to solve problems. Include equations arising from linear and quadratic func-tions, and simple rational and exponential functions. PARCC: Tasks are limited to linear, quadratic, or exponential
ns with integer exponents.
A-CED.3 Represent constraints by equations or ine-qualities, and by systems of equations and/or ine-qualities, and interpret solutions as viable or non-vi-able options in a modeling context. For example, represent inequalities describing nutritional and cost constraints on combinations of different foods.
Next Generation Standards
AI-A.CED.1 Create equations and inequalities in one variable to represent a real-world context. (Shared standard with Algebra II) Notes: • This is strictly the development of the model (equa-tion/inequality). • Limit equations to linear, quadratic, and exponen-tials of the form f(x) = a(b)x where a > 0 and b > 0 (b ≠ 1). • Work with geometric sequences may involve an ex-ponential equation/formula of the form an = arn-1, where a is the first term and r is the common ratio. • Inequalities are limited to linear inequalities. • Algebra I tasks do not involve compound inequalities. AI-A.CED.3 Represent constraints by equations or ine-qualities, and by systems of equations and/or inequalities, and interpret solutions as viable or non-viable options in a modeling context.
e.g., Represent inequalities describing nutritional and cost constraints on combinations of different foods.
NOTE: This lesson is related to Expressions and Equations, Lesson 4, Modeling Linear Equations
LEARNING OBJECTIVES
Students will be able to:
1) Model real-world word problems as mathematical inequalities.
Overview of Lesson Teacher Centered Introduction
Overview of Lesson
- activate students’ prior knowledge
- vocabulary
- learning objective(s)
- big ideas: direct instruction
- modeling
Student Centered Activities guided practice Teacher: anticipates, monitors, selects, sequences, and connects student work
- developing essential skills
- Regents exam questions
- formative assessment assignment (exit slip, explain the math, or journal entry)
VOCABULARY
See key words and their mathematical translations under big ideas.
Page 177

BIG IDEAS Translating words into mathematical expressions and equations is an important skill. General Approach The general approach is as follows:
1. Read and understand the entire problem. 2. Underline key words, focusing on variables, operations, and equalities or inequalities. 3. Convert the key words to mathematical notation (consider meaningful variable names other than
x and y). 4. Write the final expression or equation. 5. Check the final expression or equation for reasonableness.
The Solution to a Linear Inequality Can Represent a Part of a Number Line.
A linear inequality describes a part of a number line with either: 1) an upper limit; 2) a lower limit; or 3) both upper and lower limits. Example - Upper Limit
Let A represent age. A playground for little kids will not allow children older than four years. If A represents age in years, this can be represented as
Example - Lower Limit A state will not allow persons below the age of 21 to drink alcohol. If A represents age in years, the legal drinking age can be represented as
Example - Both Upper and Lower Limits A high school football team limits participation to students from 14 to 18 years old. If A represents age in years, participation on the football team can be represented as
.
X
X
Page 178

Key English Words and Their Mathematical Translations
These English Words Usually Mean Examples: English becomes math is, are equals the sum of 5 and x is 20 becomes 5 + x = 20
more than, greater than inequality >
x is greater than y becomes x > y x is more than 5 becomes x > 5 5 is more than x becomes 5 > x
greater than or equal to, a minimum of, at least
inequality ≥
x is greater than or equal to y becomes the minimum of x is 5 becomes
x is at least 20 becomes less than inequality
< x is less than y becomes x is less than 5 becomes 5 is less than x becomes
less than or equal to, a maximum of, not more than
Inequality ≤
X is less than or equal to y becomes The maximum of x is 5 becomes
X is not more than becomes
Examples of Modeling Specific Types of Inequality Problems Spending Related Inequalities
Typical Problem in English Mathematical Translation Hints and Strategies Mr. Braun has $75.00 to spend on pizzas and soda pop for a picnic. Pizzas cost $9.00 each and the drinks cost $0.75 each. Five times as many drinks as pizzas are needed. What is the maximum number of pizzas that Mr. Braun can buy?
$75 is the most that can be spent, so start with the idea that
75 something≥ • Let P represent the # of Pizzas
and 9P represent the cost of pizzas.
• Let 5P represent the number of drinks and .75(5P) represent the cost of drinks.
Write the expression for total costs:
9 .75(5 )P P+ Combine the left expression, inequality sign, and right expression into a single inequality.
75 9 .75(5 )P P≥ + Solve the inequality for P.
75 9 .75(5 )75 9 3.7575 12.75
7512.755.9
P PP P
P
P
P
≥ +≥ +≥
≥
≥
1. Identify the minimum or maximum amount on one side of the inequality.
2. Pay attention to the direction of the inequality and whether the boundary is included or not included in the solution set.
3. Develop the other side of the inequality as an expression.
Page 179

It does not make sense to order 5.9 pizzas, and there is not enough money to buy six pizzas, so round down. Mr. Braun has enough money to
buy 5 pizzas. How Many? Type of Inequalities
Typical Problem in English Mathematical Translation Hints and Strategies There are 461 students and 20 teachers taking buses on a trip to a museum. Each bus can seat a maximum of 52. What is the least number of buses needed for the trip?
Write: 461 20
52b+
≥
Solve 48652
9.25
b
b
≥
≥
A fraction/decimal answer does not make sense because you cannot order a part of a bus. Only an integer answer will work. The lowest integer value in the solution set is 10, so 10 buses will be needed for the trip.
Ignore your real life experience with field trips and buses, like how big or small are the students and teachers, or if student attendance will be influenced by how interesting the museum sounds.
Geometry Based Inequalities
Typical Problem in English Mathematical Translation Hints and Strategies The length of a rectangle is 15 and its width is w. The perimeter of the rectangle is, at most, 50. Write and solve an inequality to find the longest possible width.
The formula for the perimeter of a rectangle is 2 2l w P+ = . Substitute information from the context into this formula and write:
( )2 15 2 50w+ ≤ Then, solve for w.
( )2 15 2 5030 2 50
2 2010
wwww
+ ≤
+ ≤≤≤
The longest possible width is 10 feet.
Use a formula and substitute information from the problem
into the formula.
DEVELOPING ESSENTIAL SKILLS
A swimmer plans to swim at least 100 laps during a 6-day period. During this period, the swimmer will increase the number of laps completed each day by one lap. What is the least number of laps the swimmer must complete on the first day?
Page 180

Write the left expression and inequality sign as follows: 100 ≥
Let d represent the number of laps the swimmer must complete on the 1st day. Let d+1 represent the number of laps the swimmer must complete on the 2nd day. Let d+2 represent the number of laps the swimmer must complete on the 3rd day. Let d+3 represent the number of laps the swimmer must complete on the 4th day. Let d+4 represent the number of laps the swimmer must complete on the 5th day. Let d+5 represent the number of laps the swimmer must complete on the 6th day. Let 6d+15 represent the number of laps the swimmer must complete in total. This is the right expression.
Complete the inequality 100 6 15d≥ +
Solve the inequality 100 6 15
85 6856
14.6
dd
d
d
≥ +≥
≥
≥
A swimmer cannot swim a fraction of a lap, so round up to the next integer. The swimmer must complete 15 laps on the first day.
REGENTS EXAM QUESTIONS (through June 2018)
A.CED.A.1 A.CED.C.3: Modeling Linear Inequalities
151) Connor wants to attend the town carnival. The price of admission to the carnival is $4.50, and each ride costs an
additional 79 cents. If he can spend at most $16.00 at the carnival, which inequality can be used to solve for r, the number of rides Connor can go on, and what is the maximum number of rides he can go on? 1) ; 3 rides 3) ; 14 rides 2) ; 4 rides 4) ; 15 rides
152) Natasha is planning a school celebration and wants to have live music and food for everyone who attends. She has found a band that will charge her $750 and a caterer who will provide snacks and drinks for $2.25 per person. If her goal is to keep the average cost per person between $2.75 and $3.25, how many people, p, must attend? 1) 3) 2) 4)
153) The cost of a pack of chewing gum in a vending machine is $0.75. The cost of a bottle of juice in the same machine is $1.25. Julia has $22.00 to spend on chewing gum and bottles of juice for her team and she must buy seven packs of chewing gum. If b represents the number of bottles of juice, which inequality represents the maximum number of bottles she can buy? 1) 3) 2) 4)
154) The acidity in a swimming pool is considered normal if the average of three pH readings, p, is defined such that . If the first two readings are 7.2 and 7.6, which value for the third reading will result in an overall
rating of normal? 1) 6.2 3) 8.6 2) 7.3 4) 8.8
Page 181

155) David has two jobs. He earns $8 per hour babysitting his neighbor’s children and he earns $11 per hour working at the coffee shop. Write an inequality to represent the number of hours, x, babysitting and the number of hours, y, working at the coffee shop that David will need to work to earn a minimum of $200. David worked 15 hours at the coffee shop. Use the inequality to find the number of full hours he must babysit to reach his goal of $200.
156) Joy wants to buy strawberries and raspberries to bring to a party. Strawberries cost $1.60 per pound and
raspberries cost $1.75 per pound. If she only has $10 to spend on berries, which inequality represents the situation where she buys x pounds of strawberries and y pounds of raspberries? 1) 3) 2) 4)
SOLUTIONS
151) ANS: 3 Strategy: Write and solve an inequality that relates total costs to how much money Connor has. STEP 1. Write the inequality: The price of admission comes first and is $4.50. Write +4.50 Each ride (r) costs an additional 0.79. Write +0.79r Total costs can be expressed as:
must be less than or equal to the $16 Connor has. Write: STEP 2: Solve the inequality.
Notes Left Expression Sign Right Expression Given
Subtract 4.50 from both expressions
11.50
Divide both expressions by 0.79
r
Simplify r 14.55696203 Interpret r 14 rides
The correct answer choice is c: ; 14 rides DIMS? Does It Make Sense? Yes. Admissions costs $4.50 and 14 rides cost . After 14 rides, Connor will only have 45 cents left, which is not enough to go on another ride.
PTS: 2 NAT: A.CED.A.1 TOP: Modeling Linear Inequalities
152) ANS: 4 Strategy: STEP1. Use the definition of average cost.
Page 182

Total costs for the band and the caterer are:
If the average cost is $3.25, the formula is
If the average cost is $2.75, the formula is
DIMS? Does It Make Sense? Yes. If 750 people attend, the average cost is $2.25 per person. If 1500 people attend, the average cost is $3.25 per person. For any number of people between 750 and 1500, the average cost per person will be between $2.25 and $3.25.
PTS: 2 NAT: A.CED.A.3 TOP: Modeling Linear Inequalities
153) ANS: 4 Strategy: Examine the answer choices and eliminate wrong answers. STEP 1. Eliminate answer choices a and c because both of them have greater than or equal signs. Julia must spend less than she has, not more. STEP 2. Choose between answer choices b and d. Answer choice d is correct because the term means that Julia must buy 7 packs of chewing gum @ $0.75 per pack. Answer choice b is incorrect because the term
means that Julia will buy 7 bottles of juice. DIMS? Does It Make Sense? Yes. Answer choice d shows in the first term that Julia will buy 7 packs of gum and the total of the entire expression must be equal to or less than $22.00.
PTS: 2 NAT: A.CED.A.3 TOP: Modeling Linear Inequalities
154) ANS: 2 Step 1. Recognize that the problem is asking you to identify one pH reading that will result in an average of three readings that is greater than or equal to 7.0 and less than or equal to 7.8. Step 2. Use algebraic notation to represent the average of three pH readings, then find the answer that gives an average within the required interval. Step 3.
Page 183

Choice a) . This average is not in the required interval, so
choice a) is not a correct answer.
Choice b) . This average is in the required interval,
so choice b) is a correct answer.
Choice c) . This average is not in the required interval, so
choice c) is not a correct answer.
Choice d) . This average is not in the required
interval, so choice d) is not a correct answer. Step 4. Does it make sense? Yes.
PTS: 2 NAT: A.CED.A.1 TOP: Modeling Linear Inequalities
155) ANS: David must babysit five full hours to reach his goal of $200. Strategy: Write an inequality to represent David’s income from both jobs, then use it to solve the problem, then interpret the solution. STEP 1. Write the inequality. Let x represent the number of hours that David babysits. Let y represent the number of hours that David works at the coffee shop. Write: STEP 2. Substitute 15 for y and solve for x.
Page 184

STEP 3. Interpret the solution. The problem asks for the number of full hours, so the solution, , must be rounded up to 5 full hours. DIMS? Does It Make Sense? Yes. If David works 15 hours at the coffee shop and 5 hours at the library, he will earn more than 200
What does not make sense is why David earns $8 per hour babysitting and Edith, in the previous problem, only earns $4 per hour.
PTS: 4 NAT: A.CED.A.3 TOP: Modeling Linear Inequalities
156) ANS: 1 Strategy: There are three terms in each answer choice - sort the information in the problem to write mathematical terms, then eliminate wrong answers.
Given the Words Write Strawberries cost $1.60 per pound....
x pounds of strawberries
raspberries cost $1.75 per pound.... y pounds of raspberries
she only has $10 to spend Combine all three terms and the inequality sign to write:
PTS: 2 NAT: A.CED.A.1 TOP: Modeling Linear Inequalities
Page 185

F – Inequalities, Lesson 4, Graphing Linear Inequalities (r. 2018)
INEQUALITIES Graphing Linear Inequalities
Common Core Standard
A-REI.12 Graph the solutions to a linear inequality in two variables as a half-plane (excluding the boundary in the case of a strict inequality), and graph the solution set to a system of linear inequali-ties in two variables as the intersection of the corre-sponding half-planes.
Next Generation Standard
AI-A.REI.12 Graph the solutions to a linear inequality in two variables as a half-plane (excluding the boundary in the case of a strict inequality), and graph the solution set to a system of linear inequalities in two variables as the intersection of the corresponding half-planes. Note: Graphing linear equations is a fluency recom-mendation for Algebra I. Students become fluent in solving characteristic problems involving the analytic geometry of lines, such as writing down the equation of a line given a point and a slope. Such fluency can support them in solving less routine mathematical problems involving linearity; as well as modeling lin-ear phenomena (including modeling using systems of linear inequalities in two variables).
LEARNING OBJECTIVES
Students will be able to:
1) Graph a single inequality involving two variables on a coordinate plane. a. Determine if the boundary line is a solid line or a dashed line. b. Determine if the solution set is shaded above or below the boundary line.
Overview of Lesson
Teacher Centered Introduction Overview of Lesson
- activate students’ prior knowledge
- vocabulary
- learning objective(s)
- big ideas: direct instruction
- modeling
Student Centered Activities guided practice Teacher: anticipates, monitors, selects, sequences, and connects student work
- developing essential skills
- Regents exam questions
- formative assessment assignment (exit slip, explain the math, or journal entry)
VOCABULARY
boundary line dashed line linear inequality
shading solid line solution set
testing a solution
BIG IDEAS
A linear inequality describes a region of the coordinate plane that has a boundary line. Every point in the region is a solution of the inequality.
Page 186

The solution set of a linear inequality includes all ordered pairs that make the inequality true. The graph of an inequality represents the solution set. Graphing a Linear Inequality Step One. Change the inequality sign to an equal sign and graph the boundary line in the same manner that you would graph a linear equation. When the inequality sign contains an equality bar beneath it, use a solid line for the boundary.
Any point (ordered pair) on the boundary line is part of the solution set. When the inequality sign does not contain an equality bar beneath it, use a dashed line for the
boundary. Any point (ordered pair) on the boundary line is not part of the solution set. Step Two. Restore the inequality sign and test a point to see which side of the boundary line the solution is on. The point (0,0) is a good point to test since it simplifies any multiplication. However, if the boundary line passes through the point (0,0), another point not on the boundary line must be selected for testing. If the test point makes the inequality true, shade the side of the boundary line that includes the test
point. If the test point makes the inequality not true, shade the side of the boundary line does not include
the test point. NOTE: If the dependent variable is isolated in the left expression of the inequality, a simplified way to determine which side of the line to shade is as follows:
• If the inequality sign contains >, shade above the boundary line. o Examples: y x> and y x≥ are shaded above the boundary line.
• If the inequality sign contains <, shade below the boundary line. o Examples: y x< and y x≤ are shaded below the boundary line.
Example Graph First, change the inequality sign an equal sign and graph the line: . This is the boundary line of the solution. Since there is no equality line beneath the inequality symbol, use a dashed line for the boundary. NOTE: A graphing calculator can be used if the inequality has the dependent variable isolated as the in the left expression of the inequality
Next, test a point to see which side of the boundary line the solution is on. Try (0,0), since it makes the multiplication easy, but remember that any point will do.
y x< +2 3y x= +2 3
Page 187

Note: Most graphing calculators do not have the ability to distinguish between solid and dashed lines on a graph of an inequality.
DEVELOPING ESSENTIAL SKILLS
Graph the inequality3 2 6x y y+ ≤ + and determine if point with coordinates (3,8) is in the solution set.
STEP 1. Isolate the dependent variable in the left expression of the inequality.
3 2 63 6
3 6
x y yx y
y x
+ ≤ ++ ≤
≤ − +
STEP 2. Input the transformed inequality in a graphing computer and use the table and graph views to plot the boundary line.
Since the inequality ≤ sign contains an equal bar, the boundary line is a solid line and any points on the boundary line are included in the solution set.
STEP 3. Since the dependent variable is isolated in the left expression, and the inequality sign includes <, shade the area below the boundary line. (NOTE: The graphing calculator can be set to show < or > inequalities.)
( )
2 30 2(0) 30 3 True, so the solution of the inequality is the region that contains the point 0,0 .Therefore, we shade the side of the boundary line that contains the point (0,0).
y x< +< +
<
Page 188

STEP 4. Inspect the graph to determine if the point (3,8) is included in the solution set. It is not.
STEP 5. Do a check to see if the point (3,8) makes the original inequality true.
( ) ( )3 2 6
3 3 2 8 (8) 69 16 14
25 14 not true
x y y+ ≤ +
+ ≤ +
+ ≤≤
Since the inequality is not true for the point (3,8), the point is not in the solution set.
REGENTS EXAM QUESTIONS (through June 2018)
A.REI.D.12: Graphing Linear Inequalities
157) Which inequality is represented in the graph below?
1) 3) 2) 4)
158) On the set of axes below, graph the inequality .
159) Which inequality is represented by the graph below?
Page 189

1) 3) 2) 4)
160) Shawn incorrectly graphed the inequality as shown below:
Explain Shawn’s mistake. Graph the inequality correctly on the set of axis below.
Page 190

161) Graph the inequality on the set of axes below. State the coordinates of a point in its solution.
162) Graph the inequality on the set of axes below.
Page 191

SOLUTIONS
157) ANS: 1 Strategy: Use the slope intercept form of a line, , to construct the inequality from the graph.
The line passes though points (0,4) and (1,1), so the slope is . The y-intercept is 4.
The equation of the boundary line is , so eliminate choices c and d. The shading is above the line, so eliminate choice b. The inequality is , so answer choice a is correct.
PTS: 2 NAT: A.REI.D.12 TOP: Linear Inequalities
158) ANS:
Strategy: Transpose the inequality, put it in a graphing calculator, then use the table and graph views to create the graph on paper. STEP 1. Transpose the inequality for input into a graphing calculator.
Page 192

STEP 2. Inpout the inequality into a graphing calculator.
STEP 3. Use information from the graph and table views to create the graph on paper. Be sure to make the line dotted.
PTS: 2 NAT: A.REI.D.12 TOP: Graphing Linear Inequalities
159) ANS: 2 PTS: 2 NAT: A.REI.D.12 TOP: Graphing Linear Inequalities
160) ANS: Shawn’s mistake was he shaded the wrong side of the boundary line.
Shawn’s y-intercept is correct.
Shawn’s slope is correct.
Shawn correctly graphed a solid boundary line. Shawn’s mistake was he shaded the wrong side of the boundary line.
Page 193

PTS: 4 NAT: A.REI.D.12
161) ANS:
Strategy: Use the slope intercept form of the inequality to plot the y-intercept at -5, then use the slope of to
find another point on the boundary line. Plot the boundary line as a dashed. Shade the area above the boundary line. Select any number in the shaded area.
Check (0,0) in the inequality as follows:
PTS: 2 NAT: A.REI.D.12 TOP: Graphing Linear Inequalities
162) ANS:
Page 194

PTS: 2 NAT: A.REI.D.12 TOP: Graphing Linear Inequalities
Page 195

G – Absolute Value, Lesson 1, Graphing Absolute Value Functions (r. 2018)
ABSOLUTE VALUE Graphing Absolute Value Functions
Common Core Standards
F-IF.C.7 Graph functions expressed symbolically and show key features of the graph, by hand in sim-ple cases and using technology for more compli-cated cases. ★ F-BF.B.3 Identify the effect on the graph of replac-ing f(x) by f(x) + k, k f(x), f(kx), and f(x + k) for spe-cific values of k (both positive and negative); find the value of k given the graphs. Experiment with cases and illustrate an explanation of the effects on the graph using technology. Include recognizing even and odd functions from their graphs and alge-braic expressions for them. PARCC: Identifying the effect on the graph of replacing f(x) by f(x) +k, kf(x), and f(x+k) for specific values of k (both positive and negative) is limited to linear and quadratic functions. Experi-menting with cases and illustrating an explanation of the effects on the graph using technology is limited to linear functions, quad-ratic functions, square root functions, cube root functions, piece-wise-defined functions (including step functions and absolute value functions), and exponential functions with domains in the integers. Tasks do not involve recognizing even and odd func-tions.
Next Generation Standards
AI-F.IF.7 Graph functions and show key features of the graph by hand and by using technology where appropri-ate. ★ (Shared standard with Algebra II) AI-F.BF.3a Using f(x) + k, k f(x), and f(x + k): i) identify the effect on the graph when replacing f(x) by f(x) + k, k f(x), and f(x + k) for specific values of k (both positive and negative); ii) find the value of k given the graphs; iii) write a new function using the value of k; and iv) use technology to experiment with cases and explore the effects on the graph. (Shared standard with Algebra II) Note: Tasks are limited to linear, quadratic, square root, and absolute value functions; and exponential
functions of the form ( ) ( ) xf x a b= where a > 0 and b > 0 (b ≠ 1).
LEARNING OBJECTIVES
Students will be able to:
1) Solve and graph absolute value functions with the aid of technology.
Overview of Lesson Teacher Centered Introduction
Overview of Lesson
- activate students’ prior knowledge
- vocabulary
- learning objective(s)
- big ideas: direct instruction
- modeling
Student Centered Activities guided practice Teacher: anticipates, monitors, selects, sequences, and connects student work
- developing essential skills
- Regents exam questions
- formative assessment assignment (exit slip, explain the math, or journal entry)
VOCABULARY
absolute value absolute value function
catalog (of graphing calculator) plus or minus (± ) sign
ray transformation
Page 196

BIG IDEAS The absolute value of a number is defined as the number’s distance from zero on a number line. Distance is always positive, so the absolute value of a number is always positive. For example,
3 3− = , 3 3= , x x− = .
NOTE: x x− = − x x− − = − Pay attention to whether a negative sign is inside or outside the absolute value parentheses. An absolute value function is a function that contains an absolute value term or expression. Examples are x and 1x + .
How to Solve an Absolute Value Function STEP 1: Isolate the absolute value expression. STEP 2: Remove absolute value signs and add ± to opposite expression. STEP 3: Eliminate the ± sign by writing two new equations. STEP 4. Solve both equations. Examples: Solve for x. 4 2x= − STEP 1: Isolate the absolute value expression.
6 x= STEP 2: Remove absolute value signs and add ± to opposite expression.
6 x± = STEP 3: Eliminate the ± sign by writing two new equations.
66
Eq xEq x
+ + =− − =
STEP 4. Solve both equations. (Unnecessary in this example.)
Solve for x. 4 3 2x= + − STEP 1: Isolate the absolute value expression.
6 3x= + STEP 2: Remove absolute value signs and add ± to opposite expression.
6 3x± = + STEP 3: Eliminate the ± sign by writing two new equations.
6 36 3
Eq xEq x
+ + = +− − = +
STEP 4. Solve both equations. 6 336 39
Eq xx
Eq xx
+ + = +=
− − = +− =
Using a Graphing Calculator with Absolute Value Functions:
Absolute value functions may be input in a graphing calculator by moving all terms to the right expression of the function and setting the left expression to zero. The inequality is then entered into the graphing calculator’s y-editor using the ABS function, which is found in the calculator’s catalog. Once input, the graph and table views of the function may be inspected. Example: Given: 1 3 6x + − >
Page 197

STEP 1. Transform the absolute value function so that the left expression equals zero, as shown below.
1 3 6
1 9 0
0 1 9
x
x
x
+ − >
+ − >
< + −
STEP 2. Input the function. NOTE: The abs entry is found in the graphing calculator’s catalog.
NOTE: Since this example is an inequality, pay attention to the inequality sign on the far left of the calculator’s input screen.
STEP 3. Inspect the table and graph views of the function.
.
Graphing an Absolute Value Function
STEP 1. Input the absolute value function in the graphing calculator.
STEP 2. Inspect the graph and table views.
STEP 3. Plot three points: 1) the vertex; 2) a second point for the line to the left of the vertex; and 3) a third point for the line to the right of the vertex.
STEP 4. Draw rays from the vertex through the two points.
DEVELOPING ESSENTIAL SKILLS
Use technology to explain how what happens to the graph of ( )f x x= under the transformations
( ) 2g x x= and ( ) 2h x x= + .
( ) 2g x x= gets narrower with the vertex at the same point.
( ) 2h x x= + shifts two units to the left.
Page 198

REGENTS EXAM QUESTIONS (through June 2018)
F.IF.C.7b, F.BF.B.3: Graphing Absolute Value Functions
163) On the set of axes below, graph the function .
State the range of the function. State the domain over which the function is increasing.
164) What is the minimum value of the function ?
1) 3) 3 2) 2 4)
165) Graph the function on the set of axes below.
Explain how the graph of has changed from the related graph .
Page 199

166) Describe the effect that each transformation below has on the function , where .
167) On the axes below, graph .
If , how is the graph of translated to form the graph of ? If , how is the graph of translated to form the graph of ?
168) On the axes below, graph .
If , how is the graph of translated to form the graph of ? If , how is the graph of translated to form the graph of ?
SOLUTIONS
Page 200

163) ANS:
The range is . The function is increasing for . Strategy: Input the function in a graphing calculator and use the table and graph views to complete the graph on paper and to answer the questions.
PTS: 4 NAT: F.IF.C.7 TOP: Graphing Absolute Value Functions
164) ANS: 1 Strategy: Input function in graphing calculator and inspect the graph and table views to find answer.
PTS: 2 NAT: F.IF.C.7 TOP: Graphing Absolute Value Functions
165) ANS:
The graph has shifted three units to the right.
Page 201

Strategy: Input both functions in a graphing calculator and compare the graphs.
PTS: 2 NAT: F.BF.B.3 TOP: Transformations with Functions and Relations
166) ANS: moves “a” units to the right.
moves down by “a” units.
PTS: 2 NAT: F.BF.B.3 TOP: Graphing Absolute Value Functions
167) ANS:
a) b) If , the graph of is translated 2 down to form the graph of . c) If , the graph of translated 4 right to form the graph of . Strategy: Input the three functions in a graphing calculator and compare the graphs.
PTS: 4 NAT: F.BF.B.3 TOP: Transformations with Functions and Relations
168) ANS:
Page 202

a) b) If , the graph of is translated 2 down to form the graph of . c) If , the graph of translated 4 right to form the graph of . Strategy: Input the three functions in a graphing calculator and compare the graphs.
PTS: 4 NAT: F.BF.B.3 TOP: Transformations with Functions and Relations
Page 203

H – Quadratics, Lesson 1, Solving Quadratics (r. 2018)
QUADRATICS Solving Quadratics
Common Core Standards
A-SSE.B.3 Choose and produce an equivalent form of an expression to reveal and explain properties of the quantity represented by the expression. A-REI.B.4a Solve quadratic equations in one varia-ble. NYSED: Solutions may include simplifying radicals.
Next Generation Standards
AI-A.SSE.3 Choose and produce an equivalent form of an expression to reveal and explain properties of the quantity represented by the expression. (Shared standard with Algebra II) AI-A.REI.4 Solve quadratic equations in one variable. Note: Solutions may include simplifying radicals.
NOTE: This lesson is in four parts and typically requires four or more days to complete.
LEARNING OBJECTIVES
Students will be able to:
1) Transform a quadratic equation into standard form and identify the values of a, b, and c. 2) Convert factors of quadratics to solutions. 3) Convert solutions of quadratics to factors. 4) Solve quadratics using the quadratic formula. 5) Solve quadratics using the completing the square method. 6) Solve quadratics using the factoring by grouping method.
Overview of Lesson
Teacher Centered Introduction Overview of Lesson
- activate students’ prior knowledge
- vocabulary
- learning objective(s)
- big ideas: direct instruction
- modeling
Student Centered Activities guided practice Teacher: anticipates, monitors, selects, sequences, and connects student work
- developing essential skills
- Regents exam questions
- formative assessment assignment (exit slip, explain the math, or journal entry)
VOCABULARY
box method of factoring completing the square constant factoring by grouping factors forms of a quadratic linear term multiplication property of zero
quadratic equation quadratic formula quadratic term roots solutions standard form of a quadratic x-axis intercepts zeros
Page 204

Part 1 – Overview of Quadratics BIG IDEAS
The standard form of a quadratic is: 2 0ax bx c+ + = .
• 2ax is the quadratic term • bx is the linear term • c is the constant term
Note: If the quadratic terms is removed, the remaining terms are a linear equation. The definition of a quadratic equation is: an equation of the second degree. Examples of quadratics in different forms:
Forms Examples standard form 6 ² 11 – 35 0
2 ² – 4 – 2 04 ² – 7 12 0
20 ² –15 – 10 0² – – 3 0
5 ² – 2 – 9 03 ² 4 2 0
² 6 18 0
x xx xx x
x xx x
x xx xx x
+ ==
− + ====
+ + =− + + =
without the bx term (the linear term)
2 ² – 64 0² – 16 0
9 ² 49 02 ² – 4 0
4 ² 81 0² – 9 0
3 ² – 36 06 ² 144 0
xxxx
xx
xx
==
+ =− =
+ =− =
=+ =
without the c term (the constant term )
² – 7 02 ² 8 0
² – 9 0² 2 0
6 ² – 3 05 ² 0
12 ² 13 011 ² 27 0
x xx xx xx xx x
x xx xx x
=+ =
− =+ =
− =− + =
− + =− =
Page 205

factored forms ( )( )( )( )( )( )( )( )( )( )( )( )( )( )( )( )
2 – 3 0
1 6 0
– 6 1 0
5 3 0
5 2 0
4 2 0
2 3 3 2 0
–3 – 4 2 3 0
x x
x x
x x
x x
x x
x x
x x
x x
+ =
+ + =
+ =
− + =
− + =
− + =
+ − =
+ =
other forms ( )( )( )
– 2 4
2 3 12
3 8 25 ² 9 6 ² 2
² 27 14² 2 1
4 ² 7 158 ² 3 10025 6 99 ²
x x
x x
x xx xx xx x
x xx xx x
x x
=
+ =
+ = −
= −− = − +
= −+ =− =
− + = −+ =
(Source: your dictionary.com)
Multiplication Property of Zero: The multiplication property of zero says that if the product of two numbers or expressions is zero, then one or both of the numbers or expressions must equal zero. More simply, if , then either or , or, both x and y equal zero. Example: The quadratic equation ( )2 ( 4) 0x x+ − = has two factors: ( )2 and ( 4)x x+ − . The multiplication property of zero says that one or both of these factors must equal zero, because the product of these two factors is zero. Therefore, write two equations, as follows: Eq #1 ( )2 =0x + Therefore, 2x = − Eq #2 ( 4) 0x − = Therefore, 4x = By the multiplication property of zero, { }2, 4x = − + . Zeros: A zero of a quadratic equation is a solution or root of the equation. The words zero, solution, and root all mean the same thing. The zeros of a quadratic equation are the value(s) of x when . A quadratic equation can have one, two, or no zeros. There are four general strategies for finding the zeros of a quadratic equation:
1) Solve the quadratic equation using the quadratic formula. 2) Solve the quadratic equation using the completing the square method. 3) Solve the quadratic equation using the factoring by grouping method. 4) Input the quadratic equation into a graphing calculator and find the x-axis intercepts.
Page 206

x-axis intercepts: The zeros of a quadratic can be found by inspecting the graph view of the equation. In graph form, the zeros of a quadratic equation are the x-values of the coordinates of the x-axis intercepts of the graph of the equation. The graph of a quadratic equation is called a parabola and can intercept the x-axis in one, two, or no places. Example: Find the x-axis intercepts of the quadratic equation ( )2 ( 4) 0x x+ − = by inspecting the x-axis intercepts of its graph.
The coordinates of the x-axis intercepts are are ( ) ( )2,0 and 4,0− . These x-axis intercepts show that the values of x when y=0 are -2 and 4, so the solutions of the quadratic equation are
{ }2, 4x = − + . The Difference Between Zeros and Factors
Factor: A factor is: 1) a whole number that is a divisor of another number, or 2) an algebraic expression that is a divisor of another algebraic expression.
Examples:
o 1, 2, 3, 4, 6, and 12 all divide the number 12, so 1, 2, 3, 4, 6, and 12 are all factors of 12. o will divide the trinomial expression ,
so are both factors of the .
Start with Factors and Find Zeros Remember that the factors of an expression are related to the zeros of the expression by the multiplication property of zero. Thus, if you know the factors, it is easy to find the zeros. Example: If the factors of the quadratic equation 22 5 6 0x x+ + = are ( )2 2x + and ( )3x + ,
then by the multiplication property of zero: either ( )2 2 0x + = , or ( )3 0x + = , or both equal zero. Solving each equation for x results in the zeros of the equation, as follows:
( ) ( )3 and 2x x− + 2 6x x− −
( ) ( )3 and 2x x− + 2 6x x− −
Page 207

( )2 2 02 2
1
xxx
+ =
= −= −
( )3 03
xx
+ =
= −
Start with Zeros and Find Factors If you know the zeros of an expression, you can work backwards using the multiplication property of zero to find the factors of the expression. For example, if you inspect the graph of an equation and find that it has x-intercepts at ( )3,0 and ( )2,0− , then you know that the solutions are 3x = and 2x = − . You can use these two equations to find the factors of the quadratic expression, as follows:
( )
( )
33 0
22 0
xx
xx
=
− =
= −
+ =
The factors of a quadratic equation with zeros of 3 and -2 are ( ) ( )3 and 2x x− + . With practice, you can probably move back and forth between the zeros of an expression and the factors of an expression with ease.
Page 208

Part 1 – Overview of Quadratics DEVELOPING ESSENTIAL SKILLS
Convert the following quadratic equations to standard form and identify the values of a, b, and c: ( )( )( )
– 2 4
2 3 12
3 8 25 ² 9 6 ² 2
² 27 14² 2 1
4 ² 7 158 ² 3 10025 6 99 ²
2 ² 640 16 ²
49 -9 ²² 7
2 ² 8 0 9 ²
x x
x x
x xx xx xx x
x xx xx x
x xx
xx
x xx x
x x
=
+ =
+ = −
= −− = − +
= −+ =− =
− + = −+ =
== − +=== − += − −
2
2
2
2 4 0 a= 1 , b=-2 , c=-4 2 6 12 0 a= 2, b=6 , c= -123 24 2 0 a= 3 , b= 24, c= 2
5 ² 9 0 a= 5 , b= 1, c= 96 ² 2 0 a= -6, b= -1, c= 2
² 27 14 0 a= 1 , b=-27 ,
x xx xx x
x xx x
x x
− − =
+ − =
+ + =+ − = −
− − + =− + = c= 14
² 2 -1= 0 a= 1 , b=2 , c=-1 4 ² 7 -15 0 a= 4 , b=-7 , c=-1
8 ² 3 +100 0 a= -8 , b=3 , c=100 99 ² 25 6 = 0 a= -99 , b=25 , c=6
2 ² – 64 0 a=2 , b= 0, c= ² –
x xx x
x xx x
xx
+− =
− + =− + +
= 16 0 a=1 , b= 0, c= -16
9 ² 49 0 a= 9 , b=0 , c=49 ² – 7 0 a= 1 , b=-7 , c=0
2 ² 8 0 a= 2 , b=8 , c= 0² – 9 0 a=-1 , b=-9 , c= 0
xx xx xx x
=+ =
=+ =
− =
Find the zeros of the following quadratic equations:
( )( )( )( )( )( )( )( )( )( )( )( )( )( )( )( )
2 – 3 0
1 6 0
– 6 1 0
5 3 0
. 5 2 0
4 2 0
2 3 3 2 0
. – 3 – 4 2 3 0
.
.
.
.
.
.
a
b
c
d
f
x x
x x
x x
x x
e x x
xg
x x
x
h x x
+ =
+ + =
+ =
− + =
− + =
− + =
+ − =
+ =
{ }{ }{ }{ }{ }{ }
. 2,3
. 6,1
. 1,6
. 3,5
. 2,5
. 2, 4
3 2. ,2 33. , 42
a x
b x
c x
d x
e x
f x
g x
h x
= −
= −
= −
=
=
= −
= − = −
Page 209

Part 2 – The Quadratic Formula The quadratic formula is:
2 42
b b acxa
− ± −=
Quadratic Formula Song
SOLVING QUADRATIC EQUATIONS STRATEGY #1: Use the Quadratic Formula
Start with any quadratic equation in the form of
The right expression must be zero.
Identify the values of a, b, and c. , , and Substitute the values of a, b, and c into
the quadratic formula, which is
Solve for x
The quadratic formula can be used to solve any quadratic equation.
Part 2 – The Quadratic Formula
DEVELOPING ESSENTIAL SKILLS
Solve the following quadratic equations using the quadratic formula. Leave answers in simplest radical form.
² – – 3 0x x =
( ) ( ) ( )( )( )
2
2
42
a = 1, b = -1, c = -3
1 1 4 1 32 1
1 1 122
1 132
b b acxa
x
x
x
− ± −=
− − ± − − −=
± +=
±=
Page 210

20 ² –15 – 10 0x x =
( ) ( ) ( )( )( )
2
2
42
a = 20, b = -15, c = -10
15 15 4 20 102 20
15 225 80040
15 102540
15 25 4140
15 5 4140
3 418
b b acxa
x
x
x
x
x
x
− ± −=
− − ± − − −=
± +=
±=
± ×=
±=
±=
2 ² – 4 – 2 0x x =
( ) ( ) ( )( )( )
2
2
42
a=2, b=-4,c=-2
4 4 4 2 22 2
4 16 164
4 324
4 16 24
4 4 24
1 2
b b acxa
x
x
x
x
x
x
− ± −=
− − ± − − −=
± +=
±=
± ×=
±=
= ±
Page 211

6 ² 11 35x x+ = 6 ² 11 -35 0x x+ =
( ) ( ) ( )( )( )
2
2
42
a = 6, b = 11, c =-35
11 11 4 6 352 6
11 121 84012
11 96112
11 3112
20 42 and 12 12
5 7,3 2
b b acxa
x
x
x
x
x x
x
− ± −=
− ± − −=
− ± +=
− ±=
− ±=
−= =
= −
2– 7 12 4xx + = 2–4 - 7 12 0x x + =
( ) ( ) ( )( )( )
2
2
42
a = -4, b = -7, c = 12
7 7 4 4 122 4
7 49 1928
7 2418
b b acxa
x
x
x
− ± −=
− − ± − − −=
−
± +=
−±
=−
Page 212

Part 3 – The Box Method of Factoring
2ax
c
mx
nx
gcfgcf
gcf
gcf
The Box Method for
Factoring a Trinomial
2 0bxbx mx nx
ax c+ + == +
INSTRUCTIONS EXAMPLE STEP 1 Start with a factorable quadratic in stand-ard form: 2 0ax bx c+ + = and a 2-row by 2-column table.
Solve by factoring: 26 12 0x x− − =
STEP 2 Copy the quadratic term into the upper left box and the constant term into the lower right box.
26x
-12
STEP 3 Multiply the quadratic term by the con-stant term and write the product to the right of the table.
26x
-12 2 26 12 72x x×− = −
STEP 4 Factor the product from STEP 3 until you obtain two factors that sum to the linear term (bx).
1 721 72
2 362 36
3 243 24
4 184 18
6 126 128 9 These two factors sum to
8 9
x xx x
x xx x
x xx x
x xx x
x xx xx x bx
x x
×−− ××−
− ××−
− ××−
− ××−
− ××−
− ×
Page 213

STEP 5 Write one of the two factors found in STEP 4 in the upper right box and the other in the lower left box. Order does not matter.
8x
26x
-12
-9x
STEP 6 Find the greatest common factor of each row and each column and record these factors to the left of each row and above each column. Give each factor the same plus or minus value as the nearest term in a box. NOTE: If all four of the greatest common factors share a common factor, reduce each factor by the common factor and add the common factor as a third factor. Eg. ( ) ( )( )3 9)(3 15 3 3 5x x x x− − ⇒ − −
8x
26x
-12
-9x
-32x
3x4
STEP 7 Write the expressions above and beside the box as binomial factors of the original trino-mial.
( )( )2 3 3 4 0x x− + =
STEP 8 Check to see that the factored quadratic is the same as the original quadratic.
( )( )2
2
2 3 3 4 0
6 8 9 12 06 9 12 0 check
x x
x x xx x
− + =
+ − − =
− − =
STEP 9 Convert the factors to zeros. ( )
( )
2 3 02 3
32
3 4 03 4
43
xx
x
xx
x
− =
=
=
+ =
= −
= −
Part 3 – The Box Method of Factoring
DEVELOPING ESSENTIAL SKILLS
Solve each quadratic by factoring. 2 02 8x x =− −
2x
2x
-8
-4x
-4x
x2
Page 214

( )( ){ }
4 2 0
2,4
x x
x
− + =
= −
2 3 10 0x x− − =
2x
2x
-10
-5x
-5x
x2
( )( ){ }
5 2 0
5, 2
x x
x
− + =
= −
2 2 15 0x x− − =
3x
2x
-15
-5x
-5x
x3
( )( )
{ } 5 3 0
x= 3,5
x x− + =
−
( )( )
2
2
0
6 5 66 4 9 62 3 3 2
x x
xx x x
x+ −
−
+ −
=
+
−
9x
26x
-6
-4x
-23x
2x3
( )( )2 3 3 2 0
3 2,2 3
x x
x
+ − =
= −
( )( )
2
2
1
2 2 5 – 3
0 4 6 010 6 10 6
00
x xx x xx x
+ − =
− +
=
− =
+
10x
210x
-6
-6x
-610x
2x2
( )( )( )( )
10 6 2 2 0
2 5 3 1 0
3x= 1,5
x x
x x
− + =
− + =
−
Page 215

Part 4 – Completing the Square SOLVING QUADRATIC EQUATIONS STRATEGY #3: Completing the Square
completing the square algorithm A process used to change an expression of the form ax2 +bx +c into a perfect square binomial by adding a suitable constant.
Source: NYSED Mathematics Glossary
PROCEDURE TO FIND THE ZEROS AND EXTREMES OF A QUADRATIC Start with any quadratic equation of the general form
STEP 1 Isolate all terms with and x on one side of the equation. If , divide every
term in the equation by a to get one expression in the form of STEP 2
Complete the Square by adding to both sides of the equation.
STEP 3
Factor the side containing into a binomial expression of the form
STEP 4a (solving for roots and zeros only)
Take the square root of both sides of the equation and simplify,
STEP 4b (solving for maxima and minima only)
Multiply both sides of the equation by a. Move all terms to left side of equation.
Solve the factor in parenthesis for axis of symmety and x-value of the vertex..
The number not in parentheses is the y-value of the vertes.
STEPS: EXAMPLE A EXAMPLE B
Start with any quadratic equation of the general form
2x 1≠a2 +x bx
2
2
b
22
2 + +
bx bx
2
2 +
bx
2 + + =ax bx c n
2 2 3 4+ + =x x 25 2 3 4+ + =x x
Page 216

STEP 1) Isolate all terms with
and x on one side of the equation. If , divide every term in the equation by a to get one expression in the form of
STEP 2) Complete the Square
by adding to
both sides of the equation.
STEP 3) Factor the side containing
into a
binomial expression
of the form
STEP 4a) Take the square roots of both sides of the equation and simplify.
2x
1≠a
2 +x bx
2 2 1+ =x x
25 2 1+ =x x
2
2
5 2 15 5 5
2 15 5
+ =
+ =
x x
x x
2
2
b( )
( ) ( )( )
22
2 22
22
22, 1, 12 2 2
2 1 1 1
2 1 2
= = = =
+ + = +
+ + =
b bb
x x
x x
2 2
2 22
2 1 1, ,5 2 5 2 5
2 1 1 15 5 5 5
= = =
+ + = +
b bb
x x
22
2 + +
bx bx
2
2 +
bx
( )21 2+ =x
2 2
2
2
1 1 15 5 5
1 5 15 25 25
1 65 25
+ = +
+ = +
+ =
x
x
x
( )21 2
1 2
1 2
+ =
+ = ±
= − ±
x
x
x
21 65 25
1 65 5
1 6 1 65 5 5
+ =
+ = ±
±= − ± =
x
x
x
Page 217

STEP 4b Multiply both sides of the equation by a. Move all terms to left side of equation. Solve the factor in parenthesis for axis of symmety and x-value of the vertex. The number not in parentheses is the y-value of the vertes.
Part 4 – Completing the Square
DEVELOPING ESSENTIAL SKILLS
Solve the following quadratic equations by completing the square. ² – – 3 0x x =
2 2
2
² 3 0² =3
1 1² + =3+2 2
1 132 4
1 132 4
1 132 21 13
2
x xx x
x x
x
x
x
x
− − =−
−
− = +
− = ±
= ±
±=
( )21 2+ =x
Page 218

20 ² –15 – 10 0x x =
2
2 22
2
2
20 ² –15 – 10 020 ² –15 10
20 ² 15 10 – 20 20 20
3 1x – 4 2
3 3 1 3x – + +4 8 2 8
3 32 98 64 64
3 418 64
3 418 64
3 418 83 41
8
x xx x
x x
x
x
x
x
x
x
x
==
=
=
− = −
− = +
− =
− = ±
= ±
+=
2 ² – 4 – 2 0x x =
( )
2
2 22
2
2 ² – 4 – 2 02 ² – 4 =2
2 ² 4 2 – =2 2 2
2 1
2 22 12 2
1 1 1
1 2
1 2
x xx x
x x
x x
x x
x
x
x
=
− =
− + − = + −
− = +
− = ±
= ±
Page 219

6 ² 11 35x x+ =
2
2 22
2
2
2
6 ²+11 -35 06 ² 11 =35
6 ² 11 35 =6 6 6
11 356 6
11 11 35 116 12 6 12
11 35 12112 6 144
11 840 12112 144 144
11 96112 144
11 96112 14411 3112 12
11 3112 12
42 12
x xx x
x x
xx
xx
x
x
x
x
x
x
x
=+
+
+ =
+ + = +
+ = +
+ = +
+ =
+ = ±
+ = ±
= − ±
=20and
127 5 and -2 35 7,3 2
x
x
−
=
= −
Page 220

2– 7 12 4xx + = 2
2
2
2 22
22
2
–4 -7 =-12–4 7 -12- =
4 4 47 34
7 7 734 8 8
7 7 192 494 8 64 64
7 2418 64
7 2418 8
7 2418 87 241
8
x xx x
x x
x x
x x
x
x
x
x
− − −
+ =
+ + = +
+ + = +
+ =
+ = ±
= ±
±=
Page 221

REGENTS EXAM QUESTIONS (through June 2018)
A.APR.B.3, A.REI.B.4: Solving Quadratics
169) Solve for m by factoring.
170) Keith determines the zeros of the function to be and 5. What could be Keith's function?
1) 3) 2) 4)
171) In the equation , b is an integer. Find algebraically all possible values of b.
172) Which equation has the same solutions as
1) 3) 2) 4)
173) The zeros of the function are 1) and 3) 1 and 2 2) 1 and 4) and 2
174) The zeros of the function are 1) 3 and 3) and 1 2) 3 and 1 4) and
175) Janice is asked to solve . She begins the problem by writing the following steps: Line 1 Line 2 Line 3 Use Janice’s procedure to solve the equation for x. Explain the method Janice used to solve the quadratic equation.
176) What is the solution set of the equation ?
1) -2 and a 3) 2 and a 2) -2 and -a 4) 2 and -a
177) The function is defined by the expression . Use factoring to determine the zeros of . Explain what the zeros represent on the graph of .
178) If the quadratic formula is used to find the roots of the equation , the correct roots are
1) 3) 2) 4)
179) Which equation has the same solution as ? 1) 3) 2) 4)
180) What are the roots of the equation ?
Page 222

1) 3) 2) 4)
181) Write an equation that defines as a trinomial where . Solve for x when .
182) If , the roots of the equation are
1) and 25 3) and 5 2) , only 4) , only
183) Ryker is given the graph of the function . He wants to find the zeros of the function, but is
unable to read them exactly from the graph.
Find the zeros in simplest radical form.
184) A student was given the equation to solve by completing the square. The first step that
was written is shown below.
The next step in the student’s process was . State the value of c that creates a perfect square trinomial. Explain how the value of c is determined.
185) Which equation has the same solutions as ?
1) 3) 2) 4)
186) Solve the equation algebraically for x.
187) When directed to solve a quadratic equation by completing the square, Sam arrived at the equation
. Which equation could have been the original equation given to Sam?
1) 3)
Page 223

2) 4)
188) A student is asked to solve the equation . The student's solution to the problem starts as
A correct next step in the solution of the problem is 1) 3) 2) 4)
189) What are the solutions to the equation ? 1) 3) 2) 4)
190) The solution of the equation is 1) 3) 2) 4)
191) When solving the equation by completing the square, which equation is a step in the process? 1) 3) 2) 4)
192) Solve the equation for y:
193) Fred's teacher gave the class the quadratic function .
a) State two different methods Fred could use to solve the equation . b) Using one of the methods stated in part a, solve for x, to the nearest tenth.
194) What is the solution of the equation ?
1) 6, only 3) 2 and 2) 2, only 4) 6 and
195) Amy solved the equation . She stated that the solutions to the equation were and .
Do you agree with Amy's solutions? Explain why or why not.
196) The height, H, in feet, of an object dropped from the top of a building after t seconds is given by
. How many feet did the object fall between one and two seconds after it was dropped? Determine, algebraically, how many seconds it will take for the object to reach the ground.
197) What are the solutions to the equation ?
1) and 3) and
2) and 4) and
Page 224

198) Find the zeros of , algebraically.
199) Which value of x is a solution to the equation ?
1) 3)
2) 4)
200) The method of completing the square was used to solve the equation . Which equation is a correct step when using this method? 1) 3) 2) 4)
201) What are the solutions to the equation ? 1) 3) 2) 4)
202) Solve the equation by completing the square.
203) What are the solutions to the equation ?
1) 1 and 7 3) 2) and 4)
204) The quadratic equation is rewritten in the form , where q is a constant. What is the value of p? 1) 3) 2) 4) 9
205) Solve for x to the nearest tenth: .
SOLUTIONS
169) ANS:
and
Strategy: Factor by grouping.
Page 225

Use the multiplication property of zero to solve for m.
PTS: 2 NAT: A.SSE.B.3 TOP: Solving Quadratics
170) ANS: 3 Strategy: Convert the zeros to factors. If the zeros of are and 5, then the factors of are and . Therefore, the function can be written as . The correct answer choice is c.
PTS: 2 NAT: A.SSE.B.3 TOP: Solving Quadratics
171) ANS: 6 and 4 Strategy: Factor the trinomial into two binomials.
Page 226
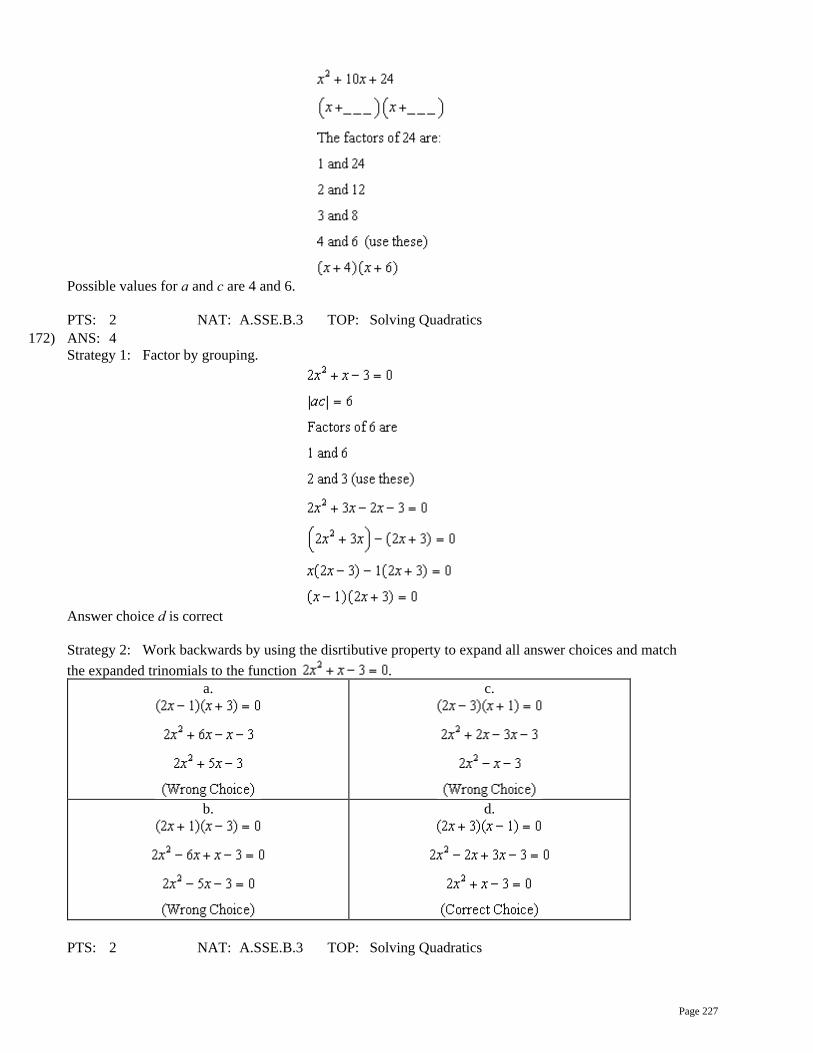
Possible values for a and c are 4 and 6.
PTS: 2 NAT: A.SSE.B.3 TOP: Solving Quadratics
172) ANS: 4 Strategy 1: Factor by grouping.
Answer choice d is correct Strategy 2: Work backwards by using the disrtibutive property to expand all answer choices and match the expanded trinomials to the function .
a.
c.
b.
d.
PTS: 2 NAT: A.SSE.B.3 TOP: Solving Quadratics
Page 227
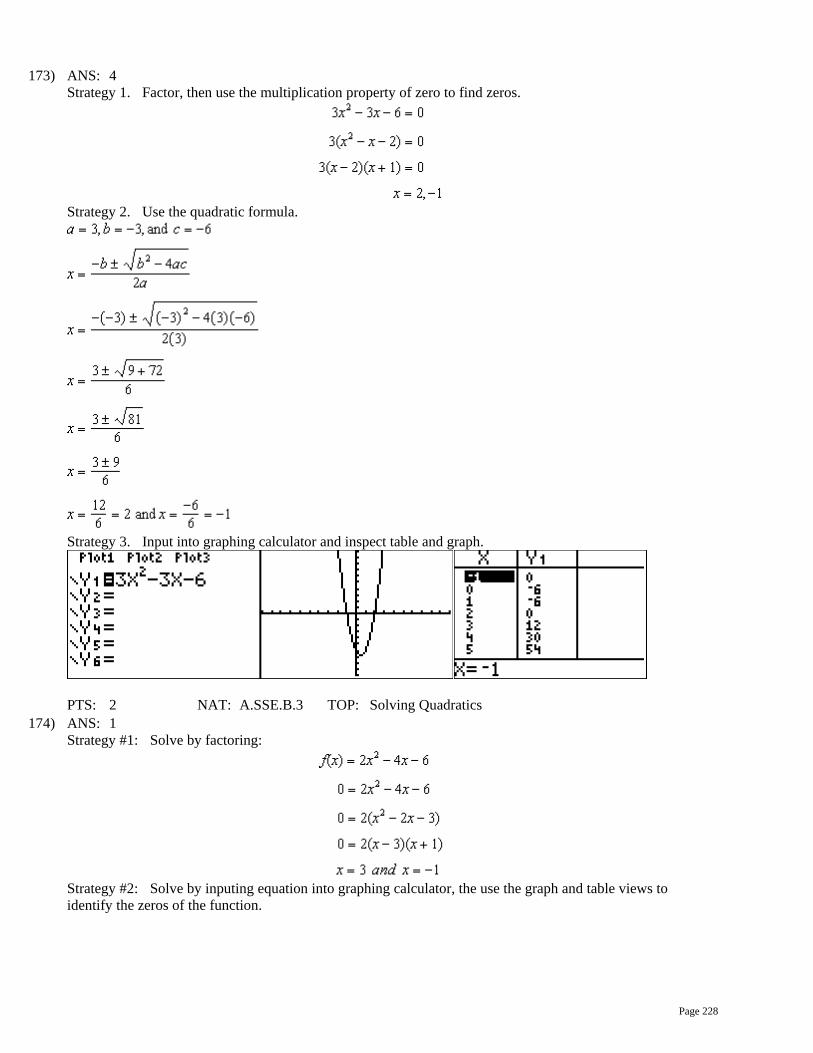
173) ANS: 4 Strategy 1. Factor, then use the multiplication property of zero to find zeros.
Strategy 2. Use the quadratic formula.
Strategy 3. Input into graphing calculator and inspect table and graph.
PTS: 2 NAT: A.SSE.B.3 TOP: Solving Quadratics
174) ANS: 1 Strategy #1: Solve by factoring:
Strategy #2: Solve by inputing equation into graphing calculator, the use the graph and table views to identify the zeros of the function.
Page 228

The graph and table views show the zeros to be at -1 and 3.
PTS: 2 NAT: A.SSE.B.3 TOP: Solving Quadratics KEY: zeros of polynomials
175) ANS: Use Janice’s procedure to solve for X. Line 4 and Line 5 Therefore: and
Explain the method Janice used to solve the quadratic formula. Janice made the problem easier by substituting B for 8x, then solving for B. After solving for B, she reversed her substitution and solved for x. Check:
PTS: 4 NAT: A.SSE.B.3a
176) ANS: 3 The solution set of a quadratic equation includes all values of x when y equals zero. In the equation
, the value of y is zero and and are factors whose product is zero. The multiplication property of zero says, if the product of two factors is zero, then one or both of the factors must be zero.
Page 229

Therefore, we can write: and .
PTS: 2 NAT: A.SSE.B.3 TOP: Solving Quadratics
177) ANS:
Factor as follows:
Then, use the multiplication property of zero to find the zeros, as follows: and
The zeros of a function are the x-values when . On a graph, the zeros are the values of x at the x-axis intercepts.
PTS: 4 NAT: A.SSE.B.3 TOP: Solving Quadratics
178) ANS: 1 Strategy: Use the quadratic equation to solve , where , , and .
Answer choice a is correct.
PTS: 2 NAT: A.REI.B.4 TOP: Solving Quadratics KEY: quadratic formula
179) ANS: 2 Strategy: Use the distributive property to expand each answer choice, the compare the expanded trinomial to the given equation . Equivalent equations expressed in different terms will have the same solutions.
a. c.
Page 230

b.
d.
PTS: 2 NAT: A.REI.B.4 TOP: Solving Quadratics KEY: completing the square
180) ANS: 2 Strategy 1: Use the quadratic equation to solve , where , , and .
Answer choice b is correct. Strategy 2: Solve by completing the square:
Page 231

Answer choice b is correct.
PTS: 2 NAT: A.REI.B.4 TOP: Solving Quadratics KEY: quadratic formula
181) ANS: and
Strategy: Transform the expression to a trinomial, then set the expression equal to 0 and solve it. STEP 1. Transform into a trinomial.
STEP 2. Set the trinomial expression equal to 0 and solve.
PTS: 4 NAT: A.REI.B.4 TOP: Solving Quadratics KEY: factoring
182) ANS: 3 Strategy: Solve using root operations.
Answer choice c is correct.
PTS: 2 NAT: A.REI.B.4 TOP: Solving Quadratics KEY: taking square roots
183) ANS:
x = ±2 2
Page 232

Strategy: Use root operations to solve for x in the equeation .
PTS: 2 NAT: A.REI.B.4 TOP: Solving Quadratics KEY: taking square roots
184) ANS:
The value of c that creates a perfect square trinomial is , which is equal to 9.
The value of c is determined by taking half the value of b, when , and squaring it. In this problem,
, so .
PTS: 2 NAT: A.REI.B.4 TOP: Solving Quadratics KEY: completing the square
185) ANS: 4 Strategy: Use the distributive property to expand each answer choice, the compare the expanded trinomial to the given equation . Equivalent equations expressed in different terms will have the same solutions.
a.
c.
b.
d.
Page 233

PTS: 2 NAT: A.REI.B.4 TOP: Solving Quadratics KEY: completing the square
186) ANS: Strategy 1: Solve using factoring by grouping.
Strategy 2: Solve by completing the square.
Page 234

Strategy 3. Solve using the quadratic formula, where , , and .
PTS: 2 NAT: A.REI.B.4 TOP: Solving Quadratics KEY: factoring
Page 235

187) ANS: 4 Strategy: Assume that Sam’s equation is correct, then expand the square in his equation and simplify.
PTS: 2 NAT: A.REI.B.4 TOP: Solving Quadratics KEY: completing the square
188) ANS: 1 Strategy: The next step should be to take the square roots of both expressions.
The correct answer choice is a.
PTS: 2 NAT: A.REI.B.4 TOP: Solving Quadratics KEY: completing the square
189) ANS: 2
Page 236

PTS: 2 NAT: A.REI.B.4 TOP: Solving Quadratics KEY: completing the square
190) ANS: 3 Strategy 1: Solve using root operations.
Strategy 2. Solve using the quadratic equation.
Page 237

PTS: 2 NAT: A.REI.B.4 TOP: Solving Quadratics KEY: completing the square
191) ANS: 2
PTS: 2 NAT: A.REI.B.4 TOP: Solving Quadratics KEY: completing the square
192) ANS: The solutions are and .
Page 238

PTS: 2 NAT: A.REI.B.4 TOP: Solving Quadratics KEY: factoring
193) ANS: a) Quadratic formula and completing the square. b) -0.7 and -3.3
Complete the Square Method Quadratic Formula Method
a=4, b=16, c=9
Page 239

PTS: 1 NAT: A.REI.A.1
194) ANS: 3 Step 1. Understand that solving the equation means isolating the value of x. Step 2. Strategy. Isolate x. Step 3. Execution of strategy.
Page 240

Step 4. Does it make sense? Yes. The values 2 and -6 satisfy the equation . x=2
x=-6
PTS: 2 NAT: A.REI.B.4 TOP: Solving Quadratics KEY: taking square roots
195) ANS: Yes. I agree with Amy’s solution. I get the same solutions by using the quadratic formula.
Page 241

NOTE: Acceptable explanations could also be made by: 1) substituting Amy’s solutions into the original equation and showing that both solutions make the equation balance; 2) solving the quadratic by completing the square and getting Amy’s solutions; or 3) solving the quadratic by factoring and getting Amy’s solutions.
PTS: 2 NAT: A.REI.B.4 TOP: Solving Quadratics KEY: factoring NOT: NYSED classifies this as A.REI.A
196) ANS: How many feet did the object fall between one and two seconds after it was dropped? Strategy: Input the function in a graphing calculator.
After one second, the object is 128 feet above the ground. After two seconds, the object is 80 feet above the ground. The object fell feet between one and two seconds after it was dropped. Determine algebraically how many seonds it will take for the object to reach the ground.
Page 242

The object will hit the ground after 3 seconds.
PTS: 4 NAT: A.SSE.B.3 TOP: Solving Quadratics
197) ANS: 1
PTS: 2 NAT: A.REI.B.4
198) ANS:
PTS: 2 NAT: A.REI.B.4
199) ANS: 4 Given =
Page 243

Add (12) +12 = +12 Simplify = 0
Add ( )
=
Simplify 25 = Divide (36)
=
Simplify =
x2
Square Root =
x
The only correct answer choice is .
PTS: 2 NAT: A.REI.B.4 TOP: Solving Quadratics KEY: taking square roots
200) ANS: 1 Given = 0
Divide by 2
=
Simplify = 0 Subtract 3 -3 = -3
Simplify = -3 Complete the Square
=
Simplify = Factor and Simplify = -3 + 9
Simplify = 6
PTS: 2 NAT: A.REI.B.4 TOP: Solving Quadratics KEY: completing the square
201) ANS: 1 Strategy 1: Use the quadratic equation to solve , where , , and .
Page 244

Answer choice a is correct. Strategy 2. Solve by completing the square.
Answer choice a is correct.
PTS: 2 NAT: A.REI.B.4 TOP: Solving Quadratics KEY: completing the square
202) ANS:
Page 245

PTS: 2 NAT: A.REI.B.4 TOP: Solving Quadratics KEY: completing the square
203) ANS: 1
PTS: 2 NAT: A.REI.B.4 TOP: Solving Quadratics KEY: taking square roots
204) ANS: 3 Strategy: Rewrite in the form of and find the value of p.
Notes Left Epression Sign Right Expression Given = 12
Complete the Square = Exponents and
Parentheses =
Factor left expression and simplify right
expression
= 21
Compare to form given in the question.
= q
Page 246

PTS: 2 NAT: A.REI.B.4 TOP: Solving Quadratics KEY: completing the square
205) ANS: Answer: -2.8, 1.8 Strategy: Use the quadratic formula STEP 1. Identify the values of a, b, and c in .
STEP 2. Substitute these values in the quadratic formula and solve.
PTS: 2 NAT: A.REI.B.4 TOP: Solving Quadratics KEY: quadratic formula
Page 247

H – Quadratics, Lesson 2, Using the Discriminant (r. 2018)
QUADRATICS Using the Discriminant
Common Core Standard
A-REI.4b Solve quadratic equations by inspection (e.g., for x2 =49), taking square roots, completing the square, the quadratic formula and factoring, as ap-propriate to the initial form of the equation. Recog-nize when the quadratic formula gives complex solu-tions and write them as a + bi, a - bi for real num-bers a and b. PARCC: Tasks do not require students to write solutions for
ic equations that have roots with non-zero imaginary parts. r, tasks can require the student to recognize cases in which a ic equation has no real solutions.
Next Generation Standard
AI-A.REI.4b Solve quadratic equations by: i) inspection, ii) taking square roots, iii) factoring, iv) completing the square, v) the quadratic formula, and vi) graphing. Recognize when the process yields no real solutions. (Shared standard with Algebra II) Notes: • Solutions may include simplifying radicals or writing solutions in simplest radical form. • An example for inspection would be x2 = 49, where a student should know that the solutions would include 7 and -7. • When utilizing the quadratic formula, there are no coefficient limits. • The discriminant is a sufficient way to recognize when the process yields no real solutions.
LEARNING OBJECTIVES
Students will be able to:
1) Identify the number and characteristics of solutions to quadratic equations based on analysis of the discriminant.
Overview of Lesson Teacher Centered Introduction
Overview of Lesson
- activate students’ prior knowledge
- vocabulary
- learning objective(s)
- big ideas: direct instruction
- modeling
Student Centered Activities guided practice Teacher: anticipates, monitors, selects, sequences, and connects student work
- developing essential skills
- Regents exam questions
- formative assessment assignment (exit slip, explain the math, or journal entry)
VOCABULARY
discriminant real solutions imaginary solutions
standard form of a quadratic solution zero
root x-axis intercept
Page 248

BIG IDEAS
Standard Form of a Quadratic:
Quadratic Formula:
Discriminant =
Analyzing the Discriminant
The discriminant can be used to determine the number of and type of solutions to a quadratic equation.
Every quadratic can have zero, one, or two solutions.
Solutions can be real or imaginary numbers.
If the Value of the Discriminant Is:
Characteristics and Number of Solutions
of the Quadratic Equation Are:
Examples
Negative
If the value of the discriminant is negative, then there will be two imaginary number solutions and no x-axis intercepts.
Zero
If the value of the discriminant is zero, then there will be one real solution and the graph will touch the x-axis at one and only one point.
20 4b ac> −
2
2 2
2
2 54 2 4(1)(5)4 16
y x xb acb ac
= + +
− = −
− = −
20 4b ac= −
2
2 2
2
2 14 2 4(1)(1)4 0
y x xb acb ac
= + +
− = −
− =
Page 249
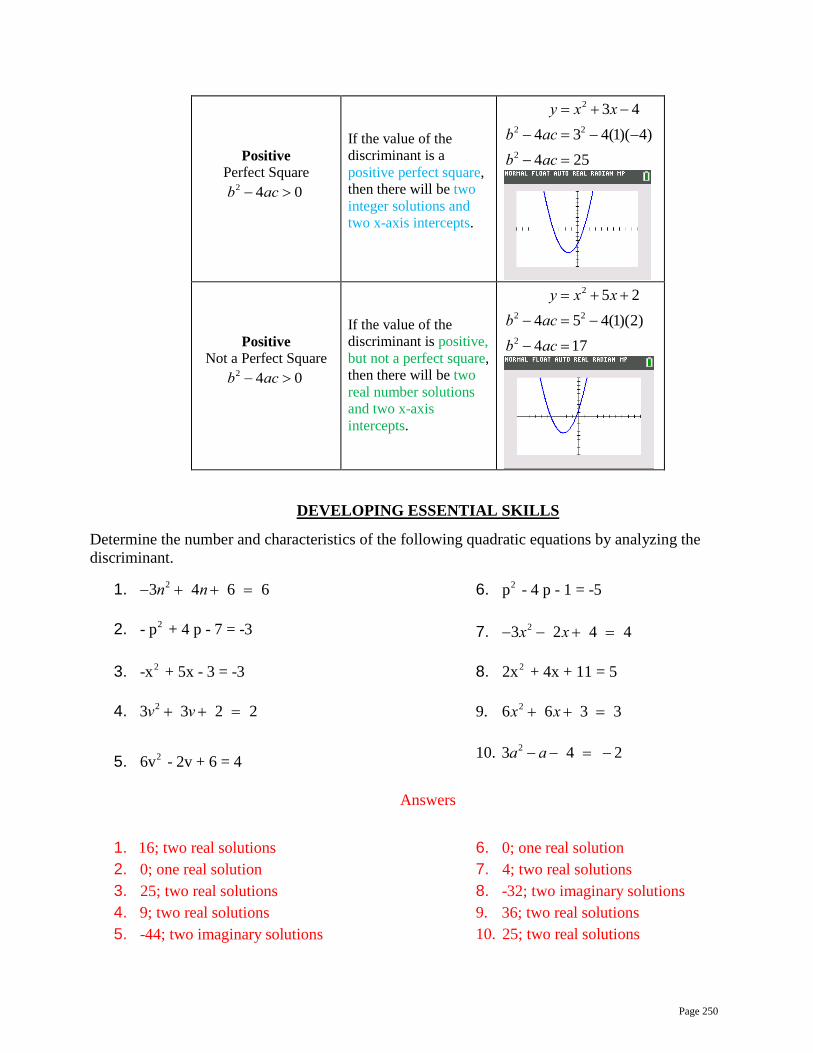
Positive
Perfect Square
If the value of the discriminant is a positive perfect square, then there will be two integer solutions and two x-axis intercepts.
Positive
Not a Perfect Square
If the value of the discriminant is positive, but not a perfect square, then there will be two real number solutions and two x-axis intercepts.
DEVELOPING ESSENTIAL SKILLS
Determine the number and characteristics of the following quadratic equations by analyzing the discriminant.
1. 23 4 6 6n n− + + =
2. 2- p + 4 p - 7 = -3
3. 2-x + 5x - 3 = -3
4. 23 3 2 2v v+ + =
5. 26v - 2v + 6 = 4
6. 2p - 4 p - 1 = -5
7. 23 2 4 4x x− − + =
8. 22x + 4x + 11 = 5
9. 26 6 3 3x x+ + =
10. 23 4 2a a− − = −
Answers
1. 16; two real solutions 2. 0; one real solution 3. 25; two real solutions 4. 9; two real solutions 5. -44; two imaginary solutions
6. 0; one real solution 7. 4; two real solutions 8. -32; two imaginary solutions 9. 36; two real solutions 10. 25; two real solutions
2 4 0b ac− >
2
2 2
2
3 44 3 4(1)( 4)4 25
y x xb acb ac
= + −
− = − −
− =
2 4 0b ac− >
2
2 2
2
5 24 5 4(1)(2)4 17
y x xb acb ac
= + +
− = −
− =
Page 250
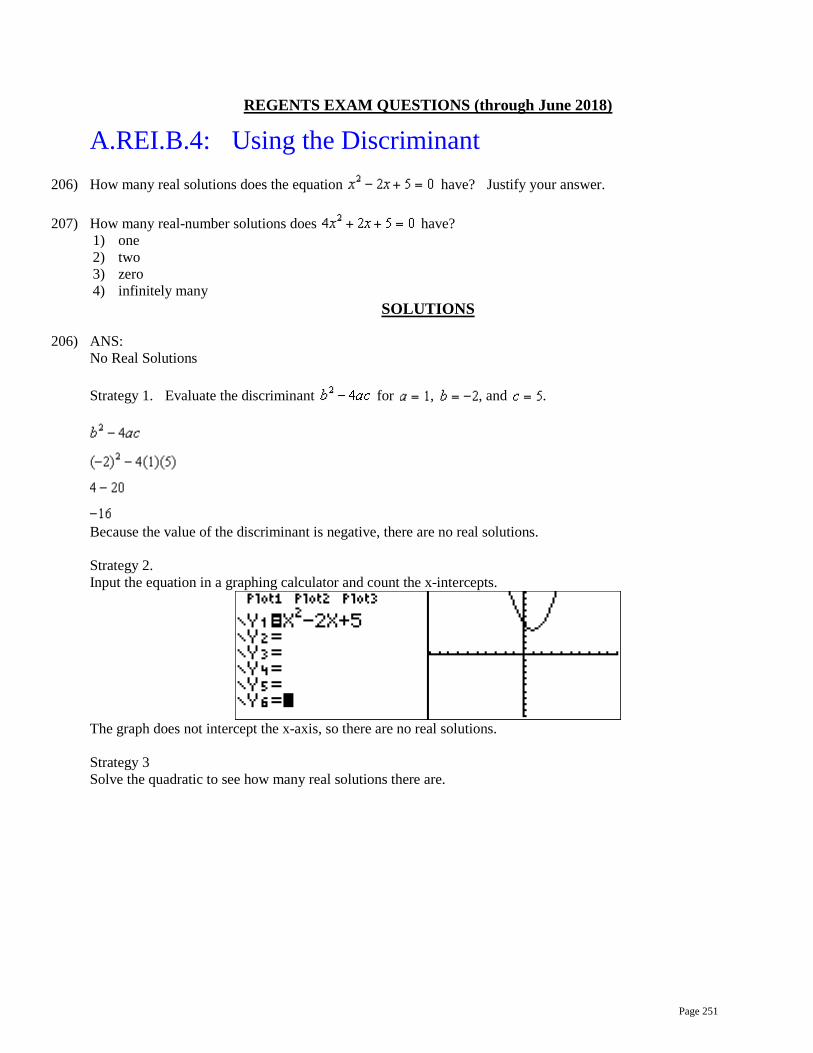
REGENTS EXAM QUESTIONS (through June 2018)
A.REI.B.4: Using the Discriminant
206) How many real solutions does the equation have? Justify your answer.
207) How many real-number solutions does have?
1) one 2) two 3) zero 4) infinitely many
SOLUTIONS
206) ANS: No Real Solutions Strategy 1. Evaluate the discriminant for , , and .
Because the value of the discriminant is negative, there are no real solutions. Strategy 2. Input the equation in a graphing calculator and count the x-intercepts.
The graph does not intercept the x-axis, so there are no real solutions. Strategy 3 Solve the quadratic to see how many real solutions there are.
Page 251

Both solutions involve imaginary numbers, so there are no real solutions.
PTS: 2 NAT: A.REI.B.4 TOP: Using the Discriminant
207) ANS: 3 Strategy: Use the discriminant, which is . If the discriminant is > 0, then the quadratic has two real-number solutions. If the discriminant is = 0, then the quadratic has one real-numer solution. If the discriminant is < 0, the the quadratic has zero real-number solutions. STEP 1. Identify the values of a, b, and c in the quadratic equation .
STEP 2. Substitute the values into and evaluate.
The quadratic has zero real-number solutions. CHECK by inputting the quadratic equation in a graphing calculator and looking at the graph view.
The number of solutions is equal to the number of x-axis intercepts. In this case, the parabola opens upward and does not cross the x-axis, which means it has zero real-numer solutions.
PTS: 2 NAT: A.REI.B.4 TOP: Using the Discriminant KEY: AI
Page 252

H – Quadratics, Lesson 3, Modeling Quadratics (r. 2018)
QUADRATICS Modeling Quadratics
Common Core Standard
A-CED.1 Create equations and inequalities in one variable and use them to solve problems. Include equations arising from linear and quadratic func-tions, and simple rational and exponential functions. PARCC: Tasks are limited to linear, quadratic, or exponential equations with integer exponents.
Next Generation Standard
AI-A.CED.1 Create equations and inequalities in one variable to represent a real-world context. (Shared standard with Algebra II) Notes: • This is strictly the development of the model (equa-tion/inequality). • Limit equations to linear, quadratic, and exponen-
tials of the form ( ) ( ) xf x a b= where a > 0 and b > 0 (b ≠ 1). • Work with geometric sequences may involve an ex-ponential equation/formula of the form an = arn-1, where a is the first term and r is the common ratio. • Inequalities are limited to linear inequalities. • Algebra I tasks do not involve compound inequalities.
NOTE: This lesson is related to Expressions and Equations, Lesson 4, Modeling Linear Equations
LEARNING OBJECTIVES
Students will be able to:
model quadratic equations that reflect real-world contexts, including: a. product of consecutive integer contexts, b. product of ages contexts, and c. squared number contexts.
Overview of Lesson Teacher Centered Introduction
Overview of Lesson
- activate students’ prior knowledge
- vocabulary
- learning objective(s)
- big ideas: direct instruction
- modeling
Student Centered Activities guided practice Teacher: anticipates, monitors, selects, sequences, and connects student work
- developing essential skills
- Regents exam questions
- formative assessment assignment (exit slip, explain the math, or journal entry)
VOCABULARY
consecutive integers consecutive odd integers consecutive even integers
BIG IDEAS General Approach The general approach to modelling quadratics is:
Page 253

1. Read and understand the entire problem. 2. Underline key words, focusing on variables, operations, and equalities or inequalities. 3. Convert the key words to mathematical notation (consider meaningful variable names other than
x and y). 4. Write the final expression or equation. 5. Check the final expression or equation for reasonableness.
Product of Consecutive Integer Problems: The key to solving product of consecutive integer problems is also defining the variables.
Typical Problem in Context Mathematical Translation Hints and Strategies Find three consecutive positive even integers such that the product of the second and third integers is twenty more than ten times the first integer.
6, 8, 10. Three consecutive even integers are x, and .
For consecutive integer problems, define your variables as x, x + 1, etc. For consecutive even or odd integer problems, define your variables as x, x +2, etc.
Product of Ages Problems: The key to solving product of consecutive integer problems is also defining the variables.
Typical Problem in Context Mathematical Translation Hints and Strategies Brian is 3 years older than Doug. The product of their ages is 40. How old is Doug?
Let d represent Doug’s age. Let d+3 represent Brian’s age. Let ( )3 40d d + = represent the product of their ages. Solve for d.
( )
( )( ){ }
2
2
3 40
3 403 40 08 5 0
8,5Reject -8 because agecannot be negative.
d d
d dd dd d
d
+ =
+ =
+ − =
+ − =
= −
Doug is 5 years old.
Define your variables carefully.
Squared Number Problems:
Typical Problem in Context Mathematical Translation Hints and Strategies
Page 254

When 36 is subtracted from the square of a number, the result is five times the number. What is the positive solution?
9 Let the square of a number be represented by 2x Let five times the number be represented by 5x Write:
( )( ){ }
2
2
36 55 36 09 4 0
4,9The problem says to select the positive solution.
x xx xx x
x
− =
− − =
− + =
= −
Underline key words.
DEVELOPING ESSENTIAL SKILLS
1) Find three consecutive positive even integers such that the product of the second and third integers is twenty more than ten times the first integer. [Only an algebraic solution can receive full credit.]
2) When 36 is subtracted from the square of a number, the result is five times the number. What is the positive
solution? 1) 9 3) 3 2) 6 4) 4
3) Noj is 5 years older than Jacob. The product of their ages is 84. How old is Noj?
4) The square of a positive number is 24 more than 5 times the number. What is the value of the number?
5) Find three consecutive odd integers such that the product of the first and the second exceeds the third by 8.
6) Three brothers have ages that are consecutive even integers. The product of the first and third boys’ ages is 20
more than twice the second boy’s age. Find the age of each of the three boys.
7) Tamara has two sisters. One of the sisters is 7 years older than Tamara. The other sister is 3 years younger than
Tamara. The product of Tamara’s sisters' ages is 24. How old is Tamara?
Answers
1) 6, 8, 10. Let x represent the first integer. Let x+2 represent the second integer. Let x+4 represent the third integer Write
Page 255

( )( )
( )( ){ }
2
2
2 4 10 20
6 8 10 204 12 06 2 0
2,6
x x x
x x xx xx x
x
+ + = +
+ + = +
− − =
− + =
= −
Reject the negative integer solution for x because the problem calls for a positive integer solution.
2) Let 2x represent the square of a number. Let 5x represent five times the number. Write:
( )( ){ }
2
2
36 55 36 0
9 4 0
4,9
x xx x
x x
x
− =
− − =
− + =
= −
The positive solution is 9.
3) Let N represent Noj’s age. Let N-5 represent Jacob’s age. Write:
( )
( )( ){ }
2
5 84
5 84 012 7 0
7,12
N N
N NN N
N
− =
− − =
− + =
= −
Reject the negative solution because age cannot be negative. Noj is 12 years old.
4) Let 2x represent the square of a number. Let 5x represent 5 times the number. Write:
( )( ){ }
2
2
24 55 24 0
8 3 0
3,8
x xx x
x x
x
= +
− − =
− + =
= −
Reject the negative solution The number is 8.
5) Let x represent the first odd integer. Let x+2 represent the second consecutive odd integer. Let x+4 represent the third consecutive odd integer. Write:
Page 256

( ) ( )
( )( ){ }
2
2
2 4 8
2 4 812 0
4 3 0
4,3
x x x
x x xx x
x x
x
+ − + =
+ − − =
+ − =
+ − =
= −
Reject the even integer solution. The three consecutive odd integers are 3, 5, and 7
6) Let x represent the age of the first brother. Let x+2 represent the age of the second brother. Let x+4 represent the age of the third brother. Write:
( ) ( )
( )( ){ }
2
2
2
4 20 2 2
4 20 2 42 24
2 24 06 4 0
6,4
x x x
x x xx x
x xx x
x
+ = + +
+ = + +
− =
− − =
+ − =
= −
Reject the negative solution because age cannot be negative. The ages of the three brothers are 4, 6, and 8.
7) Let x represent Tamara’s age. Let x+7 represent the age of Tamara’s older sister. Let x-3 represent the age of Tamara’s younger sister. Write:
( )( )
( )( ){ }
2
2
2
7 3 24
7 3 21 244 21 244 45 0
9 5 0
9,5
x x
x x xx xx x
x x
x
+ − =
+ − − =
+ − =
+ − =
+ − =
= −
Reject the negative solution. Tamara’s age is 5.
REGENTS EXAM QUESTIONS (through June 2018)
A.CED.A.1: Modeling Quadratics
208) Sam and Jeremy have ages that are consecutive odd integers. The product of their ages is 783. Which equation
could be used to find Jeremy’s age, j, if he is the younger man?
Page 257
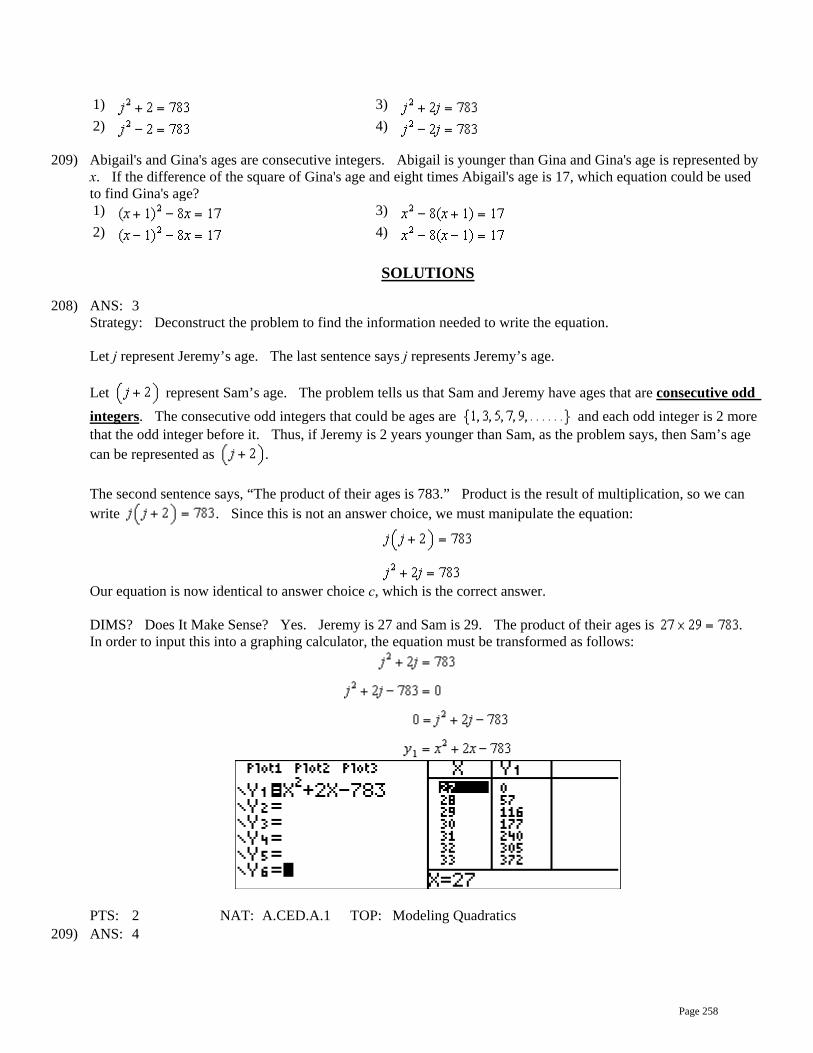
1) 3) 2) 4)
209) Abigail's and Gina's ages are consecutive integers. Abigail is younger than Gina and Gina's age is represented by x. If the difference of the square of Gina's age and eight times Abigail's age is 17, which equation could be used to find Gina's age? 1) 3) 2) 4)
SOLUTIONS
208) ANS: 3 Strategy: Deconstruct the problem to find the information needed to write the equation. Let j represent Jeremy’s age. The last sentence says j represents Jeremy’s age. Let represent Sam’s age. The problem tells us that Sam and Jeremy have ages that are consecutive odd integers. The consecutive odd integers that could be ages are and each odd integer is 2 more that the odd integer before it. Thus, if Jeremy is 2 years younger than Sam, as the problem says, then Sam’s age can be represented as . The second sentence says, “The product of their ages is 783.” Product is the result of multiplication, so we can write . Since this is not an answer choice, we must manipulate the equation:
Our equation is now identical to answer choice c, which is the correct answer. DIMS? Does It Make Sense? Yes. Jeremy is 27 and Sam is 29. The product of their ages is . In order to input this into a graphing calculator, the equation must be transformed as follows:
PTS: 2 NAT: A.CED.A.1 TOP: Modeling Quadratics
209) ANS: 4
Page 258

If Gina’s age is x, then Abigail’s age is . The square of Gina’s age is represented by . Eight times Abigail's age can be represented as . The difference of the square of Gina's age and eight times Abigail's age is 17 can be represented as
. Check by solving for x, as follows:
Gina is 9 years old and Abigail is 8 years old.
PTS: 2 NAT: A.CED.A.1 TOP: Modeling Quadratics
Page 259

H – Quadratics, Lesson 4, Geometric Applications of Quadratics (r. 2018)
QUADRATICS Geometric Applications of Quadratics
Common Core Standard
A-CED.1 Create equations and inequalities in one variable and use them to solve problems. Include equations arising from linear and quadratic func-tions, and simple rational and exponential functions. PARCC: Tasks are limited to linear, quadratic, or exponential equations with integer exponents.
Next Generation Standard
AI-A.CED.1 Create equations and inequalities in one variable to represent a real-world context. (Shared standard with Algebra II) Notes: • This is strictly the development of the model (equa-tion/inequality). • Limit equations to linear, quadratic, and exponen-tials of the form f(x) = a(b)x where a > 0 and b > 0 (b ≠ 1). • Work with geometric sequences may involve an ex-ponential equation/formula of the form an = arn-1, where a is the first term and r is the common ratio. • Inequalities are limited to linear inequalities. • Algebra I tasks do not involve compound inequalities.
LEARNING OBJECTIVES
Students will be able to:
1) model quadratic equations that reflect real-world contexts involving the area and dimensions of two-dimensional geometric figures.
Overview of Lesson Teacher Centered Introduction
Overview of Lesson
- activate students’ prior knowledge
- vocabulary
- learning objective(s)
- big ideas: direct instruction
- modeling
Student Centered Activities guided practice Teacher: anticipates, monitors, selects, sequences, and connects student work
- developing essential skills
- Regents exam questions
- formative assessment assignment (exit slip, explain the math, or journal entry)
VOCABULARY
area area formulas length width
Page 260

BIG IDEAS
Geometric Area Problems: Quadratics are frequently used to model problems involving geometric area. The keys to solving geometric area problems are to use a geometric area formula and draw a sketch to represent the problem.
Typical Problem in Context Mathematical Translation Hints and Strategies The area of the rectangular playground enclosure at South School is 500 square meters. The length of the playground is 5 meters longer than the width. Find the dimensions of the playground, in meters.
width = 20 and length = 25 A=lw Let A=500 Let width = w Let length = w+5 Write:
{ }
2
2
500 ( 5)500 50 5 5000 ( 25)( 20)
25, 20Reject -25 as a solution because width cannot be negative.
A lww w
w ww ww w
w
== +
= +
= + −= + −
= −
Start with a formula. Define variables. Substitute known information into the formula.
Sketching a Diagram Can Help to Understand and Solve a Problem
The general strategy for solving problems that involve geometric applications of quadratics is to substitute terms with a common variable for length and width in common area formulas. Drawing a picture can also help. For example: A rectangular garden has length of x+2 and width of 2x-3, and the area of the garden is 72 square feet. What are the dimensions of the garden? Start by drawing a picture to help understand the problem.
Then, use the formula for finding the area of a rectangle, which is:
Substitute information about the length and width of the garden into the area formula for a rectangle, then write:
2x-3
X+2
72 square feet
Page 261

( )( )72 2 2 3A lw
x x=
= + −
The area of the garden is 72 square feet, so we can write:
Solve for x, then for x+2 and 2x-3. The length is 8 feet and the width is 9 feet.
DEVELOPING ESSENTIAL SKILLS
1) A contractor needs 54 square feet of brick to construct a rectangular walkway. The length of the walkway is 15 feet more than the width. Write an equation that could be used to determine the dimensions of the walkway. Solve this equation to find the length and width, in feet, of the walkway.
2) A rectangle has an area of 24 square units. The width is 5 units less than the length. What is the length, in units,
of the rectangle?
3) Jack is building a rectangular dog pen that he wishes to enclose. The width of the pen is 2 yards less than the length. If the area of the dog pen is 15 square yards, how many yards of fencing would he need to completely enclose the pen?
4) A rectangular park is three blocks longer than it is wide. The area of the park is 40 square blocks. If w represents
the width, write an equation in terms of w for the area of the park. Find the length and the width of the park.
5) What is the length of one side of the square whose perimeter has the same numerical value as its area?
Answers
1) The formula for the area of a rectangle is A lw=
Let 54 represent A. Let w represent the width of the rectangle. Let w+15 represent the length of the rectangle. Write:
( )
( )( ){ }
2
2
54 15
54 150 15 540 18 3
18,3
A lww w
w ww ww w
w
=
= +
= +
= + −
= + −
= −
Reject the negative solution. The width of the sidewalk is 3 feet.
The length of the sidewalk is 18 feet.
2) The formula for the area of a rectangle is A lw= Let 24 represent A. Let l represent the length of the rectangle.
Page 262

Let l-5 represent the width of the rectangle. Write:
( )
( )( ){ }
2
2
24 5
24 50 5 240 8 3
3,8
l l
l ll ll l
l
= −
= −
= − −
= − +
= −
Reject the negative solution. The length of the rectangle is 8 units.
3) The formula for the area of a rectangle is A lw= Let 15 represent A. Let l represent the length of the rectangle. Let l-2 represent the width of the rectangle. Write:
( )
( )( ){ }
2
2
15 2
15 20 2 150 5 3
3,5
A lwl l
l ll ll l
l
=
= −
= −
= − −
= − +
= −
Reject the negative solution. If the length is 5, the width is 3.
The formula for the perimeter of a rectangle is 2 2P l w= + , so the length of fence needed is
( ) ( )2 22 5 2 316
P l wPP
= +
= +
=
16 yards of fencing are needed.
4) The formula for the area of a rectangle is A lw= The units in this problem are blocks. Let 40 represent A. Let w represent the width of the rectangle. Let w+3 represent the length of the rectangle. Write:
( )
( )( ){ }
2
2
40 3
40 30 3 400 8 5
8,5
w w
w ww ww w
w
= +
= +
= + −
= + −
= −
Page 263

Reject the negative solution. The park is 5 blocks wide and 8 blocks long.
5) The formula for the area of a square is 2A s= The formula for the perimeter of a square is 4P s= Write:
( )
{ }
2
2
40 40 4
0, 4
s ss ss s
s
=
= −
= −
=
Reject the zero solution. The length of one side of the square is 4 units.
REGENTS EXAM QUESTIONS (through June 2018)
A.CED.A.1: Geometric Applications of Quadratics
210) The length of the shortest side of a right triangle is 8 inches. The lengths of the other two sides are represented by
consecutive odd integers. Which equation could be used to find the lengths of the other sides of the triangle? 1) 3) 2) 4)
211) New Clarendon Park is undergoing renovations to its gardens. One garden that was originally a square is being adjusted so that one side is doubled in length, while the other side is decreased by three meters. The new rectangular garden will have an area that is 25% more than the original square garden. Write an equation that could be used to determine the length of a side of the original square garden. Explain how your equation models the situation. Determine the area, in square meters, of the new rectangular garden.
212) A rectangular garden measuring 12 meters by 16 meters is to have a walkway installed around it with a width of x
meters, as shown in the diagram below. Together, the walkway and the garden have an area of 396 square meters.
Write an equation that can be used to find x, the width of the walkway. Describe how your equation models the situation. Determine and state the width of the walkway, in meters.
Page 264

213) A school is building a rectangular soccer field that has an area of 6000 square yards. The soccer field must be 40 yards longer than its width. Determine algebraically the dimensions of the soccer field, in yards.
214) A landscaper is creating a rectangular flower bed such that the width is half of the length. The area of the flower
bed is 34 square feet. Write and solve an equation to determine the width of the flower bed, to the nearest tenth of a foot.
215) A rectangular picture measures 6 inches by 8 inches. Simon wants to build a wooden frame for the picture so that
the framed picture takes up a maximum area of 100 square inches on his wall. The pieces of wood that he uses to build the frame all have the same width. Write an equation or inequality that could be used to determine the maximum width of the pieces of wood for the frame Simon could create. Explain how your equation or inequality models the situation. Solve the equation or inequality to determine the maximum width of the pieces of wood used for the frame to the nearest tenth of an inch.
216) Joe has a rectangular patio that measures 10 feet by 12 feet. He wants to increase the area by 50% and plans to
increase each dimension by equal lengths, x. Which equation could be used to determine x? 1) 3) 2) 4)
217) A contractor has 48 meters of fencing that he is going to use as the perimeter of a rectangular garden. The length of one side of the garden is represented by x, and the area of the garden is 108 square meters. Determine, algebraically, the dimensions of the garden in meters.
SOLUTIONS
210) ANS: 4 Strategy: Use the Pythagorean Theorem, the sum of the squares of the lengths of the legs of a right triangle equals the square of the length of the hypotenuse.
The shortest side must be one of the legs, since the longest side is always the hypotenuse. Substitute 8 for a in the equation.
The lengths of sides b and c are consecutive odd integers. Let x represent the smaller odd integer and let represent the larger consecutive odd integer. Side c must be represented by because side c represents the hypotenuse, which is always the longest side of a right triangle. Therefore, side b is represented by x and side c is represented by . Substitute these values into the equation.
By using the commutative property to rearrange the two terms in the right expression, we obtain the same equation as answer choice d.
DIMS? Does It Make Sense? Yes. Transorm the equation for input into a graphing calculator as follows: and we find that the other two sides of the right triangle are 15 and 17.
Page 265

By the Pythagorean Theorem,
Everything checks!
PTS: 2 NAT: A.CED.A.1 TOP: Geometric Applications of Quadratics
211) ANS: a) b) Because the original garden is a square, represents the original area, represents the side decreased by 3 meters, represents the doubled side, and represents the new garden with an area 25% larger. c) The length of a side of the original square garden was 8 meters. The area of the new rectangular garden is 80 square meters. Strategy: Draw two pictures: one picture of the garden as it was in the past and one picture of the garden as it will be in the future. Then, write and solve an equation to determine the length of a side of the original garden. STEP 1. Draw 2 pictures.
Area of original garden is . Area of new garden is . STEP 2: Use the area formula, , to write an equation for the area of the new garden.
STEP 3: Transform the equation for input into a graphing calculator and solve.
x
x
Original Garden
New Garden
2x
X-3
Page 266
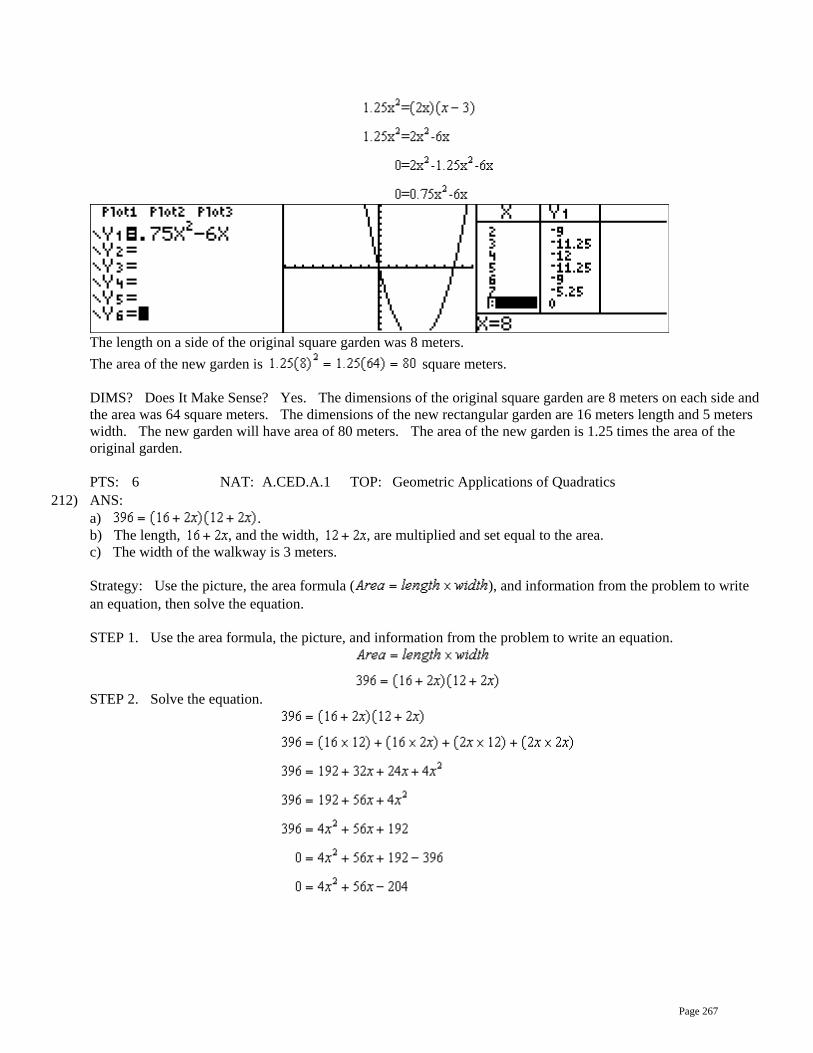
The length on a side of the original square garden was 8 meters. The area of the new garden is square meters. DIMS? Does It Make Sense? Yes. The dimensions of the original square garden are 8 meters on each side and the area was 64 square meters. The dimensions of the new rectangular garden are 16 meters length and 5 meters width. The new garden will have area of 80 meters. The area of the new garden is 1.25 times the area of the original garden.
PTS: 6 NAT: A.CED.A.1 TOP: Geometric Applications of Quadratics
212) ANS: a) . b) The length, , and the width, , are multiplied and set equal to the area. c) The width of the walkway is 3 meters. Strategy: Use the picture, the area formula ( ), and information from the problem to write an equation, then solve the equation. STEP 1. Use the area formula, the picture, and information from the problem to write an equation.
STEP 2. Solve the equation.
Page 267

The width of the walkway is 3 meters. DIMS? Does It Make Sense? Yes. The garden plus walkway is meters long and meters wide. , which fits the information in the problem.
PTS: 4 NAT: A.CED.A.1 TOP: Geometric Applications of Quadratics
213) ANS: The soccer field is 60 yards wide and 100 yards long. Strategy: Draw and label a picture, then use the picture to write and solve an equation based on the area formula:
STEP 1: Draw and label a picture.
STEP 2: Write and solve an equation based on the area formula:
DIMS? Does It Make Sense? Yes. If the width of the soccer field is 60 yards and the length of the soccer field is 100 yards, then the area of the soccer field will be 6,000 square yards, as required by the problem.
PTS: 4 NAT: A.CED.A.1 TOP: Geometric Applications of Quadratics
214) ANS:
Width (w)
Length(w + 40)
Area6000
Page 268

a) Equation
b) The width of the flower bed is approximately 4.1 feet. Strategy: Draw a picture, then write and solve an equation based on the area formula, . STEP 1. Draw a picture.
STEP 2: Write and solve an equation based on the area formula.
.
PTS: 2 NAT: A.CED.A.1 TOP: Geometric Applications of Quadratics
215) ANS: The maximum width of the frame should be 1.5 inches. Strategy: Write an inequality, then solve it. STEP 1: Write the inequality. The picture is 6 inches by 8 inches. The area of the picture is . The width of the frame is an unknown variable represented by x. Two widths of the frame (2x) must be added to the length and width of the picture. Therefore, the area of the picture with frame is The area of the picture with frame, , must be less than or equal to 100. Write STEP 2: Solve the inequality.
Area = 34
Length(l)
Width(l/2)
Page 269

Notes Left Expression Sign Right Expression Given
Use Distributive Property to Clear
Parentheses
100
Commutative Property
100
Combine Like Terms 100 Subtract 100 from both expressions
0
Use the Quadratic Formula: a=4, b=28, c=-52
DIMS? Does It Make Sense? Yes. If the frame is 1.5 inches wide, then the total picture with frame will be
PTS: 6 NAT: A.CED.A.1 TOP: Geometric Applications of Quadratics
216) ANS: 2 Strategy: STEP 1. First, determine the area of the current rectangular patio and increase its size by 50%, which will be the size of the new patio. STEP 2. Then, increase each dimension of the current rectangular patio by x, as follows: STEP 1.
Page 270

The new patio will have an area of 180 square feet. Eliminate choice (a). STEP 2.
Choose answer b.
PTS: 2 NAT: A.CED.A.1 TOP: Geometric Applications of Quadratics
217) ANS: The garden is a rectangle that measures 18 meters by 6 meters. Strategy: . Solve as a system of two equations, because the question requires solving for two variables: length and width. STEP 1. Draw a picture that illustrates the information in the problem.
STEP 2. Using the picture, write two equations using length and area formulas for rectangles. Let l represent the unknown length of the garden and let w represent the unknown width of the garden. The first equation, , is based on the formula for the perimeter of a rectangle, which is . The second equation, , is based on the area formula for rectangles, which is
STEP 2. Isolate the length variable
Area = 108
Width (w)
Length (l)
Perimeter equals 2w+2l
Page 271

STEP 3. Solve and as a system using substitution, as follows:
The garden is 6 meters wide. The length of the garden can be found using .
PTS: 4 NAT: A.CED.A.1 TOP: Geometric Applications of Quadratics
Page 272

H – Quadratics, Lesson 5, Vertex Form of a Quadratic (r. 2018)
QUADRATICS Vertex Form of a Quadratic
Common Core Standards
F-IF.C.8 Write a function defined by an expression in different but equivalent forms to reveal and ex-plain different properties of the function. F-IF.C.8a Use the process of factoring and complet-ing the square in a quadratic function to show zeros, extreme values, and symmetry of the graph, and in-terpret these in terms of a context.
Next Generation Standards
AI-F.IF.8 Write a function in different but equivalent forms to reveal and explain different properties of the function. (Shared standard with Algebra II) AI-F.IF.8a For a quadratic function, use an algebraic process to find zeros, maxima, minima, and symmetry of the graph, and interpret these in terms of context. Note: Algebraic processes include but not limited to factoring, completing the square, use of the quadratic formula, and the use of the axis of symmetry.
LEARNING OBJECTIVES
Students will be able to:
1) Transform quadratics equations to and between standard, factored, and vertex forms of a quadratic.
2) Identify the zeros, maxima, minima, and axis-of symmetry of parabolas.
Overview of Lesson Teacher Centered Introduction
Overview of Lesson
- activate students’ prior knowledge
- vocabulary
- learning objective(s)
- big ideas: direct instruction
- modeling
Student Centered Activities guided practice Teacher: anticipates, monitors, selects, sequences, and connects student work
- developing essential skills
- Regents exam questions
- formative assessment assignment (exit slip, explain the math, or journal entry)
VOCABULARY
axis of symmetry completing the square maxima minima
parabola standard form of a parabola turning point vertex
vertex form of a quadratic x-axis intercepts zeros
Page 273

BIG IDEAS The graph of a quadratic is called a parabola, and a parabola has several characteristics, including:
1) vertex, also known as the turning point. The vertex is the highest or lowest point on a parabola and is usually expressed as a coordinate pair.
2) maxima is the y-value of the turning point when the graph opens downward. 3) minima is the y-value of the turning point when the graph opens upward. 4) axis of symmetry is a vertical line that passes through the vertex of a parabola and divides
the parabola into two symmetrical halves. It is sometimes called the line of reflection. 5) zeros, also known as roots or solutions, are the x-values of the coordinates of the x-axis
intercepts. There are three general forms of a quadratic equation:
1) standard form, given by 2 0ax bx c− − = , where 2ax is the quadratic term, bx is the linear term, and c is the constant. A positive value of a indicates the parabola opens upwards and a negative value of a indicates the parabola opens downward. As the value of a approaches zero, the appearance of the parabola approaches the appearance of a horizontal line.
2) vertex form, given by 2( ) 0a x h k− + = , where (h,k) is the vertex of the parabola and x = h is the axis of symmetry.
3) factored form, given by ( )( )a x r x s− − , where r and s are solutions.
In standard form, the function rule for this parabola is:
2 2 3 0x x− − = This form reveals that the parabola opens upward and has a y-intercept of 3. In vertex form, the function rule for this parabola is:
( )21 4 0x − − = The form reveals the vertex is at (1,-4) and the axis of symmetry is x=1. In factored form, the function rule for this parabola is
( 3)( 1) 0x x− + = This form reveals the solutions are { }1,3x = −
Page 274

The ability to transform quadratic equations between standard, vertex, and quadratic forms is useful for identifying the characteristics of their graphs.
DEVELOPING ESSENTIAL SKILLS
Complete the following table.
Standard Form Vertex Form Factored Form Vertex and Axis of
Symmetry
Solutions
2 10 21 0x x− + =
( )21 4 0x − − =
( )( )2 4 0x x− + =
( )( )3 5 3 0x x− − =
2 4 5 0x x+ − =
Answers
Standard Form Vertex Form Factored Form Vertex and Axis of
Symmetry
Solutions
2 10 21 0x x− + = ( )25 4 0x − − = ( )( )7 3 0x x− − = ( )5, 45x−
= { }3,7x =
2 2 3 0x x− − = ( )21 4 0x − − = ( )( )3 1 0x x− + = ( )1, 41x−
= { }1,3x = −
2 2 8 0x x+ − = ( )21 9 0x + − = ( )( )2 4 0x x− + = ( )1, 91x
− −
= − { }4,2x = −
23 24 45 0x x− + = ( )23 4 3 0x − − = ( )( )3 5 3 0x x− − = ( )4, 34x−
= { }3,5x =
2 4 5 0x x+ − = ( )22 9 0x + − = ( )( )5 1 0x x+ − = ( )2, 92x
− −
= − { }5,1x = −
REGENTS EXAM QUESTIONS (through June 2018)
F.IF.C.8: Vertex Form of a Quadratic
218) a) Given the function , state whether the vertex represents a maximum or minimum point
for the function. Explain your answer. b) Rewrite f(x) in vertex form by completing the square.
Page 275
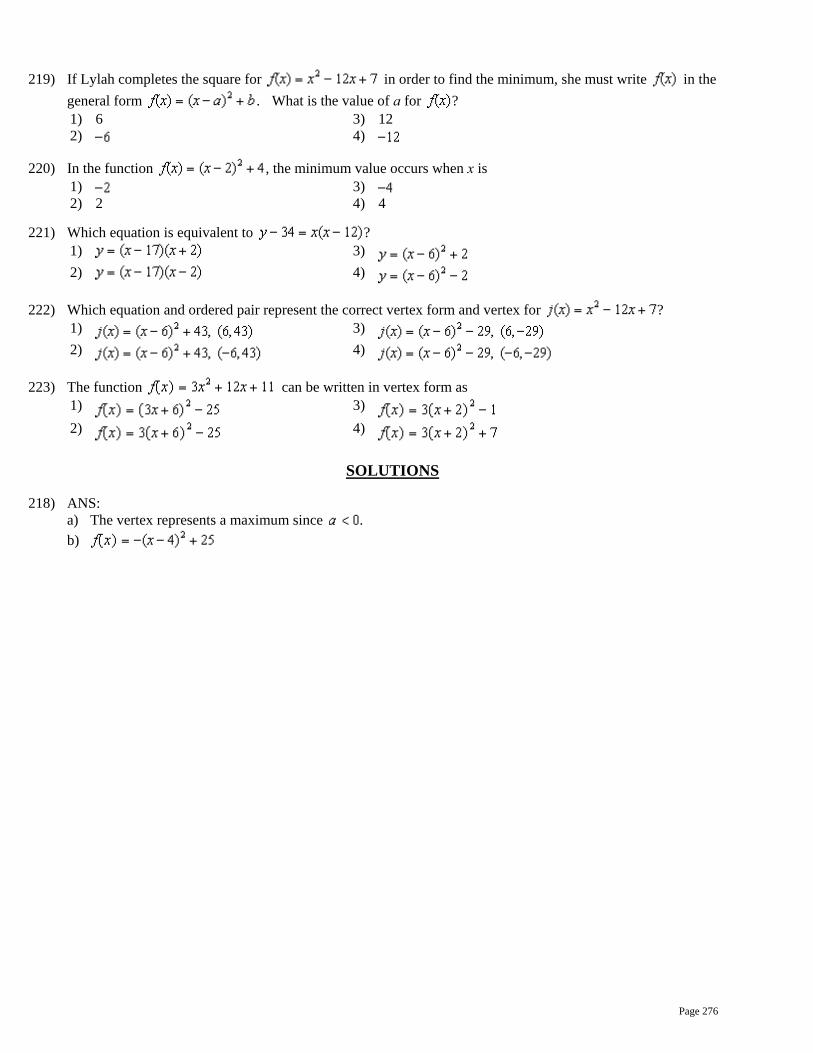
219) If Lylah completes the square for in order to find the minimum, she must write in the general form . What is the value of a for ? 1) 6 3) 12 2) 4)
220) In the function , the minimum value occurs when x is 1) 3) 2) 2 4) 4
221) Which equation is equivalent to ? 1) 3) 2) 4)
222) Which equation and ordered pair represent the correct vertex form and vertex for ? 1) 3) 2) 4)
223) The function can be written in vertex form as 1) 3) 2) 4)
SOLUTIONS
218) ANS: a) The vertex represents a maximum since . b)
Page 276

The vertex is at (4,25), but this information is not required by the problem.
PTS: 4 NAT: F.IF.C.8 TOP: Graphing Quadratic Functions
219) ANS: 1 Strategy: Transform into the form of and find the value of a.
If , then .
PTS: 2 NAT: A.SSE.B.3 TOP: Solving Quadratics KEY: completing the square
220) ANS: 2
( )
( ) ( )( )( )
2
2
2
2
2
2 22
2
2
8 9(set ( ) to 0)
8 9 0
8 98 9 (isolate both variables with 1 as coefficient of leading variable)
1 1 18 9
x 8 4 9 4
4 9 16 (complete the squ
4 25
f x x xf x
x x
x xx x
x x
x
x
x
= − + +
− + + =
− + = −
− − + = − − − − =
− + − = + −− = +
− =
( ) ( )( )
2
2
are)
1 4 1 25(multiply by a)
1 4 25 0
x
x
− − = −
− − + =
Page 277

Strategy #1. Recognize that the function is expressed in vertex form, and that the vertex is located at . Accordingly, the minimum value of occurs when . Strategy #2: Input the function rule in a graphing calculator, then examine the graph and table views to determine the vertex. The problem wants to know the x value of the when is at its minimum.
The minimum value of when is equal to 2. Strategy #3: Substitute each value of x into the equation and determine the minimum value of .
PTS: 2 NAT: A.SSE.B.3 TOP: Vertex Form of a Quadratic
Page 278

NOT: NYSED classifies this as A.SSE.3
221) ANS: 4 Strategy: Simplify the equation .
PTS: 2 NAT: A.REI.B.4 TOP: Solving Quadratics KEY: completing the square
222) ANS: 3 Step 1. Understand from the answer choices that the problem wants us to choose the answer that is equivalent to . Step 2. Strategy: Input in a graphing calulator and inspect the table and graph views of the function, then eliminate wrong answers. Step 3. Execute the strategy.
Choice c) is correct because it is the only answer choice that shows the vertex at (6, -29). Step 4. Does it make sense? Yes. You can see that and are the same funtion by inputting both in a graphing calculator.
PTS: 2 NAT: F.IF.C.8 TOP: Vertex Form of a Quadratic
223) ANS: 3
Page 279

PTS: 2 NAT: A.SSE.B.3b TOP: Families of Functions
Page 280

H – Quadratics, Lesson 6, Graphing Quadratic Functions (r. 2018)
QUADRATICS Graphing Quadratic Functions
Common Core Standard
F-IF.B.4 For a function that models a relationship between two quantities, interpret key features of graphs and tables in terms of the quantities, and sketch graphs showing key features given a verbal description of the relationship. Key features include: intercepts; intervals where the function is increas-ing, decreasing, positive, or negative; relative maxi-mums and minimums; symmetries; end behavior; and periodicity. PARCC: Tasks have a real-world context. Tasks are limited to linear functions, quadratic functions, square root functions, cube root functions, piece-wise defined functions (including step func-tions and absolute value functions) and exponential functions with domains in the integers. F-IF.C.7 Graph functions expressed symbolically and show key features of the graph, by hand in sim-ple cases and using technology for more compli-cated cases.
Next Generation Standard
AI-F.IF.4 For a function that models a relationship be-tween two quantities: i) interpret key features of graphs and tables in terms of the quantities; and ii) sketch graphs showing key features given a verbal de-scription of the relationship. (Shared standard with Algebra II) Notes: • Algebra I key features include the following: intercepts, zeros; intervals where the function is increasing, decreas-ing, positive, or negative; maxima, minima; and symme-tries. • Tasks have a real-world context and are limited to the following functions: linear, quadratic, square root, piece-wise defined (including step and absolute value), and ex-
ponential functions of the form ( ) ( ) xf x a b= where a > 0 and b > 0 (b≠1). AI-F.IF.7 Graph functions and show key features of the graph by hand and by using technology where appropri-ate. (Shared standard with Algebra II)
LEARNING OBJECTIVES
Students will be able to:
1) Create a table of values from a function rule. 2) Sketch a graph from a table of values. 3) Identify and interpret in context key features of graphs, including: intercepts, zeros; intervals
where the function is increasing, decreasing, positive, or negative; maxima, minima; and symmetries.
Overview of Lesson Teacher Centered Introduction
Overview of Lesson
- activate students’ prior knowledge
- vocabulary
- learning objective(s)
- big ideas: direct instruction
- modeling
Student Centered Activities guided practice Teacher: anticipates, monitors, selects, sequences, and connects student work
- developing essential skills
- Regents exam questions
- formative assessment assignment (exit slip, explain the math, or journal entry)
Page 281

VOCABULARY axis of symmetry decreasing intervals increasing intervals intercepts maxima
minima negative slope no slope positive slope symmetries
turning point vertex zeros
BIG IDEAS
Identify key features of graphs:
axis of symmetry: the axis of symmetry is the vertical line whose equation is 1x = decreasing intervals: the function is decreasing over the interval 0x < increasing intervals: the function is increasing over the interval 0 x< intercepts: the x-axis intercepts are -1 and 3, the y-axis intercept is -3 maxima: there is no maxima minima: the minima is -4 negative slope: the slope is negative on the left side of the axis of symmetry no slope: the function has no slope at the vertex (1,-4) positive slope: the slope is positive on the right side of the axis of symmetry symmetries: the graph left of the axis of symmetry is symmetrical to the graph right of the axis of symmetry turning point: the turning point is (1,-4) vertex: the vertex is at (1,-4) zeros: the zeros are { }1,3x = − , these are also the roots and solutions of the function.
Page 282

Sketching Graphs of Quadrilaterals
STEP 1 Create a table of values.
• Use a graphing calculator whenever possible. • Include the vertex in the table.
STEP 2 Select coordinate pairs that are easy to plot on a Cartesian plane.
• Start with the vertex. • Select integer values when possible. • Select an equal number of points on either side of the vertex • 5 coordinate pairs are usually enough.
STEP 3 Connect the plotted points.
• Use the graph view of the function as a model for your sketch. • Label the graph.
o Include the function rule and at least three coordinates of plot points, and/or
o Show the function rule and construct a table of values of plotted points on the page with the graph.
Example
Use technology to show three views of the following function: 2 2 3x x− −
DEVELOPING ESSENTIAL SKILLS
Sketch graphs of each of the following functions using technology and graph paper: 2 10 21 0x x− + = ( )21 4 0x − − =
( )( )2 4 0x x− + =
( )( )3 5 3 0x x− − = 2 4 5 0x x+ − =
Answers
Note: Students may submit answers on graph paper.
Page 283

2 10 21 0x x− + =
( )21 4 0x − − =
( )( )2 4 0x x− + =
( )( )3 5 3 0x x− − =
2 4 5 0x x+ − =
REGENTS EXAM QUESTIONS (through June 2018)
F.IF.B.4, F.IF.C.7: Graphing Quadratic Functions
224) Let represent the height of an object above the ground after t seconds. Determine
the number of seconds it takes to achieve its maximum height. Justify your answer. State the time interval, in seconds, during which the height of the object decreases. Explain your reasoning.
225) A toy rocket is launched from the ground straight upward. The height of the rocket above the ground, in
feet, is given by the equation , where t is the time in seconds. Determine the domain for this function in the given context. Explain your reasoning.
226) A ball is thrown into the air from the edge of a 48-foot-high cliff so that it eventually lands on the ground.
The graph below shows the height, y, of the ball from the ground after x seconds.
Page 284

For which interval is the ball's height always decreasing? 1) 3) 2) 4)
227) Morgan throws a ball up into the air. The height of the ball above the ground, in feet, is modeled by the function , where t represents the time, in seconds, since the ball was thrown. What is the appropriate domain for this situation? 1) 3) 2) 4)
228) The height of a rocket, at selected times, is shown in the table below. Time (sec) 0 1 2 3 4 5 6 7 Height (ft) 180 260 308 324 308 260 180 68
Based on these data, which statement is not a valid conclusion? 1) The rocket was launched from a height of
180 feet. 3) The rocket was in the air approximately 6
seconds before hitting the ground. 2) The maximum height of the rocket
occurred 3 seconds after launch. 4) The rocket was above 300 feet for
approximately 2 seconds.
229) A football player attempts to kick a football over a goal post. The path of the football can be modeled by
the function , where x is the horizontal distance from the kick, and is the height
of the football above the ground, when both are measured in feet. On the set of axes below, graph the function over the interval .
Page 285

Determine the vertex of . Interpret the meaning of this vertex in the context of the problem. The goal post is 10 feet high and 45 yards away from the kick. Will the ball be high enough to pass over the goal post? Justify your answer.
230) On the set of axes below, draw the graph of .
State the equation of the axis of symmetry.
231) If the zeros of a quadratic function, F, are and 5, what is the equation of the axis of symmetry of F?
Justify your answer.
232) Alex launched a ball into the air. The height of the ball can be represented by the equation
, where h is the height, in units, and t is the time, in seconds, after the ball was launched. Graph the equation from to seconds.
Page 286

State the coordinates of the vertex and explain its meaning in the context of the problem.
233) An Air Force pilot is flying at a cruising altitude of 9000 feet and is forced to eject from her aircraft. The
function models the height, in feet, of the pilot above the ground, where t is the time, in seconds, after she is ejected from the aircraft. Determine and state the vertex of . Explain what the second coordinate of the vertex represents in the context of the problem. After the pilot was ejected, what is the maximum number of feet she was above the aircraft's cruising altitude? Justify your answer.
234) The expression represents the height, in meters, of a toy rocket t seconds after launch.
The initial height of the rocket, in meters, is 1) 0 3) 4.9 2) 2 4) 50
235) The graph of a quadratic function is shown below.
An equation that represents the function could be
Page 287

1) 3)
2) 4)
236) Graph the function on the set of axes below.
State the coordinates of the vertex of the graph.
237) The graph of the function is given below.
Could the factors of be and ? Based on the graph, explain why or why not.
Page 288

238) When an apple is dropped from a tower 256 feet high, the function models the height of the apple, in feet, after t seconds. Determine, algebraically, the number of seconds it takes the apple to hit the ground.
SOLUTIONS
224) ANS: The object reaches its maximum height at 2 seconds. The height of the object decreases between 2 seconds and 5 seconds. Strategy: Inut the function in a graphing calculator and inspect the graph and table of values.
PTS: 4 NAT: F.IF.B.4 TOP: Graphing Quadratic Functions
225) ANS: The rocket launches at and lands at , so the domain of the function is . Strategy: Input the function into a graphing calculator and determine the flight of the rocket using the graph and table views of the function.
The toy rocket is in the air between 0 and 4 seconds, so the domain of the function is .
PTS: 2 NAT: F.IF.B.4 TOP: Graphing Quadratic Functions
226) ANS: 3
Page 289

Strategy: Identify the domain of x that corresponds to a negative slope (decreasing height) in the function, then eliminate wrong answers. STEP 1. The axis of symmetry for the parabola is and the graph has a negative slope after
all the way to , meaning that the height of the ball is decreasing over this interval. STEP 2. Eliminate wrong answers. Answer choice a can be eliminated because the the slope of the graph increases over the interval
. Answer choice b can be eliminated because the the slope of the graph both increases and decreases over the interval . Answer choice c is the correct choice, because it shows the domain of x where the graph has a negative slope. Answer choice d can be eliminated because the the slope of the graph increases from until .
PTS: 2 NAT: F.IF.B.4 TOP: Graphing Quadratic Functions
227) ANS: 1
and
The appropriate domain for this function is .
PTS: 2 NAT: F.IF.B.4 TOP: Graphing Quadratic Functions KEY: context
228) ANS: 3 Strategy: Eliminate wrong answers. Eliminate “The rocket was launched from a height of 180 feet” because the ordered pair (0, 180) indicates this statement is true. Eliminate “The maximum height of the rocket occurred 3 seconds after launch” because the ordered pair (3,324) is the vertex of the parabola modeled by the table. Select “The rocket was in the air approximately 6 seconds before hitting the ground” because the ordered pair (7, 68) shows that the rocket had not yet hit the ground after 7 seconds. Eliminate ‘The rocket was above 300 feet for approximately 2 seconds” because the rocket was above 300 feet during the 2 second interval between the ordered pairs (2, 308) and (4, 308).
PTS: 2 NAT: F.IF.B.4
229) ANS:
Page 290

a) b) The vertex is at . This means that the ball will reach it highest (25 feet) when the horizontal distance is 75 feet. c) No, the ball will not clear the goal post because it will be less than 10 feet high. Strategy: Input the equation into a graphing calculator and use the table and graph views to complete the graph on paper, then find the vertex and determine if the ball will pass over the goal post.
STEP 1. Input into a graphing calculator. Set the window to reflect the interval
and estimate the height to be approximately the domain of x.
Observe that the table of values has integer solutions at 15 unit intervals, so change the Tbl to 15.
The change in Tbl results in a table of values that is easier to graph on paper.
Page 291

Use the graph view and the table of values to complete the graph on paper. STEP 2. Use the table of values to find the vertex. The vertex is located at .
STEP 3. Convert 45 yards to 135 feet and determine if the the ball will be 10 feet or higher when .
or
The ball will be 9 feet above the ground and will not go over the 10 feet high goal post.
PTS: 6 NAT: F.IF.B.4 TOP: Graphing Quadratic Functions
230) ANS: Input the equation in a graphing calculator, then use the table and graph views to draw the graph.
The axis of symmetry is
The equation for the axis of symmetry can also be found using the formula
Page 292

PTS: 2 NAT: F.IF.B.4 TOP: Graphing Quadratic Functions NOT: NYSED classifies this as A.REI.D
231) ANS: The equation of the axis of symmetry is . The axis of symmetry is the vertical line that is midway between the zeros of a quadratic.
PTS: 2 NAT: F.IF.B.4 TOP: Graphing Quadratic Functions KEY: no context
232) ANS:
The ball reaches a maximum height of 55 units at 2.5 seconds. Strategy: Input the equation in a graphing calculator, then use the table of values to plot the graph and answer the questions.
PTS: 4 NAT: F.IF.B.4 TOP: Graphing Quadratic Functions
233) ANS: The vertex occurs at (4, 9256). This means that 4 seconds after the pilot ejects from the plane, she is 9,256 feet above the ground. After being ejected at a crusing altitude of 9,000 feet, the maximum number of feet she was above cruising altitude was feet.
Page 293

PTS: 4 NAT: F.IF.B.4 TOP: Graphing Quadratic Functions KEY: context
234) ANS: 2 The initial height of the rocket is when .
PTS: 2 NAT: F.IF.B.4 TOP: Graphing Quadratic Functions KEY: context
235) ANS: 4 The graph shows the vertex to be at (15, 25). Each of the answer choices is in vertex form: , where h is the x-coordinate of the vertex and k is the y-coorindate of the vertex. Stubstituting the x and y coordinatges of the vertex into
results in . Since the parabola opens downward, the value of a must
be negative. The correct answer is .
PTS: 2 NAT: F.IF.B.4 TOP: Graphing Quadratic Functions KEY: no context
Page 294

236) ANS:
x y 0 0 -1 5 -2 8 -3 9 -4 8 -5 5 -6 0
HINT: Use graphing
calculator! The coordinates of the vertex are (-3, 9)
PTS: 2 NAT: F.IF.B.4 TOP: Graphing Quadratic Functions KEY: no context
237) ANS: Yes, because the factors of a function and the zeros of a function are related through the multiplication property of zero. The multiplication property of zero states that the product of any number and zero is zero. This also means that if the product of two numbers is zero, then one or both of the factors must be zero. If the factors of are and , then the function rule is and the zeros of the function will occur when . By the multiplication property of zero, when , either , , or both and , must equal zero. If , then , which is shown as an x-intercept on the graph. If , then , which is also shown as an x-intercept on the graph.
PTS: 2 NAT: F.IF.C.7 TOP: Graphing Quadratic Functions
238) ANS: Answer: 4 Strategy: The apple will be on the ground when its height is zero, so evaluate the function
for .
Check:
PTS: 2 NAT: F.IF.C.7 TOP: Graphing Quadratic Functions
Page 295

I – Systems, Lesson 1, Solving Linear Systems (r. 2018)
SYSTEMS Solving Linear Systems
Common Core Standards
A-REI.C.5 Prove that, given a system of two equa-tions in two variables, replacing one equation by the sum of that equation and a multiple of the other pro-duces a system with the same solutions. A-REI.C.6 Solve systems of linear equations ex-actly and approximately (e.g., with graphs), focusing on pairs of linear equations in two variables. PARCC: Tasks have a real-world context. Tasks have hallmarks of modeling as a mathematical practice (less defined tasks, more of the modeling cycle, etc.).
Next Generation Standard
STANDARD REMOVED AI-A.REI.6a Solve systems of linear equations in two variables both algebraically and graphically. Note: Algebraic methods include both elimination and substitution.
LEARNING OBJECTIVES
Students will be able to:
1) Solve systems of linear equation by graphing. 2) Solve systems of linear equations using the substitution method. 3) Solve systems of linear equations using the elimination method.
Overview of Lesson
Teacher Centered Introduction Overview of Lesson
- activate students’ prior knowledge
- vocabulary
- learning objective(s)
- big ideas: direct instruction
- modeling
Student Centered Activities guided practice Teacher: anticipates, monitors, selects, sequences, and connects student work
- developing essential skills
- Regents exam questions
- formative assessment assignment (exit slip, explain the math, or journal entry)
VOCABULARY
context view distinct elimination method equation rule view graph view
non-distinct point of intersection solution to a system of equations substitution method
system of equations table view
Page 296

BIG IDEAS
Facts About Systems of Linear Equations
1. A system of linear equations is a collection of two or more linear equations that have the same set of variables.
2. A solution of a system of linear equations is the set of values that simultaneously satisfy each and every linear equation in the system. Systems of linear equations can be grouped into three categories according to the number of solutions they have.
a) Infinitely Many Solutions: A system of linear equations has infinitely many solutions when the equations represent the same line on a graph.
b) No Solutions: A system of linear equations has no solutions when the equations represent parallel lines on a graph.
c) One Solution: A system of linear equations has one and only solution when the equations represent distinct, non-parallel lines on a graph.
3. For a system of linear equations to have one solution, the number of distinct linear equations in the system must correspond to the number of variables in the system. For example, two variables require two distinct linear equations, three variables require three distinct linear equations, etc.
Distinct vs Non-Distinct Equations
Two equations are distinct if they describe different mathematical relationships between the variables. For example 2y x= and 3y x= describe different mathematical relationships between the variables x and y. Two equations are non-distinct if they describe the same mathematical relationships between the variables. For example 2y x= and 2 4y x= and 3 6y x= all describe the same mathematical relationships between the variables x and y, which is the idea that the value of y is two times the value of x. When linear equations are non-distinct, their graphs and tables of values will be identical.
Views of Linear Equations vs Views of Systems of Linear Equations Linear equations can be expressed in four different ways, called views. These views are:
1) an equation (or function rule) view; 2) a table view; 3) a graph view; and 4) a context view.
Systems of linear equations can be expressed using the same four views. With systems of linear equations, however, each of the four views shows two or more equations simultaneously, and it becomes important to know which values are associated with each equation. Color is used in the following examples to help distinguish between equations.
Single Linear Equation Single Linear Equation System of Linear Equations
Context View Two numbers are in the ratio 2:5.
If 6 is subtracted from the sum of two num-bers, the result is 50.
Two numbers are in the ratio 2:5. If 6 is sub-tracted from their sum, the result is 50. What is the larger number?
Equation View
25
xy= ( ) 6 50x y+ − = 2
5( ) 6 50
xyx y
= + − =
Page 297

Equation View (Calculator Input)
Table View Note that the table view for the system of linear equations has only one column for the x values.
Graph View
Solutions to systems of equations The solution to a system of linear equation is ordered pair of values that satisfies each equation in the system simultaneously (at the same time).
• In the function rule view, the solution is the ordered pair of values that makes each equation balance.
EXAMPLE: The system 2 3
3x yx y− =
+ = has a common solution of .
When the values 2x = and 1y = are inputs, both equations balance, as shown below: ( )
( ) ( )
2,12 3
2 2 1 34 1 3
3 3
x y
check
− =
− =
− ==
( )
( ) ( )
2,13
2 1 33 3
x y
check
+ =
+ =
=
• In the table view, the solution is the ordered pair of values that are the same for both equations.
• In the graph view, the solutions are the coordinates of the point of intersection.
( )2,1
Page 298

Page 299

Solution Strategies Elimination Method – an Algebraic Strategy
Overview of Strategy: Eliminate one variable by addition or subtraction, then solve for the remaining variable, then the second variable.
STEPS EXAMPLE STEP 1 Read and understand the problem.
Solve the following system of equations by elimination. 4 3 125 6 19
M CC M
+ = + =
STEP 2 Line up the like terms in columns
3 4 125 6 19C MC M+ =+ =
STEP 3 Multiply each equation by the leading coefficient of the other equation, which will result in both equations having the same leading coefficient.
( )( )
5 3 4 12 15 20 60
3 5 6 19 15 18 57
C M C M
C M C M
+ = ⇒ + =
+ = ⇒ + =
STEP 4 Add or subtract the like terms in the two equations to form a third equation, in which the leading coefficient is zero.
15 20 6015 18 57
0 2 3
C Msubtract C M
C M
+ =+ =+ =
STEP 5 Solve the new equation for the first variable.
0 2 32 3
32
C MM
M
+ ==
=
STEP 6 Input the value found in STEP 5 into either of the original equations and solve for the second variable.
4 3 1234 3 12212 3 1226 3 12
3 6
2
M C
C
C
CC
C
+ =
+ =
+ =
+ ==
=
STEP 7 Check your solutions in both equations. ( )
4 3 1234 3 2 122
12 6 1226 6 12
12 12
M C
check
+ =
+ =
+ =
+ ==
( )
5 6 1935 2 6 1921810 192
10 9 1919 19
C M
check
+ =
+ =
+ =
+ ==
Page 300

Substitution Method – an Algebraic Strategy Overview of Strategy: Isolate one variable in either equation, then substitute its equivalent expression into the other equation. This results in a new equation with only one variable. Solve for the first variable, then use the value of the first variable in either equation to solve for the second variable.
STEPS EXAMPLE STEP 1 Read and understand the problem.
Solve the following system of equations by substitution. 4 3 125 6 19
M CC M
+ = + =
STEP 2 Isolate one variable from one equation.
4
3
3 124 1 3
3
2
4
M CM C
M C= −
+ == −
STEP 3 Substitute the isolated value into the other equation.
5 6 19
35 6 3 194
C M
C C
+ =
+ − =
STEP 4 Solve the new equation with one variable.
35 6 3 194185 18 194
20 72 18 762 4
2
C C
C C
C CC
C
+ − =
+ − =
+ − ==
=
STEP 5 Input the value found in STEP 4 into either of the original equations and solve for the second variable.
( )
4 3 124 3 2 12
4 6
32
M CM
M
M
+ =
+ =
=
=
STEP 6 Check your solutions in both equations.
( )
4 3 1234 3 2 122
12 6 1226 6 12
12 12
M C
check
+ =
+ =
+ =
+ ==
( )
5 6 1935 2 6 1921810 192
10 9 1919 19
C M
check
+ =
+ =
+ =
+ ==
Page 301

DEVELOPING ESSENTIAL SKILLS
Solve each of the following systems by two algebraic methods: 1) by elimination; and 2) by substitution.
1. 4 2 163 3 15
x yx y+ =
+ =
2. 3 72 2 6x yx y+ =
+ =
3. 2 3 804 2 80
x yx y+ =
+ =
4. 5 4 654 3 50a ba b+ =
+ =
5. 2 4 283 2 30
m jm j+ =
+ =
Answers
1. 4 2 163 3 15
x yx y+ =
+ =
Elimination
.#1 4 2 16
.#2 3 3 15Eq x yEq x y
+ =+ =
( )( )
.#1 3 4 2 16 12 6 48
.#2 4 3 3 15 12 12 60
Eq x y x y
Eq x y x y
+ = → + =
+ = → + =
.#1 12 6 48
.#2 12 12 60
0 6 12
Eq b x yEq b x y
x y
+ =+ =
+ =
0 6 126 12
2
x yy
y
+ ==
=
( )
.#14 2 16
4 2 2 164 4 16
4 12
3
Eqx y
xx
x
x
+ =
+ =
+ ==
=
Substitution
Page 302

3 3 155
4 2 164( 5) 2 16
4 20 2 162 4
23 3 153 3(2) 153 6 153 9
3
x yx y
x yy y
y yy
yx yxxx
x
+ == − ++ =− + + =
− + + =− = −
=+ =+ =+ ==
=
2. 3 72 2 6x yx y+ =
+ =
Elimination
3 72 2 6x yx y+ =+ =
( )( )
2 3 7 6 2 14
3 2 2 6 6 6 18
x y x y
x y x y
+ = → + =
+ = → + =
0 4 4x y+ =
1y =
3 73 1 73 6
2
x yxx
x
+ =+ ==
=
Substitution
Page 303

( )
3 73 7
2 2 62 2 3 7 6
2 6 14 64 8
23 7
3(2) 7
1
x yy x
x yx x
x xx
xx y
y
y
+ == − +
+ =
+ − + =
− + =− = −
=+ =+ =
=
3. 2 3 804 2 80
x yx y+ =
+ =
Elimination
2 3 804 2 80
x yx y+ =+ =
( )( )
4 2 3 80 8 12 320
2 4 2 80 8 4 160
x y x y
x y x y
+ = → + =
+ = → + =
0 8 160x y+ =
20y =
( )( )
2 3 80
2 3 20 802 60 80
2 20
10
x y
xx
x
x
+ =
+ =
+ ==
=
Substitution
Page 304

4 2 802 40
2 3 802 3( 2 40) 80
2 6 120 804 40
104(10) 2 80
40 2 802 40
20
x yy x
x yx x
x xx
xyyy
y
+ == − +
+ =+ − + =
− + =− = −
=+ =+ =
=
=
4. 5 4 654 3 50a ba b+ =
+ =
Elimination
5 4 654 3 50a ba b+ =+ =
( )( )
4 5 4 65 20 16 260
5 4 3 50 20 15 250
a b a b
a b a b
+ = → + =
+ = → + =
0 1 10a b+ =
10b =
( )4 3 50
4 3 10 504 30 50
4 20
5
a ba
aa
a
+ =
+ =
+ ==
=
Substitution
Page 305

5 4 654 13
54 3 50
44 13 3 50516 52 3 505
16 260 15 25010
10
a b
a b
a b
b b
b b
b bb
b
+ =−
= +
+ =
− + + = −
+ + =
− + + =− = −
=
5 4 655 4(10) 65
5 40 655 25
5
a ba
aa
a
+ =+ =+ =
=
=
5. 2 4 283 2 30
m jm j+ =
+ =
Elimination
2 4 283 2 30
m jm j+ =+ =
( )( )
3 2 4 28 6 12 84
2 3 2 30 6 4 60
m j m j
m j m j
+ = → + =
+ = → + =
0 8 24m j+ =
3j =
( )( )
2 4 28
2 4 3 282 12 28
2 16
8
m j
mm
m
m
+ =
+ =
+ ==
=
Substitution
Page 306

2 4 282 14
3 2 303( 2 14) 2 30
6 42 2 304 12
32 4 28
2 4(3) 282 12 28
2 16
8
m jm j
m jj jj j
j
jm j
mm
m
m
+ == − +
+ =− + + =− + + =
− = −
=+ =
+ =+ =
=
=
REGENTS EXAM QUESTIONS (through June 2018)
A.REI.C.5, A.REI.C.6: Solving Linear Systems
239) Albert says that the two systems of equations shown below have the same solutions.
Determine and state whether you agree with Albert. Justify your answer.
240) Which system of equations has the same solution as the system below?
1) 3)
2) 4)
241) Which pair of equations could not be used to solve the following equations for x and y?
1) 3)
Page 307

2) 4)
242) A system of equations is given below.
Which system of equations does not have the same solution? 1) 3)
2) 4)
243) A system of equations is shown below. Equation A: Equation B:
Which method eliminates one of the variables? 1) Multiply equation A by and add the
result to equation B.
3) Multiply equation A by 2 and equation B by and add the results together.
2) Multiply equation B by 3 and add the result to equation A.
4) Multiply equation B by 5 and equation A by 4 and add the results together.
244) Which system of equations does not have the same solution as the system below?
1) 3)
2) 4)
245) Guy and Jim work at a furniture store. Guy is paid $185 per week plus 3% of his total sales in dollars, x, which can be represented by . Jim is paid $275 per week plus 2.5% of his total sales in dollars, x, which can be represented by . Determine the value of x, in dollars, that will make their weekly pay the same.
246) In attempting to solve the system of equations and , John graphed the two equations
on his graphing calculator. Because he saw only one line, John wrote that the answer to the system is the empty set. Is he correct? Explain your answer.
247) What is the solution to the system of equations below?
1) no solution 3) 2) infinite solutions 4)
Page 308

248) The line represented by the equation shares a solution point with the line represented by the table below.
The solution for this system is 1) 3) 2) 4)
SOLUTIONS
239) ANS:
Albert is correct. Both systems have the same solution .
Strategy: Solve one system of equations, then test the solution in the second system of equations. STEP 1. Solve the first system of equations.
Page 309

STEP 2: Test the second system of equations using the same solution set.
DIMS? Does It Make Sense? Yes. The solution makes both equations balance.
PTS: 4 NAT: A.REI.C.5 TOP: Solving Linear Systems
240) ANS: 2 Strategy: Find equivalent forms of the system and eliminate wrong answers. STEP 1. Eliminate answer choices c and d because the first equation in each system is not a multiple of any equation in the original system. STEP 2. Eliminate answer choice a because is not a multiple of . Choose answer choice b as the only remaining choice. DIMS? Does It Make Sense? Yes. Check using the matrix feature of a graphing calculator.
The solution set also works for the system in answer choice b.
PTS: 2 NAT: A.REI.C.5 TOP: Solving Linear Systems
241) ANS: 4 Strategy: Eliminate wrong answers by deciding which systems of equations are made of multiples of the original system of equations and which system is made of equations that are not multiples of the orginal system of equations. Choice (a) is a multiple of the original system of equations.
Choice (b) is a multiple of the original system of equations.
Page 310

Choice (c) is a multiple of the original system of equations.
Choice (d) is not a multiple of the original system of equations.
PTS: 2 NAT: A.REI.C.5 TOP: Solving Linear Systems
242) ANS: 4 Strategy: Determine which equations in the answer choices describe the same relationshops between variables as the equations in the problem. If one equation is a multiple of another equation, both equation describe the same relationship between variables and both equations will have the same solutions. Eliminate because
Eliminate because
Eliminate because
Choose because
PTS: 2 NAT: A.REI.C.5 TOP: Other Systems
243) ANS: 2 STEP 1: Multiply equation B by 3
STEP 2: Add Eq.A and Eq.B2
Note that the y variable is eliminated.
PTS: 2 NAT: A.REI.C.5 TOP: Solving Linear Systems
244) ANS: 4 Strategy: Determine which systems are multiples of the original system.
Page 311

NOTE: The second equation is not a multiple of
PTS: 2 NAT: A.REI.C.5 TOP: Solving Linear Systems
245) ANS: $18,000 Strategy: Set both function equal to one another and solve for x. STEP 1. Set both functions equal to one another.
PTS: 2 NAT: A.REI.C.6 TOP: Solving Linear Systems
246) ANS: No. There are infinite solutions. The equations and describe identical relationships between the variables x and y. When is transformed to sloped intercept format ( ), the result is . Therefore, this systems consists of two identical relationships between variables, and every solution to
solves both equations. Thus, there are infinite solutions. Given (Eq.
#2) = 4
Divide (2)
=
Simplify = 2 Subtract (3x) -3x = -3x
Simplify -y = -3x+2
Page 312

Multiply (-1) y = 3x-2
PTS: 2 NAT: A.REI.C.6 TOP: Solving Linear Systems KEY: substitution
247) ANS: 1 Use substitution to solve.
There is no solution to this system of equations.
PTS: 2 NAT: A.REI.C.6 TOP: Solving Linear Systems KEY: substitution
248) ANS: 4 Step 1. Understand that this question is asking for the coordinates of the intersection of two different lines: the first line is represented by the equation and the second line is represented by the table. Step 2. Strategy: a) Identify the function rule for the data in the table; b) transform into
format; and c) input both equations into a graphing calculator to find their intersection. Step 3. Execution of strategy: a) Use linear regression to identify an equation for the table.
The table values can be represented by the equation b) Transform into format.
cI Input both equations in a graphing calculator.
Page 313

The lines intersect at (6, 5.4). Choice d) is the correct answer.
PTS: 2 NAT: A.REI.C.6 TOP: Solving Linear Systems
Page 314

I – Systems, Lesson 2, Modeling Linear Systems (r. 2018)
SYSTEMS Modeling Linear Systems
Common Core Standard
A-CED.A.2 Create equations in two or more varia-bles to represent relationships between quantities; graph equations on coordinate axes with labels and scales.
Next Generation Standard
AI-A.CED.2 Create equations and linear inequalities in two variables to represent a real-world context. Notes: • This is strictly the development of the model (equa-tion/inequality). • Limit equations to linear, quadratic, and exponentials of
the form ( ) ( ) xf x a b= where a > 0 and b > 0 (b ≠ 1).
NOTE: This lesson is related to Expressions and Equations, Lesson 4, Modeling Linear Equations.
LEARNING OBJECTIVES
Students will be able to:
1) Create function rules for systems of linear equations from real-world contexts. 2) Solve problems involving systems of equations based on real-world contexts.
Overview of Lesson
Teacher Centered Introduction Overview of Lesson
- activate students’ prior knowledge
- vocabulary
- learning objective(s)
- big ideas: direct instruction
- modeling
Student Centered Activities guided practice Teacher: anticipates, monitors, selects, sequences, and connects student work
- developing essential skills
- Regents exam questions
- formative assessment assignment (exit slip, explain the math, or journal entry)
VOCABULARY
system of equations defining variables key words
BIG IDEAS General Approach The general approach is as follows:
1. Read and understand the entire problem. 2. Underline key words, focusing on variables, operations, and equalities or inequalities. 3. Convert the key words to mathematical notation (consider meaningful variable names
other than x and y). 4. Write two or more equations with the same variables. 5. Check the final system of linear equations for reasonableness.
Page 315

Example Equations Check Jack bought 3 slices of cheese pizza and 4 slices of mushroom pizza for a total cost of $12.50. Grace bought 3 slices of cheese pizza and 2 slices of mushroom pizza for a total cost of $8.50. What is the cost of one slice of mushroom pizza?
Equation #1.
Equation #2.
Variables: Let C represent the cost of one slice of cheeses pizza. Let M represent the cost of one slice of mushroom pizza.
Solution:
3 4 12.50C M+ =
3 2 8.50C M+ =
3 C( )1.50 4 M+ ( )2.00 12.50
4.50 8.00 12.5012.50 12.50
3 C
=
+ ==
( )1.50 2 M+ ( )2.00 8.50
4.50 4.00 8.508.50 8.50
=
+ ==
.#1 3 4 12.50
.#2 3 2 8.50
Subtract Eq.#2 from Eq.#1.#3 0 2 4.00
Solve Eq.#32.00
The cost of one slice of mushroom pizza is $2.00
Replace M in Eq#2 with 2.00
.#2 3 2
Eq C MEq C M
Eq C M
M
Eq C M
+ =+ =
+ =
=
+ ( )2.00 8.50
3 4.00 8.503 8.50 4.003 4.50
4.50 1.503
CCC
C
=
+ == −=
= =
Page 316

DEVELOPING ESSENTIAL SKILLS
Write and solve a system of linear equations for each real-world context below:
Problem 1 Problem 2
Tanisha and Rachel had lunch at the mall.
Tanisha ordered three slices of pizza and two colas. Tanisha’s bill was $6.00.
Rachel ordered two slices of pizza and three colas. Rachel’s bill was $5.25.
What was the price of one slice of pizza? What was the price of one cola?
When Tony received his weekly allow-ance, he decided to purchase candy bars for all his friends.
Tony bought three Milk Chocolate bars and four Creamy Nougat bars, which cost a total of $4.25 without tax.
Then he realized this candy would not be enough for all his friends, so he returned to the store and bought an additional six Milk Chocolate bars and four Creamy Nougat bars, which cost a total of $6.50 without tax.
How much did each type of candy bar cost?
Problem 3 Problem 4
Alexandra purchases two doughnuts and three cookies at a doughnut shop and is charged $3.30.
Briana purchases five doughnuts and two cookies at the same shop for $4.95.
All the doughnuts have the same price and all the cookies have the same price. Find the cost of one doughnut and find the cost of one cookie.
Ramón rented a sprayer and a generator.
On his first job, he used each piece of equipment for 6 hours at a total cost of $90.
On his second job, he used the sprayer for 4 hours and the generator for 8 hours at a total cost of $100.
What was the hourly cost of each piece of equipment?
Problem 5
The cost of 3 markers and 2 pencils is $1.80.
The cost of 4 markers and 6 pencils is $2.90.
What is the cost of each item? Include appropriate units in your answer.
Page 317

Answers
Problem 1 080233a Equations Check
Tanisha and Rachel had lunch at the mall.
Tanisha ordered three slices of pizza and two colas. Tanisha’s bill was $6.00.
Rachel ordered two slices of pizza and three colas. Rachel’s bill was $5.25.
What was the price of one slice of pizza? What was the price of one cola?
Equation #1.
3 2 6.00P C+ =
Equation #2.
2 3 5.25P C+ =
Equation #1.
3 P( )1.50 2 C+ ( ).75 6.00
4.50 1.50 6.006.00 6.00
=
+ ==
Equation #2.
2 P( )1.50 3 C+ ( ).75 5.25
3.00 2.25 5.255.25 5.25
=
+ ==
Variables:
Let P represent the cost of a slice of pizza.
Let C represent the cost of a cola.
Solution
.#1 3 2 6.00
.#2 2 3 5.25Multiply Eq.#1 by 2 Multiply Eq.#2 by 3
#1 6 4 12.00.#2 6 9 15.75
Subtract Eq.#1 from Eq.#2Eq.#3 5 3.75
3.75 .755
Substitute .75 for C in Eq.#1
3 2
Eq P CEq P C
Eq P CEq P C
C
C
P C
+ =+ =
+ =+ =
=
= =
+ ( ).75 6.00
3 1.50 6.003 4.50
1.50
PP
P
=
+ ==
=
Substitute .75 for C in Eq.#1
3 2P C+ ( ).75 6.00
3 1.50 6.003 4.50
1.50
PP
P
=
+ ==
=
Page 318

Problem 2 010232a Equations Check
When Tony received his weekly allow-ance, he decided to purchase candy bars for all his friends.
Tony bought three Milk Chocolate bars and four Creamy Nougat bars, which cost a total of $4.25 without tax.
Then he realized this candy would not be enough for all his friends, so he returned to the store and bought an additional six Milk Chocolate bars and four Creamy Nougat bars, which cost a total of $6.50 without tax.
How much did each type of candy bar cost?
Equation #1.
3 4 4.25M C+ =
Equation #2.
6 4 6.50M C+ =
Equation #1.
3 M( ).75 4 C+ ( ).50 4.25
2.25 2.00 4.254.25 4.25
=
+ ==
Equation #2.
6 M( ).75 4 C+ ( ).50 6.50
4.50 2.00 6.506.50 6.50
=
+ ==
Variables:
Let C represent the cost of a Creamy Nougat bar.
Let M represent the cost of a Milk Chocolate bar.
Solution
.#1 3 4 4.25
.#2 6 4 6.50Subtract Eq.#1 from Eq.#2Eq.#3 3M+0C=2.25
2.25M= .753
Substitute .75 for M in Eq.#1
3
Eq M CEq M C
M
+ =+ =
=
( ).75 4 4.25
2.25 4 4.254 2.00
2.00 .504
C
CC
C
+ =
+ ==
= =
Page 319

Problem 3 010332a Equations Check
Alexandra purchases two doughnuts and three cookies at a doughnut shop and is charged $3.30.
Briana purchases five doughnuts and two cookies at the same shop for $4.95.
All the doughnuts have the same price and all the cookies have the same price. Find the cost of one doughnut and find the cost of one cookie.
Equation #1.
2 3 3.30D C+ =
Equation #2.
5 2 4.95D C+ =
Equation #1.
2 D( ).75 3 C+ ( ).60 3.30
1.50 1.80 3.303.30 3.30
=
+ ==
Equation #2.
5 D( ).75 2 C+ ( ).60 4.95
3.75 1.20 4.954.95 4.95
=
+ ==
Variables:
Let D represent the cost of a donut.
Let C represent the cost of a cookie.
Solution
.#1 2 3 3.30
.#2 5 2 4.95Multiply Eq.#1 by 5 Multiply Eq.#2 by 2
#1 10 15 16.50.#2 10 4 9.90
Subtract Eq.#2 from Eq.#1Eq.#3 0D+11C 6.60
6.60 .6011
Substitute .60 for C in Eq.#1
10 15
Eq D CEq D C
Eq D CEq D C
C
D C
+ =+ =
+ =+ =
=
= =
+ ( ).60 16.50
10 9 16.5010 7.50
7.50 .7510
DD
D
=
+ ==
= =
Page 320

Problem 4 060133a Equations Check
Ramón rented a sprayer and a gen-erator.
On his first job, he used each piece of equipment for 6 hours at a total cost of $90.
On his second job, he used the sprayer for 4 hours and the gener-ator for 8 hours at a total cost of $100.
What was the hourly cost of each piece of equipment?
Equation #1.
6 6 90S G+ =
Equation #2.
4 8 100S G+ =
Equation #1.
6 S( )5 6 G+ ( )10 90
30 60 9090 90
=
+ ==
Equation #2.
4 S( )5 8 G+ ( )10 100
20 80 100100 100
=
+ ==
Variables:
Let S represent the hourly cost of a sprayer.
Let G represent the hourly cost of a generator.
Solution
.#1 6 6 90
.#2 4 8 100Multiply Eq.#1 by 4 Multiply Eq.#2 by 6
#1 24 24 360.#2 24 48 600
Subtract Eq.#1 from Eq.#2Eq.#3 0S+24G 240
240 1024
Substitute 10 for G in Eq.#1
6 6
Eq S GEq S G
Eq S GEq S G
G
S G
+ =+ =
+ =+ =
=
= =
+ ( )10 90
6 60 906 30
30 56
SS
S
=
+ ==
= =
Page 321

Problem 5 080837ia Equations Check
The cost of 3 markers and 2
pencils is $1.80.
The cost of 4 markers and 6 pen-cils is $2.90.
What is the cost of each item? Include appropriate units in your answer.
Equation #1.
3 2 1.80M P+ =
Equation #2.
4 6 2.90M P+ =
Equation #1.
3 M( ).50 2 P+ ( ).15 1.80
1.50 .30 1.801.80 1.80
=
+ ==
Equation #2.
4 M( ).50 6 P+ ( ).15 2.90
2.00 .90 2.902.90 2.90
=
+ ==
Variables:
Let M represent the cost of a marker.
Let P represent the cost of a pencil
Solution
.#1 3 2 1.80
.#2 4 6 2.90Multiply Eq.#1 by 4Multiply Eq.#2 by 3
.#1 12 8 7.20
.#2 12 18 8.70Subtract Eq.#1 from Eq.#2
.#3 0 10 1.5010 1.50
1.50 .1510
Substitute .15 for P in Eq.#1
.#1 3
Eq M PEq M P
Eq M PEq M P
Eq M PP
P
Eq
+ =+ =
+ =+ =
+ ==
= =
2M P+ ( ).15 1.80
3 .30 1.803 1.50
1.50 .503
MM
M
=
+ ==
= =
Page 322

REGENTS EXAM QUESTIONS
A.CED.A.2: Modeling Linear Systems
249) An animal shelter spends $2.35 per day to care for each cat and $5.50 per day to care for each dog. Pat
noticed that the shelter spent $89.50 caring for cats and dogs on Wednesday. Write an equation to represent the possible numbers of cats and dogs that could have been at the shelter on Wednesday. Pat said that there might have been 8 cats and 14 dogs at the shelter on Wednesday. Are Pat’s numbers possible? Use your equation to justify your answer. Later, Pat found a record showing that there were a total of 22 cats and dogs at the shelter on Wednesday. How many cats were at the shelter on Wednesday?
250) During the 2010 season, football player McGee’s earnings, m, were 0.005 million dollars more than those
of his teammate Fitzpatrick’s earnings, f. The two players earned a total of 3.95 million dollars. Which system of equations could be used to determine the amount each player earned, in millions of dollars? 1) 3)
2) 4)
251) Jacob and Zachary go to the movie theater and purchase refreshments for their friends. Jacob spends a total of $18.25 on two bags of popcorn and three drinks. Zachary spends a total of $27.50 for four bags of popcorn and two drinks. Write a system of equations that can be used to find the price of one bag of popcorn and the price of one drink. Using these equations, determine and state the price of a bag of popcorn and the price of a drink, to the nearest cent.
252) Mo's farm stand sold a total of 165 pounds of apples and peaches. She sold apples for $1.75 per pound
and peaches for $2.50 per pound. If she made $337.50, how many pounds of peaches did she sell? 1) 11 3) 65 2) 18 4) 100
253) At Bea's Pet Shop, the number of dogs, d, is initially five less than twice the number of cats, c. If she
decides to add three more of each, the ratio of cats to dogs will be · Write an equation or system of
equations that can be used to find the number of cats and dogs Bea has in her pet shop. Could Bea's Pet Shop initially have 15 cats and 20 dogs? Explain your reasoning. Determine algebraically the number of cats and the number of dogs Bea initially had in her pet shop.
254) Last week, a candle store received $355.60 for selling 20 candles. Small candles sell for $10.98 and large
candles sell for $27.98. How many large candles did the store sell? 1) 6 3) 10 2) 8 4) 12
255) The Celluloid Cinema sold 150 tickets to a movie. Some of these were child tickets and the rest were adult tickets. A child ticket cost $7.75 and an adult ticket cost $10.25. If the cinema sold $1470 worth of tickets, which system of equations could be used to determine how many adult tickets, a, and how many child tickets, c, were sold? 1) 3)
Page 323

2) 4)
256) For a class picnic, two teachers went to the same store to purchase drinks. One teacher purchased 18 juices boxes and 32 bottles of water, and spent $19.92. The other teacher purchased 14 juice boxes and 26 bottles of water, and spent $15.76. Write a system of equations to represent the costs of a juice box, j, and a bottle of water, w. Kara said that the juice boxes might have cost 52 cents each and that the bottles of water might have cost 33 cents each. Use your system of equations to justify that Kara’s prices are not possible. Solve your system of equations to determine the actual cost, in dollars, of each juice box and each bottle of water.
257) Alicia purchased H half-gallons of ice cream for $3.50 each and P packages of ice cream cones for $2.50
each. She purchased 14 items and spent $43. Which system of equations could be used to determine how many of each item Alicia purchased? 1) 3)
2) 4)
258) Two friends went to a restaurant and ordered one plain pizza and two sodas. Their bill totaled $15.95. Later that day, five friends went to the same restaurant. They ordered three plain pizzas and each person had one soda. Their bill totaled $45.90. Write and solve a system of equations to determine the price of one plain pizza. [Only an algebraic solution can receive full credit.]
259) Ian is borrowing $1000 from his parents to buy a notebook computer. He plans to pay them back at the
rate of $60 per month. Ken is borrowing $600 from his parents to purchase a snowboard. He plans to pay his parents back at the rate of $20 per month. Write an equation that can be used to determine after how many months the boys will owe the same amount. Determine algebraically and state in how many months the two boys will owe the same amount. State the amount they will owe at this time. Ian claims that he will have his loan paid off 6 months after he and Ken owe the same amount. Determine and state if Ian is correct. Explain your reasoning.
260) The graph below models the cost of renting video games with a membership in Plan A and Plan B.
Page 324

Explain why Plan B is the better choice for Dylan if he only has $50 to spend on video games, including a membership fee. Bobby wants to spend $65 on video games, including a membership fee. Which plan should he choose? Explain your answer.
261) Dylan has a bank that sorts coins as they are dropped into it. A panel on the front displays the total
number of coins inside as well as the total value of these coins. The panel shows 90 coins with a value of $17.55 inside of the bank. If Dylan only collects dimes and quarters, write a system of equations in two variables or an equation in one variable that could be used to model this situation. Using your equation or system of equations, algebraically determine the number of quarters Dylan has in his bank. Dylan's mom told him that she would replace each one of his dimes with a quarter. If he uses all of his coins, determine if Dylan would then have enough money to buy a game priced at $20.98 if he must also pay an 8% sales tax. Justify your answer.
262) There are two parking garages in Beacon Falls. Garage A charges $7.00 to park for the first 2 hours, and
each additional hour costs $3.00. Garage B charges $3.25 per hour to park. When a person parks for at least 2 hours, write equations to model the cost of parking for a total of x hours in Garage A and Garage B. Determine algebraically the number of hours when the cost of parking at both garages will be the same.
SOLUTIONS
249)ANS: a) b) Pat’s numbers are not possible, because the equation does not balance using Pat’s numbers. c) There were 10 cats in the shelter on Wednesday
Strategy: Use information from the first two sentences to write the equation, then use the equation to see if Pat is correct, then modify the equation for the last part of the question. STEP 1: Write the equation Let c represent the number of cats in the shelter. Let d represent the number of dogs in the shelter.
STEP 2: Use the equation to see if Pat is correct.
Page 325

STEP 3: Modify the equation to reflect the total number of animals in the shelter. Let c represent the number of cats in the shelter. Let (22-c) represent the number of dogs in the shelter.
DIMS? Does It Make Sense? Yes. If there were 10 cats in the shelter and 12 dogs, the total costs of caring for the animals would be $89.50.
PTS: 4 NAT: A.CED.A.2 TOP: Modeling Linear Equations
250) ANS: 4 Strategy: Eliminate wrong answers and choose between the remaining choices.. The problem states that McGee (m) and Fitzpatrick’s (f) combined earning were 3.95 million dollars. This can be represented mathematically as . Eliminate answer choices b and c because they state that , which is the difference of their salaries, not the sum. Choose between answer choices a and d. Choice a says that Fitzpatrick (f) makes more. Choice d says that McGee (m) makes more. The problem states that McGee (m) makes more, so choice d is the correct answer. DIMS? Does It Make Sense? Yes. Solve the system in answer choice D using the substitution method, as follows:
Page 326

Fitzpatrick earns $1,972,500 and McGee earns , which is more than Fitzpatrick. $5,000 is 0.005 million dollars, so everything
agrees with the information contained in the problem.
PTS: 2 NAT: A.CED.A.3 TOP: Modeling Linear Systems
251) ANS: a)
b) Drinks cost $2.25 and popcorn costs $5.75 Strategy: Write one equation for Jacob and one equation for Zachary, then solve them as a system of equations. STEP 1: Write 2 equations.
STEP 2. Solve both equations as a system of equations.
Page 327

Drinks cost $2.25 and popcorn costs $5.75 DIMS? Does It Make Sense? Yes. Both equations balance if drinks cost $2.25 and popcorn costs $5.75, as shown below:
PTS: 2 NAT: A.CED.A.3 TOP: Modeling Linear Systems
252) ANS: 3 Strategy: Write and solve a system of equations to represent the problem. Let a represent the number pounds of apples sold.
Page 328

Let p represent the number of pounds of peaches sold. STEP 1. Write a system of equations. Eq. 1 Eq. 2 STEP 2. Solve the system.
DIMS? Does It Make Sense? Yes. If , then , and these values make both equations balance.
Eq. 1 Eq. 2
PTS: 2 NAT: A.REI.C.6 TOP: Solving Linear Systems
253) ANS: PART 1: Write an equation or system of equations. STEP 1. Write an equation from the first sentence to describe the initial relationship between the number of dogs and cats. Let c represent the initial number of cats. Let d represent the initial number of dogs.
STEP 2. Express the current ratio of cats and dogs in the fraction form of
STEP 3. Modify the current ratio of cats and dogs to show the addition of three cats and three dogs.
STEP 4. Write a proportion that equates the modified ratio with the fraction .
STEP 5. Write a system of equations using the equation from STEP 1 and the proportion from STEP 4.
Page 329

PART 2. Answer the question, “Could Bea’s Pet Shop initially have 15 cats and 20 dogs?” and explain your reasoning. No. The initial relationship between the number of cats and dogs can be expressed mathematically as . This equation does not balance when and .
Part 3. Solve the system of equations to determine the initial number of dogs and cats.
The initial number of cats is 9 and the initial number of dogs is 13.
PTS: 6 NAT: A.CED.A.3 TOP: Modeling Linear Systems
254) ANS: 2 Strategy: Write and solve a system of equations to represent the problem. Let L represent the number of large candles sold. Let S represent the number of small candles sold. STEP 1. Write a system of equations. Eq. 1 Eq. 2 STEP 2. Solve the system.
Page 330

DIMS? Does It Make Sense? Yes. If , then , and these values make both equations balance.
Eq. 1 Eq. 2
PTS: 2 NAT: A.REI.C.6 TOP: Modeling Linear Systems
255) ANS: 1 Step 1. Recognize this problem as having two variables, a and c. Step 2. Strategy: Write a system of equations to model the problem. Step 3. Use information from the first two sentences to write the first equation.
The Celluloid Cinema sold 150 tickets to a movie. Some of these were child tickets and the rest were adult tickets.
Eliminate answer choices b) and d).
Use information from the next two sentences to write the second equation. A child ticket cost $7.75 and an adult ticket cost $10.25.
If the cinema sold $1470 worth of tickets, ....
Eliminate choice c). The answer is choice a). Step 4. Does it make sense? Yes. Answer choice a) shows that the number of adult tickets added to the number of children tickets equals 150, and the income from the adult tickets added to the income from the children tickets equals 1470.
PTS: 2 NAT: A.REI.C. TOP: Modeling Linear Systems
256) ANS: PART 1: Write a system of equations. Eq. 1. Eq. 2. PART 2. Use the system to justify that Kara’s prices are not possible.
Page 331
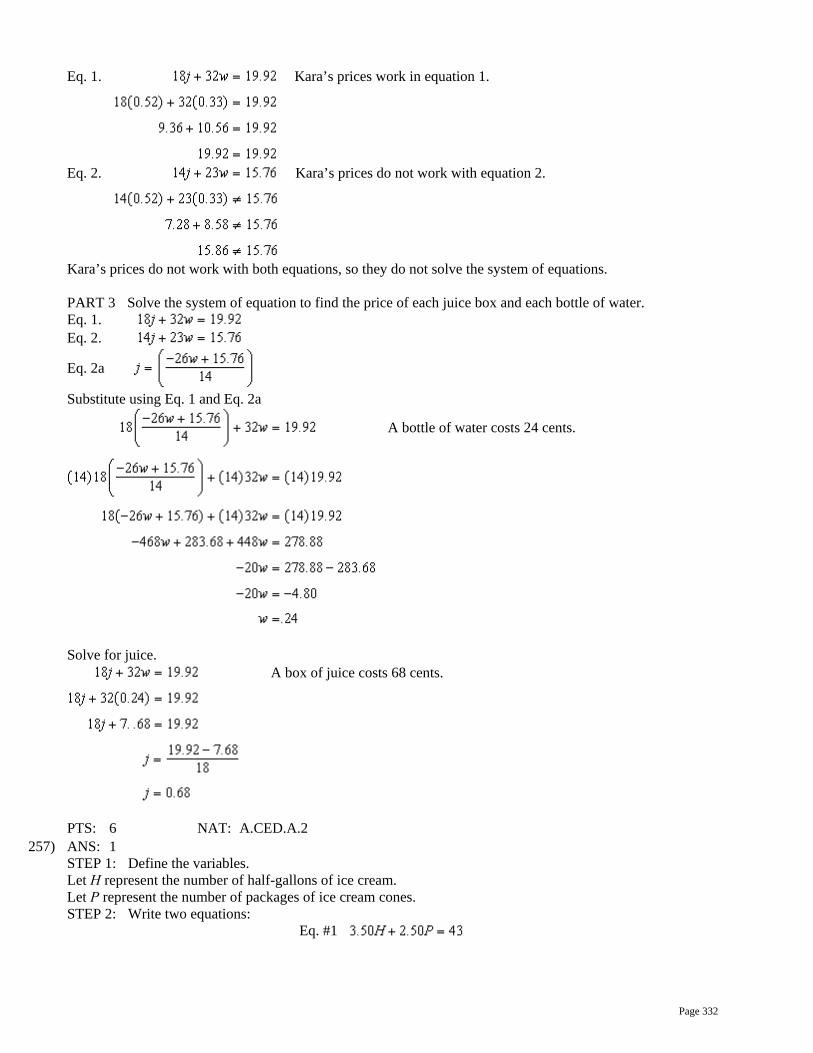
Eq. 1. Kara’s prices work in equation 1.
Eq. 2. Kara’s prices do not work with equation 2.
Kara’s prices do not work with both equations, so they do not solve the system of equations. PART 3 Solve the system of equation to find the price of each juice box and each bottle of water. Eq. 1. Eq. 2.
Eq. 2a
Substitute using Eq. 1 and Eq. 2a
A bottle of water costs 24 cents.
Solve for juice.
A box of juice costs 68 cents.
PTS: 6 NAT: A.CED.A.2
257) ANS: 1 STEP 1: Define the variables. Let H represent the number of half-gallons of ice cream. Let P represent the number of packages of ice cream cones. STEP 2: Write two equations:
Eq. #1
Page 332

This equation says that $3.50 times the number of half-gallons of ice cream plus $2.50 times the number of packages of ice cream cones is $43.00
Eq.#2 This equation says the the number of half-gallons of ice cream and the number of packages of ice cream cones is 14.
PTS: 2 NAT: A.CED.A.3 TOP: Modeling Linear Systems
258) ANS: One plain pizza costs $12.05 Step 1. Define Variables Let P represent the cost of one plain pizza Let S represent the cost of one soda. Step 2. Write 2 equations. Eq. #1 (from first and second sentences) Eq. #2 (from third, fourth and fifth sentences) Step 3. Multiply Eq. #1 times 3 Eq. #1a Step 4. Subtract Eq.#2 from Eq.#1a
Step 5. Solve for P by substituting 1.95 for S in Eq.#1.
Step 6. Check to see that and satisfy both equations. Eq. #1
Eq. #2
PTS: 4 NAT: A.CED.A.3 TOP: Modeling Linear Systems
259) ANS: Strategy - Part 1:
Let m represent the number of months. Ian’s debt is modeled by Ken’s debt is modeled by Ian and Ken will owe the same amount when , so set both expressions equal, as follows:
Page 333

Strategy - Part 2 Ian and Ken will owe the same amount after 10 months. Both will owe $400. Given =
Add (60m)
+60m Simplify 1000 =
Subtract (600) -600 -600 Simplify 400 =
40m Divide (40) =
Answer 10 = m Solve for amount owed after 10 months.
Strategy - Part 3 Ian is wrong. He will still owe his parents $40 after 16 months.
PTS: 6 NAT: A.CED.A.3 TOP: Modeling Linear Systems
260) ANS: When the cost is $50, the graph shows that Plan A purchases a smaller number of games than Plan B. When $65 is spent, both plans purchase the same amount of games, so it doesn’t matter.
PTS: 2 NAT: A.CED.A.3 TOP: Modeling Linear Systems
261) ANS: Equation 1. Equation 2. Dylan has 57 quarters With all 90 coins being quarters, Dylan would not have enough money to buy the game and pay the sales tax. Strategy: Let d represent the number of dimes and let q represent the number of quarters. Write two equations: 1) one to represent the total amount of money; and 2) another to represent the total number of coins. Convert all money to cents to avoid working with decimals. STEP 1. Write two equations. Equation 1. Equation 2. STEP 2. Multiply equation 2 by 10, so that the second equation has 10d as a term. Equation 2b. STEP 3. Subtract equation 2b from equation 1 and solve for q, as follows:
Page 334

The number of quarters Dylan has is 57.
STEP 4. Find out how much money Dylan will have if his mother replaces all the dimes with quarters. Dylan will still have 90 coins, but they will all be quarters. cents, or $22.50. STEP 5. Determine how much a $20.95 game costs with 8% sales tax.
STEP 6. Compare the amount Dylan has from STEP 5 to the amount Dylan needs from STEP 6. $22.50 < $22.65
Dylan does not have enough money.
PTS: 6 NAT: A.CED.A.3 TOP: Modeling Linear Systems
262) ANS: Strategy: Write and solve a system of linear equations. STEP 1. Let represent the cost of parking in Garage A. Let represent the cost of parking in Garage B. Let x represent the number of parking hours. STEP 2. Write two equations.
STEP 3 Let to determine the number of hours when the cost of parking will be the same.
The cost of parking in both garages will be the same for 4 hours. CHECK
Hours 2 $7.00 $6.50
Page 335

3 $10.00 $9.75 4 $13.00 $13.00
PTS: 4 NAT: A.CED.A.3 TOP: Modeling Linear Systems
Page 336
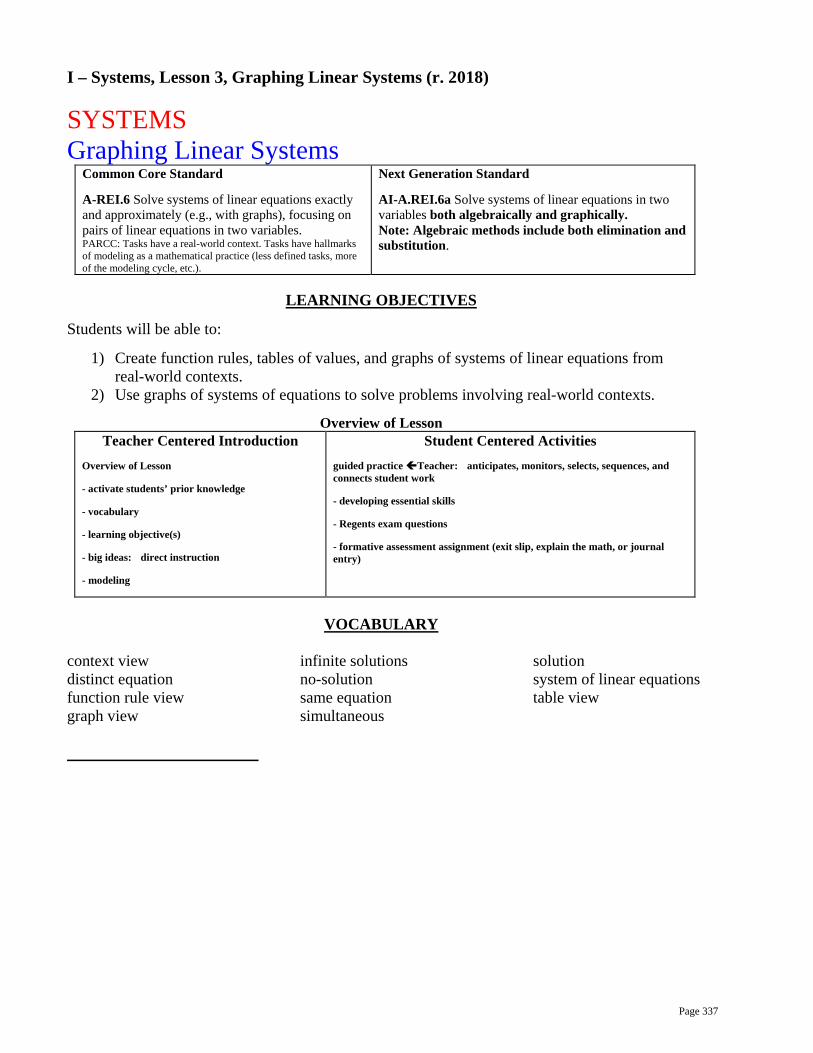
I – Systems, Lesson 3, Graphing Linear Systems (r. 2018)
SYSTEMS Graphing Linear Systems
Common Core Standard
A-REI.6 Solve systems of linear equations exactly and approximately (e.g., with graphs), focusing on pairs of linear equations in two variables. PARCC: Tasks have a real-world context. Tasks have hallmarks of modeling as a mathematical practice (less defined tasks, more of the modeling cycle, etc.).
Next Generation Standard
AI-A.REI.6a Solve systems of linear equations in two variables both algebraically and graphically. Note: Algebraic methods include both elimination and substitution.
LEARNING OBJECTIVES
Students will be able to:
1) Create function rules, tables of values, and graphs of systems of linear equations from real-world contexts.
2) Use graphs of systems of equations to solve problems involving real-world contexts.
Overview of Lesson Teacher Centered Introduction
Overview of Lesson
- activate students’ prior knowledge
- vocabulary
- learning objective(s)
- big ideas: direct instruction
- modeling
Student Centered Activities guided practice Teacher: anticipates, monitors, selects, sequences, and connects student work
- developing essential skills
- Regents exam questions
- formative assessment assignment (exit slip, explain the math, or journal entry)
VOCABULARY
context view distinct equation function rule view graph view
infinite solutions no-solution same equation simultaneous
solution system of linear equations table view
Page 337

BIG IDEAS
Graphing Method of Solving and System of Linear Equations Objective: Find the coordinates of the point where the graphs of the equations intersect.
Manually With Graphing Calculator STEP #1. Put the equations into slope-intercept form: y mx b= + .
STEP #1. Put the equations into slope-intercept form: y mx b= + .
STEP #2. Graph both equations on the same coordinate plane.
STEP #2. Input both equations in a graphing calculator.
STEP #3. Identify the coordinates of the point where the two lines intersect. This is the solution to the system of equations.
STEP #3. Use the table and/or graph views to identify the coordinates of the point where the two lines intersect. This is the solution to the system of equations. NOTE: Some calculators also have a calculate intersection feature.
STEP #4. Check your solution by substituting it into the original equations. If both equations balance, you have the correct solution.
STEP #4. Check that you have input the equations properly and that both table and graph views show the same solution.
DEVELOPING ESSENTIAL SKILLS
Solve each of the following systems by graphing.
1. 4 2 163 3 15
x yx y+ =
+ =
2. 3 72 2 6x yx y+ =
+ =
3. 2 3 804 2 80
x yx y+ =
+ =
4. 5 4 654 3 50a ba b+ =
+ =
5. 2 4 283 2 30
m jm j+ =
+ =
Answers
1. 4 2 163 3 15
x yx y+ =
+ =
Graphing 16 44 2 16 8 2 2 8
215 33 3 15 5 5
3
xx y y y x y x
xx y y y x y x
−+ = → = → = − → = − +
−+ = → = → = − = = − +
Page 338

Screenshots from TI 84 Graphing Calculator
2. 3 72 2 6x yx y+ =
+ =
Graphing 3 7 3 72 2 6 2 2 6 3x y y xx y y x y x+ = → = − ++ = → = − + → = − +
Screenshots from TI 84 Graphing Calculator
3. 2 3 804 2 80
x yx y+ =
+ =
Graphing 80 2 2 802 3 80 3 80 2
3 3 380 44 2 80 2 80 4 40 2 2 40
2
xx y y x y y x
xx y y x y y x y x
− −+ = → = − → = → = +
−+ = → = − → = → = − → = − +
Screenshots from TI 84 Graphing Calculator
4. 5 4 654 3 50a ba b+ =
+ =
Graphing
Page 339

65 4 45 4 65 5 65 4 135 5
50 3 3 254 3 50 4 50 34 4 2
ba b a b a a b
ba b a b a a b
− −+ = → = − → = → = +
− −+ = → = − → = → = +
Screenshots from TI 84 Graphing Calculator
5. 2 4 283 2 30
m jm j+ =
+ =
Graphing 28 42 4 28 2 28 4 2 14
230 2 23 2 30 3 30 2 10
3 3
jm j m j m m j
jm j m j m m j
−+ = → = − → = → = − +
− −+ = → = − → = → = +
Screenshots from TI 84 Graphing Calculator
REGENTS EXAM QUESTIONS
A.REI.C.6: Graphing Linear Systems
263) Next weekend Marnie wants to attend either carnival A or carnival B. Carnival A charges $6 for
admission and an additional $1.50 per ride. Carnival B charges $2.50 for admission and an additional $2 per ride. a) In function notation, write to represent the total cost of attending carnival A and going on x rides. In function notation, write to represent the total cost of attending carnival B and going on x rides. b) Determine the number of rides Marnie can go on such that the total cost of attending each carnival is the same. [Use of the set of axes below is optional.] c) Marnie wants to go on five rides. Determine which carnival would have the lower total cost. Justify your answer.
Page 340

264) A local business was looking to hire a landscaper to work on their property. They narrowed their choices
to two companies. Flourish Landscaping Company charges a flat rate of $120 per hour. Green Thumb Landscapers charges $70 per hour plus a $1600 equipment fee. Write a system of equations representing how much each company charges. Determine and state the number of hours that must be worked for the cost of each company to be the same. [The use of the grid below is optional.] If it is estimated to take at least 35 hours to complete the job, which company will be less expensive? Justify your answer.
265) Franco and Caryl went to a bakery to buy desserts. Franco bought 3 packages of cupcakes and 2 packages
of brownies for $19. Caryl bought 2 packages of cupcakes and 4 packages of brownies for $24. Let x equal the price of one package of cupcakes and y equal the price of one package of brownies. Write a system of equations that describes the given situation. On the set of axes below, graph the system of equations.
Page 341

Determine the exact cost of one package of cupcakes and the exact cost of one package of brownies in dollars and cents. Justify your solution.
266) Central High School had five members on their swim team in 2010. Over the next several years, the team
increased by an average of 10 members per year. The same school had 35 members in their chorus in 2010. The chorus saw an increase of 5 members per year. Write a system of equations to model this situation, where x represents the number of years since 2010. Graph this system of equations on the set of axes below.
Explain in detail what each coordinate of the point of intersection of these equations means in the context of this problem.
267) Zeke and six of his friends are going to a baseball game. Their combined money totals $28.50. At the
game, hot dogs cost $1.25 each, hamburgers cost $2.50 each, and sodas cost $0.50 each. Each person buys one soda. They spend all $28.50 on food and soda. Write an equation that can determine the number of hot dogs, x, and hamburgers, y, Zeke and his friends can buy. Graph your equation on the grid below.
Page 342

Determine how many different combinations, including those combinations containing zero, of hot dogs and hamburgers Zeke and his friends can buy, spending all $28.50. Explain your answer.
268) Rowan has $50 in a savings jar and is putting in $5 every week. Jonah has $10 in his own jar and is
putting in $15 every week. Each of them plots his progress on a graph with time on the horizontal axis and amount in the jar on the vertical axis. Which statement about their graphs is true? 1) Rowan’s graph has a steeper slope than
Jonah’s. 3) Jonah’s graph has a steeper slope than
Rowan’s. 2) Rowan’s graph always lies above Jonah’s. 4) Jonah’s graph always lies above Rowan’s.
SOLUTIONS
263) ANS: a)
b) The total costs are the same if Marnie goes on 7 rides. c) Carnival B has the lower cost for admission and 5 rides. Carnival B costs $12.50 for admission and 5 rides and Carnival A costs $13.50 for admission and 5 rides. Strategy: Write a system of equations, then input it into a graphing calculator and use it to answer parts b and c of the problem. STEP 1. Write a system of equations.
STEP 2. Input the system into a graphing calculator. Let Let
Page 343

STEP 3. Use the different views of the function to answer parts b and c of the problem. Part a) The total costs are the same at 7 rides. Part b) Carnival B costs $12.50 for admission and 5 rides and Carnival A costs $13.50 for admission and 5 rides, so Carnival B has the lower total cost.
PTS: 6 NAT: A.REI.C.6 TOP: Modeling Linear Systems
264) ANS: a)
b) The costs will be the same when 32 hours are worked. c) If the job takes at least 35 hours, Green Thumb Landscapers will be less expensive. Strategy: Write a system of equations, then set both equations equal to one another and solve for x, then answer the questions STEP 1. Write a system of equations. Let x represent the number of hours worked. Let represent the total costs of Flourish Landscape Company. Let represent the total costs of Green Thumb Landscapers. Write:
STEP 2. Set both functions equal to one another to find the break even hours..
STEP 3. Input the equations into a graphing calculator to verify the break even amount and determine which company is cheaper for 35 hours or more of work.
Green Thumb is less expensive.
PTS: 6 NAT: A.REI.C.6 TOP: Modeling Linear Systems
Page 344

265) ANS: Step 1. Write two equations. Franco’s Purchase: Franco bought 3 packages of cupcakes (3x) and 2 packages of brownies (2y) for $19.
Caryl’s Purchase: Caryl bought 2 packages of cupcakes (2x) and 4 packages of brownies (4y) for $24.
Step 2. Input both equations in a graphing calculator, then complete the graph.
Determine the exact cost of one package of cupcakes and the exact cost of one package of brownies in dollars and cents. Justify your solution.
Cupcakes
Brownies
Page 345

A package of cupcakes costs $3.50.
A package of brownies costs $4.25
Check by inserting both values in both equations. Franco
Caryl
PTS: 6 NAT: A.REI.C.6 TOP: Graphing Linear Systems
266) ANS: Step 1. Create a table of values to model membership in the two clubs, as follows: 2010 2011 2012 2013 2014 x 0 1 2 3 4 Swim
5 15 25 35 45 rate of change is a constant: 10 members
per year Chorus
35 40 45 50 55 rate of change is a constant: 5 members
per year Step 2. Use to write two linear equations to model the data in the table.
Step 3. Graph the system of equations.
The intersection of these two equations means that in the sixth year, which is 2016, the swim team and chorus will each have 65 members.
Page 346

PTS: 6 NAT: A.REI.C.6 TOP: Graphing Linear Systems
267) ANS: Seven friends have $28.50. They spend on sodas, leaving 25.00 for hot dogs and hamburgers. If hotdogs (x) cost $1.25 and hamburgers (y) cost $2.50, the following equation can be used to determine the number of hot dogs and hamburgers the 7 friends can buy.
There are 11 combinations, as each dot represents a possible combination.
PTS: 6 NAT: A.REI.C.6 TOP: Graphing Linear Systems
268) ANS: 3 Strategy: Create equations that model Rowan’s and Jonah’s savings plans, then compare the slopes. STEP 1. Create Equations
STEP 2. Compare the slopes.
Page 347

Jonah’s slope is greater than Rowan’s slope because . Therefore, Jonah’s graph will have a steeper slope. DIMS? Does It Make Sense? Yes. Input both equations in a graphing calculator, as follows:
Jonah’s graph, which is bold, is steeper than Rowan’s graph.
PTS: 2 NAT: A.CED.A.2 TOP: Graphing Linear Systems
Page 348
I – Systems, Lesson 4, Modeling Systems of Linear Inequalities (r. 2018)
SYSTEMS Modeling Systems of Linear Inequalities
CC Standard
A-CED.A.3 Represent constraints by equations or inequalities, and by systems of equations and/or ine-qualities, and interpret solutions as viable or non-vi-able options in a modeling context. For example, represent inequalities describing nutritional and cost constraints on combinations of different foods.
NG Standard
AI-A.CED.3 Represent constraints by equations or ine-qualities, and by systems of equations and/or inequalities, and interpret solutions as viable or non-viable options in a modeling context. e.g., Represent inequalities describing nutritional and cost constraints on combinations of different foods.
LEARNING OBJECTIVES
Students will be able to:
1) Create a system of linear inequalities from a real-world context.
Overview of Lesson
Teacher Centered Introduction Overview of Lesson
- activate students’ prior knowledge
- vocabulary
- learning objective(s)
- big ideas: direct instruction
- modeling
Student Centered Activities guided practice Teacher: anticipates, monitors, selects, sequences, and connects student work
- developing essential skills
- Regents exam questions
- formative assessment assignment (exit slip, explain the math, or journal entry)
VOCABULARY
see key words below
Page 349

BIG IDEAS Modeling systems of linear inequalities is similar to modeling systems of linear equations, except that an inequality sign is used instead of an equal sign.
Key English Words and Their Mathematical Translations
These English Words Usually Mean Examples: English becomes math is, are equals the sum of 5 and x is 20 becomes 5 + x = 20
more than, greater than inequality >
x is greater than y becomes x > y x is more than 5 becomes x > 5 5 is more than x becomes 5 > x
greater than or equal to, a minimum of, at least
inequality ≥
x is greater than or equal to y becomes the minimum of x is 5 becomes
x is at least 20 becomes less than inequality
< x is less than y becomes x is less than 5 becomes 5 is less than x becomes
less than or equal to, a maximum of, not more than
Inequality ≤
X is less than or equal to y becomes The maximum of x is 5 becomes
X is not more than becomes
General Approach The general approach is as follows:
1. Read and understand the entire problem. 2. Underline key words, focusing on variables, operations, and equalities or inequalities. 3. Convert the key words to mathematical notation (consider meaningful variable names
other than x and y). 4. Write two or more inequalities with the same variables. 5. Check the final system of linear inequalities for reasonableness.
Example Inequalities A high school drama club is putting on their annual theater production. There is a maximum of 800 tickets for the show. The costs of the tickets are $6 before the day of the show and $9 on the day of the show. To meet the expenses of the show, the club must sell at least $5,000 worth of tickets. a) Write a system of inequalities that represent this situation. b) The club sells 440 tickets before the day of the show. Is it possible to sell enough additional tickets on the day of the show to at least meet the expenses of the show? Justify your answer.
Inequality #1.
800b d+ ≤ Inequality #2. 6 9 5000b d+ ≥
Variables: Let b represent the number of tickets sold before the day of the show. Let d represent the number of tickets sold the day of the show.
Solution Strategy: Substitute 440 for b in both inequalities.
Inequality #1. 800
440 800360
b ddd
+ ≤+ ≤
≤ They can sell no more than 360 tickets on the day of the show.
Page 350

Inequality #2.
6 9 50006(440) 9 50002640 9 50009 5000 26409 2360
262.22
b dd
ddd
d
+ ≥+ ≥
+ ≥≥ −≥
≥
They need to sell at least 263 tickets on the day of the show.
Yes, it is possible to sell enough additional tickets on the day of the show to meet expenses.
NOTE: Systems of inequalities often have an infinite number of solutions. Graphs are useful to represent the solution sets for such systems. Graphing systems of inequalities is covered in Systems, Lesson 5, Graphing Systems of Linear Inequalities.
DEVELOPING ESSENTIAL SKILLS
Model each context below with a system of inequalities. Define the variables. Do not solve.
Contexts Systems of Inequalities Nazmun has at least $5,000 in a savings account at the bank. Her savings account balance is more than 5 times greater than her checking account balance.
Let S represent Nazmun’s savings ac-count balance. Let C represent Nazmun’s checking ac-count balance.
Write: 50005
cs c≥
≥
The senior spirit committee is selling food to raise money for the prom. They need to raise at least $500. A deluxe meal with dessert costs $10. A sandwich meal with potato chips costs $5. They have enough food to sell at most 100 meals.
Let d represent the number of deluxe meals. Let s represent the number of sandwich meals.
Write: 10 5 500
100d s
d s+ ≥
+ ≤
Dr. Steve is going to Sal’s Diner to buy sandwiches. A small sandwich costs $3.50 and larger hoagie costs $5.00. He needs to buy at least 20 sandwiches, and he can spend no more than $88.
Let s represent the number of sand-wiches. Let h represent the number of hoagies.
Write: 3.5 5 88
20s h
s h+ ≤
+ ≥
The girls soccer team is doing a fund-raiser for new soccer uniforms. They need to raise at least $2,000. A local merchant has promised to donate up to 150 plain and deluxe t-shirts to help the team with their fundraiser. Plain t-shirts sell for $8 each and fancy t-shirts sell for $12 each.
Let p represent the number of plain t-shirts. Let d represent the number of deluxe-shirts.
Write: 8 12 2000
150p d
p d+ ≥
+ ≤
Page 351

Tenzin is working math problems to pre-pare for the high stakes math exam re-quired for graduation. He wants to work at least 200 math problems before the exam. He estimates that it will take 10 minutes to work a multiple choice prob-lem and 15 minutes to work an open-end problem. He can spend at most 1300 minutes working math problems before the exam. Write a system of inequalities to help Tenzin decide how many multiple choice problems and how many open-end problems he should work before the exam.
Let x represent the number of multiple choice problems. Let y represent the number of open-end problems.
Write: 10 15 1300
200x y
x y+ ≤
+ ≥
REGENTS EXAM QUESTIONS (through June 2018)
A.CED.A.3: Modeling Systems of Linear Inequalities
269) A high school drama club is putting on their annual theater production. There is a maximum of 800
tickets for the show. The costs of the tickets are $6 before the day of the show and $9 on the day of the show. To meet the expenses of the show, the club must sell at least $5,000 worth of tickets. a) Write a system of inequalities that represent this situation. b) The club sells 440 tickets before the day of the show. Is it possible to sell enough additional tickets on the day of the show to at least meet the expenses of the show? Justify your answer.
270) A drama club is selling tickets to the spring musical. The auditorium holds 200 people. Tickets cost $12
at the door and $8.50 if purchased in advance. The drama club has a goal of selling at least $1000 worth of tickets to Saturday’s show. Write a system of intequalities that can be used to model this scenario. If 50 tickets are sold in advance, what is the minimum number of tickets that must be sold at the door so that the club meets its goal? Justify your answer.
271) The drama club is running a lemonade stand to raise money for its new production. A local grocery store
donated cans of lemonade and bottles of water. Cans of lemonade sell for $2 each and bottles of water sell for $1.50 each. The club needs to raise at least $500 to cover the cost of renting costumes. The students can accept a maximum of 360 cans and bottles. Write a system of inequalities that can be used to represent this situation. The club sells 144 cans of lemonade. What is the least number of bottles of water that must be sold to cover the cost of renting costumes? Justify your answer.
272) Jordan works for a landscape company during his summer vacation. He is paid $12 per hour for mowing
lawns and $14 per hour for planting gardens. He can work a maximum of 40 hours per week, and would like to earn at least $250 this week. If m represents the number of hours mowing lawns and g represents the number of hours planting gardens, which system of inequalities could be used to represent the given conditions? 1) 3)
Page 352

2) 4)
SOLUTIONS
269) ANS: a)
b) Yes, it is possible. They will need to sell 263 or more tickets on the day of the show. They have 360 tickets left. Strategy: Write a system of equations, then use it to answer part b. STEP 1. Let p represent the number of tickets sold before the day of the show. Let d represent the number of tickets sold on the day of the show. Write:
STEP 2. Substitute 440 for p in both equations and solve.
DIMS? Does It Make Sense? Yes. They could cover their costs by selling 263 tickets and make almost $9000 over costs if they sell 360 tickets on the day of the show.
PTS: 2 NAT: A.CED.A.3 TOP: Modeling Systems of Linear Inequalities
270) ANS: Answer: 48 Tickets PART 1: Write a system of inequalitites. Let D represent the number of tickets sold at the door. Let A represent the number of tickets sold in advance.
PART 2: Solve for 50 tickets sold in advance.
Page 353

The drama club needs to sell at least 48 tickets at the door to meet its goal of making $1000.
PTS: 4 NAT: A.REI.A.2
271) ANS: STEP 1. Write a system of inequalities. Let L represent a can of lemondae. Let W represent a bottle of water. Write:
Equation 1
Equation 2
STEP 2. Use Equation 1 to determine the least amount of W required when L=144.
You cannot sell bottles of water, so the drama club needs to sell at least 142 bottles of water
PTS: 4 NAT: A.CED.A.3 TOP: Modeling Systems of Linear Inequalities
272) ANS: 1 Strategy: Translate the words into two inequalities.
Let m represent the number of hours mowing. Let g represent the number of hours gardening.
He is paid $12 per hour for mowing lawns and $14 per hour for planting gardens. He can work a maximum of 40 hours per week, and would like to earn at least $250 this week. Inequality #1 Hours per week.
This inequality says:
the number of hours mowing (m) and the number of hours gardening (g) must be less than or equal to 40 hours.
Inequality #2 Money earned
This inequality says:
Page 354

the money earned mowing (12m) and the money earned gardening (14g) must be greater than or equal to $250.
Page 355

I – Systems, Lesson 5, Graphing Systems of Linear Inequalities (r. 2018)
SYSTEMS Graphing Systems of Linear Inequalities
Common Core Standard
A-REI.12 Graph the solutions to a linear inequality in two variables as a half-plane (excluding the boundary in the case of a strict inequality), and graph the solution set to a system of linear inequali-ties in two variables as the intersection of the corre-sponding half-planes.
Next Generation Standard
AI-A.REI.12 Graph the solutions to a linear inequality in two variables as a half-plane (excluding the boundary in the case of a strict inequality), and graph the solution set to a system of linear inequalities in two variables as the intersection of the corresponding half-planes. Note: Graphing linear equations is a fluency recom-mendation for Algebra I. Students become fluent in solving characteristic problems involving the analytic geometry of lines, such as writing down the equation of a line given a point and a slope. Such fluency can support them in solving less routine mathematical problems involving linearity; as well as modeling lin-ear phenomena (including modeling using systems of linear inequalities in two variables).
LEARNING OBJECTIVES
Students will be able to:
1) Graph the solution set of a system of linear inequalities.
Overview of Lesson
Teacher Centered Introduction Overview of Lesson
- activate students’ prior knowledge
- vocabulary
- learning objective(s)
- big ideas: direct instruction
- modeling
Student Centered Activities guided practice Teacher: anticipates, monitors, selects, sequences, and connects student work
- developing essential skills
- Regents exam questions
- formative assessment assignment (exit slip, explain the math, or journal entry)
VOCABULARY
boundary line dashed line
shading solid line
solution set testing a point
BIG IDEAS
A linear inequality describes a region of the coordinate plane that has a boundary line. Every point in the region is a solution of the inequality. Two or more linear inequalities together form a system of linear inequalities. Note that there are two or more boundary lines in a system of linear inequalities.
Page 356

A solution of a system of linear inequalities makes each inequality in the system true. The graph of a system shows all of its solutions. Graphing a Linear Inequality Step One. Change the inequality sign to an equal sign and graph the boundary line in the same manner that you would graph a linear equation. When the inequality sign contains an equality bar beneath it, use a solid line for the
boundary. When the inequality sign does not contain an equality bar beneath it, use a dashed or
dotted line for the boundary Step Two. Restore the inequality sign and test a point to see which side of the boundary line the solution is on. The point (0,0) is a good point to test since it simplifies any multiplication. However, if the boundary line passes through the point (0,0), another point not on the boundary line must be selected for testing. If the test point makes the inequality true, shade the side of the boundary line that includes
the test point. If the test point makes the inequality not true, shade the side of the boundary line does not
include the test point. Example Graph First, change the inequality sign an equal sign and graph the line: . This is the boundary line of the solution. Since there is no equality line beneath the inequality symbol, use a dashed line for the boundary.
Next, test a point to see which side of the boundary line the solution is on. Try (0,0), since it makes the multiplication easy, but remember that any point will do.
y x< +2 3y x= +2 3
( )
2 30 2(0) 30 3 True, so the solution of the inequality is the region that contains the point 0,0 .Therefore, we shade the side of the boundary line that contains the point (0,0).
y x< +< +
<
Page 357

Note: The TI-83+ graphing calculator does not have the ability to distinguish between solid and dashed lines on a graph of an inequality. The less than and greater than symbols are input using the far-left column of symbols that can be accessed through the feature. Graphing a System of Linear Inequalities. Systems of linear inequalities are graphed in the same manner as systems of equations are graphed. The solution of the system of inequalities is the region of the coordinate plane that is shaded by both inequalities.
Example: Graph the system:
First, convert both inequalities to slope-intercept form and graph.
Next, test a point in each inequality and shade appropriately.
Since point (0,0) is on the boundary line of , select another point, such as (0,1).
Y=
4 63 6 6y xx y≥
− + ≤ −
4 64 64 4
3 23m= , b=02
y xy x
y x
≥
≥
≥2
3 6 66 6 36 3 66 3 66 6 6
1 1 21m= , b=-12
x yy xy xy xD
y x
− + ≤ −≤ − +≤ −
≤ −
≤ −
32
y x≥
Page 358

Since (0,0) is not on the boundary line of , we can use (0,0) as our test point, as
follows:
Note that the system of inequalities divides the coordinate plane into four sections. The solution set for the system of inequalities is the area where the two shaded regions overlap.
DEVELOPING ESSENTIAL SKILLS
Graph the solution sets of the following systems of inequalities. State if the origin (0,0) is or is not in the solution set.
1. 2 4
2y xy x≤ +
≥ − −
2. 3
2 2y xy x≤ −
≥ − +
3. 3
2 2y xy x≥ −
≥ − +
4. 3
2 2y xy x≤ −
≤ − +
5. 3
2 2y xy x≥ −
≤ − +
( )
32
Test (0,1)31 02
1 0 This is true, so the point (0,1) is in the solution set of this inequality.Therefore, we shade the side of the boundary line that includes point (0,1).
y x≥
≥
≥
1 12
y x≤ −
( )
1 12
Test (0,0)10 0 12
0 1 This is not true, so the point (0,0) is not in the solution set of this inequality.We therefore must shade the side of the boundary line that does not incude the point (
y x≤ −
≤ −
≤ −0,0).
Page 359

Answers
1. The origin is in the solution set.
2. The origin is not in the solution set.
3. The origin is not in the solution set.
4. The origin is not in the solution set.
5. The origin is in the solution set.
Page 360

REGENTS EXAM QUESTIONS
A.REI.D.12: Graphing Systems of Linear Inequalities
273)Which ordered pair is not in the solution set of and ?
1) 3) 2) 4)
274) Given:
Which graph shows the solution of the given set of inequalities? 1)
3)
2)
4)
275) Which point is a solution to the system below?
1)
3)
2) 4)
276) What is one point that lies in the solution set of the system of inequalities graphed below?
Page 361

1) 3) 2) 4)
277) First consider the system of equations and . Then consider the system of
inequalities and . When comparing the number of solutions in each of these
systems, which statement is true? 1) Both systems have an infinite number of
solutions. 3) The system of inequalities has more
solutions. 2) The system of equations has more
solutions. 4) Both systems have only one solution.
278) The Reel Good Cinema is conducting a mathematical study. In its theater, there are 200 seats. Adult tickets cost $12.50 and child tickets cost $6.25. The cinema's goal is to sell at least $1500 worth of tickets for the theater. Write a system of linear inequalities that can be used to find the possible combinations of adult tickets, x, and child tickets, y, that would satisfy the cinema's goal. Graph the solution to this system of inequalities on the set of axes below. Label the solution with an S. Marta claims that selling 30 adult tickets and 80 child tickets will result in meeting the cinema's goal. Explain whether she is correct or incorrect, based on the graph drawn.
Page 362

279) Which graph represents the solution of and ?
1)
3)
2)
4)
280) The graph of an inequality is shown below.
Page 363

a) Write the inequality represented by the graph. b) On the same set of axes, graph the inequality . c) The two inequalities graphed on the set of axes form a system. Oscar thinks that the point is in the solution set for this system of inequalities. Determine and state whether you agree with Oscar. Explain your reasoning.
281) Determine if the point is a solution to the system of inequalities graphed below. Justify your
answer.
282) The sum of two numbers, x and y, is more than 8. When you double x and add it to y, the sum is less than
14. Graph the inequalities that represent this scenario on the set of axes below.
Page 364

Kai says that the point is a solution to this system. Determine if he is correct and explain your reasoning.
283) Solve the following system of inequalities graphically on the grid below and label the solution S.
Is the point in the solution set? Explain your answer.
284) On the set of axes below, graph the following system of inequalities:
Page 365

Determine if the point is in the solution set. Explain your answer.
285) Edith babysits for x hours a week after school at a job that pays $4 an hour. She has accepted a job that
pays $8 an hour as a library assistant working y hours a week. She will work both jobs. She is able to work no more than 15 hours a week, due to school commitments. Edith wants to earn at least $80 a week, working a combination of both jobs. Write a system of inequalities that can be used to represent the situation. Graph these inequalities on the set of axes below.
Determine and state one combination of hours that will allow Edith to earn at least $80 per week while working no more than 15 hours.
286) An on-line electronics store must sell at least $2500 worth of printers and computers per day. Each
printer costs $50 and each computer costs $500. The store can ship a maximum of 15 items per day. On the set of axes below, graph a system of inequalities that models these constraints.
Page 366

Determine a combination of printers and computers that would allow the electronics store to meet all of the constraints. Explain how you obtained your answer.
SOLUTIONS
273)Which ordered pair is not in the solution set of and ?
1) 3) 2) 4)
274) Given:
Which graph shows the solution of the given set of inequalities? 1)
3)
2)
4)
275) Which point is a solution to the system below?
1)
3)
2) 4)
276) What is one point that lies in the solution set of the system of inequalities graphed below?
Page 367

1) 3) 2) 4)
277) First consider the system of equations and . Then consider the system of
inequalities and . When comparing the number of solutions in each of these
systems, which statement is true? 1) Both systems have an infinite number of
solutions. 3) The system of inequalities has more
solutions. 2) The system of equations has more
solutions. 4) Both systems have only one solution.
278) The Reel Good Cinema is conducting a mathematical study. In its theater, there are 200 seats. Adult tickets cost $12.50 and child tickets cost $6.25. The cinema's goal is to sell at least $1500 worth of tickets for the theater. Write a system of linear inequalities that can be used to find the possible combinations of adult tickets, x, and child tickets, y, that would satisfy the cinema's goal. Graph the solution to this system of inequalities on the set of axes below. Label the solution with an S. Marta claims that selling 30 adult tickets and 80 child tickets will result in meeting the cinema's goal. Explain whether she is correct or incorrect, based on the graph drawn.
Page 368

279) Which graph represents the solution of and ?
1)
3)
2)
4)
280) The graph of an inequality is shown below.
Page 369

a) Write the inequality represented by the graph. b) On the same set of axes, graph the inequality . c) The two inequalities graphed on the set of axes form a system. Oscar thinks that the point is in the solution set for this system of inequalities. Determine and state whether you agree with Oscar. Explain your reasoning.
281) Determine if the point is a solution to the system of inequalities graphed below. Justify your
answer.
282) The sum of two numbers, x and y, is more than 8. When you double x and add it to y, the sum is less than
14. Graph the inequalities that represent this scenario on the set of axes below.
Page 370

Kai says that the point is a solution to this system. Determine if he is correct and explain your reasoning.
283) Solve the following system of inequalities graphically on the grid below and label the solution S.
Is the point in the solution set? Explain your answer.
284) On the set of axes below, graph the following system of inequalities:
Page 371

Determine if the point is in the solution set. Explain your answer.
285) Edith babysits for x hours a week after school at a job that pays $4 an hour. She has accepted a job that
pays $8 an hour as a library assistant working y hours a week. She will work both jobs. She is able to work no more than 15 hours a week, due to school commitments. Edith wants to earn at least $80 a week, working a combination of both jobs. Write a system of inequalities that can be used to represent the situation. Graph these inequalities on the set of axes below.
Determine and state one combination of hours that will allow Edith to earn at least $80 per week while working no more than 15 hours.
286) An on-line electronics store must sell at least $2500 worth of printers and computers per day. Each
printer costs $50 and each computer costs $500. The store can ship a maximum of 15 items per day. On the set of axes below, graph a system of inequalities that models these constraints.
Page 372

Determine a combination of printers and computers that would allow the electronics store to meet all of the constraints. Explain how you obtained your answer.
Page 373

I – Systems, Lesson 6, Quadratic-Linear Systems (r. 2018)
SYSTEMS Quadratic-Linear Systems
Common Core Standard
No Current Standard in New York A-REI.D.11 Explain why the x-coordinates of the points where the graphs of the equations y=f(x) and y=g(x) intersect are the solutions of the equation f(x)=g(x); find the solutions approximately, e.g., us-ing technology to graph the functions, make tables of values, or find successive approximations. In-clude cases where f(x) and/or g(x) are linear, polyno-mial, rational, absolute value, exponential, and loga-rithmic functions.
PARCC: Tasks that assess conceptual understanding of the indicated concept may involve any of the function types mentioned in the standard except exponential and logarithmic functions. Finding the solutions approximately is limited to cases where f(x) and g(x) are polynomial functions.
Next Generation Standards
AI-A.REI.7a Solve a system, with rational solutions, consisting of a linear equation and a quadratic equation (parabolas only) in two variables both algebraically and graphically. (Shared standard with Algebra II) AI-A.REI.11 Given the equations y = f(x) and y = g(x): i) recognize that each x-coordinate of the intersection(s) is the solution to the equation f(x) = g(x); ii)find the solutions approximately using technology to graph the functions or make tables of values; and iii) interpret the solution in context. (Shared standard with Algebra II) Notes: Algebra I tasks are limited to cases where f(x) and g(x) are linear, polynomial, absolute value, and
exponential functions of the form ( ) ( ) xf x a b= where a > 0 and b > 0 (b ≠ 1). Students should be taught to find the solutions ap-proximately by using technology to graph the func-tions and by making tables of values. When solving any problem, students can choose either strategy.
LEARNING OBJECTIVES
Students will be able to:
1) solve quadratic-linear systems of equations algebraically or by graphing.
Overview of Lesson
Teacher Centered Introduction Overview of Lesson
- activate students’ prior knowledge
- vocabulary
- learning objective(s)
- big ideas: direct instruction
- modeling
Student Centered Activities guided practice Teacher: anticipates, monitors, selects, sequences, and connects student work
- developing essential skills
- Regents exam questions
- formative assessment assignment (exit slip, explain the math, or journal entry)
VOCABULARY
linear equation quadratic equation solution
Page 374

BIG IDEAS Quadratic-linear systems are solved in the same ways that systems of linear equations and/or systems of linear inequalities are solved, either algebraically or by graphing. A solution of a system of equations makes each equation in the system true. Solutions can be found using three different views of a function. Quadratic linear systems will have:
• no solution (the graphs do not intersect), • one solution (the graphs intersect at one point) • two solutions (the graphs intersect at two points).
Example: If and , then the solution may be found using a graphing calculator, as follows:
The solutions to this quadratric-linear system are (-3,4) and (1,0).
NOTE: The calculate intersection function of some graphing calculators can be used to identify solutions.
How to Solve a Quadratic Linear System Algebraically
Step 1 Step 2 Step 3 Step 4 Step 4 Isolate the same variable in both
equations.
Set the opposite expressions equal
to one another.
Solve for the first variable.
NOTE: Strategies other than factoring
can be used.
Input the solutions from Step 3 into an equation and solve for the
second variable.
Write the solutions as
ordered pairs.
2 6 33 7
y x xy x= + += +
2 6 3 3 7x x x+ + = +
( )( ){ }
2
2
6 3 3 73 4 04 1 0
4,1
x x xx xx x
x
+ + = +
+ − =
+ − =
= −
( )
( )
3 73 4 7
5
3 73 1 710
y xyy
y xyy
= +
= − +
= −
= +
= +
=
Two solutions:
(-4,-5)
and (1,10)
Page 375

DEVELOPING ESSENTIAL SKILLS
Solve the following quadratic-linear systems of equations algebraically and by graphing.
1. 2 4 6
2y x xy x= − += +
2. 2 9 18
2y x xy x= − += +
3. 2 10 14
7 16y x xy x= − += −
4. 2 5 4
4y x xy x= + += +
5. 2 8 16
6y x xy x= + += +
Answers
1.
( )( ){ }
( )( )
( ) ( )
2
2
2
4 62
4 6 25 4 0
4 1 0
1,4
21 2 3
4 2 6
1,3 4,6
y x xy x
x x xx x
x x
x
y xy
y
and
= − += +
− + = +
− + =
− − =
=
= +
= + =
= + =
2.
( )( ){ }
( )( )
( ) ( )
2
2
2
9 182
9 18 210 16 0
8 2 0
2,8
22 2 4
8 2 10
2,4 8,10
y x xy x
x x xx xx x
x
y xy
y
and
= − += +
− + = +
− + =
− − =
=
= +
= + =
= + =
Page 376

3.
( )( ){ }
( )( )
( ) ( )
2
2
2
10 147 16
10 14 7 1617 30 0
15 2 0
2,15
7 167 2 16 2
7 15 16 89
2, 2 15,89
y x xy x
x x xx x
x x
x
y xy
y
and
= − += −
− + = −
− + =
− − =
=
= −
= − = −
= − =
−
4.
( ){ }
( )( )
( ) ( )
2
2
2
5 44
5 4 44 4
4
0, 4
40 4 4
4 4 0
0,4 4,0
y x xy x
x x xx x x
x x
x
y xy
y
and
= + += +
+ + = +
+ = +
+
= −
= +
= + =
= − + =
−
Page 377

5.
( )( ){ }
( )( )
( ) ( )
2
2
2
8 166
8 16 67 10 05 2 0
5, 2
65 6 1
2 6 4
5,1 2,4
y x xy x
x x xx xx x
x
y xy
y
and
= + += +
+ + = +
+ + =
+ + =
= − −
= +
= − + =
= − + =
− −
Page 378

REGENTS EXAM QUESTIONS (through June 2018)
A.REI.C.7, A.REI.D.11: SOLVE QUADRATIC-LINEAR SYSTEMS
287) The graphs of and intersect at approximately
1) , only 3) and 2) , only 4) and
288) A company is considering building a manufacturing plant. They determine the weekly production cost at site A to be while the production cost at site B is , where x represents the number of products, in hundreds, and and are the production costs, in hundreds of dollars. Graph the production cost functions on the set of axes below and label them site A and site B.
State the positive value(s) of x for which the production costs at the two sites are equal. Explain how you determined your answer. If the company plans on manufacturing 200 products per week, which site should they use? Justify your answer.
289) Let and . On the set of axes below, draw the graphs of and .
Page 379

Using this graph, determine and state all values of x for which .
290) John and Sarah are each saving money for a car. The total amount of money John will save is given by
the function . The total amount of money Sarah will save is given by the function . After how many weeks, x, will they have the same amount of money saved? Explain
how you arrived at your answer.
291) If and , for which value of x is ?
1) and 3) and 0 2) and 4 4) 4 and 0
292) If and , determine the value(s) of x that satisfy the equation .
293) Given:
Solve the equation algebraically for x, to the nearest tenth. Explain why you chose the method you used to solve this quadratic equation.
SOLUTIONS
287) ANS: 3 Strategy #1. Solve and as a system of equations.
and
Page 380

The values of x that satisfy the system are:
and
Strategy #2. Use a graphing calculator to determine the inttercepts of the graphs of the two equations.
PTS: 2 NAT: A.REI.C.7 TOP: Quadratic-Linear Systems KEY: algebraically
288) ANS:
a) b) The graphs of the production costs are equal when . c) The company should use Site A, because the costs of Site A are lower when .
Page 381

Strategy: Input both functions into a graphing calculator and use the table and graph views to construct the graph on paper and to answer the question.
PTS: 6 NAT: A.REI.D.11 TOP: Quadratic-Linear Systems
289) ANS:
a) b) when and .
Strategy: Input both functions into a graphing calculator and use the table and graph views to construct the graph on paper and to answer the question.
PTS: 4 NAT: A.REI.D.11 TOP: Quadratic-Linear Systems
290) ANS: John and Sarah will have the same amount of money saved at 7 weeks. I set the expressions representing their savings equal to each other and solved for the positive value of x by factoring. Strategy: Set the expressions representing their savings equal to one another and solve for x.
Page 382

DIMS? Does It Make Sense? Yes. After 7 weeks, John and Sarah will each have $95.00. John’s Savings
Sarah’s Savings
PTS: 2 NAT: A.REI.D.11 TOP: Quadratic-Linear Systems
291) ANS: 2 Strategy: Set both expressions equal to one another and solve for x.
PTS: 2 NAT: A.REI.D.11 TOP: Quadratic-Linear Systems
292) ANS:
Given: and , find as follows:
Therefore: and
PTS: 2 NAT: A.REI.D.11 TOP: Quadratic-Linear Systems KEY: AI
293) ANS:
Page 383

The quadratic formula can be used to solve this quadratic in standard form, where , , and .
The quadratic formula was chosen because it works with any quadratic equation.
PTS: 4 NAT: A.REI.D.11 TOP: Quadratic-Linear Systems KEY: AI
Page 384

I – Systems, Lesson 7, Other Systems (r. 2018)
SYSTEMS Other Systems
Common Core Standard
A-REI.D.11 Explain why the x-coordinates of the points where the graphs of the equations y=f(x) and y=g(x) intersect are the solutions of the equation f(x)=g(x); find the solutions approximately, e.g., us-ing technology to graph the functions, make tables of values, or find successive approximations. In-clude cases where f(x) and/or g(x) are linear, polyno-mial, rational, absolute value, exponential, and loga-rithmic functions.
PARCC: Tasks that assess conceptual understanding of the indicated concept may involve any of the function types mentioned in the standard except exponential and logarithmic functions. Finding the solutions approximately is limited to cases where f(x) and g(x) are polynomial functions.
Next Generation Standard
AI-A.REI.11 Given the equations y = f(x) and y = g(x): i) recognize that each x-coordinate of the intersection(s) is the solution to the equation f(x) = g(x); ii)find the solutions approximately using technology to graph the functions or make tables of values; and iii) interpret the solution in context. (Shared standard with Algebra II) Notes: Algebra I tasks are limited to cases where f(x) and g(x) are linear, polynomial, absolute value, and
exponential functions of the form ( ) ( ) xf x a b= where a > 0 and b > 0 (b ≠ 1). Students should be taught to find the solutions ap-proximately by using technology to graph the func-tions and by making tables of values. When solving any problem, students can choose either strategy.
LEARNING OBJECTIVES
Students will be able to:
1) use technology to create tables and graphs to find solutions of systems of equations involving linear and non-linear functions.
Overview of Lesson
Teacher Centered Introduction Overview of Lesson
- activate students’ prior knowledge
- vocabulary
- learning objective(s)
- big ideas: direct instruction
- modeling
Student Centered Activities guided practice Teacher: anticipates, monitors, selects, sequences, and connects student work
- developing essential skills
- Regents exam questions
- formative assessment assignment (exit slip, explain the math, or journal entry)
VOCABULARY
absolute value equation exponential equation families of functions
linear equation piecewise equation quadratic equations
slope intercept form solution of a system
Page 385

BIG IDEAS A solution of a system of equations makes each equation in the system true. This rule can be applied to systems involving different families of functions. Typically, graphing is the easiest way to solve systems of equations involving different families of functions. Algebraic solutions may also be used.
DEVELOPING ESSENTIAL SKILLS
Use technology to create a table of value and graph for each system, then state the solution(s) for each system.
1. absolute
linear
2y xy x=
= +
2. absolute quadratic
2
2
4
y x
y x
= −
= − +
3. quadratic piecewise
2 42 02 0
y xx x
yx x
= − +
+ <= − ≥
4. quadratic quadratic
2
2
5 55 3
y x xy x x= + +
= − − −
5. absolute quadratic
2
2y x
y x
= − +
=
Page 386

Answers
Solutions Calculator Input Table Graph 1.
2y xy x=
= +
(-1,1)
2.
2
2
4
y x
y x
= −
= − +
(-2,0) and (2,0)
3.
2 42 02 0
y xx x
yx x
= − +
+ <= − ≥
(-2,0) and (2,0) 4.
2
2
5 55 3
y x xy x x= + +
= − − −
(-4,1) and (-1,1)
5.
2
2y x
y x
= − +
=
(-1,1) and (1,1)
Page 387

REGENTS EXAM QUESTIONS (through June 2018)
A.REI.D.11: Other Systems
294) Two functions, and , are graphed on the same set of axes. Which statement is
true about the solution to the system of equations? 1) is the solution to the system because
it satisfies the equation . 3) is the solution to the system because
it satisfies both equations. 2) is the solution to the system because
it satisfies the equation . 4) , , and are the solutions to
the system of equations because they all satisfy at least one of the equations.
295) On the set of axes below, graph
How many values of x satisfy the equation ? Explain your answer, using evidence from your graphs.
296) Given the functions and , which value of x makes ?
1) 3) 3 2) 2 4)
297) The graphs of the functions and are drawn. Which statement about these functions is true? 1) The solution to is 3. 3) The graphs intersect when . 2) The solution to is 1. 4) The graphs intersect when .
298) The graph below shows two functions, f(x) and g(x). State the values of x for which .
299) Which value of x results in equal outputs for and ?
Page 388

1) 3)
2) 2 4) 4
300) Graph and on the grid below. Does ? Use your graph to explain why or why not.
SOLUTIONS
294) ANS: 3 Strategy: Input both functions in a graphing calculator, then use the table and graph views of the function to select the correct answer. STEP 1. Transpose the second function for input into a graphing calculator.
STEP 2. Input both functions in a graphing calculator.
When , the value of y in both equations is 3. (6, 3) is the solution to this system.
PTS: 2 NAT: A.REI.D.11 TOP: Nonlinear Systems
295) ANS:
Step 1. Plot
Step 2. Plot over the interval
Page 389
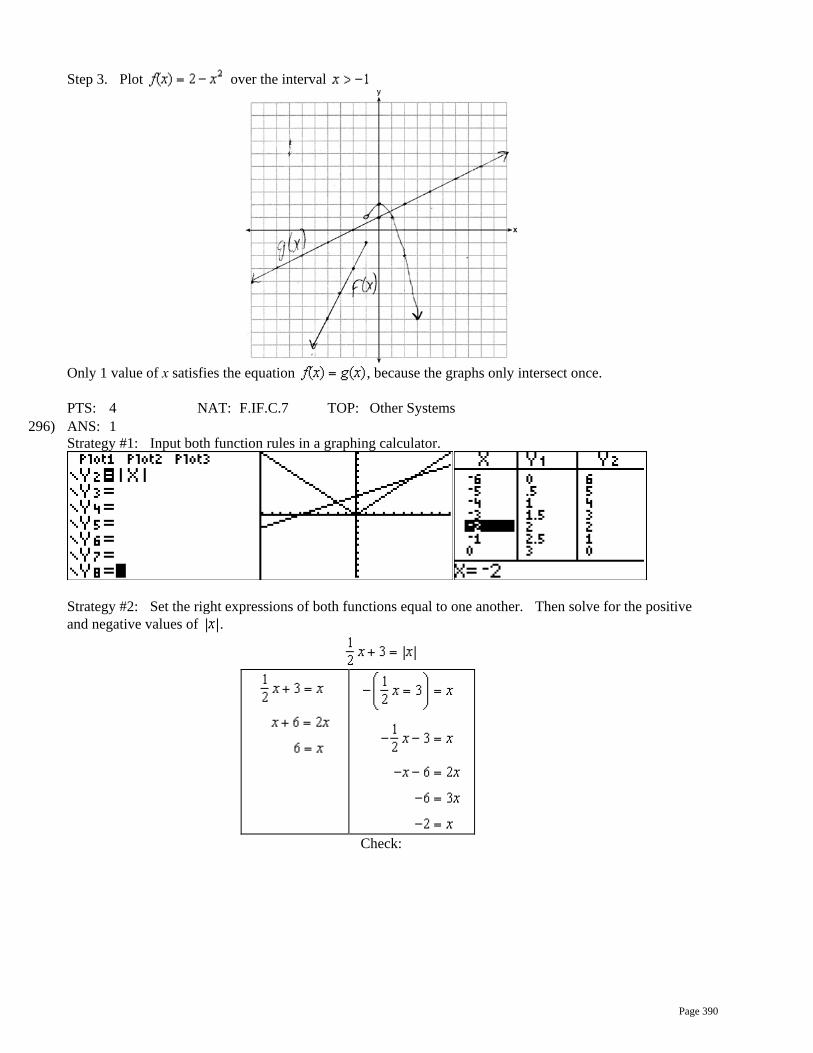
Step 3. Plot over the interval
Only 1 value of x satisfies the equation , because the graphs only intersect once.
PTS: 4 NAT: F.IF.C.7 TOP: Other Systems
296) ANS: 1 Strategy #1: Input both function rules in a graphing calculator.
Strategy #2: Set the right expressions of both functions equal to one another. Then solve for the positive and negative values of .
Check:
Page 390

PTS: 2 NAT: A.REI.D.11 TOP: Other Systems
297) ANS: 2 Step 1. Understand that only of the answer choices is true. Step 2. Strategy. Input both functions in a graphing calculator and explore the truth of each answer choice. Step 3. Execution of Strategy.
The graph and table show that the solution for this system of equations is (1,3). This means that and . Accordingly, when x is 1, . The correct answer is choice b). Step 4. Does is make sense? Yes. All of the other answer choices can be eliminated as wrong. The problem can be checked algebraically as follows:
Given: and , find
This is an extraneous solution.
This solution checks.
PTS: 2 NAT: A.REI.D.11 TOP: Other Systems
298) ANS:
Page 391

PTS: 2 NAT: A.REI.D.11
299) ANS: 2 When , .
PTS: 2 NAT: A.REI.D.11 TOP: Other Systems KEY: AI
300) ANS:
Page 392

Yes, because the graph of intersects the graph of at .
PTS: 4 NAT: A.REI.D.11 TOP: Other Systems KEY: AI
Page 393

J – Powers, Lesson 1, Modeling Exponential Functions (r. 2018)
POWERS Modeling Exponential Functions
Common Core Standards
A-SSE.B.3c Use the properties of exponents to transform expressions for exponential functions. For example, the expression 1.15t can be rewritten as (1.151/12)12t= 1.01212t to reveal the approximate equivalent monthly interest rate if the annual rate is 15%. PARCC: Tasks are limited to exponential expressions with inte-ger exponents. Tasks have a real-world context. As described in the standard, there is an interplay between the mathematical structure of the expression and the structure of the situation such that choosing and producing an equivalent form of the expression reveals something about the situation. A-CED.1 Create equations and inequalities in one variable and use them to solve problems. Include equations arising from linear and quadratic func-tions, and simple rational and exponential functions. PARCC: Tasks are limited to linear, quadratic, or exponential equations with integer exponents. F-BF.A.1 Write a function that describes a relation-ship between two quantities. F-LE.A.2 Construct linear and exponential func-tions, including arithmetic and geometric sequences, given a graph, a description of a relationship, or two input-output pairs (include reading these from a ta-ble). PARCC: Tasks are limited to constructing linear and exponential functions in simple context (not multi-step). F-LE.5 Interpret the parameters in a linear or expo-nential function in terms of a context. PARCC: Tasks have a real-world context. Exponential functions are limited to those with domains in the integers.
Next Generation Standards
AI-A.SSE.3c Use the properties of exponents to rewrite exponential expressions. (Shared standard with Algebra II) e.g., • 32x = (32)x = 9x
• 32x+3 = 32x ∙ 33=9x ∙ 27 Note: Exponential expressions will include those with in-teger exponents, as well as those whose exponents are linear expressions. Any linear term in those expres-sions will have an integer coefficient. Rational expo-nents are an expectation for Algebra II. AI-A.CED.1 Create equations and inequalities in one variable to represent a real-world context. (Shared standard with Algebra II) Notes: • This is strictly the development of the model (equa-tion/inequality). • Limit equations to linear, quadratic, and exponen-
tials of the form ( ) ( ) xf x a b= where a > 0 and b > 0 (b ≠ 1). • Work with geometric sequences may involve an ex-ponential equation/formula of the form an = arn-1, where a is the first term and r is the common ratio. • Inequalities are limited to linear inequalities. • Algebra I tasks do not involve compound inequalities. AI-F.BF.1 Write a function that describes a relationship between two quantities. (Shared standard with Algebra II) AI-F.LE.2 Construct a linear or exponential function symbolically given: i) a graph; ii) a description of the relationship; iii) two input-output pairs (include reading these from a table). (Shared standard with Algebra II) Note: Tasks are limited to constructing linear and expo-nential functions in simple context (not multi-step). AI-F.LE.5 Interpret the parameters in a linear or expo-nential function in terms of a context. (Shared standard with Algebra II) Note: Tasks have a real-world context. Exponential functions are limited to those with domains in the inte-
gers and are of the form ( ) ( ) xf x a b= where a > 0 and b > 0 (b ≠ 1).
Page 394

LEARNING OBJECTIVES
Students will be able to:
1) Transform expressions and equations between equivalent exponential and radical forms. 2) Create and solve exponential functions based on real-world contexts.
Overview of Lesson Teacher Centered Introduction
Overview of Lesson
- activate students’ prior knowledge
- vocabulary
- learning objective(s)
- big ideas: direct instruction
- modeling
Student Centered Activities guided practice Teacher: anticipates, monitors, selects, sequences, and connects student work
- developing essential skills
- Regents exam questions
- formative assessment assignment (exit slip, explain the math, or journal entry)
VOCABULARY
( )1 tA P r= ±
base cycle exponential decay exponential growth exponential regression
initial amount power rate of decay rate of growth rational exponents root scientific notation
BIG IDEAS
Rules for Rational Exponents:
Rule: For any nonzero number a, , and
Rule: For any nonzero number a and any rational numbers m and n, Rule: For any nonzero number a and any rational numbers m and n, Rule: For any nonzero numbers a and b and any rational number n
Rule: For any nonzero number a and any rational numbers m and n,
A number is in scientific notation if it is written in the form , where n is an integer and
a0 1= aa
nn
− =1
a a am n m n⋅ = +
( )a am n mn=
( )ab a bn n n=
aa
am
nm n= −
a n×101 10≤ <a
Page 395

Exponential Growth and Decay
( )1 tA P r= ±
A common formula for exponential growth or decay is
( )1 tA P r= ± Where:
A is the amount after growth or decay. P is the original amount before growth or decay.
is 100% of the original plus-or-minus the rate of growth or decay. • + is used to model growth. • - is used to model decay.
t is the number of growth or decay cycles, usually measured in units of time. Sample Problem
PROBLEM The equation can be used to find the amount of money in a bank account if the initial amount deposited was $1,500 and the money grows with interest compounded annually at the rate of 3%. Rewrite this equation to reflect a monthly rate of growth.
SOLUTION The problem wants us to write a new equation in which the rate of growth is expressed in months instead of years. STEP 1. The rate of growth will be smaller if interest compounds monthly rather than annually. Therefore, the base of the exponent (in parentheses) must be reduced. Using the rule: For any nonzero number a and any rational numbers m and n, , rewrite the exponential base (in parentheses) and its power as follows:
.
NOTE: Both expressions reflect the amount after one year of growth. • In the left expression, t represents time in years. • In the right expression, t represents time in months.
STEP 2. Simplify the base of the exponent (the term in parentheses) as follows:
, which rounds to 1.0025 NOTE: This reveals the approximate equivalent monthly interest rate.
STEP 3. Rewrite the entire equation with the new exponent.
( )1 r±
( )1500 1.03 tA =
( )a am n mn=
( )121
121.03 1.03t
t =
1121.03 1.00246627=
Page 396

NOTE: 12t represents one year, or 12 months. To find growth in months, eliminate the multiplication by 12.
STEP 4. Write the new equation.
CHECK If the new equation reflects the same mathematical relationship as the original equation, both equations should produce similar outputs for similar amounts of time.
Original Equation Expressing Growth in Years
New Equation Expressing Growth in Months
( )121500 1.0025 tA =
( )1500 1.0025 tA =
Page 397

DEVELOPING ESSENTIAL SKILLS
Solve the following problems using exponential growth or exponential decay formulas.
Problems Solutions 1 Daniel’s Print Shop purchased a new printer for $35,000.
Each year it depreciates (loses value) at a rate of 5%. What will its approximate value be at the end of the fourth year?
( )4
1
35000(1 0.05)$28,507.72
tA P r
AA
= ±
= −≈
2 Kathy plans to purchase a car that depreciates (loses value) at a rate of 14% per year. The initial cost of the car is $21,000. Write an equation that represents the value, v, of the car after 3 years.
( )3
1
21000(1 0.14)
tA P r
v
= ±
= +
3 A bank is advertising that new customers can open a savings
account with a interest rate compounded annually.
Robert invests $5,000 in an account at this rate. If he makes no additional deposits or withdrawals on his account, find the amount of money he will have, to the nearest cent, after three years.
( )3
1
5000(1 0.0375)$5,583.86
tA P r
AA
= ±
= +≈
4 Cassandra bought an antique dresser for $500. If the value of her dresser increases 6% annually, what will be the value of Cassandra's dresser at the end of 3 years to the nearest dollar?
( )3
1
500(1 0.06)$596
tA P r
AA
= ±
= +≈
5 Booster Club raised $30,000 for a sports fund. No more money will be placed into the fund. Each year the fund will decrease by 5%. Determine the amount of money, to the nearest cent, that will be left in the sports fund after 4 years.
( )4
1
30000(1 .05)$24,435.19
tA P r
AA
= ±
= −≈
Page 398

REGENTS EXAM QUESTIONS (through June 2018)
POWERS A.SSE.B.3c, A.CED.A.1, F.BF.A.1, F.LE.A.2, F.LE.B.5: Modeling Exponential Functions
301) Miriam and Jessica are growing bacteria in a laboratory. Miriam uses the growth function
while Jessica uses the function , where n represents the initial number of bacteria and t is the time, in hours. If Miriam starts with 16 bacteria, how many bacteria should Jessica start with to achieve the same growth over time? 1) 32 3) 8 2) 16 4) 4
302) Jacob and Jessica are studying the spread of dandelions. Jacob discovers that the growth over t weeks can be defined by the function . Jessica finds that the growth function over t weeks is
. Calculate the number of dandelions that Jacob and Jessica will each have after 5 weeks. Based on the growth from both functions, explain the relationship between and .
303) The growth of a certain organism can be modeled by , where is the total number
of cells after t hours. Which function is approximately equivalent to ? 1) 3) 2) 4)
304) A computer application generates a sequence of musical notes using the function , where n is the number of the note in the sequence and is the note frequency in hertz. Which function will generate the same note sequence as ? 1) 3) 2) 4)
305) Mario's $15,000 car depreciates in value at a rate of 19% per year. The value, V, after t years can be modeled by the function . Which function is equivalent to the original function? 1) 3)
2) 4)
306) Nora inherited a savings account that was started by her grandmother 25 years ago. This scenario is modeled by the function , where represents the value of the account, in dollars, t years after the inheritance. Which function below is equivalent to ? 1) 3) 2) 4)
Page 399

307) The Ebola virus has an infection rate of 11% per day as compared to the SARS virus, which has a rate of 4% per day. If there were one case of Ebola and 30 cases of SARS initially reported to authorities and cases are reported each day, which statement is true? 1) At day 10 and day 53 there are more
Ebola cases. 3) At day 10 there are more SARS cases, but
at day 53 there are more Ebola cases. 2) At day 10 and day 53 there are more
SARS cases. 4) At day 10 there are more Ebola cases, but
at day 53 there are more SARS cases.
308) Dylan invested $600 in a savings account at a 1.6% annual interest rate. He made no deposits or withdrawals on the account for 2 years. The interest was compounded annually. Find, to the nearest cent, the balance in the account after 2 years.
309) Rhonda deposited $3000 in an account in the Merrick National Bank, earning 4.2% interest, compounded
annually. She made no deposits or withdrawals. Write an equation that can be used to find B, her account balance after t years.
310) Krystal was given $3000 when she turned 2 years old. Her parents invested it at a 2% interest rate
compounded annually. No deposits or withdrawals were made. Which expression can be used to determine how much money Krystal had in the account when she turned 18? 1) 3) 2) 4)
311) The country of Benin in West Africa has a population of 9.05 million people. The population is growing at a rate of 3.1% each year. Which function can be used to find the population 7 years from now? 1) 3) 2) 4)
312) A student invests $500 for 3 years in a savings account that earns 4% interest per year. No further deposits or withdrawals are made during this time. Which statement does not yield the correct balance in the account at the end of 3 years? 1) 3) 2) 4)
313) Anne invested $1000 in an account with a 1.3% annual interest rate. She made no deposits or withdrawals on the account for 2 years. If interest was compounded annually, which equation represents the balance in the account after the 2 years? 1) 3) 2) 4)
314) Write an exponential equation for the graph shown below.
Page 400

Explain how you determined the equation.
315) The table below shows the temperature T(m), of a cup of hot chocolate that is allowed to chill over several
minutes, m. Time, m (minutes) 0 2 4 6 8 Temperature, T(m) (°F)
150 108 78 56 41
Which expression best fits the data for T(m)? 1) 3) 2) 4)
316) Jill invests $400 in a savings bond. The value of the bond, , in hundreds of dollars after x years is illustrated in the table below.
x V(x) 0 4 1 5.4 2 7.29 3 9.84
Which equation and statement illustrate the approximate value of the bond in hundreds of dollars over time in years? 1) and it grows. 3) and it grows. 2) and it decays. 4) and it decays.
317) The breakdown of a sample of a chemical compound is represented by the function , where represents the number of milligrams of the substance and t represents the time, in years. In the function , explain what 0.5 and 300 represent.
Page 401
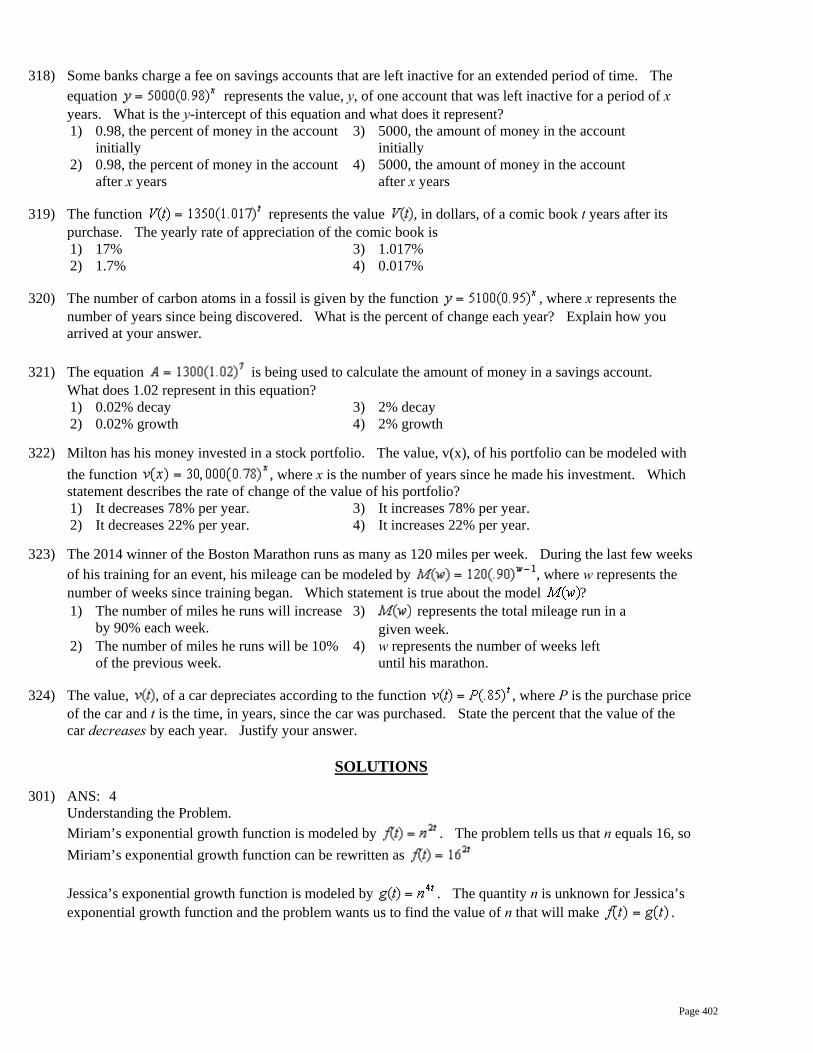
318) Some banks charge a fee on savings accounts that are left inactive for an extended period of time. The equation represents the value, y, of one account that was left inactive for a period of x years. What is the y-intercept of this equation and what does it represent? 1) 0.98, the percent of money in the account
initially 3) 5000, the amount of money in the account
initially 2) 0.98, the percent of money in the account
after x years 4) 5000, the amount of money in the account
after x years
319) The function represents the value , in dollars, of a comic book t years after its purchase. The yearly rate of appreciation of the comic book is 1) 17% 3) 1.017% 2) 1.7% 4) 0.017%
320) The number of carbon atoms in a fossil is given by the function , where x represents the number of years since being discovered. What is the percent of change each year? Explain how you arrived at your answer.
321) The equation is being used to calculate the amount of money in a savings account.
What does 1.02 represent in this equation? 1) 0.02% decay 3) 2% decay 2) 0.02% growth 4) 2% growth
322) Milton has his money invested in a stock portfolio. The value, v(x), of his portfolio can be modeled with the function , where x is the number of years since he made his investment. Which statement describes the rate of change of the value of his portfolio? 1) It decreases 78% per year. 3) It increases 78% per year. 2) It decreases 22% per year. 4) It increases 22% per year.
323) The 2014 winner of the Boston Marathon runs as many as 120 miles per week. During the last few weeks of his training for an event, his mileage can be modeled by , where w represents the number of weeks since training began. Which statement is true about the model ? 1) The number of miles he runs will increase
by 90% each week. 3) represents the total mileage run in a
given week. 2) The number of miles he runs will be 10%
of the previous week. 4) w represents the number of weeks left
until his marathon.
324) The value, , of a car depreciates according to the function , where P is the purchase price of the car and t is the time, in years, since the car was purchased. State the percent that the value of the car decreases by each year. Justify your answer.
SOLUTIONS
301) ANS: 4 Understanding the Problem. Miriam’s exponential growth function is modeled by . The problem tells us that n equals 16, so Miriam’s exponential growth function can be rewritten as Jessica’s exponential growth function is modeled by . The quantity n is unknown for Jessica’s exponential growth function and the problem wants us to find the value of n that will make .
Page 402

Strategy: Substitute equivalent expresseions for and , then solve for n. or or
DIMS? Does It Make Sense? Yes. The outputs of and are identical.
PTS: 2 NAT: A.SSE.B.3c TOP: Solving Exponential Equations
302) ANS: Jacob and Jessica will both have 256 dandelions after 5 weeks.
Both functions express the same mathematical relationships.
PTS: 2 NAT: A.SSE.B.3c TOP: Exponential Equations
303) ANS: 3 Step 1. Understand that this problem wants you to find the function in the answer choices that is equivalent to . Step 2. Strategy. Use properties of exponents to rewrite the expression. Step 3. Execute the strategy.
Page 403

Choice c is the correct answer. Step 4. Does it make sense? Yes. Check by inputting both functions in a graphing calculator.
PTS: 2 NAT: A.SSE.B.3c TOP: Exponential Equations
304) ANS: 2 Strategy #1: Isolate the exponent n in each answer choice so that the structure of each function is identical, then eliminate any answer choice that is not equivalent to the original function..
Eliminate this choice. Choose this, because .
Eliminate this choice. Eliminate this choice.
Strategy #2: Input the original function and all four answer choices in a graphing calculator. Choose the answer choice that produces the same function outputs (y-values) as the original function.
PTS: 2 NAT: A.SSE.B.3 TOP: Modeling Exponential Functions
305) ANS: 2 Strategy #1: Use properties of exponents.
Strategy #2: Use graphing calculator.
produces the same table of values as the original function .
Page 404

PTS: 2 NAT: A.SSE.B.3 TOP: Modeling Exponential Functions
306) ANS: 4
Therefore:
PTS: 2 NAT: A.SSE.B.3 TOP: Modeling Exponential Functions
307) ANS: 3 Step 1. Use to set up exponential growth equations to represent both viruses. Ebola Virus: SARS Virus: Step 2. Find and for both equations, then choose the correct answer.
At day 10, there are more SARS cases than Ebola cases.
At day 53, there are more Ebola cases than SARS cases.
PTS: 2 NAT: F.LE.A.2 TOP: Modeling Exponential Functions
308) ANS: After 2 years, the balance in the account is $619.35. Strategy: Write an exponential growth equation to model the problem. Then solve the equation for two years. STEP 1: Exponential growth is modeled by the formula , where: A represents the amount after t cycles of growth, P represents the starting amount, which is $600. r represents the rate of growth, which is 1.6% or .016 as a decimal, and t represents the number of cycles of growth, which are measured in years with annual compounding. The equation is: STEP 2: Solve for two years growth.
Page 405

DIMS: Does It Make Sense? Yes. Each year, the interest on each $100 is $1.60, so the first year, there will be interest. The second year interest will be another $9.60 for the original $600 plus 1.6% on the $9.60. The total interest after two years will be . Add this interest to the original $600 and the amount in the account will be $619.35.
PTS: 2 NAT: A.CED.A.1 TOP: Modeling Exponential Equations NOT: NYSED classifies this problem as A.CED.A.1
309) ANS:
Strategy: Use the formula for exponential growth to model the problem. The formula for exponential growth is . The formula for exponential decay is . y = final amount after measuring growth/decay a = initial amount before measuring growth/decay r = growth/decay rate (usually a percent) t = number of time intervals that have passed The problem states that B should be used to represent the final amount after growth. The problem states that $3,000 is the initial amount. The problem states that the growth factor is 4.2%, which is added to 1 and written as 1.042 The problem states that interest is compounded annually, so the number of time intervals is t years. The final equation is written as
PTS: 2 NAT: F.BF.A.1 TOP: Modeling Exponential Equations
310) ANS: 1 Strategy 1: Use the formula for exponential growth to model the problem. The formula for exponential growth is . The formula for exponential decay is . y = final amount after measuring growth/decay a = initial amount before measuring growth/decay r = growth/decay rate (usually a percent) t = number of time intervals that have passed The problem asks for the right side expression for exponential growth. The problem states that $3,000 is the initial amount. The problem states that the growth factor is 2%, which is written as .02 and added to 1. The problem states that interest is compounded annually from age 2 through age 18, so the number of time intervals is 16 years.
Page 406

The final expression for the right side of the exponential growth equation is written as . Strategy 2. Build a model and eliminate wrong answers. Model the words using a table of values to see the pattern.
Krystal’s Age
# Times Compounding
Amount
2 0 3000 3 1 3060 4 2 3121.2 5 3 3183.624 ... ... ... 18 16 ?
It is clear from the table that the number of times interest compounds is 2 less than Krystal’s age. Eliminate answer choices c and d, because both show exponents of 18, which is Krystal’s age, not the number of times the interest will compound. The choices now are a and b. The table shows that the amounts are increasing, which is exponential growth, not exponential decay. Eliminate choice b because it shows exponential decay. Check by putting choice a in a graphing calculator using x as the exponent.
Answer choice a creates the same table of values, and the amount of money on Krystal’s 18th birthday will be dollars.
PTS: 2 NAT: F.BF.A.1 TOP: Modeling Exponential Equations
311) ANS: 3 Strategy: Use the formula for exponential growth: , where A represents the amount after growth, which in this problem will be . P represents the initial amount, which in this problem will be . r represents the rate of growth expressed as a decimal, which in this problem will be 0.031 per year. t represents the number of growth cycles, which in this problem will be 7 Use the exponential growth formula and substitution to write:
Answer choice c is correct.
PTS: 2 NAT: F.LE.A.2 TOP: Modeling Exponential Functions
312) ANS: 2 Step 1. Understand from the problem that only one of the answer choices will be different from the others, and one that is different will be the correct answer. Step 2. Strategy: Use a graphing calculator to find the values of each expression.
Page 407

Step 3. Execute the strategy. a) b) c) d) Answer choice b) is the correct answer, because produces a different value. Step 4. Does it make sense? Yes. You can model an investment problem with compounding interest using the formula , where A is the amount, P is the initial amount invested, r is the interest rate expressed as a decimal, and t is the numer of compounding periods. Using this formula, the problem can be modelled as follows:
PTS: 2 NAT: F.BF.A.1 TOP: Modeling Exponential Functions
313) ANS: 2 Use the formula , where A representes the amount in the accout, P represents the amount invested, r represents the rate, and t represents time.
Anne invested $1000: 1.3% annual interest rate:
2 years: Write:
Then, eliminate wrong answers. a The minus sign is wrong. b This is correct. c The minus sign is wrong and the annual interest rate is wrong. d The annual interest rate is wrong.
PTS: 2 NAT: F.BF.A.1 TOP: Modeling Exponential Functions KEY: AI
314) ANS: .
Strategy: Input the four integral values from the graph into a graphing calculator and use exponental regression to find the equation.
Alternative Strategy: Use the standard form of an exponential equation, which is . Substitute the integral pairs of (2,1) and (3,2) from the graph into the standard form of an exponential equation and obtain the following: and .
Page 408

Therefore,
Accordingly, the equation for the graph can now be written as . Substitute the integral pair (4,4) from the graph into the new equation and solve for a, as follows:
The graph of the equation can now be written as
PTS: 2 NAT: F.LE.A.2 TOP: Modeling Exponential Equations
315) ANS: 1 Strategy #1: Check each answer using a graphing calculator.
Strategy #2: Use exponential regression to model the data in the table.
PTS: 2 NAT: F.BF.A.1
316) ANS: 3 All of the answer choices involve exponential equations and are in the form of
where A represents the current value, P represents the starting amount, r represents the rate of growth or decay, and t represents the number of times that growth occurs. This answer choices involve two equations, and combined with the words growth and decay. The table shows that the value of V(x) is growing.
Page 409

Therefore, any answer choices showing exponential decay must be eliminated and any answer choices where the value of must be eliminated. This leaves only and it grows as the only correct answer. This can be checked by inputting into a graphing calculator and inspecting the resulting table to see it it matches the table given in the problem.
PTS: 2 NAT: F.LE.A.2 TOP: Modeling Exponential Functions KEY: AI
317) ANS: 0.5 represents the rate of decay and 300 represents the initial amount of the compound. Strategy: Use information from the problem together with the standard formula for exponential decay, which is , where A represents the amount remaining, P represents the initial amount, r represents the rate of decay, and t represents the number of cycles of decay.
The structures of the equations show that and . Accordingly, 300 represents the initial amount of chemical substance in milligrams and 0.5 represents the
rate of decay each year.
PTS: 2 NAT: F.LE.B.5 TOP: Modeling Exponential Equations
318) ANS: 3 Strategy 1: The y-intercept of a function occurs when the value of x is 0. The strategy is to evaluate the function for
This represents the amount of money in the account before exponential decay begins. Strategy 2. Input the equation in a graphing calculator and view the table of values.
Page 410

The table of values clearly shows the initial value of the account and its exponential decay.
PTS: 2 NAT: F.IF.C.8 TOP: Modeling Exponential Equations
319) ANS: 2 Strategy: Identify each of the parts of the function , then answer the question.
represents the current value of the comic book in dollars. 1350 represents the original value of the comic book when it was purchased. (1.017) represents the growth factor, which consists of (1+r), where r is the rate of growth per year. The value of r is 0.017, which is found by subtracting 1 from (1.017). t represents the number of years since its purchase. The problem wants to know the value of r, which is 0.017. However, all of the answer choices are expressed as percents rather than decimals. A decimal may be converted to a percent as follows:
The yearly appreciation rate of the comic book is 1.7% and the correct answer is b. DIMS? Does It Make Sense? The appreciation rate seems to make sense, but it is difficult to understand why someone would originally pay $1,350 for a comic book.
PTS: 2 NAT: A.SSE.A.1 TOP: Modeling Exponential Equations
320) ANS: The percent of change each year is 5%. Strategy: Use information from the problem together with the standard formula for exponential decay, which is , where A represents the amount remaining, P represents the initial amount, r represents the rate of decay, and t represents the number of cycles of decay.
The structures of the equations show that . Solving for r shows that , or 5%.
Page 411
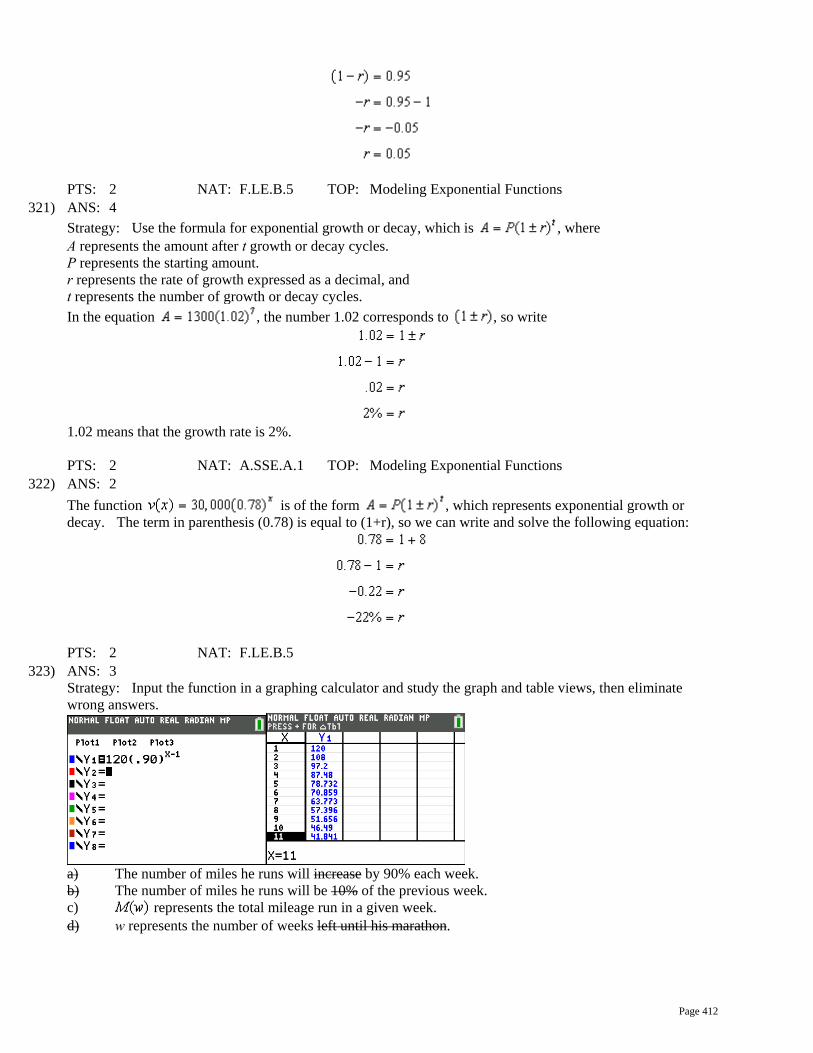
PTS: 2 NAT: F.LE.B.5 TOP: Modeling Exponential Functions
321) ANS: 4 Strategy: Use the formula for exponential growth or decay, which is , where A represents the amount after t growth or decay cycles. P represents the starting amount. r represents the rate of growth expressed as a decimal, and t represents the number of growth or decay cycles. In the equation , the number 1.02 corresponds to , so write
1.02 means that the growth rate is 2%.
PTS: 2 NAT: A.SSE.A.1 TOP: Modeling Exponential Functions
322) ANS: 2 The function is of the form , which represents exponential growth or decay. The term in parenthesis (0.78) is equal to (1+r), so we can write and solve the following equation:
PTS: 2 NAT: F.LE.B.5
323) ANS: 3 Strategy: Input the function in a graphing calculator and study the graph and table views, then eliminate wrong answers.
a) The number of miles he runs will increase by 90% each week. b) The number of miles he runs will be 10% of the previous week. c) represents the total mileage run in a given week. d) w represents the number of weeks left until his marathon.
Page 412
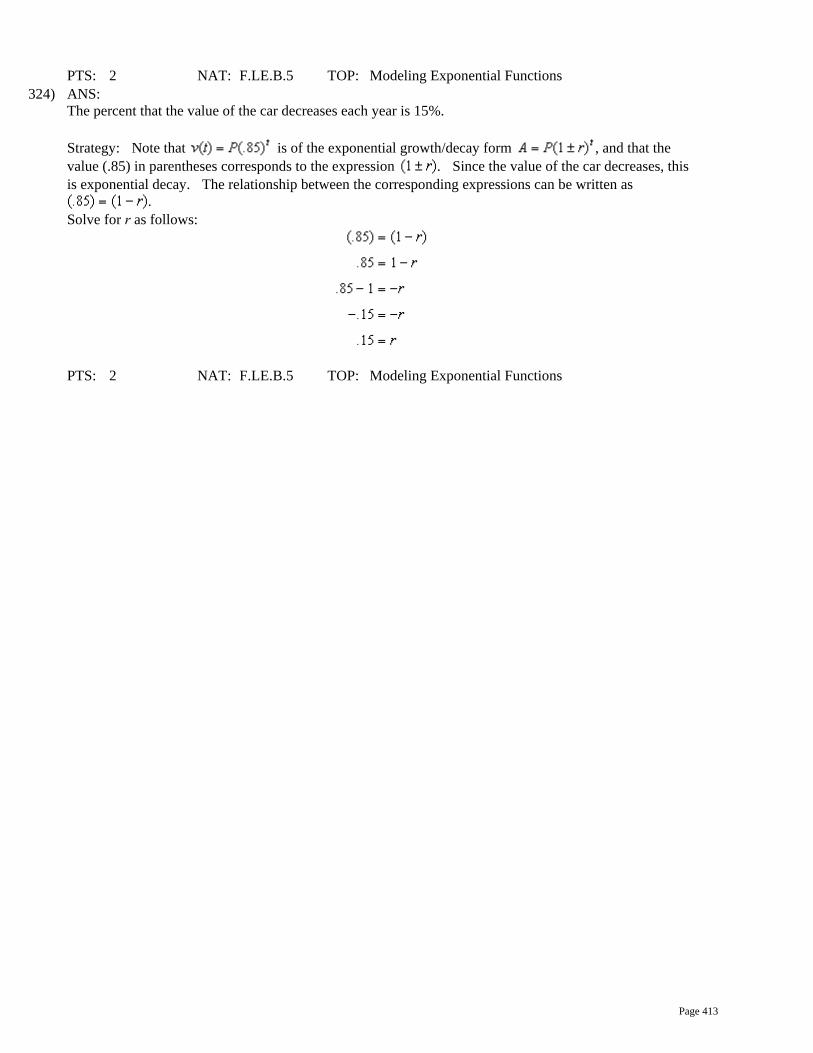
PTS: 2 NAT: F.LE.B.5 TOP: Modeling Exponential Functions
324) ANS: The percent that the value of the car decreases each year is 15%. Strategy: Note that is of the exponential growth/decay form , and that the value (.85) in parentheses corresponds to the expression . Since the value of the car decreases, this is exponential decay. The relationship between the corresponding expressions can be written as
. Solve for r as follows:
PTS: 2 NAT: F.LE.B.5 TOP: Modeling Exponential Functions
Page 413

K – Polynomials, Lesson 1, Identifying Solutions (r. 2018)
POLYNOMIALS Identifying Solutions
Common Core Standard
A-REI.10 Understand that the graph of an equation in two variables is the set of all its solutions plotted in the coordinate plane, often forming a curve (which could be a line).
Next Generation Standard
AI-A.REI.10 Understand that the graph of an equation in two variables is the set of all its solutions plotted in the coordinate plane. Note: Graphing linear equations is a fluency recom-mendation for Algebra I. Students become fluent in solving characteristic problems involving the analytic geometry of lines, such as writing down the equation of a line given a point and a slope. Such fluency can support them in solving less routine mathematical problems involving linearity; as well as modeling lin-ear phenomena.
LEARNING OBJECTIVES
Students will be able to:
1)
Overview of Lesson
Teacher Centered Introduction Overview of Lesson
- activate students’ prior knowledge
- vocabulary
- learning objective(s)
- big ideas: direct instruction
- modeling
Student Centered Activities guided practice Teacher: anticipates, monitors, selects, sequences, and connects student work
- developing essential skills
- Regents exam questions
- formative assessment assignment (exit slip, explain the math, or journal entry)
VOCABULARY
balanced equation graph
ordered pair solutions
table of values true statement
BIG IDEAS
A solution to an equation is a value or values that satisfy the equation.
• In equations, solutions are those values that make the left expression equal to the right expression. When both the left and right expressions are equal in value, the equation is said to be balanced and the equation becomes a true statement.
• In tables of values, solutions appear in the form of ordered pairs that, when substituted into the equation, will make the equation balance.
Page 414

• In a graph, solutions appear as points on the line. The graph of an equation represents the set of all points that satisfy the equation (make the equation balance). Each and every point on the graph of an equation represents a ordered pair that can be substituted into the equation to make the equation true. Thus, if a point is on the graph of the equation, the point is a solution to the equation.
MODELING ESSENTIAL SKILLS
?Solution? and Equation
Balanced Equation
Table of Values
Graph
Is (2,3) a solution of 2 13
y x= +
( ) ( )
2 1323 2 1343 13
9 4 39 7
y x= +
= +
= +
= +≠
No, the equation does not balance.
No, the table of values shows: when 2x = , the values of y is 2.3333.
No, the point (2,3) is not on the graph of the line
Is (4,-1) a solution of 3y x= − + ( ) ( )
31 4 31 4 31 1
y x= − +
− = − +
− = − +− = −
Yes. The equation balances. Yes. The table of
values shows that when x = 4, the value of y is -1.
Yes. The point (4,-1) is on the graph of the line
Page 415

DEVELOPING ESSENTIAL SKILLS
Determine if the given ordered pair is a solution to the given equation using three different methods for identifying solutions.
?Solution? and Equation
Balanced Equation
Table of Values
Graph
Is (4,5) a solution of 2 4y x= − ? ( ) ( )
2 45 2 4 45 8 45 4
y x= −
= −
= −≠
No. The equation does not balance.
No. The table of values shows that when x = 4, the value of y is also 4.
No, the point (4,5) is not on the graph of the line
Is (5,1) a solution of 2 4y x x= − + ? ( ) ( ) ( )
2
2
4
1 5 5 41 25 5 41 24
y x x= − +
= − +
= − +≠
No. The equation does not balance.
No. The table of values shows that when x=5, the value of y is 24.
No, the point (5,1) is not on the line.
Is (4,-10) a solution of 2 2y x x= − + + ? ( ) ( ) ( )
2
2
2
10 4 4 210 16 4 210 10
y x x= − + +
− = − + +
− = − + +− = −
Yes. The equation balances.
Yes. The table of values shows that when x=4, the value of y is -10.
Yes. The point (4, -10) is on the line.
Page 416

REGENTS EXAM QUESTIONS (through June 2018)
A.REI.10: Identifying Solutions
325) On the set of axes below, draw the graph of the equation .
Is the point a solution to the equation? Explain your answer based on the graph drawn.
326) Which point is not on the graph represented by ?
1) 3) 2) 4)
327) The solution of an equation with two variables, x and y, is 1) the set of all x values that make y = 0. 3) the set of all ordered pairs , that
makes the equation true. 2) the set of all y values that make x = 0. 4) the set of all ordered pairs , where
the graph of the equation crosses the y-axis
328) Which ordered pair would not be a solution to ? 1) 2) 3) 4)
329) Which ordered pair below is not a solution to ? 1) 2) 3) 4)
SOLUTIONS
325) ANS:
No, because is not on the graph.
Page 417

Strategy #1. Use the y-intercept and the slope to plot the graph of the line, then determine if the point is on the graph. STEP 1. Plot the y-intercept. Plot . The given equation is in the slope intercept form of a line, , where b is the y-intercpet. The value of b is 3, so the graph of the equation crosses the y axis at . STEP 2. Use the slope of the line to find and plot a second point on the line. The given equation is in the slope
intercept form of a line, , where m is the slopet. The value of m is , so the graph of the equation has
a negative slope that goes down three units and across four units. Starting at the y-intercept, , if you go down 3 and over 4, the graph of the line will pass through the point . STEP 3. Use a straightedge to draw a line that passes through the points and . STEP 4. Inspect the graph to determine if the point is on the line. It is not. Strategy #2. Input the equation of the line into a graphing calculator, then use the table of values to plot the graph of the line and to determine if the point is on the line.
Be sure to explain your answer in terms of the graph and not in terms of the table of values or the function rule.
PTS: 2 NAT: A.REI.10 TOP: Graphing Linear Functions
326) ANS: 4 Straegy: Input the equation in a graphing calculator, then use the table of values to eliminate wrong answers. STEP 1. Input the equation and look at the table view of the function.
STEP 2. Eliminate answers that are on the graph. The point (-6, 12) is on the graph, so eliminate answer choice a. The point (-4, -2) is on the graph, so eliminate answer choice b. The point (2, 4) is on the graph, so eliminate answer choice c. The point (3, -6) is not on the graph, so answer choice d is the correct answer.
Page 418

PTS: 2 NAT: A.REI.D.10 TOP: Graphing Quadratic Functions
327) ANS: 3 1. Understanding: The problem is asking for the definition of solution as it relates to to equations with two variables. 2. Strategy: Examine each answer choice and eliminate wrong answers. 3. Execution of Strategy: a) the set of all x-values that make is used to find the x-intercepts of an equation. b) the set of all y-values that make is used to find the y-intercepts of an equation. c) the set of all ordered pairs, (x,y) that makes the equation true is the best answer choice. d) the set of all ordered pirs, (x,y) where the graph of the equation crosses the y-axis is too limiting. 4. Does it Make Sense? Yes. An equation is true if the left expression equals the right expression. If the equation has two variables, then the solution to the equation must have values for each variable.
PTS: 2 NAT: A.REI.D.11
328) ANS: 4 Strategy #1: Input the equation into a graphing calculator and inspect the table of values to see which answer choices are solutions to the equation.
Note that , , and appear in the table and are, therefore, solutions to the equation
. The ordered pair does not appear in the table and is, therefore, not a solution to the equation
. Strategy #2 Substitute each ordered pair into the equation and see if the equation balances.
Equation balances. Equation balances.
Equation balances. Equation does not balance.
Page 419

PTS: 2 NAT: A.REI.D.10 TOP: Identifying Solutions
329) ANS: 4 Strategy: Use the table of values view in a graphing calculator to find the ordered pair that does not satisfy the function. STEP 1. Input into a graphing calculator STEP 2. Set table view to increase by half integers. STEP 3. Inspect table and eliminate any answer choice that appears in the table.
STEP 4. Select the ordered pair that does not appear in the table of values. STEP 5. Check: The ordered pair (-1,6) does not appear in the table of values and will not satisfy the function rule .
PTS: 2 NAT: A.REI.D.10 TOP: Identifying Solutions
Page 420

K – Polynomials, Lesson 2, Operations with Polynomials (r. 2018)
POLYNOMIALS Operations with Polynomials
Common Core Standard
A-APR.A.1 Understand that polynomials form a system analogous to the integers, namely, they are closed under the operations of addition, subtraction, and multiplication; add, subtract, and multiply poly-nomials.
Next Generation Standard
AI-A.APR.1 Add, subtract, and multiply polynomials and recognize that the result of the operation is also a pol-ynomial. This forms a system analogous to the integers. Note: This standard is a fluency recommendation for Algebra I. Fluency in adding, subtracting and multi-plying polynomials supports students throughout their work in algebra, as well as in their symbolic work with functions.
LEARNING OBJECTIVES
Students will be able to:
1) add, subtact, and multiply polynomials.
Overview of Lesson
Teacher Centered Introduction Overview of Lesson
- activate students’ prior knowledge
- vocabulary
- learning objective(s)
- big ideas: direct instruction
- modeling
Student Centered Activities guided practice Teacher: anticipates, monitors, selects, sequences, and connects student work
- developing essential skills
- Regents exam questions
- formative assessment assignment (exit slip, explain the math, or journal entry)
VOCABULARY
Polynomial: A monomial or the sum of two or more monomials whose exponents are positive.
Example: 5a2 + ba – 3 • Monomial: A polynomial with one term; it is a number, a variable, or the product of a number (the
coefficient) and one or more variables
Examples: , , , ,
• Binomial: An algebraic expression consisting of two terms Example (5a + 6)
• Trinomial: A polynomial with exactly three terms. Example (a2 +2a – 3)
• Like Terms: Like terms must have exactly the same base and the same exponent. Their coefficients may be different. Real numbers are like terms.
Example: Given the expression
−14
2x 24a b −1.2 m n p2 3 4
Page 421

1x2 + 2y + 3x2 + 4x + 5x3 + 6y2 + 7y + 8x3 + 9y2, the following are like terms:
1x2 and 3x2 2y and 7y
4x has no other like terms in the expression 5x3 and 8x3
6y2 and 9y2
Like terms in the same expression can be combined by adding their coefficients. 1x2 and 3x2 = 4x2
2y and 7y =9y
4x has no other like terms in the expression = 4x 5x3 and 8x3 = 13x3 6y2 and 9y2 = 15y2
1x2 + 2y + 3x2 + 4x + 5x3 + 6y2 + 7y + 8x3 + 9y2 = 4x2 + 9y + 4x + 13x3 + 15y2
BIG IDEAS
Adding and Subtracting Polynomials
To add or subtract polynomials, arrange the polynomials one above the other with like terms in the same columns. Then, add or subtract the coefficients of the like terms in each column and write a new expression. Addition Example
Subtraction Example
Multiplying Polynomials
To multiply two polynomials, multiply each term in the first polynomial by each term in the second polynomial, then combine like terms. Example:
STEP 1: Multiply the first term in the first polynomial by each term in the second polynomial, as follows:
STEP 2. Multiply the next term in the first polynomial by each term in the second polynomial, as follows:
( ) ( )4 3 4 3
4 3
4 3
4 3
Add: 3r 9 8 4r 8 8
3r -9r -8 4r +8r -8 7r - r -16
r r− − + + − ( ) ( )
( ) ( ) ( )
4 3 4 3
4 3
4 3
4 3
Subtract: 3r 9 8 4r 8 8
3r -9r -8
- 4r - +8r - -8
-1r -17 r +0
r r− − − + −
( )( )2Multiply: -8r 9 7 5 1r r− + − +
( )( ) ( )
2
2 2
3 2
-8r -5r+1
-8r -5r +-8r 1
40r -8r
Page 422
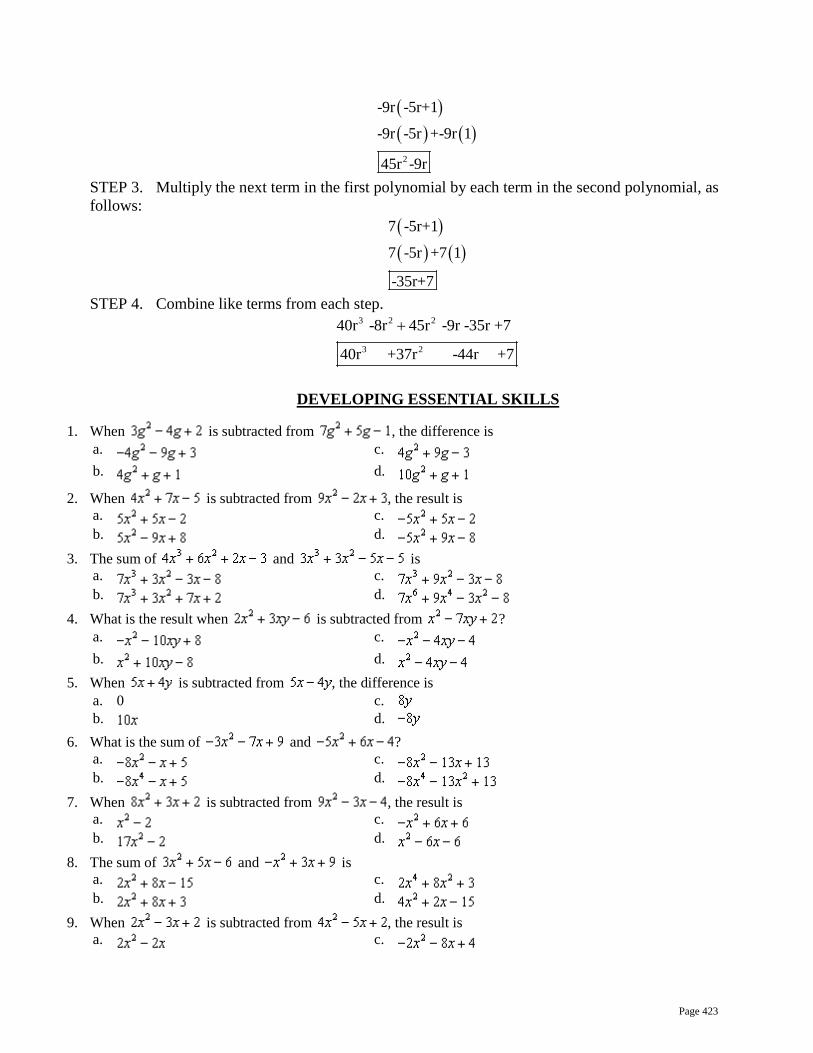
STEP 3. Multiply the next term in the first polynomial by each term in the second polynomial, as follows:
STEP 4. Combine like terms from each step.
DEVELOPING ESSENTIAL SKILLS
1. When is subtracted from , the difference is a. c. b. d.
2. When is subtracted from , the result is a. c. b. d.
3. The sum of and is a. c. b. d.
4. What is the result when is subtracted from ? a. c. b. d.
5. When is subtracted from , the difference is a. 0 c. b. d.
6. What is the sum of and ? a. c. b. d.
7. When is subtracted from , the result is a. c. b. d.
8. The sum of and is a. c. b. d.
9. When is subtracted from , the result is a. c.
( )( ) ( )
2
-9r -5r+1
-9r -5r +-9r 1
45r -9r
( )( ) ( )
7 -5r+1
7 -5r +7 1
-35r+7
3 2 2
3 2
40r -8r 45r -9r -35r +7
40r +37r -44r +7
+
Page 423

b. d.
10. The sum of and is a. c. b. d.
11. What is the result when is subtracted from ? a. c. b. d.
12. When is subtracted from , the result is a. c. b. d.
13. What is the product of and ? a. c. b. d.
14. The expression is equivalent to
a. c. b. d.
15. The expression is equivalent to a. c. b. d.
16. The length of a rectangle is represented by , and the width is represented by . Express the perimeter of the rectangle as a trinomial. Express the area of the rectangle as a trinomial.
17. What is the product of and ? a. c. b. d.
18. What is the product of and ? a. c. b. d.
Answers
1.ANS: C
2. ANS: B
3. ANS: C
4. ANS: A
5. ANS: D
6. ANS: A
7. ANS: D
8. ANS: B
9. ANS: A
10. ANS: A
11. ANS: D
12. ANS: B
13. ANS: A
14. ANS: C
15. ANS: C
16. ANS:
17. ANS: C
18. ANS: A
Page 424

REGENTS EXAM QUESTIONS (through June 2018)
A.APR.A.1: Operations with Polynomials
330) If and , then equals
1) 3) 2) 4)
331) Express the product of and in standard form.
332) Fred is given a rectangular piece of paper. If the length of Fred's piece of paper is represented by and the
width is represented by , then the paper has a total area represented by 1) 3) 2) 4)
333) Subtract from . Express the result as a trinomial.
334) If the difference is multiplied by , what is the result, written in standard form?
335) Which trinomial is equivalent to ?
1) 3) 2) 4)
336) When is subtracted from , the result is 1) 3) 2) 4)
337) The expression is equivalent to 1) 3) 2) 4)
338) What is the product of and ? 1) 3) 2) 4)
339) Which expression is equivalent to ? 1) 3) 2) 4)
340) Express in simplest form:
341) Write the expression as a polynomial in standard form.
342) Which polynomial is twice the sum of and ?
1) 3) 2) 4)
Page 425

SOLUTIONS
330) ANS: 2 Strategy: To subtract, change the signs of the subtrahend and add. Given:
Change the signs and add:
PTS: 2 NAT: A.APR.A.1 TOP: Addition and Subtraction of Polynomials KEY: subtraction
331) ANS:
Strategy: Use the distribution property to multiply polynomials, then simplify. STEP 1. Use the distributive property
STEP 2. Simplify by combining like terms.
PTS: 2 NAT: A.APR.A.1 TOP: Multiplication of Polynomials
332) ANS: 2 Strategy: Draw a picture and use the area formula for a rectange: .
PTS: 2 NAT: A.APR.A.1 TOP: Multiplication of Polynomials
333) ANS:
2x-6
3x-5A=(2x-6)(3x-5)
Page 426

Strategy: To subtract, change the signs of the subtrahend and add. Given:
Change the signs and add:
PTS: 2 NAT: A.APR.A.1 TOP: Addition and Subtraction of Polynomials KEY: subtraction
334) ANS:
Strategy. First, find the difference between , the use the distributive property to
multiply the difference by . Simplify as necessary.
STEP 1. Find the difference between . To subtract polynomials, change the signs of the subtrahend and add. Given: Change the signs and add:
STEP 2. Multiply by .
PTS: 2 NAT: A.APR.A.1 TOP: Operations with Polynomials KEY: multiplication
335) ANS: 4 Strategy: Expand and simplify the expression STEP 1 Expand the expression.
STEP 2: Simplify the expanded expression by combining like terms.
PTS: 2 NAT: A.APR.A.1 TOP: Operations with Polynomials KEY: mixed
Page 427

336) ANS: 3 Strategy: Expand the binomial, then subtract it from 5x2.
PTS: 2 NAT: A.APR.A.1 TOP: Operations with Polynomials KEY: multiplication
337) ANS: 2
PTS: 2 NAT: A.APR.A.1 TOP: Operations with Polynomials KEY: subtraction
338) ANS: 3 Strategy: Use the distributive property
PTS: 2 NAT: A.APR.A.1
339) ANS: 4 Given
Distributive Property Combine Like Terms -2g-11
PTS: 2 NAT: A.APR.A.1 TOP: Operations with Polynomials KEY: subtraction
340) ANS:
Page 428

PTS: 2 NAT: A.APR.A.1 TOP: Operations with Polynomials KEY: subtraction
341) ANS:
PTS: 2 NAT: A.APR.A.1 TOP: Operations with Polynomials KEY: multiplication
342) ANS: 3 STEP 1. Solve for the sum of and .
STEP 2. Solve for twice the sum of .
PTS: 2 NAT: A.APR.A.1 TOP: Operations with Polynomials KEY: addition
Page 429

K – Polynomials, Lesson 3, Factoring Polynomials (r. 2018)
POLYNOMIALS Factoring Polynomials
Common Core Standard
A-SSE.2 Use the structure of an expression to iden-tify ways to rewrite it. For example, see 4 4x y− as
22 22( ) ( )x y− , thus recognizing it as a difference of squares that can be factored as
2 2 2 2( )( )x y x y− + . PARCC: Tasks limited to numerical and polynomial expressions in one variable. Recognize 2 253 47− as a difference of squares and see an opportunity to rewrite it in the easier-to -evaluate form (53+47)(53-47). See an opportunity to rewrite 2 9 14a a+ + as (a+7)(a+2). NYSED: Does not include factoring by grouping and factoring the sum and difference of cubes.
Next Generation Standard
AI-A.SSE.2 Recognize and use the structure of an expression to identify ways to rewrite it. (Shared standard with Algebra II) e.g.,
( ) ( )( ) ( ) ( ) ( ) ( ) ( )
( ) ( )( ) ( )
3 2 2
2 2
2
2 2
2
2 2
2
4 2
– –
)
–
( )
((
)
( –
− = − −= + −
− = − = + − = + −− = − = + −
− + + = − = − − ++ − =
x x x x x x 153 47 53 47 53 47
16x 36 4x 6 4x 6 4x 6 4 2x 3 2x 3 or16x 36 4 4x 9 4 2x 3 2x 3
2x 8x 10 2 x 4x 5 2 x 5 x 1x 6x 7 x ( )( )2 2 2 )( ) ( )+ − = + + −7 x 1 x 7 x 1 x 1
Note: Algebra I expressions are limited to numerical and poly-nomial expressions in one variable. Use factoring techniques such as factoring out a greatest common factor, factoring the difference of two perfect squares, factoring trinomials of the form ax2+bx+c with a lead coefficient of 1, or a com-bination of methods to factor completely. Factoring will not involve factoring by grouping and factoring the sum and differ-ence of cubes.
LEARNING OBJECTIVES
Students will be able to: 1) factor monomials 2) factor binomials, and 3) factor trinomials
Overview of Lesson Teacher Centered Introduction
Overview of Lesson
- activate students’ prior knowledge
- vocabulary
- learning objective(s)
- big ideas: direct instruction
- modeling
Student Centered Activities guided practice Teacher: anticipates, monitors, selects, sequences, and connects student work
- developing essential skills
- Regents exam questions
- formative assessment assignment (exit slip, explain the math, or journal entry)
VOCABULARY
binomial factor completely greatest common factor
monomial perfect square term
trinomial
Page 430

BIG IDEAS Factoring polynomials is one of four general methods taught in the Regents mathematics curriculum for finding the roots of a quadratic equation. The other three methods are the quadratic formula, completing the square and graphing. The roots of a quadratic equation can found using the factoring method when the discriminant’s
value is equal to either zero or a perfect square.
Factoring Monomials:
Factoring Binomials: NOTE: This is the inverse of the distributive property.
Factoring Trinomials Standard Approach Given a trinomial in the form whose discriminant equals zero or a perfect square, it may be factored as follows:
Modeling:
( ) ( ) ( )2 2 2 2 2 2204 2 102 2 2 51 2 2 3 17 2 3 17x x x x x= = • = • • = • • •
( )( )2
3 2 3 6
2 6 2 3
x x
x x x x
+ = +
+ = +
2 0ax bx c+ + =
( )( )2 0 ___ ___ax bx c x x+ + = =
STEP 2. The signs of these two numbers aredetermined by the signs of b and c.
STEP 1. The product of these two numbersmust equal c.
( )( )2 0 ___ ___ax bx c x x+ + = =
Inners
Outers
STEP 3. The product of the outer numbers plus the product of the inner numbersmust sum to b.
( )( )2 5 6 2 3x x x x− + = − −
( )( )22 8 6 2 2 3x x x x− + = − −
( )( )24 10 6 2 2 2 3x x x x− + = − −
Page 431

Box Method
2ax
c
mx
nx
gcfgcf
gcf
gcf
The Box Method for
Factoring a Trinomial
2 0bxbx mx nx
ax c+ + == +
INSTRUCTIONS EXAMPLE STEP 1 Start with a factorable quadratic in stand-ard form: 2 0ax bx c+ + = and a 2-row by 2-column table.
Solve by factoring: 26 12 0x x− − =
STEP 2 Copy the quadratic term into the upper left box and the constant term into the lower right box.
26x
-12
STEP 3 Multiply the quadratic term by the con-stant term and write the product to the right of the table.
26x
-12 2 26 12 72x x×− = −
STEP 4 Factor the product from STEP 3 until you obtain two factors that sum to the linear term (bx).
1 721 72
2 362 36
3 243 24
4 184 18
6 126 128 9 These two factors sum to
8 9
x xx x
x xx x
x xx x
x xx x
x xx xx x bx
x x
×−− ××−
− ××−
− ××−
− ××−
− ××−
− ×
Page 432

STEP 5 Write one of the two factors found in STEP 4 in the upper right box and the other in the lower left box. Order does not matter.
8x
26x
-12
-9x
STEP 6 Find the greatest common factor of each row and each column and record these factors to the left of each row and above each column. Give each factor the same plus or minus value as the nearest term in a box. NOTE: If all four of the greatest common factors share a common factor, reduce each factor by the common factor and add the common factor as a third factor. Eg. ( ) ( )( )3 9)(3 15 3 3 5x x x x− − ⇒ − −
8x
26x
-12
-9x
-32x
3x4
STEP 7 Write the expressions above and beside the box as binomial factors of the original trino-mial.
( )( )2 3 3 4 0x x− + =
STEP 8 Check to see that the factored quadratic is the same as the original quadratic.
( )( )2
2
2 3 3 4 0
6 8 9 12 06 9 12 0 check
x x
x x xx x
− + =
+ − − =
− − =
STEP 9 Convert the factors to zeros. ( )
( )
2 3 02 3
32
3 4 03 4
43
xx
x
xx
x
− =
=
=
+ =
= −
= −
DEVELOPING ESSENTIAL SKILLS
1.Factored completely, the expression is equivalent to a. c. b. d.
2. Factored completely, the expression is equivalent to a. c. b. d.
3. What are the factors of the expression ? a. c. b. d.
Page 433

4. Factored completely, the expression is equivalent to a. c. b. d.
5. Factor completely:
6. The greatest common factor of is? a. c. b. d.
7. When factored completely, the expression is equivalent to a. c. b. d.
8. Which is a factor of ? a. c. b. d.
9. Which expression is a factor of ? a. c. b. d.
10. Which expression is a factor of ? a. c. b. d.
11. What are the factors of ? a. c. b. d.
12. If one factor of is , what is the other factor? a. c. b. d.
13. If is one factor of , what is the other factor? a. c. b. d.
14. Factor completely:
15. Factored completely, the expression is equivalent to a. c. b. d.
16. What are the factors of ? a. c. b. d.
17. The greatest common factor of and is a. c. b. d.
Answers
1. ANS: B
2. ANS: B
Page 434

3. ANS: B
4. ANS: D
5. ANS:
6. ANS: C
7. ANS: D
8. ANS: D
9. ANS: A
10. ANS: D
11. ANS: C
12. ANS: A
13. ANS: C
14. ANS: .
15. ANS: A
16. ANS: B
17. ANS: A
Page 435

REGENTS EXAM QUESTIONS (through June 2016)
A.SSE.A.2: Factoring Polynomials
343) Which expression is equivalent to ?
1) 3) 2) 4)
344) Four expressions are shown below. I II III IV The expression is equivalent to 1) I and II, only 3) I, II, and IV 2) II and IV, only 4) II, III, and IV
345) When factored completely, is 1) 3) 2) 4)
346) Factor the expression completely.
347) The trinomial can be expressed as
1) 3) 2) 4)
SOLUTIONS
343) ANS: 1 Strategy 1. Factor
Strategy 2. Work backwards using the distributive property to check each answer choice.
Page 436

a
(correct)
c
(wrong) b
(wrong)
d
(wrong)
PTS: 2 NAT: A.SSE.A.2 TOP: Factoring Polynomials
344) ANS: 3 Strategy: Use the distributive property to expand each expression, then match the expanded expressions to the answer choices.
I
III
II
IV
Answer choice c is correct.
PTS: 2 NAT: A.SSE.A.2 TOP: Factoring Polynomials
345) ANS: 3
PTS: 2 NAT: A.SSE.A.2 TOP: Factoring Polynomials
346) ANS:
Strategy: Factor the trinomial, then factor the perfect square. STEP 1. Factor the trinomial .
Page 437

STEP 2. Factor the perfect square.
PTS: 2 NAT: A.SSE.A.2 TOP: Factoring Polynomials
347) ANS: 1 Strategy. Multiply binomials and eliminate wrong answers. Choice 1: Correct
Choice 2: Wrong: middle term has wrong sign.
Choice 3: Wrong: no middle term and second term has wrong sign.
Choice 4: Wrong: middle term and third term have wrong coefficients.
PTS: 2 NAT: A.SSE.A.2 TOP: Factoring Polynomials KEY: quadratic
Page 438

K – Polynomials, Lesson 4, Factoring the Difference of Perfect Squares (r. 2018)
POLYNOMIALS Factoring the Difference of Perfect Squares
Common Core Standard
A-SSE.2 Use the structure of an expression to iden-tify ways to rewrite it. For example, see 4 4x y− as
22 22( ) ( )x y− , thus recognizing it as a difference of squares that can be factored as
2 2 2 2( )( )x y x y− + . PARCC: Tasks limited to numerical and polynomial expressions in one variable. Recognize 2 253 47− as a difference of squares and see an opportunity to rewrite it in the easier-to -evaluate form (53+47)(53-47). See an opportunity to rewrite 2 9 14a a+ + as (a+7)(a+2). NYSED: Does not include factoring by grouping and factoring the sum and difference of cubes.
Next Generation Standard
AI-A.SSE.2 Recognize and use the structure of an expression to identify ways to rewrite it. (Shared standard with Algebra II) e.g.,
( ) ( )( ) ( ) ( ) ( ) ( ) ( )
( ) ( )( ) ( )
3 2 2
2 2
2
2 2
2
2 2
2
4 2
– –
)
–
( )
((
)
( –
− = − −= + −
− = − = + − = + −− = − = + −
− + + = − = − − ++ − =
x x x x x x 153 47 53 47 53 47
16x 36 4x 6 4x 6 4x 6 4 2x 3 2x 3 or16x 36 4 4x 9 4 2x 3 2x 3
2x 8x 10 2 x 4x 5 2 x 5 x 1x 6x 7 x ( )( )2 2 2 )( ) ( )+ − = + + −7 x 1 x 7 x 1 x 1
Note: Algebra I expressions are limited to numerical and poly-nomial expressions in one variable. Use factoring techniques such as factoring out a greatest common factor, factoring the difference of two perfect squares, factoring trinomials of the form ax2+bx+c with a lead coefficient of 1, or a com-bination of methods to factor completely. Factoring will not involve factoring by grouping and factoring the sum and differ-ence of cubes.
LEARNING OBJECTIVES
Students will be able to:
1) factor the difference of perfect squares.
Overview of Lesson
Teacher Centered Introduction Overview of Lesson
- activate students’ prior knowledge
- vocabulary
- learning objective(s)
- big ideas: direct instruction
- modeling
Student Centered Activities guided practice Teacher: anticipates, monitors, selects, sequences, and connects student work
- developing essential skills
- Regents exam questions
- formative assessment assignment (exit slip, explain the math, or journal entry)
VOCABULARY
Completely factor Perfect square binomial
Square of a number Square root of a number
Page 439

BIG IDEA
General Rule
Examples
DEVELOPING ESSENTIAL SKILLS
1. The expression is equivalent to a. c. b. d.
2. Factored, the expression is equivalent to a. c. b. d.
3. The expression is equivalent to a. c. b. d.
4. Factor completely:
5. Which expression is equivalent to ? a. c. b. d.
6. If Ann correctly factors an expression that is the difference of two perfect squares, her factors could be a. c. b. d.
7. Which expression is equivalent to ? a. c. b. d.
8. When is factored completely, the result is a. c. b. d.
9. The expression is equivalent to a. c. b. d.
10. Which expression represents factored completely? a. c. b. d.
11. Which expression is equivalent to ? a. c. b. d.
12. The expression is equivalent to a. c. b. d.
13. The expression is equivalent to
( ) ( )( )2 2a b a b a b− = + −( )( )( )( )
2
4 2 2
4 2 2
9 3 3
x x x
x x x
− = + −
− = + −
Page 440

a. c. b. d.
14. When is factored, it is equivalent to . What is a value for b? a. 50 c. 3 b. 10 d. 100
15. Which expression is equivalent to ? a. c. b. d.
16. One of the factors of is a. c. b. d.
17. Factor completely: a. c. b. d.
18. Written in simplest factored form, the binomial can be expressed as a. c. b. d.
19. Expressed in factored form, the binomial is equivalent to a. c. b. d.
20. What is a common factor of and ? a. c. b. d.
Answers
1. ANS: C
2. ANS: A
3. ANS: B
4. ANS: .
5.ANS: A
6. ANS: B
7. ANS: C
8. ANS: B
9. ANS: C
10. ANS: B
11. ANS: B
12. ANS: C
13. ANS: A
14. ANS: B
15. ANS: C
16. ANS: B
17. ANS: C
18. ANS: B
19. ANS: B
20. ANS: B
Page 441

REGENTS EXAM QUESTIONS (through June 2018)
A.SSE.A.2: Difference of Perfect Squares
348) When factored completely, the expression is equivalent to
1) 3) 2) 4)
349) If the area of a rectangle is expressed as , then the product of the length and the width of the rectangle could be expressed as 1) 3) 2) 4)
350) The expression is equivalent to 1) 3) 2) 4)
351) Which expression is equivalent to ? 1) 3) 2) 4)
352) Which expression is equivalent to ? 1) 3) 2) 4)
353) Which expression is equivalent to ? 1) 3) 2) 4)
354) The expression is equivalent to 1) 3) 2) 4)
355) Which expression is equivalent to ? 1) 3) 2) 4)
Page 442

SOLUTIONS
348) ANS: 3 Strategy: Use difference of perfect squares. STEP 1. Factor
STEP 2. Factor
PTS: 2 NAT: A.SSE.A.2 TOP: Factoring Polynomials
349) ANS: 2 Strategy: Use the distributive property to work backwards from the answer choices.
a.
c.
b.
d.
PTS: 2 NAT: A.SSE.A.2 TOP: Factoring Polynomials
350) ANS: 3 Step 1. Understand the problem as a “difference of perfect squares”, because the terms and 16 are both perfect squares and the operation is subtraction. Step 2. Strategy: Use the pattern to separate into two binomials. Step3. Execution of Strategy The square root of is . The square of 16 is 4. = Step 4. Does it make sense? Yes. You can show that = using the distributive property, as follows:
Page 443

PTS: 2 NAT: A.SSE.A.2 TOP: Factoring the Difference of Perfect Squares
351) ANS: 2 Strategy 1. Recognize that the expression is a difference of perfect squares. Therefore,
.
Since this is not an answer choice, continue factoring, as follows:
Strategy 2. Examine the answer choices, which begin with factors 4 and 2. Extract these factors first, as follows:
Start by extracting a 4
Start by extracting a 2
PTS: 2 NAT: A.SSE.A.2
352) ANS: 2 Strategy 1: Factor
Strategy 2: Recognize that appears to be a difference of perfect squares. Recall that . Eliminate any answers that do not take the form of , which leaves only one choice:
Check:
Page 444

PTS: 2 NAT: A.SSE.A.2 TOP: Factoring the Difference of Perfect Squares KEY: quadratic
353) ANS: 3 Note that the expression is the difference of perfect squares.
PTS: 2 NAT: A.SSE.A.2 TOP: Factoring the Difference of Perfect Squares KEY: higher power
354) ANS: 3 Note that and 36 are both perfect squares. Therefore, is the difference of perfect squares.
PTS: 2 NAT: A.SSE.A.2 TOP: Factoring the Difference of Perfect Squares KEY: quadratic
355) ANS: 3 is a difference of perfect squares. All polynomials in the form of can be factored into
.
PTS: 2 NAT: A.SSE.A.2 TOP: Factoring the Difference of Perfect Squares KEY: higher power AI
Page 445

K – Polynomials, Lesson 5, Zeros of Polynomials (r. 2018)
POLYNOMIALS Zeros of Polynomials
Common Core Standard
A-APR.3 Identify zeros of polynomials when suita-ble factorizations are available, and use the zeros to construct a rough graph of the function defined by the polynomial. PARCC: Tasks are limited to quadratic and cubic polynomials in which linear and quadratic factors are available. For example, find the zeros of ( ) 2 )2 9(x x− − .
Next Generation Standard
AI-A.APR.3 Identify zeros of polynomial functions when suitable factorizations are available. (Shared standard with Algebra II) Note: Algebra I tasks will focus on identifying the zeros of quadratic and cubic polynomial functions. For tasks that involve finding the zeros of cubic polynomial func-tions, the linear and quadratic factors of the cubic polyno-mial function will be given (e.g., find the zeros of ( ) ( ) 2 )2 9(P x xx −= − ).
LEARNING OBJECTIVES
Students will be able to: 1) Identify the zeros of a polynomial expression given its factors. 2) Identify the factors of a polynomial expression given its zeros. 3) Identify the zeros and factors of a polynomial expression given the graph of the
expression.
Overview of Lesson Teacher Centered Introduction
Overview of Lesson
- activate students’ prior knowledge
- vocabulary
- learning objective(s)
- big ideas: direct instruction
- modeling
Student Centered Activities guided practice Teacher: anticipates, monitors, selects, sequences, and connects student work
- developing essential skills
- Regents exam questions
- formative assessment assignment (exit slip, explain the math, or journal entry)
VOCABULARY
Multiplication Property of Zero: The multiplication property of zero says that if the product of two numbers or expressions is zero, then one or both of the numbers or expressions must equal zero. More simply, if , then either or , or, x and y both equal zero. Factor: A factor is: 1) a whole number that is a divisor of another number, or 2) an algebraic expression that is a divisor of another algebraic expression.
Examples:
o 1, 2, 3, 4, 6, and 12 all divide the number 12, so 1, 2, 3, 4, 6, and 12 are all factors of 12. o will divide the trinomial expression , ( ) ( )3 and 2x x− + 2 6x x− −
Page 446

so are both factors of the .
Zeros: A zero of an equation is a solution or root of the equation. The words zero, solution, and root all mean the same thing. The zeros of a polynomial expression are found by finding the value of x when the value of y is 0. This done by making and solving an equation with the value of the polynomial expression equal to zero. Example:
o The zeros of the trinomial expression can be found by writing and then factoring the equation:
After factoring the equation, use the multiplication property of zero to find the zeros, as follows:
The zeros of the expression are -6 and +4. Check: You can check this by substituting both -6 or +4 into the expression, as follows: Check for -6
Check for +4
x-axis intercepts: The zeros of an expression can also be understood as the x-axis
intercepts of the graph of the equation when . This is because the coordinates of the x-axis intercepts, by definition, have y-values equal to zero, and is the same as writing an equation where the expression is equal to zero.
( ) ( )3 and 2x x− + 2 6x x− −
Page 447

The roots of are
and . These are the x coordinate values of the x-axis intercepts.
BIG IDEA #1 Starting with Factors and Finding Zeros Remember that the factors of an expression are related to the zeros of the expression by the multiplication property of zero. Thus, if you know the factors, it is easy to find the zeros. Example: The factors of an expression are , and . The zeros are found as follows using the multiplication property of zero:
The zeros are -3, -1, and +1.
Be sure to input all factors.
BIG IDEA #2
Starting with Zeros and Finding Factors If you know the zeros of an expression, you can work backwards using the multiplication property of zero to find the factors of the expression. For example, if you inspect the graph of an equation and find that it has x-intercepts at and , you can write:
The equation of the graph has factors of and , so you can write the equation:
which simplifies to
2 2 24 0x x+ − =6x = − 4x =
Page 448

With practice, you can probably move back and forth between the zeros of an expression and the factors of an expression with ease.
DEVELOPING ESSENTIAL SKILLS
Identify the factors, zeros, and x-axis intercepts of the following polynomials:
Polynomial Factors Zeros x-axis Intercepts 2 - - 6 0 x x =
2 0 7 6x x+ + = 2 -5 - 6 0 x x =
2 - 2 -1 05 x x = 2 -3 -1 00 x x = 2 - 2 -8 0 x x = 26 5 - 6 0x x+ = 26x 15 36 0x− − =
ANSWERS
Identify the factors, zeros, and x-axis intercepts of the following polynomials:
Polynomial Factors Zeros x-axis Intercepts 2 - - 6 0 x x = ( )( ) 2 – 3x x+ { }2,3x = − { }2,3x = −
2 0 7 6x x+ + = ( )( ) 1 6x x+ + { }6,1 x = − { }6,1 x = − 2 -5 - 6 0 x x = ( )( ) – 6 1x x + { }1,6x = − { }1,6x = −
2 - 2 -1 05 x x = ( )( ) 5 3x x− + { }3,5 x = { }3,5 x = 2 -3 -1 00 x x = ( )( ) 5 2x x− + { }2,5x = { }2,5x = 2 - 2 -8 0 x x = ( )( ) 4 2x x− + { }2,4x = − { }2,4x = − 26 5 - 6 0x x+ = ( )( )2 3 3 2x x+ − 3 2,
2 3x = −
3 2,
2 3x = −
26x 15 36 0x− − = ( )( )–3 – 4 2 3x x + 3 , 42
x = −
3 , 42
x = −
Page 449

REGENTS EXAM QUESTIONS (through June 2018)
A.APR.B.3: Zeros of Polynomials
356) The graphs below represent functions defined by polynomials. For which function are the zeros of the
polynomials 2 and ? 1)
3)
2)
4)
357) Which equation(s) represent the graph below? I II III
1) I, only 3) I and II 2) II, only 4) II and III
Page 450

358) For which function defined by a polynomial are the zeros of the polynomial and ? 1) 3) 2) 4)
359) The zeros of the function are 1) and 5 3) and 2 2) and 7 4) and 3
360) The graph of is shown below.
Which function could represent the graph of ? 1) 3) 2) 4)
361) A polynomial function contains the factors x, , and . Which graph(s) below could represent the graph of this function?
1) I, only 3) I and III 2) II, only 4) I, II, and III
362) What are the zeros of the function ? 1) and 3 3) and 2 2) 10 and 4) 15 and
363) The zeros of the function are 1) and 6 3) 2 and 2) 1 and 4) and 3
364) Based on the graph below, which expression is a possible factorization of p(x)?
Page 451

1) 3) 2) 4)
365) Which function has zeros of -4 and 2? 1) 3) 2)
4)
366) Which polynomial function has zeros at -3, 0, and 4? 1) 3) 2) 4)
367) The zeros of the function are 1) 3) 2) 4)
368) Determine all the zeros of , algebraically.
369) Wenona sketched the polynomial as shown on the axes below.
Page 452

Which equation could represent ? 1) 3) 2) 4)
370) The zeros of the function are 1) and 3 3) and 6 2) and 4 4) and 8
371) A cubic function is graphed on the set of axes below.
Which function could represent this graph? 1) 3) 2) 4)
SOLUTIONS
356) ANS: 3 Strategy: Look for the coordinates of the x-intercepts (where the graph crosses the x-axis). The zeros are the x-values of those coordinates. Answer c is the correct choice. The coordinates of the x-intercepts of the graph are (2, 0) and (-3, 0). The zeros of the polynomial are 2 and -3.
Page 453

PTS: 2 NAT: A.APR.B.3 TOP: Zeros of Polynomials KEY: bimodalgraph
357) ANS: 2 Strategy: Factor the trinomials in each equation, then convert the factors into zeros and select the equations that have zeros at -2, 1, and 3. STEP 1.
I
II
III
The correct answer choice is b.
PTS: 2 NAT: A.APR.B.3 TOP: Zeros of Polynomials
358) ANS: 2 Strategy. Input each function in a graphing calculator and look at the table views to find the values of x when y equals zero.
Answer choice b, enterred as , has zeros at and .
PTS: 2 NAT: A.APR.B.3 TOP: Zeros of Polynomials
359) ANS: 4 Strategy: Use root operations to solve for .
PTS: 2 NAT: F.IF.C.8 TOP: Zeros of Polynomials
360) ANS: 1 Strategy: STEP 1. Identify the zeros and convert them into factors. The graph has zeros at -4, -2, and 1. Convert these zeros of the function into the following factors: (x+4)(x+2)(x-1). The functiuon rule is f(x)= (x+4)(x+2)(x-1)
Page 454

STEP 2. Eliminate wrong answers. Choices b and d can be eliminated because (x-2) is not a factor. b.
d.
STEP 3. Choose between remaining choices by factoring the trinomials.
a.
c.
PTS: 2 NAT: A.APR.B.3 TOP: Zeros of Polynomials
361) ANS: 1 Stategy 1. Convert the factors to zeros, then find the graph(s) with the corresponding zeros. STEP 1. Convert the factors to zeros.
STEP 2. Find the zeros of the graphs. Graph I has zeros at -5, 0, and 2. Graph II has zeros at -5 and 2. Graph III has zeros at -2, 0, and 5. Answer choice a is correct. Strategy 2: Input the factors into a graphing calculator and view the graph of the function
.
Note: This graph has the same zeros as graph I, but the end behaviors of the graph are reversed. This graph is a reflection in the x-axis of graph I and the reversal is caused by a change in the sign of the leading coefficient in the expansion of . It makes no difference in answering this problem. The zeros are the same and the correct answer choice is answer choice a.
PTS: 2 NAT: A.APR.B.3 TOP: Zeros of Polynomials
362) ANS: 4 Strategy: Find the factors of , then convert the factors to zeros. STEP 1. Find the factors of .
Page 455

STEP 2. Convert the factors to zeros.
DIMS? Does It Make Sense? Yes. Check by inputting into a graphing calculator and verify that there are zeros when
PTS: 2 NAT: A.SSE.B.3 TOP: Zeros of Polynomials
363) ANS: 1 Step 1. Understand that the zeros of a function are the x values when . Step 2. Strategy: Solve for x when . Step 3. Execute the strategy
Step 4. Does it make sense? Yes. Check by inputting the function in a graphing calculator and inspecting the graph and table of values.
Page 456

PTS: 2 NAT: A.APR.B.3 TOP: Zeros of Polynomials
364) ANS: 1 Strategy: Convert the zeros of the function to factors.
Zeros occur at Factors are: (-3, 0) (x+3) (2, 0) (x-2) (4, 0) (x-4)
PTS: 2 NAT: A.APR.B.3
365) ANS: 4 The zeros of a function are the x values when y = 0. Strategy: Eliminate wrong answers. a) Solve for Eliminate this choice.
b) Solve for Eliminate this choice.
c) The graph shows x-axis intercepts at and at , so the zeros are -2 and 4. Eliminate this choice. d) The graph shows x-axis intercepts at and at , so the zeros are -4 and 2. This is the correct choice.
PTS: 2 NAT: A.APR.B.3 TOP: Zeros of Polynomials
366) ANS: 3 The zeros of a function are the x-values when Strategy: Convert the zeros to factors, then combine the factors to write the function.
Zeros Factors
Check by inputting the function in a graphing calculator and inspecting the zeros
PTS: 2 NAT: A.APR.B.3 TOP: Zeros of Polynomials
367) ANS: 3 Strategy #1. Find the factors and use the multiplication property of zero to find the zeros.
Page 457

If the factors are 2x, x-3, and x-2, the zeros are 0, 2, and 3.
Strategy #2: Use a graphing calculator.
PTS: 2 NAT: A.APR.B.3 TOP: Zeros of Polynomials
368) ANS: Strategy 1: Use factoring.
Strategy 2: Use the quadratic formula
Strategy 3. Complete the square
Page 458

PTS: 2 NAT: A.APR.B.3 TOP: Zeros of Polynomials
369) ANS: 1 Note that the zeros (x-intercepts) occur at -1 and +2. This means that the factors of the equation are (x+1) and (x-2). Eliminate and because they have the wrong factors. The choice is between and . is a third degree equation and is a second degree (quadratic) equation. The graph is definitely not a parabola, so it cannot be the graph of a quadratic function. Eliminate
. The correct answer is . Check in a graphing calculator.
PTS: 2 NAT: A.APR.B.3 TOP: Zeros of Polynomials KEY: AI
370) ANS: 3 Strategy: Let and solve the quadratic.
Notes Left Expression
Sign Right Expression
Given = Let 0 =
Factor 0 = By the zero property of multiplication: If , then . By the zero property of multiplication: If , then .
Page 459

NOTE: The zero property of multiplication says that if the product of two numbers is zero, then one or both of those numbers must be zero.
PTS: 2 NAT: A.APR.B.3 TOP: Zeros of Polynomials
371) ANS: 2 Strategy: Find the zeros of the cubic function, then convert the zeros to factors. STEP 1
Zeros Conversions to Factors Factors
STEP 2: Combine all factors into one expression.
The correct answer choice is
PTS: 2 NAT: A.APR.B.3 TOP: Zeros of Polynomials
Page 460

K – Polynomials, Lesson 6, Graphing Polynomial Functions (r. 2018)
POLYNOMIALS Graphing Polynomial Functions
Common Core Standard
F-BF.3 Identify the effect on the graph of replacing f(x) by f(x) + k, k f(x), f(kx), and f(x + k) for specific values of k (both positive and negative); find the value of k given the graphs. Experiment with cases and illustrate an explanation of the effects on the graph using technology. Include recognizing even and odd functions from their graphs and algebraic expressions for them. PARCC: Identifying the effect on the graph of replacing f(x) by f(x) +k, kf(x), and f(x+k) for specific values of k (both positive and negative) is limited to linear and quadratic functions. Experi-menting with cases and illustrating an explanation of the effects on the graph using technology is limited to linear functions, quad-ratic functions, square root functions, cube root functions, piece-wise-defined functions (including step functions and absolute value functions), and exponential functions with domains in the integers. Tasks do not involve recognizing even and odd func-tions.
Next Generation Standard
AI-F.BF.3a Using f(x) + k, k f(x), and f(x + k): i) identify the effect on the graph when replacing f(x) by f(x) + k, k f(x), and f(x + k) for specific values of k (both positive and negative); ii) find the value of k given the graphs; iii) write a new function using the value of k; and iv) use technology to experiment with cases and explore the effects on the graph. (Shared standard with Algebra II) Note: Tasks are limited to linear, quadratic, square root, and absolute value functions; and exponential functions of the form ( ) ( ) xf x a b= where a > 0 and b > 0 (b ≠ 1).
LEARNING OBJECTIVES
Students will be able to:
1) Use a constant k in the equation of the parabola to move the graph of parabolas up, down, left, and/or right.
2) Use a constant k in the equation of the parabola to make the parabola open upward or downward.
3) Use a constant k in the equation of the parabola to make the parabola narrower or wider.
Overview of Lesson
Teacher Centered Introduction Overview of Lesson
- activate students’ prior knowledge
- vocabulary
- learning objective(s)
- big ideas: direct instruction
- modeling
Student Centered Activities guided practice Teacher: anticipates, monitors, selects, sequences, and connects student work
- developing essential skills
- Regents exam questions
- formative assessment assignment (exit slip, explain the math, or journal entry)
VOCABULARY
constant narrower
scalar translation
vertex wider
Page 461

BIG IDEAS The graph of a function is changed when either or x is multiplied by a scalar, or when a constant is added to or subtracted from either or x. A graphing calculator can be used to explore the translations of graph views of functions.
Up and Down The addition or subtraction of a constant outside the parentheses moves the graph up or down by the value of the constant.
( ) ( ) moves the graph up or down k units .
+k moves the graph up.-k moves the graph down.
f x f x k⇔ ±
Examples:
Replace f(x) by f(x) + k
Left and Right The addition or subtraction of a constant inside the parentheses moves the graph left or right by the value of the constant.
( ) ( ) moves the graph left or right k units .
+k moves the graph leftg k units.-k moves the graph right k units.
f x f x k⇔ ±
Replace f(x) by f(x + k)
Page 462

Width and Direction of a Parabola Changing the value of a in a quadratic affects the width and direction of a parabola. The bigger the absolute value of a, the narrower the parabola.
( ) ( ) changes the direction and width of a parabola.+k opens the parabola upward.-k opens the parabola downward.If k is a fraction less than 1, the parabola will get wider. As k approaches zero, the
f x f kx⇔
parabola approaches a straight horizontal line.If k is a number greater than 1, the parabola will get narrower.As k approaches infinity, the parabola approaches a straight vertical line.
Examples:
Replace f(x) by f(kx)
Page 463

DEVELOPING ESSENTIAL SKILLS
1. Consider the graph of the equation , when . If a is multiplied by 3, what is true of the graph of the resulting parabola? a. The vertex is 3 units above the vertex of the original parabola. b. The new parabola is 3 units to the right of the original parabola. c. The new parabola is wider than the original parabola. d. The new parabola is narrower than the original parabola.
2. Melissa graphed the equation and Dave graphed the equation on the same coordinate grid. What is the relationship between the graphs that Melissa and Dave drew? a. Dave's graph is wider and opens in the opposite direction from Melissa's graph. b. Dave's graph is narrower and opens in the opposite direction from Melissa's graph. c. Dave's graph is wider and is three units below Melissa's graph. d. Dave's graph is narrower and is three units to the left of Melissa's graph.
3. The graph of a parabola is represented by the equation where a is a positive integer. If a is multiplied by 2, the new parabola will become a. narrower and open downward b. narrower and open upward c. wider and open downward d. wider and open upward
4. How is the graph of affected when the coefficient of is changed to a smaller positive number? a. The graph becomes wider, and the y-intercept changes. b. The graph becomes wider, and the y-intercept stays the same. c. The graph becomes narrower, and the y-intercept changes. d. The graph becomes narrower, and the y-intercept stays the same.
5. Which is the equation of a parabola that has the same vertex as the parabola represented by , but is wider? a. c. b. d.
Page 464
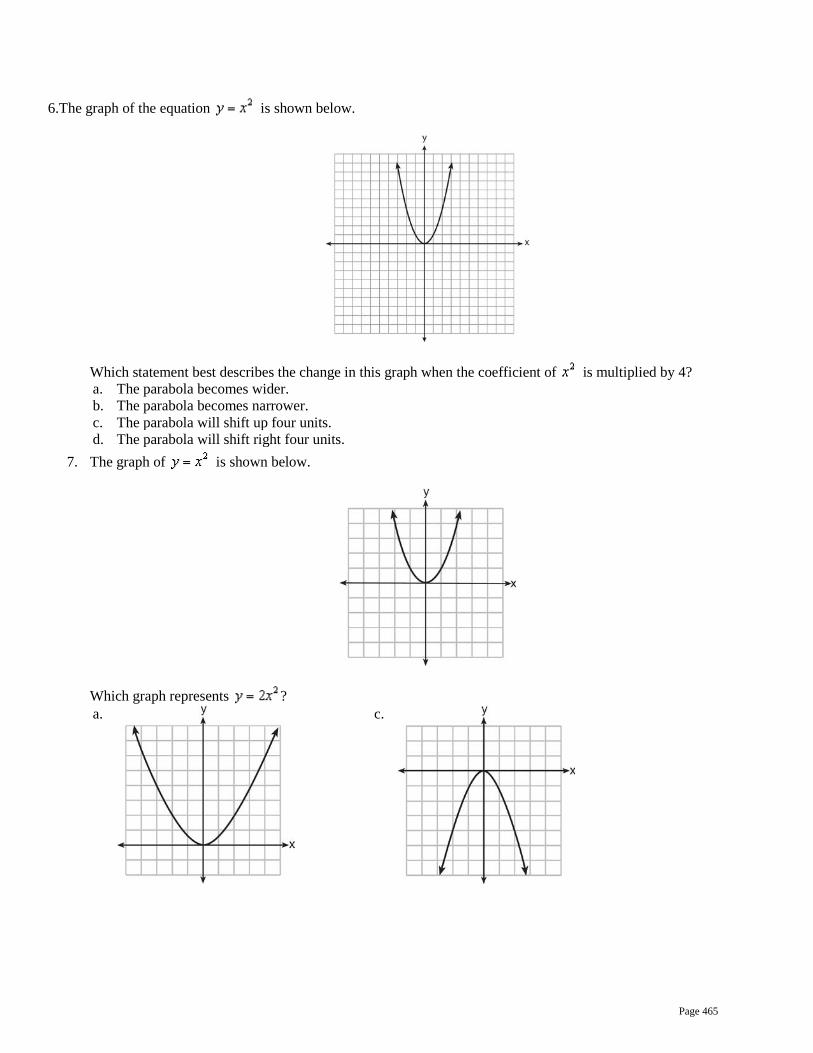
6.The graph of the equation is shown below.
Which statement best describes the change in this graph when the coefficient of is multiplied by 4? a. The parabola becomes wider. b. The parabola becomes narrower. c. The parabola will shift up four units. d. The parabola will shift right four units.
7. The graph of is shown below.
Which graph represents ? a.
c.
Page 465

b.
d.
ANSWERS
1. ANS: D
2. ANS: B
3. ANS: B
4. ANS: B
5. ANS: D
6. ANS: B
7. ANS: D
Page 466

REGENTS EXAM QUESTIONS (through June 2018)
F.BF.B.3: Graphing Polynomial Functions
372) The graph of the equation is shown below.
If a is multiplied by , the graph of the new equation is
1) wider and opens downward 3) narrower and opens downward 2) wider and opens upward 4) narrower and opens upward
373) How does the graph of compare to the graph of ? 1) The graph of is wider than the graph
of , and its vertex is moved to the left 2 units and up 1 unit.
3) The graph of is narrower than the graph of , and its vertex is moved to the left 2 units and up 1 unit.
2) The graph of is narrower than the graph of , and its vertex is moved to the right 2 units and up 1 unit.
4) The graph of is wider than the graph of , and its vertex is moved to the right 2 units and up 1 unit.
374) The vertex of the parabola represented by has coordinates . Find the coordinates of the vertex of the parabola defined by . Explain how you arrived at your answer. [The use of the set of axes below is optional.]
Page 467

375) Given the graph of the line represented by the equation , if b is increased by 4 units, the
graph of the new line would be shifted 4 units 1) right 3) left 2) up 4) down
376) When the function is multiplied by the value a, where , the graph of the new function,
1) opens upward and is wider 2) opens upward and is narrower 3) opens downward and is wider 4) opens downward and is narrower
377) In the diagram below, is graphed. Also graphed is , the result of a translation of .
Determine an equation of . Explain your reasoning.
378) In the functions and , k is a positive integer. If k is replaced by , which statement
about these new functions is true? 1) The graphs of both and
become wider. 3) The graphs of both and shift
vertically. 2) The graph of becomes narrower and
the graph of shifts left. 4) The graph of shifts left and the graph
of becomes wider.
379) If the original function is shifted to the left 3 units to make the function , which expression would represent ? 1) 3) 2) 4)
380) The graph of the function is represented below. On the same set of axes, sketch the function .
Page 468

SOLUTIONS
372) ANS: 1 Strategy: Use the following general rules for quadratics, then check with a graphiong calculator. As the value of a approaches 0, the parabola gets wider. A positive value of a opens upward. A negative value of a opens downward. Check with graphing calculator: Assume , then
If a is multiplied by , then .
Input both equations in a graphing calculator, as follows:
PTS: 2 NAT: F.BF.B.3 TOP: Transformations with Functions and Relations
373) ANS: 2 Strategy: Input both functions in a graphing calculator and compare them. Let the graph of be the graph of Let the graph of be the graph of Input both functions in a graphing calculator. g(x) is the thick line and f(x) is the thin line.
Page 469

PTS: 2 NAT: F.BF.B.3 TOP: Transformations with Functions and Relations
374) ANS:
. is a horizontal shift two units to the right Strategy 1: Compose a new function, find the axis of symmetry, solve for g(x) at axis of symmetry, as follows:
and Therefore:
The coordinates of the vertex of g(x) are (4,-1) Strategy #2. Input the new function in a graphing calculator and identify the vertex.
PTS: 2 NAT: F.BF.B.3 TOP: Transformations with Functions and Relations
375) ANS: 2 Strategy: Use the characteristics of the slope intercept form of a line, which is , where y is the dependent variable, m is the slope, x is the dependent variable, and b is the y-inctercept. If b (the y-intercept) is increased by four, the slope remains the same and the new line is shifted up 4 units. Check using a graphing calculator.
Page 470
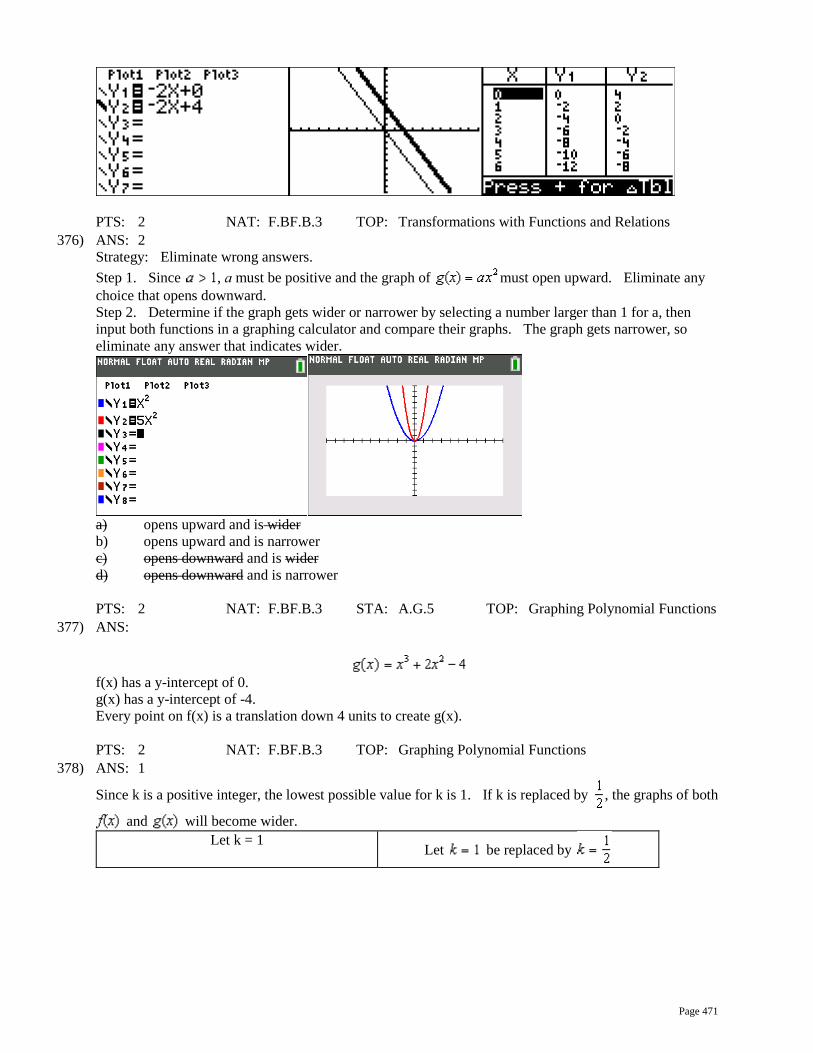
PTS: 2 NAT: F.BF.B.3 TOP: Transformations with Functions and Relations
376) ANS: 2 Strategy: Eliminate wrong answers. Step 1. Since , a must be positive and the graph of must open upward. Eliminate any choice that opens downward. Step 2. Determine if the graph gets wider or narrower by selecting a number larger than 1 for a, then input both functions in a graphing calculator and compare their graphs. The graph gets narrower, so eliminate any answer that indicates wider.
a) opens upward and is wider b) opens upward and is narrower c) opens downward and is wider d) opens downward and is narrower
PTS: 2 NAT: F.BF.B.3 STA: A.G.5 TOP: Graphing Polynomial Functions
377) ANS:
f(x) has a y-intercept of 0. g(x) has a y-intercept of -4. Every point on f(x) is a translation down 4 units to create g(x).
PTS: 2 NAT: F.BF.B.3 TOP: Graphing Polynomial Functions
378) ANS: 1
Since k is a positive integer, the lowest possible value for k is 1. If k is replaced by , the graphs of both
and will become wider. Let k = 1
Let be replaced by
Page 471

PTS: 2 NAT: F.BF.B.3 TOP: Graphing Polynomial Functions
379) ANS: 2 Strategy: Input the orginal function and the four answer choices in a graphing calculator. Then, select the function rule for the graph that is shifted 3 units to the left.
PTS: 2 NAT: F.BF.B.3 TOP: Graphing Polynomial Functions
380) ANS:
Strategy: Solve a simpler problem - pick a simple quadratic function, such as and see what happens to the graph when the function is changed to . STEP 1. Input both in functions in a graphing calcualor.
Page 472

STEP 2. Observe that the graph moves two units to the left. STEP 3. Move every point of the original function two units to the left.
PTS: 2 NAT: F.BF.B.3 TOP: Graphing Polynomial Functions
Page 473

L – Radicals, Lesson 1, Operations with Radicals (r. 2018)
RADICALS Operations with Radicals
Common Core Standard
N-RN.3 Explain why the sum or product of two rational numbers is rational; that the sum of a ra-tional number and an irrational number is irra-tional; and that the product of a nonzero rational number and an irrational number is irrational.
Next Generation Standard
AI-N.RN.3 Use properties and operations to under-stand the different forms of rational and irrational numbers. a.) Perform all four arithmetic operations and apply properties to generate equivalent forms of rational numbers and square roots. Note: Tasks include rationalizing numerical denomina-
tors of the form ab
where a is an integer and b is a
natural number. b.) Categorize the sum or product of rational or irra-tional numbers. • The sum and product of two rational numbers is ra-tional. • The sum of a rational number and an irrational num-ber is irrational. • The product of a nonzero rational number and an ir-rational number is irrational. • The sum and product of two irrational numbers could be either rational or irrational.
LEARNING OBJECTIVES
Students will be able to:
1) Perform addition, subtraction, multiplication and division with radical numbers (prior skill).
2) Identify if the sum or product of two numbers is rational or irrational and explain why.
Overview of Lesson
Teacher Centered Introduction Overview of Lesson
- activate students’ prior knowledge
- vocabulary
- learning objective(s)
- big ideas: direct instruction
- modeling
Student Centered Activities guided practice Teacher: anticipates, monitors, selects, sequences, and connects student work
- developing essential skills
- Regents exam questions
- formative assessment assignment (exit slip, explain the math, or journal entry)
VOCABULARY
Decimal form Equivalent Irrational
Perfect square Prime number Radical form
Rational Simplest radical form
Page 474

BIG IDEAS
Is a Number Irrational or Rational?
Irrational Numbers Rational Numbers If a decimal does not repeat or terminate, it is an
irrational number. Numbers with names, such as π and e are
irrational. They are given names because it is impossible to state their infinitely long values.
The square roots of all numbers (that are not perfect squares) are irrational.
If a term reduced to simplest form contains an irrational number, the term is irrational. .
If a number is an integer, it is rational, since it can be expressed as a ratio with the integer as the numerator and 1 as the denominator.
If a decimal is a repeating decimal, it is a rational number.
If a decimal terminates, it is a rational number.
Operations with Irrational and Rational Numbers
Addition and Subtraction: When two rational numbers are added or subtracted, the result is rational. When two irrational numbers are added or subtracted, the result is irrational. When an irrational number and a rational number are added or subtracted, the sum is irrational.
Multiplication and Division:
When two rational numbers are multiplied or divided, the product is rational. When an irrational number and a non-zero rational number are multiplied or divided, the product is
irrational. When two irrational numbers are multiplied or divided, the product is sometimes rational and sometimes
irrational.
Counting{1,2,3,...}
Whole
{0, 1, 2, 3, ...}
Integers
{...-3, -2, -1, 0, 1, 2, 3, ...}
Rational Numbers
A rational number is any number than can beexpressed as the ratio of two integers.
Includes fractions, repeatingdecimals, and terminating
decimals
Includes all non-repeating,non-terminating decimals.
Examples include:pi
square roots of all not perfect squarenumbers
An irrational number is any number that cannot beexpressed as
the ratio of two integers.
The Set of Real Numbersincludes two major classifications of numbers
Irrational andRational
Irrational Numbers
Page 475
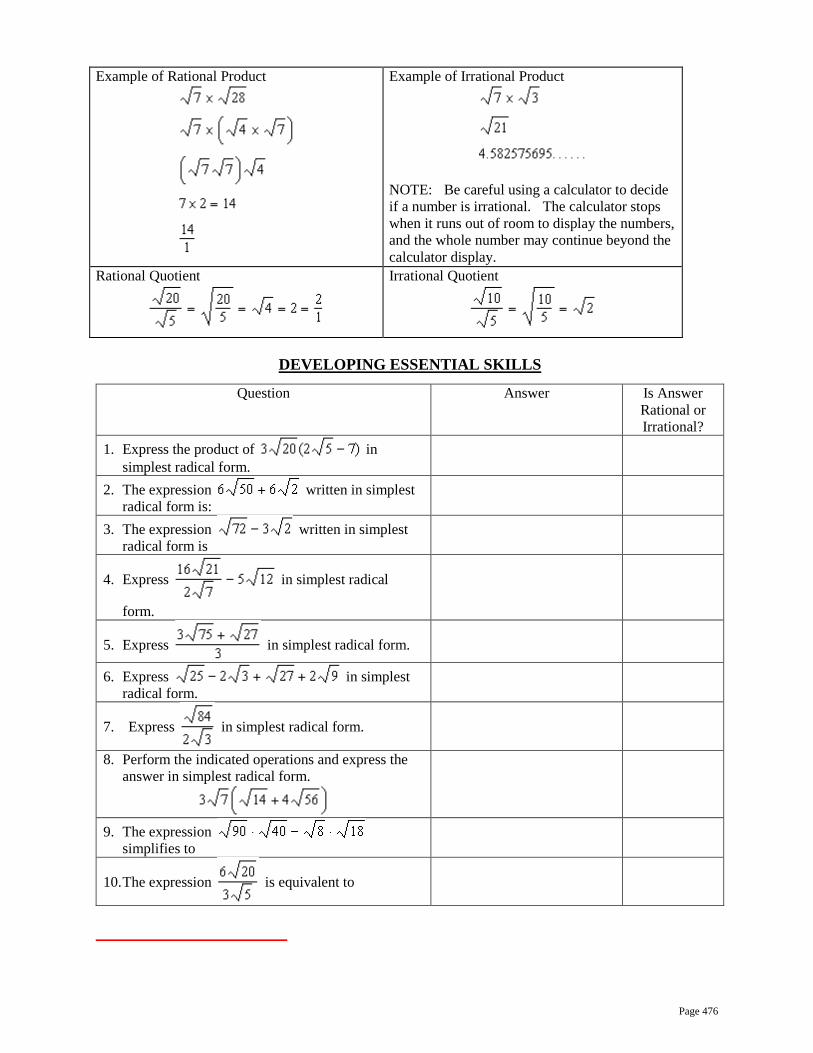
Example of Rational Product
Example of Irrational Product
NOTE: Be careful using a calculator to decide if a number is irrational. The calculator stops when it runs out of room to display the numbers, and the whole number may continue beyond the calculator display.
Rational Quotient
Irrational Quotient
DEVELOPING ESSENTIAL SKILLS
Question Answer Is Answer Rational or Irrational?
1. Express the product of in simplest radical form.
2. The expression written in simplest radical form is:
3. The expression written in simplest radical form is
4. Express in simplest radical
form.
5. Express in simplest radical form.
6. Express in simplest radical form.
7. Express in simplest radical form.
8. Perform the indicated operations and express the answer in simplest radical form.
9. The expression simplifies to
10. The expression is equivalent to
Page 476

ANSWERS
Question Answer Is Answer Rational or Irrational?
1. Express the product of in simplest radical form.
Irrational
2. The expression written in simplest radical form is:
Irrational
3. The expression written in simplest radical form is
Irrational
4. Express in simplest radical
form.
Irrational
5. Express in simplest radical form. Irrational
6. Express in simplest radical form.
11 3+ Irrational
7. Express in simplest radical form. 7 Irrational
8. Perform the indicated operations and express the answer in simplest radical form.
189 2 Irrational
9. The expression simplifies to
48 Rational
10. The expression is equivalent to 4 Rational
Page 477

REGENTS EXAM QUESTIONS (through June 2018)
N.RN.B.3: Operations with Radicals
381) Given:
Which expression results in a rational number? 1) 3) 2) 4)
382) Which statement is not always true? 1) The product of two irrational numbers is
irrational. 3) The sum of two rational numbers is
rational. 2) The product of two rational numbers is
rational. 4) The sum of a rational number and an
irrational number is irrational.
383) Ms. Fox asked her class "Is the sum of 4.2 and rational or irrational?" Patrick answered that the sum would be irrational. State whether Patrick is correct or incorrect. Justify your reasoning.
384) Which statement is not always true?
1) The sum of two rational numbers is rational.
3) The sum of a rational number and an irrational number is irrational.
2) The product of two irrational numbers is rational.
4) The product of a nonzero rational number and an irrational number is irrational.
385) For which value of P and W is a rational number? 1)
and 3)
and
2) and
4) and
386) Given the following expressions:
I. III.
II. IV.
Which expression(s) result in an irrational number? 1) II, only 3) I, III, IV 2) III, only 4) II, III, IV
387) Determine if the product of and is rational or irrational. Explain your answer.
388) Is the sum of and rational or irrational? Explain your answer.
389) Jakob is working on his math homework. He decides that the sum of the expression must be
rational because it is a fraction. Is Jakob correct? Explain your reasoning.
Page 478

390) State whether is rational or irrational. Explain your answer.
391) A teacher wrote the following set of numbers on the board:
Explain why is irrational, but is rational.
392) The product of and is
1) irrational because both factors are irrational
3) irrational because one factor is irrational
2) rational because both factors are rational 4) rational because one factor is rational
393) Is the product of and rational or irrational? Explain your reasoning.
SOLUTIONS
381) ANS: 3
may be expressed as the ratio of two integers.
Strategy: Recall that under the operation of addition, the addition of two irrational numbers and the addition of an irrational number and a rational number will always result in a sum that is irrational. To get a rational number as a sum, you must add two rational numbers. STEP 1 Determine whether numbers L, M, N, and P are ratiional, then reject any answer choice that does not contain two rational numbers.
STEP 2 Reject any answer choice that does not include . Choose answer choice c.
PTS: 2 NAT: N.RN.B.3 TOP: Classifying Numbers
382) ANS: 1 Strategy: Find a counterexample to prove one of the answer choices is not always true. Answer choice a is not always true because: and are both irrational numbers, but
, and 6 is a rational number, so the product of two irrational numbers is not always irrational.
PTS: 2 NAT: N.RN.B.3 TOP: Classifying Numbers
383) ANS: Patrick is correct. The sum of a rational and irrational is irrational. Strategy: Determine whether 4.2 and are rational or irrational numbers, then apply the rules of operations on rational and irrational numbers.
4.2 is rational because it can be expressed as , which is the ratio of two integers.
Page 479

is irrational because it cannot be expressed as the ratio of two integers. The rules of addition and subtraction of rational and irrational numbers are: When two rational numbers are added or subtracted, the result is rational. When two irrational numbers are added or subtracted, the result is irrational. When an irrational number and a rational number are added or subtracted, the sum is irrational.
PTS: 2 NAT: N.RN.B.3 TOP: Classifying Numbers
384) ANS: 2 Strategy: Find a counterexample to prove one of the answer choices is not always true. This will usually involve the product or quotient of two irrational numbers since the outcomes of addition and subtraction of irrational numbers are more predictable. Answer choice b is not always true because: and are both irrational numbers, but
, and is an rational number, so the product of two irrational numbers is not always rational.
PTS: 2 NAT: N.RN.B.3 TOP: Classifying Numbers
385) ANS: 2
Strategy: Recall that under the operation of addition, the addition of two irrational numbers and the addition of an irrational number and a rational number will always result in a sum that is irrational. To get a rational number as a sum, you must add two rational numbers. Reject any answer choice that does not contain two rational numbers.
Reject answer choice a because is irrational.
Choose answer choice b because both and can be expressed as rational numbers, as
shown above.
PTS: 2 NAT: N.RN.B.3 TOP: Classifying Numbers
386) ANS: 1 Strategy: Eliminate wrong answers. Expression I results in a rational number because the set of rational numbers is closed under addition.
Expression II is is correct because the additon of a rational number and an irrational number always results in an irrational number.
Expression III results in a rational number because , which is the
ratio of two integers.
Expression IV results in a rational number because , which the ratio of two
integers. Expression II is the only expression that results in an irrational number, so Choice (a) is the correct answer.
Page 480

PTS: 2 NAT: N.RN.B.3 TOP: Classifying Numbers
387) ANS:
The product is 144, which is rational, because it can be written as , a ratio of two integers.
PTS: 2 NAT: N.RN.B.3 TOP: Classifying Numbers
388) ANS: Irrational
is irrational because it is the product of a rational number and an irrational number.
7 is rational because it can be expressed as the ratio of two integers ( )
is irrational because the square roots of all prime numbers are irrational.
PTS: 2 NAT: N.RN.B
389) ANS: Jakob is incorrect. The sum of a rational number and an irrational number is irrational.
Note the square root of 5 in the sum. The square root of any prime is irrational.
PTS: 2 NAT: N.RN.B.3 TOP: Classifying Numbers
390) ANS: Irrational A rational number and an irrational number under addition or subtraction will always be irrational.
Note that the answer does not appear to repeat or end. is irrational because it can not be written as the ratio of two integers.
PTS: 2 NAT: N.RN.B.3 TOP: Operations with Radicals KEY: classify
391) ANS: The sum of a and b is irrational because the sum of an irrational number and a rational number is always irrational.
Page 481

The sum of b and c is rational because the sum of a rational number and another rational number is always rational.
is an irrational number that can be simplified to , but cannot be expressed as the ratio of two integers or as a never-ending, never-repeating decimal.
2.5 is a rational number because it can be expressed as the ratio of two integers, such as .
is a rational number that can be simplified to 15 and expressed as the ratio of two integers, such as
.
PTS: 2 NAT: N.RN.B.3 TOP: Operations with Radicals KEY: classify
392) ANS: 3
, which can be expressed as the ratio , which means that is a rational number.
cannot be expressed as a rational number. It can be simplified to , but it cannot be
expressed as the ratio of two integers. Therefore, is an irrational number. The product of a rational number and an irrational number is always irrational.
Note that the product of and appears to be a never ending, non-repeating decimal, which indicates that the product is an irrational number.
PTS: 2 NAT: N.RN.B.3 TOP: Operations with Radicals KEY: classify
393) ANS:
Answer: The product of and is rational.
Explanation: A rational number is a number that can be expressed as the ratio of two intergers, in the
form of , where both a and b are integers. An irrational number is a number that cannot be expressed as
the ratio of two integers.
is a rational number because can be expressed as , which is a ratio of two integers.
is a rational number because it is already expressed as a ratio of two integers.
, and is a ratio of two integers.
The product of any two rational numbers will always be a rational number.
Page 482

PTS: 2 NAT: N.RN.B.3 TOP: Operations with Radicals KEY: classify
Page 483

L – Radicals, Lesson 2, Graphing Root Functions (r. 2018)
RADICALS Graphing Root Functions
Common Core Standard
F-IF.7b Graph square root, cube root, and piece-wise-defined functions, including step functions and absolute value functions.
Next Generation Standard
AI-F.IF.7b Graph square root, and piecewise-defined functions, including step functions and absolute value functions and show key features. Note: Algebra I key features include the following: in-tercepts, zeros; intervals where the function is increas-ing, decreasing, positive, or negative; maxima, min-ima; and symmetries.
LEARNING OBJECTIVES
Students will be able to:
1) Graph functions involving square roots.
Overview of Lesson
Teacher Centered Introduction Overview of Lesson
- activate students’ prior knowledge
- vocabulary
- learning objective(s)
- big ideas: direct instruction
- modeling
Student Centered Activities guided practice Teacher: anticipates, monitors, selects, sequences, and connects student work
- developing essential skills
- Regents exam questions
- formative assessment assignment (exit slip, explain the math, or journal entry)
VOCABULARY
square root cube root nth root
BIG IDEAS
NOTE: All of the functions in this lesson require special consideration for the domain of the independent variable (the x-axis).
ROOT FUNCTIONS
Root functions are associated with equations involving square roots, cube roots, or nth roots. The easiest way to graph a root function is to use the three views of a function that are associated with a graphing calculator.
STEP 1. Input the root function in the y-editor of the calculator.
Page 484

(Note: The use of rational exponents is recommended, i.e.
12x x=
13 3x x=
14 4x x=
STEP 2. Look at the graph of the function.
STEP 3. Use the table of values to transfer coordinate pairs to graph paper.
Example: Graph the root function
STEP 1 Input the function rule in the y-editor of your graphing calculator
STEP 2. Look at the graph view of the function.
STEP 3. Select coordinate pairs from the table view to create your graph.
DEVELOPING ESSENTIAL SKILLS
Use technology to graph the following the following functions:
y x=
y x= −
( )1/2
3y x= +
(1/2) 3y x= +
3y x=
Page 485

ANSWERS
Page 486

REGENTS EXAM QUESTIONS (through June 2018)
F.IF.C.7: Graphing Root Functions
394) Which graph represents ?
1)
3)
2)
4)
Page 487

395) On the set of axes below, graph the function represented by for the domain .
396) Draw the graph of on the set of axes below.
Page 488

397) Graph the function on the set of axes below.
398) Graph over the domain .
Page 489

SOLUTIONS
394) ANS: 4 is a root function, so its graph must look like a root function.
a) This is a quadratic function.
c) This is a quadratic function.
b) This is a linear function.
d) By the process of elimination, this is the only root function.
You can also solve this problem by inputting the equation into a graphing calcualtor and looking at the graph, as fopllows:
PTS: 2 NAT: F.IF.C.7 TOP: Graphing Root Functions KEY: bimodalgraph
395) ANS:
Page 490

Strategy: Input the function in a graphing calculator, then use the graph and table views to construct the graph on paper. Limit the domain of the graph to . STEP 1: Use exponential notation to input the function into the graphing calculator, where . Then use the table and graph views to reproduce the graph on paper.
STEP 2: Limit the domain of the function to . Used closed dots to show the ends of the function at coordinates (-6, -2) and for (10, 2).
PTS: 2 NAT: F.IF.C.7 TOP: Graphing Root Functions
396) ANS:
Strategy: Input the function in a graphing calculator, then use the graph and table views to construct the graph on paper.
Page 491

STEP 1: Use exponential notation to input the function into the graphing calculator, where . Then use the table and graph views to reproduce the graph on paper.
Note: Do nopt plot coordinates with errors. Focus on plotting coordinates with integer values and estimate the graph between the points with integer values when drawing the graph. STEP 2: Limit the domain of the function to . Used closed dots to show the ends of the function at coordinates (-6, -2) and for (10, 2).
PTS: 2 NAT: F.IF.C.7 TOP: Graphing Root Functions
397) ANS: Strategy: Input the equation in a graphing calculator. Plot the coordinates with integer values. Complete the graph.
Page 492

Page 493

PTS: 2 NAT: F.IF.C.7
398) ANS:
Strategy: Input the function in a graphing calculator and use the table of values and graph views to plot the graph for integer values.
Page 494

PTS: 2 NAT: F.IF.C.7 TOP: Graphing Root Functions
Page 495

M – Functions, Lesson 1, Defining Functions (r. 2018)
FUNCTIONS Defining Functions
Common Core Standard
F-IF.A.1 Understand that a function from one set (called the domain) to another set (called the range) assigns to each element of the domain exactly one element of the range. If f is a function and x is an el-ement of its domain, then f(x) denotes the output of f corresponding to the input x. The graph of f is the graph of the equation y = f(x).
Next Generation Standard
AI-F.IF.1 Understand that a function from one set (called the domain) to another set (called the range) assigns to each element of the domain exactly one element of the range. If f is a function and x is an element of its domain, then f(x) denotes the output of f corresponding to the in-put x. The graph of f is the graph of the equation y = f(x). Note: Domain and range can be expressed using ine-qualities, set builder notation, verbal description, and interval notations for functions of subsets of real num-bers to the real numbers.
LEARNING OBJECTIVES
Students will be able to:
1) Define and identify functions.
Overview of Lesson Teacher Centered Introduction
Overview of Lesson
- activate students’ prior knowledge
- vocabulary
- learning objective(s)
- big ideas: direct instruction
- modeling
Student Centered Activities guided practice Teacher: anticipates, monitors, selects, sequences, and connects student work
- developing essential skills
- Regents exam questions
- formative assessment assignment (exit slip, explain the math, or journal entry)
VOCABULARY
Function: A rule that assigns to each number in the function's domain (x-axis) a unique number
in the function’s range (y-axis). A function takes the input value of an independent variable and pairs it with one and only one output value of a dependent variable.
BIG IDEAS
x( )f x
5
6
1
2
3
DomainX
RangeY
Function
Page 496

Expressed as ordered Pairs: Function: (1,5) (2,6) (3,5) Not a Function: (1,5) (2,7) (3,8) (1,6)
Function: A function is a relation that assigns exactly one value of the dependent variable to each value of the independent variable. A function is always a relation.
Example: y=2x
Relation: A relation may produce more than one output for a given input. A relation may or may not be a function.
Example:
This is not a function, because when x=16, there is more than one y-
value. . A function can be represented four ways. These are: a context (verbal description) a function rule (equation) a table of values a graph.
Function Rules show the relationship between dependent and independent variables in the form of an equation with two variables. The independent variable is the input of the function and is typically denoted by the x-
variable. The dependent variable is the output of the function and is typically denoted by the y-
variable. All linear equations in the form are functions except vertical lines. 2nd degree and higher equations may or may not be functions. Tables of Values show the relationship between dependent and independent variables in the form of a table with columns and rows:
5
7
6
8
1
2
3
DomainX
RangeY
Not a Function
INPUT OUTPUTFUNCTIONMACHINE
INPUT OUTPUTRELATIONMACHINE
2y x
y x
=
=
16 4= ±
Page 497
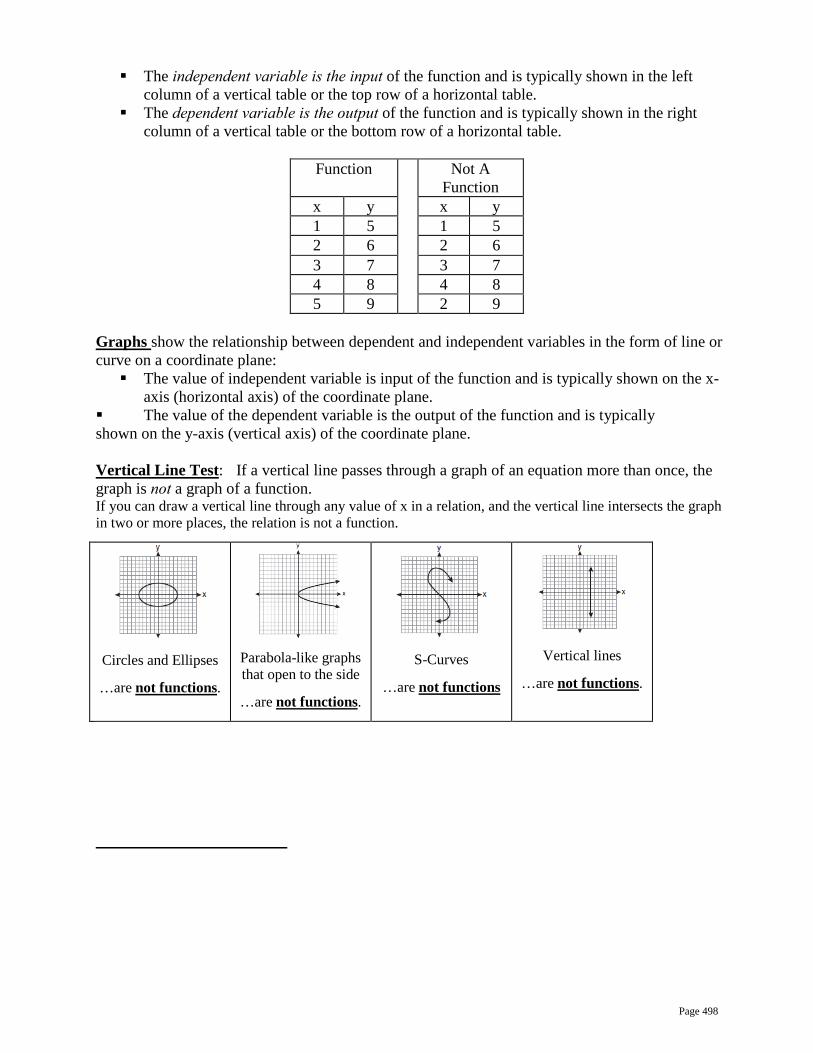
The independent variable is the input of the function and is typically shown in the left column of a vertical table or the top row of a horizontal table.
The dependent variable is the output of the function and is typically shown in the right column of a vertical table or the bottom row of a horizontal table.
Function Not A
Function x y x y 1 5 1 5 2 6 2 6 3 7 3 7 4 8 4 8 5 9 2 9
Graphs show the relationship between dependent and independent variables in the form of line or curve on a coordinate plane: The value of independent variable is input of the function and is typically shown on the x-
axis (horizontal axis) of the coordinate plane. The value of the dependent variable is the output of the function and is typically shown on the y-axis (vertical axis) of the coordinate plane. Vertical Line Test: If a vertical line passes through a graph of an equation more than once, the graph is not a graph of a function. If you can draw a vertical line through any value of x in a relation, and the vertical line intersects the graph in two or more places, the relation is not a function.
Circles and Ellipses
…are not functions.
Parabola-like graphs that open to the side
…are not functions.
S-Curves
…are not functions
Vertical lines
…are not functions.
Page 498

DEVELOPING ESSENTIAL SKILLS
1. Which graph represents a function? a.
c.
b.
d.
2. Which relation is not a function? a. c. b. d.
3. Which graph represents a function? a.
c.
b.
d.
4. Which relation is not a function? a. c. b. d.
5. Which relation is a function? a. c. b. d.
6. Which set is a function? a. c. b. d.
Page 499

ANSWERS
1. ANS: D
2. ANS: C
3. ANS: A
4. ANS: D
5. ANS: A
6. ANS: B
REGENTS EXAM QUESTIONS (through June 2018)
F.IF.A.1: Defining Functions
399) Which table represents a function?
1)
3)
2)
4)
400) The function f has a domain of and a range of . Could f be represented by ? Justify your answer.
401) Which representations are functions?
1) I and II 3) III, only 2) II and IV 4) IV, only
402) A mapping is shown in the diagram below.
This mapping is
Page 500

1) a function, because Feb has two outputs, 28 and 29
3) not a function, because Feb has two outputs, 28 and 29
2) a function, because two inputs, Jan and Mar, result in the output 31
4) not a function, because two inputs, Jan and Mar, result in the output 31
403) A function is shown in the table below.
If included in the table, which ordered pair, or , would result in a relation that is no longer a function? Explain your answer.
404) Marcel claims that the graph below represents a function.
State whether Marcel is correct. Justify your answer.
405) Nora says that the graph of a circle is a function because she can trace the whole graph without picking up
her pencil. Mia says that a circle graph is not a function because multiple values of x map to the same y-value. Determine if either one is correct, and justify your answer completely.
406) A relation is graphed on the set of axes below.
Page 501

Based on this graph, the relation is 1) a function because it passes the horizontal
line test 3) not a function because it fails the
horizontal line test 2) a function because it passes the vertical
line test 4) not a function because it fails the vertical
line test
407) A function is defined as . Isaac is asked to create one more ordered pair for the function. Which ordered pair can he add to the set to keep it a function? 1) 3) 2) 4)
SOLUTIONS
399) ANS: 3 Strategy: Eliminate wrong answers. A function is a relation that assigns exactly one value of the dependent variable to each value of the independent variable. Answer choice a is not a function because there are two values of y when . Answer choice b is not a function because there are two values of y when . Answer choice c is a function because only one value of y is paired with each value of x. Answer choice d is not a function because there are two values of y when . .
PTS: 2 NAT: F.IF.A.1 TOP: Defining Functions
400) ANS: Yes, because every element of the domain is assigned one unique element in the range. Strategy: Determine if any value of x has more that one associated value of y. A function has one and only one value of y for every value of x.
Page 502

PTS: 2 NAT: F.IF.A.1 TOP: Defining Functions
401) ANS: 2 Strategy: Determine if each of the for views are functions, then select from the answer choices. A function is a relation that assigns exactly one value of the dependent variable to each value of the independent variable. I is not a function because when , y can equal both 6 and -6. II is a function because there are no values of x that have more than one value of y. III is not a function because it fails the vertical line test, which means there are values of x that have more than one value of y. IV is a function because it is a straight line that is not vertical. Answer choice b is the correct answer.
PTS: 2 NAT: F.IF.A.1 TOP: Defining Functions
402) ANS: 3 A function has one and only one output for each input. The diagram shows that February maps to two different output numbers, so the diagram cannot represent a function.
PTS: 2 NAT: F.IF.A.1 TOP: Defining Functions KEY: ordered pairs
403) ANS: , because then every element of the domain is not assigned one unique element in the range.
PTS: 2 NAT: F.IF.A.1 TOP: Defining Functions
404) ANS: Marcel is not correct, because the relation does not pass the vertical line test. If you draw the vertical line
, there will be more than one value of y. A function can have one and only one value of y for every value of x.
PTS: 2 NAT: F.IF.A.1 TOP: Defining Functions KEY: graphs
405) ANS: Neither is correct. Nora’s reason is wrong since a circle is not a function because it fails the vertical line test. Although Mia correctly states that a circle is not a function, her reasoning is wrong. She confuses the variables in the definition of a function, which states that a function has one and only one value of y for each value of x. It is okay for a y to be associated with multiple values of x in a function. It is not okay for an x to be associated with multiple values of y.
PTS: 2 NAT: F.IF.A.1 TOP: Defining Functions KEY: graphs
406) ANS: 2 A function has one and only one value of y for each value of x. A graph represents a function if there are no vertical lines that intersect the graph at more than one point.
PTS: 2 NAT: F.IF.A.1 TOP: Defining Functions KEY: graphs
407) ANS: 4
Page 503

Strategy. The the definition of a function to eliminate wrong answers. (i.e. for each value of x in a function, there can be one and only one value of y). Choice 1: Wrong, because 0 is already paired with . Choice 2: Wrong, because 5 is already paired with . Choice 3: Wrong, because 7 is already paired with . Choice 4: Correct, because 1 is not paired with any other value of y.
PTS: 2 NAT: F.IF.A.1 TOP: Defining Functions KEY: ordered pairs
Page 504

M – Functions, Lesson 2, Function Notation, Evaluating Functions (r. 2018)
FUNCTIONS Function Notation, Evaluating Functions
Common Core Standard
F-IF.2 Use function notation, evaluate functions for inputs in their domains, and interpret statements that use function notation in terms of a context.
Next Generation Standard
AI-F.IF.2 Use function notation, evaluate functions for inputs in their domains, and interpret statements that use function notation in terms of a context.
LEARNING OBJECTIVES
Students will be able to:
1) use function notation, 2) evaluate functions for specific input values, and 3) use function notation in context.
Overview of Lesson Teacher Centered Introduction
Overview of Lesson
- activate students’ prior knowledge
- vocabulary
- learning objective(s)
- big ideas: direct instruction
- modeling
Student Centered Activities guided practice Teacher: anticipates, monitors, selects, sequences, and connects student work
- developing essential skills
- Regents exam questions
- formative assessment assignment (exit slip, explain the math, or journal entry)
VOCABULARY
function notation dependent variable
independent variable composition of functions
BIG IDEAS
Function Notation
In function notation, f (x) is used instead of the letter y to denote the dependent variable. It is read as “f of x” or “the value f(x) is a function of x,” which is the independent variable. Other letters may also be used.
There are four primary advantages to using function notation: 1) The use of function notation indicates that the relationship is a function. 2) The use of function notation explicitly defines which variable is the dependent variable and which
variable is the independent variable. 3) The use of function notation simplifies evaluation of the dependent variable for specific values of
the independent variable. Example: If
Page 505

4) The use of function notation allows greater flexibility and specificity in naming variables.
Example #1: If total cost is a function of the number of pencils bought, a function rule might begin with C(p)=.
Example #2: If miles driven at a constant speed is a function of hours driving, a function rule might begin with M(h)=.
When graphing using function notation, the label of the y-axis is changed to reflect the function notation being used.
Evaluating Functions
To evaluate a function for a specific input, simply replace the dependent variable with the desired input throughout the function.
Example: Given the function , find the value of as follows:
Composition of Functions
Some functions are defined using other functions. Such functions are called compositions of functions. For example, if ( ) 2f x x= and ( ) ( )3g x f x= , then the function ( )g x is defined in
terms of the function ( )f x . Since we know that ( ) 2f x x= , we can use substitution to write
( ) ( )3 2g x x= .
DEVELOPING ESSENTIAL SKILLS
Evaluate the following functions for the given input values:
( )( )( )( )( )( )
2 3
1
2
3
4
5
f x x
f
f
f
f
f
= +
=
=
=
=
=
( )( )( )( )( )( )
3 1
1
2
3
4
5
f x x
f
f
f
f
f
= −
=
=
=
=
=
Page 506

( )( )( )( )( )( )
2 2 3
1
2
3
4
5
f x x x
f
f
f
f
f
= + +
=
=
=
=
=
( )( ) ( )( )( )( )( )( )
2
2 3
1
2
3
4
5
f x x
g x f x
g
g
g
g
g
= +
=
=
=
=
=
=
ANSWERS
( )( )( )( )( )( )
2 3
1 5
2 7
3 9
4 11
5 13
f x x
f
f
f
f
f
= +
=
=
=
=
=
( )( )( )( )( )( )
3 1
1 2
2 5
3 8
4 11
5 14
f x x
f
f
f
f
f
= −
=
=
=
=
=
( )( )( )( )( )( )
2 2 3
1 6
2 11
3 18
4 27
5 28
f x x x
f
f
f
f
f
= + +
=
=
=
=
=
( )( ) ( )( )( )( )( )( )
2
2 3
1 25
2 49
3 81
4 121
5 169
f x x
g x f x
g
g
g
g
g
= +
=
=
=
=
=
=
REGENTS EXAM QUESTIONS (through June 2018)
F.IF.A.2: Function Notation, Evaluating Functions
408) Given that , find if .
409) The graph of is shown below.
Page 507

Which point could be used to find ? 1) A 3) C 2) B 4) D
410) The value in dollars, , of a certain car after x years is represented by the equation . To the nearest dollar, how much more is the car worth after 2 years than after 3 years? 1) 2589 3) 15,901 2) 6510 4) 18,490
411) If , which statement is true? 1) 3) 2) 4)
412) The equation to determine the weekly earnings of an employee at The Hamburger Shack is given by , where x is the number of hours worked.
Determine the difference in salary, in dollars, for an employee who works 52 hours versus one who works 38 hours. Determine the number of hours an employee must work in order to earn $445. Explain how you arrived at this answer.
413) If , then
1) 1 3) 2) -2 4)
414) Lynn, Jude, and Anne were given the function , and they were asked to find . Lynn's answer was 14, Jude's answer was 4, and Anne's answer was ±4. Who is correct? 1) Lynn, only 3) Anne, only 2) Jude, only 4) Both Lynn and Jude
415) If , what is the value of ?
1) 11 3) 27 2) 17 4) 33
Page 508

416) For a recently released movie, the function models the revenue earned, y, in millions of dollars each week, x, for several weeks after its release. Based on the equation, how much more money, in millions of dollars, was earned in revenue for week 3 than for week 5? 1) 37.27 3) 17.06 2) 27.16 4) 10.11
417) If , then is 1) 315 3) 159 2) 307 4) 153
SOLUTIONS
408) ANS: Step 1. Understand this as a composition of functions problem. Step 2. Strategy: Substitute the expression for f(x) into the equation for g(x). Step 3. Execution of Strategy.
and
PTS: 2 NAT: F.IF.A.2 TOP: Functional Notation Evaluating Functions
409) ANS: 1 Strategy: Understand that the meaning of is the value of y when , then eliminate wrong answers. Choose answer choice A because represents with coordinates . . Answer choice b is wrong because if represents . Answer choice c is wrong because if represents . Answer choice d is wrong because if represents .
PTS: 2 NAT: F.IF.A.2 TOP: Functional Notation Evaluating Functions
410) ANS: 1 Strategy #1 Input into a graphing calculator and press enter.
Page 509

Strategy #2: Input the function rule in a graphing calculator and obtain the value of the car after 2 years and 3 years from the table of values. Then, compute the difference. STEP 1: Input the function rule and obtain data from the table of values.
STEP 2: Compare the value of the car after 2 years and after 3 years. The car is worth $18,490 after 2 years. The car is worth $15,901 after 3 years. The difference is
PTS: 2 NAT: F.IF.A.2 TOP: Functional Notation Evaluating Functions
411) ANS: 2 Strategy #1: Input into a graphing calculator and inspect the table of values.
x f(x) 3 13 -2 3
-15 211 Strategy #2: Manually calculate the answer.
PTS: 2 NAT: F.IF.A.2 TOP: Functional Notation Evaluating Functions
412) ANS: a) The difference in salary, in dollars, for an employee who works 52 hours versus one who works 38 hours, is $200. b) An employee must work 43 hours in order to earn $445. See work below. Strategy: Part a: Use the piecewise function to first determine the salaries of 1) an employee who works 52 hours, and 2) an employee who works 38 hours. Then, find the difference of the two salaries. Working 38 Hours Working 52 Hours
Page 510

The difference between the values of and is $200. Strategy: Part b: The employee must work more than 40 hours, and compensation for hours worked in excess of 40 hours is found in the second formula and is equal to $15 per hour. The compensation worked in excess of 40 hours is , so
The employee must work a total of 43 hours. The employee receives $400 for the first 40 hours and $45 for the 3 hours in excess of 40 hours.
PTS: 4 NAT: F.IF.A.2 TOP: Functional Notation Evaluating Functions
413) ANS: 3
Strategy: Substitute for x, and solve.
PTS: 2 NAT: F.IF.A.2 TOP: Functional Notation Evaluating Functions
414) ANS: 1
Page 511

PTS: 2 NAT: F.IF.A.2 TOP: Functional Notation
415) ANS: 3
PTS: 2 NAT: F.IF.A.2 TOP: Functional Notation
416) ANS: 3 Strategy #1. Input the function rule in a graphing calculator, then use the table of values to identify the revenues earned in weeks 3 and 5, then compute the difference.
The table of values shows that the movie earned 27.163 million dollars in week 3. The table of values shows that the movie earned 10.107 million dollars in week 5. The difference is Strategy #2. Use a graphing calculator to evaluate the expression , which equals 17.056..
PTS: 2 NAT: F.IF.A.2 TOP: Functional Notation Evaluating Functions
417) ANS: 4 Strategy: Substitute and solve.
Notes Left Expression
Sign Right Expression
Given = Substitute 9 for x =
Exponents and Radicals = Simplify = 162-9
Page 512

Simplify = 153
PTS: 2 NAT: F.IF.A.2 TOP: Functional Notation
Page 513

M – Functions, Lesson 3, Domain and Range (r. 2018)
FUNCTIONS Domain and Range
CC Standard
F-IF.5 Relate the domain of a function to its graph and, where applicable, to the quantitative relation-ship it describes. For example, if the function h(n) gives the number of person-hours it takes to assem-ble n engines in a factory, then the positive integers would be an appropriate domain for the function.
NG Standard
AI-F.IF.5 Determine the domain of a function from its graph and, where applicable, identify the appropriate do-main for a function in context.
LEARNING OBJECTIVES
Students will be able to:
1) Determine the domain of a function from its graph. 2) Identify appropriate sets of numbers for the domain and range of a function.
Overview of Lesson
Teacher Centered Introduction Overview of Lesson
- activate students’ prior knowledge
- vocabulary
- learning objective(s)
- big ideas: direct instruction
- modeling
Student Centered Activities guided practice Teacher: anticipates, monitors, selects, sequences, and connects student work
- developing essential skills
- Regents exam questions
- formative assessment assignment (exit slip, explain the math, or journal entry)
VOCABULARY
continuous counting numbers discrete domain
integers natural numbers range rational numbers
real numbers whole numbers
BIG IDEAS
The domain of x and the range of y.
The coordinate plane consists of two perpendicular number lines, which are commonly referred to as the x-axis and the y-axis. Each number line represents the set of real numbers. The x-axis represents the independent variable (inputs) and the y-axis represents the dependent variable (outputs).
Page 514

The domain of a function is that part (or parts) of the x-axis number line required for the funtion’s input values. This can be an interval of all real numbers, or limited to specific subsets of real numbers, such as positive or negative integers. The range of a function is that part (or parts) of the y-axis number line required for the funtion’s output values. This can be an interval of all real numbers, or limited to specific subsets of real numbers, such as positive or negative integers. A function maps an element of the domain onto one and only one element of the range.
Choosing Appropriate Domains and Ranges
Many functions make sense only when a subset of all the Real Numbers are used as inputs. This subset of the Real Numbers that makes sense is known as the domain of the function. Example: If a store makes $2.00 profit on each sandwich sold, total profits might be modeled by the function , where represents total profits and s represents the number of sandwiches sold. The entire set of real numbers, including fractions and irrational numbers, make no sense for this function, because the store only sells whole sandwiches. In this example, the domain of the function
should be restricted to the set of whole numbers. Likewise, the range of a function can also be limited to a well-defined subset of the Real Numbers on the y-axis. Domains and ranges can be either continuous or discrete.
Page 515

DEVELOPING ESSENTIAL SKILLS
1. The effect of pH on the action of a certain enzyme is shown on the accompanying graph.
What is the domain of this function? a. c. b. d.
2. Data collected during an experiment are shown in the accompanying graph.
What is the range of this set of data? a. c. b. d.
3. What is the range of the relation if the domain is the set ? a. c. b. d.
4. The domain for is . The greatest value in the range of is a. c. 8 b. 2 d. 11
5. The domain of is . The largest value in the range of is a. 20 c. 3 b. 16 d. 4
Page 516

ANSWERS
1. ANS: A
2. ANS: C
3. ANS: B
4. ANS: C
5. ANS: B
REGENTS EXAM QUESTIONS (through June 2018)
F.IF.B.5: Domain and Range
418) The graph of the function is shown below.
The domain of the function is 1) 3) 2) 4)
419) If , which statement is always true?
1) 3) If , then 2) 4) If , then
420) Let f be a function such that is defined on the domain . The range of this function is 1) 3) 2) 4)
421) The range of the function defined as is 1) 3) 2) 4)
422) The range of the function is all real numbers 1) less than or equal to 3) less than or equal to 2) greater than or equal to 4) greater than or equal to
423) What is the domain of the relation shown below?
1) 3) 2) 4)
Page 517

424) If the domain of the function is , then the range is 1) 3) 2) 4)
425) Officials in a town use a function, C, to analyze traffic patterns. represents the rate of traffic through an intersection where n is the number of observed vehicles in a specified time interval. What would be the most appropriate domain for the function? 1) 3)
2) 4)
426) The function represents the height, , in feet, of an object from the ground at t seconds after it is dropped. A realistic domain for this function is 1) 3) 2) 4) all real numbers
427) Which domain would be the most appropriate set to use for a function that predicts the number of household online-devices in terms of the number of people in the household? 1) integers 3) irrational numbers 2) whole numbers 4) rational numbers
428) A store sells self-serve frozen yogurt sundaes. The function represents the cost, in dollars, of a sundae weighing w ounces. An appropriate domain for the function would be 1) integers 3) nonnegative integers 2) rational numbers 4) nonnegative rational numbers
429) A construction company uses the function , where p is the number of people working on a project, to model the amount of money it spends to complete a project. A reasonable domain for this function would be 1) positive integers 3) both positive and negative integers 2) positive real numbers 4) both positive and negative real numbers
430) An online company lets you download songs for $0.99 each after your have paid a $5 membership fee. Which domain would be most appropriate to calculate the cost to download songs? 1) rational numbers greater than zero 3) integers less than or equal to zero 2) whole numbers greater than or equal to
one 4) whole numbers less than or equal to one
431) The daily cost of production in a factory is calculated using , where x is the number of complete products manufactured. Which set of numbers best defines the domain of ? 1) integers 3) positive rational numbers 2) positive real numbers 4) whole numbers
432) At an ice cream shop, the profit, , is modeled by the function , where c represents the number of ice cream cones sold. An appropriate domain for this function is 1) an integer 3) a rational number 2) an integer 4) a rational number
433) If , which interval describes the range of this function? 1) 3) 2) 4)
Page 518

SOLUTIONS
418) ANS: 4 Strategy: Use the number line of the x-axis, the fact that the graph begins with a solid dot, indicating that -4 is included in the domain, and the fact that the graph includes an arrow indicating that the graph continues to positive infinity, to select answer choice d.
PTS: 2 NAT: F.IF.A.1 TOP: Domain and Range
419) ANS: 4 Strategy: Inspect the function rule in a graphing calculator, then eliminate wrong answers.
Answer choice a can be eliminated because the table clearly shows values greater than zero. Answer choice b can be eliminated because the table clearly shows values less than zero. Answer choice c can be eliminated because if x is greater than -27, then Choose answer choice d because the graph and table clearly show that all values of are positive when values of x are positive.
PTS: 2 NAT: F.IF.A.2 TOP: Domain and Range
420) ANS: 1
Strategy: Inspect the function rule in a graphing calculator over the domain , eliminate wrong answers.
Page 519

Choose answer choice a because the table of values and the graph clearly show that and
, and all values of y between and are between 0 and 8. Eliminate answer choice b because infinity is clearly bigger than 8. Eliminate answer choice c because these are the domain of x, not the range of y. Eliminate answer choice d because negative infinity is clearly less than 0.
PTS: 2 NAT: F.IF.A.2 TOP: Domain and Range
421) ANS: 2 Strategy: Input the function in a graphing calculator and inspect the graph and table views..
The value of y approaches zero, but never reachers zero, as the value of x decreases. The the range of is .
PTS: 2 NAT: F.IF.A.2 TOP: Domain and Range KEY: real domain, exponential
422) ANS: 2 Strategy: Input the function into a graphing calculator and inspect the range of y-values.
The graph and the table of values show that all values of f(x) are greater than or equal to -9. Choice b) is the correct answer.
PTS: 2 NAT: F.IF.A.2 TOP: Domain and Range KEY: real domain, quadratic
423) ANS: 1 Domain refers to the x-axis while range refers to the y-axis. This question is asking what values on the x-axis are required by this relation. Strategy: Underline all the x-values of the relation, then organize the unique values.
You could graph the entire relation if you have x-values of 0, 1, and 4.
Page 520

PTS: 2 NAT: F.IF.A.2 TOP: Domain and Range KEY: limited domain
424) ANS: 3 Substitute each value of the domain into the function and solve for the range for each value.
PTS: 2 NAT: F.IF.A.2 TOP: Domain and Range KEY: limited domain
425) ANS: 4 Strategy: Examine each answer choice and eliminate wrong answers. Eliminate answer choices a and b because negative numbers of cars observed do not make sense. Eliminate answer choice c because fractional numbers of cars observed do not make sense. Choose answer choice d because it is the only choice that makes sense. The number of cars observed must be either zero or some counting number.
PTS: 2 NAT: F.IF.B.5 TOP: Domain and Range
426) ANS: 2 Strategy: Input the function into a graphing calculator and examine it to determine a realistic range. First, transform to for input.
The graph and table of values show that it takes 3 seconds for the object to reach the ground. Therefore, a
realistic domain for this function is . represents the time when the object is dropped.
represents the time when the object hits the ground. Answer choice b is correct.
PTS: 2 NAT: F.IF.B.5 TOP: Domain and Range
427) ANS: 2 Strategy: Eliminate wrong answers. Eliminate answer choice a because the set of integers contains negative numbers, which do not make sense when counting the number of appliances in a household. Choose answer choice b because the set of whole numbers is defined as {0, 1, 2, 3, ...}. This does make sense when counting the number of appliances in a household.
Page 521
Eliminate answer choice c because the set of irrational numbers includes numbers like and , which do not make sense when counting the number of appliances in a household.
Eliminate answer choice d because the set of rational numbers includes fractions such as and ,
which do not make sense when counting the number of appliances in a household.
PTS: 2 NAT: F.IF.B.5 TOP: Domain and Range
428) ANS: 4 Step 1. Understand that the problem is asking for a set of numbers that would be appropriate x-values to measure the weight (in ounces) of frozen yogurt sundaes. Step 2. Strategy. Eliminate wrong answers. Step 3. Execution of Strategy. a) Integers would not be an appropriate domain because there is no need for negative whole numbers. It makes no sense to have a yogurt sundae that weighs -4 ounces. b) Rational numbers would not be an appropriate domain because, once again, there is no need for
negative numbers. It makes no sense to have a yogurt sundae that weighs ounces.
c) Nonnegative Integers could work except for zero, which is a non-negative integer. It makes no sense to have a yogurt sundae that weighs zero ounces. d) Nonnegative rational numbers are the best choice. Step 4. Does it make sense? Yes. You could weigh yogurt sundaes by the ounce, half ounce, quarter ounce, or any other nonnegative fraction.
PTS: 2 NAT: F.IF.B.5 TOP: Domain and Range
429) ANS: 1 Strategy: Eliminate wrong answers. The number of people must be counting numbers, since it makes no sense to have a half a person or a quarter person. The positive integers are 1, 2, 3, 4, ...., which makes sense. Positive real numbers should be eliminated because positive real numbers include fractions, and fractions make no sense for the number of workers. Both positive and negative integers should be eliminated because it makes no sense to have negative numbers of workers. Both positive and negative real numbers should also be eliminated because it makes no sense to have negative numbers of workers. The correct choice is positive integers.
PTS: 2 NAT: F.IF.B.5 TOP: Domain and Range
430) ANS: 2 Understand the Question: Cost is a function of the number of songs downloaded, so cost is the dependent variable and the number of songs is the independent variable. The domain of a function refers to the independent variable (x-axis), so the problem is asking which numbers are most appropriate for the number of songs downloaded. Then, eliminate wrong answers: Eliminate: Rational numbers greater than zero because there is no need for fractions. Choose: Whole numbers greater than or equal to one because you only need positive whole numbers. Eliminate: Integers less than or equal to zero because you would not download a negative number of songs. Eliminate: Whole numbers less than or equal to one because you would not download a negative number of songs.
PTS: 2 NAT: F.IF.B.5
431) ANS: 4
Page 522

Reason: If x represents the number of complete products manufactured, there is no need for fractions or negative numbers. Strategy: Eliminate wrong answers: a) integers There is no need for negative numbers. b) positive real numbers There is no need for fractions and/or irrational numbers. c) positive rational numbers There is no need for fractions. d) whole numbers A complete product can be represented by a whole number.
PTS: 2 NAT: F.IF.B.5 TOP: Domain and Range
432) ANS: 2 Strategy: Eliminate wrong answers. 1. Eliminate an integer because all of the integers less than or equal to zero are negative numbers and you cannot sell a negative number of ice cream cones. 2. Select an integer because these are the whole numbers and you can only sell a whole ice cream cone. 3. Eliminate a rational number because you cannot sell a negative number of ice cream cones or negatives fractions of ice cream cones. 4. Eliminate a rational number because you cannot sell fractional parts of ice cream cones.
PTS: 2 NAT: F.IF.B.5 TOP: Domain and Range
433) ANS: 3 Strategy: Inspect the table and graph views of this function in a graphing calculator to find the range (not the domain).
The table of values and the graph both show the smalles value of f(x) is 2, which occurs when . The maximum value of f(x) is infiniy. Therefore, the range of the function is . NOTE: is the domain of the function. Don’t confuse domain and range.
PTS: 2 NAT: F.IF.A.2 TOP: Domain and Range KEY: real domain, quadratic
Page 523

M – Functions, Lesson 4, Operations with Functions (r. 2018)
FUNCTIONS Operations with Functions
Common Core Standard
A-APR.1 Understand that polynomials form a sys-tem analogous to the integers, namely, they are closed under the operations of addition, subtraction, and multiplication; add, subtract, and multiply poly-nomials.
Next Generation Standard
AI-A.APR.1 Add, subtract, and multiply polynomials and recognize that the result of the operation is also a pol-ynomial. This forms a system analogous to the integers. Note: This standard is a fluency recommendation for Algebra I. Fluency in adding, subtracting and multi-plying polynomials supports students throughout their work in algebra, as well as in their symbolic work with functions.
LEARNING OBJECTIVES
Students will be able to:
1)
Overview of Lesson
Teacher Centered Introduction Overview of Lesson
- activate students’ prior knowledge
- vocabulary
- learning objective(s)
- big ideas: direct instruction
- modeling
Student Centered Activities guided practice Teacher: anticipates, monitors, selects, sequences, and connects student work
- developing essential skills
- Regents exam questions
- formative assessment assignment (exit slip, explain the math, or journal entry)
VOCABULARY
LEARNING OBJECTIVES
Students will be able to:
1) Use the output of one function as the input for another function. 2) Substitute expressions from one function into another.
Page 524

BIG IDEAS Polynomial expressions can be substituted into equations and functions. Example: Given that: and , then
Functions can be multiplied or divided if each and every term in both expressions is multiplied or divided by the same value.
Example:
( )( ) ( ) ( )
2 3 4
2 2 3 2 42 6 8
y x
y xy x
= +
= +
= +
DEVELOPING ESSENTIAL SKILLS
1. If f and g are two functions defined by and , then is a. c. b. d.
2. If and , then is equal to
a. c. b. d. 7
3. The accompanying tables define functions f and g.
What is ( )( 3 )g f ? a. 6 c. 8 b. 2 d. 4
4. If and , what is the value of ?
a. c. 8 b. 2 d. 13
5. If and , find .
Page 525

ANSWERS
1. ANS: B
2. ANS: A
3. ANS: C f(3) = 5, g(5) = 8
4. ANS: C
5. ANS: 5. . .
Page 526

REGENTS EXAM QUESTION (through June 2018)
A.APR.A.1: Operations with Functions
434) A company produces x units of a product per month, where represents the total cost and
represents the total revenue for the month. The functions are modeled by and . The profit is the difference between revenue and cost where
. What is the total profit, , for the month? 1) 3) 2) 4)
SOLUTION
434) ANS: 2 Strategy: Substitute and into . Given:
Therefore:
PTS: 2 NAT: A.APR.A.1 TOP: Addition and Subtraction of Polynomials KEY: subtraction
Page 527

M – Functions, Lesson 5, Families of Functions (r. 2018)
FUNCTIONS Families of Functions
Common Core Standards
F-LE.A.1 Distinguish between situations that can be modeled with linear functions and with exponential functions. F-LE.A.1a Prove that linear functions grow by equal differences over equal intervals, and that ex-ponential functions grow by equal factors over equal intervals. F-LE.A.1b Recognize situations in which one quan-tity changes at a constant rate per unit interval rela-tive to another. F-LE.A.1c Recognize situations in which a quantity grows or decays by a constant percent rate per unit interval relative to another. F-LE.A.2 Construct linear and exponential func-tions, including arithmetic and geometric sequences, given a graph, a description of a relationship, or two input-output pairs (include reading these from a ta-ble). PARCC: Tasks are limited to constructing linear and exponential functions in simple context (not multi-step). F-LE.A.3 Observe using graphs and tables that a quantity increasing exponentially eventually exceeds a quantity increasing linearly, quadratically, or (more generally) as a polynomial function.
Next Generation Standards
AI-F.LE.1 Distinguish between situations that can be modeled with linear functions and with exponential func-tions. AI-F.LE.1a Justify that a function is linear because it grows by equal differences over equal intervals, and that a function is exponential because it grows by equal fac-tors over equal intervals. AI-.F.LE.1b Recognize situations in which one quantity changes at a constant rate per unit interval relative to an-other, and therefore can be modeled linearly. e.g., A flower grows two inches per day. AI-F.LE.1c Recognize situations in which a quantity grows or decays by a constant percent rate per unit inter-val relative to another, and therefore can be modeled exponentially. e.g., A flower doubles in size after each day. AI-F.LE.2 Construct a linear or exponential function symbolically given: i) a graph; ii) a description of the relationship; iii) two input-output pairs (include reading these from a table). (Shared standard with Algebra II) Note: Tasks are limited to constructing linear and expo-nential functions in simple context (not multi-step). AI-F.LE.3 Observe using graphs and tables that a quan-tity increasing exponentially eventually exceeds a quan-tity increasing linearly, quadratically, or (more generally) as a polynomial function.
LEARNING OBJECTIVES
Students will be able to:
1) Describe characteristics of linear, exponential and quadratic functions. 2) Associate linear functions with constant rates of change. 3) Associate exponential and quadratic functions with variable rates of change.
Page 528
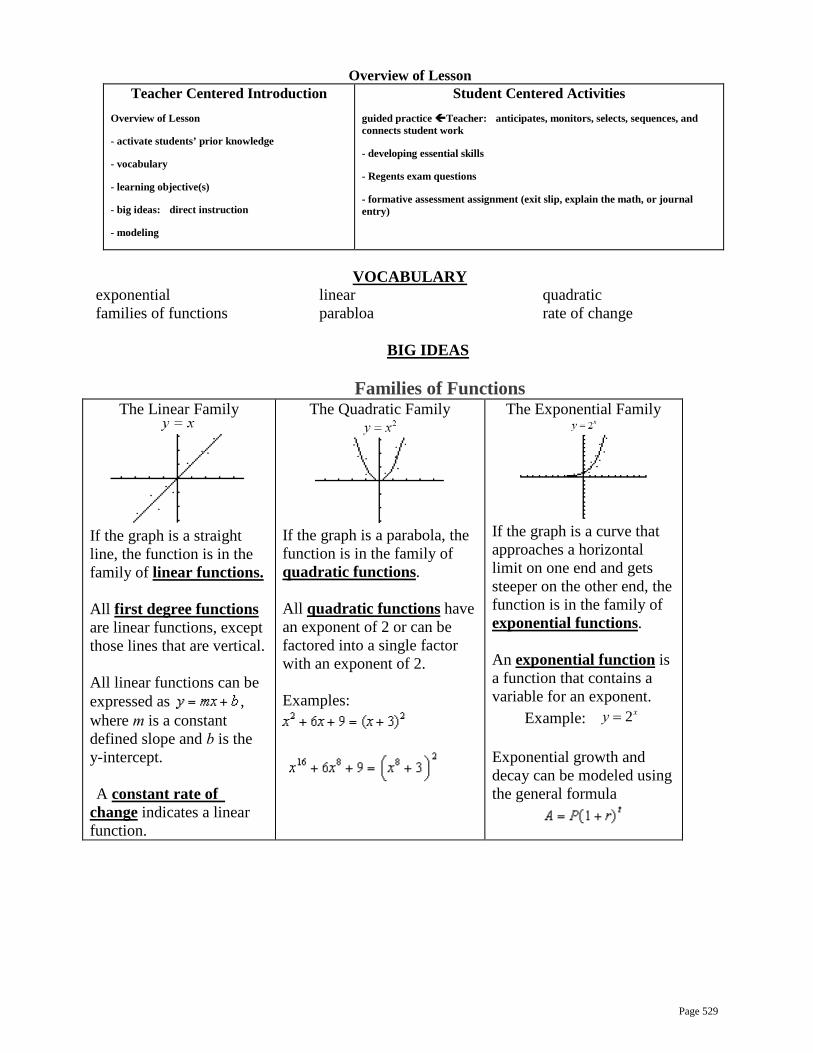
Overview of Lesson Teacher Centered Introduction
Overview of Lesson
- activate students’ prior knowledge
- vocabulary
- learning objective(s)
- big ideas: direct instruction
- modeling
Student Centered Activities guided practice Teacher: anticipates, monitors, selects, sequences, and connects student work
- developing essential skills
- Regents exam questions
- formative assessment assignment (exit slip, explain the math, or journal entry)
VOCABULARY
exponential families of functions
linear parabloa
quadratic rate of change
BIG IDEAS
Families of Functions
The Linear Family
If the graph is a straight line, the function is in the family of linear functions. All first degree functions are linear functions, except those lines that are vertical. All linear functions can be expressed as , where m is a constant defined slope and b is the y-intercept. A constant rate of change indicates a linear function.
The Quadratic Family
If the graph is a parabola, the function is in the family of quadratic functions. All quadratic functions have an exponent of 2 or can be factored into a single factor with an exponent of 2. Examples:
The Exponential Family
If the graph is a curve that approaches a horizontal limit on one end and gets steeper on the other end, the function is in the family of exponential functions. An exponential function is a function that contains a variable for an exponent.
Example: Exponential growth and decay can be modeled using the general formula
2xy =
Page 529

NOTE: All functions in the form of
, where and is an even number >1, take the form of parabolas. The larger the value of n, the wider the flat part at the bottom/top.
NOTE: All functions in the form of
, where and is an odd number >1, take the form of hyperbolas. These are not quadratic functions.
Rates of Change Can be Used to Identify a Function’s Family
Linear functions have constant rates of change. Quadratic functions have both negative and positive varying rates of change. Exponential functions have either negative or positive varying rates of change. (NOTE: A quantity increasing exponentially will eventually exceeds a quantity increasing linearly or quadratically.) When the rate of change is not constant, it is called a variable rate of change. ,
Finding Rates of Change from Tables The slope formula is used to find the rate of change in table views of a function. When
applying the slope formula to tables, it may be helpful to think of the formual as
.
Simply add two extra columns titleD and to the table, then find the differences between any two y values in the table and their corresponding x values. Example:
The above table is the table view of the function . The ratio of always reduces to ,
regardless of which coordinate pairs are selected. This means that the above table represents a linear function.
ny ax= 0a ≠ n ny ax= 0a ≠ n
Page 530

DEVELOPING ESSENTIAL SKILLS
1. Which type of graph is shown in the diagram below?
a. absolute value c. linear b. exponential d. quadratic
2. Which graph represents a linear function?
a.
c.
b.
d.
3. Antwaan leaves a cup of hot chocolate on the counter in his kitchen. Which graph is the best representation of the
change in temperature of his hot chocolate over time? a.
c.
Page 531

b.
d.
4. Which graph represents an exponential equation?
a.
c.
b.
d.
5. Which type of function is represented by the graph shown below?
a. absolute value c. linear b. exponential d. quadratic
6. Which equation represents a quadratic function?
a. c.
Page 532

b. d.
7. Which type of function is graphed below?
a. linear c. exponential b. quadratic d. absolute value
8. Which graph represents an absolute value equation?
a.
c.
b.
d.
ANSWERS
1. ANS: D
2. ANS: A
3. ANS: A
4. ANS: D
5. ANS: D
6. ANS: C
7. ANS: C
8. ANS: B
Page 533

REGENTS EXAM QUESTIONS (through June 2018)
F.LE.A.1, F.LE.A.2, F.LE.A.3: Model Families of Functions
435) Which situation could be modeled by using a linear function?
1) a bank account balance that grows at a rate of 5% per year, compounded annually
3) the cost of cell phone service that charges a base amount plus 20 cents per minute
2) a population of bacteria that doubles every 4.5 hours
4) the concentration of medicine in a person’s body that decays by a factor of one-third every hour
436) Sara was asked to solve this word problem: "The product of two consecutive integers is 156. What are the integers?" What type of equation should she create to solve this problem? 1) linear 3) exponential 2) quadratic 4) absolute value
437) A population that initially has 20 birds approximately doubles every 10 years. Which graph represents this population growth? 1)
3)
2)
4)
438) Which table of values represents a linear relationship? 1)
3)
Page 534

2)
4)
439) The table below shows the average yearly balance in a savings account where interest is compounded annually. No money is deposited or withdrawn after the initial amount is deposited.
Which type of function best models the given data? 1) linear function with a negative rate of
change 3) exponential decay function
2) linear function with a positive rate of change
4) exponential growth function
440) Rachel and Marc were given the information shown below about the bacteria growing in a Petri dish in their biology class.
Rachel wants to model this information with a linear function. Marc wants to use an exponential function. Which model is the better choice? Explain why you chose this model.
441) The function, , is shown in the table below.
Determine whether is linear or exponential. Explain your answer.
Page 535

442) The tables below show the values of four different functions for given values of x.
Which table represents a linear function?· 1) 3) 2) 4)
443) Grisham is considering the three situations below. I. For the first 28 days, a sunflower grows at a rate of 3.5 cm per day. II. The value of a car depreciates at a rate of 15% per year after it is purchased. III. The amount of bacteria in a culture triples every two days during an experiment. Which of the statements describes a situation with an equal difference over an equal interval? 1) I, only 3) I and III 2) II, only 4) II and III
444) Consider the pattern of squares shown below:
Which type of model, linear or exponential, should be used to determine how many squares are in the nth pattern? Explain your answer.
445) Which scenario represents exponential growth?
1) A water tank is filled at a rate of 2 gallons/minute.
3) A species of fly doubles its population every month during the summer.
2) A vine grows 6 inches every week. 4) A car increases its distance from a garage as it travels at a constant speed of 25 miles per hour.
446) One characteristic of all linear functions is that they change by 1) equal factors over equal intervals 3) equal differences over equal intervals 2) unequal factors over equal intervals 4) unequal differences over equal intervals
447) The highest possible grade for a book report is 100. The teacher deducts 10 points for each day the report is late. Which kind of function describes this situation? 1) linear 3) exponential growth 2) quadratic 4) exponential decay
448) Ian is saving up to buy a new baseball glove. Every month he puts $10 into a jar. Which type of function best models the total amount of money in the jar after a given number of months? 1) linear 3) quadratic 2) exponential 4) square root
449) If a population of 100 cells triples every hour, which function represents , the population after t hours? 1) 3) 2) 4)
Page 536

450) The table below represents the function F.
The equation that represents this function is 1) 3) 2) 4)
451) A laboratory technician studied the population growth of a colony of bacteria. He recorded the number of bacteria every other day, as shown in the partial table below.
Which function would accurately model the technician's data? 1) 3) 2) 4)
452) Which function is shown in the table below?
1) 3) 2) 4)
453) Vinny collects population data, , about a specific strain of bacteria over time in hours, h, as shown in the graph below.
Page 537

Which equation represents the graph of ? 1) 3) 2)
4)
454) If and , at which value of x is ? 1) 3) 2) 2 4) 4
455) Alicia has invented a new app for smart phones that two companies are interested in purchasing for a 2-year contract. Company A is offering her $10,000 for the first month and will increase the amount each month by $5000. Company B is offering $500 for the first month and will double their payment each month from the previous month. Monthly payments are made at the end of each month. For which monthly payment will company B’s payment first exceed company A’s payment? 1) 6 3) 8 2) 7 4) 9
456) Graph and for on the set of axes below.
State which function, or , has a greater value when . Justify your reasoning.
457) What is the largest integer, x, for which the value of will be greater than the value of
? 1) 7 3) 9 2) 8 4) 10
458) As x increases beyond 25, which function will have the largest value? 1) 3) 2) 4)
Page 538

459) Michael has $10 in his savings account. Option 1 will add $100 to his account each week. Option 2 will double the amount in his account at the end of each week. Write a function in terms of x to model each option of saving. Michael wants to have at least $700 in his account at the end of 7 weeks to buy a mountain bike. Determine which option(s) will enable him to reach his goal. Justify your answer.
460) Caleb claims that the ordered pairs shown in the table below are from a nonlinear function.
x f(x) 0 2 1 4 2 8 3 16
State if Caleb is correct. Explain your reasoning.
461) Which situation is not a linear function?
1) A gym charges a membership fee of $10.00 down and $10.00 per month.
3) A restaurant employee earns $12.50 per hour.
2) A cab company charges $2.50 initially and $3.00 per mile.
4) A $12,000 car depreciates 15% per year.
SOLUTIONS
435) ANS: 3 Strategy: Eliminate wrong answers. a) Eliminate answer choice a because it describes exponential growth of money in a bank account. b) Eliminate answer choice b because is describes exponential growth of bacteria. c) Choose answer choice c because it can be modeled using the slope intercept formula as follows:
d) Eliminate answer choice d because it describes exponential decay of medicine in the body.
PTS: 2 NAT: F.LE.A.1 TOP: Families of Functions
436) ANS: 2 1. Understand the question as asking what type of equation is needed to solve a product of consecutive integers problem. 2. Step 2. Strategy. Write the equation, then decide it it is linear, quadratic, exponential, or absolute value. 3. Step 3. Execution of Strategy. Let x represent the first consecutive integer. Let (x+1) represent the second consecutive integer. Write the equation This is a quadratic equation because it will have an exponent of 2.
Step 4. Does it make sense? Yes. All of the other answer choices can be eliminated as wrong.
Page 539
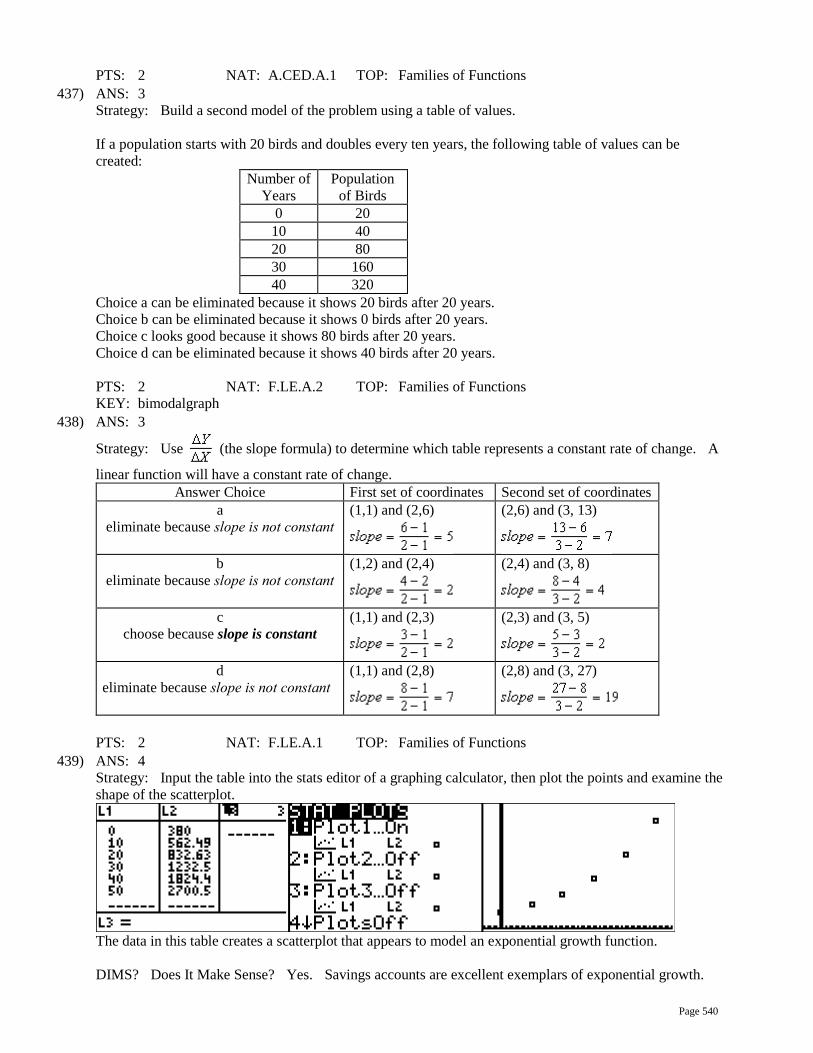
PTS: 2 NAT: A.CED.A.1 TOP: Families of Functions
437) ANS: 3 Strategy: Build a second model of the problem using a table of values. If a population starts with 20 birds and doubles every ten years, the following table of values can be created:
Number of Years
Population of Birds
0 20 10 40 20 80 30 160 40 320
Choice a can be eliminated because it shows 20 birds after 20 years. Choice b can be eliminated because it shows 0 birds after 20 years. Choice c looks good because it shows 80 birds after 20 years. Choice d can be eliminated because it shows 40 birds after 20 years.
PTS: 2 NAT: F.LE.A.2 TOP: Families of Functions KEY: bimodalgraph
438) ANS: 3
Strategy: Use (the slope formula) to determine which table represents a constant rate of change. A
linear function will have a constant rate of change. Answer Choice First set of coordinates Second set of coordinates
a eliminate because slope is not constant
(1,1) and (2,6)
(2,6) and (3, 13)
b eliminate because slope is not constant
(1,2) and (2,4)
(2,4) and (3, 8)
c choose because slope is constant
(1,1) and (2,3)
(2,3) and (3, 5)
d eliminate because slope is not constant
(1,1) and (2,8)
(2,8) and (3, 27)
PTS: 2 NAT: F.LE.A.1 TOP: Families of Functions
439) ANS: 4 Strategy: Input the table into the stats editor of a graphing calculator, then plot the points and examine the shape of the scatterplot.
The data in this table creates a scatterplot that appears to model an exponential growth function. DIMS? Does It Make Sense? Yes. Savings accounts are excellent exemplars of exponential growth.
Page 540

PTS: 2 NAT: F.LE.A.1 TOP: Modeling Exponential Equations
440) ANS: Exponential, because the function does not grow at a constant rate. Strategy 1. Compare the rates of change for different pairs of data using the slope formula.
Rate of change between (1, 220) and (5, 550):
Rate of change between (6, 690) and (10, 1680):
Strategy 2: Use stat plots in a graphing calculator to create a scatterplot view of the multivariate data.
The graph view of the data clearly shows that the data is not linear.
PTS: 2 NAT: S.ID.B.6a TOP: Comparing Linear and Exponential Functions
441) ANS: Strategy #1. Calculate the change in x and the change in y for each ordered pair in the table. If the ratio
of is constant, the function is linear.
x t(x)
+2< +2< +2< +2<
-3 10 >-2.5 >-2.5 >-2.5 >-2.5
-1 7.5 1 5 3 2.5 5 0
This table shows a linear function, because the ratio of can always be expressed as .
Strategy #2. Input values from the table into the stats editor of a graphing calculator, turn stats plot on, then use zoom stat to inspect the scatterplot.
The scatterplot shows a linear relationship.
PTS: 2 NAT: F.LE.A.1 TOP: Families of Functions
442) ANS: 1
Page 541

Step 1. Notice that in each of the tables, the values of the indepedendent variable (x) are 1, 2, 3, and 4, while the dependent variables are different. The question asks which table represents a linear function and, bu definition, a linear function must have a constant rate of change. Step 2. Use the slope formula and data from each table to determine which table represents a constant rate of change. Step 3. Execute the strategy.
f(x) . Every time x increases by 1, f(x) increases by 7. This is a
constant rate of change, so f(x) is a linear function.
g(x) . Every time x increases by 1, g(x) increases by a different
amount. This is not a constant rate of change, so g(x) is not a linear function.
h(x) . Every time x increases by 1, h(x) increases by a different
amount. This is not a constant rate of change, so h(x) is not a linear function.
k(x) . Every time x increases by 1, k(x) increases by a different
amount. This is not a constant rate of change, so k(x) is not a linear function. Step 4. Does it make sense? Yes. Only one table shows a constant rate of change.
PTS: 2 NAT: F.LE.A.1 TOP: Families of Functions
443) ANS: 1 Interpreting the Question: Equal differences over equal intervals suggests a constant rate of change, which would be a linear relationship. Strategy: Model each situation with a function rule, then select the linear functions. I. For the first 28 days, a sunflower grows at a rate of 3.5 cm per day. This can be modeled with the linear function , where h represents the height of the sunflower and d represents the number of days. Since this function is linear, it represents a situation with an equal difference over an equal interval. II. The value of a car depreciates at a rate of 15% per year after it is purchased. This can be modeled with the exponential decay function , where V represents the value of the car, P represents its price when purchased, -.15 represents the annual depreciation rate, and t represents the number of years after purchase. This is an exponential decay function, so it does not represent a situation with an equal difference over an equal interval. III. The amount of bacteria in a culture triples every two days during an experiment.
This can be modeled with the exponential growth function , where A represents the amount of
bacteria, B represents starting amount of bacteria, 3 represents the growth rate, and represents the
number of growth cyles. This is an exponential growth function, so it does not represent a situation with an equal difference over an equal interval. The only choice that represents a situation with an equal difference over an equal interval is the first situation.
PTS: 2 NAT: F.LE.A.1 TOP: Families of Functions
444) ANS:
Page 542

Exponential. The rate of change is not constant, so a linear model must be eliminated. Strategy: Build a table of values, as follows:
n 1 2 3 4 5 6 7 n f(n) 2 4 8 16 32 64 128
The pattern can be modeled using the exponential function .
PTS: 2 NAT: F.LE.A.1
445) ANS: 3 Strategy: Eliminate wrong ansers. a) A water tank is filled at a rate of 2 gallons/minute. A rate of 2 gallons a minute is a constant rate of change, so this cannot be an exponential function. b) A vine grows 6 inches every week. A rate of 6 inches every week is a constant rate of change, so this cannot be an exponential function. c) A species of fly doubles its population every month during the summer. A rate of change that doubles every month is not constant. The population of flies could be modeled with the following exponential equation.
d) A car increases its distance from a garage as it travels at a constant speed of 25 miles per hour.
PTS: 2 NAT: F.LE.A.1 TOP: Families of Functions
446) ANS: 3 All linear functions must have constant rates of change, which means equal differences over equal intervals.
PTS: 2 NAT: F.LE.A.1 TOP: Families of Functions
447) ANS: 1 The rate of change is constant (-10 points per day), so it must be a linear function.
PTS: 2 NAT: F.LE.A.1 TOP: Families of Functions
448) ANS: 1 The sentence “Every month he puts $10 into a jar” indicates a constant rate of change. Linear functions represent constant rates of change.
PTS: 2 NAT: F.LE.A.1 TOP: Families of Functions
449) ANS: 2 Build a table that models the growth, then test the answer choices to see which one produces the table.
t 0 1 2 3 p(t) 100 300 900 2700
Page 543

is the correct answer because it reproduces the table view of the function.
PTS: 2 NAT: F.LE.A.2 TOP: Families of Functions KEY: AI
450) ANS: 3 Strategy: Test each function to see if it fits the table:
Choice Equation (3,9) (6,65) (8,257) a
(eliminate)
b (correct)
(eliminate)
c (correct)
(correct) (correct)
d (correct)
(eliminate)
PTS: 2 NAT: F.LE.A.2 TOP: Modeling Exponential Equations
451) ANS: 2 Strategy: Input all four functions into a graphing calculator and compare the table of values.
Answer choice b produces a table of values that agrees with the table of values in the problem.
PTS: 2 NAT: F.LE.A.2 TOP: Modeling Linear and Exponential Equations
452) ANS: 4 Strategy: Put the functions in a graphing calculator and inspect the table view. The correct answer is
.
PTS: 2 NAT: F.LE.A.2 TOP: Families of Functions
453) ANS: 1 Note that the graph represents an exponential function. Choice Family of Functions Standard Form a Exponential
b Linear
c Quadratic
Page 544

d Cubic
PTS: 2 NAT: F.LE.A.2 TOP: Families of Functions
454) ANS: 1 Strategy: Input both functions in a graphing calculator and compares the values of y for various values of x.
The table of values shows: When , When ,
When , When ,
PTS: 2 NAT: F.LE.A.3 TOP: Families of Functions
455) ANS: 3 Strategy: Build a table of values for the integer values of the domain to compare both offers.
x 6 40,000 16,000 7 45,000 32,000 8 50,000 64,000 9 55,000 128,000
Offer B is greater than offer A when .
PTS: 2 NAT: F.LE.A.3 TOP: Comparing Linear and Exponential Functions
456) ANS:
has a greater value:
Page 545

Strategy: Input both functions in a graphing calculator, use the table of values to create the paper graph, and to compare the values of y for various values of x.
The table of values shows that when , .
DIMS? Does It Make Sense? Yes.
PTS: 4 NAT: F.LE.A.3 TOP: Comparing Quadratic and Exponential Functions
457) ANS: 3 Step 1. Understand that the problem asks you to select the largest value of x where the value of f(x) will be greater than the value of g(x). Step 2. Strategy. Input both functions in a graphing calculator and explore the table of values. Step 3. Execution of Strategy.
The table shows that f(x) is greater than g(x) when , , and , but not when . The largest integer for which f(x) is greater than g(x) is 9. Step 4. Does it make sense? Yes. is a quadratic function and is an exponential function. Exponential growth evetually outpaces quadratic growth.
PTS: 2 NAT: F.LE.A.3 TOP: Families of Functions
458) ANS: 1 Strategy: Input all functions in a graphing calculator and inspect the table of values.
x f(x) g(x) h(x) k(x) 25 25,251 40.5 937.5 24,375
PTS: 2 NAT: F.LE.A.3
459) ANS:
Option 1 can be modeled by the function
Option 2 can be modeled by the function
Page 546

Either option will allow Michael to have at least $700 in his account at the end of 7 weeks.
and
, ; both, since and
PTS: 4 NAT: F.LE.A.3 TOP: Families of Functions
460) ANS: Yes. Caleb is correct because the function does not have a constant rate of change. A linear function must have a constant rate of change.
Strategy: Compare the rate of change between each row of the table of values.
PTS: 2 NAT: F.LE.A.1 TOP: Families of Functions
461) ANS: 4 Strategy: A linear function will have a constant rate of change, so find the function that does not have a constant rate of change. Choice 1: $10.00 per month is a constant rate, so eliminate this choice. Choice 2: $3.00 per mile is a constant rate, so eliminate this choice Choice 3: $12.50 per hour is a constant rate, so eliminate this choice Choice 4: depreciates 15% per year is an exponential rate of change. The amount of change gets smaller each year as the car depreciates in value. This is the correct answer because it is not a constant rate of change and all linear functions must have constant rates of change.
PTS: 2 NAT: F.LE.A.1 TOP: Families of Functions
Page 547

Page 548

M – Functions, Lesson 6, Transformations with Functions (r. 2018)
FUNCTIONS Transformations with Functions
Common Core Standard
F-BF.3 Identify the effect on the graph of replacing f(x) by f(x) + k, k f(x), f(kx), and f(x + k) for specific values of k (both positive and negative); find the value of k given the graphs. Experiment with cases and illustrate an explanation of the effects on the graph using technology. Include recognizing even and odd functions from their graphs and algebraic expressions for them. PARCC: Identifying the effect on the graph of replacing f(x) by f(x) +k, kf(x), and f(x+k) for specific values of k (both positive and negative) is limited to linear and quadratic functions. Experi-menting with cases and illustrating an explanation of the effects on the graph using technology is limited to linear functions, quad-ratic functions, square root functions, cube root functions, piece-wise-defined functions (including step functions and absolute value functions), and exponential functions with domains in the integers. Tasks do not involve recognizing even and odd func-tions.
Next Generation Standard
AI-F.BF.3a Using f(x) + k, k f(x), and f(x + k): i) identify the effect on the graph when replacing f(x) by f(x) + k, k f(x), and f(x + k) for specific values of k (both positive and negative); ii) find the value of k given the graphs; iii) write a new function using the value of k; and iv) use technology to experiment with cases and explore the effects on the graph. (Shared standard with Algebra II) Note: Tasks are limited to linear, quadratic, square root, and absolute value functions; and exponential
functions of the form ( ) ( ) xf x a b= where a > 0 and b > 0 (b ≠ 1).
NOTE: This lesson is related to Polynomials, Lesson 6, Graphing Polynomial Functions
LEARNING OBJECTIVES
Students will be able to:
1)
Overview of Lesson
Teacher Centered Introduction Overview of Lesson
- activate students’ prior knowledge
- vocabulary
- learning objective(s)
- big ideas: direct instruction
- modeling
Student Centered Activities guided practice Teacher: anticipates, monitors, selects, sequences, and connects student work
- developing essential skills
- Regents exam questions
- formative assessment assignment (exit slip, explain the math, or journal entry)
VOCABULARY
down function
left right
transform up
Page 549

BIG IDEAS
Transforming Any Function The graph of any function is changed when either or x is multiplied by a scalar, or when a constant is added to or subtracted from either or x. A graphing calculator can be used to explore the translations of graph views of functions.
Up and Down The addition or subtraction of a constant outside the parentheses moves the graph up or down by the value of the constant.
( ) ( ) moves the graph up or down k units .
+k moves the graph up.-k moves the graph down.
f x f x k⇔ ±
Examples:
Replace f(x) by f(x) + k
Left and Right The addition or subtraction of a constant inside the parentheses moves the graph left or right by the value of the constant.
( ) ( ) moves the graph left or right k units .
+k moves the graph leftg k units.-k moves the graph right k units.
f x f x k⇔ ±
Replace f(x) by f(x + k)
Page 550

Width and Direction of a Parabola Changing the value of a in a quadratic affects the width and direction of a parabola. The bigger the absolute value of a, the narrower the parabola.
( ) ( ) changes the direction and width of a parabola.+k opens the parabola upward.-k opens the parabola downward.If k is a fraction less than 1, the parabola will get wider. As k approaches zero, the
f x f kx⇔
parabola approaches a straight horizontal line.If k is a number greater than 1, the parabola will get narrower.As k approaches infinity, the parabola approaches a straight vertical line.
Examples:
Replace f(x) by f(kx)
Page 551

DEVELOPING ESSENTIAL SKILLS
1. The graph below shows the function .
Which graph represents the function ? a.
c.
b.
d.
Page 552

2.The graph below represents .
Which of the following is the graph of ? a.
c.
b.
d.
3. The minimum point on the graph of the equation is . What is the minimum point on the graph of
the equation ? a. c. b. d.
Page 553
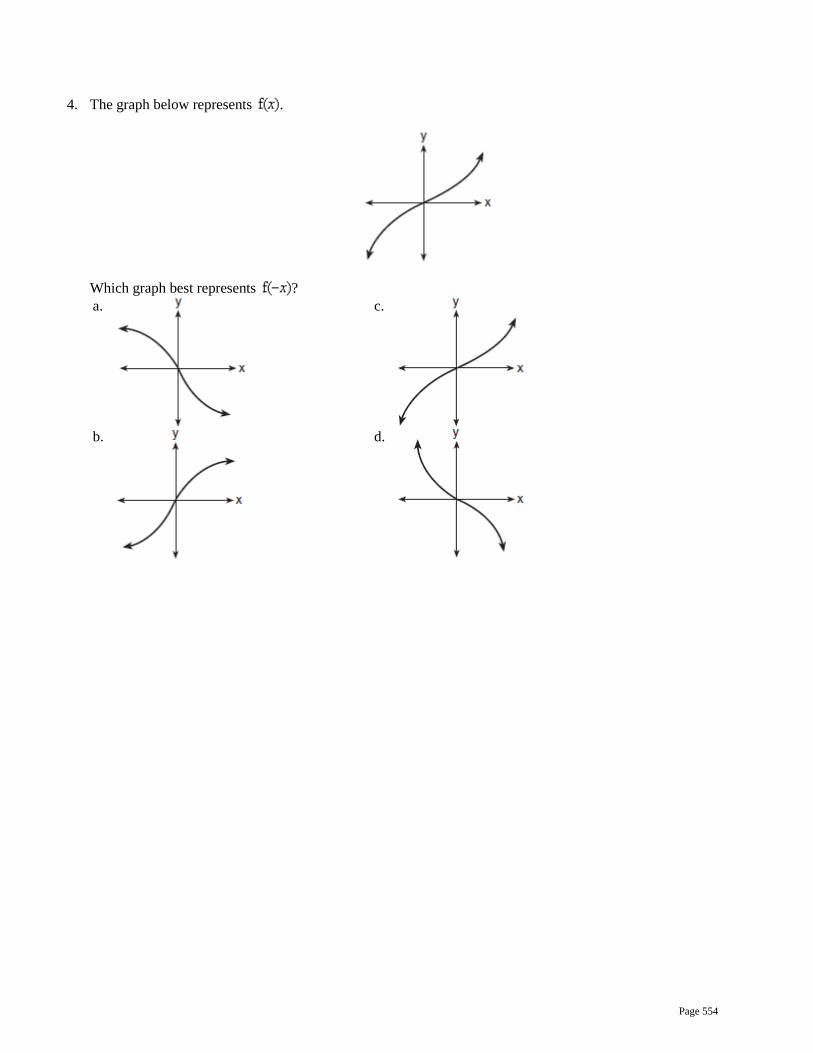
4. The graph below represents .
Which graph best represents ? a.
c.
b.
d.
Page 554

5. The graph of is shown in the accompanying diagram
Which graph represents ?
a.
c.
b.
d.
Page 555

ANSWERS
1. ANS: B
2. ANS: C
3. ANS: A
4. ANS: D
5. ANS: B
Page 556

REGENTS EXAM QUESTIONS (through June 2018)
F.BF.B.3: Transformations with Functions
462) The graph of is shown below.
What is the graph of ? 1)
3)
2)
4)
463) Richard is asked to transform the graph of b(x) below.
The graph of b(x) is transformed using the equation . Describe how the graph of b(x) changed to form the graph of h(x).
SOLUTIONS
462) ANS: 1 Strategy: Identify the differences between the two function rules, then verify using the four points shown in the answer choices. Function rules:
Page 557

Difference #1: The term becomes . This means the graph will move to the left 1 unit. The mapping of each x value can be expressed as Difference #2: The term is added to the function rule. This means the graph will move 2 units down. The mapping of each y value can be expressed as . The 2 differences in the function rules mean that each point on the graph will move left 1 unit and down 2 units. Answer choice (a) shows this:
(-2, 1) (-1, 2) (2, 3) (7, 7) (-3, -1) (-2, 0) (1, 1) (6, 2)
PTS: 2 NAT: F.BF.B.3 TOP: Graphing Radical Functions
463) ANS: Every point moves down 3 units. Every point moves right 2 units.
PTS: 2 NAT: F.BF.B.3
Page 558

M – Functions, Lesson 7, Comparing Functions (r. 2018)
FUNCTIONS Comparing Functions
CC Standard
F-IF.C.9 Compare properties of two functions each represented in a different way (algebraically, graph-ically, numerically in tables, or by verbal descrip-tions). For example, given a graph of one quadratic function and an algebraic expression for another, say which has the larger maximum. PARCC: Tasks are limited to linear functions, quadratic func-tions, square root, cube root, piecewise defined (including step functions and absolute value functions), and exponential func-tions with domains in the integers.
NG Standard
AI-F.IF.9 Compare properties of two functions each rep-resented in a different way (algebraically, graphically, nu-merically in tables, or by verbal descriptions). (Shared standard with Algebra II) Note: Algebra I tasks are limited to the following func-tions: linear, quadratic, square root, piecewise defined (including step and absolute value), and exponential
functions of the form ( ) ( ) xf x a b= where a > 0 and b > 0 (b ≠ 1).
LEARNING OBJECTIVES
Students will be able to:
1) Compare properties of two functions each represented in a different way.
Overview of Lesson
Teacher Centered Introduction Overview of Lesson
- activate students’ prior knowledge
- vocabulary
- learning objective(s)
- big ideas: direct instruction
- modeling
Student Centered Activities guided practice Teacher: anticipates, monitors, selects, sequences, and connects student work
- developing essential skills
- Regents exam questions
- formative assessment assignment (exit slip, explain the math, or journal entry)
VOCABULARY
context equation four views of a function function rule
graph maximum minimum table of values
vertex x-intercept y-intercept
BIG IDEAS
Definition of a Function: a function takes the input value of an independent variable and pairs it with one and only one output value of a dependent variable.
Function: A function is a relation that assigns exactly one value of the dependent variable to each value of the independent variable. A function is always a relation.
Example: y=2x
INPUT OUTPUTFUNCTIONMACHINE
Page 559

Regents Exam Questions F.IF.C.9: Comparing Functions 2 Page 2 www.jmap.org Name: __________________________________
A function can be represented mathematically through four inter-related views. These are: #1 a function rule (equation) #2 a table of values #3 a graph. #4 context (words)
The TI-83+ graphing calculator allows you to input the function rule and access the graph and table of values, as shown below:
Function Rule View
View
View
Function Rules show the relationship between dependent and independent variables in the form of an equation with two variables.
§ The independent variable is the input of the function and is typically denoted by the x-variable.
§ The dependent variable is the output of the function and is typically denoted by the y-variable.
When inputting function rules in a TI 83+ graphing calculator, the y-value (dependent variable) must be isolated as the left expression of the equation. Tables of Values show the relationship between dependent and independent variables in the form of a table with columns and rows:
§ The independent variable is the input of the function and is typically shown in the left column of a vertical table or the top row of a horizontal table.
§ The dependent variable is the output of the function and is typically shown in the right column of a vertical table or the bottom row of a horizontal table.
Graphs show the relationship between dependent and independent variables in the form of line or curve on a coordinate plane:
§ The value of independent variable is the input of the function and is typically shown on the x-axis (horizontal axis) of the coordinate plane.
§ The value of the dependent variable is the output of the function and is typically shown on the y-axis (vertical axis) of the coordinate plane.
Y= GRAPH 2 TABLEnd
Page 560

Regents Exam Questions F.IF.C.9: Comparing Functions 2 Page 3 www.jmap.org Name: __________________________________
DEVELOPING ESSENTIAL SKILLS
1 The x-value of which function’s x-intercept is larger, f or h? Justify your answer.
( ) 5f x x= −
x h(x)
6
0 4
1 2
2 0
3
2 Consider the function ( ) 2 2 4p x x x= − − and the function q represented in the table below.
x q(x)
0
0 0
1
2 0
Determine which function has the smaller minimum value for the domain . Justify your answer.
Page 561

Regents Exam Questions F.IF.C.9: Comparing Functions 2 Page 4 www.jmap.org Name: __________________________________
3 Which function shown below has a greater average rate of change on the interval ? Justify your answer.
x f(x)
0.3125
0.625
1.25
2.5
0 5
1 10
2 20
3 40
4 80
5 160
6 320
1 ANS: f(x) The graph of f(x) crosses the x-axis when x = 5. The graph of h(x) crosses the x-axis when
x = 2.
2 ANS: q has the smaller minimum value for the domain . p’s minimum is -5 q’s minimum is .
3 ANS: has a greater rate of change
Page 562

Regents Exam Questions F.IF.C.9: Comparing Functions 2 Page 5 www.jmap.org Name: __________________________________
REGENTS EXAM QUESTIONS (through June 2018)
F.IF.C.9: Comparing Functions
464) Which function has the greatest y-intercept?
1) 3) the line that has a slope of 2 and passes through (1, -4).
2) 4)
465) Given the following quadratic functions:
and
Which statement about these functions is true? 1) Over the interval , the average
rate of change for is less than that for .
3) The function has a greater maximum value than .
2) The y-intercept of is greater than the y-intercept for .
4) The sum of the roots of is greater than the sum of the roots of .
466) Let f be the function represented by the graph below.
Page 563

Regents Exam Questions F.IF.C.9: Comparing Functions 2 Page 6 www.jmap.org Name: __________________________________
Let g be a function such that . Determine which function has the larger maximum value.
Justify your answer.
467) Which quadratic function has the largest maximum?
1) 3) 2)
4)
468) Which statement is true about the quadratic functions , shown in the table below, and ?
1) They have the same vertex. 3) They have the same axis of symmetry. 2) They have the same zeros. 4) They intersect at two points.
469) The graph representing a function is shown below.
Page 564

Regents Exam Questions F.IF.C.9: Comparing Functions 2 Page 7 www.jmap.org Name: __________________________________
Which function has a minimum that is less than the one shown in the graph? 1) 3) 2) 4)
470) Nancy works for a company that offers two types of savings plans. Plan A is represented on the graph below.
Plan B is represented by the function , where x is the number of weeks. Nancy wants to have the highest savings possible after a year. Nancy picks Plan B. Her decision is 1) correct, because Plan B is an exponential
function and will increase at a faster rate 3) incorrect, because Plan A will have a
higher value after 1 year 2) correct, because Plan B is a quadratic
function and will increase at a faster rate 4) incorrect, because Plan B is a quadratic
function and will increase at a slower rate
471) The function , which is graphed below, and the function are given.
Page 565

Regents Exam Questions F.IF.C.9: Comparing Functions 2 Page 8 www.jmap.org Name: __________________________________
Which statements about these functions are true? I. has a lower minimum value than . II. For all values of x, . III. For any value of x, . 1) I and II, only 3) II and III, only 2) I and III, only 4) I, II, and III
472) Which quadratic function has the largest maximum over the set of real numbers? 1) 3) 2)
4)
473) Which of the quadratic functions below has the smallest minimum value? 1) 3) 2)
4)
Page 566

Regents Exam Questions F.IF.C.9: Comparing Functions 2 Page 9 www.jmap.org Name: __________________________________
SOLUTIONS
464) ANS: 4 Strategy: Find y-intercept for each answer choice, then eliminate wrong answers. Eliminate because . Eliminate because
Eliminate the line that has slope of 2 and passes through (1, -4) because it has a positive slope and it’s y-intercept must be less than -4. Choose the graph because the y-intecept is 5, which is greater than the y-intercepts of the other three choices.
PTS: 2 NAT: F.IF.C.9
465) ANS: 4 Strategy: Each answer choice must be evaluated using a different strategy. a. Use the slope formula to find the rate of change for
Statement a is false. The average rate of change for is more than that for . b. Compare the y-intercepts for both functions. The y-intercepts occur when x = 0. The y-intercept for g(x) = 6. The y-intercept for n(x) = 8 from the table. Statement b is false. The y-intercept of is less than the y-intercept for . c. Compare the maxima of both functions. The maxima of is 6. This can be found manually or with a graphing calculator.
The maxima of n(x) = 9, which can be seen in the table. Statement c is false. The function has a smaller maximum value than . d. Compare the sum of the roots for both functions. The sum of the roots for g(x) = from a graphing calculator.
Page 567

Regents Exam Questions F.IF.C.9: Comparing Functions 2 Page 10 www.jmap.org Name: __________________________________
The sum of the roots for n(x) = from the table. Statement d is true. The sum of the roots of is greater than the sum of the roots of .
PTS: 2 NAT: F.IF.C.9 TOP: Graphing Quadratic Functions
466) ANS: Function g has the larger maximum value. The maximum of function g is 11. The maximum of function f is 6. Strategy: Determine the maximum for f from the graph. Determine the maximum for g by inputting the function rule in a graphing calculator and inspecting the graph.
The table of values shows the maximum for g is 11. Another way of finding the maximum for g is to use the axis of symmetry formula and the function rule, as
follows:
PTS: 2 NAT: F.IF.C.9 TOP: Graphing Quadratic Functions
467) ANS: 3 Strategy: Each answer choice needs to be evaluated for the largest maximum using a different strategy.. a) Input in a graphing calculator and find the maximum.
The maximum for answer choice a is a little more than 6.
Page 568
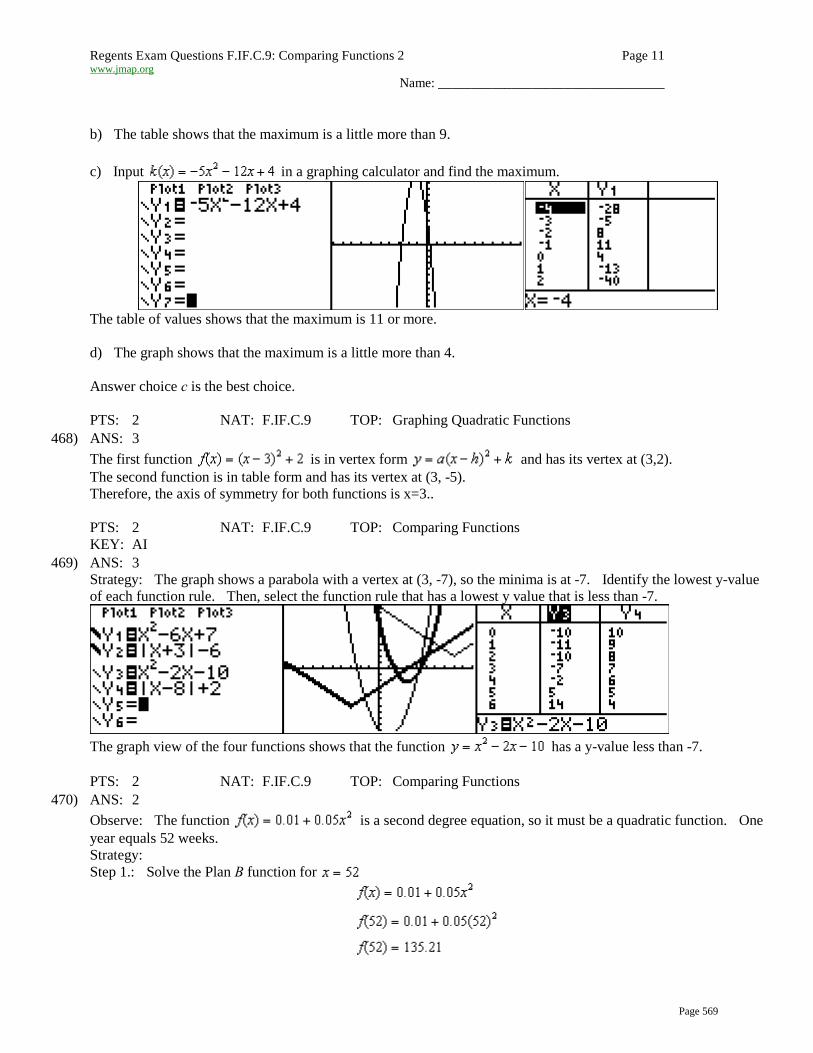
Regents Exam Questions F.IF.C.9: Comparing Functions 2 Page 11 www.jmap.org Name: __________________________________
b) The table shows that the maximum is a little more than 9. c) Input in a graphing calculator and find the maximum.
The table of values shows that the maximum is 11 or more. d) The graph shows that the maximum is a little more than 4. Answer choice c is the best choice.
PTS: 2 NAT: F.IF.C.9 TOP: Graphing Quadratic Functions
468) ANS: 3 The first function is in vertex form and has its vertex at (3,2). The second function is in table form and has its vertex at (3, -5). Therefore, the axis of symmetry for both functions is x=3..
PTS: 2 NAT: F.IF.C.9 TOP: Comparing Functions KEY: AI
469) ANS: 3 Strategy: The graph shows a parabola with a vertex at (3, -7), so the minima is at -7. Identify the lowest y-value of each function rule. Then, select the function rule that has a lowest y value that is less than -7.
The graph view of the four functions shows that the function has a y-value less than -7.
PTS: 2 NAT: F.IF.C.9 TOP: Comparing Functions
470) ANS: 2 Observe: The function is a second degree equation, so it must be a quadratic function. One year equals 52 weeks. Strategy: Step 1.: Solve the Plan B function for
Page 569

Regents Exam Questions F.IF.C.9: Comparing Functions 2 Page 12 www.jmap.org Name: __________________________________
Step 2. Compare the Plan A (52, 105) and Plan B (52, 135.21) coordinates for 52 weeks and observe that B has higher savings. Step 3. Eliminate wrong answers. a) correct, because Plan B is an exponential function and will increase at a faster rate b) correct, because Plan B is a quadratic function and will increase at a faster rate c) incorrect, because Plan A will have a higher value after 1 year d) incorrect, because Plan B is a quadratic function and will increase at a slower rate
PTS: 2 NAT: F.IF.C.9 TOP: Comparing Functions
471) ANS: 2 Strategy: Graph , then examine the truth value of the answer choices.
I. has a lower minimum value than . True: II. For all values of x, . False. is always > than . III. For any value of x, . True. is always 5 more than .
PTS: 2 NAT: F.IF.C.9 TOP: Comparing Functions
472) ANS: 2 Strategy: Find the maximum y-value for each function rule using a graphing calculator. Estimate the maximum y-value for each table.
Both function rules have maximum values of 5. The maximum value of is estimated as greater that 5. The maximum value of is estimated as less than 5.
PTS: 2 NAT: F.IF.C.9 TOP: Comparing Functions
473) ANS: 2 Strategy: Determine the minimum y-value for each function, then choose the smallest y-value. STEP 1. Evaluate each answer choice. Answer Choice 1. The minimum can be found by transforming the function from standard form to vertex form.
Page 570

Regents Exam Questions F.IF.C.9: Comparing Functions 2 Page 13 www.jmap.org Name: __________________________________
The vertex occurs at (-1, -7), so the minimum y-value is -7. Answer Choice 2. The minimum can be found by inspection of the graph. The minimum y-value is -10. Answer Choice 3. The minimum can be found using the graph or table views of the function in a graphing calculator. The minimum y-value is between -2 and -3.
Answer Choice 4. The miinimum can be found by inspection of the table of values. The minim y-value is -6. STEP 2. Pick the lowest y-value of all the answer choices.
PTS: 2 NAT: F.IF.C.9 TOP: Comparing Functions
Page 571

M – Functions, Lesson 8, Relating Graphs to Events (r. 2018)
FUNCTIONS Relating Graphs to Events
CC Standard
F-IF.4 For a function that models a relationship be-tween two quantities, interpret key features of graphs and tables in terms of the quantities, and sketch graphs showing key features given a verbal description of the relationship. Key features include: intercepts; intervals where the function is increas-ing, decreasing, positive, or negative; relative maxi-mums and minimums; symmetries; end behavior; and periodicity. PARCC: Tasks have a real-world context. Tasks are limited to linear functions, quadratic functions, square root functions, cube root functions, piece-wise defined functions (including step func-tions and absolute value functions) and exponential functions with domains in the integers.
NG Standard
AI-F.IF.4 For a function that models a relationship be-tween two quantities: i) interpret key features of graphs and tables in terms of the quantities; and ii) sketch graphs showing key features given a verbal de-scription of the relationship. (Shared standard with Algebra II) Notes: • Algebra I key features include the following: intercepts, zeros; intervals where the function is increasing, decreas-ing, positive, or negative; maxima, minima; and symme-tries. • Tasks have a real-world context and are limited to the following functions: linear, quadratic, square root, piece-wise defined (including step and absolute value), and ex-ponential functions of the form ( ) ( ) xf x a b= where a > 0 and b > 0 (b≠1).
LEARNING OBJECTIVES
Students will be able to:
1) relate graphs to real-world contexts, and 2) relate real-world contexts to graphs.
Overview of Lesson
Teacher Centered Introduction Overview of Lesson
- activate students’ prior knowledge
- vocabulary
- learning objective(s)
- big ideas: direct instruction
- modeling
Student Centered Activities guided practice Teacher: anticipates, monitors, selects, sequences, and connects student work
- developing essential skills
- Regents exam questions
- formative assessment assignment (exit slip, explain the math, or journal entry)
VOCABULARY
speed rate of change
increasing decreasing
interval
Page 572

BIG IDEAS Increasing or Decreasing Intervals and Slope
A Function is Increasing Over an Interval that has
Positive Slope
A Function is Decreasing Over an Interval that has
Negative Slope.
Example:
The function at right is
• increasing over the interval
0 < x < 2.5
• decreasing over the interval
2.5 < x < 5.5
NOTE: Graphs involving time and distance variables are about speed.
DEVELOPING ESSENTIAL SKILLS
1. The accompanying graph shows Marie’s distance from home (A) to work (F) at various times during her drive.
Marie left her briefcase at home and had to return to get it. State which point represents when she turned back around to go home and explain how you arrived at that conclusion. Marie also had to wait at the railroad tracks for a train to pass. How long did she wait?
2. John left his home and walked 3 blocks to his school, as shown in the accompanying graph.
Page 573

What is one possible interpretation of the section of the graph from point B to point C? a. John arrived at school and stayed
throughout the day. c. John returned home to get his mathematics
homework. b. John waited before crossing a busy street. d. John reached the top of a hill and began
walking on level ground.
3. The accompanying graph show the amount of water left in Rover’s water dish over a period of time.
How long did Rover wait from the end of his first drink to the start of his second drink of water? a. 10 sec c. 60 sec b. 30 sec d. 75 sec
4. A bug travels up a tree, from the ground, over a 30-second interval. It travels fast at first and then slows down. It
stops for 10 seconds, then proceeds slowly, speeding up as it goes. Which sketch best illustrates the bug’s distance (d) from the ground over the 30-second interval (t)? a.
c.
b.
d.
ANSWERS
1. ANS:
B, 5 minutes. At point B, Mary’s distance from home begins to decrease, representing the point where she turned back around to go home. The interval between points D and E is the only portion of the graph where Mary’s distance from home remains constant. It lasts for 5 mins.
Page 574

2. ANS: B Between points B and C, John’s distance from home remains constant. (2) represents an interpretation in which John’s distance remains constant, waiting before crossing a busy street. (1) also represents an interpretation in which John’s distance remains constant, but at points B and C, John had not yet arrived at school. In both (3) and (4), John’s distance from school is changing.
3. ANS: B When Rover is drinking, the amount of water in his dish decreases over time. The first decrease ends at 30 seconds and the second decrease begins at 60 seconds. The difference between these points is 30 seconds.
4. ANS: C In this sketch, the bug’s speed is decreasing during the first third of time, equals 0 during the second third of time and is increasing the last third of time. In (4), the bug is traveling down the tree. In (1) and (2), the bug’s speed remains constant.
Page 575

REGENTS EXAM QUESTIONS (through June 2018)
F.IF.B.4: Relating Graphs to Events
474) To keep track of his profits, the owner of a carnival booth decided to model his ticket sales on a graph. He
found that his profits only declined when he sold between 10 and 40 tickets. Which graph could represent his profits? 1)
3)
Profits in this graph decline between 10 and 40 tickets, so
2)
The slope in this graph is always positive, so the profit never declines.
4)
Page 576

475)During a snowstorm, a meteorologist tracks the amount of accumulating snow. For the first three hours of the storm, the snow fell at a constant rate of one inch per hour. The storm then stopped for two hours and then started again at a constant rate of one-half inch per hour for the next four hours. a) On the grid below, draw and label a graph that models the accumulation of snow over time using the data the meteorologist collected.
b) If the snowstorm started at 6 p.m., how much snow had accumulated by midnight?
476) The graph below models Craig's trip to visit his friend in another state. In the course of his travels, he
encountered both highway and city driving.
Based on the graph, during which interval did Craig most likely drive in the city? Explain your reasoning. Explain what might have happened in the interval between B and C. Determine Craig's average speed, to the nearest tenth of a mile per hour, for his entire trip.
Page 577

477) The graph below represents a jogger's speed during her 20-minute jog around her neighborhood.
Which statement best describes what the jogger was doing during the minute interval of her jog? 1) She was standing still. 3) She was decreasing her speed 2) She was increasing her speed. 4) She was jogging at a constant rate.
478) A driver leaves home for a business trip and drives at a constant speed of 60 miles per hour for 2 hours. Her car gets a flat tire, and she spends 30 minutes changing the tire. She resumes driving and drives at 30 miles per hour for the remaining one hour until she reaches her destination. On the set of axes below, draw a graph that models the driver’s distance from home.
Page 578

SOLUTIONS
474) ANS: 3 Declining profits over the interval 10 to 40 tickets sold will be shown as a negative slope.
a) Over the interval between 10 and 40 tickets sold, there is no negative slope, so this is a wrong choice.
c) Over the interval between 10 and 40 tickets sold, the slope is negative, so this is the correct choice.
b) Over the interval between 10 and 40 tickets sold, the slope is always positive, so this is a wrong choice.
d) Over the interval between 10 and 40 tickets sold, there is first a positive slope and then a negative, so this is a wrong choice.
PTS: 2 NAT: F.IF.B.4 TOP: Relating Graphs to Events
475) ANS:
At midnight, 6 hours after the storm began, inches of snow have fallen.
Strategy - Part a). Label the x and y axes and the corresponding intervals, then use the rates of change from the problem to complete the graph. STEP 1. Plot the rate of change for the first three hours of the storm. The rate of change during this time is 1 inch per 1 hour. STEP 2. Plot no change in accumulation for the two hours when the storm is stopped.
Page 579

STEP 3. Plot the rate of change for the next four hours. During this interval, the rate of change is
inch per 1 hour. Strategy: Part b). Determine which point on the graph corresponds to midnight.
Midnight it six hours after 6 p.m., so the coordinate can be used to determine the amount of
accumulation at midnight. The amount of snow accumulation at midnight is inches.
PTS: 4 NAT: F.IF.B.4 TOP: Relating Graphs to Events
476) ANS: Craig most likely was driving in the city during the interval . The slope of is less steep than the slopes of and , indicating a lower speed. Speed limits are usually lower in the city than on the highway. During the interval , Craig stopped. Craig’s average speed for the entire trip was 32.9 miles per hour.
PTS: 4 NAT: F.IF.B.4 TOP: Relating Graphs to Events
477) ANS: 4 Strategy: Pay close attention to the labels on the x-axis and the y-axis, then eliminate wrong answers. NOTE: A horizontal line (no slope) means that speed is not changing. Answer a can be eliminated because she would have a speed of 0 if she were standing still. She was only standing still at the start and end of her jog. Answer b can be eliminated because the speed does not change during the minute interval of her jog. Answer c can be eliminated because the speed does not change during the minute interval of her jog. Answer d is the correct choice because a horizontal line (no slope) means that speed is not changing.
PTS: 2 NAT: F.IF.B.4 TOP: Relating Graphs to Events
478) ANS:
Strategy - Use the speed of the car as the rate of change to complete the graph.
Page 580

STEP 1. Plot 2 hours at 60 miles per hour slope, based on the language “... a constant speed of 60 miles per hour for 2 hours.”
STEP 2. Plot hour at 0 slope based on the language “...she spends 30 minutes changing the tire.”
STEP 3. Plot 1 hour at 30 miles per hour slope based on the language “...drives at 30 miles per hour for the remaining one hour...”
PTS: 2 NAT: F.IF.B.4 TOP: Relating Graphs to Events
Page 581

M – Functions, Lesson 9, Graphing Piecewise-Defined Functions (r. 2018)
FUNCTIONS Graphing Piecewise-Defined Functions
Common Core Standard
F-IF.C.7 Graph functions expressed symbolically and show key features of the graph, by hand in sim-ple cases and using technology for more compli-cated cases.
Next Generation Standard
AI-F.IF.7 Graph functions and show key features of the graph by hand and by using technology where appropri-ate. (Shared standard with Algebra II)
LEARNING OBJECTIVES
Students will be able to:
1) Graph and interpret piecewise functions. 2) Input piecewise functions in a graphing calculator.
Overview of Lesson
Teacher Centered Introduction Overview of Lesson
- activate students’ prior knowledge
- vocabulary
- learning objective(s)
- big ideas: direct instruction
- modeling
Student Centered Activities guided practice Teacher: anticipates, monitors, selects, sequences, and connects student work
- developing essential skills
- Regents exam questions
- formative assessment assignment (exit slip, explain the math, or journal entry)
VOCABULARY
closed dot continuous function interval open dot piece piecewise function sub function
Page 582

BIG IDEAS
PIECEWISE FUNCTIONS
A piecewise function is a function that is defined by two or more sub functions, with each sub function applying to a certain interval on the x-axis. Each sub function may also be referred to as a piece of the overall piecewise function, hence the name piecewise.
Example. The following is a piecewise function:
( )2 1, 1
4, 1x x
f xx
+ <= ≥
This example of a piecewise function has two “pieces,” or sub functions.
a. Over the interval 1x < , the sub function is ( ) 2 1f x x= + .
b. Over the interval 1x ≥ , the sub function is ( ) 4f x = ..
Continuity
Piecewise functions are often discontinuous, which means that the graph will not appear as a single line. In the above table, the piecewise function is discontinuous when . This is because is not included in the sub function. Because piecewise functions are often discontinuous, care must be taken to use proper inequalities notation when graphing.
A table of values for this function. A graph for this function.
x
-3 -5 na
-2 -3 na
-1 -1 na
0 1 na
1 na 4
2 na 4
3 na 4
4 na 4
5 na 4
6 na 4
7 na 4
X-Axis
Y-Ax
is
-1
-2
-3
-4
-5
1 2 3 4 5 67
Page 583

Using Line Segments to Define Pieces If the circle at the beginning or end of a solution set (graph) is empty, that value is not included in the solution set. If the circle is filled in, that value is included in the solution set.
The number 1 is not included in the this solution set:
The number 1 is included in this following solution set:
NOTE: The TI83/84 family of graphing calculators can graph piecewise functions using the n-d function in the catalog and the test (second-math) function, as shown in the following screenshots.
Lesser Greater
0 1 2 3-1-2-3
Lesser Greater
0 1 2 3-1-2-3
Page 584

DEVELOPING ESSENTIAL SKILLS
Use technology to graph the following piecewise functions.
( )3, 1, 1
x xf x
x x− <
= − ≥
( )5, 12, 1
x xg x
x x− <
= − + ≥
( )3, 1
2 1, 1x x
h xx x+ <
= − ≥
ANSWERS
( )f x
( )g x
( )h x
Page 585

REGENTS EXAM QUESTIONS (through June 2018)
F.IF.C.7: Graphing Piecewise-Defined Functions
479) At an office supply store, if a customer purchases fewer than 10 pencils, the cost of each pencil is $1.75.
If a customer purchases 10 or more pencils, the cost of each pencil is $1.25. Let c be a function for which is the cost of purchasing x pencils, where x is a whole number.
Create a graph of c on the axes below.
A customer brings 8 pencils to the cashier. The cashier suggests that the total cost to purchase 10 pencils would be less expensive. State whether the cashier is correct or incorrect. Justify your answer.
480) Which graph represents ?
1)
3)
Page 586

2)
4)
481) A function is graphed on the set of axes below.
Which function is related to the graph? 1)
3)
2)
4)
482) Graph the following function on the set of axes below.
483) Which graph does not represent a function that is always increasing over the entire interval ?
1)
3)
Page 587

2)
4)
484) On the set of axes below, graph the piecewise function:
SOLUTIONS
479) ANS:
Page 588

The cashier is correct. 8 pencils cost $14 and 10 pencils cost $12.50. Strategy: Use a graphing calculator and graph the function in two sections. Note that the domain of the function is whole numbers. You cannot buy a part of a pencil. This means that the graph of the function will consist of points and not lines. After completing the graph, answer the questions presented in the problem. STEP 1: Graph the section of the function represented by . Plot closed dots for each whole number in the domain .
STEP 2: Graph the section of the function represented by . Plot closed dots for each whole number in the domain .
STEP 3: Answer the questions presented in the problem. The data tables and the graph show that it would be cheaper to purchase 10 pencils that to purchase 8 pencils.
PTS: 4 NAT: F.IF.C.7 TOP: Graphing Piecewise-Defined Functions
480) ANS: 2 Strategy: Eliminate wrong answers.
Page 589
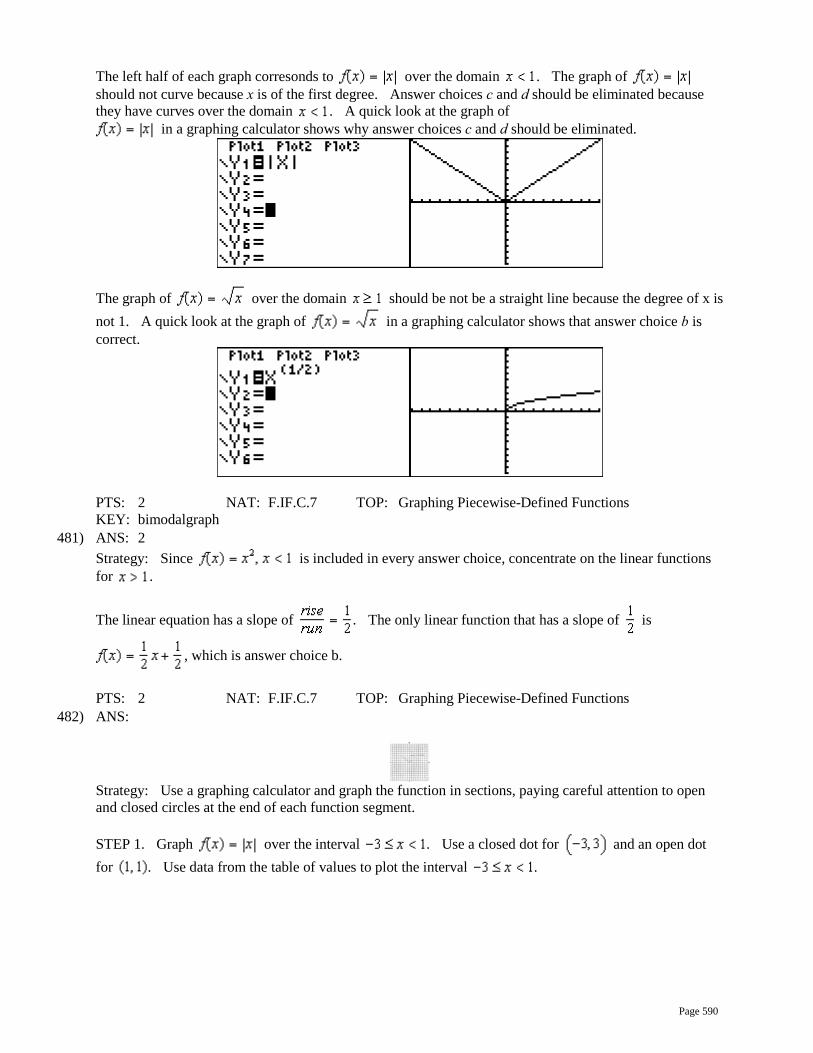
The left half of each graph corresonds to over the domain . The graph of should not curve because x is of the first degree. Answer choices c and d should be eliminated because they have curves over the domain . A quick look at the graph of
in a graphing calculator shows why answer choices c and d should be eliminated.
The graph of over the domain should be not be a straight line because the degree of x is not 1. A quick look at the graph of in a graphing calculator shows that answer choice b is correct.
PTS: 2 NAT: F.IF.C.7 TOP: Graphing Piecewise-Defined Functions KEY: bimodalgraph
481) ANS: 2 Strategy: Since is included in every answer choice, concentrate on the linear functions for .
The linear equation has a slope of . The only linear function that has a slope of is
, which is answer choice b.
PTS: 2 NAT: F.IF.C.7 TOP: Graphing Piecewise-Defined Functions
482) ANS:
Strategy: Use a graphing calculator and graph the function in sections, paying careful attention to open and closed circles at the end of each function segment. STEP 1. Graph over the interval . Use a closed dot for and an open dot for . Use data from the table of values to plot the interval .
Page 590

STEP 2: Graph over the interval . Use a closed dot for and a closed dot for
. Use data from the table of values to plot the interval .
Do not connect the two graph segments.
PTS: 2 NAT: F.IF.C.7 TOP: Graphing Piecewise-Defined Functions
483) ANS: 3 Strategy: Looks at the slope of the graph over the interval . Select the answer choice where the slope of the graph is negative anywhere in this interval.
Answer choice (3) is the only graph that has a negative slope over the interval .
PTS: 2 NAT: F.IF.C.7 TOP: Graphing Piecewise-Defined Functions
484) ANS:
Page 591

Strategy: Use a graphing calculator to help find and plot two points that define the lines for each part of this piecewise function. STEP 1. Input the piecewise function as two separate equations in a graphing calculator and inspect the table of values for both functions.
STEP 2. Plot the points for both functions when , which is the x-value where the function changes from the first piece to the second piece. (2, -1) is plotted for the first part of the function with an open circle, because the domain for this piece of the function is . (2, 2) is plotted for the second part of the function with a closed circle, because the domain for this piece of the function is . STEP 3. Pick a second point in the domain to plot for the first piece ( ) of the function. (0, 0) is an easy ordered pair to plot. STEP 4. Draw a directed line that starts at (2,-1) and passes through (0,0). STEP 5. Pick a second point in the domain to plot for the second piece ( ) of the function. (6, 6) is an easy ordered pair to plot. STEP 6. Draw a directed line that starts at (2,2) and passes through (6,6).
PTS: 2 NAT: F.IF.C.7 TOP: Graphing Piecewise-Defined Functions
Page 592

M – Functions, Lesson 10, Graphing Step Functions (r. 2018)
FUNCTIONS Graphing Step Functions
Common Core Standard
F-IF.C.7 Graph functions expressed symbolically and show key features of the graph, by hand in sim-ple cases and using technology for more compli-cated cases.
Next Generation Standard
AI-F.IF.7 Graph functions and show key features of the graph by hand and by using technology where appropri-ate. (Shared standard with Algebra II)
NOTE: This lesson is related to Functions, Lesson 9, Graphing Piecewise Functions
LEARNING OBJECTIVES
Students will be able to:
1) Graph and interpret step functions.
Overview of Lesson
Teacher Centered Introduction Overview of Lesson
- activate students’ prior knowledge
- vocabulary
- learning objective(s)
- big ideas: direct instruction
- modeling
Student Centered Activities guided practice Teacher: anticipates, monitors, selects, sequences, and connects student work
- developing essential skills
- Regents exam questions
- formative assessment assignment (exit slip, explain the math, or journal entry)
VOCABULARY
closed dot continuous function interval open dot piece piecewise function sub function
Page 593

BIG IDEAS
STEP FUNCTIONS A step function is typically a piecewise function with many sub functions that resemble stair steps.
Each step corresponds to a specific domain. The function rule for the graph above is:
DEVELOPING ESSENTIAL SKILLS
Model each context with a step function.
1. You want to bring cupcakes to math club to celebrate your birthday. Each box of cupcakes contains 6 cupcakes and costs $4.00. You expect as many as 30 students to be at math club. Create a function rule that models the cost in terms of the number of students in math club.
( )
4, 0 68, 7 1212, 13 1816, 19 24
ss
C sss
< ≤ < ≤= < ≤ < ≤
2. You’re ordering pizza for your math teacher’s birthday party. You estimate that each pizza will serve 4 people and that up to 26 people may attend. Create a function rule that models the number of pizzas you need to order in terms of the number of people attending.
( )
1, 0 42, 5 83, 9 124, 13 165, 17 206, 21 247, 25 28
sss
P s ssss
< ≤ < ≤ < ≤= < ≤ < ≤
< ≤ < ≤
Page 594

REGENTS EXAM QUESTIONS (through June 2018)
F.IF.C.7: Graphing Step Functions
485) Morgan can start wrestling at age 5 in Division 1. He remains in that division until his next odd birthday
when he is required to move up to the next division level. Which graph correctly represents this information? 1)
3)
2)
4)
486) The table below lists the total cost for parking for a period of time on a street in Albany, N.Y. The total cost is for any length of time up to and including the hours parked. For example, parking for up to and including 1 hour would cost $1.25; parking for 3.5 hours would cost $5.75.
Graph the step function that represents the cost for the number of hours parked.
Page 595

Explain how the cost per hour to park changes over the six-hour period.
SOLUTIONS
485) ANS: 1 Strategy: Focus on whether the line segments should begin and end with closed or open circles. A closed circle is included. An open circle is not included.
PTS: 2 NAT: F.IF.C.7 TOP: Graphing Step Functions KEY: bimodalgraph
486) ANS:
The cost per houir to park gets bigger over the six hour period.
Page 596

Strategy: Graph this step function by hand using information from the table. This function has too many sections to easily input into a graphing calculator. STEP 1. Graph the section for the domain . The table shows that this interval corresponds to a cost of $1.25 on the y-axis. Use an open dot at (0, 1.25) and a closed dot at (1, 1.25). Connect the two dots with a solid line. STEP 2. Graph the section for the domain . The table shows that this interval corresponds to a cost of $2.50 on the y-axis. Use an open dot at (1, 2.50) and a closed dot at (2, 2.50). Connect the two dots with a solid line. STEP 3. Graph the section for the domain . The table shows that this interval corresponds to a cost of $4.00 on the y-axis. Use an open dot at (2, 4.00) and a closed dot at (3, 4.00). Connect the two dots with a solid line. STEP 4. Graph the section for the domain . The table shows that this interval corresponds to a cost of $5.75 on the y-axis. Use an open dot at (3, 4.75) and a closed dot at (4, 4.75). Connect the two dots with a solid line. STEP 5. Graph the section for the domain . The table shows that this interval corresponds to a cost of $7.75 on the y-axis. Use an open dot at (4, 7.75) and a closed dot at (5, 7.75). Connect the two dots with a solid line. STEP 6. Graph the section for the domain . The table shows that this interval corresponds to a cost of $10.00 on the y-axis. Use an open dot at (5, 10.00) and a closed dot at (6, 10.00). Connect the two dots with a solid line. STEP 7: Answer the question based on the graph and the table.
PTS: 4 NAT: F.IF.C.7 TOP: Graphing Step Functions
Page 597

N – Sequences and Series, Lesson 1, Sequences (r. 2018)
SEQUENCES AND SERIES Sequences
CC Standard
F-IF.A.3 Recognize that sequences are functions, sometimes defined recursively, whose domain is a subset of the integers. For example, the Fibonacci sequence is defined recursively by f(0) = f(1) = 1, f(n+1) = f(n) + f(n-1) for n ≥ 1. PARCC: This standard is part of the Major work in Algebra I and will be assessed accordingly. F-LE.2 Construct linear and exponential functions, including arithmetic and geometric sequences, given a graph, a description of a relationship, or two input-output pairs (include reading these from a table). PARCC: Tasks are limited to constructing linear and exponential functions in simple context (not multi-step).
NG Standard
AI-F.IF.3 Recognize that a sequence is a function whose domain is a subset of the integers. (Shared standard with Algebra II) Notes: • Sequences (arithmetic and geometric) will be written explicitly and only in subscript notation. • Work with geometric sequences may involve an expo-nential equation/formula of the form an = arn-1, where a is the first term and r is the common ratio. AI-F.LE.2 Construct a linear or exponential function symbolically given: i) a graph; ii) a description of the relationship; iii) two input-output pairs (include reading these from a table). (Shared standard with Algebra II) Note: Tasks are limited to constructing linear and expo-nential functions in simple context (not multi-step).
LEARNING OBJECTIVES
Students will be able to:
1) Define sequences as recursive functions. 2) Evaluate recursive functions for the nth term.
Overview of Lesson
Teacher Centered Introduction Overview of Lesson
- activate students’ prior knowledge
- vocabulary
- learning objective(s)
- big ideas: direct instruction
- modeling
Student Centered Activities guided practice Teacher: anticipates, monitors, selects, sequences, and connects student work
- developing essential skills
- Regents exam questions
- formative assessment assignment (exit slip, explain the math, or journal entry)
VOCABULARY
arithmetic progression explicit formula geometric progression pattern recursive formula
sequence series set term
Page 598

BIG IDEAS An explicit formula is one where you do not need to know the value of the term in front of the term that you are seeking. For example, if you want to know the 55th term in a series, an explicit formula could be used without knowing the value of the 54th term. Example: The sequence 3, 11, 19, 27, ... begins with 3, and 8 is added each time to form the pattern. The sequence can be shown in a table as follows:
Term # (n) 1 2 3 4 3 11 19 27
Explicit formulas for the sequence 3, 11, 19, 27, ... can be written as:
or Using these explicit formulas, we can find the following values for any term, and we do not need to know the value of any other term, as shown below:
Recursive formulas requires you to know the value of another term, usually the preceding term, to find the value of a specific term. Example: Using the same sequence 3, 11, 19, 27, ... as above, a recursive formula for the sequence 3, 11, 19, 27, ... can be written as:
This recursive formula tells us that the value of any term in the sequence is equal to the value of the term before it plus 8. A recursive formula must usually be anchored to a specific term in the sequence (usually the first term), so the recursive formula for the sequence 3, 11, 19, 27, ... could be anchored with the statement
Using this recursive formula, we can reconstruct the sequence as follows:
Observe that the recursive formula includes two different
values of the dependent variable, which in this example are and , and we can only reconstruct our original sequence using this recursive formula if we know the term immediately preceding the term we are seeking.
Two Kinds of Sequences arithmetic sequence (A2T) A set of numbers in which the common difference between each term and the preceding term is constant.
Example: In the arithmetic sequence 2, 5, 8, 11, 14, … the common difference between each term and the preceding term is 3. A table of values for this sequence is:
Page 599

Term # (n) 1 2 3 4 5 2 5 8 11 14
An explicit formula for this sequence is A recursive formula for this sequence is:
geometric sequence (A2T) A set of terms in which each term is formed by multiplying the preceding term by a common nonzero constant. Example: In the geometric sequence ... the common ratio is 2. Each term is 2 times the preceding term. A table of values for this sequence is:
Term ( n) 1 2 3 4 5 2 4 8 16 32
An explicit formula for this sequence is A recursive formula for this sequence is:
DEVELOPING ESSENTIAL SKILLS
1) If ( )1 5f = and ( ) ( )3 1f n f n= − − , then ( )4f = 1) -15 3) 45 2) 20 4) -135
2) If a sequence is defined recursively by ( )0 6f = and ( ) ( )1 3 4f n f n+ = − + for all 0n ≥ , then
( )2f is equal to 1) 22 3) 46 2) -27 4) -14
3) In a sequence, the first term is 3 and the common difference is 4. The fifth term of this sequence is 1) 3) 16 2) 4) 19
4) Given the function ( )f n defined by the following:
( )( ) ( )1 7
3 1 4
f
f n f n
=
= − − +
Which set could represent the range of the function? 1) { }7, 17,55, 111,...− − 3) { }1,7,17,55,... 2) { }7,25,79,321,... 4) { }1,7,25,79,...
ANSWERS
1) 4 2) 3 3) 4 4) 1
Page 600

REGENTS EXAM QUESTIONS (through June 2018)
F.IF.A.3, F.LE.A.2: Sequences and Series
487) If and , then
1) 3) 21 2) 11 4) 43
488) If a sequence is defined recursively by and for , then is equal to 1) 1 3) 5 2) 4) 17
489) In a sequence, the first term is 4 and the common difference is 3. The fifth term of this sequence is 1) 3) 16 2) 4) 19
490) Given the function defined by the following:
Which set could represent the range of the function? 1) 3) 2) 4)
491) A sequence of blocks is shown in the diagram below.
This sequence can be defined by the recursive function and . Assuming the pattern continues, how many blocks will there be when ? 1) 13 3) 28 2) 21 4) 36
492) Determine and state whether the sequence displays exponential behavior. Explain how you arrived at your decision.
493) A sunflower is 3 inches tall at week 0 and grows 2 inches each week. Which function(s) shown below
can be used to determine the height, , of the sunflower in n weeks? I. II. III. 1) I and II 3) III, only 2) II, only 4) I and III
494) The diagrams below represent the first three terms of a sequence.
Page 601

Assuming the pattern continues, which formula determines , the number of shaded squares in the nth term? 1) 3) 2) 4)
495) A pattern of blocks is shown below.
If the pattern of blocks continues, which formula(s) could be used to determine the number of blocks in the nth term?
1) I and II 3) II and III 2) I and III 4) III, only
496) The third term in an arithmetic sequence is 10 and the fifth term is 26. If the first term is , which is an equation for the nth term of this sequence? 1) 3) 2) 4)
497) Which recursively defined function has a first term equal to 10 and a common difference of 4? 1) 3)
2) 4)
498) Which recursively defined function represents the sequence ? 1) 3) 2) 4)
499) Which function defines the sequence -6, -10, -14, -18, ..., where ? 1) 3) 2) 4)
Page 602
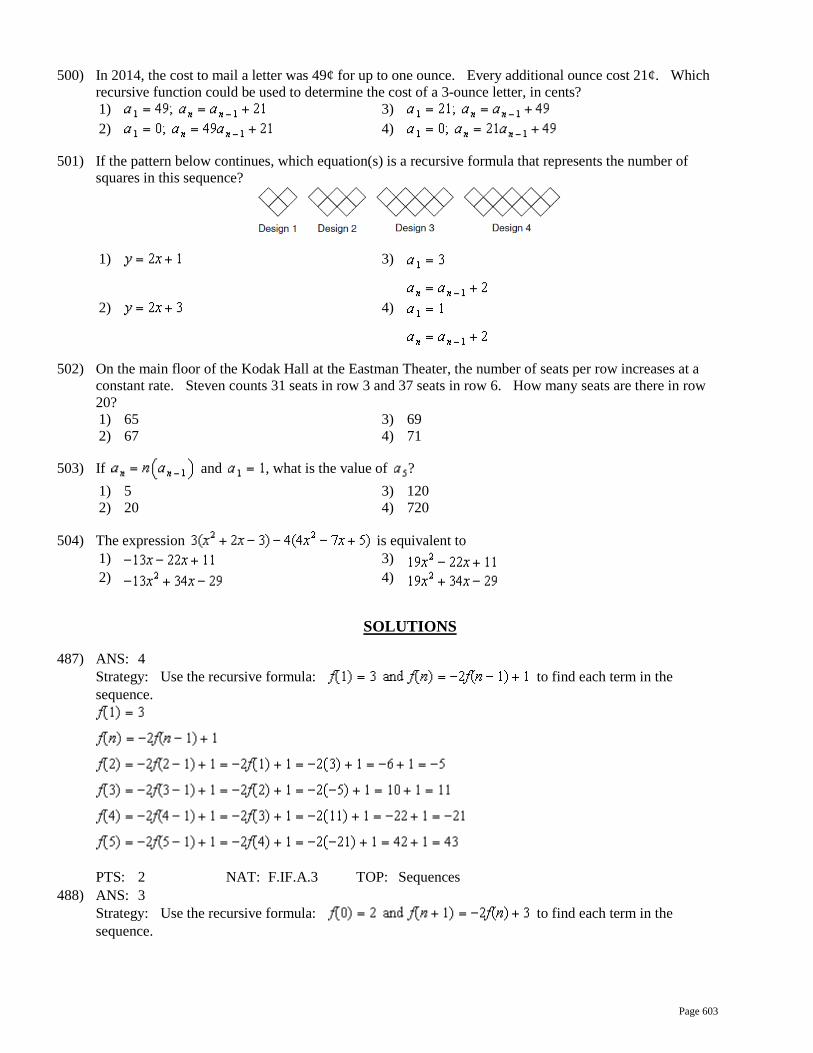
500) In 2014, the cost to mail a letter was 49¢ for up to one ounce. Every additional ounce cost 21¢. Which recursive function could be used to determine the cost of a 3-ounce letter, in cents? 1) 3) 2) 4)
501) If the pattern below continues, which equation(s) is a recursive formula that represents the number of squares in this sequence?
1) 3)
2) 4)
502) On the main floor of the Kodak Hall at the Eastman Theater, the number of seats per row increases at a constant rate. Steven counts 31 seats in row 3 and 37 seats in row 6. How many seats are there in row 20? 1) 65 3) 69 2) 67 4) 71
503) If and , what is the value of ? 1) 5 3) 120 2) 20 4) 720
504) The expression is equivalent to 1) 3) 2) 4)
SOLUTIONS
487) ANS: 4 Strategy: Use the recursive formula: to find each term in the sequence.
PTS: 2 NAT: F.IF.A.3 TOP: Sequences
488) ANS: 3 Strategy: Use the recursive formula: to find each term in the sequence.
Page 603

Answer choice c corresponds to .
PTS: 2 NAT: F.IF.A.3 TOP: Sequences
489) ANS: 3 Step 1. Understand that the problem wants to know the fifth term in a sequence when the first term is 4 and the common difference is 3. Step 2. Strategy. Build a table. Step 3. Execute the strategy. Term # 1 2 3 4 5
Value 4 7 10 13 16 Step 4. Does it make sense? Yes. You can check it by writing the following formula based on the table and using it to find any term in this arithmetic sequence.
PTS: 2 NAT: F.IF.A.3 TOP: Sequences KEY: term
490) ANS: 2 The first value in the function must be 2. Therefore, and
must be wrong choices.
Since -8 is the second number, the correct answer choice is .
PTS: 2 NAT: F.IF.A.3 TOP: Sequences KEY: term
491) ANS: 3
PTS: 2 NAT: F.IF.A.3 TOP: Sequences KEY: term
492) ANS:
Page 604

Yes. Each number in the sequence is three times bigger than the previous number, so the sequence has a common ratio, which is 3.
PTS: 2 NAT: F.LE.A.1 TOP: Families of Functions
493) ANS: 4 Strategy: If sunflower’s height is modelled using a table, then the three formulas can be tested to see which one(s) produce results that agree with the table.
Weeks (n)
Height
0 3
1 5 2 7 3 9
Formula I, , is an explicit formula that agrees with the table. Formula II is an explicit formula that does not agree with the table. Formula III, , is a recursive formula that agrees with the table.
PTS: 2 NAT: F.IF.A.3 TOP: Sequences
494) ANS: 2 Strategy: Examine the pattern, then test each formula and eliminate wrong choices.
Term 1 has 12 shaded squares. Term 2 has 16 shaded squares. Term 3 has 20 shaded squares.
Choice Equation Term 1 = 12 Term 2 = 16 Term 3 = 20 a = 16 (eliminate) b = 12 (correct) = 16 (correct) = 20 (correct) c = 8 (eliminate) d = 6 (eliminate)
PTS: 2 NAT: F.LE.A.2 TOP: Sequences
495) ANS: 3 Strategy: Examine the pattern, then test each formula and eliminate wrong choices.
Term 1 has 2 squares. Term 2 has 6 squares.
Term 3 has 10 squares. Term 4 has 14 squares
n 1 2 3 4 2 6 10 14
Formula Equation Term 1 = 2 Term 2 = 6 Term 3 = 10 Term 4 = 14
I
Page 605

This is wrong, so eliminate
choices a and b..
II correct
correct correct
correct III
correct
correct
correct
correct Choose answer choice c because Formulas II and III are both correct.
PTS: 2 NAT: F.BF.A.1 TOP: Sequences
496) ANS: 2 Strategy: Build the sequence in a table, then test each equation choice and eliminate wrong answers.
10 26
The term must be half way between 10 and 26, so it must be 18. The common difference is 8, so we can fill in the rest of the table as follows:
-6 2 10 18 26
The first term in the sequence is -6. Choice Equation Term = -6 Term = 10 Term = 26
a = 18 (eliminate) b = -6 (correct) = 10 (correct) = 26 (correct) c = 26 (eliminate) d = -12 (eliminate)
PTS: 2 NAT: F.LE.A.2 TOP: Sequences
497) ANS: 1 Strategy: Eliminate wrong answers. Choices b and d have first terms equal to 4, but the problem states that the first term is equal to 10. Therefore, eliminate choices b and d. A common difference of 4 requires the addition or subtraction of 4 to find the next term in the sequence. Eliminate choice c because choice c multiplies the preceding term by 4. Choice a is correct because the first term is 10 and 4 is added to each preceding term.
PTS: 2 NAT: F.IF.A.3 TOP: Sequences
498) ANS: 3
Page 606

Each choice has a first term equal to 3. Each additional term is twice its preceding term plus 1. Strategy: Eliminate wrong answers and check. All choices have show the the first term equals three: . Eliminate and because they are exponential. Eliminate because each term is not three times its preceding term minus two. Check as follows:
produces the sequence 3, 7, 15, 31,.....
PTS: 2 NAT: F..IF.A.3 TOP: Sequences
499) ANS: 1 Strategy #1 Construct the following table from the problem:
x 1 2 3 4 5 6 f(x) -6 -10 -14 -18
Then, input the four answer choices in a graphing calculator and inspect the table view to determine which answer choice reproduces the table. Strategy #2 Use a graphing calculator to find a regression equation for the data in the above table.
PTS: 2 NAT: F.IF.A.2
500) ANS: 1 Strategy: Eliminate wrong answers. The first ounce costs 49 cents, so eliminate any answer choice where does not equal 49.
PTS: 2 NAT: F.LE.A.2 TOP: Sequences
501) ANS: 3 STEP 1: Count the number of squares in Designs, 1, 2, 3, and 4. Design 1 = 3 Design 2 = 5 Design 3 = 7 Design 4 = 9 STEP 2: Eliminate answer choices and because they are not written as recursive formulas. STEP 3: Eliminate because the first value in the sequence is three, so .
STEP 4: Choose
PTS: 2 NAT: F.LE.A.2 TOP: Sequences
502) ANS: 1 Strategy: Find the constant rate of change, then write an equation to solve for the number of seats in row 20.
Page 607

STEP 1. Find the constant rate of change. x values increase by 1
row # (x) 3 4 5 6 # seats (y) 31 33 35 37
y values increase by 2
STEP 2. Write the slope-intercept form of the line having a constant rate of change of 2 and any pair of known x and y values.
Given
Solve for b
Write the Entire Equation
STEP 3. Use the linear equation to solve for .
Notes Left Expression
Sign Right Expression
Given y = Let x equal 20 y =
Remove Parentheses y = 40+25 Simplify y = 65
PTS: 2 NAT: F.IF.A.3 TOP: Sequences KEY: term
503) ANS: 3 Strategy: Build a table.
n Calculations 1 , Given 1 2 2
3 6
4 24
5 120
The correct answer is .
PTS: 2 NAT: F.IF.A.3 TOP: Sequences KEY: term
504) ANS: 2 Strategy: Use the distributive property to clear parentheses, then combine like terms.
Notes Expression Given
Distributive Property Reorder by Like Terms Combine Like Terms
PTS: 2 NAT: A.APR.A.1 TOP: Operations with Polynomials KEY: subtraction
Page 608

Page 609