JMAA 2015.2
57
Volume 11, Number 2, February 2015 (Serial Number 117) Journal of Modern Accounting and Auditing David David Publishing Company www.davidpublisher.com Publishing David
-
Upload
davidpublishing -
Category
Documents
-
view
5 -
download
0
Transcript of JMAA 2015.2

Volume 11, Number 2, February 2015 (Serial Number 117)
Journal ofModern Accounting and Auditing
David
David Publishing Company
www.davidpublisher.com
PublishingDavid

Publication Information: Journal of Modern Accounting and Auditing is published monthly in hard copy (ISSN1548-6583) and online (ISSN1935-9683) by David Publishing Company located at 240 Nagle Avenue #15C, New York, NY 10034, USA. Aims and Scope: Journal of Modern Accounting and Auditing, a monthly professional academic journal, covers all sorts of researches on accounting research, financial theory, capital market, audit theory and practice from experts and scholars. Editorial Board Members: Avis Andoni, Albania. Benedetta Siboni, Italy. Brad S. Trinkle, USA. Daniela Cretu, Romania. Drazen Koski, the Republic of Croatia. Elisabete Fátima Simões Vieira, Portugal. Emmanuel Attah, Ghana. Fabrizio Rossi, Italy. Haihong He, USA. Joanna Błach, Poland. João Paulo Torre Vieito, Portugal. Liang Song, USA. Lindita Rova, Albania. Mohammed Al-Omiri, Saudi Arabia. Mohamed Rochdi Keffala, Tunisia. Mohammad Talha, Saudi Arabia. Monika Wieczorek-Kosmala, Poland. Narumon Saardchom, Thailand.
Peter Harris, USA. Philip Harris Siegel, USA. Philip Yim Kwong Cheng, Australia. Rosa Lombardi, Italy. Sabina Hodzic, Croatia. Selim Mekdessi, Lebanon. Sheikh Abdur Rahim, Bangladesh. Thomas Gstraunthaler, South Africa. Tita Djuitaningsih, Indonesia. Tiziana Di Cimbrini, Italy. Tumellano Sebehela, United Kingdom. Valdir de Jesus Lameira, Brazil. Valerio Pesic, Italy. Vintilescu Belciug Adrian, Romania. Wan Mansor W. Mahmood, Malaysia. Yezdi H. Godiwalla, USA. Zeynep Özsoy, Turkey.
Manuscripts and correspondence are invited for publication. You can submit your papers via Web Submission, or E-mail to [email protected]. Submission guidelines and Web Submission system are available at http://www.davidpublisher.com/. Copyright©2015 by David Publishing Company and individual contributors. All rights reserved. David Publishing Company holds the exclusive copyright of all the contents of this journal. In accordance with the international convention, no part of this journal may be reproduced or transmitted by any media or publishing organs (including various websites) without the written permission of the copyright holder. Otherwise, any conduct would be considered as the violation of the copyright. The contents of this journal are available for any citation, however, all the citations should be clearly indicated with the title of this journal, serial number, and the name of the author. Abstracted/Indexed in: Database of EBSCO, Massachusetts, USA Universe Digital Library Sdn Bhd, Malaysia Australian ERA ProQuest CSA-Natural Sciences, USA Chinese Database of CEPS, Airiti Inc. & OCLC Google Scholar Ulrich’s Periodicals Directory CiteFactor, USA Social Science Research Network (SSRN), USA
Polish Scholarly Bibliography Database of Summon Serials Solutions, USA Turkish Education Index CrossRef Electronic Journals Library Chinese Scientific Journals Database, VIP Corporation, Chongqing, P.R. China Scholar Steer Scientific Indexing Services
Subscription Information: Price (per year): Print $640; Online $480; Print and Online $800 David Publishing Company 240 Nagle Avenue #15C, New York, NY 10034, USA Tel: 1-323-984-7526, 323-410-1082; Fax: 1-323-984-7374, 323-908-0457 E-mail: [email protected], [email protected]
David Publishing Company www.davidpublisher.com
DAVID PUBLISHING
D

Journal of Modern Accounting and Auditing
Volume 11, Number 2, February 2015 (Serial Number 117)
Contents The Impact of Turnover Ratios on Jordanian Services Sectors’ Performance 77
Lina Warrad, Rania Al Omari
Information on Financial Statements for Loan Decision-Making of Commercial Banks in Vietnam 86
Mai Thi Hoang Minh
Growth and Inequality in Indonesia: Does Kuznets Curve Hold? 93
G. A. Diah Utari, Retni Cristina
Corporate Social and Environmental Reporting Institutionalized 112
René P. Orij
Embedding Economic Excellence: A Transformational Definition of “Corporate Governance” for Malaysia 124
Zulkifflee Mohamed, Garry James Clayton, Mohd Yaziz Mohd Isa


Journal of Modern Accounting and Auditing, February 2015, Vol. 11, No. 2, 77-85 doi: 10.17265/1548-6583/2015.02.001
The Impact of Turnover Ratios on Jordanian
Services Sectors’ Performance
Lina Warrad Applied Science University, Amman, Jordan
Rania Al Omari Al-Asra University, Amman, Jordan
Profitability ratios are a group of financial ratios that indicate how much profit a business is earning within a
certain context, while asset utilization ratios indicate how efficient a business is in operating its assets to generate
cash. The difference between profitability ratios and turnover ratios is the fact that turnovers are more specific.
While profitability ratios measure overall performance in terms of profits, asset utilization ratios focus on specific
measurements within the business.1 We conduct this study to verify the impact of turnover ratios on Jordanian
services sectors’ performance during the period from 2009 to 2012. The study showed that there is no significant
impact of turnover ratios on Jordanian services sectors’ profitability, and by testing the main and sub hypotheses,
the study revealed that there is no significant impact of turnover ratios on Jordanian services sectors’ return on
assets (ROA), there is no significant impact of working capital turnover on Jordanian services sectors’ ROA,
there is no significant impact of total asset turnover on Jordanian services sectors’ ROA, and there is no
significant impact of fixed asset turnover on Jordanian services sectors’ ROA. Also, the study showed that there is
no significant impact of turnover ratios on Jordanian services sectors’ return on equity (ROE), there is no
significant impact of working capital turnover on Jordanian services sectors’ ROE, there is no significant
impact of total asset turnover on Jordanian services sectors’ ROE, and there is no significant impact of fixed
asset turnover on Jordanian services sectors’ ROE. Moreover, the study concluded that the educational services
sector has the lowest working capital turnover and healthcare services sector has the highest. In addition, we find
that the hotels and tourism sector has the lowest total asset turnover ratio, while the utilities and energy sector has
the highest and that the hotels and tourism sector has the lowest fixed asset turnover, while the utilities and energy
sector has the highest. The transportation sector has the lowest ROA and technology and communication sector
has the highest. Finally, we find that transportation sector has the lowest ROE and the technology and
communication sector has the highest.
Keywords: working capital turnover, total asset turnover, fixed asset turnover, return on assets (ROA), return on
equity (ROE), Amman Stock Exchange (ASE)
Lina Warrad, associate professor, Faculty of Economic and Administrative Science, Accounting Department, Applied Science
University. Email: [email protected]. Rania Al Omari, assistant professor, Faculty of Administrative and Financial Sciences, Accounting Department, Al-Asra
University. 1 Retrieved from http://smallbusiness.chron.com/difference-between-profitability-ratios-asset-utilization-ratios-37803.html.
DAVID PUBLISHING
D

IMPACT OF TURNOVER RATIOS ON JORDANIAN SERVICES SECTORS’ PERFORMANCE
78
Introduction Financial statements report on both a firm’s position at a point in time and its operations over some past
periods. However, the real value of financial statements lies in the fact that they can be used to help predict future earnings, dividends, and free cash flows. Profitability ratios and asset utilization ratios are considered to be the most common and simple to calculate. Each type of ratio reveals something different about a business, but they deal with some of the same measurements and issues (Schmidlin, 2014).
Working capital turnover ratio is a measure to determine how effectively a company is operating its assets to generate sales. The working capital turnover ratio is used to analyze the relationship between the money used to fund operations and the sales generated from these operations. The smaller the current capital compared to the sales in this ratio, the higher the capital turnover ratio.2 Moreover, the total asset turnover is similar to fixed asset turnover ratio, which measures a company’s effectiveness in generating sales from investments related to the company. Total asset turnover evaluates the efficiency of managing all the company’s assets.
The most active sector in the Jordanian economy is the service sector, which forms 67% of the GDP. Jordan has been a participant since December 2000 in the WTO General Agreement on Trade in services and one of the seven Mediterranean partners that officially opened negotiations on liberalization on services and the right of establishment at the Euro-Mediterranean Trade Ministerial Conference in Marrakech. Liberalization will provide Jordan with an access to the EU services market, the largest in the world, and provide benefits from EU service technologies, company links, and investments.3
This paper will try to investigate the previous relations mentioned above by studying the impact of turnover ratios on the performance of the Jordanian services sectors which are listed at Amman Stock Exchange (ASE) during the period from 2009 to 2012.
Previous Studies The impact of working capital turnover on chemical companies’ profitability measured by return on assets
(ROA) was presented by the study of Warrad (2014) which covered a period from 2009 to 2011, and a simple liner regression was applied. The study revealed a significant impact of independent variable working capital turnover on dependent variable ROA among chemical industries listed on ASE during the period from 2009 to 2011.
The working capital performance of Dabur India Ltd. during the period from 2003 to 2010 was investigated by Chakraborty’s (2013) study which used inventory turnover ratio, working capital turnover ratio, current asset turnover ratio, and debtor’s turnover ratio to achieve good performance of the company, while in terms of current ratio and the liquidity position of the company are not good.
Banks’ performance was investigated by Jahan’s (2012) study which used determinants of banks’ profitability, which are ROA, return on equity (ROE), and return on debt (ROD) as a criterion for the Bangladesh Bank to evaluate banks’ performance by evaluating the efficiency ratio, asset utilization ratio, asset size, and ROD as a determinant of banks’ profitability measured by ROA. The study was conducted on randomly selected six commercial banks of Bangladesh. The results showed that the Prime Bank is considered to be superior in terms of total assets, while the Arab Bangladesh Bank is showing high performance in terms of profitability. The explanatory variables operational efficiency, asset size, and ROD were found to be
2 Retrieved from http://www.finweb.com/investing/a-discussion-of-capital-turnover.html#axzz3CMBN0wvJ. 3 Retrieved from http://www.jedco.gov.jo/joomla/index.php?option=com_content&id=484&Itemid=266&lang=en.

IMPACT OF TURNOVER RATIOS ON JORDANIAN SERVICES SECTORS’ PERFORMANCE
79
positively related and asset utilization was found to be negatively related to ROA through the results of the regression analysis, but these associations are statistically insignificant.
The impact of working capital and liquidity on the profitability of Tata Motors during the period of 2002-2010 was presented by Raheja, Bhardwaj, and Priyanka (2012) who used Karl Pearson’s correlation, T-test, regression, rank correlation, average, and standard deviation to analyze the variables. The results revealed that there is no significant relationship between liquidity and profitability. Out of seven components of working capital, only two factors have a negative impact on profitability: working capital turnover ratio and cash turnover ratio. Also, the results showed that there was a positive correlation between working capital components and profitability.
The relationship between working capital management and profitability in firms belonging to information technology and telecommunication industry in India during the period from 1999 to 2010 was investigated by Singh’s (2012) study which used pooling cross section and time series data, and 11 firms were randomly selected, out of which, five belonged to the information technology industry and six were from the telecommunication industry. The study used the return on capital employed as a measure of profitability. Other variables for working capital management were working capital turnover, current ratio, days’ inventory outstanding, days’ sales outstanding, days’ payable outstanding, and cash conversion cycle. The study revealed a positive relationship among working capital turnover, current ratio, sales to total asset ratio, and profitability. Days’ inventory outstanding indicated a negative relationship with profitability. The relationship of current ratio with profitability was positive.
The confirmation of the existence of differences in retail firms’ strategy to the direction of accomplishing profitability targets was presented by Arnis, Kolias, and Filios (2008) who used ROE and ROA ratios as well as the average sales growth rate. The results did not differ statistically within the sub-sectors of the retail sector through the previous variables. However, significant differences not only among the sub-sectors but also among firms are noticed in the other elements which define the profitability, gross margin, asset turnover ratio, and the general expenses to sales ratio. We also find, by using econometric methods, that gross margin is positively correlated with general expenses to sales ratio and negatively correlated with asset turnover ratio. The study arrives at the conclusion that the retail firms use different strategies to achieve the same ROE and ROA. Finally, the results do not support the hypothesis that the rapid developing firms show less profitability as it is expressed by ROA.
A study of Fairfield and Yohn (2001) gave the evidence that disaggregating ROA into asset turnover and profit margin does not provide incremental information for forecasting the changes in ROA one year ahead, but that disaggregating the changes in ROA into the changes in asset turnover and the changes in profit margin is useful in forecasting the changes in ROA one year ahead.
The return on investment (ROI), ROE, and probable dividend action of J. C. Penney Company, Inc. in 1978 was analyzed by Weller (1977) who concluded that return on invested capital is not projected to return to a high level within the forecast period. The company attributed the deterioration of its fixed asset turnover to the poor performance of its soft line stores.
Hypotheses Main Hypotheses
For studying the effect of net working capital on net operating cash flow, we test the following hypotheses:

IMPACT OF TURNOVER RATIOS ON JORDANIAN SERVICES SECTORS’ PERFORMANCE
80
H1: There is no significant impact of turnover ratios on Jordanian services sectors’ ROA. H2: There is no significant impact of turnover ratios on Jordanian services sectors’ ROE.
Sub Hypotheses (Branched From the Main Hypotheses) H11: There is no significant impact of working capital turnover on Jordanian services sectors’ ROA. H12: There is no significant impact of total asset turnover on Jordanian services sectors’ ROA. H13: There is no significant impact of fixed asset turnover on Jordanian services sectors’ ROA. H21: There is no significant impact of working capital turnover on Jordanian services sectors’ ROE. H22: There is no significant impact of total asset turnover on Jordanian services sectors’ ROE. H23: There is no significant impact of fixed asset turnover on Jordanian services sectors’ ROE.
Research Methodology This section presents the research methodology adopted in this study. It explains sample selection criteria,
variables of the study, and research model and tests the hypotheses.
The Research Sample The study examines the financial reports of eight Jordanian services sectors listed on the ASE for the
period from 2009 to 2012.
Dependent Variables of the Study ROA. ROA provides the readers with a measure of the profitability of a concern and the effectiveness
with which the firm has used their assets. The ROA ratio may also be calculated on a pre-tax basis by using earnings before interest and tax (EBIT). Thus, the higher the ROA, the more profitable and effective the use of assets (Association of Chartered Certified Accountants [ACCA], 2008).
It can be calculated as follows (CFA, 2011):
Net ProfitROAAverage Total Assets
=
ROE. ROE shows the return on capital provided by shareholders. To calculate this important ratio, net profit is set in relation to the average shareholders’ equity over the business year. In the calculation, it is important to bring in net profit and shareholders’ equity after minority interest has been deducted in order to only consider figures that shareholders are actually entitled to. This ratio gives investors a figure that can be compared between different firms and investment opportunities (Brigham & Ehrhardt, 2005).
It can be calculated as follows (CFA, 2011):
’Net ProfitROE
Average Shareholders Equity
=
Independent Variables of the Study Working capital turnover. Working capital is known as current assets minus current liabilities. Working
capital turnover measures how efficiently the company generates sales on its working capital.4
4 Retrieved from http://www.investopedia.com/terms/w/workingcapitalturnover.asp.

IMPACT OF TURNOVER RATIOS ON JORDANIAN SERVICES SECTORS’ PERFORMANCE
81
It can be calculated as follows (CFA, 2011):
SalesWorking Capital TurnoverAverageWorking Capital
=
Total asset turnover. Total asset turnover measures overall investment efficiency by aggregating the joint impact of both short- and long-term assets. This comprehensive measure is a key component of the disaggregation of ROA.5
It can be calculated as follows (CFA, 2011):
SalesTotal Asset TurnoverAverage Total Assets
=
Fixed asset turnover. Fixed asset turnover measures the efficiency of long-term capital investment. The ratio reflects the level of sales generated by investments in productive capacity. The level and trend of this ratio are affected by characteristics of its components. First, sales growth is continuous, albeit at varying rates. Increase in capacity to meet that sales growth, however, is discrete, depending on the addition of new factories, warehouses, stores, and so forth. Compounding this issue is the fact that the management often has discretion over timing, form, and financial reporting of the acquisition of incremental capacity.
It can be calculated as follows (CFA, 2011):
SalesFixed Asset TurnoverAverage Fixed Assets
=
Research Model In order to test the study hypotheses, no research model can be designed, because we do not have an
effectible relation. Liner regressions. To test the research hypotheses, the Statistical Package for Social Sciences (SPSS)
program was used to prepare the table of analysis of variance (ANOVA) as shown in Table 1. H11: There is no significant impact of working capital turnover on Jordanian services sectors’ ROA.
Table 1 ANOVAa for H11 Model Sum of squares df Mean square F Sig. Regression 73.910 1 73.910 2.218 0.147b Residual 999.911 30 33.330 Total 1,073.821 31 Notes. a: Dependent variable: ROA. b: Predictors: (constant), working capital turnover.
By reviewing Table 1, we find that the P-value = 0.147 > 5%, which is not significant, and this supports the acceptance of main null hypothesis. There is no significant impact of working capital turnover on Jordanian services sectors’ ROA.
H12: There is no significant impact of total asset turnover on Jordanian services sectors’ ROA.
5 Retrieved from http://financialanalysishub.com/total-asset-turnover/.

IMPACT OF TURNOVER RATIOS ON JORDANIAN SERVICES SECTORS’ PERFORMANCE
82
Table 2 ANOVAa for H12 Model Sum of squares df Mean square F Sig. Regression 15.067 1 15.067 0.427 0.518b Residual 1,058.754 30 35.292 Total 1,073.821 31 Notes. a: Dependent variable: ROA. b: Predictors: (constant), total asset turnover.
By reviewing Table 2, we find that the P-value = 0.518 > 5%, which is not significant, and this supports the acceptance of main null hypothesis. There is no significant impact of total asset turnover on Jordanian services sectors’ ROA.
H13: There is no significant impact of fixed asset turnover on Jordanian services sectors’ ROA.
Table 3 ANOVAa for H13 Model Sum of squares df Mean square F Sig. Regression 0.338 1 0.338 0.009 0.923b Residual 1,073.483 30 35.783 Total 1,073.821 31 Notes. a: Dependent variable: ROA. b: Predictors: (constant), fixed asset turnover.
By reviewing Table 3, we find that the P-value = 0.923 > 5%, which is not significant, and this supports the acceptance of main null hypothesis. There is no significant impact of fixed asset turnover on Jordanian services sectors’ ROA.
H1: There is no significant impact of turnover ratios on Jordanian services sectors’ ROA.
Table 4 ANOVAa for H1 Model Sum of squares df Mean square F Sig. Regression 155.683 3 51.894 1.583 0.216b Residual 918.138 28 32.791 Total 1,073.821 31 Notes. a: Dependent variable: ROA. b: Predictors: (constant), fixed asset turnover, total asset turnover, and working capital turnover.
By reviewing Table 4, we find that the P-value = 0.216 > 5%, which is not significant, and this supports the acceptance of main null hypothesis. There is no significant impact of turnover ratios on Jordanian services sectors’ ROA.
H21: There is no significant impact of working capital turnover on Jordanian services sectors’ ROE.
Table 5 ANOVAa for H21 Model Sum of squares df Mean square F Sig. Regression 62.086 1 62.086 0.471 0.498b Residual 3,950.663 30 131.689 Total 4,012.749 31 Notes. a: Dependent variable: ROE. b: Predictors: (constant), working capital turnover.
IMPACT OF TURNOVER RATIOS ON JORDANIAN SERVICES SECTORS’ PERFORMANCE
83
By reviewing Table 5, we find that the P-value = 0.498 > 5%, which is not significant, and this supports the acceptance of main null hypothesis. There is no significant impact of working capital turnover on Jordanian services sectors’ ROE.
H22: There is no significant impact of total asset turnover on Jordanian services sectors’ ROE.
Table 6 ANOVAa for H22 Model Sum of squares df Mean square F Sig. Regression 45.701 1 45.701 0.346 0.561b Residual 3,967.049 30 132.235 Total 4,012.749 31 Notes. a: Dependent variable: ROE. b: Predictors: (constant), total asset turnover.
By reviewing Table 6, we find that the P-value = 0.561 > 5%, which is not significant, and this supports the acceptance of main null hypothesis. There is no significant impact of total asset turnover on Jordanian services sectors’ ROE.
H23: There is no significant impact of fixed asset turnover on Jordanian services sectors’ ROE.
Table 7 ANOVAa for H23 Model Sum of squares df Mean square F Sig. Regression 266.754 1 266.754 2.136 0.154b Residual 3,745.995 30 124.866 Total 4,012.749 31 Notes. a: Dependent variable: ROE. b: Predictors: (constant), fixed asset turnover.
By reviewing Table 7, we find that the P-value = 0.154 > 5%, which is not significant, and this supports the acceptance of main null hypothesis. There is no significant impact of fixed asset turnover on Jordanian services sectors’ ROE.
H2: There is no significant impact of turnover ratios on Jordanian services sectors’ ROE.
Table 8 ANOVAa for H2 Model Sum of squares df Mean square F Sig. Regression 856.000 3 285.333 2.531 0.077b Residual 3,156.749 28 112.741 Total 4,012.749 31 Notes. a: Dependent variable: ROE. b: Predictors: (constant), fixed asset turnover, total asset turnover, and working capital turnover.
By reviewing Table 8, we find that the P-value = 0.077 > 5%, which is not significant, and this supports the acceptance of main null hypothesis. There is no significant impact of turnover ratios on Jordanian services sectors’ ROE.
Statistical Analysis This section presents the results of descriptive statistics for the study variables.

IMPACT OF TURNOVER RATIOS ON JORDANIAN SERVICES SECTORS’ PERFORMANCE
84
Table 9 Independent Variables Ranking Among Jordanian Services Sectors
Sector Rank Working capital turnover Rank Total asset
turnover Rank Fixed asset turnover
Healthcare services 7 22.72691032 2 0.437600028 3 0.820361 Educational services 1 -341.5877909 3 0.485854432 2 0.725536 Hotels and tourism sector 2 -18.70213213 1 0.217584706 1 0.347901 Transportation sector 3 -9.023490437 7 1.232560347 6 2.336932 Technology and communication 4 3.348739266 5 0.638342112 5 2.108911 Media sector 6 8.266755908 4 0.615516328 4 1.394416 Utilities and energy 8 67.72690163 8 1.915349438 8 8.719408 Commercial services 5 6.2270192 6 0.818082456 7 2.373262
By reviewing Table 9, we found that the educational services sector has the lowest working capital turnover and utilities and energy sector has the highest. In addition, we find that the hotels and tourism sector has the lowest total asset turnover ratio and the utilities and energy sector has the highest. We also find that the hotels and tourism sector has the lowest fixed asset turnover and the utilities and energy sector has the highest.
Table 10 Dependent Variables Ranking Among Jordanian Services Sectors Sector Rank ROA Rank ROE Healthcare services 4 2.45221 4 2.40506 Educational services 7 12.34124 7 16.08534 Hotels and tourism sector 3 2.347837 3 1.505846 Transportation sector 1 0.498605 1 -3.49581 Technology and communication 8 13.06871 8 21.74977 Media sector 2 2.167077 2 1.382623 Utilities and energy 6 4.083593 6 14.03826 Commercial services 5 3.065356 5 2.792097
By reviewing Table 10, we found that the transportation sector has the lowest ROA and the technology and communication sector has the highest. We also find that the transportation sector has the lowest ROE and the technology and communication sector has the highest.
Summary and Conclusion This study aims to approve if there is a significant impact of turnover ratios expressed by working capital
turnover, total asset turnover, and fixed asset turnover on Jordanian services sectors’ performance expressed by ROA and ROE.
The results showed that there is no significant impact of turnover ratios on Jordanian services sectors’ profitability, and by testing the main and sub hypotheses, the study revealed that there is no significant impact of turnover ratios on Jordanian services sectors’ ROA, there is no significant impact of working capital turnover on Jordanian services sectors’ ROA, there is no significant impact of total asset turnover on Jordanian services sectors’ ROA, and there is no significant impact of fixed asset turnover on Jordanian services sectors’ ROA.

IMPACT OF TURNOVER RATIOS ON JORDANIAN SERVICES SECTORS’ PERFORMANCE
85
Also, the study results showed that there is no significant impact of turnover ratios on Jordanian services sectors’ ROE, there is no significant impact of working capital turnover on Jordanian services sectors’ ROE, there is no significant impact of total asset turnover on Jordanian services sectors’ ROE, and there is no significant impact of fixed asset turnover on Jordanian services sectors’ ROE.
Moreover, the study concluded that the educational service sector has the lowest working capital turnover and the utilities and energy sector has the highest. We also find that the hotels and tourism sector has the lowest total asset turnover ratio and the utilities and energy sector has the highest and the hotels and tourism sector has the lowest fixed assets turnover while the utilities and energy sector has the highest. The transportation sector has the lowest ROA and the technology and communication sector has the highest. In addition, we find that the transportation sector has the lowest ROE and the technology and communication sector has the highest.
The findings of this study differ from studies investigating the same relations, and its results disagree with the results of most previous studies which found a significant effect of turnover ratios on profitability. This is what distinguishes this study from others, which can be explained by the distinct item between the sales as a numerator of the turnover ratios and the net income as a numerator of ROA and ROE which is cost of sales.
In order to maintain a significant effect of turnovers on profitability, the cost of sales should move in parallel with sales movements positively at the same percent or less.
This study mentioned that in order to intervene in market competition, the services sectors should follow the net profit deduction strategy, and the way to achieve that was to increase the cost of sales with a higher percent than the increase in sales. This revealed a distortion in the expected relationship between turnover ratios and profitability ratios, because of which, the study found no significant impact of turnover ratios on Jordanian services sectors’ profitability.
We will apply the study among Jordanian services sectors as a comparative study, in order to investigate different conclusions among different sectors within ASE sectors.
References Arnis, N. I., Kolias, G. D., & Filios, V. F. (2008). The profitability of the Greek retail firms and the relations among the
determinants (in Greek). Review of Economic Sciences, 14, 161-180. Association of Chartered Certified Accountants [ACCA]. (2008). Paper F7, financial reporting (International). Brigham, E. F., & Ehrhardt, M. C. (2005). Financial management, theory, and practice (11th ed.). Mason, OH: Thomson
Southwest. CFA. (2011). Financial reporting and analysis. Program Curriculum, Volume 3, Level 1. Chakraborty, N. (2013). Working capital performance: A case study on Dabur India Ltd.. International Journal of Research in
Commerce and Management, 4(10), 93-97. Fairfield, P. M., & Yohn, T. L. (2001). Using asset turnover and profit margin to forecast changes in profitability. Review of
Accounting Studies, 6(4), 371-385. Jahan, N. (2012). Determinants of bank’s profitability: Evidence from Bangladesh. Indian Journal of Finance, 6(2), 32-38. Raheja, R., Bhardwaj, R., & Priyanka. (2012). The impact of working capital management on profitability and liquidity.
International Journal of Research in Commerce and Management, 3(3), 99-102. Schmidlin, N. (2014). The art of company valuation and financial statement analysis: A value investor’s guide with real-life case
studies. John Wiley & Sons. Singh, D. P. (2012). Working capital management and profitability in the IT and telecom industry in India. Indian Journal of
Finance, 6(3), 54-61. Warrad, L. (2014). The impact of working capital turnover on Jordanian chemical industries’ profitability. American Journal of
Economics and Business Administration, 5(3), 116-119. Weller, E. A. (1977). Return on investment, return on equity, and probable dividend action (pp. 8-9). J.C. Penney Company.

Journal of Modern Accounting and Auditing, February 2015, Vol. 11, No. 2, 86-92 doi: 10.17265/1548-6583/2015.02.002
Information on Financial Statements for Loan Decision-Making
of Commercial Banks in Vietnam
Mai Thi Hoang Minh University of Economics, Ho Chi Minh City, Vietnam
Financial statements (FS) are tools which provide information to users for making business decisions. Among the
organizations, banks are the firms which conducted and did business with risks. In particular, commercial banks
continue to play a dominant role in the whole system, and local commercial banks still have an edge in its
widespread network across the country over foreign banks. This article is going to present the survey which clarifies
the role of FS in commercial banks’ loan decisions in Vietnam. Moreover, this paper also discusses FS’s quality
currently, thereby making suggestions for enterprises to enhance the usefulness of accounting information in
borrowing activities. This paper has taken performance with 74 official employees in commercial banks in Vietnam.
The results indicated the qualitative characteristics of banks when disclosing the financial statements. This article
also gave the six oriented solutions to improvement of the loan decision-making by banks.
Keywords: usefulness of financial statement (FS), accounting information quality, loan decisions, banking
Introduction The quality of accounting information is evaluated by its usefulness to users. At present, based on the
Ministry of Finance (2013) and the International Accounting Standards Board (IASB, 2010), criteria used to identify the usefulness of accounting information are displayed in the Conceptual Framework for Financial Reporting, and the requirements for accounting information in Vietnam are stated in Vietnamese Accounting Standards No. 1 (VAS 01). In fact, the usefulness of accounting information for users has been studied quite early. Recent researches have showed some issues related to quality of financial reporting in Vietnam which makes them less useful to loan decisions (Nichols, 1997). This study continues to learn more about financial reporting’s quality issues to make specific recommendations which help enhance their usefulness for business borrowing activities.
Results of Previous Researches About How Accounting Information Has Affected Loan Decisions
General Information Previous researches showed that accounting information plays an important role in banks in developed
economies. Since the 1970s, banks in USA have considered financial reporting as the most important source for loan decisions (Stanga & Benjamin, 1978). This information can change the decisions of commercial banks
Mai Thi Hoang Minh, associate professor, doctor of Accounting, vice dean of Principle Accounting Department, School of
Accounting and Auditing, University of Economics. Email: [email protected].
DAVID PUBLISHING
D

LOAN DECISION-MAKING OF COMMERCIAL BANKS IN VIETNAM
87
(Danos, Holt, & Imhoff, 1989). Operating cash flow was demonstrated to have a close relationship with credit risk at enterprises which have high long-term loan rates or less business risks (Independent Evaluation Group [IEG], 2010).
Information used for making loan decisions is plenty and its roles vary by country. In USA, credit history information, project’s financial reporting, financial operating cash flow, detail of fixed assets, and indirect cash flow statement are the most important (Catanach & Kemp, 1999). Meanwhile in Hong Kong, information from note in financial statements (FS) is the most exploited, while information on cash flow takes the next concern (Kwok, 2002; Marian, Lui, & Lew, 2002).
In Australia, each financial statement is exploited from a different angle, e.g., cash flow statement is used to evaluate the payment ability to make loan decisions. Balance sheet plays the assessment and monitoring roles and income statement is considered important when appraising the enterprise’s operation (Jones, 1998; Kitindi, Magembe, & Sethibe, 2007).
This role of accounting information to loan decisions in developing countries is less important. It is proved by individual country and showed that the quality of information on FS does not satisfy users in general and banks in particular.
Consequently, information on FS is not considered important when making decisions (Abu-Nassar & Rutherford, 1996; Dang, N. Marriott, & P. Marriott, 2006; 2008). The common issues of accounting information are delays, lack of reliability, and incomplete notes (Mirshekary & Saudagaran, 2005). However, FS is still used as a source of information. Income statement and balance sheet are most widely used. Especially, audited information will be more valuable.
Research Method This article summarized information from FS analysis process of 10 commercial banks in Vietnam and
surveyed 74 credit staffs to learn the role of information in the FS for making decisions for loans as well as for assessing their quality. Statistical inference methods and calibration techniques pair-sample t-test are used for data processing. Although the number of staffs surveyed in each bank was not large, the survey was distributed across multiple banks to ensure representativeness. Moreover, each bank applies loan process and FS analysis techniques consistent with all of their branches, hence, some branches can also be capable of representing the entire.
Criterion for Evaluating the Usefulness of Accounting Information in Accordance With International Accounting Standards
The quality of accounting information is evaluated by its usefulness to users. According to FS theory, properties affecting the usefulness of accounting information include two main quality indicators and four secondary quality indicators as follows.
The Main Quality Indicators The main quality indicators include “Relevant” and “True”. Relevant information is likely to create a difference or can change users’ decisions. This feature is
disclosed through the predicted value and asserted value. Value prediction means that information can be used as input data for a process which helps users predict future results. Value assertion is presented by the feedback from predicted value (Al-Razeen & Karbhari, 2004).

LOAN DECISION-MAKING OF COMMERCIAL BANKS IN VIETNAM
88
True information must have three properties: completeness, neutrality, and no errors. Completeness means presenting all necessary information so that users can understand what the phenomenon mentions about, including detailed descriptions and related explanations.
Neutrality means that information contained in the FS must be free from bias. It should reflect a balanced view of the affairs of the company without attempting to present them in a favored light. Information may be deliberately biased or systematically biased. Neutral or reliable accounting information does not target interests of specific users of accounting information (i.e., does not favor certain users of accounting information over the others) and presents the actual position of banking. No error does not mean absolutely having no error, and the information on the report must be generated from fairly chosen processes. Besides, no error is found when applying those processes.
Additional Quality Indicators
Additional quality indicators include comparability, verifiability, timeliness, and understandability. These indicators enhance the usefulness of information which is identified as relevant and true.
Comparability helps users to indicate the similarity and difference among items, normally related to two items or more.
Verifiability means that independent observers who have knowledge in various fields can still agree that the information is presented truly. The verification can be done first through observation (direct) or checking the input of the calculation method and then by recalculating the result using the same method (indirect).
Timeliness means that information must be transferred to users to make decisions at the point time and can affect their decisions.
Understandability means that information should be classified, described, and presented in a clear and concise way.
Information on FS for Loan Decisions of Commercial Banks in Vietnam and Quality Assessment
Role of FS in Loan Processes
In comparison with other elements affecting loan decisions in Vietnam, FS just plays an average role, much lower than information provided by independent organizations. It has five levels of information in banking statements as illustrated in Table 1. This partly reflects low trustfulness of banks on information provided by enterprises compared with other sources.
Table 1 Units for Magnetic Properties No. Content 1 The information from credit center, assurance assets, customer’s business plan, and direct check 2 Intuition of decision-maker 3 FS and tax reports 4 The information from internal chart
5 Industry statistical information and macroeconomic indicators, the information from the press, the introduction of bank’s leaders/other clients, and the third party guarantee
Information from checking customers directly and assurance asset value are also much more important than that from FS. It indicates that most banks do not rely on the information provided by enterprises but apply other strategies to minimize credit risks. Customers’ business plans are highly considerable.
LOAN DECISION-MAKING OF COMMERCIAL BANKS IN VIETNAM
89
It means that there is a great need for information helping predict future events. Intuition in decision processes plays a rather important role which reinforces the judgment that banks in Vietnam make decisions by emotional orientation model rather than by rational model.
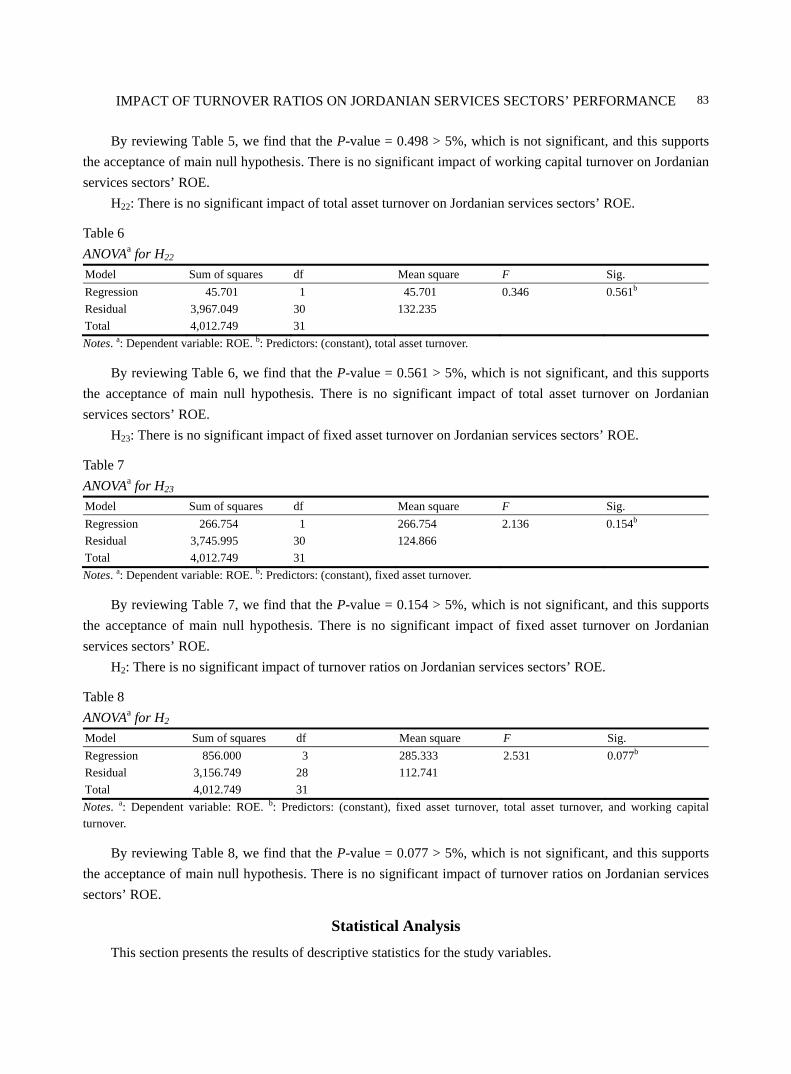
Information From the FS Exploited by the Banks There is a small difference in using financial statements among banks in Vietnam. However, in general
ways, FS is used in the following process: First of all, enterprises are required to submit FS of 2-3 years, depending on the nature of the loan. Less financial statements are required for short-term loans than medium- or long-term loans. FS required includes: balance sheets, income statements, cash flow statements (if yes), and notes for FS. Then, credit staffs are asked to check the accuracy of those statements. Common techniques applied are checking the audited reports, reconciling with tax reports, visiting the enterprises’ working places, recalculating the data on FS, etc.. Finally, FS of banks will be analyzed by tool of analysis in trend or ratio analysis for learning the financial and operating status and predicting the repayment ability of customers.
Recent researches have showed that income statements are mostly used, followed by balance sheets. Two remained reports are used at a lower level. For each FS, the information usage level is also uneven. The information items used in the FS are displayed in Tables 2 and 3.
Table 2 Information Used by Over 70% of Banks When Analyzing FS Type of FS Main content in those official reports
Balance sheets 1. General data: total assets, short-term assets, long-term assets, total equity, short-term equity, long-term equity, equity, short-term liabilities, and long-term liabilities. 2. Detail data: inventory, account receivable.
Income statements 1. General data: total revenue, gross profit, operating profit, profit before tax and interest expenses, and profit after tax, 2. Detail data: cost of sales, depreciation expenses, and interest expenses.
Note for FS
1. Debt to credit institutions and interest of loans. 2. Fixed assets used as assurance for loans. 3. The number of customers and receivable recollect time. 4. Details revenue for each industry, sector, and geographic region.
Table 3 Information Used by Less Than 30% of Banks When Analyzing FS Type of FS Main content in those official reports Balance sheets Financial investment, other assets, other liabilities, and capital contributed by owners. Income statements Selling expenses, admin expenses.
Cash flow statements Cash flows from operating activities, cash flows from selling, and cash flows from operating expense.
Note for FS
1. Accounting system, principles of business accounting. 2. Detailed financial investments of enterprises, distinction between investments in equity securities and investments in debt securities. 3. Fixed assets involved serving major business activities.
Evaluation of the Banks on the Quality of Information Provided by FS Comparison between expectations and reality shows that the quality of corporate FS is rated quite low by
the bank. They failed to reach the “standards” on most basic quality criteria, in which the “Fair” feature was the most unsatisfactory. General purpose FS is designed to meet the needs of many diverse users, particularly present and potential owners and creditors. FS results from simplifying, condensing, and aggregating masses of
LOAN DECISION-MAKING OF COMMERCIAL BANKS IN VIETNAM
90
data obtained primarily from a company’s accounting system. They sometimes are unable to reflect the real situation of that firm at that time for presented FS.
The accounting estimates are not clearly explained and the method of estimate is unreasonable. These reasons make the FS reduce its relevance for decision-making and partly explain the reason why the FS failed to play the important role in lending decisions (Nguyen, 2008).
Besides the above unappreciated factors, FS now achieved some certain requirements of the banks. Specifically, banks do not require changing the method of evaluating the value of assets or current liabilities. At the same time, they are also satisfied with the classification and presentation of current information.
Application of the Research: Improving the Quality of FS Information for the Sake of Borrowing
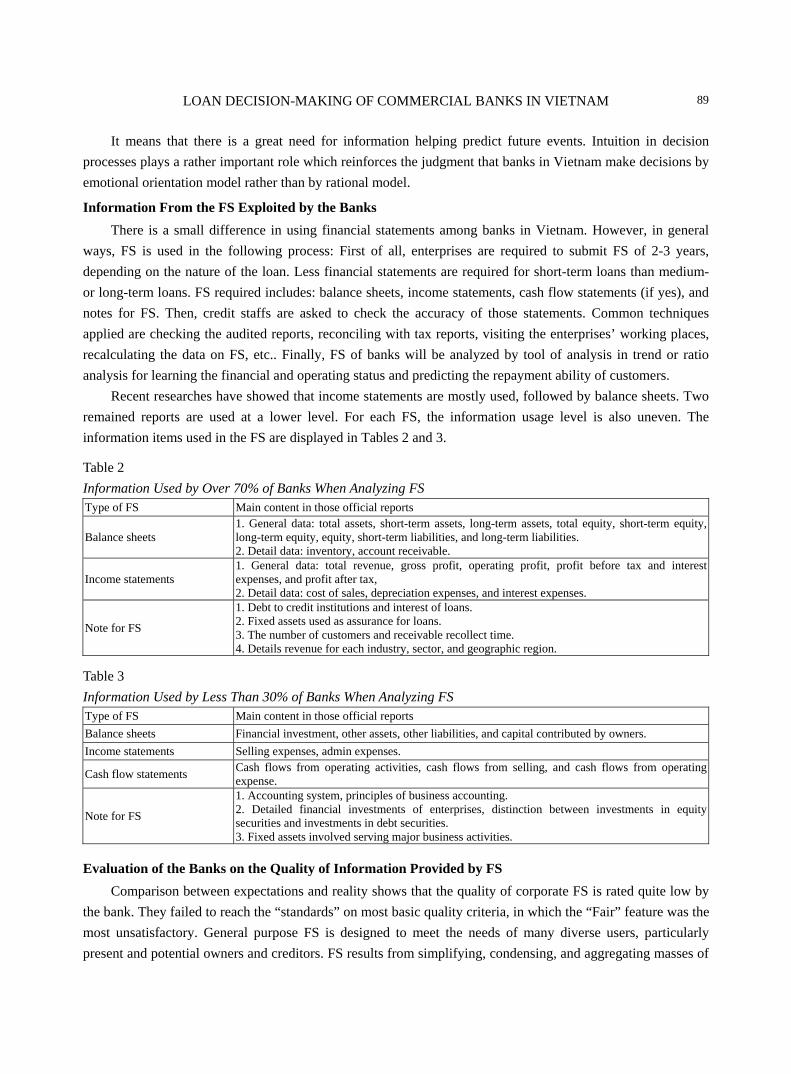
Based on the above results, this paper has suggested the followings to improve the quality of FS information (demonstrated in Tables 4 and 5) and enhance the usefulness of accounting information for lending activities.
Table 4 The Qualitative Characteristics of FS That Met the Expectations of Banks No. The current requirement that FS has met the expectations of banks Qualitative characteristic 1 The values of assets and liabilities are calculated in a reasonable manner Faithful representation 2 Information is classified and presented for an easy comparison during the period Comparability 3 Understandable Understandability
Table 5 The Qualitative Characteristics of FS That Did Not Meet the Expectations of Banks No. The current requirement that FS has not met the expectations of banks Qualitative characteristic
1 FS reflects the real situation of the customer Faithful representation (completeness, neutrality)
2 The accounting estimates are explained explicitly and fully in FS Faithful representation (completeness)3 The FS presents no bias in favor of the borrower Faithful representation (neutrality) 4 Information on FS can be verifiable Verifiable 5 Additional information on special events happening in enterprises is fully provided Faithful representation (completeness)6 Information should be provided promptly Timeliness
7 Information could help predict future outcomes and test the results predicted in the past Relevance
8 The estimates were calculated reasonably Faithful representation
The causes which have made FS in Vietnam fail to achieve qualitative characteristics, as have been shown in previous studies, are the lack of awareness of business owners in providing truthful information to the outside and the weak level of a lot of accountants. Therefore, in order for the information provided to ensure “completeness” and “neutrality”, business owners need to be aware of the benefits of providing truthful information to business.
Based on Nguyen, Le, and Jerman (2007), that awareness will motivate them to recruit qualified accountants, train and encourage them to update their knowledge, and improve the professional knowledge for accountants, and in the meantime, the business owners themselves also need to understand that publishing FS honestly is a way to help build and strengthen corporate reputation with external partners.
For accountants, this article has some suggestions for improving the quality of accounting information for lending activities:

LOAN DECISION-MAKING OF COMMERCIAL BANKS IN VIETNAM
91
(1) In terms of accounting estimates (estimates of doubtful receivables, obsolete inventory value, product warranty obligations, etc.): They need to be reviewed for developing, implementing, and disclosing information. Vietnam has had some legal documents which show the method for calculating the accounting estimates. This is required by VAS; however, the current study showed that the borrowers do not perform well. The documents guiding the implementation of the current accounting estimates are Circular 228/2009/TT-BTC and Circular 89/2013/TT-BTC. Businesses can refer to these documents but we should note that the above guidelines are documents which serve for calculating deductible expenses when calculating corporate income tax. Therefore, there are some points which might not fit in the actual business activities. Businesses should develop written procedures for estimates of their own instead of just copying the instructions of tax authorities. The process should also be reviewed over time, and should also be assessed if old processes and estimation methods are still reasonable and make appropriate adjustments when necessary. Presentation of details of the estimate method not only enhances the completeness of the FS, but also helps increase the verifiability;
(2) Complete presentation of loans and fixed assets used as collateral for business loans. This information is important which once disclosed can help FS users make some predictions about future obligations as well as financial risk assessment of the business. The discloser of this information helps increase the relevance of FS and give a true and fair view of FS. For banks, this information can be found through their own information systems, however, complete disclosure of information will help increase the timeliness of the information, and the verification investigation will take place more smoothly and help shorten the time to consider the loan application;
(3) For fixed assets, in addition to sorting out in the current form, businesses should consider the track record of fixed assets, classified as fixed assets for main operations of business and fixed assets not serving the main business activity;
(4) Although it is not financial information but survey shows information about the board of directors, the history of the company is also interested in finding out more in the lending process. Enterprises should prepare this information and may consider disclosure in the notes to FS or other statements included;
(5) With business operating in many sectors or many regions, it is necessary for information systems management, account details, etc., to record accounting information effectively and efficiently, so that business is able to track revenues and expenses separately according to sectors and geographical areas. This will provide useful information for the evaluation of performance of the business. Those unlisted enterprises are also advised to disclose segment information in FS under the guidance of the VAS No. 28, “Segment Reporting”;
(6) Disclosure of information on important current events is also evaluated as unsatisfactory, reducing the relevance of FS information. Therefore, prior to publication of the FS, the organizations should review all information and events which are not mentioned on FS but are significant, such as contingent liabilities, commitments, events of related parties, etc..
Conclusion The quality of FS is always cared by both business and other users. Under the gaze of the commercial
banks, based on the quality of financial information, Vietnamese FS of banking has faced many issues together with problems, in which faithful representation is most underrated. This article gives some suggestions for enterprises to improve the faithful representation, relevance, and timeliness of FS, thereby making them more useful to borrowing activities of business.

LOAN DECISION-MAKING OF COMMERCIAL BANKS IN VIETNAM
92
References Abu-Nassar, M., & Rutherford, B. A. (1996). External users of financial reports in less developed countries: The case of Jordan.
The British Accounting Review, 28(1), 73-87. Al-Razeen, A., & Karbhari, Y. (2004). Annual corporate information: Importance and use in Saudi Arabia. Managerial Auditing
Journal, 19(1), 117-133. Catanach, A. H., & Kemp, R. S. (1999). The information needs of bank lending officers. Commercial Lending Review, 14(3),
76-78. Dang, D. S., Marriott, N., & Marriott, P. (2006). Users’ perceptions and uses of financial reports of small and medium companies
(SMCs) in transitional economies: Qualitative evidence from Vietnam. Qualitative Research in Accounting and Management, 3(3), 218-235.
Dang, D. S., Marriott, N., & Marriott, P. (2008). The banks’ uses of smaller companies’ financial information in the emerging economy of Vietnam: A user’s oriented model. In M. Tsamenyi, & S. Uddin (Eds.), Corporate governance in less developed and emerging economies (Vol. 8, pp. 519-548). Emerald Group Publishing Limited.
Danos, P., Holt, D., & Imhoff, E. (1989). The use of accounting information in bank lending decisions. Accounting, Organizations, and Society, 14(3), 235-247.
Independent Evaluation Group [IEG]. (2010). An evaluation of World Bank support, 2002-08: Gender and development. World Bank, IFC, MIGA. Retrieved from http://ieg.worldbank.org/Data/reports/gender_eval.pdf
International Accounting Standards Board [IASB]. (2010). Conceptual framework for financial reporting. Jones, S. (1998). An evaluation of user ratings of cash vs. accrual based financial reports in Australia. Managerial Finance, 24(11),
16-28. Kitindi, E. G., Magembe, B. A. S., & Sethibe, A. (2007). Lending decision making and financial information: The usefulness of
corporate annual reports to lenders in Botswana. The International Journal of Applied Economics and Finance, 1(2), 55-66. Kwok, H. (2002). The effect of cash flow statement format on lenders’ decisions. The International Journal of Accounting, 37(3),
347-362. Marian, Y. J. W. T., Lui, G., & Lew, A. Y. (2002). The expectations-performance gap in financial reporting from the perspective of
Hong Kong bank loan officers. Pacific Accounting Review, 14(1), 1-22. Ministry of Finance. (2013). Vietnamese Accounting Standard No. 21-24-28 (based on the Decision of Minister, Hanoi, Vietnam). Mirshekary, S., & Saudagaran, S. M. (2005). Perceptions and characteristics of financial statement users in developing countries:
Evidence from Iran. Journal of International Accounting, Auditing, and Taxation, 14(1), 33-54. Nguyen, P. S. (2008). Enhancing the usefulness of financial statements of Vietnamese enterprise at current period (The Ph.D.
dissertation). Nguyen, V. T., Le, T. B. N., & Jerman, R. (2007). Institutional impact to the process of making decision: Case study for banking of
SMEs in US and Vietnam. Retrieved from http://www.apim.edu.vn/ Nichols, L. M. (1997). An investigation of the effect of reporting changes proposed by the AICPA on lending decisions. Journal of
Applied Business Research, 13(2), 47-53. Stanga, K. G., & Benjamin, J. J. (1978). Information needs of bankers. Management Accounting, 59, 17-21.

Journal of Modern Accounting and Auditing, February 2015, Vol. 11, No. 2, 93-111 doi: 10.17265/1548-6583/2015.02.003
Growth and Inequality in Indonesia: Does Kuznets Curve Hold?
G. A. Diah Utari, Retni Cristina Central Bank of Indonesia, Jakarta, Indonesia
Sustainable economic growth has put Indonesia as a middle-income country (MIC) and currently, the level of per
capita income has already exceeded US$3,000. The increase in income per capita is followed by the increasing
number of middle-class population and the reduction in poverty. However, it has not been accompanied by
declining inequality that reflects the quality of economic growth. According to Kuznets theory, an increase in
inequality is a common problem in the process of economic growth. Inequality will further decline after the country
has reached a certain threshold level of income. This study aims to analyze the trend and nature of income
inequality in Indonesia and to test whether the Kuznets Curve holds. This paper used dynamic panel method with
26 provincial panel data from 2000 to 2011. The empirical result proves the existence of inverted U-shaped
Kuznets Curve in Indonesia and it may have the turning points when the real GDP per capita in each province
reached Rp. 179.41 million/year or around US$17.000. For the determinant of inequality in Indonesia, this study
found that the percentage of urban population, inflation, and share of agricultural sector contributed to the increase
of inequality, while high-level education and share of industrial sector are associated with the lower level of
inequality.
Keywords: growth, middle class, poverty, inequality, Kuznets Curve, dynamic panel
Introduction The Indonesian economy has regained the status of lower middle-income countries (MICs) since 2003 and
currently, the level of per capita income has already exceeded US$3,000. The increase in per capita income is followed by the increasing number of people who are in the middle class and the declining number of people who are in poor or near poor category (see Figure 1). With its robust recent growth performance, which has been growing at 5.7% on average over the last decade and endurance throughout the global financial crises, Indonesia is gaining prominence as an emerging market economy with global influence. It is also considered as one of the largest MICs in the world.
An increasing number of middle-class categories have positive sides, but at the same time, there are also challenges. On the positive side, it will create potential demand for goods and services and thus will boost investment opportunity. The increasing number of middle-income people benefited the government, because it raised potential tax payers and can gradually reduce the amount of government’s subsidy. However, we also have to be aware of the fact that this social transformation can lead to a middle-income trap.
G. A. Diah Utari, senior researcher, Centre for Central Banking Research and Educations, Central Bank of Indonesia. Email:
[email protected]. Retni Cristina, researcher, Centre for Central Banking Research and Educations, Central Bank of Indonesia.
DAVID PUBLISHING
D

94
As incproducts thBoston Coand high-tehigh-tech preflecting tdomestic instill dominthose that acannot satisustainable(middle-inc
Figure 1. G
come rises anhat previouslnsulting Grouech products products are the dependenndustries to p
nated by enerare able to suisfy the incree growth pathcome trap).
GROW
GDP/capita and
Figure 2. W
nd living staly address juup (2012) share the mostmostly fulfil
nce on goodproduce high-rgy/resource cupply goods aeasing need oh in the futu
WTH AND I
percentage of m
Wealth and spen
andards improst their basic
hows that thert popular onelled from abrs of high ad-tech productcommodities and services of the middleure, which c
INEQUALITY
middle-class pe
nding. Source:
ove, consumec needs to thre is a big jume for the midroad. This ca
dded value (ss is still limit(see Figure
of high addee-income groould lead In
Y IN INDON
ople. Source: P
Boston Consult
ers’ needs alshose that offemp in the purddle class (sean be seen insee Figure 3)ted. The struc4). Therefored value and a
oup, this woudonesia to s
NESIA
Povcal Net and W
ting Group.
so follow a ner greater conrchase of con
ee Figure 2). n the structur). On the othcture of Indone, economic are innovativuld be a risk tuck in the c
World Bank.
natural progrenvenience. Snsumer durabThe domestire of Indoneher hand, thnesian exportactors that ca
ve. If domestik for the achicurrent level
ession from Survey from ble products ic needs for sian import e ability of t products is an exist are ic industries ievement of l of income

GROWTH AND INEQUALITY IN INDONESIA
95
Figure 3. Indonesia’s import structure. Source: United Nations Conference on Trade and Development (UNCTAD).
Figure 4. Indonesia’s export structure. Source: United Nations Economic and Social Commission
for Asia and the Pacific (UNESCAP).
Another challenge that we also have to face is the increasing inequality which is represented by the Gini ratio1. For almost three decades, GDP per capita has increased by five times, but Gini ratio has also increased from 0.30 in 1984 to 0.41 in 2012 (see Figure 5).
Figure 5. GDP/capita and inequality. Source: Statistics Indonesia BPS.
1 The Gini coefficient is derived from the ratio of the share of income going to the lowest quintile of the income distribution and the share going to the highest quintile. The Gini coefficient can be viewed as an average of deviations of quintile shares from 0.2, the value that holds under full equality (Barro, 2008).
0
0.2
0.4
0.6
0.8
1
1996 1999 2002 2005 2008 2012% R&D-Intensive % Energy/Resource-Intensive % Labor-Intensive
0
0.2
0.4
0.6
0.8
1
1996 1999 2002 2005 2008 2009 2012% R&D-Intensive Commodities % Energy/Resource-Intensive % Labor-Intensive
05001000150020002500300035004000
0.2
0.25
0.3
0.35
0.4
0.45
Gini Ratio GDP/capita (in USD-PPP 2005 contant)

GROWTH AND INEQUALITY IN INDONESIA
96
Based on the abovementioned background, it is necessary to analyze how the quality of economic development in Indonesia could support the long-term goal of achieving a sustainable and equitable growth. Therefore, the aim of this paper is:
(1) To analyze the trend of income inequality in Indonesia and how it evolves as the income level rises; (2) To test whether the Kuznets Curve holds and if it is proven to hold, then we would like to find the
turning point of the income level.
Growth and Inequality in Indonesia
Indonesia had successfully maintained quite high economic growth and reduced poverty (see Figure 6) during the period from the 1980s to the mid-1990s. In line with the increase of GDP per capita (see Figure 7), the number of poor people2 decreased from 35 million in 1984 (21.6% of total population) to 22.5 million in 1996 (11.3% of total population). In 1996, the methodology was revised and the percentage of poverty with the new definition was estimated at 17.5%. In 1998, poverty jumped significantly due to the impact of the Asian financial crises before it started to decrease in 2000. Afterwards, poverty kept going down except in 2006, which was due to rising domestic oil price that drove up the price of staple food. As a result, people who were not classified as poor but whose income was around the poverty line shifted to the poor category. Even though the average growth rate after the crises3 (5.6%) is smaller than that before the crisis4 (6.7%), the declining rate of the number of poor people is higher. After the crises, the number of poor people was reduced over 1.45 million each year (or about 0.88% a year), while before the crises, the declining rate was 1.04 million people a year (or about 0.85% a year). This indicates an improvement in the government poverty alleviation program after the crises.
Figure 6. GDP growth and poverty. Source: BPS.
2 According to BPS, people are classified as poor people if their monthly income per capita is below the poverty line. 3 Period before the crisis is calculated between 1984 and 1996. 4 Period after the crisis is calculated between 1999 and 2012.
0
10
20
30
40
50
60
1984 1987 1990 1993 1996 1996 1998 1999 2000 2001 2002 2003 2004 2005 2006 2007 2008 2009 2010 2011 20120
1
2
3
4
5
6
7
8
9
No. of poor people (million - RHS) GDP Growth (LHS) (%) of Poor People (LHS)
Revised Method

GROWTH AND INEQUALITY IN INDONESIA
97
Figure 7. GDP per capita and poverty. Source: UNESCAP and BPS.
Although both the GDP per capita and the number of poor people have gradually increased and decreased respectively after the crises, the inequality as indicated by Gini ratio tends to increase (see Figure 8). The inequality decreases during the period of 1984-1987 in line with the decrease of GDP growth. After 1987, Gini coefficient was relatively stable and began to increase from 1993 to 1996. During this period, the economic growth was relatively high, which stood between 6% and 8% (see Figures 3-12). The Gini ratio then declined as a result of the 1997 Asian Financial Crisis (AFC). Comparing to the period before the crises, the inequality tends to increase for the last decade. There was a relative constancy of the overall Gini index before the crises. It changed very slightly, which was only 0.01 over 12 years (1984-1996). After the crises (1999-2012), the Gini index increases to 0.12 point, 10 times higher than the period before.
Figure 8. GDP growth and Gini ratio.
Figure 9 shows the share of national income that is proxied by expenditure of three income groups, namely, the 20% richest households, the 40% middle-income households, and the 40% poorest households. The 20% richest households enjoy, on average, 44% of income while the middle-income households and the poorest households enjoy 37% and 20% of income respectively. For the last three years, it seems that there is a significant increase in the share of income enjoyed by the 20% richest households, which is accompanied by the decline in income share of the 40% poorest households and the 40% middle-income households. By the end of 2012, the share of income enjoyed by the richest group was 49%, increased from 41% in 1999. During the period of 1999-2012, the 20% highest income group has gained 20% additional share, while the 40% poorest and the middle-income households have loosed income share by 22% and 9.5% respectively.
05001000150020002500300035004000
0
10
20
30
40
50
60
1984 1987 1990 1993 1996 1996 1998 1999 2000 2001 2002 2003 2004 2005 2006 2007 2008 2009 2010 2011 2012No. of Poor People (Million-RHS) (%) of Poor People (LHS) GDP/capita (in USD-PPP 2005 contant)
0
2
4
6
8
10
0.00
0.10
0.20
0.30
0.40
0.50
1984 1987 1990 1993 1996 1999 2002 2003 2004 2005 2006 2007 2008 2009 2010 2011 2012Gini Ratio (LHS) g-GDP (LHS)
Revised Method

GROWTH AND INEQUALITY IN INDONESIA
98
Figure 9. Share of national income. Source: BPS.
Figure 10. Gini ratio (urban-rural-national). Source: BPS.
After the AFC, the domestic economy had been exposed to the volatility of global economic conditions which contributed to the increase of inequality. In late 2005, the hike of world oil prices forced the government to raise domestic oil prices that pushed inflation higher. Inflation reduces the real income and the impact is worse to low-income people compared to the high-income one. As a result, we see the increase of inequality in 2006. Later in the period after 2008, the impact of the subprime mortgage crisis also spread to financial markets in developing countries. Subprime mortgage crisis has triggered a reversal of capital flows in developing countries so that the exchange rate and asset prices fall. In addition, the impact of the subprime mortgage crisis is also accompanied by soaring oil prices, followed by a rise in prices of many other commodities. The combination of all these events caused considerable inflationary pressures to domestic economy which contributed to the increase of inequality after 2008.
10
15
20
25
30
35
40
45
50
55
1999 2002 2003 2004 2005 2006 2007 2008 2009 2010 2011 2012
% o
f GD
P
40% residents with lowest income 40% residents with middle income
20% residents with highest income
0.20
0.25
0.30
0.35
0.40
0.45
1984 1987 1990 1993 1996 1999 2002 2003 2004 2005 2006 2007 2008 2009 2010 2012
Urban Rural National Average

Inequcompared tincreasing average. Thincreased rthan 50% (2010), Inddata, the upopulation Asian averassociated have a high
0
10
20
30
40
50
60
70
80
90
0
10
20
30
40
50
60
70
80
90
ality seemed to rural areastrend. Inequhe influence rapidly over tof the increa
donesia has gurban populat
in Indonesiarage since 19with econom
h level of urb
Figure
Indonesia
Indonesia
UP
GROW
to be more s with a leveluality in urban
of urban Ginthe last decadase in inequarown to becotion in 2012
a is relatively995. Accordi
mic growth. Fban population
11. Indonesian
Figure 12. U
a Malay
Malays
1995-2000
WTH AND I
apparent in ul of 0.33 (seen areas was
ni on the natiodes. As statedality in Indonome one of th
was 44.9%.y higher (see Fing to the stu
For some richn (see Figure
urban populati
Urban populati
ysia K
UP 20
sia Kor
UP 200
INEQUALITY
urban Indone Figure 10). higher than i
onal aggregatd in Kanbur anesia at the n
he most urban Comparing Figure 11). Tudy of Lewi
her countries 12).
ion and South E
on of some cou
Korea
005-2010
rea J
00-2005
Y IN INDON
esia, reachingInequality in in rural areaste grew over and Zhuang (2national leve
nized countriewith average
The urban popis (2013), thein Asia like
East Asia averag
untries. Source:
Jepan
UP 2012
Jepan
UP 2005-2
NESIA
g a level of 0both urban a
s and was vetime as Indon2013), urbanil. According
es in the regioe South Eastpulation has ee level of urKorea, Japan
ge. Source: UN
UNESCAP.
China
China
2010
0.43 in Septeand rural areaery close to tnesia’s urbanization contri
g to World Bon. Based on t Asian counexceeded therbanization isn, and Malay
NESCAP.
Philippines
Philippines
UP 2012
99
mber 2012, as shows an the national n population ibuted more
Bank Report UNESCAP
ntries, urban e South East s positively sia, they do
s

GROWTH AND INEQUALITY IN INDONESIA
100
The pattern of rising inequality also occurred in provinces. From Table 1, we can see that almost all provinces experienced worsening inequality in 2012 compared to 1984, almost two decades before. The provincial average of inequality increased from 0.29 in 1984 to 0.31 in 1996 and then to 0.32 in 2008, and became 0.38 in 2012. There is a significant increase in the provincial average Gini ratio from 2008 to 2012 (17.9%), compared to the increase from 1984 to 1996 (4.5%) and from 1996 to 2008 (4.7%). In 1984, the number of provinces that have inequality above national average is 13 and in 1996, it declined to 10 provinces.
Table 1 Inequality in Provinces No. Province 1984 1996 2008 2012 1 Papua 0.37 0.39 0.40 0.44 2 Gorontalo 0.34 0.44 3 DIY 0.34 0.38 0.36 0.43 4 West Papua 0.31 0.43 5 Bali 0.29 0.31 0.30 0.43 6 North Sul 0.35 0.34 0.28 0.43 7 DKI 0.29 0.36 0.33 0.42 8 South Sul 0.35 0.32 0.36 0.41 9 West Java 0.30 0.36 0.35 0.41 10 Central Sul 0.30 0.30 0.33 0.40 11 South East Sul 0.32 0.31 0.33 0.40 12 Riau 0.26 0.30 0.31 0.40 13 South Sum 0.27 0.30 0.30 0.40 14 Banten 0.34 0.39 15 South Kal 0.26 0.29 0.33 0.38 16 Central Java 0.31 0.29 0.31 0.38 17 West Kal 0.25 0.30 0.31 0.38 18 Maluku 0.30 0.27 0.31 0.38 19 Lampung 0.29 0.28 0.35 0.36 20 NTT 0.31 0.30 0.34 0.36 21 East Kal 0.36 0.32 0.34 0.36 22 East Java 0.31 0.31 0.33 0.36 23 West Sum 0.26 0.28 0.29 0.36 24 Bengkulu 0.21 0.27 0.33 0.35 25 NTB 0.30 0.29 0.33 0.35 26 Kepri 0.30 0.35 27 North Mal 0.33 0.34 28 Jambi 0.20 0.25 0.28 0.34 29 North Sum 0.26 0.30 0.31 0.33 30 Central Kal 0.29 0.27 0.29 0.33 31 Aceh 0.26 0.26 0.27 0.32 32 West Sul 0.31 0.31 33 Babel 0.26 0.29 Above average 13 10 17 18 Below average 13 16 16 15 Provincial average 0.29 0.31 0.32 0.38 Note. Source: BPS and the authors’ calculation.

GROWTH AND INEQUALITY IN INDONESIA
101
After the crises, if we take a look at more recent periods of 2008 and 2012, in 2012, there are 18 provinces that have inequalities above national average, increased from 17 provinces in 2008. For the period of 2008-2012, Bali, West Papua, and North Sulawesi experienced the highest increase in Gini coefficient. Among 18 provinces with inequality above national average in 2012, some of them are provinces with urban population or GDP per capita above provincial average. Provinces with urban population above national average are DKI, DIY, Banten, West Java, East Kal, Bali, Riau, East Java, Central Java, North Sumatra, North Sulawesi, and NTB (see Figure 13). Provinces with GDP per capita above provincial average are DKI, Riau, West Papua, Papua, and West Sulawesi (see Figure 14). The high inequality in urban areas occurs because these places can attract large numbers of less-skilled people who think that there are more economic opportunities in urban areas than in rural areas. Meanwhile, there are also high inequalities in provinces with high GDP per capita. Except for DKI, those provinces with high GDP per capita have abundance of natural resources. Using national average for GDP per capita and inequality (see Figure 15), we can see that there are four provinces that have both GDP per capita and inequality above average. Meanwhile, there are only three provinces (Babel, Riau, and West Sulawesi) with GDP per capita above average and inequality below average.
Figure 13. Urban population provinces. Source: http://www.datastatistik-indonesia.com.
Figure 14. GDP/capita by provinces. Source: BPS.
0102030405060708090
100
DK
ID
IYB
ante
n W
est J
ava
East
Kal
Bal
iR
iau
East
Java
Cen
tral J
ava
Nor
th S
umN
orth
Sul
NTB
Sout
h K
alSo
uth
Sum
Ben
gkul
uC
entra
l Kal
Wes
t Sum
Gor
onta
loJa
mbi
Sout
h Su
lA
ceh
Lam
pung
Wes
t Kal
Nor
th M
alM
aluk
uSo
uth
East
Sul
Papu
aC
entra
l Sul
NTT
% Urban Population in 2010 National Average
05000
100001500020000250003000035000400004500050000
DK
IEa
st K
alB
abel
Ria
uW
est P
apua
Papu
aW
est S
ulEa
st Ja
vaC
entra
l Sul
Cen
tral K
alSo
uth
Sum
Nor
th S
umSo
uth
Kal
Bal
iW
est S
umW
est J
ava
Ace
hW
est K
alN
orth
Sul
Jam
biD
IYSo
uth
Sul
Cen
tral J
ava
Sout
heas
t Sul
Lam
pung
NTB
Ben
gkul
uM
aluk
uN
TT
GDP Per Capita in 2011 (Rp) National Average of GDP Per Capita

102
We alDuncan, 2Figure 16, level in 20persistencecompared t
5 This methdeviation fro(average – stdeviation); a
0.00
0.05
0.10
0.15
0.20
0.25
0.30
0.35
0.40
0.45
0.50
-
L
MM
H
Fig
lso adopt the013)5 to seewe see that
01 and 2012.e. Jambi and to other prov
od was mentio
om the averagetandard deviati
and (3) High = p
- 5,000
Jambi, Aceh,South Sum, N
Low-Low
Medium-Medium
Low-Medium
Medium-Low
High-Medium
GROW
gure 15. Inequa
e approach ue the persiste
Papua and D. Lampung, NCentral Kali
vinces.
Figu
oned in OECD e. Persistence oion); (2) Mediupoverty or inequ
10,000 1
Pap
West S
Gorontalo
West Sum, KepNorth Sum, NTB
m Me
WTH AND I
ality and GDP/c
used in the pence in inequDIY are provNTT, South Simantan have
ure 16. Persiste
working paperf poverty or in
um = (average –uality rate ≥ (av
15,000 20,00
West Papupua
Sul
pri, North Mal,B, South Kal, E
edium-High & Hi
INEQUALITY
capita. Source:
aper by OECuality betweevinces with aSulawesi, ande the less inc
ence of inequali
r by Miranti etnequality is clas– standard deviverage + standa
00 25,000
Riau
ua
Central Kal,East Java
igh-High
Y IN INDON
BPS and the au
CD (Miranti,en two pointa degree of ind South East Screment of G
ity (2001 and 20
t al. (2013). Thssified as followiation) ≤ pover
ard deviation).
30,000 35
Babel
NESIA
uthors’ calculati
Vidyattamats in time innequality perSulawesi mov
Gini during th
012).
he classificatiows: (1) Low = rty or inequality
5,000 40,00
East Kal
Maluku, CenBali, West KNorth Sul, D
ion.
a, Hansnata, Cn 2001 and 2rsisted at theve from medhe period of
on is divided upoverty or ineq
y rate ≤ (averag
00 45,000
DKI
ntral Sul,Kal,DIY
Cassells, & 2012. From e same high ium to high 2001-2012,
using standard quality rate < ge + standard
50,000

GROWTH AND INEQUALITY IN INDONESIA
103
Figure 17 shows the annual change in inequality between 2001 and 2012. The three provinces that experienced the most rapid decline in inequality are Gorontalo, North Sulawesi, and Maluku. For Papua Barat, Papua, and DIY, where inequality is persistently high, the annual change in inequality is small. The same pattern also occurs for provinces that have low inequality like Bangka Belitung.
Figure 17. Annualized change in inequality (2001-2012).
Among regions in Indonesia, Java and Sulawesi have the highest economic inequality from time to time followed by Maluku-Papua, Bali-NTB, Kalimantan, and Sumatra (see Figure 18).
Figure 18. Inequality across regions.
From the fact above, we can get a rough conclusion for the trend of growth and poverty and inequality in Indonesia: (1) Poverty has been decreased while inequalities have been increased by both national aggregate and provincial data; (2) The increase in GDP per capita has succeeded in reducing the number of poor people, but inequality is keep rising. The increase in inequality for the last five years is higher compared to that in the period of two decades before; and (3) Higher inequalities mostly occurred in urbanized provinces or in provinces with high GDP per capita. Therefore, the next question we would like to explore is whether the ongoing increase of inequality follows the Kuznets hypothesis or not.
0
1
2
3
4
5
6
Gor
onta
loN
orth
Sul
Mal
uku
Bal
iR
iau
Sout
heas
t Sul
Sout
h Su
mat
era
Wes
t Jav
aC
entra
l Sul
Ben
gkul
uN
orth
Mal
uku
Cen
tral J
ava
Sout
h Su
lW
est J
ava
Cen
tral K
alLa
mpu
ng
Ban
ten
Sout
h K
alJa
mbi
NTB DK
IW
est K
alK
epri
NTT
Ace
hEa
st K
alD
IYN
orth
Sum
Papu
aEa
st Ja
vaW
est P
apua
Wes
t Sul
Bab
el
00.05
0.10.15
0.20.25
0.30.35
0.40.45
Avg Sumatra Avg Java Avg Balnustra Avg Kalimantan Avg Sulawesi Avg Maluku-Papua
2008 2009 2010 2011 2012

GROWTH AND INEQUALITY IN INDONESIA
104
Methodology and Data There are two questions that we would like to explore in this paper: (1) “Whether the Kuznets Curve holds
true for Indonesia?”; and (2) “Is there an increase in the current inequality reflecting the process of which the Kuznets theory mentioned?”. In addition, we aim to analyze the determinant of inequality.
When testing the Kuznets Curve, the functional specification to be estimated is Equation (1). This method was also applied by Frazer (2006) to test economical Kuznets Curve and by Stern (2004) and Lessmann (2011) to test spatial inequality and development:
2, , , ,ln( ) ln( )i t i t i t i tGini C Ycap Ycapα β ε= + + + (1)
where Ginii,t = income inequality (Gini ratio) in province i at year t, Ycap = GDP per capita of province i at year t, and ln is natural logarithm.
This paper uses the dynamic panel method to test the existence of inverted U shape of the Kuznets Curve. This approach was also used in the studies of Li and Zou (1998), Calderon and Chong (2001), Ranjan (2001), and Nikoloski (2009), and the specification of the model is:
2, .( 1) , , ,ln( ) ln( )i t i t i t i t i tGini C Gini Ycap Ycapγ α β ε−= + + + + (2)
where Ginii,t = income inequality (Gini ratio) in province i at year t, Ycap = GDP per capita of province i at year t, and ln is natural logarithm.
Given this model, Arcand, Berkes, and Panizza (2012) and Lind and Mehlum (2010) showed that in order to check the presence of an inverted-U relationship, it is necessary to formulate the following joint null hypothesis:
0 min max: ( 2 ( ) 0) ( 2 ( ) 0)Ycap Ycapα β α βΗ + ≤ ∪ + ≥ (3)
Against the alternative:
1 min max: ( 2 ( ) 0) ( 2 ( ) 0)Ycap Ycapα β α βΗ + > ∩ + < (4)
where (Ycap)min and (Ycap)max are the minimum and maximum values of GDP per capita respectively. The null hypothesis implies a U-shaped condition. If either of the two hypotheses is rejected, we can conclude that the regression has an inverted U-shaped condition. The inverted U-shaped conditions are shown in Equation (4), describing that when Ycap is still under the maximum value (Ycap still grew until reached the threshold), the curve will have an increasing trend. But then, the trend is likely to be reversed (decreased) after Ycap has reached a certain maximum value.
To verify the inverted-U shape of the Kuznets Curve, the signs and magnitudes of α and β should be examined. The Kuznets Curve holds, if α > 0 and β < 0. If it holds, then we can find the turning point or the maximum point of the Kuznets Curve using the following formula (Taguchi, 2012; Tam, 2008):
exp( /(2 ))k α β= − (5)
To test the determinant of inequality, we add control variables to Equation (2). The estimation using additional control variables was also applied in the studies of Nikoloski (2009) and Frazer (2006), and the specification of the model is:

GROWTH AND INEQUALITY IN INDONESIA
105
2, .( 1) , , , ,ln( ) ln( )i t i t i t i t i t i i tGini Gini Ycap Ycap Zγ α β δ μ ε−= + + + + + (6)
where Ginii,t = income inequality (Gini ratio) in province i at year t, Ginii.(t-1) = the one period lagged dependent variable, Ycap = GDP per capita of province i at year t, and Zi,t represents a vector of one or more control variables.
As the Kuznets theory mentioned, during the process of growth, there is a movement from low-productivity agricultural sector to more productive sectors, such as manufacturing and services. In order to control for the gradual shift towards industry and manufacturing, we use the share of agriculture sector and manufacturing sector to total GDP. We also use urban population as a control variable based on the hypothesis that the shifting from low productivity sector to more productive sectors, in the first place, will benefit the urban people. There has also been some research that has tapped into the relationship between inflation and inequality. Zhou (2009; as cited in Jiang, Shi, Zhang, & Ji, 2011) found that inflation can significantly widen the income gap at the national level. In this paper, inflation is used in order to gauge the impact of macroeconomic volatility on inequality. Using inflation and real GDP per capita together in one model seemingly can raise the potential colinearity issue. But according to Baltagi (2005), this issue can be addressed by dynamic panel model. Jiang et al. (2011) and Son (2010) also used real GDP per capita together with inflation in one model to estimate relationship of that variable with inequality. Their paper presents the estimation result when one of real GDP either inflation dropped in order to check the impacts of a potential colinearity issue. Their estimation shows that there is only a slight difference if taking both real GDP and inflation into model or dropping one of them6. To accommodate the issue of human capital to inequality, we add variable Lschool. The complete specification of data and the expected sign is presented in Table 2.
Table 2 Data Specification Variable Note Source Expected sign Gini Gini ratio BPS (+) Ycap Real GDP per capita BPS (+) Ycap2 Real square of GDP per capita BPS (-) CPI Consumer Price Index with base year 2007 BPS (+) Pop Share of urban population over total population BPS (+)/(-) S.Agriculture Share of agricultural sector to total GDP BPS (+) S.Industry Share of manufacturing sector to total GDP BPS (-)
Lschool Number of students from elementary schools to higher education universities BPS (-)
Note. All data are converted to logarithm except for Gini and CPI.
In order to alleviate endogeneity and unobserved heterogeneity problem, this paper uses General Method of Moments System (GMM-SYS) which is a dynamic panel technique proposed by Arellano and Bover. This method uses instruments in first differences for equation in levels and instruments in levels for equations in first differences. The GMM-SYS technique estimates the dynamic panel model for both levels and first differences, as level equations are simultaneously estimated using differenced lagged regressor as instruments. This process, therefore, has the advantage of controlling for individual heterogeneity. 6 That slight difference lends evidence to the effectiveness of the dynamic panel model in controlling colinearity bias (Baltagi, 2005).

GROWTH AND INEQUALITY IN INDONESIA
106
The unobserved heterogeneity problem can thus be effectively resolved by estimating first difference equations. The GMM method not only employs lag term (Ginii.(t-2)) and difference (ΔGinii.(t-2)) as instrument variables but also uses additional instruments obtained by utilizing the orthogonal conditions that exist between the disturbances and the lagged values of the dependent variable. This method makes a progress in utilizing instrumental variables in the dynamic panel analysis for lagged dependent model. Arellano and Bover found that computing the original level variable equation along with the difference equation as an instrument can improve the efficiency of the estimation (Son, 2010). Furthermore, the two-step GMM estimators, which use one-step residuals to construct asymptotically optimal weighting matrices, are more efficient than one-step estimators (Blundell & Bond, 1998; as cited in Jiang et al., 2011).
The first-differenced endogenous variables of inequality (Ginii,t) with lagged of endogenous variable can be a valid instrument provided that there is no second-order autocorrelation in the idiosyncratic error terms using Arellano-Bond test. If there is an autocorrelation, it implies that the lagged variables, used as the instrumental variables, are in fact close to endogenous variables, not exogenous. Since the first degree of autocorrelation in the variable implies the second degree of autocorrelation in the error terms in difference equation (Δεi,t = εi,t − εi,t), we can check the error term autocorrelation using the Sargan test.
This dynamic panel method testing the relationship between inequality and growth is found in Nikoloski (2009), Calderon and Chong (2001), Li and Zou (1998), Son (2010), as well as Grijalva (2011).
Empirical Result Table 3 presents the dynamic panel GMM estimation results for testing whether the Kuznets Curve holds
true for Indonesia (see Equation (2)). The two-step GMM-SYS method lends us a promising solution to the unobserved bias and endogeneity issue in estimating Equation (2). This method estimates both levels and first difference equations for Equation (2). The unobserved heterogeneity problem can thus be effectively resolved by estimating first difference equations, whereby the time-invariant disturbances are eliminated. Also, the extensive instrument variables (lag Gini ratio) utilized in this method can solve the endogeneity and even some other model specification problems.
To estimate the model in this paper, we conducted a two-step systematic GMM (GMM-SYS) that has met the criteria of the best model. In Verbeek (2004), the criteria for dynamic panel models with the best GMM approach are the validity of the instrument and the consistency. Based on the methodology of the GMM-SYS estimator, for each regression, we test the specification of equation with the Sargan test of over-identifying restrictions, and then with the Arellano-Bond test for the second-order serial correlation. The test results show that all the regressions satisfy the specification tests, which indicates that our instruments are valid and there exists no evidence of second-order serial correlation in our regressions.
As seen in Table 3, we find evidence of the existence of inverted U-shaped Kuznets Curve in Indonesia. In our model, GDP per capita and the squared term of the GDP per capita enter the equations with the expected sign (GDP per capita is positive, while the squared term is negative).
In terms of model robustness, the first criterion that we check is consistency. It can be seen from the results of the Arellano-Bond that the test is rejected at Order 1 using 10% level of significance, because p-value = 0.0689 and at Order 2 indicating that errors are serially uncorrelated, because p = 0.2060 > 0.05. Thus statistically, it shows that the model is good enough. The second criterion is validity of the instrument, and the Sargan test shows that the insignificant p-value is 0.5904, which means that the instrument is valid.

GROWTH AND INEQUALITY IN INDONESIA
107
Table 3 Dynamic Panel GMM-SYS Estimation of the Kuznets Curve Hypothesis Gini ratio Estimated coefficient Standard error P > |z| L.Gini ratio 0.7524 0.1303 0.000 YCap 0.0262 0.0107 0.014 YCap2 -0.0013 0.0007 0.042 Constant -0.0320 0.0750 0.669 Arellano-Bond test z Prob. > z Order 1 -1.8190 0.0689 Order 2 -1.2645 0.2060
Sargan test Chi2(11) = 25.68395 Prob. > Chi2 = 0.5904
Turning point = exp(-α2/(2α3)) (179.41 million)
After verifying that inverted-U Kuznets Curve does hold in Indonesia, then the turning point of the Kuznets Curve can be examined. Table 3 shows the result that Indonesia may have the turning points when the real GDP per capita in each province reached 179.41 million rupiahs. From this evidence, we can conclude that with 7% growth each year and well-maintained macro-stability, it will take at least 25 years to reach the turning point.
Figure 19. Kuznets Curve of some countries.
Figure 20. Kuznets Curve of Indonesian provinces.
20253035404550556065
2.3 2.4 2.5 2.6 2.7 2.8 2.9 3 3.1 3.2 3.3 3.4 3.5 3.6 3.7 3.8 3.9 4
Gin
i Ind
ex
Log GDP Per Capita
Malaysia Thailand Philippines India VietnamChina Mexico Brazil Indonesia
15
20
25
30
35
40
45
6.25 6.35 6.45 6.55 6.65 6.75 6.85 6.95 7.05 7.15 7.25 7.35 7.45 7.55 7.65 7.75
Gin
i Ind
ex
BENGKULU Indonesia ACEH BALI DIY DKI JABAR JAMBI JATENG JATIM KALBAR KALSELKALTENG KALTIM LAMPUNG MALUKU NTB NTTPAPUA RIAU SULSEL SULTENG SULTRA SULUTSUMBAR SUMSEL SUMUT
Log of GDP Per Capita

GROWTH AND INEQUALITY IN INDONESIA
108
Figure 19 shows a plot of Kuznets Curve in some countries using log GDP per capita and Gini index. Indonesia and India seem still in the first stage of development according to Kuznets hypothesis where increase in GDP per capita is accompanied by increase in inequality. Meanwhile, the plot for Brazil and Mexico seems not linear and more complex. In empirical fact, after the burst of economic growth in the middle of the last century and after reaching middle-income group for 40-50 years7 (income group classification by World Bank8), Brazil and Mexico experienced something like a middle-income trap and have yet to progress to advanced economic status. For Malaysia, the plot appears to be an inverted-S curve. If seen from the current facts found, Malaysia has reached the middle-income category since 40 years ago, but Malaysia has not yet fallen into the middle-income trap categories.
When we see closer to the level of province in Indonesia, it can be seen from Figure 20 that almost all provinces in Indonesia are experiencing the rising inequality which is in line with the national movement. For provinces with higher GDP per capita than provincial average such as Jakarta, Riau, and East Kalimantan, it is clear that increasing GDP per capita is in line with the increase of income inequality.
The result for estimation of determinant of inequality is presented in Table 4. All the independent variables are significant with signs as expected. The coefficients of lag Gini ratio are positive and significant at the level of 1% for regression which suggests a strong support for dynamic effect of inequality in the model. Indeed, higher past levels of inequality are associated with higher current levels of inequality. Lagged levels of Gini ratio are positively significant at the level of 1%, which shows a strong positive correlation between past and present values of Gini ratio. We also find evidence of the existence of the inverted U-shaped Kuznets Curve after adding some control variables. The coefficients GDP per capita and the squared term of the GDP per capita showed signs of the inverted-U shape and are significantly different from zero. The model also met the robustness criteria of consistency and validity of instruments.
Table 4 Dynamic Panel GMM-SYS Estimation of Kuznets Curve Hypothesis Gini ratio Estimated coefficient Standard error P > |z| L.Gini Ratio 0.1850 0.0179 0.000 YCap 0.1566 0.0298 0.000 YCap2 -0.0015 0.0000 0.000 Pop 0.0696 0.0340 0.041 CPI 0.0005 0.0000 0.000 Schooling -0.0604 0.0100 0.000 S.Agriculture 0.0415 0.0167 0.013 S.Industry -0.0343 0.0049 0.000 Arellano-Bond test z Prob. > z Order 1 -1.9176 0.0552 Order 2 -1.4867 0.1371
Sargan test Chi2(11) = 24.83771 Prob. > Chi2 = 0.1660
7 This fact is mentioned in Economic Insight (Maccalum & Moretti, 2013). 8 World Bank divided countries into four income group categories based on income per capita. The groups are: low-income countries with income per capita $1,035 or less; lower-middle-income $1,036-$4,085; upper-middle-income $4,086-$12,615; and high-income countries with income per capita $12,616 or more.

GROWTH AND INEQUALITY IN INDONESIA
109
We find strong evidence that the percentage of urban population is associated with the higher level of inequality. This happens because in the early stages of development, economic development comes with increasing urbanization and inequality. Increasing returns of industrial activities, decreasing transport costs, and labor mobility generate the concentration of workers and economic activity in the urban sector, allowing higher urban wages. As people and resources are reallocated from agricultural activities towards industrial activities, this process leads to increasing inequality, as higher incomes are perceived in urban areas compared to rural areas. Both higher inequality and higher urbanization favor the concentration of production factors necessary for growth, and this concentration itself reinforces labor’s reallocation from the rural towards the urban areas (Ros, 2000; Castells & Royuela, 2011). This finding is similar with Kanbur and Zhuang (2013) whose empirical evidence shows that higher urban population in the early stages of development in Indonesia will raise inequality. The paper also shows that Indonesia has not reached the turning point yet. For Indonesia, the current composition of urban population is around 47%, which is still far lower than the predicted turning point of 84.9%. That finding shows that Indonesia still has many years to go for national inequality to peak even if urban and rural inequalities and the urban-rural income gap stay constant. From this empirical evidence, it is useful to know that shifting population from the rural to urban sectors, holding all other factors constant, will increase national inequality for Indonesia in the early stages of development.
We also find that higher inflation is associated with higher inequality. Inflation can increase inequalities through its effect on individual income and can reduce inequalities in the presence of progressive tax system. The inequality widening effect of inflation is more pronounced when wages fail to chase increasing price levels. In developing countries, trade unions are weak and minimum wage laws are dysfunctional in the presence of weak institutions. Thus, workers are left with less or no rise in wages, while owners of the firms enjoy benefits of rising prices and get richer (MacDonald & Majeed, 2010).
From the empirical result, this paper also finds that education has a negative impact on income inequality. This result convinces the theory that education is widely seen as one of the most efficient ways to reduce inequality (Abdullah, Doucouliagos, & Manning, 2011; Meschi & Scervini, 2012). Education provides greater economic opportunities especially to the poor, because it determines occupational choice and the level of pay and it also provides a signal of ability and productivity in the job market. Education shifts the composition of the labour force away from unskilled to skilled. Better educated individuals are perceived to be more able to cope with technological tools that directly influence productivity levels, which are needed by Indonesia as a low middle-income country to move to a higher level economy.
As Kuznets theory mentioned, during the process of growth, there is a movement from low productivity agriculture to more productive sectors, such as manufacturing and services. We find some support for Kuznets’ original suggestion that changes in the structure of production provide a mechanism through which development affects inequality. The share of agriculture in total GDP is significantly related to the pattern of inequality. Higher share of agriculture in total GDP is associated with higher inequality. As the modern sector expands, it absorbs larger proportions of the labor force into high income employment, thus reducing the pressure of population in the traditional sectors and thereby narrowing inter-sector income differentials. The empirical result of this paper also finds that the share of industrial sector over total GDP has a negative significant effect on income inequality. This result shows that a rising share of the modern sector (mainly the manufacturing industry) in terms of GDP makes income distribution unequal in the early stages of economic

GROWTH AND INEQUALITY IN INDONESIA
110
development. As Kuznets theory mentioned before, the process of development is supposed to be accompanied by a rise in the shares of the non-agricultural sectors and a corresponding fall in the share of the agricultural sector in total output.
Conclusion Poverty has been decreased while inequality has been increased both by national aggregate and provincial
data. The increase in GDP per capita has succeeded in reducing the number of poor people, but inequality is keeping rising.
The increase in inequality for the last five years is higher compared to that in the period of two decades before. Higher inequalities mostly occurred in urbanized provinces or in provinces with high GDP per capita. Almost all provinces experience an increasing trend of inequality.
This study indicates that the Kuznets Curve holds in Indonesia. It seems that the current increasing trend of inequality is expected to continue.
Percentage of urban population, inflation, and share of agricultural sector contributed to the increase of inequality, while high-level education and share of industrial sector are associated with the lower level of inequality.
References Abdullah, A. J., Doucouliagos, H., & Manning, E. (2011). Education and income inequality: A meta-regression analysis
(University Teknologi Mara, Sarawak, Malaysia). Arcand, J. L., Berkes, E., & Panizza, U. (2012). Too much finance? IMF Working Paper No. WP/12/161. Baltagi, B. H. (2005). Econometric analysis of panel data (4th ed.). Chichester: John Wiley & Sons. Barro, R. J. (2008). Inequality and growth revisited. ADB Working Paper on Regional Economic Integration No. 11. Boston Consulting Group. (2012). Asia’s next big opportunity: Indonesia’s rising middle-class and affluent consumer report. Calderon, C., & Chong, A. (2001). External sector and income inequality in interdependent economies using a dynamic panel data
approach. Economics Letters, 71(2), 225-231. Castells, D., & Royuela, V. (2011). Agglomeration, inequality, and economic growth. Research Institute of Applied Economics. Frazer, G. (2006). Inequality and development across and within countries. World Development, 34(9), 1459-1481. Grijalva, D. F. (2011). Inequality and economic growth: Bridging the short-run and the long-run. University of California, Irvine. Jiang, Y., Shi, X., Zhang, S., & Ji, J. (2011). The threshold effect of high-level human capital investment on China’s urban-rural
income gap. China Agricultural Economic Review, 3(3), 297-320. Kanbur, R., & Zhuang, J. (2013). Urbanization and inequality in Asia. Asian Development Review, 30(1), 131-147. Lessmann, C. (2011). Spatial inequality and development—Is there an inverted-U relationship? CESifo Working Paper No. 3622. Lewis, D. B. (2013). Urbanization and economic growth in Indonesia: Good news, bad news, and (possible) local government
mitigation. Regional Studies, 48(1), 192-207. Li, H., & Zou, H. F. (1998). Income inequality is not harmful for growth: Theory and evidence. Review of Development
Economics, 2(3), 318-334. Lind, J. T., & Mehlum, H. (2010). With or without U? The appropriate test for a U-shaped relationship. Oxford Bulletin of
Economics and Statistics, 72(1), 109-118. Maccalum, J., & Moretti, G. (2013). Economic insight. Middle Kingdoms UBS. MacDonald, R., & Majeed, M. T. (2010). Distributional and poverty consequences of globalization: A dynamic comparative
analysis for developing countries. University of Glasgow. Meschi, E., & Scervini, F. (2012). Expansion of schooling and educational inequality in Europe: Educational Kuznets curve
revisited. Gini Discussion Paper 61. Miranti, R., Vidyattama, Y., Hansnata, E., Cassells, R., & Duncan, A. (2013). Trends in poverty and inequality in decentralising
Indonesia. OECD Social, Employment, and Migration Working Paper. Nikoloski, Z. (2009). Economic and political determinants of income inequality. University of College London.

GROWTH AND INEQUALITY IN INDONESIA
111
Ranjan, P. (2001). Dynamic evolution of income distribution and credit-constrained human capital investment in open economies. Journal of International Economics, 55(2), 329-358.
Ros, J. (2000). Development theory and the economics of growth. Ann Arbor: University of Michigan Press. Son, J. C. (2010). A reassessment the relationship between growth and inequality: Evidence from new data. Institute for Monetary
and Economic Research, the Bank of Korea. Stern, D. I. (2004). The rise and fall of the environmental Kuznets curve. World Development, 32(8), 1419-1439. Taguchi, H. (2012). The environmental Kuznets curve in Asia: The case of sulphur and carbon emissions. Asia-Pacific
Development Journal, 19(2), 77-92. Tam, H. (2008). An economic or political Kuznets curve? Public Choice, 134(3/4), 367-389. Verbeek, M. (2004). A guide to modern econometrics (2nd ed.). Chichester: John Wiley & Sons.

Journal of Modern Accounting and Auditing, February 2015, Vol. 11, No. 2, 112-123 doi: 10.17265/1548-6583/2015.02.004
Corporate Social and Environmental Reporting Institutionalized
René P. Orij Leiden University, Leiden, the Netherlands
External Corporate Social and Environmental Reporting (CSER) finds its raison d’être in corporations’ search for
both a license to operate and accountability towards society. This suggests a relationship between corporations and
society. In this study, that relationship is analyzed, specifically the relationship between levels of CSER and
economic institutions. A strong link with institutions is an outcome of institutionalization. The economic
institutions applied are economic freedom and legal origin as a proxy for national corporate governance systems.
The results of this descriptive study show associations between CSER levels and economic freedom. CSER is also
related to national corporate governance systems through legal origin. CSER appears to be institutionalized, or in
any case, corporations seem to be aware of the economic institutionalization of CSER.
Keywords: social and environmental reporting, economic institutions, stakeholders, legitimacy
Introduction
The major idea behind this study is the existence of the systems orientation of businesses. In other words, businesses are parts of the system society, which is expressed through corporate reporting. Corporate Social and Environmental Reporting (CSER) relates to the systems orientation. With CSER, corporations show their social and environmental performance to society or specific groups within society. This study contains an empirical search for societal determinants of CSER. In this study, societal determinants are societal institutions, societal moulds. Three types of institutions exist: economic, social, and political. In this paper, only economic institutions are studied.
Institutions exist both formally and informally. Laws are examples of formal institutions. Institutions are humanly determined constraints on human interaction, as described by North (1990). In order to be able to analyze voluntary behavior, informal institutions are chosen. Associations between CSER and the economic institutional environment are analyzed with the use of a system-theoretical framework. The framework consists of two theories: stakeholder theory and legitimacy theory. Hypotheses with regard to the associations studied are drawn from these theories. Both theories are applied at a national level. National institutions are suggested to be related to corporate-level reporting. The hypotheses are assessed with the use of an economic-institutional regression model.
Economic institutions are seen as the most relevant in the field of financial accounting by Ball, Kothari, and Robin (2000) and in the field of assurance of CSER by Simnett, Vanstraelen, and Chua (2009). The two studies limit the economic institutions by legal origin only.
The research problem of this study is whether an association exists between CSER levels and economic institutions. This emerges from the institutional moulds, which are determinants of actions by system participants—the corporations.
René P. Orij, assistant professor, Department of Business Studies, Leiden University. Email: [email protected].
DAVID PUBLISHING
D
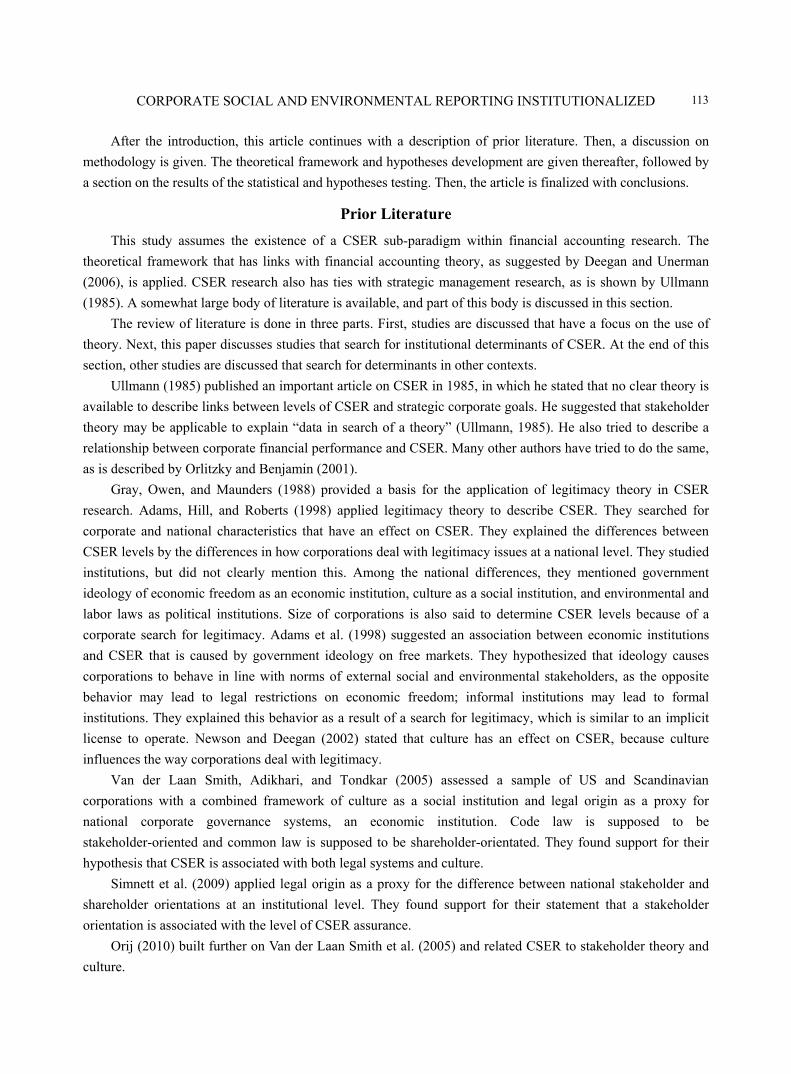
CORPORATE SOCIAL AND ENVIRONMENTAL REPORTING INSTITUTIONALIZED
113
After the introduction, this article continues with a description of prior literature. Then, a discussion on methodology is given. The theoretical framework and hypotheses development are given thereafter, followed by a section on the results of the statistical and hypotheses testing. Then, the article is finalized with conclusions.
Prior Literature This study assumes the existence of a CSER sub-paradigm within financial accounting research. The
theoretical framework that has links with financial accounting theory, as suggested by Deegan and Unerman (2006), is applied. CSER research also has ties with strategic management research, as is shown by Ullmann (1985). A somewhat large body of literature is available, and part of this body is discussed in this section.
The review of literature is done in three parts. First, studies are discussed that have a focus on the use of theory. Next, this paper discusses studies that search for institutional determinants of CSER. At the end of this section, other studies are discussed that search for determinants in other contexts.
Ullmann (1985) published an important article on CSER in 1985, in which he stated that no clear theory is available to describe links between levels of CSER and strategic corporate goals. He suggested that stakeholder theory may be applicable to explain “data in search of a theory” (Ullmann, 1985). He also tried to describe a relationship between corporate financial performance and CSER. Many other authors have tried to do the same, as is described by Orlitzky and Benjamin (2001).
Gray, Owen, and Maunders (1988) provided a basis for the application of legitimacy theory in CSER research. Adams, Hill, and Roberts (1998) applied legitimacy theory to describe CSER. They searched for corporate and national characteristics that have an effect on CSER. They explained the differences between CSER levels by the differences in how corporations deal with legitimacy issues at a national level. They studied institutions, but did not clearly mention this. Among the national differences, they mentioned government ideology of economic freedom as an economic institution, culture as a social institution, and environmental and labor laws as political institutions. Size of corporations is also said to determine CSER levels because of a corporate search for legitimacy. Adams et al. (1998) suggested an association between economic institutions and CSER that is caused by government ideology on free markets. They hypothesized that ideology causes corporations to behave in line with norms of external social and environmental stakeholders, as the opposite behavior may lead to legal restrictions on economic freedom; informal institutions may lead to formal institutions. They explained this behavior as a result of a search for legitimacy, which is similar to an implicit license to operate. Newson and Deegan (2002) stated that culture has an effect on CSER, because culture influences the way corporations deal with legitimacy.
Van der Laan Smith, Adikhari, and Tondkar (2005) assessed a sample of US and Scandinavian corporations with a combined framework of culture as a social institution and legal origin as a proxy for national corporate governance systems, an economic institution. Code law is supposed to be stakeholder-oriented and common law is supposed to be shareholder-orientated. They found support for their hypothesis that CSER is associated with both legal systems and culture.
Simnett et al. (2009) applied legal origin as a proxy for the difference between national stakeholder and shareholder orientations at an institutional level. They found support for their statement that a stakeholder orientation is associated with the level of CSER assurance.
Orij (2010) built further on Van der Laan Smith et al. (2005) and related CSER to stakeholder theory and culture.

CORPORATE SOCIAL AND ENVIRONMENTAL REPORTING INSTITUTIONALIZED
114
In CSER research, little attention is given to economic institutions as a determinant of disclosure compared to mainstream financial accounting research. In financial accounting research, Ball et al. (2000) related economic institutions to properties of accounting earnings. Other financial accounting studies by Hope (2003a; 2003b) and Hope, Kang, Thomas, and Yoo (2008) studied determinants that relate to enforcement of accounting regulation, auditor choice, legal systems, and culture. With regard to the discussion on legal origin, they referred to the research paradigm of law and economics and the specific study by La Porta, Lopez-de-Silanes, Shleifer, and Vishny (1999). The latter also provides detailed data on code law sub-groups. They stated that clear differences exist among French, German, and Nordic code laws, which may affect national corporate governance systems.
Methodology CSER research can be classified as interpretative or sometimes critical research. A positive,
theory-verification research methodology is chosen in order to be able to draw generic conclusions. In this study, descriptives of CSER are looked for through the search for associations between CSER and economic institutions.
The regular focus of mainstream research on decision usefulness for investment purposes of all external corporate reporting is not applied. There are two reasons for not using that approach. The first is that this study focuses on outside determinants that have an internal effect. An outside-in approach is applied, as is described by Burritt and Schaltegger (2010). The second reason is theoretical. The system-oriented approach that is applied in most CSER research suggests that everything in society is interrelated. The corporation-shareholder relationship is not the only relevant relationship for corporate reporting, especially not for CSER. The raison d’être for CSER is societal, not solely economic, which is one of the fundamental premises of this study.
Hypotheses are developed out of a theoretical framework and prior literature. The hypotheses are tested with the use of statistical material from a large sample of CSER data. The data provided by Sustainalytics consist of 600 corporations from 22 countries. The selection of corporation originates from the MSCI World Index (MSCI Barra, 2010). The statistical analysis consists of multivariate regression models, supported by bivariate correlations. Independent variables are country data on institutions. The dependent variable is the CSER score provided by Sustainalytics. Further details on the CSER score are provided below.
The main methodological limitation of this study is its static character; only one year, 2012, is studied. Institutions are supposed to be “fluid”, a general characteristic of institutions nowadays, as Bauman (2007) stated.
Theoretical Framework and Hypotheses Development The theoretical framework consists of stakeholder theory, legitimacy theory, and institutions from
institutional theory. Institutions will be discussed firstly. Thereafter, legitimacy theory and stakeholder theory are discussed. After the discussion on the theoretical framework, hypotheses are developed.
Institutions have been defined by North (1990) in his institutional theory. He recognized three types of institutions: economic, social, and political. Institutions are social phenomena. They are patterns in society—constraints created by people, which can be ideological or ethical. Institutions are not set forever. They may change, particularly through globalization. Bauman (2007) described this and Stiglitz (2007) related it to multinational corporations. In this study, it is assumed that corporations may be “asked” to adapt to

CORPORATE SOCIAL AND ENVIRONMENTAL REPORTING INSTITUTIONALIZED
115
societal institutions. Corporations are assumed to show their adaptation to the institutions by their CSER. The motives for adaptation may be found in other theories. The other theories are system-oriented theories that explain corporate behavior, stakeholder theory, and legitimacy theory. These system-oriented theories are seen as part of a financial accounting research paradigm by Deegan and Unerman (2006). These theories describe the relations between the society as a system and the corporation.
Stakeholder theory has been developed by Freeman (1984). According to this theory, the corporation directs its activities towards the interests of several stakeholders, in such way as it is described by Mitchell, Agle, and Wood (1997).
Related to stakeholder theory are the concepts of communitarianism and contractarianism. These concepts define stakeholder orientation at a national level. Communitarianism stands for a society which is oriented towards responsibility and sharing equally (Bradley, Schipani, Sundaram, & Walsh, 1999). Contractarianism stands for a society in which individual freedom and interests stand first. In recent research, communitarianism has also been linked to a stakeholder orientation or a social orientation of the society (Simnett et al., 2009). With that assumed theoretical relationship, the connection between institutions and social orientation at a national level can be established.
Legitimacy theory originates from the social contract of Rousseau (2003, original publication in 1762) and other enlightenment philosophers. Legitimacy is an informal contract with society, and legitimacy of corporations is sometimes called license-to-operate. It may also be seen as the social acceptance of the corporation. A corporation may deal with legitimacy at three different levels: creating legitimacy, preserving legitimacy, or regaining legitimacy (Suchman, 1995). Legitimacy theory suggests that social pressure relating to legitimacy differs for every particular corporation. Corporations in certain risky industries experience larger pressures than others, and large corporations experience more pressure than small ones. Legitimacy theory is generally applied at an organizational level, as Suchman (1995) described. Newson and Deegan (2002) applied the theory at a national level. They suggested that differences exist internationally concerning the search for organizational legitimacy. They related their outcomes to a combination of cultural and economic institutions.
The theoretical framework and the hypotheses development are visualized in Figure 1.
Figure 1. Visualization of relationships between theoretical framework and hypotheses development.

CORPORATE SOCIAL AND ENVIRONMENTAL REPORTING INSTITUTIONALIZED
116
The size of this study only allows searching for relationships between the level of CSER and one type of institution. Only economic institutions are studied. The economic institutions studied are national corporate governance systems and government free market ideology, that is to say, economic freedom, which may be seen as the level to which governments favor capitalism. The national corporate governance systems relate to legal origin of the country involved. The relationship between corporate governance and legal systems can only be established through stakeholder theory and communitarianism. The latter suggests that a stakeholder orientation within nations may be caused by a social orientation that relates to the legal origin. A stakeholder orientation leads to a corporate focus on stakeholder accountability, which further leads to a higher level of CSER. Code law leads to a stakeholder orientation, whereas common law systems lead to a shareholder orientation. Common law is seen as the opposite with regard to social orientation. This reasoning leads to the following hypothesis:
H1: Legal origin and its related national corporate governance system are associated with the level of CSER through a negative association with common law and a positive association with code law.
Prior studies, such as Simnett et al. (2009), confirmed the theoretical associations, as suggested by stakeholder theory and communitarianism. Legal origin in H1 can only be related to stakeholder issues instead of legitimacy issues. There is no proof of the relevance of legitimacy issues with regard to legal origin.
H1 suggests legal origin to be an explanatory variable, which differs from Orij (2010). In that study, legal origin was a control variable, as culture was the main issue to be studied.
A further hypothesis is based upon free market ideology. The existence of a relationship between levels of CSER and free market ideology is suggested by Adams et al. (1998). They suggested a positive association. Corporations want to keep freedom intact, and for this reason, they try to please the lawmakers with the use of CSER. Corporations are supposed to deal with lawmakers in a similar manner as is explained by the political cost hypothesis from positive accounting theory (PAT). Milne (2002) linked CSER to PAT.
However, another reasoning may be possible. Orij (2012) suggested that the relationship between levels of CSER and free market ideology can be explained by a national stakeholder orientation, similar to legal origin. The reasoning behind this suggestion is as follows: The higher the level of economic freedom, the fewer the corporations willing to deal with stakeholders other than shareholders. Free markets do not coincide with a stakeholder orientation. Therefore, levels of CSER are likely to be negatively associated with economic freedom.
The discussion on this hypothesis leads to two sub-hypotheses: H2a: Economic freedom is positively associated with levels of CSER, through national levels of
legitimacy-seeking corporate behavior. H2b: Economic freedom is negatively associated with levels of CSER, through stakeholder-oriented
corporate behavior. The two sub-hypotheses suggest opposite directions of the relationships. The possible outcomes of H2a
and H2b, which conflict, are shown in Table 1. In brief, Table 1 describes which sub-hypothesis, H2a or H2b, can be confirmed, if a particular association
is found. Concluded from the analysis in Table 1 may be that depending on the direction of the association, H2a or H2b can be confirmed, not both at the same time.

CORPORATE SOCIAL AND ENVIRONMENTAL REPORTING INSTITUTIONALIZED
117
Table 1 Possible Outcomes of Opposing H2a and H2b
Possible strength of theoretical relationships Possible empirical relationship found Possible confirmation of hypotheses
Positive legitimacy effect is suggested to be stronger than negative stakeholder effect on CSER. Overall effect is suggested to be positive.
Positive
The empirical test shows that the positive effects are stronger than the negative effects. The positive legitimacy effect can be confirmed. The negative stakeholder effect cannot be confirmed, as it seems to disappear within the larger legitimacy effect. H2a can be confirmed. H2b cannot be confirmed.
Positive legitimacy effect is suggested to be weaker than negative stakeholder effect on CSER. Overall effect is suggested to be negative.
Positive
The negative stakeholder effect is found to overrule the positive legitimacy effect, if it exists, as the empirical test shows that the negative effects are stronger than the positive effects. Both H2a and H2b cannot be confirmed.
Positive legitimacy effect is stronger than negative stakeholder effect. Overall effect is suggested to be positive.
Negative
The positive legitimacy effect is found to overrule the negative stakeholder effect, if it exists, as the empirical test shows that the negative effects are stronger than the positive effects. Both H2a and H2b cannot be confirmed.
Positive legitimacy effect is weaker than negative stakeholder effect. Overall effect is suggested to be negative.
Negative
The negative stakeholder effect is suggested to overrule the positive legitimacy effect. The empirical test shows that the negative effects are stronger than the positive effects. The positive legitimacy effect can be confirmed, but the negative stakeholder effect cannot be confirmed; H2a cannot be confirmed, while H2b can be confirmed.
Sample, Data, and Operationalization In this paper, a sample from 2012 is studied. The sample contains 3,553 companies from 56 countries. The
selection of the sample and the contents of the database are based upon all available information provided by Sustainalytics, an international corporate social responsibility (CSR) research company. The dataset is compiled by a content analysis of the companies’ publicly available reports and interviews done by Sustainalytics. The scoring system is based upon a combined assessment of the quantity and quality of CSR activities by companies. A description of the assessment methods by Sustainalytics is available to the author. Sustainalytics aims to collect CSR data from all companies included in the “World Index”. The collection of the Sustainalytics data has been a combined effort by the SiRi group of research institutes, originally also including Kinder Lydenberg Domini (KLD). KLD data are used in the majority of CSR and CSER studies (Orlitzky & Benjamin, 2001) and are useful data, as Sharfman (1996) demonstrated. The availability of CSR data is the bottleneck in CSR research, which makes these data the starting point for the sample selection (Sharfman, 1996). A similar approach to application of the data is done in Orij (2010), but with older data (2006) and other combinations of variables.
Industry or sector data are also provided by Sustainalytics. The variable on sector data is a dummy variable that scores the membership of an industry group or sector. GSCI sector data consist of 10 sectors, which lead to nine dummy variables (sector (STR)).
Institutional data come from several sources and these are values per nation. The first economic institution is economic freedom (ECF), as suggested by Adams et al. (1998). They did not assess this variable, but hypothesized a relationship with CSER. A relevant source is Simnett et al. (2009). They applied data by Kaufmann, Kraay, and Mastruzzi (2009). Kaufmann et al. (2009) applied data on economic freedom by the Heritage Foundation (2012), a US think tank on conservatism and economic freedom.

CORPORATE SOCIAL AND ENVIRONMENTAL REPORTING INSTITUTIONALIZED
118
Data on corporate governance system, particularly its legal origin basis, are taken from La Porta et al. (1999). Corporate governance as an economic institution is represented by a dummy variable for legal origin, as Van der Laan Smith et al. (2005) and Simnett et al. (2009) suggested. Hope (2003a) applied detailed sub-groups of legal systems: French (FRE), German (GER), and Nordic (NOR) code laws. La Porta et al. (1999) provided the fifth1 type of legal origin: socialist. Table 2 shows these data per country.
Table 2 Country Data Country Number of companies Legal origin Economic freedom Australia 186 Common 95.5 Austria 32 German 73.6 Bahamas 1 Common 69.2 Belgium 19 French 91.6 Bermuda 12 Common 45.4 Brazil 78 French 53.0 Canada 249 Common 91.7 Cayman Islands 1 Common 58.9 Channel Islands 4 Common 25.2 Chile 15 French 70.5 China 117 Socialist 48.0 Colombia 8 French 90.2 Cyprus 2 Common 80.7 Czech Republic 3 Socialist 65.8 Denmark 21 Nordic 98.4 Egypt 9 French 63.3 Finland 22 Nordic 94.8 France 125 French 84.0 Germany 162 German 92.1 Greece 10 French 77.1 Hong Kong 101 Common 98.9 Hungary 4 Socialist 79.1 India 91 Common 37.3 Indonesia 27 French 20.2 Ireland 21 Common 83.4 Israel 19 Common 66.1 Italy 35 French 76.9 Japan 347 German 81.3 Luxembourg 8 French 74.8 Macau 2 French 60.0 Malaysia 39 Common 79.9 Mauritius 1 Common 78.2 Mexico 23 French 81.4 Morocco 3 French 76.4 The Netherlands 74 French 57.2 New Zealand 7 Common 99.9 Norway 17 Nordic 92.6 1 The five types are FRE, GER, NOR, SOC, and common law.

CORPORATE SOCIAL AND ENVIRONMENTAL REPORTING INSTITUTIONALIZED
119
(Table 2 continued)
Country Number of companies Legal origin Economic freedom Papua New Guinea 1 Common 58.3 Peru 2 French 72.3 The Philippines 18 French 72.3 Poland 22 Socialist 64.0 Portugal 10 French 82.8 Russia 29 Socialist 69.2 Singapore 37 Common 97.1 South Africa 46 Common 74.7 South Korea 75 German 93.6 Spain 51 French 80.3 Sweden 36 Nordic 93.2 Switzerland 55 German 75.8 Taiwan 106 German 94.3 Thailand 23 Common 73.2 Turkey 23 French 68.2 Ukraine 1 Socialist 47.6 United Arab Emirates 2 Common 74.0 UK 138 Common 94.1 US 983 Common 90.5 Total 3,553 Note. Sources: Legal origin: La Porta et al. (1999); Economic freedom: Heritage Foundation (2012).
Table 3 shows the descriptive statistics of the variables.
Table 3 Descriptive Statistics Variable N Minimum Maximum Mean Standard deviation CSER 3,553 0.00 275.00 30.1435 53.86289 ECF 3,553 252.00 999.00 834.6696 147.16631 Notes. CSER is corporate social and environmental reporting. ECF is economic freedom. Sources: CSER: Sustainalytics; ECF: Heritage Foundation (2012).
Results In this section, results of various statistical tests are shown: correlations, T-tests, and regression models.
The results from the statistical tests are used further in the hypotheses testing. In Table 4, bivariate Pearson correlations among variables CSER, ECF, and legal origin are shown. In Table 4, it is shown that CSER correlates significantly with all variables, except for COM. None of the
bivariate correlations is alarmingly high, as very high correlations may disturb other associations. The significance of the detailed code law dummies with COM is obvious, as these score 0, while COM scores 1.
In Table 5, results of bivariate T-tests are shown, which provide evidence on the differences in mean CSER levels between the legal origins.
The results from Table 5 show that the CSER level differs between many of the legal origins. As suggested before, it is likely that corporations from code law countries score higher than those from common law countries. But the outcomes of the T-tests do not support the suggested difference. The only type of legal origin that shows significant differences in CSER levels is socialist legal origin. These are lower than all other levels.
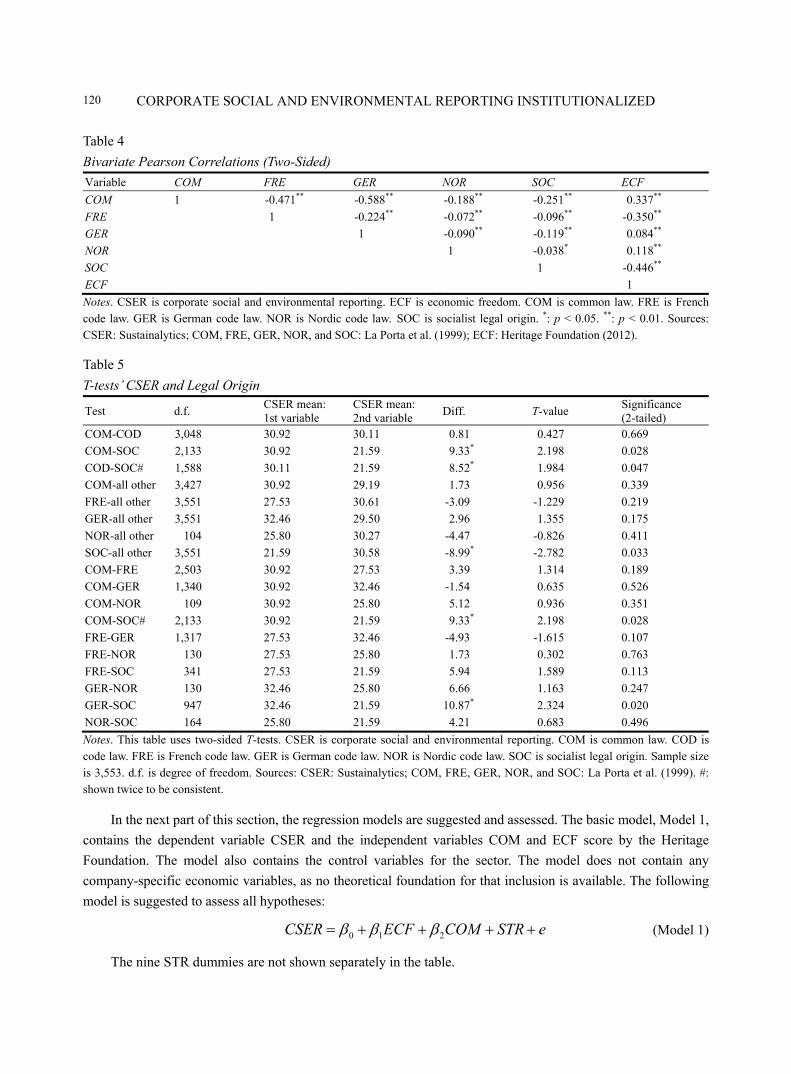
CORPORATE SOCIAL AND ENVIRONMENTAL REPORTING INSTITUTIONALIZED
120
Table 4 Bivariate Pearson Correlations (Two-Sided) Variable COM FRE GER NOR SOC ECF COM 1 -0.471** -0.588** -0.188** -0.251** 0.337** FRE 1 -0.224** -0.072** -0.096** -0.350** GER 1 -0.090** -0.119** 0.084** NOR 1 -0.038* 0.118** SOC 1 -0.446** ECF 1 Notes. CSER is corporate social and environmental reporting. ECF is economic freedom. COM is common law. FRE is French code law. GER is German code law. NOR is Nordic code law. SOC is socialist legal origin. *: p < 0.05. **: p < 0.01. Sources: CSER: Sustainalytics; COM, FRE, GER, NOR, and SOC: La Porta et al. (1999); ECF: Heritage Foundation (2012).
Table 5 T-tests’ CSER and Legal Origin
Test d.f. CSER mean: 1st variable
CSER mean: 2nd variable Diff. T-value Significance
(2-tailed) COM-COD 3,048 30.92 30.11 0.81 0.427 0.669 COM-SOC 2,133 30.92 21.59 9.33* 2.198 0.028 COD-SOC# 1,588 30.11 21.59 8.52* 1.984 0.047 COM-all other 3,427 30.92 29.19 1.73 0.956 0.339 FRE-all other 3,551 27.53 30.61 -3.09 -1.229 0.219 GER-all other 3,551 32.46 29.50 2.96 1.355 0.175 NOR-all other 104 25.80 30.27 -4.47 -0.826 0.411 SOC-all other 3,551 21.59 30.58 -8.99* -2.782 0.033 COM-FRE 2,503 30.92 27.53 3.39 1.314 0.189 COM-GER 1,340 30.92 32.46 -1.54 0.635 0.526 COM-NOR 109 30.92 25.80 5.12 0.936 0.351 COM-SOC# 2,133 30.92 21.59 9.33* 2.198 0.028 FRE-GER 1,317 27.53 32.46 -4.93 -1.615 0.107 FRE-NOR 130 27.53 25.80 1.73 0.302 0.763 FRE-SOC 341 27.53 21.59 5.94 1.589 0.113 GER-NOR 130 32.46 25.80 6.66 1.163 0.247 GER-SOC 947 32.46 21.59 10.87* 2.324 0.020 NOR-SOC 164 25.80 21.59 4.21 0.683 0.496 Notes. This table uses two-sided T-tests. CSER is corporate social and environmental reporting. COM is common law. COD is code law. FRE is French code law. GER is German code law. NOR is Nordic code law. SOC is socialist legal origin. Sample size is 3,553. d.f. is degree of freedom. Sources: CSER: Sustainalytics; COM, FRE, GER, NOR, and SOC: La Porta et al. (1999). #: shown twice to be consistent.
In the next part of this section, the regression models are suggested and assessed. The basic model, Model 1, contains the dependent variable CSER and the independent variables COM and ECF score by the Heritage Foundation. The model also contains the control variables for the sector. The model does not contain any company-specific economic variables, as no theoretical foundation for that inclusion is available. The following model is suggested to assess all hypotheses:
0 1 2CSER ECF COM STR e (Model 1)
The nine STR dummies are not shown separately in the table.

CORPORATE SOCIAL AND ENVIRONMENTAL REPORTING INSTITUTIONALIZED
121
The second model contains the detailed legal origin sub-groups, instead of the straightforward distinction between code law and common law countries:
0 1 2 3 4 5 6CSER ECF FRE GER NOR SOC STR e (Model 2)
The third model will be tested without the SOC group. The classic distinction between common and code law legal origins is hypothesized. The model is similar to Model 1.
The exclusion of one part of the dataset is based upon this classic distinction. Legal origin has never been hypothesized as having a relationship with corporate governance systems:
0 1 2 6 Without SOC Legal OriginCSER ECF COM STR e (Model 3)
The results of the regression models are shown in Table 6.
Table 6 Regression Models That Describe CSER Levels
Variable
Model 1 CSER described by economic freedom, legal origin, and sector
Model 2 CSER described by economic freedom, legal origin in detail, and sector
Model 3 CSER described by economic freedom, legal origin, and sector, without socialist legal origin
Constant 18.180** 25.34*** 1.098*** COM 0.882 -0.150*** ECF 0.007 -3.50 0.00013** FRE 1.47 GER -3.83 NOR -8.10 SOC -0.00 STR
Dummy, consisting of nine items, some***
Dummy, consisting of nine items, some***
Dummy, consisting of nine items, some***
F 11.344*** 13.987*** 67.432*** Adj. R-squared 0.039 0.039 0.217 Notes. First line is coefficient. Second line is T-value. CSER is corporate social and environmental reporting. ECF is economic freedom. COM is common law. FRE is French code law. GER is German code law. NOR is Nordic code law. STR is sector. SOC is socialist legal origin. F is F-statistic of the analysis of variance (ANOVA). ***: p < 0.001, **: p < 0.01, *: p < 0.5. Sources: CSER: Sustainalytics; COM, FRE, GER, NOR, and SOC: La Porta et al. (1999); ECF: Heritage Foundation (2012); STR: Sustainalytics.
Before a full analysis of the regression models can be provided, an analysis of the expected signs is given (see Table 7). The variable legal origin, as the distinction between corporations from common law and code law countries, is supposed to score negatively. The dummy variable scores 1 for common law and 0 for code law. The expected negative association is explained by the shareholder orientation within common law countries.
The direction of the ECF variable may vary with the explanatory theory (see Table 1).
Table 7 Signs of Variables
Variable Expected sign Empirically found sign (Model 3)
ECF - or + # + COM - - Notes. ECF is economic freedom. COM is common law. #: direction dependent on the explanatory power of two theories (see Table 1).

CORPORATE SOCIAL AND ENVIRONMENTAL REPORTING INSTITUTIONALIZED
122
Now we follow the analysis of the results given in Tables 6 and 7. All three models in Table 6 are significant on the whole, as can be seen by the significance of the F-statistic. For the first two, the significance is most probably caused by the industry variables. Models 1 and 2 show no significance for any of the main variables. The total dataset seems to be out of balance. The companies that relate to the non-hypothesized socialist legal origin are taken out for Model 3, which works out well. The main variables COM, legal origin, and ECF contribute significantly to Model 3.
For Model 3, the contribution of COM is consistent with the expectations, according to Table 7. The contribution of ECF is positive, also consistent with expectations, as is suggested by stakeholder theory according to Table 7, as both signs may occur, depending on the theoretical backing.
With older data (2006), Orij (2012) found other conclusions, though one important addition is made here: the separation between socialist legal origin and the others.
On the basis of the prior results, H1 can be confirmed: The legal origin and the related corporate governance system are determinants of corporate levels of CSER; legal origin up to the level of the distinction between code law and common law and with the specific additional conclusion about socialist legal origin. Not all legal systems and related corporate governance systems are determinants of CSER, in particular, socialist legal origin and the related corporate governance systems cannot be confirmed as a determinant of CSER. The bivariate analyses show that particularly the socialist legal origin matters particularly in a negative way. The multivariate analysis also confirms the significance of the common law-code law distinction on legal origin, as was hypothesized.
The analysis of H2a and H2b is based upon all possible outcomes of the confrontation of hypotheses and findings in Table 1. The positive impact by legitimacy-related motives may “overrule” possible smaller, negative effects suggested by stakeholder theory. Only the negative impact can be confirmed, which leads to a confirmation of H2b. H2a cannot be confirmed. Overall, economic freedom is confirmed as a determinant of CSER, particularly through legitimacy-related motives. The sector effects also contribute to that conclusion.
Conclusions and Discussion In this study, a relationship has been established between CSER and the economic-institutional
environment of corporations. These economic institutions are economic freedom and the national corporate governance systems. The latter are represented by the legal origins of the nations. This was shown to be relevant, as a corporate governance-systematic determinant of CSER, but not generically. Common law and code law systems are relevant determinants, but socialist legal origin is not.
Further, the economic institution of government ideology that promotes economic freedom has a positive impact on CSER levels. This ideology is the level to which government favors economic freedom. More capitalism relates to more legitimacy-oriented social and environmental reporting. This effect is disturbed by companies from countries with a socialist legal origin, which shows low economic freedom and low levels of CSER. The latter can only clearly be shown in the correlation table, as the regressions do not show significant associations.
In general, a relationship among economic institutions can be confirmed, though less clear than initially expected. CSER is somewhat institutionalized with regard to economic institutions.

CORPORATE SOCIAL AND ENVIRONMENTAL REPORTING INSTITUTIONALIZED
123
References Adams, C. A., Hill, W. Y., & Roberts, C. B. (1998). Corporate social reporting practices in Western Europe: Legitimating
corporate behaviour? The British Accounting Review, 30(1), 1-21. Ball, R., Kothari, S. P., & Robin, A. (2000). The effect of international institutional factors on properties of accounting earnings.
Journal of Accounting and Economics, 29(1), 1-51. Bauman, Z. (2007). Liquid times: Living in an age of uncertainty. Cambridge: Polity Press. Bradley, M., Schipani, C. A., Sundaram, A. K., & Walsh, J. P. (1999). The purposes and accountability of the corporation in
contemporary society: Corporate governance at a crossroads. Law and Contemporary Problems, 62(3), 9-86. Burritt, R. L., & Schaltegger, S. (2010). Sustainability accounting and reporting: Fad or trend? Accounting, Auditing, and
Accountability Journal, 23(7), 829-846. Deegan, C., & Unerman, J. (2006). Financial accounting theory. Maidenhead: McGraw-Hill Education. Freeman, R. E. (1984). Strategic management: A stakeholder approach. Boston: Pitman. Gray, R., Owen, D., & Maunders, K. (1988). Corporate social reporting: Merging trends in accountability and the social contract.
Accounting, Auditing, and Accountability Journal, 1(1), 6-20. Heritage Foundation. (2012). Index of economic freedom. Retrieved from
http://www.heritage.org/Index/pdf/2012/book/Index_2012.pdf Hope, O. K. (2003a). Disclosure practices, enforcement of accounting standards, and analysts’ forecast accuracy: An international
study. Journal of Accounting Research, 41(2), 235-272. Hope, O. K. (2003b). Firm-level disclosures and the relative roles of culture and legal origin. Journal of International Financial
Management and Accounting, 14(3), 218-248. Hope, O. K., Kang, T., Thomas, W., & Yoo, Y. K. (2008). Culture and auditor choice: A test of the secrecy hypothesis. Journal of
Accounting and Public Policy, 27(5), 357-373. Kaufmann, D., Kraay, A., & Mastruzzi, M. (2009). Governance matters VIII: Aggregate and individual governance indicators,
1996-2008. Washington: The World Bank. La Porta, R., Lopez-de-Silanes, F., Shleifer, A., & Vishny, R. (1999). The quality of government. Journal of Law, Economics, and
Organization, 15(1), 222-279. Milne, M. J. (2002). Positive accounting theory, political costs, and social disclosure analyses: A critical look. Critical
Perspectives on Accounting, 13(3), 369-395. Mitchell, R. K., Agle, B. R., & Wood, D. J. (1997). Toward a theory of stakeholder identification and salience: Defining the
principle of who and what really counts. Academy of Management Review, 22(4), 853-886. MSCI Barra. (2010). Global investable market indices methodology. Newson, M., & Deegan, C. (2002). Global expectations and their association with corporate social disclosure practices in
Australia, Singapore, and South Korea. The International Journal of Accounting, 37(2), 183-213. North, D. C. (1990). Institutions, institutional change, and economic development. Cambridge: Cambridge University Press. Orij, R. P. (2010). Corporate social disclosures in the context of national cultures and stakeholder theory. Accounting, Auditing,
and Accountability Journal, 23(7), 868-889. Orij, R. P. (2012). Societal determinants of corporate social disclosures. Leiden: Leiden University Press. Orlitzky, M., & Benjamin, J. D. (2001). Corporate social performance and firm risk: A meta-analytic review. Business and Society,
40(4), 369-396. Rousseau, J. J. (2003). On the social contract. Mineola: Dover Publications. Sharfman, M. (1996). The construct validity of the Kinder, Lydenburg, & Domini social performance ratings data. Journal of
Business Ethics, 15(3), 287-296. Simnett, R., Vanstraelen, A., & Chua, W. F. (2009). Assurance on sustainability reports: An international comparison. The
Accounting Review, 84(3), 937-967. Stiglitz, J. E. (2007). Making globalization work. New York, NY: Norton. Suchman, M. C. (1995). Managing legitimacy: Strategic and institutional approaches. Academy of Management Journal, 20(3),
571-610. Ullmann, A. A. (1985). Data in search of a theory: A critical examination of the relationships among social performance, social
disclosure, and economic performance of U.S. firms. Academy of Management Review, 10(3), 540-557. Van der Laan Smith, J., Adikhari, A., & Tondkar, R. H. (2005). Exploring differences in social disclosures internationally: A
stakeholder perspective. Journal of Accounting and Public Policy, 24(2), 123-151.

Journal of Modern Accounting and Auditing, February 2015, Vol. 11, No. 2, 124-129 doi: 10.17265/1548-6583/2015.02.005
Embedding Economic Excellence: A Transformational
Definition of “Corporate Governance” for Malaysia
Zulkifflee Mohamed, Garry James Clayton, Mohd Yaziz Mohd Isa Universiti Tun Abdul Razak (UNIRAZAK), Kuala Lumpur, Malaysia
The Malaysian government has carefully crafted policies to ensure that the nation achieves its aspirational goal to
become a developed nation by 2020. Crucial for which is the success of the Securities Commission’s “Corporate
Governance Blueprint 2011” and “Capital Market Master Plan 2” designed to provide a business environment
which attracts investment and talent. Somewhat overlooked in these otherwise robust policy shifts has been a
critical critique of the definition, nature, and purpose of corporate governance itself. Recognizing this oversight,
Tan Sri Muhyiddin Yassin, Malaysia’s Deputy Prime Minister, has directed that the definition of corporate
governance be rejuvenated for the 21st century. This paper looks to answer that challenge by recommending the
following transformational definition for corporate governance: “the proactive implementation of accountable
ethical processes, procedures, and policies that inspires innovative aspirational economic activity to produce
sustainable wealth and prosperity for shareholders, stakeholders, and society”.
Keywords: corporate governance, Malaysian Code of Corporate Governance (MCCG), sustainability, Malaysia
Introduction Over the last 15 years, the Malaysian economy, though challenged by a multiplicity of global financial
crisis, has remained both stable and reliable in its performance. This robustness in the economy has been facilitated primarily by judicious governmental policy with respect to the development of a strengthened “Malaysian Code of Corporate Governance” (MCCG). Developed in response to the Asian Financial Crisis of the late 1990s, the MCCG incorporates the internationally recognized standards of best practice articulated by the Organization of Economic Cooperation and Development (OECD, 1999) as:
(1) Fairness; (2) Transparency; (3) Accountability; (4) Responsibility. The value of the MCCG is perhaps best illustrated by the confidence and trust it has engendered with
international institutional investors and rating agencies, ensuring favorable terms and recognition for the
Zulkifflee Mohamed, associate professor and deputy dean, Bank Rakyat School of Business & Entrepreneurship (BRSBE),
Universiti Tun Abdul Razak (UNIRAZAK). Email: [email protected]. Garry James Clayton, professor and dean, Bank Rakyat School of Business & Entrepreneurship (BRSBE), Universiti Tun
Abdul Razak (UNIRAZAK). Mohd Yaziz Mohd Isa, senior lecturer, Bank Rakyat School of Business & Entrepreneurship (BRSBE), Universiti Tun Abdul
Razak (UNIRAZAK).
DAVID PUBLISHING
D

A TRANSFORMATIONAL DEFINITION OF “CORPORATE GOVERNANCE” FOR MALAYSIA
125
Malaysian economy. Its holistic and integrated approach of process, structure, and objective provides clarity of both principles and purposes for businesses.
The core of the MCCG is the seminal “Report on Corporate Governance” written by the Finance Committee on Corporate Governance (FCCG, 1999). It crafted a prescriptive guide of conduct that was based on a working definition it crafted and that is still currently used in Malaysia. The FCCG defined corporate governance as:
... The process and structure used to direct and manage the business and affairs of the company towards enhancing business prosperity and corporate accountability with the ultimate objective of realizing long-term shareholder value, whilst taking into account the interests of other stakeholders.
Underpinned by a strong and evolving regulatory framework, Malaysia’s corporate governance system has been continuously improved since its inception through additional legislation, increased regulations, and the establishment of new facilitating agencies such as the “Minority Shareholder Watchdog Group” and the “Audit Oversight Board” (Securities Commission Malaysia [SCM], 2011a).
One unintended consequence of the internationally well-regarded regulatory regime has been an overemphasis by firms on compliance and risk management (Monsod, 2010; Muhyiddin Yassin, 2012). Though these are vital ingredients for quality corporate governance, they are insufficient for the economic transformation signaled by the Malaysian government’s New Economic Models (NEM) and Economic Transformation Programme (ETP).
Rejuvenating Malaysian Corporate Governance
Recognizing the innate weakness embedded in the very strength of the current corporate governance regime, the SCM has ambitiously embarked on a project to rejuvenate the system. Establishing an “International Corporate Governance Consultative Committee” to provide strategic direction and advice, the Securities Commission has begun to craft a clear strategic direction for the enhancement of corporate governance in Malaysia. Two results from this endeavor have been the publication of “Corporate Governance Blueprint 2011: Towards Excellence in Corporate Governance” and the “Capital Market Master Plan 2” (themed “Growth with Governance”). In combination, they provide support for the quantum leap needed for the implementation of the “NEM” and the government plan to ensure that Malaysia’s economy reaches a developed nation status by 2020. Excellent corporate governance ongoing contribution to the economic transformation will be continued access to funds from internationally influential investors who are constantly reviewing governance practices and development before deploying their capital. Access to such funds at reasonable rates will further foster a conducive business environment, especially for entrepreneurial and innovative economic activities viewed as critical to the future of the Malaysian economy (SCM, 2011a; 2011b).
What the Securities Commission did not undertake, however, was the equally important critical re-examination of the very concept and definition of corporate governance. This challenge has been raised by Tan Sri Muhyiddin Yassin, Malaysia’s Deputy Prime Minister, in the keynote address he presented to the 2012 Companies Commission National Conference in Kuala Lumpur. In a concise review of corporate governance practice in Malaysia, the Deputy Prime Minister highlighted the urgent need to transform the concept from being a tool to mitigate risks into a strategic 21st century mechanism to boost economic endeavor in an ethical manner. He foresaw that such a transformation would motivate employees, increase productivity, as well as become a magnate for investors and talent (Muhyiddin Yassin, 2012).
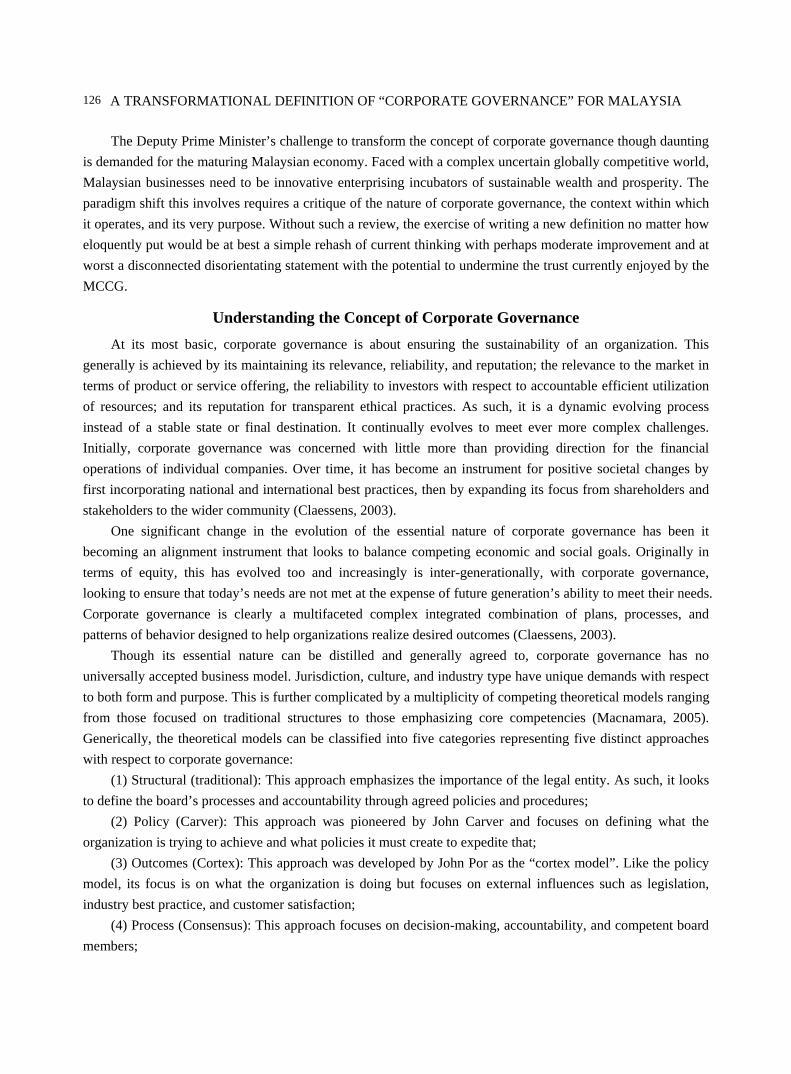
A TRANSFORMATIONAL DEFINITION OF “CORPORATE GOVERNANCE” FOR MALAYSIA
126
The Deputy Prime Minister’s challenge to transform the concept of corporate governance though daunting is demanded for the maturing Malaysian economy. Faced with a complex uncertain globally competitive world, Malaysian businesses need to be innovative enterprising incubators of sustainable wealth and prosperity. The paradigm shift this involves requires a critique of the nature of corporate governance, the context within which it operates, and its very purpose. Without such a review, the exercise of writing a new definition no matter how eloquently put would be at best a simple rehash of current thinking with perhaps moderate improvement and at worst a disconnected disorientating statement with the potential to undermine the trust currently enjoyed by the MCCG.
Understanding the Concept of Corporate Governance At its most basic, corporate governance is about ensuring the sustainability of an organization. This
generally is achieved by its maintaining its relevance, reliability, and reputation; the relevance to the market in terms of product or service offering, the reliability to investors with respect to accountable efficient utilization of resources; and its reputation for transparent ethical practices. As such, it is a dynamic evolving process instead of a stable state or final destination. It continually evolves to meet ever more complex challenges. Initially, corporate governance was concerned with little more than providing direction for the financial operations of individual companies. Over time, it has become an instrument for positive societal changes by first incorporating national and international best practices, then by expanding its focus from shareholders and stakeholders to the wider community (Claessens, 2003).
One significant change in the evolution of the essential nature of corporate governance has been it becoming an alignment instrument that looks to balance competing economic and social goals. Originally in terms of equity, this has evolved too and increasingly is inter-generationally, with corporate governance, looking to ensure that today’s needs are not met at the expense of future generation’s ability to meet their needs. Corporate governance is clearly a multifaceted complex integrated combination of plans, processes, and patterns of behavior designed to help organizations realize desired outcomes (Claessens, 2003).
Though its essential nature can be distilled and generally agreed to, corporate governance has no universally accepted business model. Jurisdiction, culture, and industry type have unique demands with respect to both form and purpose. This is further complicated by a multiplicity of competing theoretical models ranging from those focused on traditional structures to those emphasizing core competencies (Macnamara, 2005). Generically, the theoretical models can be classified into five categories representing five distinct approaches with respect to corporate governance:
(1) Structural (traditional): This approach emphasizes the importance of the legal entity. As such, it looks to define the board’s processes and accountability through agreed policies and procedures;
(2) Policy (Carver): This approach was pioneered by John Carver and focuses on defining what the organization is trying to achieve and what policies it must create to expedite that;
(3) Outcomes (Cortex): This approach was developed by John Por as the “cortex model”. Like the policy model, its focus is on what the organization is doing but focuses on external influences such as legislation, industry best practice, and customer satisfaction;
(4) Process (Consensus): This approach focuses on decision-making, accountability, and competent board members;
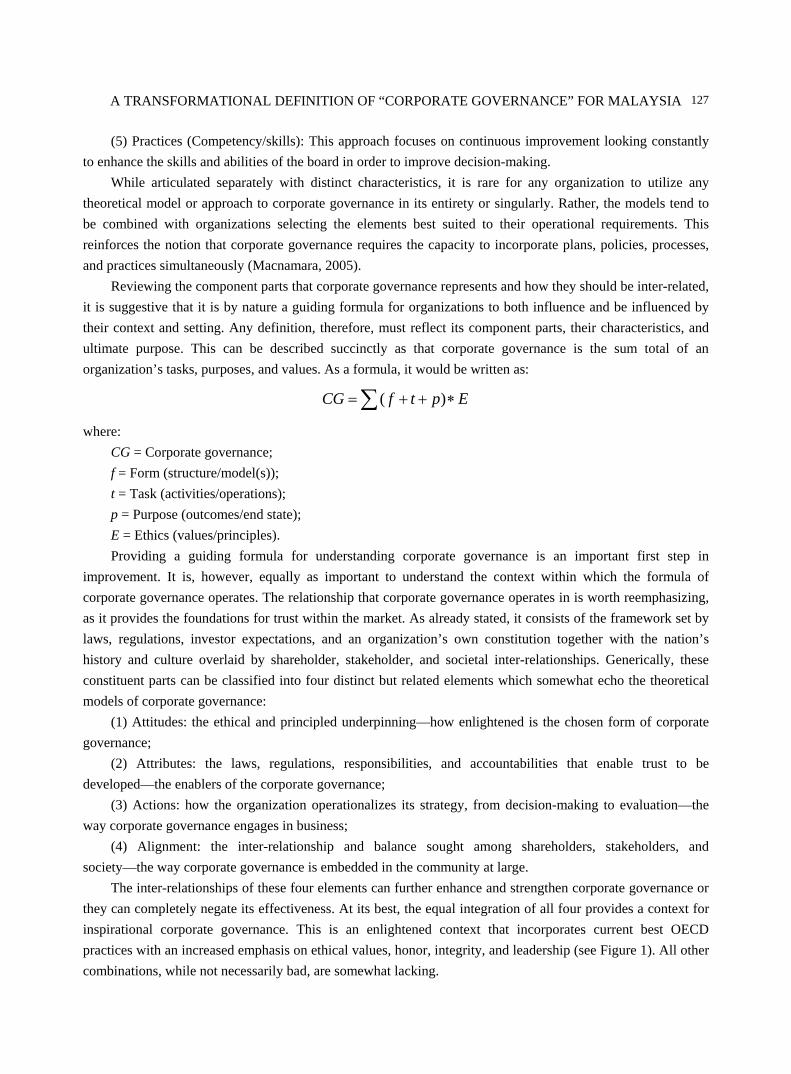
A TRANSFORMATIONAL DEFINITION OF “CORPORATE GOVERNANCE” FOR MALAYSIA
127
(5) Practices (Competency/skills): This approach focuses on continuous improvement looking constantly to enhance the skills and abilities of the board in order to improve decision-making.
While articulated separately with distinct characteristics, it is rare for any organization to utilize any theoretical model or approach to corporate governance in its entirety or singularly. Rather, the models tend to be combined with organizations selecting the elements best suited to their operational requirements. This reinforces the notion that corporate governance requires the capacity to incorporate plans, policies, processes, and practices simultaneously (Macnamara, 2005).
Reviewing the component parts that corporate governance represents and how they should be inter-related, it is suggestive that it is by nature a guiding formula for organizations to both influence and be influenced by their context and setting. Any definition, therefore, must reflect its component parts, their characteristics, and ultimate purpose. This can be described succinctly as that corporate governance is the sum total of an organization’s tasks, purposes, and values. As a formula, it would be written as:
( )CG f t p E= + + ∗∑
where: CG = Corporate governance; f = Form (structure/model(s)); t = Task (activities/operations); p = Purpose (outcomes/end state); E = Ethics (values/principles). Providing a guiding formula for understanding corporate governance is an important first step in
improvement. It is, however, equally as important to understand the context within which the formula of corporate governance operates. The relationship that corporate governance operates in is worth reemphasizing, as it provides the foundations for trust within the market. As already stated, it consists of the framework set by laws, regulations, investor expectations, and an organization’s own constitution together with the nation’s history and culture overlaid by shareholder, stakeholder, and societal inter-relationships. Generically, these constituent parts can be classified into four distinct but related elements which somewhat echo the theoretical models of corporate governance:
(1) Attitudes: the ethical and principled underpinning—how enlightened is the chosen form of corporate governance;
(2) Attributes: the laws, regulations, responsibilities, and accountabilities that enable trust to be developed—the enablers of the corporate governance;
(3) Actions: how the organization operationalizes its strategy, from decision-making to evaluation—the way corporate governance engages in business;
(4) Alignment: the inter-relationship and balance sought among shareholders, stakeholders, and society—the way corporate governance is embedded in the community at large.
The inter-relationships of these four elements can further enhance and strengthen corporate governance or they can completely negate its effectiveness. At its best, the equal integration of all four provides a context for inspirational corporate governance. This is an enlightened context that incorporates current best OECD practices with an increased emphasis on ethical values, honor, integrity, and leadership (see Figure 1). All other combinations, while not necessarily bad, are somewhat lacking.

A TRA
128
Witho(1) A
lacking an (2) A
regulatory (3) Ac(4) A
connection
In crait must buiSecond, it mand valuescorporate g
The cdefinition responsibilmanagemethis from tfor a devel
ANSFORMA
out: ttitude (Valuappropriate e
Attributes (Frregime; ctions (Opera
Alignment (Shn with its com
Towaafting a new dild on existinmust meet th. Finally, it n
governance acchallenge of
clearly muslity. In addint to compelhe perspectivoped nation s
ATIONAL DE
ues): Corporaemphasis on eramework):
ationalizationhareholder/sta
mmunity.
Figur
ards a Newdefinition of ng strengths; he four basic cneeds to be incts within. Tan Sri Mu
st maintain ition, it neelling missionve of the widstatus by bein
EFINITION
ate governancethical valuesCorporate g
n): Corporate akeholder/soc
re 1. Contextua
w Malaysiancorporate govthere is little
characteristicnspirational,
uhyiddin Yasthe OECD
ds to be am. It cannot ig
der communitng aligned to
OF “CORPO
ce functions s; governance i
governance icietal balanc
al elements of c
n Definitionvernance for e point in en
cs of form, taspositioned at
ssin is definD standards mbitious, incgnore the impty at its aspirthe goals of t
ORATE GOV
well at curre
s incapacitat
s inept, lackince): Corporat
orporate govern
n of CorporMalaysia, it
ndangering a sk, and purpot the juncture
nitely dauntinof fairness,
corporating tportance of srations. Finallthe “NEM”.
VERNANCE”
ent OECD st
ted, lacking
ng basic mane governmen
nance.
rate Goveris necessary well-regarde
ose underpinne of the four c
ng but is achtransparenc
the desired shareholder rely, it must fa
” FOR MALA
tandard but i
an appropr
nagement ovent is imperio
nance to do three th
ed reputation ned by appropcontextual el
hievable. Thcy, accountashift from
eturn, but it nacilitate Malay
AYSIA
is impeded,
riate robust
ersight; ous, lacking
hings. First, needlessly.
priate ethics lements that
he proposed ability, and compliance needs to do ysia’s drive

A TRANSFORMATIONAL DEFINITION OF “CORPORATE GOVERNANCE” FOR MALAYSIA
129
While it is possible to write a vast number of permutations that would meet all the requirements for the new transformational definition of corporate governance for Malaysia, the following is perhaps the most succinct: the proactive implementation of accountable ethical processes, procedures, and policies that inspires innovative aspirational economic activity to produce sustainable wealth and prosperity for shareholders, stakeholders, and society.
Conclusion Malaysia has an opportunity to move from simply imitation and innovation of other’s best practice with
respect to corporate governance to invention and trend setting by adopting a new transformational definition. Whatever the final word selected maybe, it is essential that they reflect the nature, form, purpose, and context that corporate governance operates in and for. It will need to retain existing internationally accepted standards but imbue then with a needed mix of both values and aspiration.
References Claessens, S. (2003). Corporate governance and development. Washington: The International Bank for Reconstruction and
Development/The World Bank. Finance Committee on Corporate Governance [FCCG]. (1999). Report on corporate governance. Malaysia: Ministry of Finance. Macnamara, D. (2005). Models of corporate/board governance. Leadership Acumen, Issue 21, pp. 1-10. Retrieved from
http://www.banffexeclead.com/Newsletter04/PDF/Leadership%20Acumen%2021%20V2%20Models%20of%20Corporate%20and%20Board%20Governance.pdf
Monsod, A. (2010). Evolution of corporate governance in Malaysia. Journal on Corporate Governance in Asia, 7(3), 20-22. Muhyiddin Yassin, T. S. (2012). Keynote address. In SSM National Conference 2012 “Managing Corporate Governance.
Creating Value. Transforming Economy”. Organization for Economic Cooperation and Development [OECD]. (1999). Principles of corporate governance. Retrieved from
http://www.oecd.org/corporate/oecdprinciplesofcorporategovernance.htm Securities Commission Malaysia [SCM]. (2011a). Corporate governance blueprint 2011: Towards excellence in corporate
governance. Retrieved from http://www.sc.com.my/wp-content/uploads/eng/html/cg/cg2011/pdf/cg_blueprint2011.pdf Securities Commission Malaysia [SCM]. (2011b). Capital market master plan 2 (growth with governance). Retrieved from
http://www.sc.com.my/post_archive/capital-market-masterplan-2-growth-with-governance/