Marital Sorting and Child Outcomes Jennifer Roff and Ryan D ...
Upload
khangminh22Category
view
0download
0
I. Sol-Gel Deposition of Oxide-IonConducting Thin Films
II. Liquid Precursors to Hafnium andTantalum Carbides
by
Jennifer Woodbridge Pell
B.S., Brandeis University
(1993)
M.S., Brandeis University
(1993)
SUBMITTED TO THE DEPARTMENT OF CHEMISTRYIN PARTIAL FULFILLMENT OF THE REQUIREMENTS
FOR THE DEGREE OF DOCTOR OF PHILOSOPHY
at the
MASSACHUSETTS INSTITUTE OF TECHNOLOGY
May 1999
© 1999 Massachusetts Insti tute ofTechnologyAll rights reserved
Signature of Author/1 7
Certified by
Department of Chemistry13 May, 1999
Dietmar SeyferthThesis Supervisor
Accepted by 'IDietmar Seyferth
Chairman, Departmental Committee on Graduate Students
MASSACHUSETTS INSTITUTEOF TECHNOLOGY
K) ITIbRARIES V

Thi dotoa thsi hasa M bee exmie by- a Committeeofth
This doctoral thesis has been examined by a Committee of theDepartment of Chemistry as follows:
Professor Alan Davison
Chairman of Thesis Committee
r A
Professor Dietmar Seyferth I N
Thesis Supervisor I
Professor Hans-Conrad zur Loye
Thesis Supervisor II
2

I. Sol-Gel Deposition of Oxide-IonConducting Thin Films
II. Liquid Precursors to Hafnium and TantalumCarbides
By
Jennifer Woodbridge Pell
SUBMITTED TO THE DEPARTMENT OF CHEMISTRY ON
May 13, 1999 IN PARTIAL FULFILLMENT OF THE REQUIREMENTS FOR
THE DEGREE OF DOCTOR OF PHILOSOPHY IN CHEMISTRY
ABSTRACT
I. The deposition of thin films of the BiMeVOx oxygen ion conductingceramics was studied. The sol-gel precursor solution included asoluble form of bismuth acetate, a vanadium alkoxide, and the acetateor alkoxide of the dopant metal (Me). Copper-doped films were spin-coated onto nonporous quartz substrates and pyrolyzed. These wereinitally defect-free, but became agglomerated on heating at highertemperatures. The use of a number of different additive compoundswas tried, but did not greatly improve the behavior of the films onquartz substrates. These films, when deposited onto platinum-coatedsubstrates, remained defect-free to all temperatures. Niobium-dopedfilms remained defect-free on quartz substrates at all heatingtemperatures. The reasons for these behaviors are examined.Copper-doped films were deposited defect-free onto porous aluminasubstrates. The structure of a single-molecule bismuth-vanadiumprecursor in the sol-gel solution is suggested.
II. Liquid precursors to refractory transition metal carbides wereproduced via both organometallic and metal alkoxide startingmaterials. These precusors were pyrolyzed under inert atmosphereand found to convert to the metal carbide, plus excess carbon,between 1100 OC and 1500 0C.
3
The use of Grignard reagents to functionalize (chloromethyl)silyl-terminated carbosilane dendrimers was investigated briefly. Thesyntheses were plagued by long reaction times and low purities,contrary to the behavior expected for the (chloromethyl)silyl group.Reasons for this behavior are discussed.
Thesis Supervisor, Part I: Dr. Hans-Conrad zur LoyeThesis Supervisor, Part II: Dr. Dietmar SeyferthTitle: Robert T. Haslam and Bradley Dewey Professor of Chemistry
4

Acknowledgments
I would like to thank Professor Hanno zur Loye for providing mewith the opportunity and financial support needed to pursue researchthat was of interest to me. I would also like to thank the NationalScience Foundation for financial support through an NSF GraduateResearch Fellowship and through grants which supported Part I of thisresearch. Further, I must express my appreciation to ProfessorDietmar Seyferth for agreeing to take me on when Hanno left MIT. Heprovided me with the opportunity to become exposed to differentareas of research, and was extremely patient with my "learning time."
Several members of the research groups I have been in shouldbe acknowledged for their intellectual and moral support. In the zurLoye group, Dr. Joel Houmes and Dr. Carlos Navas were invaluablecritics and crossword puzzle partners. UROP Katya Delak worked onthe project in Part I of this thesis under my guidance; hercontributions are indicated in the text. In the Seyferth group, Dr.Shane Krska got me started with the dendrimer chemistry andshowed me how Schlenk line work is supposed to be done. Dr.Herbert Petschelt and Dr. Bernhard Lungwitz taught me some lessons- not necessarily in chemistry - I will hopefully never forget.Experience is the worst teacher, as they say: she gives the examfirst, the lesson later. Seyferth group secretary Terry King was thebackbone of my work over the last two years, providing computerhelp, a finger ready to dial Physical Plant's repair line, and a listeningear; secretaries Debra Alibrandi and Colleen Rasmussen shared theircomputers and answered endless stupid questions about MicrosoftWord. Likewise, Susan Brighton was a pillar of support, particularlyduring my research group transition. During my time at MIT I was a TAfor numerous semesters, and I thank Dr. Miriam Diamond and Dr.Mircea Gheorgiu for their advice in improving my teaching, and ChuckWarren for his perennial friendly greeting (and easy access to thestockroom).
In the Center for Materials Science and Engineering (CMSE) atMIT, several people in different labs were very helpful in providing mewith access to equipment and intellectual support not available in theChemistry Department. In the ESEM lab, Dr. David Bell, who showedme how to stigmate correctly. In the XRD facility, Peter was alwaysready to help me re-boot and recover lost files. In the MicrofabricationLab, Dr. Rich Perilli taught me how to use the EBEAM and profilimetryequipment.
Finally, I must thank my family, and especially my husband Seth.Any enumeration of the reasons I have to be grateful to each of themwould fall short of the truth.
5

TABLE OF CONTENTS:
Title page 1Abstract 3Acknowledgements 5Table of Contents 6
Part I: Sol-Gel Deposition of Oxide-Ion Conducting Thin Films
1. Oxygen Ion Conducting Membranes: Brief Survey and 11Introduction
1.1 Mass Transport in Solids: Fast Ionic Conduction 121.2 The BiMeVOx Family of Oxygen Ion Conductors 181.3 Measurement of Oxygen Ion Conductivity 30
1.3.1 Impedance Spectroscopy 301.3.2 Non-ac Methods 34
1.4 Applications of Oxygen Ion Conductors 371.4.1 Solid Oxide Fuel Cells (SOFCs) 371.4.2 Oxygen Sensors 401.4.3 Air Separators 431.4.4 Catalytic Inorganic Membrane Reactors 451.4.5 Expected Benefits of Use of BiMeVOx Compounds 51
1.5 Conclusions and Project Goals 531.6 References 56
2. Pulsed Laser Deposition of Bi(Me)VOx onto Non-Porous 62Substrates
2.1 Introduction: Pulsed Laser Deposition 632.1.1 Method: How it works 632.1.2 Pitfalls and Problems 70
2.2 Results and Discussion 742.3 Conclusions 892.4 Experimental 912.5 References 94
3. Sol-Gel Approaches to Bulk BiMeVOx 953.1 Introduction to the Sol-Gel Method 96
3.1.1 Definitions, History, Background 963.1.2 True Sols 993.1.3 Macromolecular "Sols" 1013.1.4 Gel-to-Ceramic Transition 1053.1.5 Applications and Outlook 1073.1.6 Other Precursor Routes 109
6

3.1.7 Outline of the Research Done 1103.1.8 Vanadic Acid Background 110
3.2 Results and Discussion 1143.3 Conclusions 1293.4 Description of Salient Experiments 129
3.4.1 Experiments using NaVO 3 1303.4.2 Experiments using NH 4VO3 134
3.5 References 1424. Synthesis of Bulk BiMeVOx (Me = Cu, Nb, Fe, Ti, Mn) 146
4.1 Introduction and General Approach 1474.1.1 Transition Metal Alkoxides 1474.1.2 Synthesis of Vanadium Alkoxides 1514.1.3 Bismuth Part of the Precursor 1544.1.4 Synthesis of Bulk Oxygen-Ion Conductors 156
4.2 Results 1574.2.1 Vanadium Alkoxides Synthesis 1574.2.2 Synthesis and Characterization of Alcohol- 161
Soluble Bismuth Acetate4.2.3 Bulk Bi 2VO5.5 Synthesis 176
4.3 Conclusions 2004.4 Experimental Section 203
4.4.1 Vanadium Alkoxides 2034.4.2 Bismuth Part of the Precursor 2064.4.3 Bulk Bi 2VO5 .5 2164.4.4 Synthesis of Bulk BiMeVOx 234
4.5 References 2595. Describing the Bi/V Precursor: Synthesis and 263Characterization of a Bismuth-Vanadium HeterobimetallicAlkoxide
5.1 Introduction: Brief Review of Heterobimetallic 264Alkoxides
5.2 Results and Discussion 2715.2.1 Structure and Properties of III-76B 2715.2.2 Experiments in Preparing Analogs of III-76B 2815.2.3 Precursor Characterization 288
5.3 Conclusions 2995.4 Experimental Section 3005.5 References 326
6. Deposition of BiMeVOx Films onto Smooth and Porous 329Substrates
6.1 Introduction 3306.1.1 Background 330
6.1.2 Materials and methods 3336.2 Background on Films 355
7

6.2.1 Modes of film growth 3556.2.2 Defects in films 3576.2.3 Texture development 3616.2.4 Effects of sol-gel precursor variation on film 362
morphology6.2.5 The role of additives 368
6.3 Results and Discussion - Smooth Substrates 3746.3.1 Role of the substrate preparation 3746.3.2 Role of the precursor 402
6.4 Results and Discussion - Porous Substrates 4236.5 Conclusions 4326.6 Experimental Section 436
6.6.1 Dip coating experiments 4366.6.2 Spin coating experiments 4396.6.3 Deposition of BiCuVOx on quartz substrates 4426.6.4 Variation of hydrolysis water 4456.6.5 Variation of annealing temperature 4466.6.6 Behavior of bulk gels in the presence of additives 4476.6.7 Film quality when additives were used 4526.6.8 BiCuVOx films on metal substrates 4566.6.9 Preparation of films on porous substrates 4586.6.10 BiMeVOx films on assorted substrates 460
6.7 References 4927. Conclusions and Outlook 498A. Appendix to Part I: Materials and Methods 507
Al. Chemicals used 507A2. Instrumentation 512A3. References 520
Part II: Liquid Precursors to Hafnium and Tantalum Carbides
8. Introduction and Background on Transition Metal Carbides 5218.1 Technological Uses of Transition Metal Carbides 522
8.1.1 Structural/refractory uses 5228.1.2 Catalytic uses 527
8.2 Structures of Transition Metal Carbides 5308.3 Synthesis and Characterization 534
8.3.1 Traditional methods 5348.3.2 Precursor methods 5368.3.3 Characterization 538
8.4 Tour of the Group IV-V Carbides 5428.4.1 General trends 5428.4.2 Group IV 545
8

8.4.3 Group V 5468.5 Goals of the Part II Project 5518.6 References 554
9. Sol-Gel Approaches to TaC and HfC 5599.1 General Comments 556
9.1.1 Previous work 5579.1.2 Background 562
9.2 Results and Discussion 5679.2.1 Tantalum carbide precursors 5679.2.2 Hafnium carbide precursors 5729.2.3 Precursors to other metal carbides 576
9.3 Conclusions and Outlook 5799.4 Experimental 583
9.4.1 Tantalum carbide precursors 5859.4.2 Hafnium carbide precursors 5929.4.3 Pyrolysis condition tests 6009.4.4 Expansion of the alkoxide route to other 603
carbides9.5 References 648
10. Assorted Projects in Functionalizing Dendrimers 65110.1 Introduction and Background on Dendrimers 65210.2 Results and Discussion 659
10.2.1 Grignard reactions to functionalize dendrimers 65910.2.2 Addition of Ziegler-Natta catalysts to 664
dendrimers10.2.3 Other comments 667
10.3 Experimental 67110.3.1 Synthesis of assorted dendrimers 67210.3.2 Attempts at functionalization of dendrimers via 675
Grignard reagents10.3.3 Attempts at functionalization of dendrimers via 688
hydrosilylation reactions10.3.4 Zirconium-based catalysts 691
10.4 References 704
9

01
dcu IL'U<K( 41
C4 L WIC14c '
CULIL NLUL (
C/IL"
4iLLUU

Chapter One
Oxygen Ion Conducting Membranes: Brief Survey and
Introduction
11

1.1 Mass Transport in Solids: Fast Ionic Conduction
In most solid state materials, ionic conduction does not occur
to any appreciable extent. Defects in the crystal lattice or large
interstitial spaces, however, can provide empty sites (vacancies) via
which ions can migrate in a "hopping" mechanism, wherein ions
move sequentially into adjacent energy-equivalent empty sites.
(Figure 1.1) Cooperative motion of the ions also occurs. At room
temperature, most ionic solids do not have enough vacancies to
permit appreciable conduction of ions. However, when defect
concentrations become high, as they do near the material's melting
point, the ionic conductivity of the material increases. For example,
NaCl, which is an insulator at room temperature, can reach a
conductivity of 10-3 S cm- 1 at 800 0C, just below the melting point of
the material. Doping aliovalent "impurities" into the parent
structure of a material creates vacancies on the opposite ionic
lattice to maintain charge electroneutrality. In addition, some
materials, such as AgCl, accommodate ions in the interstitial space
to compensate for vacancies on the lattice (Frenkel defects), so that
movement of ions from lattice sites to interstitial sites and vice-versa
provides a second potential mechanism for mass transport. (Figure
1.2) In both of the examples given, it is the cation that is the
mobile species, although examples where anion Frenkel defects
provide the mode for mass transport are known (e.g. AgF).
Certain metal oxides, as well, experience a gradual increase in
defect concentration on the oxide sublattice as the sample
12

temperature rises, resulting in the potential for oxide ion
conductivity. Oxides that crystallize in the fluorite structure, such as
Hf0 2, CeO 2, ThO 2, and stabilized zirconia have sufficient unoccupied
volume in the unit cell that anions can move into interstices. These
materials can also accommodate a large concentration of lower-
valent dopant cations such as Ca 2+ and y3+ in their structures,
resulting in a high oxygen vacancy concentration and thus a high
oxide ion conductivity. Zirconias can be doped with heterometals to
maintain them in the cubic fluorite structure, yielding, for instance,
the industry standard oxide ion conductor yttria-stabilized zirconia
(YSZ). They have conductivities on the order of 5x10⁻² S cm' at
1000 OC, and are classified as "solid electrolytes."
Solid electrolytes, also known as fast ionic conductors or
superionic conductors, are a class of materials with a significantly
higher low-temperature (below the material's melting point)
conductivity than would be expected from a simple statistical
assumption regarding the number of vacancies. In these materials,
either a cationic or an anionic component of the structure is not
confined to specific lattice sites, resulting in a high concentration of
mobile species and a low activation energy for ion migration. As
noted above, this situation may come about due to a large
interstitial volume native to the structure type, which accommodates
ion movement; or because of a large impurity concentration which
produces extrinsic vacancies on the lattice of the conducted species.
However, dopant ions and vacancies tend to interact, and the extra
energy required to overcome this attraction increases the activation
energy for conduction. Therefore simply doping a structure reaches
13

a point beyond which further increases in dopant concentration
actually decrease the conductivity realized.1
A high degree of intrinsic vacancy disordering on the ionic
sublattice, whether in the room temperature phase or in a
metastable high temperature phase, can also provide for fast ionic
conductivity because the random distribution of ions over an excess
number of sites having equal potential permits all of the ions on
that sublattice to be mobile, at least in principle. For instance,
disorder on both the cation and oxygen sublattices of the
pyrochlore (A2 B2 0 7 ) materials, where A and B may switch positions
and 0 move into interstitial sites, provides the high oxygen ion
conductivities seen in these materials; furthermore, the pyrochlore
materials have a vacant oxygen site, when compared with the
closely-related fluorite structure A0 2 (A4 08 , compare with A2 B2 0 7 ). 2
A major goal of research in oxygen ion conducting materials is
the development of new compounds having high oxygen ion
conductivity at relatively low temperatures (400-800 0C), for use in a
number of different applications. The design of new conductors
attempts to combine the extrinsic vacancies made through doping
with the intrinsic vacancies already in the parent structure. The
provision of a low activation energy barrier for hopping between
adjacent sites by using structures with a large free volume and
highly polarizable ions, is a second consideration. "Intergrowth"
hybrids of known structures are possible. For example, while the
perovskite structure (ABO 3) is stoichiometric, it accepts a large
variation in A' and B' dopants, so that the net compound
AxA'1_xByB'1-y03-8 can become oxygen-deficient and therefore
conductive. The Brownmillerite oxides (A2B'B"0 5 ) have essentially
14

the perovskite structure with ordered oxygen vacancies in alternate
layers along the [101] direction. A number of examples of good
oxygen ion conductivity above the temperature of an order-disorder
transition in the Brownmillerite family exist. 3 ,4 The Brownmillerites
may be intergrown with perovskites to produce hybrid oxygen ion
conducting materials. 4 ,5 Another hybrid-type family, the Aurivillius 6
phases (Bi 2An. 1 MnO 3n+ 3) sandwich perovskitic {An-1 MnO 3n+ 1} 2 - regions
between sheets of {Bi20 2} 2 +. Oxygen vacancies in the perovskite
region lead to the high conductivity reported for Bi 2WO 6 and Bi 2VO5 .5
(n=1).7-10 (Figure 1.3) The intergrowth of Brownmillerite and
Aurivillius structures produced a new class of oxygen ion
conductors.11
15

Figure 1.1: Hopping mechanism for ionic conductivity.
'U
a
a a~
16

Figure 1.2: Ionic conductivity via Frankel defects (interstitial
atoms).
0Ela4T7
000
A
A -- interstitialB -- interstitial
= atom # 1
to lattice siteto interstitial
0D= atom # 2
17
I In

1.2 The BiMeVOx Family of Oxygen Ion Conductors
It is the Aurivillius phases that have given us materials with
some of the highest oxygen-ion conductivities measured to date.
These materials were first reported by Bush1 2 and Debreuille-
Gresse. 7 , 1 3 The solid-state synthesis is accomplished by heating
two equivalents of bismuth oxide, Bi20 3 , with one of vanadium
pentoxide, V2 0 5 , to 600 0C, followed by re-grinding of the pelletized
sample and calcination at 850 0C in air. 1 4 Two phase changes occur
in the parent structure on heating prior to congruent melting at 890
OC. (Equation 1.1)
(1.1)cX 450 -G 570 CY
The a phase, stable at room temperature, has a face-centered
orthorhombic mean cell, a=5.533(1), b=5.611(1), c=15.288(4) A, by
powder XRD. Single-crystal X-ray data were consistent with the
powder data. In the P phase, the mean cell is tetragonal and some
weak reflections indicate doubled cell parameters to give
a=b=11.285(8), c=15.400(9) A at 500 0C. The y phase is tetragonal
14/mmm with parameters a=b=4.004(1) and c=15.488(8) A at 700
OC. The X-ray data indicate a layered structure of {Bi20 2} 2 + sheets
and perovskite-like slabs similar to those found in Bi 2 MO 6 (M=W,
Mo), but the cell parameters and elemental composition indicate
that the perovskite slabs are incomplete. While the 0 atoms in the
puckered sheets are easily located, those in the vanadium
18

octahedra of the perovskitic regions are split among high-multiplicity
crystallographic sites. There is a certain degree of debate in the
literature about the details of the structure, partially due to the
ambiguity introduced by the site disordering, and partially due to
the superlattice reflections observed by a number of authors. 15
Whatever the particulars of the structure, the overall
formulation indicates vacancies and therefore high oxygen-ion
mobility in the perovskitic planes: {Bi 20 2} 2+{VO 3 .5 o.5 } 2 - (where l
is a vacancy). The measured oxide-ion conductivities were indeed
quite high, and the transport number near unity. Abraham's report
spurred a flurry of other papers reporting various partial
substitutions of other elements for the Bi, V, or both metals in the
structure, and the resulting modifications to the ionic
conductivity. 16,17
The puckered {Bi20 2} 2 + sheets have basal edge-shared BiO 4
groups in which the Bi is at the apex of a square pyramid and the
four oxygen atoms form the base plane. Partial substitution of the
Bi with Sb, Pb, and Te has been achieved but with no real
improvement in the ionic conductivity.18- 2 2 The A and B sites of the
perovskite block can be substituted by a wide range of cations,
provided that the perovskite and bismuth oxide layers continue to
match structurally. Substitution of aliovalent cations onto the
vanadium sites can stabilize the high-temperature, high-conductivity
y phase to room temperature, as well. The collective term for the
metal-substituted members of this family is "BiMeVOx", with the
general formula BiMxVlXO5 .5 -.
19

Further work by Abraham1 4 led to the initial members of the
BiMeVOx family. He doped the parent structure with up to 12
atom% of Cu 2+ and found that for 0<x<0.07 in the general formula
above, the material is found in the orthorhomic (a) phase, while for
0.07<x<0.12 the tetragonal y phase is stabilized to ambient
temperature. The formulation Bi 2CuO. 1VO. 905.35 was found to have
ionic conductivity (pressed pellet) of 1x10⁻² S cm-1 at 300 OC, some
three orders of magnitude greater than that of YSZ at the same
temperature. (Figure 1.4) Measurement of the conductivity of a
single crystal of the parent (undoped) material and of
Bi 2CuO. 1VO. 90 5 .35 demonstrated a marked anisotropy, with the
conductivity parallel to the {Bi20 2} 2+ planes (crystallographic ab
plane) some 100 times higher than that perpendicular to the
{Bi20 2} 2+ planes (crystallographic c plane). 2 3 , 2 4 This is consistent
with the perovskitic layer's being primarily responsible for the ionic
conduction. The addition of the dopant prevents the ordering of the
metal positions and oxygen vacancies, and permits the stabilization
of the high-symmetry y phase; the disorder on these sites also
provides the high conductivity observed in these samples.
Substitution of Li+, Zn 2+, and Ti4+, at 10 atom%, all led to the
stabilization of the y structure to room temperature, while use of
Al3+ and Ge 4+ did not lead to the y structure. 9 Surprisingly, the Ti-
substituted materials showed the highest conductivities in this set
of compounds - higher, even, than for the 10% Cu-doped
compounds reported by Abraham. This illustrates that oxygen-ion
vacancy concentration alone does not determine the ionic
conductivity. The conductivity order among those ion substituents
20

that stabilized the y structure is Ti4 +>Cu 2 + = Zn 2 + >Li+, paralleling the
order of the ability of the cation to polarize anions. The authors
suggest that the polarization of the oxygen ions somehow "eases"
the hopping of oxide ions from filled sites to vacant sites. Among 4+
cation substituents Pb, Zr, Sn, and Ti, the conductivity increased
with decreasing ionic radius, 2 5 as expected from the model
developed by Cherry et al. for migration of oxygen ions in
perovskite-type oxides. 2 6 The conductivities of the BiMeVOx
materials and the quantity of dopant required for their stabilization
in the y phase are listed in Tables 1.1 and 1.2.27
The coordination geometry around the dopant cation is,
similarly, important. Substitution of Sb(V) and Nb(V) into the parent
structure to generate Bi 2 MO. 3V 70 5 .5 (M=Sb, Nb) stabilizes the
tetragonal phase and gives materials with conductivities
comparable to or slightly better than BiCuVOx and BiTiVOx. 2 8
However, the conductivity of the Sb-substituted material is higher
than for the Nb-substituted material, and this appears to be
correlated with the regular octahedral geometry around the Sb,
versus the off-center positioning of Nb in its coordination
octahedron, as well as with the polarizability of Sb relative to that of
Nb. The distorted and oxygen-deficient surroundings of the Nb may
act as a trapping area during anionic diffusion, thereby lowering the
conductivity. In Cr(III)-doped samples, the tendency for Cr(III) to
adopt a full regular octahedral coordination and form clusters seems
to be associated with the rise the number of tetrahedrally
coordinated V(V) in the lattice. 2 9 This clustering, as well as the
increase in the number of unfavorable tetrahedral V(V) sites, may
21

cause the poor oxide ion conductivity of Cr(III)-doped samples.
Conversely, in the high-conductivity Cu-doped BiCuVOx, EPR and
UV-VIS spectroscopic data suggest that the Cu 2 + sites are
distorted-octahedral, with the oxygen atoms compressed along the
apical direction. 3 0
Most of this discussion must be taken with somewhat of a
grain of salt, however, since cations of suitable charge and size may
substitute onto either the Bi or V sites. West et al. demonstrates
that three or four mechanisms of accommodating the aliovalent
cations may take place: V <- Bi, V " M, Bi k-- M, and possibly
interstitial M. 31,32 Double substitutions, either of two different
metals for V or of heterometals on the V and Bi sites, have been
reported. These failed to give an improvement in conductivity over
the BiCuVOx standard, and the authors report that the resulting
solid solutions are metastable. 2 2 The questionable nature of the
assumption that all the dopants introduced are going into given
sites may account for the variation among reports of the minimum
dopant levels required to stabilize the y phase. 2 3 ,31,33
The high oxide ion conductivity reported for the BiMeVOx family
is believed to be due to the disorder of the oxygen vacancies that
are associated with the vanadium atoms in the perovskitic layer.
Mairesse has summarized results for the substitutions of various
metal cations onto the vanadium site. 1 7 The highest conductivities
are found for BiCuVOx, BiTiVOx, and BiNbVOx; doping with other
metals results in compounds with lower oxide ion conductivities,
though in all doped materials the conductivities are still higher than
in the undoped parent phase. (Figure 1.5)
22

All told, the BiMeVOx family of materials, with their
exceptionally high oxygen ion conductivity at low temperatures,
have been extensively studied and show potential for a number of
applications. However, because the electronic transport number
has been shown to be at least a few percent (ti=0.987 at 557
C), 3 4 these materials cannot be used in devices where electrical
"shorting" of the circuit is detrimental: e.g. in oxygen sensors and
fuel cells. For other applications, the presence of some electronic
conductivity is beneficial. Bi 2VO5 .5 and BiMeVOx (Me=Cu, Fe, Sr)
have also been tested as catalysts for the oxidative coupling of
methane (vide infra). 35
23

Figure 1.3: Bi 2VO.s structure.
Eh
=U0 5 -5
Q
=oygen
=bismuth
24

Comparison of YSZ, Bi 2VOS.S , Bi 2 CuO.VO.9 05 .5.8 ionic
conductivities over a range of temperatures.14
YSZBiCuUOH
000. BiDOnH
2 1.4 1.6
1000/T (10)
0
W- 1 VLa
ai%Z
P
a6
-e -
0.4 1.8 2
25
Figure 1.4:
I I

Comparison of Bi 2VO 5.5 , Bi 2CuO.lVO.Os5. 5-8,
Bi 2Tio.VO.O95.5 ., Bi 2 NbO.3VO. 7 0 5 .5 - ionic conductivities over a
range of temperatures.3 3
a
00O
acoo
O BiVOxA BiCuVOx
A BiTiVOx0 BiNbVOx
1.4
0000
a wo xA
0 a0 "
O
A
a00
0
1.8
0
2.2
1000/T (1/K)
26
-2
EU
0,U
-3
-4
-5
-6
-71.0
Figure 1.5:

Conductivities of the Aurivillius phase oxygen ion
conductors.2 7
Compound T (*C) a (S/cm) Comments
Bi 2WO 6 900 1x10 2
Bi 2 WO 6 900 1x10~1 single crystal, parallel
to ab plane
Bi 2VO5 .5 300 5x10⁻⁵ a-phase
300 1x10⁻⁵ single crystal, parallel
to ab plane
300 1x10⁻⁵ single crystal,
perpendicular to ab
plane
500 1x10⁻² P-phase
500 1x10⁻² single crystal, parallel
to ab plane
500 1x10⁻⁴ single crystal,
perpendicular to ab
plane
600 1x10⁻¹ y-phase
600 3x10⁻¹ single crystal, parallel
to ab plane
Bi 2 VO. 8A10 .205 .4 500 1.8x10- 2 polycrystalline
Bi 2VO. 9CuO. 105 .35 500 5x 10⁻² polycrystalline
Bi 2VO. 9CoO. 105 .35 500 7x10⁻² polycrystalline
Bi 2VO. 9Feo. 10s.40 650 6.7x10⁻² polycrystalline
27
Table 1.1:
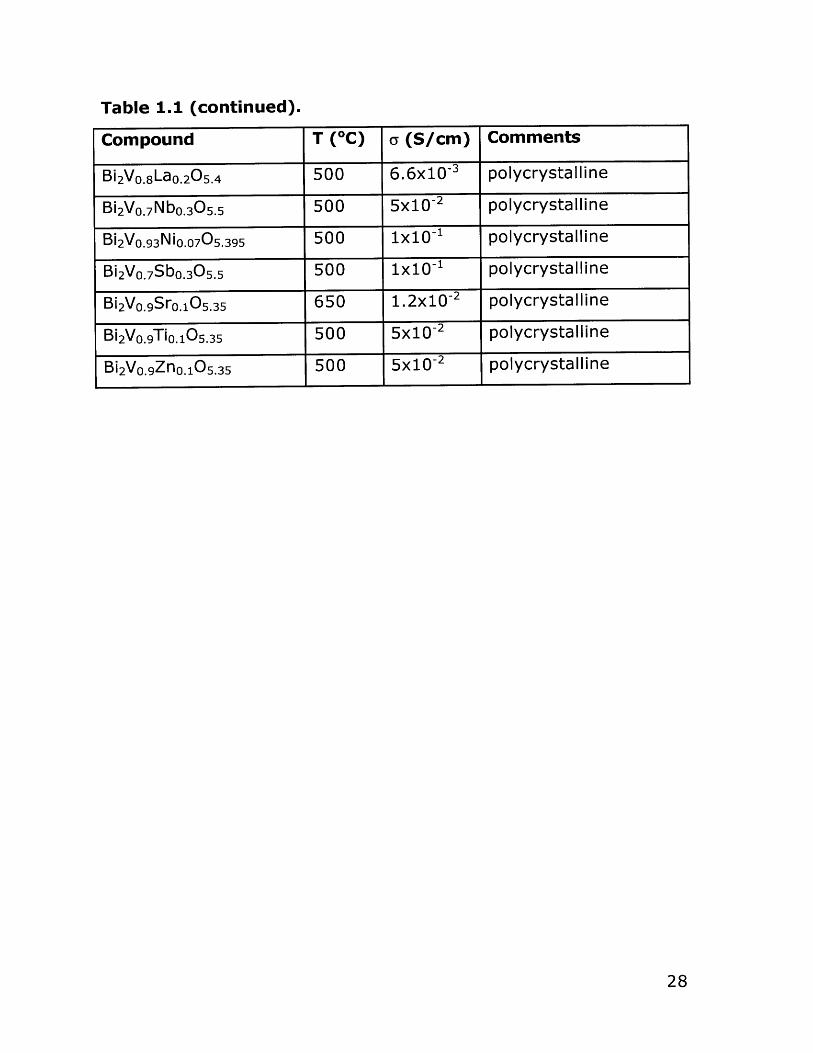
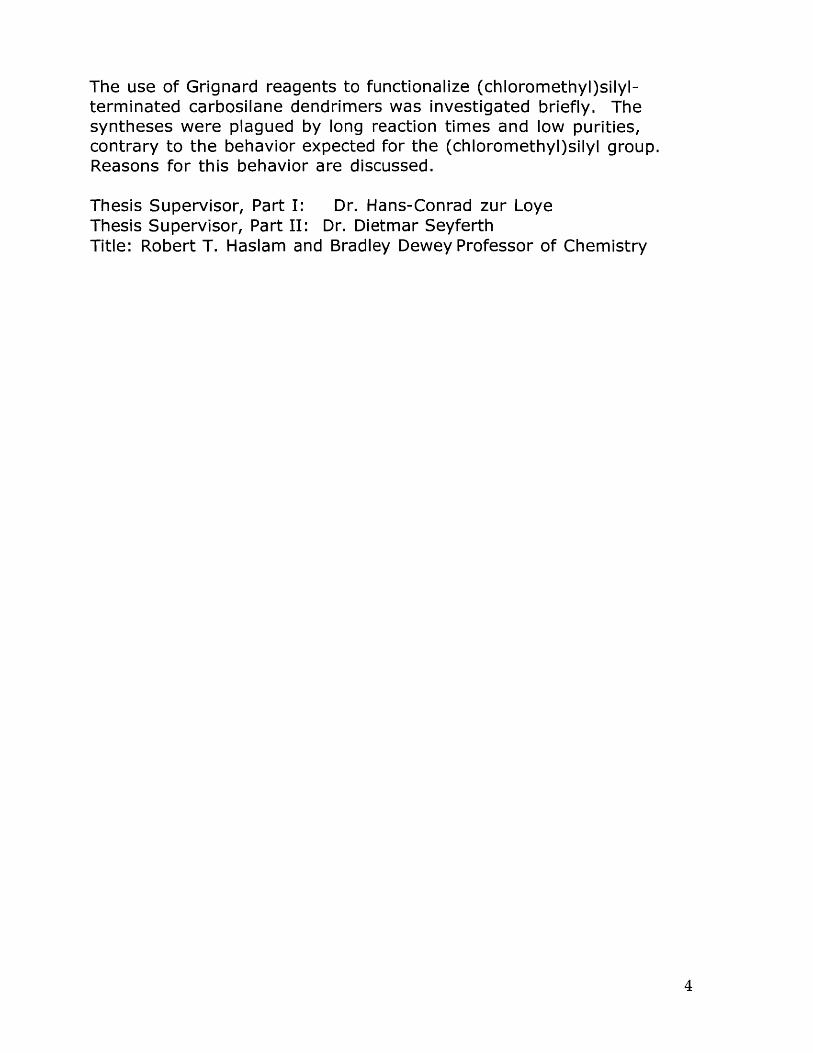
Table 1.1 (continued).
Compound T (*C) y (S/cm) Comments
Bi 2VO. 8LaO. 205 .4 500 6.6x10⁻³ polycrystalline
Bi 2VO. 7 Nbo. 305 .5 500 5x10⁻² polycrystalline
Bi 2VO.93NiO. 07 05 .395 500 1x10⁻¹ polycrystalline
Bi 2 VO. 7 Sbo.305 .5 500 1x10⁻¹ polycrystalline
Bi 2VO. 9Sro.10 5 .35 650 1. 2x10⁻² polycrystalline
Bi 2VO. 9TiO. 10 5.35 500 5x1 0-2 polycrystalline
Bi 2VO. 9ZnO.10 5 .35 500 5x10⁻² polycrystalline
28

Table 1.2: Cation dopant concentrations required to stabilize the
high-temperature (y) phase of Bi 2VO.. 2 7
Dopant Cation 0/ of Vanadium Substitution
Li+ 10
Zn2+ 10
Pb2+ 9-10
Cu 2 + 7-12
N i2+ 10
Co2+ 7.5-25
Sb 5 + 15-50
Nb 5 + 10-50
Ta5 + 10-25
Ti4 10-20
Zr4+ 10-15
Mg2+ 7.5-15
29

1.3 Measurement of Oxygen Ion Conductivity3 6 , 3 7
1.3.1 Impedance Spectroscopy
Ionic conductivity, a, is generally treated the same way as is
electronic conductivity, and is expressed by the Equation 1.2:
(1.2) a=neZt
where n is the number of charge carriers per unit volume, e is the charge on
the electron, Z is the charge on the carriers, and p is a measure of the carrier
mobility.
Because the hopping mechanism described in Section 1.1 is an
activated process the carrier mobility is expressed by an Arrhenius-
type equation. (Equation 1.3)
(1.3) p = goe(-Ea/kT)
where po depends on the attempt frequency (the number of times per
second that a given ion tries to move), the distance moved by the ion, and
the magnitude of the imposed external field (if this is small, about 300 V
cm 1 ,po will include a 1/T dependence as well).
All told, the expression for the conductivity has the form given by
Equation 1.4.
(1.4) a = (ao/T)e(-Ea/T)
30

Thus a plot of In(aT) against 1/T will give a line of slope -Ea. Over a
range of temperatures this plot may have regions of different
activation energies corresponding to different sources (extrinsic or
intrinsic) of the conductivity observed.
While the electrical conductivity of materials can be measured
directly by imposing a dc current and measuring the voltage drop
across the material according Ohm's law, the measurement of ionic
conductivity is not so straightforward. Imposition of a dc voltage
across an ion-conducting solid will result in an initial current which
will be the sum of the ion current and any electronic current.
Because many electrode materials are blocking to the ions being
conducted, the solid will become polarized over time and the
voltage will drop to zero. Thus the ionic conductor behaves as a
capacitor when blocking electrodes are used. One solution to the
problem of making the conductivity measurement is, of course, to
use an electrode that permits conduction of both electrons and the
mobile ions; however, such electrodes are not available for all
materials.
A second commonly used alternative is to impose an ac
voltage oscillating at a range of different frequencies, and measure
the impedance (or the admittance; the equations cited below are
for the impedance). A Wheatstone bridge type of apparatus is
used, where for impedance measurements the resistive and
capacitative circuit elements are in series. Gold or platinum blocking
electrodes are typical, and the interface between the electrode and
the sample therefore adds a double-layer capacitance in series with
the simple bulk resistance and with the resistance due to grain
boundary effects (the latter is seen in polycrystalline samples only).
31

Each of these sample resistances has a capacitance in parallel with
it, and the electronic resistance of the sample is parallel the ionic
resistances and capacitances. (Figure 1.6) Because the apparatus
measures only the composite R and C values the sample is a sort of
"black box," so that the interpretation of ac impedance or
admittance measurements to yield R and C values for each of the
circuit components is somewhat of an art.
According to Ohm's law, I=ER-1 and is frequency-independent
for direct current passing through a resistor. For a capacitor, a
frequency-dependent ac current can pass through (Equation 1.5).
(1.5) I=j(o)CE
j=(-1)"', o=angular frequency 2fnt
Ohm's law can also be written in terms of impedance, Z, as
Z=E(t)/I(t), where E(t) = Em sin ot and I(t) = Im sin (wt+$). Since the
total voltage drop across a circuit containing resistive and capacitive
elements is a simple sum of the voltage drops across each element,
E=ER + Ec; the total impedance for such a circuit is given by
Equation 1.6:
(1.6) Z = R + 1/jwC = R - j/C.
The impedance of a parallel RC circuit is given by Equation 1.7. After
some algebra, this separates into real and imaginary parts as in
Equations 1.8a-b. Elimination of the frequency w gives the equation
of a circle with its center at (R/2, 0) and radius R/2. (Equation 1.9)
Thus, when the imaginary part Z" of the complex impedance is
32
plotted against the real part Z', each parallel RC circuit gives rise to
a semicircle in the Z* plane and each series RC element gives a
vertical line in this plane. (Figure 1.7) The R value of each circuit
element is the intersection of either the line or the semi-circle with
the Z' axis. The maximum of the semicircle occurs such that wRC=1.
When the frequencies are not sufficiently far apart, the semi-circles
often overlap, so that some curve-fitting is necessary to deduce the
locations of the useful points in the Z* plane. (Figure 1.7) The
overall sample resistance will be the sum of the bulk and grain
boundary resistance. As shown in Figure 1.7, the zero intercept of
the net arc is this sum. Furthermore, since the electrodes are
normally blocking for the ion conducted, their frequency response
curve is a line inclined at a slope of n/4 to the horizontal (Z') axis,
and thus may be distinguished easily from the material's
resistances. Closer analysis of the data can differentiate the
contributions to the total conductivity of the current carrier
concentration and the rates of ion hopping from site to site. 3 8 As
the number of circuit elements increases, the expressions for Z' and
Z" become increasingly complicated, so that the circuit in Figure 1.7
would have the complex impedance expression given by Equation
1.10.
(1.7) Z = [1/R + j*(2noC)]-1
(1.8a) Z' = 1/R * [(h/R) 2 + (21ToC) 2]-1
(1.8b) Z" = 2coC * [(h/R)2 + (2noC) 2]-1
(1.9) (Z") 2 + (Z' - R/2) 2 = R2/4
(1.10) Z* = Re + [1/jWCdl + (1/Rb + jOCb)~1 + (1/Rgb + jOCgb)- 1]
33

The impedance of a sample is typically measured over a range of
frequencies w from 1 mHz to 1 MHz. 3 7
1.3.2 Non-ac Methods
Other methods of measuring ionic conductivity include far
infrared 3 9 and Raman 4 0 spectroscopy, where the vibrations of
mobile ions can provide a direct measurement of hop-attempt
frequencies; examination of the motional narrowing of NMR
absorption lines; 4 1,42 and examination of the diffusion rate of
labeled ions such as [017]2- and radioactive [Na*]+. Non-blocking
electrodes can be used to obtain a value of the transport number.
Use of the Hall Effect, where a potential difference is created across
a current-carrying sample in a transverse magnetic field, can give a
measure of the charge on, and number per unit volume of, the
conducted species. Finally, electrochemical oxygen pumping (see
Section 1.4.2 below) has been used to study the oxygen transport
characteristics of a number of materials. 43
34

Figure 1.6: Equivalent circuit diagram for a polycrystalline
oxygen ion conductor. R = electronic resistance; CdI = double-
layer capacitance at the blocking electrode; Cb, Rb = bulk
capacitance and resistance; Cgb, Rgb = grain boundary
capacitance and resistance.
Cb Cgb
r4wtzC d Rb Rgb
Re
35

Figure 1.7: Typical plot resulting from complex impedance
measurements on the circuit shown in Fig. 1.6.
grain bdys.co R C=1
S|, bulkwRC= 1
r -
z R2
' - Betl)
36

1.4 Applications of Oxygen Ion Conductors
1.4.1 Solid Oxide Fuel Cells (SOFCs)
In a fuel cell two electrodes are separated by an electrolyte,
which in a solid oxide fuel cell (SOFC) is the oxide ion conducting
ceramic. Fuels such as hydrogen (fed directly or produced in situ by
hydrocarbon reforming) or carbon monoxide are fed to the anode
where they are oxidized, releasing electrons to an external circuit.
On the cathode side, oxygen fed into the SOFC unit is reduced by
the electrons arriving through the external circuit. (Figure 1.8) The
electron flow through the external circuit produces dc electricity at
an open-circuit voltage which can be derived from the Gibbs energy
expression for the chemical reaction taking place combined with
Faraday's law. The actual closed-circuit voltage falls off with
increasing current density and power as more and more chemical
potential is converted to heat rather than to electrical energy. 4 4
However, because a fuel cell converts chemical potential directly into
electrical work without going though the intermediate of heat, as in
steam turbine-based electrical generators, its conversion efficiency
is not Carnot-limited. To build up to the desired voltage, single fuel
cell units are arranged as a stack and connected in series or in
parallel or in a combination of the two, depending on the
application. Compared with traditional steam-turbine generators,
fuel cells are also higher in efficiency at partial load, 4 4 may be
constructed modularly on virtually any site, and are less polluting.
Ceramic fuel cells - SOFCs - have been constructed for
37

multikillowatt applications and operated for thousands of hours;
they offer a number of benefits over other types of fuel cells. 4 5
One of the difficulties with SOFCs, however, is that
maintaining the high operating temperature (1000 C) required for
sufficient ionic conductivity in the electrolyte (usually stabilized
zirconia 4 5 ), uses up some of the energy benefit realized by the
greater theoretical efficiency. Furthermore, the operating conditions
put stringent requirements on the other materials (anode, cathode,
interconnects) to be used in the cell. The other materials to be
used must be stable and compatible with each other at high
temperatures. While temperatures over 600 OC are desirable to
permit in situ hydrocarbon fuel reforming, it is also preferable to be
able to operate the fuel cell at temperatures less than 800 OC to
reduce the material-based problems associated with other cell
components. Some research 1 1, 15,16,46 has sought to develop
new materials that exhibit high oxide ion conductivities below 800
0C, while having other desirable properties such as low cost and
stability over a wide range of temperatures and oxygen partial
pressures, many present-day technologies seek simply to reduce
the thickness of the YSZ solid electrolyte. By reducing the path
length for oxide ion conduction, such electrolyte films or membranes
can increase the effective oxygen flux at a given temperature.
38
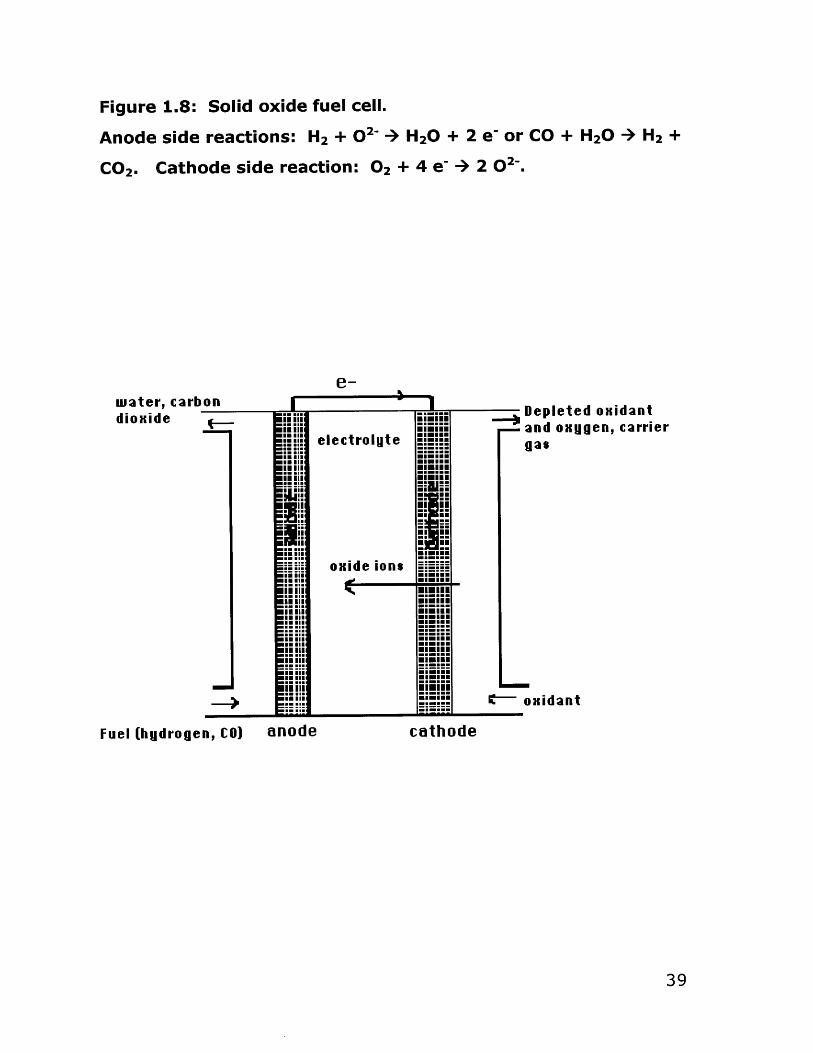
Figure 1.8: Solid oxide fuel cell.
Anode side reactions: H2 + 02- + H20 + 2 e- or CO + H20 + H2 +
CO 2 . Cathode side reaction: 02 + 4 e- + 2 02-
I
MOM I'm..E .IEKE Eli
EKE liiimilliiEu liii
.o...
il Ilii ii
El Eli-
Moo I'miii iiiEKE Eli
Eu iii
-a~u
I
electrolgte
oxide ions
anode
.......=MIM
M H
El.'..
!!!El-...
I . NO
WIVIIIII
U.-...
El....El.'..
Eu"M
II
E-...
=ow..
Depleted oxidantand oxugen, carriergas
c-oxidant
cathode
39
wuater, carbondioxide
Fuel (hydrogen, CO)
-..

1.4.2 Oxygen Sensors
Increasing demands for efficient combustion processes which
maximize energy output while minimizing polluting partial-
combustion products such as raw hydrocarbons, CO, and NOx, have
made the development of accurate methods for monitoring the
oxygen-content of process streams essential. On-line monitoring
requires good sensor technology. Oxide-ion conducting materials
are the basis for such sensors.
Nernst, in 1900, first observed the electrolytic evolution of
oxygen from a sample of zirconia stabilized with 15 mol% yttria. 4 7
He theorized that the electrical conduction was due to ionic motion
and developed the equation that bears his name to quantify it:
E=kT/4q In (P02'/P O2 "), where P02" and P0 2 ' are the oxygen partial
pressures on either side of the sample. This development of
electrical potential can be measured and used to determine the
oxygen partial pressure in an unknown gas mixture, if that in a
reference gas is known.
In automobile emissions control equipment, for example, the
exhaust from the engine is passed over a platinum-containing
catalyst downstream of the engine. For efficient operation of the
catalytic converter, the fuel-to-air ratio must be kept near 0.07 over
the entire range of driving conditions. 2 A feedback circuit enabling
constant adjustment of the fuel injection system employs an oxygen
sensor in which a yttria-stabilized zirconia (YSZ) oxide-ion conductor
is exposed on one side to the exhaust gas stream and on the other
to a reference gas of known oxygen content (air). (Figure 1.9) The
40
difference in oxygen partial pressures on either side of the YSZ
barrier produces an electrical potential difference across the YSZ
according to the Nernst equation. However, because many oxide
ion conductors are partially "shorted out" by some electronic
conduction, the actual voltage falls below the Nernst potential
(Equation 1.11).
(1.11) Emeas = tionic kT/4q In (P0 2'/PO2" )
where ti0nc, is the fraction of the total conductivity which is due to ion
movement.
The electrical conductivity comes about through partial reduction of
the metal oxide. Because electrons are significantly more mobile
than ions, a few excess electrons will lead to a large electronic
contribution to the total conductivity; thus a small degree of
reduction can short out the sensor.
Oxide ion conducting ceramics proposed for use in oxygen
sensor applications must therefore have an initial transference
number near unity and be stable to reduction over the whole range
of oxygen partial pressures - and temperatures - which it will
encounter in the process stream to be monitored. In addition, the
present operating temperature of YSZ-based sensors is over 800
0C, while a desirable operating temperature is lower, in the 200-400
0C range. Thus methods of lowering the operating temperature of
these units, either by finding new oxide ion conductive materials
that satisfy the requirements, or by using thin films or membranes
of known conductive materials, are being sought. 46
41

Figure 1.9: Oxygen sensor probe in an automotive exhaust gas
stream.
Exhaust Gase
11]' r 'IF..-
P2 = exhaust gasoxggen content
------------- r-r-r-rrrrrrrrr-rr-r-r-r-r-r-rrr-rr
Pt electrodes-- air (P 1 =0.21 atm)~*1
L.-.-.-- .- - ..--- -..- .- - . . . .. .-- -- -- ---- -- ---
........i.YSt ceramic
42
3

1.4.3 Air Separators
The situation of oxygen pumping is essentially the reverse of
the oxygen sensing: an applied voltage E produces an oxygen
partial pressure difference on either side of a solid electrolyte, in
accordance with the Nernst equation. (Equation 1.11) A device
designed to take advantage of this may be used to separate
oxygen out of air or specialty gases to obtain, for example, oxygen-
free nitrogen or argon. In other cases, the pure oxygen is the
desired product of the separation process, frequently to be used in
chemical oxidation processes or industrial combustion or oxidation
processes, or in health-related industries.
Cryogenic distillation is the preferred process, currently, for
large-scale (50-2000 tons/day) production of high-purity (>95%)
oxygen. Contaminants in the compressed air feed, such as water,
carbon dioxide, and hydrocarbons, must be removed prior to the
distillation to prevent blockage of heat exchangers and hazardous
waste buildup in the distillation column sump. 4 8 Removal of these
contaminants is expensive both in terms of the extra capital
equipment requirement and the energy requirements. Crude argon
(1% in air) is one product of the cryogenic air separation process.
At this stage it contains some 2-7% oxygen, which must be
removed prior to the argon's use in inert atmosphere applications;
but because of the proximity of the boiling point of argon (87.28 K)
and oxygen (90.19 K), further purification of the argon by distillation
is extremely uneconomical. Currently, oxygen contamination in
crude argon streams is reduced to the ppm level by reduction to
43

water using excess hydrogen over a platinum catalyst, followed by
drying and distillation to remove water, hydrogen, and nitrogen
contaminants. 4 9 In addition to the expense of using hydrogen in
this way, the drying and distillation steps introduce large capital and
operating costs into the purification process. A number of cyclic
adsorption/desorption processes for removing oxygen from argon
are also reported in the patent literature. 5 0
An air separator constructed from a pore- and defect-free
oxide-ion conductor, on the other hand, is completely permselective
for oxygen, and offers significant advantages over air separation
methods based on conventional technology.51, 5 2 The feed stock
may be crude argon, 5 3 air, or the hot exhaust from a combustion
process. 5 2 , 5 4 Application of an electrical potential difference across
the ionic conducting ceramic will "pump" oxide ions against an
unfavorable concentration gradient at a reasonable rate to induce
separation. 5 2 Air separator designers prefer to have concomitant
electrical and ionic conduction (tionic < 1), as this situation makes it
unnecessary to have an external circuit prevent charge buildup on
the membrane. Potential losses associated with the ohmic
resistance of the electrolyte and electrodes, in addition to nonohmic
rate processes such as charge transfer, adsorption, and slow gas
phase and surface diffusion of oxygen and oxide ions, cause the
actual applied potential to exceed the theoretical (Nernst) potential
required to achieve a given P0 2 .5 5 Furthermore, air separators
must be operated at temperatures at or above 800 0C where the
ceramic material, typically YSZ, has sufficient ionic conduction to be
useful. 5 6 Both of these problems have clear associated costs,
44

driving research into improving oxygen pump/air separator
efficiencies. One approach to the problem is the development of
low-temperature (200-400 C) oxide ion conducting
materials.11,15,16, 4 6 For instance, Dumelie et al. used a highly
conductive solid solution, called P (a at 600 0C = 1 S cm-1), in the
Bi 20 3-PbO system as a pressed pellet "membrane" some 4 mm thick
to take advantage of the high conductivity of this material compared
with YSZ. 5 6 They found that the air separator performance declined
after a few operating hours as grain coarsening and the
development of orientation in the pellet caused cracks.
A second approach to improving the performance of solid
electrolyte air separators is to fabricate the oxide ion conductive
material as a thin film or membrane. The resulting decrease in the
conduction path will result in a corresponding increase in the total
oxygen flux realizable at a given temperature, as well as decreasing
the required overpotential.
1.4.4 Catalytic Inorganic Membrane Reactors
The ability to include in-line air separation in a chemical
process is particularly attractive for designers of catalytic inorganic
membrane reactors (CIMRs) for partial oxidation reactions. Partial
oxidation reactions are among the most widespread in use in
industry, and lead to a number of important organic intermediates.
(Table 1.3) The current technology for performing these reactions
on an industrial scale uses the standard fixed-bed reactor design in
which a mixture of reagent and inert gases flow over a
heterogeneous catalyst; air or oxygen is injected at the outset of
45

the reactor flow and possibly at intermediate points. Reactant
profiles tend to decrease monotonically with distance from oxygen
(air) inlets and the selectivity for the desired partial oxidation
product is low near the inlet due to complete oxidation in this high-
P02 area. The organic materials must be diluted to below explosive
concentrations with inert gases to ensure safety. Such diluent
gases or air (as opposed to pure oxygen) create an additional need
for downstream separation processes.
The potential benefits of using a membrane reactor geometry,
where components of the feed stock are kept separated by a
barrier permselective to oxygen are clear. In plants where pure
oxygen is the desired reagent, a membrane reactor setup
eliminates the need for off-line cryogenic air separation. The ability
to add oxygen continually and gradually to the reagent stream can
increase conversion rates and will increase the selectivity for the
desired partial oxidation products. Modulation of oxygen injection
by varying the partial pressure or electrical overpotential gives a
finer reaction control than is realizable with a finite-point injection
design. Finally, the ability to "leak" in oxygen permits the use of
pure (undiluted) feedstocks and reduces the downstream separator
load. While polymer-based membrane reactors were used in
biotechnology applications during the 1970s and 1980s, catalytic
inorganic membrane reactors were not used until the mid-1980s,
when methods of fabrication became sufficiently well-advanced. 5 7
Commercialization of such reactor geometries was first
accomplished in 1991.58 Initial work focused on the oxidative
coupling of methane (OCM) to ethene or higher (C2+) products, on
partial oxidation to methanol or formaldehyde, or on methane
46
conversion to synthesis gas ("syngas," CO + H2 ), which is then
converted via Fischer-Tropsch technology to higher-value products-
because the high temperatures required for methane activation (>
600 OC) are also required by YSZ for achieving a reasonable oxygen
flux.
Large worldwide reserves of methane make it an inexpensive
gas to obtain and increase the potential economic benefit of a
system of converting it to higher value products. The selectivity of
conversion of methane to ethane, then to ethylene, is determined
by the rate at which oxygen is made available to the reagent
stream. Selectivity - avoidance of losses of carbon into low-value
COx - is more important economically than is achieving a high raw
yield. 5 9 The best catalytic reactors offer 20% conversion at 8 0 %
selectivity for C2H4 and C2H6.6 0 The use of steam reforming to
convert methane to syngas, followed by conversion to C2 + products
via Fischer-Tropsch processes, is energy and capital intensive;
syngas production by steam reforming accounts for upwards of 6 0%
of the integrated cost of a plant. 6 0 Some 40% of the capital
investment goes into the air separation and syngas generation
equipment. 6 1
A process using a dense solid electrolyte hollow-tube reactor
packed with an Rh-based catalyst achieved up to 99% conversion
with 90-95% CO and H2 selectivity. The tube reactor (Figure 1.10)
was cast from a perovskite in the La-Sr-Fe-Co-O system (a mixed
conductor) and was 0.25-1.20 mm thick; it was operated at 800 'C
for up to 500 h. 6 0 Work at British Petroleum using both the La-Sr-
Fe-Co-Cr-O perovskites and an In 203/PrO 2-doped zirconia gave
47

similar results for a range of reaction geometries. There, the focus
was on making thinner solid electrolyte membranes for achieving
the same flux at lower temperatures, and on improving fabrication
processes for the membranes, rather than on examining new
materials which may give higher fluxes at still-high temperatures. 6 1
Other processes using CIMRs have been reported. DiCosimo
reports and patents a process for oxidative dehydrodimerization of
propylene over a Bi 20 3-La 2 0 3 oxide-ion conductive catalytic
membrane some 0.5 mm thick in a counterflow reactor operated at
600 C. 6 2 ,6 3 However, he found that he needed to add oxygen
(1% by volume) to the propylene feedstock to stabilize the
membrane against Bi 3+ reduction to the metal, and had a
conversion rate to C3 dimers of less than 5% of the propylene, with
selectivity near 50% for C3 dimers. A later patent discloses a 5-300
im-thick dense membrane of titania-doped YSZ atop a porous YSZ
support (0.2-1 mm thick) used at 700-900 OC for OCM at conversions
of 10-50% of methane (MnO 2-Na or MgO-Li catalyst) with C2+
selectivity of over 50%.64 The patent also claims partial oxidation
of ethylene to ethylene oxide and propylene to propylene oxide or
acrylonitrile over assorted catalysts, also with high conversion rates
(> 20%) and selectivities (>50%) at lower temperatures. The
permselectivity of YSZ to oxygen has also been used to shift the
equilibrium of the decomposition of CO 2 to CO + 02.65
As the discussion above indicates, there is an interest in
partial oxidation reactions which must be run in the 200-600 0C
range, below the temperatures where a reasonable oxygen flux can
be expected from traditional YSZ electrolytes. All of the reactions in
48

Table 1.3, except for those involving methane, are best run at 270-
500 OC; higher temperatures result in excessive oxidation to COx.
While some work has accomplished these partial oxidations in
CIMRs by making thinner YSZ membranes and by adding Bi 2 0 3
dopants to provide for electronic conduction so that oxygen
pumping increases the activity of partial oxidation catalysts, 5 7 ,6 6
conversion numbers are still low. 5 7 The oxygen flux achievable
through a 1-mm thickness 8% Y20 3-doped zirconia is 10-11 mol
cm- 2 s-1 at 800 OC and La-Sr-Mn-O perovskite systems can achieve
10-10 mol cm-2 s-1 at the same temperature. This creates quite a
limitation on the conversion reaction. 5 7
The largest hurdles faced in the construction of commercially
useful CIMRs include 6 7 (1) improvement of the oxygen fluxes
available at the temperatures desired for the partial oxidation
reactions, (2) prevention of cracking during thermal cycling, (3)
design issues including how to seal the membrane into existing
plant components or how to fabricate a standalone membrane
reactor unit, (4) matching the oxygen supply rates to the reaction
rates to optimize yield and selectivity, and (5) issues of heat
transfer. While several of these points are chemical engineering
problems, the initial advances must be made in the area of
materials chemistry. New mixed oxygen-ion/electronic conductors
with good material strength and high flux at lower temperatures
need to be developed; methods of fabricating a defect-free
membrane either as a supported film or as a standalone design are
vital.
49

Table 1.3: Industrial Partial Oxidation Processes 6 8
Organic Reactant Products Current Catalysts
napthalene maleic anhydride V205
o-xylene maleic anhydride V205 + MoO 3
methanol formaldehyde Fe 2(MoO4) 3 + MoO 3 or
Ag
ethylene ethylene oxide Ag
proplyene aldehyde acrolein bismuth molybdates
propylene acrolein bismuth molybdates
methane syngas (CO + H2) Rh-based catalyst
methane ethylene + C2+ Rh-based catalyst
1-butene butadiene bismuth scheelites
propylene (+ NH 3) acrylonitrile bismuth molybdates
50
1.4.5 Expected Benefits of Use of BiMeVOx Compounds
The devices described above all suffer from the need to be
operated at high temperatures (> 600 C) to achieve economic
oxygen fluxes. While part of the solution to the problem involves
reducing the length of the conduction path by fabrication of thinner
membranes of the solid electrolyte atop porous supports to provide
the proper structural integrity, there is a natural limit to how thin
membranes can become before pinholes and other defects become
technically unavoidable. 5 7 Thus, the thinner-membrane approach is
best combined with the use of novel materials with higher oxide ion
conductivities. The BiMeVOx materials, with some of the highest
oxygen-ion conductivities, are not appropriate for all the devices
discussed above due to their concomitant electronic conductivity,
which increases as the bismuth in the lattice is reduced to the metal
over long-term use at very low P0 2 . Still, the BiMeVOx compounds
can be useful for oxygen pumps and air separators, and for CIMRs.
Fabricated as membranes, they can be extremely powerful. For
comparison, a 1 cm 2 area of a 1 mm-thick membrane of YSZ
operated at 500 OC has an expected oxygen flux of 2.3x10⁻¹² mol
cm-2 s-1 while under the same conditions a BiCuVOx membrane gives
2.3x10⁻⁷ mol cm-2 S-1 oxygen flux. For 1 iim films, the flux jumps to
2.3x10⁻⁹ mol cm-2 s-1 and 2.3x10~4 mol cm- 2 S-1 for YSZ and BiCuVOx,
respectively. 6 9
In addition to the benefits realizable due to the BiMeVOx
phases' high low-temperature oxide ion conductivity, these
51

materials are expected to be catalytically active in partial oxidation
reactions, so that in a CIMR including a BiMeVOx membrane, the
membrane may contribute to the catalysis. In general, metal
oxides, especially mixed oxygen ion/electronic conductors, are
superior to metals as catalysts for partial oxidation reactions. 5 7 ,6 7
The active sites on the catalyst are variously thought to be oxygen
vacancies with local migration of electrons to or away from these
sites7 0 or lattice oxygen near the surface. Adsorbed oxygen is
responsible for nonselective reactions on the surface of the
catalyst. 7 1 The most active catalysts are able to cycle between two
valence states and thereby store and release oxygen. Ready
incorporation of oxygen into the lattice minimizes the adsorbed
(non-selective) oxygen species.
Bismuth-containing species, particularly those based on the
scheelite structure, are known to be active partial oxidation
catalysts. The scheelite structure (named for the mineral CaWO 4 ) is
tetragonal AMX 4 with tetrahedral (MX 4 )"- units and A"+ cations. It is
not a layered or chainlike structure. Anion vacancies exist in the
scheelite structure and oxygen ion mobility is significant in many of
the bismuth-containing scheelites. 7 2 The scheelite polymorph of
bismuth orthovanadate, BiVO 4 has been found to have low but
measurable mixed conduction which is accounted to anion
vacancies. 7 3 -7 5 It is catalytically active for OCM, though the
bismuth molybdates are more commonly used due to their higher
activity. 6 7 ,7 2 Tests of the Aurivillius phases Bi 20 2(An 1BnO3n,+1 ), A=
Ca, Sr, Ba, Pb; B=Nb, Ta; n=2-4 showed that these materials are
selective and stable in the OCM reaction. 7 6 Direct tests on the
52

BiMeVOx family show a correlation between methane conversion
and oxygen conductivity, and for M=Fe, Cu, Sr doping at 10 mol%,
the C2 selectivity increases. 3 5 In all these cases the catalyst was
used in a packed-bed reactor geometry.
In partial oxidation systems other than OCM, the bismuth-
containing scheelite catalysts are effective, and their activity and
selectivity increases with increasing vacancy concentration, 7 2 which
leads to increased oxygen ion mobility. On the other hand,
catalysts with vacancies but no bismuth in the lattice have high
isomerization activity and low oxidation activity for olefin oxidation
or coupling; so while bismuth is not directly involved in the first step
of olefin oxidation, it is relevant for selective oxidation of the allyl
intermediate. 7 2 Furthermore, catalysts containing bismuth are re-
oxidized more readily than those that have no bismuth. The
evidence suggests, then, that the BiMeVOx family promises at least
some catalytic activity in partial oxidation applications, so that a
membrane fabricated from BiMeVOx for use in a CIMR would have a
dual function of permselectivity and catalytic activity.
1.5 Conclusions and Project Goals
While the electronic conductivity of the BiMeVOx family of
oxygen-ion conductors prevents them from being useful in fuel cell
and oxygen sensor applications, this same property is desirable in
air separation and CIMR technology. In both cases there is a
industrial strong interest in lowering the temperatures presently
required for economical oxygen fluxes (600-900 0C). The high
oxygen conductivity at low temperatures (200-600 OC) characteristic
of some members of the BiMeVOx family can be used in combination
with fabrication of these materials as membranes or thin films to
53

obtain very high oxygen fluxes. Furthermore, the experience with
bismuth-based oxide catalysts suggests that BiMeVOx membranes
may be catalytically active in appropriate devices. It is vital that
these films be defect-free so that the permselectivity is
uncompromised, and that they be able to maintain their integrity in
reducing conditions during thermal cycling.
The practical goal of the research described in Part I of this
thesis was to produce defect-free thin films (<1-10 gm thick on a
porous support) of BiMeVOx solid oxide conductors, test and verify
their oxide ion conductivity, and use them - in collaboration with the
Ying group in the Chemical Engineering Department at MIT - in a
CIMR. The research eventually succeeded in the deposition of
Bi 2 CuO 1VO.90s.s5 - and Bi2NbO. 3VO.70s.s- films onto porous alumina
substrates. Further progress was checked by the termination of the
project.
The succeeding chapters describe the deposition of BiMeVOx
films onto a number of substrates using pulsed laser deposition
(Chapter Two) and two sol-gel based methods of preparing a film-
castable precursor (Chapters Three and Four). Characterization of
the precursor solution is reported in Chapter Five. Film-casting onto
non-porous and porous substrates, finally, is described (Chapter
Six). Because much of the work described relies on techniques and
ideas often outside the purvey of traditional chemistry, each chapter
includes, where appropriate, a brief introductory review of the
relevant material. This part of the thesis will conclude with a
discussion of future directions and usefulness of this work (Chapter
Seven).
54

0
0
Atmospheric 0?conducted as 0?
Porous support withoxygen ionconductive coating
C diersacrolein
propylene
on
I
0'
LINI
0
L
0OIM7p
U,U,

1.6 References
1)Kilner, J. A.; Brook, R. J. Solid State Ionics 1982, 6, 237.
2)Tuller, H. L.; Moon, P. K. Mater. Sci. and Eng. B1 1988, 171.
3)Schwartz, M.; Link, B. F.; Sammells, A. F. J. Electrochem. Soc.
1993, 140, L62.
4)Goodenough, J. B.; Ruiz-Diaz, J. E.; Zhen, Y. S. Solid State Ionics
1990, 44, 44.
5)Thomas, J. K.; Krause, W. E.; zur Loye, H.-C. Solid State Ionics;
Nazri, G.-A., Tarascon, J.-M. and Armand, M., Ed.; Mater. Res.
Soc.: Boston, MA, 1992; Vol. 293, pp 307.
6)Aurivillius, B. Ark. Kemi. 1949, 1, 463.
7)Abraham, F.; Debreuille-Gresse, M. F.; Mairesse, G.; Nowogrocki,
G. Solid State Ionics 1988, 28-30, 529.
8)Lee, C. K.; Sinclair, D. C.; West, A. R. Solid State Ionics 1993, 62,
193.
9)Sharma, V.; Shukla, A. K.; Gopalakrishnan, J. Solid State Ionics
1992, 58, 359.
10)Yanovskii, V. K.; Voronkova, V. I.; Aleksandrovskii, A. L.; Dyakov,
V. A. Sov. Phys. Dok. Engl. Trans. 1975, 20, 306.
11)Kendall, K. R.; Thomas, J. K.; zur Loye, H.-C. Chem. Mater. 1995,
7, 50.
12)Bush, A. A.; Venetsev, Y. N. Zh. Neorg. Khim. 1986, 31, 1346.
13)Debreuille-Gresse, M.-F., Ph.D. Thesis, Universite de Lille, 1986.
14)Abraham, F.; Boivin, J. C.; Mairesse, G.; Nowogrocki, G. Solid
State Ionics 1990, 40-41, 934.
15)Kendall, K. R.; Navas, C.; Thomas, J. K.; zur Loye, H.-C. Solid
State Ionics 1995, 82, 215.
56

16)Kendall, K. R.; Navas, C.; Thomas, J. K.; zur Loye, H.-C. Chem.
Mater. 1996, 8, 642.
17)Mairesse, G. in Fast Ion Transport in Solids; Scrosati, B. et al, Ed.;
Kluwer Academic Publishers: Netherlands, 1993, pp 271-290.
18)Millan, P.; Castro, A.; Torrance, J. B. Mater. Res. Bull. 1993, 28,
117.
19)Ramirez, A.; Millan, P.; Castro, A.; Torrance, J. B. Eur. J. Solid
State Inorg. Chem. 1994, 31, 173.
20)Castro, A.; Millan, P.; Martinez-Lope, M. J.; Torrance, J. B. Solid
State Ionics 1993, 63-65, 897.
21)Castro, A.; Millan, P.; Enjalbert, R.; Snoeck, E.; Galy, J. Mater. Res.
Bull. 1994, 29, 871.
22)Vannier, R. N.; Mairesse, G.; Abraham, F.; Nowogrocki, G. Solid
State Ionics 1994, 70-71, 248.
23)Pernot, E.; Anne, M.; Bacmann, M.; Strobel, P.; Fouletier, J.;
Vannier, R. N.; Mairesse, G.; Abraham, F.; Nowogrocki, G. Solid
State Ionics 1994, 70-71, 259.
24)Vannier, R. N.; Mairesse, G.; Abraham, F.; Nowogrocki, G.;
Pernot, E.; Anne, M.; Bacmann, M.; Strobel, P.; Fouletier, J.
Solid State Ionics 1995, 78, 183.
25)Yan, J.; Greenblatt, M. Solid State Ionics 1995, 81, 225-233.
26)Cherry, M.; Islam, M. S.; Catlow, C. R. A. J. Solid State Chem.
1995, f118, 125.
27)Kendall, K. R.; Ph.D. Thesis, Massachusetts Institute of
Technology: Cambridge, MA, 1996.
28)Joubert, 0.; Jouanneaux, A.; Ganne, M.; Vannier, R. N.; Mairesse,
G. Solid State Ionics 1994, 73, 309.
57

29)Joubert, 0.; Ganne, M.; Vannier, R. N.; Mairesse, G. Solid State
Ionics 1996, 83, 199.
30)Aboukais, A.; Delmaire, F.; Rigole, M.; Hubaut, R.; Mairesse, G.
Chem. Mater. 1993, 5, 1819.
31)Lee, C. K.; Lim, G. S.; West, A. R. J. Mater. Chem. 1994, 4, 1441.
32)Lee, C. K.; Tan, M. P.; West, A. R. J. Mater. Chem. 1994, 4, 525.
33)Goodenough, J. B.; Manthiram, A.; Parantham, M.; Zhen, Y. S.
Mater. Sci. Eng. B, 1992, 12, 357.
34)Iharada, T.; Hammouche, A.; Fouletier, J.; Kleitz, M.; Boivin, J. C.;
Mairesse, G. Solid State Ionics 1991, 48, 257.
35)Cherrak, A.; Hubaut, R.; Barbaux, Y.; Mairesse, G. Catal. Lett.
1992, 15, 377.
36)this section is based on the discussion in West, A. R. Solid State
Chemistry and Its Applications; John Wiley and Sons: New York,
1984, pp 482-489.
37)Macdonald, J. R. Impedance Spectroscopy: Emphasizing Solid
Materials and Systems; John Wiley & Sons: New York, 1987.
38)Almond, D. P.; Hunter, C. C.; West, A. R. J. Mater. Sci. 1984, 19,
3236.
39)Allen, S. J.; Remeika, J. P. Phys. Rev. Letters 1974, 33, 1478.
40)Harley, R. T.; Hayes, W.; Rushworth, A. J.; Ryan, J. F. J. Phys. C
1975, 8, L530.
41)McGeehin, P.; Hooper, A. J. Mater. Sci. 1977, 12, 1.
42)Abragam, A. The Principles of Nuclear Magnetism; Clarendon
Press: Oxford, 1961.
43)Doshi, R.; Shen, Y.; Alcock, C. B. Solid State Ionics 1994, 68, 133.
44)Cross, J. Fuel Cell Technology, 1998; Vol. 76, pp 11-13, 21.
45)Minh, N. Q. J. Am. Ceram. Soc. 1993, 76, 563.
58

46)Hagenmuller, P. ; Laskar, A. L. and Chandra, S., Eds. Superionic
Solids and Solid Electrolytes; Academic Press: New York, 1989,
pp 679-704.
47)Nernst, W. Z. Elektrochem. 1900, 3, 41.
48)Carolan, M.F., Dyer, P.N., LaBar Sr., J.M., Thorogood, R.M., Air
Products and Chemicals Co: U.S. Patent No. 5,240,473, 1992.
49)Latimer, R. E. Chem. Eng. Process 1967, February, 35.
50)Erickson, D.C., U.S. Patent No. 4,132,766, 1979.
51)Thorogood, R. M.; Srinivasan, R.; Yee, T. F.; Drake, M. P., Air
Products and Chemicals: US Patent No. 5,240,480, 1993.
52)Chen, M. S.; Hegarty, W. P.; Steyert, W. A., Air Products and
Chemicals, Inc.: US Patent No. 5,118,395, 1992.
53)Chen, M.S., Cook, P.J., Air Products and Chemicals Co.:U.S.
Patent No. 5,035,726, 1991.
54)Chen, M.S., Hegarty, W.P., Steyert, W.A., Air Products and
Chemicals Co.: U.S. Patent No. 5,174,866, 1992.
55)Rincon-Rubio, L. M.; Nguyen, B. C.; Mason, D. M. 3. Electrochem.
Soc. 1985, 132, 2919.
56)Dumelie, M.; Nowogrocki, G.; Boivin, J. C. Solid State Ionics 1988,
28-30, 524.
57)Saracco, G.; Specchia, V. Catal. Rev. - Sci. Eng. 1994, 36, 305.
58)Hsieh, H. P. Catal. Rev. - Sci. Eng. 1991, 33, 1.
59)Lunsford, J. H. Angew. Chem. Int. Ed. Engl. 1995, 34, 970.
60)Balachandran, U.; al., e. Amer. Ceram. Soc. Bull. 1995, 74, 71.
61)Mazenek, T., talk given to zur Loye group.
62)DiCosimo, R.; Burrington, J. D.; Grasselli, R. K., The Standard Oil
Company: U.S. Patent No. 4,571,443, 1986.
59

63)DiCosimo, R.; Burrington, J. D.; Grasselli, R. K. J. Catal. 1986,
102, 234.
64)Hazbun, E.A., U.S. Patent No. 4,791,079, 1988.
65)Itoh, N.; Sanchez, M. A.; Xu, W.-C.; Haraya, K.; Hongo, M. J.
Membrane Sci. 1993, 77, 245.
66)Stoukides, M.; Vayenas, C. G. J. Catal. 1981, 70, 137.
67)Harold, M. P.; Lee, C.; Burggraaf, A. J.; Keizer, K.; Zaspalis, V. T.;
de Lange, R. S. A. MRS Bulletin 1994, April, 34.
68)Gates, B.C.; Katzer, J.R., Schuit, G.C.A. Chemistry of Catalytic
Processes, New York: McGraw-Hill, pp 325-388.
69)Numbers were calculated using literature values for c for YSZ
and BiCuVOx at 500 OC, and setting tionic =1, P1=0.001 atm,
and P2 =0.21 atm (atmosphere side) in the Nernst equation.
Thus, E=tionic RT/4F ln(P2/P1 ), R=LAcf' (A=1 cm 2 ; L=1 mm, 1pm),
i=E/R, and Gox=i/4F, giving the final equation G=EAa/4LF.
70)Nguyen, B. C.; Lin, T. A.; Mason, D. M. 3. Electrochem. Soc. 1986,
133, 1807.
71)Zhang, Z.; Verykios, X.; Baerns, M. in Catalysis : An Integrated
Approach to Homogeneous, Heterogeneous and Industrial
Catalysis; Mouljin, J.A., et al., Eds.; Marcel Dekker, 1994, pp
507-556.
72)Sleight, A. W. in Heterogeneous Catalysis: Principles and
Applications; Bond, G.C., Ed., New York: Clarendon Press, pp
181.
73)Wood, P.; Sinclair, D. C.; Glasser, F. P. Solid State Ionics 1993,
66, 151.
74)Lu, T.; Steele, B. C. H. Solid State Ionics 1986, 21, 339.
60

75)Vinke, I. C.; Diepgrond, J.; Boukamp, B. A.; de Vries, K. J.;
Burggraaf, A. J. Solid State Ionics 1992, 57, 83.
76)Barrault, J.; Grosset, C.; Dion, M.; Ganne, M.; Tournoux, M. Catal.
Lett. 1992, 16, 203.
61

Chapter Two
Pulsed Laser Deposition of Bi(Me)VOx onto Non-
Porous Substrates
The experimental work described in this chapter was adapted,
in part, from Pell, J.W., Auyeung, R.C.Y., Chrisey, D.B., zur Loye, H.-
C., Thin Solid Films 300 (1997), 154-158.
62

2.1 Introduction: Pulsed Laser Deposition
We initially attempted to deposit films of the BiMeVOx
materials using pulsed laser deposition. The actual depositions
were done at the Naval Research Laboratory in Bethesda, MD, by
Ray Auyeung and Dr. Doug Chrisey, using targets provided by us;
characterization work was done by us at MIT. The idea had been
that if we could produce thin films of the BiMeVOx materials by this
route, we could get a "head start" on designing the equipment
needed to check that the ionic conductivity of the material was not
significantly lessened by the large surface-to-bulk ratio of the thin
film, as well as on building an appropriate reactor for testing the
membranes in CIMR applications.
2.1.1 Method: How it works
In a pulsed laser deposition (PLD) process, an ultraviolet (UV)
laser spot rastered over the surface of a target made of the
material - metal or ceramic - to be deposited, causes a rapid
heating and excitation of the target material. A plume of atoms,
molecules, ions, clusters, micron-sized particles, and molten globs of
the target material spews off the target and deposits onto a
substrate, held some distance away and usually heated. (Figure
2.1) The precise mechanism of this ablation is a function of the
laser properties (pulse rate, rastering rate, wavelength,
energy/fluence) and the target properties (optical,
thermodynamical, topological). The laser light hitting the target is
63

absorbed in three main ways: (1) volume absorption by electrons
and phonons in the crystal lattice, (2) free carrier absorption at the
surface (mainly in metal targets), and (3) thermal absorption by the
plume. The absorbed light produces a molten layer (Knudsen layer)
at the target surface. Thermal evaporation of the material is a
minor contributor to the plume content: instead, the rapid
vaporization process gives a strong recoil pressure on the liquid
layer and expels material directly. 1 The behavior of the plume of
spewed material is therefore difficult to model, and development of
the technique has relied on a trial-and-error phenomenological
approach.
The general idea of PLD has been known for some time. Since
most materials absorb strongly in the 200-400 nm region, early
research used a standard Nd:YAG laser (primary energy 1064 nm),
frequency-doubled to 532 nm and mixed with the original 1064-nm
beam to obtain 355 nm radiation, or frequency-doubled a second
time to achieve a 266 nm beam. However, the resulting beam had
only 15-20% of the power of the fundamental, so real use of PLD
had to await advances in eximer laser technology, where the
fundamental emission is directly in the UV region (KrF lasers, for
example, emit at 248 nm). As a result of this gradual development,
PLD appeared in a number of sub-fields of physics and materials
science under a number of different names, including "pulsed laser
evaporation (PLE)," "laser molecular beam epitaxy (LMBE)," "laser-
induced flash evaporation (LIFE)," "laser-assisted deposition and
annealing (LADA)," and "laser sputtering." At the Spring 1989
Materials Research Society (MRS) symposium meeting the
membership voted for the standardization of the term "pulsed laser
64

deposition (PLD)" to describe the process, but the other terms
continue to appear occasionally in the literature. 2
The advantages of film deposition by PLD include (1) the
flexibility of the system design - different targets can be brought
into position during a deposition, so that multilayer or gradient films
can be produced. (2) The congruent evaporation permits the
stoichiometry of the deposited film to mirror more closely that of the
target - a problem with certain other film deposition methods. (3) A
single eximer laser can be "time shared" among multiple deposition
chambers, so that costs can be kept low - about ten times less
than a molecular beam epitaxy (MBE) system. 1 (4) There are a
relatively small number of control parameters. (5) High vacuum is
not necessary, so a reactive background gas - such as 02, 03, NO 2 ,
and N20, all used to maintain oxidative conditions in high-
temperature superconductor (HTS) depositions - may be used. The
dynamic range of deposition pressures is the largest of all the
physical (vapor) deposition techniques.3 (6) Virtually any material
can be laser-evaporated.
Other deposition techniques include thermal evaporation (TE);
accelerated molecular beam epitaxy (AMBE), ion cluster beam
deposition (ICBD), and ionized vapor deposition (IVD), where the
vapor flux is ionized by electron impact and a bias placed on the
substrate; molecular beam epitaxy (MBE) and atomic layer epitaxy
(ALE), where continuous molecular beams are deposited - layer-by-
layer, in ALE; chemical vapor deposition (CVD) and metal-organic
chemical vapor deposition (MOCVD), where chemical vapors react on
or above the substrate to form the desired phase; plasma-
enhanced or laser-assisted CVD, which include reaction energy
65

supplied to the chemical vapor cloud by production of a plasma or
heating by laser light, near the substrate; ion beam deposition
(IBD) and its combination with TE as ion-beam assisted deposition
(IBAD), where a low-energy ion beam is produced by decelerating a
high-energy ion beam or by accelerating a gas species in a broad-
beam source; and sputter deposition (S), where extracting ions
(usually Ar) from a plasma strike the target and cause the expulsion
of target material onto the substrate. Table 2.1 compares the
assorted deposition techniques for their deposition parameters.
Table 2.2 compares the materials depositable by these techniques.
In addition, the details of the deposition event - where a
wave of the material, at high energy (and therefore high surface
mobility) appears suddenly at the substrate surface, followed by a
delay which may be on the same time-scale as adatom
rearrangement and film nucleation processes - are unique among
film deposition techniques, and provides a number of opportunities
for research into the physics of film depositions.
66

Table 2.1: Comparison of Film Deposition Parameters. 4 See text
for explanation of abbreviations.
Method Plume Vacuum Deposition Use of >10
energy(eV) Rate (A/s) mtorr gas?
AMBE 0.1-100 UHV 3 no
ALE 0.1 UHV 1 no
CVD forms 0.1 (-500 HV (UHV for 10-20 yes
PECVD) MOCVD)
IBAD 0.1-1000 HV 10 no
IBD 20-200 UHV 0.1 no
ICBD 0.1-10 HV 10 no
IVD 0.1-1000 HV 20 no
MBE 0.1 UHV 3 no
PLD 1-1000 HV 10 yes
S 1-1000 HV 10 no
TE 0.1 HV 20 no
67

Table 2.2: Comparison of Common Materials Deposited by
Various Techniques4 See text for explanation of abbreviations.
Method Semi- Carbides Nitrides 1-2 3-4
conductors Element Element
Oxides Oxides
AMBE X
ALE X
CVD X X X
IBAD X X
IBD X
ICBD
IVD X
LACVD X
MOCVD X
MBE X X
PECVD X
PLD X X X X X
S X X X X
TE X
68

Figure 2.1: Pulsed laser deposition (PLD) setup for deposition of
Bi 2VOS.s and Bi 2CuO.VO. 90 5 .35 described in this chapter.
C0N
-e
0 n
000m
9000 U9-4VE4- -
/
-d-
- -
Cm
EC
-U
I.
69

2.1.2 Pitfalls and Problems
Two major problems in the PLD method impede its more wide-
scale commercial use. First, the deposited film often contains
particulates - like boulders on a smooth sandy beach - of a size
unacceptable in films intended for high-performance electronic and
optical applications such as high-temperature superconductors,
dielectrics, and ferroelectrics. Second, scale-up of the process so
that large areas can be covered with film in a high-throughput
setting remains an ongoing challenge.
The particulates found on the deposited film are believed to
be from large clusters or molten globules of material ejected from
the target and depositing as a unit onto the substrate. They can
range in size from the nanometers to microns. There are a number
of possible mechanisms, 5 including (1) break-off of protruding
features on the target surface, either when it is fresh or after
damage due to the laser irradiation, (2) rapid expansion of trapped
gas bubbles beneath the target surface causing ejection of surface
material, (3) splashing of the molten layer of the target due to a
subsurface superheated region or recoil due to the rapid surface
evaporation, and (4) condensation from a supersaturated vapor.
Several techniques for reducing the size and number of particulates
or eliminating them entirely have been tried. A shutter mechanism
("velocity filter") switching in and out of the plume path permits
passage of the small, high-velocity plume particles while stopping
the large, slow chunks. 5 This, however, reduces the total
throughput and therefore the overall deposition rate. "Off-axis"
70

depositions, in which the substrate is 1800 to the initial plume
direction (00, or line-of-sight, is the usual geometry) has been used
to benefit.6 A second laser aimed at the plume breaks apart the
large particles in it. Finally, reduction of the laser power density and
wavelength may eliminate the splashing that gives particulate
deposition, though with too-low power density and wavelength,
incongruent deposition occurs. Thus, while the problem of the
particulates in a PLD thin film has not been eliminated, progress has
been made toward solving it.
Scale-up of PLD to enable deposition of films onto large (>100
mm diameter substrates) has been approached mainly through
adjustments to the deposition chamber geometry. Offsetting the
rotating target from the substrate center, and counter-rotating the
substrate in the resulting off-center plume, combined with a
rastering laser, has been used to deposit films over 125-mm
diameter substrates. 7 Other approaches have used (1) an off-axis
stationary beam focused on a rotating target, with deposition onto
a counter-rotating substrate; (2) increasing the target-substrate
distance; (3) and a stationary beam focused on a rotating target,
with the substrate rotating and translating across the plume. While
these approaches are reasonably satisfactory, the major challenges
remain. Currently, the target must be resurfaced - usually with
sandpaper - between depositions to smooth out the grooves
caused by the laser's impinging on the target surface. The resulting
waste of material and time is uneconomical in a commercial setting.
Other problems are technical in nature: the challenges of uniformly
heating a large substrate, of monitoring the deposition rate, of
reducing the particulate deposition, and of finding a way to deposit
71

films onto non-planar substrates. Until solutions to these difficulties
are found, the commercialization of PLD is unlikely. See Table 2.3
for a comparison of PLD with other deposition techniques.
Despite these major problems with PLD, a number of
companies had entered the arena as of 1994,3 and were producing
films of high-temperature superconductors. Ferroelectric films for
use in nonvolatile memories and other novel devices, dielectric films
for microwave and field effect devices, and semiconductor films have
been deposited successfully by PLD and shown high quality and
performance. Bioceramics and tribological coatings, as well as
polymer thin films, are potential areas for application of PLD. To our
knowledge, however, the work reported in this chapter is the first
PLD of a thin film of a material intended for use as an oxide-ion
conductive membrane.
72

Table 2.3: Comparison of Deposition Techniques - Commercial
Factors4
HDR=high deposition rate, LST=low substrate temperature, LA = large area,
LC = low cost, EMC = easy material change, MC = material conservation
Method HDR LST LA LC EMC MC Problems
AMBE X Uniformity
ALE Slow
CVD X X X High T
substrates
IBAD X X Impurities,
uniformity
IBD X X X Slow growth,
small area
ICBD X X Impurities
reproducibility
IVD X X X X X Impurities
LACVD X Selected areas
only
MOCVD X X X High T
substrates
MBE X High T
substrates
PECVD X X X Uniformity
PLD ? X ? X X X Particulates,
small area
S X X X X Impurities
TE X X X X Impurities
73

2.2 Results and discussion
As noted in Chapter One, Bi 2VO5 .5 , a member of the Aurivillius
family of compounds, undergoes two consecutive phase transitions
on heating (Equation 2.1). The higher temperature forms exhibit
higher oxygen ion conductivity.
(2.1) cx 450 C' - 5 - Y
These phase transitions are reversible but can be suppressed by a
10-30% doping of the parent Bi 2 VO 5 .5 structure ("BiVOx") with a
wide range of elements. 8 In particular, a 10 mol% doping with
copper results in the stabilization of the high-temperature (y)
polymorph as the compound Bi 2 Cu0 .1V0 .905 .35 ("BiCuVOx").
Bi 2VO5 .5 and Bi 2 CuO.1VO. 90 5 .35 were deposited by PLD onto a
number of substrates, including MgO, YSZ, and SrTiO 3 (STO). The
BiMeVOx target materials were made originally by solid state
synthesis and verified phase-pure by XRD. (Figure 2.2 a, b)
BiVOx films deposited on MgO and YSZ underwent severe
delamination during post-deposition cooling. This is due to a
combination of the thermal expansion mismatch and lattice
mismatch between BiVOx and these substrates, and because of the
severe strains developed in the films during the y-c phase
transitions. See Table 2.4 for a summary of relevant lattice
parameters.
As can be seen in Table 2.4, based on their lattice parameters
neither MgO nor YSZ can accommodate both the y (high-
temperature) and the c (room temperature) phases. On the other
74

hand, the SrTiO 3 (STO) lattice matches that of the y phase along its
a direction and that of the u phase along its face diagonal. Samples
deposited on STO were thus of better quality. See Table 2.5 for a
summary deposited film thicknesses. The substrate temperature
listed for each film was the one that yielded the X-ray diffraction
patterns with the best phase purity and the narrowest rocking
curve.
All films on STO were strongly c-axis oriented, as shown by
the absence of all but the 001 peaks in the X-ray diffraction patterns.
(Figure 2.3) No other oxide phases were observed in the XRD
patterns of any of the deposited films, and Rutherford back-
scattering showed the stoichiometry to be correct within detection
limits. Both of the BiVOx films showed large-scale cracking and
delamination, but were smooth, without granularity in the
uncracked areas. (Figure 2.4 a, b) The films were cooled slowly to
minimize the effects of thermal strains; however, thermal
contraction and phase-change strains were exacerbated by the 450
crystallite re-orientation required for the ingrowing a-BiVOx phase
to match the substrate STO lattice. The results of the second
heating and cooling illustrates the extent of grain disorder and
internal strain in the a-Bi2VO5 .5 films. (Figure 2.5) This cracking
occurs in spite of the low temperature (below the a-0 transition) of
the heating step, and the strain relief that may be expected from
the cracks already present in the film. The light areas in the
electron micrographs are probably due to hillock formation during
the second annealing step; similar results have been observed in
75

BiMeVOx films made by sol-gel deposition methods. (See Chapter
Six.)
The stabilized y-Bi2Cuo. 1VO. 905 .35 (BiCuVOx) films deposited onto
STO were adherent and smooth, free of microcracking and
granularity, unlike the undoped parent phase. (Figure 2.6) Since it
can be expected that the thermal expansion coefficient of BiCuVOx
is similar to that of BiVOx, the absence of cracking and delamination
in the BiCuVOx films indicates that the phase transition and the
corresponding lattice-match problem were the main causes of the
cracking observed in the BiVOx films, rather than the development
of thermal strains. As with the BiVOx films, the BiCuVOx film is c-axis
oriented (Figure 2.7) with non-00l peaks completely absent.
However, while the quality of the as-deposited BiCuVOx films is
high, the severe cracking that occurred during the second heating
to 400 OC (well below the mp of 890 OC) and subsequent medium-
rate cooling (10 OC min-') suggests that the membrane, when
deposited via PLD, is still too strained to accommodate thermal
expansion mismatch. Moreover, the results of the second annealing
step (Figure 2.8) indicate little or no randomness to the orientation
of the a-b plane with respect to the STO lattice (Figure 2.9) as
would be expected, given the near-perfect match of the two lattices
(Table 2.4).
Pulsed laser deposition of films of the parent (c) phase
Bi 2VO5 .5 onto LaNiO 3 and SrTiO 3 substrates has been previously
reported. 9 In the latter paper, while the rapid (10 0C min-) cooling
from the deposition temperature (675 0C) was not reported to
cause cracking or delamination of the films, the films exhibit a more
or less random grain orientation in the plane of the substrate,
76

although the XRD reported there shows strong c-axis orientation,
as seen in our results, and a high degree of granularity, as
evidenced by inspection of the published SEM micrographs. Grain-
boundary grooving in these samples may relieve strain in the film,
preventing the cracking that we see in our films.1 0 If so, it may be
that higher-temperature treatment of those films would have lead
to agglomeration and dewetting (See Chapter 6). On the other
hand, the films deposited in the experiments described above are
oriented, smooth, and defect-free as deposited, without obvious
graininess. The extremely slow cooling rate may have permitted
quasi-single crystal film nucleation in the case of our films. The film
quality in the BiCuVOx case seems to be due mostly to a
combination of the close lattice match to the substrate and the
suppression of phase transitions. In the undoped BiVOx film the
change in cell parameter size and in the direction of the primary cell
axes required to match the substrate lattice induces severe strains
in the film, causing the observed cracking pattern and delamination.
77

Table 2.4: Lattice parameters of substrates and PLD films.
Compound Lattice Face
Parameters (A) Diagonal (A)
a-Bi 2VOs.5 a=5.54, b=5.62, 7.89
(c=15.32)
y-Bi 2VO5 .5 a=b=4.004 5.66
(c= 15.488)
Bi 2CuO. 1VO. 9O5 .35 a=b=3.92 5.54
MgO a=b=c=4.16 5.88
YSZ (15% Y2 0 3/85% a=b=c=5.14 7.27
ZrO2)
LaNiO 3 a=b=c=3.83 5.41
SrTiO 3 a=b=c=3.94 5.57
78

Table 2.5: Results for BiMeVOx Films PLD onto STO
Film Substrate Temp. Laser Pulses Thickness (gm)*
("C)
BiVOx-A 700 3000 1.05 (0.84+)
BiVOx-B 635 2000 0.22
BiCuVOx 635 2000 0.20
*by profilometry +by Rutherford back-scattering (RBS)
79

Bi 2VO.s sample prepared by solid state methods
and used as a target in the PLD depositions.
6000 1
5000 -
4000 -
3000-
2000 -
1000-
0-- j
20
K~JJ30 40 50 60 70
2 Theta (deg.)
80
BiVO 40
10
-a W- -
4a.-LiL
Figure 2.2a:
L---. - - -. A--

Figure 2.2b: Bi 2CuO.lVO.9 0 5 .. sample prepared by solid state
methods and used as a target in the PLD depositions.
4000 1
10 20 30 40
3000-
2000-
1000-
0-60
2 Theta (deg.)81
50 70
I
I I
I
LULIULO-W4ft-M, - A-0 A

Figure 2.3: Grazing incidence XRD (GIXRD, grazing angle 10) of
Bi 2VOS.. films deposited by PLD onto STO. Deposition
temperature 700 0C.200000 1
STO 0
BiVOx oo002
004
1I I I I 310 15 20 25 30
006
0
it'I
35 40 45 50 55
2 Theta (deg.)
150000-
100000 -
U,
CZ)
C
a)C
50000 -
060
82

Figure 2.4: (a) B12VO~5. film on STO, deposited at 635 *C, X
2500. (b) BiVO5 ,5 film on STO, deposited at 700 0C, X 515.
(a)
(b)
83

BiVO5 .5 film on STO after 2nd heating cycle, X 740.
84
Figure 2.5:

Figure 2.6:
*C, X 1350.
Bi 2Cuo.IVgjO5.5 s., film on STO after initial PLD at 635
85

Figure 2.7:
100000 1
GIXRD of BiCuVOx films deposited on STO by PLD.
STO 0
0 BiCuVOx <0
002 00 6
004
i I i15 20 25
I
04>0 0 0 0
I I I I I I30 35 40 45 50 552 Theta (deg.) 86
75000 -
50000-
C,
25000 -
010
,60
I
j
>

Figure 2.8: BICuVOx film on STO after 2"" heating cycle, X 785.
87

Figure 2.9: Alignment of the deposited BiCuVOx film with the a
or b substrate directions ensures that cracking (dark lines)
occurs in a rectilinear manner. (a) This is also the case for y-
Bi 2VO5.5. (b) However, grain reorientation to align the c-
Bi 2VO.S with the STO face diagonal during the y-c transition
results in a circular cracking pattern (c).
~~BiVOX y-BiVOx BiCuVOx
CM b aEl
bC a

2.3 Conclusions
Smooth and defect-free BiCuVOx films were successfully
deposited onto STO substrates by PLD, while BiVOx films were
smooth, but cracked due to the rotation of the film lattice with
respect to the STO lattice during the cooling-step y-ca phase
transition undergone by these films.
Both BiVOx and BiCuVOx films were subjected to a second
low-temperature (400 OC) heating cycle with moderately fast
heating and cooling to determine whether the instantaneous-
deposition nature of the PLD process had created films which were
highly strained and merely metastable. This temperature was
chosen to be well below the film's melting point (890 OC for
Bi 2VO 5.511 , 895 OC for Bi 2 CuO.1VO.90 5 .35 , see DTA/TGA results in
Chapter Six) to limit the atomic mobility expected in the film and
prevent island formation, and to be below the temperature for the
u-p phase transition (450 OC) so that strains in the films generated
by their initial depositions and cooling would be highlighted without
interference from additional phase transitions. It was expected also
that this temperature would be sufficiently low that thermal
expansion would not contribute greatly to any cracking seen. Both
films exhibited severe strain-cracking. The cracking pattern
reflected the underlying orientation of the film with respect to the
substrate lattice. While BiCuVOx, oriented along the lattice-
matched a-b direction of the STO lattice, cracked in a rectilinear
pattern, the BiVOx films cracked in a rounded pattern reflective of
89

their re-orientation during cooling from the y phase matching of the
a-b direction to the a phase matching of the cell diagonal. (See
Figure 2.6.)
The results highlight the importance of judicious substrate
choice in thin film depositions. Substrates must not only be lattice
matched, but also compatible in terms of their thermal expansion
coefficients. Finally, phase transitions in the film must be
suppressed. While many thin films are inspected for quality directly
post-deposition, the result of the second heating cycle reported
here points up the need for testing films under a variety of heating
and cooling regimes, if they are to be used in a practical application.
90

2.4 Experimental
Details on the reagents and instruments used in this Chapter
may be found in the Appendix to Part I of this thesis.
Experiment #1 Synthesis of Target Pellets (JWP/II/99A, B)
Stoichiometric quantities of Bi 2 0 3 (9.3190 g, 20 mmol) and V20 5
(1.8188 g, 10 mmol) were ground together in an agate mortar
under acetone and a pellet pressed of the resulting mixed solid.
The pellet was heated in air on platinum foil for 20 h at 850 0C with
an intermediate grinding to prepare Bi 2VO5 .5 (BiVOx), phase purity
verified by powder X-ray diffraction (PXRD). Similarly, bulk
Bi 2 CuO.1VO. 90 5 .35 (BiCuVOx) was prepared from stoichiometric
quantities of Bi 2 0 3 (9.3190 g, 20 mmol), V20 5 (1.637g, 9 mmol) and
CuO (0.1591 g, 2 mmol) heated in air on a platinum foil for 20 h at
850 0C. Pressed and sintered pellets, approximately 2 cm in
diameter, of each compound, were used as targets for the
deposition.
Experiment #2 PLD of BiMeVOx Films (performed at Naval
Research Laboratory)
The BiVOx and BiCuVOx films were prepared by pulsed laser
deposition on (100) SrTiO 3, (100) MgO, and (100) 15 %Y20 3-doped
ZrO2 (yttria-stabilized zirconia, YSZ) using a KrF laser (248 nm).
91

Laser pulses of approximately 30 ns duration were focused through
a 50 cm focal length lens onto the BiVOx or BiCuVOx target. With an
incident power of 0.8 W at 5 Hz, the focal spot size of 0.07-0.08 cm 2
yielded a fluence of 1.8-2 J cm- 2 at the target. Before each
deposition, the targets were pre-burned for 2000 shots in oxygen
to remove surface contaminants and to reach a steady state
ablation composition. Targets were rotated in the rastered beam to
minimize surface cratering. The target-to-substrate distance was
3.23 cm. Substrates were not specially prepared before deposition.
Substrate temperatures from 635 OC to 700 OC were tried. The
depositions were carried out in 0.3 Torr 02 with slow cooling (< 1 0C
min-') in approximately 100 Torr 02. A faster cooling rate resulted in
delamination of the films.
Experiment #3 Characterization of PLD Films (JWP/III/139)
The surface morphology of the films was examined without
further sample preparation using environmental scanning electron
microscopy (ESEM, Electro-Scan) at 15 kV beam energy and 4.9 Torr
water vapor pressure to prevent surface charging and achieve the
desired resolution. Film thicknesses were determined by
profilometry (Dektak, 2.5 jtm stylus). Some material was removed
from a small area of each film sample using concentrated HCI to
create a step for the profilometer. The thickness and stoichiometry
was verified in one of the BiVOx samples by Rutherford
backscattering spectroscopy (RBS). Films were checked for
orientation and phase purity at the Naval Research Laboratory by
rocking-curve XRD using Cu Ka radiation (1.5418 A). Full X-ray
92

diffraction patterns were collected with rocking and re-aligning on
the F(002) peak of BiVOx.
Experiment #4 Post Deposition Thermal Treatment (JWP-III-
142)
Samples were subjected to a second annealing in air at 400
'C for 2h and cooled at 10 0C min-'. These films were re-examined
for changes in surface morphology using ESEM. For the latter
examination, approximately 50 A of gold was evaporated onto the
film surfaces to relieve charging effects.
93

2.5 References
1)Cheung, J. in Pulsed Laser Deposition of Thin Films, Chrisey, D. B.
and Hubler, G. K., Ed.; John Wiley & Sons: New York, 1994.
2)Chrisey, D. B. in Pulsed Laser Deposition of Thin Films, Chrisey, D.
B. and Hubler, G. K., Ed.; John Wiley & Sons: New York, 1994.
3)Venkatesan, T. in Pulsed Laser Deposition of Thin Films; Chrisey, D.
B. and Hubler, G. K., Ed.; John Wiley & Sons: New York, 1994.
4)Hubler, G. K. in Pulsed Laser Deposition of Thin Films; Chrisey, D. B.
and Hubler, G. K., Ed.; John Wiley & Sons: New York, 1994.
5)Chen, L.-C. in Pulsed Laser Deposition of Thin Films; Chrisey, D. B.
and Hubler, G. K., Ed.; John Wiley and Sons: New York, 1994.
6)Kennedy, R. 3. Thin Solid Films 1992, 214, 223.
7)Greer, 3. A. in Pulsed Laser Deposition of Thin Films; Chrisey, D. B.
and Hubler, G. K., Ed.; John Wiley & Sons: New York, 1994.
8)Mairesse, G. in Fast Ion Transport in Solids; Scrosati, B. and al., e.,
Ed.; Kluwer Academic Publishers: Netherlands, 1993.
9)Prasad, K. V. R.; Varma, K. B. R.; Raju, A. R.; Satyalakshmi, K. M.;
Mallya, R. M.; Hegde, M. S. Appl. Phys. Lett. 1993, 63, 1898.
10)Srolovitz, D. J.; Goldiner, M. G., JOM, 1995, March, 31.
11)Abraham, F.; Debreuille-Gresse, M. F.; Mairesse, G.; Nowogrocki,
G. Solid State Ionics 1988, 28-30, 529.
94

Chapter Three:
Sol-Gel Approaches to Bulk BiMeVOx
95

3.1 Introduction to the Sol-Gel Method
In addition to the films of the BiMeVOx materials produced by
pulsed laser deposition described in Chapter Two, a number of
BiMeVOx films were produced by the sol-gel method. This work is
described in the remainder of Part I of this thesis. Chapter Three
provides background information on the sol-gel method and reports
our early and informative, albeit unsuccessful, attempts at
developing a formulation which would produce BiMeVOx membranes
on casting and pyrolysis. Chapters Four and Five report and discuss
the formulation that was eventually found to be most useful, and
the work done to characterize that precursor. Chapter Six reports
deposition of the BiMeVOx films onto a number of substrates.
While the majority of the background material needed for
discussion of the work reported in these chapters is provided
below, some significant pieces of information are left to be
introduced as needed in subsequent chapters.
3.1.1 Definitions, History, Background
Brinker and Scherer, in their text on the subject, define the
"sol-gel" process as "the preparation of ceramic materials by the
preparation of a sol, gelation of the sol, and removal of the
solvent." 1 Most definitions by the many reviewers of the sol-gel
process are similar; however, throughout the literature the term
has been more widely applied to include systems that form neither
true sols nor true gels. Therefore the term "sol-gel" has come to
96

refer to virtually any ceramic preparative technique that involves
dissolved or colloidal ceramic precursors. Sol-gel-type chemistry has
also appeared in the literature under the terms "soft-solution
processing" and "chimie douche," where the "soft" refers to the
differences between this technique and those involving grinding and
firing to high temperatures of dry ceramic powders.
Most reviewers cite Ebelman's 1846 synthesis of silicon
alkoxides as the earliest step in sol-gel processing's
development. 2 ,3 By the early 1900s Walter A. Patrick of the Silica
Gel Corporation was issued dozens of patents revealing sol-gel
processes for making silica-gel supported catalysts, mixed oxides,
adsorbents, and porous glasses, thereby demonstrating the
potential industrial uses of this chemistry. 4 - 6 Later advances by
Moulton (American Optical Company, 1943),7-9 in which mixtures of
silicon, titanium, and tin alkoxychlorides were partially hydrolyzed
and used as antireflective coatings on glass; by Kimberlin
(1953),10,11 who used aluminum alkoxides to produce high-purity
fine powders of aluminum metal; and by Yoldas (1975),12,13 who
found that alumina sols could be used to produce transparent gel
monoliths, set the stage for rapid development and copious
publishing on the potential and actual uses of the sol-gel process.
The sol-gel process has made it into the realm of quasi-political
discussion, as well: one recent paper points out the
"environmentally friendly" aspects of sol-gel and other "soft
chemistry" methods, insofar as lower firing temperatures are
necessary for making solid ceramic items via sol-gel-type processes,
97

and water (or recyclable organic solvents) can be used as the liquid
carrier for the precursors.14
Because the term "sol gel" has come to refer both to a
process where the ceramic precursor is a true sol (a colloidal
suspension of solid particles in a liquid) and where the precursor is
a macromolecular network, (from condensation polymerization of
metal alkoxides), some care must be taken in identifying what sort
of chemical and physical processes are occurring in a preparation
identified as "sol-gel." Inorganic precursor salts, including chlorides,
nitrates, sulfides, and, ultimately, hydroxides, are usually used to
create true sols. Metal or silicon alkoxides are the precursors to
macromolecular suspensions; metal carboxylates and other organic
acid salts may be used to introduce the primary or additional metals
into solution in either case. Flocculation (in the sol) or
hydrolysis/condensation (in the alkoxide case) results in a gel, a
continuous semisolid or viscoelastic skeleton enclosing or enclosed
by a continuous liquid phase. Aging or drying of the gel results in
further condensation, which leads to shrinkage of the gel as the
liquid is expelled. If the expulsion occurs more rapidly than the
evaporation, the process is called syneresis; under normal drying
conditions, however, a porous and high-surface area xerogel results,
while under supercritical conditions, little shrinkage occurs and the
resulting low-density material is called an aerogel. Aside from the
environmental conditions of the drying, the final dry product
properties are controlled by a number of parameters active during
the condensation or flocculation and as the solvent evaporates out
of the gel pores. Ionic strength or pH variation and the steric
properties of the precursor lead to different degrees of
98

condensation and branching in the condensed material. Drying
control chemical additives can reduce the development of the
capillary pressures that lead to cracking during solvent evaporation.
Firing of the dry product "greenbody" results in pyrolysis of residual
(unhydrolyzed) organic groups, usually with concomitant gas
production, followed by crystallization and sintering. The intimate
mixing of the constituents ensures that the crystallization and
sintering will occur at temperatures several hundreds of degrees
lower than those required for more traditional mixed-oxide powder
processes, at least in principle. These issues will be discussed in
more detail below.
3.1.2 True Sols
A sol is a colloidal suspension of solid particles in a liquid. In
sol-gel preparations, the sol is generally polydisperse. The high
surface free energy of the particles makes them tend to collapse
together to form aggregate larger particles with reduced surface
energy; van der Waals and Coulomb forces further attract the
particles to each other. Thus, a colloid is kinetically stable only;
thermodynamically, it is unstable if colloid particles alone are
considered.
However, for oxide and hydroxide sols, where the particles
have low to mid-range surface potentials, the behavior can be well-
described by the Derjaguin, Landau, Verwey, and Overbeek (DLVO)
Theory.1 5 In this model, an electric double layer is formed when
the surface of the colloid particle acquires a charge in a polar
solvent and becomes surrounded by a diffuse layer of counter-ions
99

and some opposite-charge co-ions. This ionic atmosphere protects
the colloid particle from the approach of other likewise-screened
particles. The particle surface acquires the charge by: (1)
ionization, where a functional group on the surface dissociates and
forms an ion, depending on the pH of the solution; (2) preferential
adsorption of ions from solution; and (3) dissolution of the colloid
particle surface into its cationic and anionic parts at different rates.
The ionic strength of the solution determines the degree of
screening of the colloidal particle's native charge; at high ionic
strength the surface potential falls rapidly within a short distance
and van der Waals forces drive the ensuing flocculation. Likewise,
flocculation will occur in any situation where close approach of the
particles - due to thermal (Brownian) or mechanical agitation -
permits the short-range van der Waals forces to dominate the
system.
The addition of a surfactant will stabilize a colloid against
coagulation of its particles. For example, soap (long-chain fatty
acids) will collect ionic carboxylate-ends toward the colloid particle,
and the hydrophobic chains will thus protect the particle from
coming within coagulation distance of other particles.
If the electric double layer or surfactant preventing
coagulation is removed, so that sol particles can approach within
the active distance of van der Waals forces and coagulate, they may
form a densely packed sediment, a re-suspendable loose sediment,
or a network of aggregated particles where the "sediment" volume
is equal to that of the solvent. In the last case, the aggregate
particles may cross-link and immobilize the solvent, providing a
viscoelastic gelatinous mass. The degree of cross-linking
100

determines the physical properties of the gel. The induction of
gelation can be accomplished by a gradual change of ionic strength
or by removal of solvent by evaporation. Gently heating a sol in an
aqueous solvent (enthalpy-stabilized sol), or gently cooling one
which is in a non-aqueous solvent (entropy-stabilized sol) can also
induce gelation.
Multicomponent gels, where several metals need to be
simultaneously present in the sol, suffer from co-solubility and
preferential precipitation problems. The additional ionic strength
provided by the addition of metal A, in some form, to a sol of metal B
may disrupt the sol of metal B and cause it to flocculate; or metal A
simply will "refuse" to form a sol in the presence of metal B. Careful
control of the pH, temperature, and ionic strength, and sometimes
the addition of surfactant materials, is usually necessary if a
multicomponent gel is required. High dilution, of course, aids in
getting all metal components into the sol but does not permit gel
formation. These difficulties are exacerbated by an increased
number of metals required to be simultaneously in the final gel.
3.1.3 Macromolecular "So/s"
Polymeric or macromolecular gels, which are not formed from
true sols, are usually formed from metal alkoxide-based precursor
solutions. Most studies have dealt with the reactivity of silicon
alkoxides, because their hydrolysis is slow in "neutral" solutions
(insofar as the concept of pH can be applied to non-aqueous
regimes) and the relative rates of hydrolysis and condensation can
be controlled by the use of acid, base, or nucleophilic catalysts.
101

Metal alkoxides, on the other hand, are extremely reactive to water
and other hydroxyl compounds, so that while reports of applications
involving metal-based sol-gel preparations are manifold, studies of
the kinetics and mechanism of the reactions they undergo are few.
The chemistry and behavior of multicomponent alkoxide systems,
and of systems with metal alkoxides and metal salts together, is
more complex still.
In general, the reactions of alkoxides can be broken into two
categories: hydrolysis and condensation (Equations 3.1-3.2). Via
these reactions, a network of M-O-M- bonds form.
(3.1) Hydrolysis: M(OR)n + x H20 < M(OR)n-x(OH)x + x ROH
(3.2a) Condensation by dehydration:
2 (RO) 3 M(OH) -> (RO) 3M-0-M(OR) 3 + H20
(3.2b) Condensation by dealcoholation:
2 (RO) 3M(OH) -> (RO) 3M-O-M(OR) 2 (OH) + ROH
The mechanisms and rates of these reactions depend on pH,
temperature, and the concentration of water in the nonaqueous
solvent. Furthermore, depending on these factors and the
identities of M and R, the morphology of the resulting oligimers may
be either linear or branched. For tetraethoxysilane (TEOS), the
hydrolysis rate increases with increasing [H'] or [OH-] in acidic and
basic conditions, respectively. In acid, the rate of the hydrolysis
reactions exceed that of the condensation reactions, and a linear
gel morphology results. Under basic conditions the rapidity of the
condensation reactions leads to a branched and cross-linked gel
morphology. 16
102

The oligimer chains may cross-link to form a gel either as
evaporative losses of solvent cause them to approach, or as the
condensation reactions continue to propagate. The gel network is
formed as continued polymerization splits off alcohol groups and
forms an extended M-0-M- structure. The degree of crosslinking
determines the physical properties of the gel, including its ability to
wet a substrate.17,18
One of the difficulties with using alkoxides to make
multicomponent gels is that different metal alkoxides hydrolyze at
different rates. If one component hydrolyzes too rapidly relative to
the other(s), it may precipitate as a hydroxide within the gel, or the
gel micromorphology will be similar to that of a block co-polymer,
with regions of mostly one metal type, and other regions of mostly
the other. The resulting inhomogeneity in the gel undoes one of
the major benefits of the sol-gel method, the atomic-level mixing of
the assorted metal species that provides for a reduced
crystallization temperature. This difficulty can be addressed by the
judicious choice of pH and solvent polarity and viscosity. Adjusting
the identities of the alcohol groups can modify the hydrolysis rate as
well. Other processes based on decreasing the reactivity of the
metal alkoxide precursors by chemical modification (alcohol
exchange, addition of carboxylic acid ligands or P-diketones), or by
controlling the local concentration of water (by alcohol dehydration,
esterification, and emulsion reaction) have been used with
success.19
Because metal alkoxides are usually expensive and difficult to
obtain in large quantities, it is often the case that only some of the
metals of a multicomponent gel are added as alkoxides. The
103

remainder are provided as metal salts chosen to be soluble in the
alcoholic solvent. Citrates, acetates, formates, tartrates, and
nitrates are typically used. Chlorides and sulfates, due to their
stability, are often hard to remove, leading to impurities in the final
ceramic. Nitrates, being highly oxidizing, can lead to fires or
explosions if care is not taken during the gel drying, and tend to
crystallize out during solvent evaporation. Metal acetates and other
salts of weak organic acids are usually soluble in a range of
alcoholic solvents; however, their thermal degradation occurs at a
higher temperature than for nitrates, so that their removal from the
gel is more difficult. Heating a mixture of metal acetate and alkoxide
can create some non-hydrolytic M-0-M' formation, with liberation of
the alkyl acetate (Equation 3.3).
(3.3) M(OR)x + M'(OAc)y -- (RO)x. 1M-0-M'(OAc)y. 1 + ROAc
Likewise, a metal halide may be used in conjunction with a
metal alkoxide to produce a mixed alkoxide, with liberation of the
alkyl chloride (Equation 3.4).20
(3.4) M(OR)x + M'Xy -> (RO)x_1M-0-M'Xy 1 + RX
Nonhydrolytic routes to gels, particularly where silicon and a
transition metal are required in the same gel, are an active area of
research.1 9 Such routes provide a work-around for the problem of
the faster hydrolysis of transition metal alkoxides, compared with
the hydrolysis rate of the analogous silicon alkoxides.
104

3.1.4 Gel-to-Ceramic Transition
Once the gel is formed, heat treatment converts it to an
inorganic oxide ceramic. During this step, the organic solvent
further evaporates from the gel and organic ligands are pyrolyzed;
some structural rearrangement and densification occurs; the
structure crystallizes (and at higher temperature, sinters). The
structure of the gel and the degree of real atomic-level mixing that
has occurred in the gel will greatly affect the temperatures at which
each of these stages will occur.
Differences in the gel morphology can lead to different
behavior on solvent removal and densification. Linear polymeric
chains undergo considerable collapse and structural rearrangement
and pack into a high-density, low-porosity dried gel. Highly
crosslinked gels, on the other hand, tend to maintain their structure
on solvent removal, leaving pores where solvent had been and
leading to a low-density dried gel. In both cases, as normal drying
occurs, the gel shrinks by a large amount, and it often cracks due to
the high capillary forces developed by the solvent in the gel pores.
Slow drying permits the gel to dissipate the stresses built up in this
way, so that the resulting xerogel will be uncracked. Gels with a
particle-type or cluster-type morphology tend to have larger pores
than those with a highly-crosslinked polymer morphology, so that
the capillary stresses associated with the solvent drying out of the
pores are smaller.
The use of drying control chemical additives (DCCAs) in
alkoxide sol-gel preparations minimizes the vapor pressure of the
solvent in the pores, reduces the pore size distribution, and
105

decreases the drying stresses. Common DCCAs include formamide,
glycerol, oxalic acid, glycols, and ethanolamines. 2 1 , 2 2
Drying the gel under supercritical conditions for the solvent in
question - e.g. at a position in its phase diagram where the
liquid/vapor phase boundary has disappeared - leads to uncracked
and mostly unshrunken aerogels. These materials have low density
and very high porosity.
No matter how the drying process is done, there still will
remain unhydrolyzed organic-containing ligands that need to be
driven out of the gel by pyrolysis. This must be done while there is
still some porosity to the gel, so that gases produced from pyrolysis
of the organics can escape without cracking the gel. As the
processing temperature is increased, viscous sintering, driven by
the reduction in surface free energy, occurs. Finally, the metal and
oxygen atoms rearrange into the crystal structure predicted by the
elements' phase diagram according to composition of the gel and
the treatment temperature, or kinetic products may result. This
occurs at a much lower temperature than it would in a traditional
solid-state synthesis, in which metal oxide powders are mixed and
heated, because the intimate mixing of the metals has already
occurred in the gel formation, while in solid state syntheses atoms
of each metal must cross grain boundaries in order to come into
proximity with each other.
While much of the above discussion of the care required in the
drying step applies to gel monoliths, the principles of gel
densification and drying are similar for sol-gel production of films.
Films deposited as a single thick coating are prone to crack due to
capillary pressure in the pores. On the other hand, films created by
106

the repeated deposition of thin layers must be dried and in many
cases pyrolyzed as each layer is deposited, so that gases created
by the decomposition of organics in layer n do not escape in such a
way as to destroy layer n+1. An additional problem in the drying
stage of film deposition is that anisotropic shrinkage can cause
"mud cracking" or "islanding," as the film shrinks back from cracks.
Delamination, or peeling, of the film from the substrate can also
occur. (Figure 3.1)
3.1.5 Applications and Outlook
As indicated above, the sol-gel method brings with it a number
of benefits over more traditional methods of ceramic synthesis due
to the atomic-level mixing of the metals which can occur in the sol
and gel. This permits crystallization and sintering to happen at a
lower temperature than for mixed-oxide powder methods,
producing savings in time, capital equipment, and energy.
Furthermore, lower temperatures help to avoid contamination of the
sample from the pyrolysis container or furnace materials, so that
sol-gel processes can provide higher-purity materials than powder
syntheses. Phases and microstructures not available in high-
temperature processing are accessible via the sol-gel method.
Because some sintering occurs during a high-temperature powder
synthesis, finely-divided powders are difficult to obtain, while sol-gel
precursors - often combined with spray pyrolyses - may lead to
high-surface-area, fine, and reasonably monodisperse powders.
Finally, the sol-gel method permits solids to be fabricated in a
107

number of forms, including not only powders, but monoliths, fibers,
and films.
In particular, films of ceramics for electronic and magnetic
applications have been extensively produced by the sol-gel
process. 2 3 High-temperature superconductors, most notably
YBa 2 Cu 30 7 ,2 4 , 2 5 electrochromic ceramics such as V2 05 and W0 3,2 3
ionic conductors (YSZ), 2 6 - 2 8 , dielectrics such as SrTiO 3,2 9 and
ferroelectric perovskites, particularly those in the lanthanum-
modified lead zirconate titanate (PLZT) system, 3 0 ,31 have been
widely studied for sol-gel depositions. Another ferroelectric, lithium
niobate, LiNbO 3 (LNO), melts incongruently at an equimolar ratio of
Li and Nb, resulting in inhomogenous single crystals. As a result, it
is extremely difficult to prepare LNO by conventional (solid state)
methods. However, there are a number of reports for the
preparation of LNO by sol-gel processing. 3 2 ,3 3 Finally, the layered
ferroelectric Bi 4Ti 3O12 has been prepared in bulk 3 4 ,3 5 and in thin film
form3 6 ' 3 7 by the sol-gel method.
Commercialization of the sol-gel process requires the ability to
fabricate on a large scale or with high throughput, and profitability
must be demonstrated. Recently, sol-gel derived electrical and
magnetic ceramics, including alumina substrates (Mitsubishi),
layered ceramic capacitors (NEC), and silica display panel spacers
and printed circuit boards (GelTech) went into production. 2 3 Trends
in the microelectronics industry are expected to lead to further
commercial application of sol-gel derived materials. Antireflective
and other optical coatings have been applied by dip-coating sol-gel
precursor solutions onto glass panes and mirrors for years, 2 1 and it
108

can be expected that this trend will continue. The technology,
therefore, is present or within reach for scale-up and commercial
application of the sol-gel deposition of oxide-ion conducting films
described in this work.
3.1.6 Other precursor routes
Certain other precursor routes to oxide ceramics show
potential for the production of film-castable multicomponent
solutions. Hydroxycarboxylic acids (citric, lactic, or tartaric), which
form polybasic acid chelates with metal ions, metal salts (nitrates,
carbonates, and hydroxides), and polyhydroxyl alcohols (ethylene
glycol) may be co-dissolved; the condensation reaction between the
metal chelate and the alcohol may then form an ester. On heating,
polyesterification occurs, resulting in a homogenous solution of the
metal ions in an organic matrix. This stable solution is film-castable
and dries to a glass, which can then be calcined to a dense
material. 3 8 The process is variously known as the "Pechini process"
or the "amorphous citrate process." Powders of Pb 3MnNb 2O9 are
reported to have been synthesized by this route, 3 9 as have
strontium and lanthanum manganese oxides; 4 0 however, there
have been few, if any, reports of the use of this process in film
casting. A similar process, entailing the use of glycine and metal
nitrates, has been reported, but due to the sometimes violent
exothermic decomposition that occurs on heating, it is unlikely to be
of use in the synthesis of anything but powders. 4 1 Polyacrylamide
gels 4 2 and polyethylenimine4 3 have also been used as an organic
matrix for maintaining multiple metal ions in simultaneous solution.
109

Finally, yttria, zirconia, and YSZ thin films have been prepared from
solution of metal carboxylate precursor salts in a carboxylic
acid/amine solvent system. The precursor salts were prepared by
reacting the metal nitrates with ammonium trimethylacetate and
dissolved in propionic acid/amylamine/xylene. The resulting solution
was spin-cast onto Si(111) substrates to produce dense, if
somewhat granular films. 4 4
3.1.7 Outline of the Research Done
Our initial approaches to producing a film-castable sol
containing 2 Bi: 1 V centered on the use of vanadic acid
condensation to polyvanadic acid to produce a gel network. The
bismuth was to be introduced as a salt dissolved in the trapped
solvent. As discussed below, most attempts along this line of
research led to preferential precipitation of 1:1 Bi:V materials.
Other formulations led to thick granular films with large-scale
cracking. Reports of this work make up the remainder of Chapter
Three. Chapter Four discusses work in which the gel-producing
materials were vanadium alkoxides.
3.1.8 Vanadic Acid Background
Vanadium pentoxide gels have been the subject of extensive
research due to their electrical properties. Their electrical
conductivity is high, and they exhibit semiconducting behavior. They
have been examined for use in antistatic coatings and switches.4 5
110

Vanadium pentoxide gels may be prepared by pouring molten
V20 5 into cold water 4 6 or by the polycondensation of decavanadic
acid, which in turn is obtained by running sodium metavanadate,
NaVO 3, over an acidic ion-exchange resin. 4 7 In reality, the specific
vanadate species present in a solution, and their degrees of
condensation, depend on the pH and total concentration of
vanadium. While in very basic solution the primary species is
[V0 4 ] 3, protonation of the orthovanadate ion followed by
condensation leads to pyrovanadate ion [V 20 7 ]4 -, and repetition of
the protonation and condensation reactions lead up through
[V4012]4- as the acidity rises. In acidic solution, protonation and
condensation of the species [V 30 9]3 - leads to the decavanadate
anion 4 8 [H 2V1 00 2 8]5 - until the pH drops far below the isoelectric
point of pH 2.2, when the polymer is broken up and VO 2+ and/or
VO 3+ are formed. 4 9 Decavanadic acid (H4V10 0 2 7), in turn, undergoes
polycondensation to create fiberlike sol particles which may then
make up a gel. While the gels can be produced by adding acids,
e.g. HNO 3, to vanadate salts (NH 4VO 3, NaVO 3), this leaves unwanted
ions in the gel. 2 3 Depending on the concentration of the vanadium
species and the pH, the gelation will occur within 2-50 hours.
Tetravalent vanadium serves as a polymerization inititator. It
may be formed (at about 1%)45 during the ion exchange process
from sodium metavandate to vanadic acid, or from the oxidation of
organics in the solution by V5 . The polymerization is
autocatalytic.4 7
The vanadium oxide gel structure is made up of flat ribbons
some 1000 A long and 100 A wide and having a structure similar to
111
that of the ac plane of orthorhombic V20 5, i.e. edge-shared V0 5
pyramids. 4 5 , 5 0 This basic ribbon structure is considered to be the
root of the gel's layered nature. When deposited as thin films,
vanadium pentoxide sols produce a highly-oriented layered
structure where the layer planes are parallel to the substrate. 5 1
The layered structure of the V20 5 gel has been pillared with a
number of cations of varying sizes and charges: the alkali and
alkaline earth metal cations, NH 4+, several transition metal cations,
and A13+, as well as with the Al13 cation and the Mo 6 and Nb 6 chloride
clusters. 5 2 Therefore, we thought that vanadic acid sols would be
a good starting point for creating precursors to the BiMeVOx oxides.
112

Figure 3.1: ESEMs of films showing mudcracking (a, X 710; b, X
310) and delamination (c, X 1150).
(a)
(b) (c)
---- -7---- -
~Il
V t
Sz
... .. . . .. .A
113

3.2 Results and Discussion
Initially, 0.1M solutions of NaVO 3 were ion-exchanged and
mixed with Bi(N0 3) 3-5H 20 dissolved in glacial acetic acid at room
temperature or with Bi 2 0 3 partly dissolved in hot glacial acetic acid.
In both cases an immediate precipitate formed-this was calcined
and found to be BiVO 4. (Expts. 1-2, Figure 3.2) Higher
concentrations of NaVO 3 in the initial solution were tried in the hope
of providing a higher probability for gelation (0.1M solutions gelled
after 24 hours in the absence of the bismuth salts). Therefore 0.5 M
vanadate solution, which gelled after 12 hours in the absence of the
bismuth salts, was used with each of Bi(N0 3)3-5H 20 and Bi20 3, and
an alcohol (2MOE) provided as a sacrificial reductant, so that V(IV)
would be generated to catalyze the gel-forming polymerization. In
both cases here as well, a precipitate formed immediately, and after
calcining these precipitates were identified as a mix of Bi 2 0 3 and
BiVO 4, plus an unidentified minor phase. (Expts. 3-4, Figure 3.3)
The minor phase may be a sodium-containing oxide of Bi and/or V,
which would occur if the ion-exchange on the column was
incomplete. A still-higher concentration (0.6 M) of NaVO 3 was also
tried; Bi 3 * was put into solution by dissolving Bi 2 0 3 in HNO 3. This
provided more free H+ for exchange with the sodium metavanadate,
so that even if the column failed to exchange the sodium for
protons, the strong acid was likely to work. In addition, it was
hoped that the decreased pH would serve to prevent preferential
precipitation of any bismuth-containing species prior to gelation.
114

However, the initial try here (Experiment 5) still resulted in a
precipitate which on calcining was identified as a mixture of BiVO 4
and Bi 2VO5 .5 (Figure 3.4); the mother liquor gave BiVO 4 only. Aging
of the ion-exchanged vanadate solution prior to the addition of the
bismuth-containing solution permitted polymerization of the vanadic
acid to begin, as evidenced the appearance of red fibrils in the
beaker (Experment 6); addition of the bismuth solution gave a clear
solution which was stable at least overnight. Slow evaporation of
the solvent gave a precipitate which even prior to calcination could
be identified as a mix of BiVO4 and Bi 2VO5 .5 . Repetition of the
experiment gave a solution which was stable for at least two days
(Experiment 7). The solid left behind from evaporation of the
solution was calcined for 10 hours at a number of temperatures.
For temperatures up to 550 OC the solid was identified by XRD as a
mixture of BiVO4 and Bi20 3; by 650 OC peaks associated with Bi 2VO5 .5
started to appear, and by 750 0C the calcined product was a
mixture of BiVO 4 and Bi 2VO5 .5 only. No Bi20 3 was found in any of
these samples, but it may have been hidden under the background
as an amorphous phase.
Ion-exchanged NaVO 3 solutions did not prove to be useful
precursor solutions at any of the concentrations tried. The
presence of acetic or nitric acids inhibited the gelation of vanadate
solutions somewhat, but in the presence of the bismuth salts, these
solutions would not gel at all. Instead, precipitates formed which
were often identifiable by powder XRD as BiVO 4, even prior to
calcination. Whether this is due to destabilization of the
poly(vanadic acid) sol because of the bismuth salts' ionic strength
contribution (or in the case of the suspensions, the presence of
115

nucleation sites for flocculation), or because of a disruption of the
condensation reactions leading to poly(vanadic acid) in the first
place, is unclear.
Due to the doubt regarding whether complete ion exchange
was occurring between the sodium metavanadate and the resin,
we began to test ammonium metavanadate for its ability to ion-
exchange with a strong acid and thereby to produce the vanadic
acid required for polymerization and gelation. Excess ammonium-
containing salt was expected to burn out during the calcination step
in air, unlike sodium-containing salts in the NaVO3 preparations.
Several concentrations of NH 4VO 3 were tested for gelation using
glacial acetic acid and a combination of nitric and acetic acids to
provide excess H-. (Expts. 8-10) While acetic acid alone gave gel-
like chunks in the solvent with 0.5 M NH 4 VO 3, it gave a fibrous
semigel which became a chunky gel overnight with 0.25 M NH 4VO 3.
The use of HNO 3 alone or with acetic acid gave similar results. Thus
both acids, at least in principle, could be expected to work with the
ammonium metavanadate to give the V20 5 gel as required.
Initial experiments combining 0.25 M NH 4VO 3 with bismuth
solutions (Experiments 11-13) gave precipitates which in all cases
were identified as BiVO 4. Evaporation of the solvent from a
suspension of supernatant and precipitate gave a homogenous
solid which after calcination at 725 OC gave Bi 2VO5 .5 or a mixture of
BiVO 4 and Bi 2VO5 5. (Figures 3.6, 3.7) At about the time this work
was being done a report appeared in which Bi(N0 3)3-5H 20 and
NH 4VO 3 were co-dissolved in concentrated HN 3-quantities are not
reported-and the solution subsequently diluted and anion-
extracted to precipitate a solid which, after heating to 350 OC, had
116

the composition Bi 4V2 . 101 1 .2 and was isomorphous with the y phase
of Bi 2VO 5 .5 3 However, in our similar experiment (Experiment 11)
we observed a precipitate immediately on dilution.
Because it was suspected that the "precipitate" observed was
the flocculant from an unstable sol, several experiments used gum
arabic, a polysaccharide colloidal stabilizer, to keep all of the ions in
a common liquid phase. (Expts. 13-14) The precursor "solution"
was opalescent when the bismuth and vanadium components were
mixed at 40 OC. This suspension was evaporated and the calcined
solid identified as V20 5 + Bi 20 3. (Expt. 13) For room temperature
mixing a clear solution was obtained (Expt. 14) but a solid settled
out over several days. This solid, when calcined, was identified as
BiVO 4. The suspension, with plasticizers ethylene glycol and glycine
added, gave Bi 2VO5 .5 after 22 h at 750 OC. This compares with the
behavior of a simple mixture of Bi 20 3 and V20 5, which - unground
and not pressed into a pellet - remained as the starting materials
after a similar heat treatment. The precipitates in these
experiments could be redissolved with the addition of more nitric
acid; evaporation of these solutions gave Bi 2 0 3 and V20 5 , or in some
cases BiVO 4 (experiments not detailed here).
A number of reports cite the use of ethylene glycol alone or in
combination with glycine (Pechini process3 8 ) to obtain a gellable
sol. 2 3 , 2 8 , 5 4 Co-dissolution of NH 4VO3 and Bi(N0 3)3-5H 20 in
ethylene glycol and water gave a precipitate (Experiment 15).
Addition of glycine did not redissolve the solid, which after
calcination was identified as a mix of BiVO 4 and Bi 2VO 5.5 . Likewise,
adding glycine to a similar mix initially (Experiment 16) gave a
117

reasonably stable paintlike suspension that after calcination was
identified as BiVO4 plus Bi 2 0 3.
Thus the approach using NH 4VO 3 was only able to produce a
stable solution (sol) in the presence of colloidal stabilizer gum arabic
and excess nitric acid, and even then, a flocculant/precipitate
appeared after 24-48 hours at room temperature. Plasticizers
ethylene glycol and glycine did not improve matters. In all cases,
the precipitate, even after high-temperature calcination, gave the
1:1 BiVO4 phase with some Bi 2VO5 .5 in many cases, for the highest
calcination temperatures.
Several factors appear to be at work in causing the failure of
these experiments to produce a stable film-castable solution that
would result in the formation of Bi 2VO5 5. In many cases, the
concentration of vanadic acid may have been too low to provide for
sufficient polymerization. That BiVO4 precipitated out, in a form
sufficiently crystalline, in many experiments, to diffract X-rays even
without heat treatment, points to a certain thermodynamic stability
that the assorted methods tried just could not overcome.
Experiments with the solid-state reaction of BiVO 4 with Bi 2 0 3
demonstrate that the former will indeed incorporate more bismuth
to form the desired Bi 2VO5 .5 phase (Experiment 16). In light of the
solid state experiments, however, it is surprising that even in
experiments where the solution was boiled down along with the
precipitate, so that no metals should have been lost, in most cases
the major phase produced was BiVO 4. This suggests that the
degree of homogeneity and intimate contact between the bismuth
and vanadium species in these preparations is less than that
obtainable by hand-grinding in a mortar! However, in cases where
118

the solids were not ground together, but were simply stirred,
neither BiVO 4 nor Bi 2VO 5 .5 formed after 20-25 h at > 700 OC, so
those experiments reported here which gave Bi 2VO5 .5 had at least
some advantage over a simple mixing of the solid reagents.
Preferential precipitation of the BiVO 4 certainly played a role in the
dehomogenization; also, the crystallization of bismuth nitrate out of
the gels during the drying stage may have contributed to the loss of
homogeneity. 1,55
119

Figure 3.2: Precipitate from Experiment #1,, calcined. Lines
marked show positions of BiVO4 (JCPDS 14-688) peaks.
0 cc
0 In
12

Figure 3.3: Precipitate from Experiment #3, calcined. o = BiVO4
peak positions (JCPDS 14-688), x = Bi 2O3 peak positions
(JCPDS 14-699), unmarked peaks are an unidentified phase.
0
(D
Lii
CU
XX0
002
cn n CU
Ul 4" Mv ZntD ((D
U Z I-- WN-fW U
121
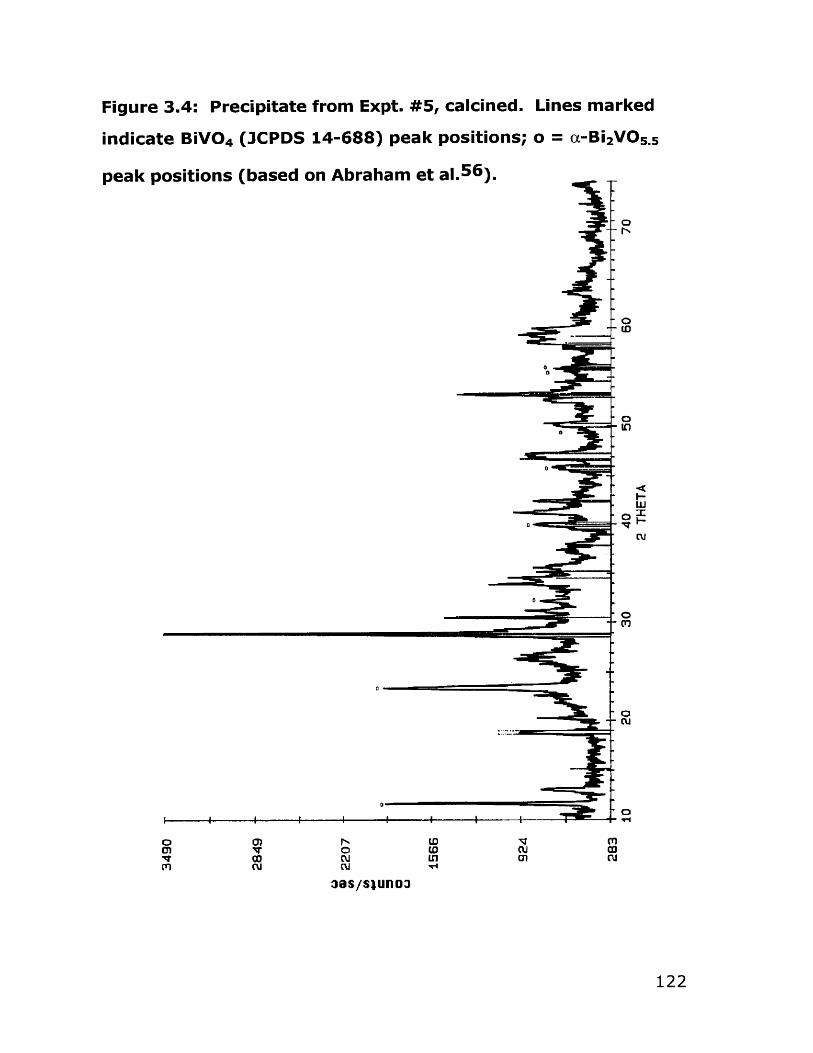
Figure 3.4: Precipitate from Expt. #5, calcined. Lines marked
indicate BiVO4 (JCPDS 14-688) peak positions; o = a-Bi 2 VO.S5
peak positions (based on Abraham et al. 5 6 ).
0
00 F0K)
0 0) LO01 IT 0 ss CU
Iq 0 CU M ~ 01 CUM CU lu
3as/swunoa
0CU
122

Figure 3.5a: Experiment #7, solvent evaporated from
preparation, solid calcined at 350 *C. Lines indicate position of
BiVO 4 (JCPDS 14-688) peaks.
O
CU
123
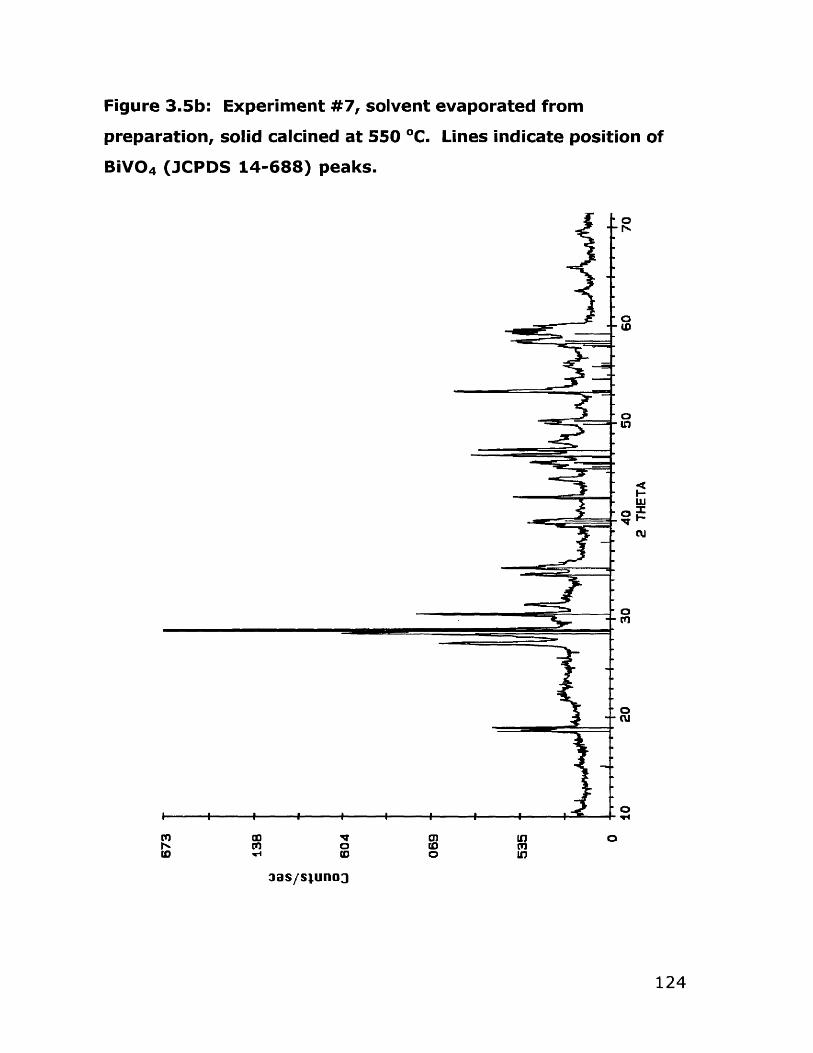
Figure 3.5b: Experiment #7, solvent evaporated from
preparation, solid calcined at 550 0C. Lines indicate position of
BiVO4 (JCPDS 14-688) peaks.
X
U,
0fu
124
00 V0 LM CD CD
CD -ICD0 LD
3as/siunoj

Figure 3.5c: Experiment #7, solvent evaporated from
preparation, solid calcined at 750 'IC. Lines indicate position of
BiVO4 (JCPDS 14-688) peaks,, * -Bi 2VO5S5 peak positions.
0 C0
M *LO M *
M CU VU z -w w w
125

Figure 3.6: Experiment #11, solvent evaporated from
preparation and solid heated at 400 *C for 6 h, then 725 *C for
36 h. Lines marked show positions expected for BiVO4 (JCPDS
14-688), * = peak positions for x-Bi 2VOs..
-0
H0
(D
0
U,
H
H
qqCU
0
CU
U, 0 ML 0a) CU Nin ~- (r)LO Il (U W
U 2-" F- -U U
126

Figure 3.7a: Experiment #12, solvent evaporated from
suspension and solid heated 400 0C for 6 h. Lines marked
indicate positions of BiVO4 (JCPDS 14-688) peaks, o = Bi 2O3
peaks (JCPDS 14-699).
0U
0-
0 --
a --
0-U -
a
Ii
0
3as/sjunu3
CU V-400
CO0n Iq
127
w_---
-I
0
W)
0-I~
0I

Figure 3.7b: Solid shown in Figure 3.7a, heated at 725 OC for 36
h. All peaks are in the proper positions for cx-Bi 2VO. 5 .
7
0U')
.-
I
cu
m 0 WCT) (DCD (7
LD~~ a r I c
04 cn N1 0W c0u
Ci Z - ml - Wl W U
128

3.3 Conclusions
Vanadic acid gels were intended for use as a gel matrix in
which bismuth ions would be trapped in solvent pockets. Gels were
successfully made by ion-exchange of sodium metavanadate
solutions or by providing excess acid to ammonium metavanadate
solutions. However, the conditions under which the bismuth salts
were soluble were anathemic to the vanadic acid. In most cases, a
precipitate which was directly identifiable by powder XRD as BiVO4,
or which formed BiVO 4 after calcination at low temperatures,
appeared on mixing or brief standing of the Bi/V precursor solutions.
Those solutions which were stable contained large amounts of acid,
and were found to be non-gelling and not film-castable. Due to the
problems found with this particular approach to forming a film-
castable solution, vanadium alkoxides were next tried, again to
produce a gel matrix which would hopefully trap the bismuth ions
homogeneously. That work is the subject of Chapter Four.
3.4 Description of Salient Experiments
All experiments were performed in open air. The ion-exchange
resin was packed in a 1-inch diameter glass tube fitted with a
burette valve and having glass wool at the bottom to prevent loss
of the resin. The tube was loaded with approximately 100 g of the
resin to create a column some 14 inches high. Between uses, the
resin was regenerated by washing with 1M H2 SO4 . All pyrolyses
129

were done in A12 0 3 crucibles in air. Materials and instrumentation
used in this Chapter are listed and described in the Appendix to
Part I of this thesis.
It should be noted that the term "solution" below is being
used loosely to refer to both true solutions and colloidal
suspensions where the liquid phase was clear to the eye (e.g.
particles small enough not to scatter visible light). Where the
distinction is important, "sol" will be used. The abbreviation "2MOE"
indicates 2-methoxyethanol.
3.4.1 Experiments using NaVO3
Experiment 1 (JWP/I/110N) 0.1 M NaVO 3 + Bi(NO3) 3 -5H20 in
acetic acid
A 0.1M aqueous solution of NaVO 3 (1.2191g, 10 mmol in 100
ml water) was made. A solution of 10 mmol of Bi(NO 3)3-5H 20
(4.8516g) in approximately 50 ml of glacial acetic acid was made.
The NaVO 3 solution was poured down the ion-exchange column
and, after the first 10 ml of eluant were discarded, 50 ml were
measured to deliver 5 mmol of vanadium. This yellow-orange
solution was mixed immediately with the bismuth nitrate solution,
and became slightly milky. Heating the solution for 5 minutes with
stirring resulted in a dark orange solution and precipitate. The
mixture was allowed to stand, covered, at room temperature for 24
h. The mixture was filtered to remove precipitated solids and 15 ml
ethanol (95%) added. After another 24 h the liquid was decanted
130

off and the solid calcined at 200 0C for 1 h, then for 11 h at 450 OC.
The resulting pale yellow solid was characterized by XRD as BiVO 4,
JCPDS 14-688. (Figure 3.2)
Experiment 2 (JWP/I/110A) 0.1 M NaVO 3 + Bi 2O3/acetic acid
A 0.1 M solution of NaVO 3 was prepared as above. Bi 20 3 was
dissolved in hot glacial acetic acid and the white crystals that
formed on cooling collected (JP/I/106). This solid, thought to be
Bi(OAc) 3, (3.8616g, 10 mmol) was stirred in 150 ml hot glacial acetic
acid; most of it dissolved. The NaVO3 solution was poured down
the ion exchange column and after the first 10 mi was discarded, 50
ml (5 mmol vanadium) added to the hot bismuth acetate solution. A
fluffy precipitate formed immediately. The mixture was filtered after
24 h and 15 mi ethanol (95%) added; after another 24 h the liquid
was decanted off and the solids calcined as above. The XRD
pattern was that of BiVO 4, 14-688.
Experiment 3 (JWP/I/113N) 0.5 M NaVO 3 + Bi(N0 3) 305H 2 0/
acetic acid/ 2MOE
A 0.5 M solution of NaVO 3 was prepared by dissolving the solid
(6.095g, 50 mmol) in 100 ml deionized water. A solution of
Bi(NO 3)3 05H 2O was prepared by dissolving (4.8527g, 10 mmol) in 20
ml warm glacial acetic acid. 2-methoxyethanol (5 ml, 66 mmol) was
added. The NaVO 3 solution was poured down the ion exchange
column and the first 10 ml discarded, then 10 ml (5 mmol) mixed
with the Bi(N0 3)3 solution. A milky yellow-white gel-precipitate
131

instantly formed. This was permitted to age at room temperature
24 h, then added directly to a crucible as a wet gel. After calcining
as above, the XRD pattern showed a mixture of BiVO 4 (14-688),
Bi20 3 (14-699), and peaks belonging to an unknown phase(s).
(Figure 3.3)
Experiment 4 (JWP/I/113A) 0.5 M NaVO 3 + Bi 2 O3/acetic acid/
2MOE
A 0.5 M solution of NaVO 3 was prepared as above. The white
bismuth solid prepared in Expt. 2 (1.9305 g, 5 mmol) was stirred in
85 ml hot glacial acetic acid and 5 ml 2MOE (66 mmol). Most of the
solid dissolved. To this was added 5 ml (2.5 mmol vanadium) of the
ion exchange eluant as described above. A milky yellow-white
slurry formed instantly. This was permitted to age 24 h at room
temperature, then the liquid removed and the yellow solid washed
with water, then ethanol and acetone. After drying in air the
material was calcined as above. The XRD pattern showed BiVO 4
(14-688), Bi 2 0 3 (14-699), and peaks belonging to an unknown
phase(s).
Experiment 5 (JWP/I/131) 0.6 M NaVO 3 + Bi 2O3/HNO 3
A 1.2 M Bi3+ solution of 13.9788g Bi20 3 (30 mmol) was made
by dissolving the solid in a hot mixture of 15 ml conc. HNO 3 and 10
ml deionized H20. A 0.6 M solution of NaVO 3 was made by the solid
dissolving (7.3158 g, 60 mmol) in 100 ml deionized water. This was
poured down an ion-exchange column and when the eluant became
132

dark yellow-orange, 50 ml were taken off and poured slowly into
the bismuth solution. A fine orange precipitate formed. The mixture
was permitted to stand three days at room temperature, covered.
The liquid was decanted off and evaporated (JWP/I/131B); the
residue was identified by XRD as BiVO 4. The remaining solid was
dried (JWP/I/131A) and identified by XRD as BiVO 4 (14-688) plus
some peaks in the expected positions for Bi 2VO5 5. (Figure 3.4)
Experiment 6 (JWP/I/134) 0.5 M NaVO 3 + Bi 2O3/HNO 3, aged
A solution of Bi20 3 was made by dissolving (6.9894 g, 15
mmol) in a hot mixture of 20 ml conc. HNO 3 and 15 ml H20. A 0.6 M
sodium vanadate solution was made as in Expt. 5. After enough of
the vanadate solution eluted from the ion exchange column to
deliver 15 mmol of vanadium (25 ml), it was permitted to sit for 15
minutes at room temperature so that the polymerization could
begin. Red fibrous structures were observed in the beaker. This
was then added slowly to the Bi 3 + solution with stirring to break up
the polymer. A clear orange solution resulted; this was heated for
10 minutes with heating and stirring. The solvent was slowly
evaporated to deposit brown-and-white solids. The brown part
was, after calcining at 400 OC for 4 hours, found to be mostly BiVO 4,
while the white part was mostly Bi20 3 .
Experiment 7 (JWP/I/139-2) 0.5 M NaVO 3 + Bi 2O3/HNO 3, aged
Solutions of Bi 3+ and NaVO3 were prepared and mixed as in
Expt. 6 above. The resulting clear yellow-orange solution was left
133

at room temperature, covered, 2 days with no change noted. This
material was distributed among 6 crucibles and the solvent
evaporated. Each crucible was heated in 02 for 10 h at 350, 450,
550, 650, 700, and 750 OC, respectively. The calcined solids were
identified by XRD (Table 3.1).
Table 3.1: Results of Experiment 7 (JWP/I/139-2)
Calcining Temp (*C) XRD results Figure
350 BiVO 4 + Bi20 3 3.5a
450 BiVO 4 + Bi 20 3
550 BiVO 4 + Bi 2 0 3 3.5b
650 BiVO4 + ? Bi 2VO5 .5
700 BiVO4 + ? Bi 2VO5 .5
750 BiVO4 + Bi 2VOs.5 3.5c
3.4.2 Experiments using NH4VO3
Experiment 8 (JWP/I/123A) 0.5M NH 4VO3/acetic acid, gel test
A 0.5 M solution of NH 4VO 3 was made by adding 1.4622g (12.5
mmol) of solid to 25 ml deionized water and heating to dissolve,
giving a light yellow solution. To this was added 25 ml glacial acetic
acid. The solution turned red-orange immediately, and a yellow
precipitate appeared but redissolved quickly. On cooling, and
standing overnight, the preparation yielded a chunky, fibrous
precipitate in a supernatant liquid.
134
Experiment 9 (JWP/I/123B) 0.5M NH 4VO 3/acetic acid / HNO 3,
gel test
A 0.5 M solution of NH 4VO 3 was made as in Expt. 8. To 25 ml
of this solution were added 7.8 ml of 16 M HNO 3 and 17.2 ml glacial
acetic acid. The solution immediately becomes orange-red, and
becomes darker red over time. Red-orange fibers appear on the
beaker sides within 5 minutes of mixing. After standing overnight a
chunky solid had developed within a supernatant liquid.
Experiment 10 (JWP/I/123C) 0.25M NH 4VO 3/acetic acid, gel
test
A 0.25 M solution of NH 4VO 3 was made by dissolving 0.7310 g
of solid (6.25 mmol) in 25 ml deionized water and 25 ml of glacial
acetic acid were added. The solution remained clear but became
orange in color. Within an hour of cooling fibers appeared in the
beaker. After standing overnight a chunky solid developed within a
supernatant liquid.
Experiment 11 (JWP/I/124-IV) 0.25M NH 4VO 3 +
Bi(N0 3) 3*5H20 / acetic acid
A 0.25 M solution of NH 4VO 3 was made by dissolving (0.7311g,
6.25 mmol) of the solid in 25 ml hot deionized water. A 0.5 M
solution of bismuth nitrate was made by dissolving the solid in 25 ml
hot acetic acid. The bismuth-containing solution was poured slowly
into the vanadium-containing solution with rapid stirring, and the
135

heating continued. An orange precipitate appeared instantly. After
standing overnight the preparation was split into two parts: one
part (JWP/I/124-IV-A) was filtered and the solid added to an
alumina crucible, while the other part (JWP/I/124-IV-B) was added
directly to a crucible and the solvent evaporated. Both were heated
in air for 4 h at 300 0C and for 6 h at 400 0C and the resulting solids
X-rayed. JWP/I/124-IV-A was identified as BiVO 4 (14-688); and
JWP/I/124-IV-B identified as a mixture of BiVO 4 and Bi20 3 (14-699).
JWP/I/124-IV-B, after calcining, was pressed into a pellet without
intermediate grinding and heated for 36 h at 725 OC. The resulting
solid was identified by XRD as a mixture of Bi 2VO5 .5 (identified by
comparison with standard made by a solid-state route) and BiVO 4
(14-688). (Figure 3.6)
Experiment 12 (JWP/I/124-V) 0.25M NH 4 VO 3 + Bi 2O3/ acetic
acid
A white suspension/solution of Bi20 3 was prepared by heating
the solid (2.9122g, 6.25 mmol) in 75 ml hot acetic acid. A 0.25 M
solution of NH 4VO 3 was prepared (0.7311 g, 6.25 mmol) in 25 ml hot
deionized water. The hot bismuth preparation was poured slowly,
with rapid stirring, into the vanadium preparation. An orange
precipitate instantly formed. After standing overnight, the
preparation was split into two parts and calcined as in Expt. 11.
The solid part, JWP/I/124-V-A, was identified after calcining as BiVO 4
(14-688); and the combined precipitate-plus-solution part,
JWP/I/124-V-B, was identified after calcining as a mix of BiVO4 (14-
688) and Bi 2 0 3 (14-699). (Figure 3.7a) JWP/I/124-V-B, after
136

calcining, was pressed into a pellet and heated at 725 OC for 36 h.
The resulting solid was identified by XRD as Bi 2VO5 .5 (Figure 3.7b).
Experiment 13 (JWP/I/142-1) 0.25M NH 4 VO 3 + Bi 2O3/HNO 3 +
gum arabic, mix at 40 *C
A solution of Bi 3+ was made by dissolving Bi 20 3 (JM 99%,,
6.9894 g, 15 mmol) in 25 ml conc. HNO 3 with warming; the solution
was cooled to room temperature. A solution of NH 4VO 3 was made
by dissolving solid (1.7547 g, 15 mmol) in 300 ml deionized water
with heating and stirring; the solution was cooled to room
temperature. To this solution was added 10 ml of a 2 g/100 ml gum
arabic solution, followed by the bismuth solution, with stirring, at 40
0C. The resulting material was slightly milky orange-yellow. The
suspension was transferred to a crucible and the solvent
evaporated off to leave a red-orange coating (V2 05 ) on the crucible
sides and a yellow-white powder (Bi20 3) on the crucible bottom.
Experiment 14 (JWP/I/142-3) 0.25M NH 4 VO 3 + Bi 2O3/HNO 3 +
gum arabic, mix at room temperature
A Bi 3 + solution was prepared as in Expt. 13. A solution of
NH 4VO 3 was prepared by dissolving the solid (1.7547g, 15 mmol) in
350 ml hot deionized water along with 3 g of gum arabic. Both
solutions were permitted to cool to room temperature; the bismuth
solution was added slowly to the vanadate solution with stirring.
The initially cloudy solution became a clear yellow-orange after a
few minutes. The clear mixture was placed in a capped bottle to
137

settle. Over several days a solid settled out and was filtered off
and heated at 350 OC for 2h, then 725 OC for 12 h in air. The
resulting calcined solid was identified by XRD as BiVO 4. To the other
half of the suspension ethylene glycol and glycine were added. The
resulting slightly milky solution was heated to dryness - with a
violent reaction and evolution of brown gas - and the solid heated
for 22h at 750 0C. The calcined solid was identified by XRD as
Bi 2VO 5.s.
Experiment 15 (JWP/I/149-2) Bi(N0 3 ) 3-5H 20 + NH 4 VO 3 +
ethylene glycol/glycine
To 20 ml hot deionized water was added Bi(N0 3)3-5H 20
(12.1268g, 25 mmol) 1.14 g (15 mmol) glycine, and 80 ml (1.42 mol)
ethylene glycol, resulting in a white-yellow milky suspension.
NH 4VO 3 was added (1.4622 g, 12.5 mmol) to 20 ml deionized water
and heated to dissolve. The vanadate solution was added to the
bismuth suspension to give a red-orange paintlike mixture. This
was heated to 60 OC for 3 h with stirring, in open air, then brought
to 85 OC for another 2 h, then brought to 130 OC and let cool. The
volume was thereby reduced to less than 100 ml. This was
removed from the heat and left uncovered overnight with slow
stirring. The suspension was relatively stable, like a paint. After
evaporation of the solvent, the solid was calcined at 350 OC/2h,
then 725 OC/12 in air. The resulting material was identified as BiVO4
+ Bi20 3.
138

Experiment 16 (JWP/I/83L21) BiVO4 + Bi 2 O3, solid state
BiVO 4 (JWP/I/68, as above), and one-half the moles of Bi 2 0 3
(to deliver total 2 Bi: 1 V) were ground together in an agate mortar,
pressed into a pellet, and heated in an alumina crucible for 21 h at
725 OC. XRD of the pellet showed clean Bi 2VO5 .5 . The same
amounts of BiVO 4 and Bi 20 3 were simply stirred together for 5
minutes with a stirring rod, and the loose powder heated according
to the same heating scheme. XRD of the powder showed starting
materials with some indication of peaks in the expected locations for
Bi 2VO 5.5.
139

Table 3.2: Summary of Experiments Reported
Expt. # Formulation Result
1 0.1 M NaVO3 + Bi(N0 3) 3-5H 20, HOAc precipitate: BiVO 4
2 0.1 M NaVO3 + Bi 20 3, HOAc precipitate: BiVO 4
3 0.5 M NaVO3 + Bi(N0 3)3-5H20, HOAc/2MOE suspension evaporated for BiVO 4 + Bi 203
4 0.5 M NaVO3 + B120 3, HOAc/2MOE precipitate: BiVO4 + Bi 203
5 0.6 M NaVO3 + Bi20 3, HNO 3 precipitate calcines to: BiVO4 + Bi 2VO5 .s;
supernatant: BiVO 4
6 0.6 M NaVO 3 + Bi 20 3, HNO 3, pre-gelled suspension evaporated for BiVO 4 + Bi 2 0 3
7 0.6 M NaVO3 + Bi20 3, HNO 3, pre-gelled and suspension evaporated, range of heating
aged gives BiVO 4 + Bi20 3 (low T) to BiVO 4 + Bi 2VO5 .5
(high T)
11 0.25 M NH 4VO 3 + Bi(N0 3)3-5H20, HOAc precipitate: BiVO 4
suspension evaporated for BiVO 4 + Bi20 3,
calcined to BiVO4 + Bi 2VO 5.5
0

Table 3.2 continued.
12 0.25 M NH 4VO 3 + Bi 20 3 , HOAc precipitate: BiVO4
suspension evaporated for BiVO 4 + Bi 2 0 3,
calcined to Bi 2VO 5.5
13 0.25 M NH 4VO3 + Bi20 3, HNO 3, gum arabic, 40 suspension evaporated, pyrolyzed for Bi 20 3
0C mixing + V205
14 0.25 M NH 4VO 3 + Bi20 3, HNO 3, gum arabic, precipitate: BiVO4
room temperature mixing suspension (eth. gly. and glycine added)
evaporated, calcined to Bi 2VOs.5
15 0.25 M NH4VO3+ Bi(NO3)3-5H20, glycine, paintlike precursor pyrolyzed to Bi20 3 + BiVO 4
ethylene glycol
16 Bi20 3 + BiVO 4, grind and pellet, 725 OC/21h Bi 2VO5 .5
16 Bi20 3 + BiVO 4, mixed, 725 OC/21h starting materials
4

3.5 References
1)Brinker, C. I.; Scherer, G. W. Sol-Gel Science: The Physics and
Chemistry of Sol-Gel Processing; Academic Press: New York,
1990.
2)Ebelmen, J. J. Compt. Rend. 1844, 19, 398.
3)Ebelmen, 3. J. Ann. Chim. Phys. 1846, 16, 129.
4)Patrick, W. A., Silica Gel Corporation: U.S. Patent No. 1,696,645,
1928.
5)Patrick, W. A., Silica Gel Corporation: U.S. Patent No. 1,297,724,
1919.
6)Patrick, W. A.,Silica Gel Corporation: U.S. Patent No. 1,520,305,
1924.
7)Moulton, H. R.,
2,601,123,
8)Moulton, H. R.,
2,432,484,
9)Moulton, H. R.,
2,531,945,
10)Kimberlin Jr.,
11)Kimberlin Jr.,
12)Yoldas, B. E.,
American Optical Company: U.S.
1952.
American Optical Company: U.S.
1947.
American Optical Company: U.S.
1950.
C. N., U.S. Patent No. 2,636,865,,
C. N., U.S. Patent No. 2,754,176,,
U.S. Patent No. 3,941,719, 1976.
Patent No.
Patent No.
Patent No.
1953.
1956.
13)Yoldas, B. E. Ceramic Bull. 1975, 54, 286.
14)Yoshimura, M. J. Mater. Res. 1998, 13, 796.
15)Shaw, D. J. An Introduction to Colloid and Surface Chemistry;
Butterworths: London, 1970.
16)Hench, L. L.; West, J. K. Chem. Rev. 1990, 90, 33.
142

17)Lee, G. R.; Crayston, J. A. Adv. Mater. 1993, 5, 434.
18)Kordas, G.; Moore, G. A.; Jorgenson, J. D.; Rotella, F.; Hitterman,
R. L.; Volin, K. J.; Faber, J. J. Mater. Chem. 1991, 1, 175.
19)Corriu, R. J. P.; Leclercq, D. Angew. Chem. Int. Ed. Engl. 1996, 35,
1420.
20)Corriu, R.; Leclercq, D.; Lefevre, P.; Mutin, P. H.; Vioux, A. Chem.
Mater. 1992, 4, 961.
21)Jones, R. W. Fundamental Principals of Sol Gel Technology, 1989.
22)Calzada, M. L.; Sirera, R.; Carmona, F.; Jimenez, B. J. Am. Ceram.
Soc. 1995, 78, 1802.
23)Lakeman, C. D. E.; Payne, D. A. Mater. Chem. and Phys. 1994,
38, 305.
24)Wedemeyer, H.; Zhang, J.-Y. in Eurogel '91; Vilminot, S., Nass, R.
and Schmidt, H., Ed.; Eslevier Science Publishers: Netherlands,
1992.
25)Kenzer, D. S.; Teepe, M. R.; Moore, G. A.; Kordas, G.; Mater. Res.
Soc. Symp. Proc., 1990, 180, 947.
26)Shane, M.; Mecartney, M. L. J. Mater. Sci. 1990, 25, 1537.
27)Kueper, T. W.; Visco, S. J.; DeJonghe, L. C. Solid State Ionics
1992, 52, 251.
28)Chen, C. C.; Nasrallah, M. M.; Anderson, H. U. Solid State Ionics
1994, 70/71, 101.
29)Selvaraj, U.; Prasadarao, A. V.; Komarneni, S.; Roy, R. Mater.
Lett. 1995, 23, 123.
30)Selvaraj, U.; Prasadarao, A. V.; Komarneni, S. Mater. Lett. 1994,
20, 71.
31)Kim, C. J.; Yoon, D. S.; Lee, J. S.; Choi, C. G.; No, K. Jpn. J. Appl.
Phys. 1994, 33, 2675.
143

32)Eichorst, D. J.; Payne, D. A.; Wilson, S. R.; Howard, K. E. Inorg.
Chem. 1990, 29, 1458.
33)Yanovskaya, M. I.; Turevskaya, E. P.; Leonov, A. P.; Ivanov, S. A.;
Kolganova, N. V.; Stefanovich, S. Y.; Turova, N. Y.; Venevtsev,
Y. N. 3. Mater. Sci. 1988, 23, 395.
34)Yamaguchi, 0.; Maruyama, N.; Hirota, K. Br. Ceram. Trans. J.
1991, 90, 111.
35)Toyoda, M.; Payne, D. A. Mater. Lett. 1993, 18, 84.
36)Toyoda, M.; Hamaji, Y.; Tomono, K.; Payne, D. A. Jpn. 3. Appl.
Phys. 1993, 32, 4158.
37)Dayalan, E.; Peng, C. H.; Desu, S. B. Ceram. Trans. 1992, 25,
189.
38)Pechini, M., U.S. Patent No. 3,330,697, 1967.
39)Anderson, H. U.; Pennell, M. J.; Guha, J. P., in Ceramic Powder
Science (Advances in Ceramic Science Vol. 21); New York:
American Ceramic Society, 1987; pp 91-98.
40)Baythoun, M. S. G.; Sale, F. R. J. Mater. Sci. 1982, 17, 2757.
41)Chick, L. A.; Pederson, L. R.; Maupin, G. D.; Bates, J. L.; Thomas,
L. E.; Exarhos, G. J. Mater. Lett. 1990, 10, 6.
42)Douy, A.; Odier, P. Mat. Res. Bull. 1989, 24, 1119.
43)Miao, H.; Sapina, F.; Ibanez, R.; Beltran, A.; Beltran, D.; de la
Fuente, G. F. Solid State Ionics 1993, 66, 231.
44)Chu, P.-Y.; Buchanan, R. C. 3. Mater. Res. 1991, 6, 1736.
45)Legendre, J.-J.; Livage, J. 3. Colloid and Interface Sci. 1983, 94,
75.
46)Gharbi, N.; R'Kha, C.; Ballutaud, D.; Michaud, M.; Livage, J.;
Audiere, J. P.; Schiffmacher, G. J. Non-Crystalline Solids 1981,
46, 247.
144

47)Lemerle, J.; Nejem, L.; Lefebvre, J. J. Inorg. Nuc. Chem. 1980,
42, 17.
48)Greenwood, N. N.; Earnshaw, A. Chemistry of the Elements; 1st
ed.; Pergamon Press: New York, 1984.
49)Hazel, J. F.; McNabb, W. M.; Santini Jr., R. J. Phys. Chem. 1953,
57, 681.
50)Legendre, J.-J.; Aldebert, P.; Baffier, N.; Livage, J. J. Co//oid and
Interface Sci. 1983, 94, 84.
51)Bullot, J.; Cordier, P.; Gallais, 0.; Gauthier, M. J. Non-Crystalline
Solids 1984, 68, 123.
52)Khairy, M.; Tinet, D.; van Damme, H. J. Chem. Soc. Chem.
Commun. 1990, 856.
53)Bhattacharya, A. K.; Mallick, K. K.; Thomas, P. A. Solid State
Communications 1994, 91, 357.
54)Wedemeyer, H.; Zhang, J. Y. in Eurogel '91, Vilminot, S., Nass, R.
and Schmidt, H., Ed.; Elsevier Science Publishers: Netherlands,
1992.
55)Gugliemi, M.; Carturan, G. J. Non-Crystalline Solids 1988, 100, 16.
56)Abraham, F.; Boivin, J. C.; Mairesse, G.; Nowogrocki, G. Solid
State Ionics 1990, 40-41, 934.
145

Chapter Four
Synthesis of Bulk BiMeVOx (Me = Cu, Nb, Fe, Ti, Mn)
The experimental work described in this chapter was adapted, in
part, from Pell, J.W., Ying, J.Y., and zur Loye, H.-C., Mater. Lett. 25,
1995, 157-160.
146

4.1 Introduction and general approach
In Chapter Three, initial attempts at producing bulk undoped
Bi 2VO 5.5 from a precursor solution that contained bismuth as the
acetate or nitrate, and vanadium as poly(vanadic acid) were
described. However, these precursors failed to yield phase-pure
Bi 2VOs.5 at temperatures significantly lower than the solid-state
synthesis required, and were plagued by preferential precipitation
of bismuth nitrate or BiVO4, leading to multiple phases in the
pyrolyzed product and mud-cracked films. True gelation never
occurred in these precursor solutions.
Another way of forming vanadium-oxide gels is by hydrolysis
of vanadyl alkoxides.
4.1.1 Transition metal alkoxides-7
The majority of this section is culled from literature reviews,
many of which are by R. C. Mehrotra and co-workers, as referenced
above.
4.1.1.1 Synthetic Methods
There are a variety of synthetic routes available for making
almost any alkoxide of any metal. The best method for synthesizing
a given metal alkoxide depends on the electronegativity and ionic
radius of the metallic element and the steric and electronic nature of
the alcohol group.
147

Alkoxides of strongly electropositive metals may be made by
direct reaction of the alcohol with the metallic element (Equation
4.1).
(4.1) M + n ROH + M(OR)n + n/2 H2
M=alkali or alkaline earth metal
For less strongly electropositive elements, a catalyst may assist this
process (Equation 4.2).
(4.2) M + cat + n ROH + M(OR)n + n/2 H2 + cat
M= Mg, Be, Al, lanthanides, TI; cat= 12, HgX 2, 02
As the acidity of the alcohol decreases, the facility with which these
reactions proceed also decreases.
Alkoxides of less electropositive elements may sometimes be
made by reaction of the alcohol with the oxide or hydroxide
(Equation 4.3a,b).
(4.3a) M(OH)n + n ROH < M(OR)n + n H20
(4.3b) MOn/ 2 + n ROH > M(OR)n + n/2 H20
M = B, Si, Ge, Sn, Pb, As, Se, V, Hg
The reaction goes significantly to the right only if the displaced
water is removed from the reaction system. The ramification, or
degree of branching, (and therefore the acidity) and the boiling
point of the alcohol influence the position of the equilibrium.
Alkoxides of somewhat electronegative metals may be made
by reaction of the metal halide with alcohol (Equation 4.4).
148

(4.4) MXn + n ROH 4 M(OR)n + HX
X = Cl
For electropositive metals, the mixture of metal halide and alcohol
tends to yield the solvate rather than the alkoxide, while many
transition metal halides will undergo only partial substitution of
alcohol groups for halides. However, these reactions can in most
cases be driven to completion if ammonia is added to scavenge HCL.
Alkoxides of transition metals may be made by exchange
between the metal halide and an alkali alkoxide (Equation 4.5).
(4.5) MXn + n M'OR + M(OR)n + n M'X
M= transition metal; M' = Li, Na, K; X = Ci
(4.6) M(OR)n + n HOR'+ M(OR')n + n HOR
M= early transition metal or non-transition metal
Alkoxides may be made by alcohol-exchange reactions
(Equation 4.6). In general this reaction will not provide complete
substitution of one alcohol group for another unless it is driven to
the right by the removal of the lower-boiling alcohol. The facility for
alcohol group interchange increases as the ramification of the group
decreases, i.e. primary alcohols will easily substitute tertiary
alcohols. For later transition metals, the degree of interchange is
partially determined by the stability of different coordination forms.
Alkoxides may be made by ester exchange reactions (Equation
4.7) where again, the reaction may be driven toward complete
149

substitution of the original alcohol groups by removal of the ester
from the system.
(4.7) M(OR)n + x CH 3COOR'+ M(OR')n + x CH 3COOR
M= Al, Ga, Fe, Ti, Zr, Hf, Nb, Ta, lanthanides
Alkoxides may be made by alcoholysis of metal dialkylamides
(Equation 4.8). This is driven forward by the high reactivity of metal
amides with hydroxy compounds, as well as by the volatility of the
resulting dialkylamine, which can be driven off from the reaction
system.
(4.8) M(NR 2)n + n R'OH -- M(OR')n + HNR 2
4.1.1.2 Properties and Reactions
Although metal-alcohol bonds could be expected to be highly
polar based on consideration of Pauling electronegativities, many
metal alkoxides are volatile and soluble in organic solvents.
(Methoxides are an exception.) Inductive effects, which increase
with increasing ramification of the alcohol group, explain the
decreased polarity of the M-OR bond. The formation of oligimers
through dative bonds likewise may decrease the polarity of the
M-OR bond by increasing the electron density around the metal.
Oligimerization and polymerization that occurs to satisfy the
coordination demands of the metal may result in an insoluble
alkoxide complex, but may be suppressed by the use of sterically
demanding alcohols.
150

Metal alkoxides are extremely sensitive to atmospheric
moisture and therefore must be handled under dry conditions. They
react with hydroxy compounds (water, other alcohols, esters,
glycols, and organic acids) with partial or full substitution of the
attacking reagent for the original alcohol group. They also react
with ketones and diketones, P-ketoamines, alkanolamines,
hydroxylamines, thiols, and coordinating ligands. These reactions
are sensitive to steric factors, with reactivity decreasing in the order
MeO > EtO > iPrO > tBuO; they may be pushed to completion by
removal of the displaced alcohol group.
The hydrolysis of a metal alkoxide in solution is usually
followed by polycondensation (dehydration and dealcoholation)
reactions (Equations 4.9a-c). These polycondensation reactions
can, depending on the concentration of the solution, result in
sufficient crosslinking to give a gel. The balance of pH, temperature,
and water-to-alkoxide ratio determines how much each of these
reactions contributes to the final product distribution.
(4.9a) M(OR)n + x H20 + M(OH)x(OR)n-1 + x ROH (hydrolysis)
(4.9b) -M-OH + H-0-M + -M-0-M- + H20 (dehydration)
(4.9c) -M-OH + R-O-M + -M-0-M- + ROH (dealcoholation)
4.1.2 Synthesis of Vanadium Alkoxides
Vanadyl alkoxides have recently been examined as model
compounds for research on the interaction of vanadate with the
tyrosine and serine amino acids in enzymes involved in
151

phosphorylation reactions. The enzymatic cleavage and formation
of phosphoester bonds proceeds via a transition state where the
phosphorus has a trigonal bipyramidal geometry similar to that of
oxovanadium alkoxides in the solid state; 8 these reactions are
often inhibited or catalyzed by vanadate. 9 Vanadium complexes
have been identified as insulin mimics and as cofactors for
haloperoxidases and nitrogenases.10, 1 1 As a result of the interest
in vanadium alkoxides in bioinorganic research, a relatively large
number of papers have been published on the structure and
reactivity of vanadium alkoxides and the reaction products with
diols, amine-alcohols, and other molecules with biologically-relevant
motifs.
"Vanadic acid esters" - vanadium alkoxides - were first
prepared by Prandtl and Hess 1 2 by refluxing together V205 and
alcohol. Later work by Funk et al. 1 3 involved the alcoholysis of
VOCl 3 followed by the passage of dry ammonia through the reaction
mix to trap evolved HCI as NH 4 Cl. These methods resulted in yields
of 10- 3 5%. Alcohol interchange reactions are reported to give
better yields, some 70%, when the evolved alcohol can be removed
as an azeotrope with benzene14 (Equation 4.10). All of these
reactions, however, suffer from the reduction of vanadium(V) to
vanadium(IV) by the alcohol, even when the latter reagent is not in
excess.
(4.10) VO(OEt) 3 + 3 ROH -> VO(OR) 3 + 3 EtOH
R=Me, iPr, tBu, sAm, tAm, sHex, tHex, cyHex
152

Gels prepared from vanadyl alkoxides have fibrous
structures,15-1 8 as do those formed from the poly(vanadic acid);
but the fibers are finer and form thinner films.1 9 Acid catalysis
gives faster hydrolysis but slower gelation, with gel collapse
(syneresis) which is not observed for hydrolysis at neutral pH. 2 0
This is due to the change in fiber with changing hydrolysis-to-
condensation rate ratios. This is analogous to the effect of pH on
silicon alkoxide hydrolysis, where the presence of H+ in solution
increases the rate of hydrolysis and increase of OH- increases the
rate of condensation, leading to more branched oligimers in basic
solution, and more linear ones in acidic medium. 2 1 Under conditions
of intermediate-to-high alkoxide concentrations and
water-to-alkoxide ratios, and neutral pH, a monolithic gel is
produced. This becomes green over time from the reduction of V5+.
There is debate about the source of the reduction of V(V) to V(IV),
with some argument for reduction by the alcohol. However, since
this reduction is also seen in vanadic acid solutions not containing
organic materials, another possible reaction is analogous to the
reaction which forms the vanadium bronzes (Equation 4.11).8,22
(4.11) 2 V5+0(OR)3 + (3+n+x/2)H20 ->
HxVx V2-xs+0s-nH20+ 6 ROH + (x/4)0 2
To prepare film-castable precursor solutions for bismuth
vanadium oxide, we used vanadium 2-methoxyethoxide and
introduced the bismuth as bismuth acetate, prepared by us in an
alcohol-soluble form. This preparative procedure permitted the
153

production of phase-pure Bi 2VO5 .5 at exceptionally low pyrolysis
temperatures, and was extended to making bulk powders of the
doped BiMeVOx materials for a number of metal dopants.
Furthermore, the solutions did achieve true gelation, without
precipitation of any species, and were therefore film castable.
4.1.3 Bismuth part of the precursor
In Chapter Three we described experiments in which the
precursor solution used poly(vanadic acid) and either bismuth
nitrate or bismuth acetate. The bismuth acetate, used as-received
from a commercial source, would not dissolve except in hot acetic
acid solutions, consistent with what is reported in the
literature; 2 3 , 2 4 and the bismuth nitrate tended to dissolve readily
but to crystallize out as the solution was being concentrated.
Therefore, a number of other bismuth compounds were tested for
use with the vanadium alkoxides. These included commercial
bismuth 2-ethylhexanoate and a bismuth nitrate-poly(ethylene
glycol) complex, 2 5 neither of which gave very good results. Bismuth
2-methoxyethoxide proved to be a successful starting material for
the Bi-V precursor solution. It was prepared both directly from
bismuth chloride and sodium 2-methoxyethoxide 2 6 and via the
bismuth dimethylsilamide as an intermediate. 2 7
Mehrotra et al. 2 6 first synthesized bismuth alkoxides Bi(OR) 3
(R=Me, Et, and Pr) which were insoluble or sparingly soluble in the
parent alcohol. The synthesis was by reflux of bismuth chloride with
the sodium alkoxide of the alcohol, in a mixture of benzene and the
parent alcohol. While a number of workers have reported success
154

in obtaining monomeric or at least soluble bismuth alkoxides using
this general method with more sterically demanding alcohol groups,
for example -OCH(CF 3)2, -OC 6 F5 ,2 8 -OCMe 3, -OC 6H3Me 2-2,6, 2 9
-OCH 2CH 2OMe, 3 0- 3 3 -OC 6H3(iPr) 2-2,6, 2 7 reactions with more
common alcohols have been accompanied by the formation of
insoluble materials and have produced yields of only 50% or so. It
is possible in some of these cases that trace water in the
commercially produced bismuth chloride is forming condensed
oxo-alkoxides which precipitate from solution. 2 7 Freshly
synthesized BiI 3 reacted with potassium alkoxide gives potassium
bismuth iodides K2BiI 5 and K3BiI 6 due to side reactions with the KI,
leading to a low (<30%) yield of Bi(OR) 3 : thus BiI 3 is not a good
alternative to BiCl 3 as a starting material. 2 7
Several workers have obtained bismuth alkoxides by
alcoholyzing bismuth amides, rather than using bismuth halides.
Matchett et al. used Bi(NMe 2)3 to obtain [Bi(OR) 3]n for R=iPr,
CH 2CH 2OMe, CH 2CH 2NMe 2, CHMeCH 2NMe 2, and CMe 2Et. 3 2 They
found that the crystal structure of the soluble 2-methoxyethoxide is
polymeric, with a [Bi(g-0) 20] backbone and a p-O dimeric asymmetric
unit. Massiani et al. used both the sodium alkoxide and alcoholysis
of Bi(N(SiMe 3) 2) 3 to obtain the 2-methoxyethoxide, 3 0 while Sauer et
al. alcoholyzed Bi(N(SiMe 3) 2)3 with t-butoxide and
diisopropylphenoxide to obtain the alkoxides in high yields.2 7 The
bismuth amides, in turn, may be synthesized by the reaction of BiCl3
with the lithium salt of the amine in appropriate solvent: benzene
or hexane for silylated amines, 3 4 and petroleum ether-THF for
non-silylated amines. 3 5 There is also a report of bismuth
155

2-methoxyethoxide having been prepared by alcoholysis of
[Bi(OEt) 3 L].3 3 Unless very sterically demanding ligands are used,
even the bismuth alkoxide species prepared in these are insoluble.
Although the metal is an 18-electron center for the tris(alkoxide),
bismuth is also Lewis acidic with a large ionic radius: therefore it
will seek to become hypervalent through oligimerization if steric
demands by the alkoxy groups do not prevent this.
Due to reports of the solubility of the bismuth
tris(2-methoxyethoxide) "(Bi-2MOE) 3" 2 7 , 3 0, 3 2 , 3 3 we synthesized it
using the alkali metal alkoxide method and the trimethylsilylamide
method. We also returned to look at the carboxylates of bismuth
as potential starting materials. In addition to the acetate, a number
of other carboxylates are reported in the literature, and all
decompose cleanly under 400 OC in air.3 6
4.1.4 Synthesis of Bulk Oxygen-Ion Conductors
The bismuth precursor species and vanadium
2-methoxyethoxide were first used to make bulk Bi 2VO5 .5 so that
water ratios and pyrolysis temperatures and times could be
examined and optimized. Due to the lessons learnt in the PLD
experiments (Chapter 2) film-casting experiments were not done
until dopant-stabilized y-BiMeVOx was available from a sol-gel
preparation.
As reported by Abraham et al. 3 7 (see Chapter 1), Bi 2VO5 .5
undergoes transitions to higher-conductivity phases at 450 0C and
570 OC. The highest-temperature phase, designated y, may be
stabilized to room temperature by the doping of 5-40% of assorted
156

metal ions into the structure. 3 8 The dopant is thought mainly to
occupy the V positions, though some site-mixing is suspected. 3 9
Doping onto the Bi sites has been claimed by one group. 4 0 The
conductivities of the doped materials are higher than that of the
parent (undoped) y phase (Figure 1.5), even in cases where the
charge on the dopant does not lead to an increase in the number of
vacancies. In addition to the extrinsic vacancies brought about
through doping, and the higher conductivity achievable due to the
higher symmetry of the high-temperature phase, the dopants make
the passage of oxide ions through the lattice easier due to
increased polarizability.
The oxygen ion conductivities are reported to be the highest
for Bi 2CuO.1VO. 905.35, Bi 2 Nbo.3VO.705 .5, Bi 2Ti0 .1V0 .9O5. 5 , Bi 2 Feo.1VO.905 .5 -,
and Bi 2 Mno. 15VO. 8505.5-8. 3 8 (See Table 1.1) We synthesized these
materials in bulk form by a modification of the sol-gel method
described above: bismuth acetate, synthesized as described, was
dissolved in 2MOE and mixed with V-2MOE, synthesized by
alcoholysis of V20 5 ; the (commercial product) metal carboxylate or
alkoxide was dissolved in this precursor solution, all in ratios such
that the final metals content was those of the desired phases.
4.2 Results
4.2.1 Vanadium Alkoxides Synthesis
Our first attempts at making the vanadium alkoxide precursor
solutions centered on alcoholysis of VOCI3 . The alcoholysis reaction
157

did not go to completion, leaving a product VO(OR)xCl 3.x (R=Et, iPr,
nBu, 2MOE) which was extremely sensitive to hydrolysis and
precipitated rather than gelling. Bubbling anhydrous ammonia into
the reaction vessel lead to a white-grey gelatinous precipitate or
black gum accompanied by loss of the yellow color characteristic of
the higher vanadium alkoxides. The use of alkali metal alcoholates8
to remove the final Cl atom was not explored.
We chose to focus our efforts on using vanadium
2-methoxyethoxide to introduce vanadium into the sol-gel precursor
because it is more reactive than the common alcohols and is known
for some metals, most notably yttrium, to be able to convert the
oxoalkoxide into the complete alkoxide. We thus expected high
yields in synthesizing the alkoxide from V20 5 or from lower
alkoxides. It is also associated with producing soluble alkoxides -
not by reduction in the degree of condensation of the metal
alkoxide but by formation of a cyclic oligimer that exposes the
organic parts of the alkoxide ligand to the solvent, ensuring
solubility.3 3 Metal 2-methoxyethoxides are for the same reason
less susceptible to nucleophilic attack and therefore more stable to
hydrolysis.
Synthesis of vanadium 2-methoxyethoxide via alcohol
interchange of commercially available VO(OiPr) 3 was attempted.
However, even with attempted removal of the lower-boiling alcohol
by repeated distillation, complete substitution of the isopropyl
groups was not realized. Nor was the new alkoxide purifiable by
vacuum distillation, as the products decomposed at all pressures
available to us. The deep green color of the alkoxide produced by
the alcohol exchange indicated some degree of reduction to V(IV),
158

presumably due to the action of V(V) on the alcohols. The
substituted alkoxide in solution was analyzed for total vanadium
content by hydrolysis followed by pyrolysis and gravimetric
determination of V2 05 . Vanadium alkoxide so formed was used in
some precursor syntheses, as described below.
To ensure uniformity of the alkoxy groups, we typically
prepared vanadium alkoxides for the precursor solutions by the
alcoholysis of V20 5 : e.g., by boiling finely-ground V20 5 in the alcohol,
with continuous removal of water as an azeotrope in benzene. 9
This method resulted in a green solution apparently containing
primarily V(OR) 4 .4 1 Vanadium content was determined as described
above. Attempts to purify the alkoxide by vacuum distillation failed,
again due to the decomposition of the alkoxide under all the
pressures available. (Anticipated conditions were approximately
150-1600 C/0.5mm based on V(OnBu) 4, which is the closest analogue
to V(2MOE) 4 reported in the literature. 4 1 ) The best yields for this
method were approximately 70-80% based on V20 5 recovered after
hydrolysis and pyrolysis of the alkoxide product. Literature yields of
V(OnBu) 4 near 70% of vacuum-purified material were reported. 9
Concentration ranges where the hydrolysis of the alkoxide yielded a
gel were tested. DTA/TGA of the vanadium oxide gels prepared in
this manner showed that decomposition was complete by 370 0C.
(Figure 4.1)
159

Figure 4.1: DTA/TGA of vanadium oxide gel from hydrolysis of
V-2MOE. Heating rate: 25 *C/min.
(o.) eou..jsJina s-jn~vjedmm±
cuu
cu
1600ED0
0
0~ 0 C
(8W) KOa
160

4.2.2 Synthesis and characterization of alcohol-soluble bismuth acetate
Bismuth acetate that is soluble in 2-methoxyethanol - the
parent alcohol of choice for the vanadium alkoxide - was prepared
by reaction of Bi20 3 with glacial acetic acid with continuous removal
of the water produced. To our knowledge, this is the only report of
the solubility of bismuth acetate in a solvent other than hot acetic
acid. The synthesis of insoluble Bi(OAc) 3 via a method similar to our
procedure, has been reported by Spath 4 2 and by Gattow and
Schwank. 4 3 The latter reports the powder X-ray diffraction pattern,
which does not match that of the JCPDS (#14-726) or our pattern.
(Figure 4.2) Our powder XRD pattern does, however, resemble the
pattern reported by Troyanov and Pisarevskii 4 4 , if the severe
preferential orientation in our sample is ignored. (Table 4.1) In
both cases, the synthesis is by refluxing Bi(N0 3)-5H 20 4 2 or Bi 2 0 34 3
in acetic anhydride. Their procedures give no indication of having
protected the synthesized material from air. It is likely that Gattow
and Spath produced materials heavily contaminated with BiO(OAc).
We found a mixture of Bi(OAc) 3 and BiO(OAc) (JCPDS # 14-0800)
when we attempted to perform the synthesis in an open dish (Expt.
11) or when the material synthesized under inert atmosphere was
left open to air. (Figure 4.3) Gattow and Spath report that their
"bismuth acetate" is insoluble in all solvents tried.
Our DTA/TGA data, showing percent weight loss during the
conversion to the oxide and decomposition temperatures (Figure
4.4), are consistent with the identification of our soluble precursor
161

as Bi(OAc) 3, as is elemental analysis. This is further supported by
the PA-FTIR data (Figure 4.5).43,45 The sample was decomposed at
700 0C in air to Bi20 3 and the weight retention was found to be
60.07%, consistent with Bi(OAc) 3 (60% expected) and not with
BiO(OAc) (82% expected). The sample that had been synthesized in
open-air conditions was similarly oxidized to Bi20 3 and found to
have a weight retention of 82 %. This sample, as well as a sample
of bismuth acetate synthesized under inert atmosphere that was
left open in air two days, would not dissolve in 2MOE.
Single-crystal X-ray diffraction on the compound synthesized
by our procedure (Experiment 12) showed space group P2 1/a, with
lattice parameters a=12.0848 A, b=10.8859 A, c=7.2889 A,
P=106.173, Z=4. (Figure 4.6) This slightly different from that
reported by Troyanov and Pisarevskii, 4 5 who find P2 1/c, a=12.082
A, b=10.858 A, c=7.348 A, P=105.83 0, Z=4; however, the bonding
in the asymmetric unit and the layered chain disposition of the
bismuth acetate trimers described by them were identical to what
we found. They report that the compound is insoluble in all solvents
tried. The basic unit in bismuth acetate is a bismuth atom
surrounded by the three acetate groups bonded through both
oxygens, as expected. Bismuth centers are linked via secondary
bonding with the oxygens on the acetate groups, so that the
asymmetric unit is a bismuth-acetate trimer, which lies in chains in
the crystal. The lone pair is stereochemically active: the acetate
groups bonded as bidentate ligands are found on one side of the
bismuth atom, while the secondary-bonded ones are on the other
side. On this basis we may guess that the lone pair is pointed in
162

the direction of the latter ligands. 2 5 ,3 2 ,4 6 The powder X-ray
diffraction pattern of the sample before and after exposure to air
(Figures 4.2, 4.3) demonstrated decomposition of the original
sample to (eventually) one matching the known powder pattern for
bismuth oxide acetate (JCPDS #14-800). The before-exposure XRD
pattern, however, did not match the one listed in the JCPDS
database (#14-726), even accounting for preferential orientation,
but did match the pattern simulated using the crystal structure
information provided by the single crystal data once preferential
orientation was accounted-for, demonstrating the purity of the
material examined by powder XRD. The bismuth acetate purchased
from commercial sources (See Appendix to Part I), although sold and
handled "under inert atmosphere," was likewise heavily
contaminated with bismuth oxide acetate according to powder XRD.
This is probably the major reason for the commercial materials'
failure to dissolve, as observed in the experiments described in
Chapter Three.
Reports of sol-gel preparations using commercial bismuth
acetate have all mentioned its insolubility. Toyoda et al. 2 3 ,2 4
twice-refluxed commercial bismuth acetate in glacial acetic acid,
removing the solvent each time, then dissolved the resulting
powder in a 2-methoxyethanol solution of titanium
2-methoxyethoxide. In this case it may be argued that the
dissolution of the bismuth species was associated with the
formation of a heterobimetallic alkoxy-acetate; 4 7 however, the
bismuth acetate prepared by us is soluble directly in
2-methoxyethanol and several other alcohol ethers. The key to the
solubility of our bismuth acetate preparation probably involves the
163

careful exclusion of air and moisture after synthesis, so that the
conversion to the insoluble oxyacetate was impeded. The acetate,
as prepared here, forms an adduct with pyridine4 8 in which the
bismuth center retains three acetate ligands and adds two pyridine
ligands. The pyridine and pyrazine-carboxylates of bismuth may be
made in a similar synthetic process to that given here for bismuth
acetate, but the resulting compounds are insoluble. 4 9 It likewise
forms an adduct with thiourea. 5 0 We suggest that a similar
interaction with the alcohol ether 2MOE assists the dissolution.
The white crystalline bismuth acetate prepared in this way was
dissolved in 2MOE with warming to produce a clear, faintly yellow
solution which could be cooled to room temperature without
precipitation. On standing 1-2 hours, however, a white fibrous
semisolid occupied the entire solvent volume. A clear solution could
be re-obtained on warming or vigorous stirring at ambient
temperature; however, the solid could not be redissolved if the
mother liquor was removed from it. Very dilute preparations
remained clear for periods up to several days, even without stirring.
The PA-FTIR of the solid is nearly identical to that of the alcoholysis
product of Bi(N(SiMe 3)2)3, with some extra peaks attributed to
acetate groups. (Figure 4.7 a, b) Their TGA traces are similar.
(Figure 4.8 ab) Alcoholysis of Bi(N0 3) 3-5H 20 by polyethylene glycols
has been reported 2 5 and the exchange Pb(OAc) 2 + HOiPr ->
Pb 4 0(OiPr) 6 is known. 5 1 The white fibrous semisolid is thus thought
to be an alcoholysis product of the acetate, supposed formula
[Bi(OAc)x(2MOE) 3_x].. The Bi(OAc) 3 could also be dissolved in diglyme
but was insoluble in THF, DMSO, benzene, and isopropanol.
164

Table 4.1: Powder X-ray diffraction pattern for bismuth acetate
prepared by method described in text.
Indexing and d(lit) from Troyanov. 4 4 Literature values (single crystal)
P2 1/c, a=12.082 A, b=1o.858 A, c=7.348 A, P=105.83*, Z=4. Cell
parameters from single crystal XRD: P2 1/a, a=12.0848 A, b=10.8859 A,
c=7.2889 A, P=106.1730, Z=4.
h k I d(exp) A d(Iit) A I/Io (exp, O/o)
12.51 1.29
1 0 0 11.46 11.54 100
1 1 0 7.87 7.847 3.59
5.851 (111)
2 0 0 5.78 5.786 42.10
2 1 0 5.10 5.112 4.74
4.912 (120)
4.866 (111)
3 0 0 3.86 3.877 25.38
2 2 1 3.75 3.766 0.34
3.739 (211)
3 1 0 3.64 3.649 0.50
3.481 (112)
3.472 (202)
3.360 (012)
3.208 (131)
3.057 (302)
3.040 (122)
2 2 2 2.94 2.920 0.42
4 0 0 2.90 2.904 9.34
165

Table 4.1, continued.
h k I d(exp) A d(iit) A I/Io (exp,/ %)4 1 0 2.80 2.806 2.84
2.623 (402)4 2 0 2.56 2.562 0.38
2.550 (412)2.475 (331)
5 0 0 2.32 2.324 1.212.305 (431)
5 1 0 2.27 2.272 2.542.24 (502)
1 2 3 2.22 2.227 0.962.205 (521)2.196 (512)2.180 (142)2.130 (322)
2 5 0 2.03 2.034 0.262.013 (511)2.006 (531)
6 1 1 1.98 1.978 0.415 3 0 1.96 1.955 0.296 0 0 1.94 1.935 4.865 1 3 1.92 1.910 0.33
1.885 (422)
4 0 4 1.73 1.733 0.311.70 0.361.66 2.181.64 0.521.44 0.731.42 0.40
166

Figure 4.2: Powder XRD pattern of bismuth acetate. Note the
preferred orientation.
I I II
N 0s-ufloo
-%0
Lf)
U)
U)
U)
N
167
Lrl%-4

Figure 4.3: Powder XRD pattern of bismuth acetate (a) freshly-
made, fast scan in air; (b) left open to air for two days.
-7;
I
I
I
I
I
I
*
I
(D
0 z F- M I*. M W U
CIO
II
I
CUCU
0(D01'I
0nmn
MUr)L3
0
168
a I
0LOU
-If
-o
-0
- L ii
-U
In
LO)
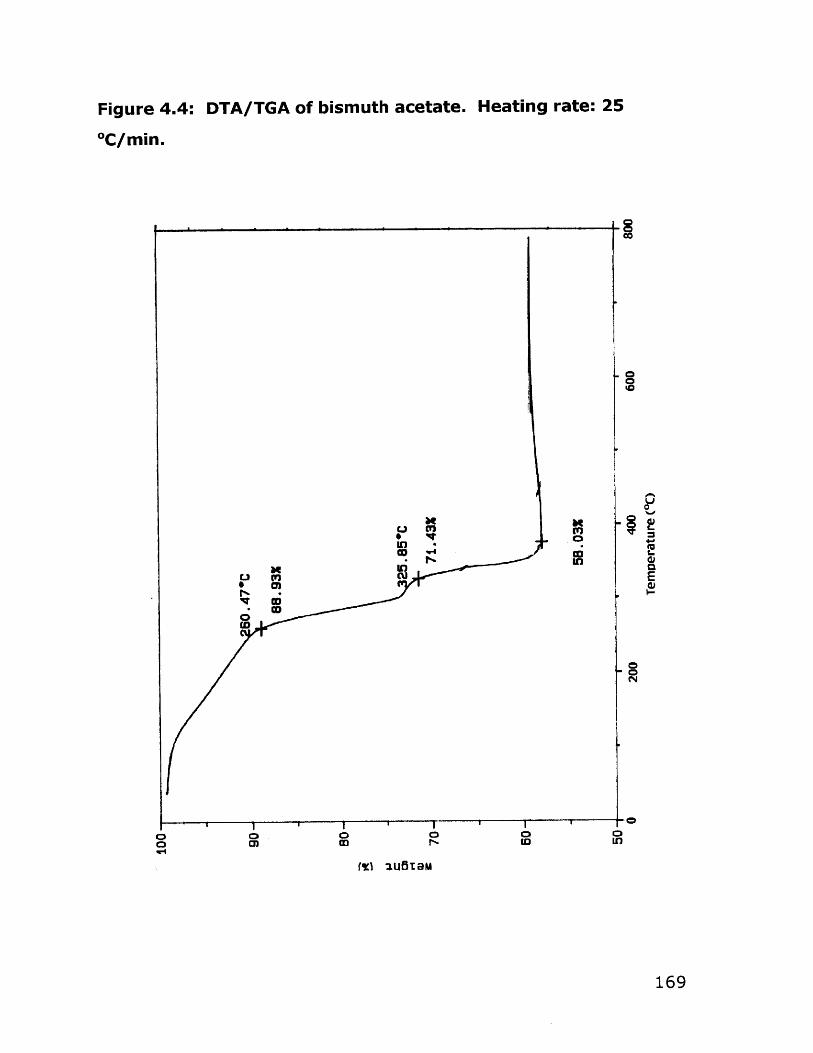
Figure 4.4: DTA/TGA of bismuth acetate. Heating rate: 25
*C/min.
1~
-o0i0
0
4-I
I-
0EI-
00N
I I I K0 0l
U30In
fgl IUB~m
169
InI
00'-I
00)
0

Figure 4.5: Photoaccoustic FTIR of bismuth acetate.
10
In
10
r7

T /-
TEO
90
t7 0 so
Bo 9TED
23 OTTO
Cie 990
eo 9ED Ell 0
STEM 9 F 0990
Tie Ge
Bie
V23 V123
VTO VED V170
V20vvo
VIE3
VTTO
otpoEs Wo
-(E)19-(T)o JOES (9)0-(E)!g-(S)o 'oSmOS (tp)O-(E)!S-(E)O lo6f-
(9)0-(E)!B-(E)o 1008 (9)0-(E)!11-(Iv)o I otpf- (9)0-(E)!S-(T)o1 008 (s)o-(E)!B-(T)o I of-TT (tp)o-(E)!B-(T)O 'fosmzsT Wo
-(E)!S-(T)o !OSZ (vE)O-(E)!g "ESZ (Stp)O-(E)!g 'tF6Z (SZ)O
-(E)!g "tpzz (9)0-(E)!g fzsz (s)o-(E)!g fotpz (lt?)O-(E)!g '119Z
(E)O-(E)IS JOEZ (Z)O-(E)!g ftpSZ (T)O-(E)!g :salBue pue (Lud)
sLjjBu9j puoq papolaS -9jejeoe Ljjnwsiq 10 d3.L-dO :9-lt7 9.jn5ij

Figure 4.7a: Photoaccoustic FTIR of bismuth acetate-2MOE
polymer.
IP
172

Figure 4.7b: Photoaccoustic FTIR of product of alcoholysis of
Bi(N(SiMe3 )2)3 by 2MOE.
.4
0
CCC-fliL
UICUp.
N
CC
C
N
=1
173

Figure 4.8a: DTA/TGA of bismuth acetate-2MOE polymer.
Heating rate: 25 *C/min.
(o,) souxejaJo ejn~ejedw9.j
LO 0'-4 1(1 0
0 aiI
Io,,-MG00.N
00)
0 0 toI
in
0r'O
0
cu
In
174
0cu
00'-4
C.
L
aCL
M 4145TGM

Figure 4.8b: DTA/TGA of product of alcoholysis of
Bi(N(SiMe3)2)3 by 2MOE. Heating rate: 25 OC/min.
00
0.
OWI
040
WC.
Cn m CD I
(Z) :14BTS
175

4.2.3 Bulk Bi 2VO5.5 Synthesis
Vanadium 2-methoxyethoxide (V-2MOE) was prepared by
azeotropic distillation of finely ground V20 5 in excess 2MOE and
benzene. 1 2 Alternatively, the 2-methoxyethoxide could be made by
twice-refluxing VO(OiPr) 3 in 2MOE with distillation each time above
100 oC. 1 4 In either case, the concentration of the resulting yellow
solution was verified by gravimetric determination of V20 5 following
hydrolysis of the alkoxide and heating the resulting gel in air to 700
OC. Direct use of VO(OiPr) 3 resulted in poor gel quality due to the
extremely fast hydrolysis of the isopropoxide group, yielding the
a-Bi 2VO5 .5 only after extended heating to temperatures (750 OC)
higher than those required for gels made from V-2MOE (450 0C).
Soluble bismuth acetate was prepared as described above and
dissolved in 2MOE. Vanadium 2-methoxyethoxide (V-2MOE) and
bismuth acetate solutions in 2-methoxyethanol were mixed in
quantities to give a 1:2 V:Bi mole ratio. The clear yellow solution
which resulted was stable under nitrogen for weeks, though
hydrolysis was evident within an hour of being opened to the air.
Refluxing this precursor solution overnight resulted in precipitation
of a brown solid which after heating at 625 0C for 1 h in air became
a mixture of BiVO 4 (JCPDS 14-688) and Bi 2VO 5.53 7 as identified by
powder XRD.
The precursor solution was hydrolyzed with water or water
mixed with concentrated ammonium hydroxide or glacial acetic acid.
Immediate precipitation was seen in precursor solutions containing
176

NH 40H, presumably due to a complex formation between NH 3 and
the vanadium alkoxide. 1 1 , 5 2 However, translucent gels were
obtained for precursor solutions hydrolyzed with pure water or with
water and acetic acid. Different alkoxide/water/acid ratios resulted
in varying gel qualities. Pyrolysis of the gel occurred with initial
formation of BiVO 4, with ingrowth of the desired Bi 2VO5 .5 phase as
pyrolysis temperature increased. (Figure 4.9) The presence of acetic
acid did not appear to make a difference in the pyrolysis
temperature at which the ca-Bi 2VO5 .5 appeared in the XRD patterns.
There was, however, a correlation between gel quality and the
temperature at which the desired u-Bi 2VO5 .5 phase appeared in the
powder XRD pattern, with more homogenous-looking gels producing
cleaner diffraction patterns at low pyrolysis temperatures. TGA/DTA
of this gel showed decomposition was complete by 430 OC. (Figure
4.10) Vanadium tris(isopropoxide) oxide was also directly tested for
use in the precursor solution, but its rapid hydrolysis resulted in
poor-quality gels or fibrous precipitates which on pyrolysis did not
show the a-Bi2VO5 .5 phase until 750 0C.
Several early experiments had given a mixture of Bi 2VO5 .5 and
BiVO 4 (Expts. 16, 17). Because a number of papers suggested that
BiVO 4, had some significant 02- conductivity, 5 3 complex impedance
(CI) experiments were undertaken to determine the conductivity
behavior of pure BiVO 4 and of sol gel prepared Bi 2VO5 .5
contaminated with BiVO 4. Complex impedance plots (Z" vs Z') for
pure BiVO4 showed at low temperatures (340.1 OC) a high-frequency
arc with a spike at lower frequencies. As the temperature rose
(594.5 OC), the first arc disappeared and the spike resolved into a
177

second arc. This second arc is attributed to the electrodes' having
become non-blocking, and represents electronic conductivity.
(Figure 4.11a, b) The total conductivity shown by the BiVO 4 pellet
was low. (Figure 4.12) A combination pellet, synthesized by a
sol-gel method but with the sample having a PXRD pattern showing
a mixture of BiVO 4 and Bi 2 VO5 .5 , was also investigated using CI. In
this case, it should be noted that a lower conductivity reading may
have resulted from a failure to densify the pellet completely. The
high-temperature sintering was omitted in order to maintain the
original post-synthesis sample composition for at least the lower
temperature readings; thus pressure alone was used in densifying
the pellet. The data show very noisy plots at low temperature,
probably due to the low pellet density, which would lead to a high
grain boundary-type resistance. At higher temperatures (490.2 OC)
a single high-frequency arc terminates on its low-frequency side in a
line representing the electronic contribution to the conductivity.
(Figure 4.13 a-d) The conductivity on the cooling leg of the
experiment is higher due to the increased densification of the pellet.
(Figure 4.14)
Synthesis of c-Bi 2VO5 .s was also accomplished by mixing
appropriate ratios of V-2MOE with Bi(2MOE) 3 made by the
alcoholysis of Bi(N(Si(CH3)3) 2)3.2 7 Hydrolysis and heating of the bulk
gel result in a material that undergoes direct conversion to
c-Bi 2VO5 .5 at 450 0C. DTA/TGA shows a single-step decomposition
by 310 0C. (Figure 4.15) The X-ray powder diffraction patterns
(Figure 4.16) show no evidence of BiVO 4 peaks, although at
intermediate temperatures some unidentified peaks appear. These
peaks disappear and the desired phase increases in crystallinity at
178

subsequent heating to higher temperatures. The precursor solution
that included alkoxides of both metals had a lower temperature for
formation of the desired u-Bi 2VO5 .5 phase because (1) the possible
formation of a bimetallic alkoxide in solution may have provided
stable atomic-level mixing and adjacent placement of Bi and V atoms
before hydrolysis, or (2) the fact that both compounds were
hydrolyzable permitted the formation of Bi-O-V bonds - i.e. intimate
metal mixing - in the condensation reactions leading to the gel. The
lesser susceptibility of the Bi(OAc) 3 to hydrolysis or alcoholysis may
have decreased its incorporation in the gel structure relative to that
of the bismuth alkoxides, so that its main method of incorporation
may have been by being dissolved in the solvent trapped in the
vanadium oxide gel, rather than by Bi-O-V bonding.
The formation of Bi 2VO5 .5 , which is a layered structure, at low
temperatures in the sol-gel process, is due to "templating" by the
initial layered structure of the V205 gel. V20 5 gel has a layer
structure similar to that of the x- and y-vanadium bronze, MXV 2 0 5 ,
where the M+ layer is interposed by the layers of V0 6
octahedra. 2 0 , 5 4
The BiMeVOx materials (Me=Cu, Nb, Ti, Fe, Mn) were
successfully synthesized using a modification of the method
described for Bi 2VO 5.5 : to bismuth acetate and V-2MOE solutions in
2MOE were added metal salts or alkoxides in the ratios required to
obtain the desired metal stoichiometry in the final product. Copper
and manganese were added as the acetates, while iron was added
as the acetate or acetylacetonate, and niobium and titanium added
as the isopropoxides. Several other methods of adding niobium,
e.g. as the acetate and as the chloride, failed to give stable
179

solutions. In all cases, all of the components were soluble in 2MOE.
Precursor solutions were hydrolyzed with 1-2 equivalents of water
and pyrolyzed. In all cases powder XRD shows low-temperature
formation of the desired y-BiMeVOx phase. (Figures 4.9, 4.17-4.21)
Bi(N(SiMe 3)2) 3, Cu(OAc) 2, and V-2MOE mixed in a 2MOE solution also
led to a low-temperature synthesis of BiCuVOx. (Figure 4.22)
Due to the presence of the dopant, the metal-doped phases
are disordered, so that less diffusion of metal atoms needs to occur
in order to have these atoms attain their final positions in the
structure. This is one mechanism for the lower-temperature
formation of the doped phases from a preparation otherwise
identical to that which forms the undoped parent structure Bi 2VO 5.5 .
In addition, the metal dopants may catalyze the burn-out of the
organic materials, as is sometimes seen with polymeric ceramic
powder binders. 5 5
The total conductivity of a solid electrolyte is the sum of the
conductivities of a number of processes - i.e. intergrain and
intra-grain conductivity, and grain-boundary conductivity. Because
of this, processing parameters may influence the conductivity of a
given sample of oxygen-ion conducting material. In particular, the
grain size achieved during synthesis, and the density or level of
sintering achieved during the later processing of the synthesized
powder, is relevant. For BiCuVOx samples prepared by standard
solid-state methods, then ball-milled to produce various grain sizes
and/or mixed with binder before sintering into a pellet for
conductivity testing, some variation in the oxygen ion conductivity
with the grain size and degree of sintering/densification of the
pellet is reported in the literature. 5 6 As a result, the oxygen ion
180

conductivity of a sample of Bi 2 CuO.1VO. 905 .35 made by the sol-gel
method as described above was tested by complex impedance
spectroscopy. (Figure 4.23 a-d) A single arc was observed in the
complex impedance data, with a spike occurring at lower
frequencies which eventually evolved to a line with increasing
temperatures. The line indicated the significant electronic
contribution to the total conductivity of the samples. The high
frequency arc, arising from oxide ion conductivity, represented the
sum of grain boundary and bulk resistances; the individual
contributions could not be separated out. It was found that the
conductivity was essentially the same as that reported in the
literature for samples made by a solid state synthesis procedure. 5 7
(Figure 4.24)
181

Figure 4.9: Powder XRD patterns at various pyrolysis
temperatures for sol-gel produced Bi 2VOs.s. The bismuth
nrpr..rsnr was hismuth acetateI-- I
xt
YKA
x +x +
+
x
Lfl't* 0 0 ~0 > 0 0 0
> ClJ Lg) 0 0D*r ~C' L) I)
I-. CO LO*
C0in
in
C
0
182
C)

Figure 4.10: TGA of Bi2VO5*5 precursor gel after hydrolysis and
removal of solvents. Heating rate: 25 OC/min. (JP-II-39-O)
co
('KI~ aila
183

Figure 4.11: Complex impedance plots for BiVO4. (a) 340.1 *C.
(b) 594.5 *C.
o..0
I N
2 I 1 I I I I I I I I
N
184
0
In
Nq
0
0e
0
C5
qw
I

Conductivity of BiVO 4 as a function of temperature.
1.4 1.6 1.8
1IXOT (K)
185
6-
5-
4-AWE%
03
0
3-
0I
0:
03
13C
.. 12)
I.8 i 1.2
Figure 4.12:
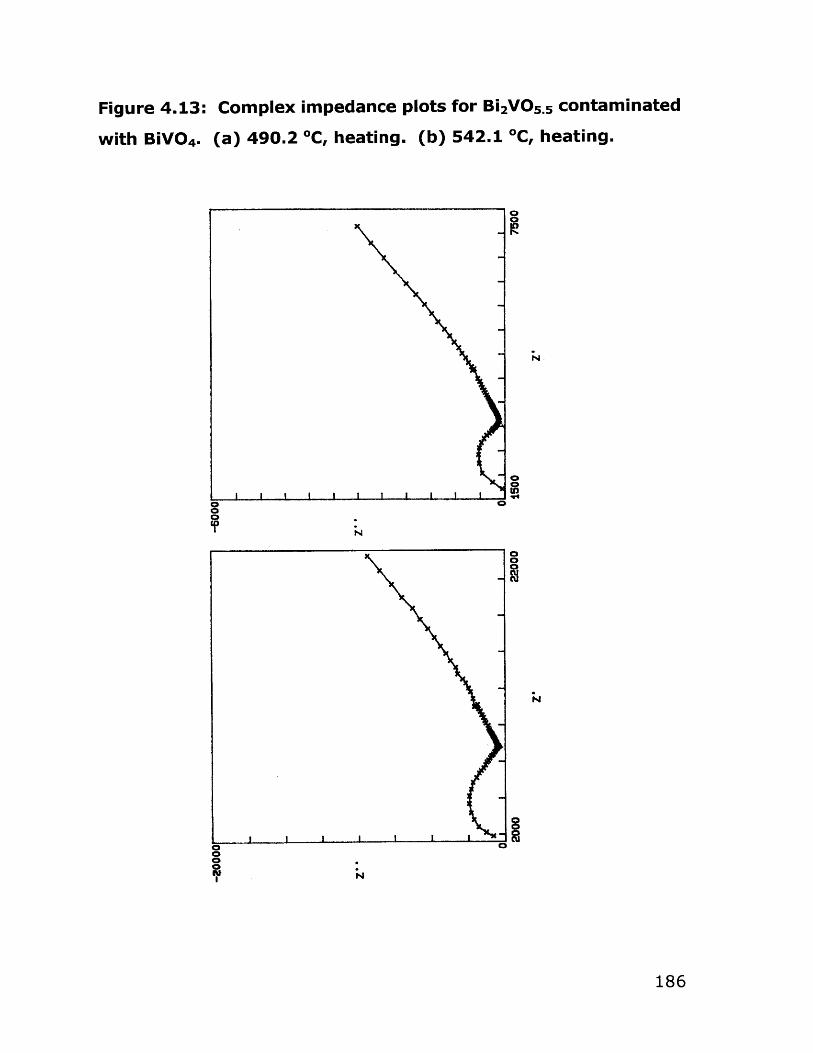
Figure 4.13: Complex impedance plots for Bi 2VOS.. contaminated
with BiVO4. (a) 490.2 *C, heating. (b) 542.1 *C, heating.
I I I I I t 1 3 I I I
NJ
N
N
00
In
N
0000N
186

Figure 4.13, continued: (c) 390.0 'C, cooling. (d) 339.8 *C,
cooling.
I i I 1 1 I I I
0 00
C00
CU N
0000Cu'4
N
0
C0CIDCU
N
1 I I I I I I I I 10
187
40

Figure 4.14: Conductivity of Bi 2VOS.. contaminated with BiVO4
as a function of temperature.
1.2 1.4
1000/T (K)
1.6 1.8
188
6-
5-
4-
3 -
13>
M 0
03 bG~tIng~
,, C Bolin g
21I
CM
0

Figure 4.15: DTA of hydrolyzed and gelled precursor to Bi 2VO5 .
Bismuth was added as Bi(N(SiMe3)2)3. Heating rate: 25 OC/min.
(o.) eouedS44To ejnqejedwj.L
CLE
CU
r ro
CUu
o~r U-) 0 IL)
189

Figure 4.16: Powder XRD patterns at various pyrolysis
temperatures for sol-gel produced Bi 2VOS..
precursor was Bi(N(SiMe 3) 2) 3-
t
*
n
071 U U (.
N a LL 10
n
The bismuth
0
0en~
"04
190
-44
d

Figure 4.17: Powder XRD patterns at various pyrolysis
temperatures for sol-gel produced Bi 2Cu 01,V0.905 .5. The
precursor was V-2MOE,. Cu(OAc) 2, and Bi(OAc) 3.
ILn
In
(S)
In
In
mn
U
00 . E sjuno.-
191

Figure 4.18: Powder XRD patterns at various pyrolysis
temperatures for sol-gel produced Bi 2 NbO.3VO.7 0S.5 . The
precursor was V-2MOE, Nb(OiPr)s, and Bi(OAc)3-
000
nfl) 4 4' 4*4 4 4 04 44 44000 -
350 WC
I'D 20 30 40 50 6
2 ThEta
192

Figure 4.19: Powder XRD patterns at various pyrolysis
temperatures for sol-gel produced Bi 2Mno.s15 VO.850 5 .5 . The
precursor was V-2MOE, Mn(OAc) 2, and Bi(OAc) 3-
-rG
550 "r
350 0C
44* #4 4 *
15 2b 25 3 35 40 15 50 55 60
2 Theta
193
IUOU -
lnaa -
JIGM -
N.
10

Figure 4.20: Powder XRD patterns at various pyrolysis
temperatures for sol-gel produced Bi 2Feo.VO.90 5 .s-8 . The
precursor was V-2MOE, Fe(OAc) 2, and Bi(OAc) 3.
5DDD
+DDD - *
BDDD -
2DDD -
IDID -
0-
* 4 -r
IIIIII I I I Ini CM "I -It n
2 ThEta
194
4
7 50 C
15 50 " C
550 T---.. Mo.-
450 C
3510) *C

Figure 4.21: Powder XRD pattern at a pyrolysis temperature of
750 OC for sol-gel produced Bi 2Ti01,V0*9O5.5-,. The precursor was
V-2MOE, Ti(OiPr)4, and Bi(OAc) 3.
LI,LI)
In
-N
N
U i
CD
00 01661 sjunoo001
195

Figure 4.22: Powder XRD patterns at various pyrolysis
temperatures for sol-gel produced Bi 2CuO.*VO.*0 5 .5 . The
precursor was V-2MOE, Cu(OAc) 2, and Bi(N(SiMe 3) 2) 3.
0
x
x
x
x
-0
.0
0
X1SUOIU!
196
-een w*00
CD
I

Complex impedance plots for sol-gel produced
Bi 2CuO.1 VO.9 0 5 .5 .
It,
(a) 294.8 0C heating.
100
(b) 395.3 *C heating.
C
0OIn
U,
CD00
8 )
0
C'.
CD4)
IiH.z 0
197
I I I
L0
Figure 4.23:
LO4)

Figure 4.23, continued: (c) 675.1 0C heating. (d) 805.7 *C
heating.
0IL)
0LO
I I
ILO
q
IL, 0to0q 0i
I I
liz
Co
0Q
ILO
I I
ILQ
0CI'
0
* 0
0
I'ON
OIL,
198

Conductivity of sol-gel produced Bi 2CuO.,Vo.905 . as
a function of temperature.
1. 5 .o 1.75 2.00
10OX/T (KI
199
(1)-
(3)-
b
(5)
4.
a 4 '0 1
0 4 10. nBtifla
+ cniling
+ 2ndheating
00
00
"0
0*
(6)-
1.00
Figure 4.24:
(7)d I0.7 S

4.3 Conclusions
Vanadium 2-methoxyethoxide was used to generate the gel
for sol-gel precursors to BiMeVOx materials with considerably more
success than had been found for solutions using poly(vanadic acid),
described in Chapter Three. Bismuth acetate prepared from the
oxide by repeated reflux in glacial acetic acid under inert
atmosphere with removal of water, was found to be soluble in
alcohol ethers such as 2-methoxyethanol and was used successfully
in precursor solutions. On standing in 2-methoxyethanol solution,
the bismuth acetate alcoholyzes to form a fibrous insoluble material
thought to be polymerized bismuth 2-methoxyethoxide. The
formation of this material is suppressed in the presence of
vanadium 2-methoxyethoxide. This suppression could indicate the
formation of an associated Bi-O-V complex in solution, which may aid
in keeping the bismuth atoms in place in the gel network during
gelation, drying, and pyrolysis, assisting the Bi 2VO5 .5 phase in
appearing at a lower temperature than for solid state synthesis.
The layered nature of the primary vanadium-based gel component,
combined with the linear structure of the alcoholytic Bi-2MOE-OAc
polymer that develops on standing, is a second factor in the
low-temperature development of the layered Bi 2VO5 .5 phase. The
disordered doped phases form at still lower temperatures.
Bismuth 2-methoxyethoxide made by alcoholysis of the
dimethylsilamide was also used successfully in the precursor
solution. Here, the desired phase formed directly at 450 0C
pyrolysis temperature, with no trace of intermediate BiVO 4
200

formation. Presumably the possibility for the bismuth alkoxide's
participation in hydrolysis and condensation reactions permitted this
low-temperature formation. However, due to the multistep nature
of the procedure, and the low yields, this precursor was deemed
uneconomical for scale-up and industrial application and was
dropped from further investigation.
Bulk parent a-Bi2VO5 .5 and several y-phase doped BiMeVOx
materials, e.g. BiCuVOx, BiNbVOx, BiTiVOx, BiFeVOx, and BiMnVOx,
were synthesized from a sol-gel precursor solution made up of
soluble bismuth acetate, vanadium alkoxide, and dopant alkoxide or
carboxylate. In doped materials, the desired phase formed directly,
presumably, as DTA/TGA indicated decomposition at 430 OC and
pure y-phase was found at 450 OC. This is in contrast to the
behavior of the undoped parent phase made by the same precursor
process, which appears at 450 OC but is not completely formed
phase-pure until 725 OC. All of these temperatures are some 300 0C
lower than for the standard solid-state synthesis, demonstrating
the success of the method in providing for intimate mixing of the
metals in the compound. Complex impedance spectroscopy data
taken for BiCuVOx made by the sol-gel method described shows
oxygen ion conductivity on par with that reported in the literature
for samples made by the solid-state powder synthesis route.
The result that the doped BiMeVOx materials could be
synthesized by a sol-gel method at low temperature provided the
possibility for deposition of films of these materials. The work
towards the goal of producing defect-free films of BiMeVOx on
porous substrates is described in Chapter Six. However, since a
number of observations during the course of the work described in
201

this Chapter were suggestive of the formation of a single precursor
complex between bismuth and vanadium in solution, some
experiments were undertaken to elucidate the nature of this
putative precursor. That work is described in the next Chapter.
202

4.4 Experimental Section
See the Appendix to Part I of this thesis for a list of materials and
their sources, and for specifics on instrumentation used.
4.4.1 Vanadium Alkoxides
Several attempts to make VO(OEt) 3 by refluxing together V20 5
and ethanol or butanol with distillation of water/alcohol/benzene
azeotrope gave a hydrolyzable product which could not be cleanly
isolated by distillation. The distillation was attempted at
atmospheric pressure and under vacuum, but the equipment used
for vacuum distillation was inadequate. Attempts to make the
alkoxide by alcoholysis of VOC 3 with a sweep of inert gas to carry
off HCI, gave a yellow undistillable material, and in combination with
NH 3 generated by NH 40H gave a white gelatinous precipitate or a
black gum. Combinations of VOCI3 with EtOH, iPrOH, BuOH, and
2MOE gave materials which precipitated on addition of water.
These experiments are described in more detail below.
Experiment #1 (JWP-I-19127) V20 5 + nBuOH -> VO(OBu) 3
Finely ground V205 (18.185g, 100 mmol) was added to nBuOH
(110 ml, 1200 mmol) in 100 ml benzene. A small amount of 3 A
molecular sieve was added to the reaction pot to scavenge evolved
water and the mixture refluxed with distillation for 4.5 h. When
distillate stopped coming over, the reaction mixture was filtered to
yield a green-brown liquid. An attempt to vacuum distill the product
decomposed it. Addition of water to a sample of this provided a red
203

gel in under 1 minute. The gel subsequently became green-black on
standing for a few minutes. A known amount of solid was
hydrolyzed to a fibrous gelatinous solid and carefully heated to
dryness, then pyrolyzed 18 hours in air at 600 0C. The orange
brown solid, verified by powder XRD as V2 0 5 , was weighed and the
concentration of the sample found to be 1.350 mmol V/g solution.
Experiment #2 (JWP-I-21) V20 5 +excess nBuOH + VO(OBu) 3
The same synthesis as Experiment #1 was tried, this time
with a 10x excess of BuOH in hopes of getting all of the V20 5 to
react. A green-grey solid remained in the pot.
Experiment #3 (JWP-I-28) V205 + 2MOE + VO(2MOE) 3, single
heating
V20 5 was ground finely in a mortar and added (4.0158g, 22
mmol) to 100 ml benzene and 150 ml 2MOE (2 mol). This was
heated with distillation for 3 hours and the olive green product
filtered. The solid residue was washed with 2x 25 ml 2MOE and the
washings combined with the filtrate. The filtrate became
red-orange on addition of water. A known amount of the product
was hydrolyzed and carefully heated to dryness, then heated for 18
hours in air at 600 0C. The orange-brown solid, verified by XRD as
V20 5 , was weighed and the concentration of the sample found to
contain 0.2436 mmol V/g solution, approximately 56% yield from
V 20 5 .
204

Experiment #4 (JWP-I-53) V20. + 2MOE + VO(2MOE) 3, smaller
excess of 2MOE
V20 5 , finely ground (4.0306 g, 22 mmol), was added to 75 ml
benzene and 100 ml (1.32 mol) 2MOE and heated 3 h until
distillation of clear and colorless liquid stopped. The reaction mix
was filtered to leave a light yellow liquid which was found by the
usual method to deliver 0.1018 mmol V/g solution, approximately
59% yield from V20 5.
Experiment #5 (JWP-II-93a) VO(OiPr) 3 + 2MOE + VO(2MOE) 3
VO(OiPr) 3, 25 ml (0.1 mol) was added to 75 ml 2MOE (1 mol)
and refluxed 1.5 h, followed by distillation at 83-105 OC. An
additional 100 ml 2MOE (1.25 mol) were added and distillation
continued until the vapor temperature exceeded 100 0C. It was
permitted to stand and cool overnight to yield a brown liquid.
Standard analysis showed concentration 1.068 mmol V/g solution,
approximately 63% yield from the initial vanadium content of the
vanadium isopropoxide solution.
Experiment #6 (JWP-II-94a) V20 5 + 2MOE + VO(2MOE) 3, 2
distillations
Finely ground V20 5 (10g, 53.5 mmol) was added to 100 ml
benzene and 200 ml (2.63 mol) 2MOE and heated for 1 hour. It was
then distilled until the vapor temperature was 105 0C, and 40 ml
more (0.52 mol) 2MOE added. Distillation was continued until the
205

vapor temperature exceeded 105 OC. The green-brown liquid was
cooled and filtered twice. The standard analysis found 0.7266 mmol
V/g solution, approximately 77% yield based on V20 5 .
Experiment #7 (JWP-II-201) Standard V-2MOE Preparation
25 g of finely ground V205 was added to benzene (100 ml) and
2MOE (200 ml) and distilled at 100 OC for 2 hours. Up to 50 ml more
2MOE was added and the mixture again distilled until the
temperature exceeded 105 OC. The cooled mixture was left stirring
overnight, then filtered under inert atmosphere with 2MOE rinses.
Aliquots of known mass were taken, hydrolyzed, and carefully dried,
then pyrolyzed in air for 8 h at 750 OC. The remaining solid was
weighed as V2 05 to calculate moles V delivered per g of solution.
Yields were generally 70-80% based on V20 5 added.
4.4.2 Bismuth Part of the Precursor
Experiment # 8 (JWP-I-9315) Bi(N0 3) 3 *5H 2 0 +
HO(CH 2CH 20) 4 H + [Bi(N0 3) 2 (O(CH 2 CH 2 O) 4 )] 2 * 2 MeOH
In inert atmosphere Bi(N0 3)3-5H 20 (4.865 g, 10 mmol) were
added to 7.5 ml acetonitrile and 2.5 ml MeOH and warmed;
tetraethylene glycol (2.3g, 11.84 mmol) was added to MeOH (2.5 ml)
and dissolved. This was added to the bismuth nitrate solution and
warmed 1.5 h. On cooling overnight some crystals appeared; these
were redissolved on warming and stirring. After again sitting
overnight the flask was left for several hours on ice. The solid was
206

filter washed with 2x 10 ml of cold MeOH, then vacuum dried. The
filtrate was clear and yellow. 3.82 g of the solid was recovered
(33%, white solid) and stored in the glove box. The experiment
was repeated on (JWP-I-90, 32% yield, white crystals in yellow oil).
In that experiment, the product was hydrolyzed to a gellatinous
precipitate with TGA/DTA (Figure 4.25). Likewise, the synthesis was
repeated on a larger scale (JWP-I-95, again in approximately 30%
yield).
Experiment #9 (JWP-II-8) BiCI3 + NaN(SiMe 3) 2 ->
Bi(N(SiMe 3) 2) 3 "BiSA"
BiCI 3 (3.0208 g, 9.6 mmol) was added to a schlenk flask in the
glove box and dissolved to an opalescent solution in 70 ml diethyl
ether. NaN(SiMe 3)2 (5.5357 g, 30 mmol) was added to a second
schlenk flask and suspended in 50 ml diethyl ether. The latter
solution was cooled to 0 OC and the BiCl 3 solution added slowly to it
via cannula. The reaction was stirred at room temperature
overnight, then the ether removed in vacuo to yield a fine yellow
powder. This was dissolved in pentane, leaving a pale yellow solid
('H NMR in C6D6 0.373 ppm (s)) which was filtered off, pyrolyzed,
and identified by XRD as NaCl plus some Bi 2 0 3. Some of the filtrate
was hydrolyzed and dried, then pyrolyzed - XRD identified this as
Bi 20 3. To the remainder of the filtrate excess 2MOE was added,
giving a clear and colorless solution. Removal of the solvent in
vacuo gave a white solid. Hydrolysis and pyrolysis of this material
gave Bi 2 0 3 (identified by XRD). DTA/TGA was done on Bi(N(SiMe 3)2) 3
powder and on the hydrolyzed gel. (Figure 4.26 ab) The
207

preparation was repeated on II-18A, 11-46 (39% yield), 11-57, and
11-95 (29% yield).
Experiment #10 (JWP-II-24A) BiCI3 + NaN(SiMeA) 2 + BiSA;
BiSA + 2MOE + "Bi(2MOE) 3"
BiC13 (5.0932g, 15 mmol) and NaN(SiMe 3)2 (8.3g, 45 mmol)
were each dissolved in 75 ml Et 20 and added, one to the other, at
room temperature. The evolved heat boiled the solvent and a
yellow green-grey suspension resulted. This was stirred overnight
and the ether distilled off to near-dryness, then the remainder
removed in vacuo. This was extracted with pentane and filtered. To
the filtrate was added 10 ml 2MOE to get a clear and colorless
solution. The volume was reduced in vacuo and the solution's [Bi]
determined by hydrolysis and pyrolysis as Bi20 3 to be 0.11 mmol/g
solution. DTA/TGA (Figure 4.27) and PA-FTIR (Figure 4.7b) were
performed on the product, which was assumed to have the formula
Bi(2MOE) 3.
Experiment #11 (JWP-I-19) Bi 2O3 + acetic acid in open air +
Bi(OAc)3 + BiO(OAc)
Bi20 3 (30.692g, 66 mmol) was added to 100 ml glacial acetic
acid (1600 mmol) with heating and stirring. The yellow suspension
became white and was permitted to cool to room temperature,
producing large flat crystals which were covered with a fine white
powder. This was filtered and the solid washed with cold ethanol,
leaving a fine white powder. The sample was oxidized to Bi20 3 and
208

found to have a weight retention of 8 2 % (82% expected for
BiO(OAc) 3). Yield 100% based on bismuth oxide acetate.
Experiment #12 (JWP-II-77A) Bi 2O3 + acetic acid in N2 sweep
+ Bi(OAc) 3
Bismuth oxide was twice covered with glacial acetic acid in an
open Schlenk flask and boiled to near-dryness under rapidly flowing
nitrogen. During the first heating the pale yellow oxide suspension
became milky white, and during the second a colorless solution was
obtained. On cooling, white mica-like crystals formed and were
separated by filtration. Drying was completed under vacuum. The
material was stable indefinitely at room temperature under inert
atmosphere, but decomposed in air to an insoluble off-white talclike
powder. Yield: 100% of Bi recovered as Bi(OAc) 3. Elemental
analysis (Oneida): 18.42 C, 2.10 H (expected for Bi(OAc) 3 18.66 C,
2.35 H). The sample was decomposed at 700 0C in air to Bi20 3 and
the wt. retention was found to be 60%, consistent with Bi(OAc) 3
(60% expected) and not with BiO(OAc) (82% expected). DTA/TGA
showed total weight loss 40% actual, expected for conversion to
bismuth oxide 39.7%; decomposition steps at 275 0C to oxyacetate,
375 0C to oxide. (Figure 4.4) PA-FTIR: (cm-1) 3013 m, 2935 m, 2486
w, 2334 w, 1970 w, 1622 sh, 1542 s, 1426 s, 1348 sh, 1051 s, 1024
s, 941 s, 687 s, 617 m, 475 m (Figure 4.5). Powder XRD of the
material was difficult due to the high degree of orientation of the
crystals; the peak positions could not be matched to anything in the
JCPDS database, including JCPDS #14-0726 (Bi(OAc) 3) nor to the
patterns reported in the literature. 4 3 (Figure 4.2) The material was
209

ground in air and left open to air overnight, and the powder XRD
repeated to give a pattern matching JCPDS #14-0800 (BiO(OAc)).
(Figure 4.3)
X-ray diffraction was performed on a single crystal of the
bismuth acetate prepared in this experiment. Space group P2 1/a
a=12.0848 A, b=10.8859 A, c=7.2889 A, P=106.1730, Z=4. Atomic
distances and angles to be given in figure caption. (Figure 4.6)
The solubility of -77A in several solvents was tested: it was
soluble in 2MOE, ethylene glycol, and diglyme, but not in HOiPr,
benzene, or THF. The sample, after being ground and left open to
air overnight, would not dissolve even in large amounts of 2MOE
with warming.
Experiment #13 (JWP-II-77B) Bi(OAc) 3 + 2MOE ->
[Bi(2MOE)x(OAc) 3-x]
The procedure of Experiment #6 (II-77A) was repeated, and
hot 2MOE was added (20 ml) to dissolve the solid. On cooling, a
copious white puffy precipitate formed. This redissolved on heating.
2MOE was added to make up a total volume of 50 ml and the
solution left overnight at room temperature. The resulting white
solid mass occupied the entire solution volume. Addition of 50 ml
more 2MOE would not redissolve the solid, even with heating. The
white solid was collected and dried and decomposed at 700 0C for 1
hour in air. The resulting yellow powder, identified as Bi20 3, showed
an 80.0% weight retention. Bi(2MOE) 3 gives 53.7% weight
retention expected.
210

Experiment #14 (JWP-II-121) Bi(OAc) 3 + 2MOE ->
[Bi(2MOE)x(OAc) 3-x.]
Bi20 3 (6 g, 12.9 mmol) was added to a schlenk flask and
covered 3x with glacial acetic acid. The acetic acid was distilled off
each time under swift nitrogen flow. Finally, acetic anhydride was
added and removed in the same manner, and the resulting white
crystalline solid dried in vacuo overnight. (II-121A) 50 ml 2MOE was
added to this and stirred with warming to 50 0C to get a clear
solution which after a few minutes became milky. Another 25 ml
2MOE were added to produce a clear solution and the stirring and
heating discontinued. Within 6 hours white woolly fibers appeared
to be growing from the flask walls; within 12 hours the entire
solvent volume was occupied by a white fibrous material. Some of
this was removed and stored in the glovebox. (II-121B) The
solvent was removed in vacuo from the remainder: during this
removal the fibers broke up to give a milky suspension. The
resulting white amorphous solid was pumped down on over the
weekend, and some of it saved (II-121C). (Figure 4.7a)
The solid was insoluble in deuterated NMR solvents benzene,
THF, CHCI 3, and dimethoxyethane. It could not be redissolved in
2MOE but would dissolve in the V-2MOE solution in 2MOE.
DTA/TGA was done on the solid and showed a two-step
decomposition complete by 350 0C. (Figure 4.8a)
PA-FTIR was done on the solid and was found to overlay with that
of 11-24, the alcoholysis product of Bi(N(SiMe 3) 2) 3. (Figure 4.7b)
211

Figure 4.25: DTA/TGA of [Bi(N0 3)2(0(CH 2CH 20) 4)12* 2 MeOH.
Heating rate: 25 OC/min.
(o.) souv-iswoc ejn~jmdwea±o in
I I
'4-
ILLNE
0
LlL
C) 0u
212

Figure 4.26a: DTA/TGA of Bi(N(SiMe 3)2)3. Heating rate: 25
*C/min.
(o.) 9ou9.js4flIc a-jfl;94edWa9j 0
CU ID ID 'cu v w w w
cu'41
gcx
P.--..M M.
21

Figure 4.26b: DTA/TGA of the product of the alcoholysis of
Bi(N(SiMe 3) 2)3 with 2MOE, after hydrolysis and removal of
solvents. Heating rate: 25 "C/min.
C> in
SI a
wU
0ICU
0
0-oID
0-o
4J
CLMJ
CU
00~-1
1001
w% 418M
- 10-
CUa.,
001a.O
214

Figure 4.27: DTA/TGA of the product of the alcoholysis of
Bi(N(SiMe3)2)3 with 2MOEU Heating rate: 25 OC/min.
(o.) 9)ui9,jse4T ejn4i9.iadws.CUC
N 0 I I10
0
-0
o O
LnL
wC.)
0 Sa.;00
+ Lq
0
-0
0In 0 In In
215

4.4.3 Bulk Bi 2VO5.5
Experiment #15 (JWP-I-43) Bi(N0 3) 3-5H20 + V(OBu) 4;
Bi(N0 3) 3 -nH 20 + V(OBu) 4 ; to make Bi 2 VO5 .5
To Bi(N0 3) 3-5H 20 (4.3834 g, 9 mmol) dissolved in 10 ml glacial
acetic acid was added V(OBu) 4 (3.333 g, 4.5 mmol), resulting in an
instant orange precipitate. To the same weight of Bi(N0 3)3-5H 20
which had been left in a dessicator with P20 5 for several days (34%
weight loss), the same amount of V(OBu) 4 was added. A deep red
liquid, which eventually settled out an orange ppte, was formed.
On addition of water to each a yellow ppte settled out. There was
no gelation.
Experiment #16 (JWP-I-43) Bi(N0 3) 3-5H20 + V-2MOE + to
make Bi 2VOS.S
V-2MOE (18.4748 g, 4.5 mmol) was added Bi(N0 3) 3-5H 20
(4.3835g, 9 mmol) dissolved in 10 ml glacial acetic acid. A clear
orange-brown solution resulted. This was hydrolyzed to yield a
yellow precipitate which, after heating at 350 0C was found by XRD
to contain only BiVO4 ; likewise the solid, pressed as a pellet and
heated to 600 0C for 44 h and found to be a mixture of BiVO 4 and
Bi 2VO5.5.
216

Experiment #17 (JWP-I-54(3)) Bi(N0 3 ) 3 -5H 20 + VO(OiPr) 3 ->
to make Bi 2VO5 .5
#1 (Nitric acid present)
Bi(N0 3)3-5H 20 (4.3813 g, 9 mmol) was dissolved in 30 ml
glacial acetic acid and 10 ml isopropanol and 1 ml concentrated nitric
acid (initial pH 2.96). VO(OiPr) 3 (1.1210 g, 4.57 mmol) were added.
The solution became orange yellow instantly, and was clear.
Addition of 1 ml (56 mmol, 4x excess) water give no change. After
heating, 1 ml more water was added and a yellow precipitate
settled out from a pale green liquid. The dried powder was
amorphous to XRD but after heating to 350 OC may have contained
poorly crystalline BiVO 4 and Bi 2VO5 .5 . After heating to 650 0C (12h)
the XRD showed BiVO 4 and Bi 2 VO5 .5 peaks.
#2 (No nitric acid)
Bi(N0 3)3-5H 2 0 (4.3804 g,9 mmol) was dissolved in 30 ml glacial
acetic acid and 10 ml isopropanol (pH measured 2.65), and
VO(OiPr) 3 (1.1106 g, 4.53 mmol) added. A light yellow-orange
precipitate formed immediately. Addition of 1 ml (56 mmol, 4x
excess) water of caused the precipitate to settle. After drying the
precipitate was dark orange with white flakes and was mostly BiVO4
by XRD. After decomposition at 350 0C the solid showed BiVO 4 only,
but after heating as a pellet at 650 0C (12 h) the XRD showed a mix
of BiVO 4 and Bi 2VO 5.s.
217

Experiment # 18 (JWP-I-58) Bi(N0 3) 3-5H 2 0 + VO(OiPr) 3;
Bi(N0 3) 3 -nH 20 + VO(OiPr) 3 + both to make Bi 2 VO.s5
Bi(N0 3) 3-5H 20 (5.0140 g, 10.34 mmol) was stored in a
dessicator over P2 0 5 for 1 week then weighed to find that the new
weight was 4.6990, a 33.8% loss attributed to loss of 1.75 H20.
This was added to 30 ml glacial acetic acid and 30 ml HOiPr and
warmed to dissolve. VO(OiPr) 3 (1.268 g, 5.17 mmol) was added to
produce a yellow solution. Water was added to part of the sample
(8x excess, 2 ml) and a light yellow precipitate formed. The solvent
was evaporated off with heating. XRD showed a mixture of BiVO 4
and Bi 2VO 5.s.
The same procedure was followed using Bi(N0 3) 3-5H 20 that
had not been left over P2 05 . The XRD showed only BiVO 4 in the
sample.
Experiment #19 (JWP-I-85) Bi(N0 3) 3-2.5H20 + V-2MOE + to
make Bi 2 VOs.5
Bi(N0 3) 3-5H 20 (5.0325 g, 10.4 mmol) was left in a dessicator for 2
weeks over P20 5 (weight loss attributed to loss of 2.5 H2 0) was
dissolved in 30 ml acetic acid and 20 ml 2MOE. This was added to
V-2MOE solution (25.01 g, 2.55 mmol) to give a yellow-orange
solution accompanied by a slight exotherm. 2 ml water were added
to give instant milkiness. The solvent was evaporated from the
218
sample, leaving a yellow-white powder which was heated on a
hotplate (ca 300 'C) for 1 hr then identified by XRD as BiVO 4.
Experiment #20 (JWP-I-97) [Bi(N0 3) 2 (O(CH 2 CH 2 ) 4 )]2*2
MeOH + V-2MOE + to make Bi 2VO5 .5
[Bi(N0 3)2 (O(CH2 CH 2 0) 4 )] 2 - 2 MeOH (See Expt. 8, 2.1178 g, 3.63
mmol) was added to 25 ml each of acetonitrile and methanol with
warming and stirring, to produce a white susp. To this was added
V-2MOE (17.835 g, 1.82 mmol) to give a dark yellow milky
suspension. Part of this was permitted to evaporate, yielding a
green powder with orange-yellow flecks. The remainder was
hydrolyzed with excess water and the resulting gelatinous
precipitate divided: part was and the solid set aside, and part was
evaporated. All samples' powder XRD show BiVO 4 after heating for
3 h at 525 0C.
Experiment #21 (JWP-I-100) [Bi(N0 3) 2 (O(CH 2 CH 2 O) 4 )] 2 * 2
MeOH + VO(OiPr) 3 + to make Bi 2VO.s5
[Bi(N0 3)2(O(CH2CH 20) 4)] 2- 2 MeOH was made freshly by
adding Bi(N0 3)3-5H 20 (4.9607g, 10.02 mmol) in 25 ml methanol and
75 ml acetonitrile to a suspension of tetraethylene glycol (2.5102 g,
12.92 mmol) in methanol in a 250 ml three-neck flask equipped with
a condensor. The mixture was refluxed under nitrogen for 2.5
hours, yielding a milky suspension and a white precipitate. This was
hot-filtered via a cannula filter and cooled to room temperature
219

slowly, then left at 0 0C overnight. This was cold-filtered to collect
white crystals of [Bi(N0 3)2(O(CH 2CH 20)4)] 2- 2 MeOH (4.34 g, 36%).
A second crop was not collected.
The sample of [Bi(N0 3)2(O(CH 2CH 20)4)] 2 made above was
added to a 3-neck flask equipped with a condensor (4.0131 g, 3.44
mmol) with 75 ml acetonitrile and 25 ml methanol at reflux. To this
was added VO(OiPr) 3 solution (0.844g, 3.45 mmol). The mixed
solution became a clear yellow-orange. This was stirred for 15
minutes, then cooled and hydrolyzed with one equivalent of water
and the liquids evaporated off the sample. The resulting solid was
calcined at 600 OC for 12 h, resulting in an inhomogenous material
with a powder XRD pattern matching BiVO 4 (JCPDS 14-688).
Experiment #22 (JWP-I-103) commercial Bi(OAc)3 + V-2MOE ->
to make Bi2 VO.S5
Bi(OAc) 3 (2.6743 g, 6.93 mmol commercial product) was added
to 50 ml glacial acetic acid and heat to produce a white milky
suspension. 25 ml 2MOE were added, followed by 34.02 g V-2MOE
(3.47 mmol) in 20 ml 2MOE, yielding a yellow solution. When 1.0 ml
water (4 equivalents) was added to the hot solution, a precipitate
formed, then redissolved and the solution became yellow-green.
The solvent was evaporated to a light green-brown solid. This is
pyrolyzed 350 OC/32h and 650 OC/lh in air. Powder XRD showed
BiVO 4 and trace Bi 2VO5.s.
220

Experiment #23 (JWP-II-35 (repeated JWP-II-37)) Bi(OAc) 3 +
V-2MOE, refluxed -> to make Bi 2VOS.S
Bi20 3 (1.20g, 2.58 mmol) was added to a 3-neck flask with 25
ml glacial acetic acid and heated to near-dryness, with air blown
across the surface of the suspension to increase the rate of
evaporation of the acetic acid. This produced a fine white powder,
which was air-dried then put under nitrogen. 75 ml 2MOE were
added and the mixture warmed to distillation. The white solid
nearly dissolved in cold 2MOE but on heating became very milky.
Most of the solvent was distilled off; 100 ml more 2MOE was added
and the milky white mixture permitted to cool. V-2MOE (19.26 g, 1.3
mmol) was added to yield a milky yellow solution. This was refluxed
overnight, leaving a chocolate brown mixture which was distilled to
dryness, then heated 1.5 h at 650 OC - XRD showed BiVO 4 and
Bi 2VO 5.5 ; then 625 OC/8 h and 650 OC/20 h - the final XRD showed
Bi 2VO 5.5 and trace amounts of BiVO 4.
Experiment #24 (JWP-II-39) Bi(OAc)3 + V-2MOE, assorted
hydrolysis conditions
Bi 2 0 3 (1.2055 g, 2.59 mmol) was added to 15 ml glacial acetic
acid and heated under flowing N2. Another 15 ml acetic acid was
added and evaporated off to near dryness. Finally, air was blown
across the solid to dry it. The resulting solid was mostly-dissolved
in 25 ml warm 2MOE and V-2MOE solution (19.9225 g, 1.3 mmol)
added to give a clear yellow solution. 2MOE was added to a 65 ml
221

final volume and the mixture stirred 2h at room temperature.
11-39-0 was the resulting solution. 'H NMR peaks at (6, ppm)
1.66(s), 3.08 (s), 3.24 (s, broad) in C6D6 . This was hydrolyzed to a
golden-brown gel.
11-39-1: 10 ml of solution 39-0 (0.4 mmol Bi) was hydrolyzed
with 1 ml (70x excess) of (2.5 ml 2MOE + 0.5 ml H20 + 0.5 ml acetic
acid) and became milky instantly. Left open, it became a yellow gel
overnight.
11-39-2: 10 ml solution 39-0 was hydrolyzed with 1 ml of (2.5
ml 2MOE + 0.5 ml H20 + 0.5 ml NH 40H) to give a white-yellow
stringy precipitate. Left open overnight, it became a gelatinous
white-yellow precipitate in a clear and colorless solvent.
11-39-3: 10 ml of 39-0 was hydrolyzed with 1 ml of (2.5 ml
2MOE + 1.0 ml H20) and became slightly more viscous. Left open
overnight, it became a translucent yellow gel.
11-39-4: 5 ml solution 39-0 was hydrolyzed with 1 ml of (1.25
ml 2MOE + 0.25 ml H20 + 0.25 ml HNO 3) became darker orange but
stayed clear. Left open overnight, it remained a yellow liquid.
All of the gels were dried and heated for 8 h at 600 OC in air
and XRD to show BiVO 4 + Bi 2VO5 .5 + amorphous phase which is
probably Bi20 3 . A second heating of each of these at 650 OC for 20
h gives in all cases Bi 2VO5 5.
DTA/TGA was done on the hydrolyzed and unhydrolyzed 39-0.
Solvent was removed from both prior to thermal analysis The
unhydrolyzed material showed a two-step decomposition, with a
large exotherm at the second step, complete by 350 OC. (Figure
4.28a) A second sample of the unhydrolyzed material was aged for
six months; its decomposition is similar but has a more pronounced
222
first decomposition step. (Figure 4.28b) Formation of an equilibrium
complex in the precursor solution may have occurred over the aging
period, leading to an initial step in the decomposition involving the
breaking of these complex bonds. The hydrolyzed material,
conversely, shows a multistep decomposition not complete until 430
OC. (Figure 4.10)
Experiment #25 (JWP-II-12A) Bi(N(SiMe3 ) 2) 3 + V-2MOE + to
make Bi 2VOS.S
Bi(N(SiMe 3)2)3 (0.6348g, 0.92 mmol) was added to a
round-bottom flask in the glove box and dissolved in 50 ml 2MOE to
give a clear and colorless solution. V-2MOE (3.7572 g, 0.45 mmol) in
15 ml 2MOE was added to the bismuth solution. 5 ml of this clear
yellow solution was hydrolyzed with 2 ml of water (800x excess) to
give a yellow-white translucent material. A gel formed as the
volume of the solution was reduced in vacuo. This gel was dried
and pyrolyzed at 500 OC for 12 hours to produce a powder whose
XRD shows only Bi 2VO.5 5 . Another 5 h at 600 OC improved the
crystallinity and confirmed phase-purity. DTA/TGA performed on the
600 OC sample to demonstrate phase changes at proper places.
EDX showed some contamination with Na and Si.
Experiment #26 (JWP-II-30-5) "Bi(2MOE) 3" + V-2MOE + to
make Bi 2VO.5 5
To 10 g of the solution of "Bi(2MOE) 3" made in Experiment #10
above (0.1078 mmol Bi) were added 4.378 g V-2MOE (0.05 mmol).
223

The resulting yellow solution was hydrolyzed with 0.5 ml H2 0 in 1.0
ml 2MOE (150x excess) to give a yellow-white gelatinous
precipitate. This was left open overnight to leave a yellow
gelatinous precipitate that settled out of a clear and colorless liquid.
Removal of the solvent by heating left brown lumps which on
heating for 8 hours at 500 0C in air gave poorly crystalline Bi 2VO 5.5 ;
heatings at 600 OC/10h and 650 OC/12h gave Bi 2VO5 .5 of improved
crystallinity
Experiment #27 (JWP-II-58) Bi-2MOE + V-2MOE
A solution of Bi(N(SiMe 3)2)3 in 2MOE (8.952g, 3.146 mmol Bi) was
added to V-2MOE (10.612 g, 1.6 mmol) and the clear yellow solution
stirred at room temperature for 3 hours. The volume was reduced
by half in vacuo. This was stirred another 3 hours and divided in
half: to II-58A 1.0 ml (17.5x excess) of water was added, resulting
in a white gel formation in a yellow solution, which was left open
overnight and gelled throughout; II-58B was left open overnight
without addition of water. When hydrolyzed, -B became a gel
almost instantly. Both samples were oven dried for 6 hours and
heated 8 hours at 450 0C. XRD of each of these showed Bi 2VO5 .5 ,
with very small or nonexistent BiVO 4 peaks; each pyrolyzed sample
was then heated at 550, 650, and 750 0C with improvements in
crystallinity. Some of the stray peaks could be identified as Bi 12 SiO 20
or NaCl. (Figure 4.16)
224

Experiment # 28 (JWP-I-89) Conductivity of BiVO4
Approximately 4 g of BiVO4 were ground finely in an agate
mortar, then pressed into a 1/2" pellet mold at 7500 psi. The pellet
was placed on an alumina boat on platinum foil and heated at 10
0C/min. ramp rate to 800 0C for 24 h, then cooled at 5 OC/min. to
room temperature. The outside surface of the pellet became purple,
but after the very outer layer was removed with fine-grained
sandpaper, the underlayer, and presumably the bulk, showed the
yellow color expected of BiVO4 . The pellet was measured with a
vernier calipers and weighed, and density calculated to be 6.457
g/cm 3, some 92.9% of the theoretical density (based on cell
dimensions given in JCPDS #14-688) of 6.949 g/cm 3. Opposing
faces were painted with platinum ink and the pellet, stood on its
edge on a platinum sheet in an alumina boat, heated again with a
20 OC/min ramp to 800 0C for 5 min., followed by cooling to room
temperature at 25 OC/min. The conductivity of the pellet was
measured by complex impedance spectroscopy, as described in the
Appendix to Part I of this thesis. Measurements were made at 50
0C intervals from 350 0C to 750 OC. At several temperatures the
data showed spiky or otherwise nonsmooth high-frequency arcs,
which may have indicated some separation into bulk and grain
boundary resistances, and several cases a second low-frequency
arc indicated that the electrode had become non-blocking (e.g.
significant electronic conduction). Because the worst-case or
lower-limit of the actual conductivity was the information sought,
the separation of the bulk and grain boundary contributions was
225

not calculated. All of the conductivity values given are based on the
sum of the grain and bulk resistances, therefore. Figure 4.11 shows
the impedance spectra for BiVO 4 at several temperatures. Figure
4.12 shows the plot of conductivity with temperature.
Experiment # 29 (JWP-I-109) CI Measurement on a Mixed-
Phase Pellet
A three-necked flask equipped with a vigreaux column,
side-arm condensor, and receiver, all under nitrogen, was charged
with of VO(OiPr) 3 (2.453 g, 10 mmol) and 20 ml 2MOE. The mixture
was heated until the vapor temperature was 100 0C, then 5 ml
more 2MOE were added twice, with distillation to vapor temperature
of 100 0C on the first time and to 120 OC on the second time. The
distillation was stopped. Meanwhile, "Bi(OAc) 3" (7.7222g, 20 mmol)
made in an open vessel (Expt. 11) were dissolved with heating and
stirring in 180 ml of a 1:1 2MOE/glacial acetic acid mixture. The hot
contents of the distillation apparatus were added to the hot
bismuth solution, yielding a green-brown mixture with brown
precipitate. A mixture of 10 ml each of 2MOE, acetic acid, and water
was slowly added, producing a white precipitate. The solution was
boiled to remove solvent with stirring, and appeared to homogenize
somewhat; it became an orange-green color. After stirring for 2
days, the solvent was completely boiled off, and the
yellow/green/brown/white inhomogenous solid transferred to an
alumina crucible and heated at 400 0C for 3 hours. It was found by
XRD to contain a mixture of BiVO4 and Bi 2VO 5.s. (Figure 4.29) The
sample was pressed into a 1/2" pellet at 10,000 psi and the faces
226

sanded smooth. The pellet was heated at 250 OC for 12 h, then
measured and weighed, and the density found to be 5.06 g/cm3,
64% of theoretical density (7.80 g/cm 3) if the pellet were all Bi 2VO5 .5
and 78% of theoretical density (6.949 g/cm 3) were the pellet all
BiVO 4 . The faces of the pellet were not prepared with platinum ink
due to the high decomposition temperature of the ink binder. This
was not anticipated to cause a significant difference in the
results. 5 8 Complex impedance measurements were conducted as
described in the Appendix to Part I of this thesis. Measurements
were made at temperature intervals of 25 or 50 OC from 200 0C to
700 OC, and back to 275 OC. After removal from the apparatus, the
pellet was inhomogenous, with orange and yellow speckles; it was
ground for XRD and found to contain (Figure 4.30) unknown peaks
(they did not match JCPDS #14-699. 14-688, or 9-387, nor Bi 2VO5 .5 ).
For the first few temperature data-points the conductivity was
insufficiently high to provide a readable arc among the noise points.
A clear trend could not be clearly distinguished until approximately
500 OC: here the high-frequency arc was ignored and the
conductivity (principally electronic) found from the intercept of the
line (see Figure 4.13 for representative impedance plots). Two of
the cooling-side plots were analyzed using the high-frequency arc,
as the line was indistinguishable. See Figure 4.14 for the plot of
conductivity vs. temperature. It should be noted that the main
mechanism for the increase in conductivity on the cooling leg of the
plot is the increased density of the pellet after being heated to 700
OC.
227
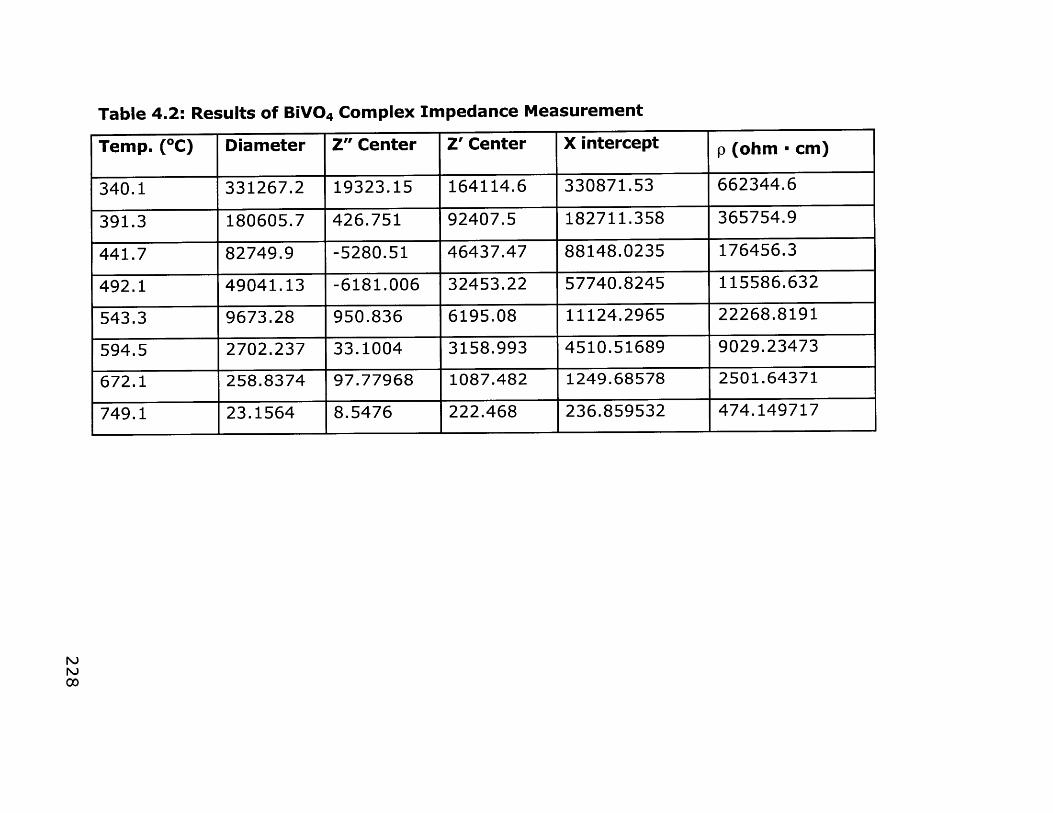
Table 4.2: Results of BiVO4 Complex Impedance Measurement
Temp. (*C) Diameter Z" Center Z' Center X intercept p (ohm - cm)
340.1 331267.2 19323.15 164114.6 330871.53 662344.6
391.3 180605.7 426.751 92407.5 182711.358 365754.9
441.7 82749.9 -5280.51 46437.47 88148.0235 176456.3
492.1 49041.13 -6181.006 32453.22 57740.8245 115586.632
543.3 9673.28 950.836 6195.08 11124.2965 22268.8191
594.5 2702.237 33.1004 3158.993 4510.51689 9029.23473
672.1 258.8374 97.77968 1087.482 1249.68578 2501.64371
749.1 23.1564 8.5476 222.468 236.859532 474.149717
NPQ
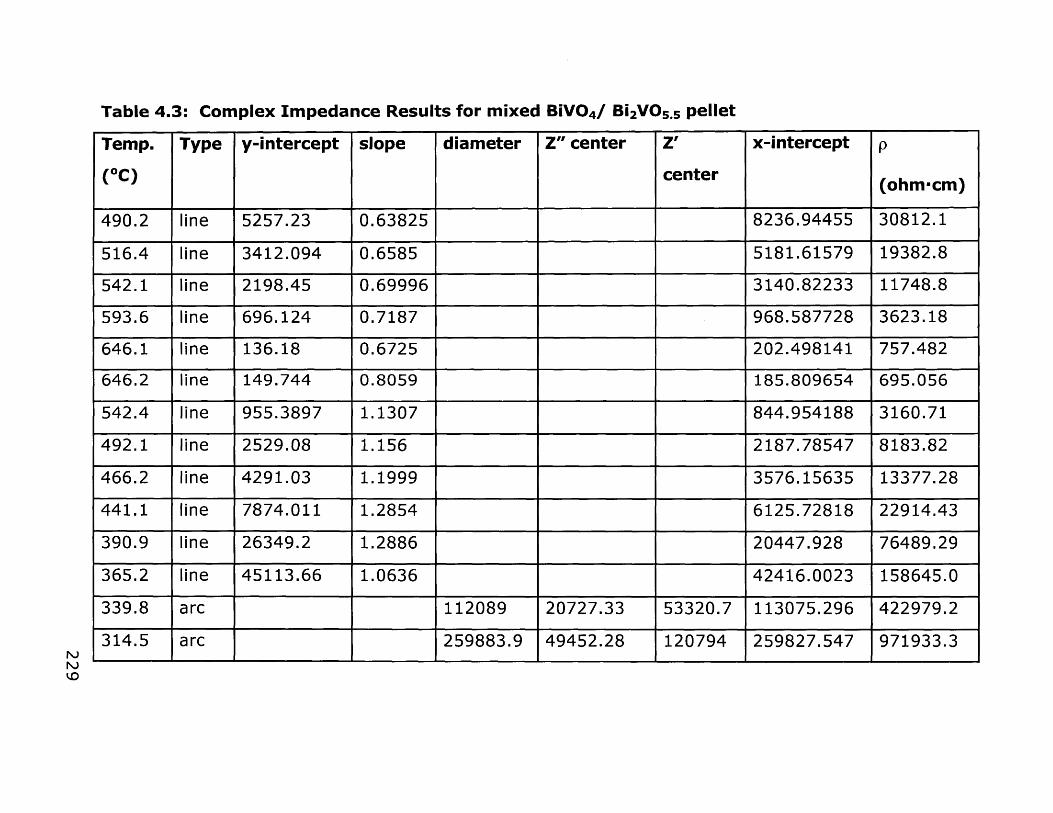
Table 4.3: Complex Impedance Results for mixed BiVO4/ Bi 2VOs.s pellet
Temp. Type y-intercept slope diameter Z" center Z' x-intercept p
(*C) center (ohm-cm)
490.2 line 5257.23 0.63825 8236.94455 30812.1
516.4 line 3412.094 0.6585 5181.61579 19382.8
542.1 line 2198.45 0.69996 3140.82233 11748.8
593.6 line 696.124 0.7187 968.587728 3623.18
646.1 line 136.18 0.6725 202.498141 757.482
646.2 line 149.744 0.8059 185.809654 695.056
542.4 line 955.3897 1.1307 844.954188 3160.71
492.1 line 2529.08 1.156 2187.78547 8183.82
466.2 line 4291.03 1.1999 3576.15635 13377.28
441.1 line 7874.011 1.2854 6125.72818 22914.43
390.9 line 26349.2 1.2886 20447.928 76489.29
365.2 line 45113.66 1.0636 42416.0023 158645.0
339.8 arc 112089 20727.33 53320.7 113075.296 422979.2
314.5 arc 259883.9 49452.28 120794 259827.547 971933.3NJNJ

Figure 4.28a: DTA/TGA of the Bi 2VO5 . gel precursor JP-II-39-0,
solvent removed soon after mixing. Heating rate: 25 *C/min.
(0.) sou8sja44jC ain;ajodwej.
10
Go UOr"
0It)
I0
0N ED
(z) 4qIGM
230
011~~r4
toa)
' I0 ' I
UM
IC
L4J
a
L

Figure 4.28b: DTA/TGA of the Bi 2VO5 .5 gel precursor JPII1-39-O,
solvent removed after six months' aging of the solution. Heating
rate: 25 OC/min. (01 G~a~jaaiqjdIn 0 in 0 in
V.4
0O-0
wU
L.
C.4J
--
00
o 0 0I0
41)4BjOaM
231

Figure 4.29: Powder XRD of sol-gel Bi 2VO.S. contaminated with
BiVO4. The sample was pressed into a pellet and its conductivity
was checked by C1.
0
(D
0
0=0
=W-0
CSu
CM 0
=0U
Ll) Iq C CUU,) (D U3 0 (
"4 0) LO CU
L) Z F- U) V) In L)U
232

Figure 4.30: Powder XRD of sample from Figure 4.29, after CI
data was taken. None of the peaks match the known oxides of Bi
and/or V.
LCU
a) CO a)--IV4 I
U1 17
WN M 0)U
ul N (n 0) u
233

4.4.4 Synthesis of Bulk BiMeVOx
Experiments with a notebook numbering KD-x were performed by
UROP Katya M. Delak under my technical guidance.
Experiment #30 (JWP-II-99A1) Solid State Synthesis of
Standard Bi 2VOS.S
Bi 2VO5 .s was made by solid state methods to provide a standard
against which sol-gel prepared samples could be checked.
Stoichiometric quantities of Bi20 3 (9.3190 g, 20 mmol)) and V205
(1.8188 g, 9.9 mmol) were ground under acetone and pressed into
a 1/2" pellet at 7000 psi. The pellet was placed on platinum foil in a
small alumina crucible and heated at 850 0C for 20 h (heating 10
OC/min, cooling 4 OC/min), then re-ground and re-pressed, and
heated under the same regime for 40 h. The XRD pattern compared
favorably with that reported in the literature. 3 7 (Figure 4.31)
Experiment #31 (JP-II-99B2) Solid state synthesis of standard
Bi 2CuO.IVO. 9 05 .35
Bi 2 CuO. 1VO. 9 0 5 .35 was made by solid state methods to provide a
standard against which sol-gel prepared samples could be readily
compared. Stoichiometric quantities of Bi20 3 (9.3190g, 20 mmol),
V205 (1.637g, 9 mmol), and CuO (0.1591g, 2 mmol) were ground
under acetone in an agate mortar ad the mixed powder pressed
into a 1/2" pellet at 7000 psi. The pellet was placed on platinum foil
234

in an alumina crucible and heated for 20 h at 850 0C (10 0C/min
heating, 5 0C/min cooling), then removed, reground, re-pressed,
and heated for another 40 h at 850 OC (same heating/cooling
rates). Powder XRD showed clean y-phase Bi 2CuO. 1VO. 905 .35, indexing
gives a=3.9179 A, c=15.4478 A, all angles 900. (Figure 4.32)
Experiment #32 (JWP-II-97b) Bi(OAc) 3 + V-2MOE +
Cu(2-ethylhexanoate) 2 with acetylacetone + to make
Bi 2CUo. 1V0 .90 5 .3 5
Bi(OAc) 3 (1.9306g, 5 mmol) was added in the glove box to a
flask and dissolved in 50 ml 2MOE. V-2MOE (3.0972 g, 2.25 mmol)
in 25 ml 2MOE was added. Copper 2-ethylhexanoate (0.0875 g,
0.25 mmol) was dissolved in 25 ml 2MOE and added into the Bi/V
solution, which became green-yellow. 2,4-pentanedione (10 ml,
100 mmol) in 25 ml 2MOE was added, and the solution turned dark
red-brown. This was stirred at room temperature overnight, then
hydroyzed with 10 ml water to give a yellow-green viscous solution.
Over two days this became a green gel with a green supernatant.
The gel was dried together with the supernatant at 120 0C, then
heated at 700 OC in air for 10 h to yield an inhomogenous orange
and yellow solid. This was identified by XRD as a mixture of Bi 2VO5 .5 ,
BiVO 4 , and Bi 2 0 3.
A sample of the solution was hydrolyzed and permitted to
stand without stirring, then heated to dryness and pyrolyzed as
above. XRD showed a combination of BiVO 4 and Bi 2VO 5.s
235

Experiment #33 (JWP-II-103) Bi(OAc) 3 + V-2MOE +
Cu(2-ethylhexanoate) 2 + to make Bi2CuO1 VO.9 0 5 .35
Bi(OAc) 3 (7.7222g, 20 mmol) was added to V-2MOE (12.393 g,
8 mmol) and copper 2-ethylhexanoate (0.3501 g, 2 mmol) in 200 ml
2MOE to give a green solution. This was stirred over the weekend
then the volume was halved by heating under vacuum. The solution
was hydrolyzed with 10 ml H20 (17x excess) + 5 ml glacial acetic
acid in 10 ml 2MOE. A white-green gel formed with a green
supernatant liquid. This was stirred and dried together at 120 0C
overnight to leave a solid which was green-grey on the bottom and
yellow on top; there were blue deposits on the beaker sides. The
solid was pyrolyzed at 700 0C/10 h in air and identified by XRD as
Bi 2 CuO. 1VO. 90 5 .3 5 . However, the solid from the furnace was
inhomogenous in color; contaminants at below XRD detection level
were assumed.
Experiment #34 (JWP-II-105) Bi(OAc) 3 + V-2MOE + Cu(OAc) 2
+ Bi 2 CuO.1 VO. 90 5 .3 s
Bi(OAc) 3 (7.7224 g, 20 mmol) dissolved in 150 ml 2MOE. To a
second flask were added Cu(OAc) 2 (0.1816g, 2 mmol) and V-2MOE
(12.3889 g, 8 mmol) in 50 ml 2MOE. The bismuth solution was
added into the V/Cu solution and stirred over the weekend to leave
a green opalescent solution with a small amount of white solid
precipitate. The solvent volume was reduced in vacuo to about 160
ml and the sample was split into two parts, one of which (B) was
hydrolyzed with 5 ml acetic acid/10 ml H20/10 ml 2MOE (17x excess)
and the other (C) with 10 ml H2 0/10 ml 2MOE (17x excess). Both
236
gelled instantly, B with a loose gel texture and the appearance of
white fibers with a teal green supernatant liquid, C with a
orange-green firm gel with a more homogenous appearance and a
pale yellow supernatant liquid. Both were dried overnight to leave
yellow solids with blue copper deposits on the beaker sides. They
were heated at 700 oC/10 h. XRD of both show clean y phase.
(Figure 4.17)
Experiment #35 (JWP-II-107) Bi(N(SiMe3 ) 2) 3 + V-2MOE +
Cu(OAc) 2 + Bi 2 CuO.lVO.9 0 5 .35
Bi(N(SiMe 3)2)3 (0.9880 g, 1.43 mmol) was dissolved in 10 ml
2MOE. In a second flask Cu(OAc) 2 (0.0128g, 0.072 mmol) and
V-2MOE (0.8684g, 0.65 mmol) were dissolved in 15 ml 2MOE. This
was added to the bismuth solution with 15 ml 2MOE rinse and
warmed 5 min with stirring to give a yellow-green solution. This
was hydrolyzed with 0.3 ml water (1 equivalent) in 0.7 ml 2MOE.
Gelatinous white clusters appeared; the sample was left lightly
covered overnight. A blue solid gel in a clear and colorless
supernatant resulted; the solvent was driven off with heating and
the resulting cohesive gel cake pyrolyzed at 700 OC for 10 h in air.
XRD shows clean y phase.
Experiment #36 (JWP-II-113) Bi(N(SiMe 3) 2) 3 + V-2MOE +
Cu(OAc) 2 + Bi 2 CuO.lVO.905 .35
Bi(OAc) 3 (15.4448g, 40 mmol) was dissolved in 225 ml 2MOE
with Cu(OAc) 2 (0.3639 g, 2 mmol) and V-2MOE (24.7773 g, 18 mmol)
237

and the solution stirred 2.5 h to yield a clear deep green solution.
Some (15 ml) was set aside and the remainder hydrolyzed with 1.0
ml water (0.8 equivalents), giving a dark blue-green opaque
solution with some white precipitate. This did not gel on standing
overnight. 1 ml more water (total 1.6 equivalents) was added and
the solution stirred with warming to get a thick green gel. This was
divided into 4 samples and heated for 8 h at 350, 450, 550, and 650
0C in Ni crucibles in air. XRD showed y phase appearance at 350 0C
and clean at 450 OC. (Figure 4.22)
Some of the 650 0C sample was set aside and pressed into a
1/2" pellet at 9000 psi. The pellet dimensions were measured and
the density found to be 5.0322 g/cm3 , some 65% of theoretical
density (7.784 g/cm 3 theory). The faces were painted with platinum
ink and the sample heated at 300 0C for 8 h; however, it was found
that the ink did not decompose, so it was sanded off the faces.
Complex impedance spectroscopy was done on the sample
according to the procedure noted in the Appendix to Part I of this
thesis. Impedance measurements were taken at temperature
intervals of 25 or 50 0C from 250-825 0 C, with a short cooling leg to
475 0C and a second heating leg to 825 OC. The final density was
6.075 g/cm 3, 78% of theoretical.
The first several temperatures were extremely noisy and only
barely able to be fitted with a high-frequency arc, but by 325 0C the
high-frequency arc arising from the combined bulk and
grain-boundary resistances and a line arising from electronic
conductivity is clearly evident. (Figure 4.23) By higher
temperatures still the high-frequency part of the slightly-curved line
is fitted to the left side of the arc; this is justified by the portions of
238

the data falling below x-axis, which indicate an overlaid semicircle
and line. Figure 4.24 shows the conductivity vs. temperature plot.
Experiment #37 (JWP-II-115) Bi(N(SiMe3 ) 2) 3 + V-2MOE +
Cu(OAc) 2 -> Bi 2 CuO.IVO. 90 5 .35
To a round-bottom flask was added Bi(N(SiMe 3)2)3 (1.1061 g,
1.6 mmol), Cu(OAc) 2 (0.0152g, 0.08 mmol) and V-2MOE (0.9951g,
0.72 mmol). These were dissolved in 25 ml 2MOE. The solution was
hydrolyzed with 0.1 ml water (2 equivalents) to a powder
blue-green gel which produced a colorless supernatant overnight.
The solution was poured off and dried with virtually no residue. The
gel was divided into 4 samples which were heated 8 hours at 350,
450, 550, and 650 OC respectively, in Ni crucibles in air. XRD showed
y phase appearance at 350 OC with some amorphous phase
contamination; BiVO 4 peaks appear in the 450 OC sample, but the
550 0C sample is phase-pure y-BiCuVOx.
Experiment # 38 (KD-I-7) Solid State synthesis of standard
sample of Bi 2 NbO.3VO.7 05 .5
Stoichiometric quantities of Bi20 3 (4.6596g, 10 mmol), V20 5
(0.6366g, 3.5 mmol), and Nb 205 (0.3987g, 1.5 mmol) were ground in
an agate mortar under acetone, then pressed into a pellet and
heated at 850 0C for 40 h (heating 10 OC/min, cooling 5 OC/min). The
sample, after XRD, found not to have incorporated the Nb, and it
was reground, pressed into a pellet, and heated at 1000 0C for 20 h
239

(heating 10 OC/min, cooling 5 OC/min). Examination by PXRD showed
phase pure Bi 2NbO. 3VO. 7 05 .5. (Figure 4.35)
Experiment #39 (KD-31) Bi(OAc) 3 + NbCI 5/2MOE +
Bi 2VO. 7 NbO. 3 0 5 .5
Bi(OAc) 3 (0.5 g, 1.3 mmol) was dissolved in 40 ml 2MOE and V-
2MOE (1.201g, 0.46 mmol) added. In a separate flask, NbCI5
(0.0725 g, 0.2 mmol) was dissolved with warming in 25 ml 2MOE
and added to the Bi/V solution. The solution became cloudy yellow.
The solution was hydrolyzed with 0.031 ml water (1.5 equivalents)
was added to this solution, resulting in two milky layers, one white,
the other yellow. The two layers were separated and heated 450
OC/8 h then 550 OC/ 8h. The XRD pattern did not match the
expected y phase pattern for Bi2 Nbo.3VO. 70 5 .5.
Experiment #40 (KD-50) Bi(OAc) 3/diglyme + V-2MOE +
Nb(OiPr)s + Bi 2 VO.7 Nbo.30.5
Bi(OAc) 3 (0.5 g, 1.3 mmol) was added to 30 ml diglyme and the
mixture warmed to dissolve all solids. Nb(OiPr)5/HOiPr solution
(0.676g., 0.197 mmol) and V-2MOE solution (1.6976 g, 0.46 mmol)
were added and warmed with stirring for 1 hour to give a
transparent yellow solution. The solution was left open to air (not
hydrolyzed) for 12 hours, then heated in a 60 oven for 3 h to form
an opaque gel, which was heated at 350 and 450 0C for 8 h in air.
The 350 0C sample was too poorly crystalline to show much in the
240

XRD, while the 450 OC sample, while poorly crystalline, showed
phase pure Bi 2 NbO. 3VO. 7 05 .5. (Figure 4.18)
Experiment #41 (KD-51) Bi(OAc) 3/2MOE + V-2MOE +
Nb(OiPr)s + Bi2VO7 Nbo.30 5 .5
Bi(OAc) 3 (0.5g, 1.3 mmol), V-2MOE (1.6800 g, 0.46 mmol) , and
Nb(OiPr) 5 solution (0.675 g, 0.196 mmol) were added together with
20 ml 2MOE. With warming and stirring a transparent bright yellow
solution resulted. This was stirred 1 hour and hydrolyzed with 29 RI
(0.57 equivalents) of water. A solid formed at the point of contact
of the water, but redissolved on stirring. A gel formed on standing
overnight. This was dried at 120 0C then split into three parts and
each part heated at 550, 650, and 750 0C for 8 hours in air. All
showed phase-pure Bi 2VO. 7 NbO. 305 .5 by XRD. (Figure 4.18)
Experiment #42 (JWP-II-175) Bi(OAc) 3 + V-2MOE + Mn(OAc) 2
+ Bi 2VO.SMnO.j50 .s.1 5
Bi(OAc) 3 (5g, 130 mmol), 15.622 g V-2MOE solution (15.622g,
55.3 mmol) and Mn(OAc) 2-4H20 (0.2380g, 9.75 mmol) were
dissolved in 2MOE to give a yellow solution. This was hydrolyzed
with excess water to make a fibrous precipitate, which was dried 4
days at 100 *C and pyrolyzed at 625 0C for 8 h in air to give an
olive-green solid. XRD shows the appearance of the standard
tetragonal y phase expected for Bi 2VO. 85MnO.1 5O5 .s5-.
241

Experiment #43 (JWP-II-199A) Bi(OAc) 3 + V-2MOE +
Mn(OAc) 2 + Bi2V 85 Mn 0.15O5 .5 -
Bi(OAc) 3 (2.0007 g, 5.20 mmol) V-2MOE (6.25g, 2.2 mmol), and
Mn(OAc) 2-4H20 (0.0953g, 0.39 mmol) were mixed in 150 ml 2MOE to
dissolve and hydrolyzed with 2 ml H20 (13 equivalents) to give a
milky grey-yellow solution. This was warmed at 60 OC to dry for 3
hours, then 100 OC overnight. The resulting gel was split among 5
alumina crucibles and heated for 8 hours at 350, 450, 550, 650, and
750 OC in air. XRDs showed the evolution of the desired y phase
Bi 2VO. 85Mno. 15O5.5- with pyrolysis temperature. (Figure 4.19)
Experiment #44 (JWP-II-176B) Bi(OAc) 3 + V-2MOE + Fe(OAc) 2
+ Bi 2VO.9 FeO.1 0 5 .5 _.
Bi(OAc) 3 (2.5g, 6.48 mmol), V-2MOE (8.27 g, 2.93 mmol) and
Fe(OAc) 2 (0.0563g, 0.325 mmol) were mixed in 100 ml 2MOE to give
a yellow solution. This was hydrolyzed with 0.5 ml H20 (2.5
equivalents), yielding a milky yellow-grey suspension. This was
warmed on a hot plate to remove approximately 1/2 the volume of
solvent. After 1 hour a gel was produced; this was dried and
pyrolyzed at 625 0C for 8 hours. The XRD showed the appearance
of the standard tetragonal y phase Bi 2VO. 9FeO. 105 .5 -. (Figure 4.33)
242

Experiment #45 (JWP-II-176A) Bi(OAc) 3 + V-2MOE +
Fe(acac) 2 + Bi 2VO. 9FeO 105.58,
Bi(OAc) 3 (2.5g, 6.5 mmol) were added to V-2MOE solution
(8.27g, 2.93 mmol) and 100 ml 2MOE and stirred to dissolve.
Fe(acac) 2 (0.1144 g, 0.33 mmol) was added to obtain a red-orange
solution. 0.5 ml water (2.5 equivalents) were added, resulting in
some milkiness; this was warmed on a hot plate to remove some
solvent. After 4 hours a gel was produced; this was dried and
pyrolyzed at 625 0C for 8 hours. The XRD pattern showed the
appearance of the standard tetragonal y phase expected for
Bi 2VO.9FeO.10 5.5-. (Figure 4.34)
Experiment #46 (JWP-II-199B) Bi(OAc) 3 + V-2MOE +
Fe(acac) 2 + Bi 2VO.gFeo.10 5 .5-
Bi(OAc) 3 (2.3386g 6.06 mmol), V-2MOE (7.7364 g, 2.73 mmol),
and Fe(acac) 2 (0.10695 g, 0.30 mmol) were dissolved in 100 ml
2MOE and hydrolyzed with 2 ml H20 (10 equivalents) to yield a milky
red solution. This was warmed at 60 0C to dry for 3 hours, then 100
0C overnight. The resulting gel was split among 5 alumina crucibles
and heated for 8 hours at 350, 450, 550, 650, and 750 0C in air.
XRDs showed the evolution of the desired y phase
Bi 2VO. 9FeO.10 5.5- with pyrolysis temperature. (Figure 4.20)
243

Experiment #47 (JWP-III-53) Bi(OAc) 3 + V-2MOE + Ti(OiPr) 4
-> Bi 2TiO.VO.90 5 .-
Bi(OAc) 3 (1g, 2.59 mmol), V-2MOE solution (2.35 g, 1.17 mmol),
and Ti(OiPr) 4 (0.0367 g, 0.129 mmol) were mixed in 60 ml 2MOE to
dissolve. This was hydrolyzed with 0.4 ml water (4.3 equivalents)
to produce a clear yellow solution which became a tan liquidy gel on
standing overnight. The solvent was evaporated from this and the
gel pyrolyzed for 8 h at 700 OC. Examination by XRD showed a clean
y phase pattern for Bi 2TiO. 1VO.O 5.5-. (Figure 4.21)
244
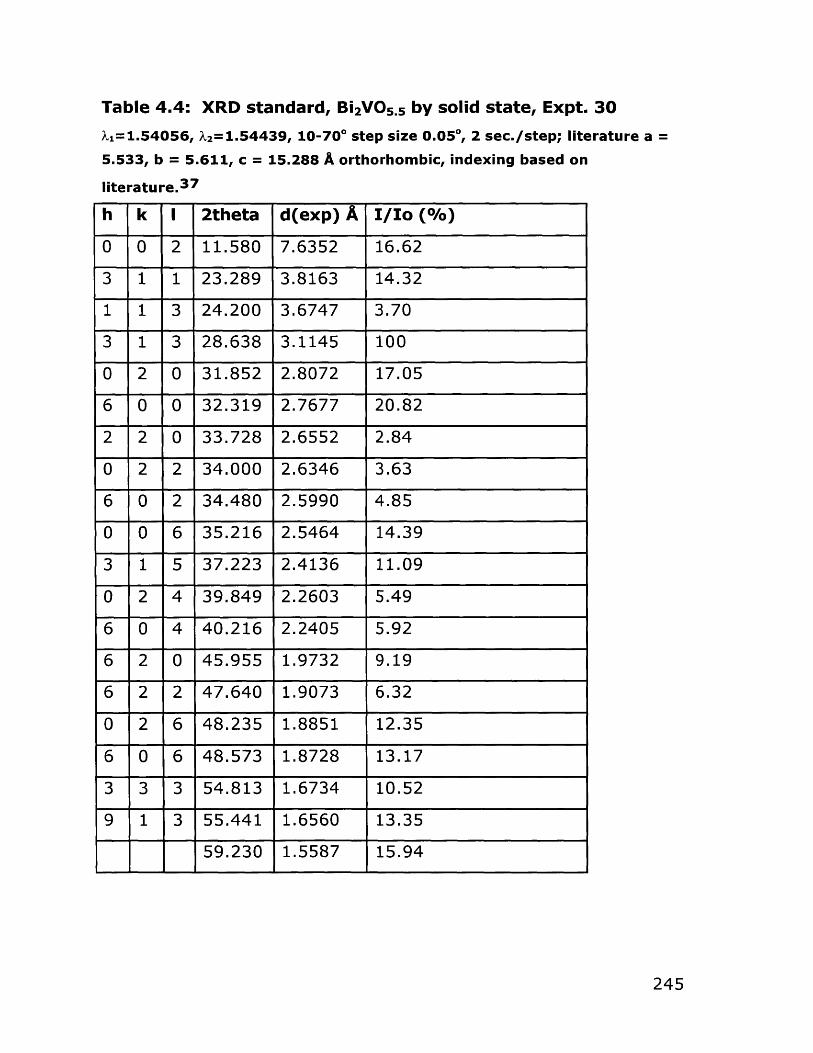
Table 4.4: XRD standard, Bi 2 VOS.5 by solid state, Expt. 30
X1=1.54056, X2=1.54439, 10-700 step size 0.050, 2 sec./step; literature a =5.533, b = 5.611, c = 15.288 A orthorhombic, indexing based on
literature. 3 7
h k I 2theta d(exp) A I/Io (0/)
0 0 2 11.580 7.6352 16.62
3 1 1 23.289 3.8163 14.32
1 1 3 24.200 3.6747 3.70
3 1 3 28.638 3.1145 100
0 2 0 31.852 2.8072 17.05
6 0 0 32.319 2.7677 20.82
2 2 0 33.728 2.6552 2.84
0 2 2 34.000 2.6346 3.63
6 0 2 34.480 2.5990 4.85
0 0 6 35.216 2.5464 14.39
3 1 5 37.223 2.4136 11.09
0 2 4 39.849 2.2603 5.49
6 0 4 40.216 2.2405 5.92
6 2 0 45.955 1.9732 9.19
6 2 2 47.640 1.9073 6.32
0 2 6 48.235 1.8851 12.35
6 0 6 48.573 1.8728 13.17
3 3 3 54.813 1.6734 10.52
9 1 3 55.441 1.6560 13.35
59.230 1.5587 15.94
245

Table 4.5: XRD standard, Bi 2 CuO.1VO. 9 0 5 .35 by solid state,
Experiment 31
Scan conditions same as for Table 4.4. Indexing gives a=3.9179 A,
c=15.4478 A, all angles 900.
h k I 2theta d(exp) A d(calc) A I/I0 O)
0 0 2 11.480 7.7020 7.72 54.93
0 0 4 23.025 3.8594 3.862 9.95
1 0 1 23.439 3.7922 3.798 22.61
1 0 3 28.604 3.1181 3.118 100
1 1 0 32.310 2.7684 2.770 68.74
1 1 2 34.349 2.6086 2.608 12.07
0 0 6 34.803 2.5756 2.575 34.00
1 0 5 37.034 2.4254 2.426 14.87
1 1 4 40.018 2.2512 2.251 11.33
2 0 0 46.340 1.9577 1.959 25.06
2 0 2 47.879 1.8983 1.899 6.31
1 1 6 48.213 1.8859 1.886 30.80
2 1 3 55.328 1.6591 1.659 23.95
1 0 9 58.686 1.5719 1.572 17.50
2 0 6 59.222 1.5589 1.559 6.99
2 1 5 60.693 1.5246 1.524 5.33
246

Table 4.6: Reflections and indexing for BiCuVOx made by sol-gel
method, Expt. 34
Scan conditions same as for Table 4.4. Indexing gives a=3.9195 A,
c=15.4045 A, all angles 900.
h k I 2theta d(exp) A d(calc) A I/Io (%)
0 0 2 11.499 7.6892 7.71 27.57
0 0 4 26.051 3.8551 3.857 3.19
1 0 1 23.408 3.7972 3.800 12.57
1 0 3 28.608 3.1177 3.118 100
1 1 0 32.289 2.7702 2.773 23.41
1 1 2 34.374 2.6068 2.609 5.58
0 0 6 34.894 2.5691 2.571 9.89
1 0 5 37.069 2.4232 2.425 8.01
1 1 4 40.033 2.2504 2.251 6.45
2 0 0 46.267 1.9606 1.961 9.13
2 0 2 47.848 1.8995 1.900 4.75
1 1 6 48.240 1.8850 1.885 17.46
2 1 1 52.470 1.7425 1.742 3.44
2 1 3 55.302 1.6598 1.660 15.18
1 0 9 58.727 1.5709 1.571 8.08
2 0 6 59.179 1.5600 1.559 6.45
247

Table 4.7: Complex Impedance Data for Sol-Gel Derived Bi 2 CuO.1VO.9 0 5 .35
Temp. (*C) Type y- slope diameter Z" real Z' imag. x- p (ohm-cm)intercept center center intercept
242.2 circle 2.227E6 1.05E6 3.61E5 2.109E6 4.360E6
269.3 circle 1.435E6 5.545E6 3.83E6 1.161E6 2.401E6
294.8 circle 4.434E5 2.061E5 8.40E4 4.113E5 8.504E5
320.1 circle 2.118E5 9.762E4 4.27E4 1.945E5 4.021E5
345.4 circle 8.835E4 4.214E4 1.65E4 8.310E4 1.718E5
370.5 circle 5.635E4 2.427E4 1.45E4 4.841E4 1.001E5
395.3 circle 2.751E4 1.4163E4 5042 2.696E4 5.575E4
420 circle 1.582E4 8930.44 2650 1.638E4 3.387E4444.7 circle 8767.66 5340.4 1709 9.378E3 1.939E4
469.5 circle 1292.5 1536.22 248.1 2.133E3 4.410E3
494.6 line 303.42 -. 707 4.291E2 8.872E2
520 circle 737.4 539.64 215.5 9.399E2 1.734E3
545.4 circle 390.28 241.1 117.4 3.970E2 8.208E2
570.7 circle 36.788 70.265 8.103 8.678E1 1.794E2
596.6 circle 27.45 40.304 6.312 5.429E1 1.085E2
622.6 circle 13.60 26.84 2.705 3.307E1 6.837E1675.1 circle 7.981 11.743 1.993 1.520E1 3.143E1
726.8 circle 5.583 9.473 1.568 1.179E1 2.437E1
753.4 circle 1.556 7.216 0.308 7.931E0 1.640E1
N

Temp. (*C) Type y- slope diameter Z" real Z' imag. x- p (ohm-cm)intercept center center intercept
805.7 circle 0.958 5.802 0.243 6.215E0 1.285E1831.8 circle 0.558 5.329 0.117 5.582E0 1.154E1779.8 circle 0.268 0.035 5.479 5.608E0 1.159E1727.7 circle 0.926 6.068 0.168 6.500EO 1.344E1675.6 circle 2.313 7.046 0.486 8.096E0 1.674E1623 circle 3.941 8.579 0.719 1.041E1 2.153E1570.9 circle 3.380 9.329 0.430 1.095E1 2.266E1520 circle 26.493 21.275 5.946 3.311E1 6.846E1469.2 circle 24.904 26.233 3.824 3.808E1 7.874E1520.1 circle 5.000 12.144 0.611 1.457E1 3.012E1571.1 line 8.331 -1.088 7.658E 1.583E1623 line 5.7055 -0.858 6.648E 1.374E1675.1 circle 3.252 7.717 0.601 9.228E0 1.908E1726.9 circle 0.431 5.876 0.053 6.085E0 1.258E1779.6 circle 0.381 5.533 0.065 5.712E0 1.181E1831.6 circle 0.174 5.102 0.026 5.185E0 1.072E1
NJ

Table 4.8: XRD standard Bi2 NbO. 3VO. 7 0 5 .5 by solid state, Expt. 38.
Scan conditions same as for Table 4.4. Indexing gives a=3.909113 A,
c=15.74489 A, all angles 900. Note the preferred orientation problem with
the 001 peaks.
h k I 2theta d(exp) A d(calc) A I/I (0 /o)
0 0 2 11.212 7.8852 7.87 14.07
0 0 4 3.943
1 0 1 23.399 3.7986 3.794 9.85
1 0 3 28.432 3.1366 3.135 100
1 1 0 32.375 2.7630 2.764 29.60
0 0 6 34.150 2.6234 2.624 6.91
1 1 2 34.317 2.6110 2.608 7.91
1 0 5 36.624 2.4516 2.452 6.98
1 1 4 39.830 2.2614 2.262 6.94
2 0 0 46.435 1.9539 1.955 13.48
1 1 6 47.777 1.9021 1.903 18.66
2 1 1 52.638 1.7373 1.738 3.36
2 1 3 55.327 1.6591 1.659 21.05
2 0 6 58.851 1.5679 1.568 7.69
250

Table 4.9: Bi 2VO.*SMno. 1505 .5-8, Expt. 43.
Scan conditions same as for Table 4.4. Indexing gives a=3.91805 A,
c=15.49123 A, all angles 900.
h k I 2theta d(exp) A d(calc) A I/Io (0/o)
0 0 2 11.383 7.7671 7.75 14.11
0 0 4 22.907 3.8791 3.8728 2.68
1 0 1 23.389 3.8002 3.798 11.67
1 0 3 28.557 3.1232 3.121 100
1 1 0 32.273 2.7715 2.770 31.48
1 1 2 34.313 2.6112 2.6086 6.83
0 0 6 34.718 2.5817 2.582 10.99
1 0 5 36.960 2.4301 2.4302 9.61
1 1 4 39.998 2.2523 2.2533 7.91
2 0 0 46.300 1.9593 1.959 14.33
1 1 6 48.134 1.8888 1.889 22.51
2 1 1 52.509 1.7413 1.7411 4.23
2 1 3 55.332 1.6589 1.659 23.20
1 0 9 58.552 1.5752 1.5759 10.08
2 0 6 59.149 1.5607 1.5606 10.08
251
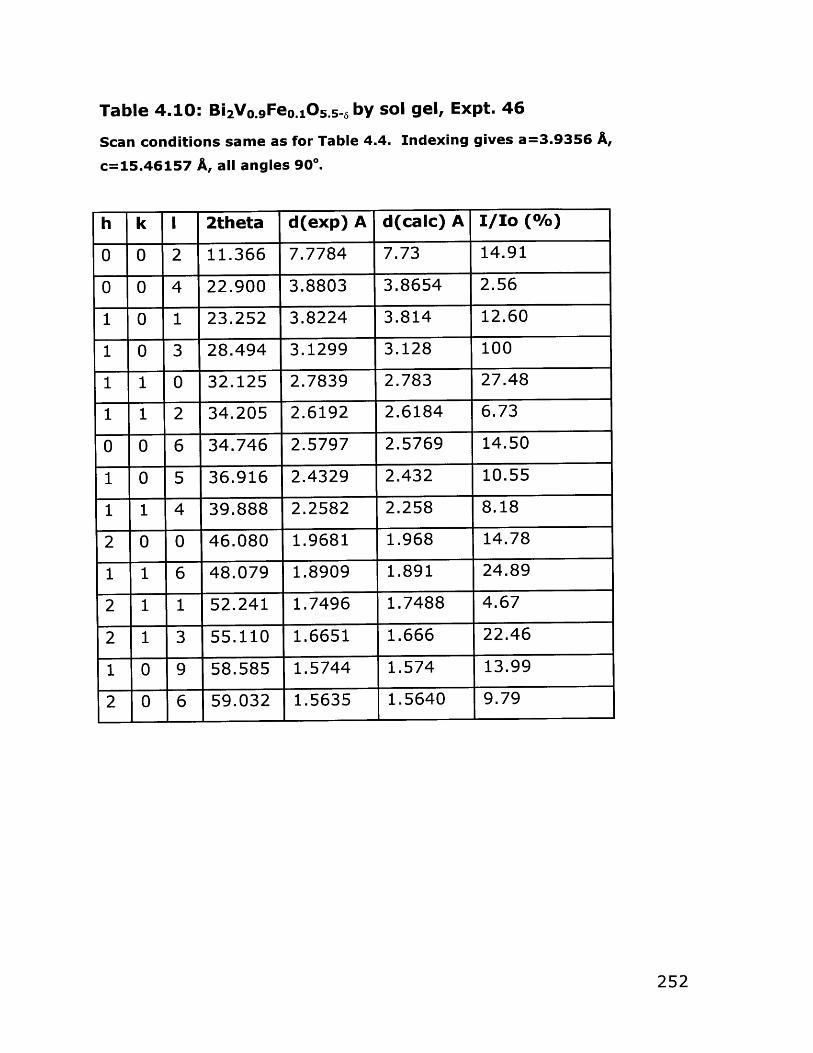
Table 4.10: Bi 2VO. 9FeO.1 5 .5 -8 by sol gel, Expt. 46
Scan conditions same as for Table 4.4. Indexing gives a=3.9356 A,
c=15.46157 A, all angles 900.
h k i 2theta d(exp) A d(calc) A I/I0 o)
0 0 2 11.366 7.7784 7.73 14.91
0 0 4 22.900 3.8803 3.8654 2.56
1 0 1 23.252 3.8224 3.814 12.60
1 0 3 28.494 3.1299 3.128 100
1 1 0 32.125 2.7839 2.783 27.48
1 1 2 34.205 2.6192 2.6184 6.73
0 0 6 34.746 2.5797 2.5769 14.50
1 0 5 36.916 2.4329 2.432 10.55
1 1 4 39.888 2.2582 2.258 8.18
2 0 0 46.080 1.9681 1.968 14.78
1 1 6 48.079 1.8909 1.891 24.89
2 1 1 52.241 1.7496 1.7488 4.67
2 1 3 55.110 1.6651 1.666 22.46
1 0 9 58.585 1.5744 1.574 13.99
2 0 6 59.032 1.5635 1.5640 9.79
252
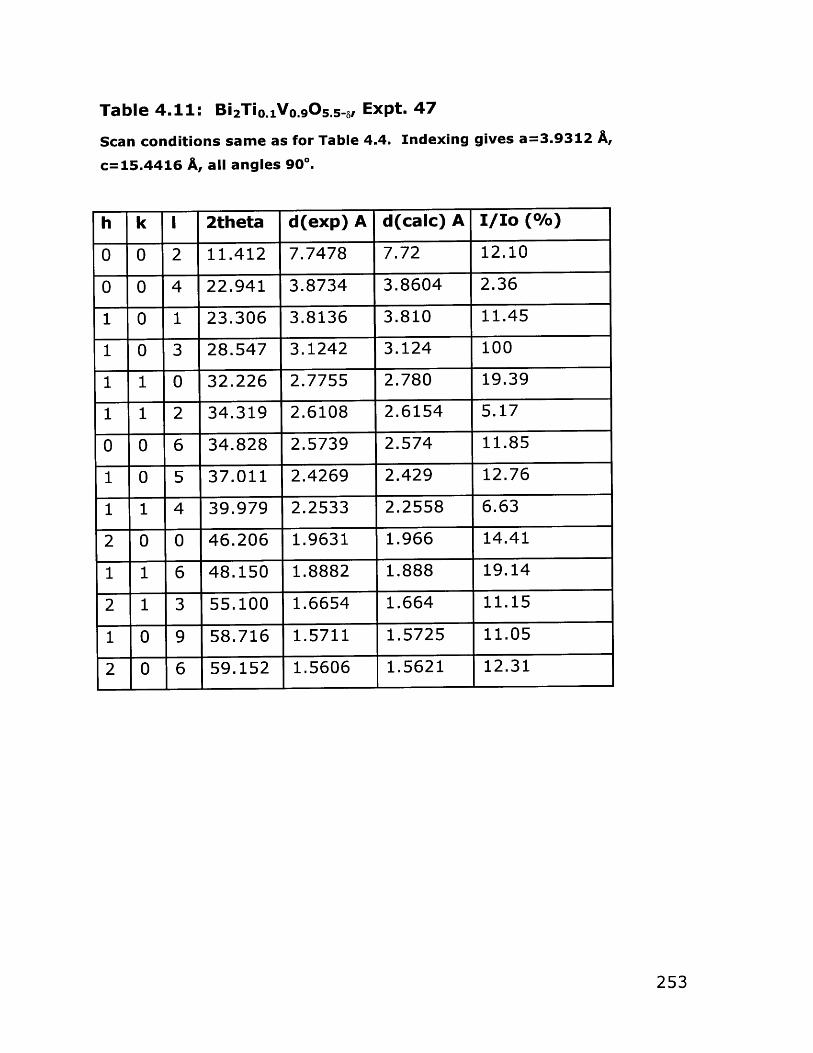
Table 4.11: Bi 2Tio.VO90 5. 5 -8, Expt. 47
Scan conditions same as for Table 4.4. Indexing gives a=3.9312 A,
c=15.4416 A, all angles 900.
h k I 2theta d(exp) A d(calc) A I/Io (o)
0 0 2 11.412 7.7478 7.72 12.10
0 0 4 22.941 3.8734 3.8604 2.36
1 0 1 23.306 3.8136 3.810 11.45
1 0 3 28.547 3.1242 3.124 100
1 1 0 32.226 2.7755 2.780 19.39
1 1 2 34.319 2.6108 2.6154 5.17
0 0 6 34.828 2.5739 2.574 11.85
1 0 5 37.011 2.4269 2.429 12.76
1 1 4 39.979 2.2533 2.2558 6.63
2 0 0 46.206 1.9631 1.966 14.41
1 1 6 48.150 1.8882 1.888 19.14
2 1 3 55.100 1.6654 1.664 11.15
1 0 9 58.716 1.5711 1.5725 11.05
2 0 6 59.152 1.5606 1.5621 12.31
253

Figure 4.31: Powder XRD of solid-state synthesized Bi 2VO5.5.
This is the XRD pattern that has been used to verify the sol-gel
synthesis products throughout this research.
i_0
LII
m
4-,0Gan
-CM
E---C I
I 00.98LZ S1.Lufoo 00*0
254

Figure 4.32: Powder XRD of solid-state synthesized
Bi2CuO01 VO.q0 5..5. This is the XRD pattern that has been used to
verify the sol-gel synthesis products throughout this research.
I-n
U,
LI,
N
'C9
U fI-I
255

Powder XRD of sol-gel produced Bi 2VO.gFeo. 105 5...
Pyrolysis temperature was:
Fe(OAc) 2-
0000
IL
625 *C. The iron was supplied as
CD01I,
squfloo
"0
ILn
0
U-)Cu
Figure 4.33:
256
.0)
CM
CU
CU

Figure 4.34: Powder XRD of sol-gel produced Bi 2VO.gFeo.1O5 .-.
Pyrolysis temperature was: 625 "C. The iron was supplied as
Fe(acac) 2.
L.
U
Q
CD C)
S3 CI C)
sjuno2
257

Figure 4.35: Powder XRD of solid-state synthesized
Bi 2VO 7 Nbo.30 5 .5 . This is the XRD pattern that has been used to
verify the sol-gel synthesis products. Pyrolysis temperature was
1000 *C.
s-+unco3 00*1
258
41
N00 6L91
In
ILn
In
In
In
CS)
N
LSD

4.5 References
1)Bradley, D. C.; Mehrotra, R. C.; Gaur, D. P. Metal Alkoxides;
Academic Press: New York, 1978.
2)Mehrotra, R. C. Inorg. Chim. Acta Rev. 1967, 1, 99.
3)Mehrotra, R. C. Adv. Inorg. Chem. Radiochem. 1983, 26, 269.
4)Mehrotra, R. C. J. Non-Crystalline Solids 1988, 100, 1.
5)Mehrotra, R. C. in Sol-gel Science and Technology : Proceedings of
the Winter School on Glasses and Ceramics from Gels, Sao Carlos
(SP), Brazil, 14-19 August 1989 , 1989, p 17.
6)Mehrotra, R. C. in Sol-gel Science and Technology : Proceedings of
the Winter School on Glasses and Ceramics from Gels, Sao Carlos
(SP), Brazil, 14-19 August 1989, 1989, p 40.
7)Mehrotra, R. C.; Singh, A.; Sogani, S. Chem. Rev. 1994, 94, 1643.
8)Hillerns, F.; Rehder, D. Chem. Ber. 1991, 124, 2249.
9)Priebsch, W.; Rehder, D. Inorg. Chem. 1990, 29, 3013.
10)Crans, D. C.; Chen, H.; Felty, R. A. J. Am. Chem. Soc. 1992, 114,
4543.
11)Crans, D. C.; Shin, P. K. J. Am. Chem. Soc. 1994, 116, 1305.
12)Prandtl, W.; Hess, L. Z. Anorg. Chem. 1913, 82, 103.
13)Funk, H.; Weiss, W.; Zeising, M. Z. Anorg. Al/g. Chem. 1958, 296,
36.
14)Mittal, R. K.; Mehrotra, R. C. Z. Anorg. Chem. 1964, 327, 311.
15)Legendre, J.-.; Livage, J. J. Colloid and Interface Sci. 1983, 94,
75.
16)Legendre, J.-J.; Aldebert, P.; Baffier, N.; Livage, J. J. Colloid and
Interface Sci. 1983, 94, 84.
259

17)Lemerle, J.; Nejem, L.; Lefebvre, J. J. Inorg. Nuci. Chem. 1980,
42, 17.
18)Livage, J. Chem. Mater. 1991, 3, 578.
19)Hirashima, H.; Kamimura, S. in Better Ceramics Through Chemistry
III; Brinker, C. J., Clark, D. E. and Ulrich, D. R., Eds.; Mater.
Res. Soc.: Pittsburgh, 1988, pp 779-784.
20)Hirashima, H.; Tsukimi, K.; Muratake, R. J. Ceram. Soc. Jpn. Inter.
Ed. 1989, 97, 232.
21)Hench, L. L.; West, J. K. Chem. Rev. 1990, 90, 33.
22)Hirashima, H.; Sato, A.; Yoshida, T. Yogyo-Kyokai-shi 1986, 94,
875.
23)Toyoda, M.; Payne, D. A. Mater. Lett. 1993, 18, 84.
24)Toyoda, M.; Hamaji, Y.; Tomono, K.; Payne, D. A. Jpn. J. Appi.
Phys. 1993, 32, 4158.
25)Rogers, R. D.; Bond, A. H.; Aguinaga, S. J. Am. Chem. Soc. 1992,
114, 2960.
26)Mehrotra, R. C.; Rai, A., K Ind. J. Chem. 1966, 4, 537.
27)Sauer, N. N.; Garcia, E.; Ryan, R. R. Mat. Res. Soc. Symp. Proc.,
1990; 180, 921.
28)Jones, C. M.; Burkart, M. D.; Bachman, R. E.; Serra, D. L.; Hwu,
S.-J.; Whitmire, K. H. Inorg. Chem. 1993, 32, 5136.
29)Evans, W. J.; Hain, J. H. J.; Ziller, J. W. J. Chem. Soc. Chem.
Commun. 1989, 1628.
30)Massiani, M.-C.; Papiernik, R.; Hubert-Pfalzgraf, L. G. Polyhedron
1991, 10, 437.
31)Massiani, M. C.; Papiernik, R.; Hubert-Pfalzgraf, L. G.; Daran, J. C.
J. Chem. Soc. Chem. Commun. 1990, 301.
260

32)Matchett, M. A.; Chiang, M. Y.; Buhro, W. E. Inorg. Chem. 1990,
29, 360.
33)Hubert-Pfalzgraf, L. G.; Poncelet, 0.; Papiernik, R.; Boulmaaz, S.;
Sirio, C. in Eurogel '91, Vilminot, S., Nass, R. and Schmidt, H.,
Eds.; Elsevier: Netherlands, 1991, pp 293.
34)Clegg, W.; Compton, N. A.; Errington, R. J.; Norman, N. C.;
Wishart, N. Polyhedron 1989, 8, 1579.
35)Ando, F.; Hayashi, T.; Ohashi, K.; Koketsu, J. J. Inorg. Nuc. Chem.
1975, 37, 2011.
36)Devillers, M.; Tirions, 0.; Cadus, L.; Ruiz, P.; Delmon, B. J. Solid
State Chem. 1996, 126, 152.
37)Abraham, F.; Debreuille-Gresse, M. F.; Mairesse, G.; Nowogrocki,
G. Solid State Ionics 1988, 28-30, 529.
38)Mairesse, G. in Fast Ion Transport in Solids; Scrosati, B. et al.,
Eds.; Kluwer Academic Publishers: Netherlands, 1993, pp 271.
39)Kendall, K. R.; Navas, C.; Thomas, J. K.; zur Loye, H.-C. Chem.
Mater. 1996, 8, 642.
40)Vannier, R. N.; Mairesse, G.; Nowogrocki, G.; Abraham, F.; Boivin,
J. C. Solid State Ionics 1992, 53-56, 713.
41)Bradley, D. C.; Mehta, M. L. Can. J. Chem. 1962, 40, 1183-1188.
42)Spath, E. Monatsh. 1912, 33, 235.
43)Gattow, G.; Schwank, H. Z. anorg. Chem. 1971, 382, 49.
44)Troyanov, S. I.; Pisarevskii, A. P. Koord. Khim. 1991, 17, 909.
45)Pisarevskii, A. P.; Matynenko, L. I.; Dzyubenki, N. G. Zh. Neorg.
Khim. 1990, 35, 1489.
46)Rogers, R. D.; Bond, A. H.; Aguinaga, S.; Reyes, A. J. Amer. Chem.
Soc. 1992, 114, 2967.
261

47)Sauer, N. N.; Garcia, E.; Salazar, K. V.; Ryan, R. R.; Martin, J. A. J.
Am. Chem. Soc. 1990, 112, 1524.
48)Boyle, T., personal communication via email.
49)Zevaco, T.; Guilhaume, N.; Postel, M. New. J. Chem. 1991, 15,
927.
50)Bench, W.; Blazso, E.; Dubler, E.; Oswald, H. R. Acta Crystallogr.
1987, 43C, 1699.
51)Papiernik, R.; Hubert-Pfalzgraf, L. G.; Massiani, M. C. Polyhedron
1991, 10, 1657.
52)Nugent, W. A.; Harlow, R. L. J. Am. Chem. Soc. 1994, 116, 6142-
6148.
53)Lu, T.; Steele, B. C. H. Solid State Ionics 1986, 21, 339.
54)West, A. R. Solid State Chemistry and its Applications; John Wiley
and Sons: New York, 1992.
55)Birchall, J. D.; Mockfort, M. J.; Stanley, D. R., Imperial Chemical
Industries, PLC: U.S. Patent No. 4,950,626, 1990.
56)Krok, F.; Bogusz, W.; Kurek, P.; Wasiucionek, M.; Jakubowski,
W.; Dygas, J. Mat. Sci. and Eng. B 1993, B21, 70.
57)Abraham, F.; Boivin, J. C.; Mairesse, G.; Nowogrocki, G. Solid
State Ionics 1990, 40-41, 934.
58)Kendall, K., personal communication.
262

Chapter Five
Describing the Bi/V Precursor: Synthesis and
Characterization of a Bismuth-Vanadium
Heterobimetallic Alkoxide
The experimental work described in this chapter was adapted, in
part, from Pell, J.W., Davis, W.C, and zur Loye, H.-C., Inorg. Chem.
1996, 5754-5755.
263

5.1 Introduction: Brief Review of Heterobimetallic Alkoxides
A number of observations made during the work described in
Chapter Four suggested that some experiments, tangential to the
project goal of producing defect-free films of the BiMeVOx ceramic,
be undertaken to investigate whether a single bismuth-vanadium
complex was formed in the precursor solution. The observation that
the yellow vanadium 2-methoxyethoxide became orange when the
bismuth acetate solution was added, suggested that a change
occurred in the vanadium coordination sphere due to the Bi(OAc) 3.
Likewise, the behavior of the fibrous bismuth acetate-alcohol
polymer that was formed in the bismuth acetate solution in 2-
methoxyethanol, suggested an interaction with the vanadium
alkoxide: it would not form in the presence of vanadium alkoxide,
even in concentrated solutions of Bi(OAc) 3; in solutions where it had
formed, addition of the vanadium alkoxide would redissolve it
readily. That the bismuth 2-methoxyethoxide made from bismuth
tris(dimethylsilamide) formed the Bi 2VO5 .5 phase directly was also
suggestive of a high degree of interaction between the precursor
materials.
We expect chemical interactions to occur between the Bi(OAc) 3
and V-2MOE in solution. Vanadium alkoxides tend to form R-alkoxo
dimers in order to increase their coordination numbers, as do most
transition metal alkoxides.1-3 While unbridged vanadium alkoxides
are colorless, the bridged dimeric or oligomeric derivatives tend to
be yellow to red in color; the degree of bridging changes with the
264

alkoxide's concentration in solution. 4 Likewise, bismuth, even when
its compounds have eighteen electrons, also tends to become
hypervalent, increasing its coordination number through bridging by
its ligands, as seen in bismuth acetate (Chapter Four). 5 The alcohol
in use in our sol-gel preparations, 2-methoxyethanol, is capable of
acting as a bridging ligand, as seen in Ba 2Cu 2(OR) 4(acac) 4*2HOR
(R=CH 2CH 20CH3)6 and in Ba 4Ti 13(g3-O)12(g5-O) 6(g1-1 1-
OCH 2CH 20CH3) 12(gl,p3-T1-OCH 2CH 20CH3)12.7
As we have indicated in the previous Chapters, the use of
metal alkoxides in sol-gel processes requires that the hydrolysis
and condensation rates of each alkoxide be matched to prevent
inhomogeneities in the gel. One method of reaching homogeneity is
to use only one alkoxide species and to add other metals as
decomposable salts. Another is to modify the ligands of one or
more of the alkoxides to be used so that the rate of hydrolysis and
condensation of the least stable alkoxide is close to that of the
most stable. A more elegant method is to prepare a heterometallic
alkoxide which already has locked in its structure the proper metal
ratio. The lability of the coordination sphere permits the synthesis
of heterometallic alkoxides, often by nothing more complicated than
simply mixing them. Incorporation of the metals required in the final
oxide product into a single source precursor is the ultimate in
attaining atomic-level mixing of the metals.
Despite the widespread interest in multi-metal alkoxide
precursors to a number of ceramic classes - mainly those intended
for electronic applications (superconductors, ferro- and di- electrics,
etc.) where high-temperature processing often creates grain
265

morphologies that reduce the material's desired performance -
there is little information regarding the exact composition of many
precursor systems, and less about the structure of many purported
heterometallic alkoxide precursor species. Partly this is because the
majority of the research in these areas is goal- or product-oriented,
and the specific details of precursor species' structures usually are
tangential to the question of what precursor "recipe" works the
best. Aside from this, however, it is often difficult to isolate the
putative species because they tend to precipitate or polymerize as
solvent is removed, usually with loss of the solution-stable
structure, rather than crystallize. Combination species may arise
simultaneously in solution from an attempted heterometallic
alkoxide synthesis. Many vanadium alkoxides, in fact, undergo
rearrangement and exchange in solution. 2 The distribution of such
species will be statistical, depending on the thermodynamics and
kinetics of the species' formation and on the concentration of the
solution. In such cases isolation of "the" precursor is problematic.
Despite the difficulties, a number of heterometallic alkoxide
precursors have been reported. A number of bimetallic alkoxides
were synthesized early in this century by the titration of alkali metal
alkoxides with less basic alkoxides of p-block metalloids and
transition metals. 8 They were considered to be alkoxo salts until
the 1958 work of Bartley and Wardlaw, which demonstrated the
covalent nature of [Na(Zr 2(OR) 9)]. 9 More recent work has produced
combinations of transition metals in a single alkoxide:
[(BaTiO) 4(iOPr) 16 ]-3HOiPr, 10 Pb 2Ti 2 (p4-0)(g3-OiPr) 2 (-OiPr) 4 (OiPr) 4 , 11
Ba 2Cu 2(2MOE) 4(acac) 4-2H2MOE; 6 MNb 2 (p-OAc) 2(g-OR) 4(OR) 6 (M=Cd,
266

Mg), PbZr 3(g4-0)( g-OAc) 2(9-OR)5 (OR) 5 , Gd 2Zr 6(p4-0) 2(g-OAc) 6 (g-
OR) 1O(OR) 10, R=iPr;12 Pb4 Zr 2 (OiPr) 16 , Pb2Zr 4 (OiPr) 2 0 , 1 3 Pb6Nb4(g4-
0)(g3-OEt)4(p2-OEt)12(OEt)8.,14 Ba4Ti13(p3-0)12(pt5-0)6(91-TI1-
2MOE) 12(p1, g3-,n2 -2MOE) 12,7 and a number of others. Most of these
are g-oxo materials; in most cases the appearance of oxo-bridging
is due to partial hydrolysis of the parent alkoxides.
There are a number of different methods for making
heterometallic alkoxides; which one will work depends on the
nature of the metals involved (electronegativity and tendency to
increase coordination sphere) and the steric and electronic nature
(ramification) of the alkoxo groups. Simply mixing two metal
alkoxides, particularly where one of the metals is strongly
electropositive, has yielded a heterometallic alkoxide product in a
number of examples. A precursor to LiNbO3, for example, is
LiNb(OEt) 6 , made by simply refluxing an ethanolic solution of Li(OEt)
with Nb(OEt) 5 in 1:1 ratio. 1 5 Likewise, Ba(2MOE) 2 and Ti(2MOE) 4
refluxed together in 2-methoxyethanol left a white solid
BaTi(2MOE) 6;7 and Ti(OiPr)4 and [Pb(OiPr) 2]- refluxed in toluene
gave crystalline Pb 2Ti 2 O(OiPr) 10.1 1 Furthermore, the second metal
alkoxide may be produced by in situ dissolution of the metal; the
alkaline earth metals dissolve faster in alcohol in the presence of
alkoxides of the transition metals and main group metalloids
(Equation 5.1).
(5.1) M + 2 ROH + 2 M'(OR)x ---- > (HgCI2/ROH) [M(M'(OR)y)z]
M=Mg, Ca, Sr, Ba; M'=Al, Ga, Zr, Hf, Nb, Ta; R=Et, iPr; x, y, z as needed for
electroneutrality.
267

Such solubilizing of a metal-containing species is often evidence of
the formation of a mixed alkoxide. For instance, Pb 40(OEt) 6
dissolves in non-polar solvents when [Nb(OEt)5] 2 is added at room
temperature. Cooling the solution gives crystalline
Pb 6O4(OEt) 4[Nb(OEt)5] 4. 12
Other leaving groups can also be used; for instance,
Ba[N(SiMe 3) 2] 2(THF) 2 reacted with Zr 2(OiPr) 8 (HOiPr) 2 gives
[BaZr 2(OiPr) 10 ]2 .15 The reaction of a metal alkoxide and a metal
carboxylate may be reacted. Where simple ligand exchange does
not occur, the metal species may react to form an oxo-bridged
heterometallic alkoxide with ester elimination (Equation 5.2).
(5.2) M(OR)n + M'(0 2CR')m -- > (RO)n-1MOM'(O 2CR')m-1 + RO 2CR'.
For example, a precursor to YSZ was prepared according to
Equation 5.3.15
(5.3) Y(OAc) 3 + Zr(OnBu) 4 -- >
Y(OAc) 2[OZr(OnBu) 2]OH + C4 H8 + nBuOAc
(The origin of the butene was not discussed.)
Likewise, production of Nb-containing heterometallic alkoxides has
been accomplished (Equation 5.4).12
(5.4) M(OAc) 2 + 2 Nb(OiPr)5 -- > MNb 2 (OAc) 2 (OiPr)1 o
(M=Mg, Cd, Pb)
268
One problem with this approach, however, is that the reaction
is thermodynamically controlled, and the factors that determine the
distribution of products are not well-understood. Salt-elimination
reactions of the type given in Equation 5.5 may occur, but commonly
do not result in controlled-stoichiometry products; the reaction is
often incomplete. For example, the reaction between PbC 2 and
KNb(OEt) 6 in refluxing ethanol gives mostly unreacted starting
material.12
(5.5) MXn + nM'M"(OR)m -- > M[M"(OR)m]n + nM'X
x=ci, Br, I
Hirota et al. reported that mixing BiCI 3 and vanadium(V)
tris(ethoxide) oxide in the presence of sodium ethoxide results in
the precipitation of a substance they label "a bismuth vanadyl
alkoxide." This, after hydrolysis and vacuum drying at 120 0C,
produced BiVO 4 according to powder XRD. They do not report any
characterization work for the precursor alkoxide they claim.16
Likewise, there are a number of examples where lanthanide-
aluminum alkoxides have been made by co-dissolving the chlorides
in the presence of potassium alkoxide (Equation 5.6).
(5.6) LnCI 3+ 3 AIC13 + 12 KOiPr -- > [Ln(AI(OiPr) 4)3] + 12 KCI
(Ln= Gd, Ho, Er). 8
Ter- and tetra-metallic alkoxides have been made using metal
alkoxides as chelating ligands Lm=(M(x)(OR)x+y)Y~ according to
Equation 5.7.
269

(5.7) M'C12 + [KLm] -- > [CIM'Lm] + KC18 where M=AI, Ga, Nb, Ta, Zr and
M'=Fe, Co, Ni, Cu
There has been a flurry of interest in bismuth alkoxides as
potential precursors for sol-gel and chemical vapor deposition
preparations of bismuth-containing superconductors1 7 - 1 9 and
ferroelectrics, notably Bi 3Ti40 12 .2 0 - 2 2 Heterometallic alkoxides with
the correct metal ratios for the final product are especially sought-
after. There is, however, a dearth of information about even the
homometallic alkoxides of bismuth. Insoluble bismuth alkoxides
have been known since 196623 and in recent years a number of
soluble bismuth alkoxide complexes have been isolated. 17-19,24-28
While several groups have claimed the existence of a bismuth-
transition metal precursor in their sol-gel processes16, 2 2 ,2 9 , 3 0 and
have published IR and mass spectral data, none of these species
have been isolated 5 for elemental analysis and/or x-ray crystal
structure analysis. During our attempts at synthesizing a 2:1 Bi:V
precursor to the oxide-ion conducting ceramic Bi 2VO5 .5, we were able
to isolate and characterize
[BiCI3(p-0)( p-OC2H40CH3)2(OC 2H40CH3)V] 2, which to our knowledge
represents the first structural description of a heterobimetallic
bismuth-containing alkoxide complex. After the isolation of this
material, we went on to try to prepare analogs, but were unable to
obtain isolable products.
270

5.2 Results and Discussion
5.2.1 Structure and Properties of III-76B
Bismuth (III) chloride was dissolved in a 2:1 molar ratio with
VO(OiPr) 3 in 2MOE solution. Brief warming, followed by several
days' standing, led to the growth of crystals of the dimeric Bi-V
complex III-76B. The synthesis was based on a "non-hydrolytic sol-
gel method" published in the literature. 3 1
There are relatively few compounds available with which to
compare [BiCI 3(9-O)( -OC 2H40CH3)2(OC 2 H40CH3)V] 2 . The
asymmetric unit contains one bismuth and one vanadium atom
(Figure 5.1). The vanadium atom is located in a distorted octahedral
environment that is unusual among vanadium (V) alkoxides, which
prefer a square pyramidal geometry. The shortest V-0 distance of
160 pm, belonging to the bridging oxide atom 0(4), compares well
with the usual vanadyl distance of 158 pm. 4 , 3 2 , 3 3 A band at 945
cm-1 confirms the weakening of the vanadyl bond (usually 950-990
cm'1). 4 (Figure 5.2) Taking 0(4) as the "top" vertex of the
octahedron, the equatorial plane (defined relative to 0(4)) is
deflected slightly downward. The trans oxygen, 0(2), and V, form
an angle of 1700 with 0(4), the deviation from 1800 presumably
caused by the short reach of the 2MOE group. Two of the 2MOE
groups are bidentate on vanadium, in contrast with the cases found
in lead(II) 2-methoxyethoxide 3 4 and bismuth 2-methoxyethoxide, 2 4
271

where the ligand is monodentate; bidentate 2MOE has been
observed in a barium-titanium complex. 7
The coordination environment around the bismuth atom is a
distorted capped octahedron with the chlorine atoms and 0(4),
0(6), and 0(14) as octahedral vertices. The alkoxy oxygen 0(1)
caps the 0(4)-0(6)-0(14) face at 285 pm. This atom connects
nearly at the equator (taking the bridging oxygen 0(4) as the top
vertex), distorting 0(6)-Bi-0(14) to 1140 and pinching 0(6)-Bi-CI(3)
and 0(14)-Bi-CI(1) to 820 and 750, respectively. The Bi-0(1) bond
may be designated as a secondary bond. 3 5
The examples of other bismuth alkoxides suggest that a
stereochemically active lone pair should be sought. 2 4 , 2 6 , 2 7 The
distortion around the bismuth center implies that such a lone pair
would be directed toward the 0(6)-0(14)-0(4) face. Were this the
case, it would be expected that the Bi-0(1) bond would be weak;
however, this bond is only slightly longer than the complex's other
Bi-O bonds. The distortion in the octahedron is small, indicating no
real gap in the coordination geometry; and the Bi-Cl(3) and Bi-Cl(2)
bonds, which are trans to the expected location of a lone pair, are
not significantly shorter than Bi-CI(1). Thus we conclude that a
stereochemically active lone pair is absent.
Combined DTA/TGA of the compound in oxygen (Figure 5.3)
shows an endotherm at 144 OC with no attendant weight change,
which is assigned to a separation of the complex into the original
BiC13 and VO(OC2H40CH3)3 parts. If this assignment is correct, the
complex is surprisingly stable. Stepped exothermic weight losses
up to 328 OC correspond to the removal of the -OC 2 H4 0CH3 groups,
while the weight loss from 375-450 OC is assigned to the
272

dissociation of the six chlorine atoms. The final product was
identified by powder XRD to be primarily BiVO4 (JCPDS #14-688),
with some V20 5 (JCPDS # 9-387) and possibly Bi20 3 under the
amorphous background (Figure 5.4).
The complex is soluble only in donor solvents. 51V NMR of the
complex and parent V alkoxide both gave a single peak. 3 2 (Figure
5.5) In the 13C and 'H NMR spectra (Figures 5.6, 5.7), peaks
corresponding to the bidentate ligands are shifted only slightly from
the corresponding peaks of the parent vanadium alkoxide, while
additional peaks arise from the bridging 2MOE group. This suggests
that the heterometallic complex maintains its structure in DMSO
solution. In alcohols (methanol, diglyme) the complex appears to
break apart.
To our knowledge, [BiCI 3(g-0)( -OC 2 H4 0CH3)2 (OC 2 H4 0CH3)V] 2
is the first example of a heterobimetallic alkoxide involving bismuth.
The presence of chlorine in the structure could allow for further
substitution by alkali metal-containing alkoxides, with the potential
for increasing the number of metals present. Chemistry similar to
that described in this section was used in an attempt to synthesize
isolable analogs of JWP-III-76B.
273

Figure 5.1: ORTEP of JWP-II-76B, bismuth-vanadium alkoxide.
Protons have been omitted for clarity. Selected bond distances
(pm): Bi-Cl(1) 257.1, Bi-Cl(2) 251.7, Bi-CI(3) 250.8, Bi-O(6)
259.7, Bi-O(1) 284.9, Bi-O(4) 270.3, Bi-O(14) 279.8, V-O(1)
178.9, V-O(2) 236.0, V-O(3) 180.0, V-O(4) 160.3, V-O(5)
216.8, V-O(6) 190.7, Bi-V (short side) 368.8. Selected bond
angles (deg.): CI(3)-Bi-CI(2) 93.81, CI(3)-Bi-CI(1) 87.44,
CI(2)-Bi-CI(1) 94.35, CI(3)-Bi-O(6) 82.28, CI(2)-Bi-O(6)
88.46, CI(1)-Bi-O(6) 169.51, CI(3)-Bi-O(4) 89.31, CI(2)-Bi-
0(4) 176.74, CI(1)-Bi-0(4) 86.73, 0(6)-Bi-0(4) 91.02,
0(14)-Bi-0(4) 89.37, 0(14)-Bi-0(6) 114.19, 0(14)-Bi-CI(1)
75.8, 0(14)-Bi-CI(2) 91.94, 0(14)-Bi-CI(3) 162.69.
C(51)
C(53) 0(5)
00 C021)
C(52) cgC22)
QBM(A) V 002 (23)
OW 0(6)
CI(3 001)
V(OA) Bi(1 C(11) --- 4CIO2
0(4A)
0014)
CI(1 C(13)
274

OOO;009T
009a oooS
ooge ooo1F
a I
I -
I
'I
I 11
V
'V
009 I-Iuo
0008
N(N
A/(U
~m
Nm
LAL-
00' 0
-00100;
ia

Figure 5.3: DTA/TGA of JWP-II-76B. See text for details.
eouaiallip ainje.Iadwal
CD tOcu 0
-0
-0
L
04.
0I to IDCU
276
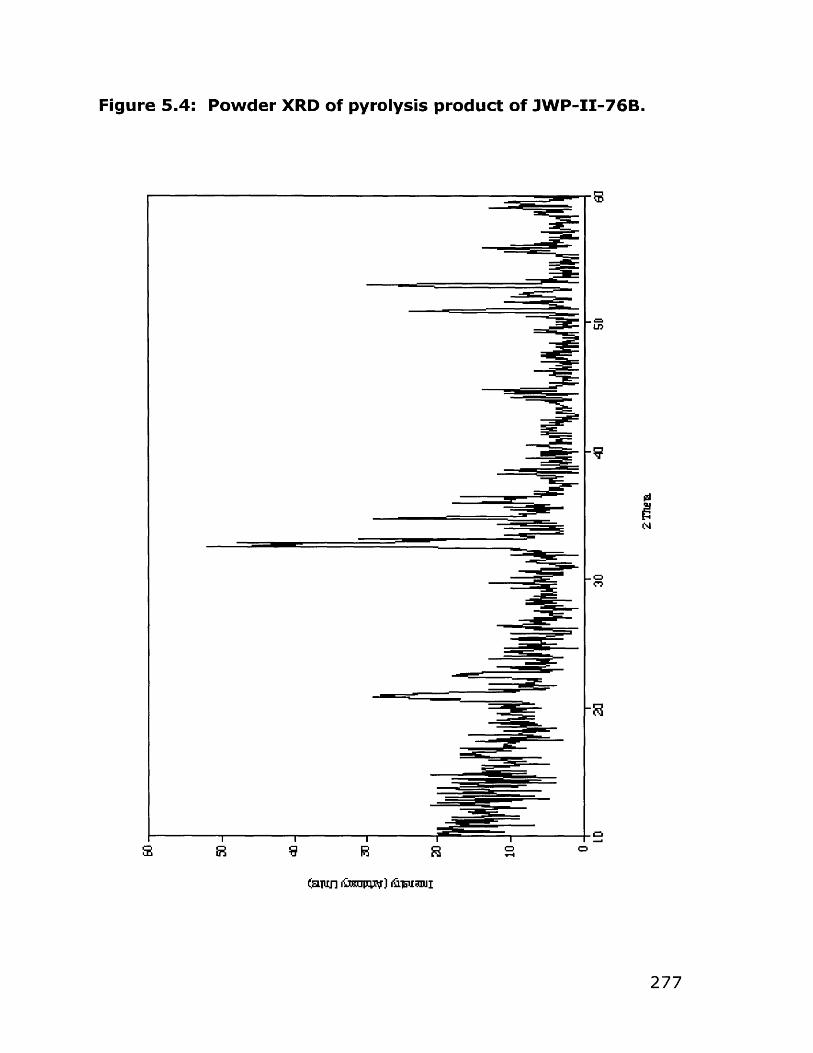
Figure 5.4: Powder XRD of pyrolysis product of JWP-II-76B.
LD
IN
0 CD
(aimn km'mm) knavr
277

Figure 5.5: 5 1V NMR of JWP-II-76B (d 6 -DMSO)
-U
-I
U
U
278
U0 CEQ -- =01--

Figure 5.6: 1 3 C NMR of JWP-II-76B (d 6 -DMSO)
CL
C
279

Figure 5.7: 1H NMR of JWP-II-76B (d6 -DMSO)
0
(.0
LO
n
280
5.2.2 Experiments in Preparing Analogs of III-76B
Compound JWP-III-76A (abbreviated III-76A from here on)
was synthesized by mixing V-2MOE directly with BiCI3 in 2MOE
solution. While III-76A was not extensively characterized, it is
suspected that its structure is similar, if not identical, to that of III-
76B. EDAX showed that Bi, V, and Cl were all present, although no
direct elemental analysis was done on the compound. Its FTIR was
identical with that of III-76B. (Compare Figures 5.2, 5.8) DTA/TGA
was identical in overall shape but event locations had variations
that were in some cases outside the reproducibility of the
instrument (temperatures +2 OC). Compare Figures 5.3, 5.9. A
crystal structure of III-76A was unobtainable due to the loss of
solvent from the crystals during their isolation. Attempts to
reproduce III-76A resulted in either oils or precipitates.
Because the precursor in the Bi 2VO5 .5 synthesis described in
Chapter 4 was based on bismuth acetate, rather than the chloride,
several attempts were made to isolate a Bi/V precursor
(Experiments 3-11). Initial experiments centered on the literature
report that the formation of a heterobimetallic alkoxide can drive
precursor solubilization in polar solvents: 1 2 bismuth acetate and
either vanadium isopropoxide or vanadium 2-methoxyethoxide were
mixed in hexane solvent and stirred or refluxed (Experiments 3-5).
Likewise, bismuth acetate, 2-methoxyethanol, and vanadium
isopropoxide were stirred in THF solvent (Experiment 8). In these
cases the persistence of the milky suspension of Bi(OAc) 3 in the
solvent suggested no reaction had occurred; for the mixture of
281

Bi(OAc) 3 and V-2MOE in hexane without reflux, an oil formed which
unfortunately could not be induced to yield crystals. It was hoped
that THF would be useful in solubilizing the hoped-for product, in
case hexane was too nonpolar to dissolve it after its formation.
However, it is probable that the donor solvent instead blocked
reaction. 1 2 Bismuth acetate and the vanadium alkoxides were
mixed with repeated removal and replacement of 2MOE solvent, in
the hopes of driving off with the evaporated solvent the acetate
and isopropoxy groups. Using vanadium 2-methoxyethoxide
(Experiment 6, 10, 11), this tactic gave back the reactants; on the
other hand vanadium isopropoxide gave a homogenous waxy solid
which, on redissolving in 2MOE, resulted in the fibrous growth
associated with the alcoholysis of Bi(OAc) 3 rather than in crystals
(Experiment 7). Since the presence of V-2MOE in solution with
Bi(OAc) 3 had been observed to suppress the formation of the
fibrous product, this result is surprising. A second attempt of the
latter experiment gave a yellow oil that resulted in a precipitate
after one month at -10 OC. EDX on the precipitate showed that the
only metal it contained was Bi. Whatever interaction is occurring
between the bismuth acetate and the vanadium 2-methoxyethoxide
in solution, an intermediate did not prove isolable. Possibly partial
hydrolysis of the Bi- and V- containing precursor solution would
have yielded a heterobimetallic oxoalkoxide, but this experiment
was not pursued.
Other attempts to synthesize analogs of III-76B were made
as well. The original idea had been to take BiCI 3 and V-2MOE and
make analogs of the III-76B complex by adding a species of the
type E--- E, where E is an element having donatable electrons. Thus
282

the 2MOE "analogs" used were ethanolamine (HOCH 2CH 2NH 2) and
ethylene glycol (HOCH 2CH 2OH), both in diethyl ether and
tetrahydrofuran solvents (Experiments 12-18). All experiments
resulted in a precipitate plus yellow or orange oil (diethyl ether
solvent) or a yellow-orange gum (THF solvent). VO(OiPr) 3 and
ethanolamine gave a yellow precipitate which was possibly
VO(NHCH 2CH 2OH) 2 (Experiment 14).36
It is probable that the 2MOE "analogs" used created polymeric
products because both end groups were ionizable, of the type X---
X, 3 7 while 2MOE is of the type L---X (L=neutral donor, X=ionizable
donor). A donor of the type L---X, Me 2NCH 2CH 2OH was tried
(Experiment 19), using the N,N-dimethylethanolamine itself as the
solvent. This mixture resulted in a red solution that did not yield
crystals on either attempt. In hindsight, this is probably due to high
solubility of any product in the N,N-dimethylethanolamine, and a
different solvent should have been explored. It is also possible that
the potential adduct forms a chelate-type complex with vanadium
alone, as seen in the vanadium trialkanolamine complexes. 3 6
Bismuth alkoxides have demonstrated difficulty in terms of
reproducibility where the specific product (cluster oxoalkoxide)
varied with the commercial source of the reagents, the temperature,
and the bismuth species' concentration at time of synthesis. 3 8
These factors may not have been well-controlled in the experiments
described above. Most of these latter attempts at making an
analogue of III-76B, due to the 1:1 metals ratio seen in III-76B,
used the metals in 1:1. This may have provided too little of one or
the other metal to form a stable structure. At the very least, 2:1
and 1:2 Bi:V ratios should have been tried. Also, the ligand was
283

consistently used in > 10-fold excess, which may have blocked
potential reaction sites on the metals with a sort of "solvation."
Synthesis of an analog of III-76B using Ti(OiPr) 4 was attempted
once, but resulted in a precipitate that could not be re-dissolved
and therefore was not further characterized. (Experiment 22)
As discussed in the introduction to this Chapter, one way to
make heterobimetallic alkoxides is to use the alkali metal bimetallic
alkoxide with the desired metal, followed by a salt metathesis
(Equation 5.9). For example, the termetallic alkoxide
[{Cd(OiPr) 3}Ba{Zr(OiPr) 9}] 2 was made by sequential salt elimination
reactions (Equation 5.10a,b).
(5.9) MxM'(OR)n + M"CIx 4 M"M'(OR)n + x MCI
(5.10a) CdI 2 + KZr 2 (OiPr) 9 + ICd{Zr 2 (OiPr) 9 + KI
(5.10b) ICd{Zr2(OiPr) 9 + KBa(OiPr) 3 4
1/2 [{Cd(OiPr) 3}Ba{Zr(OiPr) 9}] 2
Several of the syntheses described in this Chapter were to take
advantage of this. Sodium-bismuth alkoxides are known, e.g.
NaBi 3(pL3-0)(OR)(THF) and others. 3 8 One promising route, which
was to give the correct stoichiometry for Bi 2VO5 .5 , was based on
published reactions (Equations 5.11a, b). 3 9
(5.11a) SbCl 3 + 4K + 4 ROH + KSb(OR) 4 + 3 KCI in benzene
(5.11b) KSb(OR) 4 + SnCl 2 - Sn(Sb(OR)4) 2 + 2 KCI in benzene
R=Me, Et, iPr, nBu, tBu, jAm
284
It was expected that the analogous reaction would occur with
bismuth, yielding KBi(OR) 4; whether VX 2 could be persuaded to act
as did SnCl 2 was more doubtful, but using VX 2 or VOC13 (even for the
incorrect stoichiometry) seemed worth trying. However, as the
experiments described below show, we were unable to isolate
KBi(OR) 4 cleanly, so this route was abandoned.
285

-n I CD18
8 %
T
-n -I0 -h
4000
35
00
3000
25
00
2000
15
00
1000
CI
50
001

Figure 5.9: DTA/TGA of JWP-II-76A
temperature difference0 C0
0
OCU
287

5.2.3 Precursor Characterization
The focus in precursor characterization was the exploration of
the interaction between Bi(OAc) 3 and V-2MOE in solution. The
results were somewhat confusing. UV/VIS spectra of V-2MOE alone
and of a 1:2 mixture of V-2MOE and Bi(OAc) 3 revealed some change
in the vanadium coordination sphere, as demonstrated by the 35-
nm red shift of the absorption on mixing. (Figure 5.10). This shift is
in the expected direction for acetate entering the vanadium
coordination sphere. 3 2 On the other hand, 51V NMR showed only a
slight shift in the V-2MOE peak on addition of Bi(OAc) 3 (-544 ppm
neat, -541 ppm in the presence of Bi(OAc) 3). (Repeatability ± 1
ppm; however, 51V NMR is sensitive to the ionic environment, 3 2 and
the addition of the bismuth acetate may have caused the shift in
this way, rather than by actual change of the vanadium coordination
sphere.)
Both standard transmission and photoaccoustic FTIR were
used to characterize what changes occurred in the bonding sets of
both metals. It was thought that several changes to the IR spectra
could occur during the formation of a mixed Bi-V complex in solution:
(1) Acetate groups on the Bi would be replaced by 2MOE groups,
leaving free HOAc, which could be removed in vacuo, and (2) New C-
o bands would appear and/or old ones would shift toward lower
wavenumber (weaker bonds) due to pl or g2 bridging by the 2MOE
group.
288

There is some indication that some loss of acetate groups
occurs in the presence of 2MOE. As expected, Bi(OAc) 3 (Figure 5.11)
lacks the C=O stretch at 1720 cm-1 (location based on neat HOAc),
but has bands at 1426 and 1348 cm-1, the Vas and the vs carbonyl
peak locations expected for a carboxylate ligand. (The shift to
lower-than-usual wavenumber is expected for a solid-state IR
method. 4 0 ) A solution of V-2MOE and Bi(OAc) 3 in 2MOE (Figure
5.12) conversely shows the free C=O peak at 1740 cm-1, while the
Vas and the vs carbonyl peaks are overlaid on the absorptions of the
2MOE. This demonstrates at least partial alcoholysis of the acetate
groups in the presence of excess 2MOE. When the solution of V-
2MOE and Bi(OAc) 3 is placed onto a 3M Type 61 IR card and the
solvent removed in vacuo, the C=O peak (1720 cm-1) remains but is
attenuated, possibly due to incomplete evaporation of the acetic
acid. (Figure 5.13) This spectrum also retains the bands at 1540
and 1399 cm-1, indicating the retention of acetate on the bismuth
center. However, PA-FTIR of the Bi(OAc) 3-2MOE polymeric material
and the Bi(N(SiMe 3)2)3-2MOE solid (Figure 5.14, 5.15 respectively)
both show peaks in this area - e.g. they may be polymerization-
broadened C-O (alcohol/ether) absorbances, so the presence of
these bands in the Bi(OAc) 3-V-2MOE solution is not conclusive
evidence of acetate-group retention. The 2MOE solvent almost
certainly plays a role in breaking apart the Bi(OAc) 3 trimer and
possibly in alcoholyzing the acetate groups from the Bi center, but it
remains uncertain whether 2MOE groups bound to the vanadium
also bridge to the bismuth in solution. An acetate-based analog of
the bonding situation seen in III-76B is possible, however, if the
positions taken by the bridging acetate groups in II-77A (Figure
289

5.16) are occupied instead by 2MOE groups. (Figure 5.17) Weak
back-interactions from Bi-based acetate groups, or entry of
liberated acetic acid into the vanadium coordination sphere, may
explain the 5 V and UV-VIS spectra.
In an attempt to determine whether the bismuth acetate
remained in solution in the gel interstices, or bonded in some way
to the hydrolyzed vanadium alkoxide structure of the gel, two 2:1
Bi(OAc) 3 : V-2MOE samples in 2MOE were hydrolyzed with excess
water and permitted to gel (experiment 23). In one sample, only
the syneresis fluid was removed, without breaking up the gel, and
the residue from it was found to be negligible. In the other case,
the gel was mechanically broken up to free trapped fluid. Again, the
residue from the fluid after evaporation was found to be negligible.
Thus the bismuth acetate appears not to remain as a trapped
solute, but to participate chemically in the gel structure. The
remnant of the gel pyrolyzed to give BiVO 4 and Bi 2VO5 .5 , indicating
that the bismuth was still located in the gel.
290

Figure 5.10: UV-VIS of V-2MOE solution with and without added
Bi(OAc) 3 solution.
0
C3
0 E
C
CY
c
00
i1 0
291

Figure 5.11: Photoaccoustic FTIR of JWP-II-77A,, bismuth
acetate.
C
rCD1t2In
292
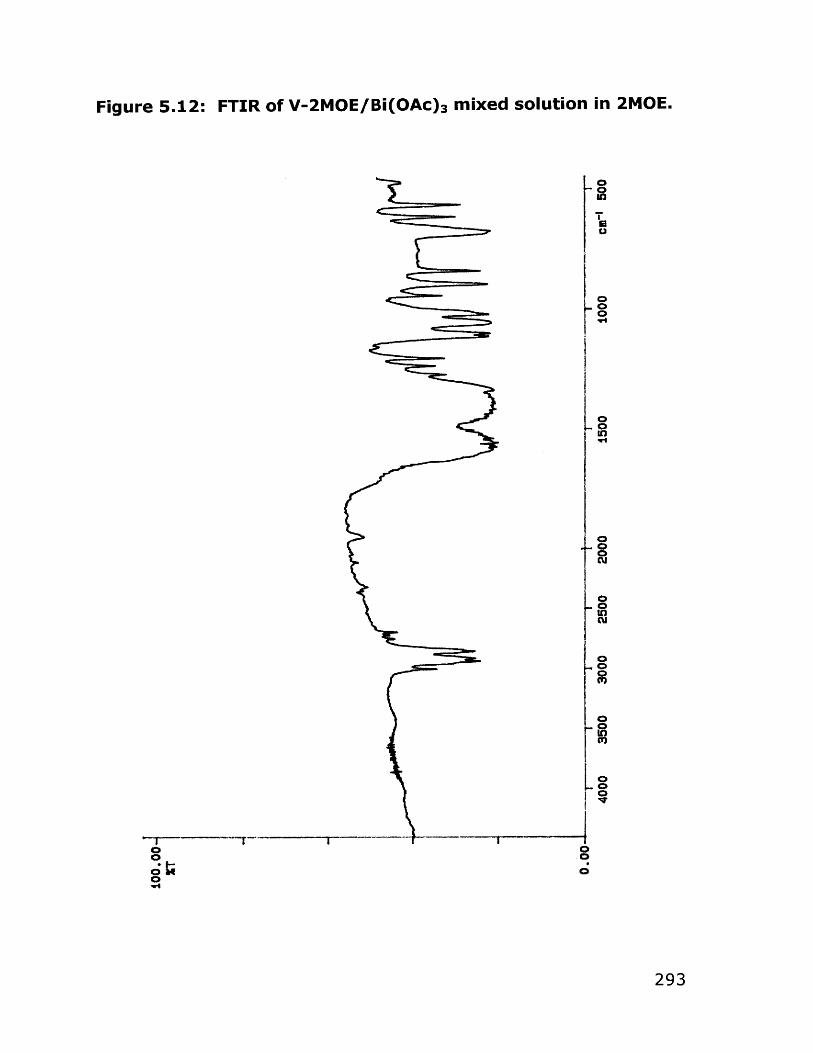
Figure 5.12: FTIR of V-2MOE/Bi(OAc) 3 mixed solution in 2MOE.
0
00
293

Figure 5.13: FTIR on V-2MOE/Bi(OAc) 3 mixed solution in 2MOE,
after vacuum removal of solvent.
aU3TU
C
a
2
Vqa
29

Figure 5.14: Photoaccoustic FTIR on JWP-121C, bismuth
acetate/2MOE polymer.
0
8.
12
295
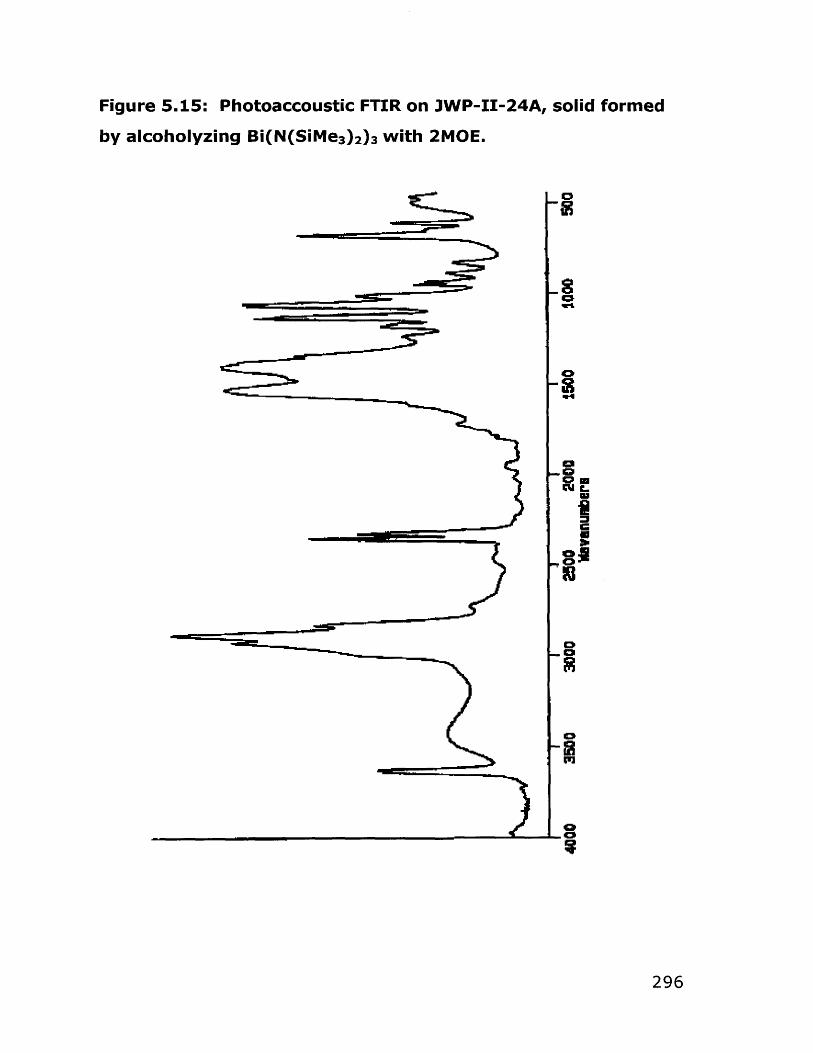
Figure 5.15: Photoaccoustic FTIR on JWP-II-24A, solid formed
by alcoholyzing Bi(N(SiMe3)2)3 with 2MOE.
C
WL
C
3
C
296

Figure 5.16: ORTEP of JWP-II-77A, bismuth acetate (see text).
Selected bond lengths (pm) and angles: Bi(3)-O(1) 254, Bi(3)-
0(2) 230, Bi(3)-0(3) 267, Bi(3)-0(4) 240, Bi(3)-O(5) 252,
Bi(3)-0(6) 224, Bi(3)-0(2B) 294, Bi(3)-0(4B) 283, Bi(3)-
0(3A) 280; O(1)-Bi(3)-0(3) 152.50, O(1)-Bi(3)-0(4) 117*,
0(1)-Bi(3)-0(5) 800, 0(1)-Bi(3)-0(6) 740, 0(4)-Bi(3)-0(6)
800, 0(3)-Bi(3)-0(6) 790, 0(3)-Bi(3)-O(4) 50.50, 0(5)-Bi(3)-
0(6) 530, 0(1)-Bi(3)-0(2) 53.40
CIIA
C31ACIA
02A
04A C3A OIA
C21A C2A 5
BI2 C2B38 BI1
05B 028 03A C21BCIB 046
0 1 E C3E3 . 03
06B BI3
C11B6 C21C315 C2
05 04
01 02 -3
CI06
C11C31
297
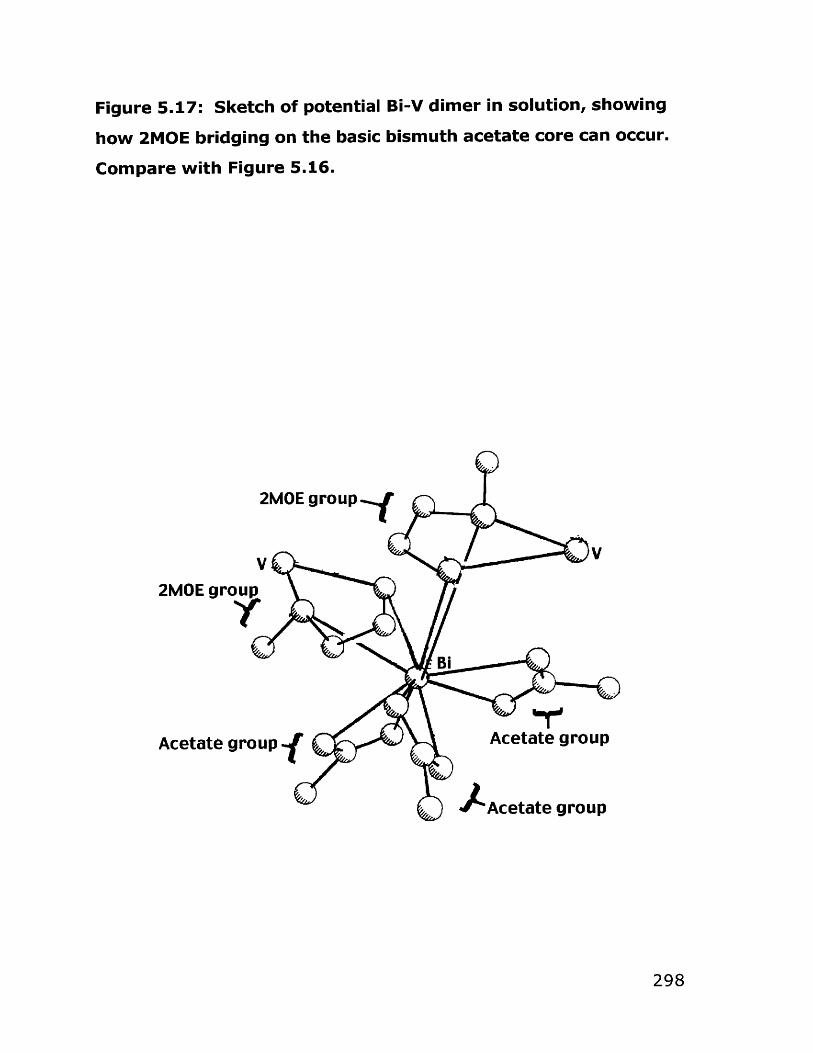
Figure 5.17: Sketch of potential Bi-V dimer in solution, showing
how 2MOE bridging on the basic bismuth acetate core can occur.
Compare with Figure 5.16.
2MOE group
2MOE group
Bi
Acetate group Acetate group
JAcetate group
298

5.3 Conclusions
Overall, the isolation of one example of a jt-O Bi-V complex,
synthesized starting with bismuth chloride and vanadium alkoxide,
is an interesting result but one which cannot necessarily be
extended to count as evidence of the formation of a single
precursor complex in the bismuth acetate-vanadium alkoxide
solutions used in the sol-gel synthesis of the BiMeVOx materials.
The types of bridging that the 2MOE group on vanadium can
perform with bismuth, however, provide a potential for interaction
between the vanadium alkoxide and the bismuth acetate, and one
can speculate that the sorts of inter-bismuth bridging done by the
acetate groups in the bismuth acetate structure (see Figure 5.16)
could potentially also be done by 2MOE groups on bismuth, with
complete retention of the acetate groups. Conversely, the acetate
groups on Bi(OAc) 3 can be lost through alcoholysis by 2MOE in
forming the fibrous polymeric material. (Figure 5.14) Such
substitution of 2MOE groups for acetato ligands demonstrates a
second process by which 2MOE groups on the vanadium could
create bridged Bi-V complexes. The suppression of the formation of
the fibrous material in the presence of V-2MOE suggests of
interaction between the vanadium alkoxide and bismuth compound
in solution - "alcoholysis" or bonding by the 2MOE groups on V-
2MOE may act to block polymer formation by free 2MOE and
Bi(OAc) 3.1 2 The shift in the visible absorption spectrum of the
vanadium alkoxide in the presence of the bismuth precursor also
suggests interaction between the two species in solution, though
299

the shift of the 51V NMR peak by 3 ppm is not strong evidence of
changes taking place in the vanadium coordination sphere. The UV-
VIS spectral shift, is thus not adequately explained. Until a Bi-V
precursor complex is obtained from the preparation actually used in
the sol-gel depositions, the existence of a single Bi-V precursor
complex in solution prior to hydrolysis remains speculative. In the
hydrolyzed precursor solution, the bismuth appears to become
bonded to the poly(vanadium oxide) gel structure, rather than
remaining as a trapped solute.
A number of the experiments in this Chapter may be worth
repeating under more favorable synthesis conditions and with more
attention to indirect (e.g. spectroscopic) methods of characterizing
what is taking place in solution, rather than relying on crystallization
to provide a characterizable material. It is likely, also, that attempts
to crystallize out a Bi-V complex from solutions containing vanadium
alkoxide and bismuth dimethylsilamide would be fruitful.
5.4 Experimental Section
All experimental work was done in an argon-filled glove box or
on an nitrogen-equipped Schlenk line. Solvents were used pre-
dried by the manufacturer without further preparation.
See the Appendix to Part I of this thesis for a list of materials
and instruments used in this chapter.
Experiment 1 (JWP/III/76A) V-2MOE + BiCI3
In the glovebox V-2MOE (6.4035 g, 3.2 mmol) was mixed with
4 ml 2MOE. To this was added BiCI 3 (2.1047 g 6.7 mmol) and 10 ml
300

more 2MOE. All solids were dissolved after a brief stirring at room
temperature, producing a yellow liquid. This was removed from the
glove box and warmed in vacuo to remove the solvent. A brown oil
remained. Anhydrous pentane (0.5 ml) was added and stirred with
the oil, then removed by evaporation to again leave an oil. Five ml
of 2MOE was added to form a yellow-brown solution, which was
placed in a sealed flask at 4 OC under N2. After four days tiny
orange crystals and some white crystals had formed. After another
week at 4 OC the mother liquor was removed by syringe and the
orange crystals rinsed with a small quantity of cold 2MOE, then
dried under vacuum. The mother liquor was concentrated and left
at 4 0C for several days under N2 with no further crystallization. The
main set of crystals were orange but blackened on exposure to air.
The crystals were checked for elemental content by EDAX using a
backscatter detector and 15 keV exciting energy and found to
contain Bi, V, and Cl. FTIR (Figure 5.8) (nujol, cm-') showed bands
at 2948 s, 2364 w, 1462 s, 1377 s, 1232 m, 1197 m, 1102 m, 1084
m, 1038 m, 1010 m, 996 m, 946 m, 902 m, 827 m, 774 w, 722 s, 631
w, 560 m. None of the crystals were suitable for single-crystal XRD
due to loss of solvent from them. DTA/TGA on the solid showed
endotherms at 134 and 647 OC and exotherms accompanied by
weight losses of 9.75%, 38%, and 68% at 182, 312, and 450 oCt
respectively. (Figure 5.9) Yield (0.16g) 17% assuming identical
formula to III-76B below. Elemental analysis and NMR were not
performed.
Attempts to repeat the experiment in diethyl ether solvent
(JWP/III/83A) resulted in a yellow-brown oil that separated from the
301

solvent. Isolation of this oil and refrigeration at 4 OC did not result
in crystals.
Experiment 2 (JWP/III/76B) VO(OiPr) 3 + BiCI3 in 2MOE
In the glovebox VO(OiPr) 3 (0.80g, 3.26 mmol) was added to
BiCl 3 (2.0485 g, 6.5 mmol) and 10 ml 2MOE. The resulting yellow
solution was stirred briefly at room temperature then removed from
the glove box in a sealed flask and the solvent removed with
warming in vacuo to leave an orange oily precipitate. This was
redissolved with some warming in 5 ml 2MOE and left overnight at
room temperature, then left at 4 0C for several days under N2. After
four days, orange crystals had appeared. These were collected one
week later by removal of the mother liquor by syringe and rinsing in
a small amount of cold 2MOE. The crystals were dried in vacuo; the
mother liquor was concentrated and left again at 4 0 C, but no
further crystallization occurred. Yield: 35% (based on bismuth) air-
sensitive orange crystals. The crystals were stable at room
temperature under argon.
The crystals were checked for elemental content by EDAX
using a backscatter detector and 15 keV exciting energy and found
to contain Bi, V, and Cl. Analysis (Galbraith Laboratories, by ICP-
EAS) found: C 17.38, H 3.36, Cl 15.67, Bi 35.03, V 8.11; expected: C
17.8, H 3.5, Cl 17.5, Bi 34.4, V 8.4.
Single crystal XRD indicated a dimeric complex of the formula
[BiCl3(p-O)( g-OC2 H4 0CH3) 2(OC 2 H4 0CH3) V] 2 (C9H21 BiCI30 7V,
M=607.53). The crystal was monoclinic P2 1/n, a=10.7405(8) A,
b=14.9328(1) A, c=11.2839(8) A, P=97.2330(10)0. V=1795.4(2) A3
302

at T=188(2) K. Z=4, Dc=2.248 g/cm3, X=0.71073 A (Mo K.). Of the
7070 reflections collected, 2567 were independent with I>2a(I),
yielding R1=0.0258, wR2=0.0508. See Figure 5.1 for ORTEP and
representative bond lengths and angles.
FTIR was run in KBr and Nujol, with the following peaks:
(cm-1) 2930 s, 1447 m, 1341 m, 1250, 1224, 1192 broad, m, 1050 m,
944, 911, 830, 647, 600 576 507 m/w. (Figure 5.2). NMR data: 5 1V
(8, ppm; 300 MHz, DMSO-d 6, VOCI 3 =0 ppm) -553.1 (s); 1H (8, ppm,
300 mHz, DMSO-d 6 ) 3.24 (S, 3H), 3.30 (s, 6H), 3.33 (t, 3j-5.2 Hz,
2H), 3.49 (q, 4 J=5.2 Hz, 2H), 3.57 (t, 3 J=4.8 Hz, 6H), 4.58 (t, 3 J=5.2
Hz, 1H), 4.92-4.95 (broad, 4H); ' 3C (6, ppm, 300 MHz, DMSO-d 6 )
57.95, 73.25, 80.36, 86.18, 92.09, 102.21 (high background noise).
(Figures 5.5-5.7) It should be noted that the DMSO solvent was
used as-received and turned out to be contaminated with a small
quantity of water, which we believe protonated 0(3). This gives
rise to the extra splitting in the 3.49 ppm peak (to a quartet) and in
the 4.58 ppm peak in the proton spectrum. See Figure 5.3 for
DTA/TGA on the solid, which showed an endotherm at 144 OC with
no attendant weight change, stepped exothermic weight losses up
to 328 OC, and a major weight loss from 375-450 OC. The product of
the thermal analysis was identified by powder XRD to be primarily
BiVO 4 (JCPDS #14-688). (Figure 5.4)
Attempts at repeating the experiment in diethyl ether solvent
(JWP/III/83B) resulted in an instant white precipitate which was not
characterized further. The experiment described here was
reproduced (JWP/III/107A) to give a 33.8% yield of orange crystals.
These were verified by NMR and IR for authenticity.
303

Experiment 3 (JWP/IIII/78A) Bi(OAc) 3 + V-2MOE in hexane
To a suspension of Bi(OAc) 3 (2.0071 g, 5.2 mmol) in 15 ml of
hexane was added V-2MOE solution (5.23 g, 2.6 mmol) in 2MOE.
This was stirred for 5 hours at room temperature then heated 1
hour to leave a yellow-green solution and some white solid. This
was permitted to cool to room temperature and filtered, and the
concentrated filtrate refrigerated at 4 0C for one month. A brown oil
separated out of the yellow mother liquor. No further
characterization was performed.
Experiment 4 (JWP/III/79A) Bi(OAc) 3 + VO(OiPr) 3 in hexane
with reflux
To a suspension of Bi(OAc) 3 (2.0159 g, 5.22 mmol) in 15 ml of
hexane was added of VO(OiPr) 3 (0.65 g, 2.65 mmol). This was
stirred at room temperature for 5 hours to form a milky suspension,
which was refluxed for one hour. The suspension was permitted to
cool to room temperature and settle. This was filtered and added
to the filtrate from /79B (Experiment 5).
Experiment 5 (JWP/III/79B) Bi(OAc) 3 + VO(OiPr) 3 in hexane
To Bi(OAc) 3 (2.0185 g, 5.22 mmol) was added VO(OiPr) 3 (0.65
g, 2.65 mmol) and 15 ml hexane. This was stirred at room
temperature for 5 hours to produce a milky suspension, which was
warmed to give a yellow solution and a white solid. This was cooled
to room temperature and filtered, and the filtrate from /79A (Expt.
304

4) added to it. This was refrigerated at 4 'C for two days, then the
solvent volume reduced in vacuo. Yellow deposits were noted in the
trap, indicating sublimation of a vanadium compound. The
concentrated solution was again cooled to 4 OC for one month. No
crystals appeared.
Experiment 6 (JWP/III/84A) Bi(OAc) 3 + V-2MOE
In the glove box Bi(OAc) 3 (2.0120g, 5.22 mmol) was added to
V-2MOE solution (5.2249 g, 2.5 mmol), and 20 ml 2MOE added. This
was warmed with stirring to dissolve, then permitted to cool
overnight to room temperature, and refrigerated for two days at 4
0C. The solvent was removed in vacuo with warming on a water
bath, resulting in a white-yellow solid in a yellow-brown oil. To this
was added 60 ml hexane and the resulting mix refluxed and hot
filtered. White powder appeared in the filtrate as it cooled. The
solid on the filter was pyrolyzed in air at 800 OC for 2 h. Powder
XRD of this material could not be matched to any Bi- and/or V-
containing phase in the JCPDS database (Figure 5.18).
Experiment 7 (JWP/III/91A) Bi(OAc) 3 + VO(OiPr) 3 in 2MOE
Bi(OAc) 3 (0.5038 g, 1.3 mmol) and VO(OiPr) 3 (0.2947g, 1.20
mmol) were dissolved in 20 ml 2MOE. The solution was warmed at
45 0C for 2 h and the solvent removed in vacuo to give an
inhomogenous white-yellow solid. 20 ml of 2MOE were again added
to redissolve the solid, and the mixture was heated at 55 0C
overnight. The solvent was removed in vacuo to yield a
305

homogenous yellow semisolid. This was again dissolved in 15 ml
2MOE with warming and left at room temperature overnight. Some
precipitate appeared in the flask bottom. The solution was
refrigerated (4 OC) two days. A yellow fibrous solid appeared which
occupied the entire solvent volume. After four days more at 4 oC,
the solvent was removed in vacuo. FTIR (Figure 5.19) in nujol gave
bands at (cm', approx.) 3500 vw, 3000-2850 m, 1949 w, 1574 s,
br, 1416-1335 s, br, 1271 w, 1235 w, 1203 w, 1113 m, 1099 m,
1056 m, 1020 m, 942 w, 895 m, 840 m, 673 m, 614 w, 564 w. The
experiment was repeated on JWP/III/91C. This product gave an
identical IR.
Experiment 8 (JWP/III/92A) Bi(OAc) 3 + VO(OiPr) 3 in THF
Bi(OAc) 3 (0.25 g, 0.65 mmol) was added to 50 ml THF
containing VO(OiPr) 3 (0.39 g ,1.59 mmol) and 0.5 ml (6.6 mmol)
2MOE. The resulting mixture was opalescent yellow. This was
warmed with stirring for one week and the maize-yellow suspension
permitted to settle, leaving a white solid and yellow solution.
Because no reactions appeared to have occurred, no further
characterization was done.
Experiment 9 (JWP/III/109A) Bi(OAc) 3 + VO(OiPr) 3 in 2MOE
Bi(OAc) 3 (0.7053 g, 1.83 mmol) and VO(OiPr) 3 (0.3681 g, 1.50
mmol) were added to 20 ml 2MOE. These were dissolved with
warming then permitted to stand overnight. The solvent was
removed in vacuo and 2MOE re-added to redissolve the material.
306

The volume was reduced in vacuo and the sample let stand at room
temperature overnight. This was reduced again in volume and the
clear solution decanted and left in a refrigerator at 4 0C. FTIR in KBr
on the solid left from the decantation shows bands at (cm') approx.
3500 vw, 3000-2850 w, 1578 s, 1384 s, 1336 s, 1235 w, 1204 w,
1113 m, 1100 m, 1056 s, 1020 m, 942 w, 896 m, 840 m, 675 s, 613
w, 564 w. (Figure 5.20) Over several days a yellow oil separated
out from the now-colorless solution. The solvent was removed in
vacuo and the oil redissolved in a small amount of 2MOE and left at -
10 OC for one month. A yellow precipitate formed. The solvent was
removed from this in vacuo and the solid rinsed with cold 2MOE and
Et 20. EDX on the solid (see JWP/III/145) showed that it contained
only Bi.
Experiment 10 JWP-II-120 Bi(OAc) 3 + V-2MOE, evap. together
In the glovebox, Bi(OAc) 3 (4.0026 g, 2.6 mmol) was added to a
flask and 50 ml 2MOE added. V-2MOE (7.127g, 3.53 mmol) was
added with a 25 ml 2MOE wash to obtain a clear yellow solution.
Some of this sample was saved for IR (JWP-II-120A). The remainder
of the solution was distilled with vacuum assistance and heating to
1/3 volume, followed by addition of 2MOE back to the original
volume and continued vacuum distillation to near dryness. The
remainder of the solvent removal was performed in vacuo without
heating (JWP-II-120C). The solid was kept at 30 mT vacuum over
three days but remained a dark yellow-brown oily solid with white
speckles. The solid could be redissolved in 2MOE, hydrolyzed, and
pyrolyzed at 600 0C to yield Bi 2 VO 5.s. PA-FTIR was done on II-120C
307

and compared with 11-39-0 (this had been aged approximately 9
months prior to evaporation of the solvent and PA-FTIR). (Figure
5.21a,b) The III-120C solid's PA-FTIR is very similar to that of 11-39-
0, with new or more intense bands at 1740, 1100, and 1018 cm-.
The III-120A FTIR, taken in 2MOE solution, is dominated by the
2MOE peaks. (Figure 5.22)
Experiment 11 (JWP-II-86A) Bi(OAc) 3 + V-2MOE
Bismuth acetate (II-69A) and V-2MOE were dissolved in
minimum 2MOE in a 2:1 molar proportion and left in an open vial in a
glove box for 5 months. Semicrystalline clear plates covered with
green-black spots resulted. PA-FTIR of this material (dried and
ground) was identical to that of 11-39-0. (Figure 5.23)
Experiment 12 (JWP/III/88A) BiCI3 + VO(OiPr) 3 +
ethanolamine in Et 2O
Ethanolamine (1.5 ml, 24.8 mmol) was added to a solution of
BiC 3 (1.0281g, 3.3 mmol) in 50 ml of Et 20. A white fluffy precipitate
formed. To this was added VO(OiPr) 3 (0.69 g, 2.82 mmol) and the
yellow slurry sonicated, then left stirring at 45 0C overnight. No
change in the appearance of the mixture was noted. No further
characterization was done.
308

Experiment 13 (JWP/III/88B) BiCI3 + VO(OiPr) 3 +
ethanolamine in THF
Ethanolamine (1 ml, 16.5 mmol) was added BiCI 3 to (1.0804 g,
3.42 mmol) and VO(OiPr) 3 (0.6477 g, 2.64 mmol) dissolved in 40 ml
THF. An orange-yellow clump instantly fell out of solution. This was
sonicated and left stirring on a warm (45 OC) bath overnight to give
a faint green solution and a white-brown powder. No further
characterization was done.
Experiment 14 (JWP/III/93A) VO(OiPr) 3 + ethanolamine
Ethanolamine (0.6g, 9.8 mmol) was added to VO(OiPr) 3
(0.5110g, 2.08 mmol) in 30 ml Et 20. A yellow-white precipitate
appeared, then became a deep yellow-orange over some minutes.
The solution was stirred at room temperature for several hours to
obtain a precipitate and a yellow oil which clung to the flask sides.
The Et 20/precipitate suspension was decanted off the oil and
minimal acetonitrile was added with warming to dissolve the oil.
This was left for several weeks at 4 0C. No crystals grew. The
yellow precipitate was filtered and dried: 0.2333 g. It became
purple-black on exposure to moist air. FTIR (KBr, cm- 1) showed
bands at (Figure 5.24) 3227 s, br, 2869 s, 1596 s, 1461 s, 1389 w,
1355 m, 1304 m, 1264 m, 1192 vw, 1136 m, 1072 s, br, 908 s, br,
704 m, 623 m, 602 m, 480 m.
309

Experiment 15 (JWP/III/103A) BiCI 3 + VO(OiPr) 3 +
ethanolamine
BiCI3 (1.0648g, 3.4 mmol) dissolved readily in 75 ml Et 20.
VO(OiPr) 3 (0.83g, 3.4 mmol) was added to give a yellowish
opalescent solution. On addition of 1 ml (16.5 mmol) ethanolamine
a canary yellow precipitate and orange oil formed. After stirring 1 h
at room temperature the solvent was removed and benzene and
pyridine added sequentially to try to dissolve the solid and oil.
Neither solvent would dissolve the solid or the oil. The solvents
were decanted off and the solid and oil dried in vacuo; 2MOE was
added to give a yellow paintlike suspension which settled to give a
yellow solution and yellow solid. No further characterization was
done.
Experiment 16 (JWP/III/89A) BiCI3 + VO(OiPr) 3 + ethylene
glycol in Et 2O
VO(OiPr) 3 (0.6496 g, 2.6 mmol) was added to BiC 3 (1.0093 g,
3.4 mmol) dissolved in 50 ml Et 20. A faintly yellow opalescent
solution resulted. To this was added 1.5 ml (26.6 mmol) ethylene
glycol. A bright yellow precipitate appeared instantly, and
separated from an orange oil. After sonication, the precipitate
redissolved to give an orange oil only. This was left stirring on a
warm bath (30-40 OC) overnight to give a green solution with
opaque orange-green oil. Concentration to approximately 10 ml
Et 20 and cooling at 4 0C for 1 month did not yield crystals.
310

Experiment 17 (JWP/III/89B) BiCI3 + VO(OiPr) 3 + ethylene
glycol in THF
Experiment 9 was repeated as follows: BiCI 3 (1.012 g, 3.4
mmol) and VO(OiPr) 3 (0.6517g, 2.6 mmol) were mixed in 100 ml THF
to give a white-yellow suspension. To this was added 1 ml (17.7
mmol) ethylene glycol. The resulting mixture became orange-juice
yellow and translucent (some cloudiness). This was stirred
overnight at 30-45 OC. A bright yellow precipitate was collected
from the yellow liquid. This would not dissolve in any of the NMR
solvents tested.
Experiment 18 (JWP/III/103B) BiCI3 + VO(OiPr) 3 + ethylene
glycol
BiC13 (1.0808 g, 2.8 mmol) was dissolved in 75 ml Et 20 and
VO(OiPr) 3 (0.64 g, 2.6 mmol) added to give a yellowish opalescent
solution. 1.5 ml (26.6 mmol) of ethylene glycol was added to give a
fluffy yellow precipitate and an orange oil. After 1 h at room
temperature the solvent was removed in vacuo and more ethylene
glycol added to give a yellow paintlike suspension. On settling, this
gave a yellow solid and an orange-yellow liquid. No further
characterization was done.
311
Experiment 19 (JWP/III/106A) BiCI3 + VO(OiPr) 3 + N,N-
dimethylethanolamine
BiCI3 (1.037g, 3.3 mmol) was added to VO(OiPr) 3 (0.7871g, 3.2
mmol) in 15 ml Me 2NCH 2CH 2OH. This was stirred for 8 h with light
warming to yield a dark red solution with a clump of yellow-white
solid at the bottom of the flask, and the mixture was sonicated in an
attempt to break up the solid clump. After 40 min of sonication the
solution has became cloudy and was discarded. The experiment
was repeated on JWP/III/108C: BiCI 3 (1.0081 g, 3.2 mmol) was
stirred in 4 ml Me 2NCH 2CH 2OH and VO(OiPr) 3 (0.6570 g, 2.7 mmol) in
5 ml Me 2NCH 2CH 2OH added. A dark red solution resulted; the
solvent volume was reduced to approximately 7 mi. This was left at
4 OC for several months, but no crystals grew.
Experiment 20 (JWP/III/113B) KOiPr + BiCI3
Potassium metal (2.9972 g, 77 mmol) was refluxed in 30 ml
HOiPr for 2 h to dissolve all the metal. The solution was cooled BiC13
(5.99g, 19 mmol) in 75 ml THF added slowly by cannula. The
resulting solution was refluxed 1.5 h, resulting in a thick green-grey
precipitate. Hexane was added to aid stirring. The mixture was
permitted to stand overnight at room temperature. A brown liquid
and white-grey solid resulted. To this was added 5 ml more HOiPr
and the mixture filtered to leave a light tan solid. XRD of the solid
shows KCL. The solvent was removed in vacuo from the filtrate to
leave a solid. ESEM one the solid showed a set of crystals (KCI?)
312

embedded in an amorphous matrix. (Figure 5.16) Elemental
analysis (Oneida): 26.45 C, 4.87 H, 45.62 Bi, 18.40 K (29.8C, 5.8H,
8.07 K, 43.1 Bi expected).
Experiment 21 (JWP/III/117A) BiCI3 + 4 KOiPr + V1 2
Potassium metal (0.4976g, 12.8 mmol) was dissolved with
reflux in 40 ml HOiPr. After cooling, this was added slowly to a
solution of BiCI3 (1.007g, 3.2mmol) in 60 ml THF and the mixture
refluxed 1.5 h to give a blue-grey suspension. This was cooled and
a suspension of V12 (0.4838 g, 1.59 mmol) in 50 ml HOiPr added to
give a dark purple-grey suspension. This was warmed (40 C)
overnight and filtered to yield a black solid and a brown liquid. The
solid was washed with HOiPr and dried (0.9668 g found, 0.71 g KCI
expected). XRD on the solid showed BiCI 3, KCI, KI, and V12 (find and
check).
Experiment 22 (JWP/III/107B) BiCI3 + Ti(OiPr) 4 in 2MOE
BiCI3 (1.0083 g, 3.2 mmol) and Ti(OiPr) 4 (1.7068 g, 5.92 mmol)
were stirred in 15 ml 2MOE at room temperature for 8 hr to dissolve
all solids. The clear and colorless solution was stirred for 10 min at
45 OC and the solvent removed in vacuo. With warming under
vacuum the solution became milky. 9 ml 2MOE was added to
redissolve the precipitate, but the suspension remained milky. The
experiment was discarded.
313

Experiment 23 (JWP-II-143) location of Bi in gel
To two flasks were added a solution of Bi(OAc) 3 (1 g, 2.6
mmol) and V-2MOE (1.3 mmol) dissolved in 40 ml 2MOE. The
solution in each flask was hydrolyzed with 2 ml of water in 4 ml of
2MOE, resulting in a gel with syneresis in both cases. (1) From one
flask, the syneresis fluid was removed and the gel rinsed several
times. The rinsings were added to the syneresis fluid, which was
evaporated carefully in a tared container. Residue 0.0004 g. (2)
The gel in the other flask was broken up with a stirring rod and
filtered gently with repeated washings with 2MOE. The filtrate was
carefully evaporated in a tared container. Residue 0.000 g. The gel
remaining on the filter was vacuum dried and pyrolyzed. DTA-TGA
showed a monotonic weight decrease until approximately 450 0C,
with exotherms at 290 and 385 and an endotherm at 830 OC.
(Figure 5.25) The gel, pyrolyzed at 550 OC for 8 h in air, was
identified by XRD to be BiVO 4 + Bi 2VO5 .5.
Experiment 24 (JWP-III-127) 51V NMR and UV-VIS of precursor
solutions
The V-2MOE solution prepared by dissolving V-2MOE (0.6057g,
13.2 mmol) in 25 ml 2MOE above was found to have a single 51V
NMR peak at -543.8 ppm. A 1:1 mix of this V-2MOE solution and a
solution of Bi(OAc) 3 (0.994g, 2.57 mmol in 25 ml 2MOE) gave a single5 V NMR peak at -541.1 ppm. A solution made by combining 1:4
314

glacial HOAc in the V-2MOE solution gave a single peak at -512.6
ppm.
The V-2MOE (background = 2MOE), and 1:1 Bi/V (background
= Bi(OAc) 3 solution) solutions were scanned 300-800 nm on a
HP8452A diode array spectrophotometer in a 1 cm plastic cell (cutoff
300 nm), with the backgrounds indicated for each solution
subtracted. The experiment was repeated several times to ensure
that the observed red-shifting of the Bi/V solution relative to the V
solution was not an artifact of the instrument. The observed shift
between the V-2MOE solution and that containing Bi(OAc)3
averaged to 35 nm to the red; the average instrument
reproducibility between two runs was +_2 nm (5 trials). (Figure
5.10)
Experiment 25 (JWP-III-111) 51V NMR of precursor solutions
5 1V NMR were run on the Varian Unity (300 MHz) NMR, using
the deuterium lock off and VOC 3 as an external standard (8=0 ppm).
315

Table 5.1: 51V NMR Results of Expt. 25.
Solution 51 V NMR Peaks
(ppm)
VO(OiPr) 3 10% in iPrOH (commercial, from -627*
Strem)
V-2MOE from V20 5 -544
VO(OiPr) 3 in 2MOE, after 1h -627, -594, -571
VO(OiPr) 3 + BiC 3 in THF -628, -606, -596
V-2MOE + HOAc -521
V-2MOE + Bi(OAc) 3 -541
*-629 ppm expected 3 2
Experiment 26 (JWP-II-148) FTIR of precursor solutions
The 2:1 Bi(OAc) 3 :V-2MOE precursor solution was spread onto 3M
Type 61 IR cards and FTIRs run before and after the cards were
dried under vacuum. The "wet" solution IR was dominated by the
2MOE solvent bands. (Figure 5.12) The dried precursor IR (Figure
5.13), however, showed a greatly reduced band and 3400 cm-1,
indicating the disappearance of most of the -OH groups from the
material on the IR card; the 1722 cm- 1 band shifted to 1707 cm-1,
indicating the weakening of the C=O groups present in the dried
precursor. Bands at 1540, 1400, 1113 (v(C-O ether)), 1052 (v(C-O
alcohol), and 1014 (p(OCH 3)?) cm-1 are attributable to the retained
2MOE groups according to the assignments given. The broad
shoulder 980-700 cm-1 and moderately strong peak at 680 cm'1 may
be assignable to the V=O and V-O bands, respectively.
316

Figure 5.18: Powder XRD of the pyrolysis product of JWP-III-
84A.
In
C,
N
MGML sj.unoo00,
317

009 000o;
ol;
MEo
00oa 0ooS
006 000o?
0II-0A
I F
-00"001

Figure 5.20: Phototaccoustic FTIR of JWP-III-109A.
8I
31

c
30-
25-0
"0
20-
15-
to- 5- 4000
3500
3000
2500
2000
0500
1000
500
Wavenumbers
C)

2500
2000
Wav
enum
bers
60-
50-
40-
30-
20-
10- 40
00
En 'a -I FA 0 En
3500
3000
wJ
1500
1000
500
I
0
k

0003 0OW
OOOE
009e 0001
I I
tO
T;00g9
Nf %M
009 i.U
D
0 N--I
u.4)MI
N.
-00-000'00

25-
~0
20-
15-
10- 5- 4000
35
00
3000
25
00
2000
1500
1000
50
0Wa
venu
mber
s

on I0 C- tD10
0 .00
-1
-I w
0.00
140
00
3500
30
00
2500
20
00
1500
10
00
cm-1
500
(A Nj

Figure 5.25: DTA/TGA of gel from experiment JWP-II-143.
(0.) BOUG.J844TO 9jn;e1jedwes±
0
00'a
LO Gu-i
0
U-ri-
63
S
0-o
0-o
CD
//
I3a, CL,a, I*
0,cuM)
00)
325
0-oCu
I I 1-0

5.5 References
1)Crans, D. C.; Shin, P. K. J. Am. Chem. Soc. 1994, 116, 1305.
2)Crans, D. C.; Felty, R. A.; Chen, H.; Eckert, H.; Das, N. Inorg. Chem.
1994, 33, 2427.
3)Mondal, S.; Rath, S. P.; Dutta, S.; Chakravorty, A. J. Chem. Soc.
Dalton Trans. 1996, 1996, 99.
4)Crans, D. C.; Felty, R. A.; Anderson, 0. P.; Miller, M. M. Inorg.
Chem. 1993, 32, 247.
5)Mehrotra, R. C.; Singh, A.; Sogani, S. Chem. Rev. 1994, 94, 1643.
6)Sauer, N. N.; Garcia, E.; Salazar, K. V.; Ryan, R. R.; Martin, J. A. J.
Am. Chem. Soc. 1990, 112, 1524.
7)Campion, J.-F.; Payne, D. A.; Chae, H. K.; Maurin, J. K.; Wilson, S.
R. Inorg. Chem. 1991, 30, 3244.
8)Mehrotra, R. C. J. Non-Crystalline Solids 1988, 100, 1.
9)Bartley, W. G.; Wardlaw, W. J. Chem. Soc. 1958, 422.
10)Gaskins, B. C.; Lannutti, J. J. J. Mater. Res. 1996, 11, 1953.
11)Danielle, S.; Papiernik, R.; Hubert-Pfalzgraf, L. G.; Jagner, S.;
Hakansson, M. Inorg. Chem. 1995, 34, 628.
12)Hubert-Pfalzgraf, L. G. Mater. Res. Soc. Symp. Proc., 1992, 271,
15.
13)Teff, D. J.; Huffman, J. C.; Caulton, K. G. Inorg. Chem. 1995, 34,
2491.
14)Papiernik, R.; Hubert-Pfalzgraf, L. G.; Daran, J.-C.; Jeannin, Y. J.
Chem. Soc. Chem. Commun. 1990, 695.
15)Chandler, C. D.; Roger, C.; Hampden-Smith, M. J. Chem. Rev.
1993, 93, 1205.
326

16)Hirota, K.; Komatsu, G.; Takemura, H.; Yamaguchi, 0. Ceramics
International 1992, 285.
17)Massiani, M. C.; Papiernik, R.; Hubert-Pfalzgraf, L. G.; Daran, J. C.
J. Chem. Soc. Chem. Commun. 1990, 301.
18)Massiani, M.-C.; Papiernik, R.; Hubert-Pfalzgraf, L. G. Polyhedron
1991, 10, 437.
19)Sauer, N. N.; Garcia, E.; Ryan, R. R. in Better Ceramics Through
Chemistry IV; Philadelphia: Materials Research Society, 1990;
Vol. 180, pp 921.
20)Tohge, N.; Fukuda, Y.; Minami, T. Jpn. J. Appl. Phys. 1992, 31,
4016.
21)Toyoda, M.; Payne, D. A. Mater. Lett. 1993, 18, 84.
22)Yamaguchi, 0.; Maruyama, N.; Hirota, K. Br. Ceram. Trans. J.
1991, 90, 111.
23)Mehrotra, R. C.; Rai, A., K Ind. J. Chem. 1966, 4, 537.
24)Matchett, M. A.; Chiang, M. Y.; Buhro, W. E. Inorg. Chem. 1990,
29, 360.
25)Jones, C. M.; Burkart, M. D.; Bachman, R. E.; Serra, D. L.; Hwu,
S.-J.; Whitmire, K. H. Inorg. Chem. 1993, 32, 5136.
26)Rogers, R. D.; Bond, A. H.; Aguinaga, S.; Reyes, A. J. Am. Chem.
Soc. 1992, 114, 2967.
27)Rogers, R. D.; Bond, A. H.; Aguinaga, S. J. Am. Chem. Soc. 1992,
114, 2960.
28)Evans, W. J.; Hain, J. H. J.; Ziller, J. W. J. Chem. Soc. Chem.
Commun. 1989, 1628.
29)Toyoda, M.; Hamaji, Y.; Tomono, K.; Payne, D. A. Jpn. J. App.
Phys. 1993, 32, 4158.
327

30)Turova, N. Y.; Kessler, V. G.; Kuchieko, S. I. Polyhedron 1991, 10,
2617.
31)Corriu, R.; Leclercq, D.; Lefevre, P.; Mutin, P. H.; Vioux, A. Chem.
Mater. 1992, 4, 961.
32)Priebsch, W.; Rehder, D. Inorg. Chem. 1990, 29, 3013.
33)Nandra, K. K.; Sinn, E.; Addison, A. W. Inorg. Chem. 1996, 29,
3013.
34)Goel, S. C.; Kramer, K. S.; Gibbons, P. C.; Buhro, W. E. Inorg.
Chem. 1989, 28, 3619.
35)Alcock, N. W. Adv. Inorg. Chem. Radiochem. 1972, 15, 1.
36)Nugent, W. A.; Harlow, R. L. J. Am. Chem. Soc. 1994, 116, 6142.
37)Cummins, C., personal communication.
38)Whitmire, K. H.; Jones, C. M.; Burkart, M. D.; Hutchinson, J. C.;
McKnight, A. L. in Mater. Res. Soc. Symp. Proc., 1992; 271, 149.
39)Athar, T.; Bohra, R.; Mehrotra, R. C. Main Grp. Met. Chem. 1987,
10, 399.
40)Bowdoin, C. Infrared Spectroscopy: I. Interpretation of Spectra and
II. Instrumentation, Polymer Spectra, Sample Handling, and
Computer Assisted Spectroscopy; Bowdoin College: Brunswick,
ME, 1987; Vol. 1.
328

Chapter Six: Deposition of BiMeVOx Films onto
Smooth and Porous Substrates
The experimental work described in this chapter was adapted, in
part, from Pell, J.W., Delak, K.M., and zur Loye, H.-C., in
Polycrystalline Thin Films, MRS Symp. Proc. 403, 1996, 459-464; and
Pell, J.W., Delak, K.M., and zur Loye, H.-C., Chem. Mater., 10, 1998,
1764-1770.
329

6.1 Introduction
6.1.1 Background
Air separators utilizing a thin, dense membrane of an oxygen-
ion conducting material offer significant advantages over
conventional methods involving repeated fractional distillation of air,
both in terms of efficiency and economics. 1 , 2 Likewise, membrane
reactors incorporating an ionic conductor can have increased
conversion efficiency and selectivity over fully oxidized products in
partial oxidation and ammonoxidation reactions.3- 7 The use of a
thin membrane of the conducting material shortens the path that
oxygen ions must traverse, effecting a corresponding reduction in
the temperature required to achieve a given oxygen flux. Further
decreases in operating temperature are desirable to reduce heating
costs in both air separators and membrane reactors, and to
broaden the range of reactants which can be used in partial
oxidation or ammonoxidation reactions.
An important restriction, however, is that the membrane must
be crack- and pore-free, and robust under thermal cycling.
Unsupported membranes must be thick (hundreds of pm) to give
reliable performance, while some supported membranes such as
films of yttria-stabilized zirconia (YSZ) on porous substrates need to
be on the order of 30 ptm thick to be initially crack-free. 8 , 9 This
thickness still requires operating temperatures near 1000 0 C to
reduce resistive losses-and these films developed gas leaks during
thermal cycling. Furthermore, the use of ever-thinner membranes
330

does not guarantee a continuous increase in oxygen flux, since the
kinetics of oxygen-ion recombination reactions become limiting. 2 On
the other hand, a material with a conductivity greater than YSZ may
be used to fabricate thicker, more reliable membranes. If the
conductive material has both ionic and electronic conductivity, so
that charge balance may be maintained across the membrane
without having to resort to the incorporation of an external circuit in
the device design, this situation is even better.
One of the most versatile techniques for producing thin films of
oxide materials is the sol-gel method, which has been
demonstrated to produce high-quality films of a number of
materials, including YSZ10, 11 and bismuth and lead titanates. 12 - 15
In the sol-gel method, a solution of suitable precursors is deposited
onto a substrate, followed by gelation to a homogenous solid layer,
which is dried and fired (350-450 OC) to remove unwanted organic
components.16 Higher-temperature processing yields a crystalline
film, and repetition of this procedure can result in films of up to
several pm in thickness. The film thickness will be a function of the
solution concentration and viscosity, in addition to parameters
associated with the specific deposition method-e.g. dip- or spin-
coating. Thinner films develop less strain during drying shrinkage,
and are thus less prone to crack. Additionally, cracking may be
reduced by increasing film-substrate adhesion through substrate
cleaning, or by rapid solvent removal and polymer network
modification aimed at preventing the extensive cross-linking which
can lead to an inelastic film.11
331

Several groups have reported the sol-gel deposition of films of
YSZ on a number of continuous and porous substrates. Chen et
al. 1 7 observe that solutions with a viscosity below 50 cps will not
wet a smooth glass substrate, while high viscosities (>500 cps)
gave inhomogenous, cracked films. On porous substrates, on the
other hand, viscosities of nearly 200 cps and multiple coatings were
required to produce continuous films of 0.1 to 0.5 gm thickness.
Kueper et al.11 use less viscous precursor solutions to prepare
crack-free thin films of 0.1-0.5 pm thickness on cleaned quartz
substrates. They establish a principle of rapid solvent removal after
film casting to minimize polymeric cross-linking in the film, in order to
provide maximum film flexibility and limit cracking. Only on
substrates with the smallest-scale porosity examined (0.02 gm)
could a continuous film be formed by their process; substrates with
larger pores suffered from entry of the film into the pores. In
addition to the solvent-removal rate, the importance of network-
modifying additives in controlling the elastic properties and porosity
of the green and calcined films must be taken into consideration.18
In this Chapter we report the deposition of BiCuVOx films onto
quartz substrates from the sol-gel precursor formulations discussed
in Chapter 4. The films showed poor thermal behavior,
agglomerating and forming holes and hillocks on heating. The
water-to-alkoxide ratio and additives used in the BiCuVOx precursor
formulation were varied but found to exacerbate the defect-
formation behavior of these films on quartz substrates. A number of
other substrates, comprised of metal films electron beam deposited
onto quartz, were tested. BiCuVOx films remained defect-free over
332

the entire range of temperatures on these substrates. Other
BiMeVOx films were prepared on quartz and metal substrates and
found to be reproducibly defect-free in several cases. Finally,
BiCuVOx films were prepared defect-free on porous alumina
substrates. This latter accomplishment provided supported oxide-
ion conductive films ready for testing in a membrane reactor.
6.1.2 Materials and Methods
Some initial comments about what was done experimentally will
make the discussion easier to follow. See Section 6.6 for the details
of individual experiments.
6.1.2.1 Precursor Solutions
The standard precursor solution for BiCuVOx films was made
as described in Chapter Four: bismuth acetate, vanadium 2-
methoxyethoxide, and copper acetate were dissolved in 2-
methoxyethanol to produce a stock solution approximately 0.05 M in
BiCuVOx equivalents. This was aged some two weeks prior to its
first use, then was used throughout the majority of the film casting
experiments as follows: the solution was diluted 50% with
methanol just prior to use, then hydrolyzed by adding slowly, with
stirring, one mole of water per hydrolyzable alkoxide group (e.g. 4
H2 0/V). Solutions were then permitted to stir one hour at room
temperature in a closed container prior to deposition. The pre-
hydrolysis dilution with methanol was found to be necessary to
produce thin, rapidly-drying films.
333

A similar recipe was used to make precursor solutions for
other BiMeVOx films. In these, Nb was added as niobium(V)
isopropoxide, Mn as manganese(II) acetate, Fe as iron(II)
acetylacetonate, and Ti as titanium(IV) isopropoxide, all in
appropriate amounts to deliver the required number of moles of
dopant. Concentrations of the stock solutions were approximately
0.05 M in BiMeVOx equivalents; the stock solutions were again
diluted 50% with methanol prior to hydrolysis and casting. The
quantity of hydrolysis water was set at one mole water per mole
total alkoxide groups, including those on the vanadium and on the
dopant metals.
The precursor solutions were prepared and stored under inert
atmosphere until hydrolysis. After hydrolysis, they were permitted
to be open to air, but were kept tightly closed between withdrawal
of aliquots for depositions. A hydrolyzed solution was used for a
day's experiments (the maximum time before use was five hours
after hydrolysis), then discarded.
6.1.2.2 Substrates
Quartz microscope slides were cut into pieces measuring
approximately 1 cm square. It was found that these slides, as
received, were not wet by the precursor solution described above -
e.g. a drop of solution formed a very rounded bead on the surface
of the quartz. Sonicating the slide in acetone or methanol permitted
the solution to wet the surface to the extent that the bead became
highly flattened, probably due to the removal of hydrophobic organic
334

residues or coatings left on the quartz from the fabrication of the
slides. However, films produced by dip coating onto quartz
substrates which had been prepared in this way flaked off easily.
It was thought that "roughing up" the surface of the quartz
substrates by rinsing them in aqueous hydrofluoric acid would
improve the precursor solution wetting as well as the film adhesion.
This may operate by leaving dangling Si-0- bonds (capped with
adsorbed atmospheric water) or otherwise providing a charged
surface to facilitate wetting. This sort of behavior has been seen
with polymeric siloxane solutions on silica substrates. 1 9 Therefore,
quartz slides were prepared by sonication for 30 minutes in acetone
or methanol to remove hydrophobic contaminants gained during
fabrication and packaging, followed by immersion for one minute in
48% aqueous HF. They were then rinsed thoroughly with water
and methanol and dried. Quartz slides prepared in this way were
examined by environmental scanning electron microscopy (ESEM)
and compared with those prepared by other methods. They were
found to have no gross surface damage, unlike those which, for
instance, had been sonicated in aqueous HF. (Figure 6.1) In some
cases, the quartz substrates were dried at high temperature (600
OC) or on a hot plate (300 OC) and cooled in a dessicator prior to
use; neither step made any discernible difference in the film
adhesion or general quality.
The film's adhesion to metal substrates was also investigated.
Metal substrates were initially constructed by cutting 1 cm squares
pieces from thin metal sheets (0.001" Ag, 0.01" Ag, 0.005" Pt), and
subsequently pressing them flat. However, wrinkles and bends in
the substrates that developed during the coating process due to
335

the handling procedures often cracked the deposited films and
made it difficult to distinguish defects arising from precursor
chemistry from those arising from careless handling of the
substrates. Promising results seen with the BiCuVOx coatings on
platinum substrates (Figure 6.2) prompted us to find a better way of
producing metal substrates.
Later metal substrates were therefore prepared by electron
beam (E-beam) deposition. Quartz samples were cleaned as
described above, dried, and mounted in an electron beam
deposition apparatus. A 100 A layer of titanium was first deposited
to improve the 1000-A platinum layer's adhesion to the quartz. The
platinum coatings deposited in this way were adherent to the
"scotch tape test." The slides were examined by ESEM and found to
be smooth and defect-free. (Figure 6.3) Platinum peaks in the
grazing-incidence X-ray diffraction (GIXRD) patterns were in the
expected positions; the titanium underlayer could not be detected
at a grazing angle of 10. (Figure 6.4)
A number of other metals and oxides were identified as
potentially able to act as substrate materials for the BiMeVOx
materials, according to their ability to provide a matching lattice.
(Table 6.1) Substrates were prepared with some of these coatings
and used, e.g. Pt, W0 3, A120 3, Ag. The silver films would not adhere
to the quartz substrates, even with a Ti underlayer. The tungsten
oxide films appeared adherent to the naked eye but under ESEM
inspection were fraught with holes and delaminated areas. The
platinum and alumina films were of good quality, and were used in
deposition experiments with each of the BiMeVOx materials (M = Cu,
Nb, Ti, and Mn).
336

Porous alumina disks (Whatman brand, AnodiscTM) having a
regular 0.02 Rm pore size were sonicated in acetone and baked at
650 OC for one hour to remove organics left on them during their
fabrication. These were examined in ESEM so that film voids could
be distinguished from the original appearance of the substrate and
were examined with GIXRD. Scanned in both the grazing incidence
and normal modes, the anopore discs appeared amorphous due to
a combination of X-ray scattering from the pores and the small
material-to-void volume ratio in the discs. (Figure 6.5)
6.1.2.3 Deposition of Films onto Substrates
Two methods of depositing a sol-gel precursor onto a
substrate are common: dip coating and spin coating. Both require
specialized equipment to provide reproducible depositions. Because
dip-coating is more appropriate for depositions onto large, non-flat
pieces, we first tried dip-coating solutions by hand, then built a dip-
coating apparatus.
Dip coating is a method of applying a precursor solution to a
large surface area of any shape in a short time. (Figure 6.6) A
single coating run may produce a film less than about 0.2 Rm in
thickness. 2 0 During dip-coating, the substrate is immersed in and
withdrawn from the coating solution at a constant rate and angle.
For a continuous process, e.g. a loop being pulled through the
solution, the thickness h of the liquid layer adhering to the
substrate can be given by Equation 6.1.
337

(6.1) h=K(TIU/pg) 1 2
where p is the solution density, g the gravitational acceleration, 1 the
viscosity, U the withdrawal speed; and K is a function of the capillary forces,
which in turn depend on solution viscosity and surface tension, as well as the
withdrawal speed. K is usually near 0.8 for a Newtonian liquid. 2 1
For an individual piece, the thickness is parabolic with distance x
from the leading edge of the substrate and the time that the
leading edge left the bath (Equation 6.2):
(6.2) h = (,x/pgt)12
The equation has been verified experimentally to a first
approximation; 2 2 however, because the equation was developed
for an ideal viscous liquid, where the thickness is determined solely
by run-off from the substrate, it is not fully applicable to sol-gel
films, where the solvent vapor pressure, humidity, substrate
temperature, and other factors control the transformation of a
partially polymerized metal alkoxide sol to a gel on a substrate. In
the sol-gel case, the viscosity of the deposited solution is changing
constantly during the dip-coating process. An empirical equation2 3
to describe the thickness of a densified film produced by dip-coating
a silicon alkoxide precursor solution takes K in Equation 6.1 as being
a function of a dimensionless flow term J and the densities of the
solution p, the densified film pp and solvent ps. (Equation 6.3):
(6.3) hPJ [(P-Ps)(pPps)][nU/pg] 12
338

The slower the dip speed, the smaller the viscous drag force
by which the substrate lifts the liquid, and the thinner the film as a
result. For films under a micron in thickness, the disjoining pressure
limits the thin-ness. This pressure stems from London-van der
Waals forces and electric double layer forces. If the disjoining
pressure varies with the film thickness such that there is some
equilibrium value of the thickness, the liquid will wet the substrate
perfectly and the film thickness will fall to this limit as the substrate
withdrawal speed is reduced. 2 1 Evaporation also may set a limit on
the film thin-ness, since the viscosity rises as the solvent
evaporates from the film. Problems with the method include the fact
that the precursor solution bath surface responds to any slight
vibration with ripples that affect the film as it is deposited; the film
tends to sag if left in the vertical orientation while the coating is still
liquid; particulate matter can easily fall into the precursor bath; and
the rate of evaporation of solvent from the substrate may fluctuate
according to local conditions.
We dip-coated BiCuVOx precursor solutions onto cleaned
quartz slides and pyrolyzed them to investigate the feasibility of
using this method of film casting. Initial dip-coatings by hand
proved irreproducible, so we assembled a crude dip-coating
apparatus. (Figure 6.7) A range of withdrawal rates were tried, as
were precursor solutions at different concentrations and degrees of
hydrolysis.
In general, the films produced by dip-coating were badly
cracked. Irregularities in the film caused by poor control of the
dipping rate and vibrations from the motor may have caused the
cracking. Reproducibility was an ongoing problem. However, GIXRD
339

showed that the films were phase-pure and highly-oriented
BiCuVOx. Because of the unpromising results, in addition to the
expense of designing and building a proper dip-coating apparatus,
we abandoned dip-coating in favor of spin-coating.
In spin-coating (Figure 6.8), excess precursor solution is
dropped onto the center of the substrate, which is then spun
around its center like a record. Centrifugal force and the balance of
surface tension with the tendency to wet the substrate causes the
solution to flow outward radially as the substrate begins to spin. As
the substrate reaches its final angular velocity, the excess liquid
runs to the edges of the substrate and flies off. As the film thins,
the resistance to flow increases, and the evaporation of the solvent
increases the viscosity of the liquid, until viscous drag balances the
centrifugal forces. This results in a uniform film. If the spin-off
speed is too fast relative to the evaporation rate, the liquid will fly
off rather than coat the substrate. At the point when the
centrifugal force and the viscous drag are equal, the rate of film
thinning may be expressed by a differential equation with solutions
in thickness (h) for three stages of spin-coating, one for during the
initial solution spreading (Equation 6.4), one for the period during
spin-off (Equation 6.5), and one for the final thinning during solvent
evaporation (Equation 6.6).21
(6.4) h(t) = ho(1+4pW2 ho2t/3p)1 /2
(6.5) h = (3pE/2PA0 2)1/3
(6.6) h = (1-pAO/pA)(3g/2PA% 2)1/3
where ho is the initial film thickness (after spreading, prior to spin-off), pt is
viscosity, p is density, w is the angular momentum, t is time, PA is the mass
340

of volatile solvent per unit volume (PA* is the initial value of this) and E is the
evaporation rate.
Complications to thickness control include the influence of the
gas flow dynamics on the evaporation rate, which, if too fast, may
lead to the formation of a skin on the solution surface or to
premature precipitation of the contents of the precursor solution.
These cause inhomogeneity and cracking of the film, and are ideally
prevented by maintenance of a controlled atmosphere in the spin-
coating chamber. Too-fast spin-up of the substrate can lead to a
radial "spoke" pattern caused by breakup of the wave front; this
pattern may persist in the way the particles are packed in the
coating. As with dip-coating, contamination will damage the
integrity of the film produced in a spin-coating process.
We constructed a crude spin-coater from a centrifuge using a
variable transformer to control the motor speed and calibrated the
spin rate stroboscopically. This equipment worked well in terms of
reproducibility and per-deposition film thickness, and was used for
most of the depositions described in this Chapter.
6.1.2.4 Heat Treatment
The loss of solvent or volatile decomposition products of the
precursor will leave holes in an already-formed film. This problem is
exacerbated when several additional layers of film have been added
on top of the one from which the decomposition gases are
escaping. As a result, after each layer was deposited and air-dried,
the substrate was placed onto a hot plate for initial decomposition
341

of the organic components of the precursor. The hot plate
temperature was approximately 350 0C. DTA/TGA had shown
(Chapter 4, Figure 4.10, 4.17) that the Bi 2VO5 .5 precursor was
completely decomposed by approximately 430 OC; powder XRD on
the Bi 2 CuO.lVO. 90 5 .35 precursor suggested that it was mostly
decomposed by 350 OC. There was sufficient precedent for this
procedural step in the literature that we did not look into how
failure to do this would affect the film quality. To give one example,
it was found for PZT (PbZrO. 5Tio.503) films on platinum that more
efficient removal of the organics, e.g. by heating them at 400 OC
rather than 275 0C prior to annealing, resulted in more uniform
films. 2 4
In most experiments, we also sought to form the y-BiCuVOx
phase in steps, e.g. after every five layers were deposited. This
was done by a process of rapid thermal anneal (RTA), 1 4 in which
the substrates were placed into an already-hot furnace. The
furnace temperature was 450 OC, the lowest at which the y phase
was seen in the bulk experiments. After approximately ten minutes,
the samples were removed and permitted to cool slowly (thick
alumina slabs served as thermal sinks to modulate the cooling rate)
in air before additional layers were deposited. Samples not
subjected to this treatment often had the appearance of cracks in
underlayers and showed agglomeration behavior (vide infra, section
6.3.1).
All samples were subjected to a final annealing step, which
involved their being placed in furnace initially at room temperature,
then ramped at 5 OC/minute to a set temperature for 4 or 8 hours
(there did not appear to be a difference in film quality with the soak
342

time; early experiments used the longer period). The samples were
cooled at a rate of 20C/minute. Cooling rates faster than 5
OC/minute were associated with cracked films. Slower rates did not
appear to make a difference in the film quality.
6.1.2.5 General Comments
A description of the chemicals and the general instrumentation
used for the experiments described in this Chapter may be found in
the Appendix to Part I of this thesis.
While E-beam depositions were conducted in the CMSE
Fabrication Lab cleanroom, all sol-gel depositions, whether dip- or
spin-coated, were carried out in a normal laboratory hood. Some
precautions were taken to prevent particulate matter from getting
into the precursor solution or films. Substrates were handled with
forceps after cleaning or other preparations were complete. After
mounting the substrate in the spin-coater, the sample was blown
with Aero-Duster m and the cover of the spin-coater lowered; the
precursor solution was drawn into a syringe, and passed through a
filter disc as it was deposited onto the substrate through a hole in
the spin-coater cover. This method was found to be satisfactory in
preventing excessive particulate matter from getting into the films;
in the absence of these precautions, ESEM revealed the films to be
riddled with boulder-like dust particles and cracks around them.
343

Lattice Parameters for various E-beam materials
Material Lattice Type Lattice Size (A) Face Diagonal (A)
Pt cubic 3.923 5.548
A120 3 hexagonal 4.759x12.99 n/a
Ag cubic 4.086 5.779
Au cubic 4.079 5.769
Al cubic 4.049 5.726
Ni cubic 3.524 4.984
W0 3 cubic 3.714 5.252
MgO cubic 4.123 5.831
YSZ cubic 5.139 7.268
(15%)
BiCuVOx tetragonal 3.92x15.45 5.54 5.15*
BiNbVOx tetragonal 3.91x15.75 5.53 5.25
BiTiVOx tetragonal 3.93x15.44 5.56 5.15
BiMnVOx tetragonal 3.92x15.49 5.54 5.16
BiFeVOx tetragonal 3.94x15.46 5.57 5.15
* 1/3 of the c parameter
344
Table 6.1:

Figure 6.1: Effects of the preparation steps on the quartz
substrates. (a) Quartz substrate cleaned with acetone and 48%
HF solution as described in the text. The large white object is a
dust mote. X 865. The cleaning steps used for the depositions
described in the text do little or no gross surface damage to the
quartz. (b) Quartz substrate sonicated 5 min. in 48% HF
solution. X 940. The damage to the substrate is clear.
(a)
(b)
345

Figure 6.2: BICuVOx film on a platinum sheet. The two objects
near the top are dust motes; the "canals" are due to wrinkles on
the metal sheet. X 1350.
4.
4 4
346
.. ..... ... .. ... ..

Figure 6.3: Platinum film deposited onto quartz by E-beam. The
dark area is bare substrate created by masking the quartz. The
large white spot at center is a dust mote. X 8050.
347
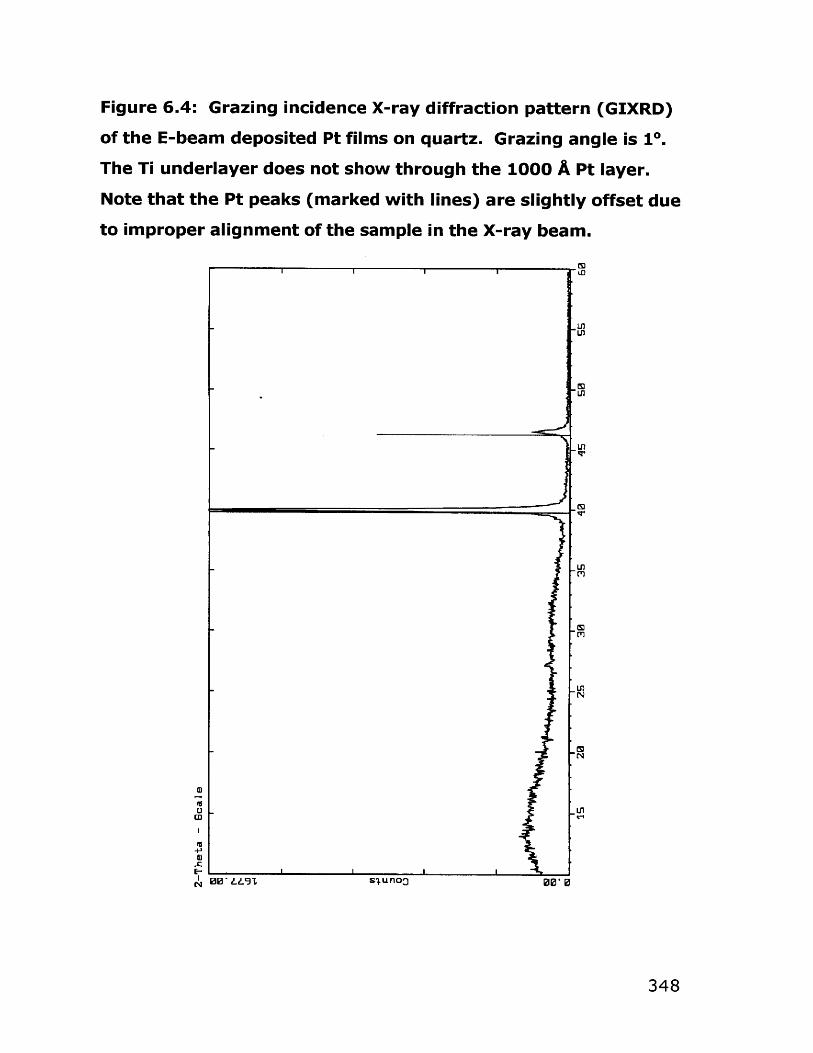
Figure 6.4: Grazing incidence X-ray diffraction pattern (GIXRD)
of the E-beam deposited Pt films on quartz. Grazing angle is 10.
The Ti underlayer does not show through the 1000 A Pt layer.
Note that the Pt peaks (marked with lines) are slightly offset due
to improper alignment of the sample in the X-ray beam.
L34
CDD
_348

Figure 6.5: (a) Porous alumina (Whatman brand Anodisc M )filter used as a porous substrate. The white mass is dust. X11500.
349

Figure 6.5, continued: (b) GIXRD of the porous alumina, with
positions for A12 0 3 (corundum) marked with lines. The
amorphous appearance is due to scattering from the pores.uL
-in-
Ln
NOW U
'an
UL
'an
350

Figure 6.6: Cartoon of the dipcoating process. (a) Insertion of
the sample into the precursor solution. (b) Solution begins to
run off the substrate as it is withdrawn and (c) reaches a
uniform thickness.
4
1 If-
(a)
-I-I1V
(b)
.j , 0
(c)
351
I

Figure 6.7: Home-made dipcoating apparatus. The switchable
motor, mounted on the back wall of the housing, turns a gear. A
toothed belt connects this to two other gears, which drive
threaded rods. These spin freely, and a metal block with
threaded holes moves up and down (depending on the motor
direction) The substrate is attached to the block.
.r '_01 5T
( ~t'Al
TY'lre 1AtX
r-7RCOD
WI '
;FET-o i
352
HLr~t

Figure 6.8: Cartoon of the spincoating process. (a) Precursor
solution is dropped onto the substrate and spreads. (b) During
spin-up, centrifugal forces thin the film. (c) Viscous drag
balances centrifugal forces at a critical thickness to yield a
uniform film, which (d) thins further as it dries.
I I
(a) (b)
~flll& &&
(c) (d)
353

Figure 6.9: Cartoon showing the angles and dimensions for film
grains on a substrate. See discussion in the text.
140
I
'V
(7~I I
'1'
'V
B
(7 (tIC>
354
-eq

6.2 Background on Films
There is a wealth of information in the applied physics
literature regarding the growth of vapor-deposited films of a variety
of materials. On the other hand, there few studies of films which
were deposited by the sol-gel method. Thus all of the discussion of
the behaviors seen in the BiMeVOx films reported in this Chapter is
based on studies of vapor-deposited films.
6.2.1 Modes of Film Growth
It is generally understood that there are three modes of
crystal growth on a surface that can take place during physical or
chemical vapor deposition processes. 2 5 In the Volmer-Weber
mode, small clusters are nucleated directly on the substrate surface
and grow into islands of the condensed phase; this occurs if the
adatoms are more strongly bound to each other than to the
substrate. In layer, or Frank-van der Merwe mode, the adatoms are
more strongly bound to the substrate than to each other, so they
initially form a complete monolayer on the surface, then a second
layer atop that one. The Stranski-Krastanov, layer-plus-island
mode, combines the two: after forming some monolayers,
subsequent layer growth becomes unfavorable and islands form
atop the layers below. Small imperfections in the surface of the
substrate can strongly influence the binding of single adatoms or
small clusters to the substrate and influence the adsorption,
diffusion, and nucleation behavior of the growing film. The layer
growth (Franck-van der Merwe) mode is what would be expected
355

for a situation where many of the adatoms are arriving at the
substrate at once (high supersaturation). 2 5 This is approximately
what occurs in the sol-gel method.
Film growth can be considered to be a multi-stage process: 2 6
(1) nucleation, when clusters of solid begin to condense on the
substrate at active centers (defects, impurities, etc.) on the
substrate surface; (2) crystal (grain) growth as nucleated clusters
join; (3) coalescence, during which the intergrain area develops
and the coalescing crystals influence the reorganization of the film
structure; and (4) secondary nucleation, growth, and coalescence,
during which stage the channels between the grains are filled,
leading to the growth of a continuous film. The coalescence stages
can be treated as sintering processes, but they may be incomplete,
leaving an intergranular area containing defects or high- or low-
angle grain boundaries. The effects of impurities or dopants
become very important when their solubility in the primary material
at the given temperature is not sufficiently high. In this case they
can become segregated during the crystal growth and coalescence
phases and move onto grain boundaries, where they can block
surface self-diffusion and may change the surface free energy. 2 6
Thus the presence of a dopant may result in rounded crystals with
broad, deep grooves between grains. In the extreme case, islands
of the primary material, separated by the bare substrate, form and
remain separated by grain boundaries coated with impurity/dopant.
Liquid-like coalescence tends to occur with small crystals and often
leads to the development of crystal lattice orientation
356

("texture").2 6 ,2 7 The grain size and the texture are partially
controlled by the presence of impurities or dopants. 2 8
6.2.2 Defects in films
As discussed in the section above, one of the major
contributors to defects in thin films is the presence of contaminants
or poorly-soluble dopants which may segregate to grain boundaries
and prevent grain coalescence. The inhomogeneity created by
surface segregation of contaminants has a high relative effect on
the material properties of the film because the number of atoms at
the surface of a grain is a large percentage of the total number of
atoms in the grain. Thus surface segregation modifies the bulk
concentration as well because there is not a large reservoir of bulk
material to make up for the local inhomogeneities. Surface
segregation can be predicted to some degree, and is a function of
film thickness, average composition, heat of segregation, and the
temperature. 2 9
A more severe case of the grain boundary grooving seen with
surface segregation of impurities occurs when the film
agglomerates. In this instance, the initially continuous film
"dewets," or uncovers, the substrate. The process is driven by the
surface tension of the film material and by stresses and strains
within the film. Agglomeration begins with the formation of a hole,
which exposes the substrate; the hole then grows. Defects in the
film are therefore critical in the inception of agglomeration. Tensile
stresses (strains) within a film lead to agglomeration, while
357

compressive stresses lead to hillock formation; however, from a
hillocked film, agglomeration may still occur as the hillock gains more
and more matter from the surrounding area, leaving it bare of film.
The free energy per unit area of film (g) is the energy of the film-
vapor interface (Yfv) plus that of the film-substrate interface (yfs).
(Equation 6.7)
(6.7) g= Yfv + yfs
If the energetics of the film agglomeration are controlled only by
isotropic interface energies, the equilibrium morphology will have a
constant curvature - i.e. flat or spherical cross-sections. The
stability of an island morphology (spherical cross-sections) is
determined by how well the film wets the substrate and measured
by the contact angle 0 between film and substrate. This is a
function of the interface energies, so the minimum thickness for a
stable film increases with decreasing wettability. The stability
condition is expressed by Equation 6.8. The island radius r in this
equation is determined kinetically in PVD films, while a sol-gel film's
island radius may be determined by the precursor morphology.
(6.8) r/t > (3 sin 0/(1-cos 0)
in which r is the radius of the island (=D/2) and t is the thickness of the
original film. 3 0 (Figure 6.9)
An initially flat surface with positive surface tension will not
spontaneously form holes. The usual source for the nucleation of
holes is grain boundary grooving, which is most severe where three
358

grains intersect. In general, grain boundary grooving and the
subsequent formation of holes is a consequence of the competition
of adjacent grains for the material between them. Smaller grains
have a higher surface curvature (higher chemical potential) than do
large grains, so polycrystalline films are nonequilibrium systems:
the small grains lose matter to larger ones and thin in the direction
normal to the substrate. 3 1 Grain boundary grooving is exacerbated
when surface-segregated dopants or contaminants prevent grain
coalescence. Pinholes from dust particles and other contaminants
also form potential points for hole nucleation. Holes will grow only if
they are larger than a critical radius rc. (Equation 6.9)
(6.9) r > rc = hyfv/(yv + yfs - ysv) = t/(1-cos 0)
The behavior of holes that do form depends therefore on the
assorted interfacial energies. When ysv > yfv + yfs, rc becomes infinite
and the hole will shrink: the film wets the substrate well. When ysv
< yfv + yfs, then 0> 0 and the film only partially wets the surface. In
this case, holes where r > rc will grow. 3 0
Film stresses contribute to the initial formation and growth of
holes, whether these stresses arise from lattice misfits, thermal
expansion mismatches, or from the growth process, including phase
changes. Misfit strains will increase the stability of islands over that
of the continuous film. When hole nucleation arises through grain
boundary grooving, there is an incubation time for agglomeration. 3 0
This incubation time depends on the film thickness. If the grain size
is several times larger than the film thickness little grain growth
359
occurs on annealing because of grain boundary grooving. If a grain
is under lower compressive stress than the surrounding grains,
atoms diffuse into it, leading to hillock formation. On the other
hand, a grain with lower tensile stress will lose material to grains
with higher tensile stress, leading to a hole in the film. In
compressively stressed samples, therefore, hillock formation often
precedes agglomeration. 3 0 The formation of a hill around the atom
source (hole) is typical. Holes, once formed, grow and collide,
leading eventually to the formation of islands.
Finally, fractures may occur in films having either large-scale
contamination (e.g. dust particles), or having stresses or strains
arising from inhomogeneities in the film density, thermal expansion
coefficient mismatch, or from mismatch between the film's crystal
lattice and that of the substrate. Where radial cracking has
occurred, it is centered on a dust particle or a region of higher film
density. During sintering the lower density matrix surrounding the
defect shrinks away from it. Circumferential cracking is seen when
the central lower density region pulls inward from the higher-
density matrix in order to sinter.3 2 (Figure 6.10a) Strains in the
film occur when the substrate lattice is larger than that of the film,
or when the substrate has a higher thermal expansion coefficient
than the film. The film under such strains appears to have been
"pulled apart." In the opposites of these cases, stresses in the film
cause an appearance of having been "pushed together," with
plates of the film piling one atop the other. (Figure 6.10b)
360

6.2.3 Texture development
Little or no information is available in the literature regarding
the development of orientation (texture) in sol-gel deposited films.
This is curious, since oriented films of dielectrics, ferroelectrics, and
superconductors (Bi 3Ti4012, PbZrO.5TiO. 50 3, YBa 2 Cu 30 7 - etc.) are highly
desirable to the electronics industry. 3 3 ,3 4 For vapor-deposited
films, nucleation is not orientation-selective during the deposition,
but grain growth may be orientation-selective. When the film wets
the substrate fully, oriented or epitaxial growth is usually promoted
by a substrate with a lattice matching that of the film. In this
context, a "lattice match" is not necessarily a direct correspondence,
say, between the film and substrate a and c parameters, but can be
an overlap in the periodicity of the electrostatic charge pattern. 3 4
Conversely, if the substrate is amorphous, it is surface energy
minimization that drives texture uniformity (all grains having the
same planes parallel to that of the film). Differential thermal
expansion during heating leads to high biaxial strain in a film, so
strain energy minimization may occur during grain growth. Thus
strain energy minimization and surface and interface energy
minimization both favor the development of texture via preferred
growth of grains with specific orientations; the interface energy, in
particular, is a strong function of the crystallographic orientation of
the grain. 2 7 For films that do not wet the substrate well, texture
development occurs during coalescence or thickening of the films.
Slight changes in the film composition can greatly change the
texture development of the film. For example, in YBCO films E-beam
361

deposited onto SrTiO 3 substrates at low temperature showed
strong a-axis orientation (i.e. a-axis normal to the substrate), while
those produced at high temperature gave little or no orientation. A
slight change in composition (Ba-rich and Cu-poor) gave c-axis
oriented films. 3 5
6.2.4 Effects of Sol-Gel Precursor Variation on Film Morphology
In sol-gel films, the morphology prior to the inception of any of
the film growth processes discussed above is influenced by four
major factors: (1) the kinetics of the loss of organics during
solidification, (2) the quantity of organics remaining in the film prior
to crystallization, (3) the homogeneity of the components within the
film, and (4) the structure and rigidity of the polymer prepared in
solution. The first two factors are primarily controlled by choosing
the ligands on the metals to be hydrolyzable into volatile
components, which will evaporate out of the film at a relatively low
temperature, or by the use of ligands that decompose cleanly at low
temperature, leaving little carbonaceous residue. Heating steps
prior to the film crystallization and annealing heat treatment can
help reduce organic residues, as discussed above (Section 6.1.2.4).
Aging the solution after hydrolysis also reduces the carbon
formation in the pyrolyzed film. 1 9 Finally, the use of a thin coating
and a low heating rate to permit oxygen diffusion into the film to
burn off organics cleanly will also reduce the amount of carbon
formation.
362
During sol-gel processing the metal alkoxide and/or salt
components are homogeneously mixed on the molecular level; this
state of affairs is maintained on hydrolysis, gelation, and pyrolysis.
However, differences in hydrolysis rates, the limited solubility of one
component in the others (preferential precipitation) and the
separation of components during thermal processing due to the
higher stability of a non-target phase at the lower temperatures, all
may produce inhomogeneity. Such problems often are seen in
YBa 2 Cu 307., sol-gel syntheses due to the insolubility of the copper
alkoxides and the fast gelation rate of the yttrium alkoxides.3 6
Complexing additives like carboxylic acids, amines, diols and alcohol-
ethers, and acetylacetonate have been known to help maintain
homogeneity in a number of sol-gel systems by coordinating to the
metal centers, modulating the hydrolysis rate. However, these
additives may disrupt the formation of the M-0-M network because
they do not hydrolyze off the metal nor contribute to the
condensation reactions.
The morphology of the precursor in solution can affect several
aspects of the pyrolyzed film morphology. As noted in Chapter
Three, vanadium oxide gels yielding V205 on pyrolysis have a ribbon-
like microstructure. 3 7 ,3 8 Passerini 3 9 found that rapidly spin-coated
V2 05 films (3000 RPM) tended to be amorphous, with a uniform-
appearing surface that revealed agglomerates at high
magnification. The ribbons in these films were randomly oriented
due to the high shear forces experienced by the gel precursor
during spin-coating which disrupted ribbon self-alignment. The
rapid evaporation of the solvent from the freshly deposited film
prevents further reorganization. The agglomeration is due to the
363

random grain orientation: the grains could not coalesce into a
continuous film. Conversely, in a dip-coated film the V20 5 crystallites
stacked with 001 perpendicular to the substrate, and films spin-
coated at a slower 1750 RPM had the V20 5 crystallites preferentially
oriented with 001 parallel to the substrate. This is opposite to what
we found, i.e. that dip-coated films were less oriented than those
spin-coated at approximately 3000 RPM.
The relative rates of hydrolysis and condensation of the
precursors in solution may affect the film morphology - primarily the
porosity - by changing the ability of the gel oligimers to pack
together tightly as the gel becomes densified. Film precursor
solutions are dilute, so individual species are at most weakly
interacting. During deposition drying, the rapid increase in
concentration forces the precursors close to each other.
Evaporation (during which the structure compacts and becomes
"frozen" in position) competes with continuing condensation (which
stiffens the structure against further compacting). The deposition
method puts a shear stress on the film and shrinkage during the
removal of solvent and continued condensation puts tensile
stresses on it as well.
The degree of interaction between species in the precursor
solution, and the amount of compaction expected from them, has
been studied at some length using fractal concepts to make sense
of small-angle X-ray scattering (SAXS) data. SAXS is the X-ray scale
equivalent of Rayleigh scattering, in general terms. In SAXS, the
dependence of the scattered beam intensity on the scattering
wavevector K, defined in Equation 6.10, leads to the fractal
dimension D. This latter value relates the mass (M) of an object to
364

its radius according to Equation 6.11. Euclidian objects (e.g. not
fractal) have D=4, but fractal structures have lower values which
depend on the degree of branching in the structure. A random
walk-type structure, for example, would have D=2. 1 8 Fractal
objects are the type that come about in sol-gel precursor solutions.
Those objects for which Equation 6.11 applies are mass fractals.
Others, which are uniform on the interior and ramified on the
surface, scatter X-rays only from the surface; for these objects, a
surface fractal dimension may be defined. 4 0
(6.10a) I(K) oc K-D
(6.10b) K = 47c/X sin 0/2
k = wavelength of the incident beam, 0 = scattered angle
(6.11) M ~ rD
The mass fractal dimension of the precursor oligimers in
solution can be directly related to their ability to interact and pack
tightly. Mandelbrot 4 1 shows that for two fractal structures of radius
R placed next to each other, the number of times (I1,2) an "arm" of
one intersects an "arm" of the other goes according to Equation
6.12. Intersections represent a lost opportunity for mutual
interpenetration by the fractal objects.
(6.12) 11,2 oc R exp (D1 + D2 - d)
D1, D2 = mass fractal dimensions of the structures 1, 2;
d = the dimension of space (=3)
365

It can be seen from Equation 6.12 that if D1+D 2 < 3, the
probability of intersections decreases as R increases, and there is a
situation of "mutual transparency," where the two objects may
interpenetrate extensively. If D1+D 2 > 3, on the other hand, the
probability of intersection increases with increasing R (e.g. less
interpenetration). Depending on the condensation rate, there is a
given probability that intersections will lead to the "sticking" of two
precursor polymers. This probability depends on the chemical
identities of the precursor structures. If the sticking probability is
high, the structure will be more porous because the cluster
interpenetration is inhibited; if the sticking probability is low, few
intersections result in sticking, and the precursors interpenetrate to
give denser structures. Brinker found that weakly branched,
compliant structures interpenetrate and rearrange until the solvent
is removed, giving an efficient packing and high density.18 Highly
branched and rigid precursor clusters, on the other hand, do not
interpenetrate and do not collapse under capillary drying forces,
leaving pores. Likewise, branched precursors that stick irreversibly
form non-uniform rigid structures and have an associated porosity.
Because individual cluster density decreases with the distance from
the center of mass, the porosity of noninterpenetrating clusters
increases with increasing cluster size.
Controlling the structure of the oligimers in the precursor
solution is well-understood for the hydrolysis of alkoxysilane
solutions. Increasing the water of hydrolysis when preparing a
siloxane solution improves the wetting behavior of the solution on
many substrates, and such solutions yield films that readily densify
on heat treatment due to the superior wetting. Acid catalysis of
366

tetraethoxysilane (TEOS) solutions leads to a linear polymer
structure.1 6 Within this regime, it has been found that the ratio of
hydrolysis water to TEOS is important in determining the shape of
the polymers. Where W=[H 20]/[TEOS], W=1-2 leads to long linear
polymers. At W=5, spherical polymer growth begins, and by W=20
spherical or three-dimensional growth of the polymers
predominates. 2 0 Linear particles, therefore, were best obtained
with acid catalysis and a small amount of water (W < 4).42
Additives likewise may have an effect on the oligimer structure: in
tetramethoxysilane (TMOS) gels, SAXS scattering developed rapidly
in the presence of acid catalysts and in the absence of formamide
additive. 4 3 Formamide acts by slowing hydrolysis and speeding
condensation. In a regime where hydrolysis occurs rapidly,
monomers are more likely to be hydrolyzed than are sites already
on clusters, and the monomers are therefore incorporated into the
clusters. Less branching occurs as the growth occurs from
monomers which are partially hydrolyzed. On the other hand, as
polymerization continues, eventually monomer-cluster growth shifts
to cluster-cluster growth, and because clusters are somewhat
mutually opaque, this leads to ramified structures. 4 0
Metal alkoxides can be expected to behave similarly, though
there are fewer literature reports regarding them. A diluted and
unrestricted hydrolysis of metal hydroxides leads to spherical
polymers with a network connectivity (c) (a smaller connectivity
value corresponds to a more open network) that follows Equation
6.13.44 The quantity of hydrolysis water affects the chemical
makeup of the product by producing a higher M-O-M content. The
367

increase in connectivity gives a tighter network that retains its
shape on the removal of organics, and therefore remains porous;
less-hydrolyzed, looser networks collapse when the organic groups
are removed during pyrolysis.
(6.13) c = 4- (367r/n)113
n is the number of hydrolyzed groups
6.2.5 The Role of Additives
The cracking of films may be controlled by the addition of
drying control chemical additives (DCCAs) to the precursor solution.
The DCCA is usually added in an amount comparable to the amount
of silicon alkoxide when it is functioning to control capillary forces
developed as solvent evaporates out of pores in the gel
matrix.16, 4 5 To what extent this model can be transferred to the
situation of a thin layer of gel that makes up a film is questionable.
DCCAs also replace alcoholic ligands on transition metals and
silicon and stabilize them. Small quantities of DCCAs such as glycols
or ethanolamines suppress the precipitation of oxides in metal
alkoxide solutions. 4 6 Dimethylformamide has also been used. 4 5
Zirconium butoxide-containing precursors have been stabilized
using acetylacetonate.4 7 In synthesizing YBa 2Cu 40 8 by a sol-gel
procedure it was found that the homogeneity of the material was
greatly dependent on the additive, which was used in a ratio of
0.44 mole additive to 1 mole copper. Tartaric acid prevented
segregation of the metal acetates and gave a single 124 phase, as
368
did 1,2-ethanediol. The other additives tried, ascorbic acid, citric
acid, poly(vinyl alcohol), and succinic acid, gave the 123 phase
(YBa 2 Cu 30 7 ,) plus BaCuO 2 and CuO: they failed in preventing metal
segregation. EDS showed that the precursor powders were
inhomogenous, and the fired samples followed suit.4 8 Additives
also may affect the pyrolyzed film morphology, as seen with
zirconium oxide coatings: those prepared from a precursor
containing acetylacetonate had 1 jtm crystallites on quartz, while
0.5 gm crystallites were obtained from a solution containing
triethanolamine. Only diethanolamine additive led to a hard, dense,
and smooth ZrO2 film. 4 9
The DCCAs act in these instances by coordinating with the
metals either alongside or by displacing the original alkoxide
ligands. In zirconium oxide solutions stabilized by acetylacetone,
the chelation of the additive was shown by the observation that the
p-p* transition shifted to longer wavelength. Hydrolysis of the
chelated ligand began when over three equivalents of water had
been added; otherwise, the butoxy groups were hydrolyzed first, in
accordance with the partial charge model. 4 7
In this model by Livage and Henry5 0 ,51 nucleophilic attack of
a metal alkoxide by a molecule XOH (e.g. hydrolysis (X=H),
condensation (X=M), or chemical modification (X=R') is described as
a three step process. (1) nucleophilic addition of XOH onto the
positively charged metal (Equation 6.14), (2) proton transfer from
the entering molecule to the leaving alkoxy group (Equation 6.15),
and (3) departure of the positively charged protonated group.
(Equation 6.16)
369

(6.14) X-OH + M-OR - ) X-O-M-OR
8+8+(6.15) (product from 6.14) 0- XO--M--ROH
(6.16) (product from 6.15) P XO--M + ROH
The process depends on the charge distribution in the alkoxide and
in the transition state (product of Equation 6.14). In the partial
charge model, the electronegativity of an atom Xi varies linearly with
its partial charge 8j, and electron transfer ends when all
electronegativities reach a mean electronegativity Xm given by
Equation 6.17. The partial charge 8i on each atom is given by
Equation 6.18. This model deals only with the enthalpy changes
involved in the chemical reactions, and does not account for
entropic, steric, or resonance stabilization contributions to the
reactions.
(6.17) Xm = (X- pi(Xi)" 2 ) / (Z, p,/(X,0)" 2)
(6.18) 8i = (Xm - Xi )/k(Xi")1
where the molecule's atom (Xi) count is given by (pIXI*p 2X2 *... piX) and k is a
constant depending on the electronegativity scale used (k=1.36 for Pauling's
scale).
370
6-8- 8+

These equations can be used to calculate the charge
distribution on atoms of the transition state (product of Equation
6.15). Groups that remain negatively charged will remain
coordinated to the metal, while those that are positively charged
will be good leaving groups. This information can be used, in turn,
to predict the outcome of chemical modifications (e.g. will the
additive substitute for one of the alkoxy groups), as well as
hydrolysis reactions (which additive will hydrolyze off first). For
example, the model can be used to explain why addition of acetic
acid to a TEOS solution reduces the gelation time, 5 2 while it
prevents precipitation and increases the gelation time in Ti(OnBu) 4
solutions. Titanium in the tetrabutoxide, according to the model,
has a high positive charge (8 = +0.61). On addition of acetic acid to
make a transition state Ti(OnBu) 4(HOAc) the HOAc becomes
negatively charged (8 = -0.7) while HOBu becomes positively
charged (6 = +0.1). One alcohol molecule is thus removed, leading
to Ti(OnBu) 3(OAc). Experimental data confirms these predictions. 5 0
In Si(OEt) 4, on the other hand, the initial partial charge on Si is
+0.32, leading to more weakly-associated transition state. The
alkoxy group is only weakly positive (8=+0.05) and, though the
acetic acid is negatively charged (8=-0.53), the drive toward loss of
the ethoxy group is not very strong. Reflux of TEOS with HOAc does
eventually provide a substituted compound. 5 0 On metals, acetate
groups tend to act as bidentate ligands and are generally last to be
removed on hydrolysis, in accordance with the partial charge
model. 5 3
371

The enol form of acetylacetonate is readily reactive with metal
alkoxides and essentially inert to hydrolysis. Alkoxides of a number
of transition metals, as well as of Al and Si, react with glycols,
leading to glycolate derivatives in which two alcohol groups of the
glycol are bound to the same metal. The chelate effect adds to the
stability of such complexes against hydrolysis. The stabilization of
the metal alkoxide against hydrolysis by organic additives prevents
inhomogeneities from arising as one component of the precursor
hydrolyses and co-condenses faster than the other(s). The
additives also serve to modify the oligimer structures accessible in
solution, leading to a change in the fractal dimension versus what
would be the case in the absence of the additive. They act in this
way by limiting possible sites for hydrolysis, thereby also limiting the
degree of branching; furthermore, coordinated additives sterically
block potential sites for condensation of hydrolyzed monomers or
oligimers, again limiting the degree of branching and modifying the
sticking probability.
372

Figure 6.10: (a) Circumferential cracking seen just to the right
of the inset. Background is X 865, inset is X 6400 close-up on
the grains not in the defect area. (b) Side-on view of a film
showing cracking under compressive stress. x 1050.
(a)
(b)
373

6.3 Results and Discussion - Smooth Substrates
6.3.1 Role of the substrate preparation
Initially, we attempted to deposit films of BiCuVOx onto quartz
substrates as-received from the supplier. Samples which had been
dip-coated showed a grainy first layer, and subsequent layers
stress-cracked on heating. (Figure 6.11) Spin-coated films were
also cracked or extremely grainy (Figure 6.12) for all deposition
conditions examined. While the Figures show electron micrographs,
the cracked nature of these films was visible under optical
microscopy and in many cases to the naked eye. Later depositions
were performed on quartz substrates which had been cleaned with
hydrofluoric acid solution before use. Films deposited on such
substrates were mainly uncracked according to electron microscopy
were transparent and slightly colored, where the color was a
function of the film thickness and angle of viewing. Films in excess
of 1.5 gm thick were yellow in color. Those films which were of poor
quality were, conversely, cloudy or opaque, and in many cases a
crazing pattern could be seen under a low-power (x150) optical
microscope. However, even these films appeared to be porous
under ESEM.
The pores were assumed not to be due to the explosive
departure of the organics from the film during pyrolysis, because if
the pores had originated from a rapid departure of gas from a fully-
or even partially-formed film, the edges of the pores would have
been lifted out and away. However, high-resolution ESEM
micrographs did not show this. (Figure 6.13) Despite this, the
additional steps of pre-decomposing the film by placing freshly-
374

deposited and air-dried samples on a hot plate (350 OC), followed
by a rapid thermal treatment at 500 0C (with some exceptions to
the latter step) were put into the standard deposition procedure in
the hope of removing a larger proportion of organics prior to film
crystallization and annealing. Films produced in this way continued
to have holes, according to ESEM micrographs.
We therefore considered that the pores in the films were
arising from something inherent in the precursor itself. A V20 5 gel is
composed of ribbon-like fibers, crosslinked and approximately 1 gm
long. Such a cross-linked network of linear pieces densify to a
porous film, 3 7 ,3 8 ,5 4 ,5 5 just as randomly piled sticks will form a
stack with a large amount of void space. Certain other colloid
particle morphologies are reported to lead to porous gels as
well. 5 6 , 5 7 The precursor morphology may also be responsible for
the film's 001 orientation as shear forces aligned the ribbons during
spin-coating. Films which were spin- then dip-coated were not
strongly oriented. (Figure 6.51)
We first attempted to remove the porosity by "annealing it
out" - by raising the pyrolysis temperature to densify the film.
BiCuVOx films were deposited onto a number of smooth metallic
substrates to help determine the origin of the behavior seen on the
quartz. Later work focused on changing the precursor particle
morphology in the hope of getting a dense and pore-free film.
BiCuVOx films were deposited onto a number of other smooth
substrates to help determine the origin of the behavior seen.
It was hoped that bringing the film samples near the BiCuVOx
melting point (determined by DTA/TGA) of 895 0C would increase the
film grain mobility enough to close up defects in the film. BiCuVOx
375
precursor solutions containing no additives were spin-cast onto
cleaned quartz substrates and heat-treated at 450, 550, and 6500 C. BiCuVOx films annealed at 450 OC were homogenous and
defect-free, but those heated at 550 and 650 *C exhibited grain
formation with the appearance of voids. (Figure 6.14) GIXRD
showed formation of the desired phase at 450 OC; crystallinity, as
well as a strong 00-texturing, developed further with increasing
firing temperature. (Figure 6.15) This behavior is typical of all films
cast. It was hoped that heating BiCuVOx films to still higher
temperatures (750, 800, and 850 OC) would cause the films to
anneal and regain homogeneity. However, these films remained
agglomerated. (Figure 6.16) In addition, films heated to 875 0C
demonstrated a drastic loss of crystallinity according to GIXRD, with
the ingrowth of unidentified new peaks. (Figure 6.17)
BiCuVOx films were deposited by dip- and spin-coating onto
platinum sheet samples and appeared smooth and elastic, with a
high degree of preferential orientation. (Figures 6.18, 6.19) These
experiments were later reproduced using as substrates quartz
samples onto which a 1000 A layer of platinum had been deposited
by E-beam. The samples were heated at a number of different
pyrolysis temperatures and found to remain smooth and defect-free
over the entire regime of temperatures. Samples deposited onto
silver substrates, conversely, were grainy in appearance and
showed mainly Bi20 3 in GIXRD. The poor match between the
BiCuVOx lattice and that of the silver is the likely culprit for the poor
quality of these films. (Table 6.1)
One cause suggested for the agglomeration seen in the
BiCuVOx films is the formation of intermediate molten or semi-liquid
376

phases during the annealing process. However, the agglomeration
temperatures were well under the temperature at which BiCuVOx
(895 *C) melts without evidence of decomposition, therefore low-
melting phases would not have come about through decomposition
of this phase - for instance, by sublimation losses of bismuth oxide
- nor were other phases seen in the GIXRDs. Also, the BiCuVOx
phase is completely formed by 450 OC, well below the melting points
of oxides that may be intermediates (V205-690 0 C, Bi203-825 0 C,
BiVO4-8800 C). Moreover, were the agglomeration due to the
formation of intermediate or decomposition phases, it should have
also occurred on the platinum. There was no indication in the
GIXRDs that the bismuth oxide layer of the BiCuVOx had reacted
with the quartz substrate, although the small degree of reaction
necessary to alter the film-substrate interactions and cause
agglomeration would have fallen below the GIXRD detection limits.
BiNbVOx precursor solutions were spin-cast onto quartz
substrates using a procedure similar to that for the BiCuVOx films.
Those heat-treated at 450 0C were homogenous and defect-free,
and GIXRD showed the desired Bi 2 NbO. 3VO.70. 5 phase, with
preferred 001-orientation. These films, contrary to what was
observed with BiCuVOx films, remained homogenous, phase-pure,
and mainly defect-free according to ESEM (some defects could be
traced to dust contamination) to the highest heating temperature of
650 *C. (Figures 6.20, 6.21) BiNbVOx films cast onto platinum
substrates (Figures 6.22, 6.23) were likewise defect-free.
While there are numerous reports in the literature regarding
the phenomena of grain growth, hillock and void formation, and film
agglomeration for films grown by physical deposition techniques,2 5 -
377

27,30 we have seen only one 5 8 corresponding published report on
sol-gel films. Several reports of the behavior of sol-gel films on
thermal cycling have focused on cracking due to thermal
stresses. 8 , 9 However, it may be instructive to examine our
observations in light of the agglomeration seen in some films
deposited by physical methods (electron-beam evaporation,
ion-implantation, sputtering, PVD).
Film agglomeration, or de-wetting, is associated with stresses
in the film parallel to the substrate, or with defects in the film
providing nucleation points for holes. 3 0 Stresses are typically due
to thermal expansion mismatch and lattice mismatch. Since,
however, the quartz substrates are amorphous, lattice mismatch
should not be at issue in our study. Likewise, thermal expansion
mismatch between the quartz and the BiCuVOx film is unlikely to be
the cause of the agglomeration, since the BiNbVOx films on quartz
did not show agglomeration on heating to the same temperatures.
BiNbVOx is expected to have a thermal expansion coefficient close
to that of BiCuVOx, although no measurements of either value have
been made. Finally, the fact of the non-agglomeration of the
BiNbVOx films contradicts explanations of the BiCuVOx
agglomeration which involve the formation of other phases or
reaction with the substrate. These arguments suggest that the
explanation for the agglomeration of the BiCuVOx films at
temperatures where BiNbVOx films remained defect-free, lies either
in the energetics of the film-substrate interaction or in the precursor
morphology.
The relative energies of adhesion of the film with itself
(surface tension) and the film with the substrate vary with the
378

elemental composition of the ceramic film. 2 5 , 2 6 ,3 0 Therefore, one
reason for the difference in the annealing behavior of the 30%
Nb-doped and the 10% Cu-doped films lies in the relative strengths
of the films' adhesion to the substrate versus their self-adhesion. A
second explanation may lie in the differences in precursor
morphology due to the different methods of introducing the dopant.
In the case of BiNbVOx, the dopant is added as a hydrolyzable
alkoxide which is easily incorporated into the growing vanadium
oxide polymer. Conversely, the Cu(OAc) 2 dopant may not be
homogeneously distributed in the precursor material, and copper
atoms are therefore more likely to segregate to grain surfaces.
Segregation of impurities-either the dopant metal or organics
remaining from the precursor-onto grain surfaces may block grain
growth and coalescence and contribute to the formation of grooves
which subsequently deepen to expose bare substrate. 2 6 The initial
grain size-which depends on the metal-oxide polymer cluster size
and morphology-can also contribute to the ease of void formation,
as smaller grains lose matter to larger grains. 3 0 This material loss
will be normal to the substrate and eventually will result in the
formation of voids in the film. This occurs when the degree of
spheridization (v) (Figure 6.9) of the grains is greater than a critical
value (wcrit) which is related to the ratio of the grain size (D) and the
film thickness (t) according to Equation 6.19.58
(6.19) D/t = 4 ( 1+ cos Vrit) / (71 - Icrit - sin Vrit)
(See Figure 6.9 for an explanation of the variables.)
379

The degree of spheridization V is determined by the balance of
interface energies between film and vapor, film and substrate,
vapor and substrate, and grain boundaries. These interface
energies are a property of the film and the substrate.
Consideration of the total free energy of the surfaces and
interfaces enables the location of an energy minimum as a function
of the degree of spheridization W. Miller et al. 5 8 found that for grain
size-to-film thickness ratios of D/t <= 8/n, the continuous film is the
most stable configuration for all values of W. For D/t => 13.3/n an
island morphology is the most stable state, regardless of the value
of W. D/t ratios between these values have metastable states
whose fate depends on xi. Further calculations permit the
development of a phase diagram relating the film morphology to the
D/t and the wetting angle 0.58 (Figure 6.24)
To further investigate the behavior of BiMeVOx films on
smooth substrates, BiCuVOx, BiNbVOx, BiTiVOx, BiFeVOx, and
BiMnVOx films were deposited onto quartz, platinum, and alumina
substrates and heated at either 450 OC or 650 OC. The lower-
temperature samples, after examination by GIXRD and ESEM, were
heated a second time, now at 750 OC. (Figures 6.25-6.30) The Nb-
and Ti-containing films were smooth and unagglomerated on both
quartz and platinum (although hillocks and pores were formed) at
650 0C, while the Cu-, Fe-, and Mn-doped films were agglomerated
on the quartz slides but smooth (with hillock formation) on the
platinum. The films on alumina followed a similar pattern. All films
were heated again at 750 OC and showed cracking and
agglomeration. GIXRD of all these films showed a strong 001
380

orientation. (Figure 6.62) The experiment that would clarify the
relative roles of the dopant identity and the method of adding the
dopant (alkoxide or organic salt) - namely, to cast films of, say,
BiNbVOx on quartz using a precursor solution made from Nb(OAc)5 ,
or of BiCuVOx on quartz using a precursor solution containing
Cu(OR) 2 - was not done.
381

Figure 6.11: BiCuVOx film dipcoated onto a quartz slide as
received from the manufacturer. X 545.
382

Figure 6.12: BiCuVOx films spincoated onto quartz slides as
received from the manufacturer. (a) X 2200, (b) X 6250. Note
the large-scale cracking due to the film's failure to adhere to the
substrate.
(a)
4%
xv
(b)... ... ... -- -- ---
383
M
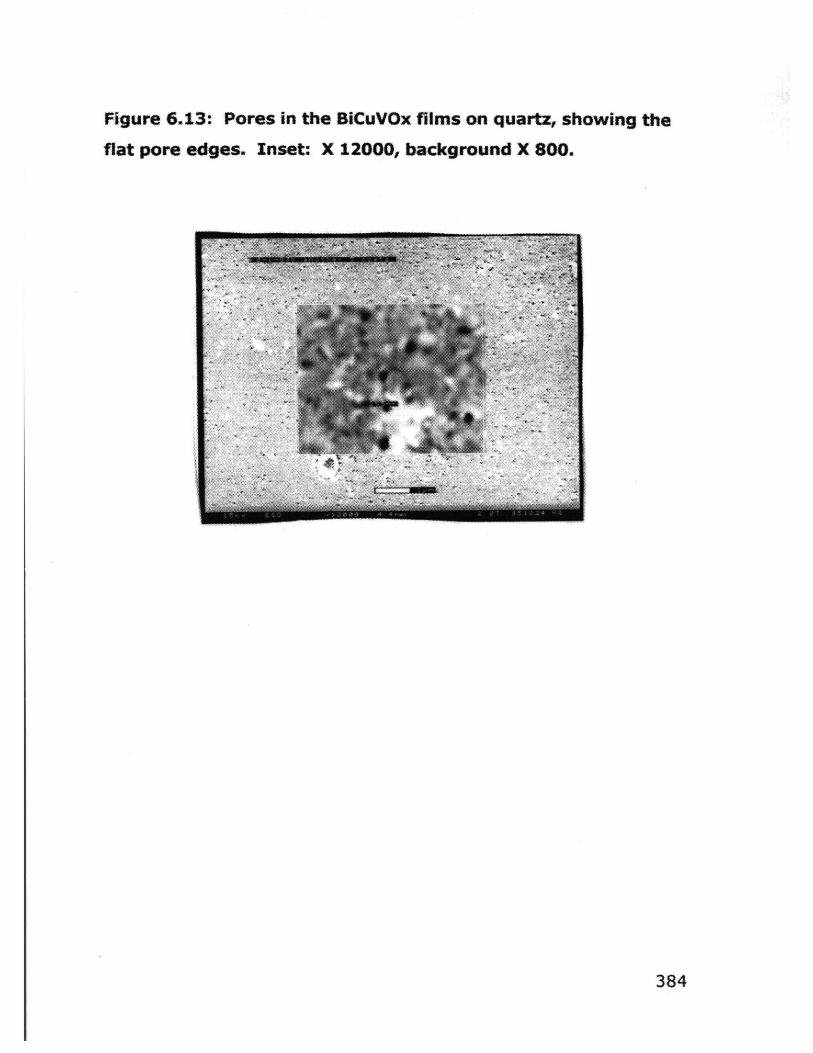
Figure 6.13: Pores in the BICuVOx films on quartz, showing the
flat pore edges. Inset: X 12000, background X 800.
384
I
m

Figure 6.14: BiCuVOx films on quartz heated at (a) 450 0C, (b)
550 *C, (c) 650 0C. All are X 7500. The films show an
increasing dewetting from the substrate.
(a)
(b) (c)
385

Figure 6.15: GIXRD of BiCuVOx films on quartz shown in Fig.
6.14. (a) 450 OC, (b) 550 0C,. (c) 650 OC. Grazing angle 10. The
films are strongly 001-oriented.
Lfl
Ln
N
N
03'U
00'~U u4T 0,
386

Figure 6.16: BiCuVOx films heated to (a) 750 0C (X 4700), (b)800 0C (X 970), and (c) 850 0C (X 290). The large areas ofbare substrate seen in (b) and (c) are typical of the overallappearance of the films. The film in (a) shows grain coarsening(compare with Fig. 6.14) but longer heating times at thistemperature did not result in better substrate coverage.
(a)
(b R4
*-* ---
Stoo
44
A11
(b) (c) E
387S
I
I

Figure 6.17: GIXRD of BiCuVOx film on quartz, heated to 875 OC.
The y phase has disappeared; the peaks do not match V2 0 5, C UO,
Bi 2O3, or any known combination of these, nor any known Bi-Si
oxide. BiCuVOx melts congruently at 895 OC.
I-n
cIn
-Cm
ED
N~, 09Z s4l no 0
388
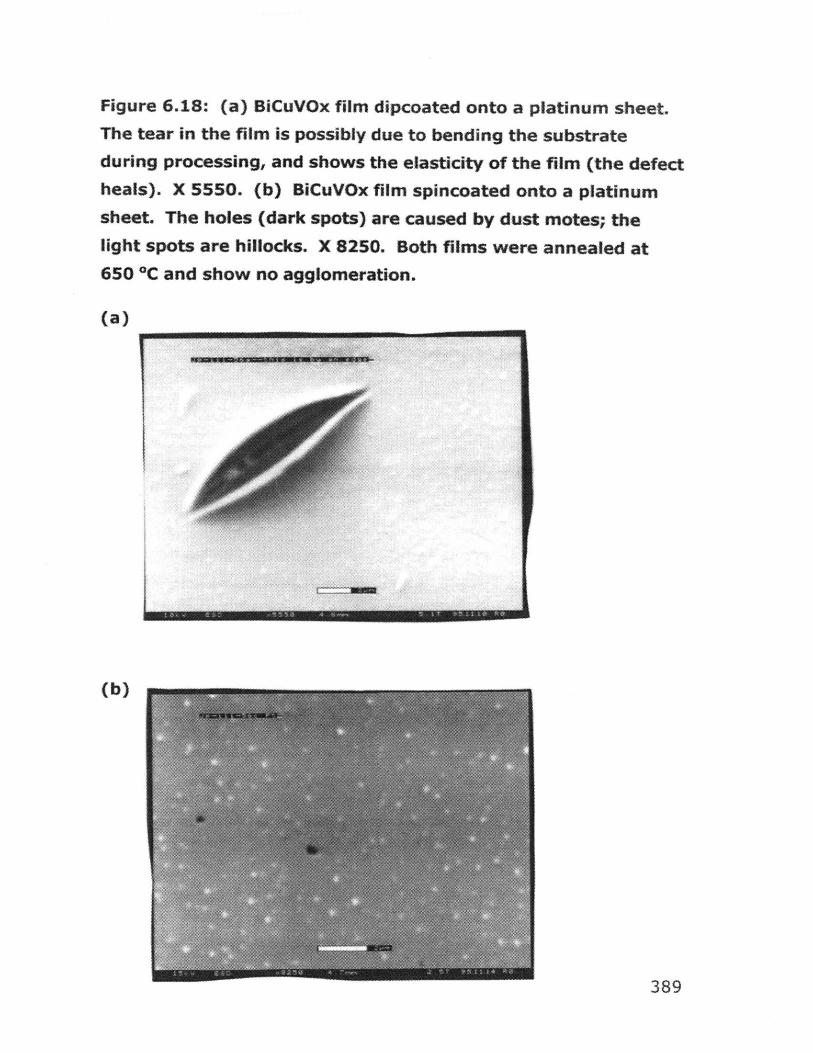
Figure 6.18: (a) BiCuVOx film dipcoated onto a platinum sheet.The tear in the film is possibly due to bending the substrateduring processing, and shows the elasticity of the film (the defectheals). X 5550. (b) BiCuVOx film spincoated onto a platinumsheet. The holes (dark spots) are caused by dust motes; thelight spots are hillocks. X 8250. Both films were annealed at650 *C and show no agglomeration.
(a)
(l
(b)
389

Figure 6.19: GIXRD (10) of BiCuVOx films on platinum. (a) Dip-
coated. (b) Spin-coated. Note the greater degree of orientation
of the spin-coated film. Platinum peaks are marked *.
0 =Pt peak
0021-7
2500-
2000-
1500-
1000-
500-
20 30 40 50 60
2 Theta
390
b
110 200
10406 10900 114 )116 213~d~AJ A A A,.
10

Figure 6.20: BiNbVOx films on quartz. (a) 450 0 C, X 2850, (b)
550 *C, X 7600, (c) 650 "C, x7500. The films remain
unagglomerated and defect-free, though hillock formation is
visible in (c). Compare with Fig. 6.14.
(a) * ii& W____
(b) (c)
391

Figure 6.21: GIXRD (1O) of BiNbVOx films on quartz. (a) 4500C, (b) 550 OC,, (c) 650 OC. The films,, like BiCuVOx (Fig. 6.15),
are strongly 001-oriented.
Lfl
Lfl
N
_N
Si
E-,
4
00, ST17 00*
392

Figure 6.22: BiNbVOx on E-beam platinum substrates, heated to
650 0C. (a) X 1350. White spots are dust motes. (b) Close-up
(X 10000) of the area near the dust mote in the upper left of (a).
The grain morphology is visible: there is some mild hillocking but
no grain boundary grooving.
(a)
(b) 1
393

Figure 6.23: GIXRD (10) of BiNbVOx film on Pt (650 OC). The
lines mark the expected positions for y phase peaks. The film is
strongly 001 oriented.
V,
S(0M
U U,
UU,
EC'
I sju(a1
N 00 0 L*
-394

Figure 6.24: Film behavior as a function of grain size (D)-to-film
thickness (t) ratio and wetting angle.5 8
20 I11A
E/t in
5-j
0
n-cz fl
I
140 160 180t-u-r'-r"v,''",rm',''"
0 20 40 60 80 100 120
Wetting Angle, 0e
395
- - MrW W 5 -

96C
-a- ir------ >
'(osrTX) X0A1J49S %oosG X) xoAqfl9 :UMOp 5uIo5 '46M ioo0fsX) XOAUW!S '(ost;T X) XOA04!9 '(osse X) XOAfl2!9 *UMOP
S6tiO- *a~pownswojfi6eun aOM swill 2). ost -atnwsadwa;
buteaq h) 099 'sa~tejsqns z~aenb uo sw,j x0A1W!9 :Sr-9 osn8l~4

Figure 6.26: BiMeVOx films on platinum substrates, 650 *C
heating temperature. 450 0C films were defect-free. Clockwise
from left: BiCuVOx (X 10000), BiNbVOx (X 10500), BiMnVOx
(X 8800), BITIVOx (X 9100). Dark spots are pores caused by
decomposition of organics or by dust.
397

Figure 6.27: SiMeVOx films on alumina substrates, 650 *C
heating temperature. 450 *C films were defect-free. Clockwise
from left: BiCuVOx (X 8350), BiNbVOx (X 9200), BIMnVOx (X
7400), BITIVOx (X 9150).
398

Figure 6.28: BiMeVOx films on quartz substrates, 750 0C heating
temperature. Clockwise from left: BiCuVOx (X 1200), BINbVOx
(X 1100), BiMnVOx (X 6450), BiTiVOx (X 5200). The platelike
grains appear to have stacked edge-on against the substrate.
399

Figure 6.29: BiMeVOx films on platinum substrates, 750 *Cheating temperature. Clockwise from left: BICuVOx (X 2050),BINbVOx (X3100), BiMnVOx (X 5100), BITiVOx (X 3800).
400

Figure 6.30: BiMeVOx films on alumina substrates, 750 *Cheating temperature. Clockwise from left: BiCuVOx (X 6200),BiNbVOx (X5000), BiMnVOx (X 8100), BiTiVOx (X 10500).
401

6.3.2 Role of the Precursor
Because the nature of the precursor may have been playing
an important role in the morphology of the film, we turned our
attention to what effect chemical modifications to the BiCuVOx
precursor would have on the final quality of the film. That the grain
size-to-film thickness ratio is important in determining whether a
continuous film is more stable than an island morphology has been
discussed above. Furthermore, the degree of branching - or the
fractal dimension - of the precursor oligimers in the sol or gel
determines the degree to which the oligimers can interpenetrate
and densify. The fractal dimension, in turn, is determined by the
relative degrees or rates of hydrolysis and condensation of the
metal alkoxide precursor. Thus several experiments were
undertaken to try to change the degree of branching of the
precursor oligimers. The actual (average) fractal dimension of the
oligimers resulting in each experiment was not found due to the
unavailability of SAXS measurements.
One approach to improving the film quality was to add an acid
catalyst. In TEOS gels, use of an acid catalyst during hydrolysis
produces gels that collapse easily, 5 9 ,60 because the gel so
produced is less branched than those made with base catalysis,
where the sol particles are compact and highly branched.1 6 This
experiment was tried (Experiment #5) and found to give no
improvement in the film quality.
Several approaches to BiCuVOx precursor solution preparation
were tested to see whether the agglomeration seen in the BiCuVOx
402
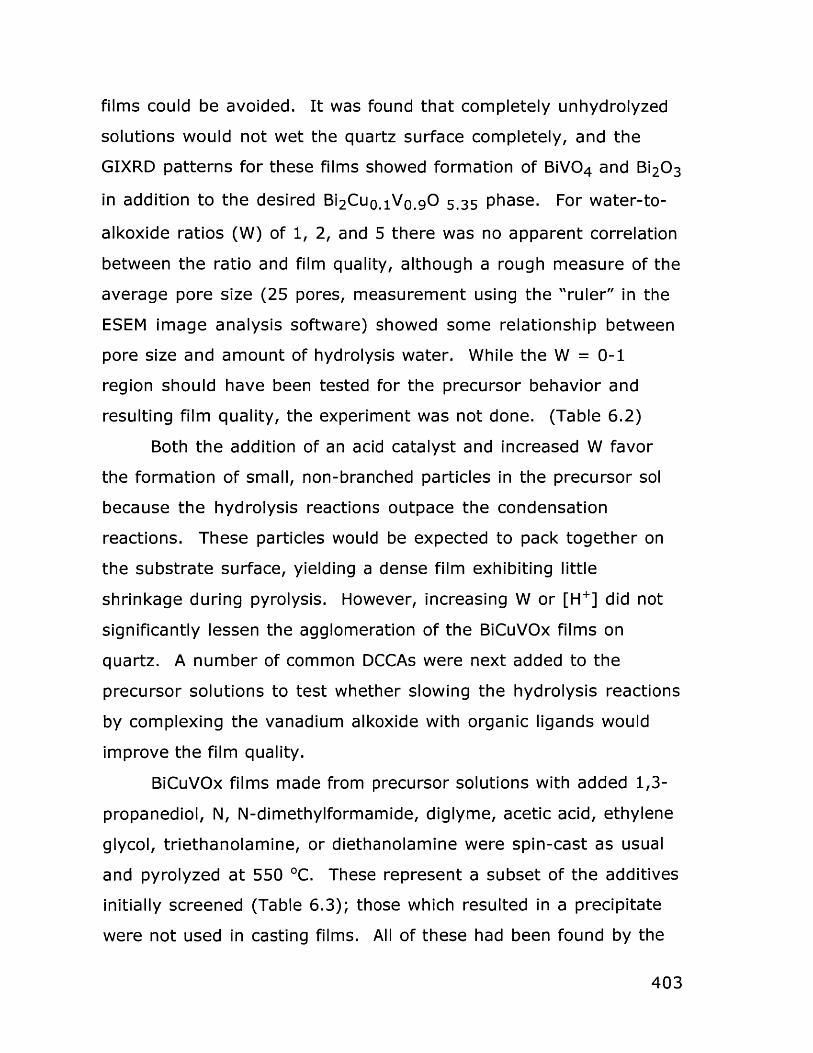
films could be avoided. It was found that completely unhydrolyzed
solutions would not wet the quartz surface completely, and the
GIXRD patterns for these films showed formation of BiVO4 and Bi 203
in addition to the desired Bi 2 CuO. 1VO.90 5.35 phase. For water-to-
alkoxide ratios (W) of 1, 2, and 5 there was no apparent correlation
between the ratio and film quality, although a rough measure of the
average pore size (25 pores, measurement using the "ruler" in the
ESEM image analysis software) showed some relationship between
pore size and amount of hydrolysis water. While the W = 0-1
region should have been tested for the precursor behavior and
resulting film quality, the experiment was not done. (Table 6.2)
Both the addition of an acid catalyst and increased W favor
the formation of small, non-branched particles in the precursor sol
because the hydrolysis reactions outpace the condensation
reactions. These particles would be expected to pack together on
the substrate surface, yielding a dense film exhibiting little
shrinkage during pyrolysis. However, increasing W or [H+] did not
significantly lessen the agglomeration of the BiCuVOx films on
quartz. A number of common DCCAs were next added to the
precursor solutions to test whether slowing the hydrolysis reactions
by complexing the vanadium alkoxide with organic ligands would
improve the film quality.
BiCuVOx films made from precursor solutions with added 1,3-
propanediol, N, N-dimethylformamide, diglyme, acetic acid, ethylene
glycol, triethanolamine, or diethanolamine were spin-cast as usual
and pyrolyzed at 550 0C. These represent a subset of the additives
initially screened (Table 6.3); those which resulted in a precipitate
were not used in casting films. All of these had been found by the
403

partial charge model (vide supra) to be likely to substitute for a
2MOE ligand on the vanadium alkoxide. The additives were added
in the quantity of one mole additive per mole of alkoxide group, and
were thus present in sufficiently small amounts that they were not
expected to have affected the bulk solution viscosity.
The films made with additive-containing precursor solutions
showed agglomeration or dewetting which is in some cases worse
than that in the controls. (Figure 6.31, Table 6.3) A variation in the
appearance of the BiCuVOx grains or islands with the identity of the
additive was noted: the amount of bare substrate decreased as
the identity of the additive changed, in the order (least coverage -
most coverage, determined by the image-analysis software with the
ESEM) 1,3-propanediol > ethylene glycol > NN-dimethylformamide >
acetic acid > diethanolamine. Films made from precursor solutions
containing triethanolamine showed a mixture of BiCuVOx and BiVO 4
phases, but all other GIXRD patterns showed formation of 001-
oriented, phase-pure BiCuVOx. (Figure 6.32) Film thicknesses were
0.8-1.4 gm by profilometry (10 layers).
The effects of additives in the precursor solutions on BiNbVOx
film morphology was also investigated. BiNbVOx films demonstrated
little variation in quality with precursor additive, and all except TEA
showed formation of 00-oriented and phase-pure BiNbVOx by
GIXRD. As with BiCuVOx, the triethanolamine-containing precursor
solution gave films which were blotchy and inhomogenous; GIXRD of
these films showed a mixture of BiNbVOx and BiVO 4. (Figures 6.33,
6.34)
The quantities of additive used (<1 vol%) would not be
expected to modify significantly the bulk properties of the precursor
404

solution, such as the surface tension or the viscosity. Therefore it is
unlikely that the effects of the different additives on the film
morphology is due to a difference in the wetting behavior of the
precursor solution on the substrate. The additives probably have
acted by reducing the precursor homogeneity, adversely affecting
the growth and coalescence of grains in the film by permitting
segregation of some component of the BiCuVOx at grain
boundaries. This effect would be in opposition to what has
generally been seen in other sol-gel systems where additives have
been used; for example, additives such as those used in our
experiments greatly increased the homogeneity and improved the
particle morphology in the 124 superconductors. 4 8 In those cases,
however, the components of the sols were added as alkoxides. The
additives in our experiments also have a distinct effect on the gel
greenbody morphology, as shown in the ESEM micrographs. (Figure
6.35) Triethanolamine, which produced clumpy and phase-mixed
films, gives a "fuzzy" precursor morphology, indicating a high degree
of branching and/or inhomogeneity. The other additives give a
uniform-appearing precursor. The precursor gel from
diethanolamine has some elements of the triethanolamine gel and
those of the other additives.
In addition to segregating some gel component to the grain
boundaries, a second possible mechanism for the additive effects on
the film morphology revolves around the hydrolyzability of the
additive from the vanadium center. When VO(OR) 3, is hydrolyzed,
fast condensation processes lead to the formation of intermediate
decavanadate species, and the subsequent slow processes lead to
different equilibrium species.6 1 Since the decavanadate species
405

lead to the ribbonlike morphology, 3 7 , 3 8 steric limits on the fast
condensations can prevent the usual oligimer form from taking
shape. The oligimers with the resulting morphology pack less well
in the film than the ribbonlike ones.
Double-donor additive ligands may also act by cross-linking
the metal centers, effectively forcing a more open structure in the
unpyrolyzed film by increasing the sticking probability and
decreasing the interpenetration of growing oligimers. Bridging of
1,2-diols in aqueous complexes of vanadium(V) is common; 6 2 for
example, ethylene glycol can be used to create a bridged dinuclear
vanadium (V) complex. 6 3 The additives which gave the lowest-
quality films, namely ethylene glycol, propanolamine, and
triethanolamine, replace some or all of the 2MOE ligands on the
vanadium center, producing a bridged complex. These bridging
ligands are unlikely to hydrolyze off, according to the partial charge
model, IR data, and the literature. Work by Crans et al. 6 4 shows
that triethanolamine, as well as tripropanolamine, is bound by the
central N and only two alcohol arms, leaving the third dangling. This
seems to be true of u-o difunctional molecules in general. Ligands
of the form HO(CH 2)xOH, HO(CH 2)xNHR, and HO(CH 2)xC(O)OMe can
be attached to {VO(OR) 2} via the hydroxyl and carboxyl functions,
respectively, to give a species VO(OR) 20R', where R' has a terminal
"dangling" function. 6 5 This is likely to be true of the propanolamine
also: it will be bound only on the amine end, leaving a dangling -OH
group. Ethylene glycol also has the potential for a dangling alcohol
group. On the other hand, diethanolamine is bound by the amine
nitrogen and both alcohol arms, even in aqueous solution; 6 4 this
406

additive gave a fairly dense, albeit defected, film. These
correlations suggest that the dangling alcohol group is key: it
represents an opportunity for the ligand to coordinate to more than
one metal center. In the vocabulary of the fractal model, the
dangling -OH group provides an increased sticking probability for
approaching branched oligimers, and limits interpenetration.
The additives, as unhydrolyzed groups, also place a steric
constraint on the packing of the metal oxide polymer chains. They
are, however, removed during pyrolysis of the films, possibly
expelling membrane from the path of the decomposition gas,
leaving voids which can become nucleation points for hole
formation. 19,44
Several experiments were undertaken to characterize the
chemical basis for the effects of the additives on BiCuVOx films. A
mixture of Bi(OAc) 3 and V-2MOE, aged overnight, spread on an IR
card, hydrolyzed and vacuum dried, gives the IR spectrum shown in
Figure 6.36a. Peaks at 1540 and 1400 cm-1 are evidence of bridging
acetate groups 6 6 which remain bound after hydrolysis. (For
monodentate carboxylate the expected bands would be at 1320
cm-1 (symmetric) and 1660 and 1630 cm- 1 (asymmetric). 6 2 ) The -OH
stretch is greatly reduced; the remnant is probably due to still-
bound 2MOE (which is also responsible for the stretches in the
1000-1100 cm 1 region). The broad band from 600-1000 cm-1
arises from extended V-O and v(V=O) bonding. 6 7 - 6 9 Normally the
v(V=O) band falls in the 990-950 cm- 1 region. Bi-O bands should
appear near 500 and 350 cm' , below the range of the
instrument. 7 0 IR spectra for Bi(OAc) 3/V-2MOE/additive mixtures
407

treated similarly show, for example, retention of ethylene glycol
(Figure 6.36b). The presence of the bands attributable to the
additive, even after vacuum drying overnight, suggests that it has
complexed with one of the metals. The strong -OH band, as well as
the v(C-0) bands in the 1000-1100 cm-1 region, are due to the
retention of the ethylene glycol and/or 2MOE. The band at 1650
cm- 1 may arise from a monodentate acetate group (the other
expected bands are swallowed in the alcoholic ones). The broad
band 850-500 cm- 1 is again from extended V-O bonding, and the
band at 880 cm-1 may arise from a stronger-than-usual v(V=O).
A direct indication of the interaction level between the
additives and the vanadium center in V-2MOE is found in the 5 1V
NMR data. (Table 6.4) Solutions of 0.02 M [V-2MOE] in 2MOE were
prepared and one mole equivalent of additive per mole of alkoxide
group was added. ( H and 13C NMR spectra were dominated by the
solvent and additive peaks and were therefore uninformative.)
Triethanolamine and 1,3-propanediol induce immediate precipitation
of an insoluble complex when added directly to the V-2MOE solution.
This behavior has been seen with other vanadium
alkoxides4 5 ,6 2 ,6 4 ,6 8 , 7 1 and points to the reason for these
additives' negative effects on the gel and film quality.
Trialkanolamines (L), in particular, replace -OnPr in VO(OnPr) 3 to give
LV=0. 7 1 These complexes were poorly soluble in ethereal solvents
and precipitated as white solids. Presumably a similar mechanism is
responsible for what was seen in our experiments. Multiple peaks
appearing in the 5 1V NMR of the diethanolamine and ethylene glycol
samples indicate the presence of several vanadium-containing
408

species with differing degrees of condensation and/or ligand
substitution. For comparison (Table 6.4), published experiments
show that the addition of one equivalent of VO(OEt) 3 to two of
ethylene glycol give a precipitate which has the 51V NMR signals -
496 and -515 ppm; the solution gives peaks at -463, -474, -503, -
506, and -515 ppm, representing the precipitate species (complete
substitution of the ethoxy groups) plus some partially-substituted
species. 6 4 The high upfield shifts of the V signal in these solutions
indicates strong binding. It should be noted in interpreting these
results, however, that the 8(5 1V) depends strongly on concentration
for smaller R in VO(OR) 3, where the shift becomes less negative with
increasing concentration. 6 9
The identity of the precursor solution additive has little or no
effect on the BiNbVOx film morphology. The change in the elemental
composition versus BiCuVOx may be sufficient to stabilize the flat
film against any tendency for grain coarsening, hillock formation, or
agglomeration. Also, the additional interconnection potential
realized by the extremely hydrolyzable Nb(OiPr) 5 dopant in
relatively high proportion (0.3 Nb:2 Bi) may have counteracted the
effects additives may otherwise have had on the precursor
morphology or on elemental segregation during grain growth.
409

Table 6.2: Effect of Changing Water-to-Alkoxide Ratio on Film
Quality
H2 0/-OR Groups Time to Gel (h) Film Avg. Pore (nm)
0 stable sol'n will not wet substrate
1 stable sol'n 290
2 48 300
3 6-8 320
5 4-6 340
10 ppte. after 1 h not measured
410

Table 6.3: Effects of Additive on Gel and Film Quality
Additive Gel Behavior Film Morphology
Diisopropanolamine ppte not tested
Ethanolamine ppte not tested
Diethanolamine cracked gel nearly continuous
Triethanolamine gel (ppte at needlelike structures
high conc.)
N, N-dimethylformamide gel liquidlike coalescence
Acetylacetone gel + ppte. not tested
ethylene glycol gel excess: liquidlike
coalescence;
equivalent:
homogenous film
di(glycol) methyl ether cracked gel grainy, large pores
(diglyme)
1,3-propanediol cracked gel small round islands
acetic acid gel excess: no pores
equivalent: grainy,
large pores
nitric acid stable sol'n no wetting
ammonium hydroxide ppte not tested
411

Table 6.4: s1V NMR of V-2MOE
412
Additive 91V NMR Peak Positions
none -541 ppm
diethanolamine -437, -461
triethanolamine pale green ppte., no NMR done
ethylene glycol -471, -479, -541
dimethylformamide -544
acetic acid -521
methanol -532
1,3-propanediol yellow fibrous ppte., no NMR
+ additives (8., VOC13= 0 PPM)

Figure 6.31: BiCuVOx films on quartz spin-cast from precursors
containing additives. All films shown have been heated to 550 0C
and are X 7500. (a) ethylene glycol, (b) triethanolamine, (c) N,
N-dimethylformamide.
(a)
(b) (c)
413

Figure 6.31, continued: (d) diethanolamine, (e) acetic acid, (f)
1,3-propanediol. See Fig. 6.14b for a "control" film with no
additive.
(d)
(e) (f)
414

Figure 6.32: GIXRD (P0) of BiCuVOx films on quartz made from
precursor solutions containing additives. (a) no additive, (b)
ethanolamine (N, N-dimethylformamide, ethylene glycol, acetic
acid same), (c) 1.,3-propanediol
N
Cu -
Lfl
'U4
j
415

Figure 6.32, continued: (d) triethanolamine.
LI)m
InN
U
CSD
N 0'6 S~uflOO 000
416
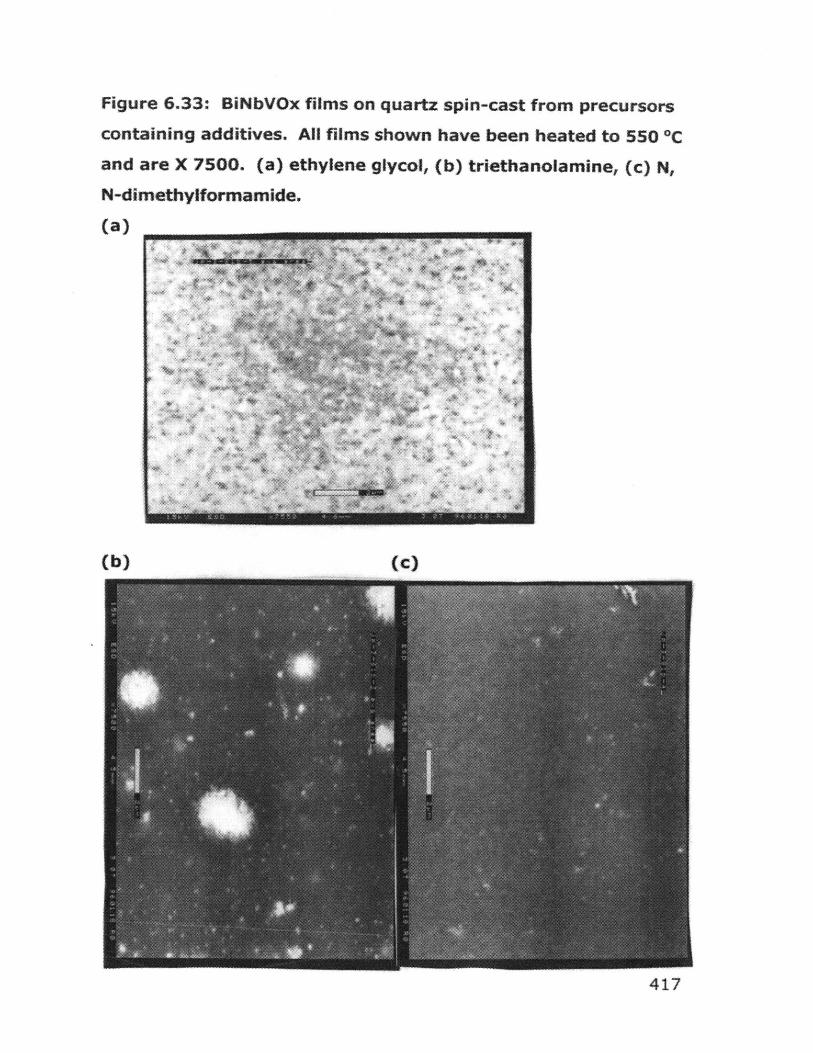
Figure 6.33: BiNbVOx films on quartz spin-cast from precursors
containing additives. All films shown have been heated to 550 *Cand are X 7500. (a) ethylene glycol, (b) triethanolamine, (c) N,N-dimethylformamide.
(a)
(b) (c)
417

Figure 6.33, continued: : (d) diethanolamine, (e) acetic acid,
(f) 1,3-propanediol. See Fig. 6.20b for a "control" film with no
additive.
(d)
(e) (f)
418

Figure 6.34: GIXRD (10) of BiNbVOx films on quartz made from
precursor solutions containing additives. (a) no additive, (b)
ethanolamine (diethanolamine, N, N-dimethylformamide,
ethylene glycol, acetic acid same), (c) 1,3-propanediol. The film
produced using triethanolamine is completely amorphous to XRD.
-6*8(.9
~V 0019T
S*904T
419

Figure 6.35: Effect of additives on the precursor gel morphology.
Clockwise from left: no additive (X 160), 1,3-propanediol (X
865, ethylene glycol, dimethylformamide same), diethanolamine
(X 175), triethanolamine (X 235).
420

Figure 6.36: (a) FTIR of Bi 2VO5 .5 precursor hydrolyzed and dried
in vacuo overnight on an IR card (background subtracted).
-5*SSE;- -Ot'9
01--;"0
- rova
e go 0
421

Figure 6.36, continued: (b) FTIR of Bi 2VO.S.5 precursor plus
ethylene glycol, hydrolyzed and dried in vacuo overnight on an
IR card (background subtracted).
TC,
Q
0n
0
0
0 in
02

6.4 Results and Discussion - Porous Substrates
To date, CIMR components have been fabricated by extruding
or otherwise forming a tube of the oxygen-ion conducting ceramic,
usually YSZ. 7 2 The degree to which the wall thickness can be
reduced is limited by the strength of the ceramic. Forming the
conductor as a membrane on a porous support is an alternative,
and was the ultimate goal of this project. The porosity of the
support is necessary for gas permeability. One method of
depositing such a film is disclosed in the patent literature: 7 3
electrochemical chemical vapor deposition (ECVD) is used to deposit
an oxygen-ion conductor into a porous support. The conductor fills
the pores, blocking them and providing semipermeability. In this
case, the length of the conducting path is at least equal to the
thickness of the support, and is more likely to be greater than the
support's thickness because of the various twists and turns the
pores in the support may take. Furthermore, the ECVD process
does not lend itself to rapid or large-scale fabrication. We wanted
to deposit a film of BiCuVOx atop the pores via, ultimately, a dip-
coating process; and our original choice for a support was porous
Vycor glass. However, due to the severe agglomeration seen with
BiCuVOx films on the smooth quartz used as a model system for
Vycor, porous alumina was chosen instead. This substrate was
available with a highly monodisperse 0.02 9m pore size from
Whatman.
The first step was to deposit films of BiCuVOx on porous
alumina substrates having the pores plugged with BiCuVOx
423

material. This was done to provide a way of seeing whether the
agglomeration seen on quartz substrates would also be an issue on
the alumina (the results for BiCuVOx deposited on E-beam alumina
were ambiguous due to questions about the adherence of the
alumina film itself on the quartz (Figure 6.27)); the pores were
plugged so that agglomeration effects could be distinguished from
those arising from the porosity of the substrate. Aliquots of each of
the stock solutions, made as described above, were diluted 50%
with anhydrous methanol as usual and one of the following network
modifiers was added in a ratio of one mole of additive per mole of
alkoxide groups present: diethanolamine, triethanolamine, NN-
dimethylformamide, ethylene glycol, 1,3-propanediol, or acetic acid.
One sample was left additive-free as a control. Each of the
resulting precursor solutions was hydrolyzed with deionized water
in an amount equivalent to the moles of alkoxide groups present.
Each precursor solution was permitted to soak into an
Anopore disc, which was then dried and heated rapidly to 375 *C to
remove solvents and most organics. One surface of each disc was
swabbed quickly with dilute HCI to remove surface film (leaving
BiCuVOx in the pores) and dried, then fired at 400 OC for 2h. This
was expected to remove organics from the material in the pores
and prevent production of volatiles which would damage the spin-
cast film overlayers. After this initial preparation, 5 layers of film
were deposited for each precursor solution as described above.
The final thermal treatment was at 550 0 C in air.
The samples were examined in ESEM and were found to be
cracked. (Table 6.5) This was probably due to incomplete removal
of the surface oxide by the HCI swab, leaving a thick and inelastic
424

film in some areas of each substrate. The appearance of pores in
many of the films indicates the failure of the precursor to cover the
substrate surface, in addition to the expulsion of ceramic material
from the pores as organics not removed during the 400 IC heating
step decomposed. (Figure 6.37) In most films, this appears to be
the case, with many of the pores filled with film, while others remain
empty. GIXRD on these films shows the presence of 00-oriented
BiCuVOx. (Figure 6.38) Identification of other phases remained
uncertain due to the excessive noise in the diffraction pattern
caused by X-ray scattering off the pores of the substrate. This
occurred at all angles within the diffractometer's range. Despite the
poor quality of the films, it was apparent that the gross
agglomeration seen with the BiCuVOx films on quartz was not
occurring on the alumina substrates. We therefore went on to try
to deposit films of BiCuVOx directly atop the substrate by spin-
coating.
Five layers of BiCuVOx film were spin-coated onto a fresh
Anopore disc for each additive-containing precursor solution
described above. The final heating step was at 550 0C in air. The
results for these samples are summarized in Table 6.5.
Several precursor solutions gave homogenous, pore-free films,
though these had pinholes which were most likely due to dust
contaminants. The area around these holes was uncracked,
indicating a high degree of elasticity in the film. (Figure 6.39) The
roughness in the surface morphology of the defect-free films reflects
the texture of the substrate. The films were 0.3-0.5 pm thick
according to measurement of the fracture-surface cross-sections in
ESEM. GIXRD patterns tended to show a poor signal/noise ratio
425

due to the small quantity of diffracting material present, and a
highly amorphous background which is due to the small effective
crystallite size of the BiMeVOx ceramic on the alumina disc combined
with X-ray scattering off the substrate pores. Lower incident angles
did not improve the pattern. Due to the background, the phase
purity of the films is uncertain. While the lattice of alumina (see
Table 6.1) does not fit that of BiCuVOx in any direction - which may
explain extreme graininess of the films on the E-beam alumina - the
porosity of the Anopore discs may interfere with the regularity of
the alumina lattice so that the substrate is in fact virtually
amorphous. Films on E-beam alumina were phase-pure and 001-
oriented. If so, there is no reason to expect that the film is not
phase-pure BiCuVOx.
As with the precursor solutions used on smooth (poreless)
substrates, it is unlikely that the small volume of the additives acted
to produce continuous films by modifying the surface tension or
viscosity of the precursor solutions. Instead, the difference
between the film-producing behavior of the solutions containing
various additives is in their hydrolysis behavior. The "control"
solution, containing no additive, and dimethylformamide,
diethanolamine, and 1,3-propanediol gave continuous films on the
porous substrates. These gave varied results for films on smooth
quartz. It may be that the additives which failed to give continuous
films were those that tend to chelate rather than bridge, 7 4 and in
failing to be removed on hydrolysis prevented formation of large
precursor oligimers in the sol that could maintain structural integrity
over the 0.02 pm span across the pores.
426

Table 6.5: Effects of Additives on BiCuVOx films
alumina
on porous
Additive Pore-Plugged No Plug
N,N-dimethylformamide cracking & pores pore-free
1,3-propanediol pores visible pore-free
Ethylene glycol cracking & pores cracking & pores
none cracking & pores pore-free
Acetic acid cracking & pores cracking & pores
Diethanolamine pores visible pore-free
Triethanolamine pores visible pores visible
427

Figure 6.37: BiCuVOx films deposited on pre-plugged Anopore
porous alumina substrates. Additive: 1, 3-propanediol. (a) X
5900, (b) X 10000. Covered and non-covered parts are clearly
visible.
(a)
(b)
NOW
tk
428
........ ....
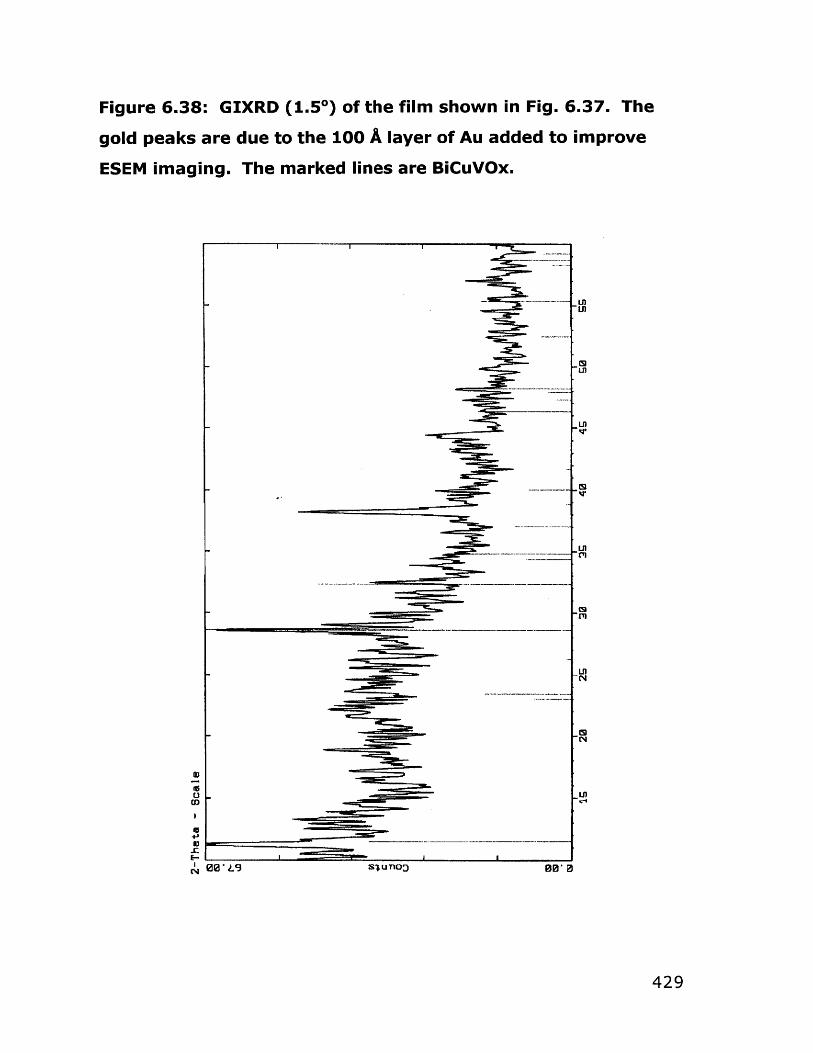
Figure 6.38: GIXRD (1.50) of the film shown in Fig. 6.37. The
gold peaks are due to the 100 A layer of Au added to improve
ESEM imaging. The marked lines are BiCuVOx.
LOl
Lfl
N
Ln
r00'L9 SjuT1D)
429

Figure 6.39: BiCuVOx films deposited on Anopore porous
alumina substrates. (a) diethanolamine, X 17000. The dark
areas are gouges deliberately made on the sample. (b)
methanol, X 10000. The film has no defects.
(a)
(b)
430

T EV
j((e) U! UBOS WIlj pciws
po sjop Sqil at sewse POsW.u o5.1eg Oj) 4BnoJ eq oit uses sf
wjgl o4;1 40 Aqdea~odoj 041 imewuozPOq 0; 0 SZ te pRMof Aaepns
*WrPe4l 'OS6t.X '0UJWej0U54)09' (a) '0104 aq;l punoas po~fpw:un
s.1 wig 94j Wsq4 8OoN 'n~ow-;snp e Aq spew Ajqeqozd 55M
S14±1 *G') p0 .aJOW9 944 ul awod 041 jo dn-aesop3e s 'OOSZ x (P) pus
osarT x iu'uedo-sd-e:'r (')) :.(osaM~i2op:) panunuo, 161E-9 aanfij

6.5 Conclusions
See Table 6.6 for a summary of key experiments and results
described in this Chapter. Defect-free BiNbVOx films were cast onto
smooth (poreless) quartz substrates, while films of BiCuVOx on
quartz substrates were initially homogenous but showed
agglomeration with increasing annealing temperatures. The film-
substrate interaction energies are partly responsible for the
difference between how these films behave on quartz. However,
the higher number of hydrolyzable groups in the BiNbVOx precursor
leads to a more highly connected and densifiable gel network and
possibly mitigates the grain boundary segregation of dopants,
which causes grain-boundary grooving and dewetting of the film
from the substrate. Several gel-network modifying compounds
were added to the BiCuVOx precursor solutions and did not
significantly improve the quality of the resulting films, and in several
cases had a deleterious effect on film quality due to interactions
between the additive and the vanadium alkoxide. Films of BiMeVOx
on quartz also had agglomeration behavior that followed the
number of alkoxide groups. (Table 6.7)
Films of BiCuVOx were successfully cast onto porous alumina
substrates. While GIXRD identification of these films was
impossible, it is assumed that the change of substrate did not
negatively affect the formation of the desired phase. Some BiCuVOx
films deposited onto the porous alumina substrates were sufficiently
thick to give a readable diffraction pattern, and appeared to contain
only BiCuVOx. ESEM examination revealed these films to be on the
whole defect-free and elastic, as evidenced by the behavior of the
films around the occasional holes caused, apparently, by
adventitious dust contaminants.
432

Table 6.6: Summary of key experiments and results
Experiment Class Detail Result Summary
basic parameters spin vs. dip dip-coat equipment gives
poor reproducibility; use
spin-coating
substrate quartz slides must be
preparation cleaned with acetone and
48% HF(aq) rinse
spin rate best films at 3500 RPM
heat treatment require heating on hot-plate
between layers; final anneal
T>450 0C
BiCuVOx on quartz final anneal defect free at 450 0C but
temp. develop agglomeration at
higher temperature
"anneal out" severe agglomeration/
bare areas islanding to 850 0C
change increased water gives no
hydrolysis ratio change in agglomeration,
increases pore size
additives worsen agglomeration;
variation among additives
connected to presence of
dangling -OH group?
use copper still agglomerated
aminoalkoxide
433

Table 6.6, continued.
Experiment Class Detail Result Summary
BiCuVOx on other platinum defect-free for control and all
substrates additives
alumina defect-free but very grainy
other BiMeVOx on BiNbVOx defect-free on Pt and quartz
quartz for control and all additives
BiFeVOx agglomeration on quartz
substrates
BiMnVOx agglomeration on quartz
substrates
BiTiVOx defect-free on quartz
substrates
BiCuVOx on porous plug pores overlayer film destroyed by
substrates decomposition from pores
pores not defect-free for control and
plugged some additives
434

Table 6.7: Effect of Alkoxide Groups on Film Behavior on Quartz
Film # OR from # OR from -OR / Film Quality
V alkoxide M dopant Bi
BiMnVOx 3.4 0 1.7 agglomerated
BiFeVOx 3.6 0 1.8 agglomerated
BiCuVOx 3.6 0 1.8 agglomerated
BiCuVOx 3.6 0.2 1.9 agglomerated
(aminoalkoxide)
BiTiVOx 3.6 0.4 2.0 defectless
BiNbVOx 2.8 1.5 2.15 defectless
435

6.6 Experimental Section
General comments regarding experimental procedures may be
found in Sections 6.1.2 and in the Appendix to Part I of this thesis.
6.6.1 Dip coating experiments
Experiment 1 (JWP-II-161) Dip Coating BiCuVOx on Quartz and
Pt
A precursor solution was made by dissolving Bi(OAc) 3 (5.000 g,
12.95 mmol) V-2MOE (16.54 g, 5.827 mmol), and Cu(OAc) 2 (0.1176
g, 0.6475 mmol) in 150 ml 2MOE as described in Chapter Four to
produce a 0.0432 M BiCuVOx solution. The solution was split into
two samples. One of them was hydrolyzed with water (0.1 ml to
18.5 ml solution, 2 mol H20 per alkoxide group). Quartz slides were
cleaned in acetone and 48 % aqueous HF solution, rinsed with
water, then heated on a hotplate (350 OC) for 15 minutes. They
were then cooled to room temperature in a dessicator. These
substrates were dipped by hand with an approximate withdrawal
rate of 1 cm/sec, into either the hydrolyzed or unhydrolyzed
precursor solution twice, with intermediate drying in air or under
vacuum (vacuum dessicator, approximately 1 torr) followed by 5
min. on a 300 0C hotplate or in a 550 0C furnace. (Table 6.8)
Samples were heated in a furnace at 350, 450, 550, or 650 0C for 3
hours followed by slow cooling and examination under light
microscope, GIXRD, and ESEM. (Figure 6.40)
436

Table 6.8: Parameters and Results Summary for Experiment 1
Table codes: hyd = sample was hydrolyzed; air or vac = method of drying,
hp = sample placed on hot plate; rta = sample put in and out of 550 *C
furnace; T = temperature of final annealing; in GIXRD Results column: g,
other = phases seen; pref = 001-oriented.
Sample hyd air hp rta T Appearance GIXRDOR (*C) Resultsvac
161HAQ Y air N N 550 translucent, y, other, prefI_ crazing
161HBQ Y vac N N 550 opaque y161HCQ Y vac Y Y 550 translucent, y,pref
cracks161HDQ Y vac Y N 550 translucent / y, other, pref
opaque, cracks
161HEQ Y air Y Y 550 opaque y161HFQ Y air Y N 550 opaque y161UAQ N air N N 550 crazing y, other161UBQ N vac N N 550 crazing y, other161UCQ N vac Y Y 550 cracked y, pref161UDQ N vac Y N 550 smooth, y, amorph
islands161UEQ N air Y Y 550 cracked y, other161UFQ N air Y N 550 islands, y, other
,cracked161HQ3 Y air Y N 350 crazing, voids amorph161HQ4 Y air Y N 450 crazing, y
I___ _ I_ _ I_ _ _opaque ____
437

Table 6.8, continued.
Sample hyd air hp rta T Appearance GIXRD
OR ("C) Results
vac
161HQ5 Y air Y N 550 crazing, voids y, other
161HQ6 Y air Y N 650 crazing, voids y, slight pref
161UQ3 N air Y N 350 crazing, voids amorph
161UQ4 N air Y N 450 crazing, voids y
161UQ5 N air Y N 550 crazing, voids y
161UQ6 N air Y N 650 crazing, voids y, other
438
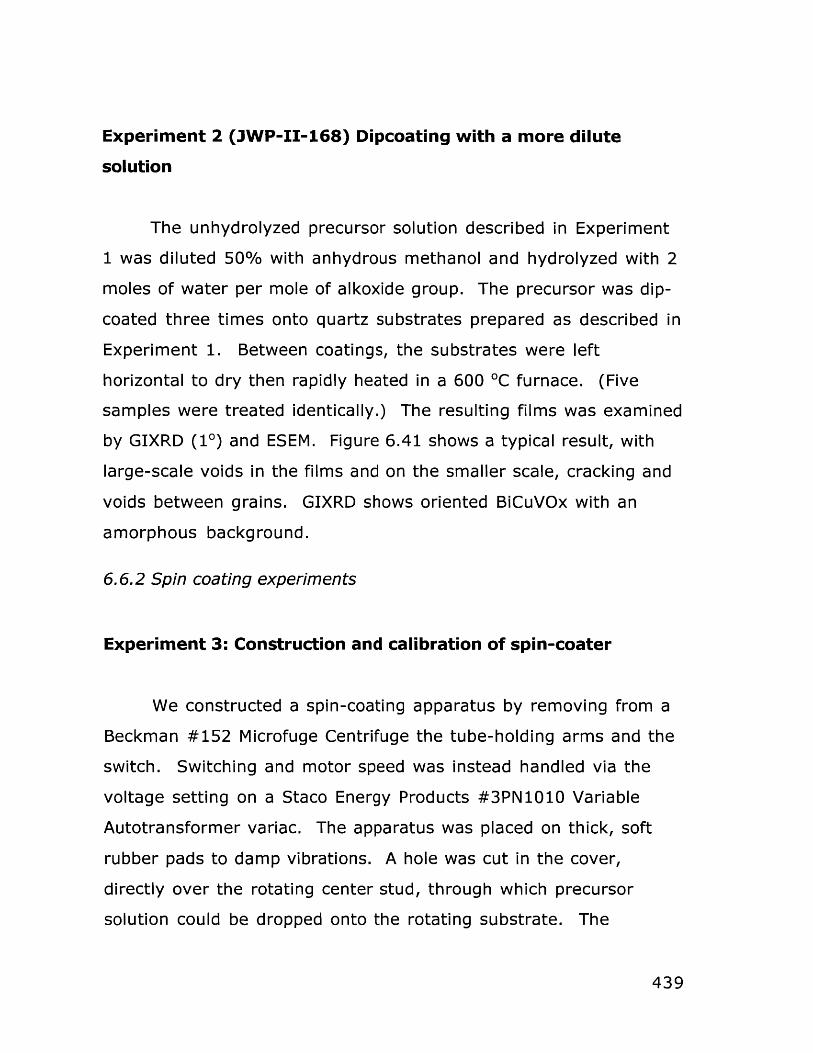
Experiment 2 (JWP-II-168) Dipcoating with a more dilute
solution
The unhydrolyzed precursor solution described in Experiment
1 was diluted 50% with anhydrous methanol and hydrolyzed with 2
moles of water per mole of alkoxide group. The precursor was dip-
coated three times onto quartz substrates prepared as described in
Experiment 1. Between coatings, the substrates were left
horizontal to dry then rapidly heated in a 600 OC furnace. (Five
samples were treated identically.) The resulting films was examined
by GIXRD (10) and ESEM. Figure 6.41 shows a typical result, with
large-scale voids in the films and on the smaller scale, cracking and
voids between grains. GIXRD shows oriented BiCuVOx with an
amorphous background.
6.6.2 Spin coating experiments
Experiment 3: Construction and calibration of spin-coater
We constructed a spin-coating apparatus by removing from a
Beckman #152 Microfuge Centrifuge the tube-holding arms and the
switch. Switching and motor speed was instead handled via the
voltage setting on a Staco Energy Products #3PN1010 Variable
Autotransformer variac. The apparatus was placed on thick, soft
rubber pads to damp vibrations. A hole was cut in the cover,
directly over the rotating center stud, through which precursor
solution could be dropped onto the rotating substrate. The
439

substrate was mounted on the rotating center stud with red clay
initially, and later with Fun-Tak m adhesive. The spin-coater was
calibrated using a Strobotac Type 1531 (General Radio Co.) strobe
light. A line was marked on the rotating center stud and the variac
set at the desired voltage setting. After 5 sec, the strobe light was
set to make the red line appear to stand still. The setting was read
directly from the strobe light; for RPM of the hub center, these
numbers are to be divided by 2 due to the sampling method used.
It was noted that the rotation rate varied somewhat with the
time the centrifuge had been running, becoming constant
approximately 20-30 s after the switch had been turned to the "on"
position. The calibration plot is reported below; points very far off,
and those for variac setting > 40, at which the speed reached a
plateau, where discarded. (Figure 6.42)
Experiment 4 (JWP-II-169) optimization of spin coat speeds
A number of different spin rate settings and times were tried
and an "optimum" setting chosen according to what gave the most
consistent and best results for the same solution. It should be
noted that the optimum spin rate varies with the solution viscosity;
however, since we sought to optimize the solution itself, the initial
tests were used to obtain a convenient set of spin coater settings
for what was believed to be a reasonably standard solution.
Because the spin-coater required some 30 s of spin time before its
rate became constant, some tests were done comparing films
where the precursor solution was dropped on, then the sample
spinning started, with those where the solution was dropped onto
440
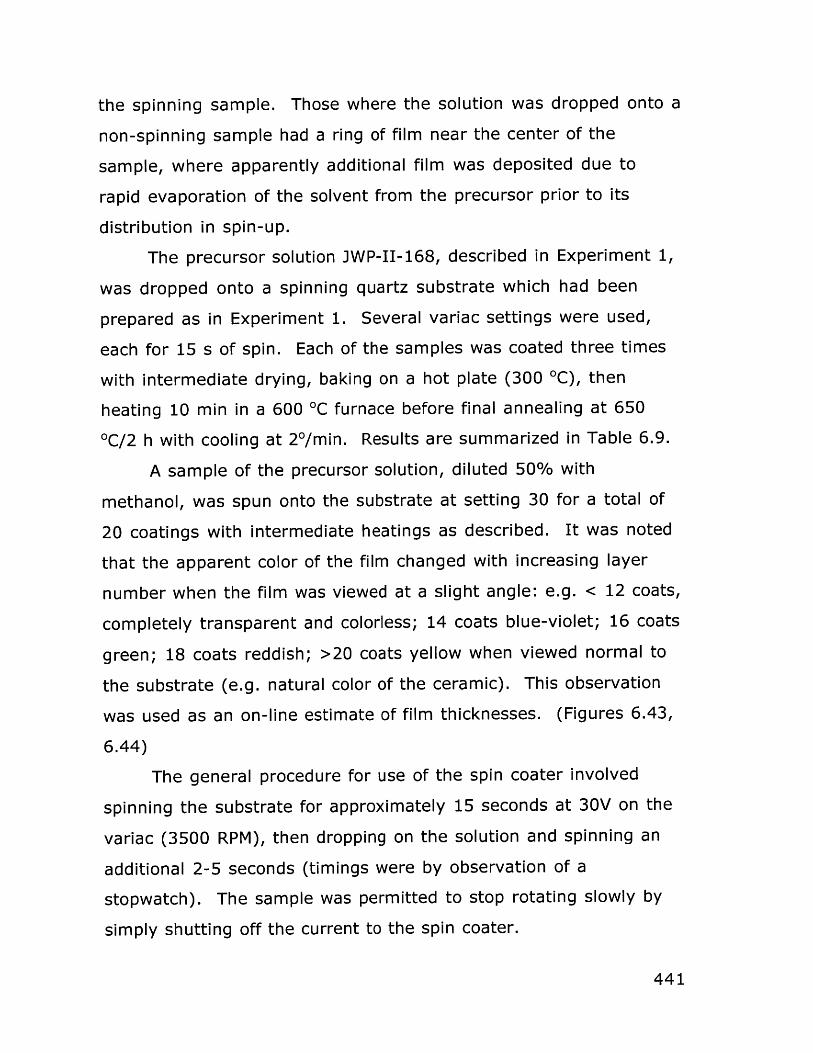
the spinning sample. Those where the solution was dropped onto a
non-spinning sample had a ring of film near the center of the
sample, where apparently additional film was deposited due to
rapid evaporation of the solvent from the precursor prior to its
distribution in spin-up.
The precursor solution JWP-II-168, described in Experiment 1,
was dropped onto a spinning quartz substrate which had been
prepared as in Experiment 1. Several variac settings were used,
each for 15 s of spin. Each of the samples was coated three times
with intermediate drying, baking on a hot plate (300 OC), then
heating 10 min in a 600 0C furnace before final annealing at 650
OC/2 h with cooling at 20/min. Results are summarized in Table 6.9.
A sample of the precursor solution, diluted 50% with
methanol, was spun onto the substrate at setting 30 for a total of
20 coatings with intermediate heatings as described. It was noted
that the apparent color of the film changed with increasing layer
number when the film was viewed at a slight angle: e.g. < 12 coats,
completely transparent and colorless; 14 coats blue-violet; 16 coats
green; 18 coats reddish; >20 coats yellow when viewed normal to
the substrate (e.g. natural color of the ceramic). This observation
was used as an on-line estimate of film thicknesses. (Figures 6.43,
6.44)
The general procedure for use of the spin coater involved
spinning the substrate for approximately 15 seconds at 30V on the
variac (3500 RPM), then dropping on the solution and spinning an
additional 2-5 seconds (timings were by observation of a
stopwatch). The sample was permitted to stop rotating slowly by
simply shutting off the current to the spin coater.
441

Because dust particles were expected to cause problems in
the film quality, dust was kept to a minimum in the region of the
spin-coating by (1) keeping the centrifuge cover down, (2) using a
low-particulate Aero-Duster TM spray to clean the immediate area of
the depositions before spin-coating, and (3) passing the precursor
solutions through a filter (Gelman Sciences Acrodisc TM 0.2 ptm syringe
filter) as they were dropped onto the spinning substrate.
Table 6.9: Results of Varying the Spin Rate
Variac Setting/ GIXRD Appearance
Speed (RPM)
20/1100 001 oriented translucent, cracked
25/2600 001 oriented translucent, cracked
30/3500 001 oriented transparent, grainy
in ESEM
40/5500 amorphous not covered with
film?
6.6.3 Deposition of BiCuVOx on Quartz Substrates
Experiment 5 (JWP-III-17) BiCuVOx Precursor with Catalyst,
Different Anneal Temperatures
A precursor solution was made to approximately 0.05 M
BiCuVOx by adding Bi(OAc) 3 (9.653g, 25 mmol), V-2MOE (22.695g at
4.96x10 4 mol/g, 11.3 mmol), and Cu(OAc) 2 (0.227g, 1.3 mmol) to
250 ml 2MOE. Ten ml of this solution was diluted with 10 ml of a
442

mixture of MeOH and acid or base, as described in the table below.
These solutions were then hydrolyzed with water (0.25 ml, 13.9
mmol, 1.25 equivalents relative to vanadium; the water content of
the acids/bases was ignored). Samples were spin-coated as
described above for 6 coats, with intermediate heating, first on a
hot plate (300 0C), then in a furnace at 550 0C for 10 minutes with
rapid heating and medium cooling. (The cooling rate was
moderated by handling the samples on a thick block of alumina
which was placed in the oven and removed with the samples on it,
and which cooled to room temperature fairly slowly when placed on
an insulated pad.) Samples were then final-annealed at 600 0C or
875 0C for 8 h, with cooling to RT at 1.5 /min. (Table 6.10) The acid
catalysis alone made no improvement in the film quality.
443

Table 6.10: Effect of Acid/Base and Heating Temperature
Sample Temp Added to 10 Optical ESEM result
("C) ml precursor Microscope location
III-18A 875 10 ml MeOH some cracking Figure 6.45d
III-18B 600 10 ml MeOH cracking Figure 6.45a
III-18C 875 5 ml MeOH + 5 cracked areas Figure 6.45e
ml HOAc
III-18D 600 5 ml MeOH + 5 smooth with Figure 6.45b
ml HOAc porosity
III-18E 875 8 ml MeOH + 2 cracking, large-scale
ml HOAc beading cracking
III-18F 600 8 ml MeOH + 2 spotty not done
ml HOAc coverage
III-18G 875 9 ml MeOH + 1 "molten" not done
ml NH 40H spots, peeled
areas
III-18H 600 9 ml MeOH + 1 spotty not done
ml NH 40H coverage (inst.
blue gel in
precursor
sol'n)
111-181 875 9.75 ml MeOH severe not done
+ 0.25 ml HNO 3 cracking
III-183 600 9.75 ml MeOH grainy; crazed Figure 6.45c
+ 0.25 ml HNO 3 areas
444

6.6.4 Variation of hydrolysis water
Experiment 6 (JWP-III-34) BiCuVOx Films, Varying Water
The precursor solution made in Experiment 5 above was
diluted 2/3 with methanol and split into several 25-ml samples. One
sample was left unhydrolyzed, while the others were or hydrolyzed
with, respectively, 68 1d, 136 gi, 0.34, or 0.68 ml of water (1, 2, 5, 10
equivalents relative to the number of alkoxide groups). These were
spin-coated under the usual conditions onto quartz substrates
(prepared as described above) with intermediate heating on a
hotplate, followed by 5 min. at 550 OC, for a total of 9 coats.
Unhydrolyzed precursor solution would not wet the quartz
sufficiently to deposit a film. The samples were pyrolyzed at 575 0C
for 8 hours with cooling at 5 0/min, then examined by GIXRD and
ESEM. All GIXRD showed highly oriented films (002, 004, 006 only);
ESEM showed high porosity in all cases. See Table 6.2 above.
(Figure 6.46)
Experiment 7 (JWP-III-43) Additional layers to "fill in" pores
Films produced in Experiment 6 above were spin-coated again
according to the same procedure, placing on an additional 4 layers
of film. These were heated again at 575 OC/8h with 50/min cooling,
and re-examined under an ESEM. Figure 6.47.
445

6.6.5 Variation of annealing temperature
Experiment 8 (JWP-III-5) BiCuVOx, Variation of Annealing
Temperatures
Quartz substrates were spin-coated with a precursor solution
made by diluting 15 ml of the precursor solution made in Experiment
1 with 25 ml MeOH and hydrolyzing with 0.5 ml (12 equivalents
relative to the number of alkoxide groups) of water. Five layers
were spin-coated (setting 30, 3 sec) onto the samples, with
intermediate time on a hot plate (300 OC). Some samples were
dipped one time in the precursor solution after the spin layers were
deposited. Samples were heated 1 hour in each of 450, 550, and
650 OC and examined by GIXRD and ESEM. (Figure 6.48, 6.49) One
sample was not heated in a furnace at all; after the final layer it
was left on the hot plate at its highest setting (approx. 350 OC) for 1
hour. GIXRD (10) shows increasing crystallinity and orientation of
the BiCuVOx phase with rising temperature. The samples which had
been dipped for their final coat were less oriented. (Figure 6.50)
Experiment 9 (JWP-III-21) Higher temperature to anneal out
pores
The samples from Experiment 8 were reheated for 1 hour
(ramp 50/min, cooling 10/min) in 750, 800, and 850 OC furnaces. The
ESEMs show "beading" of the film into islands and increased voiding
between grains. Figure 6.51. The samples were subjected to a 3 rd
heating at 750 0C for 8 hours and were found to have still increased
446

voiding between grains, as well as agglomerated areas. Figure
6.52.
Experiment 10 (JWP-III-81) Varying temperature, less water
Stock solution was produced by adding Bi(OAc) 3 (2 g, 5.2
mmol), V-2MOE (4.7g at 4.96x10⁻⁴ mol/g, 2.3 mmol), and Cu(OAc) 2
(0.0485 g, 3 mmol) to 2MOE to make a 100 ml total volume. This
was diluted 50% with methanol and hydrolyzed with 0.17 ml water
(1 equivalent relative to alkoxide groups). This solution was
deposited by spin-coating (variac at 30%) for 3 s, followed by
placement on a hot plate (300 OC) between layers. Eight layers of
film were deposited in this manner. The films were heated in air for
2 h at 450, 550, and 650 OC with cooling at 2 O/min then were
examined by GIXRD and ESEM. (Figures 6.14, 6.15).
6.6.6 Behavior of Bulk Gels in Presence of Additives
Experiment 11 (JWP-II-122) Additive effects on phase
formation, gel quality
Precursor solutions containing Bi(OAc) 3 (4 g, 10.4 mmol), V-
2MOE (7.125 g, 3.53 mmol), and Cu(OAc) 2 (0.094 g, 5 mmol) in 30 ml
2MOE were mixed with diisopropanolamine (0.47 g, 3.5 mmol),
acetylacetone (0.35 g, 3.5 mmol), or ethylene glycol (0.22 g, 3.5
mmol), in the amount of 1 mol additive per mol vanadium. The
sample containing diisopropanolamine showed no change at first,
but overnight had a fluffy white sediment in a deep green liquid.
447

The sample containing acetylacetone became milky blood red and
on heating, green; standing overnight produced a bright yellow
precipitate. The solution containing ethylene glycol showed no
immediate change but had some white precipitate after overnight
standing. These were stirred again and diluted to 150 ml with
2MOE, then hydrolyzed with water (0.25 g, 1 equivalent relative to
the number of alkoxide groups). After standing overnight, the one
containing diisopropanolamine gave a pale green gelatinous solid
and green supernatant; acetylacetone one gave a beige and
orange precipitate and orange-green supernatant; ethylene glycol
one gave a firm green gel with no syneresis. All were heated 12 h
at 550 OC in air and characterized by XRD. All three showed y phase
BiCuVOx with a distinct BiVO 4 impurity.
Experiment 12 (JWP-II-137) Additive effects on gel and phase
quality II
Precursor solutions were made as in Experiment 11, and
additives dimethyl succinate (0.51 g, 3.5 mmol), 1,3-propanediol
(0.27 g, 3.5 mmol), ethanolamine (0.21 g, 3.5 mmol),
diethanolamine (0.37 g, 3.5 mmol), and triethanolamine (0.52 g, 3.5
mmol) added in the amount of 1 mol additive per mol of vanadium.
Each solution was hydrolyzed with water (0.25 g, 1 equivalent
relative to the number of alkoxide groups). See results in Table
6.11.
The solids were pyrolyzed 550 0C for 12 hours and
characterized by XRD; all gave clean y phase BiCuVOx, except
448

diethanolamine and triethanolamine, which gave BiCuVOx
contaminated with BiVO 4.
Table 6.11: Results for Experiment 12, effects of some additives
on bulk gels.
Additive Solution, pre- After hydrolysis behavior on
hydrolysis + 12 hours quartz slide,
hydrolyzed
dimethyl clear green inhomogenous uniform
succinate gelatinous liquid wetting
1,3-propanediol milky green firm gel uniform
wetting
ethanolamine yellow-green blue liquid & ppte beading,
milky particles
diethanolamine yellow-green blue liquid & wetting,
clear milky gel particles
triethanolamine clear bright infirm gel uniform
yellow wetting
Experiment 13 (JWP-II-162) Effects of additives on gel III;
initial dip-coating experiments
A precursor solution was made by dissolving Bi(OAc) 3 (5.000 g,
12.95 mmol) V-2MOE (16.54 g, 5.827 mmol), and Cu(OAc) 2 (0.1176
g, 0.6475 mmol) in 150 ml 2MOE as described in Chapter Four to
produce a 0.043 M BiCuVOx solution. Three 10-ml samples (5 mmol
V) of this solution were set aside and ethanolamine (0.684 g, 11.2
mmol), diethanolamine (1.052 g, 10.0 mmol) or triethanolamine
449
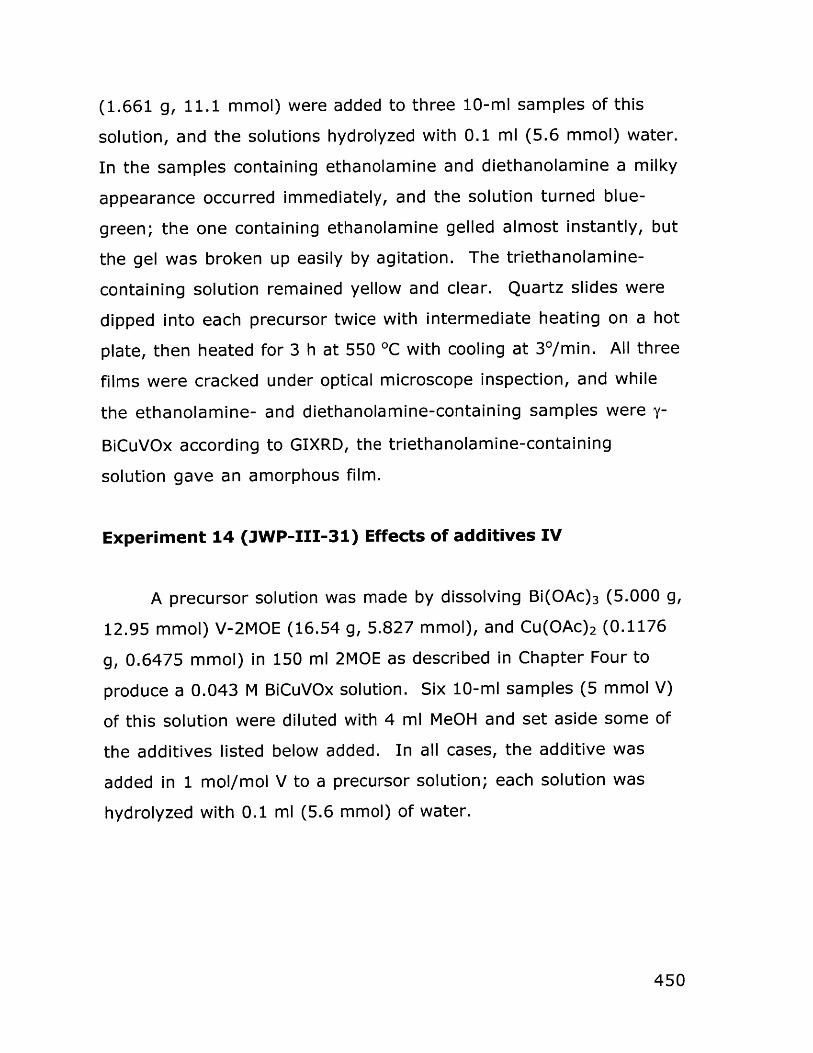
(1.661 g, 11.1 mmol) were added to three 10-ml samples of this
solution, and the solutions hydrolyzed with 0.1 ml (5.6 mmol) water.
In the samples containing ethanolamine and diethanolamine a milky
appearance occurred immediately, and the solution turned blue-
green; the one containing ethanolamine gelled almost instantly, but
the gel was broken up easily by agitation. The triethanolamine-
containing solution remained yellow and clear. Quartz slides were
dipped into each precursor twice with intermediate heating on a hot
plate, then heated for 3 h at 550 0C with cooling at 30/min. All three
films were cracked under optical microscope inspection, and while
the ethanolamine- and diethanolamine-containing samples were y-
BiCuVOx according to GIXRD, the triethanolamine-containing
solution gave an amorphous film.
Experiment 14 (JWP-III-31) Effects of additives IV
A precursor solution was made by dissolving Bi(OAc) 3 (5.000 g,
12.95 mmol) V-2MOE (16.54 g, 5.827 mmol), and Cu(OAc) 2 (0.1176
g, 0.6475 mmol) in 150 ml 2MOE as described in Chapter Four to
produce a 0.043 M BiCuVOx solution. Six 10-ml samples (5 mmol V)
of this solution were diluted with 4 ml MeOH and set aside some of
the additives listed below added. In all cases, the additive was
added in 1 mol/mol V to a precursor solution; each solution was
hydrolyzed with 0.1 ml (5.6 mmol) of water.
450

Table 6.12: Effects of additives on gel quality, Experiment 14
Additive Am't Instant Result Overnight Result
(g)
pyridine 0.40 milky blue color opaque green gel
acetylacetone 0.50 clear red-brown transparent green
color gel, brown
particles
triethanolamine 0.75 clear green color no gelation
diglyme 0.68 clear green color transparent gel,
cracked
1,3-propanediol 0.38 clear green color transparent gel,
uncracked
ethylene glycol 0.31 clear green color transparent gel,
dense
Experiment 15 (JWP-III-129) 51V NMR of solutions with
additives
Several of the additives used in the experiments above were
added to 10-ml V-2MOE solutions 2.2x10~3 mol/g in V, at 1 mol
alkoxide per mole of additive. 51V NMR spectra were taken on a
Varian Unity 300 MHz instrument using VOCI3 as an external
standard (8=0 ppm). See Table 6.13 for results.
451
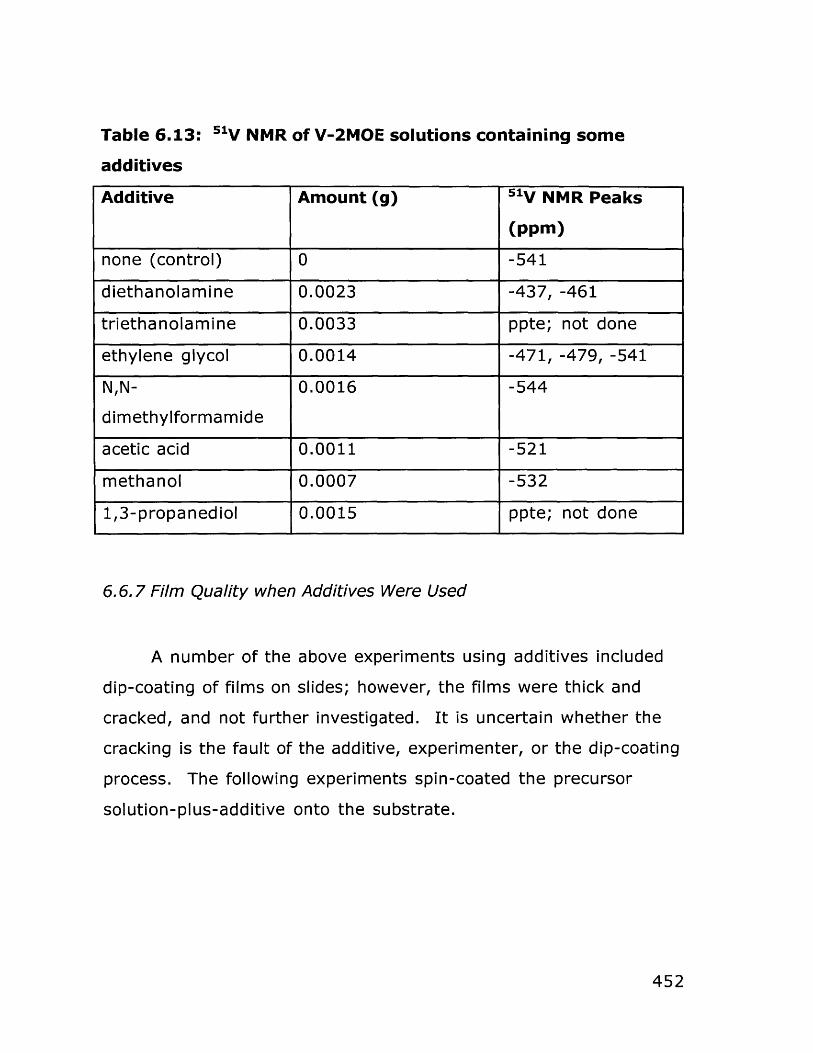
Table 6.13: 51V NMR
additives
of V-2MOE solutions containing some
6.6.7 Film Quality when Additives Were Used
A number of the above experiments using additives included
dip-coating of films on slides; however, the films were thick and
cracked, and not further investigated. It is uncertain whether the
cracking is the fault of the additive, experimenter, or the dip-coating
process. The following experiments spin-coated the precursor
solution-plus-additive onto the substrate.
452
Additive Amount (g) 51V NMR Peaks
(ppm)
none (control) 0 -541
diethanolamine 0.0023 -437, -461
triethanolamine 0.0033 ppte; not done
ethylene glycol 0.0014 -471, -479, -541
N,N- 0.0016 -544
dimethylformamide
acetic acid 0.0011 -521
methanol 0.0007 -532
1,3-propanediol 0.0015 ppte; not done

Experiment 16 (JWP-III-57) BiCuVOx on quartz, with additives
A precursor solution was made with Bi(OAc) 3 (1 g, 2.6 mmol),
V-2MOE (2.35 g at 4.96x10⁻⁴ mol/g, 1.2 mmol), and Cu(OAc) 2 (0.024
g, 0.13 mmol) in 40 ml 2MOE. From this stock solution, 10 ml was
taken and diluted with 25 ml MeOH. This was hydrolyzed with 21 pl
of water (1 mol water/mol alkoxide) and spin-coated onto quartz
slides, 8 layers with intermediate heating on a hot plate and at 5500C (10 min). Other precursor solutions were made using 20 ml of
the stock BiCuVOx solution, diluting 50% with MeOH, and adding
N,N-dimethylformamide (0.2 g, 2.6 mmol), ethylene glycol (0.16 g,
2.6 mmol), diethanolamine (0.27 g, 2.6 mmol), or triethanolamine
(0.39 g, 2.6 mmol) (1 mol additive/mol alkoxide). These precursor
solutions were hydrolyzed (47 gI water, 1 mol H20/mol alkoxide
group) and deposited as above onto quartz substrates, 8 layers.
All samples were pyrolyzed 600 OC/4h with cooling at 30/min and
were examined by GIXRD and ESEM. The films were pure but
strongly oriented (Figure 6.53) and showed agglomeration and
porosity. (Figure 6.54)
Experiment 17 (JWP-III-81) BiCuVOx on quartz, with additives
Experiment 16 was repeated to verify the results. A precursor
solution was made of Bi(OAc) 3 (2.0036 g, 5.2 mmol ), V-2MOE
(4.7004 g, 2.3 mmol), and Cu(OAc) 2 (0.0485 g, 0.27 mmol) in 100 ml
2MOE, diluted 50% in methanol, and split into 8 portions. Likewise,
a precursor solution was made to the same base concentration
using Bi(OAc) 3 (2.0024 g, 5.2 mmol) V-2MOE (3.68 g, 1.8 mmol) and
453

Nb(OiPr)5 (2.44 g, 0.8 mmol) diluted 50% in methanol, and split into
8 portions. Each portion received 1 mol additive/mol alkoxide
present (see Table 6.14), and was hydrolyzed using 16.8 pl water
for the BiCuVOx solutions and 20 pi water for the BiNbVOx solutions
(1 mol water/mol alkoxide present). Eight layers were deposited by
spin-coating onto quartz substrates for each solution, with
intermediate heating on a hot plate followed by 5 minutes in a 550
0C furnace. The slides were pyrolyzed at 550 0C/2 h with cooling at
20/min and examined by GIXRD and ESEM. Surface coverage was
determined using the image analysis software of the ESEM.
(Figures 6.31 - 6.34)
The solutions were left over the weekend to be gelled.
Diethanolamine gave a viscous milky liquid and triethanolamine an
ungelled yellow liquid. The solvent was evaporated out of all
samples and some of the precursor solids inspected under ESEM.
Figure 6.35. The bulk gels were pyrolyzed at 550 0C for 8 h. XRD
showed clean y phase in was produced from all precursor solutions
except that containing triethanolamine. This solution produced g-
BiCuVOx, BiVO 4, and unidentified peaks. (Figure 6.55)
454

Table 6.14: Amounts of additive used for Experiment 17
Sample # Additive Amt. for Amt. for
BiCuVOx (g) BiNbVOx
(g)
81x-1 ethanolamine 0.0570 0.0715
81x-2 diethanolamine 0.1009 0.1237
81x-3 triethanolamine 0.1530 0.1660
81x-4 dimethylformamide 0.0739 0.0832
81x-5 ethylene glycol 0.0592 0.0719
81x-6 acetic acid 0.0563 0.0701
81x-7 methanol (also 0 0
samples 8-10)
81x-11 1,3-propanediol 0.0723 0.089
Experiment 6.18 (JWP-III-58) Addition of Cu as hydrolyzable
substance
A precursor solution was made by mixing Bi(OAc) 3 (2 g, 5.18
mmol), V-2MOE (4.700 g at 4.957x10⁴ mol/g, 2.33 mmol), and
copper dimethylaminoethoxide (0.0621 g, 0.259 mmol) in 80 ml of
2MOE. Twenty ml of this mixture was diluted with 30 ml of methanol
and hydrolyzed with water (84 pl, 4.67 mmol). A precipitate formed
and the sample was discarded. This was repeated, adding the
water slowly together with the methanol, but a precipitate formed
again. Ten ml of the precursor solution was diluted with 10 ml of
methanol and the unhydrolyzed solution used to spin-coat 8 layers,
with intermediate heating, onto quartz slides. These were heated
455

at 550 OC for 4 h according to the usual procedure. ESEM showed
agglomerated films, and GIXRD showed a strongly 00-oriented but
phase-pure BiCuVOx film.
6.6.8 BiCuVOx Films on Metal Substrates
Experiment 19 (JWP-II-170) BiCuVOx films on Pt sheets
A precursor solution was made by dissolving Bi(OAc) 3 (5.000 g,
12.95 mmol) V-2MOE (16.54 g, 5.827 mmol), and Cu(OAc) 2 (0.1176
g, 0.6475 mmol) in 150 ml 2MOE as described in Chapter Four to
produce a 0.0432 M BiCuVOx solution. The solution was split into
two samples. The solution was diluted 50% with methanol and
hydrolyzed (100 ml solution) with 0.16 ml water (1 mole of water
per mole of alkoxide group). Substrates made from platinum sheet
as described in Section 6.1.2.2 above were dipcoated once or twice,
or spincoated once or twice, with intermediate heating on a
hotplate, then pyrolyzed at 650 0C for 2h with cooling at 20/min.
Samples were examined by GIXRD (Figure 6.18) and showed a high
degree of preferential orientation, and in ESEM showed smooth
coatings. (Figure 6.19) The experiment was repeated on JWP-II-
181, with the same results.
Experiment 20 (JWP-III-34) BiCuVOx on Pt, varying water
The precursor solutions described in Experiment 6 were also
deposited by dip-coating onto platinum sheets and by spin coating
456
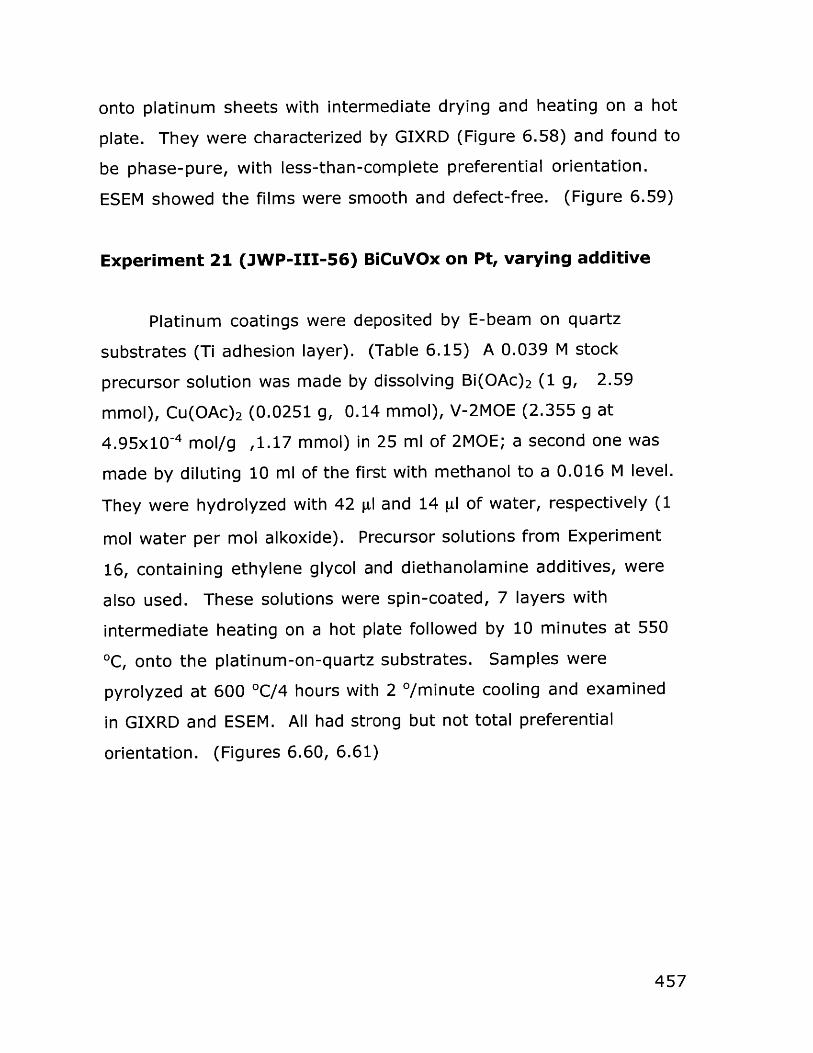
onto platinum sheets with intermediate drying and heating on a hot
plate. They were characterized by GIXRD (Figure 6.58) and found to
be phase-pure, with less-than-complete preferential orientation.
ESEM showed the films were smooth and defect-free. (Figure 6.59)
Experiment 21 (JWP-III-56) BiCuVOx on Pt, varying additive
Platinum coatings were deposited by E-beam on quartz
substrates (Ti adhesion layer). (Table 6.15) A 0.039 M stock
precursor solution was made by dissolving Bi(OAc) 2 (1 g, 2.59
mmol), Cu(OAc) 2 (0.0251 g, 0.14 mmol), V-2MOE (2.355 g at
4.95x10 4 mol/g ,1.17 mmol) in 25 ml of 2MOE; a second one was
made by diluting 10 ml of the first with methanol to a 0.016 M level.
They were hydrolyzed with 42 gl and 14 gI of water, respectively (1
mol water per mol alkoxide). Precursor solutions from Experiment
16, containing ethylene glycol and diethanolamine additives, were
also used. These solutions were spin-coated, 7 layers with
intermediate heating on a hot plate followed by 10 minutes at 550
0C, onto the platinum-on-quartz substrates. Samples were
pyrolyzed at 600 OC/4 hours with 2 0/minute cooling and examined
in GIXRD and ESEM. All had strong but not total preferential
orientation. (Figures 6.60, 6.61)
457

Table 6.15: E-beam
(Ti adhesion layer used
deposition parameters for substrates made
with Pt, Ag, parameters are for this adhesion layer)
Parameter Ti Pt A12 0 3 Ag W0 3
rise time 0.5 0.5 0.3 1 1
soak time 0.5 0.5 0.3 1 1
soak power 15 35 12 15 10
rate 3 3 3 3 5
thickness2 50 100 200 500 1000
fall time 0.3 0.3 0.3 0.3 0.3
idle power 0 0 0 0 0
max power 30 55 25 25 20
gain/damp 5.4 5.4 5.4 4.5 4.3
Z factor 0.628 0.245 0.336 0.929 1
tool factor 086 086 086 086 086
density 4.5 21.45 3.79 10.49 7.16
thickness (A) 59 107 616 496 1200
6.6.9 Preparation of films on porous substrates
Experiment 22 (JWP-III-149) BiCuVOx on pore-plugged
substrates
Whatman AnoporeT M 0.02 ptm porosity alumina membranes
were prepared as described in Section 6.1.2.2 above. Solutions
from Experiment 17 containing additives, were permitted to soak
into the membranes, which were then lightly swabbed with dilute
458

HCI to remove the surface coating and heated for 2 h at 400 OC to
decompose organics. The wetting behavior of each solution was
monitored during this process. (Table 6.15) After the heating, the
precursor solutions were spin-cast onto these "pre-clogged" and
onto some new (no prior coating) Anopore membranes, 5 s at
setting 30V, with intermediate hotplate (2 min) and furnace (500
OC/5 min). GIXRD proved impossible due to interference from the
porous alumina. The films were examined in ESEM (Figure 6.37) and
the results are described in Table 6.16.
459

Table 6.16 Effects of Additives
Quality on Porous Substrates
on Wetting Behavior and Film
Additive Wetting Pore- Not Pore-Plugged
Behavior Plugged
*
diethanolamine beads pores pore-free
triethanolamine soaks pores pores
dimethylformamide beads cracking, pore-free
pores
ethylene glycol soaks cracking, cracking, pores
pores
acetic acid soaks cracking, cracking, pores
pores
methanol (control) soaks cracking, pore-free
pores
1,3-propanediol soaks pores pore-free
*Here, "soaks" means the solution moved rapidly into the pores of the
membrane, while "beads" means the solution sat on the surface in a bead
during the pre-clogging step.
6.6.10 BiMeVOx Films on Assorted Substrates
Experiment 23 (JWP-IV-1) BiMeVOx on quartz, Pt, A12 0 3
Four precursor solution were made according to Table 6.17,
dissolving the materials listed there in 50 ml 2MOE and 25 ml MeOH
to create precursor solutions 0.052 M (in Bi 2 ) delivering
460

Bi 2Cu 0.1V0 .9O 5 .35, Bi2 NbO.3V 7 O5. 5 , Bi 2Ti1.1V0.905.5_ , and
Bi 2 Mn 0 .15V0 .85O5.5 , respectively. These solutions were hydrolyzed
with water equivalent to the number of alkoxide groups present in
each precursor solution.
Precursor solutions were spin-coated (30V, 3500 RPM) onto
quartz substrates prepared as usual. Part of each were masked for
profilometry. Between each of the seven coatings, the sample was
dried on a hot plate (300 C) then left in a furnace at 400 0C for 5
minutes. The same procedure was followed to deposit films on Pt
substrates (E-beam on quartz) and A120 3 substrates (E-beam on
glass). One of each sample was heated at 450 OC/8h with cooling
at 2 OC/min, while the other was heated at 650 OC/8h with cooling
at 2 OC/min. Films were characterized by GIXRD and ESEM. (Figures
6.62, 6.25 - 6.27) Then, all samples that had been heated at 450 0C
were again heated, now at 750 OC/8 h with cooling at 2 0C/min and
re-examined by GIXRD and ESEM. (Figures 6.28 - 6.30) GIXRD
showed all remained phase-pure and oriented.
Table 6.17: Preparation of BiMeVOx precursor solutions
Dopant Bi(OAc) 3 g V-2MOE g Dopant H 2 0 plIdentity (mmol)* 9 (mmol)
(mmol) **
Cu(OAc) 2 2.0013 6.9254 0.0482 42
Nb(OiPr)s 2.0023 5.3799 2.4444 56
Ti(OiPr)4 2.0005 6.9145 0.0865 48
Mn(OAc) 2*4H 20 2.0009 6.5352 0.0672 40
*3.37x10-4 mol/g**used on 1/3 of the solution
461

Experiment 24 (KD-83) BiFeVOx on quartz
Bi(OAc) 3 (0.4999g, 1.3 mmol), V-2MOE (2.685 g at 2.235x10⁻⁴
mol/g (from vanadium isopropoxide), 0.58 mmol), and Fe(acac) 2
(0.0187g, 0.07 mmol) were mixed in a total of 25 ml of 2MOE to
produce a 0.052 M solution. This was added to 50 ml methanol and
hydrolyzed with 40 pil of water (1 mol H20/ mol alkoxide). The
solution was spin cast in the usual manner to deposit 10 coatings
onto quartz slides, prepared in the usual manner. All samples were
heated to 450 OC/8 hours with 1 O/min cooling; two of them were
given 5 more coats after the first pyrolysis and heated at 550 OC/8 h
with 20/min cooling. ESEMS (Figure 6.63) indicated some
agglomeration in the films, but no cracking or pore formation. GIXRD
indicated poorly crystalline phase-pure but oriented films. (Figure
6.64)
462

r hurt Ift
4, 4:1) ~
aV'<I: Xk4:
a I
4
U
AAle
3
(q)
'4 4a~ ,
V.
>~~
v~ q* #4..
.4
is t&g I:.:
U
44
4-u
(e)
-os9t X (cj),'0Sgt x (e)OSS le psinauue pus pansoo-dlpt'~senb uo xOAflg ~l9~n;
itb
I
I ---------- --I-
M?
:ovmg aun6jj

Figure 6.41: BiCuVOx on quartz, dip-coated and annealed at 550
OC, using a more dilute solution than in Fig. 6.40. Patchy areas in
(a) may be due to irregularities in the dipping. The blowup of
one area (b) shows a cracked top layer plus a grainy underlayer.
(a) X 665, (b) X 10500.
(a)
(b)
(r
5?
4
ai4 t2ZZ
464

Figure 6.42: Calibration curve for the spin-coater.
6000
0
5000 00
4000- -
3000 -
00
2000-
0
010 15 20 25 30 35 40
variac
465

Figure 6.43: Optimization of spin-coater setting for BiCuVOx
films. (a) Coating produced at variac setting 30 V (3500 RPM),
X 1250. (b) Coating produced at variac setting 20 V (1100
RPM), X 230.
(a)
I- ----------
LZZZ2S
_ _ _ _ _ _ _ _ _ _ _..........
(b)
466

Figure 6.44: Effects of different spin-coater speeds on GIXRD.
All are at 10 grazing angle. (a) Setting 20 V (1100 RPM), (b)
Setting 30 V (3500 RPM). The GIXRD for setting 40 V showed
an amorphous material. The lines marked are for BiCuVOx.
00 61 su loD
U,
U,
-m
K9
In
E-
N
467
Wk
A

Figure 6.45: BICuVOx on quartz, acid catalysts. (a) control (no
catalyst), 600 0C annealing, X 5250. (b) acetic acid, 600 0 C
annealing, X 2250. (c) nitric acid, 600*C annealing, X 2300.
(a)
(b) (c)
468
11

Figure 6.45, continued: (d) control (no catalyst), 875 *C
annealing, X 2950. (e) acetic acid, 875 *C annealing, X 540.
(d)
(e)
469

Figure 6.46: BICuVOx on quartz, varying water-to-akoxide ratio
(W). (a) W=I, X 4350, (b) W=2, X 7200, (c) W=5, X 4400.
(a)
I-M
(b)(maw-
470

Figure 6.47: BICuVOx on quartz, varying water-to-alkoxide ratio
(W), 5 layers added to samples in Fig. 6.46. (a) W=1, X 2150,
(b) W=2, X 5500 (inset X 9050), (c) W=5, X 5400.
(a)
(b) (c)"Na
471
44
t'c 4
Ilk,
4 j r~ t
I

Figure 6.48: BiCuVOx on quartz, varying temperature of final
annealing step. (a) 450 *C, X 3550, (b) 550 *C, X 6600, (c) 650*C, X 5650 (inset).
(a)
(b) (C)
111111 11111'
.. ... ...-- --- r -
472

BiCuVOx on quartz, varying temperature of final
annealing step. Grazing angle 1*. (a) 450 *C, (b) 550 "C, (c)
650 *C.
OWELI
-=1
71
sjunco
LI)LI
'U
+2
0
473
L) C13
Figure 6.49:
%r
-Li
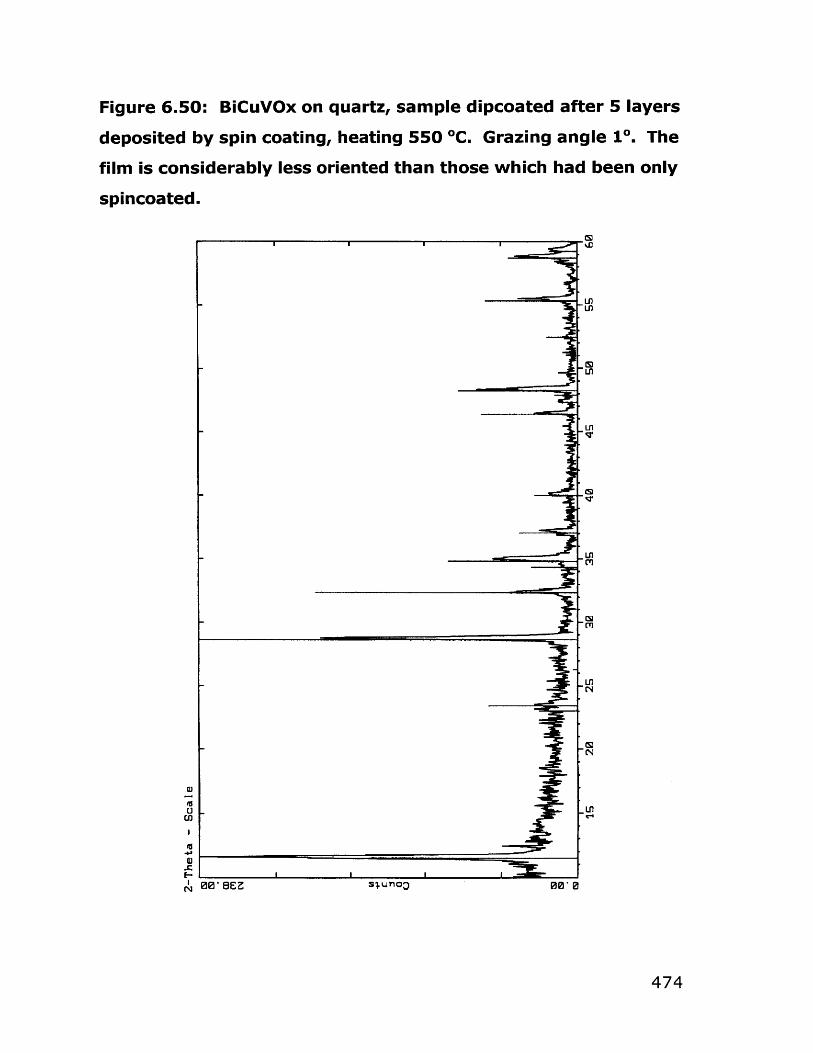
Figure 6.50: BiCuVOx on quartz,, sample dipcoated after 5 layers
deposited by spin coating, heating 550 OC. Grazing angle 10. The
film is considerably less oriented than those which had been only
spincoated.
LI)U)
C9,
Li,
(N
aJM
o In
U
474

Figure 6.51: BICuVOx on quartz, heated a second time to anneal
out pores. (a) 750 *C, X 2900, (b) 800 *C, X 1100.
(a)I
e 4
4141
4<4 W
Mw9$W: Alk,~
(b)
475

Figure 6.52: BICuVOx on quartz, heated a third time to anneal
out pores, at 750 0C for 8 hours. (a) X 470, (b) X 9050.
(a)
(b)
476

Figure 6.53: BiCuVOx on quartz, varying additives. Samples
heated at 550 *C. Grazing angle 10. (a) control (no additive),
(b) diethanolamine, (c) N, N-dimethylformamide. The
triethanolamine-containing sample was amorphous to GIXRD.
~1
T11
III 4
I
II
Cu
00SEZI S' uiloo
-w
Lfl
-Ln
000
* U
-C(I,
477
I
J
I

Figure 6.54: BICuVOx on quartz, varying additives. Samples
heated at 550 0C. (a) control (no additive), (b) N, N-
dimethylformamide, (c) ethylene glycol. All X 8000.
(a)
( b ) (C ). ..-........ - ...... .
478

Figure 6.54, continued: (d) diethanolamine (X 1350), (e)
triethanolamine (X 8050)
(d)
(e)
479

Figure 6.55: Bulk BiCuVOx made from a precursor solution
containing triethanolamine. Pyrolyzed at 550 0C.
U,
LI,
Lfl
U M
I
TLfSM
Lfl
UN
NL.lINN
NLn
CMVA
480

LL~-~ _______ -~ - -=-~-,-~-- .~-. - -~-- - - - - -- - - -
Figure 6.56: BeCuVOx on quartz, with copper dopant added as
dimethylaminoethoxide. (a) X 325, (b) X 8050.
(a)
481

Figure 6.57: BiCuVOx on quartz, with copper dopant added as
dimethylaminoethoxide. Grazing angle, 1*.
I-L1)(N
-MS(N
-In
CU
L.
0)
CO
CO
I*Eg9L1 sjunoo I 00*0
482
%D
-In
I-S)
~Lf
L1
m
I -

Figure 6.58: BiCuVOx on E-beam platinum. Platinum peaks are
marked with *- The lines marked are BiCuVOx. Grazing angle
10. Sample was heated at 550 0C.
I IS
N(T)
M
co
%"
N
N
+31
a),ZN
N 00 -4uno 00,
483

Figure 6.59: BiCuVOx on E-beam platinum, Sample is same as
the one in Fig. 6.58.
484
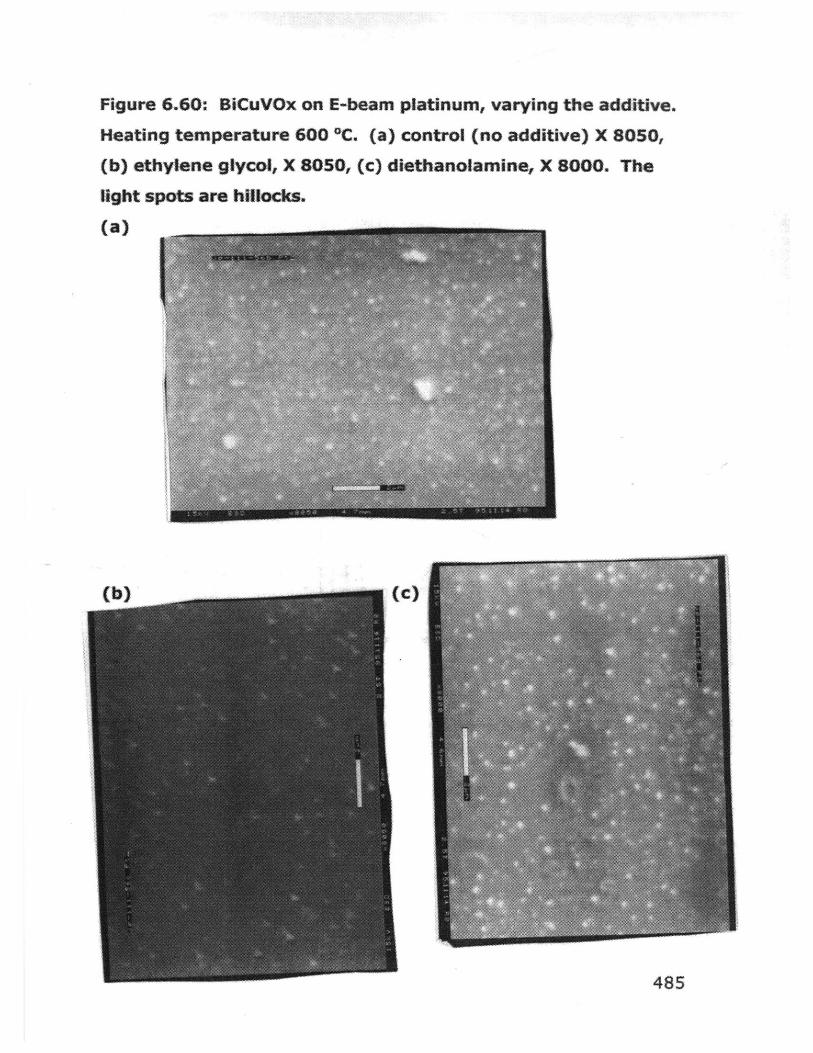
Figure 6.60: BiCuVOx on E-beam platinum, varying the additive.
Heating temperature 600 0C. (a) control (no additive) X 8050,
(b) ethylene glycol, X 8050, (c) diethanolamine, X 8000. The
light spots are hillocks.
(a)
(c)
485

Figure 6.61: BiCuVOx on E-beam platinum, varying the additive.
Heating temperature 600 "C.
(c) diethanolamine.
t
~00 SZT 7
.0
S;Urioo
(a) control, (b) ethylene glycol,
00
486
Lfl
UT
U,
V
U,9qV
N
ED
'a
U)ci)
I
N
---I

BiMeVOx on platinum substrates. Heated to 600
*C. (a) BiCuVOx, (b) BiMnVOx. Other dopants similar.
-W
U4-
qR.
0o
In
-(9
-In
Lfl1w.
'53
In
CL
CU
4
487
WL6 s-+unoo ~ 00,0
Figure 6.62:

Figure 6.62, continued: BiMeVOx on alumina substrates. Heated
to 600 OC. (c) BiCuVOx, (d) BiTiVOx. Other dopants similar.
In
U)
In
N
LN
M
3quvS ~ Be
488

Figure 6.62, continued: BiMeVOx on quartz substrates. Heated
to 600 'C. (e) BiCuVOx, (f) BiTiVOx. Other dopants similar.
-1
N0CM
3* BEZ 01'
-InIn
Ln
-w
LflVI
wn
03
Co
489
Ca

BiFeVOx on quartz. Heated to 550 0C. X 7900.
490
Figure 6.63:
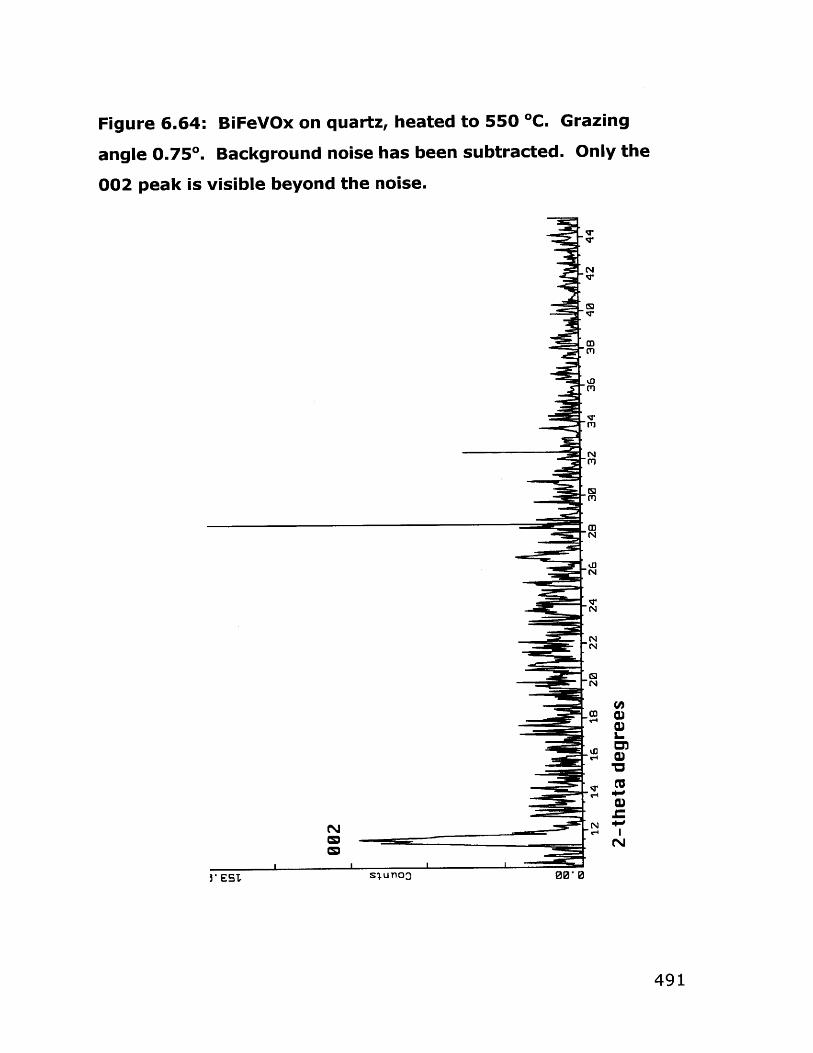
Figure 6.64: BiFeVOx on quartz, heated to 550 0C. Grazing
angle 0.750. Background noise has been subtracted. Only the
002 peak is visible beyond the noise.
N
m
N
IwN
N
N
Co C
-N
491

6.7 References
1)Chen, M. S.; Hegarty, W. P.; Steyert, W. A., Air Products and
Chemicals, Inc.: US Patent No. 5,118,395, 1992.
2)Thorogood, R. M.; Srinivasan, R.; Yee, T. F.; Drake, M. P., Air
Products and Chemicals: US Patent No. 5,240,480, 1993.
3)Rincon-Rubio, L. M.; Nguyen, B. C.; Mason, D. M. J. Electrochem.
Soc. 1985,132, 2919.
4)Minh, N. Q. J. Am. Ceram. Soc. 1993, 76, 563.
5)Harold, M. P.; Lee, C.; Burggraaf, A. J.; Keizer, K.; Zaspalis, V. T.;
de Lange, R. S. A. MRS Bulletin 1994, April, 34.
6)Hsieh, H. P. Catal. Rev. - Sci. Eng. 1991, 33, 1.
7)Dumelie, M.; Nowogrocki, G.; Boivin, J. C. Solid State Ionics 1988,
28-30, 524.
8)Isenberg, A. 0. S. S. Ionics 1981, 3/4, 431.
9)Sekiguchi, T.; Sawano, M.; Eguchi, K.; Arai, H. S. S. Ionics 1990,
40/41, 502.
10)Chen, C. C.; Nasrallah, M. M.; Anderson, H. U. Solid State Ionics
1994, 70/71, 101.
11)Kueper, T. W.; Visco, S. J.; DeJonghe, L. C. Solid State Ionics
1992, 52, 251.
12)Selvaraj, U.; Prasadarao, A. V.; Komarneni, S.; Roy, R. Mater.
Lett. 1995, 23, 123.
13)Joshi, P. C.; Mansingh, A.; Kamalasanan, M. N.; Chandra, S. Appi.
Phys. Lett. 1991, 59, 2389.
14)Joshi, P. C.; Krupanidhi, S. B. J. Appi. Phys. 1992, 72, 5827.
15)Toyoda, M.; Payne, D. A. Mater. Lett. 1993, 18, 84.
492
16)Brinker, C. J.; Scherer, G. W. Sol-Gel Science: The Physics and
Chemistry of Sol-Gel Processing; Academic Press: New York,
1990.
17)Chen, L.-C. in Pulsed Laser Deposition of Thin Films, Chrisey, D. B.
and Hubler, G. K., Ed.; John Wiley and Sons: New York, 1994,
pp 167-198.
18)Brinker, C. J.; Hurd, A. J.; Ward, K. J. Fundamentals of Sol-Gel
Thin-Film Formations; Mackenzie, 3. D. and Ulrich, D. R., Ed.;
Wiley: New York, 1988, pp 223-239.
19)Yoldas, B. E.; Partlow, P. Thin Solid Films 1985, 129, 1.
20)Sakka, S.; Kozuka, H. J. Non-Crystalline Solids 1988, 100, 142.
21)Scriven, L. E. Physics and Applications of Dip Coating and Spin
Coating; Mat. Res. Soc., 1988; Vol. 121, pp 717.
22)Mukherjee, S. P. in Ultrastructure Processing of Advanced
Ceramics, Glasses, and Composites; Hench, L. L. and Ulrich, D.
R., Eds., New York: Wiley, 1988, pp 178.
23)Strawbridge, I.; James, P. F. J. Non-Crystalline Solids 1986, 82,
366.
24)Lipeles, R. A.; Coleman, D. J. in Ultrastructure Processing of
Advanced Ceramics, Glasses, and Composites, Mackenzie, J. D.
and Ulrich, D. R., Ed.; Wiley: New York, 1988, pp 919-924.
25)Venables, J. A.; Spiller, G. D. T.; Hanbucken, M. Rep. Prog. Phys.
1984, 47, 399.
26)Barna, P. B. in Diagnostics and Applications of Thin Films; IOP
Publishing Ltd.: London, 1992, pp 295.
27)Thompson, C. V.; Carel, R. Mat. Sci. and Eng. 1995, B32, 211.
28)Chopra, K. L. Thin Film Phenomena; McGraw-Hill: New York, 1969.
29)Swaminarayan, S.; Srolovitz, D. J. Acta Mater. 1996, 44, 2067.
493

30)Srolovitz, D. J.; Goldiner, M. G. JOM (Journal of Metallurgy) 1995,
March, 31.
31)Hackney, S. A. Scripta Metal!. 1988, 22, 1273.
32)Lange, F. F.; Claussen, N. E. in Ultrastructure Processing of
Advanced Ceramics, Glasses, and Composites Hench, L. L. and
Ulrich, D. R., Ed.; Wiley: New York, 1984, pp 493-505.
33)Lakeman, C. D. E.; Payne, D. A. Mater. Chem. and Phys. 1994,
38, 305.
34)Guo, R.; Bhalla, A. S.; Cross, L. E.; Roy, R. J. Mater. Res. 1994, 9,
1644.
35)Oh, B.; Naito, M.; Arnason, S.; Rosenthal, P.; Barton, R.; Beasley,
M. R.; Geballe, T. H.; Hammond, R. H.; Kapitulnik, A. App. Phys.
Lett. 1987, 51, 852.
36)Houk, C. S.; Burgoine, G. A.; Page, C. J. Chem. Mater. 1995, 7,
649.
37)Legendre, J.-J.; Livage, J. J. Colloid and Interface Sci. 1983, 94,
75.
38)Legendre, J.-J.; Aldebert, P.; Baffier, N.; Livage, J. J. Colloid and
Interface Sci. 1983, 94, 84.
39)Passerini, S.; Chang, D.; Chu, X.; Le, D. B.; Smyrl, W. Chem.
Mater. 1995, 7, 780.
40)Schaefer, D. W.; Martin, J. E.; Hurd, A. J.; Keefer, K. D. Structure
of Random Materials; Boccara, N. and Daoud, M., Ed.; Springer-
Verlag: New York, 1985.
41)Mandelbrot, B. B. The Fractal Geometry of Nature; Freeman: San
Fransisco, 1982.
42)Kozuka, H.; Kuroki, H.; Sakka, S. J. Non-Crystalline Solids 1988,
100, 226.
494

43)Orcel, G.; Gould, R. W.; Hench, L. L. Mater. Res. Soc. Symp. Proc.,
1986; 73, 289.
44)Yoldas, B. E. "Modification of Oxides by Polymerization Process"
in Ultrastructure Processing of Advanced Ceramics, Glasses, and
Composites, Hench, L. L. and Ulrich, D. R., Ed.; Wiley: New
York, 1984.
45)Uchida, N.; Ishiyama, N.; Kato, Z.; Uematsu, K. J. Mater. Sci.
1994, 29, 5188.
46)Calzada, M. L.; Sirera, R.; Carmona, F.; Jimenez, B. J. Am. Ceram.
Soc. 1995, 78, 1802.
47)Yamada, K.; Chow, T. Y.; Horihata, T.; Nagata, M. J. Non-
Crystalline Solids 1988, 100, 316.
48)Kareiva, A.; Bryntse, I.; Karppinen, M.; Niinisto, L. J. S. S. Chem.
1996, 121, 356.
49)Selvaraj, U., et al., Mater. Lett. 1991, 12, 311.
50)Sanchez, C.; Livage, J.; Henry, M.; Babonneau, F. J. Non-Crys.
Solids 1988, 100, 65.
51)Livage, J.; Henry, M. in Ultrastructure Processing of Advanced
Ceramics, Glasses, and Composites, Mackenzie, J. D. and Ulrich,
D. R., Ed.; Wiley: New York, 1988, pp 183-195.
52)Pope, E. J. A.; Mackenzie, J. C. J. Noncrystalline Solids 1986, 87,
185.
53)Gugliemi, M.; Carturan, G. J. Non-Crystalline Solids 1988, 100, 16.
54)Bullot, J.; Cordier, P.; Gallais, 0.; Gauthier, M. J. Non-Crystalline
Solids 1984, 68, 123.
55)Gharbi, N.; R'Kha, C.; Ballutaud, D.; Michaud, M.; Livage, J.;
Audiere, J. P.; Schiffmacher, G. J. Non-Crystalline Solids 1981,
46, 247.
495
56)Xu, Q.; Anderson, M. A. Mater. Res. Soc. Symp. Proc., 1989; 132,
41.
57)Anderson, H. U.; Pennell, M. J.; Guha, J. P. in Ceramic Powder
Science, New York: American Ceramic Society, 1987; Vol. 21,
pp 91-98.
58)Miller, K. T.; Lange, F. F.; Marshall, D. B. Mater. Res. Soc. Symp.
Proc., 1988; 121, 823.
59)Hirashima, H.; Kamimura, S. in Better Ceramics Through Chemistry
III, Brinker, C. J., Clark, D. E. and Ulrich, D. R., Ed.; Mater. Res.
Soc.: Pittsburgh, 1988, pp 779-784.
60)Hirashima, H.; Sato, A.; Yoshida, T. Yogyo-Kyokai-shi 1986, 94,
875.
61)Langbein, H.; Polte, A.; Lang, R.; Grossmann, G. Z. Naturforsch
1991, 49b, 1509.
62)Mondal, S.; Rath, S. P.; Dutta, S.; Chakravorty, A. J. Chem. Soc.
Dalton Trans. 1996, 1996, 99.
63)Crans, D. C.; Felty, R. A.; Anderson, 0. P.; Miller, M. M. Inorg.
Chem. 1993, 32, 247.
64)Crans, D. C.; Shin, P. K. J. Am. Chem. Soc. 1994, 116, 1305.
65)Hillerns, F.; Rehder, D. Chem. Ber. 1991, 124, 2249.
66)Nakomoto, K. Infrared and Raman Spectra of Inorganic and
Coordination Compounds; 4th ed.; Wiley: New York, 1986.
67)Crans, D. C.; Chen, H.; Felty, R. A. J. Amer. Chem. Soc. 1992,
114, 4543.
68)Crans, D. C.; Felty, R. A.; Chen, H.; Eckert, H.; Das, N. Inorg.
Chem. 1994, 33, 2427.
69)Priebsch, W.; Rehder, D. Inorg. Chem. 1990, 29, 3013.
70)McDevitt, N. T.; Baun, W. L. Spectrochim. Acta 1964, 20, 799.
496

71)Nugent, W. A.; Harlow, R. L. J. Am. Chem. Soc. 1994, 116, 6142.
72)Mazenek, T., talk given to zur Loye group.
73)Burggraaf, A. J. J. Eur. Cer. Soc. 1991, 8, 59.
74)Chandler, C. D.; Roger, C.; Hampden-Smith, M. J. Chem. Rev.
1993, 93, 1205.
497

Chapter Seven:
Conclusions and Outlook
498

We set out in this research project to produce thin films of
oxide ion conducting ceramics on porous supports. On the whole,
we were successful in doing so.
The family of Aurivillius structures known as the BiMeVOx
materials, with the general formula Bi 2 MxV 1.xO 5.5-, have the highest
oxide-ion conductivities known among ceramics. The parent
structure is Bi 2VO5 .5, an oxygen-deficient layered structure
comprised of alternating (Bi 202) 2 + layers and perovskitic (V0 3.5L 0 .5 )5-
layers. Its highest-temperature, highest-conductivity phase may be
stabilized to room temperature by the addition of a dopant metal M,
which also may introduce extrinsic oxygen vacancies, increasing the
oxide ion conductivity still further. Thin films of oxygen ion
conductors such as the BiMeVOx materials are potentially useful
because the reduced length of the conduction path in a film permits
a greater oxide ion flux at a given temperature than do more
traditionally fabricated bulk forms of the materials. Potential
commercial uses of the such films include air separation units and
catalytic inorganic membrane reactors. The BiMeVOx materials may
be expected to have some catalytic properties with respect to
partial oxidation reactions. This would be a further benefit to using
these materials in a partial oxidation CIMR, in addition to the high
oxygen flux achievable with films of this ceramic.
Films of the parent (undoped) Bi 2VO5 .5 and the doped
Bi 2 Cu 0 .1V0 .905 .3 5 were deposited by pulsed laser deposition (PLD)
onto lattice-matched SrTiO 3 substrates. The undoped parent
ceramic cracked and delaminated as the sample was cooled down
from the deposition temperature, due to the need for the lattice to
499

shift 450 to match the substrate lattice as the phase went from
high-temperature y to room-temperature a. The initially crack-free
doped (BiCuVOx) films were subjected to a second thermal
treatment and found to have cracked due to thermal expansion
mismatch. However, the direction of the cracking highlighted the
oriented nature of the film on the lattice-matched substrate.
Magnesium oxide and YSZ were also tried as substrates, but both
Bi 2VO5 .5 and BiCuVOx films cracked and delaminated severely, due to
the complete lack of lattice match. This section of the project
pointed out the importance of obtaining substrates with good lattice
and thermal expansion coefficient matches to the BiMeVOx film.
The sol-gel method is a wet-chemical process for depositing
films of oxide ceramics onto substrates. It can be low-cost in terms
of capital equipment needed for film deposition, and in many cases,
in terms of the precursor chemicals needed to form the solution from
which the films are to be cast. Our initial attempts to produce a
precursor solution to the doped BiMeVOx materials centered on the
use of vanadic acid with a number of different bismuth compounds.
While vanadic acid will gel spontaneously under many conditions,
the highly acidic conditions necessary for dissolving the bismuth
species used in these experiments were detrimental to the
polycondensation of the vanadic acid, and film-castable solutions
were never produced.
Vanadium 2-methoxyethoxide was therefore used in place of
the vanadic acid, and a way of producing bismuth acetate that
would dissolve in 2-methoxyethanol was found. This bismuth
acetate, on examination by single-crystal XRD, was found to be very
similar (there were small discrepancies in the lattice parameters) to
500

the structure published already in the literature. However, all
previous reports of the compound's behavior, including those
regarding commercial materials, said that bismuth acetate was
insoluble. The bismuth acetate, when left in 2-methoxyethanol
solution, produced a fibrous material thought to have formed
through alcoholysis and polymerization. The vanadium 2-
methoxyethoxide and bismuth acetate were successfully combined
to form a precursor solution which gelled on hydrolysis and which
formed bulk Bi 2VO5 .5 at temperatures low relative to those needed
for solid-state synthesis. Dopant metals Cu, Mn, Fe, Ti, and Nb
were added as the alkoxides or acetates, and bulk BiMeVOx
materials were also formed phase-pure at low pyrolysis
temperatures. The precursor solutions were determined to be film-
castable. In the course of this research, a bismuth-vanadium
alkoxide complex, possibly analogous to the precursor structure in
solution, was isolated and structurally characterized. It is to our
knowledge the first bismuth-containing heterobimetallic alkoxide to
be so characterized.
Films of BiCuVOx were cast initially defect-free onto quartz
substrates but found to agglomerate on heating at higher
temperatures. Addition of a variety of coordinating compounds
decreased the film quality, while use of acid catalysts and increasing
the water-to-alkoxide ratio for hydrolysis had little effect on the
quality of the films. BiCuVOx films on platinum substrates, however,
remained defect-free over all temperatures examined, suggesting
that the quartz substrate had a major role in the agglomeration
observed. On the other hand, BiNbVOx films remained defect-free
over all temperatures on both quartz and platinum substrates.
501

Films of other BiMeVOx materials (M=Fe, Ti, Mn) on quartz were
examined. The quality of these appeared to vary with the method
of adding the dopant: BiTiVOx and BiNbVOx (dopant added as
alkoxide) did not agglomerate, while BiCuVOx, BiMnVOx, and
BiFeVOx (dopant added as acetate or acac) did. The relative
importance of how the dopant was added, versus the role of the
identity of the dopant, was not carefully examined. Since the
BiMeVOx examples that did not agglomerate on quartz were those
whose dopants were added as alkoxides, it is suggested that the
precursor structure - in particular, the greater gel network
connectivity available where there are more hydrolyzable groups -
also was important in enabling some films to remain defect-free at
temperatures where others agglomerated.
All films cast were 00-oriented, e.g. c-axis perpendicular to the
substrate. This is 900 to the direction necessary for the highest
conductivity available in the material to be achieved. The
orientation was influenced by the deposition method to some
extent - e.g. spin coating gave more strong texturing than did dip
coating for many samples - and to some degree by the substrate.
Both sol-gel and pulsed laser deposited films were oriented,
however, on widely different substrates. Some films on platinum
were less oriented, possibly because platinum's lattice is 1/3 the c-
axis of BiMeVOx. (Table 6.1) Methods of producing nonoriented
films or films with the c-axis parallel to the substrate, are worth
exploring.
BiCuVOx films were successfully cast defect-free onto porous
alumina substrates (pore size 0.02 tm). The use of the complexing
additives with the films on porous substrates had either no effect or
502

a detrimental one, relative to the quality of the film produced by the
additive-free precursor solution.
The ultimate test of the process would be to prepare the
BiCuVOx films onto the porous alumina substrates under cleanroom
conditions, then test them in a permeation cell for gas-tightness.
Following that, their conductivity would be examined by impedance
spectroscopy. Furthermore, the principle of increased oxygen flux
with decreased conduction path hits a point of diminishing returns
when the kinetics of oxide ion recombination become large relative
to the rate of conduction through the membrane. Another issue
with the membrane conductivity is whether the large proportion of
surface species, relative to the bulk, affects the oxide ion
conductivity. Since the location (random distribution) of vacancies
and the energy surfaces over which a moving 02- ion must travel in
hopping from site to site during conduction are bulk properties
which are subject to distortion by proximity to the surface, the ionic
conductivity of the thin film cannot be assumed to be necessarily
identical to that of the bulk. Early termination of the project made it
impossible to make any permeation cell or conductivity
measurements on the films deposited in this project.
The process of depositing BiMeVOx films onto porous
substrates requires several more development steps before the
question of commercial viability can be addressed. The work
described here was successful only with spin-coating depositions,
while large-scale processes (in terms of the size of the pieces, not
the throughput) require the precursor solutions to be optimized for
dip-coating. It may well be that with a proper dip-coating
apparatus this goal would be achievable with no or few
503

modifications to the precursor solutions reported in this work. (We
realized after the project had ended that a potential solution to the
problem of the vibrations from the motor (or an unsteady hand),
and the inconsistent and irreproducible withdrawal rate, could have
been solved by draining the solution out away from the substrate.
This could be done crudely but reproducibly with an assembly of
standard laboratory equipment, and the precursor solution could be
kept protected from moisture and evaporation, and recycled to
minimize waste.) A better synthesis of the vanadium 2-
methoxyethoxide is necessary to make the process cost-effective,
as the methods used in this work were wasteful in a way that was
unimportant on the laboratory scale but would be prohibitive on
even a pilot scale. It may be worth investigating the use of
Na(OCH 2CH 20CH3) with VOC 3 as a synthetic route. The sodium
alkoxide will be less susceptible to oxidation than is the alcohol.
Another issue is that 2-methoxyethanol is associated in industry -
particularly the silicon chip industry - with human reproductive
toxicity. Substituting ethoxyethanol or 2-ethoxyethanol, or an even
larger alcohol-ether, would increase the safety of the process, but
this substitution will require re-optimization of the precursor
formulation, including, possibly, modification of the vanadium
alkoxide synthesis. Were these issues addressed, however, we
believe that the sol-gel deposition of films of BiMeVOx, particularly
BiCuVOx, onto porous supports could be a cost-effective process
and lead to improvements in air separation and CIMR technology.
A number of interesting tangents arose in the course of this
project, and may be worth pursuing. There are to date no studies
of the mechanism of film growth and defect formation for films
504

produced in a wet deposition process, despite the great wealth of
publications regarding films produced by any of a great range of
physical and vapor deposition processes. In all of these latter
processes, the arrival of film material at the substrate surface can
be modeled as a one-adatom-at-a-time process, with building-up of
either monolayers or of islands that later coalesce. Reports in the
PLD literature refer to the difficulty of modeling the situation where
a large flux of ceramic atoms appear at the substrate surface nearly
all at once; but even in PLD the Volmer-Weber, Frank-van der
Merwe, or Stranski-Krastanov growth models can be used with
some modification. In the sol-gel film case, however, the adatoms
must considered to be all nearly in place - i.e. several monolayers'
worth - simultaneously prior to the start of the model time. What
steps occur next in the mechanism of film formation from the gel
network is an open field for investigation and modeling.
A second area of investigation that remains to be spun off this
project is the question of the precursor chemistry. The exact nature
of the interactions between the partially- or fully-alcoholyzed
bismuth acetate species with the vanadium alkoxide were examined
only cursorily in the work reported here because it was tangential
to the project goal. However, the isolation of the bismuth-vanadium
chloroalkoxide is tantalizing: can a bismuth-vanadium acetate-
alkoxide be isolated and characterized? Can standard metatheses
be performed on the chloroalkoxide to add more metals, perhaps
increase the Bi-to-V ratio to that needed for the BiMeVOx materials?
Extension of the precursor chemistry into Bi-Ti combinations would
be even more interesting from a practical point of view, since
505

bismuth-titanium oxides are of great interest in the electronics
industry.
The project described in Part I of this thesis achieved its main
goal of producing defect-free films of Bi 2 CuO.1VO. 905 .35 on porous
supports. The further work necessary to "tie up loose ends," both
from the scientific perspective and with an eye towards eventual
commercialization of the process was left undone due to the early
termination of the project.
506

Appendix to Part I:
Materials and Methods
507

Al. Chemicals used
The reagent compounds used in Part I of this thesis are listed
below. "Homemade" refers to a compound made by the author.
"JM/AA" refers to a compound from Johnson-Matthey Alfa-Aesar or
any of its subsidiaries prior to 1999. Purities listed typically refer to
the metals purity and not to the compound purity.
Table Al: Compounds Used
Compound Manufacturer Purity (%) Chapter
Used
V2 05 JM/AA 99.995 2
Bi20 3 JM/AA 99.99 2
CuO JM/AA 99.99 2
Dowex 50Wx2-100 Aldrich 3
strongly acidic cation
exchanger
NaVO 3 JM/AA 98% (99% 3
found to be
wrong phase)
Bi(N0 3)3e5H20 JM/AA technical 3
NH 4VO 3 JM/AA 99.99 3
gum arabic Aldrich n/a 3
glycine Aldrich 98 3
508

Table Al, continued.
Compound Manufacturer Purity (%) Chapter
Used
2-methoxyethanol Aldrich 99 anhydr. 3
ethylene glycol Aldrich 95 3
glacial acetic acid Malinkrodt technical 3
ethanol Malinkrodt 95 3
nitric acid, conc. Malinkrodt technical 3
Bi(OAc) 3 Strem 99 3
Bi(OAc) 3 JM/AA 3
V-2MOE homemade n/a 4, 5, 6
Bi(OAc) 3 homemade n/a 4, 5, 6
V205 JM/AA 99.5 4
VOCI3 Strem 99 4
BuOH Malinkrodt technical 4
benzene Aldrich 98 4
iPrOH Malinkrodt technical 4
VO(OiPr) 3 Strem 10% in HOiPr 4
EtOH Aldrich 100% 4
NH 3 gas Matheson anhydr. 4
tetreethylene glycol Aldrich 99 4
BiC 3 Strem 99.999 4
BiC 3 JM/AA 99.95 4
NaN(SiMe 3) 2 United 95 4
Technologies
MeOH Malinkrodt technical 4
509

Table Al, continued.
Compound Manufacturer Purity (%) Chapter
Used
acetonitrile Malinkrodt technical 4
diethyl ether Aldrich anhydr., 99.5 4
sodium Aldrich n/a 4
pentane Aldrich anhydr., 99.5 4
tetrahydrofuran Aldrich anhydr., 99.5 4
2-methoxyethyl ether Aldrich anhydr., 99.5 4
(diglyme)
acetic anhydride Malinkrodt technical 4
d4-tetrahydrofuran, Cambridge standard NMR 4
CDCI 3, dio- Isotope Labs purity
dimethoxyethane
V(OnBu) 4 homemade n/a 4
P20s Aldrich technical 4
NH 40H, conc. Malinkrodt technical 4
copper 2- Strem solvent-free 4
ethylhexanoate
bismuth 2- Strem 72% in mineral 3, 4
ethylhexanoate spirits
Cu(OAc) 2 Strem anhydr. 4
Nb(OiPr)5 Strem 10% in 4
HOiPr/pentane
NbCI 5 Strem 99.99 4
acetylacetone Aldrich 99.5 4
510

Table Al, continued.
Compound Manufacturer Purity (%) Chapter
Used
Mn(OAc) 2*4H 20 Strem 99+ 4
Fe(OAc) 2 Strem anhydr., 97 4
Fe(acac) 2 Strem 99 4
Ti(OiPr) 4 Aldrich 99 4
ethanolamine Aldrich 99.5 5
N,N- Aldrich 99.5 5
dimethylethanolamine
V12 Cerac 5
hexane Aldrich anhydr., 99.5 5
potassium Aldrich n/a 5
diisopropanolamine Aldrich 95 6
acetylacetone Aldrich 99+ 6
dimethyl succinate Aldrich 98+ 6
1,3-propanediol Aldrich 98 6
ethanolamine Aldrich 99.5 6
diethanolamine Aldrich 98.5 6
triethanolamine Aldrich 98 6
pyridine Aldrich 99 6
N,N-dimethylformamide Aldrich 99.8 6
copper Strem n/a 6
dimethylaminoethoxide
511

A2. Instrumentation
FTIR: Transmission IR measurements were made on a Perkin-Elmer
model 1610 FTIR, with the background subtracted out of the final
spectrum. Spectra were run from 4000 to 400 cm'1 at a resolution
of 4 cm-1 , and 16-32 scans were collected and summed to give the
resultant spectrum. Samples were prepared either as KBr disks or
as nujol mulls, when solids, or were used neat when liquids, as
indicated in the text. Some samples were deposited as liquids onto
3M Type 61 IR cards, and spectra were taken with the sample either
wet or after drying.
PA-FTIR: Photoaccoustic fourier transform infrared spectroscopyl
measurements were made on a Bio-Rad FTS-60A at room
temperature.
P-XRD: Powder X-ray diffraction data was collected on two
diffractometers. The first, used during the early part of the
research, was a Rigaku RU300 rotating anode 0/20 diffractometer
with Cu Ka radiation, X(Kai) = 1.5406 A, X(Ku 2 ) = 1.54439 A,
unresolved X(K)=1.54184 A.2 The diffractometer was equipped
with a graphite monochromator. The generator was operated at 50
kV and 200 mA and the slits used were DS 0.50, SS 0.50, RS 0.15*.
Samples were generally run as a continuous scan (20 0/min) from 5-
750, though in some cases shorter 20 ranges were used.
512

The second diffractometer used was a Siemens D5000
theta/theta diffractometer using a stationary copper vacuum tube to
produce the Cu X-radiation. The diffractometer was operated at 40
kV and 45 mA and was equipped with a monochromator. X-ray
patterns were measured with a rotating sample stage to ensure
uniform sample exposure. The slits used were SS 1 mm, DS 1 mm,
RS 0.6 mm. Samples were generally run as a stepped scan from 5-
750, with step size 0.050 and 1 sec/step data collection.
The Siemens diffractometer was also equipped with a grazing
incidence attachment, where the incident beam arm was kept at a
constant settable incident angle (usually 10) and the detector arm
moved through diffracted angles theta. The grazing incidence
attachment permitted detection of the diffracted beam.
In both cases, samples were prepared by grinding to a fine
powder and suspending the powder in a Collodion/amyl acetate
(1:3 ratio) binder, then applying the suspension to a glass slide.
The solvent in the binder was removed in a drying oven (ca. 120
OC). The glass slide was then mounted on the sample holder
(aluminum for the Rigaku, plastic for the Siemens) with clay. For
grazing incidence measurements, the substrate holding the film was
mounted directly onto the sample holder using clay.
Lattice parameters were determined using the computer
software PPLP in the NRCVAX package. 3 Theoretical powder
patterns were also calculated using the NRCVAX package. The
JCPDS database was used to find matching powder patterns for
known compounds, using the matching and searching utilities of the
resident software on the Rigaku and Siemens instruments.
513

SC-XRD: Single-crystal X-ray diffraction data collection and analysis
was performed in the chemistry department facility by Dr. William C.
Davis.
ESEM: Environmental scanning electron microscopy was performed
on an Electro-Scan unit (CMSE Microscope Facility). Except where
indicated, samples were mounted on aluminum studs using carbon
tape and the water vapor level was set at 2-4 mTorr; no other
sample preparation was performed. Where indicated, a thin layer of
gold was evaporated onto the sample surface to relieve charging
effects. Stigmation was performed at 8000 X or at the magnification
level used, whichever was higher. The unit was equipped with a
Link Analytical energy dispersive spectroscopy (EDS) analyzer, and it
and the attached software were used in some experiments.
NMR: 'H and 13 C NMR were performed on a Brucker AC250 250 MHz
NMR, or on a Varian Unity UN300 300 MHz NMR. For measurements
on both instruments, deuterated solvents (Cambridge Isotope
Laboratories) to provide a lock signal. 51V NMR were performed on a
Varian Unity UN300 300 MHz NMR equipped with a tunable
broadband probe.
Thermal analysis: Simultaneous differential thermogravimetric
analysis and thermogravimetric analysis (DTA-TGA) data were
obtained using a TA Instruments SDT 2960. Samples were run
under atmospheres of oxygen, nitrogen, or air. The furnace was
generally ramped up and down at 25 0C/min unless otherwise
noted.
514

Profilometry: A Dektak 3 profilimeter equipped with 12.5 pm stylus
was used to detect the height of the drop between the area of the
substrate covered with film and that which was not. Uncovered
areas were produced by masking the substrate. After
approximately 5 measurements on samples produced with a given
set of deposition parameters, all samples deposited with the same
parameters were assumed to have the same thickness. Sample
thicknesses were rechecked when changes were made to the
deposition parameters.
E-beam: Electron-beam deposition of platinum, alumina, and other
materials was performed using an E-beam unit built by the
Microfabrication Lab in CMSE, with electron gun control by a PAK-8
Programming unit. Deposition parameters for various substrates
are listed in Chapter 6.
Substrates: Smooth (non-porous) substrates were quartz
microscope slides obtained from Finkenbeiner, Inc. (Waltham, MA),
in some cases used as a support for a film of platinum (1000 A) atop
a titanium adhesion layer (100 A), or a film of alumina, both applied
by E-beam. Porous substrates were Whatman Anopore (aluminum
oxide) filter disks, porosity 0.02 pm.
Solid state synthesis: Stoichiometric amounts of the starting
materials were weighed and combined in an agate mortar. Acetone
was added as a mixing aid and the powders were ground for 15-30
minutes, then the acetone was permitted to evaporate. Powders
515

were pressed into a pellet to increase reactivity by decreasing the
intergrain distances. The powder was placed into a 1/2-inch pellet
die and pressed uniaxially to 5000-8000 pounds. The pellet was
removed from the press and placed on platinum foil in an alumina
tray or crucible.
Heating: Samples, prepared by solid state or by precursor
methods, were placed in alumina trays or crucibles and heated in a
Lindberg@ box furnace (max. T 1050 OC) or a Lindberg@ tube
furnace (max. T 1150 OC). Ramp rates for solid state syntheses
were generally 10 OC/minute unless otherwise noted; cooling rates
were generally 5 OC/minute. For films, ramp rates were 5 OC/minute
up and 2 OC/minute down; some samples were placed into an
already-hot furnace (See Chapter 6). For samples produced by the
solid-state method, the pellets usually needed to be re-ground and
re-pressed, followed by another heating period, before samples
were phase-pure. Film samples were heated (See Chapter 6) after
deposition of each layer on an alumina plate atop a standard
laboratory hot plate, maximum surface temperature approximately
350 0C.
Conductivity measurements: For solid state syntheses, pellets
made in a 1/2 inch pellet die were sintered for 8-12 hours 25 0C
higher than the synthesis temperature. For sol-gel samples, pellets
were merely pressed from the powder. The dimensions of the
pellets were measured with calipers (±0.02 mm) followed by
weighing the samples to determine their density. The faces of the
sintered pellets were sanded and painted with platinum ink
516

(Engelhard) to form electrodes. The paint was baked onto the
surface of the pellet at 850 OC for 1 hour to remove the binder, in
the case of solid state samples, and was baked at the pyrolysis
temperature of the sample for 1 hour for sol-gel samples. The
platinum tended to flake off the samples on cooling, so complete
coverage of both faces was difficult to obtain.
The sample holder consisted of nested nickel metal and
ceramic tubes, both open at both ends. The nickel tube was
grounded to eliminate noise in the impedance plots, though spikes
at 60 Hz were still occasionally observed. Inside the nickel tube
was a mullite tube (3/4" OD) with Cajon@ Ultra-torr connectors at
each end; inserted into this mullite tube was a smaller diameter
(1/2" OD) mullite rod with two small holes bored through the rod
along the long axis. The platinum electrode lead and the
thermocouple were inserted into these bores. The end of the
thermocouple was positioned approximately 2mm away from the
sample at the end of the tube. The electrodes were made of
platinum foil and were attached to the platinum lead. BNC
connectors were soldered to the platinum leads and to the nickel
ground. Ultra-torr fittings were used to align the tubes inside each
other and to help apply pressure on the electrodes; springs
attached to the end of the double-bore rod and the nickel tube also
kept pressure on the electrodes to ensure maximum contact.
(Figure A.1) 4
The sample holders were placed in a hinged tube furnace
equipped with a programmable controller connected to a
thermocouple placed directly outside of the nickel tube. The
517

temperature settings were changed by resetting the set point on
the controller.
AC impedance measurements were performed using a
Solartron 1260 Impedance/Gain-Phase analyzer interfaced to a PC
computer driven by Z-plot software. Frequency was varied between
5 MHz to 1 Hz, with a waveform amplitude of 10 mV and zero mV
bias, with integration over 100 cycles and a 10 sec. measurement
delay. Frequencies were swept by logs, downward, at increments
of 10. Measurements were made between 300 OC and 975 OC in 50,
25, or 10 0C increments, except where noted. Heating or cooling
rates between intervals was not varied. Pellets were allowed to
equilibrate for 4-6 hours at each temperature interval before the
conductivity was measured. The overall temperature range was
limited by the resolution and the sample holder: at low T, the
resistance was too high (Z>2-3 Mi) for interpretation, and at high T
the resistance would become sufficiently low that the Solartron
could not measure the impedance.
Air-sensitive procedures were done in either an argon-filled glove
box or using oven-dried glassware on a double-manifold supplied
with vacuum and nitrogen gas.
UV-VIS measurements were performed on an Hewlett-Packard
HP5245A spectrophotometer using plastic cells.
518

Platinum Electrodes
Sam e ------- ---- -- ----- ---- --- -----
Sample
End ofCeramic Tube
latinum Wirehermocouple
on0 §
MIO (D.
>0
M 0
0-EL
(0
5.
U,
'.0
A3. References
1) Ying, J. Y.; Benziger, J. B.; Navrotsky, A. J. Am. Ceram. Soc. 1993,
76, 2571.
2) Klug, H.; Alexander, L. X-ray Diffraction Procedures; 2 nd ed.; John
Wiley & Sons: New York, 1974.
3) Gabe, E. J.; Page, Y. L.; Charland, J.-P.; Lee, F. L.; et al. NRCVAX --
An interactive program system for structure analysis, 1989; Vol.
22, pp 384.
4) Kendall, K. R., Ph.D. Thesis, Massachusetts Institute of
Technology: Cambridge, MA, 1996.
520

Chapter Eight
Introduction and Background on Transition Metal
Carbides
521
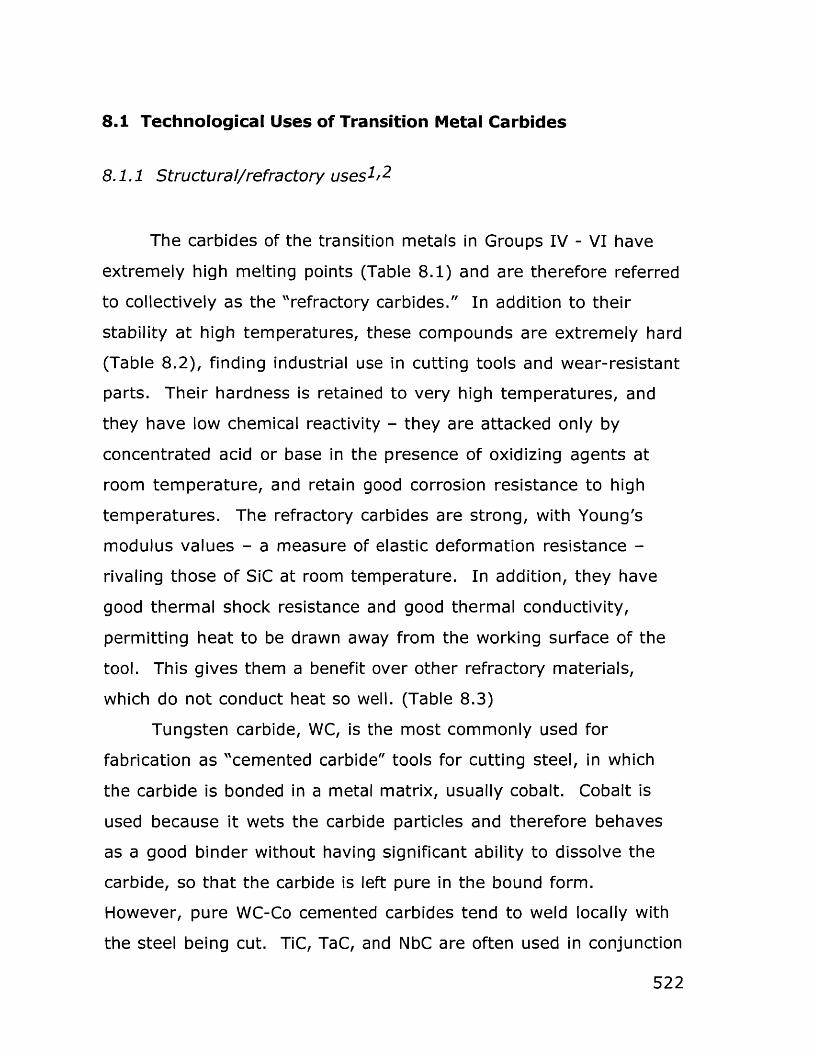
8.1 Technological Uses of Transition Metal Carbides
8.1.1 Structural/refractory uses1 ,2
The carbides of the transition metals in Groups IV - VI have
extremely high melting points (Table 8.1) and are therefore referred
to collectively as the "refractory carbides." In addition to their
stability at high temperatures, these compounds are extremely hard
(Table 8.2), finding industrial use in cutting tools and wear-resistant
parts. Their hardness is retained to very high temperatures, and
they have low chemical reactivity - they are attacked only by
concentrated acid or base in the presence of oxidizing agents at
room temperature, and retain good corrosion resistance to high
temperatures. The refractory carbides are strong, with Young's
modulus values - a measure of elastic deformation resistance -
rivaling those of SiC at room temperature. In addition, they have
good thermal shock resistance and good thermal conductivity,
permitting heat to be drawn away from the working surface of the
tool. This gives them a benefit over other refractory materials,
which do not conduct heat so well. (Table 8.3)
Tungsten carbide, WC, is the most commonly used for
fabrication as "cemented carbide" tools for cutting steel, in which
the carbide is bonded in a metal matrix, usually cobalt. Cobalt is
used because it wets the carbide particles and therefore behaves
as a good binder without having significant ability to dissolve the
carbide, so that the carbide is left pure in the bound form.
However, pure WC-Co cemented carbides tend to weld locally with
the steel being cut. TiC, TaC, and NbC are often used in conjunction
522

with WC because TiC locally forms a layer of TiO 2 or TiO 23 which
protects the tool from wear, and TaC and NbC raise the melting
temperature and oxidation resistance of the tool.
For high-temperature applications, the carbides are used as
pure-material sintered parts or in a Co/Mo/W/carbide sintered
composite. They outperform the standard alloys and so-called
"superalloys" in such applications as rocket nozzles and jet engine
parts, where erosion resistance at temperatures of 2500 OC and up
is crucial. TiC1_x and VC 1_x in particular maintain high strengths up to
1800 OC and therefore can be used as high temperature structural
materials, provided that internal and surface flaws, such as stress
cracks and pores introduced during fabrication and sintering, are
removed. Such defects lead to a high room-temperature
brittleness; plastic flow relieves internal stresses caused by defects
and leads to reduced brittleness at high temperatures. Plastic
deformation occurs particularly via a mechanism of dislocation glide
along {111} planes.
It must be noted that there is some variation in the literature
with respect to the reports of assorted mechanical and
thermodynamic properties of the refractory carbides. The transition
metal carbides show a range of nonstoichiometries and possibilities
for vacancy ordering, so the precise phases being tested for a given
property are often unclear. Furthermore, small concentrations of
oxygen present as metal oxide are famously difficult to remove - or
even detect - and can be expected to affect the properties of the
material.
Mixed-metal carbides have been examined for their melting
point and hot-hardness behavior as well. The hardness arc-cast or
523

zone-melted samples of (Tao. 8 Hfo. 2)C1 +x was tested (by indentation
using diamond or B4 C tips) and compared with that of the similarly-
prepared pure-metal carbides TaC1.x and HfC1+x over the
temperature range 800 - 2000 oC. 4 In all cases the hot hardness
decreased with increasing temperature. For temperatures up to
1400 OC the hardness order increased as HfC1+x < (Tao. 8HfO. 2 )C1+x <
TaC1..x, but over 1400 OC the mixed carbide began to outperform the
tantalum carbide. Hardnesses varied from 600 kg/mm 2 to 150
kg/mm 2 over the temperature range tested.
The melting points of the mixed-metal carbides outperform
those of the pure-metal carbides, as well. Samples prepared by
vacuum reduction of the mixed oxide powders at 2000 OC, followed
by sintering at 2200 OC and 2500 OC in good vacuum were tested for
their melting behavior. 5 8TaC-ZrC and 4TaC-HfC had melting points
3890 0C and 3990 *C, respectively, somewhat higher than those of
the pure-metal carbides (measured at 3470, 3750, and 3840 *C for
Zr, Hf, and Ta carbides, respectively). The higher melting points in
the mixed-metal carbides was attributed to composition changes
due to the selective evaporation of carbon during melting.
524

Table 8.1: Melting points of the carbides of Groups IV-VI
Metal Name Metal MP (oC) 2 Carbide Carbide
(MC) MP (MC) MP
(oC)* 2 (oC)** 6
T 1677 3067 2940
Zr 1852 3420 3420
Hf 2222 3928 3820
V 1917 2648
Nb 2487 3600
Ta 2997 3983
Cr 1900 1810 (Cr 3 C2 )
Mo 2610 2600
W 3380 2776
* Values listed in Toth (see Ref. 2)
** Values listed in Kirk-Othmer Encyclopedia of Chemical Technology
(See Ref. 6)
525
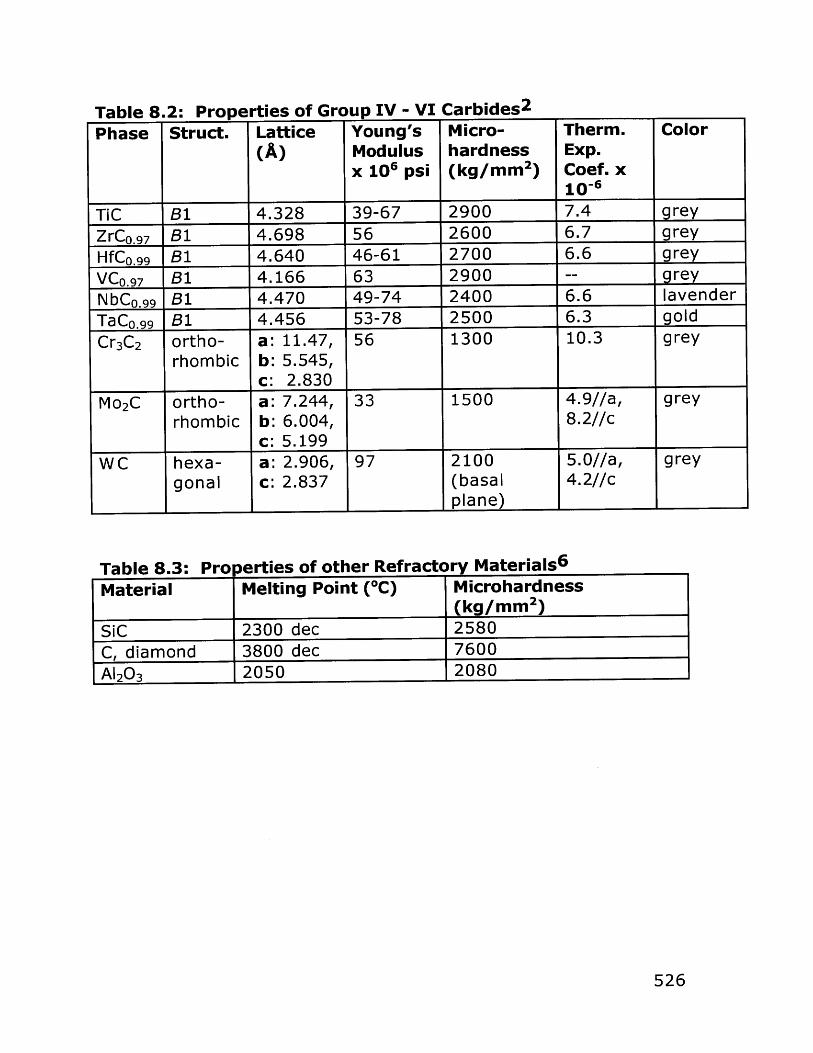
Table 8.2: Properties of Group IV - VI Carbides 2
Phase Struct. Lattice Young's Micro- Therm. Color(A) Modulus hardness Exp.
x 106 psi (kg/mm 2) Coef. x10-6
TiC B1 4.328 39-67 2900 7.4 grey
ZrCO. 97 B1 4.698 56 2600 6.7 grey
HfCO.99 B1 4.640 46-61 2700 6.6 grey
VCo. 97 B1 4.166 63 2900 -grey
NbCO.99 B1 4.470 49-74 2400 6.6 lavender
TaC0 .99 B1 4.456 53-78 2500 6.3 gold
Cr 3C2 ortho- a: 11.47, 56 1300 10.3 greyrhombic b: 5.545,
c: 2.830Mo 2C ortho- a: 7.244, 33 1500 4.9//a, grey
rhombic b: 6.004, 8.2//cc: 5.199
W C hexa- a: 2.906, 97 2100 5.0//a, greygonal c: 2.837 (basal 4.2//c
I_ , plane)
TabIe 8.3: Pro Jerties of other Refractory Materials6.
Material Melting Point ("C) Microhardness(kg/MM2)
SiC 2300 dec 2580C, diamond 3800 dec 7600
A12 0 3 2050 2080
526

8.1.2 Catalytic uses
In addition to the technological uses of transition metal
carbides which exploit their high hardness and stability at high
temperatures, certain carbides have been examined for their
catalytic properties in a number of reactions. This is in addition to
their being potential supports for more traditional catalytic materials
(Ni, Pt, Rh, etc.) due to their high heat stability.
The observation has been made that tungsten was active as
a catalyst and showed good selectivity toward xylene formation
during the isomerization and hydrogenolysis of 1,1,3-
trimethylcyclopentane, but only after an induction period, as is also
characteristic of platinum and paladium. 7 Base transition metals do
not behave this way. The behavior was explained by invoking the
formation of tungsten carbide on the surface of the metal; WC is
similar to Pt in selectivity for neopentane isomerization as well. 8
Mo 2 C has been found to behave similarly to Ru in CO-H 2 reactions. 9
These are merely two examples: in fact, carbides of the Group IV-VI
metals have been studied for their activity in oxidation,
hydrogenation/dehydrogenation, isomerization, hydrogenolysis, and
CO-H 2 reactions, and in many cases have been found to rival the
performance of the less economic Group VIII metals. While the
refractory carbides do not show high activity for oxidation reactions
(for example, the rate of H2 oxidation follows the order metal >>
carbide > oxide for Group V and VI metals 1 0 , and the rate of NH 3
oxidation over refractory carbides is lower than that over Group VIII
metals 1 1 ), they are as active as the transition metals themselves
527

for hydrogenation and dehydrogenation reactions. In isomerization
reactions, WC, Pt, and Ir are unique in their high activity and
selectivity.1 2 However, it is not necessary for the refractory
carbides to be more or even equally active in catalyzing given
reactions compared with the noble metals, because the lower cost
of the carbides will in many cases offset the losses in catalytic
activity.
The Group IV-VI metal carbides are, however, difficult to
prepare as high purity (e.g. free of surface oxide or graphitic and
amorphous carbon contamination) and high surface area powders.
There have been a number of approaches to synthesizing the
carbides in a way that produces a high specific surface area,
including carburization of a spray of the oxide powder using a
CH 4/H 2 gas mixture,1 3 reaction of the metal oxide vapors with
activated carbon,1 4 ultrasound irradiation of the metal carbonyl,15
carburization of a precursor deposited onto a support such as
alumina,16,17 and similar approaches.1 8 The problem of surface
contamination has been addressed as well, with most solutions
centering on the idea of activation of the surface of the carbide via a
thermal treatment prior to catalytic use. The thermal treatment
includes heating in vacuum, which has been found to activate TaC,
TiC, and WC for hydrogenation of ethylene,19, 20 or reduction in
flowing hydrogen gas.14,21 These methods, of course, are for
removing surface oxygen; surface carbon (amorphous or graphitic)
is difficult to remove.
The catalytic uses of the transition metal carbides are
mentioned in the context of this project because the low-
temperature precursor methods reported in Chapter 9 have the
potential for yielding high-surface area carbides possibly useful for
catalytic applications. However, the structural and refractory
528

characteristics of the carbides were the focus of the project
reported in Part II of this thesis, and no exploration of the catalytic
potential, even characterization as basic as finding the surface area
via BET analysis, was considered.
529

8.2 Structures of Transition Metal Carbides
Most of the transition metal monocarbides form in the B1
(NaCI) structure, fcc metal with carbon occupying the octahedral
interstitial sites. The shortest M-M distance is about 30% greater in
the B1 carbide than in the pure metal for the Group IV and V
carbides, but drops to less than 10% greater for the Group VI or VII
carbides. 1 8 At 100% site occupancy, the stoichiometry of the
carbide is MC 1 .O, though this situation is rarely realized. The
concentration and ordering, if any, of the vacancies that result from
a nonstoichiometric M-C ratio have a great effect on the
thermodynamic, mechanical, electronic, and magnetic properties of
the metal carbides; however, the details of these effects are a
matter of some debate in the literature, due to the difficulties
inherent in synthesizing pure compounds and in measuring the
exact details of the crystal structure of a given sample. The metal
carbides share many characteristics with the metals themselves,
having a plastic deformation like the fcc metals which, while
lowering the high-temperature hardness, protects parts fabricated
from the carbides from catastrophic failure in response to stresses.
Most of the Group IV-V metal carbides conform to the H~gg
rules, which were developed empirically to "predict" the structures
of the transition metal borides, carbides, halides, and nitrides. 2 2
The structure adopted by the metal carbide is determined by the
ratio of the radius of the nonmetal atom (rx) to that of the metal
atom (rm). For r = rx / rm < 0.59, the structures adopted are the
530

simple Al, A2, A3, and hexagonal lattices. For r > 0.59, more
complex structures form to prevent the expansion of the lattice -
which would have been required for the simple structure to
accommodate the large nonmetal atom - from taking the metal
atoms beyond the distance for favorable metal-metal interactions.
The monocarbides take on an fcc metal lattice with carbon atoms on
the octahedral interstitial sites, while random occupation of half of
the Oh sites in M2 C or M3 C leads to the L3' (anti-NiAs) structure, and
carbon occupation of the trigonal prismatic sites in the hcp lattice
formed by the tungsten atoms leads to the CdI 2 structure. 2 Non-
H~gg structures are known among the carbides as well, a major
example being Cr 2 C3. Specific phases available to each metal will be
discussed in Section 8.4 below.
One much-noted feature of the structure of the transition
metal carbides is that the lattice adopted by the metal in the
carbide is never that of the parent metal. That is to say, if the metal
has an hcp lattice, its carbide has the metal on an fcc lattice; the fcc
parent metal occupies a non-cubic lattice in the daughter carbide;
and bcc parent metals have both fcc and hcp lattices available in the
daughter carbides. This has been explained using Engel-Brewer
theory of metals, 2 3 ,2 4 in which the structure adopted by a metal or
alloy depends on the s-p electron count.1 8 With increasing s-p
electron count the metal structure progresses from bcc to hcp to fcc
across the transition series. Likewise, the Group IV and V metal
carbides MC form in the Bi structure rather than a hexagonal form
because the incompletely filled bands of the host metals can
accommodate a high ratio of sp-electron-rich carbon to metal. In
Group VI the stoichiometry M2C occurs often, while Groups VII and
531

VIII, when they form carbides at all, take on metal-rich
stoichiometries M3C and M4 C, consistent with an attempt to avoid
filling antibonding levels in the metal bands. 2 5
The nature of the bonding in the monocarbides is a matter of
some debate, although all agree that the simple ionic model (M*C-
or M-C+) is not consistent with the properties of the carbides. Ionic
materials will not typically slip on the {111} planes due to the
strong repulsive (coulombic) interactions across the shear plane in
the half-glide position; instead, they will slip on the {110} or {100}
planes. 2 The catalytic behavior of WC is similar to that of Pt, as
noted in Section 8.1.2, and this is explained according to the
addition of the carbon valence electrons to those of tungsten to
give a count equal to that of platinum. However, the exact direction
of electron transfer is the subject of some controversy. X-ray
photelectron spectroscopy (XPS) and electronegativity
considerations suggest simple M + C electron donation, but the XPS
data is questionable due to the possibility for backdonation or
screening effects. 2 5 Furthermore, simple M + C donation would
result in ionic compounds such as the alkali and alkaline earth metal
carbides. However, these materials are resistors with low optical
transparency or reflectivity, and readily hydrolyze to the metal oxide
and hydrocarbon. In contrast, the transition metal carbides are
conductors with a shiny metallic and colored appearance and are
hydrolytically stable. Band occupation suggests C + M electron
transfer. Carbon appears to combine its sp electrons with the metal
spd bands, leading to the similarity between the crystal structures,
reactivities, and catalytic activities of the refractory carbides and the
Group VIII metals. Such a donation scheme may be used to explain,
532
if crudely, the trend in melting point maxima, which occurs in Group
VI for the metals, Group V for the carbides, and Group IV for the
analogous mononitrides: the maxima may be associated with the
half-filled d shell. 2 5
The Group IV-V carbides are able to form continuous solid
solutions with each other over a wide range of compositions, but
are only partially miscible with the carbides of the Group VI - VIII
metals.1 8 Ceramic materials of mixed C, N, and 0 composition are
also common, with oxycarbides of definite stoichiometry having
been reported for a number of the early transition metals. Even
"pure" metal carbides tend to contain small amounts of dissolved
oxygen.
533

8.3 Synthesis and Characterization
The distinction between "traditional" methods and "precursor"
methods made in this section is admittedly somewhat arbitrary,
since any starting material besides the elements themselves could
be considered to be "precursors." However, the separation has
been made so that simple starting materials are included with
"traditional" methods, and starting materials requiring some high
degree of design and synthetic effort have been designated
"precursor" methods.
8.3.1 Traditional Methods2
The usual method of preparing polycrystalline transition metal
carbides on the research scale entails the direct reaction of metal or
metal hydride powders with carbon. Pure materials with a
homogenous composition are difficult to achieve, however, requiring
high-purity gases or good vacuum in combination with very high
tempertures. The methods are summarized in Equations 8.3-8.6.
(8.3a) M + C - MC
(8.3b) MH + C + MC + H2
Direct reaction by melting or sintering the starting material with carbon in
vacuum or inert atmosphere.
534

(8.4) MxOy + C + MC + CO
Reaction of the metal oxide and excess carbon in inert or reducing
atmosphere.
(8.5a) M + CxH 2 x+y - MC + H2
(8.5b) M + CO + MC + 02
Reaction of the metal with a carburizing gas.
(8.6a) MCIn + CxH 2x+y + MC + HCI + (CqHr)
(8.6b) M(CO)n + H2 + MC + (CO, C0 2, H2, H20)
Reaction of the metal halide or carbonyl vapor with hydrogen.
The reaction temperatures for synthesis of the refractory
carbides according to Equations 8.3a, b are listed in Table 8.5.
However, most carbide systems must be heated for several hours
at temperatures over 2000 0C to ensure compositional
homogeneity. With good vacuum, such treatment also will remove
oxygen contamination from many of the metal carbides. Reports
regarding the range of temperatures required to form the carbides
according to other reaction schemes give variable numbers.
535

Table 8.5: Reaction temperatures for direct formation of metal
carbides 2
Metal Reaction Temperature Range ( 0C)
T 8.3a, b 1700 - 2100
Zr 8.3a, b 1800 - 2200
Hf 8.3a, b 1900 - 2300
V 8.3a 1100 - 1200
Nb 8.3a 1300 - 1400
Ta 8.3a 1300 - 1500
Cr 8.3a 1400 - 1800
Mo 8.3a 1200 - 1400
W 8.3a 1400 - 1600
8.3.2 Precursor Methods
Many of the reported precursor methods for making high-
temperature carbides focus on the synthesis of cx- or P-SiC rather
than on the carbides of the early transition metals. In addition the
solid-state reaction between silica and carbon (Acheson process), 6
P-SiC has been made by pyrolysis of high-Si rice hulls (a
carbothermal reduction of SiO 2 collected by the rice plant and
locallized in the hulls). This process is commercially practiced. It has
also been synthesized, more notably, by the pyrolysis of polymers
such as poly(dimethylsilane) or poly(phenylmethylsilane). 2 6 These
polymers are synthesized via the WLrtz-type coupling of
appropriate chlorosilanes, e.g. coupling in the presence of sodium or
536

potassium metal (M) with loss of MCI driving the polymerization.
Linear polycarbosilanes produce nearly zero ceramic yield:
branching on the silicon backbone is crucial. The presence of Si-H
and Si-vinyl functionalities lead to the potential for hydrosilation
cross-linking and a still-higher ceramic yield.
Similar work has been done to give organometallic precursors
for the transition metal carbides. This work is dogged by the
relatively few compounds of the Group IV - V metals which are
stable, have a low C/M ratio (so that excess free carbon is avoided),
and which do not contain oxygen. Those which do fulfill these
criteria tend to be sublimable, leading to a low ceramic yield, since
the opportunities for polymerization or cross-linking of these
materials are few. Seyferth and Tracy attempted to couple
dimethyltitanocene with methyldichlorosilane in the presence of
sodium metal to produce a copolymer precursor for (Si, Ti)C, but
little of the product was soluble in toluene and the ceramic yield
was low. 3 Dichlorobis(2,4-pentanedionato)titanium(IV) was reacted
similarly with methyldichlorosilane in the presence of Na, but the
products were soluble only in THF and contained chlorine. Finally,
dimethylmetalloocene, which decomposes in ultraviolet light to Cp 2 M
and 2 -CH 3 (M=Ti, Zr, Hf), was used with the polysilane made by the
Wrtz coupling of HMeSiC12 to produce air-sensitive metal-containing
polysilanes with ceramic yields ranging from 44% (Hf) to
approximately 80% (Ti). The polymers were at least sparingly
soluble in aromatic or ethereal solvents, sometimes more soluble,
depending on the specific reaction conditions.
Unpublished research performed in the Seyferth labs
polymerized zirconium and hafnium metallocene methacrylates for
537

use as precursors for ZrC and HfC. The precursors were solids or
viscous polymers. Liquid precursors were obtained when
substituted metallocene dichlorides were polymerized with n-
butyllithium and a diyne. These gave ceramic yields near 60%, but
the process suffered from the inability to scale it up.
Most other research involving organometallic precursors for
the refractory carbides has centered on the small-molecule,
monomeric metallocene compounds for use with various forms of
chemical vapor deposition of films of these the carbide materials.
Precursors for the refractory carbides have been made from
the metal alkoxides transesterified with polyhydroxyl alcohols and
mixed with phenolic resins or furfuryl alcohol to provide excess
carbon. In most of these cases the precursor was a solid, though
some soluble precursor polymers resulted. Past work along this line
will be discussed in more detail in Chapter 9.
8.3.3 Characterization
Complete characterization of the refractory carbides is difficult.
Since many of the important mechanical and catalytic properties are
sensitive to a number of factors which tend to vary widely among
samples, there is a variation in literature reports regarding
measurement of these properties. These factors include (1) the
crystal structure and lattice parameters, including the presence of
vacancy ordering; (2) the chemical composition, including not only
the overall carbon-to-metal ratio present in the bulk sample, but the
amount of free carbon versus combined (lattice) carbon; (3) the
impurity concentration, particularly that of oxygen; (4) the overall
538

defect structure, including grain size, dislocations, and porosity;
and (5) the sample homogeneity.
The crystal structure can be found and the lattice parameters
measured by X-ray and neutron diffraction experiments. Sample
homogeneity may be deduced from X-ray diffraction (XRD) data by
noting the sharpness of the splitting the K, and K lines, and
crystalline impurity phases present in concentrations over
approximately 5% may often be detected using XRD. Even large
oxygen impurity concentrations, however, may escape notice due to
the formation of a solid solution with the carbide. The effects of
medium-to-large oxygen impurity concentrations on lattice
parameters are not well-described. Very careful XRD analysis may
also detect ordering of carbon atoms or vacancies in the structures
of the carbides of the lighter metals, when such ordering is
accompanied by a distortion of the lattice. The specific details of the
ordering would not be easy to determine even using modelling
techniques such as Rietveld analysis; 2 7 ordering without an
accompanying symmetry or lattice parameter change would only be
detectable using a complex Fourier analysis of the XRD peak
intensities. 2 8 Neutron or electron diffraction experiments, on the
other hand, would give unambiguous information regarding the
ordering of carbon atoms on the interstitial sites, however, electron
diffraction sample preparation is made difficult by the need to make
a thin section of the brittle and possibly porous carbide material,
and neutron diffraction is not immediately available to most
researchers.
Chemical analysis of the bulk material primarily yields
information about the quantity of carbon in the sample. The total
539

carbon content may be found by heating the carbide in a stream of
oxygen, completely converting it to the metal oxide. The CO 2
generated is captured and measured by weight or by the
conductivity of a combusted C0 2-0 2 mixture in a commercial Leco
unit. This process is complicated by the high temperatures
tolerated by the refractory carbides, since it relies on all of the
carbon's being driven off as C0 2. Diffusion of carbon and/or oxygen
through the metal carbide and/or oxide is slow even at very high
temperatures. Free carbon (graphite) may be determined by
dissolving the carbide in a mixture of hydrofluoric and nitric acids
(warning: the dissolution reaction is violent and exothermic). The
unbound carbon does not dissolve; it is collected, washed, and
analyzed as C0 2.
Oxygen analysis is extremely difficult because once the solid
solution M(CO) has formed the oxygen is nearly impossible to
remove. This is particularly true in the case of nonstoichiometric
carbides MC 1.x, where empty octahedral interstitial sites are very
inviting to the stray oxygen atom. Vacuum-fusion techniques, e.g.
heating the refractory carbide to 2400-2800 0C in a graphite mold or
platinum bath under vacuum, followed by determination of the
oxygen removed as COx, are the major methods available, but are
often only partially successful. This is particularly true of the
carbides of the Group IV metals. Neutron activation analysis, in
which oxygen is activated by the reaction 160(n,p)16N, then
monitoring the 6.1 and 7.1 MeV y-radiation from 16N, has proven
useful.
Sample homogeneity and local compositions may be measured
by microprobe analysis, in which the X-ray emission of elements on
540

irradiation with an electron beam, as in an electron microscope, is
measured and correlated with the concentration of the element.
The microprobe must be equipped with a thin detector window to
give good quantitative information regarding light elements (Z< 10),
however. Electron energy loss spectroscopy (EELS), on the other
hand, can sensitively detect elements in the Z < 10 region. 2 9 Both
of these methods are extremely locallized, however, and multiple
areas of several samples must be examined for conclusions
regarding the bulk material to be validly made.
Vacancy concentration is likewise difficult to measure due to
the ambiguities in chemical composition measurements. Where the
composition is well-known, comparison of X-ray density with a
physically-measured density will give a good estimate of the
vacancy concentration. Likewise, density measurements can give
information regarding larger-scale defects such as porosity.
Electron microscopy can give reasonable estimates of the grain size.
541

8.4 Tour of the Group IV - V Carbides
The material in Section 8.4 is primarily based on E.K. Storms' The
Refractory Carbides.1
8.4.1 General Trends
Approximate preparation of the transition metal carbides is
straightforward, but ensuring a given stoichiometry and purity
against oxygen contamination is famously difficult. Variations in the
quantity of vacancies on the carbon (or, less frequently, the metal)
lattice, as well as variations in the amount of dissolved oxygen, lead
to a wide range of claims regarding even basic thermodyanmic,
mechanical, and electromagnetic data for the early transition metal
carbides. Removal of the oxycarbide phases, which can be
considered to be solid solutions of MO and MC, depends on the
partial pressure of CO over the sample to be purified. At the high-
carbon end of the stoichiometric range, Equation 8.7 leads to
additional dissolved oxygen in the lattice if CO is removed. At the
low-carbon end, Equation 8.8 occurs independently of the CO partial
pressure. Thus if excess graphite is present, a high CO partial
pressure leads to more nearly stoichiometric carbide as Equation
8.7 is forced left; but the success of this approach in purifying a
given metal carbide depends on the stability of the oxycarbide, the
annealing temperature and time, and, clearly, the partial pressure
of carbon monoxide.
542

(8.7) MxOy + C (dissolved in MC) = MO (dissolved in MC) + CO(g)
(8.8) MxOy + M (dissolved in MC) = MO (dissolved in MC)
Group IV carbides are difficult to purify without melting;
heating up to 2000 0C will result in increased oxygen contamination
if the vacuum is not better than 10-6 torr. Moreover, as noted in the
previous section, few straightforward chemical methods exist for
finding the oxygen level in the Group IV carbides MC 1.x bulk
materials; none are reliable. The Group V and VI carbides purify
readily at temperatures over 1800 0C.
Slow diffusion of carbon in all of the refractory carbides results
in stoichiometry gradients which are difficult to detect in bulk
materials but which may compromise the material strength,
hardness, and high-temperature behavior. The lattice parameter
and the sharpness of the XRD pattern can give some rough
indication of the homogeneity, however.
Group IV metals tend to form in a single cubic phase with a
limiting stoichiometry near MC 1.0, but which normally varies from
MCO. 5 to MCO. 97 depending on the synthesis conditions. Group V
metals form an M2 C phase in addition to the monocarbide. The
composition range of the M2 C phase is narrow at room temperature,
with decomposition into the cubic phase plus liquid at high
temperatures. The V-C system has a cubic phase extending to
MCO. 88 , while NbC and TaC approach MC 1.0 and melt congruently
even at carbon-deficient stoichiometries. The Group VI metals have
a more complex M-C phase diagram, forming a number of distinct
compositions. The chromium carbides behave uniquely, while the
Mo-C and W-C systems have common features, with the MC and
543

M2 C phases stable at high temperatures. (Table 8.4) The trends in
melting points indicate that the Group IV, V, and lower two Group VI
metals have strong M-C and M-M bonds, distinct from the Groups IA
- IIIB metals, which form acetylenic M-C bonds, and from the Groups
VIII - IIB metals, which form unstable carbides, if at all.
Removal of bound carbon causes the lattice parameter to
decrease in most of the refractory carbides, but to increase in TiC
and ZrC. The behavior of HfC on decrease of the lattice carbon-to-
metal ratio is uncertain due to the variation in this behavior among
reports. For several metal carbides, the variation of lattice
parameter with carbon content is linear. Removal of carbon from
the lattice also is associated with reductions in hardness, at least
for the Group IV carbides. Dissolved oxygen lowers the lattice
parameter in Group IV carbides, while it increases it in Group V
carbides, and has an uncertain effect for carbides of Group VI
metals. The effect of oxygen contamination on mechanical
properties is not clearly reported in the literature.
The refractory carbides show high chemical resistance but will
react under certain conditions. At high temperatures, the high-
carbon compositions form hydrocarbons in the presence of
hydrogen. The reactions with oxygen have been indicated above
(Equations 8.7, 8.8), and are complex. The carbides will form the
nitrides at high temperatures and in the presence of N2 , NH 3, or
N2/H 2 mixtures; however, the cubic carbides and nitrides are
completely miscible.
544

8.4.2 Group IV
The conversion of TiO 2 to TiC occurs via the intermediates
Ti30 5, Ti 2 0 3 , and TiO in the temperature range 1000 - 1500 0C. The
carbide closest to TiC1.0 forms at 1600-1700 OC under 1-10 torr of
CO. Titanium hydride and carbon form TiC 1 .o.x after 1 hour in
vacuum at 1200 0C. TiC has also been formed by heating a
tungsten wire or carbon filament in an atmosphere of TiCI4, H2 , and
hydrocarbon, or by reaction of CaC 2, TiCI4, and H2 at 800 OC (CaC 2
and CaC 2 are removed by washing with water after the reaction is
complete). The last traces of oxygen are difficult to remove, and
have a significant effect on the material properties. Later heating
may recontaminate even a "pure" sample of titanium carbide if the
vacuum is not sufficiently good; a nonprotecting, non-adherent TiO 2
(anatase) layer forms at about 450 OC. The Ti-C system has one
cubic compound of formula TiC, although other phases have
occasionally been claimed. TiC is metallic and grey, and is stable to
most concentrated acids or bases. It will dissolve completely in
HNO 3 and combinations of HNO 3 with HCI (aqua regia), HF, and
H2SO 4 .
The reduction of ZrO2 proceeds via Zr 2 0 3 and ZrO to the
carbide between 950-1200 OC. It has also been formed using ZrH
plus graphite or from ZrC 4 in the presence of hydrogen and
hydrocarbon vapor. Attempts to remove oxygen completely are
generally unsuccessful except under melting conditions. "Pure" ZrC
heated at temperatures under 1800 OC tends to gather oxygen up
to several percent. The Zr-C system contains one cubic compound,
ZrC, and the lattice parameter varies with oxygen contamination
545

noticibly at levels of 1000 ppm. ZrC is somewhat more susceptible
to acid attack than is TiC and oxidizes rapidly above 500 0C.
Hf0 2 forms an oxycarbide of constant composition between
1743 - 2033 0C and under 70-1000 torr of CO, with Hf 2 0 3 forming at
1000-1200 OC and the HfC-HfO solid solution between 1300-1800
0C. HfC forms a carbon-deficient lattice between 1800 - 2000 0C,
but can be made stoichiometric by repeated heating at 1900 OC.
HfC has also been formed from HfCI 4 + H2 + CH 4 in the presence of a
hot tungsten wire and from hafnium hydride and carbon. It is one
the most difficult carbides to rid of its oxygen, only becoming "pure"
when melted or heated at temperatures in excess of 2500 0C in
good vacuum. The Hf-C system has one cubic phase HfC, but the
composition can range to a low of HfCO.5 2 . Its melting point
increases with increasing carbon content up to a maximum, then
HfC forms a eutectic with carbon. There has been no study of lattice
parameter variation with either oxygen or carbon content.
8.4.3 Group V
Vanadium carbide has been formed by heating V20 5 or V2 0 3
with carbon for two hours at 1800 0C in 1-10 torr of CO. V20 5
begins reacting with carbon at 435 0 C, and the oxygen
concentration is relatively easily reduced to below detectable limits
by higher-temperature treatments or by the reaction of vanadium
metal or hydride with carbon. Loss of vanadium at high
temperatures and low carbon content presents a difficulty, but
nearly-saturated VC can be heated to 2000 0C without loss of
vanadium. The carbide has been made by treatment of VC14 in an
546

atmosphere of hydrogen and methane at 1500 - 2000 OC. The two
main phases are cubic VC, available over the range VC0 .7 8-VC 1.0, and
the hexagonal P-V 2 C, available for C/V atom ratios of 0.4-0.5
between approximately 1500 - 2000 OC, but presenting a very
narrow range of stable compositions at room temperature. Reports
of V5C and V4C3 have been discredited. VC will react with dry HCI
gas at 750 OC to produce VCI 2, methane, and hydrogen, and has a
high rate of oxidation in air, with powdered VC and V2C being
attacked slowly by air even at room temperature. V2 C is soluble in
hot 50% HCI solution, leaving a carbon residue, but VC is inert
under these conditions; both of the vanadium carbides are attacked
by concentrated nitric, sulfuric, and perchloric acids.
Niobium (V) oxide begins to react with carbon at 675 *C,
forming NbO 2 and NbCx below 1200 OC and forming an NbCxOY solid
solution between 1450 and 1500 OC. Pure NbC is accessible by
heating the metal and carbon powders directly, but high
temperatures and heating times are required to complete the
reaction and drive off oxygen and nitrogen contaminants. The
conditions are made less stringent by the presence of an H2
atmosphere. NbCI5 heated in the presence of hydrogen and
methane forms the pure carbide at 900 -1000 OC. The Nb-C system
has the cubic phase NbC and two crystal forms (c, room
temperature, with a very narrow composition range and P, existing
between 2300-3000 OC and over the C/Nb ratio range 0.4-0.5) of
Nb 2C. A third, ( phase of Nb 2 C (C/Nb range 0.5-0.7) has been
suggested to exist on the basis of a single weak powder pattern
line, but has not been verified. The lattice parameter increases as
the C/Nb atom ratio approaches unity, and is increased as well by
547

the presence of oxygen and nitrogen. NbC is inert even to boiling
aqua regia but will dissolve in HNO 3/HF mixtures; it is severely
corroded in air at temperatures above 1100 OC. Its color ranges
from grey (NbCO. 9) to lavender (NbCo. 99).
The tantalum carbide system is relatively easy to free of
oxygen impurities, but due to the slow rate of carbon diffusion it
tends to have inhomogeneities in its bulk composition. Evaporation
of carbon at temperatures above 2400 OC renders the use of high
temperatures to establish a uniform composition problematic.
Reaction from the elements in vacuum begins at approximately 10000C but is slow to reach completion. Use of hydrogen or methane
atmospheres increases the reaction rate but requires a post-
synthesis vacuum annealling step to remove dissolved hydrogen.
TaC cannot be made from TaC 5 in a hydrocarbon/hydrogen
atmosphere due to the formation of metallic tantalum, but has been
made with varying success by heating Ta wire in methane. Arc-
melting tends to produce C-deficient, inhomogenous carbides. The
Ta-C system has the cubic phase TaC and a hexagonal compound
Ta 2 C (actually the C6 anti-CdI 2 structure type due to ordering of the
carbon atoms) with an a-P transition near 2000 OC. A ( phase has
been claimed at 2000 - 3000 OC over the C/Ta atom ratio 0.70-0.75
but its existence remains a point of debate. The cubic phase
persists over a wide temperature and composition range, possibly
as low as TaCO.5 8 and verified down to at least TaCO. 74 . The
composition TaCO. 89 is the highest-melting substance known. Very
small amounts of carbon (Ta64C) result in a tetragonal distortion to
the normally bcc Ta parent lattice. The TaC lattice varies linearly
with composition, with the equation C/Ta = -25.641 + 5.9757a. It is
548

grey and metallic in appearance up to about TaCO.8 5 , then becomes
increasingly brown with rising carbon content until the golden
TaC 0 .99 is reached. It is the most acid-stable of the refractory
carbides, dissolving in a nitric/hydrofluoric acid mix, and reacts with
pure oxygen above 800 0C. Loss of carbon results from lower-
temperature reactions with oxygen in air.
549

Table 8.4: Range of Melting Points for Group IV-VI Carbidesl
Metal Element MP Maximum MP in the Atom Ratio
(*C) MP (*C) presence of C ("C) at Max MP
Ti 1668 3067 2776 0.8
Zr 1855 3420 2850 0.83
Hf 2222 3950 3180 0.95
V 1888 2700 2700 0.85
Nb 2467 3600 3300 0.82
Ta 3014 4000 3400 0.88
Cr 1915 1875 1875 0.68
Mo 2620 >=2580 2580 0.72
W 3410 >=2780 2780 0.75
550

8.5 Goals of the Part II Project
The specific goals of Part II of this thesis were the synthesis of
a industrially-useful liquid precursor for tantalum and hafnium
carbides, TaC and HfC. As indicated in Section 8.3.2 above, most
precursor methods have resulted in solid or at best soluble
polymeric materials. Liquid precursors were preferred in this project
so that removal of solvent during fabrication of HfC or TaC monoliths
could be avoided. The liquid precursors were to be used in
conjunction with proprietary technology owned by Foster-Miller, Inc.,
of Waltham, Massachusetts, to fabricate high-performance parts of
solid TaC or HfC. Factors of concern included (1) ease of synthesis,
particularly of scale-up; (2) ease of handling (e.g. room-temperature
stability, reasonable air-stability); (3) clean decomposition to the
target carbide without undue contamination by metal oxide or by
excess graphitic carbon; (4) low volatility - e.g. the material should
decompose in situ during pyrolysis, rather than distill; (5) low gas
production on decomposition, so that bubbles in the solid would not
become points of structural weakness; (6) low viscosity over a
temperature range near or just above room temperature (e.g. the
precursor was to be a liquid or low-melting solid). Cost was an
addtional concern but was left to be addressed in later phases of
the project.
Early work on the project focused on the use of organometalic
precursors for TaC and for HfC. The main idea behind this approach
was that the precursor was best formed by putting the M-C bonds
551
in place during the synthesis, eliminating any need to remove
heteroatom bonds (particularly oxygen) from the metal center via
carbothermal reduction during the pyrolysis step. Large, waxy
groups or smaller, symmetry-destroying groups, would enforce the
liquid form of the precursor. Efforts first focused on using CpTaC 4 or
Cp 2TaCI 2 as starting materials, and using organolithium or Grignard
reagents to add alkyne groups based on 1-hexyne,
trimethylsilylacetylene, and triethylsilylacetylene by a salt
metathesis; however, the products consistently decomposed,
possibly due to reduction of the tantalum by the organolithium or -
magnesium reagent. A similar approach using hafnocene and
substituted hafnocenes (e.g. bis(methylcyclopentadienyl)hafnium
dichloride, bis(vinyldimethylsilylcyclopentadienyl) hafnium dichloride)
gave liquid precursors which pyrolyzed to HfC, and which were
obtained in pure form. Stirring pentakis(dimethylamido)tantalum
with alkynes, with loss of > 2 dimethylamine groups, gave liquid
precursors which pyrolyzed to TaC but which defied purification and
characterization attempts. Thus this work showed some success,
but was dogged by the sensitivity of the organometallic compounds
made. The organometallic approach has not been discussed in
detail in this Thesis.
Practical concerns of scalability were a major factor in the
abandonment of this approach in favor of a sol-gel-type route in
which the alkoxide in alcohol solution would be hydrolyzed to form
the precursor, which would be reduced carbothermally during
pyrolysis. This route was superior in ease of synthesis, scale-up,
handling, and cost, but was found to give a too-low mass-of-
carbide-per-gram-of-precursor. It also formed a glassy, bubble-
552

ridden solid which was high in excess carbon. The work is
discussed in Chapter 9, and has been continued by researchers at
Foster-Miller, Inc.
It should be noted by the reader that the work described in
Chapter 9 involved a practical challenge to the academic chemist.
Traditional methods of purifying chemical materials for
characterization include primarily crystallization and distillation or
sublimation. However, the materials synthesized in these chapters
were designed not to crystallize, and were expected to decompose
on heating rather than to distill. Therefore, purification for the sake
of getting NMR, MS, or elemental analytic evidence of the structure
claimed was rarely possible. Production of a formulation with
reproducible properties and pyrolysis behavior was given priority
over isolation and characterization of an exact precursor molecule.
553

8.6 References
1)Storms, E. K. The Refractory Carbides; Academic Press: New York,
1967.
2)Toth, L. E. Transition Metal Carbides and Nitrides; Academic Press:
New York, 1971.
3)Tracy, H. J., Ph.D. Thesis, Massachusetts Institute of Technology:
Cambridge, MA, 1990.
4)Koester, R. D.; Moak, D. P. J. Am. Ceram. Soc. 1967, 50, 290.
5)Andrievskii, R. A.; Strel'nikova, N. S.; Poltoratskii, N. I.; Kharkardin,
E. D.; Smirnov, V. S. Porosh. Met. 1967, 7, 85.
6)Mark, H. F.; Othmer, D. F.; Overberger, C. G.; Seaborg, G. T. Kirk-
Othmer Encyclopedia of Chemical Technology; 3rd ed.; John
Wiley & Sons: New York, 1978; Vol. 4, pp 480, 492, 497.
7)Muller, J. M.; Gault, F. G. Bull. Soc. Chim. Fr. 1970, 2, 416.
8)Boudart, M.; Levy, R. Science 1973, 181, 547.
9)Leclerq, L.; Imura, K.; Yoshida, S.; Barbee, T.; Boudart, M. ; in
Preparation of Catalysts III, Delman, B. et al., Eds.; Elsevier:
Amsterdam, 1978, pp 627.
10)Il'chenko, N. I. Kinet. Katal. 1977, 18, 153.
11)Il'chenko, N. I.; Chevotareva, N. P.; Shvidak, N. V. React. Kinet.
Catal. Lett. 1976, 4, 343.
12)Ptak, L. D.; Boudart, M. J. Catal. 1970, 16, 90.
13)Lee, J. S.; Oyama, S. T.; Boudart, M. J. Catal. 1987, 106, 125.
14)Ledoux, M. J.; Huu, C. P.; Guille, J.; Dunlop, H. J. Catal. 1992,
134, 383.
554

15)Suslick, K. S.; Hyeon, T.; Fang, M.M.; Cichowlas, A.A. Mat. Sci.
Eng. A. 1995, 204, 186.
16)Lee, J. S.; Yeom, M. H.; Park, K. Y.; Nam, I.-S.; Chung, J. S.; Kim,
T. G.; Moon, S. H. J. Catal. 1991, 128, 126.
17)Brenner, A.; Burwell Jr., R. L. J. Am. Chem. Soc. 1975, 97, 2566.
18)Oyama, S. T. Catal. Today 1992, 15, 179.
19)Vidik, B.; Lemaitre, J.; Leclercq, L. J. Catal. 1986, 99, 439.
20)Kojima, I.; Miyazaki, E.; Inoue, Y.; Yasumori, I. J. Catal. 1982, 73,
128.
21)Ledoux, M.-J.; Guille, J.-L.; Pham-Huu, C.; Maria, S., Pechiney
Recherche: U.S. Patent No. 5,139,987, 1992.
22)Hagg, G. Z. Phys. Chem, Abt.. 1931, B12, 33.
23)Engel, N. Ingenioren 1939, N101.
24)Brewer, L. Science 1968, 161, 115.
25)Oyama, S. T. J. Solid State Chem. 1992, 96, 442.
26)Schilling Jr., C. L. Brit. PolymerJ. 1986, 18, 355.
27)Young, R. A. The Rietveld Method; Oxford University Press: New
York, 1993.
28)Klug, H.; Alexander, L. X-ray Diffraction Procedures; 2 ed.; John
Wiley & Sons: New York, 1974.
29)Cheetham, A. K.; Day, P. Solid State Chemistry: Techniques;
Oxford University Press: New York, 1987.
555

Chapter Nine
Sol-Gel Approaches To TaC and HfC
556

9.1 General Comments
9.1.1 Previous Work
In addition to looking at organometallic tantalum and hafnium
compounds as precursors for TaC and HfC, a second route was
developed for synthesizing liquid precursors for tantalum and
hafnium carbides. Reduction of metal oxides to the carbides, known
as carbothermal reduction, takes place at elevated temperatures
under inert atmosphere or good vacuum for all of the transition
metals. This route to particulate formulations of metal carbides has
been used traditionally, either as a single-step process, in which
high-surface area metal oxides are mixed with finely-divided carbon
black, then heated, or as a two step process, where the metal
oxides are first reduced to the metals with hydrogen, then are
heated together with carbon.1, 2 Firing temperatures required are
in excess of 1500 OC, and particles with high surface area cannot be
made by this method due to sintering during the high-temperature
treatment. In addition, monolithic ceramic pieces cannot be
produced directly; they must be hot-pressed or otherwise fabricated
from the pre-synthesized powder. Fibers are also inaccessible by
this route. A number of alternatives to the traditional powder
method have appeared in the literature and/or in industrial use. In
particular, polymer precursors for silicon carbide have been a
popular area of research. 3 -5
557

One alternate route to transition metal carbide materials is
the carbothermal reduction of oxygen-containing polymeric
transition metal compounds. Such precursors can be made in
reactions of the sol-gel type. This section reviews briefly the U.S.
patents and articles in the open literature regarding polymeric
precursors for refractory ceramics. It is not intended to be a
complete review.
Birchall et al. in 1989 received a patent for a process for
making refractory borides and silicides by reacting together the
metal alkoxide (or halide) with silicon or boron alkoxides and
glycerol or another polyalcohol. 6 Polymerization of the mixture,
leading to a solid powder, occurs on the removal by distillation of
the alkoxide groups, and their replacement with the polyalcohol.
The reaction could be seen as a process in which the metal oxide
reacts with the boron or silicon oxide and with excess carbon
present due to the "coking" reduction of the organics present in the
alcoholic groups. Because of the atomic-scale mixing that occurs in
the solution of liquid precursors, the purity is high and the reaction
temperatures and times are lower than would be necessary for
mechanically-mixed samples of the same metal and nonmetal
oxides. Follow-up patents were issued to Birchall and his co-
workers, which reveal processes for the production of refractory
carbides and nitrides. One uses trace quantities of aluminum
chloride to increase the proportion of carbon retained in the coked
product. 7 Others use furfuryl alcohol, in addition to the glycerol or
other polyalcohol, to provide excess carbon to bring about the
carbothermal reduction.8-10 Dispersant (polyhydroxystearic acid
derivatives of polymethyl methacrylate) is used in another case to
558

provide for small precipitate particles. 1 1 Several produce polymeric
(gel) products which are soluble in water, acetone, ethanol, 7 1,1,1-
trichloroethylene, N-methylpyrollidone, 8 and other solvents, while
others specify the insolubility of the polymeric precursor.11 Other
researchers also patent processes involving the reaction of metal or
nonmetal alkoxides or chlorides with furfuryl alcohol in an inert
solvent, leading to fine powder precursors which may be pyrolyzed
to carbides (or nitrides, in nitrogen or ammonia atmospheres). 1 2
Thus the production of SiC, AIC, and transition metal carbides, as
well as the analogous borides, nitrides, and silicides, are
accomplished by the mixture of compounds of the metal or nonmetal
which are reactive with hydroxyl groups (halides, alkoxides), with
polyhydroxyl compounds (glycerol, ethylene glycol), in the presence
of materials (furfuryl alcohol, aluminum) which provide for the
retention of sufficient carbon in the "coked" (pyrolyzed) product to
effect the carbothermal reduction of the M-O bonds.
Rhine and Jiang used furfuryl alcohol in direct reaction with
titanium n-butoxide in tetrahydrofuran, with hydrolysis, to produce
soluble solid or liquid precursors for TiC.13,1 4 Use of acid catalyst
increased the carbon retention during removal of the solvent and
during pyrolysis by catalyzing the polymerization of furfuryl alcohol;
however, this approach gave less soluble solid precursors. For
making SiC, Rhine and Jiang compared furfuryl alcohol,
polyphenylpropylsilsesquioxane, and polyphenylvinylsilsesquioxane
as sources of carbon, and found very different morphologies of the
pyrolyzed products, with more excess carbon and less homogeneity
of the SiC/C composite resulting from pyrolysis.15
559

Other solution-derived precursors for transition metal carbides
include the use of soluble molybdenum or tungsten compounds
(peroxo acids or ethylene glycolates) with carbonaceous gel or
saccharose as carbon sources;1 6 these sources of carbon are also
used with niobium or tantalum alkoxides.1 7 Cellulose triacetate
and titanium or zirconium alkoxide undergo a transesterification
reaction to form a gel, which pyrolyzed leads to the metal
carbide. 1 8 Preiss et al. reported a study of the polymeric precursors
for TaC, NbC, and Mo 2 C in which reaction between the alkoxide,
acetylacetone, and a polyalcohol "bridging group" was studied.
They found that tantalum n-butoxide reacted with ethylene glycol,
saccharose, tartaric acid, catechol, and resorcinol gave a soluble
and fiber-spinnable precursor that on pyrolysis gave little excess
carbon (weight% carbon ranged from 5.2-7.1%).19 TiC/C composite
fibers were produced by reaction of titanium isopropoxide with
phenolic resin fibers. 2 0 Transesterification of titanium isopropoxide
with o-xylene-u-a'-diacetate led to a polymeric TiC precursor which
was soluble and fiber-spinnable, and formed TiC at 800 OC. Other
bifunctional acetates (H3CCOO) 2R (R= (CH 2)3, (CH 2)4, m,p,o-xylenes)
were tested and found to give either insoluble products or
precursors which failed to form TiC, or which required high
temperatures (1600 OC) to do so.2,21 Fibers and films were
accessible using any of these precursor methods.
In this Chapter we report the formulation of liquid and
gelatinous precursors for TaC, HfC, ZrC, TiC, and NbC, using the
metal alkoxides in combination with hydrolysis-rate modifying 2-
methoxyethanol, furfuryl alcohol to provide a high carbon retention
560

on pyrolysis, as well as the potential for polymerization during heat
treatment. Unlike the work reported in the patent literature to
date, the hydrolytic removal of alkoxide groups is performed in order
to provide for a M-0-M network.
561

9.1.2 Background
The chemistry of the transition metal alkoxides has already
been discussed extensively in Part I of this thesis, and the reader is
referred to the relevant Chapters there. The properties of metal
alkoxides taken advantage of in this chapter are their facile
exchange of ligands - e.g. the original ethoxide, propoxide,
butoxide, etc. for a furfuryl alcohol group - and their hydrolyzability.
In all cases we attempted to produce either a liquid state precursor
directly by substitution of the original ligands on the metal alkoxide
for larger ones that would block crystallization and oligomerization,
or by production of a sol of the hydrolyzed metal alkoxide. Furfuryl
alcohol was the substitute alkoxide ligand chosen due to its
polymerization reaction and its high conversion to carbon during
pyrolysis.
Furfuryl alcohol 2 2 (Figure 9.1a) is derived from the basic furan
ring, and is obtained by reduction of furfural (2-
furancarboxylaldehyde), which in turn may be synthesized from
vegetable resources such as rice hulls, corncobs, and wood. Most
of the furan derivatives, including furfuryl alcohol, cross-link on
heating, particularly in the presence of an acid catalyst. They
therefore fall under the rubric of the "thermosetting resins."
Furfural gives a black cross-linked product on heating at 100 - 2500C in inert atmosphere, and on treatment with Lewis or Bronsted
acids in the absence of water. Furfuryl alcohol polymerizes in the
presence of air or acid catalyst by condensation of the methylol
group with the C-5 hydrogen atom, leading to linear chains. (Figure
562

9.1b) Condensation between methylene groups in a chain and the
methylol group of a furfuryl alcohol molecule lead to cross-linking.
When the crosslinking is carried out at pH 3-5, quick cooling
followed by neutralization of the acid will stop the condensation
reactions at the desired viscoscity.2 3 When heated at
temperatures up to 320 0C, the resin cross-links further, but over
380 0C it tends to release hydrogen and produce paramagnetic
centers. Pyrolysis above 450 0C gives high yields of glassy and
porous carbon. The intense red-brown to black coloring of the resin
comes about when the "homoconjugated" system of methylene-
linked furan rings broadens the range of UV absorbtion and shifts it
toward lower frequencies. 2 3
Another furfural derivative, 2,5-bis(hydroxymethyl)furan, made
from reaction of furfuryl alcohol with formaldehyde, was considered
for use in these experiments. It polymerizes and cross-links at
lower temperatures than does the monoalcohol.
Jiang and Rhine found that furfuryl alcohol substitutes for one
of the butoxide groups in titanium tetra(n-butoxide),1 3 and that the
Ti-OFu bond was more resistant to hydrolysis than the Ti-OnBu
bond. This can be expected to be the case also with the tantalum
and hafnium alkoxides. Despite this hydrolysis resistance, they
found that FuOH was lost from the system when the hydrolyzed
alkoxide/furfuryl alcohol mixture was distilled; a catalytic quantity of
sulfuric acid was added to assist in the retention of the FuOH
through its polymerization. However, addition of the acid decreased
the solubility of the precursor. The precursor, when acid-free water
was used, was a soluble solid or viscous liquid, depending on the
quantity of water used. XRD showed that their TiC was phase-pure
563

after 12 h heating in argon at 1150 0C or more; lower temperature
treatments led to TiO 2 and an unidentified oxycarbide phase.
However, elemental analysis suggested that temperatures of 1300
0C were required to effect complete conversion. Most of their
products analyzed to be high in carbon, however. They calculated
that each furfuryl alcohol molecule gave a carbon yield of
approximately 45%, so that for the Equation 9.1 to go completely, a
metal-to-furfuryl alcohol ratio of 0.8 would be required. For
Equation 9.2, the same ratio would need to be nearly 1.9.
(9.1) M 2 +3C+xC-+MC+2CO+xC
(9.2) M20 5+7C+xC-+MC+5CO+xC
x C = moles of excess carbon
While Jiang and Rhine used a low heating rate of 3 OC/min. for
pyrolysis, since slow heating rates lead to maximum carbon yield,
other work has found that precursor polymers similar to those used
by Jiang and Rhine, and by us, had a post-pyrolysis carbon content
which was independent of the heating rate used.1 0 In all of our
experiments, it should be noted, we used a high heating rate due
to the expectation that we would have plenty of excess carbon.
Stanley et al. noted that the quantity of carbon yield in the coked
(heated to approximately 450 OC) precursor was obtained from the
amount of aliphatic versus unsaturated organic groups in the
polymer, but that there seemed to be a secondary effect of the
identity of the metal. 1 0 This effect also has been reported
regarding burnout of polymer binders from ceramic greenbodies:
addition of metal oxide powders to the greenbodies decreases the
564

amount of carbonaceous residue in the pyrolyzed product. It was
found that highly acidic or basic metal oxide powders were
associated with a higher carbon residue because they lead to
dehydration and formation of additional unsaturation in the organic
polymer. The trend for the Group IV metals is Ti< Zr < Hf in
increasing carbon residue expected.
We investigated briefly the behavior of furfuryl alcohol and an
acid catalyst in the absence of the metal alkoxide (Experiment 23)
As the temperature increased, the viscoscity increased, particularly
over 100 0C. By 115 0C the mixture had become a brown-black gum
and by 120-125 0C it had become a brittle brown-black solid. It
pyrolyzed with a 44% weight retention to X-ray amorphous
material, presumably carbon. This behavior is also what was
observed for precursor mixtures containing furfuryl alcohol and
metal alkoxide.
565
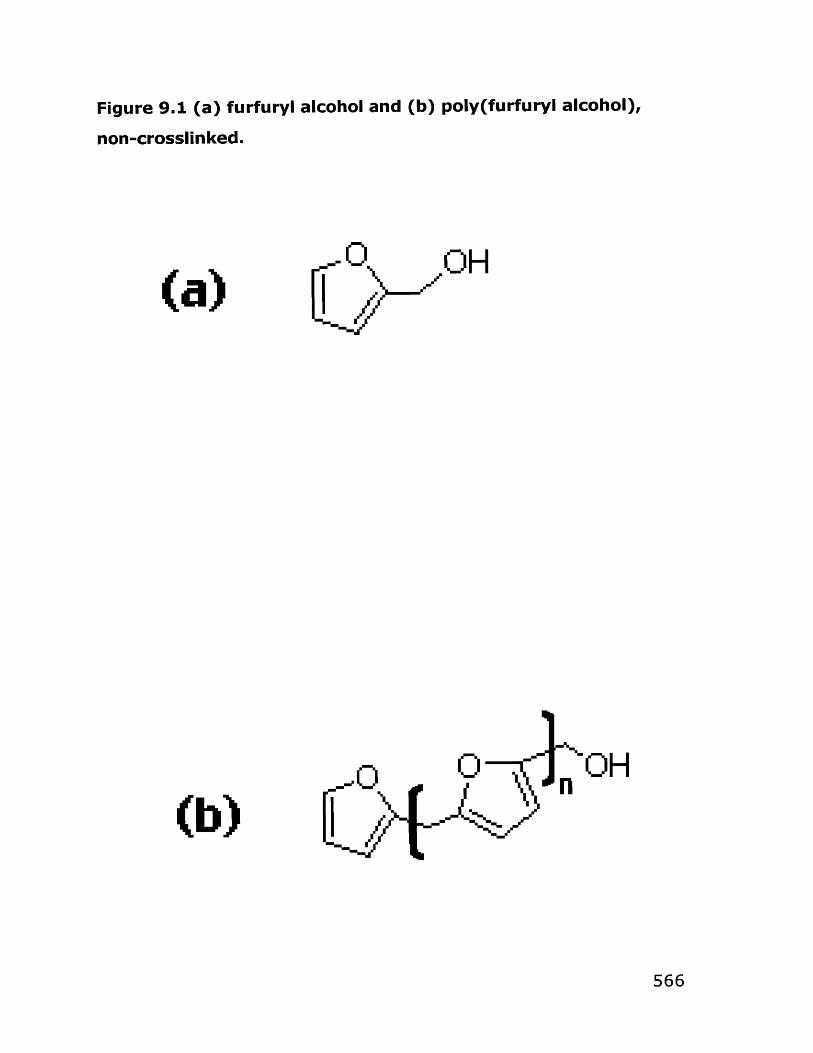
Figure 9.1 (a) furfuryl alcohol and (b) poly(furfuryl alcohol),
non-crosslinked.
(b)
o OH
0 0 OH
I/I
566

9.2 Results and Discussion
9.2.1 Tantalum Carbide Precursors
Initial attempts at using a tantalum alkoxide as a liquid
precursor for tantalum carbide centered on the TiC precursor
prepared by this method and reported in the literature by Jiang and
Rhine.1 3 These preparations (Experiments 1-3) were based on
refluxing tantalum ethoxide with furfuryl alcohol in tetrahydrofuran,
followed by hydrolysis with water equivalent to one mole of
tantalum ethoxide. In the initial experiment, gelatinous solids
appeared immediately on hydrolysis; these pyrolyzed to a
combination of tantalum carbide and oxide, with a 50% weight
retention. Later experiments of this series added 2-
methoxyethanol (2MOE) as a hydrolysis rate modifier and increased
the furfuryl alcohol-to-alkoxide ratio. In these trials, the addition of
less than two equivalents of water provided a precursor that
remained liquid until heating to 120 0C, at which point it gelled; four
equivalents of water added, however, led to an immediate gellation.
Both samples, however, pyrolyzed to TaC.
Because it was undesirable for the precursor to be diluted by
the inert solvent THF, due to the requirements of the application,
the remaining experiments omitted this solvent. Use of seven
equivalents each of 2MOE and FuOH, plus 1.2 equivalents of water,
led to a liquid precursor that gelled on extended heating at 90 0C,
after removal of some solvent in vacuo. (Experiment 4) It produced
TaC (30% weight retention) on pyrolysis. A smaller FuOH- and
2MOE-to-alkoxide ratio (five and three, respectively), combined with
567

hydrolysis with 1.2 equivalents of a 1M sulfuric acid solution, also
gave a solution which was concentrated under vacuum and heating
to an orange-brown viscous liquid. This gave a 56 % weight
retention on pyrolysis to phase-pure TaC. (Experiment 5) Mixing
tantalum ethoxide with furfuryl alcohol directly, with distillation of
liquid between 80-83 0C (presumably be ethanol) and no hydrolysis,
gave an increasingly concentrated liquid which suddenly became a
black solid at 140 OC heating temperature. (Several previous
attempts at this experiment led to a rapid reaction that blew apart
the apparatus and left a glassy black solid.) This solid pyrolyzed to
TaC under several heating conditions with a 55-65% weight
retention. (Experiment 6, see Table 9.1) The FuOH-to-Ta(OEt) 5
ratio was further reduced in Experiment 7 to 2.5, the ratio of 2MOE
to tantalum ethoxide increased to 5, and the amount of hydrolysis
water (acid solution) increased slightly, still leading to a liquid
precursor. On heating to 130 OC, however, with loss of solvent
permitted, the precursor became a rubbery gel. The gel was
insoluble in a range of solvents. It was pyrolyzed by researchers at
Foster-Miller, Inc. to TaC at 1600 OC in 2 h, but weight retention was
not reported by them.
In all cases the pyrolyzed materials were assumed to contain
excess carbon, and this problem was addressed in Experiment 8,
which looked at the effect of varying amounts of FuOH on the
hydrolysis and pyrolysis behavior of the precursor solutions. In
these experiments the 2MOE was left out, and THF used as a
solvent. It was found that ratios of FuOH-to-tantalum ethoxide of
less than 2 gave solid precipitates which persisted when the ratio
became less than 1.5. Solvent THF and in some cases ethanol were
568

distilled from the samples, and they gelled as heating continued.
For higher FuOH:Ta(OEt) 5 ratios the "cured" gel was darker and
more brittle; those containing little FuOH were light-colored and
resinous. Samples having an FuOH:Ta(OEt) 5 ratio of at least 1.5
pyrolyzed to TaC, while those containing less FuOH gave an oxide
and carbide mixed-phase product.
Obtaining a liquid precursor for TaC was, therefore,
reasonably straightforward. Tantalum ethoxide, a liquid, was used
neat with two mole equivalents of furfuryl alcohol and in most cases
up to five equivalents of 2-methoxyethanol. Up to 1.2 equivalents
of 1 M aqueous sulfuric acid as a solution in 2MOE or THF, provided
slowly to the stirred alkoxide solution, could be used to hydrolyze
the alkoxide and provide for polymerization of the FuOH present. It
was not clear from the experiments performed, however, whether
the acid was actually necessary for obtaining a good yield of metal
carbide; it may merely have served to increase the amount of free
carbon in the samples. Due to the difficulties involved with getting
reliable elemental analyses on the refractory carbides, few of these
experiments had their pyrolyzed products analyzed for carbon. For
those that did (see Table 9.4) the carbon analysis was
approximately 20 wt% (6.2 wt% expected for TaC) for the
hydrolyzed samples (pyrolysis time 57 h at 1400 OC) and 40% for
the unhydrolyzed one (pyrolysis time 12 h at 1400 OC). Extended
heating can be expected to remove the excess carbon, but it is
preferable to avoid such a step.
The key to the behavior of the precusor is the replacement of
one or more ethoxide groups on the tantalum center with furfuryl
alkoxide groups. The latter ligands hydrolyze more slowly than
569

ethoxide ligands, and therefore modulate the hydrolysis behavior.
The retention of unsaturated groups on the tantalum center
ensures that material for carbothermal reduction of the Ta-O bonds
will be nearby during pyrolysis. A distillation step was introduced
into the final formulation of the tantalum carbide precursor
(Experiment 9) to help this substitution take place, by providing for
the removal of substituted ethanol from the system. The
hydrolyzed precusor that results from this formulation remains a
liquid until over 100 0C, continued heating and loss of solvent
permits the gelation of the hydrolyzed alkoxide and the
polymerization of the furfuryl alcohol. The reactions that take place
at that temperature are rapid and may take place with release of
gas (see Experiment 6A). Pyrolysis at a ramp rate of 25 OC/min. to
1400, with a 2-hour soak at this temperature, led to phase-pure
TaC in at least one case, but use of temperatures nearer to 1490 OC
and soak times near 12 h, were more typical. Extensive work to
determine minimum heating temperatures and times for formation of
the TaC phase was not done, partially due to the concern regarding
excess free carbon and the difficulties involved in the elemental
analysis, which would have led to slow feedback of information
regarding the effects of the heating regimes.
In the formulation given, however, there is still quite a bit of
excess solvent that could possibly be removed from the system.
The present recommendation, based on how the precursor behaved
on heating, is to perform the curing step (100 0C heating) with
vacuum-assisted solvent removal. However, it is perhaps possible
to synthesize a tantalum alkoxide already containing heavy -OFu
substitution, which would be a liquid and could be used, therefore,
570

neat (possibly without hydrolysis). The experiments described in
this Chapter provide one method of such a synthesis: e.g.
distillation of Ta(OEt) 5 with FuOH to produce the substitution of 2-3
ethoxide groups, followed by careful purification of the mixed-ligand
alkoxide by vacuum distillation. An alternative would be to
synthesize the furfuryl alkoxide directly from TaCIs, or via the
pentakis(dimethylamide) as an intermediate. 2 4 , 2 5 Steric
constraints may limit the substitution to some number less than five,
yielding a chloroalkoxide; but this could be substituted in a second
step with a smaller alcohol such as ethanol. 2 6 An approach via
furfuryl acetate may also be possible. 2 7 , 2 8
A solution to the problem of excess carbon in the pyrolyzed
product may be to hydrolyze the alkoxide with more than the 1-1.5
equivalents which were used in the experiments described. This is,
of course, in addition to decreasing the excess furfuryl alcohol. Use
of a chelating agent such as acetylacetone will help to prevent
precipitation, should that be necessary.
A number of pyrolysis conditions were also tested in the
course of these experiments. Pyrolysis under CO and under non-
flowing argon did not appear to affect the product (although this
was not the case for the hafnium precursors, see below).
(Experiments 17-18)
571

9.2.2 Hafnium Carbide Precursors
Because hafnium ethoxide is commercially available as a solid,
which is probably considerably oligomerized, 2 9 formulation of a
hafnium carbide precursor by the alkoxide method presented an
additional challenge.
In the initial test (Experiment 10), the a high (10-fold) excess
of FuOH and 2MOE were used. The hafnium ethoxide dissolved with
stirring at reflux, but a gel formed on hydrolysis with a single
equivalent of acid solution. The gel broke down with stirring and
heating to 85 OC. A second equivalent of acid solution , plus
distillation of the volatiles, led to a brown viscous gel. Several
pyrolysis conditions were tested (see Table 9.3). Soak times of 10-
12 h over 1400 OC were required to get HfC; some of those
samples, where the temperature ramp rate was 10 OC/min. or less,
were contaminated with Hf0 2. For both fast (25 OC/min) and slow (5
OC/min) heating rates, however, a 20-h soak at 1490 OC was
sufficient to get HfC, phase-pure according to XRD.
While Jiang and Rhine found that furfuryl alcohol substitutes
for one of the butoxide groups in titanium tetra(n-butoxide), 1 3
distillation of hafnium ethoxide with five equivalents of furfuryl
alcohol dissolved all the solids; measurement of the distillate gave a
formula for the substituted alkoxide as Hf(OEt) 1.6(OFu) 2.4. This
hydrolyzed in acid solution (1 equivalent) to a loose gel, which
pyrolyzed to HfC. (Experiment 11) The unhydrolyzed liquid was not
pyrolyzed, however. A single equivalent of furfuryl alcohol, plus
572

three equivalents of 2MOE, were sufficient to dissolve the hafnium
ethoxide with stirring overnight (warming sped the process).
Hydrolysis with slightly over one equivalent of acid solution in 2MOE
gave some gel formation, but this re-dissolved and the mixture
appeared to be a homogeneous liquid after stirring and heating.
The liquid was heated, in fact, to some 195 OC (volatiles were
refluxed, rather than being permitted to vent) without solidification.
A second equivalent of acid solution and heating led to an insoluble
gel, which was pyrolyzed to HfC by heating at 1600 OC for 2 hours
by researchers at FMI, Inc.; the weight retention was not reported
by them. (Experiment 12)
Later preparations (Experiments 13 and 15) used a high
excess of FuOH and 2MOE to attempt to suppress any solids or gel
formation. While these mixtures did in fact behave in the desired
manner with respect to hydrolysis, they were insufficiently
concentrated to satisfy the requirements of the application.
Hafnium ethoxide (Experiment 14) was stirred with ethanol
overnight before mixing with excess furfuryl alcohol, in the hopes of
being able to thereby improve the solubility and alcohol-exchange
reactivity of the ethoxide. The volatiles were distilled off at 76-80 OC
and the distillate, identified by NMR as ethanol, was weighed to give
a presumptive formula of Hf(OEt) 2(OFu) 2 in a furfuryl alcohol
solution. This liquid was pyrolyzed directly, giving HfC; however, the
morphology of the pyrolyzed product suggested that a large
quantity of gas had caused foaming during some stage of the
pyrolysis. Mixing the liquid with glycerol, then pyrolyzing, also gave
HfC, but this sample was relatively dense, probably due to alcohol
exchange between the hafnium alkoxide in solution and the
573

polyalcohol, which has the potential for cross-linking. Use of
polyalcohols with simple alkoxides to provide solid polymer
precursors for carbides is known from the patent
literature.6-9 1 1,12
Finally, the isopropanol adduct of hafnium isopropoxide was
tested in the hopes of providing improved solubility (due to a
smaller degree of oligomerization expected with the bulkier alkoxide
ligand and due to the alcohol adduct) and slower hydrolysis (as
expected for a larger and more ramified alkoxide group).
(Experiments 16, 18) Even in high excess furfuryl alcohol, however,
hydrolysis with only one equivalent of acid solution led to gelation.
Hafnium ethoxide was chosen as the starting material for
these experiments because only very small samples of other
alkoxides were available commercially, and there were long (6-8
week) lead times for delivery of orders. Other alkoxides were, in
addition, more expensive. Hafnium isopropoxide monoisopropylate
was tested because it was expected to have improved solubility
and slower hydrolysis, relative to the ethoxide. The butoxide would
have been a superior starting material, as it is a liquid, but cost and
availability issues prevented its being tested. A possible solution to
the solubility and hydrolysis problem is to synthesize the desired
hafnium alkoxides directly. While many metal alkoxides are
synthesized from either metal chloride plus the alkali metal salts of,
say furfuryl and alcohols (two equivalents of each), or from the
chloride and alcohol directly, in the presence of an ammonia to act
as an HCI trapping agent, it is questionable whether this approach
will work well with hafnium. Bradley et al. first convert the hafnium
tetrachloride into the pyridinium hexachloride, then react with
574

alcohol in the presence of ammonia. 3 0 A synthesis of hafnium
alkoxides starting from the tetrachloride and an ester also looks
promising, but does not appear to be in wide use. 2 7 , 2 8
A further point is that all the experiments described in this
section involved acid hydrolysis of the alkoxide/furfuryl alcohol
mixture. It is possible that hydrolysis with neutral water would
have not led to the gelation and solids that were seen in these
experiments; on the other hand, the acid was added to improve
retention of the furfuryl alcohol, to ensure its availability for the
carbothermal reduction. While many of the experiments here had
furfuryl alcohol in such high excess that "running out" of it was
unlikely to be a problem, that consideration would become
important as further work reduced the quantity of excess alcohol
required to dissolve the hafnium alkoxide.
Pyrolyses under a number of conditions were explored.
Pyrolysis under CO yielded hafnium oxide, as did pyrolysis under
non-flowing argon. Pyrolysis under a very slow argon flow, with a
33 h soak at 1490 OC, led to HfC (20% weight retention) with a 7.3
wt% carbon analysis. The use of a graphite crucible led to a
pyrolyzed product with a soft, greasy feel, suggesting that it was
extremely high in graphitic carbon. Slow heating rates did not
appear to affect the results; for 25 h soaks at 1490 0C, a 5 OC/min.
ramp rate gave HfC with 11.93 wt% carbon, while the 25 OC/min
ramp rate gave 12.19 wt%. Experiments involving shorter soak
times at these temperatures and ramp rates were not performed,
due to time constraints. See Table 9.5 for a summary of
experimental conditions used.
575

9.2.3 Precursors for Other Metal Carbides
Because the major goals of this project only referred to the
production of precursors for tantalum and hafnium carbide,
exploration into using the alkoxide approach as a route to other
carbides was at best cursory. Of course, a process for making
titanium carbide has been reported in the literature. 1 3 A more or
less direct substitution of Ti(OiPr)4 in the tantalum carbide precursor
recipe, however, also gave a liquid precursor for TiC. Use of
titanium tetrabutoxide was successful as well in giving a liquid
precursor for TiC. (Experiments 25, 27)
Niobium carbide was tried only once due the limited quantity
of niobium alkoxide that was immediately available. In this case,
hydrolysis led to a gelatinous solid, possibly due to the hexane
present in the starting material (Nb(OiPr) 5 10 w/v% in 50-50 iPrOH-
hexane). The extremely fast hydrolysis of niobium alkoxides, in
general, contributed to the formation of solid on hydrolysis; the
large quantity of parent alcohol in the starting material preparation
would have acted to suppress substitution of the -OiPr groups with
the slower-hydrolyzing -OFu or -2MOE. However, the solid
pyrolyzed to give NbC plus some other phases tentatively identified
as other niobium carbides (Nb 5 C6). The peaks did not match any
niobium oxides in the JCPDS database. (Experiment 25)
Zirconium carbide was tried several times using in all cases a
70 wt% solution of the n-propoxide in the parent alcohol as a
starting material. A sample with 5 equivalents of FuOH and 1.5
equivalents of sulfuric acid solution, gave a gelatinous solid which
576

pyrolyzed to ZrC. (Experiment 25) In another experiment, the
propanol was distilled off to give a solution of Zr(OFu) 2.4(OPr) 1.6 in
furfuryl alcohol, but hydrolysis with 1 equivalent of acid solution
gave a suspension of gelatinous clots. A second equivalent of acid
solution led to a gel, which became ZrC on pyrolysis. (Experiment
26) A variation on this experiment led to a viscous liquid that
remained liquid to 210 0C until vacuum was applied: because gel
was present when the hydrolysis was done, however, it is uncertain
whether this preparation could be considered to be a "liquid
precursor" - i.e. whether it would have passed completely through,
say, a filter medium. A third variation on this experiment, with a
higher quantity of 2MOE than had previously been used, gave wisps
of solid on hydrolysis, but these redissolved when the mixture was
heated. (Experiment 27) The mixture remained liquid to 210 OC.
The viscous liquid was pyrolyzed to ZrC and ZrO2 contamination,
and the morphology of the pyrolyzed material suggested that the
precursor had produced a large quantity of gaseous material, as it
appeared that a foam had been produced before the organics
became charred in the furnace. A second sample of this precursor,
which had been left open to air for several weeks and became a
dense amberlike solid, pyrolyzed to ZrC. Finally, a preparation
containing a large excess of 2MOE and FuOH (Experiment 28) was
hydrolyzed without appearance of solids; after heating and being
permitted to stand in a closed container for several weeks,
however, this became a crumbly tarlike solid.
In all of the ZrC precursor experiments, it appears that the
too-fast rate of hydrolysis of the zirconium propoxide was a
stumbling block. Further experimentation, using the butoxide
577

and/or more carefully removing the excess parent alcohol to ensure
substitution of the alkoxide ligands, needs to be done.
These preliminary results demonstrate that the alkoxide route
outlined for the tantalum and hafnium carbide precursors can readily
be adjusted to formulate precursors for other metal carbides. The
problem of too-fast hydrolysis leading to the formation of a gel or
precipitate can be addressed by changing to a less-hydrolyzable
starting material at the outset (where these are easily available) or
by use of a chelating agent (acetylacetone, for instance) or other
materials to modify the hydrolysis and condensation rates. Such
methods are well-known in the sol-gel field, and are cited in Part I
of this thesis. By the same basic strategies, mixed-metal carbides
can be synthesized simply by mixing appropriate starting ratios of
the metal alkoxides with furfuryl alcohol and adjusting the
hydrolysis rates using the methods cited in Part I so that one metal
alkoxide does not react significantly faster than the other(s).
578
9.3 Conclusions and Outlook
Using metal alkoxides and furfuryl alcohol as starting
materials, we were able to formulate liquid or soluble precursors for
metal carbides. The precursors, in most cases, underwent
polymerization to gums or glassy solids on heating with removal of
solvent during a 125-150 0C curing step, then were pyrolyzed to the
metal carbides with a 30-50% weight retention compared with the
cured solid. Generally this pyrolysis step was performed at
temperatures of at least 1400 OC and heating times of 10-12 h.
Because the ability to produce metal carbide at lower temperatures
was not a goal of the project, however, a study of which phases
appeared at what heating temperatures and times was not
performed. The pyroylzed solids contained some 20 percent carbon
by weight, on average, compared with the 6% carbon expected for
a pure metal carbide sample. The alkoxide-based precursors for
metal carbides have the benefit of ease of preparation at even the
multikilogram scale.
There are several difficulties that remain to be addressed with
this route, however. Those metal alkoxides which are not liquid
require an excess of furfuryl alcohol to dissolve them. This
contributes to a low carbide production per gram of liquid starting
material, because the excess furfuryl alcohol solvent must be
removed at some point during the fabrication step; and any excess
furfuryl alcohol that is not removed contributes to the free carbon
excess in the pyrolyzed solid. This issue was not a major concern
579

for the tantalum carbide precursor, where the neat tantalum
ethoxide starting material is a liquid. However, the low solubility of
the hafnium ethoxide starting material made the excess solvent a
real problem. For the other metal carbides produced in this
Chapter, the starting alkoxides were available as more or less
concentrated solutions in the parent alcohols, so while less furfuryl
alcohol was required in these cases, the precursor liquid was still
more dilute than it ideally should be.
One solution, mentioned above, is to synthesize liquid hafnium
and zirconium alkoxides directly as starting materials. Larger
alcohol groups will deter the oligomerization that leads to
insolubility of these alkoxides; if the furfuryl alcohol is directly used
as an alkoxide ligand, this will save on the quantity of solvent
required. An ideal situation would be to produce a homoleptic metal
alkoxide using unsaturated alcohols with an unsymmetrical
substitution to prevent crystallization. The unsaturation will provide
sufficient carbon on pyrolysis to force the carbothermal reduction of
the metal-oxygen bonds. Such metal alkoxides could be made via
the usual methods of alkoxide synthesis.
Hydrolysis of the precursor solutions was carried out in this
formulation for three reasons. First, it provided the acidic
environment required for catalyzing the polymerization of the
furfuryl alcohol. Second, the hydrolysis and condensation reactions
of the metal alkoxides led to a M-O-M network which safeguarded
against evaporative metal loss during thermal treatment and
removed the most hydrolyzable alkoxide ligands, viz. ethoxide,
propoxide, butoxide (leaving the furfuryl alkoxide ligands) from the
bonding sphere of the metal. This reduced the amount of excess
580

carbon in the pyrolyzed product. Finally, the hydrolysis step may
make a significant difference between the processes already
patented and the one designed here.
However, the hydrolysis step comes with the risk of
precipitation or gelation of the precursor material prior to the curing
step. This can be avoided in some cases by using less than or
equal to one equivalent of water in the hydrolysis step. In other
cases, a compound added to slow the hydrolysis further can be
added. Here, we used 2-methoxyethanol, which had shown
success in the work on vanadium alkoxides presented in Part I of
this thesis. However, other compounds may be more beneficial,
particularly acetylacetone or alkanolamines. These will, at least in
theory, substitute the more hydrolyzable alkoxide groups first, so
that the furfuryl alkoxide ligands will remain intact on the metal
despite the addition of these materials.
Many of the precursor samples produced a brittle, glassy
pyrolyzed material. While this morphology may have been partially
due to the excess carbon, gas production during the pyrolysis is a
concern. Samples which were loaded into the furnace as a liquid,
rather than as a densified post-cured solid, appeared to have
foamed up with gas during the heat treatments. It is unclear to us
how to eliminate this difficulty via the chemistry, although some of
the concepts regarding the fractal dimension of the hydrolyzed and
condensed alkoxides, discussed in Part I of this thesis, may be
applied. In particular, tweaking the hydrolysis chemistry to give a
more linear M-0-M polymer by adjusting the acidity of the hydrolysis
water could help. Also, using slow, multistage heat treatments and
vacuum-assisted removal of the solvent vapors and decomposition
581

gases produced during heating, will maximize densification and
minimize pore production.
While the process discussed in this Chapter specifically uses
furfuryl alcohol as the source of carbon for the reduction of the M-0
bonds, metal alkoxides can be used with a number of other
materials reactions with the same basic concept to produce liquid
precursors for metal carbides. There was not sufficient time during
this project to explore these possibilities, but they will be mentioned
here for completeness.
Copolymerization of metal (Ti, Nb, Ta) alkoxides with ethyl
cellulose (the ethyl ether of cellulose) led to a material with M-0-
cellulose bonds. The copolymerization was effected by heating
equal weights of the alkoxide and ethyl cellulose in toluene for two
hours, followed by removal of the solvent by distillation. 3 1 While
the products were solids, it is possible that using a higher metal-to-
cellulose ratio could lead to a liquid. Vanadium alkoxide has been
reacted with acetoacetoxyethylmethacrylate (AAEM) in the presence
of azobis(isobutyronitrile) (AIBN) and water, leading to the
simultaneous development of inorganic (metal alkoxide-based) and
organic (AAEM-based) polymers. The resulting material was a film-
castable sol. 3 2 The analogous reaction for hafnium or zirconium
alkoxides may be worth exploring. Other possibilities may arise by
examining the optical coating literature for promising inorganic-
organic polymers. A final suggestion is the mixture of poly(vinyl
alcohol) with the alkoxides: the unsaturation on the PVA will
possibly provide for sufficient carbon retention on coking for the
carbothermal reduction to take place.
582

9.4 Experimental
All of the experiments were done in pre-dried glassware on a
Schlenk line equipped with vacuum and oxygen-scavenged argon.
Solid samples were loaded into glassware in a nitrogen-filled
glovebox. Solvents were distilled from Na/benzophenone or CaH 2
prior to use. Except where indicated, reagents were used as-
received from the indicated manufacturer.
NMR and XRD characterizations were performed on same
instruments as those described in the Appendix to Part I. Pyrolyses
were carried out in Lindberg(R) 1500 IC tube furnaces using mullite
tubes joined gas-tightly at the ends with quartz fittings. A thick-
walled rubber tube led from an argon tank, through a tube
containing an oxygen scavenger, and into the mullite tube via the
quartz fitting. The quartz fitting on the downstream end was
directed to a thinner-walled rubber tube leading to a mineral oil
bubbler and into a fume hood. The mullite tube was flushed rapidly
for 30 minutes prior to the insertion of a tared sample; the sample
was inserted into the approximate center of the furnace under rapid
argon counter-flow, then the furnace tube closed up and flushed for
15-30 minutes further. The gas flow rate was then reduced to
approximately 1 bubble/minute and left at that rate during the
furnace's heating and cooling cycle. Due to problems with the
furnace controllers, the furnace was checked often and adjustments
made during a run if the final temperature had not been reached
appropriately. Samples were pyrolyzed in graphite or alumina boats
583

and were ground and examined by XRD as described in the
Appendix to Part I of this thesis. It should be noted that for a
number of the XRD experiments, the monochromator was not in
place, leading to a set of peaks arising from the Cu KP line. These
peaks have been positively identified, and are marked on the
relevant figures; they do not arise from a second phase. (Figure
9.2)
TGA/DTA was performed on a Perkin-Elmer TGS-1 under Ar.
Simultaneous differential thermogravimetric analysis and
thermogravimetric analysis (DTA-TGA) data were obtained using a
TA Instruments SDT 2960 under He in the lab of Dr. H.-C. zur Loye,
at the University of S. Carolina.
Compounds used include: furfuryl alcohol (Aldrich, 98%), 2-
methoxyethanol (Aldrich, 99.8% anhydrous), Ta(OEt) 5 (Strem,
99.99+%), Hf(OEt) 4 (Strem, 99%), Hf(OiPr) 4*HOiPr (Strem 99%),
Zr(OPr) 4 (Aldrich, 70 wt% in propanol), Ti(OiPr) 4 (Aldrich 97%),
Ti(OBu) 4 (Strem 98%), Nb(OiPr)5 (Aldrich, 10% w/v in 1:1
iPrOH/hexane).
In the experimental descriptions below, the quantity of moles
listed beside sulfuric acid solutions is that of the water, not of the
acid. The following abbreviations are used: FuOH = furfuryl alcohol,
2MOE = 2-methoxyethanol.
584

9.4.1 Tantalum Carbide Precursors
Experiment 1: JP-I-285 Ta(OEt)s + FuOH/THF + H2 0
In a 100 ml 3-neck flask equipped with a stir bar and a condensor
were placed furfuryl alcohol (used as-received, 2.2 ml, 25.4 mmol)
and 30 ml tetrahydrofuran, to give a pale yellow solution. Ta(OEt) 5
(10 g, 24.6 mmol) was added, making the solution a darker shade
of yellow. The mixture was refluxed briefly, then water (0.45 ml, 25
mmol, 1 equiv.) added at 40 OC. White-yellow chunks of solid
instantly appeared. The mixture was refluxed overnight to give a
milky tan suspension. The solvent was removed in vacuo, leaving
approx. 6 g of solid which would not redissolve in any common
solvent.
A 2.4694 g sample was pyrolyzed in an alumina boat under
argon, heating at 10 OC/min to 350 0C, hold for 1 hour, then ramping
25 OC/min to 1450 0C, hold for 30 min., then cooling. After this heat
treatment, there were 1.2401 g (50. 2 %) recovered of a chunky
blue-black shiny solid. XRD showed poorly crystalline TaC, Ta2 0 5 ,
and other materials. (Figure 9.3)
Experiment 2: JP-I-286-1 Ta(OEt)s + 2MOE + FuOH/THF + H2 0
Ta(OEt)5 (5.5 g, 13.5 mmol), 2-methoxyethanol (5 ml, 63 mmol), 10
ml of tetrahydrofuran, and furfuryl alcohol (5 ml, 56 mmol, used as-
received) was added to a 50-ml 3-neck flask equipped with a stir
585

bar and a condensor to give a yellow-brown solution. To this
solution, stirring vigorously, a suspension of H20 in 15 ml
tetrahydrofuran (0.45 ml, 25 mmol, 1.85 equiv.) was added
dropwise. No immediate reaction was apparent; the mixture was
set to reflux and became a viscous gel at 120 OC bath temperature.
It was cooled and the solvent removed in vacuo to give 5.190 g of
solid.
A 2.1738 g sample was pyrolyzed in an alumina boat under
argon, heating at 10 OC/min to 350 OC, hold for 1 hour; ramping 25
OC/min to 1450 0C, hold for 30 min.; then cooling. After this heat
treatment, there were 0.8613 g (39. 6 %) recovered of a chunky
blue-black shiny solid. XRD showed TaC, but no Ta2 0 5 . In a second
pyrolysis trial, the sample (0.6637 g) was pyrolyzed, ramping from
room temperature at 10 OC/min. to 200 0C, held for 10 h, then
ramped at 20 0C/min to 1400 0C and held for 57 h, all under flowing
argon. This left a mixture of dull grey and brown-gold solid, 0.4265
g (64.3%), identified by XRD as TaC. (Figure 9.4)
Experiment 3: JP-I-286-2 Ta(OEt)s + 2MOE + FuOH/THF + H2 0
Ta(OEt) 5 (5.5 g, 13.5 mmol) was added to a 50-ml 3-neck flask
equipped with a stir bar and a condensor with 2-methoxyethanol (5
ml, 63 mmol), 10 ml of tetrahydrofuran, and furfuryl alcohol (5 ml, 56
mmol, used as-received), to give a yellow-brown solution. A
suspension of H20 (1 ml, 55.6 mmol, 4 equiv.) in 15 ml
tetrahydrofuran was added dropwise to the rapidly stirred mixture
at room temperature; within approximately 2 mintues an opalescent
gel immobilized the stir bar. The gel became opaque over 10-15
586

min. The solvent was removed in vacuo to give 6.704 g of amber-
like glassy chunks.
A 2.0616 g sample was pyrolyzed in an alumina boat under
argon, heating at 10 OC/min to 350 0C, hold for 1 hour; ramping 25
OC/min to 1450 0C, hold for 30 min., then cooling. After this heat
treatment, there were 1.5722 g (76.3%) recovered of a chunky
blue-black shiny solid. XRD showed TaC, Ta20 5 , and possibly other
phases. In a second pyrolysis attempt the sample (0.4342 g) was
pyrolyzed, ramping from room temperature at 10 OC/min. to 200 OC,
held for 10 h, then ramped at 20 OC/min to 1400 0C and held for 57
h, all under flowing argon. This left a dull brown-gold/grey solid,
0.2447 g (56.3%), identified by XRD as TaC.
Experiment 4: JP-I-291 Ta(OEt)s + 2MOE + FuOH + H2 0
Ta(OEt) 5 (5 g, 12 mmol) was added to 2 ml of 2MOE (25.4 mmol) and
2 ml of FuOH (23.1 mmol, vacuum distilled 70-75 OC/10-12 mm) in a
3-neck flask. This mixture became yellow over approximately 10
min. A solution of 0.25 ml H20 (13.8 mmol, 1.2 equiv.) in 4 ml 2MOE
(50 mmol) and 3 ml FuOH (34.8 mmol) was added dropwise to the
vigorously-stirred mixture, and the color became greenish. It was
stirred at room temperature for 2 h, becoming bright yellow, then
was heated to reflux. Vacuum was applied for approximately 5
minutes at 60 0C heating temperature, then the flask was returned
to atmospheric pressure under argon. At 90 OC the mixture became
a dark brown gel (18 hours after hydrolysis). The solvent was
removed under vacuum and 4 g of brown obsidian-like solid was
obtained. Elemental analysis: 31.59% C, 2.85% H.
587

The sample (3.9482 g) was pyrolyzed under gently flowing
argon, ramping from room temperature at 10 0C/min. to 200 0C, held
for 10 h, then ramped at 20 OC/min to 1400 OC and held for 57 h.
This left a black glassy solid, 1.1882 g (30%), identified by XRD as
TaC. (Figure 9.5) The sample was also pyrolyzed in a TGA/DTA
under helium, ramp rate 25 OC/min., and showed decomposition in
three main steps, at 200 0C (exothermic), 450 OC (exothermic), and
1100 OC (endothermic). The last step probably represents the
carbothermal reduction of the M-0 bonds. The TGA yield was
approximately 56%. (Figure 9.6)
Experiment 5: JP-I-292 Ta(OEt)s + FuOH + H+/H 20
Ta(OEt)5 (5 g, 12 mmol) and FuOH (5 ml, 57.8 mmol) were mixed in
a vial to give a yellow solution. A solution of 1 M H2 SO 4 (0.25 ml,
13.8 mmol, 1.2 equiv.) in 3 ml 2MOE (38 mmol) was injected slowly
into the Ta alkoxide solution with vigorous shaking. There was an
exotherm. Half of the sample was taken into a second vial and
concentrated under vacuum with heating. It was left under vacuum
over 2 days and became orange-brown and viscous liquid.
Elemental analysis: 24.27% C, 2.69% H. The other part was left
undisturbed over 2 days and remained unchanged.
The viscous sample (1.5366 g) was pyrolyzed under gently
flowing argon, ramping at 20 OC/min to 400 0C, holding for 10 min.,
then ramping at 25 OC/min. to 1400 OC and holding for 2 h. This left
0.8682 g (56%) of dense chunky solid. XRD identified the phases
present as TaC; Ta oxides were not seen. (Figure 9.7). TGA was
run under argon, ramp rate 10 OC/min., and showed a two
588
decomposition steps at approximately 160 0C and 460 OC. TGA yield
was 7 2 %, however, this represents only the removal of the
organics present to approximately 900 OC. (Figure 9.8)
Experiment 6: JP-I-298B Replacement of EtOH by FuOH
A. Ta(OEt) 5 (7.67 g 19 mmol) of was placed in a 100-ml schlenk
flask equipped with a stir bar and a short-path distillation head. 10
ml (111 mmol) FuOH was added to give a yellow solution. The
mixture was heated to distill off ethanol. Yellowish liquid distilled
72-90 OC. When the bath temperature reached 150 OC the
apparatus blew apart leaving a solid black residue. The experiment
was repeated once with the same result.
B. Ta(OEt) 5 (10.9 g, 26.8 mmol) was placed in a small flask and 10
ml FuOH (116 mmol) added. Distillation of yellowish liquid occurred
between 81-83 OC. Continued heating was performed very slowly.
When the bath temperature reached 140 OC the material in the flask
became a gummy black solid. Elemental analysis 47.42 % C 3.30%
H. The sample was pyrolyzed several times under flowing argon
using different heating regimes: see Table 9.1 below.
Experiment 7: JP-II-73A Ta(OEt)s + FuOH + H+/H 20
Ta(OEt)5 (8.5 g, 20.9 mmol) and FuOH (5 ml, 57.8 mmol, used as-
received) were added to a vial and hydrolyzed with a solution of 0.5
ml 1 M H2 SO 4 solution (27.8 mmol, 1.32 equiv.) in 5 ml 2MOE (63.4
mmol) and 2 ml FuOH (23.1 mmol). The vial was shaken and left
sealed overnight and found to be still liquid. It was heated at 130
OC with venting to a bubbler, leading to a mix of liquid and gel. This
589

was left to cool overnight, producing a hard red-brown gel. The
solvent was removed in vacuo and 14.41 g rubbery black chunks
collected. These were insoluble in tetrahydrofuran, toluene, and
heptane. Three samples were heated on the premises at Foster-
Miller, ramp rate 25 OC/min to 1600 0C, 1800 0C, or 2000 0C, hold for
2 h under argon. All three samples were identified as TaC by XRD,
and increased in crystallinity with increasing temperature, as
expected. The 2000 0C sample also showed an XRD peak for
graphite. (Figure 9.9) Weight retention was not reported by FMI
for any of the samples. ESEM examination of the 1600 0C sample
particles showed dense and smooth surfaces, suggesting that
either little gas production had occurred during pyrolysis. (Figure
9.10)
Experiment 8: JP-II-78 Ta(OEt)s + varying FuOH + H+/H 20 in
THF
In each of 7 vials 2.5 g (6.15 mmol) of Ta(OEt) 5 was stirred with
FuOH as listed below (Table 9.2) and 10 ml of tetrahydrofuran for 1
hour. The samples were then hydroyzed with 0.11 ml (6.11 mmol)
1M H2 SO 4 solution in 5 ml tetrahydrofuran and stirred over 2 days.
The samples were transferred to small flasks equipped with stir
bars and short-path distillation heads and the distillate collected.
For vials #1-3 the first fraction was collected 65-68 0C (clear and
colorless liquid) and the second from approximately 80-90 0C (yellow
liquid). In these samples the material became a brown solid. Vials
# 4-7 distilled only at approximately 64-70 0C, with no yellow liquid
collected. Gels were produced in these samples with continued
590

heating. The collected distillates were identified by NMR as being
THF with a very small amount of ethanol, so it is expected that little
or no ethanol was driven off the alkoxide. The solids were darker
and more brittle for higher amounts of FuOH; smaller amounts of
FuOH gave yellow resinous solids. The solids were held under
vacuum overnight and found that the solids were more
powdery/crumbly with decreasing FuOH. They were pyrolyzed
under argon, ramp rate 10 OC/min. to 1490 OC, hold for 4 h then
cooling. Results can be found in Table 9.2. (Figure 9.11 a-c)
Experiment 9: Formulation for TaC precursor
In the glovebox add to an oven-dried 500 ml schlenk flask
equipped with a stir bar 50 g tantalum ethoxide (250 mmol) and 40
ml (400 mmol) furfuryl alcohol (FuOH). The solution becomes yellow
(or more yellow, if the FuOH was used undistilled). Stir for 2 hours
at room temperature, then heat the stirred flask on an oil bath to
80 OC for 4 hours under a gentle inert gas sweep directed in the gas
inlet tub and out the schlenk arm to a trap (cool in ice water) which
is vented to an oil bubbler. Cool to room temperature, still with
inert gas sweep, and slowly add a solution of 4.5 ml 1M sulfuric acid
(H2 SO 4 ) (250 mmol) solution in 40 ml (500 mmol) 2-methoxyethanol
(2MOE) with rapid stirring. You may see some wisps of semisolid
form: if so, increase the stirring rate and slow the addition rate of
the hydrolysis solution. Close up and stir overnight.
591

9.4.2 Hafnium Carbide Precursors
Experiment 10: JP-I-296 Hf(OEt) 4 + 2MOE + FuOH + H20/H+
Hf(OEt) 4 (6.04 g, 16.8 mmol) was mixed with 10 ml FuOH (116 mmol,
distilled) to give a yellow milky suspension. This was warmed to try
to dissolve the solids. 5 ml of 2MOE was added, then, after 2 h of
stirring, 5 ml more 2MOE was added (total 10 ml, 126.8 mmol). After
an additonal hour of stirring, the solution was heated to reflux,
dissolving all solids. The mixture was cooled and a solution of 0.3
ml 1 M H2 SO 4 (16.7 mmol) in 1 ml 2MOE (12.7 mmol) added.
Gelatinous chunks appeared instantly. The mixture was shaken and
stirred vigorously for 10 minutes but the gel would not break up.
The mixture was heated to distill off the liquid; at 85 OC it became a
clear brown solution. An additional 0.3 ml of 1 M H2 SO 4 (16.7 mmol)
solution in 1 ml FuOH (11.6 mmol) was added at 110 OC, giving
white and brown-black solid chunks. It was stirred for 45 minutes
at 110 OC with distillation of volatiles, leaving a brown viscous gel
containing brown semisolid chunks. The mixture was placed under
vacuum overnight, leaving 13.72 g of sticky brown semisolid.
The sample (3.2764 g) was pyrolyzed under gently-flowing
argon, under several different heating schemes. Results are
summarized in Table 9.4. (Figure 9.12 a-b) DTA/TGA on the sample
was performed under helium. Heating at 25 OC/min. showed a four-
stage weight loss 50-200 0C (solvent loss, slight endothermic), 250
0C (exothermic), 500 0C (exothermic), 600 IC-1200 0C (endothermic,
592

carbothermal reaction). Weight loss is essentially complete at 1250
0C. The TGA yield was 68%. (Figure 9.13)
Experiment 11: JP-I-298 Replacement of EtOH by FuOH
A. Hf(OEt) 4 (7.27 g, 20.2 mmol) was placed in a 100 ml schlenk flask
with a short-path distillation head. 10 ml (110 mmol) FuOH was
added to give a yellow solution and white suspended powder. The
sample was heated to try to distill off the ethanol. At bath
temperature 105 0C all solids had dissolved to give a cloudy brown
solution; distillation occurred at vapor temperature 75-77 0C. At
vapor temperature 80 OC the distillation was stopped and the
mixture cooled. 2.23 g (48 mmol) of clear and colorless liquid
(identified as containing only ethanol by NMR), suggesting that
solution of a material of approximate formula Hf(OEt) 1.6(OFu) 2.4 in
FuOH had been obtained.
Approximately 1/2 the volume of the sample (10 mmol Hf) was
hydrolyzed with 0.2 ml (11.1 mmol) of 1M H2 SO 4 solution in 1 ml
2MOE (12.7 mmol), leading to a chunky gel. Solvent was partially
removed by placing the gel under vacuum for 2 h at room
temperature, leaving a sludgy gel plus a liquid. 0.1 ml (5.5 mmol) of
H20 was added directly and the sample left overnight, during which
time it solidified completely. Elemental analysis of the precursor
was 41.9 % C, 4.99% H. This precursor was pyrolyzed under
flowing argon at a ramp rate of 25 OC/min to 1490 CC, holding for 25
h then cooling, to give a glassy black solid (2.2192 g before, 0.5212
g after, 23.5%) which was HfC according to XRD. Heating to 1490
CC at 5 OC/min, holding for 25 h, then cooling, led to a glassy black
593

solid identified as HfC (2.4638 g before, 0.5619 g after, 22.8%). A
sample heated at 25 OC/min to 1490 OC was examined under ESEM,
and found to be comprised of porous particles, indicating that a
large amount of has production had occurred on pyrolysis. (Figure
9.15)
Experiment 12: JP-II-74 Hf(OEt) 4 + FuOH + 2MOE + H'/H 20
Hf(OEt) 4 (4.2 g, 11.7 mmol) and 10 ml (11.6 mmol) FuOH were
stirred together overnight. Most solids dissolved. 3 ml 2MOE (38
mmol) were added to dissolve the small amount of remaining solid.
The mixture was hydrolyzed by dropwise addition of 0.25 ml (13.9
mmol) of 1 M H2SO 4 solution in 3 ml (38 mmol) 2MOE. Some
semisolid appeared but the sample homogenized to a murky brown
viscous liquid after 2.5 h of stirring at room temperature. The
sample was heated with venting to an oil bubbler. At bath
temperature 145 0C brown liquid began to reflux in the flask (the
liquid refluxing earlier had been clear and colorless). The bath
temperature was brought to 195 0C, with the sample remaining
liquid. It was cooled and left overnight. The dark brown liquid was
hydroyzed with an additional 0.25 ml (13.9 mmol) of 1 M H2SO4
solution in 3 ml (38 mmol) 2MOE and again heated. Gelation began
at 100-110 0C and solid separate from a boiling liquid phase had
formed by 145 0C. The volatiles were removed in vacuo and 17.5 g
of gummy brown solid collected. The solid was insoluble in
tetrahydrofuran, heptane, and toluene. Three samples were
heated on the premises at Foster-Miller, ramp rate 25 0C to 1600 0C,
1800 0C, and 2000 0C, hold for 2 h under argon. Crystallinity
594

increased with increasing pyrolysis temperature; all had XRD
patterns matching HfC. The 2000 OC pattern did not show
cyrstalline graphite. Weight retention was not reported by FMI for
any of the samples. (Figure 9.16). ESEM of the 1600 OC sample
showed a large, smooth grains covered with "fuzzy" particles, which
may have been free carbon. (Figure 9.17)
Experiment 13: JP-II-81 Hf(OEt) 4 + FuOH
Hf(OEt) 4 (6.80 g, 19 mmol) was stirred in 25 ml (290 mmol) FuOH
over two days to give a clear brown solution. This was hydrolyzed
by slow addition of 0.35 ml (19.4 mmol) of a 1 M H2 SO 4 solution in 3
ml (38 mmol) of 2MOE. Some gelatinous chunks appeared. The
sample was shaken for 15 minutes and became homogenous; the
sample was heated and a yellow distillate collected, leaving 15.90 g
of glassy black residue (some sample was unrecoverable from the
flask). The precursor elemental analysis was 57.4% C, 3.87% H.
The sample was pyrolyzed in a graphite boat under flowing argon,
heating at 10 OC/min to 750 OC, hold for 20 min. then heating at 25
OC/min to 1490 OC, hold for 6 h before cooling. The black-grey solid
(1.9930 g before, 1.11499 g after, 57.7%) was identified by XRD as
Hf0 2 plus some HfC. It was re-pyrolyzed (0.7576 g before, 0.7522 g
after, 99.3%) by heating at 25 OC/min to 1490 0C, then holding for 4
h before cooling, and while it increased in crystallinity it remained a
mixture of HfC and HfO2. (Figure 9.18) 'H NMR of the precursor
solution (C6 D6) shows peaks at (ppm) 7.12 (s, FuOH, free),
6.10/6.08 (d, FuOH, free), 4.99 (s, polyFuOH), 4.44 (s, FuOH), 3.1-
595

3.8 (broad, with structure, polyFuOH), 3.06 (m, EtOH), 3.05 (s,
FuOH), 1.07 (t, EtOH). (Figure 9.19)
Experiment 14: JP-II-99 Hf(OEt) 4 + EtOH + FuOH
Hf(OEt) 4 (6.52 g, 18.2 mmol) was stirred with 15.45 g (335.4 mmol)
of ethanol (Sigma, water content < 0.1%) overnight, but remained a
milky white suspension. 14 g (143 mmol) of FuOH was added and
stirring continued overnight, during which the suspension became
yellow but remained milky. A distillation head and tared receiver
was attached and the sample heated. By bath temperature 80 0C
the solids were all dissolved and a clear and colorless liquid distilled
at 76-80 OC. The bath temperature was run to 145 0C, leaving a
brown liquid. The distillate was identified as ethanol by NMR, and
1.66 g (36 mmol) more was collected than was put into the flask
originally. The formula of the brown liquid was concluded to be
Hf(OEt) 2(OFu) 2 dissolved in excess FuOH.
The sample was pyrolyzed in a graphite boat under gentle
argon flow, heating at 10 OC/min to 1000 OC, hold for 1 h, then ramp
at 25 OC/min to 1490 0C and hold for 8 h before cooling. A shiny
black "puff" of solid was recovered (1.2823 g before, 0.4056 g after,
31.6%) and identified by XRD as HfC.
7.22 g of the sample, containing approximately 7.4 mmol of Hf
and 44 mmol of FuOH, was mixed with 3 ml of glycerol, producing a
milky suspension at first, but clearing to a viscous dark brown liquid
over three days' stirring. It was pyrolyzed in a graphite boat under
gentle argon flow, heating at 10 OC/min to 1000 0C, hold for 1 h,
then ramp at 25 OC/min to 1490 0C and hold for 8 h before cooling.
596

A grey solid (1.7754 g before, 0.3299 g after, 18.6%) was recovered
and identified by XRD as HfC. 'H NMR of the precursor (C6D6 )
showed peaks at (ppm) 7.06 (s, FuOH), 5.97/5.94 (d, FuOH), 4.24
(s, FuOH), 3.72 (t, unidentified), 3.33 (q, EtOH), 1.42 (s, broad,
EtOH), 0.94 (t, EtOH). (Figure 9.20)
Experiment 15: Generalized formulations
A. JP-II-121 Hf(OEt) 4 + FuOH
Hf(OEt) 4 (50 g, 139.6 mmol) was added to a 500-ml schlenk flask
and FuOH (used as-received, 200 ml, 2310 mmol) were added to
give a red-orange suspension. This was warmed on an oil bath to
50 0C under argon with venting to an oil bubbler, and dissolves
within 15 minutes to give a murky dark brown liquid. 1 M H2 SO4
solution (2.5 ml, 138 mmol, 1 equiv.) was added in 40 ml 2MOE (50
mmol) with stirring. The solution became slightly darker. It was
stored at room temperature in an airtight container for four days,
then shipped, still liquid, to FMI.
B. JP-II-122 Hf(OEt) 4 + FuOH
Hf(OEt) 4 (100 g, 280 mmol) was placed in a 1000-ml schlenk flask
with 300 ml FuOH (3471 mmol, used as-received) and the mixture
stirred at room temperature for several hours. To assist in
dissolving the alkoxide, 2MOE (50 ml, 630 mmol) was added. The
mixture was stirred overnight to give a dark brown clear solution. It
was heated on an oil bath at 80 0C under a gentle Ar sweep to an
oil bubbler for 8 h, then was cooled and stirred at room temperature
overnight. 1 M H2 SO 4 (5.2 ml, 289 mmol) was added in 20 ml of
597

2MOE (254 mmol) slowly with vigorous stirring overnight. There
was no change apparent. It was shipped to FMI.
Experiment 16: JP-II-123 Hf(OiPr) 4*HOiPr + FuOH
In a 200 mi schlenk flask 25 g Hf(OiPr) 4eHOiPr (60 mmol) was stirred
in 100 ml of FuOH (1157 mmol) and 20 ml 2MOE (254 mmol)
overnight. The solution was dark brown with some solids settling.
It was heated to 100 0C under argon sweep for 3 h, then to 70 OC
under argon sweep for 6 h, then cooled to room temperature. 1.2
ml of 1M H2 SO 4 solution (67 mmol) in 10 ml 2MOE (127 mmol) was
added slowly, giving white wispy solids. This was stirred overnight,
vented to an oil bubbler, at 65 OC. The resulting gel was shaken
with 100 ml 2MOE (1.27 mol) to produce a pourable opaque viscous
liquid. It was stirred over 2 days at room temperature, leading to a
viscous milky brown liquid/gel. The gel did not appear to change on
storage at room temperature for 8 months.
Experiment 17: JP-II-126 Hf(OEt) 4 + FuOH
Hf(OEt) 4 (100 g, 280 mmol) was placed in a 1000-ml schlenk flask
with 300 ml FuOH (3471 mmol, used as-received) and the mixture
stirred at room temperature for several hours. To assist in
dissolving the alkoxide, 2MOE (50 ml, 630 mmol) was added. The
mixture was stirred over three days to give a dark brown clear
solution. It was stored for 8 months in an airtight container at room
temperature and remained clear and dark brown. 1 M H2 SO 4 (6.5
ml, 360 mmol) was added in 20 ml of 2MOE (254 mmol), and the
598

mixture darkened and formed gelatinous chunks which redissolved
on vigorous stirring. The solution was permitted to stand (after 10
min. of stirring) for 1 h and settled out gelatinous chunks from a
dark brown liquid.
Experiment 18: JP-II-127 Hf(OiPr)4 .HOiPr
Hf(OiPr) 4*HOiPr (25 g, 60 mmol) was dissolved in 100 ml (1157
mmol) FuOH in a 300 ml schlenk flask and stirred at room
temperature for 2 weeks, then was stored at room temperature in
an airtight container for 8 months. It remained a viscous brown
liquid, wetting the glass container, and with no settling. 1 M H2 SO4
solution (1.10 ml, 60 mmol) was added with 10 ml 2MOE (127 mmol)
slowly, leading to the appearance of gelatinous chunks but no
precipitate. Vigorous shaking kept the mixture liquid but on being
permitted to stand for approximately 1 min. it became a solid,
resinous brown gel.
599

9.4.3 Pyrolysis Condition Tests
Experiment 19: JP-I-303/4 Varying the Furance Heating
Rate/Time
Tests of two different ramp rates, e.g. 5 0C and 25 0C per minute,
and of different heating times, were performed on TaC and HfC
samples 1/296, 1/298, and 1/300. The results are reported in the
experiments describing the preparation of those precursors.
Experiment 20: JP-II-75 Pyrolyses under CO 3 3
A. Sample 1/296 (HfC precursor) was pyrolyzed in
with CO for 45 min., ramping 25 OC/min to 1490 0C,
then cooling. A finely-divided grey-and-black solid
(1.6619 g before, 0.4387 g, 26%) and identified as
a furnace flushed
hold for 20 h,
was recovered
Hf0 2 by XRD.
B. Sample 1/291 (TaC precursor) was pyrolyzed in a furnace
flushed with CO for 45 min., ramping 25 OC/min to 1490 0C, hold for
20 h, then cooling. Black glassy chunks of solid with tan-gold areas
was recovered (1.7345 g before, 1.0294 g after, 59.3%) and
identified as TaC.
600

Experiment 21: JP-II-75 Pyrolyses under still Ar
All pyrolyses to date have been under flowing gas, argon or CO.
Here, the furnace was flushed with Ar 1 hour then shut off (vent to
bubbler to handle heating expansion) during the heating. The vent
to the bubbler was closed off during the cooling to prevent air suck-
back.
C. Sample 1/291 (TaC precursor) was pyrolyzed in a furnace with
gas flow as described, ramping 25 OC/min to 1490 0C, hold for 20 h,
then cooling. Black glassy chunks of solid with tan-gold areas was
recovered (1.2658 g before, 0.7603 g after, 60.1%) and identified
as TaC.
D. Sample 1/296 (Hf) was pyrolyzed in a furnace flushed with CO
for 45 min., ramping 25 OC/min to 1490 OC, hold for 20 h, then
cooling. A crumbly black solid was recovered (1.5107 g before,
0.3871 g, 25.6%) and identified as Hf0 2 by XRD.
Experiment 22: JP-II-80 Pyrolyses using graphite crucibles,
slow Ar
Samples II-73A (TaC precursor) and 11-74 (HfC precursor) were
placed in graphite crucibles in a furnace and flushed for 1 h with
argon. The argon flow was switched to barely-flowing (1
bubble/min. in an oil bubbler) and the furnace heated at 25 OC/min
to 1490 C, held for 20 h, then cooled. The pyrolyzed sample II-73A
601
(Ta) was grey-white on the top, glassy black on the bottom, weight
retention 53.5%; the pyrolyzed sample 11-74 (Hf) was soft and
"greasy" black, 20.4% weight retained. The pyrolyzed samples
were identified as phase-pure TaC and HfC, respectively, by XRD.
Experiment 23: JP-II-94 FuOH + H+/H 20
15 ml FuOH (173.5 mmol) and 0.25 ml of 1M H2 SO 4 (13.9 mmol H20,
0.25 mmol H+) solution were stirred and heated under argon to
observe the behavior of FuOH absent a metal alkoxide.
Temperatures given are the bath temperatures. At 50 OC the
solution became brown and frothed, and a clear and colorless liquid
began to reflux. As the temperature increased, the viscoscity
increased, particularly over 100 OC. By 115 0C the mixture had
become a brown-black gum and by 120-125 OC it had become a
brittle brown-black solid. It was heated under argon at a ramp rate
of 10 OC/minute to 1000 OC, soak for 2 h, then ramp at 25 OC/min. to
1490 OC and soak for 4 h before cooling. The resulting solid (44%
weight retention) was in the form of white-coated lumps and was
amorphous to XRD.
Experiment 24: JP-II-106 Slow heating rate
TaC precursor sample 1/298 (1.6268 g) and HfC precursor sample
1/300 (1.6156 g) were heated in graphite boats under argon,
temperature ramp rate 3 OC/min to 1400 and hold for 12 h before
cooling. For 1/298, black solids with a brown surface tint, 1.0553 g
(64.9%) were identified as TaC. (Figure 9.21) For 1/300, black
602

solids, 0.4837 g (29.9%) were identified as HfC. (Figure 9.22) The
HfC sample was examined by ESEM and found to consist of particles
with mostly smooth surfaces, with some "fuzzy" particles which may
be free carbon. (Figure 9.23)
9.4.4 Expansion of the Alkoxide Route to Other Carbides
Experiment 25: JP-II-84 Precursors for Ti, Zr, Nb carbides
A. Ti(OiPr) 4 (9.5 g, 36.9 mmol) was placed in a 100 ml schlenk flask
and 16 ml (186 mmol) of FuOH added, giving a dark red-brown
solution, some transient white vapor, and an exotherm. The
solution was stirred overnight and a little white solid noted the next
day. It was hydrolyzed by slow addition of 1 ml of 1 M H2SO4
solution (55.6 mmol, 1.5 equiv.) in 5 ml of 2MOE (63.4 mmol), giving
a darker red color. The solvent was distilled off (clear and colorless
at first, then yellow), leaving a black residue, which was left under
vacuum overnight. NMR of the distillate showed ethanol and furfuryl
alcohol (minor part). Approximately 15 g of black solids were
collected, Elemental analysis 57.02% C, 4.26 %H. The sample was
pyrolyzed in a graphite boat under argon flow, with heating at 10
OC/min to 750 0C, hold for 20 min., then heating at 25 OC/min to
1490 0C, hold for 6 h before cooling, to give a bluish solid, (2.3272 g
before, 1.1941 g after, 51.3%), identified by XRD as TiC. It was re-
pyrolyzed (0.5892 g before, 0.5776 g after, 98.0%) by heating at 25
OC/min to 1490 0C, then holding for 4 h before cooling, XRD showed
TiC. (Figure 9.24)
603

B. Zr(OPr) 4 (9.60 g, 22.7 mmol) was placed in a 100 ml schlenk flask
and 10 ml (115.7 mmol) of FuOH added, giving a darker yellow
solution. The solution was stirred overnight, then hydrolyzed by
slow addition of 0.61 ml of 1 M H2 SO 4 solution (33.9 mmol, 1.5
equiv.) in 5 ml of 2MOE (63.4 mmol), giving a gelatinous
white/yellow solid. The solvent was distilled off (faintly yellow
distillate), leaving a black residue, which was left under vacuum
overnight. NMR of the distillate showed propanol and furfuryl
alcohol (minor part). 8.14 g of black solids were collected, Elemental
analysis 44.85% C, 3.15 %H. The sample was pyrolyzed in a
graphite boat under argon flow, with heating at 10 OC/min to 600
0C, hold for 20 min., then heating at 25 OC/min to 1490 0C, hold for
12 h before cooling, to give a solid, (1.4930 g before, 0.8907 g
after, 59.7%), identified by XRD as ZrC. (Figure 9.25).
C. Nb(OiPr)5 (28.07 g, 7.23 mmol) was placed in a 100 ml schlenk
flask and 3.2 ml (37.2 mmol) of FuOH added, giving a darker yellow
solution. The solution was stirred overnight, then hydrolyzed by
slow addition of 0.2 ml of 1 M H2 SO 4 solution (11.1 mmol, 1.5 equiv.)
in 5 ml of 2MOE (63.4 mmol), giving a gelatinous white/yellow solid.
The solvent was distilled off (clear and colorless distillate), leaving a
black residue, which was left under vacuum overnight. 5.87 g of
black solids were collected, Elemental analysis 52.61% C, 5.22 %H.
The sample was pyrolyzed in a graphite boat under argon flow, with
heating at 10 OC/min to 600 0C, hold for 20 min., then heating at 25
OC/min to 1490 OC, hold for 12 h before cooling, to give a bluish
604
solid, (1.4867 g before, 0.6574 g after, 44.2%), identified by XRD as
NbC. (Figure 9.26)
Experiment 26: JP-II-114 ZrC Precursor
A. Zr(OPr) 4 (9.31g, 22 mmol) was added to a flask with 5.7 ml FuOH
(66.2 mmol), making a red solution. A short-path distillation head
was added to the flask and the sample distilled with liquid collection
97-100 OC. The clear and colorless distillate was identified as PrOH
by NMR; 6.25 g was collected, 3.157 g (52 mmol) in excess of that
which was calculated as having been provided by the alkoxide
preparation. Thus the formula of the resulting brown liquid was
deduced to be Zr(OFu) 2.4(OPr) 1.6 in FuOH solution.
To this sample was added 2 ml 2MOE (25.4 mmol) and 0.4 ml
(22.2 mmol, 1 equiv.) of 1 M H2 SO 4 solution in 3 ml 2MOE (38 mmol),
slowly with stirring. Gelatinous clots appeared and did not
homogenize despite heating at 80 OC overnight. This was permitted
to cool and stand for 2 weeks with no change noted. 0.4 ml of 1 M
H2 SO 4 solution (22.2 mmol) in 5 ml 2MOE (63.4 mmol) was added to
this, and the mixture became a solid gel within 30 minutes. The
sample was pyrolyzed (solvent was not removed by vacuum), ramp
rate 5 OC/min to 750 OC (5.0933 g sample before, 0.7044 g after,
13.8%), then was put back into the furnace and heated at 25
OC/min to 1320 OC for 4 h (0.6667 g, 13% of original, 94.6% of 1st
step). The sample was identified by XRD as ZrC. (Figure 9.27)
B. Zr(OPr) 4 (14.00 g, 30 mmol) was added to a flask with 5.2 ml
FuOH (60.4 mmol), making a red solution. 0.54 ml of 1M H2SO4
605

solution (30 mmol, 1 equiv.) in 2 ml 2MOE (25.4 mmol) was added
dropwise, producing a white/yellow semisolid. Heating at 80 OC
with stirring clarified the suspension a little. Half of the liquid was
saved and half heated to 210 OC (bath temperature) vented to an
oil bubbler. This did not solidify; once vacuum was applied at this
temperature the sample became a viscous black tar, 4.31 g. This
was pyrolyzed in a graphite boat, ramp rate 5 OC/min to 1480 0C,
hold for 6 h, then coolled to collect a black solid (1.8126 g before,
0.6333 g after, 35%). The sample was identified by XRD as ZrC.
Experiment 27: JP-II-116 Synthesis of ZrC and TiC precursors
A. Zr(OPr) 4 (9.04 g, 19.3 mmol) was mixed with 6 ml (76.1 mmol) of
2MOE and 3.4 ml FuOH (39.5 mmol) to give an orange solution. This
was stirred several days, and went from a light orange to a dark
red-brown color. 0.35 ml of 1 M H2 SO 4 solution (19.4 mmol) in 3 ml
2MOE (38 mmol) was added with stirring. Wisps of solid appeared
and redissolved after 15 minutes of stirring at room temperature.
The liquid was heated with venting to a bubbler and was a liquid
still at bath temperature 210 OC. The liquid pyrolyzed in an alumina
boat under argon, ramping at 5 OC/min to 1000 OC, hold for 30 min,
then ramping at 25 OC/min to 1490 0C for 4 h. The original 3.3804 g
of precursor produced approximately 1.29 g of black "puffy" solid on
top of approximately 0.2 g of white solid (39% total solids); white-
green solid "growths" appeared on the boat. Both the black and
the white material were identified as mixtures of two phases of
ZrO2, plus ZrC. After several weeks in air the precursor had become
a brown glassy translucent solid. This was pyrolyzed at 20
606

OC/minute to 600 OC, hold for 30 min., ramp at 25 0C/min to 1490 OC
and hold for 8 h before cooling (1.6004 g before, 0.5945 g after,
37.1%), and identified by XRD as ZrC + ZrO2. (Figure 9.28)
B. Ti(OBu) 4 (13.64 g, 40 mmol) was mixed with 3.2 ml of 2MOE (40.6
mmol) and 6.9 ml FuOH (80.2 mmol) to give a burgundy red solution
which darkened over several days' stirring. 0.72 ml of 1 M H2SO4
solution (40 mmol) in 4.5 ml 2MOE (57.1 mmol) was added with
stirring. No solid formation was noted. The sample was heated
with venting to an oil bubbler and became solid by bath
temperature 230 OC. The black glassy precursor was pyrolyzed in
an alumina boat under argon, ramping at 5 OC/min to 1000 OC, hold
for 30 min, then ramping at 25 OC/min to 1490 OC for 4 h. Black
glassy chunks were recovered (1.5116 g before, 0.7504 g after,
49.6%), identified as TiC.
Experiment 28: JP-II-124 ZrC precursor
Zr(OPr) 4 (11.41g, 24.4 mmol) was added to a 100 ml schlenk flask
with 20 ml FuOH (232 mmol) to produce an orange solution. 5 ml
2MOE (63.4 mmol) were added and the mixture stirred overnight to
produce a clear dark brown liquid. This was heated at 100 - 110 0C
under argon sweep, then left at 60 OC vented overnight, leaving a
dark brown liquid. After standing 1 week, the liquid had become
more viscous and some solids were present in the flask. 2 ml FuOH
(23.2 mmol) and 3 ml 2MOE (38 mmol) were added; this did not
dissolve the solids. 0.45 ml of 1M H2 SO 4 solution (25 mmol) in 5 ml
2MOE (63.4 mmol) was slowly added to the stirred solution. This
607

was stirred at room temperature with no solids noted, and after 2 h
was heated with venting to an oil bubbler at 100 0C. It was
permitted to cool and stand. After several days it became a dark
brown crumbly resin.
608

Table 9.1: Pyrolyses of JP-I-298B
Heating Scheme 0/0 Wt. Appearance XRD identity
Retention
RT> 1490 0C @ 25 63.5 black & grey TaC
OC/min, hold 20h glassy chunks
RT> 1490 0C @ 25 62.5 glassy black TaC
OC/min, hold 25h
RT> 1490 0C @ 5 54.5 grey chunks TaC
OC/min, hold 20h
RT> 1490 0C @ 25 58.7 glassy black TaC
OC/min, hold 25h
609

Table 9.2: Experimental Conditions and Results for JP-II-78
Vial # ml FuOH mmol FuOH FuOH/ hydrolysis Precursor Phases Wt. Ret'n
Ta(OEt)s behavior solid (g) found after pyr.
1 2.70 31.0 5 clear 3.82 TaC 55.9
2 2.15 24.8 4 clear 3.26 TaC 57.8
3 1.10 12.4 2 clear 2.42 TaC 59.4
4 0.80 9.3 1.5 ppte. 2.19 TaC 57.6
rediss.
5 0.40 4.7 0.75 yellow ppte. 1.63 TaC + Ta 2 0 5 65
6 0.27 3.1 0.5 yellow ppte. 1.56 TaC + Ta 2 0 5 70.7
7 0.13 1.6 0.25 yellow ppte. 1.69 TaC + Ta20 5 >19 *
*sample dropped on removal from furnace
0

Table 9.3: Pyrolyses of JP-I-296
Heating Scheme 0/0 Wt. Appearance XRD identity
Retention
RT>1400 0C @ 10 21 black, some grey HfC0C/min, hold 6h; areas
1400>1450 OC @ 250C/min, hold 4 h; 1450
> 1500 @ 25 OC/min,
hold 0.5 h.
RT>1495 OC @ 10 28.2 grey solid HfO2
OC/min, hold 1 h
solid from above re- 88 grey solid HfC, some
heated RT>900 OC @ HfO2
5 OC/min., hold 1 h., EA 5.32 C,
900 > 1490 OC @ 10 <0.1 % H
OC/min, hold 12 h.
repeat above on new 25 grey-black solid HfC + Hf02
sample Figure 9.12a
RT>1490 @ 5 OC/min, 21 black-grey HfC
hold 20 h powder
RT>1490 @ 25 OC/min, 20.6 black-grey HfC
hold 20 h powder Figure 9.12b
611

Table 9.4: Tantalum Precursor Experimental Conditions
sample alkox/FuOH/ (Prec. Heat Cond. XRD/O/o Ceram. Notes# 2MOE/H 20 state) EA
(acid?) mmol* Prec. EA1-285 25/25/0/25/N (milky susp.) RT@10>350(1), TaC, Ta2 0 5/
@25>1450(0.5) 50%1-286-1 14/56/63/25/N (visc. gel) RT@10>350(1), TaC/39.6% A FuOH
@25>1450(0.5)RT@10>200(10), TaC/64.3% 19.25 C A heat@20>1400(57)
1-286-2 14/56/63/56/N (visc. gel) RT@10>350(1), TaC, Ta2 0 5/ A H2 0@25>1450(0.5) 76.3%RT@10>200(10), TaC/56.3% 22.51 C A heat@20>1400(57)
I-291 12/23/25/14/N (liq. to 90 C) RT@10>200(10), TaC/30 A all para-31.6 C, 2.9 H @20>1400(57) meters
1-292 12/58/38/14/Y (liq.) RT@25>1400 (2) TaC/56 H+, A all24.3 C, 2.7 H parameters
I-298B 27/116/0/0/N (liq. to 140 RT@5>1490(20, TaC/54.5, noC) 25) 58.7 hydrolysis
47.4 C, 3.3 HRT@25>1490(20, TaC/63.5,25) 62.5RT@3>1400(12) TaC/64.9 40.3 C slow heat
a.'NJ

Table 9.4 (continued)sample alkox/FuOH/ (Prec. Heat Cond. XRD/% Ceram. Notes# 2MOE/H 20 state) EA
(acid?) mmol* Prec. EAII-73A 21/81/63/28/Y (liq. to 130 RT@10>1490(12) TaC/53.5
C)RT@25>1600(2) TaC/no
info.11-78 6.2/vary/0/6.2/Y (liq. to 90 C) RT@10>1490(4) TaC for vary FuOH
high FuOH,Ta20 5 forlow
11-108 20/20/0/30/Y (liq. initially, not pyr. THF, nogel over 2MOE used
days)* in rounded numbers
(A

Table 9.5: HfC Precursor, Experimental Conditions
Sam. # Alkox./ (Prec. State) Heat Cond. XRD//o Ceram. Note
FuOH/ Prec. EA EA
2MOE/H 20
(acid?)
mmol
1-296 17/116/ (liq. to 85, gel RT@10>1400 HfC/21% Hf(OEt) 4 =
127/ 17/Y when add 17 (6)>1450(4)>1500 alkox.
more H2 0) (0.5)
RT@10>1495 (1) Hf02J28.2% new
sample
RT@25>1490 (12) Hf0 2+HfC/ 88% 5.32 C reheat
above
RT@5>900(1)@10> Hf0 2+HfC/ 25% new
1490(12) sample
RT@25>1490(21) HfC/96% 7.25 C reheat
above,
slow Ar
flowC.'
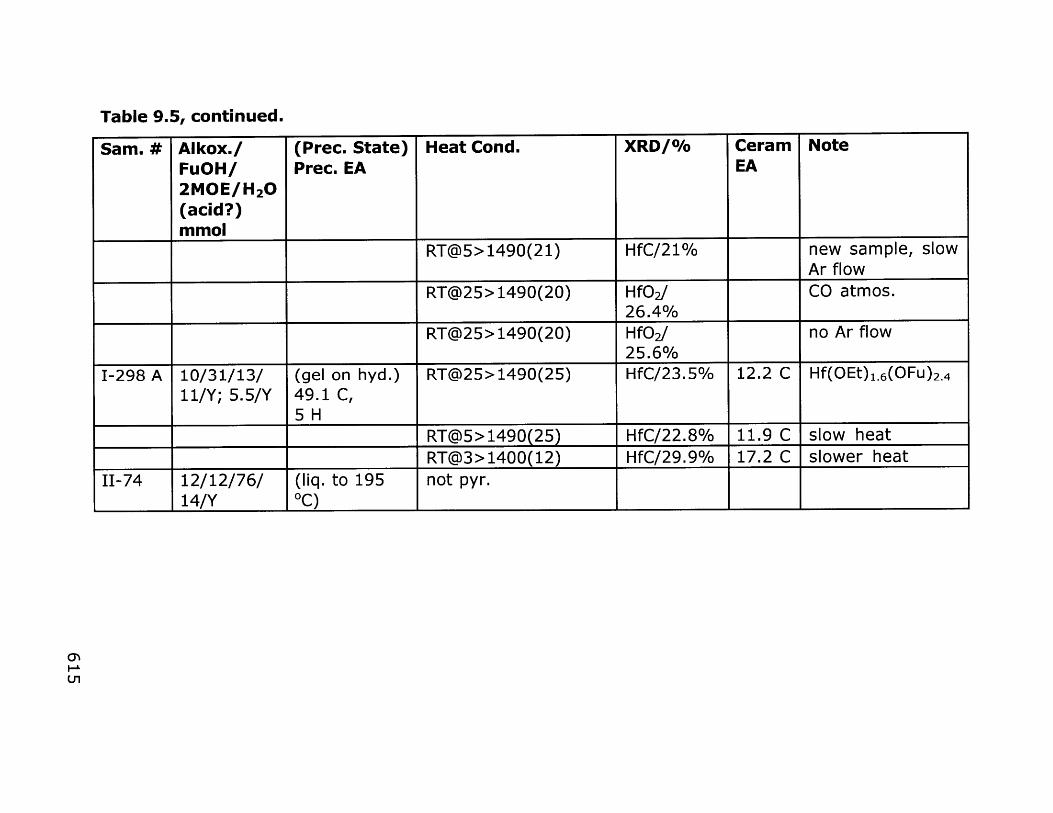
Table 9.5, continued.
Sam. # Alkox./ (Prec. State) Heat Cond. XRD/% Ceram NoteFuOH/ Prec. EA EA2MOE/H 20(acid?)mmol
RT@5>1490(21) HfC/21% new sample, slowAr flow
RT@25>1490(20) HfO2J CO atmos.26.4%
RT@25>1490(20) HfO2 no Ar flow25.6%
1-298 A 10/31/13/ (gel on hyd.) RT@25>1490(25) HfC/23.5% 12.2 C Hf(OEt) 1.6(OFu) 2.411/Y; 5.5/Y 49.1 C,
5 H
RT@5>1490(25) HfC/22.8% 11.9 C slow heatRT@3>1400(12) HfC/29.9% 17.2 C slower heat
11-74 12/12/76/ (liq. to 195 not pyr.14/Y *C) _ _
I-L
U1

Table 9.5, continued.
Sam. # Alkox./ (Prec. State) Heat Cond. XRD//o Ceram Note
FuOH/ Prec. EA EA
2MOE/H 20
(acid?)
mmol
add (gel at 110 RT@25>1600(2) HfC/no
38/14/Y C) info.
11-81 19/290/38/ (liq. to 80 C) RT@10>750, HfO2+HfC/
19/Y 57.4 C, 3.9 H @25>1490(6) 57.7%
RT@25>1490(4) HfO2+HfC/ 61.11 reheat sample
99.8% C
11-99 A 18/107/0/0 (liq.) RT@10>1000(1), HfC/31.6% used EtOH
/N @25>1490(8) Hf(OEt) 2(OFu)2
11-99 B 7.4/44/-- (liq.) RT@10>1000(1), HfC/18.6 added glycerol to
39 g @25>1490(8) 11-99 A
0~'
0~'

Table 9.5, continued
Sam. # Alkox./ (Prec. State) Heat Cond. XRD/% Ceram NoteFuOH/ Prec. EA EA2MOE/H 20(acid?)mmol
11-108 10/45/9/ (liq., gel after not pyr.15/Y days)
11-121 140/2310/ (liq.) shipped to FMI50/138/Y
11-122 280/3471/ (liq.) shipped to FMI884/289/Y
11-123 60/1157/ (liq. to 65 C) not pyr. used381/67/Y Hf(OiPr) 4.HOiPr
11-126 280/3471/ (liq.) shipped to FMI884/289/Y
11-127 60/1157/ (gel) not pyr. used127/60/Y I I I I Hf(OiPr) 49HOiPr

Table 9.6: Other Ceramics, Experimental Conditions
sample alkox/FuOH/ Prec. EA Heat Cond. XRD/% Notes
# 2MOE/H 20
(acid?) mmol
11-84 A 37/200/63/56/Y (liq. til heat) RT@10>750, TiC/51.3% used Ti(OiPr) 4
57 C, 4.3 H @25>1490(6)
RT@25>1490(4) TiC/98% reheat sample
II-116B 40/80/100/40/Y (liq. to 230 C) RT@5>1000, TiC/49.6% used Ti(OBu) 4
@25>1490(4)
11-84 C 7/36/63/11/Y (gel) RT@10>600, NbC/44.2% used Nb(OiPr)5
52.6 C, 5.2 H @25>1490(12)
11-84 B 24/264/164/25/Y (gel) RT@10>600, ZrC/59.7% used Zr(OPr) 4
44.9 C, 3.2 H @25>1490(12)
11-114 22/66/63/22/Y (gel clots) Zr(OFu) 2.4(OPr) 1.6
A
add 63/22/Y (gel) RT@5>750 13% Solvent not
removed0)

Table 9.6, continued.
sample alkox/FuOH/ Prec. EA Heat Cond. XRD/% Notes
# 2MOE/H 20
(acid?) mmol
@RT@25>1320(4) ZrC/94.60/ reheat sample
11-114 30/60/25/30/Y (liq. til 210 IC RT@5>1480(6) ZrC/35%
B + vac.)
11-116 19/77/80/19/Y (liq. til 210) RT@5>1000, ZrC + ZrO2/
A @25>1490(4) 39%
(solid after 2 RT@20>600,@25 ZrC/ 37.1%
wks. in air) >1490(8)
'0

Figure 9.2: XRDs of the same sample of HfC, (a) monochromator
absent; (b) monochromator present. This demonstrates that
some of the peaks seen in many of the XRDs in this Chapter arise
from KP radiation, rather than impurities.
620
In
LII
Ln
LII
In
N
4I-1
IrDE-

Figure 9.3: XRD of 1-285. Circles indicate TaC (JCPDS 35-801),
lines indicate Ta 20S (JCPDS 35-922).
In
*Ln
Il)
m
N
*1)
621
r)
ooOUTSdD0,

Figure 9.4: XRD of 1-286-1. Lines indicate TaC (JCPDS 35-
801), other peaks are from KP.
E-ED
L)n
LO
(I)
ton
- N020
COO
E-
622

Figure 9.5: XRD of 1-29 1. Circles indicate TaC (JCPDS 35-801),
other peaks are from KP.
0.0
1'-
U,
LO
IS)
030
U,
S0 0
0 623

Wei
gh
--
Tem
pera
ture
D
iffe
ren
ceC
itD
11.0
00
1
/>
10.0
00
/ 0.
50
II
9.00
0
--0
.5
8.00
02
7.0
00
a--
1.5
6.00
01-
-2
5.0
00
a .
1 1
-2.5
20
0
400
600
B00
10
00
1200
14
0041
Te
mp
era
ture
(C
)

Figure 9.7: XRD of 1-292. Circles indicate TaC (JCPDS 35-
801), other peaks are from KP.
-I"
I 1100 9ET1Z Sdo 00,0
625
0)
1)4L)
&
H
r- -
V~ A

'1
drT,
14.5738 mg
RATE
10.
00 Jcqt
-n
t n
G) 0
85.0
0
60.0
0 16
0.00
26
0.00
38
.00
480.
80
580.
00
680.
00
760.
00
860.
00
960.
00
1060
.00
TE
MPE
RA
TU
RE
(C
) TG
031

Figure 9.9: XRD of 11-73 (2000 0C). Lines indicate TaC (JCPDS
35-801), circle indicates graphite (JCPDS 25-284).
U)-N
(DN
EU)
I I I I IOO'SZE sd 00m
U)627

ESEM of 11-73 (1600 *C). X 615.
628
Figure 9.10: .

Figure 9.11: XRD of (a) 11-78-1, (b) 11-78-3, (c) 11-78-5.
tz
-,
Ur)
S)
LIn
LOl
IS)
U)
cr)
1)
Enra
629

Figure 9.12 a: XRD of 1-296, see Table 10.3.
0]
D
Ur)
.- D
630

Figure 9.12 b: XRD of 1-296, see Table 10.3.
LO)
0 Qo
ED-
0w
LOLO
ED
In
LO0m
a) m
163
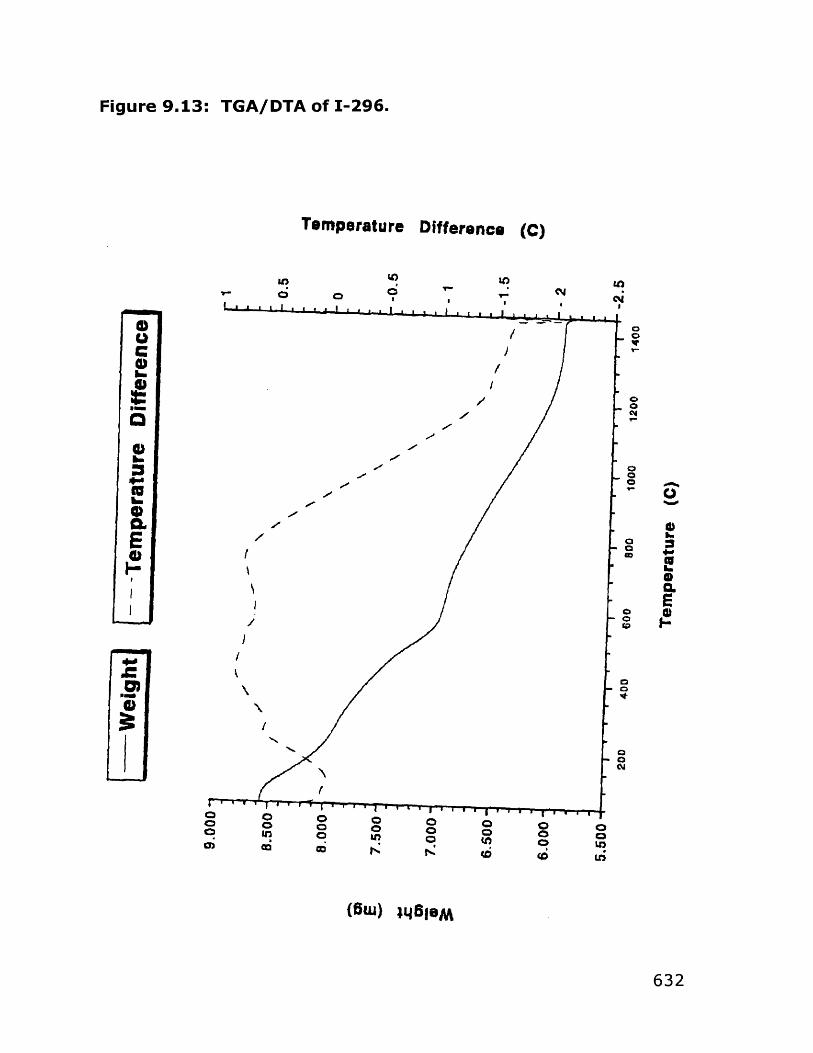
Wei
ght
-Tem
pera
ture
D
iffer
ence
9.00
0-
8.50
0 /
-.
8.00
0
7.5
00
7.00
0-
6.50
0-
6-00
0
5.50
0 .
240
600
800
1000
12
00
1400
1 0.5
0
.C'
--0.
5
-1
-M
2
Tem
pera
ture
(C
)
oft co
-n al w G) 0 %0
rCh
a.' w N

Figure 9.14: XRD of 1-296.
S86E' -, -
Ln
U)
U)
r)
- Ln
*N
U)
TG9IZ-
-U)
0)I3
EU)
.9 9SLE7 sdo 00*0
633

Figure 9.15: ESEM of 1-296, pyrolyzed at RT>1490 @ 25
"C/min, hold 20 h, X 2100.
634

Figure 9.16: XRD of 11-74, 1600 *C.
(1))
LEE' T- S
- .,-
c
a))
00 066 d 000r
635

ESEM of 11-74, 1600 0C. X 850.
636
Figure 9.17:

Figure 9.18: XRD of 11-8 1, 2n"d pyrolysis. Circles indicate HfC
(JCPDS 39-1491), other peaks are HfO2 (JCPDS 31-904)
-wn
I',-
m
U)
LO)
0m
001
U63

Figure 9.19: 1H NMR of 11-81 precursor. See Expt. 13 for peak
assignments.
C-
J4lo
63
638

Figure 9.20: 1H NMR of 11-99 precursor. See Expt. 14 for peak
assignments.
I
16
639

Figure 9.21: XRD of 11-106 (TaC). Data has been smoothed.
-I5)
In
In
I)
M
CfU)
U)
1) frI
(1)1
(0
II
'U N
00'SLE sdD 00'0
640

Figure 9.22: XRD of 11-106 (HfC).
LO e I EI
r-4 1 GT7z L -
inn
889 '1L-
ZL9 O
U))
1)9
LOlv
ICDK-E'Z;
HL
000Z~tsd3 00
ZL9, 641

Figure 9.23: ESEM of 11-106 (HfC). (a) X 580, (b) X 925.
(a)
(b)
642

Figure 9.24: XRD of II-84a (TiC).
In
0w
LOIn
In
In
LOm
m
L)
N
II i
4-)
a)
P3\ *e 000
643

Figure 9.25: XRD of II-84b (ZrC).
-'Sw
InIn
In
LI)
m
I-n
00)
644

Figure 9.26: XRD of II-84c (NbC).
U)
I.)U)
K
ID
NI 009~t~
I I 9
sdo 00*0
645
6
. -
03
U)
9
In
If)Ln
r)
InN

Figure 9.27: XRD of II-114a. Circles indicate ZrC, lines indicate
ZrO2 (JCPDS 37-1484).
-Is
1m
U)
.|
E-'
4 646
S U)
wn
wD
S Uv
U)
co LO
U)N
E-S00, 0 , Ou u)
64

Figure 9.28: XRD of II-116b. Circles indicate ZrC,. lines indicate
ZrO2 (JCPDS 37-1484 and 37-1413).
.....
Ln
U,
.-
030
(U
00 S6ST~. 00*0
647

9.5 References
1)Preiss, H.; Meyer, B.; Olschewski, C. J. Mater. Sci. 1998, 33, 713.
2)Thorne, K.; Ting, S. J.; Chu, C. J.; Mackenzie, J. D.; Getman, T. D.;
Hawthorne, M. F. J. Mater. Sci. 1992, 27, 4406.
3)Schilling Jr., C. L. Br. Polymer]. 1986, 18, 355.
4)Okamura, K. Adv. Compos. Mater. 1999, 8, 107.
5)Livage, J.; Sanchez, C.; Babonneau, F. in Chemistry of Advanced
Materials: An Overview; Interrante, L. V. and Hampden-Smith,
M. J., Ed.; Wiley-VCH: New York, 1998.
6)Birchall, J. D.; Mockford,
Industries PLC: U.S.
7)Birchall, J. D.; Mockford,
Industries PLC: U.S.
8)Birchall, J. D.; Mockford,
Industries PLC: U.S.
9)Birchall, J. D.; Mockford,
Industries PLC: U.S.
10)Stanley, D. R.; Birchall,
M. J.; Stanley, D. R., Imperial Chemical
Patent No. 4,861,735, 1989.
M. J.; Stanley, D. R. Imperial Chemical
Patent No. 4,950,626, 1990.
M. J.; Stanley, D. R., Imperial Chemical
Patent No. 4,996,174, 1991.
M. J.; Stanley, D. R., Imperial Chemical
Patent No. 5,120,689, 1992.
J. D.; Hyland, J. N. K.; Thomas, L.;
Hodgetts, K. J. Mater. Chem. 1992, 2, 149.
11)Birchall, J. D.; Mockford, M. J.; Stanley, D. R.; Asher, P. M.;
McCarthy, W. R., Imperial Chemical Industries PLC: U.S. Patent
No. 5,017,525, 1991.
12)Krumbe, W.; B., L.; Franz, G., Bayer Aktiongeschellschaft: U.S.
Patent No. 4,948,762, 1990.
13)Jiang, Z.; Rhine, W. E. Chem. Mater. 1991, 3, 1132.
14)Jiang, Z.; Rhine, W. E. Mat. Res. Soc. Symp. Proc, 1992, 249, 45.
648

15)Jiang, Z.; Rhine, W. E. Mat. Res. Soc. Symp. Proc, 1992, 249, 25.
16)Preiss, H.; Meyer, B.; Olschewski, C. J. Mater. Sci. 1998, 33, 713.
17)Preiss, H.; Schultze, D.; Klobes, P. J. Eur. Ceram. Soc. 1997, 17,
1423.
18)Kurokawa, Y.; Ota, H.; Sato, T. J. Mater. Sci. Lett. 1994, 13, 516.
19)Preiss, H.; Schultze, D.; Schierhorn, E. J. Mater. Sci. 1998, 33,
4687.
20)Narisawa, M.; Kida, S.; Simoo, T.; Okamura, K.; Kurachi, Y. J. Sol-
Gel Sci. Tech. 1995, 4, 31.
21)Ting, S. J.; Chu, C. J.; Limatta, E.; Mackenzie, J. D.; Getman, T. D.;
Hawthorne, M. F. Mat. Res. Soc. Symp. Proc., 1990, 180, 457.
22)Mark, H. F.; Korschwitz, J. I. Encyclopedia of Polymer Science and
Engineering; 2nd ed.; Wiley: New York, 1985; Vol. 7.
23)Laszlo-Hedvig, Z.; Szesztay, M. in Polymeric Materials
Encyclopedia; Salamone, J. C., Ed.; CRC Press: New York, 1996;
Vol. 4, pp 2691-2695.
24)Bradley, D. C.; Wardlaw, W.; Whitley, A. J. Chem. Soc. 1955, 726.
25)Thomas, I. M. Can. J. Chem. 1961, 39, 1386.
26)Chamberlain, L. R.; Rothwell, I. P.; Huffman, J. C. Inorg. Chem.
1984, 23, 2575.
27)Anand, S. K.; Singh, J. J.; Multani, R. K.; Jain, B. D. Isr. J. Chem.
1969, 7, 171.
28)Anand, S. K.; Singh, J. J.; Multani, R. K.; Jain, B. D. Bull. Chem.
Soc. Jpn. 1969, 42, 554.
29)Bradley, D. C.; Mehrotra, R. C.; Gaur, D. P. Metal Alkoxides;
Academic Press: New York, 1978.
30)Bradley, D. C.; Mehrotra, R. C.; Wardlaw, W. J. Chem. Soc. 1953,
1634.
649

31)Yoshinaga, I.; Yamada, N.; Katayama, S. Mat. Res. Soc. Symp.
Proc., 1996; 435, 481.
32)Campero, A.; Soto, A. M.; Jaquet, J.; Sanchez, C. Mat. Res. Soc.
Symp. Proc., 1996; 435, 527.
33)Storms, E. K. The Refractory Carbides; Academic Press: New York,
1967.
650

Chapter Ten:
Assorted Projects in Functionalizing Dendrimers
651

10.1 Introduction and Background on Dendrimers
Dendrimers are a unique type of "starburst" polymer having a
regular generationally branched three-dimensional structure and a
uniform molecular weight. 1 - 3 (Figure 10.1) The number of
branches grows exponentially with the generation number n (n=O is
the core molecule, n=1 is the 1 st layer outside the core, etc.). These
polymers have a high degree of symmetry and a large number of
functionalizable surface sites per polymer unit, and therefore have
captured the imaginations of chemists and materials scientists.
Some of the applications proposed include drug delivery,4,5 vehicles
for diagnostic imaging and radiotherapy agents, 6 building blocks for
nanostructured materials, 7 supports for liquid crystals,8 , redox-
active materials, 9 and catalyst supports. 1 0 ,11 Dendrimers have
also been examined as "hosts," trapping "guest" molecules in the
internal cavities. 1 2
Dendrimers may be constructed either in a divergent manner,
starting from the core molecule and building outward simultaneously
on all (nonprotected) arms, or convergently, constructing the
dendrimer from the outside inward. (Figure 10.2) In either case,
the regularity of the structure depends on having quantitative yield
and full selectivity at each generation's growth step. Where for
small molecule chemistry a 99% conversion means that one out of a
hundred molecules is unreacted and must be separated from the
product, for dendrimers this means that one out of a hundred arms
- of which there may be many on a single dendrimer unit - is
unreacted. However, this erroneous arm is attached to the rest of
652

the dendrimer unit, and the property differences between a
dendrimer unit with one or two errors and a unit with no errors may
be insufficient to effect separation. Random distribution of the
errors among all the available arms means that a high percentage
of the dendrimer units will have at least one error. Moreover, this
effect is multiplied by the number of generations in the dendrimer
unit, particularly as the crowding of arms sterically hinders access of
reactants to the necessary sites. While for small inclusion errors
(e.g. one or more arms has a -SiMe 3 termination rather than a -
SnBu 2H termination) this may be irrelevant, in other cases
unreacted sites may make available side reactions that greatly
affect the bulk properties of the dendrimer collection (e.g. two units
have an unreacted -SiCI termination which become hydrolyzed and
an -Si-O-Si- bond between the units forms, effectively doubling the
new unit's molecular weight ruining the product monodispersity).
A number of dendrimer classes have been synthesized,
including the poly(amidoamine) (PAMAM) "starburst" dendrimers
reported by Tomalia, 1 now available commercially, hydrocarbon
dendrimers (iptycenes), 1 3 polyethers,1 4 phosphorus-based
dendrimers, poly(siloxanes), and carbosilane dendrimers, to name a
few. 3 The carbosilane dendrimers, in particular, have been
sucessfully synthesized using hydrosilylation reactions with
substituted chlorosilanes followed by reduction of the Si-Cl bond
with LiAIH 4, in alternation with alkenylations using Grignard
reagents. 1 5 -1 9 Surface functionalization may be carried out, in all
cases, by reacting the final generation of arms with the functional
molecule - for instance, a cyclopentadienyl ring may be placed on
each arm by reacting lithium cyclopentadienide with the SiCI-
653

terminated arms of a carbosilane dendrimer. The carbosilane
dendrimers, in particular, have the benefit of a relatively chemically
inert backbone, making them useful in a number of applications.
The experiments discussed in this Chapter describe some very
brief work done to continue the work begun by a previous graduate
student, Shane Krska. The interested reader is referred to his
thesis for a more expansive treatment. 2 0 In those studies,
dendrimers terminated with (chloromethyl)silyl groups were
synthesized and used as nucleophiles, by forming lithium or
magnesium reagents, and as electrophiles, participating in a
number of reactions.
One of the principal tools used in synthesizing these
dendrimers is the hydrosilylation reaction, in which the Si-H bond of
an alkylsilane is added across the double bond of an alkene.
Platinum-compounds, particularly chloroplatinic acid (Speier's
catalyst, H2 PtC 6 .6H 2 0) and Karstedt catalyst (a platinum complex of
(ViMe 2Si) 20) catalyze the reaction, and some are activated by
oxygen. 2 1 The hydrosilylation reaction also takes place under free-
radical conditions, initated by UV radiation and peroxides. 2 2
Facilitated by the presence of electronegative groups on Si, the
reaction is somewhat regiospecific, with the proton of the Si-H bond
usually going to the olefinic carbon with the lower electron density.
For Si-CH2=CH 2 (Si-Vi) groups, this is generally the carbon P to the
silicon, but a substitution does sometimes occur. (Figure 10.3)
Formation of the ca isomer is suppressed in the presence of bulky
coordinating groups, including tetrahydrofuran solvent and
triphenylphosphine. 2 3
654

The dendrimers used in the work described in this chapter
were built up by reacting HSi(Me) 2CH 2CI with tetravinylsilane; the
resulting 4-arm dendrimer could be freed readily of any cx isomer by
careful recrystallization in ethanol. Later-generation dendrimers
were constructed by adding a chlorosilane onto the tetravinylsilane
core via a hydrosilylation reaction, then substituting at the Si-Cl
bond with vinyl Grignard (vinylmagnesium bromide), and repeating
the hydrosilylation step to continue building. Side reactions
included incomplete hydrosilylation (depending on steric crowding),
coupling of dendrimer units due to hydrolysis of the Si-Cl bonds by
adventitious moisture and cc substitution reactions.
The (chloromethyl)silyl group is known for its ready formation
of Grignard reagents due to what has become known as the c-
silicon effect, 2 4 , 2 5 and Krska used this to place a number of
substituents onto the dendrimer surfaces, including organotin, -
mercury, -platinum, and boron groups. However, he found that this
was only do-able for first-generation (4-arm dendrimers), due to the
slow (heating times over 1 week) and often incomplete reaction of
the dendrimer with the magnesium metal to form the Grignard
reagent. 2 0 In this Chapter we tested a number of reaction
conditions that we hoped would improve and simplify the
nucleophilic reaction chemistry of the (chloromethyl)silyl-terminated
dendrimers.
655

Figure 10.1: Schematic of a dendrimer.
656

Figure 10.2: Convergent synthesis (a) versus divergent
synthesis (b) of dendrimers.
B B
+ 2
A
D
DD
CD D
D U
D D D D
D
C
C"K+ 3
D
AD D
D D D D
A
A A
AA
AA
AA
C
A-CC CAMC
CC
CC
657
A
B

Structure of x- and P- substituted
Si(CH 2CH 2Si(Me) 2CH 2 CI).
+ -Si
II
-- Si
658
Figure 10.3:
- -Si SiI I
-Si-H
I
10.2 Results and Discussion
10.2.1 Grignard Reactions to Functionalize Dendrimers
The (chloromethyl)silyl group is reputed to form Grignard
reagents easily, but on the dendrimers complete reaction of the
arms with magnesium turnings in dry THF was sluggish, requiring a
week's reflux and repeated addition of 1,2-dibromoethane. The
reaction was monitored by hydrolyzing aliquots of the reaction
mixture and looking for the disappearance of the chloromethyl
proton signal near 2.1 ppm in the NMR spectra. The usual pattern
was for the disappearance of this peak to be rapid at first, but then
to "stall" after approximately 24 h of reaction time. Later reaction
with a organometal halide (in these experiments, Me 2SiHCI and
R3SnCl) gave, of course, incomplete substitution. Often hydrolysis
by adventitious water (glassware was dried thoroughly, and THF
freshly distilled from sodium benzophenone was used) or from
cleavage of the THF itself led to a high proportion of the dendrimer
arms' being terminated by -SiMe 3 groups. Triphenylmethyl-
magnesium bromide is reported to cleave tetrahydrofuran, making
triphenylmethane within 24 h at room temperature or 5 h at
reflux. 2 6 Several different approaches were taken to improve this
situation.
Reversed addition order (Barbier reaction), so that the
CISiMe 2H would be available immediately for reaction with
magnesium-substituted arms, was not helpful; the complete
reaction of chloromethyl groups occurred after several days' reflux,
659
but the product was highly contaminated with -SiMe 3 groups.
Activation of the magnesium using 1,2-dibromoethane, usually a
superior Grignard initiator, was unhelpful, even when larger
quantities were used. 2 7 1,2-dibromoethane reacts with the
magnesium to give 2-bromoethylmagnesium bromide, which
eliminates ethylene to give magnesium bromide, which dissolves
away to provide a clean and active magnesium metal surface.
Finely-divided (Rieke) magnesium was tried. This form of
magnesium is prepared by reduction of anhydrous magnesium
chloride with potassium in refluxing THF, and is made even more
active by the presence of potassium iodide. 2 8 , 2 9 Despite this, the
reaction in one case did not go to completion, and in a second trial
consumed all the chloromethyl groups but the product was
contaminated with SiMe 3 groups.
The iodomethyl-terminated dendrimers were used in the hope
of getting more facile formation of the Grignard reagent. The
substitution was carried out by taking advantage of the solubility
difference between NaI and NaCl in acetone. 3 0 A similar conversion
may have been possible to obtain the bromomethyl-terminated
dendrimers, but this was not tried. 3 1 The consumption of the
iodomethyl groups was complete after a 3-h reflux, but the product
was again contaminated with trimethylsilyl-terminated arms.
Small quantities of cyanide ions are catalytically active for the
reaction between Grignard reagents and chlorosilanes, 3 2 and as
that latter reaction was also suspected as a contributor to the
contamination of the product, copper cyanide was added in one
660

trial. However, reaction of the chloromethyl groups was found to be
incomplete.
The high-boiling dibutyl ether was used as a solvent in one
trial, both to increase the formation of the Grignard reagent, 2 7 and
to remove the possibility of THF cleavage as a source of the -SiMe 3
groups. However, a white precipitate, presumably Grignard
reagent, formed during the reaction, and after quenching with
Me 2 SiHCI it was found that the consumption of the chloromethyl
groups had not been complete. Diglyme and dimethoxyethane
should have been tried as well, but unfortunately they were not.
The organolithium reagent was briefly examined as an
alternative to the Grignard reagent for effecting the reaction.
Finely-divided lithium powder, handled under argon, was used in
hexane, first at low temperature (-78 OC), then with warming, and
finally, with sonication. The final product contained unreacted
chloromethyl groups and some -SiMe 3 groups, which probably came
about through cleavage of the THF added 3 3 (in an attempt to coax
the reaction to completion) by what organolithium-substituted arms
had formed. The yellowing of the solution on addition of the THF
may have indicated that cleavage. It is possible that the lithium
used (99.9% pure) failed to react because of insufficient sodium
content. It has been reported that sodium-free lithium is unreactive
towards organic halides, while 1-2% Na-containing lithium is
optimum. 3 3 An attempt to use tert-butyllithium to metallate the
dendrimer arms, despite the use of the more reactive iodomethyl
dendrimer, failed to give any consumption of the iodomethyl group.
This was done in pentane at low temperature (-30 0C maximum)
over a short time period, the recommended procedure for avoiding
661

side reactions, 3 3 but the poor solubility of the dendrimer under
these conditions may have been a hindrance.
The product, pure to elemental analysis but having a small -
SiMe 3 peak, was finally produced using magnesium metal which had
been activated by reaction with dilute hydrochloric acid, followed by
grinding in a mortar under argon.3 4 This reaction was assisted by
1,2-dibromoethane and involved reflux overnight. The success,
however, did not prove transferrable to the addition of -SnR 3 (R=
Me, Bu) to the dendrimer.
The notable thing about these reactions is the unexpected
difficulty in getting complete reaction of the dendrimer arms to form
the Grignard reagent. The (chloromethyl)silyl group is reportedly a
facile former of organomagnesium compounds, but in this case the
reaction was sluggish at best. Formation of organomagnesium
halides is not a quantitative reaction under the best of
circumstances. However, the effect of a small impurity is multiplied
in the case of the dendrimers (vide supra). By-products, particularly
those formed by hydrogen abstraction from the solvent, are
common. 3 4 Trace quantities of water or oxygen often may assist in
the formation of the organomagnesium halide, 3 4 but in these
syntheses, great care was taken to use thoroughly dry glassware
and solvent in order to avoid the formation of the -SiMe 3 group via
hydrolysis of the Grignard reagent.
Finally, steric issues may have played a role in the sluggish
reaction of the dendrimers. In order to form an organomagnesium
complex, the alkyl halide part of the molecule must adsorb onto the
magnesium metal surface, undergo reaction, then leave. For small
molecules, the number of available surface sites simultaneously
662

reachable by the molecules is large, but for the dendrimer, while
one arm is adsorbed, the other arms are sticking out in the direction
opposite the metal surface. This is particularly the case for the 4-
arm dendrimer, where the tetrahedral shape at the core Si atom still
controls the dendrimer structure; but even for higher-generation
dendrimers, there are still many arms pointing opposite the reactive
metal surface. The dendrimer units, due to their steric bulk, also will
tend to block one another from accessing the metal surface: one
can imagine packing ball bearings onto a tabletop, and compare the
surface area of the ball bearings in contact with the table with the
contact area that could be reached by, say, pencil-shaped objects.
This treatment, of course, assumes that the dendrimers are
mutually opaque, using a term from the discussion found in Chapter
Six of this Thesis. Certainly this becomes the case when the charge
separation in the R-Mg-X species increases the potential for
electrostatic repulsions.
A further steric concern that would tend to limit the complete
conversion of the dendrimer arms to organomagnesium complexes
involves the demands of the organomagnesium complex itself. In
addition to the metal itself, the Grignard reagent brings with it two
coordinated solvent molecules. 3 5 These may further block
unreacted arms from having access to the magnesium metal
surface.
The same reactions were examined to put a tin-containing
group on the dendrimer surfaces. Use of the Grignard reaction
consumed the chloromethyl groups, if sluggishly, but there were
-SiMe 3 decomposition peaks in the product NMR spectra.
Hydrosilylation of trialkyl- and triphenylvinyltin onto an Si-H
663

terminated dendrimer was similarly unsuccessful, with some
evidence (viz. the shiny mirror deposited in the sealed-tube
reactions) that one of the metals was completely reduced. Use of
radical initiator AIBN gave no better result, either in the presence of
or absent the platinum hydrosilylation catalyst. Radical initiators
have had some success in effecting hydrosilylation and
hydrostannylation reactions. 3 6 ,3 7 However, the compound which
was reasonably pure according to the 1H NMR spectrum became
milky on standing at room temperature in light and air, and
subsequent 1H NMR spectrum suggested that some decomposition
had taken place, despite the presumed stability of the Si-CH 2-Sn
bond.
10.2.2 Dendrimeric of Ziegler-Natta Catalysts
Another functionality which may be added to the dendrimer,
and which may take advantage of its large number of active sites
available, is the alkene polymerization (i.e., Ziegler-Natta3 8 )
catalyst. Attachment of zirconium-based catalysts, e.g. zirconocene
and its relatives, has been effected via the attachment of a Si-vinyl
group to the cyclopentadienyl ring of the catalyst, followed by a
hydrosilylation reaction in which the catalyst is attached to an Si-H
terminated dendrimer. Research into this has been done by R.
Wyra and B. Lungwitz under the direction of Professor D.
Seyferth.10,11 While some of their work was reproduced by the
author of this thesis, it will not be reported here.
664

Literature evidence suggested that the use of indenyl and
fluorenyl (Fl) ligands on the zirconium catalyst would lead to greater
activity and stereoselectivity. While nonbridged and meso-ansa
metallocenes are not stereoselective and are relatively inactive as
catalysts, bridged metallocenes, with their rigidly-held bulky and
electron-donating ligands, are both active and stereoselective. 3 9
In particular, silylene-bridged systems with one fluorene ring and
one cyclopentadiene ring are extremely active, although they gave
nonstereospecific propylene polymerization. 4 0 However, ansa-
cyclopentadienyl fluorenyl complexes are efficient catalysts for
syndiospecific polymerization of propylene. 4 1 In addition to the role
of the bridging, the special nature of the bonding in fluorenyl ligands
is key to the activity of catalysts containing them: there is facile ring
slippage (5 4 "3 4 ql bonding mode change), opening up new
coordination sites during the catalytic cycle.4 2
We looked into the attachment of fluorenylzirconium catalysts
to dendrimers. While we were able to synthesize the two ligands,
ViSiMe 2FI and the bridged ViSiMeF12 (Figures 10.4), we were never
able to obtain a pure sample of the zirconium catalysts
ViSiMe 2FI(Cp)ZrCI 2 and ViSiMeFI2ZrCl 2, respectively (Figures 10.5), for
attachment to the dendrimer. Synthesis of the ligands was dogged
by incomplete deprotonation of the fluorene starting material, and
the difficulty of separating the resulting unreacted fluorene from the
product. Cleavage of the THF solvent by the fluorenyllithium may
explain some of the many byproducts that needed to be separated
from the main product by careful chromatography and
recrystallization.26
665

The zirconium catalysts with larger substituents are
notoriously difficult to isolate.4 2 This is partially due to the low
solubilities of the compounds, particularly those with highly
annelated ligands. Some complexes are known to decompose in
THF and ether, and even in chlorinated solvents such as chloroform
and dichloromethane. 4 3 ,4 4 The decomposition of ansa-
bis(fluorenyl)zirconium dichlorides, and their low solubility, makes it
difficult to obtain NMR spectra for these compounds; one solution
that has been used is to substitute out the chloride ligands using
methyllithium. 4 5 Steric crowding, which in FI 2 ZrCI 2 is claimed to
cause one fluorenyl group to be coordinated 9-5, while the other is
coordinated r 3 , contributes to the instability of the complex. 4 6 Ring
slippage from one bonding mode to the other is encouraged by
traces of THF left from the synthesis; therefore, noncoordinating
solvents such as diethyl ether and toluene were used.
Fluorenyllithium is known to cleave tetrahydrofuran, as well. 2 6 This
may explain some of the behavior seen in our experiments,
particularly the appearance of sticky solids in the crystallization
tubes. Small amounts of impurities, including those introduced as
by-products of the use of butyllithium to deprotonate the fluorenyl
ligand, prevent the crystallization that was our sole method of
purification; the symmetry-breaking Si-vinyl pendant did not help
matters. As a result, we found only oils even after concentration of
the solvents, cooling to -30 0C, and slow evaporation of the
solvents (in a glove box) were tried.
In hindsight, the difficulties in purifying these zirconium
catalysts may have been avoided by using the zirconium
666

tetrakis(dimethylamide) as a starting material, and using the acidity
of the fluorene or cyclopentadiene proton and the loss of
dimethylamine to drive the reaction. Treatment of the substituted
metal amide with Me 2NH-HCI would give the zirconium chloride back.
This method has been found to be useful in synthesizing a number
of zirconium sandwich compounds. 4 7 ,4 8
10.2.3 Other comments
Two other dendrimers, PhSi(CH 2CH 2SiEt 3)3 and
PhSi(CH 2CH 2Si(Me) 2CH 2CI) 3 were synthesized and intended for use
in a project in which "dumbell" shaped dendrimers, with different
functionalities on each half of the dumbell, were to be made. The
phenyl-Si serves to block reaction at one site on the dendrimer
core; this bond is readily cleaved by trifluoromethanesulfonic acid,
creating the opportunity for later substitution at this site.
Specifically, the PhSi(CH 2CH 2SiEt 3)3 was to form the hydrophobic part
of the dumbell, and the PhSi(CH 2CH 2Si(Me) 2CH 2CI) 3 was to be
substituted at the chloromethyl group by amphiphilic groups as in
the work by Krska. 2 0
Formation of the PhSi(CH 2CH 2Si(Me) 2CH 2CI) 3 went smoothly via
the standard hydrosilylation reaction, but the
PhSi(CH 2CH 2Si(Me) 2CH 2CI) 3 had a high degree of -substitution and
could not be completely purified as a result. The greater-than-usual
x substitution is due mainly to the small size of the phenyl
substituent, which provided a more open structure to accommodate
667

the a isomer. The project was terminated before the use of
triphenylphosphine to force f-substitution during the hydrosilylation
reaction could be explored.
668

Figure 10.4: Vinylsilyl-substituted fluorene ligands.
/ Si
/i
669
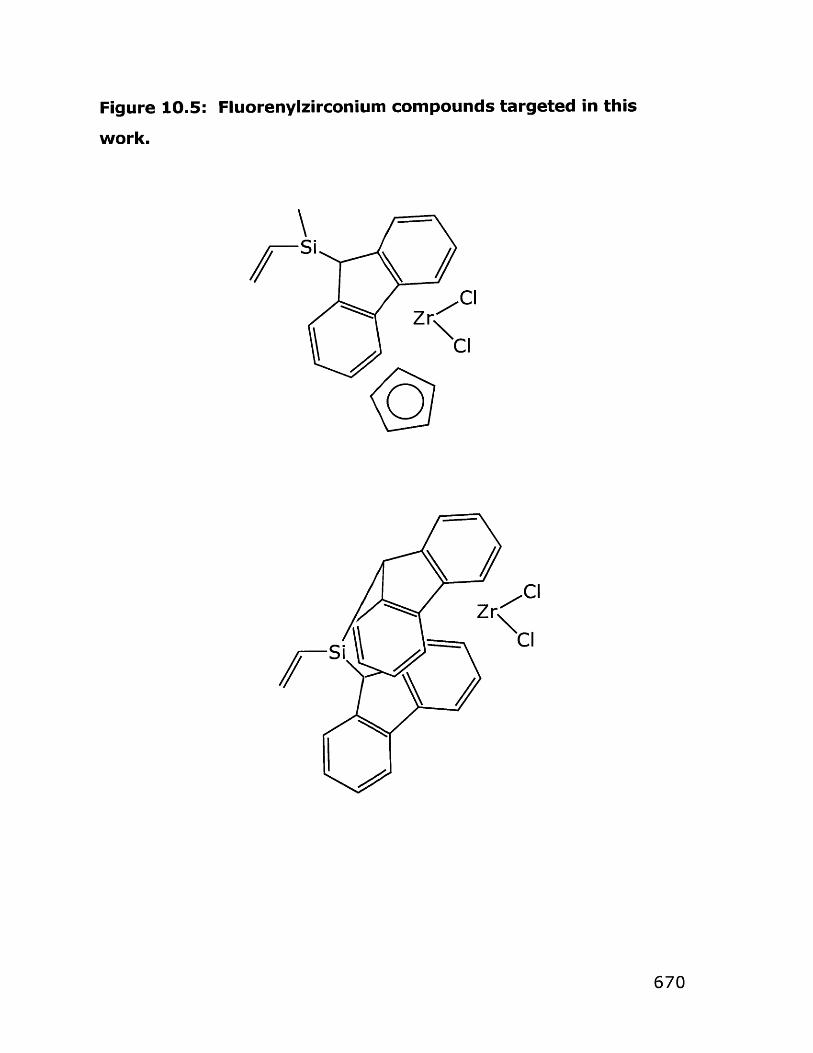
Figure 10.5: Fluorenylzirconium compounds targeted in this
work.
/SiZr Cl
Cl
Zr
CI
670

10.3 Experimental
All work was performed using standard inert-atmosphere
techniques. Glassware was dried at least overnight at 120 0C.
Solvents were dried over CaH 2 or Na-benzophenone and distilled
from these reagents immediately before use. NMR spectra were
taken on the instrumentation described in the Appendix to Part I of
this Thesis; chemical shifts are reported relative to the residual
proton in the deuterated solvents used, while 2 9Si NMR spectra are
reported relative to an external Me 4 Si standard and " 9 Sn NMR
spectra are reported relative to an external Me 4Sn standard.
Where not otherwise indicated, the term "NMR spectrum" refers to a
'H NMR spectrum. GPC measurements were performed on a
Millipore-Waters 150C HPLC/GPC system using toluene as a solvent.
The Karstedt catalyst referred to below is a solution of a Pt(II)
complex of (ViMe 2Si) 20, approximately 2 % in xylene, and was
supplied by either HOls or Gelest.
Certain starting materials were synthesized according to
literature preparations: Me 2HSiCH 2Cl, 4 9 Si(CH2 Si(Me) 2 CH 2 CI) 4 ,20
Si(CH 2 CH 2SiVi3 ) 4 , 19 Si(CH 2 CH 2Si(Me) 2 CH 2 I) 4 , 2 0 Si(CH2CH 2Si(Me) 2 H) 4,10
and PhSiVi3.5 0 For other reagents, the commercial source is noted in
the description of the experiment.
671

10.3.1 Synthesis of assorted dendrimers
Experiment 1 JP-I-123 Synthesis of
Si(CH 2 CH 2Si(CH 2CH 2SiCH 2 CI) 3 ) 4
Si(CH 2 CH 2SiVi3 )4 (6.28 g, 9 mmol, 1-103) was dissolved in 10 ml THF
in a roundbottom flask. A small amount of
chloromethyldimethylsilane (total 20 ml, 166 mmol, 1-20) was added,
followed by 0.05 ml Karstedt catalyst (H6ls), and the reaction was
heated to reflux to initiate it. Reflux was maintained by adding the
remainder of the chloromethyldimethylsilane in small batches. The
reaction was maintained at reflux overnight and monitored by NMR
spectroscopy. More chloromethyldimethylsilane and chloroplatinic
acid (0.5 ml of a 0.07 g/1 ml THF solution) were added when it was
clear that unreacted vinyl groups remained. After two days at reflux
the reaction was cooled and filtered on a celite pad using a
isopropanol/hexane rinse. The filtrate was stripped of solvent to
leave a grey sludge. This was dissolved in hot ethanol and hot-
filtered, and the clear yellow filtrate stripped of solvent to leave a
brown oil and white solid. The oil was chromatographed on silica
(1:10 ethyl acetate: hexane eluant); the fractions, stripped of
solvent, gave a brown powder. This was recrystallized from hot
ethanol to give 1.64 g (10%) white crystals.
1H NMR (CDCI 3, ppm): 0.08 (s, 4.9 H, SiMe), 0.45 (m, 5.4 H,
SiCH 2 CH 2 Si), 2.77 (s, 2 H, SiCH 2CI); the peak areas include the a-
addition peaks.
672

Elemental analysis: expected 43.42 %C, 8.57 % H, 22.62% Cl;
found 43.11% C, 8.89% H, 22.27% Cl.
Experiment 2 JP-I-156 Synthesis of
Si(CH 2 CH 2Si(CH 2 CH 2Si(Me) 2 CH 21) 3 ) 4
Si(CH 2 CH 2 Si(CH 2CH 2 SiCH 2CI) 3)4 (0.52 g, 0.28 mmol, 1-123), NaI (0.77
g, 2.8 mmol, Malinkrodt), and 25 ml acetone (HPLC grade) were
added to a 50 ml 3-neck flask equipped with a stir bar and reflux
condensor. The flask was covered with aluminum foil to block light.
The mixture was heated at reflux for 48 h, then the acetone was
removed under vacuum. Pentane (50 ml) and water (25 ml) were
stirred with the solid and the water phase removed; methylene
chloride was added to the pentane phase to dissolve the solids
remaining there. The organic phase was washed with additional
water and dried over Na 2 SO 4 . Removal of the solvent left white
needlelike crystals and a yellow oily residue, 0.73 g crude yield.
This was recrystallized from isopropanol/methylene chloride to give
0.65 g of fine white powder, 1H NMR (CDC13, ppm): 0.12 (s, 4.7 H,
SiMe), 0.45 (m, 4.3 H, SiCH2CH 2Si), 2.02 (s, 2 H, SiCH 2 I); the peak
areas include the u-addition peaks.
Elemental analysis: Expected 27.4% C, 5.42% H, 51.13% I; found
26.95% C, 5.27% H, 51.44% I.
Experiment 3 JP-I-177 Synthesis of PhSi(CH 2CH 2SiEt 3 ) 3
Phenyltrivinylsilane (2.66 g, 14.28 mmol, 11-51) and 100 ml THF were
placed in a 3-neck flask equipped with a stir bar and reflux
673

condensor. A small amount of triethylsilane (total 5.82 g, 50 mmol,
Gelest) and 5 drops of a 5% chloroplatinic acid/isopropanol solution
were added and the mixture heated to 50 0C. When the reaction
started, the remainder of the HSiEt 3 was added in several
increments. The reaction mixture was refluxed overnight, then the
solvent stripped off and the remaining yellow liquid was taken up in
hexane and run twice through 2-cm silica pads. The solvent was
removed, leaving 6.92 g (91%) water-white oil.
'H NMR (CDC13, ppm): 0.35 (m, 5.2 H, SiCH 2CH 2Si), 0.5 (q, 15.3 H,
SiCH2CH 3), 0.7 (m, 5.4 H, SiCH 2CH 2Si), 0.9 (t, 22 H, SiCH 2CH 3), 7.3,
7.45 (m, 5 H, Ph ring).
Elemental analysis: Found: 67.58% C, 11.50% H, expected
67.33% C, 11.68% H.
Experiment 4 JP-I-178 Synthesis of
PhSi(CH 2CH 2Si(Me) 2CH 2CI) 3
PhSiVi3 (2.06 g, 11.1 mmol, 11-51) and 75 ml THF were placed in a
250 ml 3-neck flask equipped with a stirbar and condensor.
HSi(Me 2)CH 2CI (5.12 g, 44.8 mmol, 1-20) was added in 1-ml intervals;
after the first interval 5 drops of a 5% chloroplatinic
acid/isopropanol solution was added and the flask heated to 60 0C,
then the rest of the reactant was added. The reaction was kept at
60 0C for 3 h, then the proton NMR spectra were checked for peaks
arising from unreacted vinyl groups. The mixture was taken up in
hexane and run through a silica pad; the solvent was removed by
rotary evaporation and the sample kept in vacuum overnight, 5.23 g
(73%) It was chromatographed on a 50-g silica gel column, using
674

1:250 ethyl acetate/hexane eluant. The first fraction, 3.72 g of a
water-white oil, had an NMR spectrum that showed the expected
product plus some c-addition.
'H NMR (CDCI 3, ppm): 0.089 (s, 11.7 H, SiMe, P), 0.113 (s, SiMe, c),
0.5 (m, 4.2 H, SiCH 2CH 2Si), 0.75 (m, 4.0 H, SiCH 2CH 2Si), 1.11 (d, c),
2.79 (s, 7.6 H, SiCH 2CI, P), 2.80 (s, SiCH 2CI, c), 7.36, 7.45 (m, 5 H, Ph
ring). Some of the c-addition peaks were not integrated.
10.3.2 Attempts at Functionalization of Dendrimers via Grignard
Reagents
Experiment 5 JP-I-29 Attempted Synthesis of
Si(CH 2CH 2Si(Me) 2CH 2Si(Me) 2H) 4
(Mg turnings)
Si(CH 2CH 2 Si(Me) 2CH 2 CI) 4 (3.135 g, 5.5 mmol, 1-27) was dissolved in
40 ml THF in a small flask. Magnesium turnings (0.83 g, 34 mmol)
were dried for 1 week in an oven and placed in a hot 500 ml 3-neck
flask equipped with a stir bar and condensor; this was cooled under
vacuum, then sufficient THF to cover the metal was added.
Dimethylchlorosilane (12 ml total, 127 mmol, HOls, distilled from Mg)
was added in small batches while the mixture was heated to 60 'C.
No reaction was noted over 4 h. The dendrimer solution was added
and the mixture refluxed overnight. As no reaction was evident in
the morning, a small amount of 1,2-dibromoethane was added.
Reaction progress was followed by 'H NMR spectroscopy over the
next several days, with increments of Me 2 SiHCI added occasionally
to replace losses during the reflux. (Table 10.1) After several days,
675

additional Mg (0.52 g, 20 mmol) was added and the reaction mixture
sonicated for 60 min., but this treatment gave no change in the -
CH 2 CI/product ratio. It was stirred for an additional 4 days, over
which time a new -SiMe 3 peak was seen to be growing in. The
reaction was eventually quenched and found by NMR spectroscopy
to contain approximately 10% unreacted -CH 2Cl groups and -SiMe 3
groups.
Table 10.1 Reaction progress*
Hours after mixing Chloromethyl/ outer methylene (of
product) ratio
20 2.13
24 0.19
48 0.11
52 0.17
70 0.12
75 0.095
117 0.13
*Based on 'H NMR spectra of aliquots of the reaction mixture, quenched and
taken in CDCI 3. Ratios compare the area under the peak from the
chloromethyl group to the areas under the peaks from the outer methylene
protons. Variations among the last few readings are probably due to
instrumental effects (using different NMR spectrometers, shimming
differences, etc.).
676

Experiment 6 JP-I-38 Attempted Synthesis of
Si(CH 2CH 2Si(Me) 2CH 2Si(Me) 2H) 4
(Mg turnings, opposite addition order)
Magnesium turnings (0.735 g, 30.2 mmol) were dried in an oven and
cooled under vacuum in a similarly-dried 50 ml 3-neck flask equipped
with a stir bar and condensor; 20 ml THF was added.
Si(CH 2 CH 2Si(Me) 2 CH 2 CI) 4 (2.758 g, 4.8 mmol, 1-27) was dissolved in
30 ml THF and 1/3 of this added to the magnesium turnings with
heating. After 10 min. no reaction appeared to have started, so 0.2
ml 1,2-dibromoethane was added. As this appeared to have begun
the reaction, the remainder of the dendrimer solution was added
and the mixture refluxed for about 3 h. Attack on the Mg was
noticeable. Me 2SiHCI (2.15 ml, 19.2 mmol, HOls) was added at once;
there was an exotherm and the pot contents became a murky
yellow-black. This was refluxed overnight. In the morning, Mg
remained; the proton NMR spectrum of an aliquot showed no peaks
assigned to -CH 2CI groups but a large number of -SiMe 3 groups. An
additional 2 ml of Me 2 SiHCI was added and the solution stirred at 50
0C for another half-hour. The dark yellow solution was again
checked by NMR spectroscopy. There were no chloromethyl groups
evident but approximately 10% of the proton area were accounted-
for by -SiMe 3 groups.
677

Experiment 7 JP-I-45 Attempted Synthesis of
Si(CH 2 CH 2Si(Me) 2 CH 2Si(Me) 2 H) 4
(Rieke magnesium)
Si(CH 2CH 2Si(Me) 2CH 2CI) 4 (2.007 g, 3.52 mmol, 1-27) was dissolved in
75 ml THF in a small flask. Magnesium chloride (2.22 g, 23.3 mmol,
Alfa 99% anhydrous) and KI (0.34 g, 2.05 mmol, MCB Reagents)
were placed in a 250 ml 3-neck flask equipped with a stir bar and a
condensor and dried in an oven overnight. They were cooled under
vacuum and 125 ml THF added. Potassium metal (1.52 g, 38.8
mmol) was cut into small pieces and kept under hexane, and added
piece-by-piece to the milky suspension of MgC 2 in THF at 80 OC.
After refluxing for three hours the reaction mixture was a murky
black suspension. The dendrimer solution was added slowly at 80
0C, then refluxed overnight. The NMR spectrum of an aliquot,
quenched in water, shows a significant -CH 2CI peak, though the
expected product is -SiMe 3. Me 2SiHCI (2 ml, 18.3 mmol) was added
anyway and the solution refluxed for two days. The 1H NMR
spectrum of the product (after quenching and removal of solvent
under vacuum) shows no -SiH or -SiCH 2CI peaks, only -SiMe 3.
Experiment 8 JP-I-49 Attempted Synthesis of
Si(CH 2CH 2Si(Me) 2CH 2Si(Me) 2H) 4
(Rieke magnesium)
Si(CH 2 CH 2 Si(Me) 2 CH 2 CI) 4 (1.004 g, 1.75 mmol, 1-27) was dissolved in
15 ml THF in a small flask. Separately, MgCI 2 (1.5 g, 15.8 mmol, Alfa,
678

anhydrous) was suspended in 70 ml THF in a 100 ml 3-neck
equipped with a stir bar and condensor. Potassium (1.09 g, 27.9
mmol), was added to this suspension. There was an exotherm and
the suspension became grey. It was stirred over 4 h, giving a
uniformly black suspension. The dendrimer solution was added
slowly to this, and there was an exotherm at each addition. The
mixture was refluxed overnight, but remained murky black.
Me 2SiHCI (1 ml, 9.17 mmol, HOls) was added slowly and the mixture
refluxed 8 h. An aliquot was taken; its NMR spectrum showed little
or no reaction. 1,2-dibromoethane (0.1 ml) was added and the
mixture stirred for 10 days. The NMR spectrum of an aliquot showed
complete disappearance of the -CH 2CI peaks. The mixture was
quenched in saturated aqueous ammonium chloride and the organic
layers separated, washed with water, and dried over magnesium
sulfate, leaving 1.02 g of yellow, viscous oil. This was taken up in
hexane and chromatographed on a silica column (30 g). All fractions
taken have 'H NMR spectra showing no -CH 2CI peaks but a large
-SiMe 3 peak.
Experiment 9 JP-I-55 Attempted Synthesis of
Si(CH 2CH 2Si(Me) 2CH 2Si(Me) 2H) 4
(BrCH 2CH 2Br, powdered Mg)
Si(CH 2CH 2Si(Me) 2CH 2CI) 4 (1.016 g, 1.75 mmol, 1-27) in 75 ml THF was
added to magnesium turnings (0.22 g, 9.05 mmol, oven-dried) and
0.05 ml 1,2-dibromoethane added. No reacton was evident. The
mixture was stirred for 24 h at 50 0C, but there was no evidence of
reaction. Some 30 drops of 1,2-dibromoethane were added, with
679

heating, but no reaction was evident. Me 2SiHCI (0.5 ml, 5.3 mmol)
was added at 55 0C, and after a minute or so the metal blackened
and there was a violent bubbling. The mixture was stirred
overnight at reflux, during which time all of the Mg was consumed.
The NMR spectrum of an aliquot showed totally unreacted
dendrimer. (Exposure of the solution to air gave an orange color.)
Since it was thought that the Mg had been consumed by the 1,2-
dibromoethane, magnesium powder (0.7074 g, 29 mmol, Alfa
99.8%, 10-20 mesh) was added under argon flow. Some exotherm
occurred and the suspension became a murky green-brown color.
Additional Me 2SiHCI (5 ml) was added and the mix heated for 2 h.
The NMR spectrum of an aliquot showed reduction of the area of the
-CH 2CI peak and the growth of product peaks, as well as a -SiMe 3
peak. The mixture was heated for 3 days with aliquots taken every
24 h and checked by NMR spectroscopy. Eventually there was no
further change in the -CH 2CI peak, and the reaction was quenched
with a mixture of saturated ammonium chloride solution and
hydrochloric acid. The organic phase was extracted with ether,
washed with water, and dried over sodium sulfate. Removal of the
solvent left a yellow oil, which was chromatographed on 20 g of
silica using hexane. The NMR spectra of all fractions showed
approximately 7% contamination with -SiMe 3 groups, as well as a
-CH 2CI peak.
680

Experiment 10 JP-I-67 Attempted Synthesis of
Si(CH 2CH 2Si(Me) 2CH 2Si(Me) 2H) 4
(lithium metal used)
Lithium powder (0.51 g, 73.5 mmol, Aldrich 99.9%, 325 mesh) and
25 ml hexane were added to a roundbottom flask equipped with a
stir bar. This was cooled to -78 0C and a solution of
Si(CH2CH 2Si(Me) 2CH 2CI) 4 (5.19 g, 9.1 mmol, 1-27) in 100 ml hexane
added slowly. There was no reaction apparent, so the mixture was
warmed, then sonicated for 1 h. Since no reaction was apparent,
the remainder of the dendrimer solution was added and the mixture
sonicated for an additional 2 h, then left overnight at room
temperature. The hexane was removed under vacuum and 25 ml
THF added; this mixture was sonicated for 2 h. The solution became
yellow. Me 2 SiHCI (7.6 g, 80 mmol) was added and the mixture
refluxed overnight. Some white precipitate formed. The solvent
was decanted off and the solids washed with ether; the combined
organic portions were washed with water (some fizzing occurred)
and dried on sodium sulfate. Removal of the solvent left a pale
yellow oil; this was chromatographed on a 20-g silica column using
hexane eluant, 1.36 g. The 'H NMR spectrum showed some
unreacted -CH 2CI peak and a large SiMe 3 peak.
681

Experiment 11 JP-I-69 Attempted Synthesis of
Si(CH 2CH 2Si(Me) 2CH 2Si(Me) 2H) 4
(use of CuCN catalyst)
Magnesium turnings (0.17 g, 7 mmol) were dried in an oven and
added hot to a hot 3-neck flask equipped with a condensor and stir
bar; they were cooled with stirring, dry, under vacuum. To this was
added 10 ml THF and 0.1 ml 1,2-dibromoethane; after a few minutes
the formation of bubbles indicated the start of the reaction. When
the reaction became vigorous, the solution was removed from the
magnesium by cannula and some of a solution of
Si(CH 2CH 2Si(Me) 2CH 2CI) 4 (0.98 g, 1.75 mmol, 1-27) in 15 ml THF
added immediately. This mixture was heated for 3 h at reflux, but
no consumption of the magensium was evident. CuCN (0.1 g, 1.12
mmol, Aldrich) was added, and the stirring at reflux continued
overnight. The resulting solution was brown-black and the Mg was
consumed; the remainder of the dendrimer solution was added.
After 2 h of reflux, Me 2 SiHCI (1 ml, 9.17 mmol, HOls) was added, and
there was a violent frothing. This was stirred for 4 h at reflux, then
left to cool overnight; a black solid settled out. The mixture was
quenched in saturated ammonium chloride solution and the organic
phase washed with water, dried on sodium sulfate, and stripped of
solvent, leaving a brown oil. The 'H NMR spectrum of the oil showed
unreacted -CH 2CI groups and a large -SiMe 3 peak.
682
Experiment 12 JP-I-83 Attempted Synthesis of
Si(CH 2CH 2Si(Me) 2CH 2Si(Me) 2H) 4
(using activated Mg)
Magnesium turnings were placed in a schlenk frit and rinsed with
10% v/v HCI, then acetone, then ether. They were placed under
vacuum over two days, and stored under argon. Some of this
magnesium (1.1 g, 45.2 mmol) was ground in a mortar in the glove
box, then placed into a 3-neck flask equipped with a stir bar,
condensor, and dropping funnel, along with 15 ml THF. Two ml of a
solution of Si(CH2CH 2Si(Me) 2CH 2CI) 4 (3.0194 g, 5.29 mmol, 1-27) in
25 ml THF were added to the Mg and heated to reflux, with periodic
additions of dendrimer solution, over 3 h. 1,2-dibromoethane (0.2
ml) was added to encourage the reaction, and when bubbling
began, more dendrimer solution was added. An exotherm occurred
and was maintained as the remainder of the dendrimer solution
was added. The mixture was refluxed overnight, giving a dark
brown solution. Me 2 SiHCI (3 ml, 27.5 mmol) was added slowly,
leading to an exotherm. The mixture was stirred for 4 h at 50 0C.
The proton NMR spectrum of an aliquot showed complete
consumption of the -CH 2CI peaks and approximately 11% -SiMe 3
contamination. The mixture was quenched with saturated
ammonium chloride solution, extracted with hexane, and the organic
portions washed with water and dried on sodium sulfate. After
removal of solvent by rotary evaporation there was 3.16 g yellowish
oil. This was taken up in hexane and run through a 1-cm silica gel
683

pad to decolorize it; removal of solvent left 2.93 g (82%) clear and
colorless liquid.
'H NMR (C6D6 , ppm): -0.22 (d, 2.2 H, SiCH 2Si), 0.10 (s, SiMe), 0.16
(s, SiMe) (total SiMe peak area 13.8 H), 0.75 (m, 6.6 H, SiCH 2CH 2Si),
4.30 (m, 1 H, SiH).
13C NMR (C6D6, ppm): -0.70 (SiCH 2Si), 0.09 (SiMe), 0.85 (SiMe), 4.71
(SiCH 2CH 2Si), 11.37 (SiCH 2CH 2Si)2 9 Si NMR (C6D6, ppm): -16.89 (SiCH 2Si), 2.95 (SiCH 2Si), 9.09 (Si-H).
Elemental analysis: found 50.85% C, 11.44% H; expected 50.52%
C, 11.51% H. (Figure 10.6 a-c)
Experiment 13 JP-I-174 Attempted Synthesis of
Si(CH 2CH 2Si(Me) 2CH 2SnMe 3 ) 4
(use of iodomethyl-terminated dendrimer)
Magnesium turnings (0.093 g, 3.83 mmol) were ground in a mortar
in the glovebox and placed in a 100 ml 3-neck flask equipped with a
condensor, stir bar, and dropping funnel; 5 ml of THF was added.
Si(CH 2CH 2Si(Me) 2CH 2I) 4 (0.51 g, 0.54 mmol, 1-157) was dissolved in
5 ml of THF and 0.5 ml added to the Mg turnings. The mixture was
heated, but no reaction occurred, so 0.05 ml 1,2-dibromoethane
was added and the mixture heated more. The reaction was
initiated, so the remaining dendrimer solution was added over the
next hour and the mixture refluxed for 3 h. The suspension was
somewhat milky white. Me 3SnCI (0.61 g, 3.06 mmol, Strem, freshly
sublimed) was dissolved in 15 ml of THF and added all at once to
the Grignard reagent. The mixture became clear yellow; it was
refluxed overnight. It was cooled to room temperature, then
684

quenched with 50 ml saturated ammonium chloride solution. The
combined organic phases were dried on magnesium sufate and the
solvent removed under vacuum. The resulting water-white oil was
left under vacuum for two days. The 1H NMR spectrum indicated no -
CH 2I groups, but multiple -SiMe 3 and -SnMe 3 groups.
Experiment 114 JP-I-107 Attempted Synthesis of
Si(CH 2CH 2Si(Me) 2CH 2SnBu3 ) 4
Magnesium turnings (1 g, 41 mmol, activated as described in
Experiment 18), were ground in a mortar in the glove box, then
placed in a 100 ml 3-neck flask equipped with a stir bar and
condensor; 5 ml THF was added. 0.1 ml of 1,2-dibromoethane was
added to the magnesium, with heating, and a reaction began after
2-3 min., then died out after 10-12 min. Some (5 ml) of a solution of
Si(CH 2CH 2Si(Me) 2CH 2CI) 4 (1.5 g, 2.63 mmol, 1-27) in 20 ml THF was
added, and there was an exotherm. The remainder of the
dendrimer solution was added, washing with 10 ml THF. Additional
amounts (0.1 ml each) of 1,2-dibromoethane were added at
intervals, and the reaction was refluxed overnight with no apparent
change or additional consumption of the magnesium. It was cooled
and Bu 3SnCI (3 ml, 6.18 mmol, Aldrich, 99%, freshly distilled 158-160
OC/12 mm) added. A precipitate formed; the mixture was refluxed 1
h, becoming black, and was quenched in saturated aqueous
ammonium chloride. The organic layers were collected, washed with
water, dried over sodium sulfate, and stripped of solvent, leaving
4.15 g of yellow milky oil. This was chromatographed on 40 g of
silica using hexane eluant. 2.66 g (92%) of clear and colorless liquid
685

found. The 'H NMR (CDCI 3) spectrum showed butyl groups,
methylene protons, and Si-methyl protons as expected; and the
" 9 Sn NMR spectrum had one peak at -84.47 ppm Left open to air,
the sample became milky; the 1H NMR spectrum indicated multiple
methylene and Si-methyl peaks, and the 11 9Sn NMR spectrum
showed three peaks, at -43.82, -84.47, and -151.91 ppm. Mass.
Spec. (m/e): 523, 467, 41, 355, 297, 235, 177, 121, 41 (parent ion
expected at 1108). (Figure 10.7 a, b)
Experiment 15 JP-I-155 Attempted Synthesis of
Si(CH 2CH 2Si(Me) 2CH 2SnBu3 ) 4
(in dibutyl ether)
Si(CH2CH 2Si(Me) 2CH 2CI) 4 (0.5243 g, 0.92 mmol, 1-27) was dissolved
in 25 ml dibutyl ether. Magnesium turnings (0.1203 g, 4.95 mmol)
were ground in a mortar in the glove box and placed with 5 ml
dibutyl ether in a 250 ml 3-neck flask equipped with a stir bar and a
condensor. 0.5 ml 1,2-dibromoethane was added and the mixture
heated, but there was no reaction evident. The dendrimer solution
was added to the magnesium and the mixture stirred at reflux (142
OC) for 9 h. The mixture became cloudy white; more solvent was
added, but the solution did not clear. Reflux was continued
overnight, during which time the solution became increasingly milky
and a white precipitate had collected on the sides of the flask;
unreacted Mg was present. The mixture was cooled to 100 0C and
Bu 3SnCl (6 ml, 24.6 mmol, distilled) added; this was stirred at room
temperature for 2 days, then at 70 0C overnight. The reaction was
quenched with saturated aqueous ammonium chloride solution; this
686

was extracted with hexane, and the combined organic parts were
washed with water, then dried over sodium sulfate. The solvent
was removed under vacuum, and the remaining yellow oil was left
on vacuum for 10 days to remove any excess tributyltin chloride.
The 'H NMR spectrum (C6D6) showed butyl peaks and the peaks for
the starting dendrimer, where the ratio of the peak area for the
SiMe peak (0.06 ppm) to that of the -CH 2CI peak (2.60 ppm) was the
same as for the unreacted dendrimer, indicating that no reaction
had taken place.
Experiment 16 JP-I-165 Attempted Synthesis of
Si(CH 2CH 2Si(Me) 2CH 2CH 2SnPh3) 4
Si(CH 2CH 2Si(Me) 2CH 2I) 4 (0.51 g, 0.54 mmol, 1-157) was added to a
50 ml 3-neck flask and dissolved in 20 ml hexane. This was cooled
to -80 0C (the dendrimer precipitated). 1.5 ml of tert-butyllithium
(2.55 mmol, Aldrich, 1.7 M in pentane) were added dropwise, and
the mixture was permitted to warm to -30 0C for 5 min. It was then
cooled to -45 0C and a solution of Ph 3SnCI (0.837 g, 2.17 mmol,
Strem) in 10 ml benzene added. The mixture was permitted to
warm to room temperature, and was stirred overnight. The NMR
spectrum of an aliquot indicated that no reaction had occurred.
687

10.3.3 Attempts at Functionalization of Dendrimers via Hydrosilylation
Reactions
Experiment 17 JP-I-125 Attempted Synthesis of
Si(CH 2CH 2Si(Me) 2CH 2CH 2SnPh3 ) 4
Si(CH 2 CH 2Si(Me) 2 H) 4 (1.65 g, 4.4 mmol, 1-119) was added to a 3-
neck flask equipped with a stir bar and condensor, and 50 ml THF
added. Triphenylvinyltin (7.03g, 18.6 mmol, lab-synthesized, purity
checked by 1H and 119Sn NMR) was added to make a yellow-brown
suspension. 0.1 ml of Karstedt catalyst (Gelest) was added and the
mixture was heated to reflux; no reaction was evident. More
catalyst was added as the NMR spectra of aliquots indicated no
reaction had taken place during the 48-h reflux. 0.5 ml of a solution
of 0.1 g of chloroplatinic acid (Strem) in THF was added at reflux; the
reaction mixture became dark brown and frothed. The NMR spectra
of subsequent aliquots showed decrease of SiH and Sn-Vi peaks
relative to the Si-Me peaks. The mixture was left at reflux over two
days more, and became black. Another aliquot was taken for NMR
spectometry and showed no decrease in the Si-H peak area.
688

Experiment 18 JP-I-131 Attempted Synthesis of
Si(CH 2CH 2Si(Me) 2CH 2CH 2SnPh3 )4, sealed tube, AIBN
In an ampoule were placed Si(CH 2CH 2Si(Me) 2H) 4 (0.51g, 1.35 mmol,
1-119), Ph 3SnVi (2.04 g, 9.15 mmol), and 3 ml benzene to dissolve
all the solids. 0.1 ml of Karstedt catalyst (HOls) was added and the
mixture was sealed in the tube. It was held for 3 days at 165 0C,
and became dark brown in color. The NMR spectrum of an aliquot
showed that no reaction had occurred.
The mixture was transferred to a 3-neck flask with a stir bar
and condensor and 100 mg AIBN (Alfa) added. Benzene was added
to make a total of 8 ml of solvent, and the mixture heated at 90 OC
overnight. The NMR spectrum of an aliquot showed no reaction.
Further additions of AIBN and continued heating gave no further
reaction.
Reaction using AIBN was repeated (1-139) on a fresh sample
of dendrimer and tin compound, now with no platinum catalyst
present, with much the same result.
Experiment 19 JP-I-127 Attempted Synthesis of
Si(CH 2CH 2Si(Me) 2CH 2CH 2SnEt 3 ) 4
Si(CH 2CH 2Si(Me) 2H) 4 (1.55 g, 4.1 mmol, 1-119) was added to a 3-
neck flask equipped with a stir bar and condensor, and 50 ml THF
added. Triethylvinyltin (4.07, 17.5 mmol, lab-synthesized, purity
checked by 1H and " 9 Sn NMR spectroscopy) was added to make a
yellow-brown suspension. 0.1 ml of Karstedt catalyst (Gelest) was
689

added and the mixture was heated to reflux; no reaction was
evident. More catalyst was added as the NMR spectra of aliquots
indicated no reaction had taken place during the 48-h reflux. 0.5 ml
of a solution of 0.1 g of chloroplatinic acid (Strem) in THF was added
at reflux; the reaction mixture became dark brown and frothed. The
NMR spectra of subsequent aliquots showed decrease of SiH and
Sn-Vi peaks relative to the Si-Me peaks. The mixture was left at
reflux over two days more, and became black. Another aliquot was
taken for NMR spectroscopy and showed no decrease in the Si-H
peak area.
Experiment 20 JP-I-133 Attempted Synthesis of
Si(CH 2CH 2Si(Me) 2CH 2CH 2SnEt 3 )4, sealed tube, then AIBN
In an ampoule were placed Si(CH 2CH 2Si(Me) 2H) 4 (0.52 g, 1.36 mmol,
1-119), Et 3SnVi (1.29 g, 7.38 mmol), and 3 ml benzene to dissolve all
the solids. 0.1 ml of Karstedt catalyst (HOls) was added and the
mixture was sealed in the tube. It was held for 3 days at 165 oCt
and became dark brown in color. A silvery mirror lined the sides of
the ampoule. The NMR spectrum of an aliquot showed that no
reaction consuming vinyl or Si-H groups had occurred.
The mixture was transferred to a 3-neck flask with a stir bar
and condensor and 100 mg AIBN (Alfa) added. Benzene was added
to make a total of 8 ml of solvent, and the mixture heated at 90 OC
overnight. The NMR spectra of aliquots showed no reaction; the
mixture was left at 75-90 OC for four days with intermittent addition
of AIBN. The fnial aliquot showed loss of the vinyl and Si-H groups,
690

and the volatiles were removed under vacuum. The 'H NMR
spectrum suggested decomposition.
Reaction using AIBN was repeated (1-139) on a fresh sample
of dendrimer and tin compound, now with no platinum catalyst
present, with much the same result.
10.3.4 Zirconium-based catalysts
Experiment 21 JP-II-17 Synthesis of ViSiMe 2FI
Fluorene (5.34g, 32.12 mmol, Aldrich, 98%) was added to a
250 ml Schlenk flask equipped with a magnetic stirrer and dissolved
in 200 ml toluene and 20 ml THF. Butyllithium (13 ml, 32.5 mmol,
Aldrich, 2.5 M in hexane) was added dropwise at room temperature.
The solution became increasingly red as the butyllithium as added,
and there was a mild exotherm. A condensor was added and the
solution was refluxed 2.5 h, leading to a brown solution. This was
cooled to room temperature and stirred overnight, then cooled to -
78 OC. Freshly-distilled vinyldimethylchlorosilane (10 ml, 83.6 mmol,
Gelest, distilled from Mg) was added to the flask slowly, and the
resulting exotherm was accompanied by a color change to milky
yellow-orange. The mixture was refluxed overnight, then cooled to
room temperature and hydrolyzed with water. The aqueous phase
was extracted with 2 x 20 ml of hexane and the organic phases
combined and dried on MgSO 4. Volatiles were removed by rotary
evaporation, leaving 7.72 g (96%) orange needles.
691

1H NMR (CDCl 31ppm) -0.1 (s, 5.6 H, Si-Me), 3.87 (s, 1 H, on Fl ring),
5.5 - 6.2 (pairs of doublets, 3.8 H, Si-Vi), 7.2 - 7.4 (m, 5 H, Fl ring
(peak area includes solvent peak), 7.45 (d, 2.4 H, Fl ring), 7.80 (d,
2.2 H, Fl ring).
13 C NMR (CDCI 3, ppm) 41.98 (Fl ring), 120 (Fl ring), 124.36 (Fl ring),
125.42 (Fl ring), 125.95 (Fl ring), 126.04 (Fl ring), 133.41 (SiCHCH 2),
137.05 (SiCHCH 2), 140.58 (Fl ring), 145.33 (Fl ring); the SiMe peak
was not detected.
Mass. Spec. (m/e): Peaks at 250 (parent ion), 233, 195, 165 (loss
of -SiMe 2Vi), 139, 115, 85 (loss of Fl), 59 (SiMe 2 group), 43.
Elemental: Found 80.94% C, 7.37 % H; expected 81.54 % C, 7.24
% H.
Experiment 22 JP-II-28 Synthesis of FI 2SiMeVi
Fluorene (10.0467 g, 60.4 mmol, Aldrich 98%) was added to a 500
ml 3-neck flask equipped with a magnetic stir bar and condensor
and dissolved in 250 ml of toluene. Butyllithium (25 ml, 62.5 mmol,
Aldrich 2.5 M in hexane) was added slowly, leading to a yellow
solution. This was refluxed for 2.5 h, and became cloudy orange. It
was permitted to cool to room temperature, and the orange
solution was removed from the solid by filter cannula. The solid was
stirred with 100 ml of toluene and permitted to settle, and the liquid
part again removed by filter cannula. Fifty ml of toluene and 200 ml
of ether was added and the orange suspension stirred; ViSiMeCl 2 (4
ml, 30.8 mmol, Gelest, distilled from Mg) was added slowly at room
temperature. There was an exotherm and the mixture became
milky yellow. It was refluxed overnight and cooled to room
temperature, then hydrolyzed with water and the water layer
692

extracted 2 x 50 ml with ether; the organic layer was similarly
extracted with water. Organic portions were combined and dried
over MgSO 4. Solvent was removed by rotary evaporation, leaving
an orange-yellow solid; this was dissolved in hexane and the white
insoluble material filtered off. Removal of the hexane left 11.63 g
yellow solid (crude, GC/MS shows 3.5% contamination with
unreacted fluorene plus other contaminants). Use of column
chromatography (2 g of sample, 30 g silica gel, CH 2 Cl 2 eluant) did
not effect purification. The remaining crude material was ground in
hexane and filtered to leave a beige solid and yellow filtrate; the
filtrate appeared by NMR to be mostly unreacted fluorene. GCMS on
the solid showed contamination with unreacted fluorene still; the
solid was recrystallized from hot hexane-ethyl acetate. 2.82 g
yellow brown rhombohedral and white rhombohedral crystals were
collected by cooling to 0 OC. The mother liquor was further
concentrated and cooled to -10 OC, and 2.32 g (18.8%) tan plates
collected.
'H NMR (CD 2CI 2, ppm): -0.4 (s, 3 H, SiMe), 4.3 (s, 1.5 H, Fl ring), 5.0 -
5.7 (sets of doublets, 2.9 H, SiVi), 7.25 (t, Fl ring), 7.4 (t, Fl ring),
7.55 (m, Fl ring), 7.9 (d, Fl ring) (Fl ring total area 12.0 H).
Mass. Spec. (m/e): Peaks at 400 (parent ion), 235 (loss of one FI),
205 (loss of Fl, 2 Me groups) 165 (Fl group), 139, 115, 70 (SiMeVi
group), 43.
Elemental: Expected 86.95% C, 6.04 % H ; found 86.92% C, 6.20
% H.
693

Experiment 23 JP-II-21 Attempted Synthesis of
ViMe 2SiFI(Cp)ZrCI 2
CpZrCl 3 (0.85 g, 3.24 mmol, Strem, base-free) was placed in a 100
ml schlenk flask in the glove box and suspended in 200 ml toluene.
Fluorenylvinyldimethylsilane (0.827 g, 3.30 mmol, 11-17) was added
to a 300 ml schlenk flask equipped with a magnetic stir bar and
dissolved in 25 ml toluene and 5 ml THF. Butyllithium (1.5 ml, 3.75
mmol, Aldrich 2.5 M in hexane) was added slowly, turning the
solution dark brown. This was refluxed 2 h, then cooled to -78 0C.
The CpZrCl 3 suspension was transferred into this by cannula and
washed in with another 10 ml of toluene. The mixture was
permitted to warm to room temperature and stirred overnight. The
solvent was removed, leaving a yellow-brown oil. Pentane was
stirred with the product, then removed by vacuum; the product was
dissolved in toluene again and filtered on celite. Solvent was
stripped from the filtrate and the resulting brown oil dissolved in 10
ml of dichloromethane It was left at -30 OC for a week, but only
sticky whitish solids were found. The 'H NMR spectrum (CDC 3)
shows multiple fluorenyl rings' worth of peaks, as well as multiple
Si-vinyl peaks, arising from unreacted fluorenyl starting material and
product. Small peaks in the alkane region suggest residues from
the butyllithium.
694

Experiment 24 JP-II-34 Attempted Synthesis of
ViMe 2SiFI(Cp)ZrCI 2
Fluorenylvinyldimethylsilane (4.02 g, 16.1 mmol, 11-17) was
dissolved in 100 ml toluene in a 3-neck flask equipped with a
condensor and a magnetic stir bar. Butyllithium (6.4 ml, 16 mmol,
Aldrich 2.5 M in hexane) was added slowly and the solution refluxed
overnight. It was cooled and CpZrC 3 (4.09 g, 15.6 mmol, Strem,
base-free) was added under argon counterflow. A orange-yellow
precipitate formed. The mixture was refluxed for an hour, then left
stirring at 40 OC overnight. It was hot-filtered through celite to
leave a red-brown filtrate and a yellow solid on the frit. The solvent
was partially removed and the solution left at -30 *C over 2 days.
No solid appeared; the solvent was removed under vacuum to leave
a caramel-like oil. This was ground in pentane and the pentane
removed by filter cannula; the remaining tar was dissolved in
dichloromethane and filtered, then stored at -30 OC over two days.
Repeated incremental removal of solvent in vacuo and cooling to -300C did not lead to crystals. Solid which appeared in the flask
seemed to be decomposition product.
The 'H NMR spectrum indicated Zr-bound Si-vinyl and fluorenyl
ligand, as well as some unreacted fluorenyl ligand; other organic
contaminants were present.
695

Experiment 25 JP-II-37 Attempted Synthesis of
ViMe 2SiFI(Cp)ZrCI 2
Fluorenylvinyldimethylsilane (0.99 g, 3.95 mmol, 11-17) was
dissolved in 100 ml ether and methyllithium (2.8 ml, 3.92 mmol,
Aldrich 1.4 M in ether) added slowly. This was stirred at room
temperature for 45 min. after gas production stopped, and CpZrCl3
(1.03 g, 3.92 mmol, Strem base-free) added under argon
counterflow. The solution became orange and milky. This was
stirred overnight at room temperature and the solvent removed in
vacuo; pentane was stirred in the product and removed by filter
cannula (yellow filtrate). The remaining semisolid was vacuum-
dried, then dissolved in dichloromethane; this was filtered to
remove undissolved material. It was left at -30 OC for two days.
Repeated incremental removal of solvent and cooling at -30 OC did
not lead to crystal formation.
Experiment 26 JP-II-47 Attempted Synthesis of
ViMe 2SiFI(Cp)ZrCI 2
Fluorenylvinyldimethylsilane (1.007 g, 4.02 mmol, 11-17) was added
to a schlenk flask and dissolved in 50 ml of toluene. Methyllithium
(2.87 ml, 4.02 mmol, Aldrich 1.4 M in ether) was added at room
temperature. The mixture was stirred overnight. CpZrCl 3 (1.055 g,
4.02 mmol, Strem base-free) was added under argon counterflow.
The resulting orange cloudy suspension was stirred at room
temperature for two days, then filtered on ceilte to give a yellow
696

filtrate and white solid on the filter. The solvent was reduced to 20
ml in vacuo and the rest left in an open vial in the glove box. While
the solvent evaporated over the next month, no crystals formed:
only an orange-brown tar.
Experiment 27 JP-II-38 Attempted Synthesis of ViMeSiF 2ZrC 2
Bis(fluorenyl)vinylmethylsilane (1.97g, 4.92 mmol, 11-28) was
dissolved in 100 ml ether in a 300 ml schlenk flask equipped with a
magnetic stir bar. Methyllithium (7.04 ml, 9.86 mmol, Aldrich 1.4 M in
ether) was added slowly at room temperature, and the solution
became milky yellow; no exotherm was observed. This was stirred
for at room temperature 45 min. after evolution of gas ceased.
Solid ZrC 4 (1.15 g, 4.93 mmol, Strem 98%, freshly sublimed) was
added slowly under argon counterflow; the reaction mixture became
dark red, with a reddish precipitate. It was stirred at room
temperature overnight, then the solvent removed in vacuo.
Pentane was added and the yellow solvent layer removed by filter
cannula. The remaining solid was dissolved in dichloromethane and
filtered through celite, leaving a clear burgundy solution. Some of
the solvent was removed in vacuo, and the remaining solution left at
-30 OC under argon. After four days some solid appeared; this was
removed, and the solution concentrated under vacuum and
returned to the -30 OC freezer. No further solids appeared, despite
repeated incremental solvent removal over the next month.
The solid collected (0.08 g, 3%) had an 1H NMR spectrum (CD 2 CI 2 ,
ppm) with peaks as would be expected, but the areas of the peaks
697
were far off from the appropriate values. Unreacted fluorenyl ligand
was present.
Elemental: Expected 62.12% C, 3.96 % H; found 55.52% C, 4.71 %
H. (Figure 10.22)
(This was repeated on 11-48 with much the same result.)
698

Figure 10.6 (a): 1H NMR spectrum of 1-83,
Si(CH 2Si(Me) 2 CH 2Si(Me) 2H)4.
IL
699

Figure 10.6 (b): 13C NMR spectrum of 1-83,
Si(CH 2Si(Me) 2CH 2Si(Me) 2H) 4.
-0
00

Figure 10.6 (C): 29 Si NMR spectrum of 1-83,.
Si(CH 2Si(Me) 2CH 2S!(Me) 2H) 4.
_0
701

Figure 10.7 (a): 1H NMR spectrum of 1-107,
Si(CH 2 CH 2 Si(Me) 2CH 2 SnBu 3 )4, immediately after isolation.
702
0~0~
0
0
0
m
0
0
CD
0

Figure 10.7 (b): 1H NMR spectrum of 1-107,
Si(CH 2 CH 2 Si(Me) 2 CH 2SnBu 3 ) 4 , immediately after isolation.
703

10.4 References
1)Tomalia, D. A.; Baker, H.; Dewald, J.; Hall, M.; Kallos, G.; Martin, S.;
Roeck, J.; Ryder, J.; Smith, P. Polymer 3. 1985, 17, 117.
2)Tomalia, D. A.; Naylor, A. M.; Goddard, W. A. Angew. Chem. Int. Ed.
Eng/. 1990, 29, 138.
3)Ardoin, N.; Astruc, D. Bull. Soc. Chim. Fr. 1995, 132, 875.
4)Barth, R. F.; Adams, D. M.; Soloway, A. H.; Alam, F.; Darby, M. V.
Bioconj. Chem. 1994, 5, 58.
5)Tomalia, D. A.; Wilson, L. R., U.S. Patent Appl. 897,455, 1986.
6)Watson, A. D., U.S. Patent Appl. 772,349, 1991.
7)Watanabe, S.; Regen, S. L. 3. Am. Chem. Soc. 1994, 116, 8855.
8)Coen, M. C.; Lorenz, K.; Kressler, J.; Frey, H.; Mulhaupt, R.
Macromol. 1996, 29, 8069.
9)Alonso, B.; Cuadrado, I.; Moran, M.; Losada, J. 3. Chem. Soc.
Chem. Commun. 1994, 2575.
10)Wyra, R., Final Report on Reserach in the Seyferth Group,
unpublished.
11)Lungwitz, B., Final Report on Research in the Seyferth Group,
unpublished.
12)Jansen, J. F. G. A.; de Brabander-van den Berg, E. M. M.; Meijer,
E. W. Science 1994, 266, 1226.
13)Shahlai, K.; Hart, H. 3. Am. Chem. Soc. 1990, 112, 3687.
14)Hawker, C. J.; Frechet, J. M. J. . Am. Chem. Soc. 1990, 112,
7638.
15)Roovers, J.; Zhou, L.-L.; Toporowski, P. M.; van der Zwan, M.;
Iatrou, H.; Hadjichristidis, N. Macromol., 1993, 26, 4324.
704

16)van der Made, A. W.; van Leeuwen, P. W. N. M. J. Chem. Soc.
Chem. Commun. 1992, 1400.
17)Roovers, J.; Toporowski, P. M.; Zhou, L.-L. Polym. Prepr. (Am.
Chem. Soc. Div. Polym. Chem.) 1992, 33, 182.
18)Zhou, L.-L.; Roovers, J. Macromol. 1993, 26, 963.
19)Seyferth, D.; Son, D. Y.; Rheingold, A. L.; Ostrander, R. L.
Organometallics 1994, 13, 2682.
20)Krska, S. W., Ph.D. Thesis; Massachusetts Institute of
Technology: Cambridge, MA, 1997.
21)Onopchenko, A.; Sabourin, E. T. J. Org. Chem. 1987, 52, 4118.
22)Eaborn, C. Organosilicon Compounds; Academic Press: New York,
1960.
23)Capka, M.; Svoboda, P.; Hetflejs, J. Coll. Czechoslov. Chem.
Commun. 1973, 38, 3830.
24)Whitmore, F. C.; Sommer, L. H. J. Am. Chem. Soc. 1946, 68, 481.
25)Sommer, L. H.; Whiltmore, F. C. J. Am. Chem. Soc. 1946, 68, 485.
26)Jensen, F. R.; Bedard, R. L. J. Org. Chem. 1959, 24, 874.
27)Lai, Y.-H. Synthesis 1981, 585.
28)Rieke, R. D.; Bales, S. E. 1. Chem. Soc. Chem. Commun. 1973,
879.
29)Rieke, R. D.; Bales, S. E. J. Am. Chem. Soc. 1974, 96, 1775.
30)Finkelstein, H. Ber. 1910, 43, 1528.
31)Willy, W. E.; McKean, D. R.; Garcia, B. A. Bull. Chem. Soc. Jpn.
1976, 49, 1989.
32)Lennon, P. J.; Mack, D. P.; Thompson, Q. E. Organometallics
1989, 8, 1121.
33)Wakefield, B. J. Chemistry of Organolithium Compounds;
Pergamon Press: New York, 1974.
705

34)Wakefield, B. J. Organomagnesium Methods in Organic Synthesis;
Academic Press: New York, 1994.
35)March, J. Advanced Organic Chemistry: Reactions, Mechanisms, and
Structure; 4th ed.; Wiley-Interscience: New York, 1992.
36)Eaborn, C.; Harrison, M. R.; Walton, D. R. M. J. Organomet. Chem.
1971, 31, 43.
37)EI-Durini, N. M. K.; Jackson, R. A. J. Organomet. Chem. 1982, 232,
117.
38)Collman, J. P.; Hegedus, L. S.; Norton, J. R.; Finken, R. G.
Principles and Applications of Organotransition Metal Chemistry;
University Science Books: Mill Valley, California, 1987.
39)Chen, Y.-X.; Rausch, M. D.; Chien, J. C. W. Macromol. 1995, 28,
5399.
40)Chen, Y.-X.; Rausch, M. D.; Chien, J. C. W. J. Organomet. Chem.
1995, 497, 1.
41)Ewen, J. A.; Jones, R. L.; Razavi, A.; Ferrara, J. D. J. Am. Chem.
Soc. 1988, 110, 6255.
42)Alt, H. G.; Samuel, D. Chem. Soc. Rev. 1998, 27, 323.
43)Schneider, N.; Huttenloch, M. E.; Stehling, U.; Kirsten, R.;
Schaper, F.; Brintzinger, H. H. Organometallics 1997, 16, 3413.
44)Morawietz, M. J. A., Ph.D. Thesis; Technical University of Munich:
Munich, Germany, 1995.
45)Patsidis, K.; Alt, H. G.; Palackal, S. J.; Elawley, G. R. Russ. Chem.
J. 1996, 45, 2216.
46)Ewen, J. A.; Elder, M. J.; Jones, R. L.; Haspeslagh, L.; Atwood, J.
L.; Bott, S. G.; Robinson, K. Makromol. Chem., Macromol. Symp.
1991, 48/49, 253.
706

47)Diamond, G. M.; Rodewald, S.; Jordan, R. F. Organometallics
1995, 14, 5.
48)Herrmann, W. A.; Morawietz, M. J. A. J. Organomet. Chem. 1994,
482, 169.
49)Hopper, S.P.; Tramelling; M.J. Ginsberg, R.J.; Mendelowitz, P.C J.
Organomet. Chem. 1977, 134, 173.
50)Rosenberg, S.D.; Walburn, J.J.; Stankovich, T.D.; Balint, A.E.;
Ramsden, H.E. J. Org. Chem. 1957, 22, 1200.
707
Copyright © 2022 FDOKUMEN