JEM 52(1)Jun 2018 00KAND - UKM
12
Jurnal Ekonomi Malaysia 52(1) 2018 257 - 268 http://dx.doi.org/10.17576/JEM-2018-5201-21 The Role of Human Capital and Innovation Capacity on Economic Growth in ASEAN-3 (Peranan Modal Insan dan Keupayaan Inovasi Terhadap Pertumbuhan Ekonomi di ASEAN-3) Suriyani Muhamad Nor Fatimah Che Sulaiman Jumadil Saputra Universiti Malaysia Terengganu ABSTRACT Human capital and innovation capacity are vital for driving economic growth. This study investigates the relationship between human capital and innovation capacity and its impact on economic growth in selected ASEAN countries, namely Malaysia, Indonesia, and Thailand. This study uses the Autoregressive Distributed Lag (ARDL) model through Bounds testing approach and the Error Correction Model (ECM) to examine the existence of long- and short-run relationships among variables. Human capital is proxied by tertiary enrolment (TER) and government expenditure on education (GEX). Meanwhile, the patent application (PTT) and high technology exports (HEX) reflect the innovation capacity. Using annual data for the periods from 1985 to 2015, the findings present substantial evidence for the existence of a long-run relationship between human capital and innovation capacity for the economic growth in Indonesia and Thailand. This study found that there is no long-run relationship between human capital and innovation capacity for the economic growth in Malaysia. The level of economic growth in Malaysia indicates that it has achieved the status of a medium to high-income nation. The policy implications suggest the need to strengthen the capability of ASEAN countries as ‘innovator’ countries instead of ‘user’ countries. Keywords: Human Capital; innovation capacity; economic growth; Dynamic ARDL Bounds Test and Error Correction Model ABSTRAK Modal insan dan keupayaan inovasi adalah penting untuk memacu pertumbuhan ekonomi. Kajian ini menyiasat hubungan modal insan dan keupayaan inovasi dan impaknya ke atas pertumbuhan ekonomi di negara-negara ASEAN yang terpilih iaitu Malaysia, Indonesia dan Thailand. Kajian ini menggunakan model auto regresif lat tertabur (ARDL) melalui pendekatan ujian sempadan dan model pembetulan ralat (ECM) untuk memeriksa kewujudan hubungan jangka panjang dan jangka pendek antara pemboleh ubah. Modal insan diproksikan oleh enrolmen pendidikan tinggi/ tertiari (TER) dan perbelanjaan kerajaan bagi pendidikan (GEX). Sementara itu, permohonan paten (PTT), dan eksport teknologi tinggi (HEX) mewakili keupayaan inovasi. Dengan mengunakan data tahunan untuk tempoh 1985 hingga 2015, hasil kajian menunjukkan bukti kewujudan hubungan jangka panjang antara modal insan dan keupayaan inovasi ke atas pertumbuhan ekonomi di Indonesia dan Thailand. Kajian ini juga mendapati bahawa tidak terdapat hubungan jangka panjang antara modal insan dan keupayaan inovasi ke atas pertumbuhan ekonomi di Malaysia. Tahap pertumbuhan ekonomi di Malaysia menunjukkan bahawa ia telah mencapai status negara berpendapatan tinggi yang sederhana. Implikasi dasar mencadangkan keperluan untuk mengukuhkan keupayaan negara-negara ASEAN dalam melangkah ke hadapan sebagai sebuah ‘negara pencipta’ berbanding sebagai ‘negara pengguna’. Kata kunci: Modal Insan; Keupayaan Inovasi; Pertumbuhan Ekonomi; Ujian Sempadan ARDL dan Model Pembetulan Ralat INTRODUCTION Over the past three decades, Asia’s extraordinary rise on the global stage is driven mostly by its being the world’s low-cost with high output factory (Asian Development Bank 2013). More innovative economies are becoming increasingly important for sustainable economic growth and providing the citizens with higher incomes and work opportunities (Fagerberg et al. 2009; OECD 2012; Maradana et al. 2017; Wong et al. 2005). Asia needs to diversify to address increasing resource depletion and to guide its workforce toward realising its full potential to achieve an innovative economy and avoid the middle-income trap that has befallen other developing regions. An innovative economy requires quality and accessible higher education, robust information infrastructure, better research and development, innovation, the right economic institutions, and freedom
-
Upload
khangminh22 -
Category
Documents
-
view
1 -
download
0
Transcript of JEM 52(1)Jun 2018 00KAND - UKM

Jurnal Ekonomi Malaysia 52(1) 2018 257 - 268http://dx.doi.org/10.17576/JEM-2018-5201-21
The Role of Human Capital and Innovation Capacity on Economic Growth in ASEAN-3
(Peranan Modal Insan dan Keupayaan Inovasi Terhadap Pertumbuhan Ekonomi di ASEAN-3)
Suriyani MuhamadNor Fatimah Che Sulaiman
Jumadil SaputraUniversiti Malaysia Terengganu
ABSTRACT
Human capital and innovation capacity are vital for driving economic growth. This study investigates the relationship between human capital and innovation capacity and its impact on economic growth in selected ASEAN countries, namely Malaysia, Indonesia, and Thailand. This study uses the Autoregressive Distributed Lag (ARDL) model through Bounds testing approach and the Error Correction Model (ECM) to examine the existence of long- and short-run relationships among variables. Human capital is proxied by tertiary enrolment (TER) and government expenditure on education (GEX). Meanwhile, the patent application (PTT) and high technology exports (HEX) reflect the innovation capacity. Using annual data for the periods from 1985 to 2015, the findings present substantial evidence for the existence of a long-run relationship between human capital and innovation capacity for the economic growth in Indonesia and Thailand. This study found that there is no long-run relationship between human capital and innovation capacity for the economic growth in Malaysia. The level of economic growth in Malaysia indicates that it has achieved the status of a medium to high-income nation. The policy implications suggest the need to strengthen the capability of ASEAN countries as ‘innovator’ countries instead of ‘user’ countries.
Keywords: Human Capital; innovation capacity; economic growth; Dynamic ARDL Bounds Test and Error Correction Model
ABSTRAK
Modal insan dan keupayaan inovasi adalah penting untuk memacu pertumbuhan ekonomi. Kajian ini menyiasat hubungan modal insan dan keupayaan inovasi dan impaknya ke atas pertumbuhan ekonomi di negara-negara ASEAN yang terpilih iaitu Malaysia, Indonesia dan Thailand. Kajian ini menggunakan model auto regresif lat tertabur (ARDL) melalui pendekatan ujian sempadan dan model pembetulan ralat (ECM) untuk memeriksa kewujudan hubungan jangka panjang dan jangka pendek antara pemboleh ubah. Modal insan diproksikan oleh enrolmen pendidikan tinggi/ tertiari (TER) dan perbelanjaan kerajaan bagi pendidikan (GEX). Sementara itu, permohonan paten (PTT), dan eksport teknologi tinggi (HEX) mewakili keupayaan inovasi. Dengan mengunakan data tahunan untuk tempoh 1985 hingga 2015, hasil kajian menunjukkan bukti kewujudan hubungan jangka panjang antara modal insan dan keupayaan inovasi ke atas pertumbuhan ekonomi di Indonesia dan Thailand. Kajian ini juga mendapati bahawa tidak terdapat hubungan jangka panjang antara modal insan dan keupayaan inovasi ke atas pertumbuhan ekonomi di Malaysia. Tahap pertumbuhan ekonomi di Malaysia menunjukkan bahawa ia telah mencapai status negara berpendapatan tinggi yang sederhana. Implikasi dasar mencadangkan keperluan untuk mengukuhkan keupayaan negara-negara ASEAN dalam melangkah ke hadapan sebagai sebuah ‘negara pencipta’ berbanding sebagai ‘negara pengguna’.
Kata kunci: Modal Insan; Keupayaan Inovasi; Pertumbuhan Ekonomi; Ujian Sempadan ARDL dan Model Pembetulan Ralat
INTRODUCTION
Over the past three decades, Asia’s extraordinary rise on the global stage is driven mostly by its being the world’s low-cost with high output factory (Asian Development Bank 2013). More innovative economies are becoming increasingly important for sustainable economic growth and providing the citizens with higher incomes and work opportunities (Fagerberg et al. 2009; OECD 2012;
Maradana et al. 2017; Wong et al. 2005). Asia needs to diversify to address increasing resource depletion and to guide its workforce toward realising its full potential to achieve an innovative economy and avoid the middle-income trap that has befallen other developing regions. An innovative economy requires quality and accessible higher education, robust information infrastructure, better research and development, innovation, the right economic institutions, and freedom

258 Jurnal Ekonomi Malaysia 52(1)
to collaborate and share information (Asian Development Bank 2013).
The innovation economy occurs through the production of knowledge-intensive goods and services and is supported by an educated and skilled workforce. These are critical factors for building an innovative economy. However, the average length of education and high levels of informal employment are challenges facing Asia in its drive to become an innovative economy (Asian Development Bank 2013). Another way to solve this issue and create opportunities is by participating in world-class institutions, strengthening university-industry links, and promoting cross-border institutional partnerships. Broadly, developing talent could also help foster greater inclusiveness. For ASEAN countries, challenge and obstacles remain regarding education and skills development, technological readiness and innovation. Hence, ASEAN countries must recognise these critical elements for building an innovative economy while working together by investing their capital to obtain dividend growth.
All ASEAN countries except Singapore are struggling to transition to an innovation-driven economy. The Innovation Capacity Index (ICI) based on five pillars is composed of 61 variables. The ICI ranks countries through their overall performance and provides scores and sub-indexes that offer a general idea of the performance achieved in those areas. The five pillars are: (i) the institutional environment, (ii) the human capital, training and social inclusion, (iii) a regulatory and legal framework, (iv) research and development, and (v) adoption and use of information and communication technologies. Except for Singapore, Malaysia and Thailand are investment-driven, while Indonesia, Vietnam, and the Philippines are transitioning between the two stages. The innovation capacity scores are listed in Table 1:
The principal issue in this area is tertiary education enrolment levels and innovative economy. Competition is relatively tight for skilled workers due to demand for innovation-driven economies. Access to high-quality education is one way to solve this issue. Innovative economies will complement the ASEAN Economic Community through goods, investments, and skilled labour. It means ASEAN countries must begin redesigning their development programs and regional cooperation activities around the elements of an innovation economy. Thus, nations will need to invest in hard and soft infrastructure to facilitate knowledge creation and diffusion, as well as cultivate an active public sector that collaborates with the private sector to nurture knowledge and innovation. The development must focus on building knowledge infrastructure rather than the simple “bricks and mortar” investments of the past.
Motivated by these issues, this study expects that the human capital and innovation capacity are important
factors contributing to economic growth for ASEAN countries. While similar studies regarding innovation and human capital capacity have been carried out in Europe and the United States (Edquist 2004; Muchie et al. 2003; Nelson 1993; Viotti 2002), no similar study has been undertaken in ASEAN countries. This study investigates the relationships of human capital and innovation capacity on the economic growth in three selected ASEAN countries, namely Malaysia, Indonesia, and Thailand. These countries are chosen based on the similarities as middle-income countries and their geographical grouping. As there are limited studies in the ASEAN countries on the issue, this study contributes to filling in the gap in the literature. The paper is organised into five sections. The next section discusses the literature review followed by the methodology. The last two sections discuss the results and conclude the study.
LITERATURE REVIEW
This section reviews several studies on human capital and innovation capacity for economic growth. In classical economic theory, workforce productivity is viewed as an exogenous factor that depends on the ratio of employees and physical capital, including technical progress. However, the beneficial effect of education on the potential growth of productivity is not taken into consideration. In the early 1980s, a new theory of
TABLE 1. Innovation Capacity Index (ICI) 2010-2011
Country ICI rank ICI score GDP per capita (USD)
Sweden 1 80.3 56,724.36Switzerland 2 78.1 83,270.24Singapore 3 76.7 52,870.54United States 5 74.8 49,854.52Denmark 6 74.3 59,911.90Canada 7 73.6 51,790.57Netherlands 8 72.8 49,886.28Taiwan 9 72.5 36,004.00Republic of Korea 11 72.1 24,155.83Hong Kong SAR 13 71.4 35,142.54New Zealand 14 71.3 37,225.69United Kingdom 14 71.3 38,927.07Japan 16 70.2 46,023.70Australia 17 69.4 62,080.98Malaysia 39 56.4 10,058.04Thailand 45 54.8 5,192.12China 64 49.9 5,447.31Vietnam 74 47.1 1,543.03Indonesia 77 46 3,469.75Philippines 81 45.3 2,357.57
Source: Innovation of Development Report, 2010-2011.
259The Role of Human Capital and Innovation Capacity on Economic Growth in ASEAN-3
economic growth was developed to correct shortcomings in the classical theory highlighting the importance of human capital elements such as education and innovation in long-term economic growth. A new method emerged as the theory of market value. This theory highlighted the effect of intangible assets such as research and development, patents, intellectual capital which lead ultimately to economic growth.
Numerous research stated that human capital is critical factor and engine of economic growth (De la Fuente & Doménech 2000, 2006; Lucas 1988; Mankiw et al. 1992; Riley 2012) as it signifies the level of workforce efficiency and productivity (Mankiw et al. 1992; Romer 1990). Human capital contributes to increasing competitive advantage over the diffusion of innovation and technology (Horwitz 2005; Pistorius 2004; Siggel 2000, 2001). Mincer (1995) states a higher growth of technological change in a sector can lead to the significant demand for educated and trained workforce. Most economists agree with the notion of human capital as a key factor in explaining rich and poor countries (Acemoglu et al. 2014; Galor 2011; Gennaioli et al. 2013; Glaeser et al. 2004; Goldin & Katz 1998; Hanushek & Woessmann 2008; Jones & Romer 2010; Lucas 2002).
However, there is debate as to the channels through which human capital fosters economic growth. On the one hand, human capital is interpreted as an independent factor of production, which increases productivity for a given level of technology (Lucas 1988; Mankiw et al. 1992). On the other, human capital is seen as an input in the innovation process and therefore as a complement to technology (Benhabib & Spiegel 1994; Nelson and Phelps 1966; Romer 1990). Hence, higher levels of human capital lead to the generation or diffusion of new technologies or a more efficient adoption of a given technology, thereby shifting the frontier of the production-possibility set outwards. Bundle et al. (1999) revealed that a growth rate of output depends on the accumulation of human capital and innovation. The stock of human capital through education level affects labour productivity. These findings are supported by Cinnirella and Streb (2017) who studied the impact of human capital on growth which involves multiple channels. This study found that an increase in human capital directly affects economic growth by enhancing labour productivity in production. Then, human capital through the incremental of labour productivity is an essential input for research & development (R&D) which accelerates technological change.
A new approach to the human capital measurement is needed to consider the conceptual framework of Human Development Index (HDI) developed by the United Nations Development Programme (UNDP). The structure of the index constituted health, knowledge, and standard living with many sub-variables such as life expectancy at birth, adult literacy rate, the gross enrolment ratio, and GDP per capita (Kwon 2009).
Hanushek (2013) revealed that human capital as a driver of economic growth in developing countries has led to undue attention to school attainment. Developing countries have made considerable progress in closing the gap with developed nations regarding school attainment. However, recently researchers have underscored the importance of cognitive skills for economic growth. This result shifts the attention to issues of school quality where developing countries have been much less successful in closing the gaps with developed countries. Without improving school quality, developing countries will find it difficult to adjust their long-run economic performance.
Also, using a sample of developed and developing countries, Ang et al. (2011) studied the effect of tertiary education attainment on innovation and growth. They found that the growth-enhancing effects of tertiary education attainment or skilled human capital promote innovation only in high-income countries. This supports the findings of the studies in OECD countries. They also found that tertiary education attainment does not contribute to innovation and growth and have no growth-enhancing effect in low-income countries. This finding is similar to Danquah and Ouattara (2017) who found that human capital does not exert a statistically significant impact on productivity growth. Pelinescu et al. (2015) highlighted the importance of human capital in ensuring economic growth expressed as a gross domestic product per capita. This study found that there is a definite relationship that is statistically significant between GDP per capita and innovation capacity of human capital (number of patents) and qualification of employees (secondary education) as expected according to economic theory. Pece et al. (2015) also found that the innovation potential of an economy influences long-term economic growth. To quantify the innovation, they used various variables such as the number of patents, number of trademarks, R&D expenditures and found evidence of a positive relationship between economic growth and innovation.
Maradana et al. (2017) studied using six different indicators of innovation: patents-residents, patents-non-residents, research and development expenditure, researchers in research and development activities, high technology exports, and scientific and technical journal articles to examine this long-run relationship with per capita economic growth. They found that the evidence of all these innovation indicators links with per capita economic growth and the presence of both unidirectional and bidirectional causality between innovation and per capita economic growth. Based on the outcome of the literature reviews, there are weakness that could be improved. Pelinescu et al. (2015) suggest a possible explanation is heterogeneity of countries and alternative variables for human capital, a weighted average of the population enrolled in primary education, secondary and tertiary enrolment and how

260 Jurnal Ekonomi Malaysia 52(1)
the results were influenced by choosing the proxy for human capital.
In the ASEAN context, the existing literature about human capital, innovation capacity towards economic growth is limited. A study by OECD (2010) indicated that Indonesia had made relatively slow progress on increasing enrolments in secondary and tertiary education. As in many countries, there are systematic differences in access to education between the rich and the poor across all levels of education, particularly at the tertiary level. Poverty and low educational attainment are strongly correlated in Indonesia. According to the World Bank (2010), evidence indicates that higher education system is being outpaced by many of its neighbours such as Malaysia and Singapore, particularly regarding patents granted and the number of researchers. Most developing countries’ innovative performance such as Malaysia, Thailand and Philippines are in line with that of other middle-income countries in the Southeast Asia region but are yet to enter a stage of innovation-led growth and research performance. This situation has not significantly improved in recent decades (IMF 2014). There is also an institutional problem, as very little funding from the government goes to R&D. Hence, there is very limited knowledge spill over.
METHODOLOGY
DATA AND DEFINITIONS OF VARIABLES
This study uses the World Development Indicator (WDI) as secondary data collected from the World Bank for the period from 1985 until 2015. We utilise
the reliable and prominent proxies for representing the variable of human capital and innovation capacity. This study uses tertiary enrolment (TER) and government expenditure on education (GEX) as a proxy for human capital. Enrolment ratios were chosen because there have been many studies showing that the enrolment ratio is an education indicator that is positively related to human capital (Barro 1991; Levine & Renelt 1992; Mankiw et al. 1992). Corray (2009) also found a vital interaction effect between government expenditure and education quality on economic growth. It can be argued that as most expenditure is devoted to education, it leads to an improvement in quality which, in turn, improves economic growth. Meanwhile, the variable of innovation capacity involves the patent application (PTT) and high technology exports (HEX). Commonly used innovation variables such as R&D expenditures and trademark application were considered but omitted and not adapted for this study due to the absence of data, especially in middle-income countries like Malaysia, Indonesia, and Thailand. As for economic growth, it is measured by gross domestic product per capita (GDP). All variables are transformed to the logarithms form. In detail, the definitions of a variable are listed in Table 2:
ECONOMETRIC MODEL
The data analyses using the Autoregressive Distributed Lag (ARDL) through Bounds testing approach by Pesaran and Shin (1995; 1999), Pesaran et al. (1996), and Pesaran (1997) and the Error Correction Model (ECM) introduced by Boswijk (1995). Both analyses examine the existence
TABLE 2. Definitions of Variables
Variable Dimension/Proxied by Definitions of VariablesIndependent VariableHuman capital Tertiary Enrolment (TER) Tertiary education, whether or not specifying advanced research qualifications,
typically requires a minimum condition of admission the successful completion of education at the secondary level.
Government Expenditure on Education (GEX)
Government education expenditure refers to current operating expenditures in education, including wages and salaries and excluding capital investments in buildings and equipment.
Innovation Capacity Total Patent Application (PTT)
Total patent applications filed through the Patent Cooperation Treaty or with a national patent office. The choice of using the number of patents applications allows us to avoid comparability problems across countries.
High Technology Exports (HEX)
High technology exports are products with high R&D intensity, such as aerospace, computers, pharmaceuticals, scientific instruments, and electrical machinery.
Dependent VariableEconomic Growth Gross Domestic Product
per capita (GDP)GDP per capita is gross domestic product divided by midyear population. GDP is the sum of gross value added by all resident producers in the economy plus any product taxes and minus any subsidies not included in the value of the products. It is calculated without making deductions for depreciation of fabricated assets or depletion and degradation of natural resources.

261The Role of Human Capital and Innovation Capacity on Economic Growth in ASEAN-3
of the long and short-run relationship between human capital and innovation capacity towards economic growth. Before embarking on the data analysis, the ARDL model has not assigned the prerequisite where the properties of data series have to fulfil the condition of stationary or no existence of a unit root in the data series. According to Pesaran et al. (2001), the presence of a relationship between variables in levels is applicable irrespective of whether the underlying regressors are I(0) and I(1) or combination of both. However, this study considers employing the unit root test to avoid problems resulting from non-stationary time series data (Laurenceson & Chai 2003). Two tests are used to detect the existence of unit root, namely Augmented Dickey-Fuller (ADF) and Phillip-Perron (PP). ADF is a procedure for testing whether a variable has a unit root or equivalently and follows a random walk (Dickey & Fuller 1979; Hamilton 1994).
The Dickey-Fuller test involves the fitting of regression model by ordinary least squares (OLS), but serial correlation will create a problem. Thus, the ADF test’s regression includes lags of the first differences of the dependent variable. In contrast, the PP test does not apply case as in the ADF test; PP assumes the variable has a random walk with drift under the null hypothesis, is just a special case (Hamilton 1994). The first step in cointegration analysis is verifying the order of integration that aims to avoid some problems resulted from non-stationary time series data by applying the unit root tests (Laurenceson & Chai 2003). The ARDL model for the relationship of human capital and innovation capacity for economic growth are as follows:
Δlog(GDP)t
= a0 + k∑i=1
b1iΔlog(GDP)t–i + k∑i=0
b2iΔlog(TER)t–i +
k∑i=0
b3iΔlog(GEX)t–i + k∑i=0
b4iΔlog(PPT)t–i +
k∑i=0
b5iΔlog(HEX)t–i + d1iΔlog(GDP)t–i +
d2iΔlog(TER)t–i + d3ilog(GEX)t–i +
d4ilog(PPT)t–i + d5ilog(HEX)t–i + ut (1)
Where υt is the error term that should be white noise, Δ shows the first-difference operator, for i, j = 0, 1, 2,…, k and k is the optimal lag length (p, q, r, s, v) and chosen by the author. The Akaike Information Criterion (AIC) is used to determine the optimal lag length selection. In the ARDL bounds testing approach, this study uses F-statistics tests to examine the null hypothesis that is no cointegration among the variables. The estimated F-statistics value will compare with the two sets of critical values of the upper- and lower-bounds. If the estimated F-statistics are higher than the critical values (upper bound and lower bound), then the null hypothesis is rejected. It means there is
cointegration among variables. After confirming the existence of cointegration between the variables, the estimated coefficients of a long-run calculated by using Equation (2) below:
Δlog(GDP)t
= a0 + k∑j=1
l1jΔlog(GDP)t–j + k∑j=0
b1jΔlog(TER)t–i +
k∑i=0
d2jΔlog(GEX)t–j + k∑j=0
d3jΔlog(PPT)t–j +
k∑j=0
d4jΔlog(HEX)t–j + mt (2)
Further, the Equation (3) is to estimate the short-run coefficient:
Δlog(GDP)t
= a0 + k∑j=1
l1jΔlog(GDP)t–j + k∑j=0
d1jΔlog(TER)t–i +
k∑i=0
d2jΔlog(GEX)t–j + k∑j=0
d3jΔlog(PPT)t–j +
k∑j=0
d4jΔlog(HEX)t–j + mt (3)
Moreover, the ARDL specification of the short-run dynamics derived by constructing an Error Correction Model (ECT(-1)). The Equation (4) and (5) below displays the speed of the adjustment to converge back to its long-run equilibrium:
Δlog(GDP)t
= a0 + k∑i=1
l1iΔlog(GDP)t–i + k∑i=0
d1iΔlog(TER)t–i +
k∑i=0
d2jΔlog(GEX)t–i + k∑i=0
d3iΔlog(PPT)t–i +
k∑i=0
d4iΔlog(HEX)t–i + ΨECMt–1 + mt (4)
Further,
ECMt–1 = log(GDP)t
– a0 – k∑i=1
l1iΔlog(GDP)t–i + k∑i=0
d1iΔlog(TER)t–i +
k∑i=0
d2jΔlog(GEX)t–i + k∑i=0
d3iΔlog(PPT)t–i +
k∑i=0
d4iΔlog(HEX)t–i (5)
Where, ψ represents the speed of adjustment coefficient and ECMt-1 represents the error correction term. In general, the value of ψ should be negative and range from 0 to 1. It indicates the speed of adjustment in relative to last period (Kim et al. 2007). In addition, the value of ψ aims to estimate directly the coefficient which a dependent variable returns to equilibrium when

262 Jurnal Ekonomi Malaysia 52(1)
accurs change in other variables. For instance, number –0.50 indicates there was 50 % adjustment occurs in the previous period to the equilibrium.
EMPIRICAL RESULTS
Before examining the dynamic long- and the short-run relationship of human capital and innovation capacity towards economic growth, this study first employs a test for determining the order of integration for each variable. The unit root test is performed using ADF and PP to ensure that there is no variable integrated at I(2) and to avoid misleading estimates or spurious result (Sofia & Ghulam 2011). According to Tursoy and Resatoglu (2017), the unit root test is essential to obtain unbiased test results from empirical studies to determine an equilibrium relationship between variables. Table 3 summarises the result of the unit root test as follows:
Table 3 shows the result of the unit root test for Malaysia, Indonesia and Thailand using ADF and PP with the trend and intercept. From the above table, the order of integration for each variable is I(0) and I(1) or combination of both. After verifying the unit root test for each variable, the bounds testing approach of cointegration apply for Equations (1) and (2) to examine the existence of the long-run relationship between the variables.
Table 4 displays the results of the bound test for determining the existence of cointegration among variables. The maximum lag length is determined using the Akaike Information Criterion (AIC). The critical value for small sample size is ranged from 30 to 80 (Pesaran 2001). Based on Table 4, there is a cointegration or the existence of the long-run relationship of human capital and innovation capacity on economic growth
in Indonesia and Thailand. For Malaysia, this study also found that there are no long-run relationships. The result of the bounds test for Indonesia, the value of F-statistics is 27.239 with k is 4 and significant at the level 1%. In Malaysia, there is no cointegration or long-run relationship between human capital and innovation capacity to the economic growth. The result of bounds testing for F-statistic is 2.261, and it is less than the upper bound of critical value (1%, 5%, and 10%).
For Thailand, there is cointegration or long-run relationship among variables where the F-statistic is 22.241 and significant at various levels; 1%, 5% and 10%. It means that the variables cointegrated each other. In other words, the human capital and innovation capacity has a considerable influence on the economic growth in the long-term. Having verified the cointegration or long-run relationship among variables, we elaborate the
TABLE 3. The result of unit root test by using ADF and PP with the trend and intercept
Country VariableADF PP
I(0) I(1) I(0) I(1)
Indonesia
Log(GDP)Log(TER)Log(GEX)Log(PTT)Log(HEX)
–2.157–2.407–1.451
–4.743***
–0.162
–3.851**
–4.724***
–5.569***
–3.574**
–4.904***
–1.756–2.513–1.723–2.832–0.198
–3.830*
–4.750**
–5.610**
14.770**
–4.900**
Malaysia
Log(GDP)Log(TER)Log(GEX)Log(PTT)Log(HEX)
–1.5580.749
–3.404*
–4.272**
–1.063
–5.055***
–3.795**
–6.237***
–13.721***
–5.953***
–1.6380.436–2.235
–4.331***
–1.010
–5.055***
–3.819**
–6.195***
–12.564***
–5.942***
Thailand
Log(GDP)Log(TER)Log(GEX)Log(PTT)Log(HEX)
–4.026**
–1.479–2.076–2.248–2.846
–3.807**
–15.053***
–4.784***
–5.452***
–4.622***
–2.044–4.961***
–2.266–2.037–2.879
–3.908**
–11.145***
–4.779***
–6.208***
–4.600***
Note: *** significant at the level 1%, ** significant at the level 5% and * significant at the level 10%
TABLE 4. The result of cointegration test using the bound testing approach
Country F-Statistics k Sig.
Bound Critical Value
Lower Bound
Upper Bound
Indonesia 27.239 41%5%10%
3.742.862.45
5.064.013.52
Malaysia 2.261 41%5%10%
3.742.862.45
5.064.013.52
Thailand 22.241 41%5%10%
3.742.862.45
5.064.013.52
Note: *** significant at the level 1%, ** significant at the level 5% and * significant at the level 10%
263The Role of Human Capital and Innovation Capacity on Economic Growth in ASEAN-3
result for the long-run estimation coefficient separately by country.
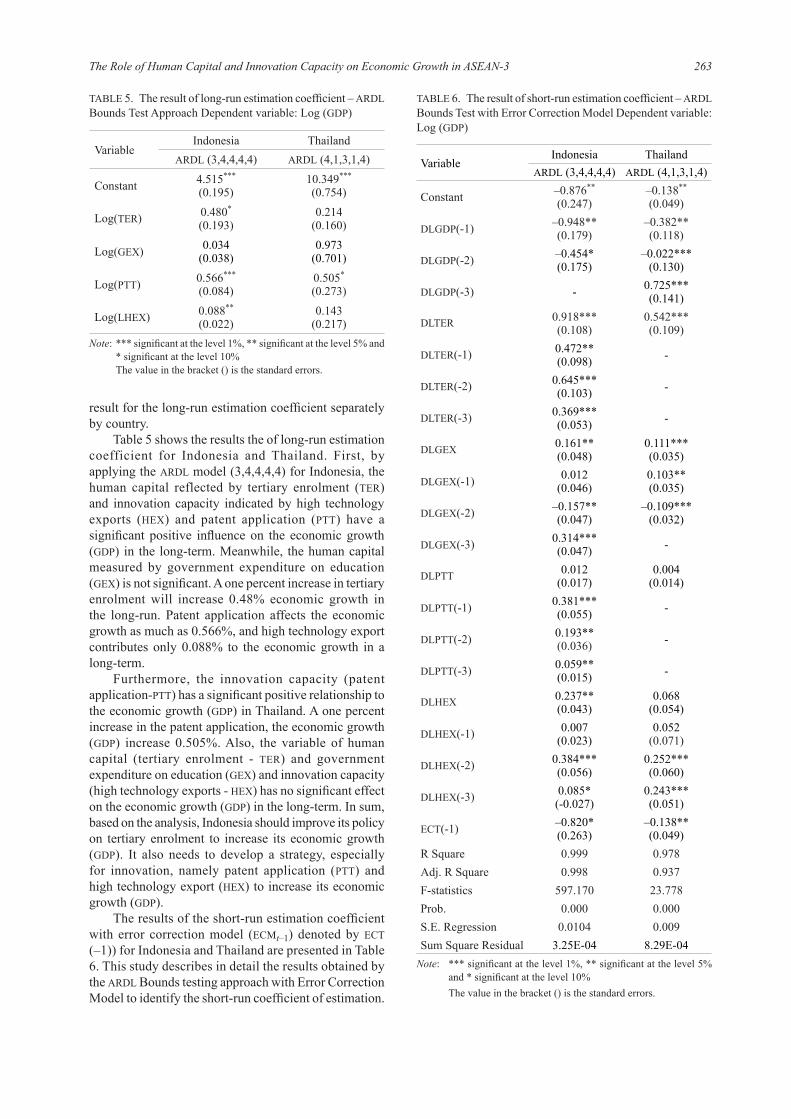
Table 5 shows the results the of long-run estimation coefficient for Indonesia and Thailand. First, by applying the ARDL model (3,4,4,4,4) for Indonesia, the human capital reflected by tertiary enrolment (TER) and innovation capacity indicated by high technology exports (HEX) and patent application (PTT) have a significant positive influence on the economic growth (GDP) in the long-term. Meanwhile, the human capital measured by government expenditure on education (GEX) is not significant. A one percent increase in tertiary enrolment will increase 0.48% economic growth in the long-run. Patent application affects the economic growth as much as 0.566%, and high technology export contributes only 0.088% to the economic growth in a long-term.
Furthermore, the innovation capacity (patent application-PTT) has a significant positive relationship to the economic growth (GDP) in Thailand. A one percent increase in the patent application, the economic growth (GDP) increase 0.505%. Also, the variable of human capital (tertiary enrolment - TER) and government expenditure on education (GEX) and innovation capacity (high technology exports - HEX) has no significant effect on the economic growth (GDP) in the long-term. In sum, based on the analysis, Indonesia should improve its policy on tertiary enrolment to increase its economic growth (GDP). It also needs to develop a strategy, especially for innovation, namely patent application (PTT) and high technology export (HEX) to increase its economic growth (GDP).
The results of the short-run estimation coefficient with error correction model (ECMt–1) denoted by ECT (–1)) for Indonesia and Thailand are presented in Table 6. This study describes in detail the results obtained by the ARDL Bounds testing approach with Error Correction Model to identify the short-run coefficient of estimation.
TABLE 5. The result of long-run estimation coefficient – ARDL Bounds Test Approach Dependent variable: Log (GDP)
VariableIndonesia Thailand
ARDL (3,4,4,4,4) ARDL (4,1,3,1,4)
Constant 4.515***
(0.195)10.349***
(0.754)
Log(TER) 0.480*
(0.193)0.214
(0.160)
Log(GEX) 0.034(0.038)
0.973(0.701)
Log(PTT) 0.566***
(0.084)0.505*
(0.273)
Log(LHEX) 0.088**
(0.022)0.143
(0.217)Note: *** significant at the level 1%, ** significant at the level 5% and
* significant at the level 10% The value in the bracket () is the standard errors.
TABLE 6. The result of short-run estimation coefficient – ARDL Bounds Test with Error Correction Model Dependent variable: Log (GDP)
VariableIndonesia Thailand
ARDL (3,4,4,4,4) ARDL (4,1,3,1,4)
Constant –0.876**
(0.247)–0.138**
(0.049)
DLGDP(-1) –0.948**(0.179)
–0.382**(0.118)
DLGDP(-2) –0.454*(0.175)
–0.022***(0.130)
DLGDP(-3) - 0.725***(0.141)
DLTER 0.918***(0.108)
0.542***(0.109)
DLTER(-1) 0.472**(0.098) -
DLTER(-2) 0.645***(0.103) -
DLTER(-3) 0.369***(0.053) -
DLGEX 0.161**(0.048)
0.111***(0.035)
DLGEX(-1) 0.012(0.046)
0.103**(0.035)
DLGEX(-2) –0.157**(0.047)
–0.109***(0.032)
DLGEX(-3) 0.314***(0.047) -
DLPTT 0.012(0.017)
0.004(0.014)
DLPTT(-1) 0.381***(0.055) -
DLPTT(-2) 0.193**(0.036) -
DLPTT(-3) 0.059**(0.015) -
DLHEX 0.237**(0.043)
0.068(0.054)
DLHEX(-1) 0.007(0.023)
0.052(0.071)
DLHEX(-2) 0.384***(0.056)
0.252***(0.060)
DLHEX(-3) 0.085*(-0.027)
0.243***(0.051)
ECT(-1) –0.820*(0.263)
–0.138**(0.049)
R Square 0.999 0.978Adj. R Square 0.998 0.937F-statistics 597.170 23.778Prob. 0.000 0.000S.E. Regression 0.0104 0.009Sum Square Residual 3.25E-04 8.29E-04
Note: *** significant at the level 1%, ** significant at the level 5% and * significant at the level 10%
The value in the bracket () is the standard errors.

264 Jurnal Ekonomi Malaysia 52(1)
Based on the result in Table 6, this study found that in the short-term, the human capital, tertiary enrolment (TER) and government expenditure on education (GEX) and innovation capacity of high technology exports (HEX) have a significant positive influence on the economic growth (GDP) of Indonesia. Meanwhile, the innovation capacity of patent application (PTT) is not significant.
Besides that, we also found in the short-run that the human capital made of tertiary enrolment (TER) and government expenditure on education (GEX) have a significant positive effect on the economic growth (GDP). Meanwhile the innovation capacity of patent application (PTT) and high technology export (HEX) does not have a significant effect on the economic growth of Thailand. The sign of an error correction term (ECT) shows evidence of causality in at least one direction. The lagged error term (ECT (–1)) in this result is negative and significant at 1% level. The estimation coefficient for Indonesia is –0.820 indicating a high rate of convergence to equilibrium or means that there 82% adjustment occurs in the previous period to the equilibrium. Meanwhile, for Thailand, the estimation coefficient of ECT (–1) is –0.138, which indicates a low rate of convergence to equilibrium or only 13.8% adjustment occurs in a dependent variable when other variables change at the previous period to the equilibrium. We also applied several diagnostic tests to examine the error correction model.
Table 7 displays the diagnostic tests of the ARDL bound model. Results indicate that the model does not have problems relating to the normality of residuals, serial correlation, or heteroscedasticity. CUSUM and CUSUMSQ test are performed to examine the stability of parameter (Turner, 2010). The result of CUSUM and CUSUMSQ tests indicate no evidence of misspecification and instability during the period estimated by the model (Refer Appendix A).
chose four indicators for measuring the human capital and innovation capacity, namely tertiary enrolment (TER), government expenditure on education (GEX), patent application (PTT) and high technology export (HEX). This study confirms that the human capital and innovation capacity are cointegrated or has a long-run relationship with economic growth. The human capital and innovation capacity has a significant positive effect on the economic growth in Indonesia. It is similar to the empirical result for Thailand, which found that the human capital in the form of tertiary enrolment and government expenditure on education has a significant positive effect on economic growth. In Malaysia case, human capital consisting of the tertiary enrolment (TER) and government expenditure on education (GEX) and innovation capacity involving patent application (PTT) and high technology exports (HEX) do not have a significant relationship on the economic growth in the long-run.
Moreover, in the short-run, the result shows that the human capital and innovation capacity in Indonesia is higher and more efficient compared to Thailand. The possible explanation based on the results is that the level of economic growth in Malaysia has achieved medium high-income status. These factors may foster economic growth in Malaysia. Meanwhile, Thailand’s economic growth has shown a significant relationship with human capital; TER and GEX but not significantly related to innovation capacity; PTT and HEX. Thailand is only one-step behind Malaysia in innovation, and this is the reason why innovation capacity is not significantly related to economic growth in Thailand. Other crucial factors have driven its economic growth. Compared to Indonesia, human capital and innovation capacity; TER, GEX PTT and HEX are significantly related to economic growth. These four factors are crucial for Indonesia in achieving the next level of economic growth. In sum, many potential indicators enhance and accelerate the human capital and innovation capacity towards economic growth. Therefore, it is crucial for ASEAN countries to develop significant policy implications. The priority should be on the enhancement of human capital and innovation capacity with the aim to advance the capability of ASEAN countries as ‘innovator’ countries instead of ‘user’ countries.
REFERENCES
Acemoglu, D., Gallego, F. A., & Robinson, J. A., 2014. Institutions, human capital and development. Annual Review of Economics, 6, 875–912.
Ang, S., Linn Van Dyne, & Mei Ling Tan, 2011. Cultural Intelligence. In The Cambridge Handbook of Intelligence. Edited by Robert J. Sternberg and Scott B. Kaufman, 582–602. New York: Cambridge University Press.
Angel De la Fuente, & Ciccone, A. 2003. Human Capital in a Global and Knowledge-Based Economy. Vol 562, Office for Official Publications of the European Communities.
TABLE 7. The result of diagnostics testing for ARDL Bound test
Indonesia Thailand
Normality Jarque – BerraProb.
0.6780.712
0.2740.871
Serial Correlation - Breusch-Godfrey
F – StatisticsProb.
1.2510.534
3.8400.070
Heteroskedasticity F – StatisticsProb.
0.3010.962
0.0510.822
SUMMARY AND CONCLUSIONS
The issue of human capital and innovation capacity has attracted numerous researchers to find a reliable and prominent indicator that can measure its effect on the economic growth of ASEAN countries. This study

265The Role of Human Capital and Innovation Capacity on Economic Growth in ASEAN-3
Asian Development Bank. 2013. Sustainability Report 2013: Investing in Asia and the Pacific’s Future. Asia Development Bank.
Barro, Robert J. 1991. Economic Growth in a Cross Section of Countries, Quarterly Journal of Economics, 106, 2 (May), 407–433.
Benhabib, J. & Spiegel, M.M. 1994. The Role of human capital in economic development: Evidence from aggregate cross-country time. Journal of Monetary Economics, 34: 143–173.
Boswijk, H. P. 1995. Efficient inference on cointegration parameters in structural error correction models. Journal of Econometrics 69(1), 133-158, September.
Bundell, R., Lorraine, D., Meghir, C., & Sianesi, B. 1999. Human Capital Investment: The Returns from Education and Training to the Individual, the Firm and the Economy. Fiscal Studies 20: 1–23.
Cinnirella, F. & Streb, J. 2017. The Role of Human Capital and Innovation in Economic Development: Evidence from Post-Malthusian Prussia. Journal of Economic Growth 22(2): 193–227.
Cooray A. 2009. Government expenditure, governance and economic growth. Comparative Economic Studies.
Danquah, M. & Amoah, J.A. 2017. Assessing the relationships between human capital, innovation and technology adoption: Evidence from sub-Saharan Africa. Technological Forecasting and Social Change 122: 24–33.
De La Fuente, Á. & Domenéch A. 2000. A Human capital in growth regressions: how much difference does data quality make? Economic Department Working Paper No. 262.
De La Fuente, Á. & Domenéch A., 2006, Human capital in growth regressions: how much difference does data quality make? Journal of the European Economic Association 4: 1–36.
Dickey, D.A. & W.A. Fuller. 1979. Distribution of the estimation for autoregressive time series with a unit root. Journal of American Statistical Association 79: 355–367.
Edquist, C. 2004. The Fixed Internet and Mobile Telecommunications Sectoral System of Innovation: Equipment Production, Access Provision and Content Provision, in Malerba, F. (ed.) Sectoral Systems of Innovation in Europe – Concepts, Issues and Analyses of Six Major Sectors in Europe, Cambridge University Press, Cambridge, UK, pp 155–192.
Fagerberg, J., Mowery, D. & Verspagen, B. 2009. The evolution of Norway’s national innovation system. Science and Public Policy 36 (6): 431–444.
Galor, O. 2011. Unified growth theory. Princeton: University Press.
Gennaioli, N., La Porta, R., Lopez-de-Silanes, F., & Shleifer, A. 2013. Human capital and regional development. Quarterly Journal of Economics 128: 105–164.
Glaeser, E. L., Porta, R. L., de Silanes, F. L., & Shleifer, A. 2004. Do institutions cause growth? Journal of Economic Growth 9: 271–303.
Goldin, C., & Katz, L. F. 1998. The origins of technology-skill complementarity. Quarterly Journal of Economics 113: 693–732.
Grigg, O. A., Farewell, V. T., & Spiegelhalter, D. J. 2003. Use of risk-adjusted CUSUM and RSPRTcharts for monitoring in medical contexts. Statistical methods in medical research, 12(2): 147–170.
Hamilton, J.D. 1994. Time Series Analysis. International Journal of Forecasting, Elsevier, 11(3): 494–495.
Hanushek, E. A., & Woessmann, L. 2008. The role of cognitive skills in economic development. Journal of Economic Literature 46: 607–668.
Hanushek, E.A. 2013. Economic Growth in Developing Countries: The Role of Human Capital. Economics of Education Review 37: 204–212.
Horwitz, F. 2005. HR CAN Competitiveness advance. Executive Business Brief 10: 50–52.
Jones, C. I., & Romer, P. M. 2010. The new kaldor facts: Ideas, institutions, population, and human capital. American Economic Journal: Macroeconomics, 2: 224–245.
Kim, J., Ogaki, M., & Yang, M. 2007. Structural error correction models: a system method for linear rational expectations models and an application to an exchange rate model. Journal of Money, Credit and Banking, 39(8): 2057–2075.
Laurenceson, J & Chai, J. 2003. Financial Reform and Economic Development in China. Cheltenham, UK, Edward Elgar.
Lucas, R. 1988. On the mechanics of economic development. Journal of Monetary Economics 22: 3–42.
Mankiw N. G., David Romer, & David N. Weil. 1992. A Contribution to the Empirics of Economic Growth. The Quarterly Journal of Economics, 107(2): 407–437.
Maradana, R.P., Pradhan, R.P., & Dash, S. 2017. Does innovation promote economic growth? Evidence from European countries. Journal of Innovation and Entrepreneurship 6: 1.
Mincer, J. 1995. Economic Development, Growth of Human. Capital, and the Dynamics of the Wage Structure, 1994-95 Discussion Paper Series No. 744, (September), Columbia University, p.38.
Muchie M., Gammeltoft P., & Lundvall B. A. 2003. Putting Africa First: The Making of African innovation systems. Aalborg, Denmark: Aalborg University Press.
Nelson, R. 1993. National Innovation Systems. A Comparative Analysis. Oxford University Press, New York/Oxford.
Nelson, R., and Phelps, E., 1966, ‘Investment in Humans, Technological Diffusion and Economic Growth’, American Economic Review, 56, pp. 69–75.
OECD (2012), Innovation for Development, A Discussion Of The Issues And An Overview Of Work Of The Oecd Directorate For Science, Technology And Industry, OECD Publishing, Paris.
Pece, A.M., Simona O.E.O., & Salisteanu, F. 2015. Innovation and economic growth: An empirical analysis for CEE countries. Procedia Economics and Finance, Elsevier.
Pelinescu, E. 2015. The Impact of Human Capital on Economic Growth. Procedia Economics and Finance 22: 184–190.
Pesaran, H.M. & Shin, Y. 1995. Autoregressive distributed lag modelling approach to cointegration analysis. DAE Working Paper Series No. 9514, Department of Economics, University of Cambridge, Cambridge.
Pesaran, M.H. & Shin, Y. 1999. An autoregressive distributed lag modelling approach to cointegration analysis. in Storm, S. (Ed.), Econometrics and Economic Theory in the 20th Century: The Ragnar Frisch Centennial Symposium, Chapter 11, Cambridge University Press, Cambridge.
Pesaran, M.H. 1997. The role of economic theory in modelling the long-run. Economic Journal 107: 178–91.
266 Jurnal Ekonomi Malaysia 52(1)
Pesaran, M.H., Shin, Y. & Smith, R.J. 2001. Bounds testing approaches to the analysis of level relationships. Journal of Applied Econometrics 16: 289–326.
Pesaran, M.H., Shin, Y., & Smith, R.J. 1996. Testing for the Existence of a Long-Run Relationship. Department of Applied Economics Working Paper no. 9622, University of Cambridge, Cambridge.
Pistorius, C. 2004. The Competitiveness and innovation. Elektron 21(3).
Ploberger, W., & Krämer, W. 1992. The CUSUM test with OLS residuals. Econometrica: Journal of the Econometric Society, 271–285.
Riley, G. 2012. Economic Growth - The Role of Human & Social Capital, Competition & Innovation. Retrieved April 16, 2014 from http://www.tutor2u.net/economics/revisionnotes/a2-macro-economic-growth-capital.html.
Robertson, P.E. 2002. Demographic shocks and human capital accumulation in the Uzawa-Lucas model. Economics Letters 74(2): 151–156.
Romer, P. 1990. Endogenous Technological Change. Journal of Political Economy 98(5): 71–102.
Siggel, E. 2001. India’s trade policy Reforms and Competitiveness industry in the 1980s.World Economy, pp.159–183.
Siggel, E. 2000. Uganda’s policy Reforms, Competitiveness and regional integration industry: A comparison with Kenya. African Economic Policy. Discussion paper 24; Washington: United States Agency for International Development: Bureau for Africa.
Sofia, A., & Ghulam, S. 2011. Relationship between financial sector development and sustainable economic development: Time series analysis from Pakistan. International Journal of Economics and Finance, 3(1), 262.
Turner, P. 2010. Power properties of the CUSUM and CUSUMSQ tests for parameter instability. Applied Economics Letters, 17(11): 1049–1053.
Tursoy, F & Resatoglu, N.G. 2017. Is Export-Led Growth Hypothesis Exist in Saudi Arabia? Evidence from an ARDL Bounds Testing Approach. Asian Journal of Economic Modelling, Asian Economic and Social Society, 110–117.
Viotti, E. B. 2002. National Learning Systems: A new approach on technological change in late industrializing economies and evidences from the cases of Brazil and South Korea. Technological Forecasting & Social Change, 69(7): 653–680.
Wong, P. K, Ho, Y. P, and Autio, E. 2005. Entrepreneurship, Innovation and Economic Growth: Evidence from GEM Data. Small Business Economics 24(3): 335–350.
World Bank. 2010. Innovation Policy for the Developing World Development Outreach. Volume 12, Issue 1 Pages: 7 – 15.
Suriyani Muhamad*School of Social and Economic DevelopmentUniversiti Malaysia Terengganu21030 Kuala Terengganu, TerengganuMALAYSIAEmail: [email protected]
Nor Fatimah Che SulaimanSchool of Social and Economic DevelopmentUniversiti Malaysia Terengganu21030 Kuala Terengganu, TerengganuEmail: [email protected]
Jumadil SaputraSchool of Social and Economic DevelopmentUniversiti Malaysia Terengganu21030 Kuala Terengganu, TerengganuEmail: [email protected]
*Corresponding author

267The Role of Human Capital and Innovation Capacity on Economic Growth in ASEAN-3
-0.4
-0.2
0.0
0.2
0.4
0.6
0.8
1.0
1.2
1.4
94 96 98 00 02 04 06 08 10 12 14
CUSUM of Squares 5% Significance
-15
-10
-5
0
5
10
15
94 96 98 00 02 04 06 08 10 12 14
CUSUM 5% Significance
APPENDIX A
FIGURE 1. CUSUM test for Indonesia
FIGURE 2. CUSUMSQ test for Indonesia

268 Jurnal Ekonomi Malaysia 52(1)
FIGURE 3. CUSUM test for Thailand
FIGURE 4. CUSUMSQ test for Thailand
-0.4
0.0
0.4
0.8
1.2
1.6
1998 2000 2002 2004 2006 2008 2010 2012 2014
CUSUM of Squares 5% Significance
-15
-10
-5
0
5
10
15
1998 2000 2002 2004 2006 2008 2010 2012 2014
CUSUM 5% Significance