JANUARY 2021 VOLUME LXXV NUMBER 1 - Reserve Bank ...
130
JANUARY 2021 VOLUME LXXV NUMBER 1
-
Upload
khangminh22 -
Category
Documents
-
view
0 -
download
0
Transcript of JANUARY 2021 VOLUME LXXV NUMBER 1 - Reserve Bank ...

JANUARY 2021
VOLUME LXXV NUMBER 1

Chair Michael Debabrata Patra
Editorial Committee
Deba Prasad RathRajiv RanjanSitikantha PattanaikG. P. SamantaPallavi ChavanSnehal HerwadkarS. Gangadaran
Editor
Shashidhar M. Lokare
The Reserve Bank of India Bulletin is issuedmonthly by the Department ofEconomic and Policy Research,Reserve Bank of India, under the direction ofthe Editorial Committee.The Central Board of the Bank is notresponsible for interpretation andopinions expressed. In the case of signedarticles, the responsibility is that of theauthor.
© Reserve Bank of India 2021
All rights reserved.Reproduction is permitted provided an acknowledgment of the source is made.
For subscription to Bulletin, please refer toSection ‘Recent Publications’
The Reserve Bank of India Bulletin can beaccessed at https://bulletin.rbi.org.in

Speech
National Strategy on Financial Education 2020-25 Shaktikanta Das 1
Articles
State of the Economy 5
Effective Exchange Rate Indices of the Indian Rupee 35
Small Finance Banks: Balancing Financial Inclusion and Viability 49
Green Finance in India: Progress and Challenges 61
Current Statistics 73
Recent Publications 119
Supplement
Report on Trend and Progress of Banking in India 2019-20
Financial Stability Report: January 2021
CONTENTS


SPEECH
National Strategy on Financial Education 2020-25 Shaktikanta Das


SPEECH
RBI Bulletin January 2021 1
National Strategy on Financial Education 2020-25
To improve the credit to GDP ratio, access to
credit and cost of credit need to be addressed by
lesser reliance on collateral security and greater cash-
flow based lending. Credit bureaus and the proposed
Public Credit Registry (PCR) framework are expected
to improve the flow of credit as well as credit culture.
As regards financial inclusion, a number of steps have
been taken by the government and the Reserve Bank.
As a result, large and hitherto excluded, sections of the
population have been brought into the formal financial
fold. In this context, promoting and deepening
financial education would play a very important part
in our endeavour to realise our collective potential.
Financial inclusion initiatives so far
Financial inclusion initiatives in India started in
the aftermath of first All India Rural Credit Survey in
1954 with promotion of cooperatives, followed later
by expansion of branch network after nationalisation
of major private sector banks, launch of Lead Bank
Scheme, promotion of Self Help Groups(SHGs),
Joint Liability Groups (JLGs), implementation of
Banking Correspondents (BC) model, expansion of
banking outlets, creation of payments banks, small
finance banks, etc. The largest impact in recent
years came from the opening of Jan Dhan accounts
and implementation of the Pradhan Mantri MUDRA
Yojana (PMMY).
The launch of Pradhan Mantri Jan Dhan Yojana
(PMJDY) in 2014 has resulted in almost every
household having access to formal banking services1
along with a platform for availing low value credit,
insurance and pension schemes. This has been ably
supported by initiatives to ensure last-mile delivery of
banking services through innovative banking channels
like the BC Model. Thanks to technology, there has
been massive improvement in deepening of digital
financial services. The Jan Dhan, Aadhaar and Mobile
I wish to thank NCAER for inviting me to deliver
the key note address at this webinar on National
Strategy for Financial Education. I appreciate the
thoughtful initiative of NCAER in choosing this
topic for the webinar. As we inch towards the close
of what has been an unprecedented year in terms of
loss of lives and livelihood and the way of living in
general, it would be appropriate to look at the area of
financial inclusion and literacy which has both broad
macro level implications for financial stability as also
a micro connotation towards an individual’s financial
wellbeing.
Introduction
India, with a large section of population in
the working age group, is already the third largest
economy in the world in terms of purchasing power
parity and is aiming to become a USD 5 trillion
economy. The Government has been undertaking
a series of calibrated macro measures through wide
ranging structural reforms. We need to harness the
demographic dividend by meeting the aspirations of a
large young population. This necessitates creating an
enabling environment and infrastructure in the form
of education, training and opportunity. Among all the
prerequisites for achieving demographic dividend
and accelerated growth, quality of human resources,
greater formalisation of economy, a higher credit
to gross domestic product (GDP) ratio and greater
financial inclusion are the differentiating factors that
would elevate our economy to the desired level.
National Strategy on Financial Education 2020-25*Shaktikanta Das
* Keynote Address by Shri Shaktikanta Das, Governor, Reserve Bank of India at the webinar on ‘Investing in Investor Education in India: Priorities for Action’ organised by National Council of Applied Economic Research (NCAER), New Delhi on December 16, 2020.
1 41.38 crore beneficiaries banked, `130,932.33 crore balance in beneficiary accounts as on December 2, 2020 - https://www.pmjdy.gov.in

SPEECH
RBI Bulletin January 20212
National Strategy on Financial Education 2020-25
(JAM) eco system has made a significant difference in
the universe of financial inclusion.
Further, several initiatives have been taken for
the creation of enabling digital infrastructure at the
ground level and accelerate the progress towards
universalising digital payments in a convenient, safe,
secure and affordable manner. Among those, the pilot
project launched by the Reserve Bank in October 2019
to make one identified district in every State/Union
Territory 100 per cent digitally enabled by March
2021 is significant. Forty-two such districts including
8 aspirational districts are part of this initiative. In
addition to putting in place the necessary digital
ecosystem, focussed attention by stakeholders on
imparting financial education to the target groups will
go a long way towards fulfilling the objectives of the
pilot and provide a blueprint for scaling up similar
initiatives in other districts.
The Financial Stability and Development Council
(FSDC) approved the National Strategy for Financial
Inclusion (NSFI) document which was launched
by RBI earlier this year2 on January 10, 2020. The
NSFI envisions to make financial services available,
accessible, and affordable to all the citizens in a safe
and transparent manner to support inclusive growth
through multi-stakeholder approach.
Financial Education in India
An important policy agenda for the Government and the fnancial sector regulators
With greater financial inclusion, there is a need to
enhance customer protection and financial education
so that people continue to access the formal financial
services without hesitation. Needless to add that
financial education plays a vital role in creating
demand side response by enabling greater awareness
and access to appropriate financial products and
services through regulated entities. Financial resilience of individuals and their families can also be strengthened through financial education. To achieve these multiple objectives, several steps have been taken. Let me touch upon two such initiatives.
Setting of a National Centre for Financial Education (NCFE)
The NCFE has been set up by the four financial sector regulators as a Section 8 (Not for Profit) Company to promote Financial Education across India for all sections of the population as per the National Strategy for Financial Education (NSFE)3. NCFE undertakes financial education campaigns across the country through seminars, workshops, conclaves, training programmes, campaigns, etc. to help people manage money more effectively and achieve financial wellbeing in the process.
Centre for Financial Literacy (CFL) project - An innovative way to impart financial education through community approach
The CFL project has been conceptualised by the Reserve Bank in 2017 as an innovative and participatory approach to financial literacy at the Block level involving select banks and non-governmental organisation (NGOs). Initially set up in 100 blocks on a pilot basis, the project is now being scaled up across the country to every block in a phased manner by March 2024. This was one of the announcements made on 4th December 2020 as part of the monetary policy committee (MPC) statement. Going forward, the project is envisaged to change the paradigm of financial inclusion as well as education by ensuring greater involvement and receptibility of the community on the demand side so as to align with the expansion of institutional initiatives on the
supply side.
2 https://rbidocs.rbi.org.in/rdocs/content/pdfs/NSFIREPORT100119.pdf.
3 The NSFE was launched on August 20, 2020. https://rbidocs.rbi.org.in/rdocs/PublicationReport/Pdfs/NSFIREPORT100119FF91DAA6B73B497 A923CC11E0811776D.PDF

SPEECH
RBI Bulletin January 2021 3
National Strategy on Financial Education 2020-25
Insights from dissemination of financial education
during the COVID-19 Pandemic
The COVID-19 related nationwide lockdown and
restrictions on mass gathering of people at various
public places has resulted in disruption in conducting
conventional financial literacy camps. During this
period, various approaches like using social media,
mass media (including local TV channels, Radio),
reaching out to local school education boards, training
missions of the SHGs were undertaken across the
country to continue dissemination of financial
education.
National Strategy for Financial Education (NSFE 2020-
2025)
Vision, Strategic Objectives and 5C approach
Financial Education is one of the strategic
pillars which sets the broad context for the National
Strategy for Financial Education (2020-2025). The
NSFE (2020-2025) has set an ambitious vision of
creating a financially aware and empowered India.
It focusses on various aspects of financial education
across banking, insurance, pension and investments
through greater role for financial institutions (both
banks and non-banks), educational institutions,
industry bodies and other stakeholders. In order to
reach out to the various target groups [school children,
teachers, young adults, women, new entrants
at workplace/ entrepreneurs (MSMEs), senior
citizens, Divyang persons, illiterate people, etc.],
innovative techniques and digital modes of delivery
including targeted modules for specific categories of
customers have been envisaged. Further, due
emphasis has also been given to safe usage of
digital financial services and enhancing awareness
about grievance redress measures. Keeping in view
the importance of evidence-based policy making,
evaluation methods to assess progress in financial
education have also been identified as one of the
strategic objectives.
The strategy includes a ‘5Cs’ approach for
dissemination of financial education through
emphasis on development of relevant Content (including Curriculum in schools, colleges and training
establishments); Capacity of the intermediaries who
provide financial services and education; leveraging
on the positive effect of Community led model for
financial literacy through appropriate Communication
Strategy; and enhancing Collaboration among various
stakeholders.
The Way Forward and Conclusion
Financial inclusion in the country is poised to
grow exponentially with digital savvy millennials
joining the workforce, social media blurring the
urban-rural divide and technology shaping the policy
interventions. Going forward, harnessing the near
universal reach of bank accounts across the length and
breadth of the country, there needs to be greater focus
on penetration of sustainable credit, investment,
insurance and pension products by addressing
demand side constraints with enhanced customer
protection.
The interventions in financial education would
have to be customised (local language and local
settings) keeping the different target audience in mind.
The scaling up of CFL project across the country at the
block level would be the cornerstone of community
led participatory approaches in our journey towards
greater financial literacy.
Technology, though being a great enabler, can also
lead to exclusion of certain segments of society. It is
imperative to build trust in formal financial services
among the hitherto excluded population. Adequate
safeguards need to be reinforced to address issues
of cyber security, data confidentiality, mis-selling,
customer protection and grievance redress through
appropriate financial education and awareness.
These cast great responsibility on financial education
providers.

SPEECH
RBI Bulletin January 20214
National Strategy on Financial Education 2020-25
To conclude, I would like to say that in a large
country like ours with an aspiring population, financial
education cannot remain just the responsibility of
financial sector regulators. This aspect is highlighted
in the NSFE document which recommends a multi
stakeholder led approach to achieve financial
wellbeing of all. Going forward, increasingly,
educational institutions, industry bodies and other
stakeholders like think tanks, research institutions
should come forward to shoulder the responsibility
of increasing financial literacy through appropriate
awareness campaigns. I invite every such person and
institution to be associated with our mission of nation
building through creation of a financially aware and
empowered India.
Thank you.

ARTICLES
State of the Economy
Effective Exchange Rate Indices of the Indian Rupee
Small Finance Banks: Balancing Financial Inclusion and Viability
Green Finance in India: Progress and Challenges


ARTICLE
RBI Bulletin January 2021 5
State of the Economy
* This article has been prepared by Deba Prasad Rath, Praggya Das, Asish Thomas George, Sangeetha Mathews, Abhilasha, Krishna Mohan Kushawaha, Madhuresh Kumar, Kunal Priyadarshi, Abhinandan Borad, Jitendra Sokal, Manu Sharma, Shobhit Goel, Saksham Sood, Avnish Kumar, Rishabh Kumar, Sreerupa Sengupta, Rajas Saroy, Shashidhar M. Lokare and Michael Debabrata Patra. Views expressed in this article are those of the authors and do not necessarily represent the views of the Reserve Bank of India.
State of the Economy
Chart 1: Portfolio Flows in EMEs
Source: Institute of International Finance (IIF).
2020 turned out to be a year in which everything changed. The year 2021 has commenced with countries across the world in a massive vaccination drive. In India, recent shifts in the macroeconomic landscape have brightened the outlook, with GDP in striking distance of attaining positive territory and inflation easing closer to the target. Financial markets remain ebullient with EMEs receiving strong portfolio inflows and India on track for receiving record annual inflows of foreign direct investment.
What a year 2020 turned out to be! It began like any other, just a day longer than 2019, with what looked like pneumonia reported to the World Health Organization (WHO) from a distant wet market in Wuhan, China. By the end of the year, COVID-19 had officially infected 81 million people, and possibly 500 million more were never diagnosed (The Economist, December 19, 2020). It caused 1.8 million recorded deaths, but many hundreds of thousands have gone
unrecorded. The two world wars and the Spanish flu caused far more deaths, but COVID-19 has altered people’s daily lives in ways that these events did not. Millions of survivors still struggle with the scars and exhaustion left by the virus, and the world is witnessing an unparalleled scale of suffering, poverty (according to the UN, over 200 million people will be thrust into extreme poverty), inequality and danger. Children have lost education, graduates placements, labour has endured forced migration, and people of all ages have faced loneliness.
Unemployment has soared and so have stock markets. Foreign investors have rushed into emerging markets – while US$ 90 billion left emerging market economies (EMEs) in March alone, portfolio flows have staged a return since then which accelerated to US$ 83.4 billion in the month of November and in December, US$ 16.6 billion has poured into debt and US$ 29.3 billion into equities (IIF, 2021) (Chart 1). Among EMEs, China and India pulled flows
on account of growth prospects.

ARTICLE
RBI Bulletin January 20216
State of the Economy
As the optimism in projections sobers, world output could be at least 7 per cent lower than without COVID-19 (The Economist, January 9, 2021) – the biggest slump since the second world war, world merchandise trade by 9.2 per cent (WTO, 2020) and world trade in services by 15 per cent (UNCTAD, 2020). History shows that social unrest surges 14 months after a pandemic and peaks at 24 months (IMF, 2020). The clear blue skies during lockdowns revealed that within the fast-moving COVID-19 crisis is a slow-moving climate crisis, impervious to populist denial, global in its disruptive capacity and far costlier.
Yet, impossibly, it appears that the world is rounding the corner on this once-in-a-century year that changed everything. As 2021 arrived, more than 12 million people had received their first doses of the vaccine (Chart 2). Newspapers have reported that 8.25 billion doses of vaccines have been secured by various countries through advance contracts (COVID-19 vaccines are two-dose regimens).
On January 3, 2021 India formally approved the emergency use of two vaccines and on January 16,
it launched the world’s biggest vaccination drives, with plans to inoculate about 300 million people on a priority list this year. It is reported that India has secured 1.2 billion advance doses, covering 85 per cent of the population (Bloomberg, 2020).
Four other features set India apart from the rest of the world, increasing the probability that our recovery may overtake most projections, as this article has consistently maintained. The 27-indicator economic activity index (EAI) (Kumar, 2020) has updated its nowcast for Q3:2020-21 and estimates the quarter’s real GDP growth at 0.1 per cent, as expected in the December 2020 issue. This is also reflected in the first advance estimates of national income for 2020-21 released by the National Statistical Office (NSO) on January 7 in which real GDP growth in 2020-21 is estimated at (-) 7.7 per cent as against (-) 10.3 per cent by the International Monetary Fund (IMF) in October 2020 and (-) 7.5 per cent by the monetary policy committee (MPC) in December 2020 (Chart 3).
First, India has so far succeeded in ducking the second wave of COVID-19. Moreover, since mid-
Source: Bloomberg.Source: Bloomberg.
No. of people covered (thousands)
11,68,381
5,84,457
532
Chart 2: Number of COVID-Vaccine Doses Contracted

ARTICLE
RBI Bulletin January 2021 7
State of the Economy
Chart 4: Seven-day Average COVID-19 Cases
Sources: WHO; and Ministry of Health and Family Welfare (MoHFW).
Chart 3: India GDP Forecasts for 2020-21
Sources: IMF; World Bank; ADB; OECD; RBI; and NSO.
Chart 5: Monthly Union Government Expenditure in 2020-21
Source: Controller General of Accounts (CGA).
September, India has ‘bent it like Beckham’ – by the end of 2020, the number of active cases had fallen to 2,54,254 from a peak of 10,17,754 on September 17. The recovery rate in India has improved to 96.1 per cent, the second highest in the world. The mortality rate is 1.4 per cent, lower than the world death rate (2.2 per cent), and the second lowest among countries with over a million infections (Chart 4).
Second, after a hiatus of four months during which total expenditure of the central government went into contraction or remained muted, it rejoined the celebration of the recovery in November 2020, surging by 48.3 per cent on a year-on-year (y-o-y) basis. Within this expenditure push, growth-nurturing capital expenditure shrugged off a three-month contraction and expanded by 248.5 per cent, close to half of which is due to increase in transfers to states for capex in line with Aatma Nirbhar 2.0 announcements (Chart 5). At the sub-national level, information for 20 states show that the growth in capital expenditure turned positive during October 2020 after contracting consecutively for 8 months. These are significant developments from the point of view of the economy gaining a stronger foothold, because government final consumption expenditure (GFCE) has provided
valuable counter-cyclical support to GDP continuously from Q4:2016-17. Without this support, real GDP growth of 7.0 per cent in 2017-18 would have been only 6.5 per cent, while it would have been 5.7 per cent instead of 6.1 per cent in 2018-19 and 3.3 per cent instead of 4.2 per cent in Q1:2019-20 (Chart 6). In Q1:2020-21 when the full brunt of COVID-19 took real GDP down by an unprecedented 23.9 per cent,

ARTICLE
RBI Bulletin January 20218
State of the Economy
Chart 6: GDP excluding GFCE
Source: NSO.
Chart 7: Broad-based Revival in Import Demand
Source: DGCI&S.
GFCE prevented an even more precipitous fall of 29.3 per cent.
Third, merchandise imports finally emerged out of contraction over 9 consecutive months and grew by 7.6 per cent (y-o-y) in December 2020 (Chart 7). The rebound in imports was broad-based, with as many as 20 out of 30 major commodities registering expansion. Many of these items are of the nature of intermediate goods in supply chains, which augurs well for domestic industrial activity and import-intensive exports. This suggests that moribund absorptive capacity of the economy is coming back to life, rekindled by domestic demand. Surges of capital inflows, which the Indian economy is enjoying currently as a preferred destination, may from hereon, support investment and growth and even crowd-in domestic saving instead of passively flowing back uphill through reserve accumulations. The days of the tail wagging the dog1 of India’s balance of payments may finally be drawing to a close.
Fourth, bank credit demand has increased at a pace above 6 per cent, reversing a 5-month stretch of sub-6 per cent growth. On top of robust credit flow to agriculture, micro and small enterprises and the services sector led by transport, trade and tourism have powered the turning around of the credit cycle.
Set against this backdrop, the remainder of the article is structured into five Sections. Section II captures in a nutshell the rapidly evolving developments in the global economy. The underlying impulses in the domestic economy are distilled in Section III. Section IV evaluates financial conditions, while the last Section puts out some perspectives.
II. The Global Setting
It was a lockdown Christmas for a swathe of advanced economies (AEs) as a new and more virulent strain of the virus and the rapid spread of the second/ third wave dampened not just the season’s cheer but also the optimism generated by the vaccine. Disruptions from the pandemic in a few EMEs have turned out to be more severe than previously anticipated, with the brunt being faced by commodity exporters. Overall, following the initial rebound since mid-2020, the global economy recovery
1 For a developing economy like India, it is the merchandise trade account that dominates its Balance of Payments, and the capital account usually plays a smaller financing role. In recent years, however, especially since 2019, net capital flows to India have risen to a level at which they play a predominant role in Balance of Payments, resulting in the phenomenon of the ‘tail wagging the dog’. For further reading, please refer to https://www.bostonfed.org/-/media/Documents/conference/28/conf28h.pdf?la=en.

ARTICLE
RBI Bulletin January 2021 9
State of the Economy
Table 1: GDP Growth Projections – Select AEs and EMEs
Country 2020 2021
Jun 2020 Jan 2021 Jun 2020 Jan 2021
World -5.2 -4.3 4.2 4.0
Advanced Economies
US -6.1 -3.6 4.0 3.5
Euro area -9.1 -7.4 4.5 3.6
Japan -6.1 -5.3 2.5 2.5
Emerging Market Economies
Brazil -8.0 -4.5 2.2 3.0
Russia -6.0 -4.0 2.7 2.6
India -3.2 -9.6 3.1 5.4
China 1.0 2.0 6.9 7.9
South Africa -7.1 -7.8 2.9 3.3
Source: World Bank.
Chart 8: GDP Shortfall in 2020-21, Relative to Pre-pandemic Projections
Source: The Economist, January 9, 2021.2 https://www.ft.com/content/20a5e763-4d2f-4872-a1f9-7852a5be6d68
has slowed. The improvement in manufacturing activity and trade has been marred by depressed services sectors. The fall in global investment has been pronounced. While financial conditions remain ultra-easy, financial fragilities are mounting, leading to fears that the COVID-19 crisis would eventually morph into a financial crisis (Reinhart, 2020). With January, the season of projection updates has arrived, and the World Bank has led off. In its latest Global Economic Prospects (GEP) released on January 5, 2021, the global economy is estimated to have contracted by 4.3 per cent in 2020 – AEs by 5.4 per cent; EMEs ex-China by 5.0 per cent (Table 1). In 2021, global output is forecast to expand by 4 per cent but remain 5.3 per cent below pre-pandemic projections, or by about US$ 4.7 trillion. AEs and EMEs ex-China will roughly look alike in growth profiles, eking out modest expansions of 3.3-3.4 per cent. India is expected to expand by 5.4 per cent, a pale shadow of its historical record. It is estimated that COVID-19 will cause a loss of US$ 10.3 trillion in world GDP in 2020 and 2021 (Chart 8). Among the developing economies, India will suffer the biggest loss of US$ 950 billion (The Economist, January 9, 2021). The pandemic may exacerbate risks around
the accumulation of debt on the one hand and a prolonged slowdown in potential output on the other. Consequently, downside risks to projections predominate the horizon.
On the price situation, economies are struggling to meet inflation targets, AEs from below and several EMEs from above (Table 2). Food prices have registered a surge, particularly in EMEs, owing to a confluence of factors working in conjunction, viz., governments shoring up their food reserves, logistical hassles, and La Nina adversely affecting crop production in Latin America2. The Food and Agriculture Organization’s food price index rose by 3.1 per cent in 2020, with the monthly index at a six-year high in December.

ARTICLE
RBI Bulletin January 202110
State of the Economy
Chart 9: Brent Futures
Source: Bloomberg.
Chart 10: Gold Prices - Spot and Futures
Source: Bloomberg.
Table 2: Inflation Projections for 2020 – Select AEs and EMEs Projections in December
(Per cent)
Country Projection Target/ Mid-point of control range or tolerance band for
2020
Advanced Economies
US 1.2 2.0
Euro area 0.2 2.0
Canada 0.6 2.0
Emerging Market Economies
Brazil 4.3 4.0
Russia 4.6 to 4.9 4.0
India 6.6* 4.0
Thailand -0.9 2.0
Indonesia below 1 per cent 3.0
*: Approximate average for 2020-21, based on actuals (June-September
2020) and forecasts for Q3 and Q4:2020-21 in the MPC statement of
December 4, 2020.
Source: Central bank websites.
Meanwhile, crude oil prices continued to rise in December and the first half of January on the back of positive developments on the vaccine front and extension of production cuts by organization of the petroleum exporting countries (OPEC) plus. At an average of US$ 49.9 per barrel in December, Brent was 15.5 per cent dearer in December (Chart 9). The average Brent price in 2020, however, was about 34 per cent lower than in 2019. The World Bank estimates oil demand to have declined by a historic 9 per cent in 2020.
Gold wrapped up a phenomenal year, which saw bullion prices scaling an all-time high in August,
with gains of 25.1 per cent, following up the 18.3 per cent ascent in the previous year. Safe haven demand and unprecedented monetary accommodation made bullion a top-performing asset in 2020. Gold prices have corrected in 2021 so far with sell-offs due to waning safe haven demand as also due to the dollar gaining strength (Chart 10). Basking in gold’s glory, silver had a good year too in 2020. Base metals,

ARTICLE
RBI Bulletin January 2021 11
State of the Economy
Chart 12: Growth in World Merchandise Trade Volume
Source: World Trade Organization.
Chart 11: Global PMI Indices
Source: IHS Markit.
which had seen a sharp dip in the initial months of the year, recovered strongly in H2:2020, and ended the year in gains.
The global composite purchasing managers’ index (PMI) moderated to 52.7 in December, mainly on account of the services PMI sliding to a five-month low of 51.8. The good news is that it has remained in expansion zone for the whole of H2:2020. The global manufacturing PMI in December maintained the 33-month high level of November. Industrial output has risen continuously in H2:2020 after the severe decline observed between February and June (Chart 11). Meanwhile, price momentum continues to build incipiently - input prices rose in December at their highest pace since May 2011.
The volume of world merchandise trade showed sequential improvement of 11.6 per cent in Q3:2020 after a contraction of 12.7 per cent in the previous quarter, according to the World Trade Organization (WTO). There was, however, a contraction of 5.6 per cent in Q3 on a y-o-y basis (Chart 12). This effectively means that the volume of merchandise trade during the first three quarters of 2020 was 8.2 per cent lower
than in the corresponding period of the previous year, though still favourable vis-à-vis the WTO’s estimate of a 9.2 per cent contraction in world trade in 2020 as a whole. The World Bank estimates that world trade volume (goods and non-factor services) declined by 9.5 per cent in 2020 and the level of trade uncertainty remains higher than trend, notwithstanding recent developments such as the African Continental Free Trade Area agreement and the Regional Comprehensive Economic Partnership.
The improving macroeconomic outlook and rapid vaccination led equity markets to build on the record gains registered in November 2020, also benefitting from the Brexit deal and the US stimulus towards end-December. Despite the rising tide of valuations, stock markets in the UK, EU, Indonesia, Thailand and Chile, ended the year in the red. On the other hand, surging gains in stock markets of EMEs pulled in strong portfolio flows. The total portfolio flows into EMEs in December were US$ 45.9 billion, and for the year as a whole, they amounted to US$ 313.6 billion (IIF, 2021). Reflation trade and risk-on sentiments caused bond yields in the AEs to move up. On the other hand, bond yields in EMEs continued to ease,

ARTICLE
RBI Bulletin January 202112
State of the Economy
Chart 13: Financial Market Developments
a: Change in Equity Indices (Per cent) b: Equity Indices (MSCI)
Sources: Bloomberg; and Thomson Reuters.
c: 10-year Government Bond Yields – Select AEs
e. Appreciation/Depreciation of Major Currencies
d: 10-year Government Bond Yields – Select EMEs
f: Currency Indices
reflecting the strong portfolio flows (Chart 13). The upbeat outlook engendered by the COVID-19 vaccine kept the US dollar on a downward slide in December
and currencies of AEs and EMEs rallied to multi-year highs. Overall, the dollar index weakened by 2.1 per cent in December, ending the year 2020 lower by 6.7

ARTICLE
RBI Bulletin January 2021 13
State of the Economy
Chart 14: Policy Rate Action in 2020 - Select Central Banks
Source: Central bank websites.
Chart 15: Half-Yearly GDP Growth
*: Implicit Growth.Source: NSO.
per cent. As a corollary, the Morgan Stanley Capital
International Emerging Markets (MSCI-EM) index
appreciated by 1.6 per cent in December and by 3.3
per cent over the year as a whole. In 2021 so far,
however, the dollar has strengthened, mostly against
AE currencies such as the euro.
On the monetary policy front, amidst the
general tendency among central banks of staying on
hold on interest rates while engendering abundant
liquidity conditions, there was a further expansion of
monetary stimulus by the European Central Bank and
the Bank of Japan in December. The Federal Reserve
gave forward guidance of continuing asset purchases
till it made progress on maximum employment and
price stability goals. On the contrary, the central bank
of Turkey effected a third policy rate hike in four
months, battling high and surging inflation (Chart 14).
As the global economy steps into the new year, the
near-term outlook remains clouded by a considerable
amount of uncertainty as AEs struggle with virulent
outbreaks of infections and stricter lockdowns, and
EMEs stare at poverty levels last seen in 2017.
III. Domestic Developments
Implicit in the January 7 GDP release is what this article has been anticipating – barring the visitation of another wave, the worst is behind us (Chart 15). Recent high frequency indicators suggest that the recovery is getting stronger in its traction

ARTICLE
RBI Bulletin January 202114
State of the Economy
Chart 16: Cross-Country Mobility Trends
Source: Apple Mobility Trends.
Chart 17: Issuance of E-way Bills
Source: CEIC.3 Adapted from William Shakespeare in Richard III.
and soon the winter of our discontent will be made glorious summer3. Cross-country comparison indicates that India is on the move, ahead of other economies (Chart 16). The six largest states – Maharashtra, Tamil Nadu, Uttar Pradesh, Karnataka, Gujarat and West Bengal – recorded 87 per cent of normal footfalls in public places, the best levels so far in the pandemic (Mint tracker). Domestic trading activity as reflected in issuance of E-way bills expanded at a brisk pace, even over a high base, posting a growth of 15.9 per cent y-o-y – intra-state by 17.3 per cent and inter-state by 13.8 per cent. In fact, the number of E-way bills issued during December 2020 was the highest, suggesting that the recovery is no longer aloft on the fleeting tailwinds of festival spending but is rising Phoenix-like on the wings of an intrinsic momentum (Chart 17).
Aggregate Demand
Aggregate demand conditions have either consolidated recent gains or vaulted up on strengthening pace in December 2020. Electricity consumption expanded at 5.0 per cent y-o-y,
maintaining its growth for the fourth successive month (Chart 18). Northern and central states such as Madhya Pradesh (15 per cent), Rajasthan (12 per cent), Bihar (14 per cent), Punjab (12 per cent) and Uttar Pradesh (10 per cent) experienced a surge in power demand in December due to increased heating load. Mercury levels plunged to multi-year lows as an unusually intense winter took hold with La

ARTICLE
RBI Bulletin January 2021 15
State of the Economy
Chart 19: Temperature Across Country
Source: India Meteorological Department.
Chart 20: GST Collections
Source: Press Information Bureau.
Chart 18: Region-wise Power Demand
Source: Power System Operation Corporation (POSOCO).
Nina cooling the waters of the Pacific and a cold wave gripped most of upper India, interspersed with sporadic unseasonal showers in these states (Chart 19).
Domestic spending is normalising rapidly, and in sync, collections under the goods and services tax (GST) surged to an all time high of `1.15 lakh crore in December, breaking out of the `1 lakh crore ‘barrier’
for the third month in succession, and higher by 11.6 per cent over a year ago (Chart 20). Business activity is regenerating in an ‘unlock’ mood, incentivised in substantial measure by a simplified return filing system.
Consumer confidence is regaining its groove. The Refinitiv-Ipsos consumer sentiment index inched up by 2.1 percentage points in December. Improvement was recorded on employment conditions, personal
09 JAN 2021

ARTICLE
RBI Bulletin January 202116
State of the Economy
Chart 21: Housing Sector
Source: Proptiger.
4 https://economictimes.indiatimes.com/industry/cons-products/fmcg/faster-moving-consumer-goods-sales-up-17-in-q3/articleshow/80124785.cms.
Chart 22: State-wise Labour Force Participation Rate
Source: CMIE Household Survey.
finance, investment climate and confidence in the outlook for the economy. This is corroborated by Dun and Bradstreet’s report that consumer confidence will improve from January 2021, peak in July and continue till September ahead of the next festival season. Purchasing behaviour is expected to reveal a preference online and offline towards health
and well-being products, ahead of a bigger shift to value added goods and essentials via digital and omni-channel sales. Alliances between e-commerce players and kirana stores are expected to expand to increase service delivery to meet rising demand. Upbeat consumer sentiment is also expressing itself in housing. There are signs of the housing sector turning around, with a sharp uptick in Q3:2020-21 in sales of residential units - almost double the level of the preceding quarter - supported by favourable interest rates, still restrained housing prices, steep discounts by developers to clear inventory, and reduction in stamp duty by a few states (Chart 21). The revival in consumer spending is also evident in India’s fast- moving consumer goods (FMCG) market, which expanded by 17.0 per cent4.
Labour market conditions are also improving pari passu, with a gradual pick up in employment across space and time, as indicated by the household survey of the Centre for Monitoring Indian Economy (CMIE). The labour force participation rate recovered to 40.06 in December from a low of 35.57 in April 2020 (Chart 22). With gradual lifting of inter-state movement restrictions, labour force participation rates across

ARTICLE
RBI Bulletin January 2021 17
State of the Economy
Chart 23: Demand for MGNREGA in 2020-21
Source: Ministry of Rural Development.
states have picked up to around pre-pandemic levels with the exception of Delhi, Gujarat, Telangana and Tripura. Some states like Rajasthan, Assam, Madhya Pradesh and Uttar Pradesh have notched up swifter recoveries, with labour force participation rates recorded in December rising higher than those seen in the pre-lockdown period (Chart 23). Under the Mahatma Gandhi National Rural Employment Act (MGNREGA), around 26.5 million households sought employment in December – 16.5 per cent higher than in the preceding month and over 55.5 per cent a year ago. By the close of December, 130 per cent of the budgeted amount was spent.
It is likely that the employment situation would brighten even more in the coming months. According to staffing solutions provider TeamLease, hiring by information technology (IT) firms across various skill sets is likely to increase by 10-12 per cent in 2021.
As mentioned earlier, a heartening development that improves the prospects of recovery is the vigorous resumption of government spending. The growth-giving role of government final consumption expenditure is invaluable at a time when all other
components of GDP are in deep retrenchment under the metastasis purveyed by the pandemic. It is difficult to fully appreciate the importance of this development for the near-term outlook without a close understanding of the underlying dynamics that were etched out for the first time this year in the December 2020 issue of the Bulletin in an article titled ‘Government Finances 2020-21: A Half Yearly Review’ (RBI, 2020) which, incidentally, fulfils India’s compliance with the Special Data Dissemination Standard (SDDS) of the IMF.
The November 2020 edition of this article vivisected and laid out the ‘system’ in the stimulus given by the centre. Earlier, the Reserve Bank’s report on State Finances (RBI, 2020) showed how the states assumed the mantle of frontline warriors in the defence against the pandemic with several setbacks but also with some shining successes that caught the attention of the world. Underneath this logged chronicle, the reality is that the pandemic has inflicted a ’scissor effect’ on government finances. On the one hand, it stretched expenditure on account of the fiscal support to the economy that was completely unanticipated at the time of drawing up budgets for 2020-21. On the other, there was contraction in revenues as activity in the economy went into catatonic withdrawal with lockdowns and other containment measures. As a result, the general government gross fiscal deficit (GFD) rose to 14.5 per cent in H1:2020-21, with Q1 recording a spike to 22.0 per cent that necessitated consolidation in Q2 in the form of rationalisation and reprioritisation of expenditure (Chart 24). Going forward, two positive features are going to shape up the fiscal landscape in H2. First, the general government GFD-GDP ratio is likely to moderate to 10.4 per cent (within a 50 per cent confidence band of 9.7-10.9 per cent). This development will be revenue-driven as the war effort of H2 bears fruit and receipts return to positive territory. Second, the quality of the fiscal deficit is also likely to be better in H2 as a substantial part of

ARTICLE
RBI Bulletin January 202118
State of the Economy
Chart 24: General Government Gross Fiscal Deficit
Source: RBI Staff Calculations.
Chart 25: Merchandise Trade
Source: DGCI&S.
investment-oriented stimulus under Aatma Nirbhar 2.0 and 3.0 (announced in October and November
2020, respectively) is expected to fructify in this
period. This is already evident in the November 2020
monthly data on capex; however, both centre and
states must resist resorting to large scale expenditure
cuts to allay fiscal concerns.
Turning to external demand, India’s merchandise
exports have reached pre-COVID-19 levels and
exhibited a growth of 0.1 per cent in December 2020.
Non-oil exports actually expanded by 5.6 per cent,
marking the fourth consecutive month of positive
growth.
More noteworthy was the pickup in merchandise
imports, which have rebounded by 7.6 per cent in
December 2020 after a protracted nine months of
contraction. The revival was led by gold, electronic
goods and vegetable oils. Rising imports of pearls and
precious stones, machinery, electronic goods and
textiles reflect the revival of domestic activity as
they are of the nature of intermediate goods in supply
chains. This also augurs well for exports going forward.
Even in the case of oil imports, moderation was seen in the rate of contraction, with oil imports declining by only 10.6 per cent in December as against a sharp contraction of 43.4 per cent in November. With robust growth in imports, the trade deficit scaled to a seventeen- month high at US$ 15.4 billion in December (Chart 25).
The faster revival seen in non-oil exports can be attributed to shipments of drugs and pharmaceuticals, agricultural items and iron ore, all of which have displayed resilience in the face of the pandemic and the massive contraction in world trade. As vaccination gathers pace across the globe, Indian pharma firms will exploit the edge they have in terms of the largest capacity globally in vaccine manufacturing - India is already manufacturing 60 per cent of the vaccines sold globally. Furthermore, the production linked incentive (PLI) scheme introduced for bulk drugs and medical devices has received a positive response and is expected to support pharmaceutical and medical exports going forward, while reducing India’s vulnerability to supply shocks in respect of raw materials and intermediates.

ARTICLE
RBI Bulletin January 2021 19
State of the Economy
5 The RoDTEP scheme would refund to exporters the central, state and local duties/taxes paid by them, which were not being rebated/refunded so far.
Chart 26: Freightos Global Container Index
Source: Reuters.
Chart 27: Composition of India’s Current Account Balance
Source: RBI.
The extension of benefits under the Scheme for Remission of Duties and Taxes on Exported Products (RoDTEP) to all export goods with effect from January 1, 2021 is expected to scale up the competitiveness of India’s exports5. The risks to India’s export prospects stem from the shortage of container supplies caused by supply chain disruptions across the globe, reduced capacity of shipping lines, empty containers getting stranded at ports during lockdowns, reduction in port manpower limiting the speed of cargo handling, and consequent congestion in the ports. For Indian exports in particular, the situation was aggravated by the huge congestion at Colombo port, which acts as the transhipment hub for Indian cargo. The result has been that a sizeable chunk of cargo traffic from Colombo has been diverted to Kochi port. This has led to a surge in freight costs as also reflected in the rising Global Container Freight Index during November- December 2020 (Chart 26).
India’s current account remained in surplus for the third consecutive quarter in July-September
2020 (2.4 per cent of GDP), although it moderated in tandem with the resumption of domestic demand (Chart 27). While the coexistence of surpluses in the current and capital accounts of the balance of payments strengthens the buffer provided by foreign exchange reserves, India continues to contend with sluggish absorptive capacity. The silver lining is that the current account surplus has started to shrink in Q2 and may moderate further in H2:2020-21.
Aggregate Supply
Aggregate supply conditions strengthened through December 2020 on the back of resilience in agriculture and revival in manufacturing activity. Services sector activity too seems to be turning around, though contact-intensive services remain subdued and below pre-COVID levels.
Agriculture remains unscathed by the pandemic. Sowing of major crops has exceeded the normal acreage levels. Rabi sowing covered an area of 651.9 lakh hectare by January 15, 2021, 1.6 per cent higher than in the preceding year, and surpassing the full season normal acreage (Table 3). The reservoir levels stood at 68 per cent of

ARTICLE
RBI Bulletin January 202120
State of the Economy
Chart 28: Reservoir Level
Source: Central Water Commission (CWC).
Table 3: All India Crop Situation - Rabi (2020-21) as on January 15, 2021.
(Area in lakh hectares)
Crop Name Normal area Sowing as on date
Percentage variation
Full season
As on
date
This year
(2021)
Last year
(2020)
Over normal as on date
Over last Year
1. Wheat 303.3 306.8 337.1 330.6 9.9 2.0
2. Rice 41.8 19.7 21.0 20.0 6.8 5.0
3. Coarse Cereals 57.1 52.9 49.1 53.5 -7.2 -8.2
a. Jowar 33.4 30.3 26.5 29.4 -12.7 -10.0
b. Barley 6.4 7.4 6.8 7.6 -7.5 -10.5
c. Maize 17.4 14.5 14.8 15.1 4.1 -4.9
4. Total Pulses 144.9 152.4 162.1 158.8 6.4 2.1
a. Gram 92.8 98.9 109.1 105.5 10.4 3.5
b. Lentil 14.2 16.3 16.4 16.0 1.1 2.5
c. Peas 8.8 10.4 10.6 10.9 1.9 -2.3
d. Kulthi (Horse Gram) 2.2 4.5 3.8 5.1 -15.8 -26.0
e. Urad 8.9 7.6 7.6 7.1 -0.2 6.5
f. Moong 9.9 5.4 5.2 5.5 -3.5 -4.2
g. Lathyrus 4.0 3.5 3.1 3.1 -11.7 0.0
I. Total Foodgrains (1+2+3+4)
547.1 531.8 569.4 562.9 7.1 1.1
5. Oilseeds 73.2 79.2 82.6 79.0 4.3 4.6
a. Rapeseed & Mustard 59.4 79.2 73.2 68.6 -7.5 6.7
b. Groundnut 7.3 4.6 4.3 4.5 -6.3 -5.1
c. Sunflower 2.4 1.6 1.0 1.0 -41.4 -1.9
d. Sesame 0.0 0.5 0.4 0.5 -20.2 -22.3
e. Safflower 1.2 0.8 0.6 0.6 -25.5 -6.4
f. Linseed 2.7 3.5 2.8 3.3 -18.4 -14.3
All- Crops (1+2+3+4+5)
620.3 610.9 651.9 641.9 6.7 1.6
Note: Area figures are as per eye assessment of State Agriculture Departments.Normal Area: Average area during the period of 2014-15 to 2018-19.Normal Area as on date: Average area during the corresponding period of 2015-16 to 2019-20.Source: Ministry of Agriculture and Farmers’ Welfare (MoAFW).
full capacity as on January 14 as against the decennial average of 56 per cent; this is an important force multiplier for the rabi season (Chart 28). Wheat – the primary rabi staple – has recorded an increase in sowing acreage (2.0 per cent), mainly due to higher sowing in major producer states, notably Haryana (1.2 per cent) and Madhya Pradesh (12.7 per cent). Pulses and oilseeds have also registered an impressive turnaround in acreage. With record kharif production,
procurement of kharif rice at 51.3 million tonnes was 26.2 per cent higher than a year ago, taking the cereals (rice and wheat) buffer stock to 3.7 times the norm by January 1, 2021.
Although industrial output remains volatile, contracting by 1.9 per cent in November 2020 after a record expansion in October by 4.2 per cent, industrial activity is finally turning around. The headline purchasing managers’ index (PMI) manufacturing expanded in December 2020 to 56.4, a tick higher than November’s reading of 56.3 (Chart 29). Both new orders and output continued to grow strongly. The future output index expanded to 60.3 on hopes of improved market conditions, though confidence was stymied by worries on inflationary pressures. With gradual revival in industrial activity, Coal India Limited (CIL) recorded a 6.3 per cent growth in coal production in Q3. With regard to sales of passenger car vehicles, most of the original equipment manufacturers (OEMs) clocked double digit growth in December, ending the year on a bright note, as they restocked their exhausted inventories. Early data from the Ministry of Road and Transport reveal that over 1.8 million vehicles

ARTICLE
RBI Bulletin January 2021 21
State of the Economy
Chart 29: Purchasing Managers’ Index (PMI)
Source: IHS Markit.
a: PMI Manufacturing b: PMI Services
were registered across India in December 2020, the highest ever since April - a growth of 10.3 per cent for the first time in the pandemic period. The quickening of activity was mainly driven in the non-transport vehicles segment. Sales of mini-trucks, pick-up vans and other light commercial vehicles are showing an uptick as more Indians turn to online shopping, increasing the need for last-mile delivery logistics.
In the services sector, a silent improvement is underway. The services PMI for December at 52.3 expanded for the third consecutive month, driven by an increase in new domestic work intakes. Steel consumption – a proximate indicator for construction activity - also registered an expansion for the third consecutive month, recording 5.7 per cent y-o-y growth. Transportation services through railways continue to exhibit strong momentum, both in terms of loading and earnings. Freight traffic grew at 8.7 per cent in December, extending an acceleration phase that began in August to the fifth successive month (Chart 30). The uptick was broad-based across all categories of commodities, with the exception of coal. Exuberant expansion also continued to characterise port cargo, which registered growth for the second
consecutive month in December after eight successive months of contraction. With growing preference for personal mobility to avoid contact, passenger vehicle sales registered an acceleration for the fifth consecutive month in December.
Inflation
CPI inflation in December 2020 eased sharply to 4.6 per cent from 6.9 per cent in the last month. This was primarily on account of a substantial correction in food inflation - by 5 percentage points - to 3.9 per cent in December from 8.9 per cent in November (Chart 31). Vegetables and cereals drove the sharp disinflation in food inflation. Prices of onions and potatoes, which had seen a substantial increase in the recent months, registered a sharp fall in December. There was also a broad-based seasonal decline in prices of other vegetables. Along with a favourable base effect, these developments pushed vegetable prices into double digit deflation in December. Early indications of price movements of key food items for January (January 1-13, 2021), based on the high frequency food price data from the Ministry of Consumer Affairs, Food and Public Distribution (Department of Consumer Affairs), point to further

ARTICLE
RBI Bulletin January 202122
State of the Economy
Chart 30: Commodity-wise Railway Freight Traffic
Source: CMIE.
Chart 31: CPI Inflation
Note: Figures in parentheses indicate weights in CPI-Headline. Sources: NSO; and RBI staff estimates.
moderation in prices of vegetables. However, price pressures in respect of edible oils have continued in January so far (Chart 32).
The Indian basket of crude oil prices edged up to US$ 53 per barrel in January so far (January
1-13, 2021) from US$ 50 a barrel in December. This has resulted in further increases in domestic pump prices in January so far. Along with it, the non-reversal of the steep increase in domestic excise duties and state taxes is pushing up pump prices to historically high

ARTICLE
RBI Bulletin January 2021 23
State of the Economy
Chart 32: DCA Essential Commodity Prices
a. Cereals b. Pulses
c. Vegetables d. Edible OIls
Sources: Department of Consumer Affairs, GoI; and RBI staff estimates.
Table 4: Petroleum Product Prices (Average of Four Major Metros)Item Unit Domestic Prices Month-over-month
(per cent)
Jan-20 Dec-20 Jan-21 Dec-20 Jan-21
Petrol `/litre 77.79 86.27 86.73^ 2.5 0.5Diesel `/litre 70.52 77.59 78.08^ 3.8 0.6Kerosene `/litre 28.80 23.21 25.83 4.7 11.3LPG `/cylinder 699.88 704.63* 704.63 16.5 0.0
*: Applicable from December 15, 2020^: For the period January 1 -13, 2021Note: Average of prices charged by Indian Oil Corporation Limited (IOCL) in four major metros (Chennai, Delhi, Mumbai and Kolkata). Sources: IOCL; Petroleum Planning and Analysis Cell (PPAC); and RBI staff estimates.
levels. Domestic kerosene prices also rose further in January. LPG prices, after a sharp increase of around
`100 per cylinder in December, were kept unchanged in January 2021 (Table 4).

ARTICLE
RBI Bulletin January 202124
State of the Economy
6 Liquidity availed by banks under the scheme should be deployed in corporate bonds, commercial paper, and non-convertible debentures issued by the entities in specific sectors over and above the outstanding level of their investments in such instruments as on September 30, 2020. The liquidity availed under the scheme can also be used to extend bank loans and advances to these sectors.
Chart 33: Utilisation of LTRO and TLTRO
Note: Banks have repaid 98.8 per cent, 32.4 per cent and 38.1 per cent of funds availed under LTRO, TLTRO and TLTRO 2.0, respectively.Source: RBI.
CPI excluding food and fuel remained elevated at 5.5 per cent in December, even while exhibiting a small moderation from the November reading of 5.7 per cent, primarily due to telephone charges, education expenses and some softening in gold prices. Prices in respect of personal care and effects and also pan, tobacco and intoxicants continued to exhibit double-digit inflation in December. In spite of some softening, transport and communications inflation remained elevated in December due to motor vehicles prices, petroleum product prices and transportation fares.
CPI food inflation is seeing considerable softening primarily due to sharp corrections in vegetables prices. In near months, prices of eggs and poultry, meat and fish could also ease on account of a likely collapse in demand for poultry products due to sharp rise in the incidence of bird flu infections in January. On the other hand, price pressures in respect of CPI core components are likely to remain. PMIs for manufacturing and services sectors point to an intensification of input price pressures in December. This is coming from an increase in fuel costs, industrial metal prices, edible oil prices and increased cost of doing business in the post-lockdown situation. In a scenario where demand conditions are getting normalised and firms are regaining pricing power, this poses the risk of higher pass-through of rising inputs costs to output prices.
IV. Financial Conditions
The Reserve Bank has been ensuring through its market operations that congenial financial conditions prevail to nurture the recovery in the form of easy monetary and credit conditions. Through December 2020, the average daily net absorptions under the liquidity adjustment facility (LAF) surged to `5,90,822 crore, notwithstanding an advance tax flow out of the banking system in the second half of the month. The surplus liquidity was mopped up through overnight reverse repos under the LAF, which rose to `7,37,314 crore as on December 31, 2020. In order to
enable banks to exploit the synergies between central bank liquidity under on tap targeted long-term repo operations (TLTRO) scheme6 and the Emergency Credit Line Guarantee Scheme 2.0 (ECLGS 2.0) of the Central Government, the Reserve Bank expanded the scope of the on tap TLTRO on December 4, 2020 to all stressed sectors identified by the Kamath Committee in addition to five sectors announced under the scheme on October 21, 2020. Banks can avail funds from the Reserve Bank under the on tap TLTRO and seek guarantee under ECLGS 2.0 to provide credit support to stressed sectors (Chart 33).
During the month, an outright open market operation (OMO) in State Development Loans (SDLs) was conducted on December 23, 2020 amounting to `10,000 crore, taking the total number of OMOs in SDLs to three starting from October 22, 2020. Two special OMOs (operation twist) were also conducted on December 17 and 30 to rein in term premia.

ARTICLE
RBI Bulletin January 2021 25
State of the Economy
Chart 34: Policy Corridor and Money Market Rates
Sources: RBI; and Bloomberg.
Chart 35: Variation in Yields across Market Segments
Sources: RBI; FIMMDA; and Bloomberg.
Money market rates edged up briefly on account of advance tax outflows, moving closer to the reverse repo rate from sub-LAF levels characterising the whole spectrum since mid of October 2020. The spread of the collateralised tri-party repo rate and market repo rate vis-à-vis the weighted average call rate (WACR) narrowed from (-) 32 basis points (bps) and (-) 29 bps in November to (-) 7 bps each in December 2020. Even rates on certificates of deposit (CDs), 91-day treasury bills and on commercial paper (CP) moved closer to overnight rates, although they continued to trade below the reverse repo rate (Chart 34).
Spreads in the other segments of financial market have narrowed considerably, mirroring the salutary impact of liquidity measures, regulatory relaxations and forward guidance. Corporate bond yields softened across the rating spectrum with yield on 1-year, 3-year and 5-year AAA-rated bonds declining by 205 bps, 184 bps and 122 bps, respectively, through May 22 and December 31, 2020 (Chart 35). Even the yield on 3-year BBB- (BBB minus)-rated corporate bond – lowest rated investment grade bond – declined by 93 bps, reflecting how liquidity stress has been eased across the board, impervious to ratings. Consequently, the
spread on 1-year, 3-year, 5-year AAA and 3-year BBB- rated corporate bonds declined by 180 bps, 145 bps, 96 bps and 54 bps, respectively, during the period (Chart 36). The yield on the old 10-year G-sec benchmark (5.77 GS 2030) slid on a declining trajectory to close at 5.90 per cent on December 31, 2020 while the yield on the new 10-year G-sec benchmark (5.85 GS 2030) closed even lower at around 5.87 per cent on December 31, 2020. With the gradual unlocking of the economy and normalisation of activity setting in, improving demand conditions, easy rates and ample liquidity are expected to propel the flow of resources from the financial to the real sector.
Broader measures of liquidity mirrored these easy monetary conditions. Reserve money (RM) adjusted for the first-round impact of changes in the cash reserve ratio (CRR) increased by 18.3 per cent y-o-y as on January 8, 2021 (11.3 per cent a year ago), powered by the ongoing surge in currency in circulation (CiC) on the components side and net foreign assets (NFA) on the sources side (Chart 37). Money supply recorded a y-o-y growth of 12.5 per cent as on January 1, 2021 (10.1 per cent a year ago), backed up by aggregate deposits growing by 10.9 per cent (9.8 per

ARTICLE
RBI Bulletin January 202126
State of the Economy
Chart 37: Monetary and Credit Aggregates
Note: Data pertain to last reporting Friday of every month for money supply, aggregate deposits and SCBs’ credit; and last Friday of every month for reserve money.Source: RBI.
Chart 36: Variation in Spreads across Market Segments
Note: Spreads are computed over policy rate for money market and over G-sec yield for corporate bond market. Sources: RBI; FIMMDA; and Bloomberg.
Chart 38: Sectoral Credit Growth
Source: RBI.
cent a year ago). After a hiatus of five months, growth in scheduled commercial banks’ (SCBs) credit to commercial sector broke out of sub-6 per cent levels and picked up to 6.7 per cent as on January 1, 2021 (7.5 per cent a year ago), responding to green shoots of recovery. SCBs’ investments in commercial paper, bonds, debentures and shares of corporate bodies on incremental terms stood at `434 crore during
the year 2020-21 so far (up to January 1) as against a
decline of `10,524 crore a year ago. On a cumulative
basis, banks have extended credit of `2,93,007 crore
to the commercial sector through April to January
1, 2021 – an increase of 31.7 per cent over a year
ago. The share of bank credit in the overall flow of
funds increased from 29.8 per cent to 34.1 per cent
during the period. Credit growth to agriculture and
services sectors accelerated in November 2020, while
credit to industry continued to contract (Chart 38).
Personal loan growth slowed across the board with
the exception of personal vehicle loans. Within the
services sector, loans to transport, trade and tourism
rose at a faster pace. While there was decline in
overall credit growth to industry, credit to medium
industry posted a robust increase and that to micro
and small enterprises edged out of contraction,
supported by measures designed by the Government
and the Reserve Bank for these sectors.
Surplus liquidity conditions permeated into the
credit market, easing interest rates all around. The
median term deposit rate (MTDR) declined by 146 bps
through March to December 2020, with a perceptible
decline occurring in shorter tenor deposits of maturity

ARTICLE
RBI Bulletin January 2021 27
State of the Economy
Table 5: Transmission from the Repo Rate to Banks’ Deposit and Lending Rates(Basis points)
Period Repo Rate Term Deposit Rates Lending Rates
Median Term Deposit Rate
WADTDR 1 - Yr. Median MCLR
WALR - Outstanding Rupee Loans
WALR - Fresh Rupee Loans
Feb 19 - Sep 19 -110 -9 -7 -30 2 -40Oct 19 – Dec 20* -140 -177 -120 -115 -85 -125Mar 20 - Dec 20* -115 -146 -81 -95 -67 -94Feb 19 – Dec 20* -250 -210 -127 -145 -83 -165
*: Latest data on WALRs and WADTDR pertain to November 2020.WALR: Weighted Average Lending Rate. WADTDR: Weighted Average Domestic Term Deposit Rate;MCLR: Marginal Cost of Funds-based Lending Rate. Source: RBI.
Chart 39: Equity Market Recovery from Lows Recorded in 2020
Source: Bloomberg.
of up to one year (163 bps). The early adjustment in deposit rates, which is otherwise lagged, bodes well for transmission to lending rates, going forward. During the same period, the 1-year median MCLR softened cumulatively by 95 bps (Table 5). The asymmetry in transmission between deposit and lending rates needs to be seen in the context of persisting structural rigidities, with banks increasingly relying on retail deposits in preference to wholesale or market based funding.
With the gradual roll-back of the lockdown by easing restrictions and resumption of normal activities, trading hours for markets regulated by the Reserve Bank, which were earlier truncated effective April 7, 2020 were restored in a phased manner since November 9, 2020. Subsequently, it was announced on January 8, 2021 that normal liquidity management operations would be restored in a phased manner, beginning with a variable rate reverse repo auction conducted on January 15, 2021 under the revised liquidity management framework. At the same time, the fixed rate reverse repo remained fully operational with average daily absorption of liquidity of the order of `4.4 lakh crore between January 15 and the time of release of this article. While calibrating the gradual restoration of normal operations, the Reserve Bank has committed to ensure the availability of ample liquidity in the system to support congenial financial conditions and nurture the recovery.
The equity market hit new highs in its rally in December, lifted by increasing evidence that the recovery is gaining traction and supported by positive global cues in the form of the passage of the US stimulus package and the Brexit trade deal. Market exuberance led to Indian equities outpacing most global peers, with the BSE Sensex touching 47,751 on December 31, 2020 - an increase of 83.8 per cent from its low of March 23, 2020 (25,981) (Chart 39 and 40).

ARTICLE
RBI Bulletin January 202128
State of the Economy
Chart 40: BSE Sensex and Institutional Flows
Note: FPI and Mutual Fund (MF) investments are represented on 15 days rolling sum basis.Source: Bloomberg.
Chart 41: Main Board IPOs during 2020-21
Note: Classified on the basis of listing date.Source: SEBI.
a: Month-wise b: Sector-wise
During December 2020, the listing of two initial
public offerings (IPOs), aggregating `1,351 crore,
took the total resource mobilisation through main
board IPOs to `15,971 crore during 2020-21 (up to
December 2020), marking a sharp rebound from
`10,487 crore in the corresponding period of the
previous year (Chart 41). Beginning with the first IPO issued in July 2020, healthcare and finance sector companies have garnered the maximum amount of resources among all initial offerings.
Increased retail participation and high system-wide liquidity helped IPOs deliver stellar returns

ARTICLE
RBI Bulletin January 2021 29
State of the Economy
Chart 42: Performance of IPOs during 2020-21 (up to December 2020)
Sources: SEBI; Prime Database; and staff calculations.
Table 6: Listing Day Returns of IPOs (Sector-wise)
S. No. Sector Minimum Maximum Mean
1 Chemicals 72.0 74.7 73.3
2 Engineering 13.8 19.3 16.6
3 Finance -14.0 14.0 -2.7
4 Healthcare 21.4 21.4 21.4
5 IT 86.0 123.5 104.8
6 Food Processing 106.8 130.7 118.7
Chart 43: Foreign Direct Investment
Source: RBI.
to investors, with 10 out of 13 IPOs generating positive listing day gains and all IPOs generating positive returns on an offer to date basis (Chart 42). Furthermore, most of these IPOs rallied beyond the listing day.
The listing day returns generated by IPOs for investors ranged between (-) 14.0 per cent and 130.7 per cent. In sectoral terms, food processing, information technology (IT) and chemicals sector generated the highest returns for investors (Table 6).
Net foreign direct investment (FDI) flows surged through August-November 2020, driven by fresh equity investments. Consequently, net FDI increased to US$ 34.1 billion in April-November 2020 from US$ 26.7 billion a year ago (Chart 43).
Net foreign portfolio investment (FPI) inflows remained robust in December 2020, following an all-time intra-month high in November 2020. This may be attributed to the continued global monetary and fiscal stimulus, weakening of the US dollar and a robust revival in appetite for emerging market economies including India. In December 2020, net FPI inflows of US$ 8.6 billion were largely driven by equity purchases of US$ 7.3 billion by foreign

ARTICLE
RBI Bulletin January 202130
State of the Economy
Chart 44: Net Foreign Portfolio Investment
Source: National Securities Depository Limited (NSDL).
Chart 45: Monthly Movements in 36-Currency REER of Indian Rupee (Base: 2004-05=100)
Source: RBI.
portfolio investors. In the debt segment, there were FPI inflows of US$ 1.3 billion, the highest monthly accretion so far in the current financial year (Chart 44). Net investment under voluntary retention route (VRR) were to the tune of US$ 0.2 billion.
In the foreign exchange market, the Indian rupee (INR), buoyed by robust capital inflows on vaccine news, appreciated by 0.9 per cent against the US
dollar in December 2020 over the previous month. By
end-December 2020, the INR appreciated by 3.2 per
cent over its level at end-March 2020, and closed
at `73.05 against the US dollar, a level last seen in
the beginning of September 2020. In terms of the
36-currency real effective exchange rate (REER), the
INR appreciated by 2.2 per cent in December 2020
over March 2020 (Chart 45).

ARTICLE
RBI Bulletin January 2021 31
State of the Economy
Chart 46: Foreign Exchange Reserves and Import Cover
Note: Figures on import cover for December 2020 are based on balance of payments data released for Q2:2020-21 and earlier quarters. Source: RBI.
Chart 47: SCBs’ GNPA Ratio Projections
Source: RBI.
7 The minimum capital to risk weighted assets ratio (CRAR) required to be maintained by SCBs is 9 per cent.
Chart 48: System* Level CRAR Projections
*: For a system of 46 SCBs accounting for 98 per cent of the assets of all SCBs. Source: RBI.
India’s external debt statistics as at end-September 2020 were released by the Ministry of Finance, Government of India, on December 31, 2020. India’s external debt remained contained at US$ 556.2 billion. Lower external commercial borrowings, portfolio debt investment and short-term trade credit caused the moderation in external debt. As at end-December 2020, reserves touched an all-time high of US$ 585.8 billion, equivalent to 18.4 months of imports or 105.3 per cent of outstanding external debt as at end-September 2020 (Chart 46).
The regulatory measures to deal with the COVID-19 pandemic entail forbearance across asset classes while maintaining credit supply and systemic resilience. Gross non-performing assets (GNPA) ratio of all SCBs has declined in successive quarters from 9.2 per cent in December 2019 to 7.5 per cent in September 2020, which was aided significantly by the regulatory dispensations. Macro stress tests carried out in the latest Financial Stability Report (FSR) of January 2021 indicate that the GNPA ratio of SCBs may increase to 13.5 per cent by September 2021 under the baseline scenario, which
may escalate to 14.8 per cent under a severe stress scenario (Chart 47).
At the aggregate level, SCBs have sufficient capital cushions7 even in the severe stress scenario (Chart 48). At the individual level, however, the capital buffers

ARTICLE
RBI Bulletin January 202132
State of the Economy
Table 7: Payment Transactions in 2020-21(in ` crore)
RTGS NEFT UPI IMPS
Apr-20 64,43,653 13,06,406 1,51,141 1,21,141
May-20 70,41,869 14,81,750 2,18,392 1,69,402
Jun-20 86,51,978 19,06,586 2,61,835 2,06,951
Jul-20 83,35,279 19,63,113 2,90,538 2,25,775
Aug-20 72,92,380 19,30,552 2,98,308 2,35,137
Sep-20 94,89,066 21,65,515 3,29,032 2,48,662
Oct-20 84,96,046 22,35,389 3,86,107 2,74,645
Nov-20 79,87,655 22,18,252 3,90,999 2,76,459
Dec-20 1,06,59,120 25,58,304 4,16,176 2,92,325
Source: RBI.
of some banks may deplete below the regulatory minimum. Hence, going forward, mitigating actions such as phase-wise capital augmentation or other strategic actions would become relevant for these banks, from a micro prudential perspective.
Network analysis reveals that total bilateral exposures among entities in the financial system increased marginally during the quarter-ended September 2020; on the other hand, shrinking inter- bank market and capitalisation of banks reduced contagion risk to the banking system as compared with the March 2020 position.
Payment System
In the payments space, digital transactions continued to surge in December 2020, with both retail and wholesale transactions expanding in alignment with the broad basing of the economic recovery. As the real-time gross settlement (RTGS) system, characterising the wholesale segment, was made available round the clock with effect from December 14, 2020, its volume growth (y-o-y) turned around sharply and rose by 20.0 per cent in December 2020 from 2.9 per cent a month ago. Transaction values through RTGS, which had started declining since October 2019 and had plummeted through the pandemic, posted a growth of 3.3 per cent in December 2020.
In the retail segment, national electronic funds transfer (NEFT) transactions grew by 31.6 per cent in volume in December 2020 as compared with 24.6 per cent recorded a month ago. In value terms, NEFT transactions rose by 31.7 and 27.9 per cent, respectively. Unified payment interface (UPI) transaction volume remained above the historic 2.2 billion mark attained last month, while transaction values increased by 105.5 per cent over December 2019 (Table 7). Transactions through immediate payment service (IMPS), national electronic toll collection (NETC) and Bharat bill payment system (BBPS) surged, hitting double digit levels in both volume and value growth. Cash withdrawals also point towards the economy poised on the cusp of a recovery.
A distinct pattern of preference shifting towards
digital payments is becoming evident this year, with
increasing e-commerce penetration, the growing
footprint of BigTech in the payment space and
competitive pressures on banks to upgrade their
payment eco-systems. Incentives such as cashbacks,
discounts on e-commerce portals, easy EMI and
buy now, pay later schemes have built a widening
customer base. They have also promoted increasing
use of digital payments and are driving up transaction
volumes in retail payment systems, especially on
the UPI. As competition in the payments industry
is set to intensify, with newer entrants offering
greater incentives for people to pay digitally, India
may emerge from the pandemic more digital than
ever before. This can bolster consumer spending and
increase the degree of formalisation of economy.
The Reserve Bank now announced opening of the
second cohort under its Regulatory Sandbox (RS) with ‘Cross Border Payments,’ as its theme. India is the
largest recipient of inbound remittances across the
globe, accounting for 15 per cent of global flows. In the
year 2019, India received US$ 83 billion and in the first
half year of 2020, US$ 27.4 billion has been received.
The cohort is expected to spur innovations capable
of recasting the cross-border payments landscape by

ARTICLE
RBI Bulletin January 2021 33
State of the Economy
leveraging new technologies to meet the needs
of a low cost, secure, convenient and transparent
remittance system. Net worth requirements for
participating entities have been reduced from `25
lakh to `10 lakh to encourage innovation and to broad
base the eligibility criteria, Partnership firms and
limited liability partnerships (LLPs) are now allowed
to participate in the RS.
V. Conclusion
What will 2021 look like? The shape of the
recovery will be v-shaped after all and the ‘v’ stands
for vaccine. On January 16, India launched the
biggest vaccination drive in the world, backed by its
comparative advantage of having the largest vaccine
manufacturing capacity in the world and a rich
experience of mass inoculation drives against polio
and measles. If successful, it will tilt the balance of
risks upwards. E-commerce and digital technologies
will likely be the bright spots in India’s recovery in
a world in which there will be rebounds for sure,
but pre-pandemic levels of output and employment
are a long way off. Japanification stares at much of
the advanced world, while for emerging economies,
potential output will be a lot flatter.
Recent shifts in the macroeconomic landscape
have brightened the outlook, with GDP in striking
distance of attaining positive territory and inflation
easing closer to the target. If these movements
sustain, policy space could open up to further support
the recovery. Merchandise trade has rebounded in
early January, attesting the slow healing of domestic
demand and the unlocking of export energies. Current
account surpluses are ebbing as domestic activity
regains vigour. Foreign investment flows are already
scenting the imminent upturn. The recent new highs
scaled by equity markets are driven by optimism
around early Q3 corporate earnings results, with IT
majors including Tata Consultancy Services, Infosys
and Wipro recording strong growth.
In H1:2021-22, GDP growth will benefit from statistical support and is likely to be mostly consumption-driven. With rabi sowing surpassing the normal acreage way before the end of the season, bumper agriculture production is expected in 2021. India being the global capital for vaccine manufacturing, pharmaceuticals exports are expected to receive a big impetus with the start of vaccination drives globally. Agricultural exports remain resilient and under the recent production linked (PLI) scheme, food processing industry has been accorded priority. Harnessing the synergies by transforming low-value semi-processed agri products through food processing would not only improve productivity but also boost India’s competitiveness.
Developments in 2020 have ushered in a new digital transformation on the back of strengthening consumption demand and growing corporate sector business transactions. According to the World Economic Forum’s report - Indian Cities in the Post Pandemic - released on January 7, 2021, the pandemic presents a historic opportunity to build back better and create a new urban paradigm – one that enables Indian cities to be healthier, more inclusive, and more resilient. An urban reform agenda can be set up across seven thematic pillars: planning; housing; transport; environment; public health; gender; and vulnerable populations.
The need to kickstart investment is acquiring urgency to secure a durable turnaround and a sustainable growth trajectory. India must look for ways in which cash sitting idly in balance sheets of corporations and banks and reverse repo balances with the Reserve Bank finds their way into credit to productive sectors and into real spending on investment activity before it imposes a persistent deflationary weight on real activity. Stress in the financial sector’s balance sheet could intensify as the camouflage of moratorium, asset classification standstill and restructuring fades, but banks have entered the health crisis with stronger capital buffers than the global financial crisis.

ARTICLE
RBI Bulletin January 202134
State of the Economy
Slippage ratios have been falling and loan recoveries are improving even as provisioning coverage ratios have risen above 70 per cent. Capital infusion and innovative ways of dealing with loan delinquencies will occupy policy attention in order to ensure that finance greases the wheels of growth on a durable basis before the demographic dividend slips away. It will take years for the economy to mend and heal, but innovative approaches can convert the pandemic into opportunities. Will the Union Budget 2021-22 be the game-changer?
References
Agarwal, R., Padhi, I., Goyal, S., Behera, S.R. and
Misra, S. ‘Government Finances 2020-21: A Half-Yearly
Review’, RBI Monthly Bulletin, December 2020.
Covid-10 trn. (January 9-15, 2021). The Economist.
Financial Stability Report. (Issue No. 22, 2021). RBI.
Global Economic Prospects. (January 2021). World
Bank.
IIF Capital Flows Tracker – December 2020. (January
2021). Back from the Brink.
Kumar, P. ‘An Economic Activity Index for India’, RBI
Monthly Bulletin, November 2020.
Reinhart, C., ‘The coming COVID-19 Credit Crunch’,
World Bank Blogs, December 2020.
Sedik, T.S. and Xu, R., ‘A Vicious Cycle: How Pandemics
Lead to Despair and Economic Unrest?’, IMF Working
Paper, October 2020.
Shahidi T., Dantewadia P., (2021, January 05), ‘State
Recovery Tracker: UP, Rajasthan, other large states led
economic recovery in December’. Livemint.
State Finances: A Study of Budgets of 2020-21. (2020).
RBI.

ARTICLE
RBI Bulletin January 2021 35
Effective Exchange Rate Indices of the Indian Rupee
captured in inflation differentials between the home economy and trading partners. Conceptually, EERs are founded on the purchasing power parity (PPP) hypothesis (Balassa, 1964; Froot and Rogoff, 1994; Sarno and Taylor, 2002).
The Reserve Bank compiles and disseminates indices of NEER and REER of the Indian rupee (both trade- and export-weighted), the latest series being constructed with the base year 2004-05.2 Structural changes in the Indian economy and shifts in the relative importance of India’s trading partners since 2004-05 warrant a review of the existing basket of currencies and the weighting scheme. Based on the assessment of India’s macroeconomic and external sector performance in a ‘normal’ year, 2015-16 is chosen as the new base year for the NEER/REER indices. In view of the growing importance of emerging market and developing economies (EMDEs) in India’s foreign trade and to better reflect shifts in external competitiveness, the coverage of the NEER/REER basket has been expanded from 36 to 40 currencies. The new indices of NEER/REER will replace the old series from 2004-05 onwards.
The remainder of the article is organised as follows. Section II discusses the rationale for choosing 2015-16 as the new base year. The coverage and criteria for selection of currencies in the new currency basket are addressed in Section III and the new weighting diagram is presented. This is followed by a review of the methodology for computing the NEER/REER indices in Section IV. An analysis of the main inferences that can be drawn from the new series of NEER/REER indices are discussed in Section V, followed
by concluding remarks and some policy perspectives.
Structural changes in the Indian economy and shifts in pattern of India’s foreign trade warrant updates to the broad (existing 36-currency-based) indices of nominal/real effective exchange rate (NEER/REER) of the Indian rupee. This article presents the updated series, with two important innovations: the base year is shifted from 2004-05 to 2015-16; and, the existing basket is expanded from 36 to 40 currencies, with the inclusion of eight new currencies and exclusion of four currencies. The new REER indices have remained around the benchmark (i.e., base year value of 100) for most part of the sample period from 2004-05 to 2019-20, reflecting India’s external competitiveness better than the old series. Inflation differentials between India and its major trading partners have declined and stabilised since the adoption of flexible inflation targeting (FIT) framework, boding well for India’s external competitiveness.
Introduction
Effective exchange rates (EERs) serve as a gauge for assessing the fair value of a currency, the external competitiveness of an economy and even serve as guideposts for setting monetary and financial conditions.1 An EER is a summary indicator of movements of the home currency against a basket of currencies of trading partners. The nominal effective exchange rate (NEER) is an index of the weighted average of bilateral exchange rates of home currency vis-à-vis currencies of trading partners, with weights derived from their shares in the trade basket of the home currency. A real effective exchange rate (REER) is the NEER adjusted by relative prices or costs, typically
* The article is prepared by John V. Guria and Jitendra Sokal of Department of Economic and Policy Research. The contribution by Anand Shankar is acknowledged. Authors thank Dr. Rajeev Jain for his valuable suggestions.
1 Singapore has the exchange rate-based monetary policy framework. The Monetary Authority of Singapore (MAS) uses nominal effective exchange rate (NEER) of Singapore dollar as operational target. It intervenes in foreign exchange market to maintain the NEER within the policy band (see, MAS, 2013).
Effective Exchange Rate Indices of the Indian Rupee*
2 The Reserve Bank has been publishing indices of CPI-based REER for 6- and 36-currency baskets since April 2014 in its monthly Bulletin and other publications. Reference is invited to the article titled ‘Real Effective Exchange Rate based on CPI as Price Index for India’ published in the April 2014 issue of the RBI Bulletin.

ARTICLE
RBI Bulletin January 202136
Effective Exchange Rate Indices of the Indian Rupee
3 See Wong (2002) for a detailed discussion on the concept of macroeconomic balance real exchange rate and its correspondence with internal and external balance.
4 Accordingly, Venezuela and Argentina, despite being India’s major trading partners, are not included in the new NEER/REER basket.
II. Choice of Base Year
The identification of an appropriate base year for the construction/rebasing of indices of NEER and REER involves an assessment of macroeconomic and external sector performance to check for broad correspondence with internal and external balance3. Internal balance implies that real output is at or close to its potential level, and the inflation is low and nonaccelerating (Wong, 2002). External balance refers to a situation in which the current account balance is sustained by capital inflows, and foreign exchange reserves are adequate and relatively stable (Montiel, 2002; Wong, 2002). Based on these definitions, 2015-16 is found to be a suitable year to rebase NEER/REER indices, with real GDP growth at 8.0 per cent, CPI inflation at 4.9 per cent and the current account deficit (CAD) at 1.1 per cent of GDP.
III. Coverage and Selection of Currencies
Reflecting India’s changing foreign trade pattern, the coverage of NEER/REER indices for the new base year, i.e., 2015-16, has been expanded from 36 to 40 currencies.
The selection of currencies for the new NEER/REER series is based on two major criteria. First, trading partners with extremely high and volatile inflation are excluded as their currencies tend to experience rapid nominal declines, undermining the stability of the NEER/REER indices and obscuring their usefulness in
the assessment of external competitiveness.4 Second,
data on inflation and exchange rates of trading
partners should be available on a regular basis.
Taking into account these caveats, bilateral
merchandise trade shares are worked out as
three-year arithmetic means of trade flows with
major trading partners for the period from 2014-15 to
2016-17 (i.e., centred around 2015-16). The evolution
of bilateral trade shares of major trading partners
warranted the inclusion of eight new countries in
the 40-currency basket, viz., Angola, Chile, Ghana,
Iraq, Nepal, Oman, Tanzania, and Ukraine. Four
countries included in the earlier 36-currency basket,
viz., Argentina, Pakistan, Philippines, and Sweden,
were replaced. The eight new entrants accounted for
5.4 per cent of India’s total merchandise trade vis-
à-vis 1.4 per cent by the exiting countries. The new
NEER/REER basket represents 88 per cent of India’s
total trade as compared with 84 per cent in the case
of the 36-currency basket.
Time-varying bilateral trade weights are used
to compute indices of NEER/REER of the rupee to
reflect the dynamically changing pattern of India’s
foreign trade.5 In order to derive the trade-based
currency weights, the geometric means of India’s
trade (exports plus imports) with trading partners
during the preceding three years are computed and
then normalised to 100. For instance, weights for
2020-21 are based on geometric means of bilateral
trade flows during the preceding three years, i.e.,
2017-18 to 2019-20 (Table 1). The new trade-weighted
basket is dominated by the currencies of EMDEs.
While the euro area retains its top position in the
trade basket, the US is assigned the highest weight in
the export basket in 2015-16.
5 Under the bilateral trade weighting scheme, each currency is assigned a weight in proportion to the share of that trading partner’s trade flows in home economy’s total trade flows.

ARTICLE
RBI Bulletin January 2021 37
Effective Exchange Rate Indices of the Indian Rupee
IV. Methodology
The methodology of computing NEER/REER
indices is explained below.
The NEER is calculated as the geometric weighted
average of bilateral exchange rates of the home
currency in terms of trading partner currencies.
Specifically, the NEER can be calculated as follows:
NEER = (1)
and the REER, which is the NEER adjusted by the
weighted average of ratio of domestic price to foreign
prices, is calculated as:
REER = (2)
where ‘e’ represents the exchange rate of the rupee
against a numeraire, i.e., the IMF’s Special Drawing
Right (SDR), in index form, and ‘ei’ is the exchange
rate of the foreign currency ‘i’ against the numeraire
in index form. A rise in ‘e’ or ‘e/ei’ represents an
appreciation of the rupee relative to currency ‘i’
and vice versa. ‘P’ and ‘Pi’ represent price indices
of the home economy and the trading partner ‘i’,
respectively. ‘ ’ denotes trade-/export-based weight
assigned to foreign currency/trading partner ‘i’, while
‘n’ is the number of currencies (other than home
currency) included in NEER/REER basket.
V. Performance of New NEER/REER Indices
The new 40-currency NEER and REER indices (both
trade- and export-weighted) and the old series, i.e., the
36-currency series, move closely, with a statistically
significant correlation coefficient of almost 1 (Appendix
Table 1). The new REER indices (both trade- and
export-weighted), which have remained around the
benchmark (i.e., base year value of 100), show a modest
appreciation/higher depreciation relative to the old
series during November 2015 to May 2019 (Charts 1a
and 1b, and Appendix Tables 2 and 3).
Table 1: New 40-Currency NEER/REER Basket – Normalised Weights
(Per cent)
Country/Area 2015-16 2020-21 (P)
Trade-based
Weight
Export-based
Weight
Trade-based
Weight
Export-based
Weight
1. Euro Area 11.4 14.0 11.6 14.72. China 10.0 5.0 12.0 5.63. UAE 9.4 12.4 7.8 10.44. US 9.1 14.7 11.6 18.45. Saudi Arabia 6.4 4.1 4.4 2.16. Switzerland 3.7 0.5 2.7 0.47. Hong Kong 2.9 4.8 3.9 4.68. Indonesia 2.9 1.8 2.8 1.69. Singapore 2.8 4.4 3.2 3.710. Iraq 2.7 0.4 3.2 0.611. Korea 2.5 1.6 2.9 1.712. Kuwait 2.5 0.4 1.3 0.513. Japan 2.5 2.3 2.3 1.714. Qatar 2.4 0.3 1.5 0.515. Nigeria 2.3 1.0 1.8 1.016. UK 2.2 3.5 2.2 3.317. Malaysia 2.2 1.8 2.2 2.218. Iran 2.1 1.5 1.4 1.119. Australia 2.0 0.9 2.2 1.220. South Africa 1.8 1.9 1.5 1.421. Brazil 1.5 2.2 1.1 1.322. Thailand 1.3 1.4 1.6 1.523. Vietnam 1.1 1.9 1.8 2.324. Bangladesh 0.9 2.2 1.3 3.125. Taiwan 0.9 0.9 0.9 0.826. Angola 0.9 0.2 0.6 0.127. Russia 0.9 0.8 1.3 0.928. Turkey 0.9 1.7 1.0 1.929. Mexico 0.9 0.8 1.2 1.330. Israel 0.9 1.3 0.7 1.331. Sri Lanka 0.8 1.9 0.7 1.632. Canada 0.8 0.8 0.9 1.033. Egypt 0.7 1.1 0.6 0.934. Oman 0.7 1.0 0.8 0.835. Nepal 0.6 1.4 1.1 2.636. Kenya 0.6 1.5 0.3 0.737. Tanzania 0.5 1.0 0.4 0.638. Chile 0.5 0.2 0.3 0.339. Ukraine 0.4 0.2 0.4 0.140. Ghana 0.2 0.3 0.5 0.2Total 100.0 100.0 100.0 100.0
Memo Items:
AE Currencies 41.7 49.7 45.0 52.6
EMDE Currencies 58.3 50.3 55.0 47.4
AE: Advanced economies. EMDE: Emerging market and developing economies. P: Provisional. Source: RBI staff calculations.

ARTICLE
RBI Bulletin January 202138
Effective Exchange Rate Indices of the Indian Rupee
V.1. Inflation Differentials and REER
The decomposition of REER into NEER and
weighted average or effective relative price (ERP)6
shows that inflation differentials have remained
broadly stable in recent years, following a steady
increase during 2008-09 to 2014-15 (Charts 2a and
2b, and Appendix Table 4). This may be attributed
to the formal adoption of flexible inflation targeting
(FIT) framework by the Reserve Bank in June 2016.
The mandate of maintaining price stability (defined
6 Joshi (1984) has used the term ‘effective relative price (ERP)’ for the weighted average of relative prices.
Chart 1: REER Indices – New and Old Series
Source: RBI staff calculations.
a. Trade-weighted Indices b. Export-weighted Indices
Chart 2: Inflation Differentials and REER(Base: 2015-16 = 100)
Source: RBI staff calculations.
a. Trade-weighted Indices b. Export-weighted Indices

ARTICLE
RBI Bulletin January 2021 39
Effective Exchange Rate Indices of the Indian Rupee
Box I: Balassa-Samuelson Effect and New REER
The standard version of the Balassa-Samuelson
hypothesis (Balassa, 1964; Samuelson, 1964) assumes
that purchasing power parity (PPP) holds for traded goods
only in the long-run, and predicts that an increase in
relative productivity of traded versus nontraded goods
in a (fast growing) country vis-à-vis its trading partners
induces an appreciation in the real exchange rate of the
home currency (Ito et al., 1997; Choudhri and Schembri,
2009; Bordo et al., 2014). A positive relationship between
real exchange rate and productivity differentials has been
confirmed by a large body of evidence in the empirical
literature (Choudhri and Khan, 2005; Ricci et al., 2008;
Meshulam and Sanfey, 2019).
Following Balassa (1964), Rogoff (1996), and Chong et al. (2010), India’s real GDP per capita relative to the US and
a group of major trading partners (including the US) is
taken as a proxy for productivity differentials. Using data
from 2004 to 2019 on real GDP per capita in PPP terms
(at constant 2017 international dollar) for India and its
major trading partners (which figure in both old and new
NEER/REER baskets), it is observed that India’s real GDP
per capita relative to the US and its major trading partners
has risen since 2004 (Chart I.1).1 For empirical analysis,
monthly data on the new REER indices (trade- and
export-weighted) are used for the period from 2004-05 to
2019-20.
The correlations between REER and relative real GDP per capita are positive and statistically significant (Table I.1). The unit root test results suggest that the variables are difference-stationary, i.e., integrated of order 1 (Appendix Table 5).
The evidence on direction of causation from productivity differentials to real exchange rate is supported in the literature; however, another strand of empirical literature provides evidence in support of the impact of real exchange rate changes on productivity (Harris, 2001; Guillaumont Jeanneney and Hua, 2003; Fung, 2008).
Chart I.1: Productivity Differentials – India vis-à-vis the US and Major Trading Partners
Source: World Bank; and RBI staff calculations.
1 Data on real GDP per capita in PPP terms (at constant 2017 international dollar) for India and its major trading partners are taken from the World Bank’s World Development Indicators database. As data on real GDP per capita are not available for Taiwan, only 31 India’s major trading partners (representing 93 per cent of total trade weights in the new NEER/REER basket) are included in the analysis.
by a target of 4 per cent for CPI headline inflation with
a tolerance band of +/- 2 per cent around it), while
keeping in mind the objective of growth has reduced
inflation and anchored inflation expectations in the
FIT regime (Eichengreen, Gupta and Choudhary,
2020). Average CPI-based inflation declined to below
4 per cent during 2017-18 to 2019-20 from more than
8 per cent during 2009-10 to 2015-16 (i.e., pre-FIT
regime after the global financial crisis).
NEER is negatively correlated with inflation
differentials during the sample period, with a
statistically significant correlation coefficient of 0.95.
This is consistent with the basic premise of the PPP
hypothesis, according to which a rise in inflation
differentials between the home economy and its
trading partners induces a depreciation of the home
currency and vice versa (Caginalp, 1982; Carbaugh,
2002; Sawyer and Sprinkle, 2015). The new REER
indices have shown an appreciating trend since
2004-05, reflecting India’s rising productivity vis-à-vis
its trading partners, i.e., the Balassa-Samuelson effect
(Box I).
(Contd...)

ARTICLE
RBI Bulletin January 202140
Effective Exchange Rate Indices of the Indian Rupee
VI. Concluding Remarks and Policy Perspectives
Since the adoption of floating exchange rates,
EERs have become a prominent summary measure of
external competitiveness of an economy’s tradables
sector relative to foreign tradables. For policymakers,
movements in REER serve as a useful guidepost of the
overall misalignment of the exchange rate of home
currency. In fact, the issue relating to under/over-
valuation of currencies has been at the core of several
global trade disputes. The International Monetary
Fund (IMF) uses REER models (along with current
account model) to make external balance assessments
for individual economies and produce multilaterally
consistent estimates for the current account and real
exchange rate norms and gaps.
Given the fact that the global trade environment is
undergoing a shift, it is important that the NEER/REER
basket of the rupee is reviewed regularly. In the case of
India, the relative importance of trading partners has
shifted mainly towards EMDEs since 2004-05. Taking
The literature on the impact of changes in real exchange rate on productivity argues that the appreciation of real exchange rate reduces the cost of imported capital goods and enhances the capital-labour ratio, thereby boosting technical progress and productivity. The appreciation in real exchange rate may also induce a rise in real wages and, thus, labour productivity in a country where wages of unskilled labourers are relatively low. Furthermore, the appreciation in real exchange rate may boost foreign competition, thereby inducing a rise in technical efficiency and productivity of firms.
Given the evidence of bi-directional causation between the real exchange rate and productivity differentials in the literature, a vector autoregression (VAR) Granger causality test for new REER and productivity differentials is conducted.
The results suggest that there is a bi-directional Granger causation between these variables (Table I.2). The
direction of causality from productivity differentials to REER confirms the Balassa-Samuelson hypothesis, while the direction of causality from REER to productivity differentials indicates the real exchange rate driven productivity growth in the Indian economy.
In empirical literature, REER also serves as a useful vari-able for assessing the Marshall-Lerner condition to gauge the efficacy of exchange rate in correcting external trade imbalances. In the Indian context, Hsing (2010) and RBI (2015), among others, have found that the Marshall-Lern-er condition holds. RBI (2015) estimates the real exchange rate (i.e., price) elasticity of exports to be in the range of 0.7 to 0.9, while elasticity of imports is found to be in the range of 0.3 to 0.5. In contrast, studies such as Raissi and Tulin (2015), and Chinoy and Jain (2019) have found real exchange rate elasticity of exports to be slightly higher in the range of 0.9 to 2.3.
Table I.1: Correlations between Productivity Differentials and New REER
(Sample Period: 2004M04 to 2020M03)LPDUS LPDMPT LPDMPX
LREERT 0.76* 0.76* -LREERX 0.81* - 0.80*
LREERT: log(REER, trade-weighted);LREERX: log(REER, export-weighted);LPDUS: log(India’s real GDP per capita relative to the US); LPDMPT: log[India’s real GDP per capita relative to major trading partners (Trade basket)]LPDMPX: log[India’s real GDP per capita relative to major trading partners (Export basket)]* indicates significant at 1 per cent level.Source: RBI staff calculations.
Table I.2: Granger Causality Test Results@(Sample Period: 2004M04 to 2020M03)
Dependent Variable
ΔLREERT ΔLREERX ΔLPDUS ΔLPDMPT ΔLPDMPX
ΔLREERT - - 27.42** 27.61* -
ΔLREERX - - 28.60** - 34.89**
ΔLPDUS 22.62* 23.29* - - -
ΔLPDMPT 26.68* - - - -
ΔLPDMPX - 25.99* - - -
@: Reported figures are Chi-sq. (χ2) statistics. Optimal lag length is based on Akaike Information Criterion (AIC).Δ: First difference operator.** and * indicate significant at 1 per cent and 5 per cent levels, respectively.Source: RBI staff estimates.

ARTICLE
RBI Bulletin January 2021 41
Effective Exchange Rate Indices of the Indian Rupee
cognisance of these factors, the broad basket of NEER/
REER indices of the rupee has been expanded from 36
to 40 currencies and rebased to 2015-16. The new REER,
on average, was 0.8 per cent above its base year level
during 2016-17 to 2019-20, a period coinciding with
moderate inflation observed since the adoption of FIT
framework. This implies that the inflation differentials
between India and its trading partners were less of a
concern for former’s external competitiveness under
FIT regime. Going forward, large capital inflows
unless fully absorbed through current account deficit
and/or mopped up as foreign exchange reserves
can cause appreciation of the rupee and potentially
undermine the export competitiveness. In such a
milieu, focus on price stability under FIT regime
should remain a policy priority to offset the erosion
in external competitiveness which may emanate from
appreciation of the rupee in nominal terms.
References
Balassa, B. (1964), “The purchasing-power parity
doctrine: A reappraisal”, Journal of Political Economy,
72(6), 584-596.
Bordo, M. D., Choudhri, E. U., Fazio, G. and MacDonald,
R. (2014), “The real exchange rate in the long run:
Balassa-Samuelson effects reconsidered”, NBER
Working Paper Series, No. 20228.
Caginalp, O. A. (1982), “Inflation differentials and
exchange rate: Theory and empirical evidence”,
Nebraska Journal of Economics and Business, 21(4),
19-31.
Carbaugh, R. J. (2002), International economics, South-
Western, Thomson Learning.
Chong, Y., Jordà, Ò. and Taylor, A. M. (2010), “The
Harrod-Balassa-Samuelson hypothesis: Real exchange
rates and their long-run equilibrium”, NBER Working
Paper Series, No. 15868.
Choudhri, E. U. and Schembri, L. L. (2009), “Productivity,
the terms of trade, and the real exchange rate: The
Balassa-Samuelson hypothesis revisited”, Bank of
Canada Working Paper 2009-22.
Choudhri, E. U. and Khan, M. S. (2005), “Real exchange
rates in developing countries: Are Balassa-Samuelson
effects present”, IMF Staff Papers, 52(3), 387-409.
Chinoy, S. Z. and Jain, T. (2019), “What drives India’s
exports and what explains the recent slowdown? New
evidence and policy implications”, in S. Shah, B.
Bosworth and K. Muralidharan (eds), India Policy Forum
2018, National Council of Applied Economic Research,
15(1), 217-256.
Eichengreen, B., Gupta, P. and Choudhary, R. (2020),
“Inflation targeting in India: An interim assessment”,
Policy Research Working Paper 9422, World Bank Group.
Froot, K. A. and Rogoff, K. (1994), “Perspectives on PPP
and long-run real exchange rates”, NBER Working Paper
Series, No. 4952.
Fung, L. (2008), “Large real exchange rate movements,
firm dynamics, and productivity growth”, Canadian
Journal of Economics, 41(2).
Harris, R. G. (2001), “Is there a case for exchange rate
induced productivity changes?”, Centre for International
Economic Studies, Discussion Paper No. 0110, Adelaide
University.
Hsing, Yu (2010), “Test of the Marshall-Lerner condition
for eight selected Asian countries and policy
implications”, Global Economic Review, 39(1), 91-98.
Ito, T., Isard, P. and Symansky, S. (1997), “Economic
growth and real exchange rate: An overview of the
Balassa-Samuelson hypothesis in Asia”, NBER Working
Paper Series, No. 5979.
Guillaumont Jeanneney, S. and Hua, P. (2003), “Real
exchange rate and productivity in China”, Document

ARTICLE
RBI Bulletin January 202142
Effective Exchange Rate Indices of the Indian Rupee
de travail de la série, CERDI, Etudes et Documents, Ec
2003.28, Centre d’Etudes et de Recherches sur le
Développement International.
Joshi, V. (1984), “The nominal and real effective
exchange rate of the Indian rupee 1971-83”, Reserve
Bank of India Occasional Papers, 5(1), 27-87.
Meshulam, D. and Sanfey, P. (2019), “The determinants
of real exchange rates in transition economies”,
Working Paper No. 228, European Bank for
Reconstruction and Development.
Monetary Authority of Singapore (2013), Monetary
policy operations in Singapore, Monetary Authority of
Singapore.
Montiel, P. J. (2002), “The long-run equilibrium
exchange rate: Theory and measurement”, in M. S.
Khan, S. M. Nsouli and Chorng-Huey Wong (eds),
Macroeconomic Management – Programs and Policies,
IMF Institute, International Monetary Fund.
Raissi, M. and Tulin, V. (2015), “Price and income
elasticity of Indian exports – The role of supply-side
bottlenecks”, IMF Working Paper, No. WP/15/161.
Reserve Bank of India (2015), Annual Report 2014-15,
Reserve Bank of India.
Ricci, L. A., Milesi-Ferretti, G. M. and Lee, J. (2008), “Real
exchange rates and fundamentals: A cross-country
perspective”, IMF Working Paper, No. WP/08/13.
Rogoff, K. (1996), “The purchasing power parity puzzle”,
Journal of Economic Literature, XXXIV, 647-668.
Samuelson, P. A. (1964), “Theoretical notes on trade
problems”, The Review of Economics and Statistics, 46(2), 145-154.
Sarno, L. and Taylor, M. P. (2002), “Purchasing power
parity and the real exchange rate”, IMF Staff Papers, 49(1).
Sawyer, W. C. and R. L. Sprinkle (2015), Applied international economics, Routledge, Taylor & Francis
Group: London and New York.
Wong, Chorng-Huey (2002), “Adjustment and internal-
external balance”, in M. S. Khan, S. M. Nsouli and
Chorng-Huey Wong (eds), Macroeconomic Management
– Programs and Policies, IMF Institute, International
Monetary Fund.

ARTICLE
RBI Bulletin January 2021 43
Effective Exchange Rate Indices of the Indian Rupee
Appendix Table 1: NEER/REER Indices – New and Old Series
a. NEER Indices
Year Trade-weighted Export-weighted
Base: 2004-05 = 100 Base: 2015-16 = 100 Base: 2004-05 = 100 Base: 2015-16 = 100
2004-05 100.0 133.8 100.0 130.8
2005-06 102.2 136.8 102.2 133.7
2006-07 97.6 130.6 98.0 128.2
2007-08 104.8 140.1 105.6 138.1
2008-09 93.3 124.9 94.0 123.0
2009-10 90.9 121.6 91.4 119.6
2010-11 93.5 125.1 94.7 123.9
2011-12 87.4 116.9 89.1 116.6
2012-13 78.3 104.8 80.1 104.7
2013-14 72.3 96.7 73.6 96.2
2014-15 74.1 99.1 75.2 98.4
2015-16 74.8 100.0 76.4 100.0
2016-17 74.7 100.1 76.4 99.6
2017-18 76.9 103.2 78.9 103.1
2018-19 (P) 72.6 97.5 74.2 97.1
2019-20 (P) 73.3 98.0 74.3 97.4
b. REER Indices
Year Trade-weighted Export-weighted
Base: 2004-05 = 100 Base: 2015-16 = 100 Base: 2004-05 = 100 Base: 2015-16 = 100
2004-05 100.0 89.2 100.0 87.4
2005-06 102.4 91.3 102.0 89.1
2006-07 100.8 89.9 100.5 87.8
2007-08 109.2 97.4 109.2 95.4
2008-09 99.6 88.9 99.7 87.1
2009-10 103.9 92.7 105.0 91.7
2010-11 112.7 100.5 115.0 100.5
2011-12 110.3 98.4 113.2 98.9
2012-13 105.6 94.2 108.7 95.0
2013-14 103.3 92.1 105.5 92.2
2014-15 109.0 97.2 111.2 97.2
2015-16 112.1 100.0 114.4 100.0
2016-17 114.5 101.8 116.4 101.4
2017-18 119.7 105.9 121.9 105.7
2018-19 (P) 114.0 100.6 116.3 100.3
2019-20 (P) 116.8 103.2 119.6 102.8
P: Provisional.Source: RBI staff calculations.

ARTICLE
RBI Bulletin January 202144
Effective Exchange Rate Indices of the Indian Rupee
Appendix Table 2: NEER Indices (Base: 2015-16 = 100)
Apr. May Jun. Jul. Aug. Sep. Oct. Nov. Dec. Jan. Feb. Mar.
a. Trade-weighted Index
2004-05 138.5 135.8 134.2 132.1 131.8 132.6 132.0 131.4 133.2 134.1 135.1 134.42005-06 135.5 137.0 138.8 140.1 138.4 137.6 136.2 134.4 134.1 136.1 136.8 136.3
2006-07 133.3 129.9 129.4 128.1 127.1 128.7 131.0 131.5 130.6 132.4 132.6 132.5
2007-08 137.0 141.3 141.7 141.5 140.8 141.2 142.2 140.7 141.3 140.7 138.9 134.3
2008-09 135.2 129.1 127.1 126.2 128.5 123.8 120.6 122.7 121.6 121.2 123.4 119.0
2009-10 119.9 121.2 121.8 119.8 119.5 118.2 121.3 121.3 121.9 123.9 124.5 126.5
2010-11 128.9 127.8 126.6 123.1 123.1 124.2 126.4 124.9 125.4 124.0 123.5 123.7
2011-12 124.2 122.8 122.7 123.6 121.1 117.2 114.0 110.7 107.8 111.0 115.2 112.4
2012-13 108.8 104.7 102.7 103.8 103.3 104.2 107.1 103.9 103.7 104.3 105.6 105.3
2013-14 105.2 104.4 98.6 98.4 93.1 92.2 94.7 93.6 94.8 95.1 94.7 96.2
2014-15 97.4 99.1 98.6 98.2 97.3 98.4 98.6 98.9 98.5 99.7 101.7 102.7
2015-16 101.9 99.6 100.1 101.4 100.3 99.5 100.8 100.1 99.7 99.8 97.7 98.7
2016-17 98.5 98.5 98.3 99.2 99.1 99.7 100.3 100.5 101.2 100.7 101.6 103.4
2017-18 105.2 104.9 104.3 103.8 103.9 102.6 102.4 103.0 103.6 103.1 101.5 100.7
2018-19 (P) 100.0 98.8 99.2 98.9 98.5 95.1 93.7 96.1 97.5 96.9 96.1 98.7
2019-20 (P) 99.0 99.3 99.4 100.1 97.9 97.8 98.1 97.3 97.4 96.9 97.6 95.3
b. Export-weighted Index
2004-05 134.9 132.1 130.8 128.9 128.4 129.2 129.0 129.0 131.1 131.8 132.6 132.1
2005-06 132.9 134.3 135.7 136.7 135.4 134.5 132.8 131.0 130.8 133.1 133.7 133.3
2006-07 130.6 127.7 126.9 125.6 124.8 126.1 128.3 129.2 128.5 130.0 130.3 130.3
2007-08 134.6 138.9 139.2 139.3 138.4 139.0 140.2 139.0 139.3 139.1 137.5 133.3
2008-09 133.8 127.6 125.7 125.0 126.9 122.1 118.6 120.4 119.4 118.7 120.9 116.6
2009-10 117.6 119.0 119.5 117.5 117.2 116.1 119.3 119.3 119.9 122.0 122.7 124.9
2010-11 127.3 126.1 125.0 122.3 121.6 122.9 125.2 123.7 124.5 123.1 122.6 123.0
2011-12 123.4 122.1 122.2 123.3 121.0 117.0 113.8 110.5 107.6 110.8 114.8 112.3
2012-13 108.8 104.6 102.6 103.7 103.3 104.1 107.0 103.9 103.7 104.2 105.5 105.1
2013-14 105.3 104.4 98.7 97.7 92.4 91.5 93.9 92.9 94.1 94.3 94.0 95.5
2014-15 96.7 98.5 97.9 97.5 96.6 97.8 97.9 98.1 97.6 98.9 101.1 102.1
2015-16 102.1 99.9 100.4 101.5 100.3 99.4 100.8 100.1 99.6 99.6 97.5 98.6
2016-17 98.4 98.2 97.9 98.5 98.5 99.0 99.7 99.9 100.7 100.3 101.2 103.0
2017-18 104.9 104.5 104.0 103.5 103.7 102.5 102.2 102.8 103.4 103.1 101.6 100.7
2018-19 (P) 100.0 98.7 99.2 98.4 98.0 94.7 93.1 95.6 97.0 96.6 95.8 98.4
2019-20 (P) 98.6 98.7 98.9 99.7 97.2 97.1 97.3 96.6 96.7 96.4 96.9 94.4
P: Provisional.Source: RBI staff calculations.

ARTICLE
RBI Bulletin January 2021 45
Effective Exchange Rate Indices of the Indian Rupee
Appendix Table 3: REER Indices (Base: 2015-16 = 100)
Apr. May Jun. Jul. Aug. Sep. Oct. Nov. Dec. Jan. Feb. Mar.
a. Trade-weighted Index
2004-05 90.9 89.4 88.9 88.2 88.7 89.1 89.1 88.4 88.8 89.9 90.1 89.22005-06 90.0 90.3 91.6 93.7 92.6 91.8 91.2 91.1 90.4 91.2 91.4 90.8
2006-07 89.0 87.5 88.3 87.7 87.5 89.2 91.9 92.3 91.0 91.5 91.6 91.1
2007-08 94.2 97.3 98.0 99.0 98.7 98.8 99.7 98.4 98.5 97.3 95.9 93.5
2008-09 93.6 88.8 87.9 88.2 90.9 88.3 87.6 89.6 87.9 88.1 89.5 86.5
2009-10 86.2 87.8 88.9 90.4 90.8 90.3 93.5 95.3 95.7 98.0 97.1 98.2
2010-11 99.9 99.7 99.7 99.0 98.7 100.1 102.1 101.2 102.5 102.3 100.7 100.6
2011-12 100.8 100.0 101.3 103.4 102.2 99.8 97.3 94.8 91.7 94.6 98.4 96.3
2012-13 94.0 91.2 90.4 92.6 93.0 94.2 97.2 94.8 94.4 95.4 96.7 96.4
2013-14 96.4 96.3 92.1 92.8 88.7 88.6 91.6 91.8 91.9 91.7 91.0 92.6
2014-15 93.4 95.5 95.6 96.7 96.5 97.3 97.4 98.0 97.0 98.2 100.0 101.0
2015-16 99.8 98.0 99.4 100.9 100.6 100.1 101.9 101.5 100.4 100.7 97.9 98.6
2016-17 99.2 99.9 100.6 102.1 101.9 101.9 102.8 102.6 102.5 101.6 102.3 104.1
2017-18 106.0 105.7 105.5 106.7 107.5 105.6 105.9 107.6 107.6 106.3 103.8 103.0
2018-19 (P) 102.8 101.7 102.3 102.7 102.4 98.4 97.0 99.6 100.6 99.7 98.6 101.4
2019-20 (P) 101.7 102.3 103.0 104.5 102.4 102.7 103.7 103.7 105.0 104.1 103.7 101.0
b. Export-weighted Index
2004-05 88.8 87.2 86.9 86.3 86.6 87.0 87.2 86.8 87.5 88.2 88.4 87.6
2005-06 88.2 88.5 89.4 91.3 90.4 89.5 88.8 88.7 88.1 89.0 89.1 88.5
2006-07 86.9 85.7 86.2 85.7 85.5 87.0 89.6 90.2 89.1 89.3 89.3 88.9
2007-08 92.0 95.1 95.8 96.9 96.5 96.7 97.8 96.6 96.5 95.3 94.1 91.9
2008-09 92.2 87.4 86.4 86.9 89.3 86.6 85.7 87.6 86.0 85.9 87.3 84.4
2009-10 85.1 86.8 87.9 89.3 89.6 89.3 92.5 94.2 94.8 97.1 96.4 97.6
2010-11 99.5 99.2 99.3 99.3 98.5 100.0 102.0 101.2 102.7 102.5 100.9 101.0
2011-12 100.9 100.3 101.7 104.0 103.0 100.4 97.9 95.3 92.2 95.1 98.8 97.0
2012-13 94.7 91.8 91.1 93.5 93.8 95.0 98.0 95.6 95.3 96.2 97.5 97.3
2013-14 97.0 96.8 92.7 92.7 88.6 88.5 91.5 91.6 91.7 91.5 90.9 92.4
2014-15 93.3 95.5 95.6 96.6 96.6 97.3 97.4 98.0 96.9 98.2 100.2 101.0
2015-16 100.0 98.2 99.5 101.0 100.6 100.0 101.8 101.4 100.3 100.5 97.9 98.7
2016-17 99.3 99.8 100.2 101.5 101.3 101.4 102.2 102.2 102.1 101.2 102.0 103.7
2017-18 105.6 105.3 105.2 106.5 107.3 105.5 105.6 107.3 107.3 106.2 103.9 103.0
2018-19 (P) 102.6 101.5 102.1 102.1 101.8 97.9 96.4 99.1 100.3 99.5 98.6 101.3
2019-20 (P) 101.6 101.9 102.6 104.3 102.0 102.3 103.3 103.3 104.6 104.0 103.6 100.7
P: Provisional.Source: RBI staff calculations.

ARTICLE
RBI Bulletin January 202146
Effective Exchange Rate Indices of the Indian Rupee
Appendix Table 4: Inflation Differentials and REER(Base: 2015-16 = 100)
Year a. Trade-weighted Index b. Export-weighted Index
REER NEER ERP REER NEER ERP
2004-05 89.2 133.8 66.7 87.4 130.7 66.8
2005-06 91.3 136.8 66.8 89.1 133.7 66.7
2006-07 89.9 130.6 68.8 87.8 128.2 68.5
2007-08 97.4 140.1 69.5 95.4 138.1 69.1
2008-09 88.9 124.9 71.2 87.1 123.0 70.9
2009-10 92.7 121.6 76.2 91.7 119.6 76.7
2010-11 100.5 125.1 80.4 100.5 123.9 81.1
2011-12 98.4 116.9 84.2 98.9 116.6 84.9
2012-13 94.2 104.8 89.9 95.0 104.7 90.7
2013-14 92.1 96.7 95.3 92.2 96.2 95.9
2014-15 97.2 99.1 98.1 97.2 98.4 98.8
2015-16 100.0 100.0 100.0 100.0 100.0 100.0
2016-17 101.8 100.1 101.7 101.4 99.6 101.8
2017-18 105.9 103.2 102.6 105.7 103.1 102.6
2018-19 (P) 100.5 97.4 103.2 100.3 97.1 103.2
2019-20 (P) 103.2 98.0 105.3 102.8 97.4 105.6
P: Provisional.Source: RBI staff calculations.

ARTICLE
RBI Bulletin January 2021 47
Effective Exchange Rate Indices of the Indian Rupee
Appendix Table 5: Unit Root Test Results
Variable Level
Constant Constant, Trend
ADF PP KPSS ADF PP KPSS
LREERT -1.94 -2.05 1.20 -3.31 -2.88 0.05**
LREERX -1.78 -1.89 1.31 -3.22 -2.74 0.05**
LPDUS -1.62 -1.09 1.69 -1.64 -3.51* 0.23
LPDMPT -1.29 -0.89 1.67 -2.52 -3.27 0.16**
LPDMPX -1.68 -1.44 1.68 -1.57 -2.68 0.33
Variable First Difference
Constant Constant, Trend
ADF PP KPSS ADF PP KPSS
LREERT -12.05** -11.96** 0.03** -12.02** -11.93** 0.03**
LREERX -11.81** -11.72** 0.04** -11.78** -11.69** 0.03**
LPDUS -2.20 -16.96** 0.15** -2.55 -17.27** 0.07**
LPDMPT -2.23 -17.03** 0.11** -2.36 -17.15** 0.06**
LPDMPX -2.31 -16.97** 0.20** -2.70 -17.16** 0.05**
** and * indicate significant at 1 per cent and 5 per cent levels, respectively.ADF: Augmented Dickey-Fuller.PP: Phillips-Perron.KPSS: Kwiatkowski-Phillips-Schmidt-Shin.Source: RBI staff estimates.


ARTICLE
RBI Bulletin January 2021 49
Small Finance Banks: Balancing Financial Inclusion and Viability
Finance Banks (SFBs). The specific mandate assigned to SFBs is to further the cause of financial inclusion by (i) providing savings vehicles, and (ii) supplying credit to small business units, including small and marginal farmers, micro and small industries; and other unorganised sector entities, and various low income groups and the migrant work force through high technology-low cost operations.1 These can be defined as differentiated financial institutions, considering their focus on serving the population with small finance needs. They have been set up in the private sector, and thus, differ from Regional Rural Banks (RRBs) - banking institutions created with the objective of including the under-served sections with predominant government shareholding.2
Following the issuance of the licensing guidelines in 2014, 10 SFBs have commenced operations so far. The first two, Capital Small Finance Bank and Equitas Small Finance Bank, started operations in 2016 followed by seven more in 2017, and one more in 2018. Most of the SFBs were previously microfinance institutions (MFIs) with a few notable exceptions, such as the Capital Small Finance Bank which was a local area bank. As MFIs, most of these institutions already had a well-developed network of customers, belonging mostly to the middle and low-income groups. These MFIs chose to convert into SFBs, in a bid, among others, to expand their reach further, while benefitting from lower cost of funds following the access to deposits that they could enjoy as SFBs.
This article analyses the performance of SFBs with specific reference to their objective of financial inclusion and viability of their business models. In addition, their compliance to various regulatory
guidelines, wherever directly measurable, is also
Small Finance Banks are a new entrant into the Indian banking system with a differentiated focus on financial inclusion. They have witnessed a rapid growth in their branch network and asset base while maintaining a healthy asset quality and generating high return on assets. These banks have been reasonably successful in reaching out to under-served sectors, such as the Micro, Small and Medium Enterprises (MSMEs), and have an impressive coverage of borrowers with small credit needs.
Introduction
Since 2005, India has actively pursued the
policy of financial inclusion. As part of this policy,
the Reserve Bank has undertaken a number of
measures, which among others, include opening
bank branches in unbanked areas, roping in business
correspondents and facilitators for ensuring last-
mile connectivity of banking, and opening small
business accounts linked to debit cards to promote
financial inclusion along with financial literacy. The
introduction of Board-approved financial inclusion
plans in 2010 has given a definite direction and
structure to the efforts for financial inclusion. The
alignment of the financial inclusion plan objectives
with those laid out as part of the Pradhan Mantri
Jan-Dhan Yojana in 2014 has imparted a mission
mode to these efforts.
Alongside the efforts to introduce new products
and platforms, the Reserve Bank has introduced
newer institutional variants for promoting financial
inclusion. One such institution has been the Small
* Prepared by Richa Saraf and Pallavi Chavan from the Department of Supervision, Reserve Bank of India. The views expressed are those of the authors and do not reflect the views of the organisation to which they are affiliated.
Small Finance Banks: Balancing Financial Inclusion and Viability*
1 RBI Press Release, “Guidelines for Licensing of Small Finance Banks in Private Sector”, November 27, 2014.
2 The original mandate of the RRBs was to exclusively serve the credit needs of rural poor, including small and marginal farmers and agricultural labourers, see Maheshwari (1995).

ARTICLE
RBI Bulletin January 202150
Small Finance Banks: Balancing Financial Inclusion and Viability
examined. Although constrained by a relatively short
time span since their inception, the analysis can throw
light on the way the operations of these institutions
are shaping up.
The data used for this article are taken from various
supervisory returns, Basic Statistical Return of credit
and deposits of Scheduled Commercial Banks (SCBs)
(BSR-1 and BSR-2) as well as Branch Banking Statistics.
The study period starts from June 2016, when the first
SFB began its operations. Although the sample size
of SFBs has varied over the study period, the period
from 2018 can be taken as comparable considering
that most SFBs had started their operations during
2017-18.
The rest of the article is divided into five sections.
Section II provides an overview of the regulatory
guidelines governing SFBs, as differentiated banking
institutions. Section III provides a few indicators
about the size and scale of operations of SFBs in a
comparative perspective with their bank and non-bank
counterparts. Section IV presents the key findings
from the analysis of supervisory and banking data on
SFBs and Section V concludes.
II. A Brief Overview of the Regulatory Guidelines for
SFBs
SFBs, which operate as SCBs, are subject to the
prudential regulatory norms similar to other SCBs.
However, being differentiated in their nature of
business, there are certain differences. Some of these
differentiated guidelines for SFBs are as follows:
(i) Being a differentiated or niche bank, the
minimum net worth for an SFB has been
fixed at a lower level than other SCBs. SFBs
need to have a minimum net worth of `2
billion (increased from `1 billion following
the issuance of the guidelines for on-tap
licensing for these banks), as compared to
`5 billion for other SCBs;3
(ii) Considering their focus on financial
inclusion, SFBs have to provide at least
75 per cent of their Adjusted Net Bank Credit
(ANBC) to priority sectors as compared to
40 per cent in the case of other SCBs
(excluding RRBs);
(iii) Considering their focus on small-sized credit,
at least 50 per cent of their loan portfolio
should comprise loans of upto `25 lakh;
(iv) In view of the inherent business risks, the
minimum Capital to Risk-weighted Assets
Ratio (CRAR) for SFBs has been fixed at
15 per cent.
III. SFBs in Comparison with the Banking and Non-Banking Segments
At present, SFBs constitute a minuscule portion
of the financial sector (comprising the SCB (including
RRBs and UCBs) and NBFC segments) (Chart 1). The
share of SFBs in total assets of the financial sector
was 0.4 per cent in March 2019. In 2018-19, the
banking business of SFBs had a ratio of 15 per cent
to that of RRBs, another banking institution with a
differentiated focus.
Starting from a low base, SFBs have expanded
their branch presence rapidly, rising to 4,307
branches by March 2020. The ratio of SFB branches
3 The exception to this regulatory requirement is of Urban Cooperative
Banks (UCBs) desirous of voluntarily converting themselves into SFBs; the
minimum net worth requirement for such UCBs is `1 billion.

ARTICLE
RBI Bulletin January 2021 51
Small Finance Banks: Balancing Financial Inclusion and Viability
to SCB branches (excluding RRBs) was 3.5 per cent in
March 2020 as compared to 1 per cent in March 2018
(Chart 2). The ratio of SFB branches to RRB branches
was about 20 per cent in March 2020.
IV. Major Features of the Operations of SFBs
Structural Features
High degree of concentration within SFBs
SFBs have shown high asset growth since their
inception. Between 2017 and 2020, the average
growth of assets of SFBs was about 150 per cent per
annum owing to a low base, as most SFBs began
their operations in 2017-18. The average growth
moderated between 2018 and 2020 to about 61
per cent.
At present, there is considerable concentration of
assets within the SFB group. Top-two SFBs accounted
for 46 per cent of total assets of all SFBs in March 2020
with top-three SFBs accounting for 60 per cent share
(Chart 3). However, the relatively big-sized SFBs have
displayed lower growth of assets in more recent years
(Chart 4). Hence, the concentration of assets within
the SFB group may come down over time.
Chart 1: Share of SFBs in Total Assets and Banking Business (in per cent)
Notes: 1) Total Business = Total Deposits + Total Credit. 2) SCBs include Public Sector Banks (PSBs), Private Sector Banks (PVBs) and Foreign Banks (FBs). 3) Based on March 2019 data.Source: Supervisory returns.
Chart 2: Comparison of Bank Branches of SFBs with Other SCBs
Note: SCBs includes PSBs, PVBs and FBs only.Source: Branch Banking Statistics.

ARTICLE
RBI Bulletin January 202152
Small Finance Banks: Balancing Financial Inclusion and Viability
Regional and Sectoral Features
Greater concentration of branch network in relatively well-banked states
While there has been a rapid growth in the branch
network of SFBs since their inception, this growth
has been markedly concentrated in the southern,
western and northern regions, which are known
as the relatively well-banked regions in the country
(Chart 5). Their penetration in the north-eastern
region, which is known to be the least banked region,
remains low.
At the state level, while SFBs are making their
presence felt in some of the under-served states of
Madhya Pradesh and Rajasthan, they continue to be
concentrated in Tamil Nadu, Maharashtra, Karnataka,
Kerala and Punjab - states with some of the lowest
population per bank branch in the country (Chart 6).
Among these, the states from the southern region
have had a high concentration of MFIs since the time
micro finance originated in India in the early-1990s
(Golait and Kumar, 2009). SFBs too, many of which
are MFIs turned into banks, have largely followed
this pattern of branch expansion. Furthermore, there
appears to be some similarity in the branch spread of
private sector banks and SFBs, with both showing a
greater concentration in the relatively well-banked
regions/states (Appendix Table 1).
Greater focus on semi-urban centres
The rapid increase of SFB branches has been in
semi-urban and urban centres; in March 2020, about
Chart 3: Asset Concentration among SFBs
Note: Lorenz curve measures the cumulative share of total assets corresponding to a certain per cent of the total number of SFB, when the SFBs are arranged in an ascending order of their assets.Based on March 2020 data.Source: Supervisory returns, RBI staff calculations.
Chart 5: Region-wise Population Per Branch and Number of SFB Branches
Note: Population per bank branch is worked out taking branches of SCBs (including RRBs) excluding SFBs.Based on March 2020 data. Central region-Chhattisgarh, Madhya Pradesh, Uttar Pradesh, Uttarakhand; Eastern region- A and N Islands, Bihar, Jharkhand, Odisha, Sikkim, West Bengal; North-eastern region- Arunachal Pradesh, Assam, Manipur, Meghalaya, Mizoram, Nagaland, Tripura; Northern region- Chandigarh, Haryana, Himachal Pradesh, Jammu and Kashmir, Ladakh, NCT of Delhi, Punjab, Rajasthan; Southern region- Andhra Pradesh, Karnataka, Kerala, Lakshadweep, Puducherry, Tamil Nadu, Telangana; Western region- Dadra and Nagar Haveli and Daman and Diu, Goa, Gujarat and Maharashtra.Source: Unique Identification Authority of India, Branch Banking Statistics.
Chart 4: Asset Growth and Share of SFBs
Note: Every point represents an SFB. Source: Supervisory returns, RBI staff calculations.

ARTICLE
RBI Bulletin January 2021 53
Small Finance Banks: Balancing Financial Inclusion and Viability
39 per cent of the total SFB branches were semi-urban
in nature followed by 26 per cent in urban centres
(Chart 7).
As the semi-urban category covers centres with
a population of 10,000 to 1 lakh, covering a fairly
broad spectrum of centres, a tier-wise distribution of
branches for SFBs has been attempted. It suggests that
about 31 per cent of the branches of SFBs are located
in Tier 2 and 3 centres (with population ranging
between 20,000 and 1 lakh), and about 8 per cent of
the branches are located at Tier 4 centres (population
ranging between 10,000 and 19,999), with Tier 5
and 6 centres (rural) (population less than 10,000)
accounting for only 18 per cent of the SFB branches
(Chart 8). In the case of only three SFBs, the share of
Chart 6: State-wise Population Per Bank Branch and Number of SFB Branches
Note: Population and Number of branches of all banks are for March 31, 2020.Population per bank branch is worked out taking branches of SCBs (including RRBs) excluding SFBs.Source: Unique Identification Authority of India, Branch Banking Statistics.
Chart 7: SFB Branch Distribution across Different Centres/Population Groups
Chart 8: Tier-wise Branch Distribution of SFBs
Note: 1) Definitions of centres are based on population as follows: Rural is <10,000; Semi-urban is 10,000 to <1 lakh; Urban is 1 lakh to <10 lakh and Metropolitan is >=10 lakh.
2) The percentages represent share of each population group in March 2020.
Source: Branch Banking Statistics.
Note: Tier Definitions: Tier 1- 100,000 and above, Tier 2- 50,000 to 99,999, Tier 3- 20,000 to 49,999, Tier 4- 10,000 to 19,999, Tier 5- 5,000 to 9,999, Tier 6- Less than 5,000.Source: Branch Banking Statistics.

ARTICLE
RBI Bulletin January 202154
Small Finance Banks: Balancing Financial Inclusion and Viability
rural branches to total was more than 25 per cent as
on March 2020, while for others, the share ranged
between 10 per cent and 22 per cent. Considering
their small finance focus, the limited spread of SFBs at
rural centres and even at smaller semi-urban centres
leaves much to be desired.
Interestingly again, SFBs show a branch
distribution pattern similar to Private Sector Banks
(PVBs); semi-urban centres had the highest share of
about 32 per cent in total branches of PVBs with rural
centres having a share of 21 per cent in March 2020.
Dominant presence of priority sectors in the lending portfolio
Given their differentiated priority sector lending
(PSL) targets and also the fact that most of them,
as MFIs, were serving the under-served economic
sectors/sections of the population, SFBs have seen a
dominant presence of priority sectors in their lending
portfolio (Chart 9). At the systemic level, priority
sectors accounted for about 75 per cent of the total
credit of SFBs. At the bank level too, there was little
variation with most SFBs reporting a share of over 75
per cent of priority sectors (Table 1).
SFBs targeting the sectors relatively under-served by commercial banks
SFBs reported a greater concentration of loans
to agriculture, trade and professional services. These
three sectors accounted for about 65 per cent of the
total credit of SFBs in March 2020 as compared to SCBs
which lent about 66 per cent of their credit to industry,
personal loans and finance (Chart 10). Considering
that SFBs, by design, were expected to extend small-
sized loans, it may not be wrong to assume that
they financed small agriculturists, small traders and
small businesses. In fact, Micro, Small and Medium
Enterprises (MSMEs) had a prominent presence in
their overall loan portfolio as well as their portfolio of
industrial and services sector credit (Table 2).
Chart 9: Share of PSL in Total Advances of SFBs Chart 10: Sector-wise Distribution of Outstanding Credit
Note: The shares are with respect to total advances rather than ANBC due to data limitations.Source: Supervisory returns.
Note: SCBs includes PSBs, PVBs and FBs only. Based on March 2020 data.Source: BSR-1.
Table 1: Distribution of SFBs by Share of PSL
Share of PSL in total advances∗ Percentage of SFBs
> =75% 60
50% =< & <75% 40
* The size categories and reported shares are based on data for March 2020. Most of the SFBs are either above or very close to the target of 75 per cent.
Source: Supervisory returns.

ARTICLE
RBI Bulletin January 2021 55
Small Finance Banks: Balancing Financial Inclusion and Viability
Credit portfolio featuring a large share of small-sized loans
SFBs have been meeting the regulatory
requirement relating to the size-wise distribution of
their loan portfolio. In March 2020, 99.9 per cent and
83 per cent of their total loan accounts and total loan
amount, respectively, had a credit limit of up to `25
lakh. Even within these, an impressive focus on very
small-sized loans by these banks was evident; about
96 per cent and 48 per cent of their total loan accounts
and total loan amount, respectively, had a credit
limit of `2 lakh, or what are called as small borrowal
accounts (Chart 11).
Balance Sheet-related Features
Rapid increase in deposit base
As already noted, most SFBs were originally
MFIs and one of the factors that was instrumental in
their conversion to SFBs was the access to deposits.
Expectedly, their deposits-to-assets ratio has been
rising rapidly since inception. Moreover, there is little
differential across SFBs in the growth of deposits
(Chart 12).
While the deposit base of SFBs has been
expanding, they still have a long distance to cover as
compared to other SCBs in mobilisation of current
and savings accounts or CASA. While there has been
a pick-up in the share of CASA in total deposits
for SFBs, it stood at 15 per cent in March 2020 as
compared to 41 per cent for other SCBs.
Table 2: MSME Share in Total Credit
Year SFBs (%) SCBs (%)
Mar 2018 42 (81) 17
Mar 2019 40 (83) 18
Mar 2020 41 (82) 17
Note: MSME shares in industry plus services sector credit are shown in brackets. SCBs includes PSBs, PVBs and FBs only. Based on March 2020 data.Source: Supervisory returns.
Chart 11: Distribution of Credit of SFBs and SCBs, by Credit Limit
Note: SCBs includes PSBs, PVBs and FBs only. Based on March 2020 data.Source: BSR-1.

ARTICLE
RBI Bulletin January 202156
Small Finance Banks: Balancing Financial Inclusion and Viability
A high credit-to-deposits (CD) ratio
SFBs started with a high CD ratio, which was
more than 2.5 times that of other SCBs in the initial
years (Chart 13). It fell over time with the growth in
deposits but was still high at 111 per cent in March
2020. CD ratio varied widely across SFBs in 2017, after
which the dispersion has come down.
Financial Operations-related Features
Higher cost of funds
Despite an increasing access to deposits as
discussed earlier, the cost of funds for SFBs has
remained high (Chart 14). The high cost of funds
needs to be seen in light of their lower percentage of
CASA as compared to other SCBs.
Higher return on funds
The return on funds has been higher due to
higher spreads maintained by the SFBs (Charts 15
and 16). Interestingly, there was not much differential
across SFBs with regard to the cost of and return on
funds (Table 3).
Higher return on assets
SFBs, on an average, reported a higher return
on assets (RoA) (net profits/average total assets) as
Chart 12: Deposits-to-Assets Ratio of SFBs
Source: Supervisory returns, RBI staff calculations.
Chart 13: Comparison of Credit to Deposit (CD) Ratio of SFBs with Other SCBs
Note: SCBs include PSBs, PVBs and FBs only.Source: Supervisory returns.
Chart 14: Comparison of Average Cost of Funds of SFBs with Other SCBs
Note: Cost of funds are annualised figures and asset-weighted averages. SCBs include PSBs, PVBs and FBs only.Source: Supervisory returns.

ARTICLE
RBI Bulletin January 2021 57
Small Finance Banks: Balancing Financial Inclusion and Viability
compared to other SCBs, following the higher return
on funds as discussed earlier. However, such a
comparison may be misleading considering that (a) the
asset size of SFBs is much smaller than the other SCBs;
(b) the other SCBs, particularly PSBs, have a legacy of
NPAs, which has adversely affected their profitability
over time. Hence, a better point of comparison of
RoA for SFBs could be NBFC-MFIs. During the period
under study, NBFC-MFIs have reported a higher RoA
than SFBs but the gap between the two entities has
been narrowing over time (Chart 17).
Lower NPA ratio
Non-performing assets (NPAs) affect the
profitability and thereby the internal accretion
of capital of any financial institution. One of the
Table 3: Distribution of SFBs, by Return on Funds, Cost of Funds and Spread
Range of RoF/CoF/Spread
Percentage of SFBs
Return on funds (RoF)
Cost of funds (CoF)
Spread
3%-5% - - 20
5%-8% - 20 10
8%-10% - 80 50
10%-11% 10 - 20
11%-15% 10 - -
15%-20% 70 - -
>20% 10 - -
Note: Data relate to March 2020.Source: Supervisory returns.
Chart 16: Comparison of Spreads of SFBs with Other SCBs
Note: Spread equals return on funds minus cost of funds. Bank-group spread is calculated as asset-weighted average of bank-level spreads. SCBs include PSBs, PVBs and FBs only.Source: Supervisory returns.
Chart 15: Comparison of Return on Funds of SFBs with Other SCBs
Note: Return on funds are annualised figures and asset-weighted averages. SCBs include PSBs, PVBs and FBs only.Source: Supervisory returns.
Chart 17: Comparison of SFBs with Other SCBs: RoA
Note: Return on assets are annualised figures and asset-weighted averages. SCBs include PSBs, PVBs and FBs only.Source: Supervisory returns.

ARTICLE
RBI Bulletin January 202158
Small Finance Banks: Balancing Financial Inclusion and Viability
creditable features associated with micro finance has been its lower loan defaults, which have been made possible by better management and supervision of the credit portfolio through the employment of social collateral of self-help groups. SFBs, many of which were erstwhile NBFC-MFIs, too have reported low NPA ratios. Furthermore, the dispersion in the NPA ratio among SFBs has also declined over time (Chart 18).
In the near future, the NPA positions in SFBs, as in other SCBs, may be shaped by various regulatory interventions, including the moratorium and Resolution Framework, introduced to address the COVID-related stress. In the case of MSMEs, the COVID-related Resolution Framework has been aligned with the MSME restructuring package announced earlier in January 2019. Effectively, this has ensured a continued regulatory support to MSMEs, which form a major part of the loan portfolio of SFBs.
V. Concluding Observations
SFBs are a new entrant into the Indian banking system with a differentiated focus on financial
inclusion. A preliminary assessment of these banks, based on supervisory and BSR data since the time of introduction of these institutions, is attempted in this article.
SFBs have witnessed a rapid growth in terms of their balance sheet size and branch network. At present, however, they constitute a minuscule part of the financial system. There is a high degree of concentration within the SFB group, with top-two and top-three banks accounting for about 46 per cent and 60 per cent of total assets of the group, respectively. There is a noticeable trend of dissipating concentration in more recent years, as some of the small-sized SFBs have been posting a higher asset growth as compared to their large-sized counterparts.
While there has been a rapid expansion in the branch network of SFBs, their branches, similar to PVBs, are concentrated in regions/states that are already well-banked. These include the southern, western and northern regions. More specifically, the states with high concentration of SFB branches are Tamil Nadu, Maharashtra, Karnataka, Kerala and Punjab, which have a much lower population per bank branch as compared to the national average. SFB branches also display concentration in the urban and semi-urban centres or more specifically Tier 1 to Tier 3 centres having population of 20,000 persons and above. Tier 5-6 (rural) centres with population of less than 10,000 persons accounted for only about 18 per cent of the SFB branches in March 2020.
These banks are catering to the economic sectors that are relatively under-served by other SCBs. The sectors include agriculture, (small scale) trade and professional services. Moreover, even within the industrial and services sector credit, these banks have succeeded reasonably in reaching out to MSMEs. Apart from serving the under-served sectors, the loan portfolio of SFBs is also geared towards small-sized borrowers. At the aggregate level, about 83 per cent of their loan portfolio had a credit limit of up to `25 lakh
in March 2020.
Chart 18: SFBs Compared with Other SCBs: NPA ratio
Note: GNPA ratio is defined as Gross NPA as a ratio of gross advances.Source: Supervisory returns.

ARTICLE
RBI Bulletin January 2021 59
Small Finance Banks: Balancing Financial Inclusion and Viability
Although the deposit base of SFBs has been on a
striking rise, their percentage of CASA remains lower
than other SCBs. An increase in the CASA base can
augur well towards lowering the cost of funds for
these banks, going forward.
The return on funds of SFBs has been higher
than other SCBs. Similarly, spread, which decides the
return on funds, has been much higher. Consequently,
the profitability of these institutions measured by
RoA is much higher than their peers in the banking
segment. It is, however, lower than NBFC-MFIs, their
counterparts in the non-banking segment.
The NPA ratio of SFBs has been moderate since
their inception, underlining a healthy asset quality.
This may be expected as these banks do not suffer
from a legacy of NPAs as other SCBs. However, their
low NPA ratio also reflects better management of
credit risk despite serving a small-sized clientele.
References
Kumar, P., & Golait, R. (2009), “Bank penetration and
SHG-Bank linkage programme: A critique”, Reserve Bank of India Occasional Papers, 29, 119–138.
Maheshwari, Shriram (1995), “Rural Development in
India: A Public Policy Approach”, Asia-Pacific Journal of Rural Development. 5(2), 121-126.

ARTICLE
RBI Bulletin January 202160
Small Finance Banks: Balancing Financial Inclusion and Viability
Appendix
Appendix Table 1: State-wise Distribution of Bank Branches
State Number of branches of State’s share in total branches of
PVBs PSBs SFBs PVBs PSBs SFBs
Tamil Nadu 3701 6486 716 10.6% 7.4% 16.6%Maharashtra 3920 7809 563 11.3% 8.9% 13.1%Rajasthan 1490 4219 343 4.3% 4.8% 8.0%Karnataka 2488 5913 332 7.1% 6.7% 7.7%Gujarat 2166 5222 310 6.2% 5.9% 7.2%Madhya Pradesh 1320 4117 302 3.8% 4.7% 7.0%Kerala 2334 3393 235 6.7% 3.9% 5.5%Punjab 1650 4271 204 4.7% 4.9% 4.7%Uttar Pradesh 2141 10900 199 6.2% 12.4% 4.6%Bihar 1037 4000 180 3.0% 4.6% 4.2%Haryana 1409 2861 138 4.0% 3.3% 3.2%Odisha 922 3087 126 2.6% 3.5% 2.9%Assam 758 1458 123 2.2% 1.7% 2.9%West Bengal 2459 5419 112 7.1% 6.2% 2.6%Chhattisgarh 574 1488 103 1.6% 1.7% 2.4%Jharkhand 438 2120 77 1.3% 2.4% 1.8%NCT of Delhi 1226 2290 72 3.5% 2.6% 1.7%Andhra Pradesh 1199 4627 48 3.4% 5.3% 1.1%Telangana 1187 3137 31 3.4% 3.6% 0.7%Uttarakhand 346 1471 24 1.0% 1.7% 0.6%Puducherry 59 146 14 0.2% 0.2% 0.3%Tripura 162 236 14 0.5% 0.3% 0.3%Chandigarh 127 255 10 0.4% 0.3% 0.2%Himachal Pradesh 175 1170 8 0.5% 1.3% 0.2%Meghalaya 62 196 8 0.2% 0.2% 0.2%Goa 199 473 4 0.6% 0.5% 0.1%Sikkim 49 105 4 0.1% 0.1% 0.1%Arunachal Pradesh 20 108 3 0.1% 0.1% 0.1%Manipur 42 131 3 0.1% 0.1% 0.1%Mizoram 35 77 1 0.1% 0.1% -Andaman & Nicobar Islands 13 57 0 0.0% 0.1% -Dadra & Nagar Haveli And Daman & Diu 42 69 0 0.1% 0.1% -Jammu & Kashmir 958 446 0 2.8% 0.5% -Ladakh 46 20 0 0.1% 0.0% -Nagaland 43 120 0 0.1% 0.1% -Lakshadweep 1 12 0 0.0% 0.0% -India 34798 87909 4307 100% 100% 100%
Note: ‘-‘ represents nil/negligible. Based on March 2020 data. Source: Branch Banking Statistics.

ARTICLE
RBI Bulletin January 2021 61
Green Finance in India: Progress and Challenges
funds) are being established. They together constitute green finance1.
Green finance is central to the overall discussion on sustainability of economic growth. Rapid economic development is often achieved at the cost of environment. Dwindling natural resources, degraded environment and rampant pollution are hazardous to public health and pose challenges to the sustainable economic growth. In order to protect and substantially improve the environment, nations around the world have been increasingly focusing on the use of eco-friendly technologies. However, it requires appropriate incentive structure for increased allocation of funds towards setting up or adopting environmentally sustainable projects. Once funds are freed from the conventional industries and are channeled into the green and environment- friendly sectors, other resources including land and labour may also follow. This eventually leads to an optimal allocation of resources2 that support sustainable growth in the long run. In order to achieve these objectives, targeted policies on green finance have been formed in major countries involving all stakeholders of economic growth, viz., corporates, governments and central banks.
In this article, we assess the progress of green finance in India. In Section II, we briefly discuss some of the best practices followed across the globe for promoting green finance and some of the major initiatives taken in India. In Section III, we outline the progress of green finance in India. In Section IV, we discuss the challenges and way forward and Section V concludes.
II. Public Policy towards Green Finance
(a) International best practices
Climate change has been on the G20 agenda ever since its first summit in 2008, though more recently
Green finance is fast emerging as a priority for public policy. This paper reviews the developments in green finance globally and in India. We use a variety of data sources to assess both the extent of public awareness (Google Trends) and financing options (bank credit and bond issuances) for green projects. Our findings indicate that while there have been improvements in public awareness and financing options in India, a reduction in asymmetric information through better information management systems and increased coordination amongst stakeholders could pave the way towards a greener and sustainable long term economic growth.
Introduction
Green finance refers to the financial arrangements that are specific to the use for projects that are environmentally sustainable or projects that adopt the aspects of climate change. Environmentally sustainable projects include the production of energy from renewable sources like solar, wind, biogas, etc.; clean transportation that involves lower greenhouse gas emission; energy efficient projects like green building; waste management that includes recycling, efficient disposal and conversion to energy, etc. Moreover, project defined sustainable under the disclosure requirement for Green Debt Securities include climate change adaptation, sustainable waste and water managements, sustainable land use including sustainable forestry and agriculture, and biodiversity conservation (SEBI 2017). In order to meet the financial needs for these types of projects, new financial instruments such as green bonds; carbon market instruments (e.g. carbon tax); and new financial institutions (e.g. green banks and green
* This article is prepared by Saurabh Ghosh, Siddhartha Nath and Abhishek Ranjan of the Strategic Research Unit of Department of Economic and Policy Research (DEPR). The views expressed in this article are those of the authors and do not necessarily represent the views of the Bank. Support extended by the research interns are acknowledged.
Green Finance in India: Progress and Challenges*
1 https://development.asia/explainer/green-finance-explained (Asian Development Bank)2 Establishing China’s Green Financial System, Report of the Green Finance Task Force, April 2015.

ARTICLE
RBI Bulletin January 202162
Green Finance in India: Progress and Challenges
the focus has been on circular carbon economy (CCE) to deal with harmful emissions. There are several flagship programmes that aim at increasing the awareness and promoting the funding of green initiatives across the globe. These programmes encourage financial and non-financial firms to embed environmental considerations into their financing. Major flagship programmes like Principles for Responsible Investment (PRI), Equator Principles (EP) for financial institutions, United Nation’s Environment Programme (UNEP) and Statement of Commitment by financial institutions on sustainable development suggest ways for implementing green finance among the signatories. Several entities from India are signatory to these programmes (Table 1). However, it is possible to ensure a steady flow of finance into sustainable projects only if there is any reliable source of information on the entities’ overall management of environmental and social risks, track record on entities’ identification of opportunities that bring both a decent rate of return and environmental benefits (UNEP)3. In this regard, Sustainable Stock
Exchange is an initiative that recommends the signatory countries’ stock exchanges to come up with stock price indices that track the stock performance of a set of companies operating in these countries, which are leaders in recognising the Environmental, Social and Governance (ESG) principles4 into their financing aspects . These indices are aimed at guiding investors who are interested in investing in green activities. Two major stock exchanges in India, the Bombay Stock Exchange (BSE) and the National Stock Exchange (NSE) are part of this initiative and publish separate ESG indices.
The regulatory framework across the globe can be broadly categorised into four. First is the sustainability disclosure by financial and non-financial companies, by which the companies are asked to periodically report their exposure to the ESG related risks from their operations. Such disclosures have picked up following the thrust given by G20 by encouraging a voluntary adoption by corporates of the recommendations of the Task Force on Climate-related Financial Disclosures (TCFD). As of June 2020, 60 per cent of the world’s 100 largest public companies committed supporting the TCFD recommendation5. The leading stock exchanges, financial market regulators and the ministries dealing with the corporate affairs in China (2008)6, Hong Kong (2012), UK (2012), India (2012), the Philippines (2013), Vietnam (2013), Singapore (2016) were among the nations to implement the framework for disclosure of ESG-related risks by the listed companies in their jurisdiction (Volz, 2018)7. Bangladesh mandated bi-
Table 1: Participation of Asian Financial Institutions in Global Initiatives
Name of the initiative Global signa-tories
Asian Signa-tories
Global signa-tories
Asian Signa-tories
From Volz, 2018 As at end 2019
Principles for Responsible Investment
1,874 122 2,698 387 *
Equator Principles Financial Institutions
91 12 101 22 **
UNEP Statement of Commitment by Financial Institutions on Sustainable Development (2011)
214 38
Sustainable Stock Exchanges 66 14 ***
Source: Volz, U. (2018, March). The latest information collected from the programmes’ websites.Notes: Asia includes Australia and New Zealand.*: Includes 3 from India: SBI Funds Management Private Limited, Equicap Asia Management Private Limited and Indus Environmental Services Pvt. Ltd.**: Only IDFC from India.***: Includes both Bombay Stock Exchange (BSE) and National Stock Exchange (NSE) from India.
3 See https://www.unenvironment.org/regions/asia-and-pacific/regional-initiatives/supporting-resource-efficiency/green-financing
4 Environmental, social and governance (ESG) principles are a set of standards for a company’s operations that are compliant with certain social, environmental and governance standards. It is a benchmark that many investors use to assess sustainability of their potential investments. Environmental criteria consider how a company balances its operation with environmental costs. Social criteria deal with companies’ relationships with their employees, suppliers, customers, and the communities where it operates. Governance deals with a company’s leadership, executive pay, audits, internal controls, and shareholder rights.5 Third TCFD Status Report Shows Progress & Highlights Need for Greater Climate-Related Disclosures and Transparency6 Stock exchange in Shanghai. 7 Parentheses indicate the years of adoption of the sustainability disclosure by these stock exchanges.

ARTICLE
RBI Bulletin January 2021 63
Green Finance in India: Progress and Challenges
annual reporting of Corporate Social Responsibilities (CSR) undertaken by the commercial banks in 2008, incentivised systematic environmental risk analysis as part of the credit appraisal by the banks in 2011 with the extension of the norm to Non-Banking Financial Institutions (NBFIs) in 2013 and further included assessment of social risks in 2017 (Volz, 2018). Bangladesh released a uniform risk reporting format for the banks as early as 2013. The Energy Transition for Green Growth Law passed by France in 2015 mandated the asset owners and managers to report on how physical and transition risks impact their activities and assets. This policy aims to link disclosures to the broader efforts to decarbonise the energy sector in France8. Second is the directed and concessional lending, that is practised in several countries. For example, a ‘revolving fund’ of US$26mn was set up under the green re-financing scheme in Bangladesh in 2009 to disburse low interest loans to over 50 renewable energy and green industries. Further, an additional fund of US$200mn was set up for the leather-textile industry for switching to green technology in 2016. Since 2015, Bangladesh mandated the commercial banks to allocate at least 5 per cent of their lending to the renewable energy sector and other green technologies (Volz, 2018). Third are the micro and macro-prudential regulations of financial and non-financial institutions. In 2006, China introduced credit restriction to the companies based on their environmental compliances. Lebanon implemented the policy of differential reserve requirement for the commercial banks in 2010, wherein the banks with larger share of green projects in their loan portfolio are required to hold less reserves (Dikau and Volz, 2018). In 2011, Brazil embedded environmental considerations into the banks’ Internal Process of Capital Adequacy Assessment by considering lending exposure to the projects containing environmental and social risks (Dikau and Volz, 2018). Eventually, Brazil recommended banks to outline their risk
assessment methods and exposure to social and environmental damages into their annual reports in 2017. Fourth is the establishment of green financial institutions. The UK Green Investment Bank plc, a GBP 3 billion (USD 3.9 bn) institution, fully owned by the UK government was established in 2012 (Geddes et al., 2018). Since 2013, Nordic Countries formed alliances of local and regional governments which issued bonds in the financial market and distributed the proceeds to its sub-national members (Kommuninvest (Sweden), Kommunalbanken and KLP Kommunekreditt AS (Norway), KommuneKredit (Denmark), and MuniFin (Finland)) (Nassiry, 2018). Asian Development Bank and United States Agency for International Development provide partial credit and bond guarantees to the partner banks and countries in their respective jurisdiction for green finance. In line with these international practices, India has also implemented several policy tools during the last decade as detailed in the following sections.
(b) Public policy in India
India has started emphasising on green finance as early as 2007. In December 2007, the Reserve Bank issued a notification on “Corporate Social Responsibility, Sustainable Development and Non-financial Reporting – Role of Banks” and mentions the importance of global warming and climate change in the context of sustainable development. In 2008, The National Action Plan on Climate Change (NAPCC) was formulated with a vision to outline the broad policy framework for mitigating the impact of climate change (Jain, 2020). The Climate Change Finance Unit (CCFU) was formed in 2011 within the Ministry of Finance as a coordinating agency for the various institutions responsible for green finance in India. The major strategic move since 2012 included implementation of the sustainability disclosure requirements. Security and Exchange Board of India (SEBI) made it mandatory for top 100 listed entities based on market capitalisation at BSE and NSE to publish annual business responsibility reports since 2012 and 8 Future of Finance, (2019), Bank of England, June.

ARTICLE
RBI Bulletin January 202164
Green Finance in India: Progress and Challenges
revised it from time to time. In May 2017, SEBI issued
guidelines for green bond issuance specifying the
disclosure requirements. In addition, the Ministry of
Corporate Affairs imposed mandatory reporting of the
progress on Corporate Social Responsibilities (CSR)
under the Companies Act, 2013.9 In October 2017,
Report of the Committee on Corporate Governance
has proposed that the board of directors shall meet
at least once a year to specifically discuss strategy,
budgets, board evaluation, risk management, ESG and
succession planning.
There have been several fiscal and financial
incentives at work in India. These incentives are
in line with India’s commitments under the 2015
Paris Agreement to reduce greenhouse gas emission
intensity by 33 to 35 per cent below 2005 levels, and
to achieve 40 per cent of installed electric power
capacity from non-fossil sources by 203010. The
Government of India (GoI) offers 30 per cent of the
installation cost of the rooftop solar panels as subsidy
to the institutional, residential and social sectors in
most states11. In some of the special category states12,
the subsidy is up to 70 per cent of the installation
cost. In addition, beneficiaries can avail a generation-
based incentive wherein they can receive ` 2 per unit
of generation, if the generation exceeds 1100kWh-
1500kWh per year. Further, the excess power can
be sold at a tariff set by the government. Moreover,
the GoI launched two phases of Faster Adoption
and Manufacturing of Hybrid and Electric Vehicles
(FAME) scheme in 2015 and 2019, to enhance the
flow of credit, reducing the up-front purchase price
of all vehicles and developing the infrastructures
(such as charging stations) to encourage green vehicle
production and sales (Jain, 2020). In order to counter the high up-front cost of such vehicles, the State Bank of India has introduced a ‘green car loans’ scheme for electric vehicles with 20 basis points lower interest rate and longer repayment window, compared to the existing car loans (Jain, 2020). The Government has also brought in a Production Linked Incentive (PLI) Scheme for manufacturing of high efficiency modules in the arena of renewable energy.
The Reserve Bank has also been taking proactive policy measures to promote and support green finance initiatives. It has included the small renewable energy sector under its Priority Sector Lending (PSL) scheme in 2015. Under this scheme, firms in renewable energy sector13 are eligible for loans upto ` 30 crore (increased from ` 15 Crore since September 4, 2020) while the households are eligible for loans upto ` 10 lakh for investing into renewable energy. In September 2019, India announced a target to reach 450 GW of renewable energy generation by 2030.
The Reserve Bank is sensitising public, investors and banks regarding the need, opportunities, and challenges of green finance through its regular reports and other communications. For instance, in its Annual Report (2015-16), the Reserve Bank has mentioned the findings of the G20 Green Finance Study Group (GFSG14) on the need for development of local green bond markets, facilitating cross-border investments in green bonds, knowledge sharing on environmental risks, and improving overall green finance activities. The annual report further mentions the broader issues related to green finance that need future consideration. These include definition of green activities, aspects of intellectual property rights in development and transfer of technology from developed countries,
9 https://www.mca.gov.in/Ministry/pdf/FAQ_CSR.pdf10 https://climateactiontracker.org/countries/india/pledges-and-targets/11 https://economictimes.indiatimes.com/small-biz/productline/power-generation/solar-subsidies-government-subsidies-and-other-incentives-for-installing-rooftop-solar-system-in-india/articleshow/69338706.cms?from=mdr12 Uttarakhand, Sikkim, Himachal Pradesh, Jammu and Kashmir, Lakshadweep, as of May 2019.
13 Renewable energy comprises of solar energy, biomass energy, wind-based energy, and micro-hydel energy.14 The G20 Green Finance Study Group (GFSG)’s work supports the G20’s strategic goal of strong, sustainable and balanced growth. It was set up post G20 Finance and Central Bank Deputies Meeting at Sanya, China in December 2015.

ARTICLE
RBI Bulletin January 2021 65
Green Finance in India: Progress and Challenges
and environmental risk assessment by the banks. In its Report on Trend and Progress of Banking in India (2018-19), the Reserve Bank noted the risk of a climate change on financial assets and the need to accelerate the green finance for environment-friendly sustainable development. It acknowledges the challenges in the development of green finance, such as “greenwashing” or false claims of environmental compliance, plurality of definitions, maturity mismatches between long-term green investment and short-term interests of investors. It further notes the need for policy action to establish a framework that promotes the green finance ecosystem in India by fostering awareness through coordinated efforts.
In the context of green financial institutions, Indian Renewable Energy Development Agency (IREDA), a government-backed agency for promoting clean energy investments, announced plans to become India’s first Green bank in May 2016. India Infrastructure Finance Corporation Limited (IIFCL) also launched a dedicated scheme known as the ‘credit enhancement scheme’ for funding viable infrastructure projects with bond tenors above five years (Jain, 2020). Considering these steps, we will assess the progress of green finance in India, including the general awareness about environmental sustainability in the next section.
III. Progress and Challenges of Green Finance in India
a) Improvements in general awareness
There is a paucity of data for assessing the awareness regarding green finance and sustainable development from conventional sources. In this regard, Google Trends can be a powerful tool for understanding the pattern of google searches made in different locations at different point in time. It can help us understand the interest on a given topic, based on the number of searches made in Google. In Google Trends, the information on the number of searches made in Google on any topic is normalised as the proportion of the number of searches made on
all topics in a region during the specified period. This normalisation removes the bias caused due to the change in overall search activities on Google across time. For example, the number of overall search volume today is much larger than it was in 2004 on account of general expansion of internet accessibility across the globe. Therefore, the absolute number of searches in any topic may not give an insightful comparison of general interest in that topic over time. Evidence based on Google Trends suggests an increase in awareness in green finance and its role in sustainable economic development.
We extract the search intensity, i.e. the number of searches as proportion to the overall searches in a country over time, for five keywords: green finance, green bond, ESG, corporate social responsibility and renewable. Chart 1 shows that the intensity of Google searches related to the climate change and green finance in India is no less than those in the advanced and major emerging economies. Chart 1 shows that India’s comparative score is higher than the advanced economies. As mentioned above, Google Trends reports the normalised search intensities for the chosen keywords. While normalising, the country
Chart 1: Google Search Related to Green Finance: India's Comparative Score
Note: Advanced economies include the USA, UK, France, Germany, Italy, Spain, Switzerland, Netherlands, Norway, Japan and Australia. Individual country scores are aggregated using GDP at purchasing power parity as weight.Source: Authors’ calculation, Google Trend.

ARTICLE
RBI Bulletin January 202166
Green Finance in India: Progress and Challenges
with maximum value of the search intensity is set to 100. Then the search intensity for other countries are proportionately adjusted. The country scores in Chart 1 represent the weighted average of these scores for the five keywords, where the weights are the percentage shares of searches on a particular keyword in the total number of searches across these five keywords. Chart 2 shows that the topics related to corporate social responsibility and renewable sources of energy dominate the public interest in India. Web-search related to the specific instruments such as green finance and green bonds, however, are still limited (about 2 per cent of all five keyword searches).
b) Green lending
For the data on bank lending to the sustainable projects, we move to the conventional sources such as Database on the Indian Economy by the Reserve Bank that contains publicly available data on policy rates, aggregate credit, sectoral credit and key financial ratios relating to Scheduled Commercial Banks (SCBs) in India. The number of individual SCBs in the sample varies from 88 in 2005 to 95 in 2019.
As part of the green finance initiative, the Reserve Bank has included the small renewable energy sector under its Priority Sector Lending (PSL) scheme in 2015. As at end-march 2020, the aggregate outstanding bank credit to the non-conventional energy sector was around `36,543 crore, constituting 7.9 per cent of the outstanding bank credit to the power generation (Table 2) compared to 5.4 per cent in March 2015. The commercial banks’ exposure to the non-conventional energy sector varied among bank groups (Table 2) and the major states in India (Chart 3).
Table 2: Bank Credit Outstanding to the Non-conventional Energy as on March, 2020
Public Sector Banks
Private Sector Banks
Foreign Banks
All Banks
Amount outstanding (` Cr.)
21,655 12,302 2,586 36,543
As per cent of power sector credit
6.2 11.9 27.1 7.9
As per cent of total bank credit (excluding personal loans)
0.5 0.5 0.7 0.5
Note: Excludes Regional Rural Banks and Small Finance Banks.Source: BSR, RBI, Authors’ calculations.
Chart 2: Distribution of Google Search of Keywords (Per cent of total): 2013-2019 Average
Source: Authors’ calculation, Google Trend.
Chart 3: Share of Non-conventional Energy Finance: As on March 2020
Note: This chart shows the share (in per cent) of non-conventional energy into the outstanding bank credit to the electricity generation. Excludes Regional Rural Banks and Small Finance Banks.Source: Basic Statistical Returns, Reserve Bank of India and Authors’ calculations.

ARTICLE
RBI Bulletin January 2021 67
Green Finance in India: Progress and Challenges
c) Green bonds
Green bonds are the bonds issued by any sovereign entity, inter-governmental groups or alliances and corporates with the aim that the proceeds of the bonds are utilised for projects classified as environmentally sustainable. We have used Bloomberg for the detailed information on green bonds issued in India and in other countries by the corporates and governments. For India, we first extracted most bonds issued by the corporate and government since January 21, 2015, irrespective of whether they are green bonds or not. In this regard, we have taken those bonds where the country of risk has been marked as India, irrespective of the issuers’ country of incorporation. Our data includes the initial issuance amount in US$, coupon rate, debt to total assets ratio, and we then looked at whether the bond proceed was to be utilised for green projects or not, for over 5000 bonds issued in Indian market since 2015. For the international comparison, we have extracted the summary information using Bloomberg terminal, without extracting detailed information.
India started issuing green bonds since 2015. As of February 12, 2020, the outstanding amount of green bonds in India was US$16.3 billion India issued green bonds of about US$8 billion since January 1, 2018, which constituted about 0.7 per cent of all the bonds issued in the Indian financial market. Although the value of green bonds issued in India since 2018 constituted a very small portion of the total bond issuance, India maintained a favourable position compared to several advanced and emerging economies (Table 3).
Most of the green bonds issued since 2015 had maturities of five years or above, but less than 10 years. However, some issuers such as Yes Bank Ltd. (2015), Indian Renewable Energy Development Agency Ltd. (2017, 2019), Rural Electrification Corporation Limited or REC Ltd. (2017), Power Finance Corporation Ltd. (2017), Indian Railway Finance Corporation Ltd.
(2017), Adani Renewable Energy Ltd. (2019)15 have issued green bonds with the maturity of 10 or more years. ReNew Power Pvt. Ltd. has issued green bonds with maturity period of less than 5 years in 2019. Around 76 per cent of the green bonds issued in India since 2015 were denominated in US$. In addition to corporates and government, the World Bank has issued green bonds towards several projects in India from time to time (Appendix Table 1). Based on the Green Bond Impact report (2019) by the World Bank, it is estimated that the outstanding amount of Green Bond proceeds allocated to support the financing of such projects in India is US$640mn, as on June 30, 201916.
Table 3: Green Bonds Issuance Since January 1, 2018(Corporate and Government: All Maturities)
Country Amount issued ($Mn)
Number of bond
issued
Amount issued as per
cent of all bond issuance
(per cent)
Number of bonds
issued as per
cent of all bond issuance
(per cent)
Euro Area1 1,96,854 594 1.7 0.4
China 63,023 183 0.3 0.2
USA 35,421 71 0.2 0.2
Japan 11,815 88 0.1 1.1
South Korea 11,781 44 1.0 0.4
Central and Southern America3
8,869 53 0.5 1.0
India 7,992 22 0.7 0.3
South-east Asia2 7,208 86 0.6 1.4
Australia and New Zealand 5,878 15 1.1 0.8
UK 5,311 17 0.4 0.5
Hong Kong 4,781 19 0.5 1.0
Singapore 496 9 0.05 1.2
Source: Authors’ calculations, Bloomberg.Notes: Includes both corporate and government bonds.1: Euro area includes all the European countries except the UK, Russia and Switzerland.2: South-east Asia includes Indonesia, Malaysia, Philippines, Thailand and Vietnam.3: Central and Southern America includes Mexico, Brazil, Argentina and Chile.
15 The parentheses indicate the year of issuance.16 The aggregate amount for active projects.

ARTICLE
RBI Bulletin January 202168
Green Finance in India: Progress and Challenges
In sum, green finance in India is still at the nascent stage. Green bonds constituted only 0.7 per cent of all the bonds issued in India since 2018, and bank lending to the non-conventional energy constituted about 7.9 per cent of outstanding bank credit to the power sector, as on March 2020. In the next section, we will highlight some of the major challenges faced by the green bond market in India.
IV. Challenges and Way forward
Existing literature and global experiences suggest that integrated policy approach towards green finance is gradually gaining momentum. In India, while there have been improvements in public awareness and financing options, the major challenges could be high borrowing costs, false claims of environmental compliance, plurality of green loan definitions, maturity mismatches between long-term green investment and relatively short-term interests of investors. In this section, we elaborate some of these challenges and discuss a few possible policy measures.
Borrowing costs
The cost of issuing green bonds has generally remained higher than the other bonds in India. Panel a in chart 4 shows that the average coupon rate for green bonds issued since 2015 with maturities between 5 to 10 years have generally remained higher than the corporate and government bonds with similar tenure. Panel b in chart 4 shows a similar pattern for the INR denominated green bonds. For the US$ denominated green bonds with tenure of more than or equal to 10 years, the coupon rate was, however lower than the corporate bonds.
It may be mentioned that most of the green bonds in India are issued by the public sector units17
or corporates with better financial health. It is evident from the fact that the private sector issuers of green bonds, on average, reported lower debt-to-assets ratio compared to the non-issuers of green bonds18
(Table 6). Their better financial health is also evident from their stock prices. Chart 5 shows that the ratio
17 For instance, Indian Railway Finance corporation ltd., Rural Electrification Corporation Limited or REC Ltd. and Power Finance Corporation Ltd.18 These entities, however, issued other bonds.
Chart 4: Average Coupon Rate (per cent) for Bonds Issued
a. Maturity (>=5 and <10 years) b. Maturity (>=10 years)
Source: Authors’ calculations based on Bloomberg Data.

ARTICLE
RBI Bulletin January 2021 69
Green Finance in India: Progress and Challenges
of ESG leaders’ stock price indices to the headline stock price indices have been consistently rising in the recent period. This implies that the stock prices of the entities that generally focussed in ESG-related initiatives are the ones that outperformed others in the market19.
Despite being relatively secured, the higher borrowing cost of green bonds in India could be on account of asymmetric information (discussed later
in this section), higher risk perception and other governance issues. Existing literature suggests that green projects often have a high up-front cost with some cost-saving features only applicable in the long-term. Maturity-mismatches in green projects and their financing increase the cost of borrowing (G20 GFSG, 2016)20. Absence of a universal definition of green finance and information asymmetry often result in “green-washing”, wherein the investors end up receiving false signals about the green bonds (Berensmann and Lindenberg, 2016). Several of these issues are also likely to be present in India, where the financial market is still emerging as compared to the developed markets.
Borrowing cost and information asymmetry
High borrowing cost has been perhaps the most important challenge and our analysis indicates that it could be due to the asymmetric information. Therefore, developing a better information management system in India may help in reducing maturity mismatches, borrowing costs and lead to efficient resource allocation in this segment. It may be mentioned that to overcome such information gap, several countries including Australia, China, India and the United States have database related to green building projects in the country (Shen et al 2020). While India does monitor green house gas emissions through various reporting mechanisms including PAT (perform-achieve trade) and RPO (renewable purchase obligations), like many other countries it does not have a national measurement, reporting and verification platform for tracking climate finance (Jain, 2020).
Market infrastructure development
Given the large size of domestic market and much smaller penetration of green instruments so far, there remain vast opportunities to be tapped. In this context, some of the studies noted the importance of
Table 6: Debt as Percentage of Total Assets for Corporates: By Category based
on Green Bond Issuances (Average between January 1, 2015 and February 12, 2020)
Sector Issuer Non-issuer
All 63.8 72.9Power 67.6 77.7Renewable/non-conventional energy 69.4 96.6
Source: Authors' calculations based on Bloomberg Data.Notes: Bonds with maturity of strictly less than 10 years (but>=5 years) are only included. Does not include government bonds.An entity is tagged as issuer if it has issued at least one green bond in a calendar year.
19 We took the ratio of MSCI ESG Leaders’ index to the MSCI overall index for India with 2015 as base. Similarly, we have plotted the ratio of BSE ESG 100 index to the BSE 100 index with Q3 2017 as base. All years are calendar years.
Chart 5: ESG Compared to General Stock Index
Source: Authors’ calculations based on MSCI official website and CEIC. BSE ESG index was available from October 2017.
20 https://www.bankofengland.co.uk/-/media/boe/files/quarterly-bulletin/2017/the-banks-response-to-climate-change.pdf?la=en&hash=7DF676C781E5FAEE994C2A210A6B9EEE44879387.

ARTICLE
RBI Bulletin January 202170
Green Finance in India: Progress and Challenges
(a) increased coordination between investment and environmental policies and (b) an implementable policy framework for both national and state levels in addressing the existing frictions. In this vein, some of the policy measures such as deepening of corporate bond market, standardisation of green investment terminology, consistent corporate reporting, and removing information asymmetry between investors and recipients can make a significant contribution in addressing some of the shortcomings of the green finance market (RBI, 2019).
Other public policies
Other approach could be engaging with industry bodies that have taken initiatives towards expanding ‘green buildings’ that are designed to consume less water and energy resources, maintain better waste management and provide healthier spaces for living. The Government at all levels can possibly engage with these bodies to better assess their financial and operational needs. It may also undertake policies that make production and distribution of non-conventional energy profitable, especially for smaller firms. There is a scope of well calibrated policies for providing fiscal incentives for green projects in India, while taking cognisance of their impact on supply-chain, inflationary pressure and fiscal consolidation.
V. Conclusion
Green finance is fast emerging as a priority for public policy. In this study we review the developments of green finance in India and our findings indicate that there have been some improvements in public awareness and financing options in India in recent years. Existing literature suggests that a reduction in the asymmetric information regarding Green Projects through better information management systems and increased
coordination amongst stakeholders could pave the way towards sustainable long term economic growth.
At this juncture, the world is fighting COVID-19 and its impact on global economic growth. Undoubtedly, the immediate policy challenge is to kick-start the global economy. However, the pandemic has also offered an opportunity to all stakeholders to rethink about the policies, and financial and operational strategies that they have adopted so far and espouse an approach that is more environmentally sustainable in the long run. Green finance is definitely an important mean that can facilitate such a shift towards sustainable economic growth.
References
Berensmann, K., & Lindenberg, N. (2016), “Green finance: actors, challenges and policy recommendations”, German Development Institute/Deutsches Institut für Entwicklungspolitik (DIE) Briefing Paper, 23
Dikau, S., & Volz, U. (2018, September), “Central Banking, Climate Change and Green Finance”, ADBI Working Paper Series(867).
Geddes A., Schmidt T. S. and Steffen, B. (2018), “The multiple roles of state investment banks in low-carbon energy finance: An analysis of Australia, the UK and Germany”, Energy Policy, 115 (2018), 158-170
Jain, S. (2020), “Financing India’s green transition”, ORF Issue Brief No. 338, January 2020, Observer Research Foundation.
Nassiry, D. (2018), “Green Bond Experiences in Nordic Countries”, ADBI Working Paper, No. 816, March
Olga, B., & Smorodinov, O. (2017), “Challenges to green finance in G20 countries”, Mirovaya ekonomika i mezhdunarodnye otnosheniya, 61(10), 16-24

ARTICLE
RBI Bulletin January 2021 71
Green Finance in India: Progress and Challenges
RBI (2019), “Opportunities and Challenges of Green Finance”, Report on Trend and Progress of Banking in India (2018-19), 17-18.
Reddy, A. S. (2018), “Green Finance- Financial Support for Sustainable Development”, International Journal of Pure and Applied Mathematics, 118(20), 645-650.
Shen, C., Zhao, K., & Ge, J. (2020), “An Overview of Green Building Performance Database”, Journal of Engineering.
Volz, U. (2018, March), “Fostering green finance for sustainable development in Asia”, ADBI Working Paper Series(814)
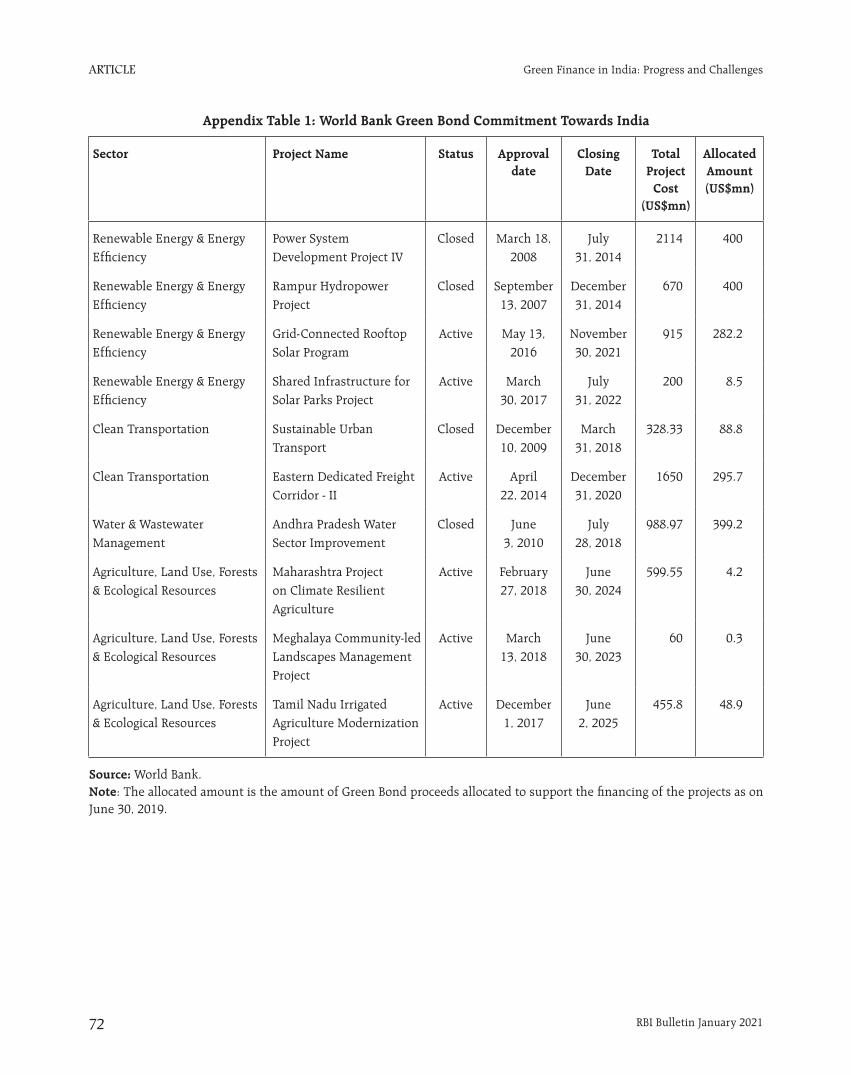
ARTICLE
RBI Bulletin January 202172
Green Finance in India: Progress and Challenges
Appendix Table 1: World Bank Green Bond Commitment Towards India
Sector Project Name Status Approval date
Closing Date
Total Project
Cost (US$mn)
Allocated Amount (US$mn)
Renewable Energy & Energy Efficiency
Power System Development Project IV
Closed March 18, 2008
July 31, 2014
2114 400
Renewable Energy & Energy Efficiency
Rampur Hydropower Project
Closed September 13, 2007
December 31, 2014
670 400
Renewable Energy & Energy Efficiency
Grid-Connected Rooftop Solar Program
Active May 13, 2016
November 30, 2021
915 282.2
Renewable Energy & Energy Efficiency
Shared Infrastructure for Solar Parks Project
Active March 30, 2017
July 31, 2022
200 8.5
Clean Transportation Sustainable Urban Transport
Closed December 10, 2009
March 31, 2018
328.33 88.8
Clean Transportation Eastern Dedicated Freight Corridor - II
Active April 22, 2014
December 31, 2020
1650 295.7
Water & Wastewater Management
Andhra Pradesh Water Sector Improvement
Closed June 3, 2010
July 28, 2018
988.97 399.2
Agriculture, Land Use, Forests & Ecological Resources
Maharashtra Project on Climate Resilient Agriculture
Active February 27, 2018
June 30, 2024
599.55 4.2
Agriculture, Land Use, Forests & Ecological Resources
Meghalaya Community-led Landscapes Management Project
Active March 13, 2018
June 30, 2023
60 0.3
Agriculture, Land Use, Forests & Ecological Resources
Tamil Nadu Irrigated Agriculture Modernization Project
Active December 1, 2017
June 2, 2025
455.8 48.9
Source: World Bank.Note: The allocated amount is the amount of Green Bond proceeds allocated to support the financing of the projects as on June 30, 2019.

CURRENT STATISTICS
Select Economic Indicators
Reserve Bank of India
Money and Banking
Prices and Production
Government Accounts and Treasury Bills
Financial Markets
External Sector
Payment and Settlement Systems
Occasional Series


CURRENT STATISTICS
RBI Bulletin January 2021 73
No. Title Page
1 Select Economic Indicators 75
Reserve Bank of India
2 RBI – Liabilities and Assets 76
3 Liquidity Operations by RBI 77
4 Sale/ Purchase of U.S. Dollar by the RBI 78
4A Maturity Breakdown (by Residual Maturity) of Outstanding Forwards of RBI (US$ Million) 79
5 RBI's Standing Facilities 79
Money and Banking
6 Money Stock Measures 80
7 Sources of Money Stock (M3) 81
8 Monetary Survey 82
9 Liquidity Aggregates 82
10 Reserve Bank of India Survey 83
11 Reserve Money – Components and Sources 83
12 Commercial Bank Survey 84
13 Scheduled Commercial Banks' Investments 84
14 Business in India – All Scheduled Banks and All Scheduled Commercial Banks 85
15 Deployment of Gross Bank Credit by Major Sectors 86
16 Industry-wise Deployment of Gross Bank Credit 87
17 State Co-operative Banks Maintaining Accounts with the Reserve Bank of India 88
Prices and Production
18 Consumer Price Index (Base: 2012=100) 89
19 Other Consumer Price Indices 89
20 Monthly Average Price of Gold and Silver in Mumbai 89
21 Wholesale Price Index 90
22 Index of Industrial Production (Base: 2011-12=100) 94
Government Accounts and Treasury Bills
23 Union Government Accounts at a Glance 94
24 Treasury Bills – Ownership Pattern 95
25 Auctions of Treasury Bills 95
Financial Markets
26 Daily Call Money Rates 96
27 Certificates of Deposit 97
28 Commercial Paper 97
29 Average Daily Turnover in Select Financial Markets 97
30 New Capital Issues by Non-Government Public Limited Companies 98
Contents

CURRENT STATISTICS
RBI Bulletin January 202174
No. Title Page
External Sector
31 Foreign Trade 99
32 Foreign Exchange Reserves 99
33 NRI Deposits 99
34 Foreign Investment Inflows 100
35 Outward Remittances under the Liberalised Remittance Scheme (LRS) for Resident Individuals 100
36 Indices of Real Effective Exchange Rate (REER) and Nominal Effective Exchange Rate (NEER) of the Indian Rupee
101
37 External Commercial Borrowings (ECBs) 101
38 India’s Overall Balance of Payments (US $ Million) 102
39 India's Overall Balance of Payments (` Crore) 103
40 Standard Presentation of BoP in India as per BPM6 (US $ Million) 104
41 Standard Presentation of BoP in India as per BPM6 (` Crore) 105
42 International Investment Position 106
Payment and Settlement Systems
43 Payment System Indicators 107
Occasional Series
44 Small Savings 109
45 Ownership Pattern of Central and State Governments Securities 110
46 Combined Receipts and Disbursements of the Central and State Governments 111
47 Financial Accommodation Availed by State Governments under various Facilities 112
48 Investments by State Governments 113
49 Market Borrowings of State Governments 114
Notes: .. = Not available. – = Nil/Negligible. P = Preliminary/Provisional. PR = Partially Revised.

CURRENT STATISTICS
RBI Bulletin January 2021 75
2019-20 2020-21
Q1 Q2 Q1 Q2
2 3 4 5
4.8 4.3 -22.8 -7.03.0 3.5 3.4 3.43.8 -0.2 -33.8 0.15.5 6.1 -24.3 -11.15.6 7.8 -19.2 -13.34.6 -3.9 -47.1 -7.3
Item2019-20
11 Real Sector (% Change) 1.1 GVA at Basic Prices 3.9 1.1.1 Agriculture 4.0 1.1.2 Industry 0.8 1.1.3 Services 5.0 1.1a Final Consumption Expenditure 6.3 1.1b Gross Fixed Capital Formation -2.8
2019-20
1 1.2 Index of Industrial Production -0.82 Money and Banking (% Change) 2.1 Scheduled Commercial Banks 2.1.1 Deposits 7.9 2.1.2 Credit 6.1 2.1.2.1 Non-food Credit 6.1 2.1.3 Investment in Govt. Securities 10.6 2.2 Money Stock Measures 2.2.1 Reserve Money (M0) 9.4 2.2.2 Broad Money (M3) 8.93 Ratios (%) 3.1 Cash Reserve Ratio 3.00 3.2 Statutory Liquidity Ratio 18.25 3.3 Cash-Deposit Ratio 4.6 3.4 Credit-Deposit Ratio 76.4 3.5 Incremental Credit-Deposit Ratio 60.3 3.6 Investment-Deposit Ratio 27.6 3.7 Incremental Investment-Deposit Ratio 36.24 Interest Rates (%) 4.1 Policy Repo Rate 4.40 4.2 Reverse Repo Rate 4.00 4.3 Marginal Standing Facility (MSF) Rate 4.65 4.4 Bank Rate 4.65 4.5 Base Rate 8.15/9.40 4.6 MCLR (Overnight) 7.40/7.90 4.7 Term Deposit Rate >1 Year 5.90/6.40 4.8 Savings Deposit Rate 3.00/3.50 4.9 Call Money Rate (Weighted Average) 5.05 4.10 91-Day Treasury Bill (Primary) Yield 4.36 4.11 182-Day Treasury Bill (Primary) Yield 4.97 4.12 364-Day Treasury Bill (Primary) Yield 4.94 4.13 10-Year G-Sec Par Yield (FBIL) 6.715 Reference Rate and Forward Premia 5.1 INR-US$ Spot Rate (Rs. Per Foreign Currency) 74.84 5.2 INR-Euro Spot Rate (Rs. Per Foreign Currency) 82.64 5.3 Forward Premia of US$ 1-month (%) 8.98 3-month (%) 5.93 6-month (%) 5.056 Inflation (%) 6.1 All India Consumer Price Index 4.76 6.2 Consumer Price Index for Industrial Workers 7.54 6.3 Wholesale Price Index 1.69 6.3.1 Primary Articles 6.77 6.3.2 Fuel and Power -1.63 6.3.3 Manufactured Products 0.297 Foreign Trade (% Change) 7.1 Imports -7.66 7.2 Exports -5.06
No. 1: Select Economic Indicators
2019 2020Oct. Nov. Oct. Nov.
2 3 4 5-6.6 2.1 3.6 -
10.3 9.5 11.1 10.58.9 7.2 5.6 5.78.8 7.2 5.6 5.87.0 8.6 21.5 19.2
15.3 12.4 12.8 15.310.6 9.8 11.6 12.5
4.00 4.00 3.00 3.00
18.50 18.50 18.00 18.004.9 4.8 3.8 3.8
75.8 75.5 72.0 72.217.0 22.5 2.0 9.528.3 28.3 31.0 30.573.3 62.4 85.4 74.7
5.15 5.15 4.00 4.004.90 4.90 3.35 3.355.40 5.40 4.25 4.255.40 5.40 4.25 4.25
8.95/9.40 8.95/9.40 7.40/8.80 7.40/8.807.70/8.20 7.65/8.10 6.65/7.10 6.60/7.106.25/6.85 6.25/6.60 4.90/5.50 4.90/5.503.25/3.50 3.25/3.50 2.70/3.00 2.70/3.00
5.07 5.03 3.19 3.105.04 4.99 3.20 2.935.21 5.12 3.36 3.265.30 5.14 3.45 3.396.54 6.65 5.91 5.84
70.96 71.73 73.97 73.8078.81 78.98 86.97 88.02
3.38 3.35 3.24 3.363.61 3.35 3.46 3.523.99 3.76 3.89 4.23
4.6 5.5 7.6 6.97.6 8.6 5.9 5.30.0 0.6 1.5 1.66.0 7.6 4.7 2.7
-8.1 -7.3 -10.9 -9.9-0.9 -0.8 2.1 3.0
-15.0 -11.8 -11.5 -13.3
-1.7 -1.2 -5.1 -8.7
Note : Financial Benchmark India Pvt. Ltd. (FBIL) has commenced publication of the G-Sec benchmarks with effect from March 31, 2018 as per RBI circular FMRD.DIRD.7/14.03.025/2017-18 dated March 31, 2018. FBIL has started dissemination of reference rates w.e.f. July 10, 2018.
No. 1: Select Economic Indicators

CURRENT STATISTICS
RBI Bulletin January 202176
No. 2: RBI - Liabilities and Assets *
(` Crore)
L 2019 2020
Dec. Nov. 27 Dec. 4 Dec. 11 Dec. 18 Dec. 25
2 3 4 5 6 7
1
1
1. 2244106 2744155 2746809 2758409 2749859 2751458
1. 12 12 13 11 11 12
1. 2244118 2744167 2746822 2758420 2749870 2751470
2
1. 89990 113222 114371 114890 117642 116647
1. 2153365 2630160 2631676 2642769 2631474 2633880
1. 763 785 775 761 754 942
1. – – – – – –
2
1
2. 913132 1445616 1468534 1460553 1454026 1460970
2. 101 100 101 100 101 100
2.
2. 42 42 42 43 42 42
2. 541417 461900 476750 445715 488262 457719
2. 6593 5547 5613 5262 5437 5507
2. 2698 2414 2411 2383 2510 2586
2. 31221 27334 25782 26871 25967 27481
2. 331060 944501 944440 966883 926924 962753
2. _ 3778 13395 13296 4783 4782
2. 1145007 1462954 1469301 1462455 1480676 1476078
2. 2058139 2908570 2937835 2923008 2934702 2937049
2
2. 12 12 13 11 11 12
2. 903533 1349768 1362970 1336197 1353079 1348295
2.
2. – – – – – –
2. 2112 2112 10576 13017 6303 3946
2. 30427 77097 77097 77097 77098 77318
2. – – – – – –
2. – – – – – –
2. – 23596 25833 25833 26133 26133
2. – – – – – –
2. 4479 9216 9242 9242 9241 9241
2. _ 9703 10451 18479 15828 15826
2.
2. – – – – – –
2. – – – – – –
2. 1005802 1284031 1286500 1286421 1285853 1296115
2. 111774 153035 155153 156711 161156 160163
2. 105494 147429 149289 150333 154686 153378
Item
2019-20
1
1 Issue Department
1.1 Liabilities
1.1.1 Notes in Circulation 2412993
1.1.2 Notes held in Banking Department 10
1.1/1.2 Total Liabilities (Total Notes Issued) or Assets 2413003
1.2 Assets
1.2.1 Gold 103439
1.2.2 Foreign Securities 2308718
1.2.3 Rupee Coin 846
1.2.4 Government of India Rupee Securities –
2 Banking Department
2.1 Liabilities
2.1.1 Deposits 1187409
2.1.1.1 Central Government 100
2.1.1.2 Market Stabilisation Scheme
2.1.1.3 State Governments 43
2.1.1.4 Scheduled Commercial Banks 536186
2.1.1.5 Scheduled State Co-operative Banks 7603
2.1.1.6 Non-Scheduled State Co-operative Banks 3445
2.1.1.7 Other Banks 32641
2.1.1.8 Others 605100
2.1.1.9 Financial Institution Outside India 2291
2.1.2 Other Liabilities 1350333
2.1/2.2 Total Liabilities or Assets 2537742
2.2 Assets
2.2.1 Notes and Coins 10
2.2.2 Balances held Abroad 1006357
2.2.3 Loans and Advances
2.2.3.1 Central Government 50477
2.2.3.2 State Governments 1967
2.2.3.3 Scheduled Commercial Banks 285623
2.2.3.4 Scheduled State Co-op.Banks –
2.2.3.5 Industrial Dev. Bank of India –
2.2.3.6 NABARD –
2.2.3.7 EXIM Bank –
2.2.3.8 Others 10064
2.2.3.9 Financial Institution Outside India 2300
2.2.4 Bills Purchased and Discounted
2.2.4.1 Internal –
2.2.4.2 Government Treasury Bills –
2.2.5 Investments 1042951
2.2.6 Other Assets 137993
2.2.6.1 Gold 127644
As on the Last Friday/ Friday
* Data are provisional
Reserve Bank of IndiaNo. 2: RBI - Liabilities and Assets *

CURRENT STATISTICS
RBI Bulletin January 2021 77
No. 3: Liquidity Operations by RBI
(` Crore)
Date
Repo ReverseRepo
VariableRateRepo
VariableRate
ReverseRepo
MSFStandingLiquidityFacilities
MarketStabilisation
SchemeSale Purchase
Long TermRepo
Operations&
TargetedLong Term
RepoOperations
#
SpecialLiquidity
Facility forMutualFunds
SpecialLiquidity
Scheme forNBFCs/HFCs **
Net Injection (+)/Absorption (-)
(1+3+5+6+9+10+11+12+13-2-4-7-8
)
1 2 3 4 5 6 7 8 9 10 11 12 13 14Nov. 1, 2020 - 148 - - 1 – - - - - - - - -147Nov. 2, 2020 - 679830 - - 165 – - – 20000 - - - - -659665Nov. 3, 2020 - 692072 - - 0 – - - - - - - - -692072Nov. 4, 2020 - 682680 - - 159 – - - 2830 - - - - -679691Nov. 5, 2020 - 691021 - - 15 – - - - - - - -984 -691990Nov. 6, 2020 - 647614 - - 18 – - – 10000 - - - - -637596Nov. 7, 2020 - 10386 - - 2958 – - - - - - - - -7428Nov. 8, 2020 - 215 - - 78 – - - - - - - - -137Nov. 9, 2020 - 642236 - - 8 – - - - - - - - -642228Nov. 10, 2020 - 670096 - - 1 – - - - - - - - -670095Nov. 11, 2020 - 659861 - - 300 – - - - - - - - -659561Nov. 12, 2020 - 698316 - - 12 – - - - - - - -491 -698795Nov. 13, 2020 - 666219 - - 143 – - 10000 10000 - - - -236 -666312Nov. 14, 2020 - 298 - - 37 – - - - - - - - -261Nov. 15, 2020 - 193 - - 13 – - - - - - - - -180Nov. 16, 2020 - 22358 - - 632 – - - - - - - - -21726Nov. 17, 2020 - 717800 - - 330 -2525 - - - - - - -493 -720488Nov. 18, 2020 - 715755 - - 140 – - - - - - - - -715615Nov. 19, 2020 - 730129 - - 0 – - - - - - - -1025 -731154Nov. 20, 2020 - 668078 - - 266 – - 10000 10000 - - - - -667812Nov. 21, 2020 - 8016 - - 718 – - - - - - - - -7298Nov. 22, 2020 - 219 - - 10 – - - - - - - - -209Nov. 23, 2020 - 652825 - - 34 350 - - - - - - -493 -652934Nov. 24, 2020 - 653535 - - 44 – - - - - -12773 - - -666264Nov. 25, 2020 - 646452 - - 0 -1325 - - - - -8091 - -493 -656361Nov. 26, 2020 - 673385 - - 84 1 - - - - -6974 - - -680274Nov. 27, 2020 - 646182 - - 0 – - 10000 10000 - -9510 - - -655692Nov. 28, 2020 - 2290 - - 70 – - - - - - - - -2220Nov. 29, 2020 - 588 - - 142 – - - - - - - - -446Nov. 30, 2020 - 27353 - - 4950 – - - - - - - - -22403
Notes: # Includes Targeted Long Term Repo Operations (TLTRO) and Targeted Long Term Repo Operations 2.0(TLTRO 2.0). Negative (-) sign indicates repayments done by Banks.**As per RBI Notification No. 2020-21/01 dated July 01, 2020. Negative (-) sign indicates maturity proceeds received for RBI's investment in the Special Liquidity Scheme.& Negative (-) sign indicates repayments done by Banks.
No. 3: Liquidity Operations by RBI

CURRENT STATISTICS
RBI Bulletin January 202178
2019 2020
Nov. Oct. Nov.
2 3 4
6928 15640 10261
7458 15640 14289
530 0 4028
49142 114896 76326
25381 58127 68388
174408 432863 509189
-6143 13556 28344
No. 4: Sale/ Purchase of U.S. Dollar by the RBI
Item2019-20
1
1 Net Purchase/ Sale of Foreign Currency (US $ Million) (1.1–1.2) 45097
1.1 Purchase (+) 72205
1.2 Sale (–) 27108
2 equivalent at contract rate 312005
3 Cumulative (over end-March) (US $ Million) 45097
(` Crores) 312005
4 Outstanding Net Forward Sales (–)/ Purchase (+) at the end of month (US $ Million)
-4939
Item2019-20
1
1 Net Purchase/ Sale of Foreign Currency (US $ Million) (1.1–1.2) 0
1.1 Purchase (+) 7713
1.2 Sale (–) 7713
2 Outstanding Net Currency Futures Sales (–)/ Purchase (+) at the end of month (US $ Million)
-500
2019 2020
Nov. Oct. Nov.
2 3 4
0 0 0
0 0 0
0 0 0
0 0 780
i) Operations in onshore / offshore OTC segment
ii) Operations in currency futures segment
` (` Crores)

CURRENT STATISTICS
RBI Bulletin January 2021 79
Item As on November 30, 2020
Long (+) Short (-) Net (1-2)
1 2 3
1. Upto 1 month 2637 0 2637
2. More than 1 month and upto 3 months 5692 0 5692
3. More than 3 months and upto 1 year 24864 0 24864
4. More than 1 year 5171 10020 -4849
Total (1+2+3+4) 38364 10020 28344
No. 4 A : Maturity Breakdown (by Residual Maturity) of OutstandingForwards of RBI (US $ Million)
No. 5: RBI's Standing Facilities
Item
2019-20
1
1 MSF 1262
2 Export Credit Refinance for Scheduled Banks
2.1 Limit -
2.2 Outstanding -
3 Liquidity Facility for PDs
3.1 Limit 10000
3.2 Outstanding 4782
4 Others
4.1 Limit -
4.2 Outstanding -
5 Total Outstanding (1+2.2+3.2+4.2) 6044
(` Crore)
2019 2020
Dec. 20 Jul. 31 Aug. 28 Sep. 25 Oct. 23 Nov. 20 Dec. 18
2 3 4 5 6 7 8
3856 80 300 50 6 266 1
- - - - - - -
- - - - - - -
2800 4900 4900 4900 4900 4900 4900
1615 30 0 0 - 0 0
- 65000 65000 65000 65000 75000 82500
- 34376 34166 37691 36488 33234 34760
5471 34486 34466 37741 36494 33500 34761
As on the Last Reporting Friday
Note :1.Special refinance facility to Others, i.e. to the EXIM Bank, is reopened since May 22, 2020 2.Refinance facility to Others, i.e. to the NABARD/SIDBI/NHB U/S 17(4H) of RBI ACT,1934, since, April 17, 2020.
No. 5: RBI’s Standing Facilities
No. 4 A : Maturity Breakdown (by Residual Maturity) of Outstanding Forwards of RBI (US $ Million)

CURRENT STATISTICS
RBI Bulletin January 202180
Money and Banking
Item
2019-20 2019 2020
Nov. 22 Oct. 23 Nov. 6 Nov. 20
1 2 3 4 5
1 Currency with the Public (1.1 + 1.2 + 1.3 – 1.4) 2349748 2172488 2619578 2637687 2673534
1.1 Notes in Circulation 2420964 2241262 2688064 2707002 2743952
1.2 Circulation of Rupee Coin 25605 25380 25738 25798 25798
1.3 Circulation of Small Coins 743 743 743 743 743
1.4 Cash on Hand with Banks 97563 94897 94967 95856 96958
2 Deposit Money of the Public 1776200 1480272 1666403 1657494 1674841
2.1 Demand Deposits with Banks 1737692 1447960 1625686 1615836 1632938
2.2 ‘Other’ Deposits with Reserve Bank 38507 32312 40717 41658 41904
3 M (1 + 2) 4125948 3652760 4285981 4295180 4348375
4 Post Office Saving Bank Deposits 150963 139402 150963 150963 150963
5 M (3 + 4) 4276911 3792162 4436944 4446143 4499338
6 Time Deposits with Banks 12674016 12292989 13517758 13639674 13589563
7 M (3 + 6) 16799963 15945749 17803739 17934854 17937939
8 Total Post Office Deposits 433441 401165 433441 433441 433441
9 M (7 + 8) 17233404 16346914 18237180 18368295 18371380
No. 6: Money Stock Measures
(` Crore)
Outstanding as on March 31/last reporting Fridays of the month/reporting Fridays
1
2
3
4
No. 6: Money Stock Measures

CURRENT STATISTICS
RBI Bulletin January 2021 81
No. 7: Sources of Money Stock (M )
Sources
2019-20 2019 2020
Nov. 22 Oct. 23 Nov. 6 Nov. 20
1 2 3 4 5
1 Net Bank Credit to Government 4960362 4890841 5587218 5716069 5691514
1.1 RBI’s net credit to Government (1.1.1–1.1.2) 992192 965438 905454 996346 1023947
1.1.1 Claims on Government 1047808 1001006 1248802 1291718 1293290
1.1.1.1 Central Government 1045314 1000408 1242339 1282681 1282559
1.1.1.2 State Governments 2494 598 6463 9037 10731
1.1.2 Government deposits with RBI 55616 35568 343348 295372 269343
1.1.2.1 Central Government 55573 35526 343305 295330 269301
1.1.2.2 State Governments 43 42 43 42 42
1.2 Other Banks’ Credit to Government 3968170 3925403 4681764 4719723 4667567
2 Bank Credit to Commercial Sector 11038644 10468270 10999620 11079549 11092385
2.1 RBI’s credit to commercial sector 13166 7144 14792 14934 12173
2.2 Other banks’ credit to commercial sector 11025478 10461126 10984828 11064615 11080212
2.2.1 Bank credit by commercial banks 10370861 9860303 10338868 10419271 10434880
2.2.2 Bank credit by co-operative banks 637776 588692 636209 635748 635516
2.2.3 Investments by commercial and co-operative banks in other securities 16842 12132 9750 9597 9815
3 Net Foreign Exchange Assets of Banking Sector (3.1 + 3.2) 3801036 3425222 4365595 4447921 4493779
3.1 RBI’s net foreign exchange assets (3.1.1–3.1.2) 3590402 3207225 4120941 4203267 4249125
3.1.1 Gross foreign assets 3590636 3207434 4121184 4203510 4249368
3.1.2 Foreign liabilities 234 209 243 243 243
3.2 Other banks’ net foreign exchange assets 210634 217997 244655 244655 244655
4 Government’s Currency Liabilities to the Public 26348 26123 26481 26541 26541
5 Banking Sector’s Net Non-monetary Liabilities 3026427 2864707 3175175 3335226 3366279
5.1 Net non-monetary liabilities of RBI 1378342 1137091 1412121 1471603 1464944
5.2 Net non-monetary liabilities of other banks (residual) 1648085 1727616 1763054 1863623 1901335
M (1+2+3+4–5) 16799963 15945749 17803739 17934854 17937939
(` Crore)
Outstanding as on March 31/last reporting Fridays ofthe month/reporting Fridays
3
3
No. 7: Sources of Money Stock (M3)

CURRENT STATISTICS
RBI Bulletin January 202182
No. 8: Monetary Survey
Item
2019-20 2019 2020Nov. 22 Oct. 23 Nov. 6 Nov. 20
1 2 3 4 5Monetary AggregatesNM1 (1.1 + 1.2.1+1.3) 4125948 3652760 4285981 4295180 4348375NM (NM + 1.2.2.1) 9745776 9103488 10294913 10358590 10389164NM (NM + 1.2.2.2 + 1.4 = 2.1 + 2.2 + 2.3 – 2.4 – 2.5) 16923893 16087659 17894503 18027697 180363721 Components1.1 Currency with the Public 2349748 2172488 2619578 2637687 26735341.2 Aggregate Deposits of Residents 14226198 13560689 14978869 15090079 15056913 1.2.1 Demand Deposits 1737692 1447960 1625686 1615836 1632938 1.2.2 Time Deposits of Residents 12488506 12112729 13353183 13474243 13423975 1.2.2.1 Short-term Time Deposits 5619828 5450728 6008932 6063409 6040789 1.2.2.1.1 Certificates of Deposit (CDs) 169419 158123 180512 74470 66156 1.2.2.2 Long-term Time Deposits 6868678 6662001 7344251 7410834 73831861.3 ‘Other’ Deposits with RBI 38507 32312 40717 41658 419041.4 Call/Term Funding from Financial Institutions 309439 322170 255339 258274 2640212 Sources2.1 Domestic Credit 16857025 16251859 17549226 17769707 17737777 2.1.1 Net Bank Credit to the Government 4960362 4890841 5587218 5716069 5691514 2.1.1.1 Net RBI credit to the Government 992192 965438 905454 996346 1023947 2.1.1.2 Credit to the Government by the Banking System 3968170 3925403 4681764 4719723 4667567 2.1.2 Bank Credit to the Commercial Sector 11896663 11361017 11962008 12053638 12046263 2.1.2.1 RBI Credit to the Commercial Sector 13166 7144 38919 38336 35419 2.1.2.2 Credit to the Commercial Sector by the Banking System 11883497 11353873 11923089 12015302 12010844 2.1.2.2.1 Other Investments (Non-SLR Securities) 846284 883989 926628 940632 9197802.2 Government’s Currency Liabilities to the Public 26348 26123 26481 26541 265412.3 Net Foreign Exchange Assets of the Banking Sector 3612303 3141351 4222595 4298103 4366249 2.3.1 Net Foreign Exchange Assets of the RBI 3590402 3207225 4120941 4203267 4249125 2.3.2 Net Foreign Currency Assets of the Banking System 21900 -65874 101655 94836 1171242.4 Capital Account 2670439 2482957 2862261 2910875 29007452.5 Other items (net) 901344 848715 1041538 1155778 1193449
(` Crore)
Outstanding as on March 31/last reporting Fridays of themonth/reporting Fridays
12
3
1
2
No. 9: Liquidity Aggregates(` Crore)
Aggregates 2019-20 2019 2020Nov. Sep. Oct. Nov.
1 2 3 4 51 NM 16923893 16087659 17826724 17894503 18036372
2 Postal Deposits 433441 401165 433441 433441 4334413 L ( 1 + 2) 17357334 16488824 18260165 18327944 18469813
4 Liabilities of Financial Institutions 57479 56839 38481 35342 34778 4.1 Term Money Borrowings 7928 3262 5700 3114 2645 4.2 Certificates of Deposit 46249 49162 29300 28700 28600 4.3 Term Deposits 3302 4415 3481 3528 35335 L (3 + 4) 17414813 16545663 18298646 18363286 18504591
6 Public Deposits with Non-Banking Financial Companies 31905 .. 31905 .. ..7 L (5 + 6) 17446718 .. 18330551 .. ..
1
2
3
3
Note : Since November 2019, updated data on liabilities of financial institutions have been incorporated in this table , and hence, are not comparable with past data.
No. 8: Monetary Survey
No. 9: Liquidity Aggregates

CURRENT STATISTICS
RBI Bulletin January 2021 83
No. 10: Reserve Bank of India Survey
Item
2019-20 2019 2020Nov. 22 Oct. 23 Nov. 6 Nov. 20
1 2 3 4 51 Components1.1 Currency in Circulation 2447312 2267385 2714545 2733543 27704931.2 Bankers’ Deposits with the RBI 543888 555408 470552 484539 504678 1.2.1 Scheduled Commercial Banks 505131 517462 437010 450857 4714881.3 ‘Other’ Deposits with the RBI 38507 32312 40717 41658 41904Reserve Money (1.1 + 1.2 + 1.3 = 2.1 + 2.2 + 2.3 – 2.4 – 2.5) 3029707 2855104 3225814 3259739 33170742 Sources2.1 RBI’s Domestic Credit 791299 758848 490513 501535 506353 2.1.1 Net RBI credit to the Government 992192 965438 905454 996346 1023947 2.1.1.1 Net RBI credit to the Central Government (2.1.1.1.1 + 2.1.1.1.2 + 2.1.1.1.3 + 2.1.1.1.4 – 2.1.1.1.5) 989741 964882 899034 987351 1013258
2.1.1.1.1 Loans and Advances to the Central Government – – – – – 2.1.1.1.2 Investments in Treasury Bills – – – – – 2.1.1.1.3 Investments in dated Government Securities 1044468 999581 1241461 1281845 1281765 2.1.1.1.3.1 Central Government Securities 1044468 999581 1241461 1281845 1281765 2.1.1.1.4 Rupee Coins 846 827 878 836 794 2.1.1.1.5 Deposits of the Central Government 55573 35526 343305 295330 269301 2.1.1.2 Net RBI credit to State Governments 2451 556 6420 8995 10689 2.1.2 RBI’s Claims on Banks -214059 -213734 -453860 -533147 -553013 2.1.2.1 Loans and Advances to Scheduled Commercial Banks -214059 -213734 -429733 -509745 -529767 2.1.3 RBI’s Credit to Commercial Sector 13166 7144 38919 38336 35419 2.1.3.1 Loans and Advances to Primary Dealers 5920 1604 – – – 2.1.3.2 Loans and Advances to NABARD – – 24127 23402 232462.2 Government’s Currency Liabilities to the Public 26348 26123 26481 26541 265412.3 Net Foreign Exchange Assets of the RBI 3590402 3207225 4120941 4203267 4249125 2.3.1 Gold 230527 192307 271325 278941 267074 2.3.2 Foreign Currency Assets 3359893 3014935 3849633 3924343 39820682.4 Capital Account 1165066 1012649 1251601 1300949 12883992.5 Other Items (net) 213276 124442 160520 170654 176545
(` Crore)
Outstanding as on March 31/last reporting Fridays of themonth/reporting Fridays
No. 11: Reserve Money - Components and Sources
Item
2019-20 2019 2020Nov. 29 Oct. 30 Nov. 6 Nov. 13 Nov. 20 Nov. 27
1 2 3 4 5 6 7
Reserve Money(1.1 + 1.2 + 1.3 = 2.1 + 2.2 + 2.3 + 2.4 + 2.5 – 2.6) 3029707 2874296 3244482 3259739 3313435 3317074 3313212
1 Components1.1 Currency in Circulation 2447312 2256875 2715266 2733543 2777389 2770493 27707731.2 Bankers' Deposits with RBI 543888 581895 488063 484539 494286 504678 4971951.3 ‘Other’ Deposits with RBI 38507 35526 41154 41658 41761 41904 452442 Sources2.1 Net Reserve Bank Credit to Government 992192 1001249 944911 996346 1022936 1023947 10365012.2 Reserve Bank Credit to Banks -214059 -247355 -467693 -509745 -528027 -529767 -5454842.3 Reserve Bank Credit to Commercial Sector 13166 6877 14795 14934 14736 12173 111752.4 Net Foreign Exchange Assets of RBI 3590402 3222285 4150295 4203267 4258517 4249125 42462612.5 Government's Currency Liabilities to the Public 26348 26178 26541 26541 26541 26541 266182.6 Net Non- Monetary Liabilities of RBI 1378342 1134938 1424366 1471603 1481267 1464944 1461859
(` Crore)
Outstanding as on March 31/ last Fridays of the month/ Fridays
No. 10: Reserve Bank of India Survey

CURRENT STATISTICS
RBI Bulletin January 202184
No. 13: Scheduled Commercial Banks' Investments
(` Crore)
Item As onMarch 27,
2020
2019 2020
Nov. 22 Oct. 23 Nov. 6 Nov. 20
1 2 3 4 51 SLR Securities 3747349 3719568 4440234 4476662 44253252 Commercial Paper 104526 99328 88751 88669 851333 Shares issued by 3.1 PSUs 14106 11286 11363 11225 11380 3.2 Private Corporate Sector 75415 66368 71675 71981 71283 3.3 Others 5734 5515 5430 5095 54164 Bonds/Debentures issued by 4.1 PSUs 125710 123067 126857 123301 122421 4.2 Private Corporate Sector 226559 239223 306444 306410 304812 4.3 Others 191690 199063 146949 146379 1441475 Instruments issued by 5.1 Mutual funds 35610 48279 31082 35432 35074 5.2 Financial institutions 97665 82173 128920 131050 131153
No. 12: Commercial Bank Survey
Item
2019-20 2019 2020Nov. 22 Oct. 23 Nov. 6 Nov. 20
1 2 3 4 51 Components1.1 Aggregate Deposits of Residents 13381983 12778214 14126937 14237881 14204846 1.1.1 Demand Deposits 1617003 1331740 1505254 1495022 1511516 1.1.2 Time Deposits of Residents 11764979 11446474 12621683 12742859 12693330 1.1.2.1 Short-term Time Deposits 5294241 5150913 5679757 5734287 5711999 1.1.2.1.1 Certificates of Deposits (CDs) 169419 158123 180512 74470 661561.1.2.2 Long-term Time Deposits 6470739 6295561 6941925 7008573 69813321.2 Call/Term Funding from Financial Institutions 309439 322170 255339 258274 2640212 Sources2.1 Domestic Credit 14967529 14463919 15708663 15837921 15782139 2.1.1 Credit to the Government 3738696 3715868 4438623 4475235 4423853 2.1.2 Credit to the Commercial Sector 11228833 10748051 11270040 11362686 11358285 2.1.2.1 Bank Credit 10370861 9860303 10338868 10419271 10434880 2.1.2.1.1 Non-food Credit 10319097 9768999 10272209 10335640 10345924 2.1.2.2 Net Credit to Primary Dealers 11997 9021 11896 10318 11115 2.1.2.3 Investments in Other Approved Securities 8653 3700 1610 1428 1472 2.1.2.4 Other Investments (in non-SLR Securities) 837321 875027 917666 931670 9108182.2 Net Foreign Currency Assets of Commercial Banks (2.2.1–2.2.2–2.2.3) 21900 -65874 101655 94836 117124 2.2.1 Foreign Currency Assets 315641 236374 330844 324993 348921 2.2.2 Non-resident Foreign Currency Repatriable Fixed Deposits 185510 180260 164575 165431 165588 2.2.3 Overseas Foreign Currency Borrowings 108231 121989 64614 64726 662082.3 Net Bank Reserves (2.3.1+2.3.2–2.3.3) 899410 816180 951675 1046118 1087871 2.3.1 Balances with the RBI 536186 517462 437010 450857 471488 2.3.2 Cash in Hand 87260 84984 84932 85516 86616 2.3.3 Loans and Advances from the RBI -275964 -213734 -429733 -509745 -5297672.4 Capital Account 1481202 1446137 1586490 1585756 15881752.5 Other items (net) (2.1+2.2+2.3–2.4–1.1–1.2) 716216 667703 793227 896965 930091 2.5.1 Other Demand and Time Liabilities (net of 2.2.3) 495445 385783 499287 541929 570401 2.5.2 Net Inter-Bank Liabilities (other than to PDs) 66273 -45368 68612 62107 62737
(` Crore)
Outstanding as on last reporting Fridays of the month/reporting Fridays of the month
No. 12: Commercial Bank Survey
No. 13: Scheduled Commercial Banks’ Investments

CURRENT STATISTICS
RBI Bulletin January 2021 85
No. 14: Business in India - All Scheduled Banks and All Scheduled Commercial Banks
(` Crore)
All Scheduled Commercial Banks
2019-202019 2020
Nov. Oct. Nov.
5 6 7 8
142 142 133 132
314513 244433 272101 258505
234348 182731 205405 203177
64001 49866 50821 38428
16163 11836 15875 16901
14480607 13953219 15303052 15340848
13567492 13098829 14420000 14478103
1617003 1416506 1571374 1570449
11950489 11682323 12848625 12907654
309439 331841 262285 269599
603676 522549 620767 593146
285623 23012 115757 77097
– – – –
285623 23012 115757 77097
623446 626159 541682 554866
87260 83184 87683 92966
536186 542975 453999 461900
260238 207281 216919 205766
155401 142276 155579 147537
14457 12215 19438 12120
140945 130062 136141 135417
20273 7015 7747 7305
30531 24968 21494 21321
54032 33022 32099 29602
3747349 3716854 4468088 4419911
3738696 3706537 4466431 4418470
8653 10317 1656 1441
10370861 9890071 10387948 10457104
51763 90526 70281 92681
10149509 9686695 10217564 10288180
25658 23902 23826 23324
145683 124288 101193 98610
20458 22762 16877 17091
29554 32424 28488 29899
Item
All Scheduled Banks
2019-202019 2020
Nov. Oct. Nov.
1 2 3 4
Number of Reporting Banks 219 219 209 208
1 Liabilities to the Banking System 320240 249308 277233 263597
1.1 Demand and Time Deposits from Banks 239943 187449 210335 208057
1.2 Borrowings from Banks 64001 49892 50821 38428
1.3 Other Demand and Time Liabilities 16295 11967 16077 17112
2 Liabilities to Others 14905949 14314792 15733984 15770273
2.1 Aggregate Deposits 13975551 13447567 14835260 14891439
2.1.1 Demand 1653242 1448683 1606832 1605873
2.1.2 Time 12322309 11998884 13228427 13285566
2.2 Borrowings 313908 335569 266583 273826
2.3 Other Demand and Time Liabilities 616491 531656 632141 605007
3 Borrowings from Reserve Bank 285623 23012 115757 77097
3.1 Against Usance Bills /Promissory Notes – – – –
3.2 Others 285623 23012 115757 77097
4 Cash in Hand and Balances with Reserve Bank 643038 642086 557017 570196
4.1 Cash in Hand 89671 85089 89874 95116
4.2 Balances with Reserve Bank 553367 556997 467143 475081
5 Assets with the Banking System 323680 262359 276923 264846
5.1 Balances with Other Banks 181460 168690 189036 181133
5.1.1 In Current Account 17204 14405 21643 14218
5.1.2 In Other Accounts 164256 154285 167393 166914
5.2 Money at Call and Short Notice 43335 24263 29193 28166
5.3 Advances to Banks 38266 28990 22005 21766
5.4 Other Assets 60619 40416 36689 33782
6 Investment 3865544 3814598 4597987 4552090
6.1 Government Securities 3850819 3797839 4590080 4544271
6.2 Other Approved Securities 14724 16759 7907 7819
7 Bank Credit 10705336 10176213 10721829 10791739
7a Food Credit 82172 117557 100684 123083
7.1 Loans, Cash-credits and Overdrafts 10480934 9969053 10548573 10620894
7.2 Inland Bills-Purchased 26214 24641 24977 23595
7.3 Inland Bills-Discounted 147209 126309 102181 99515
7.4 Foreign Bills-Purchased 20866 23182 17127 17344
7.5 Foreign Bills-Discounted 30114 33028 28971 30391
As on the Last Reporting Friday (in case of March)/ Last Friday
No. 14: Business in India - All Scheduled Banks and All Scheduled Commercial Banks

CURRENT STATISTICS
RBI Bulletin January 202186
No. 15: Deployment of Gross Bank Credit by Major Sectors
(` Crore)
Item Outstanding as on Growth (%)
Mar. 27,2020
2019 2020 Financialyear so far
Y-o-Y
Nov. 22 Oct. 23 Nov. 20 2020-21 2020
1 2 3 4 5 61 Gross Bank Credit 9263134 8764913 9213059 9286902 0.3 6.0
1.1 Food Credit 51590 91005 66428 88662 71.9 -2.6
1.2 Non-food Credit 9211544 8673908 9146631 9198240 –0.1 6.0
1.2.1 Agriculture & Allied Activities 1157796 1134004 1218717 1230526 6.3 8.5
1.2.2 Industry 2905151 2772248 2739841 2753281 –5.2 -0.7
1.2.2.1 Micro & Small 381825 362758 361563 364515 –4.5 0.5
1.2.2.2 Medium 105598 102601 123150 124028 17.5 20.9
1.2.2.3 Large 2417728 2306889 2255128 2264738 –6.3 -1.8
1.2.3 Services 2594945 2362955 2576581 2569834 –1.0 8.8
1.2.3.1 Transport Operators 144466 139754 148172 154752 7.1 10.7
1.2.3.2 Computer Software 20051 19052 19368 19120 –4.6 0.4
1.2.3.3 Tourism, Hotels & Restaurants 45977 43468 48594 51309 11.6 18.0
1.2.3.4 Shipping 6557 6704 5364 5329 –18.7 -20.5
1.2.3.5 Professional Services 177085 170660 178191 128577 –27.4 -24.7
1.2.3.6 Trade 552392 501677 575886 575549 4.2 14.7
1.2.3.6.1 Wholesale Trade 263397 217569 268058 275279 4.5 26.5
1.2.3.6.2 Retail Trade 288995 284108 307828 300270 3.9 5.7
1.2.3.7 Commercial Real Estate 229770 220685 227992 233150 1.5 5.6
1.2.3.8 Non-Banking Financial Companies (NBFCs) 807383 730907 778739 788222 –2.4 7.8
1.2.3.9 Other Services 611264 530048 594275 613826 0.4 15.8
1.2.4 Personal Loans 2553652 2404701 2611492 2644599 3.6 10.0
1.2.4.1 Consumer Durables 9298 5499 6881 6937 –25.4 26.2
1.2.4.2 Housing 1338964 1274747 1373277 1383427 3.3 8.5
1.2.4.3 Advances against Fixed Deposits 79496 62892 61460 64512 –18.8 2.6
1.2.4.4 Advances to Individuals against share & bond 5334 4982 6296 4655 –12.7 -6.6
1.2.4.5 Credit Card Outstanding 108094 105860 110207 114307 5.7 8.0
1.2.4.6 Education 65745 66902 65432 65180 –0.9 -2.6
1.2.4.7 Vehicle Loans 220609 207996 224022 228758 3.7 10.0
1.2.4.8 Other Personal Loans 726112 675823 763917 776823 7.0 14.9
1.2A Priority Sector 2897461 2694733 2930417 2934836 1.3 8.9
1.2A.1 Agriculture & Allied Activities 1146624 1125474 1203789 1214929 6.0 7.9
1.2A.2 Micro & Small Enterprises 1149394 1057378 1125326 1122053 –2.4 6.1
1.2A.2.1 Manufacturing 381826 362758 361562 364515 –4.5 0.5
1.2A.2.2 Services 767568 694620 763764 757538 –1.3 9.1
1.2A.3 Housing 449945 454000 462216 462488 2.8 1.9
1.2A.4 Micro-Credit 38237 33526 32760 32644 –14.6 -2.6
1.2A.5 Education Loans 51906 53410 51789 51506 –0.8 -3.6
1.2A.6 State-Sponsored Orgs. for SC/ST 388 387 540 588 51.5 51.9
1.2A.7 Weaker Sections 731409 698449 727814 766575 4.8 9.8
1.2A.8 Export Credit 16114 13219 13850 12916 –19.8 -2.3
No. 15: Deployment of Gross Bank Credit by Major Sectors

CURRENT STATISTICS
RBI Bulletin January 2021 87
No. 16: Industry-wise Deployment of Gross Bank Credit(` Crore)
Industry Outstanding as on Growth (%)
Mar. 27,2020
2019 2020 Financialyear so far
Y-o-Y
Nov. 22 Oct. 23 Nov. 20 2020-21 2020
1 2 3 4 5 6
1 Industry 2905151 2772248 2739841 2753281 –5.2 –0.7
1.1 Mining & Quarrying (incl. Coal) 43927 41372 42944 43831 –0.2 5.9
1.2 Food Processing 154146 136930 144158 147775 –4.1 7.9
1.2.1 Sugar 27382 24624 18371 20291 –25.9 –17.6
1.2.2 Edible Oils & Vanaspati 19240 17430 17956 18354 –4.6 5.3
1.2.3 Tea 5375 5832 5851 5809 8.1 –0.4
1.2.4 Others 102149 89044 101980 103321 1.1 16.0
1.3 Beverage & Tobacco 16522 14030 14830 14454 –12.5 3.0
1.4 Textiles 192424 186324 185856 186774 –2.9 0.2
1.4.1 Cotton Textiles 89283 83448 84289 84853 –5.0 1.7
1.4.2 Jute Textiles 2116 2181 2318 2429 14.8 11.4
1.4.3 Man-Made Textiles 26074 25821 26628 27251 4.5 5.5
1.4.4 Other Textiles 74951 74874 72621 72241 –3.6 –3.5
1.5 Leather & Leather Products 11098 10813 11368 11404 2.8 5.5
1.6 Wood & Wood Products 12233 11968 12786 12795 4.6 6.9
1.7 Paper & Paper Products 30965 30230 33159 33986 9.8 12.4
1.8 Petroleum, Coal Products & Nuclear Fuels 75834 52466 61172 60025 –20.8 14.4
1.9 Chemicals & Chemical Products 202949 173231 171479 177799 –12.4 2.6
1.9.1 Fertiliser 49066 34112 36560 37894 –22.8 11.1
1.9.2 Drugs & Pharmaceuticals 53427 48501 48477 48875 –8.5 0.8
1.9.3 Petro Chemicals 42233 37445 35172 39564 –6.3 5.7
1.9.4 Others 58223 53173 51270 51466 –11.6 –3.2
1.10 Rubber, Plastic & their Products 50415 47029 47580 49523 –1.8 5.3
1.11 Glass & Glassware 8777 8686 8748 8785 0.1 1.1
1.12 Cement & Cement Products 58689 59309 57789 57993 –1.2 –2.2
1.13 Basic Metal & Metal Product 350325 347906 337746 334078 –4.6 –4.0
1.13.1 Iron & Steel 262396 265599 247448 245072 –6.6 –7.7
1.13.2 Other Metal & Metal Product 87929 82307 90298 89006 1.2 8.1
1.14 All Engineering 157259 162680 137361 137233 –12.7 –15.6
1.14.1 Electronics 30159 32895 27146 27488 –8.9 –16.4
1.14.2 Others 127100 129785 110215 109745 –13.7 –15.4
1.15 Vehicles, Vehicle Parts & Transport Equipment 82606 81472 88400 86153 4.3 5.7
1.16 Gems & Jewellery 59515 61310 57374 60910 2.3 –0.7
1.17 Construction 104288 100091 104447 101379 –2.8 1.3
1.18 Infrastructure 1053913 1025154 999104 1007085 –4.4 –1.8
1.18.1 Power 559774 562711 552553 551731 –1.4 –2.0
1.18.2 Telecommunications 143760 130961 100969 103550 –28.0 –20.9
1.18.3 Roads 190676 186528 197379 201550 5.7 8.1
1.18.4 Other Infrastructure 159703 144954 148203 150254 –5.9 3.7
1.19 Other Industries 239266 221247 223540 221299 –7.5 0.0
No. 16: Industry-wise Deployment of Gross Bank Credit

CURRENT STATISTICS
RBI Bulletin January 202188
2019 2020
Oct, 25 Aug, 14 Aug, 28 Sep, 11 Sep, 25 Oct, 09 Oct, 23 Oct, 30
2 3 4 5 6 7 8 9
Number of Reporting Banks 32 31 31 31 31 31 31 31
1 Aggregate Deposits (2.1.1.2+2 64187.1 125939.1 126547.5 126582.5 126143.1 126795.8 127166.1 127348.2
2 Demand and Time Liabilities
2.1 Demand Liabilities 18520.0 24074.5 24751.6 24479.0 22274.4 23152.3 20866.1 22714.0
2.1.1 Deposits
2.1.1.1 Inter-Bank 5179.8 3821.7 3773.1 3873.1 4189.6 4308.6 3860.0 4028.2
2.1.1.2 Others 9889.1 13677.4 14264.3 14492.2 13472.0 13419.2 13039.0 13517.3
2.1.2 Borrowings from Banks 20.0 135.0 264.9 209.9 229.9 70.0 0.0 0.0
2.1.3 Other Demand Liabilities 3431.1 6440.4 6449.2 5903.7 4382.9 5354.5 3967.1 5168.5
2.2 Time Liabilities 109889.9 172745.5 171640.9 171314.7 172128.5 172383.8 174055.4 172354.2
2.2.1 Deposits
2.2.1.1 Inter-Bank-Bank 54683.9 58983.7 57209.2 57723.3 56835.6 57391.0 57259.1 56969.6
2.2.1.2 Others 54297.9 112261.6 112283.2 112090.2 112671.1 113376.6 114127.1 113830.9
2.2.2 Borrowings from Banks 0.0 629.9 629.9 629.9 673.0 656.5 749.9 629.9
2.2.3 Other Time Liabilities 908.1 870.2 1518.6 871.2 1948.9 959.6 1919.2 923.8
3 Borrowing from Reserve Bank 0.0 0.0 0.0 0.0 35.0 0.0 0.0 0.0
4 Borrowings from a notified ban 45401.3 57354.0 53795.3 56629.9 57927.2 58455.2 56285.3 55909.0
4.1 Demand 12636.9 14067.2 13174.5 13809.3 14065.7 14318.1 13606.7 13041.1
4.2 Time 32764.4 43286.7 40620.8 42820.6 43861.5 44137.2 42678.5 42867.9
5 Cash in Hand and Balances wi 6024.3 6875.5 6841.4 6879.6 7000.4 6955.6 6734.9 7238.4
5.1 Cash in Hand 302.8 572.4 592.3 575.6 555.1 528.6 572.3 558.9
5.2 Balance with Reserve Bank 5721.5 6303.2 6249.1 6304.0 6445.3 6426.9 6162.6 6679.5
6 Balances with Other Banks in 774.5 809.9 807.4 983.9 988.1 795.4 824.5 935.7
7 Investments in Government Se 32529.2 58199.1 55743.6 56942.0 59312.3 59137.6 59110.5 58774.4
8 Money at Call and Short Notic 18737.1 25269.1 25414.9 27749.8 26346.6 25721.7 24240.2 24871.2
9 Bank Credit (10.1+11) 63418.9 112631.8 113285.8 112267.8 111857.3 111842.7 110711.2 111109.5
10 Advances.
10.1 Loans, Cash-Credits and O 63417.1 112631.2 113285.2 112252.0 111841.4 111826.8 110695.3 111093.5
10.2 Due from Banks 78322.8 79793.4 77827.8 79526.6 79397.4 81562.1 82624.9 82258.8
11 Bills Purchased and Discount 1.8 0.6 0.6 15.7 15.9 15.9 15.9 16.0
Item
2019-20
1
Number of Reporting Banks 32
1 Aggregate Deposits (2.1.1.2+2.2.1.2) 124101.8
2 Demand and Time Liabilities
2.1 Demand Liabilities 26213.8
2.1.1 Deposits
2.1.1.1 Inter-Bank 5295.0
2.1.1.2 Others 14,523.6
2.1.2 Borrowings from Banks 100.0
2.1.3 Other Demand Liabilities 6295.2
2.2 Time Liabilities 167684.5
2.2.1 Deposits
2.2.1.1 Inter-Bank 56564.0
2.2.1.2 Others 109578.2
2.2.2 Borrowings from Banks 630.2
2.2.3 Other Time Liabilities 912.1
3 Borrowing from Reserve Bank 0.0
4 Borrowings from a notified bank / Government 52772.2
4.1 Demand 13764.4
4.2 Time 39007.8
5 Cash in Hand and Balances with Reserve Bank 9428.2
5.1 Cash in Hand 750.5
5.2 Balance with Reserve Bank 8677.8
6 Balances with Other Banks in Current Account 1521.7
7 Investments in Government Securities 50626.9
8 Money at Call and Short Notice 25283.9
9 Bank Credit (10.1+11) 110905.5
10 Advances
10.1 Loans, Cash-Credits and Overdrafts 110901.5
10.2 Due from Banks 81300.1
11 Bills Purchased and Discounted 4.0
Last Reporting Friday (in case of March)/Last Friday/Reporting Friday
(` Crore)
No. 17: State Co-operative Banks Maintaining Accounts with the Reserve Bank of IndiaNo. 17: State Co-operative Banks Maintaining Accounts with the Reserve Bank of India

CURRENT STATISTICS
RBI Bulletin January 2021 89
No. 19: Other Consumer Price Indices
2019 2020Nov. Oct. Nov.
4 5 6
– 119.5 119.9
1000 1052 1060
1006 1057 1065
Item Base Year LinkingFactor
2019-20
1 2 3
1 Consumer Price Index for Industrial Workers 2016 2.88 --
2 Consumer Price Index for Agricultural Labourers 1986-87 5.89 980
3 Consumer Price Index for Rural Labourers 1986-87 – 986
Source: Labour Bureau, Ministry of Labour and Employment, Government of India.
No. 20: Monthly Average Price of Gold and Silver in Mumbai
Source: India Bullion & Jewellers Association Ltd., Mumbai for Gold and Silver prices in Mumbai.
Item 2019-20 2019 2020
Nov. Oct. Nov.
1 2 3 4
1 Standard Gold ( per 10 grams) 37018 38122 50698 504292 Silver ( per kilogram) 42514 44938 61320 62256
`
`
Prices and Production
No. 19: Other Consumer Price Indices
No. 20: Monthly Average Price of Gold and Silver in Mumbai
No. 18: Consumer Price Index (Base: 2012=100)
Rural Urban Combined
Nov.’19 Oct.’20 Nov.’20(P) Nov.’19 Oct.’20 Nov.’20(P) Nov.’19 Oct.’20 Nov.’20(P)
4 5 6 7 8 9 10 11 12
150.9 163.4 164.4 153.6 167.0 166.7 151.9 164.7 165.2
141.8 145.4 144.4 144.1 149.7 148.8 142.5 146.8 145.8
163.7 188.6 188.5 162.4 195.5 194.0 163.2 191.0 190.4
143.8 171.6 173.3 148.4 176.9 177.9 145.6 173.6 175.1
147.1 153.8 153.9 145.9 153.9 154.3 146.7 153.8 154.0
126.0 145.4 150.0 121.5 138.0 140.5 124.3 142.7 146.5
146.2 146.5 145.9 148.8 150.5 149.9 147.4 148.4 147.8
191.4 222.2 225.4 215.7 245.3 241.2 199.6 230.0 230.8
136.2 155.9 159.5 134.6 158.7 161.1 135.7 156.8 160.0
113.8 114.9 114.3 115.0 117.2 117.0 114.2 115.7 115.2
147.3 162.0 163.5 146.3 161.4 161.2 147.0 161.8 162.7
138.7 150.0 153.2 130.5 141.5 143.1 135.3 146.5 149.0
157.7 162.7 163.6 157.2 165.1 165.9 157.5 163.8 164.7
167.2 183.4 183.6 169.9 188.8 189.8 167.9 184.8 185.3
151.5 155.5 156.3 144.2 148.8 149.3 148.6 152.8 153.5
152.3 156.3 157.1 146.3 151.1 151.6 149.9 154.3 154.9
147.0 151.0 151.6 132.6 136.4 136.6 141.0 144.9 145.4
-- -- -- 153.5 158.0 158.4 153.5 158.0 158.4
148.4 147.5 148.8 132.2 137.3 138.7 142.3 143.6 145.0
146.1 154.5 155.2 136.3 146.6 146.8 141.3 150.7 151.1
150.9 152.8 153.3 139.1 145.1 145.4 145.3 149.2 149.6
154.3 160.4 161.6 142.8 152.0 152.6 149.9 157.2 158.2
132.1 146.1 146.3 121.7 135.2 135.5 126.6 140.4 140.6
149.1 153.6 154.1 136.7 144.4 144.4 142.1 148.4 148.6
160.8 161.6 162.7 151.8 156.4 156.7 155.5 158.6 159.2
140.6 156.2 156.6 139.8 157.9 157.8 140.3 156.9 157.1
149.9 159.8 160.7 147.0 156.7 156.9 148.6 158.4 158.9
Group/Sub group 2019-20
Rural Urban Combined
1 2 3
1 Food and beverages 146.3 149.6 147.5
1.1 Cereals and products 140.7 143.2 141.4
1.2 Meat and fish 163.3 161.4 162.6
1.3 Egg 142.1 145.7 143.5
1.4 Milk and products 146.5 146.0 146.3
1.5 Oils and fats 127.1 121.8 125.1
1.6 Fruits 144.0 148.8 146.2
1.7 Vegetables 163.5 187.8 171.7
1.8 Pulses and products 133.7 132.0 133.1
1.9 Sugar and confectionery 112.0 113.4 112.5
1.10 Spices 145.6 145.1 145.5
1.11 Non-alcoholic beverages 138.8 130.2 135.2
1.12 Prepared meals, snacks, sweets 157.6 156.7 157.2
2 Pan, tobacco and intoxicants 166.3 169.0 167.0
3 Clothing and footwear 151.3 143.7 148.3
3.1 Clothing 152.0 145.7 149.5
3.2 Footwear 146.9 132.4 140.9
4 Housing -- 152.2 152.2
5 Fuel and light 148.6 131.5 142.2
6 Miscellaneous 145.6 135.9 140.9
6.1 Household goods and services 150.6 138.7 145.0
6.2 Health 153.6 142.1 149.3
6.3 Transport and communication 132.6 122.2 127.1
6.4 Recreation and amusement 148.3 135.9 141.3
6.5 Education 159.8 150.9 154.5
6.6 Personal care and effects 139.2 138.4 138.9
General Index (All Groups) 147.3 145.1 146.3
Source: National Statistical Office, Ministry of Statistics and Programme Implementation, Government of India.
P: Provisional P: Provisional.
No. 18: Consumer Price Index (Base: 2012=100)

CURRENT STATISTICS
RBI Bulletin January 202190
No. 21: Wholesale Price Index(Base: 2011-12 = 100)
Commodities Weight 2019-20 2019 2020
Nov. Sep. Oct. (P) Nov. (P)
1 2 3 4 5 61 ALL COMMODITIES 100.000 121.8 122.3 122.9 123.8 124.21.1 PRIMARY ARTICLES 22.618 143.3 147.2 148.8 152.4 151.2 1.1.1 FOOD ARTICLES 15.256 155.8 162.6 168.4 170.4 169.0 1.1.1.1 Food Grains (Cereals+Pulses) 3.462 159.6 162.5 158.6 158.1 158.8 1.1.1.2 Fruits & Vegetables 3.475 174.7 199.5 211.1 222.3 213.2 1.1.1.3 Milk 4.440 146.7 146.6 153.8 154.3 154.7 1.1.1.4 Eggs,Meat & Fish 2.402 147.0 148.7 150.7 148.0 149.6 1.1.1.5 Condiments & Spices 0.529 143.9 153.0 149.1 153.0 156.5 1.1.1.6 Other Food Articles 0.948 144.0 142.2 172.1 167.0 166.9 1.1.2 NON-FOOD ARTICLES 4.119 128.7 127.0 124.5 129.7 137.7 1.1.2.1 Fibres 0.839 128.2 123.5 110.6 114.2 119.8 1.1.2.2 Oil Seeds 1.115 151.4 149.6 155.5 158.0 162.0 1.1.2.3 Other non-food Articles 1.960 104.8 104.1 104.6 109.6 113.9 1.1.2.4 Floriculture 0.204 238.0 238.5 203.4 231.7 308.3 1.1.3 MINERALS 0.833 154.5 142.6 145.5 167.6 145.5 1.1.3.1 Metallic Minerals 0.648 147.4 133.0 136.8 162.6 136.8 1.1.3.2 Other Minerals 0.185 179.0 176.4 176.1 185.1 176.1 1.1.4 CRUDE PETROLEUM & NATURAL GAS 2.410 85.3 86.0 67.4 72.0 64.01.2 FUEL & POWER 13.152 102.2 101.3 91.9 91.1 91.3 1.2.1 COAL 2.138 125.3 126.5 126.4 126.4 126.5 1.2.1.1 Coking Coal 0.647 138.1 141.9 141.6 141.6 141.9 1.2.1.2 Non-Coking Coal 1.401 119.0 119.0 119.0 119.0 119.0 1.2.1.3 Lignite 0.090 129.1 131.1 131.1 131.1 131.1 1.2.2 MINERAL OILS 7.950 92.3 91.1 77.5 76.2 76.5 1.2.3 ELECTRICITY 3.064 111.8 110.0 105.3 105.3 105.31.3 MANUFACTURED PRODUCTS 64.231 118.3 117.8 120.1 120.3 121.3 1.3.1 MANUFACTURE OF FOOD PRODUCTS 9.122 133.9 135.4 140.7 140.7 142.1 1.3.1.1 Processing and Preserving of meat 0.134 137.5 137.6 138.3 136.9 136.9 1.3.1.2 ProcessingandPreservingoffish,Crustaceans,Molluscsand
products thereof0.204 136.1 137.9 142.1 136.3 136.0
1.3.1.3 Processing and Preserving of fruit and Vegetables 0.138 114.3 114.9 119.7 118.4 122.4 1.3.1.4 Vegetable and Animal oils and Fats 2.643 119.3 119.4 137.3 140.5 147.1 1.3.1.5 Dairy products 1.165 145.0 147.6 145.8 145.7 144.6 1.3.1.6 Grain mill products 2.010 146.3 148.1 143.8 142.9 142.0 1.3.1.7 Starches and Starch products 0.110 135.5 135.1 105.8 107.5 110.9 1.3.1.8 Bakery products 0.215 133.5 133.9 138.1 137.9 138.6 1.3.1.9 Sugar, Molasses & honey 1.163 118.3 119.5 119.7 118.6 118.6 1.3.1.10 Cocoa, Chocolate and Sugar confectionery 0.175 127.2 126.8 127.5 127.8 129.8 1.3.1.11 Macaroni, Noodles, Couscous and Similar farinaceous products 0.026 132.7 132.6 132.4 131.3 131.6 1.3.1.12 Tea & Coffee products 0.371 139.7 142.8 191.6 183.9 174.8 1.3.1.13 Processed condiments & salt 0.163 132.4 137.1 145.9 145.8 146.6 1.3.1.14 Processed ready to eat food 0.024 128.7 128.3 131.4 130.7 130.4 1.3.1.15 Health supplements 0.225 159.9 163.9 143.2 141.9 140.4 1.3.1.16 Prepared animal feeds 0.356 173.6 178.2 170.6 170.0 171.0 1.3.2 MANUFACTURE OF BEVERAGES 0.909 123.6 123.7 123.9 123.8 124.2 1.3.2.1 Wines & spirits 0.408 117.8 118.4 120.0 120.2 120.2 1.3.2.2 Malt liquors and Malt 0.225 125.7 125.1 126.8 124.8 126.0 1.3.2.3 Soft drinks; Production of mineral waters and Other bottled waters 0.275 130.5 130.5 127.4 128.5 128.5 1.3.3 MANUFACTURE OF TOBACCO PRODUCTS 0.514 153.4 153.0 155.3 155.3 156.1 1.3.3.1 Tobacco products 0.514 153.4 153.0 155.3 155.3 156.1

CURRENT STATISTICS
RBI Bulletin January 2021 91
No. 21: Wholesale Price Index (Contd.)(Base: 2011-12 = 100)
Commodities Weight 2019-20 2019 2020
Nov. Sep. Oct. (P) Nov. (P)
1.3.4 MANUFACTURE OF TEXTILES 4.881 117.7 116.5 113.6 114.7 116.4 1.3.4.1 PreparationandSpinningoftextilefibres 2.582 107.9 105.2 101.2 102.3 105.1 1.3.4.2 Weaving & Finishing of textiles 1.509 130.1 130.2 128.6 129.9 130.3 1.3.4.3 Knitted and Crocheted fabrics 0.193 114.5 114.7 114.2 113.8 114.7 1.3.4.4 Made-up textile articles, Except apparel 0.299 134.5 134.8 131.4 130.8 132.3 1.3.4.5 Cordage, Rope, Twine and Netting 0.098 143.1 146.0 154.6 155.6 157.2 1.3.4.6 Other textiles 0.201 116.8 117.9 113.2 115.5 114.7 1.3.5 MANUFACTURE OF WEARING APPAREL 0.814 138.3 138.6 138.3 138.2 139.6 1.3.5.1 Manufacture of Wearing Apparel (woven), Except fur Apparel 0.593 139.2 139.6 137.7 137.1 138.4 1.3.5.2 Knitted and Crocheted apparel 0.221 135.9 136.1 140.0 141.1 142.7 1.3.6 MANUFACTURE OF LEATHER AND RELATED PRODUCTS 0.535 118.6 119.2 118.7 118.0 118.8 1.3.6.1 Tanning and Dressing of leather; Dressing and Dyeing of fur 0.142 105.5 106.0 102.7 102.8 103.0 1.3.6.2 Luggage, HandbAgs, Saddlery and Harness 0.075 136.3 136.3 138.4 138.6 138.3 1.3.6.3 Footwear 0.318 120.3 121.1 121.3 119.9 121.2 1.3.7 MANUFACTURE OF WOOD AND PRODUCTS OF WOOD AND
CORK0.772 133.7 133.1 133.9 133.5 134.9
1.3.7.1 Saw milling and Planing of wood 0.124 122.2 121.0 119.0 120.3 119.9 1.3.7.2 Veneer sheets; Manufacture of plywood, Laminboard, Particle
board and Other panels and Boards0.493 135.5 135.8 135.2 134.7 136.6
1.3.7.3 Builder's carpentry and Joinery 0.036 176.2 176.3 188.2 189.6 189.5 1.3.7.4 Wooden containers 0.119 125.7 121.6 127.5 125.5 127.5 1.3.8 MANUFACTURE OF PAPER AND PAPER PRODUCTS 1.113 121.1 119.7 119.1 119.2 119.6 1.3.8.1 Pulp, Paper and Paperboard 0.493 125.0 122.6 120.9 120.6 121.5 1.3.8.2 Corrugated paper and Paperboard and Containers of paper and
Paperboard0.314 115.0 114.0 119.8 120.9 122.8
1.3.8.3 Other articles of paper and Paperboard 0.306 121.2 120.8 115.5 115.0 113.2 1.3.9 PRINTING AND REPRODUCTION OF RECORDED MEDIA 0.676 150.6 151.7 154.2 155.2 153.5 1.3.9.1 Printing 0.676 150.6 151.7 154.2 155.2 153.5 1.3.10 MANUFACTURE OF CHEMICALS AND CHEMICAL PRODUCTS 6.465 117.5 116.5 116.1 116.8 117.7 1.3.10.1 Basic chemicals 1.433 119.9 117.0 114.8 115.2 116.6 1.3.10.2 Fertilizers and Nitrogen compounds 1.485 123.1 123.4 123.1 123.1 122.9 1.3.10.3 Plastic and Synthetic rubber in primary form 1.001 112.4 110.8 112.4 115.5 118.5 1.3.10.4 Pesticides and Other agrochemical products 0.454 122.6 122.9 125.4 125.8 125.7 1.3.10.5 Paints, Varnishes and Similar coatings, Printing ink and Mastics 0.491 114.7 114.0 114.6 114.3 112.9 1.3.10.6 Soap and Detergents, Cleaning and Polishing preparations,
Perfumes and Toilet preparations0.612 118.6 117.8 119.6 120.0 120.8
1.3.10.7 Other chemical products 0.692 114.2 114.0 112.9 112.9 114.7 1.3.10.8 Man-madefibres 0.296 97.9 96.6 88.3 89.4 91.6 1.3.11 MANUFACTURE OF PHARMACEUTICALS, MEDICINAL
CHEMICAL AND BOTANICAL PRODUCTS1.993 127.3 127.5 130.0 131.0 131.2
1.3.11.1 Pharmaceuticals, Medicinal chemical and Botanical products 1.993 127.3 127.5 130.0 131.0 131.2 1.3.12 MANUFACTURE OF RUBBER AND PLASTICS PRODUCTS 2.299 108.5 107.7 109.5 109.7 110.8 1.3.12.1 Rubber Tyres and Tubes; Retreading and Rebuilding of Rubber
Tyres0.609 98.9 97.8 97.5 97.9 96.7
1.3.12.2 Other Rubber Products 0.272 93.5 94.1 92.2 90.8 93.2 1.3.12.3 Plastics products 1.418 115.4 114.5 117.9 118.3 120.2 1.3.13 MANUFACTURE OF OTHER NON-METALLIC MINERAL
PRODUCTS3.202 116.7 115.7 116.8 116.5 117.1
1.3.13.1 Glass and Glass products 0.295 124.5 121.2 128.3 127.6 126.4 1.3.13.2 Refractory products 0.223 108.7 108.5 108.5 109.0 110.3 1.3.13.3 Clay Building Materials 0.121 102.8 103.3 112.7 107.5 113.3 1.3.13.4 Other Porcelain and Ceramic Products 0.222 113.9 112.5 107.9 108.0 108.0 1.3.13.5 Cement, Lime and Plaster 1.645 119.5 118.5 119.6 119.1 119.5

CURRENT STATISTICS
RBI Bulletin January 202192
Commodities Weight 2019-20 2019 2020
Nov. Sep. Oct. (P) Nov. (P)
1.3.13.6 Articles of Concrete, Cement and Plaster 0.292 121.6 122.1 123.9 125.0 125.6 1.3.13.7 Cutting, Shaping and Finishing of Stone 0.234 120.2 119.1 120.8 121.3 121.5 1.3.13.8 Other Non-Metallic Mineral Products 0.169 86.6 84.9 77.6 77.6 81.3 1.3.14 MANUFACTURE OF BASIC METALS 9.646 106.2 103.4 108.2 108.9 110.8 1.3.14.1 Inputs into steel making 1.411 100.6 96.0 104.9 105.3 107.9 1.3.14.2 Metallic Iron 0.653 107.7 101.8 110.8 111.4 113.2 1.3.14.3 Mild Steel - Semi Finished Steel 1.274 95.1 93.2 97.3 97.3 99.4 1.3.14.4 Mild Steel -Long Products 1.081 105.5 101.9 106.3 108.0 109.6 1.3.14.5 Mild Steel - Flat products 1.144 108.7 102.2 111.6 115.4 117.5 1.3.14.6 Alloy steel other than Stainless Steel- Shapes 0.067 102.8 99.5 102.7 102.6 104.9 1.3.14.7 Stainless Steel - Semi Finished 0.924 102.9 99.4 105.9 105.7 106.0 1.3.14.8 Pipes & tubes 0.205 126.2 123.7 123.2 123.3 128.9 1.3.14.9 Non-ferrous metals incl. precious metals 1.693 107.0 106.7 110.9 111.0 113.5 1.3.14.10 Castings 0.925 112.8 112.6 108.6 108.5 108.9 1.3.14.11 Forgings of steel 0.271 146.5 151.4 143.0 143.6 145.4 1.3.15 MANUFACTURE OF FABRICATED METAL PRODUCTS, EXCEPT
MACHINERY AND EQUIPMENT3.155 115.5 115.7 113.3 114.4 115.8
1.3.15.1 Structural Metal Products 1.031 113.9 113.5 110.1 111.9 113.1 1.3.15.2 Tanks, Reservoirs and Containers of Metal 0.660 124.4 125.6 123.0 125.4 126.9 1.3.15.3 Steam generators, Except Central Heating Hot Water Boilers 0.145 104.7 106.3 98.6 98.6 98.7 1.3.15.4 Forging, Pressing, Stamping and Roll-Forming of Metal; Powder
Metallurgy0.383 100.5 101.4 96.1 96.3 99.4
1.3.15.5 Cutlery, Hand Tools and General Hardware 0.208 100.5 100.3 102.5 102.6 102.9 1.3.15.6 Other Fabricated Metal Products 0.728 124.0 123.5 123.9 123.9 125.4 1.3.16 MANUFACTURE OF COMPUTER, ELECTRONIC AND OPTICAL
PRODUCTS2.009 110.4 109.7 109.2 108.9 108.2
1.3.16.1 Electronic Components 0.402 98.1 97.8 97.9 98.8 99.2 1.3.16.2 Computers and Peripheral Equipment 0.336 135.0 135.0 135.2 135.2 134.0 1.3.16.3 Communication Equipment 0.310 117.0 118.8 114.3 113.8 114.4 1.3.16.4 Consumer Electronics 0.641 98.8 95.3 97.9 96.5 94.7 1.3.16.5 Measuring, Testing, Navigating and Control equipment 0.181 111.5 113.5 106.1 106.1 106.1 1.3.16.6 Watches and Clocks 0.076 139.1 139.7 142.9 142.6 141.7 1.3.16.7 Irradiation, Electromedical and Electrotherapeutic equipment 0.055 103.6 103.1 101.6 101.6 102.5 1.3.16.8 Optical instruments and Photographic equipment 0.008 110.2 109.4 102.0 102.0 95.7 1.3.17 MANUFACTURE OF ELECTRICAL EQUIPMENT 2.930 111.3 112.1 112.6 112.5 113.4 1.3.17.1 Electric motors, Generators, Transformers and Electricity
distribution and Control apparatus1.298 109.0 111.2 112.2 111.7 112.8
1.3.17.2 Batteries and Accumulators 0.236 117.0 117.9 117.9 119.0 118.9 1.3.17.3 Fibre optic cables for data transmission or live transmission of
images0.133 109.9 104.1 93.3 94.0 98.0
1.3.17.4 Other electronic and Electric wires and Cables 0.428 109.7 109.5 114.7 114.0 115.6 1.3.17.5 Wiring devices, Electric lighting & display equipment 0.263 111.1 111.7 110.1 110.7 110.8 1.3.17.6 Domestic appliances 0.366 119.9 120.3 119.4 119.0 118.9 1.3.17.7 Other electrical equipment 0.206 108.6 107.3 108.5 109.0 110.3 1.3.18 MANUFACTURE OF MACHINERY AND EQUIPMENT 4.789 113.1 112.8 113.7 113.9 113.7 1.3.18.1 Engines and Turbines, Except aircraft, Vehicle and Two wheeler
engines0.638 104.8 104.2 105.6 105.9 105.5
1.3.18.2 Fluid power equipment 0.162 119.9 120.0 119.9 119.9 120.3 1.3.18.3 Other pumps, Compressors, Taps and Valves 0.552 111.2 111.0 111.0 111.1 111.2 1.3.18.4 Bearings, Gears, Gearing and Driving elements 0.340 110.1 107.4 110.4 111.2 110.5 1.3.18.5 Ovens, Furnaces and Furnace burners 0.008 80.0 80.4 81.9 82.0 81.7 1.3.18.6 Lifting and Handling equipment 0.285 111.5 111.9 113.8 113.6 112.4
No. 21: Wholesale Price Index (Contd.)(Base: 2011-12 = 100)

CURRENT STATISTICS
RBI Bulletin January 2021 93
No. 21: Wholesale Price Index (Concld.)(Base: 2011-12 = 100)
Commodities Weight 2019-20 2019 2020
Nov. Sep. Oct. (P) Nov. (P)
1.3.18.7 OfficemachineryandEquipment 0.006 130.2 130.2 130.2 130.2 130.2 1.3.18.8 Other general-purpose machinery 0.437 130.9 130.4 128.4 129.7 128.2 1.3.18.9 Agricultural and Forestry machinery 0.833 120.6 120.9 121.7 121.2 121.6 1.3.18.10 Metal-forming machinery and Machine tools 0.224 108.1 107.9 108.7 107.9 108.1 1.3.18.11 Machinery for mining, Quarrying and Construction 0.371 75.1 75.4 75.3 75.0 75.3 1.3.18.12 Machinery for food, Beverage and Tobacco processing 0.228 125.2 123.6 127.7 128.6 128.4 1.3.18.13 Machinery for textile, Apparel and Leather production 0.192 119.7 119.9 122.4 122.4 123.3 1.3.18.14 Other special-purpose machinery 0.468 126.3 126.7 128.3 128.8 128.3 1.3.18.15 Renewable electricity generating equipment 0.046 66.0 65.6 64.4 64.3 64.4 1.3.19 MANUFACTURE OF MOTOR VEHICLES, TRAILERS AND SEMI-
TRAILERS4.969 114.5 115.0 118.3 117.3 117.8
1.3.19.1 Motor vehicles 2.600 115.2 115.2 120.4 119.2 119.9 1.3.19.2 Parts and Accessories for motor vehicles 2.368 113.7 114.8 116.0 115.3 115.5 1.3.20 MANUFACTURE OF OTHER TRANSPORT EQUIPMENT 1.648 118.0 118.4 126.2 126.7 127.5 1.3.20.1 Building of ships and Floating structures 0.117 158.8 158.8 158.8 158.8 158.8 1.3.20.2 Railway locomotives and Rolling stock 0.110 106.4 106.6 104.7 104.7 104.7 1.3.20.3 Motor cycles 1.302 114.3 114.7 124.9 125.6 126.5 1.3.20.4 Bicycles and Invalid carriages 0.117 128.9 130.5 128.2 128.2 128.7 1.3.20.5 Other transport equipment 0.002 126.1 126.9 127.5 127.7 127.7 1.3.21 MANUFACTURE OF FURNITURE 0.727 130.9 129.2 130.5 132.9 132.9 1.3.21.1 Furniture 0.727 130.9 129.2 130.5 132.9 132.9 1.3.22 OTHER MANUFACTURING 1.064 112.7 113.5 136.9 134.8 136.1 1.3.22.1 Jewellery and Related articles 0.996 109.9 110.6 135.4 133.2 134.5 1.3.22.2 Musical instruments 0.001 174.0 175.9 163.0 166.4 170.2 1.3.22.3 Sports goods 0.012 129.7 130.9 131.1 131.0 130.8 1.3.22.4 Games and Toys 0.005 136.9 137.0 142.6 142.9 142.8 1.3.22.5 Medical and Dental instruments and Supplies 0.049 162.1 162.5 166.9 168.1 168.12 FOOD INDEX 24.378 147.6 152.4 158.0 159.3 158.9
Source: OfficeoftheEconomicAdviser,MinistryofCommerceandIndustry,GovernmentofIndia.

CURRENT STATISTICS
RBI Bulletin January 202194
Gen Ge
Sect ElMa
Mi
Use-PriCa
Int
Inf
Co
Co
No. 22: Index of Industrial Production (Base:2011-12=100)
Industry Weight2018-19 2019-20
1 2 3General IndexGeneral Index 100.00 130.1 129.0
1 Sectoral Classification 1.1 Mining 14.37 107.9 109.6 1.2 Manufacturing 77.63 131.5 129.6 1.3 Electricity 7.99 156.9 158.4
2 Use-Based Classification 2.1 Primary Goods 34.05 126.1 127.0 2.2 Capital Goods 8.22 108.4 93.3 2.3 Intermediate Goods 17.22 126.2 137.7 2.4 Infrastructure/ Construction Goods 12.34 141.7 136.6 2.5 Consumer Durables 12.84 130.4 119.0 2.6 Consumer Non-Durables 15.33 145.5 145.3
Source : National Statistical Office, Ministry of Statistics and Programme Implementation, Government of India.
October
2019 20206 7
124.0 128.5
99.5 98.0126.3 130.7145.8 162.2
121.7 117.788.5 91.4
136.4 137.5129.9 140.0113.3 133.2138.6 149.0
April-October
2019-20 2020-214 5
128.0 105.6
100.4 87.0129.3 103.8164.9 155.7
124.4 108.694.6 62.0
135.1 108.6135.6 107.4124.1 84.7143.1 134.6
Government Accounts and Treasury BillsNo. 23: Union Government Accounts at a Glance
(` Crore)
Source: Controller General of Accounts, Ministry of Finance, Government of India and Union Budget 2020-21.
April - November
2020-21(Actuals)
2019-20(Actuals)
Percentage to BudgetEstimates
2020-21 2019-20
2 3 4 5
812710 983214 40.2 50.1688430 750614 42.1 45.5124280 232600 32.3 74.318141 29009 8.1 24.211962 10910 79.9 73.66179 18099 2.9 17.2
830851 1012223 37.0 48.61665200 1606215 63.3 65.6383425 341812 54.1 51.8241158 213842 58.5 63.2
1906358 1820057 62.7 65.3852490 623001 139.9 128.4
1075507 807834 135.1 114.8692082 466022 785.3 1076.5
Item
FinancialYear
2020-21(Budget
Estimates)
1
1 Revenue Receipts 2020926 1.1 Tax Revenue (Net) 1635909 1.2 Non-Tax Revenue 3850172 Non-Debt Capital Receipt 224967 2.1 Recovery of Loans 14967 2.2 Other Receipts 2100003 Total Receipts (excluding borrowings) (1+2) 22458934 Revenue Expenditure 2630145 4.1 Interest Payments 7082035 Capital Expenditure 4120856 Total Expenditure (4+5) 30422307 Revenue Deficit (4-1) 6092198 Fiscal Deficit (6-3) 7963379 Gross Primary Deficit (8-4.1) 88134
No. 22: Index of Industrial Production (Base:2011-12=100)
No. 23: Union Government Accounts at a Glance

CURRENT STATISTICS
RBI Bulletin January 2021 95
(` Crore)
2019 2020Nov. 29 Oct. 23 Oct. 30 Nov. 6 Nov. 13 Nov. 20 Nov. 27
2 3 4 5 6 7 8
15658 2885 2540 2262 2360 2357 200114558 12884 15647 11331 10912 11215 1258462729 68665 70665 69680 72680 70680 7168093697 134685 128809 131556 128879 125634 121644
72356 152639 152250 153121 149567 140282 12653627263 57664 61725 55035 49692 39002 388086078 4033 4033 4103 4103 4233 4233
26531 118301 101876 94930 90606 93761 94013
61801 136500 135642 132932 132610 138677 14090461512 124833 129471 129001 127705 120149 12083117890 15842 15842 15757 15757 15627 1636753155 122816 119782 123958 126313 132045 131253
129972 117945 116438 96693 79718 119046 159713243 392 392 63 714 198 233
513228 951749 938281 923666 911184 893661 880853
No. 24: Treasury Bills – Ownership Pattern
Item 2019-20
11 91-day
1.1 Banks 101651.2 Primary Dealers 91901.3 State Governments 81731.4 Others 48004
2 182-day2.1 Banks 664192.2 Primary Dealers 433022.3 State Governments 133862.4 Others 22465
3 364-day3.1 Banks 496603.2 Primary Dealers 706723.3 State Governments 119453.4 Others 70576
4 14-day Intermediate4.1 Banks4.2 Primary Dealers4.3 State Governments 1551124.4 Others 617
Total Treasury Bills (Excluding 14 day Intermediate T Bills) #
423957
# 14D intermediate T-Bills are non-marketable unlike 91D, 182D and 364D T-Bills. These bills are ‘intermediate’ by nature as these are liquidated to replenish shortfall in the daily minimum cash balances of State Governments
No. 25: Auctions of Treasury Bills
(Amount in ` Crore)
Date ofAuction
NotifiedAmount
Bids Received Bids Accepted TotalIssue(6+7)
Cut-offPrice
Implicit Yieldat Cut-offPrice (per
cent)
Number Total Face Value Number Total Face Value
Competitive Non-Competitive
Competitive Non-Competitive
1 2 3 4 5 6 7 8 9 1091-day Treasury Bills
2020-21 Oct. 28 9000 88 38386 8053 39 8997 8053 17050 99.21 3.1972Nov. 4 9000 99 49324 7052 26 8998 7052 16050 99.22 3.1735Nov. 11 9000 88 57933 5062 13 8989 5062 14050 99.22 3.1442Nov. 18 9000 80 43532 5059 7 8992 5059 14050 99.26 2.9789Nov. 25 9000 70 41371 5052 16 8998 5052 14050 99.28 2.9292
182-day Treasury Bills2020-21 Oct. 28 3000 59 17305 0 26 3000 0 3000 98.35 3.3594Nov. 4 3000 64 19311 1 13 2999 1 3000 98.35 3.3598Nov. 11 3000 61 19019 1 13 2999 1 3000 98.36 3.3497Nov. 18 3000 77 17144 3 25 2997 3 3000 98.36 3.3356Nov. 25 3000 103 27304 8 7 2992 8 3000 98.40 3.2599
364-day Treasury Bills2020-21 Oct. 28 4000 69 13985 0 33 4000 0 4000 96.67 3.4542Nov. 4 4000 53 13466 0 3 4000 0 4000 96.69 3.4331Nov. 11 4000 70 17260 1 10 3999 1 4000 96.67 3.4491Nov. 18 4000 62 17261 0 8 4000 0 4000 96.70 3.4168Nov. 25 4000 70 18108 741 14 3999 741 4740 96.73 3.3949
No. 24: Treasury Bills – Ownership Pattern
No. 25: Auctions of Treasury Bills

CURRENT STATISTICS
RBI Bulletin January 202196
No. 26: Daily Call Money Rates
As on Range of Rates Weighted Average Rates
1 Borrowings/ Lendings Borrowings/ Lendings
1 2
November 2, 2020 1.80-3.45 3.17
November 3, 2020 1.80-3.50 3.18
November 4, 2020 1.80-3.45 3.15
November 5, 2020 1.80-3.45 3.15
November 6, 2020 1.75-3.50 3.17
November 7, 2020 2.45-3.90 3.61
November 9, 2020 1.80-3.50 3.20
November 10, 2020 1.80-3.50 3.13
November 11, 2020 1.80-3.50 3.18
November 12, 2020 1.80-3.45 3.18
November 13, 2020 1.80-3.50 3.21
November 17, 2020 1.80-3.45 3.13
November 18, 2020 1.80-3.40 3.12
November 19, 2020 1.80-3.50 3.13
November 20, 2020 2.10-3.50 3.14
November 21, 2020 2.50-3.50 2.78
November 23, 2020 1.90-3.40 3.11
November 24, 2020 1.90-3.40 3.07
November 25, 2020 1.90-3.40 3.11
November 26, 2020 1.90-3.40 3.13
November 27, 2020 1.90-3.50 3.13
December 1, 2020 1.90-3.40 3.08
December 2, 2020 1.90-3.40 3.10
December 3, 2020 1.90-3.40 3.09
December 4, 2020 1.50-3.40 3.02
December 5, 2020 2.50-3.45 2.92
December 7, 2020 1.90-3.40 3.03
December 8, 2020 1.90-3.50 3.09
December 9, 2020 1.90-3.50 3.15
December 10, 2020 1.90-3.50 3.17
December 11, 2020 1.90-3.50 3.13
December 14, 2020 1.90-3.50 3.15
December 15, 2020 1.90-3.50 3.21
(Per cent per annum)
Note: Includes Notice Money.
Financial MarketsNo. 26: Daily Call Money Rates

CURRENT STATISTICS
RBI Bulletin January 2021 97
(` Crore)
2019 2020
Nov. 29 Oct. 23 Oct. 30 Nov. 6 Nov. 13 Nov. 20 Nov. 27
2 3 4 5 6 7 8
18304 13824 10675 9975 14308 10765 12157
3595 804 4481 3082 306 4103 632
757 816 545 560 301 755 687
379116 336437 397522 349122 385681 515057 411117
259645 313102 350328 321779 326228 380750 273258
2953 3099 5545 172 3320 8110 1208
70279 46714 56477 49601 53816 57482 57492
70233 59684 91127 59096 51551 54335 70609
4846 4546 4932 4759 4399 5400 4965
2223 5238 5243 4164 1381 758 1555
1505 2112 4644 5720 5118 8518 7120
1901 2841 2662 1839 2540 11587 4704
6
80714 74420 108608 75578 64989 80598 88953
240 3265 429 6988 4614 5196 4325
No. 29: Average Daily Turnover in Select Financial Markets
Item 2019-20
1
1 Call Money 26815
2 Notice Money 3660
3 Term Money 790
4 CBLO/TRIPARTY REPO 300691
5 Market Repo 221719
6 Repo in Corporate Bond 2468
7 Forex (US $ million) 67793
8 Govt. of India Dated Securities 93960
9 State Govt. Securities 5800
10 Treasury Bills
10.1 91-Day 3720
10.2 182-Day 2380
10.3 364-Day 2900
10.4 Cash Management Bills 2310
11 Total Govt. Securities (8+9+10) 111070
11.1 RBI –
Note : Collateralised Borrowing and Lending Obligation (CBLO) segment of the money market has been discontinued and replaced with Triparty Repo with effect from November 05, 2018.
No. 27: Certificates of Deposit
Item 2019 2020
Nov. 22 Oct. 9 Oct. 23 Nov. 6 Nov. 20
1 2 3 4 5
1 Amount Outstanding ( Crore) 162443.00 74825.00 78340.00 76335.00 67680.00
1.1 Issued during the fortnight ( Crore) 15649.53 876.88 4634.88 1686.58 791.91
2 Rate of Interest (per cent) 5.04-7.24 3.53-5.75 3.65-4.25 3.83-3.84 3.35-4.54
`
`
No. 28: Commercial Paper
Item 2019 2020
Nov. 30 Oct. 15 Oct. 31 Nov. 15 Nov. 30
1 2 3 4 5
1 Amount Outstanding ( Crore) 458415.60 395015.55 380112.20 389427.10 373146.10
1.1 Reported during the fortnight ( Crore) 80022.90 81950.20 40838.65 57001.85 64386.20
2 Rate of Interest (per cent) 5.01-13.30 3.25-11.94 3.19-14.19 3.09-11.32 2.79-8.80
`
`
No. 27: Certificates of Deposit
No. 28: Commercial Paper
No. 29: Average Daily Turnover in Select Financial Markets

CURRENT STATISTICS
RBI Bulletin January 202198
Nov. 2019 Nov. 2020
No. ofIssues
Amount No. ofIssues
Amount
7 8 9 10
1 4 440 4 7070
1 4 411 4 6905
1 4 440 3 6999
1 4 411 3 6837
1 – – 1 71
1 – – 1 68
2 – – – –
2 – – – –
2 – – – –
3 1 461 1 143
3 – – – –
3 – – – –
3 – – – –
3 1 461 1 143
3 1 461 1 143
3 – – – –
5 5 901 5 7213
5 5 901 4 7141
5 – – 1 71
2019-20 (Apr.-Nov.) 2020-21 (Apr.-Nov.)
No. ofIssues
Amount No. ofIssues
Amount
3 4 5 6
1 52 59771 43 87789
1 51 38378 43 84220
1 41 8516 28 27174
1 40 8340 28 24377
1 11 51255 15 60615
1 11 30038 15 59843
2 – – – –
2 – – – –
2 – – – –
3 24 9227 10 3871
3 – – – –
3 – – – –
3 – – – –
3 24 9227 10 3871
3 24 9227 10 3871
3 – – – –
5 76 68998 53 91660
5 65 17743 38 31045
5 11 51255 15 60615
No. 30: New Capital Issues By Non-Government Public Limited Companies
Security & Type of Issue 2019-20
No. ofIssues
Amount
1 2
1 Equity Shares 72 64926
1A Premium 70 43259
1.1 Public 57 9867
1.1.1 Premium 55 9434
1.2 Rights 15 55059
1.2.1 Premium 15 33825
2 Preference Shares – –
2.1 Public – –
2.2 Rights – –
3 Bonds & Debentures 34 14984
3.1 Convertible – –
3.1.1 Public – –
3.1.2 Rights – –
3.2 Non-Convertible 34 14984
3.2.1 Public 34 14984
3.2.2 Rights – –
4 Total(1+2+3) 106 79910
4.1 Public 91 24851
4.2 Rights 15 55059
(Amount in ` Crore)
Note : Since April 2020, monthly data on equity issues is compiled on the basis of their listing date.
Source : Securities and Exchange Board of India.
* *
* : Data is Provisional
No. 30: New Capital Issues By Non-Government Public Limited Companies

CURRENT STATISTICS
RBI Bulletin January 2021 99
No. 31: Foreign Trade
Item Unit 2019-20 2019 2020Nov. Jul. Aug. Sep. Oct. Nov.
1 2 3 4 5 6 7
1 Exports` Crore 2219854 184142 177954 170329 202583 183535 174559
US $ Million 313361 25772 23729 22810 27569 24887 23519
1.1 Oil` Crore 292340 27279 13146 14292 26511 12117 11412
US $ Million 41289 3818 1753 1914 3608 1648 1538
1.2 Non-oil` Crore 1927514 156863 164808 156037 176072 171417 163148
US $ Million 272072 21954 21976 20896 23961 23239 21982
2 Imports` Crore 3360954 275255 217931 231601 224168 247051 247840
US $ Million 474709 38523 28478 29474 30307 33605 33393
2.1 Oil` Crore 925168 79091 49069 48104 42808 44081 46530
US $ Million 130550 11069 6533 6441 5826 5981 6269
2.2 Non-oil` Crore 2435787 196165 168862 183497 181361 202970 201310
US $ Million 344159 27454 21945 23033 24481 27624 27124
3 Trade Balance` Crore -1141100 -91113 -39977 -61272 -21585 -63517 -73280
US $ Million -161348 -12752 -4748 -6664 -2738 -8718 -9873
3.1 Oil` Crore -632828 -51812 -35923 -33812 -16297 -31964 -35118
US $ Million -89262 -7251 -4780 -4526 -2218 -4332 -4732
3.2 Non-oil` Crore -508273 -39301 -4055 -27460 -5288 -31553 -38163
US $ Million -72087 -5500 31 -2137 -520 -4385 -5142Source: DGCI&S and Ministry of Commerce & Industry.
No. 33: NRI Deposits
(US$ Million)
Flows
2019-20 2020-21
Apr.-Nov. Apr.-Nov.
5 6
6190 7010
1156 -2320
3651 8272
1384 1058
2019 2020
Nov. Oct. Nov.
2 3 4
132699 137965 139261
24326 21958 21924
92325 98992 100070
16049 17015 17267
Scheme
2019-20
1
1 NRI Deposits 130581
1.1 FCNR(B) 24244
1.2 NR(E)RA 90367
1.3 NRO 15969
Outstanding
External SectorNo. 31: Foreign Trade
1.4 Reserve Tranche Position in IMF ` Crore 26349 34707 34532 34845 34657 35800 37862
US $ Million 3700 4680 4679 4725 4709 4870 5145
1.3 SDRs SDRs Million 1046 1049 1049 1049 1049 1049 1049
` Crore 10281 11067 11069 11117 11070 11142 11108
US $ Million 1441 1492 1494 1506 1503 1515 1510
No. 32: Foreign Exchange Reserves
Item Unit 2019 2020
Dec. 27 Nov. 20 Nov. 27 Dec. 4 Dec. 11 Dec. 18 Dec. 25
1 2 3 4 5 6 7
1 Total Reserves ` Crore 3264729 4266200 4257257 4275361 4261092 4274948 4272332
US $ Million 457468 575290 574821 579346 578568 581131 580841
1.1 Foreign Currency Assets ` Crore 3032614 3953351 3951006 3965740 3950143 3955679 3953337
US $ Million 424936 533103 533455 537386 536344 537727 537474
1.2 Gold ` Crore 195484 267075 260651 263659 265223 272327 270026
US $ Million 27392 36015 35192 35728 36012 37020 36711
Volume (MetricTonnes) 634.96 670.12 672.92 673.85 674.78 676.65 676.65
* Difference,if any, is due to rounding off.
No. 32: Foreign Exchange Reserves
No. 33: NRI Deposits* Difference,if any, is due to rounding off.

CURRENT STATISTICS
RBI Bulletin January 2021100
No. 34: Foreign Investment Inflows(US$ Million)
2019 2020
Nov. Oct. Nov.
4 5 6
1.1 Net Foreign Direct Investment (1.1.1–1.1.2) 2770 4562 5746
1.1.1 Direct Investment to India (1.1.1.1–1. 1.1.2) 3657 5075 6888
1.1.1.1 Gross Inflows/Gross Investments 5609 6838 10153
1.1.1.1.1 Equity 2924 5451 8635
1.1.1.1.1.1 Government (SIA/FI 58 45 48
1.1.1.1.1.2 RBI 2210 4357 7355
1.1.1.1.1.3 Acquisition of shares 536 929 1112 1.1.1.1.1.4 Equity capital of unincorporated bodie 120 120 120
1.1.1.1.2 Reinvested earnings 1197 1197 1197
1.1.1.1.3 Other capital 1489 191 321
1.1.1.2 Repatriation/Disinvestment 1952 1763 3265
1.1.1.2.1 Equity 1916 1754 3263
1.1.1.2.2 Other capital 36 9 2 1.1.2 Foreign Direct Investment by India (1.1.2.1+1.1.2.2+1.1.2.3–1.1.2.4) 887 513 1142
1.1.2.1 Equity capital 492 578 614
1.1.2.2 Reinvested Earnings 263 263 263
1.1.2.3 Other Capital 342 493 387
1.1.2.4 Repatriation/Disinvestment 209 821 122
1.2 Net Portfolio Investment (1.2.1+1.2.2+1.2.3–1.2.4) 5860 2943 9427
1.2.1 GDRs/ADRs – – –
1.2.2 FIIs 5962 2998 9763
1.2.3 Offshore funds and others – – –
1.2.4 Portfolio investment by India 101 55 336
1 Foreign Investment Inflows 8631 7505 15173
2019-20 2020-21
Apr.-Nov. Apr.-Nov.
2 3
1.1 Net Foreign Direct Investment (1.1.1–1.1.2) 26724 34090
1.1.1 Direct Investment to India (1.1.1.1–1. 1.1.2) 35309 41156
1.1.1.1 Gross Inflows/Gross Investments 47671 58368
1.1.1.1.1 Equity 33032 45153
1.1.1.1.1.1 Government (SIA/FI 2982 265
1.1.1.1.1.2 RBI 24814 38599
1.1.1.1.1.3 Acquisition of shares 4314 4985 1.1.1.1.1.4 Equity capital of unincorporated bodie 922 1303
1.1.1.1.2 Reinvested earnings 9206 10206
1.1.1.1.3 Other capital 5433 3009
1.1.1.2 Repatriation/Disinvestment 12363 17212
1.1.1.2.1 Equity 12234 17187
1.1.1.2.2 Other capital 128 26 1.1.2 Foreign Direct Investment by India (1.1.2.1+1.1.2.2+1.1.2.3–1.1.2.4) 8585 7065
1.1.2.1 Equity capital 4865 3799
1.1.2.2 Reinvested Earnings 2101 2141
1.1.2.3 Other Capital 3198 3186
1.1.2.4 Repatriation/Disinvestment 1578 2061
1.2 Net Portfolio Investment (1.2.1+1.2.2+1.2.3–1.2.4) 15760 20010
1.2.1 GDRs/ADRs – –
1.2.2 FIIs 15805 21594
1.2.3 Offshore funds and others – –
1.2.4 Portfolio investment by India 45 1584
1 Foreign Investment Inflows 42483 54100
Item 2019-20
1
1.1 Net Foreign Direct Investment (1.1.1–1.1.2) 43013
1.1.1 Direct Investment to India (1.1.1.1–1. 1.1.2) 56006
1.1.1.1 Gross Inflows/Gross Investments 74390
1.1.1.1.1 Equity 51734
1.1.1.1.1.1 Government (SIA/FIPB) 3265
1.1.1.1.1.2 RBI 39364
1.1.1.1.1.3 Acquisition of shares 7348 1.1.1.1.1.4 Equity capital of unincorporated bodies 1757
1.1.1.1.2 Reinvested earnings 14175
1.1.1.1.3 Other capital 8482
1.1.1.2 Repatriation/Disinvestment 18384
1.1.1.2.1 Equity 18212
1.1.1.2.2 Other capital 173 1.1.2 Foreign Direct Investment by India (1.1.2.1+1.1.2.2+1.1.2.3–1.1.2.4) 12993
1.1.2.1 Equity capital 7572
1.1.2.2 Reinvested Earnings 3151
1.1.2.3 Other Capital 5674
1.1.2.4 Repatriation/Disinvestment 3403
1.2 Net Portfolio Investment (1.2.1+1.2.2+1.2.3–1.2.4) 1403
1.2.1 GDRs/ADRs –
1.2.2 FIIs 552
1.2.3 Offshore funds and others –
1.2.4 Portfolio investment by India -851
1 Foreign Investment Inflows 44417
No. 35: Outward Remittances under the Liberalised Remittance Scheme (LRS) for Resident Individuals
(US$ Million)2019 2020Nov. Sep. Oct. Nov.
2 3 4 51482.00 1648.17 938.37 942.44
39.42 123.46 23.34 23.327.14 8.26 3.85 3.53
73.99 73.61 22.80 25.39153.02 225.36 108.89 110.55
0.48 0.61 1.29 0.65522.28 358.12 272.98 253.26262.96 416.70 162.64 160.81
3.04 2.51 3.66 2.92400.98 427.87 333.45 355.7718.69 11.68 5.47 6.24
Item 2019-20
11 Outward Remittances under the LRS 18760.69 1.1 Deposit 623.37 1.2 Purchase of immovable property 86.43 1.3 Investment in equity/debt 431.41 1.4 Gift 1907.71 1.5 Donations 22.33 1.6 Travel 6955.98 1.7 Maintenance of close relatives 3439.74 1.8 Medical Treatment 33.90 1.9 Studies Abroad 4991.07 1.10 Others 268.75
No. 34: Foreign Investment Inflows
No. 35: Outward Remittances under the Liberalised Remittance Scheme (LRS) for Resident Individuals

CURRENT STATISTICS
RBI Bulletin January 2021 101
No. 36: Indices of Real Effective Exchange Rate (REER) and Nominal Effective Exchange Rate (NEER) of the Indian Rupee
63.35 58.53 58.33
128.72 125.27 125.17
93.28 86.20 85.90
99.64 96.96 96.89
2019 2020
December November December
3 4 5
72.78 69.36 69.11
119.05 117.57 117.14
73.77 70.69 70.51
121.91 121.55 121.242018-19 2019-20 6-Currency Trade Based Weights
1 Base: 2004-05 (April-March) =100
1.1 NEER 63.07 63.59
1.2 REER 121.70 125.76
2 Base: 2017-18 (April-March) =100
2.1 NEER 92.88 93.63
2.2 REER 94.20 97.32
Item
2018-19 2019-20
1 2
36-Currency Export and Trade Based Weights (Base: 2004-05=100)
1 Trade-Based Weights
1.1 NEER 72.64 73.28
1.2 REER 114.01 116.75
2 Export-Based Weights
2.1 NEER 74.18 74.33
2.2 REER 116.32 119.61
(Amount in US$ Million)
2019 2020
Nov. Oct. Nov.
2 3 4
122 76 87
2116 1733 2045
- 1 -
- 300 -
122 77 87
2116 2033 2045
7.10 3.62 5.48
2.03 1.25 1.87
0.00-15.00 0.00-9.00 0.00-10.30
No. 37: External Commercial Borrowings (ECBs) – Registrations
Item 2019-20
1
1 Automatic Route
1.1 Number 1292
1.2 Amount 38011
2 Approval Route
2.1 Number 41
2.2 Amount 14921
3 Total (1+2)
3.1 Number 1333
3.2 Amount 52932
4 Weighted Average Maturity (in years) 6.00
5 Interest Rate (per cent)
5.1 Weighted Average Margin over 6-month LIBOR or reference rate for Floating Rate Loans 1.34
5.2 Interest rate range for Fixed Rate Loans 0.00-25.00
No. 36: Indices of Real Effective Exchange Rate (REER) and Nominal EffectiveExchange Rate (NEER) of the Indian Rupee
No. 37: External Commercial Borrowings (ECBs) – Registrations

CURRENT STATISTICS
RBI Bulletin January 2021102
No. 38: India's Overall Balance of Payments
(US $ Million)
Item
Jul-Sep 2019 Jul-Sep 2020(P)
Credit Debit Net Credit Debit Net
1 2 3 4 5 6
Overall Balance of Payments(1+2+3) 303790 298671 5118 304250 272682 315681 CURRENT ACCOUNT (1.1+ 1.2) 161553 169132 -7579 150955 135448 155071.1 MERCHANDISE 79952 119602 -39650 75591 90375 -147841.2 INVISIBLES (1.2.1+1.2.2+1.2.3) 81601 49530 32070 75364 45072 30292 1.2.1 Services 52777 31836 20941 49902 28733 21169 1.2.1.1 Travel 7643 6031 1611 2020 2737 -717 1.2.1.2 Transportation 5181 6009 -828 5410 4759 651 1.2.1.3 Insurance 602 354 248 590 537 53 1.2.1.4 G.n.i.e. 169 298 -128 144 190 -46 1.2.1.5 Miscellaneous 39182 19144 20038 41738 20510 21228 1.2.1.5.1 Software Services 23247 2182 21064 25069 2769 22299 1.2.1.5.2 Business Services 10878 11211 -333 11624 12379 -755 1.2.1.5.3 Financial Services 1239 594 645 1003 1107 -104 1.2.1.5.4 Communication Services 635 354 281 661 355 306 1.2.2 Transfers 21986 2034 19952 20421 2023 18398 1.2.2.1 Official 50 286 -236 36 258 -221 1.2.2.2 Private 21936 1748 20188 20385 1766 18619 1.2.3 Income 6838 15660 -8822 5041 14316 -9275 1.2.3.1 Investment Income 5434 14997 -9563 3596 13615 -10020 1.2.3.2 Compensation of Employees 1404 663 741 1445 700 7452 CAPITAL ACCOUNT (2.1+2.2+2.3+2.4+2.5) 142237 128657 13580 152658 137234 154242.1 Foreign Investment (2.1.1+2.1.2) 85751 75960 9791 97269 65689 31581 2.1.1 Foreign Direct Investment 15650 8336 7314 30475 5892 24583 2.1.1.1 In India 14875 4482 10393 29501 2450 27051 2.1.1.1.1 Equity 10113 4446 5668 23989 2445 21544 2.1.1.1.2 Reinvested Earnings 3464 3464 4024 0 4024 2.1.1.1.3 Other Capital 1298 37 1262 1488 5 1483 2.1.1.2 Abroad 775 3854 -3079 974 3442 -2468 2.1.1.2.1 Equity 775 1703 -928 974 1391 -417 2.1.1.2.2 Reinvested Earnings 0 788 -788 0 808 -808 2.1.1.2.3 Other Capital 0 1363 -1363 0 1243 -1243 2.1.2 Portfolio Investment 70101 67625 2476 66794 59796 6998 2.1.2.1 In India 68312 66307 2005 66420 58684 7736 2.1.2.1.1 FIIs 68312 66307 2005 66420 58684 7736 2.1.2.1.1.1 Equity 48252 51608 -3355 55007 48183 6824 2.1.2.1.1.2 Debt 20059 14699 5361 11413 10501 912 2.1.2.1.2 ADR/GDRs 0 0 0 0 0 0 2.1.2.2 Abroad 1789 1318 471 375 1113 -7382.2 Loans (2.2.1+2.2.2+2.2.3) 21544 18472 3072 20225 24468 -4243 2.2.1 External Assistance 1802 1366 435 3201 1330 1870 2.2.1.1 By India 2 29 -27 2 28 -26 2.2.1.2 To India 1800 1338 462 3199 1302 1897 2.2.2 Commercial Borrowings 9011 5728 3283 8362 12659 -4297 2.2.2.1 By India 1287 1082 205 769 1005 -235 2.2.2.2 To India 7724 4646 3078 7593 11654 -4061 2.2.3 Short Term to India 10731 11378 -646 8662 10479 -1817 2.2.3.1 Buyers' credit & Suppliers' Credit >180 days 10731 10940 -209 8662 9770 -1108 2.2.3.2 Suppliers' Credit up to 180 days 0 437 -437 0 709 -7092.3 Banking Capital (2.3.1+2.3.2) 23881 25699 -1818 18850 30025 -11175 2.3.1 Commercial Banks 23881 25364 -1483 18837 30025 -11188 2.3.1.1 Assets 9914 10148 -235 7295 16747 -9451 2.3.1.2 Liabilities 13967 15216 -1249 11541 13279 -1737 2.3.1.2.1 Non-Resident Deposits 13458 11178 2280 10311 8377 1934 2.3.2 Others 0 335 -335 13 0 132.4 Rupee Debt Service 0 2 -2 0 2 -22.5 Other Capital 11061 8523 2538 16314 17050 -7373 Errors & Omissions 882 -882 637 0 6374 Monetary Movements (4.1+ 4.2) 0 5118 -5118 0 31568 -31568 4.1 I.M.F. 0 0 0 4.2 Foreign Exchange Reserves (Increase - / Decrease +) 5118 -5118 0 31568 -31568
Note : P : Preliminary
No. 38: India’s Overall Balance of Payments

CURRENT STATISTICS
RBI Bulletin January 2021 103
No. 39: India's Overall Balance of Payments
(` Crore)
Item
Jul-Sep 2019 Jul-Sep 2020(P)
Credit Debit Net Credit Debit Net
1 2 3 4 5 6
Overall Balance of Payments(1+2+3) 2139568 2103519 36049 2263084 2028270 2348141 CURRENT ACCOUNT (1.1+ 1.2) 1137803 1191185 -53382 1122840 1007492 1153481.1 MERCHANDISE 563094 842346 -279252 562264 672233 -1099691.2 INVISIBLES (1.2.1+1.2.2+1.2.3) 574709 348839 225870 560576 335259 225317 1.2.1 Services 371704 224219 147485 371185 213726 157459 1.2.1.1 Travel 53826 42478 11348 15024 20359 -5335 1.2.1.2 Transportation 36488 42320 -5833 40241 35397 4843 1.2.1.3 Insurance 4243 2494 1749 4385 3994 391 1.2.1.4 G.n.i.e. 1193 2096 -904 1074 1414 -339 1.2.1.5 Miscellaneous 275955 134831 141124 310461 152561 157899 1.2.1.5.1 Software Services 163725 15370 148355 186466 20598 165868 1.2.1.5.2 Business Services 76611 78960 -2348 86464 92076 -5612 1.2.1.5.3 Financial Services 8729 4187 4543 7462 8233 -771 1.2.1.5.4 Communication Services 4475 2494 1981 4914 2638 2275 1.2.2 Transfers 154844 14327 140517 151896 15051 136845 1.2.2.1 Official 349 2014 -1665 269 1916 -1647 1.2.2.2 Private 154495 12313 142182 151627 13134 138492 1.2.3 Income 48161 110294 -62133 37495 106483 -68988 1.2.3.1 Investment Income 38270 105623 -67353 26745 101274 -74529 1.2.3.2 Compensation of Employees 9891 4671 5220 10750 5209 55412 CAPITAL ACCOUNT (2.1+2.2+2.3+2.4+2.5) 1001765 906125 95640 1135504 1020778 1147252.1 Foreign Investment (2.1.1+2.1.2) 603940 534984 68957 723512 488607 234905 2.1.1 Foreign Direct Investment 110224 58709 51515 226681 43826 182855 2.1.1.1 In India 104766 31568 73198 219436 18223 201213 2.1.1.1.1 Equity 71226 31310 39916 178436 18184 160252 2.1.1.1.2 Reinvested Earnings 24395 0 24395 29930 29930 2.1.1.1.3 Other Capital 9145 258 8886 11070 39 11032 2.1.1.2 Abroad 5458 27141 -21682 7245 25603 -18358 2.1.1.2.1 Equity 5458 11997 -6538 7245 10348 -3103 2.1.1.2.2 Reinvested Earnings 0 5548 -5548 0 6009 -6009 2.1.1.2.3 Other Capital 0 9596 -9596 0 9247 -9247 2.1.2 Portfolio Investment 493716 476275 17441 496831 444780 52050 2.1.2.1 In India 481114 466993 14122 494044 436504 57540 2.1.2.1.1 FIIs 481114 466993 14122 494044 436504 57540 2.1.2.1.1.1 Equity 339837 363469 -23632 409153 358396 50757 2.1.2.1.1.2 Debt 141277 103523 37754 84891 78108 6783 2.1.2.1.2 ADR/GDRs 0 0 0 0 0 0 2.1.2.2 Abroad 12602 9283 3320 2786 8276 -54902.2 Loans (2.2.1+2.2.2+2.2.3) 151732 130099 21633 150435 181998 -31563 2.2.1 External Assistance 12689 9624 3065 23807 9895 13911 2.2.1.1 By India 14 201 -187 12 208 -197 2.2.1.2 To India 12675 9423 3252 23795 9687 14108 2.2.2 Commercial Borrowings 63463 40344 23119 62198 94158 -31960 2.2.2.1 By India 9066 7623 1444 5722 7473 -1751 2.2.2.2 To India 54397 32721 21675 56476 86685 -30209 2.2.3 Short Term to India 75580 80132 -4551 64430 77945 -13515 2.2.3.1 Buyers' credit & Suppliers' Credit >180 days 75580 77050 -1470 64430 72671 -8241 2.2.3.2 Suppliers' Credit up to 180 days 0 3081 -3081 0 5273 -52732.3 Banking Capital (2.3.1+2.3.2) 168191 180998 -12807 140212 223336 -83124 2.3.1 Commercial Banks 168191 178639 -10448 140113 223336 -83222 2.3.1.1 Assets 69820 71474 -1654 54265 124564 -70299 2.3.1.2 Liabilities 98370 107165 -8794 85848 98771 -12923 2.3.1.2.1 Non-Resident Deposits 94785 78728 16056 76699 62311 14387 2.3.2 Others 0 2359 -2359 99 0 992.4 Rupee Debt Service 0 15 -15 0 15 -152.5 Other Capital 77902 60029 17873 121345 126824 -54793 Errors & Omissions 0 6210 -6210 4740 47404 Monetary Movements (4.1+ 4.2) 0 36049 -36049 0 234814 -234814 4.1 I.M.F. 0 0 0 0 0 0 4.2 Foreign Exchange Reserves (Increase - / Decrease +) 0 36049 -36049 234814 -234814
Note : P: Preliminary
No. 39: India’s Overall Balance of Payments

CURRENT STATISTICS
RBI Bulletin January 2021104
(US $ Million)
Item Jul-Sep 2019 Jul-Sep 2020(P)Credit Debit Net Credit Debit Net
1 2 3 4 5 61 Current Account (1.A+1.B+1.C) 161551 169104 -7553 150953 135423 15531 1.A Goods and Services (1.A.a+1.A.b) 132729 151438 -18709 125493 119109 6385 1.A.a Goods (1.A.a.1 to 1.A.a.3) 79952 119602 -39650 75591 90375 -14784 1.A.a.1 General merchandise on a BOP basis 79293 115248 -35955 75243 84287 -9044 1.A.a.2 Net exports of goods under merchanting 658 0 658 348 0 348 1.A.a.3 Nonmonetary gold 4354 -4354 0 6088 -6088 1.A.b Services (1.A.b.1 to 1.A.b.13) 52777 31836 20941 49902 28733 21169 1.A.b.1 Manufacturing services on physical inputs owned by others 58 33 25 68 11 56 1.A.b.2 Maintenance and repair services n.i.e. 44 253 -208 35 204 -169 1.A.b.3 Transport 5181 6009 -828 5410 4759 651 1.A.b.4 Travel 7643 6031 1611 2020 2737 -717 1.A.b.5 Construction 677 714 -37 589 563 26 1.A.b.6 Insurance and pension services 602 354 248 590 537 53 1.A.b.7 Financial services 1239 594 645 1003 1107 -104 1.A.b.8 Charges for the use of intellectual property n.i.e. 248 1776 -1528 313 1456 -1143 1.A.b.9 Telecommunications, computer, and information services 23947 2654 21293 25793 3290 22503 1.A.b.10 Other business services 10878 11211 -333 11624 12379 -755 1.A.b.11 Personal, cultural, and recreational services 551 923 -372 530 817 -287 1.A.b.12 Government goods and services n.i.e. 169 298 -128 144 190 -46 1.A.b.13 Others n.i.e. 1539 984 555 1782 683 1099 1.B Primary Income (1.B.1 to 1.B.3) 6838 15660 -8822 5041 14316 -9275 1.B.1 Compensation of employees 1404 663 741 1445 700 745 1.B.2 Investment income 4379 14782 -10403 2808 13314 -10507 1.B.2.1 Direct investment 1763 7056 -5293 1327 8038 -6711 1.B.2.2 Portfolio investment 54 3760 -3706 49 2126 -2076 1.B.2.3 Other investment 602 3951 -3349 78 3150 -3072 1.B.2.4 Reserve assets 1960 15 1945 1354 1 1353 1.B.3 Other primary income 1055 215 840 788 301 487 1.C Secondary Income (1.C.1+1.C.2) 21984 2006 19978 20419 1998 18421 1.C.1 Financial corporations, nonfinancial corporations, households, and NPISHs 21936 1748 20188 20385 1766 18619 1.C.1.1 Personal transfers (Current transfers between resident and/ non-resident households)
21291 1336 19955 19711 1287 18424 1.C.1.2 Other current transfers 645 412 233 674 479 195 1.C.2 General government 48 258 -210 35 232 -1982 Capital Account (2.1+2.2) 90 190 -100 109 197 -87 2.1 Gross acquisitions (DR.)/disposals (CR.) of non-produced nonfinancial assets 9 93 -84 8 100 -92 2.2 Capital transfers 81 97 -16 101 96 53 Financial Account (3.1 to 3.5) 142149 133614 8535 152550 168631 -16081 3.1 Direct Investment (3.1A+3.1B) 15650 8336 7314 30475 5892 24583 3.1.A Direct Investment in India 14875 4482 10393 29501 2450 27051 3.1.A.1 Equity and investment fund shares 13577 4446 9131 28013 2445 25568 3.1.A.1.1 Equity other than reinvestment of earnings 10113 4446 5668 23989 2445 21544 3.1.A.1.2 Reinvestment of earnings 3464 3464 4024 0 4024 3.1.A.2 Debt instruments 1298 37 1262 1488 5 1483 3.1.A.2.1 Direct investor in direct investment enterprises 1298 37 1262 1488 5 1483 3.1.B Direct Investment by India 775 3854 -3079 974 3442 -2468 3.1.B.1 Equity and investment fund shares 775 2491 -1716 974 2199 -1225 3.1.B.1.1 Equity other than reinvestment of earnings 775 1703 -928 974 1391 -417 3.1.B.1.2 Reinvestment of earnings 788 -788 0 808 -808 3.1.B.2 Debt instruments 0 1363 -1363 0 1243 -1243 3.1.B.2.1 Direct investor in direct investment enterprises 1363 -1363 0 1243 -1243 3.2 Portfolio Investment 70101 67625 2476 66794 59796 6998 3.2.A Portfolio Investment in India 68312 66307 2005 66420 58684 7736 3.2.1 Equity and investment fund shares 48252 51608 -3355 55007 48183 6824 3.2.2 Debt securities 20059 14699 5361 11413 10501 912 3.2.B Portfolio Investment by India 1789 1318 471 375 1113 -738 3.3 Financial derivatives (other than reserves) and employee stock options 7395 7138 257 9664 12339 -2675 3.4 Other investment 49003 45398 3605 45617 59035 -13418 3.4.1 Other equity (ADRs/GDRs) 0 0 0 0 0 0 3.4.2 Currency and deposits 13458 11513 1945 10325 8377 1948 3.4.2.1 Central bank (Rupee Debt Movements; NRG) 0 335 -335 13 0 13 3.4.2.2 Deposit-taking corporations, except the central bank (NRI Deposits) 13458 11178 2280 10311 8377 1934 3.4.2.3 General government 0 0 0 3.4.2.4 Other sectors 0 0 0 3.4.3 Loans (External Assistance, ECBs and Banking Capital) 21235 21281 -45 20088 35637 -15549 3.4.3.A Loans to India 19946 20170 -224 19317 34605 -15287 3.4.3.B Loans by India 1289 1111 178 771 1033 -262 3.4.4 Insurance, pension, and standardized guarantee schemes 54 71 -17 78 62 16 3.4.5 Trade credit and advances 10731 11378 -646 8662 10479 -1817 3.4.6 Other accounts receivable/payable - other 3524 1155 2369 6464 4480 1984 3.4.7 Special drawing rights 0 0 0 0 3.5 Reserve assets 0 5118 -5118 0 31568 -31568 3.5.1 Monetary gold 0 0 0 3.5.2 Special drawing rights n.a. 0 0 0 3.5.3 Reserve position in the IMF n.a. 0 0 0 3.5.4 Other reserve assets (Foreign Currency Assets) 0 5118 -5118 0 31568 -315684 Total assets/liabilities 142149 133614 8535 152550 168631 -16081 4.1 Equity and investment fund shares 71843 67071 4772 94110 66340 27770 4.2 Debt instruments 66783 60270 6513 51976 66242 -14267 4.3 Other financial assets and liabilities 3524 6273 -2750 6464 36048 -295845 Net errors and omissions 882 -882 637 0 637
No. 40: Standard Presentation of BoP in India as per BPM6
Note : P : Preliminary
No. 40: Standard Presentation of BoP in India as per BPM6

CURRENT STATISTICS
RBI Bulletin January 2021 105
(` Crore)
Item Jul-Sep 2019 Jul-Sep 2020(P)Credit Debit Net Credit Debit Net
1 2 3 4 5 61 Current Account (1.A+1.B+1.C) 1137790 1190988 -53198 1122827 1007305 115522 1.A Goods and Services (1.A.a+1.A.b) 934798 1066564 -131766 933449 885959 47490 1.A.a Goods (1.A.a.1 to 1.A.a.3) 563094 842346 -279252 562264 672233 -109969 1.A.a.1 General merchandise on a BOP basis 558456 811684 -253228 559675 626945 -67270 1.A.a.2 Net exports of goods under merchanting 4638 0 4638 2588 0 2588 1.A.a.3 Nonmonetary gold 0 30661 -30661 45287 -45287 1.A.b Services (1.A.b.1 to 1.A.b.13) 371704 224219 147485 371185 213726 157459 1.A.b.1 Manufacturing services on physical inputs owned by others 408 235 173 505 85 420 1.A.b.2 Maintenance and repair services n.i.e. 310 1779 -1468 263 1519 -1256 1.A.b.3 Transport 36488 42320 -5833 40241 35397 4843 1.A.b.4 Travel 53826 42478 11348 15024 20359 -5335 1.A.b.5 Construction 4770 5031 -261 4383 4186 197 1.A.b.6 Insurance and pension services 4243 2494 1749 4385 3994 391 1.A.b.7 Financial services 8729 4187 4543 7462 8233 -771 1.A.b.8 Charges for the use of intellectual property n.i.e. 1749 12511 -10762 2330 10833 -8503 1.A.b.9 Telecommunications, computer, and information services 168656 18693 149963 191855 24472 167382 1.A.b.10 Other business services 76611 78960 -2348 86464 92076 -5612 1.A.b.11 Personal, cultural, and recreational services 3882 6503 -2621 3944 6078 -2135 1.A.b.12 Government goods and services n.i.e. 1193 2096 -904 1074 1414 -339 1.A.b.13 Others n.i.e. 10839 6933 3906 13255 5078 8178 1.B Primary Income (1.B.1 to 1.B.3) 48161 110294 -62133 37495 106483 -68988 1.B.1 Compensation of employees 9891 4671 5220 10750 5209 5541 1.B.2 Investment income 30842 104107 -73266 20884 99036 -78152 1.B.2.1 Direct investment 12418 49694 -37276 9869 59790 -49921 1.B.2.2 Portfolio investment 380 26481 -26100 366 15810 -15445 1.B.2.3 Other investment 4241 27830 -23589 579 23428 -22848 1.B.2.4 Reserve assets 13803 103 13700 10070 7 10063 1.B.3 Other primary income 7428 1515 5913 5861 2238 3623 1.C Secondary Income (1.C.1+1.C.2) 154831 14130 140701 151883 14863 137020 1.C.1 Financial corporations, nonfinancial corporations, households, and NPISHs 154495 12313 142182 151627 13134 138492 1.C.1.1 Personal transfers (Current transfers between resident and/ non-resident households)
149953 9410 140544 146616 9573 137043 1.C.1.2 Other current transfers 4542 2903 1639 5011 3561 1450 1.C.2 General government 336 1817 -1481 257 1729 -14722 Capital Account (2.1+2.2) 632 1337 -705 813 1463 -649 2.1 Gross acquisitions (DR.)/disposals (CR.) of non-produced nonfinancial assets 63 656 -593 62 747 -685 2.2 Capital transfers 569 680 -112 751 716 363 Financial Account (3.1 to 3.5) 1001146 941034 60112 1134703 1254317 -119614 3.1 Direct Investment (3.1A+3.1B) 110224 58709 51515 226681 43826 182855 3.1.A Direct Investment in India 104766 31568 73198 219436 18223 201213 3.1.A.1 Equity and investment fund shares 95621 31310 64312 208366 18184 190182 3.1.A.1.1 Equity other than reinvestment of earnings 71226 31310 39916 178436 18184 160252 3.1.A.1.2 Reinvestment of earnings 24395 0 24395 29930 29930 3.1.A.2 Debt instruments 9145 258 8886 11070 39 11032 3.1.A.2.1 Direct investor in direct investment enterprises 9145 258 8886 11070 39 11032 3.1.B Direct Investment by India 5458 27141 -21682 7245 25603 -18358 3.1.B.1 Equity and investment fund shares 5458 17544 -12086 7245 16356 -9111 3.1.B.1.1 Equity other than reinvestment of earnings 5458 11997 -6538 7245 10348 -3103 3.1.B.1.2 Reinvestment of earnings 0 5548 -5548 6009 -6009 3.1.B.2 Debt instruments 0 9596 -9596 0 9247 -9247 3.1.B.2.1 Direct investor in direct investment enterprises 0 9596 -9596 9247 -9247 3.2 Portfolio Investment 493716 476275 17441 496831 444780 52050 3.2.A Portfolio Investment in India 481114 466993 14122 494044 436504 57540 3.2.1 Equity and investment fund shares 339837 363469 -23632 409153 358396 50757 3.2.2 Debt securities 141277 103523 37754 84891 78108 6783 3.2.B Portfolio Investment by India 12602 9283 3320 2786 8276 -5490 3.3 Financial derivatives (other than reserves) and employee stock options 52083 50270 1813 71882 91780 -19898 3.4 Other investment 345123 319731 25392 339309 439117 -99808 3.4.1 Other equity (ADRs/GDRs) 0 0 0 0 0 0 3.4.2 Currency and deposits 94785 81087 13697 76798 62311 14486 3.4.2.1 Central bank (Rupee Debt Movements; NRG) 0 2359 -2359 99 0 99 3.4.2.2 Deposit-taking corporations, except the central bank (NRI Deposits) 94785 78728 16056 76699 62311 14387 3.4.2.3 General government 0 0 0 3.4.2.4 Other sectors 0 0 0 3.4.3 Loans (External Assistance, ECBs and Banking Capital) 149558 149878 -320 149419 265077 -115658 3.4.3.A Loans to India 140478 142055 -1577 143686 257396 -113711 3.4.3.B Loans by India 9080 7823 1257 5734 7681 -1947 3.4.4 Insurance, pension, and standardized guarantee schemes 383 501 -117 580 462 117 3.4.5 Trade credit and advances 75580 80132 -4551 64430 77945 -13515 3.4.6 Other accounts receivable/payable - other 24817 8134 16683 48082 33321 14761 3.4.7 Special drawing rights 0 0 0 0 3.5 Reserve assets 0 36049 -36049 0 234814 -234814 3.5.1 Monetary gold 0 0 0 3.5.2 Special drawing rights n.a. 0 0 0 3.5.3 Reserve position in the IMF n.a. 0 0 0 3.5.4 Other reserve assets (Foreign Currency Assets) 0 36049 -36049 0 234814 -2348144 Total assets/liabilities 1001146 941034 60112 1134703 1254317 -119614 4.1 Equity and investment fund shares 505985 472376 33609 700013 493455 206557 4.2 Debt instruments 470345 424475 45870 386609 492727 -106118 4.3 Other financial assets and liabilities 24817 44183 -19366 48082 268134 -2200525 Net errors and omissions 0 6210 -6210 4740 0 4740
No. 41: Standard Presentation of BoP in India as per BPM6
Note : P: Preliminary
No. 41: Standard Presentation of BoP in India as per BPM6

CURRENT STATISTICS
RBI Bulletin January 2021106
(US$ Million)
2019 2020
Sep. Jun. Sep.
Assets Assets Assets
3 4 5
-436754 -343730 -339079
Item 2019-20
Assets
1
6 IIP (Assets - Liabilities) -375183
(US$ Million)
2019 2020
Sep. Jun. Sep.
Assets Liabilities Assets Liabilities Assets Liabilities
3 4 5 6 7 8
176244 417145 185898 419426 188366 455989
114834 398819 120322 395835 121546 430881
61410 18327 65577 23591 66820 25108
4541 260195 4303 241581 5041 253289
2344 144039 830 138961 1906 149095
2197 116155 3474 102621 3136 104195
54980 428886 53694 432321 64921 432817
1633 106581 1271 104001 2917 102193
7892 174823 7435 184391 9048 180264
27563 133105 27741 132942 34864 137519
17892 14378 17247 10987 18092 12841
433707 505702 544687
669472 1106226 749597 1093328 803016 1142095
No. 42: International Investment Position
Item2019-20
Assets Liabilities
1 2
1 Direct Investment Abroad/in India 182957 418243
1.1 Equity Capital and Reinvested Earnings 118442 395426
1.2 Other Capital 64515 22817
2 Portfolio Investment 3847 246701
2.1 Equity 602 134778
2.2 Debt 3246 111923
3 Other Investment 52422 427272
3.1 Trade Credit 1460 104276
3.2 Loan 6741 179601
3.3 Currency and Deposits 26011 130761
3.4 Other Assets/Liabilities 18210 12634
4 Reserves 477807
5 Total Assets/ Liabilities 717033 1092216
As on Financial Year /Quarter End
No. 42: International Investment Position

CURRENT STATISTICS
RBI Bulletin January 2021 107
PART I - Payment System Indicators - Payment & Settlement System Statistics
Value (` Crore)
2019 2020
Nov. Oct. Nov.
6 7 8
– – –
– – –
10655649 12416671 10692192
6869045 8849617 6942678
862104 900488 727023
2359755 4108317 1762647
3647186 3840812 4453008
3525359 3435633 3625849
261245 131420 123665
– – –
– – –
8679806 8496046 7987655
7469569 7226105 6802206
1210237 1269941 1185449
– – –
2226286 2993114 2986234
33 57 54
6908 5531 4400
202904 274645 276459
92562 91386 96069
1734651 2235389 2218252
189229 386107 390999
13 16 15
70199 79305 78709
97 192 181
70097 79022 78433
5 91 96
137707 168169 163940
60130 64652 62350
31730 26956 30495
28401 37696 31855
77577 103517 101591
37007 37110 42289
40570 66408 59302
17844 17802 16704
14652 13718 12717
3192 4084 3987
738 1045 1111
2454 3039 2877
644802 524090 494383
643678 524090 494383
1124 – –
3096840 3782480 3739970
11776646 12278526 11727625
11131843 11754436 11233243
FY 2019-20
5
–
–
–
–
–
–
–
–
–
–
–
–
–
–
–
–
–
–
–
–
–
–
–
–
–
–
–
–
–
–
–
–
–
–
–
–
–
–
–
–
–
–
–
–
–
Volume(Lakh )
2019 2020
Nov. Oct. Nov.
2 3 4
– – –
– – –
2.78 2.44 2.45
1.01 1.06 0.79
0.63 0.61 0.48
0.19 0.27 0.12
0.19 0.18 0.19
1.74 1.36 1.64
0.04 0.02 0.02
– – –
– – –
133.87 138.22 137.80
131.61 136.54 136.13
2.27 1.68 1.67
– – –
18750.31 28646.23 30269.97
0.64 1.02 0.93
1364.56 961.85 927.29
2280.75 3189.72 3391.14
722.06 1015.80 1114.23
2194.59 2761.65 2734.10
12187.71 20716.19 22102.28
0.74 0.97 0.91
766.41 920.15 944.24
6.46 10.55 9.39
758.18 848.34 869.63
1.77 61.26 65.22
6062.09 5863.58 5633.00
1762.12 1718.03 1662.58
1033.52 818.33 874.82
728.60 899.70 787.76
4299.96 4145.55 3970.43
2483.18 1983.98 2112.56
1816.79 2161.57 1857.87
4672.07 4591.51 4193.78
3354.08 3639.88 3420.83
1317.99 951.63 772.96
123.86 37.11 39.38
1194.13 914.52 733.57
866.12 643.08 596.35
864.86 643.08 596.35
1.26 0.00 0.00
31117.01 40664.55 41637.35
31250.88 40802.76 41775.15
30384.76 40159.68 41178.79
System
FY 2019-20
1
A. Settlement Systems –
Financial Market Infrastructures (FMIs) –
1 CCIL Operated Systems (1.1 to 1.3) –
1.1 Govt. Securities Clearing (1.1.1 to 1.1.3) –
1.1.1 Outright –
1.1.2 Repo –
1.1.3 Tri-party Repo –
1.2 Forex Clearing –
1.3 Rupee Derivatives @ –
B. Payment Systems –
I Financial Market Infrastructures (FMIs) –
1 Credit Transfers - RTGS (1.1 to 1.2) –
1.1 Customer Transactions –
1.2 Interbank Transactions –
II Retail –
2 Credit Transfers - Retail (2.1 to 2.6) –
2.1 AePS (Fund Transfers) @ –
2.2 APBS $ –
2.3 IMPS –
2.4 NACH Cr $ –
2.5 NEFT –
2.6 UPI @ –
2.6.1 of which USSD @ –
3 Debit Transfers and Direct Debits (3.1 to 3.3) –
3.1 BHIM Aadhaar Pay @ –
3.2 NACH Dr $ –
3.3 NETC (linked to bank account) @ –
4 Card Payments (4.1 to 4.2) –
4.1 Credit Cards (4.1.1 to 4.1.2) –
4.1.1 PoS based $ –
4.1.2 Others $ –
4.2 Debit Cards (4.2.1 to 4.2.1 ) –
4.2.1 PoS based $ –
4.2.2 Others $ –
5 Prepaid Payment Instruments (5.1 to 5.2) –
5.1 Wallets –
5.2 Cards (5.2.1 to 5.2.2) –
5.2.1 PoS based $ –
5.2.2 Others $ –
6 Paper-based Instruments (6.1 to 6.2) –
6.1 CTS (NPCI Managed) –
6.2 Others –
Total - Retail Payments (2+3+4+5+6) –
Total Payments (1+2+3+4+5+6) –
Total Digital Payments (1+2+3+4+5) –
Value(` Crore)
Volume(Lakh )
Payment and Settlement SystemsNo.43: Payment System Indicators

CURRENT STATISTICS
RBI Bulletin January 2021108
PART II - Payment Modes and Channels
Value (` Crore)
2019 2020
Nov. Oct. Nov.
6 7 8
– – –
471295 796402 778380
96802 158866 165155
374494 637535 613225
2539143 3407315 3419474
1058811 1646090 1653359
1480333 1761225 1766114
– – –
285376 271622 280522
381 240 231
284083 270488 279379
912 893 912
134 134 143
129 129 137
5 5 6
9648 18354 18820
9648 18354 18820
Volume(Lakh )
2019 2020
Nov. Oct. Nov.
2 3 4
– – –
13534.23 22713.54 22521.45
1234.84 2103.16 2191.98
12299.40 20610.38 20329.47
2719.42 2977.78 2814.17
592.01 619.27 585.09
2127.41 2358.51 2229.09
– – –
6305.28 5688.24 5913.87
7.99 4.85 4.64
6269.60 5658.36 5883.59
27.68 25.04 25.63
67.02 34.11 37.91
62.70 29.24 32.33
4.32 4.87 5.58
339.83 720.69 684.78
339.83 720.69 684.78
System
FY 2019-20
1
A. Other Payment Channels –
1 Mobile Payments (mobile app based) (1.1 to 1.2) –
1.1 Intra-bank $ –
1.2 Inter-bank $ –
2 Internet Payments (Netbanking / Internet Browser Based) @ (2.1 to 2.2) –
2.1 Intra-bank @ –
2.2 Inter-bank @ –
B. ATMs –
3 Cash Withdrawal at ATMs $ (3.1 to 3.3) –
3.1 Using Credit Cards $ –
3.2 Using Debit Cards $ –
3.3 Using Pre-paid Cards $ –
4 Cash Withdrawal at PoS $ (4.1 to 4.2) –
4.1 Using Debit Cards $ –
4.2 Using Pre-paid Cards $ –
5 Cash Withrawal at Micro ATMs @ –
5.1 AePS @ –
Note : 1. Data is provisional.2. ECS (Debit and Credit) has been merged with NACH with effect from January 31, 2020.3. The data from November 2019 onwards for card payments (Debit/Credit cards) and Prepaid Payment Instruments (PPIs) may not be comparable with earlier months/ periods, as more granular data is being published along with revision in data definitions.4. Only domestic financial transactions are considered. The new format captures e-commerce transactions; transactions using FASTags, digital bill payments and card-to-card transfer through ATMs, etc.. Also, failed transactions, chargebacks, reversals, expired cards/ wallets, are excluded.
2019 2020
Nov. Oct. Nov.
2 3 4
– – –
8851.69 9335.85 9528.15
544.11 594.20 601.13
8307.59 8741.65 8927.02
17253.28 20143.54 20443.15
16243.87 18578.62 18857.67
1009.41 1564.92 1585.48
2.32 2.34 2.34
2.10 2.10 2.09
0.22 0.24 0.25
2.35 3.49 3.57
48.83 53.94 54.19
15.94 26.05 30.46
– 657.45 697.82
SystemFY 2019-20
1
Payment System Infrastructures –
1 Number of Cards (1.1 to 1.2) –
1.1 Credit Cards –
1.2 Debit Cards –
2 Number of PPIs @ (2.1 to 2.2) –
2.1 Wallets @ –
2.2 Cards @ –
3 Number of ATMs (3.1 to 3.2) –
3.1 Bank owned ATMs $ –
3.2 White Label ATMs $ –
4 Number of Micro ATMs @ –
5 Number of PoS Terminals –
6 Bharat QR @ –
7 UPI QR * –
PART III - Payment Infrastructures (Lakh)
FY 2019-20
5
–
–
–
–
–
–
–
–
–
–
–
–
–
–
–
–
–
Volume(Lakh )
@: New inclusion w.e.f. November 2019 $ : Inclusion separately initiated from November 2019 - would have been part of other items hitherto.*: New inclusion w.e.f. September 2020; Includes only static UPI QR Code
Value(` Crore)

CURRENT STATISTICS
RBI Bulletin January 2021 109
No. 44: Small Savings
(` Crore)
2019 2020
Feb. Dec. Jan. Feb.
2 3 4 5
9839 15814 15184 16911
899191 1015010 1030037 1046766
7130 12117 11091 11460
606920 693812 704903 716363
2360 3455 3106 2690
134863 150462 153568 156258
-19 -31 -25 -20
2877 2984 2959 2939
0 -827 -2 -3
-8 -18 -20 -23
928 1753 1712 1887
191653 203460 205172 207059
1184 2070 2133 2131
54446 69464 71597 73728
2451 4296 3999 4494
121687 152622 156621 161115
70179 86344 88247 90327
5824 6749 6854 6970
6910 7328 7397 7464
38774 52201 54123 56354
215 1401 168 281
101407 114842 115010 115291
11 0 0 0
-26 -25 -25 -25
0 0 0 0
21 21 21 21
1732 3326 3524 3937
219257 240900 244267 248022
1262 2272 2458 2619
94795 110050 112508 115127
3 0 0 1
300 -289 -289 -288
-1609 -971 -1713 -1120
21232 6782 5069 3949
2065 2025 2782 2452
91314 113273 116055 118507
12 0 -1 0
-47 -179 -180 -180
-1 0 -2 -15
-82 -82 -84 -99
11745 11345 11188 11006
977 371 569 1514
73014 80298 80867 82381
Scheme 2018-19
11 Small Savings Receipts 115714
Outstanding 918459
1.1 Total Deposits Receipts 91108
Outstanding 618418
1.1.1 Post Office Saving Bank Deposits Receipts 31037
Outstanding 140247 1.1.2 MGNREG Receipts
Outstanding 1.1.3 National Saving Scheme, 1987 Receipts -31
Outstanding 3107 1.1.4 National Saving Scheme, 1992 Receipts 53
Outstanding 10 1.1.5 Monthly Income Scheme Receipts 10967
Outstanding 192658 1.1.6 Senior Citizen Scheme 2004 Receipts 13990
Outstanding 55708 1.1.7 Post Office Time Deposits Receipts 25000
Outstanding 124292 1.1.7.1 1 year Time Deposits Outstanding 71534 1.1.7.2 2 year Time Deposits Outstanding 5910 1.1.7.3 3 year Time Deposits Outstanding 6901 1.1.7.4 5 year Time Deposits Outstanding 39947 1.1.8 Post Office Recurring Deposits Receipts 10081
Outstanding 102401 1.1.9 Post Office Cumulative Time Deposits Receipts 11
Outstanding -26 1.1.10 Other Deposits Receipts 0
Outstanding 21 1.2 Saving Certificates Receipts 16067
Outstanding 221517
1.2.1 National Savings Certificate VIII issue Receipts 11318
Outstanding 98492 1.2.2 Indira Vikas Patras Receipts 334
Outstanding 263 1.2.3 Kisan Vikas Patras Receipts -18678
Outstanding 19303 1.2.4 Kisan Vikas Patras - 2014 Receipts 23018
Outstanding 93630 1.2.5 National Saving Certificate VI issue Receipts 93
Outstanding 2 1.2.6 National Saving Certificate VII issue Receipts -18 Outstanding -80 1.2.7 Other Certificates Outstanding 9907 1.3 Public Provident Fund Receipts 8539
Outstanding 78524
Source: Accountant General, Post and Telegraphs.
Occasional SeriesOccasional SeriesOccasional SeriesNo. 44: Small Savings
Note : Data on receipts from April 2017 are net receipts, i.e., gross receipt minus gross payment.

CURRENT STATISTICS
RBI Bulletin January 2021110
TABLE 45 : OWNERSHIP PATTERN OF CENTRAL AND STATE GOVERNMENTS SECURITIES
Central Government Dated Securities
Central Government Dated Securities
Category2019 2020
Sep. Dec. Mar. Jun. Sep.1 2 3 4 5
(A) Total 6314426 6512659 6486585 6704983 71370691 Commercial Banks 39.66 39.05 40.41 38.98 38.552 Non-Bank PDs 0.42 0.39 0.39 0.36 0.343 Insurance Companies 24.86 24.90 25.09 26.24 25.334 Mutual Funds 0.77 1.53 1.43 2.02 2.425 Co-operative Banks 2.01 1.97 1.90 1.86 1.866 Financial Institutions 1.15 1.14 0.53 1.19 1.427 Corporates 0.92 0.84 0.81 0.78 0.948 Foreign Portfolio Investors 3.31 3.33 2.44 1.79 2.059 Provident Funds 4.87 4.93 4.72 4.96 4.7710 RBI 14.99 14.72 15.13 14.70 15.0011. Others 7.05 7.23 7.17 7.11 7.32 11.1 State Governments 1.99 1.97 2.05 1.99 1.86
(Per cent)
(in `. Crore)
State Development Loans
State Governments Securities
Category2019 2020
Sep. Dec. Mar. Jun. Sep.1 2 3 4 5
(B) Total 2905169 3047353 3265990 3393099 35649791 Commercial Banks 32.53 32.46 34.99 33.54 34.602 Non-Bank PDs 0.72 0.64 0.76 0.74 0.543 Insurance Companies 33.39 32.50 31.63 30.85 30.264 Mutual Funds 1.12 1.20 1.14 1.74 1.965 Co-operative Banks 4.24 4.16 4.12 4.38 4.196 Financial Institutions 0.33 0.31 0.11 1.96 1.927 Corporates 0.28 0.31 0.30 0.31 0.398 Foreign Portfolio Investors 0.05 0.04 0.02 0.02 0.029 Provident Funds 22.36 23.66 22.22 21.70 21.3110 RBI 0.00 0.00 0.00 0.00 0.0011. Others 4.98 4.73 4.71 4.78 4.80 11.1 State Governments 0.16 0.17 0.18 0.18 0.18
(in `. Crore)
Treasury Bills
Treasury Bills
Category2019 2020
Sep. Dec. Mar. Jun. Sep.1 2 3 4 5
(C) Total 538041 514588 538409 881362 9822861 Commercial Banks 50.81 45.19 61.06 46.11 53.502 Non-Bank PDs 1.92 2.07 2.26 1.48 2.163 Insurance Companies 5.55 5.76 7.45 4.64 4.064 Mutual Funds 14.08 20.42 13.24 23.45 19.905 Co-operative Banks 2.55 2.07 2.55 1.95 1.636 Financial Institutions 1.82 2.12 0.58 1.67 1.347 Corporates 1.57 1.66 1.89 1.43 1.638 Foreign Portfolio Investors 0.00 0.00 0.00 0.00 0.009 Provident Funds 0.01 0.01 0.02 0.05 0.0010 RBI 0.00 0.00 0.00 11.27 4.8011. Others 21.70 20.70 10.95 7.95 10.99 11.1 State Governments 17.91 16.36 6.22 4.35 7.76
(in `. Crore)
Notes : "-" represents nil of negligible1. The revised table format since June 2016, incorporates the ownership pattern of State Governments Securities and Treasury Bills along with the Central Government Securities.2. State Government Securities include special bonds issued under Ujwal DISCOM Assurance Yojana (UDAY) scheme. 3. Bank PDs are clubbed under Commercial Banks. However, they form very small fraction of total outstanding securities.4. The category ‘Others’ comprises State Governments, Pension Funds, PSUs, Trusts, HUF/Individuals etc.
No. 45 : Ownership Pattern of Central and State Governments Securities

CURRENT STATISTICS
RBI Bulletin January 2021 111
No. 46: Combined Receipts and Disbursements of the Central and State Governments (` Crore)
Item 2015-16 2016-17 2017-18 2018-19 2019-20 RE 2020-21 BE
1 2 3 4 5 61 Total Disbursements 3760611 4265969 4515946 5040747 5875914 6470254 1.1 Developmental 2201287 2537905 2635110 2882758 3486519 3818358 1.1.1 Revenue 1668250 1878417 2029044 2224367 2708218 2920507 1.1.2 Capital 412069 501213 519356 596774 694262 794599 1.1.3 Loans 120968 158275 86710 61617 84038 103252 1.2 Non-Developmental 1510810 1672646 1812455 2078276 2295105 2556504 1.2.1 Revenue 1379727 1555239 1741432 1965907 2171963 2421566 1.2.1.1 Interest Payments 648091 724448 814757 894520 969344 1091617 1.2.2 Capital 127306 115775 69370 111029 121159 132961 1.2.3 Loans 3777 1632 1654 1340 1984 1977 1.3 Others 48514 55417 68381 79713 94290 953932 Total Receipts 3778049 4288432 4528422 5023352 5779396 6524526 2.1 Revenue Receipts 2748374 3132201 3376416 3797731 4338225 4828088 2.1.1 Tax Receipts 2297101 2622145 2978134 3278947 3547958 3951657 2.1.1.1 Taxes on commodities and services 1440952 1652377 1853859 2030050 2157126 2436871 2.1.1.2 Taxes on Income and Property 852271 965622 1121189 1246083 1386652 1510287 2.1.1.3 Taxes of Union Territories (Without Legislature) 3878 4146 3086 2814 4180 4500 2.1.2 Non-Tax Receipts 451272 510056 398282 518783 790267 876430 2.1.2.1 Interest Receipts 35779 33220 34224 36273 33272 30911 2.2 Non-debt Capital Receipts 59827 69063 142433 140287 129507 232172 2.2.1 Recovery of Loans & Advances 16561 20942 42213 44667 62499 18302 2.2.2 Disinvestment proceeds 43266 48122 100219 95621 67008 2138703 Gross Fiscal Deficit [ 1 - ( 2.1 + 2.2 ) ] 952410 1064704 997097 1102729 1408183 1409995 3A Sources of Financing: Institution-wise ----- ----- ----- ----- ----- ----- 3A.1 Domestic Financing 939662 1046708 989167 1097210 1403250 1405373 3A.1.1 Net Bank Credit to Government 231090 617123 144792 387091 518093 ----- 3A.1.1.1 Net RBI Credit to Government 60472 195816 -144847 325987 190241 ----- 3A.1.2 Non-Bank Credit to Government 708572 429585 844375 710119 885156 ----- 3A.2 External Financing 12748 17997 7931 5519 4933 4622 3B Sources of Financing: Instrument-wise ----- ----- 997097 ----- ----- ----- 3B.1 Domestic Financing 939662 1046708 989167 1097210 1403250 1405373 3B.1.1 Market Borrowings (net) 673298 689821 794856 795845 962386 1105573 3B.1.2 Small Savings (net) 80015 35038 71222 88961 213430 213430 3B.1.3 State Provident Funds (net) 35261 45688 42351 51004 42900 42529 3B.1.4 Reserve Funds -3322 -6436 18423 -18298 -241 2978 3B.1.5 Deposits and Advances 13470 17792 25138 66289 32949 35987 3B.1.6 Cash Balances -17438 -22463 -12476 17395 96518 -54272 3B.1.7 Others 158378 287268 49653 96014 55309 59147 3B.2 External Financing 12748 17997 7931 5519 4933 46224 Total Disbursements as per cent of GDP 27.3 27.7 26.4 26.6 28.9 28.85 Total Receipts as per cent of GDP 27.4 27.9 26.5 26.5 28.4 29.06 Revenue Receipts as per cent of GDP 20.0 20.3 19.7 20.0 21.3 21.57 Tax Receipts as per cent of GDP 16.7 17.0 17.4 17.3 17.4 17.68 Gross Fiscal Deficit as per cent of GDP 6.9 6.9 5.8 5.8 6.9 6.3
…: Not available. RE: Revised Estimates; BE: Budget EstimatesSource : Budget Documents of Central and State Governments.
Note : GDP data is based on 2011-12 base. GDP data from 2019-20 pertains to the Provisional Estimates of National Income released by NationalStatistics Office on 29th May 2020. GDP for 2020-21 is from Union Budget 2020-21.
Data pertains to all States and Union Territories.
Total receipts and total expenditure exclude National Calamity Contingency Fund expenditure.
1 & 2: Data are net of repayments of the Central Government (including repayments to the NSSF) and State Governments.
1.3: Represents compensation and assignments by States to local bodies and Panchayati Raj institutions.
2: Data are net of variation in cash balances of the Central and State Governments and includes borrowing receipts of the Central and StateGovernments.
3A.1.1: Data as per RBI records.
3B.1.1: Borrowings through dated securities.
3B.1.2: Represent net investment in Central and State Governments’ special securities by the National Small Savings Fund (NSSF). This data may vary from previous publications due to adjustments across components with availability of new data.3B.1.6: Include Ways and Means Advances by the Centre to the State Governments.
3B.1.7: Include Treasury Bills, loans from financial institutions, insurance and pension funds, remittances, cash balance investment account.
No. 46: Combined Receipts and Disbursements of the Central and State Governments

CURRENT STATISTICS
RBI Bulletin January 2021112
No. 47: Financial Accommodation Availed by State Governments under various Facilities
Sr.No
During November-2020
State/Union Territory Special DrawingFacility (SDF)
Ways and MeansAdvances (WMA)
Overdraft (OD)
Averageamountavailed
Numberof daysavailed
Averageamountavailed
Numberof daysavailed
Averageamountavailed
Numberof daysavailed
1 2 3 4 5 6 7
1 Andhra Pradesh 978 27 1439 24 2064 4
2 Arunachal Pradesh - - - - - -
3 Assam - - - - - -
4 Bihar - - - - - -
5 Chhattisgarh 476 18 - - - -
6 Goa 122 24 152 17 - -
7 Gujarat - - - - - -
8 Haryana - - - - - -
9 Himachal Pradesh - - 242 6 - -
10 Jammu & Kashmir UT - - 1100 29 561 13
11 Jharkhand - - - - - -
12 Karnataka - - - - - -
13 Kerala 205 22 487 18 - -
14 Madhya Pradesh - - - - - -
15 Maharashtra 4503 16 - - - -
16 Manipur 49 29 152 27 - -
17 Meghalaya - - - - - -
18 Mizoram - - - - - -
19 Nagaland 120 25 87 8 - -
20 Odisha - - - - - -
21 Puducherry - - - - - -
22 Punjab 464 19 408 12 - -
23 Rajasthan 1277 29 897 12 - -
24 Tamil Nadu - - - - - -
25 Telangana 1056 27 1611 26 685 18
26 Tripura - - - - - -
27 Uttar Pradesh - - - - - -
28 Uttarakhand - - - - - -
29 West Bengal - - - - - -
(` Crore)
Notes: 1. SDF is availed by State Governments against the collateral of Consolidated Sinking Fund (CSF), Guarantee Redemption Fund (GRF) & Auction Treasury Bills (ATBs) balances and other investments in government securities.2. WMA is advance by Reserve Bank of India to State Governments for meeting temporary cash mismatches.3. OD is advanced to State Governments beyond their WMA limits.4. Average Availed is the total accommodation (SDF/WMA/OD) availed divided by number of days for which accommodation was extended during the month.5. - : Nil.6. The State of J&K has ceased to exist constitutionally from October 31, 2019 and the liabilities of the State continue to remain as liabilities of the new UT of Jammu and Kashmir.
Source: Reserve Bank of India.
Note: The State of J&K has ceased to exist constitutionally from October 31, 2019 and the liabilities of the State continue to remain as liabilities of the new UT of Jammu and Kashmir.Source: Reserve Bank of India.
No. 47: Financial Accommodation Availed by State Governments under various Facilities

CURRENT STATISTICS
RBI Bulletin January 2021 113
No. 48: Investments by State Governments
As on end of November 2020
Sr.No State/Union Territory
ConsolidatedSinking Fund
(CSF)
GuaranteeRedemption Fund
(GRF)
GovernmentSecurities
Auction TreasuryBills (ATBs)
1 2 3 4 51 Andhra Pradesh 8418 828 -- -2 Arunachal Pradesh 1541 2 -- -3 Assam 4572 55 -- -4 Bihar 7091 0 -- -5 Chhattisgarh 4501 0 1 47506 Goa 605 304 -- -7 Gujarat 7756 491 -- -8 Haryana 1411 1229 -- -9 Himachal Pradesh -- -- -- -
10 Jammu & Kashmir UT -- -- -- -11 Jharkhand 183 0 -- -12 Karnataka 4282 0 -- 2650013 Kerala 2181 0 -- -14 Madhya Pradesh 0 932 -- -15 Maharashtra 41789 432 -- 2500016 Manipur 384 102 -- -17 Meghalaya 673 36 9 -18 Mizoram 504 40 -- -19 Nagaland 1661 34 -- -20 Odisha 12717 1479 86 1854521 Puducherry 298 0 -- 80622 Punjab 938 0 8 -23 Rajasthan 0 0 129 200024 Tamil Nadu 6737 0 40 1467825 Telangana 5755 1251 -- -26 Tripura 379 9 -- -27 Uttar Pradesh 3216 81 -- -28 Uttarakhand 664 0 180 -29 West Bengal 8946 539 214 -
Total 127201 7844 666 92279
(` Crore)
Note: 1. The State of J&K has ceased to exist constitutionally from October 31, 2019 and the liabilities of the State continue to remain as liabilities of the new UT of Jammu and Kashmir.
Note: The State of J&K has ceased to exist constitutionally from October 31, 2019 and the liabilities of the State continue to remain as liabilities of the new UT of Jammu and Kashmir.
No. 48: Investments by State Governments

CURRENT STATISTICS
RBI Bulletin January 2021114
No. 49: Market Borrowings of State Governments(` Crore)
- : Nil.
Total amountraised, so far in
2020-21
Gross Net
12 1339250 34001
481 481
7800 7800
20000 19000
6000 5000
2000 1700
28280 20323
22500 19900
3000 2200
6810 5310
2600 2100
45000 40400
16566 15566
18000 18000
65000 52800
700 700
1050 900
674 574
1064 864
3000 2000
550 350
18216 11816
34211 27129
927 927
58000 49569
29534 25783
1113 1013
25500 12791
3700 3000
29500 20000
491026 401996
Sr. No. State
2018-19
GrossAmountRaised
NetAmountRaised
1 2 3
1 Andhra Pradesh 30200 23824
2 Arunachal Pradesh 719 693
3 Assam 10595 8089
4 Bihar 14300 10903
5 Chhattisgarh 12900 12900
6 Goa 2350 1850
7 Gujarat 36971 27437
8 Haryana 21265 17970
9 Himachal Pradesh 4210 2108
10 Jammu & Kashmir UT 6684 4927
11 Jharkhand 5509 4023
12 Karnataka 39600 32183
13 Kerala 19500 13984
14 Madhya Pradesh 20496 15001
15 Maharashtra 20869 3107
16 Manipur 970 667
17 Meghalaya 1122 863
18 Mizoram 0 -123
19 Nagaland 822 355
20 Odisha 5500 4500
21 Puducherry 825 475
22 Punjab 22115 17053
23 Rajasthan 33178 20186
24 Sikkim 1088 795
25 Tamil Nadu 43125 32278
26 Telangana 26740 22183
27 Tripura 1543 1387
28 Uttar Pradesh 46000 33307
29 Uttarakhand 6300 5289
30 West Bengal 42828 30431
Grand Total 478323 348643
2020-21
September October November
GrossAmountRaised
NetAmountRaised
GrossAmountRaised
NetAmountRaised
GrossAmountRaised
NetAmountRaised
6 7 8 9 10 11
7000 6417 6000 5417 2000 1417
- - - - 53 53
2300 2300 2000 2000 2500 2500
4000 4000 4000 4000 4000 4000
700 700 2000 1000 2000 2000
400 400 200 - 300 300
5500 4500 3000 1000 5500 3500
4500 4500 2000 1200 2000 2000
- - 1500 1500 1000 1000
1405 1405 500 500 1605 1605
- - 2600 2600 - -
10000 10000 8000 6000 8000 5400
2000 2000 - - 636 -364
2000 2000 3000 3000 4000 4000
14000 12000 11000 8673 5500 350
- - - - - -
600 550 250 250 - -100
132 132 - - 232 232
150 150 250 150 314 314
- - - - - -1000
225 225 125 125 200 -
4410 3010 2785 535 3321 1871
3500 3500 3000 1730 3761 3261
148 148 - - 312 312
3250 2000 6000 4125 4000 3375
4500 4083 3000 2583 3573 3156
400 400 300 300 413 413
6000 4000 8000 5524 4000 4000
1500 1500 1200 1200 - -
4500 3000 3500 2500 4000 3500
83120 72920 74210 55912 63219 47094
Notes: 1. The State of J&K has ceased to exist constitutionally from October 31, 2019 and the liabilities of the State continue to remain as liabilities of the new UT of Jammu and Kashmir.
2019-20
GrossAmountRaised
NetAmountRaised
4 5
42415 33444
1366 1287
12906 10996
25601 22601
11680 10980
2600 2000
38900 28600
24677 20677
6580 4460
7869 6760
7500 5656
48500 42500
18073 12617
22371 16550
48498 32998
1757 1254
1344 1070
900 745
1000 423
7500 6500
970 470
27355 18470
39092 24686
809 481
62425 49826
37109 30697
2928 2578
69703 52744
5100 4500
56992 40882
634521 487454
Source : Reserve Bank of India.
No. 49: Market Borrowings of State Governments
- : Nil.Note: The State of J&K has ceased to exist constitutionally from October 31, 2019 and the liabilities of the State continue to remain as liabilities of the new UT of Jammu and Kashmir. Source: Reserve Bank of India.

CURRENT STATISTICS
RBI Bulletin January 2021 115
Explanatory Notes to the Current Statistics
Table No. 11.2& 6: Annual data are average of months.3.5 & 3.7: Relate to ratios of increments over financial year so far.4.1 to 4.4, 4.8,4.9 &5: Relate to the last friday of the month/financial year.4.5, 4.6 & 4.7: Relate to five major banks on the last Friday of the month/financial year.4.10 to 4.12: Relate to the last auction day of the month/financial year.4.13: Relate to last day of the month/ financial year7.1&7.2: Relate to Foreign trade in US Dollar.
Table No. 22.1.2: Include paid-up capital, reserve fund and Long-Term Operations Funds.2.2.2: Include cash, fixed deposits and short-term securities/bonds, e.g., issued by IIFC (UK).
Table No. 4Maturity-wise position of outstanding forward contracts is available at http://nsdp.rbi.org.in under ‘‘Reserves Template’’.
Table No. 5 Special refinance facility to Others, i.e. to the EXIM Bank, is closed since March 31, 2013.
Table No. 6 For scheduled banks, March-end data pertain to the last reporting Friday.2.2: Exclude balances held in IMF Account No.1, RBI employees’ provident fund, pension fund, gratuity and superannuation fund.
Table Nos. 7 & 113.1 in Table 7 and 2.4 in Table 11: Include foreign currency denominated bonds issued by IIFC (UK).
Table No. 8NM2 and NM3 do not include FCNR (B) deposits.2.4: Consist of paid-up capital and reserves.2.5: includes other demand and time liabilities of the banking system.
Table No. 9Financial institutions comprise EXIM Bank, SIDBI, NABARD and NHB. L1 and L2 are compiled monthly and L3 quarterly. Wherever data are not available, the last available data have been repeated.
Table No. 13Data against column Nos. (1), (2) & (3) are Final (including RRBs) and for column Nos. (4) & (5) data are Provisional (excluding RRBs)
Table No. 14Data in column Nos. (4) & (8) are Provisional.

CURRENT STATISTICS
RBI Bulletin January 2021116
Table No. 15 & 16
Data are provisional and relate to select 41 scheduled commercial banks, accounting for about 90 per cent of total non-food credit extended by all scheduled commercial banks (excludes ING Vysya which has been merged with Kotak Mahindra since April 2015).
Export credit under priority sector relates to foreign banks only.
Micro & small under item 2.1 includes credit to micro & small industries in manufacturing sector.
Micro & small enterprises under item 5.2 includes credit to micro & small enterprises in manufacturing as well as services sector.
Priority Sector is as per old definition and does not conform to FIDD Circular FIDD.CO.Plan.BC.54/04.09.01/2014-15 dated April 23, 2015.
Table No. 172.1.1: Exclude reserve fund maintained by co-operative societies with State Co-operative Banks2.1.2: Exclude borrowings from RBI, SBI, IDBI, NABARD, notified banks and State Governments.4: Include borrowings from IDBI and NABARD.
Table No. 24Primary Dealers (PDs) include banks undertaking PD business.
Table No. 30 Exclude private placement and offer for sale. 1: Exclude bonus shares.2: Include cumulative convertible preference shares and equi-preference shares.
Table No. 32Exclude investment in foreign currency denominated bonds issued by IIFC (UK), SDRs transferred by Government of India to RBI and foreign currency received under SAARC SWAP arrangement. Foreign currency assets in US dollar take into account appreciation/depreciation of non-US currencies (such as Euro, Sterling, Yen and Australian Dollar) held in reserves. Foreign exchange holdings are converted into rupees at rupee-US dollar RBI holding rates.
Table No. 341.1.1.1.2 & 1.1.1.1.1.4: Estimates.1.1.1.2: Estimates for latest months. ‘Other capital’ pertains to debt transactions between parent and subsidiaries/branches of FDI enterprises.Data may not tally with the BoP data due to lag in reporting.
Table No. 351.10: Include items such as subscription to journals, maintenance of investment abroad, student loan repayments and credit card payments.
Table No. 36 Increase in indices indicates appreciation of rupee and vice versa. For 6-Currency index, base year 2016-17 is a moving one, which gets updated every year. REER figures are based on Consumer Price Index (combined). Methodological details are available in December 2005 and April 2014 issues of the Bulletin.

CURRENT STATISTICS
RBI Bulletin January 2021 117
Table No. 37Based on applications for ECB/Foreign Currency Convertible Bonds (FCCBs) which have been allotted loan registration number during the period.
Table Nos. 38, 39, 40 & 41 Explanatory notes on these tables are available in December issue of RBI Bulletin, 2012.
Table No. 43
Part I-A. Settlement systems1.1.3: Tri- party Repo under the securities segment has been operationalised from November 05, 2018.
Part I-B. Payments systems 4.1.2: ‘Others’ includes e-commerce transactions and digital bill payments through ATMs, etc. 4.2.2: ‘Others’ includes e-commerce transactions, card to card transfers and digital bill payments through
ATMs, etc. 5: Available from December 2010. 5.1: includes purchase of goods and services and fund transfer through wallets. 5.2.2: includes usage of PPI Cards for online transactions and other transactions. 6.1: Pertain to three grids – Mumbai, New Delhi and Chennai. 6.2: ‘Others’ comprises of Non-MICR transactions which pertains to clearing houses managed by 21 banks.
Part II-A. Other payment channels
1: Mobile Payments – o Include transactions done through mobile apps of banks and UPI apps.o The data from July 2017 includes only individual payments and corporate payments initiated,
processed, and authorised using mobile device. Other corporate payments which are not initiated, processed, and authorised using mobile device are excluded.
2: Internet Payments – includes only e-commerce transactions through ‘netbanking’ and any financial transaction using internet banking website of the bank.
Part II-B. ATMs3.3 and 4.2: only relates to transactions using bank issued PPIs.
Part III. Payment systems infrastructure3: Includes ATMs deployed by Scheduled Commercial Banks (SCBs) and White Label ATM Operators (WLAOs). WLAs are included from April 2014 onwards.
Table No. 45(-): represents nil or negligibleThe revised table format since June 2016, incorporates the ownership pattern of State Governments Securities and Treasury Bills along with the Central Government Securities.State Government Securities include special bonds issued under Ujwal DISCOM Assurance Yojana (UDAY) scheme.Bank PDs are clubbed under Commercial Banks. However, they form very small fraction of total outstanding securities.The category ‘Others’ comprises State Governments, Pension Funds, PSUs, Trusts, HUF/Individuals etc.

CURRENT STATISTICS
RBI Bulletin January 2021118
Time series data of ‘Current Statistics’ is available at https://dbie.rbi.org.in. Detailed explanatory notes are available in the relevant press releases issued by RBI and other publications/releases of the Bank such as Handbook of Statistics on the Indian Economy.
The concepts and methodologies for Current Statistics are available in Comprehensive Guide for Current Statistics of the RBI Monthly Bulletin (https://rbi.org.in/Scripts/PublicationsView.aspx?id=17618)
Table No. 46GDP data is based on 2011-12 base. GDP data from 2019-20 pertains to the Provisional Estimates of National Income released by National Statistics Office on 29th May 2020. GDP for 2020-21 is from Union Budget 2020-21.Data pertains to all States and Union Territories.Total receipts and total expenditure exclude National Calamity Contingency Fund expenditure.1 & 2: Data are net of repayments of the Central Government (including repayments to the NSSF) and State Governments.1.3: Represents compensation and assignments by States to local bodies and Panchayati Raj institutions.2: Data are net of variation in cash balances of the Central and State Governments and includes borrowing receipts of the Central and State Governments.3A.1.1: Data as per RBI records.3B.1.1: Borrowings through dated securities.3B.1.2: Represent net investment in Central and State Governments’ special securities by the National Small Savings Fund (NSSF).This data may vary from previous publications due to adjustments across components with availability of new data.3B.1.6: Include Ways and Means Advances by the Centre to the State Governments.3B.1.7: Include Treasury Bills, loans from financial institutions, insurance and pension funds, remittances, cash balance investment account.
Table No. 47SDF is availed by State Governments against the collateral of Consolidated Sinking Fund (CSF), Guarantee Redemption Fund (GRF) & Auction Treasury Bills (ATBs) balances and other investments in government securities.WMA is advance by Reserve Bank of India to State Governments for meeting temporary cash mismatches.OD is advanced to State Governments beyond their WMA limits.Average amount Availed is the total accommodation (SDF/WMA/OD) availed divided by number of days for which accommodation was extended during the month.- : Nil.
Table No. 48CSF and GRF are reserve funds maintained by some State Governments with the Reserve Bank of India.ATBs include Treasury bills of 91 days, 182 days and 364 days invested by State Governments in the primary market.--: Not Applicable (not a member of the scheme).

RECENT PUBLICATIONSRECENT PUBLICATIONS
RBI Bulletin January 2021 119
Name of Publication Price
India Abroad
1. Reserve Bank of India Bulletin 2021 `300 per copy (over the counter)`350 per copy (inclusive of postage)`4,200 (one year subscription - inclusive of postage)`3,150 (one year concessional rate*)`3,360 (one year subscription - inclusive of postage@)`2,520 (one year concessional rate@)
US$ 15 per copy (inclusive of postage) US$ 180 (one-year subscription)(inclusive of air mail courier charges)
2. Handbook of Statistics on the Indian States 2019-20
`650 (Normal)`700 (inclusive of postage)
US$ 24(inclusive of air mail courier charges)
3. Handbook of Statistics on the Indian Economy 2019-20
`600 (Normal)`650 (inclusive of postage)`450 (concessional)`500 (concessional with postage)
US$ 50(inclusive of air mail courier charges)
4. State Finances -A Study of Budgets of 2020-21
`600 per copy (over the counter)`650 per copy (inclusive of postal charges)
US$ 24 per copy(inclusive of air mail courier charges)
5. Report of the committee on Fuller Capital account Convertibility (Tarapore Committee Report II)
`140 per copy (over the counter)`170 per copy (inclusive of postal charges)
US$ 25 per copy(inclusive of air mail courier charges)
6. Banking Glossary (2012) `80 per copy (over the counter)`120 per copy (inclusive of postal charges)
7. Anuvad Ke Vividh Aayam (Hindi) `165 per copy (over the counter)`205 per copy (inclusive of postal charges)
8. Bank Me Rajbhasha Niti Ka Karyanvayan: Dasha Aur Disha (Hindi)
`150 per copy (over the counter)`200 per copy (inclusive of postal charges)
9. Reserve Bank of India Occasional Papers Vol. 39, 2018
`200 per copy (over the counter)`250 per copy (inclusive of postal charges)
US$ 18 per copy(inclusive of air mail courier charges)
10. Reserve Bank of India Occasional Papers Vol. 40, No. 1 & 2, 2019
`200 per copy (over the counter)`250 per copy (inclusive of postal charges)
US$ 18 per copy(inclusive of air mail courier charges)
11. Reserve Bank of India Occasional Papers Vol. 41, No. 1, 2020
`200 per copy (over the counter)`250 per copy (inclusive of postal charges)
US$ 18 per copy(inclusive of air mail courier charges)
12. Perspectives on Central Banking Governors Speak (1935-2010) Platinum Jubilee
`1400 per copy (over the counter) US$ 50 per copy(inclusive of air mail courier charges)
Recent Publications of the Reserve Bank of India
Notes1. Many of the above publications are available at the RBI website (www.rbi.org.in).2. Time Series data are available at the Database on Indian Economy (http://dbie.rbi.org.in).3. The Reserve Bank of India History 1935-1997 (4 Volumes), Challenges to Central Banking in the Context of Financial Crisis and the Regional
Economy of India: Growth and Finance are available at leading book stores in India.* Discount of 25% is available for students, teachers/lecturers, academic/education institutions, public libraries and Booksellers in India provided
the proof of eligibility is submitted from institution.@ In order to promote electronic payments it has been decided to offer 20% discount to domestic subscribers who are willing to pay through NEFT.

RECENT PUBLICATIONSRECENT PUBLICATIONS
RBI Bulletin January 2021120
General Instructions
1. Publications once sold will not be taken back.
2. Publications will not be supplied on a consignment VPP basis.
3. Wherever concessional price is not indicated, a discount of 25 per cent is available for students, teachers/lecturers, academic/education institutions, public libraries and book sellers in India provided the proof of eligibility is submitted from the concerned institution. Back issues of the publication are generally not available.
4. The publications are available for sale (Monday to Friday), at Sales Section, Division of Reports and knowledge dissemination, Department of Economic and Policy Research, Reserve Bank of India, Amar Building, Ground Floor, Sir P. M. Road, Fort, P. B. No.1036, Mumbai - 400 001. The contact number of Sales Section is 022-2260 3000 Extn.: 4002, Email: [email protected].
5. Subscription should be made preferably by NEFT & forwarding letter enclosing NEFT details should be addressed to the Director, Division of Reports and knowledge dissemination, Department of Economic and Policy Research, Reserve Bank of India, Amar Building, Ground Floor, Sir P. M. Road, Fort, P. B. No.1036, Mumbai - 400 001.
Following information is required to be filled in NEFT form by you:
Beneficiary Name Department of Economic and Policy Research, RBI
Name of the Bank Reserve Bank of India
Branch and addess Fort, Mumbai
IFSC of Bank Branch RBIS0MBPA04
Type of Account Current Account
Account Number 41-8024129-19
Sender to reciver information Name of Subscriber........Subscriber No. ..........
6. Every endeavour will be made to despatch publications expeditiously. In case of rush of orders, dispatch will be executed on a first-come first-served basis. It may take a minimum of a month’s time to complete formalities and then to dispatch the available publications. Complaints regarding ‘non-receipt of publication’ may be sent within a period of 2 months.
7. Kindly send your subscription number, name, address, and email id to [email protected] enabling us to communicate with you in an efficient manner.