
Jaisalmer District, Rajasthan-Final.pdf - Central Ground Water ...
123
भारत सरकार जल संसाधन, नद वकास और गंगा संरण मंालय कय भूम जल बोड GOVERNMENT OF INDIA MINISTRY OF WATER RESOURCES, RIVER DEVELOPMENT AND GANGA REJUVINATION CENTRAL GROUND WATER BOARD ायो!गक जलभृत मान!चण प%रयोजना का &तवे(न थार रे!ग*तान े, जैसलमेर िजला राज*थान REPORT ON PILOT PROJECT ON AQUIFER MAPPING IN THAR DESERT, JAISALMER DISTRICT, RAJASTHAN पिचमी े, जयपुर WESTERN REGION, JAIPUR दसबर -2015 December-2015
-
Upload
khangminh22 -
Category
Documents
-
view
1 -
download
0
Transcript of Jaisalmer District, Rajasthan-Final.pdf - Central Ground Water ...
भारत सरकार
जल ससाधन, नद वकास और गगा सरण मालय
कय भम जल बोड
GOVERNMENT OF INDIA
MINISTRY OF WATER RESOURCES, RIVER DEVELOPMENT AND GANGA REJUVINATION
CENTRAL GROUNDWATER BOARD
ायो!गक जलभत मान!चण प%रयोजना का &तव(न
थार र!ग*तान , जसलमर िजला राज*थान
REPORT ON PILOT PROJECT ON AQUIFER MAPPING IN
THAR DESERT, JAISALMER DISTRICT, RAJASTHAN
पिचमी , जयपर WESTERN REGION, JAIPUR
दसबर -2015 December-2015

Preface
The Central Ground Water Board carried out the Pilot Project on Aquifer Mapping in 6
different hydrogeological environs of the country during 2011-12 to 2014-15 with active
support and funding from the World Bank. The Ramgarh Area in Jaisalmer district of
Rajasthan was selected as the type area for study of aquifers in "Desert Environment"
During the project period, available data was compiled, data gap analysis was carried out
and data generated to fill these gaps. Extensive hydrogeological surveys were carried out
including village wise well inventory, water level and water quality monitoring, collecting
hydrogeological information through well drilling, pumping tests, slug test, infiltration tests,
etc. Geophysical studies were done both by CGWB and CSIR-NGRI.The geophysical studies
included, Vertical Electrical Soundings, ERT,Ground TEM and SkyTem. Advance geophysical
techniques of heli-borne sky-TEM surveys were carried out by CSRI-NGRI, Hyderabad in
association with Aarhus University, Denmark and SkyTEM (STS),Denmark.
All the data collected using various techniques was studied and synthesized in the form of 3
dimensional aquifer maps incorporating the various attributes of the aquifer system. Based
on the 3D aquifer maps and analysis of data, Aquifer Management Plans were prepared.
Apart from the efforts made by the officers and staff members of CGWB, there was
significant contribution from the scientists of CSIR-NGRIand Ground Water Department,
Rajasthan. Sincere efforts of Shri Rana Chatterjee, Scientist 0 and nodal officer of the
project and the entire project team in bringing this project to a fruitful end and compilation
of this report are thankfully acknowledge.
I am sure that this report would form a good basis for any aquifer management studies,
including the National Aquifer Mapping and Management Programme (NAQUIM), in similar
terrains.
(P.K. Parchure)
Regional Director

ACKNOWLEDGEMENT
Er. K. B. Biswas, Chairman, CGWB, Faridabad is sincerely thanked for spearheading this
flagship project of MoWR, RD & GR, Govt. of India.
Sincere thanks is also expressed to Dr. S. C. Dhiman, Sh. Sushil Gupta and Dr. R. C. Jain
former Chairmans, CGWB, Faridabad under whose tenure the project was conceptualized
and initiated. The guidance of Sh. K. C. Naik, Member (SAM), and of former Members of
CGWB, Dr. S. Kunar, Dr. Varadaraj and Dr. R. C. Jain, Asish Chakrabarty, is gratefully
acknowledged.
The time to time support and scientific guidance during the project work extended by the
expert team of officers from CGWB, CHQ, Faridabad especially Dr. Sunil Kumar, Regional
Director & then Director (admin), Sh. Sanjay Marwah, Regional Director, Dr. S. Suresh,
Scientist D , Sh. S. K. Sinha, Scientist D, Er. K.R. Biswas, S.E., Er. Nidhish Verma, Ex.En. , Sh. K.
V. Kumar, Superintending Geophysicist (Retd.), Sh. Madhukar, Superintending geophysicist,
Sh. Pankaj Kumar, Assistant Hydrogeologist, is gratefully acknowledged. Thanks are also
due to the team of officers Dr. Subhash Chandra, Dr. Sahebrao Sonkamble, N.C.Mondal, Dr.
Murlidharan from NGRI, Hyderabad under the competent leadership of Dr. Sakeel Ahmad,
Chief Scientist, NGRI for providing useful geophysical input for compilation of this report.
The authors express sincere thanks to World Bank and its representatives, especially Dr.
Anju Gaur and Sh. B. Jayakumar and Dr. P.C. Chandra, the Consultants, World Bank for
valuable guidance. Thanks are also due to the senior officers of MoWR, RD& GR including
Sh. Avnish Kant, Scientist for coordinating the project from the beginning to the end.
The expert and consultants from Aarhus University, Denmark and SkyTEM team members
are also acknowledged for their valuable cooperation to this project.
The support and technical input from the colleagues of Central Ground Water Board,
Western Region, Jaipur and State Unit Office, Jodhpur is gratefully acknowledgement.
The authors sincerely thanks to all nodal officers of the other four pilot projects and officers
concerned for the technical discussions and inputs during the meetings.
Thanks are also due to various State and Central Govt. agencies viz., GWD, Water Resources
Department, Jodhpur, GSI, Jaipur, Irrigation Department, Jaipur, Agriculture Department,
Jaipur and SRSAC, Jodhpur for providing valuable data and suggestions. Special thanks are
due to Sh. N.K. Vaishnav and Dr. N.D. Inakhiya, GWD, Jodhpur and Jaisalmer district,
respectively. Sh. Sh. Chattar Singh Jam, Sambhav organization, Jaisalmer district have been
instrumental in demonstrating the traditional water management practices in desert
terrain. The input from Sh. Chattar Singh is gratefully acknowledged.
Last but not the least, sincere thanks is expressed to every person involved in this project
and the villagers from project area
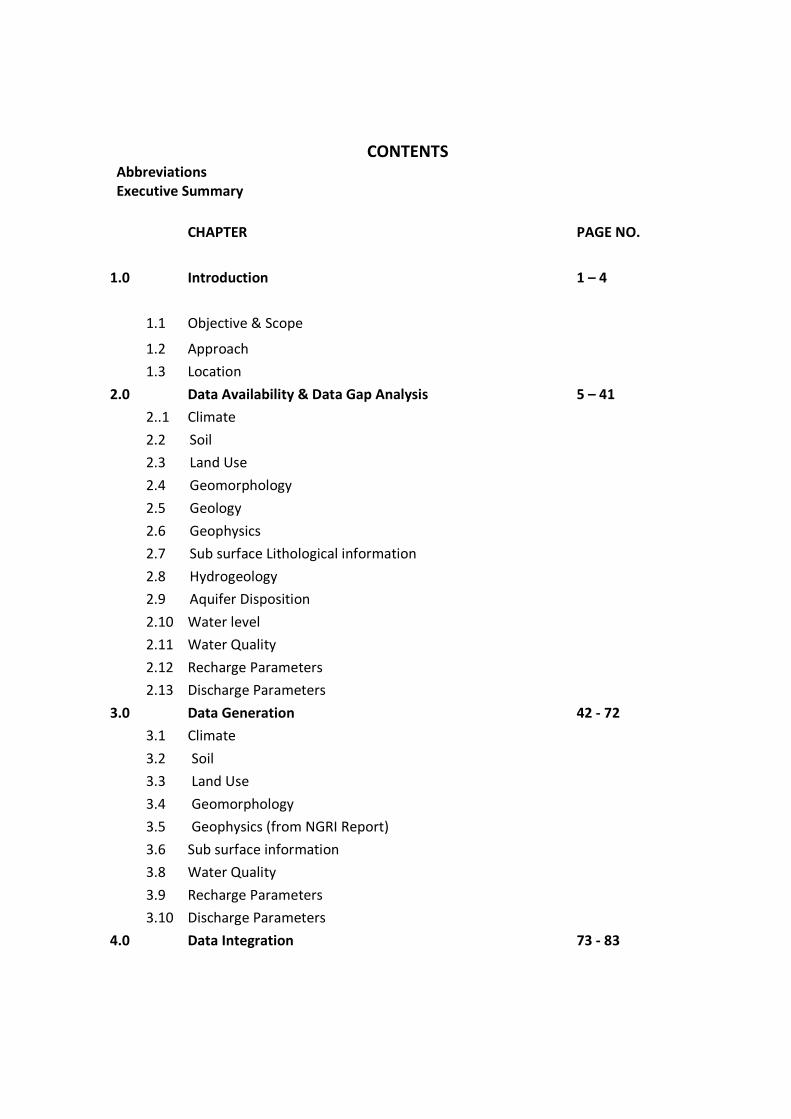
CONTENTS Abbreviations
Executive Summary
CHAPTER PAGE NO.
1.0 Introduction 1 – 4
1.1 Objective & Scope
1.2 Approach
1.3 Location
2.0 Data Availability & Data Gap Analysis 5 – 41
2..1 Climate
2.2 Soil
2.3 Land Use
2.4 Geomorphology
2.5 Geology
2.6 Geophysics
2.7 Sub surface Lithological information
2.8 Hydrogeology
2.9 Aquifer Disposition
2.10 Water level
2.11 Water Quality
2.12 Recharge Parameters
2.13 Discharge Parameters
3.0 Data Generation 42 - 72
3.1 Climate
3.2 Soil
3.3 Land Use
3.4 Geomorphology
3.5 Geophysics (from NGRI Report)
3.6 Sub surface information
3.8 Water Quality
3.9 Recharge Parameters
3.10 Discharge Parameters
4.0 Data Integration 73 - 83
CHAPTER PAGE NO.
4.1 Introduction
4.2 Translation into Hydrogeological model
4.3 Major Findings
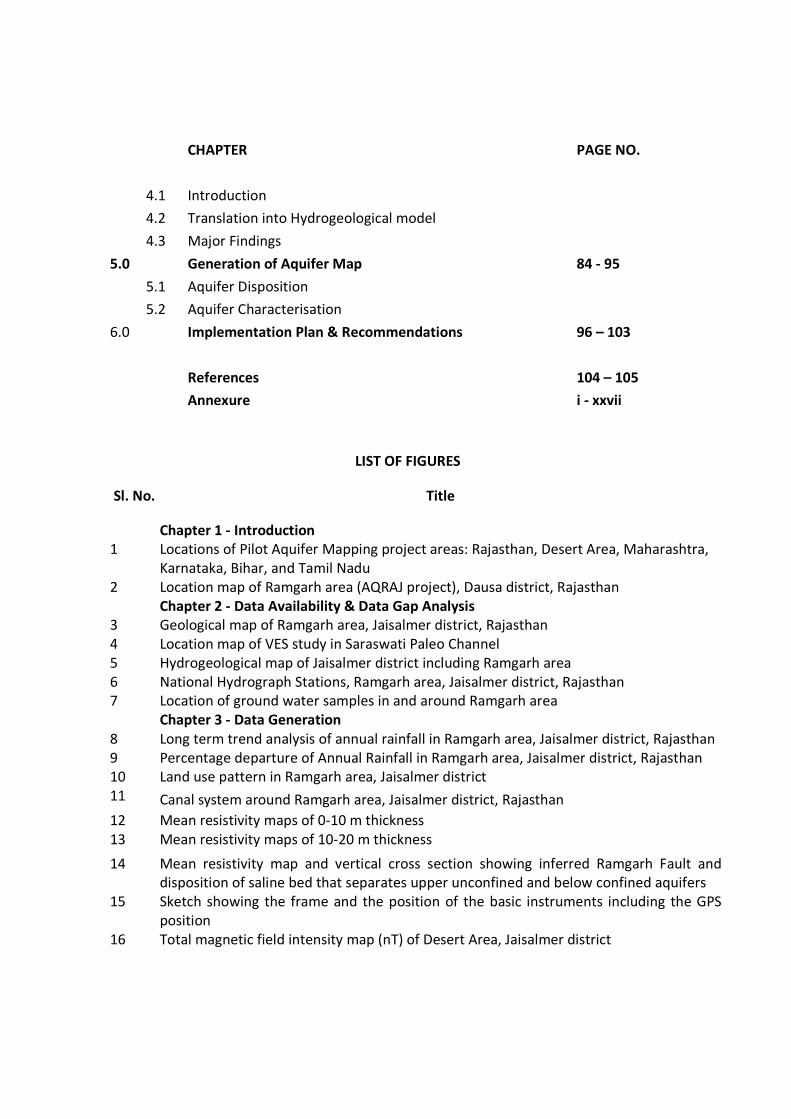
5.0 Generation of Aquifer Map 84 - 95
5.1 Aquifer Disposition
5.2 Aquifer Characterisation
6.0 Implementation Plan & Recommendations 96 – 103
References 104 – 105
Annexure i - xxvii
LIST OF FIGURES
Sl. No. Title
Chapter 1 - Introduction
1 Locations of Pilot Aquifer Mapping project areas: Rajasthan, Desert Area, Maharashtra,
Karnataka, Bihar, and Tamil Nadu
2 Location map of Ramgarh area (AQRAJ project), Dausa district, Rajasthan
Chapter 2 - Data Availability & Data Gap Analysis
3 Geological map of Ramgarh area, Jaisalmer district, Rajasthan
4 Location map of VES study in Saraswati Paleo Channel
5 Hydrogeological map of Jaisalmer district including Ramgarh area
6 National Hydrograph Stations, Ramgarh area, Jaisalmer district, Rajasthan
7 Location of ground water samples in and around Ramgarh area
Chapter 3 - Data Generation
8 Long term trend analysis of annual rainfall in Ramgarh area, Jaisalmer district, Rajasthan
9 Percentage departure of Annual Rainfall in Ramgarh area, Jaisalmer district, Rajasthan
10 Land use pattern in Ramgarh area, Jaisalmer district
11 Canal system around Ramgarh area, Jaisalmer district, Rajasthan
12 Mean resistivity maps of 0-10 m thickness
13 Mean resistivity maps of 10-20 m thickness
14 Mean resistivity map and vertical cross section showing inferred Ramgarh Fault and
disposition of saline bed that separates upper unconfined and below confined aquifers
15 Sketch showing the frame and the position of the basic instruments including the GPS
position
16 Total magnetic field intensity map (nT) of Desert Area, Jaisalmer district
Sl. No. Title
17 Location of exploratory wells drilled in Desert Area, Jaisalmer district project
18 Location Map of monitoring wells
190 Hydrographs showing monthly water level of representative monitoring stations in
Desert Area, Jaisalmer District, Rajasthan
20 Depth to water level map of pre-monsoon (May), 2014, Desert Area, Jaisalmer district,
Rajasthan
21 Depth to water level map of post-monsoon (November, 2014), Desert Area, Jaisalmer
district, Rajasthan
22 Time series data of the National Hydrograph Stations of CGWB in AQRAJ, Dausa district,
Rajasthan
Chapter 4 - Data Integration
23 Borehole Geophysical log
24 SkyTEM resistivity section and translated litho/aquifer model
25 DEM map prepared from DGPS data collected while SkyTEM survey
26 Elevation map of sand dune bottom
27 Elevation map of top of unconfined aquifer and water table surface
28 Elevation map of top of saline layer which marly limestone and gypseous clay
29 Elevation map of top of confined aquifer containing relatively fresh groundwater
30 Three- dimensional aquifer section represented by EW and NE-SW profiles of 250 m
thickness
Chapter 5 - Generation of Aquifer Map
31
a to d
Isopach maps of Sand dunes, Unsaturated Aquifer, Un-confined Aquifer and Saline layer
in Ramgarh area, Jaisalmer district, Rajast
32 3-D Aquifer Model, Ramgarh area, Jaisalmer district, Rajasthan
33 3-D model depicting volumes of different layers
34 Depth to water level map of pre-monsoon (May), 2014, un-confined aquifer, Desert
Area, Jaisalmer district, Rajasthan
35 Depth to water level map of post-monsoon (November, 2014), un-confined aquifer,
Desert Area, Jaisalmer district, Rajasthan
36 Water Table map of pre-monsoon (May, 2014), un-confined aquifer, Desert Area,
Jaisalmer district, Rajasthan
37 Water Table map of post-monsoon (November, 2014), un-confined aquifer, Desert Area,
Jaisalmer district, Rajasthan
38 Specific yield map of un-confined aquifer
39 Potential map of alluvium aquifer and hard rock aquifer
40 Aquifer Map of Ramgarh area, Jaisalmer district, Rajasthan
41 3-D Aquifer Disposition of Ramgarh area, Jaisalmer district, Rajasthan
LIST OF PLATES
Sl. No. Title
Chapter 3 - Data Generation
1 Soil Infiltration Test conducted in Ramgarh area, Jaisalmer district, Rajasthan
2 Flat rocky terrain
3 Desert terrain
4 IGNP canal near Ramgarh area, Jaisalmer district, Rajasthan
5 Exploratory drilling operation in Desert Area project, Ramgarh area, Jaisalmer district,
Rajasthan
Chapter 6 – Implementation Plan and Recommendation
6 Beri in Desert land of Ramgarh area, Jaisalmer district, Rajasthan
7 Beris in Biprasar talav, Jaisalmer district, Rajasthan
8 Ekalpar Beri, Jaisalmer district, Rajasthan
9 Water logging situation along IGNP Canal, Ramgarh area, Jaisalmer district, Rajasthan
LIST OF TABLES
Sl. No. Title
Chapter 2 - Data Availability & Data Gap Analysis
1 Data Availability and Data Gap Analysis in Ramgarh Pilot Aquifer Mapping Studies
2 Geological sequence in Ramgarh Desert Area, Jaisalmer district
3 Interpreted Layer Parameters Obtained from Vertical Electrical Soundings in Sam
Block, Jaisalmer district
4 National Hydrograph Monitoring Stations in and around Ramgarh area, Jaisalmer
district, Rajasthan
5 Recharge parameters used for computation of ground water resources in Sam
block, Jaisalmer district, Rajasthan
6 Discharge parameters used for estimation of ground water resources estimation of
part of Sam block in 2009 assessment
Chapter 3- Data Generation
7 Data Generated on various attributes of Aquifer Mapping in Ramgarh area,
Jaisalmer district, Rajasthan
8 Statistical Analysis of Annual Rainfall of the Rain Gauge Station
9 Soil Infiltration test results, Ramgarh area, Jaisalmer district, Rajasthan
10 Land Use Pattern in Ramgarh area, Jaisalmer district, Rajasthan
Sl. No. Title
11 Resistivity scale used for litho characterization
12 Salient features of exploratory wells constructed in Desert Area, around Ramgarh,
Jaisalmer district, Rajasthan
13 Monitoring Wells established in the Desert Area project, Jaisalmer district,
Rajasthan
14 Long term water level trend of National Hydrograph Monitoring Stations, CGWB
15 Average long term water level trend computed in Ground water resources
assessment, 2011
16 Electrical conductivity in Ramgarh area, Jaisalmer district, Rajasthan
17 Flouride content in ground water in Ramgarh area, Jaisalmer district, Rajasthan
18 Nitrate content in ground water in Ramgarh area, Jaisalmer district, Rajasthan
19 Infiltration Test results carried out in Ramgarh area, Jaisalmer district
Chapter 4 - Data Integration
20 Consolidated Litholog of Exploratory Borewell at I G N P Colony, Ramgarh,
District Jaisalmer
21 Performance of SkyTEM in Aquifer Mapping in Ramgarh area, Jaisalmer district,
Rajasthan
22 Performance of various Geophysical methods in Aquifer Mapping in Ramgah area,
Jaisalmer district, Rajasthan
23 Parameters for up-scaling the advanced Geophysical techniques in National Aquifer
Mapping
Chapter 5 – Generation of Aquifer Map
24 Volumes of layers in Desert Area, Jaisalmer district, Rajasthan
Chapter 6 – Implementation Plan and Recommendation
25 Dynamic Ground Water Resources of Desert project area, Jaisalmer district,
Rajasthan
LIST OF ANNEXURES
Sl. No. Title
Chapter 2 - Data Availability & Data Gap Analysis
I Details of exploratory borewells drilled in Saraswati paleo-channels
II Long Term Water level Data
Chapter 3 - Data Generation
III Details of the rainfall data in Ramgarh
IV Details of borehole drilled in Desert Area Region
V Monthly water level data in Desert Area Region
VI Chemical analysis results in Desert Area Region
ABBREVIATIONS
CGWB Central Ground Water Board cm Centimetre DES Department of Economics & Statistics Ham Hectare metre Heli-TEM Heliborne Transient Electro Magnetic Method IMD India Meteorological Department LCI Laterally constrained inversion Lps Litres per second M Meter m bgl Meter below ground level m ham Million hectare metre M.I. Minor Irrigation mcm Million cubic metre mm Millimetre MOWR Ministry of Water Resources, Govt. of India NGRI National Geophysical Research Institute SCI Spatially constrained inversion sq.m. Square meter

EXECUTIVE SUMMARY
The aquifer mapping project in Ramgarh area, Jaisalmer district, Rajasthan, India was taken
up with the objective to evolve an aquifer management plan in an arid desert terrain in the
western India. The project study involves establishing the aquifer disposition and its
characterization at 1:50,000 scale using latest state of art technology in the field of
hydrogeology and geophysics and recommending aquifer management plan.
The total study area of the pilot aquifer mapping project is about 675 sq.km. The area is
around Ramgarh town, located in Sam Panchayat Samiti (block), Jaisalmer district, in
Western Rajasthan. The aquifers in the project area are mainly sedimentary rocks of
calcareous-argillaceous-arenaceous nature of Tertiary and Mesozoic era. Aquifers are
encountered at the depths of 45 to 70 m and 125 to 160 m. These are unconfined to semi-
confined in nature. Water quality is around EC 3500-4000 micromhos/cm. Ground water
level around Ramgarh area is about 30 to 40 m bgl. However, in the area lying south of
Ramgarh, water level is comparatively deeper and goes even beyond 100 m bgl at places.
The other major source of water is IGNP canal.
The aquifer disposition and characteristics prevailing in the area has been studied based on
exploratory drilling tapping individual aquifers. Infiltration tests were carried out to
estimate the recharge rate of the aquifers. Monthly monitoring is carried out to decipher
the ground water flow pattern. Geophysical studies were carried out using ground TEM and
Sky TEM techniques. Studies were also carried out on the participatory water management
being practiced in the area by the stakeholders at grass root level. Ground water is stored in
perched aquifers and being utilized through shallow well called beri. The system provides
effective water management option in the desert terrain.
The study recommended development of holistic water management programme which
involves - replication of traditional water management practices and controlled use of
available fresh water resources.
1
1. INTRODUCTION
Government of India has launched National Aquifer Mapping programme for aquifer based
Sustainable Groundwater Management Plan of India. It requires a comprehensive country-
wide aquifer map at village or micro-watershed level. It is a holistic multi-disciplinary
scientific approach for aquifer characterization.
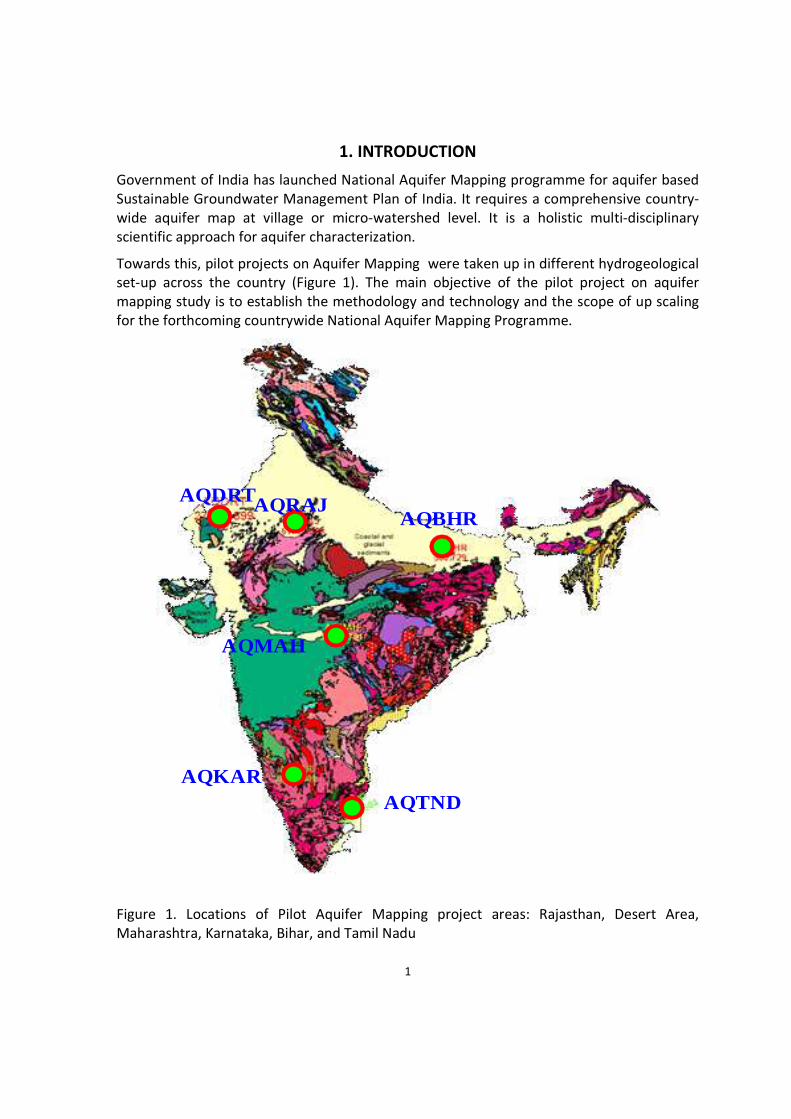
Towards this, pilot projects on Aquifer Mapping were taken up in different hydrogeological
set-up across the country (Figure 1). The main objective of the pilot project on aquifer
mapping study is to establish the methodology and technology and the scope of up scaling
for the forthcoming countrywide National Aquifer Mapping Programme.
AQTNDAQKAR
AQMAH
AQBHRAQRAJAQDRT
Figure 1. Locations of Pilot Aquifer Mapping project areas: Rajasthan, Desert Area,
Maharashtra, Karnataka, Bihar, and Tamil Nadu
2
1.1 OBJECTIVES & SCOPE:
The objectives of the pilot project are -
i. To define the aquifer geometry, type of aquifers, ground water regime behaviours,
hydraulic characteristics and geochemistry of Multi-layered aquifer systems on
1:50,000 scale
ii. Intervention of new geophysical techniques and establishing the utility, efficacy and
suitability of these techniques in different hydrogeological setup.
iii. Finalizing the approach and methodology on which National Aquifer mapping
programme of the entire country can be implemented.
iv. The experiences gained can be utilized to upscale the activities to prepare micro
level aquifer mapping.
The activities of the Pilot Project on Aquifer Mapping can be envisaged as follows
1. Data Compilation & Data Gap Analysis: One of the important aspect of the aquifer
mapping programme was the synthesis of the large volume of data already collected
during specific studies carried out by Central Ground Water Board and various
Government organizations with a new data set generated that broadly describe an
aquifer system. The data were assembled, analysed, examined, synthesized and
interpreted from available sources. These sources were predominantly non-
computerized data, which was converted into computer based GIS data sets. On the
basis of available data, Data Gaps were identified.
2. Data Generation: There was also a strong need for generating additional data to fill
the data gaps to achieve the task of aquifer mapping. This was achieved by multiple
activities such as exploratory drilling, geophysical techniques, hydro-geochemical
analysis, remote sensing, besides detailed hydrogeological surveys. CSIR-NGRI has
been hired as consultant to carry out geophysical studies including advance
Heliborne Transient Electro Magnetic Method (Heli-TEM) to delineate multi aquifer
system; to bring out the efficacy of various geophysical techniques and a protocol
for use of geophysical techniques for aquifer mapping in different hydrogeological
environs.
3. Aquifer Map Preparation: On the basis of integration of data generated from
various studies of hydrogeology & geophysics, aquifers have been delineated and
characterized in terms of quality and potential. Various maps have been prepared
bringing out Characterization of Aquifers, which can be termed as Aquifer maps
providing spatial variation (lateral & vertical) in reference aquifer extremities,
quality, water level, potential and vulnerability (quality & quantity).

3
4. Aquifer Management Plan Formulation: A suitable strategy for sustainable
development of the aquifer in the area has been evolved based on the acquired
data.
1.2. APPROACH
The overall implementation of the project has been carried out by Central Ground Water
Board (CGWB), Western Region, Ministry of Water Resources, Govt. of India under
Hydrology Project II funded by World Bank.
The project work involves collection of existing data from various sources including CGWB
records, State Government agencies, literature available in the libraries and internet, NGO
and other sources relevant for the purpose of aquifer mapping and management. Some of
the baseline reports on the project area include Status report on search of palaeochannels
in Western Rajasthan, CGWB (2002) and District Ground water Brochure (2011).
The data are assembled, analysed, examined, synthesized and interpreted from
available sources. These sources are predominantly non-computerized data, which is
converted into computer based GIS data sets. Data gap analysis was carried out and
additional data are generated through hydrogeological surveys, exploratory drilling,
advanced geophysical techniques, hydro-geochemical analysis, remote sensing etc. that
broadly describe the aquifer system prevailing in the area.
The project component related to advanced geophysical investigation was
outsourced to National Geophysical Research Institute (NGRI), Hyderabad. The Heliborne
Geophysical studies would be undertaken by Aarhus University and SkyTEM (STS), Denmark.
Rest of the project work was undertaken through departmental workforce.
The integrated database is transformed into aquifer maps in GIS platforms. The
understanding on the disposition of aquifers are refined based on the GIS outputs and a
conceptual model is developed. The conceptual model is applied to a numerical flow model
to determine the overall water budget and generate predictive scenarios based on the
proposed aquifer management strategies. Finally, an aquifer management plan is
formulated. The following flow chart highlights the broad steps adopted in the pilot aquifer
mapping project in Ramgarh area, Jaisalmer district, Rajasthan.
1.3 LOCATION
The original area identified for pilot aquifer mapping project in desert area is around
Jaluwala area in Jaisalmer district. However, since Jaluwala area is close to international
border, heli-borne geophysical survey would not be possible in the area. Hence, in the
meeting taken by Secretary on 01.11.12 at MOWR, New Delhi to review the progress in
respect of Pilot Aquifer Mapping Project, it was decided that an alternate area near
Ramgarh, Jaisalmer district, Rajasthan would be taken up for Pilot Aquifer Mapping in
desert area. Based on study of the literatures, various GIS layers and field traverses
undertaken jointly by CGWB and NGRI consultant scientists, the area around Ramgarh,
Jaisalmer district was found suitable for study under Desert Area as well as Heliborn Survey.
4
LOCATION DETAILS
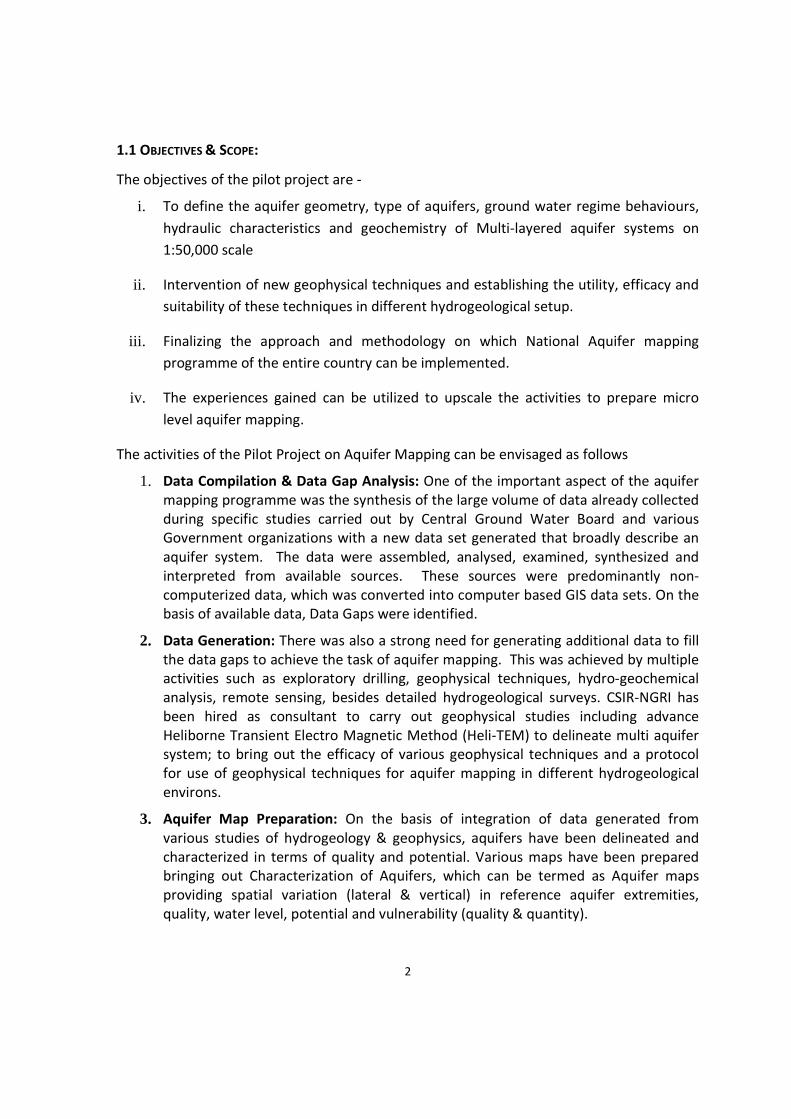
The area lies within Latitude: 27°16'N and 27°30'N and Longitude: 70°20'00"E and
70°36'20"E, falling in topo sheets 40I/7 and 40I/11 located in Sam Panchayat Samiti (block),
Jaisalmer district, in Western Rajasthan. It forms a part of Western Arid Plain (Figure 2). The
total study area of the pilot aquifer mapping project is about 675 sq.km. The area is around
Ramgarh town, approximately 25 km in North-South stretch and 25 km in East-West stretch
with Ramgarh almost at its centre.
Figure 2 Location map of Ramgarh area, Jaisalmer district, Rajasthan
5
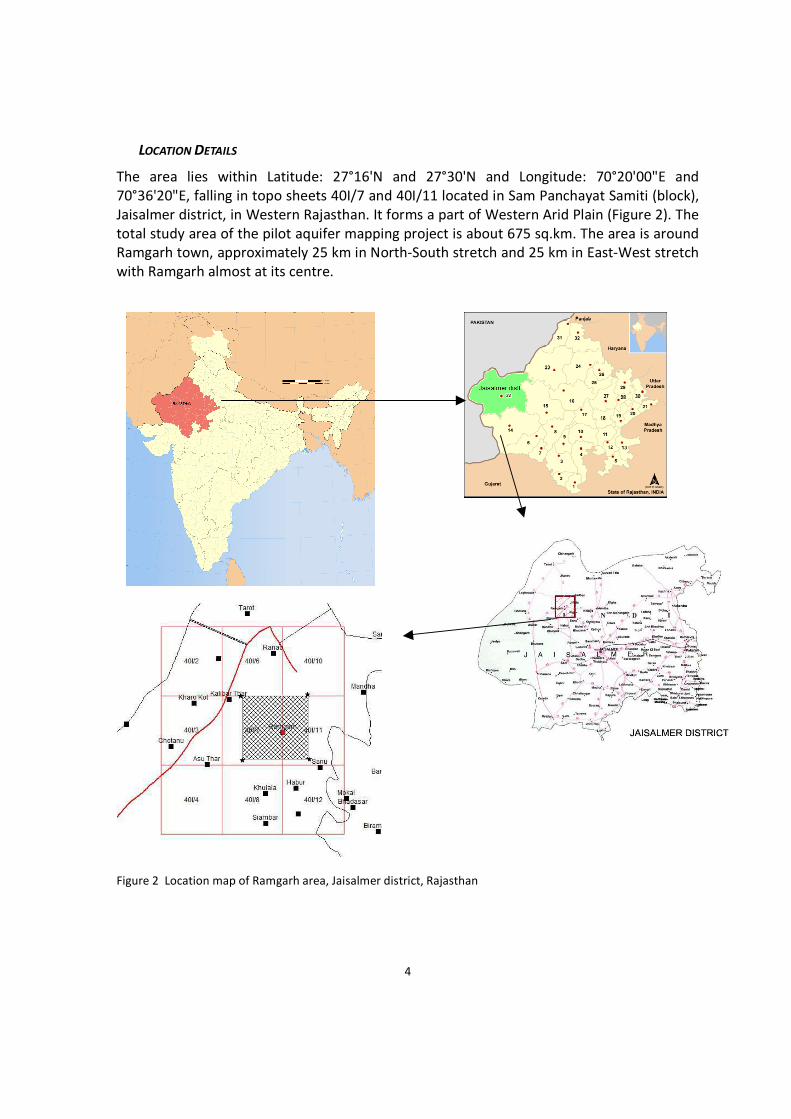
2 DATA AVAILABILITY & DATA GAP ANALYSIS
The data on various attributes of the study are collected from the available literatures of
Central Ground Water Board, State Ground Water Department of Rajasthan and various
Central and State Government agencies. The summerized table presenting the Data
Requirement, Data Availability and Data Gap Analysis is presented in table 1.
Table 1. Data Availability and Data Gap Analysis in Ramgarh Pilot Aquifer Mapping Studies
Sl. No. Items Data Requirement Data Availability Data Gap
1 Climate Season-wise Rainfall
pattern
Annual Rainfall of 1
Metereological Station
Time-series data on
Rainfall
2 Soil Soil map and Soil
Infiltration Rate
Soil map Soil Infiltration Rate
across study area
3 Land use Latest Land Use pattern No Data Latest data required
4 Geomorphology Detailed Information on
Geomorphology of the
area
District level information Study area level
information
5 Geophysics Geophyiscal data of the
Study area
No Data of the Study area Entire area unexplored
6 Exploration Data As per requirement of
Advanced Geophysical
Studies for Integration of
data and Validation of
Techniques
No Data of the Study area Entire area unexplored
7 Monitoring Regime Representative
Monitoring Wells well
distributed over the Study
Area
1 Monitoring Well Entire area unexplored
8 Recharge
Parameters
Recharge parameters for
different soil and aquifer
types based on field
studies
Recharge parameters
given in Ground Water
Resources Estimation
Entire study area
2.1 CLIMATE
Data Availability
The area lies in arid tract of Thar desert characterised by extremes of hot and cold
weather. Rainfall is erratic and normal annual rainfall in Jaisalmer district is less than 200
mm. Droughts are frequent. Almost 90% of the total annual rainfall is received during the
southwest monsoon, during July to mid of September. As the area lies in the desert area,
extreme of heat in summer and cold in winter is the characteristic of the desert. Both day
and night temperature increases gradually and reaches their maximum values in May and
June. The temperature varies from 48 degree in summer to 2 degree in winter. Atmosphere
is generally dry except during the monsoon period. The humidity is highest in August with

6
mean daily relative humidity in Jaislamer district is 43%. The annual maximum potential
evapotranspiration in the district is 1850 mm and it is highest in the month of June and
lowest in the month of December.
Data Gap Analysis
Season-wise rainfall data of the area is required.
2.2 SOIL
Date Availability
Predominant soil types area
a. Desert soil: Desert soil area is occupied by alluvium and wind blown sand, yellowish
brown, sandy to sandy loam, loose, structure less, well drained with high permeability
and lies in major part of the district.
b. Sand dunes: These are non-calcareous soil, sandy to loamy sand, loose, structure less and
well drained. It lies in northern, western, southwestern, northeastern part of the
district.
Data Gap Analysis
Data on soil infiltration rate for various types of soils existing in the project area
needs to generated in order to analyses the impact of the soil cover on the ground water
regime of the area.
2.3 LAND USE
Data Availability
No data
Data Gap Analysis
Updated land use statistics needs to be collected.
2.4 GEOMORPHOLOGY
Data Availability
The study area is a part of Great Thar Desert. Sand dunes are observed about 10 km north
of Ramgarh town. Major part of the study is predominantly covered with flat, limestone
terrain. There is little or no soil cover and thin vegetation. North of Ramgarh and along
canal, agricultural activities were observed. Vegetation is more predominant along the
canal. Several quarries were observed on both sides of the road between Ramgarh and
Sanu. The quarries were mostly of limestone and other building materials.
There is no rivers worth the name in the area nor are there any perennial stream in the
area. IGNP branch canal flows north of Ramgarh town.
7
Data Gap Analysis
Additional information need to be collected, so that the same can be used in
hydrogeological interpretations and formulation of ground water management plan.
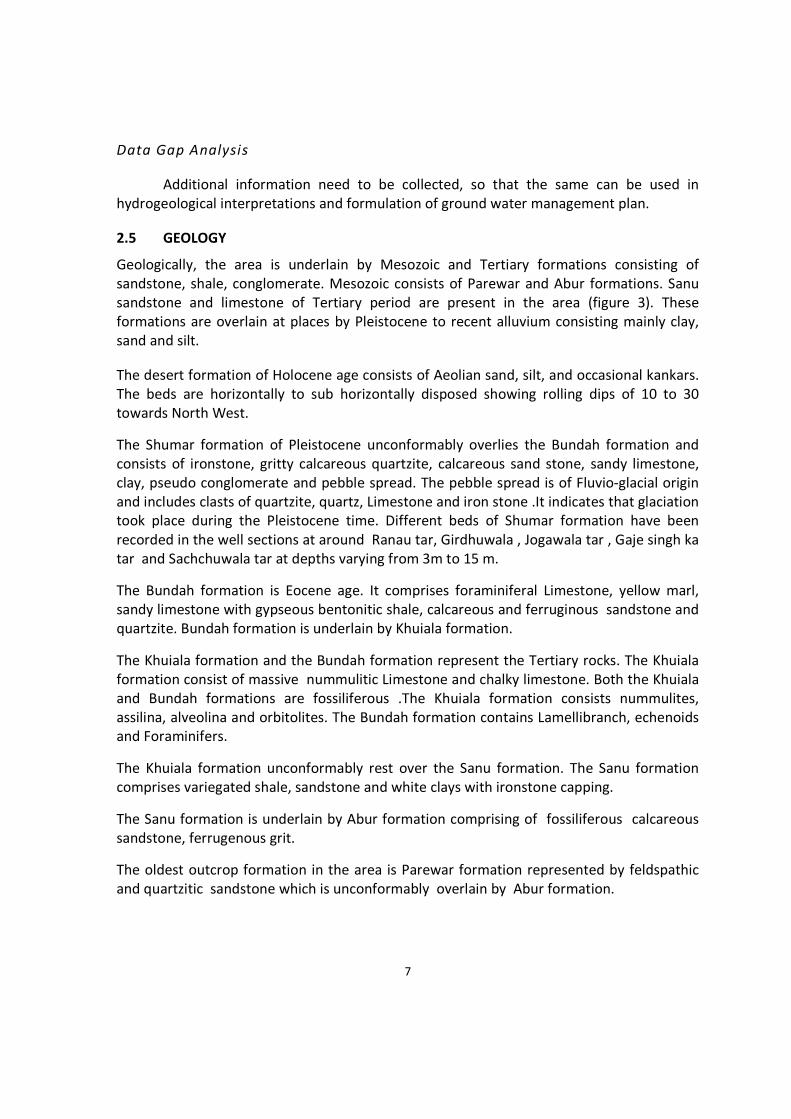
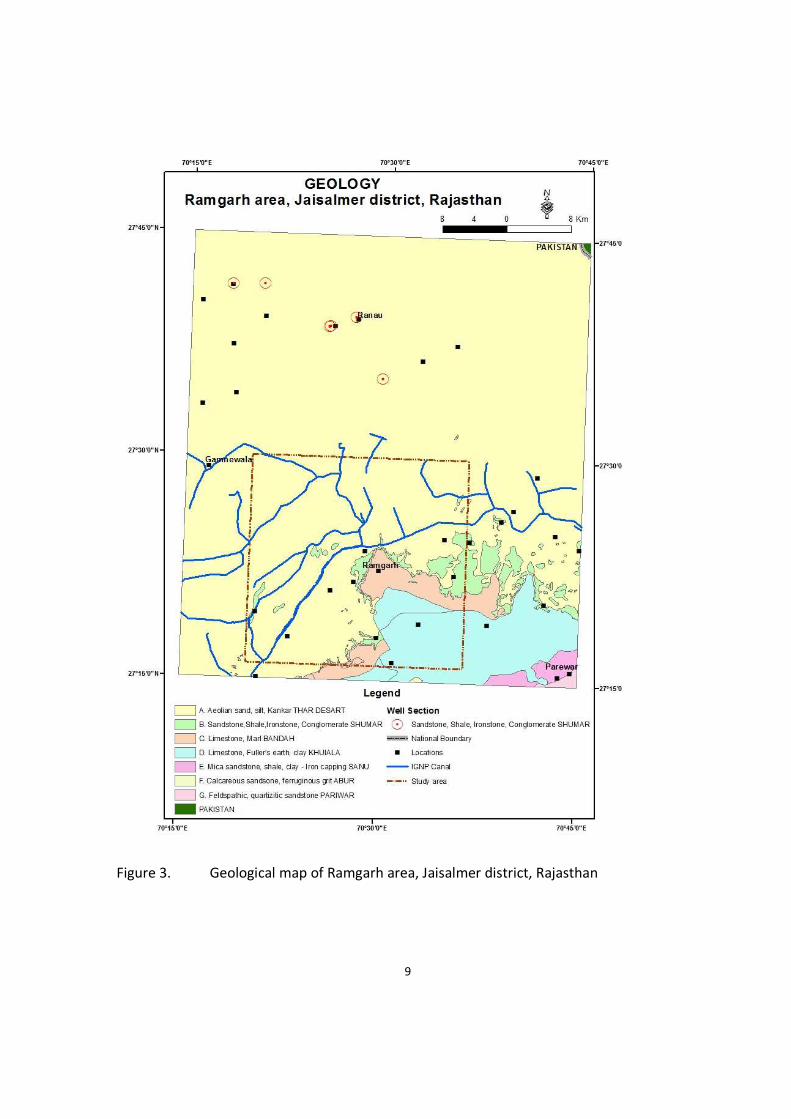
2.5 GEOLOGY
Geologically, the area is underlain by Mesozoic and Tertiary formations consisting of
sandstone, shale, conglomerate. Mesozoic consists of Parewar and Abur formations. Sanu
sandstone and limestone of Tertiary period are present in the area (figure 3). These
formations are overlain at places by Pleistocene to recent alluvium consisting mainly clay,
sand and silt.
The desert formation of Holocene age consists of Aeolian sand, silt, and occasional kankars.
The beds are horizontally to sub horizontally disposed showing rolling dips of 10 to 30
towards North West.
The Shumar formation of Pleistocene unconformably overlies the Bundah formation and
consists of ironstone, gritty calcareous quartzite, calcareous sand stone, sandy limestone,
clay, pseudo conglomerate and pebble spread. The pebble spread is of Fluvio-glacial origin
and includes clasts of quartzite, quartz, Limestone and iron stone .It indicates that glaciation
took place during the Pleistocene time. Different beds of Shumar formation have been
recorded in the well sections at around Ranau tar, Girdhuwala , Jogawala tar , Gaje singh ka
tar and Sachchuwala tar at depths varying from 3m to 15 m.
The Bundah formation is Eocene age. It comprises foraminiferal Limestone, yellow marl,
sandy limestone with gypseous bentonitic shale, calcareous and ferruginous sandstone and
quartzite. Bundah formation is underlain by Khuiala formation.
The Khuiala formation and the Bundah formation represent the Tertiary rocks. The Khuiala
formation consist of massive nummulitic Limestone and chalky limestone. Both the Khuiala
and Bundah formations are fossiliferous .The Khuiala formation consists nummulites,
assilina, alveolina and orbitolites. The Bundah formation contains Lamellibranch, echenoids
and Foraminifers.
The Khuiala formation unconformably rest over the Sanu formation. The Sanu formation
comprises variegated shale, sandstone and white clays with ironstone capping.
The Sanu formation is underlain by Abur formation comprising of fossiliferous calcareous
sandstone, ferrugenous grit.
The oldest outcrop formation in the area is Parewar formation represented by feldspathic
and quartzitic sandstone which is unconformably overlain by Abur formation.

8
Table2. Geological sequence in Ramgarh area, Desert Area, Jaisalmer district
Lithology Formation Age
Fine aeolian sand & silt with occasional kankar Thar desrt Holocene
A- shale , lime stone ,& psedo conglomerate
B- pebble spread / conglomerate
Shumar Pleistocene
a- Lime stone , foraminiferal lime stone , marl
c- Sandy lime stone ,with gypseous bentonitic shale
d-calcareous and ferrugenous sand stone & quartzite
Bundah Eocene
Massive lime stone , nummulitic Lime stone with minor
shale , chert and Quartzite
Khuiala Paleocene
Variegated , micaceous sand stone , shale , clay with iron
stone cappings
Sanu Paleocene
Fossiliferous calcareous sand stones , ferrugenous grit ,
concoidal lime stone
Abur Lower cretaceous
Feldspathic and quartzitic sand stone Pariwar Lower Jurassic to
Lower Cretaceous
9
Figure 3. Geological map of Ramgarh area, Jaisalmer district, Rajasthan

10
2.6 GEOPHYSICS
Data Availability
No geophysical study were carried out within project area.Ground geophysical
investigations are carried out in the paleo-channels north of Ramgarh area. The location
map of VES study carried out in Saraswati river paleo-channels is depicted in figure 4.
Figure 4. Location map of VES study in Swaraswati Paleo Channel
Data Gap Analysis
The entire area is un-explored as far as geophysical investigations are concerned.

11
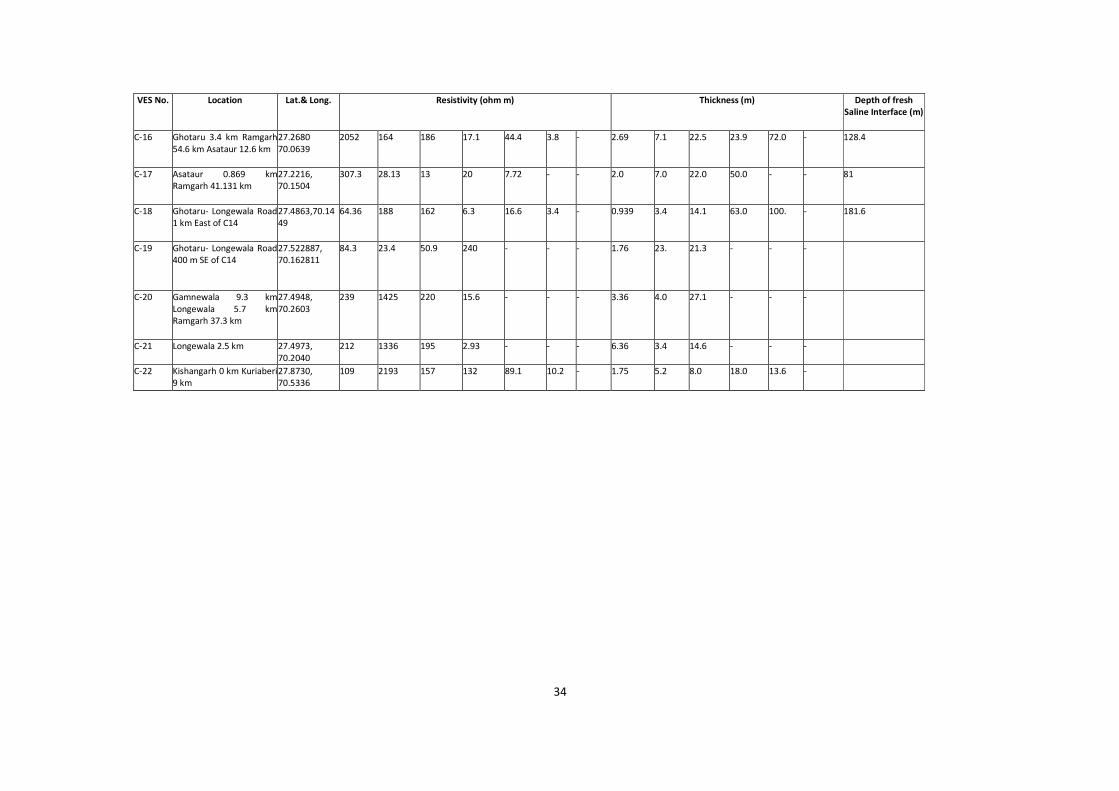
2.7 SUB-SURFACE LITHOLOGICAL INFORMATION
Data Availability
Sub-surface lithological information are obtained from the Status report on search of
palaeochannels in Western Rajasthan, CGWB (2002). However, all the VES studies and
exploratory wells are located outside project area. The interpreted hydro-geophysical layers
are given in table 3. The details of exploratory borewells drilled in Saraswati paleo-channels
is given in the annexure I.

33
Table 3. Interpreted Layer Parameters Obtained from Vertical Electrical Soundings in Sam Block, Jaisalmer district
VES No. Location Lat.& Long. Resistivity (ohm m) Thickness (m) Depth of fresh
Saline Interface (m)
p1 p2 p3 p4 p5 p6 p7 h1 h2 h3 h4 h5 h6
C-1 Tanot–21.5 km
Kishangarh -45 km (Ranau
EBH site)
27.831,
70.4649
866 156 179 76 21 9 4 1.25 4.4 13.3 27.7 39. 191 85.75
C-2 Tanot-11.485 km Ranau-
9.515 km
27.7285,
70.4306
304 976 78 10.4 7.9 - - 5.22 3.2 47.6 72.5 - - 128.6
C-3 Tanot-6.5 km (Ghantiyali) 27.5551,
70.1755
354.7 203.3 87.9 14.2 - - - 1.84 15 20.6 - - -
C-4 Tanot 7.8 km Ranau –
14.2 km
27.76710,
70.39215
583 115 369 91 16.3 1() - 5.54 17 13.4 19.8 19. - 75.31
C-5 Between 16 × 17 km
Tanot
27.69416,
70.4477
296 732 167 69 13.3 4.6 - 2.51 9.1 12.3 28.1 145. - 197.4
C-6 Tanot 14 km Ranau – 7km 27.6716,
70.4446
133 238.5 84 16 60.6 - - 3.8 19 46 99 - - -
C-7 Tanot 11.8 km 27.7397,70.42
09
103 270 107 71.7 11.6 5.8 - 2.9 3.4 19.5 14.5 85.0 - 125.3
C-8 Tanot 3.1 km Ranau 17.9
km
27.7701
70.3849
389 42 160 14 7.4 - - 0.69 2.7 32.7 103 - - 139.7
C-9 Ranau 3.1 km 27.667718,
70.446396
291 66.8 347 139 13.6 10 - 9.0 3.6 17.5 20.5 36.8 - 87.43
C-10 Tanot 9.84 km Ranau
11.16 km
27.72973,
70.4264
7167 2343 292.4 6.27 - - - 1.06 1.0 82.0 - - - 84.12
C-11 Gamnewala 1 km
Longewala 14 km
27.6360
70.2507
461 163.4 283.6 48 22.4 5.2 - 0.973 4.5 17.9 21.2 222. - 267.0
C-12 Gumnewala 7 km
Longewala – 8 km
Ramgarh 35 km
27.51070,
70.1586
336.3 163.4 127.3 50 15.98 - - 1.45 2.4 22.6 25 - - -
C-13 Ghotaru 17 km Longewala
9 km
27.4315
70.1161
444.6 527.6 447.6 54.4 21 60.9 - 1.85 11 13.3 9.28 - - -
C-14 Ghotaru 10 km Longewala
16 km
27.4156
70.112
87.31 23.06 8.42 58.96 196 - 4.57 1.09 2 7.13 8.06 50.9 359. 428.3
C-15 Ghotaru 0 km Angtala 40
km Bachia 97 km
27.3156
70.0488
111 258 132 27.1 12 28 4.6 3.2 4.0 9.0 23.0 48.3 48.8 -
34
VES No. Location Lat.& Long. Resistivity (ohm m) Thickness (m) Depth of fresh
Saline Interface (m)
C-16 Ghotaru 3.4 km Ramgarh
54.6 km Asataur 12.6 km
27.2680
70.0639
2052 164 186 17.1 44.4 3.8 - 2.69 7.1 22.5 23.9 72.0 - 128.4
C-17 Asataur 0.869 km
Ramgarh 41.131 km
27.2216,
70.1504
307.3 28.13 13 20 7.72 - - 2.0 7.0 22.0 50.0 - - 81
C-18 Ghotaru- Longewala Road
1 km East of C14
27.4863,70.14
49
64.36 188 162 6.3 16.6 3.4 - 0.939 3.4 14.1 63.0 100. - 181.6
C-19 Ghotaru- Longewala Road
400 m SE of C14
27.522887,
70.162811
84.3 23.4 50.9 240 - - - 1.76 23. 21.3 - - -
C-20 Gamnewala 9.3 km
Longewala 5.7 km
Ramgarh 37.3 km
27.4948,
70.2603
239 1425 220 15.6 - - - 3.36 4.0 27.1 - - -
C-21 Longewala 2.5 km 27.4973,
70.2040
212 1336 195 2.93 - - - 6.36 3.4 14.6 - - -
C-22 Kishangarh 0 km Kuriaberi
9 km
27.8730,
70.5336
109 2193 157 132 89.1 10.2 - 1.75 5.2 8.0 18.0 13.6 -
35
Data Gap Analysis
The entire project area is unexplored.
2.8 HYDROGEOLOGY
Data Availability
Information on hydrogeology of the project area is obtained from the district brochure of
Jaisalmer district. The aquifers are mainly sedimentary rocks of calcareous-argillaceous-
arenaceous nature of Tertiary and Mesozoic era (figure 5). Aquifers are encountered at the
depths of 45 to 70 m and 125 to 160 m. These are unconfined to semi-confined in nature.
Water quality is around EC 3500-4000 micromhos/cm. Ground water level around Ramgarh
area is about 30 to 40 m bgl. However, in the area lying south of Ramgarh, water level is
comparatively deeper and goes even beyond 100 m bgl at places.
The area falls within Sam block, Jaisalmer district. The annual replenishable ground water
resources in Sam block is around 28 million cubic metre (mcm). The net annual ground
water available for utilization after keeping an allocation for unavoidable ground water
discharge, is around 26 mcm. The annual ground water draft is 16 mcm. Thus the stage of
ground water development in the block is around 60%. The Sam block has been categorized
as Safe block.
36
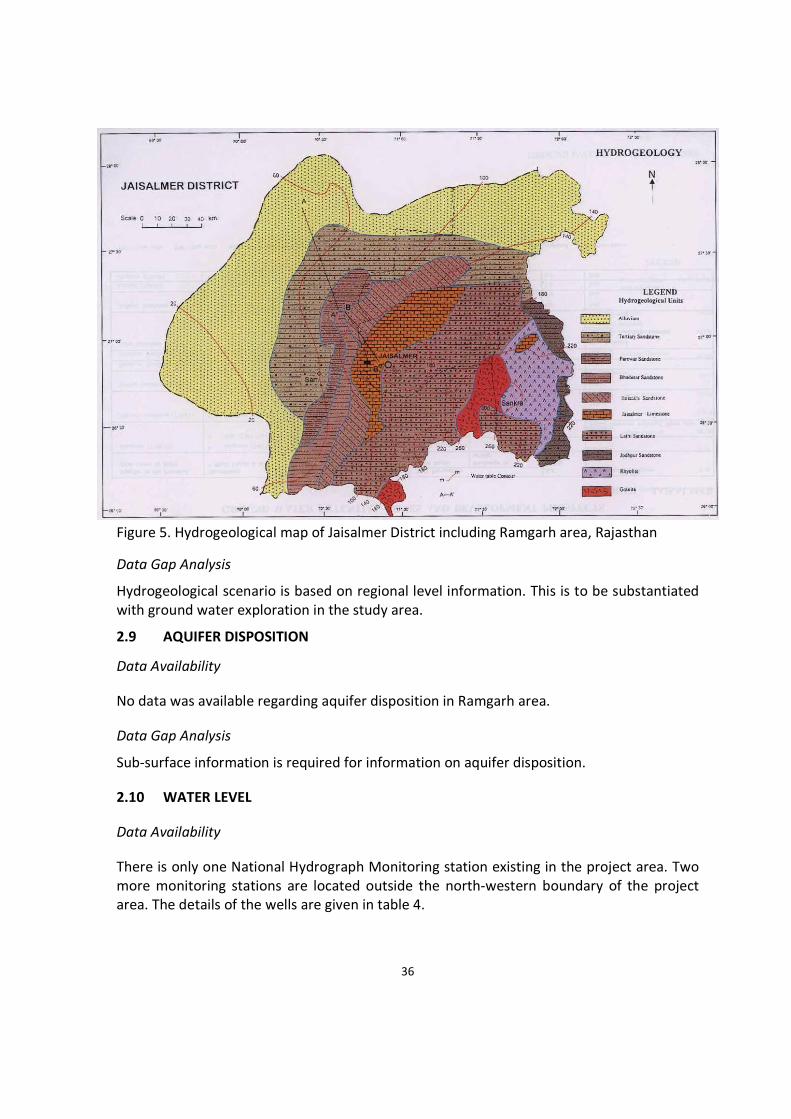
Figure 5. Hydrogeological map of Jaisalmer District including Ramgarh area, Rajasthan
Data Gap Analysis
Hydrogeological scenario is based on regional level information. This is to be substantiated
with ground water exploration in the study area.
2.9 AQUIFER DISPOSITION
Data Availability
No data was available regarding aquifer disposition in Ramgarh area.
Data Gap Analysis
Sub-surface information is required for information on aquifer disposition.
2.10 WATER LEVEL
Data Availability
There is only one National Hydrograph Monitoring station existing in the project area. Two
more monitoring stations are located outside the north-western boundary of the project
area. The details of the wells are given in table 4.

37
Table 4. National Hydrograph Monitoring Stations in and around Ramgarh area, Jaisalmer
district, Rajasthan
SITE_NAME SITE_ID SITE_VILLAGE BLOCK_NAME DISTRICT_NAME xLong yLat
GAMNEWALI W272910070160501 GAMNEWALI SAM JAISALMER 70.27 27.49
GAMANEWALA W272910070160502 GAMANEWALA SAM JAISALMER 70.27 27.49
RAMGARH W272130070300001 RAMGARH SAM JAISALMER 70.50 27.36
The long term water level data is given in annexure II. The location of the monitoring
stations are plotted in figure 6.

38
Figure 6. National Hydrograph Monitoring Stations, Ramgarh area, Sam block,
Jaisalmer district, Rajasthan
Data Gap Analysis
Monitoring stations need to be established across the entire project area, since presently it
is represented by only one well.
39
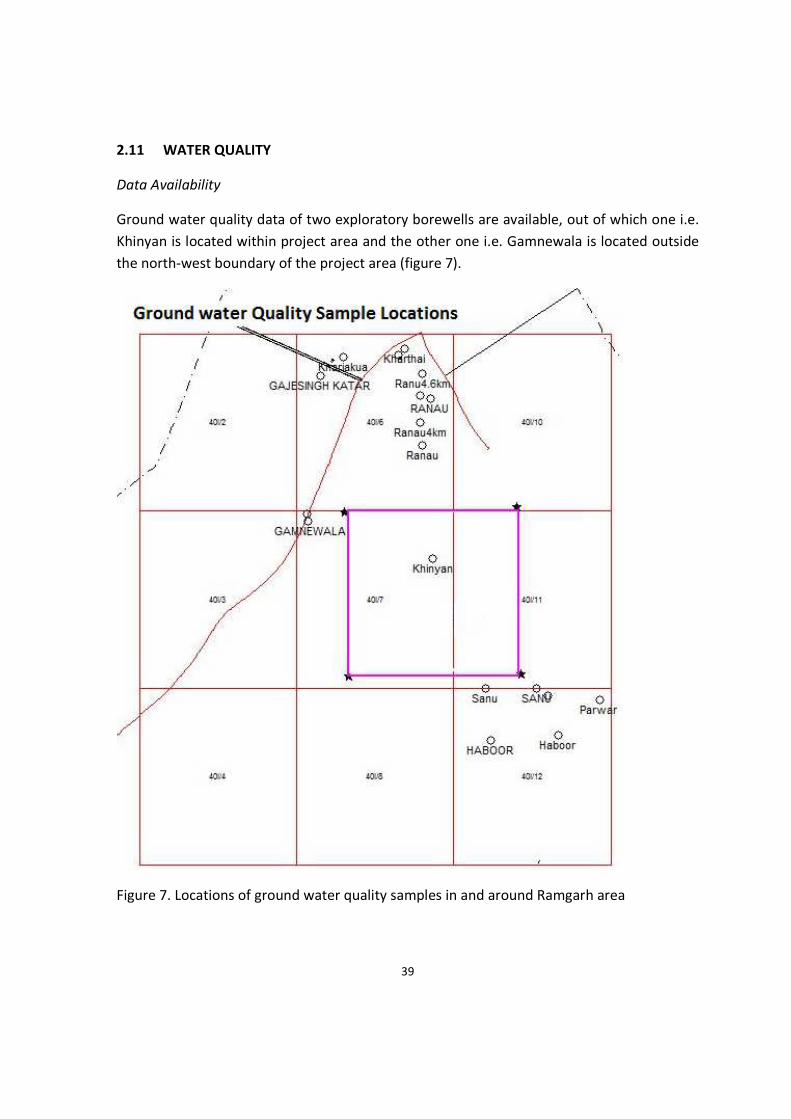
2.11 WATER QUALITY
Data Availability
Ground water quality data of two exploratory borewells are available, out of which one i.e.
Khinyan is located within project area and the other one i.e. Gamnewala is located outside
the north-west boundary of the project area (figure 7).
Figure 7. Locations of ground water quality samples in and around Ramgarh area

40
Data Gap Analysis
Ground water Quality monitoring Stations needs to be established across the entire study
area.
2.12 Recharge Parameters
Data Availability
Recharge parameters are obtained from State Ground Water Department which were used
in the ground water resources estimation of 2009 for the state of Rajasthan. Table 5
presents the various recharge parameters used for computation of dynamic ground water
resources of Sam block, Jaisalmer district for the base-year, 2009.
Table 5. Recharge parameters used for computation of ground water resources in Sam
block, Jaisalmer district, Rajasthan
Data Gap Analysis
The recharge parameters mentioned above needs to be updated by compilation of
additional information on the field studies undertaken in the area and also through carrying
out additional field experiments through pumping tests for specific yield determination and
soil infiltration tests for rainfall recharge factor determination.
Ground water
Potential Zones
Specific Yield Rainfall Recharge
Factor
Return flow from
Irrigation
Seepage factor -
Tanks & Ponds
(mm/day)
Alluvium (A2/1) 0.10 0.025
Teritiary
Sandstone
(T1/4)
0.04 0.025
Pariwar
Sandstone
(P1/1)
0.04 0.025
0.00 0.00
41
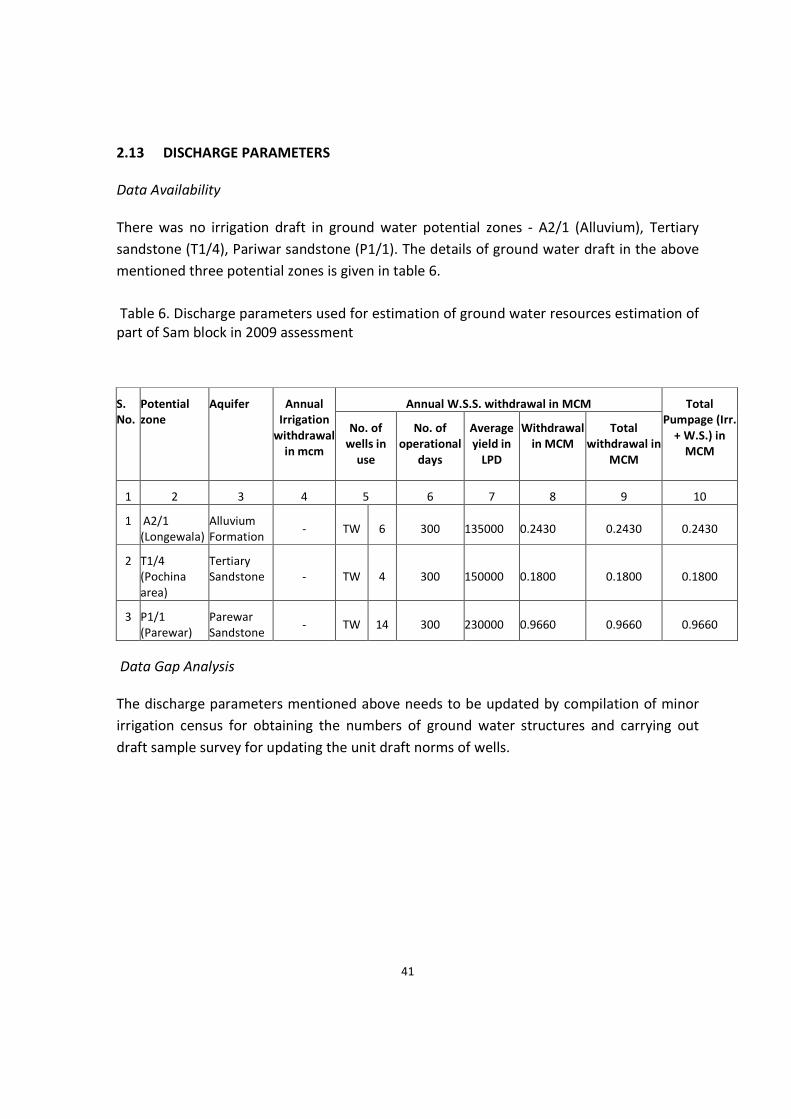
2.13 DISCHARGE PARAMETERS
Data Availability
There was no irrigation draft in ground water potential zones - A2/1 (Alluvium), Tertiary
sandstone (T1/4), Pariwar sandstone (P1/1). The details of ground water draft in the above
mentioned three potential zones is given in table 6.
Table 6. Discharge parameters used for estimation of ground water resources estimation of
part of Sam block in 2009 assessment
Data Gap Analysis
The discharge parameters mentioned above needs to be updated by compilation of minor
irrigation census for obtaining the numbers of ground water structures and carrying out
draft sample survey for updating the unit draft norms of wells.
Annual W.S.S. withdrawal in MCM S.
No.
Potential
zone
Aquifer Annual
Irrigation
withdrawal
in mcm
No. of
wells in
use
No. of
operational
days
Average
yield in
LPD
Withdrawal
in MCM
Total
withdrawal in
MCM
Total
Pumpage (Irr.
+ W.S.) in
MCM
1 2 3 4 5 6 7 8 9 10
1 A2/1
(Longewala)
Alluvium
Formation - TW 6 300 135000 0.2430 0.2430 0.2430
2 T1/4
(Pochina
area)
Tertiary
Sandstone - TW 4 300 150000 0.1800 0.1800 0.1800
3 P1/1
(Parewar)
Parewar
Sandstone - TW 14 300 230000 0.9660 0.9660 0.9660
42
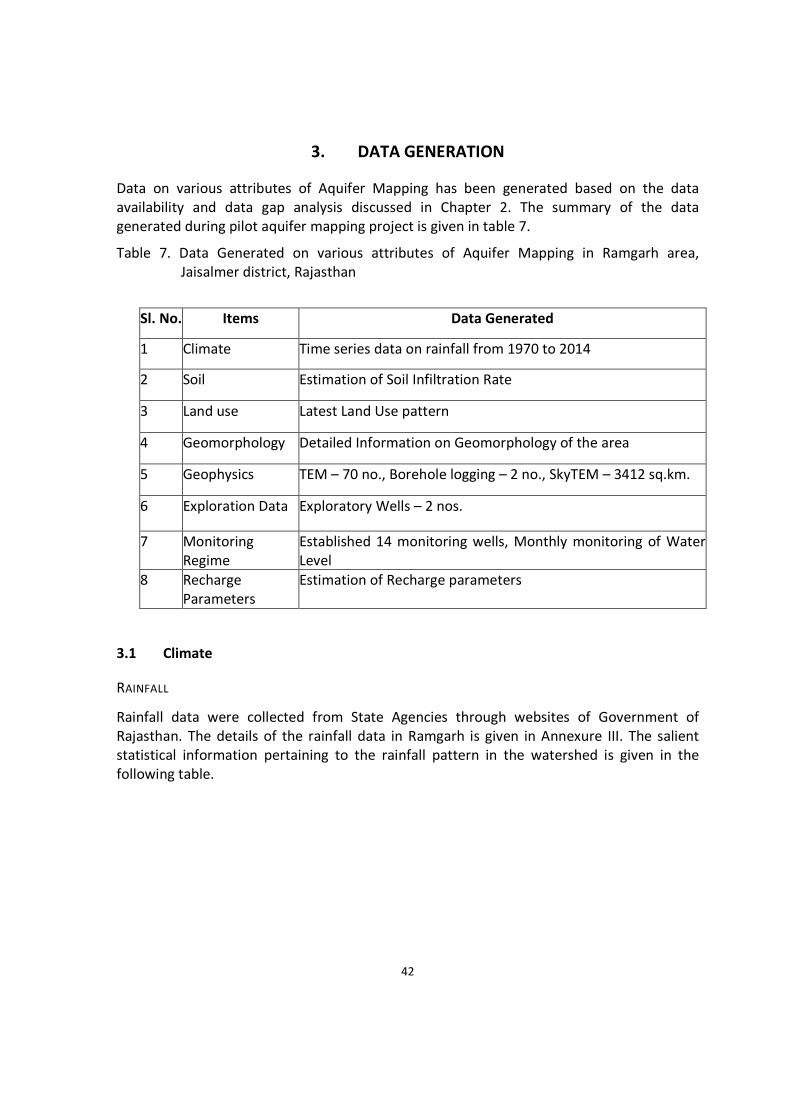
3. DATA GENERATION
Data on various attributes of Aquifer Mapping has been generated based on the data
availability and data gap analysis discussed in Chapter 2. The summary of the data
generated during pilot aquifer mapping project is given in table 7.
Table 7. Data Generated on various attributes of Aquifer Mapping in Ramgarh area,
Jaisalmer district, Rajasthan
Sl. No. Items Data Generated
1 Climate Time series data on rainfall from 1970 to 2014
2 Soil Estimation of Soil Infiltration Rate
3 Land use Latest Land Use pattern
4 Geomorphology Detailed Information on Geomorphology of the area
5 Geophysics TEM – 70 no., Borehole logging – 2 no., SkyTEM – 3412 sq.km.
6 Exploration Data Exploratory Wells – 2 nos.
7 Monitoring
Regime
Established 14 monitoring wells, Monthly monitoring of Water
Level
8 Recharge
Parameters
Estimation of Recharge parameters
3.1 Climate
RAINFALL
Rainfall data were collected from State Agencies through websites of Government of
Rajasthan. The details of the rainfall data in Ramgarh is given in Annexure III. The salient
statistical information pertaining to the rainfall pattern in the watershed is given in the
following table.
43
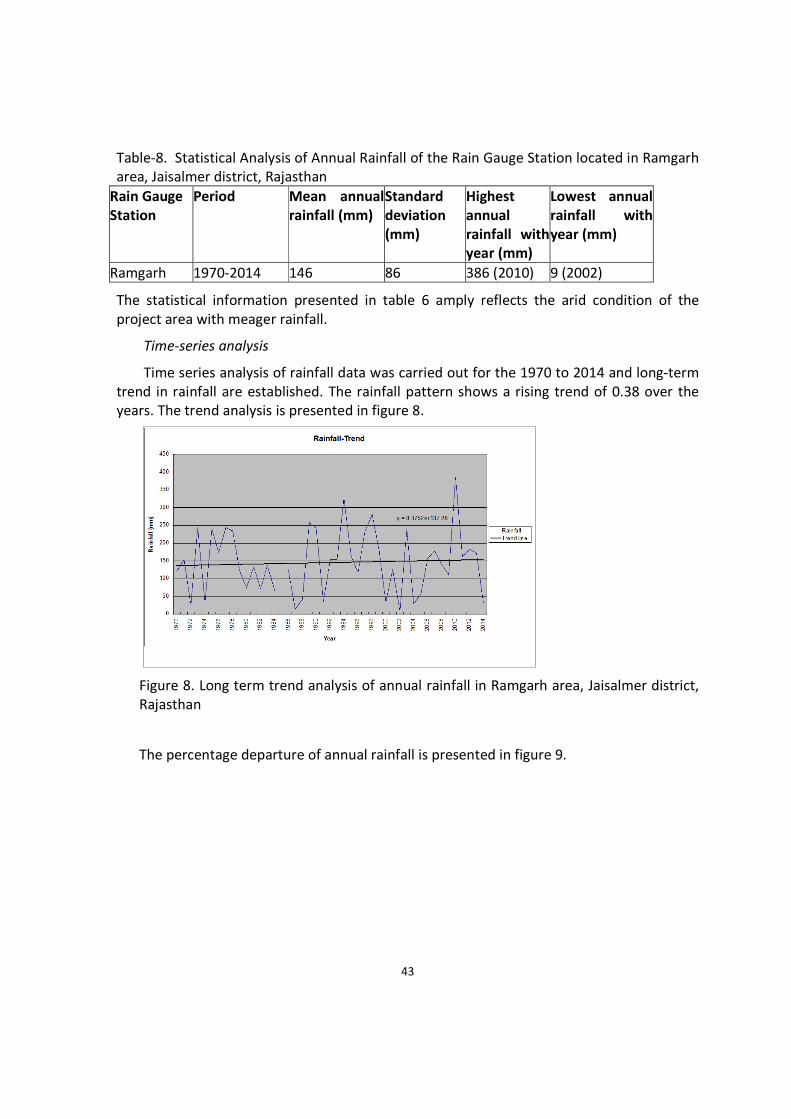
Table-8. Statistical Analysis of Annual Rainfall of the Rain Gauge Station located in Ramgarh
area, Jaisalmer district, Rajasthan
Rain Gauge
Station
Period Mean annual
rainfall (mm)
Standard
deviation
(mm)
Highest
annual
rainfall with
year (mm)
Lowest annual
rainfall with
year (mm)
Ramgarh 1970-2014 146 86 386 (2010) 9 (2002)
The statistical information presented in table 6 amply reflects the arid condition of the
project area with meager rainfall.
Time-series analysis
Time series analysis of rainfall data was carried out for the 1970 to 2014 and long-term
trend in rainfall are established. The rainfall pattern shows a rising trend of 0.38 over the
years. The trend analysis is presented in figure 8.
Figure 8. Long term trend analysis of annual rainfall in Ramgarh area, Jaisalmer district,
Rajasthan
The percentage departure of annual rainfall is presented in figure 9.
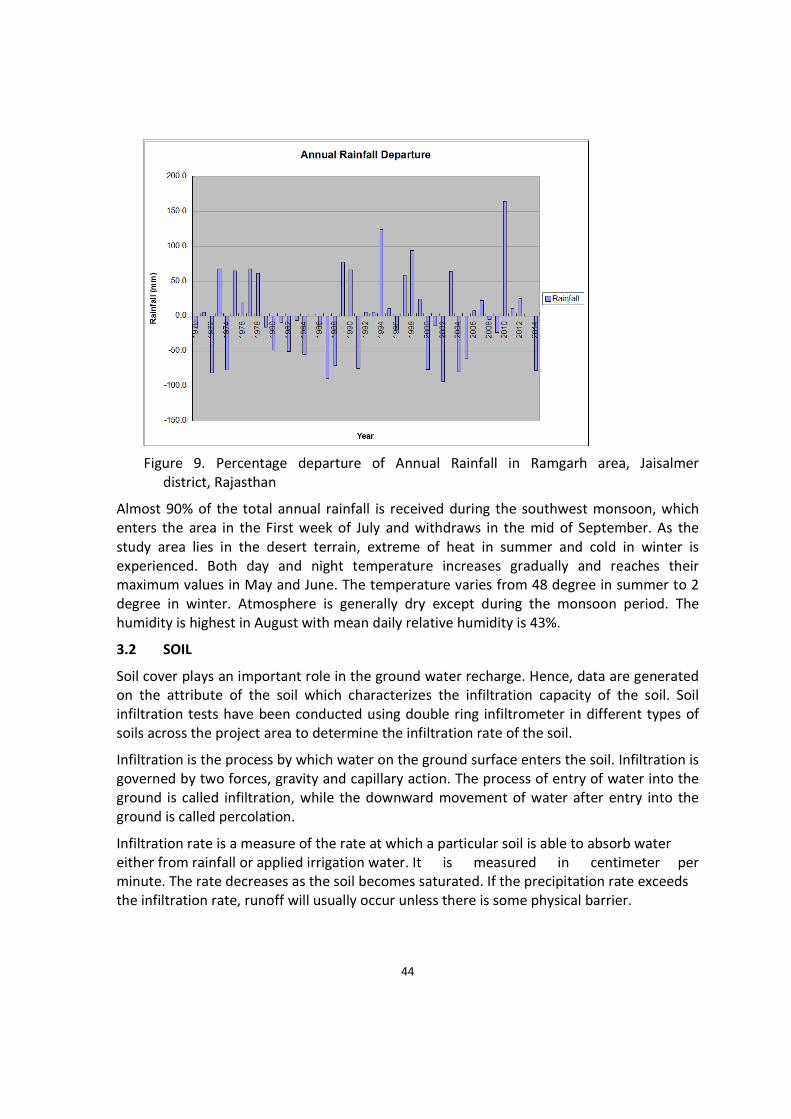
44
Figure 9. Percentage departure of Annual Rainfall in Ramgarh area, Jaisalmer
district, Rajasthan
Almost 90% of the total annual rainfall is received during the southwest monsoon, which
enters the area in the First week of July and withdraws in the mid of September. As the
study area lies in the desert terrain, extreme of heat in summer and cold in winter is
experienced. Both day and night temperature increases gradually and reaches their
maximum values in May and June. The temperature varies from 48 degree in summer to 2
degree in winter. Atmosphere is generally dry except during the monsoon period. The
humidity is highest in August with mean daily relative humidity is 43%.
3.2 SOIL
Soil cover plays an important role in the ground water recharge. Hence, data are generated
on the attribute of the soil which characterizes the infiltration capacity of the soil. Soil
infiltration tests have been conducted using double ring infiltrometer in different types of
soils across the project area to determine the infiltration rate of the soil.
Infiltration is the process by which water on the ground surface enters the soil. Infiltration is
governed by two forces, gravity and capillary action. The process of entry of water into the
ground is called infiltration, while the downward movement of water after entry into the
ground is called percolation.
Infiltration rate is a measure of the rate at which a particular soil is able to absorb water
either from rainfall or applied irrigation water. It is measured in centimeter per
minute. The rate decreases as the soil becomes saturated. If the precipitation rate exceeds
the infiltration rate, runoff will usually occur unless there is some physical barrier.

45
The soil infiltration rates are useful in determination of recharge parameters and
demarcation of areas feasible for artificial recharge. The experiments are conducted at 6
sites in Desert Area project area during post-monsoon season of 2013 and pre-monsoon
season of 2014
Procedure
Soil Infiltration Test was conducted using Double Ring Infiltrometer (plate - 1). A Double-ring
Infiltrometer consists of two concentric metal rings. The rings are driven into the ground
and filled with water. The outer ring helps to prevent divergent flow. The drop in water
level or volume in the inner ring is used to calculate an infiltration rate. The infiltration rate
is determined as the amount of water per surface area and time unit that penetrates the
soils. The final infiltration rate at which the rate of infiltration becomes constant in time
scale is taken as the infiltration rate.
Plate 1. Soil Infiltration Test conducted in Ramgarh area, Jaisalmer district, Rajasthan
The infiltration rate varies from 0.04 cm/min to 0.70 cm/min in the project area. The details
of the infiltration test results are given in table 7.
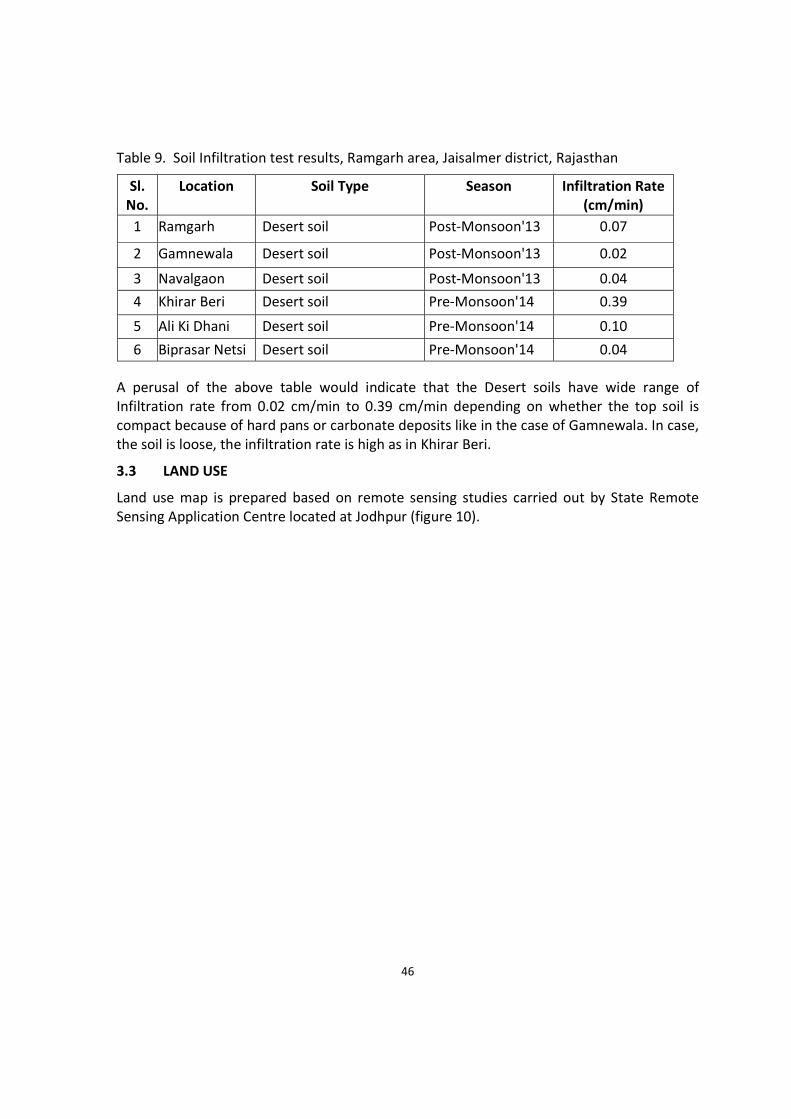
46
Table 9. Soil Infiltration test results, Ramgarh area, Jaisalmer district, Rajasthan
Sl.
No.
Location Soil Type Season Infiltration Rate
(cm/min)
1 Ramgarh Desert soil Post-Monsoon'13 0.07
2 Gamnewala Desert soil Post-Monsoon'13 0.02
3 Navalgaon Desert soil Post-Monsoon'13 0.04
4 Khirar Beri Desert soil Pre-Monsoon'14 0.39
5 Ali Ki Dhani Desert soil Pre-Monsoon'14 0.10
6 Biprasar Netsi Desert soil Pre-Monsoon'14 0.04
A perusal of the above table would indicate that the Desert soils have wide range of
Infiltration rate from 0.02 cm/min to 0.39 cm/min depending on whether the top soil is
compact because of hard pans or carbonate deposits like in the case of Gamnewala. In case,
the soil is loose, the infiltration rate is high as in Khirar Beri.
3.3 LAND USE
Land use map is prepared based on remote sensing studies carried out by State Remote
Sensing Application Centre located at Jodhpur (figure 10).
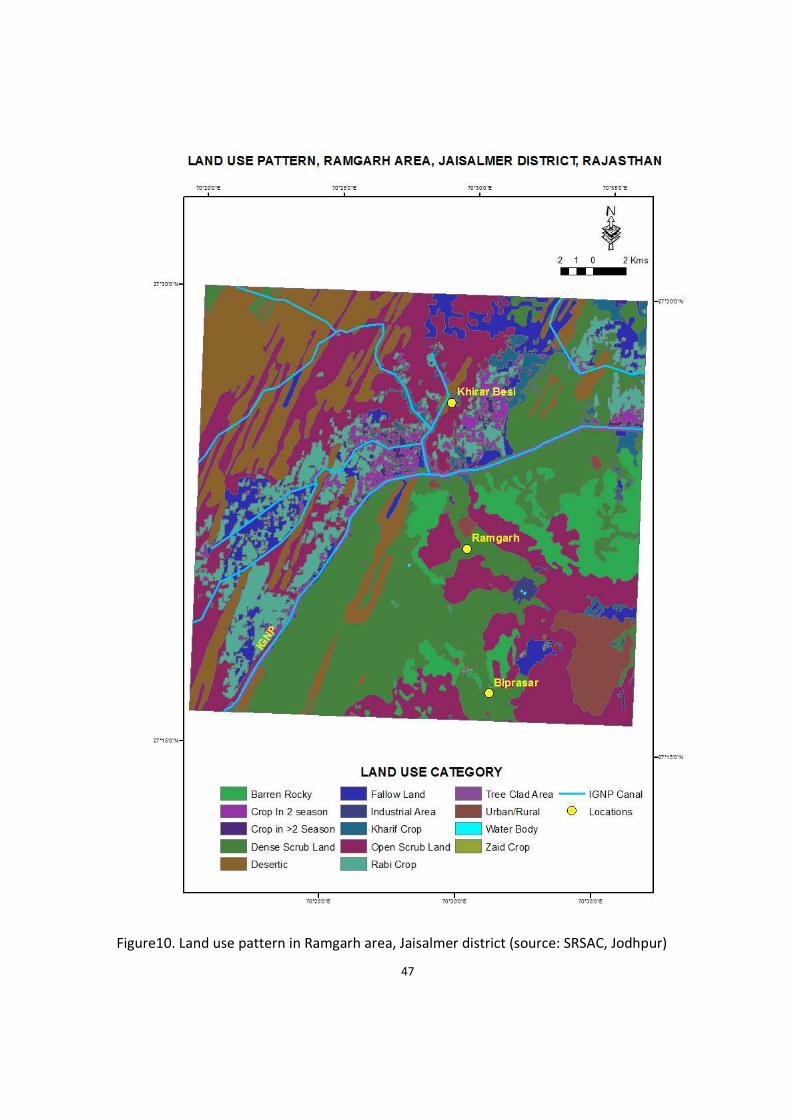
47
Figure10. Land use pattern in Ramgarh area, Jaisalmer district (source: SRSAC, Jodhpur)
48
The descriptions of various land uses are as follows.
Urban/ Rural – Areas covered by urban and rural habitations
Kharif crop - Crops which are sown in the rainy season (monsoon) and harvested in the
autumn.
Rabi crop - Crops which are sown in the winters and harvested in the spring season.
Zaid crop - Crops that are grown in the season between the growing seasons of kharif and
Rabi crops means from March to June.
Fallow Land- A piece of land that is normally used for farming but that is left with no crops
on it for a season in order to let it recover its fertility.
Desertic land - Rainfall is sporadic and in some years no measurable precipitation falls at all.
The terribly dry conditions of the deserts is due to the year-round influence of subtropical
high pressure and continentality.
Scrubland - diverse assortment of vegetation types sharing the common physical
characteristic of dominance by shrubs. A shrub is defined as a woody plant not exceeding 5
metres (16.4 feet) in height if it has a single main stem, or 8 metres if it is multistemmed.
Barren rocky – area covered with rock outcrops.
Water Body- area of impounded water, areal in extent and often with a regulated flow of
water. It includes man-made reservoirs/lakes/tank/canals, besides natural lakes,
rivers/streams and creeks.
The area for different land use pattern are computed from the digitized data of the GIS
layers. The main purpose of the table for land Use is to indicate broadly the ways in which
the land in the area is utilised. The distribution of land use pattern in Ramgarh Project area
is given in Table 10.
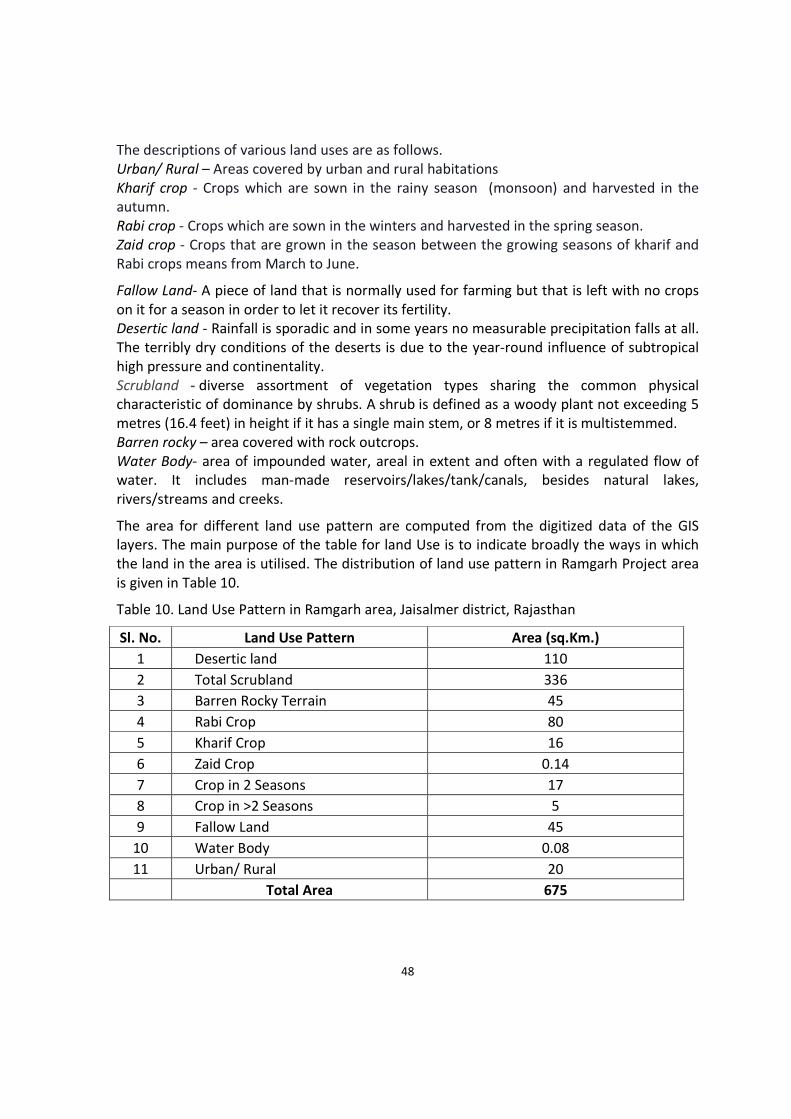
Table 10. Land Use Pattern in Ramgarh area, Jaisalmer district, Rajasthan
Sl. No. Land Use Pattern Area (sq.Km.)
1 Desertic land 110
2 Total Scrubland 336
3 Barren Rocky Terrain 45
4 Rabi Crop 80
5 Kharif Crop 16
6 Zaid Crop 0.14
7 Crop in 2 Seasons 17
8 Crop in >2 Seasons 5
9 Fallow Land 45
10 Water Body 0.08
11 Urban/ Rural 20
Total Area 675

49
3.4 GEOMORPHOLOGY
Major part of the area is covered by blown sand sheets and dunes. NNE-SSW trending
barchans and longitudinal dunes are important dunal landforms present in the area.
Drainage is poorly developed in the area and is represented by the northerly flowing
Ramgarh nadi, an ephemeral stream which disappear in sandy terrain to the north. Sand
dunes of Holocene represent the Quaternary stratigraphy of the area.
The Quaternary ( Holocene) sand and sand dunes (mainly longitudinal and barchans) cover
major part of the area Longitudinal dunes represents more evolved dunal forms than the
parabolic or comb dunes from which these have been evolved .
Study of the geomorphic units indicates that the onset of aridity in the area started during
early quaternary period when the last cycle of sedimentation in geologic history of Jaisalmer
basin was over in the form of rocks of the Shumar formation.
Plate 2. Flat rocky terrain

50
Plate 3. Desert terrain
DRAINAGE
There is no rivers worth the name in the area nor are there any perennial stream in the
area. IGNP branch canal flows north of Ramgarh town (figure 11).

51
Figure 11. Canal system around Ramgarh area, Jaisalmer district, Rajasthan
52
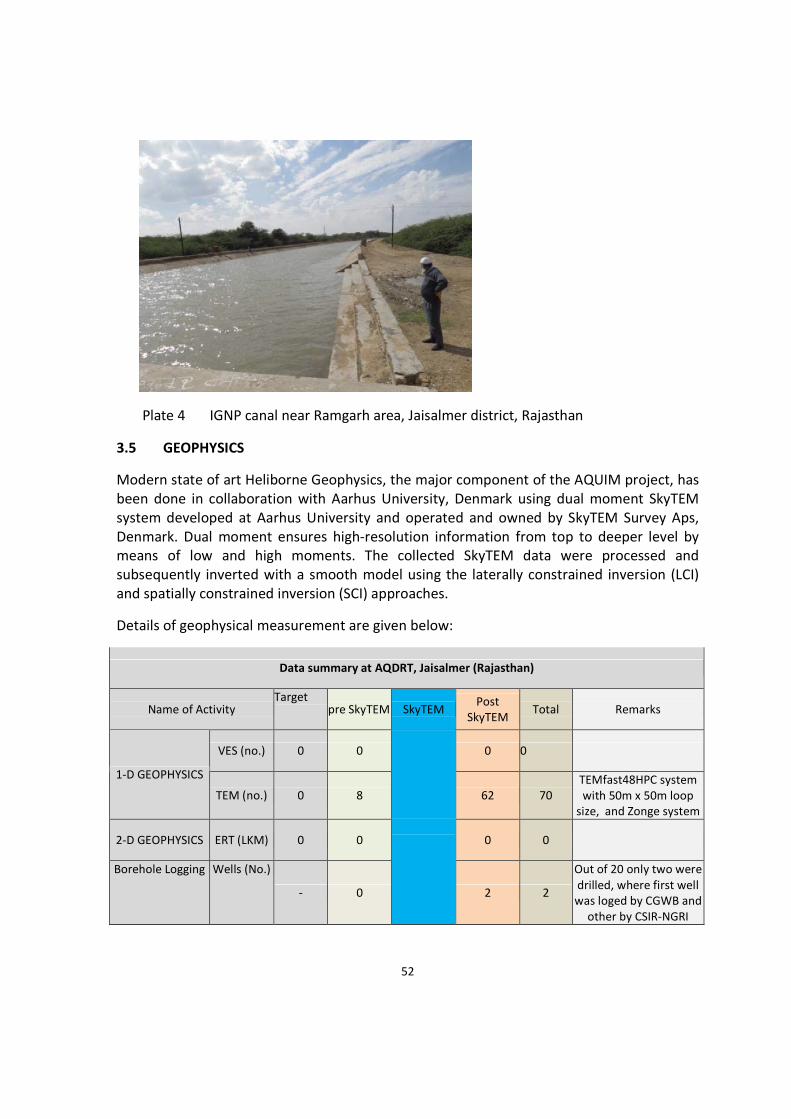
Plate 4 IGNP canal near Ramgarh area, Jaisalmer district, Rajasthan
3.5 GEOPHYSICS
Modern state of art Heliborne Geophysics, the major component of the AQUIM project, has
been done in collaboration with Aarhus University, Denmark using dual moment SkyTEM
system developed at Aarhus University and operated and owned by SkyTEM Survey Aps,
Denmark. Dual moment ensures high-resolution information from top to deeper level by
means of low and high moments. The collected SkyTEM data were processed and
subsequently inverted with a smooth model using the laterally constrained inversion (LCI)
and spatially constrained inversion (SCI) approaches.
Details of geophysical measurement are given below:
Data summary at AQDRT, Jaisalmer (Rajasthan)
Name of Activity Target
pre SkyTEM SkyTEM Post
SkyTEM Total Remarks
VES (no.) 0 0 0 0
1-D GEOPHYSICS
TEM (no.) 0 8 62 70
TEMfast48HPC system
with 50m x 50m loop
size, and Zonge system
2-D GEOPHYSICS ERT (LKM) 0 0 0 0
Borehole Logging Wells (No.)
- 0
2 2
Out of 20 only two were
drilled, where first well
was loged by CGWB and
other by CSIR-NGRI

53
HeliTEM SkyTEM (LKM) 3412 3412
TEM data using Line/Tie
line spacing : 200/2000
ms and 22 m/s flight
speed
HeliMAG Geometrics Cesium Vapour type
822A (LKM) 3412 - 3412
Magnetic data using
Line/Tie line spacing :
200/2000 ms and 22
m/s flight speed
RESISTIVITY SECTIONS OF HELITEM
HORIZONTAL PLANAR SECTION
The mean resistivity maps have been generated at 5 m depth intervals down to a depth of
300 m. The maps are prepared by gridding the data using the Kriging method with a node
spacing of 25 m and a search radius of 500 m. The nodes have further been subdivided by a
factor of 4 to obtain the interpolated resistivity pixels for the bitmaps that make up the
maps.
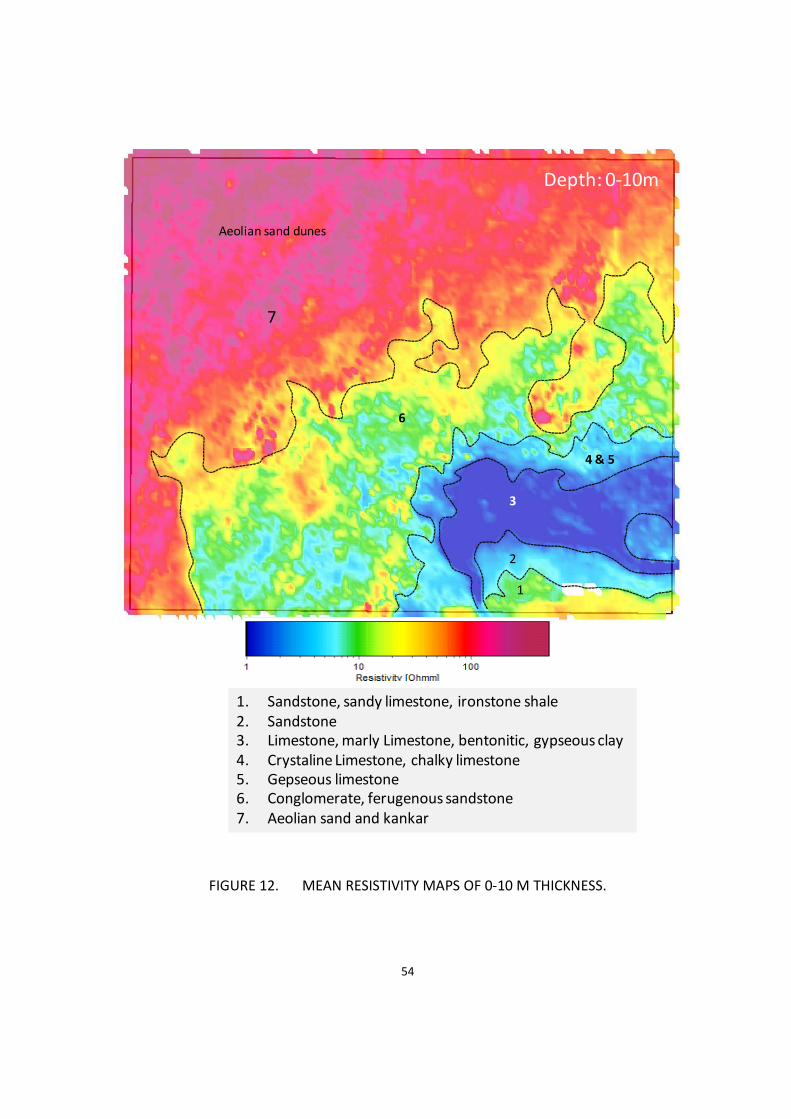
Mean resistivity map is found well corresponding to the geological map of the area. Mean
resistivity map looks to be proxy of geological map giving distinct resistivity response of
different lithology. There are five litho units existing in the surveyed boundary. The litho
unit 1 and 2 lie at southern fringe. SkyTEM mean resistivity revealed all seven litho units
starting from sandstone in SE to Aeolian sand in NW of the area. This is important note that
the mean resistivity represent 10 m thick vertical column. Hence if the ground is covered by
thin layer, it may or may not be reflected in the mean resistivity. Mapping depends on layer
thickness and resistivity contrast. Following resistivity range are taken to interpret the
geophysical image to lithological model.
Table 11. Resistivity scale used for litho characterization
S.No. Lithology Resistivity (Ωm)
1 Sandstone, sandy limestone, ironstone
shale
8-40
2 Sandstone 6-15
3 Limestone, marly Limestone, bentonitic,
gypseous clay
1-3
4 Crystalline Limestone, chalky limestone 2-6
5 Gepseous limestone 2-8
6 Conglomerate, ferruginous sandstone 10-100
7 Aeolian sand and kankar 70-1000 or more
54
Depth: 0-10m
Aeolian sand dunes
6
3
2
1
7
4 & 5
1. Sandstone, sandy limestone, ironstone shale
2. Sandstone
3. Limestone, marly Limestone, bentonitic, gypseous clay
4. Crystaline Limestone, chalky limestone
5. Gepseous limestone
6. Conglomerate, ferugenous sandstone
7. Aeolian sand and kankar
FIGURE 12. MEAN RESISTIVITY MAPS OF 0-10 M THICKNESS.
55
Depth: 10-20m
7
Alluvial Sand
Saline bed
Sandstone
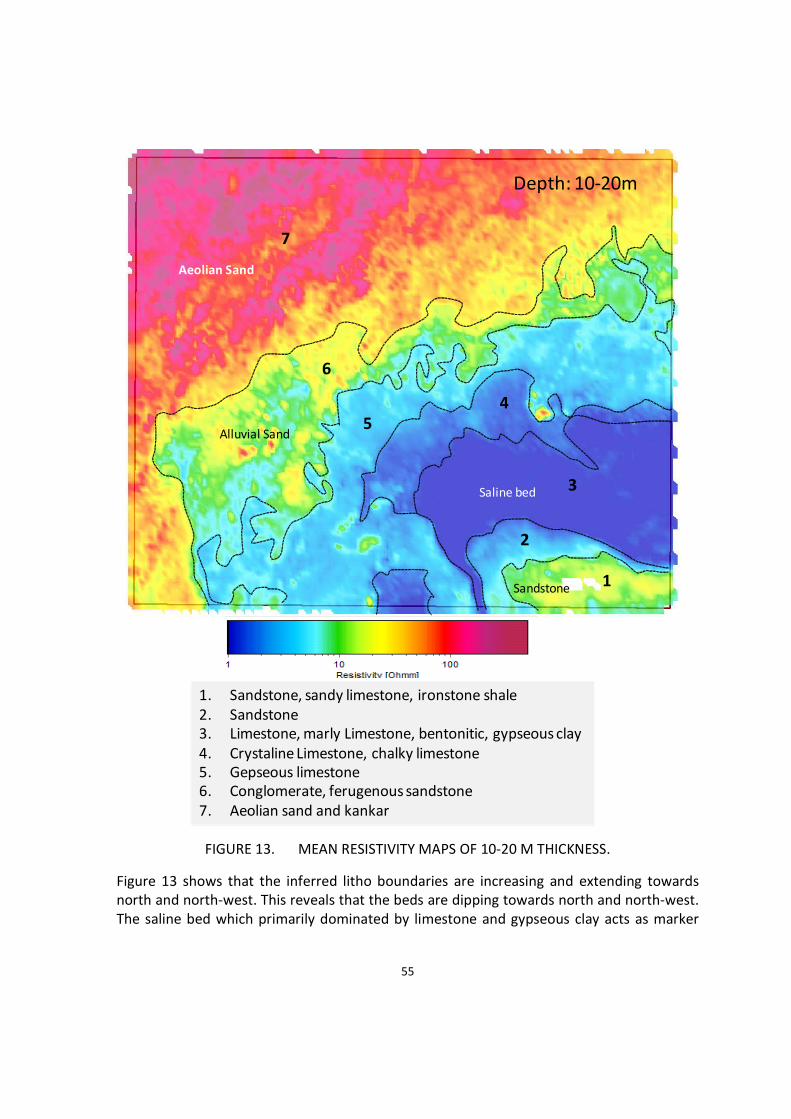
1. Sandstone, sandy limestone, ironstone shale
2. Sandstone
3. Limestone, marly Limestone, bentonitic, gypseous clay
4. Crystaline Limestone, chalky limestone
5. Gepseous limestone
6. Conglomerate, ferugenous sandstone
7. Aeolian sand and kankar
3
2
1
4
5
6
Aeolian Sand
FIGURE 13. MEAN RESISTIVITY MAPS OF 10-20 M THICKNESS.
Figure 13 shows that the inferred litho boundaries are increasing and extending towards
north and north-west. This reveals that the beds are dipping towards north and north-west.
The saline bed which primarily dominated by limestone and gypseous clay acts as marker
56
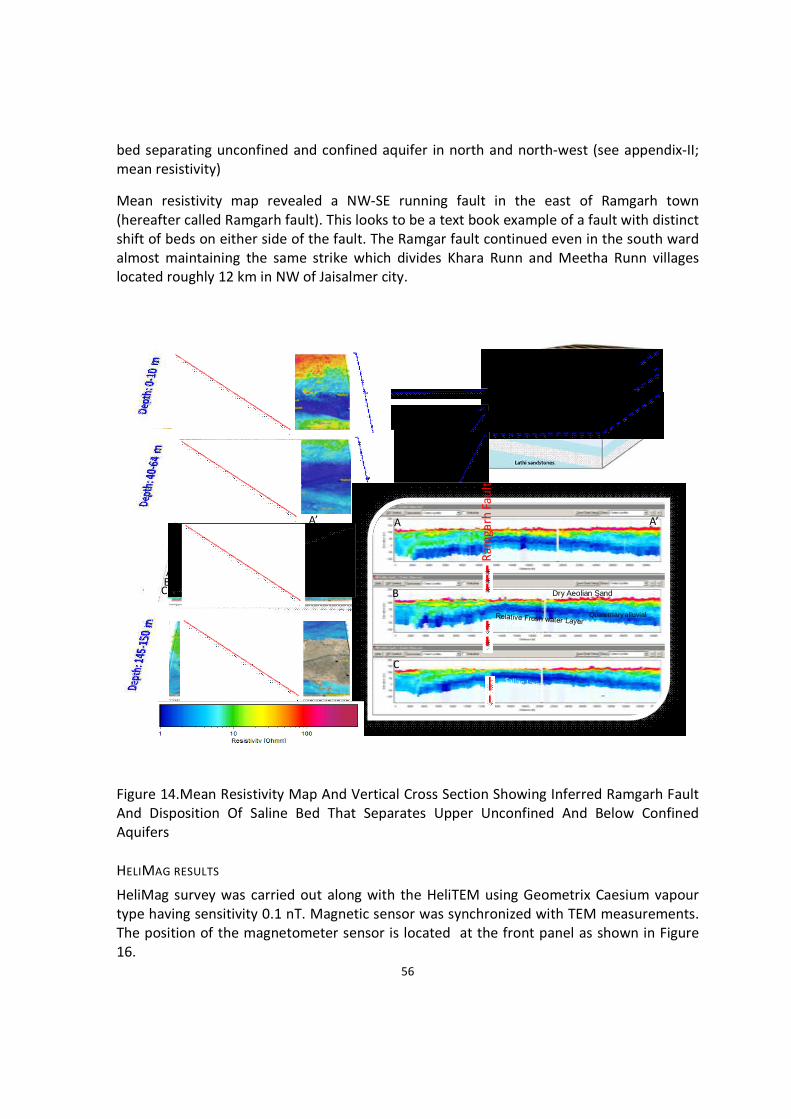
bed separating unconfined and confined aquifer in north and north-west (see appendix-II;
mean resistivity)
Mean resistivity map revealed a NW-SE running fault in the east of Ramgarh town
(hereafter called Ramgarh fault). This looks to be a text book example of a fault with distinct
shift of beds on either side of the fault. The Ramgar fault continued even in the south ward
almost maintaining the same strike which divides Khara Runn and Meetha Runn villages
located roughly 12 km in NW of Jaisalmer city.
Dry Aeolian Sand
Quaternary alluvial
Ra
mg
arh
Fau
lt
B
AB
C
AA’ A’
C
Figure 14.Mean Resistivity Map And Vertical Cross Section Showing Inferred Ramgarh Fault
And Disposition Of Saline Bed That Separates Upper Unconfined And Below Confined
Aquifers
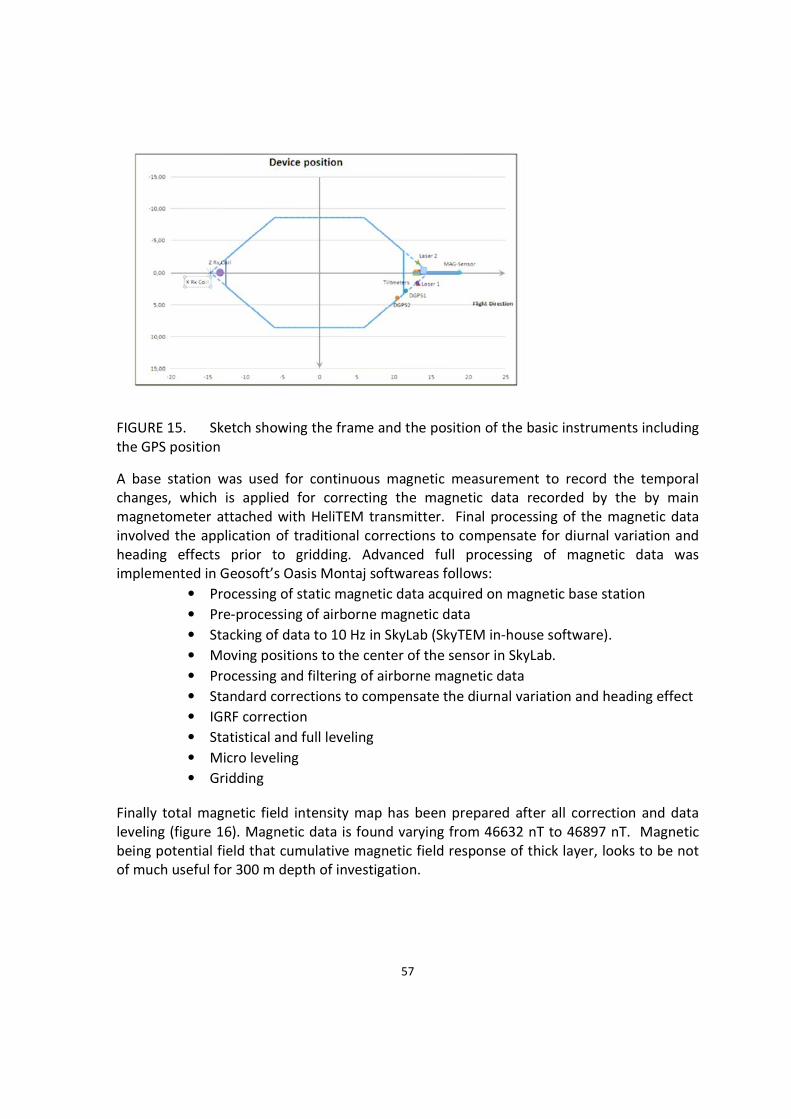
HELIMAG RESULTS
HeliMag survey was carried out along with the HeliTEM using Geometrix Caesium vapour
type having sensitivity 0.1 nT. Magnetic sensor was synchronized with TEM measurements.
The position of the magnetometer sensor is located at the front panel as shown in Figure
16.
57
FIGURE 15. Sketch showing the frame and the position of the basic instruments including
the GPS position
A base station was used for continuous magnetic measurement to record the temporal
changes, which is applied for correcting the magnetic data recorded by the by main
magnetometer attached with HeliTEM transmitter. Final processing of the magnetic data
involved the application of traditional corrections to compensate for diurnal variation and
heading effects prior to gridding. Advanced full processing of magnetic data was
implemented in Geosoft’s Oasis Montaj softwareas follows:
• Processing of static magnetic data acquired on magnetic base station
• Pre-processing of airborne magnetic data
• Stacking of data to 10 Hz in SkyLab (SkyTEM in-house software).
• Moving positions to the center of the sensor in SkyLab.
• Processing and filtering of airborne magnetic data
• Standard corrections to compensate the diurnal variation and heading effect
• IGRF correction
• Statistical and full leveling
• Micro leveling
• Gridding
Finally total magnetic field intensity map has been prepared after all correction and data
leveling (figure 16). Magnetic data is found varying from 46632 nT to 46897 nT. Magnetic
being potential field that cumulative magnetic field response of thick layer, looks to be not
of much useful for 300 m depth of investigation.

58
FIGURE 16.Total Magnetic Field Intensity Map (NT) of DESERT AREA.
3.6 SUB-SURFACE INFORMATION
Data on sub-surface information is partly generated through ground water exploration
carried out in the Desert Area project area and partly though SkyTEM study carried out by
NGRI. The objective of the construction of exploratory tubewells is to validate the
geophysical findings arrived through surface and airborne geophysical studies particularly
SkyTEM carried out by NGRI. The objective of the study is to configure the Aquifer
Geometry and its characterization. So far, 2 wells have been constructed in the area and
another well is under construction. The location of exploratory well sites constructed during
the project is given in figure 17.
59
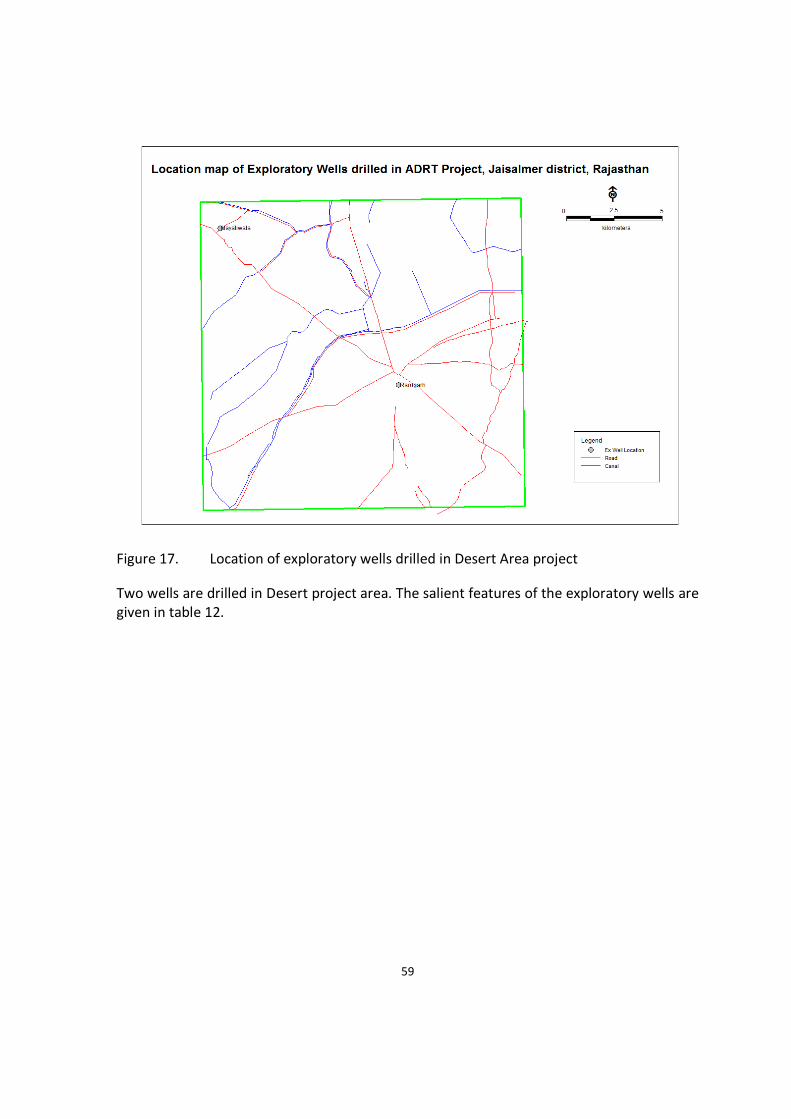
Figure 17. Location of exploratory wells drilled in Desert Area project
Two wells are drilled in Desert project area. The salient features of the exploratory wells are
given in table 12.

60
Table 12. Salient features of exploratory wells constructed in Desert Area project, Ramgarh
area, Jaisalmer district, Rajasthan
Selection of Drilling Sites
Sites for construction of Exploratory Well were selected based on the recommendation of
NGRI for validation of SkyTEM results. All the sites are located in the Government land.
Construction of Exploratory Borewells
The conventional direct Rotary Method of drilling was adopted since the formations are soft
rocks. Drag bits are used for drilling the hole. The pilot holes are drilled of 215 mm
diameter. During drilling, drill time log and lithological log are maintained. Geophysical
loggings are carried out in the pilot hole to identify the potential fresh water zones.
Geophysical loggings include Spontaneous Potential and Resistivity logging as well as
Gamma logging. Well assembly are recommended based on the combined interpretation of
drill time log, lithological log and geophysical logs. The detailed lithological logs, drill time
logs and borehole geophysical logs are given in Annexure IV.
Once, well assembly is recommended, reaming of pilot hole is carried out to accommodate
well assembly and pea gravel pack. The water wells are developed with the aim to remove
mud cake and also finer material from the aquifer, thereby cleaning out, opening up and/ or
enlarging passages in the formations so that water can enter the well more freely.
Coordinates Drill
depth
constructed
depth
Zones Tapped Disc DD S. No.
Location
Long. Lat. (m) (m) From To
Formation
(lpm) (m)
EW1
Ramgarh
70.48 27.38 300
235
221 233 Tertiary
Sedimentary
rocks
180 60
EW2 Mayatiwala 70.35 27.48 300 91 84 90 Alluvial
formation
- -

61
Plate 5 Exploratory drilling operation in Desert Area project, Ramgarh area, Jaisalmer
district, Rajasthan
3.7 WATER LEVEL
In all 14 monitoring wells are established in the project area which include 9 tubewells and
5 open wells taping perched aquifer. The perched aquifer is not connected with the
principal aquifer system of the area. It collects rain water and therefore the quality if good
as compared with the principle aquifer system. The locations of the wells are shown in the
figure 18. The basic attributes of the monitoring wells are given in table 130.

62
Figure 18. Location Map of monitoring wells
Table 13. Monitoring Wells established in the Desert Area project, Jaisalmer district,
Rajasthan
Sno. Location LongD LongM LongS LatD LatM LatS Elevation
(m)
Block Type Others
MW1 Naval sigh ki dhani 27 19 7 70 33 1 177 Sam Pz. DTW
MW2 Gamnewala 27 29 33 70 16 47 110 Sam Pz. DTW
MW3 Gamnewala 27 29 13 70 16 47 111 Sam Pz. DTW
MW4 Joga (shallow) 27 19 49 70 37 18
Sam DW Perched
MW5 Joga ( Deep ) 27 19 49 70 37 207 Sam DW DTW
MW6 Netshi 27 17 43 70 30 20 168 Sam DW Perched
MW7 Jiya desar 27 15 45 70 31 5 183 Sam DW Perched
MW8 Raypal 27 22 20 70 30 50 Sam DW Perched
MW9 Derasar (Sheuba) 27 24 7 70 39 35 Sam DW Perched
MW10 Mayati wala 27 29 1 70 21 24 117 Sam DW DTW
MW11 Samarthwala 27 24 14 70 16 26 117 Sam DW DTW
MW12 Sanu 27 14 55 70 38 59 214 Sam Pz. DTW
MW13 Ramgarh 27 21 49 70 30 21 148 Sam Pz. DTW
MW14 Ramgarh IGNP 27 22 39 70 29 12 150 Sam Pz. DTW
63
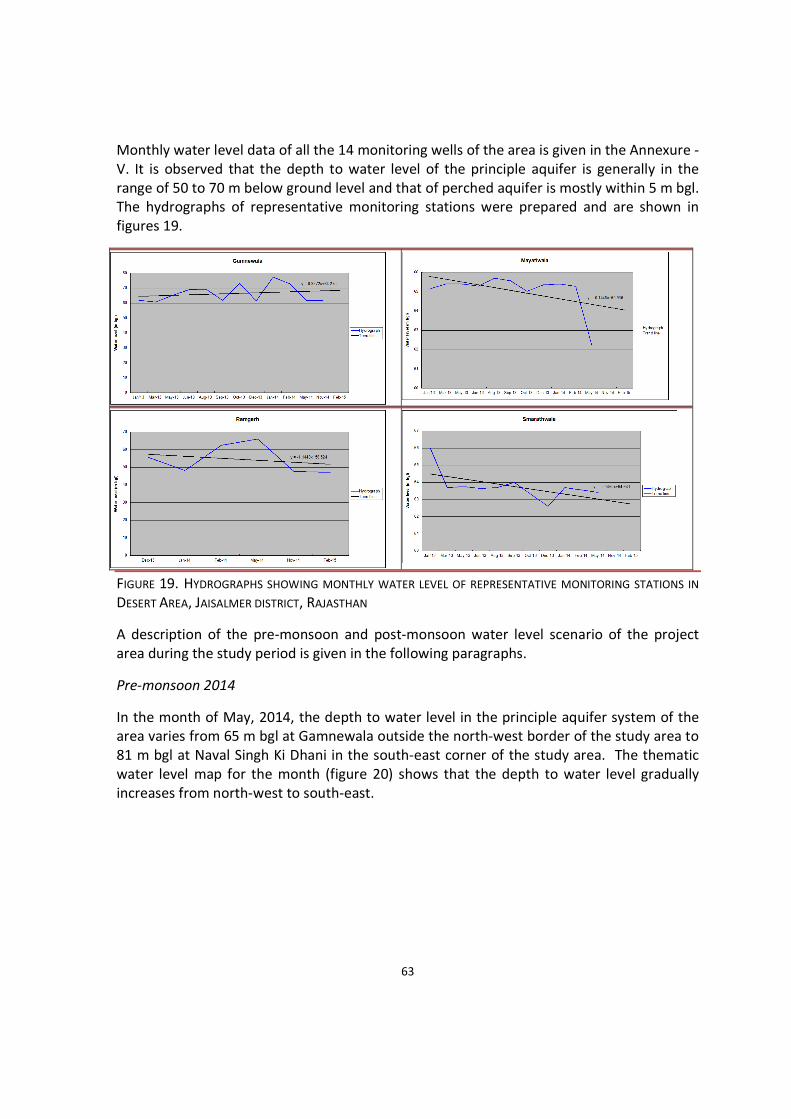
Monthly water level data of all the 14 monitoring wells of the area is given in the Annexure -
V. It is observed that the depth to water level of the principle aquifer is generally in the
range of 50 to 70 m below ground level and that of perched aquifer is mostly within 5 m bgl.
The hydrographs of representative monitoring stations were prepared and are shown in
figures 19.
FIGURE 19. HYDROGRAPHS SHOWING MONTHLY WATER LEVEL OF REPRESENTATIVE MONITORING STATIONS IN
DESERT AREA, JAISALMER DISTRICT, RAJASTHAN
A description of the pre-monsoon and post-monsoon water level scenario of the project
area during the study period is given in the following paragraphs.
Pre-monsoon 2014
In the month of May, 2014, the depth to water level in the principle aquifer system of the
area varies from 65 m bgl at Gamnewala outside the north-west border of the study area to
81 m bgl at Naval Singh Ki Dhani in the south-east corner of the study area. The thematic
water level map for the month (figure 20) shows that the depth to water level gradually
increases from north-west to south-east.

64
Figure 20. Depth to water level map of pre-monsoon (May), 2014, Desert Area,
Jaisalmer district, Rajasthan
Post-monsoon, 2014
The depth to water level scenario during November, 2014 has changed due to the seepage
from IGNP canal system which has resulted in shallower ground water level in the central
portion of the project area through which the canal is following. The depth to water level in
the area varies from 43 m bgl at Ramgarh to 67 m bgl at Joga, on the south-east boundary,
just outside the project area. As described above, the shallower ground water level in the
range of 43 m bgl to 45 m bgl have been recorded in the central portion of the project area
and deeper water level of more than 63 m bgl have been recorded at Mayatiwala,
Gamnewala sites in the north-west corner and Joga in south-east corner.

65
Figure 21. Depth to water level map of post-monsoon (November, 2014), Desert Area,
Jaisalmer district, Rajasthan
Long term ground water level trend
The long-term water level trend was computed for two national hydrograph monitoring
stations of CGWB exiting within the project area. These are Ramgarh, in the central part of
the project area and Gamnewala outside the north-western boundary of the project area.
The information on long term water level trend is given in table 14 and presented in figure
23. No significant trend in water level has been observed in monitoring wells in Ramgarh
area.
Table 14. Long term water level trend of National Hydrograph Monitoring Stations, CGWB
Sl. No. Location Longitude Latitude Data Availability long Trend (m/yr.)
1 Ramgarh 70.28 27.49 2003-2014 0.0008
2 Gamnewala 76.64 27.07 2004-2014 (-)0.0002
The Hydrographs of the Long-term water level trend stations are shown in Figure 22.

66
Figure 22. Time series data of the National Hydrograph Stations of CGWB in Ramgarh
area, Jaisalmer district, Rajasthan
The average water level long term trends of the different ground water potential zones as
computed in the ground water resources assessment, 2011 jointly assessed by State Ground

67
Water Department and CGWB is given in table 15. A perusal of the data indicates that as
such there is no significant long term trend in the study area.
Table 15. Average long term water level trend computed in Ground water resources
assessment, 2011
Sl. No. Ground Water
Potential Zone
Pre-monsoon trend
(m/year)
Post-monsoon
trend (m/year)
Pre-monsoon
(whether
significant
change?)
Post-monsoon
(whether
significant
change?)
1 Alluvium (A2/1) 0.20 0.17 Yes No
2 Pariwar sandstone
(P1/1)
-0.02 -0.17 No No
3.8 WATER QUALITY
The basic chemical parameters were determined for evaluating the groundwater quality of
Ramgarh area, Jaisalmer district, Rajasthan are pH, EC, TDS, CO3, HCO3, Cl, NO3, S04, PO4, F,
Ca, Mg, TH, Alkalinity, Na, K, and Fe. These elements are determined using instruments such
as pH meter, EC Meter, Flame Photometer, UV/Visible spectrophotometer and titrimetric
methods. Water samples are collected from both dug wells and tubewells. The chemical
analysis results are given in Annexure VI. The major quality findings are described as under.
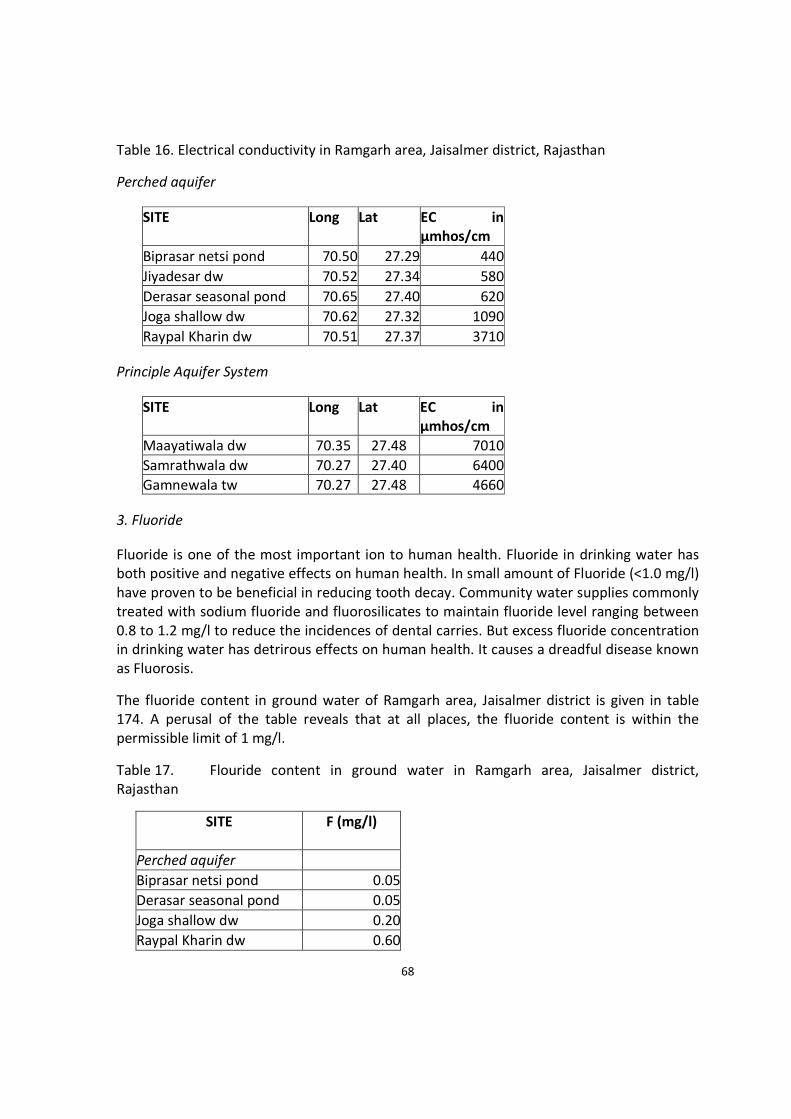
1. Electrical conductivity
Electrical conductivity represents total number of cations and anions present in ground
water indicating ionic mobility of different ions, total dissolved solids and saline nature of
water. Salinity can be caused due to the intrinsic property of the aquifer. Over exploitation
of fresh ground water, lack of recharge, average rainfall and strong evaporation in area with
shallow water tables may also lead to salinization. Excessive pumping and irrigation
practices may stimulate precipitation of dissolved solids and salts on agricultural lands
leading to salinity of ground water. In Jaisalmer district, the potable groundwater was
considered upto 3000µS/cm.
The electrical conductivity in the study area varies distinctly between water samples
collected from shallow perched aquifer and deep principle aquifer system. The perched
aquifer has EC ranges from 440 μmhos/cm to 3710 μmhos/cm, indicating potable nature of
the water. In contrast, the deeper principle aquifer system has EC range between 4660
μmhos/cm and 7010 μmhos/cm. The high salinity content of the aquifer is attributed to the
intrinsic chemical composition of the sediments which are marine deposits. Table 16 gives
the EC of the water samples collected from both the perched aquifer and deep principle
aquifer system.
68
Table 16. Electrical conductivity in Ramgarh area, Jaisalmer district, Rajasthan
Perched aquifer
SITE Long Lat EC in
μmhos/cm
Biprasar netsi pond 70.50 27.29 440
Jiyadesar dw 70.52 27.34 580
Derasar seasonal pond 70.65 27.40 620
Joga shallow dw 70.62 27.32 1090
Raypal Kharin dw 70.51 27.37 3710
Principle Aquifer System
SITE Long Lat EC in
μmhos/cm
Maayatiwala dw 70.35 27.48 7010
Samrathwala dw 70.27 27.40 6400
Gamnewala tw 70.27 27.48 4660
3. Fluoride
Fluoride is one of the most important ion to human health. Fluoride in drinking water has
both positive and negative effects on human health. In small amount of Fluoride (<1.0 mg/l)
have proven to be beneficial in reducing tooth decay. Community water supplies commonly
treated with sodium fluoride and fluorosilicates to maintain fluoride level ranging between
0.8 to 1.2 mg/l to reduce the incidences of dental carries. But excess fluoride concentration
in drinking water has detrirous effects on human health. It causes a dreadful disease known
as Fluorosis.
The fluoride content in ground water of Ramgarh area, Jaisalmer district is given in table
174. A perusal of the table reveals that at all places, the fluoride content is within the
permissible limit of 1 mg/l.
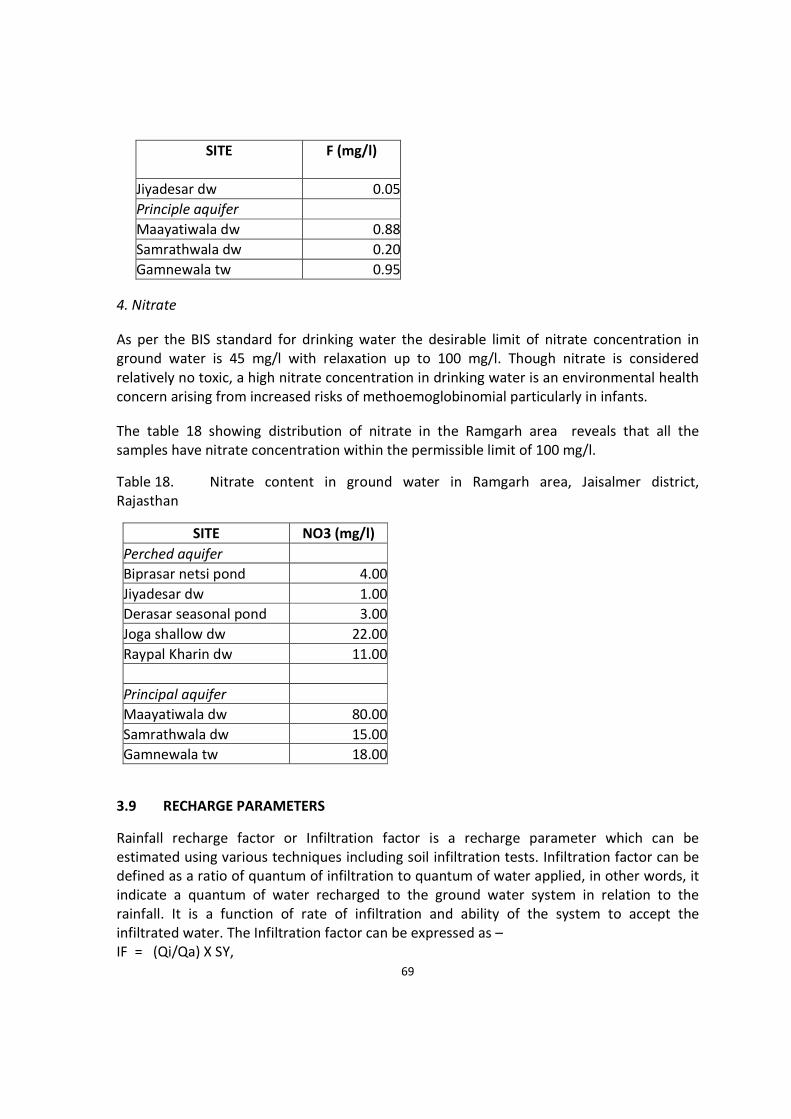
Table 17. Flouride content in ground water in Ramgarh area, Jaisalmer district,
Rajasthan
SITE F (mg/l)
Perched aquifer
Biprasar netsi pond 0.05
Derasar seasonal pond 0.05
Joga shallow dw 0.20
Raypal Kharin dw 0.60
69
SITE F (mg/l)
Jiyadesar dw 0.05
Principle aquifer
Maayatiwala dw 0.88
Samrathwala dw 0.20
Gamnewala tw 0.95
4. Nitrate
As per the BIS standard for drinking water the desirable limit of nitrate concentration in
ground water is 45 mg/l with relaxation up to 100 mg/l. Though nitrate is considered
relatively no toxic, a high nitrate concentration in drinking water is an environmental health
concern arising from increased risks of methoemoglobinomial particularly in infants.
The table 18 showing distribution of nitrate in the Ramgarh area reveals that all the
samples have nitrate concentration within the permissible limit of 100 mg/l.
Table 18. Nitrate content in ground water in Ramgarh area, Jaisalmer district,
Rajasthan
SITE NO3 (mg/l)
Perched aquifer
Biprasar netsi pond 4.00
Jiyadesar dw 1.00
Derasar seasonal pond 3.00
Joga shallow dw 22.00
Raypal Kharin dw 11.00
Principal aquifer
Maayatiwala dw 80.00
Samrathwala dw 15.00
Gamnewala tw 18.00
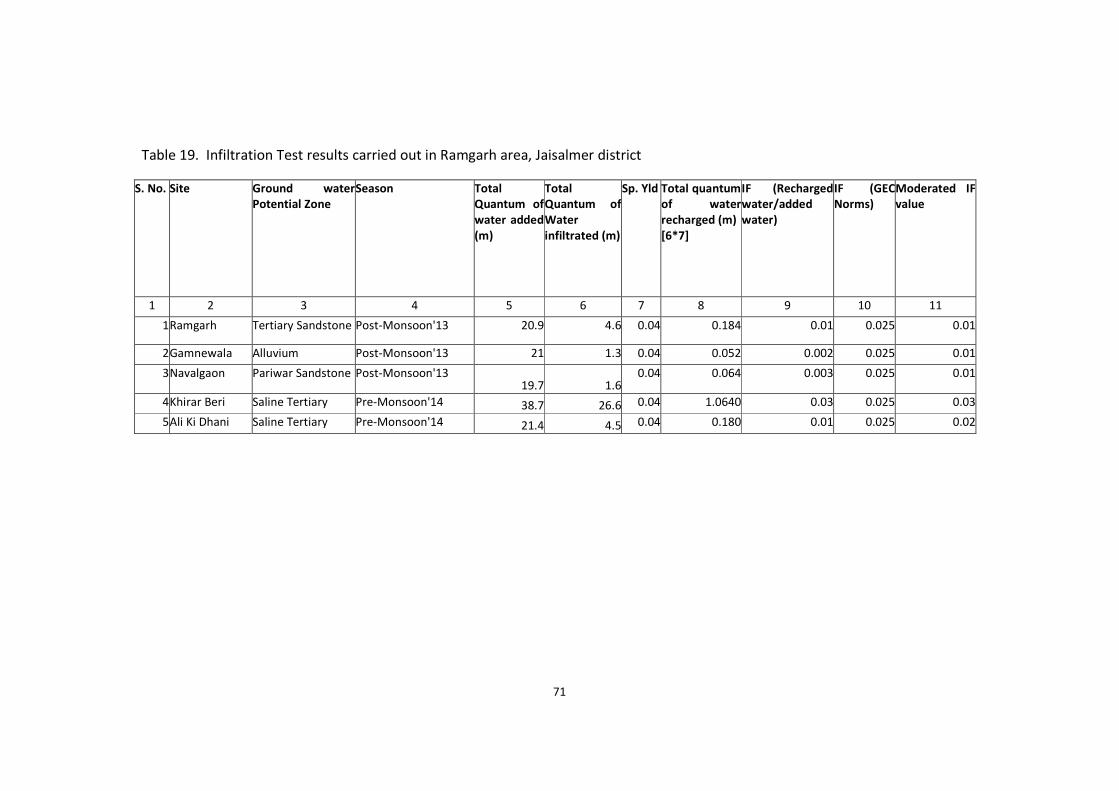
3.9 RECHARGE PARAMETERS
Rainfall recharge factor or Infiltration factor is a recharge parameter which can be
estimated using various techniques including soil infiltration tests. Infiltration factor can be
defined as a ratio of quantum of infiltration to quantum of water applied, in other words, it
indicate a quantum of water recharged to the ground water system in relation to the
rainfall. It is a function of rate of infiltration and ability of the system to accept the
infiltrated water. The Infiltration factor can be expressed as –
IF = (Qi/Qa) X SY,
70
Where,
IF = Infiltration Factor
Qi = Quantum of water infiltrated over the test period in m
Qa = Quantum of water applied in m
SY = Specific Yield
Qi and Qa are derived from the soil infiltration test as discussed in section 3.2. The specific
yield values are obtained from dynamic ground water resources assessment report of 2011
for Sam block, Jaisalmer district. Infiltration factors computed for various test sites are given
in table 19. The average Infiltration / Recharge factor of various ground water potential
zones as deducted from the above mentioned study are as follows –
Alluvium – 0.01; Tertiary sandstone –0.01 and Pariwar sandstone – 0.01
71
Table 19. Infiltration Test results carried out in Ramgarh area, Jaisalmer district
S. No. Site Ground water
Potential Zone
Season Total
Quantum of
water added
(m)
Total
Quantum of
Water
infiltrated (m)
Sp. Yld Total quantum
of water
recharged (m)
[6*7]
IF (Recharged
water/added
water)
IF (GEC
Norms)
Moderated IF
value
1 2 3 4 5 6 7 8 9 10 11
1Ramgarh Tertiary Sandstone Post-Monsoon'13 20.9 4.6 0.04 0.184 0.01 0.025 0.01
2Gamnewala Alluvium Post-Monsoon'13 21 1.3 0.04 0.052 0.002 0.025 0.01
3Navalgaon Pariwar Sandstone Post-Monsoon'13 19.7 1.6
0.04 0.064 0.003 0.025 0.01
4Khirar Beri Saline Tertiary Pre-Monsoon'14 38.7 26.6 0.04 1.0640 0.03 0.025 0.03
5Ali Ki Dhani Saline Tertiary Pre-Monsoon'14 21.4 4.5 0.04 0.180 0.01 0.025 0.02

72
3.10 DISCHARGE PARAMETERS
There are no irrigation wells as per the dynamic ground water resources of Rajasthan, 2011
in Ramgarh area. Therefore, estimation of discharge parameter has not been carried out in
Desert Area project.

73
4. DATA INTEGRATION
4.1 Introduction
Validation of the heiloborne and surface geophysical data with the drilling log results has
been done on the WellCAD platform using the evaluation version. This provides excellent
platform for data validation and integration. Finally we have integrated all sorts of available
information from heliborne, surface, borehole geophysics and drilling logs and prepared
composite and integrated litholog upto 300 m depth. There are total two well drilled where
first drill well is located at Ramgarh village and other drilled recently at Maithywala well
site. Ramgarh well is logged only for SP and short and long normal. The Maithywala well
logged last week is found successful. The logged resistivity is found almost of the same
order as achieved by SkyTEM smooth model. It is yet to be received the full log and CGWB
consolidated report. In this report the Ramgarh log has been presented in figure 23. Based
on the borehole resistivity log entire lithology could broadly be divided into three major
section. The first top 15 m is resistive which corroborate well with the SkyTEM resistivity.
Followed by low resistive zone till 33 m which is attributed as clay stone and found as low
resistivity by SkyTEM as well. Further there is distinct high resistivity shown by N-16 and
little by N-64 till 75 m that also correspond well by SkyTEM. Integrated litho units are given
in table 20.
Figure 23. Borehole geophysical logs i.e. Self potential (sp), resistivity (short normal, long normal and lateral),
drill time, penetration rate (pr), SkyTEM smooth resistivity model of ramgarh village

74
Table 20. Consolidated Litholog of Exploratory Borewell at I G N P Colony, Ramgarh,
District Jaisalmer
From To Lithology
5 14 Aeolian soil (sandy and silty)
14 33 Clay stone
33 56 Siltstone with calcareous intercalation
56 62 Limestone
62 90 Claystone
90 136 Siltstone with calcareous intercalation
136 190 Shaly limestone
190 205 Shale
205 230 Shaly limestone (slotted zone)
230 247 Shale
247 262 Shaly limestone
262 295 Shale
4.2 TRANSLATION INTO HYDROGEOLOGICAL MODEL
In order to achieve one of the main objectives of mapping the principal aquifers, we
established an approach for translating the geophysical results into the hydrogeological
models through the steps as follows:
a. SkyTEM results are calibrated against the drilling lithologs, ground and borehole
geophysical results and then integrated lithological log at each borehole are
prepared.
b. Equivalent litho-units of the integrated logs are converted into principal litho-units as
proxy of principal aquifer and aquitard.
c. The principal lithologs are imported to the Arhus Workbench and incorporated with
the individual sections prepared at each 2 km x 2 km grid line as shown in Figure 20.
d. The principal litho-facies are interpolated and extrapolated along the SkyTEM
sections using the calibrated resistivity values.
e. Based on the hydro-stratigraphy, the principle lithological units are finally attributed
into principal aquifers, exploited aquifers , confining layers and bedrocks
Lithological layer boundaries are prepared for all possible SCI model separated ~25 m from
each other along the grid lines. This is followed by gridding using the kriging interpolation
scheme. Of course, the interpolation has averaged out some of the sharp anomalies
indicating smooth variation. In order to retain the small-scale variation, it is desired to do
the digitization and demarcation of lithological boundaries for all the flight lines. Elevation
of all the inferred lithological layers at each grid intersection have been handed over to the
CGWB to form 3-D Aquifer Geometry.
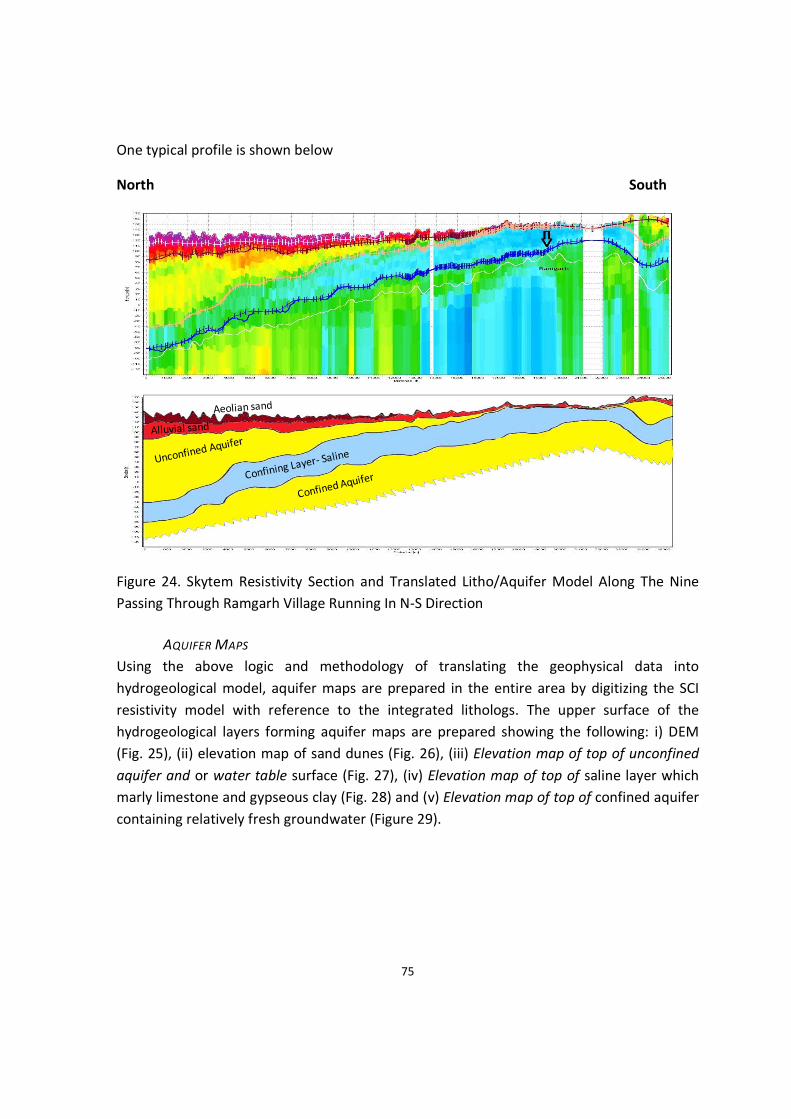
75
One typical profile is shown below
North South
Figure 24. Skytem Resistivity Section and Translated Litho/Aquifer Model Along The Nine
Passing Through Ramgarh Village Running In N-S Direction
AQUIFER MAPS
Using the above logic and methodology of translating the geophysical data into
hydrogeological model, aquifer maps are prepared in the entire area by digitizing the SCI
resistivity model with reference to the integrated lithologs. The upper surface of the
hydrogeological layers forming aquifer maps are prepared showing the following: i) DEM
(Fig. 25), (ii) elevation map of sand dunes (Fig. 26), (iii) Elevation map of top of unconfined
aquifer and or water table surface (Fig. 27), (iv) Elevation map of top of saline layer which
marly limestone and gypseous clay (Fig. 28) and (v) Elevation map of top of confined aquifer
containing relatively fresh groundwater (Figure 29).
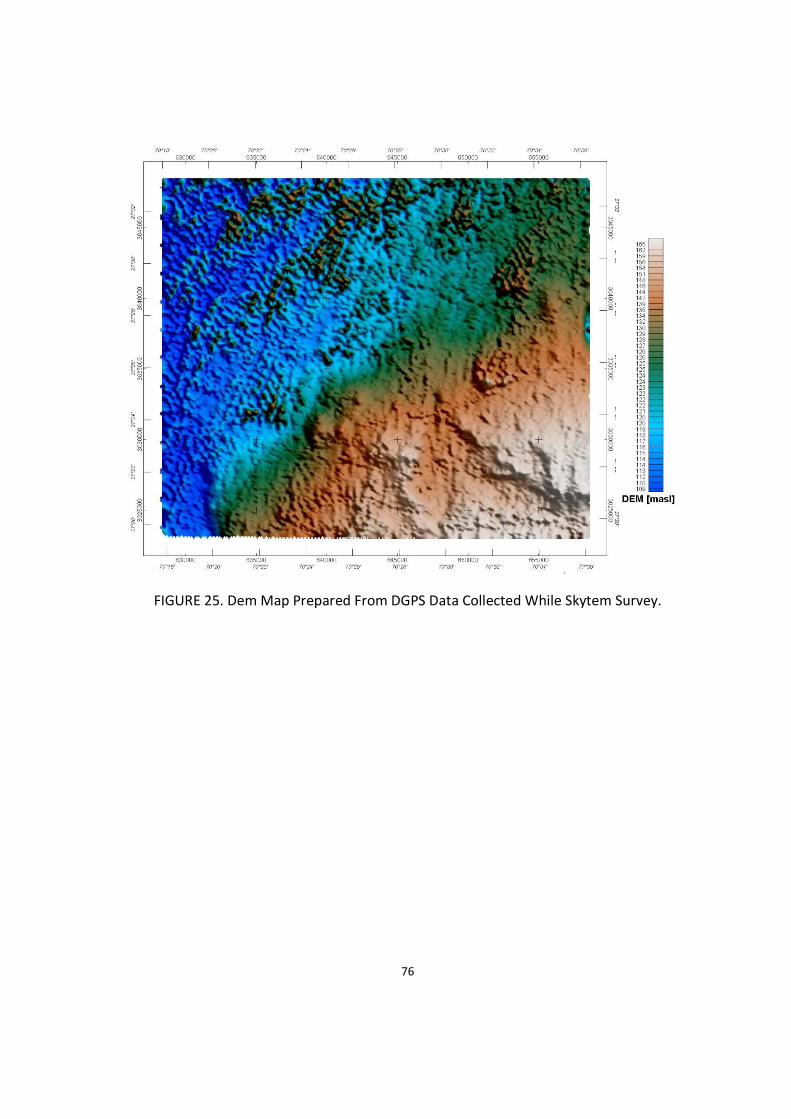
76
FIGURE 25. Dem Map Prepared From DGPS Data Collected While Skytem Survey.
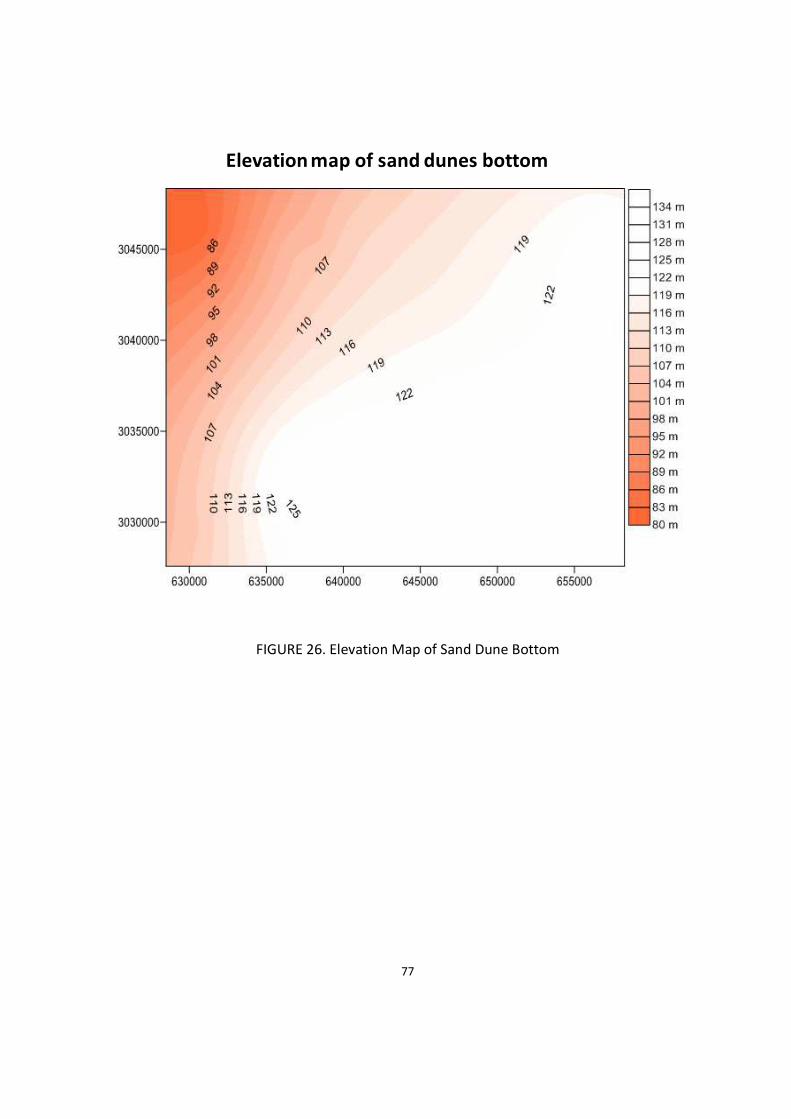
77
Elevation map of sand dunes bottom
FIGURE 26. Elevation Map of Sand Dune Bottom
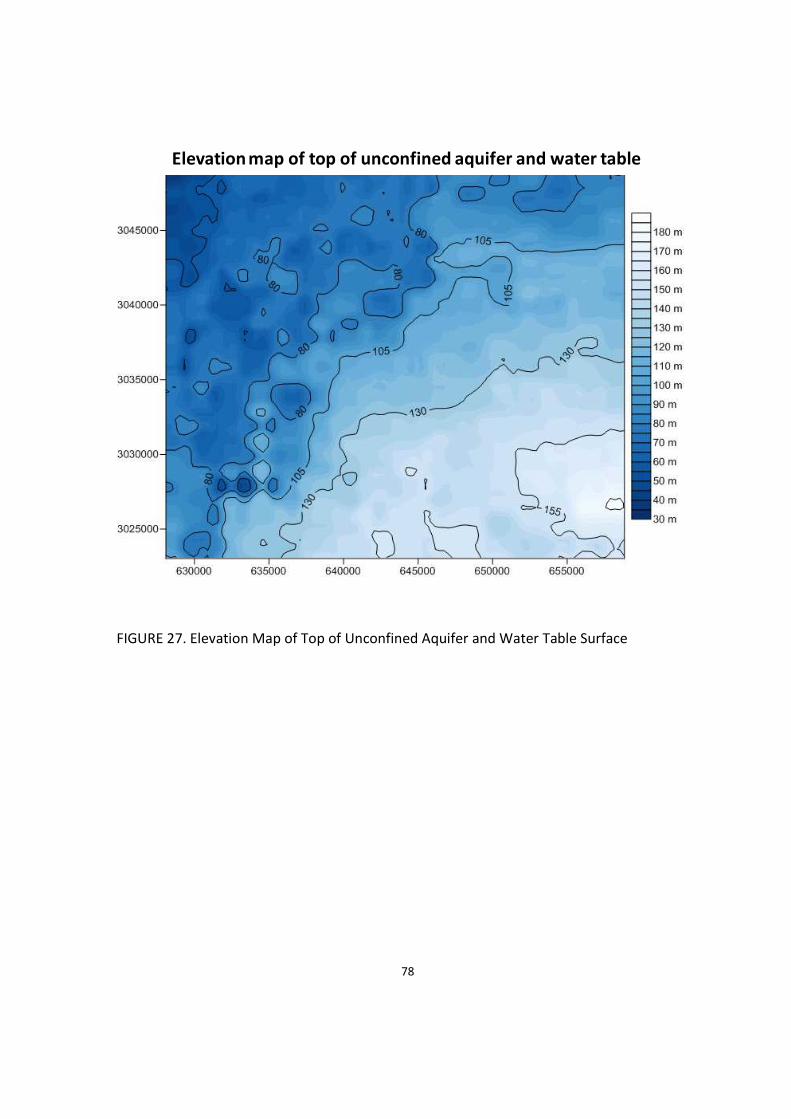
78
Elevation map of top of unconfined aquifer and water table
FIGURE 27. Elevation Map of Top of Unconfined Aquifer and Water Table Surface
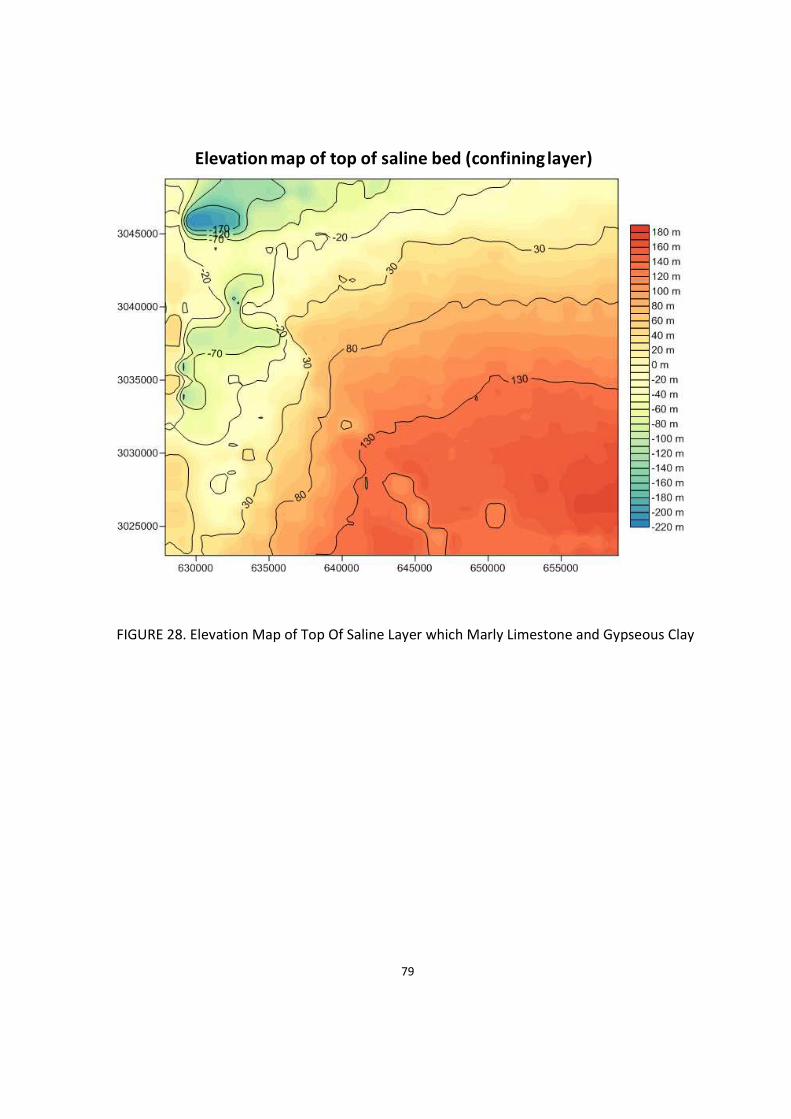
79
Elevation map of top of saline bed (confining layer)
FIGURE 28. Elevation Map of Top Of Saline Layer which Marly Limestone and Gypseous Clay
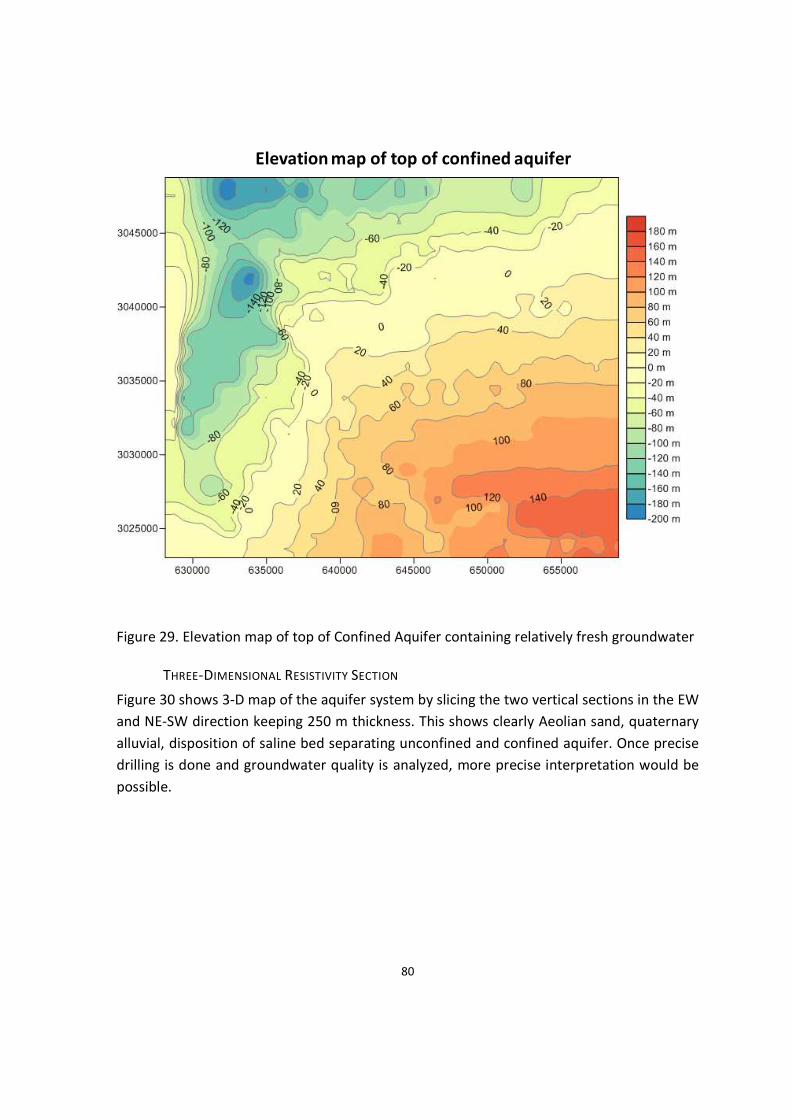
80
Elevation map of top of confined aquifer
Figure 29. Elevation map of top of Confined Aquifer containing relatively fresh groundwater
THREE-DIMENSIONAL RESISTIVITY SECTION
Figure 30 shows 3-D map of the aquifer system by slicing the two vertical sections in the EW
and NE-SW direction keeping 250 m thickness. This shows clearly Aeolian sand, quaternary
alluvial, disposition of saline bed separating unconfined and confined aquifer. Once precise
drilling is done and groundwater quality is analyzed, more precise interpretation would be
possible.
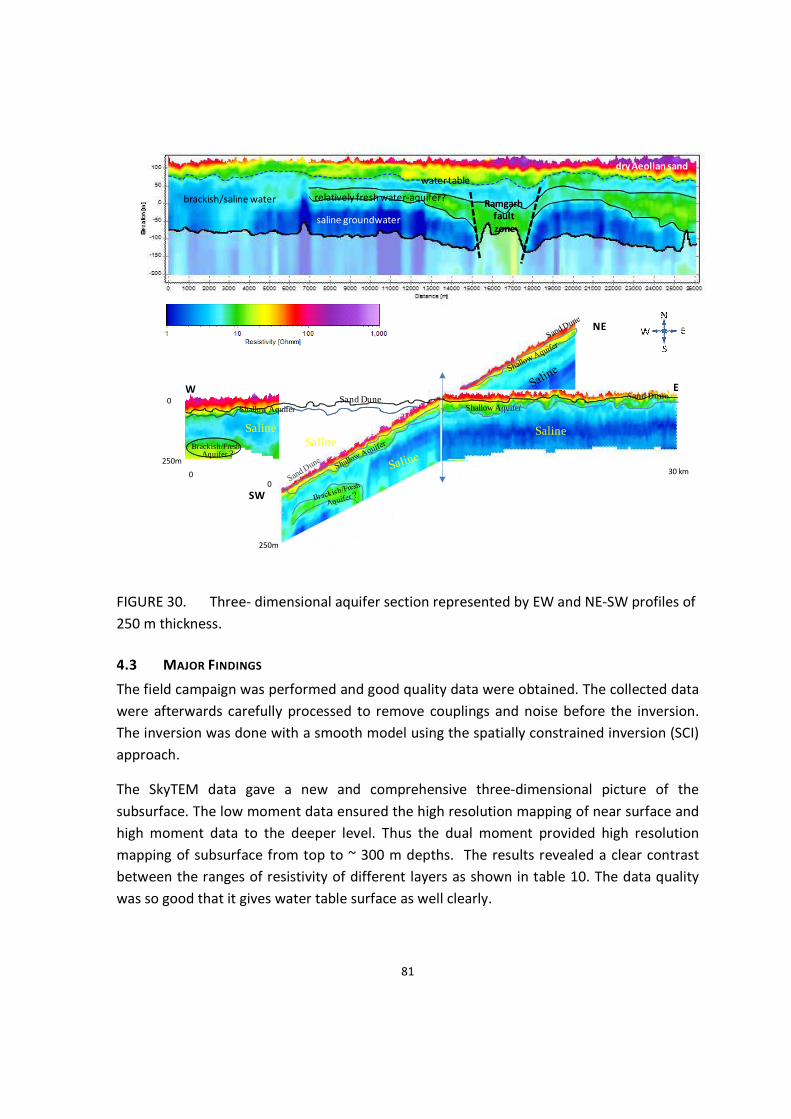
81
saline groundwater
relatively fresh water-aquifer?brackish/saline water
dry Aeolian sand
water table
Ramgarh
fault
zone
W E
SW
0
250m
0 30 km
0
250m
0
Saline SalineSaline
Shallow Aquifer Shallow AquiferSand Dune Sand Dune
Brackish/FreshAquifer ?
NE
FIGURE 30. Three- dimensional aquifer section represented by EW and NE-SW profiles of
250 m thickness.
4.3 MAJOR FINDINGS
The field campaign was performed and good quality data were obtained. The collected data
were afterwards carefully processed to remove couplings and noise before the inversion.
The inversion was done with a smooth model using the spatially constrained inversion (SCI)
approach.
The SkyTEM data gave a new and comprehensive three-dimensional picture of the
subsurface. The low moment data ensured the high resolution mapping of near surface and
high moment data to the deeper level. Thus the dual moment provided high resolution
mapping of subsurface from top to ~ 300 m depths. The results revealed a clear contrast
between the ranges of resistivity of different layers as shown in table 10. The data quality
was so good that it gives water table surface as well clearly.

82
The area is found quite favourable for heliborne TEM because of the presence of top dry
Aeolian sand that acts as a transparent window for electromagnetic induction. In such areas
the conventional DC resistivity method normally fails in injecting current into the ground
due to the presence of Aeolian resistive sand. The dimensions of Aeolian sand have been
mapped over the entire area. Its thickness increases towards north and north-west. The
relevant findings are the identification of:
• Saline groundwater zone that dips and thickens towards north,
• The regional extents of relatively fresh water aquifer underlying the saline water
zone,
• SE-NW trending Ramgarh fault that passes through the area,
• The lateral and vertical movement along the fault,
• The role of Ramgarh fault in controlling the groundwater condition. The fault
separates the Khara-Rann (i.e. brackish water) and Meetha-Rann (sweet water) and
Thick sediments deposited in a linear alignment (could be structurally controlled)
forming isolated pockets of fresh water aquifer within the saline water zone.
4.4 PERFORMANCE MATRIX
The result and outcome of various geophysical methods employed in the project area are
summarized in the following tables.
Table 21. Performance of SkyTEM in Aquifer Mapping in Ramgarh area, Jaisalmer district,
Rajasthan Status / Achievements Hydrogeology Objective/Target
Delineated Partially
Delineated
Not
Delineated
Reason for
non-
Delination
Remarks & Additional
Achievements
Aeolian sand Yes - - -
Relatively Fresh
water aquifer below
saline zone
- Yes* - -
*In a few pockets, the
thick saline zone shields
the underlying zones
with fresh water zone
Aeolian sand and
alluvium overlying
the Tertiaries
associated with
groundwater
salinity The Ramgarh Fault has
also been identified.
The fault is supposed to
have significant role in
separating the Meetha
Rann and Khara Rann

83
Table 22. Performance of various Geophysical methods in Aquifer Mapping in Ramgah area,
Jaisalmer district, Rajasthan Performance of Geophysical Methods Used
Surface Heliborne
Hydrogeological
Objective
Geophysical
Objective
VES GRP TEM TEM MAG
Borehole
Logging
Aquifers in
alluvium clay beds
Moderately
Resistive and
low Resistivity
Layers
1 NA 2 1 NA -
Aquifers in deeper
formations
Resistive
layers at
depth
3 2 NA 1 - -
Fresh-Saline
Interface
Very low
Resistivity
3 1
NA 1 - 1
Geological
Structures
5 5 5 2 - NA
(Maximum depth
– 300 m)
Index on Five point Scale : 1- Excellent, 2 – Very Good, 3 - Good, 4 - Fair, 5 – Poor, NA – Not Applicable
4.5 PROTOCOL FOR UP-SCALING THE FINDINGS OF GEOPHYICAL METHODS IN SIMILAR
HYDROGEOLOGICAL TERRAIN CONDITIONS
The advanced Geophysical techniques can be applied in an area of ~3,03,780 sq.km. in
North-western India based on the parameters mentioned in table 23.
Table 23. Parameters for up-scaling the advanced Geophysical techniques in National
Aquifer Mapping
Upscaling Parameters Quantity/ Nos.
Heli TEM Dual Moment
Flight/ Tie Line Spacing 1/10 km
Frequency 12.5 – 25 Hz
Additional Ground based measurements G-TEM, Drilling, logging, Water Quality
Deliverables High Resolution 3-D Aquifer maps with
Characterization
Following supplementary survey needs to be carried out in this region –
1. A few G-TEM to cover the non-flown area as well as to supplement the HTEM survey
2. A few traverses of CSMT will be useful for bed rock
3. Selected drilling for validation and calibration of Heliborne survey
4. Water quality measurement to apply suitable correction.
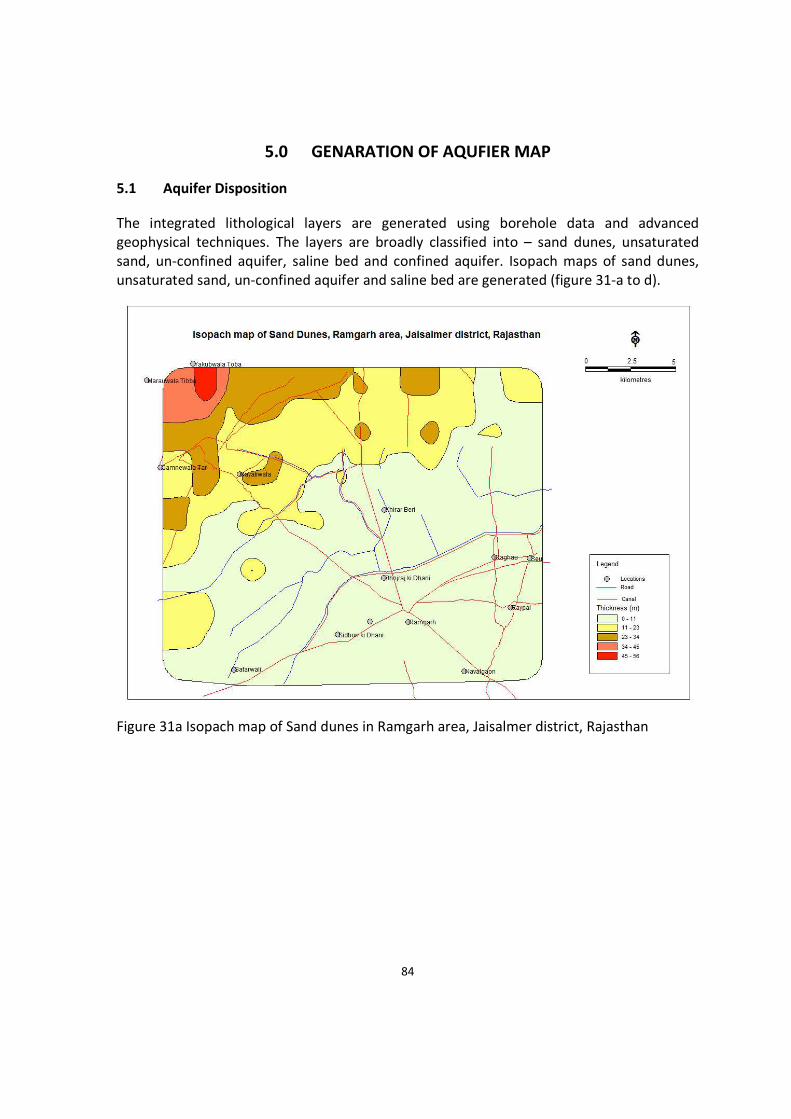
84
5.0 GENARATION OF AQUFIER MAP
5.1 Aquifer Disposition
The integrated lithological layers are generated using borehole data and advanced
geophysical techniques. The layers are broadly classified into – sand dunes, unsaturated
sand, un-confined aquifer, saline bed and confined aquifer. Isopach maps of sand dunes,
unsaturated sand, un-confined aquifer and saline bed are generated (figure 31-a to d).
Figure 31a Isopach map of Sand dunes in Ramgarh area, Jaisalmer district, Rajasthan

85
Figure 31b Isopach map of Unsaturated Aquifer in Ramgarh area, Jaisalmer district,
Rajasthan
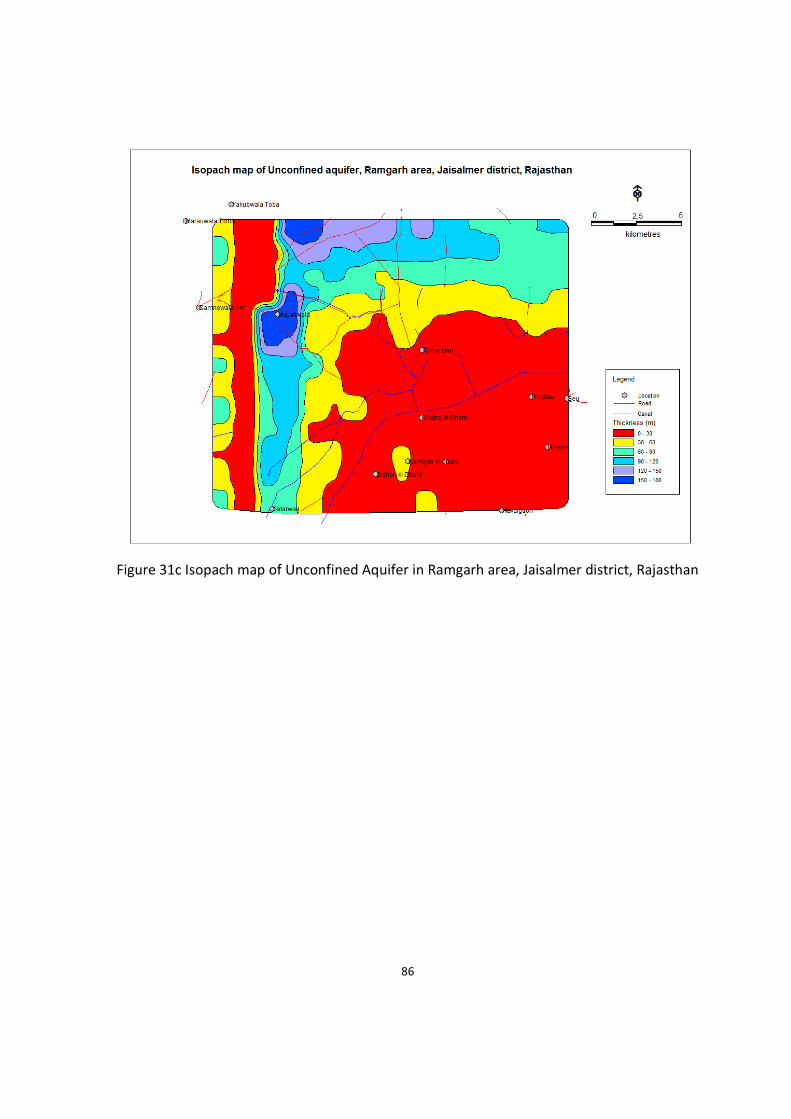
86
Figure 31c Isopach map of Unconfined Aquifer in Ramgarh area, Jaisalmer district, Rajasthan

87
Figure 31d Isopach map of Saline Bed in Ramgarh area, Jaisalmer district, Rajasthan
Thickness of un-confined aquifer in major part of the study area is upto 30 m. However,
thickness of 90 m to 180 m have also been encountered in the northern and eastern part of
the project area. Saline bed of 40 m to 60 m thickness have been encountered in major part
of the project area. Thickness of saline bed is within 20 m in a small linear belt along the
eastern boundary of the study area.
The 3-D aquifer models are depicted in Figure 32.
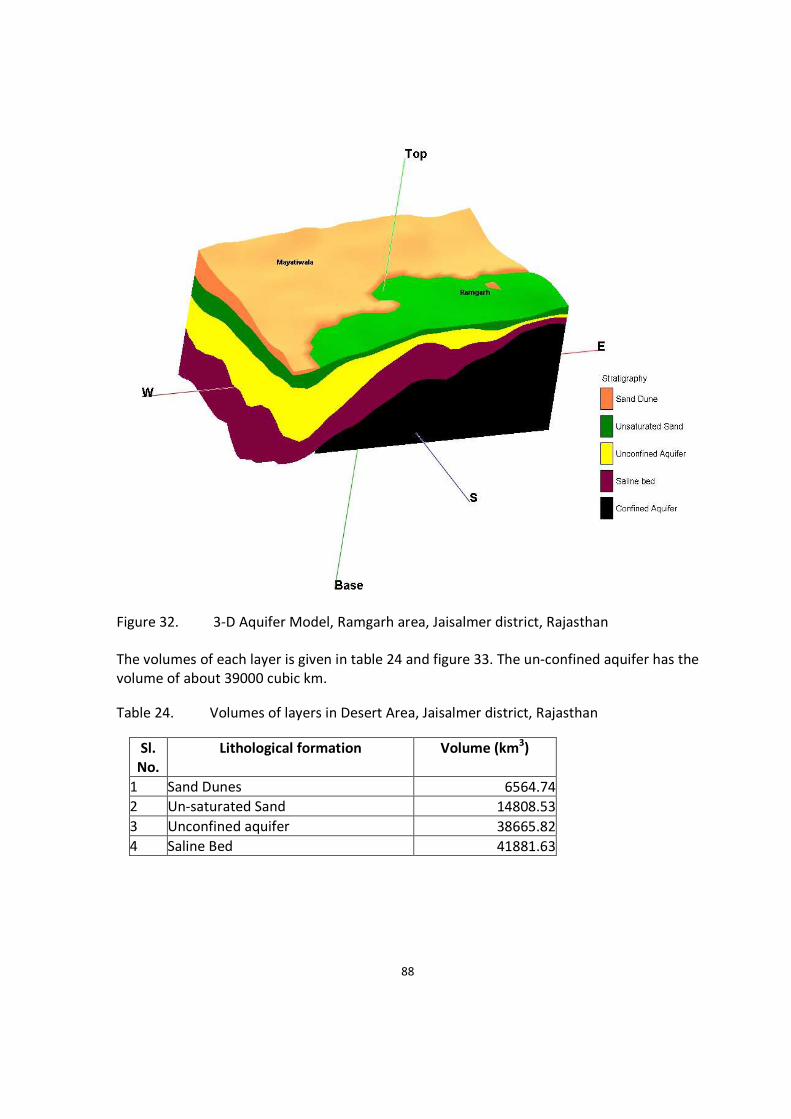
88
Figure 32. 3-D Aquifer Model, Ramgarh area, Jaisalmer district, Rajasthan
The volumes of each layer is given in table 24 and figure 33. The un-confined aquifer has the
volume of about 39000 cubic km.
Table 24. Volumes of layers in Desert Area, Jaisalmer district, Rajasthan
Sl.
No.
Lithological formation Volume (km3)
1 Sand Dunes 6564.74
2 Un-saturated Sand 14808.53
3 Unconfined aquifer 38665.82
4 Saline Bed 41881.63

89
Figure 33. 3-D model depicting volumes of different layers
5.2 Aquifer Characterization
The various attributes of the Unconfined aquifer is described in the following paragraphs. The
characteristics of the aquifers dealt in this section include – water level and water quality.
5.2.1 Water level
Ground water level monitoring in the unconfined aquifer was carried out 9 tubewells. A description
of the pre-monsoon and post-monsoon water level scenario is given in the following paragraphs.
Pre-monsoon 2014
In the month of May, 2014, the depth to water level in the unconfined aquifer varies from 65 m bgl
at Gamnewala outside the north-west border of the study area to 81 m bgl at Naval Singh Ki Dhani
in the south-east corner of the study area. The thematic water level map for the month (figure 34)
shows that the depth to water level gradually increases from north-west to south-east.
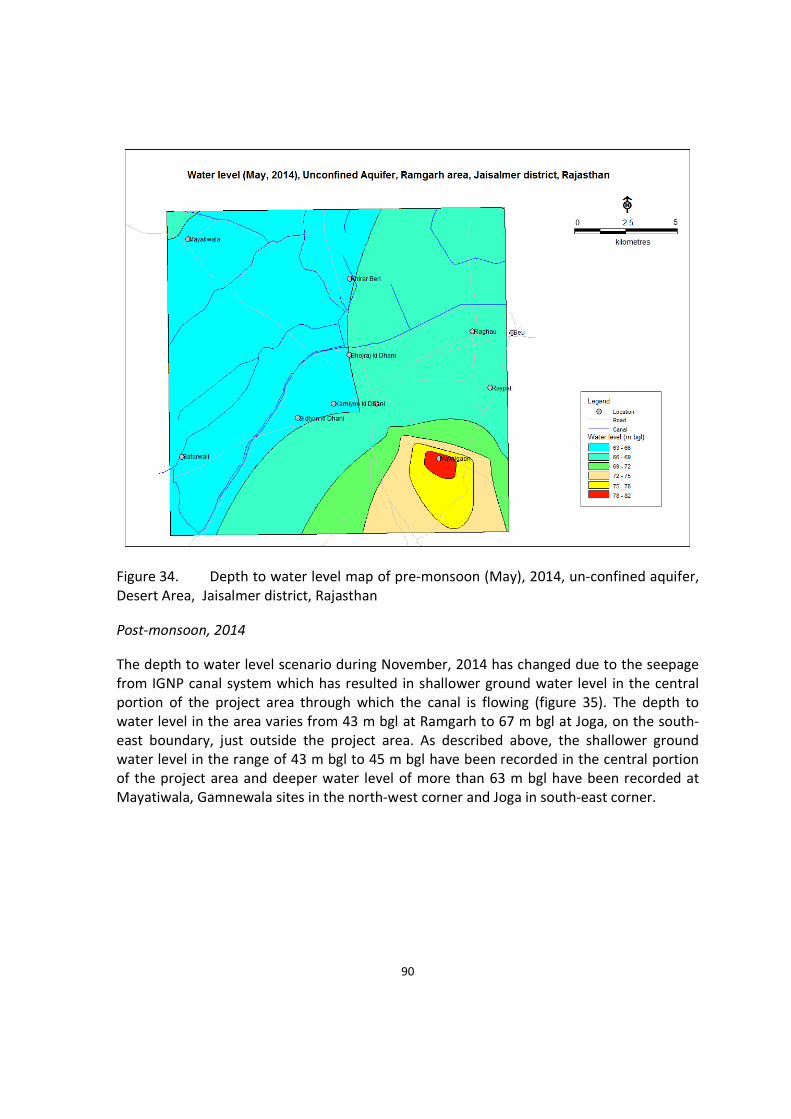
90
Figure 34. Depth to water level map of pre-monsoon (May), 2014, un-confined aquifer,
Desert Area, Jaisalmer district, Rajasthan
Post-monsoon, 2014
The depth to water level scenario during November, 2014 has changed due to the seepage
from IGNP canal system which has resulted in shallower ground water level in the central
portion of the project area through which the canal is flowing (figure 35). The depth to
water level in the area varies from 43 m bgl at Ramgarh to 67 m bgl at Joga, on the south-
east boundary, just outside the project area. As described above, the shallower ground
water level in the range of 43 m bgl to 45 m bgl have been recorded in the central portion
of the project area and deeper water level of more than 63 m bgl have been recorded at
Mayatiwala, Gamnewala sites in the north-west corner and Joga in south-east corner.
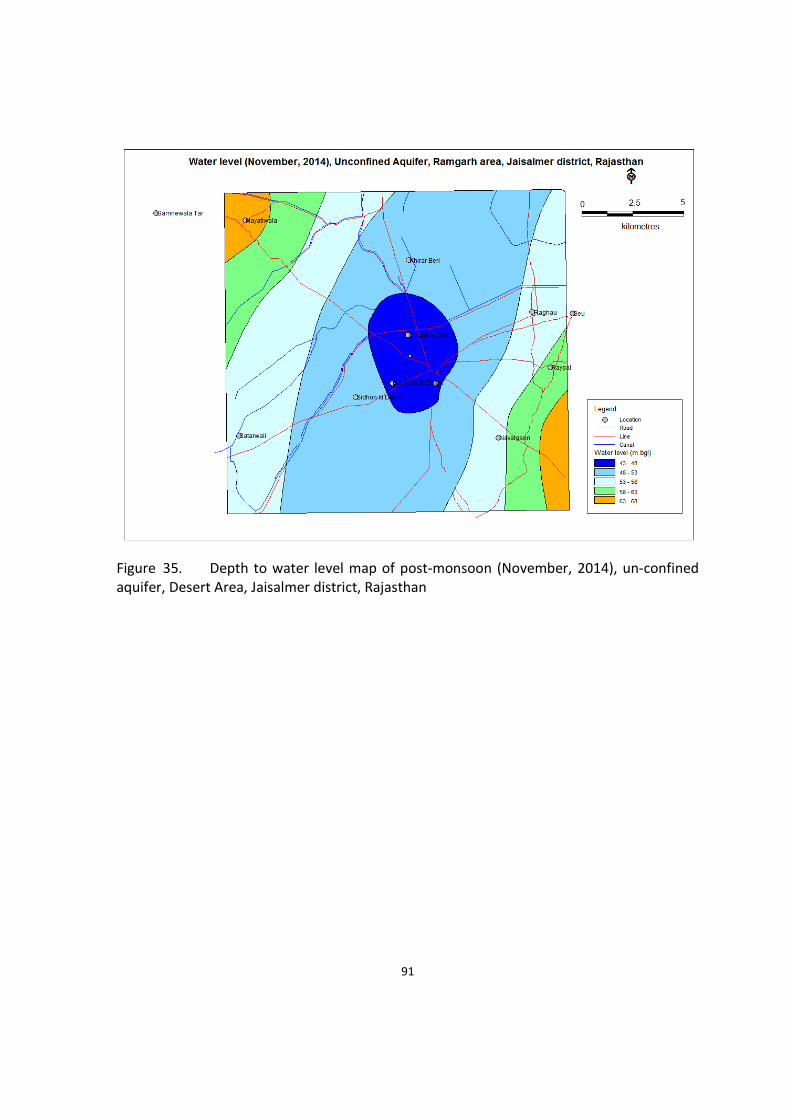
91
Figure 35. Depth to water level map of post-monsoon (November, 2014), un-confined
aquifer, Desert Area, Jaisalmer district, Rajasthan
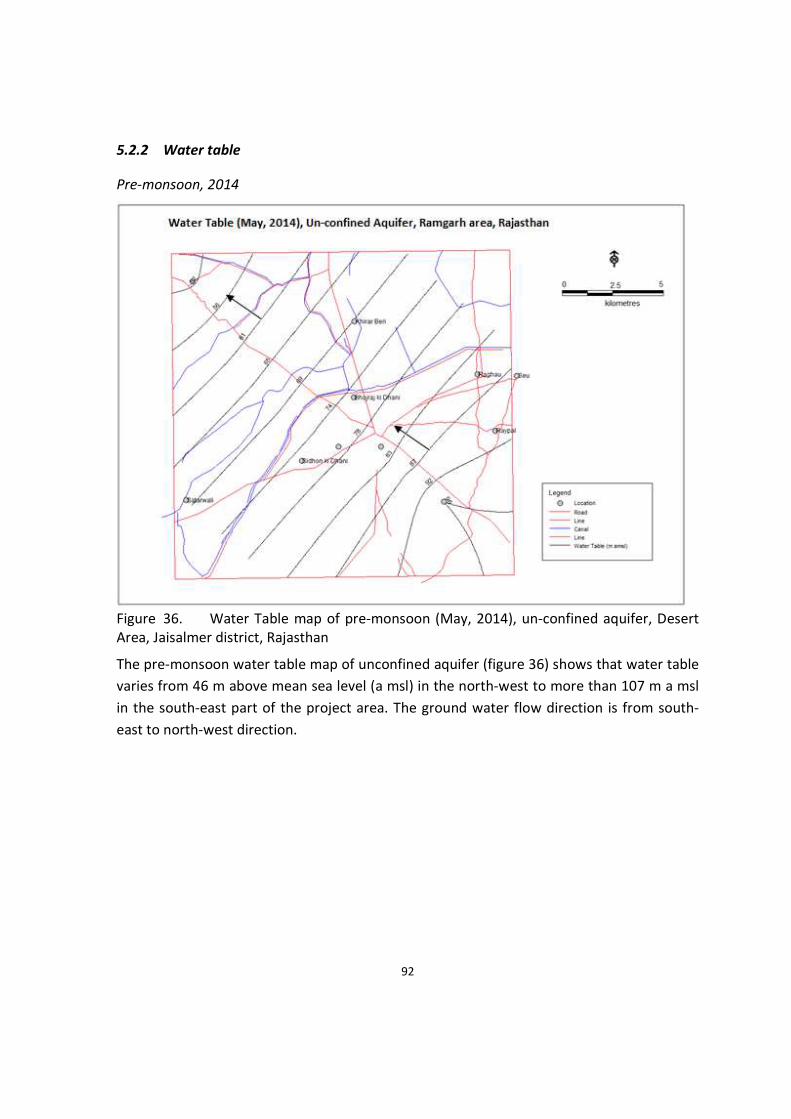
92
5.2.2 Water table
Pre-monsoon, 2014
Figure 36. Water Table map of pre-monsoon (May, 2014), un-confined aquifer, Desert
Area, Jaisalmer district, Rajasthan
The pre-monsoon water table map of unconfined aquifer (figure 36) shows that water table
varies from 46 m above mean sea level (a msl) in the north-west to more than 107 m a msl
in the south-east part of the project area. The ground water flow direction is from south-
east to north-west direction.

93
Post-monsoon, 2014
Figure 37. Water Table map of post-monsoon (November, 2014), un-confined aquifer,
Desert Area, Jaisalmer district, Rajasthan
The post-monsoon water table map of unconfined aquifer (figure 37) shows that water
table varies from less than 50 m a msl in the north-west to 100 m a msl in the south-east
part of the project area. The ground water flow direction is from south-east to north-west
direction.
5.2.3 Water Quality
The electrical conductivity in the unconfined aquifer varies between 4660 μmhos/cm and
7010 μmhos/cm. The high salinity content of the aquifer is attributed to the intrinsic
chemical composition of the sediments which are marine deposits. Apart from salinity
problem, the unconfined aquifer does not suffer from any other contamination like fluoride
and Nitrate.
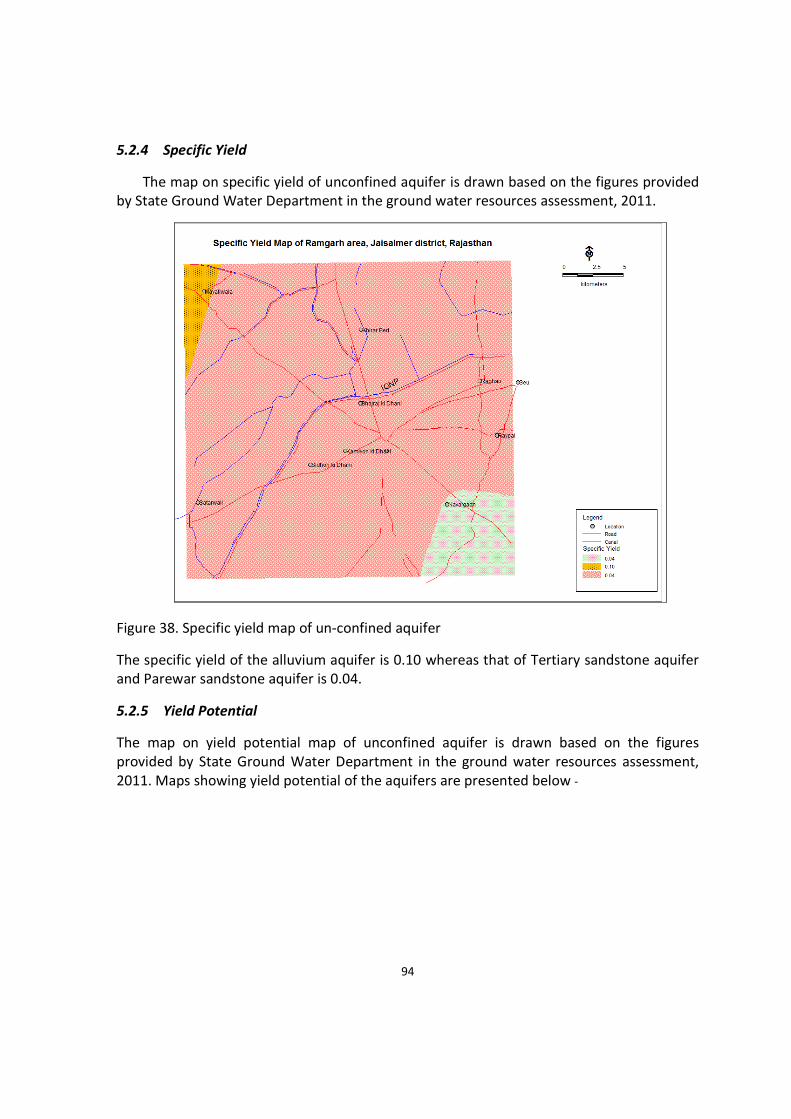
94
5.2.4 Specific Yield
The map on specific yield of unconfined aquifer is drawn based on the figures provided
by State Ground Water Department in the ground water resources assessment, 2011.
Figure 38. Specific yield map of un-confined aquifer
The specific yield of the alluvium aquifer is 0.10 whereas that of Tertiary sandstone aquifer
and Parewar sandstone aquifer is 0.04.
5.2.5 Yield Potential
The map on yield potential map of unconfined aquifer is drawn based on the figures
provided by State Ground Water Department in the ground water resources assessment,
2011. Maps showing yield potential of the aquifers are presented below -

95
Figure 39. Yield potential map of alluvium aquifer and hard rock aquifer
The yield potential map of unconfined aquifer indicates that the yield potential of alluvium
aquifer is 267 litres per minute (lpm) to 333 lpm. The Tertiary sediments are most prolific
ground water potential zone in the area, the yield potential is 500 lpm to 1000 lpm. The
yield potential zone of the Pariwar sandstone is 333 lpm to 500 lpm.

96
6. IMPLEMENTATION PLAN & RECOMMENDATIONS
The desert area around Ramgarh, Sam block, Jaisalmer district has meagre ground water
resources as reflected in the ground water resources assessment of Sam block, Jaisalmer
district, Rajasthan for the year 2011. Table 25 presents the ground water resources of
Desert Area which falls under Sam block, Jaisalmer district.
Table 25. Dynamic Ground Water Resources of Desert Area project area, Jaisalmer district,
Rajasthan
Potential
zone
Potential
zone area
Annual
Recharge
Desert
Area
Natural
Discharge_
Desert
Area
Annual
Ground
Water
Availability
_Desert
Area
Ground
water draft
Irrigation_
Desert
Area
Ground
water
draft_Dom
estic
use_Desert
Area
DRAFT_all
uses_Dese
rt Area
Stage of
Ground
Water
Developme
nt
Long term
Trend
(pre-
monsoon)
Long
term
Trend
(post-
monsoon
)
Category
Sq.km. Mcm Mcm Mcm Mcm Mcm Mcm %
A2/1 6.40 0.025 0.002 0.022 0.000 0.006 0.006 25 NO NO
T1/4 125.50 0.407 0.041 0.366 0.000 0.176 0.176 48 NO NO
P1/1 46.00 0.179 0.018 0.161 0.000 0.131 0.131 81 NO NO
177.90 0.611 0.061 0.550 0.000 0.313 0.313 57 NO NO SAFE
A perusal of the above table indicates that though the area falls in SAFE category of ground
water resources assessment of 2011, the unit annual ground water recharge is very meagre,
around 3.44 mm per year. This constitutes to be only 2% of the annual rainfall which is
around 146 mm. Even this meagre resource is brackish in nature due to intrinsic property of
the rock formations, thus rendering it to be unsuitable for use. The management
interventions proposed in the desert project area are – a. upscaling the traditional water
harvesting system in the area, b. controlled use of limited fresh ground water pockets
around IGNP canal command area.
a. Upscaling of Traditional water harvesting
Traditional water harvesting structures in Desert area, Jaisalmer district, Rajasthan
In the desert area, the traditional water harvesting practices involve collection of rain water
howsoever meagre and storage of it for long time use. During the monsoon, the rain
collects in a catchment or khadin, which is often walled up in a semi-circular fashion by the
farmers using stones and mud, just so that the water does not escape. Even when the top
layer of water evaporates, the soil retains the moisture and is ideal for sowing a variety of
crops including wheat, mustard, melons, and millets like jowar and bajra. These help to
maintain the groundwater levels too. The outlets from one khadin let out excess water
to fill up farms on the other side too, so that farmers on both sides benefit equally.
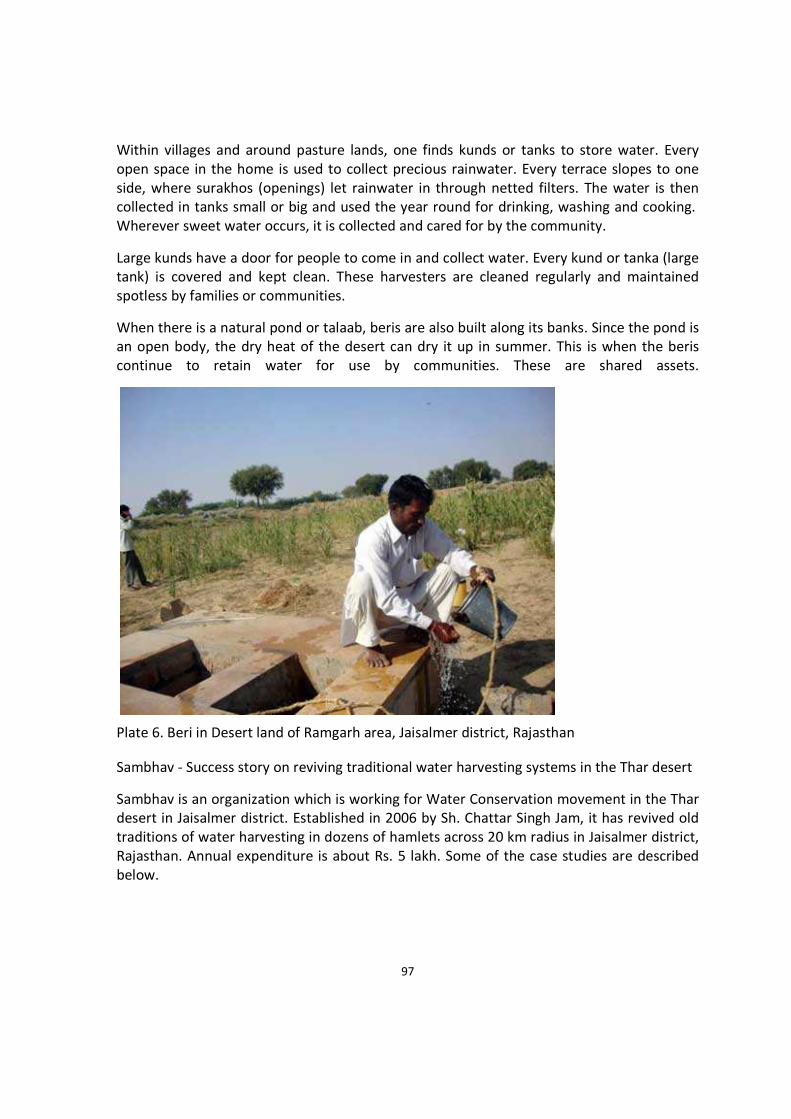
97
Within villages and around pasture lands, one finds kunds or tanks to store water. Every
open space in the home is used to collect precious rainwater. Every terrace slopes to one
side, where surakhos (openings) let rainwater in through netted filters. The water is then
collected in tanks small or big and used the year round for drinking, washing and cooking.
Wherever sweet water occurs, it is collected and cared for by the community.
Large kunds have a door for people to come in and collect water. Every kund or tanka (large
tank) is covered and kept clean. These harvesters are cleaned regularly and maintained
spotless by families or communities.
When there is a natural pond or talaab, beris are also built along its banks. Since the pond is
an open body, the dry heat of the desert can dry it up in summer. This is when the beris
continue to retain water for use by communities. These are shared assets.
Plate 6. Beri in Desert land of Ramgarh area, Jaisalmer district, Rajasthan
Sambhav - Success story on reviving traditional water harvesting systems in the Thar desert
Sambhav is an organization which is working for Water Conservation movement in the Thar
desert in Jaisalmer district. Established in 2006 by Sh. Chattar Singh Jam, it has revived old
traditions of water harvesting in dozens of hamlets across 20 km radius in Jaisalmer district,
Rajasthan. Annual expenditure is about Rs. 5 lakh. Some of the case studies are described
below.
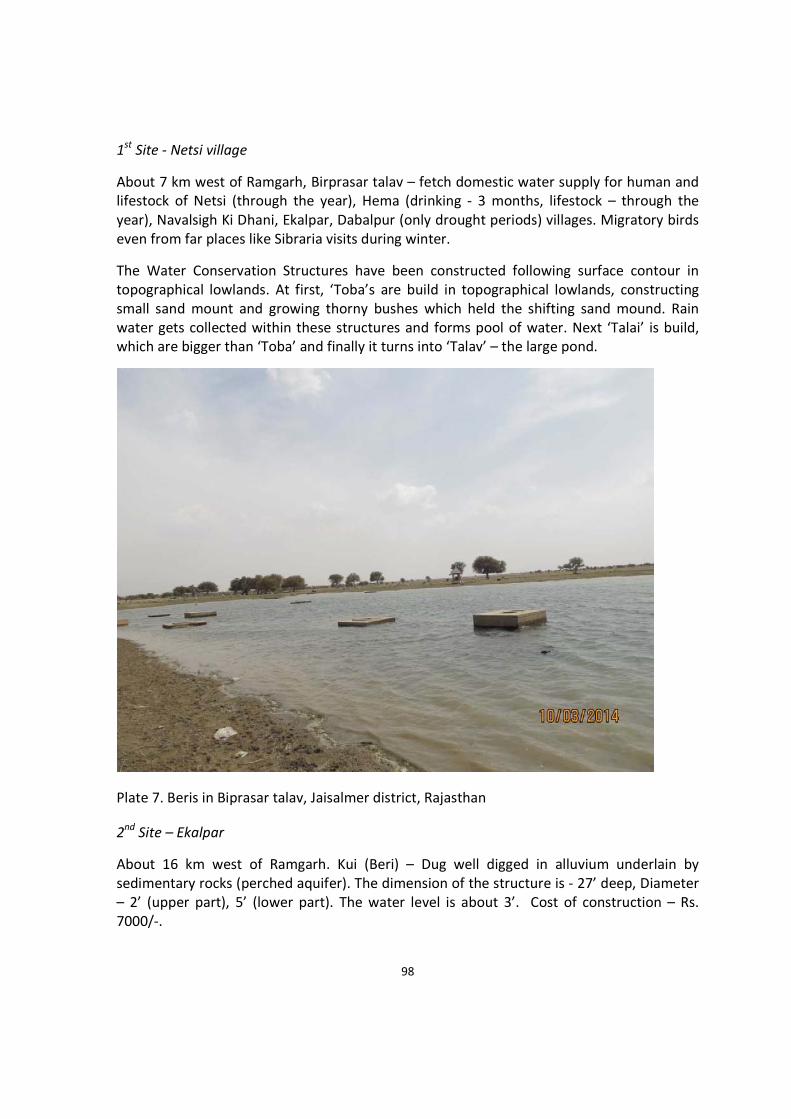
98
1st
Site - Netsi village
About 7 km west of Ramgarh, Birprasar talav – fetch domestic water supply for human and
lifestock of Netsi (through the year), Hema (drinking - 3 months, lifestock – through the
year), Navalsigh Ki Dhani, Ekalpar, Dabalpur (only drought periods) villages. Migratory birds
even from far places like Sibraria visits during winter.
The Water Conservation Structures have been constructed following surface contour in
topographical lowlands. At first, ‘Toba’s are build in topographical lowlands, constructing
small sand mount and growing thorny bushes which held the shifting sand mound. Rain
water gets collected within these structures and forms pool of water. Next ‘Talai’ is build,
which are bigger than ‘Toba’ and finally it turns into ‘Talav’ – the large pond.
Plate 7. Beris in Biprasar talav, Jaisalmer district, Rajasthan
2nd
Site – Ekalpar
About 16 km west of Ramgarh. Kui (Beri) – Dug well digged in alluvium underlain by
sedimentary rocks (perched aquifer). The dimension of the structure is - 27’ deep, Diameter
– 2’ (upper part), 5’ (lower part). The water level is about 3’. Cost of construction – Rs.
7000/-.
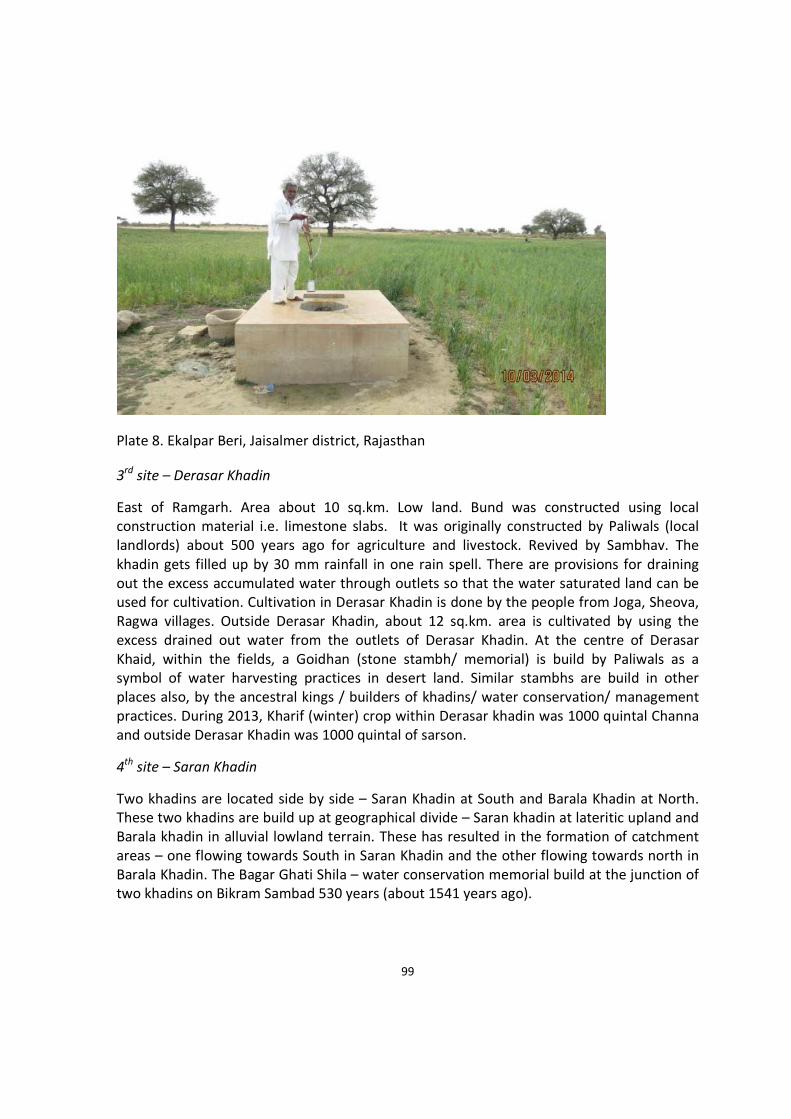
99
Plate 8. Ekalpar Beri, Jaisalmer district, Rajasthan
3rd
site – Derasar Khadin
East of Ramgarh. Area about 10 sq.km. Low land. Bund was constructed using local
construction material i.e. limestone slabs. It was originally constructed by Paliwals (local
landlords) about 500 years ago for agriculture and livestock. Revived by Sambhav. The
khadin gets filled up by 30 mm rainfall in one rain spell. There are provisions for draining
out the excess accumulated water through outlets so that the water saturated land can be
used for cultivation. Cultivation in Derasar Khadin is done by the people from Joga, Sheova,
Ragwa villages. Outside Derasar Khadin, about 12 sq.km. area is cultivated by using the
excess drained out water from the outlets of Derasar Khadin. At the centre of Derasar
Khaid, within the fields, a Goidhan (stone stambh/ memorial) is build by Paliwals as a
symbol of water harvesting practices in desert land. Similar stambhs are build in other
places also, by the ancestral kings / builders of khadins/ water conservation/ management
practices. During 2013, Kharif (winter) crop within Derasar khadin was 1000 quintal Channa
and outside Derasar Khadin was 1000 quintal of sarson.
4th
site – Saran Khadin
Two khadins are located side by side – Saran Khadin at South and Barala Khadin at North.
These two khadins are build up at geographical divide – Saran khadin at lateritic upland and
Barala khadin in alluvial lowland terrain. These has resulted in the formation of catchment
areas – one flowing towards South in Saran Khadin and the other flowing towards north in
Barala Khadin. The Bagar Ghati Shila – water conservation memorial build at the junction of
two khadins on Bikram Sambad 530 years (about 1541 years ago).

100
Khadin renovation work is being maintained during April to June, before the onset of
monsoon. Sambhav group has tried to revive and modify the already existing traditional
water conservation practices.
Recommendation
Considering the fact that the principle aquifer system of the area does not have fresh
ground water resources and as enumerated above, the traditional water harvesting
measures have been successful in not only fulfilling the domestic water demand but also to
a large extent the agricultural requirement of water, it is recommended that the storage of
meager fresh rainfall in various kinds of surface and sub-surface structures be implemented
on large scale.
b. Controlled use of fresh ground water resources
Along the Indira Gandhi Nahar Pariyojna (IGNP) canal, fresh water pockets are formed due
to seepage from the lined canal which sometimes even amount to water-logging situation
as shown in the following photograph (plate - 9).
Plate 9. Water logging situation along IGNP Canal, Ramgarh area, Jaisalmer district,
Rajasthan
It is recommended in these areas which are suffering from water logging problems and
where ground water level is within 8 m, ground water be used in a controlled manner to
mitigate the water logging situation and at the same time caution to be adopted to avoid
over-pumping which may lead to salinity ingress from the brackish water of the principle
aquifer system.

101
An overview of Aquifer map and its 3-D disposition in Ramgarh area is presented in Figure
40 and 41.

102
Figure 40. Aquifer Map of Ramgarh area, Jaisalmer district, Rajasthan
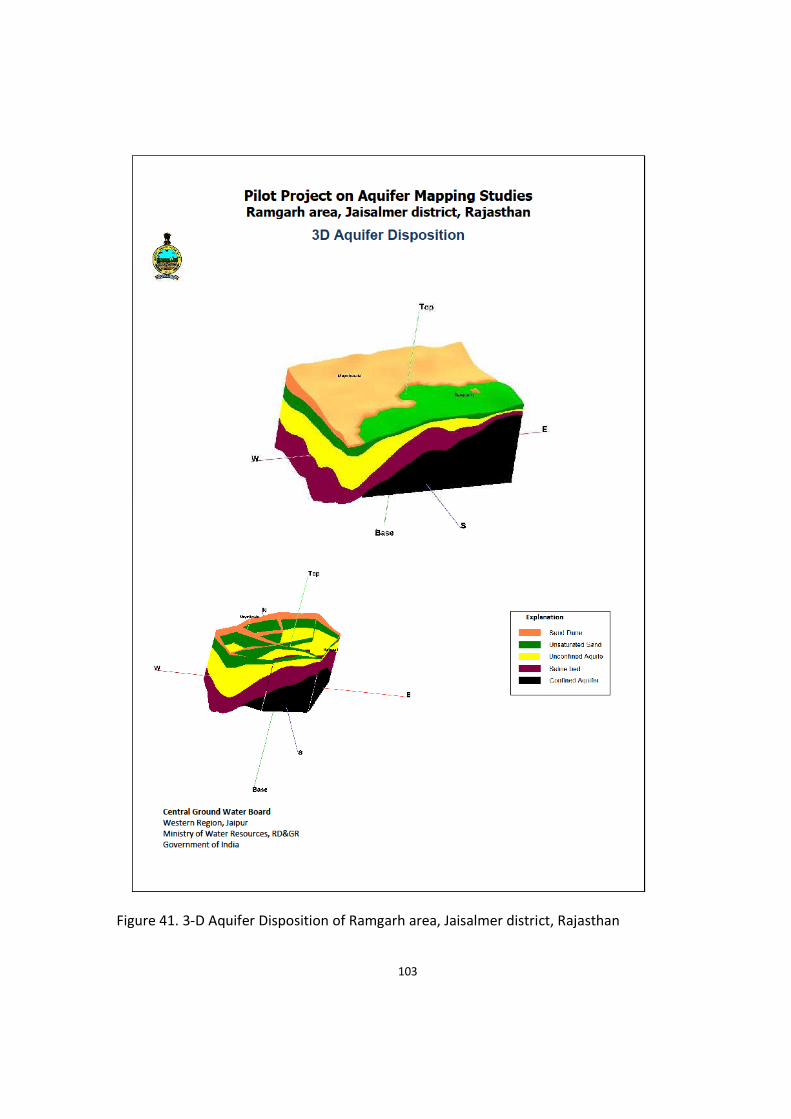
103
Figure 41. 3-D Aquifer Disposition of Ramgarh area, Jaisalmer district, Rajasthan

104
References
Central Ground Water Board, Western Region. 2011. Ground water scenario – Jaisalmer
district, Rajasthan
Central Ground Water Board, Western Region. 2012. Background Report of Pilot Aquifer
Mapping in Ramgarh area, Jaisalmer, Rajasthan
CGWB, 2012. Background Report on Pilot Micro level Aquifer Mapping Projects
State Ground Water Department, Rajasthan. 2012. Dynamic Ground Resources of Rajasthan
(As on March, 2009).
Chandra S., Kumar D., Maurya PK, et al., 2014. Dc Electrical and electromagnetic
investigation in AQDRT, Jaisalmer district, rajasthan, AQUIM mid-term report. Ngri-2014-
gw-859
Chandra, S., Ananda Rao V, and Singh, V. S., (2004): A Combined approach of Schlumberger
and axial Pole-dipole Configurations for Groundwater Exploration in Hard Rock Areas. Cur
Sci vol. 86 no. 10, pp 1437 to 1443.
Christiansen, A. V. and Auken, E., 2010, A Global Measure for Depth of Investigation,
Proceedings of the EAGE-NS, Zurich.
Christiansen, A. V., Auken, E., Foged, N., and Sørensen, K. I., 2011, Em1dinv - User manual.
www.hgg.au.dk
Effersø, F., Auken, E. and Sørensen, K., 1999, Inversion of band-limited TEM responses.
Geophysical Prospecting, 47, 551-564.
HydroGeophysics Group, 2008, Spatially Constrained Inversion of SkyTEM data, Concept and
Examples, www.hgg.geo.au.dk
HydroGeophysics Group, 2011, Guideline and standards for for skytem measurements,
processing and inversion.
Jørgensen, F., Lykke-Andersen, H., Sandersen, P., Auken, E. and Nørmark, E., 2003,
Geophysical investigations of buried Quaternary valleys in Denmark: An integrated
application of transient electromagnetic soundings, reflection seismic surveys and
exploratory drillings: Journal of Applied Geophysics, 53, 215-228.
Jørgensen, F., Sandersen, P. and Auken, E., 2003, Imaging buried Quaternary valleys using
the transient electromagnetic method: Journal of Applied Geophysics, 53, 199-213.

105
Munkholm, M.S. and Auken, E., 1996, Electromagnetic noise contamination on transient
electromagnetic soundings in culturally disturbed environments. Journal of Environmental
& Engineering Geophysics, Vol. 1, Issue 2, 119-127.
Nabighian, M. N. and Macnae, J. C., Time Domain Electromagnetic Prospecting Methods. In
Nabighian, M. N. (editor), 1991, Electromagnetic Methods in Applied Geophysics, Vol. 2,
Application, Part A, SEG.
Pebesma, E. J. and Wesseling, C. G., 1998, Gstat: A Program for geostatistical Modelling,
Prediction and Simultation: Computers & Geosciences, 24, 17-31.
SkyTEMApS, 2011, SkyTEM Survey Alkmaar - Netherlands, Data acquisition report.
SkyTEMmeasurements,processing and inversion, www.hgg.au.dk
Sørensen, K. and Auken, E., 2004, SkyTEM - a new high-resolution helicopter transient
electromagnetic system: Exploration Geophysics, 35, 191-199.
Viezzoli, A., Christiansen, A. V., Auken, E., and Sørensen, K. I., 2008, Quasi-3D-modeling of
airborne TEM data by Spatially Constrained Inversion: Geophysics, 73, F105-F113.
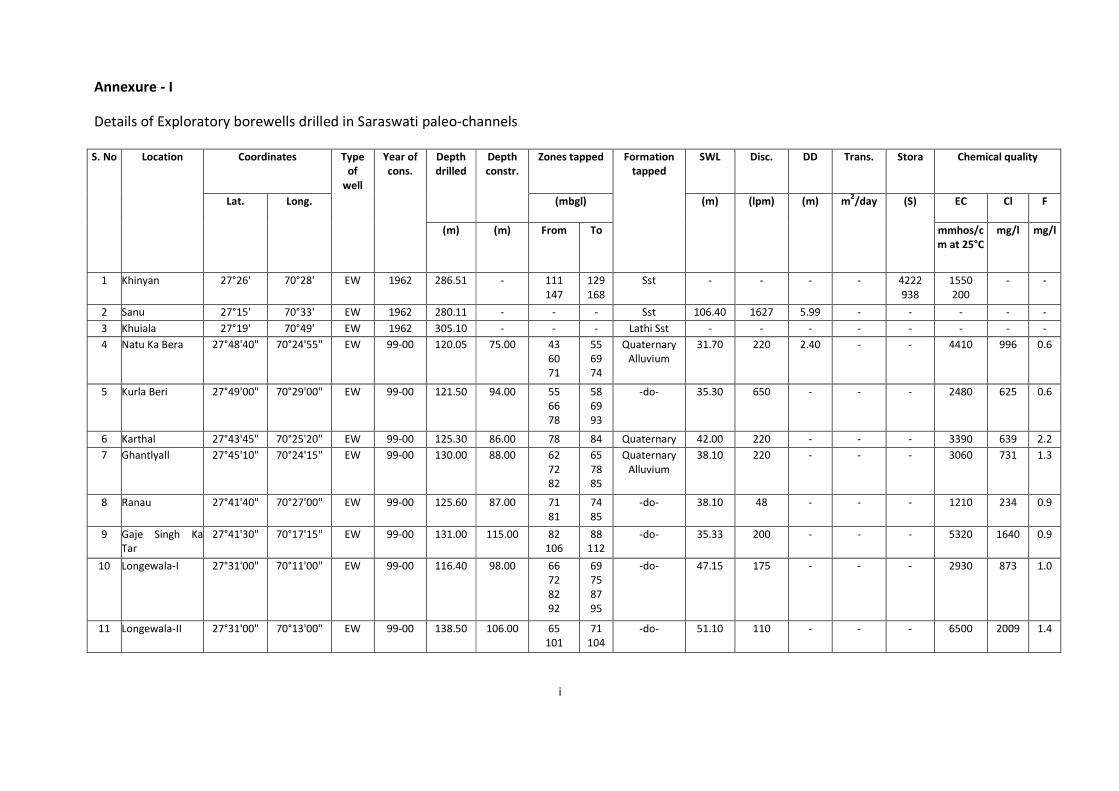
i
Annexure - I
Details of Exploratory borewells drilled in Saraswati paleo-channels
Coordinates Zones tapped SWL Disc. DD Trans. Stora Chemical quality Depth
drilled
Depth
constr.
(mbgl)
EC Cl F
S. No
Location
Lat.
Long.
Type
of
well
Year of
cons.
(m) (m) From To
Formation
tapped
(m)
(lpm)
(m)
m2/day
(S)
mmhos/c
m at 25°C
mg/l mg/l
1 Khinyan 27°26' 70°28' EW 1962 286.51 - 111
147
129
168
Sst - - - - 4222
938
1550
200
- -
2 Sanu 27°15' 70°33' EW 1962 280.11 - - - Sst 106.40 1627 5.99 - - - - -
3 Khuiala 27°19' 70°49' EW 1962 305.10 - - - Lathi Sst - - - - - - - -
4 Natu Ka Bera 27°48'40" 70°24'55" EW 99-00 120.05 75.00 43
60
71
55
69
74
Quaternary
Alluvium
31.70 220 2.40 - - 4410 996 0.6
5 Kurla Beri 27°49'00" 70°29'00" EW 99-00 121.50 94.00 55
66
78
58
69
93
-do- 35.30 650 - - - 2480 625 0.6
6 Karthal 27°43'45" 70°25'20" EW 99-00 125.30 86.00 78 84 Quaternary 42.00 220 - - - 3390 639 2.2
7 Ghantlyall 27°45'10" 70°24'15" EW 99-00 130.00 88.00 62
72
82
65
78
85
Quaternary
Alluvium
38.10 220 - - - 3060 731 1.3
8 Ranau 27°41'40" 70°27'00" EW 99-00 125.60 87.00 71
81
74
85
-do- 38.10 48 - - - 1210 234 0.9
9 Gaje Singh Ka
Tar
27°41'30" 70°17'15" EW 99-00 131.00 115.00 82
106
88
112
-do- 35.33 200 - - - 5320 1640 0.9
10 Longewala-I 27°31'00" 70°11'00" EW 99-00 116.40 98.00 66
72
82
92
69
75
87
95
-do- 47.15 175 - - - 2930 873 1.0
11 Longewala-II 27°31'00" 70°13'00" EW 99-00 138.50 106.00 65
101
71
104
-do- 51.10 110 - - - 6500 2009 1.4
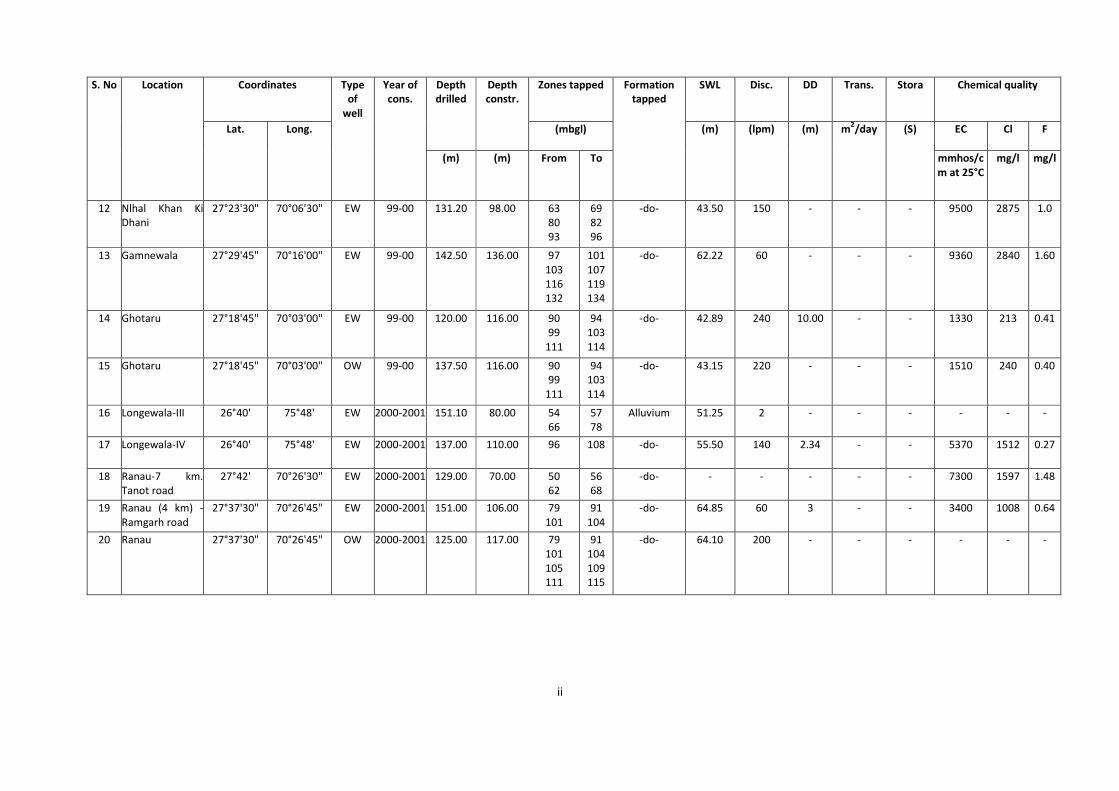
ii
Coordinates Zones tapped SWL Disc. DD Trans. Stora Chemical quality Depth
drilled
Depth
constr.
(mbgl)
EC Cl F
S. No
Location
Lat.
Long.
Type
of
well
Year of
cons.
(m) (m) From To
Formation
tapped
(m)
(lpm)
(m)
m2/day
(S)
mmhos/c
m at 25°C
mg/l mg/l
12 Nlhal Khan Ki
Dhani
27°23'30" 70°06'30" EW 99-00 131.20 98.00 63
80
93
69
82
96
-do- 43.50 150 - - - 9500 2875 1.0
13 Gamnewala 27°29'45" 70°16'00" EW 99-00 142.50 136.00 97
103
116
132
101
107
119
134
-do- 62.22 60 - - - 9360 2840 1.60
14 Ghotaru 27°18'45" 70°03'00" EW 99-00 120.00 116.00 90
99
111
94
103
114
-do- 42.89 240 10.00 - - 1330 213 0.41
15 Ghotaru 27°18'45" 70°03'00" OW 99-00 137.50 116.00 90
99
111
94
103
114
-do- 43.15 220 - - - 1510 240 0.40
16 Longewala-III 26°40' 75°48' EW 2000-2001 151.10 80.00 54
66
57
78
Alluvium 51.25 2 - - - - - -
17 Longewala-IV 26°40' 75°48' EW 2000-2001 137.00 110.00 96 108 -do- 55.50 140 2.34 - - 5370 1512 0.27
18 Ranau-7 km.
Tanot road
27°42' 70°26'30" EW 2000-2001 129.00 70.00 50
62
56
68
-do- - - - - - 7300 1597 1.48
19 Ranau (4 km) -
Ramgarh road
27°37'30" 70°26'45" EW 2000-2001 151.00 106.00 79
101
91
104
-do- 64.85 60 3 - - 3400 1008 0.64
20 Ranau 27°37'30" 70°26'45" OW 2000-2001 125.00 117.00 79
101
105
111
91
104
109
115
-do- 64.10 200 - - - - - -

iii
Coordinates Zones tapped SWL Disc. DD Trans. Stora Chemical quality Depth
drilled
Depth
constr.
(mbgl)
EC Cl F
S. No
Location
Lat.
Long.
Type
of
well
Year of
cons.
(m) (m) From To
Formation
tapped
(m)
(lpm)
(m)
m2/day
(S)
mmhos/c
m at 25°C
mg/l mg/l
21 Kishangarh 27°52'30" 70°33'30" EW 2000-2001 156.00 103.00 50
63
69
75
81
89
98
56
66
72
78
84
92
101
-do- 30.50 1000 3.70 - - 1970 412 1.00
22 Kishangarh OW-I 2000-2001 106.90 103.00 50
63
69
75
81
89
98
56
66
72
78
84
92
101
-do- 30.60 900 - - - 2210 568 1.26
23 Kishangarh OW-II 2000-2001 106.40 103.00 50
63
69
75
81
89
98
56
66
72
78
84
92
101
-do- 60.60 900 - - - 2070 504 1.01
24 Ranau-II 27°29'15" 70°26'45" EW 98-99 102.00 102.00 65
72
80
95
68
78
83
101
Alluvium 49.00 300 0.27 - - 1570 192 4
25 Choudhariya 27°06' 70°55' OW 93-94 208.90 158.00 90
102
132
150
96
120
138
156
Lst 11.11 440 8.93 - - 8295 - -
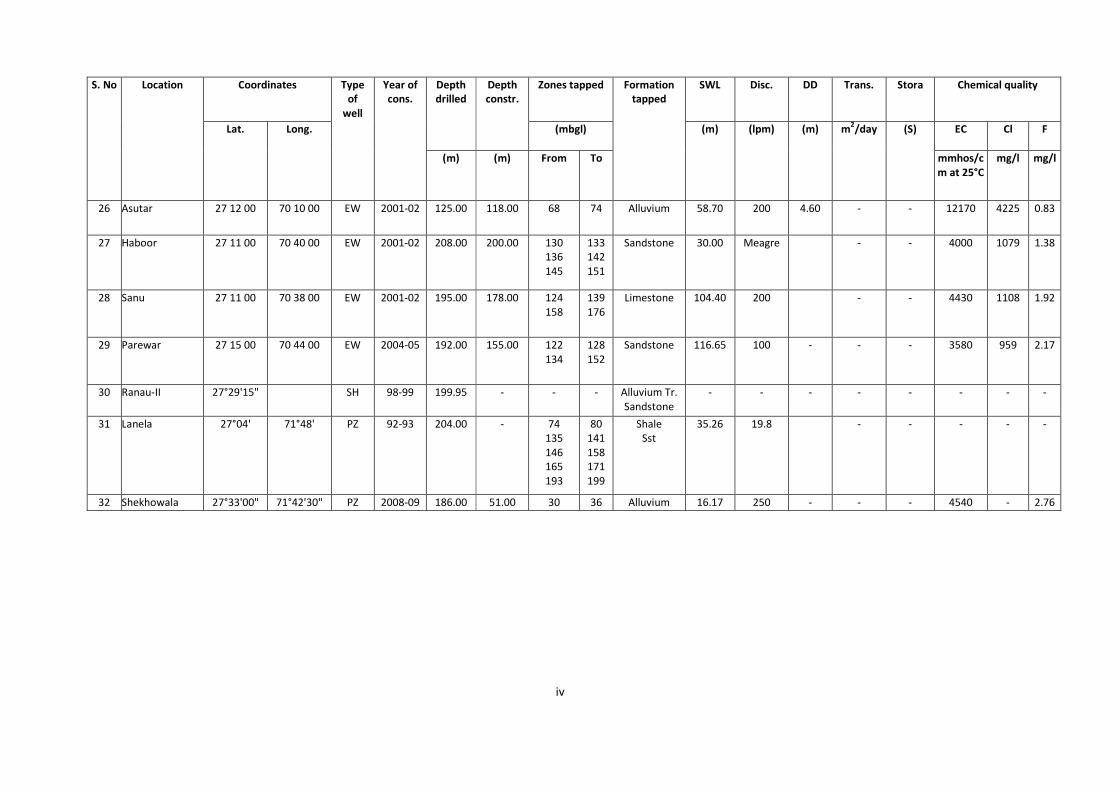
iv
Coordinates Zones tapped SWL Disc. DD Trans. Stora Chemical quality Depth
drilled
Depth
constr.
(mbgl)
EC Cl F
S. No
Location
Lat.
Long.
Type
of
well
Year of
cons.
(m) (m) From To
Formation
tapped
(m)
(lpm)
(m)
m2/day
(S)
mmhos/c
m at 25°C
mg/l mg/l
26 Asutar 27 12 00 70 10 00 EW 2001-02 125.00 118.00 68 74 Alluvium 58.70 200 4.60 - - 12170 4225 0.83
27 Haboor 27 11 00 70 40 00 EW 2001-02 208.00 200.00 130
136
145
133
142
151
Sandstone 30.00 Meagre - - 4000 1079 1.38
28 Sanu 27 11 00 70 38 00 EW 2001-02 195.00 178.00 124
158
139
176
Limestone 104.40 200 - - 4430 1108 1.92
29 Parewar 27 15 00 70 44 00 EW 2004-05 192.00 155.00 122
134
128
152
Sandstone 116.65 100 - - - 3580 959 2.17
30 Ranau-II 27°29'15" SH 98-99 199.95 - - - Alluvium Tr.
Sandstone
- - - - - - - -
31 Lanela 27°04' 71°48' PZ 92-93 204.00 - 74
135
146
165
193
80
141
158
171
199
Shale
Sst
35.26 19.8 - - - - -
32 Shekhowala 27°33'00" 71°42'30" PZ 2008-09 186.00 51.00 30 36 Alluvium 16.17 250 - - - 4540 - 2.76
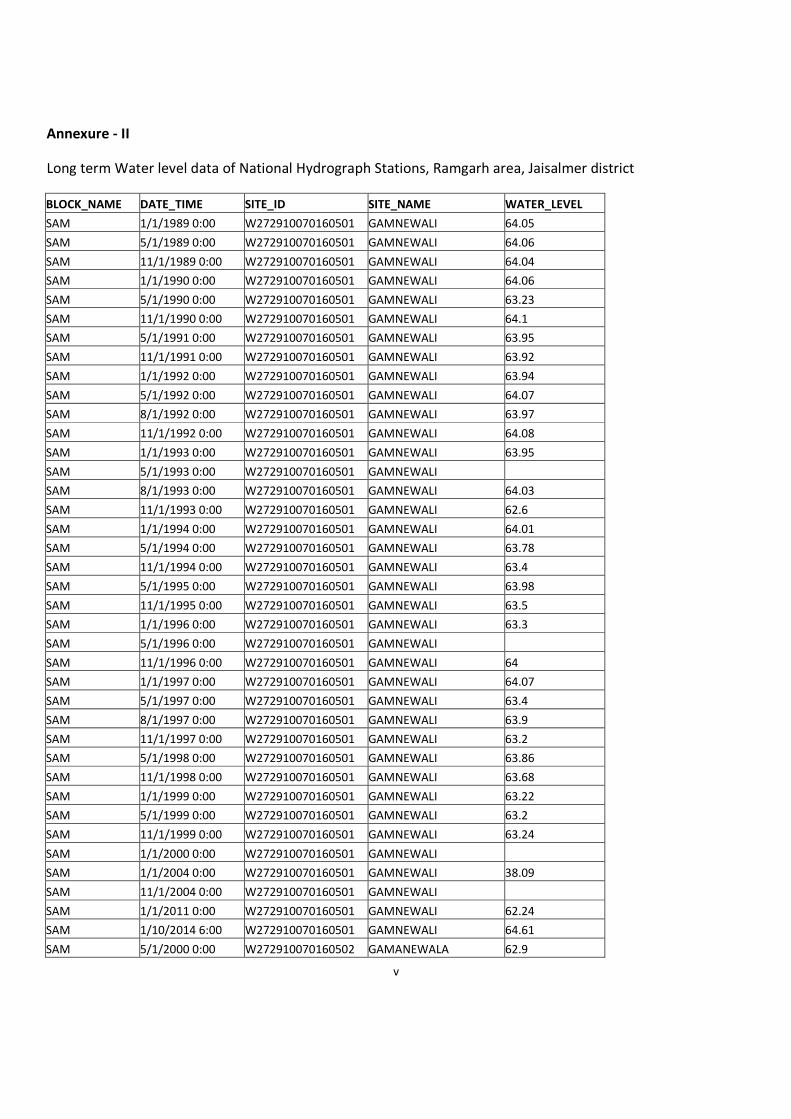
v
Annexure - II
Long term Water level data of National Hydrograph Stations, Ramgarh area, Jaisalmer district
BLOCK_NAME DATE_TIME SITE_ID SITE_NAME WATER_LEVEL
SAM 1/1/1989 0:00 W272910070160501 GAMNEWALI 64.05
SAM 5/1/1989 0:00 W272910070160501 GAMNEWALI 64.06
SAM 11/1/1989 0:00 W272910070160501 GAMNEWALI 64.04
SAM 1/1/1990 0:00 W272910070160501 GAMNEWALI 64.06
SAM 5/1/1990 0:00 W272910070160501 GAMNEWALI 63.23
SAM 11/1/1990 0:00 W272910070160501 GAMNEWALI 64.1
SAM 5/1/1991 0:00 W272910070160501 GAMNEWALI 63.95
SAM 11/1/1991 0:00 W272910070160501 GAMNEWALI 63.92
SAM 1/1/1992 0:00 W272910070160501 GAMNEWALI 63.94
SAM 5/1/1992 0:00 W272910070160501 GAMNEWALI 64.07
SAM 8/1/1992 0:00 W272910070160501 GAMNEWALI 63.97
SAM 11/1/1992 0:00 W272910070160501 GAMNEWALI 64.08
SAM 1/1/1993 0:00 W272910070160501 GAMNEWALI 63.95
SAM 5/1/1993 0:00 W272910070160501 GAMNEWALI
SAM 8/1/1993 0:00 W272910070160501 GAMNEWALI 64.03
SAM 11/1/1993 0:00 W272910070160501 GAMNEWALI 62.6
SAM 1/1/1994 0:00 W272910070160501 GAMNEWALI 64.01
SAM 5/1/1994 0:00 W272910070160501 GAMNEWALI 63.78
SAM 11/1/1994 0:00 W272910070160501 GAMNEWALI 63.4
SAM 5/1/1995 0:00 W272910070160501 GAMNEWALI 63.98
SAM 11/1/1995 0:00 W272910070160501 GAMNEWALI 63.5
SAM 1/1/1996 0:00 W272910070160501 GAMNEWALI 63.3
SAM 5/1/1996 0:00 W272910070160501 GAMNEWALI
SAM 11/1/1996 0:00 W272910070160501 GAMNEWALI 64
SAM 1/1/1997 0:00 W272910070160501 GAMNEWALI 64.07
SAM 5/1/1997 0:00 W272910070160501 GAMNEWALI 63.4
SAM 8/1/1997 0:00 W272910070160501 GAMNEWALI 63.9
SAM 11/1/1997 0:00 W272910070160501 GAMNEWALI 63.2
SAM 5/1/1998 0:00 W272910070160501 GAMNEWALI 63.86
SAM 11/1/1998 0:00 W272910070160501 GAMNEWALI 63.68
SAM 1/1/1999 0:00 W272910070160501 GAMNEWALI 63.22
SAM 5/1/1999 0:00 W272910070160501 GAMNEWALI 63.2
SAM 11/1/1999 0:00 W272910070160501 GAMNEWALI 63.24
SAM 1/1/2000 0:00 W272910070160501 GAMNEWALI
SAM 1/1/2004 0:00 W272910070160501 GAMNEWALI 38.09
SAM 11/1/2004 0:00 W272910070160501 GAMNEWALI
SAM 1/1/2011 0:00 W272910070160501 GAMNEWALI 62.24
SAM 1/10/2014 6:00 W272910070160501 GAMNEWALI 64.61
SAM 5/1/2000 0:00 W272910070160502 GAMANEWALA 62.9
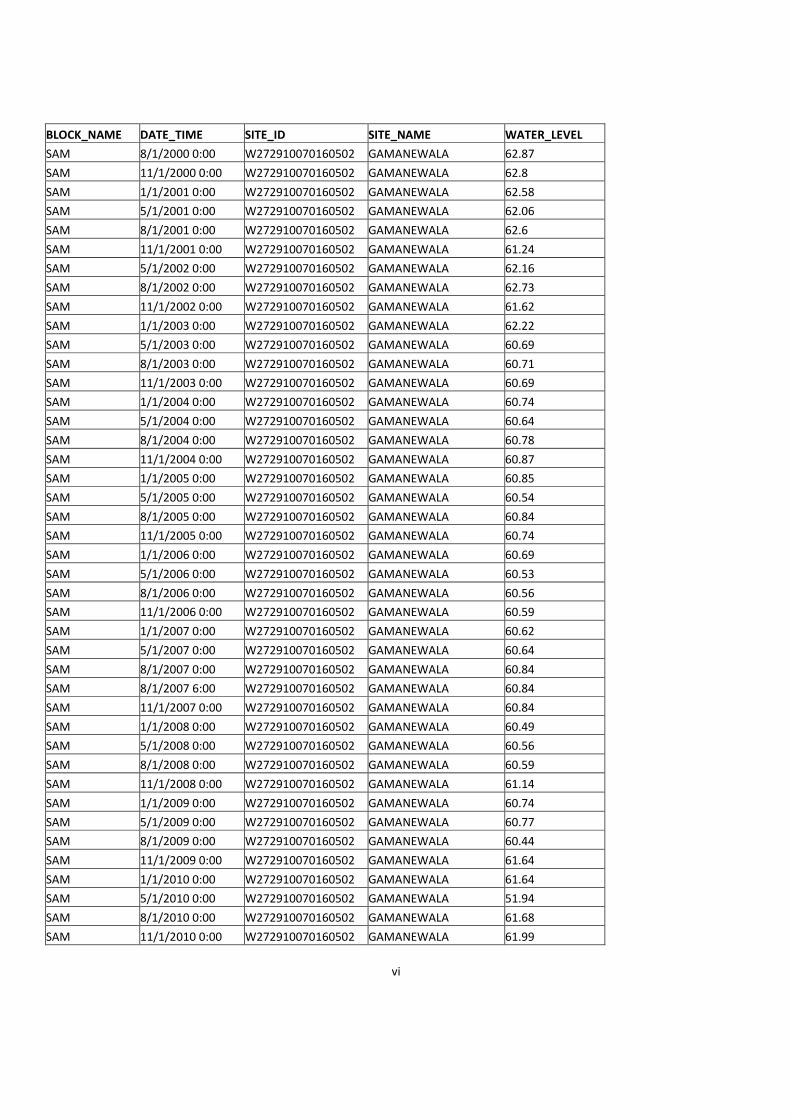
vi
BLOCK_NAME DATE_TIME SITE_ID SITE_NAME WATER_LEVEL
SAM 8/1/2000 0:00 W272910070160502 GAMANEWALA 62.87
SAM 11/1/2000 0:00 W272910070160502 GAMANEWALA 62.8
SAM 1/1/2001 0:00 W272910070160502 GAMANEWALA 62.58
SAM 5/1/2001 0:00 W272910070160502 GAMANEWALA 62.06
SAM 8/1/2001 0:00 W272910070160502 GAMANEWALA 62.6
SAM 11/1/2001 0:00 W272910070160502 GAMANEWALA 61.24
SAM 5/1/2002 0:00 W272910070160502 GAMANEWALA 62.16
SAM 8/1/2002 0:00 W272910070160502 GAMANEWALA 62.73
SAM 11/1/2002 0:00 W272910070160502 GAMANEWALA 61.62
SAM 1/1/2003 0:00 W272910070160502 GAMANEWALA 62.22
SAM 5/1/2003 0:00 W272910070160502 GAMANEWALA 60.69
SAM 8/1/2003 0:00 W272910070160502 GAMANEWALA 60.71
SAM 11/1/2003 0:00 W272910070160502 GAMANEWALA 60.69
SAM 1/1/2004 0:00 W272910070160502 GAMANEWALA 60.74
SAM 5/1/2004 0:00 W272910070160502 GAMANEWALA 60.64
SAM 8/1/2004 0:00 W272910070160502 GAMANEWALA 60.78
SAM 11/1/2004 0:00 W272910070160502 GAMANEWALA 60.87
SAM 1/1/2005 0:00 W272910070160502 GAMANEWALA 60.85
SAM 5/1/2005 0:00 W272910070160502 GAMANEWALA 60.54
SAM 8/1/2005 0:00 W272910070160502 GAMANEWALA 60.84
SAM 11/1/2005 0:00 W272910070160502 GAMANEWALA 60.74
SAM 1/1/2006 0:00 W272910070160502 GAMANEWALA 60.69
SAM 5/1/2006 0:00 W272910070160502 GAMANEWALA 60.53
SAM 8/1/2006 0:00 W272910070160502 GAMANEWALA 60.56
SAM 11/1/2006 0:00 W272910070160502 GAMANEWALA 60.59
SAM 1/1/2007 0:00 W272910070160502 GAMANEWALA 60.62
SAM 5/1/2007 0:00 W272910070160502 GAMANEWALA 60.64
SAM 8/1/2007 0:00 W272910070160502 GAMANEWALA 60.84
SAM 8/1/2007 6:00 W272910070160502 GAMANEWALA 60.84
SAM 11/1/2007 0:00 W272910070160502 GAMANEWALA 60.84
SAM 1/1/2008 0:00 W272910070160502 GAMANEWALA 60.49
SAM 5/1/2008 0:00 W272910070160502 GAMANEWALA 60.56
SAM 8/1/2008 0:00 W272910070160502 GAMANEWALA 60.59
SAM 11/1/2008 0:00 W272910070160502 GAMANEWALA 61.14
SAM 1/1/2009 0:00 W272910070160502 GAMANEWALA 60.74
SAM 5/1/2009 0:00 W272910070160502 GAMANEWALA 60.77
SAM 8/1/2009 0:00 W272910070160502 GAMANEWALA 60.44
SAM 11/1/2009 0:00 W272910070160502 GAMANEWALA 61.64
SAM 1/1/2010 0:00 W272910070160502 GAMANEWALA 61.64
SAM 5/1/2010 0:00 W272910070160502 GAMANEWALA 51.94
SAM 8/1/2010 0:00 W272910070160502 GAMANEWALA 61.68
SAM 11/1/2010 0:00 W272910070160502 GAMANEWALA 61.99

vii
BLOCK_NAME DATE_TIME SITE_ID SITE_NAME WATER_LEVEL
SAM 5/1/2011 0:00 W272910070160502 GAMANEWALA 61.74
SAM 8/1/2011 0:00 W272910070160502 GAMANEWALA 52.64
SAM 1/10/2013 6:00 W272910070160502 GAMANEWALA 52.03
SAM 5/30/2013 6:00 W272910070160502 GAMANEWALA 64.34
SAM 8/30/2013 6:00 W272910070160502 GAMANEWALA 61.92
SAM 11/10/2013 6:00 W272910070160502 GAMANEWALA 62.34
SAM 1/10/2014 6:00 W272910070160502 GAMANEWALA 61.59
SAM 5/30/2014 6:00 W272910070160502 GAMANEWALA 73.02
SAM 5/1/2003 0:00 W272130070300001 Ramgarh2 50.65
SAM 8/1/2003 0:00 W272130070300001 Ramgarh2 46.64
SAM 11/1/2003 0:00 W272130070300001 Ramgarh2 46.71
SAM 8/1/2004 0:00 W272130070300001 Ramgarh2 46.73
SAM 11/1/2004 0:00 W272130070300001 Ramgarh2 46.6
SAM 1/1/2005 0:00 W272130070300001 Ramgarh2 46.74
SAM 5/1/2005 0:00 W272130070300001 Ramgarh2 46.8
SAM 8/1/2005 0:00 W272130070300001 Ramgarh2 46.76
SAM 11/1/2005 0:00 W272130070300001 Ramgarh2 46.7
SAM 1/1/2006 0:00 W272130070300001 Ramgarh2 46.75
SAM 5/1/2006 0:00 W272130070300001 Ramgarh2 46.69
SAM 8/1/2006 0:00 W272130070300001 Ramgarh2 46.59
SAM 11/1/2006 0:00 W272130070300001 Ramgarh2 46.7
SAM 1/1/2007 0:00 W272130070300001 Ramgarh2 46.7
SAM 5/1/2007 0:00 W272130070300001 Ramgarh2 46.7
SAM 8/1/2007 0:00 W272130070300001 Ramgarh2 46.62
SAM 8/1/2007 6:00 W272130070300001 Ramgarh2 46.62
SAM 11/1/2007 0:00 W272130070300001 Ramgarh2 46.75
SAM 1/1/2008 0:00 W272130070300001 Ramgarh2 47.13
SAM 5/1/2008 0:00 W272130070300001 Ramgarh2 46.64
SAM 8/1/2008 0:00 W272130070300001 Ramgarh2 46.65
SAM 11/1/2008 0:00 W272130070300001 Ramgarh2 46.69
SAM 1/1/2009 0:00 W272130070300001 Ramgarh2 46.77
SAM 8/1/2009 0:00 W272130070300001 Ramgarh2 46
SAM 11/1/2009 0:00 W272130070300001 Ramgarh2 47.5
SAM 1/1/2010 0:00 W272130070300001 Ramgarh2 46.8
SAM 5/1/2010 0:00 W272130070300001 Ramgarh2 46.8
SAM 8/1/2010 0:00 W272130070300001 Ramgarh2 46.9
SAM 11/1/2010 0:00 W272130070300001 Ramgarh2 46.8
SAM 1/1/2011 0:00 W272130070300001 Ramgarh2 49
SAM 5/1/2011 0:00 W272130070300001 Ramgarh2 49.5
SAM 8/1/2011 0:00 W272130070300001 Ramgarh2 49
SAM 11/1/2011 0:00 W272130070300001 Ramgarh2 46.9
SAM 1/1/2012 6:00 W272130070300001 Ramgarh2 46.7

viii
BLOCK_NAME DATE_TIME SITE_ID SITE_NAME WATER_LEVEL
SAM 5/30/2012 6:00 W272130070300001 Ramgarh2 46.9
SAM 8/30/2012 6:00 W272130070300001 Ramgarh2 46.95
SAM 11/10/2012 6:00 W272130070300001 Ramgarh2 47.2
SAM 1/10/2013 6:00 W272130070300001 Ramgarh2 47.1
SAM 5/30/2013 6:00 W272130070300001 Ramgarh2 46.9
SAM 8/30/2013 6:00 W272130070300001 Ramgarh2 48.2
SAM 11/10/2013 6:00 W272130070300001 Ramgarh2 49.78
SAM 1/10/2014 6:00 W272130070300001 Ramgarh2 47.7
SAM 5/30/2014 6:00 W272130070300001 Ramgarh2 65.6
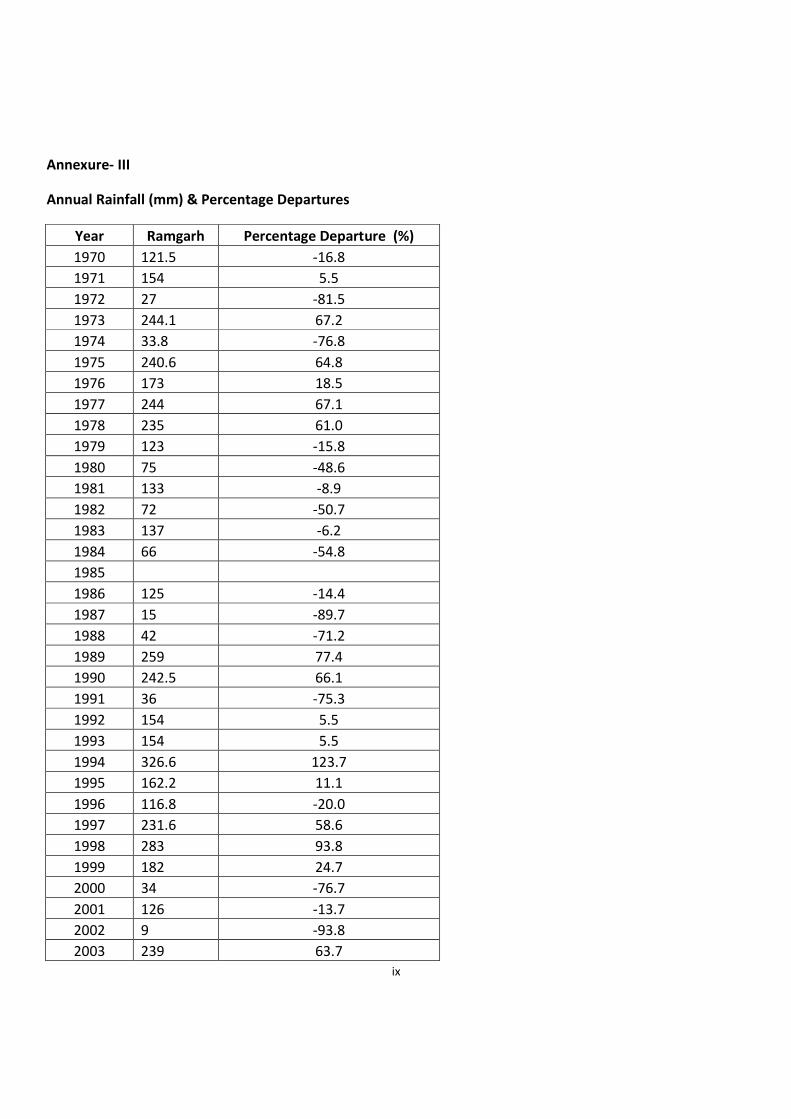
ix
Annexure- III
Annual Rainfall (mm) & Percentage Departures
Year Ramgarh Percentage Departure (%)
1970 121.5 -16.8
1971 154 5.5
1972 27 -81.5
1973 244.1 67.2
1974 33.8 -76.8
1975 240.6 64.8
1976 173 18.5
1977 244 67.1
1978 235 61.0
1979 123 -15.8
1980 75 -48.6
1981 133 -8.9
1982 72 -50.7
1983 137 -6.2
1984 66 -54.8
1985
1986 125 -14.4
1987 15 -89.7
1988 42 -71.2
1989 259 77.4
1990 242.5 66.1
1991 36 -75.3
1992 154 5.5
1993 154 5.5
1994 326.6 123.7
1995 162.2 11.1
1996 116.8 -20.0
1997 231.6 58.6
1998 283 93.8
1999 182 24.7
2000 34 -76.7
2001 126 -13.7
2002 9 -93.8
2003 239 63.7
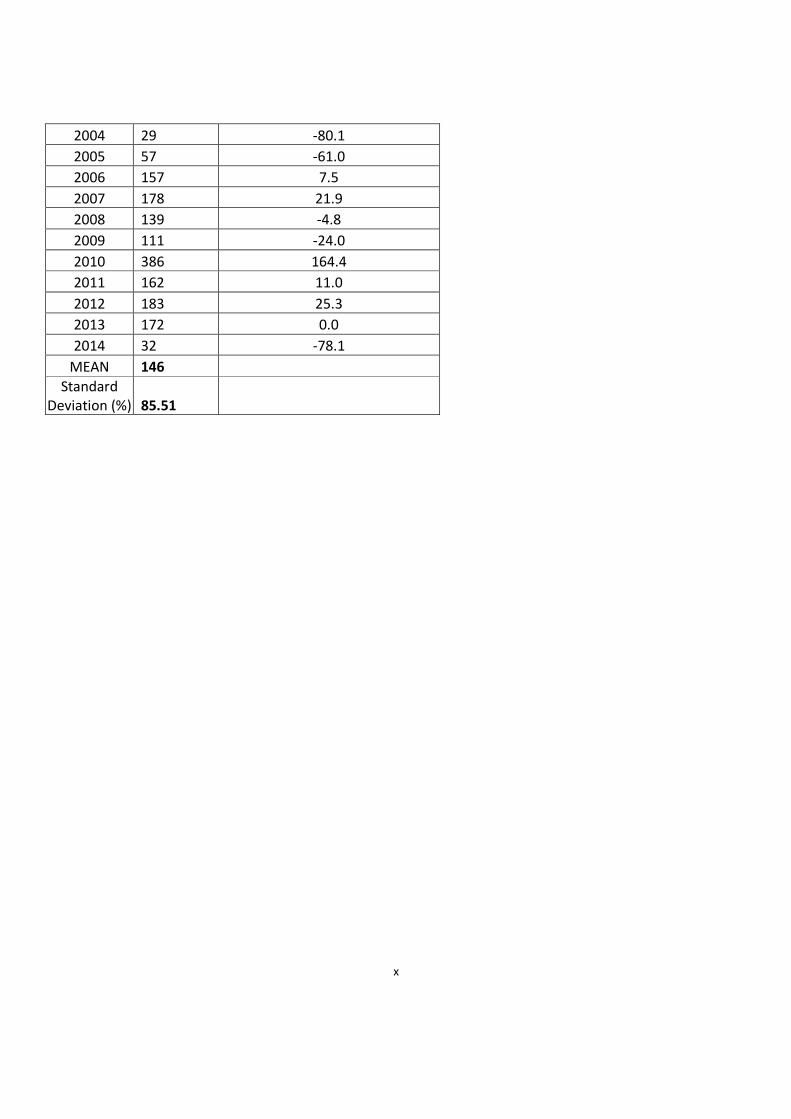
x
2004 29 -80.1
2005 57 -61.0
2006 157 7.5
2007 178 21.9
2008 139 -4.8
2009 111 -24.0
2010 386 164.4
2011 162 11.0
2012 183 25.3
2013 172 0.0
2014 32 -78.1
MEAN 146
Standard
Deviation (%) 85.51
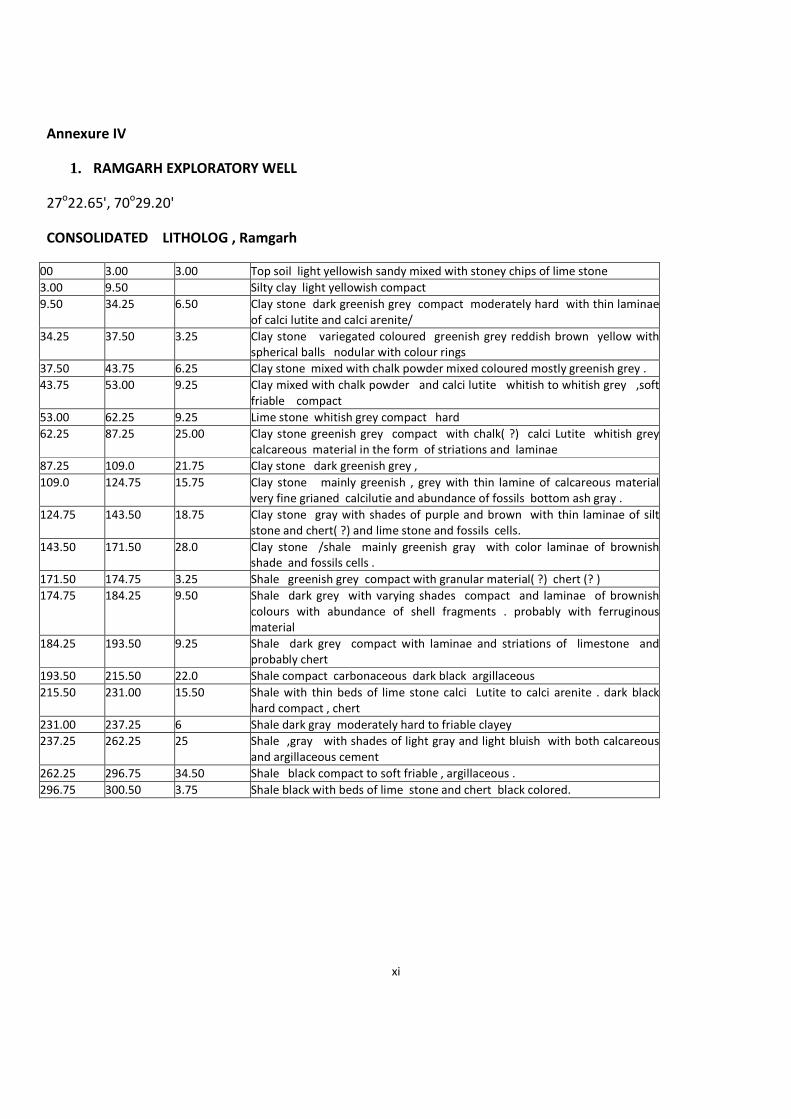
xi
Annexure IV
1. RAMGARH EXPLORATORY WELL
27o22.65', 70
o29.20'
CONSOLIDATED LITHOLOG , Ramgarh
00 3.00 3.00 Top soil light yellowish sandy mixed with stoney chips of lime stone
3.00 9.50 Silty clay light yellowish compact
9.50 34.25 6.50 Clay stone dark greenish grey compact moderately hard with thin laminae
of calci lutite and calci arenite/
34.25 37.50 3.25 Clay stone variegated coloured greenish grey reddish brown yellow with
spherical balls nodular with colour rings
37.50 43.75 6.25 Clay stone mixed with chalk powder mixed coloured mostly greenish grey .
43.75 53.00 9.25 Clay mixed with chalk powder and calci lutite whitish to whitish grey ,soft
friable compact
53.00 62.25 9.25 Lime stone whitish grey compact hard
62.25 87.25 25.00 Clay stone greenish grey compact with chalk( ?) calci Lutite whitish grey
calcareous material in the form of striations and laminae
87.25 109.0 21.75 Clay stone dark greenish grey ,
109.0 124.75 15.75 Clay stone mainly greenish , grey with thin lamine of calcareous material
very fine grianed calcilutie and abundance of fossils bottom ash gray .
124.75 143.50 18.75 Clay stone gray with shades of purple and brown with thin laminae of silt
stone and chert( ?) and lime stone and fossils cells.
143.50 171.50 28.0 Clay stone /shale mainly greenish gray with color laminae of brownish
shade and fossils cells .
171.50 174.75 3.25 Shale greenish grey compact with granular material( ?) chert (? )
174.75 184.25 9.50 Shale dark grey with varying shades compact and laminae of brownish
colours with abundance of shell fragments . probably with ferruginous
material
184.25 193.50 9.25 Shale dark grey compact with laminae and striations of limestone and
probably chert
193.50 215.50 22.0 Shale compact carbonaceous dark black argillaceous
215.50 231.00 15.50 Shale with thin beds of lime stone calci Lutite to calci arenite . dark black
hard compact , chert
231.00 237.25 6 Shale dark gray moderately hard to friable clayey
237.25 262.25 25 Shale ,gray with shades of light gray and light bluish with both calcareous
and argillaceous cement
262.25 296.75 34.50 Shale black compact to soft friable , argillaceous .
296.75 300.50 3.75 Shale black with beds of lime stone and chert black colored.
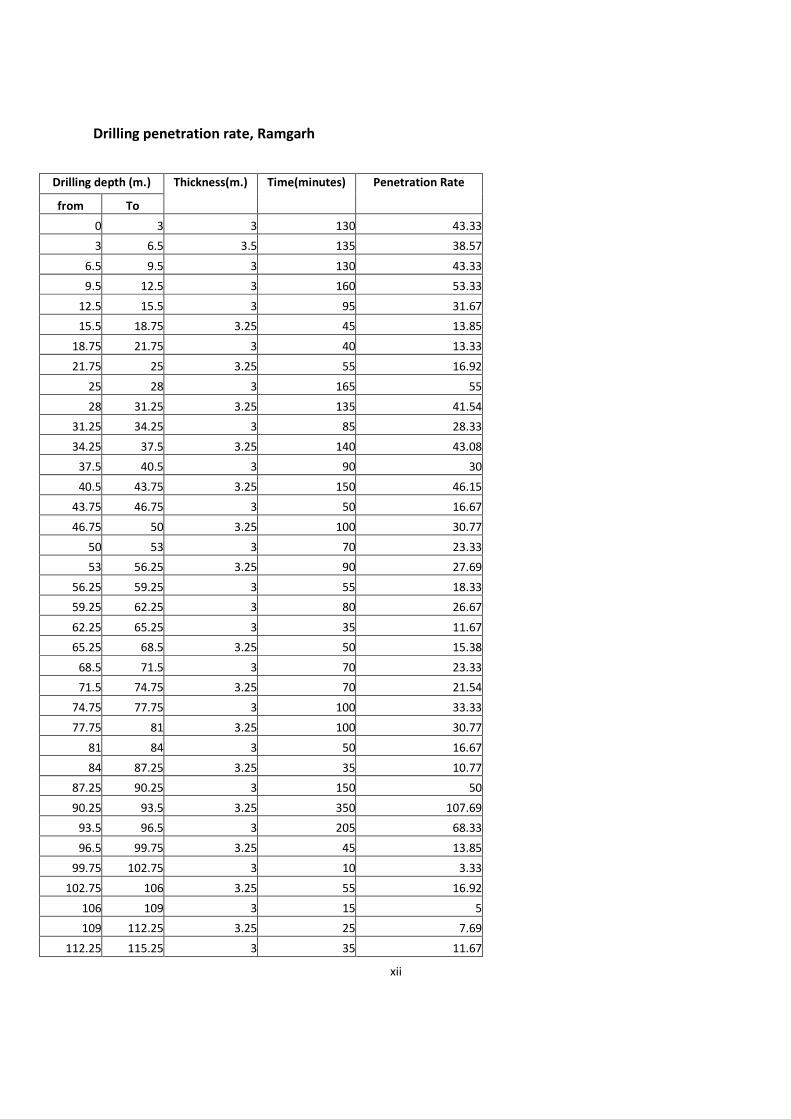
xii
Drilling penetration rate, Ramgarh
Drilling depth (m.)
from To
Thickness(m.) Time(minutes) Penetration Rate
0 3 3 130 43.33
3 6.5 3.5 135 38.57
6.5 9.5 3 130 43.33
9.5 12.5 3 160 53.33
12.5 15.5 3 95 31.67
15.5 18.75 3.25 45 13.85
18.75 21.75 3 40 13.33
21.75 25 3.25 55 16.92
25 28 3 165 55
28 31.25 3.25 135 41.54
31.25 34.25 3 85 28.33
34.25 37.5 3.25 140 43.08
37.5 40.5 3 90 30
40.5 43.75 3.25 150 46.15
43.75 46.75 3 50 16.67
46.75 50 3.25 100 30.77
50 53 3 70 23.33
53 56.25 3.25 90 27.69
56.25 59.25 3 55 18.33
59.25 62.25 3 80 26.67
62.25 65.25 3 35 11.67
65.25 68.5 3.25 50 15.38
68.5 71.5 3 70 23.33
71.5 74.75 3.25 70 21.54
74.75 77.75 3 100 33.33
77.75 81 3.25 100 30.77
81 84 3 50 16.67
84 87.25 3.25 35 10.77
87.25 90.25 3 150 50
90.25 93.5 3.25 350 107.69
93.5 96.5 3 205 68.33
96.5 99.75 3.25 45 13.85
99.75 102.75 3 10 3.33
102.75 106 3.25 55 16.92
106 109 3 15 5
109 112.25 3.25 25 7.69
112.25 115.25 3 35 11.67

xiii
Drilling depth (m.)
from To
Thickness(m.) Time(minutes) Penetration Rate
115.25 118.5 3.25 60 18.46
118.5 121.5 3 60 20
121.5 124.75 3.25 85 26.15
124.75 127.75 3 25 8.33
127.75 131 3.25 30 9.23
131 134 3 25 8.33
134 137.25 3.25 30 9.23
137.25 140.25 3 60 20
140.25 143.5 3.25 70 21.54
143.5 146.5 3 30 10
146.5 149.75 3.25 80 24.62
149.75 152.75 3 75 25
152.75 156 3.25 85 26.15
156 159 3 55 18.33
159 162.25 3.25 40 12.308
162.25 165.25 3 70 23.33
165.25 168.5 3.25 55 16.923
168.5 171.5 3 45 15
171.5 174.75 3.25 50 15.38
174.75 177.75 3 55 18.33
177.75 181 3.25 30 9.23
181 184.25 3.25 150 46.15
184.25 187.25 3 110 36.67
187.25 190.5 3.25 50 15.38
190.5 193.5 3 60 20
193.5 196.75 3.25 120 36.92
196.75 199.75 3 35 11.67
199.75 203 3.25 120 36.92
203 206 3 230 76.67
206 209.25 3.25 90 27.69
209.25 212.25 3 90 30
212.25 215.5 3.25 70 21.54
215.5 218.5 3 65 21.67
218.5 221.75 3.25 52 16
221.75 224.75 3 6 2
224.75 228 3.25 35 10.77
228 231 3 30 10
231 234.25 3.25 22 6.77
234.25 237.25 3 30 10
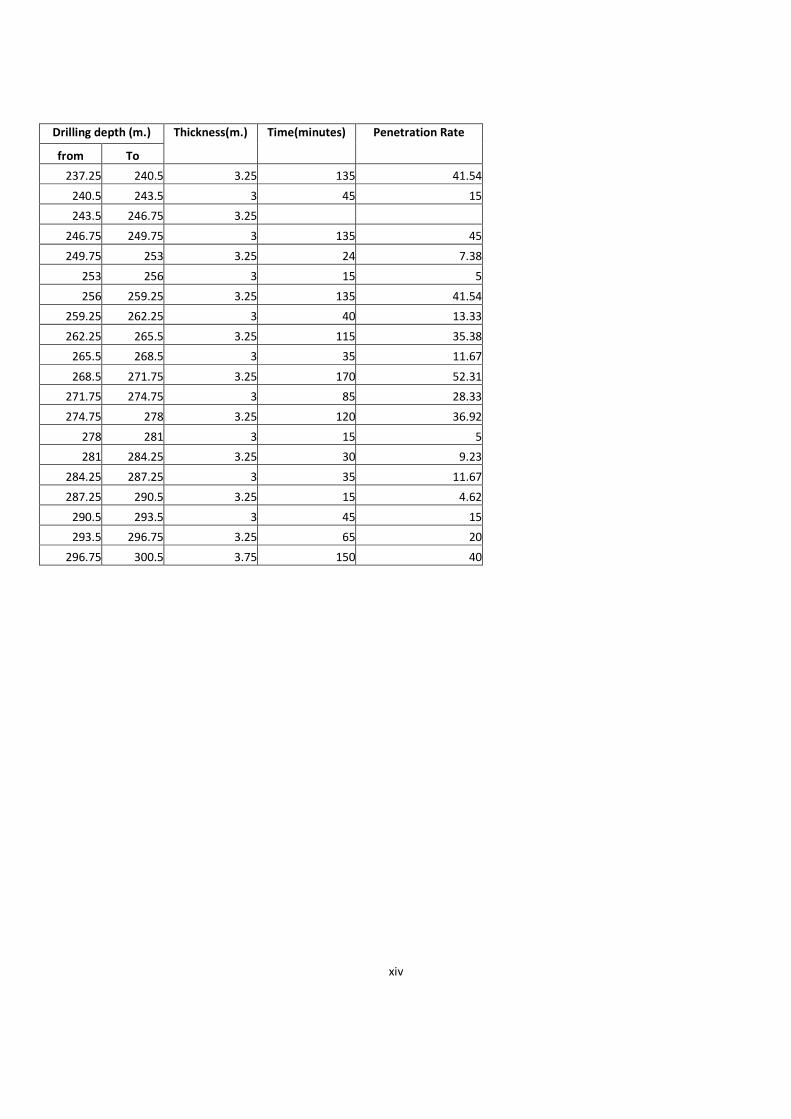
xiv
Drilling depth (m.)
from To
Thickness(m.) Time(minutes) Penetration Rate
237.25 240.5 3.25 135 41.54
240.5 243.5 3 45 15
243.5 246.75 3.25
246.75 249.75 3 135 45
249.75 253 3.25 24 7.38
253 256 3 15 5
256 259.25 3.25 135 41.54
259.25 262.25 3 40 13.33
262.25 265.5 3.25 115 35.38
265.5 268.5 3 35 11.67
268.5 271.75 3.25 170 52.31
271.75 274.75 3 85 28.33
274.75 278 3.25 120 36.92
278 281 3 15 5
281 284.25 3.25 30 9.23
284.25 287.25 3 35 11.67
287.25 290.5 3.25 15 4.62
290.5 293.5 3 45 15
293.5 296.75 3.25 65 20
296.75 300.5 3.75 150 40
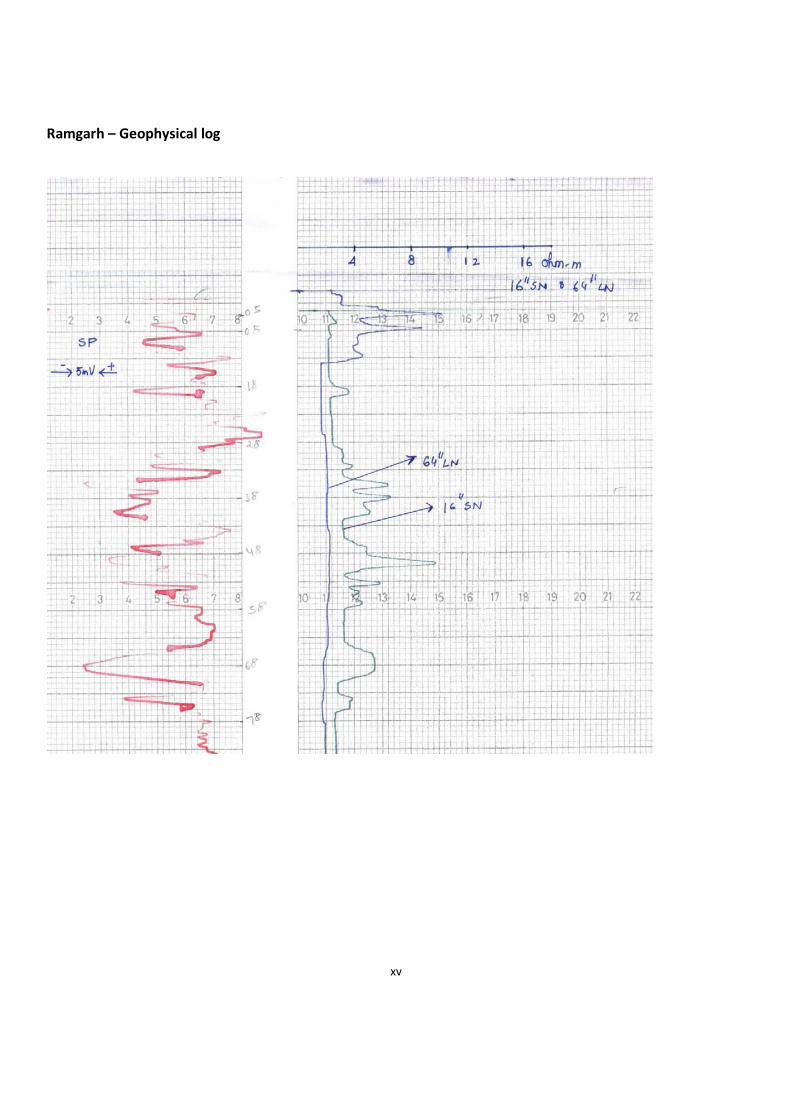
xv
Ramgarh – Geophysical log
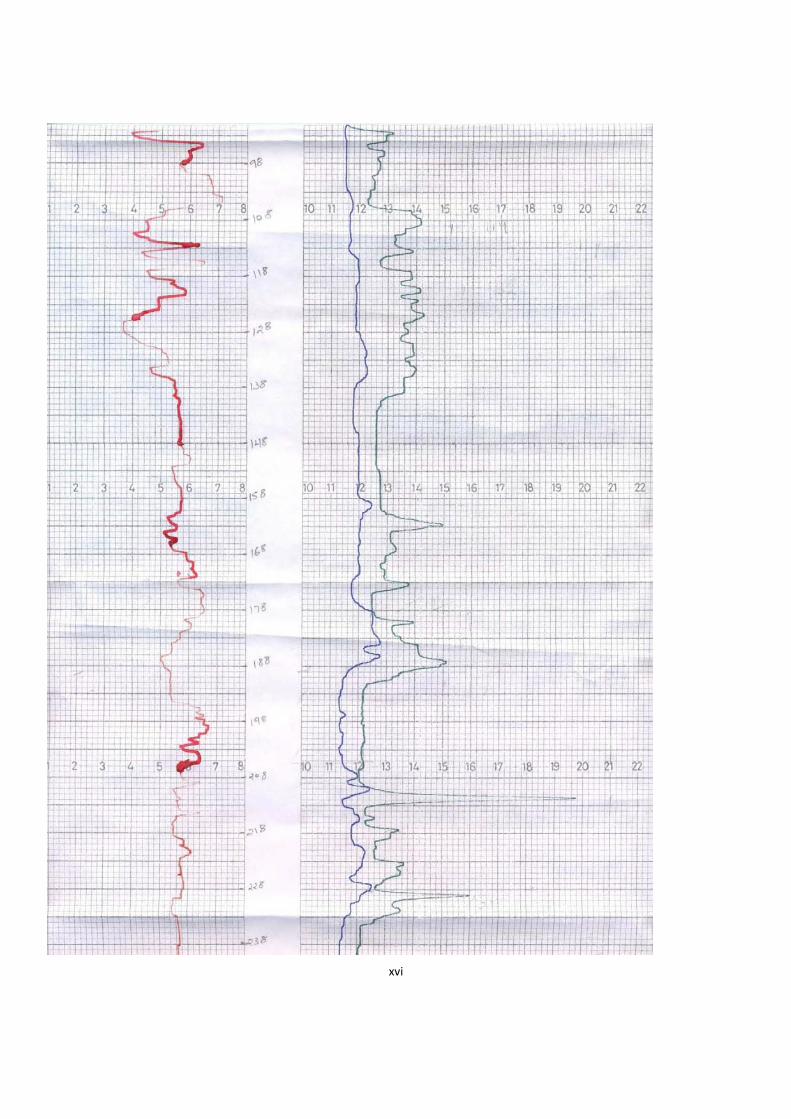
xvi
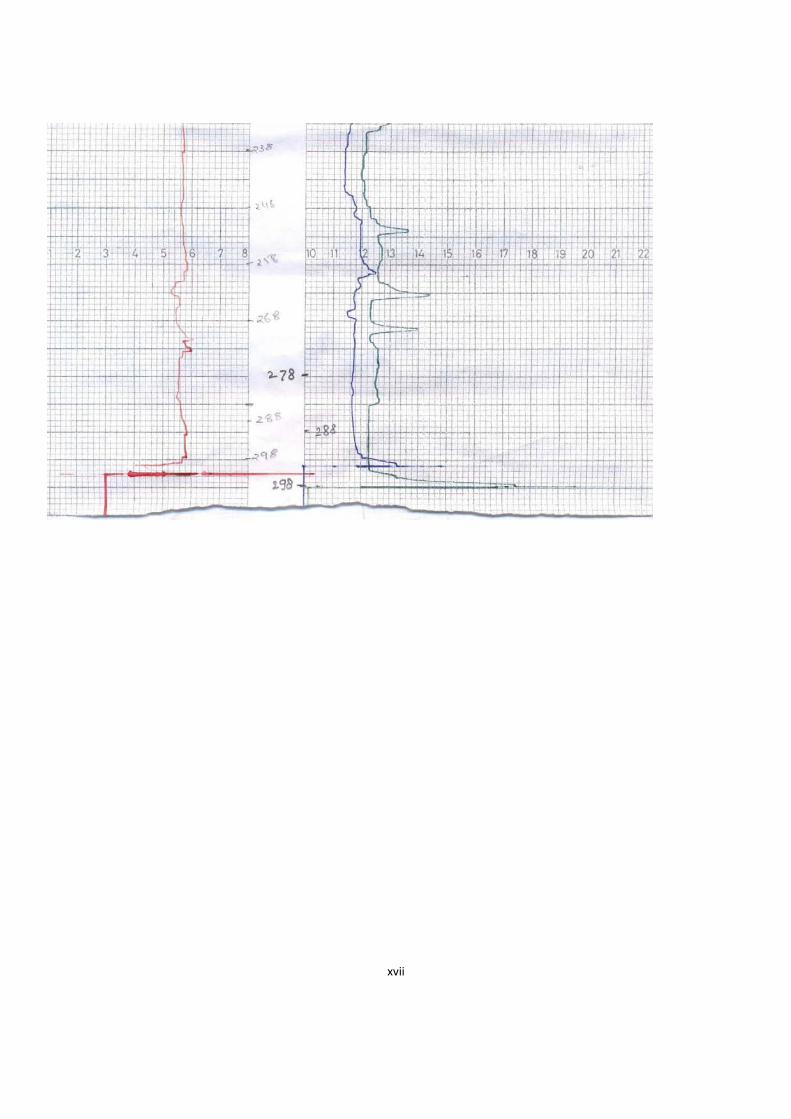
xvii
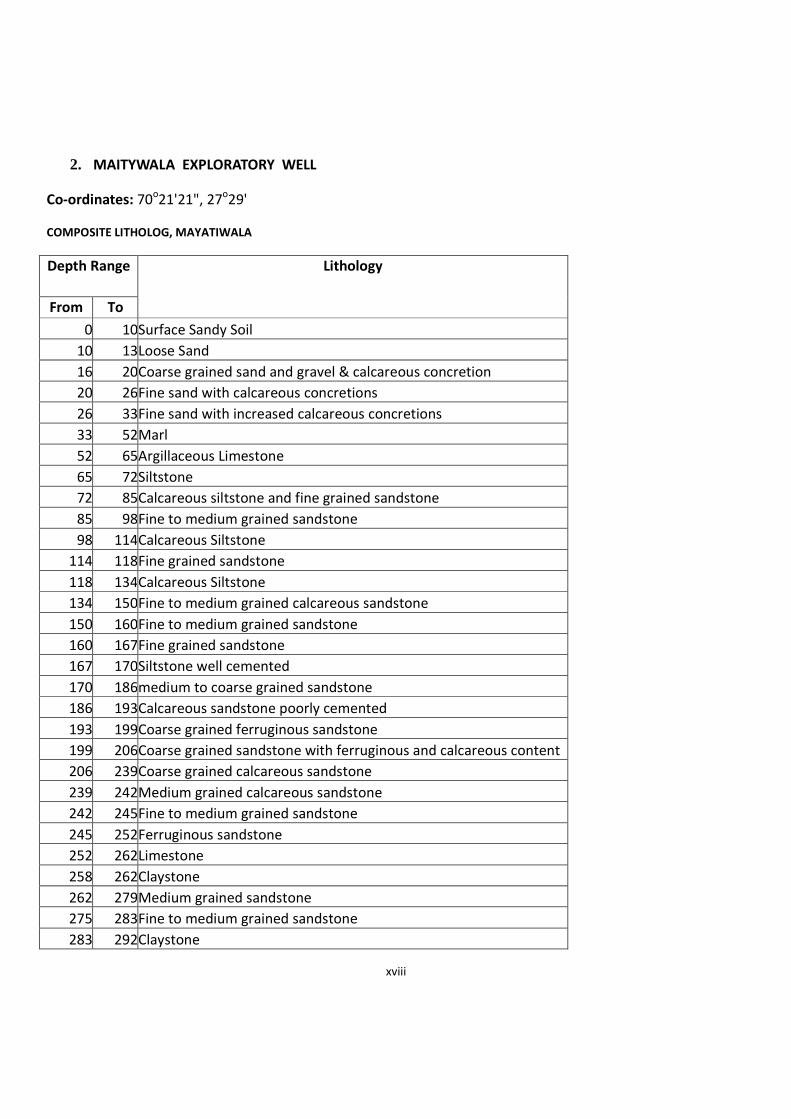
xviii
2. MAITYWALA EXPLORATORY WELL
Co-ordinates: 70o21'21", 27
o29'
COMPOSITE LITHOLOG, MAYATIWALA
Depth Range
From To
Lithology
0 10Surface Sandy Soil
10 13Loose Sand
16 20Coarse grained sand and gravel & calcareous concretion
20 26Fine sand with calcareous concretions
26 33Fine sand with increased calcareous concretions
33 52Marl
52 65Argillaceous Limestone
65 72Siltstone
72 85Calcareous siltstone and fine grained sandstone
85 98Fine to medium grained sandstone
98 114Calcareous Siltstone
114 118Fine grained sandstone
118 134Calcareous Siltstone
134 150Fine to medium grained calcareous sandstone
150 160Fine to medium grained sandstone
160 167Fine grained sandstone
167 170Siltstone well cemented
170 186medium to coarse grained sandstone
186 193Calcareous sandstone poorly cemented
193 199Coarse grained ferruginous sandstone
199 206Coarse grained sandstone with ferruginous and calcareous content
206 239Coarse grained calcareous sandstone
239 242Medium grained calcareous sandstone
242 245Fine to medium grained sandstone
245 252Ferruginous sandstone
252 262Limestone
258 262Claystone
262 279Medium grained sandstone
275 283Fine to medium grained sandstone
283 292Claystone

xix
292 300Fine to medium grained sandstone
Drill Time Log, Mayatiwala
Corrected Depth Drilling time
From To ( minutes) min/m
0.00 3.00 65 21.67
3.00 6.50 205 58.57
6.50 9.50 55 18.33
9.50 12.50 85 28.33
12.50 15.75 70 21.54
15.75 18.75 40 13.33
18.75 22.00 65 20.00
22.00 25.00 35 11.67
25.00 28.25 65 20.00
28.25 31.25 105 35.00
31.25 34.50 85 26.15
34.50 37.50 100 33.33
37.50 40.75 35 10.77
40.75 43.75 55 18.33
43.75 47.00 75 23.08
47.00 50.00 130 43.33
50.00 53.25 50 15.38
53.25 56.25 100 33.33
56.25 59.50 90 27.69
59.50 62.50 55 18.33
62.50 65.75 80 24.62
65.75 68.75 145 48.33
68.75 72.00 90 27.69
72.00 75.00 25 8.33
75.00 78.25 40 12.31
78.25 81.25 30 10.00
81.25 84.50 45 13.85
84.50 87.50 55 18.33
87.50 90.75 45 13.85
90.75 93.75 51 17.00
93.75 97.00 50 15.38
97.00 100.00 45 15.00
100.00 103.25 165 50.77

xx
Corrected Depth Drilling time
From To ( minutes) min/m
103.25 106.25 55 18.33
106.25 109.50 60 18.46
109.50 112.50 140 46.67
112.50 115.75 60 18.46
115.75 118.75 75 25.00
118.75 122.00 95 29.23
122.00 125.00 55 18.33
125.00 128.25 75 23.08
128.25 131.25 75 25.00
131.25 134.50 40 12.31
134.50 137.50 40 13.33
137.50 140.75 60 18.46
140.75 143.75 75 25.00
143.75 147.00 55 16.92
147.00 150.00 30 10.00
150.00 153.25 40 12.31
153.25 156.25 45 15.00
156.25 159.50 40 12.31
159.50 162.50 45 15.00
162.50 165.75 55 16.92
165.75 168.75 65 21.67
168.75 172.00 70 21.54
172.00 175.00 90 30.00
175.00 178.25 80 24.62
178.25 181.25 70 23.33
181.25 184.50 135 41.54
184.50 187.50 60 20.00
187.50 190.75 120 36.92
190.75 193.75 60 20.00
193.75 197.00 115 35.38
197.00 200.00 60 20.00
200.00 203.25 180 55.38
203.25 206.25 65 21.67
206.25 209.50 110 33.85
209.50 212.50 70 23.33
212.50 215.75 65 20.00
215.75 218.75 90 30.00
218.75 221.75 90 30.00
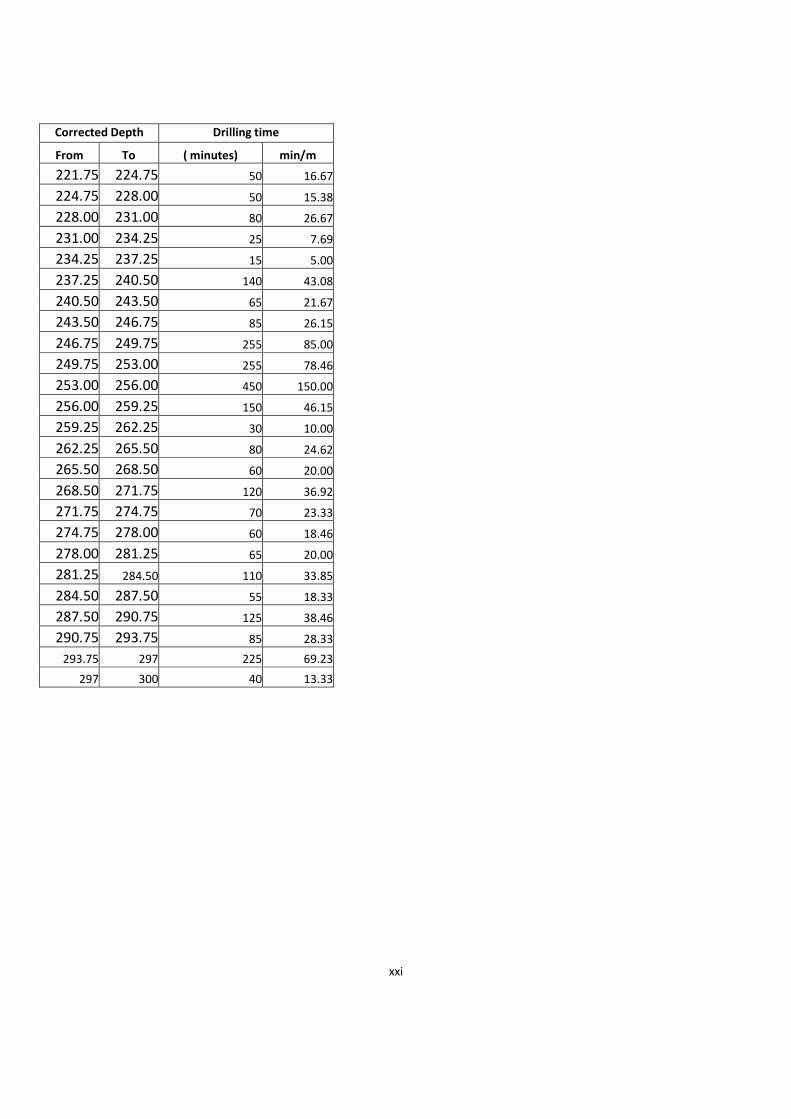
xxi
Corrected Depth Drilling time
From To ( minutes) min/m
221.75 224.75 50 16.67
224.75 228.00 50 15.38
228.00 231.00 80 26.67
231.00 234.25 25 7.69
234.25 237.25 15 5.00
237.25 240.50 140 43.08
240.50 243.50 65 21.67
243.50 246.75 85 26.15
246.75 249.75 255 85.00
249.75 253.00 255 78.46
253.00 256.00 450 150.00
256.00 259.25 150 46.15
259.25 262.25 30 10.00
262.25 265.50 80 24.62
265.50 268.50 60 20.00
268.50 271.75 120 36.92
271.75 274.75 70 23.33
274.75 278.00 60 18.46
278.00 281.25 65 20.00
281.25 284.50 110 33.85
284.50 287.50 55 18.33
287.50 290.75 125 38.46
290.75 293.75 85 28.33
293.75 297 225 69.23
297 300 40 13.33
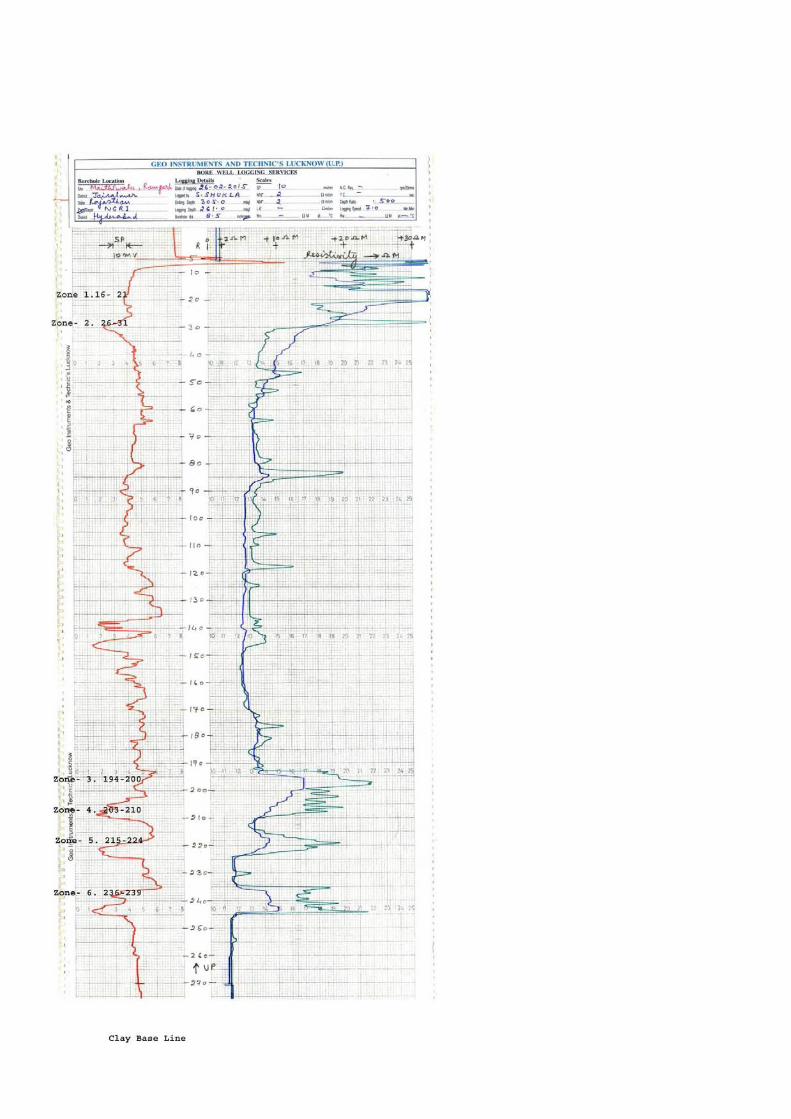
xxii
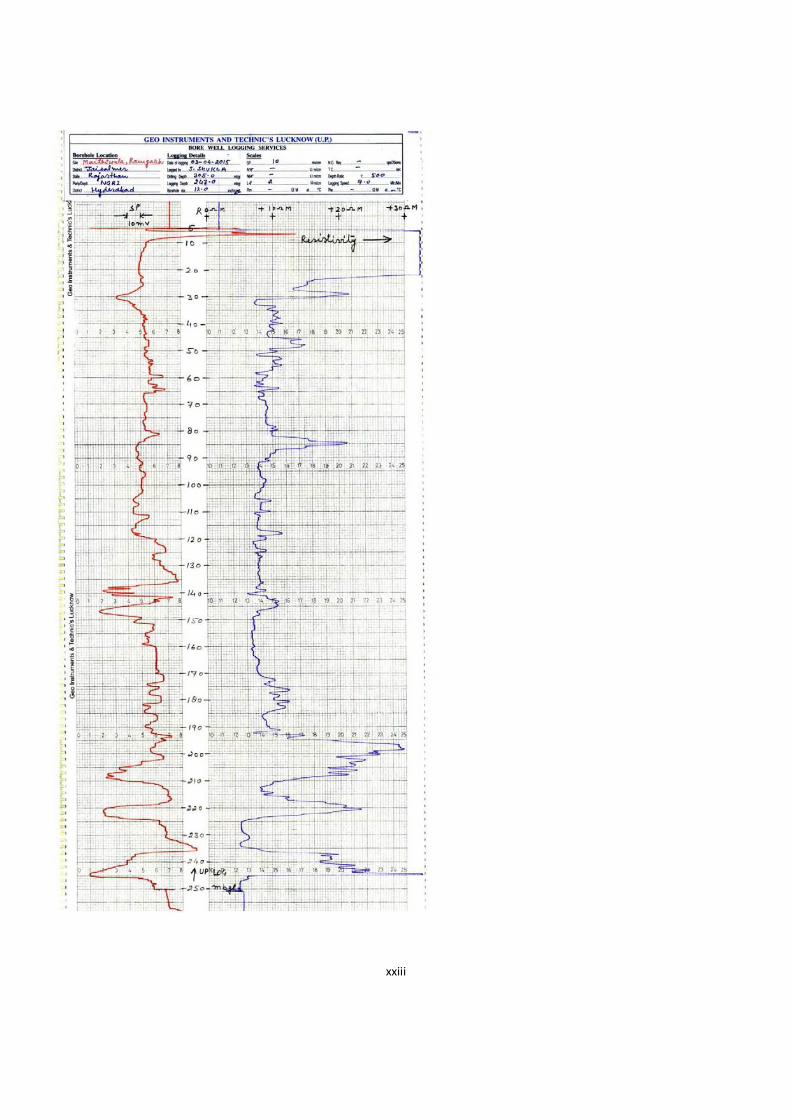
xxiii
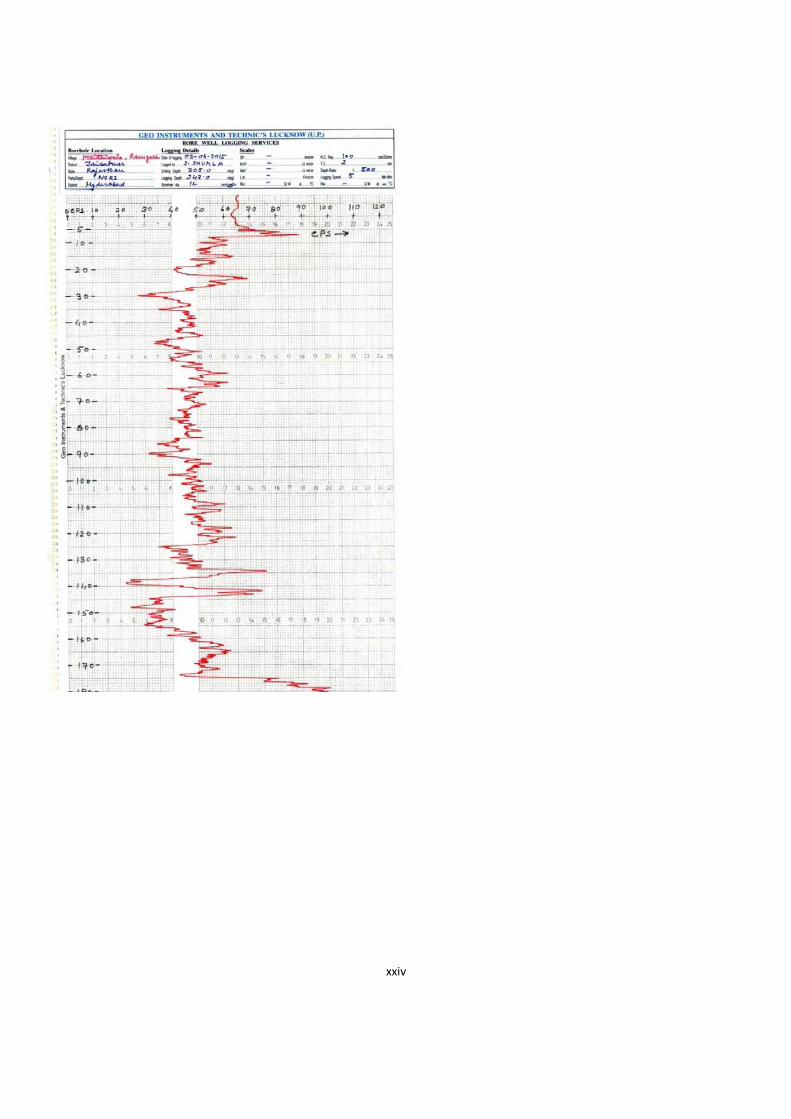
xxiv

xxv
Annexure - V
Water level in Ramgarh area, Jaisalmer district, Rajasthan
Sno. Location LatD LatM LatS LongD LongM LongS Elevation
(m)
mp (agl.) Jan-13 Mar-13 May-13 Jun-13 Aug-13 Sep-13 Oct-13 Dec-13 Jan-14 Feb-14 May-14 Nov-14 Feb-15
MW1 Naval sigh ki
dhani
27 19 7 70 33 1 177 1.1 - 53.85 56.4 63.7 64.73 76.2 - 77.64 65.98 86.47 81 - -
MW2 Gamnewala 27 29 33 70 16 47 110 0.85 - 61.85 60.76 65.25 69 69.3 61.9 73.18 61.5 77.5 72.93 61.81 61.85
MW3 Gamnewala 27 29 13 70 16 47 111 0.7 - 72.5 65.2 66.46 66.5 67.2 65.24 72.7 64.67 71.6 65.2 64.99 64.88
MW4 Joga (shallow ) 27 19 49 70 37 18 0.45 -
- - 4.25 -0.45 1.85 -0.45 3.91 4.05 3.8 4.05 - -
MW5 Joga ( Deep ) 27 19 49 70 37 207 0.6 -
67.57 67.8 3.9 -0.6 67.7 77.09 77.55 67.41 67.57 67.99 67.66 67.47
MW6 Netshi 27 17 43 70 30 20 168 0.6 -
- 3.2 1.5 1.4 -0.6 -0.6 - - 1.5 3.47 -
MW7 Jiya desar 27 15 45 70 31 5 183 0.75 -
- 4.05 2.05 3.95 1.05 1.05 1.15 -0.75 -0.75 2.05 4.17 -
MW8 Raypal 27 22 20 70 30 50 168 0.5 -
- 3.5 -0.5 -0.5 1.3 3.2 -0.5 -0.5 3.5 3.39 -
MW9 Derasar( Sheuba ) 27 24 7 70 39 35 155 0.5 -
- 3.7 4.15 -0.5 -0.5 -0.5 1.9 -0.5 -0.5 4.15 5.9 -
MW10 Mayati wala 27 29 1 70 21 24 117 1.2 -
- 65.15 65.4 65.4 65.3 65.7 65.57 65.02 65.35 65.4 65.28 62.18
MW11 Samarthwala 27 24 14 70 16 26 117 1.2 -
- 66 63.7 63.75 63.65 63.7 64 63.3 62.6 63.7 63.56 63.42
MW12 Sanu 27 14 55 70 38 59 214 1.2 112.5 - 105.48 - 106 92.8 97.6 111.92 105.45 106.2 - 105.8 -
MW13 Ramgarh 27 21 49 70 30 21 148 0.5 48.1 47.53 47.45 66.1 0.7 - - 55.6 48.2 62.41 66.1 47.59 47.22
MW14 Ramgarh ignp
27 22 7 70 29 20 150 - - - - - - - - - - - 42.82 42.78
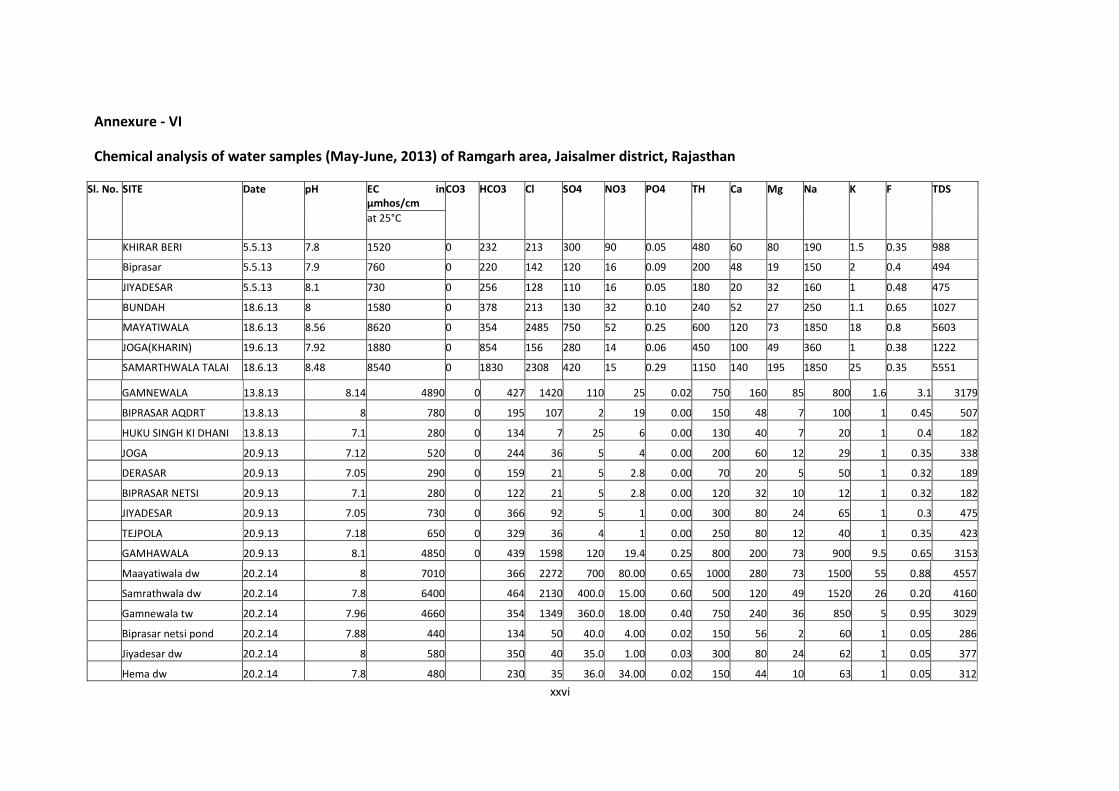
xxvi
Annexure - VI
Chemical analysis of water samples (May-June, 2013) of Ramgarh area, Jaisalmer district, Rajasthan
EC in
μmhos/cm
Sl. No. SITE Date pH
at 25°C
CO3
HCO3
Cl
SO4
NO3
PO4
TH
Ca
Mg
Na
K
F
TDS
KHIRAR BERI 5.5.13 7.8 1520 0 232 213 300 90 0.05 480 60 80 190 1.5 0.35 988
Biprasar 5.5.13 7.9 760 0 220 142 120 16 0.09 200 48 19 150 2 0.4 494
JIYADESAR 5.5.13 8.1 730 0 256 128 110 16 0.05 180 20 32 160 1 0.48 475
BUNDAH 18.6.13 8 1580 0 378 213 130 32 0.10 240 52 27 250 1.1 0.65 1027
MAYATIWALA 18.6.13 8.56 8620 0 354 2485 750 52 0.25 600 120 73 1850 18 0.8 5603
JOGA(KHARIN) 19.6.13 7.92 1880 0 854 156 280 14 0.06 450 100 49 360 1 0.38 1222
SAMARTHWALA TALAI 18.6.13 8.48 8540 0 1830 2308 420 15 0.29 1150 140 195 1850 25 0.35 5551
GAMNEWALA 13.8.13 8.14 4890 0 427 1420 110 25 0.02 750 160 85 800 1.6 3.1 3179
BIPRASAR AQDRT 13.8.13 8 780 0 195 107 2 19 0.00 150 48 7 100 1 0.45 507
HUKU SINGH KI DHANI 13.8.13 7.1 280 0 134 7 25 6 0.00 130 40 7 20 1 0.4 182
JOGA 20.9.13 7.12 520 0 244 36 5 4 0.00 200 60 12 29 1 0.35 338
DERASAR 20.9.13 7.05 290 0 159 21 5 2.8 0.00 70 20 5 50 1 0.32 189
BIPRASAR NETSI 20.9.13 7.1 280 0 122 21 5 2.8 0.00 120 32 10 12 1 0.32 182
JIYADESAR 20.9.13 7.05 730 0 366 92 5 1 0.00 300 80 24 65 1 0.3 475
TEJPOLA 20.9.13 7.18 650 0 329 36 4 1 0.00 250 80 12 40 1 0.35 423
GAMHAWALA 20.9.13 8.1 4850 0 439 1598 120 19.4 0.25 800 200 73 900 9.5 0.65 3153
Maayatiwala dw 20.2.14 8 7010 366 2272 700 80.00 0.65 1000 280 73 1500 55 0.88 4557
Samrathwala dw 20.2.14 7.8 6400 464 2130 400.0 15.00 0.60 500 120 49 1520 26 0.20 4160
Gamnewala tw 20.2.14 7.96 4660 354 1349 360.0 18.00 0.40 750 240 36 850 5 0.95 3029
Biprasar netsi pond 20.2.14 7.88 440 134 50 40.0 4.00 0.02 150 56 2 60 1 0.05 286
Jiyadesar dw 20.2.14 8 580 350 40 35.0 1.00 0.03 300 80 24 62 1 0.05 377
Hema dw 20.2.14 7.8 480 230 35 36.0 34.00 0.02 150 44 10 63 1 0.05 312
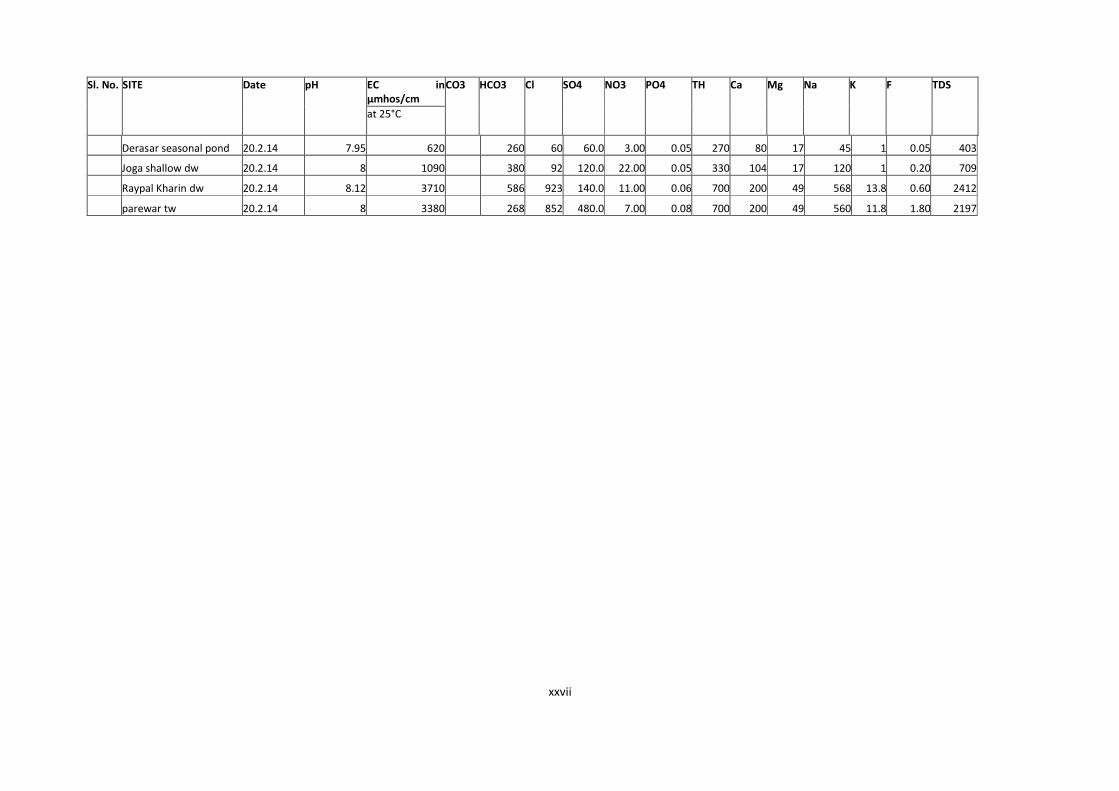
xxvii
EC in
μmhos/cm
Sl. No. SITE Date pH
at 25°C
CO3
HCO3
Cl
SO4
NO3
PO4
TH
Ca
Mg
Na
K
F
TDS
Derasar seasonal pond 20.2.14 7.95 620 260 60 60.0 3.00 0.05 270 80 17 45 1 0.05 403
Joga shallow dw 20.2.14 8 1090 380 92 120.0 22.00 0.05 330 104 17 120 1 0.20 709
Raypal Kharin dw 20.2.14 8.12 3710 586 923 140.0 11.00 0.06 700 200 49 568 13.8 0.60 2412
parewar tw 20.2.14 8 3380 268 852 480.0 7.00 0.08 700 200 49 560 11.8 1.80 2197
106
Principal Authors
P.K. Parchure, Regional Director
Rana Chatterjee, Scientist 'D' NGRI Team (Geophysics)
Other Contributors
Hydrogeology: Sh Binoy Ranjan, Scientist ‘C’
Geophysics: Dr. S.L. Dhabai, Scientist 'C' Water Chemistry Sh. Yashveer Singh, Scientist 'B'
Dr. J.P. Garg, Asstt. Chemist
Smt. Aruna Saini, Asstt. Chemist
Dr. Prerna Mathuria, STA (Chemist)
Drawing & Cartography Sh J.K.Tandon, Draftsman
Advanced Geophysical Techniques:
NGRI, CSIR, Hyderabad
Borehole construction: Div. I Ahmedabad/ Div XII Jodhpur