iTABLE OF CONTENTS - USAID Policy LINK Program
85
Feed the Future Market Systems Assessment East Africa Market Systems Activity February 2021 1 i TABLE OF CONTENTS Cereals .......................................................................................................................................................... 3 1. Value Chain Overview and Market Segments ................................................................................ 3 1.1. Value Chain Actors ................................................................................................................................3 1.2. Target Cereal Crops ...............................................................................................................................5 2. Overview of Current Trade Flows .................................................................................................. 8 2.1. Cereal Trade Flows by Crop ..................................................................................................................9 2.2. Main Corridors for Cross-border Trade in Cereals ........................................................................... 11 2.3. Cereal Exports from East Africa ......................................................................................................... 13 3. Regional Growth Potential ........................................................................................................... 14 4. Constraints Analysis ...................................................................................................................... 17 4.1. Production Systems ............................................................................................................................. 17 4.2. Market Access and Market information ............................................................................................ 21 4.3. Technology and Inputs ....................................................................................................................... 25 4.4. Transport and Logistics ...................................................................................................................... 27 4.5. Access to Finance................................................................................................................................. 27 4.6. Processing and Value Addition........................................................................................................... 29 4.7. Policy Constraints ............................................................................................................................... 30 4.8. Political Economy Constraints ........................................................................................................... 35 4.9. Constraints on Women’s Participation in the VC ............................................................................ 36 4.10. Constraints on Youth Participation in the VC ............................................................................. 37 5. Opportunities ................................................................................................................................ 38 6. Appendix 1 ..................................................................................................................................... 45 Legumes...................................................................................................................................................... 48 1. Value Chain Overview and Market Segments .............................................................................. 48 1.1. Production Structure .......................................................................................................................... 48 1.2. Inputs Supply Structure ...................................................................................................................... 49 1.3. Marketing Structure ............................................................................................................................ 49
-
Upload
khangminh22 -
Category
Documents
-
view
5 -
download
0
Transcript of iTABLE OF CONTENTS - USAID Policy LINK Program

Feed the Future Market Systems Assessment East Africa Market Systems Activity February 2021
1
iTABLE OF CONTENTS
Cereals .......................................................................................................................................................... 3
1. Value Chain Overview and Market Segments ................................................................................ 3
1.1. Value Chain Actors ................................................................................................................................3
1.2. Target Cereal Crops ...............................................................................................................................5
2. Overview of Current Trade Flows .................................................................................................. 8
2.1. Cereal Trade Flows by Crop ..................................................................................................................9
2.2. Main Corridors for Cross-border Trade in Cereals ........................................................................... 11
2.3. Cereal Exports from East Africa ......................................................................................................... 13
3. Regional Growth Potential ........................................................................................................... 14
4. Constraints Analysis ...................................................................................................................... 17
4.1. Production Systems ............................................................................................................................. 17
4.2. Market Access and Market information ............................................................................................ 21
4.3. Technology and Inputs ....................................................................................................................... 25
4.4. Transport and Logistics ...................................................................................................................... 27
4.5. Access to Finance ................................................................................................................................. 27
4.6. Processing and Value Addition........................................................................................................... 29
4.7. Policy Constraints ............................................................................................................................... 30
4.8. Political Economy Constraints ........................................................................................................... 35
4.9. Constraints on Women’s Participation in the VC ............................................................................ 36
4.10. Constraints on Youth Participation in the VC ............................................................................. 37
5. Opportunities ................................................................................................................................ 38
6. Appendix 1 ..................................................................................................................................... 45
Legumes...................................................................................................................................................... 48
1. Value Chain Overview and Market Segments .............................................................................. 48
1.1. Production Structure .......................................................................................................................... 48
1.2. Inputs Supply Structure ...................................................................................................................... 49
1.3. Marketing Structure ............................................................................................................................ 49
Feed the Future Market Systems Assessment East Africa Market Systems Activity February 2021
2
1.4. Processing Structure ............................................................................................................................ 52
1.5. Value Chain Supporters and Influencers ........................................................................................... 53
2. Overview of cu©rrent trade flows ................................................................................................. 54
2.1. Sources of Supplies and Global Trade ................................................................................................ 54
2.2. Legumes Exports ................................................................................................................................. 58
2.3. Intraregional Trade in Grain Legumes ............................................................................................... 58
3. Regional Growth Potential ........................................................................................................... 61
4. Constraints Analysis ...................................................................................................................... 63
4.1. Production Systems ............................................................................................................................. 63
4.2. Prevalence of Pests and Diseases ......................................................................................................... 63
4.3. Market Access and Market Information ............................................................................................ 64
4.4. Market Infrastructure ......................................................................................................................... 65
4.5. Transport and Logistics ...................................................................................................................... 66
4.1. Access to Technology and Inputs....................................................................................................... 66
4.2. Access to Finance and Investment ...................................................................................................... 67
4.3. Policy Constraints to Cross-border Trade ......................................................................................... 69
4.4. Political Economy of Legumes Markets ............................................................................................. 72
4.5. Constraints to Participation of Women and Youth in the VC......................................................... 72
5. Opportunities ................................................................................................................................ 74
Feed the Future Market Systems Assessment East Africa Market Systems Activity February 2021
3
CEREALS
1. VALUE CHAIN OVERVIEW AND MARKET SEGMENTS
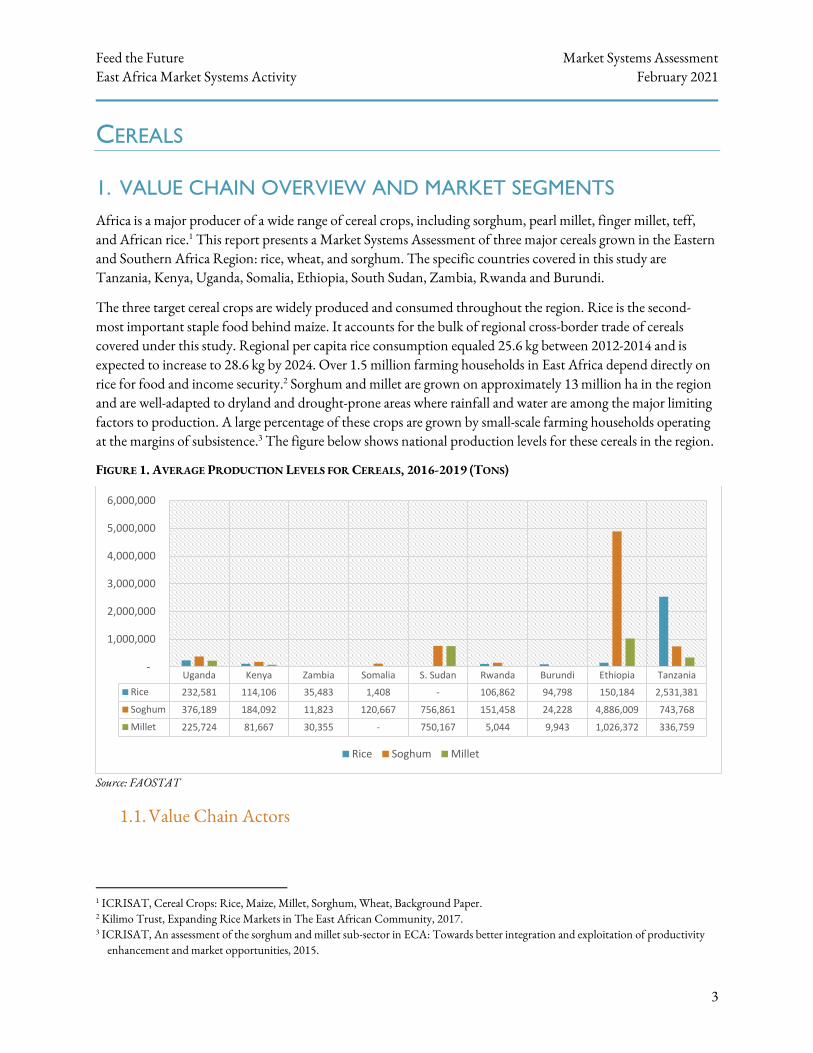
Africa is a major producer of a wide range of cereal crops, including sorghum, pearl millet, finger millet, teff, and African rice.1 This report presents a Market Systems Assessment of three major cereals grown in the Eastern and Southern Africa Region: rice, wheat, and sorghum. The specific countries covered in this study are Tanzania, Kenya, Uganda, Somalia, Ethiopia, South Sudan, Zambia, Rwanda and Burundi.
The three target cereal crops are widely produced and consumed throughout the region. Rice is the second-most important staple food behind maize. It accounts for the bulk of regional cross-border trade of cereals covered under this study. Regional per capita rice consumption equaled 25.6 kg between 2012-2014 and is expected to increase to 28.6 kg by 2024. Over 1.5 million farming households in East Africa depend directly on rice for food and income security.2 Sorghum and millet are grown on approximately 13 million ha in the region and are well-adapted to dryland and drought-prone areas where rainfall and water are among the major limiting factors to production. A large percentage of these crops are grown by small-scale farming households operating at the margins of subsistence.3 The figure below shows national production levels for these cereals in the region.
FIGURE 1. AVERAGE PRODUCTION LEVELS FOR CEREALS, 2016-2019 (TONS)
Source: FAOSTAT
1.1. Value Chain Actors
1 ICRISAT, Cereal Crops: Rice, Maize, Millet, Sorghum, Wheat, Background Paper. 2 Kilimo Trust, Expanding Rice Markets in The East African Community, 2017. 3 ICRISAT, An assessment of the sorghum and millet sub-sector in ECA: Towards better integration and exploitation of productivity
enhancement and market opportunities, 2015.
Uganda Kenya Zambia Somalia S. Sudan Rwanda Burundi Ethiopia Tanzania
Rice 232,581 114,106 35,483 1,408 - 106,862 94,798 150,184 2,531,381
Soghum 376,189 184,092 11,823 120,667 756,861 151,458 24,228 4,886,009 743,768
Millet 225,724 81,667 30,355 - 750,167 5,044 9,943 1,026,372 336,759
-
1,000,000
2,000,000
3,000,000
4,000,000
5,000,000
6,000,000
Rice Soghum Millet
Feed the Future Market Systems Assessment East Africa Market Systems Activity February 2021
4
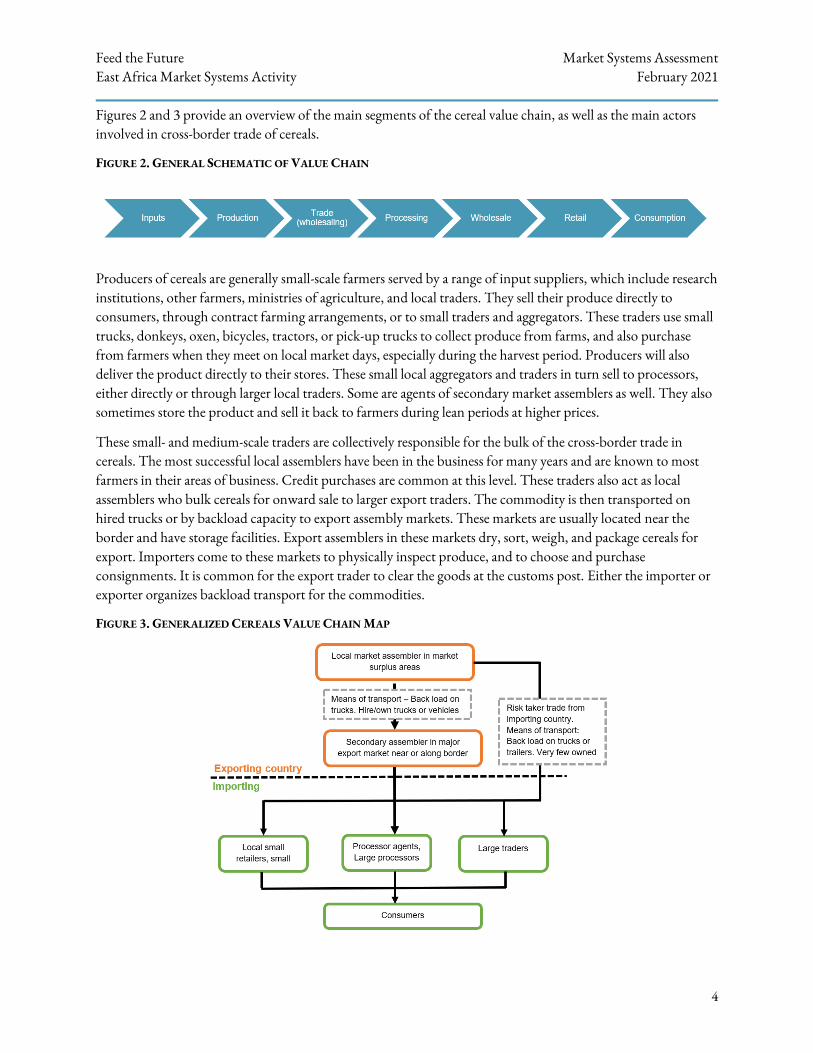
Figures 2 and 3 provide an overview of the main segments of the cereal value chain, as well as the main actors involved in cross-border trade of cereals.
FIGURE 2. GENERAL SCHEMATIC OF VALUE CHAIN
Producers of cereals are generally small-scale farmers served by a range of input suppliers, which include research institutions, other farmers, ministries of agriculture, and local traders. They sell their produce directly to consumers, through contract farming arrangements, or to small traders and aggregators. These traders use small trucks, donkeys, oxen, bicycles, tractors, or pick-up trucks to collect produce from farms, and also purchase from farmers when they meet on local market days, especially during the harvest period. Producers will also deliver the product directly to their stores. These small local aggregators and traders in turn sell to processors, either directly or through larger local traders. Some are agents of secondary market assemblers as well. They also sometimes store the product and sell it back to farmers during lean periods at higher prices.
These small- and medium-scale traders are collectively responsible for the bulk of the cross-border trade in cereals. The most successful local assemblers have been in the business for many years and are known to most farmers in their areas of business. Credit purchases are common at this level. These traders also act as local assemblers who bulk cereals for onward sale to larger export traders. The commodity is then transported on hired trucks or by backload capacity to export assembly markets. These markets are usually located near the border and have storage facilities. Export assemblers in these markets dry, sort, weigh, and package cereals for export. Importers come to these markets to physically inspect produce, and to choose and purchase consignments. It is common for the export trader to clear the goods at the customs post. Either the importer or exporter organizes backload transport for the commodities.
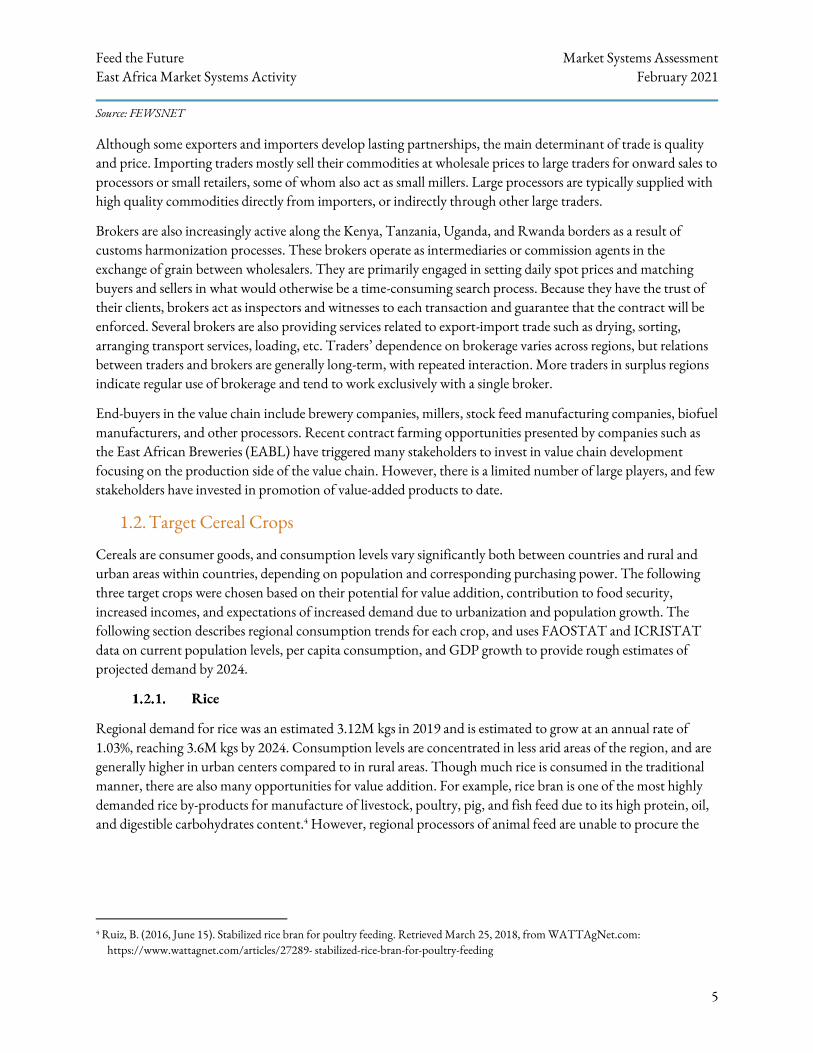
FIGURE 3. GENERALIZED CEREALS VALUE CHAIN MAP
Feed the Future Market Systems Assessment East Africa Market Systems Activity February 2021
5
Source: FEWSNET
Although some exporters and importers develop lasting partnerships, the main determinant of trade is quality and price. Importing traders mostly sell their commodities at wholesale prices to large traders for onward sales to processors or small retailers, some of whom also act as small millers. Large processors are typically supplied with high quality commodities directly from importers, or indirectly through other large traders.
Brokers are also increasingly active along the Kenya, Tanzania, Uganda, and Rwanda borders as a result of customs harmonization processes. These brokers operate as intermediaries or commission agents in the exchange of grain between wholesalers. They are primarily engaged in setting daily spot prices and matching buyers and sellers in what would otherwise be a time-consuming search process. Because they have the trust of their clients, brokers act as inspectors and witnesses to each transaction and guarantee that the contract will be enforced. Several brokers are also providing services related to export-import trade such as drying, sorting, arranging transport services, loading, etc. Traders’ dependence on brokerage varies across regions, but relations between traders and brokers are generally long-term, with repeated interaction. More traders in surplus regions indicate regular use of brokerage and tend to work exclusively with a single broker.
End-buyers in the value chain include brewery companies, millers, stock feed manufacturing companies, biofuel manufacturers, and other processors. Recent contract farming opportunities presented by companies such as the East African Breweries (EABL) have triggered many stakeholders to invest in value chain development focusing on the production side of the value chain. However, there is a limited number of large players, and few stakeholders have invested in promotion of value-added products to date.
1.2. Target Cereal Crops
Cereals are consumer goods, and consumption levels vary significantly both between countries and rural and urban areas within countries, depending on population and corresponding purchasing power. The following three target crops were chosen based on their potential for value addition, contribution to food security, increased incomes, and expectations of increased demand due to urbanization and population growth. The following section describes regional consumption trends for each crop, and uses FAOSTAT and ICRISTAT data on current population levels, per capita consumption, and GDP growth to provide rough estimates of projected demand by 2024.
Rice
Regional demand for rice was an estimated 3.12M kgs in 2019 and is estimated to grow at an annual rate of 1.03%, reaching 3.6M kgs by 2024. Consumption levels are concentrated in less arid areas of the region, and are generally higher in urban centers compared to in rural areas. Though much rice is consumed in the traditional manner, there are also many opportunities for value addition. For example, rice bran is one of the most highly demanded rice by-products for manufacture of livestock, poultry, pig, and fish feed due to its high protein, oil, and digestible carbohydrates content.4 However, regional processors of animal feed are unable to procure the
4 Ruiz, B. (2016, June 15). Stabilized rice bran for poultry feeding. Retrieved March 25, 2018, from WATTAgNet.com:
https://www.wattagnet.com/articles/27289- stabilized-rice-bran-for-poultry-feeding
Feed the Future Market Systems Assessment East Africa Market Systems Activity February 2021
6
required volumes of rice bran due to limited supply of raw materials for manufacture of animal feed. In Kenya and Tanzania, the average supply deficit is 41% and 36%, respectively.5
Broken rice is also used in the regional brewery industry, both as a main ingredient (as with Congolese beer) or as an ‘adjunct’ grain to make beers lighter and produce a dry, clean taste.6,7 The EAC Customs Management Act allows the manufacturers to import broken rice for the brewery industry at a duty rate of 0% under the Duty Remissions Scheme, which has facilitated cross-border trade for this purpose.8 Broken rice is also used in the confectionary industry to make doughnut cakes (Vitumbua), rice cakes (Mkate wa Sinia), and as a substitute for wheat.
Finally, use of rice by-products such as rice husks, hulls, and straws is growing but is still largely unexploited in the EAC. Rice husks can be used to make briquettes for construction as well as domestic and industrial cooking and heating.9 In Rwanda, for example, the company STRAWTEC utilizes rice straws to make straw panels for the construction industry. And in Tanzania, Kilombero Plantations Limited (KPL) has a gasification plant that utilizes rice husks to generate electricity, while Mamboleo Farm Limited (MFL) has a locally built gasifier and is experimenting with production of stones from ash, as well as ash for cement substitution.10,11
Sorghum
In 2019, estimated regional demand for sorghum was 6.37M kgs. This is projected to grow to 8.2M kgs by 2024, an increase of 1.05% per year. In general, sorghum is more commonly consumed in rural areas, with urban demand mainly concentrated in areas close to production. It is grown primarily for food and consumed in a variety of forms that vary from region to region. In general, it is consumed as whole grain or processed into flour, from which traditional meals such as injera (Ethiopia) and ugali uji (Tanzania) are prepared.12
Additionally, new value-added/processed food products for human consumption are emerging such as popped sorghum, biscuits, simple cakes, cookies and instant soft porridge such as Morvite, a product of King Food in South Africa. Morvite is a pre-cooked sorghum dry powder with added vitamins that is prepared by adding either hot or cold water or milk to make a breakfast porridge or beverage.13
5 Kilimo Trust. (2017 B). Characteristics of markets for animal feeds raw materials in the East African community: Focus on maize bran
and sunflower seed cake. Kampala, Uganda: Kilimo Trust. 6 Eddings, B. (2018, March 5). Why some Brewers use rice or corn in their beer. 7 Rikolto VECO. (2017, June 7). Congolese rice farmers conquer the local market. Retrieved March 25, 2018, from Rikolto VECO:
https://www.rikolto.org/en/project/ Congolese-rice-farmers-conquer-local-market 8 EAC. (2006). Agriculture and rural development strategy for the East African Community. Arusha, Tanzania: EAC Secretariat. 9 Kabeja, B. B. (2016, January 2). STRAWTEC brings its green building technology to Rwanda. Retrieved March 25, 2018, from
CLEANLEAP: http://cleanleap.com/ strawtec-brings-its-green-building-technology-Rwanda 10 Klaus, T. (2017). Setting up value chains with rice husk and polish. 11 -ibid-.
12 Wambugu, S. M (2011). Increasing Sorghum Utilization and Marketability Through Food Products Diversification. Kenya industrial Research and Development Institute, Nairobi, Kenya. 31pp.
13 Taylor, J. R. N. (2003). Overview: Importance of sorghum in Africa. In: Proceedings of the Workshop on the Proteins of Sorghum and Millets: Enhancing Nutritional and functional properties for Africa. (Edited by Belton, P. S. and Taylor, J. R. N.), 2 – 4 April 2003, Pretoria, South Africa. 21pp
Feed the Future Market Systems Assessment East Africa Market Systems Activity February 2021
7
Sorghum is also processed into a variety of non-alcoholic drinks, such as Togwa in Tanzania, as well as alcoholic drinks such as various beer products produced throughout the region.14,15 Demand for traditional beers such as chibuku and Mwamba in Burundi, Zambia, Rwanda and Tanzania has increased in recent years, particularly in the rural areas. All countries in the region except for Ethiopia produce sorghum beer commercially.16 In addition, the Heineken Group recently increased the manufacturing of beer from locally sourced sorghum in Rwanda and Burundi.
Sorghum is also used for livestock feed. In East Africa, residual crop grazing is the major mode of utilization of sorghum straw to help maintain animal live weight, especially during dry seasons. Other methods of utilization of straw involve stalk feeding of supplemented treated or non-treated straw.17 With increased use of sorghum grains in breweries and milling industries, more by-products are becoming available for livestock use for poultry, rabbits, pigs, and ruminants. In poultry feed, sorghum cultivars with low tannins and that are less susceptible to molds have been used as alternative feeding material to maize.18 Poultry feed trials have shown that sorghum can replace maize completely in poultry feed especially in broilers in terms of growth rate, livability, egg production, and weight.19
Millet
Across the region, millet is widely recognized by consumers as a nutritious cereal. Its exceptionally high calcium content makes it an important food for pregnant women, nursing mothers and children. Demand for millet increasingly exceeds supply, and is expected to grow 1.06% per year from 1.88M kgs in 2019 to 2.49M kgs in 2024. As with sorghum, millet is consumed mainly in rural areas or urban centers close to production. It is a high-quality subsistence food crop: its small grains can be stored safely for many years without spoilage, and are an excellent dietary source of calcium, iron, manganese, and methionine, an amino acid lacking in the diets of hundreds of millions of the poor who live on starchy foods such as cassava, plantain, polished rice, and maize meal. Millet is also productive in a wide range of environments and growing conditions throughout the middle-elevation areas of the region.
There has been growing demand for millet from urban, middle class consumers, particularly for millet flour, for which demand is growing at 10% per year. A growing number of small, medium, and large commercial grain millers and processors in East Africa each mill 10–800 tons of millet per month, producing both pure millet flour or composite flour and porridge mixtures, mainly for the domestic market. It is primarily consumed as a thick porridge known as ugali, and as a thin porridge known as uji. It is estimated that potential utilization of millet flour will reach 169,000 t/year by 2025, fueled mainly by its status as a “smart food” desired by health-conscious consumers that have sufficient disposable income to afford processed and specialty food products. It
14 URT/PMO/RALG (2012). Kondoa District Social-Economic Profile, and Progress Report on Sorghum Production. United
Republic of Tanzania, Kondoa 15p 15 Dendy, D. V. N. (1995). Sorghum and Millet: Production and Importance. American Association of Cereal Chemistry, St. Paul, USA.
80pp 16 Mackintosh, I, and Higgins, B. 2004 The development of a sorghum-based lager beer in Uganda: A model of cooperation between
industry and government in the development of local ingredients for the production of a quality lager beer and consequential benefits for the parties involved, Aspects of Applied Biology 72: 235-245.
17 ICRISAT (2004). Sorghum. A Crop of Subsistence. International Crop Research Institute for Semi-Arid Tropics, Patencheru Andhra, India. 101pp.
18 Smith, S. E. (2010). What is sorghum? [http://www.wisegeek.com] site visited on 21/10/2013 19 Tulasi, S. L., Rajashekhe, A. R., Raghunadha, R. G., Prasad, V. L. K. Rao., P. P. and Ramachandraiah, D. (2004). Performance of
broilers on sorghum-based diets. International Sorghum and Millets 45: 37 – 40

Feed the Future Market Systems Assessment East Africa Market Systems Activity February 2021
8
also has excellent malting properties and is used to make local beers. Therefore, there is great potential for further product diversification. Furthermore, the high nutritional quality and gluten-free characteristics of millet flour offer potential for export to Europe, the United States, and other markets where the demand for gluten-free products is increasing.20
2. OVERVIEW OF CURRENT TRADE FLOWS
Cereals make up a substantial percentage of total regional exports and imports between East African nations. The magnitude of this cross-border trade differs by country and commodity type. To illustrate trade flow levels and trends, we have used four-year data series from the ITC-TRADEMAP Database to derive average annual estimates for cross border trade based on available trade data.21
The table below presents an overview of the magnitude (trade value in US$) and breakdown of regional trade in the targeted cereals by country. Overall, there is huge deficit of rice across the region except for Tanzania which has a positive trade balance. For the case of sorghum and millet, only Tanzania and Uganda have positive trade balance. It should be noted that this data only represents trade conducted within the region. Furthermore, the data does not capture informal trade, which may underrepresent the magnitude of the product flowing across regional borders. A significant proportion of cross‐border intra-EAC trade is conducted informally and equates to approximately 40% of GDP in African countries.
TABLE 1. CROSS BORDER TRADE (FIVE-YEAR AVERAGE 2016-2019) – US$ 000”
Tanzania Kenya Uganda Rwanda Burundi Zambia Ethiopia Somalia S. Sudan Rice
Imports
2.4
1,359.0
17,821.0
6,997.2
1,653.8
23.0 - - -
Exports
27,663.6
27.8
139.8
1.8
0.4 NA - - - Trade Balance
27,661.2
(1,331.2)
(17,681.2)
(6,995.4)
(1,653.4) - - - -
Sorghum
Imports
529 1,615 1,247 4,906
92 0 NA 316 4,000
Exports
3,463
123
4,772
0
31 - NA - - Trade Balance
2,934
(1,492)
3,525
(4,906)
(61) - -
(316)
(4,000)
Millet
Imports
8
9,317
15
73
142 - - 7 147
Exports
809
153
8,587
-
7 - - - - Trade Balance
801
(9,164)
8,572
(73)
(135) - -
(7)
(147)
20 Integrated sorghum and millet sector for increased economic growth and improved livelihoods in Eastern and Central Africa
Proceedings of the ECARSAM Stakeholders Conference 20–22 November 2006, Dar es Salaam, Tanzania, 2012. 21 The linear correlation between trade volume and value is a justification for using trade value information (data) as a proxy for traded
volume.

Feed the Future Market Systems Assessment East Africa Market Systems Activity February 2021
9
Source: Computed from ITC-TRADEMAP Database
Analysis from FAOSTAT to compare total volume of trade (including intraregional trade) shows that, overall, the region is a net importer for cereals.
TABLE 2. TOTAL TRADE VOLUME (FIVE-YEAR AVERAGE 2016-2019) – IN TONS
Tanzania Kenya Uganda Rwanda Burundi Zambia Ethiopia Somalia S. Sudan
Rice
Imports
43,111.20 581,653 36,676 80,206 154 10,105 292,610 377,506 12,836
Exports
6,518.20 202 9,673 31,829 - 2,528 15 - 5 Surplus/ deficit (36,593.00) (581,451.20) (27,002.60) (48,376.80) (154.20) (7,577.00) (292,594.80) (377,505.80)
(12,831.20)
Sorghum
Imports 634 133,261 17,011 27,973 633 828 634.2 70,539 92,281
Exports 7,859 65,845 79,789 1,437 22 231 7,859 7 - Surplus/ deficit 7,224.60
(67,416.00) 62,777.80 (26,535.60) (611.40) (597.40) 7,224.40 (70,532.20)
(92,281.00)
Millet
Imports 55 27,899 45 224 32 6 1 - 103
Exports 1,704 58 7,651 - - 17 - 14 4 Surplus/ deficit 1,648.80
(27,840.40) 7,605.80 (223.60) (31.80) 11.20 (1.20) 14.40 (99.40)
Source: FAOSTAT
2.1. Cereal Trade Flows by Crop
Rice
Rice accounts for the bulk of regional cross-border trade for cereals covered under this study. Total value of imports from within the EAMS countries is estimated at around US$ 32 million per annum. Tanzania is the region’s biggest producer of rice– total production is estimated at 2,531,381 tons per annum, providing over 90% of the rice traded in the region. Uganda is the second largest producer at 2,531,381 tons per annum. Uganda is also the largest importer at US$ 20 million, followed by Rwanda at US$ 8 million.
FIGURE 4. MAIN IMPORTERS OF (BUYERS) FOR RICE IMPORTED WITHIN THE REGION (US000’)
Computed from TRADEMAP Data
FIGURE 5. MAIN EXPORTERS (SUPPLIERS) FOR RICE EXPORTED WITHIN THE REGION (US000’)
2,067 1,482
8,234
20
20,813
1 6 -
5,000
10,000
15,000
20,000
25,000
Burundi Kenya Rwanda Somalia Uganda Tanzania, Zambia
Feed the Future Market Systems Assessment East Africa Market Systems Activity February 2021
10
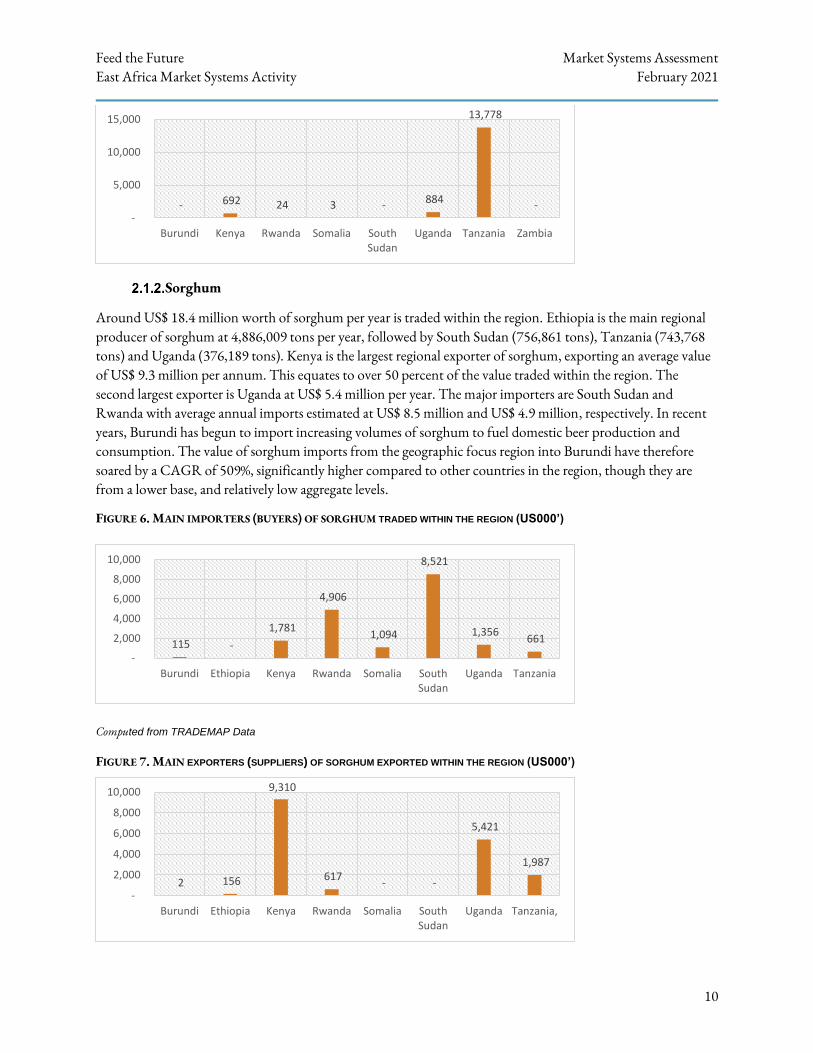
Sorghum
Around US$ 18.4 million worth of sorghum per year is traded within the region. Ethiopia is the main regional producer of sorghum at 4,886,009 tons per year, followed by South Sudan (756,861 tons), Tanzania (743,768 tons) and Uganda (376,189 tons). Kenya is the largest regional exporter of sorghum, exporting an average value of US$ 9.3 million per annum. This equates to over 50 percent of the value traded within the region. The second largest exporter is Uganda at US$ 5.4 million per year. The major importers are South Sudan and Rwanda with average annual imports estimated at US$ 8.5 million and US$ 4.9 million, respectively. In recent years, Burundi has begun to import increasing volumes of sorghum to fuel domestic beer production and consumption. The value of sorghum imports from the geographic focus region into Burundi have therefore soared by a CAGR of 509%, significantly higher compared to other countries in the region, though they are from a lower base, and relatively low aggregate levels.
FIGURE 6. MAIN IMPORTERS (BUYERS) OF SORGHUM TRADED WITHIN THE REGION (US000’)
Computed from TRADEMAP Data
FIGURE 7. MAIN EXPORTERS (SUPPLIERS) OF SORGHUM EXPORTED WITHIN THE REGION (US000’)
- 692 24 3 - 884
13,778
- -
5,000
10,000
15,000
Burundi Kenya Rwanda Somalia SouthSudan
Uganda Tanzania Zambia
115 -
1,781
4,906
1,094
8,521
1,356 661
-
2,000
4,000
6,000
8,000
10,000
Burundi Ethiopia Kenya Rwanda Somalia SouthSudan
Uganda Tanzania
2 156
9,310
617 - -
5,421
1,987
-
2,000
4,000
6,000
8,000
10,000
Burundi Ethiopia Kenya Rwanda Somalia SouthSudan
Uganda Tanzania,
Feed the Future Market Systems Assessment East Africa Market Systems Activity February 2021
11
Computed from TRADEMAP Data
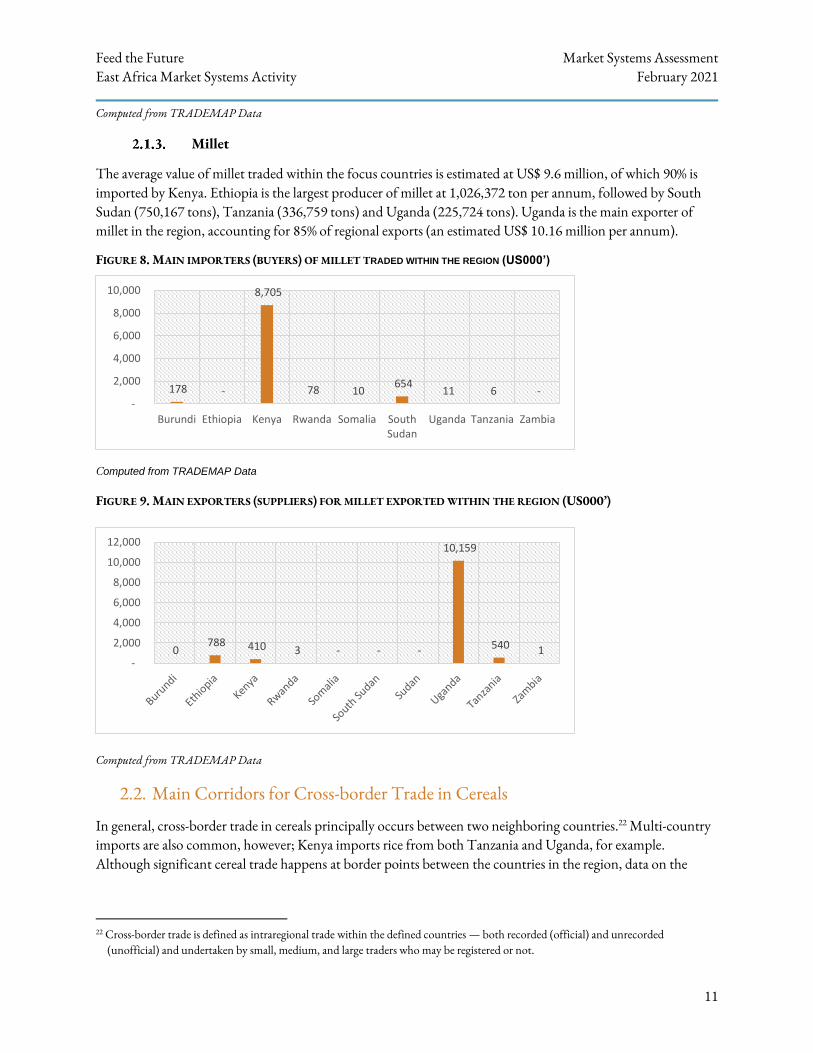
Millet
The average value of millet traded within the focus countries is estimated at US$ 9.6 million, of which 90% is imported by Kenya. Ethiopia is the largest producer of millet at 1,026,372 ton per annum, followed by South Sudan (750,167 tons), Tanzania (336,759 tons) and Uganda (225,724 tons). Uganda is the main exporter of millet in the region, accounting for 85% of regional exports (an estimated US$ 10.16 million per annum).
FIGURE 8. MAIN IMPORTERS (BUYERS) OF MILLET TRADED WITHIN THE REGION (US000’)
Computed from TRADEMAP Data
FIGURE 9. MAIN EXPORTERS (SUPPLIERS) FOR MILLET EXPORTED WITHIN THE REGION (US000’)
Computed from TRADEMAP Data
2.2. Main Corridors for Cross-border Trade in Cereals
In general, cross-border trade in cereals principally occurs between two neighboring countries.22 Multi-country imports are also common, however; Kenya imports rice from both Tanzania and Uganda, for example. Although significant cereal trade happens at border points between the countries in the region, data on the
22 Cross-border trade is defined as intraregional trade within the defined countries — both recorded (official) and unrecorded
(unofficial) and undertaken by small, medium, and large traders who may be registered or not.
178 -
8,705
78 10 654
11 6 - -
2,000
4,000
6,000
8,000
10,000
Burundi Ethiopia Kenya Rwanda Somalia SouthSudan
Uganda Tanzania Zambia
0 788 410 3 - - -
10,159
540 1 -
2,000
4,000
6,000
8,000
10,000
12,000
Feed the Future Market Systems Assessment East Africa Market Systems Activity February 2021
12
actual volumes traded between these points is scarce. The main trade corridors for cereals in the region are as follows:
Uganda – South Sudan Trade
Uganda is considered South Sudan’s main trading partner compared with other countries in the region. Virtually all cereals (rice, sorghum, and millet) are traded at these border points.23 Trade between South Sudan and Uganda has grown rapidly, albeit unevenly, over the past six years. The restoration of peace in South Sudan, coupled with improved security in northern Uganda, has led to significant increases in the amount of trade between the two countries. However, significant volumes of transactions are informal and cross the borders unrecorded. The trade is also highly asymmetric with the volume of exports from Uganda to South Sudan being disproportionately larger than the volume of exports from South Sudan to Uganda. Ugandan cereal exports to South Sudan totaled US$74.4 million during 2018.24
Uganda – Kenya Trade
The food security linkages between Kenya and Uganda are among the strongest in the region. Primary agricultural commodities (millet and sorghum) usually flow from Uganda to Kenya.25 Four major border points handle cross border trade in cereal commodities between Kenya and Uganda: Busia, Malaba, Suam, and Lwakhakha. A number of small ports along Lake Victoria also move foodstuffs in both directions. Food also moves across the northern sections of the border, although volumes are limited due to the sparse populations in these predominantly pastoral zones.
Tanzania – Kenya Trade
Agricultural trade between Kenya and Tanzania has historically been very strong. In recent years, Tanzania has made much progress in its infrastructure, which has widened the food sources available for the Kenyan market. The main border points between Kenya and Tanzania include Horohoro, Taveta, Rombo, Namanga, and Sirari. Foodstuffs move through each of these points, as well as across Lake Victoria. Out of the three target cereal crops, rice is the main product traded between these two countries.
Tanzania – Uganda Trade
Both sides of the border between Uganda and Tanzania have similar and favorable agro-climatic conditions, conducive for ample food production with surpluses exported to Kenya and Rwanda. There is limited trade within the border areas. Agricultural trade between Uganda and Tanzania is low compared to trade between Tanzania and Kenya, Zambia, Rwanda, Burundi, DRC, and Malawi. The main border point between Tanzania and Uganda is at Mutukula, but goods are also shipped across Lake Victoria from Bukoba in Tanzania. Rice is the primary cereal product traded between Tanzania and Uganda. Rice imported from Tanzania remains the largest commodity traded between the two countries, mostly informally. It should be noted that most of the Tanzanian rice imported to Uganda is re-exported to South Sudan where demand continues to grow as result of relative calm.
23 African Development Bank: South Sudan: A Study on Competitiveness and Cross Border Trade with Neighbouring Countries, 2013.
24 UN-COMTRADE database 25 Kenya’s major agricultural exports to Uganda are not primary commodities, but value-added processed goods, such as wheat flour,
cooking oil and sugar.
Feed the Future Market Systems Assessment East Africa Market Systems Activity February 2021
13
Tanzania – Zambia Trade
Rice is the major cereal traded between Zambia and Tanzania, mainly through the Tunduma border post. The flow of rice is mainly from Tanzania to Zambia, since rice volumes produced in Zambia are relatively low. It should also be noted that Zambia does not trade most of its rice with Tanzania but rather with DRC (outside the scope of this study).
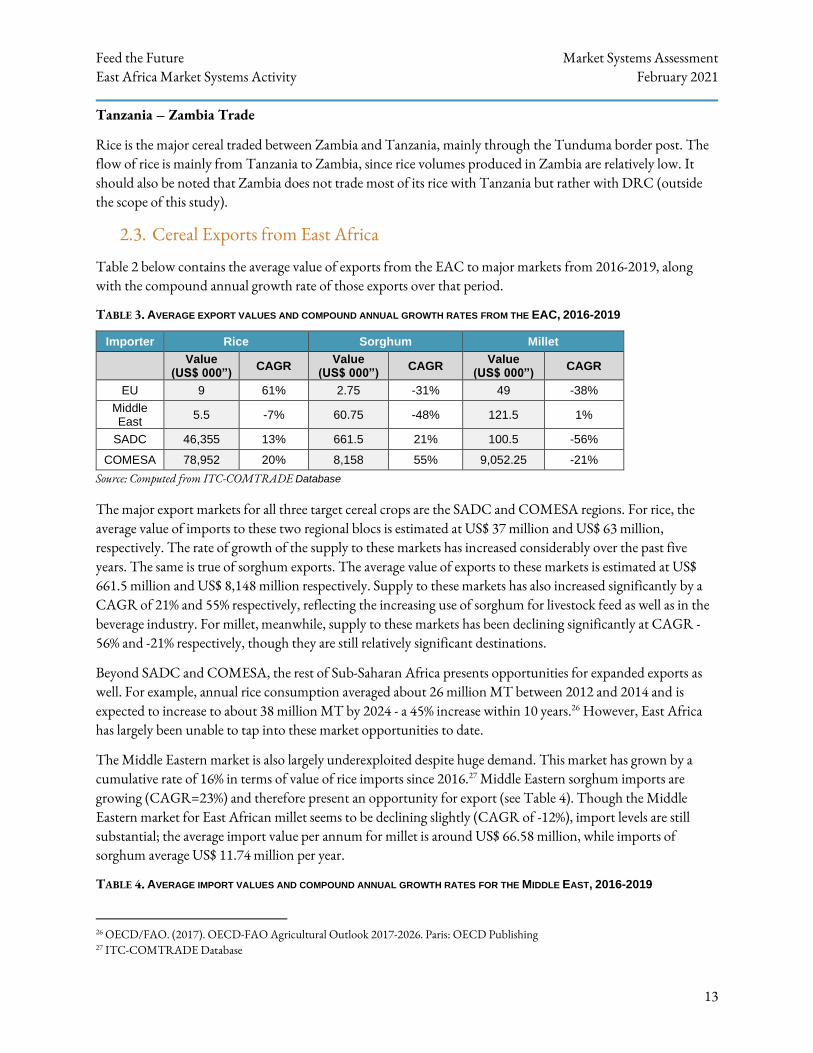
2.3. Cereal Exports from East Africa
Table 2 below contains the average value of exports from the EAC to major markets from 2016-2019, along with the compound annual growth rate of those exports over that period.
TABLE 3. AVERAGE EXPORT VALUES AND COMPOUND ANNUAL GROWTH RATES FROM THE EAC, 2016-2019
Importer Rice Sorghum Millet
Value
(US$ 000”) CAGR
Value (US$ 000”)
CAGR Value
(US$ 000”) CAGR
EU 9 61% 2.75 -31% 49 -38%
Middle East
5.5 -7% 60.75 -48% 121.5 1%
SADC 46,355 13% 661.5 21% 100.5 -56%
COMESA 78,952 20% 8,158 55% 9,052.25 -21%
Source: Computed from ITC-COMTRADE Database
The major export markets for all three target cereal crops are the SADC and COMESA regions. For rice, the average value of imports to these two regional blocs is estimated at US$ 37 million and US$ 63 million, respectively. The rate of growth of the supply to these markets has increased considerably over the past five years. The same is true of sorghum exports. The average value of exports to these markets is estimated at US$ 661.5 million and US$ 8,148 million respectively. Supply to these markets has also increased significantly by a CAGR of 21% and 55% respectively, reflecting the increasing use of sorghum for livestock feed as well as in the beverage industry. For millet, meanwhile, supply to these markets has been declining significantly at CAGR -56% and -21% respectively, though they are still relatively significant destinations.
Beyond SADC and COMESA, the rest of Sub-Saharan Africa presents opportunities for expanded exports as well. For example, annual rice consumption averaged about 26 million MT between 2012 and 2014 and is expected to increase to about 38 million MT by 2024 - a 45% increase within 10 years.26 However, East Africa has largely been unable to tap into these market opportunities to date.
The Middle Eastern market is also largely underexploited despite huge demand. This market has grown by a cumulative rate of 16% in terms of value of rice imports since 2016.27 Middle Eastern sorghum imports are growing (CAGR=23%) and therefore present an opportunity for export (see Table 4). Though the Middle Eastern market for East African millet seems to be declining slightly (CAGR of -12%), import levels are still substantial; the average import value per annum for millet is around US$ 66.58 million, while imports of sorghum average US$ 11.74 million per year.
TABLE 4. AVERAGE IMPORT VALUES AND COMPOUND ANNUAL GROWTH RATES FOR THE MIDDLE EAST, 2016-2019
26 OECD/FAO. (2017). OECD-FAO Agricultural Outlook 2017-2026. Paris: OECD Publishing 27 ITC-COMTRADE Database
Feed the Future Market Systems Assessment East Africa Market Systems Activity February 2021
14
Crop Import Value (US$ 000”)
CAGR
Sorghum 11,738 23%
Millet 66,577 -12%
3. REGIONAL GROWTH POTENTIAL
Demand for cereals and cereal-derived products from processors and consumers will continue to grow across the region over the coming years due to a variety of factors, presenting a substantial opportunity for increased trade flows within the region. Increasing the availability of cereals and cereal products to meet this demand will be key to boosting regional trade and integration. Several of the key drivers of regional growth potential are outlined below.
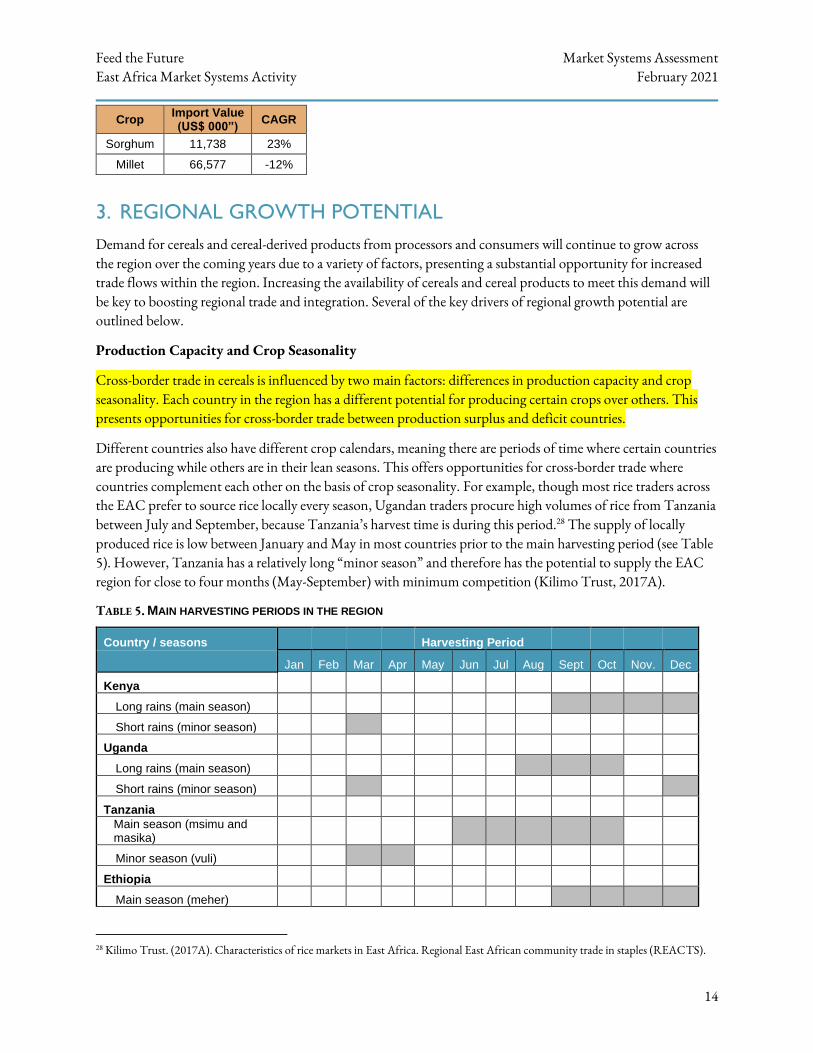
Production Capacity and Crop Seasonality
Cross-border trade in cereals is influenced by two main factors: differences in production capacity and crop seasonality. Each country in the region has a different potential for producing certain crops over others. This presents opportunities for cross-border trade between production surplus and deficit countries.
Different countries also have different crop calendars, meaning there are periods of time where certain countries are producing while others are in their lean seasons. This offers opportunities for cross-border trade where countries complement each other on the basis of crop seasonality. For example, though most rice traders across the EAC prefer to source rice locally every season, Ugandan traders procure high volumes of rice from Tanzania between July and September, because Tanzania’s harvest time is during this period.28 The supply of locally produced rice is low between January and May in most countries prior to the main harvesting period (see Table 5). However, Tanzania has a relatively long “minor season” and therefore has the potential to supply the EAC region for close to four months (May-September) with minimum competition (Kilimo Trust, 2017A).
TABLE 5. MAIN HARVESTING PERIODS IN THE REGION
Country / seasons Harvesting Period
Jan Feb Mar Apr May Jun Jul Aug Sept Oct Nov. Dec
Kenya
Long rains (main season)
Short rains (minor season)
Uganda
Long rains (main season)
Short rains (minor season)
Tanzania
Main season (msimu and masika)
Minor season (vuli)
Ethiopia
Main season (meher)
28 Kilimo Trust. (2017A). Characteristics of rice markets in East Africa. Regional East African community trade in staples (REACTS).
Feed the Future Market Systems Assessment East Africa Market Systems Activity February 2021
15
Minor season (belg)
Somalia
Main season (gu)
Minor season (deyr)
Rwanda
Long rains (Season B)
Short rains (Season A)
South Sudan
Long rains (main season)
Short rains (minor season)
Source: FAO (production data); FEWS NET (surplus/deficit data)
Population – Growing Market Size
East Africa’s large and expanding population will drive consumption of cereals and, by extension, intraregional trade.29,30 Growing population can be taken as a proxy for market size, on the assumption that consumer demand for cereals is driven primarily by population growth, as most families consume cereals in their daily meals due to their affordable nature. Between 2020 and 2025, the combined population in the region will grow at a rate of about 3% per year, from 334 million to 398 million. Meeting this growing demand presents a key business opportunity for the industry, particularly through intraregional trade.
Population growth will be a particularly strong driver in the region’s dryland areas, giving rise to rapidly increasing demand for food, especially sorghum and millet, which are key cereal crops in those areas.31 As climate change causes the region to become hotter and drier over time, millet and sorghum will become increasingly suited for production in areas where other crops are now grown, further increasing demand. However, rice production will likely suffer in the region under these scenarios.
Increased Urbanization
The rate of urbanization in the EA region has accelerated since the turn of the century, increasing from 17.7% in 2000 to 26.7% in 2020. The combined urban population of the target countries is expected to grow substantially from 2020 to 2050, from 26.7 million to 42.5 million (a CAGR of 19%).32 As urbanization proceeds, market demand for cereals will grow. In absolute terms, the urban population in the region offers a sizeable market for growers of rice, sorghum, and millet. Urbanization goes hand-in-hand with changes in consumption patterns and increased demand for value-added products, including processed foods.
For example, the growing demand for millet porridge in Kenya far exceeds local supply. Kenyan processors regularly search for millet suppliers in neighboring Tanzania and Uganda. This has stimulated increased investment by agro-processors supplying this and related products to supermarkets and other retail outlets.
29 Based on the latest United Nations estimates, Eastern Africa ranks number one (1) in Africa among subregions ranked by Population.
The population density in Eastern Africa is 67 per Km2 (173 people per mi2). Eastern Africa population is equivalent to 5.71% of the total world population.
30 Global urban population is growing at an alarming rate. Between 2014 and 2050, the global urban population is expected to grow by 2.5 billion people. This situation is also reflected in the Eastern Africa where Compounded Annual Growth rate is estimated at 19% between 2000 and 2050.
31 -ibid- 32 EAC/UNIDO, Baseline Study of Urban Sustainability in the East African Community, 2018

Feed the Future Market Systems Assessment East Africa Market Systems Activity February 2021
16
Similarly, increasing demand for cereals from brewing companies, particularly for sorghum, has strong potential to boost cross-border trade between production surplus and production deficit countries.
Strong and Growing Economies
Continuous economic growth in East African countries and rising per capita incomes will raise the spending capabilities of individuals and increase demand for consumer products including cereals.33 With an average economic growth rate of 6.7% between 2013 and 2017 – double the African average – East Africa is one of the fastest growing regions in the world. This strong performance is underpinned by notable improvements in agricultural production and sustained infrastructure investment.34 Rising disposable income levels will drive individuals to purchase more cereals and cereal-derived products, which in turn, will positively influence the local market and intraregional trade growth for these products.
As incomes rise, diets change and the demand for livestock products (i.e., meat, milk) increases. This growing demand is increasing the market value of both rice by-products and sorghum and millet residues. Crop residues (stover) from sorghum and millet as well as grains are vital feed stocks for cattle, goats and chickens, and rice bran is a sought-after component of livestock, poultry, pig, and fish feed. Pearl millet grain is also a valuable animal feed, comparable to maize for poultry, but with a higher protein content and a better-balanced amino acid profile, so that less protein concentrate is required in a pearl millet-based feed ration.
Rising incomes will also drive demand for specialty products such as health foods made from cereals. There has been a growing realization of the health benefits of sorghum and millet. For example, several small (and to some extent medium) processors have formulated blending recipes for composite flour from sorghum and millet as well as wheat, to take advantage of the high nutritional content of millet. As awareness and importance of healthy diets increases among the growing middle class, it will trigger increased demand and promote cross-border trade.
High Degree of Specialization for Actors
There is a significant degree of specialization among actors involved in the trading of cereals. For example, sorghum buyers for brewing purposes require only the “white” variety, while the “red” variety is more demanded for school feeding programs, particularly in Kenya. Traders will be increasingly looking for specialized varieties instead of the “generic” product. This is expected to drive future investments in the value chain, particularly in terms of service provision support, marketing strategies, technology, and innovation. This means that cross-border trade in these value chains will increasingly be of both a more varied and more specialized nature.
Services Opportunities
As the value chain continues to mature towards sophisticated commercial level operations, there will be increased prospects for linking the cereal sector to the service industry. Industry stakeholders should begin to factor this into their investment decisions and operations and make necessary adjustments. Relatively little attention has been paid to the role of services in value chains, and the barriers that exist to accessing or
33 For example, following a strong growth that lifted the average income of the people to the levels of the group, Tanzania has joined the
ranks of Middle-Income Countries (MIC) eight years ahead of schedule. The GDP per Capita in Tanzania is equivalent to 8 percent of the world's average.
34 UNECA, 2018.
Feed the Future Market Systems Assessment East Africa Market Systems Activity February 2021
17
importing these services despite emphasis on industrialization as an engine to drive national economies. Likewise, the increasing contribution of knowledge services, such as research and development, in industrial value chains is often neglected.
Access to service inputs in the cereal sector in the region is therefore critical to promote future growth and competitiveness. Services such as information and communications technology (ICT), transport and logistics will become increasingly important. Companies that are unable to access well-priced and good quality services domestically, or imported from abroad, will find it difficult to participate in regional or global value chains. Any barriers to services trade could pose a significant constraint on the emergence of a robust cereal value chain in the region.
Establishment of One-Stop Border Post (OSBP) system
With the establishment of One-Stop Border Posts (OSBP) between EAC partner states, there will be greater prospects for improved formal cross-border EAC trade for cereal products. As part of ongoing efforts to promote free trade, the EAC has made significant efforts to provide guidance on the rules and regulations for conducting cross-border trade. For example, the EAC and the ILO have developed a comprehensive information pack (Simplified Guide/Tool) containing up-to-date and relevant information on the existing policies, procedures, requirements, rules of origin, taxes, tariffs, exemptions, and facilities available to cross-border traders, to facilitate trade within the region. This guide provides information on key EAC trade rules, regulations and procedures related to trade within the EAC (intra-EAC trade) in a simplified and user-friendly manner.
Further prospects for improvement of cross-border trade are expected to derive from recent changes to EAC export regimes. For example, in June 2018, the EAC rolled out a new export regime that seeks to establish a Single Customs Territory (SCT). As a result, exporters in the EAC have started to enjoy faster transit times because these commodities are being cleared under the SCT.35 The new regime seeks to minimize delays and costs for goods moving across borders to export markets by having them cleared at the point of origin. This helps avoid further customs checks at border points and during loading for overseas shipping.
4. CONSTRAINTS ANALYSIS
This section examines the major constraints causing continued inefficiencies for intraregional trade in cereals, highlighting common constraints across EAMS countries where cross-border trade in cereals products is relatively significant.
4.1. Production Systems
The risks and vulnerabilities of climate change are now noticeable in many countries in EA; for example, in Uganda there was a recorded 40 -55% reduction in cumulative rains for the October-December 2016 rainy season, which had a significant effect on crop yields.36 It has been argued that potential gains for sorghum and millet are as large as those derived from the Green Revolution in rice and wheat, and realizing even a modest portion of that potential would be transformative in the impoverished areas that are traditionally reserved for
35 This is part of the implementation of a directive of the 19th East African Community Summit in February 2018, which requires the
Single Customs Territory regime to cover all products. 36 -ibid-
Feed the Future Market Systems Assessment East Africa Market Systems Activity February 2021
18
sorghum and millet production.37 This would require increased access to productive resources such as land, improved infrastructure (e.g., irrigation systems relevant for small scale agriculture, seeds, fertilizers and agrochemicals) and other supportive services such as extension services, finance, etc.
Low Yields
Sorghum and millet remain low-yielding food grains due to low and irregular rainfalls, high temperatures, poor soils, and inappropriate agronomic practices.38 Even in favorable seasons, average yields are lower than the average yield for maize. Average productivity estimates for sorghum and millet in the region are about 800 kg/ha compared to those found in other parts of the world (1200 kg/ha in Asia, 4000 kg/ha in America, and 5000 kg/ha in Europe).39 Although sorghum and millet are more tolerant to drought, their productivity is low when they do not receive enough water. Additionally, the rice ecologies are prone to drought, especially upland rice farming areas, where the poorest rice farmers are located. The lowland rice ecologies also have challenges of water control and weed management.40
None of the EAC countries is self-sufficient in rice production and deficits are covered through imports. Rice imports mainly from Asia (Thailand, India, Pakistan, and Vietnam) have tripled over the last ten years to meet rice demands in the EAC. This clearly shows a gap in the local production of rice which can be attributed to: (1) small scale of operations by the majority of producers who cultivate farms of less than a hectare, (2) inadequate access to inputs and improved varieties, and (3) limited access to markets which reduces smallholders’ appetite for “farming as a business” (i.e., taking risks with productivity-enhancing inputs and other good agricultural practices).
Post-Harvest Loss
One of key challenges that exacerbates food insecurity and stifles efforts for commercialisation of sorghum and millet in the region is postharvest losses (PHL). According to estimates by the African Postharvest Losses Information System (APHLIS), the average percentage of PHL losses for rice, sorghum and millet are estimated at around 12.6%, 12%, and 9% respectively. The major causes of post-harvest losses are high crop perishability; mechanical damage; excessive exposure to high ambient temperature, relative humidity and rain; contamination by spoilage fungal and bacteria; invasion by birds, rodents, insects and other pests; and inappropriate handling, storage and processing techniques. Losses may be aggravated by poor infrastructure, harvesting methods, post-harvest handling procedures, distribution, sales and marketing policies. The economic importance of the factors leading to high post-harvest losses varies from commodity to commodity, season to season, and the enormous diversity of circumstances under which commodities are grown, harvested, stored, processed and marketed.
There are a number of other “indirect” factors which contributes to high incidences of PHL for cereals in the region. For example, information is not readily available on post-harvest grain quality management. Potential low-cost technologies and interventions for post-harvest losses have not been adequately identified. Weak linkages between farmers and processors also exacerbate the challenge of post-harvest loss. The combination of
37 -ibid- 38 ICRISAT 2015, 39 FAO, 1994 40 Seck, P. A., Tollens, E., Wopereis, M. C., Diagne, A., & Bamba, I. (2010). Rising trends and variability of prices: Threats and
opportunities for Sub-Saharan Africa. Food Policy, 403-411.
Feed the Future Market Systems Assessment East Africa Market Systems Activity February 2021
19
these constraints leads to reduced productivity; as a result, farmers are not interested in expanding or commercializing millet cultivation, preferring to grow the crop on small plots for household consumption.
Prevalence of Pests and Diseases
Cereal VCs are impacted by a variety of biological threats that affect plant health and harvest that vary across VCs and along the stages of each VC (from production to post-harvest). These biological threats include:
• Pests. The prevalence of pests in the region is a major constraint to cross-border trade in cereals. Pests in the field threaten quantities of raw commodities harvested, while pests in storage damage quality and increase postharvest losses. Insect pest infestations also spread across borders, devastating harvest seasons if not dealt with swiftly through cross-border coordination. Specific pests impacting each cereal VC are summarized below:
o Sorghum: The main insect pests for sorghum in order of economic importance are midge, shoot fly, stem borers, and the cotton bollworm.41
o Millet: About a hundred insect pests attack millet in the field and during storage, some of which are common throughout the millet growing areas. Stem borers and grain midge are of regular occurrence. Sporadic attacks of blister beetles, armyworms, grasshoppers, chinch bugs, leaf beetles, head caterpillars and head bugs result in severe yield losses in certain seasons. There are higher incidences of storage pests during the rainy season.
o Rice: Though rice is not as susceptible to insect pests as other crops, snails and worms can impact plant health. Crop damage by quelaquela birds is a constant, serious threat to the crop, and rodents are a notable pest particularly in Uganda.
o Desert locust: Swarms of desert locusts, which can emerge in periods of heavy rains, devasted cereal crops (including rice, millet, and sorghum) across East Africa and the Horn of Africa in 2020. Locust swarms cover vast grounds in short periods of time and are difficult to control, making them a formidable transboundary pest. Effects of climate change and extreme weather will continue to increase the frequency of locust plagues (i.e., infestations that affect multiple countries simultaneously), making multilateral coordination critical for swift action. In early 2021, locusts have already damaged significant crops in Ethiopia, Somalia, and Kenya, though quick action seems to have quelled breeding, heavy rains in February could lead to new hatchings in late March.
• Diseases. The most common diseases for sorghum are caused by fungus: anthracnose (colletotrichum graminicola);42 charcoal rot (macrophomina phaseolina);43 gray leaf spot (cercospora sorghi); and rough
41 ICRISAT, Pests of African Sorghum. 42 Small, circular red lesions with a distinct margin develop on leaves and stems; lesions may enlarge during humid weather conditions;
plant becomes defoliated; tan spots with red margins may appear on upper parts of stems; plants may die before reaching maturity 43 Lower stalk appears shredded and dark gray; small, black fungal structures on internal parts of the stalk giving tissues a dark gray color;
pith decomposes leaving only the outer stem tissue; infected plants will usually lodge
Feed the Future Market Systems Assessment East Africa Market Systems Activity February 2021
20
spot (ascochyta sorghi).44 Other fungi diseases include covered kernel smut (sporisorium sorghi)45 and zonate leaf spot (gloeocercospora sorghi).
Millet is also affected by fungal diseases including leaf spot (cercospora penniseti);46 downy mildew (sclerospora graminicola);47 rust (puccinia substriata);48 and seedling and leaf blight (helminthosporium nodulosum).49 Millet blast disease is by far the most devastating, causing over 50% yield loss.50
Rice is also susceptible to diseases, particularly the rice yellow mottle virus and rice blast fungus. Rice blast is the most significant, sometimes causing more than 30% yield reductions; it affects 54% of the cultivated rice area in Uganda with severities recorded in the main rice-producing districts of Bugiri, Butaleja, Mbale and Lira.51
• Parasitic weeds. There are various types of parasitic weeds that affect cereal VCs, ultimately feeding on and strangling host plants for nutrients and water. They pose a significant threat to rain-fed production, and given their genetic and biochemical characteristics, they are difficult to control or eradicate as they are resistant to traditional weed control practices. The most common weeds are striga asiatica, s. aspera, and s. hermonthica in rain-fed uplands, and rhamphicarpa fistulosa in rain-fed lowlands. The known hot spots for parasitic weed infestation in rice are in southern Tanzania (i.e., all three types of common weeds), eastern Uganda (striga asiatica), and western Kenya. Parasitic weeds have been reported to have cause up to 59% and 61% rice yield losses in Kenya and Tanzania, and yet the locations of highest frequency of these occurrences have been in areas populated by some of the most vulnerable rice farmers. The physical losses caused by parasitic weeds in 2016 were estimated at 20,000 MT (8.1 million USD) and 17,000 MT (6.81 million USD) in Tanzania and Uganda respectively.52
• Aflatoxins are common challenges for cereals in East Africa, though the levels of aflatoxins and their significance as a constraint to cross-border trade varies by cereal VC.53 Aflatoxin-contaminated food is
44 Small, oval or elongated red spots on leaves; lesions coalesce and develop hard black fungal fruiting bodies, giving the leaves a
sandpaper-like texture; rough areas may become large enough to kill entire leaf 45 Head replaced by brown, powdery mass of fungal spores covered by gray to brown membrane; entire head may be affected or fungus
may be localized at the top, bottom or sides of the head; plants are usually or normal height 46 Small dark lesions on leaves which are usually oval in shape but may be oblong to rectangular; centers of lesions are gray to tan in color
with visible black dots; lesions may be covered in spores during wet weather; lesions may also be present on the stems and are slightly longer than those on the leaves
47 Chlorosis of leaves beginning at base of the infected leaf beginning lower down on the plant and progressing upwards; downy white to gray fungal growth on undersides of leaves; brown, necrotic leaves; distinct margin between diseased leaf tissue at base of leaf and healthy tissue towards tip
48 Small yellow or white raised spots on upper and lower leaf surfaces; spots tend to be more numerous on lower leaf surface; spots enlarge and develop into red-brown pustules which may be surrounded by a yellow halo
49 Disease occurs in India, Japan and Africa; fungus attacks other millet species; disease spread through infected seed 50 Esele JP. 1989. Cropping systems, production technology, pests and diseases of millet in Uganda in Small Millets in Global Agriculture
(Seetharam A, Riley KW and Harinarayana G, eds.). Ottawa, Canada: IDRC. 51 Onaga, G., & Asea, G. (2016). Occurance of rice blast (Magnaporthe oryzae) and identification of potential resistance sources in
Uganda. Crop protection, 65-72. 52 Rodenburg, J., Demont, M., Zwart, S. J., & Bastiaans, L. (2016). Parasitic weed incidence and related economic losses in rice in Africa.
Agriculture, Ecosystems and Environment, 235, 306-317. 53 Aflatoxin is a toxic metabolite of certain molds in the genus Aspergillus. Aflatoxins are highly resistant to processing. In animal feed
aflatoxins have a significant effect on livestock productivity and contamination can be transferred up the food chain to humans particularly through milk.
Feed the Future Market Systems Assessment East Africa Market Systems Activity February 2021
21
a public health concern. For example, contamination of staple foods in Kenya has in the past led to loss of human lives as well as condemnation of large quantities of food, contributing to food insecurity. Aflatoxin-related cases have been reported in several countries in the region. For example, a study conducted in four (4) agro-ecological zones in Kenya concluded that overall, 76% of maize, 64% of millet and 60% of sorghum samples tested positive for aflatoxin B1. Of these, the proportion of samples with aflatoxin B1 levels above the Kenya Bureau of Standards limit of five parts per billion was 26% for maize, 10% for millet, and 11% for sorghum.54
4.2. Market Access and Market information
Low, Irregular Supply and Poor Grain Quality
Despite growing demand from agro-processors, traders, and other end buyers, many producers are unable to meet the necessary market standards and production targets to enter into structured supplier contracts with such buyers. Low and variable production and the lack of an efficient marketing chain increases processors’ cost of production, thus reducing profits. There are also cases where grain delivered to processors is usually of poor quality. There are number of instances where grain is contaminated by foreign matter (stones, dust, sand, husk etc). High moisture content caused by poor drying and or poor storage results in high moisture content and spoilage. Quality is also affected by immature grain because the crop is sometimes harvested too early.
A small number of medium and large-scale mills have been built over the last 5-10 years that operate higher quality processing machines –with de-stoners, polishers, and graders – and brand their output. To ensure the quantities and quality of supply, the millers have increasingly vertically integrated trading operations, proactively purchasing paddy directly from farmers or small traders and selling milled rice to traders. A few millers own their distribution networks with transporters, wholesalers, and retail operations in urban centers. The density of commercial processors is greatest where there are more commercially orientated smallholders. These schemes are not widespread yet, and tend to be unsophisticated, save a few exceptions, and the number of smallholders engaged in this way per scheme is low, ranging from under 100 to 1,500.55
Market Infrastructure
Market infrastructure is critical to enhance market access, reduce post-harvest losses, and promote integration between growers, wholesalers, and retailers. Access to adequate storage facilities is the most important market infrastructure for cereals to prevent quality deterioration and to make calculated marketing decisions. Without access to appropriate storage and fumigation, both farmers and traders are unable to store cereals until the pries in markets have improved. Inadequate storage leads to high physical losses due to pests and rodents, while quality deterioration is caused by humidity.
Market infrastructure (storage warehouses, collection and aggregation points) can also facilitate mass marketing and provision of other supply chain services. While lacking in East Africa, these kinds of infrastructure could provide “embedded” services: product distribution; storage; grading, sorting, and proper integration of post-harvest technology into marketing supply-chain. Furthermore, the infrastructure arrangement does not promote a transparent and efficient platform for sale and purchase of produce by connecting growers through
54 African Journal for Food and Agriculture, Nutrition and Development, Vol. 20 No. 4 (2020) 55 Kilimo Trust, Expanding Rice Markets in the EAC, 2017
Feed the Future Market Systems Assessment East Africa Market Systems Activity February 2021
22
growers’ associations with wholesale buyers in various markets across the countries and the region. As such, they do not provide incentives for improved quality and productivity, thereby improving farmers’ income.
Additionally, the success of warehouse financing is dependent on the availability of infrastructure to facilitate the storage of grain for use as collateral. However, across East Africa, there is a need for increased certified warehouses equipped with the monitoring systems needed to guarantee minimum quality requirements. The high costs incurred in establishing and operating warehouses, coupled with low volumes from small-scale traders, makes it difficult to attain the economies of scale needed to make warehouse operations commercially viable, and thus attract private investment.56
To improve structured cereals trade in the region and market access, commodity exchanges have been set up in Ethiopia, Rwanda, Tanzania, and Zambia. However, challenges for cereals trade on these exchanges include: (i) existence of registered and licensed warehouses able to effectively manage warehouse receipt systems, certify and guarantee commodity quantity and quality, and with oversight by Warehouse Regulatory Authorities, (ii) policies that enable enforcement and compliance with national and regional standards for agricultural commodities across value chains, (iii) existence of an enabling legal and regulatory framework governing these commodity exchanges (with regulatory oversight and supervision being done mainly through Capital Markets Authorities in the different countries), (iv) effective engagement of the financial services industry to support the clearing of payment systems and providing different financing solutions to those engaged in trade on the exchange, (vi) acquisition of the right technology systems for trade platform management, and (v) availability of willing buyers (off-takers), with enough financial resources and wider off-take opportunities. For example, the Uganda Commodity Exchange has struggled with generating sufficient commodity volumes to sustain its operational costs, forcing it to function only as a regulator on behalf of the Ugandan government.57
Marketing Coordination
The marketing of cereals is characterized by long and inefficient marketing chains that lack formal, organized market structures and have numerous middlemen. Producers lack market information and market access - simultaneously, buyers lack information on crop availability, quality and price. Additionally, the growing sophistication of consumers means that cereal buyers are increasingly becoming more specific on the products they purchase. In most cases, producers are not necessarily aware of these standards, and even if they are, it is difficult to meet the volumes and quality required. Also, smallholder farmers find it difficult to implement standards because cost of compliance can be prohibitive. Furthermore, institutions responsible for quality control are not sufficiently equipped in terms of personnel, technical and even financial resources, which brings inefficiencies in the marketing system.
Marketing through rural producer organizations (POs) capitalizes on economies of scale and can be a means to overcome constraints faced by individual small-scale farmers. Through POs, higher food-quality and safety standards can be better met if farmers make joint investments and are willing to exercise mutual control and ban free-rider behavior. Bargaining power vis-à-vis input suppliers, traders and retailers can be more effective and POs are also the basis for gradually improving the share of the farmers in value addition.58 POs can also be used a vehicle for channeling essential services needed by small scale farmers. Contract farming could also give
56 ATPAF. 2016. "Towards Creating an Enabling Environment for Grain Trade in Africa: Technology, Investment, Information, Policy
and Services." link 57 IACO. 2015. An Overview of Commodity Exchanges in Africa. link 58 SNV-Netherlands Development Organisation: Producer Organisations: Going into Business with Formal Markets, 2016.
Feed the Future Market Systems Assessment East Africa Market Systems Activity February 2021
23
processors the leverage for quality products and timely supply especially if processors undertake regular inspection of producers’ facility and field level performance of the crops.
Despite the prevalence of POs in staple crops throughout the region, sorghum and millet producers are not well organized, which constrains their integration into more commercial supply chains. At present, the rice VC has multi-layered marketing channels without any significant vertical coordination between key actors. This makes it difficult to bring together farmers either through cooperatives, contract farming systems and retail chains and ultimately facilitate better delivery of output; reduce market risks; attract more investment; and/ or acquire better extension services. Without stronger linkages between markets and producers, farmers are not incentivized to invest in upgrading their production and post-harvest techniques.
One of the major challenges in the millet value chain is that actors work independently without deliberate attempts to form strategic partnerships. Where they do, they are short term—temporary and not binding. In such circumstances, there are losses in efficient information exchange, economies of scale and decreased competitiveness. Usually, partnerships across the market participants—farmer and trader, trader and transporter and wholesaler and retailer listed above—are weak, largely informal, and do not create sustainable market access. One also finds that these partnerships tend to be firmer as one climbs the marketing chain: very weak at the farm level and stronger as one climbs higher up the marketing chain. Partnerships help create market links that are necessary and key to increasing production because they provide a powerful incentive for smallholder farmers to invest in productivity-enhancing technologies.
Price Competitiveness
A major constraint to sorghum and millet grain marketing is the low and variable producer price, which fluctuates between and within markets depending on progression of the marketing season and in reaction to lower yields. Prices are lowest immediately after harvesting and can peak during lean season periods. Lower yields for sorghum and millet translate into higher prices (particularly for millet) compared to maize and imported wheat, which makes them uncompetitive as a source of animal feed and meal. These prices do not support production of these commodities as a reliable source of income. The lower price of maize and the preference for imported wheat among higher-income consumers mean that the growth in urban markets has not resulted in a proportionate growth in demand for sorghum and millet.59
According to a study conducted by Kilimo Trust,60 affordability was identified by most rice consumers as ‘important’ or ‘very important’. For 84% of consumers in Tanzania and Uganda, and 90% in Kenya, economic factors largely dictate how much rice urban consumers buy, placing it above quality and taste. The farm gate price for paddy depends on demand and supply, quality, and market information available to the farmers and traders. However, the cost of production of rice is much higher in the EAC in comparison to Vietnam, Thailand or Pakistan, where most rice imports are sourced. This makes locally produced rice uncompetitive. For example, farm-gate prices of paddy in the EAC range from US$ 455/MT in Morogoro, Tanzania to as high as US$ 700/MT in Kenya. Such prices are often double the prices of paddy in the Asian countries that are exporting rice to the EAC, for example, US$ 175/MT in Bangladesh, US$ 169/MT in India, and US$ 371/MT China61.
59 ICRISAT, Value Chains for Sorghum and Millets in Eastern and Southern Africa: Priorities for the CGIAR research program for
Dryland Cereals, Series Paper Number 42, 2017 60 Kilimo Trust, 2016, Expanding Rice Markets in The East African Community 61 -ibid-
Feed the Future Market Systems Assessment East Africa Market Systems Activity February 2021
24
In addition, there are concerns among stakeholders, particularly traders, that the margins for cereals traded across the regional borders are too small. The huge transportation costs, and unnecessary delays at the border posts erodes the profit margins considerably. The disincentives have forced both producers to prefer trading more locally or requiring export traders to buy ex-warehouse.
Market Information
There are a number of market information systems (MIS) and platforms in the region, driven by the rise in accessibility of internet-based applications and mobile phones. In most of these MIS, market prices have been integrated with other mobile agriculture information tools to provide additional information or services, including agricultural extension advice, input price information, weather forecasts, and trading platforms to match producers with buyers. These systems tended to be created and led by the private sector, farmers’ or traders’ associations, and donors, rather than governments, and they attempt to achieve financial sustainability by charging user fees, permitting advertising and/or providing fee-based additional services. Examples include Esoko (based in Ghana and now active in 16 countries), Infotrade (Uganda) and the Regional Agriculture Trade Intelligence Network or RATIN (based in Kenya but operating throughout East Africa). Most of the systems which were reviewed collect data using enumerators who observe prices in public marketplaces and report those prices via mobile phone.
There are a number of challenges/gaps in the existing MIS. Market information within the cereal sector is not well integrated with other information systems – public and private. The lack of information is particularly prevalent among SMEs. Except for some medium and large companies who have the financial means to undertake their own research, many SMEs lack tailored and targeted market information on opportunities for cereal trade and investment potential. This limitation means that many of these SMEs often lack the confidence to test new regional markets, perceiving entry into these as too risky or too costly. A lot of the support that is available to SMEs is often of a general nature (for example, sensitization on the Common Market Protocol and its provisions); is often poorly targeted and sometimes poor value for money (for example taking companies to general trade fairs, general training on standards and / or export requirements).
This lack of information about opportunities in other countries also means that there is lack of synergies across the region, where companies may collaborate, perhaps to specialize, or build main supply routes to meet demand. The rapid growth of demand for cereal and cereal products will require an efficient market information system. Furthermore, increasing trade in cereals, along with the high degree of uncertainty in the sector, will increase the complexity of problems, required analysis and analytical procedures which increases the demand for information. Thus, it becomes necessary to establish a marketing information system (MIS) with the ability to collect and analyse data to derive useful information that can be used to enable industry actors to make informed decisions.
In addition, most of the past and current initiatives for information management are donor supported, therefore not very sustainable. Most MIS face challenges with delivering market information to end users in a way that is profitable without ongoing government or donor support. An ever-increasing number of smallholder farmers have obtained access to mobile phones, and demand for mobile-based market information has grown as well. At the moment, the current service providers have not been able to adequately convert this potential demand into a sustainable business model. As more research is conducted, MIS providers may begin to narrow their scope to selected crops and regions which are better suited to take advantage of market information.
Feed the Future Market Systems Assessment East Africa Market Systems Activity February 2021
25
4.3. Technology and Inputs
Production Inputs
Increased production and productivity for sorghum and millet requires consistent access to quality input, especially seeds. Increased use of modern inputs (seeds, fertilizers, agrochemicals) is a pre-requisite for achieving high levels of productivity and competitiveness of the industry. Key challenges are related to their accessibility, availability, utilization and affordability. In most cases farmers do not have access to the right inputs and agro-dealers do not necessarily stock what is needed for the crops.
• There is still low utilization of time and labor-saving technologies (e.g., power tillers, shellers) for both on-farm and off-farm rice operations across EA. This greatly affects supply of rice in the region because it generates low efficiency of operations which affects quality of rice, high post-harvest losses and high labor requirements to complete tasks such as weeding, transplanting and harvesting. In Kenya, the post-harvest losses account for 15 – 50% of the market value of production.62 Due to an almost complete lack of labor-saving mechanization, rice farmers in Tanzania spend 130 days per hectare/season in the farming operations, as opposed to 14 person-days spent by Thai farmers.
• For millet, there is also a challenge associated with “drudgery” associated to weeding. Across the region, there is limited use of technology for controlling weeds (e.g., herbicides or draught animals). Weeding by hand demands a lot of labor and if it is not done well and on time it, causes high crop yield losses. In addition to frequent droughts common in most arid and semi-arid areas, there is also a challenge of poor soil fertility. Fertilizer and other amendments are rarely applied on millet.
• Inadequate water management for paddy production under both irrigated and rainfed systems. For example, over 75% of paddy production in Tanzania uses rain-fed and/or rainwater harvesting systems with very limited water control systems. The main challenge is the costs of setting up irrigation schemes, which range from US$ 3,000 to 12,000 per hectare.
Branded packaging: Packaging is very important for consumers in the region, particularly for rice. However, traders are constrained by limited availability of packaging material which also expensive. Poor and inadequate packaging is the main reason why an estimated 80% of consumers goods sold in Africa are imported. In general, across the region, rice consumers in urban areas prefer branded packaging more than those in rural areas. The preferences for product presentation may relate to the level of sophistication of retail practices around the region.63 In Kenya for example, retailing is significantly more sophisticated than in the rest of the region. Consumers’ expectations of branded packaging rise with their exposure to formal retail shops and supermarkets.
64
Suitable varieties: Consumer preferences drive demand for rice in the region. In order to increase trade, the region should produce sufficient and affordable rice that meets the tastes and preferences of its increasing number of consumers who are rapidly urbanizing, and which can compete against imported rice in terms of price and quality. For example, in Rwanda, 70% of domestic consumers prefer aromatic rice and long grain rice.
62 Atera, E. A., Onyancha, F. N., & Majiwa, E. B. (2018). Production and marketing of rice in Kenya: Challenges and opportunities.
Journal of Development and Agricultural Economics, 10(3), 64-70. 63 Consumers purchase rice from a variety of sources including at the farm-gate, rice processors, wholesale shops, open markets, small
shops, mini-supermarkets and supermarkets. In general, the level of sophistication at the point of purchase (i.e., retail shops and supermarkets rather than open markets) increases with consumer income and location – whether urban or rural.
64 Kilimo Trust, Characteristics of Rice Markets in East Africa, 2017.
Feed the Future Market Systems Assessment East Africa Market Systems Activity February 2021
26
Although almost all imported rice is aromatic and long-grain, 70% of Rwandan rice farmers produce short and bold grain rice, which is preferred by only 14% of domestic consumers. Moreover, local rice is of relatively low quality, due to high levels of impurities and rice that is broken. This challenge is caused by both post-harvest handling and the varieties that are used.65
In addition, governments are not prioritizing these crops or fast-tracking seed variety development. For example, the Ethiopian Seed Enterprise and some private companies are responsible for multiplying improved seeds. However, they are concentrating on more profitable crops, mainly hybrid seeds of maize, wheat and teff. Crops such as sorghum and millet have been neglected, and improved seeds of these crops are not available to farmers. As a result, farmers are forced to grow local, low yielding varieties.
Research and Development
Despite the importance sorghum and millet to the livelihoods of millions of smallholder farmers in East Africa, their valuable nutritional and processing properties, the growing demand exceeding supply, and regional and international trade potential, these crops have largely been neglected by national and international research organizations and major donors’ organisations. This neglect has contributed to a lack of realization of the potential for these crops.
The institutions charged with the responsibility of spearheading the development of agriculture (e.g., research, extension service or value chain operators) are weak and often starved of operation funds and human capacity needed to effectively carry out their mandates. Many national research institutions are poorly equipped, and lack the critical technical mass needed to implement the complex scientific procedures that modern science demands, leading to high staff turnover, as good national scientists seek better opportunities, quite often overseas. There is total dependence on donor funds for most operations.
Millet in particular, has been neglected by mainstream research across the region. One way to boost production and productivity and enhance acceptability is to assemble diverse germplasm resources, characterize them to identify traits of agronomic importance, and use them to breed superior varieties. There are important gaps in the region’s germplasm collections, in cultivated varieties as well as wild species. The available varieties are not fully characterized and utilized in breeding programs. Also, there is challenge of improved varieties in terms of: availability, promotion and dissemination. There is lack of improved varieties adapted to specific zones. Lack of seed of adapted varieties is also a major constraint to adoption.66
Improved coordination among national, regional and international research organizations is key to improving research efficiencies and impact in the region. National organizations need to strengthen their capacity to conduct impact assessments, since the results can influence policy formulation and guide the development of a national agricultural research agenda to enhance the impact of research on cereal productivity. For example, research has shown that returns to research are marginal when improved sorghum/millet is grown in a difficult environment without any other inputs. But returns are high and comparable with other commodities when the shift to new sorghum/ millet varieties is combined with an increase in other inputs, especially in better environments where input use is less risky.
65 -ibid- 66 ASARECA, Integrated sorghum and millet sector for increased economic growth and improved livelihoods in Eastern and Central
Africa Proceedings of the ECARSAM Stakeholders Conference 20–22 November 2006, Dar es Salaam, Tanzania
Feed the Future Market Systems Assessment East Africa Market Systems Activity February 2021
27
4.4. Transport and Logistics
Transport and logistical challenges are key non-tariff barriers (NTBs) to trade in East Africa and reduce the trade potential of the EAC. The poor market and transport infrastructure across the EAC limits trade between the member states. For example, smallholders in Rwanda have poor access to markets because the state or tertiary road transport costs represent as high as 40% of export and import values, which constitute a significant obstacle for competitive trade.67 The investment in transport infrastructure for example the Standard Gauge Railway (SGR) and one stop border posts (OSBP) is anticipated to ease movement of goods and people within the region, reducing the transport costs and promoting inter-regional trade. The Malaba OSBP for example has reduced the clearing time for goods from 24 hours to 4 hours and increased the number of trucks passing through the border from 150 to 400 per day.68 The Mutukula OSBP between Tanzania and Uganda is also anticipated to reduce the time taken by traders to lodge import and export documentation by 30%.69
Rice is most commonly transported to market centers by small and medium sized traders and then sold at wholesale markets in urban markets or direct to specific wholesalers or retailers. This fragmented approach is a challenge for large wholesalers to reliably procure the volumes and quality of rice needed for a profitable enterprise. Although anecdotal, this suggests that even for Tanzania, the region’s largest producer, quality and quantity of supply remains too variable for some large traders to become heavily involved in the cross-border trade of local rice. Trading in rice thus remains highly fragmented with a large number of small-scale players.
4.5. Access to Finance
Financial service providers (FSPs) serving the cereals’ value chain in East Africa include regional, local and commercial banks, which typically lend to SMEs that meet their collateral requirements. The emergence of Commodity Exchanges in countries such as Uganda, Tanzania, Rwanda, and Ethiopia, which leverage trading platforms to link buyers and sellers and increase price transparency of agricultural commodities, has helped increase the usage of warehouse financing for cereals through the use of Warehouse Receipt Systems (WRS).70,71 Examples of commercial banks offering credit to cereals traders through WRS in the region include Ecobank Group, Commercial Bank of Ethiopia, NMB Bank, Cooperative Rural Development Bank (CRDB), and Centenary Bank, which have provided WRS financing to rice and maize traders in Rwanda, Ethiopia, Tanzania, and Uganda.
Non-bank financial institutions (NBFIs) include impact investors and fintechs and provide trade finance solutions to cereal businesses in the region. Examples of such players include FACTS Africa and TruTrade, which offer digital supply chain finance solutions (e.g., invoice discounting) and LPO finance, respectively, to cereal (e.g., rice, millet, sorghum) businesses in Uganda and Kenya for purposes such as produce handling, storage, and transport. Another example is Zuricap, who offer online invoice discounting solutions to maize and wheat SMEs in Kenya. There are also a few impact investors that provide trade finance solutions for the cereals value chain in East Africa. For instance, Root Capital, which has provided WRS lending to rice traders in
67 FAPDA. (2016). Country fact sheet on food and agriculture policy trends. FAO 68 JICA. (2016). JICA in a dynamic Africa. JICA 69 Sabiti, M. (2017, November 9). Mutukula one-stop border post to ease trade between Tanzania, Uganda. 70 A warehouse receipt is issued to a named depositor (who may be a farmer, farmer group, processor or trader) as evidence that he or she
has deposited a specified commodity, of stated quantity and quality, at a specified location. The holder of the receipt may pledge it to a lender (with the stored commodity being the collateral for a loan) or transfer it to a buyer (by way of a sale).
71 International Trade Centre. What Are Warehouse Receipts. link
Feed the Future Market Systems Assessment East Africa Market Systems Activity February 2021
28
Rwanda, and Triodos, who offers export finance to rice exporters across the region. Other players include trade insurance providers such UAP insurance in Kenya and Tanzania, and SORAS Insurance in Rwanda. They both have provided insurance for cereal exporters, with a focus on sorghum.
Development partners are also key players in the cereals’ value chain and comprise of national, regional, and multi-national organizations that help ease access to trade finance. A key player in this space is the International Finance Corporation (IFC), which has the Global Warehouse Finance Program that provides lines of credit and guarantees to commercial banks internationally for on-lending to commodity producers and traders through WRS in Sub-Saharan Africa. Through this program, the IFC has provided risk-sharing facilities to banks, such as BNP Paribas (Suisse) SA, to help promote food security to regional countries, including Burundi, by supporting on-lending to cereal businesses (e.g., rice). Additionally, in Ethiopia, the IFC supported the launch of WRS financing at the Ethiopia Commodity Exchange to support on-lending to maize traders.72, 73 Regionally, there are also other development partners such as East Africa Development Bank (EADB) and Agriculture Business Initiative (Abi) Trust, which provide solutions such as lines of credit and guarantees to financial institutions for on-lending to multiple agriculture value chains, including cereals.
Supply-side constraints:
1. Limited balance sheet capacity: Banks in East Africa are characterized by relatively smaller balance sheets for lending compared to their European and American partners and competitors. Consequently, within the agriculture sector, banks in the region prioritize lending to cash crop traders in structured, formalized value chains, instead of cereal traders because trade for crops like rice is largely done without fixed contracts across fragmented players, hence a riskier investment.74, 75
2. Limited availability of risk mitigation instruments: There is a need for increased provision of storage and transportation insurance for cereals held in warehouses. This would help mitigate against potential security, quality, and transportation risks associated with the handling of the cereals pledged as collateral for WRS. However, provisions of such insurance products remain limited in East Africa given the lack of information available to insurance providers on supply chain actors, and the informal and fragmented nature of most agricultural markets.
3. Limited appreciation for non-traditional trade finance solutions: Warehouse Receipt Systems present a great opportunity for providing trade financing to cereal traders as it helps facilitate the collateralization of cereals, which have low perishability and can be stored for long durations. However, banks in East Africa are generally risk-averse and may need to be educated to realize the potential benefits of using WRS as a form of collateral when financing cereal exporters.
Demand-side constraints:
72 World Bank. 2019. IFC Supported Warehouse Receipt Financing System Launched in Ethiopia. link 73 IFC, 2012. “IFC, BNP Paribas Team Up to Boost Agriculture Financing in Sub-Saharan Africa, Eastern Europe.” link 74 Structured value chains have trading systems whereby, farmers, traders, processors, millers, banks and other key value chain players
enter organized, regulated trading and financing arrangements with clear rules that buyers and sellers should follow. The rules are captured in trade contracts which clearly highlight key issues such as quality grades. Within the EAC, such systems are commonly used for export commodities such as coffee and cashew nut, but they are seldom used for cereals.
75 ATPAF. 2016. "Towards Creating an Enabling Environment for Grain Trade in Africa: Technology, Investment, Information, Policy and Services." link

Feed the Future Market Systems Assessment East Africa Market Systems Activity February 2021
29
1. High financing costs: While WRS provide a suitable trade finance option for cereal traders, high-interest rates charged on loans (ranging from 18% to 24% per annum in the EAC) and high processing costs make it unaffordable for most traders in the region. Such high rates can only be met if produce prices also increase over time. However, in most cases, this does not happen partly due to government price interventions in the cereal value chain since they are staples in most East African countries. In addition, several other charges are associated with processing loans under WRS financing, including payments to collateral management companies, insurance charges, and loan processing fees. These charges are transferred to the loan applicants which in turn increases the cost of loans.76
2. Lengthy approval processes: Banks in the region tend to apply focused scrutiny when appraising trade finance applications for cereal traders given the unstructured nature of cereal trading, compared to other value chains such as cash crops (e.g., coffee, cotton). As such, trade finance processing durations for cereals, such as rice, tend to be relatively long (may take several weeks to months depending on existing relationship with bank), which discourages traders from applying.
3. High minimum stock requirements: The uptake of warehouse financing by smaller cereals traders remains low in the East Africa Community (EAC) region, given high minimum stock requirements, i.e., at least 10MT or 110 bags for participation in WRS. These traders operate at a small scale, making it hard to meet the required minimum volumes for participation in WRS.77
4.6. Processing and Value Addition
Milling Capacity
Rice processors are generally located near the production areas. Given that paddy is 35- 40% heavier than milled rice, it is cost effective to aggregate paddy and mill it near the production zones and then transport milled rice. At least 80% of the paddy produced is milled by small-scale village mills with outdated technology that delivers out-turns of around 50% paddy conversion to milled rice, compared to modern mills that can convert up to 72% of paddy to milled rice. The old small-scale mills also deliver low quality as they do not have de-stoning, polishing and grading capabilities. Therefore, a high proportion of locally milled rice is of poor quality, reducing its market competitiveness even further. At the same time, there is serious underutilization of installed capacity of modern (medium to large scale) mills. Most utilize less than 30% of installed capacity reducing incentive for further investment in modern equipment.
There is a particular missing link between small scale sorghum farmers and large processors for beverage, feed, and biofuel manufacturers. Small scale millers own grinding mills and process sorghum grain into mealie meal as and when required. In urban centers there are relatively more organized and large-scale actors involved in processing and packaging of mealie meal and stock feed for onward sale to wholesalers and retailers. However, due to unreliable and low supply of sorghum grain, most stock feed processors avoid using the grain as a raw material regardless of its high crude protein content.
Across the region, there is limited scope to use technology for value addition because industrial methods of processing millet and sorghum are not as well developed as those for maize, wheat and rice. For example, a growing number of small, medium, and large commercial grain millers and processors in East Africa each mill
76 ATPAF. 2016. "Towards Creating an Enabling Environment for Grain Trade in Africa: Technology, Investment, Information, Policy
and Services." link
77 ATPAF. 2016. "Towards Creating an Enabling Environment for Grain Trade in Africa: Technology, Investment, Information, Policy and Services." link
Feed the Future Market Systems Assessment East Africa Market Systems Activity February 2021
30
10–800 tons of millet per month, producing both pure millet flour or composite flour and porridge mixtures, mainly for the domestic market. Furthermore, there is limited product range: few millet and sorghum-based foods are available in urban markets, reducing sales and promotional prospects.78 There is also a serious problem of the “missing” medium scale enterprises – because the installed capacity for processing cereals and perhaps other commodities is skewed towards small scale enterprises. There is also a significant proportion of the installed capacity that is in the form of large scale, which is severely underutilized.
Furthermore, value addition is associated with high initial investment costs for processing equipment and facilities. There are also high operating costs associated with costly imported packaging materials and preservatives, insufficient organizational training to small-scale processors and the promotion of locally processed products, lack of critical mass of processors to absorb and consume products, and lack of varieties for processing.
Product Diversification
Despite the potential for value addition in sorghum, millet and rice and product diversification, there has been limited progress in region outside of the beverage (beer) industry. There are poor linkages between research-processor-consumer within the sorghum and millet subsectors, hence lack of feedback on consumer demands and market opportunities. In general, apart from milling, there is little processing for sorghum and millet to other consumer products, including ready-to-eat foods, such as processed popped sorghum, biscuits, and instant porridge, which would appeal the growing middle class. Expansion in product range is particularly relevant given the increasing urbanization and the new consumption patterns associated with the expanding middle class.
Despite the potential, the use of sorghum and millet for animal feed within the region also remains limited.79 Inconsistent supply is the primary reason that manufacturers in the region do not demand sorghum and millet as a source of animal feed. Supplies may be available after a particularly favorable rainy season, but then may be limited when rains are poor. While larger feed manufacturers will commonly switch ingredients as relative input prices change, this practice is less common among the many smaller-scale feed manufacturers in the region, many of whom seem to prefer a consistent formula.
4.7. Policy Constraints
Policy constraints hindering trade in cereals can be categorized through the 2016 USAID Trade Capacity Building (TCB) Policy’s lens of beyond the border (harmonization of standards), at the border (administrative paperwork and alignment of border processes), and behind the border (in-country legal, regulatory, and institutional frameworks). Constraints under each category are outlined below.
Beyond the Border
There are several multilateral trade policies and agreements that could benefit the growth of the cereal VCs within the region to access external markets. Since several of the target countries are members of the WTO, they should have access to more than 90% of world markets with Most Favored Nation (MFN) treatment. Under the
78 ICRISAT, 2015 79 Orr, A, Mwema, C, Gierend, A, and Nedumaran, S. 2016. Sorghum and Millets in Eastern and Southern Africa: Facts, Trends and
outlook. Working Paper Series No. 62. Patancheru, Telengana, India: International Crops Research Institute for the Semi-Arid Tropics. http://oar.icrisat.org/9441/
Feed the Future Market Systems Assessment East Africa Market Systems Activity February 2021
31
EPA Agreement, the EU pledges to ensure duty-free-quota-free (DFQF) access to its market for all EAC counties. Individual countries have also signed multilateral and bilateral trade agreements, such as the ACP-EU Trade Agreement. Though value of exports to certain external markets (such as the EU) have been growing for commodities like rice, export volumes to countries and regions beyond the EAR are still relatively small.
Ideally access to external markets would have a knock-on effect for intraregional trade (with opportunities for value addition and re-export), but it has become increasingly clear that trade agreements between the trading blocs and other external blocs have not translated into increased trade within the blocs. Trade policy within EAR is complicated. Focus countries of this report are members of one or more RECs – COMESA, EAC, IGAD, and SADC (Zambia and Tanzania) – introducing challenges of harmonization and implementation both within and among EAR trading blocs.
Within the EAC, despite operating as a Common Market, in large part the legal, regulatory, and institutional frameworks to implement regional policies are left to the member states and intra-EAC trade remains low at 22%.80 By comparison, intraregional trade within COMESA and SADC is only marginally higher, accounting for 25% of trade for each respectively.81 Among the blocs, even though the Tripartite Agreement (EAC-COMESA-SADC) was signed in 2015, it has still not met the threshold requiring ratification by 14 (of the 28) members countries to enter into force. Overlapping membership in multiple RECs by countries continues to be a challenge and further complicates implementation at the national level. Challenges resulting from multiple memberships include rectifying different approaches to regional integration such as rules of origin and non-tariff barriers (NTBs),82 and multiple membership continues to be considered as one of the primary factors inhibiting countries from realizing the full benefit of bloc membership.
Persistent policy constraints for trade in cereals include the following:
Harmonization, implementation, and awareness of SPS: Sanitary and Phytosanitary Standards (SPS) are intended to protect plant, animal, and human health. In cereals, relevant SPS issues include pests, diseases, pesticide residues, and presence of mycotoxins (particularly aflatoxin). The latter is the most significant of these SPS issues hindering intraregional trade flows of cereals. The key to increasing regional and international market access is to establish sound and functional SPS management systems to ensure free but safe trade and build confidence in a country’s exports.
EAC, COMESA, and SADC all have individual SPS Protocols and regulations. While each bloc emphasizes member states’ commitment to basing measures on the WTO’s SPS Agreement, not all protocols maintain the full language from the WTO.
80 According to data from United Nations Conference on Trade and Development (UNCTAD). 81 COMESA-EAC-SADC tripartite free trade area: challenges and prospects, 2018. 82 Trade Policy Review: EAC – Report by the Secretariat | February 2019
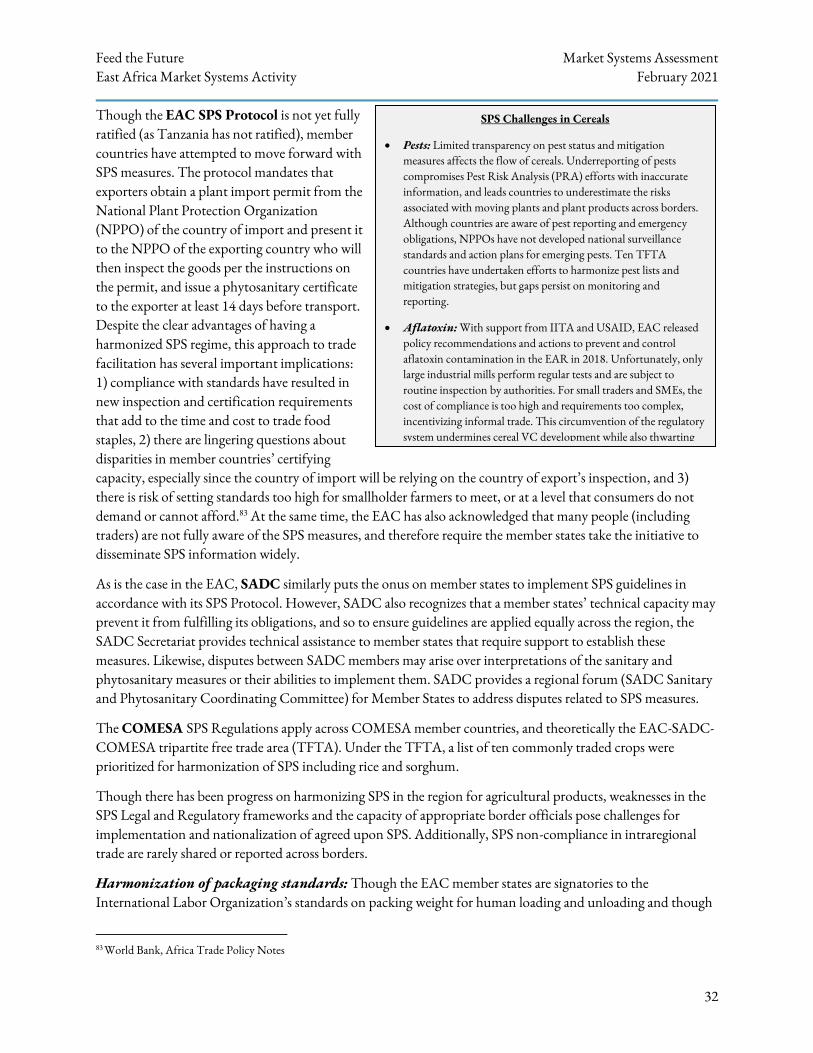
Feed the Future Market Systems Assessment East Africa Market Systems Activity February 2021
32
Though the EAC SPS Protocol is not yet fully ratified (as Tanzania has not ratified), member countries have attempted to move forward with SPS measures. The protocol mandates that exporters obtain a plant import permit from the National Plant Protection Organization (NPPO) of the country of import and present it to the NPPO of the exporting country who will then inspect the goods per the instructions on the permit, and issue a phytosanitary certificate to the exporter at least 14 days before transport. Despite the clear advantages of having a harmonized SPS regime, this approach to trade facilitation has several important implications: 1) compliance with standards have resulted in new inspection and certification requirements that add to the time and cost to trade food staples, 2) there are lingering questions about disparities in member countries’ certifying capacity, especially since the country of import will be relying on the country of export’s inspection, and 3) there is risk of setting standards too high for smallholder farmers to meet, or at a level that consumers do not demand or cannot afford.83 At the same time, the EAC has also acknowledged that many people (including traders) are not fully aware of the SPS measures, and therefore require the member states take the initiative to disseminate SPS information widely.
As is the case in the EAC, SADC similarly puts the onus on member states to implement SPS guidelines in accordance with its SPS Protocol. However, SADC also recognizes that a member states’ technical capacity may prevent it from fulfilling its obligations, and so to ensure guidelines are applied equally across the region, the SADC Secretariat provides technical assistance to member states that require support to establish these measures. Likewise, disputes between SADC members may arise over interpretations of the sanitary and phytosanitary measures or their abilities to implement them. SADC provides a regional forum (SADC Sanitary and Phytosanitary Coordinating Committee) for Member States to address disputes related to SPS measures.
The COMESA SPS Regulations apply across COMESA member countries, and theoretically the EAC-SADC-COMESA tripartite free trade area (TFTA). Under the TFTA, a list of ten commonly traded crops were prioritized for harmonization of SPS including rice and sorghum.
Though there has been progress on harmonizing SPS in the region for agricultural products, weaknesses in the SPS Legal and Regulatory frameworks and the capacity of appropriate border officials pose challenges for implementation and nationalization of agreed upon SPS. Additionally, SPS non-compliance in intraregional trade are rarely shared or reported across borders.
Harmonization of packaging standards: Though the EAC member states are signatories to the International Labor Organization’s standards on packing weight for human loading and unloading and though
83 World Bank, Africa Trade Policy Notes
SPS Challenges in Cereals
• Pests: Limited transparency on pest status and mitigation measures affects the flow of cereals. Underreporting of pests compromises Pest Risk Analysis (PRA) efforts with inaccurate information, and leads countries to underestimate the risks associated with moving plants and plant products across borders. Although countries are aware of pest reporting and emergency obligations, NPPOs have not developed national surveillance standards and action plans for emerging pests. Ten TFTA countries have undertaken efforts to harmonize pest lists and mitigation strategies, but gaps persist on monitoring and reporting.
• Aflatoxin: With support from IITA and USAID, EAC released policy recommendations and actions to prevent and control aflatoxin contamination in the EAR in 2018. Unfortunately, only large industrial mills perform regular tests and are subject to routine inspection by authorities. For small traders and SMEs, the cost of compliance is too high and requirements too complex, incentivizing informal trade. This circumvention of the regulatory system undermines cereal VC development while also thwarting protocols intended to safeguard human health.
Feed the Future Market Systems Assessment East Africa Market Systems Activity February 2021
33
the EAC has released a standard regulation to guide packing and weights for cereals, disparate product standards (in terms of packaging, weights, and marking) still pose a challenge to trade in cereals as manufacturers need to comply with varying requirements for different markets. This increases manufacturers’ costs of doing business as there is an increase in the fixed and variable costs needed to meet these disparate standards. Harmonization of clear, well publicized standards is one way to address the challenge, and is an important step for increasing regional competitiveness of cereals for trade.
Related to the lack of standardization, markets across East Africa have limited supplies of packaging materials, which makes it difficult to follow existing packaging regulations. For example, size of storage bags can be an issue as often sizes of bags required varies from country to country; in Kenya and Tanzania, the required weight of the bag is 90kg for maize, while in Malawi and Zambia it is 50kg. Differences in packaging and labeling requirements can necessitate repackaging at the border at an additional cost, multiplying package-related inefficiencies.
Non-tariff barriers (NTBs): The EAC describes NTBs as laws, regulations and administrative and technical requirements (other than tariffs) imposed by a partner state, whose effect is to impede trade. In 2015, the EAC passed the EAC Elimination of Non-Tariff Barriers Act to provide a legal framework for monitoring and addressing NTBs in the region.84 However, the causes of NTBs in the EAC like poor coordination among the government agencies, inadequate infrastructure and uncoordinated implementation structures for EAC policies among others have not been sufficiently addressed by the member states. As of June 2016, 25 NTBs continued to restrict intra-EAC trade; 104 had been removed since the establishment of the NTB Monitoring Mechanism.85 Persistent NTBs, such as those related to rules of origin, acutely affect smaller traders, as compliance with specific requirements increases their costs of doing business.
Uneven application of CET: In 2005, the EAC member states agreed to a high Common External Tariff (CET) of 75% on rice to protect regional producers from cheap imports. However, the EAC common market protocol also allows for duty remissions which gives member states leeway to reduce or eliminate tariffs as they deem necessary.86 The EAC countries mainly reduce CET to address domestic shortages and reduce prices of rice. Prices for locally produced rice in Uganda for example are driven low by CET at 35% instead of 75% in the Kenyan market, which in turn encourages smuggling and discourages local production volumes.87 Rice exports from Tanzania were charged 100% duty instead of 75% by the Uganda and Rwanda governments due to re-exportation of rice from Pakistan. RCT also reported that Zanzibar does not impose the 75%88 CET on rice imported to the island but rather imposes only an effective tariff of 6%, making imported rice cheaper than locally produced rice.89 The inconsistent application of CET across the EAC puts national interests first and thus limits the level of regional integration. Regional traders are also unable to plan for the long term and changes in CET necessitate changes in their business models, particularly lowering pricing to remain
84 Owino, S. (2017, June 19). ‘Plastic rice’ not on sale in Kenya-KEBS. Retrieved March 25, 2018, from Daily Nation:
https://www.nation.co.ke/news/Plastic-rice-not-onsale-in-Kenya-Kebs/1056-3977262-h4pftg/index.html 85 Calabrese, L., & Eberhard-Ruiz, A. (2016). What types of non-tariff barriers affect the East African Community. 203 Blackfriars Road
London SE1 8NJ: Overseas Development Institute 86 TMEA, 2015 87 MoFPED. (2015). Rice value chain in Uganda. MoFPED. 88 Ligami, C. (2017, October 17). Bonanza as Africa prepares to abolish call roaming charges. . Retrieved March 3, 2018, from The East
African: http://www.theeastafrican. co.ke/business/Africa-prepares-to-abolish-call-roaming-charges-/2560- 4142872-vrfjwtz/index.html
89 RCT. (2015). RCT’s strategic plan 2015-2019.

Feed the Future Market Systems Assessment East Africa Market Systems Activity February 2021
34
competitive. The requirements for cross border movement of ‘sensitive’ products like rice have also not been harmonized across the region.
Violation of trade protocols: There have been several cases where countries have violated trade protocols. For example, rice is subject to Common External Tariff (CET) arrangements under the EAC Customs Union. However, the prevailing situation is that Partner States e.g., Kenya have entered into bilateral arrangements with major rice producers like Pakistan for supply of tea in exchange to rice under tariff structure lower than those prevailing in the EAC Protocols. There are also situations where other countries (e.g., Tanzania) have lifted the Stay of Application of CET for rice by lowering the export price. This has led to the flooding of rice to the deficit countries including Kenya and thereby making the locally produced rice uncompetitive. As a result, processors have had to close operations because of rice retailing at very low prices Such unilateral decisions and bilateral trade arrangements bring barriers to intraregional trade and in particular, the cross-border trade.
At the Border
Unilateral Export Bans: Export bans on cereals are among the major policies affecting cereal VCs. While cereal export of all agricultural products is liberalized across the region, some countries make unilateral decisions to impose export bans ostensibly to address food security concerns. Tanzania, for example, has frequently imposed impromptu bans on rice exports to stabilize domestic supply and prices. For instance, in 2016, Tanzanian Government suspended food exports, thus denying Tanzanian rice farmers access to regional markets, and in turn threatening their livelihood. In Rwanda, the Government prevented imports of paddy in an effort to protect local farmers.90 While bans may arguably provide short-term solutions to food insecurity or price stabilization in a particular member state, the measure limits traders from receiving higher prices offered in regional or international markets, discourages further production by farmers who target the regional market, constrains supply of raw material available for value addition, and ultimately disincentives trade between surplus and deficit regions. Unilateral bans further undermine efforts to encourage small-scale traders to move from informal cross-border trade into formal trade, such as the simplified trade regime (STR). Small-scale traders trading in sensitive commodities prone to export bans are incentivized to continue their informal trading routes for fear of being turned away at the border if they are caught unaware of a ban.
Behind the Border
Prioritization among policymakers for public investment and utilization: Though in certain countries rice may arguably receive too much attention from policymakers (resulting in some of the “beyond the border” constraints outlined above), awareness and recognition of the importance and potential of sorghum and millet crops among policymakers in the region is relatively limited.91 This limited appreciation hinders the focused development of a business enabling environment to support growth in these crops. Currently, countries lack policy frameworks to encourage utilization in potential areas for growth (e.g., animal feed, baking, brewing, etc.), and the public sector has provided limited if any support for Research and Development (R&D) hampering technology and innovation development and dissemination. This constraint also partially accounts
90 EAGC. (2016). Communique on the Regional Meeting of Rice Value Chain Stakeholders. Regional Meeting of Rice value chain
stakeholders. Dar-es-Salaam, Tanzania: EAGC. 91 In Tanzania for example, sorghum and millet are considered as poor man’s crops. However, in other countries such as Burkina Faso,
sorghum and millet are the main food crops. Stakeholders have made little effort to improve the status/position of these crops. Good quality sorghum and millet can be utilized in the brewing industry. Also, a variety of foodstuffs such as biscuits, cake and buns can be made from the crops.
Feed the Future Market Systems Assessment East Africa Market Systems Activity February 2021
35
for the lack of official product standards or quality grades across the region in millet and sorghum, which in turn reduces incentives to improve quality.
Additionally, governments’ neglect of drylands across the region (which includes lack of infrastructure investment) constrains the ability for private sector actors in millet and sorghum VCs, two of the more adaptable crops for arid and semi-arid regions, to grow. As these regions also tend to be some of the same where food security is a recurring challenge, focused attention supporting the growth of these VCs would help governments reach other development objectives.92
Poor contract enforcement: Stakeholders have reported numerous incidences where parties which go into contract may not honor their part of the contract. For example, under contract buying garments, farmers have been tempted to sell produce to other parties at harvest if and when prices are high. On the other hand, buyers also have been reported to breach contracts by not buying at the agreed price and volumes or not buying at all. The lack of formal mechanisms and institutions to oversee contract enforcement has exacerbated the challenge further.
Weak institutional enforcement of WRS frameworks: Several East African countries, including Tanzania, Uganda, and most recently, Kenya, have WRS institutional and legal frameworks to guide the WRS operations. However, most countries have struggled with the enforcement of these frameworks. For example, the regulatory agencies in Tanzania and Uganda have experienced capacity challenges due to a lack of clear and detailed implementation plans to guide them in effectively enforcing WRS frameworks.93 Such concerns have undermined investor confidence in the regulatory framework and limited financing opportunities created by WRS in the region.
Additionally, though well-intentioned, some government interventions in cereal’s trading processes have compromised the stability of prices needed to establish a stable and conducive environment for WRS. For instance, past ad hoc impositions of export bans and waivers of import duties by the government of Tanzania have compromised the success of the use of WRS for grains, as they undermine private storage incentives and investor confidence in the ability to recover funds lent using cereals as collateral.94
4.8. Political Economy Constraints
Informal market trading structures. The cereal trade market system lacks formal institutions to oversee and regulate trade and deter opportunistic behavior. Weak public market information, the lack of grain standardization, the oral nature of contracts, and limited legal enforcement of contracts are all factors that contribute to the difficulty that traders encounter in attempting to trade directly with an unknown partner. In order to circumvent this commitment problem, traders face two alternatives: either to limit trade to known partners or to trade with an anonymous partner through the intermediation of a broker. The growing importance of brokers in cross-border cereal trading is premised on the fact that effective functioning of the grain market depends on the ability of traders to exchange grain anonymously with buyers and sellers in distant markets, without risk of commitment failure.
92 ICRISAT, Value Chains for Sorghum and Millets in Eastern and Southern Africa: Priorities for the CGIAR research program for
Dryland Cereals, Series Paper Number 42, 2017 93 EPRC. 2017. “Uganda Warehouse Receipt System: Improving Market Competitiveness and Service Delivery”. link 94 FAO. 2016. Agriculture and Food Security Risk Management in Africa: link
Feed the Future Market Systems Assessment East Africa Market Systems Activity February 2021
36
Lack of regional institutional integration. Public sector bodies responsible for promoting cereal value chains in respective countries have been working in isolation, and not sharing innovations across institutions in the region or developing strategic linkages with the private sector in order to commercialize innovations. In addition, stakeholders interviewed expressed concern regarding the prevailing institutional competition which makes it difficult for the subsector to operate towards a common goal for promoting cross border trade. The institutions on the ground are competing for a small pool of donor resources and makes them operate in silos with limited impact. In view of this, there is need for multisectoral platforms which could coordinate various activities of the value chain (including research and innovation) and as well as actors involved.
COVID-19. The outbreak of the COVID-19 pandemic has caused significant supply chain disruption to cross-border trade in the region, with dire impacts on food security and livelihoods - cross border trade is estimated to account for the livelihood of about 60% of EAC residents. The pandemic has increased border delays, exacerbated long queues of trucks, added to the lack of harmonization among countries (for example, varying requirements of COVID19 testing for truck drivers), resulted in allegations of harassment and eventually freezing the movement of goods across borders, including grain produce. According to the EAGC, during the first quarter of 2020, cross-border trade of maize in the EAC dropped by 70% compared to the previous quarter due to COVID19 restrictions. Overall cross-border trade dropped by 19% between the last quarter of 2019 and the 1st quarter of 2020.
Transport along commodity routes have been disrupted by restrictions on cross-border movement. The movement of cargo and services has been affected more by measures instituted by the EAC Partner States to contain the pandemic. Truck drivers have been increasingly reported as a high-risk group for transmission of the disease, which has led to further measures on cargo transports that further disrupt the movement of agricultural goods. Borders have witnessed unprecedented long queues of trucks, long periods of waiting for COVID 19 results by truck drivers, and some being denied entry into neighboring countries if found to be positive. In Kenya for example, concerns over safety and requirements for COVID-19 tests for the long-distance truckers crossing borders in Eastern Africa resulted in a shortage of food truck drivers and delays in the delivery services.95 The shortage of food truck drivers has also hampered ability of cereal surplus countries (e.g., Uganda, Tanzania and Zambia) to carry food supplies to the neighboring countries.
Trade restrictions due to COVID have also disrupted agricultural input supply chains, which has subsequently pushed up prices of agricultural inputs, such as fertilizers and farm equipment. Kenya, where the COVID-19 outbreak coincided with the planting season, has been especially hard hit. Fortunately, Uganda and Tanzania, who are both major exporters of grain in the region, had already completed their planting seasons at the time of the outbreak and were less affected, according to the EAGC. In addition, farmers were cut off from markets due to restricted movement measures imposed by governments. This has increased post-harvest losses as they were unable to sell their produce and did not have proper storage facilities.
4.9. Constraints on Women’s Participation in the VC
Across the region, women historically dominate the production level in the cereal VC compared to men. In the rice VC, which is high value crop, women dominate the production stage while men tend to own the fields, make decisions on sales for premium quality produce, and control revenues. According to the World Bank, evidence suggests that women are less likely to participate in trade opportunities because they lack access to
95 FAO, Impact of COVID-19 on agriculture, food systems and rural livelihoods in Eastern Africa: Policy and programmatic options,
June 2020
Feed the Future Market Systems Assessment East Africa Market Systems Activity February 2021
37
inputs and commercial networks. For example, in Meru, Kenya, 90 percent of export contracts went to men, likely as a result of land rights being in men’s names.96 However, women are beginning to take more of a role in the marketing of cereal product and small-scale processing for cottage industries.
Women living near border regions do engage in small-scale informal cross-border trade in cereals, legumes, and horticulture. Women cross-border traders experience verbal and physical abuse as well encounter high incidences of bribery and corruption. Such problems are most prevalent due to a myriad of reasons, including lack of harmonization and standardization of entry and exit procedures at customs and border stops, low levels of female customs officials, lack of decent and affordable accommodation in border towns.
Across the region, women’s utilization of trade finance is lower than that of men, which is driven by cultural, social, and religious norms that limit their participation in commercial agricultural activities. For example, women’s utilization of WRS in Uganda is lower than men’s due to their lower production volumes that result in low returns after incurring WRS costs, which discourages WRS usage. Low production volumes are driven by limited land ownership for commercial farming, lack of finances to access agricultural inputs (e.g., fertilizers), and lack of access to markets for selling produce. Additionally, while the idea of using the warehouse receipts appeals to some women farmers and traders, high-interest rates have discouraged applications.97 In countries such as Tanzania, studies have shown that women’s participation in WRS has been lower than men’s, due to limited awareness of the benefits of WRS, indicating a need for capacity building to encourage greater participation.98
In view of the informal nature of cereal trade, there is need for women-owned businesses to be streamlined in the formal markets. For example, the Intra-regional Trade Facility (IRTF), an EAC-GIZ cooperation programme initiative, supports the EAGC project “Enhancing Women’s Participation in Cross-Border Grain Trade” to enable women grain traders in Uganda and Kenya to overcome the informal and unstructured nature of the way they conduct their business and help them to become part of a structured commodity trading system that will facilitate trade in large volumes of good quality grain. These kind of initiatives needs to be scaled up and replicated in wide areas in the region for maximum impact.
4.10. Constraints on Youth Participation in the VC
Constraints to youth participation in cereal VCs mirrors those constraints inhibiting youth participation in agriculture more broadly. Though the average age of farmers is 60 years old, countries in the region have exceedingly young populations, which is only expected to increase. As with multiple other agricultural crops, many youths would prefer general trade and white-collar jobs over cereal farming. This preference is driven by the negative social perception that cereals are used only as a subsistence crop and present minimal potential for commercialization. In Uganda and Ethiopia, youths with higher literacy rates have demonstrated this preference for white-collar jobs over cereal production or trading through migration.99 Making agriculture profitable and attractive to young people requires constraints outlined above to be overcome. At the same time, there are
96 World Bank. 2011. “Gender Equality and Development: World Development Report 2012. Washington, DC: World Bank. 97 EPRC. 2017. “Uganda Warehouse Receipt System: Improving Market Competitiveness and Service Delivery”. link 98 ATPAF. 2016. "Towards Creating an Enabling Environment for Grain Trade in Africa: Technology, Investment, Information, Policy
and Services." link 99 Essa, Chanie Musa. “Youth Aspirations, Perceptions of Farming, and Rural Migrations in Rural Sub-Saharan Africa: Further
Empirical Evidence from Ethiopia.” link
Feed the Future Market Systems Assessment East Africa Market Systems Activity February 2021
38
constraints unique to youth participation in agricultural VC development that are necessary to address for the sake of future food security, economic growth, and livelihood development.
The key constraints to youth engagement in cereal VCs include:
Access to information and education: As the youth bulge increases, considerable youth populations will reside in rural areas, where accessibility to information, extension support, and know-how is already a challenge. Youth who do remain on-farm in rural areas often learn from their parents and other family members, and do not have the opportunities to learn, hone, and implement GAP, technology solutions (including improved seed varieties), or other modern techniques for cultivation that reduce labor, time, costs, etc. while increasing yields and quality. Though significant populations of youth will continue to live in rural areas, not all of them will farm. Entrepreneurship skills and investment in off-farm employment opportunities (such as value addition) are critical to inclusive development of the agricultural market system. This need necessitates that graduates have the skills required for rural employment opportunities. For young women, these skills and knowledge gaps are even more acute, and some development projects have attempted to incorporate agricultural skills into rural education to address this issue (e.g., Mastercard and TechnoServe’s STRYDE).
Access to and control over land: Population growth in rural areas will only exacerbate access to land challenges for youth. Land as a scarce resource coupled with the fact that adults are living longer mean that youth wait longer to inherit small plots of land – further dampening the attractiveness of agriculture and pushing them to migrate to urban areas in search of employment. Though some East African countries, such as Uganda, have attempted to put land registration and tenure policies in place, much of the rural agricultural land is unregistered, and registration processes are long and tedious. Inheritance laws and cultural norms in multiple East African furthermore make it difficult or impossible for young women to inherit land. Limited access to land in Kenya and Ethiopia has been documented to contribute to low uptake of WRS among youth.
Access to financing: Financing is critical for investment at all stages of cereal VCs, from input provision for production through to packaging, transport, and retail. In addition to the finance challenges outlined above, youth have unique challenges accessing finance to start their own cross-border trade and agribusiness operations. Most youth rely on borrowing from family and friends, since financial institutions rarely offer services that are appropriate for youth borrowers. Specifically, youth often have little to no collateral necessary for borrowing from financial institutions in East Africa, and their incomes may be infrequent or relatively sporadic, which raises concerns of repayment.
Limited involvement in policy dialogue: Youth often lack the social capital to be elected as leaders in the public sphere. As a result, there are few, if any, champions amplifying youth voices in policymaking processes, which translates directly into youth-specific issues being overlooked or ignored. Additionally, as the definition of “youth” is sufficiently broad, when there are considerations of youth-friendly policies or initiatives, governments, donors, and other actors often do not segment the youth market to fully understand youths’ needs.
5. OPPORTUNITIES
The opportunities in cereals are categorized into two: (1) direct engagement with the private sector through strategic alliances and partnerships to jumpstart trade and overcome practical bottlenecks in cross-border trade, and (2) addressing systemic VC issues hindering the growth of cross-border trade.
Feed the Future Market Systems Assessment East Africa Market Systems Activity February 2021
39
1. Developing strategic partnerships and VC alliances. Anchor firms - agro-processors, large traders and buyers in the region – will be the initial entry point for Activity interventions in the cereals VC. The Activity will develop strategic partnerships and VC alliances with private sector actors that represent the regional market demand and will provide the pull effect from cross border production areas, providing feedback on market specifications in terms of quality, varieties, and quantity along the rest of the chain. By developing direct partnerships with some of the largest regional buyers for sorghum and rice, the Activity will orient activities around the most pressing challenges for regional supply chains, unlocking trade flows.
Through interviews with many of these key players, the need to sustain thin margins from trading in these commodities necessitates improving cost efficiencies across the whole chain, organizing suppliers, enhancing sourcing relationships, and closing the information gap regarding market requirements. There is also recognition of the need for wider understanding of strategic market opportunities in the region for value-added products, especially where agro-processors, traders and other players have started to respond to this emerging demand and are being challenged by an improving ability to supply regionally supported by increased capacity for large scale production, aggregation, and improved coordination among value chain actors.
Partnership and alliance opportunities include:
▪ Partnerships with agro-processors. With increased demand across the region for value-added products (foods, beverages, baking, industrial feed), the Activity will establish partnerships with agro-processors to meet demand for these products. Currently, large companies in the beverage industry with a regional presence are using locally produced broken rice, sorghum, and millet as substitutes for the less available or more expensive raw materials, such as barley and maize. In the baking industry, sorghum and millet, which are more nutritious cereals, have proven their potential to be a good substitute for wheat, which is more expensive. Agro-processors struggle to source enough inputs of these commodities, and consequently, manufacturing capacity utilization hovers around 40% - representing a critical opportunity area for the Activity.
As industrial demand for rice, sorghum, and millet increases, availability of by-products of these commodities is also increasing. This is creating opportunities for conversion of these by-products into construction materials, energy, and livestock feed products. Many agro-processors are eager to take advantage of government incentives through new industrialization policies and strategies across many of the target countries for exporting value-added rather than raw agricultural products. However, consistency in sourcing adequate quantities and quality, remains a challenge, driven in a number of cases by the varieties of commodities planted not being those best suited for industrial processing. The Activity will develop partnerships with some of the largest buyers in the region, including Heineken, SAB Miller, Diageo, AFGRI, and Export Trade Group, to facilitate large scale sourcing relationships across the region to meet demand with large cereals traders, especially where the knowledge of market and varietal requirements has been established.
o Partnerships with traders. While the agro-processors will be the anchor firms in these VCs, in almost all
cases, agro-processors are working with traders. The more granular work of establishing regional supply chains that meet the demand of agro-processors lays with large traders and aggregators that have
Feed the Future Market Systems Assessment East Africa Market Systems Activity February 2021
40
established capacity to supply regional agro-processors, but require support to expand or upgrade operations. The Activity will support large traders and aggregators to:
o Engage effectively in proven contract farming models, and structure enforceable supplier contracts with clear and speedy dispute resolution mechanisms. Regional supply chains, because of the long distances covered by the partners and the produce, tend to be particularly vulnerable to conflicts or challenges that are not resolved quickly.
o Adopt improved quality management and traceability systems, which provide assurance of the quality, safety, source, and means of verification for the agro-processors and other players with a mandate to ensure compliance across border points.
o Facilitate access to business services providers targeting regional supply chains for management capacity building, access to finance or other required services.
▪ Support commercialization of value-added products. Through interviews with regional agro-processors
and large buyers, stakeholders highlighted the desire to expand the commercialization of cereal-based products (blended flours, animal feeds, etc.) that have been developed but not taken to commercial scale. These are essentially off-the-shelf products developed for key market segments that use local ingredients including rice, sorghum, and millet. The Activity will support companies to commercialize value-added products using rice, sorghum, and millet by sharing market demand information, developing linkages with retailers or other buyers, facilitating access to financial services providers for working capital or investment in equipment, and establishing links with research and other food product development specialists. These would form a growing reference group for agro-processors and other players like those developing processing lines and packaging materials for these new products, in verifying the product characteristics, suitability for value-added processing, and nutritional value of products. The Activity will also work towards enhancing stronger linkages between research-processors-consumers within the sorghums and millet VCs and the research-processors-industrial users for the rice VC, to enhance the feedback between the end market opportunities and the rest of the value-addition agro-processing VC.
▪ Partnerships with regional packaging suppliers. Like in other VCs where opportunities for value-added
product-markets, a systemic constraint of access to appropriate packaging materials exists. Agro-processors have challenges sourcing packaging materials locally, which they often sourced from India, China, South Africa, or Eastern Europe often. The market failures in this are around packaging solutions providers being unaware of the size of the market, regional demand, and lack access to investment to upgrade equipment to meet different product packaging requirements and specifications. The Activity will work with agro-processors to identify regional suppliers to develop prototypes and produce packaging to meet the needs of agro-processors in the region. The Activity will facilitate the market linkages and support packaging producers to access finance where necessary to develop prototypes and invest in new equipment.
▪ Facilitate B2B events to promote regional market linkages. The Activity will support large buyers, agro-
processors, and traders to capitalize on regional market opportunities by hosting B2B events to link market actors and investors. These events will allow large buyers to clearly communicate their needs in terms of quality (meeting standards) and volumes required, as well introduce business and financial services providers, market information solutions, and allow equipment and machinery manufacturers
Feed the Future Market Systems Assessment East Africa Market Systems Activity February 2021
41
to meet potential customers. The events will also target input providers who can increase the availability of desired varieties as well as introduce inputs solutions that enhance productivity and control of pests. The Activity will explore partnering opportunities with organizations such as the EAGC, EABC, COMESA Business Council, Investment Promotion Centers, AGRA and ASARECA.
2. Scaling Access to inputs and technologies. To overcome challenges related to low quality and volumes of production, and the increasing demand for value addition, the following opportunities have been identified for the cereals VC.
▪ Facilitate access to improved varieties. In line with the requirements for rice and sorghum varieties demanded by anchor firms and agro-processors, the Activity will partner with national research organizations and regional organizations, such as ICRISAT and IRRI, to identify high yielding and demanded sorghum and rice varieties available in the region and support recommendations for adoption and scaling. Supporting national and regional research institutions to coordinate more closely with the private sector and focus their research and development activities on varieties demanded by consumers and processors will help in addressing this long-term challenge. As necessary, the Activity will support timely adoption of these new varieties at the national level.
▪ Facilitate access to irrigation and cleaning machinery. Given the importance of irrigation, especially to
expanding rice production, the Activity will identify irrigation solutions providers in the region and link them to the regional agro-dealer network or associations to scale uptake. Agro-processors in the region like Diageo have also highlighted the need for cleaning machinery. The Activity will work to link machine suppliers with such manufacturers either directly or through the regional agro-dealer network.
▪ Scale pest and disease management solutions to improve yields. The Activity will work closely with
research and private sector organizations to scale already tested and scalable technologies (such as Integrated Striga Control) to VC actors through national and regional agro-dealers. In addition to striga, sorghum and rice are highly prone to locust and FAW infestations which are causing serious production and quality problems in many countries across the region. The Activity will work closely with key stakeholders such as EAC, COMESA, National Pest Control Organizations, DLCO_EA, FAO, Regional Agrochemical associations, agro-dealers, and private sector actors to identify best practices to mitigate this problem. Working with regional solutions providers to enable training and capacity building activities would be conducted in tandem with facilitation of regional workshops and service provider product improvement activities like reviews of training programs and materials. The Activity will link the regional agro-dealer network to inputs manufacturers with a regional presence, such as Corteva, Syngenta, BASF, and Bayer Crop Sciences, to facilitate access quality inputs for the control of sorghum and rice pests. Aflatoxin is a major SPS challenge for cereals as its impact spans across processed grains, feed, milk, and other commodities, posing a significant cross-border trade impediment. The Activity will explore scaling and adoption strategies for aflatoxin solutions with input suppliers and other regional partners by:
o Enhancing availability and application of the technology in countries where established commercial supply exists (Burundi, Uganda, and Rwanda). In some cases, there will be a need to enhance the commercial distribution of the technology to ensure it reaches last mile
Feed the Future Market Systems Assessment East Africa Market Systems Activity February 2021
42
producers, and the Activity will explore the role of the regional agro-dealer network and other players in this.
o Through the regional agro-dealer network, the Activity will explore additional activities like promotion of cost-effective Aflatoxin diagnostic test kits to be more widely available to producers and processors.
o Exploring Aflasafe manufacturing capability in Kenya, which has the potential to supply more countries in the region. Collaboration with IITA’s Aflasafe Technology Transfer and Commercialization Activity, will be central in this.
▪ Pesticide residue management. Due to lack of infrastructure and expertise to measure pesticide residues
in grains, exports are often barred from entry where levels are too high, and importers then impose import bans and demand compensation as well as disposal or repatriation costs. The Activity will explore opportunities with regional and national organizations and associations to establish the necessary infrastructure for pesticide residue testing in selected target countries. In addition, the Activity may work with multinational inputs companies and regional and national plant protection centers to support capacity building on GAP on aspects like food safety protocols, safe use of plant protection products, and Integrated Pest Management.
3. Addressing the costs of logistics and transportation in the region. A key challenge for cereal trade in the region is the inefficiency of logistics and transportation solutions available to ensure end-to-end cost-efficiencies while minimizing loss of grain. To address the lack of storage and transportation networks that are not suited for efficient bulk storage and movement, lack of available or affordable grain-drying solutions, and delays in cross-border delivery due to non-tariff barriers, the Activity will identify specialized, regional logistics service providers to support the VC alliances and partnerships to establish storage and transport networks and models that are cost-efficient and reduce post-harvest losses. The Activity will develop scalable service solutions and enhance the business models of such providers, based on the business potential identified in the cereals VCs. For example, Kumwe Logistics in Rwanda has a platform that aggregates transport solutions to efficiently provide affordable logistics solutions for trade. However, they are challenged by working capital and unpredictability of supply from storage facilities that are not strategically located.
4. Support dispute resolution to address NTBs. Unilateral bans on trade in cereals and grains in general are quite common across the region. A recent event of banning horticultural and cereal products among EAC countries illustrates the frequency and long-standing effects of such events. Despite harmonization of standards for several agricultural commodities, there is an expectation that SPS issues will continue to be raised and utilized as tools to restrict trade for protectionism. Value chains that are highly organized and with strong representation have greater success pressuring governments to act quickly to resolve trade disputes. For the cereals VC, the Activity may support solutions to avoid NTBs and SPS challenges, including:
o Explore integration of traceability systems into transportation and logistics solutions as well as any testing and compliance certification issued to provide a quick means of verification of any information that is under dispute leading to an NTB being applied.
o Leverage VC partnerships and the regional business membership organizations to enhance coordination and collaboration starting with national institutions responsible for overseeing trade facilitation activities to minimize overlaps.
Feed the Future Market Systems Assessment East Africa Market Systems Activity February 2021
43
o Explore adoption of digital SPS tools and data management systems and the e-Phyto certification system.
o Piloting a fast-track system for cross-border cereal trade, in collaboration with stakeholders like TMEA and the East Africa Business Council, which is already vocalizing support for implementation of a fast-track system at some cross-border points, such as Busia.
5. Enabling regional trade through existing Commodity Exchanges: Ethiopia, Rwanda, Tanzania, and Zambia have functioning commodity exchanges (or mercantile exchanges) that include trade in agricultural commodities (including cereals and inputs). With several large buyers and agro-processors expressing interest in sourcing cereal grains from exchanges in the region, and given the advantages this can provide, including the increased formalization of trade and price stabilization, the Activity will explore this opportunity to build on the work that has been undertaken across the region to promote these exchanges. Key issues identified by stakeholders in this area include: (i) challenges of ownership structure, where governments are not playing a major role, (ii) too few success stories in the region to sustain the interest of a majority of stakeholders, (iii) lack of supporting functions, such as collateral management which would demonstrate to financial institutions the ability of warehouse systems to meet their requirements, (iv) warehouses that are not strategically located, and (v) underdeveloped exchange trading systems in some countries.
Opportunity areas include:
• Support the establishment of collateral management companies that can bridge the gap between the weak warehouse infrastructure and their commercial management, and the need to provide confidence, assurance and risk mitigation to the financial institutions, traders, and owners of the quality and quantity of stored commodities as well as their release and delivery. Collateral managers also help lower the financial spread applicable to trade transactions on the exchange, enabling more trade to take place, while making trade financing more economical for many players. The Activity will review best practices from outside the region (e.g., South Africa) and within the region – AFGRI, a large commodity trading company with interest in regionally sourcing grain, has established such a company in Uganda, to close a major market eco-system gap.
• Collaborate with regional exchanges to identify barriers to electronic infrastructure to improve capacity of exchanges to cross-list tradable produce across the region, to increase the pool of potential buyers.
• To further expand the availability of licensed warehouses, the Activity may partner with existing commodity exchanges to conduct market research on strategic locations for warehouses to enable them to generate sufficient commodity volumes to cover their operational costs, and identify areas for improving the functioning of existing warehouses along key trade corridors.
6. Support emphasis on intra-African trade among EAC/COMESA members’ agricultural export authorities. Member states’ export promotion efforts are often geared toward markets outside of Africa (e.g., EU, US, Middle East), and are also not we well-coordinated at the regional level. With the newly introduced AfCFTA, there is an opportunity to leverage the region’s comparative advantage and product differentiation in cereals, complementing efforts to incentivize formal trade and increase intraregional trade in EA with efforts to better position the region to trade with other African countries. EAMS could serve in a supporting role for the development of market intelligence to support regional efforts to showcase competitiveness of EA (including
Feed the Future Market Systems Assessment East Africa Market Systems Activity February 2021
44
regional positioning/branding initiatives if/when it makes sense) and to shape countries’ regional export strategies to include EA and other regions on the continent.
6. Facilitate expansion of financial products, services, and risk mitigation solutions. The Activity can introduce finance and risk mitigation solutions for producers and intermediaries in the supply chain that often hinder getting enough production to meet demand. The Activity will explore the following financial solutions:
▪ Value chain finance. Through VC partnerships and alliances, the Activity can provide TA to anchor firms to support the scaling and access to finance for existing value chain financing models, directly through agribusinesses or ecosystem players. This could also include pre-season working capital loans (to help the supplier finance seeds, fertilizer, pesticides etc.), and structuring agreements that facilitate the provision of pre-export finance and reverse factoring solutions.
▪ Support to financial institutions to tailor products and services. Provide tailored TA to financial institutions to improve and scale the supply of suitable lending products, services, and platforms that can support grain-specific requirements and conditions. This may include providing technical assistance to financial institutions to help them develop trade finance products suited to SMEs with less physical collateral or using moveable assets as collateral (e.g., equipment, cars, or valuable household goods and not just land or cattle) and exploring other opportunities to de-risk lending besides physical collateral. This will allow better access to finance for SME agribusinesses that do not have the traditional collateral required for agriculture-based loans.
▪ Assess opportunities to better leverage existing de-risking facilities for lending, such as guarantee and first loss coverage facilities; support would focus on understanding and overcoming the key reasons why many existing facilities are not being drawn upon at scale and would likely include a two-fold approach of: (i) facility optimization, and (ii) tailored technical assistance to financial institutions for improved credit decision making processes to reflect the existence of the facility.
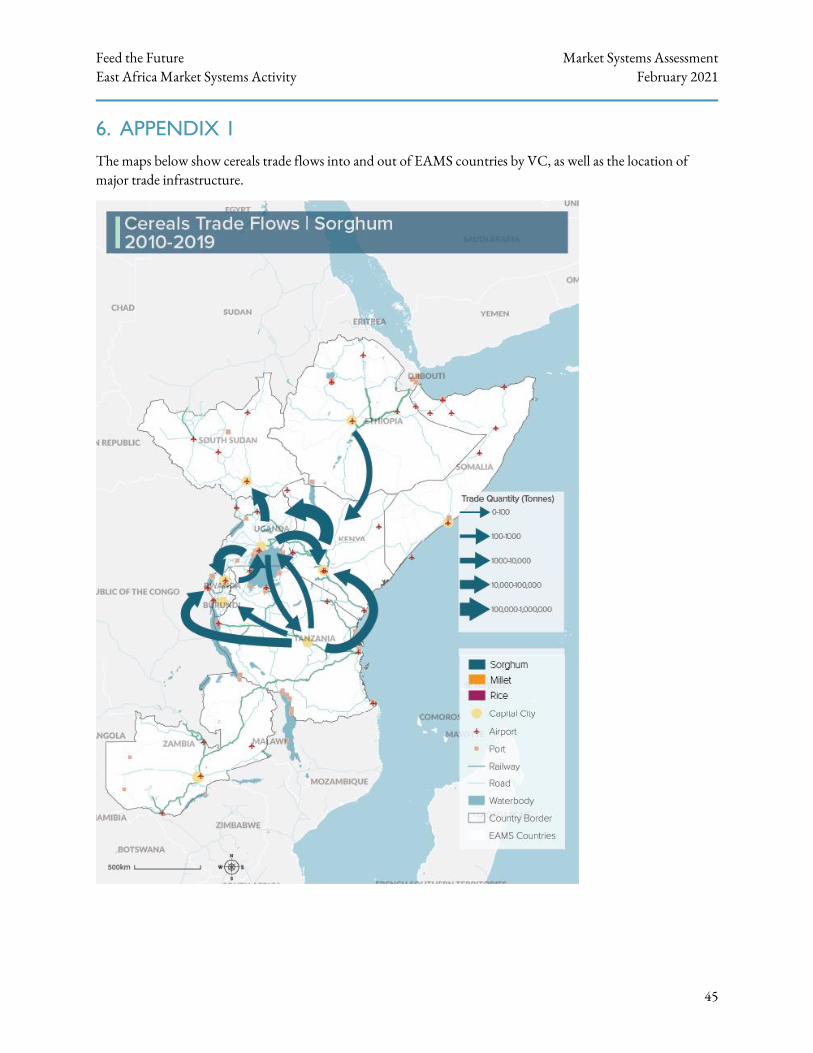
Feed the Future Market Systems Assessment East Africa Market Systems Activity February 2021
45
6. APPENDIX 1
The maps below show cereals trade flows into and out of EAMS countries by VC, as well as the location of major trade infrastructure.
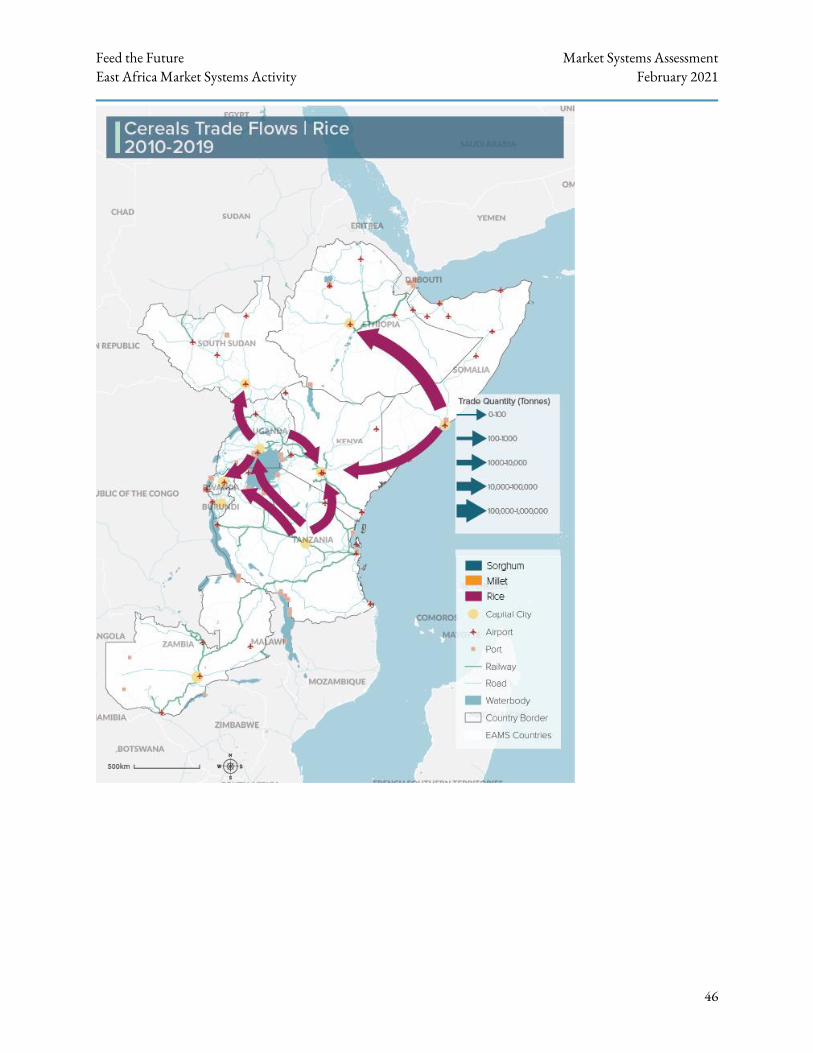
Feed the Future Market Systems Assessment East Africa Market Systems Activity February 2021
46
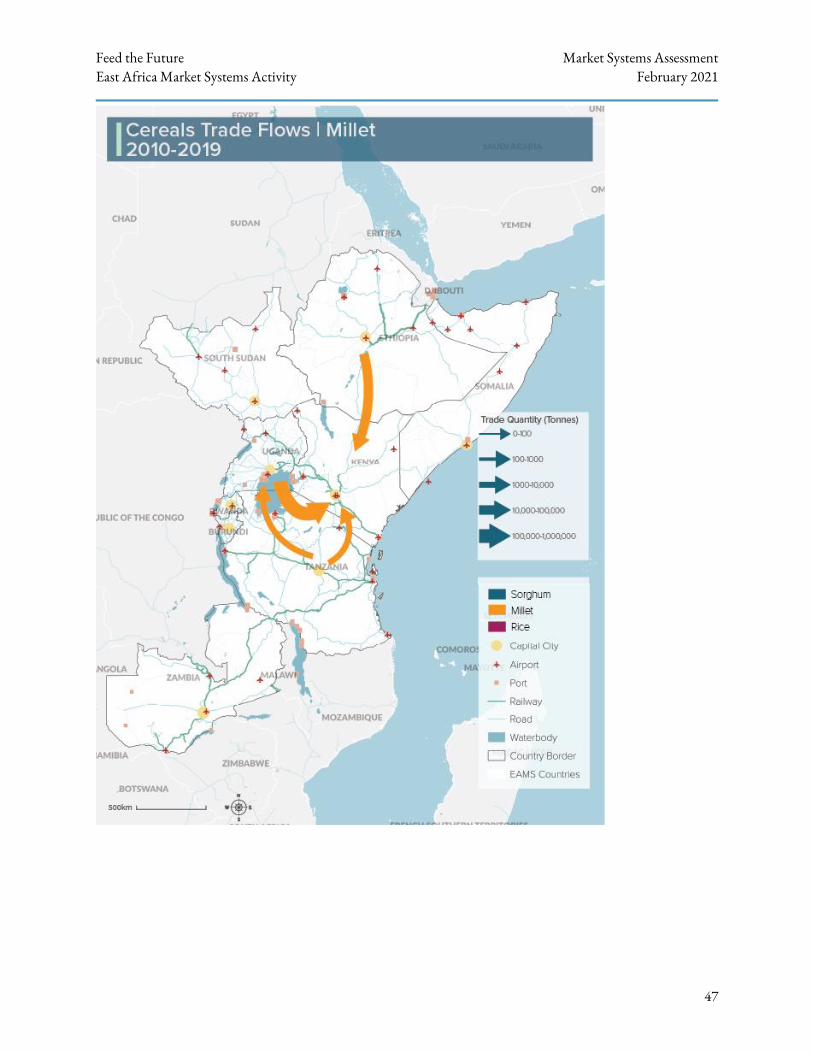
Feed the Future Market Systems Assessment East Africa Market Systems Activity February 2021
47
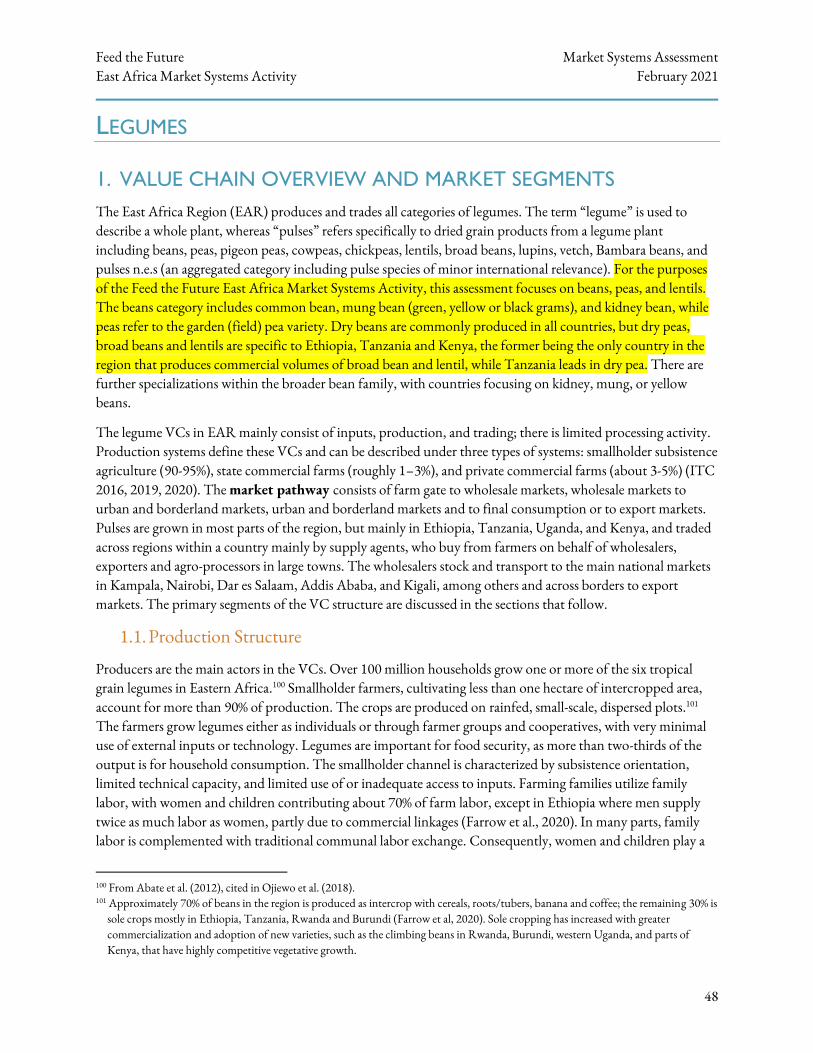
Feed the Future Market Systems Assessment East Africa Market Systems Activity February 2021
48
LEGUMES
1. VALUE CHAIN OVERVIEW AND MARKET SEGMENTS
The East Africa Region (EAR) produces and trades all categories of legumes. The term “legume” is used to describe a whole plant, whereas “pulses” refers specifically to dried grain products from a legume plant including beans, peas, pigeon peas, cowpeas, chickpeas, lentils, broad beans, lupins, vetch, Bambara beans, and pulses n.e.s (an aggregated category including pulse species of minor international relevance). For the purposes of the Feed the Future East Africa Market Systems Activity, this assessment focuses on beans, peas, and lentils. The beans category includes common bean, mung bean (green, yellow or black grams), and kidney bean, while peas refer to the garden (field) pea variety. Dry beans are commonly produced in all countries, but dry peas, broad beans and lentils are specific to Ethiopia, Tanzania and Kenya, the former being the only country in the region that produces commercial volumes of broad bean and lentil, while Tanzania leads in dry pea. There are further specializations within the broader bean family, with countries focusing on kidney, mung, or yellow beans.
The legume VCs in EAR mainly consist of inputs, production, and trading; there is limited processing activity. Production systems define these VCs and can be described under three types of systems: smallholder subsistence agriculture (90-95%), state commercial farms (roughly 1–3%), and private commercial farms (about 3-5%) (ITC 2016, 2019, 2020). The market pathway consists of farm gate to wholesale markets, wholesale markets to urban and borderland markets, urban and borderland markets and to final consumption or to export markets. Pulses are grown in most parts of the region, but mainly in Ethiopia, Tanzania, Uganda, and Kenya, and traded across regions within a country mainly by supply agents, who buy from farmers on behalf of wholesalers, exporters and agro-processors in large towns. The wholesalers stock and transport to the main national markets in Kampala, Nairobi, Dar es Salaam, Addis Ababa, and Kigali, among others and across borders to export markets. The primary segments of the VC structure are discussed in the sections that follow.
1.1. Production Structure
Producers are the main actors in the VCs. Over 100 million households grow one or more of the six tropical grain legumes in Eastern Africa.100 Smallholder farmers, cultivating less than one hectare of intercropped area, account for more than 90% of production. The crops are produced on rainfed, small-scale, dispersed plots.101 The farmers grow legumes either as individuals or through farmer groups and cooperatives, with very minimal use of external inputs or technology. Legumes are important for food security, as more than two-thirds of the output is for household consumption. The smallholder channel is characterized by subsistence orientation, limited technical capacity, and limited use of or inadequate access to inputs. Farming families utilize family labor, with women and children contributing about 70% of farm labor, except in Ethiopia where men supply twice as much labor as women, partly due to commercial linkages (Farrow et al., 2020). In many parts, family labor is complemented with traditional communal labor exchange. Consequently, women and children play a
100 From Abate et al. (2012), cited in Ojiewo et al. (2018). 101 Approximately 70% of beans in the region is produced as intercrop with cereals, roots/tubers, banana and coffee; the remaining 30% is
sole crops mostly in Ethiopia, Tanzania, Rwanda and Burundi (Farrow et al, 2020). Sole cropping has increased with greater commercialization and adoption of new varieties, such as the climbing beans in Rwanda, Burundi, western Uganda, and parts of Kenya, that have highly competitive vegetative growth.

Feed the Future Market Systems Assessment East Africa Market Systems Activity February 2021
49
prominent role in production, until the enterprise becomes commercially lucrative.102 Unlike smallholder farmers, large-scale producers generate large and consistent volumes because of advanced production technology, including use of irrigation, and easier access to finance. They are primarily focused on exports and large domestic end-markets, such as supermarket and grocery chains, institutional buyers, and processors. Within this category are the state commercial farms that focus on supplying government institutions, including national food reserves.
The two production channels are essential and complementary for the functioning of the VC in the region, and they ultimately define trading and other market activities. Commercial orientation is country- and commodity-specific, with a number of countries producing some pulses for export. These include dry peas and mung beans in Uganda, Tanzania, and Ethiopia. For common beans, the bulk of annual production (>80%) is retained for home use except in those same countries (Uganda, Tanzania, and Ethiopia). Examples of increased commercialization of beans include navy and red beans from the Central Rift Valley and southern Ethiopia, and red beans from western Uganda, Rwanda and eastern DR Congo that are exported to Kenya and Tanzania (Farrow et al, 2020).
1.2. Inputs Supply Structure
Because legumes production is predominantly subsistence, the use of external inputs is limited. The source of seed for planting is mainly informal, recycled, or farm-saved and, because of their nitrogen-fixing capabilities, very little fertilizer is applied. Fertilizer use on bean production is low, but adoption appears to be rising, especially in commercial production systems, like in Ethiopia. Furthermore, any equipment and tools used in production are supplied by local service providers – usually neighboring farmers. Consequently, the market for commercial inputs is too thin to attract many suppliers; therefore, the VCs have limited formal input supply systems. The few formal suppliers are national companies, government institutions, farmer cooperatives, NGOs and relief agencies, and small general agro-dealers. A majority of agro-dealers supply seeds and agro-chemicals to the few medium-technology commercial farmers, but maintain only limited stock for peak planting seasons.
1.3. Marketing Structure
An analysis of the marketing channels provides a systematic understanding of the flow of produce from source to final destinations. Like production, the marketing structure does not vary significantly across the pulse VCs or countries. Of the marketed grains, typically 10-35% by type and country, trade is mostly informal consisting of micro and small traders, intermediaries (supply agents), and some wholesalers buying at the farm-gate. Medium to large wholesalers, including aggregators and suppliers, wholesalers, and exporters, operate nationally and internationally, and source from supply agents.
The VC is characterized by long but unsophisticated supply chains with many intermediaries (variously known as middlemen, brokers, or supply agents). Marketing starts with collection of grains from the farm-gate and village markets (primary markets), followed by bulking and transport to local towns (secondary markets), and then on to terminal markets in major towns/cities (tertiary markets). The products pass successively through multiple market actors (the links) including a network of assemblers, retailers, wholesalers, farmers’ organizations, exporters, and processors operating at different stages along the value chain. These, and other intermediaries, constitute the supply chains linking producers with different end-users. About 20 marketing
102 In most countries, legumes are considered “woman’s crop” and, therefore, production attracts limited attention and investment by
men who control capital and assets, until they are proven commercially lucrative.
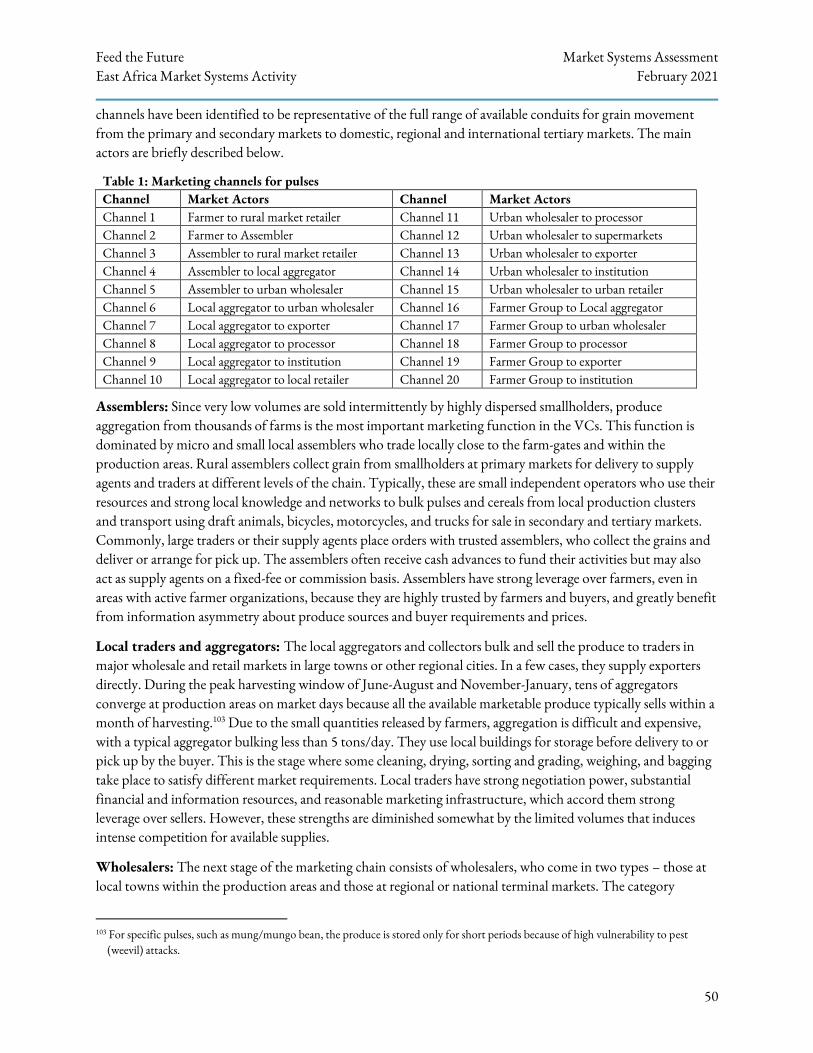
Feed the Future Market Systems Assessment East Africa Market Systems Activity February 2021
50
channels have been identified to be representative of the full range of available conduits for grain movement from the primary and secondary markets to domestic, regional and international tertiary markets. The main actors are briefly described below.
Table 1: Marketing channels for pulses Channel Market Actors Channel Market Actors Channel 1 Farmer to rural market retailer Channel 11 Urban wholesaler to processor Channel 2 Farmer to Assembler Channel 12 Urban wholesaler to supermarkets Channel 3 Assembler to rural market retailer Channel 13 Urban wholesaler to exporter Channel 4 Assembler to local aggregator Channel 14 Urban wholesaler to institution Channel 5 Assembler to urban wholesaler Channel 15 Urban wholesaler to urban retailer Channel 6 Local aggregator to urban wholesaler Channel 16 Farmer Group to Local aggregator Channel 7 Local aggregator to exporter Channel 17 Farmer Group to urban wholesaler Channel 8 Local aggregator to processor Channel 18 Farmer Group to processor Channel 9 Local aggregator to institution Channel 19 Farmer Group to exporter Channel 10 Local aggregator to local retailer Channel 20 Farmer Group to institution
Assemblers: Since very low volumes are sold intermittently by highly dispersed smallholders, produce aggregation from thousands of farms is the most important marketing function in the VCs. This function is dominated by micro and small local assemblers who trade locally close to the farm-gates and within the production areas. Rural assemblers collect grain from smallholders at primary markets for delivery to supply agents and traders at different levels of the chain. Typically, these are small independent operators who use their resources and strong local knowledge and networks to bulk pulses and cereals from local production clusters and transport using draft animals, bicycles, motorcycles, and trucks for sale in secondary and tertiary markets. Commonly, large traders or their supply agents place orders with trusted assemblers, who collect the grains and deliver or arrange for pick up. The assemblers often receive cash advances to fund their activities but may also act as supply agents on a fixed-fee or commission basis. Assemblers have strong leverage over farmers, even in areas with active farmer organizations, because they are highly trusted by farmers and buyers, and greatly benefit from information asymmetry about produce sources and buyer requirements and prices.
Local traders and aggregators: The local aggregators and collectors bulk and sell the produce to traders in major wholesale and retail markets in large towns or other regional cities. In a few cases, they supply exporters directly. During the peak harvesting window of June-August and November-January, tens of aggregators converge at production areas on market days because all the available marketable produce typically sells within a month of harvesting.103 Due to the small quantities released by farmers, aggregation is difficult and expensive, with a typical aggregator bulking less than 5 tons/day. They use local buildings for storage before delivery to or pick up by the buyer. This is the stage where some cleaning, drying, sorting and grading, weighing, and bagging take place to satisfy different market requirements. Local traders have strong negotiation power, substantial financial and information resources, and reasonable marketing infrastructure, which accord them strong leverage over sellers. However, these strengths are diminished somewhat by the limited volumes that induces intense competition for available supplies.
Wholesalers: The next stage of the marketing chain consists of wholesalers, who come in two types – those at local towns within the production areas and those at regional or national terminal markets. The category
103 For specific pulses, such as mung/mungo bean, the produce is stored only for short periods because of high vulnerability to pest
(weevil) attacks.
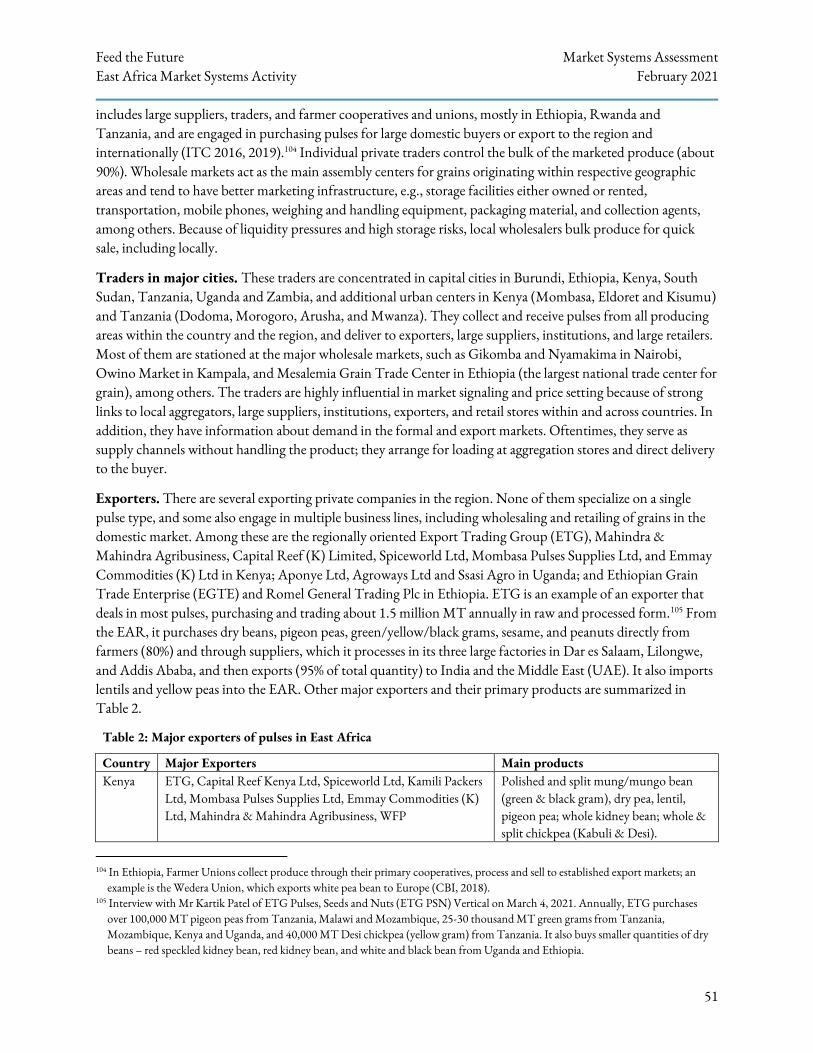
Feed the Future Market Systems Assessment East Africa Market Systems Activity February 2021
51
includes large suppliers, traders, and farmer cooperatives and unions, mostly in Ethiopia, Rwanda and Tanzania, and are engaged in purchasing pulses for large domestic buyers or export to the region and internationally (ITC 2016, 2019).104 Individual private traders control the bulk of the marketed produce (about 90%). Wholesale markets act as the main assembly centers for grains originating within respective geographic areas and tend to have better marketing infrastructure, e.g., storage facilities either owned or rented, transportation, mobile phones, weighing and handling equipment, packaging material, and collection agents, among others. Because of liquidity pressures and high storage risks, local wholesalers bulk produce for quick sale, including locally.
Traders in major cities. These traders are concentrated in capital cities in Burundi, Ethiopia, Kenya, South Sudan, Tanzania, Uganda and Zambia, and additional urban centers in Kenya (Mombasa, Eldoret and Kisumu) and Tanzania (Dodoma, Morogoro, Arusha, and Mwanza). They collect and receive pulses from all producing areas within the country and the region, and deliver to exporters, large suppliers, institutions, and large retailers. Most of them are stationed at the major wholesale markets, such as Gikomba and Nyamakima in Nairobi, Owino Market in Kampala, and Mesalemia Grain Trade Center in Ethiopia (the largest national trade center for grain), among others. The traders are highly influential in market signaling and price setting because of strong links to local aggregators, large suppliers, institutions, exporters, and retail stores within and across countries. In addition, they have information about demand in the formal and export markets. Oftentimes, they serve as supply channels without handling the product; they arrange for loading at aggregation stores and direct delivery to the buyer.
Exporters. There are several exporting private companies in the region. None of them specialize on a single pulse type, and some also engage in multiple business lines, including wholesaling and retailing of grains in the domestic market. Among these are the regionally oriented Export Trading Group (ETG), Mahindra & Mahindra Agribusiness, Capital Reef (K) Limited, Spiceworld Ltd, Mombasa Pulses Supplies Ltd, and Emmay Commodities (K) Ltd in Kenya; Aponye Ltd, Agroways Ltd and Ssasi Agro in Uganda; and Ethiopian Grain Trade Enterprise (EGTE) and Romel General Trading Plc in Ethiopia. ETG is an example of an exporter that deals in most pulses, purchasing and trading about 1.5 million MT annually in raw and processed form.105 From the EAR, it purchases dry beans, pigeon peas, green/yellow/black grams, sesame, and peanuts directly from farmers (80%) and through suppliers, which it processes in its three large factories in Dar es Salaam, Lilongwe, and Addis Ababa, and then exports (95% of total quantity) to India and the Middle East (UAE). It also imports lentils and yellow peas into the EAR. Other major exporters and their primary products are summarized in Table 2.
Table 2: Major exporters of pulses in East Africa
Country Major Exporters Main products Kenya ETG, Capital Reef Kenya Ltd, Spiceworld Ltd, Kamili Packers
Ltd, Mombasa Pulses Supplies Ltd, Emmay Commodities (K) Ltd, Mahindra & Mahindra Agribusiness, WFP
Polished and split mung/mungo bean (green & black gram), dry pea, lentil, pigeon pea; whole kidney bean; whole & split chickpea (Kabuli & Desi).
104 In Ethiopia, Farmer Unions collect produce through their primary cooperatives, process and sell to established export markets; an
example is the Wedera Union, which exports white pea bean to Europe (CBI, 2018). 105 Interview with Mr Kartik Patel of ETG Pulses, Seeds and Nuts (ETG PSN) Vertical on March 4, 2021. Annually, ETG purchases
over 100,000 MT pigeon peas from Tanzania, Malawi and Mozambique, 25-30 thousand MT green grams from Tanzania, Mozambique, Kenya and Uganda, and 40,000 MT Desi chickpea (yellow gram) from Tanzania. It also buys smaller quantities of dry beans – red speckled kidney bean, red kidney bean, and white and black bean from Uganda and Ethiopia.
Feed the Future Market Systems Assessment East Africa Market Systems Activity February 2021
52
Uganda Aponye Ltd, Azacom Ltd, Africot Trading Company Ltd, Link N Global Commodity (U) Ltd, Discovery Trading (U) Ltd, Lola Exports Smc Ltd, Ssasi Agro (U) - Smc Ltd, Ugagrains Ltd, Lota Agro Processors Ltd, Nkoola Agencies International Ltd, WFP
Red kidney beans (speckled & light); polished mung bean
Ethiopia Ethiopian Grain Trade Enterprise (EGTE), Romel General Trading PLC, Tamrin International Trading PLC, Filimon Import & Export International, Agrozan International Trading PLC, Zablom, Ambasel
Red kidney bean; Faba bean; polished & split mung bean, chickpea, dry pea, and lentil
Tanzania ETG Tanzania, S.M. Holdings Ltd, BFJKR Investment Ltd, Global Agro Exports (T) Ltd, McWillis Agricbased Enterprise
Yellow kidney bean; sugar bean; polished & split mung bean, chickpea, dry pea, & pigeon pea
Market brokers. One key link in the marketing chain is the broker, also called supply agent. Transactions along the supply chain are facilitated by broker arbitrage that coordinates inter-market flow. Brokers identify buyers, sell on behalf of local wholesalers, and collect and send back money to local traders. They are in constant communication with their clients to relay market information and intelligence, and to take orders. The counterpart to the market brokers in the formal channel are the nascent national commodity exchanges, including the Ethiopia Commodity Exchange (ECX), East Africa Commodity Exchange (EAX) in Rwanda, Tanzania Mercantile Exchange (TMX), and Zambia Agricultural Commodity Exchange (ZAMACE). Other regional online commodity brokerage platforms include EAGC’s GSoko.
Retailers. The retailing segment, both rural and urban, sell small quantities of grains with varying types and quality, procured from diverse sources, including wholesalers and small traders. The retailers perform the most important role in selling pulses to the final consumer. They are categorized into village market retailers, district market retailers, sub-regional market retailers, and national retailers. An overwhelming majority of these retailers are women traders.
1.4. Processing Structure
Processing of pulses is limited in the region because the largest consumer demand is for whole grains. Only a few processors in each country are engaged in primary processing, such as dehulling, splitting, milling and packaging of mung bean, dry pea, pigeon pea, chickpea, and lentil. ETG is the single largest processor of pulses in the region with large plants in Tanzania, Ethiopia, and Malawi. A few small- and medium-scale processors perform dehulling and splitting for high-end markets, mostly located in Ethiopia and Kenya, with nascent activity in Uganda. In Kenya, the large processors include Spiceworld Ltd, Kamili Packers Ltd (KPL), Capwell Industries Ltd (CIL), and Unga Ltd. In Ethiopia, large processors include the East Africa and Green Star Food Company (canning), which specialize in chickpea (CBI, 2018; Faffa Co. website). Small-scale pulses flour milling occurs mostly in Ethiopia, Rwanda, Tanzania and Kenya; in Kenya, flour processors include KPL (gram and urad flour) and Spiceworld (gram flour).106 While there are numerous medium and small-scale processors at the tertiary markets, their numbers, scale of operation and end-markets are less understood. Most of them process small quantities into flour and paste for blending into specialty foods that are sold to supermarkets or directly to consumers through small outlets in urban areas. An example is Faffa Food Share Company (Ethiopia) that uses
106 Flour of pulses: on average, the region exported about 415 MT of pulses flours from Ethiopia (62%) and Rwanda (34%), and
imported 10,371 MT (94% to Somalia) (ITC, 2021).
Feed the Future Market Systems Assessment East Africa Market Systems Activity February 2021
53
chickpea paste in blending baby food.107 Apart from ETG, most processors do not engage directly with farmers but instead rely on suppliers, large traders, and large-scale farmers.
Table 3: Major processors of pulses in East Africa
Country Major Exporters Main products
Kenya Spiceworld Ltd, Kamili Packers Ltd, Capwell Industries, Unga Ltd
All process and package polished/sortex whole dried beans, green/black gram, pea, cowpea, lentil, chickpea; Spiceworld & KPL process split green/black gram, dry pea, lentil, pigeon pea, chickpea (kabuli & desi) into chana dal, moong dal, masoor dal, urad dal, toordal, muter dal, etc., and gram and urad flour
Ethiopia Faffa Food Company, Green Star Food Company
Canned chickpea; split chickpea, dry pea, lentil
Tanzania ETG Tanzania, S.M. Holdings Ltd Whole chickpea, dry pea, pigeon pea; polished & split mung bean, chickpea, dry pea, pigeon pea
1.5. Value Chain Supporters and Influencers
In addition to the direct participants, there are VC supporters and influencers that make up the larger agricultural market system, including from the private and public sectors, development partners, and NGOs. Some of these actors are highlighted in Table 4 below.
Table 4. VC Supporters and Influencers
Actor Role Selected Actors
Chain Influencers
– Public and private
➢ National Agricultural Research System (NARS), Regional ARS, CGIAR: serves as reference research centers for pulses.
➢ Ministries of Agriculture, Trade, Industry, Transport, and Finance & Planning: responsible for production, marketing, trade, infrastructure, policy/regulation, financing, etc.
➢ Central Banks & Revenue Authorities ➢ RECs: EAC, COMESA, AfCFTA, SADC ➢ Ethiopian Pulses, Oilseeds and Spices Processors-Exporters Association (EPOSPEA). ➢ Chambers of Commerce ➢ Ethiopian Pulse Council ➢ Tanzania Pulse Concil ➢ East Africa Grain Council (EAGC)
Chain Supporters
- Financers, development organizations and projects
➢ Financial institutions (banks and micro finances) ➢ Supporting Indian Trade to Africa (SITA), a UKAID program to promote trade between east Africa
and India implemented by the International Trade Center(ITC), and focusing on the promotion of pulses, spices and oilseeds exports.
➢ AGRA ➢ FAO
107 See Faffa’s website at https://www.faffafood.com/products/
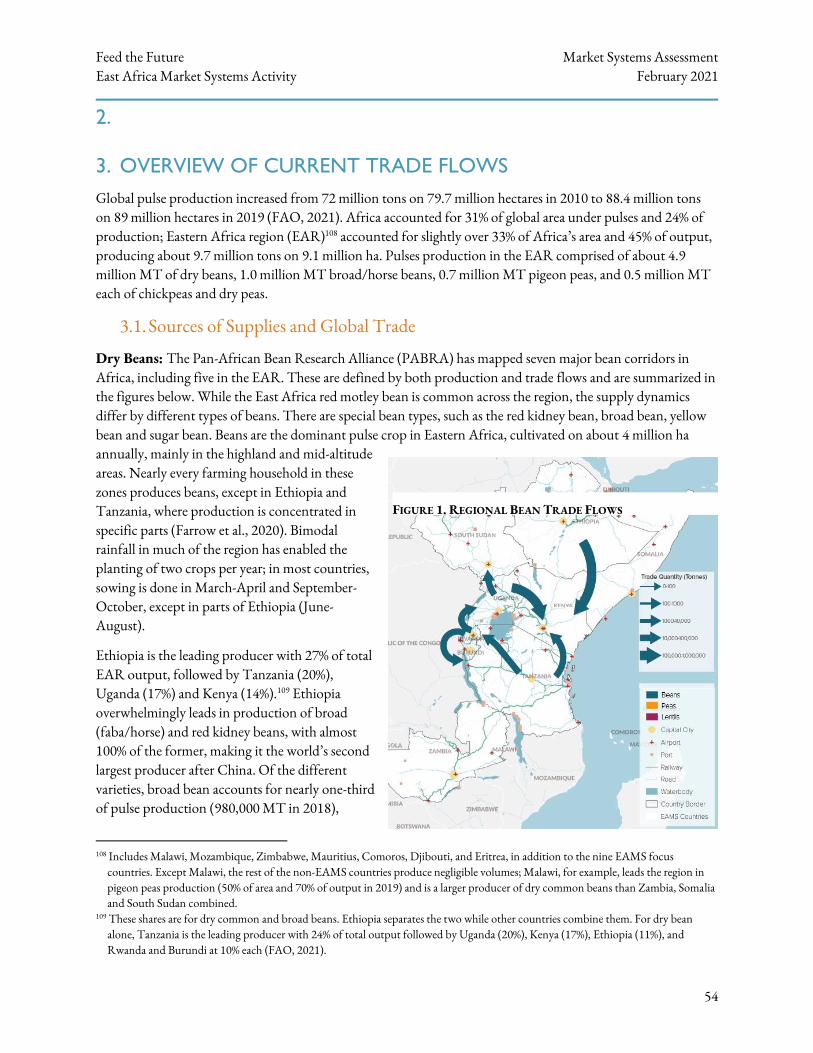
Feed the Future Market Systems Assessment East Africa Market Systems Activity February 2021
54
2.
3. OVERVIEW OF CURRENT TRADE FLOWS
Global pulse production increased from 72 million tons on 79.7 million hectares in 2010 to 88.4 million tons on 89 million hectares in 2019 (FAO, 2021). Africa accounted for 31% of global area under pulses and 24% of production; Eastern Africa region (EAR)108 accounted for slightly over 33% of Africa’s area and 45% of output, producing about 9.7 million tons on 9.1 million ha. Pulses production in the EAR comprised of about 4.9 million MT of dry beans, 1.0 million MT broad/horse beans, 0.7 million MT pigeon peas, and 0.5 million MT each of chickpeas and dry peas.
3.1. Sources of Supplies and Global Trade
Dry Beans: The Pan-African Bean Research Alliance (PABRA) has mapped seven major bean corridors in Africa, including five in the EAR. These are defined by both production and trade flows and are summarized in the figures below. While the East Africa red motley bean is common across the region, the supply dynamics differ by different types of beans. There are special bean types, such as the red kidney bean, broad bean, yellow bean and sugar bean. Beans are the dominant pulse crop in Eastern Africa, cultivated on about 4 million ha annually, mainly in the highland and mid-altitude areas. Nearly every farming household in these zones produces beans, except in Ethiopia and Tanzania, where production is concentrated in specific parts (Farrow et al., 2020). Bimodal rainfall in much of the region has enabled the planting of two crops per year; in most countries, sowing is done in March-April and September-October, except in parts of Ethiopia (June-August).
Ethiopia is the leading producer with 27% of total EAR output, followed by Tanzania (20%), Uganda (17%) and Kenya (14%).109 Ethiopia overwhelmingly leads in production of broad (faba/horse) and red kidney beans, with almost 100% of the former, making it the world’s second largest producer after China. Of the different varieties, broad bean accounts for nearly one-third of pulse production (980,000 MT in 2018),
108 Includes Malawi, Mozambique, Zimbabwe, Mauritius, Comoros, Djibouti, and Eritrea, in addition to the nine EAMS focus
countries. Except Malawi, the rest of the non-EAMS countries produce negligible volumes; Malawi, for example, leads the region in pigeon peas production (50% of area and 70% of output in 2019) and is a larger producer of dry common beans than Zambia, Somalia and South Sudan combined.
109 These shares are for dry common and broad beans. Ethiopia separates the two while other countries combine them. For dry bean alone, Tanzania is the leading producer with 24% of total output followed by Uganda (20%), Kenya (17%), Ethiopia (11%), and Rwanda and Burundi at 10% each (FAO, 2021).
FIGURE 1. REGIONAL BEAN TRADE FLOWS
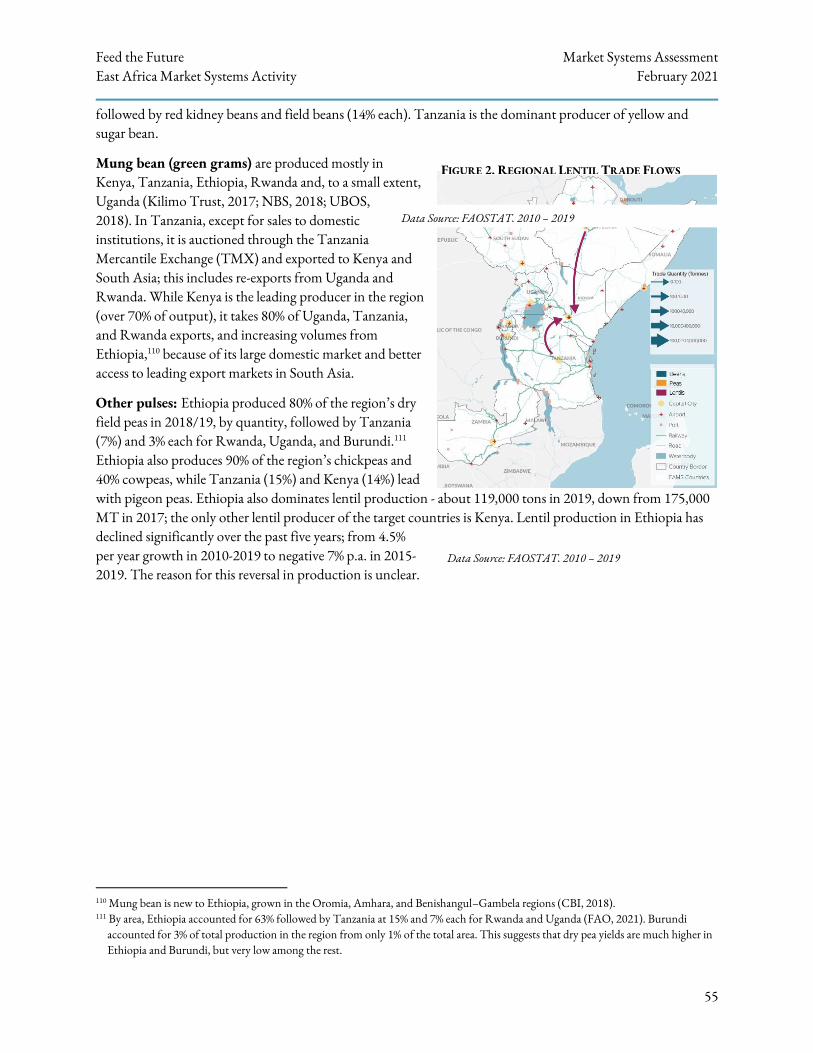
Feed the Future Market Systems Assessment East Africa Market Systems Activity February 2021
55
followed by red kidney beans and field beans (14% each). Tanzania is the dominant producer of yellow and sugar bean.
Mung bean (green grams) are produced mostly in Kenya, Tanzania, Ethiopia, Rwanda and, to a small extent, Uganda (Kilimo Trust, 2017; NBS, 2018; UBOS, 2018). In Tanzania, except for sales to domestic institutions, it is auctioned through the Tanzania Mercantile Exchange (TMX) and exported to Kenya and South Asia; this includes re-exports from Uganda and Rwanda. While Kenya is the leading producer in the region (over 70% of output), it takes 80% of Uganda, Tanzania, and Rwanda exports, and increasing volumes from Ethiopia,110 because of its large domestic market and better access to leading export markets in South Asia.
Other pulses: Ethiopia produced 80% of the region’s dry field peas in 2018/19, by quantity, followed by Tanzania (7%) and 3% each for Rwanda, Uganda, and Burundi.111 Ethiopia also produces 90% of the region’s chickpeas and 40% cowpeas, while Tanzania (15%) and Kenya (14%) lead with pigeon peas. Ethiopia also dominates lentil production - about 119,000 tons in 2019, down from 175,000 MT in 2017; the only other lentil producer of the target countries is Kenya. Lentil production in Ethiopia has declined significantly over the past five years; from 4.5% per year growth in 2010-2019 to negative 7% p.a. in 2015-2019. The reason for this reversal in production is unclear.
110 Mung bean is new to Ethiopia, grown in the Oromia, Amhara, and Benishangul–Gambela regions (CBI, 2018). 111 By area, Ethiopia accounted for 63% followed by Tanzania at 15% and 7% each for Rwanda and Uganda (FAO, 2021). Burundi
accounted for 3% of total production in the region from only 1% of the total area. This suggests that dry pea yields are much higher in Ethiopia and Burundi, but very low among the rest.
FIGURE 2. REGIONAL LENTIL TRADE FLOWS
Data Source: FAOSTAT, 2010 – 2019
Data Source: FAOSTAT, 2010 – 2019
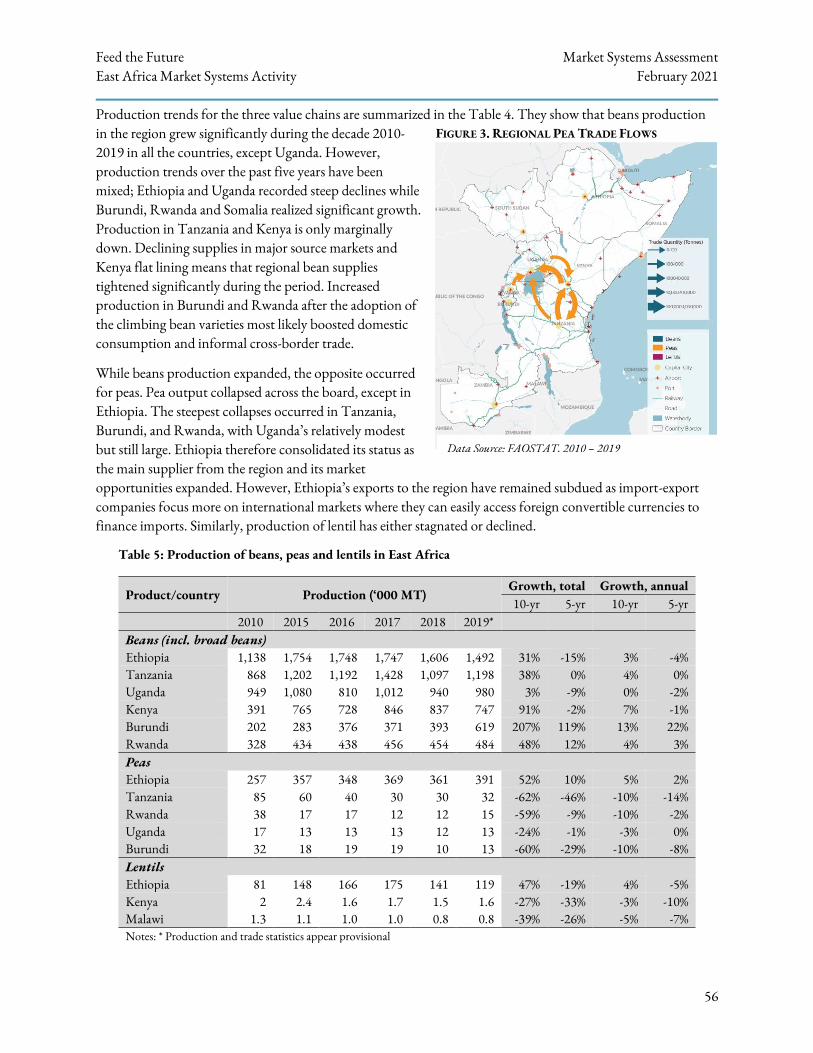
Feed the Future Market Systems Assessment East Africa Market Systems Activity February 2021
56
Production trends for the three value chains are summarized in the Table 4. They show that beans production in the region grew significantly during the decade 2010-2019 in all the countries, except Uganda. However, production trends over the past five years have been mixed; Ethiopia and Uganda recorded steep declines while Burundi, Rwanda and Somalia realized significant growth. Production in Tanzania and Kenya is only marginally down. Declining supplies in major source markets and Kenya flat lining means that regional bean supplies tightened significantly during the period. Increased production in Burundi and Rwanda after the adoption of the climbing bean varieties most likely boosted domestic consumption and informal cross-border trade.
While beans production expanded, the opposite occurred for peas. Pea output collapsed across the board, except in Ethiopia. The steepest collapses occurred in Tanzania, Burundi, and Rwanda, with Uganda’s relatively modest but still large. Ethiopia therefore consolidated its status as the main supplier from the region and its market opportunities expanded. However, Ethiopia’s exports to the region have remained subdued as import-export companies focus more on international markets where they can easily access foreign convertible currencies to finance imports. Similarly, production of lentil has either stagnated or declined.
Table 5: Production of beans, peas and lentils in East Africa
Product/country Production (‘000 MT) Growth, total Growth, annual 10-yr 5-yr 10-yr 5-yr
2010 2015 2016 2017 2018 2019* Beans (incl. broad beans) Ethiopia 1,138 1,754 1,748 1,747 1,606 1,492 31% -15% 3% -4% Tanzania 868 1,202 1,192 1,428 1,097 1,198 38% 0% 4% 0% Uganda 949 1,080 810 1,012 940 980 3% -9% 0% -2% Kenya 391 765 728 846 837 747 91% -2% 7% -1% Burundi 202 283 376 371 393 619 207% 119% 13% 22% Rwanda 328 434 438 456 454 484 48% 12% 4% 3% Peas Ethiopia 257 357 348 369 361 391 52% 10% 5% 2% Tanzania 85 60 40 30 30 32 -62% -46% -10% -14% Rwanda 38 17 17 12 12 15 -59% -9% -10% -2% Uganda 17 13 13 13 12 13 -24% -1% -3% 0% Burundi 32 18 19 19 10 13 -60% -29% -10% -8% Lentils Ethiopia 81 148 166 175 141 119 47% -19% 4% -5% Kenya 2 2.4 1.6 1.7 1.5 1.6 -27% -33% -3% -10% Malawi 1.3 1.1 1.0 1.0 0.8 0.8 -39% -26% -5% -7% Notes: * Production and trade statistics appear provisional
Data Source: FAOSTAT, 2010 – 2019
FIGURE 3. REGIONAL PEA TRADE FLOWS
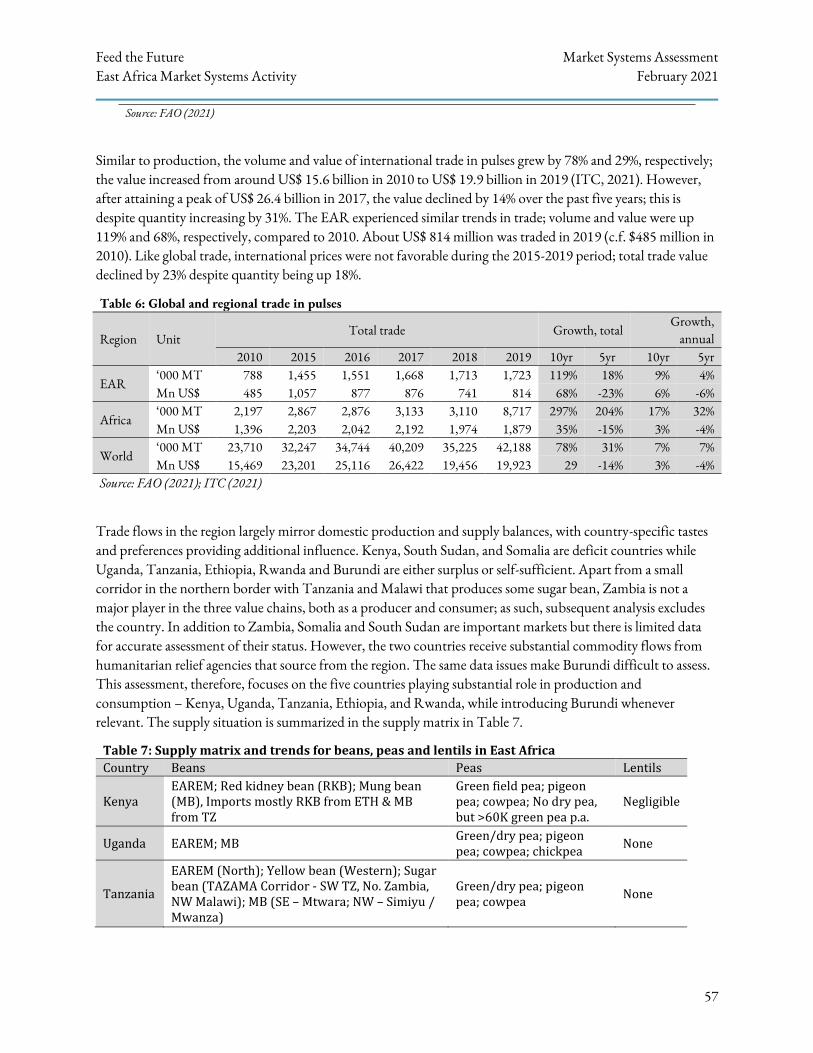
Feed the Future Market Systems Assessment East Africa Market Systems Activity February 2021
57
Source: FAO (2021)
Similar to production, the volume and value of international trade in pulses grew by 78% and 29%, respectively; the value increased from around US$ 15.6 billion in 2010 to US$ 19.9 billion in 2019 (ITC, 2021). However, after attaining a peak of US$ 26.4 billion in 2017, the value declined by 14% over the past five years; this is despite quantity increasing by 31%. The EAR experienced similar trends in trade; volume and value were up 119% and 68%, respectively, compared to 2010. About US$ 814 million was traded in 2019 (c.f. $485 million in 2010). Like global trade, international prices were not favorable during the 2015-2019 period; total trade value declined by 23% despite quantity being up 18%.
Table 6: Global and regional trade in pulses
Region Unit Total trade Growth, total
Growth, annual
2010 2015 2016 2017 2018 2019 10yr 5yr 10yr 5yr
EAR ‘000 MT 788 1,455 1,551 1,668 1,713 1,723 119% 18% 9% 4% Mn US$ 485 1,057 877 876 741 814 68% -23% 6% -6%
Africa ‘000 MT 2,197 2,867 2,876 3,133 3,110 8,717 297% 204% 17% 32% Mn US$ 1,396 2,203 2,042 2,192 1,974 1,879 35% -15% 3% -4%
World ‘000 MT 23,710 32,247 34,744 40,209 35,225 42,188 78% 31% 7% 7% Mn US$ 15,469 23,201 25,116 26,422 19,456 19,923 29 -14% 3% -4%
Source: FAO (2021); ITC (2021)
Trade flows in the region largely mirror domestic production and supply balances, with country-specific tastes and preferences providing additional influence. Kenya, South Sudan, and Somalia are deficit countries while Uganda, Tanzania, Ethiopia, Rwanda and Burundi are either surplus or self-sufficient. Apart from a small corridor in the northern border with Tanzania and Malawi that produces some sugar bean, Zambia is not a major player in the three value chains, both as a producer and consumer; as such, subsequent analysis excludes the country. In addition to Zambia, Somalia and South Sudan are important markets but there is limited data for accurate assessment of their status. However, the two countries receive substantial commodity flows from humanitarian relief agencies that source from the region. The same data issues make Burundi difficult to assess. This assessment, therefore, focuses on the five countries playing substantial role in production and consumption – Kenya, Uganda, Tanzania, Ethiopia, and Rwanda, while introducing Burundi whenever relevant. The supply situation is summarized in the supply matrix in Table 7.
Table 7: Supply matrix and trends for beans, peas and lentils in East Africa
Country Beans Peas Lentils
Kenya EAREM; Red kidney bean (RKB); Mung bean (MB), Imports mostly RKB from ETH & MB from TZ
Green field pea; pigeon pea; cowpea; No dry pea, but >60K green pea p.a.
Negligible
Uganda EAREM; MB Green/dry pea; pigeon pea; cowpea; chickpea
None
Tanzania
EAREM (North); Yellow bean (Western); Sugar bean (TAZAMA Corridor - SW TZ, No. Zambia, NW Malawi); MB (SE – Mtwara; NW – Simiyu / Mwanza)
Green/dry pea; pigeon pea; cowpea
None

Feed the Future Market Systems Assessment East Africa Market Systems Activity February 2021
58
Ethiopia RKB (SW); faba/horse bean & MB (Central & NW)
Dry pea; chickpea; cowpea Large
Rwanda EAREM; MB Green/dry pea None
Burundi EAREM; Yellow (NE border with TZ) Green/dry pea None
Notes: EAREM - East Africa red mottled beans; TAZAMA – Tanzania, Zambia and Malawi; SW – Southwest; NW – Northwest; NE – Northeast; M – Imports; X – Exports Source: PABRA Bean Corridors Summary; NBS (2018)
In terms of trade balance, the region is a net exporter of most grain legumes. The largest trade surpluses are recorded for pigeon peas, chickpeas, mung beans, and kidney beans. Apart from a one-off deficit in 2017, the region increased its trade surplus in dry beans, from US$ 1.1 million in 2014 to US$ 9.6 million in 2019. The surplus, however, was a significant erosion from the peak attained in 2015 and 2016. In contrast, the region reversed its surplus status in dried peas in 2017, a trend that has persisted. The worsening trade balance in peas reflects the sharp declines in production discussed above. The twin trends of declining production and worsening trade balance strongly suggest that, rather than curtailing consumption, the region turned to international markets to bridge supply deficits.
3.2. Legumes Exports
Markets and trade for legumes in East Africa differ depending on supply availability and consumption. Kenya, South Sudan, and Somalia are deficit countries that attract inflows from the region and, to a limited extent, internationally. In contrast, Uganda, Tanzania, Ethiopia, Rwanda, and Burundi are either self-sufficient or surplus countries. Ethiopia is among global top exporters of faba beans (#6), mung beans (#7), kidney beans (#8), and chickpeas (#13). Similar to national markets, regional trade in legumes is largely informal and unorganized, which makes official trade data an underestimation of the true picture. ITC data show that Ethiopia exported 94,374 MT of kidney beans in 2019, valued at US$ 44.5 million, with Kenya overtaking India as the largest market. Mung bean followed at 38,468 MT, mostly to Indonesia and Kenya (13,145 MT), then Faba bean at 17,631 MT, mostly to Egypt, the world’s largest importer of the bean, and none to EAR.
In line with production, trade data shows that dry bean is by far the most exported product in the region, with peas and lentils playing only minor roles. Similar to production volumes, the leading exporters of beans are Uganda, Ethiopia and Tanzania; Kenya, despite being a major producer, exports little because of its large domestic consumer market. While beans exports have steadily increased in Uganda and Tanzania, significant declines occurred in Ethiopia and Kenya – 18% and 67%, respectively. These trends are partly attributable to increased domestic demand and decreased output; Uganda is an exception, having increased exports despite significant output declines. Rwanda is emerging as a major player in beans export, with quantities growing at 33% annually over the past five years. For lentils, the data suggests that despite increasing deficits, trade activity in the region is minimal. Since 2015, the EAR has recorded supply deficits ranging from 1,800 to 10,500 MT; the latter largely driven by what appears to be unusually large imports in 2019, the bulk of which was recorded in Kenya and Ethiopia. The case of Ethiopia is particularly interesting because, despite being the largest producer in the region, exports have ceased and imports increased.
3.3. Intraregional Trade in Grain Legumes
Sources of imports into East Africa. Uganda, USA and Tanzania are the leading sources of pulses imported into the region, combining for about 80% of total value. Uganda is the single largest source for the region with about two-thirds of import value in 2019; this was a significant increase from the 45% attained in 2015. The
Feed the Future Market Systems Assessment East Africa Market Systems Activity February 2021
59
USA contributed about 10%, with its share declining from 20% in 2015. The only other notable exporter from the region is Ethiopia, at 3%. Overall, intra-regional imports increased from 55% in 2015 to 77% in 2018. The EAC pulses imports are mostly dry beans, which accounted for about 60% of total value in 2018, followed by dry peas (20%) and green grams (5%). For the leading importer, beans constituted 65% of the total value, followed by dry peas and green grams at 20% and 6%, respectively.
Destination for exports from East Africa. Kenya, India and Pakistan are the leading destinations for pulses exports from the region, combining for about 70% of total value. In Tier 2 are UAE, Sudan and Uganda. Other notable destinations are Tanzania, South Sudan, DRC, Burundi and Rwanda. The share of intra-regional pulses exports increased from 17% in 2015 to 37% in 2018. Dry beans and green grams were the leading exports, at US$ 70 million and US$ 49 million, respectively (about 50% of total). The data shows that exports of dry peas collapsed in 2017, recording a value 77% lower than 2015; this is the same year the region registered its first trade deficit of US$ 23 million. It coincided with significant declines in output from Tanzania and Rwanda.
The increasing intra-regional trade clearly suggests that countries in the region are increasingly finding value in trading with each other. By individual countries, Tanzania and Uganda are the leading exporters of pulses from the EAC, accounting for about 80% of the total value in 2018. Both countries trade mostly in beans of different types, including green grams. Kenya receives the bulk of the pulses from the region, taking about four-fifth of total value, followed by Tanzania.
Informal trade. Informal cross border trade (ICBT) thrives in the East Africa region due to supply/demand differences across countries and highly integrated borderlands. Because of lack of attention by public institutions and relatively lower trade volumes compared to cereals, ICBT in pulses is often equal to or higher than formal trade. ICBT plays an important role in food security in the region, especially for the landlocked borderlands. According to Bhan (2016) and Titeca (2020), informal trade tends to reflect national comparative or development advantages; often, the more economically advanced countries send manufactured goods in exchange for agricultural or natural products. Other drivers are localized due to differential development and isolation within countries. Among the pulses, dry beans are the most traded across the borders. According to FEWS NET, on average, the EAR informally traded about 320,000 MT of dry beans annually between 2018 and 2020. Uganda accounted for about 60% with 15% from Ethiopia. Other notable informal exporters are Tanzania and Rwanda. Over 95% of the informal beans trade went to Kenya and South Sudan.
Key border points. Formal and informal trade occurs across hundreds of border points, both official and unofficial. The region is teeming with hundreds of border crossing points that are highly porous and ungoverned.112 Several border points have been identified according to their relative importance to regional trade. Niti Bhan (2016) identified about 18 major boundaries stretching from Sudan to Tanzania. These are major power centers because of location on major trade routes and abundance in natural and human resources. The economic scale and reach of these borderlands through the rich web of trader networks is vast. There is also trade activities centered around key refugee camps at specific borders, such as western Tanzania, eastern DRC, northern Kenya, northern Uganda, and northwestern Zambia.
The key regional trade corridors include the following:
112 The entire West Nile region of Uganda, for example, from Nebbi, Paidha, Arua to Koboko has over 300 cross border trade routes,
with Arua alone having about 100.
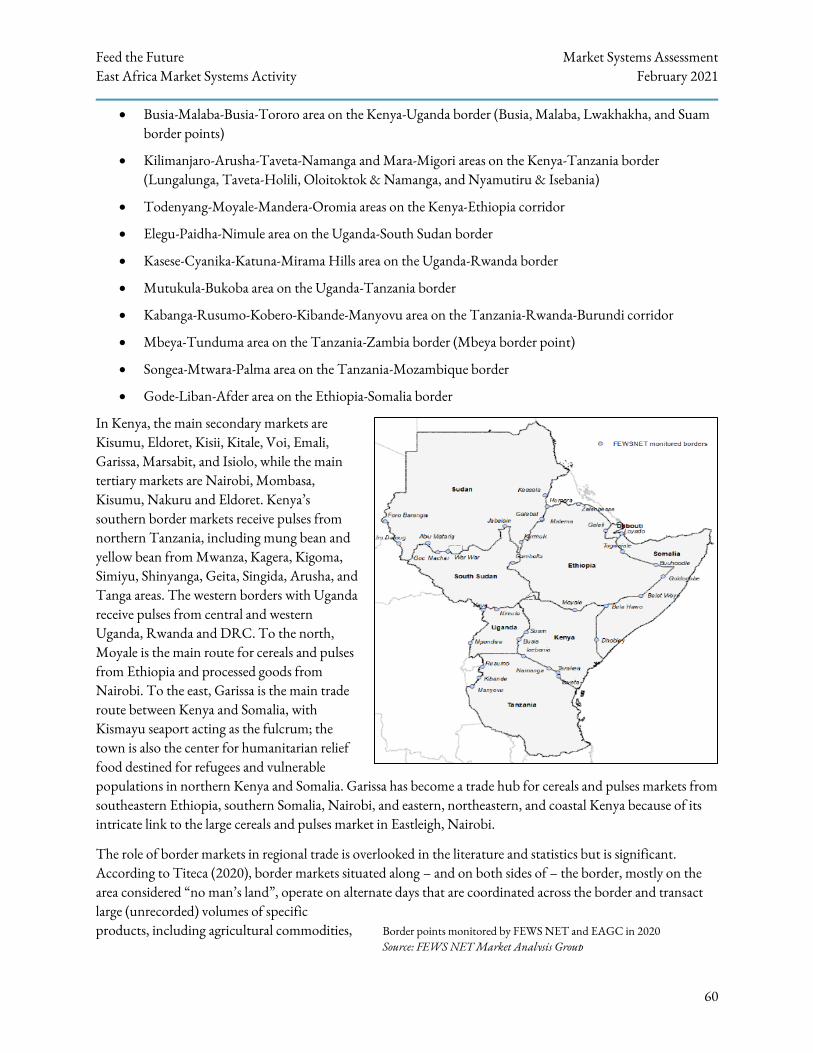
Feed the Future Market Systems Assessment East Africa Market Systems Activity February 2021
60
• Busia-Malaba-Busia-Tororo area on the Kenya-Uganda border (Busia, Malaba, Lwakhakha, and Suam border points)
• Kilimanjaro-Arusha-Taveta-Namanga and Mara-Migori areas on the Kenya-Tanzania border (Lungalunga, Taveta-Holili, Oloitoktok & Namanga, and Nyamutiru & Isebania)
• Todenyang-Moyale-Mandera-Oromia areas on the Kenya-Ethiopia corridor
• Elegu-Paidha-Nimule area on the Uganda-South Sudan border
• Kasese-Cyanika-Katuna-Mirama Hills area on the Uganda-Rwanda border
• Mutukula-Bukoba area on the Uganda-Tanzania border
• Kabanga-Rusumo-Kobero-Kibande-Manyovu area on the Tanzania-Rwanda-Burundi corridor
• Mbeya-Tunduma area on the Tanzania-Zambia border (Mbeya border point)
• Songea-Mtwara-Palma area on the Tanzania-Mozambique border
• Gode-Liban-Afder area on the Ethiopia-Somalia border
In Kenya, the main secondary markets are Kisumu, Eldoret, Kisii, Kitale, Voi, Emali, Garissa, Marsabit, and Isiolo, while the main tertiary markets are Nairobi, Mombasa, Kisumu, Nakuru and Eldoret. Kenya’s southern border markets receive pulses from northern Tanzania, including mung bean and yellow bean from Mwanza, Kagera, Kigoma, Simiyu, Shinyanga, Geita, Singida, Arusha, and Tanga areas. The western borders with Uganda receive pulses from central and western Uganda, Rwanda and DRC. To the north, Moyale is the main route for cereals and pulses from Ethiopia and processed goods from Nairobi. To the east, Garissa is the main trade route between Kenya and Somalia, with Kismayu seaport acting as the fulcrum; the town is also the center for humanitarian relief food destined for refugees and vulnerable populations in northern Kenya and Somalia. Garissa has become a trade hub for cereals and pulses markets from southeastern Ethiopia, southern Somalia, Nairobi, and eastern, northeastern, and coastal Kenya because of its intricate link to the large cereals and pulses market in Eastleigh, Nairobi.
The role of border markets in regional trade is overlooked in the literature and statistics but is significant. According to Titeca (2020), border markets situated along – and on both sides of – the border, mostly on the area considered “no man’s land”, operate on alternate days that are coordinated across the border and transact large (unrecorded) volumes of specific products, including agricultural commodities, Border points monitored by FEWS NET and EAGC in 2020
Source: FEWS NET Market Analysis Group
Feed the Future Market Systems Assessment East Africa Market Systems Activity February 2021
61
such as grain cereals and pulses. Each border is its own ecosystem, with particular understandings of the relevant regulatory frameworks. Border crossing arrangements are very much localized, not standardized, and informal. The quantity of consignments generally determines the formality of tax. Political and security connections play an important role in the payment of taxes, particularly for medium- and large-scale traders. The better connected, the less tax needs to be paid.
4. REGIONAL GROWTH POTENTIAL
The EAR provides tremendous market opportunities for pulses grains and products. Specific drivers of this regional growth potential include:
Growing regional consumption. The internal market within the EAR is very large because of large and growing population and high consumption of pulses. The region’s domestic market of 350 million people (projected to reach 450 million in 2030) and a GDP of about US$ 426 billion anchor the pulses market. According to PABRA, per capita bean consumption in the region is the highest in the world, with people in major consuming regions in western Kenya, Rwanda and Burundi eating large quantities as pulses provide an affordable source of protein and other nutrients. On average, about 24 kg of pulses are consumed per person annually in the region, the bulk of which is dry beans. Rwanda and Burundi are the leading consumers of beans in the region and globally. These two countries consume more than twice the next country – Uganda and Tanzania, and nearly three times the EAR average, and their consumption increased in the recent past. Uganda is the only country to record large declines in per capita consumption over the past decade; the country has significantly increased exports of beans amidst stagnant or declining output and negligible imports. It means that Uganda’s domestic supply availability has deteriorated considerably.
Among the major producers, Ethiopia consumes the least amounts of dry beans per capita – about 2 kg; the country however compensates for this by consuming large amounts of broad beans – about 9 kg/capita p.a. The data further suggests that consumption of peas is low in all the countries; only Ethiopia and Tanzania consume modest amounts, about 3 kg. Kenya also consumes reasonable amounts of peas, but in the form of green peas (about 1.2 kg/capita), which also includes unrecorded green peas dried and retained for home consumption.113 In addition to peas and beans, the region also consumes several other legumes, including cowpeas, pigeon peas and chickpeas. Kenya and Ethiopia are unique cases where the per capita consumption of other pulses is as high as beans. In Kenya, the bulk of the consumption is cowpeas and pigeon peas, while in Ethiopia it is mostly chickpeas, cowpeas, vetches, and lentils. Tanzania also produces and consumes large amounts of cowpeas, pigeon peas and chickpeas.
Consumer preferences, tastes and trends are rapidly changing toward pulses, which are valuable and affordable protein replacement for meat-based products. There is a growing social, nutritional, health and environment trend across the world as consumers look for alternative sources to supplement protein requirements.
Import substitution and value addition. The region is estimated to have recorded a supply deficit in dry peas of approximately 80,000 MT in 2020, which is projected to grow at 12% p.a. to about 250,000 MT by 2030. Similarly, lentil supply deficit is expected to increase to about 90,000 MT by 2030. These represent market opportunities for expanded production of peas and lentils in the region to bridge the deficit. The opportunity
113 For example, Kenya, respectively, produced, exported and consumed 73,000 MT, 5000 MT, and 64,000 MT of green peas in 2019 (FAO, 2021).
Feed the Future Market Systems Assessment East Africa Market Systems Activity February 2021
62
for import substitution is further demonstrated by increasing availability of processing capacity, as demand for processed and/or niche products rises domestically, regionally and internationally. The commitment shown by the private sector to invest in the purchase and processing of pulses by setting up buying centers and processing plants in the region provides an opportunity for farmers to tap into the value chains. These expansions will require significant amounts of pulses, especially dry peas, mung beans, pigeon peas, and lentils.
The heavy investments in processing are undertaken on the assurance offered by production expansion and new high yielding varieties, and therefore provide readily available markets. For example, Kenyan processors, such as ETG, Spiceworld Ltd, Kamili Parkers Ltd, and Capwell Industries Ltd, require large quantities of pulses annually and are estimated to get only about 40% of the annual requirements currently. Optimally utilizing the established capacity and expanding processing will largely rely on increased production from the region.
Large and expanding export market. The region recorded bean surpluses of about 1.9 million MT in 2020, which is projected to be about 1.1 million MT by 2030. In addition, it recorded surpluses of 1.2 million MT of “other pulses” that is projected to be about 1 million MT by 2030. In total, the region will have about 2.7 million MT surplus pulses by 2030; Ethiopia and Tanzania will contribute the bulk of this. The East Africa region not only enjoys a large and growing domestic market, but also an extended external market in the Central, Northern and Southern Africa, with nearly 500 million people and a GDP of nearly US$ 2 trillion. This expansive market offers attractive incentives to stimulate increased production of right types and quality, and trade. South Africa, for example, is increasingly looking at the region as a major source of dry beans and is actively engaged in sourcing from Tanzania and Malawi for specific types, like sugar bean.114
Comparative production advantage. The EAR has a high potential for producing pulses in all its 10 main agro-ecological zones. FAO data suggests that, were the region a single country, it would be the 2nd largest producer of pulses and dry beans after India, but only the 7th largest exporter. It was the 3rd largest dry beans producer after Southern Asia and Southeast Asia in 2019, and 2nd largest in broad beans after Eastern Asia. Since most farmers still grow pulses at subsistence levels, there is massive potential (area and yield) to expand production.115
The production of pulses engages the largest number of farmers, who, although highly dispersed, produce large volumes that generate significant surpluses for regional and international trade. For example, in 2019, the region recorded surpluses of about 5.8 million and 4 million MT of dry beans and other pulses, respectively, but deficits in dry peas and lentils. The surpluses were due to area expansion and higher yields, while deficits are due to shrinking acreage. Contrary to popular opinion, the average national and regional yields (t/ha) are higher than or comparable to world averages for beans, peas and lentils. This is a result of improvements in yield, which were up 54%, 96% and 109% for beans, peas and lentils, respectively, over 20 years. Ethiopia and Tanzania are already producing beans, peas and lentils at significantly higher yield levels. Opportunities for increasing yield exist within countries, specifically Kenya, Burundi and Rwanda for beans, and Uganda, Tanzania and Rwanda for peas.116
114 From interview with Ones Karuho, the AGRA Head of Markets, on March 1, 2021. 115 The average area under pulses is very small (about 0.6 ha); land under peas and lentils (0.3 ha). Estimates suggest that the uncultivated arable land suitable for beans in the region is about 124 million hectares (PABRA). 116 For example, were Kenya, Burundi and Rwanda to increase average yield to the Tanzania levels, an additional 860,000 MT of dry beans would have been produced (Kenya - 400,000 MT; Burundi - 260,000 MT), which would have been more than enough to turn each country into surplus producer. For peas, Tanzania, Uganda, and Rwanda could produce about 30,000 MT more on the same area simply by attaining the EAR yield average.
Feed the Future Market Systems Assessment East Africa Market Systems Activity February 2021
63
Untapped potential. The growth in trade for pulses has been hindered by the lack of product innovation to match modern consumer habits. Looking for innovative ways to repackage pulses for the modern consumer, especially in urban markets, could satisfy the general trend towards ready-to-eat meals that are quick and easy to prepare. However, this would require investment in R&D and industrial processes currently not present in the region.
5. CONSTRAINTS ANALYSIS
The situation analysis in this report suggests that while legumes have the potential to consolidate strong competitive advantages in the region, numerous constraints limit the capacity to increase formal intraregional trade. Whereas both supply and demand exist for legumes, the challenge is to match them; there is a failure of coordination and the market for risk, resulting in market instability, price volatility and inefficiencies. This section examines the constraints causing continued inefficiencies in the legumes market system along key trade corridors, highlighting common constraints across Activity countries where cross-border trade in legumes is relatively significant.
5.1. Production Systems
Fragmented production and poor agricultural practices lead to high production prices. Low-technology smallholders cultivating small fragmented, sparsely distributed, and poorly managed plots produce very little and retain the bulk of it for home consumption. While average yields may be about average, the plots are too small to generate reasonable volumes and marketed volumes too little to attract reliable buyers. Because farmers depend on the small volumes for cash income, their price expectations are often higher than what the market is willing to pay. The value chain therefore relies on a complex but unsophisticated system of aggregators and brokers to bring the small volumes into the market. This adds to the already high farm-gate prices and raises prices even further along the chain. Inadequate information about where the produce is and the expected volumes, together with high transaction costs due to poor infrastructure, make aggregation logistically challenging and expensive, and thus uncompetitive.
5.2. Prevalence of Pests and Diseases
There is a recognized gap in knowledge and research on pests/diseases related to legumes in East Africa, which is less a function of their significance than of the underdeveloped structure of the VCs. Additionally, the prevalence and frequency of pests and diseases in these VCs vary across agro-ecological zones due to climate, soil, and production systems, among other factors. As trade in legumes increases, on-farm and storage pests and disease prevalence will become an increasingly more significant constraint to trade, affecting quality and volumes, and will potentially drive increases in post-harvest losses. As with cereals, both pests and diseases are a greater challenge in periods of heavy rain.
Pests and diseases threatening specific legume VCs include:
• Beans: Beans are most severely affected by insects in the field as opposed to insects in storage, though there are some insects that damage beans even in storage and transport. Those insects affecting bean yields in the field, though the prevalence of each varies across the region, include black bean aphids,
Feed the Future Market Systems Assessment East Africa Market Systems Activity February 2021
64
legume pod borers, beanfly, thrips, leaf hoppers, whiteflies, African pod bugs, and others.117 Bean stem maggots (BSM) are among the most significant pests, and especially threaten crop stand during the seedling stage.118 BSM continues to be an issue even in storage, along with bruchids (also known as the dry bean weevil). Multiple diseases affect beans across the region caused by a range of fungi, bacteria, and viruses depending on location. Common bacterial blight (CBB) is common in all three leading bean producing countries – Ethiopia, Tanzania, and Uganda. In Uganda, the loss in yield can range from 10-40% as a result of CBB.119 Other diseases include leaf spot, root rot, anthracnose, rust, and common mosaic virus.120,121
• Peas: As with beans, peas are affected by multiple pests, the most important of which is the legume pod borer, which affects the pea pods and seeds. Other insects, some of the same as beans (like thrips and aphids) are attracted to the stalks, flowers, and other parts of the plant ultimately affecting yield. Though wilt was the most common disease in peas historically, ICRISAT has been at the forefront of breeding wilt-resistant varieties for over 30 years. Other diseases that commonly affect peas similarly include fungal disease anthracnose (a different species of which affects peas than beans), mosaic diseases, and leaf spot.122
• Lentils: Though multiple insects can threaten lentil production and marketing (including aphids and leaf weevils), disease is a more significant constraint to lentil trade. There are incidences when disease can decimate lentil farmers’ whole crops for the season. Limited uptake of improved varieties increases the prevalence and susceptibility of lentil crops to disease. In Ethiopia, just 9% of lentil production is estimated to be utilization of improved varieties.123 The primary diseases affecting lentils are fusarium wilt and Ascochyta blight.
5.3. Market Access and Market Information
Accessing markets for legumes on a sustainable basis is important for the region’s economy. Limiting factors include inadequate knowledge of market size, opportunities, and requirements – varieties, types, and standards for different products among producers and traders. In addition, linkages from production to markets are either poor or non-existent.
117 JO Ogecha, W Arinaitwe, JW Muthomi, V Aritua & JN Obanyi (2019): Incidence and Severity of Common Bean (Phaseolus
vulgaris L.) Pests in Agro-Ecological Zonesand Farming Systems of Western Kenya, East African Agricultural and Forestry Journal, DOI:10.1080/00128325.2019.1599151.
118 "Potential of Controlling Common Bean Insect Pests (Bean Stem Maggot (Ophiomyia phaseoli), Ootheca (Ootheca bennigseni) and Aphids (Aphis fabae)) Using Agronomic, Biological and Botanical Practices in Field". Regina W. Mwanauta, Kelvin M. Mtei, Patrick A. Ndakidemi, published by Agricultural Sciences, Vol.6 No.5, 2015.
119 Status of Common Bean (Phaseolus vulgaris L.) Diseases in Metekel Zone, North West EthiopiaTizazu Degu*, Wasihun Yaregal, Tesfaye GudisaEthiopian Institute of Agricultural Research, Pawe Research Center, Ethiopia. https://www.longdom.org/open-access/status-of-common-bean--phaseolus-vulgaris-l-diseases-in-metekel-zone-north-west-ethiopia.pdf.
120 -ibid-. 121 Viruses infecting common bean (Phaseolus vulgaris L.) in Tanzania: A review on molecular characterization, detection and disease
management options. Beatrice Mwaipopo, Susan Nchimbi-Msolla, Paul Njau, Fred Tairo, Magdalena William, Papias Binagwa, Elisiana Kweka, Michael Kilango, Deusdedith Mbanzibwa Afr J Agric Res. 2017; 12(18): 10.5897/AJAR2017.12236. Published online 2017 May 4. doi: 10.5897/AJAR2017.12236.
122 Centre for Agriculture and Bioscience International (CABI), Africa Soil Health Consortium (ASHC). http://africasoilhealth.cabi.org/wpcms/wp-content/uploads/2015/10/AHSC-Summary-cards-legumes-lowres.pdf.
123 Matny, O.N. Lentil ( Lens Culinaris Medikus ) current status and future prospect of production in Ethiopia. Adv Plants Agric Res. 2015;2(2):45-53. DOI: 10.15406/apar.2015.02.00040
Feed the Future Market Systems Assessment East Africa Market Systems Activity February 2021
65
Inadequate market information and data. Throughout the legumes VC, the demand for both unprocessed and processed products far exceeds the supply. The imbalance attracts speculators and opportunists who take advantage of information asymmetries along the VC and markets. Legumes market systems suffer from a lack of regular and reliable agricultural statistics for effective planning and monitoring. Data on pulses are either patchy, poor quality, or nonexistent, so that most stakeholders and experts cannot accurately estimate how much of each crop is produced or marketed. Consequently, most decisions and interventions are based on unreliable production, trade and marketing data. FAO (2018) suggests that this indifference to the crops is because they are not considered strategic staple crops. This is clearly manifested in widely conflicting data from national and international databases. Inadequate information breeds poor business ethics, low trust, and poor reliability, because actors trade on information asymmetries and in less than transparent manner.
5.4. Market Infrastructure
Marketing infrastructure is inadequate or nonexistent at all levels of the value chain. According to ITC (2016, 2019) and discussions with value chain stakeholders, apart from individual collection, drying, and warehousing centers owned by few exporters and large traders, most traders rely on temporary facilities either owned or rented.
• Good quality handling, storage and market facilities are scarce at most production and border areas. There are very few facilities dedicated to storage of pulses, and storage losses due to poor facilities account for about 30% of post-harvest losses (e.g., in Kenya) which leads to lower volumes and poor-quality product. For example, since initiating warehousing certification project in 2016, available records show that the EAGC has certified about 70 warehouses in the region – Tanzania (41), Uganda (19), Kenya (8), and Rwanda (1).124 These are mostly used for the warehouse receipting systems (WRS), and mostly for cereals.
• Handling and cleaning of grains in the region is predominantly manual and, thus, the high labor requirements, high cost of labor, and inadequate skills make the operations uncompetitive. Available cleaning and polishing plants are located in major terminal markets, like Nairobi, Mombasa, Dar es Salaam, and Kampala, which are beyond the reach of most traders. ETG and Capital Reef (K) Ltd have cleaning and polishing plants at the seaports of Mombasa and Dar es Salaam, and more companies are investing in cleaning plants for pulses to enhance their access to export markets; recent examples include Spiceworld (K) Ltd and KPD (T) Plc.
• While some border points have been upgraded through the One-Stop Border Posts (OSBPs) initiative spearheaded by TradeMark EA, the investments mostly focus on facilitating commercial truck-based trade. Small traders use dilapidated facilities, such as parking yards and makeshift stands, which tend to increase insecurity, slow down procedures, and encourage corruption and informality.
Limited processing and value addition activities. Value-add activities, such as grading, polishing, splitting, sprouting, milling and canning, increase the value of pulses and make them more exportable. However, there is little value addition done on legumes in East Africa, with splitting dry pea, mung bean, lentil and pigeon pea into dal being the most widespread. Since demand for dal in Europe and India is unmet, the region is missing out on a big market by not embracing processing.
124 RATIN, “Grain Storage Facilities Within EAC.” Retrieved in February 2021 at https://ratin.net/site/grain_storage
Feed the Future Market Systems Assessment East Africa Market Systems Activity February 2021
66
Commodity exchanges and platforms have had minimal impact on market access and information issues. There are gaps in the current functioning of commodity exchanges, such as the ECX, EAX, TMX, and ZAMACE, that reduce their impact, especially for legumes marketing and trade. Commodity exchanges need to maintain certain levels of trading volumes which has proven difficult for the region, and, in times of food insecurity, trading in staples can become a contentious political issue. Except in Tanzania, where the government has instituted an auctioning system for green grams through the TMX, the exchanges currently have negligible role in general legumes trade currently.
5.5. Transport and Logistics
The pulses sector requires innovation in trade logistics to reorganize and improve inputs and output supply chains, both domestically and regionally. Transportation networks and logistics systems in the region are underdeveloped, expensive and unreliable, and, hence, high cost of transport and logistics. Consequently, despite ongoing improvements, transporting bulky produce, such as pulses, from remote dispersed rural areas to secondary and tertiary markets remains difficult.
Trade logistics capacity remains relatively weak in the region. Using the World Bank Logistics Performance Index (LPI), which measures a country’s logistics readiness for global trade, all the EAMS target countries, except Kenya (68) and Rwanda (57th), ranked outside the top 100 (out of 160 countries and territories) in 2018. Most countries fell in the bottom third, with Somalia (144th) and Burundi (158th) in the bottom 10%. The countries did not fare any better on logistics quality and competence pillar, which suggests that the region has some way to go before logistics can facilitate regional trade. The main constraints include:
Underdeveloped transport infrastructure, particularly rural access roads, and related logistics inefficiencies make moving produce from points of production to points of competition more challenging and costly. Poor roads discourage traders and transporters from deploying vehicles and increase the cost of vehicle servicing and maintenance. It also makes logistics planning difficult and the system inefficient because of delays due to slow movement and frequent breakdown of vehicles. Because of landlocked status of all but three countries, poor transport infrastructure constrains cross border and international trade.
The supply of transportation services and vehicles is inadequate and the trucking industry less competitive. This is partly related to poor road infrastructure, high cost of fuel, small volumes of produce in dispersed locations off the main transport arteries, and strict regulations that prohibit transit vehicles from carrying backloads.
High transit and port handling fees make trading expensive. Since a majority of the EAR countries are landlocked and dependent on the seaports of Mombasa, Dar es Salaam, Djibouti, and Beira for international trade, port handling and connectivity are key drivers of trade. Due to technical and operational inefficiencies, insufficient capacity and technology, taxation and corruption, the cost of using region’s main seaports remains prohibitively high.
Analysis of parity prices show that the cost of moving agricultural commodities within countries to major ports of exit is more than double what it would cost major competitors to ship products to Mombasa. This high cost has the potential of weakening national competitive advantages.
5.1. Access to Technology and Inputs.
Feed the Future Market Systems Assessment East Africa Market Systems Activity February 2021
67
Legumes in East Africa are produced in traditional subsistence systems characterized by low technology, unorganized producers, and unsophisticated value chains. Development and supply of improved seed remains inadequate, businesses are not sufficiently sophisticated, and processing is primary based on inefficient technology. Poor access to inputs is attributable partly to: i) Low innovation capability at the national and regional levels; ii) Limited information on available varieties, variety profiles, yield potential, and suitability; and iii) Limited access to high-quality seed of superior varieties.
Limited availability of legume seed. For the small but increasing proportion of farmers adopting improved seed, access to good quality seed remains a major constraint in transforming the legumes VC. While new varieties have been bred, there has been minimal integration into the private sector seed systems. Seed multiplication and bulking has proven difficult, partly due to problems with seed viability and access to freshly released varieties. Private seed companies tend to shy away from pulses seeds because they are open pollinated – famers can use retained seed or buy from local markets, thereby diminishing repeat business that companies depend on for scale and profitability.
Limited access to and adoption of climate-smart technology. Slow innovative response to changing climate could reduce opportunities for expanding production of and/or make other countries more competitive. Though the region has two rainy seasons and reasonably fertile soils, it regularly experiences drought that affect crop production. Pulses are particularly sensitive to rainfall and temperature fluctuations. Excessive rainfall impairs flowering and pod formation due to flower drop and low activity by pollinators. Prolonged droughts reduce crop yield due to impaired pod formation – farmers find it difficult to produce marketable surpluses and attain good quality.
Low innovation capability in the region partly explains the persistent subsistence systems. The pulses sector requires innovation to improve seeds, manage soil fertility and water, develop appropriate machines and equipment, reorganize production, aggregation and marketing, improve postharvest handling and processing, provide climate-smart information and technology, and increase the efficiency of transportation and logistics services. In a rapidly expanding and changing sector globally, lack of innovation could undermine the region’s international competitive advantage. The Global Competitiveness Report 2019 ranked the countries very poorly on innovation capability; other than Kenya, the rest ranked outside the top 100.
5.2. Access to Finance and Investment
Access, suitability, and cost of finance is problematic in the region, more so for legumes value chain actors. The economics of pulses production and trade suggests that significant capital outlay is required to move farmers into optimal production systems and better functioning market systems. The existence of financial institutions, such as commercial banks, savings and credit organizations (SACCOs), and other micro credit institutions, are evenly spread across the major growing regions.
Banking financial institutions (BFIs) consisting of local, regional, and international banks and microfinance institutions (MFIs) help provide funding and support for production and trade. Financial providers, such as the Co-operative Bank, Equity Group, KCB Group, and NCBA offer products and services to value chain players, such as working capital loans, revolving credit lines, asset finance, letters of credit, and small business loans. Equity Group, a Kenyan commercial bank, has invested over USD 10M through their Kilimo Biashara project to improve market access, capacity building, and growth in legumes production. They have helped farmers expand their crop portfolios by encouraging farmers of seasonal crops to grow beans for year-round production
Feed the Future Market Systems Assessment East Africa Market Systems Activity February 2021
68
and income. Financing gaps still exist in legume production and trade, and present an opportunity for BFIs to provide more accessible financing to increase trade and export volumes.
Non-bank financial institutions (NBFIs). Non-bank financial service providers, such as fintechs, impact investors, and trade-techs, offer non-traditional trade finance solutions along the legumes supply chain across East Africa. NBFIs’ innovative solutions provide an alternative route to traditional trade financing for legume exporters to ease trade finance frictions, such as digitized payments, tailored agricultural loans, and digital finance training. Pearl Capital, a specialist agriculture investment management firm, lends between USD 250K and USD 2M to legume SMEs in Rwanda, Malawi, Uganda and Tanzania. They offer customized combinations of debt, quasi-equity, and equity investments, which provide capital to improve operations and scale for crop production and trade. For instance, the CDC Group provides trade finance risk-sharing facilities (e.g., guarantees) to banks in Africa to increase liquidity and reduce costs so they can inject more capital into the supply chains.
Development partners. Development partners enable trade financing, often through partnerships with financial institutions and governments. Their initiatives help break down finance access barriers through capacity building, funding (loans or grants), advisory services to regulators, and de-risking solutions, among others. In Ethiopia, USAID and ACDI-VOCA partnered to launch the Agricultural Marketing Development project that supports chickpea production, breeding, seed multiplication, post-harvest management, marketing, processing and export. The World Bank has also partnered with Uganda’s Ministry of Agriculture to invest USD 150M to boost and scale farm production of cassava and beans, helping make cross-border legumes trade more financially viable.
Despite the existence of numerous FIs, a majority of the value chain actors have limited access to financing for investment and operations. Whereas the financial sector is liberalizing and expanding, it still focuses on urban clientele and the modern sectors, with very limited financial products appropriate for agriculture and rural sectors. Wherever financial services are available, the cost of finance is too high (average annual interest rates of 20-100 percent). The following constraints hinder access to finance for legumes value chain actors:
Supply-side constraints:
• Most BFIs have limited capital and balance sheets, and, therefore, prioritize lending to safer investments, such as real estate, government projects, or more valuable agricultural value chains like industrial or export crops. Like most agricultural value chains, BFIs consider lending to legume producers and traders risky due to heavy reliance on rain fed production. Processing and approvals for trade finance for legume SMEs are more difficult.
• Most of the sector’s finance solutions have limited provision of tailored finance instruments because they are exclusively designed to meet the needs of larger corporates, who can more easily access traditional forms of credit. This excludes agribusiness SMEs who need products that are tailored to their needs, such as the unique planting, harvest, and post-harvest cycles, and amounts that are larger than those provided by MFIs and smaller than those of NBFIs. More so, medium to long term financing for investment in infrastructure and trade is inadequate.
• Many legume farmers in East Africa lack financial records and credit history to be approved for loans. Since they often operate informally and do not record their operational and financial performance, there is a lack of accounting and financial history. This limits the availability of reliable information for assessment of creditworthiness by financial services providers.
Feed the Future Market Systems Assessment East Africa Market Systems Activity February 2021
69
• Lengthy approval processes: FIs have lengthy approval and verification processes that are out of tune with the unpredictable nature of financing requirements among legume SMEs.
• Limited capacity for agriculture financing: Few FSBs have departments and adequately trained and experienced personnel dedicated to agriculture finance.
Demand-side constraints:
• High collateral requirements: Smallholder farmers and agribusiness SMEs in the legumes value chain have fewer valuable assets that can be used as collateral.
• Limited awareness and understanding of financial services among value chain actors due to low literacy levels and inadequate information. Many actors do not apply even when they need and may qualify for the available products.
5.3. Policy Constraints to Cross-border Trade
Policy constraints hindering trade in legumes can be categorized through the 2016 USAID Trade Capacity Building (TCB) Policy’s lens of beyond the border (harmonization of standards), at the border (administrative paperwork and alignment of border processes), and behind the border (in-country legal, regulatory, and institutional frameworks). Constraints under each category are outlined below.
Beyond the Border
Membership in multiple RECs and slow or incomplete ratification of relevant policies: As discussed in other VC chapters of this assessment, trade policy in East Africa is complicated by the multiple intertwining and overlapping multilateral agreements and guidelines of RECs operating in the region. Each REC has its own policies, guidelines, and trade facilitation initiatives and some countries are members of more than one trade bloc, which introduces confusion about which policies and guidelines they implement at the national level. There are also challenges within RECs of member countries either not ratifying certain agreements or picking and choosing which regional policies it will prioritize. Tanzania, for example, has yet to ratify the EAC SPS Protocol. Similarly, as discussed, Ethiopia is an important country in terms of cross-border trade of pulses, but despite being a member of COMESA, Ethiopia has not ratified the COMESA Free Trade Area and only implements some COMESA policies. The simplified trade regime (STR), intended to streamline customs and documentation requirements and to waive duties under a threshold, is one such COMESA harmonization effort that Ethiopia does not implement. Given the future potential in legumes, multilateral trade policies and standards will become increasingly more important and should incentivize a more organized VC to increase formal trade.
Disregard and / or weak enforcement of quality standards and SPS measures. While quality standards and SPS measures exist for pulses both nationally and regionally, the regional value chain is not yet as sensitive to them as international markets. One key reason for this is the dominance of informal trade, with a multitude of competing channels, and intense competition for limited volumes, i.e., whatever is rejected in one channel easily finds a buyer in another. Moreover, there is inadequate information about the specifications because the regulations are made at higher levels without the participation or sensitization of key actors. This makes the standards and SPS measures more legalistic than practical, and they ultimately require coercion to be enforced, eliciting resentment. Disregard for standards and SPS measures leads to high rates of wastage and high cost of
Feed the Future Market Systems Assessment East Africa Market Systems Activity February 2021
70
processing, low prices to compensate for low recovery rates, and inefficient market systems. It partly explains the failure of many commodity exchange experiments in the region.
At the Border
Unpredictable cross-border trade restrictions and disruptions. Unilateral trade bans and restrictions are common in the region but are rarely applied on pulses. There is an expectation that as deficits in pulses increases and the VC develops regionally, there may be potential for unilateral restrictions on pulses. National governments often effect regulations to restrict cross-border trade in certain products, mostly staple foods. They are used to mitigate transmission of price inflation across borders, prevent shortages, protect food security, settle political scores, or tackle insecurity. The political and conflict mediated trade restrictions are the most devastating because they affect both formal and informal trade in all crops (including pulses). Recent examples include the disruptions caused by troubled relations, such as Uganda-Rwanda, Rwanda-Burundi, Ethiopia-Sudan, and the Kenya-Tanzania. For example, Uganda’s informal trade with Rwanda declined drastically (78%) in 2019 due to the prolonged closure of the Uganda-Rwanda border (UBOS, 2020). Escalating conflict along the Uganda-South Sudan, Uganda-DRC, and Ethiopia-Sudan borders also disrupt trade because pulses must be transported across several borders to reach end-markets. According to UBOS, insecurity along the Uganda-South Sudan border in 2016 reduced in informal exports by 47%.
Enforcement of simplified policies, regulations, protocols and procedures is inadequate and weak. Although cross-border trade in East Africa has significantly liberalized through lower tariffs and quotas, overall trade costs remain high. Non-tariff barriers such as poor-quality infrastructure, dysfunctional logistics services, and overly bureaucratic trade procedures make exportation very difficult. In addition, with legumes’ low price points, margins are extremely small, leading to a lack of incentive for exportation. The lower volumes combined with the non-tariff obstacles make margins extremely slim and trade less financially attractive. At the borders, there is weak coordination among agencies on either side of the border and local and national offices, as well as language barriers, misunderstandings about the respective regulatory frameworks (i.e., what is considered legal and illegal in both countries), fragmented border governance with a multitude of actors, and coordination problems between agencies within one country because of inadequate inter-agency coordinating policies (see UNDP, 2021).
Behind the Border
One of the principal responsibilities of the public sector in agriculture is to create an enabling environment for the private sector to invest in production, processing, and trade. The region falls short in this, especially maintaining clarity, coherence, consistency, and predictability in agricultural policies and interventions. Existence of multiple and conflicting initiatives have made interventions and investment in the agricultural sector ineffective, largely because of policy uncertainties and/or indifference. Policy and regulatory inadequacies generally result from weak institutions rather than lack of will or interest. Except Kenya (68th) and Rwanda (36th), the GCR 2019 ranked all but two EAR countries outside the top 100 on strength of institutions (see Table 11 in annex).
Specific domestic policy issues hindering cross-border trade in pulses include:
Limited attention on the grain legumes from the public and private sectors. The legume VCs do not get sufficient policy attention nor the opportunity to attract private sector investment as a result of numerous policy, institutional, technical and socio-economic constraints. Specifically, agricultural research and
Feed the Future Market Systems Assessment East Africa Market Systems Activity February 2021
71
development has paid relatively little attention to legumes despite their nutritional, health, ecological, and economic importance. There is inadequate documentation of what legumes are grown and where, and a dearth of adoption studies. With a few exceptions, such crops are ignored in favor of mono-cropped or staple crops, particularly exportable commodities.125 This constraint is reflected in other policy constraints, including inadequate agricultural statistics for effective planning and monitoring of policies and initiatives.
Unpredictable, uncoordinated, and incoherent policies, strategies, and interventions: Pulses attract only sparse, disjointed, underfunded, and biased development interventions, mostly mediated by development organizations and donors. The limited public, private and donor activity focuses on a narrow set of interests promoting commercial seed, fertilizer and agrochemical industries at the expense of potentially more impactful agronomic practices. An additional challenge is the poor coordination of policy and regulations by public agencies toward common policy goals as well as coordination between agencies and harmonization of donor support and interventions. Interviews with supporters and facilitators of production and trade of legumes largely confirm that the policy and regulatory regime is nationally focused and unnecessarily complex, uncoordinated, and lacks harmony.126 An additional challenge is policy unpredictability, such as haphazard pronouncements of trade restrictions and monetary policy. An example is the policy enacted by the National Bank of Ethiopia in 2017 to control the birr and make it inconvertible. The stringent restrictions made access to forex nearly impossible and greatly disrupted the activities of importers, who responded by finding innovative ways to bypass the NBE and access forex directly through exports, mainly of agricultural products. The policy change caused a frantic rush for any available exportable commodities and significantly boosted the country’s exports, especially of pulses.127
Weak value chain governance institutions, including weak farmer and private sector institutions. Farmer institutions for pulses are either nonexistent or weak in most of the region. Specifically, the collective production and marketing approach has failed to take root in most countries, meaning that farmers have been unable to cooperate for effective production, storage, processing, and marketing. The few existing groups are weak and not able to effectively engage with other actors on issues that affect them. Since 2010, most countries in the region have formed national grains and pulses Networks, variously called Councils or Associations, to facilitate coordination of the legume value chain actors.128 Further challenges pertain to poor coordination capacities between stakeholders, specifically among private sector players, due to limited expertise in key areas, such as policy advocacy, gathering, and dissemination of market intelligence, and trade promotion (ITC 2016, 2019). This limitation manifests as poor civic expression and poor knowledge and skills, both of which compound the problem of inefficient and expensive market systems.
Poor contract enforcement. Even where some farmers are engaged in contract farming, this does not provide a guarantee of actual delivery by farmers to the buyer. On the other hand, buyers renege on contracts when supplies are plenty and market prices are lower than the negotiated price. This makes return to investment unpredictable.
125 Unlike cereal crops, most legumes are considered as neither staple nor cash crops; consequently, the policy and development organizations are not keen to promote them. For more detailed treatment of this topic, see Ojiewo et al. (2018) and FAO (2018). 126 Both the EAGC and AGRA were in agreement on the problem of policy incoherence and inadequate coordination. Specifically, inadequate enforcement of policies and regulations exacerbated the problem. 127 For a detailed discussion of this policy, see CBI (2018). 128 These include the Tanzania Pulses Network (TPN), the Grain Council of Uganda (TGCU), and Ethiopian Pulses, Oil Seeds and
Spices Processors and Exporters Association (EPOSPEA). Most of this trend was catalyzed by the EAGC.

Feed the Future Market Systems Assessment East Africa Market Systems Activity February 2021
72
5.4. Political Economy of Legumes Markets
The regional legumes value chain and markets present several political economy challenges that could influence outcomes of interventions toward policy change. Small and medium scale traders are the most likely to strongly oppose any intervention that would erode their influence in the markets. Because of strong well-established networks with farmers and traders, these two groups of actors exert strong influence on the value chains and possess the power of both facilitation and sabotage. Importantly, they provide versatile informal market channels for products rejected by the formal channels, which would make enforcement of some reforms, such as quality standards, difficult. The smallholder farmers are too fragmented to be impactful, but would support interventions that offer reliable profitable markets and oppose those deemed likely to upend their production systems and relationships. Overall, implementing pulses markets development interventions will be challenging primarily because of potential strong competitive opposition from key market players, largely informal in nature, resistance from farmers to attain higher quality standards, legal/regulatory challenges of structured farming and trading, and low capacity for implementation, among others.
5.5. Constraints to Participation of Women and Youth in the VC
Like all of agriculture in Africa, legumes production is an enterprise for the elderly and women, and attract minimal interest from men and the youth. The weak infrastructure and lack of social amenities in rural areas discourages the youth, and hence the tendency to migrate to urban areas.
Attitude: Majority of farming households in the region have not adopted agriculture as a commercial activity. The subsistence orientation increases farmers’ risk averseness to food insecurity and elevates food self-sufficiency above all else. Besides, legumes are generally treated as a “woman’s crop”, until it becomes lucrative enough to attract the attention of males. It is the main reason farmers allocate just enough land to these crops. Demonstrating the comparative advantage and opportunity cost of production remains a challenge. Promoting commercial production therefore requires significant attitudinal and cultural reorientation of the target farmers.
Limited financial literacy and collateral: Women often have insufficient access to information on trade finance products because of lower literacy rates in rural areas, where most legume production occurs, and less frequent rural outreach from many FSPs and NFSPs, compared to urban centers. Additionally, societal norms, such as limited ownership of valuable assets and being left out on decision-making, often prevent women in East Africa from accessing trade finance, such as export contracts and agricultural credit. For example, in Uganda, it is estimated that 80% of bean growers are smallholder producers, with a majority being women. However, less than 20% of women control outputs, with their husbands selling the produce and keeping the returns, undermining their participation in the commercial production of legumes. In Malawi, women farm owners consistently produce 25% less per hectare than their male counterparts because of their limited access to finance services to pay skilled laborers, gap in literacy, and lack of knowledge on agricultural best practices.
Similarly, youths in the region’s rural areas also have insufficient access to information on trade finance products because of lower literacy rates and a lack of interactions with FSPs and NFSPs, compared to their urban counterparts. They also have limited access to collateral for use in trade finance, given that asset transfer often happens at a later age and young men and women have to wait many years before inheriting their share of the family assets.
Feed the Future Market Systems Assessment East Africa Market Systems Activity February 2021
73
Feed the Future Market Systems Assessment East Africa Market Systems Activity February 2021
74
6. OPPORTUNITIES
The opportunities in legumes are segmented into two categories to simultaneously: (1) engage with the private sector through strategic alliances and partnerships to jumpstart cross-border trade and overcome practical bottlenecks, and (2) address systemic issues impacting the regional VC.
1. Develop strategic partnerships and VC Alliances. The Activity will engage anchor firms (agro-processors, large buyers, and aggregators) as entry points to unlock cross-border trade. By leveraging the market pull of established regional players, the Activity will support linkages to strengthen supply chains from countries and areas of seasonal surplus, while also strengthening suppliers’ understanding of anchor firms’ market requirements in terms of quality, varieties, and volumes demanded. Linkages with agro-processors will be key to unlocking trade flows both for raw commodities and value-added products, while linkages with large traders and buyers will be key to unlocking trade in whole grain pulses for end-consumption in the focus countries or re-export to external markets. Improved market coordination among actors will also attract new entrants who will want to take advantage of an increasingly more organized VC, emerging demand opportunities related to import substitution in dry bean-food products and the growing regional deficit for peas and lentils, and the expanding re-export markets for pulses.
Specific partnership and alliance opportunities include:
• Partnerships with large buyers, traders, and aggregators. Most large players in the region engaged in pulses trade are also engaged in cereal grain trade, and as the sizes of the actors decrease, the proportion of those more specialized in pulse VCs increases. As a result, the Activity will work with some of the same large players in pulses as it will in cereals, and will also explore opportunities to strengthen linkages with slightly smaller players in this category to spur their growth and deepen their engagement in cross-border trade. The Activity will support large traders and aggregators to:
o Engage effectively in proven contract farming models, and structure enforceable supplier contracts with clear and speedy dispute resolution mechanisms. To do this, the Activity will identify legal firms with regional service outreach that are currently engaged in structuring and facilitating trade and investment contracts, and explore ways to support their expansion or for additional legal firms to expand their offerings.
o Adopt improved quality management and traceability systems, which provide assurance of the quality, safety, source, and means of verification for the agro-processors and other players with a mandate to ensure compliance across border points.
o Facilitate access to business services providers targeting regional supply chains for management capacity building, access to finance or other required services.
• Partnerships with agro-processors. Increased regional demand for value-added bean and pigeon pea food products creates import substitution opportunities for East African agro-processors. Several emerging companies in Kenya, Rwanda, Uganda, Tanzania, and Zambia are already increasing their capacity to produce value-added food products. As consumer demand for these products increases, more companies are exploring commercialization of legume-based food products. By collaborating with partners who have been researching, supporting, and testing value-added legumes products and promotional campaigns such as the University of Nairobi (testing for canned beans), ICRISAT
Feed the Future Market Systems Assessment East Africa Market Systems Activity February 2021
75
(pigeon pea product promotion), and CIAT (through the regional PABRA project), the Activity will support expansion of value addition in the region by: sharing market demand opportunities including substituting legume imports among institutional buyers like schools, health facilities, government institutions, armed forces, and correctional facilities; supporting acquisition of appropriate processing technologies through co-investment grants and/or technical assistance; engaging financial service providers to tailor working capital or capital expenditure products for agro-processors. The Activity will also build on demonstrated successes to raise awareness for new market entrants, including service providers offering market information and finance solutions.
• Partnerships with regional packaging suppliers. Limited access to and availability of appropriate packaging materials to meet food safety standards and consumer preferences constrains firms’ abilities to take advantage of opportunities for value-addition. Agro-processors have challenges sourcing packaging materials locally, and the ultimately import materials from India, China, South Africa, or Eastern Europe. Packaging solutions providers are unaware of the potential demand, including the size of the market and demanded specifications, and they lack finance to upgrade their equipment to meet packaging requirements. The Activity will work with agro-processors to identify regional potential regional suppliers to develop prototypes and produce packaging to meet the agro-processors’ needs. The Activity will also facilitate market linkages and support packaging producers to access finance where necessary for investing new equipment and materials.
• Facilitate B2B events to promote regional market linkages. The Activity will support large buyers, agro-processors, and traders to capitalize on regional market opportunities by hosting B2B events to link market actors and investors. These events will allow large buyers to clearly communicate their needs in terms of quality (meeting standards) and volumes required, as well introduce business and financial services providers, market information solutions, and allow equipment and machinery manufacturers to meet potential customers. The events will also target input providers who can increase the availability of desired varieties as well as introduce inputs solutions that enhance productivity and control of pests. The Activity will explore partnering opportunities with organizations such as the EAGC, EABC, COMESA Business Council, Investment Promotion Centres, AGRA and ASARECA.
2. Scale access to inputs and technologies. Development of the regional legume VCs requires increased productivity, reduced postharvest losses, and overall modernization of VC activities from inputs to retail of value-added products. The following opportunities have been identified to support access to and scaling of inputs and technologies for the legume VCs:
• Increase access to improved, high-demand varieties. While regional capacity for breeding of bean seed has been marginally improved since the release of common varieties in the EAC, breeding of other legumes still lags behind. The Activity will explore opportunities to collaborate with research institutions and seed traders in the regions to stimulate the breeding of peas and lentils, while also stimulating seed multiplication, utilization of breeding infrastructure, seed storage systems, and where necessary irrigation systems, for varieties in high demand. National and regional research institutions are best placed to continue work on varietal improvements in the agro-ecological production areas in the region. A good example is Uyole Research Station in Tanzania, which has collaborated with sugar bean importers in Southern Africa to develop desirable varieties of sugar beans, ultimately leading to production capacity of those varieties in-country with the potential to trade seeds. In light of regional initiatives to enhance seed trade, like COMSHIP, the Activity will explore opportunities with research
Feed the Future Market Systems Assessment East Africa Market Systems Activity February 2021
76
centers, private, sector, and COMESA to increase availability of varieties and replicate similar market – research connections.
• Scale labor-saving technologies. Women are actively engaged in legume VCs, partly because the VC has not been as developed and pulses have historically been considered a subsistence crop rather than one with commercial potential. Some technology companies have tested affordable labor-saving technology solutions for legume planting, weeding, and harvesting. The Activity will explore opportunities for scaling these technologies through the agro-dealer network, associations, and/or other organizations to benefit women who are most involved in these labor-intensive activities, oftentimes in high temperature environments where the hardier pulses tend to be grown.
• Pesticide residue management. Due to lack of infrastructure and expertise to measure pesticide residues in grains, exports are often barred from entry where levels are too high and importers then impose import bans and demand compensation as well as disposal or repatriation costs. The Activity will explore opportunities with regional and national organizations and associations to establish the necessary infrastructure for pesticide residue testing in selected target countries. In addition, the Activity will work with multinational inputs companies and regional and national plant protection centers to support capacity building on GAP on aspects like food safety protocols, safe use of plant protection products, Integrated Pest Management and others.
• Scale storage and pest control solutions. The types of materials used for storage affect PHL of pulses, specifically how well pulses can withstand handling (such as loading and offloading) as well as potential for reinfestation during transportation. The Activity will work with technology solutions companies, such as A2Z, with innovative products and/or regional presence to increase access to and uptake of affordable storage solutions at farm-level through awareness building, while also supporting distribution of such technologies by leveraging the agro-dealer network and partnerships with financial service providers to provide working and investment capital to increase availability. These efforts will support and enhance commercialization of storage solutions, such as hermetic storage bags, for pest management at farm-level and during transport.
3. Address high costs of logistics and transportation: A key challenge for legume trade in the region is the inefficiency of logistics and transportation solutions available to ensure end-to-end cost-efficiencies while minimizing loss of grain. The Activity will identify and collaborate with specialized logistics service providers to establish and/or expand cost-effective and efficient, integrated logistics solutions offerings for the legume VCs. The Activity will support the development of these scalable service solutions and enhance the business models of such providers based on the business potential identified in the legume VCs. As these types of logistics and integrated freight forwarding service providers often struggle to access working capital and face uncertainty about volumes of commodity to be moved, the Activity will support proof of concept efforts to then attract investment by financial institutions with tailored products. For pulses, this opportunity will require additional coordination with other bilateral programs and partners given the current informal nature of the VC, and the fact that many of the specialized SMEs are small and disparate.
4. Support dispute resolution to address NTBs. Though pulses have not often been the focus of unilateral bans on cross-border trade, and though there have been some successes addressing NTBs, the overall expectation is that new NTBs will continue to be raised and utilized as tools to restrict trade. As also described for cereals, the Activity may support solutions to avoid NTBs and SPS challenges for the legumes VC, including:
Feed the Future Market Systems Assessment East Africa Market Systems Activity February 2021
77
• Enhance the monitoring capacities of VC alliances to track, monitor, and notify members of new NTBs, and to use this information for coordinated cross-border advocacy to pressure governments to quickly solve trade disputes.
• Explore integration of traceability systems into transportation and logistics solutions as well as any testing and compliance certification issued to provide a quick means of verification of any information that is under dispute leading to an NTB being applied.
• Leverage VC partnerships and the regional business membership organizations to enhance coordination and collaboration starting with national institutions responsible for overseeing trade facilitation activities to minimize overlaps.
• Explore adoption of digital SPS tools and data management systems and the e-Phyto certification system.
• Explore opportunities to support operationalization of institutional mechanisms for dispute resolution, such as the EAC Committee on Trade Remedies, which is mandated in the Customs Union Protocol.
5. Enable regional trade through existing commodity exchanges. With several large buyers and agro-processors expressing interest in sourcing grains (including legume grains) from exchanges in the region, and given the advantages this can provide, including the increased formalization of trade (especially important for pulses) and price stabilization, the Activity will explore opportunities to build work that has previously been undertaken across the region to promote these exchanges.
Opportunity areas include:
• Support the establishment of collateral management companies that can bridge the gap between the weak warehouse infrastructure and their commercial management, and the need to provide confidence, assurance and risk mitigation to the financial institutions, traders, and owners of the quality and quantity of stored commodities as well as their release and delivery.
• Collaborate with regional exchanges to identify barriers to electronic infrastructure to improve capacity of exchanges to cross-list tradable produce across the region, to increase the pool of potential buyers.
• To further expand the availability of licensed warehouses, the Activity may partner with existing commodity exchanges to conduct market research on strategic locations for warehouses to enable them to generate sufficient commodity volumes to cover their operational costs, and identify areas for improving the functioning of existing warehouses along key trade corridors.
6. Facilitate expansion of financial products, services, and risk mitigation solutions. The Activity can introduce finance and risk mitigation solutions for producers and intermediaries in the supply chain that often hinder production finance and commodity origination. The Activity will explore the following financial solutions:
• Value chain finance. Through VC partnerships and alliances, the Activity can provide TA to anchor firms to support the scaling and access to finance for existing value chain financing models, directly through agribusinesses or ecosystem players. This could also include pre-season working capital loans (to help the supplier finance seeds, fertilizer, pesticides etc.), and structuring agreements that facilitate the provision of pre-export finance and reverse factoring solutions.
Feed the Future Market Systems Assessment East Africa Market Systems Activity February 2021
78
• Support to financial institutions to tailor products and services. Provide tailored TA to financial institutions to improve and scale the supply of suitable lending products, services, and platforms that can support grain-specific trade requirements and conditions. This may include providing technical assistance to financial institutions to help them develop trade finance products suited to SMEs with less physical collateral or using moveable assets (e.g., equipment, cars, or valuable household goods and not just land and other household assets) or tradable documentation (e.g., warehouse receipts on commodity exchanges) as collateral, and exploring other opportunities to de-risk lending besides physical collateral.
• Support and encourage financial institutions to adopt a regional perspective for trade-related finance. To stimulate replication or adoption by financial institutions financing cross-border trade, the Activity will explore ways to: (i) develop and promote success cases where financing of regional trade deals has worked well, (ii) align BDS provision to support cross-border VC alliances through TA as part of financial institutions’ risk mitigation strategies, (iii) leverage mechanisms to de-risk transactions and investment that support regional trade, and (iv) host strategic events targeting high-level executives from financial institutions for industry-networking (and co-financing opportunities) and to undertake initiatives that would increase the attractiveness of trade financing, including advocacy to address any policy or regulatory issues that currently disincentivize trade finance.
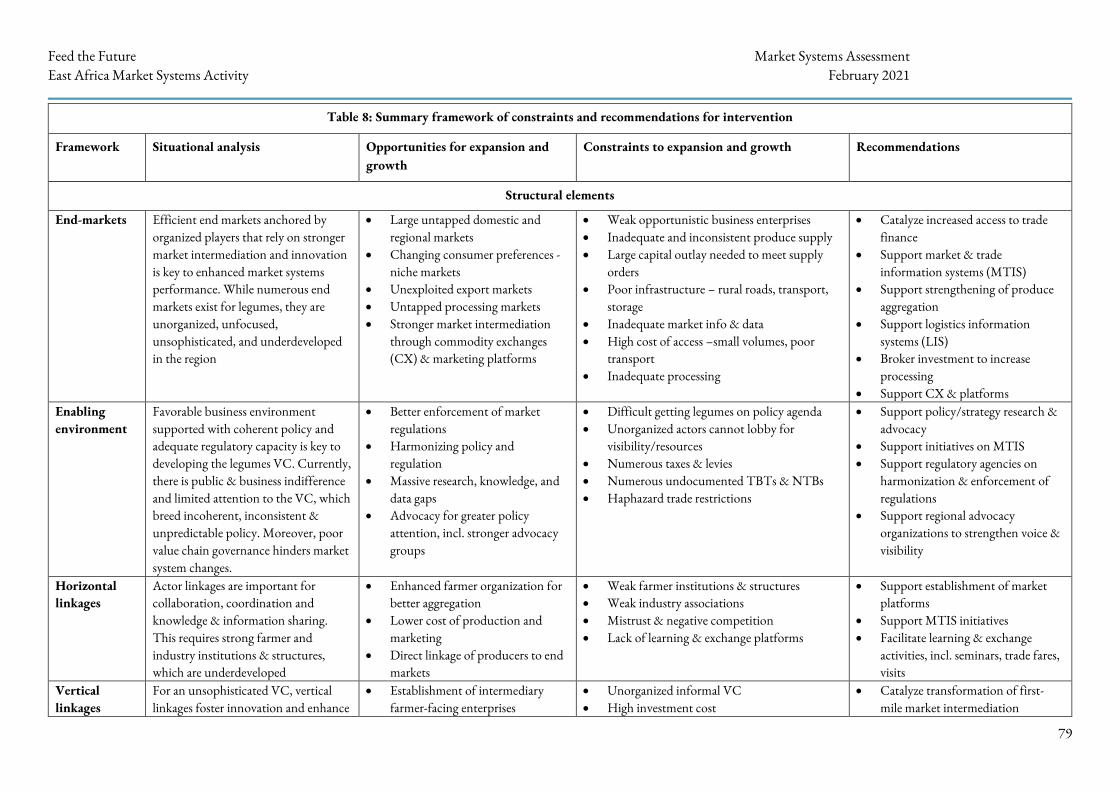
Feed the Future Market Systems Assessment East Africa Market Systems Activity February 2021
79
Table 8: Summary framework of constraints and recommendations for intervention
Framework Situational analysis Opportunities for expansion and growth
Constraints to expansion and growth Recommendations
Structural elements
End-markets Efficient end markets anchored by organized players that rely on stronger market intermediation and innovation is key to enhanced market systems performance. While numerous end markets exist for legumes, they are unorganized, unfocused, unsophisticated, and underdeveloped in the region
• Large untapped domestic and regional markets
• Changing consumer preferences - niche markets
• Unexploited export markets • Untapped processing markets • Stronger market intermediation
through commodity exchanges (CX) & marketing platforms
• Weak opportunistic business enterprises • Inadequate and inconsistent produce supply • Large capital outlay needed to meet supply
orders • Poor infrastructure – rural roads, transport,
storage • Inadequate market info & data • High cost of access –small volumes, poor
transport • Inadequate processing
• Catalyze increased access to trade finance
• Support market & trade information systems (MTIS)
• Support strengthening of produce aggregation
• Support logistics information systems (LIS)
• Broker investment to increase processing
• Support CX & platforms Enabling environment
Favorable business environment supported with coherent policy and adequate regulatory capacity is key to developing the legumes VC. Currently, there is public & business indifference and limited attention to the VC, which breed incoherent, inconsistent & unpredictable policy. Moreover, poor value chain governance hinders market system changes.
• Better enforcement of market regulations
• Harmonizing policy and regulation
• Massive research, knowledge, and data gaps
• Advocacy for greater policy attention, incl. stronger advocacy groups
• Difficult getting legumes on policy agenda • Unorganized actors cannot lobby for
visibility/resources • Numerous taxes & levies • Numerous undocumented TBTs & NTBs • Haphazard trade restrictions
• Support policy/strategy research & advocacy
• Support initiatives on MTIS • Support regulatory agencies on
harmonization & enforcement of regulations
• Support regional advocacy organizations to strengthen voice & visibility
Horizontal linkages
Actor linkages are important for collaboration, coordination and knowledge & information sharing. This requires strong farmer and industry institutions & structures, which are underdeveloped
• Enhanced farmer organization for better aggregation
• Lower cost of production and marketing
• Direct linkage of producers to end markets
• Weak farmer institutions & structures • Weak industry associations • Mistrust & negative competition • Lack of learning & exchange platforms
• Support establishment of market platforms
• Support MTIS initiatives • Facilitate learning & exchange
activities, incl. seminars, trade fares, visits
Vertical linkages
For an unsophisticated VC, vertical linkages foster innovation and enhance
• Establishment of intermediary farmer-facing enterprises
• Unorganized informal VC • High investment cost
• Catalyze transformation of first-mile market intermediation
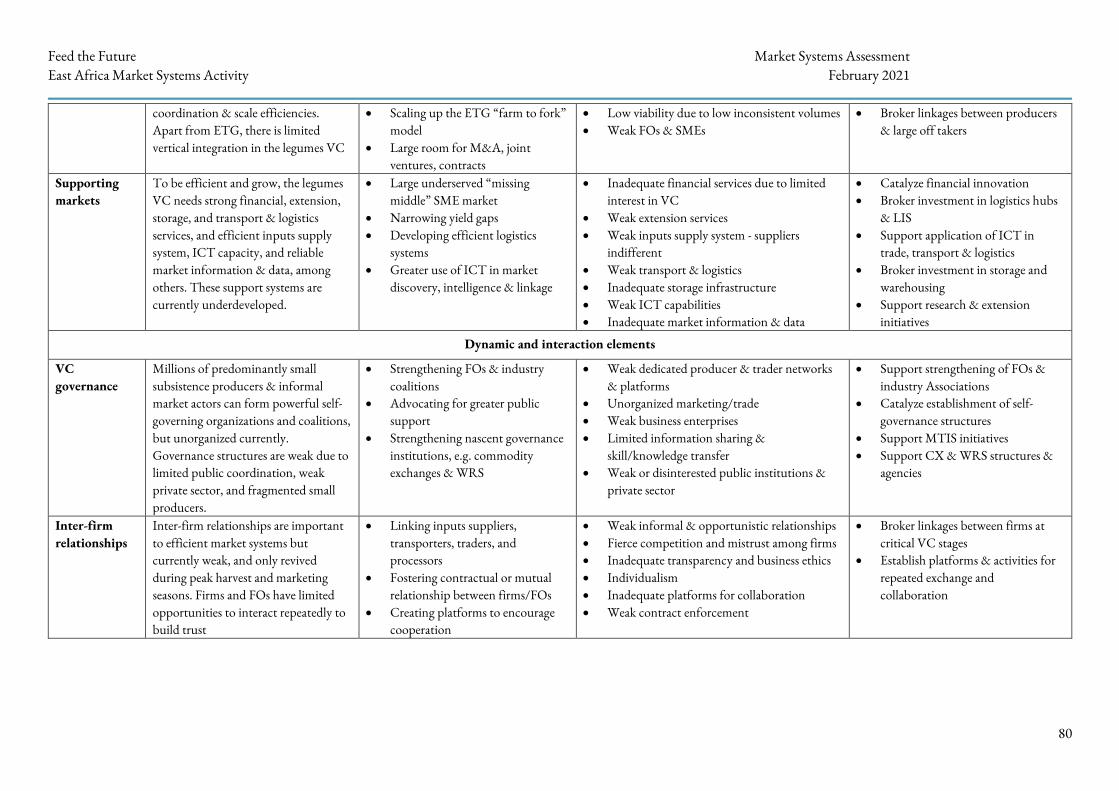
Feed the Future Market Systems Assessment East Africa Market Systems Activity February 2021
80
coordination & scale efficiencies. Apart from ETG, there is limited vertical integration in the legumes VC
• Scaling up the ETG “farm to fork” model
• Large room for M&A, joint ventures, contracts
• Low viability due to low inconsistent volumes • Weak FOs & SMEs
• Broker linkages between producers & large off takers
Supporting markets
To be efficient and grow, the legumes VC needs strong financial, extension, storage, and transport & logistics services, and efficient inputs supply system, ICT capacity, and reliable market information & data, among others. These support systems are currently underdeveloped.
• Large underserved “missing middle” SME market
• Narrowing yield gaps • Developing efficient logistics
systems • Greater use of ICT in market
discovery, intelligence & linkage
• Inadequate financial services due to limited interest in VC
• Weak extension services • Weak inputs supply system - suppliers
indifferent • Weak transport & logistics • Inadequate storage infrastructure • Weak ICT capabilities • Inadequate market information & data
• Catalyze financial innovation • Broker investment in logistics hubs
& LIS • Support application of ICT in
trade, transport & logistics • Broker investment in storage and
warehousing • Support research & extension
initiatives
Dynamic and interaction elements
VC governance
Millions of predominantly small subsistence producers & informal market actors can form powerful self-governing organizations and coalitions, but unorganized currently. Governance structures are weak due to limited public coordination, weak private sector, and fragmented small producers.
• Strengthening FOs & industry coalitions
• Advocating for greater public support
• Strengthening nascent governance institutions, e.g. commodity exchanges & WRS
• Weak dedicated producer & trader networks & platforms
• Unorganized marketing/trade • Weak business enterprises • Limited information sharing &
skill/knowledge transfer • Weak or disinterested public institutions &
private sector
• Support strengthening of FOs & industry Associations
• Catalyze establishment of self-governance structures
• Support MTIS initiatives • Support CX & WRS structures &
agencies
Inter-firm relationships
Inter-firm relationships are important to efficient market systems but currently weak, and only revived during peak harvest and marketing seasons. Firms and FOs have limited opportunities to interact repeatedly to build trust
• Linking inputs suppliers, transporters, traders, and processors
• Fostering contractual or mutual relationship between firms/FOs
• Creating platforms to encourage cooperation
• Weak informal & opportunistic relationships • Fierce competition and mistrust among firms • Inadequate transparency and business ethics • Individualism • Inadequate platforms for collaboration • Weak contract enforcement
• Broker linkages between firms at critical VC stages
• Establish platforms & activities for repeated exchange and collaboration
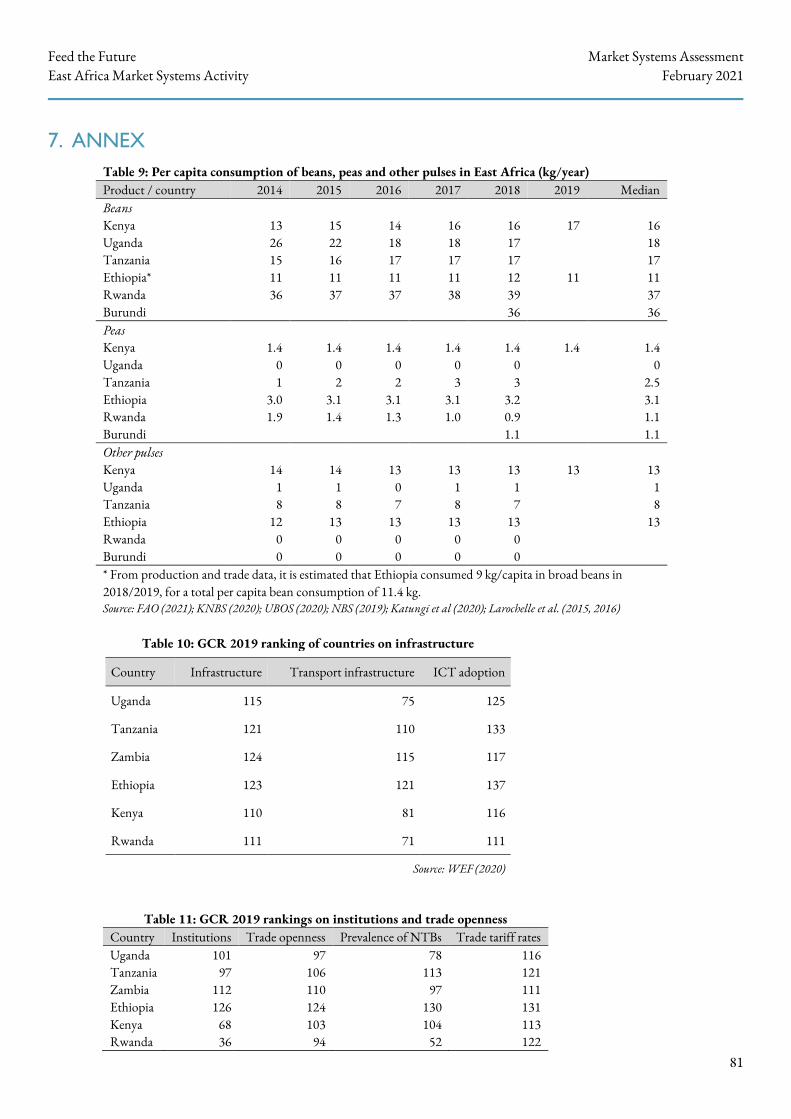
Feed the Future Market Systems Assessment East Africa Market Systems Activity February 2021
81
7. ANNEX
Table 9: Per capita consumption of beans, peas and other pulses in East Africa (kg/year) Product / country 2014 2015 2016 2017 2018 2019 Median Beans Kenya 13 15 14 16 16 17 16 Uganda 26 22 18 18 17 18 Tanzania 15 16 17 17 17 17 Ethiopia* 11 11 11 11 12 11 11 Rwanda 36 37 37 38 39 37 Burundi 36 36 Peas Kenya 1.4 1.4 1.4 1.4 1.4 1.4 1.4 Uganda 0 0 0 0 0 0 Tanzania 1 2 2 3 3 2.5 Ethiopia 3.0 3.1 3.1 3.1 3.2 3.1 Rwanda 1.9 1.4 1.3 1.0 0.9 1.1 Burundi 1.1 1.1 Other pulses Kenya 14 14 13 13 13 13 13 Uganda 1 1 0 1 1 1 Tanzania 8 8 7 8 7 8 Ethiopia 12 13 13 13 13 13 Rwanda 0 0 0 0 0 Burundi 0 0 0 0 0 * From production and trade data, it is estimated that Ethiopia consumed 9 kg/capita in broad beans in 2018/2019, for a total per capita bean consumption of 11.4 kg. Source: FAO (2021); KNBS (2020); UBOS (2020); NBS (2019); Katungi et al (2020); Larochelle et al. (2015, 2016)
Table 10: GCR 2019 ranking of countries on infrastructure
Country Infrastructure Transport infrastructure ICT adoption
Uganda 115 75 125
Tanzania 121 110 133
Zambia 124 115 117
Ethiopia 123 121 137
Kenya 110 81 116
Rwanda 111 71 111
Source: WEF (2020)
Table 11: GCR 2019 rankings on institutions and trade openness Country Institutions Trade openness Prevalence of NTBs Trade tariff rates Uganda 101 97 78 116 Tanzania 97 106 113 121 Zambia 112 110 97 111 Ethiopia 126 124 130 131 Kenya 68 103 104 113 Rwanda 36 94 52 122
Feed the Future Market Systems Assessment East Africa Market Systems Activity February 2021
82
Feed the Future Market Systems Assessment East Africa Market Systems Activity February 2021
83
Bibliography
East African Community (EAC). East African Standards (EAS) Catalog 2020. http://tbs.go.tz/uploads/files/EAS_Catalogue_2020.pdf
FAO. FAOSTAT. Accessed in February 2021.
Farrow A; Muthoni-Andriatsitohaina R. (Eds.). 2020. Atlas of Common Bean Production in Africa: Second Edition. Pan-Africa Bean Research Alliance (PABRA); International Center for Tropical Agriculture (CIAT). Nairobi, Kenya. 242 pp. accessed in February 2021 at https://cgspace.cgiar.org/handle/10568/110556
FEWS NET. East Africa Cross Border Trade Bulletin Volume XXXII (January 2021). Accessed on Feb. 11, 2021 at https://ratin.net/assets/uploads/files/63683-quarterly-gha-cross-border-trade-bulletin-january-2021.pdf
Heiner Lehr & Yared Sertse. 2018. Value chain analysis of pulses and oilseeds from Ethiopia. Report for the EU Centre for the Promotion of Imports from Developing Countries (CBI). Retrieved on February 21 2021 from https://www.cbi.eu/sites/default/files/vca_ethiopia_oilseeds_and_pulses_-_def.pdf
ICRISAT. 2009. Situation & Outlook of the ESA Bean VC. http://tropicallegumes.icrisat.org/wp-content/uploads/2016/02/rso-common-bean-esa.pdf
International Trade Center (ITC). 2021. TradeMap Statistics. Accessed in February 2021.
ITC. Ethiopia Pulses RoadMap 2019-2024 (https://www.intracen.org/uploadedFiles/intracenorg/Content/Redesign/Projects/SITA/Ethiopia%20Pulses%20strategy.pdf)
ITC. Kenya Pulses RoadMap 2016-2020. Accessed at SITA Publications (https://www.intracen.org/SITA/SITA-Publications1/)
ITC. Tanzania Pulses VC Roadmap 2016-2020. http://unossc1.undp.org/sscexpo/content/ssc/library/solutions/partners/expo/2016/GSSD%20Expo%20Dubai%202016%20PPT/Day%202_November%201/SF%204_Room%20D_ITC/Value%20chain%20roadmaps/Tanzania/Tanzania%20Pulses%20Value%20Chain%20RoadMap.pdf
Karanja, David (2016). Pulses crops grown in Ethiopia, Kenya and United Republic of Tanzania for local and Export Market. International Trade Centre, Eastern Africa Grain Council (EAGC). Accessed on February 15, 2021 at http://eagc.org/wp-content/uploads/2016/07/Pulses_Crops_Grown_ITC_web-1.pdf
Katungi, E.; Nduwarigira, E.; Ntukamazina, N.; Niragira, S.; Mutua, M.; Kalemera, S.; Onyango, P.; Nchanji, E.; Fungo, R.; Birachi, E.; Rubyogo, J.C.; Buruchara, R. (2020) Food security and common bean productivity: Impacts of improved bean technology adoption among smallholder farmers in Burundi. The Alliance of Bioversity International and CIAT. Report 36 p. Accessed on February 18, 2021 at https://cgspace.cgiar.org/handle/10568/109119
Kilimo Trust, 2017. Characteristics of green gram markets in the EAC: Regional East African Community Trade in Staples (REACTS) Project.
Feed the Future Market Systems Assessment East Africa Market Systems Activity February 2021
84
Kilimo Trust. 2016. Beans Enterprises and Structured Trade in East Africa Community. https://www.kilimotrust.org/documents/2018/success_stories/BEST-EAC_BMB-SuccessStory.pdf
Larochelle et al. 2015. Household consumption and demand for bean in Uganda: Determinants and implications for nutrition security. Catherine Larochelle, Enid Katungi, and Zhen Cheng. Invited paper presented at the 5th International Conference of the African Association of Agricultural Economists, September 23-26, 2016, Addis Ababa, Ethiopia. Accessed in February 2021 at https://ageconsearch.umn.edu/record/246457/
Miriri, Duncan. “African Union to Set up Infrastructure Fund for the Continent.” Reuters, February 19, 2021. https://www.reuters.com/article/us-africa-infrastructure-idUSKBN2AJ0TG.
NISR. 2020. Rwanda Upgraded Seasonal Agriculture Survey (USAS) in 2019/2020. National Institute of Statistics of Rwanda (NISR). http://www.statistics.gov.rw/publication/upgraded-seasonal-agricultural-survey-annual-report-2020
Niti Bhan. 2016. Informal Cross Border Trade in the East African Community, the Democratic Republic of Congo, and South Sudan: Literature Review. http://nitibhan.com/wp-content/uploads/2017/07/Literature-Review-Informal-Trade-in-the-EACDRCSSudan-23-Jan-2016_NitiBhan.pdf
PABRA Africa Bean Corridors. https://cgspace.cgiar.org/bitstream/handle/10568/80540/PABRA20_Bean_Corridors_BRIEF.pdf?sequence=5&isAllowed=y
PABRA. How beans are beating hunger in Burundi. Summary. Pan-Africa Bean Research Alliance (PABRA); International Center for Tropical Agriculture (CIAT) 1 p. Accessed on February 18, 2021 at https://cgspace.cgiar.org/handle/10568/109120
Porter, M., (1998), The Competitive Advantage of Nations, New York: The Free Press.
Rubyogo JC; Lung'aho M; Ochieng J; Binagwa P; Mdachi M; Zakayo, E; Shida N; Msaky J; Kadege E; Birachi B; Mutua M; Nyakundi F; Kalemera S. 2019. Consumer acceptance of and willingness to pay for high-iron beans in northern Tanzania. Nairobi (Kenya): International Center for Tropical Agriculture (CIAT); Tanzania Agricultural Research Institute (TARI). Arusha, Tanzania. 60 p. https://cgspace.cgiar.org/handle/10568/105881
Rubyogo JC; Lung'aho M; Ochieng J; Binagwa P; Mdachi M; Zakayo, E; Shida N; Msaky J; Kadege E; Birachi B; Mutua M; Nyakundi F; Kalemera S. 2019. Consumer acceptance of and willingness to pay for high-iron beans in northern Tanzania. Nairobi (Kenya): International Center for Tropical Agriculture (CIAT); Tanzania Agricultural Research Institute (TARI). Arusha, Tanzania. 60 p. Accessed in February 2021 at https://cgspace.cgiar.org/handle/10568/105881
Rwanda Statistical Year Book 2019. http://www.statistics.gov.rw/statistical-publications/subject/statistical-yearbook/reports
Snapp, S., Rahmanian, M., Batello, C. 2018. Pulse crops for sustainable farms in sub-Saharan Africa, edited by T. Calles. Rome, FAO. http://www.fao.org/3/i8300en/I8300EN.pdf
The United Republic of Tanzania. 2016/17 Annual Agriculture Sample Survey (AASS) Crop and Livestock Report. National Bureau of Statistics (NBS), May 2018. Accessed on February 12, 2021 at https://www.nbs.go.tz/nbs/takwimu/Agriculture/Tanzania_Food_Balance_Sheets_Report_2014-2017.pdf
Feed the Future Market Systems Assessment East Africa Market Systems Activity February 2021
85
The United Republic of Tanzania. National Food Balance Sheets Report 2014-2017. National Bureau of Statistics (NBS), May 2019. Accessed on February 12, 2021 at https://www.nbs.go.tz/nbs/takwimu/Agriculture/Tanzania_Food_Balance_Sheets_Report_2014-2017.pdf
Titeca, Kristof (2020). Informal cross-border trade along the Uganda-DRC Border. UNDP United Nations Development Programme, Policy Brief Series, No 2. Accessed on February 18 2021 at https://www.africa.undp.org/content/rba/en/home/library/issue-briefs/borderland-policy-briefing-series---informal-cross-border-drc-ug.html
UBOS. 2019. Uganda Annual Agricultural Survey 2018 Report. https://www.ubos.org/wp-content/uploads/publications/06_2020AAS_2018_Report_Final_050620.pdf
UBOS. 2020. Uganda Time to cross survey 2020. The Great Lakes Trade Facilitation Project (GLTFP), Ministry of Trade and Industry. [Mpondwe, Bunagana, Goli - DRC border]
UBOS. Uganda Food Balance Sheets Report 2013-2018. https://www.ubos.org/wp-content/uploads/publications/10_2020Uganda_Food_Balance_Sheets_Report_2013-2018_Final_08Oct2020-1.pdf
UBOS. Uganda Statistical Abstract 2020. https://www.ubos.org/wp-content/uploads/publications/11_2020STATISTICAL__ABSTRACT_2020.pdf
UNDP. 2021. ICBT along the Uganda- DRC border. Policy Brief
United Nations. COMTRADE. Accessed in February 2021.
WFP. 2013. Comparative review of market assessments methods, tools, approaches and findings. Accessed in February 2021 at https://documents.wfp.org/stellent/groups/public/documents/manual_guide_proced/wfp259756.pdf)
World Customs Organization (WCO). 2016. Harmonized Commodity Description and Coding System: Harmonized System Nomenclature 2017, 6th ed.
World Bank. 2018. Connecting to Compete: Trade Logistics in the Global Economy. The Logistics Performance Index and Its Indicators. Washington, DC: The International Bank for Reconstruction and Development/The World Bank.
i