PNACL980.pdf - USAID
347
Bihar
-
Upload
khangminh22 -
Category
Documents
-
view
0 -
download
0
Transcript of PNACL980.pdf - USAID

Bihar

World Summit for Children Indicators: Bihar, NFHS-2, 1998-99
BASIC INDICATORS
Childhood mortality Infant mortality rate1 73Under-five mortality ratel 105
Childhood malnutrition Percent stunted (children age 0-35 months) 53.7Percent wasted (children age 0-35 months) 21.0Percent underweight (children age 0-35 months) 54.4
Clean water supply Percent of households within 15 minutes of a safe water suppll 65.7
Sanitary excreta disposal Percent of households with flush toilets 13.3
Basic education Percent of women age 15-49 with completed primary education 26.8Percent of men age 15-49 with completed primary education 59.1Percent of girls age 6-12 attending school 55.1Percent of boys age 6-12 attending school 70.2Percent of women age 15-49 who are literate 31.3
Children in especially difficult situations Percent of children age 0-14 who live in single adult households 3.1
SUPPORTING INDICATORS
Birth spacing Percent of births within 24 months of a previous birth 25.2
Safe motherhood Percent of births with medical antenatal care 36.0Percent of births with antenatal care in first trimester 15.1Percent of births with medical assistance during delivery 23.4Percent of births in a medical facility 14.6Percent of births at high risk 57.1
Family planning Contraceptive prevalence rate (any method, currently married women) 24.5Percent of currently married women with an unmet need for family
planning 24.5Percent of currently married women with an unmet need for family
planning to avoid a high~risk birth 18.4
Maternal nutrition Percent of women with low body mass index (BMI) 39.3
Low birth weight Percent of births with low birth weight (of those reporting a numericweight) 22.3
Breastfeeding Percent of children under 4 months who are exclusively breastfed 55.2
Iodized salt intake Percent of households that use iodized salt (at least 15 ppm) 46.9
Vaccinations Percent of children whose mothers received tetanus toxoid vaccinationsduring pregnancy 62.8
Percent of children age 12-23 months with measles vaccination 16.6Percent of children age 12-23 months fully vaccinated 11.0
Diarrhoea control Percent of children with diarrhoea in the preceding 2 weeks whoreceived ORS, sugar-salt-water solution, or gruel 24.5
Acute respiratory infection Percent of children with acute respiratory infection in the preceding 2weeks seen by medical personnel 58.2
1Per 1,000 live births2Water from pipes, hand pump, covered well, or tanker truck

NATIONAL FAMILY HEALTH SURVEY (NFHS-2)
INDIA
1998-99
BIHAR
International Institute for Population SciencesMumbai, India
MEASURE DHS+, ORC MACROCalverton, Maryland, USA
May 2001

Suggested citatiou: International Iustitute forPopulation Sciences (lIPS) and ORC Macro. 2001.National Family Health Survey (NFHS-2), India,1998-99: Bihar. Mumbai: lIPS.
For additional information about the National Family Health Survey (NFHS-2), please contact:
International Institute for Population SciencesGovandi Station Road, Deonar, Mumbai-400 088Telephone: 5564883,5563254,5563255,5563256Fax: 5563257E-mail: [email protected]: http://www.nfhsindia.org
NFHS-2 data sets for this state can be obtained from the website listed above.

CONTRIBUTORS
T.K. RoyVinod K. Mishra
R.K. SinhaDilip Kumar
Zaheer Ahmad KhanU.P. Sinha
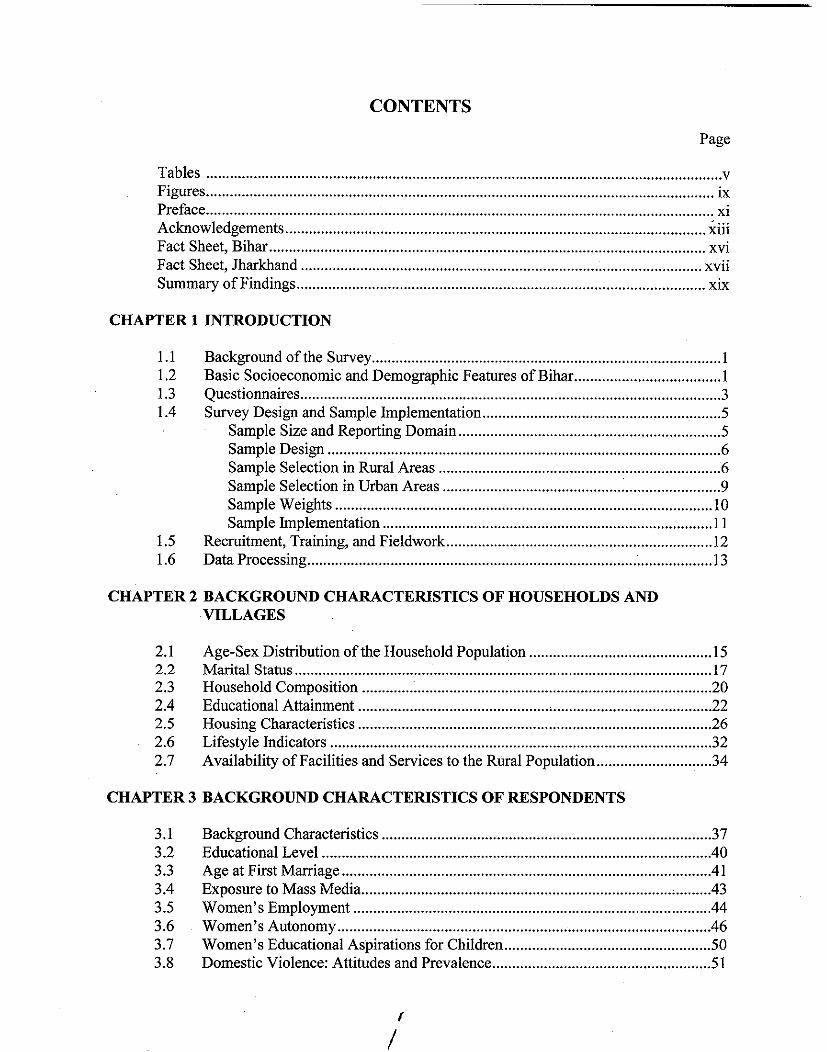
CONTENTS
Page
Tables vFigures ixPreface xiAcknowledgements xiiiFact Sheet, Bihar xviFact Sheet, Jharkhand xviiSummary of Findings xix
CHAPTER 1 INTRODUCTION
1.1 Background ofthe Survey 11.2 Basic Socioeconomic and Demographic Features ofBihar. l1.3 QuestIOnnaires .31.4 Survey Design and Sample Implementation 5
Sample Size and Reporting Domain 5Sample Design 6Sample Selection in Rural Areas 6Sample Selection in Urban Areas 9Sample Weights 10Sample Implementation 11
1.5 Recruitment, Training, and Fieldwork 121.6 Data Processing 13
CHAPTER 2 BACKGROUND CHARACTERISTICS OF HOUSEHOLDS ANDVILLAGES
2.1 Age-Sex Distribution ofthe Household Population .152.2 Marital Status 172.3 Household Composition 202.4 Educational Attainment 222.5 Housing Characteristics 262.6 Lifestyle Indicators .322.7 Availability of Facilities and Services to the Rural Population 34
CHAPTER 3 BACKGROUND CHARACTERISTICS OF RESPONDENTS
3.1 Background Characteristics .373.2 Educational Level .403.3 Age at First Marriage 413.4 Exposure to Mass Media .433.5 Women's Employment 443.6 Women's Autonomy .463.7 Women's Educational Aspirations for Children 503.8 Domestic Violence: Attitudes and Prevalence 51
f
/

PageCHAPTER 4 FERTILITY AND FERTILITY PREFERENCES
4.1 Age at First Cohabitation .594.2 Current Fertility Levels 614.3 Fertility Differentials and Trends 644.4 Children Ever Born and Living 684.5 Birth Order 704.6 Birth Intervals 704.7 Age at First and Last Birth 734.8 Postpartum Amenorrhoea, Abstinence, Insusceptibility, and Menopause 754.9 Desire for More Children 774.10 Ideal Number of Children 824.11 Sex Preference for Children 834.12 Fertility Planning 86
CHAPTER 5 FAMILY PLANNING
5.1 Knowledge of Family Planning Methods 915.2 Contraceptive Use 93
Ever Use ofFamily Planning Methods 93Current Use of Family Planning Methods 94Socioeconomic Differentials in Current Use of Family Planning
Methods 96Number of Living Children at First Use ofContraception 100Problems with Current Method 101
5.3 Timing of Sterilization 1025.4 Sources ofContraceptive Methods 1035.5 Reasons for DiscontinuationINon-Use ofContraception .1075.6 Future Intentions Regarding Contraceptive Use .1095.7 Exposure to Family Planning Messages 1135.8 Discussion ofFamily Planning 1155.9 Need for Family Planning 117
CHAPTER 6 MORTALITY, MORBIDITY, AND IMMUNIZATION
6.1 Crude Death Rates and Age-Specific Death Rates 1226.2 Infant and Child Mortality .123
Assessment of Data Quality 124Levels, Trends, and Differentials in Infant and Child Mortality 125Socioeconomic Differentials in Infant and Child Mortality 127Demographic Differentials in Infant and Child Mortality 128
6.3 Morbidity 131Asthma 132Tuberculosis 132Jaundice 133Malaria ; ~ 134
ii

Page
6.4 Child Immunization .......................................................................................•.....1346.5 Vitamin A Supplementation 1416.6 Child Morbidity and Treatment 144
Acute Respiratory Infection 144Fever 146Diarrhoea 146
6.7 HIV/AIDS 152Knowledge of AIDS 153Source ofKnowledge About AIDS 153Knowledge of Ways to Avoid AIDS 156
CHAPTER 7 NUTRITION AND THE PREVALENCE OF ANAEMIA
7.1 Women's Food Consumption 1597.2 Nutritional Status of Women 1607.3 Anaemia Among Women " 1637.4 Infant Feeding Practices 1667.5 Nutritional Status of Children '" 1737.6 Anaemia Among Children 1777.7 Iodization of Salt 179
CHAPTER 8 MATERNAL AND REPRODUCTIVE HEALTH
8.1 Antenatal Problems and Care 184Problems During Pregnancy 184Antenatal Check-Ups 186Reasons for Not Receiving Antenatal Check-Ups 188Number and Timing of Antenatal Check-Ups .189Components of Antenatal Check-Ups 191Tetanus Toxoid Vaccination 192Iron and Folic Acid Supplementation .195
8.2 Delivery Care 196Place ofDe1ivery 196Assistance During Delivery 198Delivery Characteristics 20 I
8.3 Postnatal Care 202Postpartum Complications 205
8.4 Reproductive Health Problems 205
CHAPTER 9 QUALITY OF CARE
9.1 Source of Health Care for Households 2139.2 Contacts at Home with Health and Family Planning Workers 2149.3 Quality of Home Visits 2159.4 Matters Discussed During Home Visits or Visits to Health Facilities 217
iii

Page
9.5 . Quality of Services Received at the Most Recent Visit to a Health Facility 2199.6 Family Planning Information and Advice Received .2199.7 Availability ofPills and Condoms 2209.8 Person Motivating Users of a Modem Contraceptive Method 2219.9 Quality of Care of Family Planning Services 222
REFERENCES .225
APPENDICES
Appendix A Estimates of Sampling Errors 233Appendix B Data Quality Tables .243Appendix C Bihar NFHS-2 Staff... 251Appendix D Survey Instruments 257
iv

Table l.l
Table 1.2
Table 1.3
Table 2.1
Table 2.2
Table 2.3
Table 2.4
Table 2.5
Table 2.6
Table 2.7
Table 2.8
Table 2.9
Table 2.10
Table 2.11
Table 2.12
Table 2.13
Table 2.14
Table 3.1
Table 3.2
Table 3.3
Table 3.4
Table 3.5
Table 3.6
Table 3.7
Table 3.8
Table 3.9
Table 3.10
Table 3.11
Table 4.1
Table 4.2
Table 4.3
Table 4.4
TABLESPage
Sampling stratification : 7
Sample results ~ 11
Sample results by region 12
Household population by age and sex .16
Population by age and sex from the SRS and NFHS-2 17
Marital status of the household population 18
Singulate mean age at marriage 20
Household characteristics 21
Educational level of the household population 23
School attendance .26
Reasons for children not attending schooL 27
Housing characteristics 28
Household ownership of agricultural land, house, and livestock .30
Household ownership of durable goods and standard of living .31
Lifestyle indicators .33
Distance from the nearest health facility .35
Availability of facilities and services 36
Background characteristics ofrespondents .38
Respondent's level of education by background characteristics .41
Age at first marriage .42
Exposure to mass media .44
Employment.. .45
Household decisionmaking .47
Women's autonomy .49
Perceived educational needs of girls and boys .51
Reasons given for justifYing a husband beating his wife .53
Women's experience with beatings or physical mistreatment .55
Frequency ofbeatings or physical mistreatment ...................................•......57
Age at first cohabitation with husband 60
Current fertility 62
Fertility by background characteristics 64
Fertility trends 67

Table 4.5
Table 4.6
Table 4.7
Table 4.8
Table 4.9
Table 4.10
Table 4.11
Table 4.12
Table 4.13
Table 4.14
Table 4.15
Table 4.16
Table 4.17
Table 4.18
Table 4.19
Table 5.1
Table 5.2
Table 5.3
Table 5.4
Table 5.5
Table 5.6
Table 5.7
Table 5.8
Table 5.9
Table 5.10
Table 5.11
Table 5.12
Table 5.13
Table 5.14
Table 5.15
Table 6.1
Table 6.2
Page
Fertility by marital duration 68
Children ever born and living 69
Birth order 71
Birth interval 72
Median age at first birth 74
Age at last birth 75
Postpartum amenorrhoea, abstinence, and insusceptibility 76
Menopause 77
Fertility preferences 78
Desire to have no more children by background characteristics 81
Ideal and actual number of children 83
Ideal number of children by background characteristics 84
Indicators of sex preference 85
Fertility planning 87
Wanted fertility rates 89
Knowledge of contraceptive methods 92
Ever use of contraception 93
Current use of contraception 95
Current use by background characteristics .....................•............................98
Number of living children at first use 100
Problems with current method 101
Timing of sterilization 102
Source of modem contraceptive methods 104
Reasons for discontinuation/non-use 108
Future use of contraception 110
Reasons for not intending to use contraception .111
Preferred method 112
Exposure to family planning messages .114
Discussion of family planning 116
Need for family planning services 118
Age-specific death rates and crude death rates 123
Infant and child mortality 126
VI

Table 6.3
Table 6.4
Table 6.5
Table 6.6
Table 6.7
Table 6.8
Table 6.9
Table 6.10
Table 6.11
Table 6.12
Table 6.13
Table 6.14
Table 6.15
Table 6.16
Table 7.1
Table 7.2
Table 7.3
Table 7.4
Table 7.5
Table 7.6
Table 7.7
Table 7.8
Table 7.9
Table 7.10
Table 7.11
Table 7.12
Table 8.1
Table 8.2
Table 8.3
Table 8.4
Table 8.5
Table 8.6
Page
Infant and child mortality by background characteristics 128
Infant and child mortality by demographic characteristics 129
Morbidity 133
Childhood vaccinations by source of information 136
Childhood vaccinations by background characteristics 138
Childhood vaccinations recei"ed by 12 months of age 140
Source of childhood vaccinations 142
Vitamin A supplementation for children 143
Prevalence of acute respiratory infection, fever, and diarrhoea 145
Knowledge of diarrhoea care 148
Treatment of diarrhoea 150
Source of ORS packets 152
Source of knowledge about AIDS 154
Knowledge about avoidance of AIDS 157
Women's food consumption 160
Women's food consumption by background characteristics 161
.Nutritional status ofwomen 162
Anaemia among women 164
Initiation of breastfeeding 168
Breastfeeding status by child's age 169
Type of food received by children 170
Median duration of breastfeeding by background characteristics 172
Nutritional status of children by demographic characteristics 174
Nutritional status of children by background characteristics 176
Anaemia among children 178
Iodization of salt 181
Health problems during pregnancy 185
Antenatal check-ups 187
Reason for not receiving an antenatal check-up 189
Number and timing of antenatal check-ups and stage of pregnancy 190
Components of antenatal check-Ups 192
Tetanus toxoid vaccination and iron and folic acid tablets or syrup 194
vii

Table 8.7
Table 8.8
Table 8.9
Table 8.10
Table 8.11
Table 8.12
Table 8.13
Table 9.1
Table 9.2
Table 9.3
Table 9.4
Table 9.5
Table 9.6
Table 9.7
Table 9.8
Table 9.9
Table 9.10
Appendix A
Table A.l
Table A.2
AppendixB
Table B.1
Table B.2
Table B.3
Table B.4
Table B.5
Table B.6
Page
Place of delivery 197
Assistance during delivery 199
Characteristics of births .201
Postpartum check-ups 203
Symptoms ofpostpartum complications .206
Symptoms ofreproductive health problems 208
Treatment ofreproductive health problems .21 0
Source ofhealth care 214
Home visits by a health or family planning worker .216
Quality ofhome visits 217
Matters discussed during contacts with a health or family planningworker 218
Quality of care during the most recent visit to a health facility 220
Family planning discussions with a health or family planning worker ..221
Availability ofregular supply of condoms/pills 221
Motivation to use family planning 222
Discussions about alternative methods of family planning 223
Information on side effects and follow-up for current method 224
List of selected variables for sampling errors, Bihar, 1998-99 235
Sampling errors, Bihar, 1998-99 236
Household age distribution 244
Age distribution of eligible and interviewed women 245
Completeness ofreporting 245
Births by calendar year .247
Reporting ofage at death in days 248
Reporting of age at death in months .249
viii

Figure 2.1
Figure 2.2
Figure 3.1
Figure 4.1
Figure 4.2
Figure 4.3
Figure 4.4
Figure 5.1
Figure 5.2
Figure 6.1
Figure 6.2
Figure 6.3
Figure 6.4
Figure 6.5
Figure 7.1
Figure 7.2
Figure 7.3
Figure 8.1
Figure 8.2
Figure 8.3
Figure 8.4
Figure 8.5
Figure 9.1
FIGURES
Page
Population Pyramid 16
School Attendance by Age, Sex, and Residence 26
Percentage of Women Participating in Different Household Decisions .and Percentage with Access to Money ..48
Age-Specific Fertility Rates by Residence 62
Age-Specific Fertility Rates, NFHS-1 and NFHS-2 63
Total Fertility Rate by Selected Background Characteristics 65
Fertility Preferences Among Currently Married Women 80
Current Use of Family Planning by Residence, NFHS-1 and NFHS-2 96
Sources of Family P1auning Among Current Users ofModem .Contraceptive Methods 107
Infant Mortality Rate for Five-Year Periods by Residence 126
Infant Mortality Rate by Selected Demographic Characteristics 130
Percentage of Children Age 12-23 Months Who Have ReceivedSpecific Vaccinations 137
Percentage ofChildren Age 12-23 Months Who Have Received AllVaccinations 139
Source of Childhood Vaccinations by Residence .141
AnaemiaAmong Women 165
Stunting Among Children Under Three Years by Mother's Education and...SLI 177
Anaemia Among Children 179
Problems During Pregnancy 185
Source ofAntenatal Check-Ups During Pregnancy 188
Number and Timing of Antenatal Check-Ups .191
Place of Delivery and Assistance During Delivery 198
Reproductive Health Problems Among Currently Married Women 207
Motivator for Current Users ofModem Contraceptive Methods 223
/'1-

PREFACE
The success of the first National Family Health Survey, conducted in 1992-93, in creating animportant demographic and health database in India has paved the way for repeating the survey.The second National Family Health Survey (NFHS-2), undertaken in 1998-99, is designed tostrengthen the database further and facilitate implementation and monitoring of population andhealth programmes in the country. As in the earlier survey, the principal objective ofNFHS-2 isto provide state and national estimates of fertility, the practice of family planning, infant andchild mortality, maternal and child health, and the utilization of health services provided tomothers and children. In addition, the survey provides indicators of the quality of health andfamily welfare services, women's reproductive health problems, and domestic violence, andincludes information on the status ofwomen, education, and the standard ofliving.
Another feature of NFHS-2 is measurement of the nutritional status of women. Heightand weight measurements, which were available only for young children in the earlier survey,were extended to cover all eligible women in NFHS-2. In addition, ever-married women andtheir children below age three had their blood tested for the level of haemoglobin, using theHemoCue instrument. Through these blood tests, for the first time the survey providesinformation on the prevalence ofanaemia throughout India. In two metropolitan cities, Delhi andMumbai, a further test was done for children below age three to measure the lead content in theirblood. The survey also measured the extent to which households in India use cooking salt thathas been fortified with iodine.
The NFHS-2 survey was funded by the United States Agency for InternationalDevelopment (USAID) through aRC Macro, USA. UNICEF provided additional financialsupport for the nutritional components of the survey. The survey is the outcome of thecollaborative efforts of many organizations. The International Institute for Population Sciences(lIPS) was designated as the nodal agency for this project by the Ministry of Health and FamilyWelfare, Government of India, New Delhi. Thirteen reputed field organizations (FOs) in India,including five Population Research Centres, were selected to carry out the houselisting operationand data collection for NFHS-2. The field organization for Bihar was the ORG Centre for SocialResearch in New Delhi. aRC Macro, Calverton, Maryland, USA, and the East-West Center,Honolulu, Hawaii, USA, provided technical assistance for all survey operations.
The NFHS-2 survey covered a representative sample of more than 90,000 eligible womenage 15-49 from 26 states that comprise more than 99 percent of India's population. The datacollection was carried out in two phases, starting in November 1998 and March 1999. Thesurvey provides state-level estimates of demographic and health parameters as well as data onvarious socioeconomic and programmatic factors that are critical for bringing about desiredchanges in India's demographic and health situation. The survey provides urban and ruralestimates for most states, regional estimates for four states (Bihar, Madhya Pradesh, Rajasthan,and Uttar Pradesh), separate estimates for three metro cities (Chennai, Kolkata, and Mumbai),and estimates for slum areas in Mumbai.
The survey used uniform questionnaires, sample designs, and field procedures tofacilitate comparability of the data and to achieve a high level ofdata quality. Preliminary reportswith selected results were prepared earlier for each state and presented to policymakers and
-

programme administrators responsible for improving health and family welfare programmes inmost states.
The final state reports are based on a standard tabulation plan developed at a workshopheld in Kodaikanal on 15-17 January 1999. lIPS finalized the tabulation plan according to therecommendations of the NFHS-2 Technical Advisory Committee and produced the tables andfigures for the final reports. In most states, the final state reports were written by representativesof the Population Research Centres, faculty members from lIPS, representatives from ORCMacro and the East-West Center, and reputed researchers from other organizations in the field ofpopulation and health in India. Each report has been reviewed by an Indian expert in the field ofpopulation sciences.
We are happy to present the final NFHS-2 state report for Bihar, which was covered inthe first phase of the survey. We hope that the report will provide helpful insights into thechanges that are taking place in the state and will provide policymakers and programmemanagers with up-to-date estimates of indicators that can be used for effective management ofhealth and family welfare programmes, with an emphasis on reproductive health dimensions.The report should also contribute to the knowledge of researchers and analysts in the fields ofpopulation, health, and nutrition.
T.K.RoyDirector
International Institute forPopulation Sciences
Mumbai
xii

ACKNOWLEDGEMENTS
The second National Family Health Survey was successfully completed due to the efforts andinvolvement of numerous organizations and individuals at different stages of the survey. Wewould like to thank everyone who was involved in the survey and made it a success.
First of all, we are grateful to the Ministry of Health and Family Welfare, Government ofIndia, New Delhi, for its overall guidance and support during the project. Mr. Y.N. Chaturvedi andMr. K.S. Sugathan, the then Secretary and Joint Secretary, respectively, at the Department ofFamily Welfare deserve special thanks. They initiated the project and designated the InternationalInstitute for Population Sciences (lIPS) as the nodal agency for the survey. They also formed theSteering Committee, the Administrative and Financial Management Committee, and the TechnicalAdvisory Committee for the smooth and efficient functioning of the project. Special thanks are dueto Mr. A.R. Nanda, the present Secretary of the Department of Family Welfare, who continued totake an active interest in the project and provided timely guidance and support. The contributions ofMr. Vijay Singh, Joint Secretary (FA), Ms. Meenakshi Dutta Ghosh, Joint Secretary (S),Mr. Gautam Basu, Joint Secretary (RCH), Mr. P.K. Saba, Chief Director (S), and Dr. K.V. Rao,Chief Director (S), are acknowledged with gratitude.
We gratefully acknowledge the immense help received from the Office of the RegistrarGeneral, India, New Delhi (particularly Dr. M. Vijayanunni, the then Registrar General of India,Mr. J.K. Banthia, the present Registrar General of India, Mr. S.P. Sharma, Consultant, and Mr. S.K.Sinha, Deputy Registrar General, Vital Statistics) in implementing the sample design and makingthe latest SRS results available to' cite in the reports. We thank all the expert participants in theseries of workshops to finalize the questionnaire design, the sample design, and tabulation plans forthe survey. Special mention and thanks are due to Dr. Vijay Verma for his expert advice on thesample design and the calculation of sample weights.
We are grateful to the Directorate of Census Operations, Maharashtr'a, for their support inconducting training of the trainers for the houselisting operation. We acknowledge the support ofthe All India Institute of Medical Sciences, New Delhi, which extended its facilities for training ofthe health investigators.
We are thankful to the Department ofHealth and Family Welfare, Government of Bihar, forhelping the field organization by providing logistic assistance, whenever possible. Special thanks goto the local officials in all ofthe sample areas for facilitating the data collection.
The United States Agency for International Development (USAID) provided generousfunding for NFHS-2. USAID's contribution to the project is sincerely acknowledged. Specialthanks are due to Mr. William Goldman, the former Director of the Office of Population, Health andNutrition (PHN), USAID, New Delhi, Ms. Sheena Chhabra, Team Leader, Policy, Research,Evaluation, and Marketing (PHN), and Dr. Victor K. Barbiero, current Director of PHN, for theirinitiative and involvement in the project. Many thanks are due to UNICEF for providing additionalfunding for the nutrition component of the project and the most modem medical equipment forcarrying out the height-weight measurements and anaemia testing. Special thanks are due toDr. Sanjiv Kumar, Project Officer (Health), UNICEF, New Delhi, for his earnest cooperation in thisrespect.

We gratefully acknowledge the help and cooperation given by Dr. Rameshwar Sharma, thethen Director, and Dr. Shiv Chandra Mathur, Professor, State Institute of Health and FamilyWelfare (SlliFW), Jaipur, during the national pretest ofthe NFHS-2 questionnaires in Rajasthan.
Thanks are due to all the members of the Steering Committee, Administrative and FinancialManagement Committee, and Technical Advisory Committee for participating in various meetingsand providing valuable guidance for successful execution of the project.
Dr. K.B. Pathak was the Director of IIPS during the development of the project andthroughout the first phase of data collection. His immense interest and great assistance toNFHS-2 are gratefully acknowledged.
We appreciate and acknowledge the untiring efforts, interest and initiative taken by Dr. FredArnold, Dr. Sunita Kishor, Mr. Sushil Kumar, and Mr. zaheer Ahmad Khan from ORC Macro andDr. Robert D. Retherford and Dr. Vinod Mishra from the East-West Center. It is only due to theirhard work that NFHS-2 could be completed successfully. Thanks go to Dr. Umesh Kapil,Additional Professor, Department of Human Nutrition, All India Institute ofMedical Sciences, NewDelhi, for organizing, in collaboration with lIPS, the training programme for the health componentof the survey, and to Dr. Almaz Sharman of ORC Macro for assisting with the training programme.We also thank the health coordinators, Dr. Vikash Chandra, Dr. P.V. Kaushik, and Dr. Sanjeev P.Walokar, for their involvement in the NFHS-2 nutrition training programme and their sinceresupervision of the nutrition component of the survey. We gratefully acknowledge Mr. O.P. Sharmafor his able assistance in ensuring the timely printing and distribution of the survey reports.
ORC Macro made available the ISSA (Integrated System for Survey Analysis) computerpackage for data entry and tabulation. Special thanks go to Mr. Martin Wulfe and Mr. Hendrik J.Raggers for their immense help in the data processing operation, data analysis, and preparation ofthe tables for NFHS-2 reports and to Dr. Raj ib Acharya for his assistance at every stage of the dataprocessing operation and report writing and his maintenance of the NFHS website. Special thanksgo to Mr. Somnath W. Choughule, Data Entry Operator, for designing the NFHS website. Wegratefully acknowledge the valuable contribution of lIPS Senior Research Officers Dr. RajeshriChitanand, Dr. Damodar Sahu, and Dr. Yonah Bhutia, and Research Officers Ms. PavaniUpadrashta and Dr. M. Hemanta Meitei. Thanks are due to Ms. Sally Dai of the East-West Centerfor her assistance in the preparation of this report. Thanks are also due to the other supporting staffof the project, as well as the Administrative, Accounts, and Library staff of lIPS, for theircontinuous cooperation during the entire project period.
The difficult task of data collection and data processing in the state of Bihar wassuccessfully carried out by ORG Centre for Social Research, New Delhi. Our special thanks are dueto Mr. C.V.S. Prasad, Survey Director, and the three Survey Coordinators (Dr. P.K. Chopra,Mr. Nazir Haider, and Mr. SA Khan) for successfully coordinating the fieldwork and dataprocessing for the state. Special thanks go to Mr. Anup Murari Rajan, lIPS Research Officer,NFHS-2, for assisting during the training of the field staff and monitoring the data collection inBihar. This acknowledgement carmot be concluded without expressing appreciation for the hardwork put in by the interviewers, health investigators, supervisors, and field editors in collecting datain Bihar.
Thanks are due to Dr. Dilip Kumar, Population Research Centre, Patna, Dr. R.K. Sinha,Reader, International Institute for Population Sciences, Mumbai, and Dr. U.P. Sinha, Retd.
xiv

-
Professor, International Institute for Population Sciences, Mumbai, for their contribution in reportwriting. We extend our sincere thanks to Dr. S. Mukerji, Retd. Professor, International Institute forPopulation Sciences, Mumbai for reviewing this report and giving his comments.
Last but not the least, credit goes to all the eligible women and the household respondents ofBihar who spent their time and responded to the rather lengthy questionnaires with tremendouspatience and without any expectation from NFHS-2.
IK RoySumati Kulkarni
Arvind PandeyKamlaGupta
Parveen Nangia
xv
-

FACT SHEET - BIHAR'NATIONAL FAMILY HEALTH SURVEY, 1998-99
Sample SizeHouseholds 6,345Ever-married women age 15-49 7,024
Characteristics of HouseholdsPercent with electricity 18.2Percent within 15 minutes of safe water supplyl 65.7Percent with flush toilet 13.3Percent with no toilet facility 83.2Percent using govt. health facilities for sickness 9.1Percent using iodized salt (at least 15 ppm) 46.9
Characteristics ofWonien2
Percent urban I0.2Percent illiterate 76.6Percent completed high school and above 8.4Percent Hindu ; 83.6Percent Muslim 14.8Percent Christian 0.8Percent regularly exposed to mass media 27.3Percent working in the past 12 months 26,4
Status ofWomen2
Percent involved in decisions about own health .47.6Percent with control over some money 66.7
MarriagePercent never married among women age 15-19 54.0Median age at marriage among women age 20-49 15.1
Fertility and Fertility PreferencesTotal fertility rate (for the past 3 years) 3,49Mean number ofchildren ever born to women 40-49 5.25Median age at first birth among women age 20-49 19.1Percent ofbirths3oforder 3 and above .54.7Mean ideal number of children4 .3.3Percent ofwomen with 2 living children wanting
another child ,49.2
Current Contraceptive UsesAny method 24.5
Any modem method 22,4Pill 1.0100 , 0.5Condom 0.7Female sterilization , 19.2Male sterilization 1.0
Any traditional method : 1.6Rhythm/safe period 0.9Withdrawal... 0.7
Other traditional or modem method 0.5
Unmet Need for Family PlanningS
Percent with unmet need for family planning 24.5Percent with unmet need for spacing 12.6
'Includes JharkhandIWater from pipes, hand pump, covered well, or tanker truck2Ever-married women age 15-493For births in the past 3 years4Excluding women giving non-numeric responsesSAmong currently married women age 15-49
Quality of Family Planning Services'Percent told about side effects of method 15.8Percent who received follow-up services 77.1
Childhood MortalityInfant mortality rate7 72.9Under-five mortality rate' 105.1
Safe Motherhood and Women's Reproductive HealthPercent ofbirths8 within 24 months ofprevious birth........ 25.2
Percent ofbirths3whose mothers received:Antenatal check-up from a health professional 36.0Antenatal check-up in first trimester 15.1Two or more tetanus toxoid injections 57.8Iron and folic acid tablets or syrup 24.1
Percent ofbirths3 whose mothers were assisted at delivery by a:Doctor : 14.5ANMINursehnidwiteILHV 5.7Traditional birth attendant.. 65.8
PercentS reporting at least one reproductivehealth problem 44.2
Awareness of AIDSPercent of women who have heard of AIDS 1l.7
Child HealthPercent of children age 0-3 months exclusivelybreastfed 55.2
Median duration ofbreastfeeding (months) <:36.0
Percent of children9 who received vaccinations:BCG 37.7DPT (3 doses) : 24.2Polio (3 doses) .41.0Measles 16.6All vaccinations 11.0
Percent of childrenJO with diarrhoea in the past2 weeks who received oral rehydration salts (ORS) .......... 15,4
Percent of children10 with acute respiratory infection inthe past 2 weeks taken to a health fucility or provider.. ..... 58.2
NutritionPercent ofwomen with anaemiaI1 63.4Percent ofwomen with moderate/severe anaemi·all 20.5Percent of children age 6-35 months with anaemiaJl 81.3Percent of children age 6-35 months with moderate/severe anaemiaII 54.4
Percent of children chronically undernourished(stunted)l2 53.7
Percent of children acutely undernourished (wasted)l2 21.0Percent of children underweightl2 54.4
6por current users ofmodem methods'For the 5 years preceding the survey (1994-98)SFor births in the past 5 years (excluding first births)'Children age 12-23 monthsIOChildren under 3 yearsllAnaemia-haemoglobin level < 11.0 grams/decilitre (gldl)
for children and pregnant women and < 12.0 gldl fornonpregnant women. Moderate/severe anaemia-haemoglobin level < 10.0 gldl.
l2Stunting assessed by height-for-age, wasting assessed byweight-for-height, underweight assessed by weight-for-age
Xvi

FACTSHEET-JHARKHANDNATIONAL FAMILY HEALTH SURVEY, 1998-99
Sample SizeHouseholds 1,642Ever-married women age 15-49 1,614
Characteristics of HouseholdsPercent with electricity .23.6Percent within 15 minutes of safe water supplyl 33.8Percent with flush toilet 12.1Percent with no toilet facility 84.6Percent using govt. health facilities for sickness 19.0Percent using iodized salt (at least 15 ppm) 56.1
Characteristics ofWomen2
Percent urban 17.2Percent illiterate 76.3Percent completed high school and above 6.7Percent Hindu 82.6Percent Muslim 11.7Percent Christian ,..- 3.0Percent regularly exposed to mass media 28.8Percent working in the past 12 months 31.7
Status of Women2
Percent involved in decisions about own health 66.8Percent with control over some money 64.5
MarriagePercent never married among women age 15-19 62.3Median age atmarriage among women age 20--49 15.8
Fertility and Fertility PreferencesTotal fertility rate (for the past 3 years) 2.76Mean number ofchildren ever born to women 40-49 .4.83Median age at first birth among women age 20-49 19.0Percent ofbirths3 of order 3 and above 53.7Mean ideal number ofchildren' .3.1Percent ofwornen with 2 living children wanting
another child 48.4
Current Contraceptive Use5
Any method 27.6
Any modem method 24.9Pill 1.5IUD 0.3Condom , 1.1Female sterilization .21.1Male sterilization 0.9
Any traditional method ~ 1.1Rhythm/safe period 0.5WithdrawaI. , 0.7
Other traditional or modem method 1.6
Unmet Need for Family Planning'Percent with unmet need for family planning 21.0Percent with unmet need for spacing 1L1
lWater from pipes, hand pump, covered well, or tanker truck2Ever-married women age 15--493Por births in the past 3 years4Excluding women giving non-numeric responses5Among currently married women age 15-49
XVII
Quality of Family Planning Services6
Percent told about side effects of method 18.4Percent who received follow-up services 80.9
Childhood MortalityInfant mortality rate' 54.3Under-five mortality rate7
: 78.3
Safe Motherhood and Women's Reproductive HealthPercent ofbirths8 within 24 months ofprevious birth 25.2
Percent ofbirths3 whose mothers received:Antenatal check-up from a health professional.. .41.7Antenatal check-up in first trimester 18.0Two or more tetanus toxoid injections 50.6Iron and folic acid tablets or syrup 32.7
Percent ofbirths3 whose mothers we~e assisted at delivery by a:Doctor 11.7ANMINurse/midwife/LHV 5.3Traditional birth attendant 64.2
Percent5 reporting at least one reproductivehealth problem 44.7
Awareness of AIDSPercent ofwomen who have heard ofAIDS 15.4
Child HealthPercent of children age 0-3 months exclusively
breastfed 55.8Median duration ofbreastfeeding (months) 86.0
Percent ofchildren9 who received vaccinations:BCG .44.4DPT (3 doses) 21.7Polio (3 doses) 36.5Measles 18.2All vaccinations 8.8
Percent ofchildren10 with diarrhoea in the past2 weeks who received oral rehydration salts (ORS) 20.4
Percent ofchildren10 with acute respiratory infection in.the past 2 weeks taken to a health facility or provider ...... .41.1
Nutrition ..! .!:.
Percent ofwomen with anaemia11 72.9Percent ofwomen with moderate/severe anaemiall 28.6Percent of children age 6-35 months with anaemiall 82.4Percent of children age 6-35 months with moderate!
severe anaemia l ! 56.2Percent ofchildren chronically undernourished
(stunted)" ..49.0Percent of children acutely undernourished (wasted)12 25.4Percent ofchildren underweight12 54.3
6por current users ofmodem methods'For the 5 years preceding the survey (1994-98)8For births in the past 5 years (excluding first births)'Children age 12-23 monthsIOChildren under 3 yearsllAnaemia-haemoglobin level < 11.0 gramsldecilitre (gldl)
for children and pregnant women and < 12.0 gldl fornonpregnant women. Moderate/severe anaemia-haemoglobin level < 10.0 gldi.
12Stunting assessed by height-for-age, wasting assessed byweight-for-height, underweight assessed by weight-for-age

SUMMARY OF FINDINGS
The second National Family Health Survey (NFHS-2), conducted in 1998-99, providesinformation on fertility, mortality, family planning, and important aspects of health, nutrition,and health care. The International Institute for Population Sciences (lIPS) coordinated thesurvey, which collected information from a nationally representative sample of more than 90,000ever-married women age 15--49. The NFHS-2 sample covers 99 percent of India's populationliving in all 26 states.
lIPS also coordinated the first National Family Health Survey (NFHS-I) in 1992-93.Most of the types of information collected in NFHS-2 were also collected in the earlier survey,making it possible to identify trends over the intervening period of six and one-half years. Inaddition, the NFHS-2 questionnaire covered a number of new or expanded topics with importantpolicy implications, such as reproductive health, women's autonomy, domestic violence,women's nutrition, anaemia, and salt iodization.
In Bihar, NFHS-2 field staff collected information from 6,345 households between 3December 1998 and 31 March 1999 and interviewed 7,024 eligible women in these households.In addition, the survey collected information on 2,947 children born to eligible women during thethree years preceding the survey. One health investigator on each survey team measured theheight and weight ofwomen and young children and took blood samples to assess the prevalenceofanaemia.
Background Characteristics of the Survey Population
According to the 1991 Census, 87 percent of the population of Bihar lives in rural areas. The agedistribution is typical of high fertility populations, with a higher proportion of population in theyounger age groups. Forty-two percent of the population is below age 15, and 4 percent is age 65and above. The sex ratio is 955 females for every 1,000 males in rural areas but only 932 femalesfor every 1,000 males in urban areas, suggesting that more men than women have migrated tourban areas.
The survey provides a variety of demographic and socioeconomic backgroundinformation. In the state as a whole, 83 percent of household heads are Hindu, 15 percent areMuslim, and I percent are Christian. Muslims are more concentrated in urban areas, where theycomprise 20 percent of household heads. Twenty-one percent of household heads belong toscheduled castes, 10 percent belong to scheduled tribes, and 50 percent belong to other backwardclasses (OBCs). Less than one-fifth ofhousehold heads do not belong to any of these groups.
Although there are some improvements since the time ofNFHS-I, the housing conditions'.and the standard of living of household members remain very poor in Bihar. Only 18 percent ofhouseholds in Bihar have electricity, and only 8 percent have piped drinking water, comparedwith 17 percent and 8 percent, respectively, in NFHS-l. Eighty-three percent of households inBihar do not have any toilet facility.
Nearly two-thirds (63 percent) of males but only about one-third (35 percent) of femalesage six and above are literate, an increase of 3 percentage points for males and 6 percentagepoints for females from literacy rates at the time of NFHS-l. Sixty-three percent of children age
XVIII
-

6-14 are attending school, an increase from 51 percent in NFHS-l. The proportions enrolled arerising rapidly at all levels of schooling, particularly for girls, but girls still lag behind boys inschool attendance. Moreover, the disparity in school attendance by sex grows with increasingage of children. At age 15-17,58 percent of boys attend school, compared with 35 percent ofgirls.
Women'in Bihar tend to marry at an early age. Forty-six percent of women age 15-19 arealready married. Age at marriage is much lower in rural areas than in urban areas. In rural areas,one-half (50 percent) of women age 15-19 are married, compared with only about one-quarter(24 percent) in urban areas. Older women are more likely than younger women to have marriedat an early age: 59 percent of women who are now age 45--49 married before they were 15,compared with 24 percent of women age 15-19. Although this indicates that the proportion ofwomen who marry young is declining rapidly, the majority of women in Bihar still marry beforereaching the legal minimum age of 18 years. On average, women are five years younger than themen they marry.
As part of an increasing emphasis on gender issues in NFHS-2, the survey asked womenabout their participation in household decisionmaking. In Bihar, 87 percent of women areinvolved in decisionmaking on at least one of four selected topics. A much lower proportion,however, are involved in decisionmaking about their own health care (48 percent), purchasingjewellery or other major household items (43 percent), or staying with parents or siblings (44percent). Only 27 percent of women in Bihar do work other than housework, and 7 out of 10 ofthese women work for cash. Fifty-one percent of women who earn cash can decideindependently how to spend the money that they earn.
Fertility and Family Planning
Fertility continues to decline in Bihar. At current fertility levels, women will have an average of3.5 children each throughout their childbearing years. Although the total fertility rate hasdeclined by about half a child in the six-year period between NFHS-l and NFHS-2, it remainsquite high and far from the replacement level.
Efforts to lower fertility might usefully focus on groups within the population that havehigher fertility than average. In Bihar, rural women, illiterate women, poor women, and Muslimwomen have much higher fertility than other women. A more striking feature is the high level ofchildbearing among young women. The median age at first childbirth is 19 years, and womenage 15-19 account for 16 percent of total fertility. Studies in India and elsewhere have shownthat health and mortality risks increase when women give birth at such young ages--both for thewomen themselves and for their children. Family planning programmes focusing on women inthis age group could make a significant impact on maternal and child health as well as reducingoverall fertility in the state.
The appropriate design of family planning programmes depends, to a large extent, onwomen's fertility preferences. Women may have large families because they want manychildren, or they may prefer small families but, for a variety of reasons, may have more childrenthan they actually want. For 13 percent of births over the three years preceding NFHS-2, mothersreport that they did not want the pregnancy at all, and for another 12 percent of these births,mothers say that they would have preferred to delay the pregnancy. When asked about their
xx

preferred family size, 18 percent of women who already have three children and 11 percent ofwomen with four or more children respond that they consider the two-child family ideal. Thisgap between women's actual fertility experience and what they want or would consider idealsuggests a need for expanded or improved family welfare services to help women achieve theirfertility goals.
If many women in Bihar are not using family planning, it may not be due to lack ofknowledge. Knowledge of contraception is nearly universal: 99 percent of currently marriedwomen know at least one modem family planning method. Women are most familiar withfemale sterilization (99 percent), followed by male sterilization (97 percent), the pill (75percent), the condom (64 percent), and the IUD (59 percent). Knowledge of modem spacingmethods has increased by 10-18 percentage points since the time of NFHS-l, although use ratesfor these methods remain extremely low.
Only 25 percent of married women are currently using some method of contraception, aslight increase from 23 percent at the time ofNFHS-l. Contraceptive prevalence is considerablyhigher in urban areas (39 percent) than in rural areas (23 percent). Female sterilization is by farthe most popular method: 19 percent of currently married women are sterilized, a slight increasefrom 17 percent at the time ofNFHS-l. By contrast, only 1 percent of women reported that theirhusbands are sterilized in both NFHS-l and NFHS-2. Overall, sterilization accounts for 82percent oftotal contraceptive use. Use rates for the pjll, IUD, and condom remain very low, eachat 1 percent or less.
Contraceptive prevalence varies widely among socioeconomic groups. Rural women,illiterate women, Muslim women, scheduled-tribe women, and women belonging to low standardof living households have much lower levels of contraceptive use than other women. Urbanwomen, women with high school or more education, and women from households with a highstandard of living are all more likely than other women to use the three modem spacingmethods-pill, IUD, and condom, but the use of these methods does not exceed 10 percent inany group.
Given the near-exclusive emphasis on sterilization, women tend to adopt family plarmingonly after they have achieved their desired family size. As a result, contraceptive use can beexpected to rise steadily with age and with number of living children. In Bihar, contraceptive usedoes indeed go up with age, peaking at 41 percent for women age 40-44. Use also goes up withthe number of children, peaking at 37 percent for women with three living children. Sonpreference has considerable effect on contraceptive use. Women who have one or more sons aremore likely to use contraception than are women who have the same number ofchildren but haveonly daughters.
Thirteen percent of currently married women are not using contraception but say thatthey want to wait at least two years before having another child. Another 12 percent are not usingcontraception although they do not want any more children. These women are described ashaving an 'unmet need' for family planning. The unmet need for spacing declines from 30percent among women age 15-19 to less than 2 percent among women age 35--49. The unmetneed for limiting increases with age to peak at 22 percent among women age 30-34 and declinesgradually among older women. These results underscore the need for strategies that provide
xxi

spacing as well as terminal methods in order to meet the changing needs of women over theirlifecycle.
For many years, the Government ofIndia has been using electronic and other mass mediato promote family planning. Exposure to mass media is quite low in Bihar, where only 42percent of rural residents live in villages that are electrified and only 5 percent live in villagesthat have a cable connection. Overall, only 20 percent of ever-married women listen to the radioat least once a week and only 17 percent watch television at least once a week. About threequarters (73 percent) of women are not regularly exposed to radio, television, or other types ofmedia. Exposure to each type of media is much higher among urban women, more-educatedwomen, Christian women, women not belonging to a scheduled caste, scheduled tribe, or otherbackward class, and women from high standard of living households. Forty percent of womensaw or heard a family planning message in the media during the few months preceding thesurvey. In addition to radio and television, wall paintings and hoardings are important sources ofexposure to family planning messages in Bihar. As with the exposure to mass media itself,exposure to family planning messages is much lower among disadvantaged socioeconomicgroups.
More than three-fourths (77 percent) of women who use modem contraception obtainedtheir method from a government hospital or other source in the public sector. Only 18 percentobtained their method from the private medical sector. The private medical sector, along withshops, is the major source of pills and condoms, however. The private sector plays a larger rolein urban areas (where it is the source of modem methods for 34 percent of users) than in ruralareas (where it is the source of modem methods for 15 percent of users).
An important indication of the quality of family planning services is the information thatwomen receive when they obtain contraception and the extent to which they receive follow-upservices after accepting contraception. In Bihar, only 15 percent of users of modemcontraceptives who were motivated by someone to use their method were told about any othermethod. Only 16 percent were told by a health or family planning worker about possible sideeffects of the method they adopted, at the time of adopting the method. Seventy-seven percent ofcontraceptive users, however, have received follow-up services.
From the information provided in NFHS-2, a picture emerges of women marrying early,having their first child soon after marriage, and having two or three more children in closesuccession by the time they reach their late-20s. At that point, about one-third of women getsterilized. The median age for female sterilization has been declining in recent years and is now27.7 years. Very few women use modem spacing methods that could help them delay their firstbirths and increase intervals between pregnancies.
Infant and Child Mortality
NFHS-2 provides estimates of infant and child mortality and factors associated with the survivalof young children. During the five years preceding the survey, the infant mortality rate was 73(deaths of infants per 1,000 live births), a decrease from the corresponding rate of 89 per 1,000live births in NFHS-l. The child mortality rate, at 35 (deaths of children age 1-4 years per 1,000children reaching age one), declined from 42 at the time of NFHS-l. Expressed differently, I in14 children die in the first year of life, and I in 10 die before reaching age five. Child-survivalprogrammes might usefully focus on specific groups ofchildren with particularly high infant and
xxii

child mortality rates, such as children who live in rural areas, children whose mothers areilliterate, children belonging to scheduled castes, and children from poor households.
Along with various socioeconomic groups, efforts to promote child survival need toconcentrate on very young mothers and mothers whose children are closely spaced. Infantmortality is 49 percent higher among children born to mothers under age 20 than among childrenborn to mothers age 20-29 (98 deaths, compared with 66, per 1,000 live births). Infant mortalityis more than two and one-half times as high among children born less than 24 months after aprevious birth as among children born after a gap of 48 months or more (110 deaths, compared
. with 41, per 1,000 live births). Clearly, efforts to expand the use of temporary contraceptivemethods for delaying and spacing births would help reduce infant mortality as well as fertility.
Health and Health Care
Promotion of maternal and child health has been one of the most important components of theFamily Welfare Programme ofthe Government ofIndia. One goal is for each pregnant woman toreceive at least three antenatal check-ups plus two tetanus toxoid injections and a full course ofiron and folic acid supplementation. In Bihar, mothers of only 36 percent of the children born inthe three years preceding NFHS-2 received at least one antenatal check-up, and mothers of only18 percent of these children received at least three antenatal check-ups. For 58 percent of thesechildren, mothers received the recommended number of tetanus toxoid vaccinations, and for 24percent of children, mothers received iron and folic acid supplementation. Coverage by all threeinterventions is somewhat lower for women in disadvantaged socioeconomic groups than forother women. Coverage is also lower for women who already have four or more childre!!.
The Family Welfare Programme encourages women to deliver in a medical facility or, ifat home, with assistance from a trained health professional and to receive at least three check-upsafter delivery. During the three years preceding NFHS-2, only 15 percent of births in Bihar weredelivered in a medical facility. Among births delivered at home, only 10 percent were assisted bya health professional, but 78 percent by a traditional birth attendant. Only lout of 10 birthsoutside a medical facility were followed by a postpartum check-up within two months ofdelivery. Overall, these results show that utilization of health services in Bihar during pregnancy,during delivery, and after childbirth remains very low. They also point to the important role oftraditional birth attendants for the substantial proportion of births that occur at home.
The Government of India recommends that breastfeeding should begin immediately afterchildbirth and that infants should be exclusively breastfed for the first four months of life.Although breastfeeding is nearly universal in Bihar, very few children begin breastfeedingimmediately after birth--only 6 percent in the first hour and 21 percent in the first day. Fifty-fivepercent of children under four months of age are exclusively breastfed. The median duration ofbreastfeeding is more than three years, but the median duration ofexclusive breastfeeding is only1.9 months. At age 6-9 months, all children should be receiving solid or mushy food in additionto breast milk. However, only 15 percent of children age 6-9 months receive the recommendedcombination ofbreast milk and solid/mushy foods.
NFHS-2 uses three internationally recognized standards to assess children's nutritionalstatus--weight-for-age, height-for-age, and weight-for-height. Children who are more than twostandard deviations below the median of an international reference population are considered
.xxiii

underweight (measured in terms of weight-for-age), stunted (height-for-age), or wasted (weightfor-height). Stunting is a sign of chronic, long-term undernutrition, wasting is a sign of acute,short-term undernutrition, and underweight is a composite measure that takes into account bothchronic and acute undernutrition.
Based on international standards, 54 percent of children under age three years areunderweight, a similar proportion (54 percent) are stunted, and 21 percent are wasted. Childnutritional status has improved in Bihar since the time of NFHS-l, when 63 percent of youngchildren were underweight, 56 percent were stunted, and 24 percent were wasted, butundernutrition remains a serious problem in Bihar. Undernutrition is higher in rural areas than inurban areas and is particularly high among children from disadvantaged socioeconomic groups.The prevalence of undernutrition is about the same for girls as for boys. Four out of five childrenage 6-35 months are anaemic, including a large majority of children in every subgroup of thepopulation.
Child immunization is an important component of child-survival programmes in India,with efforts focussing on six serious but preventable diseases--tuberculosis, diphtheria,pertussis, tetanus, polio, and measles. The objective of the Universal Immunization Programme(DIP), launched in 1985-86, was to extend immunization coverage against these diseases to atleast 85 percent of infants by 1990. In Bihar, only 11 percent of children age 12-23 months arefully vaccinated, 72 percent have received some but not all of the recommended vaccinations,and 17 percent have not been vaccinated at all.
Full immunization coverage in Bihar has remained at 11 percent since NFHS-l, but thepercent not receiving any of the vaccinations has declined substantially from 54 percent inNFHS-l to 17 percent in NFHS-2. This is primarily due to a big increase in the first two doses ofpolio vaccine, undoubtedly because of the introduction of the Puise Polio ImmunizationCampaign in 1995. Full immunization coverage is so low primarily because only 17 percent ofchildren have been vaccinated against measles. Dropout rates for the series of DPT and poliovaccinations are also a problem. Forty percent of children received the first DPT vaccination, butonly 24 percent received all three doses; 81 percent received the first polio vaccination, but only41 percent received all three doses. It is also recommended that children under age five yearsshould receive oral doses of vitamin A every six months starting at age nine months. However,only 10 percent of children age 12-35 months have received any vitamin A supplementation andonly 7 percent have received a dose of vitamin A in the six months preceding the survey.
NFHS-2 collected information on the prevalence and treatment of three health problemsthat cause considerable mortality in young children--fever, acute respiratory infection (ARI),and diarrhoea. In Bihar, 31 percent of children under age three were ill with fever during the twoweeks preceding the survey, 22 percent were ill with ARI, and 18 percent had diarrhoea. Fiftyeight percent of the children who became ill with ARI and 50 percent of the children whobecame ill with diarrhoea received advice or treatment from a health facility or health-careprovider. Knowledge of the appropriate treatment of diarrhoea remains low. Only 38 percent ofmothers of children age less than 3 years know about oral rehydration salt (ORS) packets and 32percent of mothers incorrectly believe that when children are sick with diarrhoea, they should begiven less to drink than usual. Only 41 percent of children with diarrhoea received some form oforal rehydration therapy (ORT), including 15 percent who received ORS. The percentage ofchildren with diarrhoea who received ORS has increased slightly since NFHS-I, when it was
xxiv

only 12 percent, suggesting that there has been very little improvement in the management ofchildhood diarrhoea.
Based on a weight-for-height index (the body mass index), two out of five (39 percent)women in Bihar are undernourished. Nutritional deficiency is particularly serious for women inrural areas and women in disadvantaged socioeconomic groups. Women who are undernourishedthemselves are also much more likely than other women to have children who areundernourished. Overall, 63 percent of women in Bihar have some degree of anaemia, and 21percent are moderately to severly anaemic. Anaemia is a serious problem among women in everypopulation group, with prevalence rates ranging from 50 to 87 percent. Pregnant women aremore likely than nonpregnant women to be moderately to severely anaemic, but much less likelyto be mildly anaemic.
Less than one-half of households (47 percent) use cooking salt that is iodized at therecommended level of 15 parts per million(ppm), suggesting that iodine deficiency disorders arelikely to be a serious problem. Rural households and households with a low standard of livingare much less likely than other households to be using adequately iodized cooking salt.
Forty-four percent of currently married women in Bihar report some type ofreproductive-health problem, including abnormal vaginal discharge, symptoms of urinary tractinfections, and pain or bleeding associated with intercourse. Among these women, 69 percenthave not sought any advice or treatment. These results suggest a need to expand reproductivehealth services and information programmes that encourage women to discuss their problemswith a health-care provider.
In recent years, there has been growing concern about domestic violence in India.NFHS-2 found that in Bihar there is widespread acceptance among ever-married women that thebeating of wives by husbands is justified under some circumstances. About one-half (47 percent)of all ever-married women accept at least one of six reasons as a justification for a husbandbeating his wife. Domestic violence is also fairly common. Twenty-seven percent of evermarried women in Bihar have experienced beatings or physical mistreatment since age 15 and 18percent experienced such violence in the 12 months preceding the survey. Most of these womenhave been beaten or physically mistreated by their husbands. Domestic violence against womenis more prevalent in rural areas and among illiterate and poor women. Domestic violence isparticularly high against working women.
The survey collected information on the prevalence of tuberculosis, asthma, malaria, andjaundice among all household members. Disease prevalence based on reports from householdheads must be interpreted with caution, however. The survey found that about 1 percent of thepopulation in Bihar suffers from tuberculosis, 2 percent suffers from asthma, 4 percent sufferedfrom malaria during the three months preceding the survey, and 2 percent suffered from jaundiceduring the 12 months preceding the survey. Prevalence of asthma, tuberculosis, and malaria ismuch higher in rural areas than in urban areas, but prevalence of jaundice is slightly higher in'urban areas. Men are more likely than women to suffer from tuberculosis, jaundice, and malaria,but women are slightly more likely to suffer from asthma.
Most households in Bihar (83 percent) go to private doctors or private hospitals or clinicsfor treatment when a family member is ill. Only 9 percent normally use the public medicalsector. Even among poor households, only 8 percent normally use the public medical sector
xxv

when members become ill. Most respondents are generally satisfied with the health care theyreceive. Ratings on quality of services are lowest for public-sector facilities in rural areas, wherethe majority of respondents are critical of staff attitudes and cleanliness of the facilities.
Overall, only 2 percent of women received home visits from health or family planningworkers during the 12 months preceding the survey. The few who did receive home visits werenot visited regularly-receiving only one home visit, on average, in the year preceding thesurvey. A large majority ofthe women who received a home visit expressed satisfaction with theamount of time that the worker spent with them, and with the way the worker talked to them.
NFHS-2 also collected information on selected lifestyle indicators for householdmembers. According to household respondents, 26 percent of adult men and 6 percent of adultwomen smoke, 22 percent of adult men and 3 percent of adult women drink alcohol, and 52percent of adult men and 7 percent of adult women chew paan masala or tobacco.
Although the spread ofHIV/AIDS is a major concern in India, nearly 9 out of 10 womenin Bihar (88 percent) have not heard of AIDS. Awareness of AIDS is particularly low amongwomen in rural areas, and among women who are socioeconomically disadvantaged. Amongwomen who have heard of AIDS, 83 percent learned about the disease from television and 55percent from radio. Among women who have heard of AIDS, however, one-half do not know ofany way to avoid infection. Survey results suggest that health personnel could playa much largerrole in promoting AIDS awareness. In Bihar, only 1 percent of women who know about AIDSlearned about the disease from a health worker.
xxvi

CHAPTERl
INTRODUCTION
1.1 Background ofthe Survey
India's first National Family Health Survey (NFHS-l) was conducted in 1992-93 (InternationalInstitute for Population Sciences, 1995). The Ministry of Health and Family Welfare (MOHFW)subsequently designated the International Institute for Population Sciences (IIPS), Mumbai, asthe nodal agency to initiate a second survey (NFHS-2), which was conducted in 1998-99. Animportant objective of NFHS-2 is to provide state-level and national-level information onfertility, family planning, infant and child mortality, reproductive health, child health, nutritionof women and children, and the quality of health and family welfare services. Another importantobjective is to examine this information in the context of related socioeconomic and culturalfactors. The survey is also intended to provide estimates at the regional level for four states(Bihar, Madhya Pradesh, Rajasthan, and Uttar Pradesh) and for three metro cities (Chennai,Kolkata, and Mumbai), as well as slum areas in Mumbai. This information will assistpolicymakers and programme administrators in planning and implementing strategies forimproving population, health, and nutrition programmes. Comparative state results from NFHS-2have already been published (International Institute for Population Sciences and ORC Macro,2000). The current report provides a more comprehensive picture of the findings for Bihar.
The NFHS-2 sample covers more than 99 percent of India's population living in all 26states. It does not cover the union territories. NFHS-2 is a household sample survey with anoverall sample size of 90,303 ever-married women in the age group 15-49 living in 92,486households.
NFHS-2 was conducted with financial support from the United States Agency forInternational Development (USAID), with additional funding from UNICEF. Technicalassistance was provided by ORC Macro, Calverton, Maryland, USA, and the East-West Center,Honolulu, Hawaii, USA. Thirteen field organizations were selected to collect the data. Eight ofthe field organizations are private sector organizations and five are Population Research Centres(PRCs) established by the Government of India in various states. Each field organization hadresponsibility for data collection in one or more states. The Operations Research Group (ORG)in New Delhi was selected as the field organization for NFHS-2 in Bihar.
1.2 Basic Socioeconomic and Demographic Features of Bihar!
Bihar is the second most populous state, next to Uttar Pradesh, in India. It has an area of 173,877km2 and ranks ninth in terms of area among the states and union territories of India. According tothe 1991 Census, the state is divided into 42 districts distributed in three regions: North BiharPlain, comprising Saran, Siwan, Gopalganj, Pashchim Champaran, Purba Champaran, Sitamarhi,Vaishali, Darbhanga, Madhubani, Samastipur, Muzaffarpur, Pumia, Araria, Kishanganj, Katihar,Saharsa, and Madhepura districts; South Bihar Plain, comprising Patna, Nalanda, Gaya,
IBecause the NFHS-2 was conducted before the state of Jharkhand was established, this report covers Bihar as itexisted at the time ofthe survey. A fact sheet, which provides summary information about the new state ofJharkhand, is included in this report.

Jehanabad, Aurangabad, Nawada, Bhojpur, Rohtas, Begusarai, Munger, Khagaria, andBhagalpur districts; and Jharkhand2
, comprising Godda, Sahibganj, Dumka, Deoghar, Dhanbad,Giridih, Hazaribag, Palamu, Lohardaga, Gumla, Ranchi, Purbi Singhbhum, and PashchimiSinghbhum districts.
Although Bihar is predominantly an agricultural state, the state has been changingrapidly. The contribution of the agricultural sector to the state domestic product declined from 48percent in 1980-81 to 31 percent in 1996-97. The contribution of the manufacturing sector to thestate domestic product increased from around 11 percent in 1980-81 to 14 percent in 1996-97.The share of other sectors increased from 41 percent in 1980-81 to 55 percent in 1996-97 (EPWResearch Foundation, 1998). At the time of the 1991 Census, the agricultural sector providedlivelihood to 81 percent of the working population in the state (Office of the Registrar Generaland Census Commissioner, 1992). Paddy,jowar, bazra, fur, maize, potato, onion, tobacco, jute,and sugarcane are extensively cultivated. Kharif and rabi food grains constitute 64 and 36percent of the total production of food grains in the state, respectively (Centre for MonitoringIndian Economy, 1991). Bihar is rich in mineral resources: bauxite, coal, copper ore, iron,limestone, mica, manganese, chromite, sulphur pyrites, graphite, silver, gold, and vanadium arethe principal minerals of the state. The state has 32 percent of the mineral reserves in the countryand contributes 35 percent to the all-India production. Although Bihar is rich in mineralresources, it is industrially not well developed. The state has a few industries, includingmanufacture of cement, fertilizer, caustic soda, and steel. In the core sector, the state has steelplants at Bokaro and Jamshedpur, alloy steel plants at Patratu and Adityapur, a sponge ironproject at Chandel, coal mining industries, heavy engineering, and forging plants at Ranchi, afertilizer factory at Sindri, a caustic soda plant at Garhwa road (Palamu), an oil refinery atBarauni, and a copper complex at Ghatsila.
The average armual per capita income of the state increased marginally from Rs. 917 in1980-81 to Rs. 1,010 in 1996-97 at constant (1980-81) prices. At current prices, the averageannual per capita income in the state in 1996-97 is Rs. 3,835 (EPW Research Foundation, 1998).As per the estimates given by the Planning Commission for 1993-94, 58 percent of the ruralpopulation and 35 percent of the urban population in Bihar were below the poverty line (CentralStatistical Organisation, 1999).
According to the Census, the total population of Bihar was 56 million in 1971,70 millionin 1981, and 86 million in 1991, accounting for 10 percent of the total population ofIndia. Thedecadal growth rate increased from 21 percent for the period 1961-71 to 24 percent for 1971-81and remained at 24 percent during 1981-91. The 1981-91 intercensal increase in population inBihar (23.5 percent) was about the same as that for the country as a whole (23.9 percent). Thepopulation density, which was 324 persons per km2 in 1971, increased to 405 in 1981, and 497 in1991. The increase in population density by 173 persons per km2 during 1971-91 indicates anincreasing pressure on land and other resources. The population density is much higher in Biharthan in India as a whole (497 compared with 273 persons per km2
).
Bihar has been undergoing a slow process of urbanization. The percentage of populationin Bihar that is urban increased from 10 percent in 1971 to 13 percent in 1981. The percentageliving in urban areas remained at 13 percent in 1991. The level of urbanization in Bihar (13percent) is much lower than for India as a whole (26 percent). The sex ratio (number of females
20rginalIy the Chota Nagpnr Plateau region, which coincides with the newly formed state of Jharkhand.
2

per 1,0'00 males) in the state declined from 954 in 1971 to 946 in 1981 and 911 in 1991. The sexratio in Bihar is lower than in India as a whole (911 compared with 927). The percentage ofpopulation age 0-14 years declined from 43 percent to 41 percent between 1971 and 1991. Thepercentage of population age 65 and above increased marginally during this period.
According to the 1991 Census, the proportions of the total population designated asscheduled castes and scheduled tribes3 are lower in Bihar than in all of India. The scheduledcaste population increased marginally from 14 percent of the total population in 1971 to 15percent in 1991. The scheduled-tribe population decreased slightly from 9 percent of the totalpopulation in 1971 to 8 percent in 1991.
Bihar is one ofthe educationally backward states in India. According to the 1991 Census,the literacy rate among the population age seven and above was 39 percent, compared with 52percent for India as a whole. The literacy rates were 53 percent for males and 23 percent forfemales in Bihar, compared with 64 percent and 39 percent for males and females, respectively,for India. The gap in literacy rates between males and females in Bihar is higher than the gap inIndia as a whole.
According to the Sample Registration System (SRS), fertility in Bihar declinedconsiderably during 1981-91, but it has been stagnating since. The crude birth rate declined from39.1 per 1,000 population in 1981 to 30.7 in 1991, but has increased slightly to 31.7 in 1997. Thetotal fertility rate also declined substantially, from 5.7 children per woman in 1981 to 4.4children per woman in 1991---dropping by 1.3 children per woman during the 1981-91 decade,but has remained around that level since (4.4 children per woman in 1997). Mortality decline inBihar also exhibits a similar pattern, i.e., a decline during the 1980s and stagnation during the1990s. The crude death rate declined from 13.9 per 1,000 population in 1981 to 9.8 in 1991. Theinfant mortality rate declined from 118 per 1,000 live births in 1981 to 69 in 1991-a decline of49 percent. The crude death rate and infant mortality rate in 1997 were 10.0 and 71, respectively,indicating no improvement since 1991.
The infant mortality rate estimated by the Sample Registration System for Bihar in 1997was the same as that for India as a whole (i.e., 71 per 1,000 live births). For 1996-2001, lifeexpectancy is projected to be 65.6 years for males and 62.1 years for females, a substantialincrease from the estimates of 55.2 years for males and 53.0 years for females in 1981-86. Thecouple protection rate (defined as the percentage of eligible couples effectively protected againstpregnancy by various methods of contraception) in Bihar was 21 percent in 1997, compared with6 percent in 1971. The couple protection rate in Bihar in 1997 was much lower than the 45percent estimate for all India.
1.3 Questionnaires
NFHS-2 used three types of questionnaires: the Household Questionnaire, the Woman'sQuestionnaire, and the Village Questionnaire. The overall content and format of thequestionnaires were determined through a series of workshops held at IIPS in Mumbai in 1997and 1998. The workshops were attended by representatives of a wide range of organizations in
'Scheduled castes and scheduled tribes are castes and tribes which the Government of India officially recognizes associally and economically backward and in need of special protection from injustice and exploitation.
3

the population and health fields, as well as experts working on gender issues. The questionnairesfor Bihar were bilingual, with questions in both Hindi and English.
The Household Questionnaire lists all usual residents in each sample household plus anyvisitors who stayed in the household the night before the interview. For each listed person, thesurvey collected basic information on age, sex, marital status, relationship to the head of thehousehold, education, and occupation. The Household Questionnaire also collected informationon the prevalence of asthma, tuberculosis, malaria, and jaundice, as well as three riskbehaviours-ehewing paan masala or tobacco, drinking alcohol, and smoking. Information wasalso collected on the usual place where household members go for treatment when they get sick,the main source of drinking water, type of toilet facility, source of lighting, type of cooking fuel,religion of the household head, caste/tribe of the household head, ownership of a house,ownership of agricultural land, ownership of livestock, and ownership of other selected items. Inaddition, a test was conducted to assess whether the household uses cooking salt that has beenfortified with iodine. Finally, the Household Questionnaire asked about deaths occurring tohousehold members in the two years preceding the survey, with particular attention to maternalmortality. The information on the age, sex, and marital status of household members was used toidentifY eligible respondents for the Woman's Questionnaire.
The Woman's Questionnaire collected information from ever-married women age 15--49who were usual residents of the sample household or visitors who stayed in the samplehousehold the night before the interview. The questionnaire covered the following topics:
Background characteristics: Questions on age, marital status, education, employment status, andplace of residence provide information on characteristics likely to influence demographic andhealth behaviour. Questions are also asked about the background characteristics of a woman'shusband.
Reproductive behaviour and intentions: Questions cover dates and survival status of all births,current pregnancy status, and future childbearing intentions ofeach woman.
Quality of care: Questions assess the quality of family planning and health services.
Knowledge and use of contraception: Questions cover knowledge and use of specific familyplanning methods. For women not using family planning, questions are included about reasonsfor not using contraception and intentions for future use.
Sources of family planning: Questions determine where a user obtained her family planningmethod.
Antenatal, delivery, and postpartum care: The questionnaire collects information on whether awoman who had a birth since January 1995 received antenatal and postpartum care, whoattended the delivery, and the nature of any complications during pregnancy.
Breastfeeding and health: Questions cover feeding practices, the length of breastfeeding,immunization coverage, and recent occurrences of diarrhoea, fever, and cough for the last twobirths since January 1995.
4

Reproductive health: Questions assess various aspects of women's reproductive health and thetype of care sought for health problems.
Status of women: The questionnaire asks about gender roles, women's autonomy, and violenceagainst women.
Knowledge of AIDS: Questions assess women's knowledge of AIDS and sources of theirknowledge, as well as their knowledge about ways to avoid getting AIDS.
In addition, the health investigator on each survey team measured the height and weightof each woman and each of her children born since January 1995. This height and weightinformation is useful for assessing levels of nutrition prevailing in the population. The healthinvestigators also took blood samples from each woman and each of her children born sinceJanuary 1995 to assess haemoglobin levels. This information is useful for assessing prevalencerates of anaemia among women and children. Haemoglobin levels were measured in the field atthe end of each interview using portable equipment (the HemoCue) that provides test results inless than one minute. Severely anaemic women and children were referred to local medicalauthorities for treatment.
For each village selected in the NFHS-2 sample, the Village Questionnaire collectedinformation on the availability of various facilities in the village (especially health and educationfacilities) and amenities such as electricity and telephone connections. Respondents to theVillage Questionnaire were also asked about development and welfare programmes operating inthe village. The village survey included a short, open-ended questionnaire that was administeredto the village head, with questions on major problems in the village and actions that could betaken to alleviate those problems.
1.4 Survey Design and Sample Implementation
Sample Size and Reporting Domain
The overall target sample size for Bihar was 7,000 completed interviews with eligible women.The NFHS-l nonresponse rates at the household and individual levels were used to estimate thesample size that would be required to achieve the target number of completed interviews inNFHS-2.
The sample was designed to provide estimates for the state as a whole, for urban andrural areas, and for the three major regions of the state. The sample is not large enough toprovide reliable estimates for individual districts. Within a region, the required sampling rates forrural and urban areas were determined by allocating the sample proportionally to the populationof the two areas and taking into account their expected urban and rural nonresponse rates (basedon the nonresponse rates in NFHS-I).
The district composition of the three major regions and eight sub-regions (based on the42 districts in Bihar at the time ofthe 1991 Census) is as follows:
5

Region I (North Bihar Plain):Subregion 1: Saran, Siwan, Gopalganj, Pashchim Champaran, Purba ChamparanSubregion 2: Sitamarhi, Vaishali, Darbhanga, Madhubani, Samastipur,
Muzaffarpur, SaharsaSubregion 3: Purnia, Araria, Kishanganj, Katihar, Madhepura
Region II (South Bihar Plain):Subregion 4: Patna, Bhojpur, RohtasSubregion 5: Munger, Khagaria, BhagalpurSubregion 6: Nalanda, Gaya, Jehanabad, Aurangabad, Nawada, Begusarai
Region III (Jharkhand):Subregion 7: Godda, Sahibganj, Dumka, Deoghar, Dhanbad, GiridihSubregion 8: Hazaribag, Palamu, Lohardaga, Gumla, Ranchi, Purbi Singhbhurn,
Pashchimi Singbhum
Sample Design
Within each of the six sampling domains (rural and urban areas of each of the three majorregions), a systematic, multi-stage stratified sampling design was used. The rural sample withineach region was selected in two stages: the selection of Primary Sampling Units (PSUs), whichare villages or groups of villages (in the case of small linked villages), with probabilityproportional to size (PPS) in the first stage, followed by selection of households using systematicsampling within each selected PSU in the second stage. In urban areas within each region, athree-stage sampling procedure was followed. In the first stage, wards were selected with PPS.From each selected ward, one census enumeration block (CEB) was selected with PPS in thesecond stage, followed by selection of households using systematic sampling within eachselected CEB in the third stage.
Sample Selection in Rural Areas
In rural areas, the 1991 Census list of villages served as the sampling frame. Within each region,the list was stratified by a number of variables. The first level of stratification was geographic,with villages classified into the contiguous subregions described earlier. In each subregion,villages were further stratified by village size and the percentage of population designated asscheduled castes or SCheduled tribes. Table 1.1 provides details of sample stratification in ruralareas along with the population of each stratum. The final level of stratification was implicit forall the strata, consisting of an ordering of villages within each stratum by level of female literacy(obtained from the 1991 Census Village Directory). From the list of villages within each majorregion arranged in this manner, villages were selected systematically with probabilityproportional to the 1991 Census population of the village. Small villages with 5-49 householdswere linked with one or more adjoining villages to form PSUs with a minimum of 50households. Villages with fewer than five households were excluded from the sampling frame.
6

Table 1.1 Sampling stratification
Sampling stratification procedure in rural areas, Bihar
Stratification variables
Village size(number of Percent
Geographic residential SC/STStratum Region stratum households) population Population1
1 1 1 ~250 ~ 12.0 2,306,7662 1 1 ~250 > 12.0 2,175,9753 1 1 > 250 and ~ 400 NU 2,193,0744 1 1 >400 ~ 12.0 2,277,0175 1 1 >400 > 12.0 2,014,5026 1 2 ~300 ~ 15.0 2,485,2037 1 i ~300 > 15.0 2,559,3368 1 2 > 300 and ~ 700 ~ 15.0 , 2,949,2739 1 2 > 300 and ~ 700 > 15.0 2,709,189
10 1 2 > 700 ~ 14.0 3,257,43911 1 2 > 700 > 14.0 2,884,37812 1 3 ~400 NU 2,593,32713 1 3 >400 ~ 15.0 2,273,38214 1 3 >400 > 15.0 2,002,17915 2 4 ~ 175 NU 2,572,97516 2 4 > 175 and::; 425 NU 2,806,04117 2 4 >425 NU 2,019,91418 2 5 ~250 NU 2,192,46119 2 5 > 250 and ~ 600 NU 1,931,37820 2 5 >600 NU 2,167,64321 2 6 ~ 150 NU 2,518,31022 2 6 > 150 and ~ 300 NU 2,631,66923 2 6 > 300 ~20.0 2,337,75224 2 6 > 300 > 20.0 1,945,15525 3 7 ~225 ~20.0 1,737,86026 3 7 ~225 > 20.0 and ~ 60.0 1,641,82327 3 7 ~225 >60.0 1,522,33628 3 7 > 225 ~20.0 1,242,88629 3 7 > 225 >20.0 1,264,78530 3 8 ~200 ~27.0 1,335,74031 3 8 ~200 > 27.0 and ~ 73.0 2,109,97432 3 8 ~200 > 73.0 2,132,48433 3 8 >200 535.0 1,864,69534 3 8 >200 > 35.0 2,290,617
Total NA NA NA NA 74,987,538
Note: The level of female literacy is used for implicit stratification.SC: Scheduled casteST: Scheduled tribeNA: Not applicableNU: Not used for stratificationlThe population shown is the 1991 Census population, excluding persons living in villages with fewerthan five households.
7

The domain sampling fraction, i.e., the probability of selecting a woman in a domain (the ruralpart ofone of the three major regions) if) was computed as:
I=!!:LN,
where ni = number of women to be interviewed in the i'h domain (after adjusting upward toaccount for nonresponse and other loss),Ni = projected population ofeligible women in the i'h domain in December 1998.
The probability of selecting a PSU from the domain (jj) was computed as:
fi- aXs,J---
~>where a = number ofPSUs to be selected from the domain,
s, = population size ofthe ith PSU within the domain,
Ls, = total population ofthe domain.
A mapping and household listing operation carried out in each sample area provided thenecessary frame for selecting households at the second stage. The household listing operationinvolved preparing up-to-date notional and layout sketch maps of each selected PSU, assigningnumbers to structures, recording addresses of these structures, identifying residential structures,and listing the names of heads ofall the households in residential structures in the selected PSUs.Sample villages larger than 500 households were segmented into three or more segments, andtwo segments were selected randomly using the PPS method. The household listing in thesePSUs was carried out only in the selected segments. The work was carried out by nine teams,each comprising one lister and one mapper, under the supervision of four field supervisors andone field executive. The teams were trained from 16-20 September 1998 in Patna by an officialfrom ORO, who was earlier trained in a workshop conducted by lIPS. The mapping andhousehold listing operation was carried out between September 1998 and January 1999. Thehouseholds to be interviewed were selected with equal probability from the household list ineach area using systematic sampling.
The probability of selecting a household from a selected PSU in the domain (the ruralpart ofone of the three major regions) (ji) was computed as:
12= ~
On average, 30 households were initially targeted for selection in each selectedenumeration area. To avoid extreme variations in workload, minimum and maximum limits wereput on the number of households that could be selected from any area, at 15 and 60, respectively.All the selected households were visited during the main survey, and no replacement wasallowed if a selected household was absent during data collection. However, if a PSU was
8

inaccessible, a replacement PSU with similar characteristics was selected by IlPS and providedto the field organization.
Sample Selection in Urban Areas
The 1991 Census list of urban wards in each of the three major regions was arranged accordingto districts and within districts by level of female literacy, and a sample of wards was selectedsystematically with probability proportional to population size. Next, one census enumerationblock (CEB), consisting of approximately 150-200 households, was selected from each selectedward using the PPS method. As in rural areas, a household listing operation was carried out inthe selected CEBs and, on average, 30 households per block were targeted for selection.
The domain sampling fraction, i.e., the probability of selecting a woman in a domain (theurban part of one of the three major regions) if) was computed as:
f=!!.LN i
where ni = number ofwomen to be interviewed in the i th domain (after adjusting upward toaccount for nonresponse and other loss),
Ni = projected population ofeligible women in the ith domain in December 1998.
The probability of selecting a ward from the domain (1;) was computed as:
where a = number ofwards selected from the domain,
s; = population size of the ith ward within the domain,
Lsi = total population of the domain.
The probability of selecting a CEB from a selected ward (I;) was computed as:
where Bi = population size of the ith block,
LBi = total population of the ward.
9

A household listing operation carried out in each selected block provided the necessaryframe for selecting households in the third stage of sample selection. The probability of selectinga household from a selected CEB (j,) was computed as:
f= I3 f.. xI2
Sample Weights
Sample weights for households and women have been calculated to adjust for the effect ofdifferential nonresponse in different geographical areas. The method of calculating the weights isspecified below.
Let RHi and RWi be the households' and eligible women's response rates, respectively.Then the household weight WHi is calculated as follows:
W D,wH-=--'
I Rm
where WDi = the design weight for the i'h domain (rural or urban part of one of the three majorregions), calculated as the ratio of the overall sampling fraction (F = n/N) and the samplingfraction for the i'h domain (f= n/NJ Note that n = I.ni and N = I.Ni•
An eligible woman's weight WWi is calculated as follows:
After adjustment for nonresponse, the weights are normalized so that the total number ofweighted cases is equal to the total number of unweighted cases. The final weights forhouseholds and eligible women are:
_ IniWH;-,\; xWHi
.L.wmxn j
In iWWi = '\; XWWi
£.J wWjxn j
where ni refers to the actual number of cases (households or eligible women) interviewed in the.th d .I omam.
For the tabulations on anaemia and height/weight of women and children, two separatesets of weights were calculated using a similar procedure. In this case, however, the responserates for anaemia (for both women and children) are based on the percentage of eligible womenwhose haemoglobin level was measured, and the response rates for height/weight (for bothwomen and children) are based on the percentage of eligible women whose height or weight wasmeasured.
10

Table 1.2 Sample results
Sample results for households and ever-married women age 15-49 by residence, Bihar, 1998-99
Urban Rural Total
Result Number Percent Number Percent Number Percent
Households selected 747 100.0 5,887 100.0 6,634 100.0Households completed (C) 701 93.8 5,644 95.9 6,345 95.6Households with no household memberat home or no competent respondentat home at the time of interview (HP) 9 1.2 48 0.8 57 0.9
Households absent for ex1ended period (HA) 29 3.9 167 2.8 196 3.0Households postponed (P) 1 0.1 2 0.0 3 0.0Households refused (R) 3 0.4 6 0.1 9 0.1Dwelling vacant/address not a dwelling (OV) 4 0.5 9 0.2 13 0.2Dwelling not found (DNF) 0 0.0 11 0.2 11 0.2
Households occupied 714 100.0 5,711 100.0 6,425 100.0Households interviewed 701 98.2 5,644 98.8 6,345 98.8Households not interviewed 13 1.8 67 1.2 80 1.2
Household response rate (HRR)' NA 98.2 NA 98.8 NA 98.8
Eligible women 727 100.0 6,574 100.0 7,301 100.0Women interviewed (EWe) 687 94.5 6,337 96.4 7,024 96.2Women not at home (EWNH) 26 3.6 165 2.5 191 2.6Women postponed (EWP) 2 0.3 5 0.1 7 0.1Women refused (EWR) 7 1.0 26 0.4 33 0.5Women partly interviewed (EWPC) 2 0.3 15 0.2 17 0.2Other (EWO) 3 0.4 26 0.4 29 0.4
Eligible women's response rate (EWRRf NA 94.5 NA 96.4 NA 96.2
Overail response rate (ORR)' NA 92.8 NA 95.3 NA 95.0
Note: Eligible women are defined as ever-married women age 15-49 who stayed in the household the night before theinterview (inclUding both usual residents and visitors). This table is based on the unweighted sample; all other tablesare based on the weighted sample unless otherwise specified.NA: Not applicable1Using the number of households falling into specific response categories, the household response rate (HRR) iscalculated as:
HRR C xlOOC+HP+P+R+DNF
2Using the number of eligible women falling into specific response categories, the eligible women's response rate(EWRR) is calculated as:
EWRREWC xlOO
EWC+EWNH+EWP+EWR+EWPC+EWO1"he overall response rate (ORR) is calculated as:
ORRHRRxEWRR
100
Sample Implementation
A total of 233 PSUs were selected, of which 31 (13 percent) were urban and 202 (87 percent)were rural. Table 1.2 shows response rates for households and individuals and reasons fornonresponse. Nonresponse can occur at the stage of the household interview or at the stage of thewoman's interview. The last row of the table shows the overall effect of nonresponse at the twostages. The survey achieved an overall response rate of95 percent (93 percent in urban areas and95 percent in rural areas). Table 1.3 shows that the overall response rate is lowest in the SouthBihar Plain region (92 percent) and highest in the North Bihar Plain region (97 percent).
11

Table 1.3 Sample results by region
Sample results for households and ever-married women age 15-49 by region, Bihar, 1998-99
Region .North SouthBihar Bihar Jhar-
Result Plain Plain khand Total
Number of households interviewed 2,787 1,916 1,642 6,345
Number of eligible women interviewed 3,295 2,115 1,614 7,024
Household response rate 99.0 98.4 98.7 98.8
Eligible women's response rate 98.2 93.8 95.4 96.2
Overall response rate 97.2 92.3 94.2 95.0
Note: Eligible women are defined as ever-married women age 15-49 who stayed in the householdthe night before the interview (including both usual residents and Visitors). This table is based onthe unweighted sample.
Of the 6,634 households selected in Bihar, interviews were completed in 96 percent ofthe cases, 3 percent of the selected households were absent for an extended period, and in Ipercent of the cases no household member or no competent respondent was at home at the timeof interview (Table 1.2). The household response rate-the number of households interviewedper 100 occupied households-was 99 percent.
In the interviewed households, 7,301 women were identified as eligible for the individualinterview. Interviews were successfully completed with 96 percent of the eligible women.Nonresponse at the individual level was primarily due to eligible women not being at homedespite repeated household visits (3 percent). One-half of one percent of the eligible womenrefused to be interviewed.
1.5 Recruitment, Training, and Fieldwork
Field staff for the main survey were trained in Patna and Ranchi by officials of ORG, who weretrained earlier in a Training of Trainers Workshop conducted by lIPS. Training in Biharconsisted of classroom training, general lectures, and demonstration and practice interviews, aswell as field practice and additional training for field editors and supervisors. Healthinvestigators attached to interviewing teams were given additional specialized training onmeasuring height and weight and testing for anaemia in a centralized training programmeconducted by lIPS in collaboration with the All India Institute of Medical Sciences (AIIMS),New Delhi. This specialized training took place in New Delhi. It included classroom training andextensive field practice in schools, anganwadis, and communities.
Eight interviewing teams conducted the main fieldwork in Bihar, each team consisting ofone field supervisor, one female field editor, four female interviewers, and one healthinvestigator. The fieldwork was carried out between 3 December 1998 and 3I March 1999.Coordinators and senior staff of ORG monitored and supervised the data collection operations.lIPS also appointed one research officer to help with monitoring throughout the training andfieldwork period in order to ensure that correct survey procedures were followed and data qualitywas maintained. From time to time, project coordinators, senior research officers, and other
12

faculty members from lIPS, as well as staff members from ORC Macro and the East-WestCenter, visited the field sites to monitor the data collection operation. Medical healthcoordinators appointed by lIPS monitored the nutritional component of the survey. Field datawere quickly entered into microcomputers, and field-check tables were produced to identifycertain types of errors that might have occurred in eliciting information and filling outquestionnaires. Information from the field-check tables was fed back to the interviewing teamsand their supervisors so that they could improve their performance.
1.6 Data Processing
Completed questionnaires were sent to the ORG office in New Delhi for data processing, whichconsisted of office editing, coding, data entry, and machine editing, using the Integrated Systemfor Survey Analysis (ISSA) software. Data entry was done in New Delhi by eight data entryoperators under the supervision of ORG senior staff who were trained at a data-processingworkshop in Vadodara. Data entry and editing operations were completed by April 1999.Tabulations for the preliminary report as well as for the present final report were carried out atlIPS in Mumbai.
13

CHAPTER 2
BACKGROUND CHARACTERISTICSOF HOUSEHOLDS AND VILLAGES
This chapter presents 'a profile of the demographic and socioeconomic characteristics of theNFHS-2 households and describes facilities and services that are available in villages in Bihar.The chapter also includes some comparisons of NFHS-2 results with results from NFHS-I, theCensus of India, and the Sample Registration System.
2.1 Age-Sex Distribution of the Household Population
The NFHS household population can be tabulated in two ways: de facto (the place each personstayed the night before the survey interview) or de jure (the place of usual residence). The defacto and de jure populations in Bihar may differ because of temporary population movements.Table 2.1 shows the de facto population in the NFHS-2 household sample for Bihar, classified byage, residence, and sex. The total defacto sample population is 37,713. The sample is II percenturban and 89 percent rural.
The age distribution of the population in Bihar is typical ofpopulations in which the levelof fertility has been high (Figure 2.1). Forty-two percent are below 15 years of age, and 4 percentare age 65 or older. The proportion below age 15 is slightly higher in rural areas (42 percent)than in urban areas (38 percent). The proportion ofpersons age 65 or older is also slightly higherin rural areas (4 percent) than in urban areas (3 percent).
The single-year age distributions by sex in the de facto population (see Appendix TableB.I) indicate substantial misreporting of ages, including considerable preference for ages endingin particular digits, especially the digits 0 and 5. One of the most commonly used measures ofdigit preference in age reporting is Myers' Index (United Nations, 1955). This index provides anoverall summary ofpreferences for, or avoidance of, each ofthe 10 digits, from 0 to 9. Values ofMyers' Index computed for the age range 10-69 in the household sample population in Bihar are18 for males and 11 for females. Comparable values from NFHS-I are 20 for males and 12 forfemales!. The lower values of Myers' Index in NFHS-2 than in NFHS-l (revised from thepublished NFHS-l estimates) indicate that the quality of age reporting improved between thetwo surveys. The change in the pattern and extent of age misreporting in NFHS-l and NFHS-2has implications for the estimation of the trend in fertility between NFHS-I and NFHS-2, asdiscussed in Chapter 4.
IThe ages used in the calculation of Myers' Index are those obtained in the household interview, in which thehousehold respondent (usually the head of the household) provided the age of each person in the household. In theNFHS-I reports, a different set of ages was used for females when calculating Myers' index, inasmuch as the agesof ever-married women age 15-49 from the women's file were copied over to the household file so that some ageswere provided by the household respondents and some by the women themselves. Because of this, the value ofMyers' Index for females given here for NFHS-l differs from the value given in the NFHS-I report. It should alsobe noted that the values of Myers' Index in the NFHS-l report for both men and women are twice as large as theyshould be, due to failure to complete the last step ofthe calculation of the index, which is division by two. This erroris corrected in the present report. The values of Myers' Index presented here, for both NFHS-I and NFHS-2, arecomparable and correctly incorporate the final division by two.
PREVIOUS PAGE BLANK , /.5.

Table 2.1 Household population by age and sex
Percent distribution of the household population by age, according to residence and sex, Bihar, 1998-99
Urban Rural Total
Age Male Female Total Male Female Total Male Female Total
<1 2.1 2.1 2.1 2.7 2.6 2.7 2.7 2.5 2.61-4 7.7 9.1 8.4 10.9 10.7 10.8 10.5 10.6 10.55-9 12.3 13.4 12.8 16.1 15.5 15.8 15.7 15.2 15.510-14 13.6 15.3 14.5 13.1 12.9 13.0 13.1 13.2 13.215-19 11.9 12.7 12.3 9.1 9.6 9.4 9.5 10.0 9.720-24 9.5 8.7 9.1 7.5 9.1 8.3 7.8 9.1 8.425-29 7.8 7.9 7.9 7.0 8.6 7.8 7.1 8.5 .7.830-34 5.4 6.1 5.7 6.3 6.4 6.3 6.2 6.4 6.335-39 6.1 5.9 6.0 6.1 5.8 6.0 6.1 5.8 6.040-44 5.7 4.8 5.3 4.2 4.0 4.1 4.3 4.1 4.245-49 4.3 3.8 4.0 4.1 3.4 3.8 4.1 3.4 3.850-54 4.3 2.8 3.6 3.1 2.5 2.8 3.2 2.5 2.955-59 3.3 2.9 3.1 2.5 3.1 2.8 2.6 3.1 2.860-54 2.6 1.7 2.2 2.8 2.4 2.6 2.8 2.3 2.665-69 1.2 0.9 1.1 1.9 1.7 1.8 1.8 1.6 1.770-74 0.8 0.8 0.8 1.5 0.7 1.1 1.4 0.7 U75-79 0.5 0.3 0.4 0.5 0.4 0.5 0.5 0.4 0.580+ 0.8 0.5 0.7 0.6 0.4 0.5 0.6 0.5 0.5
Total percent 100.0 100.0 100.0 100.0 100.0 100.0 100.0 100.0 100.0
Number of persons 2,201 2,052 4,253 17,112 16,348 33.460 19,314 18,399 37,713
Sex ratio1 NA NA 932 NA NA 955 NA NA 953
Note: Table is based on the de facto population, Le., persons who stayed in the household the night before the interview(including both usual residents and Visitors).NA: Not applicable1Females per 1,000 males
Figure 2.1Population Pyramid
Age
80+
75-79
70-74
65-69
60-64
55-59
50-54
45-49
40-44
35-39
30-34
25-29
20-24
15-19
10-14
5-9
0-4
10 8 6 4 2 oPercent
2 4 6 8 10
16
NFHS-2, Bihar, 1998-99

Table 2.2 Population by age and sex from the SRS and NFHS-2
Percent distribution of population by age and sex from the SRS and NFHS-2, Bihar,1997-1998/99
SRS (1997) NFHS-2 (1998-99)
Age Male Female Male Female Sex ratio1
<5 12.6 12.5 13.0 13.0 9535-14 28.3 27.5 28.4 28.2 94315-29 26.0 25.3 24.8 27.7 1,06230-49 21.4 22.6 21.0 19.8 8975lJ-<>4 8.0 8.3 8.5 8.0 89065+ 3.6 3.8 4.3 3.2 700
Total 100.0 100.0 100.0 100.0 949
Median age U U 19.2 19.3 NA
Note: Table is based on the dejure population, Le., usual residents.NA: Not applicableU: Not availablelFemales per 1,000 malesSource for SRS: Office of the Registrar General, 1999a
Table 2.2 compares the age distributions by sex from the NFHS-2 de jure sample with theage distributions by sex from the Sample Registration System (SRS) for 1997. The SRS baselinesurvey, which is de jure, counts all usual residents in a sample area (Office of the RegistrarGeneral, India, 1999a). The NFHS-2 and SRS age distributions are similar for broad age groups,despite the misreporting ofage that is evident in the NFHS-2 single-year age data,
Tables 2.1 and 2.2 also present sex ratios (females per 1,000 males) in Bihar fromNFHS-2. The sex ratio for the defacto population of the state is 953 (Table 2.1). The sex ratio ofthe de jure population (949) in Table 2.2 is almost the same as the sex ratio of the de factopopulation (953). The small difference is caused by slight differences in the composition of thede facto and de jure populations, Table 2,1 shows that the sex ratio for the de facto sample is 932in urban areas and 955 in rural areas, suggesting that rural-urban migration has been dominatedby males in Bihar.
2.2 Marital Status
NFHS-2 includes information on the marital status of all household members age six and above,Table 2.3 shows the percent distribution by marital status of the de facto household population,classified by age, residence, and sex. Among females age six and above, 54 percent are currentlymarried and 38 percent have never been married. (Comparable percentages from NFHS-l are 56percent and 37 percent, indicating a minor change over the six years between the two surveys,)The proportion never married is higher for males (47 percent) than for females (38 percent) andhigher in urban areas (53 percent for males and 45 percent for females) than in rural areas (47percent for males and 37 percent for females). The proportion divorced, separated, or deserted isnegligible in Bihar, and widowhood is quite limited until the older ages. Thirty-five percent ofwomen age 50 or older are widowed,
17

Table 2.3 Marital status of the household population
Percent distribution of the household population age 6 and above by marital status, according to age, residence, andsex, Bihar, 1998--99
Marital status
Married,Never Currently gauna not Total
Age married married performed Widowed Divorced Separated Deserted percent
URBANMale
6-12 99.2 0.8 0.0 0.0 0.0 0.0 0.0 100.013-14 99.1 0.0 0.9 0.0 0.0 0.0 0.0 100.016-19 97.3 2.3 0.4 0.0 0.0 0.0 0.0 100.020-24 77.5 21.1 1.0 0.5 0.0 0.0 0.0 100.025-29 36.3 63.1 0.0 0.6 0.0 0.0 0.0 100.030-49 5.5 92.3 0.0 1.9 0.0 0.0 0.2 100.050+ 1.3 86.8 0.0 11.5 0.0 0.0 0.3 100.0
Total 53.0 44.3 0.2 2.4 0.0 0.0 0.1 100.0
Female
6-12 99.5 0.5 0.0 0.0 0.0 0.0 0.0 100.013-14 99.0 1.0 0.0 0.0 0.0 0.0 0.0 100.015-19 76.1 19.3 3.9 0.0 0.0 0.0 0.8 100.020-24 29.9 66.7 1.1 0.6 0.6 0.6 0.6 100.025-29 6.9 90.1 0.0 1.2 0.0 0.0 1.8 100.030-49 1.0 92.5 0.0 5.6 0.0 0.2 0.7 100.050+ 0.0 67.0 0.0 32.5 0.0 0.5 0.0 100.0
Total 45.3 47.9 0.7 5.3 0.1 0.2 0.5 100.0
RURALMale
6-12 99.5 0.3 0.1 0.0 0.0 0.0 0.0 100.013-14 99.4 0.0 0.6 0.0 0.0 0.0 0.0 100.015-19 88.5 5.9 5.5 0.0 0.0 0.0 0.1 100.020-24 48.0 45.2 6.4 0.2 0.0 0.0 0.2 100.025-29 14.3 82.2 2.3 0.7 0.0 0.2 0.3 100.030-49 1.7 95.3 0.3 2.3 0.1 0.1 0.3 100.050+ 0.4 85.3 0.0 14.1 0.0 0.0 0.2 100.0
Total 46.6 48.8 1.5 2.9 0.0 0.1 0.1 100.0
Female
6-12 99.2 0.2 0.6 0.0 0.0 0.0 0.0 100.013-14 92.4 0.7 6.9 0.0 0.0 0.0 0.0 100.015-19 50.4 39.3 9.5 0.1 0.0 0.1 0.6 100.020-24 8.4 87.2 2.7 0.5 0.3 0.1 0.9 100.025-29 1.4 95.5 0.4 1.2 0.1 0.4 1.0 100.030-49 0.1 92.6 0.0 6.0 0.1 0.2 0.9 100.050+ 0.2 64.4 0.0 35.2 0.0 0.2 0.1 100.0
Total 36.5 64.5 1.9 6.4 0.1 0.1 0.5 100.0
18

Table 2.3 Marital status of the household population Ccontd.l
Percent distribution of the household population age 6 and above by marital status, according to age, residence, andsex, Bihar, 1998-99
Marital status
Married,Never Currently gauna not Total
Age married married performed Widowed Divorced Separated Deserted percent
TOTAL
Male
6-12 99.5 0.3 0.1 0.0 0.0 0.0 0.0 100.013-14 99.4 0.0 0.6 0.0 0.0 0.0 0.0 100.015-19 89.7 5.4 4.8 0.0 0.0 0.0 0.1 100.020-24 52.1 41.9 5.6 0.3 0.0 0.0 0.1 100.025-29 17.0 79.8 2.0 0.7 0.0 0.1 0.2 100.030-49 2.1 94.9 0.3 2.3 0.1 0.1 0.3 100.050+ 0.5 85.4 0.0 13.8 0.0 0.0 0.2 100.0
Total 47.4 48.2 1.4 2.8 0.0 0.0 0.1 100.0
Female
6 -12 99.2 0.2 0.5 0.0 0.0 0.0 0.0 100.013-14 93.2 0.7 6.1 0.0 0.0 0.0 0.0 100.015-19 54.0 36.5 8.7 0.1 0.0 0.1 0.6 100.020-24 10.7 85.0 2.5 0.5 0.3 0.1 0.8 100.025-29 2.0 94.9 0.3 1.2 0.1 0.4 1.1 100.030-49 0.2 92.6 0.0 6.0 0.1 0.2 0.9 100.050+ 0.2 64.6 0.0 34.9 0.0 0.2 0.1 100.0
Total 37.5 53.7 1.8 6.2 0.1 0.1 0.5 100.0
Note: Table is based on the de facto population, i.e., persons who stayed in the household the night before the interview(including both usual residents and Visitors). The marital status distribution for females by age cannot be directlycompared with the published distribution for NFHS-1 because the ages in the current table are based entirely on thereports of the household respondents, whereas in NFHS-1 the ages of ever-married women age 13-49 were taken fromthe Woman's Questionnaire.
Also of interest is the proportion of persons who marry young. At age 15-19, theproportions ever married are 3 percent for males and 24 percent for females in urban areas, 11percent for males and 50 percent for females in rural areas, and 10 percent for males and 46percent for females in the state as a whole. By age 25-29, marriage is nearly universal forfemales. For males in this age group, the proportion ever married is 64 percent in urban areas, 86percent in rural areas, and 83 percent in the state as a whole. Overall, the table shows that womenmarry at much younger ages than men, and that both men and women marry at much youngerages in rural areas than in urban areas.
Table 2.4 shows estimates of the singulate mean age at marriage (SMAM), which iscalculated from age-specific proportions single in a census or household survey. SMAM iscalculated from the de jure population in NFHS-2 in order to arrive at estimates that are morecomparable to those derived from the various censuses, which, as mentioned earlier, aremodified de jure counts. According to the SMAM measure, men in Bihar tend to marry women5.1 years younger than themselves. The census data indicate that age at marriage has been risingfor both men and women. The NFHS-l and NFHS-2 data indicate that age at marriage has risenconsiderably since 1991 for both men and women. During the six years between NFHS-l andNFHS-2, the age at marriage has increased noticeably in both urban and rural areas for bothmales and females.
19

Table 2.4 Singulate mean age at marriage
Singulate mean age at marriage by sex from selected sources, Bihar, 1961-1998/99
Singulate mean age at marriage (SMAM)
Source Male Female Difference
1961 Census 18.9 14.3 4.61971 Census 20.0 15.3 4.71981 Census 21.6 16.6 5.01991 Census 22.1 17.6 4.5
1993 NFHS-1Urban 25.4 20.3 5.1Rural 22.7 17.6 5.1Total 23.2. 18.0 5.2
1998-99 NFHS-2Urban 26.3 20.9 5.3Rural 23.5 18.5 5.1Total 23.8 18.8 5.1
Note: Table is based on the de jure population. The male SMAM minus femaleSMAM may not correspond exactly to the difference in SMAM due to rounding.
2.3 Household Composition
Table 2.5 shows the percent distribution of households by various characteristics of thehousehold head (sex, age, religion, and caste/tribe), as well as by household type and number ofusual household members. The table is based on the de jure population because household typeand number of usual household members pertain to the usual-resident population. The tableshows that 92-95 percent of household heads are male, regardless of area (rural or urban) orregion of residence. The median age of household heads varies slightly by residence or region,from 43 years in rural areas to 46 years in urban areas and from 42 years in the Jharkhand regionto 46 years in the South Bihar Plain region. Household heads are somewhat more concentrated inthe 45-59 age group in urban areas than in rural areas. Eighty-three percent of household headsare Hindu, 15 percent are Muslim, 1 percent are Christian, and less than 1 percent belong to otherreligions. Muslims are more concentrated in urban areas; they constitute 20 percent of urbanhouseholds and 14 percent of rural households. Twenty-one percent of household heads belongto scheduled castes and 10 percent to scheduled tribes. Both of these groups constitute higherproportions of the population in rural areas than in urban areas. The largest group of householdheads belongs to other backward classes (OBCt Fifty-three percent of all households arenuclear family households (consisting of an unmarried adult living alone or a married person orcouple and their unmarried children, if any). Mean household size for the state as a whole is 6.1persons per household, which is about the same in urban and rural areas. However, the meanhousehold size is relatively low in the Jharkhand region (5.4 persons per household) and high inthe South Bihar Plain region (6.7 persons per household).
20ther backward classes are castes and communities that have been designated by the Government of India associally and educationally backward and in need of protection from social injustice.
20

Table 2.5 Household characteristics
Percent distribution of households by selected characteristics of the household head, household type, andhousehold size, according to residence and region, Bihar, 1998-99
Region
Residence North SouthBihar Bihar Jhar-
Characteristic Urban Rural Plain Plain khand Total
Sex of household headMale 93.4 93.3 92.8 92.3 95.2 93.3Female 6.6 6.7 7.2 7.7 4.8 6.7
Age of household head< 30 10.0 13.9 14.8 11.0 14.2 13.530-44 37.3 39.1 39.3 34.8 42.8 38.945-69 36.4 28.1 28.4 29.9 29.1 29.160+ 16.2 18.9 17.4 24.3 13.9 18.6Don't know/missing 0.1 0.0 0.1 0.0 0.0 0.0
Median age 45.5 42.8 42.7 46.3 42.0 43.2
Religion of household headHindu 77.4 83.9 80.7 86.8 82.8 83.2Muslim 19.5 14.2 18.9 12.7 10.6 14.8Christian 2.0 1.0 0.3 0.2 3.5 1.1Sikh 0.1 0.0 0.0 0.1 0.1 0.0Jain 0.4 0.0 0.1 0.1 0.0 0.0Zoroastrian/Parsi 0.0 0.0 0.0 0.1 0.0 0.0No religion 0.0 0.0 0.0 0.0 0.1 0.0Other 0.4 0.9 0.0 0.1 2.9 0.8
Caste/tribe of household headScheduled caste 15.6 21.5 20.6 26.1 15.0 20.8Scheduled tribe 2.7 10.9 1.7 2.3 31.7 9.9Other backward class 47.8 50.2 53.6 54.7 38.8 49.9Other 33.9 17.4 24.1 16.9 14.5 19.3
Household typeNuclear household 56.0 52.7 54.2 44.4 61.3 53.1Non-nuclear household 43.9 47.1 45.7 55.5 38.6 46.8Household with no usual members 0.1 0.1 0.1 0.1 0.1 0.1
Number of usual members0 0.1 0.1 0.1 0.1 0.1 0.11 4.9 2.0 1.8 2.0 3.7 2.42 4.9 6.2 5.8 4.9 7.8 6.13 9.7 9.2 9.4 7.1 11.4 9.24 12.3 13.6 13.5 11.0 16.1 13.45 14.9 15.7 15.4 13.9 17.8 15.66 14.8 16.5 17.2 15.6 15.5 16.37 13.9 12.3 12.6 13.5 11.0 12.58 9.1 8.4 9.0 9.4 6.6 8.59+ 15.5 16.0 15.1 22.4 10.1 16.0
Mean household size 6.0 6.1 6.1 6.7 5.4 6.1
Total percent 100.0 100.0 100.0 100.0 100.0 100.0
Number of households 720 5,625 2,701 1,937 1,707 6,345
Note: Table is based on the de jure population.
21

2.4 Educational Attainment
The level of education of household members tends to affect reproductive behaviour,contraceptive use, the health of children, and proper hygienic practices. Table 2.6 shows thepercent distribution of the de facto household population by educational level, according to age,residence, and sex. (This table and all subsequent tables and figures in this report are based onthe de facto sample, unless otherwise specified.)
Table 2.6 shows that 65 percent of females and 37 percent of males age six and above areilliterate. Comparable figures from NFHS-1 are 71 percent of females and 40 percent of males,indicating a considerable decline in illiteracy in six years. The increase in educational attainmentcan also be seen by examining the differences in educational levels by age. For example, theproportion of males completing at least high school rises from 20 percent at age 50 and above to40 percent at age 20-29. For females, the proportion completing at least high school is negligible(only I percent) at age 50 and above but reaches a level of 14 percent at age 20-29.
A higher percentage of males than females has completed each level of schooling. Theproportion illiterate is lowest at age 10-14 and is highest at age 50 and above for either sex. Themedian number of years of schooling for males is 3.6, whereas the majority of women in Biharhave never been to school, implying a median ofzero.
Education levels are much higher in urban areas than in rural areas. The proportionilliterate is almost twice as high for rural females (69 percent) as for urban females (35 percent),and more than twice as high for rural males (39 percent) as for urban males (18 percent).
Table 2.7 and Figure 2.2 show school attendance rates for the school-age householdpopulation by age, sex, and residence. In the state as a whole, 63 percent of children age 6-14 areattending school, up from 51 percent in NFHS-I. The attendance rate drops off sharply at age15-17. For the age group 6-17, the attendance rate is 68 percent for males, 51 percent forfemales, and 60 percent for the state as a whole. Attendance rates are higher in urban areas thanin rural areas. In urban areas, attendance rates are almost the same for males and females at age11-14, but males record higher school attendance at ages 6-10 and 15-17. In rural areas,however, attendance rates are considerably higher for males than for females at all ages, and thedifferentials are higher in the older age groups.
Table 2.8 shows reasons for children never attending school or not currently attendingschool (for those who have dropped out of school). For both boys and girls, 'costs too much' and'not interested in studies' stand out as main reasons for never attending school or not currentlyattending school. Not surprisingly, the need for children to work in the household is mentionedmore frequently for girls than for boys. For girls, other frequently mentioned reasons for notcurrently attending school include 'got married', 'no proper school facilities for girls', and'further education not considered necessary'. For both boys and girls, the accessibility of schools('school too far away' and 'transport not available') is mentioned infrequently for both neverattending and not currently attending school. The need for children to remain out of school inorder to work (including household work, taking care of siblings, working in a family farm orbusiness, and working outside for payment in cash or kind) is mentioned as the main reason fornever attending school for 10 percent of boys and 16 percent of girls, and as the main reason fornot currently attending school for 23 percent of boys and 22 percent ofgirls.
22

Table 2.6 Educational level of the household population
Percent distribution of the household population age 6 and above by literacy and level of education, and median number ofcompleted years of schooling, according to age, residence, and sex, Bihar, 1998-99
Educational levell
Literate, Higher Median< primary Primary Middle High secondary Number number ofschool school school school complete Total of years of
Age Illiterate complete complete complete complete and above Missing percent persons schooling
URBANMale
6-9 28.8 69.8 1.4 0.0 0.0 0.0 0.0 100.0 222 1.510-14 15.9 35.1 31.9 15.4 1.7 0.0 0.0 100.0 300 5.015-19 16.0 5.8 17.1 29.4 23.0 8.6 0.0 100.0 262 9.120-29 11.6 4.9 7.6 10.1 21.6 44.3 0.0 100.0 380 10.830-39 15.4 4.1 12.1 13.0 22.7 32.7 0.0 100.0 253 10.240-49 17.4 4.7 14.5 8.0 23.5 31.9 0.0 100.0 219 10.250+ 24.9 8.5 16.0 7.9 19.8 22.8 0.0 100.0 300 8.2
Total 18.0 17.6 14.6 12.2 16.3 21.3 0.0 100.0 1,937 8.0
Female
6-9 33.7 65.5 0.9 0.0 0.0 0.0 0.0 100.0 224 1.210-14 18.1 36.7 28.8 15.4 1.0 0.0 0.0 100.0 314 4.915-19 19.6 6.3 15.0 28.6 21.7 8.8 0.0 100.0 260 9.020-29 30.0 6.0 11.5 10.3 20.0 22.3 0.0 100.0 342 8.630-39 44.6 6.2 9.2 7.5 15.0 17.5 0.0 100.0 246 4.940-49 52.1 7.0 17.0 6.4 10.5 7.0 0.0 100.0 176 0.050+ 62.3 6.4 18.9 5.4 5.4 1.5 0.0 100.0 207 0.0
Total 34.9 19.2 14.8 11.2 11.0 8.9 0.0 100.0 1,770 4.3
Total
6-9 31.2 67.6 1.1 0.0 0.0 0.0 0.0 100.0 446 1.410-14 17.0 35.9 30.3 15.4 1.3 0.0 0.0 100.0 615 5.015-19 17.8 6.1 16.1 29.0 22.4 8.7 0.0 100.0 522 9.020-29 20.3 5.4 9.4 10.2 20.8 33.9 0.0 100.0 721 10.330-39 29.8 5.1 10.6 10.3 18.9 25.2 0.0 100.0 499 8.940-49 32.8 5.7 15.6 7.3 17.7 20.8 0.0 100.0 395 7.550+ 40.1 7.7 17.2 6.9 14.0 14.1 0.0 100.0 507 5.3
Total 26.1 18.4 14.7 11.7 13.8 15.4 0.0 100.0 3,707 6.2
23
-

Table 2.6 Educational level of the household population (contd.l
Percent distribution of the household population age 6 and above by literacy and level of education, and median number ofcompleted years of schooling, according to age, residence, and sex, Bihar,1998-99
Educationallevel1
Literate, Higher Median< primary Primary Middle High secondary Number number ofschool school school school complete Total of years of
Age Illiterate complete complete complete complete and above Missing percent persons schooling
RURAL
Male
6-9 44.0 55.3 0.7 0.0 0.0 0.0 0.0 100.0 2,158 1.010-14 27.8 40.8 24.1 6.8 0.5 0.0 0.0 100.0 2,238 3.515-19 28.4 9.1 20.7 25.3 12.5 4.1 0.0 100.0 1,564 6.820-29 31.2 6.2 13.8 13.1 17.3 18.2 0.0 100.0 2,482 7.730-39 44.7 6.3 12.5 9.3 13.1 14.1 0.0 100.0 2,114 4.740--49 45.7 7.4 13.6 9.3 15.4 8.5 0.0 100.0 1,421 4.150+ 54.3 8.5 15.2 5.4 10.6 6.1 0.0 100.0 2,210 0.0
Total 39.4 19.9 14.2 9.3 9.6 7.5 0.0 100.0 14,187 3.0
Female
6-9 54.0 45.3 0.7 0.0 0.0 0.0 0.0 100.0 2,000 0.010-14 48.5 28.8 17.4 5.0 0.3 0.0 0.0 100.0 2,113 1.815-19 55.9 6.3 14.4 13.8 8.0 1.6 0.1 100.0 1,576 0.020-29 72.7 3.5 8.1 4.9 7.7 3.1 0.0 100.0 2,897 0.030-39 81.5 3.8 8.0 2.4 2.8 1.5 0.0 100.0 2,001 0.040--49 84.4 4.3 7.8 1.3 1.6 0.6 0.0 100.0 1,206 0.050+ 91.5 3.0 3.8 0.9 0.6 0.2 0.0 100.0 1,845 0.0
Total 69.1 13.9 8.6 4.0 3.2 1.1 0.0 100.0 13,640 0.0
Total
6-9 48.8 50.5 0.7 0.0 0.0 0.0 0.0 100.0 4,157 0.010-14 37.9 34.9 20.8 5.9 0.4 0.0 0.0 100.0 4,351 2.915-19 42.2 7.7 17.5 19.5 10.2 2.8 0.0 100.0 3,140 5.020-29 53.6 4.8 10.7 8.7 12.2 10.1 0.0 100.0 5,379 0.030-39 62.6 5.1 10.3 5.9 8.1 8.0 0.0 100.0 4,115 0.040--49 63.5 6.0 10.9 5.6 9.1 4.9 0.0 100.0 2,627 0.050+ 71.2 6.0 10.0 3.4 6.1 3.4 0.0 100.0 4,055 0.0
Total 54.0 17.0 11.4 6.7 6.5 4.4 0.0 100.0 27,827 0.0
24

Table 2.6 Educational level of the household population (contd.)
Percent distribution of the household population age 6 and above by literacy and level of education, and median number ofcompleted years of schooling, according to age, residence, and sex, Bihar,1998-99
Educationallevel1
Literate, Higher Median< primary Primary Middle High secondary Number number ofschool school school school complete Total of years of
Age Illiterate complete complete complete complete and above Missing percent persons schooling
TOTALMale
6-9 42.6 56.6 0.8 0.0 0.0 0.0 0.0 100.0 2,380 1.11G--14 26.4 40.1 25.0 7.8 0.6 0.0 00 100.0 2,538 3.716-19 26.7 8.6 20.1 25.9 14.0 4.7 0.0 100.0 1,825 7.32G--29 28.6 6.1 13.0 12.7 17.9 21.7 00 100.0 2,862 8.43G--39 41.6 6.1 12.5 9.7 14.2 16.0 0.0 100.0 2,367 5.540-49 41.9 7.0 13.7 9.1 16.5 11.7 0.0 100.0 1,640 5.250+ 50.8 8.5 15.3 5.7 11.7 8.1 0.0 100.0 2,510 0.0
Total 36.8 19.7 14.2 9.7 10.4 9.2 0.0 100.0 16,124 3.6
Female
6-9 51.9 47.3 0.7 0.0 0.0 0.0 0.0 100.0 2,224 0.01G--14 44.6 29.8 18.9 6.3 0.4 0.0 0.0 100.0 2,427 2.316-19 50.8 6.3 14.5 15.9 9.9 2.6 0.1 100.0 1,836 0.02G--29 68.2 3.8 8.5 5.5 9.0 5.1 0.0 100.0 3,239 0.03G--39 77.5 4.1 8.1 3.0 4.1 3.3 0.0 100.0 2,247 0.040-49 80.3 4.7 8.9 2.0 2.8 1.4 0.0 100.0 1,382 0.050+ 88.5 3.4 5.3 1.4 1.1 0.3 0.0 100.0 2,051 00
Total 65.2 14.5 9.3 4.8 4.1 2.0 0.0 100.0 15,410 00
Total
6-9 47.1 52.1 0.8 0.0 0.0 0.0 0.0 100.0 4,604 0.01G--14 35.3 35.1 22.0 7.1 0.5 0.0 0.0 100.0 4,965 3.116-19 38.8 7.5 17.3 20.9 11.9 3.7 0.0 100.0 3,661 5.72G--29 49.6 4.8 10.6 8.9 13.2 12.9 0.0 100.0 6,101 2.53G--39 59.1 5.1 10.3 6.4 . 9.3 9.8 0.0 100.0 4,614 0.040-49 59.5 5.9 11.5 5.8 10.2 7.0 0.0 100.0 3,022 0.050+ 67.7 6.2 10.8 3.7 6.9 4.6 0.0 100.0 4,562 0.0
Total 50.7 17.1 11.8 7.3 7.4 5.7 0.0 100.0 31,534 0.0
Note: This table and all the sUbsequent tables (unless otherwise indicated) are based on the de facto population i.e., usualresidents. Illiterate persons may have been to school, but they cannot read and write. Total includes 2 males and 4 females withmissing information on age, who are not shown separately.11n this report, 'primary school complete' means 5-7 completed years of education, 'middle school complete' means 8-9 completedyears of education, 'high school complete' means 10-11 completed years of education, and 'higher secondary complete andabove' means 12 or more completed years of education.
25

Table 2.7 School attendance
Percentage of the household population age 6-17 years attending school by age, sex, and residence, Bihar, 1998-99
Male Female Total
Age Urban Rural Total Urban Rural Total Urban Rural Total
6-10 81.0 68.0 69.3 72.1 53.0 55.0 76.6 60.8 62.411-14 78.6 71.6 72.4 78.2 48.7 52.6 78.4 60.4 62.716-17 76.1 54.3 57.5 62.4 29.9 34.7 69.3 42.2 46.3
6-14 80.0 69.4 70.5 74.8 51.3 54.1 77.4 60.6 62.56-17 79.1 66.8 68.2 72.1 47.5 50.5 75.5 57.4 59.6
Figure 2.2School Attendance by Age, Sex, and Residence
AGE 6-10, URBAN
Male
Female
AGE 6-10, RURAL
Male
Female
AGE 11-14, URBAN
Male
Female
AGE 11-14, RURAL
Male
Female
o 10 20 30 40 50 60 70 80 90
2.5 Housing Characteristics
Percent
NFHS-2, Bihar, 1998-99
Table 2.9 provides information on housing characteristics by residence and region. Only 18percent of households in Bihar have electricity (compared with 17 percent in NFHS-l). Theproportion of households with electricity is 72 percent in urban areas and 11 percent in ruralareas. The proportion of households with electricity is much lower in the North Bihar Plainregion (12 percent) than in other regions (23-24 percent).
26

Table 2.8 Reasons for children not attending schoof
Percent distribution of children age 6-17 years who never attended school by the main reason for never attending school andpercent distribution of children age 6-17 years who have dropped out of school by the main reason for not currently attendingschool, according to residence and sex, Bihar, 1998-99
Urban Rural Total
Reason Male Female Male Female Male Female
Main reason for never attending school1
School too far away 0.0 2.8 3.2 2.8 3.0 2.8Transport not available 0.0 0.0 0.5 0.5 0.4 0.5Education not considered necessary 6.8 13.8 9.1 12.4 8.9 12.5Required for household work 0.9 11.1 5.5 14.2 5.2 14.0Required for work on farm/family business 5.8 0.0 2.9 1.0 3.0 0.9Required for outside work for payment incash or kind 1.9 0.7 1.4 0.4 1.4 0.4
Costs too much 42.9 38.0 38.5 35.6 38.8 35.8No proper school facilities for girls 0.0 0.0 0.0 3.4 0.0 3.2Required for care of siblings 0.0 0.0 0.6 0.7 0.5 0.7Not interested in studies 31.9 21.6 27.6 20.1 27.9 20.2Other 9.8 11.2 9.1 7.7 9.1 7.9Don't know 0.0 0.7 1.8 1.3 1.7 1.2
Total percent 100.0 100.0 100.0 100.0 100.0 100.0
Number of children 105 146 1,466 2.314 1,571 2,460
Main reason for not currently attendingschoof
School too far away (0.0) (0.0) 1.0 6.5 0.9 5.6Transport not available (0.0) (0.0) 0.0 0.6 0.0 0.6Further education not considered necessary (2.7) (4.1) 3.0 6.3 3.0 6.0Required for household work (5.6) (23.4) 9.6 18.7 9.1 19.3Required for work on farm/family business (8.0) (0.0) 8.1 1.0 8.1 0.8Required for outside work for payment incash or kind (8.0) (0.0) 5.4 1.3 5.7 1.1
Costs too much (40.6) (29.6) 26.0 16.7 27.7 18.4No proper school facilities for girls (0.0) (2.2) 0.0 7.7 0.0 6.9Required for care of siblings (0.0) (0.0) 0.0 1.3 0.0 1.1Not interested in studies (27.0) (34.1 ) 38.5 21.9 37.2 23.5Got married (0.0) (2.2) 0.3 10.5 0.3 9.4Other (8.2) (4.2) 5.5 6.9 5.8 6.5Don't know (0.0) (0.0) 2.7 0.7 2.4 0.6
Total percent 100.0 100.0 100.0 100.0 100.0 100.0
Number of children 38 48 297 310 334 358
~ ) Based on 25-49 unweighted casesFor children who never attended school
2For children who have dropped out of school
Water sources and sanitary facilities have an important influence on the health ofhousehold members, especially children. NFHS-l and NFHS-2 contained questions on sourcesof drinking water and types of sanitary facilities. NFHS-2 found that only 8 percent ofhouseholds use piped drinking water (9 percent in NFHS-l), 68 percent get water from handpumps, and 23 percent from wells. As in the case of electricity, there are large urban-rural andregional differences in the source of drinking water. For example, the proportion of householdswith piped drinking water is 35 percent in urban areas but only 4 percent in rural areas. Eightypercent of households can fetch drinking water in less than 15 minutes. The proportion ofhouseholds that purify water by any method is 24 percent in urban areas and only 6 percent inrural areas. Households in the Jharkhand region are more likely to purify water than in otherregIOns.
27

Table 2.9 Housing characteristics
Percent distribution of households by housing characteristics, according to residence and region, Bihar, 1998-99
Region
Residence North SouthBihar Bihar Jhar-
Housing characteristic Urban Rural Plain Plain khand Total
ElectricityYes 72.0 11.3 11.6 22.7 23.6 18.2No 28.0 88.7 88.4 77.3 76.4 81.8Total percent 100.0 100.0 100.0 100.0 100.0 100.0
Source of drinking waterPiped 34.6 4.3 3.1 8.9 13.9 7.8Hand pump 50.4 69.8 88.5 68.7 33.3 67.6Well water 14.2 23.5 7.3 22.0 47.1 22.6Surface water 0.3 1.6 0.1 0.1 5.2 1.5Other 0.4 0.7 1.0 0.3 0.6 0.7Total percent 100.0 100.0 100.0 100.0 100.0 100.0
Time to get drinking waterPercentage < 15 minutes 87.8 79.4 90.1 80.4 64.9 80.4Median time (minutes) 0.0 0.0 0.0 0.0 9.2 0.0
Method of drinking water purification1
Strains water by cloth 6.9 2.9 0.3 2.9 8.9 3.4Uses alum 1.4 0.4 0.2 0.5 1.1 0.5Uses water filter 9.1 0.7 1.1 1.5 2.5 1.6Boils water 10.3 2.6 0.8 1.8 9.5 3.4Uses electronic purifier 1.0 0.0 0.0 0.1 0.3 0.1Uses other method 0.7 0.3 0.0 0.2 1.1 0.4Does not purify water 75.9 93.9 97.8 94.4 79.7 91.9
Sanitation facilityFlush toilet 57.1 7.7 11.1 17.3 12.1 13.3Pit toileUlatrine 9.4 2.8 3.3 4.1 3.3 3.6No facility 33.5 89.5 85.6 78.5 64.6 83.2Total percent 100.0 100.0 100.0 100.0 100.0 100.0
Main type of fuel used for cookingWood 20.2 53.0 51.8 33.3 63.6 49.3Crop residues 3.2 15.6 25.8 9.3 1.6 14.2Dung cakes 5.8 24.5 15.4 43.6 9.2 22.4Coal/coke/lignite/charcoal 34.0 4.2 1.0 5.7 20.0 7.6Kerosene 10.3 0.8 1.2 3.2 1.5 1.9Electricity 1.7 0.0 0.0 0.2 0.6 0.2liquid petroleum gas 24.0 1.7 4.6 4.4 3.4 4.2Biogas 0.9 0.1 0.1 0.3 0.1 0.1Other 0.0 0.0 0.0 0.0 0.1 0.0Total percent 100.0 100.0 100.0 100.0 100.0 100.0
Type of houseKachha 18.8 63.8 58.3 51.3 67.6 58.7Semi~pucca 23.9 26.0 30.8 28.5 14.6 25.7Pucca 57.2 10.1 10.7 20.1 17.8 15.5Missing 0.1 0.1 0.1 0.1 0.0 0.1Total percent 100.0 100.0 100.0 100.0 100.0 100.0
Gontd ...
28

Table 2.9 Housing characteristics (eonld.)
Percent distribution of households by housing characteristics, according to residence and region, Bihar, 1998-99
Region
Residence North SouthBihar Bihar Jhar-
Housing characteristic Urban Rural Plain Plain khand Total
Persons per room<3 63.1 55.7 50.1 55.8 67.5 56.53-4 22.8 28.1 31.5 27.3 21.4 27.55-6 9.1 11.1 12.4 10.5 8.7 10.87+ 5.1 5.1 5.9 6.4 2.4 5.1Don't know/missing 0.0 0.1 0.0 0.1 0.1 0.0Total percent 100.0 100.0 100.0 100.0 100.0 100.0
Mean number of persons per room 2.7 2.9 3.1 3.0 2.5 2.9
Number of households 720 5,625 2,701 1,937 1,707 6,345
1Totals may add to more than 100.0 because households may use more than one method of purification.
Regarding sanitation facilities, only 13 percent of households have a flush toilet (usingeither piped water or bucket water for flushing), no change from NFHS-l; 4 percent have a pittoilet or latrine; and 83 percent have no facility. There are large urban-rural differences: 57percent of urban households have a flush toilet compared with only 8 percent of ruralhouseholds.
Several types of fuel are used for cooking in Bihar, with wood as the most common type.In the state as a whole, 49 percent of households rely mainly on wood, 22 percent on dung cakes,14 percent on crop residues, 8 percent on coallcoke/lignite/charcoal, 4 percent on liquidpetroleum gas, and 2 percent on kerosene. Use of biogas or electricity as a primary cooking fuelis rare. Again there are large urban-rural and regional differences. Fifty-eight percent of urbanhouseholds rely mainly on liquid petroleum gas or coal/coke/lignite/charcoal, whereas 93 percentof rural households rely mainly on wood, crop residues, or dung cakes. By region, use of cropresidues as a primary cooking fuel ranges from 2 percent in the Jharkhand region to 26 percent inthe North Bihar Plain region, and use of coallcoke/lignite/charcoal ranges from 1 percent in theNorth Bihar Plain region to 20 percent in the Jharkhand region. Use of wood and dung cakes alsovaries considerably across regions.
Regarding type of house construction, 59 percent of houses are kachha (made from mud,thatch, or other low-quality materials), 26 percent are semi-pucca (partly low-quality and partlyhigh-quality materials), and 16 percent are pucca (high-quality materials throughout, includingroof, walls, and floor). By residence, the proportion of houses that are pucca is 57 percent inurban areas and 10 percent in rural areas.
Crowded conditions may also affect health as well as the quality of life. Forty-threepercent of households live in houses with three or more persons per room. The mean number ofpersons per room is 2.7 in urban areas, 2.9 in rural areas, and 2.9 (compared with 2.8 in NFHS-l)in the state as a whole.
Table 2.10 gives a number of measures related to the socioeconomic status of thehousehold, including ownership of land, house, and livestock. Overall, 45 percent of households
29
-

Table 2.10 Household ownership of agricultural land. house, and livestock
Percent distribution of households owning agricultural land and percentage owning a house and livestockby residence and region, Bihar, 1998-99
Region
Residence North SouthBihar Bihar Jhar-
Asset Urban Rural Plain Plain khand Total
No agricultural land 69.6 42.0 50.7 49.8 30.9 45.1
Irrigated land only< 1 acre 3.0 15.5 18.2 16.2 5.1 14.11-5 acres 5.4 13.0 13.9 15.7 5.2 12.16+ acres 3.7 3.1 3.2 4.9 1.1 3.1
Nonirrigated land only< 1 acre 5.6 6.1 2.7 2.8 15.0 6.01-5 acres 5.9 8.8 1.7 2.5 25.8 8.46+ acres 1.3 2.3 0.2 0.6 7.0 2.2
Both irrigated and nonirrigated land< 1 acre 1.1 2.1 2.7 1.1 1.8 2.01-5 acres 2.3 5.5 5.3 4.8 5.2 5.16+ acres 1.7 1.6 1.3 1.6 2.4 1.7
Missing 0.3 0.2 0.1 0.1 0.4 0.2
Total percent 100.0 100.0 100.0 100.0 100.0 100.0
Percentage owning a house 84.7 95.7 99.0 90.9 91.3 84.5
Percentage owning livestock 20.4 60.9 57.9 55.5 54.7 56.3
Number of households 720 5,625 2,701 1,937 1,707 6,345
do not own any agricultural land. Forty-two percent of households in rural areas do not ownagricultural land (41 percent in NFHS-l), compared with 70 percent of households in urbanareas. In rural areas, among those who own land, 70 percent have at least some irrigated land.This proportion is much lower in the Jharkhand region (31 percent) than in the North or SouthBihar Plain regions (88-91 percent). The proportion of households owning a house is 85 percentin urban areas, 96 percent in rural areas, and 95 percent overall. The proportion of householdsowning livestock is 20 percent in urban areas, 61 percent in rural areas, and 56 percent overall.The proportion owning a house or a livestock does not vary much by region.
The possession of durable goods is another indicator of a household's socioeconomiclevel, although these goods may also have other benefits. For example, having access to a radioor television may expose household members to innovative ideas or important information abouthealth and family welfare; a refrigerator prolongs the wholesomeness of food; and a means oftransportation allows greater access to many services outside the local area. Table 2.11 showsthat in the state as a whole, the majority of households have a cot or a bed (94 percent), or aclock or watch (51 percent). Other durable goods often found in households are bicycles (45
. percent), chairs (40 percent), tables (34 percent), radios/transistors or mattresses (28 percenteach), electric fans (17 percent), televisions (14 percent), and pressure cookers (13 percent), withsmaller proportions owning sewing machines (9 percent), motorcycles or scooters or mopeds (5percent), water pumps (5 percent), refrigerators or bullock carts (3 percent each), threshers ortelephones (2 percent each), and tractors (1 percent). Only one-half of one percent own a car.
30

Table 2.11 Hoysehold ownership of durable goods and standard of living
Percentage of households owning selected durable goods and percent distribution of households by type ofkitchenware and the standard of living index, according to residence and region, Bihar, 1998-99
Region
Residence North SouthBihar Bihar Jhar-
Asset Urban Rural Plain Plain khand Total
Durable goodsMattress 58.2 23.9 30.0 30.9 20.9 27.8Pressure cooker 49.5 8.2 11.4 15.7 11.9 12.9Chair 70.4 36.0 44.3 37.3 35.9 39.9CoUbed 98.1 92.9 92.6 95.8 92.1 93.5Table 70.7 29.7 36.5 32.9 32.6 34.4Clock/watch 82.6 46.5 51.7 52.3 46.8 50.6Electric fan 66.7 10.6 12.6 20.3 20.2 17.0Bicycle 62.2 42.7 45.5 38.7 51.3 45.0Radio/transistor 49.0 25.8 30.9 26.7 26.5 28.4Sewing machine 30.3 6.6 8.5 10.6 8.8 9.3Telephone 9.4 0.9 2.2 1.9 1.4 1.9Refrigerator 14.9 1.0 2.1 2.3 3.6 2.6Television (black and white) 46.1 7.5 10.0 11.8 15.1 11.9Television (colour) 9.2 1.0 1.3 2.0 2.8 1.9Mopedfscooter/motorcycle 18.4 2.9 4.3 3.8 6.3 4.7Car 2.3 0.3 0.5 0.4 0.7 0.5Water pump 5.1 4.5 5.4 4.1 3.6 4.5Bullock cart 1.4 2.9 2.2 0.9 5.8 2.8Thresher 1.9 2.2 2.3 3.0 0.9 2.1Tractor 1.3 0.9 1.4 0.9 0.3 0.9None of the above 0.4 3.9 4.9 1.8 3.2 3.5
Main type of kitchenware usedClay 2.1 0.7 0.4 0.9 1.6 0.8Aluminum 29.5 54.5 45.3 62.9 49.0 51.7Cast iron 0.8 0.3 0.2 0.5 0.6 0.4Brass/copper 0.1 0.3 0.0 0.1 1.0 0.3Stainless steel 67.4 44.1 54.1 35.7 47.8 46.8Don't know/missing 0.0 0.0 0.0 0.0 0.1 0.0Total percent 100.0 100.0 100.0 100.0 100.0 100.0
Standard of living indexLow 24.1 61.7 56.6 57.1 59.0 57.4Medium 43.0 32.7 35.1 33.6 32.3 33.9High 32.8 5.5 8.1 9.2 8.7 8.6Missing 0.1 0.1 0.2 0.1 0.0 0.1Total percent 100.0 100.0 100.0 100.0 100.0 100.0
Number of households 720 5.625 2.701 1.937 1.707 6.345
Urban households are much more likely than rural households to own each of these durablegoods, except bullock carts and threshers. Four percent of households in Bihar do not own any ofthe above durable goods. In the state as a whole, 52 percent of households mainly use aluminumkitchenware and 47 percent use stainless steel kitchenware. Stainless steel kitchenware is used by67 percent ofurban households, compared with 44 percent of rural households.
Table 2.11 includes a standard of living (SLI) index, defined in terms of ownership ofhousehold goods by adding the following scores:
House type: 4 for pucca, 2 for semi-pucca, 0 for kachha;
31

Toilet facility: 4 for own flush toilet, 2 for public or shared flush toilet or own pit toilet, 1 forshared or public pit toilet, 0 for no facility;
Source oflighting: 2 for electricity, 1 for kerosene, gas, or oil, 0 for other source oflighting;
Main fuel for cooking: 2 for electricity, liquid petroleum gas, or biogas, 1 for coal/coke/lignite,charcoal, or kerosene, 0 for other fuel;
Source ofdrinking water: 2 for pipe, hand pump, or well in residence/yard/plot, 1 for public tap,hand pump, or well, 0 for other water source;
Separate room for cooking: 1 for yes, 0 for no;
Ownership ofhouse: 2 for yes, 0 for no;
Ownership ofagricultural land: 4 for 5 acres or more, 3 for 2.0-4.9 acres, 2 for less than 2 acresor acreage not known, 0 for no agricultural land;
Ownership ofirrigated land: 2 if household owns at least some irrigated land, 0 for no irrigatedland;
Ownership 0/livestock: 2 ifowns livestock, 0 if does not own livestock;
Ownership ofdurable goods: 4 each for a car or tractor, 3 each for a moped/scooter/motorcycle,telephone, refrigerator, or colour television, 2 each for a bicycle, electric fan, radio/transistor,sewing machine, black and white television, water pump, bullock cart, or thresher, and 1 each fora mattress, pressure cooker, chair, cotlbed, table, or clock/watch.
Index scores range from 0--14 for a low SLI to 15-24 for a medium SLI and 25-67 for ahigh SLI. By this measure, 57 percent of households in Bihar have a low standard of living, 34percent have a medium standard of living, and 9 percent have a high standard of living. Theproportion with a low standard ofliving is much higher in rural areas than in urban areas (62 and24 percent, respectively), and the proportion with a high standard of living is much higher inurban areas than in rural areas (33 and 6 percent, respectively). The proportion with a mediumstandard ofliving is somewhat higher in urban areas (43 percent) than in rural areas (33 percent).There is little regional variation in the distribution of households by the standard ofliving index.
2.6 Lifestyle Indicators
The NFHS-2 Household Questionnaire asked about certain aspects of the lifestyle of householdmembers. Table 2.12 shows the percentages of males and females age 15 and above who chewpaan masala or tobacco, drink alcohol, or smoke. These lifestyle indicators are of considerableinterest, because the use of paan masala, tobacco, and alcohol all have detrimental effects onhealth.
The respondent to the Household Questionnaire reports on these lifestyle indicators forall persons in the household who may not be aware of use that takes place outside the householdenvirons, and therefore the results should be interpreted with caution. In addition, to the extentthat social stigma may be attached to the use of some ofthe substances, underreporting is likely.
32

Table 2.12 Lifestyle indicators
Percentage of usual household members age 15 and above who chew paan masala or tobacco, drinkalcohol, currently smoke, or have ever smoked by selected background characteristics and sex, Bihar,1998-99
Chewpaan Number ofmasala or Drink Currently Ever household
Background characteristic tobacco alcohol smoke smoked1 members
MALE
Age15-19 14.1 4.8 5.1 6.4 1,91720-24 33.4 14.0 14.0 16.8 1,57025-29 52.8 22.4 24.1 29.0 1,42430-39 65.9 31.9 33.3 40.1 2,47940-49 69.6 31.4 38.8 46.0 1,68450-59 66.4 28.0 34.8 44.4 1,14560+ 64.0 23.4 36.7 45.6 1,409
ResidenceUrban 38.4 13.7 16.4 20.2 1,435Rural 53.6 23.6 27.7 33.6 10,193
EducationIlliterate 64.3 32.4 37.3 43.8 4,400Literate, < middle school complete 52,6 22.2 25.4 31.6 2,568Middle school complete 37.2 15.7 16.8 21.4 1,404High school complete and above 40.4 11.7 16.1 20.9 3,257
Standard of liVing index .
Low 58.3 28.4 31.8 37.7 5,607Medium 48.5 19.4 23.5 29.2 4,630High 36.1 7.4 13.4 18.2 1,377
Totai 51.7 22.4 26.3 32.0 11,629
FEMALE
Age15-19 0.8 0.4 0.3 0.4 1,86720-24 3.2 1.6 1.4 1.5 1,73725-29 4.0 3.1 2.5 3.0 1,61130-39 6.3 4.4 6.1 6.7 2,32040-49 12.0 5.1 11.5 13.0 1,41450-59 14.9 5.6 14.6 16.4 1,06960+ 15.1 4.5 16.6 18.8 1,041
ResidenceUrban 6.9 1.2 2.7 3.2 1,255Rural 6.9 3.6 6.8 7.7 9,805
Educationilliterate 8.5 4.3 8.3 9.3 8,028Literate, < middle school complete 4.6 1.1 2.4 2.7 1,448Middle school complete 1.3 0.5 0.3 0.3 622High school complete and above 1.4 0.2 0.3 0.3 960
Standard of living indexLow 8.7 5.1 9.0 9.9 5,495Medium 5.7 2.0 4.5 5.2 4,288High 3.4 0.1 1.4 1.8 1,263
Total 6.9 3.3 6.4 7.2 11,060
Total male and female 29.9 13.1 16.6 19.9 22,689
Note: Totals include 1 female with missing infonnation on education and 15 males and 15 females withmissing information on the standard of living index, respectively, who are not shown separately.llncludes household members who currently smoke
33

Fifty-two percent of males and 7 percent of females age 15 and above are reported tochew paan masala or tobacco. This proportion rises from 14 percent of males and 1 percent offemales at age 15-19 to 66 percent and 15 percent, respectively, at age 50-59. For males theproportion is highest in the age group 40-49 (70 percent). Chewing ofpaan masala or tobacco ismore common among rural males than among urban males. The proportion chewing paanmasala or tobacco is much lower among more educated men and women and among those livingin higher standard of living households.
Twenty-two percent of males, but only 3 percent of females, age 15 and above drinkalcohol. The proportion who drink alcohol rises with age up to age 30-39 for men and age 50-59for women. The proportion who drink is higher in rural areas than in urban areas and amongilliterate men and women than among the literate. Drinking alcohol is negatively related to thehousehold standard ofliving.
Twenty-six percent of males and 6 percent of females age 15 and above currently smoke.The proportion of males who smoke rises from 5 percent at age 15-19 to 39 percent at age 40-49and then falls to 37 percent at age 60 and above. The proportion who smoke is much higher inrural areas than in urban areas. It is more than two times higher among illiterate males thanamong those with at least a middle school education, and also among males with a low standardofliving than among males with a high standard of living. Eighty-two percent of males who eversmoked were still smokers at the time of the survey. The pattern of differentials for ever-smokersclosely resembles the pattern for current smokers. Only 7 percent of females are reported to haveever smoked, and the pattern ofdifferentials for females is similar to that for males.
·2.7 Availability of Facilities and Services to the Rural Population
The NFHS-2 Village Questionnaire collected information on a number of characteristics thataffect health and family planning. One of these characteristics is distance of the village fromvarious types of health facilities, including Primary Health Centres (PHCs), sub-centres,hospitals, and dispensaries or clinics. Table 2.13 summarizes findings on distance from a healthfacility. The unit of analysis is ever-married women age 15-49 who reside in rural areas.Thirteen percent of rural women live in a village with a Primary Health Centre, 29 percent live ina village with a sub-centre, and 32 percent live in a village with either a PHC or a sub-centre.The proportions who live in a village with other health facilities are 6 percent for hospitals and 9percent for dispensaries or clinics. Nearly one-third of women (34 percent) live in a village thathas some kind of health facility. Median distances from particular health facilities are 5.6 km fora PHC, 7.4 km for a hospital, 7.5 km for a dispensary or a clinic, and 2.6 km for a sub-centre.
Table 2.14 shows the proportion of rural population in Bihar that lives in villages thathave various facilities and services. Four-fifths of rural residents (82 percent) live in villages thathave a primary school, two-fifths (40 percent) live in villages with a middle school, and nearlyone-fifth (19 percent) live in villages that have a secondary school. Higher secondary schools areavailable in villages where 8 percent of rural people live. Two-fifths of rural residents (40percent) live in villages that have an anganwadi (a nursery school for children age 3-6 years)and 7 percent live in villages with an adult education centre. One-third of rural residents (33
3Anganwadi workers provide integrated child development services and may also engage in the promotion of familyplanning.
34

Table 2.13 Distance from the nearest health facility
Percent distribution of ever-married rural women age 15-49 by distance from the nearest healthfacility, Bihar, 1998-99
Health facility
EitherPrimary PHear AnyHealth Sub- sub- Dispensary! health
Distance Centre centre centre Hospital1 clinic facility
Within village 13.1 28.5 31.6 5.7 9.2 34.2< 5 km 31.1 41.8 41.5 29.3 24.9 44.35-9km 28.5 17.8 16.4 23.4 25.3 13.410+ km 27.3 11.9 10.5 41.6 40.5 8.0
Total percent 100.0 100.0 100.0 100.0 100.0 100.0
Median distance (in km) 5.6 2.6 2.4 7.4 7.5 1.9
Note: The category '< 5 km' excludes cases where the facility is within the village. When mediandistance is calculated, 'within village' cases and cases with a facility less than 1 km from thevillage are assigned a distance of zero.PHC: Primary Health Centre1lncludes community health centre, rural hospital, government hospital, and private hospital
percent) live in villages that have a doctor and 42 percent live in villages with a traditional birthattendant.
Only two-fifths (42 percent) of rural residents live in villages that are at least partlyelectrified. Although only 12 percent of rural residents live in villages with an STD booth (fortelephoning within India), 29 percent live in villages that have at least one household with aprivate telephone. Only 5 percent live in villages that have cable television service, indicatingthat exposure to modem influences through the mass media is minimal in the state. Eight percentlive in villages with a mahila mandaI, a government-sponsored women's community group thatfocusses on health and family welfare educational activities. Other facilities and servicesavailable within villages to a majority of rural residents include kirana shops and paan shops.The most widely available rural development programmes are the Indira Awas Yojana and theIntegrated Rural Development Programme.
35
-

Table 2.14 Availability of facilities and services
Percentage of rural residents living in villages that have selected facilities and services, Bihar, 1998-99
Percentage PercentageFacility/service of residents Facility/service of residents
Primary school 82.0 At least one village household has a telephone 29.2Middle school 40.3 Mill/small-scale industry 5.7Secondary school 18.5 Credit cooperative society 9.5Higher secondary school 7.9 Agricultural cooperative society 10.2College 3.9 Fishermen's cooperative society 1.2
Milk cooperative society 6.5Anganwadi 39.8 Kirana/general market shop 64.7Adult education centre 7.0 Weekly market 32.2
Fair price shop 48.9Primary Health Centre 13,1 Paan shop 62.9Sub-centre 28.0 Phannacy/medical shop 30.4Hospital1 5.9 Mahila mandai 7.8Dispensary/clinic 9.4 Youth club 12.9
Community centre 7.4Private doctor 32.5 Community television set 2.9Visiting doctor 17.8 Cable connection 5.3Village heallh guide 12.2Traditional birth attendant 41.7 Integrated Rural Development Programme (IRDP) 35.3Mobile health unit 1.3 National Rural Employment Programme (NREP) 7.1
Training Rural Youth for Self-Employment (TRYSEM) 8.9Electricity 42.0 Employment Guarantee Scheme (EGS) 4.4Bank 12.7 Development of Women and Children of Rural Areas (DWACRA) 7.6Post office 32.3 Indira Awas Yojana (lAY) 55.0Telegraph office 5.6 Sanjay Gandhi Nlradhar Yojana (SGNY) 0.1STD (Subscriber Trunk
Dialling) phone booth 12.2 Total population 34,339
Note: Table is based on de jure population.11ncludes community health centre, rural hospital, government hospital. and private hospital
36

CHAPTER 3
BACKGROUND CHARACTERISTICS OF RESPONDENTS
Women's demographic and health-seeking behaviour is associated with several characteristics,including their age, marital status, religion, and caste. Modernizing influences, such as women'sand men's education, exposure to mass media, and women's work participation, are alsoimportant catalysts for demographic and socioeconomic change. In addition, women's status andautonomy are critical in promoting change in reproductive attitudes and behaviour, especially inpatriarchal societies (Dyson and Moore, 1983; Das Gupta, 1987; Jeffery and Basu, 1996). TheNational Population Policy, 2000, ofthe Government of India identifies the low status of womenin India, typified by factors such as discrimination against the girl child and female adolescents,early age at marriage, and high rates of maternal mortality, as an important barrier to theachievement of population and maternal and child welfare goals (Ministry of Health and FamilyWelfare, 2000).
This chapter presents a profile of the demographic and socioeconomic characteristics ofever-married women age 15-49 who were identified by the Household Questionnaire as eligiblerespondents for the NFHS-2 Woman's Questionnaire. In addition, data are presented on theextent to which women in Bihar enjoy autonomy, as measured by their participation inhousehold decisionmaking, freedom of movement, and access to money they can spend as theywish. Finally, data on women's attitudes towards the acceptance of spousal violence underspecific circumstances and their experience ofphysical violence are discussed.
3.1 Background Characteristics
Table 3.1 presents the percentage distribution of ever-married women age 15-49 by age, maritalstatus, coresidence with husband, education, religion, caste/tribe, work status, and husband'seducation. In Bihar, the proportion of respondents in five-year age groups increases from 12percent in the age group 15-19 years to 20 percent in the age group 20-24, remains at the samelevel in the age group 25-29, and then falls steadily to 8 percent in the age group 45-49. Theinitial increase reflects the increasing share of ever-married women in each of these age groups.The decline after age 25-29 (an age by which most women have been married) reflects thenormal pyramidal shape of the population's age distribution. A greater proportion of ruralwomen fall in the younger age groups than of urban women. This higher share of youngrespondents among rural women is largely a consequence of the lower average age at marriage inrural areas.
Ninety-five percent of respondents are currently married, 3 percent are widowed, and 2percent are divorced, separated, or deserted. Eighty-six percent of respondents are living withtheir husbands. The distribution of respondents by marital status and coresidence with husbandsdoes not vary between urban and rural areas. By contrast, there are sharp differences betweenurban and rural areas in the composition of respondents by religion and caste/tribe. Theproportion of women who are Hindu is lower in urban areas (77 percent) than in rural areas (84percent), whereas the proportion who are Muslim is higher in urban areas (21 percent) than inrural areas (14 percent). For Bihar as a whole, 84 percent of all ever-married women are Hindu,15 percent are Muslim, and less than 1 percent are Christian.

Table 3.1 Background characteristics of respondents
Percent distribution of ever-married women age 15-49 by selected background characteristics, according to residenceand region, Bihar, 1998-99
Region
Residence North South Number of womenBihar Bihar Jhar~
Background characteristic Urban Rural Plain Plain khand Total Weighted Unweighted
Age15-19 8.5 12.1 13.0 10.6 10.9 11.7 825 82920-24 15.5 20.7 19.9 21.3 19.4 20.2 1,419 1,41925-29 18.9 20.3 19.5 21.3 20.0 20.2 1,419 1,41530-34 18.3 15.2 14.0 15.9 17.6 15.5 1,088 1,08235-39 15.7 12.8 13.1 12.7 13.7 13.1 921 92140-44 12.5 10.6 11.1 10.8 10.3 10.8 759 76145-49 10.5 8.2 9.3 7.4 8.2 8.4 593 597
Marital statusCurrently married 94.2 94.9 94.9 94.3 95.3 94.8 6,661 6,662Widowed 3.6 3.4 3.4 3.1 3.8 3.4 238 238Divorced 0.3 0.2 0.3 0.1 0.2 0.2 15 15Separated 1.7 1.4 1.2 2.3 0.6 1.4 99 98Deserted 0.1 0.2 0.1 0.2 0.1 0.2 11 11
Coresidence with husbandLiving with husband 86.2 85.6 83.5 85.3 90.2 85.7 6,018 6,011Not living with husband 8.1 9.3 11.4 9.1 5.1 9.2 643 651Not currently married 5.8 5.1 5.1 5.7 4.7 5.2 363 362
EducationIlliterate 46.2 80.1 79.4 72.9 76.3 76.6 5,383 5,397Literate, < primary schoolcomplete 5.2 2.7 2.3 3.1 3.9 3.0 208 205
Primary school complete 12.8 7.6 7.1 9.7 8.1 8.1 570 568Middle school complete 7.9 3.3 3.1 4.0 5.0 3.8 267 264High school complete 14.6 4.7 5.3 7.9 3.8 5.7 403 401Higher secondary complete
and above 13.2 1.5 2.8 2.5 2.9 2.7 191 189
ReligionHindu 76.8 84.4 81.1 88.0 82.5 83.6 5,872 5,873Muslim 20.5 14.1 18.6 11.7 11.7 14.8 1,038 1,044Christian 1.9 0.7 0.2 0.0 3.0 0.8 59 56Sikh 0.2 0.0 0.0 0.1 0.1 0.0 2 2Jain 0.3 0.0 0.1 0.0 0.0 0.0 2 2Zoroastrian/Parsi 0.0 0.1 0.0 0.1 0.0 0.0 3 3No religion 0.0 0.0 0.0 0.0 0.1 0.0 2 2Other 0.3 0.7 0.0 0.1 2.5 0.6 45 42
Caste/tribeScheduled caste 16.6 21.1 20.0 25.8 15.2 20.7 1,452 1,446Scheduled tribe 2.1 9.0 1.4 2.1 29.1 8.3 582 555Other backward class 49.3 52.1 55.4 54.8 41.4 51.8 3,642 3,673Other 32.0 17.7 23.1 17.4 14.3 19.2 1,348 1,350
Work statusWorking in family farm/business 3.8 9.7 7.5 9.4 11.7 9.1 639 632Employed by someone else 5.3 12.3 10.6 12.9 11.7 11.6 814 817Self-employed 3.9 6.0 4.3 5.9 8.3 5.7 404 398Not worked in past 12 months 86.9 72.0 77.7 71.8 68.3 73.6 5,168 5,177
Gontd...
38

Table3.1 Background characteristics of respondents (contd.)
Percent distribution of ever-married women age 15-49 by selected background characteristics, according to residenceand region, Bihar, 1998-99
Region
Residence North South Number of womenBihar Bihar Jhar-
Background characteristic Urban Rural Plain Plain khand Total Weighted Unweighted
Husband's educationIlliterate 20.4 45.0 44.4 38.3 44.4 42.5 2,986 2,992Literate, < primary school
complete 3.8 5.6 5.4 3.6 7.9 5.4 383 382Primary school complete 12.5 13.0 13.9 12.2 12.4 13.0 912 917Middle school complete 9.8 9.2 8.2 8.8 11.6 9.2 649 647High school complete 21.2 15.4 14.8 20.7 12.1 16.0 1,122 1,120Higher secondary complete
and above 32.2 11.6 13.0 16.3 11.6 13.7 963 956Missing 0.0 0.2 0.2 0.1 0.0 0.1 10 10
Total percent 100.0 100.0 100.0 100.0 100.0 100.0 NA NA
Number of womenWeighted 718 6,306 3,133 2,199 1,692 7,024 7,024 NAUnwelghted 687 6,337 3,295 2,115 1,614 7,024 NA 7,024
NA: Not applicable
One-fifth (21 percent) of ever-married women in Bihar belong to scheduled castes,comprising 21 percent of women in rural areas and 17 percent of women in urban areas. Eightpercent of ever-married women belong to scheduled tribes--9 percent of women in rural areasand 2 percent in urban areas. Scheduled tribes are mostly concentrated in the Jharkhand region.More than one-halfofwomen in Bihar (52 percent) belong to other backward classes (OBC).
The educational levels of women and their husbands have an important influence ondemographic and health-seeking behaviour. Seventy-seven percent of ever-married women age15-49 are illiterate, about the same proportion observed at the time of NFHS-I (78 percent).There has been a marginal decline in illiteracy among rural women, from 84 percent in NFHS-Ito 80 percent in NFHS-2, whereas illiteracy levels among urban women are almost the same inNFHS-I (45 percent) and NFHS-2 (46 percent). The difference in literacy level between urbanand rural areas remains high, however. Only 8 percent of all respondents have completed highschool and above, the same percentage as in NFHS-I. Twenty-eight percent of women in urbanareas have attained this educational level, compared with only 6 percent of women in rural areas.Among women who are literate, the largest proportion have completed primary school (but notmiddle school). Thirteen percent of women in urban areas have completed primary school (butnot middle school), compared with only 8 percent in rural areas.
Forty-three percent ofever-married women have illiterate husbands, about the same levelas in NFHS-I (45 percent). The proportion of respondents with illiterate husbands is more thantwice as high in rural areas (45 percent) as in urban areas (20 percent). The proportion of womenwith illiterate husbands has declined in rural areas since NFHS-I, however, when it was 49percent. Nearly one-third (30 percent) of women have husbands who have at least completedhigh schoo1. This percentage is much higher in urban areas (53 percent) than in rural areas (27
39

percent). By contrast, there are only negligible differences by residence in the proportions ofwomen with husbands who have completed primary or middle school.
Three-fourths (74 percent) of ever-married women in Bihar did not participate in workother than their regular housework during the 12 months preceding NFHS-2. A larger proportionofwomen fall in this category in urban areas (87 percent) than in rural areas (72 percent). In bothurban and rural areas, the highest proportions of working women were employed by someoneelse (12 percent of all rural women and 5 percent of all urban women). Ten percent of ruralwomen worked on their own family farm or in a family business, compared with only 4 percentof urban women. A slightly higher proportion of women are self-employed in rural areas (6percent) than in urban areas (4 percent).
3.2 Educational Level
Table 3.2 shows the percent distribution of ever-married women age 15-49 by the highest levelof education attained, according to age, religion, caste/tribe, and husband's education. Theeducational levels of women in various age groups reflect progress in the spread of educationover a period ofabout three decades. Illiteracy is lower among younger women than among olderwomen: 73 percent of women age 15-24 are illiterate, compared with 81 percent of women age40-49. The proportion of women who have at least completed high school, although still verylow, is about four times as high for women age 20-24 (12 percent) as for women age 45-49 (3percent).
A higher proportion of Muslim women are illiterate (83 percent) than Hindu women (76percent) or Christian women (43 percent), and Hindu women are more likely to have completedhigh school or more education (9 percent) than Muslim women (3 percent). Women'seducational attainment also varies widely by caste/tribe membership. Ninety percent of womenwho belong to schedules tribes, 88 percent who belong to schedules castes, and 80 percent whobelong to other backward classes are illiterate, compared with only 51 percent of women who donot belong to any of these disadvantaged groups. Scheduled-tribe women and scheduled-castewomen are also less likely than other women to have completed middle school or high school.
Ninety-eight percent of women with illiterate husbands are themselves illiterate. Fifty-sixpercent of women whose husbands have completed high school (but not higher secondaryschool) and 26 percent of women whose husbands have completed higher secondary school andabove are also illiterate. Nearly all women whose husbands are literate have a lower level ofeducation than their husbands. Specifically, the proportion of women with less education thantheir husbands is 87 percent for women whose husbands are literate but have not completedprimary school, 89 percent for women whose husbands have completed primary school, 91percent for women whose husbands have completed middle school, 88 percent for women whosehusbands have completed high school, and 81 percent for women whose husbands havecompleted higher secondary school and above.
40

Table 3.2 Respondent's level of education by background characteristics
Percent distribution of ever-married women age 15-49 by highest level of education attained, according to selected backgroundcharacteristics, Bihar, 1998-99
Respondent's level of education
Uterate, Higher< primary Primary Middle High secondary Numberschool school school school compiete Totai of
Background characteristic Illiterate complete complete complete complete and above percent women
Age15-19 74.0 3.5 10.1 6.9 4.6 0.9 100.0 82520-24 72.9 2.5 8.0 4.2 9.6 2.7 100.0 1,41925-29 75.1 2.8 6.6 4.6 6.9 4.0 100.0 1,41930-34 77.0 2.1 7.9 3.8 5.3 3.9 100.0 1,08835-39 80.2 3.5 7.7 2.3 3.4 2.9 100.0 92140-44 79.6 4.2 8.8 1.6 3.6 2.1 100.0 75945-49 83.1 2.8 9.3 1.7 2.7 0.5 100.0 593
ReligionHindu 75.7 2.6 8.3 4.2 6.3 3.0 100.0 5,872Muslim 83.4 5.1 7.7 1.0 1.9 0.9 100.0 1,038Christian 42.7 3.7 7.3 18.0 19.5 8.8 100.0 59Other 90.3 2.0 2.0 0.0 2.1 3.6 100.0 55
Caste/tribeScheduled caste 88.3 2.1 4.0 2.4 2.6 0.7 100.0 1,452Scheduled tribe 89.5 1.3 4.1 2.2 2.2 0.7 100.0 582Other backward class 79.6 3.2 7.3 3.4 4.8 1.7 100.0 3,642Other 50.6 4.0 16.5 7.0 13.4 8.5 100.0 1,348
Husband's educationIlliterate 97.7 0.7 1.0 0.3 0.2 0.0 100.0 2,986Literate, < primary school
complete 87.1 8.1 3.5 0.8 0.5 0.0 100.0 383Primary school complete 84.2 4.5 9.0 1.6 0.6 0.1 100.0 912Middle school complete 73.4 4.8 13.1 5.4 2.8 0.5 100.0 649High schooi complete 55.7 4.8 18.4 8.8 11.6 0.7 100.0 1,122Higher secondarycomplete and above 26.2 3.0 15.8 11.1 25.1 18.7 100.0 963
Total 76.6 3.0 8.1 3.8 5.7 2.7 100.0 7,024
Note: Total includes 10 women with missing information on husband's education, who are not shown separately.
3.3 Age at First Marriage
Table 3.3 gives information on age at first marriage. The table shows the percentage of allwomen (ever-married and never-married) who first married by specified exact ages as well as themedian age at first marriage and first cohabitation by current age and residence. The median age
. at first marriage/cohabitation for a cohort of women is the age by which 50 percent of the cohortmarries/cohabits.
There is evidence that age at first marriage is rising in Bihar. The proportion married byage 15 falls steadily from the oldest to the youngest age group. More remarkable, the proportionfalls from 40 percent for women age 20-24 to 24 percent for women age 15-19, who are onlyfive years younger on average. This decline in the proportion of women married by age 15 isevident in both rural and urban areas. In rural areas, the proportion of women married by age ISdeclines from 43 percent among women age 20-24 to 26 percent among women age 15-19; thecorresponding decline in urban areas is from 20 percent to 9 percent. The median age at first
41

Table 3.3 Age at first marriage
Percentage of women married by specific exact ages, median age at first marriage, and median age at first cohabitationwith husband, according to current age and residence, Bihar, 1998-99
Median ageat first
Percentage ever married by exact age Median age cohabitationat first with
Current age1 13 15 18 20 22 25 marriage husband
URBAN
15-19 2.8 8.8 NA NA NA NA NC NC20-24 5.1 19.7 38.8 57.7 NA NA 19.0 19.525-29 6.2 22.5 54.5 72.5 80.2 87.0 17.1 18.330-34 11.6 31.7 62.9 78.8 85.7 92.1 16.7 17.535-39 14.6 37.8 66.7 86.6 91.9 93.7 16.3 17.640-44 11.6 28.8 68.9 88.4 97.4 97.4 16.3 17.445-49 17.7 44.0 80.3 92.9 97.2 98.5 15.3 16.9
20-49 10.1 29.0 58.9 76.7 NA NA 16.9 18.025-49 11.6 31.7 64.7 82.1 88.9 92.8 16.4 17.6
RURAL
15-19 9.0 26.4 NA NA NA NA NC NC20-24 15.8 42.7 74.7 85.7 NA NA 15.5 17.025-29 19.8 48.8 83.3 93.1 95.4 97.1 15.1 16.630-34 22.2 50.9 86.3 95.9 98.2 98.8 14.9 16.535-39 25.5 54.0 87.4 95.6 98.5 99.0 14.7 16.440-44 30.2 60.7 89.3 97.0 99.6 99.8 14.3 16.345-49 32.3 60.8 89.1 95.5 99.2 99.6 14.2 16.5
20-49 22.3 50.8 83.4 92.7 NA NA 14.9 16.625-49 24.6 53.6 86.4 95.1 97.7 98.6 14.8 16.5
TOTAL
15-19 8.2 24.0 NA NA NA NA NC NC20-24 14.7 40.4 71.0 82.7 NA NA 15.7 17.225-29 18.4 46.1 80.4 91.0 93.9 96.2 15.3 16.730-34 20.9 48.5 83.4 93.7 96.6 98.0 15.1 16.635-39 24.2 52.1 84.9 94.6 97.8 98.5 14.9 16.540-44 28.0 57.0 86.8 96.0 99.4 99.5 14.5 16.445-49 30.5 58.7 87.9 95.2 98.9 99.4 14.4 16.6
20-49 20.9 48.3 80.6 90.8 NA NA 15.1 16.725-49 23.0 51.0 83.9 93.6 96.7 97.9 14.9 16.6
NA: Not applicableNC: Not calculated because less than 50 percent of women in the age group, 15--19 have married or started living withtheir husband by age 15.1The current age groups include both never-married and ever-married women.
marriage has also risen over the past three decades. In urban areas, the median age at firstmarriage is nearly four years higher for women age 20--24 than for women age 45-49; in ruralareas, the corresponding increase in the median age at first marriage is more than one year.
Despite this evidence of a rising age at marriage, Table 3.3 shows that in Bihar mostwomen age 20-49 were married before they reached the legal minimum age of 18 years, as setby the Child Marriage Restraint Act of 1978. Specifically, 81 percent of all women age 20-49,including 83 percent of rural women and 59 percent of urban women, married by exact age 18.Although the median age at first marriage for women age 20-49 is two years higher in urban
42

-
areas (16.9) than in rural areas (14.9), both are less than 18 years. The only group with a medianage at first marriage of 18 years or higher is urban women age 20-24. Even among young urbanwomen, more than one-third marry before reaching the legal minimum age. In Bihar, thedifference between median age at first marriage and median age at first cohabitation is about oneand one-half years among women age 20-49. It is also one and one-half years for women age20-24. This suggests that gauna or similar cultural practices that create a lag between marriageand cohabitation are still observed in Bihar.
3.4 Exposure to Mass Media
In a country such as India, where the majority of women are illiterate or have little formaleducation, information channels such as the mass media play an important role in bringing aboutmodernization. NFHS-2 asked women whether they read a newspaper or magazine, watchtelevision, or listen to radio at least once a week, and whether they visit the cinema or theatre atleast once a month. Table 3.4 gives information on women's exposure to these media by selectedbackground characteristics.
In Bihar, nearly three-fourths (73 percent) of women are not regularly exposed to anymass media. Media exposure is similar among women in different age groups, but exposurevaries widely by women's education and household standard of living. As expected, regularexposure to mass media increases with education, ranging from 14 percent among illiteratewomen to 57-86 percent among women in other education categories. Regular exposure tomedia also increases with household standard of living, ranging from 8 percent among womenliving in households with a low standard of living to 87 percent among women in householdswith a high standard of living.
Seventy-seven percent of rural women are not regularly exposed to any media, comparedwith 33 percent of urban women. Slightly more Muslim women are not regularly exposed to anymedia (79 percent) than Hindu women (72 percent). Eighty-eight percent of scheduled-tribewomen, 82 percent of scheduled-caste women, and 75 percent of women from other backwardclasses are not regularly exposed to any media, compared with only 50 percent of women whodo not belong to any ofthese disadvantaged groups.
Among the different types of mass media, radio has the greatest reach across allcategories of women including illiterate and poor women. Overall, 20 percent of ever-marriedwomen listen to the radio at least once a week, and 17 percent watch television at least once aweek, compared with less than 10 percent who are regularly exposed to print media orcinema/theatre. The proportion of women who listen to the radio at least once a week hasdeclined since the time of NFHS-I, however, when it was 26 percent. By contrast, regularexposure to television has risen over the same period-from 13 percent in NFHS-I to 17 percentin NFHS-2. Cinema/theatre is the least widely used medium. Exposure to each type of mediaincreases sharply with women's education and household standard ofliving.
43

Table 3.4 Exposure to mass media
Percentage of ever-married women age 15-49 who usually read a newspaper or magazine, watch television, or listen to theradio at least once a week, who usually visit a cinema/theatre at least once a month, or who are not regularly exposed toany of these media by selected background characteristics, Bihar, 1998-99
Exposure to mass media
Reads a Watches Visits thenewspaper or television at Listens to the cinema/theatre Not re9ularly Numbermagazine at least least once radio at least at least once exposed to of
Background characteristic once a week a week once a week a month any media women
Age15-19 9.5 13.9 19.5 4.9 72.7 82520-24 10.3 15.9 22.4 5.1 71.5 1,41925-29 9.5 17.7 21.5 4.7 72.4 1,41930-34 10.7 17.6 20.2 4.9 71.5 1,08835-39 8.8 16.6 18.2 4.2 75.2 92140-44 7.6 17.5 19.1 3.8 73.6 75945-49 6.3 18.1 18.8 1.3 73.7 593
ResidenceUrban 31.4 59.1 39.6 18.3 32.7 718Rural 6.8 11.9 18.1 2.8 77.3 6,306
RegionNorth Bihar Plain 9.2 14.6 22.0 4.3 73.8 3,133South Bihar Plain 9.6 17.3 19.8 5.3 72.3 2,199Jharkhand 9.0 20.0 17.8 3.4 71.2 1,692
EducationIlliterate 0.0 7.0 10.6 1.4 85.9 5,383Literate, < middle schoolcomplete 21.9 34.7 41.6 7.5 42.6 779
Middle school complete 40.7 46.9 50.2 13.4 26.3 267High school complete
and above 62.7 68.1 66.9 23.4 14.0 595
ReligionHindu 10.0 17.4 21.3 4.4 71.7 5,872Muslim 4.2 13.2 14.1 4.0 78.9 1,038
. Christian 24.8 23.2 40.7 12.2 57.5 59Other 7.7 13.5 9.8 1.8 82.5 55
Caste/tribeScheduled caste 4.2 9.6 13.1 2.7 82.1 1,452SchedUled tribe 2.7 4.2 10.4 1.1 88.3 582Other baCkWard class 7.1 14.9 18.4 3.7 74.9 3,642Other 23.4 34.9 37.5 9.4 50.0 1,348
Standard of liVing indexLow 1.3 2.5 6.2 1.2 91.8 3,709Medium 10.2 20.3 27.6 5.3 62.0 2,595Hi9h 47.6 77.8 67.2 17.7 12.6 .712
Total 9.3 16.8 20.3 4.4 72.7 7,024
Note: Total includes 8 women with missing information on the standard of living index, who are not shown separately.
3.5 Women's Employment
Labor force participation not only gives women an opportunity to earn income but also exposesthem to the outside world and to networks and authority structures other than kin-based ones(Dixon-Mueller, 1993). In a developing country such as' India, however, where women'sworkforce participation is often motivated by poverty, these benefits are likely to be mediated by
44

Table 3.5 Employment
Percent distribution of ever-married women age 15-49 by employment characteristics, according toresidence, Bihar, 1998-99
Employment characteristic Urban Rural Total
Employment statusCurrently working 12.6 26.5 25.1Worked in past 12 months (not currently working) 0.5 1.5 1.4Not worked in past 12 months 86.9 72.0 73.6
Continuity of employment1
Throughout the year 70.2 61.2 61.7Seasonally/part of the year 24.1 35.4 34.9Once in a while 5.6 3.4 3.5
Type of earning1
Cash only 69.2 34.7 36.4Cash and kind 17.3 34.2 33.4Kind only 3.4 12.1 11.7Not paid 10.1 19.0 18.5
Occupation1
Professional 16.4 2.2 2.9Sales worker 14.2 4.7 5.2Service worker 4.3 0.3 0.5Production worker 18.9 10.6 11.0Agricultural worker 21.2 70.9 68.4Other worker 23.7 10.6 11.3Don't know/missing 1.1 0.7 0.7
Earnings contribution to total family earnings2
Almost none 10.3 7.7 7.8Less than half 42.2 33.1 33.7About half 15.0 16.4 16.3More than half 16.9 9.8 10.2All 15.6 33.0 32.0
Total percent 100.0 100.0 100.0
I Number of women 718 6,306 7,024I Number of employed women1 94 1,763 1,856
Number of women earning cash 81 1,215 1,296
1For currently working women and women who have worked in the past 12 months2For women earning cash
the social context of women's work and their total work burden (Bardhan, 1985; Desai and Jain,1994). In addition, the empowering effects of employment for women are likely to depend ontheir occupation, the continuity oftheir workforce participation, and whether they earn income. Itis expected that women who work at a regular job, who earn cash, and who perceive that theircontribution is a substantial part of total family earnings are more likely to be empowered thanother employed and unemployed women (Youssef, 1982; Sen, 1990; Mahmud and Johnston,1994). Table 3.5 provides information on these aspects of women's employment for evermarried women age 15-49 according to residence.
In Bihar, 26 percent of ever-married women age 15-49 were either currently employed atthe time ofNFHS-2 or had been employed during the 12 months preceding the survey. Twentyeight percent of rural respondents but only 13 percent of urban respondents worked at any timeduring the preceding 12 months. The majority of women in both urban (70 percent) and ruralareas (61 percent) who worked at any time during the 12-month period worked throughout the
45

year. The majority who worked earned cash for their work, but the proportion earning cash washigher in urban areas (87 percent) than in rural areas (69 percent). Nearly one in five (19 percent)working women in rural areas and 1 in 10 (10 percent) in urban areas were unpaid workers.
Nearly three-quarters (71 percent) of rural women who work are farm workers. In urbanareas, there is greater occupational diversity. Twenty-one percent of urban women who work arefarm workers, 19 percent are production workers, 19 percent are in sales and services, and 16percent are professionals.
A significant feature of women's work participation in Bihar is their substantialcontribution to family earnings. One-third (33 percent) of rural women and nearly one-sixth (16percent) ofurban women who earned cash in the 12 months preceding the survey report that theirfamily is entirely dependent on their earnings. Another one-third (32 percent) in urban areas andone-fourth (26 percent) in rural areas report that they contribute about half or more of totalfamily earnings. Only 10 percent of women in urban areas and 8 percent in rural areas report thatthey contribute almost nothing to family earnings.
3.6 Women's Autonomy
Education, work participation, and exposure to mass media are some of the means by whichwomen gain status and autonomy, both important aspects of their empowerment. To measurewomen's autonomy and empowerment more directly, NFHS-2 asked about women'sparticipation in household. decisionmaking, their freedom of movement, and their access tomoney that they can spend as they wish. Women's autonomy is likely to have a significantimpact on the demographic and health-seeking behaviour of couples bec~use it affects women'srelative control over fertility and contraceptive use and influences women's attitudes (forexample, attitudes concerning the sex composition of children) and abilities (for example, theability to obtain health services for themselves and their children) (Sen and Batliwala, 1997).
In order to measure women's participation in household decisionmaking, NFHS-2 askedwomen to report who in their households makes decisions about the following: choosing whatitems to cook, obtaining health care for the woman, purchasing jewellery or other majorhousehold items, and deciding about the woman going and staying with parents or siblings. Thesurvey also asked women who earn cash who decides how the money they earn is spent. Table3.6 gives the percent distribution of ever-married women age 15-49 by the person (or persons)who makes each of the specified household decisions according to residence.
As expected, women in Bihar are most likely to participate in the decision about what tocook: 64 percent of women make this decision on their own, and another 18 percent make thisdecision jointly with their husband or someone else in the household. The remaining 18 percentofwomen are not involved in decisions regarding what to cook. More than half ofwomen are notinvolved in decisions about seeking their own health care (52 percent), purchasing jewellery orother major household items (57 percent), or going and staying with parents or siblings (56percent) (Figure 3.1). Among these three types of decisions, the decision that women are mostlikely to take on their own is the one about their own health care (19 percent); the decision thatthey are least likely to take on their own is about the purchase of jewellery or other majorhousehold items (9 percent). Surprisingly, there are no sharp differences by residence in theproportion of women participating in these different types ofdecisions.
46

Table 3.6 Household decisionmaking
Percent distribution of ever~married women by person who makes specific household decisions, according to residence,Bihar, 1998-99
Respondent Others in RespondentRespondent Husband with household with others in Total
Household decision only only husband only household percent
URBAN
What items to cook 65.6 6.6 8.1 10.2 9.4 100.0
Obtaining health care for herself 22.8 36.8 24.0 9.0 7.4 100.0
Purchasing jewellery or othermajor household items 13.1 36.3 28.9 11.7 10.0 100.0
Going and staying with herparents or siblings 11.8 37.7 28.7 11.0 10.8 100.0
How the money she earns will beused1 63.3 12.7 20.2 2.6 1.2 100.0
RURAL
What items to cook 64.3 7.1 8.2 10.6 9.7 100.0
Obtaining health care for herself 19.0 41.8 19.4 11.3 8.5 100.0
Purchasing jewellery or othermajor household items 9.0 46.1 23.2 12.1 9.6 100.0
Going and staying with herparents or siblings 9.7 44.5 23.1 12.4 10.4 100.0
How the money she earns will beused1 50.4 26.7 19.9 0.4 2.6 100.0
TOTAL
What items to cook 64.4 7.1 8.2 10.6 9.7 100.0
Obtaining health care for herself 19.4 41.3 19.8 11.1 8.4 100.0
Purchasing jewellery or othermajor household items 9.4 45.1 23.8 12.0 9.7 100.0
Going and staying with herparents or siblings 9.9 43.8 23.7 12.2 10.4 100.0
How the money she earns will beused1 51.3 25.8 19.9 0.5 2.5 100.0
1For women earning cash
About half (51 percent) of women who earn cash report that they decide on their ownhow the money they earn will be used, and more than one-fifth (22 percent) make this decisiontogether with their husbands or other members of the household. One-fourth of these women (26percent) are not involved in decisions about how the money they earn will be used. Theproportion of women who decide independently on the use of money they earn is higher in urbanareas (63 percent) than in rural areas (50 percent), while the proportion who do not participate insuch decisions is higher in rural areas (27 percent) than in urban areas (15 percent).
47

Figure 3.1Percentage of Women Participating in Different Household Decisions
and Percentage with Access to Money
TYPE OF DECISION
What to Cook
OWn Health Care
Purchasing JewelielY orOther Major Household Items
Going and Staying withParents/Siblings
ACCESS TO MONEY
82
o 10 20 30 40 50
Percent60 70 80 90
NFHS-2, Bihar, 1998-99
The proportion of women who are not involved in any household decisionmaking tendsto go down with age, ranging from 24 percent among women age 15-19 to 9 percent amongwomen age 35-44 (Table 3.7). Participation in decisions about what to cook tends to increasewith women's age, but there is not much variation by age in other areas of decisionmaking..Urban women are somewhat more likely than rural women to participate in decisions about theirown health care, about purchasing jewellery or other major household items, and about goingand staying with parents or siblings. Women in the Jharkhand region are consistently moreinvolved in household decisionmaking than are women in the other two regions of Bihar.
Scheduled-tribe women are much more likely to be involved in householddecisionmaking than are women in any other caste/tribe group. Women who worked in the 12months preceding the survey, whether or not for cash, are more likely to be involved inhousehold decisionmaking than are women who did not work. Hindu women are slightly morelikely than Muslim women to be involved in household decisionmaking (except for decisionsabout what to cook), and Christian women and women of 'other' religions are much more likelyto be involved. Women with at least a high school education are more likely than other women toparticipate in three of the four types of decisions covered by the survey, but illiterate womenhave the lowest proportion not involved in any decisionmaking. Similarly, women fromhouseholds with a high standard of living are more likely than other women to participate inthree out of four types of decisions, but they also have the highest proportion not involved in anydecisionmaking.
Table 3.7 also gives information on two other dimensions of women's autonomymeasured in NFHS-2, namely, women's freedom of movement and their access to money thatthey can spend as they wish. With regard to freedom of movement, respondents were askedwhether they need permission to go to the market or to visit friends or relatives. Women's access
48

Table 3.7 Women's autonomy
Percentage of ever-married women involved in household decisionmaking, percentage with freedom of movement, and percentage withaccess to money by selected background characteristics, Bihar, 1998-99
Percentage whodo not need
Percent- Percentage involved in decisionmaking on: permission to:age not Percent-involved Staying Visit -age within any Own Purchasing with her Goto friends! access Number
Background decision- What to health jewellery, parents! the relati- to ofcharacteristic making cook care etc. siblings market ves money women
Age15-19 24.3 70.4 42.0 41.8 43.9 10.5 10.6 54.1 82520-24 16.7 78.3 47.5 44.0 45.0 13.2 12.8 60.3 1,41925-29 13.6 81.8 47.4 43.6 44.8 20.9 19.2 66.1 1,41930-34 10.4 85.7 51.2 43.3 44.4 23.7 21.9 68.1 1,08835-39 8.6 88.8 48.4 41.3 43.3 28.3 27.0 72.8 92140-44 8.6 89.9 48.1 41.9 41.9 28.5 26.7 74.6 75945-49 10.6 84.2 47.9 42.7 42.7 36.9 35.1 79.1 593
ResidenceUrban 10.4 83.2 54.2 52.0 51.3 30.5 28.2 77.0 718Rural 13.9 82.3 46.9 41.8 43.1 20.7 19.6 65.6 6,306
RegionNorth Bihar Plain 14.3 82.4 36.5 32.6 34.4 16.9 16.4 73.6 3,133South Bihar Plain 19.0 76.1 48.7 40.2 41.0 15.2 14.4 58.6 2,199Jharkhand 4.9 90.5 66.8 65.4 65.5 39.1 35.9 64.5 1,692
EducationIlliterate 12.5 83.9 46.9 41.9 43.2 22.4 21.2 64.5 5,383Literate, < middle school
complete 16.5 78.0 47.1 41.3 41.9 19.2 17.9 72.6 779Middle school complete 19.0 74.1 51.4 48.3 48.0 20.9 20.5 69.8 267High school complete
and above 16.0 77.8 52.9 51.6 51.8 19.3 17.7 78.0 595
ReligionHindu 13.9 81.8 47.9 43.0 44.3 21.5 20.4 66.6 5,872Muslim 12.3 84.3 44.3 40.0 40.0 18.7 18.0 67.0 1,038Christian 7.1 91.0 59.3 64.7 62.9 52.4 39.6 78.1 59other 4.1 95.9 68.7 64.8 66.7 68.3 60.5 68.0 55
CasteltribeScheduled caste 15.0 81.5 43.8 40.5 42.7 20.5 20.2 60.2 1,452Scheduled tribe 5.6 90.6 73.2 61.2 63.8 48.3 41.6 63.8 582Other backward class 14.2 81.5 45.7 41.6 42.4 19.2 18.1 67.3 3,642other 13.5 82.0 45.8 40.9 41.2 18.4 18.2 73.4 1,348
Cash employmentWorking for cash 8.2 89.4 53.3 48.0 49.9 28.6 28.2 67.0 1,296Working but not for cash 7.7 90.0 54.7 51.4 54.3 32.2 30.5 61.4 561Not worked in past 12
months 15.5 79.8 45.4 40.7 41.4 18.8 17.5 67.2 5,168
Standard of living indexLow 12.1 85.1 47.7 42.1 43.5 24.2 22.7 63.2 3,709Medium 14.4 80.5 46.5 42.7 43.4 18.0 17.5 68.7 2,595High 17.9 74.7 51.5 47.4 48.7 22.2 20.0 78.1 712
Total 13.5 82.4 47.6 42.9 44.0 21.7 20.5 66.7 7,024
Note: Total includes 8 women with missing information on the standard of living index, who are not shown separately.
49

to spending money was measured by asking respondents, 'Are you allowed to have some moneyset aside that you can use as you wish?'
Most women say that they need permission to go to the market or to visit friends orrelatives. Only 22 percent say that they do not need permission to go to the market, and 21percent say that they do not need permission to visit friends or relatives. Freedom of movementtends to increase with age. It is relatively high for urban women, women who live in theJharkhand region, Christian women and women of 'other' religions, scheduled-tribe women, andwomen who worked in the 12 months preceding the survey, whether or not they worked for cash.Freedom of movement does not vary widely according to women's educational level orhousehold standard of living.
Women are much more likely to have access to money that they can spend as they wishthan the freedom to go to the market or visit friends or relatives without permission. Two-thirds(67 percent) of women say that they are allowed access to some money. As with freedom ofmovement, access to money increases with age. Access is relatively high for urban women,women who live in North Bihar Plain region, women who have at least completed high school,Christian women, women in households with a high standard of living, and women who do notbelong to a scheduled caste, scheduled tribe, or other backward class. Perhaps surprisingly,women who worked for cash in the 12 months preceding the survey are no more likely to haveaccess to money than are women who did not work.
3.7 Women's Educational Aspirations for Children
The desire to invest in children, including investing in their education, is an important aspect ofthe transition from uncontrolled to controlled fertility. In order to obtain information on thissubject, NFHS-2 asked ever-married women how much education, in their opinion, should begiven to a girl or a boy. Women's responses to these questions also provide an indication of thedegree of son preference prevailing at the time of the survey.
As shown in Table 3.8, 28 percent of women believe that a boy should be given as mucheducation as he wants, compared with only 16 percent who believe that a girl should be given asmuch education as she wants. Although women are somewhat more likely to say that boysshould receive higher education than girls, the largest proportion of women specifYing anyparticular level of education feel that both boys and girls should complete high school. Very fewwomen feel that girls should not be given any education at ail (3 percent), and even fewer feelthat boys should not be educated (1 percent). One-third (34 percent) of women said that the levelof education appropriate for boys 'depends' on the circumstances, compared with less than onefourth (22 percent) who gave this response for girls.
Table 3.8 indicates that there are sharp differences in educational aspirations for bothgirls and boys among women in rural and urban areas. Rural women have lower educationalaspirations for their children than do urban women, particularly for girls.
50

Table 3.8 Perceived educational needs of girls and boys
Percent distribution of ever~married women by their opinion on how much educationshould be given to girls and boys, according to residence, Bihar, 1998-99
Educational level Urban Rural Total
Education for girlsNo education 1.0 3.0 2.8Less than primary school 0.9 2.3 2.1Primary school 1.3 6.6 6.1Middle school 3.5 16.4 15.1High school 17.9 24.4 23.8Higher secondary school 6.1 5.8 5.8Graduate and above 7.4 3.0 3.5Professional degree 5.2 1.5 1.9As much as she desires 31.2 13.8 15.5Depends 24.5 21.9 22.1Don't know 1.0 1.3 1.3
Total percent 100.0 100.0 100.0
Education for boysNo education 0.1 0.6 0.6Less than primary school 0.2 0.3 0.3Primary school 0.1 0.8 0.7Middle school 1.0 3.0 2.8High school 6.4 15.1 14.2Higher secondary school 3.0 7.4 6.9Graduate and above 9.0 7.7 7.9Professional degree 7.3 3.4 3.8As much as he desires 39.9 26.5 27.9Depends 32.0 34.4 34.1Don't know 0.9 0.9 0.9
Total percent 100.0 100.0 100.0
3.8 Domestic Violence: Attitudes and Prevalence
In recent years, there has been increasing concern about violence against women in general anddomestic violence in particular, in both developed and developing countries (United NationsGeneral Assembly, 1991). Not only has domestic violence against women been acknowledgedworldwide as a violation of basic human rights, but a growing body of research is highlightingthe health burdens, intergenerational effects, and demographic consequences of such violence(Heise et aI., 1994, 1998; Jejeebhoy, 1998; Ramasubban and Singh, 1998; Rao and Bloch, 1993).In patriarchal societies such as India, women are not only socialized into being silent about theirexperience of violence, but traditional norms teach them to accept, tolerate, and even rationalizedomestic violence (Jaisingh, 1995; Hegde, 1996; Prasad, 1999). Both tolerance ofand experienceof domestic violence are significant barriers to the empowerment of women, with consequencesfor women's health, their health-seeking behaviour, their adoption of a small-family norm, andthe health of their children. In NFHS-2 an attempt was made to assess whether women viewwife-beating as justified and to measure the prevalence of violence against women including, butnot limited to, violence committed by a woman's husband. Special training was provided tointerviewers to sensitize them to the issue of domestic violence and impress upon them thenecessity of ensuring privacy when asking these questions.
In order to assess women's attitudes towards wife-beating, before asking about personalexperience with domestic violence, the survey asked all respondents whether they thought that ahusband is justified in beating his wife for each of the following reasons: if he suspects her of
51

being unfaithful; if her natal family does not give expected money, jewellery, or other items; ifshe shows disrespect for her in-laws; if she goes out without telling him; if she neglects thehouse or children; or if she does not cook food properly. These reasons, which range fromsuspicions about a wife's moral character to issues that might be considered rather trivial, werechosen to provide variation in the perceived seriousness of violations of behavioural norms.Table 3.9 gives the percentages of ever-married women who agree with specific reasons forwife-beating according to sociodemographic background characteristics.
Nearly one-half of women in Bihar (47 percent) accept at least one reason as justificationfor wife-beating. Women are most likely to agree that wife-beating is justified when a husbandsuspects his wife is unfaithful (28 percent). They are slightly less likely to agree that wifebeating is justified if a wife neglects her house or children, if she goes out without telling herhusband, if she shows disrespect for her in-laws, or if she does not cook food properly (21-25percent). Women are least likely to agree that wife-beating is justified if a wife's natal familydoes not give expected money, jewellery, or other items (4 percent).
There are no sharp differences in women's attitudes towards wife-beating by age ormarital duration, but there are consistent differences between women in rural and urban areas.Not only do a higher proportion of rural women (48 percent) than urban women (37 percent)agree with at least one reason justifying wife-beating, but rural women are also more likely thanurban women to agree with each specific reason. Among the regions, agreement is much higherin the North Bihar Plain than in the other regions. Agreement with at least one reason for wifebeating and with each specific reason declines consistently with increases in women's level ofeducation and household standard of living. Women who work but not for cash are more likelythan women in the other employment categories to agree with at least one reason for wifebeating and with all of the specific reasons.
Overall, one-third to one-half of women in almost every group agree with at least onereason justifying wife-beating. These findings indicate that women in Bihar are socialized innorms that give husbands the right to use force to discipline wives who are perceived to beviolating traditional gender norms.
In order to assess the prevalence of domestic violence, NFHS-2 also asked women if theyhad been beaten or physically mistreated since age 15.1 Women who reported being beaten orphysically mistreated were asked who beat or physically mistreated them, and interviewersrecorded all the persons mentioned. The culture of silence surrounding the topic of domesticviolence makes the collection of data on this sensitive topic particularly difficult. Even womenwho want to speak about their experience of domestic violence may find it difficult because offeelings of shame or fear. This may be particularly true if violence occurred recently (forexample, in the preceding 12 months) rather than in the more distant past. In addition, dependingon the varied cultural meanings ascribed to different acts, there may be women who do not reportdomestic violence because they do not view what they experienced as violence or physicalmistreatment. For all of these reasons, NFHS-2 results on the prevalence of domestic violenceneed to be interpreted with caution.
IThe question does not limit women to reporting only domestic violence. Nonetheless, almost all women whoreported any violence only reported beatings or physical mistreatment by husbands or other relatives.
52

Table 3.9 Reasons given for justifying a husband beating his wife
Percentage of ever-married women who agree with specific reasons for justifying a husband beating his wife by selected backgroundcharacteristics, Bihar, 1998-99
Percentage who agree with specific reasons
Percent- Natal family Wifeage who does not Wife goes Wife doesagree with Husband give Wife out neglects notat least suspects expected shows without house cook Number
Background one wife is money or disrespect telling or food ofcharacteristic reason unfaithful other items for in-laws husband children properly women
Age15-19 48.5 30.4 4.1 22.1 28.9 25.0 22.3 82520-29 44.2 26.4 3.7 20.7 23.6 23.9 20.3 2,83830-39 47.1 29.6 3.7 20.6 23.4 25.5 20.0 2,00940-49 49.4 29.7 5.3 22.5 27.2 277 22.3 1,353
Marital duration (in years)<5 43.9 26.8 4.0 19.8 24.6 22.3 20.0 1,6035-9 46.5 27.7 3.4 21.8 24.1 24.8 21.5 1.,10210 or more 48.1 29.6 4.1 21.6 25.2 26.7 21.1 3,955Not currently married 40.5 24.7 5.2 21.2 24.5 23.5 19.1 363
ResidenceUrban 36.7 19.9 2.9 18.4 19.3 21.2 16.6 718Rural 47.6 29.4 4.2 21.5 25.5 25.7 21.3 6,306
RegionNorth Bihar Plain 54.1 33.1 4.6 21.8 26.9 26.3 22.0 3,133South Bihar Plain 42.2 21.4 4.3 21.4 23.3 27.8 26.1 2,199Jharkhand 38.1 28.8 2.6 19.8 23.1 19.8 11.9 1,692
EducationIlliterate 50.0 31.0 4.7 22.5 27.0 27.5 22.9 5,383Literate, < middle school
complete 41.5 25.1 2.2 18.9 21.5 22.3 17.2 779Middle school complete 34.5 19.4 3.0 16.3 18.9 19.0 14.3 267High school completeand above 27.1 13.5 1.0 14.3 12.6 11.5 9.9 595
ReligionHindu 46.2 27.1 3.9 20.7 24.3 25.0 21.0 5,872Muslim 49.1 35.7 4.3 23.4 28.0 26.3 20.4 1,038Christian 41.4 35.8 1.9 23.6 20.1 25.4 11.2 59Other 34.1 20.1 12.1 26.1 32.1 24.2 20.2 55
Caste/tribeScheduled caste 49.8 32.6 4.9 23.8 28.5 26.4 23.8 1,452Scheduled tribe 40.3 28.9 2.8 20.2 24.5 21.9 13.2 582Other backward class 47.9 27.5 4.3 21.5 24.6 26.7 22.7 3,642Other 41.9 26.0 2.9 18.2 21.7 21.3 16.0 1,348
Cash employmentWorking for cash 48.0 29.0 6.0 25.5 28.0 28.4 24.3 1,296Working but not for cash 54.7 37.0 6.5 29.8 31.2 35.1 25.9 561Not worked in past 12
months 45.2 27.3 3.3 19.2 23.4 23.3 19.4 5,168
Standard of living indexLow 50.2 32.8 4.4 22.4 28.0 26.7 22.2 3,709Medium 45.1 25.5 3.8 20.5 23.6 25.5 21.1 2,595High 32.3 15.6 3.2 17.5 13.3 17.0 13.0 712
Total 46.5 28.4 4.0 21.2 24.9 25.2 20.8 7,024
Note: Total includes 8 women with missing information on the standard of living index, who are not shown separately.
53

Table 3.10 presents results on the prevalence of beatings or physical mistreatment sinceage IS according women's background characteristics. Prevalence is also shown according to theperson(s) who beat or physically mistreated the women reporting violence--their husbands, theirin-laws, or other persons. Twenty-seven percent of women in Bihar have experienced violence,and 25 percent have been beaten or physically mistreated by their husbands. Relatively few havebeen beaten or physically mistreated by their in-laws (2 percent) or other persons (3 percent).These findings indicate that more than 9 out of 10 women (94 percent) who report violence havebeen beaten or physically mistreated by their husbands.
Women age 15-19 are less likely than older women to have been beaten, but because oftheir young age they have had less time to be exposed to the risk of being beaten since age 15.Similarly, women who have been married for less than five years are also less likely to have beenbeaten (19 percent) than women who have been married longer (29-30 percent). Rural women(28 percent) are more likely than urban women (19 percent) to have experienced violence, andilliterate women (30 percent) are three times more likely to have experienced violence than arewomen who have completed high school or more education (10 percent). The prevalence ofviolence also decreases substantially as the household standard of living increases, ranging from32 percent of women in households with a low standard of living to 11 percent of women inhouseholds with a high standard ofliving.
Women from nuclear households are more likely than women from non-nuclearhouseholds to experience domestic violence. A similar finding was reported by Visaria (1999)among women in rural Gujarat. Women who worked in the 12 months preceding the survey, andparticularly women who did not work for cash, are more likely than nonworking women to haveexperienced violence.
In Bihar, women with no living children are somewhat less likely than other women tohave experienced violence (19 percent compared with 25-29 percent). This may be due in part tothe fact that childless women tend to be younger, and younger women have had less time toexperience violence than do older women. There is no apparent variation in the prevalertce ofviolence among women who do or do not have a son.
Among women with specific socioeconomic background characteristics, the proportionswho have been beaten or physically mistreated by their husbands are similar to the proportionswho have experienced violence in general. This is not surprising since, as already noted, mostwomen who report beatings are beaten by their husbands. The proportions of women who havebeen beaten or physically mistreated by their in-laws or by other persons are too small to allow ameaningful discussion of differentials by background characteristics. Nonetheless, it is notablethat women who are not currently married (divorced, separated, deserted, or widowed) are morelikely than currently married women to have been beaten or physically mistreated by their inlaws or other persons
54

Table 3.10 Women's experienc~ with beatings or physical mistreatment
Percentage of ever-married women who have been beaten or physically mistreated by theirhusband, in-laws, or other persons since age 15, according to selected backgroundcharacteristics, Bihar, 1998-99
Percentage Percentage beaten or physicallybeaten or mistreated since age 15 by:physically Numbermistreated Other of
Background characteristic since age 15 Husband In-Jaws persons women
Age15-19 16.5 14.3 2.2 2.9 8252G-29 28.1 26.5 2.7 3.3 2,83830-39 30.7 29.2 2.4 2.8 2,0094G-49 23.6 21.6 2.0 3.0 1,353
Marital duration (in yearsl<5 18.6 16.6 2.0 3.0 1,6035-9 29.0 27.6 2.1 3.5 1,10210 or more 29.7 28.2 2.5 2.7 3,955Not currently married 20.7 17.4 4.2 5.2 363
ResidenceUrban 18.9 18.0 1.5 1.5 718Rural 27.5 25.7 2.5 3.2 6,306
RegionNorth Bihar Plain 27.5 26.2 2.0 3.1 3,133South Bihar Plain 29.3 26.9 3.2 3.7 2,199Jharkhand 21.5 20.0 2.2 2.0 1,692
EducationIlliterate 30.2 28.4 2.7 3.4 5,383Literate, < middle school complete 17.7 16.2 2.1 2.2 779Middle schooi compiete 17.0 15.4 2.0 2.3 267High school complete and above 10.4 8.8 0.8 1.7 595
ReligionHindu 26.2 24.6 2.4 2.7 5,872Muslim 28.9 27.2 2.7 5.0 1,038Christian 19.9 18.1 3.6 0.0 59Other 34.1 28.1 0.0 8.0 55
Caste/tribeScheduled caste 34.5 32.0 3.6 3.3 1,452Scheduled tribe 23.8 22.5 1.5 2.3 582Other backward class 26.5 25.1 2.4 2.8 3,642Other 19.6 17.9 1.7 3.9 1,348
Household typeNuclear household 29.7 28.3 2.0 3.2 2,879Non-nuclear household 24.5 22.6 2.7 3.0 4,140
Cash employmentWorking for cash 38.0 36.4 3.3 3.9 1,296Working but not for cash 40.7 38.4 3.6 6.9 561Not worked in past 12 months 22.2 20.6 2.1 2.4 5,168
Standard of living indexLow 31.6 29.8 2.8 3.0 3,709Medium 23.9 22.3 2.3 3.4 2,595High 10.8 9.4 1.2 1.9 712
Gontd...
55

Table 3.10 Women's experience with beatings or physical mistreatment (contd.)
Percentage of ever-married women who have been beaten or physically mistreated by theirhusband, in-laws, or other persons since age 15, according to selected backgroundcharacteristics, Bihar, 1998-99
Percentage Percentage beaten or physicallybeaten or mistreated since age 15 by:physically Numbermistreated Other of
Background characteristic since age 15 Husband In-laws persons women
Living childrenNo living children 19.1 16.5 2.9 3.4 984Only daughters 25.7 23.8 2.1 2.9 885Only sons 25.3 23.5 2.6 3.8 1,232Both daughters and sons 29.1 27.7 2.3 2.8 3,922
Total 26.6 24.9 2.4 3.1 7,024
Note: Total includes 5 women in households with no usual residents and 8 women with missinginformation on the standard of living index, who are not shown separately.
NFHS-2 asked women who experienced violence how often they were beaten orphysically mistreated in the 12 months preceding the snrvey: many times, a few times, once, ornot at all. Table 3.11 shows the frequency of violence in the past 12 months for all women whoreport beatings or physical mistreatment. Two-thirds (69 percent) of women who experiencedviolence were beaten or physically mistreated at least once during the 12 months preceding thesnrvey. Fifty-one percent were beaten or physically mistreated more than once during thisperiod. Among women who have experienced violence since age 15, women with the followingcharacteristics are most likely to have been beaten or physically mistreated in the 12 monthspreceding the survey: younger women, women married less than 10 years, and women with noliving children.
As mentioned earlier, largely due to a general tendency to underreport domestic violence,these results need to be interpreted with caution. Nevertheless, the NFHS-2 estimates set a lowerbound on the proportion of women experiencing violence in Bihar: at least one in four evermarried women in Bihar has experienced violence since age 15, and at least one in five hasexperienced violence in the 12 months preceding the snrvey, These estimates of the prevalenceof physical violence in Bihar are somewhat higher than the estimates provided by the IndiaSAFEstudy offamily violence in India conducted at about the same time as NFHS-2. According to theIndiaSAFE study, one in five women report ever being hit, kicked, or beaten by husbands and 1in 10 women report violent physical behaviours by husbands in the past 12 months (InternationalClinical Epidemiology Network, 2000).
56

Table 3 11 Frequency of beatings or physical mistreatment
Percent distribution of ever-married women who report being beaten or physically mistreated since age 15 by frequency ofbeatings or physical mistreatment in the 12 months preceding the survey, according to selected background characteristics,Bihar, 1998-99
Beaten or physically mistreated in the past 12 months NumberTotal of
Background characteristic Many times A few times Once Not beaten percent women
Age15-19 14.8 43.9 23.1 18.2 100.0 .13620-29 23.0 29.8 20.1 27.2 100.0 79830-39 19.5 31.6 17.2 31.7 100.0 61640-49 13.0 27.7 17.0 42.4 100.0 319
Marital duration (in years}<5 17.6 35.6 23.7 23.1 100.0 2985-9 24.8 28.3 20.4 26.4 100.0 32010 or more 18.6 31.8 17.8 31.9 100.0 1,176Not currently married 19.0 13.6 9.4 58.0 100.0 75
ResidenceUrban 28.6 23.9 13.9 33.5 100.0 136Rural 18.8 31.6 19.2 30.4 100.0 1,733
RegionNorth Bihar Plain 13.3 30.5 20.4 35.8 100.0 860South Bihar Plain 28.5 26.3 18.3 26.9 100.0 645Jharkhand 18.3 41.0 15.9 24.8 100.0 364
EducationIlliterate 20.0 32.1 18.4 29.5 100.0 1,624Literate, < middle school complete 16.6 25.7 19.7 38.0 100.0 138Middle school complete (15.8) (20.7) (25.1) (38.4) 100.0 45High school complete and above 16.4 22.8 22.5 38.3 100.0 62
ReligionHindu 19.7 31.0 19.3 30.1 100.0 1,538Muslim 19.0 . 30.7 16.6 33.7 100.0 300
CasteJtribeScheduled caste 23.5 35.9 15.8 24.9 100.0 501Scheduled tribe 17.1 38.8 20.5 23.7 100.0 138Other backward class 19.4 28.0 20.1 32.4 100.0 965Other 13.7 29.2 18.9 38.3 100.0 265
Household typeNuclear household 18.3 35.1 16.9 29.7 100.0 855Non-nuclear household 20.5 27.7 20.5 31.3 100.0 1,014
Cash employmentWorking for cash 26.9 30.5 19.3 23.3 100.0 493Working but not for cash 15.9 31.2 17.7 35.2 100.0 228Not worked in past 12 months 17.1 31.3 18.8 32.8 100.0 1,148
Standard of living indexLow 21.4 34.1 17.6 26.8 100.0 1,172Medium 17.8 26.1 21.0 35.0 100.0 619Hi9h 4.1 23.8 19.6 52.5 100.0 77
Living childrenNo living children 25.9 27.7 23.2 23.2 100.0 188Only daughters 21.0 30.4 20.4 28.2 100.0 227Only sons 19.2 33.8 18.5 28.5 100.0 311Both daughters and sons 18.3 31.0 17.9 32.8 100.0 1,142
Total 19.5 31.1 18.8 30.6 100.0 1,869
Note: Total includes 12 and 19 women belonging to Christian and 'other' religions, respectively, and 1 woman with missinginformation on the standard of living index, who are not shown separately.( ) Based on 25-49 unweighted cases
57
•
CHAPTER 4
FERTILITY AND FERTILITY PREFERENCES
A major objective of NFHS-2 is to provide detailed information on fertility levels, differentials,and trends. This chapter presents a description of current and past fertility, cumulative fertilityand family size, fertility by sociodemographic characteristics, pregnancy outcomes, birthintervals, age at first cohabitation with husband, age at first and last birth, age at menopause, anddurations of postpartum amenorrhoea, abstinence, and insusceptibility. Also discussed arefertility preferences, ideal and actual number of children, preference for sons or daughters,p'lanning status ofpregnancies, and wanted and actual total fertility rates.
Most of the fertility measures presented in this chapter are based on the complete birthhistories collected from ever-married women age 15-49 years. Several measures and procedureswere used to obtain complete and accurate reporting of births, deaths, and the timing of theseevents. First, women were asked a series of questions aimed at recording all the live births thathad occurred in their lifetime. Second, for each live birth, information was collected on the age,sex, and survival status of the child. For dead children, age at death was recorded. Interviewerswere given extensive training in probing techniques designed to help respondents report thisinformation accurately. For example, interviewers were instructed to check any documents (suchas horoscopes, school certificates, or vaccination cards) that might provide additionalinformation on dates of birth, and to probe for the reason for any birth interval of four or moreyears in order to prevent omission of births, especially of children who died soon after birth.Stillbirths, miscarriages, and induced abortions that occurred between live births were alsorecorded.
Despite these measures to improve data quality, NFHS-2 is subject to the same types oferrors that are inherent in all retrospective sample surveys-namely, the omission of some births(especially births of children who died at a very young age) and the difficulty of determining thedate of birth of each child accurately. These difficulties can bias estimates of fertility levels andtrends.
4.1 Age at First Cohabitation
The number of children that a woman will have in her lifetime is strongly influenced by the ageat which she marries. In many parts of India, however, formal marriage is not alwaysimmediately followed by cohabitation. Rather, the husband and the wife only begin to cohabitafter the gauna ceremony. Even in states where gauna is not practiced, a marriage may not beconsummated immediately if it occurs at a very young age. In such instances, there is a differencebetween age at marriage and age at consummation of marriage. Age at consummation ofmarriage is, of course, what is relevant for fertility. NFHS-2 measured age at first cohabitation asa proxy for age at consummation of marriage. Accordingly, Table 4.1 presents information on themedian age at first cohabitation to supplement the information on the median age at firstmarriage presented in Chapter 3. In Table 4.1, the median age at first cohabitation for a group ofwomen is defined as the age by which half of the entire group began to cohabit, rather than theage by which half of all ever-cohabiting women in the group began to cohabit. If the mediancalculated for an age group lies above the lower limit of that age group, it is not valid because
PREVIOUS PAGE BLANK.67-

Table 4.1 Age at first cohabitation with husband
Median age at first cohabitation with husband among women age 20-49 years by current age and selectedbackground characteristics, Bihar, 1998-99
Current age
Background characteristic 20-24 25-29 3Q--(l4 35-39 40-49 20-49 25-49
ResidenceUrban 19.5 18.3 17.5 17.6 17.2 18.0 17.6Rural 17.0 16.6 16.5 16.4 16.4 16.6 16.5
RegionNorth Bihar Plain 17.0 16.4 16.3 16.4 16.2 16.4 16.3South Bihar Plain 17.7 17.3 17.2 17.1 17.1 17.3 17.2Jharkhand 16.9 16.7 16.6 16.3 16.4 16.6 16.5
EducationIlliterate 16.5 16.3 16.3 16.4 16.2 16.3 16.3Literate, < middle school
complete 18.3 17.0 17.5 16.6 17.0 17.3 17.0Middle school complete 19.0 18.3 (17.1) (16.6) (17.3) 18.1 17.4High school complete
and above NC 19.5 19.0 19.1 18.5 19.5 19.2
ReligionHindu 17.3 16.7 16.6 16.5 16.5 16.7 16.6Muslim 16.7 16.4 16.4 16.7 16.1 16.5 16.4Christian . . . . . 19.0 18.9Other NC . . . . 17.3 (16.7)
Caste/tribeScheduled caste 16.7 16.1 16.3 16.1 16.1 16.3 16.1Scheduled tribe 16.8 17.0 16.5 16.7 16.8 16.8 16.8Other backward class 17.0 16.7 16.4 16.4 16.3 16.6 16.5Other 19.0 17.3 17.7 17.2 17.1 17.7 17.3
Standard of living indexLow 16.4 16.2 16.3 16.3 16.2 16.3 16.2Medium 17.9 17.1 16.7 16.6 16.5 16.9 16.7High NC 19.1 18.3 18.0 17.5 18.5 18.2
Total 17.2 16.7 16.6 16.5 16.5 16.7 16.6
NC: Not calculated because less than 50 percent of the women have started JiVing with husband by age 20( ) Based on 25-49 unweighted cases*Median not shown; based on fewer than 25 unweighted cases
some younger women in the age group who have not yet begun to cohabit will not have reachedthe median age by the time of the survey. In such cases, the estimated median is biased and is notshown.
Table 4.1 shows that, in Bihar, the median age at first cohabitation with husband is 16.7years for women age 20-49. The lowest median age at first cohabitation is 16.5 years for womenage 35-49, and the highest is 17.2 years for women age 20-24, suggesting a modest increase of0.7 years in the median age at first cohabitation over a period of approximately 20 years. Thevalue of 17.2 for the younger age group is still low, however, suggesting that whatever decline in
60

fertility that has occurred in Bihar has resulted mainly from family limitation within marriagerather than from an increase in age at first cohabitation.
Table 4. I also shows that the median age at first cohabitation is 1.4 years higher for urbanwomen than for rural women. Over time, the median age at first cohabitation has risen in bothurban and rural areas, but the rise has been greater in urban areas. Differentials by education inthe median age at first cohabitation are even larger than differentials by residence. For example,for women age 20-49, the median age at first cohabitation ranges from 16.3 for illiterate womento 19.5 for women who have at least completed high school. Within education categories, themedian age has increased over time among literate women, but not among illiterate women. Byreligion, the median age at first cohabitation for women age 20-49 ranges from 16.5 for Muslimsto 19.0 for Christians. By caste/tribe, it ranges from 16.3 for scheduled-caste women to 17.7 forwomen in the 'other' category. The median age of first cohabitation increases steadily with thestandard of living, from 16.3 for women living in households with a low standard of living to18.5 for women living in households with a high standard ofliving.
4.2 Current Fertility Levels
NFHS-2 provides estimates of age-specific fertility rates (ASFR), total fertility rates (TFR), andcrude birth rates (CBR) for the three-year period preceding the survey, which in Biharcorresponds roughly to the period 1996-98. This three-year period was chosen as a compromisebetween the need to obtain recent information (suggesting the use of a short period closer to thesurvey date) and the need to reduce sampling variation and minimize problems related todisplacement of births from recent years to earlier years (suggesting the use of a longer period).The ASFR for any specific age group is calculated by dividing the number of births to women inthe age group during the period 1-36 months preceding the survey by the number of womenyears lived by women in the age group during the same three-year time period. The TFR is asummary measure based on the ASFRs that gives the number of children a woman would bearduring her reproductive years if she were to experience the ASFRs prevailing at the time of thesurvey. Mathematically, the TFR is five times the sum of all the ASFRs of the five-year agegroups. The CBR is defined as the annual number ofbirths per 1,000 population.
Based on estimates for the three-year period before NFHS-2, the CBR was 28.1 births perthousand population and the TFR (15-49) was 3.49 births per woman, as shown in Table 4.2.Both the CBR and TFR are considerably higher in rural areas than in urban areas (28.8 and 3.59compared with 22.3 and 2.75, respectively).
Table 4.2 and Figure 4.1 show that ASFRs are higher in rural areas than in urban areas forall the age groups. The urban-rural differential in ASFRs for the 15-19 age group is highest. Forthe other age groups, urban-rural differences in ASFRs are relatively small. Sixty-five percent ofurban total fertility and 57 percent of rural total fertility is concentrated in the prime childbearingages of 2(}-29. There is also a substantial amount of early childbearing. Fertility at age 15-19accounts for I3 percent of total fertility in urban areas, 17 percent in rural areas, and 16 percentoverall. Fertility at ages 35 and older accounts for 5 percent of total fertility in urban areas, I Ipercent in rural areas, and 10 percent overall.
61

Table 4.2 Current fertility
Age-specific and total fertility rates and crude birth rates from NFHS-1, NFHS-2, and the SRS by residence,Bihar
NFHS-1 (1990-92) NFHS-2 (1996-98) SRS (1997)
Age Total Urban Rural Total Urban Rural Total
16-19 0.121 0.072 0.119 0.113 0.037 0.057 0.05520-24 0.241 0.200 0.226 0.223 0.183 0.250 0.24226-29 0.190 0.160 0.182 0.180 0.187 0.236 0.23130-34 0.141 0.088 0.115 0.112 0.121 0.185 0.17836-39 0.078 0.030 0.053 0.050 0.056 0.104 0.09940-44 0.026 0.000 0.020 0.018 0.029 0.055 0.05245-49 (0.004) (0.000) 0.003 0.002 0.006 0.017 0.015
TFR 16-44 3.98 2.75 3.57 3.48 3.07 4.44 4.29TFR 15-49 4.00 2.75 3.59 3.49 3.10 4.52 4.36
CBR 32.1 22.3 28.8 28.1 23.6 32.7 31.7
Note: Rates from NFHS-1 ,and NFHS-2 are for the period 1-36 months preceding the survey. Rates for theage group 45-49 might be slightly biased due to truncation. Rates from the SRS are for one calendar year.Age-specific and total fertility rates are expressed per woman.TFR: Total fertility rateCBR: Crude birth rate, expressed per 1,000 popUlation( ) Based on 126-249 woman-years of exposureSource for SRS: Office of the Registrar General, 1999a
Figure 4.1Age-Specific Fertility Rates
by Residence
250
A.
200
c
"E;; 1500 -00_~
Ii; 100c.00.c
"iii 50
016-19 20-24 25-29 30-34 35-39
Age
I -o-Urban ---/:so-Rural I40-44 45-49
Note: Rates are for the three yearspreceding the survey (1996-98)
62
NFHS-2, Bihar, 1998-99

Figure 4.2Age-Specific Fertility Rates
NFHS-1 and NFHS-2
250
200
c'"E0 150;;:
00q~
l;; 1000.00
-'=tiii 50
015-19
'''.
'''.
20-24 25-29 30-34 35-39 40--44 45--49Age
-Q-NFHS-1 .. "" -' NFHS-2 INote: Rates are for the three years preceding theNFHS-1 (1990-92) and NFHS-2 (1996-98) surveys Bihar
Based on estimates for the three-year periods preceding NFHS-l and NFHS-2, the CBRfell from 32.1 to 28.1 between the two surveys, a decline of 12 percent in about six years. Overthe same period, the TFR fell from 4.00 to 3.49, a decline of 13 percent. Table 4.2 and Figure 4.2show that fertility fell for all age groups between the two surveys. Although fertility fellconsiderably for both 40--44 and 45--49 age groups from NFHS-l to NFHS-2, fertility for theseage groups was already low in NFHS-l, so that the fertility decline above age 40 had a very smallimpact on the CBR and the TFR during the six years between the two surveys.
NFHS-2 fertility estimates can be compared with estimates from the Sample RegistrationSystem (SRS), which is maintained by the Office of the Registrar General, India. Since theNFHS-2 rates refer to 1996-98, it is appropriate to compare them with the SRS estimates for1997, which are also shown in Table 4.2 (Office of the Registrar General, 1999a). The NFHS-2estimate of the CBR, at 28.1, is lower than the SRS estimate of the CBR, at 31.7. Also, theNFHS-2 estimate of the TFR, at 3.49, is 0.87 children per woman lower than the SRS estimate,at 4.36. Differences between NFHS-2 and the SRS estimates may be attributed to differentmethodologies adopted in the collection ofdata on ages of women and their children. The greaterdiscrepancy in rural areas may be caused by more age misreporting in rural areas, which tends toresult in the displacement of births further into the past. Retrospective surveys such as NFHS-land NFHS-2 are subject to such displacement, whereas the SRS, in which births are recordedduring the year in which they occur, is not. Narasimhan et al. (1997) compared NFHS-l and SRSestimates of fertility and concluded that both are probably underestimates. Nonetheless, since theSRS estimates are not subject to displacement, they are likely to be closer to the true level offertility than NFHS-l estimates. This argument is probably equally valid for NFHS-2 estimates
63

Table 4.3 Fertility by background characteristics
Total fertility rate for the three years preceding the survey, percentage of all women age 15-49currently pregnant, and mean number of children ever born to ever-married women age 40-49by selected background characteristics, Bihar, 1998-99
Mean number ofchildren ever born
Percentage to ever-marriedTotal currently women age
Background characteristic fertility rate1 pregnant' 40-49 years
ResidenceUrban 2.75 4.2 4.84Rural 3.59 7.1 5.31
RegionNorth Bihar Plain 3.82 7.4 5.40South Bihar Plain 3.63 6.9 5.36Jharkhand 2.76 5.2 4.83
EducationIlliterate 3.78 7.6 5.41Literate, < middle school complete 2.93 4.4 4.99Middle school complete 2.69 3.5 ·High school complete and above 2.50 5.1 3.63
ReligionHindu 3.36 6.5 5.04Muslim 4.44 8.0 6.41Christian (1.90) 5.2 ·Other (2.41 ) 9.0 ·
Caste/tribeScheduled caste 3.91 7.9 5.44Scheduled tribe 2.45 5.2 4.60Other backward class 3.64 6.8 5.46Other 3.13 6.2 4.81
Standard of living indexLow 3.89 7.7 5.51Medium 3.24 6.3 5.19High 2.47 3.6 4.56
Total 3.49 6.7 5.25
( ) Rate is based on 125-249 woman-years of exposure*Mean not shown; based on fewer than 25 unweighted cases1Rate for women age 15-49 years2For this calculation, it is assumed that women who are never married, widowed, divorced,separated, or deserted are not currently pregnant.
of fertility as compared with the corresponding SRS estimates.
4.3 Fertility Differentials and Trends
Table 4.3 and Figure 4.3 show how the TFR, the percentage currently pregnant, and the meannumber of children ever born to women age 40-49 vary by selected background characteristics.The TFR varies considerably by residence, being 0.84 children higher in rural areas than in urbanareas. It varies substantially by education, being 1.28 children higher among illiterate womenthan among women who have at least completed high school. The TFR also varies substantially
64

Figure 4.3Total Fertility Rate by Selected Background Characteristics
RESIDENCE
Urban
Rural
EDUCATION
Illiterate
Literate, < Middle School Complete
Middle School Complete
High School Complete and Above
STANDARD OF LIVING INDEX
Low
Medium
High
o 2 3 4 5
Note: Rates are for the three yearspreceding the survey (1996-98)
Total Fertility Rate
NFHS~2, Bihar, 1998-99
by religion, being 1.08 children higher among Muslims than among Hindus. By caste/tribe, theTFR is 0.78 children higher among scheduled-caste women and 0.51 children higher amongother backward class women than among women in the 'other' category. The TFR is lowest, at2.45, among scheduled-tribe women, 0.68 children lower than among women in the 'other'caste/tribe/class category. The characteristic showing the greatest variation is household standardof living. The TFR is 1.42 children higher among women living in households with a lowstandard of living than among women living in households with a high standard of living. Theseresults indicate that fertility differentials by background characteristics remain quite substantialin Bihar.
Differentials in the percentage of all women who are currently pregnant are larger thanthe differentials in the TFR. The percentage currently pregnant is much higher in rural areascompared with urban areas. The percentage currently pregnant is also higher among illiteratewomen than among literate women. Muslims have higher fertility than Hindus, and they alsohave higher percentages currently pregnant. As in the case of fertility, the proportion currentlypregnant is highest among scheduled-caste women and lowest among scheduled-tribe women,and it declines rapidly with increase in the household standard of living index.
The last column of Table 4.3 shows the mean number of children ever born to evermarried women age 4D-49 at the time of the survey. Because only women age 40-49 are
65

considered, age variations among the different categories of women do not affect theinterpretation of differentials. In each case, the pattern of differentials in the mean number ofchildren ever born parallels the pattern of differentials in the TFR. The mean number of childrenever born is higher among rural women than among urban women. As in the case of the totalfertility rate, Muslims have by far the highest mean number ofchildren ever born ofall categoriesof women.
Table 4.4 shows fertility trends for five-year time periods preceding the survey. It is notpossible to show TFRs because of progressively greater age truncation as one goes back in time.In NFHS-2, birth histories were collected only for women age 15-49. This means that for theperiod 5-9 years before the survey it is not possible to compute an ASFR for age 45-49.Similarly, for the period 10-14 years preceding the survey, it is not possible to compute ASFRsfor the oldest two age groups, and for the period 15-19 years preceding the survey, it is notpossible to compute ASFRs for the oldest three age groups. Thus Table 4.4 shows only thetruncated trends in ASFRs. Results are shown separately for urban and rural areas as well as forthe entire state. These results show considerable fertility declines in all age groups over a 15-yearperiod in both urban and rural areas. The proportionate decline is somewhat greater at the olderreproductive ages.
For the periods {}-4 years and 5-9 years before the survey, it is possible to calculatetruncated TFRs (more appropriately called cumulative fertility rates, or CFRs) for the age range15-39, based on the ASFRs shown in Table 4.4. This is done by summing ASFRs for the agegroups 15-19 through 35-39 and multiplying the sum by five. For the state as a whole, CFR(1539) declined from 5.16 to 3.65 over the five year period, a decline of 1.5 children. The declinewas 1.1 for urban areas and 1.6 for rural areas, indicating that fertility fell more rapidly in ruralareas than in urban areas during the five years before the survey. This is to be expected becausethe practice of family limitation tends to start in urban areas and spread to rural areas. It shouldbe noted that these estimated fertility declines may exaggerate to some degree the magnitude ofthe decline between these two five-year periods because there is considerable age misreporting inBihar which could result in displacement of births from the first five-year period into the secondfive-year period before the survey (Narasimhan et al. 1997).
Another way of looking at fertility is to calculate fertility rates by years since firstcohabitation. These rates are measures of marital fertility, i.e., fertility within marriage. Table 4.5shows fertility rates by duration of cohabitation for ever-married women for four five-yearperiods preceding the surveyl. Fertility has declined for all durations, but more so for the longerdurations. The limited fertility decline during the first {}-4 years after cohabitation is typical ofpopulations in which contraception is initiated only after the first birth or later, as is the case inBihar (see Table 5.5). The declines in fertility rates by duration confirm the earlier observationthat fertility within marriage has declined to some extent in Bihar.
'Because NFHS-2 collected infonnation only on a woman's age at the time of first cohabitation and not the year andmonth when she first began cohabiting with her husband, the exact number of months since first cohabitation cannotbe calculated. For this reason, the first year since cohabitation contains only six months, on average, and the first fiveyears since cohabitation contain only 4.5 years, on average.
66

Table 4.4 Fertility trends
Age-specific fertility rates for five-year periods preceding the survey by residence,
Bihar, 1998-99
Years preceding survey
Age 0-4 5-9 1G-14 15-19
URBAN
15-19 0.080 0.130 0.183 0.16420-24 0.214 0.267 0.301 0.28725-29 0.170 0.221 0.278 0.2623G-34 0.101 0.127 0.156 [0.164J35-39 0.033 0.071 [0.068J U40-44 0.007 [0.036J U U45-49 [0.000) U U U
RURAL
15-19 0.134 0.198 0.198 0.17620-24 0.244 0.330 0.314 0.29825-29 0.198 0.266 0.275 0.26630-34 0.113 0.175 0.176 [0.186]35-39 0.057 0.091 [0.107] U40-44 0.021 [0.047] U U45-49 [0.002] U U U
TOTAL
15-19 0.128 0.191 0.196 0.1752G-24 0.241 0.323 0.313 0.29725-29 0.195 0.260 0.275 0.26630-34 0.111 0.169 0.174 [0.184J35-39 0.054 0.089 [0.102J U40-44 0.019 [0.046J U U45-49 [0.002) U U U
Note: Age-specific fertility rates are expressed per woman.U: Not available[ 1Truncated, censored
It is also evident from Table 4.5 that marital fertility is lower in urban areas than in ruralareas for most durations and time periods. During the first five years after cohabitation, however,urban women have higher fertility than rural women for most of the time periods. This pattern .isnot uncommon in populations in which the age at first cohabitation is higher in urban areas thanin rural areas, as is the case in Bihar (Table 4.1). Women who marry when they are older tend tohave their first birth sooner after marriage and concentrate their births earlier in their marriagesthan women who marry when they are younger (Basil, 1993; Pandey et aI., 1990). In addition,because breastfeeding is shorter in urban areas (see Table 7.8), another contributing factor maybe a shorter period of postpartum amenorrhoea, which results in shorter birth intervals in theabsence ofbirth control (which is rarely practised during the first few years ofmarriage in Bihar).
67.

Table 4.5 Fertility by marital duration
Fertility rates for ever~married women by duration since first cohabitation with husband(in years) and residence for five-year periods preceding the survey, Bihar, 1998-99
Duration since Years preceding surveyfirst cohabitation(in years) Q-4 5-9 10-14 15-19
URBAN
<5 0.324 0.314 0.357 0.3095-9 0.214 0.285 0.312 0.28310-14 0.139 0.191 0.214 0.25515-19 0.077 0.107 0.158 ·20-24 0.019 0.056 · ·25-29 0.009 . • U
RURAL
<5 0.274 0.323 0.315 0.2835-9 0.247 0.341 0.317 0.30210-14 0.172 0.233 0.249 0.24515-19 0.097 0.155 0.160 0.18620-24 0.050 0.080 0.105 ·25-29 0.017 0.034 · U
TOTAL
<5 0.279 0.323 0.319 0.2865-9 0.244 0.335 0.316 0.30010-14 0.169 0.228 0.245 0.24615-19 0.094 0.149 0.160 0.18520-24 0.046 0.077 0.104 ·25-29 0.016 0.034 • U
Note: Duration-specific fertility rates are expressed per woman. The duration since firstcohabitation with husband is defined as the difference between the woman's age at thespecific time period and her age when she began living with her husband.U: Not available*Rate not shown; based on fewer than 125 woman~years of exposure
4.4 Children Ever Born and Living
The number of children a woman has ever borne is a cohort measure of fertility. Because itreflects fertility in the past, it provides a somewhat different picture of fertility levels, trends, anddifferentials than do period measures of fertility such as the CBR and the TFR. Table 4.6 showsthe percent distribution of the number of children ever born (CEB) to all women and to currentlymarried women by women's age at the time ofthe survey. The table also shows the mean numberof children ever born and the mean number of living children by women's age.
Among women age 15-49 in Bihar, the mean number of children ever born is 2.8 for allwomen, irrespective of marital status, and 3.3 for currently married women. The mean number ofchildren ever born increases steadily with age, reaching a high of 5.3 children among all womenage 45-49 and 5.5 among currently married women in this age group. The table also shows thatearly childbearing is common in Bihar. Nineteen percent of all women age 15-19 have alreadyhad a child.
68

Table 4.6 Children ever born and JiVing
Percent distribution of all women and of currently married women by number of children ever born (CEB) and mean number of children ever born and liVing,according to age, Bihar, 1998-99
MeanChildren ever born Number Mean number
Total 01 number of livingAge 0 1 2 3 4 5 6 7 8 9 10+ percent women olCES children
ALL WOMEN
15-19 81.0 14.3 4.2 0.5 0.0 0.0 0.0 0.0 0.0 0.0 0.0 100.0 1,888 0.24 0.2220-24 29.8 24.4 25.6 14.3 5.1 0.6 0.1 0.0 0.0 0.0 0.0 100.0 1,647 1.43 1.2725-29 9.0 8.3 20.5 25.1 19.7 10.9 4.7 1.3 0.3 0.1 0.1 100.0 1,467 2.99 2.6930-34 3.7 5.8 9.8 19.0 21.5 16.4 12.6 6.9 2.9 1.1 0.3 100.0 1,097 4.10 3.5935-39 3.6 2.6 9.3 16.6 18.9 17.9 13.7 7.8 5.3 3.2 1.3 100.0 925 4.57 3.9740-44 2.0 2.9 6.5 10.3 17.5 19.7 14.0 12.3 6.2 4.5 4.1 100.0 760 5.19 4.4845-49 2.1 3.0 5.7 9.9 19.7 15.1 15.1 11.2 7.5 5.1 5.6 100.0 595 5.34 4.37
Total 26.9 11.0 12.9 13.3 12.3 9.0 6.3 3.9 2.1 1.3 1.0 100.0 8,380 2.75 2.39
CURRENTLY MARRIED WOMEN
15-19 56.1 33.0 9.7 1.1 0.0 0.0 0.0 0.0 0.0 0.0 0.0 100.0 802 0.56 0.5120-24 18.2 28.4 29.9 16.8 5.8 0.7 0.2 0.0 0.0 0.0 0.0 100.0 1,379 1.66 1.4825-29 5.7 8.3· 21.2 25.9 20.8 11.3 5.0 1.4 0.3 0.1 0.1 100.0 1,373 3.11 2.8030-34 2.3 5.4 9.7 19.2 21.6 17.1 12.9 7.3 3.1 1.2 0.3 100.0 1,027 4.21 3.6835-39 2.5 2.2 9.1 16.1 19.8 18.1 13.9 8.1 5.7 3.2 1.3 100.0 859 4.67 4.0740-44 2.0 2.7 5.5 10.3 17.7 19.5 14.4 12.5 6.5 4.9 4.2 100.0 698 5.26 4.5645-49 1.5 2.1 5.0 10.2 19.2 15.2 16.2 11.2 7.9 5.4 6.0 100.0 522 5.48 4.51
Total 12.7 13.1 15.4 15.9 14.7 10.7 7.6 4.6 2.6 1.6 1.1 100.0 6,661 3.29 2.87

For women age 45-49, the number of children ever born is of particular interest becausethese women have virtually completed their childbearing. Among all women in this age group,irrespective of marital status, the modal number of children is four. Twenty percent of thesewomen have reached the end of childbearing with four children ever born. Among currentlymarried women age 45-49, the modal number of children is also four. Nineteen percent of thesewomen have reached the end of childbearing with four children ever born. Only two percent ofcurrently married women age 45-49 have never given birth. This suggests that primary infertility(which is the proportion ofcouples who are unable to have any children) is very low in Bihar.
Among all women age 15-49, the average number of dead children per woman is 0.36.Among currently married women it is 0.42. Thirteen percent of children ever born to currentlymarried women have died. The proportion of children ever born who have died increases withwomen's age. Among currently married women, for example, the proportion of children everborn who have died increases from 9 percent for women age 15-19 to 18 percent for women age45-49.
4.5 Birth Order
The distribution of births by birth order is yet another way to view fertility. Table 4.7 shows thedistribution of births during the three-year period before the survey by birth order for selectedbackground characteristics. Twenty-three percent of all births are first-order births, 22 percent aresecond-order births, 17 percent are third-order births, and 37 percent are of order four or higher.
The highest proportion of births to mothers age 15-19 are of order one; by contrast, thehighest proportion births to mothers age 30-49 are of order four or higher. The proportion ofbirths that are of order four or higher is 29 percent in urban areas and 38 percent in rural areas.The proportion of births of order four or higher is relatively large for births to illiterate women,Muslim women, and scheduled-caste and scheduled-tribe women. By work status, 51-56 percentof births to women who work are of order four or higher compared with 33 percent amongwomen who did not work in the past 12 months. This suggests a positive association betweenfertility and work status that requires further investigation. Among women with a low standard ofliving, the proportion of births of order four or higher is 44 percent, compared with 18 percentamong women with a high standard of living.
4.6 Birth Intervals
A birth interval, defined as the length of time between two successive live births, indicates thepace of childbearing. Short birth intervals may adversely affect a mother's health and herchildren's chances of survival. Past research has shown that children born too close to a previousbirth are at increased risk of dying, especially if the interval between the births is less than 24months (Pandey et aI., 1998; Govindasamyet aI., 1993).
Table 4.8 shows the percent distribution of births during the five years preceding thesurvey by birth interval according to selected demographic and socioeconomic backgroundcharacteristics. In Bihar, 11 percent of births occur within 18 months of a previous birth, and 25percent occur within 24 months. Forty percent of births occur after an interval of three years ormore.
70

Table 4.7 Birth order
Percent distribution of births during the three years preceding the survey by birth order, according to selectedbackground characteristics, Bihar, 1998-99
Birth orderTotal Number
Background characteristic 1 2 3 4+ percent of births
Mother's current age15-19 75.6 21.9 2.4 0.0 100.0 3712Q.-29 20.6 28.8 23.6 27.0 100.0 1,9243Q.-39 1.2 3.2 8.0 87.6 100.0 5934Q-49 0.0 0.0 4.6 96.4 100.0 66
ResidenceUrban 32.8 20.2 18.4 28.6 100.0 259Rural 22.2 22.3 17.3 38.1 100.0 2,695
RegionNorth Bihar Plain 23.0 22.0 15.8 39.2 100.0 1,380South Bihar Plain 22.8 22.3 17.6 37.3 100.0 983Jharkhand 24.1 22.1 20.8 32.9 100.0 591
Mother's educationIlliterate 20.3 19.6 17.1 43.0 100.0 2,267Literate, < middle school complete 28.2 27.0 18.8 26.0 100.0 282Middle school complete 33.0 28.9 19.3 18.8 100.0 127High school complete and above 36.7 34.9 17.9 10.5 100.0 277
ReligionHindu 24.2 22.5 18.2 35.1 100.0 2,384Muslim 18.5 21.1 13.0 47.4 100.0 533
Caste/tribeScheduled caste 22.0 21.2 16.5 40.3 100.0 672Scheduled tribe 22.4 16.6 21.0 40.0 100.0 197Other backward class 22.9 22.1 18.3 36.8 100.0 1,550Other 25.7 25.6 14.7 34.0 100.0 534
Mother's work statusWorking in family farm/business 11.5 17.1 17.1 54.3 100.0 231Employed by someone else 15.1 14.7 19.2 51.0 100.0 291Self-employed 11.4 20.3 12.6 55.7 100.0 135Not worked in past 12 months 26.1 23.7 17.5 32.8 100.0 2,296
Standard of living indexLow 19.9 19.4 17.0 43.8 100.0 1,680Medium 26.0 23.7 19.1 31.3 100.0 1,030High 33.9 34.7 13.8 17.7 100.0 237
Total 23.2 22.1 17.4 37.3 100.0 2,954
Note: Total includes 17 and 20 births to mothers belonging to Christian and 'other' religions, respectively, and 6births with missing infonnation on the standard of living index, who are not shown separately.
71

Table 4.8 Birth interval
Percent distribution of births during the five years preceding the survey by interval since previous birth and median number of monthssince previous birth, according to selected background characteristics, Bihar, 1998-99
Medianmonths
Months since previous birth sinceTotal previous Number
Background characteristic < 12 12-17 18-23 24-35 36-47 48+ percent birth of births
Mother's current age15-19 6.3 19.9 13.8 35.4 19.6 5.0 100.0 26.0 9720-29 2.5 8.9 15.8 36.3 20.7 15.9 100.0 31.3 2,49230-39 2.1 5.6 12.9 31.3 22.6 25.4 100.0 35.1 1,18440-49 1.7 9.4 9.9 26.8 18.9 33.2 100.0 36.5 169
ResidenceUrban 2.7 10.6 17.6 31.7 17.5 20.0 100.0 30.0 317Rural 2.4 8.0 14.3 34.6 21.5 19.2 100.0 32.5 3,625
RegionNorth Bihar Plain 2.2 6.8 13.1 36.9 21.8 19.1 100.0 33.0 1,775South Bihar Plain 2.9 10.0 16.4 33.0 19.5 18.2 100.0 30.8 1,349Jharkhand 2.2 8.1 14.9 31.3 22.4 21.1 100.0 33.2 818
Mother's educationIlliterate 2.3 7.9 13.8 34.1 21.8 20.1 100.0 33.0 3,191Literate, < middle school complete 3.2 8.4 17.0 36.5 18.8 16.2 100.0 30.3 356Middle school complete 3.2 9.6 16.5 30.8 22.4 17.6 100.0 31.2 127High school complete and above 1.8 11.3 20.1 37.2 15.7 13.9 100.0 29.1 268
ReligionHindu 2.3 7.8 14.4 34.6 21.3 19.7 100.0 32.4 3,125Muslim 2.9 9.8 15.6 33.7 20.4 17.6 100.0 32.0 765Other (3.9) (15.6) (11.6) (37.9) (19.5) (11.5) 100.0 (27.9) 28
Caste/tribeScheduled caste 2.1 8.8 12.0 37.1 21.4 18.5 100.0 32.5 893Scheduled tribe 2.5 8.9 13.4 32.8 20.7 21.6 100.0 32.7 296Other backward class 2.5 7.6 15.2 33.9 21.9 18.9 100.0 32.5 2,082Other 2.4 9.1 16.6 33.0 18.8 20.1 100.0 31.6 671
Standard of living indexLow 2.2 7.6 13.1 34.9 22.1 20.1 100.0 33.1 2,385Medium 2.6 8.6 16.5 33.9 20.2 18.1 100.0 32.0 1,293High 3.1 11.6 18.9 32.7 16.8 16.9 100.0 28.1 261
Order of previous birth1 2.4 9.6 15.0 33.1 20.5 19.4 100.0 32.1 1,0862 2.1 7.5 14.3 37.6 21.7 16.9 100.0 32.3 9073 2.4 8.3 16.2 32.8 20.0 20.3 100.0 31.8 6954+ 2.7 7.5 13.5 34.1 21.9 20.3 100.0 33.0 1,254
Sex of previous birthMale 2.1 8.0 15.0 34.8 21.0 19.1 100.0 32.2 1,937Female 2.7 8.4 14.2 34.0 21.3 19.4 100.0 32.5 2,005
Survival of previous birthLiving 1.9 6.8 14.6 34.3 22.0 20.4 100.0 33.2 3,465Dead 6.0 18.2 14.8 34.8 15.3 10.8 100.0 26.5 477
Total 2.4 8.2 14.6 34.4 21.2 19.2 100.0 32.3 3,942
Note: Table includes only second- and higher-order births. The interval for multiple births is the number of months since the precedingpregnancy that ended in a Jive birth. Total includes 24 births to mothers belonging to the Christian religion and 3 births with missinginformation on the standard of living index, who are not shown separately.( ) Based on 25-49 unweighted cases
72

The median birth interval in Bihar is 32 months. The median birth interval for women age15-19 is 26 months, which is substantially lower than the median interval of 37 months forwomen age 40-49. The relatively short birth interval for women age 15-19 at the time of thesurvey may result partly from a selection effect: Only women who have had two or more birthsare included in the table, and women age 15-19 with more than one birth are likely to be morefecund than average. Given the finding that the median birth interval increases with mother's age,it is surprising that it does not also increase substantially with the order of the previous birth.Perhaps this is due to the absence of the selection effect just noted in the case of age. There mayalso be another type of selection effect operating: Mothers of higher-order births may be morefecund, on average, than mothers of lower-order births.
The median birth interval varies little by sex of previous child. Birth intervals are muchshorter if the previous child died (27 months) than if the previous child survived (33 months). Inpart, this reflects the shortening of postpartum amenorrhoea that occurs when the preceding childdies in infancy and breastfeeding stops prematurely. Women are also less likely to use temporarymethods of contraception to postpone fertility if the previous child died and they want to replacethe dead child. Temporary methods of contraception are used by very few women in Bihar,however, so that the main effect is probably through prematurely terminated breastfeeding.
Birth intervals are three months shorter among urban women than among rural women,perhaps because breastfeeding is shorter among urban women. There is also a tendency for birthintervals to decrease with education. Mothers with at least a high school education have a medianbirth interval that is four months shorter than the interval for illiterate mothers. It is significant tonote that a greater proportion of births occur within 24 months among mothers with at least highschool education (33 percent) than among illiterate mothers (24 percent). Similarly, mothersliving in households with a high standard of living have a median birth interval that is fivemonths shorter than the interval for mothers who live in households with a low standard ofliving. Differences in birth intervals by religion and caste/tribe of household head tend to besmall.
4.7 Age at First and Last Birth
The ages at which women start and stop childbearing are important demographic determinants offertility. A higher median age at first birth and a lower median age at last birth are indicators oflower fertility. Table 4.9 shows the median age at first birth for various age groups by selectedbackground characteristics. The median age at first birth for any group of women is defined inthis table as the age by which half of all women in the group have had a first birth, rather than theage by which half of all mothers in the group have had a first birth. If the median age at first birth
.calculated for an age group lies above the lower limit of that age group, it is not valid becausesome younger women in the age group who have not yet had a first birth will not have reachedthe median age by the time ofthe survey. In such cases, the estimate of the median is not shown.
As shown in the last row of the table, the median age at first birth in the state as a wholehas increased in recent years. This is shown by the fact that the median increases from 18.9 yearsfor women age 25-29 to 19.6 years for women age 20-24.
Among all women age 25-49, the median age at first birth is 0.8 years higher in urbanareas than in rural areas. Hindu women have a slightly higher median age at first birth (19.0
73

Table 4.9 Median age at first birth
Median age at first birth among women age 20-49 years by current age and selected backgroundcharacteristics, Bihar, 1998-99
Current age
Background characteristic 2Q--24 25-29 30-34 35-39 40-44 45-49 2Q--49 25-49
ResidenceUrban NC 20.3 19.7 19.4 19.6 18.9 NC 19.7Rural 19.4 18.8 18.9 18.9 18.8 18.8 19.0 18.9
RegionNorth Bihar Plain 19.3 18.5 18.6 18.8 18.6 18.4 18.7 18.6South Bihar Plain 19.9 19.4 19.6 19.5 19.3 19.8 19.6 19.5Jharkhand 19.6 19.0 18.7 18.6 18.8 18.7 19.0 18.8
EducationIlliterate 18.9 18.5 18.6 18.8 18.8 18.6 18.7 18.7Literate, < middle schoolcomplete NC 19.0 19.6 18.8 18.6 19.6 19.3 19.1
Middle school complete NC 19.7 (19.5) · · • 20.0 19.7High school completeand above NC 21.5 21.1 21.9 (21.1 ) · NC 21.4
ReligionHindu 19.6 18.9 19.1 19.0 18.9 19.0 19.1 19.0Muslim 19.1 18.6 18.7 18.8 18.9 17.7 18.7 18.6Christian . . . · · · NC (20.5)Other NC . . · · · (19.8) (19.1 )
Caste/tribeScheduled caste 19.1 18.5 18.6 18.5 18.5 18.2 18.6 18.5Scheduled tribe 19.5 19.1 18.7 19.4 19.5 (18.7) 19.1 19.0Other backward class 19.3 18.9 18.9 19.0 18.8 18.9 19.0 18.9Other NC 19.3 19.7 19.3 19.3 19.4 19.8 19.4
Standard of living indexLow 18.8 18.3 18.5 18.8 18.8 18.8 18.6 18.6Medium 19.9 19.3 19.3 18.8 18.8 18.8 19.3 19.1High NC 21.1 20.3 20.5 19.5 18.8 NC 20.2
Total 19.6 18.9 19.0 19.0 18.9 18.8 19.1 18.9
NC: Not calculated because less !han 50 percent of women had their first birth by age 20( ) Based on 25-49 unweighted cases*Median not shown; based on fewer than 25 unweighted cases
years) than Muslim women (18.6 years). By caste/tribe, the 'other' category has a median of 19.4,which is 0.9 years higher than the median for scheduled-caste women, 0.4 years higher than themedian for scheduled-tribe women, and 0.5 years higher than the median for women from otherbackward classes. Women living in households with a high standard ofliving have a median ageat first birth of 20.2, which is 1.6 years higher than the median for women living in householdswith a low standard of living. The differentials by education are also ·substantial. The median ageat first birth is 18.7 years among illiterate women compared with 21.4 years among women whohave at least completed high school.
For older women, the age at last childbirth is an indicator of cessation of childbearing.Table 4. I0 presents the distribution ofever-married women in the age group 40-49 by age at last
74

Table 4.10 Age atlast birth
Percent distribution of ever-married women age 40-49 years by age at last birth and median age at last birth,according to current age, Bihar, 1998-99
Age at last birth Median NumberNo Total age at of
Current age birth <20 20-24 25-29 30-34 35-39 40-44 45-49 percent last birth women
40-44 1.9 1.8 11.4 28.9 28.3 23.4 4.3 NA 100.0 31.3 75945-49 1.9 2.6 8.4 26.2 27.8 21.8 10.9 0.5 100.0 31.6 593
40-49 1.9 2.2 10.1 27.7 28.1 22.7 7.2 0.2 100.0 31.4 1,353
NA: Not applicable
birth, as well as the median age at last birth. Although a few of these women may have anotherbirth later on, the very low fertility rates for women in this age group suggest that childbearing isvirtually complete by these ages. Seventy percent of women (including women who never gavebirth) had their last birth by age 35, and 93 percent by age 40. The median age at last birth inBihar for women age 4Q-49 is 31.4 years. It is 31.3 for women age 4Q-44 and 31.6 for womenage 45-49. The difference between the median age at first birth and the median age at last birthprovides an estimate of the typical reproductive age span, Among women age 45-49, thisestimated reproductive age span is the difference between 18.8 and 31.6, or 12.8 years.
4.8 Postpartum Amenorrhoea, Abstinence, Insusceptibility, and Menopause
Among the factors that influence the risk of pregnancy following a birth are breastfeeding andsexual abstinence. Breastfeeding prolongs postpartum protection from conception through itseffect on the period of amenorrhoea (the period prior to the return of menses) following a birth.Delaying the resumption of sexual relations following a birth also prolongs the period ofpostpartum protection. Women are defined as insusceptible to pregnancy if they are not at risk ofconception because they are amenorrhoeic, are abstaining from sexual relations, or both,following a birth.
Table 4.11 shows the percentage of births occurring during the three years preceding thesurvey whose mothers are postpartum amenorrhoeic, abstaining, or insusceptible, by number ofmonths since birth. These distributions are based on current status information, i.e., on theproportions of births occurring within the 36 months before the survey whose mothers wereamenorrhoeic, abstaining, and insusceptible at the time of the survey. In other words, the table isbased on cross-sectional data and does not represent the experience of a real cohort of births overtime. The data are grouped in two-month intervals to minimize fluctuations in the distributions.Median and mean durations of amenorrhoea, abstinence, and insusceptibility are also shown inthe table. The prevalence/incidence mean is obtained by dividing the number of mothers who areamenorrhoeic, abstaining, or insusceptible by the average number of births per month over the36-month period.
Ninety-five percent of all women who had a birth in the two months before the survey arestill amenorrhoeic, and 82 percent of women who had a birth 2-3 months before the survey arestill amenorrhoeic. The proportion amenorrhoeic gradually decreases as the number of months
75

Table 4.11 Postpartum amenorrhoea abstinence, and insusceptibility
Percentage of births during the three years preceding the survey whose mothers are postpartumamenorrhoeic, abstaining, or insusceptible by number of months since birth, and median andmean durations, Bihar, 1998-99
Percentage of births whose mothers are:Number
Months since birth Amenorrhoeic Abstaining Insusceptible of births
<2 94.5 84.0 96.4 1442-3 82.2 51.8 87.4 2394-5 72.0 33.7 75.9 2156--7 60.1 19.6 63.4 1856--9 63.3 13.6 67.3 12910-11 55.7 13.6 58.6 10712-13 47.3 8.1 51.0 18614-15 32.5 9.4 36.6 21316--17 21.5 7.4 25.5 18018-19 25.9 3.5 27.9 14820--21 24.5 1.7 24.5 11422-23 24.0 5.1 28.1 9924-25 14.9 5.0 18.5 14026--27 7.2 2.9 9.4 14928-29 5.3 1.9 7.2 16830-31 10.0 2.4 11.9 20932-33 5.0 0.6 5.6 15834-35 4.3 3.6 7.9 143
Median1 11.3 2.9 11.9 NAMean 13.3 5.7 14.3 NAPrevalence/incidence mean 13.4 5.7 14.4 NA
Note: Median and mean durations are based on current status. Insusceptible is defined asamenorrhoeic, abstaining, or both.NA: Not applicable1Sased on a three-period moving average of percentages
since last birth increases. About one-half (47 percent) of all women who had births 12-13months before the survey are still amenorrhoeic, but the proportion amenorrhoeic drops offrapidly thereafter. More than four-fifths ofall mothers abstain from sexual intercourse within twomonths after the birth of a child. The proportion abstaining at all durations is substantially lowerthan the proportion amenorrhoeic. About one-third of all women still abstain from sexualintercourse 4-5 months after a birth, but this percentage drops off rapidly at longer durations.Overall, when amenorrhoea and abstinence are considered together, half of women becomesusceptible to pregnancy by 12-13 months after giving birth, and about three-fourths becomesusceptible by 16-17 months.
The median and mean durations of insusceptibility are 11.9 and 14.3 months,respectively. Because the mean is affected by extreme values and the median is not, and becausethe distribution is skewed towards the higher durations, the mean is somewhat higher than themedian. The median duration of amenorrhoea (11.3 months) is almost four times as high as themedian duration of abstinence (2.9 months). The results indicate that women in Bihar remainnonsusceptible to conception for a little more than one year after a birth, primarily due to theeffect ofpostpartum amenorrhoea.
76

Table 4.12 Menopause
Percentage of currently married women age 30-49 years who are in menopause by age and residence, Bihar,1998-99
Urban Rural Total
Age Percentage Number Percentage Number Percentage Number
30-34 4.4 124 2.7 903 2.9 1,02735-39 5.9 107 9.7 753 9.2 85940-41 (30.0) 31 22.9 268 23.6 29942-43 (42.1 ) 39 34.0 227 35.2 26644-45 (60A) 32 49.8 224 51.1 25646-47 (53.5) 27 61.7 190 60.7 21746-49 . 22 75.1 159 75.8 181
30-49 23.3 382 21.4 2,725 21.7 3,107
Note: Percentage menopausal is defined as the percentage of currentry married women who are not pregnant andnot postpartum amenorrhoeic and who reported that their last menstrual period occurred six or more monthspreceding the surveyor that they are menopausal or have had a hysterectomy.( ) Based on 25-49 unweighted cases*Percentage not shown; based on fewer than 25 unweighted cases
Menopause is a primary limiting factor of fertility. It is the culmination of a gradualdecline in fecundity with increasing age. After age 30, the risk of pregnancy declines with age asincreasing proportions of women become infecund. In NFHS-2, menopause is defined as theabsence of menstruation for six or more months preceding the survey among currently marriedwomen. Women who report that they are menopausal or that they have had a hysterectomy arealso included in this category. Women who are pregnant or postpartum amenorrhoeic areassumed not to be menopausal. Table 4.12 presents data on menopause for women age 30-49. InBihar, menopause is not common for women in their thirties, but its incidence increases rapidlyafter age 40. By age 42-43, slightly over one-third of women are in menopause, and theproportion rises to over three-fourths for women age 48-49. The onset of menopause appears tobe later in rural areas, but this observation is based on a fairly small number of women in someof the age groups.
4.9 Desire for More Children
In order to obtain information on fertility preferences, NFHS-2 asked nonsterilized, currentlymarried, nonpregnant women: 'Would you like to have (aJanother) child or would you prefer notto have any (more) children?' Pregnant women were asked, 'After the child you are expecting,would you like to have another child or would you prefer not to have any more children?'Women who expressed a desire for additional children were asked how long they would like towait before the birth of their next child. The survey also collected information on the preferredsex of the next child and the ideal number of children by sex.
Table 4.13 and Figure 4.4 show future fertility preferences of currently married women,classified by their number of living children. Overall, 30 percent ofcurrently married women saythat they do not want any more children, an additional 20 percent cannot have another childbecause either the wife or the husband has been sterilized, and 6 percent of woman say that theycannot get pregnant (that is, they are 'declared infecund'). One-third of the women say they
77

Table 4.13 Fertility preferences
Percent distribution of currently married women by desire for children and preferred sex of additional child,according to number of living children and resfdence, Bihar, 1998-99
Number of living children1
Desire for children 0 1 2 3 4+ Total
URBAN
Desire for additional childWants another soon2 65.4 22.1 5.0 0.9 2.0 10.8Wants another later3 15.2 56.3 14.8 10.3 2.0 15.9Wants another, undecided when 11.5 7.5 0.8 2.5 2.4 3.7Undecided 0.0 0.0 0.9 1.6 0.4 0.6Up to God 4.1 1.9 2.6 2.4 1.6 2.2Wants no more 0.0 5.6 42.1 35.4 41.1 31.1Sterilized 2.0 1.9 27.1 40.1 40.1 28.3Declared infecund 1.8 4.6 6.7 6.7 10.4 7.4Missing 0.0 0.0 0.0 0.0 0.0 0.0
Total percent 100.0 100.0 100.0 100.0 100.0 100.0
Number of women 54 112 125 122 263 677
Preferred sex of additional child4
Boy (47.6) 52.5 (55.6) · · 56.9Girl (0.0) 20.1 (24.1 ) · · 13.3Doesn't matter (14.5) 8.6 (3.8) · · 8.2 ..Up!o God (38.0) 18.8 (16.5) · 7.1 21.7
Total percent 100.0 100.0 100.0 100.0 100.0 100.0
Number of women wanting more4 50 84 26 15 15 189
RURAL
Desire for additional childWants another soon2 69.4 28.4 17.5 7.9 3.1 18.1Wants another later3 7.9 42.7 27.3 11.6 3.8 15.8Wants another, undecided when 14.0 13.9 7.9 3.9 2.0 6.6Undecided 0.7 0.9 0.8 0.9 0.7 0.8Up to God 4.6 6.1 3.7 2.9 3.6 4.0Wants no more 0.6 4.2 22.6 37.2 50.2 30.1Sterilized 0.3 1.7 16.5 30.4 . 28.2 19.2Declared infecund 2.6 2.1 3.8 5.2 8.4 5.4Missing 0.0 0.0 0.0 0.1 0.0 0.0
Total percent 100.0 100.0 100.0 100.0 100.0 100.0
Number of women 696 928 1,038 1,097 2,226 5,984
Preferred sex of additional child4
Boy 51.7 59.1 62.4 81.3 74.4 61.0Girl 0.4 11.6 14.1 7.6 8.2 8.2Doesn't matter 15.1 6.5 4.2 2.3 1.9 7.8Up to God 32.8 22.8 19.2 8.7 15.5 23.0
Total percent 100.0 100.0 100.0 100.0 100.0 100.0
Number of women wanting more4 640 651 471 216 167 2,145
78

Table 4.13 Fertility preferences (eontd.)
Percent distribution of currently married women by desire for children and preferred sex of additional child,according to number of living children and residence, Bihar, 1998-99
Number of living children1
Desire for children 0 1 2 3 4+ Total
TOTAL
Desire for additional childWants another 500n
2 69.1 27.7 16.1 7.2 2.9 17.3Wants another later3 8.4 44.2 25.9 11.5 3.7 15.8Wants another, undecided when 13.8 . 13.2 7.2 3.7 2.0 6.3Undecided 0.7 0.8 0.8 1.0 0.7 0.8Up to God 4.6 5.7 3.6 2.8 3.4 3.8Wants no more 0.5 4.4 24.7 37.0 49.2 30.2Sterilized 0.4 1.7 17.6 31.4 29.5 20.1Declared infecund 2.5 2.4 4.1 5.4 8.6 5.6Missing 0.0 0.0 0.0 0.1 0.0 0.0
Total percent 100.0 100.0 100.0 100.0 100.0 100.0
Number of women 750 1,040 1,163 1,220 2,489 6,661
Preferred sex of additional child4
Boy 51.4 58.3 62.1 81.6 75.4 60.7Girl 0.4 12.6 14.6 7.6 8.1 8.6Doesn't matter 15.0 6.8 4.2 2.2 1.8 7.8Up to God 33.2 22.3 19.1 8.6 14.8 22.9
Total percent 100.0 100.0 100.0 100.0 100.0 100.0
Number of women wanting more4 690 735 497 231 182 2,334
( ) Based on 25-49 unweighted cases*Percentage not shown; based on fewer than 25 unweighted cases1'ncludes current pregnancy, if any2Wants next birth within 2 years3Wants to delay next birth for 2 or more years4Excludes currently pregnant women
would like to have another child, Seventeen percent want a child within two years, and 16percent want to wait at least two years before the birth of the next child, The desire to stopchildbearing increases rapidly with the number of living children, Only 1 percent of women withno living children do not want any children (the woman or her husband is sterilized or the womansays she wants no more children) compared with 42 percent of women with two living childrenand 68 percent or more of women with three or more living children. About 4 percent ofwomerisay that the decision about having any (more) children is up to God, Overall, 66 percent ofwomen want to either space their next birth, are sterilized, or do not want any more children,This proportion is 75 percent in urban areas and 65 percent in rural areas,
The desire to have a child within two years drops rapidly with the number of livingchildren, from 69 percent for women without any living children to 7 percent or less for womenwith three or more living children, Forty-four percent of women with one living child (56 percentin urban areas and 43 percent in rural areas) would like to wait at least two years before havingthe next child, And yet, as will be seen in the next chapter, very few women in Bihar use anytemporary method of contraception, These findings suggest that encouraging the use of
79

Figure 4.4Fertility Preferences Among Currently
Married Women
Note: Percents add to less than 100.0due to rounding
Wants AnotherAfter 2 Years
16%
~
Wants AnotherWithin 2 Years
17%
Other10%
Wants Another,Undecided When
6%
Stenlized20%
Wants No More30%
NFHS-2, Bihar, 1998-99
temporary methods would lower overall fertility and population growth, as well as provide healthbenefits to mothers and their children through increased birth spacing.
Sixty-one percent of women who want another child say they want the next child to be aboy, 9 percent say they want the child to be a girl, and the rest say that the sex of the child doesnot matter (8 percent) or that it is up to God (23 percent). Irrespective of their number of livingchildren, women are much more likely to express a desire for a son than for a daughter,indicating a strong preference for sons in Bihar. In addition, the proportion of women expressinga desire specifically for a son increases with the number of living children. Among women whohave no living children, very few women (less than one-half of one percent) express a specificdesire for a daughter, 15 percent say it does not matter whether they have a son or a daughter, and33 percent say it is up to God. Even among this group, 51 percent say they would like their firstchild to be a boy.
Table 4.14 provides information about differentials in the desire to limit family size byselected background characteristics. Women who are sterilized (or whose husbands aresterilized) are included among those who say they want no more children. As expected, olderwomen are much more likely than younger women to want no more children. Already by age 25~
34,61 percent of women want no more children. The proportion who want no more children issomewhat higher among urban women (59 percent) than among rural women (49 percent). Theproportion who want no more children is higher among Hindus (53 percent) than amongChristians (45 percent) or Muslims (38 percent). By caste/tribe, the proportion who want no more
80

Table 4.14 Desire to have no more children by background characteristics
Percentage of currently married women who want no more children by number of living children and selectedbackground characteristics, Bihar, 1998-99
Number of living children1
Background characteristic 0 1 2 3 4+ Total
Age15-24 0.2 2.4 28.2 55.0 73.6 15.725-34 2.1 9.8 47.0 68.3 77.5 60.535-49 6.7 36.5 70.4 76.8 79.8 75.1
ResidenceUrban 2.0 7.5 69.2 75.5 81.2 59.4Rural 0.8 5.9 39.1 67.6 78.4 49.4
RegionNorth Bihar Plain 1.1 6.6 43.0 69.4 79.3 51.3South Bihar Plain 1.4 3.8 40.1 63.0 77.0 48.1Jharkhand 0.0 8.2 43.8 72.7 79.9 51.6
EducationIlliterate 1.1 5.9 33.8 63.9 77.5 49.4Literate, < middle school complete 1.0 4.8 45.8 79.0 84.9 54.7Middle school complete (0.0) (4.5) 58.2 83.7 81.4 48.5High school complete and above 0.0 9.1 72.3 83.0 88.1 53.9
ReligionHindu 0.9 6.2 45.1 70.6 83.4 52.6Muslim 1.0 3.4 25.5 48.3 59.4 38.4Christian . . . . . 44.9Other . . . . . (42.0)
CasteltribeScheduled caste 1.2 5.8 31.4 64.0 82.0 48.1Scheduled tribe 0.0 6.5 36.1 58.6 70.0 40.9Other backward class 1.0 5.0 38.6 68.4 80.1 50.6Other 0.9 9.3 60.5 77.2 74.2 56.2
Standard of Iivi ng indexLow 1.0 5.1 33.7 60.1 75.7 46.4Medium 0.3 6.4 43.2 74.2 80.8 52.5High 2.7 11.1 68.3 86.2 89.1 63.0
Number of living sons2
0 0.9 3.7 16.2 20.3 38.7 6.31 NA 9.6 42.8 55.8 71.7 42.72 NA NA 59.9 85.4 85.0 79.83+ NA NA NA 78.6 80.4 80.1
Number of liVing daughters2
0 0.9 9.6 59.9 78.6 80.7 25.41 NA 3.7 42.8 85.4 81.4 54.92 NA NA 16.2 55.8 84.7 66.53+ NA NA NA 20.3 74.6 70.8
Total 0.9 6.1 42.3 68.4 78.7 50.4
Note: Women who have been sterilized or whose husbands have been sterilized are considered to want no morechildren.NA: Not applicable( ) Based on 25-49 unweighted cases*Percentage not shown; based on fewer than 25 unweighted cases1'ncludes current pregnancy, if any2Excfudes pregnant women
81

children is highest for women in the 'other' category (56 percent) and lowest for scheduled-tribewomen (41 percent). The proportion who want no more increases with the standard of livingfrom 46 percent for women with a low standard of living to 63 percent for women with a highstandard of living. The proportion who want no more children is highest for women with two ormore living sons (80 percent) and lowest for women with no living sons (6 percent). Differencesassociated with number of living daughters are also large but not as large as differencesassociated with the number of living sons, again indicating a considerable amount of sonpreference. The proportion who want no more children is highest for women with three or moreliving daughters (71 percent) and lowest for women with no living daughters (25 percent).Overall, the table shows that an overwhelming majority of women in every subgroup with two ormore living children want no more children. It also shows that within each subgroup, theproportion who want no more children rises sharply with the number of living children.
4.10 Ideal Number of Children
To assess women's ideal number of children, NFHS-2 asked each woman the number of childrenshe would like to have if she could start over again. Women with no children were asked, 'If youcould choose exactly the number of children to have in your whole life, how many would thatbe?' Women who already had children were asked, 'If you could go back to the time you did nothave any children and could choose exactly the number of children to have in your whole life,how many would that be?' Some women had .difficulty in answering these hypotheticalquestions, and hence the questions often had to be repeated to ensure that the meaning wasunderstood. Ninety-three percent of respondents were able to give a numerical response whenasked for their ideal number of children.
Table 4.15 shows that 25 percent of ever-married women in Bihar consider two childrento be the ideal. Another 31 percent consider three children to be the ideal. For 37 percent ofwomen, the ideal number of children is four or more. Seven percent of women were unable togive a numeric response to the question. Among all wOJ:nen who gave a numeric response, theaverage number of children considered ideal is 3.3, ranging from 2.8-2.9 for women who havetwo or fewer children to 3.8 for women who already have four or more children.
Asking a question on ideal family size is sometimes criticized on the grounds that womentend to adjust their ideal family size upward as the number of their living children increases, in aprocess ofrationalizing previously unwanted children as wanted. It is argued that the question onideal family size prompts many women to state the actual number of children they already haveas their ideal. It is evident from Table 4.15, however, that this is not so for many women inBihar. Among women with four or more living children, for example, about one-third state thatfewer than four children would be ideal. Similarly, among women with three living children, 18percent state that their ideal family size is smaller than three children. It is evident that aconsiderable proportion of women already have more children than they now consider ideal. Thisproportion may be taken as another indicator of surplus or unwanted fertility.
Table 4.16 shows the mean ideal number of children for ever-married women by ageaccording to selected background characteristics. The mean ideal number increases steadily from2.9 children for women age 15-19 to 3.7 children for women age 45--49. The mean ideal numberis higher in rural areas compared with urban areas, by 0.5 children. By education, it ranges from3.4 for illiterate women down to 2.4 for women with at least a high school education. Muslim
82

Table 4.15 Ideal and actual number of children
Percent distribution of ever-marri~d women by ideal number of children, and mean ideal number of children,by number of living children, Bihar, 1998--99
Number of living children1
Ideal number of children 0 1 2 3 4+ Total , .
1 1.6 2.0 0.9 0.4 0.3 0.82 36.5 40.0 41.5 17.5 10.8 24.93 32.9 30.6 31.6 49.5 20.9 30.94 18.7 18.7 18.9 24.1 40.7 27.95 2.3 2.0 1.9 3.1 10.2 5.36+ 1.0 2.2 1.6 1.8 6.5 3.5Non-numeric response 7.1 4.4 3.6 3.6 10.7 6.8
Total percent 100.0 100.0 100.0 100.0 100.0 100.0
Number of women 814 1,091 1,229 1,282 2,608 7,024
Mean ideal numbe~ 2.9 2.9 2.8 3.2 3.8 3.3
Number of women givingnumeric response 756 1,043 1,184 1,235 2,330 6,549
11ncludes current pregnancy, if any2Means are calculated eXcluding women who gave non-numeric responses.
women report a considerably higher mean ideal number of children than other women.Differences in the mean ideal number by caste/tribe of household head and work status of womenare small. Women who live in households with a low standard of living have a mean ideal familysize that is 0.7 children higher than the ideal for women who live in households with a highstandard of living. For women whose husbands are illiterate, the mean ideal family size is 0.8children higher than for women whose husbands have completed at least a higher secondaryeducation.
4.11 Sex Preference for Children
A strong preference for sons has been found to be pervasive in Indian society, affecting bothattitudes and behaviour with respect to children (Arnold et aI., 1998; Arnold, 1996; Basu, 1989;Das Gupta, 1987; Kishor, 1995; Koenig and Foo, 1992; Murthi et aI., 1995; Nag, 1991;Parasuraman et aI., 1994). In NFHS-2, women who gave a numerical response to the question onideal number of children were also aSked how many of these children they would like to be boys,how many they would like to be girls, and for how many the sex would not matter. Table 4.17shows the mean ideal number of sons and daughters, the percentage who desire more sons thandaughters, the percentage who desire at least one son, and the percentage who desire at least onedaughter according to selected background characteristics. The table shows a consistent, ratherstrong preference for sons over daughters. Overall, the average ideal family size of 3.3 childrenconsists of 1.9 sons, 1.3 daughters, and 0.1 children of either sex. Forty-eight percent of womenwant more sons than daughters but only 2 percent want more daughters than sons. Almost allwomen (97 percent) say they want at least one son among their children and a slightly smallerpercentage (94 percent) want at least one daughter.
83

Table 4.16 Ideal number of children by background characteristics
Mean ideal number of children reported by ever-married women, according to current age and selected backgroundcharacteristics, Bihar, 1998-99
Current age
Background characteristic 15--19 2D--24 25--29 3D--34 35--39 4D--44 45--49 Total
ResidenceUrban 2.4 2.4 2.8 2.8 3.0 3.1 3.3 2.8Rural 3.0 3.1 3.2 3.4 3.5 3.6 3.7 3.3
RegionNorth Bihar Plain 3.0 3.1 3.3 3.5 3.5 3.6 3.8 3.3South Bihar Plain 3.0 3.0 3.2 3.4 3.5 3.8 3.8 3.3Jharkhand 2.8 3.0 3.0 3.2 3.2 3.1 3.3 3.1
EducationIlliterate 3.0 3.2 3.4 3.5 3.6 3.7 3.8 3.4Literate, < middle school
complete 2.9 2.8 3.0 3.0 3.1 3.3 3.4 3.0Middle school complete 2.5 2.6 2.7 (2.8) · · • 2.7High school complete and above (2.3) 2.4 2.4 2.5 2.4 (2.6) · 2.4
ReligionHindu 2.8 2.9 3.1 3.3 3.4 3.5 3.6 3.2Muslim 3.6 3.6 3.9 4.0 4.1 4.0 4.3 3.9Christian · . • • • · · 2.9Other • • . . · · · (3.0)
CasteltribeScheduled caste 2.9 3.1 3.3 3.4 3.7 3.6 3.5 3.3Scheduled tribe 3.0 3.2 3.4 3.5 3.4 (3.5) (3.4) 3.4Other backward class 2.9 3.0 3.2 3.4 3.5 3.6 39 3.3Other 3.2 2.9 2.9 3.1 3.1 3.3 3.5 3.1
Work statusWorking in family farm/business (2.8) 3.0 3.4 3.4 3.3 3.6 3.5 3.3Employed by someone else 2.9 3.1 3.5 3.5 3.7 3.8 3.7 3.5Self-employed · 3.3 3.4 3.2 3.3 (3.6) (3.4) 3.4Not worked in past 12 months 2.9 3.0 3.1 3.3 3.4 3.5 3.7 3.2
Standard of living indexLow 3.1 3.2 3.4 3.6 3.7 3.7 3.8 3.4Medium 2.8 2.9 3.1 3.3 3.3 3.6 3.7 3.2High (2.5) 2.4 2.5 2.5 2.7 2.7 3.5 2.7
Husband's educationIlliterate 3.1 3.3 3.5 3.6 3.6 3.7 3.8 3.5Literate, < primary school
complete (3.1 ) 3.1 3.3 (3.4) 3.5 (3.8) (3.8) 3.4Primary school complete 2.9 3.1 3.4 3.5 3.8 3.7 3.9 3.4Middle school complete 2.7 3.0 3.0 3.3 3.5 3.3 3.4 3.1High school complete 2.7 2.8 3.0 3.2 3.2 3.3 3.6 3.1Higher secondary completeand above 2.7 2.5 2.6 2.7 2.7 3.1 3.3 2.7
Total 2.9 3.0 3.2 3.4 3.4 3.5 3.7 3.3
Note: Means are calculated excluding women who gave non-numeric responses.( ) Based on 25--49 unwelghted cases*Mean not shown; based on fewer than 25 unweighted cases
84

Table 4.17 Indicators of sex preference
Mean ideal number of sons, daughters, and children of either sex for ever-married women, percentage who want more sons thandaughters, percentage who want more daughters than sons, percentage who want at least one son, and percentage who want atleast one daughter by selected background characteristics, Bihar, 1998-99
Percentage PercentageMean ideal number of: who want who want Percentage Percentage
more sons more who want at who want at NumberEither than daughters least one least one of
Background characteristic Sons Daughters sex daughters than sons son daughter women
ResidenceUrban 1.5 1.1 0.2 35.7 2.8 93.0 90.0 693Rural 1.9 1.3 0.1 49.3 2.0 97.7 94.0 5,851
RegionNorth Bihar Plain 2.0 1.3 0.1 52.6 1.3 98.5 94.6 2,832South Bihar Plain 1.9 1.3 0.1 48.2 2.3 98.6 94.2 2,036Jharkhand 1.7 1.2 0.2 39.5 3.2 93.3 91.1 1,675
Educati01.1
Illiterate 2.0 1.3 0.1 50.8 2.2 97.7 94.2 4,949Literate, < middle school complete 1.8 1.2 0.1 47.4 2.0 97.2 93.9 739Middle school complete 1.5 1.1 0.1 38.4 2.0 98.1 94.2 265High school complete and above 1.3 1.0 0.2 28.6 1.6 92.5 88.0 591
ReligionHindu 1.8 1.2 0.1 48.1 2.0 97.2 93.5 5,623Muslim 2.3 1.5 0.1 48.8 2.7 98.1 95.1 809Christian 1.5 1.1 0.3 35.8 3.6 87.8 86.0 59Other (1.5) (1.2) (0.3) (30.7) (5.9) (90.1 ) (88.2) 53
Caste/tribeScheduled caste 1.9 1.3 0.1 52.6 1.7 98.0 94.3 1,367Scheduled tribe 1.8 1.3 0.2 40.1 3.5 93.2 91.1 574Other backward class 1.9 1.3 0.1 49.4 1.8 97.8 94.4 3,389Other 1.8 1.2 0.1 42.2 2.6 96.4 91.7 1,214
Work statusWorking in family farm/business 1.9 1.3 0.1 46.2 1.4 96.3 93.1 566Employed by someone else 2.0 1.3 0.1 52.1 2.8 96.3 93.4 767Seil-employed 2.0 1.3 0.1 53.2 2.5 97.3 92.1 380Not worked In past 12 months 1.9 1.3 0.1 47.0 2.0 97.4 93.8 4,831
Standard of living indexLow 2.0 1.3 0.1 51.0 2.3 97.7 93.9 3,390Medium 1.8 1.3 0.1 46.8 1.9 97.4 94.5 2,453High 1.5 1.0 0.2 36.7 2.0 94.0 88.8 694
Husband's educationIlliterate 2.0 1.4 0.1 50.7 2.4 97.6 94.3 2,687Literate, < primary school complete 2.0 1.4 0.1 49.9 2.8 98.0 95.8 361Primary school complete 2.0 1.3 0.1 49.7 1.7 97.4 94.6 845Middle school complete 1.8 1.2 0.1 50.2 1.4 97.7 93.0 626High school complete 1.8 1.2 0.1 45.9 1.7 98.1 94.5 1,081Higher secondary complete
and above 1.5 1.0 0.1 38.3 2.2 94.1 89.1 940
Total 1.9 1.3 0.1 47.9 2.1 97.2 93.6 6,544
Note: Table excludes women who gave non-numeric responses to the questions on ideal number of children or ideal number of sonsand daughters. Total includes 8 and 4 women with missing information on the standard of living index and husband's education,respectively, who are not shown separately.( ) Based on 25-49 unweighted cases
85

Son preference is relatively moderate in urban areas, in the Jharkhand region, amongmore educated women, among women belonging to a religion other than Hindu or Muslim, andamong women from higher standard of living households. Son preference does not vary much bywork status of women. The proportion of ever-married women who desire more sons thandaughters is 36 percent in urban areas and 49 percent in rural areas. By women's education, thisproportion ranges from 51 percent for illiterate women to 29 percent for women who havecompleted high school or more education. The proportion wanting more sons than daughtersranges from 51 percent among women from low standard of iiving households to 37 percentamong women from high standard ofliving, households. The proportion wanting more sons thandaughters is also relatively low among scheduled-tribe women and among women whosehusbands have at least completed high school. The proportion wanting more daughters than sonsis universally low across all groups ofwomen.
4.12 Fertility Planning
For each child born in the three years before the survey and for each current pregnancy, NFHS-2asked women whether the pregnancy was wanted at that time (planned), wanted at a later time(mistimed), or not wanted at all. Because a woman may retrospectively describe an unplannedpregnancy as one that was wanted at that time, responses to these questions may lead to anunderestimation of unplanned childbearing. Nevertheless, this information provides a potentiallypowerful indicator of the degree to which couples successfully control childbearing. It should benoted that the proportion unplanned is influenced not only by whether, and how effectively,couples use contraception, but also by the couple's ideal family size.
Table 4.18 shows the percent distribution of births during the three years preceding thesurvey and current pregnancies according to fertility planning status. One-quarter of allpregnancies that resulted in live births in the three years preceding the survey (including currentpregnancies) were unplanned, that is, unwanted at the time the woman became pregnant (12percent were wanted later and 13 percent were not wanted at all). The proportion of births thatwere unplanned is highest for women age 35-44 (40-42 percent) and lowest for women belowage 20 (14 percent). Within the unplanned category, the proportion of births that were wantedlater goes down and the proportion that were not wanted at all goes up with the age of themother. The proportion of births that were unplanned is slightly higher in urban areas (33percent) than in rural areas (24 percent). By region, the Jharkhand region has the highestproportion of births that were wanted later and the lowest proportion of births that were notwanted at all. The proportion wanted later increases and the proportion not wanted at alldecreases as mother's education increases. A similar percentage of births were reported asunplanned for both Hindus and Muslims (24 percent each). By caste/tribe, scheduled-castewomen were most likely (14 percent) and scheduled-tribe women were least likely (8 percent) tohave births that were not wanted at all. The proportion wanted later increases with the householdstandard ofliving, but the proportion not wanted at all does not show any clear relationship withliving standard. Not surprisingly, births of higher order are more likely to be unplanned.Specifically, the proportion unplanned increases from II percent among first-order births to 37percent among births oforder four or higher.
86

Table 4.18 Fertility planning
Percent distribution of births during the three years preceding the survey and current pregnancies by fertility planningstatus, according to selected background characteristics, Bihar, 1998-99
Planning status of pregnancy Number ofbirths and
Wanted Wanted Not wanted Total currentBackground characteristic then later alall Missing percent pregnancies
Mother's age at birth1
<20 85.2 10.2 3.4 1.1 100.0 75620-24 77.7 14.2 7.2 0.9 100.0 1,23725-29 71.5 11.3 16.4 0.8 100.0 89130-34 61.4 11.0 26.8 0.8 100.0 42835-39 58.2 6.4 33.5 2.0 100.0 15240-44 (53.0) (2.4) (39.1 ) (5.5) 100.0 41
ResidenceUrban 65.5 15.5 17.5 1.5 100.0 300Rural 75.5 11.4 12.2 1.0 100.0 3,210
RegionNorth Bihar Plain 78.0 9.2 12.7 0.1 100.0 1,650South Bihar Plain 70.6 12.7 14.3 2.4 100.0 1,162Jharkhand 73.3 16.1 9.7 0.9 100.0 698
Mother's educationIlliterate 74.3 11.0 13.6 1.1 100.0 2,718Literate, < middle school complete 77.5 12.0 9.8 0.7 100.0 324Middle school complete 75.2 14.9 8.5 1.5 100.0 145High school complete and above 73.9 16.2 9.3 0.7 100.0 322
ReligionHindu 74.7 11.6 12.7 1.1 100.0 2,828Muslim 74.9 11.7 12.6 0.7 100.0 634
Caste/tribeScheduled caste 73.2 11.0 14.4 1.4 100.0 803Scheduled tribe 77.6 13.3 8.3 0.9 100.0 234Other backward class 74.2 11.4 13.3 1.1 100.0 1,832Olher 76.3 13.1 10.3 0.3 100.0 640
Standard of living indexlow 75.8 10.6 12.4 1.2 100.0 2,000Medium 73.2 12.7 13.5 0.6 100.0 1,230Hi9h 72.7 15.5 11.0 0.8 100.0 271
Birth order'1 88.1 6.8 4.0 1.1 100.0 9682 79.9 14.2 5.0 1.0 100.0 7533 70.8 17.9 10.4 0.9 100.0 5824+ 62.3 11.2 25.5 1.0 100.0 1,206
Total 74.6 11.7 12.7 1.0 100.0 3,510
Note: Table includes only the two most recent births in the three years preceding the survey. Total includes 4 births towomen age 45-49 at the time of birth, 21 and 26 births to mothers belonging to Christian and 'other' religions,respectively, and 8 births with missing information on the standard of living jndex, which are not shown separately.\ ) Based on 25-49 unweighted casesFor current pregnancy, estimated maternal age at birth
21ncludes current pregnancy, jf any
87

The impact of unwanted fertility can be measured by comparing the total wanted fertilityrate with the total fertility rate (TFR). The total wanted fertility rate represents the level offertility that theoretically would result if all unwanted births were prevented. A comparison of theTFR with the total wanted fertility rate indicates the potential demographic impact of theelimination of all unwanted births. The total wanted fertility rates presented in Table 4.19 arecalculated in the same way as the TFR except that unwanted births are excluded from thenumerator. In this case, a birth is considered unwanted if the number of living children at thetime of conception was greater than or equal to the ideal number of children reported by therespondent. (Women who did not give numeric response to the question on ideal number ofchildren are assumed to have wanted all the births they had.)
Overall the total wanted fertility rate of 2.58 is lower by 0.91 children (i.e., 26 percent)than the total fertility rate of 3.49. This means that if all unwanted births could be eliminated, theTFR in Bihar would drop by about one child per woman. The difference between the totalfertility rate and the total wanted fertility rate is about the same for both rural and urban women.The difference is larger for illiterate women (0.97 children) than for women with at least highschool complete (0.56 children). It is larger for Muslims (1.09 children) than for Hindus (0.89children) or Christians (0.66 children). It is also larger for scheduled-caste women (1.11 children)than for women from other backward classes (0.94 children), women in the 'other' caste/tribecategory (0.76 children), or scheduled-tribe women (0.64 children). The difference is larger forwomen living in households with a low standard of living (1.02 children) than for women livingin households with a high standard of living (0.54 children). Overall, the TFR exceeds the totalwanted fertility rate most for scheduled-caste women, Muslim women, and women from lowstandard of living households.
88

Table 4.19 Wanted fertility rates
Total wanted fertility rate and total fertility rate for the three years preceding thesurvey by selected background characteristics, Bihar, 1998-99
Total wantedBackground characteristic fertilitv rate Total fertility rate
ResidenceUrban 1.84 2.75Rural 2.68 3.59
RegionNorth Bihar Plain 2.88 3.82South Bihar Plain 2.65 3.63Jharkhand 1.97 2.76
EducationIlliterate 2.81 3.78Literate, < middle school complete 2.20 2.93Middle school complete 1.87 2.69High school complete and above 1.94 2.50
ReligionHindu 2.47 3.36Muslim 3.35 4.44Christian (1.24) (1.90)Other (1.51 ) (2.41 )
Caste/tribeScheduled caste 2.80 3.91Scheduled tribe 1.81 2.45Other backward class 2.70 3.64Other 2.37 3.13
Standard of living indexLow 2.87 3.89Medium 2.36 3.24High 1.93 2.47
Total 2.58 3.49
Note: Rates are based on births in the period 1-36 months preceding the surveyto women age 15-49. The total fertility rates are the same as those presented inTable 4.3.() Based on 125-249 woman-years of exposure
89

CHAPTER 5
FAMILY PLANNING
The National Family Welfure Programme in India has traditionally sought 'to promoteresponsible and planned parenthood through voluntary and free choice of family planningmethods best suited to individual acceptors' (Ministry of Health and Family Welfare, 1998a). InApril 1996, the programme was renamed the Reproductive and Child Health Programme andgiven a new orientation to meet the health needs of women and children more completely. TheReproductive and Child Health Programme aims to cover all aspects of women's reproductivehealth throughout their lives. With regard to family planning, this new approach emphasizes thetarget-free promotion of contraceptive use among eligible couples, the provision to couples of a
. choice of various contraceptive methods (including condoms, oral pills, IUDs, and male andfemale sterilization), and the assurance of high-quality care. In addition, the programmeencourages the spacing of births with at least three years between births (Ministry of Health andFamily Welfare, n.d.(b)).
The new National Population Policy, 2000, adopted by the Govemment of India has set asits immediate objective the task of addressing unmet need for contraception in order to achievethe medium-term objective of bringing the total fertility rate down to replacement level by theyear 2010. One of the 14 national socio-demographic goals identified for this purpose is toachieve universal access to information/counselling and services for fertility regulation andcontraception with a wide range ofchoices (Ministry of Health and Family Welfare, 2000).
Information about the knowledge and use of contraceptive methods provided in thischapter is designed to be of practical relevance to programme administrators and policymakersresponsible for monitoring existing programmes and formulating new strategies to meet thehealth and family planning needs of the population. The chapter begins with an appraisal ofwomen's knowledge of contraceptive methods and then discusses women's past and present useof contraception before moving on to the sources of supply of modem contraceptive methods.Special attention is focussed on reasons for discontinuation and nonuse of contraception and onintentions to use family planning methods in the future. The chapter also contains information onexposure to family planning messages through the media and on discussions about familyplanning with relatives and friends. It concludes with an assessment of the extent to which theneed for family planning services in Bihar is being met effectively.
5.1 Knowledge of Family Planning Methods
Lack of knowledge of contraceptive methods is a major obstacle to their use. In NFHS-2,interviewers obtained information on knowledge and ever use of contraceptive methods byasking each respondent the following question: 'Now I would like to talk about familyplanning-the various ways or methods that a couple can use to delay or avoid a pregnancy. Foreach method I mention, please tell me if you have ever heard of the method and whether youhave ever used the method at any time in your life.' If a respondent did not recognize the name ofa method, a short description was read. In this way, the survey assesses women's knowledge andever use of seven contraceptive methods, namely the pill, condom, IUD, female sterilization,male sterilization, rhythm or safe period method, and withdrawal. In addition, the survey
PREVIOUS PAGE BLANK

Table 5.1 Knowledge of contraceptive methods
Percentage of currently married women who know any contraceptive method byspecific method and residence, Bihar, 1998-99
Method Urban Rural Total
Any method 99.7 99.2 99.2
Any modern method 99.7 99.1 99.2Pill 90.5 73.2 74.9IUD 82.8 56.0 58.7Condom 85.9 61.8 64.3Female sterilization 99.7 98.8 98.9Male sterilization 98.1 97.2 97.3
Any traditional method 57.3 37.5 39.5Rhythm/safe period 52.1 34.4 36.2Withdrawal 41.4 22.5 24.4
Other method1 4.2 3.4 3.4
Number of women 677 5,984 6,661
11ncludes both modern and traditional methods that are not listed separately
collected infonnation on respondents' knowledge and ever use of any other contraceptive method(modem, traditional, or folkloric).
Table 5.1 shows the extent ofknowledge of contraceptive methods among currently marriedwomen by specific method and residence. Knowledge of contraceptive methods is nearly universalin Bihar, with 99 percent of currently married women recognizing at least one method ofcontraception and at least one modem method ofcontraception.
Female sterilization is the most widely known method of contraception in Bihar, followedby male sterilization. Overall, 99 percent of currently married women know about femalesterilization and 97 percent know about male sterilization. There is little difference by residence inknowledge of male and female sterilizations. Knowledge of the officially sponsored spacingmethods (the pill, IUD, and condom) is less widespread. The best known spacing method is the pill,which is known by 75 percent of currently married women, followed by the condom (64 percent),and then the IUD (59 percent). There are large differences in knowledge of spacing methods byresidence. For example, only 56 percent of rural women know about the IUD, compared with 83percent of urban women. Although knowledge of these spacing methods is lower than knowledgeof sterilization, these results suggest that knowledge of spacing methods has grown since NFHS-l.At the time of NFHS-l, only 57 percent of currently married women knew about pills, 44 percentknew about IUDs, and 55 percent knew about condoms (PRe, Patna and TIPS, 1995).
hJ. Bihar, traditional methods of contraception are less well known than modem methods.Forty percent of currently married women report knowledge of a traditional method, with therhythm or safe period method being better known (36 percent) than withdrawal (24 percent).Knowledge of traditional methods is much higher in urban areas (57 percent) than in rural areas (38percent).
92

Table 5.2 Ever use of contraception
Percentage of currently married women who have ever used any contraceptive method by specific method, according to age andresidence, Bihar, 1998-99
AnyAny Female Male tradl- Rhythml Number
Any modern Gon- ster- ster- tional safe With- Other ofAge method method Pill IUD dom ilization ilization method period drawal method1 women
URBAN
15-19 7.3 3.6 1.9 0.0 1.8 0.0 0.0 3.6 1.7 1.9 0.0 5920-24 23.3 19.1 9.1 0.9 6.1 3.0 0.0 6.2 3.1 4.1 3.2 10525-29 48.0 44.9 14.0 2.4 11.3 24.6 1.6 7.0 4.7 4.6 0.8 13130-34 55.1 49.9 16.9 2.4 10.3 32.2 0.0 5.2 1.8 3.4 0.9 12435-39 61.3 57.5 7.1 4.8 4.9 42.7 2.8 5.6 3.8 2.8 2.1 10740-44 54.5 51.0 7.4 3.7 9.8 38.7 3.7 9.7 7.3 4.8 1.2 8345-49 48.0 46.4 4.7 0.0 1.5 40.3 6.3 4.7 3.1 1.5 1.7 69
Total 44.8 41.1 9.9 2.3 7.3 26.6 1.8 6.1 3.7 3.5 1.5 677
RURAL
15-19 4.2 2.4 1.3 0.0 0.8 0.3 0.0 2.0 1.1 1.3 0.0 74320-24 11.2 7.6 2.5 0.4 1.0 4.0 0.2 4.0 2.7 1.9 0.3 1,27425-29 25.0 22.2 4.4 1.2 2.1 15.9 0.7 4.4 3.1 2.4 1.0 1,24230-34 35.6 34.1 4.8 1.4 1.2 27.5 0.4 3.2 2.3 1.9 1.6 90335-39 40.1 38.9 3.2 0.8 0.9 33.4 1.5 3.3 2.6 1.3 1.5 75340-44 41.9 40.0 3.4 0.3 0.8 33.8 2.6 2.9 2.7 0.5 1.6 61545-49 37.9 36.9 1.8 0.9 0.7 30.8 3.4 2.2 1.8 1.1 1.3 454
Total 25.7 23.5 3.2 0.8 1.2 18.3 1.0 3.4 2.5 1.6 1.0 5,984
TOTAL
15-19 4.4 2.5 1.4 0.0 0.9 0.2 0.0 2.1 1.2 1.3 0.0 80220-24 12.1 8.5 3.0 0.5 1.4 3.9 0.2 4.1 2.7 2.1 0.5 1,37925-29 27.2 24.4 5.3 1.3 3.0 16.7 0.7 4.6 3.3 2.6 1.0 1,37330-34 37.9 36.0 6.2 1.6 2.3 28.0 0.4 3.4 2.2 2.0 1.5 1,02735-39 42.7 41.2 3.7 1.3 1.4 34.6 1.6 3.6 2.8 1.5 1.6 85940-44 43.4 41.3 3.9 0.7 1.9 34.4 2.7 3.7 3.3 1.0 1.6 69845-49 39.3 38.1 2.2 0.8 0.8 32.0 3.8 2.5 1.9 1.2 1.4 522
Total 27.6 25.3 3.9 0.9 1.8 19.2 1.0 3.6 2.6 1.8 1.0 6,661
11ncludes both modern and traditional methods that are not listed separately
5.2 Contraceptive Use
Ever Use of Family Planning Methods
NFHS-2 asked respDndents if they had ever used each of the methods they knew about. Womenwho said they had not used any of the methods were further asked if they had 'ever used anythingor tried in any way to delay or avoid getting pregnant'. Table 5.2 presents the pattern of ever useof family planning methods for currently married women by age and residence.
Although nearly all currently married women know at least one method of contraception,only 28 percent have ever used a method, which is a slight increase from 26 percent at the time ofNFHS-l. Twenty-five percent of currently married women have ever used modem methods, but
93

only 4 percent have ever used traditional methods. Ever use of any method is higher in urban areas(45 percent) than in rural areas (26 percent). Ever use of both modem methods and traditionalmethods is also higher in urban areas. The most commonly used method is female sterilization,which has been adopted by 19 percent of currently married women. Only I percent have adoptedmale sterilization, and only 1-4 percent have ever used each of the modem spacing methods (thepill, condom, or IUD). Ever use of every method of family planning is much higher in urban areasthan in rural areas.
Ever use of any modem method increases with women's age, from 3 percent for women age15-19 to a peak of 41 percent for women age 40-44, and decreases at older ages to 38 percent forwomen age 45-49. This increase in contraceptive use with age likely reflects a life-cycle effect,with women adopting contraception as their fertility goals are met. On the other hand, the lowerlevel of ever use of modem methods by older women reflects, at least in part, the loweracceptability and availability of modem contraceptive methods at the time when these women werehaving their children. The pattern of ever use by age is the same for urban and rural areas, althoughurban women are more likely to have used contraception than rural women at every age.
Current Use of Family Planning Methods
Table 5.3 provides information on current use of family planning methods for currently marriedwomen in Bihar by age and residence. Current contraceptive prevalence in Bihar is low, withonly 25 percent of currently married women using some method of contraception. Current use ofany method is considerably higher in urban areas (39 percent) than in rural areas (23 percent).Almost all current users are using a modem method, and almost all currently married womenwho have ever used contraception are current users. This is because in Bihar, as in most of theother states of India, sterilization dominates the contraceptive method mix. Nineteen percent ofcurrently married women are sterilized, and female sterilization accounts for 78 percent of thetotal current contraceptive prevalence. Another 1 percent of currently married women reportedthat their husbands are sterilized. Female sterilization and male sterilization together account for82 percent of current contraceptive prevalence in Bihar. No other individual method of familyplanning is used by more than I percent of currently married women. By residence, female andmale sterilization together account for 73 percent of contraceptive prevalence in urban areas and84 percent in rural areas. Only two percent of currently married women in Bihar are currentlyusing a modem spacing method. Current use of all modem methods is higher in urban areas thanin rural areas. By age, current contraceptive use increases from 2 percent for women age 15-19 toa peak of 41 percent for women age 40-44, and decreases for older women. The pattern ofvariation by age is similar in both urban areas (peaking at 56 percent in 35-39 age group) andrural areas (peaking at 40 percent in 40-44 age group).
94
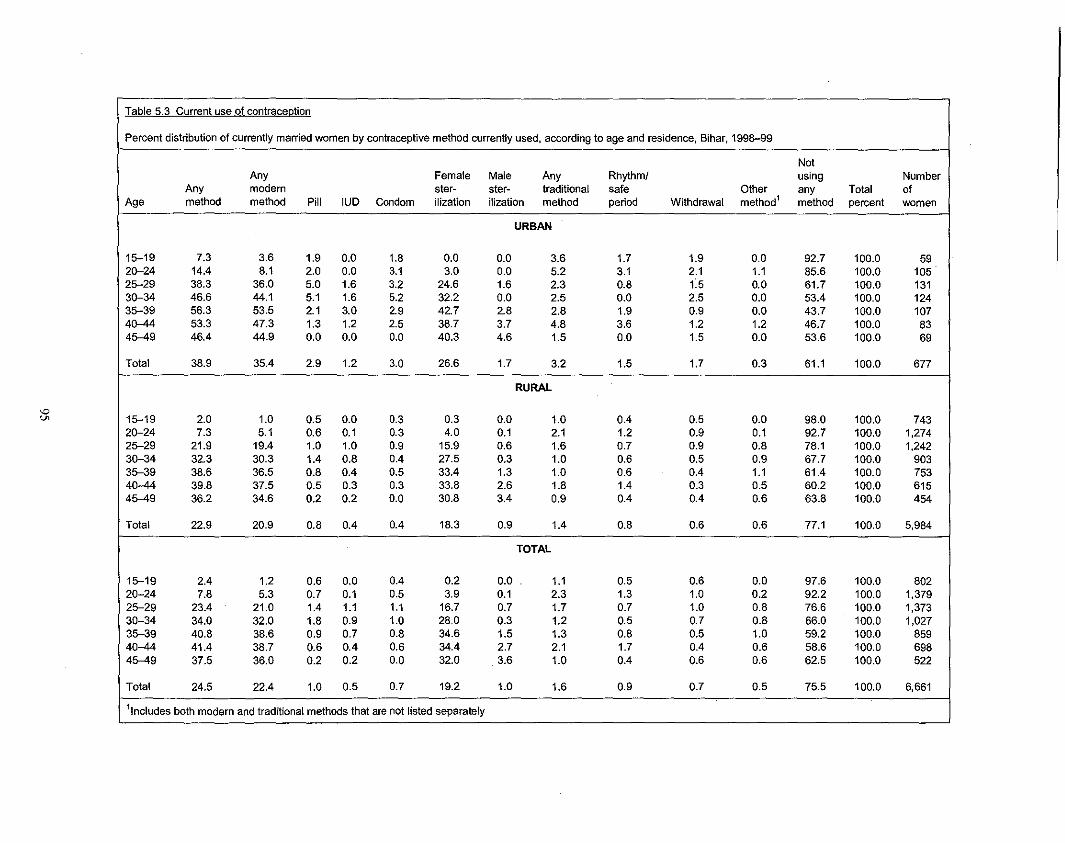
Table 5.3 Current use of contraception
Percent distribution of currently married women by contraceptive method currently used, according to age and residence, Bihar, 1998-99
NotAny Female Male Any Rhythm! using Number
Any modem ster- ster- traditional safe Other any Total ofAge method method Pill IUD Condom ilization ilization method period Withdrawal method1 method percent women
URBAN
15-19 7.3 3.6 1.9 0.0 1.8 0.0 0.0 3.6 1.7 1.9 0.0 92.7 100.0 592G-24 14.4 8.1 2.0 0.0 3.1 3.0 0.0 5.2 3.1 2.1 1.1 85.6 100.0 10525-29 38.3 36.0 5.0 1.6 3.2 24.6 1.6 2.3 0.8 f5 0.0 61.7 100.0 13130-34 46.6 44.1 5.1 1.6 5.2 32.2 0.0 2.5 0.0 2.5 0.0 53.4 100.0 12435-39 56.3 53.5 2.1 3.0 2.9 42.7 2.8 2.8 1.9 0.9 0.0 43.7 100.0 1074G-44 53.3 47.3 1.3 1.2 2.5 38.7 3.7 4.8 3.6 1.2 1.2 46.7 100.0 8345-49 46.4 44.9 0.0 0.0 0.0 40.3 4.6 1.5 0.0 1.5 0.0 53.6 100.0 69
Total 38.9 35.4 2.9 1.2 3.0 26.6 1.7 3.2 1.5 1.7 0.3 61.1 100.0 677
RURAL
15-19 2.0 1.0 0.5 0.0 0.3 0.3 0.0 1.0 0.4 0.5 0.0 98.0 100.0 74320-24 7.3 5.1 0.6 0.1 0.3 4.0 0.1 2.1 1.2 0.9 0.1 92.7 100.0 1,27425-29 21.9 19.4 1.0 1.0 0.9 15.9 0.6 1.6 0.7 0.9 0.8 78.1 100.0 1,2423G-34 32.3 30.3 1.4 0.8 0.4 27.5 0.3 1.0 0.6 0.5 0.9 67.7 100.0 90335-39 38.6 36.5 0.8 0.4 0.5 33.4 1.3 1.0 0.6 0.4 1.1 61.4 100.0 7534G-44 39.8 37.5 0.5 0.3 0.3 33.8 2.6 1.8 1.4 0.3 0.5 60.2 100.0 61545-49 36.2 34.6 0.2 0.2 0.0 30.8 3.4 0.9 0.4 0.4 0.6 63.8 100.0 454
Total 22.9 20.9 0.8 0.4 0.4 18.3 0.9 1.4 0.8 0.6 0.6 77.1 100.0 5,984
TOTAL
15-19 2.4 1.2 0.6 0.0 0.4 0.2 0.0 1.1 0.5 0.6 0.0 97.6 100.0 80220-24 7.8 5.3 0.7 0.1 0.5 3.9 0.1 2.3 1.3 1.0 0.2 92.2 100.0 1,37925-29 23.4 21.0 1.4 1.1 1.1 16.7 0.7 1.7 0.7 1.0 0.8 76.6 100.0 1,37330-34 34.0 32.0 1.8 0.9 1.0 28.0 0.3 1.2 0.5 0.7 0.8 66.0 100.0 1,02735-39 40.8 38.6 0.9 0.7 0.8 34.6 1.5 1.3 0.8 0.5 1.0 59.2 100.0 85940-44 41.4 38.7 0.6 0.4 0.6 34.4 2.7 2.1 1.7 0.4 0.6 58.6 100.0 69845-49 37.5 36.0 0.2 0.2 0.0 32.0 3.6 1.0 0.4 0.6 0.6 62.5 100.0 522
Total 24.5 22.4 1.0 0.5 0.7 19.2 1.0 1.6 0.9 0.7 0.5 75.5 100.0 6,661
11ncludes both modern and traditional methods that are not listed separately

Figure 5.1Current Use of Family Planning by Residence
NFHS-1 and NFHS-2
TOTAL
NFHS-2
NFHS-1
URBAN AREAS
NFHS-1
,RURAL AREAS
NFHS-2
NFHS-1
o 10 20
• Sterilization
30
Percent
i!! Other methods
40
43
50
Bihar
Comparison of NFHS-2 results for current contraceptive use with those from NFHS-lreveals a 2 percentage-point increase in contraceptive prevalence since NFHS-l, when theprevalence was 23 percent (Figure 5.1). The share of female sterilization in contraceptiveprevalence has increased from 75 percent to 78 percent over the six-year period. Since the shareof male sterilization has declined from 6 percent in NFHS-I to 4 percent in NFHS-2, however,the share of female and male sterilization together in total contraceptive prevalence did notchange much between the two surveys (81 percent in NFHS-I compared with 82 percent inNFHS-2). The proportion of currently married women using the officially sponsored spacingmethods declined from 3 percent in NFHS-l to 2 percent in NFHS-2. These results suggest thatdespite the increased emphasis on contraceptive choice and on spacing methods in theReproductive and Child Health Programme, female sterilization continues to dominate themethod mix in Bihar, and spacing methods still account for only a negligible amount ofcontraceptive use.
Socioeconomic Differentials in Current Use of Family Planning Methods
Table 5.4 shows differences in current contraceptive use by background characteristics.Current use of contraceptive methods is considerably higher in urban areas (39 percent) than inrural areas (23 percent). This is true for each specific modem or traditional method. Bygeographic region, current contraceptive use is somewhat higher in the Jharkhand region (28percent) than in the North Bihar Plain region (24 percent) and in the South Bihar Plain region (22percent).
96

Current use of contraceptive methods is much lower among illiterate women (21 percent)than among literate women (36-40 percent). The differences by education are largely the resultof two factors: the predominance of sterilization in the method mix and the fact that moreeducated women tend to be younger women who may not yet have reached their desired level offertility. The use of spacing methods (which are particularly appropriate for women who have notyet reached their desired family size) generally rises with education. Use of traditional methodsalso rises with education. Modem spacing methods are used by I percent of illiterate women and9 percent of women who have completed at least high school. Female and male sterilizationaccount for 87 percent of contraceptive use by illiterate women and only 67 percent ofcontraceptive use by women who have completed at least high school. Contraceptive use hasincreased since NFHS- I among illiterate women, but declined among literate women.
Contraceptive prevalence is much lower among Muslims (9 percent) than among Hindus(27 percent) and Christians (26 percent). Lower use of contraceptive methods among Muslims ismainly due to a much lower use of sterilization among Muslims than among Hindus and Christians.The use of modem temporary methods is about the same among Muslims and Hindus (2 percenteach). Christians in Bihar are unique in that they are much less likely to use modem temporarymethods but much more likely to use traditional methods than Hindus or Muslims.
Contraceptive prevalence is highest (34 percent) among women who do not belong to ascheduled caste, scheduled tribe, or other backward class, followed by women belonging to otherbackward classes (25 percent) and scheduled castes (20 percent). Contraceptive use is lowestamong women belonging to scheduled tribes (14 percent). The use of male sterilization, however, ismarginally higher for husbands of women from the 'other' caste/tribe category (2 percent) than forhusbands of women from a scheduled caste, scheduled tribe, or other backward class (less than 1percent each).
The use of any contraception as well as the use of each specific contraceptive method ispositively related to the household standard of living index (SLl). Whereas contraceptiveprevalence is only 17 percent among the poorest women (low SLl), it is 49 percent among womenwith a high SLI. The use of officially-sponsored spacing methods is also much higher amongwomen with a high SLI (9 percent) than among women with a medium SLI (3 percent) or low SLI(l percent).
Table 5.4 also shows differences in current use by the number and sex of living children.Contraceptive use increases sharply from only 2 percent for women with no living children to 37percent for women with three living children and then falls to 35 percent for women with four ormore living children. A similar pattern is evident for both male and female sterilization.Prevalence rates by sex composition of living children indicate the existence of some sonpreference. At each parity, current use of family planning is lower among women with no sonsthan among women with one or more sons. Son preference does not completely outweigh parityin determining contraceptive use, however, as is evident from the fact that a considerableproportion of higher-parity women with no sons use family planning, including permanentmethods.
97

Table 5.4 Current use by background characteristics
Percent distribution of currently married women by contraceptive method currently used, according to selected background characteristics, Bihar, 1998-99
NotAny Female Male Any Rhythml using Number
Any modern ster- ster- traditional safe With- Other any Tolal ofBackground characteristic method method Pill IUD Condom ilization ilization method period drawal method1 method percent women
ResidenceUrban 38.9 35.4 2.9 1.2 3.0 26.6 1.7 3.2 1.5 1.7 0.3 61.1 100.0 677Rural 22.9 20.9 0.8 0.4 0.4 18.3 0.9 1.4 0.8 0.6 0.6 77.1 100.0 5,984
RegionNorth Bihar Plain 24.4 22.8 0.7 0.6 0.6 19.9 1.0 1.6 1.0 0.6 0.1 75.6 100.0 2,974South Bihar Plain 22.2 19.8 1.0 0.6 0.5 16.7 1.0 2.0 1.0 1.0 0.4 77.8 100.0 2,074Jharkhand 27.6 24.9 1.5 0.3 1.1 21.1 0.9 1.1 0.5 0.7 1.6 72.4 100.0 1,613
EducationIlliterate 20.5 18.7 0.6 0.2 0.2 17.0 0.8 1.2 0.8 0.4 0.6 79.5 100.0 5,083Literate, < middle school
complete 36.1 33.3 1.5 1.2 1.5 28.0 1.2 2.0 0.5 1.5 0.7 63.9 100.0 748Middle school complete 36.3 33.4 3.9 0.8 3.1 24.3 1.2 2.9 0.8 2.1 0.0 63.7 100.0 256High school completeand above 40.3 35.9 2.9 2.5 3.2 24.9 2.3 4.4 1.9 2.5 0.0 59.7 100.0 573
ReligionHindu 27.3 25.1 1.0 0.6 0.7 21.8 1.1 1.6 0.8 0.8 0.6 72.7 100.0 5,574Muslim 9.1 7.5 1.3 0.2 0.5 5.0 0.5 1.4 0.9 0.4 0.2 90.9 100.0 982Christian 25.8 14.9 0.0 0.0 0.0 13.0 1.9 7.3 3.6 3.7 3.7 74.2 100.0 57Olher (15.5) (13.1 ) (0.0) (0.0) (2.0) (11.1 ) (0.0) (0.0) (0.0) (0.0) (2.4) (84.5) 100.0 48
CasteftribeScheduled caste 19.5 17.7 0.7 0.2 0.5 15.8 0.6 1.4 1.0 0.4 0.4 80.5 100.0 1,383Scheduled tribe 14.1 9.8 0.6 0.0 0.2 8.6 0.4 1.4 0.6 0.8 2.9 85.9 100.0 546Other backward class 24.6 22.4 1.0 0.6 0.7 19.2 0.9 1.8 1.0 0.8 0.4 75.4 100.0 3,454Other 34.3 32.8 1.6 0.9 1.2 27.3 1.7 1.5 0.6 0.9 0.0 65.7 100.0 1,277
Standard of living indexLow 16.5 14.7 0.3 0.1 0.2 13.6 0.5 1.1 0.8 0.3 0.7 83.5 100.0 3,480Medium 29.1 26.9 1.3 0.4 0.9 23.2 1.0 1.7 0.8 0.9 0.5 70.9 100.0 2,491High 48.8 45.0 3.3 3.3 2.4 32.6 3.4 3.7 1.3 2.4 0.0 51.2 100.0 682
Gonld...

Table 5.4 Current use by background characteristics (contd.l
Percent distribution of currently married women by contraceptive method currently used, according to selected background characteristics, Bihar, 1998-99
NotAny Female Male Any Rhythm! using Number
Any modern ster- ster- traditional safe With- Other any Total ofBackground characteristic method method Pill IUD Condom ilization ilization method period drawal method1 method percent women
Number and sex ofliving children
No children 1.5 0.5 0.2 0.0 0.0 0.2 0.1 0.9 0.4 0.5 0.0 98.5 100.0 920
1 child 6.4 4.0 1.1 0.2 0.8 1.6 0.2 2.2 1.0 1.1 0.2 93.6 100.0 9881 son 7.6 5.4 1.2 0.2 1.1 2.6 0.2 2.1 1.2 0.9 0.2 92.4 100.0 529No sons 5.0 2.5 1.1 0.2 0.5 0.5 0.2 2.3 0.9 1.4 0.2 95.0 100.0 460
2 children 24.2 21.4 1.3 1.2 1.1 16.6 1.2 2.3 1.0 1.2 0.5 75.8 100.0 1,1522 sons 37.5 34.1 0.6 0.8 1.1 29.2 2.4 2.8 0.8 2.0 0.6 62.5 100.0 3591 son 20.9 18.2 2.1 1.6 0.7 12.9 0.9 2.1 1.2 0.9 0.6 79.1 100.0 580No sons 11.0 8.7 0.0 1.0 2.4 5.3 0.0 1.8 0.9 0.9 0.4 89.0 100.0 213
3 children 37.3 35.4 1.1 0.8 1.4 30.8 1.4 1.1 0.6 0.5 0.8 62.7 100.0 1,1883 sons 47.2 44.8 2.4 1.2 0.6 38.3 2.2 1.2 1.2 0.0 1.2 52.8 100.0 1732 sons 48.6 46.0 0.2 0.2 1.2 43.2 1.2 1.8 1.0 0.8 0.8 51.4 100.0 5201 son 25.0 24.2 1.7 1.5 2.0 17.5 1.5 0.5 0.0 0.5 0.2 75.0 100.0 403No sons 9.9 7.7 1.2 0.0 1.1 5.3 0.0 0.0 0.0 0.0 2.2 90.1 100.0 93
4+ children 34.6 32.2 1.0 0.4 0.4 29.1 1.3 1.6 1.0 0.6 0.8 65.4 100.0 2,4122+ sons 37.0 34.7 0.9 0.3 0.3 31.7 1.5 1.6 1.1 0.5 0.7 63.0 100.0 1,9441 son 25.9 23.1 1.8 1.0 0.7 18.9 0.7 1.5 0.5 1.0 1.3 74.1 100.0 398No sons 15.8 14.4 0.0 0.0 0.0 14.4 0.0 1.5 1.5 0.0 0.0 84.2 100.0 70
Total 24.5 22.4 1.0 0.5 0.7 19.2 1.0 1.6 0.9 0.7 0.5 75.5 100.0 6,661
Note: Total includes 8 women with missing information on the standard of living index, who are not shown separately.~ ) Based on 25-49 unweighted casesIncludes both modern and traditional methods that are not listed separately

Table 5.5 Number of living children at first use
Percent distribution of ever-married women by number of living children at the time of first use ofcontraception, according to current age and residence, Bihar, 1998-99
Number of living children at the time of first use NumberCurrent Never Total ofage used 0 1 2 3 4+ Missing percent women
URBAN
15-19 93.0 1.9 5.2 0.0 0.0 0.0 0.0 100.0 612Cl-24 78.0 3.7 7.7 8.7 1.8 0.0 0.0 100.0 11125-29 52.3 3.9 9.1 11.4 12.6 10.6 0.0 100.0 1363Cl-34 47.8 4.2 4.0 14.6 10.2 19.3 0.0 100.0 13235-39 40.4 0.9 6.3 10.7 13.0 28.8 0.0 100.0 1134Cl-44 46.5 0.0 2.3 6.9 13.6 30.7 0.0 100.0 9045-49 55.2 0.0 4.2 2.7 7.0 30.8 0.0 100.0 76
Total 56.6 2.4 5.8 9.0 9.0 17.2 0.0 100.0 718
RURAL
15-19 95.8 1.3 2.5 0.1 0.2 0.0 0.0 100.0 7632Cl-24 89.1 1.4 2.9 3.7 2.1 0.8 0.0 100.0 1,30825-29 75.3 0.9 3.0 6.3 7.5 7.0 0.0 100.0 1,2833Cl-34 65.2 0.2 1.5 4.6 12.1 16.4 0.1 100.0 9563s-;l9 61.8 0.1 1.5 4.6 9.0 23.1 0.0 100.0 8084Cl-44 60.2 0.1 0.3 4.1 7.0 28.0 0.2 100.0 66945-49 64.1 0.0 0.8 2.5 6.6 26.1 0.0 100.0 518
Total 74.8 0.7 2.0 4.0 6.3 12.2 0.0 100.0 6,306
TOTAL
15-19 95.6 1.4 2.7 0.1 0.2 0.0 0.0 100.0 8252Cl-24 88.2 1.6 3.3 4.0 2.1 0.8 0.0 100.0 1,41925-29 73.1 1.2 3.6 6.8 8.0 7.4 0.0 100.0 1,4193Cl-34 63.1 0.7 1.8 5.8 11.9 16.7 0.1 100.0 1,08835-39 59.2 0.2 2.1 5.3 9.4 23.8 0.0 100.0 9214Cl-44 58.6 0.1 0.5 4.4 7.8 28.3 0.1 100.0 75945-49 62.9 0.0 1.2 2.5 6.6 26.7 0.0 100.0 593
Total 73.0 0.9 2.4 4.5 6.5 12.7 0.0 100.0 7,024
Number of Living Children at First Use of Contraception
In order to examine the timing of initial family planning use, NFHS-2 included a question onhow many living children women had when they first used a method. Table 5.5 shows thedistribution of ever-married women by the number of living children at the time of firstcontraceptive use, according to current age and residence. Only 1 percent of ever-married women(3 percent of women who have ever used contraception) began using contraception when theydid not have any children and another 2 percent (9 percent of ever users) began using when theyhad only one living child. Although early use of contraception is rare, 53 percent of ever usersbegan when they had three or fewer living children. This pattern of first acceptance at lowparities means that family planning has a larger demographic impact than it would ifcontraceptive use were initiated later. A similar age pattern is observed among women in urbanand rural areas, but urban women are more likely to begin using when they have fewer than threeliving children. Given the near-exclusive emphasis on sterilization in the contraceptive method
100

Table 5.6 Problems with current method
Percentage of current users of specific contraceptive methods who have had problems in using the method, Bihar, 1998-99
Contraceptive method
Female Male Rhythmlsterili- sterili- safe With- Other
Problem Pill IUD Condom zation zation period drawal method1 Total
No problem 82.9 (85.3) (93.6) 77.4 96.8 95.1 (95.8) (100.0) 80.7Weight gain 4.6 (0.0) (0.0) 1.5 1.5 1.6 (0.0) (0.0) 1.5Weight loss 4.7 (0.0) (0.0) 2.0 1.5 0.0 (0.0) (0.0) 1.8Too much bleeding 4.7 (8.7) (0.0) 1.7 0.0 0.0 (0.0) (0.0) 1.7Hypertension 1.5 (0.0) (2.1 ) 1.4 0.0 0.0 (4.2) (0.0) 1.3Headache/bodyache/backache 6.4 (0.0) (4.1 ) 6.6 0.0 1.6 (4.2) (0.0) 5.8Nausea/vomiting 3.1 (3.2) (0.0) 0.8 0.0 1.6 (2.0) (0.0) 0.9No menstruation 1.4 (0.0) (0.0) 0.2 0.0 1.6 (0.0) (0.0) 0.2Weakness/tiredness 6.3 (0.0) (0.0) 6.8 0.0 0.0 (2.0) (0.0) 5.6Dizziness 0.0 (0.0) (0.0) 1.8 0.0 0.0 (0.0) (0.0) 1.4Fever 1.4 (0.0) (0.0) 3.2 0.0 1.6 (0.0) (0.0) 2.6Cramps 0.0 (0.0) (0.0) 1.3 0.0 0.0 (O.0l. (0.0) 1.0Spotting 0.0 (0.0) (0.0) 0.3 0.0 0.0 (0.0) (0.0) 0.2Inconvenient to use 0.0 (0.0) (0.0) 0.2 0.0 1.6 (0.0) (0.0) 0.2Abdominal pain 3.2 (5.8) (0.0) 8.2 0.0 0.0 (2.0) (0.0) 6.7White discharge 0.0 (2.8) (2.0) 3.1 0.0 0.0 (2.0) (0.0) 2.6Irregular periods 0.0 (2.8) (2.4) 0.5 1.5 0.0 (0.0) (0.0) 0.6Breast tenderness 0.0 (0.0) (0.0) 0.6 1.5 0.0 (0.0) (0.0) 0.5Allergy 0.0 (0.0) (0.0) 0.1 1.5 0.0 (0.0) (0.0) 0.2Reduced sexual satisfaction 0.0 (3.0) (4.1) 0.1 0.0 0.0 (2.2) (0.0) 0.3Other 0.0 (0.0) (0.0) 1.1 1.7 0.0 (0.0) (0.0) 0.9
Number of users 66 35 47 1,277 65 58 49 36 1,633
Note: Percentages may add to more than 100.0 because multiple problems could be recorded.~ ) Based on 25-49 unweighted casesIncludes both modern and traditional methods that are not listed separately
mix, women usually begin contraceptive use only after achieving their desired family size.Clearly, spacing methods need to be promoted if further reductions are sought in the parity atwhich women first accept contraception.
Problems with Current Method
Women who were using a contraceptive method were asked if they had experienced any problemwith their current method. Table 5.6 presents the percentage of current contraceptive users whoreport specific problems. Overall, four-fifths (81 percent) of current users report having noproblem with their method. This may be an underestimate of the extent of problems, however,because women who have experienced problems with spacing methods may have stopped usingcontraception altogether, and these women are not represented in the table.
The analysis of method-specific problems reveals that 77 percent of sterilized women and97 percent of women whose husbands are sterilized report having no problem with their method.The most common problems experienced by sterilized women are abdominal pain (8 percent),weakness/tiredness (7 percent), headache/bodyache/backache (7 percent), fever (3 percent), andwhite discharge (3 percent). These results point to a continuing need to strengthen post-operativecare and counselling for sterilization acceptors. It is not possible to assess the problems
101

Table 5.7 Timing of sterilization
Percent distribution of currently married, sterilized women and wives of sterilized men by age at the time of sterilizationand median age of the woman at the time of sterilization, according to the number of years since sterilization, Bihar,1998-99
Woman's age at the time of sterilizationYears since Total Number Mediansterilization <20 20-24 25-29 30-34 35-39 4D--44 45-49 percent sterilized age1
STERILIZED WOMEN
<2 1.3 25.1 44.7 20.3 6.7 2.0 0.0 100.0 150 27.62-3 2.3 23.3 40.2 22.9 8.9 1.7 0.5 100.0 180 27.84-5 3.8 27.2 37.6 19.2 8.9 2.8 0.4 100.0 212 26.95-7 2.0 25.6 35.0 22.5 11.6 3.3 U 100.0 155 28.18-9 0.0 27.8 39.0 27.0 6.2 0.0 U 100.0 132 28.210+ 2.5 24.4 42.1 26.2 4.7 U U 100.0 449 NC
Total 2.2 25.3 40.2 23.5 7.2 1.3 0.1 100.0 1,277 27.7
WIVES OF STERILIZED MEN
< 10 (3.2) (13.7) (42.1) (13.6) (20.8) (0.0) U 100.0 29 28.510+ (2.7) (25.3) (47.4) (19.0) (5.6) U U 100.0 36 NC
Total 2.9 20.0 45.0 16.6 12.4 0.0 3.0 100.0 65 27.7
STERILIZED WOMEN AND WIVES OF STERILIZED MEN
<2 1.2 25.1 44.9 19.3 7.0 1.9 0.6 100.0 158 27.52-3 2.3 22.9 40.4 23.0 8.8 1.7 1.0 100.0 184 27.84-5 3.7 26.9 37.1 19.6 9.6 2.7 0.4 100.0 218 27.05-7 1.9 25.2 35.6 22.1 12.0 3.2 U 100.0 158 28.18-9 0.7 26.9 39.0 26.2 7.2 0.0 U 100.0 140 28.310+ 2.5 24.5 42.5 25.7 4.8 U U 100.0 484 NC
Total 2.2 25.1 40.5 23.2 7.5 1.3 0.3 100.0 1,342 27.7
NC: Not calculated due to censoringU: Not available~ ) Based on 25-49 unweighted casesTo avoid censoring, median age is calculated only for sterilizations that took place when the woman was less than 40
years old.
experienced by women using spacing methods because the number of women using these methodsis too small.
5.3 Timing of Sterilization
Table 5.7 shows how many years before the survey women or their husbands were sterilized andhow old the women were when the sterilization took place. Of 1,342 sterilizations reported, 95percent are female sterilizations. Forty-two percent of female sterilizations took place less than 6years before the survey, another 22 percent took place 6--9 years before the survey, and theremaining 35 percent took place 10 or more years before the survey. By contrast, 55 percent ofmale sterilizations took place 10 or more years before the survey. The median age of women atthe time they or their husbands were sterilized was only 27.7 years, with 27 percent of sterilizedcouples undergoing sterilization before the wife was age 25. Two-thirds (68 percent) of
102

sterilizations took place before the wife was age 30 and less than 2 percent took place when wifewas in her forties.
Male sterilization is not as common as it was 10 or more years ago. Only 3 percent ofsterilizations during the 10 years preceding the survey were male sterilizations, compared with 7percent of sterilizations 10 or more years before the survey.
The median age of women at the time of sterilization has declined marginally, from age28.3 during the period 8-9 years before the survey to age 27.5 during the 2 years before the survey.From NFHS-2 data it is not possible to assess the trend in the median age at sterilization for morethan 10 years before the survey because only women age 15-49 years were interviewed. Women intheir forties 10 or more years before the survey would have been 50-59 years at the time of thesurvey and would therefore not have been interviewed. A comparison with NFHS-I data, however,suggests that the decline in women's age at sterilization began more than 10 years ago. Women'smedian age at sterilization declined by about one year between about 1984-85 (8-9 years beforeNFHS-I) and the mid-to-Iate 1990s.
5.4 Sources of Contraceptive Methods
Family planning methods and services in Bihar are provided primarily through a network ofgovernment hospitals and urban family welfare centres in urban areas and Primary HealthCentres (PHC) and sub-centres in rural areas. Family planning services are also provided byprivate hospitals and clinics, as well as nongovernmental organizations (NGOs). Sterilizationsand IUD insertions are carried out mostly in government hospitals and PHCs. Sterilizationcamps, organized from time to time, also provide sterilization services. Modern spacing methodssuch as the IUD, pill, and condom are available through both the government and private sectors.
In order to assess the relative importance of various sources of contraceptive methods,NFHS-2 included a question about where current contraceptive users obtained their methods. Table5.8 and Figure 5.2 show the percent distribution of current modern contraceptive users by the mostrecent source, according to specific method and residence. The public medical sector, consisting ofgovernment or municipal hospitals, government dispensaries, Primary Health Centres, and othergovernmental health infrastructure, is the source of contraception for over three-fourths (77 percent)of current users of modern methods. The private medical sector, including private hospitals orclinics, private doctors, private mobile clinics, private paramedics, vaidyas, hakims, homeopaths,traditional healers, and pharmacies or drugstores, is the source for 18 percent of current users. Fourpercent of current users obtain their methods from other sources such as shops, friends, andrelatives, and lli:ss than 1 percent from NGOs. Government or municipal hospitals are the mainsource (70 percent) for female sterilization, followed by private hospitals or clinics (13 percent),camps (7 percent), and cornmunity health centres, rural hospitals, or Primary Health Centres (4percent). Similar sources are used for male sterilizations. About one-half (49 percent) of IUD usersobtain their IUD from the public medical sector and the other half (49 percent) from the privatemedical sector. Private shops are the major source for condoms and pills (55-56 percent).
Eighty-one percent of rural users obtain their contraceptives from the public medical sectorcompared with 56 percent ofurban users. The role of the private medical sector in providing femalesterilization services in urban areas is especially notable. In urban areas, 34 percent of femalesterilizations are performed by the private medical sector, compared with 14 percent in rural areas.
103
-

Table 5.8 Source of modern contraceptive methods
Percent distribution of current users of modern contraceptive methods by most recent source, according to specificmethod and residence, Bihar, 1998-99
Contraceptive method
Female Male All modernSource Pill IUD Condom sterilization sterilization methods
URBAN
Public medical sector · · · 65.6 · 56.0Government/municipal hospital · · · 59.8 · 50.3Government dispensary · · · 0.0 · 0.5UHC/UHP/UFWC · · • 0.0 · 0.0CHC/rural hospital/PHC · · · 1.7 · 1.3Sub-centre · · · 0.0 · 0.0Government mobile clinic · · · 0.0 • 0.0Government paramedic · · · 0.0 · 0.0Camp · · · 2.9 · 2.2Other pUblic medical sector · · • 1.2 • 1.8
NGO or trust · • · 0.6 · 0.4Hospital/clinic · · · 0.6 · 0.4
Private medical sector · • · 33.8 · 33.9Private hospital/clinic · · · 25.8 · 23.3Private doctor · · · 7.5 · 6.9Private mobile clinic · • • 0.0 • 0.4Private paramedic · • · 0.0 · 0.9Pharmacy/drugstore · · · 0.0 · 1.4Other private medical sector · · • 0.6 • 0.9
Other source · · · 0.0 · 8.2Shop · · · 0.0 · 7.8Other · · · 0.0 · 0.4
Don't know1 · · · 0.0 • 1.4
Total percent 100.0 100.0 100.0 100.0 100.0 100.0
Number of users 19 8 20 180 11 239
104

Table 5.8 Source of modern contraceptive methods (contd.l
Percent distribution of current users of modern contraceptive methods by most recent source, according to specificmethod and residence, Bihar, 1998-99
Contraceptive method
Female Male All modernSource Pill IUD Condom sterilization sterilization methods
RURAL
Public medical sector (15. 9) (55.6) (11.6) 86.0 79.2 80.9Government/municipal hospital (9.0) (33.4) (11.6) 71.5 73.3 67.1Government dispensary (2.3) (0.0) (0.0) 0.0 0.0 0.1UHC/UHP/UFWC (0.0) (7.1 ) (0.0) 1.1 0.0 1.1CHC/rural hospital/PHC (2.3) (11.6) (0.0) 4.5 2.0 4.3Sub-centre (0.0) (3.5) (0.0) 0.0 0.0 0.1Government mobile clinic (0.0) (0.0) (0.0) 0.4 0.0 0.4Government paramedic (2.2) (0.0) (0.0) 0.0 0.0 0.1Camp (0.0) (0.0) (00) 8.1 3.9 7.3Other public medical sector (0.0) (0.0) (0.0) 0.5 0.0 0.4
NGO or trust (0.0) (0.0) (0.0) 0.4 0.0 0.3Hospital/clinic (0.0) (0.0) (0.0) 0.4 0.0 0.3
Private medical sector (18.8) (44.4) (11.6) 13.5 20.8 14.6Private hospital/clinic (2.3) (33.4) (0.0) 11.0 17.0 11.2Private doctor (8.0) (11.1 ) (7.6) 2.3 3.7 2.9Private mobile clinic (0.0) (0.0) (0.0) 0.0 0.0 0.0Private paramedic (2.1 ) (0.0) (0.0) 0.0 0.0 0.1Pharmacy/drugstore (6.4) (0.0) (3.9) 0.0 0.0 0.3Other private medical sector (0.0) (0.0) (0.0) 0.2 0.0 0.2
Other source (59.0) (0.0) (62.0) 0.1 0.0 3.6Shop (59.0) (0.0) (62.0) 0.0 0.0 3.5Other (0.0) (0.0) 90.0) 0.1 0.0 0.1
Don't know1 (6.3) (0.0) (14.8) 0.0 0.0 0.5
Total percent 100.0 100.0 100.0 100.0 100.0 100.0
Number of users 47 27 26 1,097 53 1,250
105

Table 5.8 Source of modern contraceptive methods lcontd')
Percent distribution of current users of modern contraceptive methods by most recent source, according to specificmethod and residence, Bihar, 1998-99
Contraceptive method
Female Male All modernSource Pill IUD Condom sterilization sterilization methods
TOTAL
Public medical sector 16.2 (48.5) (11.1 ) 83.1 78.3 76.9Government/municipal hospital 8.1 (31.6) (11.1 ) 69.8 71.7 64.4Government.dispensary 3.3 (0.0) (0.0) 0.0 0.0 0.1UHC/UHP/UFWC 0.0 (5.4) (0.0) 0.9 0.0 0.9CHC/rural hospital/PHC 1.6 (8.8) (0.0) 4.1 1.6 3.8Sub-centre 0.0 (2.6) (0.0) 0.0 0.0 0.1Government mobile clinic 0.0 (0.0) (0.0) 0.4 0.0 0.3Governmentparamedic 1.6 (0.0) (0.0) 0.0 0.0 0.1Camp 0.0 (0.0) (0.0) 7.4 3.2 6.5Other public medical sector 1.6 (0.0) (0.0) 0.6 1.7 0.6
NGO or trust 0.0 (0.0) (0.0) 0.4 0.0 0.4Hospital/clinic . 0.0 (0.0) (0.0) 0.4 0.0 0.4
Private medical sector 20.1 (48.7) (23.0) 16.4 21.7 17.7Private .hospital/c1inic 3.4 (34.0) (7.0) 13.1 17.1 13.1Private doctor 7.3 (11.5) (4.3) 3.1 4.6 3.6Private mobile clinic 0.0 (0.0) (2.3) 0.0 0.0 0.1Private paramedic 3.2 (0.0) (2.3) 0.0 0.0 0.2Pharmacy/drugstore 6.2 (0.0) (7.1 ) 0.0 0.0 0.5Other private medical sector 0.0 (3.1) (0.0) 0.2 0.0 0.3
Other source 55.9 (2.8) (55.2) 0.1 0.0 4.3Shop 55.9 (0.0) (55.2) 0.0 0.0 4.2Other 0.0 (2.8) (0.0) 0.1 0.0 0.1
Don't know1 7.9 (0.0) (10.8) 0.0 0.0 0.7
Total percent 100.0 100.0 100.0 100.0 100.0 100.0
Number of users 66 35 47 1,277 65 1,490
UHC: Urban health centre; UHP: Urban health post; UFWC: Urban family welfare centre; CHC: Community healthcentre; PHC: Primary Health Centre; NGO: Nongovernmental organization( ) Based on 25-49 unweighted cases·Percentage not shown; based on fewer than 25 unweighted cases1For the pill and the condom, this category includes women who say their husband or a friend or other relativeobtained the method, but they don't know the original source of supply.
106

Figure 5.2Sources of Family Planning Among Current
Users of Modern Contraceptive Methods
Private Medical Sector18%
NGOorTrust0.4%
Note: Percents add to morelhan 100.0due 10 rounding
Other Source4%
Don't Know1%
lJublic Medical Seclor77%
NFHSv 2, Bihar, 1998-99
5.5 Reasons for DiscontinuationlNon-Use of Contraception
All currently married, nonpregnant women who were not using a contraceptive method at thetime of the survey fall into two categories with respect to their contraceptive experience: thosewho used contraception only in the past and those who never used contraception. NFHS-2 askedwomen who had discontinued contraceptive use their main reason for discontinuing. The surveyasked women who had never used contraception the main reason for not currently using amethod. Table 5.9 shows that in the NFHS-2 Bihar sample only 170 nonpregnant women whoever used family planning methods have discontinued use. Because 73 percent of ever users aresterilized, only a small percentage of ever users even have the option of discontinuing use.Among the small group who discontinued contraception, the most commonly mentioned reasonfor discontinuing is that the couple wanted to have a child (32 percent). Eleven percent of theusers mentioned 'husband away' as their main reason for discontinuation, 10 percent reportedthat the method failed or they got pregnant, 9 percent reported that the method created a healthproblem, and 7 percent reported that the method created a menstrual problem. Another 7 percentdiscontinued contraception because they did not like the method.
Among women who never usedcontraception, the most commonly mentioned reason fornever using a method is the desire for more children (43 percent). Another I3 percent ofwomen saythey are not using contraception because they are menopausal, have had a hysterectomy, or areinfecund or subfecund. Only 4 percent mention a health-related problem (health concerns or worryabout side effects), 9 percent mention any type of opposition to family planriing, and 8 percentmention a lack ofknowledge as reasons for not currently using contraception. Four percent say theyare not using contraception because they are afraid of sterilization (thereby implicitly equatingfamily planning with sterilization). There are no substantial urban-rural differences in reasons fornon-use of contraception, except that the proportion reporting lack of knowledge is much greater inrural areas (8 percent) than in urban areas (4 percent).
107

Table 5.9 Reasons for discontinuation/non-use
Percent distribution of nonpregnant, currently married women who stopped using contraception bymain reason for stopping use and percent distribution of nonpregnant, currently married womenwho never used contraception by main reason for not currently using, according to residence,Bihar, 1998-99
Reason Urban Rural Total
REASON FOR StOPPING USE
Method failed/got pregnant (9.1 ) 9.9 9.7Lack of sexual satisfaction (0.0) 3.1 2.4Created menstrual problem (6.1 ) 7.5 7.2Created health problem (12.2) 8.3 9.1Inconvenient to use (2.9) 1.6 1.9Hard to get method (0.0) 1.4 1.1Did not like the method (9.5) 6.6 7.2Wanted to have a child (33.3) 31.7 32.1Wanted to replace dead child (0.0) 0.7 0.6Lack of privacy for use (0.0) 0.8 0.7Husband away (5.8) 11.7 10.5Costs too much (3.3) 6.1 5.5Other (17.9) 10.6 12.1
Total percent 100.0 100.0 100.0
Number of women 35 135 170
REASON FOR NOT CURRENTLY USING
Husband away 3.7 2.5 2.6
Fertility-related reasons 70.4 64.6 65.1Not having sex 0.6 0.4 0.4Infrequent sex 3.0 1.5 1.7Menopausal/had hysterectomy 17.7 9.6 10.2Subfecund/infecund 4.5 3.1 3.2Postpartum/breastfeeding 8.2 6.8 6.9Wants more children 36.4 43.2 42.6
Opposition to use 8.7 9.3 9.2Opposed to family planning 1.2 0.9 0.9Husband opposed 3.8 3.9 3.9Other people opposed 0.3 0.6 0.6Against religion 3.4 3.9 3.9
Lack of knowledge 3.9 8.4 8.1Knows no method 0.3 1.7 1.6Knows no source 3.6 6.7 6.5
Method-related reasons 10.0 13.2 12.9Health concerns 3.4 1.9 2.0Worry about side effects 2.8 2.1 2.2Hard to get method 0.0 0.5 0.4Costs too much 0.6 2.0 1.9Inconvenient to use 0.0 0.1 0.1Afraid of sterilization 1.6 4.5 4.3Doesn't like existing methods 1.6 2.1 2.1
Other 2.3 1.2 1.3Don't know/missing 0.9 0.8 0.8
Total percent 100.0 100.0 100.0
Number of women 337 3,957 4,295
( ) Based on 25-49 unweighted cases
108

5.6 Future Intentions Regarding Contraceptive Use
Currently married women who were not using any contraceptive method at the time of the survey(including those who were currently pregnant) were asked about their intentions to use a methodin the future. If they intended to use a method, they were asked about their preferred method.This type of information can help managers of family welfare programmes to identify potentialgroups of users and to provide the types of contraception that are likely to be in demand. Table5.10 gives women's responses to the questions on future use according to residence and numberofliving children.
Fifty-seven percent of currently married women who are not currently using anycontraceptive method express an intention to use a method in the future. Among women who intendto use contraception, only 28 percent intend to use a method within the next 12 months. About twothirds (63-68 percent) of women with two or fewer living children intend to use contraception anytime in the future, compared with 58 percent of women with three living children. By contrast, 55percent of women with four or more living children say they have no intention of usingcontraception at any time in the future.
The expressed timing of future use also varies by number ofliving children. The proportionof women who say that they intend to use contraception after 12 or more months falls steadily withthe number of living children from 59 percent among women with no living children to 22 percentamong those with four or more children. The proportion expressing an intention to usecontraception within the next 12 months increases from 4 percent among those with no children to25 percent among those with three children and then falls to 20 percent among those with four ormore children. The overall proportion of women who intend to use contraception at some time inthe future does not differ greatly by residence, but the timing of intended future use is quitedifferent for women in rural and urban areas. Fifteen percent of women in rural areas intend to usecontraception in the next 12 months, compared with 23 percent in urban areas. By contrast, 41percent of women in rural areas intend to use contraception at some time after 12 months,compared with 33 percent in urban areas. The proportion intending to use contraception after 12months is higher for women in rural areas than in urban areas at each parity.
The survey asked currently married women who were not using any method ofcontraception and who said that they did not intend to use a method at any time in the future whythey did not intend to use contraception. This type of information is crucial for understanding theobstacles to further increases in contraceptive use and for designing effective informationprogrammes. Table 5.11 shows that 47 percent of women mention a fertility-related reason for notintending to use contraception in the future, 24 percent mention a method-related reason, and 25percent mention a reason related to opposition to use or lack of knowledge. The major single reasongiven for not intending to use contraception is that the woman is menopausal or she has undergonea hysterectomy (24 percent). Other important reasons are that the woman wants as many children aspossible (15 percent) or that the couple is subfecund or infecund (7 percent). Thirty-one percent ofyounger women (age less than 30) mention the desire to have as many children as possible as themain reason for not intending to use contraception, compared with 6 percent of women age 30-49.By contrast, 45 percent of older women mention reasons related to menopause, hysterectomy,infecundity, or subfecundity, compared with only 3 percent of younger women. Twenty-fourpercent of younger women mention that they do not intend to use family planning because it is
109

Table 5.10 Future use of contraception
Percent distribution of currently married women who are not currently using any contraceptive method byintention to use in the future, according to number of living children and residence, Bihar, 1998-99
Number of living children1
Intention to use in the future 0 1 2 3 4+ Total
URBAN
Intends to use in next 12 months (10.2) 23.9 38.2 31.5 17.6 23.4Intends to use later (56.4) 53.4 26.5 22.0 17.9 32.8Intends to use, unsure when (0.0) 0.0 0.0 0.0 0.8 0.3Unsure as to intention (8.2) 3.3 1.5 3.5 2.9 3.5Does not intend to use (25.2) 19.4 33.8 42.9 60.7 40.0
Total percent 100.0 100.0 100.0 100.0 100.0 100.0
Number of women 50 97 66 56 144 414
RURAL
Intends to use in next 12 months 3.5 8.7 14.8 24.6 20.4 15.3Intends to use later 58.7 57.2 49.4 33.3 22.5 41.0Intends to use, unsure when 0.7 1.4 1.5 0.4 0.3 0.8Unsure as to intention 8.6 4.7 3.8 3.2 2.8 4.3Does not intend to use 28.6 28.0 30.5 38.4 53.9 38.6
Total percent 100.0 100.0 100.0 100.0 100.0 100.0
Number of women 686 879 818 719 1.511 4,614
TOTAL
Intends to use in next 12 months 3.9 10.2 16.5 25.1 20.2 16.0Intends to use later 58.5 56.8 47.7 32.5 22.1 40.3Intends to use, unsure when 0.6 1.3 1.4 0.4 0.4 0.8Unsure as to intention 8.6 4.6 3.7 3.2 2.9 4.2Does not intend to use 28.4 27.1 30.8 38.8 54.5 38.8
Total percent 100.0 100.0 100.0 100.0 100.0 100.0
Number of women 736 976 864 776 1,655 5,027
\ ) Based on 25-49 unweighted casesIncludes current pregnancy, if any
against their religion, compared with 12 percent of older women. The much greater proportion ofyounger women reporting 'want as many children as possible' and 'against religion' as mainreasons for not intending to use family planning than older women suggests that younger womenmay not have thought enough about using family planning in the future, not that they really wantmore children or that they are more religious than older women.
Since younger women (age 15~29) account for 74 percent of total current fertility inBihar, the reasons they give for not intending to use contraception are extremely important froma policy perspective. Of the 62 percent of younger women who give reasons not related tofertility, 51 percent report opposition to use of family planning, 16 percent mention that they areafraid of sterilization, 15 percent mention health concerns or concerns about side effects, and
110

Table 5.11 Reasons for not intending to use contraception
Percent distribution of currently married women who are not using any contraceptivemethod and who do not intend to use any method in the future by main reason fornot intending to use contraception, according to current age, Bihar, 1998-99
Current age
Reason 15-29 30-49 Total
Fertjlity~related reasons 34.6 54.3 47.1Not having sex 0.2 1.2 0.8Infrequent sex 0.6 1.4 1.1Menopausal/had hysterectomy 1.4 36.1 23.5Subfecund/infecund 1.7 9.3 6.5Wants as many children as possible 30.7 6.2 15.2
Opposition to use 31.8 16.4 22.0Opposed to family planning 1.0 1.6 1.3Husband opposed 5.2 2.6 3.6Other people opposed 1.4 0.3 0.7Against religion 24.2 11.9 16.4
Lack of knowledge 4.5 2.4 3.2Knows no method 2.8 1.0 1.7Knows no source 1.7 1.4 1.5
Method·related reasons 26.0 23.0 24.1Health concerns 2.9 2.1 2.3Worry about side effects 6.3 3.0 4.2Hard to get method 0.2 0.8 0.6Costs too much 2.5 1.8 2.0Inconvenient 0.1 0.2 0.2Afraid of sterilization gg 11.2 10.7Doesn't like existing methods 4.2 3.9 4.0
Other 0.7 3.4 2.5Don't know/missing 2.4 0.5 1.2
Total percent 100.0 100.0 100.0
Number of women 709 1,239 1,948 I
another 7 percent mention lack of knowledge. This suggests that improved quality of servicesand information programmes could enhance the family welfare programme in Bihar.Nevertheless, among younger women who are not using contraception, the desire for highfertility remains the major reason for not intending to use contraception in the future.
NFHS-2 asked currently married women who were not using contraception but intended touse a method in the future which method of family planning they would prefer to use. Table 5.12shows the results according to the timing of intended use. A large majority ofwomen who intend touse contraception (68 percent) say they intend to use female sterilization. The next most preferredmethod is the pill, which is the preference of 25 percent of women. Only one percent of womenprefer that their husbands get sterilized, and I percent prefer to use the IUD.
111

Table 5.12 Preferred method
Percent distribution of currently married women who are not currently usinga contraceptive method but who intend to use a method in the future bypreferred method, according to timing of intended use and residence,Bihar, 1998-99
Timing of intended use
UnsureNext 12 about
Preferred method months Later timing Total
URBAN
Pill 31.6 21.2 • 25.4IUD 7.5 0.8 · 3.5Condom 3.1 1.5 • 2.1Female sterilization 50.0 69.5 • 61.1Male sterilization 1.2 0.8 • 0.9Rhythm/safe period 2.2 0.0 · 0.9Withdrawal 0.0 0.0 · 0.0Other 0.0 0.8 · 1.0Unsure/missing 4.4 5.5 • 5.0
Total percent 100.0 100.0 100.0 100.0
Number 97 136 1 234
RURAL
Pill 34.1 21.5 (10.8) 24.7IUD 1.1 0.6 (2.5) 0.8Condom 0.7 0.3 (0.0) 0.4Female sterilization 56.3 73.0 (83.8) 68.7Male sterilization 1.3 1.1 (0.0) 1.1Rhythm/safe period 0.7 0.3 (0.0) 0.4Withdrawal 1.0 0.2 (0.0) 0.4Other 3.5 1.1 (0.0) 1.7Unsure/missing 1.3 2.0 (2.8) 1.8
Total percent 100.0 100.0 100.0 100.0
Number 707 1,890 37 2,633
TOTAL
Pill 33.8 21.4 (10.5) 24.8IUD 1.9 0.6 (2.4) 1.0Condom 1.0 0.3 (0.0) 0.5Female sterilization 55.5 72.8 (81.3) 68.0Male sterilization 1.3 1.0 (0.0) 1.1Rhythm/safe period 0.9 0.3 (0.0) 0.5Withdrawal 0.9 0.2 (0.0) 0.4Other 3.0 1.1 (3.0) 1.7Unsure/missing 1.7 2.2 (2.8) 2.1
Total percent 100.0 100.0 100.0 100.0
Number 803 2,025 38 2,867
( ) Based on 25-49 unweighted cases." Percentage not shown; based on fewer than 25 unweighted cases
112

There are important differences in the choice of preferred methods by timing of intendeduse. Women who intend to use within the next 12 months show a much greater preference forspacing methods, whereas women who plan to use contraception later intend to rely primarily onfemale sterilization. Among the spacing methods mentioned by women intending to usecontraception within the next 12 months, the pill is mentioned most often (34 percent), followed bythe IUD (2 percent), and the condom (1 percent). Very few women (1 percent) mention malesterilization as their preferred method, both among women planning to use contraception within thenext 12 months and among women planning to use contraception later. Results are similar for urbanand rural areas with some exceptions. Among women who intend to use a method within the next12 months, a higher proportion of rural women prefer the pill than urban women, whereas a higherproportion ofurban women prefer the IUD and condom than rural women.
Overall, the mix of contraceptive methods that intended future users say they would preferto use is not very different from the methods currently being used, with the heavy reliance onfemale sterilization. Yet, the fact that 37 percent of the women intending to use contraceptionwithin the next year prefer to use a spacing method suggests that there is a significant short-termpotential demand for spacing methods that will need to be met.
5.7 Exposure to Family Planning Messages
For many years, the family planning programme has been using electronic and other mass mediato promote family planning. Studies have confirmed that even after controlling the effect ofresidence and education, exposure to electronic mass media has a substantial effect oncontraceptive use (Ramesh et aI., 1996; Retherford and Mishra, 1997). Exposure to mass mediahas also been found to strengthen women's motivation to prevent unwanted fertility (Kulkarniand Choe, 1998). In order to explore the reach of family planning messages through various massmedia, NFHS-2 asked women whether they had heard or seen any message about family planningin the past few months. Table 5.13 shows the proportions of ever-married women who reporthaving heard or seen a family planning message in the past few months, according to variousbackground characteristics. Results indicate that messages disseminated through the mass mediahave reached 40 percent of ever-married women in Bihar. The most common source of exposureto family planning messages is radio. Twenty-six percent of ever-married women report havingheard a family planning message on radio, followed by wall paintings or hoardings (22 percent)and television (21 percent). Only 8 percent were exposed to a message through a newspaper ormagazine, 7 percent through cinema or film show, and 3 percent through a drama, folk dance, orstreet play.
Ever-married women below age 35 years report slightly greater exposure to family planningmessages from mass media than women age 35 years and above. Overall exposure to mass mediamessages on family planning is much higher in urban areas than in rural areas. Seventy-two percentof urban ever-married women report seeing or hearing a family planning message from at least onemedia source, compared with only 36 percent of rural women. Urban women are much more likelythan rural women to have been exposed to family planning messages through each form of massmedia.
Exposure to mass media messages on family planning among ever-married women is lower in theJharkhand region than in the North and South Bihar Plain regions. Exposure to family planningmessages varies greatly by education. More than 65 percent of women who are literate have heard
113

Table 5.13 Exposure to family planning messages
Percentage of ever-married women who have heard or seen any message about family planning in the past few months byspecific media source and selected background characteristics, Bihar, 1998-99
Source of family planning message
News- Wall Drama! NumberCinema! paper! painting! folk dance! Any of
Background characteristic Radio Television film show magazine hoarding street play source women
Age15-24 26.5 19.3 7.5 8.0 23.0 3.2 41.1 2,24425-34 26.9 22.0 7.3 8.1 .21.9 2.4 40.3 2,50735-49 24.3 21.2 6.1 7.1 20.2 3.2 37.7 2,274
ResidenceUrban 45.5 61.7 26.6 26.2 35.7 3.6 71.7 718Rural 23.7 16.2 4.8 5.7 20.1 2.9 36.1 6,306
RegionNorth Bihar Plain 26.2 18.4 5.9 7.9 26.9 3.4 40.4 3,133South Bihar Plain 27.1 22.9 7.7 7.7 20.6 2.6 40.8 2,199Jharkhand 23.9 22.9 8.1 7.5 13.5 2.5 37.2 1,692
EducationIlliterate 16.6 10.8 2.4 1.0 14,7 2.5 29.0 5,383Literate, < middle schoolcomplete 45.6 39.2 . 11.0 13.5 35.2 3.1 65.1 779
Middle school complete 57.3 55.4 24.2 30,1 41.6 3.8 78,7 267High school completeand above 70.3 72.8 35.3 51.2 58.3 6.3 86.1 595
ReligionHindu 26.8 21.6 7.4 8.4 22.6 3.1 40.8 5,872Muslim 20.6 16.9 4.9 3.8 11.3 2.1 34.0 1,038Christian 42.6 23.3 9.2 16.2 19.7 1.9 46.4 59Other 17.6 17.4 3.6 5.7 11.7 5.8 29.0 55
Caste/tribeScheduled caste 17.4 12.5 4.6 3.2 16.1 1.8 30.6 1,452Scheduled tribe 15.7 8.0 2.0 1.7 10.5 3.9 25.6 582Other backward class 23.8 19.1 6.2 6.3 21.4 2.6 37.9 3,642Other 45.3 40.2 13.8 19.2 33.2 4.5 60.7 1,348
Standard of living indexLow 11.2 6.2 1.6 1,0 12.2 1.7 22.6 3,709Medium 35.2 26.1 8.6 8.4 26.7 4.3 51.5 2,595High 68.9 78.5 29.3 40.8 52.5 4.4 86.0 712
Use of contraceptionEver used 38.7 34.7 12.5 14.8 30.6 4.8 55.5 1,898Never used 21.2 15.8 5.0 5.1 18.4 2.2 33.9 5,126
Total 25.9 20.9 7.0 7.8 21.7 2.9 39.7 7,024
Note: Total includes 8 women with missing information on the standard of living index, who are not shown separately.
or seen a family planning message from at least one media source in the past few months,compared with only 29 percent of women who are illiterate. Exposure to family planningmessages through specific media sources is even more closely linked to education than isexposure in general. For example, 73 percent of women who have completed at least high school
114

have heard or seen a family planning message on television, compared with only II percent ofwomen who are illiterate.
Exposure to family planning messages also differs by religion. Forty-six percent ofChristian women say they have heard or seen a family planning message through the media,followed by 41 percent of Hindu women, 34 percent of Muslim women, and 29 percent ofwomen belonging to 'other' religions. Christian women also report more exposure through radio,television, cinema or film show, and newspapers or magazines than do women of other religions.
Sixty-one percent of ever-married women not belonging to scheduled castes/tribes or otherbackward classes have seen or heard a family planning message, followed by 38 percent of womenfrom other backward classes, 31 percent of women from scheduled castes, and 26 percent ofwomen from scheduled tribes. This pattern of differential exposure by caste/tribe/class status is alsoobserved for most specific media sources. Exposure to family planning messages rises sharply withan increasing standard of living, both for media in general and for each specific media source.Finally, as expected, women who have ever used contraception are more likely to report hearing orseeing a media message on family planning than are women who have never used contraception.All of these differentials are likely to reflect some combination of the greater access to broadcastsignals in urban areas, the greater ability of higher-income households to own radios andtelevisions, and variations in attentiveness to media messages associated with differing levels ofeducation, leisure, and interest.
5.8 Discussion of Family Planning
Irrespective of whether they had ever used contraception, all currently married women wereasked whether they had discussed family planning with their husbands, friends, neighbours, orother relatives in the past few months. Information on whether women talk about family planningat all, and with whom they discuss it, sheds light on their level of interest in family planning andtheir familial and other sources of family planning information. Table 5.14 shows that only 20percent of currently married women in Bihar discussed family planning with their husbands,friends, neighbours, or other relatives in the past few months. Only 14 percent of currentlymarried women discussed family planning with their husbands, and 12 percent discussed familyplanning with their friends or neighbours. Discussions of family planning with relatives otherthan the husband are even less common.
Women age 25-34 years are more likely to have discussed family planning with someone(25 percent) than women age 15-24 (19 percent) or women age 35-49 (15 percent). Women in theSouth Bihar Plain region are more likely to have discussed family planning with someone (24percent) than women in the North Bihar Plain region (19 percent) or women in the Jharkhandregion (16 percent). In general, the proportion of women who have discussed family planning withother persons varies predictably by most other background characteristics. Urban women are morelikely than rural women to have discussed family planning. The proportion of women reportingsuch discussions rises with women's education, husband's education, and the household standard ofliving index. Hindu women are more likely to have discussed family planning than Muslim orChristian women. Discussions of family planning are considerably lower for scheduled-caste andscheduled-tribe women than for other groups. As expected, women who have ever usedcontraception are much more likely to have discussed family planning (28 percent) than womenwho have never used contraception (17 percent).
115

Table 5.14 Discussion of family planning
Percentage of currently married women who discussed family planning with their husbands, friends, neighbours, or other relatives in the pastfew months by selected background characteristics, Bihar, 1998-99
Person with whom discussed family planningAny of Number
Mother- Sister- Friend! Other these ofBackground characteristic Husband Mother Sister Daughter in-law in-law neighbour relative persons women
Age15-24 13.4 1.2 0.4 0.1 1.7 3.6 11.9 0.2 18.8 2,18125-34 17.7 2.0 0.6 0.0 2.1 5.0 15.0 0.2 24.9 2,40035-49 10.2 0.7 0.4 0.3 1.0 3.2 9.7 0.1 15.1 2,079
ResidenceUrban 16.6 1.9 0.9 0.6 1.4 5.1 12.2 0.0 23.2 677Rural 13.6 1.3 0.4 0.1 1.6 3.8 12.4 0.2 19.5 5,984
RegionNorth Bihar Plain 12.8 1.1 0.4 0.1 1.5 5.4 14.4 0.3 19.0 2,974South Bihar Plain 16.6 1.7 0.9 0.2 2.1 4.5 14.0 0.2 24.0 2,074Jharkhand 12.5 1.3 0.2 0.1 1.1 0.6 6.4 0.1 15.9 1,613
Educationilliterate 11.8 1.0 0.3 0.1 1.2 3.0 11.0 0.1 17.1 5,083Literate, < middle school complete 15.9 2.0 0.4 0.1 2.1 4.6 12.5 0.1 22.7 748Middle school complete 24.0 2.5 1.2 0.0 3.8 8.6 17.3 1.1 30.8 256High school complete and above 25.4 2.7 1.9 0.0 3.3 9.6 21.8 0.7 35.4 573
ReligionHindu 14.7 1.4 0.5 0.1 1.7 4.2 13.0 0.2 20.8 5,574Muslim 9.5 1.1 0.3 0.0 1.4 2.4 8.9 0.1 14.3 982Christian 12.8 0.0 0.0 0.0 0.0 1.7 9.3 0.0 16.6 57Other (15.5) (2.4) (0.0) (0.0) (0.0) (2.3) (13.6) (0.0) (22.4) 48
Caste/tribeScheduled caste 11.5 0.7 0.4 0.1 1.0 2.2 10.9 0.1 16.8 1,383Scheduled tribe 9.4 1.8 0.0 0.0 0.6 0.4 5.1 0.0 11.9 546Other backward class 15.1 1.3 0.4 0.1 1.7 4.1 12.6 0.2 20.8 3,454Other 15.2 1.8 1.1 0.2 2.5 6.9 16.2 0.4 23.8 1,277
Standard of living indexLow 11.4 0.7 0.2 0.1 1.0 2.3 11.5 0.1 16.9 3,480
-Medium 15.3 1.9 0.5 0.1 2.1 4.2 11.8 0.4 21.1 2,491High 21.3 2.4 1.5 0.4 2.9 11.1 18.5 0.3 30.3 682
Use of contraceptionEver used 19.6 2.2 0.8 0.2 2.4 7.8 17.5 0.2 28.0 1,840Never used 11.8 1.0 0.3 0.1 1.3 2.5 10.4 0.2 16.7 4,821
Husband's educationIlliterate 10.2 0.7 0.3 0.1 0.8 2.1 10.3 0.1 15.3 2,783Literate, < middle school complete 13.0 1.1 0.2 0.1 1.3 3.1 11.6 0.0 18.2 1,241Middle school complete 15.0 1.7 0.7 0.2 1.8 3.8 11.1 0.3 20.9 621High school complete and above 19.3 2.2 0.9 0.2 2.7 7.0 16.0 0.3 26.8 2,008
Total 13.9 1.3 0.5 0.1 1.6 3.9 12.3 0.2 19.8 6,661
Note: Total includes 8 women with missing information on the standard of living index and 8 women with missing information on husband'seducation, who are not shown separately.( ) Based on 25-49 unwelghted cases
116

5.9 Need for Family Planning
Currently married women who are not using any method of contraception but who do not wantany more children or want to wait two or more years before having another child are defined ashaving an unmet need for family planning. Current contraceptive users are said to have a metneed for family planning. The total demand for family planning is the sum of the met need andthe unmet need. Table 5.15 shows the unmet need, met need, and total demand for familyplauning, according to whether the need is for spacing or limiting births. The footnotes in thetable provide detailed definitions of these concepts.
According to these definitions, 25 percent of currently married women in Bihar have anunmet need for family planning. The unmet need is about the same for spacing births (13 percent)as for limiting births (12 percent). If all of the women who say they want to space or limit theirbirths were to use family planning, the contraceptive prevalence rate would increase from 25percent to 49 percent of currently married women. This means that current programmes are meetingonly about one-half of the family planning need in the state (as shown in the last column of theTable 5.15). These results suggest that there has been no change in unmet need during the six-yearperiod since NFHS-I when unmet need for Bihar was also estimated to be 25 percent. Theproportion of demand satisfied has also remained virtually unchanged during this period (48 percentin NFHS-l and 50 percent in NFHS-2).
Unmet need generally declines with women's age. As expected, unmet need at younger agesis primarily for spacing and at older ages it is primarily for limiting. For women under age 20, theunmet need is almost entirely for spacing rather than for limiting. Unmet need is highest for womenage 20-24 (33 percent), with 76 percent of the need being for spacing. Among women age 25-29,31 percent have an unmet need, and 58 percent of this need is for limiting. Only 7 percent of thetotal demand for family planning is being met for currently married women age 15-19. Thisproportion rises sharply to 19 percent for women age 20-24, 43 percent for women age 25-29, 55percent for women age 30-34, and 71 percent or more for' women age 35-49. The met and unmetneed for contraception among women age 30 years and above is almost exclusively for limiting.
The unmet need for family planning is slightly higher in rural areas (25 percent) than in.urban areas (23 percent), whereas the percentage of demand satisfied is considerably lower in ruralareas. The unmet need for family planning is higher in the South Bihar Plain region (28 percent)than in the North Bihar Plain region (24 percent) or in the Jharkhand region (21 percent). The totalunmet need shows no relationship with women's level of education, but unmet need for spacing isgreater among literates and unmet need for limiting is greater among illiterates. Because met needincreases with women's education, the percentage of demand satisfied is lower among illiteratewomen (45 percent) than among literate women (58--62 percent).
Hindu women have somewhat lower unmet need for family planning (24 percent) thaneither Muslim women (29 percent) or Christian women (26 percent). Because met need is muchlower among Muslim women (9 percent) compared with Hindu or Christian women (26-27percent), the percentage of total demand satisfied is also much lower among Muslim women (24percent) than among Hindu or Christian women (50-53 percent). Unmet need is higher forscheduled-caste women (27 percent) than for women in 'other' caste/tribe/class groups (21-25percent). The percent of demand satisfied is lower for scheduled-caste and scheduled-tribe women
117

Table 5.15 Need for family planning services
Percentage of currently married women with unmet need, met need, and total demand for family planning (FP) services andpercentage of total demand satisfied, by selected background characteristics, Bihar, 1998-99
Met need (currentlyUnmet need for Fp1 using)2 Total demand for FP
PercentageFor For For For For For of demand
Background characteristic spacing limiting Total spacing limiting Tolal spacing limiting Tolal satisfied
Age15--19 29.7 1.7 31.4 1.9 0.5 2.4 31.6 2.2 33.8 7.120-24 25.1 7.9 33.0 2.5 5.3 7.8 27.7 13.1 40.8 19.125--29 12.7 17.9 30.6 2.3 21.1 23.4 15.0 39.0 54.0 43.430-34 6.1 21.7 27.8 0.4 33.6 34.0 6.5 55.3 61.8 55.035--39 1.9 14.5 16.4 0.4 40.4 40.8 2.3 55.0 57.2 71.340-44 0.4 8.8 9.3 0.3 41.1 41.4 0.7 49.9 50.7 81.745-49 0.2 2.9 3.1 0.0 37.5 37.5 0.2 40.4 40.6 92.4
ResidenceUrban 11.6 11.5 23.1 3.3 35.6 38.9 14.9 47.1 61.9 62.8Rural 12.8 11.9 24.7 1.2 21.7 22.9 13.9 33.7 47.6 48.1
RegionNorth Bihar Plain 11.6 12.2 23.8 1.0 23.5 24.4 12.6 35.7 48.2 50.7South Bihar Plain 15.4 13.0 28.4 1.7 20.6 22.2 17.0 33.5 50.6 43.9Jharkhand 11.1 9.9 21.0 1.7 25.9 27.6 12.8 35.9 48.7 56.8
EducationIlliterate 11.9 13.0 24.9 0.8 19.7 20.5 12.7 32.6 45.3 45.1Literate, < middle school complete 13.4 8.5 21.8 2.3 33.8 36.1 15.7 42.2 57.9 62.3Middle school complete 18.4 7.5 25.9 4.1 32.2 36.3 22.5 39.7 62.2 58.3High school complete and above 15.6 8.9 24.5 4.1 36.1 40.3 19.7 45.0 64.7 62.2
ReligionHindu 12.3 11.5 23.8 1.3 26.0 27.3 13.6 37.5 51.1 53.4Muslim 14.6 14.4 29.0 1.5 7.6 9.1 16.0 22.0 38.0 23.8Christian 16.8 9.5 26.3 3.5 22.4 25.8 20.3 31.8 52.2 49.5Other (9.1) (6.5) (15.7) (2.4) (13.1) (15.5) (11.5) (19.6) (31.1) (49.7)
Caste/tribeScheduled caste 13.6 13.6 27.2 1.3 18.2 19.5 14.8 31.8 46.7 41.8Scheduled tribe 9.7 10.9 20.6 1.4 12.7 14.1 11.1 23:7 34.7 40.6Other backward class 13.2 12.0 25.2 1.4 23.1 24.6 14.7 35.1 49.8 49.4Other 11.4 10.3 21.6 1.3 33.0 34.3 12.7 43.2 55.9 61.3
Standard of living indexLow 13.1 13.8 26.9 0.6 15.8 16.5 13.7 29.7 43.3 38.0Medium 12.6 10.2 22.8 1.5 27.7 29.1 14.1 37.8 51.9 56.1High 10.6 8.4 19.0 4.7 44.1 48.8 15.3 52.5 67.8 72.0
Conld...
118

Table 5.15 Need for family planning services (contd.)
Percentage of currently married women with unmet need, met need, and total demand for family planning (FP) services andpercentage of total demand satisfied, by selected background characteristics, Bihar, 1998-99
Met need (currentlyUnmet need for Fp1 using)2 Total demand for FP
PercentageFor For For For For For of demand
Background characteristic spacing limiting Total spacing limiting Total spacing limiting Total satisfied
Number of living children0 16.0 0.0 16.0 1.1 0.3 1.5 17.1 0.3 17.4 6.41 27.5 1.6 29.1 3.8 2.6 6.4 31.3 4.2 35.5 18.02 17.6 8.2 25.8 2.2 22.0 24.2 19.8 30.2 50.1 48.43 9.4 13.9 23.4 1.0 36.4 37.3 10.4 50.3 60.7 61.54 6.3 17.6 23.9 0.3 40.0 40.3 6.6 57.6 64.2 62.85 3.6 22.0 25.6 0.0 35.3 35.3 3.6 57.3 60.9 58.06+ 2.7 26.4 29.1 0.4 24.9 25.4 3.1 51.3 64.5 46.6
Total 12.6 11.9 24.5 1.4 23.1 24.5 14.0 35.0 49.1 50.0
~ ) Based on 25-49 unweighted casesUnmet need for spacing includes pregnant women whose pregnancy was mistimed, ame-norrhoeic women whose last birth was
mistimed, and women who are neither pregnant nor amenorrhoeic and who are not using any method of family planning and who saythey want to wait two or more years for their next birth. Also included in unmet need for spacing are women who are unsure whetherthey want another child or who want another child but are unsure when to have the birth. Unmet need for limiting refers to pregnantwomen whose pregnancy was unwanted, amenorrhoeic women whose last child was unwanted, and women who are neither pregnantnor amenorrhoeic and who are not using any method of family planning and who want no more children.2Met need for spacing refers to women who are using some method of family planning and say they want to have another child or areundecided whether to have another child. Met need for limiting refers to women who are using some method and who want no morechildren. Note that spacing and limiting refer to the reason for using contraception rather than to the particular method used.
(41-42 percent) than for women in other groups (49-61 percent). Unmet need for familyplanning declines and the percentage of demand satisfied increases steadily with the standard ofliving index.
Unmet need for family planning is lower for women with no children (16 percent) thanfor women with one or more living children (23-29 percent). Among women with no children orone child, unmet need is almost exclusively for spacing, whereas for women with two children32 percent ofnnmet need is for limiting, and for women with three or more children nnmet needis almost exclusively for limiting. For women with no living children, only 8 percent of the totaldemand for family planning is satisfied, and for women with one child, only 18 percent of thedemand is satisfied. The percentage of demand satisfied rises sharply to 48 percent for womenwith two children and 62-63 percent for women with 3-4 children. These results show that thealmost exclusive emphasis of the family planning programme on sterilization fails to meet theneeds of young women who are still in the process of family formation. Many of these womenhave an unmet need for spacing, especially before their first birth and between their first andsecond births.
119

CHAPTER 6
MORTALITY, MORBIDITY, AND IMMUNIZATION
This chapter presents mortality rates, particularly for infants and young children, and data on theprevalence of certain diseases (morbidity). It also presents information on the prevention andtreatment of diseases, especially those that are life-threatening to young children. The chapterends with data on women's knowledge of AIDS. This type of information is relevant both to anassessment of the demographic situation and to the design of appropriate health policies andprogrammes. Mortality estimates are also useful for projecting the future size of the population.Detailed information on mortality and morbidity (by demographic and socioeconomiccharacteristics) can be used to identify population groups that are at high risk and in need ofhealth services. This chapter primarily presents information on child health, while other chaptersof this report, particularly Chapter 8, present information on maternal and reproductive health.
The Government of India has repeatedly taken steps to strengthen maternal and childhealth services in India, starting during the First and Second Five-Year Plans (1951-56 and1956-61) under the Ministry of Health, and continuing with the Minimum Needs Programmeinitiated during the Fifth Five-Year Plan (1974-79). More recently, efforts to improve maternaland child health have been enhanced by activities of the Family Welfare Programme and by theintroduction of the Child Survival and Safe Motherhood Programme (Ministry of Health andFamily Welfare, 1992). The Ministry of Health and Family Welfare has also sponsored specialprojects under the Maternal and Child Health Programme, including the Oral RehydrationTherapy (aRT) programme, the establishment of Regional Institutes of Maternal and ChildHealth in states where infant mortality rates are high, the Universal Immunization Programme,and the Maternal and Child Health Supplemental Programme within the Postpartum Programme(Ministry of Health and Family Welfare, 1992). These programmes are now integrated into theReproductive and Child Health Programme launched in 1996.
Maternal and child health services in rural areas of India are delivered mainly bygovernment-run Primary Health Centres and sub-centres. In urban areas, such services areavailable mainly through government or municipal hospitals, urban health posts, hospitals andnursing homes operated by nongovernmental organizations (NGOs), and private nursing homesand maternity homes.
The second National Family Health Survey (NFHS-2) includes questions on mortalityand morbidity on both the Household Questionnaire and the Woman's Questionnaire. TheHousehold Questionnaire has questions on individuals in the household suffering from asthma,tuberculosis, jaundice, and malaria, plus questions on deaths occurring to usual residents of thehousehold during the past two years. The Woman's Questionnaire collects information on thesurvival status of all births and the age at death of children who died. The Woman'sQuestionnaire also contains questions on child immunization coverage and sources; vitamin Asupplementation for children; prevalence of acute respiratory infection, fever, and diarrhoeaamong children and the treatment of these illnesses; and mothers' knowledge of oral rehydrationtherapy.
PREVIOUS PAGE BlANK -/r9./-

The information on child health and health-care practices was collected from mothers forchildren born since 1 January 1995. If a woman had more than two live births during the threeyears preceding the survey, the information was collected for only the two most recent births.The information on child health presented in this chapter pertains to children born during thethree years preceding the survey.
6.1 Crude Death Rates and Age-Specific Death Rates
Table 6.1 shows crude death rates (CDR) and age-specific death rates by sex for the usualresident (de jure) population of Bihar from NFHS-2 and the Sample Registration System (SRS).The table also presents crude death rates and age-specific death rates from NFHS-1 for the totalpopulation (both sexes combined). The SRS death rates are based on deaths to the usual residentpopulation in 1997. The NFHS-1 and NFHS-2 death rates are based on the average armualnumber of deaths occurring to usual residents of the household during the two-year periodpreceding the .survey (approximately 1991-92 for NFHS-1 and 1997-98 for NFHS-2). Thedenominators for the NFHS-2 death rates are obtained by projecting the number of usualresidents at the time of the survey backwards to the mid-point of the time period in question onthe basis of the intercensal population growth rate in the state. The intercensal growth rate isassumed to be the same for all age and sex groups.
Questions on the number of deaths occurring to usual residents in each household duringa particular time period have been included in demographic surveys in many countries and haveoften resulted in a substantial underreporting of deaths. The Sample Registration System (SRS),maintained by the Office of the Registrar General of India, provides the most useful comparison.The most recent report on mortality estimates by age for Bihar is for 1997 (Office of theRegistrar General, 1999a).
Table 6.1 shows an estimated average annual CDR for Bihar of 11.3 deaths per 1,000population based on NFHS-2 data (covering roughly 1997-98) compared with 10.0 from the1997 SRS. Thus, contrary to expectations, the CDR estimated from NFHS-2 is higher than thecorresponding SRS estimate. NFHS-2 age-specific death rates are also higher than the SRS ratesfor all of the broad age groups above age 5, especially for the 60+ age group. For ages below 5years, the NFHS-2 rate is lower than the SRS rate.
The NFHS-2 CDR estimate of 1I.3 is almost the same as the corresponding NFHS-1estimate of 11.5 (covering roughly 1991-92). The age-specific death rate at age 60 and above ishigher in NFHS-2 than in NFHS-I, but death rates for children less than 15 years of age arelower in NFHS-2 than in NFHS-1. This comparison suggests an increase in death rates at olderages and a decrease in death rates for children in Bihar since 1991-92 if the completeness ofreporting ofdeaths is the same in the two surveys.
In most countries, male death rates are higher than female,death rates at nearly all ages.South Asia generally has been an exception in this respect, with higher death rates for femalesover much of the age span (Tabutin and Willems, 1995; Preston, 1989; Ghosh, 1987). TheNFHS-2 shows that the male CDR is slightly higher than the female CDR, but according to theSRS the reverse is true. The age-specific death rates are also reversed between NFHS-2 and theSRS. According to the NFHS-2, male death rates are higher at younger ages (0--14) and lower atolder ages (50+), but according to the SRS, female death rates are higher at younger ages (0--14)
122

Table 6.1 Age-specific death rates and crude death rates
Age-specific death rates and crude death rates (CDR) by sex from NFHS-l, NFHS-2, and the SRS, Bihar
NFHS-1 (1991-92) NFHS-2 (1997-98) SRS (1997)
Age Total Maie Female Total Male Female Total
<5 28.0 19.3 18.7 19.0 24.8 27.1 25.95-14 3.3 3.1 2.5 2.8 1.8 2.9 2.415-49 4.0 4.6 5.1 4.8 3.7 4.1 3.95Q-59 17.5 16.6 17.7 17.1 16.7 16.4 16.660+ 54.7 69.2 79.6 73.6 58.9 50.7 55.1
CDR 11.5 11.5 11.1 11.3 9.9 10.2 10.0
Note: Age-specific death rates and crude death rates by sex from NFHS-1 and NFHS~2 are based on the annualnumber of deaths reported for the de jure population during the two years preceding the survey. The SRS ratesare also de jure, based on deaths during 1997. Rates are specified on a per-thousand basis.Source for SRS: Office of the Registrar General, 1999b
and lower at older ages (50+). According to both the NFHS-2 and the SRS, female death ratesare slightly higher than male death rates during the reproductive years (15-49).
6.2 Infant and Child Mortality
Infant and child mortality rates reflect a country's level of socioeconomic development andquality of life and are used for monitoring and evaluating population and health programmes andpolicies. NFHS-2 asked all ever-married women age 15-49 to provide a complete history of theirbirths, including for each live birth, the sex, month and year of birth, survival status, and age at thetime of the surveyor age at death. Age at death was recorded in days for children dying in the firstmonth of life, in months for other children dying before their second birthday, and in years forchildren dying at later ages. This information was used to calculate the following direct estimates ofinfant and child mortalityt:
Neonatal mortality:Postneonatal mortality:
Infant mortality (lqO):Child mortality (4ql):
Under-five mortality (sqo):
The probability ofdying in the first month of lifeThe probability of dying after the first month of life butbefore the first birthdayThe probability of dying before the first birthdayThe probability of dying between the first and fifthbirthdaysThe probability of dying before the fifth birthday
'A detailed description ofthe method for calculating the probabilities presented here is given in Rutstein (1984). Themortality estimates are not rates, but are true probabilities, calculated according to the conventional life-tableapproach. Deaths and exposure in any calendar period are first tabulated for the age intervals 0, 1-2,3-5,6-11,1223, 24-35, 36--47, and 48-59 months. Then age-interval-specific probabilities of survival are calculated. Finally,probabilities of mortality for larger age segments are produced by multiplying the relevant age-interval survivalprobabilities together and subtracting the product from one:
"qx=l-n(1-qJi
123

Assessment of Data Quality
The reliability of mortality estimates calculated from retrospective birth histories depends uponthe completeness with which deaths of children are reported and the extent to which birth datesand ages at death are accurately reported and recorded. Estimated rates of infant and childmortality are subject to both sampling and nonsampling errors. While sampling errors for variousmortality estimates are provided in Appendix A, this section describes the results of variouschecks for nonsampling errors-in particular, underreporting of deaths in early childhood (whichwould result in an underestimate of mortality) and misreporting the date of birth or age at death(which could distort the age pattern ofunder-five mortality). Both problems are likely to be morepronounced for children born further in the past than for children born recently. Underreportingof infant deaths is usually most serious for deaths that occur very early in infancy. If deaths inthe early neonatal period are selectively underreported, there will be an abnormally low ratio ofdeaths under seven days to all neonatal deaths and an abnormally low ratio of neonatal to infantmortality. Changes in these ratios over time can be examined to test the hypothesis thatunderreporting of early infant deaths is more common for births that occurred further in the pastthan for births that occurred more recently. Failure to report deaths will result in mortality figuresthat are low and if underreporting is more severe for children born longer ago than for childrenborn recently, any decline in mortality will tend to be understated.
Results from Table B.5 (Appendix B) suggest that early neonatal deaths have not beenseriously underreported in the NFHS-2 results for Bihar, since the ratios of deaths under seven.days to all neonatal deaths are consistently high (between 71 and 78 percent) for the differenttime periods preceding the survey (a ratio of less than 25 percent is often used as a guideline toindicate underreporting ofearly neonatal deaths). The ratios of infant deaths that occurred duringthe neonatal period (Appendix Table B.6) are also consistently high (between 66 and 67 percent)for the different time periods preceding the survey.
Another problem inherent in most retrospective surveys is heaping of age at death oncertain digits, e.g., 6,12, and 18 months. If the net result ofmisreporting is the transference ofdeaths between age segments for which the rates are calculated, misreporting of the age at deathwill bias estimates of the age pattern of mortality. For instance, an overestimate of childmortality relative to infant mortality may result if children dying during the first year of life arereported as having died at age one or older. Thus, heaping at 12 months can bias the mortalityestimates because a certain fraction of these deaths may have actually occurred during infancy(i.e., at ages 0-11 months). In such cases, heaping would bias infant mortality (lqO) downwardand child mortality (4ql) upward.
In the Bihar NFHS-2, there appears to be a slight preference for reporting age at death at1,6, 8, 12, 15,20, and 30 days (Table B.5 in Appendix B). An examination of the distribution ofdeaths under age two years during the 15 years preceding the survey by month of death(Appendix Table B.6) indicates a heaping of deaths at 6, 12, and 18 months of age. The amountof heaping on 12 months is minor, probably due to the strong emphasis on this problem duringthe training of interviewers for NFHS-2 fieldwork2
• This brief assessment of the internalconsistency of NFHS-2 childhood mortality data for Bihar suggests that, although there may be
'Interviewers were trained to probe for the exact number of months lived by the child if the age at death wasreported as 'one year' .
124

some heaping of age at death at certain ages, the heaping is minimal and any resulting bias ininfant and child mortality rates is negligible.
It is seldom possible to establish mortality levels with confidence for a period of morethan 15 years before a survey. Even within the recent IS-year period considered here, apparenttrends in mortality rates should be interpreted with caution for several reasons. First, there maybe differences in the completeness of death reporting related to the length of time before thesurvey. Second, the accuracy of reports of age at death and of date of birth may deteriorate withtime. Third, sampling variability of mortality rates tends to be high, especially for groups withrelatively few births. Fourth, mortality rates are truncated as they go back in time becausewomen currently age 50 or above who were bearing children during earlier periods were notincluded in the survey. This truncation affects mortality trends, in particular. For example, fOr theperiod 10-14 years before the survey, the rates do not include any births for women age 4~9since these women were over age 50 at the time of the survey and not eligible to be interviewed.Since these excluded births to older women were likely to be at a somewhat greater risk of dyingthan births to younger women, the mortality rates for the period may be slightly underestimated.Estimates for more recent periods are less affected by truncation bias since fewer older womenare excluded. The extent of this bias depends on the proportion of births omitted. Table 4.18(Chapter 4) shows that very few of the children born in the five years before NFHS-2 were bornto women age 35 and above. Given the small proportion of births excluded, selection bias forinfant and child mortality statistics as far back as 15 years before the survey should be negligible.
Levels, Trends, and Differentials in Infant and Child Mortality
Table 6.2 and Figure 6.1 present various measures of infant and child mortality by residence forthe three five-year periods preceding the survey. Infant mortality in Bihar declined from 78deaths per 1,000 live births during 1989-94 (5-9 years before the survey) to 73 deaths per 1,000live births during 1994-98 (0-4 years before the survey), an average rate of decline of one infantdeath per 1,000 live births per year. However, when compared with the period 10-14 yearsbefore the survey, the infant mortality rate in Bihar does not show any decline during the past 15years. A comparison of the infant mortality rate for the period 0-4 years before NFHS-2 (73)with the infant mortality rate 0-4 years before NFHS-l (89) suggests a more rapid decline of 16deaths per 1,000 live births over the six years between the two surveys.
Neonatal mortality and child mortality rates presented in Table 6.2 also suggest a veryslow pace ofdecline, and postneonatal mortality shows no decline during the past 15 years. As inthe case of infant mortality, however, a comparison with the corresponding rates derived fromNFHS-l suggests that the declines may have been more rapid than indicated by NFHS-2 dataalone.
Despite the overall decline in infant and child mortality, 1 in every 14 children born inBihar during the five years before NFHS-2 died within the first year of life, and 1 in every 10children died before reaching age five. Clearly child-survival programmes in Bihar need to beintensified to achieve further reductions in infant and child mortality. Overall, 64 percent ofinfant deaths recorded in Bihar during the five-year period before NFHS-2 occurred during thefirst month of life, up slightly from 61 percent for the comparable period before NFHS-l. Thisindicates that the decline in the infant mortality rate in recent years has come disproportionatelyfrom improvement in postneonatal mortality.
125

Table 6.2 Infant and child mortality
Neonatal, postneonatal, infant, child, and under-five mortality rates for five-year periodspreceding the survey by residence, Bihar, 1998-99
Years Neonatal Postneonatal Infant Child Under-fivepreceding mortality mortality1 mortality mortality mortalitythe survey (NN) (PNN) (,q,) (,q,) (,q,)
URBAN
0-4 (32.8) (20.5) (53.3) (15.8) (68.3)5-9 37.6 18.0 55.6 (23.4) 77.710-14 37.3 10.9 48.2 (25.4) 72.4
RURAL
0-4 47.8 27.0 74.8 36.5 108.65-9 53.2 27.0 80.2 42.2 119.110-14 49.4 27.2 76.6 48.8 121.7
TOTAL I
0-4 46.5 26.4 72.9 34.7 105.15-9 51.8 26.2 78.0 40.2 115.110-14 48.1 25.3 73.3 45.9 115.8
Note: The first five-year period preceding the survey does not include the month inwhich the interview took place. Rates are specified on a per-thousand basis. See textfor definition of rates.~ ) Based on 250-499 children surviving to the beginning of the age intervalComputed as the difference between the infant and neonatal mortality rates
Figure 6.1Infant Mortality Rate for Five-Year Periods by Residence
100
9078
80•~
70"in0 6000.
50~"- 40
30
20
10
0Total Urban Rural
• 10-14 years ago • 5-9 years ago • 0-4 years ago
Note: Rates are for five-year periodspreceding the survey
126
NFH&-2, Bihar, 1998-99

Rural mortality rates are considerably higher than urban mortality rates. During the fiveyears preceding the survey, infant mortality is 40 percent higher in rural areas and child mortalityis 131 percent higher in rural areas. Under-five mortality is 59 percent higher in rural areas thanin urban areas.
In both urban and rural areas, child mortality has declined gradually during the 15 yearspreceding the survey. But, neonatal, postneonatal, and infant mortality rates do not show anyconsistent decline during this period in either urban or rural areas. A comparison withcorresponding figures from NFHS-l, however, suggests a considerable decline in both urban andrural areas in all indicators of infant and child mortality during the six and one-half yearsbetween the two surveys.
The estimated NFHS-2 infant mortality rate of 73 deaths per 1,000 live births during1994-98 is in close agreement with the SRS value of70 deaths per 1,000 live births averaged forthe period 1994-98. The NFHS-2 and average SRS estimates of the infant mortality rate for ruraland urban areas over the same period are also in close agreement. For rural areas, NFHS-2estimated the infant mortality rate at 75 deaths per 1,000 live births, compared with the SRSvalue of 71 deaths per 1,000 live births; and for urban areas, NFHS-2 estimated the infantmortality rate at 53 deaths per 1,000 live births, compared with the SRS value of 55 deaths per1,000 live births.
Socioeconomic Differentials in Infant and Child Mortality
The probability of dying in early childhood is higher in some population groups than in others.Table 6.3 presents differentials in infant and child mortality rates for the lO-year periodpreceding the survey by selected background characteristics. Children in rural areas of Biharexperience a 42 percent higher probability of dying before their first birthday and 55 percenthigher probability of dying before their fifth birthday than urban children. Infant and childmortality rates are somewhat lower in the Jharkhand region than in other regions.
All the infant and child mortality rates decline sharply with an increase in education ofmothers, as expected. Infant mortality rate ranges from a high of 82 deaths per 1,000 live birthsfor illiterate mothers to a low of 37 deaths per 1,000 live births for mothers who have at leastcompleted high school. Under-five mortality similarly ranges from a high of 121 for illiteratemothers to a low of 47 for mothers who have at least completed high school.
All the infant and child mortality rates are higher for Hindus than for Muslims. Underfive mortality is 112 death per 1,000 live births for Hindu children and 99 deaths per 1,000 livebirths for Muslim children. At the time ofNFHS-l, by contrast, all the infant and child mortalityrates were higher for Muslims than for Hindus. The sample size for Muslim children is relativelysmall, however. Mortality differentials by religion presumably reflect influences other thanreligion. This is confirmed by a study based on NFHS-l data, which noted that the difference ininfant and child mortality rates between Hindu and Muslim children is reduced considerablywhen other demographic and socioeconomic variables are controlled statistically (Pandey et aI.,1998).
Children whose mothers belong to scheduled castes, scheduled tribes, and otherbackward classes have considerably higher levels of infant and child mortality than do childrenwhose mothers do not belong to any of these groups. As expected, all indicators of infant and
127

Table 6.3 Infant and child mortality by background characteristics
Neonatal, postneonatal, infant, child, and under-five mortality rates for the 10-year period preceding the survey byselected background characteristics, Bihar, 1998-99
Neonatal Postneonatal Infant Child Under-fivemortality mortality1 mortality mortality mortality
Background characteristic (NN) (PNN) (,qo) (.q,) (sqo)
ResidenceUrban 35.3 19.2 54.6 19.8 73.3Rural 50.7 27.0 77.7 39.2 113.9
RegionNorth Bihar Plain 49.6 25.4 75.0 40.2 112.2South Bihar Plain 50.4 29.1 79.5 40.5 116.8Jharkhand 47.1 24.0 71.1 27.1 96.3
Mother's educationIlliterate 53.2 29.0 82.2 42.0 120.8Literate, < middle schoolcomplete 39.2 19.9 59.1 22.1 79.9
Middle school complete (35.5) (10.2) (45.7) (17.0) (61.9)High school complete and above 26.3 10.7 37.0 10.6 47.2
ReligionHindu 49.9 26.5 76.5 38.7 112.2Muslim 46.5 24.8 71.3 29.6 98.7
Caste/tribeScheduled caste 52.8 33.5 86.3 52.0 133.8Scheduled tribe 56.3 25.6 81.9 37.8 116.6Other backward class 51.0 24.3 75.3 34.1 106.8other 37.2 24.0 61.2 29.9 89.3
Standard of liVing indexLow 58.3 31.0 89.3 48.4 133.4Medium 37.9 20.4 58.3 23.4 80.4High 31.2 15.0 46.2 17.2 62.6
Total 49.3 26.3 75.7 37.3 110.2
Note: The 1O-year period preceding the survey does not include the month in which the interview took place. Rates arespecified on a per-thousand basis. See text for definition ohates.~ ) Based o~ 250-499 children surviving to the beginning of the age intervalComputed as the difference between the infant and neonatal mortality rates
child mortality decline substantially with increases in the household standard of living.For example, for children in the households with a high standard of living the infant mortalityrate is 46 deaths per 1,000 live births and the under-five mortality rate is 63 deaths per 1,000 livebirths; the corresponding rates for children in households with a low standard ofliving are abouttwice as high at 89 and 133, respectively. The neonatal and postneonatal mortality rates are alsoabout two times higher and the child mortality rate is almost three times higher in householdswith a low standard of living than in households with a high standard ofliving.
Demographic Differentials in Infant and Child Mortality
This section examines differentials in early childhood mortality by demographic characteristicsof both the child and the mother. Table 6.4 and Figure 6.2 present various indicators of infantand child mortality for the 10 years preceding the survey by sex of the child, mother's age atchildbirth, birth order, length of the previous birth interval, and medical care received by themother during pregnancy, delivery, and the early postpartum period.
128

Table 6.4 Infant and child mortality by demographic characteristics
Neonatal, postneonatal, infant, child, and under-five mortality rates for the 10-year period preceding thesurvey by selected demographic characteristics, Bihar, 1998-99
Neonatal Postneonatal Infant Child Under-fivemortality mortality1 mortality mortality mortality
Demographic characteristic (NN) (PNN) (,QO) (,Q,) (,Qo)
Sex of childMale 51.9 23.6 75.5 31.4 104.6Female 46.6 29.1 75.8 43.6 116.0
Mother's age at birth< 20 65.9 32.2 98.1 33.6 128.520-29 42.8 22.9 65.7 37.3 100.530-39 45.8 27.2 73.0 43.9 113.7
Birth order1 62.9 21.9 84.8 28.1 110.52 44.9 26.2 71.1 32.4 101.23 38.7 20.3 59.0 37.3 94.14+ 48.8 31.8 80.6 45.9 122.8
Previous birth interval< 24 months 68.9 41.1 109.9 59.3 162.724-47 months 36.8 22.5 59.3 34.8 92.148+ months 25.2 16.2 41.4 14.7 55.4
Medical care2
No care 43.7 25.3 69.1 U UOne or two types of care 34.4 18.0 52.4 U U
Birth size3
Large (44.9) (17.7) (62.6) U UAverage 24.2 21.4 45.6 U USmall (81.3" (32.1) (113.4) U U
Note: The 10-year period preceding the survey does not include the month in which the interview tookplace. Rates are specified on a per-thousand basis. See text for definition of rates.U: Not available~ ) Based on 250-499 children surviving to the beginning of the age intervalComputed as the difference between the infant and neonatal mortality rates
2Medical care inclUdes (i) antenatal care received from a health worker, (ii) delivery assistance given by adoctor, nurse, trained midwife, or other health professional, and (iii) postnatal care received in a healthfacility or at home within two months of delivery; rates are for the three-year period preceding the survey.3 Birth size as reported by mother; rates are for the three-year period preceding the survey.
Table 6.4 shows that under-five mortality in Bihar is slightly higher for girls than for<boys. Excess female mortality occurs mainly after the first year of life. The infant mortality rateduring the 10-year period before the survey is about the same for boys and girls (76 deaths per1,000 live births), but the child mortality rate (4qt) is considerably higher for girls (44 deaths per1,000 live births) than for boys (31 deaths per 1,000 live births). This reversal of sex differentialsin mortality with increasing age has been observed in other studies in South Asia and is thoughtto reflect the relative medical and nutritional neglect of the girl-child (Das Gupta, 1987; Basu,1989). Within the first year oflife,neonatal mortality is higher for boys (52 deaths per 1,000 livebirths) than for girls (47 deaths per 1,000 live births), but postneonatal mortality is higher forgirls (29 deaths per 1,000 live births) than for boys (24 deaths per 1,000 live births). This patternof gender differentials in mortality during the first year of life is expected because neonatalmortality (which reflects largely congenital conditions) tends to be higher for boys than girls inmost populations. The male-female differences in the neonatal and postneonatal mortality rates
129

Figure 6.2Infant Mortality Rate by Selected Demographic Characteristics
SEX OF CHILD
Male
Female
MOTHER'S AGE AT BIRTH
<20
20-29
31hl9
BIRTH ORDER
2
3
4+
PREVIOUS BIRTH INTERVAL
< 24 Months
24-:47 Months
48+ Months
98
!!I!!!!I!!!IIIIIIIIIIIIIIIIIIII. 110
o 20 40 60 80
Infant Mortality Rate100 120
Note: Based on births in the 10 yearspreceding the survey (1989-98) NFHS~2, Bihar, 1998-99
in Bihar are, however, unlikely to be significant given the large sampling errors associated withthe different estimates of infant and child mortality (Appendix Table A.2).
For both social and biological reasons, infant mortality rates and child mortality ratesoften exhibit a V-shaped pattern with respect to the mother's age at childbirth, with children ofboth very young and very old mothers experiencing higher mortality rates than children whosemothers are in the prime reproductive ages. Bihar exhibits the expected V-shaped pattern ofmortality by mother's age, with higher infant mortality rate among children of mothers under age20 (98 deaths per 1,000 live births) and children of mothers age 30-39 (73 deaths per 1,000 livebirths) than among children of mothers age 20-29 (66 deaths per 1,000 live births). Similarpatterns are observed for neonatal and postneonatal mortality rates. Infants born to youngmothers are more likely to be of low birth weight, which is probably an important factorcontributing to their higher neonatal mortality rate. Similarly, children born to mothers above age30 are at higher risk than other children of experiencing congenital problems. The V-shapedrelationship is not observed in the case of child mortality. Mortality among children age 1-4years increases steadily with mother's age at childbirth.
Birth order also tends to have a V-shaped relationship to infant deaths, with first birthsand high-order births having elevated mortality rates. In Table 6.4, birth order shows theexpected V-shaped pattern for neonatal, postneonatal, and infant mortality rates, althoughpostneonatal mortality rate is higher for birth order two than for birth order one. This association
130

is likely to reflect not only the effect of birth order but also the effect of the age of the mother atchildbirth. Child mortality tends to increase with birth order, as with mother's age at childbirth.The increase in the child mortality rate with birth order may reflect a more intense competitionfaced by higher birth-order children for the caregiver's time, for medical resources, and fornutritious food once children are weaned. It is also likely that higher birth-order children aredisproportionately from lower socioeconomic groups, where mortality tends to be higher. Underfive mortality, combining infant and child mortality, has a U-shaped relationship with birthorder, as expected.
The timing of successive births has a powerful effect on the survival chances of childrenin Bihar. Infant and child mortality rates decrease as the length of the previous birth intervalincreases and both measures are especially high for children born less than 24 months after aprevious birth. The infant mortality rate is 165 percent higher for children with a preceding birthinterval of less than 24 months than for children with a preceding birth interval of 48 months ormore (110 deaths compared with 41 deaths per 1,000 live births). The previous birth interval hasa similar effect on all other indicators of infant and child mortality as shown in Table 6.4.Although the length of the preceding birth interval is likely to affect mortality risks directly, asubstantial portion of the association between birth intervals and mortality risks may reflect theeffect of factors that are correlated with birth intervals. For example, shorter birth intervals arelikely to occur in large families, and large families tend to come from lower socioeconomicgroups and are more likely than other families to live in rural areas where medical facilities andother survival-enhancing resources are less readily available. Nevertheless, multivariate analysesof birth-interval effects on child survival commonly find an association between short birthintervals (less than 24 months) and increased mortality even after controlling for otherdemographic and socioeconomic characteristics (Retherford et aI., 1989).
Antenatal, delivery, and postnatal care are usually associated with lower infant mortality.Table 6.4 shows thatchildren of mothers who receive one or two types of care have considerablylower risk of neonatal and postneonatal mortality than do children whose mothers receive nomaternity-related medical care. It is not possible to compare the mortality rates for children ofmothers who receive all three types of maternity-related care due to the small number of cases inthat category.
6.3 Morbidity
There is limited experience in collecting morbidity data from population-based demographicsample surveys. NFHS-l collected data on five major morbidity conditions-partial andcomplete blindness, tuberculosis, leprosy, physical impairment of the limbs, and malariaamong all persons in the sampled households. The results were found to be generally plausibleand useful. For this reason, it was decided to include similar morbidity questions in NFHS-2. InNFHS-2, questions on blindness, leprosy, and physical impairment of the limbs were replaced byquestions on asthma and jaundice. The questions on tuberculosis and malaria were retained, anda question on medical treatment of tuberculosis was added to get a better measure of theprevalence of tuberculosis. The household head or other knowledgeable adult in the householdreported morbidity for all household members, and no effort was made to do clinical tests for anyof the disease conditions.
131

Table 6.5 shows the prevalence of asthma, tuberculosis, jaundice, and malaria in thehousehold population by age, sex, and place of residence. There are several reasons why theresults ofNFHS-2 may understate the prevalence ofthese conditions. Diseases carrying a stigma,such as tuberculosis, may be underreported due to intentional concealment by respondents.Underestimation may also occur because the respondents are unaware that they or othermembers of the household have the condition. It is also possible that the respondents know that ahousehold member suffers from a given condition but fail to report it because they do notrecognize the term used by the enumerator to describe the condition. On the other hand, a factorcontributing to a possible overestimation of prevalence without clinical verification is that someother disease can be mistaken by the respondent as one of the listed diseases; for example,chronic bronchitis may be reported as tuberculosis or common flu as malaria.
Asthma
Asthma is a chronic respiratory disease characterized by sudden attacks of laboured breathing,chest constriction, and coughing. There has been a rapid increase in asthma cases in recent yearsin many parts of the world. In Bihar, 2 percent of the population was reported to be sufferingfrom asthma at the time of the survey. The prevalence of asthma is considerably higher in ruralareas (2,103 per 100,000 population) than in urban areas (1,430 per 100,000 population). Theprevalence is slightly lower among males (1,991 per 100,000) than among females (2,067 per100,000). Age differences are marked, with the prevalence of asthma increasing from 477 per100,000 for the 0-14 to 11,149 per 100,000 at age 60 and over.
Tuberculosis
Tuberculosis, which is also resurgent worldwide, is an infectious disease that affects the lungsand other body tissues. Tuberculosis of the lungs, the most commonly known form, ischaracterized by coughing up mucus and sputum, fever, weight loss, and chest pain. In Bihar,about 1 percent of the population was reported to be suffering from tuberculosis at the time ofNFHS-2, up considerably from about 0.6 percent at the time of NFHS-l. The prevalence oftuberculosis is 65 percent higher in rural areas (1,035 per 100,000) than in urban areas (629 per100,000). The prevalence of tuberculosis increases rapidly with age, ranging from 249 per100,000 among persons age 0-14 to 1,372 per 100,000 among persons age 15-59 and 2,651 per100,000 among persons age 60 and above. The prevalence rate is much higher for males (1,170per 100,000) than for females (799 per 100,000). The overall gender differential in theprevalence of tuberculosis in Bihar stems from a large differential in rural areas. In urban areas,the gender differential is negligible. Probable causes for the much higher prevalence oftuberculosis among males than females are that men are more likely than women to come incontact with people who suffer from active tuberculosis and that men in Bihar smoke more thanwomen.
Medically treated tuberculosis is expected to give a more reliable measure of theprevalence of active tuberculosis than a measure based on all reported cases considered in thepreceding paragraph. As expected, the prevalence of medically treated tuberculosis in Bihar isconsiderably lower (833 per 100,000) than the prevalence based on all reported cases (989 per100,000). The prevalence of medically treated tuberculosis reported in NFHS-2 is much higherthan the prevalence of all reported cases in NFHS-l, indicating that the prevalence oftuberculosis may be increasing in Bihar. Differentials in the prevalence of medically treated
132

Table 6.5 Morbidity
Number of persons per 100,000 usual household residents suffering from asthma, tuberculosis, jaundice, or malaria byage, sex, and residence, Bihar, 1998-99
Number of persons per 100,000 suffering from:
Medically Jaundice Malaria Numbertreated during the during the of usual
Age and sex Asthma TUberculosis1 tuberculosis past 12 months past 3 months residents
URBAN
Age< 15 374 184 184 1,395 1,310 1,63815-59 1,438 819 736 1,714 2,262 2,46860+ 9,028 1,784 1,335 897 935 225
SexMale 1,306 621 577 1,786 1,832 2,252Female 1,564 638 538 1,296 1,834 2,078
Total 1,430 629 558 1,551 1,833 4,330
RURAL
Age<15 489 256 200 1,099 3,608 14,33715-59 2,243 1,449 1,212 1,881 4,235 17,77160+ 11,362 2,738 2,420 1,199 5,174 2,231
SexMale 2,079 1,240 1,073 1,946 4,106 17,586Female 2,130 819 653 1,052 3,960 16,753.
Total 2,103 1,035 868 1,510 4,034 34,339
TOTAL
Age<15 477 249 199 1,129 3,373 15,97415-59 2,145 1,372 1,154 1,860 3,994 20,23960+ 11,149 2,651 2,321 1,171 4,786 2,456
SexMale 1,991 1,170 1,017 1,928 3,847 19,838Female 2,067 799 640 1,079 3,725 18,831
Total 2,028 989 833 1,515 3,788 38,669
11ncludes medically treated tuberculosis
tuberculosis by residence, age, and sex are similar to differentials in the prevalence of allreported cases.
Jaundice
Jaundice is characterized by yellowish discolouration of the eyes and skin, fever, liverenlargement, and abdominal pain. NFHS-2 asked household respondents if any member of thehousehold had suffered from jaundice at any time during the 12 months preceding the survey. InBihar, 1,515 persons per 100,000 population were reported to have suffered from jaundice duringthe past 12 months. The prevalence of jaundice was similar in rural (1,510 per 100,000) andurban (1,551 per 100,000) areas. Males were much more likely to have suffered from jaundice(1,928 per 100,000) than females (1,079 per 100,000). The prevalence of jaundice was highest
133

for the age group 15-59 (1,860 per 100,000) followed by the age groups 60 and above (1,171 per100,000) and 0-14 (1,129 per 100,000). Age and sex differentials in the prevalence of jaundiceare similar in the urban and rural areas, except the prevalence in urban areas is higher for personsage 0-14 than for persons age 60 and above.
Malaria
Malaria is characterized by recurrent high fever with shivering. NFHS-2 asked householdrespondents whether any member of their household had suffered from malaria at any timeduring the three months preceding the survey. In Bihar, 3,788 persons per 100,000 populationwere reported to have suffered from malaria during the three months before the survey. Since theprevalence of malaria is known to vary considerably by season, the NFHS-2 estimates should notbe interpreted as representative of the level throughout the year. It is also misleading to comparethis estimate with the much higher NFHS-l estimate because months of the year comprising thereference period for the malaria estimates from the two surveys are different.
Rural residents are more than twice as likely to suffer from malaria (4,034 per 100,000)as are urban residents (1,833 per 100,000). The prevalence of malaria increases steadily with age,from 3,373 per 100,000 in the population age 0-14 to 4,786 per 100,000 in the population age 60and above. The steady increase with age occurs in rural areas but not in urban areas. Theprevalence of malaria is slightly higher among males (3,847 per 100,000) than among females(3,725 per 100,000). This is mainly due to higher malaria prevalence among males than femalesin rural areas. There is no gender differential in malaria prevalence in urban areas.
6.4 Child Immunization
The vaccination of children against six serious but preventable diseases (tuberculosis, diphtheria,pertussis, tetanus, poliomyelitis, and measles) has been a cornerstone of the child health caresystem in India. As part of the National Health Policy, the National Immunization Programme isbeing implemented on a priority basis. The Expanded Programme on Immunization (EPI) wasinitiated by the Government ofIndia in 1978 with the objective of reducing morbidity, mortality,and disabilities from these six diseases by making free vaccination services easily available to alleligible children. Immunization against poliomyelitis was introduced in 1979-80, and tetanustoxoid for school children was added in 1980-81. Immunization against tuberculosis (BCG) wasbrought under the EPI in 1981-82. The latest addition to the Programme was vaccination againstmeasles in 1985-86 (Ministry of Health and Family Welfare, 1991).
The Universal Immunization Programme (UIP) was introduced in 1985-86 with thefollowing objectives: to cover at least 85 percent of all infants against the six vaccineepreventable diseases by 1990 and to achieve self-sufficiency in vaccine production and themanufacture of cold-chain equipment (Ministry of Health and Family Welfare, 1991). Thisscheme has been introduced in every district of the country, and the target now is to achieve 100percent immunization coverage. Pulse Polio Immunization Campaigns began in December 1995as part of a major national effort to eliminate polio. The standard immunization scheduledeveloped for the child immunization programme specifies the age at which each vaccine is to beadministered, the number of doses to be given, and the route of vaccination (intramuscular, oral,or subcutaneous). Vaccinations received by infants and children are usually recorded on avaccination card that is issued for the child.
134

NFHS-2 asked mothers in Bihar whether they had a vaccination card for each child bornsince January 1995. If a card was available, the interviewer was required to copy carefully thedates when the child received vaccinations against each disease. For vaccinations not recordedon the card, the mother's report that the vaccination was or was not given was accepted. If themother could not show a vaccination card, she was asked whether the child had received anyvaccinations. If any vaccination had been received, the mother was asked whether the child hadreceived a vaccination against tuberculosis (BCG); diphtheria, whooping cough (pertussis), andtetanus (DPT); poliomyelitis (polio); and measles. For DPT and polio, information was obtainedon the number of doses of the vaccine given to the child. Mothers were not asked the dates ofvaccinations. To distinguish Polio 0 (polio vaccine given at the time of birth) from Polio 1 (poliovaccine given about six weeks after birth), mothers were also asked whether the first poliovaccine was given just after birth or later3
.
Table 6.6 gives the percentages of urban and rural children age 12-23 months whoreceived specific vaccinations at any time before the interview and before 12 months of age,according to whether a vaccination card was shown to the interviewer or the mother was thesource of all vaccination information. The 12-23 month age group was chosen for analysisbecause both international and Government of India guidelines specify that children should befully immunized by the time they complete their first year of life. Because the date ofvaccination was not asked of the mother if she could not show a vaccination card, for childrenwhose information is based on the mother's report, the proportion of vaccinations given duringthe first year of life is assumed to be the same as the proportion of vaccinations given during thefirst year of life among children with an exact date ofvaccination on the card.
In NFHS-2, children who received BCG, measles, and three doses each ofDPT and polio(excluding Polio 0) are considered to be fully vaccinated. Based on information obtained from acard or reported by the mother ('Either source'), 11 percent of children age 12-23 months arefully vaccinated, and 17 percent have not received any vaccinations. Coverage for BCG, DPT,and polio (except Polio 0) vaccinations is much higher than the percentage fully vaccinated.Thirty-eight percent of children have received BCG, 24 percent of children have received threedoses of DPT, and 41 percent have received,three doses of polio vaccine. More than 70 percenthave received the first and second doses of polio vaccine (see Figure 6.3). Even though the DPTand polio vaccines are normally given together as part of the routine immunization programme,the polio coverage rates are much higher than the DPT coverage rates, undoubtedly because ofthe Pulse Polio Campaigns. Not all childrtm who begin with the DPT and polio vaccination seriesgo on to complete them. The difference between the percentages of children receiving the firstand third doses is 16 percentage points for DPT and 40 percentage points for polio. Only 17percent of children age 12-23 months have been vaccinated against measles. The relatively lowpercentage vaccinated against measles is partly responsible for the fact that the percentage fullyvaccinated is not higher than it is.
'Because mothers sometimes report that the first dose was given just after birth even if it was given several weekslater, an adjustment was made to the estimates of the number of polio vaccinations given, based on reports of thenumber of OPT vaccinations. This adjustment is based on the fact that when children receive a OPT vaccination,they are almost always given a polio vaccination at the same time. Thus, if the number of polio vaccinations wasreported to be less than the number ofOPT vaccinations and the first polio vaccination was reported to be given justafter birth, then Polio 0 was assumed to really be Polio I, Polio I was assumed to be Polio 2, etc. For comparativepurposes, this same adjustment was made to the NFHS-I vaccination estimates.
135

Table 6.6 Childhood vaccinations by source of information
Percentage of children age 12-23 months who received specific vaccinations at any time before the interview and before 12 months of age bysource of information on vaccination history and residence, Bihar, 1998-99
Percentage vaccinated
DPT Polio Numberof
Source of information BeG Polio 0 1 2 3 1 2 3 Measles All' None children
URBANVaccinated at any timebefore the interview
Vaccination card . . • . . . • . . . . 16Mother's report 54.2 5.1 45.7 32.5 22.6 88.2 83.3 45.6 29.6 9.5 10.1 64Either source 63.5 8.1 56.8 46.2 37.0 89.3 85.4 54.0 39.8 22.4 8.1 80
Vaccinated by 12months of age2 57.8 8.1 48.5 42.4 33.7 75.3 75.3 48.4 35.9 19.3 14.5 80
RURALVaccinated at any timebefore the interview
Vaccination card 89.1 10.9 96.4 85.5 66.2 97.1 84.7 68.1 38.5 35.0 0.0 137Mother's report 24.0 1.5 25.9 21.1 14.0 77.1 67.3 33.8 9.3 4.7 21.3 665Either source 35.1 3.1 38.0 32.1 23.0 80.6 70.3 39.7 14.3 9.9 17.7 802
Vaccinated by 12months of age2 28.9 3.1 31.3 25.1 17.2 65.6 54.7 30.1 9.1 5.9 31.6 802
TOTALVaccinated at any timebefore the interview
Vaccination card 90.2 11.9 96.8 87.0 69.1 96.7 85.6 70.1 42.9 39.1 0.0 154Mother's report 26.6 1.8 27.6 22.1 14.8 78.1 68.7 34.8 11.1 5.1 20.3 729Either source 37.7 3.6 39.7 33.4 24.2 81.3 71.7 41.0 16.6 11.0 16.8 882
Vaccinated by 12months of age2 31.4 3.6 32.8 26.6 18.7 66.5 56.6 31.7 11.4 7.0 30.0 882
Note: Table includes only surviving children from among the two most recent births in the three years preceding the survey.*Percentage not shown; based on fewer than 25 unweighted cases1SCG, measles, and three doses each of OPT and polio vaccines (excluding Polio 0)2For children whose information was based on the mother's report, the proportion of vaccinations given by 12 months of age is assumed to bethe same as for children with a written record of vaccination.
The proportion of children fully immunized has remained at II percent since NFHS-1.However, the proportion of children who had received no vaccinations has declined substantiallyfrom 54 percent to 17 percent between the two surveys, indicating that many more children havebeen brought into the programme during recent years. The coverage of BCG and measles hasincreased marginally, but the coverage of DPT has declined between the two surveys. Thecoverage of polio, especially the first two doses, has increased dramatically since NFHS-1,undoubtedly due to the Pulse Polio Campaigns initiated in 1995. The comparative data from thetwo surveys suggest that the child immunization programmes in Bihar are lagging way behindthe expectations and the goal of universal immunization coverage for children has yet to take off.
According to the immunization schedule, all primary vaccinations, including measles,should be completed by the time a child is 12 months old. Table 6.6 shows that only 7 percent ofall children (or 64 percent of fully vaccinated children) were fully vaccinated by age 12 months.Thirty percent of all children did not receive any vaccination by age 12 months. Coverage ofeach type of vaccine was much lower within the recommended first year of life. For example,
136

Figure 6.3Percentage of Children Age 12-23 MonthsWho Have Received Specific Vaccinations
BGG
OPT 1
OPT 2
OPT 3
Polio 1
Polio 2
Polio 3
Measles
All
0 10 20 30 40
Percent
50 60 70 80
81
90
NFHS-2, Bihar, 1998-99
although the measles vaccine is supposed to be given when a child is nine months old, about onethird (31 percent) of all children who were vaccinated against measles received the vaccine aftertheir first birthday.
The analysis of vaccine-specific data indicates much higher coverage for each type ofvaccine in urban areas than in rural areas. Twenty-two percent of children age 12-23 months inurban areas were fully vaccinated at some time before the survey, compared with only 10 percentin rural areas. The proportion fully vaccinated during the first year of life is also higher in urbanareas (19 percent) than in rural areas (6 percent). Consistent with this, dropout rates for DPT andpolio are lower in urban areas than in rural areas. As expected, vaccination coverage is muchhigher for children for whom a vaccination card was shown than for other children.
Table 6.7 and Figure 6.4 present vaccination coverage rates (according to the vaccinationcard or the mother) for children age 12-23 months by selected background characteristics. Thetable also shows the percentage of children with vaccination cards that were shown to theinterviewers. Mothers could show vaccination cards for only 17 percent of children age 12-23months. There has been no change in the percentage of mothers who could show vaccinationcards for children age 12-23 since NFHS-l. Vaccination cards were shown for 20 percent ofchildren in urban areas and 17 percent in rural areas.
137

Table 6.7 Childhood vaccinations by background characteristics
Percentage of children age 12-23 months who received specific vaccinations at any time before the interview (according to the vaccination<4rd or the mother) and percentage with a vaccination card that was shown to the interviewer by selected background characteristics, Bihar,1$98-99
Percentage vaccinated Percent-
DPT Polioageshowing Number
Background vaccinat- ofcharacteristic BeG Polio 0 1 2 3 1 2 3 Measles All' None ion card children
Sex of childMale 39.6 4.0 42.8 36.4 25.8 82.5 74.2 39.8 19.5 13.0 14.8 18.4 457Female 35.7 3.1 36.3 30.0 22.6 80.1 69.0 42.2 13.5 9.0 18.9 16.4 425
Birth order1 43.7 4.4 46.9 40.6 31.6 84.0 75.8 48.1 21.5 13.7 15.0 20.8 2112 41.5 3.5 39.8 35.1 25.4 80.6 71.8 42.6 19.4 14.2 15.8 19.7 2233 40.7 5.8 40.6 33.0 23.9 79.1 68.6 44.2 19.6 12.8 19.6 15.4 1634+ 28.6 1.8 33.8 26.8 18.0 81.3 70.4 32.6 9.1 5.6 17.3 14.3 284
ResidenceUrban 63.5 8.1 56.8 46.2 37.0 89.3 85.4 54.0 39.8 22.4 8.1 20.3 80Rural 35.1 3.1 38.0 32.1 23.0 80.6 70.3 39.7 14.3 9.9 17.7 17.1 802
RegionNorth Bihar Plain 38.6 2.8 42.2 36.5 28.2 92.0 82.0 47.1 16.6 12.6 7.0 19.5 407South Bihar Plain 32.4 4.6 33.4 28.1 20.3 73.7 64.4 35.3 15.7 10.4 23.8 14.9 294Jharkhand 44.4 3.6 44.2 34.9 21.7 69.8 60.1 36.5 18.2 8.8 27.3 16.8 182
Mother's educationIlliterate 27.7 1.8 30.7 25.1 17.3 79.1 69.0 37.7 10.7 7.1 19.4 13.7 887Literate, < middleschool complete 58.0 6.9 54.3 42.0 29.7 85.3 74.0· 39.4 31.2 18.7 13.6 25.5 91
Middle schoolcomplete (67.2) (0.0) (70.1 ) (61.4) (50.3) (85.9) (77.2) (58.0) (26.6) (23.5) (11.3) (26.9) 37
High school completeand above 80.5 15.2 80.3 75.7 60.5 92.6 87.0 60.5 42.2 28.1 2.6 33.1 87
ReligionHindu 40.4 3.7 41.3 35.9 26.7 82.2 72.6 42.1 18.3 12.5 16.3 19.1 714Muslim 25.4 2.6 32.1 21.5 13.5 78.6 67.9 36.3 8.4 4.6 17.6 10.2 160
Caste/tribeScheduled caste 30.7 1.5 32.0 27.3 19.3 76.1 69.0 35.0 13.4 9.5 21.5 14.9 215Scheduled tribe 36.8 2.2 30.6 26.5 12.3 61.9 59.8 32.4 8.0 4.0 38.1 12.1 53Other backward class 36.7 3.0 39.9 33.3 24.5 84.6 73.3 44.2 16.0 11.1 13.5 18.1 459Other 50.9 8.7 52.7 44.2 34.5 85.4 74.4 42.7 25.8 15.3 12.6 20.7 155
Standard of livingindex
Low 25.8 1.3 27.6 22.4 15.5 76.3 66.4 34.7 9.7 6.0 22.1 12.1 498Medium 47.9 4.5 50.8 43.0 31.0 87.0 76.5 48.4 20.4 15.4 11.0 25.0 308Hi9h 76.1 15.4 75.8 67.8 55.5 91.4 86.0 53.7 47.7 27.3 5.8 22.0 74
Total 37.7 3.6 39.7 33.4 24.2 81.3 71.7 41.0 16.6 11.0 16.8 17.4 882
Note: Table includes only surviving children from among the two most recent births in the three years preceding the survey. Total includes 3and 4 children belonging to Christian and 'other' religions, respectively, and 2 children with missing information on the standard of living index,who are not shown separately.~) Based on 25-49 unweighted casesBCG, measles, and three doses each of OPT and polio vaccines (excluding Polio 0)
138
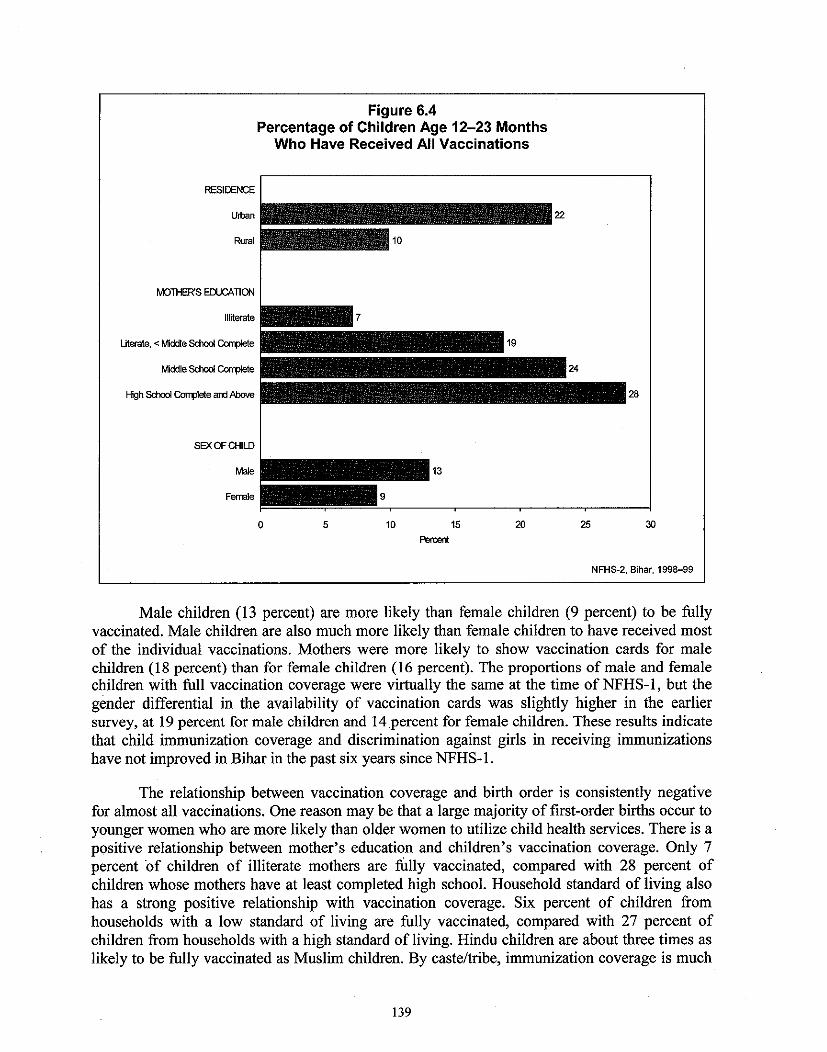
Figure 6.4Percentage of Children Age 12-23 Months
Who Have Received All Vaccinations
RESIDENCE
Uiban
Rural
MOTHER'S EDUCATION
Illiterate
Literate, < fv1iddle School Corrl>Iete
fv1iddle School CorrpIete
High School Corrple<e am MxNe
SEX OF CHILD
Male
Female
o 5 10 15Percent
20 25
28
30
NFHS-2, Bihar, 1998-99
Male children (13 percent) are more likely than female children (9 percent) to be fullyvaccinated. Male children are also much more likely than female children to have received mostof the individual vaccinations. Mothers were more likely to show vaccination cards for malechildren (18 percent) than for female children (16 percent). The proportions of male and femalechildren with full vaccination coverage were virtually the same at the time of NFHS-1, but thegender differential in the availability of vaccination cards was slightly higher in the earliersurvey, at 19 percent for male children and 14 percent for female children. These results indicatethat child immunization coverage and discrimination against girls in receiving immunizationshave not improved in Bihar in the past six years since NFHS-1.
The relationship between vaccination coverage and birth order is consistently negativefor almost all vaccinations. One reason may be that a large majority of first-order births occur toyounger women who are more likely than older women to utilize child health services. There is apositive relationship between mother's education and children's vaccination coverage. Only 7percent 'of children of illiterate mothers are fully vaccinated, compared with 28 percent ofchildren whose mothers have at least completed high school. Household standard of living alsohas a strong positive relationship with vaccination coverage. Six percent of children fromhouseholds with a low standard of living are fully vaccinated, compared with 27 percent ofchildren from households with a high standard of living. Hindu children are about three times aslikely to be fully vaccinated as Muslim children. By caste/tribe, immunization coverage is much
139

Table 6.8 Childhood vaccinations received by 12 months of age
Percentage of children age 12-23 months and 24-35 months with a vaccination card that was shown to the interviewer andpercentage who received specific vaccinations by 12 months of age according to residence and child's current age, Bihar,199B-99
Urban Rural Total
12-23 24-35 12-23 24-35 12-23 24-35Vaccination status months months months months months months
Vaccination cardshown to interviewer 20.3 23.7 17.1 11.4 17.4 12.4
Percentage vaccinatedby 12 months of age1
BCG 57.8 44.0 28.9 18.7 31.4 21.0
Polio 0' 8.1 NC 3.1 2.8 3.6 3.2
DPT1 48.5 41.5 31.3 17.5 32.8 19.52 42.4 36.8 25.1 15.3 26.6 17.13 33.7 27.6 17.2 11.6 18.7 12.9
Polio1 75.3 55.3 65.6 40.3 66.5 42.32 75.3 50.9 54.7 40.0 56.6 41.53 48.4 38.4 30.1 26.2 31.7 27.6
Measles 35.9 44.2 9.1 5.3 11.4 8.1
All vaccinations2 19.3 24.4 5.9 3.7 7.0 5.3
No vaccinations 14.5 47.3 31.6 58.2 30.0 56.7
Number of children 80 70 802 810 882 880
Note: Table includes only surviving children from among the two most recent births in the three years preceding the survey.NC: Not calculated since there was no case with a valid date11nfonnation was obtained either from the vaccination card or from the mother if there was no written record. For childrenwhose infonnation was based on the mother's report, the proportion of vaccinations given by 12 months of age is assumedto be the same as for children with a written record of vaccinations.2BCG, measles, and three doses each of DPT and polio vaccines (excluding POlio 0)
lower among scheduled-tribe children than among other children. Children in the Jharkhandregion are somewhat less likely to be fully vaccinated than children in other regions.
Table 6.8 shows, for children age 12-35 months, the percentage with a vaccination cardthat was shown to the interviewer and the percentage who received specific vaccinations duringthe first year of life by current age of the child and place of residence. The table suggests someimprovement in vaccination coverage over time. For children without a vaccination card, theproportion vaccinated during the first year of life is assumed to be the same as for children with awritten record of vaccinations. The proportion vaccinated during the first year of life is estimatedseparately for children in each age group. The row labelled 'No vaccinations' indicates thepercentage ofchildren who have not received any vaccination by age 12 months.
The proportion of children whose vaccination status was determined from a vaccinationcard declines with the age of children. This may reflect an upward trend in the use of vaccinationcards as well as an upward trend in overall vaccination coverage. It is also possible thatvaccination cards may have been lost or discarded, especially for older children who havereceived all their vaccinations. The proportion of children fully vaccinated by age 12 months,which is very low to begin with, declines slightly from 7 percent for children age 12-23 monthsto 5 percent for children age 24-35 months. A small decline in coverage with increasing
140

Figure 6.5Source of Childhood Vaccinations by Residence
PublicMedicalSector71%
Urban
NGOorTrust Hospitall
Clinic1%
PrivateMedicalSector28%
PublicMedical
Sectoc \
89% \
Rural
NGOorTrust Hospllall
Clinic0.3%
Private__~_Medical-- Sector
11%
OtherSource0.4%
Note: Percents for rural add to more than100.0 due to rounding NFHS-2, Bihar, 1998-99
children's age is also observed for all vaccines in rural areas, but in urban areas coverage formeasles is higher in the older age group.
Table 6.9 and Figure 6.5 give the percent distribution of children under age three yearswho have received any vaccinations by the source of most of the vaccinations, according toselected background characteristics. In Bihar, the public sector is the primary provider ofchildhood vaccinations. Eighty-seven percent of all children who have received any vaccinationsreceived most of them from a public-sector source and only 12 percent received them from aprivate-sector source. The percentage of children receiving vaccinations from the private sectoris considerably lower in rural areas (11 percent) than in urban areas (28 percent), where privatesector services tend to be concentrated. Even in urban areas, however, 71 percent of childrenreceived their vaccinations from the public sector. Children of more educated mothers and thosebelonging to households with a high standard of living are more likely than other children toreceive vaccinations from the private sector. Hindu children are slightly more likely to receivevaccinations from the private sector than Muslim children. Children who belong to scheduledcastes, scheduled tribes, or other backward classes are much less likely than other children toreceive vaccinations from the private sector.
6.5 Vitamin A Supplementation
Vitamin A deficiency is one of the most common nutritional deficiency disorders in the world,affecting more than 250 million children worldwide (Bloem et aI., 1997). The NationalProgramme on Prevention of Blindness targets children under age five years and administers oraldoses of vitamin A every six months starting at age nine months. NFHS-2 asked mothers ofchildren born during the three years before the survey whether their children ever received a doseof vitamin A. Those who said that their child had received at least one dose of vitamin A wereasked how long ago the last dose of vitamin A was given. Table 6.1 0 shows the percentage ofchildren age 12-35 months who received at least one dose of vitamin A and who received a doseof vitamin A within the past six months by selected background characteristics. In the state as a
141

Table 6.9 Source of childhood vaccinations
Percent distribution of children under age 3 who have received any vaccinations by source of most of thevaccinations, according to selected background characteristics, Bihar, 1998-99
Source
NGOorPublic trust Private Numbermedical hospitaV medical Total 01
Background characteristic sector clinic sector Other percent children
Age of child< 12 months 85.9 0.3 13.4 0.3 100.0 62612-23 months 85.8 0.3 13.6 0.4 100.0 73424-35 months 89.1 0.6 10.0 0.3 100.0 730
Sex ofchiJdMale 86.0 0.6 13.0 0.4 100.0 1,072Female 88.0 0.2 11.5 0.3 100.0 1,018
Birth order1 83.1 0.6 18.3 0.0 100.0 5052 83.5 0.7 15.4 0.4 100.0 4713 87.5 0.0 12.2 0.3 100.0 3634+ 91.5 0.3 7.7 0.5 100.0 752
ResidenceUrban 71.2 1.0 27.7 0.0 100.0 205Rural 88.7 0.3 10.6 0.4 100.0 1,885
RegionNorth Bihar Plain 93.3 0.1 6.5 0.1 100.0 1,089South Bihar Plain 81.5 0.7 17.9 0.0 100.0 624Jharkhand 77.7 0.9 19.8 1.6 100.0 377
Mother's educationIlliterate 92.3 0.4 6.9 0.3 100.0 1,528Literate, < middle schoolcomplete 76.0 0.5 22.7 0.9 100.0 222
Middle school complete 83.6 1.1 15.3 0.0 100.0 99High school completeand above 64.4 0.0 35.6 0.0 100.0 240
ReligionHindu 86.7 0.4 12.5 0.4 100.0 1,712Muslim 89.9 0.0 10.1 0.0 100.0 358
CasteltribeScheduled caste 88.9 0.4 10.2 0.4 100.0 452Scheduled tribe 85.0 1.1 13.9 0.0 100.0 101Other backward class 88.6 0.5 10.6 0.4 100.0 1,135Other 80.7 0.0 19.0 0.2 100.0 403
Standard of living indexLow 92.8 0.5 6.4 0.4 100.0 1,121Medium 85.3 0.3 14.0 0.4 100.0 768High 60.5 0.6 38.9 0.0 100.0 197
Total 87.0 0.4 12.3 0.3 100.0 2,090
Note: Table includes only surviving children from among the two most recent births in the three yearspreceding the survey. Total includes 14 and 7 children belonging to Christian and 'other' religions,respectively, and 5 children with missing information on the standard of living index, who are not shownseparately.NGO: Nongovernmental organization
142

Table 6.10 Vitamin A supplementation for children
Percentage of children age. 12-35 months who received at least one dose of vitamin Aand who received at least one dose of vitamin A within the six months preceding thesurvey by selected background characteristics, Bihar, 1998-99
Percentage who received vitamin A
At least one dose Numberwithin past six of
Background characteristic At least one dose months children
Age of child12-23 months 9.2 7.7 88224-35 months 11.2 6.0 880
Sex of childMale 11.1 7.3 895Female 9.2 6.4 868
Birth order1 13.3 9.9 4042 14.7 8.9 4083 9.3 6.3 3054+ 5.7 3.9 646
ResidenceUrban 19.4 14.5 150Rural 9.3 6.1 1.613
RegionNorth Bihar Plain 9.5 6.3 830South Bihar Plain 9.8 5.5 575Jharkhand 12.3 10.2 357
Mother's educationIlliterate 6.2 4.4 1.329Literate, < middle school
complete 14.6 9.7 182Middle school complete 20.7 15.3 72High school complete
and above 31.0 18.2 179
ReligionHindu 11.3 7.8 1,418Muslim 5.1 2.5 324
CasteltribeScheduled caste 8.6 6.3 408Scheduled tribe 5.9 5.9 109Other backward class 10.6 7.0 919Other 12.2 7.4 326
Standard of living indexLow 5.2 3.8 982Medium 14.6 9.3 632High 24.6 16.4 145
Total . 10.2 6.8 1.762
Note: Table includes only surviving children from among the two most recent births inthe three years preceding the survey. Total includes 11 and 10 children belonging toChristian and 'other' religions, respectively, and 3 children with missing infonnation onthe standard of living index, who are not shown separately.
143

whole, only 10 percent of children age 12-35 months received at least one dose of vitamin A,and only 7 percent received a dose within the past six months. This indicates that a large majorityof children in Bihar have not received vitamin A supplementation at all and even fewer childrenreceive vitamin A supplementation regularly.
Table 6.10 shows that children living in urban areas and children living in the Jharkhandregion are considerably more likely than other children to receive vitamin A supplementation.Children of more educated mothers and children from households with a high standard of livingare also much more likely than other children to receive vitamin A. Muslim children are lesslikely than Hindu children to receive vitamin A supplementation, and scheduled-tribe childrenare less likely than other children to receive vitamin A. Children of higher birth orders are muchless likely than children of lower birth orders to receive vitamin A supplementation. In general,children from groups that are less likely to have received at least one dose of vitamin Asupplementation are also less likely to have received a dose in the past six months.
6.6 Child Morbidity and Treatment
This section discusses the prevalence and treatment of acute respiratory infection (ARI), fever,and diarrhoea. Mothers of children born during the three years preceding the survey were askedif their children suffered from cough, fever, or diarrhoea during the past two weeks, and if so, thetype of treatment given. Accuracy of all these measures is affected by the reliability of themother's recall of when the disease episode occurred. The two-week recall period is thought tobe most suitable for ensuring that there will be an adequate number of cases to analyze and thatrecall errors will not be too serious. Table 6.11 shows the percentage of children with coughaccompanied by fast breathing (symptoms of acute respiratory infection), fever, and diarrhoeaduring the two weeks preceding the survey and the percentage with acute respiratory infectionwho received advice or treatment from a health facility or provider, by selected backgroundcharacteristics.
Acute Respiratory Infection
Acute respiratory infection, primarily pneumonia, is a major cause of illness among infants andchildren and the leading cause of childhood mortality throughout the world (Murray and Lopez,1996). Early diagnosis and treatment with antibiotics can prevent a large proportion ofARI/pneumonia deaths. NFHS-2 found that 22 percent of children under age three in Biharsuffered from acute respiratory infection (cough accompanied by short, rapid breathing) at sometime during the two-week period before the survey. A comparison with NFHS-I ARI data is notmeaningful since the two surveys took place at different times of the year and rates of ARI areaffected by the time ofthe year when the measurements are taken.
Table 6.11 shows that there was little variation in the prevalence of ARI by most of thebackground characteristics included in the table. The prevalence levels of ARI are similar forboys and girls and for children living in urban and rural areas. ARI prevalence levels are alsosimilar in the three geographic regions in Bihar. Children of mothers who have at leastcompleted high school had a lower prevalence of ARI than other children. The prevalence ofARI was lower among children from high standard ofliving households (17 percent) than amongchildren from low standard of living households (23 percent). The small variation in theprevalence of ARI by most socioeconomic characteristics indicates that respiratory infectionsaffect children ofall strata in Bihar irrespective of their socioeconomic background.
144

Table 6.11 Prevalence of acute respiratory infection, fever, and diarrhoea
Percentage of children under age 3 who were ill with a cough accompanied by fast breathing (symptoms of acute respiratoryinfection-ARI), fever, or diarrhoea during the two weeks preceding the survey and percentage with ARI who were taken toa health facility or provider, by selected background characteristics, Bihar, 1998-99
Percentage of children suffering in past two weeks from:Percentage
Cough withARI Numberaccompanied Diarrhoea taken to a ofby fast Number health childrenbreathing Any Diarrhoea of facility or with
Background characteristic (ARI) Fever diarrhoea1 with blood children provider ARI
Age of child1-5 months 20.3 23.6 14.0 0.8 532 45.4 1086-11 months 24.6 30.3 23.7 4.0 398 63.3 9812-23 months 23.1 36.4 20.8 3.4 882 60.5 20424-35 months 19.9 30.4 14.1 3.2 880 60.7 175
Sex of childMale 21.8 30.4 17.1 2.7 1,370 62.2 299Female 21.6 31.5 18.3 3.1 1,322 54.1 286
Birth order1 21.9 30.5 17.2 2.3 622 59.9 1362 23.4 32.8 17.3 3.1 598 61.8 1403 21.8 28.7 18.3 1.9 478 56.9 1044+ 20.6 31.3 18.0 3.7 994 55.4 205
ResidenceUrban 21.5 24.1 15.6 3.5 244 63.3 52Rural 21.7 31.7 17.9 2.8 2,448 57.7 532
RegionNorth Bihar Plain 22.4 35.2 19.0 3.1 1,266 59.3 284South Bihar Plain 20.8 26.7 13.4 2.5 872 67.9 181Jharkhand 21.7 28.2 21.5 3.2 554 41.1 120
Mother's educationIlliterate 22.5 32.3 18.5 3.0 2,049 58.5 461Literate, < middle school complete 25.4 31.1 16.9 1.9 267 56.1 68Middle school complete 16.1 19.2 19.7 5.3 115 . 19High school complete and above 14.2 25.8 11.7 1.9 261 (57.5) 37
ReligionHindu 21.1 30.5 17.2 2.8 2,167 57.5 457Muslim 23.4 33.3 19.4 3.5 493 63.1 115
Caste/tribeScheduled caste 25.7 33.4 20.6 3.0 607 54.2 156Scheduled tribe 24.9 31.4 19.3 1.8 178 (39.6) 44Other backward class 19.2 29.1 16.6 3.0 1,413 60.5 272Other 22.8 33.2 16.7 3.1 495 65.6 113
Standard of living indexLow 22.9 32.2 18.3 3.0 1,511 52.5 346Medium 20.9 30.0 17.9 2.9 951 67.3 199High 17.0 26.0 12.4 2.2 226 (63.6) 38
Contd ...
Table 6.11 also shows the percentage of children suffering from AR1 symptoms in thetwo weeks before the survey for whom advice or treatment was sought from a health facility orprovider. Fifty-eight percent of children received some advice or treatment from a health facilityor health provider when ill with ARI. The percentage receiving advice or treatment is relativelylow for children under six months of age, for female children, for rural children, for children in
145

Table 6.11 Prevalence of acute respiratory infection. fever. and diarrhoea (contd,}
Percentage of children under age 3 who were ill with a cough accompanied by fast breathing (symptoms of acute respiratoryinfection-ARI), fever, or diarrhoea during the two weeks preceding the survey and percentage with ARI who were taken toa health facility or provider, by selected background characteristics, Bihar, 1998-99
Percentage of children suffering in past two weeks from:Percentage
Cough withARI Numberaccompanied Diarrhoea taken to a ofby fast Number health childrenbreathing Any Diarrhoea of facility or with
Background characteristic (ARI) Fever diarrhoea1 with blood children provider ARI
Source of drinking waterPiped water 16.3 26.4 13.4 1.7 187 (75.1 ) 31Hand pump 22.6 31.9 18.0 3.1 1.935 58.4 436Well water 21.4 30.1 18.7 2.8 509 54.1 109Surface water (14.6) (17.0) (14.9) (2.3) 42 · 6
Purification of water.2Straining by cloth 24.4 20.2 23.0 5.5 79 · 19Water filter (12.7) (13.0) (6.2) (0.0) 33 • 4Boiling 24.5 24.9 25.3 8.0 80 · 20Nothing 21.7 31.7 17.6 2.8 2.514 58.1 545
Total 21.7 31.0 17.7 2.9 2.692 58.2 585
Note: Table includes only surviving children age 1-35 -months from among the two most recent births in the three yearspreceding the survey. Total includes a small number of children to mothers belonging to Christian and 'other' religions, childrenin households having 'other' sources of drinking water, children in households using alum or electronic water purifiers or 'other'methods to purify water, and children with missing infonnation on the standard of living index, who are not shown separately.( ) Based on 25-49 unweighted cases*P~rcentagenot shown; based on fewer than 25 unwieghted cases11ncludes diarrhoea with blood2Number of children and number of children with ARI sum to more than the respective totals because multiple methods ofpurification of water could be recorded.
the Jharkhand region, for scheduled-tribe children, and for children from low standard of livinghouseholds. Hindu children are somewhat less likely to receive advice or treatment when ill withARI than Muslim children. The likelihood ofreceiving advice or treatment for ARI does not varyby mother's level of education.
Fever
Fever was the most common of the three conditions examined, with 31 percent of childrensuffering from fever during the two weeks before the survey. The prevalence of fever is loweramong children under age six months (24 percent) than among older children (30-36 percent).The prevalence of fever is higher among rural children, children in the North Bihar Plain region,children of less educated mothers, and children from lower standard of living households. Ingeneral, the prevalence of fever does not vary widely or in any predictable direction with most ofthe remaining demographic and socioeconomic characteristics. As with acute respiratoryinfection, fever tends to affect young children irrespective of their demographic andsocioeconomic background.
Diarrhoea
Diarrhoea is the second most important killer of children under age five worldwide, followingacute respiratory infection. Deaths from acute diarrhoea are most often caused by dehydrationdue to loss of water and electrolytes. Nearly all dehydration-related deaths can be prevented by
146

prompt administration of rehydration solutions. Because deaths from diarrhoea are a significantproportion of all child deaths, the Government of India has launched the Oral RehydrationTherapy Programme as one of its priority activities for child survival. One major goal of thisprogramme is to increase awareness among mothers and communities about the causes andtreatment of diarrhoea. Oral rehydration salt (ORS) packets are made widely available andmothers are taught how to use them. NFHS-2 asked mothers of children born during the pastthree years a series of questions about episodes of diarrhoea suffered by their children in the twoweeks before the survey, including questions on feeding practices during diarrhoea and treatmentof diarrhoea, and about their knowledge and use of ORS.
Table 6.11 shows that 18 percent of children under age three suffered from diarrhoea inthe two-week period before the interview. There are seasonal variations in the prevalence ofdiarrhoea, however, so that the percentages shown in Table 6.11 cannot be assumed to reflect thesituation throughout the year.
Among children age 1-35 months, those in the middle age groups (6-23 months old)were more likely to have suffered from diarrhoea than either younger (0-5 months old) or older(24-35 months old) children. The prevalence of diarrhoea was about the same among boys (17percent) and girls (18 percent). Differentials by birth order, place of residence, mother'seducation, religion, and caste/tribe membership were small with one exception: Children whosemothers have at least a high school education were less likely to suffer from diarrhoea than werechildren of mothers in other education categories. Children in the South Bihar Plain region wereless likely to suffer from diarrhoea than were children in the other two regions of Bihar. Asexpected, children in households with a high standard of living were less likely than otherchildren to have suffered from diarrhoea. Also consistent with expectations, diarrhoea wassomewhat less common among children living in households that use piped water for drinking(13 percent) than among children in households that use hand pumps (18 percent) or wells (19percent) for drinking water.
About 16 percent of children who suffered from diarrhoea in Bihar during the two weekspreceding NFHS-2 suffered from diarrhoea with blood, a symptom of dysentery. Children underage six months had a much lower prevalence ofdiarrhoea with blood (0.8 percent) than did olderchildren (3--4 percent). Children living in urban areas, children of birth order four or higher, andMuslim children all have slightly elevated risks of bloody diarrhoea. Unexpectedly, theprevalence of bloody diarrhoea is noticeably higher among children of mothers who havecompleted middle school but not any higher level of education and among children living inhouseholds that purify water by boiling or straining with a cloth. This may be due to smallnumbers of cases in these categories.
Table 6.12 shows that 38 percent of mothers with births during the three years precedingthe survey know about ORS packets. The knowledge of ORS packets among mothers has notimproved much in Bihar since NFHS-l, when 37 percent of mothers with births during the threeyears preceding the survey had reported knowledge of ORS packets. Knowledge of ORS packetsis highest for mothers age 20-24. As expected, knowledge is considerably higher among urbanmothers than among rural mothers, and higher among literate mothers than among illiteratemothers. Knowledge is slightly higher in the Jharkhand region than in the other two regions.Knowledge ofORS is about the same among Hindu mothers and Muslim mothers. Knowledge ofORS packets is much lower among mothers who are not regularly exposed to any mass mediathan among mothers who are regularly exposed to some media. By caste/tribe, knowledge ranges
147

Table 6.12 Knowledge of diarrhoea care
Among mothers with births during the three years preceding the survey, percentage who know about oral rehydration salt (ORS)packets, percent distribution by quantity to be given to drink during diarrhoea, and percentage who know two or more signs ofdiarrhoea that indicate the need for medical treatment by selected background characteristics, Bihar, 1998-99
Percentagewho knowtwo or more
Percentage Reported quantity to be given to drink signs forwho know medical' Numberabout ORS Don't know! Total treatment of of
Background characteristic packets Less Same More missing percent diarrhoea1 mothers
Age15-19 34.8 38.7 25.0 20.6 15.8 100.0 49.9 3382Q....24 42.1 30.8 25.5 30.6 13.2 100.0 50.3 92425-29 35.1 31.7 25.4 27.1 15.8 100.0 52.5 7653Q....34 33.7 31.1 22.8 29.6 16.5 100.0 46.8 38535-49 37.1 31.2 22.5 24.4 21.8 100.0 40.9 225
ResidenceUrban 63.1 28.7 26.4 36.0 8.8 100.0 54.1 227Rural 35.1 32.4 24.6 26.9 16.1 100.0 49.2 2,411
RegionNorth Bihar Plain 35.5 37.6 23.8 24.1 14.5 100.0 52.9 1,229South Bihar Plain 37.9 24.9 22.3 32.2 20.6 100.0 46.3 869Jharkhand 41.4 31.2 30.8 28.3 9.7 100.0 47.2 539
EducationIlliterate 30.2 34.6 24.7 23.3 17.4 100.0 48.3 2,036Literate, < middle school complete 50.9 29.7 18.7 40.2 11.5 100.0 50.5 253Middle school complete 58.1 20.0 33.2 35.5 11.3 100.0 50.8 110High school complete and above 75.6 19.0 27.7 48.2 5.0 100.0 58.6 239
ReligionHindu 37.6 30.9 25.1 28.1 16.0 100.0 50.0 2,126Muslim 36.7 37.5 22.0 26.2 14.3 100.0 47.5 479
casteftribeScheduled caste 30.0 34.3 24.3 23.2 18.3 100.0 46.9 594Scheduled tribe 25.5 33.5 32.4 19.6 14.5 100.0 50.0 184Other backward class 38.0 32.6 24.3 28.0 15.1 100.0 50.1 1,386Other 50.1 27.6 23.6 35.3 13.5 100.0 51.1 474
Exposure to mediaExposed to any media 60.5 27.8 23.6 38.8 9.8 100.0 51.9 678Watches television weekly 64.9 25.9 25.6 40.5 8.0 100.0 53.5 379Listens to radio weekly 61.0 28.2 24.4 37.6 9.8 100.0 53.1 530Visits cinema/theatre monthly 62.3 27.3 29.2 37.0 6.5 100.0 48.6 107Reads newspaper/magazineweekly 71.6 15.8 28.4 49.5 6.4 100.0 53.8 218
Not regularly exposed to anymedia 29.5 '33.6 25.1 23.8 17.5 100.0 48.8 1,960
Total 37.5 32.1 24.7 27.6 15.5 100.0 49.6 2,638
Note: Total includes 17 and 15 women belonging to Christian and 'other' religions, respectively, who are not shown separately.1percentage who know two or more signs of illness that indicate that a child should be taken to a health· facility or health worker
from a low of 26 percent among scheduled-tribe mothers to a high of 50 percent among motherswho do not belong to a scheduled caste, scheduled tribe, or other backward class. Mothersbelonging to scheduled tribes are less likely to know about ORS than mothers with any otherbackground characteristics.
148

In order to assess mothers' knowledge of children's need for extra fluids during episodesof diarrhoea, all mothers of children born in the past three years were asked: 'When a child issick with diarrhoea, should he/she be given less to drink than usual, about the same, or more thanusual?' Table 6.12 shows the response of mothers to this question by selected backgroundcharacteristics. In Bihar, only 28 percent of mothers report that children should be given more todrink than usual during an episode of diarrhoea and, contrary to the standard recommendation,32 percent report that children should be given less to drink. This suggests that mothers in Biharneed much more education in the proper management of diarrhoea. The proportion reportingcorrectly that children with diarrhoea should be given more to drink is particularly low amongrural mothers, mothers in the North Bihar Plain region, illiterate mothers, mothers belonging to ascheduled tribe or scheduled caste, and mothers not regularly exposed to any mass media.Mothers age 15-19 and 35-49 are also less likely to know that children with diarrhoea should begiven extra fluids when ill with diarrhoea than are mothers age 20-34.
To assess whether mothers are aware of one or more signs associated with diarrhoeawhich suggest the need for medical treatment, mothers were also asked: 'When a child is sickwith diarrhoea, what signs of illness would tell you that he or she should be taken to a healthfacility or health worker?' All answers given by the respondent were recorded. The signswarranting medical treatment include repeated watery stools, repeated vomiting, blood in thestools, fever, marked thirst, not eating or not drinking well, getting sicker or very sick, and notgetting better. Table 6.12 shows that 50 percent of women were able to name two or more signsof diarrhoea that indicate that a child with diarrhoea should be given medical treatment.Knowledge of danger signs of diarrhoea does not vary much by any of the demographic orsocioeconomic background characteristics included in Table 6.12. Women age 35-49 havenoticeably lower knowledge of two or more signs of diarrhoea requiring medical treatment thanwomen age 15-34. Education level has some positive association with knowledge of two ormore danger signs of diarrhoea, but exposure to mass media has virtually no effect. Thesefindings suggest a need for further educating mothers with regard to children's diarrhoea so thatthey are better able to recognize the signs of diarrhoea for which a health provider should beconsulted.
Table 6.13 shows the percentage of children under age three who had diarrhoea duringthe two weeks preceding NFHS-2 for whom advice or treatment was sought from a healthfacility or health provider, the percentage who received various types of oral rehydration therapy(ORT), and the percentage who received other types of treatment, by selected backgroundcharacteristics. Medical advice or treatment was sought for 50 percent of children in Bihar whosuffered from diarrhoea during the two weeks preceding the survey. Thirty-nine percent ofchildren with diarrhoea did not receive any treatment at all. Children in the Jharkhand regionwere much less likely to receive medical advice or treatment when sick with diarrhoea thanchildren in the other two regions. Urban children and scheduled-tribe children were also muchless likely to receive medical advice or treatment than other children, but these figures are basedon small numbers ofcases and should be viewed with caution. The likelihood of seeking medicaladvice or treatment does not vary much by other demographic or socioeconomic backgroundcharacteristics.
149
-

~
'-"o
Table 6.13 Treatment of diarrhoea
Among children under age 3 who had diarrhoea during the two weeks preceding the survey, percentage taken to a health facility or provider, percentage who received various types of oral rehydrationtherapy (ORT), and percentage who received other treatments by selected background characteristics, Bihar, 1998-99
Oral rehydration Other treatmentNumber
Taken to Oral Homemade Intra- Home ofa health rehydration sugar-salt~ venous remedy! No childrenfacility or salt (ORS) water Increased ORTnot Pill or (IV/drip/ herbal treatM with
Background characteristic provider packets Gruel solution fluids given syrup Injection bottle) medicine ment diarrhoea
Age of child1-11 months 43.5 10.0 7.6 2.4 18.0 73.6 35.2 20.9 8.1 4.9 48.4 16912-23 months 54.0 18.4 20.8 0.5 27.1 49.9 45.8 21.8 3.4 2.8 32.8 18424-35 months 54.1 18.3 22.0 4.0 31.2 52.5 47.4 29.3 7.1 5.5 34.5 125
Sex of childMale 49.8 16.8 18.1 2.5 22.6 58.8 41.0 20.2 5.5 3.5 39.6 234Female 50.7 14.1 14.9 1.7 27.3 59.1 43.8 26.5 6.6 4.9 38.0 242
ResidenceUrban (38.9) (28.1) (19.5) (2.6) (27.2) (50.1) (33.0) (14.0) (2.8) (2.8) (44.5) 38Rural 51.3 14.3 16.2 2.0 24.8 59.7 43.3 24.2 6.3 4.3 38.3 439
RegionNorth Bihar Plain 56.7 14.0 10.4 2.8 20.3 68.5 54.6 30.8 6.3 3.6 35.0 240South Bihar Plain 54.2 13.3 23.3 1.8 28.6 51.6 41.4 27.6 8.9 3.5 36.0 117Jharkhand 33.5 20.4 22.1 0.9 30.8 47.0 18.9 4.4 2.6 6.2 49.2 119
Mother's educationIlliterate 50.5 13.8 15.3 2.6 24.5 60.9 42.4 23.6 6.8 4.8 38.6 378Literate, < middle school complete (50.3) (21.7) (13.7) (0.0) (27.1) (51.1) (40.8) (28.0) (2.3) (2.3) (38.8) 45High school complete and above (47.2) (20.2) (26.7) (0.0) (36.6) . (43.0) (46.5) (23.8) (6.8) (0.0) (39.9) 31
ReligionHindu 49.8 16.5 16.5 1.8 22.5 60.0 41.3 22.5 6.4 4.6 39.9 372Muslim 54.4 12.7 17.8 3.3 33.6 54.5 49.7 29.1 5.3 3.2 30.0 96
Caste/tribeScheduled caste 49.5 12.5 15.1 1.5 19.6 62.3 40.2 20.7 4.0 1.6 41.3 125Scheduled tribe (18.7) (12.9) (15.3) (3.2) (31.6) (52.7) (8.7) (5.7) (3.0) (9.4) (60.1) 34Other backward class 54.6 16.0 15.7 1.6 24.5 60.1 47.1 25.5 6.6 5.0 37.1 235Other 52.3 19.3 21.2 3.8 31.8 53.4 46.6 29.1 8.5 3.8 30.8 83
Standard of living indexLow 47.0 11.1 14.6 2.5 21.0 65.2 40.2 21.6 5.2 3.6 39.7 277Medium 54.5 21.1 18.2 1.7 31.7 50.0 46.5 26.4 7.3 5.3 36.5 170High (54.0) (24.9) (25.9) (0.0) (25.2) (49.1) (42.4) (24.6) (7.4) (3.8) (39.1) 28
Total 50.3 15.4 16.5 2.1 25.0 59.0 42.4 23.4 6.0 4.2 38.8 477
Note: Table includes only surviving children age 1-35 months from among the two most recent births in the three years preceding the survey. Total includes 23 children whose mother's education is middleschool complete, 3 and 5 children belonging to Christian and 'other' religions, respectively, and 2 children with missing information on the standard of living index, who are not shown separately.( ) Based on 25-49 unweighted cases

Fifteen percent of the children age 1-35 months who suffered from diarrhoea during thetwo weeks preceding the survey were treated with a solution made from ORS packets. This is upfrom 12 percent in NFHS-l, indicating a slight improvement in the use ofORS packets in Biharfor the treatment of childhood diarrhoea.
The proportion of children who did not receive any of the various types of oralrehydration therapy (ORT) when sick with diarrhoea declined from 70 percent in NFHS-l to 59percent in NFHS-2, again suggesting improvements in the management of childhood diarrhoeain the state. Only 25 percent received increased fluids when sick with diarrhoea, and only 17percent received gruel.
The use of antibiotics and other antidiarrhoeal drugs is not generally recommended forthe treatment of childhood diarrhoea. Yet, 42 percent of children who had diarrhoea in the twoweeks before NFHS-2 were treated with pills or syrup, and 23 percent received an injection.These figures indicate poor knowledge about the proper treatment of diarrhoea not only amongmothers but also among health-care providers. They underscore the need for informationalprogrammes for mothers and supplemental training for health-care providers that emphasizes theimportance of ORT, increased fluid intake, and continued feeding during bouts of childhooddiarrhoea and discouraging the use of drugs.
Children less than one-year old, children living in rural areas, children in the North BiharPlain region, children of illiterate mothers, Hindu children, children belonging to a scheduledcaste or other backward class, and children from low standard of living households are less likelythan other children to receive any of the various types of oral rehydration therapy. The use ofunnecessary drugs or injections is substantially higher for rural children than for urban children,in the North Bihar Plain and South Bihar Plain regions than in the Jharkhand region, for Muslimchildren than for Hindu children, and for children whose mothers do not belong to a scheduledcaste, scheduled tribe, or other backward class. The use of drugs or injections is lowest amongscheduled-tribe children.
Table 6.14 shows the percent distribution of children who were treated with ORS fordiarrhoea in the two weeks before NFHS-2 by source ofthe ORS packets. Only 74 children weretreated with ORS packets in the Bihar sample, so the results in this table should be interpretedwith caution. For 18 percent of children who were treated with ORS, the packets were obtainedfrom public-sector sources, for 28 percent the packets were obtained from private-sector medicalsources, and for the remaining 54 percent the packets were obtained from other sources. Amongthe public-sector sources, ORS packets were most often obtained from government or municipalhospitals, followed by sub-centres. Among private-sector sources, ORS packets were most oftenobtained from a private doctor, followed by a private hospital or clinic or a pharmacy ordrugstore. The pharmacy or drugstore category, listed under private-sector sources, accounts for4 percent of all cases. If the pharmacy/drugstore category is added to the shop category, theproportion purchasing ORS packets from shops, pharmacies, or drugstores becomes 42 percent.
151

Table 6.14 Source of DRS packets
Among children under age 3 who were treated with a solution made from oralrehydration salt (DRS) packets for diarrhoea in the two weeks preceding thesurvey, percent distribution of children by source of DRS packets, Bihar,1998-99
Source Percent
Public medical sector 18.2GovernmenUmunicipal hospital 10.8UHC/UHP/UFWC 1.5Sub-centre 4.4Other public medical sector 1.5
Private medical sector 28.1Private hospital/clinic 5.5Private doctor 14.2Private paramedic 1.3Pharmacy/drugstore 4.3Other private medical sector 2.8
Other source 53.7Shop 38.1Husband 15.6
Total percent 100.0
Number of children treated withQRS 74
Note: Table includes only surviving children age 1-35 months from among thetwo most recent births in the three years preceding the survey. Table excludeschildren with missing information on source of DRS packets.UHC: Urban health centre; UHP: Urban health post; UFWC: Urban familywelfare centre
6.7 HIV/AIDS
Acquired Immune Deficiency Syndrome (AIDS) is an illness caused by the HumanImmunodeficiency Virus (HIV), which weakens the immune system and leads to death throughsecondary infections such as tuberculosis or pneumonia. The virus is generally transmittedthrough sexual contact, through the placenta of HIV-infected women to their unborn children, orthrough contact with contaminated needles (injections) or blood. HIV and AIDS prevalence inIndia have been on the rise for more than a decade and have reached alarming proportions inrecent years. The Government of India established a National AIDS Control Organization(NACO) under the Ministry of Health and Family Welfare in 1989 to deal with the epidemic.Since then there have been various efforts to prevent HIV transmission, such as public healtheducation through the media and the activities of many nongovernmental organizations (NGOs).
NFHS-2 included a set of questions on knowledge of AIDS and AIDS prevention. Evermarried women age 15-49 were first asked if they had ever heard of an illness called AIDS.Respondents who had heard of AIDS were asked further questions about their sources ofinformation on AIDS, whether they believe that AIDS is preventable, and if so, whatprecautions, if any, a person can take to avoid infection.
152

Knowledge of AIDS
Table 6.15 shows the percentage of women who have heard about AIDS by backgroundcharacteristics. Eighty-eight percent of women in Bihar have never heard of AIDS. NFHS-I didnot include AIDS-awareness questions for Bihar so it is not possible to assess any trend in AIDSawareness between NFHS-I and NFHS-2.
Knowledge of AIDS varies little by women's age. Urban residence, education, andhousehold standard of living have a strong positive association with AIDS knowledge. Forty-twopercent of urban women in Bihar have heard about AIDS, compared with only 8 percent of ruralwomen. Knowledge of AIDS increases from only 3 percent among illiterate women to 66percent among women who have at least completed high schoo!' Similarly, knowledge of AIDSincreases from only 3 percent among women in households with a low standard of living to 52percent among women in households with a high standard of living. Christian women are morelikely to know about AIDS (30 percent) than other women (7-12 percent). Knowledge of AIDSis much lower among women belonging to a scheduled tribe, scheduled caste, or other backwardclass (4-10 percent) than among other women (26 percent). Exposure to mass media increaseswomen's knowledge about AIDS substantially. Sixty-two percent of women who read anewspaper or magazine at least once a week know about AIDS compared with just 2 percent ofwomen who are not regularly exposed to any mass media (newspapers, magazines, radio,television, cinema, or theatre).
Source of Knowledge About AIDS
As part of its AIDS prevention programme, the Government of India has been using mass mediaextensively, especially the electronic media, to create awareness among the general public aboutAIDS and its prevention. NFHS-2 asked women who had heard of AIDS about their sources ofAIDS information. Table 6.15 shows the percentage of ever-married women who have heardabout AIDS from specific sources by background characteristics. Television is the mostimportant source of information about AIDS among ever-married women in Bihar. Eighty-threepercent of women who have heard about AIDS report television as a source of their informationabout AIDS, followed by radio (55 percent), newspapers/magazines (22 percent), and cinema (14percent). Only I percent of women report that they received information about AIDS from ahealth worker.
Television is the most important source of information about AIDS in both rural andurban areas, followed by the radio. Urban women are more likely than rural women to havelearned about AIDS from television, cinema, or a newspaper or magazine. On the other hand,urban women are less likely than rural women to have learned about AIDS from the radio orfrom friends or relatives. More-educated women are more likely than less-educated women tohave learned about AIDS from the radio, television, newspaper or magazine, cinema, or a posteror hoarding, but are less likely to have learned about AIDS from a friend or relative. Hinduwomen are more likely than Muslim women to have learned about AIDS from the radio, from anewspaper or magazine, or from a friend or relative, but are less likely to have learned aboutAIDS from television.
153

¥.'
Table 6.15 Source of knowledge about AIDS
Percentage of ever-married women who have heard about AIDS and among women who have heard about AIDS, percentage who received information from specific sources by selected backgroundcharacteristics, Bihar, 1998-99
NumberAmong those who have heard about AIDS, percentage who received information from: of women
Percentage who havewho have Number Adult heardheard about of Newspaper! Posterl Health education Friend! School Other about
Background characteristic AIDS women- Radio Television Cinema magazine hoarding worker programme relative teacher source AIDS
,
Age15-24 11.4 2,244 57,5 80.8 12.1 18.7 2.1 0.8 0.0 16.8 0.4 1.7 25625--34 13.3 2,507 58.2 83.6 17.8 26.5 4.0 1.2 0.3 16.6 1.6 4.2 33435-49 10.2 2,274 48.9 84.3 9.8 19.5 2.2 1.8 0.9 15.8 0.9 3.5 231
ResidenceUrban 42.0 718 51.1 93.7 17.8 30.1 3.9 0.7 0.4 11.2 0.3 2.4 301Rural 8.2 6,306 57.8 76.7 11.4 17.4 2.3 1.6 0.4 19.5 1.5 3.7 520
RegionNorth Bihar Plain 9.6 3,133 63.5 84.2 11.8 21.6 3.8 1.0 0.3 18.1 0.0 4.8 301South Bihar Plain 11.8 2,199 52.1 81.1 11.7 16.6 1.7 2.0 0.8 16.5 2.5 2.5 260Jharkhand 15.4 1,692 49.2 83.3 18.0 28.1 3.0 0.8 0.0 14.4 0.8 2.1 260
EducationIlliterate 2.9 5,383 47.9 71.1 8.2 1.3 0.6 2.1 0.0 19.5 2.8 3.2 155Literate, < middle school complete 21.5 779 50.6 80.0 8.5 10.5 1.9 0.6 0.0 15.9 0.0 1.3 168Middle school complete 40.5 267 53.6 82.8 15.2 22.0 0.0 0.0 0.0 13.2 0.0 1.8 108High school complete and above 65.6 595 60.9 88.9 17.8 35.4 5.0 1.5 0.8 16.3 1.1 4.4 390
ReligionHindu 12.4 5,872 56.1 82.5 13.7 22.2 3.1 1.4 0.3 17.3 1.2 3.1 726Muslim 6.9 1,038 46.5 86.4 14.7 16.0 0.0 0.0 1.5 8.4 0.0 1.4 72Christian 30.4 59 · · • • · · · · • • 18Other 9.5 55 • • · • · • · · · · 5
Caste/tribeScheduled caste 7.0 1,452 41.2 77.7 9.7 11.4 6.2 0.0 0.0 18.5 2.2 3.1 102Scheduled tribe 4.3 582 • · · • · • • · · · 25Other backward class 9.5 3,842 53.7 81.1 13.9 19.7 2.4 0.9 0.6 16.4 1.9 3.0 345Other 25.9 1,348 59.8 87.5 14.8 26.9 2.6 1.5 0.3 15.7 0.0 2.5 349
Gontd...

-::!:
Table 6.15 Source of knowledge about AIDS (eonld.)
Percentage of ever-married women who have heard about AIDS and among women who have heard about AIDS. percentage who received information from specific sources by selected backgroundcharacteristics, Bihar, 1998-99
NumberAmong those who have heard about AIDS, percentage who received in(ormation from: of women
Percentage who havewho have Number Adult heardheard about of Newspaper! Poster! Health education Friendl School Other about
Background characteristic AIDS women Radio Television Cinema magazine hoarding worker programme relative teacher source AIDS
Standard of living indexLow 2.5 3,709 39.7 57.5 4.5 6.5 1.0 1.2 0.0 25.0 2.3 4.4 94Medium 13.7 2,595 56.5 77.7 14.9 15.9 1.7 1.7 0.3 15.9 1.2 2.6 357High 51.8 712 58.2 94.3 14.8 32.1 4.5 0.9 0.6 14.9 0.6 3.5 369
Exposure to mass mediaExposed. to any media 36.8 1,915 57.3 88.3 15.1 24.8 3.2 1.0 0.4 13.1 0.8 3.2 705
Listens to radio weekly 36.5 1,428 71.0 87.5 15.3 27.0 2.7 0.9 0.6 12.3 0.6 3.4 521Watches television weekly 49.2 1,177 53.3 97.1 16.2 24.4 3.4 1.0 0.5 11.8 0.8 3.1 579Goes to cinema/theatre monthly 52.1 309 63.9 95.7 33.3 29.2 3.1 0.0 0.7 5.6 0.7 3.0 161Reads newspaper/magazineweekly 62.1 652 60.4 89.9 18.7 35.7 4.3 1.0 0.7 13.2 1.1 3.5 405
Not regularly exposed to anymedia 2.3 5,109 43.5 50.4 5.5 5.4 0.8 2.7 0.0 36.5 2.8 3.5 116
Total 11.7 7,024 55.4 82.9 13.8 22.1 2.9 1.2 0.4 16.4 1.1 3.2 821
Note: Total includes a small number women with missing infonnation on the standard of liVing index, who are not shown separately.*Percentage not shown; based on fewer than 25 unweighted cases

Women in households with a high standard ofliving are more likely than other women tohave learned about AIDS from the mass media, but are less likely to have learned about AIDSfrom a friend or relative. Not surprisingly, a considerable proportion (37 percent) of women whoare not regularly exposed to any media have learned about AIDS from a friend or relative, buteven among this group 50 percent have heard about AIDS from television and 44 percent fromthe radio.
Knowledge of Ways to Avoid AIDS
Respondents who had heard of AIDS were asked if a person could do anything to avoidbecoming infected. Those who reported that something could be done were asked what a personcould do to avoid AIDS. Table 6.16 shows the percentage of ever-married women who know ofno way to avoidAIDS and the percentage who report that AIDS can be avoided in specific ways,by selected background characteristics.
Among women who have heard about AIDS, 50 percent do not know any way to avoidinfection. As expected, the percentage who do not know any way to avoid becoming infectedwith AIDS decreases sharply with increasing levels of education and household standard ofliving. This percentage is higher among Muslim women (59 percent) than among Hindu women(49 percent). Women belonging to scheduled castes and other backward classes are less likely toknow any way to avoid AIDS than other women. The percentage who do not know any way toavoid becoming infected with AIDS is substantially higher among women not regularly exposedto mass media than among other women.
Among women who report that something can be done to prevent AIDS, 'having onlyone sex partner' (26 percent) and 'using condoms' (24 percent) are the most commonlymentioned ways of avoiding AIDS infection. 'Abstaining from sex', 'avoiding injections/usingclean needles', and 'avoiding sex with commercial sex workers' are also mentioned as ways toavoid AIDS by substantial proportions of women (19 percent, 17 percent, and 12 percent,respectively). Only 5 percent mention 'avoiding intravenous drug use' and only 3 percentmention 'avoiding sex with homosexuals' as ways to avoid AIDS. The percentage reporting'abstaining from sex', 'using condoms', or 'having only one sex partner' are higher among urbanwomen than among rural women. The level of education and the household standard of living arestrongly and positively associated with women mentioning each ofthese ways of avoiding AIDS.The use of condoms as a way of avoiding AIDS is mentioned most often by women who have atleast completed high school, women from households with a high standard of living, and womenwho go to the cinema or theatre regularly.
156

-V.-.J
Table 6.16 Knowledge about avoidance of AIDS
Among ever~married women who have heard about AIDS, percentage who believe AIDS can be avoided in specific ways by selected background characteristics, Bihar, 1998-99
Percentage who believe AIDS can be avoided by:Knows
Having Avoiding Avoiding Avoiding noonly sex with sex with Avoiding injections! Avoiding way to Number
Abstaining Using one sex commercial homo~ blood using clean IV drug Other avoid ofBackground characteristic from sex condoms partner sex workers sexuals transfusions needles use ways AIDS women
Age15-24 16.4 18.8 25.4 9.7 2.0 9.3 13.0 4.6 12.0 51.6 25625-34 20.1 27.0 28.3 13.7 3.6 10.6 20.4 5.4 13.9 48.6 33435-49 19.4 24.2 22.2 11.3 4.0 9.1 15.6 3.0 9.7 48.7 231
ResidenceUrban 20.8 27.2 28.1 9.3 2.7 8.5 17.4 3.8 11.9 47.0 301Rural 17.6 21.6 24.3 13.2 3.5 10.5 16.4 4.9 12.2 51.0 520
RegionNorth Bihar Plain 19.8 28.7 29.6 16.2 4.2 8.9 18.8 6.0 12.1 45.2 301South Bihar Plain 20.9 24.8 22.1 14.4 4.1 9.4 12.8 1.9 7.0 55.6 260Jharkhand 15.6 16.8 24.6 4.1 1.2 11.2 18.4 5.2 17.2 48.6 260
EducationIlliterate 17.2 9.0 12.8 9.0 5.3 10.9 14.5 4.4 11.1 61.2 155Literate, < middle school complete 12.0 19.4 13.4 11.5 1.7 7.4 11.5 1.2 6.9 64.1 168Middle school complete 19.6 14.8 28.4 10.0 3.6 8.7 17.8 6.6 13.1 55.9 108High school complete and above 22.1 33.8 35.3 13.5 2.9 10.7 19.6 5.3 14.5 36.9 390
ReligionHindu 18.4 24.1 26.4 11.6 3.0 10.1 16.3 4.0 12.4 49.4 726Muslim 15.8 20.1 15.6 15.7 4.4 5.6 18.3 8.4 7.2 58.8 72
Caste/tribeScheduled caste 19.8 18.6 20.4 8.8 2.0 8.5 13.8 1.1 11.3 55.4 102Other backward class 18.4 22.9 23.0 11.3 2.6 9.3 16.0 6.0 12.1 52.2 345Other1 18.4 26.8 31.4 13.4 3.7 9.8 18.6 4.3 12.3 45.1 349
Gontd ...

t;;00
Table 6.16 Knowledge about avoidance of AIDS (contd.)
Among ever-married women who have heard about AIDS, the percentage who believe AIDS can be avoided in specific ways by selected background characteristics, Bihar, 1998-99
Percentage who beHeve AIDS can be avoided by:Knows
Having Avoiding Avoiding Avoiding noonly sex with sex with Avoiding injections! Avoiding way to Number
Abstaining Using one sex commercial homo- blood using clean IV drug Other avoid ofBackground characteristic from sex condoms partner sex workers sexuals transfusions needles use ways AIDS women
Standard of living indexLow 13.1 14.0 13.1 8.8 2.3 5.6 13.8 0.0 5.5 63.9 94Medium 18.7 19.3 21.6 10.4 4.2 10.1 17.7 4.7 13.1 52.6 357High 20.4 30.5 33.0 13.9 2.5 10.6 16.7 5.4 12.9 42.7 369
Exposure to mass mediaExposed to any media 18.6 25.6 27.8 11.9 2.9 10.1 17.6 5.1 12.9 47.1 705
Listens to radio weekly 19.1 26.0 29.1 11.8 2.6 10.4 16.9 4.3 11.6 47.1 521Watches television weekly 19.4 27.6 28.0 11.9 2.6 10.0 18.4 5.0 13.3 46.3 579Goes to cinema/theatre monthly 30.4 42.8 37.8 15.8 4.9 12.6 17.7 7.3 15.5 32.7 161Reads newspaper/magazine weekly 20.0 32.7 33.2 14.8 3.5 11.9 18.9 4.6 13.2 38.8 405
Not regularly exposed to any media 19.8 12.1 12.8 11.1 5.3 8.1 11.4 0.9 7.1 64.3 116
Total 18.8 23.7 25.7 11.8 3.2 9.8 16.8 4.5 12.1 49.6 821
Note: Total includes18 and 5 women belonging to Christian and 'other' religions, respectively, 25 scheduled~tribe women, and 2 women with missing infonnation on the standard ofliving index, who are not shown separately.lChildren not belonging to a scheduled caste, a scheduled tribe, or an other backward class

CHAPTER 7
NUTRITION AND THE PREVALENCE OF ANAEMIA
This chapter focusses on the nutrition of women and young children, examining both the types offood consumed and the consequences of inadequate nutrition and poor feeding practices.NFHS-l included basic information about feeding practices and the nutritional status of youngchildren. NFHS-2 contains greatly expanded information on these topics, and, for the first time,information on the diet of women. Measurement of height and weight has been expanded toinclude ever-married women as well as young children. Two additional tests have been includedfor the first time--anaemia testing for women and young children and the testing of cooking saltto determine the extent of iodization. The height and weight measurements and anaemia testingwere conducted by a specially-trained health investigator attached to each interviewing team.
7.1 Women's Food Consumption
The consumption of a wide variety of nutritious foods is important for women's health.Adequate amounts of protein, fat, carbohydrates, vitamins, and minerals are required for a wellbalanced diet. Meat, fish, eggs, and milk, as well as pulses and nuts, are rich in protein. Green,leafy vegetables are a rich source of iron, folic acid, vitamin C, carotene, riboflavin, and calcium.Many fruits are also good sources of vitamin C. Bananas are rich in carbohydrates. Papayas,mangoes, and other yellow fruits contain carotene, which is converted to vitamin A. Vitamin A isalso present in milk and milk products, as well as egg yolks (Gopalan et aI., 1996).
NFHS-2 asked ever-married women how often they consume various types of food(daily, weekly, occasionally, or never). Women in Bihar consume vegetables most often (Table7.1). More than three-quarters of women consume vegetables on a daily basis. Pulses and beansare also an important part of the everyday diet for about one-half (49 percent) of women. On theother hand, very few women eat fruits; eggs; or chicken, meat, or fish on a daily basis. Fruits,which are often available only seasonally, are eaten daily by only 3 percent ofwomen, weekly by 16percent of women, and occasionally by 76 percent of women. Less than 2 percent eat eggs daily,and only about 1 percent eat chicken, meat, or fish daily. Nineteen percent never eat eggs and 13percent never eat chicken, meat, or fish. Only 21 percent consume milk or curd daily. Themajority of women in Bihar (53 percent) either never consume milk or curd or consume it onlyoccasionally.
Table 7.2 shows that there are substantial differentials in food consumption patterns byselected background characteristics. Age does not play a major role in women's consumptionpatterns, except that younger women are slightly more likely than older women to eat eggs, as wellas chicken, meat, or fish. Women in urban areas are more likely than women in rural areas toinclude every type of food in their diet, particularly nutritious foods such as dairy products; fruits;eggs; and chicken, meat or fish. Women in the South Bihar Plain region are considerably morelikely to consume milk or curd than women in the North Bihar Plain region or in the Jharkhandregion. Use ofdairy products is particularly low in the Jharkhand region. Women in the South BiharPlain region are also somewhat more likely to consume fruits; eggs; and chicken, meat, or fish thanwomen in other regions. Illiterate women have poorer and less varied diets than literate women, andtheir diets are particularly deficient in dairy products. Consumption of fruits; eggs; and chicken,
< /$1/.

Table 7.1 Women's food consumption
Percent distribution of ever-married women by frequency of consumption of specific foods,Bihar, 1998--99
Frequency of consumptionTotai
Type of food Daily Weekly Occasionally Never percent
Milk or curd 21.4 25.3 44.5 8.8 100.0Pulses or beans 49.4 39.3 11.0 0.3 100.0Green, leafy vegetables 73.3 22.7 4.0 0.0 100.0Other vegetables 83.9 12.2 3.2 0.7 100.0Fruits 2.6 15.7 76.2 5.5 100.0Eggs 1.6 20.5 58.5 19.4 100.0Chicken, meat, or fish 1.1 20.4 65.3 13.2 100.0
meat, or fish is also positively associated with the level of education. Hindu women consume dairyproducts more often than Muslim women, and Muslim women consume non-vegetarian food moreoften than Hindu women. Eighteen percent of Hindu women eat chicken, meat, or fish at least oncea week compared with 38 percent of Muslim women. Women from scheduled castes, scheduledtribes, and other backward classes have relatively poor diets compared with the diets of otherwomen. Women from scheduled tribes have a diet particularly deficient in dairy products. Asexpected, poverty has a strong negative effect on the consumption of nutritious types of food.Women in households with a low standard of living are much less likely than other women to eatfruits and dairy products on a regular basis.
7.2 Nutritional Status of Women
In NFHS-2, ever-married women age 15-49 were weighed using a solar-powered digital scalewith an accuracy of ±IOO grams. Their height was measured using an adjustable woodenmeasuring board specially designed to provide accurate measurements (to the nearest 0.1 cm) ofwomen and children in a field situation. The weight and height data were used to calculateseveral indicators of women's nutritional status as shown in Table 7.3. The height of an adult isan outcome of several factors including nutrition during childhood and adolescence. A woman'sheight can be used to identify women at risk of having a difficult delivery, since small stature isoften related to small pelvic size. The risk ofhaving a baby with a low birth weight is also higherfor mothers who are short.
The cutoff point for height, below which a woman can be identified as nutritionally atrisk, varies among populations, but it is usually considered to be in the range of 140-150centimetres (cm). NFHS-2 found a mean height for women in Bihar of 150 cm. The mean heightvaries only slightly (between 149 and 152 cm) for women in different population groups, asshown in Table 7.3. Twenty percent of women are under 145 cm in height. Younger women aremore likely than older women to be short, as are women in the South Bihar Plain region, illiteratewomen, women from scheduled castes, women who are employed by someone else, and womenliving in households with a low standard ofliving. Short stature is particularly strongly related topoverty. One in every four women living in households with a low standard of living is below145 cm in height compared with I in every 11 women living in households with a high standardofliving.
160

Table 7.2 Women's food consumption by background characteristics
Percentage of everMmarrled women consuming specific foods at least once a week by selected backgroundcharacteristics, Bihar, 1998-99
Type oflood
Green, Chicken, NumberMilk or Pulses or leafy Other meat, of
Background characteristic curd beans vegetables vegetables Fruits Eggs or fish women
Age15-24 46.4 88.9 95.8 96.1 17.9 23.3 22.7 2,24425-34 46.4 89.1 96.0 95.8 18.3 21.8 20.5 2,50735-49 47.4 88.1 96.0 96.4 18.6 21.3 21.4 2,274
ResidenceUrban 60.3 96.6 98.5 95.5 41.2 43.1 41.8 718Rural 45.2 87.8 95.7 96.2 15.7 19.7 19.2 6,306
RegionNorth Bihar Plain 43.7 87.3 96.3 99.6 15.3 20.1 21.2 3,133South Bihar Plain 64.1 93.5 95.1 98.5 23.0 24.5 24.7 2,199Jharkhand 29.6 85.1 96.5 86.6 17.8 22.7 17.9 1,692
EducationIlliterate 39.9 86.4 95.4 95.6 12.8 19.7 18.4 5,383Literate, < middle school
complete 59.5 94.8 96.8 97.5 24.9 25.2 26.8 779Middle school complete 68.0 96.5 98.4 95.2 34.1 28.8 29.1 267High school completeand above 82.4 98.0 98.9 99.1 52.3 36.6 39.0 595
ReligionHindu 48.6 88.9 95.7 95.9 18.1 18.3 18.4 5,872Muslim 38.4 88.3 97.1 97.9 17.7 42.6 38.1 1,038Christian 21.3 90.7 100.0 94.3 23.3 30.4 39.4 59Other 32.5 76.5 100.0 84.0 38.8 29.5 19.6 55
Caste/tribeScheduled caste 37.6 83.9 93.9 95.8 15.0 18.9 19.6 1,452Scheduled tribe 27.0 80.1 95.5 84.7 14.5 20.2 14.3 582Other backward class 47.9 90.5 96.4 97.4 16.1 20.9 20.4 3,642Other 61.7 92.7 97.3 98.0 29.2 29.7 29.6 1,348
Standard of living indexLow 32.6 83.2 94.9 95.1 10.7 16.8 15.6 3,709Medium 57.2 93.7 96.5 96.9 20.0 25.1 25.0 2,595Hi9h 82.1 99.0 99.3 98.7 51.3 38.6 39.5 712
Total 46.7 88.7 96.0 96.1 18.3 22.1 21.5 7,024
Note: Total includes 8 women with missing information on the standard of living index, who are not shown separately.
Table 7.3 also shows an index that relates a woman's weight to her height. The bodymass index (BMI) can be used to assess both thinness and obesity. The BMI is defined as theweight in kilograms divided by the height in metres squared (kg/m2
). This index excludeswomen who were pregnant at the time of the surveyor women who had given birth during thetwo months preceding the survey. The mean BMI for women in Bihar is 19.4. Chronic energydeficiency is usually indicated by a BMI of less than 18.5. About two-fifths (39 percent) ofwomen have a BMI below 18.5, indicating a high prevalence of nutritional deficiency amongwomen in Bihar. Nutritional problems are particularly serious for rural women, women in theJharkhand region, illiterate women, Muslim women, women employed by someone else or
161

Table 7.3 Nutritional status of women
Among ever-married women, mean height, percentage with height below 145 em, mean body mass index (BMI), andpercentage with BMI below 18.5 kg/m2 by selected background characteristics, Bihar, 1998-99
Height Weight-for-height'
Percent- Number Percent-Mean age of Mean body age with Number ofheight below women mass index 8MI below women for
Background characteristic (em) 145 em for height (8MI) 18.5 kg/m' 8MI
Age15-19 149.0 22.6 784 19.4 35.2 72521}-24 149.2 21.3 1,347 19.2 39.8 1,14925-29 149.7 15.8 1,350 19.4 40.0 1,17731}-34 149.5 19.4 1,051 19.5 39.2 97335-49 149.6 19.7 2,173 19.7 40.1 2,137
Marital statusCurrently married 149.5 19.6 6,360 19.5 39.1 5,819Not currently married 149.5 18.9 345 19.3 43.3 342
ResidenceUrban 150.2 18.3 686 20.5 31.1 650Rural 149.4 19.7 6,020 19.3 40.3 5,511
RegionNorth Bihar Plain 149.6 17.7 2,992 19.4 38.7 2,733South Bihar Plain 149.1 22.3 2,097 19.6 38.7 1,912Jharkhand 149.9 19.2 1,616 19.3 41.1 1,516
EducationIlliterate 149.0 21.1 5,115 19.2 42.5 4,668Literate, < middle school complete 150.6 15.6 770 20.0 33.0 727Middle school complete 150.5 14.6 263 20.0 33.1 242High school complete and above 151.5 12.5 557 21.1 22.8 523
ReligionHindu 149.4 20.1 5,618 19.5 38.7' 5,186Muslim 149.6 16.8 973 19.2 43.3 863Christian 152.1 8.9 60 19.2 38.1 59Other 150.3 16.3 55 (19.2) (37.4) 53
Caste/tribeScheduled caste 148.5 24.9 1,385 18.9 46.7 1,257Scheduled tribe 149.7 19.3 548 19.2 41.0 514Other bac~rd class 149.3 19.8 3,488 19.4 38.8 3,207Other 151.0 13.1 1,285 20.2 32.1 1,184
Work statusWorking in family fannlbusiness 149.6 18.6 605 19.1 41.5 575Employed by someone else 148.7 23.5 776 18.8 50.4 720Self-employed 149.0 21.0 376 19.5 39.6 350Not worked in past 12 months 149.6 18.9 4,948 19.6 37.3 4,516
Standard of living indexLow 148.7 23.2 3,523 19.0 44.6 3,212Medium 149.9 17.1 2,499 19.6 37.2 2,302High 151.8 9.5 676 21.3 21.0 641
Total 149.5 19.5 6,705 19.4 39.3 6,161
Note: Total includes a small number of women with missing information on the standard of living index, who are not shownseparately.~ ) Based on 25-49 unweighted casesExcludes women who are pregnant and women with a birth in the preceding two months. The body mass index (BMI) is the
ratio of the weight in kilograms to the square of the height in metres (kg/m 2).
162

working on a family farm or in a family business, and women from scheduled castes orscheduled tribes. The standard of living is negatively related to chronic energy deficiency.Women from households with a low standard ofliving are more than two times as likely to havea low BMI as women from households with a high standard of living. Currently married womenare somewhat less likely than women who are currently not married to have a low BM!.
7.3 Anaemia Among Women
Anaemia is characterized by a low level of haemoglobin in the blood. Haemoglobin is necessaryfor transporting oxygen from the lungs to other tissues and organs of the body. Anaemia usuallyresults from a nutritional deficiency of iron, folate, vitamin BIZ, or some other nutrients. Thistype of anaemia is commonly referred to as iron-deficiency anaemia. Iron deficiency is the mostwidespread form of malnutrition in the world, affecting more than two billion people (Stolzfusand Dreyfuss, 1998). In India, anaemia affects an estimated 50 percent of the population(Seshadri, 1998).
Anaemia may have detrimental effects on the health of women and children, may becomean underlying cause of maternal mortality and perinatal mortality, and results in an increased riskof premature delivery and low birth weight (Seshadri, 1997). Early detection ofanaemia can helpprevent complications related to pregnancy and delivery, as well as child-development problems.Information on the prevalence of anaemia can be useful for the development of healthintervention programmes designed to prevent anaemia, such as iron-fortification programmes.
In India, under the Government's Reproductive and Child Health Programme, iron andfolic acid tablets are provided to pregnant women in order to prevent anaemia during pregnancy.Because anaemia is such a serious health problem in India, NFHS-2 undertook directmeasurement ofthe haemoglobin levels of all ever-married women and their children under threeyears of age. Measurements were taken in the field using the HemoCue system I. This systemuses a single drop of blood from a finger prick (or heel prick in the case of infants under sixmonths old), which is drawn into a cuvette and then inserted into a portable, battery-operatedinstrument2• In less than one minute, the haemoglobin concentration is indicated on a digitalread-out.
Before the anaemia testing was undertaken in a household, the health investigator read adetailed informed consent statement to the respondent, informing her about anaemia, describingthe procedure to be followed for the test, emphasizing the voluntary nature of the test, and askingwhether or not she would consent to have the test done for herself and her young children, if any.The health investigator then signed the questionnaire at the bottom of the statement to indicatethat it had been read to the respondent and recorded her agreement or lack of agreement to thetesting. If the test was conducted, at the end of the test the respondent was given a written recordof the results for herself and each of her young children. In addition, the health investigator
'The HemoCue instrument has been used extensively throughout the world for estimating the concentration ofhaemoglobin in capillary blood in field situations. The HemoCue has been found to give accurate results on venousblood samples, comparable to estimates from more sophisticated laboratory instruments (Von Schenk et aI., 1986;McNulty et aI., 1995; Krenzicheck and Tanseco, 1996). A recent small-scale study in India (Prakash et aI., 1999),however, found that the HemoCue provided slightly higher estimates of haemoglobin than the standard blood cellcounter (BCC) method.'Because the first 2-3 drops of blood are wiped away to be sure that the sample used for analysis consists of freshcapillary blood, it is actually the third or fourth drop of blood that is drawn into the cuvette.
163

Table 7.4 Anaemia among women
Percentage of ever-married women classified as having iron-defrciency anaemia by degree of anaemia,according to selected background characteristics, Bihar, 1998-99
Percentage Percentage of women with:of women Numberwith any Mild Moderate Severe of
Background characteristic anaemia anaemia anaemia anaemia women
Age15-19 64.2 43.8 18.9 1.5 73120-24 63.4 40.0 21.7 1.7 1,24125-29 63.2 42.6 18.8 1.7 1,2493Q--34 63.7 43.2 19.3 1.2 98135-49 63.1 44.5 17.3 1.3 2,021
Marital statusCurrently married 63.6 43.0 19.1 1.5 5,897Not currently married 60.6 41.6 17.6 1.4 326
ResidenceUrban 59.6 42.6 15.2 1.8 637Rural 63.9 43.0 19.4 1.4 5,586
RegionNorth Bihar Plain 60.2 44.2 15.0 1.1 2,775South Bihar Plain 60.7 40.2 18.7 1.8 1,948Jharkhand 72.9 44.3 26.8 1.8 1,499
EducationIlliterate 66.2 43.2 21.3 1.7 4,736Literate, < middle school complete 57.7 43.5 13.4 0.8 725Middle school complete 54.5 41.6 13.0 0.0 250High school complete and above 50.0 40.3 8.6 1.1 512
ReligionHindu 63.1 42.6 19.1 1.3 5,238Muslim 63.1 44.3 17.0 1.8 873Christian 76.9 52.4 20.4 4.2 57Other 86.6 45.2 33.7 7.7 55
Caste/tribeScheduled caste 67.0 43.8 22.0 1.1 1,274Scheduled tribe 82.1 43.3 35.9 2.9 512
I Other backward class 60.9 42.2 17.0 1.6 3,253Other 58.5 43.9 13.8 0.8 1,185
Work statusWorking in family farm/business 63.5 42.6 19.1 1.8 573Employed by someone else 71.8 44.1 24.9 2.8 717Self-employed 70.1 43.0 25.7 1.4 346Not worked in past 12 months 61.6 42.8 17.5 1.2 4,586
Gontd...
described to her the meaning of the results and advised her if medical treatment was necessary.In cases of severe anaemia, the respondent was read an additional statement asking whether ornot she would give her permission for the health investigator to inform a local health officialabout the problem. For each Primary Sampling Unit, a local health official was given a list ofseverely anaemic women (and children) who had consented to the referral.
Table 7.4 and Figure 7.1 show anaemia levels for ever-married women age 15-49. Threelevels of severity of anaemia are distinguished: mild anaemia (10.0-10.9 g/dl for pregnantwomen and 10.0-11.9 g/dl for nonpregnant women), moderate anaemia (7.0-9.9 g/dl), andsevere anaemia (less than 7.0 g/dl). Appropriate adjustinents in these cutoff points were made for
164

Table 7.4 Anaemia among women (contd.l
Percentage of ever-married women classified as having iron-deficiency anaemia by degree of anaemia,according to selected background characteristics, Bihar, 1998-99
Percentage Percentage of women with:of women Numberwith any Mild Moderate Severe of
Background characteristic anaemia anaemia anaemia anaemia women
Standard of living indexLow 68.9 43.7 23.4 1.8 3,268Medium 59.5 42.7 15.4 1.3 2,328High 50.3 40.3 9.4 0.6 620
Pregnancy/breastfeeding statusPregnant 49.8 22.1 25.5 2.2 508Not pregnant (breastfeeding) 67.4 46.8 19.0 1.6 1,907Not pregnant (non-breastfeeding) 63.2 43.8 18.1 1.3 3,808
Height< 145cm 65.9 41.8 22.1 2.0 1,219;;::: 145 cm 62.8 43.3 18.2 1.3 4,994
Body mass index< 18.5 kg/m' 65.2 42.9 20.5 1.9 2,357~ 18.5 kg/m' 62.3 43.1 18.1 1.2 3,842
Fruit and vegetable consumption1
Fruits and vegetables 59.5 43.2 15.1 1.2 1,137Vegetables only 63.9 42.8 19.6 1.5 4,884Neither 74.1 46.7 25.8 1.6 217
Total 63.4 42.9 19.0 1.5 6,223
Note: The haemoglobin levels are adjusted for smoking when calculating the degree of anaemia. Noadjustment for altitude of the enumeration area was made because all of the sample PSUs in Bihar areat an altitude below 1,000 metres. Total includes 6 women consuming fruit only and 8, 11, and 24women with missing information on the standard of living index, height, and body mass index,respectively, who are not shown separately.1Sased on consumption at least weekly. Vegetables include only green, leafy vegetables.
Figure 7.1Anaemia Among Women
70
60
50
30
20
10
o
63
Any Anaemia Mild Anaemia
165
Moderate Anaemia
2
Severe Anaemia
NFHS-2, Bihar, 1998-99

women living at altitudes above 1,000 metres and women who smoke, since both of these groupsrequire more haemoglobin in their blood (Centers for Disease Control and Prevention, 1998).
In Bihar, haemoglobin levels were tested for 88 percent of women (see Table B.3 inAppendix B). Overall, 63 percent of women have some degree of anaemia. Forty-three percentof women are mildly anaemic, 19 percent are moderately anaemic, and 2 percent are severelyanaemic3
. There are some differences in the prevalence of anaemia by backgroundcharacteristics, but anaemia is substantial for women in every population group. The prevalenceof anaemia does not vary much by age. It is slightly higher for currently married women (64percent) than for women who are currently not married (61 percent), and slightly higher for ruralwomen (64 percent) than for urban women (60 percent). Differences by region, education,religion, caste/tribe, work status, and standard of living are more pronounced. The prevalence ofanaemia is much higher in the Jharkhand region (73 percent) than in the North Bihar Plain orSouth Bihar Plain regions (60-61 percent). Anaemia is relatively high for illiterate women,women belonging to religions other than Hindu or Muslim, scheduled-tribe women, and selfemployed women and women employed by someone else. Anaemia, especially moderate tosevere anaemia, decreases as the standard ofliving rises.
Pregnant women are more likely to have moderate to severe anaemia (28 percent) thannonpregnant women (19-21 percent). However, pregnant women are considerably less likelythan other women to have mild anaemia (probably because a substantial proportion of pregnantwomen consume iron and folic acid tablets or syrup). Overall, pregnant women are considerablyless likely to be anaemic (50 percent) than nonpregnant women (63-67 percent). Shorter womenand women with a low body mass index have somewhat higher prevalence of moderate to severeanaemia than other women. The diet of women also plays a role in the likelihood that they haveanaemia. Consumption of iron-rich foods can reduce the prevalence or severity of anaemia, andthe absorption of iron from the diet can be enhanced (for example, by vitamin C) or inhibited (forexample, by tea or coffee) if particular items are consumed around the time that a meal is eaten.In NFHS-2, differentials in anaemia by consumption of fruits and vegetables are large. Womennot eating fruits and green, leafy vegetables regularly have considerably elevated levels ofmoderate to severe anaemia.
7.4 Infant Feeding Practices
Infant feeding practices have significant effects on both mothers and children. Mothers areaffected through the influence of breastfeeding on the period of postpartum infertility, and henceon fertility levels and the length of birth intervals. These effects vary by both the duration andintensity of breastfeeding. Proper infant feeding, starting from the time of birth, is important forthe physical and mental development of the child. Breastfeeding improves the nutritional statusof young children and reduces morbidity and mortality. Breast milk not only provides importantnutrients but also protects the child against infection. The timing and type of supplementaryfoods introduced in an infant's diet also have significant effects on the child's nutritional status.
The Baby Friendly Hospitals Initiative, launched by UNICEF, recommends initiation ofbreastfeeding immediately after childbirth. The World Health Organization (WHO) and the
'Rates that are not adjusted for altitude and smoking are almost the same as the corresponding adjusted rates (with atmost a 0.2 difference in any rate). This is to be expected since, in Bihar, the proportion of women who smoke issmall (see Table 2.12), and all ofthe sample PSUs are at an altitude below 1,000 metres.
166

United Nations Children's Fund (UNICEF) recommend that infants should be given only breastmilk for about the first six months of their life. Under the Reproductive and Child HealthProgramme, the Government of India recommends that infants should be exclusively breastfedfrom birth to age four months (Ministry of Health and Family Welfare, n.d.(a)). Most babies donot require any other foods or liquids during this period. By age seven months, adequate andappropriate complementary foods should be added to the infant's diet in order to providesufficient nutrients for optimal growth. It is recommended that breastfeeding should continue,along with complementary foods, through the second year of life or beyond. It is furtherrecommended that a feeding bottle with a nipple should not be used at any age, for reasonsrelated mainly to sanitation and the prevention ofinfections.
WHO has suggested several indicators of breastfeeding practices to guide countries ingathering information for measuring and evaluating infant feeding practices. These indicatorsinclude the ever breastfed rate, the exclusive breastfeeding rate, the timely complementaryfeeding rate, the continued breastfeeding rate, and the bottle feeding rate. The exclusivebreastfeeding rate is defined as the proportion of infants under age four months who receive onlybreast milk. The timely complementary feeding rate is the proportion of infants age 6-9 monthswho receive both breast milk and solid or semi-solid food. The continued breastfeeding ratethrough one year ofage is the proportion of children age 12-15 months who are still breastfed.The continued breastfeeding rate until two years ofage is the proportion of children age 20-23months who are still breastfed. The bottle feeding rate is the proportion of infants who are fedusing a bottle with a nipple. These indicators of breastfeeding and other feeding practices arepresented in this section.
In NFHS-2, data on breastfeeding and complementary feeding were obtained from aseries of questions in the Woman's Questionnaire. These questions pertain to births sinceJanuary 1995, but the tables are restricted to children born in the three years preceding thesurvey. For any given woman, information was obtained for a maximum oftwo births.
Initiation of breastfeeding immediately after childbirth is important because it benefitsboth the mother and the infant. As soon as the infant starts suckling at the breast, the hormoneoxytocin is released, resulting in uterine contractions that facilitate expulsion of the placenta andreduce the risk of postpartum haemorrhage. It is also recommended that the first breast milk(colostrum) should be given to the child rather than squeezed from the breast and discarded,because it provides natural immunity to the child.
Table 7.5 shows the percentage of children born during the three years before the surveywho started breastfeeding within one hour and one day of birth. It also gives the percentage ofchildren whose mothers squeezed the first milk from the breast before breastfeeding, which isnot the recommended practice. Although breastfeeding is nearly universal in Bihar, very fewchildren are put to the breast immediately after birth. Only 6 percent of children beganbreastfeeding within one hour of birth, and only 21 percent began breastfeeding within one day.Forty-two percent of mothers squeezed the first milk from the breast before they beganbreastfeeding. Differentials in the early initiation of breastfeeding and in squeezing the first milkfrom the breast are also shown in Table 7.5. No more than 13 percent of children in any groupwere put to the breast within one hour of birth. The percentage of children that startedbreastfeeding within one day of birth does not vary much by urban-rural residence, mother'seducation, religion, standard of living, assistance during delivery, or place ofdelivery. However,
167

Table 7.5 Initiation of breastfeeding
Percentage of children born during the three years preceding the survey 'vYho started breastfeeding within one hour andwithin one day of birth and percentage whose mother squeezed the first milk from her breast before breastfeeding byselected background characteristics, Bihar, 1998-99
Percentage whosePercentage started Percentage started mother squeezed Numberbreastfeeding within breastfeeding within first milk from of
Background characteristic one hour of birth one day of birth1 breast children
ResidenceUrban 5.3 21.8 41.7 258Rural 6.3 20.6 42.1 2,689
RegionNorth Bihar Plain 5.0 14.1 36.2 1,378South Bihar Plain 6.3 24.0 38.3 979Jharkhand 9.0 30.5 62.1 590
Mother's educationIlliterate 6.3 20.4 43.1 2,262Literate, < middle school complete 4.7 21.7 42.3 280Middle school complete 6.2 23.0 45.3 127High school complete and above 6.7 20.7 32.0 277
ReligionHindu 5.6 20.0 41.1 2,378Muslim 8.4 22.8 45.6 532
Caste/tribeScheduled caste 7.0 22.5 40.9 672Scheduled tribe 12.6 33.8 60.9 197Other backward class 4.3 16.8 41.3 1,544Other 8.5 24.5 38.9 533
Mother's work statusWorking in family farm/business 7.8 18.3 46.0 230Employed by someone else 7.0 23.8 47.3 290Self-employed 9.4 33.1 53.0 135Not worked in past 12 months 5.8 19.8 40.4 2,292
Standard of living indexLow 6.2 20.7 44.4 1,676Medium 6.5 20.6 40.9 1,028Hi9h 5.2 20.9 32.1 237
Assistance during deliveryHealth professional2 3.8 19.6 38.9 688Dai (TBA) 7.4 20.9 41.8 1,940Other 4.8 24.0 57.2 283
Place of deliveryPublic health facility 3.7 20.1 42.5 112Private health facility 3.2 19.4 37.3 310Own home 7.4 21.6 42.4 2,076Parents' home 3.7 18.5 48.3 388
Total 6.2 20.7 42.1 2,947
Note: Table includes only the two most recent births during the three years preceding the survey, whether living or deadat the time of interview. Total includes 17 and 20 children belonging to Christian and 'other' religions, respectively; 8 and16 children delivered in nongovernmental organization (NGO) or trust hospitals/clinics and 'other' places of delivery,respectively; and 6, 35, and 36 children with missing information on the standard of living index, assistance duringdelivery, and place of delivery, respectively, who are not shown separately.TBA: Traditional birth attendant11ncludes children who started breastfeeding within one hour of ~irth21ncludes doctor, auxiliary nurse midwife, nurse, midwife, lady health visitor, and other health professionals
168

Table 7.6 Breastfeeding status by child's age
Percent distribution of children under age 3 by breastfeeding status, according to child's age in months, Bihar, 1998-99
Breastfeeding status
Breastfeeding and:
Receiving Don't know NumberNot Exclusively plain Receiving if fed Total of living
Age in months breastfeeding breastfeeding water only supplements supplements percent children
<2 3.0 63.0 21.3 12.7 0.0 100.0 1372-3 2.3 50.4 28.4 19.0 0.0 100.0 2264-<i 3.0 34.8 38.6 23.7 0.0 100.0 2076-7 4.3 20.7 35.1 39.9 0.0 100.0 1748-9 4.8 16.1 31.1 48.0 0.0 100.0 12210-11 2.1 7.8 17.4 72.6 0.0 100.0 10212-13 1.1 1.7 13.8 83.4 0.0 100.0 17514-15 8.2 1.0 8.6 82.2 0.0 100.0 19916-17 6.5 1.7 6.3 85.4 0.0 100.0 17118-19 7.0 0.7 12.0 80.3 0.0 100.0 14020-21 18.3 0.9 7.5 73.4 0.0 100.0 10522-23 11.0 0.0 14.1 74.9 0.0 100.0 9224-25 34.8 0.0 1.6 63.6 0.0 100.0 13126-27 33.6 0.7 3.0 62.7 0.0 100.0 14028-29 37.2 0.0 0.0 62.8 0.0 100.0 15430-31 34.6 0.0 1.6 63.8 0.0 100.0 18432-33 41.6 0.7 0.0 57.6 0.0 100.0 14334-35 38.5 0.0 4.8 56.0 0.7 100.0 128
< 4 months 2.5 55.2 25.7 16.6 0.0 100.0 3644-6 months 3.6 32.7 36.3 27.4 0.0 100.0 2937-9 months 4.3 15.2 34.5 46.0 0.0 100.0 210
Note: Table includes only surviving children from among the two most recent births in the three years preceding thesurvey. Breastfeeding status refers to the day or night before the interview. Children classified as 'breastfeeding andreceiving plain water only' receive no supplements.
some differentials are notable. Children in the Jharkhand region, scheduled-tribe children, andchildren of self-employed mothers are much more likely than other children to have startedbreastfeeding within one day of birth, but the majority of children in every group were notbreastfed within one day ofbirth.
The custom of squeezing the first milk from the breast before breastfeeding a child iswidely practised in every group, but it is much more common in the Jharkhand region and forscheduled-tribe children. The percentage ofchildren whose mothers squeezed the first milk fromthe breast is also higher for children of less educated mothers and self-employed mothers.Children who live in households with a high standard of living are less likely than children inother households to have mothers who squeezed the first milk from the breast beforebreastfeeding. It should be stressed, however, that contrary to recommendations for feedinginfants, mothers squeeze the first milk from the breast before breastfeeding for one-third to twothirds ofchildren in different groups.
Mothers of children born in the three years before the survey were asked if the child hadbeen given plain water, other liquids, or solid or mushy (semi-solid) food at any time during theday or night before the interview. Results are shown in Tables 7.6 and 7.7. Children whoreceived nothing but breast milk during that period are defined as being exclusively breastfed.The introduction of supplementary foods before four months of age puts infants at risk ofmalnutrition because other liquids and solid foods are nutritionally inferior to breast milk.
169

Table 7.7 Type of food received by children
Percentage of children under age 3 who received specific types of food the day or night before the interview and percentageusing a bottle with a nipple by current breastfeeding status and child's age in months, Bihar, 1998-99
Type of food receivedUsing Number
Powdered Any other Any other Green, leafy Any solid or bottle with of livingAge in months milk milk liquid vegetables Fruits mushy food1 a nipple children
BREASTFEEDING CHILDREN
<2 2.3 10.0 1.6 0.0 0.0 0.0 3.8 1332-3 5.9 13.5 1.8 0.4 0.0 0.9 9.2 2214-5 7.5 16.5 3.6 1.1 0.0 3.5 8.3 2016-7 4.8 27.2 13.9 3.6 1.2 12.7 9.3 1668-9 8.2 27.5 24.2 6.9 1.0 19.9 9.9 11710-11 9.2 35.4 44.6 18.0 2.1 50.6 10.2 10012-13 5.4 47.1 48.2 28.5 6.7 64.9 12.5 17314-15 6.1 45.3 53.8 33.4 5.5 76.9 6.7 18316-17 3.1 37.4 58.4 38.8 11.5 79.5 6.9 16016-23 3.9 34.8 51.9 39.5 7.8 75.3 4.1 29724-29 7.4 43.7 70.4 56.8 8.9 91.3 6.6 27530-35 3.7 40.0 76.9 57.9 15.0 90.8 5.7 282
< 4 months 4.6 12.2 1.7 0.3 0.0 0.5 7.2 3544-5 months 7.5 16.5 3.6 1.1 0.0 3.5 8.3 2016-9 months 6.2 27.3 18.2 5.0 1.1 15.7 9.6 283
NON-BREASTFEEDING CHILDREN
< 10 (42.3) (64.7) (11.2) (11.4) (7.5) (15.0) (67.7) 2910-17 (27.0) (67.6) (68.1) (39.8) (20.8) (77.5) (37.1) 3218-23 (17.9) (49.1 ) (71.7) (49.4) (20.7) (79.3) (28.4) 3924-29 6.0 50.5 79.9 72.5 22.8 95.9 11.4 15030-35 4.7 46.8 81.0 66.9 13.2 96.0 8.9 173
ALL CHILDREN
<2 2.9 11.3 1.6 0.0 0.0 0.0 5.1 1372-3 6.8 14.6 1.8 0.4 0.0 0.8 10.4 2264-5 8.8 18.5 4.0 1.6 0.5 3.9 10.6 2076-7 5.8 27.9 14.5 4.7 1.8 14.0 10.7 1746-9 10.9 30.2 23.1 6.6 0.9 19.0 14.3 12210-11 10.2 34.7 43.7 18.6 2.0 50.5 11.1 10212-13 5.9 47.6 48.8 28.2 6.6 65.2 12.9 17514-15 7.8 48.3 54.6 34.3 7.3 76.8 8.8 19916-17 4.2 38.6 60.0 38.7 12.1 79.7 8.9 17118--23 5.5 36.4 54.2 40.6 9.3 75.7 7.0 33724-29 6.9 46.1 73.7 62.3 13.8 92.9 8.3 42530-35 4.1 42.6 78.5 61.4 14.3 92.8 6.9 455
< 4 months 5.3 13.4 1.7 0.3 0.0 0.5 8.4 3644-5 months 8.8 18.5 4.0 1.6 0.5 3.9 10.6 2076-9 months 7.9 28.9 18.1 5.5 1.4 16.1 12.2 296
Note: Table includes only surviving children from among the two most recent births in the three years preceding the survey.Percents by type of food may sum to more than 100.0 because children may have received more than one type of food.~ ) Based on 25-49 unweighted cases
I Includes green, leafy vegetables and fruits
Consumption of liquids and solid or mushy foods at an early age also increases children'sexposure to pathogens and consequently puts them at a greater risk of getting diarrhoea.However, a recent study based on findings from NFHS-l (Anandaiah and Choe, 2000)concluded that breastfeeding with supplements is more beneficial than exclusive breastfeedingeven for children at very young ages (less than four months). That report suggests that mothers
170

who are not well nourished and who are in poor health themselves may not be able to provideadequate breast milk for their infants.
In Bihar, 55 percent of children under four months of age are exclusively breastfed, 26percent receive breast milk plus water, and 17 percent receive supplements along with breastmilk (Table 7.6). The percentage of infants exclusively breastfed drops off after three months to 35percent at age 4-5 months and 21 percent at age 6-7 months. The proportion of children receivingsupplements along with breast milk increases from 24 percent for children age 4-5 months to 85percent for children age 16-17 months, and declines thereafter as children are weaned from thebreast and their food consumption no longer supplements breast mille However, breastfeedinggenerally continues for a long period. Ninety-three percent of children age 18-19 months are stillbeing breastfed, as are 62 percent ofchildren age 34-35 months.
Table 7.7 shows in more detail the types of food consumed by children under age threeyears during the day or night before the interview. Because of the small number ofnonbreastfeeding children, some two-month age categories have been combined into broader agegroups. Powdered milk is rarely given to young children at any age, but other milk (such ascow's milk or buffalo's milk) is given to young children more often. About one-half of nonbreastfeeding children were given these other types of milk the day or night before the interview.About one-quarter to one-halfof breastfeeding children age 6-35 months received non-powderedmilk in addition to breast milk. Among all children, other liquids, such as juice or tea, are givenless often than milk for children under age 9 months and more often for children age 10--35months. The consumption of green, leafy vegetables generally increases with age, from 5 percentat age 6-7 months to 61 percent at age 30--35 months for all children. The consumption of fruitsis generally quite low for all children under three years in Bihar. Less than 2 percent of infantsand only 7-14 percent of children age 12-35 months receive fruits on a regular basis.
From about six months of age, the introduction of complementary food is critical to meetingthe protein, energy, and micronutrient needs of children. However, in Bihar, the introduction ofcomplementary food is delayed for a substantial proportion of children. Only 13 percent ofbreastfeeding children age 6-7 months consume solid or mushy foods. This proportion rises to65 percent at age 12-13 months and more than 90 percent at age 24-35 months. Only 16 percentofbreastfeeding children age 6-9 months receive solid or mushy food, as recommended.
Bottle feeding has a direct effect on the mother's exposure to the risk of pregnancybecause the period of amenorrhoea may be shortened when breastfeeding is reduced or replacedby bottle feeding. Because it is often difficult to sterilize the nipple properly, the use of bottleswith nipples also exposes children to an increased risk of getting diarrhoea and other diseases.The use of bottles with nipples is not common in Bihar, especially for children who are beingbreastfed. In every age group, less than 13 percent of breastfeeding children drank anything froma bottle with a nipple during the day or night before the interview (Table 7.7). The use ofa bottlewith a nipple is much more common for children who are not being breastfed, particularly in theearly months of life.
Table 7.8 shows several statistics that describe the duration of breastfeeding. The medianlength of any breastfeeding is more than three years. Estimates of both means and medians arebased on the current proportions of children breastfeeding in each age group because informationon current status is usually more accurate than information based on mother's recall.
171

Table 7.8 Median duration of breastfeeding by background characteristics
Median duration of breastfeeding among children under age 3 by sex of child and residence, and meanduration of breastfeeding, Bihar, 1998-99
Median duration (months)1
Exclusivebreastfeeding or Number
Any Exclusive breastfeeding plus ofBackground characteristic breastfeeding breastfeeding water only children
Sex of childMale ~36.0 1.6 7.7 1,519Female ~36.0 2.2 7.3 1,428
ResidenceUrban 24.0 (0.6) 3.1 258Rural ~36.0 2.1 8.0 2,689
Median duration ~ 36.0 1.9 7.5 2,947
Mean duration (months)1 28,3 4.3 8.7 2,947
Prevalence/incidence mean 27.8 4.2 9.0 2,947
Note: Table includes only the two most recent births during the three years preceding the survey. Themedian duration of any breastfeeding is shown as ;;:: 36.0 months for groups in which the exact mediancannot be calculated because the proportion of breastfeeding children does not drop below 50 percent inany age group for children under 36 months of age.~ ) Based on 25-49 unweighted casesBased on current status
Supplementation begins relatively early, however. The median length of exclusive breastfeeding is1.9 months, and the median length of exclusive breastfeeding or breastfeeding with water only is7.5 months.
The mean durations of any breastfeeding, exclusive breastfeeding, and exclusivebreastfeeding or breastfeeding with water only are 28.3 months, 4.3 months, and 8.7 months,respectively. The mean durations differ from the median durations because of extreme values of theduration of breastfeeding for some children. (The mean duration is strongly affected by extremevalues, but the median duration is not.)
An alternative measure of the duration of breastfeeding is the prevalence-incidence mean,which is calculated as the 'prevalence' of breastfeeding divided by its 'incidence', In this case,prevalence is defined as the number of children whose mothers were breastfeeding at the time ofthe survey, and incidence is defined as the average number of births per month (averaged over a36-month period to overcome problems of seasonality of births and possible reference-perioderrors), For each measure of breastfeeding, the prevalence-incidence mean is about the same asthe mean calculated in the conventional manner.
The median duration of breastfeeding is more than three years for both boys and girls. Themedian length ofbreastfeeding is two years in urban areas and more than three years in rural areas.
172

7.5 Nutritional Status of Children
Nutritional status is a major determinant of the health and well-being of children. Inadequate orunbalanced diets and chronic illness are associated with poor nutrition among children. To assesstheir nutritional status, measurements of weight and height/length were obtained for childrenborn in the three years preceding the survey. Children were weighed and measured with the sametype of scales and measuring boards used for women. Children under two years of age weremeasured lying down and other children were measured standing up. Data on weight andheight/length were used to calculate the following three summary indices ofnutritional status:
• weight-for-age• height-for-age• weight-for-height
The nutritional status of children calculated according to these three measures iscompared with the nutritional status of an international reference population recommended bythe World Health Organization (Dibley et aI., 1987a; 1987b). The use of this referencepopulation is based on the empirical finding that well-nourished children in all population groupsfor which data exist follow very similar growth patterns (Martorell and Habicht, 1986). Ascientific report from the Nutrition Foundation ofIndia (Agarwal et aI., 1991) has concluded thatthe WHO standard is generally applicable to Indian children.
The three indices of nutritional status are expressed in standard deviation units (z-scores)from the median for the international reference population. Children who are more than twostandard deviations below the reference median on any of the indices are considered to beundernourished, and children who fall more than three standard deviations below the referencemedian are considered to be severely undernourished.
Each of these indices provides somewhat different information about the nutritionalstatus of children. Weight-for-age is a composite measure that takes into account both chronicand acute undernutrition. Children who are more than two standard deviations below thereference median on this index are considered to be underweight. The height-for-age indexmeasures linear growth retardation. Children who are more than two standard deviations belowthe median of the reference population in terms of height-for-age are considered short for theirage or stunted. The percentage in this category indicates the prevalence of chronicundernutrition, which often results from a failure to receive adequate nutrition over a long periodof time or from chronic or recurrent diarrhoea. Height-for-age, therefore, does not varyappreciably by the season in which data are collected.
The weight-for-height index examines body mass in relation to body length. Childrenwho are more than two standard deviations below the median of the reference population interms of weight-for-height are considered too thin or wasted. The percentage in this categoryindicates the prevalence of acute undernutrition. Wasting is associated with a failure to receiveadequate nutrition in the period immediately before the survey and may be the result of seasonalvariations in food supply or recent episodes of illness.
The validity of these indices is determined by many factors, including the coverage of thepopulation of children and the accuracy of the anthropometric measurements. The survey was
173

Table 7.9 Nutritional status of children by demographic characteristics
Percentage of children under age 3 classified as undernourished on three anthropometric indices of nutritional status,according to selected demographic characteristics, Bihar, 1998-99
Weight-for-age Height-far-age Weight-far-height
Percentage Percentage Percentage Percentage Percentage Percentage NumberDemographic below below below below below below ofcharacteristic -380 _280' -380 _280' -380 -280' children
Age of child< 6 months 3.4 16.1 5.5 16.5 3.9 15.7 4176-11 months 19.4 45.1 20.7 40.2 5.6 19.7 31912-23 months 31.3 65.6 43.6 66.9 6.3 24.9 68024-35 months 36.2 71.3 47.2 70.0 5.5 21.0 670
Sex of childMale 24.6 52.8 33.6 53.0 5.7 21.4 1,078Female 26.4 56.1 33.6 54.6 5.2 20.5 1,008
Birth order1 21.8 51.6 27.4 52.6 6.7 20.7 4712-3 22.1 52.0 34.9 52.5 4.4 19.1 8334-5 29.9 57.9 35.5 55.7 6.3 20.7 4856+ 33.4 59.8 36.9 55.8 5.0 27.3 298
Previous birthinterval2
First birth 21.9 51.6 27.2 52.3 6.9 20.8 473< 24 months 31.9 61.3 42.1 61.2 6.4 22.9 27124--47 months 26.3 55.4 35.7 55.2 4.1 20.6 91048+ months 23.5 51.1 31.0 47.4 6.1 20.9 432
Total. 25.5 54.4 33.6 53.7 5.5 21.0 2,086
Note: Each index is expressed in standard deviation (SO) units from the median of the International ReferencePopulation.11ncludeschildren who are below -3 SO from the International Reference Population median2First·born twins (triplets, etc.) are counted as first births because they do not have a previous birth intelVa1.
not able to measure the height and weight of all eligible children, usually because the child wasnot at home at the time of the health investigator's visit or because the mother refused to allowthe child to be weighed and measured, In Bihar, NFHS-2 failed to measure height or weight for11 percent of children under age three (see Table B.3 in Appendix B). Also excluded from theanalysis are children whose month and year of birth were not known and those with grosslyimprobable height or weight measurements, In addition, two of the three indices (weight-for-ageand height-for-age) are sensitive to misreporting of children's ages, including heaping onpreferred digits.
Table 7,9 shows the percentage of children classified as undernourished by selecteddemographic characteristics, More than one-half of children under three years of age areunderweight (54 percent), and a similar percentage are stunted (54 percent). The proportion ofchildren who are severely undernourished is also notable-26 percent according to weight-for-ageand 34 percent according to height-for-age, Wasting is also quite evident in Bihar, affecting 21percent of children under three years of age, The proportion of children under three years of agewho are underweight decreased from 63 percent in NFHS-l to 54 percent in NFHS-2 and theproportion severely underweight decreased from 32 percent to 26 percent. There has been relativelylittle improvement in the proportion stunted or proportion wasted since the time of NFHS-l, The
174

proportion of children under three years of age who are stunted decreased from 56 percent inNFHS-I to 54 percent in NFHS-2, and the proportion wasted decreased from 24 percent to 21percent, respectively.
The proportion of children who are underweight and stunted increases steadily with child'sage, whereas wasting increases up to age 12-23 months and then declines slightly at age 24-35months. Even during the first six months of life, when most babies are breastfed, about 16 percentof children are undernourished according to the three nutritional indices. It is notable that at age 2435 months, when most children have been weaned from breast milk, about one-half are severelystunted and more than one-third are severely underweight.
Girls and boys are about equally undernourished, but girls are slightly more likely than boysto be uncterweight and stunted, whereas boys are slightly more likely to be wasted.Undernourishment generally increases with increasing birth order. Young children in families withfour or more children are nutritionally the most disadvantaged. First births have lower than averagelevels of undernutrition on almost every measure, and children born after a short birth interval havehigher than average levels on all measures.
Table 7.10 shows the nutritional status of children by selected background characteristics.Undernutrition is substantially higher in rural areas than in urban areas. Even in urban areas,however, 42-47 percent of children are underweight or stunted. Children whose mothers areilliterate are much more likely to be undernourished than children whose mothers have completed atleast high school (see Figure 7.2). Muslim children and Hindu children are about equally likely tobe undernourished. Children belonging to scheduled castes, scheduled tribes, or other backwardclasses have relatively high levels of undernutrition according to all three measures. Interestingly,undernutrition is relatively low for children whose mothers have not worked in the past 12 months.
Undernutrition among children is strongly related to maternal nutritional status.Undernutrition is more common for children of mothers whose height is less than 145 centimetresor whose body mass index is below 18.5 than for other children. All of the measures ofundernutrition are strongly related to the household's standard of living. Children from householdswith a low standard ofliving are 2-5 times as likely to be severely undernourished as children fromhouseholds with a high standard of living. Even among children from high standard of livinghouseholds, about one-third (33 percent) are underweight and more than one-third (36 percent) arestunted.
175
-

Table 7.10 Nutritional status of children by background characteristics
Percentage of children under age 3 years classified as undernourished on three anthropometric indices of nutritionalstatus, according to selected background characteristics, Bihar, 1998-99
Weight-for-age Height-for-age Weight-for-height
Percent- Percent- Percent- Percent- Percent- Percent-age age age age age age Numberbelow below below below below below of
Background characteristic -3 SO -2 SO' -3 SO -2 SO' -3 SO -2 SO' children
ResidenceUrban 12.1 47.4 24.2 42.2 3.8 17.1 199Rural 26.9 55.1 34.6 55.0 5.6 21.4 1,886
RegionNorth Bihar Plain 22.7 52.0 33.0 52.3 5.2 18.3 1,022South Bihar Plain 29.0 58.3 37.6 59.3 6.5 22.4 629Jharkhand 26.8 64.3 29.4 49.0 4.6 25.4 435
Mother's educationIlliterate 28.1 57.4 35.7 56.2 5.9 22.4 1,559Literate, < middle school complete 22.4 55.6 32.7 57.2 2.9 17.8 228Middle school complete 17.3 43.1 24.0 42.1 8.7 18.3 96High school complete and above 12.5 35.3 23.4 36.2 3.2 15.5 203
ReligionHindu 24.8 64.2 34.0 64.0 5.2 20.7 1,687Muslim 27.6 55.0 32.2 53.0 6.4 22.1 370
Caste/tribeScheduled caste 28.3 58.5 36.2 57.6 5.5 23.1 463Scheduled tribe 36.1 59.7 36.4 56.4 7.7 33.5 124Other backward class 25.5 55.8 34.9 64.7 5.3 19.7 1,125Other 18.5 43.1 25.6 45.1 5.0 18.3 374
Mother's work statusWorking in family farm/business 33.8 61.9 46.2 64.9 5.0 22.9 162Employed by someone else 39.2 59.7 38.5 59.1 8.7 28.7 191Self-employed 28.7 60.8 39.7 62.0 6.8 25.8 89Not worked in past 12 months 22.9 52.7 31.5 51.6 5.0 19.7 1,644
Mother's height< 145cm 32.7 64.3 39.4 57.8 7.2 25.5 366:::: 145 cm 24.0 52.2 32.5 52.9 5.1 20.1 1,716
Mother's body mass index< 18.5 kgfm' 31.3 62.2 37.1 58.4 5.4 23.6 803~ 18.5 kgfm' 21.9 49.3 31.5 50.9 5.5 19.4 1,277
Standard of living indexLow 30.4 59.5 37.4 57.5 6.4 23.4 1,137Medium 21.9 52.1 31.4 52.4 5.0 19.8 766High 9.9 32.7 19.4 35.7 1.2 11.1 179
Total 25.5 54.4 33.6 53.7 5.5 21.0 2,086
Note: Each index is expressed in standard deviation (SO) units from the median of the International ReferencePopulation. Total includes 13 and 15 children belonging to Christian and 'other' religions, respectively, and 3, 6, and 4children with missing information on mother's height, mother's body mass index, and the standard of living index,respectively, who are not shown separately.11ncludes children who are below -3 SO from the International Reference Population median
176

Figure 7.2Stunting Among Children Under Three Years
by Mother's Education and Sli
MOTHER'S EDUCATION
Illiterate
Literate, < MiddleSchool Complete
Middle SchoolComplete
High School Completeand Above
STANDARD OF LIVINGINDEX
Low
Medium
High
57
58
o 10 20 30 40Percent
50 60 70
NFHS-2, Bihar, 1998-99
7.6 Anaemia Among Children
Anaemia is a serious concern for young children because it can result in impaired cognitiveperformance, behavioural and motor development, coordination, language development, andscholastic achievement, as well as increased morbidity from infectious diseases (Seshadri, 1997).One of the most vulnerable groups is children age 6---24 months (Stoltzfus and Dreyfuss, 1998).
Table 7.11 and Figure 7.3 show anaemia levels for children age 6---35 months. Overall,four-fifths (81 percent) of these children have some level of anaemia, including 27 percent whoare mildly anaemic (10.0-10.9 gldl), 50 percent who are moderately anaemic (7.0-9.9 gldl), and4 percent who are severely anaemic (less than 7.0 g/dl{ Notably, a much higher proportion ofchildren than women are anaemic.
Several groups of children have particularly high levels of moderate to severe anaemia.These include scheduled-tribe children and children of mothers who are employed by someoneelse. The prevalence of moderate to severe anaemia is also relatively high among children age
'Because all sample PSUs in Bihar are at an altitude below 1,000 metres, no adjustment for altitude was made whenestimating anaemia levels among children.
177

Table 7.11 Anaemia among children
Percentage of children age 6-35 months classified as having iron~deficiency anaemia by selectedbackground characteristics, Bihar, 1998-99
Percentage Percentage of children with:of children Numberwith any Mild Moderate Severe of
Background characteristic anaemia anaemia anaemia anaemia children
Age of child6-11 months 83.6 30.3 49.0 4.2 30312-23 months 83.4 26.9 52.4 4.1 67824-35 months 78.1 25.3 48.6 4.1 676
Sex of childMale 80.5 25.6 51.0 3.9 852Female 82.1 28.3 49.5 4.3 805
Birth order1 80.2 26.0 51.6 2.6 3832-3 81.6 28.5 48.7 4.4 6474-5 81.5 26.8 49.7 5.0 385
. 6+ 81.6 24.0 53.0 4.6 242
ResidenceUrban 80.7 27.5 48.4 4.8 167Rural 81.3 26.8 50.5 4.0 1,490
RegionNorth Bihar Plain 81.2 28.9 47.9 4.4 777South Bihar Plain 80.6 24.4 52.5 3.7 512Jharkhand 82.4 26.2 52.2 4.0 368
Mother's educationIlliterate 82.5 26.1 52.0 4.4 1,238Literate, < middle school complete 79.4 21.0 52.4 6.0 184Middle school complete 79.3 30.3 46.4 2.6 74High school complete and above 75.0 37.9 36.4 0.7 162
ReligionHindu 81.0 27.1 49.7 4.1 1,373Muslim 81.5 25.2 52.0 4.3 261
Caste/tribeScheduled caste 83.5 25.1 53.6 4.7 368Scheduled tribe 93.5 24.1 63.0 6.4 114Other backward class 80.2 28.1 48.3 3.7 894Other 76.8 26.4 46.8 3.6 281
Mother's work statusWorking in family farm/business 83.2 30.0 51.7 1.5 148Employed by someone else 85.5 18.6 62.1 4.7 150Self-employed 84.9 19.9 56.1 8.9 77Not worked in last 12 months 80.3 27.9 48.3 4.1 1,281
Contd ...
12-23 months, male children, rural children, Muslim children, scheduled-caste children, childrenof self-employed mothers, and children from poor families. The prevalence of moderate tosevere anaemia among children whose mothers have completed at least a high school educationis lower than among children whose mothers are illiterate or have less than a high schooleducation. As expected, there is a strong positive relationship between the anaemia status ofmothers and prevalence of moderate to severe anaemia among children. The prevalence of mildanaemia among children age 6-35 months varies little by most background characteristics.
178

Table 7.11 Anaemia among children (contd.l
Percentage of children age 6--35 months classified as having iron-deficiency anaemia by selectedbackground characteristics, Bihar, 1998-99
Percentage Percentage of children with:of children Numberwith any Mild Moderate Severe of
Background characteristic anaemia anaemia anaemia anaemia children
Standard of living indexLow 83.3 25.0 53.6 4.7 891Medium 79.5 28.6 47.2 3.7 621High 76.4 32.0 42.2 2.3 142
Mother's anaemia statusNot anaemic 78.4 29.6 45.2 3.6 595Mildly anaemic 79.9 25.6 51.7 2.6 711Moderately anaemic 86.0 26.5 54.3 7.1 327
Total 81.3 26.9 50.3 4.1 1,657
Note: Haemoglobin levels are not adjusted for altitude when calculating the degree of anaemiaamong children because all of the sample PSUs in Bihar are at an altitude below 1,000 metres. Totalincludes 12 and 11 children belonging to Christian and 'other' religions, respectively, 21 childrenwhose mothers are severely anaemic, and 3 children each with missing information on the standardof living index and mother's anaemia status, who are not shown separately.
Figure 7.3Anaemia Among Children
100
90
80
70
C60
~ 50•a.40
30
20
10
0
81
4
Any Anaemia
7.7 Iodization of Salt
Mild Anaemia Moderate Anaemia Severe Anaemia
NFHS-2, Bihar, 1998-99
Iodine is an important micronutrient. A lack of iodine in the diet can lead to Iodine DeficiencyDisorders (IDD), which, according to the World Health Organization, can cause miscarriages,brain disorders, cretinism, and retarded psychomotor development. It is the single mostimportant and preventable cause of mental retardation worldwide.It has been estimated that 200million people in India are exposed to the risk of iodine deficiency and 70 million suffer from
179

goitre and other IDDs (IDD & Nutrition Cell, 1998). In addition, about one-fifth of pregnantwomen are at considerable risk of giving birth to children who will not reach their optimumphysical and mental potential because of maternal iodine deficiency (Vir, 1995).
Iodine deficiency can be avoided by using salt that has been fortified with iodine. In1983-84, the Government of India adopted a policy to achieve universal iodization of edible saltby 1992. In 1988, the Prevention of Food Adulteration Act was amended to fix the minimumiodine content of salt at 30 parts per million (ppm) at the manufacturing level and 15 ppm at theconsumer level (Ministry of Health and Family Welfare, 1994). The Government of Indiaadvised all states and union territories to issue notifications banning the sale of edible salt that isnot iodized. However, the ban on non-iodized salt was lifted in September, 2000.
NFHS-2, with its representative sample of households throughout Bihar and the rest ofIndia, is an ideal vehicle for measuring the degree of salt iodization in the country. Iodine levelsin salt can be measured in the laboratory using a standard titration test or in the field using arapid-test kit. In NFHS-2, interviewers measured the iodine content of cooking salt in eachinterviewed household using a rapid-test kit. The test kit consists of ampoules of a stabilizedstarch solution and of a weak acid-based solution. The interviewer squeezes one drop of thestarch solution on a sample of cooking salt obtained from the household respondent. If the colourchanges (from light blue through dark violet), the interviewer matches the colour of the salt asclosely as possible to a colour chart on the test kit and records the iodine level as 7, 15, or 30ppm. If the initial test is negative (no change in colour), the interviewer is required to conduct asecond confirmatory te'st on a new salt sample, using the acid-based solution in addition to thestarch solution. This test is necessary because the starch solution will not show any colourchange even on iodized salt if the salt is alkaline or mixed with alkaline free-flow agents. If thecolour of the salt does not change even after the confirmatory test, the salt is not iodized.Because of uncertainties and subjective judgement in the matching process, the rapid test shouldnot be seen as giving an exact quantitative estimate of salt iodization, but it does providereasonable information on whether or not salt is iodized, as well as the extent of iodization. Arecent multicentric study in eight centres in India concluded that the rapid test kit can be used forsemi-quantitative estimation ofthe iodine content of salt to monitor the quality of salt being usedin a community (Kapil et aI., 1999).
Table 7.12 shows the extent of salt iodization at the household level. Overall, only aboutone-half of households (47 percent) use cooking salt that is iodized at the recommended level of15 ppm or more. About one-quarter of households (23 percent) use salt that is not iodized at alland about one-third (30 percent) use salt that is inadequately iodized (less than 15 ppm).Differentials in salt iodization by background characteristics are pronounced. More than threefourths of households in urban areas use salt with 15 ppm or more of iodine compared with only43 percent of households in rural areas. Hindu households and Muslim households are less likelyto use iodized salt than Christian or 'other' households. The use of iodized salt is relatively lowin households headed by persons from scheduled castes, scheduled tribes, or other backwardclasses. The widest differentials are observed for the standard ofliving index. Eighty-one percentof households with a high standard ofliving use adequately iodized salt compared with only 38percent ofhouseholds with a low standard ofliving.
180

Table 7.12 lodization of salt
Percent distribution of households by degree of iodization of salt, according to selected background characteristics, Bihar, 1998-99
Total Number ofBackground characteristic Not iodized 7 ppm 15 ppm 30 ppm Missing percent households
Type of place of residenceLarge city 1.3 21.3 12.0 65.3 0.0 100.0 77Small city 8.9 7.5 25.1 58.5 0.0 100.0 163Town 10.4 14.0 22.8 52.8 0.0 100.0 480Rural area 24.7 32.3 27.1 15.9 0.0 100.0 5,625
Religion of household headHindu 23.7 30.1 25.9 20.2 0.0 100.0 5,276Muslim 20.1 31.7 30.5 17.8 0.0 100.0 938Christian 8.8 17.8 23.7 49.7 0.0 100.0 70Other 12.1 27.7 22.4 37.9 0.0 100.0 61
Caste/tribe of household head, Scheduled caste 26.1 33.6 25.2 15.1 0.0 100.0 1,320
Scheduled tribe 22.2 31.2 25.1 21.5 0.0 100.0 631Other backward class 24.0 30.7 27.2 18.1 0.0 100.0 3,169Other 17.0 24.5 27.0 31.4 0.1 100.0 1,225
Standard of living indexLow 27.1 35.1 26.0 11.8 0.0 100.0 3,641Medium 19.7 26.5 29.7 24.1 0.0 100.0 2,151High 7.8 11.3 18.0 62.9 0.0 100.0 545
Total 22.9 30.1 26.6 20.4 0.0 100.0 6,345
Note: Total includes 8 households with missing information on the standard of living index, which are not shown separately.ppm: Parts per million
181

CHAPTER 8
MATERNAL AND REPRODUCTIVE HEALTH
Promotion of maternal and child health has been one of the most important objectives of theFamily Welfare Programme in India. The Government of India took steps to strengthen maternaland child health services as early as the First and Second Five-Year Plans (1951-56 and 195661). As part ofthe Minimum Needs Programme initiated during the Fifth Five-Year Plan (197479), maternal health, child health, and nutrition services were integrated with family planningservices. The primary aim at that time was to provide at least a minimum level of public healthservices to pregnant women, lactating mothers, and preschool children (Kanitkar, 1979).
In 1992-93, the Child Survival and Safe Motherhood Programme continued the processof integration by bringing together several key child survival interventions with safe motherhoodand family planning activities (Ministry of Health and Family Welfare, 1992). In 1996, safemotherhood and child health services were incorporated into the Reproductive and Child HealthProgramme. This new programme seeks to integrate J;Ilaternal health, child health, and fertilityregulation interventions with reproductive health programmes for both women and men. Withregard to maternal and reproductive health, the important elements ofthe programme include:
• Provision of antenatal care, including at least three antenatal care visits, iron prophylaxis forpregnant and lactating mothers, detection and treatment of anaemia in mothers, andmanagement and referral of high-risk pregnancies
• Encouragement of institu~ional deliveries or home deliveries assisted by trained healthpersonnel
• Provision ofpostnatal care, including at least three postnatal visits
• Identification and management of reproductive tract and sexually transmitted infections
In rural areas, the government delivers reproductive and other health services through itsnetwork of Primary Health Centres (PHCs), sub-centres, and other government health facilities.In addition, pregnant women and children can obtain services from private maternity homes,hospitals, private practitioners, and in some cases, nongovernmental organizations (NGOs). Inurban areas, reproductive health services are available mainly through government or municipalhospitals, urban health posts, hospitals and nursing homes operated by NGOs, and privatenursing and maternity homes.
In rural areas, a female paramedical worker, called an auxiliary nurse midwife (ANM), isposted at a sub-centre to provide basic maternal health, child health, and family welfare servicesto women and children either in their homes or in the health clinic. Her work is overseen by thelady health visitor (LHV) posted at the PHC. With regard to safe motherhood, the ANM isresponsible for registering pregnant women, motivating them to obtain antenatal and postnatalcare, assessing their health throughout pregnancy and in the postpartum period, and referringwomen with high-risk pregnancies. The ANM is assisted by a male health worker whose dutiesinclude motivating men to participate in the family welfare programme and educating men about
PREVIOUS PAGE BLANK

reproductive tract and sexually transmitted infections. The ANM and LHV also assist themedical officer at the PHC where health services including antenatal and postnatal care areprovided (Ministry ofHealth and Family Welfare, 1997; 1998b).
An important objective of NFHS-2 is to provide information on the use of safemotherhood services. In addition, the survey includes questions on the prevalence and treatmentofreproductive health problems. The Woman's Questionnaire includes relevant questions on safemotherhood for women age 15-49 who have given birth since 1 January 1995. The topicscovered include pregnancy complications, antenatal and postnatal care, place of and assistanceduring delivery, delivery characteristics, and postpartum complications. Although the surveyobtained information for the two most recent live births since 1 January 1995, the informationpresented in this chapter pertains only to the subset of those births that took place during thethree years preceding the survey. With regard to reproductive health, all women were asked abouttheir experience of specific symptoms of reproductive health problems, and if problems werereported, whether and where they received treatment.
8.1 Antenatal Problems and Care
Antenatal care (ANC) refers to pregnancy-related health care provided by a doctor or a healthworker in a medical facility or at home. The Safe Motherhood Initiative proclaims that allpregnant women must receive basic, professional antenatal care (Harrison, 1990). Ideally,antenatal care should monitor a pregnancy for signs of complications, detect and treat preexisting and concurrent problems of pregnancy, and provide advice and counselling onpreventive care, diet during pregnancy, delivery care, postnatal care, and related issues. TheReproductive and Child Health Programme recommends that as part of antenatal care, womenreceive two doses of tetanus toxoid vaccine, adequate amounts of iron and folic acid tablets orsyrup to prevent and treat anaemia, and at least three antenatal check-ups that include bloodpressure checks and other procedures to detect pregnancy complications (Ministry of Health andFamily Welfare, 1997; 1998b).
NFHS-2 collected information from women on specific problems they may have hadduring their pregnancies and whether they received any antenatal check-ups. Women who did notreceive antenatal check-ups were asked why they did not. Women who received antenatalcheck-ups were asked about the care provider, the timing of the first antenatal check-up, the totalnumber of check-ups, the procedures conducted during the check-ups, and the advice given. Inaddition, the survey asked women whether they received tetanus toxoid injections and iron andfolic acid tablets or syrup. Results from each ofthese questions are discussed in this chapter.
Problems During Pregnancy
For each of the two most recent births in the three years preceding the survey, the mother wasasked if at any time during the pregnancy she experienced any of the following pregnancy-relatedproblems: night blindness, blurred vision, convulsions (not from fever), swelling (oflegs, body,or face), excessive fatigue, anaemia, or vaginal bleeding. Night blindness, or difficulty seeing atdusk, is the result of chronic vitamin A deficiency and is often seen in pregnant women in areaswhere vitamin A deficiency is endemic. Convulsions accompanied by signs of hypertension canbe symptomatic of eclampsia, a potentially fatal condition. The potential health risk posed byvaginal bleeding during pregnancy varies by when in the pregnancy the bleeding takes place.
184

Table 8.1 Health problems during pregnancy
Among births during the three years preceding the SUlVey, percentage of mothersexperiencing specific health problems during pregnancy by residence, Bihar,1998-99
Problem during pregnancy Urban Rural Total
Night blindness 11.7 20.2 19.4Blurred vision 37.2 38.1 38.0Convulsions not from fever 29.7 30.5 30.4Swelling of the legs, body, or face 32.8 35.0 34.8Excessive fatigue 52.8 50.5 50.7Anaemia 32.2 28.3 28.6Vaginal bleeding 2.0 3.7 3.6
INumber of births 258 2,689 2,947 I
Note: Table includes only the two most recent births during the three yearspreceding the sUlVey.
Although documenting the prevalence of the symptoms of pregnancy complications is vital forplanning services to reduce maternal morbidity and mortality, the information presented here isbased on women's self reports and should be interpreted with care.
As shown in Table 8.1 and Figure 8.1, problems during pregnancy are common in Bihar.The problem reported most often is excessive fatigue (51 percent), followed by blurred vision (38percent), swelling ofthe legs, body, or face (35 percent), convulsions not from fever (30 percent),and anaemia (29 percent). Nineteen percent of women reported night blindness and 4 percentreported any vaginal bleeding during pregnancy. The reported prevalence of night blindness ismuch higher in rural (20 percent) than in urban areas (12 percent).
Figure 8.1Problems During Pregnancy
Excessive Fatigue
Blurred Vision
Swelling of Legs,Body. or Face
Convulsions Notfrom Fever
Anaemia
Night Blindness
Vaginal Bleeding
o 10 20 30
Percent
40 50
51
60
Note: Based on births in the three yearspreceding the survey (1996-98)
185
NFHS·2, Bihar, 1998-99

Antenatal Check-Ups
A pregnant woman can have an antenatal check-up by visiting a doctor or another healthprofessional in a medical facility, receiving a home visit from a health worker, or both. NFHS-2asked women who had a birth during the three years preceding the survey whether any healthworker had visited them at home to provide antenatal check-ups. The survey also asked whetherwomen had gone for antenatal check-ups outside the home, and if they had, what type of serviceprovider gave them the check-ups.
Table 8.2 and Figure 8.2 show the percent distribution of births in the three yearspreceding the survey by the source of antenatal check-ups received during pregnancy. Womenwho received antenatal check-ups both at home and outside the home are categorized as havingreceived care outside the home. If women received check-ups from more than one type of healthprovider, only the provider with the highest qualification is considered.
NFHS-2 results for Bihar show that 63 percent of mothers did not receive any antenatalcheck-up for their births during the three years preceding the survey. There has been no change inthis percentage since NFHS-1. Mothers received antenatal check-ups from doctors for 25 percentof births and from other health professionals (such as ANMs, nurses, midwives, or LHVs) for 5percent ofbirths. Mothers received antenatal check-ups exclusively at home from a health workerfor 6 percent of births.
Older women and women having higher-order births are much less likely to havereceived antenatal check-ups (especially from doctors) for their births. As expected, antenatalcheck-ups from doctors are much more common in urban areas (55 percent) than in rural areas(22 percent). The percentage receiving antenatal check-ups is highest (43 percent) in theJharkhand region, followed by 38 percent in the South Bihar Plain region and 34 percent in theNorth Bihar Plain region.
In Bihar, 71 percent of illiterate women did not receive any antenatal check-ups for theirbirths in the three years preceding the survey. The proportion of births whose mothers receivedantenatal check-ups from a doctor increases steadily with education, from 18 percent for illiteratemothers to 65 percent for mothers who have completed at least a high school education. Theprevalence of antenatal check-ups only at home from a health worker does not show a clearrelationship with education. The utilization of antenatal check-up services is slightly higheramong Hindu women than among Muslim women. By caste/tribe, the likelihood of havingreceived antenatal check-ups overall and from a doctor is lowest for births to scheduled-castemothers and highest for births to mothers who do not belong to scheduled castes, scheduledtribes, or other backward classes. The likelihood of having received antenatal check-ups from adoctor increases with the standard of living of the household, from only 16 percent for births tomothers with a low standard of living to 63 percent for births to mothers with a high standard ofliving.
186

Table 8.2 Antenatal check-ups
Percent distribution of births during the three years preceding the survey by source of antenatal check-up, according to selectedbackground characteristics, Bihar, 1998-99
Antenatal check-up outside home' from: NoAntenatal ante-check-up only Traditional birth natalat home from Other health attendant, check- Total Number
Background characteristic health worker Doctor professional other' up Missing percent of births
Mother's age at birth< 20 9.9 25.8 5.0 0.5 57.6 1.3 100.0 65320-34 5.6 25.7 4.5 0.2 63.0 1.0 100.0 2,12535-49 1.1 16.8 2.9 0.0 76.0 3.1 100.0 168
Birth order1 8.4 33.2 6.0 0.3 50.6 1.6 100.0 6842-3 5.9 27.9 4.9 0.4 59.9 1.1 100.0 1,1654-5 6.9 18.2 2.5 0.2 71.3 1.0 100.0 6676+ 3.5 16.0 4.1 0.0 75.2 1.2 100.0 430
ResidenceUrban 6.6 54.8 6.3 0.0 30.6 1.7 100.0 258Rural 6.3 22.4 4.3 0.3 65.6 1.1 100.0 2,689
RegionNorth Bihar Plain 9.3 21.1 3.9 0.1 65.6 0.1 100.0 1,378South Bihar Plain 4.2 26.4 4.5 0.4 61.6 2.9 100.0 979Jharkhand 3.0 32.7 6.0 0.4 56.9 1.1 100.0 590
Mother's educationIlliterate 6.3 17.5 3.8 0.2 70.9 1.3 100.0 2,262Literate, < middle schoolcomplete 7.7 36.8 6.9 0.7 47.1 0.8 100.0 280
Middle school complete 7.9 49.1 2.4 0.0 38.9 1.7 100.0 127High school completeand above 4.6 65.2 8.4 0.0 21.0 0.8 100.0 277
ReligionHindu 6.6 25.8 4.6 0.3 61.5 1.2 100.0 2,378Muslim 5.1 22.0 3.6 0.0 68.4 0.8 100.0 532
Caste/tribeScheduled caste 6.7 17.1 3.8 0.0 70.7 1.7 100.0 672Scheduled tribe 3.8 19.4 5.5 0.5 69.7 1.1 100.0 197Other backward class 7.2 24.3 4.3 0.4 62.5 1.3 100.0 1,544Other 4.3 40.1 5.4 0.0 49.8 0.4 100.0 533
Standard of living indexLow 5.3 15.5 3.8 0.2 73.6 1.5 100.0 1,676Medium 7.3 32.5 4.9 0.3 54.4 0.7 100.0 1,028High 8.6 62.6 7.7 0.0 20.2 0.9 100.0 237
Total 6.3 25.2 4.5 0.2 62.5 1.2 100.0 2,947
Note: Table includes only the two most recent births during the three years preceding the survey. Total includes 17 and 20 births tomothers belonging to Christian and 'other' religions, respectively, and 6 births with missing information on the standard of living index,which are not shown separately.'Includes all births for which the mothers received an antenatal check-up outside the home, even if they also received an antenatalcheck-up at home from a health worker. If more than one type of antenatal check-up provider was mentioned, only the provider with thehighest qualification is shown.21ncludes hakim and 'Don't know'
187

Figure 8.2Source of Antenatal Check-Ups
During Pregnancy
Antenatal Check.UpOnly at Home from
Missing Health Worker1% 6%
Doctor25%
lDai (TBA),Other0.2%
No AntenatalCheck-Up
63%
Note: Percents add to more than 100.0due to rounding
Other Health---Professional
5%
NFHS-2, Bihar, 1998-99
In summary, less than 4 out of 10 women in Bihar received any antenatal check-ups fortheir births in the three years preceding the survey. Women who did not receive an antenatalcheck-up are disproportionately older women, women of higher parity, women living in ruralareas, illiterate women, women from scheduled castes and tribes, and women living inhouseholds with a low standard of living. This suggests that improving the coverage of antenatalprogrammes in Bihar requires special efforts to reach older higher-parity women, women whoare socioeconomically disadvantaged, and women living in rural areas.
Reasons for Not Receiving Antenatal Check-Ups
Table 8.3 shows the percent distribution of births in the three years preceding the survey whosemothers did not receive any antenatal check-ups in a health facility or at home by the main reasonfor not receiving check-ups. For births to mothers who did not receive any antenatal check-ups,two-thirds of mothers did not consider having a check-up to be necessary (65 percent) orcustomary (3 percent). For 20 percent of births, the financial cost was reported as the main reasonfor not receiving any antenatal check-ups and for 3 percent of births, lack of knowledge aboutantenatal care was the main reason. For 5 percent of births, mothers did not have any antenatalcheck-ups because the family did not allow them to. Cost as a reason for non-utilization ofantenatal care services is reported more frequently by mothers in rural areas (21 percent) than inurban areas (15 percent). Contrary to expectation, 'family did not allow' and 'lack of knowledge'are more frequently reported reasons for non-utilization of antenatal care services in urban areasthan in rural areas. These results suggest the need to inform mothers about the availability andbenefits of antenatal check-ups to help overcome traditional attitudes and other hurdles thatprevent mothers from seeking antenatal care for their pregnancies. Utilization of antenatal careservices could also be increased by lowering the cost and making the services more accessible.
188

Table 8.3 Reason for not receiving an antenatal check-up
Percent distribution of births during the three years preceding the survey to motherswho did not receive an antenatal check-up by the main reason for not receiving anantenatal check-up, according to residence, Bihar, 1998-99
Reason for not receiving anantenatal check-up Urban Rural Total
Not necessary 63.6 64.5 64.5Not customary 2.7 3.4 3.4Costs too much 14.6 20.6 20.4Too farIna transport 0.0 2.0 1.9Poor quality service 0.0 0.2 0.2No time to go 2.7 0.6 0.7Family did not allow 8.1 4.9 5.1Lack of knowledge 8.3 2.9 3.1No health worker visited 0.0 0.2 0.2Other 0.0 0.6 0.6
Total percent 100.0 100.0 100.0
Number of births 79 1,764 1,843
Note: Table includes only the two most recent births during the three yearspreceding the survey.
Number and Timing of Antenatal Check-Ups
The number of aotenatal check-ups aod the timing of the first check-up are important for thehealth of the mother and the outcome of the pregnaocy. The conventional recommendation fornormal pregnaocies is that once pregnaocy is confirmed, antenatal check-ups should be scheduledat four-week intervals during the first seven months, then every two weeks until the last month,and weekly thereafter (MacDonald and Pritchard, 1980). Four antenatal check-ups---one eachduring the third, sixth, eighth, aod ninth month of pregnancy-have been recommended as theminimum necessary (Park and Park, 1989). The conventional recommendation is to schedule thefirst check-up within six weeks ofa womao's last menstrual period. Studies on the timing of theinitial aotenatal check-up, however, show that even when antenatal care is initiated as late as thethird trimester, there is a substantial reduction in perinatal mortality (Ramachandran, 1992).
In India, the Reproductive aod Child Health Programme includes the provision of at leastthree antenatal care check-ups for pregnant women. Guidelines of the programme require thateach pregnancy be registered in the first 12-16 weeks (Ministry of Health aod Family Welfare,1997). Accordingly, the first antenatal check-up should take place at the latest during the secondtrimester ofpregnancy. NFHS-2 asked women who received antenatal check-ups for pregnanciesin the three years preceding the survey about the total number of check-ups they received andwhen in their pregnaocies they received their first check-up.
189

Table 8.4 Number and timing of antenatal check-ups and stage of pregnancy
Percent distribution of births during the three years preceding the survey by number ofantenatal check-ups and by the stage of pregnancy at the time of the first check-up,according to residence, Bihar, 1998-99
,
Number and timing of check-ups Urban Rural Total
Number of antenatal check-ups0 30.6 65.6 62.51 8.2 10.2 10.12 9.6 8.2 8.43 17.1 8.8 9.54+ 32.5 6.0 8.3Don't know/missing 2.1 1.1 1.2
Total percent 100.0 100.0 100.0
Median number of check-ups(for those who received atleast one antenatal check-up) 2.9 1.8 2.0
Stage of pregnancy at the timeof first antenatal check-up
No antenatal check-up 30.6 65.6 62.5First trimester 38.2 12.9 15.1Second trimester 23.7 15.9 16.6Third trimester 5.8 4.4 4.5Don't know/missing 1.7 1.1 1.2
Total percent 100.0 100.0 100.0
Median months pregnantat first antenatal check-up (forthose who received at least oneantenatal check-up) 3.2 4.4 4.2
Number of births 258 2,689 2,947
Note: Table includes only the two most recent births during the three years preceding thesurvey.
Table 8.4 and Figure 8.3 show the percent distribution of births in the three yearspreceding the survey by number and timing of antenatal check-ups. In Bihar, mothers of only 18percent of births received at least three antenatal check-ups and only 8 percent received four ormore check-ups. For those who received antenatal check-ups, the median number of check-upswas 2.0. There are substantial differences in the number of antenatal check-ups by residence. Atleast three antenatal check-ups were received for 50 percent of births to mothers living in urbanareas, compared with only 15 percent of births to mothers living in rural areas. The mediannumber of check-ups is also higher in urban areas (2.9) than in rural areas (1.8). The shorterdistances to antenatal-care services and the comparative ease of travelling in urban areas, as wellas the higher educational attainment of mothers in urban areas, could be important factors for thelarger number of check-ups received by mothers in urban areas.
In Bihar, mothers of only 15 percent of the births that took place in the three yearspreceding the survey received their first antenatal check-up in the first trimester of pregnancy,and another 17 percent received their first check-up in the second trimester (Table 8.4 and Figure8.3). Check-ups during the first trimester were much more common in urban areas (38 percent)
190

Figure 8.3Number and Timing of Antenatal Check-Ups
NUMBER OF CHECK-UPS
o1
2
3~4+
Don't Know/Missing
TIMING OF FIRST CHECK-UP
No Antenatal Check·Up
First Trimester
Second Trimester
Third Trimester
Don't Know/Missing
63
o 10 20 30 40 50 60 70
Note: Based on births in the three yearspreceding the survey (1996-98)
Percent
NFHS-2, Bihar, 1998-99
than in rural areas (13 percent). The first check-up was rarely received as late as the thirdtrimester. The median timing of the first antenatal check-up is 4.2 months for Bihar as a whole,and it is considerably later in rural areas (4.4 months) than in urban areas (3.2 months).
Components of Antenatal Check-Ups
The effectiveness of antenatal check-ups in ensuring safe motherhood depends in part on the testsand measurements done and the advice given during the check-ups. For births during the threeyears preceding the survey for which antenatal check-ups were received, Table 8.5 presents thepercentage whose mothers received specific components of check-ups by residence. Except forX-rays (which are not recommended as a standard component of antenatal care), all of themeasurements and tests are part of essential obstetric care or are required for monitoring highrisk pregnancies.
Among all births for which mothers received antenatal check-ups, 65 percent of mothershad an abdominal examination. Other relatively common components of antenatal check-upswere blood pressure check (47 percent), urine test (45 percent), and blood test (44 percent).Mothers of about one-third of births received an internal examination (37 percent) or had theirweight measured (31 percent), and only 11 percent had their height measured during anyantenatal check-up. X-rays, sonogram or ultrasound, and amniocentesis were rarely performed.All of these measurements or tests were performed more often in the case of births to mothers inurban areas than in rural areas. The differences by residence are most pronounced for weightmeasurement (49 percent in urban areas compared with 28 percent in rural areas) and forsonography or ultrasound (17 percent in urban areas compared with 4 percent in rural areas).
191

Table 8.5 Components of antenatal check-ups
Among births during the three years preceding the survey for which an antenatal check-up wasreceived, percentage receiving specific components of antenatal check-ups by residence,Bihar, 1998-99
Components of antenatal check-ups Urban Rural Total
Antenatal measurements/testsWeight measured 48.6 28.0 31.3Height measured 12.1 10.2 10.5Blood pressure checked 64.7 43.8 47.2Blood tested 590 41.3 44.2Urine tested 56.8 42.5 44.9Abdomen examined 76.2 62.8 65.0Internal examination 39.6 36.6 37.1X-ray 4.8 4.8 4.8Sonography or ultrasound 16.8 3.6 5.7Amniocentesis 3.0 0.5 0.9
Antenatal adviceDiet 79.8 68.8 70.6Danger signs of pregnancy 50.2 33.8 36.5Delivery care 54.7 44.6 46.2Newborn care 46.6 33.7 35.8Family planning 24.1 16.5 17.7
Number of births for which the motherreceived at least one antenatal check-up 175 894 1,069
Table 8.5 also shows the type of advice received by mothers who had antenatal check-upsfor births in the three years preceding the survey. Dietary advice was given to mothers most often(in 71 percent of cases). Mothers were less likely to receive advice on delivery care (46 percent),on danger signs of pregnancy (37 percent), and on newborn care (36 percent). Only 18 percent ofmothers received advice on family planning. The proportions receiving advice on different topicsare greater in urban areas than in rural areas.
Tetanus Toxoid Vaccination
In India, an important cause of death in infancy is neonatal tetanus, which is caused by newborninfants becoming infected by tetanus organisms, usually at the umbilical stump. Neonatal tetanusis most common among children who are delivered in unhygienic environments and whenunsterilized instruments are used to cut the umbilical cord. Tetanus typically develops during thefirst or second week of life and is fatal in 70-90 percent of cases (Foster, 1984). Where expertmedical help is not available, as is common in many rural areas in Bihar, death due to neonataltetanus is almost certain. Neonatal tetanus, however, is a preventable disease. Two doses oftetanus toxoid vaccine given one month apart during early pregnancy are nearly 100 percenteffective in preventing tetanus both among newborn infants and their mothers. Immunity againsttetanus is transferred to the foetus through the placenta when the mother is vaccinated.
In India, the tetanus toxoid immunization programme for expectant mothers was initiatedin 1975-76 and was integrated with the Expanded Programme on Immunization (EPI) in 1978(Ministry of Health and Family Welfare, 1991). To step up the pace of the immunizationprogramme, the Government of India initiated the Universal Immunization Programme (UIP) in1985-86. An important objective ofthe UIP was to vaccinate all pregnant women against tetanus
192

by 1990. In 1992-93, the VIP was integrated into the Child Survival and Safe MotherhoodProgramme, which in tum has been integrated into the Reproductive and Child HealthProgramme. According to the National hnmunization Schedule, a pregnant woman shouldreceive two doses of tetanus toxoid injection, the first when she is 16 weeks pregnant and thesecond when she is 20 weeks pregnant (Central Bureau of Health Intelligence, 1991). Reinoculation is recommended every three years. If two doses were received less than three yearsearlier, a single booster injection is recommended.
For each birth during the three years preceding the survey, NFHS-2 asked motherswhether they were given an injection in the arm to prevent them and their baby from gettingtetanus. Women who said they had received a tetanus injection were asked how many times theyhad received the injection during pregnancy. Table 8.6 shows the distribution of births by thenumber of tetanus toxoid injections given to mothers, according to selected backgroundcharacteristics. Tetanus toxoid coverage in Bihar is far from complete. For births in the threeyears preceding the survey, 36 percent of the mothers did not receive any tetanus toxoidinjections during pregnancy, and another 5 percent received only one injection. The proportion ofmothers who received two or more tetanus toxoid injections during their pregnancies rose from31 percent to 58 percent between NFHS-I and NFHS-2.
Tetanus toxoid injections are more common in urban areas than in rural areas. Coveragevaries inversely by age of mother and by birth order. Tetanus toxoid coverage (two or moreinjections) is higher for births to women under age 35 (58-60 percent) than for the small numberof births to older mothers (46 percent). At least two tetanus toxoid injections were received bymothers for 67 percent of first births, compared with 52 percent of fourth and fifth births andonly 42 percent of sixth or higher-order births. By region, coverage is lower in the Jharkhandregion (51 percent) than in the South Bihar Plain region (56 percent) and in the North Bihar Plainregion (62 percent). Hindu and Muslim mothers have about the same level of tetanus toxoidcoverage. Coverage is substantially lower for births to scheduled-tribe mothers (36 percent) thanfor scheduled-caste (50 percent), other backward class (59 percent), and 'other' caste/tribe/class(72 percent) mothers. For 52 percent of their births, scheduled-tribe mothers did not receive anytetanus toxoid vaccine and for another 10 percent they received only one injection. Tetanustoxoid coverage increases with an increase in the level of mother's education and in the standardof living of the household. Only 51 percent of illiterate mothers received at least two tetanustoxoid injections for their births, compared with 90 percent for births to mothers with high schoolcomplete or more education. By living standard, the coverage increases from 48 percent forbirths in low standard of living households to 83 percent for births in high standard of livinghouseholds. These results suggest that despite generally improving coverage of tetanus toxoidvaccinations, the coverage is still quite low in Bihar, particularly for socioeconomicallydisadvantaged women.
193

Table 8.6 Tetanus toxoid vaccination and iron and folic acid tablets orsyruQ
Percent distribution of births during the three years preceding the survey by the number of tetanus toxoid injections received by the mother,percentage of births for which the mothers were given iron and folic acid (IFA) tablets or syrup during pregnancy, and among those whoreceived iron and folic acid tablets or syrup, percentage who received enough for three months or longer and percentage who consumedall the supply given, according to selected background characteristics, Bihar, 1998-99
Percent-Number of tetanus toxoid injections age given Percent- Percent-
iron and age who age who Number ofDon't folic acid received consumed births whose
Background Two know! Total tablets or Number supply for all the motherscharacteristic None Ona or more missing percent syrup of births 3+ months1 supply1 received IFA
Mother's age at birth<20 32.7 5.2 60.3 1.8 100.0 26.9 653 83.3 87.2 17620-34 36.0 4.7 57.9 1.4 100.0 24.0 2,125 81.3 83.4 51035-49 41.8 7.5 46.3 4.3 100.0 14.7 168 (88.5) (92.3) 25
Birth order1 27.8 3.8 66.5 1.9 100.0 31.3 684 84.8 89.0 2142--3 31.9 5.2 61.7 1.3 100.0 27.5 1,165 82.9 83.9 3204-5 40.8 5.0 52.3 1.9 100.0 17.0 667 75.2 83.4 1146+ 49.7 6.5 42.1 1.7 100.0 14.4 430 80.4 75.5 62
ResidenceUrban 17.8 2.1 78.0 2.1 100.0 46.1 258 88.3 89.1 119Rural 37.3 5.3 55.9 1.6 100.0 22.0 2,689 80.8 83.7 591
RegionNorth Bihar Plain 33.5 4.1 62.1 0.3 100.0 21.9 1,378 84.5 85.7 301South Bihar Plain 35.0 5.2 56.1 3.7 100.0 22.0 979 75.4 85.0 . 216Jharkhand 41.2 7.0 50.6 1.2 100.0 32.7 590 85.7 82.5 193
Mother's educationIlliterate 41.9 5.8 50.6 1.7 100.0 16.5 2,262 76.8 80.2 374Literate, < middle schoolcomplete 21.2 3.6 73.6 1.5 100.0 35.8 280 86.6 90.7 100
Middle school complete 15.3 0.9 82.2 1.7 100.0 48.3 127 90.5 86.6 62High school complete
and above 7.5 2.3 89.5 0.8 100.0 62.7 277 87.6 90.0 174
ReligionHindu 35.4 5.0 57.9 1.7 100.0 25.0 2,378 81.9 85.2 595Muslim 36.2 5.1 57.5 1.2 100.0 19.1 532 80.2 80.2 101
Caste/tribeScheduled caste 41.7 5.4 50.3 2.6 100.0 18.0 672 76.4 78.1 121Scheduled tribe 52.3 10.2 36.4 1.1 100.0 21.3 197 (69.3) (81.9) 42Other backward class 35.0 4.4 59.1 1.5 100.0 22.8 1,544 81.6 85.6 352Other 23.1 4.5 71.6 0.8 100.0 36.5 533 89.0 87.5 195
Standard of living indexLow 44.5 6.0 47.6 1.9 100.0 15.5 1,676 76.0 78.4 259Medium 26.3 3.7 68.8 1.2 100.0 29.4 1,028 83.7 87.1 302High 13.0 3.5 82.6 0.9 100.0 62.4 237 89.1 90.3 148
Total 35.6 5.0 57.8 1.6 100.0 24.1 2,947 82.0 84.6 710
Note: Table includes only the two most recent births during the three years preceding the survey. Total includes a small number of births tomothers belonging to Christian and 'other' religions, and births with missing information on the standard of living index, which are not shownseparately.~ ) Based on 25--49 unweighted casesAmong births whose mothers received iron and folic acid tablets or syrup
194

Iron and Folic Acid Supplementation
Nutritional deficiencies in women, such as iron deficiency, are often exacerbated duringpregnancy because of the additional nutrient requirements of foetal growth. Iron deficiencyanaemia is the most common micronutrient deficiency in the world. It is a major threat to safemotherhood and to the health and survival of infants because it contributes to low birth weight,lowered resistance to infection, impaired cognitive development, and decreased work capacity.Studies in different parts of India have estimated that the proportion of births with a low birthweight (less than 2,500 grams) ranges from 15 percent in Trivandrum to 46 percent in Baroda(Nutrition Foundation of India, 1993). Overall, about one-third ofnewbom children in India are oflow birth weight, indicating that many pregnant women in India suffer from nutritional deficiencies.Improvement in a woman's nutritional status, coupled with proper health care during pregnancy,can substantially increase her child's birth weight (Ramachandran, 1992). To this end, the provisionof iron and folic acid (IFA) tablets to pregnant women to prevent nutritional anaemia forms anintegral part of the safe-motherhood services offered as part of the MCH activities of the FamilyWelfare Programme (Ministry of Health and Family Welfare, 1991), and now offered as part of theReproductive and Child Health Programme. The programme recommendation is that pregnantwomen consume 100 tablets of iron and folic acid during pregnancy.
For each birth during the three years preceding the survey, NFHS-2 collected informationon whether the mother received IFA tablets or syrup during pregnancy. Table 8.6 shows that onlyabout one in four mothers in Bihar received IFA supplements for their births in the three yearspreceding the survey. As in the case of tetanus toxoid coverage, IFA coverage is well belowaverage for mothers age 35 years and above and for fourth and higher order births. Urban womenare more than twice as likely to receive IFA tablets or syrup as rural women. IFA coverage isconsiderably higher in the Jharkhand region (33 percent) than in the North and South Bihar Plainregions (both 22 percent). Hindu mothers are more likely than Muslim mothers to have receivedIFA supplements for their births. Mothers not belonging to a scheduled caste, scheduled tribe, orother backward class are more likely to have received IFA tablets or syrup than those belongingto any of these caste, tribe, or class categories. IFA coverage has a strong positive correlationwith mother's education and household living standard. Only 17 percent of illiterate mothersreceived IFA tablets or syrup compared with 63 percent of mothers with high school or moreeducation. By living standard, IFA coverage ranges from just 16 percent for births to mothers inlow standard of living households to 62 percent in high standard of living households. For thestate as a whole, IFA coverage increased slightly from 21 percent in NFHS-l to 24 percent inNFHS-2.
Not all mothers who received IFA received the recommended three-month supply of 100tablets (or the equivalent in terms of syrup). Among mothers who received IFA duringpregnancy, 82 percent received at least a three-month supply and 85 percent consumed all thesupplements that were given to them. Differentials by background characteristics in theproportion that received at least a three-month supply are minimal. Consumption of the supplyreceived is negatively related to birth order and positively related to mother's education level andthe standard of living. Consumption of the supply received is relatively low for Muslim andscheduled-caste mothers.
In summary, few pregnant women in Bihar receive IFA, and still fewer receive therecommended three-month supply and consume all the supply they receive. This suggests that the
195

Reproductive and Child Health Programme needs to do a better job of distributing IFA tabletsand syrup and of informing pregnant women about the advantages of IFA, trying to understandwhy women resist consuming IFA, and overcoming this resistance.
8.2 Delivery Care
Place of Delivery
Another important thrust of the Reproductive and Child Health Programme is to encouragedeliveries under proper hygienic conditions under the supervision of trained health professionals.For each birth during the three years preceding the survey, NFHS-2 asked the mother where shegave birth and who assisted during the delivery. Table 8.7 and Figure 8.4 show that a largemajority of births in Bihar take place at home. Only about 15 percent of births in the past threeyears took place in health facilities, 70 percent took place in women's own homes, and 13percent took place in parents' homes. Eleven percent of births took place in private or NGO/trusthealth facilities and 4 percent took place in public health facilities (such as government-operatedhospitals and Primary Health Centres). Institutional deliveries are much more prevalent in urbanareas (40 percent) than in rural areas (12 percent). The 1997 SRS also estimated that 15 percentof births in Bihar take place in institutions. The NFHS-2 estimate of institutional deliveries forrural areas is also similar to the 1997 SRS estimate for rural areas (12 percent in NFHS-2compared with 14 percent in the SRS), but the NFHS-2 estimate for urban areas is higher thanthe SRS estimate for urban areas (40 percent in NFHS-2 compared with 32 percent in the SRS)(Office of the Registrar General, 1999a). Institutional deliveries in Bihar have risen only slightlyfrom 12 percent at the time ofNFHS-l to 15 percent at the time ofNFHS-2.
The proportion of births occurring in health facilities is lower for mothers age 35 yearsand older (6 percent) than for mothers age less than 35 years (15 percent). The proportion ofbirths that were delivered in a health facility decreases as birth order rises, from birth order one(25 percent) to birth order four or more (6-8 percent). Hindu mothers are much more likely togive birth in a health facility (16 percent) than are Muslim mothers (9 percent). Only 5 percent ofbirths to scheduled-tribe mothers are institutional deliveries, compared with 29 percent of birthsto mothers who do not belong to scheduled castes, scheduled tribes, or other backward classes.Institutional deliveries, particularly in private facilities, increase sharply with mother's educationand with household standard of living. Institutional deliveries are more prevalent in the SouthBihar Plain region (22 percent) than in the Jharkhand region (14 percent) and in the North BiharPlain region (10 percent).
196

Table 8.7 Place of delivery
Percent distribution of births during the three years preceding the survey by place of delivery, according to selected backgroundcharacteristics, Bihar, 1998-99
Place of delivery
HomeHealth facility/institution Number
Parents! Total ofBackground characteristic Public NGO/trust Private Own home home Other1 percent births
Mother's age at birth< 20 4.0 0.0 11.2 61.5 21.1 2.2 100.0 65320-34 3.9 0.3 10.9 71.9 11.5 1.5 100.0 2,12535--49 2.4 0.6 2.9 86.8 3.7 3.7 100.0 168
Birth order1 6.1 0.3 18.6 52.8 19.9 2.3 100.0 6842-3 3.9 0.3 11.0 68.2 14.8 1.8 100.0 1,1654-5 3.0 0.2 5.1 81.7 8.6 1.4 100.0 6676+ 1.2 0.4 4.7 87.0 5.2 1.4 100.0 430
ResidenceUrban 11.9 0.9 27.3 47.3 10.2 2.5 100.0 258Rural 3.0 0.2 8.9 72.7 13.5 1.7 100.0 2,689
RegionNorth Bihar Plain 3.1 0.1 6.7 74.9 14.3 0.8 100.0 1,378South Bihar Plain 4.4 0.3 16.8 59.7 15.4 3.4 100.0 979Jharkhand 4.5 0.6 8.9 77.8 6.8 1.4 100.0 590
Mother's educationIlliterate 2.3 0.2 5.2 77.5 13.0 1.7 100.0 2,262Literate, < middle school complete 6.1 0.0 21.3 55.2 16.3 1.2 100.0 280Middle school complete 9.4 0.9 20.9 54.6 11.1 3.2 100.0 127High school complete and above 11.0 0.7 38.0 35.8 12.3 2.2 100.0 277
ReligionHindu 4.4 0.3 11.3 69.3 12.9 1.9 100.0 2,378Muslim 1.5 0.0 7.1 75.0 15.2 1.2 100.0 532
Caste/tribeScheduled caste 2.5 0.1 5.5 75.2 14.6 2.2 100.0 672Scheduled tribe 0.5 1.1 3.7 87.8 4.7 2.2 100.0 197Other backward class 3.7 0.1 9.9 70.6 13.9 1.9 100.0 1,544Other 7.1 0.6 21.3 5U 12.5 0.8 100.0 533
Standard of living indexLow 2.0 0.1 4.1 78.5 13.2 2.0 100.0 1,676Medium 5.4 0.2 13.8 66.0 13.4 1.2 100.0 1,028Hi9h 9.8 1.7 41.7 33.1 11.6 2.1 100.0 237
Number of antenatal check-ups0 1.6 0.1 3.6 80.8 13.5 0.4 100.0 1,8431 5.2 0.0 9.1 73.0 11.8 1.0 100.0 2972 6.2 0.0 20.1 58.8 14.1 0.8 100.0 2463 8.3 1.1 18.7 53.3 17.3 1.4 100.0 2794+ 11.9 1.7 46.7 30.8 9.0 0.0 100.0 245Don't know/missing (0.0) (00) (0.0) (3.0) (0.0) (97.0) 100.0 36
Total 3.8 0.3 10.5 70.4 13.2 1.8 100.0 2,947
Note: Table includes only the two most recent births during the three years preceding the survey. Tatar includes 17 and 20 births to mothersbelonging to Christian and 'other' religions, respectively, and 6 births with missing information on the standard of living index, which are notshown separately.NGO: Nongovernmental organization( ) Based on 25-49 unweighted cases11ncludes missing
197

Figure 8.4Place of Delivery and Assistance During Delivery
Own Home70%
Place of Delivery
Note: Percents add to more than 100.0due to rounding
Parents'Home13%
Privatelnsl~Ulion
11%
PublicInsmulion
4%
NGOorTrust
HospitaVClinic0.3%
Oa; (TBA)66%
Missing1%
Doctor15%
ANM/NurselMi(!wifelLHV
6%
Other HealthProfessional
3%Assistance During Delivery
NFHS-2, Bihar, 1998-99
Institutional deliveries are much more common for births to mothers who had four ormore antenatal check-ups (60 percent) than for those who had only two or fewer antenatalcheck-ups (26 percent or less). Institutional deliveries are least prevalent (5 percent) for births tomothers who did not receive any antenatal check-ups. Several different factors are likely tocontribute to the positive relationship between antenatal check-ups and delivery in a healthfacility. Women who receive antenatal check-ups are more likely than other women to deliver ina health facility because their antenatal care providers advised them to do so. Conversely, womenwho register themselves with a health facility for delivery may be called for regular check-ups bythe facility. Another important factor may be pregnancy complications, because women withcomplications are more likely than other women to have antenatal check-ups and also to deliverin a health facility. Yet another contributing factor may be the growing awareness of the benefitsof professional medical care during both pregnancy and delivery, especially among urban, young,and educated women.
With regard to deliveries at home, the proportion of deliveries in a woman's own homeincreases and the proportion at parents' home decreases with age and birth order. Mother'seducation and standard ofliving are both negatively associated with deliveries at home.
Assistance During Delivery
Table 8.8 and Figure 8.4 provide information on assistance during delivery by selectedbackground characteristics. If more than one type of attendant assisted at delivery, only the mostqualified attendant is shown.
198

Table 8.8 Assistance during delivery
Percent distribution of births during the three years preceding the survey by attendant assisting during delivery, according toselected background characteristics, Bihar, 1998-99
Attendant assisting during delivery1
ANM/nursel Other health Dai Total NumberBackground characteristic Doctor midwife/LHV professional (TBA) Other Missing percent of births
Mother's age at birth< 20 16.1 6.1 4.1 64.0 8.4 1.3 100.0 65320-34 14.7 5.8 2.7 65.9 9.9 1.0 100.0 2,12535-49 6.5 3.0 3.5 72.0 11.3 3.7 100.0 168
Birth order1 25.4 7.4 4.1 54.0 7.5 1.6 100.0 6842-3 14.7 6.0 2.7 66.5 9.0 1.1 100.0 1,1654-5 8.6 3.8 3.1 71.9 11.5 1.1 100.0 6676+ 6.2 5.2 2.5 73.5 11.6 1.0 100.0 430
ResidenceUrban 32.9 14.3 4.7 43.2 3.2 1.7 100.0 258Rural 12.8 4.9 2.9 68.0 10.2 1.1 100.0 2,689
RegionNorth Bihar Plain 10.6 4.7 5.4 70.7 8.5 0.1 100.0 1,378South Bihar Plain 21.8 7.4 1.4 59.9 6.6 2.8 100.0 979Jharkhand 11.7 5.3 0.5 64.2 17.1 1.1 100.0 590
Mother's educationlIIiterate 8.4 3.7 3.3 72.3 10.9 1.3 100.0 2,262Literate, < middle school
complete 23.2 9.9 3.8 53.9 8.4 0.8 100.0 280Middle school complete 27.8 18.3 2.4 49.0 0.8 1.7 100.0 127High school complete and above 49.4 12.2 1.0 32.5 4.0 0.8 100.0 277
ReligionHindu 16.0 5.9 3.0 64.7 9.1 1.3 100.0 2,378Muslim 8.0 4.8 3.7 71.8 11.1 0.6 100.0 532
Caste/tribeScheduled caste 9.0 3.8 4.9 67.7 12.9 1.7 100.0 672Scheduled tribe 4.3 2.2 0.0 68.9 23.6 1.1 100.0 197Other backward class 14.6 5.7 2.7 68.7 7.0 1.2 100.0 1,544Other 25.3 9.6 3.0 53.9 7.8 0.4 100.0 533
Gontd.
Less than one in four births in the last three years were attended by a health professional,including 15 percent by a doctor, 6 percent by an ANM, nurse, midwife, or LHV, and 3 percentby other health professionals. About two-thirds of births (66 percent) were attended by atraditional birth attendant (TBA), and IO percent were attended by friends, relatives, and otherpersons. The NFHS-2 estimates for assistance during delivery by a health professional and by atraditional birth attendant are similar to the corresponding SRS estimates for Bihar. According tothe 1997 SRS, 19 percent of deliveries were attended by a health professional and 64 percent by aTBA. The proportion of deliveries attended by friends, relatives, or others is much higher inNFHS-2 (10 percent) than in the SRS (2 percent). The proportion of deliveries attended by ahealth professional increased slightly from 19 percent in NFHS-l to 23 percent in NFHS-2.
199

Table 8.8 Assistance during deliverv (contd.)
Percent distribution of births during the three years preceding the survey by attendant assisting during delivery, according toselected background characteristics, Bihar, 1998-99
Attendant assisting during delivery1
ANMJnursel Other health Dai Total NumberBackground characteristic Doctor midwife/LHV professional (TBA) Other Missing percent of births
Standard of living indexLow 6.6 3.1 3.6 73.3 11.9 1.4 100.0 1,676Medium 19.7 7.0 2.5 62.4 7.7 0.7 100.0 1,028HI9h 48.4 19.3 1.7 27.9 1.8 0.9 100.0 237
Number of antenatal check-ups0 6.1 3.0 3.5 75.9 11.5 0.1 100.0 1,6431 13.4 6.6 3.6 67.5 8.9 0.0 100.0 2972 25.7 8.2 1.6 58.6 5.9 0.0 100.0 2463 27.2 12.5 4.6 48.3 7.4 0.0 100.0 2794+ 56.4 15.5 0.0 24.8 3.4 0.0 100.0 245Don't know/missing (0.0) (0.0) (0.0) (3.0) (3.0) (94.0) 100.0 36
Place of deliveryPublic health facility 68.7 28.5 2.0 0.9 0.0 0.0 100.0 112Private health facility 81.4 17.3 0.6 0.7 0.0 0.0 100.0 310Own home 3.0 2.7 3.2 80.1 11.0 0.0 100.0 2,076Parents' home 6.7 5.2 5.4 69.8 12.8 0.0 100.0 388Other' 5.4 11.2 0.0 6.0 9.9 67.4 100.0 52
Total 14.5 5.7 3.1 65.8 9.6 1.2 100.0 2,947
Note: Table includes only the two most recent births during the three years preceding the survey. Total includes 17 and 20 birthsto women belonging to Christian and 'other' religions, respectively, 8 births delivered in nongovernmental organization (NGO) ortrust hospital/clinic, and 6 births with missing infonnation on the standard of living index, which are not shown separately.ANM: Auxiliary nurse midwife; LHV: Lady health visitor; TBA: Traditional birth attendant~ ) Based on 25-49 unweighted casesIf the respondent mentioned more than one attendant, only the most qualified attendant is shown.
21ncludes missing
Eighty-one percent of deliveries in private institutions were attended by a doctor,compared with 69 percent of deliveries in public institutions, Eighty percent of deliveries atrespondents' own homes and 70 percent at parents' homes were attended by a traditional birthattendant (TBA), Only 9 percent of deliveries at respondents' own homes and 17 percent atparents' homes were attended by a health professional. The percentage of births attended by adoctor decreases steadily by age of the mother and by birth order. Deliveries are much morelikely to be attended by a doctor in urban areas (33 percent) than in rural areas (13 percent). Theproportion of births attended by doctors is almost twice as high for births to mothers living in theSouth Bihar Plain region (22 percent) as in the Jharkhand or the North Bihar Plain regions (1112 percent),
Mother's education and household living standard have large positive effects on thelikelihood that a birth is attended by a doctor. Forty-nine percent ofbirths to mothers with at leasta high school education were attended by a doctor compared with only 8 percent of births toilliterate mothers. The difference is equally large for births to mothers who live in high standardof living households (48 percent), compared with births to mothers in low standard of livinghouseholds (7 percent), Among religious groups, Hindu women are twice as likely (16 percent)as Muslim women (8 percent) to have a delivery attended by a doctor. Births to women who do
200

Table 8.9 Characteristics of births
Percentage of births during the three years preceding the sUlVey that were delivered by caesarian sectionand percent distribution of births by birth weight and by the mother's estimate of the baby's size at birth,according to residence, Bihar, 1998-99
Characteristic of births Urban Rural Total
Percentage delivered bycaesarian section 9.3 2.4 3.0
Birth weight< 2.5 kg 8.0 0.9 1.52.5 kg or more 20.3 3.9 5.3Don't know/missing 6.2 3.3 3.5Not weighed 65.6 91.9 89.6
Total percent 100.0 100.0 100.0
Size at birthLarge 9.1 12.8 12.5Average 69.6 66.8 67.1Small 14.1 15.9 15.8Very small 5.5 3.3 3.5Don't know/missing 1.7 1.2 1.2
Total percent 100.0 100.0 100.0
Number of births 258 2,689 2,947
Note: Table includes only the two most recent births during the three years preceding the SUlVey.
not belong to a scheduled caste, scheduled tribe, or other backward class are more likely to beattended by a doctor than are other births. Only 4 percent of births to scheduled-tribe womenwere attended by a doctor, compared with 25 percent of births to women not belonging toscheduled castes, scheduled tribes, or other backward classes. There is a strong positiveassociation between number of antenatal check-ups and delivery assistance by a doctor. Only 6percent of births to women who did not have any antenatal check-ups were attended by a doctor,compared with 56 percent of births to women who had four or more antenatal check-ups.
Delivery Characteristics
Table 8.9 shows the percentage of births during the three years preceding the survey that weredelivered by caesarian section and the percent distribution of births by birth weight and themother's estimate of the baby's size at birth. Based on mothers' reports, 3 percent of childrenborn in Bihar in the past three years were delivered by caesarian section. The proportion ofcaesarian section deliveries was much higher in urban areas (9 percent) than in rural areas (2percent).
Low birth weight babies face higher risks of dying than do babies of normal birth weight.For each birth that took place in the three years preceding the survey, respondents were asked thebaby's birth weight. Since babies delivered at home are unlikely to be weighed, the survey askedmothers about the size ofeach baby at birth (large, average, small, or very small).
In Bihar, 9 out of 10 babies born in the three years preceding the survey were not weighedat birth. The proportion not weighed is 66 percent in urban areas and 92 percent in rural areas.
201

Even for babies that were weighed, some mothers did not remember the weight. Therefore, theresulting sample of births whose weights are reported is subject to a potentially large selectionbias, and the results should be interpreted with caution. Among children for whom birth weightsare reported, 22 percent weighed less than 2.5 kilograms. The proportion weighing less than 2.5kilograms is higher in urban areas (28 percent) than in rural areas (19 percent).
According to mothers' estimates, 67 percent of births in the three years preceding thesurvey were of average size, 13 percent were large, 16 percent were small, and 4 percent werevery small. The proportion of babies reported as small or very small was about the same in urbanand rural areas.
8.3 Postnatal Care
The health of a mother and her newborn child depends not only on the health care. she receivesduring her pregnancy and delivery, but also on the care she and the infant receive during the firstfew weeks after delivery. Postpartum check-ups within two months after delivery are particularlyimportant for births that take place in noninstitutional settings. Recognizing the importance ofpostpartum check-ups, the Reproductive and Child Health Programme recommends threepostpartum visits (Ministry of Health and Family Welfare, 1998b).
Table 8.10 gives the percentage of noninstitutional deliveries in the three years precedingthe survey that were followed by a postpartum check-up within two months of delivery. Amongbirths that were followed by a postpartum check-up, the table also shows the percentage with acheck-up within two days of delivery (which is the most crucial period), the percentage with acheck-up within one week of delivery, and the percentage whose mothers received specificrecommended components of care during the check-up.
Only lout of 10 noninstitutional births was followed by a check-up within two months ofthe delivery. Among births that were followed by a postpartum check-up, few check-ups tookplace shortly after birth---only 14 percent within two days and 31 percent within one week.Mothers in the Jharkhand region (14 percent) are somewhat more likely to have received apostpartum check-up than mothers in the South Bihar Plain (II percent) and North Bihar Plain (8percent) regions. The likelihood of a postpartum check-up generally increases with mother'seducation and standard of living of the household. Births to mothers who received three or moreantenatal check-ups were much more likely to be followed by a postpartum check-up (22percent) than were births to mothers who received one or no antenatal check-up (less than 10percent). Births delivered with the assistance of a health professional were more likely to befollowed by a postpartum check-up (18 percent) than were births delivered with the assistance ofa TBA (9 percent) or other person (13 percent). These results clearly indicate that women aremore likely to have a postpartum check-up if they have had continuous interaction with healthproviders through their pregnancy and delivery, even if they did not give birth in a health facility.There are no major differences in the percentage of women with postpartum check-ups bymother's age, birth order, residence, religion, or caste/tribe/class.
202

Table 8.10 Postpartum check-ups
Percentage of noninstitutional births during the three years preceding the sUivey for which a postpartum check-up was received withintwo months of birth and, among those receiving a postpartum check-up, percentage seen within two days and one week of birth andpercentage receiving specific components of check-ups by selected background characteristics, Bihar, 1998-99
Percent- Among those with postpartum check-upage with a Numberpostpartum Percent- Percent- Components of postpartum check-up (%) of birthscheck-up age seen age seen followedwithin two within two within Family Breast- Baby by a post-months of Number days of one week Abdominal planning feeding care partum
Background characteristic birth of births birth of birth examination advice advice advice check-up
Mother's age at birth< 20 10.0 545 11.5 28.2 23.6 10.9 40.6 58.6 552Cl-34 10.2 1,783 14.0 32.0 19.3 11.6 30.0 39.4 18235-49 7.9 152 · · · • · · 12
Birth order1 9.8 502 (14.5) (28.8) (30.5) (12.0) (47.0) (60.7) 492-3 10.4 976 11.2 30.8 21.8 14.0 31.9 47.5 1014-5 9.9 604 11.7 27.0 13.5 6.7 25.5 33.2 606+ 9.7 397 (24.1 ) (42.2) (10.1) (10.6) (21.0) (23.5) 39
ResidenceUrban 10.0 150 · · · • · · 15Rural 10.1 2,330 13.4 30.4 19.6 10.7 30.9 43.8 234
RegionNorth Bihar Plain 7.9 1,239 9.7 29.1 23.3 11.7 29.2 51.6 98South Bihar Plain 10.9 739 6.5 18.1 15.4 6.4 28.5 26.8 81Jharkhand 14.0 501 28.6 49.5 19.6 16.3 38.7 49.3 70
Mother's educationIlliterate 9.1 2,056 14.2 31.4 18.7 10.2 30.2 41.0 187Literate, < middle schoolcomplete 14.6 201 (10.7) (31.1) (24.1) (10.6) (27.9) (48.4) 29
Middle school complete 15.5 86 • • · • · · 13High school completeand above 14.4 137 · · · · · · 20
ReligionHindu 10.4 1,968 14.0 30.0 20.0 11.7 31.0 41.0 205Muslim 8.4 482 (12.6) (35.1 ) (17.4) (7.6) (34.9) (51.0) 41
Caste/tribeScheduled caste 9.2 606 20.2 38.4 11.2 12.6 31.4 41.6 56Scheduled tribe 8.7 184 • · • · · · 16Other backward class 10.1 1,313 8.5 26.5 19.2 12.8 27.1 40.4 133Other 12.0 376 (17.8) (30.9) (24.5) (2.2) (40.3) (46.2) 45
eontd...
203

Table 8.10 Postpartum check-ups (contd.l
Percentage of noninstitutional births during the three years preceding the survey for which a postpartum check-up was received withintwo months of birth and, among those receiving a postpartum check-up, percentage seen within two days and one week of birth andpercentage receiving specific components of check-ups by selected background characteristics, Bihar, 1998-99
Percent- Among those with postpartum check-upage with a Numberpostpartum Percent- Percent- Components of postpartum check-up (%) of birthscheck-up age seen age seen followedwithin two within two within Family Breast- Baby by a post-months of Number days of one week Abdominal planning feeding care partum
Background characteristic birth of births birth of birth examination advice advice advice check-up
Standard of living indexLow 8.5 1,545 12.5 35.7 16.2 10.2 25.9 39.0 131Medium 12.6 821 14.1 26.4 23.2 11.5 38.7 48.2 103Hi9h 13.7 109 . . . . . . 15
Number of antenatalcheck-ups
0 7.7 1,744 15.1 28.1 14.6 9.8 25.3 41.1 1351 9.9 254 (12.1) (36.4)
,(11.8) (0.0) (23.8) (39.3) 25
2 12.6 182 . . . . • . 233+ 21.9 298 16.1 36.5 26.4 13.6 37.9 44.0 65
Assistance duringdelivery
Doctor/nurse/midwife/ 18.0 261 (18.9) (33.6) (19.7) (12.6) (28.4) (37.8) 47LHV' 8.6 1,937 10.5 29.9 22.7 13.4 36.2 42.7 167
DB; (TBA) 12.6 282 (23.9) (34.8) (5.6) (0.0) (14.5) (50.8) 35Other
10.0 2,480 14.0 31.3 19.7 11.3 31.7 43.0 249Total
Note: Table includes only the two most recent births during the 2-35 months preceding the survey. Total includes a small number ofbirths to mothers belonging to Christian and 'other' religions, and births with missing information on the standard of living index andnumber of antenatal.check-ups, which are not shown separately.LHV: Lady health visitor; TBA: Traditional birth attendant( ) Based on 25-49 unweighted cases*Percentage not shown; based on fewer than 25 unweighted cases11ncludes other health professionals
Mothers who did not deliver in a health facility but who received a postpartum check-upwere asked whether they had received specific components of postpartum care, including anabdominal examination and advice on family planning, breastfeeding, and baby care, For 20percent of births, mothers who received a postpartum check-up said that their abdomen wasexamined during the check-up, and 11 percent said that they received family planning advice,Advice on breastfeeding and baby care was much more common (given in 32-43 percent ofcases), For women having postpartum check-ups after noninstitutional births, mothers under age20 years were more likely than older mothers to receive each of the components, except familyplanning advice. The likelihood of receiving various components of a postpartum check-upgenerally declined for higher order births, Except for baby care advice, mothers of births assistedby a TBA were more likely to receive each check-up component than were mothers of birthsassisted by a health professional or any other person. Mothers belonging to low standard of livinghouseholds were less likely to receive each component of a postpartum check-up than weremothers belonging to medium standard of living households. Due to the small number of births
204

in some categories, it is not possible to draw conclusions about the effects of other backgroundcharacteristics.
Postpartum Complications
Every woman who had a birth in the three years preceding the survey was asked if she hadmassive vaginal bleeding or a very high fever-both symptoms of possible postpartumcomplications-at any time during the two months after delivery. Table 8.11 shows that for 15percent of births, mothers reported massive vaginal bleeding, and for 17 percent of births,mothers reported a very high fever in the two-month postpartum period. Both complications weremore common among rural than urban mothers. Massive vaginal bleeding was slightly morecommon among younger mothers, but very high fever was more common among older mothers.Mothers of births delivered in public health facilities and at parents' homes were more likely tohave had massive vaginal bleeding as well as very high fever than were mothers of birthsdelivered elsewhere. Mothers ofbirths assisted by a doctor were less likely to have had very highfever than were mothers of births assisted by some other health professional or a traditional birthattendant.
8.4 Reproductive Health Problems
Absence of reproductive tract infections (RTIs) is essential for the reproductive health of bothwomen and men and is also critical for their ability to meet their reproductive goals, There arethree different types of reproductive tract infections for women: endogenous infections that arecaused by the multiplying of organisms normally present in the vagina; iatrogenic infectionscaused by the introduction of bacteria or other infection-causing micro-organisms throughmedical procedures such as an IUD insertion; and sexually transmitted infections (STIs).Endogenous infections and several of the iatrogenic and sexually transmitted infections are ofteneasily cured if detected early and given proper treatment. If left untreated, RTIs can causepregnancy-related complications, congenital infections, infertility, and chronic pain. They arealso a risk factor for pelvic inflammatory disease and HIV (Population Council, 1999).
A number of studies (Bang et aI., 1989; Bang and Bang, 1991; Pachauri and Gittlesohn,1994; Jeejeebhoyand Rama Rao, 1992) have shown that many Indian women suffer from RTIs.Several researchers have also shown that women in India often bear the symptoms of RTIssilently without seeking health care. RTIs and their sequellae are an important component ofprogrammes for family planning, child survival, women's health, safe motherhood, and HIVprevention. RTIs have profound implications for the success of each of these initiatives, andconversely, these initiatives provide a critical opportunity for the prevention and control of RTIs(Germain et aI., 1992). Studies have demonstrated that RTIs are an important reason for the pooracceptance and low continuation rates of contraceptive methods such as the IUD. Bhatia andCleland (1995) found a higher incidence of gynaecological symptoms among women who hadundergone a tubectomy than among other women. The Government of India highlighted theimportance of RTIs and STIs in undermining the health and welfare of individuals and couples ina policy statement on the Reproductive and Child Health Programme, which states that couplesshould be 'able to have sexual relations free of fear of pregnancy and contracting diseases'(Ministry of Health and Family Welfare, 1997:2). The Reproductive and Child HealthProgramme includes the following interventions: RTI/STI clinics at district hospitals (where not
205

Table 8.11 Symptoms of postpartum complications
Among births during the three years preceding the survey, percentage for which themother had massive vaginal bleeding or very high fever within two months after thedelivery by selected background characteristics, Bihar, 1998-99 ,
Massive VeryBackground characteristic vaginal bleeding high fever Number of births
ResidenceUrban 11.8 11.6 247Rural 14.7 17.1 2,554
RegionNorth Bihar Plain 14.7 17.7 1,311South Bihar Plain 13.5 15.3 929Jharkhand 15.4 15.9 561
Mother's age at birth<20 15.5 15.8 62520-34 14.2 16.6 2,01535-49 13.6 19.5 162
Birth order1 16.0 14.2 6502-3 13.1 16.4 1,0964-5 15.9 18.5 6386+ 13.5 17.8 417
Place of deliveryPublic health facility 21.8 20.0 108Private health facility 13.5 10.4 295Own home 13.9 16.8 1,972Parents' home 17.8 21.6 367Other1 3.9 2.1 52
Assistance during deliveryDoctor 15.4 13.3 410ANM/nurse/midwife/LHV 16.8 16.4 159Other health professional 18.1 21.4 87Dai(TBA) 15.1 17.4 1,842Other1 7.4 14.6 304
Total 14.5 16.6 2,801
Note: Table includes only the two most recent births during the 2-35 months precedingthe survey. Total includes 7 births delivered in nongovernmental organization (NGO) ortrust hospitals/clinics, which are not shown separately.ANM: Auxiliary nurse midwife; LHV: Lady health visitor; TBA: Traditional birth attendant~ ) Based on 25-49 unweighted casesIncludes missing
already available), provision of technicians for laboratory diagnosis ofRTIs/STIs, and in selecteddistricts, screening and treatment ofRTIs/STIs (Ministry of Health and Family Welfare, 1997).
NFHS-2 collected information from women on some common symptoms ofRTIs, namelyproblems with abnormal vaginal discharge, urinary tract infections, and intercourse-related painand bleeding. Specifically, the prevalence of reproductive health problems among ever-marriedwomen is estimated from women's self-reported experience in the three months preceding thesurvey with each of the following problems: vaginal discharge accompanied by itching, byirritation around the vaginal area, by bad odour, by severe lower abdominal pain, by fever, or by
206

Figure 8.5Reproductive Health Problems Among
Currently Married Women
Any ReproductiveHealth Problem
TYPE OF PROBLEM
Any Abnormal VaginalDischarge
Symptoms of a UrinaryTract Infection
Painful Intercourse
Bleeding AfterIntercourse
o 5 10 15 20 25Percent
30 35 40 45 50
NFHS~2, Bihar, 1998-99
any other problem; pain or burning while urinating or frequent or difficult urination; and (amongcurrently married women) painful intercourse and bleeding after intercourse. Women whoexperience one or more of these reproductive health problems could either have or be at risk ofgetting an RTI/STI. However, since information on health problems is based on self-reportsrather than clinical tests or examinations, the results should be interpreted with caution.
Table 8.12 shows the prevalence of different reproductive health problems among womenin Bihar during the three months preceding the survey by background characteristics. Thirty-fourpercent of ever-married women reported at least one type of problem related to vaginal discharge,and 26 percent reported symptoms of a urinary tract infection. Overall, 42 percent of womenreported either problems with vaginal discharge or symptoms of a urinary tract infection. Amongproblems related to vaginal discharge, severe lower abdominal pain was mentioned mostfrequently (23 percent), followed by itching or irritation (19 percent). The prevalence ofproblems related to vaginal discharge and symptoms of urinary tract infections is about the sameamong currently married and ever-married women.
Table 8.12 and Figure 8.5 show that 44 percent of currently married women report thatthey have one or more reproductive health problems. Eleven percent report painful intercourseand 2 percent report bleeding after intercourse. Reproductive health problems are somewhatmore common among currently married women in the age range 25-39 than among women age15-24 or 40-49. The prevalence of reproductive health problems is higher in rural areas (45percent) than in urban areas (37 percent). The prevalence does not vary much by geographicregion. Among education groups, the prevalence of reproductive health problems is highest forilliterate women (45 percent) and lowest for women who have completed high school or highereducation (36 percent). Muslim women (50 percent) are more likely to have reproductive healthproblems than Hindu women (43 percent) or Christian women (30 percent). There is not muchvariation in the prevalence ofreproductive health problems by caste, tribe, or class.
207

Table 8.12 Symptoms of reproductive health problems
Percentage of ever~married women reporting abnormal vaginal discharge or symptoms of a urinary tract infection during the three months preceding the survey and percentage of currently marriedwomen reporting painful intercourse or bleeding after intercourse by background characteristics, Bihar, 1998-99
Ever-married women
Vaginal discharge accompanied by: Any abnormal Currently married womenvaginal Number
Any Severe Symptome discharge or Number Bleeding Any ofabnormal Itching lower of a urinary symptoms of of ever- Painful after reproductive currentlyvaginal or Bad abdominal Other tract a urinary tract married intercourse intercourse health married
Background characteristic discharge irritation odour pain1 Fever problem infection2 infection2 women (often) (ever)1 problem women
Age15-19 24.4 13.0 10.2 15.4 6.5 6.4 19.7 32.0 825 13.9 2.8 36.9 8022Q.-24 33.0 19.5 16.8 22.4 10.2 7.7 25.4 41.0 1,419 14.7 3.5 43.8 1,37925-29 37.1 21.8 18.2 24.7 10.0 11.9 27.1 45.6 1,419 11.7 1.9 47.5 1,3733Q.-34 39.1 22.8 18.4 28.3 12.6 12.3 28.3 47.5 1,088 12.3 2.0 48.9 1,02735-39 38.2 20.8 17.9 25.6 12.2 14.2 28.0 46.6 921 11.7 2.8 48.5 85940-44 30.8 19.0 14.1 20.8 9.4 8.4 27.5 40.4 759 7.1 1.9 41.9 69845-49 24.5 12.5 9.1 17.0 6.7 9.0 19.7 34.5 593 1.9 1.2 35.0 522
ResidenceUrban 27.7 15.7 11.1 18.9 9.2 10.4 16.9 34.2 718 11.6 1.7 37.1 677Rural 34.2 19.6 16.3 23.2 10.1 10.1 26.6 42.9 6,306 1·1.4 2.5 45.1 5,984
RegionNorth Bihar Plain 32.2 18.5 15.5 22.5 10.3 10.9 26.4 40.8 3,133 10.4 1.8 42.5 2,974South Bihar Plain 37.5 21.2 18.4 25.1 9.8 10.1 23.8 44.1 2,199 11.9 3.1 46.4 2,074Jharkhand 30.6 18.0 12.8 20.0 9.5 8.8 26.4 41.6 1,692 12.8 2.6 44.7 1,613
EducationIlliterate 33.8 19.3 16.2 23.0 10.7 9.9 26.7 43.0 5,383 11.5 2.4 45.2 5,083Literate, < middle school complete 35.0 21.8 16.0 23.4 9.0 12.0 25.8 42.6 779 10.9 2.0 44.9 748Middle school complete 33.4 20.5 13.1 23.4 9.1 13.2 20.3 39.1 267 12.4 2.8 41.1 256High school complete
and above 28.9 14.6 12.4 19.5 5.4 8.8 17.2 33.7 595 11.1 2.6 36.3 573
ReligionHindu 32.9 18.9 15.6 22.4 9.6 9.7 24.6 41.1 5,872 11.3 2.3 43.4 5,574Muslim 36.9 21.3 17.5 25.1 12.4 12.0 31.2 47.3 1,038 12.4 3.0 49.5 982Christian 25.1 10.7 5.5 14.4 1.8 10.5 8.8 26.9 59 3.8 0.0 29.8 57Other 38.7 29.2 13.8 19.5 11.5 18.9 39.2 52.5 55 (13.6) (2.3) (55.4) 48
Contd...

Table 8.12 Symptoms of reproductive health problems (contd.)
Percentage of ever-married women reporting abnormal vaginal discharge or symptoms of a urinary tract infection during the three months preceding the survey and percentage of currently marriedwomen reporting painful intercourse or bleeding after intercourse by background characteristics, Bihar, 1998-99
Ever-married women
Vaginal discharge accompanied by: Any abnormal Currently married womenvaginal Number
Any Severe Symptoms discharge or Number Bleeding Any ofabnormal Itching lower of a urinary symptoms of of ever- Painful after reproductive currentlyvaginal or Sad abdominal Other tract a urinary tract married intercourse intercourse health married
Background characteristic discharge irritation odour pain1 Fever problem infection2 infection2 women (often) (ever)1 problem women.
Caste/tribeScheduled caste 33.9 19.6 15.5 23.6 9.6 11.6 25.3 43.1 1,452 12.0 2.2 452 1,383Scheduled tribe 32.6 20.4 15.3 21.7 10.2 8.3 30.8 44.2 582 13.6 3.7 45.5 546Other backward class 33.2 18.8 16.1 22.1 9.3 9.7 24.4 41.0 3,642 11.0 2.2 43,4 3,454Other 34,4 19.6 15.3 24.0 11.9 10.7 26.8 42.7 1,348 10.9 2.7 44.9 1,277
Standard of living indexLow 34.5 19.3 16.9 23.4 10.3 9.9 26.9 43.8 3,709 11.9 2.7 45.9 3,480Medium 33.7 20.2 15.3 23.1 10.7 10.4 25.6 41.7 2,595 11.7 2.2 44.1 2,491High 27.5 15.1 11.5 18.2 5.4 10.5 19.0 34.0 712 8.2 1.8 36.3 682
Work statusWorking in family farm/business 32.5 19.4 12.5 22.5 10.5 11.4 25.5 41.8 639 12.4 1.4 42.7 590Employed by someone else 39.2 23.6 21.8 28.6 13.3 14.1 30.3 47.8 814 14.7 3.3 50.1 753Self-employed 36.2 21.9 17.1 26.6 14.6 13.0 25.3 44.9 404 12.1 1.2 45.6 345Not worked in past 12 months 32.5 18.3 15.1 21.6 9.0 9.1 24.9 40.9 5,168 10.7 2.5 43.5 4,973
Number of childrenEver born0 31.1 17.5 14.9 21.6 9.8 7.9 24.9 39.3 897 19.4 4.9 45.0 8461 30.6 17.1 16.7 19.0 8.6 8.2 23.1 37.7 921 11.9 1.7 39.5 8742-3 34.5 19.9 16.2 24.2 9.7 9.9 26.0 422 2,194 10.7 2.5 44.3 2,0824-5 35.8 20.5 16.5 23.9 11.4 11.5 27.1 45.5 1,789 10.3 1.8 46.9 1,6926+ 32.2 19.0 13.7 22.1 9.5 11.7 25.0 41.7 1,223 8.2 1.7 43.3 1,167
All ever-married women 33.5 19.2 15.7 22.7 10.0 10.1 25.6 42.0 7,024 NA NA NA NA
All currently married women 33.7 19.3 15.8 22.8 10.1 10.2 25.7 42.2 6,661 11.4 2.4 44.2 6,661
Note: Total includes a small number of women with missing information on the standard of living index, who are not shown separately.NA: Not applicable( ) Based on 25-49 unweighted cases1Not related to menstruation21ncludes pain or burning while urinating or more frequent or difficult urination

Table 8.13 Treatment of reproductive health problems
Among women with a reproductive health problem, percentage who sought advice or treatmentfrom specific providers by residence, Bihar, 1998--99
Provider Urban Rural Total
Public medical sector 6.2 4.8 4.9Government doctor 6.2 3.9 4.1Public health nurse 0.8 1.9 1.8ANMfLHV 0.0 0.6 0.5Male MPW/supervisor 0.0 0.1 0.1Anganwadi worker 0.0 0.1 0.1Village health guide 0.0 0.2 0.2Other public medical sector 0.0 0.3 0.2
Private medical sector 36.7 25.1 26.1Private doctor 29.0 19.3 20.1Private nurse 2.7 2.9 2.9Compounder/pharmacist 0.4 0.3 0.3Va~yalhaWm/homeop~h 6.8 3.1 3.4Dai(TBA) 2.1 1.5 1.5Traditional healer 0.4 1.9 1.8Other private medical sector 0.8 0.8 0.8
Other 1.2 2.2 2.1
None 59.1 70.4 69.4
Number of women 261 2.826 3,087
Note: Table includes currently married women who report abnormal vaginal discharge,symptoms of a urinary tract infection, painful intercourse, or bleeding after intercourse andwomen who are ever married but not currently married who report abnormal vaginal dischargeor symptoms of a urinary tract infection. Percentages add to more than 100.0 because womencould report treatment from mUltiple providers.ANM: Auxiliary nurse midwife; LHV: Lady health Visitor; MPW: Multipurpose workerTBA: Traditional birth attendant
Women in households with a medium or low standard of living (44-46 percent) are morelikely to have reproductive health problems than women in househOlds with a high standard ofliving (36 percent). Women who are employed by others are somewhat more likely to reportreproductive health problems than other woman (50 percent compared with 43--46 percent). Theprevalence ofreproductive health problems does not vary much by number ofchildren ever born.
Among women who report any reproductive health problem, 69 percent have not seenanyone for advice or treatment (Table 8.13). The proportion of women who have not obtainedany advice or treatment is higher in rural areas (70 percent) than in urban areas (59 percent).Among women who have obtained advice or treatment, 66 percent saw a private doctor (71percent in urban areas and 65 percent in rural areas). Only one-sixth (16 percent) of women whohave obtained advice or treatment were seen by someone in the public medical sector.
NFHS-2 results show that although a large proportion of ever-married women in Bihar(44 percent) report at least one reproductive health problem that could be symptomatic of aserious reproductive tract infection, the majority of them bear their problems silently withoutseeking advice or treatment. Moreover, women who seek advice or treatment for reproductivehealth problems do not usually go to government health professionals. These findings highlight
210

the need to educate women regarding the symptoms and consequences of reproductive healthproblems and the urgent need to expand counselling and reproductive health services in bothrural and urban areas, particularly in the public sector.
211

CHAPTER 9
QUALITY OF CARE
The historic International Conference on Population and Development in Cairo in 1994 broughtabout a paradigm shift in population-related policies. The conference helped focus the attentionof governments on making programmes more client-oriented with an emphasis on the quality ofservices and care. In line with the conference recommendations, the Government of Indiaacknowledged the need to abandon the use of targets for monitoring its family welfareprogramme. It recognized that the top-down target approach does not reflect user needs andpreferences and de-emphasizes the quality of care provided (Ministry of Health and FamilyWelfare, 1998b). Recent research on the different aspects of service delivery, especially at thegrass-roots level, including programme coverage, client-provider interactions, and informed
.choice, also endorses the need to take a different approach to meet the reproductive and healthneeds of the Indian population (Koenig and Khan, 1999). This research suggests that inadequateattention to the quality of care has contributed to the inability of the Government's familywelfare programme to meet its goals.
In 1996, the existing family welfare programme was transformed into the newReproductive and Child Health (RCH) Programme. This new programme integrates all familywelfare and women and child health services with the explicit objective of providingbeneficiaries with 'need based, client centred, demand driven, high quality integrated RCHservices' (Ministry of Health and Family Welfare, 1998b:6). The strategy for the RCHProgramme shifts the policy emphasis from achieving demographic targets to meeting thereproductive needs of individual clients (Ministry of Health and Family Welfare, 1996).
NFHS-2 included several questions on the quality of care of health and family welfareservices provided in the public as well as the private sector. In this chapter, sources of health carefor households are described first. The chapter then examines different aspects of home visits byhealth and family planning workers and visits by respondents to health facilities, includingfrequency, source, and quality. Finally, information is presented on the quality of care for familyplanning services.
9.1 Source of Health Care for Households
To examine the role of different health providers in meeting the health-care needs of households,the NFHS-2 Household Questionnaire included the question, 'When members of your householdget sick, where do they generally go for treatment?' Table 9.1 shows the use of services fromvarious types of health providers. A large majority of households (89 percent) normally use theprivate medical sector when a household member gets sick. Only 9 percent normally use publicsector medical services. In the private health sector, private doctors are the most popular sourceof health care for households, whereas in the public medical sector households normally go tohospitals. The pattern of service utilization is similar for rural and urban households. But,contrary to expectation, the use of the private medical sector is higher in rural areas than in urbanareas; 90 percent of rural households use private medical sector sources as against 81 percent ofurban households. Less than 2 percent of households in Bihar normally use a vaidya/hakim/homeopath or a traditional healer, and less than I percent use a CHC/rural hospital/PHC. Among
PREVIOUS PAGE BLANK. c2/!3.

Table 9.1 Source of health care
Percent distribution of households by main source of health care when household members get sick, according to residenceand the standard of living index, Bihar, 1998-99
Residence Standard of living index
Source Urban Rural Low Medium High Total
Public medical sector 16.6 8.2 8.4 9.1 14.1 9.1Government/municipal hospital 9.3 5.6 6.1 5.4 8.3 6.0Government dispensary 2.6 0.4 0.4 0.6 2.1 0.6UHC/UHP/UFWC 0.1 0.1 0.0 0.1 0.2 0.1CHC/rural hospital/PHC 0.1 0.6 0.6 0.4 1.0 0.6Sub-eentre 0.1 0.8 0.7 0.8 0.0 0.7Government paramedic 0.0 0.3 0.3 0.3 0.0 0.3Other public medical sector 4.2 0.4 0.2 1.4 2.5 0.8
NGO or trust 1.2 0.7 0.7 0.3 2.3 0.7Hospital/clinic 1.2 0.3 0.2 0.2 2.3 0.4NGO worker 0.0 0.4 0.5 0.1 0.0 0.3
Private medical sector 81.1 89.7 89.4 89.3 81.7 88.7Private hospital/clinic 20.6 17.5 17.3 18.5 19.0 17.8Private doctor 55.4 66.9 66.1 66.7 57.8 65.6Private mobile clinic 0.0 0.4 0.5 0.1 0.2 0.3Private paramedic 0.4 0.8 0.8 0.8 0.2 0.7Vaidyalhakim/homeopath 1.3 1.3 1.7 0.6 0.9 1.3Traditional healer 0.3 0.7 0.8 0.5 0.7 0.7Pharmacy/drugstore 0.7 0.3 0.4 0.3 0.2 0.3Other private medical sector 2.3 1.8 1.8 1.8 2.8 1.9
Other source 1.1 1.5 1.5 1.2 1.8 1.4Shop 0.6 0.4 0.4 0.3 0.9 0.4Home treatment 0.6 0.8 0.8 0.9 0.5 0.8 .
Missing 0.0 0.3 0.3 0.1 0.4 0.2
Total percent 100.0 100.0 100.0 100.0 100.0 100.0
Number of households 720 5,625 3,641 2,151 545 6,345
Note: Total includes 8 households with missing information on the standard of living index, which are not shown separately.UHC: Urban health centre; UHP: Urban health post; UFWC: Urban family welfare centre; CHC: Community health centre;PHC: Primary Health Centre; NGO: Nongovernmental organization
the small proportion of households who normally use a public medical sector source of healthcare when household members get sick, the majority prefer to use a government or a municipalhospital. Less than I percent of households use an NGO or a trust as their main source of healthcare,
The pattern of use of health-care services is similar for households with low and mediumstandards ofliving. The pattern of utilization for these two categories of households is similar towhat is observed in the case ofrural households. On the other hand, the service utilization patternof households with a high standard of living is similar to that of the urban households. Forexample, 82 percent of households with a high standard of living use the private medical sector,compared with 89 percent of households with either a medium or low standard of living.
9.2 Contacts at Home with Health and Family Planning Workers
Under the family welfare programme, health or family planning workers are required to regularlyvisit each household in their assigned area. During these contacts, the female health or family
214

planning worker is required to monitor various aspects of health of women and children, provideinformation related to health and family planning, counsel and motivate women to adoptappropriate health and family planning practices, and deliver other selected services. Thesecontacts are also important for enhancing the credibility of services and establishing necessaryrapport with the clients. Only 2 percent of women in Bihar, however, report that they received ahome visit from a health or family planning worker during the 12 months preceding the survey(Table 9.2).
The reporting of home visits by a health or family planning worker is low for women ofall ages. Rural women are somewhat more likely to report a home visit than urban women. Byregion, women in the Jharkhand region are more likely to report receiving a home visit (4percent) than those in the North Bihar Plain region (2 percent) or in the South Bihar Plain region(1 percent). Home visits are more common among scheduled-tribe women (7 percent) thanamong other caste/tribe/class groups (2-3 percent). By religion, Christian women and womenbelonging to 'other' religions are considerably more likely to receive home visits than womenbelonging to the Hindu or Muslim religion. However, religion differentials should be viewedwith caution as the percentages for Christians and 'other' religions are based on small numbersof cases. The variations in home visits by level of education of women, standard of living of thehousehold, number of children ever born, and family planning status are small and do not revealany specific pattern.
Women who reported a visit by a health or family planning worker during the 12 monthspreceding the survey were asked the frequency of home visits during the past 12 months and thenumber of months since the last visit. These women, on average, received only one home visitover the year with the median duration of2.5 months since the last visit (Table 9.2). The averagenumber of home visits and the duration since the last visit do not vary substantially according toany of the background characteristics measured. In other words, although some groups are morelikely to be visited by a health or family planning worker than others, among women who werevisited the frequency ofvisits does not vary widely.
9.3 Quality of Home Visits
The quality of the care provided during home visits can be assessed in terms of client satisfactionwith the services received during the visit. Each woman who reported that a health or familyplanning worker had visited her during the 12 months preceding the survey was asked about thequality of care received. Questions were asked with reference only to the most recent home visit.The questions covered how the worker talked to the woman during the visit and whether theworker spent enough time with her. Table 9.3 provides this information by the type of servicesreceived and whether the worker was from to the private or public sector.
Most of the recent home visits were provided by public-sector health or family planningworkers; private-sector health workers provided only 16 percent of the most recent home visits.Eighty-six percent of women who were visited at home reported that they received servicesrelated to health and 22 percent reported that they received services related to family planning.
215

Table 9.2 Home visits by a health or family planning worker
Percentage of ever-married women who had at least one home visit by a health or family planning worker in the12 months preceding the survey and, among women who had home visits, median number of visits and mediannumber of months since the most recent visit by selected background characteristics, Bihar, 1998-99
Medianmonths
Percentage Number Median since Number ofwith at feast of number the most women with
Background characteristic one visit women of visits 1 recent visit1 home visit
Age15--24 2.7 2,244 1.0 2.1 6025--34 2.0 2,507 (1.2) (2.8) 5035-49 2.5 2,274 1.5 2.7 58
ResidenceUrban 1.8 718 • · 13Rural 2.5 6,306 1.2 2.5 155
RegionNorth Bihar Plain 2.0 3,133 1.4 2.3 64South Bihar Plain 1.3 2,199 (0.9) (2.5) 29Jharkhand 4.4 1,692 1.3 2.8 74
Education/IIiterate 2.3 5,383 1.3 2.4 122Literate, < middle school complete 2.4 779 · · 18Middle school complete 4.3 267 · · 12,
High school complete and above 2.6 595 · • 16
ReligionHindu 2.4 5,872 1.3 2.4 139Muslim 1.4 1,038 · · 14Christian 10.9 59 · • 6Other 13.5 55 · · 7
Caste/tribeScheduled caste 2.8 1,452 (0.9) (2.5) 40Scheduled tribe 7.0 582 (1.5) (2.5) 41Other backward class 1.5 3,642 1.5 2.4 55Other 2.4 1,348 (0.9) (2.7) 32
Standard of living indexLow 2.5 3,709 1.3 2.2 92Medium 1.9 2,595 (1.2) (3.3) 50High 3.6 712 (1.3) (2.4) 26
Number of children ever born0 1.8 897 · · 161 2.0 921 · · 192 2.4 1,081 (1.0) (2.4) 263 2.5 1,114 (1.3) (2.1 ) 284 3.1 1,035 (1.2) (2.8) 325+ 2.4 1,977 (1.4) (2.6) 47
Family planning statusSterilized 2.2 1,342 (1.5) (2.9) 29Using method other than sterilization 4.1 291 · · 12Nonuser 2.4 5,391 1.1 2.4 127
Total 2.4 7,024 1.3 2.5 168
Note: Total includes a small number of women with missing information on the standard of living index, who arenot shown separately.( ) Based on 25-49 unweighted cases'"Median not shown; based on fewer than 25 unweighted cases1For women who received at least one visit
216

Table 9.3 Quality of home visits
Quality of care indicators for the most recent home visit by a health or family planning worker during the 12 months preceding thesurvey, according to type of health worker and type of services received during the visit, Bihar, 1998-99
Types of health worker and type of services received
Public-sector worker Private-sector/NGOltrust worker Total
Family Family FamilyFamily planning Family planning Family planning
Quality indicator planning Health or health planning Health or health planning Health or health
Percentage who saidworker spent enoughtime with them (82.4) 88.8 87.3 · · · (84.1) 87.6 86.6
Percentage who saidworker talked to them:
Nicely (78.6) 67.9 68.9 · · · (80.6) ·68.2 69.2Somewhat nicely (17.9) 26.3 25.4 • • · (16.2) 27.1 26.1Not nicely (3.5) 5.8 5.6 · · · (3.2) 4.7 4.7
Total percent 100.0 100.0 100.0 100.0 100.0 100.0 100.0 100.0 100.0
Number of women visitedat home 30 106 127 3 24 25 33 130 152
Note: Cases where the source of service was neither the public sector nor the private sector/NGO/trust, and cases where neitherfamily planning nor health services were received are excluded from the table. The number of women receiving family planning andhealth services add to more than the number receiving any visits because some visits were for both family planning and health.NGO: Nongovernmental organization( ) Based on 25-49 unweighted cases*Percentage not shown; based on fewer than 25 unweighted cases
Irrespective of the type of service received, the majority of women (82 percent or more)who were visited by a public-sector health or family planning worker were satisfied that theworker had spent enough time with them. In general, women had only a few complaints aboutthe way the worker talked to them. About two-thirds (69 percent) of the women who receivedfamily planning or health services reported that the worker talked to them nicely; less than 5percent said that the worker did not talk to them nicely. Women who received family planningservices gave workers a slightly better assessment than did women who received health services.
9.4 Matters Discussed During Home Visits or Visits to Health Facilities
Women who were visited at home by a health or family planning worker, as well as those whovisited a health facility during the 12 months preceding the survey, were asked about thedifferent topics discussed with the workers during any of these visits. Table 9.4 shows thepercentage of women who discussed specific topics during all home visits or visits to a healthfacility during the past 12 months.
The major focus of home visits was immunizations, treatment of health problems, andchildcare. In addition, 21 percent of women mentioned that family planning was discussedduring home visits and 6 percent each reported having discussions about antenatal care anddelivery care. It seems that family planning is often not discussed during a home visit.Discussions about family planning are more common for current contraceptive users and forwomen who are either pregnant or have children under age three years than for current nonusers.Women who were pregnant or women with children under age three were also much more likely
217

Table 9.4 Matters discussed during contacts with a health or family planning worker
Among ever-married women who had at least one contact with a health or family planningworker in the 12 months preceding the survey, percentage who discussed specific topicswith the health or family planning worker, Bihar, 1998-99
Other womenPregnant womenor women with Currentchildren under contraceptive Current
Topic discussed age 3 users nonusers Total
During home visitFamily planning 23.6 (23.9) 14.3 20.8Breastfeeding 3.6 (0.0) 0.0 1.9Immunization 46.5 (29.0) 26.1 37.1Disease prevention 3.4 (13.5) 3.9 5.4Treatment of health problem 14.5 (20.1 ) 42.3 24.1Antenatal care 11.0 (3.5) 0.0 6.3Delivery care 11.4 (0.0) 1.9 6.4Postpartum care 5.0 (0.0) 0.0 2.6Childcare 25.7 (13.7) 23.9 23.0Sanitation/cleanliness 0.0 (3.1 ) 0.0 0.6Oral rehydration 0.0 (0.0) 1.8 0.6Other 0.0 (0.0) 6.0 1.9
Number of women 86 30 52 168
During visit to health facilityFamily planning 2.3 4.0 3.1 2.8Breastfeeding 0.4 0.2 0.2 0.3Supplementary feeding 0.2 0.6 0.0 0.2Immunization 36.2 7.8 12.0 24.9Nutrition 0.9 0.2 0.3 0.6Disease prevention 0.4 0.7 0.6 0.5Treatment of health problem 23.4 60.4 61.9 39.9Antenatal care 8.0 0.7 0.8 4.8Delivery care 8.0 0.4 1.1 4.9Postpartum care 2.0 0.2 0.4 1.3Childcare 47.3 36.5 29.0 40.7Sanitation/cleanliness 0.5 0.0 0.3 0.4Oral rehydration 0.1 0.0 0.2 0.1
Number of women 1,435 452 656 2.543
Note: Percentages add to more than 100.0 because of multiple responses.( ) Based on 25-49 unweighted cases
than other women to have talked about immunizations and antenatal and delivery care, but lesslikely to have discussed treatment of health problems. The topic discussed most often duringhome visits by health or family planning workers with current nonusers was treatment of healthproblems, which was mentioned by 42 percent ofwomen.
Visits to health facilities are largely for reasons related to childcare (41 percent),treatment of health problems (40 percent), or immunization (25 percent). Only 3 percent of thewomen say that they discussed family planning during the visits. Even among currently pregnantwomen or women with children under age three, only 2 percent report having discussed familyplanning during a visit to health facility. Forty-seven percent of these women discussedchildcare, 36 percent discussed immunization, and 23 percent discussed treatment of a healthproblem. These data on topic discussed during home visits and visits to health facilities suggestthat delivery of health and family planning services in Bihar is not well integrated. Indeed, healthfacilities and workers in the process of providing health and childcareservices are missing the
218

opportunity to discuss family planning with even the women who may be most in need of suchservices. It is also evident that advice and information on safe motherhood practices to pregnantwomen and mothers with young children is often not provided, and many important healthrelated topics (feeding practices, nutrition, disease prevention, sanitation, and oral rehydration)are rarely discussed during either home visits or visits to health facilities.
9.5 Quality of Services Received at the Most Recent Visit to a Health Facility
NFHS-2 asked women who had visited a health facility in the 12 months preceding the survey anumber of questions to ascertain their perception of the quality of care they received during theirmost recent visit. Specific dimensions covered were: whether women received the service theywent for, the waiting time -before receiving the service (or before finding out that the service wasnot available), whether the staff at the health facility spent enough time with them, whether thestaff talked nicely to them, and whether the staff respected their privacy, if they needed privacy.Women were also asked their opinion regarding the cleanliness of the facility.
Almost all respondents (99.5 percent) said that they received the services for which theyhad visited the facility (Table 9.5). The median waiting time to receive services was 29 minutes,which was about 50 percent longer at private facilities (29 minutes) than at public facilities (19minutes). For those visiting public or private facilities, the median waiting time did not differ byurban-rural residence. Satisfaction with the amount of time the staff spent with the woman wasgenerally high (91 percent), but was considerably lower in the public sector (77 percent) than inthe private sector (96 percent).
The private sector was also rated higher than the public sector on all of the otherindicators of quality. Eighty-two percent of women who received services in a private-sectorfacility said that the staff talked to them nicely, compared with 39 percent of women whoreceived services in a public-sector facility. Consistent with this, only 1 percent of women whovisited a private-sector facility said that the staff did not talk to them nicely, compared with 5percent for women who visited a public-sector facility. The greatest dissatisfaction wasexpressed by urban women who visited public-sector facilities (8 percent).
Among women who wanted privacy during their visit, 77 percent were satisfied that thestaff respected their need for privacy. The percentage was much higher for private-sectorfacilities (84 percent) than for public-sector facilities (55 percent). It was also higher for womenliving in urban areas (83 percent) than for women living in rural areas (76 percent).
Private-sector facilities are also perceived to be much more clean than public-sectorfacilities, and this is true for both urban and rural areas. Overall, 81 percent of women whovisited a private-sector facility said that the facility was very clean compared with only 28percent ofwomen who visited a public-sector facility.
9.6 Family Planning Information and Advice Received
To gain a better understanding of the information provided to women about differentcontraceptive methods, all eligible women were asked to recollect all the specific methods thathad ever been discussed during any of the contacts they had ever had with a health or familyplanning worker. Overall, 88 percent of women said that they had either no contact or nodiscussion about any method of family planning with health or family planning personnel (Table
219

Table 9.5 Quality of care during the most recent visit to a health facility
Among ever-married women, indicators of quality of care during the most recent visit to a health facility in the 12months preceding the survey by sector of most recent visit and residence, Bihar, 1998-99
Public sector Private sector/NGOltrust Total
Quality indicator Urban Rural Total Urban Rural Total Urban Rural Total
Percentage who receivedthe service they went for 96.4 99.3 98.9 100.0 99.7 99.8 99.0 99.6 99.5
Median waiting time(minutes) 19.0 19.2 19.1 29.1 29.4 29.3 19.7 29.1 29.1
Percentage who said thestaff spent enough timewith them 80.4 76.5 77.0 96.4 95.5 95.6 91.9 90.4 90.6
Percentage who said thestaff talked to them:
Nicely 49.5 36.8 38.6 86.1 81.8 82.3 75.7 69.7 70.5Somewhat nicely 42.7 58.7 56.5 12.6 17.2 16.6 21.2 28.3 27.4Not nicely 7.8 4.5 4.9 1.3 1.0 1.0 3.2 1.9 2.1
Total percent 100.0 100.0 100.0 100.0 100.0 100.0 100.0 100.0 100.0
Percentage who said thestaff respected their needfor privaci 64.3 53.2 54.6 89.3 82.8 83.6 83.1 75.8 76.7
Percentage who ratedfacility as:
Very clean 47.5 25.4 28.4 78.6 80.8 80.5 69.8 65.9 66.4Somewhat clean 51.3 68.9 66.5 20.9 183 18.7 29.6 31.9 31.6Not clean 1.2 5.7 5.1 0.4 0.9 0.8 0.7 2.2 2.0
Total percent 100.0 100.0 100.0 100.0 100.0 100.0 100.0 100.0 100.0
Number of women 94 590 685 237 1,613 1,850 331 2,204 2,535
Number ofwomen whosaid they needed privacy 63 415 479 193 1,331 1,524 257 1,746 2,003
Note: Cases where the source of service was neither the public sector nor the private sector/NGOltrust areexcluded from the table.NGO: Nongovernmental organization1Among women who said they needed privacy
9.6). Among those who discussed contraception, by far the most frequently discussed methodwas sterilization, particularly female sterilization. Less than 4 percent of women mentioned everdiscussing pills. Discussions about condoms, IUDs, or traditional methods such as rhythm orwithdrawal were also rare. The patterns for urban and rural areas are similar, although everymethod was slightly more likely to be discussed in urban areas than in rural areas.
9.7 Availability of Pills and Condoms
NFHS-2 asked current users of condoms and pills if they ever had a problem in getting theirsupply. The results are presented in Table 9.7. Nine percent of condom users report ever having aproblem in getting their supply of condoms, and only 2 percent ofpill users report ever having aproblem in getting their supply ofpills.
220

Table 9.6 Family planning discussions with a health or family planning worker
Percentage of ever-married women who reported ever discussing specific contraceptivemethods with health or family planning workers by residence, Bihar, 1998-99
Method Urban Rural Total
Pill 6.2 3.2 3.5Condom 28 1.6 1.7IUD 3.1 1.3 1.5Female sterilization 13.0 9.9 10.2Male sterilization 2.7 2.4 2.4Rhythm/safe period 1.3 0.3 0.4Withdrawal 0.8 0.1 0.2Other method 0.2 0.2 0.2No method/no contact 82.6 88.2 87.6
Number of women 718 6,306 7,024
Note: Percentages add to more than 100.0 because more than one method may havebeen discussed.
Table 9.7 Availability of regular supply of condoms/pills
Percentage of current condom or pill users who ever had a problem getting asupply of condoms/pills, Bihar, 1998-99
Percentage who had aMethod problem getting supply Number of users
Condom (8.7) 47Pill 1.5 66
( ) Based on 25-49 unweighted cases
9.8 Person Motivating Users of a Modern Contraceptive Method
To help understand the dynamics of adoption of contraceptive methods and the roles that healthcare providers and others play, NFHS-2 asked current users of modem methods who hadmotivated them to use their current method. A majority (53 percent) of the current users of amodem method in Bihar said that their motivator was someone other than a government, private,or NGO worker (Table 9.8 and Figure 9.1), Another sizeable proportion (39 percent) said thatthey were not motivated by anyone, but rather they adopted the method on their own, Only 6percent of the users said that a government worker was the one who mainly motivated them,Condom users are least likely to be self-motivated and IUD users are most likely to be selfmotivated. Even in the case of female sterilization, which is the most popular method, 41 percentsaid that it was their own decision to use the method, and no one else had motivated them.Among women whose husbands had accepted sterilization, 37 percent stated that no one hadmotivated their husband to get sterilized. The role of different motivators does not differ muchbetween urban and rural users,
221

Table 9.8 Motivation to use family planning
Percent distribution of current users of modern contraceptive methods by type of person who motivated them to use themethod, according to current method and residence, Bihar, 1998-99
Type of person who motivated the user to use current method
Government Private-sector Total NumberCurrent method health worker health worker NGO worker Other Noone percent of users
URBAN
Pill · · · · · 100.0 19Condom • · · · • 100.0 20IUD · · · · · 100.0 8Female sterilization 4.0 1.7 0.0 50.1 44.2 100.0 180Male sterilization · • • • • 100.0 11
All modem methods 4.3 2.2 0.0 56.4 37.1 100.0 239
RURAL
PIli (6.4) (6.4) (0.0) (60.0) (27.1 ) 100.0 47Condom (0.0) (4.2) (0.0) (88.7) (7.2) 100.0 26IUD (0.0) (0.0) (3.9) (37.9) (58.2) 100.0 27Female sterilization 6.0 2.1 0.1 51.4 40.5 100.0 1,097Male sterilization 18.2 3.9 0.0 44.6 33.2 100.0 53
All modern methods 6.3 2.3 0.2 51.9 39.4 100.0 1,250
TOTAL
PHI 9.3 7.9 0.0 63.6 19.2 100.0 66Condom (0.0) (2.4) (0.0) (91.3) (6.3) 100.0 47IUD (0.0) (0.0) (3.0) (46.8) (50.3) 100.0 35Female sterilization 5.7 2.0 0.1 51.2 41.0 100.0 1,277Male sterilization 15.0 3.2 0.0 45.0 36.8 100.0 65
All modem methods 5.9 2.3 0.1 52.6 39.0 100.0 1,490
NGO: Nongovernmental organization( ) Based on 25-49 unweighted cases*Percentage not shown; based on fewer than 25 unweighted cases
9.9 Quality of Care of Family Planning Services
NFHS-2 investigated several other aspects of quality of care. Each current user of a modemfamily planning method was asked whether the person who motivated her to use her currentmethod informed her about alternative methods of family planning; whether she was told by ahealth or family planning worker about the possible side effects of the method at the time thatshe accepted the method; and whether she received any follow-up care either at home or in ahealth facility after she accepted the method. Tables 9.9 and 9.10 present the results of thisinvestigation.
An important indication of the quality of family planning services is whether women areinformed about a variety of methods and are allowed to make an informed choice about themethod most suited to their family planning and reproductive health needs. Women who reportedthat someone had motivated them to use family planning were asked whether the motivator toldthem about alternate methods that they could use. Only 15 percent of users of modemcontraceptive methods who were motivated by someone were informed about at least onealternative method (Table 9.9). Twenty-one percent of users who were motivated by a public-
222

Figure 9.1Motivator for Current Users of Modern Contraceptive Methods
Other53%
NGOWorker--__0.1%
Private-sector HealthWorker
2%
Note: Percents add to more than 100.0due to rounding
Government HealthWorker
6%
Nobne39%
NFHS-2, Bihar, 1998-99
Table 9.9 Discussions about alternative methods of family planning
Percentage of current users of modern contraceptive methods who were told about atleast one other method by the person Who motivated them to use the current method,according to the sector of the motivator and residence, Bihar, 1998-99
NumberSector of motivator Urban Rural Total of users
Public health sector (29.1 ) 19.5 20.6 89Private health sector . (13.7) (14.7) 34Other 22.7 12.9 14.6 784
Total 23.1 13.6 15.2 909
Note: Table excludes women who said that no one motivated them to use their currentmethod. Total inclUdes 2 users of modern contraceptive methods who were motivatedby a worker from a nongovernmental organization (NGO), who are not shownseparately.( ) Based on 25-49 unweighted cases*Percentage not shown; based on fewer than 25 unweighted cases
sector health worker received such information, compared with 15 percent of users who weremotivated by a private-sector worker or someone else. Users in urban areas were more likelythan users in rural areas to be told about alternative methods.
Another important element of informed contraceptive choice is being fully informedabout any side effects associated with the method. Table 9.10 shows the percentage of currentusers of modem contraception who were told about side effects by a health or family planningworker at the time they accepted their current method. Women were also asked if they receivedfollow-up services after they had accepted the method.
223

Table 9.10 Information on side effects and follow~up for current method
Percentage of current users of modern contraceptive methods who weretold about side effects or other problems of current method by a healthor family planning worker at the time of accepting the method andpercentage who received follow-up services after accepting themethod by current method and residence, Bihar, 1998-99
Information/follow-up Urban Rural Total
Told about side effectsSterilization 19.7 15.1 15.8Other modern method (17.6) 15.3 16.0Any modern method 19.2 15.1 15.8
Received follow-upSterilization 84.3 77.4 78.3Other modern method (64.0) 66.3 65.5Any modern method 80.2 76.5 77.1
( ) Based on 25-49 unweighted cases
In Bihar, only 16 percent of users of any modem method were informed about possibleside effects of their current method at the time of adopting the method. This percentage is onlyslightly higher in urban areas (19 percent) than in rural areas (15 percent). It is clear that bothpublic and private health and family planning workers in Bihar are not providing couples withthe information they need to make an informed choice about contraceptive methods.
The situation is much better with respect to follow-up services. Among sterilization users,77 percent in rural areas and 84 percent in urban areas received follow-up services. Even so, thisimplies that one in five users of sterilization had no follow-up. About two-thirds (66 percent) ofusers of other modem methods received follow-up services.
224
REFERENCES
Agarwal, K.N., D.K. Agarwal, D.G. Benakappa, S.M. Gupta, P.C. Khanduja, S.P. Khatua, K.Ramachandran, P.M. Udani, and C. Gopalan. 1991. Growth Performance of Affluent IndianChildren (Under-jives): Growth Standardfor Indian Children. New Delhi: Nutrition FoundationofIndia.
Anandaiah, Ravilla and Minja Kim Choe. 2000. Are the WHO guidelines on breastfeedingappropriate for India? National Family Health Survey Subject Reports No. 16. Mumbai:International Institute for Population Sciences; and Honolulu: East-West Center.
Arnold, Fred. 1996. Son preference in South Asia. Paper presented at the Seminar onComparative Perspectives on Fertility Transition in South Asia, International Union for theScientific Study ofPopulation, Rawalpindi, 17-20 December.
Arnold, Fred, Minja Kim Choe, and T.K. Roy. 1998. Son preference, the family-building processand child mortality in India. Population Studies 52(3): 301-315.
Bang, R.A. and A. Bang. 1991. Why women hide them: Rural women's viewpoints onreproductive tract infections. Manushi 69:27-30.
Bang, R.A., A.T. Bang, M. Baitule, Y. Chaudhury, S. Sarmukaddam, and O. Tale. 1989. Highprevalence of gynaecological diseases in rural Indian women. Lancet 1(8629): 85-88.
Bardhan, Kalpana. 1985. Women's work, welfare and status: Forces of tradition and change inIndia. Economic and Political Weekly 20(51): 2261-2267.
Basu, Alaka Malwade. 1989. Is discrimination in food really necessary for explaining sexdifferentials in childhood mortality? Population Studies 43(2): 193-210.
Basu, Alaka Malwade. 1993. Cultural influences on the timing of first births in India: Largedifferences that add up to little difference. Population Studies 47: 88-93.
Bhatia, J.C. and John Cleland. 1995. On self-reported symptoms of gynecological morbidity andtheir treatment in South India. Studies in Family Planning 26(4): 203-216.
Bloem, Martin W., Saskia de Pee, and Ian Darnton-Hill. 1997. Vitamin A Deficiency in India,Bangladesh and Nepal. In Stuart Gillespie (ed.), Malnutrition in South Asia: A Regional Profile.Kathmandu: Regional Office for South Asia, UNICEF.
Centers for Disease Control and Prevention (CDC). 1998. Recommendations to prevent andcontrol iron deficiency in the United States. Morbidity and Mortality Weekly Report 47(RR-3):1-29.
Central Bureau of Health Intelligence (CBHI). 1991. Health Information of India - 1991. NewDelhi: CBHI, Directorate General of Health Services, Ministry of Health and Family Welfare.

Centre for Monitoring Indian Economy. 1991. Basic Statistics Relating to the Indian Economy, Vol2: States, Bombay: CMIE.
Central Statistical Organisation (CSO). 1999. Selected Socio-Economic Statistics, India 1998.New Delhi: CSO, Department of Statistics and Programme Implementation, Ministry ofPlanning and Programme Implementation.
Das Gupta, Monica. 1987. Selective discrimination against female children in rural Punjab,India. Population and Development Review 13(1): 77-100.
Desai, Sonalde and Devaki Jain. 1994. Maternal employment and changes in family dynamics:The social context of women's work in rural South India. Population and Development Review20(1): 115-136.
Dibley, MJ., J.B. Goldsby, N.W. Staehling, and F.L. Trowbridge. 1987a. Development ofnormalized curves for the international growth reference: Historical and technical considerations.American Journal ofClinical Nutrition 46(5): 736-748.
Dibley, MJ., N.W. Staehling, P. Neiburg, and F.L. Trowbridge. 1987b. Interpretation ofz-scoreanthropometric indicators derived from the international growth reference. American Journal ofClinical Nutrition 46(5): 749-762.
Dixon-Mueller, Ruth. 1993. Population Policies and Women's Rights: TransformingReproductive Choice. Westport, Connecticut: Praeger.
Dyson, Tim and Mick Moore. 1983. On kinship structure, female autonomy and demographicbehavior in India. Population and Development Review 9(1): 35-60.
EPW Research Foundation. 1998. National Accounts Statistics of India, 1950-51 to 1996-97.Mumbai: EPW Research Foundation.
Foster, Stanley. 1984. Immunizable and Respiratory Diseases and Child Mortality. In W. HenryMosley and Lincoln C. Chen (eds.), Child Survival: Strategies for Research. Population andDevelopment Review 10 (Suppl.): 119-140.
Germain, Adrienne, King K. Holmes, Peter Piot, and Judith N. Wasserheit. 1992. ReproductiveTract Infections: Global Impact and Priorities for Women's Reproductive Health. New York:Plenum Press.
Ghosh, Shanti. 1987. The female child in India: A struggle for survival. Bulletin ofthe NutritionFoundation ofIndia 8(4).
Gopalan, C., B.V. Rama Sastri, and S.C. Balasubramanian. 1996. Nutritive Value of IndianFoods. Hyderabad: National Institute ofNutrition.
Govindasamy, Pavalavalli, M. Kathryn Stewart, Shea O. Rutstein, J. Ties Boerma, and A.Elisabeth Sommerfelt. 1993. High-risk births and maternity care. DHS Comparative Studies No.8. Columbia, Maryland: Macro International.
226

Harrison, Kelsey A. 1990. The political challenge of maternal mortality in the Third World.Maternal Mortality and Morbidity - A Call to Women for Action. Special Issue, May 28, 1990.
Hegde, Radha S. 1996. Narratives of silence: Rethinking gender, agency and power from thecommunication experiences of battered women in south India. Communication Studies 47:303317.
Heise, Lori, Mary Ellsberg, and Megan Gottemoeller. 1998. Ending violence among women.Population Reports, Series L, No. 11. Baltimore: Population Information Program, JohnsHopkins University School of Public Health.
Heise, Lori, Jacqueline Pitanguy, and Adrienne Germain. 1994. Violence Against Women: TheHidden Health Burden. Washington D.C.: The World Bank.
IDD & Nutrition Cell. 1998. Policy Guidelines on National Iodine Deficiency Disorders ControlProgramme. New Delhi: Directorate General of Health Services, Ministry of Health and FamilyWelfare.
International Clinical Epidemiology Network (INCLEN). 2000. WorldSAFE and IndiaSAFE:Studying the prevalence of family violence. INCLEN Monograph Series on CriticalInternational Health Issues, Monograph 9. Philadelphia: INCLEN.
International Institute for Population Sciences (IIPS). 1995. National Family Health Survey(MCH and Family Planning), India 1992-93. Bombay: IIPS.
International Institute for Population Sciences (IIPS) and ORC Macro. 2000. National FamilyHealth Survey (NFHS-2), 1998-99: India. Mumbai: IIPS.
Jaisingh,1. 1995. Violence Against Women: The Indian Perspective. In J. Peters and A. Wolper(eds.), Women's Rights, Human Rights. New York: Routledge.
Jeffery, Roger and Alaka M. Basu. 1996. Girls' Schooling, Women's Autonomy and FertilityChange in South Asia. New Delhi: Sage Publications.
Jejeebhoy, Shireen J. 1998. Associations between wife-beating and fetal and infant death:Impressions from a survey in rural India. Studies in Family Planning 29(3): 300--308.
Jejeebhoy, Shireen J. and S. Rama Rao. 1992. Unsafe motherhood: A review of reproductivehealth in India. Paper presented at the Workshop on Health and Development in India, sponsoredby the National Council of Applied Economic Research and Harvard University, Center forPopulation and Development Studies, New Delhi, 2-4 January.
Kanitkar, Tara. 1979. Development of Maternal and Child Health Services in India. In K.Srinivasan, P.C. Saxena, and Tara Kanitkar (eds.), Child in India. Bombay: Himalaya PublishingHouse.
Kapil, Umesh, R.S. Raghuvanshi, Kumud Khanna, B.P. Mathur, T.D. Sharma, Beena, S.S.Swami, and S. Seshadri. 1999. Utility of spot testing kit in the assessment of iodine content ofsalt - A multicentric study. Indian Pediatrics 37:182-186.
227

Kishor, Snnita. 1995. Gender Differentials in Child Mortality: A Review of Evidence. In MonicaDas Gupta, Lincoln C. Chen, and T.N. Krishnan (eds.), Women's Health in India: Risk andVulnerability. Bombay: Oxford University Press.
Koenig, Michael A. and Gillian H.C. Foo. 1992. Patriarchy, women's status and reproductivebehaviour in rural North India. Demography India 21(2):145-166.
Koenig, Michael A. and M.E. Khan (eds.). 1999. Improving Quality of Care in India's FamilyWelfare Programme: The Challenge Ahead. New York: Population Council.
Krenzischeck, D.A. and F.V. Tanseco. 1996. Comparative study of bedside and laboratorymeasurements of haemoglobin. American Journal ofCritical Care 5:427--432.
Kulkarni, Sumati and Minja Kim Choe. 1998. Wanted and unwanted fertility in selected states ofIndia. National Family Health Survey Subject Reports No.6. Mumbai: International Institute forPopulation Sciences; and Honolulu: East-West Center.
MacDonald, Paul C. and Jack A. Pritchard. 1980. Williams Obstetrics. Sixteenth Edition. NewYork: Appleton-Century-Crofts.
Mahmud, Simeen and Anne M. Johnston. 1994. Women's Status, Empowerment andReproductive Outcomes. In Gita Sen, Adrienne Germain, and Lincoln C. Chen (eds.), PopulationPolicies Reconsidered: Health, Empowerment and Rights. Harvard Series on Population andInternational Health. Boston: Harvard School of Public Health.
Martorell, R. and J.P. Habicht. 1986. Growth in Early Childhood in Developing Countries. InFrank Falkner and J.M. Tanner (eds.). Human Growth: A Comprehensive Treatise, Vol. 3. NewYork: Plenum Press.
McNulty, Stephen E., Marc Torjman, Wlodzimierz Grodecki, Alex Marr, and Hugh Schieren.1995. A comparison of four bedside methods of hemoglobin assessment during cardiac surgery.Anesthesia and Analgesic 81(6): 1197-1202.
Ministry of Health and Family Welfare (MOHFW). 1991. Family Welfare Programme in India:Year Book, 1989-90. New Delhi: Department of Family Welfare, MOHFW.
Ministry of Health and Family Welfare (MOHFW). 1992. Family Welfare Programme in India:Year Book, 1990-91. New Delhi: Department of Family Welfare, MOHFW.
Ministry of Health and Family Welfare (MOHFW). 1994. Annual Report 1992-93. New Delhi:MOHFW.
Ministry of Health and Family Welfare (MOHFW). 1996. Model Plan for District BasedPilot/Sub-projects ofReproductive and Child Health (RCH). New Delhi: MOHFW.
Ministry of Health and Family Welfare (MOHFW). 1997. Reproductive and Child HealthProgramme: Schemes for Implementation. New Delhi: Department of Family Welfare,MOHFW.
228

Ministry of Health and Family Welfare (MOHFW). 1998a Family Welfare Programme in India,Year Book, 1996-1997. New Delhi: Department ofFamily Welfare, MOHFW.
Ministry of Health and Family Welfare (MOHFW). 1998b. Manual on Community NeedsAssessment Approach in Family Welfare Programme. New Delhi: Department of FamilyWelfare, MOHFW.
Ministry of Health and Family Welfare (MOHFW). 2000. National Population Policy, 2000.New Delhi: Department of Family Welfare,
Ministry of Health and Family Welfare (MOHFW). n.d.(a). Basic Guide to Reproductive and ChildHealth Programme for Use by NGOs, Training Institutions and Health Functionaries. Governmentof India.
Ministry of Health and Family Welfare (MOHFW). n.d.(b). Reproductive and Child HealthProgramme. New Delhi: Department of Family Welfare, MOHFW.
Murray, Christopher J.L. and Alan D. Lopez. 1996. The Global Burden ofDisease. Cambridge,Massachusetts: Harvard University Press.
Murthi, M., A.-C. Guio, and J. Dreze. 1995. Mortality, fertility, and gender bias in India.Population and Development Review 21(4): 745-782.
Nag, Moni. 1991. Sex preference in Bangladesh, India and Pakistan and its effect on fertility.Demography India 20(2): 163-185.
Narasimhan, R.L., Robert D. Retherford, Vinod Mishra, Fred Arnold, and T.K. Roy. 1997.Comparison of fertility estimates from India's Sample Registration System and National FamilyHealth Survey. National Family Health Survey Subject Reports No.4. Mumbai: InternationalInstitute for Population Sciences; and Honolulu: East-West Center.
Nutrition Foundation of India. 1993. NFl Bulletin 14(4).
Office of the Registrar General. 1999a. Sample Registration System: Statistical Report 1997.New Delhi: Office of the Registrar General, India.
Office of the Registrar General. 1999b. SRS Compendium of India's Fertility and MortalityIndicators, 1971-1997 (Based on the Sample Registration System). New Delhi: Office of theRegistrar General, India.
Office of the Registrar General. 2000. SRS Bulletin. Volume 34, No.1. New Delhi: Office of theRegistrar General, India.
Office of the Registrar General and Census Commissioner. 1992. Census ofIndia, 1991, Series 1,India, Paper-2 of1992, Final Population Totals, BriefAnalysis ofPrimary Census Abstract, NewDelhi: Office of the Registrar General and Census Commissioner.
229

Pachauri, S. and J. Gittlesohn. 1994. Summary of Research Studies and Implications for HealthPolicy and Programmes. In J. Gittlesohn, M.E. Bentley, PJ. Pelto, M. Nag, S. Pachauri, A.D.Harrison, and L.T. Landman (eds.), Listening to Women Talk about Their Health Issues andEvidencefrom India. New Delhi: Ford Foundation and Har-Anand Publications.
Pandey, Arvind, Sada Nand Dwivedi, and Ravindra Nath Mishra. 1990. Distribution of closedbirth-intervals with some biosocial components: A stochastic model and its applications. JournalofMathematical Sociology 16(1): 89-106.
Pandey, Arvind, Minja Kim Choe, Norman Y. Luther, Damodar Sahu, and Jagdish Chand. 1998.Infant and child mortality in India. National Family Health Survey Subject Reports No. 11.Mumbai: International Institute for Population Sciences; and Honolulu: East-West Center.
Parasuraman, Sulabha, T.K. Roy, and S. Sureender. 1994. Sex Composition of Children andFertility Behaviour in Rural Maharashtra. In K.B. Pathak, U.P. Sinha, and Arvind Pandey (eds.),Dynamics ofPopulation and Family Welfare. Bombay: Himalaya Publishing House.
Park, J.E. and K. Park. 1989. Textbook of Preventive and Social Medicine. Twelfth Edition.Jabalpur: MIS Banarsidas Bhanot Publishers.
Population Council. 1999. Reproductive tract infections: A set of factsheets. Bangkok:Population Council.
Population Research Centre, Patna Univerity; and International Institute for Population Sciences(lIPS). 1995. National Family Health Survey (MCH and Family Planning), Bihar 1993.Bombay: lIPS.
Prakash, S., U. Kapil, G. Singh, S.N. Dwivedi, and M. Tandon. 1999. Utility of Hemocue inestimation of hemoglobin against standard blood cell counter method. Journal ofthe AssociationofPhysicians ofIndia 47:995-997.
Prasad, Shally. 1999. Medicolegal response to violence against women III India. ViolenceAgainst Women 5(5): 478-506.
Preston, Samuel H. 1989. Mortality in India. In International Union for the Scientific Study ofPopulation (IUSSP), International Population Conference, New Delhi, 1989, Vol. 4. Liege:IUSSP.
Ramachandran, Prema. 1992. Need of organization of antenatal and intrapartum care in India.Demography India 21(2): 179-193.
Ramasubban, Radhika and Bhanwar Singh. 1998. 'Ashaktapana' (Weakness) and ReproductiveHealth in a Slum Population in Mumbai, India. In Carla M. Obermeyer (ed.), CulturalPerspectives in Reproductive Health. Oxford: Oxford University Press.
Ramesh, B.M., S.C. Gulati, and Robert D. Retherford. 1996. Contraceptive use in India. NationalFamily Health Survey Subject Reports No.2. Mumbai: International Institute for PopulationSciences; and Honolulu: East-West Center.
230

Rao, Vijayendra and Francis Bloch. 1993. Wife-beating, Its Causes and Its Implications forNutrition Allocations to Children: An Economic and Anthropological Case Study of a RuralSouth Indian Community. Washington, D.C.: Policy Research Department, Poverty and Human .Resources Division, World Bank.
Retherford, Robert D., Minja Kim Choe, Shyam Thapa, and Bhakta B. Gubhaju. 1989. To whatextent does breastfeeding explain birth-interval effects of early childhood mortality?Demography 26(3): 439-450.
Retherford, Robert D. and Vinod Mishra. 1997. Media exposure increases contraceptive use.National Family Health Survey Bulletin, No.7. Mumbai: International Institute for PopulationSciences; and Honolulu: East-West Center Program on Population.
Rutstein, Shea O. 1984. Infant and child mortality: Levels, trends, and demographic differentials.Revised edition. WFS Comparative Studies No. 43. Voorburg, Netherlands: InternationalStatistical Institute.
Sen, Amartya K. 1990. Gender and Cooperative Conflicts. In Irene Tinker (ed.), PersistentInequalities: Women and World Development. New York: Oxford University Press.
Sen, Gita and Srilatha Batliwala. 1997. Empowering women for reproductive rights: Movingbeyond Cairo. Paper presented at the Seminar on Female Empowerment and DemographicProcesses: Moving Beyond Cairo, IUSSP, Lund, Sweden, 21-24 April.
Seshadri, Subadra. 1997. Nutritional Anaemia in South Asia. In Stuart Gillespie (ed.),Malnutrition in South Asia: A Regional Profile. Kathmandu: Regional Office for South Asia,UNICEF.
Seshadri, Subadra. 1998. A Data Base on Iron Deficiency Anemia (IDA) in India: Prevalence,Causes, Consequences and Strategies for Prevention. Vadodara: The Maharaja SayajiraoUniversity of Baroda.
Stolzfus, Rebecca J. and Michele L. Dreyfuss. 1998. GUidelinesfor the Use ofIron Supplementsto Prevent and Treat Iron Deficiency Anemia. International Nutritional Anemia ConsultativeGroup. Washington, DC: International Life Sciences Institute Press.
Tabutin, Dominique and Michel Willems. 1995. Excess female child mortality in the developingworld in the 1970s and 1980s. Population Bulletin ofthe United Nations 39:45-78.
United Nations. 1955. Methods ofAppraisal ofQuality ofBasic Data for Population Estimates.New York: United Nations.
United Nations General Assembly. 1991. Advancement of women: Convention on theelimination of all forms of discrimination against women, Report of the Secretary-General. NewYork: United Nations.
Vir, Sheila. 1995. Iodine deficiency in India. Indian Journal ofPublic Health 39(4): 132-134.
231

Visaria, Leela. 1999. Violence Against Women in India: Evidence from Rural Gujarat. InInternational Center for Research on Women (ICRW), Domestic Violence in India; A SummaryReport a/Three Studies. Washington, DC: ICRW.
Von Schenk, H., M. Falkensson, and B. Lundberg. 1986. Evaluation of "HemoCue", a newdevice for determining hemoglobin. Clinical Chemistry 32(3): 526-529.
Youssef, Nadia H. 1982. The Interrelationship Between the Division of Labor in the Household,Women's Roles and Their Impact on Fertility. In R. Anker, M. Buvinic, and N.H. Youssef (eds.),Women's Roles and Population Trends in the Third World. London: Croom Helm.
232

APPENDIX A
ESTIMATES OF SAMPLING ERRORS
Two types of errors affect the estimates from a sample survey: (I) nonsampling errors and (2)sampling errors. Nonsampling errors are the result of errors committed during data collection anddata processing, such as failure to locate and interview the correct household, misunderstanding ofthe questions on the part of either the interviewer or the respondent, and data entry errors.Although numerous efforts were made during the implementation of NFHS-2 to minimizenonsampling errors, they are impossible to avoid and difficult to evaluate statistically.
Sampling errors, on the other hand, can be evaluated statistically. The sample of womenselected in NFHS-2 is only one of many samples that could have been selected from the samepopulation, using the same design and expected sample size. Each of these samples would yieldresults that differ somewhat from the results of the actual sample selected. The sampling error is ameasure of the variability among all possible samples. Although the degree of variability is notknown exactly, it can be estimated from the survey results.
The sampling error is usually measured by the standard error for a particular statistic (forexample, a mean or percentage), which is the square root of the variance. The standard error can beused to calculate confidence intervals within which the true value for the population canreasonably be assumed to fall. For example, for any given statistic calculated from a samplesurvey, the value ofthat statistic will fall within a range, calculated as the value ofthe statistic plusor minus two times the standard error of that statistic, in 95 percent of all possible samples ofidentical size and design.
If the sample of women had been selected as a simple random sample, it would have beenpossible, for many statistics, to use straightforward formulas for calculating sampling errors.However, the NFHS-2 sample is the result of a multi-stage stratified sample design, and it istherefore necessary to use more complex formulas. The computer software used to calculatesampling errors for NFHS-2 is ISSA (the Integrated System for Survey Analysis). The linearTaylor series approximation method for variance estimation is used for estimates of means,proportions, and ratios. The JACKKNIFE repeated replication method is used with ISSA forvariance estimation for more complex statistics such as fertility and mortality rates.
The ISSA package treats any percentage or average as a ratio estimate, r = y/x, where yrepresents the sample value for variable y, and x represents the number of cases in the group orsubgroup under consideration. The variance of r is computed using the formula given below, withthe standard error being the square root of the variance:

in which
where
h represents the stratum that varies from 1 to H,mh is the total number ofPSUs selected in the hth stratum,Yhi is the sum ofthe values of variable Y in PSU i in the hili stratum,Xhi is the sum of number of cases in PSU i in the hili stratum,fis the overall sampling fraction, which is so small that the program ignores it.
In addition to the standard error, ISSA computes the relative standard error, confidencelimits for the estimates, and the design effect (DEFT) for each estimate. The design effect isdefined as the ratio of the standard error using the given sample design to the standard error thatwould result if a simple random sample had been used. A DEFT value of 1.0 indicates that thesample design is as efficient as a simple random sample, while a value greater than 1.0 indicatesthe increase in the sampling error due to the use of a more complex and less statistically efficientdesign.
Sampling errors for NFHS-2 are calculated for selected variables considered to be ofprimary interest. The results in this appendix are presented for the state as a whole and for urbanand rural areas separately, except for the variable on salt iodization for which the results are shownseparately for large cities, small cities, towns, and rural areas. For each variable, the type ofstatistic (mean, proportion, ratio, or rate) and the base population are given in Table A.1. Table A.2presents the value ofthe statistic (R), its standard error (SE), the relative standard error (SE/R), andthe 95 percent confidence limits (R±2SE), for each variable. In addition, for all variables exceptthe fertility and mortality rates, the table shows the unweighted number of cases (N), the weightednumber of cases (WN), the standard error assuming a simple random sample (SER), and the designeffect (DEFT).
234

Table A.1 List of selected variables for sampling errors. Bihar. 1998 99
Variable
Sex ratioIlliterateHave tuberculosisSalt iodized at 15 ppm or moreIlliterateHigh school complete and aboveCurrently marriedNumber of children ever bornNumber of living childrenHave ever used any methodCurrently using any methodCurrently using any modern methodCurrently using pillsCurrently using IUDCurrently using condomsCurrently using female sterilizationCurrently using male sterilizationCurrently using rhythm/safe periodUsing public source for modern methodDo not want any more childrenWant to delay birth at least 2 yearsIdeal number of childrenIdeal number of sonsIdeal number of daughtersVisited by hea~h/familyplanning workerReceived no antenatal check-up-Received iron and folic acid tablets or syrupReceived medical assistance during deliveryReceived postpartum check-UpHad diarrhoea in past 2 weeksTreated with DRS packetsTaken to a health facility/provider for diarrhoeaShowing a vaccination cardReceived BCG vaccinationReceived OPT vaccination (3 doses)Received polio vaccination (3 doses)Received measles vaccinationFully vaccinatedReceived Vitamin AHad reproductive health problemNot involved in any decisionmakingEver beaten or physically mistreated sinceage 15
Not worked in past 12 monthsAnaemic womenAnaemic childrenFertility ratesMortality rates
Estimate
RatioProportionRateProportionProportionProportionProportionMeanMeanProportionProportionProportionProportionProportionProportionProportionProportionProportionProportionProportionProportionMeanMeanMeanProportionProportionProportionProportionProportionProportionProportionProportionProportionProportionProportionProportionProportionProportionProportionProportionProportion
ProportionProportionProportionProportionRateRate
235
Base population
De facto household populationDe facto household population age 6 and above1,000 de jure household populationHouseholdsEver-married women age 15-49Ever-married women age 15-49Ever-married women age 15-49Currently married women age 15-49Currently married women age 15-49Currently married women age 15-49Currently married women age 15-49Currently married women age 15-49Currently married women age 15-49Currently married women age 15-49Currently married women age 15-49Currently married women age 15-49Currently married women age 15-49Currently married women age 15-49Current users of modern methodsCurrently married women age 15-49Currently married women age 15-49Ever-married women age 15-49Ever-married women age 15-49Ever-married women age 15-49Ever-married women age 15-49Births in past 3 yearsBirths in past 3 yearsBirths in past 3 yearsNoninstitutional births in past 3 yearsChildren under age 3 yearsChildren under age 3 with diarrhoea in past 2 weeksChildren under age 3 with diarrhoea in past 2 weeksChildren age 12-23 monthsChildren age 12-23 monthsChildren age 12-23 monthsChildren age 12-23 monthsChildren age 12-23 monthsChildren age 12-23 monthsChildren age 12-35 monthsCurrently married women age 15-49Ever-married women age 15-49
Ever-married women age 15-49Ever-married women age 15-49Ever-married women age 15-49Children age 6-35 monthsAll women, populationBirths, population

Table A.2 Sampling errors, Bihar, 1998--99
StandardNumber of cases error Relative
Standard assuming Design standard Confidence limitsVariable! Value error Unweighted Weighted SRS effect errorresidence (R) (SE) (N) (WN) (SER) (DEFT) (SE/R) R-2SE R+2SE
Sex ratio (De facto household population)
Urban 932 28.009 2,146 2,201 24.394 1.148 0.030 876 988Rural 955 8.305 17,181 17,112 8.392 0.990 0.009 939 972Totai 953 8.060 19,327 19,314 7.937 1.016 0.008 937 969
liiiterate (De facto household population age 6 and above)
Urban 0.261 0.025 3,615 3,707 0.012 2.040 0.097 0.210 0.311Rural 0.540 0.010 27,941 27,827 0.005 2.054 0.019 0.520 0.560Total 0.507 0.011 31,556 31,534 0.005 2.326 0.022 0.485 0.529
Have tuberculosis (1,000 de jure household population)
Urban 6.290 1.504 4,223 4,330 1.443 1.043 0.239 3.282 9.299Rural 10.347 0.763 34,478 34,339 0.627 1.216 0.074 8.821 11.874Total 9.893 0.703 38,701 38,669 0.581 1.211 0.071 8.487 11.299
Salt iodized at 15 ppm or more (Households)
Large city 0.773 0.121 75 77 0.049 2.483 0.156 0.532 1.000Smali city 0.837 0.054 159 163 0.029 1.838 0.065 0.729 0.945Town 0.756 0.034 467 480 0.020 1.729 0.045 0.687 0.825Rural 0.430 0.015 5,644 5,625 0.007 2.317 0.036 0.399 0.460Total 0.469 0.016 6,345 6,345 0.006 2.478 0.033 '0.438 0.500
Illiterate (Ever-married women age 15-49)
Urban 0.462 0.037 687 718 0.019 1.959 0.081 0.388 0.537Rural 0.801 0.011 6,337 6,306 0.005 2.153 0.013 0.779 0.823Total 0.766 0.012 7,024 7,024 0.005 2.372 0.016 0.742 0.790
High school complete and above (Ever-married women age 15-49)
Urban 0.278 0.035 687 718 0.017 2.023 0.124 0.209 0.347Rural 0.063 0.007 6,337 6,306 0.003 2.179 0.106 0.049 0.076Total 0.085 0.008 7,024 7,024 0.003 2.376 0.093 0.069 0.100
Currently married (Ever-married women age 15-49)
Urban 0.942 0.007 687 718 0.009 0.828 0.008 0.928 0.957Rural 0.949 0.004 6,337 6,306 0.003 1.361 0.004 0.941 0.956Total 0.948 0.003 7,024 7,024 0.003 1.318 0.004 0.941 0.955
Number of children ever born (Currently married women age 15-49)
Urban 3.303 0.090 647 677 0.089 1.009 0.027 3.122 3.483Rural 3.264 0.036 6,015 5,984 0.031 1.180 0.011 3.212 3.357Total 3.286 0.034 6,662 6,661 0.029 1.163 0.010 3.218 3.353
Number of living children (Currently married women age 15-49)
Urban 3.046 0.080 647 677 0.081 0.991 0.026 2.885 3.207Rural 2.850 0.029 6,015 5,964 0.026 1.121 0.010 2.791 2.909Total 2.870 0.028 6,662 6,661 0.025 1.116 0.010 2.814 2.925
Have ever used any method (Currently married women age 15-49)
Urban 0.448 0.030 647 677 0.020 1.551 0.068 0.387 0.509Rural 0.257 0.010 6,015 5,964 0.006 1.813 0.040 0.236 0.277Total 0.276 0.010 6,662 6,661 0.005 1.878 0.037 0.256 0.297
236

Table A.2 Sampling errors. Bihar 1998-99IContd.)
StandardNumber of cases error Relative
Standard assuming Design standard Confidence limitsVariablel Value error Unweighted Weighted SRS effect errorresidence (R) (SE) (N) (WN) (SER) (DEFT) (SE/R) R-2SE R+2SE
Currently using any method (Currently married women age 15-49)
Urban 0.389 0.028 647 677 0.019 1.455 0.072 0.333 0.445Rural 0.229 0.010 6,015 5,984 0.005 1.763 0.042 0.210 0.248Total 0.245 0.010 6,662 6,661 0.005 1.804 0.039 0.226 0.264
Currently using any modem method (Currently married women age 15-49)
Urban 0.354 0.025 647 677 0.019 1.356 0.072 0.303 0.405Rural 0.209 O.OOg 6,015 5,984 0.005 1.732 0.043 0.191 0.227Total 0.224 0.009 6,662 6,661 0.005 1.756 0.040 0.206 0.242
Currently using pills (Currently married women age 15-49)
Urban 0.029 0.006 647 677 0.007 0.940 0.215 0.016 0.041Rural 0.008 0.001 6,015 5,984 0.001 1.026 0.149 0.005 0.010Total 0.010 0.001 6,662 6,661 0.001 1.052 0.129 0.007 0.012
Currently using IUD (Currently married women age 15-49)
Urban 0.012 0.004 647 677 0.004 0.961 0.341 0.004 0.020Rural 0.004 0.001 6,015 5,984 0.001 1.292 0.248 0.002 0.007Total 0.005 0.001 6,662 6,661 0.001 1.233 0.207 0.003 0.007.Currently using condoms (Currently married women age 15-49)
Urban 0.030 0.009 647 677 0.007 1.284 0.288 0.013 0.047Rural 0.004 0.001 6,015 5,984 0.001 1.132 0.219 0.002 0.006Total 0.007 0.001 6,662 6,661 0.001 1.265 0.185 0.004 0.010
Currently using female sterilization (Currently married women age 15-49)
Urban 0.266 0.020 647 677 0.017 1.175 0.077 0.225 0.307Rural 0.183 0.008 6,015 5,984 0.005 1.679 0.046 0.167 0.200Total 0.192 0.008 6,662 6,661 0.005 1.650 0.041 0.176 0.208
Currently using male sterilization (Currently married women age 15-49)
Urban 0.017 0.007 847 677 0.005 1.325 0.400 0.003 0.030Rural 0.009 0.001 6,015 5,984 0.001 1.099 0.149 0.006 0.012Total 0.010 0.001 6,662 6,661 0.001 1.147 0.142 0.007 0.012
Currently using rhythm/safe period (Currently married women age 15-49)
Urban 0.015 0.004 847 677 0.005 0.913 0.290 0.006 0.024Rural 0.008 0.001 6,015 5,984 0.001 1.165 0.167 0.005 0.011Total 0.009 0.001 6,662 6,661 0.001 1.131 0.148 0.006 0.011
Using public source for modern method (Current users of modern methods)
Urban 0.560 0.030 229 239 0.033 0.898 0.053 0.501 0.619Rural 0.809 0.013 1,260 1,250 0.011 1.172 0.016 0.783 0.835Total 0.769 0.013 1,489 1.490 0.011 1.229 0.017 0.742 0.796
Do not want any more children (Currently married women age 15-49)
Urban 0.311 0.026 647 677 0.018 1.428 0.084 0.259 0.363Rural 0.301 0.007 6,015 5,984 0.006 1.242 0.024 0.287 0.316Total 0.302 0.007 6,662 6,661 0.006 1.260 0.023 0.288 0.316
Want to delay birth at least 2 years (Currently married women age 15-49)
Urban 0.159 0.015 647 677 0.014 1.048 0.095 0.129 0.189Rural 0.158 0.006 6,015 5,984 0.005 1.173 0.035 0.147 0.169Total 0.158 0.005 6,662 6,661 0.004 1.158 0.033 0.148 0.169
237

Table A.2 Sampling errors, Bihar 1998-99 (Contd.)
StandardNumber of cases error Relative
Standard assuming Design standard Confidence limitsVariable! Value error Unweighted Weighted SRS effect errorresidence (R) (SE) (N) (WN) (SER) (DEFT) (SE!R) R-2SE R+2SE
Ideal number of children (Ever-married women age 15-49)
Urban 2.802 0.074 662 693 0.041 1.799 0.026 2.655 2.949Rural 3.312 0.028 5,883 5,856 0.015 1.892 0.008 3.256 3.367Total 3.258 0.028 6,545 6,549 0.014 1.983 0.008 3.202 3.313
Ideal number of sons (Ever-married women age 15-49)
Urban 1.541 0.057 662 693 0.033 1.730 0.037 1.428 1.655Rural 1.925 0.021 5,878 5,851 0.011 1.935 0.011 1.883 1.966Total 1.884 0.021 6,540 6,544 0.010 2.014 0.011 1.842 1.926
Ideal number of daughters (Ever-married women age 15-49)
Urban 1.107 0.034 662 693 0.022 1.516 0.031 1.040 1.175Rural 1.294 0.012 5,878 5,851 0.008 1.480 0.009 1.270 1.319Total 1.274 0.012 6,540 6,544 0.008 1.541 0.009 1.250 1.299
Visited by healthlfamily planning worker (Ever-married women age 15-49)
Urban 0.018 0.005 687 718 0.005 1.072 0.304 0.007 0.029Rural 0.025 0.003 6,337 6,306 0.002 1.553 0.123 0.019 0.031Total 0.024 0.003 7,024 7,024 0.002 1.520 0.116 0.018 0.029
Received no antenatal check-up (Births in past 3 years)
Urban 0.306 0.048 245 258 0.032 1.493 0.157 0.209 0.402Rural 0.656 0.018 2,703 2,689 0.010 1.829 0.027 0.620 0.692Total 0.625 0.018 2,948 2,947 0.010 1.847 0.028 0.590 0.661
Received iron and folic acid tablets or syrup (Births in past 3 years)
Urban 0.461 0.049 245 258 0.032 1.527 0.106 0.384 0.558Rural 0.220 0.012 2,703 2,689 0.008 1.461 0.053 0.197 0.243Total 0.241 0.012 2,948 2,947 0.008 1.540 0.050 0.217 0.265
Received medical assistance during delivery (Births in past 3 years)
Urban 0.519 0.053 245 258 0.035 1.535 0.103 0.412 0.625Rural 0.206 0.015 2,703 2,689 0.008 1.791 0.072 0.177 0.236Total 0.234 0.015 2,948 2,947 0.008 1.788 0.064 0.204 0.284
Received postpartum check-up (Noninstitutional births in past 3 years)
Urban 0.100 0.022 143 150 0.025 0.893 0.225 0.055 0.145Rural 0.101 0.007 2,347 2,330 0.006 1.191 0.074 0.086 0.115Total 0.100 0.007 2,490 2,480 0.006 1.173 0.070 0.086 0.115
Had diarrhoea in past 2 weeks (Children under age 3 years)
Urban 0.156 0.024 232 244 0.024 1.014 0.155 0.108 0.205Rural 0.179 0.009 2,463 2,448 0.008 1.162 0.050 0.161 0.197Total 0.177 0.008 2,695 2,692 0.007 1.147 0.048 0.160 0.194
Treated with DRS packets (Children under age 3 with diarrhoea in past 2 weeks)
Urban 0.281 0.084 36 38 0.075 1.126 0.299 0.113 0.449Rural 0.143 0.017 440 439 0.017 1.014 0.119 0.109 0.177Total 0.154 0.017 476 477 0.017 1.022 0.111 0.120 0.188
Taken to a health facility/provider for diarrhoea (Children under age 3 with diarrhoea in past 2 weeks)
Urban 0.389 0.060 36 38 0.081 0.744 0.155 0.269 0.510Rural 0.513 0.025 440 439 0.024 1.038 0.049 0.462 0.563Total 0.503 0.024 476 477 0.023 1.018 0.047 0.455 0.550
238

Table A.2 Sampling errors. Bihar. 1998--99 (Contd.)
StandardNumber of cases error Relative
Standard assuming Design standard Confidence limitsVariable! Value error Unweighted Weighted SRS effect errorresidence (R) (SE) (N) (WN) (SER) (DEFT) (SE/R) R-2SE R+2SE
Showing a vaccination card (Children age 12-23 months)
Urban 0.203 0.052 76 80 0.046 1.123 0.255 0.100 0.306Rural 0.171 0.014 806 802 0.013 1.043 0.081 0.143 0.199Total 0.174 0.013 882 882 0.013 1.047 0.077 0.147 0.201
Received BeG vaccination (Children age 12-23 months)
Urban 0.635 0.074 76 80 0.055 1.347 0.117 0.487 0.783Rural 0.351 0.020 806 802 0.017 1.178 0.057 0.312 0.391Total 0.377 0.020 882 882 0.016 1.220 0.053 0.337 0.417
Received OPT vaccination (3 doses) (Children age 12-23 months)
Urban 0.370 0.063 76 80 0.055 1.134 0.169 0.245 0.495Rural 0.230 0.017 806 802 0.015 1.122 0.073 0.196 0.263Total 0.242 0.016 882 882 0.014 1.136 0.068 0.209 0.275
Received polio vaccination (3 doses) (Children age 12-23 months)
Urban 0.540 0.052 76 80 0.057 0.914 0.096 0.436 0.645Rural 0.397 0.021 806 802 0.017 1.193 0.052 0.356 0.438Total 0.410 0.020 882 882 0.017 1.183 0.048 0.371 0.449
Received measles vaccination (Children age 12-23 months)
Urban 0.398 0.063 76 80 0.056 1.127 0.159 0.272 0.524Rural 0.143 0.014 806 802 0.012 1.148 0.100 0.115 0.172Total 0.166 0.015 882 882 0.013 1.182 0.090 0.136 0.196
Fully vaccinated (Children age 12-23 months)
Urban 0.224 0.038 76 80 0.048 0.796 0.169 0.148 0.300Rural 0.099 0.012 806 802 0.011 1.094 0.116 0.076 0.122Total 0.110 0.011 882 882 0.011 1.078 0.103 0.088 0.133
Received Vitamin A (Children age 12-35 months)
Urban 0.194 0.040 142 150 0.035 1.130 0.204 0.115 0.273Rural 0.093 0.009 1,622 1,613 0.007 1.241 0.097 0.075 0.111Total 0.102 0.009 1,764 1,762 0.007 1.238 0.089 0.083 0.120
Had reproductive health problem (Currently married women age 15-49)
Urban 0.371 0.025 647 677 0.019 1.319 0.068 0.321 0.421Rural 0.451 0.010 6,015 5,984 0.006 1.634 0.023 0.430 0.472Total 0.442 0.010 6,682 6,661 0.006 1.624 0.022 0.423 0.462
Not involved in any decisionmaking (Ever-married women age 15-49)
Urban 0.104 0.018 687 718 0.012 1.577 0.177 0.067 0.141Rural 0.139 0.009 6,337 6,306 0.004 2.042 0.064 0.121 0.156Total 0.135 0.008 7,024 7,024 0.004 2.008 0.061 0.119 0.151
Ever beaten or physically mistreated since age 15 {Ever-married women age 15-49}
Urban 0.189 0.024 687 718 0.015 1.593 0.126 0.142 0.237Rural 0.275 0.008 6,337 6,306 0.006 1.506 0.031 0.258 0.292Total 0.266 0.008 7,024 7,024 0.005 1.534 0.030 0.250 0.282
Not worked in past 12 months {Ever-married women age 15-49}
Urban 0.869 0.015 687 718 0.013 1.130 0.017 0.840 0.899Rural 0.720 0.011 6,337 6,306 0.006 2.034 0.016 0.698 0.743Total 0.736 0.011 7,024 7,024 0.005 2.044 0.015 0.714 0.757
239

TableA.2 Sampling errors, Bihar 1998-99 (Contd,)
StandardNumber of cases error Relative
Standard assuming Design standard Confidence limitsVariable! Value error Unweighted Weighted SRS effect errorresidence (R) (SE) (N) (WN) (SER) (DEFT) (SE/R) R-2SE R+2SE
Anaemic women (Ever-married women age 15-49)
Urban 0,596 0,029 571 637 0,021 1,418 0,049 0,538 0,654Rural 0,639 0,012 5,652 5,586 0,006 1,809 0,018 0,615 0,662Total 0,634 0,011 6,223 6,223 0,006 1,771 0,017 0,613 0,656
Anaemic children (Children age 6-35 months)
Urban 0,807 0,037 149 167 0,032 1,153 0,046 0,732 0,882Rural 0,813 0,013 1,511 1,490 0,010 1,333 0,016 0,786 0,840Total 0.813 0,013 1,660 1,657 0.010 1,309 0,015 0,787 0,838
240

Table A.2 Sampling errors, Bihar. 1998-99 lContd.)
RelativeStandard standard Confidence limits
Variable! Value error errorresidence (R) (SE) (SE/R) R-2SE R+2SE
Total fertility rate (Women age 15-49)
Urban 2.748 0.167 0.061 2.414 3.081Rural 3.588 0.080 0.022 3.427 3.749Total 3.489 0.074 0.021 3.341 3.636
Age-specific fertility rate (Women age 15-19)
Urban 0.072 0.009 0.125 0.054 0.090Rural 0.119 0.005 0.044 0.108 0.129Total 0.113 0.005 0.042 0.103 0.123
Age-specific fertility rate (Women age 20-24)
Urban 0.200 0.019 0.094 0.162 0.238Rural 0.226 0.006 0.029 0.213 0.239Total 0.223 0.006 0.027 0.211 0.235
Age-specific fertility rate (Women age 25-29)
Urban 0.160 0.020 0.123 0.120 0.199Rural 0.182 0.006 0.034 0.170 0.195Total 0.180 0.006 0.033 0.168 0.192
Age-specific fertility rate (Women age 30-34)
Urban 0.088 0.020 0.222 0.049 0.127Rural 0.115 0.007 0.058 0.102 0.129Total 0.112 0.006 0.057 0.099 0.124
Age-specific fertility rate (Women age 35-39)
Urban 0.030 0.010 0.322 0.011 0.050Rural 0.053 0.005 0.095 0.043 0.063Total 0.050 0.005 0.091 0.041 0.059
Age-specific fertility rate (Women age 40-44)
Urban 0.000 0.000 NC 0.000 0.000Rural 0.020 0.004 0.173 0.013 0.027Total 0.018 0.003 0.175 0.011 0.024
Age-specific fertility rate (Women age 45-49)
Urban 0.000 0.000 NC 0.000 0.000Rural 0.003 0.002 0.577 0.000 0.006Total 0.002 0.001 0.576 0.000 0.005
241

TableA.2 Sampling errors, Bihar 1998-99 (Conld,)
RelativeStandard standard Confidence limits
Variable! Value error errorresidence (R) (SE) (SE/R) R-2SE R+2SE
Neonatal mortality rate (5~year period preceding survey)
Urban 32,751 10.480 0,320 11,791 53,711Rural 47,810 3,703 0.077 40.404 55,216Total 46.476 3.495 0,075 39.487 53.465
Infant mortality rate 1QO (5-year period preceding survey)
Urban 53,300 10,956 0,206 31.388 75,212Rural 74,810 4.579 0,061 65,652 83,969Total 72,924 4.293 0,059 64.338 81,511
Child mortality rale ,q, (5-year period preceding survey)
Urban 15,803 8,037 0,509 0,000 31,877Rural 36.493 2,759 0,076 30,974 42,012Total 34,666 2,628 0,076 29.429 39,942
Under-five mortality rate sqo (5-year period preceding survey)
Urban 68,261 13.476 0,197 41,308 95,213Rural 108.573 5.515 0,051 97,543 119,603Total 105.081 5,207 0,050 94.666 115.495
Crude death rate (Based on Household Questionnaire)
Urban 8,317 1,056 0,127 6,206 10.429Rural 11.641 0.560 0,048 10.521 12,761Total 11,269 0.527 0,047 10,215 12,323
Crude birth rate (Based on women's birth history)
Urban 22.329 1.314 0,059 19.701 24.957Rural 28.813 0.585 0.020 27.644 29.982Total 28.106 0.642 0.019 27.023 29,190
NC: Not calculated because denominator is 0.000.SRS: Simple random sample
242

APPENDIXB
DATA QUALITY TABLES
The purpose of this appendix is to provide the data user with an overview of the general quality ofthe NFHS-2 data. Whereas Appendix A is concerned with sampling errors and their effects on thesurvey results, the tables in this appendix refer to possible nonsampling errors: for example,rounding or heaping on certain ages or dates; omission of events occurring further in the past;deliberate distortion of information by some interviewers in an attempt to lighten their workload;noncooperation of the respondent in providing information; or refusal to have children measuredfor height and weight or tested for anaemia. A description of the likely magnitude of suchnonsampling errors is provided in this appendix.
The distribution of the de facto household population by single years of age and sex ispresented in Table B.l. In many (but not all) cases, the respondent was the head of the household.It is well documented that ages are poorly reported in most parts of India. Ages are of littlerelevance to much of the rural population in particular, and no amount of probing will ensure thatages are properly recorded. In interviewer training for NFHS-2, a great deal of emphasis wasplaced on obtaining as accurate information as possible on ages and dates of events. Nevertheless,it is clear that age reporting in NFHS-2 shares the same problems inherent in all Indian censusesand surveys. Heaping on ages ending in 0, 2, 5, and 8 is considerable and is particularly severe inthe older age groups. Another measure of the quality of the NFHS-2 age data is the percentage ofpersons whose ages were recorded as not known or missing. In Bihar, information on age wasmissing for only 6 persons out of 37,713 persons who stayed in the sample households the nightbefore the interview.
Table B.2 examines the possibility that some eligible women (that is, ever-married womenage 15-49) were not properly identified in NFHS-2. In some surveys, interviewers may try toreduce their workload by pushing women out of the eligible age range or recording ever-marriedwomen as never married so that they will not have to be interviewed. If such practices were beingfollowed to a noticeable extent, Table B.2 would normally show (I) a shortage of ever-marriedwomen in the 45-49 age group and an excess in the 50-54 age group or (2) an unusually lowproportion of ever-married women by age. Neither of these patterns is evident in the NFHS-2data. It can, therefore, be concluded that there was no concerted effort to misidentify eligiblewomen in NFHS-2 iii Bihar.
One traditional measure of the quality of data is the extent to which information is missingon key variables. Although completeness of responses does not necessarily indicate that theresults are accurate, the existence of missing information for a large number of cases wouldsuggest that data collection was not carried out with sufficient care. In NFHS-2 in Bihar, theextent of missing information is very low for age at death, age at first marriage, woman'seducation, and prevalence of diarrhoea in the two weeks preceding the survey (Table B.3).Missing information is higher for the month of birth of children born in the past 15 years. It isimportant to note, however, that the year of birth is reported almost in every case in which themonth is missing. Data on height and weight of children and woman's haemoglobin level areavailable for more than 88 percent of the members of the respective reference groups. Missinginformation is highest (24 percent) for children's haemoglobin level. The response rates are

Table B.1 Household age distribution
Single-year age distribution of de facto household population by sex (weighted), Bihar, 1998-99
Male Female Male Female
Age Number Percent Number Percent Age Number Percent Number Percent
<1 514 2.7 465 2.5 38 256 1.3 234 1.31 477 2.5 459 2.5 39 128 0.7 159 0.92 465 2.4 478 2.6 40 289 1.5 191 1.03 516 2.7 467 2.5 41 128 0.7 121 0.74 567 2.9 538 2.9 42 254 1.3 232 1.35 651 3.4 582 3.2 43 68 0.4 84 0.56 711 3.7 840 3.5 44 100 0.5 124 0.77 477 2.5 496 2.7 45 260 1.3 175 1.08 723 3.7 662 3.6 46 153 0.8 149 0.89 469 2.4 426 2.3 47 66 0.3 109 0.610 659 3.4 605 3.3 48 223 1.2 150 0.811 379 2.0 364 2.0 49 99 0.5 48 0.312 684 3.5 635 3.4 50 221 1.1 64 0.313 351 1.8 377 2.0 51 120 0.6 67 0.414 465 2.4 447 2.4 52 162 0.8 150 0.815 383 2.0 328 1.8 53 62 0.3 87 0.516 447 2.3 437 2.4 54 64 0.3 99 0.517 239 1.2 281 1.5 55 149 0.8 148 0.818 508 2.6 471 2.6 56 123 0.6 156 0.819 249 1.3 320 1.7 57 40 0.2 63 0.320 353 1.8 370 2.0 58 129 0.7 135 0.721 225 1.2 297 1.6 59 60 0.3 62 0.322 410 2.1 426 2.3 60 248 1.3 136 0.723 219 1.1 234 1.3 61 63 0.3 77 0.424 291 1.5 339 1.8 62 139 0.7 129 0.725 353 1.8 352 1.9 63 40 0.2 41 0.226 350 1.8 388 2.1 64 49 0.3 46 0.227 158 0.8 172 0.9 65 164 0.9 103 0.628 339 1.8 404 2.2 66 58 0.3 54 0.329 163 0.8 257 1.4 67 22 0.1 36 0.230 387 2.0 314 1.7 68 80 0.4 75 0.431 145 0.8 201 1.1 69 25 0.1 31 0.232 377 2.0 340 1.8 70+ 493 2.6 295 1.633 114 0.6 134 0.7 Don't34 164 0.8 184 1.0 know!35 399 2.1 295 1.6 missing 2 0.0 4 0.036 313 1.6 278 1.537 83 0.4 107 0.6 Total 19,314 100.0 18,399 100.0
Note: The de facto population includes all usual residents and visitors who stayed in the household the night before theinterview.
acceptable for the height and weight and child haemoglobin level since in any survey manychildren cannot be measured because they are not at home or they are ill at the time of the survey.In some cases when the child was at home, either the child refused to be measured or the motherrefused to allow the child to be measured because of cultural beliefs. Before undertakinghaemoglobin measurements, a separate 'informed consent' statement was read to the respondentexplaining that participation in the haemoglobin testing was completely voluntary. At this point,some women declined to take part in the anaemia testing and/or to have their children participate.
244

Table 8.2 Age distribution of eligible and interviewed women
Age distribution of the de facto household population of women age 10-54and of interviewed women age 15-49, and percentage of eligible womenwho were interviewed (weighted), Bihar, 1998-99
Ever- Interviewed womenmarried Percent
Age All women women Number Percent interviewed
10-14 2,427 14 NA NA NA15-19 1,836 685 660 9.4 96.320-24 1,666 1,446 1,385 19.8 95.825-29 1,573 1,536 1,481 21.1 96.430-34 1,173 1,168 1,130 16.1 96.835-39 1,074 1,072 1,033 14.7 96.440-44 751 751 719 10.3 95.745-49 631 630 599 8.6 95.150-54 466 466 NA NA NA
15-49 8,704 7,288 7,008 100.0 96.1
Note: The de facto population includes all usual residents and visitors whostayed in the household the night before the interview. For all columns, theage distribution is taken from ages reported in the Household Questionnaire.The total number of interviewed women in this table differs from the totalnumber in earlier tables because this table uses household weights ratherthan women's weights for the calculations.NA: Not applicable
Table 8.3 Completeness of reporting
Percentage of observations with missing infonnation for selected demographic and health indicators (weighted), Bihar,1998-99
Percentage missingIndicator Reference group infonnation Number of cases
Birth date Births in past 15 yearsMonth only 1.20 16,022Month and year 0.04 16,022
Age at death Deaths to births in past 15 years 0.46 1,786
Age at first marriage Everwmarried women age 15-49 0.69 7,024
Woman's education Ever-married women age 15-49 0.00 7,024
Anthropometry Living children age 0-35 monthsHeight 10.22 2,732Weight 10.25 2,732Height or weight 10.52 2,732
Woman's haemoglobin level Ever-married women age 15-49 11.65 7,024
Child's haemoglobin level Living children age 6--35 months 23.59 2,161
Diarrhoea in past 2 weeks Living children age 1-35 months 0.35 2,692
245

Another measure of data quality is the completeness and accuracy of information onbirths. Table BA examines the distribution of births by calendar year to identify any unusualpatterns that may indicate that births have been omitted or that the ages of children have beendisplaced. Overall, 99 percent of living children listed in the birth history had complete birth datesrecorded, as did 97 percent of children who had died. The completeness of data on birth dates forboth surviving and nonsurviving children is excellent, particularly in recent years. The annualdata on the number of births can be examined to see if there is an abnormally large decline in thenumber of births after January 1995, the cutoff point for the health questions and measurementsmade on young children in the survey. It is typical for the annual number of births to fluctuatesomewhat, so small annual fluctuations are to be expected. However, the sharp drop in the annualnumber of births between 1992-94 and 1995-98 (particularly for nonsurviving children) suggeststhat there has been some omission of recent births or displacement of birth dates that could resultin an underestimate of both fertility and infant mortality rates for recent years.
Many surveys that include both demographic information and health information forchildren below a specified age have been subject to a substantial amount of age displacement. Inparticular, there is often a tendency for interviewers to 'age' children out of the eligible period forasking health questions. This problem was well known before NFHS-2 began; therefore,interviewer training stressed this issue to try to reduce the extent of biases due to agedisplacement. Apparently, the training was not entirely successful in avoiding this type ofproblem, however.
Table B.5 presents information on the reporting of age at death in days. Results from thetable suggest that early infant deaths have not been seriously underreported in Bihar, because theratios of deaths under seven days to all neonatal deaths are consistently high (a ratio of less than25 percent is often used as a guideline to indicate underreporting of early neonatal deaths). Theratios are 77 for 0-4 years, 78 for 5-9 years, and 71 for 10-14 years preceding the survey.Although there was no severe underreporting of early neonatal deaths in NFHS-2, there was somemisreporting of age at death due to a preference for reporting the age at death at 6, 8, 12, 15, and20 days (Table B.5).
Table B.6 shows the percentage of infant deaths that occurred during the neonatal period.These percentages are also consistently high for the different time periods preceding the survey,suggesting that there is no major omission of early deaths. One problem that is inherent in mostretrospective surveys is heaping of the age at death on certain digits, e.g., 6, 12, and 18 months.Misreporting of age at death will bias estimates of the age pattern of mortality if the net result ofmisreporting is the transference of deaths between age segments for which the rates arecalculated. For example, an overestimate of child mortality relative to infant mortality may resultif children dying during the first year of life are reported as having died at age one or older. Thus,heaping at 12 months can bias the mortality estimates because a certain fraction of these deathsmay have actually occurred during infancy (that is, at ages 0-11 months). In this case, heapingwould bias the infant mortality rate downward and the child mortality rate upward.
246

~
Table 8.4 Births by calendar year
Number of births, percent with complete birth date, sex ratio at birth, and calendar year ratio for children still alive at the time of the survey (L), children who died by the time of thesurvey (D), and total children (T), by calendar year (weighted), Bihar, 1998-99
Number of births Percent with complete birth date1 Sex ratio at birth2 Calendar year ratio3
Calendar year L D T L D T L D T L D T
1999 118 5 123 100.0 100.0 100.0 826 0 767 NA NA NA1998 982 65 1,047 99.9 100.0 99.9 930 974 933 NC NC NC1997 859 60 918 99.6 100.0 99.6 934 809 926 NC NC NC1996 884 100 984 99.4 100.0 99.5 1,007 692 970 103.1 157.0 106.81995 856 68 923 99.4 100.0 99.4 916 835 910 84.8 52.6 81.11994 1,135 157 1,292 99.1 96.6 98.8 930 1,202 960 115.4 157.4 119.21993 1,111 132 1,244 99.2 94.5 98.7 950 940 949 95.1 82.2 93.61992 1,202 165 1,367 98.8 96.1 98.5 890 1,012 904 120.1 122.1 120.31991 890 138 1,027 98.5 97.7 98.4 963 1,038 973 73.1 83.2 74.41990 1,231 166 1,397 98.4 96.9 98.2 921 1,091 940 143.0 123.3 140.41989 832 131 963 98.7 97.6 98.6 912 1,420 968 72.6 87.0 74.31988 1,062 136 1,198 98.8 100.0 98.9 897 1,109 919 137.2 117.7 134.7
1993-97 4,844 518 5,362 99.3 97.6 99.1 947 925 944 NA NA NA
1988-92 5,217 735 5,952 98.6 97.6 98.5 915 1,117 937 NA NA NA
1983-87 3,750 574 4,323 98.7 97.4 98.5 977 1,124 996 NA NA NA
1978-82 2,739 466 3,204 98.7 96.0 98.3 849 1,005 870 NA NA NA
1977 or earlier 2,418 612 3,029 98.5 97.0 98.2 814 887 828 NA NA NA
All 20,066 2,974 23,040 98.9 97.2 98.7 912 1,008 924 NA NA NA
NA: Not applicableNC: Not calculated because full~year data were not collected for 1998 and 1999 (the sUlvey began during 1998)1 Both year and month of birth given2(Bf/Bm)x1000, where B\ and 8m are the numbers offamale and male births, respectively3{2Bx/(Bx_1+Bx+1)]x100, where Bxis the number of births in calendar year x

Table 8.5 Reporting of age at death in days
Distribution of reported deaths under 1 month of age by age at death in days andpercentage of early neonatal deaths for births during fiveRyear periods precedingthe survey (weighted), Bihar, 1998-99
Years preceding survey
Age at death (days) Q-4 5-9 10-14 0-14
< 1 45 59 42 1471 54 73 65 1922 20 29 16 653 16 36 11 634 11 17 10 385 12 14 9 356 22 21 13 577 9 10 5 248 7 10 14 319 8 8 3 1910 4 11 4 1911 3 3 2 812 2 5 10 1713 0 2 1 314 0 0 1 115 4 5 11 2016 0 0 1 117 1 0 0 118 1 2 4 719 0 0 0 020 5 6 2 1321 1 2 2 522 0 2 3 523 0 0 ·0 024 1 2 0 325 1 0 2 326 1 0 0 127 0 0 0 028 1 0 0 129 0 0 0 030 5 0 3 8
0-30 236 317 235 787
Percent early neonatal1 77.0 78.4 71.0 75.8
1Deaths during the first 6 days divided by deaths during the first 30 days
Examination of the distribution of deaths under age two years during the 15 years beforethe survey by month of death (Table B.6) indicates there is some heaping of deaths at 6, 12, and18 months of age. Digit preference appears not to be serious enough to alter substantially themortality rates calculated here. Because the extent of heaping on 12 months is minor, probablydue to the strong emphasis on this potential problem during training of the interviewers,adjustment of the infant and child mortality rates is unnecessary.
248

Table B.6 Reporting of age at death in months
Distribution of reported deaths under two years of age by age at death in months andpercentage of neonatal deaths for births during five-year periods preceding the survey(weighted), Bihar, 1998-99
Years preceding survey
Age at death (months) D-4 5-9 10-14 0-14
<1 236 317 235 7871 22 22 16 612 19 24 19 623 16 21 14 514 8 15 7 305 7 5 5 176 15 23 14 537 8 13 6 278 6 9 9 249 2 5 17 2410 7 7 5 1911 4 11 9 2412 10 8 13 3113 6 12 8 2614 1 12 11 2415 3 5 5 1316 2 3 4 817 1 2 4 718 4 17 16 3619 0 2 2 420 0 0 1 121 1 3 0 422 1 1 3 523 2 0 1 3
1 year 7 13 7 27
Missing 3 1 0 4
0-11 350 472 356 1,178
Percent neonataJ1 67.3 67.1 66.0 66.8
1Deaths during the first month divided by deaths during the first year
249

APPENDIXC
BIHARNFHS-2 STAFF
ORG Centre for Social Research, New Delhi
Mr. C.V.S. Prasad(Survey Director)
Team Supervisors
Mr. Kumar Ranjit SinghMr. Ashok Kumar SinghMr. Pankaj KumarMr. Ranjit Kumar MishraMr. SubharantMr. Sandeep KumarMr. Shakeel Ahmad KhanMr. Shamendu Kumar Verma
Ms. ManormaMs. Pushpa BharatiMs. Reeta KumariMs. Munni Kumari
Ms. Sudha ToppoMs. SucheetaMs. Sandhya TirkiMs. Usha KumariMs. Nisha LajMs. Rita SinhaMs. Manju KumariMs. Seema SinhaMs. Madhu Bala TiggaMs. SimpalMs. Namita PathakMs. Indu KumariMs. Subhani EkkaMs. Indira KumariMs. Gauri KumariMs. Rajshree Kumari
PREVIOUS PAGE BLANK
Dr. P.K. ChopraMr. Nazir HaiderMr. S.A. Khan(Survey Coordinators)
Field Editors
Ms. Nazish BanoMs. Laj NishaMs. Ragni BalaMs. Neetu KumariMs. Shabnam SinhaMs. Ratna BaneJjeeMs. Pratima VermaMs. Nirmala Sinha
Health Investigators
Ms. Seeta DeviMs. Uma KumariMs. Kiran DeviMs. Shashi Kumari
Interviewers
Ms. Sangeeta RaniMs. Asha LakraMs. Chinta KumariMs. Gayatri KumariMs. Savita SinghMs. Meena KumariMs. Rinki KumariMs. Ruby KumariMs. SandhyaMs. Mamata DeviMs. Leena KumariMs.NutanMs. Veena SrivastavaMs. Rashmi SinhaMs. Jyoti KumariMs. Chandna Ghosh

Mr. Vishnu Tiwari(House Listing Coordinator)
Mr. S.K. TandonMr. Nasim Ahmed
Mr. Rajeev Ranjan OjhaMr. Diwesh Kumar VermaMr. Prahbat KumarMr. Navlesh KumarMr. Vinod Kumar SharmaMr. Mukund Kumar VermaMr. Sanjeet KumarMr. Dharrni NathMr. Ranjit KumarMr. Ashok Kumar SinghMr. Forooq AlarnMr. Sivesh Sahay
Dr. M.K. Mohanty
Mr. Sailendra SinghMr. Ajay Kumar TiwariMr. Shiv Kumar NagarMs. Sudha Singh
Mr. Iyer BalasubramaniamMr. Umesh Pathak(Programmers)
House Listing Supervisors
Mr. Prarnod Narayan SinghMr. Ranjit Kumar Singh
Household Listers & Mappers
Mr. Amit KumarMr. Ashok DasMr. Bhavesh KumarMr. Santosh MishraMr. Santosh Kumar SinghMr. Rajeev KumarMr. Ratnesh KamMr. Gopal PrasadMr. Harikant ThakurMr. Rajeev RanjanMr. Prashant Kumar
Office Editors
Mr.M.K. Sen
Data Entry Operators
Mr. Virender SinghMr. Kumar SinghMr. Tejbar SinghMs. Ravinder Kaur
International Institute for Population Sciences, Mumbai
Prof. K.B. PathakProf. T.K. Roy(Project Directors)
Senior Research Officers
Dr. Rajeshri R. ChitanandDr. Damodar SahuDr. Yonah Bhutia
252
Prof. Sumati KulkarniProf. Arvind PandeyProf. Karnla GuptaDr. Parveen Nangia(Project Coordinators)
Health Coordinators
Dr. Vikash ChandraDr. P.V. KaushikDr. Sanjeev P. Walokar

Mr. Mukul AgarwalDr. Sushanta Kumar BanerjeeMs. Shahina BegumMr. B.N.N. ChowdaryDr. Madhumita DasMrs. N. HemalataDr. A.A. JayachandranDr. V. JayachandranDr. Biranchi N. JenaMr. Nizamuddin Khan
Research Officers
Mr. Anurag MishraMr. M.N. MurthyMr. Rajesh NainakwalMr. Anup Murari RajanDr. K.L ShajyMr. Vivek SharmaMr. Vishal Dev ShastriMs. Preeti UpadhyayaMs. Pavani UpadrashtaMrs. Y. Vaidehi
Accounts & Administrative Staff
Mr. R.S. Hegde, Sr. AccountantMr. D. Lokanathan, Sr. Secretarial AssistantMr. John D'Souza, Jr. Secretarial AssistantMr. Sadashiv Jathade, Jr. Secretarial Assistant
Consultants
Dr. Rajib AcharyaDr. Fred ArnoldMs. Elizabeth BrittonMr. David CantorDr. Umesh KapilMr. Zaheer Ahmad KhanDr. Sunita KishorMr. Sushil KumarDr. Norman Y. Luther
Mr. Pramod T. Sawant, Office BoyMr. Parasnath Verma, Office Boy
Dr. Vinod MishraMr. Hendrik 1. RaggersDr. Robert RetherfordDr. Tulshi SahaMr. O.P. SharmaDr. Almaz SharmanDr. Vijay K. VermaMs. Sidney B. WestleyMr. Martin Wulfe
Steering Committee for NFHS-2
Secretary (Family Welfare)Ministry ofHealth and Family WelfareNew Delhi
Joint Secretary (S)Department ofFamily WelfareMinistry ofHealth and Family WelfareNew Delhi
Joint Secretary and Financial AdvisorMinistry ofHealth and Family WelfareNew Delhi
253
ChiefDirector (S)Department ofFamily WelfareMinistry ofHealth and Family WelfareNew Delhi
Advisor (Health)Planning CommissionNew Delhi
SecretaryDepartment of StatisticsMinistry ofPlanning and ProgrammeImplementationNew Delhi

SecretaryWomen and Child WelfareMinistry ofHuman ResourceDevelopmentNew Delhi
Registrar General, IndiaNew Delhi
Director General ofHealth ServicesMinistry ofHealth and Family WelfareNew Delhi
RepresentativeUnited States Agency for InternationalDevelopmentNew Delhi
Prof. M.M. GandotraAdditional DirectorPopulation Research CentreM.S. University ofBarodaVadodara
Prof. K. SrinivasanExecutive DirectorPopulation Foundation of IndiaNew Delhi
Prof. Pravin VisariaDirectorInstitute ofEconomic GrowthNew Delhi
DirectorInternational Institute for PopulationSciencesMumbai
Administrative and Financial Management Committee for NFHS-2
Joint Secretary and Financial AdvisorMinistry ofHealth and Family WelfareNew Delhi
Joint Secretary (S)Department ofFamily WelfareMinistry ofHealth and Family WelfareNew Delhi
ChiefDireetor (S)Department ofFamily WelfareMinistry ofHealth and Family WelfareNew Delhi
Dr. A.K. SenguptaHonorary DirectorPopulation Research CentreDepartment ofEconomicsLucknow UniversityLucknow
Prof. Sumati KulkarniHeadDepartment ofDevelopment StudiesInternational Institute for PopulationSciencesMumbai
DirectorInternational Institute for PopulationSciencesMumbai
RepresentativeORCMacroCalverton, Maryland, USA
RepresentativeUnited States Agency for InternationalDevelopmentNew Delhi
Technical Advisory Committee for NFHS-2
Prof. T.K. RoyDirectorInternational Institute for PopulationSciences, Mumbai
254
ChiefDirector (S)Department ofFarnily WelfareMinistry ofHealth and Family WelfareNew Delhi

SecretaryDepartment ofStatisticsMinistry ofPlanning and ProgrammeImplementationNew Delhi
Prof. P.N. Mari BhatPopulation Research CentreInstitute ofEconomic GrowthNew Delhi
Prof. M.M. GandotraAdditional DirectorPopulation Research CentreM.S. University ofBaroda, Vadodara
Prof. P. Hanumantha RayappaFormer HeadPopulation Research CentreInstitute of Social and Economic ChangeBangalore
255
Prof. Sumati KulkarniHeadDepartment ofDevelopment StudiesInternational Institute for PopulationSciencesMumbai
RepresentativeORCMacroCalverton, Maryland, USA
RepresentativeEast-West CenterHonolulu, Hawaii, USA
RepresentativeUnited States Agency for InternationalDevelopmentNew Delhi

LIST OF CONTRIBUTORS
Prof. T. K. Roy, Director, International Institute for Population Sciences, Govandi Station Road,Deonar, Mumbai-400 088, India
Dr. Vinod K. Mishra, Theme Leader, Behavior and Health, and Fellow, Population and HealthStudies, East-West Center, 1601 East-West Road, Honolulu, Hawaii, 96848-1601, USA
Dr. R. K. Sinha, Reader, Department of Mathematical Demography and Statistics,Internationallnstitute for Population Sciences, Govandi Station Road, Deonar, Mumbai-400 088,India
Dr. Dilip Kumar, Joint Director, Population Research Centre, Patna University,Patna-800 005, India
Mr. Zaheer Ahmad Khan, Consultant, ORC Macro, 11785 Beltsville Drive, Calverton,Maryland 20705, USA
Prof. U. P. Sinha, Retd. Professor, lnternationallnstitute for Population Sciences, GovandiStation Road, Deonar, Mumbai-400 088, India
256

APPENDIXD
SURVEY INSTRUMENTS

NATIONAL FAMILY HEALTH SURVEY, 1998-99 (NFHS-2)HOUSEHOLD QUESTIONNAIRE
INDIA
CONFIDENTIALFor ResearchPurposes Only
IDENTIFICATION
STATE
DISTRICT
TEHSIL/TALUK
CITY/TOWN/VILLAGE
URBAN/RURAL (urban=l, rural=2) .....................~
LARGE CITY/SMALL CITY/TOWN/RURAL AREA..............(large city=l, small city=2, town=3, rural area=4) -
PSU NUMBER......................................... dIEHOUSEHOLD NUMBER...................................
NAME OF HOUSEHOLD HEAD
ADDRESS OF HOUSEHOLD
INTERVIEWER VISITS
1 2 3 FINAL VISIT
DATE DAY
MONTH
YEAR 1 9
INTERVIEWER'S NAME NAME CODE
RESULT* RESULT CODE'--
NEXT VISIT, DATE
r~lil~I;II~11 TOTAL NUMBER 0TIME OF VISITS
*RESULT CODES, TOTAL ~1 COMPLETED PERSONS IN2 NO HOUSEHOLD MEMBER AT HOME OR NO COMPETENT HOUSEHOLD
RESPONDENT AT HOME AT THE TIME OF VISIT3 ENTIRE HOUSEHOLD ABSENT FOR EXTENDED PERIOD TOTAL
~4 POSTPONED ELIGIBLE5 REFUSED WOMEN6 DWELLING VACANT OR ADDRESS NOT A DWELLING7 DWELLING DESTROYED LINE NO.
~8 DWELLING NOT FOUND OF RESP.9 OTHER TO HOUSE-
(SPECIFY) HOLD SCHEDULE
SUPERVISOR
~FIELD
~OFFICE
~KEYED
~EDITOR EDITOR BYDATE
NAME
PREVIOUS PAGE BLANK

HOUSEHOLD SCHEDULE
1 RECORD THE TIME. HOUR ..........................~Now I would like some information about the people who usually
MINUTES ........•.............. live in your household or who are staying with you now.
LINE USUAL RESIDENTS AND RELATIONSHIP RESIDENCE SEX AGE IF AGE 6 YEARS OR OLDERNO. VISITORS TO HEAD OF
HOUSEHOLD MARITAL STATUS ELIGI- EDUCATION_. BILITY
IF NEVER IF EVER ATTENDED SCHOOLATTENDED
CIRCLE SCHOOL IF AGE LESS THAN 18 YEARSLINENUMBER IF NOT IN SCHOOLOF EVER-MARRIEDFEMALESAGE 15-49
Please give me the (EXCLUDEames of the persons NG ANDho usually live in
~hat is theNM)
our household and Does Did I, Howald Can Ha' What is the What isuests of the house- relationshi (NAME) (NAME) {NAME) i' (NAME) (NAME) main reason the high-old who stayed here of (NAME) to ~sually stay male (NAME)? What is the read ever (NAME) est grade I, What is the main
last night, starting the head live here or .. current and been never went (NAME) ha' (NAME) reason (NAME) i,ith the head of the of the here? last female marital status write? to to school? completed? still in not going toousehold. ihousehold?* night? ? of (NAME) ?*** school? **** ***** school? school?******
(2) (3) (4) (5) (6) (7) (8) (9) (10 ) (11) (12) (13) (14 ) (15) (16)
YES NO YES NO M F IN YEARS CM NG S OS 0 W NM YES NO YES NO REASON GRADE YES NO REASON
01 m 1 2 1 2 1 2 m 1 2 3 4 5 6 7 01 1 2 1 2 m m 1 2 m-02 m 1 2 1 2 1 2 m 1 2 3 4 5 6 7 02 1 2 1 2 m m 1 2 m03 m 1 2 1 2 1 2 m 1 2 3 4 5 6 7 03 1 2 1 2 m m 1 2 In-----
04 In 1 2 1 2 1 2 In 1 2 3 4 5 6 7 04 1 2 1 2 In In 1 2 mI---
05 m 1 2 1 2 1 2 m 1 2 3 4 5 6 7 05 1 2 1 2 In In 1 2 In06 In 1 2 1 2 1 2 In 1 2 3 4 5 6 7 06 1 2 1 2 m m 1 2 mI---
07 m 1 2 1 2 1 2 m 1 2 3 4 5 6 7 07 1 2 1 2 In In 1 2 In'----
08 rn 1 2 1 2 1 2 rn 1 2 3 4 5 6 7 08 1 2 1 2 rn rn 1 2 rn

HOUSEHOLD SCHEDULE (CONTINUED)
(2) I (3) I (4) (Si (6) I (7) I (8) I (9) I (10) (11) (12) (13) I (14) (15) (16) I
YES NO YES NO M F IN YEARS eM NG S DS D W NM YES NO YES NO REASON GRADE YES NO REASON
09 In 1 2 1 2 1 2 In 1 2 3 4 5 6 7 09 1 2 1 2 In In 1 2 In-
10 m 1 2 1 2 1 2 m 1 2 3 4 5 6 7 10 1 2 1 2 m m 1 2 m11 In 1 2 1 2 1 2 In 1 2 3 4 5 6 7 11 1 2 1 2 In In 1 2 In-12 In 1 2 1 2 1 2 In 1 2 3 4 5 6 7 12 1 2 1 2 In m 1 2 m13 m 1 2 1 2 1 2 m 1 2 3 4 5 6 7 13 1 2 1 2 m m 1 2 m--
14 In 1 2 1 2 1 2 In 1 2 3 4 5 6 7 14 1 2 1 2 In m 1 2 m15 m 1 2 1 2 1 2 m 1 2 3 4 5 6 7 15 1 2 1 2 m m 1 2 m16 ITJ 1 2 1 2 1 2 ITJ 1 2 3 4 5 6 7 16 1 2 1 2 ITJ ITJ 1 2 ITJ
TICK HERE IF CONTINUATION SHEET USED 0 TOTAL NUMBER OF ELIGIBLE WOMEN ITJ*****CODES FOR Q.14
GRADE:OO=LESS THAN 1
YEAR COMPLETED
CODES FOR Q.4RELATIONSHIP TO HEAD OF HOUSEHOLD:
01== HEAD02== WIFE OR HUSBAND03== SON OR DAUGHTER04== SON-IN-LAW OR DAUGHTER-IN-LAW05== GRANDCHILD06== PARENT07== PARENT-IN-LAW08== BROTHER OR SISTER09= BROTHER-IN-LAW OR SISTER-IN-LAW10= NIECE OR NEPHEW11= OTHER RELATIVE12= ADOPTED/FOSTER CHILD13", NOT RELATED
** CODES FOR Q.800= AGE LESS THAN ONE YEAR95= AGE 95 YEARS OR MORE
*** CODES FOR Q.9MARITAL STATUS:
1= CURRENTLY MARRIED2= MARRIED,BUT GAUNA
NOT PERFORMED3== SEPARATED4= DESERTED5= DIVORCED6= WIDOWED7= NEVER MARRIED
****CODES FOR Q.1301= SCHOOL TOO FAR AWAY02= TRANSPORT NOT AVAILABLE03= EDUCATION NOT CONSIDERED
NECESSARY04= REQUIRED FOR HOUSEHOLD WORK05= REQUIRED FOR WORK ON FARM/FAMILY BUSINESS06= REQUIRED FOR OUTSIDE WORK FOR PAYMENT
IN CASH OR KIND07= COST TOO MUCH08= NO PROPER SCHOOL FACILITIES FOR GIRLS09= REQUIRED FOR CARE OF SIBLINGS10= NOT INTERESTED IN STUDIES96= OTHER98", DK
******CODES FOR Q.1601= SCHOOL TOO FAR AWAY02= TRANSPORT NOT AVAILABLE03= FURTHER EDUCATION NOT CONSIDERED NECESSARY04= REQUIRED FOR HOUSEHOLD WORK05== REQUIRED FOR WORK ON FARM/FAMILY BUSINESS06= REQUIRED FOR OUTSIDE WORK FOR PAYMENT
IN CASH OR KIND07= COST TOO MUCH08= NO PROPER SCHOOL FACILITIES FOR GIRLS09= REQUIRED FOR CARE OF SIBLINGS10= NOT INTERESTED IN STUDIES11= REPEATED FAILURES12= GOT MARRIED96= OTHER98", DK

PSU NO. _
HH NO
LINE IF AGE 6 YEARS OR OLDER AFTER COMPLETING COLUMNS 1-18 FOR ALL LISTED PERSONS, ASK:NO. -_.. ..._. .------------ --- .._ .._..
OCCUPATION- Does anyone listed suffer from:
Does anyone listed:IF WORKING IF SUFFERS
FROMTUBERCULOSIS
Has any(other)
sthma? Tuberculosis? Did anyone personlisted suffer Did anyone listed listed everfrom malaria suffer from Chew paan Drink Smoke? smokedat any time jaundice at any masala or alcohol? regularly?
What kind of Does (NAME) RECORD RECORD FOR during the time during the tobacco?work does (NAME) earn cash FOR EACH PERSON Has (NAME) last three last twelvedo most of the for this EACH received month~ month~ RECORD FORtime? work? PERSON medical RECORD RECORD RECORD CURRENT
treatment for RECORD FOR RECORD FOR EACH FOR EACH FOR EACH FOR EACH NONSMOKERStuberculosis? EACH PERSON PERSON PERSON PERSON PERSON ONLY
(17 ) (I8) (19) (20) (21) (22) (23) (24) (25) (26) (27)
YES NO YES NO YES NO YES NO YES NO YES NO YES NO YES NO YES NO YES NO DK
01 ITI 1 2 1 2 1 2 1 2 1 2 1 2 1 2 1 2 1 2 1 2 3I-----
02 ITI 1 2 1 2 1 2 1 2 1 2 1 2 1 2 1 2 1 2 1 2 3I-----
03 fII 1 2 1 2 1 2 1 2 1 2 1 2 1 2 1 2 1 2 1 2 3I----- .
04 ITI 1 2 1 2 1 2 1 2 1 2 1 2 1 2 1 2 1 2 1 2 3I-----
05 fII 1 2 1 2 1 2 1 2 1 2 1 2 1 2 1 2 1 2 1 2 3I-----
06 ITI 1 2 1 2 1 2 1 2 1 2 1 2 1 2 1 2 1 2 1 2 3I-----
07 r--r-l 1 2 1 2 1 2 1 2 1 2 1 2 1 2 1 2 1 2 1 2 3I-----
08 D:=J 1 2 1 2 1 2 1 2 1 2 1 2 1 2 1 2 1 2 1 2 3

PSU NOo _
HH NO- I (17) I (18) (l9) I (20) I (21) I (22) I (23) I (24) I (25) I (26) I (27) I
YES NO YES NO YES NO YES NO YES NO YES NO YES NO YES NO YES NO YES NO DK
09 rrl 1 2 1 2 1 2 1 2 1 2 1 2 1 2 1 2 1 2 1 2 3-
10 fT, 1 2 1 2 1 2 1 2 1 2 1 2 1 2 1 2 1 2 1 2 3-
11 rrl 1 2 1 2 1 2 1 2 1 2 1 2 1 2 1 2 1 2 1 2 3
12 f T , 1 2 1 2 1 2 1 2 1 2 1 2 1 2 1 2 1 2 1 2 3
13 rrl 1 2 1 2 1 2 1 2 1 2 1 2 1 2 1 2 1 2 1 2 3
14 r T l 1 2 1 2 1 2 1 2 1 2 1 2 1 2 1 2 1 2 1 2 3f---
15 rrl 1 2 1 2 1 2 1 2 1 2 1 2 1 2 1 2 1 2 1 2 3r--
16 rrl 1 2 1 2 1 2 1 2 1 2 1 2 1 2 1 2 1 2 1 2 3
28 Just to make sure that I have a complete listing:
YES~>ENTER EACH D1) Are there any other persons such as small children or infants that we have not listed? IN TABLE NO
2} In addition, are there any other people who may not be members of your family,~>
ENTER EACH Dsuch as domestic servants, lodgers or friends who usually live here? YES IN TABLE NO
3} Do you have any guests or temporary visitors staying here, or anyone else~>
ENTER EACH Dwho staved here last niaht? YES IN TABLE NO

.N.O•."" ~Q~U.E.S.T.'O.N.S_AN_D_F~'~L.T~E~RiS ... .C.O.D.'.N.GiooiC.A.TjE.G.O.R.'.E.S ~=
29
When members of your household get sick, where do theygenerally go for treatment?
PUBLIC MEDICAL SECTORGOVT./MUNICIPAL HOSPITAL 11GOVT. DISPENSARY 12UHC/UHPjUFWC _.. 13CHe/RURAL HOSPITAL/PRe 14SUB-CENTRE 15GOVT. MOBILE CLINIC 16GOVT. PARAMEDIC 17OTHER PUBLIC SECTOR
HEALTH FACILITY. . 18
NGO/TRUST HOSPITAL/CLINIC 21NGO WORKER .••••.•.••.•.••.••••.•22
PRIVATE MEDICAL SECTORPVT. HOSPITAL/CLINIC 31PVT. DOCTOR .............•..•.. 32PVT. MOBILE CLINIC 33PVT. PARAMEDIC 34VAIDYA/HAKIM/HOMEOPATH 35TRADITIONAL HEALER 36PHARMACY/DRUGSTORE 37DAI (TBA) 38OTHER PRIVATE SECTOR
HEALTH FACILITY 39
OTHERSHOP 41HOME TREATMENT 42
OTHER ---===c---_96(SPECIFY)
30
31
32
What is the main source of drinking waterfor members of your household?
How long does it take to go there, get water,and come back in one trip?
What do you do to purify drinking water, if anything?
RECORD ALL MENTIONED.
264
PIPED WATER IPIPED INTO
RESIDENCE/yARD/PLOT 11----->32
GR;;;:;~;:;N ~ESIDENCEI 12 IYARD/PLOT 21----->32
PUBLIC HANDPUMP 22WELL WATER
WELL IN RESIDENCE/YARD/PLOTCOVERED WELL 31~
OPEN WELL 32 >32PUBLIC WELL
COVERED WELL 33OPEN WELL 34
SURFACE WATERSPRING. . . 41RIVER/STREAM 42POND/LAKE '.. 4.3DAM..................... .44
RAINWATER 51TANKER TRUCK 61
OTHER. -,,;""'''''';v; 96(SPECIFY)
MINUTES ......•.•..•.....~
STRAIN BY CLOTH AALUM .............•..•........... BWATER FILTER CBOILING 0ELECTRONIC PORIFIER ENOTHING F
OTHER -,===,, ~X(SPECIFY)

ISKICODING CATEGORIESQUESTIONS AND FILTERSNO P
FLUSH TOILET33 OWN FLUSH TOILET .•.••.••.••. _ .11
SHARED FLUSH TOILET....... ' ... 12PUBLIC FLUSH TOILET ....... " .. 13
What kind of toilet facility does your household have? PIT TOILET/LATRINEOWN PIT TOILET/LATRINE ........ 21SHARED PIT TOILET/LATRINE ..... 22PUBLIC PIT TOILET/LATRINE ..... 23
NO FACILITY/BUSH/FIELD....... ... 31
OTHER 96(SPECIFY)
ELECTRICITy ........ _. . . . . . . . . . . .134 KEROSENE ••••••• _ •••••••••• _ ••••• 2
GAS. ............ - . . . . . . . . . . . . . .. 3What is the main source of lighting for your household? OIL .. - .... ....... . . . . . . . . . . .. . .. 4
OTHER 6(SPECIFY)
ROOMS •••••••••••••••••••••• [I]How many rooms are there in your household?
yES .•.•.........••.........•••.. 136
1 Do you have a separate room which is used as a kitchen? INO . ...... " ... 2
37
What type of fuel does your household mainly usefor cooking?
WOOD 01CROP RESIDUES 02DUNG CAKES. . 03COAL/COKE/LIGNITE 04CHARCOAL... . 05KEROSENE 06ELECTRICITy 07LIQUID PETROLEUM GAS.. . . 08BIO-GAS " . .. . .. 09OTHER 96
(SPECIFY)
38
What other types of fuel does your household commonlyuse for cooking or heating?
RECORD ALL MENTIONED.
WOOD ACROP RESIDUES BDUNG CAKES. . . . . . . . CCOAL/COKE/LIGNITE DCHARCOAL '" EKEROSENE ' FELECTRICITY GLIQUID PETROLEUM GAS HBIO-GAS IOTHER X
(SPECIFY)NO OTHER TYPE '" .. Y
39
What is the religion of the head of the household?
HINDU. " .. . 01MUSLIM........•. '" ....•....... 02CHRISTIAN.. . 03SIKH 04BUDDHIST/NEO BUDDHIST 05JAIN ..................•..•..... 06JEWISH " .07ZOROASTRIAN/PARSI 08NO RELIGION. . 09OTHER 96
(SPECIFY)
40
CASTE ---,===;;- '(SPECIFY)
What is the caste or tribe of the head of the household?TRIBE ---,ooo;c=;;- '
(SPECIFY)NO CASTE/TRIBE 3----->42
41
Is this a scheduled caste, a scheduled tribe,other backward caste, or none of them?
SC 1ST , .........••............ 2CBC 3NONE OF THEM. . . . . . . . . .. . 4
265

Does this household own this house or any other house?
Does this household own any agricultural land?
yES ...........................•. 1
NO 2
YES 1 INO 2-->46
I
44 ACRES··············~·D{SIZE AND UNIT)
How much agricultural land does this household own?
45 AcRES··············~·D(SIZE AND UNIT)
Out of this land, how much i, irrigated?NONE ................ .. . .. ... . 9995
yES ..............••.•........... 1
47
Does this household own any livestock?
Does the household own any of the following:
NO . . ..... 2
YES NO
IA mattress? MATTRESS 1 2
A pressure cooker?
A chair?
A cot or bed?
A table?
A clock or watch?
An electric fan?
A bicycle?
A radio or transistor?
A sewing machine?
A telephone?
PRESSURE COOKER... ... . .. 1
CHAIR.. ... ..... ... ... . .. 1
COT/BED....... . ..... 1
TABLE 1
CLOCK/WATCH 1
ELECTRIC FAN 1
BICYCLE 1
RADIO/TRANSISTOR 1
SEWING MACHINE 1
TELEPHONE 1
2
2
2
2
2
2
2
2
2
2
A refrigerator? REFRIGERATOR . ..... 1 2
A black and white television?
A colour television?
A moped, scooter, or motorcycle?
A car?
A water pump?
TELEVISION (B&W) 1
TELEVISION{COLOUR) 1
MOPED/SCOOTER/MOTORCYCLE ... 1
CAR 1
WATER PUMP 1
2
2
2
2
2
A bullock cart? BULLOCK CART . .1 2
A thresher?
A tractor?
THRESHER 1
TRACTOR 1
2
2
48
What is the main type of kitchenware thishousehold uses?
266
CLAy 1ALUMINIUM..........•..••........ 2CAST IRON 3BRASS/COPPER .4STAINLESS STEEL 5OTHER 6
(SPECIFY)

49 TYPE OF HOUSE.
RECORD OBSERVATION.
ROOF _
WALLS _
FLOOR
PUCCA •••••••••••••••••••••••••• 1SEMI-PUCCA •••••••••.••.•.••.•.• 2KACHHA ••••••••••••••••••••••••• 3
50A
50B
TYPE OF SALT USED FOR COOKING:
TEST COOKING SALT FOR IODINE:
267
REFINED SALT ••.•..•..•.••.••.•• 1COARSE SALT •••••.••.••.••.•..•. 2
o PPM (NO IODINE) 17 PPM •.•.••.•.••.••.••.••.••.•.. 215 PPM •••.••.•.••.•..•..•.••..•.• 330 PPM •••••••••••.•.••.••.••.••.• 4

YES ••••••••••••••••.•••••••••••• 1 INO 2-->63
I
NO.
51 IQUESTIONS AND FILTERS
Did any usual resident of this household die sinceJanuary 1996?
CODING CATEGORIES SKIP
TOTAL DEATHS 0 IHow many persons died?
53 54 55 56 57 58 59 60 61 62
CHECK 54AND 55: Was (NAME) Did (NAME)
What Was (NAME) How old was he/she In what month What did (NAME) pregnant die during(was/were) a male or when he/she died? and year did die of? DECEASED when she childbirth? Did (NAME) die Was the death ofthe name (s) a female? (NAME) die? WAS FEMALE died? within two months (NAME) due to aof the RECORD DAYS IF LESS AGED 15-49 after the end of a complication of theperson (s) THAN ONE MONTH, AT THE TIME pregnancy or pregnancy orwho died? MONTHg IF LESS THAN OF DEATH childbirth? childbirth?
TWO YEARS, OR YEARS
~MALE •..•. 1 DAYS .... 1
~MONTH ..~ CD
yES ...•.. 1 YES ••••.• 1](G;Eio' NEXT1]
yES •.••••••..•.• 1 yES •••....•...... 1(GO TO 62)<
FEMALE.;.2 MONTHS .. 2 YEAR .•• DEATH} <(NAME)
(G~oTO' NEXT2]NO ••..... 2 NO ..•.••• 2
N~Go·TO·NEXT····2]NO .•••.•..•.••••• 2
YEARS . . . 3DEATH) < DEATH) <
~MALE .••.. 1 DAYS .••. 1
~MONTH .•~ CD
yES •.•.•• 1(~~sTO' 52)~] (G;Eio . NEXT1]
yES ••••••.•••.•. 1 yES ....•••.•••••• 1
FEMALE ••• 2 MONTHS •. 2 YEAR •.• DEATH) <(NAME)
(G~oTO' NEXT2]NO •.•.••. 2 NO ••..... 2
N~GO·TO·NEXT····2]NO •••.•.••.••••.• 2
YEARS ... 3DEATH) < DEATH) <
~MALE •..•. 1 DAYS .... 1
~MONTH ..~ CD
YES .••••• 1(~~STO' 52)~] (G;Eio' NEXT1]
yES ..••..•...•.• 1 yES •••.••.••••••. 1
FEMALE ••• 2 MONTHS .. 2 YEAR .•. DEATH) <(NAME)
(G~oTO' NEXT2]NO ••.•... 2 NO .•••••• 2
N~Go'To'NEXT'" .2]NO ••••••••...•... 2
YEARS .. . 3DEATH) < DEATH) <
63 RECORD THE TIME. HOUR ...............~
MINUTES .•.•••.•..••

NATIONAL FAMILY HEALTH SURVEY, 1998-99 {NFHS-2lWOMAN'S QUESTIONNAIRE
INDIA
CONFIDENTIALFor ResearchPurposes Only
IDENTIFICATION
STATE
DISTRICT
TEHSIL/TALUK
CITY/TOWN/VILLAGE
URBAN/RURAL (urban=1, rural=2) .....................-
LARGE CITY/SMALL CITY/TOWN/RURAL AREA..............(large city=!, small city=2, town=3, rural area=4) -PSU NUMBER •••••••••••••..•••••••••••••••.•.••••••••
cflliHOUSEHOLD NUMBER •••••••••••...••••••••••••••••..•••
NAME AND LINE NUMBER OF WOMAN
ADDRESS OF HOUSEHOLD
INTERVIEWER VISITS
1 2 3 FINAL VISIT
DATE DAY
MONTH
YEAR 1 9
INTERVIEWER'S NAME NAME CODE
RESULT* RESULT CODE'-----
NEXT VISIT: DATEtllllllll111111 TOTAL NUMBER DTIME OF VISITSpi ...:
*RESULT CODES:1 COMPLETED 3 POSTPONED 5 PARTLY COMPLETED2 NOT AT HOME 4 REFUSED 6 OTHER (SPECIFY)
NATIVE LANGUAGE OF RESPONDENT** ...........................~**LANGUAGE CODES:
01 Assamese 05 Hindi 09 Manipuri 14 Konkani02 Bengali 06 Kannada 10 Marathi 15 Sindhi03 English 07 Kashmiri 11 Nepali 16 Tamil04 Gujarati 08 Malayalam 12 Oriya 17 Telugu19 Other (SPECIFY) 13 Punjabi 18 Urdu
SUPERVISOR
~FIELD
~OFFICE
~KEYED
~EDITOR EDITOR BYDATE
NAME

SECTION 1. RESPONDENT'S BACKGROUND
NO. I QUESTIONS AND FILTERS I CODING CATEGORIES I SKIP
101 RECORD THE TIME. HOUR······················rn
MINUTES ....................
Namaste. My name i' and I am working with (NAME OF THE ORGANISATION) . We areconducting a national survey about Che health of women and children. We would very muchappreciate your participation in this survey.
I would like to eok you about your health (and the health of your children) . Thisinformation will help the government to plan health services. The amount of time neededwill be less than one hour. Participation in this survey i' Voluntary. If you decide toparticipate, you may stop answering questions at any time. Whatever information you providewill be kept strictly confidential and will not be shown to other persons.
We hope that you will participate in the survey since your views are important. Do youwant to ask me anything about the survey at this time?
Signature ofInterviewer: Date:
RESPONDENT AGREES RESPONDENT DOES NOT AGREEFOR INTERVIEW........... 1 FOR INTERVIEW.................... 2-> END
IV
102
CITY /TOWN .....................•. 1
First I would like to eok some questions about you and VILLAGE ......................... 2your household. For most of the time until you were 12years old, did you live in a city, a town, or a village?
103 YEAR5.. .............. [1] IHow long have you been living continuously in (NAME OF SINCE BIRTH ....................9~CURRENT PLACE OF RESIDENCE)? VISITOR..............•......... 9 >105
104CITY ITOWN....................... 1
Just before you moved here, did you live in a city, a VILLAGE ......................... 2town, or a village?
105 MONTH ...................... [1]DK MONTH ....................... 98
In what month and year were you born? yEAR.................~
OK YEAR...................... 9998
106 I IAGE [1]How old were you at your last birthday? IN COMPLETED yEARS .....
COMPARE AND CORRECT 105 AND/OR 106 IF INCONSISTENT.
270

QUESTIONS AND FILTERSNO CODING CATEGORIES SKIP
107 CURRENTLY MARRIED ................ 1 IMARRIED BUT GAUNA NOT PERFORMED •• 2-->END
SEPARATED.................•...... [3-DESERTED ••••••••••••••••••••••••• 4 >110
What i' your current marital status? DIVORCED •.••••••••••••••••••••••• 5WIDOWED ••••••••••••••••••••••••••NEVER MARRIED .................... 7-->END
108 ILIVING WITH HUSBAND....•..•..•.. 1--:>110
Are you living with your husband Dow or i, he staying STAYING ELSEWHERE ••••••••••••••• 2 Ielsewhere?
109
EEMONTHS ••••••••••••••••••• 1For how long have you aDd your husband Dot been livingtogether? yEARS •••••••••••••••••••• 2
IF LESS THAN 1 YEAR, RECORD MONTHS;OTHERWISE RECORD COMPLETED YEARS.
110
Now I would like to .,k you some questions about your ONCE ............................1-->114marriage.
MORE THAN ONCE ........•.......•. 2
Have you been married only once·or more than once?
111 IAGE IN COMPLETED yEARS .....~How old were you at the time of your first marriage?
112YEARS .....~AGE IN COMPLETED
How old were you when you started living with your GAUNA HAD NOT TAKEN PLACE ...... 96first husband?
113
AGE IN COMPLETED YEARS .....~How old were you when your first marriage dissolved?
11< I I IAGE IN COMPLETED yEARS .....How old were you at the time of your (current) marriage? ~
115
AGE IN COMPLETED YEARS .....~
How old were you when you started living withyour (current) husband? GAUNA HAS NOT TAKEN PLACE ..... 96 ---->END
I
271

ns l INO _ 2-->119
I
NO.
116
QUESTIONS AND fILTERS
Have you ever attended school?
CODING CATEGORIES SKI!?
117
GRADE •••••••••••••••••••••• [I]What is the highest grade you completed?
Can ,you read and write?
119
CHECK 117: I118 GRADE 6 AND ABOVE LO-' ---,:->120.._.._.GRA_OE_0-.5_~-------------~-----------~-- ..
YES., - 1 INO.....•..•.•..•..•.•..•.••.•..•2-->121
I
120yES .... _•. _....•..•.•..•..•.•... 1
Do you usually read a newspaper or a magazine at leastonce a week?
NO••••••••••••••••••••••••.••••• 2
121yES ..•.......•..•....•..•.•..•.• 1
Do you usually listen to a radio at least once a week? NO•••••••••••••••••••••••••••••• 2
122yES •..•..•..•.••.•..•..•..•.•.•• 1
Do you usually watch television at least once a week? 00 .••.•..•..•..•.•...•.•..•.•..• 2
123yES .•.•..•..•..•..•....•..•..•.• 1
DO you usually go to a cinema hall or theatre to see -amovie at least once a month?
00 .••.•..••.•..•...•••....•..•.. 2
124
How often do you yourself consume the following items:daily, weekly, occasionally, or never:
Milk or Curd?
Pulses or beans?
Green leafy vegetables?
Other vegetables?
Fruits?
Eggs?
Chicken, meat, or fish?
aceADAILY WEEK SION- NEVER
LY ALLY
MILK OR CURD .. 1 2 3
PULSES/BEANS .• I 2 3 4.
GREEN LEAFY ..• 1 2 3 4
OTH. VEG ..•..• 1 2 3
FRUITS .•..•..• 1 2 3
EGGS .•....•..• 1 2 3
CHICKEN/MEAT/FISH ......• 1 2 3
272

SECTION 2. RBPRODUCTION
SKIPCODING CATEGORIES
INO _ _ 2-->206
yES 1
QUESTIONS AND FILTERS
Now I would like to ask about all the births you havehad during your life. Have you ever given birth?
201
NO.
202 I IyES ............................. 100 you have any sons 0' daughters to whom you havegiven birth who ace now living with you? NO .............................. 2-->204
203 SONS AT HOME ...............~
DAUGHTERS AT HOME ..........How many sons live with you?And how many daughters live with you?IF NONE, RECORD '00' .
20< IyES ............................. 1 IDo you have any sons or daughters to whom you have NO ........... ................... 2-->206given birth who are alive but do not live with you? I
205 SONS ELSEWHERE .............~
DAUGHTERS ELSEWHERE ........How many sons are alive but do not live with you?And how many daughters are alive but do not live withyou?IF NONE, RECORD '00' .
206
yES ............................. 1
NO..............................2-->208Have you ever given birth to a boy or a girl who w"' Iborn alive but later died? IF NO, PROBE: Anybaby who cried or showed any sign of life butonly survived a few hours or days?
207 BOYS DEAD ..................~
GIRLS DEAD ....... _.........In all, how many boys have died?And how many girls have died?IF NONE, RECORD '00' .
208 SUM ANSWERS TO 203, 205, AND 207, AND ENTER TOTAL. TOTAL ...................... [DIF NONE RECORD '00' _
209 CHECK 208:
Just to make sure that I have this right: you have hadin TOTAL -- births during your life. " thatcorrect?
? 0-, PROBE ANDYES NO CORRECT 201-208
AS NECESSARYV
210 CHECK 208: IONE OR MORE ? NO BIRTHS 0 I >225BIRTHS
v
273

211Now I would like to talk to you about all the births in your lifetime, whether currently alive or not, starting with the first one you had.
RECORD NAMES OF ALL THE LIVE BIRTHS IN 212. RECORD TWINS AND TRIPLETS ON SEPARATE LINES.
212 213 214 215 216 217 218 2ISA 219 220*
IF ALIVE: IF ALIVE: IF ALIVE: IF DEAD:
RECORDHOUSEHOLDLINE NUMBER How old was (NAME)OF CHILD when he/she died? Between (NAME OF PREVIOUS BIRTH)(RECORD ' 00' and (NAME OF THIS BIRTH) did you haveIF CHILD NOT IF "1 YEAR", PROBE: any stillbirth, spontaneous abortion,LISTED IN or induced abortion?
In what month HOUSEHOLD}and year was(NAME) born? How old was
(NAME) at How many monthsPROBE: his/her last old was (NAME)? (* FOR FIRST CHILD ASK: Before (NAME) ,
birthday? did you have any stillbirth, spontan-What name was Were Is " (NAME) " (NAME) RECORD DAYS IF LESS eous abortion, or induced abortion?)given to your any of (NAME) still RECORD AGE living THAN 1 MONTH, MONTHS(first, next) these a boy or What is his/her alive? IN COMPLETED with you? IF LESS THAN TWO IF NONE, RECORD '0' •baby? twins? a girl? birthday? YEARS. YEARS, OR YEARS. FOR SECOND TWIN, RECORD '0 ' IN EACH
BOX WITHOUT ASKING.
~ SING ••• 1IBOY.. 1 IMONTH am YES ••• 1 AGE IN IYES ....... 1 LINE NUMBER IDAYS .... 1 EBNUMBER OF STILLBIRTHS ........... B
YEARS
[[]MULT ••• 2 GIRL •• 2 YEAR •• NO •••• 2
IIINO •••••••• 2 MONTHS •• 2 NUMBER OF SPON. ABORTIONS •••••••
(NAME) Iv L...L....J t YEARS ••• 3 W NUMBER OF INDUCED ABORTIONS ••••• l-J
219 (GO TO 220)
~ SING ••• 1 BOY ••• 1 MONTH.am YES ••• 1 AGE IN ~ LINE NUMBER DAYS •••• 1
EBNUMBER OF STILLBIRTHS ........... B
YEARS
[[]Mur,T ••• 2 GIRL •• 2 YEAR •• NO •••• 2
IIINO •••••••• 2 MONTHS •• 2 NUMBER OF SPON. ABORTIONS •••.•••
(NAME) Iv L...L....J t YEARS ••• 3 W NUMBER OF INDUCED ABORTIONS ••••• l-J
219 (GO TO 220)
~ SING ••• 1 BOY ••• 1 MONTH.am YES ••• 1 AGE IN~ LINE NUMBER DAYS •••• 1
EBNUMBER OF STILLBIRTHS···········B
YEARS
[[]MULT ••• 2 GIRL •• 2 YEAR •• NO •••• 2
IIINO •••••••• 2 MONTHS •• 2 NUMBER OF SPON. ABORTIONS •••••••
(NAME) Iv L...L....J t YEARS ••• 3 W NUMBER OF INDUCED ABORTIONS ••••• l-J
219 (GO TO 220)
~ SING ••• 1 BOY ••• 1 MONTH.am YES ••• 1 AGE IN~ LINE NUMBER DAYS •••• 1
EBNUMBER OF STILLBIRTHS ........... B
YEARS [[]MULT ••• 2 GIRL •• 2 YEAR •• NO •••• 2 IIINO •••••••• 2 MONTHS •• 2 NUMBER OF SPON. ABORTIONS •••••••
(NAME) Iv L...L....J i t YEARS ••• 3 W NUMBER OF INDUCED ABORTIONS •.••• l-J
219 (GO TO 220)

212 I ,213 I 21L_ I 215 L216 I 217 I 218 I 218A I 219 I 220* I
~ ISING ..• 1 IBOY ..• 1 IMONTH··rrm····IYES ••. 1 I~ MULT •.. 2 GIRL .• 2 YEAR.. NO .... 2
(NAME) 1
AGE INYEARS
m IYES ..•.... 1 ILINE NUMBER
NO •••••••• 2 OJ IDAYS .... 1 rnMONTHS •• 2~ INUMBER OF STILLBIRTHS ...•.......D
NUMBER OF SPON. ABORTIONS ~
'::jV>
v L...L..J .I. YEARS ••• 3 W NUMBER OF INDUCED ABORTIONS .....~219 (GO TO 220)
~SING ... l BOY ... 1
MDNTH·rrmYES ••• 1 AGE IN ~:"~ LINE NUMBER DAYS •••• 1
EBNUMBER OF STILLBIRTHS .....•.....B
YEARS
OJMULT ••• 2 GIRL .• 2 YEAR •• NO•.•• 2 m NO •••••••• 2 MONTHS .. 2 NUMBER OF SPON. ABORTIONS .......(NAME) I
v L...L..J
~:~ ,YEARS ••• 3 W I:~~ '"""'" ~~ ....~219 (GO TO 220)
~SING .•. 1 BOY ••• 1 MONTH·rrm YES ••• 1 AGE IN YES ..... 1 LINE NUMBER DAYS.•I EB NUMBER OF STILLBIRTHS ..•....•..B
YEARSNO •••••••• 2 OJMULT ••• 2 GIRL •. 2 YEAR •• NO •••• 2 m MONTHS .. 2 NUMBER OF SPON. ABORTIONS .......
(NAME) IV L...L..J
I:: \:::t'YEARS ••• 3 W NUMBER OF INDUCED ABORTIONS ••••• U
219 (GO TO 220)
~SING ••• 1 BOY ••• 1
MONTH·rrmYES ••• 1 AGE IN YES ••••.•• 1 LINE NUMBER DAYS •••• 1
EBNUMBER OF STILLBIRTHS •.•........B
YEARSNO •••••..• 2 OJMULT ••• 2 GIRL •• 2 YEAR •• NO •••• 2 m MONTHS •• 2 NUMBER OF SPON. ABORTIONS •••••••
(NAME) IV L-'--..J
~..~. ~ ,YEARS ••• 3 W l"~~ '0 """"" ~"~" ...~219 (GO TO 220)
~ SING ••• 1 BOY ••• 1MDNTH·rrm
YES ••• 1 AGE IN YES ••••••• 1 LINE NUMBERDAYS 1 EB NUMBER OF STILLBIRTHS ..•.......•B
YEARSNO •••••••• 2 OJMOLT ••• 2 GIRL •• 2 YEAR •• NO •••• 2 m MONTHS •• 2 NUMBER OF SPON. ABORTIONS •••••••
(NAME) IV L...L..J .I. ,~, LlJ I"_O"_~"_.~219 (GO TO 220)
~ SING ••• 1 BOY ••• 1 MONTH·rrmYES ••• 1 AGE IN yES ••••.•• 1 LINE NUMBER DAYS .... 1 EB NUMBER OF STILLBIRTHS ...•..•....B
YEARS
OJMULT ••• 2 GIRL •• 2 YEAR •• NO •••• 2 m NO •••••••• 2 MONTHS •• 2 NUMBER OF SPaN. ABORTIONS •••••..(NAME) I
~ '~L...L..J
~ r' 1~"LlJNUMBER OF INDUCED ABORTIONS ••••• U
219 (GO TO 220)
=:J SING ••• 1 BOY ••• 1 MONTH.rrm YES ..• 1 AGE IN yES ....... 1 LINE NUMBER DAYS .. 1 EB NUMBER OF STILLBIRTHS ..•......•.BYEARS
NO ••••••• 2 OJ MONTHS •• 2MULT ••• 2 GIRL •• 2 YEAR.. NO •••• 2 m NUMBER OF SPON. ABORTIONS •••••••(NAME) I
i 2~9i L...L..J i i.l. i YEARS .•• 3 W NUMBER OF INDUCED ABORTIONS ••••• U(GO TO 220)

-::J=INAM=EIC--I :::::::I:::~::: I ::::~:tdE Iiii i I
212 I 213 I 214 I 215 I 216 I 217
AGE INYEARS
I 218
I::~::::::::i
I 2I8A
LINE NUMBER
IT]t
(GO TO 220)
I 219
DAYS •••• 1
MONTHS •• 2
YEARS ••• 3ffiw
I 220*
INUMBER OF
NUMBER OF
i NUMBER OF
STILLBIRTHS ..•.•.•.•.•BSPON. ABORTIONS .
INDUCED ABORTIONS ...•.~
221
After the last birth, did you have any stillbirth,spontaneous abortion, or induced abortion?
IF NONE, RECORD '0'
NUMBER OF STILLBIRTHS , §NUMBER OF SPON. ABORTIONS .
NUMBER OF INDUCED ABORTIONS .
222CHECK 220 AND 221:
Just to make sure that I haveABORTIONS, and INDUCED
YES, g
this right: you have had inABORTIONS during your life:
NO 0-> PROBE AND CORRECT
TOTAL STILLBIRTHS, SPONTANEOUSIs that correct?
220 - 221 AS NECESSARY
223COMPARE 208 WITH NUMBER OF BIRTHS IN HISTORY ABOVE AND MARK:
CHECK:
NUMBERS NUMBERS ARE r--lARE SAME c;J DIFFERENT L.....L.> (PROBE AND RECONCILE)
FOR EACH BIR;H: YEAR OF BIRTH IS RECORDED. ~FOR EACH LIVING CHILD: CURRENT AGE IS RECORDED.FOR EACH DEAD CHILD: AGE AT DEATH IS RECORDED.FOR AGE AT DEATH 12 MONTHS: PROBE TO DETERMINE EXACT NUMBER OF MONTHS.FOR EACH CALENDAR BIRTH INTERVAL 4 OR MORE YEARS: EXPLANATION IS GIVEN.
224 CHECK 215 AND ENTER THE NUMBER OF BIRTHS SINCE JANUARY 1995.IF NONE, RECORD '0 ' . o .>229

NO.
225
QUESTIONS AND FILTERS
Have you ever had a stillbirth?
How many stillbirths have you had?
CODING CATEGORIES , SKIP
YES 1 INO•..•.•.. _.......•.•..•..•..•.. 2-->227
IINUMBER OF STILLBIRTHS..•..•.••0 I
227 yES ..•.•..•.•..•..•. _•.•..•.•..• 1 IHave you ever had an abortion? NO•.•••••••••••••••••••••.• .. _ .. 2-->229
PROBE FOR SPONTANEOUS AND INDUCED ABORTIONS. I22B
NO. OF SPON. ABORTIONS ....•.•• t=:JHow many abortions have you had?
NO. OF INDUCED ABORTIONS ......PROBE FOR NUMBER OF SPONTANEOUS AND INDUCED ABORTIONS.IF NONE, RECORD '0' .
229 CHECK 107: SEPARATED ITDESERTED 0CURRENTLY DIVORCED I >301
MARRIED WIDOWEDv
230 yES •.•.•.....•..•.•..•..•.•..•.. 1 IAce you pregnant now? ::~~~~::::::::::::::::::::::::::::=1:>233
How many months pregnant are you?IMONTHS............. rn I
,I
232 THEN •.•..••••.•..•....•..••••.•.,}
LATER ••••••••••••••••••••••••.•• 2 :>30
NO MORE ••••••••••••••••••••••••• 3
At the time you became pregnant, did you want to become Ipregnant then, did you want to wait until later,or did you want no (more) children at all?
233
When did your last menstrual period start?
~_··············'mWEEKS AGO ••••••••••••• 2
MONTHS AGO •••••••••••••••• 3
(DATE, IF GIVEN) YEARS AGO••••••••••••••••• 4
IN MENOPAUSE/HYSTERECTOMY ••••• 993BEFORE LAST BIRTH ••••••••••••• 994NEVER MESTRUATED ••••••••••••••.995
277

NO
SECTION 3A. QUALITY OF CARE
QUESTIONS AND FILTERS CODING CATEGORIES , SKIP
yES ..•..•....•..•....•....••... 1
301
303
304
305
305A
During the last 12 months, has a health or familyplanning worker visited you at home?
How many times did a worker visit you in thelast 12 months'?
During these visits, what were the different matterstalked about?
Anything else?
RECORD ALL MENTIONED.
When was the last time a health or family planningworker visited you at home?
IF LESS THAN ONE MONTH, RECORD '00' MONTHS.
Who visited you at that time?
What type of services did you receiveduring this visit?
Any other service?
RECORD ALL MENTIONED.
Did she/he spend enough time with you?
278
INO 2-->308
NUMBER OF TIMES ~
FAMILY PLANNING •••••••••••••••• 1',
BREASTFEEDING .•....•••••...••.. BSUPPLEMENTARY FEEDING CIMMUNIZATION DNUTRITION •.••...•.....•.•.•..•. EDISEASE PREVENTION FTREATMENT OF HEALTH PROBLEM GANTENATAL CARE HDELIVERY CARE IPOSTPARTUM CARE ........•....... JCHILD CARE ..................•.. KSANITATION/CLEANLINESS LORAL REHyDRATION .........•.....M
OTHER "",,",",,,,__-~X{SPECIFY)
MONTHS AGO ~
PUBLIC SECTOR WORKERGOVT. DOCTOR...•.............. 11PUBLIC HEALTH NURSE 12ANM/LHV 13MALE MPW/SUPERVISOR 14ANGANWADI WORKER ......•....... 15VILLAGE HEALTH GUIDE .....•.... 16OTHER PUBLIC SECTOR
HEALTH WORKER 17
NGO DOCTOR ........•.•........... 21NGO i'10RKER .......•.............. 22
PRIVATE SECTOR WORKERPRIVATE DOCTOR 31PRIVATE NURSE 32COMPOUNDER 33TRADITIONAL HEALER 34DAI (TBA) ................•..... 35OTHER PRIVATE SECTOR
HEALTH WORKER 36
OTHER'-__-c""''''''''''',, ''- (SPECIFY)
PILL SUPPLY ACONDOM SUPPLy•.................. BFOLLOW-UP FOR STERILIZATION CFOLLOW-UP FOR IUD INSERTION DFAMILY PLANNING ADVICE EOTHER FAMILY PLANNING SERVICE FIMMUNIZATION ...........•........GANTENATAL CARE HDELIVERY CARE ......•............ IPOSTPARTUM CARE .......•..•...... JDISEASE PREVENTION ....•.........K·MEDICAL TREATMENT FOR SELF LTREATMENT FOR SICK CHILD MTREATMENT FOR OTHER PERSON N
OTHER, ""'''''''''''''__~X(SPECIFY)
yES 1
NO 2

NO.
307
308
QUESTIONS AND FILTERS
Did she/he talk to you nicely, somewhat nicely, ornot nicely?
CODING CATEGORIES
NICeLY ..•..•....•.......•..•..• 1
SOMEWHAT NICELy _ 2
NOT NICELy ....•..•.•..••.••.•.. 3
SKIP
309
310
Have you visited a health facility or camp for anyreason for yourself (or your children) in the lastlast 12 months?
During these visits in the last 12 months,what were the different matters talked about?
Anything else?
RECORD ALL MENTIONED.
What type of health facility did you visit mostrecently for yourself (Or your children)?
yES ..•.•.....•....•..•.....•... 1
NO ............................•2-->317
FAMILY PLANNING .•..•..•..•....• ABREASTFEEDING •••••••••••••••••• BSUPPLEMENTARY FEEDING CIMMUNIZATION ••••.••••••••••••.• DNUTRITION •..•..•....••.•...•..•. EDISEASE PREVENTION FTREATMENT OF HEALTH PROBLEM GANTENATAL CARE HDELIVERY CARE IPOSTPARTUM CARE JCHILD CARE KSANITATION/CLEANLINESS LORAL REHYDRATION M
OTHER_~,o;;-;;=,"",,,~ .X(SPECIFY)
PUBLIC MEDICAL SECTORGQVT./MUNICIPAL HOSPITAL ....•• 11GOVT. DISPENSARy 12UHC/UHP/UrnC 13CHC/RURAL HOSPITAL/PHC 14SUB-CENTRE 15GOVT. MOBILE CLINIC 16CAMP 17OTHER PUBLIC SECTOR
HEALTH FACILITy .......•.... 18
NGO/TRUST HOSPITAL/CLINIC 21
PRIVATE MEDICAL SECTORPVT. HOSPITAL/CLINIC 31PVT. MOBILE CLINIC 32PHARMACY/DRUGSTORE 33OTHER PRIVATE SECTOR
HEALTH FACILITy ....•....... 34
OTHER __""""===- 96(SPECIFY)
311
What service did you go for?
Any other service?
RECORD ALL MENTIONED.
Did you receive the service that you went for?
279
PILL SUPPLY...........•.........ACONDOM SUPPLY BIUD/LOOP INSERTION CSTERILIZATION OPERATION ..•...... DFOLLOW-UP FOR STERILIZATION EFOLLOW-UP FOR IUD INSERTION FFAMILY PLANNING ADVICE .... , GOTHER FAMILY PLANNING SERVICE HIMMUNIZATION .....•..........•... IANTENATAL CARE ...••............. JDELIVERY CARE ...•............... KPOSTPARTUM CARE LDISEASE PREVENTION MMEDICAL TREATMENT FOR SELF NTREATMENT FOR SICK CHILD OTREATMENT FOR OTHER PERSON P
OTHER._~__-;O="TI;v.__~_X(SPECIFY)
yES 1
NO 2

NO.
312CHECK 311A:RECEIVED SERVICE
QUESTIONS AND FILTERS
DID NOT RECEIVE SERVICE
v v
CODING CATEGORIES
MINUTES 1rn
HOURS 2rn
NO WAIT AT ALL•..•••..•.••.• 995
SKIP
How long did you haveto wait before beingserved?
How long did you have to waitbefore you learned that theservice you went for would notbe available?
OTHER._~--,'"'=;;v;:-~~_996(SPECIFY)
314
315
31'/
317
During this visit did the staff spend enough time withyou?
Did the staff talk to you nicely, somewhat nicely, ornot nicely?
Did the staff respect your need for privacy?
Would you say the health facility was very clean,somewhat clean, or not clean?
Now I would like to ask about all the contacts youhave had with health or family planning workers at homeor anywhere else in the last 12 months or ever before.
During any of these contacts, which methods of delayingor avoiding pregnancy were discussed, if any?
PROBE: Any other methods discussed?
RECORD ALL MENTIONED.
280
yES •.••.•..•.......•....•...... 1
NO••••••••••••••••••••••••••••• 2
NICELy •.••..•.•..•.......•.••.• 1
SOMEWHAT NICELY ..•.•..•..•.•..• 2
NOT NICELY ••...•....•.....•.••. 3
yES •..•..••......•....•....••.• 1
00 ...•..•..•......•..•..•.•...• 2
SAYS PRIVACY NOT NEEDED 3
VERY CLEAN 1SOMEWHAT CLEAN 2NOT CLEAN 3
PILL ACONDOM/NIRODH BIUD/LOOP CFEMALE STERILIZATION....•...... 0MALE STERILIZATION ERHYTHM/SAFE PERIOD FWITHDRAWAL......•..............G
OTHER. --,===,, X(SPECIFY)
NONE/NEVER DISCUSSED Y

318.
SECTION 38. CONTRACEPTION
Now I would like to talk about family planning - the various ways or methodsthat a couple can use to delay or avoid a pregnancy.
For each method r mention, please tell me if you have ever heard of the method and whether you have everused the method at any time in your life?
pill Women can take a pill daily or weekly.
Condom or Nirodh Men can use a rubber sheath duringsexual intercourse.
HAS USED 1HAS HEARD, BUT HAS NOT USED 2HAS NOT HEARD 3
HAS USED 1HAS HEARD, BUT HAS NOT USED 2HAS NOT HEARD 3
IUD or Loop Women can have athem by a doctor or a nurse.
lOOp or coil placed in, ide IHAS USED 1HAS HEARD, BUT HAS NOT USED 2HAS NOT HEARD 3
~
Have you ever heard of femalesterilization? " YES: Have you everhad an operation to avoid having anymore children?
HAS USED ........................ 1Female sterilization Women can have an operation to HAS HEARD, BUT HAS NOT USED ..... 2avoid having any more children. HAS NOT HEARD ... ..... ........... 3
~
Have you ever heard of malesterilization? IF YES; H" yourhusband ever had an operation toavoid having any more children?
HAS USED........................ 1HAS HEARD, BUT HAS NOT USED..... 2
Male sterilization Men can have an operation to HAS NOT HEARD................... 3avoid having any more children.
~HAS USED ......... ..... ... ....... 1
HAS HEARD, BUT HAS NOT USED..... 2Rhythm or safe period method Couples can avoidhaving sexual intercourse on certain days of the month HAS NOT HEARD ................... 3when the woman i, more likely to become pregnant.
HAS USED 1
Withdrawal Men can be careful and pullout beforeclimax.
Have you ever heard of any other ways or methods thatwomen or men can use to delay or avoid pregnancy?IF YES: Have you ever used this method?
' === _(SPECIFY)
2 -----;0;==--(SPECIFY)
281
HAS HEARD, BUT HAS NOT USED ..... 2
HAS NOT HEARD 3
HAS USED 1
HAS HEARD, BUT HAS NOT USED ..... 2
HAS NOT HEARD 3
HAS USED 1
HAS HEARD, BUT HAS NOT USED ..... 2
HAS NOT HEARD 3

NO. I QUESTIONS AND FILTERS I CODING CATEGORIES I SKIP
What have you used or done?CORRECT 318 AND 319.
Have you ever used anything or tried in any way todelay or avoid getting pregnant?
320
"'I
1.3.'.'...C.H.E.C.K.3.'.'.'.N.O"T.A.S.'.N.G.LE.C"O.D.E••".'''''''V:..•••••A.T.L.E.A.s.T.,o.N.E.c.o.D.E.'.'.'••_Diiiiiiii ~••JI(NEVER USED) ~ (EVER US£D) > SKIP TO 322
YES 1 INO _; .. 2-->356
I
322
NUMBER OF CHILDREN .........~
Now I would like to ask you about the time when youfirst did something or used a method to delay or avoidgetting pregnant.
How many living children did you have at that time,if any?
IF NONE, RECORD 'QQ' •
323 CHECK 107: ISEPARATEDCURRENTLY
TDESERTED 0MARRIED DIVORCED I >364WIDOWED
v
324 CHECK 230: INOT PREGNANT
TPREGNANT 0OR UNSURE I >358
v
325 CHECK 318: INE:ITHER HE OR SHESTERILIZED
TSTERILIZED 0 I >327
v
326 YES. _........................... 1 INO .......... .................... 2-->355
Are you or your husband currently doing something or Iusing any method to delay or avoid getting pregnant?
327 PILL......... _................. 01 ICONDOM/NIRODH.............. _... 02·IUD/LOOP....................... 03-->336
Which method are you using? FEMALE STERILIZATION........... 04==:1MALE STERILIZATION............ _05 >339RHYTHM/SAFE PERIOD............_O~
327A CIRCLE '04 ' FOR FEMALE STERILIZATION. WITHDRAWAL ..................... 07 >350CIRCLE 'OS' FOR MALE STERILIZATION. OTHER 9
(SPECIFY) I
282

NO
328
QUESTIONS AND FILTERS
For how many months have you been usingpills/condoms continuously?IF LESS THAN 1 MONTH, RECORD '00'.
CODING CATEGORIES
MONTHS •••••••••..•••••••••• [I]8 YEARS OR LONGER ••_•••••••••••• 96
I SKIP
OTHER
329
330
Where did you obtain the pills/condoms the last time?
IF SOURCE IS HOSPITAL OR CLINIC, WRITE THE NAMEOF THE PLACE. PROBE TO IDENTIFY THE TYPE or PLACEAND CIRCLE THE APPROPRIATE CODE.
(NAME OF PLACE IF HOSPITAL OR CLINIC)
Do you know where this person obtained thepills/condoms the last time?
IF SOURCE IS HOSPITAL OR CLINIC, WRITE THE NAME OF THEPLACE. PROBE TO IDENTIFY THE TYPE OF PLACE AND CIRCLETHE APPROPRIATE CODE.
(NAME OF PLACE IF HOSPITAL OR CLINIC)
283
PUBLIC MEDICAL SECTOR IGOVT./MUNICIPAL HOSPITAL 11 --GOVT. DISPENSARy 12UHC/UHP/urnc 13CHC/RURAL HOSPITAL/PHC 14SUB-CENTRE 15GOVT. MOBILE CLINIC .........•. 16GOVT. PARAMEDIC 17CAMP 19OTHER PUBLIC SECTOR
HEALTH FACILITy 19
NGO/TRUST HOSI?ITAL/CLINIC .••.•.. 21 >331NGO WORKeR •••••••••••••••••••••• 22
PRIVATE MEDICAL SECTORPVT. HOSPITAL/CLINIC .......•.. 31PVT. DOCTOR .............•..... 32PVT. MOBILE CLINIC 33PVT. PARAMEDIC 34VAIDYA/HAKIM/HOMEOPATH 35TRADITIONAL HEALER 36PHARMACY/DRUGSTORE '" 37DAI (TBA) 38OTHER PRIVATE SECTOR
HEALTH FACILITy .....•...... 39
OTHER SOURCESHOP .•..•••....•..•..•.•..••.• 41---:-HUSBAND •••••••••••••••• ~ •••••• 42 IFRIEND/OTHER RELATIVE .. '" .... 43
OTHER 96---->33(SPECIFY)
PUBLIC MEDICAL SECTORGOVT./MUNICIPAL HOSPITAL 11GOVT. DISPENSARy 12UHC/UHP/UFWC 13CHC/RURAL HOSPITAL/PRC 14SUB-CENTRE 15GOVT. MOBILE CLINIC ......•.... 16GOVT. PARAMEDIC 17CAMP 18OTHER PUBLIC SECTOR
HEALTH FACILITy 19
NGO/TRUST HOSPITAL/CLINIC 21NGO WORKER 22
PRIVATE MEDICAL SECTORPVT. HOSPITAL/CLINIC 31PVT. DOCTOR 32PVT. MOBILE CLINIC 33PVT. PARAMEDIC 34VAIDYA/HAKIM/HOMEOPATH 35TRADITIONAL HEALER...........• 36PHARMACY/DRUGSTORE 37DAI (TBA) .....................• 38OTHER PRIVATE SECTOR
HEALTR FACILITy 39
OTHER SOURCESHOP ...............•.......... 41
___=,"",,,,, ·96(SPECIFY)
DK 98

NO QUESTIONS AND FILTERS CODING CATEGORIES I SKIP
35
4
333
331 IMay I s" th, packet of pills/condoms you
:::::TN:::N............~~>
ace using now?
PACKET NOT SEEN ••••••••••••••••• 2 IIF PACKET 8E8N, RECORD BRAND NAME.
332 I I ITIJBRAND NAMEDo you know the brand name of th, pills/condoms youaco using now? OK•••••• _••••••••••••••••••••• 998
333 COST Rs, ................ ITIJ IHow much does on, packet of pills/condoms cost you? ;~~~::: ::: ::: ::::: ::: ::::: ::: :~~~~>3
334 INUMBER·····················rn IFoe that cost how many condoms/pill cycles do you get?
335 IYES ••• _••••••••••••••••••••••••• 1
::J>34Have you been able to got th, supply of pills/condoms NO •••••••••••••••••••••••.•••••• 2whenever you need them? I
336MONTHS .... _.. _............. rn
For how many months have you been using theIUD/LOOP continuously?
8 YEARS OR LONGER .............. 96IF LESS THAN 1 MONTH, RECORD '00' .
GOVERNMENT DOCTOR .............. 01337 GOVERNMENT NURSE/PARAMEDIC ..... 02
NGO DOCTOR ..................... 03NGO NURSE/PARAMEDIC ............ 04PRIVATE DOCTOR ................. 05
Who inserted the IUD/LOOP? PRIVATE NURSE/PARAMEDIC ........ 06
OTHER 96(SPECIFY)
PUBLIC MEDICAL SECTOR338 GOVT./MUNICIPAL HOSPITAL ....•. 11
GOVT. DISPENSARY.............. 12UHC/UHP/umc .................. 13CHC/RURAL HOSPITAL/PHC ........ 14SUB-CENTRE .................... 15GOVT. MOBILE CLINIC ........... 16CAMt' .......................... 17
Where did you go to got th, IUD/LOOP inserted? OTHER t'UBLIC SECTORHEALTH FACILITy ............ 18
NGO/TRUST HOSt'ITAL/CLINIC ....... 21
(NAME OF PLACE IF HOSPITAL OR CLINIC) PRIVATE MEDICAL SECTORPVT. HOSPITAL/CLINIC .......... 31PVT. DOCTOR ..................• 32t'VT. MOBILE CLINIC ............ 33OTHER PRIVATE SECTOR
HEALTH FACILITY ......•..•.. 34
OTHER 96(SPECIFY)
284

NO
338A
339
340
QUESTIONS AND FILTERS
How much did the IUD/LOOP insertion cost you?IF NO CHARGE, RECORD '0000'.
In what month and year was your/your husband'ssterilization operation performed?
Where did you/your husband get sterilized?
(NAME OF PLACE IF HOSPITAL OR CLINIC)
CODING CATEGORIES , SKIP
COST R" ~~
DK•••••••••••••••••••••••••• 9998 :>342
MONTH •••••••••••••••••••••• [I]
YEAR ~
PUBLIC MEDICAL SECTORGOVT.!MUNICIPAL HOSPITAL 11OHC/UHP/UFWC ••••••••••••••.••• 12CHe/RURAL HOSPITAL/PHC 13GOVT. MOBILE CLINIC 14CAMP •••••••••••••••••••••••••• 15OTHER PUBLIC SECTOR
HEALTH FACILITy •....•..•..• 16
NGO/TRUST HOSPITAL/CLINIC 21
PRIVATE MEDICAL SECTORPVT. HOSPITAL/CLINIC 31PVT. DOCTOR 32PVT. MOBILE CLINIC .....•...... 33OTHER PRIVATE SECTOR
HEALTH FACILITy 34
OTHER __---,===-___96(SPECIFY)
OTHER
341
342
343
How much did the operation cost you?
IF NO CHARGE, RECORD '0000'.
How would you rate the care you/your husband receivedduring or immediately after the operation/IUD insertion:very good, all right, not so good, or bad?
What improvements would you suggest in the careyou/your husband received during or immediatelyafter the operation/IUD insertion?
Anything else?
RECORD ALL MENTIONED.
285
COST Rs ~
DK .•.....•...•..•.••.•..•..•.• 9998
VERY GooD 1ALL RIGHT 2NOT SO GOOD 3BAD 4
MORE CLEANLINESS AMORE PRIVACy BBETTER ,CARE BY THE DOCTOR CBETTER CARE BY THE OTHER STAFF DSHORTER WAITING TIME ELOWER COST •...................... F
__ ---,"""""'''' x(SPECIFY)
NONE Y

NO. QUESTIONS AND FILTERS CODING CATEGORIES SKIP
344
345
346
347
348
349
350
Who ma~nly motivated you to use (CURRENT METHOD)?
Did he/she tell you about any othermethods that you might use?
Which other methods were you told about?
RECORD ALL MENTIONED.
At the time when you accepted the (CURRENT METHOD) didany health or family planning worker tell you about sideeffects or other problems you might have using the(CURRENT METHOD)?
Were you told what to do in case you experiencedproblems with the method?
Did you receive any follow-up, either at home or in ahealth facility, after you accepted the(CURRENT METHOD)?
PROBE FOR TYPE OF VISIT.
For how long have you been using thismethod continuously?IF LESS THAN 1 MONTH, RECORD 'QQ'.
286
GOVT. DOCTOR ....•..•....•..•.•. 01PUBLIC HEALTH NURSE 02ANM!LHV•••••••••••••••••••••••• 03MALE MPW/SUPERVISOR •....•..•..• 04ANGANWADI WORKER...•....•..•... 05OTHER GOVT. HEALTH WORKER 06NGO WORKER••••••••••••••••••••• 07PRIVATE DOCTOR ....•..•..•..•.•. 08PRIVATE PARAMEDIC 09DA1 (TBA) .•..•.••.•..•..•..•.•. 10TEACHER•••••••••••••••••••••••• 11RELIGIOUS LEADER 12POLITICAL LEADER .• _•••.•.••..•. 13HUSBAND•••••••••••••••••••••••• 14MOTHER!MOTHER-IN-LAW.•......... 15OTHER RELATIVE/FRIEND, , ...•.... 16
::H::E/SELF(:~E~'~)··... ······::---1--->347
yES •..•.••.••.•..•..•..•.••.•••• 1
NO.•..•..•.••....•..•.••.•..•.•. 2----->347
PILL ..•.•..••.•..•.••.•..•..•.•. ACONDOM/NIRODH ••••••••••••••••• _.BIUD/LOOP••.•..•..•.•..•..•.•..•. CFEMALE STERILIZATION..........•. 0MALE STERILIZATION .•..•.••.•.••. ERHYTHM/SAFE PERIOD .•.....•...... FWITHDRAWAL •••••••••••••••••••••• G
OTHER.__--,""""'"i'ii',,- .X(SPECIFY)
yES .••.•..•..•..•.••.••.•..•..•.. 1
00 ..•..•..•..•..•.••.••.•..••.•.• 2
yES •........•.••.•...•.•.......•• 1
00 2
IAT HOME ONLy ' 'l~
IN A FACILITY ONLy 2 -
BOTH 3 _ >351
NEITHER 4
MONTHS. -. _..... - .••.....•.• OJ8 YEARS OR LONGER 96

NO
351
QUESTIONS AND FILTERS CODING CATEGORIES SKIP
352
353
354
355
Have you had any problems related to the useof (CURRENT METHOD)?
What problems have you had related to the useof (CURRENT METHOD)?
PROBE: Any other problems?
RECORD ALL MENTIONED.
When you first started having these problems, did youtalk to anyone about these problems?
Who did you talk to about these problems?
Any other person?
RECORD ALL PERSONS TALKED TO.
What is the main reason you stopped usingfamily planning?
287
yES •..•.•..•. ·.•.•..•....•.••••••• 1
NO ..•....•.••••••••.•..•......... 2-->362
WEIGHT GAIN ••••••••••••••••••••• AWEIGHT LOSS .••......•.......•..• BTOO MUCH BLEEDING CHYPERTENSION ................•..• DHEADACHE/BODYACHE!BACKACHE ENAUSEA!VOMITING•..•....•....•..• FNO MENSTRUATION GWEAKNESS/TIREDNESS ..•. , RDIZZINESS ...•..•....•...•..•...• IFEVER ••••.••••.••••••••••••••••• JCRAMPS •••••••••••••••••••••••••• KSPOTTING LINCONVENIENT TO USE MABDOMINAL PAIN NWHITE DISCHARGE OIRREGULAR PERIODS PBREAST TENDERNESS QALLERGy REXPULSION ...........•........... SREDUCED SEXUAL SATIS~ACTION ..... T
OTHER__---,"'""""'"c--~ X(SPECI~Y)
yES 1
NO 2-->362
GOVT. DOCTOR A-PUBLIC HEALTH NURSE ....•........ BANM/LHV CANGANWADI WORKER DOTHER GOVT. HEALTH WORKER•...... ENGO DOCTOR ~
NGO WORKER GPRIVATE DOCTOR HPRIVATE PARAMEDIC I >362COMPOUNDER/PHARMACIST JTRADITIONAL HEALER KHUSBAND........................•LFRIEND/OTHER RELATIVE M
OTHER, ===,, ~X-
(SPECIFY) IMETHOD ~AILED/GOT PREGNANT 01-LACK OF SEXUAL SATISFACTION 02CREATED MENSTRUAL PROBLEM 03CREATED HEALTH PROBLEM 04INCONVENIENT TO USE 05HARD TO GET METHOD 06PUT ON WEIGHT 07 ::>358DID NOT LIKE THE METHOD 08WANTED TO HAVE A CHILD......•... 09WANTED TO REPLACE DEAD CHILD ...• 10LACK OF PRIVACY FOR USE 11HUSBAND AWAY 12COST TOO MUCH 13
OTHER =""'''''',---- 96-.(SPECIFY)

NO. I QUESTIONS AND FILTERS I CODING CATEGORIES I SKIP
356 CHECK 107: ISEPARATEDCURRENTLY
TDESERTED 0MARRIED DIVORCED I >364WIDOWED
v
3561'. CHECK 230: INOT PREGNANT
TPREGNANT 0OR UNSURE I >358
v
357HUSBAND AWAY ......... ..... ... . .11
FERTILITY-RELATED REASONSNOT HAVING SEX ............... 21INFREQUENT SEX ............... 22MENOPAUSAL/HAD HYSTERECTOMY .. 23--->362
What is the main reason you are not using a method SUBFECUND/INFECUND........... 24of contraception to delay or avoid pregnancy? POSTPARTUM/BREASTFEEDING..... 25
WANTS MORE CHILDREN.......... 26
OPPOSITION TO USEOPPOSED TO FAMILY PLANNING... 31HUSBAND OPPOSED .............. 32OTHER PEOPLE OPPOSED ......... 33AGAINST RELIGION ............. 34
LACK OF KNOWLEDGEKNOWS NO ME:THOD.............. 41KNOWS NO SOURCE .............. 42
METHOD-RELATED REASONSHEALTH CONCERNS .............. 51WORRY ABOUT SIDE EFFECTS ..... 52HARD TO GET METHOD........... 53COSTS TOO MUCH ............... 54INCONVE:NIE:NT ......•.•........ 55AFRAID OF STERILIZATION...... 56DON'T LIKE EXISTING METHODS .. 57
OTHER 96(SPECIFY)
OK............................. 98
358 IyES .............................1-->360
Do you think you will use a method to delay or avoid NO .............................. 2 Ipregnancy within the next 12 months? ~ .............................. B
359 IyES ............................. 1Do you think you will use a method to delay or avoid
~~::::::::::::::::::::::::::::::~=:=L>361pregnancy at any time in the future?
PILL........................... 01-360 CONDOM/NIRODH.................. 02
IUD/LOOP ...............•....... 03FE:MALE STERILIZATION........... 04MALE STERILIZATION............. 05 ~>362
RHYTHM/SAFE PERIOD............. 06WITHDRAWAL ..................... 07
Which method would you prefer to use? OTHER 96(SPECIFY)
OK/UNSURE: ................. ..... 98--
288

NO.
361
QUESTIONS AND FILTERS
What is the main reason that you think you will notuse a family planning method at any time in the future?
CODING CATEGORIES
FERTILITY-RELATED REASONSNOT HAVING SEX ••••••••••••••• 11INFREQUENT SEX .•..•.••.•..••• 12MENOPAUSAL/HAD HYSTERECTOMY .. 13SUBFECUND/INFECUND _ 14WANTS AS MANY CHILDREN
AS POSSIBLE ......•..•.••.•.. 15
OPPOSITION TO USEOPPOSED TO FAMILY PLANNING ... 21HUSBAND OPPOSED •••••••••••••• 22OTHER PEOPLE OPPOSED 23AGAINST RELIGION _ 24
LACK OF KNOWLEDGEKNOWS NO METHOD , 31KNOWS NO SOURCE ,_ 32
METHOD-RELATED REASONSHEALTH CONCERNS 41WORRY ABOUT SIDE EFFECTS 42HARD TO GET METHOD ..•.•..••.• 43COSTS TOO MUCH ...•..•.••.•..• 44INCONVENIENT ...•..•.••.•..•.• 45AFRAID OF STERILIZATION •.••.• 46DON'T LIKE EXISTING METHODS .• 47
SKIP
yES .••....•..•.•..... _ .•..•..• 1
OTHERc -,==cov__---96(SPECIFY)
DK•..•....•.•..•..•.•..•...••.. 98
362
363
364
In the last few months, have you discussed the practiceof family planning with your husband, friends,neighbours, or relatives?
With whom?
Anyone else?
RECORD ALL MENTIONED.
In the last few months, have you heard or seen anymessage about family planning:
on radio?
on television?
in a cinema or film show?
in a newspaper or magazine?
on a wall painting or hoarding?
in a drama, folk dance,or street play?
289
INO .•....•....•..•.••.•....•..•2--->364
IHUSBAND•.•..•...• _ .••.••.•..•.. AMOTHER .•..•.......•.•..•..•.•.. BSISTER(S) ...••.•.... _ .••.••.•.. CDAUGHTER •••.•..•.•..•..•..•••.. DMOTHER-IN-LAW•...............•. ESISTER-IN-LAW...........•....•. FFRIEND/NEIGHBOUR•.•..•.••.•..•. G
OTHER· """'rnm x- (SPECIFY)
YES NO
RADIO •.•..•.•.....•....•. 1 2
TELEVISION •••••.•.••.•..• 2
CINEMA/FILM SHOW•..••.•.• 2
NEWSPAPER/MAGAZINE ..•...• 1 2
WALL PAINTING/HOARDING .•. 1 2
DRAMA/FOLK DANCE/STREETPLAy •.•..••.•....•..•..• 2
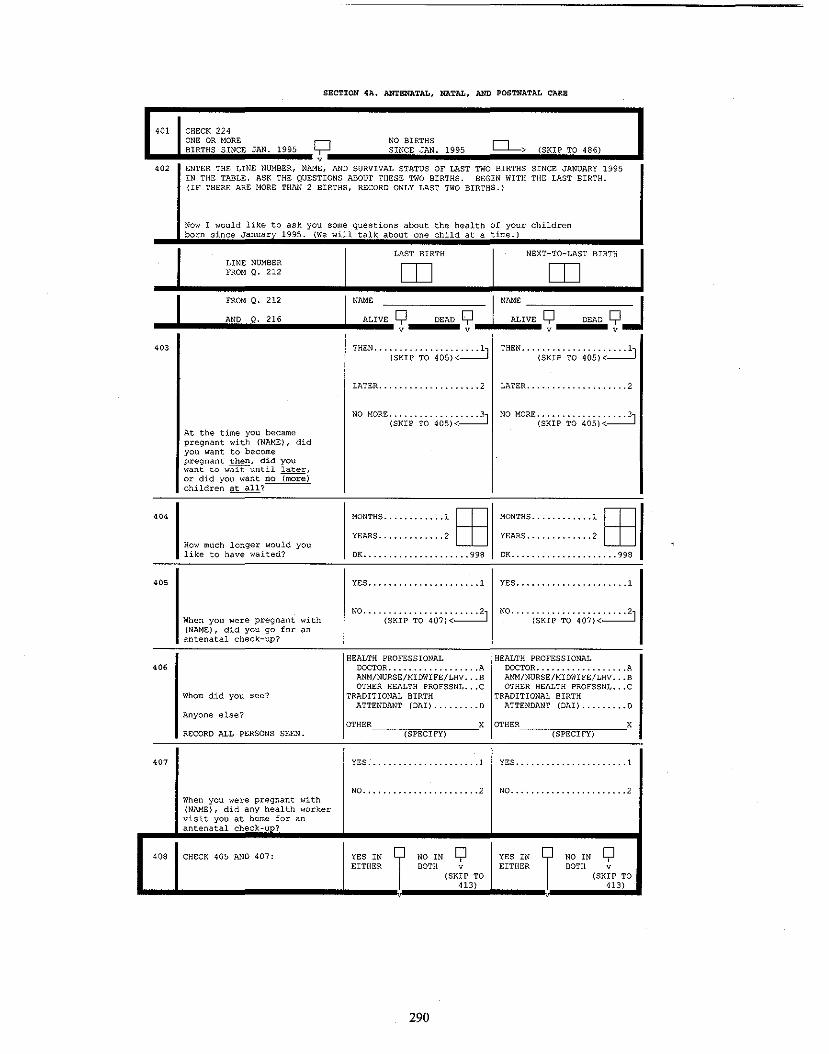
SECTION 4A. ANTENATAL, NATAL, AND POSTNATAL CARE
401 CHECK 224ONE OR MORE c;::J NO BIRTHS
0->BIRTHS SINCE JAN. 1995 SINCE JAN. 1995 (SKIP TO 486)v
402 ENTER THE LINE NUMBER, NAME, AND SURVIVAL STATUS OF LAST TWO BIRTHS SINCE JANUARY 1995IN THE TABLE. ASK THE QUESTIONS ABOUT THESE TWO BIRTHS. BEGIN WITH THE LAST BIRTH.{IF THERE ARE MORE THAN 2 BIRTHS, RECORD ONLY LAST TWO BIRTHS.}
Now I would like to ask you some questions about the health of your childrenborn since Januarv 1995. (We will talk about one child at a time.)
LAST BIRTH NEXT-TO-LAST BIRTHLINE NUMBER rn rnFROM 0. 212
J FROM Q. 212
.. A.ND.ilO•.•'.'.' .I
NAME
ALIVE Yv
DEAD Q:.I N~:'VE Q DEAD Qv:Jv v __iii.403
THEN ... {S~~P'TO' 40S;~.:..:..:..:2J THEN ... (s~ip'TO' 40S}~.:..:..:..:.j
LATER 2 LATER 2
At the time you becamepregnant with (NAME}, didyou want to becomepregnant then, did youwant to w~until later,or did you want no ~)children at all?
404
How much longer would youlike to have waited?
405
MONTHS 1 EByEARS 2
DK 998
Y8S 1
MONTHS 1 EByEARS 2
DK 998
yES 1
When you were pregnant with(NAM8), did you go for anantenatal check-up?
NO .... (SKip' TO'407;~~ NO .... (SKip' TO'407;~~
OTHER__-,=="",,__X OTHER__-,=="",, 'X(SPECIFy) (SPECIFY)
406
407
Whom did you see?
Anyone else?
RECORD ALL PERSONS S8EN.
When you were pregnant with(NAME), did any health workervisit you at home for anantenatal check-un?
HEALTH PROFESSIONALDOCTOR AANM/NURSE/MIDWIFE!LHV BOTHER HEALTH PROFSSNL C
TRADITIONAL BIRTHATTENDANT (DAI} 0
yES 1
NO 2
HEALTH PROFESSIONALDOCTOR AANM!NURSE!MIDWIFE!LHV BOTHER HEALTH PROFSSNL C
TRADITIONAL BIRTHATTENDANT (DAI) ........•o
yES 1
NO 2
408 CH8CK 405 AND 407: YES INEITHER
NO IN YBOTH v
(SKIP TO413}
290
YES INEITHER
NO IN YBOTH v
(SKIP TO413}

J.. .I.:N:AM:E:.,;;;:L:A:S:T:B:':R:T:H::::::;:JI NAME NEXT-TO-LAST BIRTH
409
410
411
412
How many months pregnant wereyou when you first received anantenatal check-up?
HOW many times did you receiveantenatal check-ups duringthis pregnancy?
Did you have the followingperformed at least once duringany of your antenatal check-upsfor this pregnancy:
Weight measured?
Height measured?
Blood pressure checked?
Blood test?
Urine test?
Abdomen examined?
Internal exam?
X-ray?
Sonogram or ultrasound?
Amniocentesis?
Did you receive advice on anyof the following during atleast one of your antenatalcheck-Ups for this pregnancy:
Diet?
Danger signs of pregnancy?
Delivery care?
Newborn care?
Family planning?
MONTHS ........•.....~ MONTHS ~
NO. OF TIMES ~ NO. OF TIMES _.~
YES NO YES NO
WEIGHT ............ 1 2 WEIGHT ............ 1 2
HEIGHT ............ 1 2 HEIGHT ............ 1 2
BLOOD PRESSURE .... 1 2 BLOOD PRESSURE ... _ 1 2
BLOOD TE:ST ........ 1 2 BLOOD TEST ........ 1 2
URINE TE:ST ........ 1 2 URINE: TEST ........ 1 2
ABDOME:N EXAMINED .. 1 2 ABDOMEN EXAMINED.. 1 2
INTERNAL EXAM ..... 1 2 INTERNAL E:XAM ..... 1 2
X-RAy ............. 1 2 X-RAy ......... .... 1 2
SONOGRAM/ULTRAS ... 1 2 SONOGRAM/ULTRAS ... 1 2
AMNIOCENTESIS ..... 1 2 AMNIOCENTESIS ..... 1 2
YES NO YES NO
DIET ............. ·.. 1 2 DIET ... ......... ... 1 2
DANGER SIGNS ....... 1 2 DANGER SIGNS ....... 1 2
DELIVERY CARE ...... 1 2 DELIVERY CARE ...... 1 2
NEWBORN CARE ....... 1 2 NEWBORN CARE ....... 1 2
FAMILY PLANNING .... I, 2, FAMILY PLANNING .... I, 2-,(SKIP TO 414)<--J---J (SKIP TO 414)<--l---J
413
What is the main reason youdid not receive an antenatalcheck-Up?
NOT NECESSARy .•......... 01NOT CUSTOMARY 02COST TOO MUCH '" 03TOO FAR/NO TRANSPORT 04POOR QUALITY SERVICE: 05NO TIME TO GO .•......... 06FAMILY DID NOT ALLOW 07LACK OF KNOWLEDGE. '" 08NO HEALTH WORKER
VISITED 09
OTHER_~,,===c--__96,(SPECIFY)
291
NOT NECESSARY •.......... 01NOT CUSTOMARY 02COST TOO MUCH '" .03TOO FAR/NO TRANSPORT 04POOR QUALITY SERVICE 05NO TIME TO GO ..........• 06FAMILY DID NOT ALLOW 07LACK OF KNOWLEDGE: 08NO HEALTH WORKER
VISITED 09
OTHER__===,,__96(SPECIFY)
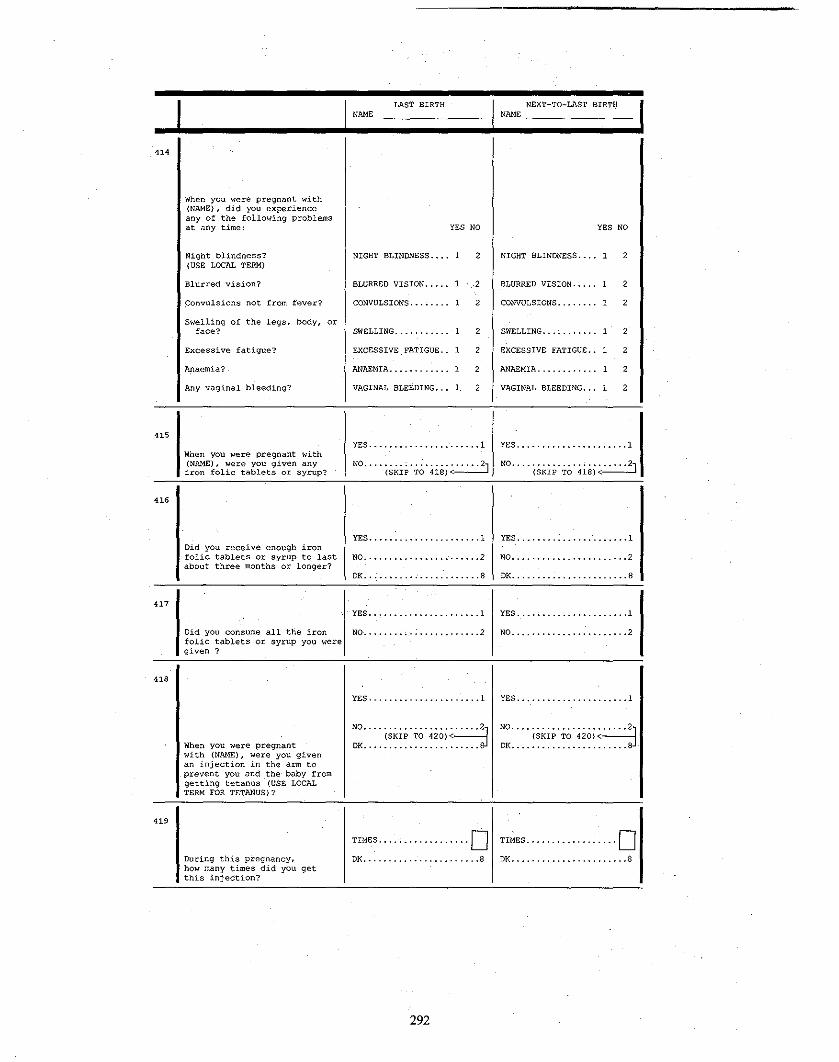
J, ...I~N:AM:E;.;;;;LA;;;;S;T;;;;B;';RT;H;;;;;;;;;;;;;.I NAME NEXT-TO-LAST BIRTH
<14
YES NO YES NO
NIGHT BLINDNESS .... 1 2 NIGHT BLINDNESS .•.. 1 2
BLURRED VISION ..... 1 2 BLURRED VISION ..... 2
CONVULSIONS ••• , •••• 2 CONVULSIONS •.•..•.• 2
SWELLING ..•.••.••.• 2 SWELLING••• , ••••••• 2
EXCESSIVE FATIGUE •. 1 2 EXCESSIVE FATIGUE •• 2
ANAEMIA•••••••••••• 2 ANAEMIA ..•.•.••.... 1 2
VAGINAL BLEEDING .•. 1 2 VAGINAL BLEEDING .•• 1 2.
Any vaginal bleeding?
Anaemia?
Excessive fatigue?
~onvulsions not from fever?
When you were pregnant with(NAME), did you experienceany of the following problemsat any time:
Blurred vision?
Night blindness?(USE LOCAL TERM)
Swelling of the legs, body, orface?
415yES .•••••.•..••••. ,·..•..• 1 yES •..•.••.•.••••.••.••.• 1
When you were pregnant with(NAME), were you given anyiron folic tablets or syrup? NO .... (SKi:~'T~' ,jiej~~ NO.... (SKIP' TO' ,jiej~~
416
Did you receive enough ironfolie tablets or syrup to lastabout three months or longer?
.
yES •.•• ; •..•..•..•.••.••. 1
NO · 2
OK ••••• , ••• ; 8
yES •.•..•..•.••.•••••.••• 1
NO 2
OK••••••••••••••••••••••• 8
417yES ..•..• ·•· .•..•.••.••.••. 1 yES ...... • ·..•.••.•..•..•.•1
Did you consume all the iron NO , 2folic tablets or syrup you weregiven?
NO 2
.
418
yES .•..•.••..•.•. ...•.••.• 1 yES .•.••.•.....•..•..•.•• 1
When you were pregnantwith (NAME), were you givenan injection in the arm toprevent you and .the baby fromgetting tetanus (USE LOCALTERM FOR TETANUS)?
NO .... (SK~p'TO'420;~~OK ••••••••••••••••••••••• 8
419
During this pregnancy,how many times did you getthis injection?
TIMES ; 0OK ••••••••••••••.••••••••• 8
TIMES .............•... , 0OK ••••••••••••••••••••••• 8
292

INEXT-TO-LAST BIRTH
NAM"LAST BIRTHJ
HOME HOME420 YOUR HOME •••••••••••••• 11 YOUR HOME •••••••••••••• 11
PARENTS' HOME •••••.•••• 12 PARENTS' HOME •••.•••••• 12OTH8R HOME ••••••••••••• 13 OTHER HOME ••••••••••••• 13
PUBLIC MEDICAL SECTOR PUBLIC MEDICAL SECTORWhere did you give GQVT./MUNICIPAL HOSP ... 21 GOVT./MUNICIPAL HOSP., .21birth to (NAME) ? GOVT. DISPENSARY ....... 22 GOVT. DISPENSARY •.•..•. 22
UHC/UHP/UfWC •••• ; •••••• 23 URe/UHP/UFWe ••••••• _" .23eHG/RURAL HOSP.fPHC .••. 24 CHC/RURAL HQSP./PHC.. , .24SUB-CENTRE ••••••••••••• 25 SUB-CE:NTRE •••••••.••••• 25OTHER PUBLIC SECTOR OTHER PUBLIC SECTOR
HEALTH FACILITY ..••. 26 HEALTH FACILITY .••.• 26
NGO/TRUST HOSP./CLINIC .. 31 NGO/TRUST HOSP./CLINIC .. 31
PRIVATE MEDICAL SECTOR PRIVATE MEDICAL SECTORPVT. HOSPITAL!CLINIC! PVT. HOSPITAL!CLINIC!
MATERNITY HOME ...... 41 MATERNITY HOME ..•... 41OTHER PRIVATE SECTOR OTHER PRIVATE SECTOR
HEALTH FACILITY ..... 42 HEALTH FACILITY ..... 42
OTHER 96 OTHER 96(SPECIFY) {SPECIFY}
(SKIP TO 422)< (SKIP TO 422)<
421 NOT NECESSARY ........... 01 NOT NECESSARY ........... 01NOT CUSTOMARY ........... 02 NOT CUSTOMARY ........... 02COST TOO MUCH ....... '" .03 COST TOO MUCH ........... 03TOO FAR!NO TRANSPORT .... 04 TOO FAR!NO TRANSPORT .... 04POOR QUALITY SERVICE .... 05 POOR QUALITY SERVICE .... 05NO TIME TO GO.....•..... 06 NO TIME TO GO........... 06FAMILY DID NOT ALLOW .... 07 FAMILY DID NOT ALLOW .... 07
What i, the main reason you did BETTER CARE AT HOME ..... OB BETTER CARE AT HOME..... OBnot go to a'hea1th facility LACK OF KNOWLEDGE ....... 09 LACK OF KNOWLEDGE ....... 09for delivery?
OTHER 96 OTH£R 96(SPECIFY) (SFECIFY)
HEALTH PROFESSIONAL HEALTH PROFESSIONAL422 DOCTOR..................A DOCTOR..................A
ANM!NURSE!MIDWIFE!LHV ... 8 ANM!NURSE!MIDWIFE!LHV ... 8OTHER HEALTH PROFESSNL .. C OTHER HEALTH PROFESSNL .. C
Who assisted with thedelivery of (NAME) ? OTHER PERSON OTHER PERSON
DAI{TBA) ................ D DM (TBA) ................ DAnyone else? FRIEND!RELATIVE......... E FRIEND!RELATIVE......... E
PROBE FOR TH" TYPE OF OTHER X OTHER XPERSON AND RECORD ALL (SPECIFY) (SPECIFY)PERSONS WHO ASSISTED. NO ONE .................... Y NO ONE ....................Y
423 CHECK 422: ANY Q NO 1ANY Q NO 1CODE v CODE CODE v CODEA, B, (SKIP TO A, B, A, B, (SKIP TO A, B,OR C 425) OR C OR C 425) OR C
NOT NECESSARY .......... 01 NOT NECESSARy .......... 01424 NOT, CUSTOMARY .......... 02 NOT CUSTOMARY .......... 02
COST TOO MUCH .......... 03 COST TOO MUCH .......... 03TOO FAR/NO TRANSPORT •.. 04 TOO FAR!NO TRANSPORT ... 04PROFES. NOT AVAI'BLE ... 05 PROFES. NOT AVAI'BLE ... 05NO CONFIDENCE IN NO CONFIDENCE IN
AVAILABLE PROFESIONAL.06 AVAILABLE PROFESIONAL.06What i, the main reason you did NO TIME TO GET HELP .... 07 NO TIME TO GET HELP .... 07not take the help of e health FAMILY DID NOT ALLOW ... Os FAMILY DID NOT ALLOW ... OBprofessional? OTHER 96 OTHER 96
(SPECIFY) (SPECIFY)(SKIP TO 426)<- (SKIP TO 426)<-
293

yES ••..••••.••.•..•.•..•. 1
NO••••••••••••••••••••••• 2
yES .•..•..•..•........•.• 1
NO•.••••.••••••••••.••••• 2
J .. I.N~AM:E:..;;;;LA;;;;5~T;;;;B~'~R~TH;;;;;;;;;;;;;;;;JI ~N:AM:E~NE~X~T~-~T~O~-~LA~5~T;;;;B~'~R~T~H;;;;;J
425
1Was (NAME) delivered bycaesarian section?
426
427
When (NAME) was born,was he/she:large, average, small, orvery small?
(NAME) weighed at birth?
LARGE •••••••••••••••••••• 1AVERAGE •••••••••••••.•••• 2SMALL ••••••••••••••••••• 3VERY SMALL ••••••••••••••• 4
yES ••..••.•..•..•.••...•. 1
LARGE •••••••••••••••••••• 1AVERAGE •••••••••••••••••• 2SMALL ••••••••••••••••••• 3VERY SMALL ••••••••••••••• 4
YES .•..•..•.•••••.••.•.•• 1 INO •••• (SKip' ~o· 429)~~
42' IHow much did (NAME) weigh? IGRAM5·········[[[1]1
DK•.•..•.••..••.•.•..• 9998
GRAMS [[[1]IOK •••••••••••••••••••• 9998
42'
yES ...................... 1 yES ...................... 1Now I would like to .,k youabout th, 2-month period after
NO. '" {SKIP' TO'433;~~ NO ... '(SKip'TO'433i~~th, delivery of (NAME) . Duringthat period, did a doctor orother health professionalcheck your health or th' healthof your baby?
430DAYS. '" ., ........l~ DAyS ..............1~
How soon after th, birth ofWEEKS .... , ........2~ WEEKS .... '" ......2~(NAME) did you first get a
check-up?
431 HOME VISIT............... 11 HOME VISIT ...........•... 11
PUBLIC MEDICAL SECTOR PUBLIC MEDICAL SECTORWhere did you get tM GOVT./MUNICIPAL HOSP .... 21 GOVT./MONICIPAL HOSP.... 21check-up? GOVT. DISPENSARY........ 22 GOVT. DISPENSARy ........ 22
UHC/UHP/urnc ............ 23 UHC/UHP/UFWC ...........• 23CHC/RURAL HOSP./PHC. '" .24 CHC/RURAL HOSP./PHC..... 24SUB-CENTRE.............. 25 SUB-CENTRE .............. 25OTHER PUBLIC SECTOR OTHER PUBLIC SECTOR
HEALTH FACILITy ...... 26 HEALTH FACILITY...... 26
NGO/TRUST HOSP./CLINIC ... 31 NGO/TRUST HOSP./CLINIC ... 31
PRIVATE MEDICAL SE:CTOR PRIVATE MEDICAL SECTORPVT. HOSPITAL/CLINIC/ PVT. HOSPITAL/CLINIC/
MATERNITY HOME .....•. 41 MATE:RNITY HOME ......• 41OTHER PRIVATE SECTOR OTHER PRIVATE SECTOR
HEALTH FACILITY...... 42 HEALTH FACILITY...... 42
OTHER 96 OTHER 96(SPECIFY) (SPECIFY)
294

..J~.......••.•..._I':N:AM:O.;;;;LA;;;;S~T;;;;B~'~R~T~H;;;;;;;;;;;;;;;;.I NAMo NoXT-TO-LAST BIRTH
432
Did any of the followinghappen when you had thecheck-up: YES NO YES NO
Was your abdomen examined? ABDOMEN EXAMINED ... 1 2 ABDOMEN EXAMINED ... 1 2
Did you receive advice onfamily planning? FAMILY PLANNING .... 1 2 FAMILY PLANNING .... 1 2
Did you receive advice onbreast feeding? BREASTFEEDING 1 2 BREASTFEEDING... _._ 1 2
Did you receive advice onbaby care? BABY CARE •••••••••• 1 2 BABY CARE •••••••••• 1 2
43'
At any time during the twomonths after the delivery of(NAME), did you have any ofthe following: YES NO n:s NO
Massive vaginal bleeding? VAGINAL BLEEDING ... 1 2 VAGINAL BLEEDING ... 1 2
MONTHS .....•.......~
DK ••••••••••••••••••••• 98
2VERY HIGH FEVER .... 1
MONTHS ~
DK•••••••••••••••••••••• 98
NO .•.•. (SKip' TO' 439' i~~.
2
YES .. (SKip'To'436i~~
NO, "'(SKip'To'437i~~
VERY HIGH FEVER.... 1Very high fever?
Did your period return betweenthe birth of (NAME) and yournext pregnancy?
IHas your period returnedsince the birth of (NAME)?
434
'36
'35
For how many months afterthe birth of (NAME) didyou not have a period?
yES •.•..•..•..•.•..•..•.• 1
RESPONDENT PREGNANT?
CHECK 230:
Have you resumed sexualrelations since the birthof (NAME)?
438
437 NOT PREGNANTPREGNANT I OR n
OR UNSURE '-r'Q230 v
1o••I. N.O.T.A.S.K.E.D v ••'S.K.'.P.T.O.'.'.'.'..
295

...J~ ~I~N:1\M:E_;;;;LA;;;;S~T;;;;B~'R~T~H;;;;;;;;;;;;;;;.1 N1\ME NEXT-TO-LAST BIRTH
439
For how many months afterthe birth of (NAME) didyou not have sexualrelations?
MONTHS ~
DK •••••••••••••••••••••• 98
MONTHS ~
OK •••••••••••••••••••••• 98
440 IDid you ever I
YES"'(SKi:P'To'442;~~1 YES"'(SKi:P'To'442i~~1breast feed (NAME)? NO ..•..•.•........•..•..•2 NO ..•.••.•..•..•.•....•.• 2
MOTHER ILL/WEAK•..•..•.. 01 MOTHER ILL/WEAK•.•..•..• 01441 CHILD ILL/WEAK.......... 02 CHILD ILL/WEAK .•.•..•..• 02
CHILD DIED....•..••.••.. 03 CHILD DIED..•..•..•....• 03NIPPLE/BREAST PROBLEM ••• 04 NIPPLE/BREAST PROBLEM ••• 04INSUFFICIENT MILK ••••••• 05 INSUFFICIENT MILK ••••••• 05
Why did you not MOTHER WORKING .......... 06 MOTHER WORKING .......... 06breastfeed (NAME)? CHILD REFUSED ........... 07 CHILD REFUSED ........... 07
OTHER 96 OTHER 9&(SPECIFY) (SPECIFY)
(SKIP TO 448)<- (SKIP TO 448)<-
442 IMMEDIATELy ........... 000 IMMEDIATELy ........... 000
How long after birth did you HOURS ............. 1~ HOURS ............. 1~first puc (NAME) Co Che breast?
IF LESS THAN 1 HOUR, DAyS .............. 2~ DAyS .............. 2~RECORD '00' HOURS.IF LESS THAN 24 HOURS,
RECORD HOURS.OTHERWISE, RECORD DAYS.
443
yES ...................... 1 yES ...................... 1Did you squeeze out the milkfrom the breast before you NO....................... 2 NO ....................... 2first put (NAME) to the breast?
444 CHECK 216:ALIVE
IDEAD
QALIVE
IDEAD
QCHILD ALIVE?v v
(SKIP TO 446) (SKIP TO 446)v v
445
1Are you still breast feeding(NAME)? I
YES"',(SKi:P'To'449i~~1 YES"'(SKi:P'To'449;~~1NO , 2 NO 2
446 MONTHS ..............~ MONTHS ..............~
For how many months didUNTIL(~~~~·TO·452i~~ UNTIL(~~~~·TO·452i~~you breast feed (NAME) ?
MOTHER ILL/WEAK......... 01 MOTHER ILL/WEAK......... 01447 CHILD ILL/WEAK.......... 02 CHILD ILL/WEAK.......... 02
CHILD DIED.............. 03 CHILD DIED.............. 03NIPPLE/BREAST PROBLEM ... 04 NIPPLE/BREAST PROBLEM ... 04
Why did you stop INSUFFICIENT MILK ....... 05 INSUFFICIENT MILK ....... 05breast feeding (NAME)? MOTHER WORKING .......... 06 MOTHER WORKING .......... 06
CHILD REFUSED ........... 07 CHILD REFUSED........... 07WEANING AGE ............. 08 WEANING AGE ...... '" .... 08BECAME PREGNANT ......... 09 BECAME PREGNANT ......... 09STARTED USING STARTED USING
CONTRACEPTION .......... 10 CONTRACEPTION.......... 10
OTHER 96 OTHER 96(SPECIFY) (SPECIFY)
296

~ST BIRTH NEXT-TO-LAST BIRTHNANE NANE
448 CHECK 216:ALIVE
IDEAD
QALIVE
IDEAD
QCHILD ALIVE?v v
(SKIP TO 452) (SKIP TO 452)v v
449 YES. ...•.. ~ .•..•.•..•.... 1 yES .•..•....•..•....•.... 1
NO ...•..•. ,•..•..•.•..•... 2 NO ...•..•..•.•..•..•....• 2Did (NAME) drink anythingfrom a bottle with a nipple OK .•..•..•.•.....•.•..... 8 OK ....•.•.....•..•..•..• '.8yesterday or last night?
450
At' any time yesterday or lastnight, wa' (NAME) given anyof the following: YES NO DK YES NO DK
Plain water? PLAIN WATER ....•. 1 2 8 PLAIN WATER ..•... 1 2 8
Powdered milk? POWDERED MILK•..• 1 2 8 POWDERED MILK .•.. 1 2 8
Any other milk (other thanbreast milk) ? OTHER MILK •••..•. 1 2 8 OTHER MILK••••... 1 2 8
Any other liquid? ANY OTHER LIQUID. 1 2 8 ANY OTHER LIQUID; 1 2 8
Green, leafy vegetables? GREEN/LEAFY VEG .• 1 2 8 GREEN/LEAFY VEG •. 1 2 8
Fruits? FRUITS .•..•.•..•. 1 2 8 FRUITS ..•.•..•..• 1 2 8
Any other solid or mushy food? SOLID/MUSHY FOOD. 1 2 8 SOLID/MUSHY FOOD. 1 2 8
451
1 ~ EVERY DAY 1 ~ EVERY DAY2 ~ SOME DAYS 2 ~ SOME DAYS
How often during the 3 ~ NOT AT ALL 3 ~ NOT AT ALLlast seven days was, (NAME) 8 ~ DK 8 ~ DKgiven any of the following:
Plain water? PLAIN WATeR .•....•..•.• 0 PLAIN WATER .•..•.••..•. 0
Powdered milk? POWDERED MILK•..••...•. 0 POWDERED MILK .•.•..•..• 0
Any other milk (other than 0 0breast milk) ? OTHER MILK ..•..•.•.••.. OTHER MILK...•..•.••..•
Any other liquid? OTHER LIQUID. _.....•. .. 0 OTHER LIQUID..•.....•.. 0Green, leafy vegetables? GREEN/LEAFY VEG .••.••.. 0 GREEN/LEAFY VEG ...•. '" 0
Fruits? FRUITS .•..••••..•••..•. 0 FRUITS •.••..•....•...•. 0
Any other solid or mushy food? SOLID/MUSHY FOOD .•....• 0 SOLID/MUSHY FOOD•••..•. 0
452 GO BACK TO 403 IN NEXT> COLUMN; OR, IF NO MORE GO TO 453
BIRTHS, GO TO 453
297

SECTION 48. IMMUNIZATION 1tml HEALTH
453 ENTER THE LINE NUMBER AND NAME OF LAST TWO BIRTHS SINCE JANUARY 1995 IN THE TABLE.ASK THE QUESTIONS ABOUT THESE TWO BIRTHS. BEGIN WITH THE LAST BIRTH.{IF THERE ARE MORE THAN 2 BIRTHS, RECORD ONLY LAST TWO BIRTHS.}
LAST BIRTH NEXT-TO-LAST BIRTHLINE NUMBER
CD CDFROM D. 212
FROM Q. 212 NAME NAME
AND Q. 216 ALIVE
rDEAD Q ALIVE
rDEAD Q
v v(GO TO NEXT (GO TO 481)COLUMN, ORIF NO MOREBIRTHS, GOTO 481)
v v
454YES,
~i~ip'TO'456j~~YES,
~i~ip'TO'456;~~
YES, NOT SEEN ......~ YES,~~~I~E~~'458j~~Do you have a card where (SKIP TO 458)<
(NAME'S) vaccinationsare written down? NO CARD .................. 3 NO CARD.................. 3
IF YES: May I ,ee it, please?
455YES .. (SKIP'TO'458;~~ YES. ';SSip'TO'4;B;;~ IIDid you eve, have a vaccination NO....~................... 2 NO........•............•. 2
card for (NAME)?
(1) COPY VACCINATION DATES FOR456 EACH VACCINE FROM THE CARD.
(2) WRITE '44 ' IN 'DAY' COLUMNIF CARD SHOWS THAT AVACCINATION WAS GIVEN,BUT NO DATE IS RECORDED. DAY MO YEAR DAY MO YEAR
BCG BCG BCG
POLIO 0 PO pO
OPT 1 01 01
OPT 2 02 02
OPT 3 03 03
POLIO 1 PI PI
POLIO 2 P2 P2
POLIO 3 P3 P3
MEASLES MEA MEA
457yES ...................... 1 yES ...................... 1
(PROBE FOR VACCINATIONS (PROBE FOR VACCINATIONSAND WRITE ' 66' IN THE AND WRITE '66 ' IN THE
Ha, (NAME) reCeived any vacci- CORRESPONDING DAY CORRESPONDING DAYnations that are not recorded COLUMN IN 456)
<==:JCOLUMN IN 456)
<--==oJon this card? (SKIP TO 460) (SKIP TO 460)
RECORD 'YES' ONLY IF RESPONDENT ~~:::::::::::::::::::::: :~~ ~~:::::::::::::::::::::: :~lMENTIONS BCG, DPT 1-3, POLIO (SKIP TO 460) < (SKIP TO 460) <0-3 AND/OR MEASLES VACCINE(S).
298

J I.;;NAM:E:.,;;;~LA~S~T,;;;B~'~R~T~H,;;;,;;;,;;;;;.~I~N:AM:E~N~EX~T~-~T~O~-~LA,;;;ST,;;;B~'~R~T~H,;;;;;.
'58yES ...••....••...••.•..•. 1 yES •..•.•..•••..••••.•..• 1
Did (NAME) ever receive any NO. "(SKip'TO'46i;~~vaccinations to prevent him/her DK ........•.............. 8from getting diseases?
NO••• {SKIp'TO'462i~~DK ••••••••••••••••••••••• 8
'59
Please tell me if (NAME)has received any of thefollowing vaccinations:
459A
A BeG vaccination againsttuberculosis, that is, aninjection in the leftshoulder that caused a scar?
yES ..•.•..•.•..••.•..•.•. 1
NO ••••••••••••••••••••••• 2
DK••••••••••••••••••••••• 8
yES ••..•.•..•.••.•.••..•. 1
NO ••••••••••••••••••••••• 2
OK ••••••••••••••••••••••• 8
459B
yES.••.••.•.••.••.•.••.•. 1 yES •••.••...•.••.•.••.••• 1A OPT vaccination againstdiphtheria, whooping cough,and tetanus given as aninjection?
NO. '(SK~~'To'459D;~~OK ...•..•••..•.•..•..•.•. 8
NO"(SKi~'TO'459D;~~OK••••.•....•..•.•..•..•. 8
459CNUMBER OF TIMES ••.••.•. c=J NUMBER OF TIMES •..•.••. c=J
How many times?
4590 yES •.•..•••..•.••.•....•. 1 yES .•..•.••.••.•..•.••.•. 1
Polio vaccine, that is,drops in the mouth?
NO"(SKi~'TO'459G;~~OK ••.••.•..•.••.•....•..• 8
NO"(SKi~'TO' 459G;~~OK•..••.•..•.••.••••..•..• 8
459EHow many times? NUMBER OF TIMES .••.•... c=J NUMBER OF TIMES •..••••• c=J
459F
JUST AFTER BIRTH •••..•.•. 1 JUST AFTER BIRTH •.••.••.• 1
459G
When was the first poliovaccine given -- just afterbirth or later?
An injection against measles?
LATER .•....•..•.••.•..•.• 2
YES J,NO .••.•.••••..••••.••.•.. 2
OK•..•...•...•.•..•.•..•• 8(SKIP TO 461) <
LATER .••.•..••.•.•..•.••. 2
YES J,NO 2
DK .•..•••..•.••..••.•.•.• 8(SKIP TO 461) <
460 CHECK 456: YESANY VACCINATIONS RECEIVED? C? N°9 YESC? NO Q
•.._ _.._l .•,jSiiKjI.p_TiiO.'ii62..'_ •••_1._(SiiKii,.p.,TiiO"V.'ii6ii2.',.
299

Where did (NAME) receivemost of his/her vaccinations?
461
JI. I.:N:AM:E:.,;;;;LA;;ST;;B;';R;T;H;;;;;;~I NAME NEXT-TO-LAST BIRTH
PUBLIC MEDICAL SECTOR PUBLIC MEDICAL SECTORGOVT./MUNICIPAL HOSP 11 GOVT.!MUNICIPAL HOSP, 11GOVT. DISPENSARY 12 GOVT. DISPENSARy 12UHe/UHF/orne ..•.••..•••. 13 UHC/UHP/UFWC.•.•..•.•..• 13CHC/RURAL HO$P.!PHC. _._ .14 eHe/RURAL HOSP./PHC ..... 14SUB-CENTRE •••••••••••••• 15 SOB-CENTRE •••••• _••••••• 15GOVT. MOBILE CLINIC ..... 16 GOVT. MOBILE CLINIC ..... 16CAMP •••• , ••••••••••••••• 17 CAMP•••••• , ••••••••••••• 17PULSE POLIO LOCATION .... 18 PULSE POLIO LOCATION .... 18OTHER PUBLIC SECTOR OTHER POBLIC SECTOR
HEALTH Fl!>CILITY .•.. ,",19 HEALTH FACILITY •.•.•. 19
NGO/TRUST HOSP./CLINIC ... 21 NGO/TRUST HOSP./CLINIC ... 21
PRIVATE MEDICAL SECTORPVT. HOSPITAL/CLINIC ;31pVT. DOCTOR 32pVT. MOBILE CLINIC., •.... 33VAIDYA/HAKIM/HOMEOPATH .. 34PHARMACY/DRUGSTORE 35OTHER PRIVATE SECTOR
HEALTH FACILITy 36
PRIVATE MEDICAL SECTORPVT. HOSPITAL/CLINIC 31PVT. DOCTOR ~ 32PVT. MOBILE CLINIC .. , 33VAIDYA/HAKIM/HOMEOPATH .. 34PHARMACY/DRUGSTORE •..•.. 35OTHER PRIVATE SECTOR
HEALTH FACILITY 36
OTHER _~",=""",__96 OTH~R(SPECIFY)
__===__96(SPECIFY)
462
yES 1 yES 1
Was a dose of vitamin A liquidor capsule ever given to (NAME)to protect him/her from nightblindness (USE LOCAL TERM)?
NO.. {SKi~'~o' 464;~"'" .. 2]DK ............•.......... 8
NO .. (SKip '~o' 464j ~ ..."... 2]OK•••••••••••• '••••••••••• 8
463MONTHS AGO ~ MONTHS AGO.... , .•...~
How many months ago did (NAME)receive the last dose ofVitamin A?
464 yES 1 yES ..................•... 1
.
Has (NAME) been ill with afever at any time in the last2 weeks?
NO 2
OK••••••••••••••••••••••• 8
NO•...................... 2
OK ••••••••••••••••••••••• 8
465yES 1 yES 1
Has (NAME) been ill with acough at any time in the last2 weeks?
NO.. (SKip' TO' 469j~""" .2]OK ••••••••••••••••••••••• 8
NO •. (SKi~'~o' 469) ~ ..- 2]OK 8
466yES 1 yES 1
NO '..•... 2 NO ....•.................. 2
When (NAME) was ill with acough, did he/she breathefaster than usual with short,rapid breaths?
Did you seek advice ortreatment for the cough?
DK 8
yES 1
NO .. (SKip' ~o· 469j ~ 2]
OK ••••••••••••• '•••••••••• 8
YES 1INO .. (SKip' ~o· 469j ~ 2J
300

Where did you seek advice ortreatment?
468
..J. �..;N:AM:E~,;;;~L~A~S~T~B,;;;'R~T~H,;;;,;;;,;;;,;;;;.I NAME NEXT-TO-LAST BIRTH
PUBLIC MEDICAL SECTOR PUBLIC MEDICAL SECTORGOVT.jMUNICIPAL HOSP A GQVT.jMUNICIPAL HOSP AGOVT. DISPENSARy .•.. , B GOVT. DISPENSARy 8URC/UHPlume C UHC/UHPIUFWe..•.•..••••••CCHC/RURAL HOSP.jPHC 0 eRe/RURAL HOSP.jPHC 0SUB-CENTRE ••••••••••••••• E SUB-CENTRE ••••••••••••••• EGOVT. MOBILE CLINIC F GQVT. MOBILE CLINIC FGOVT. PARAMEDIC ..•....•. G GQVT. PARAMEDIC ..•.•..•. GCAMP ••••••••••••••••••••• H CAMP ••••••••••••••••••••• ROTHER PUBLIC SECTOR OTHER PUBLIC SECTOR
HEALTH FACILITy .•..•.. I HEALTH FACILITy ......• I
NGO/TRUST HOSP./CLINIC J NGO/TRUST HOSP./CLINIC .... JNGO WORKE:R K NGO WORKE:R•..•............ K
Anywhere else?
RECORD ALL MENTIONED.
PRIVATE: ME:DICAL SECTORPVT. HOSPITAL/CLINIC LPVT. DOCTOR MPVT. MOBILE CLINIC NPVT. PARAME:DIC OVAIOYA/HAKIM/HOME:OPATH PTRADITIONAL HE:ALE:R QPHARMACY/DRUGSTORE: ROTHER PRIVATE SECTOR
HEALTH FACILITY S
PRIVATE MEDICAL SECTORPVT. HOSPITAL/CLINIC LPVT. DOCTOR MPVT. MOBILE CLINIC NPVT. PARAMEDIC ...•....... 0VAIDYA/HAKIM/HOMEOPATH PTRADITIONAL HEALER QPHARMACY/DRUGSTORE ROTHER PRIVATE SECTOR
HEALTH FACILITY .....•. S
OTHER SOURCESHOP...........•......... TFRIEND/RELATIVE U
OTHER SOURCESHOP ...•................. TFRIEND/RELATIVE U
OTHER _~===~__x OTHER(SPECIIT)
_==",__x(SPECIFY)
469 yES ....................•. 1 yES 1
Has (NAME) had diarrhoeain the last two weeks?
NO .. (SKIP' TO' 480) ~ 2]DK ••••••••••••••••••••••• 8
NO .. (SKIP' TO' 480)~""" .2]OK 8
470 yES .....•................ 1 yES 1
Was there any blood inthe stools?
NO ...........•........... 2 NO 2
471 SAME 1 SAME 1
MORE 2 MORE 2
(Including breast milk)Was he/she given the sameamount to drink as beforethe diarrhoea, or more,or less?
LESS 3
OK..........•....•....... 8
LESS 3
OK 8
472SAME ...•.•............... 1 SAME ..............•...... 1
MORE 2 MORE 2
STOPPED COMPLETELY 4 STOPPED COMPLETELY 4
OK .....•..•.............. 8 DK ••••••••••••••••••••••• 8
Was he/she given the sameamount of food as beforethe diarrhoea, or more,or less?
LESS ........•............ 3 LESS ..................•.. 3
473 YES .............•........ 1 YES 1
Did you seek advice ortreatment for the diarrhoea?
NO •. '(SKIp'To'475;~~ NO. "{SKIp'TO'475j~~
301

PUBLIC MEDICAL SECTORGOVT.!HUNICIPAL HOSP AGOVT. DISPENSARy BUHC/UHP!UFWC ..........•.. ceHC/RURAL HOSP.jPHC 0SOB-CENTRE •..•..•.••...•• EGOVT. MOBILE CLINIC FGOVT. PARAMEDIC......... GCAMP ....................•HOTHER PUBLIC SECTOR
HEALTH FACILITY 1
Where did you seek advice ortreatment?
474
J I.N:AM:8:..,;;;;LA;S;T,;;;B;';R;T;H,;;;,;;;,;;;;.ll~N:AM:8~N;8X;T;-;T;O;-;LA,;;;ST,;;;B;';R;T;H,;;;;.PUBLIC MEDICAL SECTOR
GOVT./MUNICIPAL HOSP..... AGOVT. DISPENSARy ..•••.••• BUHC/UHP/urne•..•..•.•.••. CeRe/RURAL HOSP./PHC DSUB-CENTRE ••••••••••••••• EGOVT. MOBILE CLINIC FGOVT. I?ARAMEDIC ..•.••.•.. GCAMP ••••••••••••••••••••• ROTHER PUBLIC SECTOR
HEALTH FACILITy 1
NGO/TRUST HOSP./CLINIC .... J NGO!TRUST HOSP./CLINIC .... JNGO WORKER•••••••••••••••• K NGO WORKER •••••••••••••••• K
Anywhere else?
RECORD ALL MENTIONED.
PRIVATE MEDICAL SECTORPVT. HOSPITAL/CLINIC LPVT. DOCTOR MPVT. MOBILE CLINIC ..•..•. NPVT. PARAMEDIC 0VAIDYA/HAKIM/HOMEOPATH PTRADITIONAL HEALER QPHARMACY/DRUGSTORE ROTHER PRIVATE SECTOR
HEALTH FACILITY S
PRIVATE MEDICAL SECTORPVT. HOSPITAL/CLINIC LPVT. DOCTOR MPVT. MOBILE CLINIC NPVT. PARAMEDIC OVAIDYA/HAKIM/HOMEOPATH PTRADITIONAL HEALER.....•. QPHARMACY/DRUGSTORE ROTHER PRIVATE SECTOR
HEALTH FACILITY S
OTHER SOURCESHOP TFRIEND/RELATIVE .•..•.•... U
OTHER SOURCESHOP _ TFRIEND/RELATIVE U
OTHER --iOO"""",,---,X OTHER(SPECIFY) - --c""""",,,,--,X(SPECIFY)
4'5
When (NAME) had diarrhoea,was he/she given any of thefollowing to drink:
YES NO DK YES NO OK
A fluid made from a specialpacket called [LOCAL NAME]?
FLUID FROM ORSPACKET 1 2 8
FLUID FROM ORSPACKET 1 2 8
Gruel made from rice [OR OTHERLOCAL GRAIN, TUBER, ORPLANTAIN) ?
476 CHECK 475:
FLUID FROM ORS PACKET GIVEN?
GRUEL........... 1 2 8 GRUEL........... 1 2 B
Y8S
INO OR DKQ Y8S
INO OR DKQ
v v(SKIP TO 478) (SKIP TO 478)
v v
302

I.NEXT-TO-LAST BIRTH
NAM'LAST BIRTHJ
PUBLIC MEDICAL SECTOR PUBLIC MEDICAL SECTOR
477 GOVT./MUNICIPAL HOSF •••• 11 GOVT. /MUNICIPAL HOSP •••• 11GOVT. DISPENSARy ......•. 12 GOVT. DISPENSARy .•...... 12UHC/UHP/urne ..•.••••..•. 13 uRe/uHP/urne............ 13CHC/RURAL HOSP./PHC ..... 14 CHC/RURAL HOSP./PHC ..... 14SUB-CENTRE •••••••••••••• 15 SUB-CENTRE •••••••••••••• 15GOVT. MOBILE CLINIC ..••• 16 GOVT. MOBILE CLINIC .•..• 16GOVT. PARAMEDIC ••••••••• 17 GOVT. PARAMEDIC ••••••••• 17
Where did you obtain the ORS OTHER PUBLIC SECTOR OTHER PUBLIC SECTOR
packet? HEALTH fACILITY ...•.. 18 HEALTH FACILITY ...... 18
NGO!TRUST HOSP./CLINIC ... 21 NGO/TRUST HOSP./CLINIC ... 21NGO WORKER................ 22 NGO WORKER............... 22
PRIVATE MEDICAL SECTOR PRIVATE MEDICAL SECTORPVT. HOSPITAL/CLINIC .... 31 PVT. HOSPITAL/CLINIC .... 31PVT. DOCTOR ............. 32 PVT. DOCTOR ............. 32PVT. MOBILE CLINIC ...... 33 PVT. MOBILE CLINIC...... 33PVT. PARAMEDIC .......... 35 PVT. PARAMEDIC .......... 35VAIOYA/HAKIM/HOMEOPATH .. 34 VAIDYA/HAKIM/HOMEOPATH .. 34PHARMACy/DRUGSTORE ...... 36 PHARMACY/DRUGSTORE ...... 36DAI (TBA) .•.............. 37 DAI (TBA) ......•......... 37OTHER PRIVATE SECTOR OTHER PRIVATE SECTOR
HEALTH FACILITY...... 38 HEALTH FACILITY...... 38
OTHER SOURCE OTHER SOURCESHOP .................... 41 SHOP ...... _..........•.. 41HUSBAND ...•..........•.. 42 HUSBAND .........•....... 42FRIEND/OTHER RELATIVE •.. 43 I FRIEND/OTH'R RELATIVE ... 43
OTHER 96 OTHER 96(SPECIFY) (SPECIFY)
478 yES ...................... 1 Yes .................. 1 IIW" ,nything (else) given to NO"'(SKip'TO'480;~~ NO.. '(SKip'TO'480;~~treat the diarrhoea? DK......................• 8 OK ....................... 8
479
PILL OR SYRUP ............A PILL OR SYRUP ............AINJECTION ................ B INJECTION................BINTRAVENOUS (1. V.lDRIP/ INTRAVENOUS (I.V./DRIP/
What w., given to treat BOTTLE) ................ C BOTTLE) ....•...........Cthe diarrhoea? HOMEMADE SUGAR-SALT- HOMEMADE SUGAR-SALT-
WATER SOLUTION ......... D WATER SOLUTION ......... DHOME REMEDY/ HOME REMEDY/
Anything else? HERBAL MEDICINE .•....... E HERBAL MEDICINE ....•.... E
OTHER X OTHER XRECORD ALL MENTIONED. (SPECIFY) (SPECIFY)
480 GO BACK TO 454 IN NEXT> COLUMN; OR, IF NO MORE GO TO 481
BIRTHS, GO TO 481
303

NO. I QUESTIONS AND FILTERS I CODING CATEGORIES I SKIP
481 CHECK 475 ALL COLUMNS: IORS FLUID 0FROM PACKET >483GIVEN TO ORS FLUID FROM PACKETANY CHILD NOT GIVEN TO ANY CHILD
TOR475 NOT ASKED
v
"2
Have you ever heard of a special product called(LOCAL TERM FOR ORS] you can get for the treatment ofdiarrhoea?
YES, WITHOUT SHOWING PACKETS .... l
IF SHE NEVER HEARD OF ORS, SHOW GOVERNMENT AND YES, AFTER SHOWING PACKETS ...... 2COMMERCIAL ORS PACKETS AND ASK:
00 ...................•.......... 3
Have you ever seen a packet like one of the-se before?
483 LESS TO ~INK .................... l
ABOUT SAME AMOUNT TO DRINK ....... 2
MORE TO DRINK .................... 3
When a child has diarrhoea, should he/she be given OK .......................... ; .... 8less to drink than usual, about the same amount,or more than usual? -
484 REPEATED WATERY STOOLS ........ , ... 1'.ANY WATERY STOOLS .................BREPEATED VOMITING .................CANY VOMITING ....•.•............... DBLOOD IN STOOLS .................•. E
When a child i' sick with diarrhoea, what signs of FEVER ............................. Fillness would tell you that he or ,he should be taken MARKED THIRST .....................Gto a health facility or health worker? NOT EATING/NOT DRINKING WELL ......H
GETTING SICKER/VERY SICK.......... INOT GETTING BETTER................ J
Any other signs?OTHER X
(SPECIFY)RECORD ALL MENTIONED. DK.- ............................... Z
485
RAPID BREATHING.....•.............ADIFFICULT BREATHING...............B
When a child i' sick with a cough, what signs NOISY BREATHING...................Cof illness would tell you that he or 'he FEVER............................. 0should be taken to a health facility or UNABLE TO DRINK................... Ehealth worker? NOT EATING/NOT DRINKING WELL ...... F
GETTING SICKER/VERY SICK.....•....GAny other signs? NOT GETTING BETTER.............•..H
OTHER XRECORD ALL MENTIONED. (SPECIFY)
OK................................ Z.
304

QUESTIONS AND FILTERS CODING CATEGORIES SKIP
486
Now I would like to ask you about some healthsymptoms you yourself may have ..
During the past three months, have you had any of thefollowing problems with your vaginal discharge: YES NO
Any itching or irritation in vaginal area with the ITCHING/IRRITATION ... 1 "2discharge?
A bad odour along with the discharge? BAD ODOUR 1 2
Severe lower abdominal pain with the discharge,not related with menstruation? ABDOMINAL PAIN....... 2
A fever along with the discharge? FEVER. . . . . . . . . . . . . . . . 2
Any other problem with the discharge? OTHER PROBLEM. ... .... 2
487
yES .....•..................•.... 1
During the past three months have you had a problemwith pain or burning while urinating, or havevou had more frequent or difficult urination?
NO 2
CHECK 107:CURRENTLY MARRIED
488SEPARATED I
TDESERTED r-lDIVORCED L---' -'-'.>491
1._1- v __.".'OO.";;:E.D I-_I
489
yES 1
Another problem some women have is feeling pain intheir abdomen or vagina during intercourse. Do youoften experience this kind of pain?
NO ; 2
490 YES ' 1
Do you ever see blood after having sex, at timeswhen ou are not menstruatino?
NO 2
491 CHECK 486, 487, 489 and 490: OTHER IYES TO ANY r-l 0........ '-r:'~ ....:...:_ ;;;oi;i>5~01..
492
Have you seen anyone for advice or treatment tohelp you with (this problem/these problems)?
PUBLIC MEDICAL SECTORGOVT. DOCTOR APUBLIC HEALTH NURSE ...•.......... BANM/LHV CMALE MPW/SUPERVISOR 0ANGANWADI WORKER EVILLAGE HEALTH GUIDE FOTHER PUBLIC SECTOR
HEALTH WORKER G
NGO WORKER ..•............•........ H
H' YES, ASK:
Whom did you see?
Anyone else?
PRIVATE MEDICAL SECTORPRIVATE DOCTOR IPRIVATE NURSE JCOMPOUNDER/PHARMACIST KVAID/HAKIM/HOMEOPATH LDAI (TBA) MTRADITIONAL HEALER NOTHER PRIVATE SECTOR
HEALTH WORKER .....•...........°RECORD ALL PERSONS SEEN. OTHER' ,""m"",__~~x
- (SPECIfY)NO, NOBODY SEEN Y
305

SECTION SA. FERTILITY PREFERENCES
NO. I QUESTIONS AND FILTERS I CODING CATEGORIES I SKIP
501 CHECK 107: ICURRENTLY MARRIED SEPARATED
TDESERTED 0DIVORCED I >507WIDOWED
V
502 CHECK 327/327A: INEITHER
THE OR SHE 0 "STERILIZED STERILIZED I >507
V
CHECK 230:503
NOT PREGNANT OR UNSURE
TJPREGNANT
TJi iV V HAVE R (ANOTHER) CHILD.......... 1
NO MORE/NONE ....................2-->506SAYS SHE CAN'T GET PREGNANT ..... 3-->507UP TO GOD ....................... 4===r>506UNDECIDED/DK.................... 8
Now I· have some questions Now , have some questionsabout the future. about the future.Would you like to have After the child you are(a/another) child or expecting, would you likewould you prefer not to to have another child orhave any (more) children? would you prefer not to
have any more children?
50'
.BOy ............................. 1GIRL ............................ 2
Would you prefer your next child to be a boy or a girl DOESN'T MATTER .................. 3or doesn't it matter? UP TO GOD....................... 4
CHECK 230:
EB505 MONTHS ................... 1NOT PREGNANT OR UNSURE
TJPREGNANT
TJ yEARS .................... 2i i
V V SOON/NOW..•....•.............. 993
SAYS SHE CAN'T GET PREGNANT ... 994---->507
OTHER 996(SPECIFY)
DK.................•.......... 998How long would you like How long would you like toto wait from now before wait after the birth ofthe birth of (a/another) the child you are expectingchild? before the birth of another
child?
306

NO
506 CHECK 230:
QUESTIONS AND FILTERS CODING CATEGORIES SKIP
NOT PREGNANT OR UNSURE Y,-, .---J
v
Do you think your husbandwould like to have(a/another) child or do youthink he would prefer nothave any (more) children?
CHECK 216:
PREGNANT CfJ,-,----'v
After the child you areexpecting, do you thinkyour husband would like tohave another child or doyou think he would prefernot have any more children?
HAVE A (ANOTHER) CHILD 1NO MORE/NONE •••••••••••••••••••• 2UP TO GOD •.••••••••••••••...•••• 3UNDECIDED ••••••..••••••••••••••• 4DK •••••••••••..••••••••••••••••• 8
507HAS LIVING CHILD (REN) Y,-, .---J
v
NO LIVING
,v
CHILDRENCfJ
NUMBER·····················m
OTHER ANSWER'__'T<"",nw.__96-->S09(SPECIFY)
If you could go back to thetime you did not have anychildren and could chooseexactly the number of childrento have in your whole life,hOw many would that be?
If you could chooseexactly the number ofchildren to have inyour whole life, howmany would that be?
m m
508
RECORD SINGLE NUMBER OR OTHER ANSWER.
BOYS
NUMBER···m
GIRLS EITHER
509
510
How many of these children would you like to beboys, how many would you like to be girls, andfor how many would the sex not matter?
In your opinion, how much education should be given togirls these days?
In your opinion, how much education should be given to~ these days?
307
OTHER. -c~~"",,---- __99999;(SPECIFY)
NO EDUCATION 01LESS THAN PRIMARy 02PRIMARY 03MIDDLE 04HIGH SCHOOL 05HIGHER SECONDARy 06GRADUATE AND ABOVE 07PROFESSIONAL DEGREE 08AS MUCH AS SHE DESIRES 09DEPENDS 10DK••••••••.••••••••••••.••••••• 98
NO EDUCATION 01,LESS THAN PRIMARy oiPRIMARy 03MIDDLE 04HIGH SCHOOL 05HIGHER SECONDARy 06GRADUATE AND ABOVE 07PROFESSIONAL DEGREE 08AS MUCH AS HE DESIRES 09DEPENDS 10DK ••••••••••••••••••••••••••••• 98

NO QUESTIONS AND FILTERS
SECTION 5B. STATUS OF WOMAN
CODING CATEGORIES SKIP
51> 1 ~ RESPONDENT2 ~ HUSBAND3 ~ JOINTLY WITH HUSBAND4 ~ OTHERS IN HOUSEHOLD5 ~ JOINTLY WITH OTHERS IN HOUSEHOLD
Who makes the following decisions in your household:
What items to cook? I 2 3 4 5
Obtaining health care for yourself? I 2 3 4 5
Purchasing jewellery or other major household items? 1 2 3 4 5
Your going and staying with parents or siblings? 1 2 3 4 5
512Do you need permission to: NOT
ALLOWEDYES NO TO GO
go to the market? GO TO THE MARKET .... 1 2 3
visit relatives or friends? VISIT RELATIVES/FRIENDS .......... 1 2 3
513 I yES ............................. 1 IAre you allowed to have some money set aside that you NO.............................. 2ceo use as you wish?
514
Sometimes a wife can do things that bother herhusband. Please tell me if you think that a husbandis justified in beating his wife in each of thefollowing situations: YES NO OK
If he suspects her of being unfaithful? UNFAITHFUL ............ 1 2 8
If hor natal family does not give expected money, MONEY/JEWELLERY/jewellery, or other items? OTHER ITEMS .......... 1 2 8
If she shows disrespect for in-laws? DISRESPECT............ 1 2 8
If she goes out without telling him? GOING WITHOUT TELLING. 1 2 8
If she neglects the house or children? NEGLECT .......•....... 1 2 8
If she doesn't cook food properly? NOT COOK PROPERLy ..... 1 2 8
515
yES .....................•....... 1Since you completed 15 years of age, have you beenbeaten or mistreated physically by any person? NO .............................. 2-->601
308

NO
516
517
QUESTIONS AND FILTERS
Who has beaten you or mistreated you physically?
Anyone else?
RECORD ALL PERSONS MENTIONED.
How often have you been beaten or mistreated physicallyin the last 12 months: once, a few times, many times,or not at all?
309
CODING CATEGORIES
MOTHER...••••••••••••..•.•••••••• AFATHER ••••••••.•••••••••••••••••• 8STEP MOTHER•••••••••••••••••••••• CSTEP FATHER •••••••••...•••••••••• DSON ••••••••••••••••••••••••••••.• EDAUGHTER •••••••••..•••••••••••••• FBROTHER/SISTER .•....•........•..• GBOYFRIEND .•.•..•.......•..••.•..• HHUSBAND••..••••••••••••.••••••••• IEX-HUSBAND••••••••••••••••••••••• JSON-IN-LA~'1. ..•..••...•..•..•..... KDAUGHTER-IN-LAW •••••.•••••••••••• LMOTHER-IN-LAW •.• _.•.........•.•.. MFATHER-IN-LAW ••••••••••••••••••.• NBROTHER- IN- LAW ••••.••••••••••••.• aSISTER-IN-LAW •••••••••••••••••••• POTHER RELATIVE ••••••••••••••••••• QFRIEND/ACQUAINTANCE ••••••••••••.• RTEACHER •••••••••••••••••••••••••• SEMPLOYER ••••••••.•••••••••••••••• TSTRANGER ••.••••••••••••.••••••••• U
OTHER~__,=~"",, ~~X(SPECIFY)
ONCE ••••••••••••••••••••••••••••• 1A FEW TIMES ••••••••••.••••••••••• 2MANY TIMES ••••••••••••••••••••••• 3NOT BEATEN ••••••••••••••••••••••• 4
SKIP

SECTION 6. HUSBAND'S BACKGROUND AND WOMAN'S WORK
NO. I QUESTIONS AND FILTERS I CODING CATEGORIES I SKIP
601 CHECK 107:
1CURRENTLY MARRIED SEPARATED
TDESERTED 0DIVORCED I >603WIDOWED
v
602
1 How old was your husband on his last birthday?AGE IN COMPLETED yEARS .....~ 1
Did your (last) husband ever attend school?
YES 1 INO 2-->606
60<
What is the hiahest grade he completed?GRADE ......................~
605 CHECK 604: 0 I
TGRADE 6 AND ABOVE >607
GRADE 0-5
v
yES ·· 1
(Can/Could) he read and write?
What kind of work (does/did) your(last) husband mainly do?
NO 2
~
608 CHECK 607: IWORKS (WORKED) 0 DOES (DID) 0
.. O.N_F.A.RM l .g.~.TF.~.~.R.K ...I'.6.'.0.
609HIS LAND 1FAMILY LAND 2RENTED LAND....................• 3SOMEONE ELSE 1 S LAND 4
610
611
(Does/did) your husband work mainly on hisown land or family land, or (does/did) he rent land,or (does/did) he work on someone else's land?
Aside from your own housework,are you currently working?
As you know, some women take up jobs for which theyare paid in cash or kind. Others sell things, havea small business or work on the family farm or inthe family business.
Are you currently doing any of these things or anyother work?
310
IyES 1-->613NO 2 I
yES 1-->613
NO 2

NO. QUESTIONS AND ~ILTERS CODING CATEGORIES , SKIP
612
613
614
615
616\
617
618
Have you done any work in the last 12 months?
What is your occupation, that is,what kind of work do/did you mainly do?
00 you do this work for your family's farm or business,for someone else, or are you self-employed?
Do you usually work throughout the year, ordo you work seasonally, or only once in a while?
Are you paid in cash or kind for this work, or are younot paid at all?
Generally, how much do your earnings contribute to thetotal family earnings: almost none, less than half,about half, more than half, or all?
Who mainly decides how the money you earnwill be used?
311
yES l INO.................•...........•2-->701
-----CD
FAMILY FARM/BUSINESS ••.•..•.••.•. 1SOMEONE ELSE •••••.••••••••••••••• 2SELF-EMPLOYED•••••••••••••••••••• 3
THROUGHOUT THE YEAR ..... '" , 1SEASONALLY/PART OF THE yEAR 2ONCE IN A WHILE •....•.•••.•.••.•. 3
CASH ONLy •.•..•....•..•..•...... 1 ICASH AND KIND .•.••..•....•..•••• 2KIND ONLY •.......•..•..•.•..•.•• 3==r:>619NOT PAID ..•.•..•.....•.•..•.•..• 4
ALMOST NONE •...•..•....••....•.. 1LESS THAN HALF ....•..•....••.•.. 2ABOUT HALF ...•....•..•..•..•.••. 3MORE THAN HALF.••..•.•.....••••. 4ALL•..•....•..•....•.......•..•. 5
RESPONDENT DECIDES .... ,. '" ••.. 1HUSBAND DECIDES ..•.•.•••.•..•.. 2JOINTLY WITH HUSBAND•..•..•..•. 3SOMEONE ELSE DECIDES ••.•.••..•. 4JOINTLY WITH SOMEONE ELSE .•..•. 5

NO.
619
QUESTIONS AND FILTERS
Do you usually work at home or away from home?
CODING CATEGORIES , SKIP
I~~~~:::::::::::::::::::::::::: :~1>701
620 CHECK 215/218: IHAS CHILD BORN SINCE YES NOJAN. 1995 AND LIVING 0 0
.......AT.".O.".E.'••••••••••• !_••••L.-.~.-.-.-.-.-.-.-.-.-.-.-.~~-.-.-.-.-.-.-.-.-.-.-.-.-.-.-.-.-.-.-.-.-.~~-.-.-.-.-.-JI~.·>7.0.'..621
USUALLY ..•.•..•....•..•.•.••..•. 1-->701SOMETIMES .. _..•..•.•..•.•..•...• 2NEVER••••••••••••••••.•••••••••• 3
While you are working, do you usuallyhave (NAME OF YOUNGEST CHILD AT HOME) with you,sometimes have him/her with you, ornever have him/her with you?
622
Who usually takes care of(NAME OF YOUNGEST CHILD AT HOME)while you are working?
312
HUSBAND •••••••••••••••••••••••• 01OLDER BOyS .•..•..•.•.•.....•..• 02OLDER GIRLS •..•.••.•.••...•••.• 03OTHER RELATIVES .•.••.•.. _•...•• 04NEIGHBOURS ••••••••••••••••••••• 05FRIENDS .•.•..•.••.•..•..•.•..•. 06SERVANTS/HIRED HELP 07CHILD IS IN SCHOOL 08INSTITUTIONAL CHILDCARE 09
OTHER --,===,, 96(SPECIFY)

NO.
701
702
703
704
705
SBCTION 7 - AIDS
QUESTIONS AND FILTERS
Have you ever heard of an illness called AIDS?
From which sources of information have you learnedabout AIDS?
Any other source?
RECORD ALL MENTIONED.
IS there anything a person can do to avoid gettingAIDS?
What can a person do?
Any other ways?
RECORD ALL MENTIONED.
RECORD THE TIME
CODING CATEGORIES , TO
YES ••••••••••••••••••••••••••••• 1 INO.•.•..•....••.•..........•.... 2--:>705
RADIO•..•....•..•..•.......•.••. ATELEVISION ..••..•.•.••.....•.••• BCINEMA •••••••••••••••••••••••••• CNEWSPAPERS/MAGAZINES 0POSTERS/HOARDINGS. . _. __ ._.EEXHIBITION!MELA.. _, , FHEALTH WORKERS GADULT EDUCATION PROGRAMME .. , HRELIGIOUS LEADERS 1POLITICAL LEADERS JSCHOOLS/TEACHERS KCOMMONITY MEETINGS LFRIENDS/RELATIVES•....... , MWORK PLACE N
OTHER. "'''''''''';;;;: .X{SPECIFY}
yES 1
~~:: ::: ::::: ::: :::::::: ::: ::: :::~=r705
ABSTAIN FROM SEX AUSE CONDOMS BHAVE ONLY ONE SEX PARTNER CAVOID SEX WITH COMMERCIAL
SEX WORKERS ........•........... DAVOID SEX WITH HOMOSEXUALS EAVOID BLOOD TRANSFUSIONS FAVOID INJECTIONS/USE CLEAN
NEEDLES GAVOID I.V. DRUG USE HAVOID KISSING IAVOID HUGGING JAVOID HAND SHAKING .......•......KAVOID SHARING CLOTHES _.. _ LAVOID SHARING UTENSILS MAVOID SHARING SHAVING
KITS/RAZORS .. _ _.. _ NAVOID STEPPING ON URINE/STOOL 0AVOID MOSQUITO BITES P
OTHER 'CW",""",,__-,X~ {SPECIFY}
OK Z
HOUR·······················rnMINOTES .
YES NO706 PRESENCE OF OTHERS DURING MOST
OF THE INTERVIEW TIME.
313
CHILDREN UNDER 10 1HUSBAND 1MOTHER-IN-LAW 1OTHER MALES 1OTHER FEMALES 1
22222

HEALTH INVESTIGATOR VISITS
1 2 3 FINAL VISIT
DATE DAY
MONTH
YEAR I 11 9
INVESTIGATOR'S NAME NAME CODE
RESULT* RESULT CODE'-----
NEXT VISIT: DATE
11111111I1I11I1111111 TOTAL NUMBER DTIME OF VISITS
*RESULT CODES:1 COMPLETED 3 POSTPONED 5 PARTLY COMPLETED2 NOT AT HOME 4 REFUSED 6 OTHER (SPECIFY)
314

SECTION 8: HEIGHT AND WEIGHT
INTERVIEWER: IN 801 (COLUMNS 2-3) RECORD THE LINE NUMBER FOR EACH CHILD BORN SINCE JANUARY 1995 AND STILL ALIVE.IN 802 AND 803 RECORD THE NAME OF THE RESPONDENT AND ALL HER LIVING CHILDREN BORN SINCE JANUARY1995, AND THE DATE OF BIRTH OF THE CHILDREN.IN 804 AND 806 RECORD THE HEIGHT AND WEIGHT OF THE RESPONDENT AND LIVING CHILDREN.
(NOTE:IF THERE ARE MORE THAN 2 LIVING CHILDREN BORN SINCE JANUARY 1995, CHECK BOX DAND USE ADDITIONAL QUESTIONNAIRE)
801LINE NO.
FROM Q.212
802NAME
FROM Q.212 FOR CHILDREN
803DATE OF BIRTH
FROM Q.21S FOR CHILDREN, COPYMONTH AND YEAR OF BIRTH AND ASKFOR DAY OF BIRTH
804HEIGHT{in centimetres}
805WAS HEIGHT/LENGTH OF CHILDMEASURED LYING DOWN ORSTANDING UP?
806WEIGHT(in kilograms)
807DATEWEIGHEDANDMEASURED
l'J RESPONDENT l'J YOUNGEST l'J NEXT-TO-LIVING CHILD YOUNGEST
LIVING CHILD
CD CD(NAME) (NAME)
DAY""dill DAY "dillMONTH ...... MONTH ......
YEAR. YEAR.
rro-D rro-DLYING .......•.. 1 LYING .......... 1
STANDING....... 2 STANDING....... 2
rro-D ITIlD ITIlDDAY""dill DAY" dill DAY" dillMONTH ...... MONTH ...... MONTH ......
YEAR. YEAR. YEAR.
808RESULT
COMPLETED 1
NOT PRESENT .... 2
REFUSED 3
OTHER ......•... 6
(SPECIFY)
COMPLETED 1CHILD SICK 2CHILD NOT
PRESENT 3CHILD DID NOT
ALLOW 4MOTHER REFUSED.SOTHER 6
(SPECIFY)
COMPLETED 1CHILO SICK 2CHILD NOT
PRESENT 3CHILO DID NOT
ALLOW 4MOTHER REFUSED.SOTHER 6
(SPECIFY)
809NAME OFMEASURER: CD
315
NAME OFASSISTANT: CD

901
SECTION 9. ANAEMIA
As a part of this survey, we are studying anaemia among women and children.We request your co-operation in this regard. This will assist the Governmentof India to develop programmes to prevent and treat anaemia.
Anaemia is a serious health problem in India, which results from poornutrition. However, if a person is found to have anaemia, the person can be given ironfolic tablets to cure the disease.
If you decide to be tested for anaemia, we will request that you give a dropof blood from your finger for the test. (Also, if you have a child under 3 years old,please allow me to take a(few)drop(s)of blood from him/her for anaemia testing).We will use disposable sterile instruments that are clean and completely safe.Your child will feel a slight pinch when the blood is drawn. There is essentiallyno risk to your child from this procedure. The blood will be analyzed with newequipment provided by the United Nations. The result(s) of the test(s) will be given toyou right after the blood is taken. The results of the tests will be kept confidentialand will not be shown to other persons. Are there any questions about the blood testingthat you would like to ask me now?
May I ask you now to give your consent to have the test(s) done. If youdecide not to have the testes), it is your right, and we will respect your decision. Nowplease tell me whether you agree to have the testes) (and allow me to test your child).
AFTER EXPLAINING THE ABOVE, I HAVE FOUND THAT AGREED TO GIVE(NAME OF RESPONDENT)
A (FEW) DROP{S) OF BLOOD FOR HERSELF [AND FOR HER CHILD(REN) NAMED,"",OC,","TM",~,"__________l (NAME OF CHILD(REN})
Signature ofInterviewer : -'--_
RESPONDENT AGREES TO TESTING OFHERSELF AND/OR HER CHILD (REN) ... 1
Signature ofWitness: __
Date
Date
RESPONDENT DOES NOT AGREETO TESTING ...•......••..••. 2 ->END
RESPONDENT'S HAEMOGLOBINLEVEL (G/DL)
v----------'----------------'
[lID
316

MEASURED........••........•.........••.......•.•... 1903 RESULT
REFUSED•.•.........•............................... 2
OTHER 6(SPECIFY)
904 CHECK 215/216:
ONE OR MORE LIVING CHILDREN r NO LIVING CHILDREN BORND...->910BORN SINCE JANUARY 1995 SINCE JANUARY 1995
vIN 905 RECORD THE LINE NUMBER FOR EACH CHILD BORN SINCE JANUARY 1995 AND STILL ALIVE.IN 906 RECORD THE NAMES OF THE LIVING CHILDREN.IN 907 RECORD THE HAEMOGLOBIN LEVEL IN THE BLOOD OF THE LIVING CHILDREN.
(NOTE:IF THERE ARE MORE THAN 2 LIVING CHILDREN BORN SINCE JANUARY 1995, CHECK BOX 0AND USE ADDITIONAL QUESTIONNAIRE)
905
906
907
LINE NUMBER FROM Q. 212
NAME FROM Q.212
HAEMOGLOBIN LEVEL INTHE BLOOD (G/DL)
NAME
YOUNGEST LIVINGCHILD
[D
[D·D
NAME
NEXT-TO-YOUNGESTLIVING CHILD
[D
[D·DMEASURED......••.......•• 1 MEASURED.....•........... 1
908 RESULTCHILD SICK........•...... 2 CHILD SICK.....•......... 2
CHILD NOT PRESENT ....•... 3 CHILD NOT PRESENT ........ 3
CHILD DID NOT ALLOW...... 4 CHILD DID NOT ALLOW...•.. 4
MOTHER REFUSED ......•.... 5 MOTHER REFUSED ..•.......• 5
OTHER 6 OTHER 6(SPECIFY) (SPECIFY)
NAME OF MEASURER909
[D
910 CHECK 902 AND 907 :
NO VALUES BELOW 7 G/DL 0-> GIVE MOTHER RESULT OF HAEMOGLOBINMEASUREMENT AND END THE INTERVIEW
ANY VALUE BELOW 7 G/DL0->FOR MOTHER AND/OR CHILD(REN) GIVE MOTHER RESULT OF HAEMOGLOBIN
MEASUREMENT AND CONTINUE WITH 911.
317

911 CHECK COLUMN (5) OF HOUSEHOLD SCHEDULE:
RESPONDENT IS RESPONDENT ISUSUAL RESIDENT VISITOR
D...->ENDQ
V
912
We detected a low level of haemoglobin in your (your child's) blood. This indicates you(your child) have developed severe anaemia, which is a serious health problem. We wouldlike to inform the doctor at about your (your child's) condition.This will assist you to obtain appropriate treatment of your (your child's) condition.
Do you agree that the information about the level of haemoglobin in your (your child's)blood may be given to the doctor.
AFTER EXPLAINING THE ABOVE, I HAVE FOUND THAT AGREED FOR(NAME OF RESPONDENT)
REFERRAL FOR HERSELF (AND FOR HER CHILD(REN) NAMED1 (NAME OF CHILD{REN)}
Signature ofInterviewer: Date ,
RESPONDENT AGREES FOR REFERRAL FOR RESPONDENT DOES NOT AGREEHERSELF AND/OR HER CHILD (REN) .... 1 FOR REFERRAL ••.••......••. 2 -> END
IV
913 RECORD NAMES OF WOMAN AND CHILD (REN) WITH HAEMOGLOBIN LEVEL LESS THAN 7 G/DL ONREFERRAL FORM.
318

INTERVIEWER'S OBSERVATIONS(To be filled in after completing interview)
Comments About Respondent:
Comments on Specific Questions:
Any Otber Comments:
SUPERVISOR'S OBSERVATIONS/COMMENTS
Name of Supervisor: _ Date: _
EDITOR'S OBSERVATIONS/COMMENTS
Name of Editor: _
319
Date: _

NATIONAL FAMILY HEALTH SURVEY, 1998-99 (NFHS-2)
INTERNATIONAL INSTITUTE FOR POPULATION SCIENCES, MUMBAI
RESULTS OF HAEMOGLOBIN MEASUREMENT IN THE BLOOD:
Date: _
Woman Child Child
NAME NAME NAMEHaemoglobin level in the blood (G/DL) [lID OD-D OD-D
You have Your child has Your child has
WHO CLASSIFICATION OF ANAEMIA
NORMAL LEVEL HB LEVEL ABOVE 11 G/DL NORMAL LEVEL NORMAL LEVEL NORMAL LEVEL
MILD ANAEMIA HB (10-10.9 G/DL) MILD ANAEMIA MILD ANAEMIA MILD ANAEMIA
MODERATE ANAEMIA HB (7-9.9 G/DL) MODERATE ANAEMIA MODERATE ANAEMIA MODERATE ANAEMIA
SEVERE ANAEMIA HB (LESS THAN 7 G/DL) SEVERE ANAEMIA SEVERE ANAEMIA SEVERE ANAEMIA
In case of severe anaemia (lIb less than 7 GIDL), we recommend that you immediately contact your doctor.
320

NATIONAL FAMILY HEALTH SURVEY, 1998-99 (NFHS-2)VILLAGE QUESTIONNAIRE
INDIA
CONFIDENTIALFor ResearchPurpose only
IDENTIFICATION
STATE
DISTRICT .
TEHSIL/TALUK
VILLAGE IPSU NUMBER ......................................
TOTAL POPULATION OF THE VILLAGEACCORDING TO THE 1991 CENSUS ...................
INTERVIEWER'S NAME CDDATE OF INTERVIEW "",e ...••••~
MONTH ..............
yEAR.........
RESULT:
BOTH VILLAGE SCHEDULE AND VILLAGE HEAD SCHEDULE COMPLETED ......... 1
ONLY VILLAGE SCHEDULE COMPLETED ................................... 2
OTHER 6(SPECIFY)
SUPERVISOR
CDFIELD
CDOFFICE
CDKEYED
CDEDITOR EDITOR BYDATE
NAME
32-/ -

VILLAGE SCHEDULE
~ .,ijQ.U.E.ST_IO.N.S ... .C.O.D.'.N.G.C.'.T.E.G.O.R.'.E.S ,
1 I Current population of the village: rn=m I2 I Area of the village (in Hectares) : [II] I3 I Total number of households in the village: ITrn I4
5
6
Total arable land in the village (in Hectares) :
Main source of irrigation in the village:
Major crops grown in the village:
Distance to the nearest town (in kilometres) :
Distance to the District Headquarters (in kilometres) :
Distance to the nearest railway station(in kilometres) :
Distance to available transport service to other place(in kilometres) :
Distance of the village from all-weather road inconnection to other place (in kilometres) :
village Electrification:
322
IRRIGATED LAND ...•••.•.• [II]NON-IRRIGATED LAND [II]
RAIN WATER ................•.•.• 01TANK/POND 02STREAM/RIVER 03CANAL •..•.••.•.•..•..•.•..•.•.. 04WELL 05TUBE WELL........... . 06
OTHER 96(SPECIFY)
1
~2
3
colcolcolcolcol
NOT ELECTRIFIED 1
ELECTRIFIED, BUTIRREGULAR SUPPLY 2
ELECTRIFIED ANDREGULAR SUPPLY 3

NO
13
14
15
QUESTIONS
Educational Facilities:
Primary School
Middle School
Secondary School
Higher Secondary School
College
IF DISTANCE MORE THAN 90 KILOMETRES, RECORD 90;IF FACILITY IS AVAILABLE IN THE VILLAGE, RECORD 95
Health Facilities:
Sub-Centre
Primary Health Centre
community Health Centre/Rural Hospital
Government Dispensary
Government Hospital
Private Clinic
Private Hospital
IF DISTANCE MORE THAN 90 KILOMETRES, RECORD 90;IF FACILITY IS AVAILABLE IN THE VILLAGE, RECORD 95
Other facilities;
Post Office
Telegraph Office
STD Booth
Bank
IF DISTANCE MORE THAN 90 KILOMETRES, RECORD 90;IF FACILITY IS AVAILABLE IN THE VILLAGE, RECORD 95
323
CODING CATEGORIES
DISTANCE TO THE NEAREST FACILITYAVAILABLE (IN KILOMETRES) :
PRIMARY SCHOOL .........••.•.~
MIDDLE SCHOOL......•..••....~
SECONDARY SCHOOL•.••........~
COLLEGE ••.••.•.•••••••••••••~
DISTANCE TO THE NEAREST FACILITYAVAILABLE (IN KILOMETRES) :
SUB-CENTRE .••...........•.••~
~~~~~~:.~~~~~~ ~
COMMUNITY HEALTH ~
CENTRE/RURAL HOSPITAL ~
GOVERNMENT DISPENSARY ......•~
GOVERNMENT HOSPITAL ~
PRIVATE CLINIC ..•.••........~
PRIVATE HOSPITAL.......•.•••~
DISTANCE TO THE NEAREST FACILITYAVAILABLE (IN KILOMETRES) ;
POST OFFICE .....•••.......,.~
TELEGRAPH OFFICE •••.........~
STD BOOTH .....••............~
BANK••............••.••.•...~

~~ . ..Q~UE_S.T.'O.N.S" ..I~ C.O.D.'.N.G.C.A.T.E.G.O.R.'.E.S.. .'
16 Availability of health provider in the village: YES NO
Private doctor
Visiting doctor
village health guide (VHG)
Traditional birth attendant (dai)
Mobile health unit/visit
17 Other facilities:
PRIVATE DOCTOR •••••.••••• 1
VISITING DOCTOR •••.•••••• 1
VHG ••••••••••••••••••• '.,. 1
TBA (DAI) ••••.•••••••.•.• 1
MOBILE HEALTH UNIT 1
AVAILABLE IN THE VILLAGE
2
2
2
2
2
YES NO
Mills/small scale industries (M/SSI)
Credit cooperative society (eeS)
Agricultural cooperative society (ACS)
Fishermen's cooperative society (FeS)
Milk cooperative society (MeS)
Kirana/General Market Shop (K/GMS)
Weekly market
Fair price shop
Paan shop
Pharmacy/Medical shop
Mahila Mandal
Youth club
Anganwadi centre
Community centre
Adult education centre
Community television set
Cable connection
M/SSI .••.•.•••••••.•••••• 1
CCS •.•.......•.......•.•. 1
ACS •••••••.••.•.••••.••.• 1
FCS •••••.•••••••.••••••.• 1
MCS •••.•••••••.••••.•.••. 1
K/GMS ••••.••.•••••••••.•• 1
WEEKLY MARKET............ 1
FAIR PRICE SHOP.......... 1
PAAN SHOP •••••.•••••••.•• 1
PHARMACY/MEDICAL SHOP ••.• 1
MAHILA MANDAL............ 1
YOUTH CLUB............... 1
ANGANWADI CENTRE ••••.••.• 1
COMMUNITY CENTRE •••••.••• 1
ADULT EDUCATION CENTRE ••. 1
COMMUNITY TV SET ••••••••• 1
CABLE CONNECTION ••••.••.• 1
2
2
2
2
2
2
2
2
2
2
2
2
2
2
2
2
2
Total nUmber of television sets in the village:
Total nUmber of households having telephone connection: 1
The type of drainage facility in the village:
324
OJIUNDERGROUND DRAINAGE 1 IOPEN DRAINAGE 2
NO •.•..•..•.•..•..•....•..•.•..• 3

EB2.
1.
..N.O....'I000 ,iQ.U.E.S.T.'.O.N.S .'1. C.O~D~'~N.GO';C~A:;T~E~G.O~R~';iEiS ~
21IAny epidemic in the village during the last one year, I22 I Number of health or family welfare camps in the last I
one year?
23 Any beneficiaries in the village from the followingprogrammes:
BENEFICIARIES
Integrated Rural Development Programme (IROP)
National Rural Employment Programme (NREP)
Training Rural Youth for Self Employment (TRYSEM)
Employment Guarantee Scheme (EGS)
Development of Women and Children of Rural Areas(ONARCA)
Indira Awas Yojana (lAY)
sanjay Gandhi Niradhar Yojana (SGNY)
IRDP •.•••••••.••.••.•••••• [DNREP ••••••••••••••••••••••[DTRYSEM ••••••••••••••••••• [DEGS ••••••••••••••••••••••• [DDWACRA....•..........•.••. [DIAY •.••.••.•••••••.••••••• [DSGNY •••••••.••.••••.••••.• [D
24 Community level IEC activities for health and familywelfare during the last one year: YES NO
Film show FILM SHOW •••••••.•••••••• 1 2
Exhibition EXHIBITION. • • • . • • • • • • . • .• 1 2
Drama/song/dance performance DRAMA/SONG/DANCE PERFORM. 1 2
Puppet show POPPET SHOW.............. 1 2
Group meeting GROUP MEETING •••••••••••• 1 2
25Persons providing information for the village schedule:
RECORD ALL THE SOURCES.
SARPANCH .•.•••••••••••••••••••••• APATWARI _ BGRAM: SEVAK.•..•.•.••.........•••• CSCHOOL TEACHER .. DHEALTH PERSONNEL _...•.••..... E
OTHERS ==== ,X(SPECIFY)
325

VILLAGE HEAD SCHEDULE(SARPANCH/PRADHAN/MUKHIYA)
6. No. of Children
I. Age
S. Education
CD
CD
2. Sex Male .... 1Female .. 2
3. Religion
CD
Hindu ... 1Muslim .. 2Other ... 6
4. Caste SC ...• 1ST .•.. 2OBC ... 3Other.6
QUESTIONS
.
7In your opinion what are the two most important problems in this village?
l.
2..
8What are the two most important health problems in this village?
l.
2.
9What are the two most important health problems faced by women and children in this village?
l.
2.
Do you feel that it is necessary to encourage couplesin this village to have a small number of children? IyES 1
NO ••••••••••••••••••••••••• 2I
---->12
11If you are asked to prepare a plan to achieve this objective, what are the two mostimportant actions you would suggest?
l.
2.
12If you are asked to prepare a health plan for this Village, what are the two mostimportant actions you would recommend?
l.
2.
326