Role of dietary fatty acids and acute hyperglycemia in modulating cardiac cell death

General and Comparative Endocrinology xxx (2014) xxx–xxx
Contents lists available at ScienceDirect
General and Comparative Endocrinology
journal homepage: www.elsevier .com/locate /ygcen
Is plasma cortisol response to stress in rainbow trout regulatedby catecholamine-induced hyperglycemia?
http://dx.doi.org/10.1016/j.ygcen.2014.04.0020016-6480/� 2014 Elsevier Inc. All rights reserved.
⇑ Corresponding author. Address: Laboratorio de Fisioloxía Animal, Facultade deBioloxía, Edificio de Ciencias Experimentais, Universidade de Vigo, E-36310 Vigo,Spain. Fax: +34 986 812 556.
E-mail address: [email protected] (M. Conde-Sieira).
Please cite this article in press as: Gesto, M., et al. Is plasma cortisol response to stress in rainbow trout regulated by catecholamine-induced hypemia? Gen. Comp. Endocrinol. (2014), http://dx.doi.org/10.1016/j.ygcen.2014.04.002
Manuel Gesto, Cristina Otero-Rodiño, Marcos A. López-Patiño, Jesús M. Míguez, José L. Soengas,Marta Conde-Sieira ⇑Laboratorio de Fisioloxía Animal, Departamento de Bioloxía Funcional e Ciencias da Saúde, Facultade de Bioloxía, Universidade de Vigo, Spain
a r t i c l e i n f o a b s t r a c t
Article history:Available online xxxx
Keywords:Rainbow troutHead kidneyLiverCortisolGlucosePropranolol
Based on previous studies we hypothesize that under stress conditions catecholamine-induced hypergly-cemia contributes to enhance cortisol production in head kidney of rainbow trout. Therefore, treatmentwith propranolol (b-adrenoceptor blocker) should reduce the hyperglycemia elicited by stress and, there-fore, we expected reduced glucosensing response and cortisol production in head kidney. Propranololtreatment was effective in blocking most of the effects of catecholamines in liver energy metabolismresulting in a lower glycemia in stressed fish. The decreased glycemia of stressed fish treated with pro-pranolol was observed along with reduced transcription of genes involved in the cortisol synthetic path-way, which supports our hypothesis. However, changes in putative glucosensing parameters assessed inhead kidney were scarce and in general did not follow changes noted in glucose levels in plasma. Further-more, circulating cortisol levels did not change in parallel with changes in glycemia. As a whole, the pres-ent results suggest that glycemia could participate in the regulation of cortisol synthetic pathways butother factors are also likely involved. Propranolol effects on trout stress response were different depend-ing on time passed after stress onset; the direct or indirect involvement of catecholaminergic response inthe regulation of cortisol production and release deserves further investigation.
� 2014 Elsevier Inc. All rights reserved.
1. Introduction
A well established paradigm in stress physiology is that cortico-steroids stimulate glucose production to fuel metabolic processesfor reestablishing homeostasis (Wendelaar Bonga, 1997). However,an allostatic control of cortisol levels requires adjustment of setpoints for cortisol production and release. Levels of circulatingmetabolites like glucose could be involved in such a mechanismthrough either inhibitory or stimulatory effects. In a previousstudy, in order to elucidate the effects of circulating glucose on cor-tisol production, we incubated head kidney of rainbow trout at dif-ferent glucose concentrations and monitored cortisol productionunder ACTH stimulation (Conde-Sieira et al., 2013). We observedthat glucose levels modulate the release of cortisol from head kid-ney in the presence of ACTH. An increased release occurred underhigh glucose levels, and a decreased release occurred in the pres-ence of cytochalasin B, an inhibitor of transmembrane glucosetransport. The relationship between circulating glucose levels
and cortisol production suggests that under stress conditions glu-cose is important for the regulation of cortisol synthesis andrelease.
The initial step of the stress response in fish results in a surge ofplasma catecholamines adrenaline and noradrenaline (WendelaarBonga, 1997). The rise in circulating catecholamines results inhyperglycemia due primarily to the activation of hepatic b-adreno-ceptors and glycogenolysis (Fabbri et al., 1998). As commentedabove, based on a previous in vitro study (Conde-Sieira et al.,2013), we hypothesize that this catecholamine-induced hypergly-cemia contributes to enhance cortisol production in head kidneyinterrenal cells under stress conditions. To test this hypothesis,rainbow trout were treated with propranolol, an effective b-adre-noceptor blocker in this species (Wright et al., 1989; Dugan andMoon, 1998; Weber and Shanghavi, 2000; Dugan et al., 2003)and exposed to acute stress (chasing for 5 min). Our hypothesispredicts that propranolol would reduce the hyperglycemia elicitedby stress and, therefore, a reduced glucosensing response and cor-tisol production should occur in head kidney. Since cortisolresponse to stress is usually fully developed in no less than15 min (Mommsen et al., 1999; Gesto et al., 2013; López-Patiñoet al., 2014), and the cortisol elevation could also influence plasmaglucose levels (Wendelaar Bonga, 1997), we carried out a second
rglyce-

2 M. Gesto et al. / General and Comparative Endocrinology xxx (2014) xxx–xxx
experiment applying the same stress protocol, but allowing thefish recover for 10 additional minutes before sacrifice. Also, in thissecond experiment, we included two additional treatment groups(glucose; propranolol + glucose) in order to corroborate if glucosetreatment could counteract the effects induced by propranolol. Inboth experiments, we evaluated several stress markers in plasma(levels of cortisol, adrenaline, noradrenaline, glucose, and lactate)and liver (glycogen levels, and the activities and/or mRNA levelsof fructose 1,6-bisphosphatase (FBPase), glucose 6-phosphatase(G6Pase), glucokinase (GK), pyruvate kinase (PK), glycogen phos-phorylase (GPase), and glycogen synthase (GSase)). In head kidneywe monitored parameters related to glucosensing (Polakof et al.,2011), such as glycogen levels, activities of GK, PK, FBPase, andGSase, and mRNA abundance of GK, and components of ATP-dependent inward rectifier potassium channel (K+
ATP) such as poretype 6.x-like (Kir6.x-like), and sulfonylurea receptor-like (SUR-like).Finally, we also monitored in head kidney parameters related to cor-tisol synthesis including mRNA abundance of 3b-hydroxysteroiddehydrogenase (3bHSD), 11b-hydroxylase (11bH), cytochromeP450 cholesterol side chain cleavage (P450scc), and steroidogenicacute regulatory protein (StAR).
2. Materials and methods
2.1. Fish
Rainbow trout (Oncorhynchus mykiss Walbaum) were obtainedfrom a local fish farm (A Estrada, Spain). Fish were maintainedfor 15 days under laboratory conditions on a 12:12 L:D photope-riod in dechlorinated tap water at 15 �C. Fish mass was 101 ± 4 gat the beginning of the experiment. Fish were fed once daily(10:00 h) to satiety with commercial dry fish pellets (Dibaq-Dipro-teg; proximate food analysis was 48% crude protein, 14% carbohy-drates, 25% crude fat, and 11.5% ash; 20.2 MJ/kg of feed). Theexperiments described comply with the Guidelines of the Euro-pean Union Council (2010/63/EU), and of the Government of Spain(RD55/2013) for the use of animals in research. Animal protocolswere approved by the animal care committee of the University ofVigo.
2.2. Experimental design
Fish were randomly assigned to 100 L experimental tanks (twotank replicates per treatment), and acclimated for 15 days. Follow-ing acclimation, fish were fasted for 24 h before treatment toensure basal hormone and metabolite levels were achieved. Inexperiment 1, fish were anesthesized within tanks with 2-phen-oxyethanol (0.2% v/v), and IP injected once with 5 lL g�1 bodymass of saline alone (control and stress groups), or saline contain-ing propranolol (1 mg kg�1 body mass, propranolol from SigmaChemical Co.). In experiment 2, two additional groups were added,one injected with glucose (200 mg kg�1) and another injected withglucose and propranolol (at the same final concentrations men-tioned above). The concentration of propranolol was similar to thateffectively used in previous studies in the same species (Wrightet al., 1989; Dugan and Moon, 1998), and we evaluated in preli-minary experiments that treatment was effective in blockinghyperglycemic effects of stress (data not shown). The concentra-tion of glucose used in experiment 2 was evaluated in preliminaryexperiments (data not shown) to induce increased glucose levels inthe range typically observed under acute stress conditions. Imme-diately after injection, fish were returned to their tanks. All fishremained undisturbed for 1 h. After 1 h, in experiment 1 stressedgroups were disturbed by chasing for 5 min whereas non-stressedgroups in separate tanks remained undisturbed. Therefore, the 4experimental groups (2 tank replicates/treatment) used in experi-
Please cite this article in press as: Gesto, M., et al. Is plasma cortisol response tmia? Gen. Comp. Endocrinol. (2014), http://dx.doi.org/10.1016/j.ygcen.2014.04
ment 1 were: (1) control (non-stressed) fish (C); (2) non-stressedfish treated with propranolol (P); (3) fish stressed for 5 min (S);and, (4) fish treated with propranolol and stressed for 5 min(S + P). In experiment 2 stressed groups were also disturbed bychasing for 5 min and followed by 10 min of resting whereasnon-stressed groups were undisturbed. Therefore, the 6 experi-mental groups (2 tank replicates/treatment) used in experiment2 were: (1) control (non-stressed) fish (C); (2) non-stressed fishtreated with propranolol (P); (3) fish stressed for 5 min that restedfor 10 min (S); (4) fish treated with propranolol, stressed for 5 min,and rested for 10 min (S + P); (5) fish treated with glucose, stressedfor 5 min, and rested for 10 min (S + G); and, (6) fish treated withglucose and propranolol, stressed for 5 min, and rested for10 min (S + G + P).
For each sampling, fish were anesthesized in tanks with 2-phenoxyethanol (0.2% v/v) and sampled. Blood was collected bycaudal puncture with an ammonium-heparinized syringe, andplasma samples were obtained after blood centrifugation, anddivided into two aliquots. One aliquot was immediately frozenon liquid nitrogen for the assessment of plasma cortisol levels,whereas the other aliquot, for the assessment of plasma metabo-lites was deproteinized immediately (0.6 M perchloric acid) andneutralized (with 1 M potassium bicarbonate) before freezing onliquid nitrogen. Fish were rapidly sacrificed by decapitation, andliver and head kidney were taken, and snap-frozen in liquid nitro-gen. All samples were stored at�80 �C until assayed. In each group,10 fish were used to assess enzyme activities and metabolite levelswhereas 6 fish were used for the assessment of mRNA levels byqRT-PCR.
2.3. Analytical procedures
2.3.1. Assessment of hormone and metabolite levels in plasmaLevels of glucose and lactate in plasma were determined enzy-
matically using commercial kits (Biomérieux, Grenoble, France, forglucose; Spinreact, Barcelona, Spain for lactate) adapted to a micro-plate format. Plasma cortisol levels were assessed by ELISA using acommercially available kit (Cayman, Ann Arbor, MI, USA).
Levels of adrenaline and noradrenaline were assessed in plasmaby HPLC with electrochemical detection after plasma deproteiniza-tion followed by solid-phase extraction (SPE) as previouslydescribed (Gesto et al., 2013). A deproteinized plasma aliquotwas diluted to 1 mL in ultrapure water to be used for the SPE pro-cedure. The SPE cartridges (1 mL–100 mg tubes; Discovery� DSC-WCX, Supelco) were conditioned with 1.5 mL of ultrapure waterat a flow rate of 5 mL/min. The samples were then placed in theconditioned columns at 1 mL/min, and the columns washed twicewith 1 mL of ultrapure water (5 mL/min). Finally, the catechola-mines were eluted from the columns with two 400 lL aliquots of0.3 M HClO4 at 1 mL/min. Recoveries for noradrenaline and adren-aline exceeded 97%. Aliquots of 20 lL of these eluates were directlyinjected into the HPLC system, which was equipped with a JascoPU-2080 Plus pump, a 5 lm analytical column (Phenomenex,Nucleosil C18, 150 mm length � 4.6 mm diameter) and a ESA Cou-lochem II detector. The detection system included a double analyt-ical cell (M5011) with oxidation potentials set at +40 mV (firstelectrode) and +400 mV (second electrode). The mobile phase con-sisted of 25 mM citric acid, 25 mM Na2HPO4, 25 lM Na2EDTA,0.21 mM sodium 1-octanesulfonate, and 1% (v/v) methanol; pHwas adjusted to 3.4 with ortho-phosphoric acid (before the addi-tion of methanol), filtered (0.20 lm filter, Millipore, Bedford,USA), and degasified under vacuum before use. Analytical run timewas 10 min at an isocratic flow rate of 1.3 mL min�1 at room tem-perature. The sample peaks were quantified by comparing peakareas to those of appropriate external standards. The detection lim-its for the catecholamines were 3 pg of noradrenaline and 5 pg of
o stress in rainbow trout regulated by catecholamine-induced hyperglyce-.002
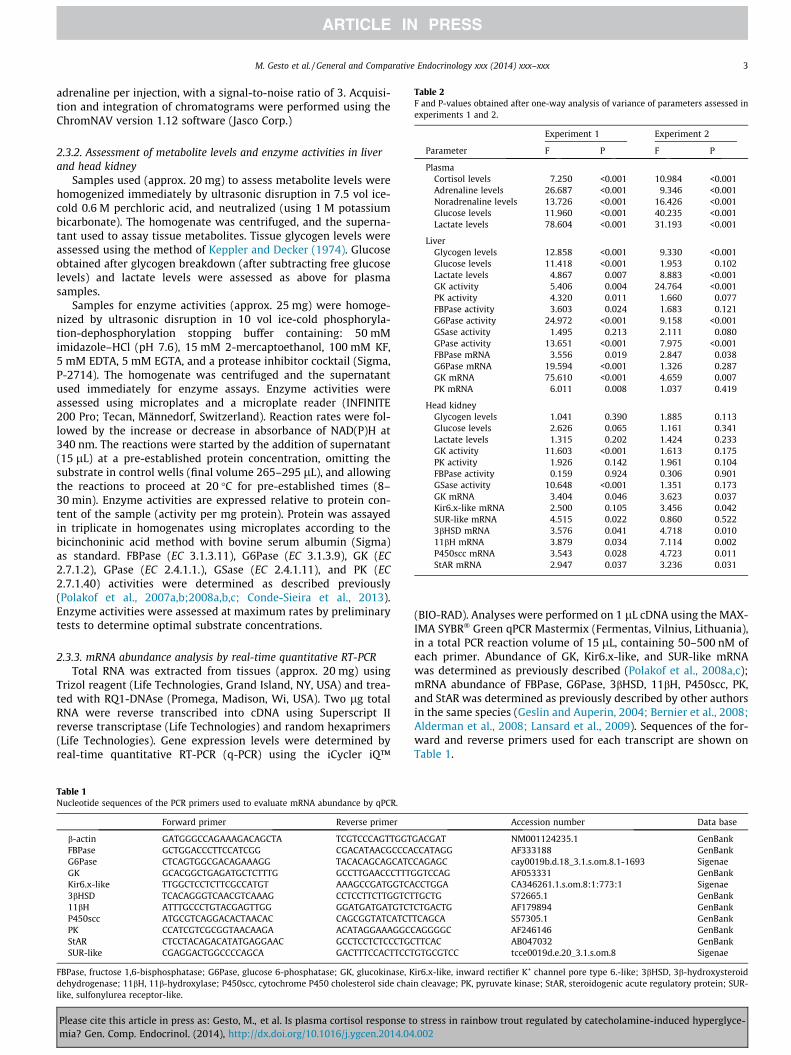
Table 2F and P-values obtained after one-way analysis of variance of parameters assessed inexperiments 1 and 2.
Experiment 1 Experiment 2
Parameter F P F P
PlasmaCortisol levels 7.250 <0.001 10.984 <0.001Adrenaline levels 26.687 <0.001 9.346 <0.001Noradrenaline levels 13.726 <0.001 16.426 <0.001Glucose levels 11.960 <0.001 40.235 <0.001Lactate levels 78.604 <0.001 31.193 <0.001
LiverGlycogen levels 12.858 <0.001 9.330 <0.001Glucose levels 11.418 <0.001 1.953 0.102Lactate levels 4.867 0.007 8.883 <0.001GK activity 5.406 0.004 24.764 <0.001PK activity 4.320 0.011 1.660 0.077FBPase activity 3.603 0.024 1.683 0.121G6Pase activity 24.972 <0.001 9.158 <0.001GSase activity 1.495 0.213 2.111 0.080GPase activity 13.651 <0.001 7.975 <0.001FBPase mRNA 3.556 0.019 2.847 0.038G6Pase mRNA 19.594 <0.001 1.326 0.287GK mRNA 75.610 <0.001 4.659 0.007PK mRNA 6.011 0.008 1.037 0.419
Head kidneyGlycogen levels 1.041 0.390 1.885 0.113Glucose levels 2.626 0.065 1.161 0.341Lactate levels 1.315 0.202 1.424 0.233GK activity 11.603 <0.001 1.613 0.175PK activity 1.926 0.142 1.961 0.104FBPase activity 0.159 0.924 0.306 0.901GSase activity 10.648 <0.001 1.351 0.173GK mRNA 3.404 0.046 3.623 0.037Kir6.x-like mRNA 2.500 0.105 3.456 0.042SUR-like mRNA 4.515 0.022 0.860 0.5223bHSD mRNA 3.576 0.041 4.718 0.01011bH mRNA 3.879 0.034 7.114 0.002P450scc mRNA 3.543 0.028 4.723 0.011StAR mRNA 2.947 0.037 3.236 0.031
M. Gesto et al. / General and Comparative Endocrinology xxx (2014) xxx–xxx 3
adrenaline per injection, with a signal-to-noise ratio of 3. Acquisi-tion and integration of chromatograms were performed using theChromNAV version 1.12 software (Jasco Corp.)
2.3.2. Assessment of metabolite levels and enzyme activities in liverand head kidney
Samples used (approx. 20 mg) to assess metabolite levels werehomogenized immediately by ultrasonic disruption in 7.5 vol ice-cold 0.6 M perchloric acid, and neutralized (using 1 M potassiumbicarbonate). The homogenate was centrifuged, and the superna-tant used to assay tissue metabolites. Tissue glycogen levels wereassessed using the method of Keppler and Decker (1974). Glucoseobtained after glycogen breakdown (after subtracting free glucoselevels) and lactate levels were assessed as above for plasmasamples.
Samples for enzyme activities (approx. 25 mg) were homoge-nized by ultrasonic disruption in 10 vol ice-cold phosphoryla-tion-dephosphorylation stopping buffer containing: 50 mMimidazole–HCl (pH 7.6), 15 mM 2-mercaptoethanol, 100 mM KF,5 mM EDTA, 5 mM EGTA, and a protease inhibitor cocktail (Sigma,P-2714). The homogenate was centrifuged and the supernatantused immediately for enzyme assays. Enzyme activities wereassessed using microplates and a microplate reader (INFINITE200 Pro; Tecan, Männedorf, Switzerland). Reaction rates were fol-lowed by the increase or decrease in absorbance of NAD(P)H at340 nm. The reactions were started by the addition of supernatant(15 lL) at a pre-established protein concentration, omitting thesubstrate in control wells (final volume 265–295 lL), and allowingthe reactions to proceed at 20 �C for pre-established times (8–30 min). Enzyme activities are expressed relative to protein con-tent of the sample (activity per mg protein). Protein was assayedin triplicate in homogenates using microplates according to thebicinchoninic acid method with bovine serum albumin (Sigma)as standard. FBPase (EC 3.1.3.11), G6Pase (EC 3.1.3.9), GK (EC2.7.1.2), GPase (EC 2.4.1.1.), GSase (EC 2.4.1.11), and PK (EC2.7.1.40) activities were determined as described previously(Polakof et al., 2007a,b;2008a,b,c; Conde-Sieira et al., 2013).Enzyme activities were assessed at maximum rates by preliminarytests to determine optimal substrate concentrations.
2.3.3. mRNA abundance analysis by real-time quantitative RT-PCRTotal RNA was extracted from tissues (approx. 20 mg) using
Trizol reagent (Life Technologies, Grand Island, NY, USA) and trea-ted with RQ1-DNAse (Promega, Madison, Wi, USA). Two lg totalRNA were reverse transcribed into cDNA using Superscript IIreverse transcriptase (Life Technologies) and random hexaprimers(Life Technologies). Gene expression levels were determined byreal-time quantitative RT-PCR (q-PCR) using the iCycler iQ™
Table 1Nucleotide sequences of the PCR primers used to evaluate mRNA abundance by qPCR.
Forward primer Reverse primer
b-actin GATGGGCCAGAAAGACAGCTA TCGTCCCAGTTGGTFBPase GCTGGACCCTTCCATCGG CGACATAACGCCCAG6Pase CTCAGTGGCGACAGAAAGG TACACAGCAGCATCGK GCACGGCTGAGATGCTCTTTG GCCTTGAACCCTTTGKir6.x-like TTGGCTCCTCTTCGCCATGT AAAGCCGATGGTCA3bHSD TCACAGGGTCAACGTCAAAG CCTCCTTCTTGGTCT11bH ATTTGCCCTGTACGAGTTGG GGATGATGATGTCTP450scc ATGCGTCAGGACACTAACAC CAGCGGTATCATCTPK CCATCGTCGCGGTAACAAGA ACATAGGAAAGGCCStAR CTCCTACAGACATATGAGGAAC GCCTCCTCTCCCTGCSUR-like CGAGGACTGGCCCCAGCA GACTTTCCACTTCCT
FBPase, fructose 1,6-bisphosphatase; G6Pase, glucose 6-phosphatase; GK, glucokinase, Kdehydrogenase; 11bH, 11b-hydroxylase; P450scc, cytochrome P450 cholesterol side chailike, sulfonylurea receptor-like.
Please cite this article in press as: Gesto, M., et al. Is plasma cortisol response tmia? Gen. Comp. Endocrinol. (2014), http://dx.doi.org/10.1016/j.ygcen.2014.04
(BIO-RAD). Analyses were performed on 1 lL cDNA using the MAX-IMA SYBR� Green qPCR Mastermix (Fermentas, Vilnius, Lithuania),in a total PCR reaction volume of 15 lL, containing 50–500 nM ofeach primer. Abundance of GK, Kir6.x-like, and SUR-like mRNAwas determined as previously described (Polakof et al., 2008a,c);mRNA abundance of FBPase, G6Pase, 3bHSD, 11bH, P450scc, PK,and StAR was determined as previously described by other authorsin the same species (Geslin and Auperin, 2004; Bernier et al., 2008;Alderman et al., 2008; Lansard et al., 2009). Sequences of the for-ward and reverse primers used for each transcript are shown onTable 1.
Accession number Data base
GACGAT NM001124235.1 GenBankCCATAGG AF333188 GenBankCAGAGC cay0019b.d.18_3.1.s.om.8.1-1693 SigenaeGTCCAG AF053331 GenBankCCTGGA CA346261.1.s.om.8:1:773:1 SigenaeTGCTG S72665.1 GenBankCTGACTG AF179894 GenBankTCAGCA S57305.1 GenBankAGGGGC AF246146 GenBankTTCAC AB047032 GenBankGTGCGTCC tcce0019d.e.20_3.1.s.om.8 Sigenae
ir6.x-like, inward rectifier K+ channel pore type 6.-like; 3bHSD, 3b-hydroxysteroidn cleavage; PK, pyruvate kinase; StAR, steroidogenic acute regulatory protein; SUR-
o stress in rainbow trout regulated by catecholamine-induced hyperglyce-.002

4 M. Gesto et al. / General and Comparative Endocrinology xxx (2014) xxx–xxx
Relative quantification of the target gene transcript was doneusing b-actin as housekeeping gene (Olsvik et al., 2005), whichwas stably expressed in this experiment. Thermal cycling was ini-tiated with incubation at 95 �C for 90 s using hot-start iTaq™ DNApolymerase activation; 35 steps of PCR were performed, each oneconsisting of heating at 95 �C for 20 s for denaturing, and at specificannealing and extension temperatures. Following the final PCRcycle, melting curves were systematically monitored (55 �C tem-perature gradient at 0.5 �C/s from 55 to 94 �C) to ensure that onlyone product was amplified. Samples without reverse transcriptaseand samples without RNA were run for each reaction as negative
Fig. 1. Levels of cortisol (A), adrenaline (B), noradrenaline (C), glucose (D), and lactate (E)(P); fish stressed by chasing for 5 min (S); fish treated with propranolol and stressed by chfish stressed by chasing for 5 min followed by 10 min resting (S); fish treated with protreated with glucose and stressed by chasing for 5 min followed by 10 min resting (S + G);10 min resting (S + G + P). Fish were previously intraperitoneally injected with 5 lL g�1 b(200 mg kg�1) or both. Each value is the mean + SD of n = 10 fish per group. Different le
Please cite this article in press as: Gesto, M., et al. Is plasma cortisol response tmia? Gen. Comp. Endocrinol. (2014), http://dx.doi.org/10.1016/j.ygcen.2014.04
controls. Relative quantification of the target gene transcript withthe b-actin as reference was made following the Livak andSchmittgen (2001) method.
2.4. Statistics
Comparisons among groups were carried out using one-wayANOVA. In those cases where a significant effect was noted, posthoc comparisons were carried out using the Tukey test, and differ-ences were considered statistically significant at P < 0.05. All com-parisons were carried out with the Sigma Stat statistical package.
in plasma of rainbow trout. Left column: non-stressed fish treated with propranololasing for 5 min (S + P). Right column: non-stressed fish treated with propranolol (P);pranolol and stressed by chasing for 5 min followed by 10 min resting (S + P); fishfish treated with glucose and propranolol, stressed by chasing for 5 min followed byody mass of saline alone (control) or containing propranolol (1 mg kg�1) or glucosetters indicate significant differences (P < 0.05) among treatments within each time.
o stress in rainbow trout regulated by catecholamine-induced hyperglyce-.002

M. Gesto et al. / General and Comparative Endocrinology xxx (2014) xxx–xxx 5
When necessary data were log transformed to fulfill the criteria forthe analysis of variance.
3. Results
Table 2 describes F-statistics and P-values obtained for theparameters assessed in experiments 1 and 2.
3.1. Experiment 1
Stress induced increased levels of all parameters assessed inplasma (cortisol, adrenaline, noradrenaline, glucose and lactate)compared with control groups. Treatment with propranolol coun-teracted this effect of stress on glucose levels whereas inducedenhanced levels of adrenaline, noradrenaline and lactate in plasma.Propranolol treatment alone increased levels of adrenaline andnoradrenaline compared with control (Fig. 1).
Levels of metabolites assessed in liver (Fig. 2) showed thatstress treatment alone induced a decrease in glycogen contentand an increase in glucose and lactate contents compared withthe control group. These increments induced by stress were notobserved in groups stressed and treated with propranolol.
Enzyme activities in liver are shown in Fig. 3. Stress decreasedPK, and increased FBPase, G6Pase, and GPase activities comparedwith the control group whereas stress in the presence of propran-olol induced no differences vs. the control group except for GKactivity (lower).
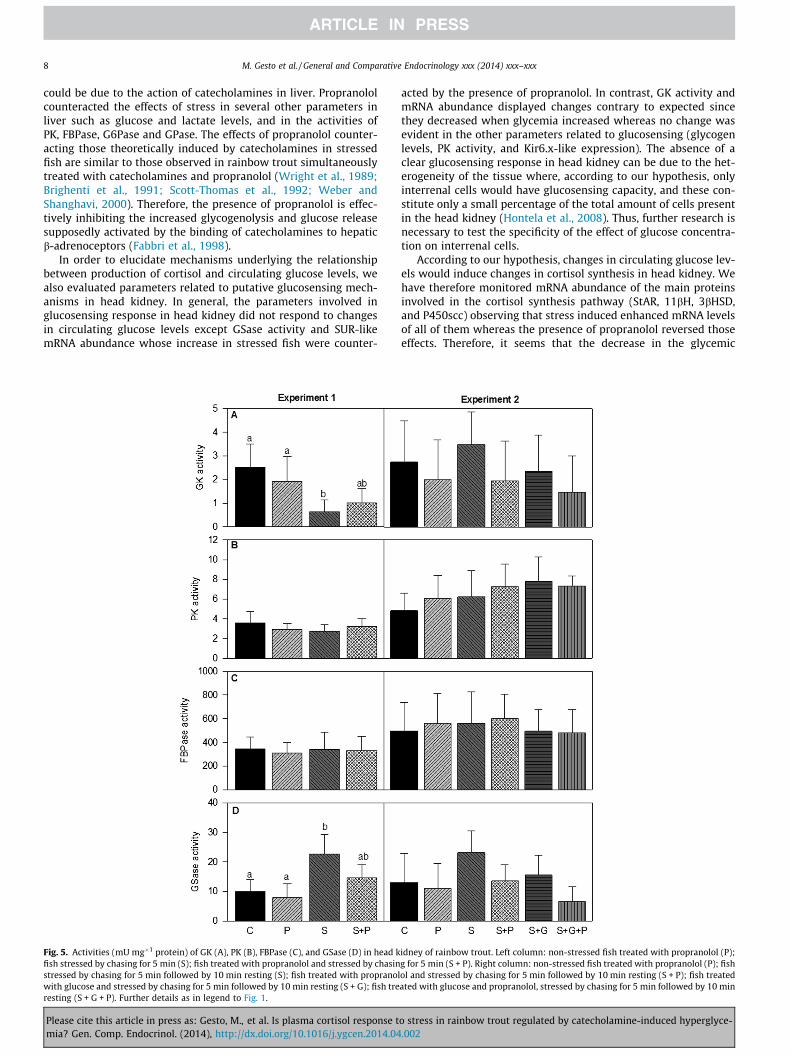
In head kidney, no significant differences were observed formetabolite levels (Fig. 4) whereas in enzyme activities (Fig. 5)
Fig. 2. Levels of glycogen (A), glucose (B), and lactate (C) in liver of rainbow trout. Left c5 min (S); fish treated with propranolol and stressed by chasing for 5 min (S + P). Right5 min followed by 10 min resting (S); fish treated with propranolol and stressed by chasinby chasing for 5 min followed by 10 min resting (S + G); fish treated with glucose and propdetails as in legend to Fig. 1.
Please cite this article in press as: Gesto, M., et al. Is plasma cortisol response tmia? Gen. Comp. Endocrinol. (2014), http://dx.doi.org/10.1016/j.ygcen.2014.04
stress treatment induced a decrease in GK and an increase inGSase activities compared with the control but these changes werenot observed when stress and propranolol treatments werecombined.
Changes in mRNA transcript abundance are shown in Table 3.Compared with the control, propranolol treatment reduced theabundance of GK mRNA in liver and kidney and increased that ofPK in liver. Stress treatment compared with controls increasedabundance of FBPase and G6Pase mRNAs and decreased GK mRNAlevels in liver. In head kidney stress increased abundance of SUR-like, 3bHSD, 11bH, P450scc and StAR. Stress in the presence of pro-pranolol induced higher mRNA levels than control for FBPase,G6Pase and PK mRNAs in liver, and lower for GK in liver and11bH and StAR in head kidney; abundance of GK mRNA in liverand 11bH and StAR in head kidney were also lower than thoseinduced by stress alone.
3.2. Experiment 2
Changes in parameters assessed in plasma are shown in Fig. 1.Propranolol treatment increased levels of adrenaline, noradrena-line, and lactate compared with controls. Stress treatment aloneincreased levels of cortisol, adrenaline, glucose, and lactate com-pared with the control and those of glucose and lactate comparedwith propranolol-treated group (levels were lower for noradrena-line). The effect of stress in the presence of propranolol wasenhanced for cortisol and noradrenaline levels, whereas it wasabolished for glucose and not affected for adrenaline and lactatelevels. The stressed group treated with glucose displayed the same
olumn: non-stressed fish treated with propranolol (P); fish stressed by chasing forcolumn: non-stressed fish treated with propranolol (P); fish stressed by chasing forg for 5 min followed by 10 min resting (S + P); fish treated with glucose and stressedranolol, stressed by chasing for 5 min followed by 10 min resting (S + G + P). Further
o stress in rainbow trout regulated by catecholamine-induced hyperglyce-.002

6 M. Gesto et al. / General and Comparative Endocrinology xxx (2014) xxx–xxx
values than stress alone except for glucose levels that were higher,but this effect was reduced when glucose and stress were accom-panied by propranolol treatment.
Levels of metabolites assessed in liver are shown in Fig. 2. Stresstreatment alone increased lactate levels compared with the controland propranolol groups. The stressed group treated with propran-olol displayed lower values than the stressed group for glycogenlevels.
Fig. 3. Activities (mU mg�1 protein) of GK (A), PK (B), FBPase (C), G6Pase (D), GSase (E),propranolol (P); fish stressed by chasing for 5 min (S); fish treated with propranolol andpropranolol (P); fish stressed by chasing for 5 min followed by 10 min resting (S); fish tre(S + P); fish treated with glucose and stressed by chasing for 5 min followed by 10 min resfollowed by 10 min resting (S + G + P). Further details as in legend to Fig. 1.
Please cite this article in press as: Gesto, M., et al. Is plasma cortisol response tmia? Gen. Comp. Endocrinol. (2014), http://dx.doi.org/10.1016/j.ygcen.2014.04
Enzyme activities in liver are displayed in Fig. 3. Stress alone didnot induce any significant change with respect to controls whereaspropranolol alone induced an enhanced activity of G6Pase. Whenstress was induced in presence of propranolol or glucose, activityof GK was decreased and that of G6Pase increased (also forS + G + P group). .
No significant differences were found in head kidney for metab-olite levels (Fig. 4) and enzyme activities (Fig. 5).
and GPase (F) in liver of rainbow trout Left column: non-stressed fish treated withstressed by chasing for 5 min (S + P). Right column: non-stressed fish treated with
ated with propranolol and stressed by chasing for 5 min followed by 10 min restingting (S + G); fish treated with glucose and propranolol, stressed by chasing for 5 min
o stress in rainbow trout regulated by catecholamine-induced hyperglyce-.002

M. Gesto et al. / General and Comparative Endocrinology xxx (2014) xxx–xxx 7
Changes in mRNA abundance are shown in Table 3. In liver,FBPase mRNA was lower than controls and the other groups whenstress, glucose and propranolol treatments were combined. GKmRNA abundance increased with stress and propranolol and withstress, propranolol and glucose treatments together. In head kid-ney, stress induced lower GK mRNA levels but this effect was abol-ished in presence of propranolol. Higher GK abundance thancontrols was obtained when stress was applied together with glu-cose or with both glucose and propranolol (less accentuated). Pro-pranolol treatment alone also induced an increment in GK mRNAlevels in head kidney. On the contrary, Kir6.x-like mRNA levelswere lower than controls in groups exposed to propranolol aloneand to stress, glucose and propranolol altogether. Regarding mRNAlevels of genes related to cortisol synthesis, stress induceddecreased levels compared with controls for 3bHSD, 11bH andStAR but this effect was reverted when stress was combined withpropranolol treatment and was similar (StAR) or abolished (3bHSD,11bH) when stress was combined with propranolol and glucose. Ingroups where stress and hyperglycaemia were induced together,11bH and P450scc mRNA levels were lower than controls but theseeffects were counteracted by the combined exposure to stress, glu-cose and propranolol.
4. Discussion
We aimed to evaluate if hyperglycaemia induced by catechola-mines during the stress response is able to affect cortisol produc-tion in head kidney through a putative glucosensing mechanismpresent in this tissue. This hypothesis was based in a previous
Fig. 4. Levels of glycogen (A), glucose (B), and lactate (C) in head kidney of rainbow trout.for 5 min (S); fish treated with propranolol and stressed by chasing for 5 min (S + P). Righ5 min followed by 10 min resting (S); fish treated with propranolol and stressed by chasinby chasing for 5 min followed by 10 min resting (S + G); fish treated with glucose and propdetails as in legend to Fig. 1.
Please cite this article in press as: Gesto, M., et al. Is plasma cortisol response tmia? Gen. Comp. Endocrinol. (2014), http://dx.doi.org/10.1016/j.ygcen.2014.04
in vitro study carried out in head kidney of rainbow trout that sug-gested that cortisol production induced by ACTH is higher whenglucose level in the medium is elevated (Conde-Sieira et al.,2013). As a whole, the present results suggest that increased corti-sol synthesis under stress conditions is probably associated withthe hyperglycaemia elicited by catecholamines, however this rela-tionship cannot be linked to enhanced glucosensing capacity inhead kidney.
In fish treatment with propranolol normally affect few parame-ters, though there are references indicating changes at cardiac level(Massarsky et al., 2011). In the present study, propranolol treat-ment alone did not induce significant changes vs. control groupin most parameters assessed in liver and head kidney whereas inplasma a clear increase vs. controls was noted for levels of adren-aline and noradrenaline. In general, these results agree with thosereported previously in the same species (Moon et al., 1998; Wrightet al., 1989; Brighenti et al., 1991; Weber and Shanghavi, 2000).Interestingly, propranolol treatment increased the levels of circu-lating catecholamines in both stressed and unstressed fish.Gerwick et al. (1999) reported a similar propranolol-mediatedincrease in the levels of adrenaline in non-stressed trout, but notin stressed fish. These changes could be part of a homeostatic feed-back pathway trying to increase catecholaminergic signalling afterthe receptor blockade by propranolol (Gerwick et al., 1999).
4.1. Experiment 1
Propranolol treatment counteracted the increase in plasma glu-cose levels induced by stress. We may therefore suppose that thehyperglycemia observed in the first steps of the stress response
Left column: non-stressed fish treated with propranolol (P); fish stressed by chasingt column: non-stressed fish treated with propranolol (P); fish stressed by chasing forg for 5 min followed by 10 min resting (S + P); fish treated with glucose and stressedranolol, stressed by chasing for 5 min followed by 10 min resting (S + G + P). Further
o stress in rainbow trout regulated by catecholamine-induced hyperglyce-.002
8 M. Gesto et al. / General and Comparative Endocrinology xxx (2014) xxx–xxx
could be due to the action of catecholamines in liver. Propranololcounteracted the effects of stress in several other parameters inliver such as glucose and lactate levels, and in the activities ofPK, FBPase, G6Pase and GPase. The effects of propranolol counter-acting those theoretically induced by catecholamines in stressedfish are similar to those observed in rainbow trout simultaneouslytreated with catecholamines and propranolol (Wright et al., 1989;Brighenti et al., 1991; Scott-Thomas et al., 1992; Weber andShanghavi, 2000). Therefore, the presence of propranolol is effec-tively inhibiting the increased glycogenolysis and glucose releasesupposedly activated by the binding of catecholamines to hepaticb-adrenoceptors (Fabbri et al., 1998).
In order to elucidate mechanisms underlying the relationshipbetween production of cortisol and circulating glucose levels, wealso evaluated parameters related to putative glucosensing mech-anisms in head kidney. In general, the parameters involved inglucosensing response in head kidney did not respond to changesin circulating glucose levels except GSase activity and SUR-likemRNA abundance whose increase in stressed fish were counter-
Fig. 5. Activities (mU mg�1 protein) of GK (A), PK (B), FBPase (C), and GSase (D) in head kfish stressed by chasing for 5 min (S); fish treated with propranolol and stressed by chasinstressed by chasing for 5 min followed by 10 min resting (S); fish treated with propranolwith glucose and stressed by chasing for 5 min followed by 10 min resting (S + G); fish treresting (S + G + P). Further details as in legend to Fig. 1.
Please cite this article in press as: Gesto, M., et al. Is plasma cortisol response tmia? Gen. Comp. Endocrinol. (2014), http://dx.doi.org/10.1016/j.ygcen.2014.04
acted by the presence of propranolol. In contrast, GK activity andmRNA abundance displayed changes contrary to expected sincethey decreased when glycemia increased whereas no change wasevident in the other parameters related to glucosensing (glycogenlevels, PK activity, and Kir6.x-like expression). The absence of aclear glucosensing response in head kidney can be due to the het-erogeneity of the tissue where, according to our hypothesis, onlyinterrenal cells would have glucosensing capacity, and these con-stitute only a small percentage of the total amount of cells presentin the head kidney (Hontela et al., 2008). Thus, further research isnecessary to test the specificity of the effect of glucose concentra-tion on interrenal cells.
According to our hypothesis, changes in circulating glucose lev-els would induce changes in cortisol synthesis in head kidney. Wehave therefore monitored mRNA abundance of the main proteinsinvolved in the cortisol synthesis pathway (StAR, 11bH, 3bHSD,and P450scc) observing that stress induced enhanced mRNA levelsof all of them whereas the presence of propranolol reversed thoseeffects. Therefore, it seems that the decrease in the glycemic
idney of rainbow trout. Left column: non-stressed fish treated with propranolol (P);g for 5 min (S + P). Right column: non-stressed fish treated with propranolol (P); fishol and stressed by chasing for 5 min followed by 10 min resting (S + P); fish treatedated with glucose and propranolol, stressed by chasing for 5 min followed by 10 min
o stress in rainbow trout regulated by catecholamine-induced hyperglyce-.002
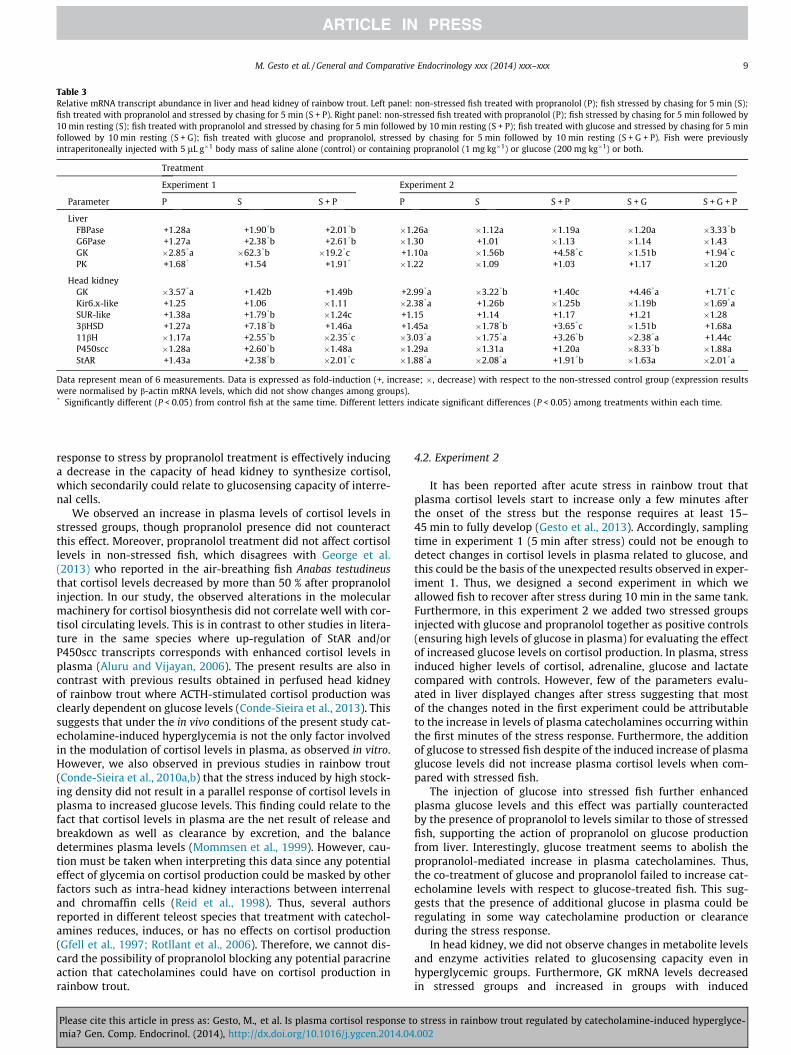
Table 3Relative mRNA transcript abundance in liver and head kidney of rainbow trout. Left panel: non-stressed fish treated with propranolol (P); fish stressed by chasing for 5 min (S);fish treated with propranolol and stressed by chasing for 5 min (S + P). Right panel: non-stressed fish treated with propranolol (P); fish stressed by chasing for 5 min followed by10 min resting (S); fish treated with propranolol and stressed by chasing for 5 min followed by 10 min resting (S + P); fish treated with glucose and stressed by chasing for 5 minfollowed by 10 min resting (S + G); fish treated with glucose and propranolol, stressed by chasing for 5 min followed by 10 min resting (S + G + P). Fish were previouslyintraperitoneally injected with 5 lL g�1 body mass of saline alone (control) or containing propranolol (1 mg kg�1) or glucose (200 mg kg�1) or both.
Treatment
Experiment 1 Experiment 2
Parameter P S S + P P S S + P S + G S + G + P
LiverFBPase +1.28a +1.90*b +2.01*b �1.26a �1.12a �1.19a �1.20a �3.33*bG6Pase +1.27a +2.38*b +2.61*b �1.30 +1.01 �1.13 �1.14 �1.43GK �2.85*a �62.3*b �19.2*c +1.10a �1.56b +4.58*c �1.51b +1.94*cPK +1.68* +1.54 +1.91* �1.22 �1.09 +1.03 +1.17 �1.20
Head kidneyGK �3.57*a +1.42b +1.49b +2.99*a �3.22*b +1.40c +4.46*a +1.71*cKir6.x-like +1.25 +1.06 �1.11 �2.38*a +1.26b �1.25b �1.19b �1.69*aSUR-like +1.38a +1.79*b �1.24c +1.15 +1.14 +1.17 +1.21 �1.283bHSD +1.27a +7.18*b +1.46a +1.45a �1.78*b +3.65*c �1.51b +1.68a11bH �1.17a +2.55*b �2.35*c �3.03*a �1.75*a +3.26*b �2.38*a +1.44cP450scc �1.28a +2.60*b �1.48a �1.29a �1.31a +1.20a �8.33*b �1.88aStAR +1.43a +2.38*b �2.01*c �1.88*a �2.08*a +1.91*b �1.63a �2.01*a
Data represent mean of 6 measurements. Data is expressed as fold-induction (+, increase; �, decrease) with respect to the non-stressed control group (expression resultswere normalised by b-actin mRNA levels, which did not show changes among groups).* Significantly different (P < 0.05) from control fish at the same time. Different letters indicate significant differences (P < 0.05) among treatments within each time.
M. Gesto et al. / General and Comparative Endocrinology xxx (2014) xxx–xxx 9
response to stress by propranolol treatment is effectively inducinga decrease in the capacity of head kidney to synthesize cortisol,which secondarily could relate to glucosensing capacity of interre-nal cells.
We observed an increase in plasma levels of cortisol levels instressed groups, though propranolol presence did not counteractthis effect. Moreover, propranolol treatment did not affect cortisollevels in non-stressed fish, which disagrees with George et al.(2013) who reported in the air-breathing fish Anabas testudineusthat cortisol levels decreased by more than 50 % after propranololinjection. In our study, the observed alterations in the molecularmachinery for cortisol biosynthesis did not correlate well with cor-tisol circulating levels. This is in contrast to other studies in litera-ture in the same species where up-regulation of StAR and/orP450scc transcripts corresponds with enhanced cortisol levels inplasma (Aluru and Vijayan, 2006). The present results are also incontrast with previous results obtained in perfused head kidneyof rainbow trout where ACTH-stimulated cortisol production wasclearly dependent on glucose levels (Conde-Sieira et al., 2013). Thissuggests that under the in vivo conditions of the present study cat-echolamine-induced hyperglycemia is not the only factor involvedin the modulation of cortisol levels in plasma, as observed in vitro.However, we also observed in previous studies in rainbow trout(Conde-Sieira et al., 2010a,b) that the stress induced by high stock-ing density did not result in a parallel response of cortisol levels inplasma to increased glucose levels. This finding could relate to thefact that cortisol levels in plasma are the net result of release andbreakdown as well as clearance by excretion, and the balancedetermines plasma levels (Mommsen et al., 1999). However, cau-tion must be taken when interpreting this data since any potentialeffect of glycemia on cortisol production could be masked by otherfactors such as intra-head kidney interactions between interrenaland chromaffin cells (Reid et al., 1998). Thus, several authorsreported in different teleost species that treatment with catechol-amines reduces, induces, or has no effects on cortisol production(Gfell et al., 1997; Rotllant et al., 2006). Therefore, we cannot dis-card the possibility of propranolol blocking any potential paracrineaction that catecholamines could have on cortisol production inrainbow trout.
Please cite this article in press as: Gesto, M., et al. Is plasma cortisol response tmia? Gen. Comp. Endocrinol. (2014), http://dx.doi.org/10.1016/j.ygcen.2014.04
4.2. Experiment 2
It has been reported after acute stress in rainbow trout thatplasma cortisol levels start to increase only a few minutes afterthe onset of the stress but the response requires at least 15–45 min to fully develop (Gesto et al., 2013). Accordingly, samplingtime in experiment 1 (5 min after stress) could not be enough todetect changes in cortisol levels in plasma related to glucose, andthis could be the basis of the unexpected results observed in exper-iment 1. Thus, we designed a second experiment in which weallowed fish to recover after stress during 10 min in the same tank.Furthermore, in this experiment 2 we added two stressed groupsinjected with glucose and propranolol together as positive controls(ensuring high levels of glucose in plasma) for evaluating the effectof increased glucose levels on cortisol production. In plasma, stressinduced higher levels of cortisol, adrenaline, glucose and lactatecompared with controls. However, few of the parameters evalu-ated in liver displayed changes after stress suggesting that mostof the changes noted in the first experiment could be attributableto the increase in levels of plasma catecholamines occurring withinthe first minutes of the stress response. Furthermore, the additionof glucose to stressed fish despite of the induced increase of plasmaglucose levels did not increase plasma cortisol levels when com-pared with stressed fish.
The injection of glucose into stressed fish further enhancedplasma glucose levels and this effect was partially counteractedby the presence of propranolol to levels similar to those of stressedfish, supporting the action of propranolol on glucose productionfrom liver. Interestingly, glucose treatment seems to abolish thepropranolol-mediated increase in plasma catecholamines. Thus,the co-treatment of glucose and propranolol failed to increase cat-echolamine levels with respect to glucose-treated fish. This sug-gests that the presence of additional glucose in plasma could beregulating in some way catecholamine production or clearanceduring the stress response.
In head kidney, we did not observe changes in metabolite levelsand enzyme activities related to glucosensing capacity even inhyperglycemic groups. Furthermore, GK mRNA levels decreasedin stressed groups and increased in groups with induced
o stress in rainbow trout regulated by catecholamine-induced hyperglyce-.002
10 M. Gesto et al. / General and Comparative Endocrinology xxx (2014) xxx–xxx
hyperglycemia. This could suggest that head kidney responds bet-ter to exogenous than to endogenous glucose produced duringstress response.
Concerning synthesis of cortisol in head kidney, we observedthat after 5 min stress and 10 min resting, gene expression of mainproteins involved is inhibited, and the presence of propranololcounteracted such inhibition. This allows us to suggest that themodulation of cortisol synthesis by glucose is only important atthe very beginning of the stress response, i.e. the time at whichthe catecholamine surge occurred. Furthermore, induced hypergly-cemia enhanced the decrease of 11bH and P450scc mRNA levels, aneffect counteracted by propranolol addition.
In conclusion, we were effective in blocking with propranololtreatment most of the effects of catecholamines in liver energymetabolism resulting in a lower glycemia in stressed fish. Thedecreased glycemia of stressed fish treated with propranolol wasobserved together with decreased capacity for synthesis of cortisolin head kidney 5 min after the onset of stress exposure. This sup-ports our hypothesis of cortisol synthesis in head kidney ofstressed fish enhanced by previous hyperglycemia possibly elicitedby catecholamine action. However, changes in putative glucosen-sing parameters assessed in head kidney were scarce and in gen-eral did not follow changes noted in glucose levels in plasmaprobably due to the low amount of putative glucosensing cells inthe tissue. Furthermore, circulating cortisol levels did not reflectthe alterations observed in gene transcription, suggesting a morecomplex regulation of cortisol production and release. As a whole,the present results suggest that increased cortisol synthesis understress conditions is probably linked to the hyperglycemia elicitedby immediate catecholamines release. However, other factorsincluding paracrine relationships between chromaffin and interre-nal cells within head kidney (among others) are also likelyinvolved and clearly deserve future research. Interestingly, theeffects of propranolol treatment and subsequent b-receptor block-ade, such as the decrease in plasma glucose, were differentdepending on time passed from the onset of the stress exposure,highlighting the need of further studies about the dynamics ofthe regulation of cortisol production and release during the stressresponse.
Acknowledgments
This study was supported by research grants from Spanish Min-isterio de Ciencia e Innovación and European Fund for RegionalDevelopment (AGL2010-22247-C03-03 and FEDER), and Xunta deGalicia (Consolidación e estructuración de unidades de investiga-ción competitivas do sistema universitario de Galicia, CN2012/004). M.G. and M.C-S. were recipients of post-doctoral fellowshipsfrom Xunta de Galicia (Programa de formación posdoutoral).
References
Alderman, S.L., Raine, J.C., Bernier, N.J., 2008. Distribution and regional stressor-induced regulation of corticotrophin-releasing factor binding protein inrainbow trout (Oncorhynchus mykiss). J. Neuroendocrinol. 20, 347–358.
Aluru, N., Vijayan, M.M., 2006. Aryl hydrocarbon receptor activation impairs cortisolresponse to stress in rainbow trout by disrupting the rate-limiting steps insteroidogenesis. Endocrinology 147, 1895–1903.
Bernier, N.J., Alderman, S.L., Bristow, E.N., 2008. Heads or tails? Stressor-specificexpression of corticotropin-releasing factor and urotensin I in the preoptic areaand caudal neurosecretory system of rainbow trout. J. Endocrinol. 196, 637–648.
Brighenti, L., Puviani, A.C., Gavioli, M.E., Fabbri, E., Ottolenghi, C., 1991. Interactionof salmon glucagon, glucagon-like peptide, and epinephrine in the stimulationof phosphorylase a activity in fish isolated hepatocytes. Gen. Comp. Endocrinol.82, 131–139.
Conde-Sieira, M., Aguilar, A.J., López-Patiño, M.A., Míguez, J.M., Soengas, J.L., 2010a.Stress alters food intake and glucosensing response in hypothalamus,hindbrain, liver, and Brockmann bodies of rainbow trout. Physiol. Behav. 101,483–493.
Please cite this article in press as: Gesto, M., et al. Is plasma cortisol response tmia? Gen. Comp. Endocrinol. (2014), http://dx.doi.org/10.1016/j.ygcen.2014.04
Conde-Sieira, M., Agulleiro, M.J., Aguilar, A.J., Míguez, J.M., Cerdá-Reverter, J.M.,Soengas, J.L., 2010b. Effect of different glycaemic conditions on gene expressionof neuropeptides involved in control of food intake in rainbow trout; interactionwith stress. J. Exp. Biol. 213, 3858–3865.
Conde-Sieira, M., Alvarez, R., López-Patiño, M.A., Míguez, J.M., Flik, G., Soengas, J.L.,2013. ACTH-stimulated cortisol release from head kidney of rainbow trout ismodulated by glucose concentration. J. Exp. Biol. 216, 554–567.
Dugan, S.G., Moon, T.W., 1998. Cortisol does not affect hepatic alfa- and beta-adrenoceptor properties in rainbow trout (Oncorhynchus mykiss). Fish Physiol.Biochem. 18, 343–352.
Dugan, S.G., Lortie, M.B., Nickerson, J.G., Moon, T.W., 2003. Regulation of therainbow trout (Oncorhynchus mykiss) hepatic b2-adrenoceptor by adrenergicagonists. Comp. Biochem. Physiol. C. 136, 331–342.
Fabbri, E., Capuzzo, A., Moon, T.W., 1998. The role of circulating catecholamines inthe regulation of fish metabolism: an overview. Comp. Biochem. Physiol. C. 120,177–192.
George, N., Peter, V.S., Subhash Peter, M.C., 2013. Physiologic implications of inter-hormonal interference in fish: lessons from the interaction of adrenaline withcortisol and thyroid hormones in climbing perch (Anabas testudineus Bloch).Gen. Comp. Endocrinol. 181, 122–129.
Gerwick, L., Dermes, N.E., Bayne, J., 1999. Modulation of stress hormones in rainbowtrout by means of anesthesia, sensory deprivation and receptor blockade. Comp.Biochem. Physiol. A. 124, 329–334.
Geslin, M., Auperin, B., 2004. Relationship between changes in mRNAs of the genesencoding steroidogenic acute regulatory protein and P450 cholesterol sidechain cleavage in head kidney and plasma levels of cortisol in response todifferent kinds of acute stress in the rainbow trout (Oncorhynchus mykiss). Gen.Comp. Endocrinol. 135, 70–80.
Gesto, M., López-Patiño, M.A., Hernández, J., Soengas, J.L., Míguez, J.M., 2013. Theresponse of brain serotonergic and dopaminergic systems to an acute stressor inrainbow trout: a time-course study. J. Exp. Biol. 213, 4435–4442.
Gfell, B., Kloas, W., Hanke, W., 1997. Neuroendocrine effects on adrenal hormonesecretion in carp (Cyprinus carpio). Gen. Comp. Endocrinol. 106, 310–319.
Hontela, A., Leblond, V.S., Chang, J.P., 2008. Purification and isolation ofcorticosteroidogenic cells from head kidney of rainbow trout (Oncorhynchusmykiss) for testing cell-specific effects of a pesticide. Comp. Biochem. Physiol. C.147, 52–60.
Keppler, D., Decker, K., 1974. Glycogen determination with amyloglucosidase. In:Bergmeyer, H.U. (Ed.), Methods of Enzymatic Analysis. Academic Press, NewYork, pp. 1127–1131.
Lansard, M., Panserat, S., Seiliez, I., Polakof, S., Plagnes-Juan, E., Geurden, I., Médale,F., Kaushik, S., Corraze, G., 2009. Hepatic protein kinase B (Akt)-target ofrapamycin (TOR)-signalling pathways and intermediary metabolism in rainbowtrout (Oncorhynchus mykiss) are not significantly affected by feeding plant-based diets. Br. J. Nutr. 102, 564–1573.
Livak, K.J., Schmittgen, T.D., 2001. Analysis of relative gene expression data usingreal-time quantitative PCR and the 2�DDCT method. Methods 25, 402–408.
López-Patiño, M.A., Hernández-Pérez, J., Gesto, M., Librán-Pérez, M., Míguez, J.M.,Soengas, J.L., 2014. Short-term time course of liver metabolic response to acutehandling stress in rainbow trout, Oncorhynchus mykiss. Comp. Biochem. Physiol.A. 168, 40–49.
Massarsky, A., Trudeau, V.L., Moon, T.W., 2011. b-Blockers as endocrine disruptors:the potential effects of human b-blockers on aquatic organisms. J. Exp. Zool. A.313, 251–265.
Mommsen, T.P., Vijayan, M.M., Moon, T.W., 1999. Cortisol in teleosts: dynamics,mechanisms of action, and metabolic regulation. Rev. Fish Biol. Fisheries 9, 211–268.
Moon, T.W., Walsh, P.J., Perry, S.F., Mommsen, T.P., 1998. Effects of in vivo beta-adrenoceptor blockade on hepatic carbohydrate metabolism in rainbow trout. J.Exp. Zool. 248, 88–93.
Olsvik, P.A., Lie, K.K., Jordal, A.E., Nilsen, T.O., Hordvik, I., 2005. Evaluation ofpotential reference genes in real-time RT-PCR studies of Atlantic salmon. BMCMol. Biol. 6, 21.
Polakof, S., Míguez, J.M., Moon, T.W., Soengas, J.L., 2007a. Evidence for the presenceof a glucosensor in hypothalamus, hindbrain, and Brockmann bodies of rainbowtrout. Am. J. Physiol. Regul. Integr. Comp. Physiol. 292, R1657–R1666.
Polakof, S., Míguez, J.M., Soengas, J.L., 2007b. In vitro evidences for glucosensingcapacity and mechanisms in hypothalamus, hindbrain, and Brockmann bodiesof rainbow trout. Am. J. Physiol. Regul. Integr. Comp. Physiol. 293, R1410–R1420.
Polakof, S., Míguez, J.M., Soengas, J.L., 2008a. Changes in food intake andglucosensing function of hypothalamus and hindbrain in rainbow troutsubjected to hyperglycemic or hypoglycemic conditions. J. Comp. Physiol. A.194, 829–839.
Polakof, S., Míguez, J.M., Soengas, J.L., 2008b. Dietary carbohydrates induce changesin glucosensing capacity and food intake in rainbow trout. Am. J. Physiol. Regul.Integr. Comp. Physiol. 295, R478–R489.
Polakof, S., Panserat, S., Plagnes-Juan, E., Soengas, J.L., 2008c. Altered dietarycarbohydrates significantly affect gene expression of the major glucosensingcomponents in Brockmannn bodies and hypothalamus of rainbow trout. Am. J.Physiol. Regul. Integr. Comp. Physiol. 295, R1077–R1088.
Polakof, S., Mommsen, T.P., Soengas, J.L., 2011. Glucosensing and glucosehomeostasis: from fish to mammals. Comp. Biochem. Physiol. B. 160, 123–149.
Reid, S.D., Bernier, N.J., Perry, S.F., 1998. The adrenergic stress response in fish:control of catecholamine storage and release. Comp. Biochem. Physiol. 120, 1–27.
o stress in rainbow trout regulated by catecholamine-induced hyperglyce-.002

M. Gesto et al. / General and Comparative Endocrinology xxx (2014) xxx–xxx 11
Rotllant, J., Ruane, N.M., Dinis, M.T., Canario, A.V.M., Power, D.M., 2006. Intra-adrenal interactions in fish: catecholamine stimulated cortisol release in seabass (Dicentrarchus labrax L.). Comp. Biochem. Physiol. A. 143, 375–381.
Scott-Thomas, D.A.F., Ballantyne, J.S., Leatherland, J.F., 1992. Interactive effects ofhigh stocking density and triiodothyronine-administration on aspects of thein vivo intermediary metabolism and in vitro hepatic response to catecholamineand pancreatic hormone stimulation in brook charr, Salvelinus fontinalis. J. Exp.Zool. 263, 68–82.
Please cite this article in press as: Gesto, M., et al. Is plasma cortisol response tmia? Gen. Comp. Endocrinol. (2014), http://dx.doi.org/10.1016/j.ygcen.2014.04
Weber, J.M., Shanghavi, D.S., 2000. Regulation of glucose production in rainbowtrout: role of epinephrine in vivo and in isolated hepatocytes. Am. J. Physiol.Regul. Integr. Comp. Physiol. 278, R956–R963.
Wendelaar Bonga, S.E., 1997. The stress response in fish. Physiol. Rev. 77, 591–625.Wright, P.A., Perry, S.F., Moon, T.W., 1989. Regulation of hepatic gluconeogenesis
and glycogenolysis by catecholamines in rainbow trout during environmentalhypoxia. J. Exp. Biol. 147, 169–188.
o stress in rainbow trout regulated by catecholamine-induced hyperglyce-.002
Copyright © 2022 FDOKUMEN