Is participation in Early Childhood Education related to child ...
58
Is participation in Early Childhood Education related to child health and development? A report submitted to the Ministry of Social Development – Children and Families Research Fund – June 2019 Scott Duncan PhD Associate Professor, School of Sport and Recreation, AUT University Sarah Gerritsen PhD Research Fellow, Department of Epidemiology and Biostatistics, University of Auckland Stephanie D’Souza PhD Research Fellow, Centre of Methods and Policy Application in the Social Sciences, University of Auckland Tom Stewart PhD Research Fellow, School of Sport and Recreation, AUT University Andrew Gibbons PhD Associate Professor, School of Education, AUT University
-
Upload
khangminh22 -
Category
Documents
-
view
0 -
download
0
Transcript of Is participation in Early Childhood Education related to child ...
Is participation in Early Childhood Education related to child health and development?
A report submitted to the Ministry of Social Development – Children and Families Research Fund – June 2019
Scott Duncan PhD Associate Professor, School of Sport and Recreation, AUT University
Sarah Gerritsen PhD Research Fellow, Department of Epidemiology and Biostatistics, University of Auckland
Stephanie D’Souza PhD Research Fellow, Centre of Methods and Policy Application in the Social Sciences, University of Auckland
Tom Stewart PhD Research Fellow, School of Sport and Recreation, AUT University
Andrew Gibbons PhD Associate Professor, School of Education, AUT University
Contents Introduction ...............................................................................................................................5
Early childhood education in New Zealand ...........................................................................5
The association between ECE and behavioural outcomes ....................................................7
Childcare quantity..............................................................................................................8
Childcare type ....................................................................................................................9
Childcare quality ..............................................................................................................10
Other childcare factors ....................................................................................................10
The association between ECE and infectious illness ...........................................................11
Research Aims......................................................................................................................12
The current study.............................................................................................................12
Hypotheses ......................................................................................................................12
Methods...................................................................................................................................14
Participants ..........................................................................................................................14
Early Childhood Education measures ..................................................................................14
Behavioural outcomes .........................................................................................................15
Infectious illnesses ...............................................................................................................15
Sociodemographic factors ...................................................................................................16
Covariates specific to behavioural outcomes......................................................................16
Covariates specific to infectious illness outcomes ..............................................................17
Data analysis ........................................................................................................................17
Behavioural outcomes analyses ......................................................................................17
Infectious illness analyses................................................................................................17
Results......................................................................................................................................19
Cohort characteristics ..........................................................................................................19
Behavioural outcomes analyses ..........................................................................................19
Bivariate associations.......................................................................................................19
Multivariate prospective analyses ...................................................................................22
Infection illness analyses .....................................................................................................28
Summary of Key Points ............................................................................................................46
The association between ECE and behavioural outcomes ..................................................46
The association between ECE and infectious illness ...........................................................46
Implications for ECE policy...................................................................................................47
1

Strengths and Limitations ....................................................................................................47
Overall conclusion................................................................................................................48
References ...............................................................................................................................50
Appendices...............................................................................................................................55
2
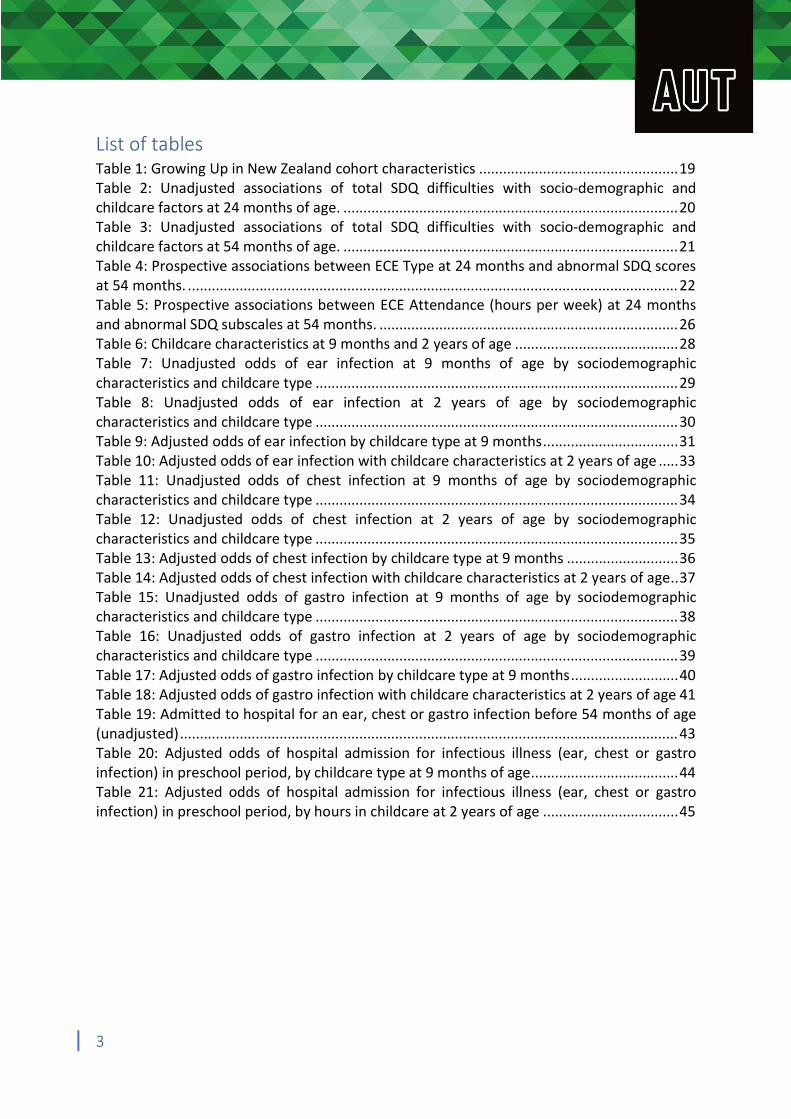
List of tables Table 1: Growing Up in New Zealand cohort characteristics ..................................................19 Table 2: Unadjusted associations of total SDQ difficulties with socio-demographic and childcare factors at 24 months of age. ....................................................................................20 Table 3: Unadjusted associations of total SDQ difficulties with socio-demographic and childcare factors at 54 months of age. ....................................................................................21 Table 4: Prospective associations between ECE Type at 24 months and abnormal SDQ scores at 54 months. ...........................................................................................................................22 Table 5: Prospective associations between ECE Attendance (hours per week) at 24 months and abnormal SDQ subscales at 54 months. ...........................................................................26 Table 6: Childcare characteristics at 9 months and 2 years of age .........................................28 Table 7: Unadjusted odds of ear infection at 9 months of age by sociodemographic characteristics and childcare type ...........................................................................................29 Table 8: Unadjusted odds of ear infection at 2 years of age by sociodemographic characteristics and childcare type ...........................................................................................30 Table 9: Adjusted odds of ear infection by childcare type at 9 months..................................31 Table 10: Adjusted odds of ear infection with childcare characteristics at 2 years of age .....33 Table 11: Unadjusted odds of chest infection at 9 months of age by sociodemographic characteristics and childcare type ...........................................................................................34 Table 12: Unadjusted odds of chest infection at 2 years of age by sociodemographic characteristics and childcare type ...........................................................................................35 Table 13: Adjusted odds of chest infection by childcare type at 9 months ............................36 Table 14: Adjusted odds of chest infection with childcare characteristics at 2 years of age..37 Table 15: Unadjusted odds of gastro infection at 9 months of age by sociodemographic characteristics and childcare type ...........................................................................................38 Table 16: Unadjusted odds of gastro infection at 2 years of age by sociodemographic characteristics and childcare type ...........................................................................................39 Table 17: Adjusted odds of gastro infection by childcare type at 9 months...........................40 Table 18: Adjusted odds of gastro infection with childcare characteristics at 2 years of age 41 Table 19: Admitted to hospital for an ear, chest or gastro infection before 54 months of age (unadjusted).............................................................................................................................43 Table 20: Adjusted odds of hospital admission for infectious illness (ear, chest or gastro infection) in preschool period, by childcare type at 9 months of age.....................................44 Table 21: Adjusted odds of hospital admission for infectious illness (ear, chest or gastro infection) in preschool period, by hours in childcare at 2 years of age ..................................45
3
List of figures Figure 1: Directed Acyclic Graph showing causal hypotheses of relationship between ECE attendence on child behaviour and infections variables collected in Growing Up in NZ† ......13 Figure 2: Prospective associations between ECE Type / sociodemographic variables at 24 months and abnormal SDQ total difficulties at 54 months (fully adjusted model, binary logistic regression). ..............................................................................................................................24 Figure 3: Prospective associations between ECE Attendance / sociodemographic variables at 24 months and abnormal SDQ total difficulties at 54 months (fully adjusted model, binary logistic regression). ..................................................................................................................27
4

Introduction Early childhood education in New Zealand Over the past 30 years, early childhood education (ECE) has undergone a period of considerable change and growth in New Zealand (NZ). These changes have included the establishment of an early childhood curriculum, Te Whāriki,1 and the implementation of a 10-year strategic plan, Pathways to the Future.2 The Pathways to the Future plan concentrated sector efforts towards increasing quality through funded programmes of innovative practice-led research, incentivising the employment of qualified teachers, and increasing ECE participation rates. These aims were consistent with globally recognised trends in ECE policy.3
Although it is not compulsory, almost all New Zealand children attend an early learning service for a sustained period of time before starting school or kura. Overall participation is increasing for all age groups and children are attending from younger ages. The provision of ECE in Aotearoa/New Zealand is recognised and valued as diverse, with several community, public, and private services, reflecting a wide range of philosophies regarding early childhood care and education. Licensed services are governed by the Education (Early Childhood Services) Regulations (2008) and Licensing Criteria4 and audited by the Education Review Office on 2 to 4 yearly plans dependent on perceived quality of service.
In 2017 there were 4,599 licensed services, including:
2,558 Education and Care centres 658 Kindergartens 476 home-based centres 454 Kohanga Reo 421 Playcentres4
In addition there were 927 certificated playgroups. These services are not licensed, have their own regulations and receive lower funding.
The 2017 annual census of ECE participation indicated:
132,221 enrolments in Education and Care 29,787 in Kindergarten 18,440 in Home-based 13,326 in Playcentre 8,631 in Kohanga Reo 16,595 in Playgroups
The Government provides an ECE subsidy per child, and also funding options designed to incentivise participation in ECE for communities perceived to benefit from increased participation in licensed services. The baseline funding is in the form of the ECE Funding Subsidy, paid three times per year to a service, subsidising the service for the hourly operating, for up to 6 hours a day and 30 hours a week. The Government also provides a 20
5
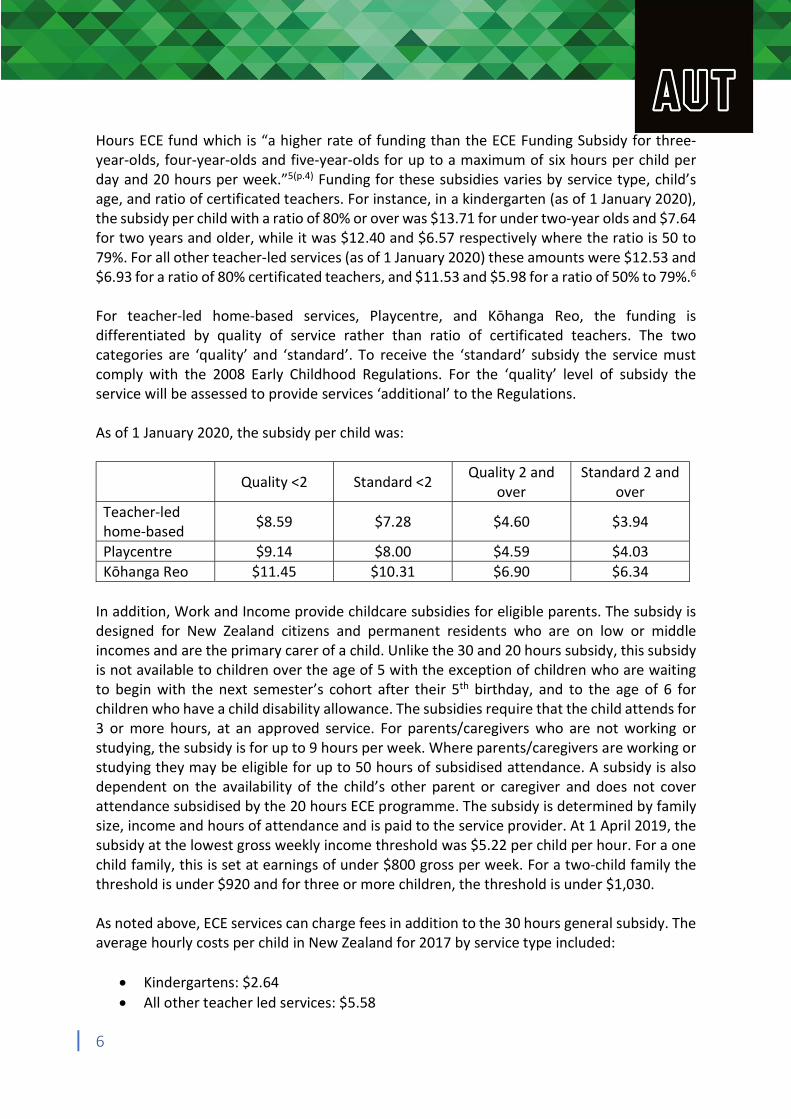
Hours ECE fund which is “a higher rate of funding than the ECE Funding Subsidy for three-year-olds, four-year-olds and five-year-olds for up to a maximum of six hours per child per day and 20 hours per week.”5(p.4) Funding for these subsidies varies by service type, child’s age, and ratio of certificated teachers. For instance, in a kindergarten (as of 1 January 2020), the subsidy per child with a ratio of 80% or over was $13.71 for under two-year olds and $7.64 for two years and older, while it was $12.40 and $6.57 respectively where the ratio is 50 to 79%. For all other teacher-led services (as of 1 January 2020) these amounts were $12.53 and $6.93 for a ratio of 80% certificated teachers, and $11.53 and $5.98 for a ratio of 50% to 79%.6
For teacher-led home-based services, Playcentre, and Kōhanga Reo, the funding is differentiated by quality of service rather than ratio of certificated teachers. The two categories are ‘quality’ and ‘standard’. To receive the ‘standard’ subsidy the service must comply with the 2008 Early Childhood Regulations. For the ‘quality’ level of subsidy the service will be assessed to provide services ‘additional’ to the Regulations.
As of 1 January 2020, the subsidy per child was:
Teacher-led home-based Playcentre
Quality <2
$8.59
$9.14
Standard <2
$7.28
$8.00
Quality 2 and over
$4.60
$4.59
Standard 2 and over
$3.94
$4.03 Kōhanga Reo $11.45 $10.31 $6.90 $6.34
In addition, Work and Income provide childcare subsidies for eligible parents. The subsidy is designed for New Zealand citizens and permanent residents who are on low or middle incomes and are the primary carer of a child. Unlike the 30 and 20 hours subsidy, this subsidy is not available to children over the age of 5 with the exception of children who are waiting to begin with the next semester’s cohort after their 5th birthday, and to the age of 6 for children who have a child disability allowance. The subsidies require that the child attends for 3 or more hours, at an approved service. For parents/caregivers who are not working or studying, the subsidy is for up to 9 hours per week. Where parents/caregivers are working or studying they may be eligible for up to 50 hours of subsidised attendance. A subsidy is also dependent on the availability of the child’s other parent or caregiver and does not cover attendance subsidised by the 20 hours ECE programme. The subsidy is determined by family size, income and hours of attendance and is paid to the service provider. At 1 April 2019, the subsidy at the lowest gross weekly income threshold was $5.22 per child per hour. For a one child family, this is set at earnings of under $800 gross per week. For a two-child family the threshold is under $920 and for three or more children, the threshold is under $1,030.
As noted above, ECE services can charge fees in addition to the 30 hours general subsidy. The average hourly costs per child in New Zealand for 2017 by service type included:
Kindergartens: $2.64 All other teacher led services: $5.58
6
Home-based ECE: $6.80 Kōhanga Reo: $1.88
Under its Better Public Services Programme, the NZ Government set a target of 98% participation in ECE by 2016 for children in the year prior to starting school.7 While this target has not been officially met, attendance rates are close: results from the Early Childhood Education census indicated that 96.3% of children aged 4 years attended ECE in 2018.8 While rates are lower for children under 4 years, these attendance rates show an upward trend in children aged 0 to 4 years since 2000.9 In addition, the average weekly hours attended across all ECE types has increased from 16.7 hours in 2005 to approximately 21.5 hours in 2018.8,9
Given these increasing trends in ECE attendance and average hours attended, it is important to understand how ECE may be related to children’s health and development. This is particularly the case for infants and toddlers – a priority highlighted in a report to the Ministry of Education,10 a report from the Office of the Children’s Commissioner,11 and more recently recognised in a new strategic plan for ECE. In 2018, the Ministry of Education launched the consultation draft of a second strategic plan for early childhood education: He taonga te tamaiti | Every child a taonga: Strategic plan for early learning 2019-29 draft for consultation.12 The Ministerial foreword to the plan “puts the wellbeing of the learner at the centre” of the entire educational system. With a focus on wellbeing at the centre of the system, Minister of Education Chris Hipkins notes that the government aspires for each learner to “discover and achieve their full potential, engage fully in society, and lead rewarding and fulfilling lives”.12(p.7) This positioning of wellbeing has significant implications for research of the health and wellbeing effects of participation in early childhood education services. These implications will inform and support the proposed strategic plan across all of its goals, and in particular, goals for the development of more coherence in health and education wrap-around services for children, families, and communities.
This report explores the relationship between ECE factors such as:
Type of service; Hours of attendance; Group size; Adult to child ratio; Multiple childcare use; Presence of a primary caregiver at ECE service;
with two primary measures of child wellbeing in under 5-year-olds:
1) Behavioural outcomes (emotional symptoms, conduct problems, hyperactivity/inattention, peer relationship problems, prosocial behaviour);
2) Mother-reported and hospitalisations for infectious illnesses (ear, chest, gastro, skin).
The association between ECE and behavioural outcomes
7
Research has shown that behavioural outcomes linked to socioemotional functioning, self-control and attention, are important for long term wellbeing and socioeconomic success.13,14
The early childhood period appears to be particularly important for the development of these outcomes.15 An adverse family environment during early childhood can negatively impact the development of these skills.15 However, there is evidence to suggest that this negative impact can be ameliorated by high quality childcare.13
Given that ECE can play a significant role in children’s behavioural development, it is important to examine how various elements of ECE relate to children’s behavioural outcomes. Not all ECE options are the same, and can vary based on type and quality. Additionally, some children may spend more time in ECE than others. As such, the literature on the relationship between ECE and behavioural outcomes has primarily focused on whether and how children’s behaviour is influenced by three elements of ECE: quantity of childcare, type of childcare, and quality of childcare.
Childcare quantity Childcare quantity is generally defined as time spent in childcare, either on average or as an accumulation over time. Much of the knowledge on outcomes associated with childcare quantity, and other elements of childcare, come from the National Institute of Child Health and Development Study of Early Child Care and Youth Development (NICHD SECCYD), a study that originated in 1991 in the United States of America (USA) for the purposes of investigating developmental outcomes associated with children’s child care experiences.16 The study has found that more time in non-maternal care across the first 4.5 years of child’s life was associated with greater externalising behaviours (e.g. disobedience/defiance, aggression) at 54 months and in kindergarten.17 A subsequent study by Belsky et al.18 on the NICHD SECCYD sample extended the association between time in childcare to externalising outcomes at 6 to 7 years. Furthermore, a review of several studies in the USA, some of which are from the NICHD SECCYD, observed that average hours per week of non-maternal childcare was the strongest and most consistent childcare-specific predictor of children’s behavioural outcomes.19
This finding has also been supported in European and Australian studies. In a United Kingdom sample of children in centre-based care, Eryigit-Madzwamuse and Barnes20 reported that children with more exposure to centre-based childcare before 2 years showed an increase in behaviour problems from 30 to 51 months, despite showing lower levels of behavioural difficulties at the initial 30 month assessment. A Swiss study has also found that the accumulation of time in group-based childcare specifically was associated with greater externalising (aggression, ADHD symptoms, non-aggressive externalising behaviours) and internalising (depression, anxiety) behaviours at 7 years.21 The Longitudinal Study of Australian Children (LSAC) also observed that time in non-maternal childcare was associated with externalising and internalising behavioural outcomes at 4 to 5 years.22 Specifically, the authors found that increased time in childcare from birth to 3 years was associated with higher levels of externalising problems but, in contrast to the finding by Averdijk et al.,21 lower levels of internalising behaviours.
8
However, not all studies have found significant associations between quantity of childcare and behavioural outcomes in children. Babchishin, Weegar and Romano23 found that quantity of non-maternal childcare during approximately the first year of life was not associated with later externalising or internalising behavioural outcomes at 6 to 7 years in Canadian children. Within NZ, the Christchurch Health and Development Study found that ECE participation over time was not significantly associated with behavioural outcomes in childhood and adolescence once sociodemographic factors, child-rearing practices and child characteristics were accounted for.
Childcare type ECE types in NZ are broadly grouped into four categories: teacher-led, centre-based ECE (e.g. daycare centre or kindergarten); Māori & Pasifika immersion and bilingual centre-based services; home-based ECE (this includes either an organised home-based programme or a nanny); and informal care (e.g. by parents, other relatives, or friends/neighbours).25 All ECE types except informal care are subsidised by the NZ Ministry of Education, though there are some instances where informal care by a grandparent or other relative may be subsidised. From an educational achievement and holistic development perspective, participation in good quality, centre-based ECE is promoted, due to international evidence that it is associated with benefits in linguistic functioning, early literacy, numeracy, memory and attention.12,17,18,27–30
A consistent association has been found between centre-based care and externalising behaviour. The NICHD SECCYD have found that greater exposure to childcare in centres was associated with increased externalising and disobedient behaviour at several time points from 54 months to 12 years, suggesting that centre-based care may have an enduring influence on behavioural development.17,18 Other studies have generally found similar results to that of NICHD SECCYD. Two North American studies have found that centre-based care was associated with behavioural problems at 5 years29 and at 6 to 7 years.23 Further, LSAC found that the association between time in non-maternal care and behavioural problems at 4 to 5 years was primarily driven by children who were in centre-based care.22
While it is unclear exactly what mechanism underlies the association between centre-based care and child behaviour, it has been suggested that the social environment in these centres may play a role.21 Specifically, the presence of other children may mean that children learn problematic behaviours from their peers or show externalising behaviours as a way of competing and gaining the caregiver’s attention.31
However, childcare centres also provide the opportunity for fostering positive social behaviours. Investment into children’s social behaviour at such a key developmental time point can set them up with skills that are important for long term positive social and academic outcomes, such as higher educational attainment, income, and reduced criminal activity.32
There is evidence that children in centre-based care show greater prosocial behaviours compared to children in home-based care until 3 years.33 This appears to be the case for centres that focus on delivering high quality child care. 32
9

Childcare quality Childcare quality can relate to both structural quality and process quality. Structural quality encompasses factors such as the adult-to-child ratio, group size, and caregiver education.33
Process quality relates to the child’s daily experiences, for example high sensitivity in the caregiver, frequent interactions between the caregiver and the child, and a stimulating environment for the child would all indicate high process quality.33 Research has indicated that structural and process quality are associated with more positive behavioural outcomes in children.32–34 It is suggested that structural quality is related to process quality; for example, a lower adult-to-child ratio means that children are able to have more frequent interactions with the caregiver, who may also be more sensitive to the child’s needs as they do not need to divide their attention across as many children. Structural quality is often more easily quantifiable than process quality, making it the preferred measure when evaluating ECE quality.35
The NICHD SECCYD has found that children in centres that met recommended standards relating to structural quality (e.g. adult-to-child ratio, group size, caregiver training and education) showed greater social competence at 6 months to 36 years, amongst other beneficial outcomes, than children in centres that did not adequately meet these standards.36
Furthermore, there is evidence that high quality childcare can be particularly beneficial for children from low socioeconomic backgrounds.32 There is evidence that centres with high quality preschool programmes can promote important social skills.32 This is thought to be particularly significant for children from disadvantaged backgrounds; high quality childcare can foster the development of socio-emotional skills in these children and as such, compensate for any negative effects that may arise as a result of exposure to disadvantage.32
Other childcare factors There are several other childcare factors that have been linked to behavioural outcomes in children, though these have not been studied as thoroughly as childcare quantity, type and quality. Two noteworthy factors include age of entry into childcare and instability in childcare. Age of entry is linked to quantity of childcare, as children who have an early entry into childcare are more likely to have an overall greater amount of time spent in childcare. However, it has been suggested that children who begin ECE during the first year of life are more likely to have negative behavioural outcomes.19,39 For example, a review by Jacob noted that childcare entry during the first year was associated with less social competence and cooperation as well as greater aggression, negative mood and conflict. However, similar to quantity of childcare, this association has not been consistently observed in the literature, particularly when adjusting for sociodemographic covariates (e.g., Lekhal40).
Instability in childcare is essentially defined as greater changes in childcare settings, or an exposure to more childcare arrangements. Earlier research with the NICHD SECCYD found that instability in childcare during the first 2 years of life was associated with greater behavioural problems at 2 years, though this association was not replicated at 3 years.41
Another study by Youngblade42 found that an association between early maternal employment and externalising behaviours in 8 to 10 year olds was partially accounted for by instability in childcare.
10
The association between ECE and infectious illness It has been known since the early 1990s that group-based childcare outside the home increased the risk of upper respiratory illnesses43 and ear infections,44 after adjustment for demographics and risk factors, with even greater risk in under 17 month olds,43 and when group sizes were over six children.44 A review in 1996 confirmed that this positive association with childcare attendance had been found for multiple types of infections (gastro/enteric infection, respiratory tract infection, herpesvirus infection, influenza, and skin infections), and raised the possibility that this increased prevalence of early infection was resulting in antimicrobial resistance due to over-prescribing of antibiotics for viruses when young children were ill.45
Sickness in a young child that attends childcare results not only in discomfort and pain for the child, but also in significant costs to society. A parent will need to take time off work to care for the child and there is increased primary health care, prescription, and possibly hospital costs.46 Childcare teachers, families of children, and other close contacts are also at increased risk of infectious diseases associated with childcare environments.45,47
The increased likelihood of an infant being exposed to infections in childcare environments has led Danish researchers to call for the delaying of enrolment until after a child’s first birthday.48,49 Most researchers on this topic have concluded that hand-hygiene and strict nappy-changing/toileting procedures would reduce this risk, and there is some evidence that both influenza and respiratory tract infections are reduced in education settings following hand hygiene interventions.50 However, a US study found multiple childcare arrangements also increase the risk of infection51 and therefore simply improving the hygiene and quality of childcare settings would be inadequate and wider ECE policy that minimises multiple childcare arrangements may be required.
Having an infection early in life has some benefits for childhood health, provided the infection does not become serious. One of the earliest studies on this topic,52 found children who enter day care as infants and remain in day care through the preschool years have a lower incidence of respiratory infections in later childhood, confirmed in an Australian study in 1992.53 Ball et al’s study found that the increased prevalence of the common cold in young children provided protection in the form of immunity so that by primary-school age, children who have been in early childcare were less likely to suffer colds and other respiratory infections. However, this immunity appeared to wane by 13 years of age.54 Zutavern et al.55 confirmed in a German study that children in daycare centres acquire infections at a younger age, which provides a certain level of immunity for infections at primary school. Analyses of the Quebec Longitudinal Study of Child Development found that participation in large group based care (up to 10 groups of 8-12 children in the same setting, although different classrooms) before two and a half years of age, although associated with increased respiratory tract, ear and gastrointestinal tract infections, and seemed to protect against infection during the preschool years.56
11
Previous analyses of the Growing Up in New Zealand cohort data found that children attending daycare at 9 months of age had 1.4 times the risk of hospitalisation due to infection in their first year of life, when adjusted for gender, birth weight, parity, exclusive breastfeeding to 4 months, incomplete vaccinations, maternal experience of racism from health care professional, ethnicity, deprivation, and maternal smoking (CI: 1.12-1.81, p=0.003). Māori and Pacific children, and children in the most socio-economically deprived households had a greater risk of hospitalization for infections.57
Research Aims The current study While there is considerable research on the associations between childcare factors and both child behavioural outcomes and infectious illness, the majority of this information has come from international studies. Studies on behavioural outcomes and infectious illnesses associated with ECE factors in New Zealand are notably lacking. Given the considerable government investment in ECE, the target participation rates and the increasing trends in average weekly hours of attendance in NZ, it is important to consider how ECE participation is related to child behavioural development and health within a NZ context.
This study examined two primary measures of child wellbeing. Firstly, we investigated child behaviour (emotional symptoms, conduct problems, hyperactivity/inattention, peer relationship problems, and prosocial behaviour) and the association with ECE use, both in terms of childcare type, and hours of weekly attendance. Secondly, we examined the prevalence of common infectious illnesses and associated hospitalizations. We investigated associations for four common childhood illnesses (ear, chest, gastro and skin infections) at two time points (9 months and 2 years of age) with childcare attendance at the same age by type of service. We also report associations between service type and hospitalization for ear, chest or gastro infections across the preschool period. We further explore the link between childcare characteristics at 2 years of age (group size, multiple childcare use, hours of attendance per week, and teacher-to-child ratio) and risk of infectious illness, including hospitalization.
Hypotheses Figure 1 presents the hypotheses tested in this study. We test the hypothesis that attending ECE at two years of age is associated with greater prosocial behaviour, but also greater conduct problems at four and a half years of age. We also hypothesised an increased risk of infectious illness and hospitalization for infection among infants and toddlers attending centre-based childcare in New Zealand, and that this risk decreases with smaller group size, a higher teacher to child ratio, non-mixed age settings, lower hours of attendance and stability in childcare.
12
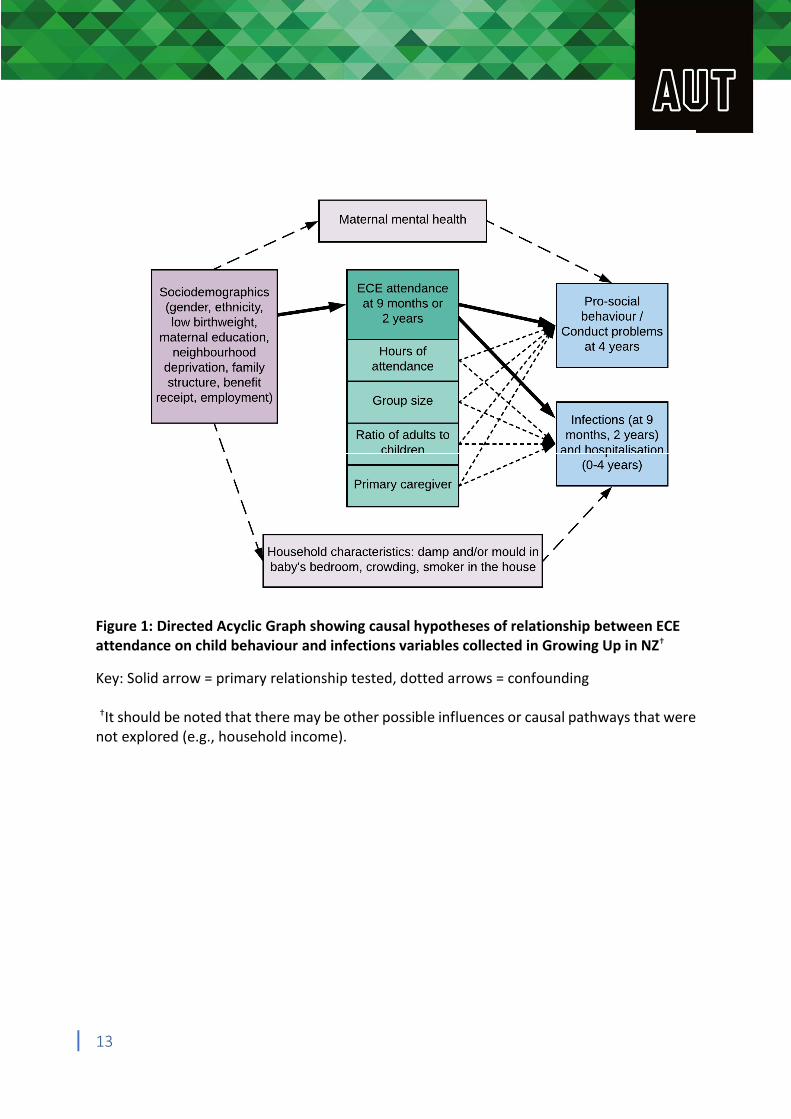
Figure 1: Directed Acyclic Graph showing causal hypotheses of relationship between ECE attendance on child behaviour and infections variables collected in Growing Up in NZ†
Key: Solid arrow = primary relationship tested, dotted arrows = confounding
†It should be noted that there may be other possible influences or causal pathways that were not explored (e.g., household income).
13
Methods Participants Participants in the study were children and mothers who were part of the longitudinal Growing Up in New Zealand study, which aims to provide information on the experience of growing up in 21st century New Zealand. A total of 6,822 pregnant women with expected delivery dates between 25th April 2009 and 25th March 2010 were recruited into the study. Women were recruited from the geographic area containing approximately one third of the NZ birth population, which covered three adjacent District Health Board regions: Auckland, Counties Manukau, and Waikato.58 There was no other inclusion or exclusion criteria specified. A detailed description of the study’s design and recruitment can be found elsewhere.58,59 The final sample consisted of 6,853 children. The cohort represents 11% of national birth during the enrolment period and is broadly generalizable to the national birth cohort regarding ethnicity and socioeconomic position.58
Longitudinal data collection in the study focuses on six inter-connected domains of child development: health and wellbeing; psychological and cognitive development; education; family and whānau (extended family); culture and identity; and neighbourhoods and the societal context. To date, four major face-to-face data collection waves (DCWs) have been conducted during the antenatal period and when the children were aged 9 months, 2 years and 54 months. Ethical approval for the study was obtained from the Ministry of Health Northern Regional Ethics Committee.
The external dataset was used which excluded two sets of triplets in the cohort. For analyses in this paper we have also excluded 133 children not living in New Zealand at 2 years (597 observations with missing data for this question were assumed to be living in NZ). For multivariate analyses twins have been excluded to allow for independent observations. This resulted in 6,720 children included in the univariate analyses, and 6,536 children for the multivariate analyses (although observations with missing data for one or more variables were excluded from the model).
Early Childhood Education measures Mothers were asked about the type of ECE service used at 9 months, 2 years, and 54 months. Main childcare type had five categories at each timepoint as follows: none (parental care only), centre-based (included kindergarten, early childhood education centres, Māori and Pacific services, Kōhanga Reo Māori cultural immersion, gym or church crèche), home-based, grandparent, or other (included nanny, other relative, other person).
Mothers reported the usual number of hours per week their child attended the main childcare provider at 9 months and 2 years. The mean number of hours per week per type was calculated, and variables categorized as: < 10 hours per week, 10-19 hours and 59 minutes, 20-29 hours and 59 minutes, 30-39 hours and 59 minutes, 40+ hours per week.
Total group size was collected at 2 years from mother-reported estimations of the number of children attending the same childcare provider/home as their child aged under 2 years of age,
14
and 2 years or older. These variables were combined and categorized as 1 (only the child by him/herself), 2-5, 6-9, 10-19, 20 or more. Seventy observations with 0 number of children attending the service were recoded as 1 (only the child by him/herself); all of these instances were children cared for by grandparent or other relatives, and two in home-based care.
Adult to child ratio was derived from the total group size divided by the number of adults at childcare service (as reported by mother at 2 years) and categorized as 1 adult to 3 or fewer children, 1:4, 1:5, or 1:6 or more. Multiple childcare use between the age of 9 months and 2 years was collected in a question at 2 years of age, and categorized as 1, 2, 3 or more different providers. Primary care provider was collected at 2 years of age as a dichotomized (yes/no) variable.
Questionnaires for the Growing Up in New Zealand study are available online from: http://www.growingup.co.nz/en/access-to-guinz-data/data-collection-waves-questionnaires-technical-documents.html
Behavioural outcomes Emotional and behavioural measures were assessed using the mother-rated Strengths and Difficulties Questionnaire (SDQ). The preschool version of the SDQ was used when children were aged 2 years and the standard format was used when children were 54 months. The minor differences between the preschool and standard SDQ are described on the SDQ website (www.sdqinfo.com; Youth in Mind, 2014). Typically, the SDQ consists of five subscales, each measured by five items, and include: emotional symptoms, peer problems, hyperactivity-inattention, conduct problems and prosocial behaviour. While this was the case for the 2 year SDQ, an item (‘often fights with other children or bullies them’) corresponding to the conduct problems subscale was missing from the 54 month SDQ, due to an administrative error. As a result, the conduct problems score was prorated to account for this missing item. Prorating is the standard practice for calculating SDQ scores, to account for missing data. Individuals are excluded if data is missing for more than two items (or more than one item, in the case of the 54 month conduct problem subscale).
SDQ items are rated on a 3-point Likert scale as either not true, somewhat true or certainly true. All subscales except for prosocial behaviour can be summed to give a measure of total difficulties. SDQ subscales range from 0 to 10 and the total difficulties score ranges from 0 to 40. Scores can also be categorised into normal, borderline and abnormal ranges, based on previously determined cut-offs.61,62 The normal band reflects those who are unlikely to have a behavioural or emotional disorder, the borderline range indicates those with a ‘possible disorder, and the abnormal range reflects those with a ‘probable’ behavioural or emotional disorder.63
Infectious illnesses At the in-home face-to-face interview when their child was around 9 months of age, mothers were asked “How many times has your baby had an [ear] infection?” and “How many times has baby been admitted to hospital because of an ear infection? By admitted to hospital, I mean the baby stayed in hospital at least one night”, repeated for each type of infectious
15
illness (ear, chest, gastroenteritis and skin infections). At two years of age, mothers were asked “Since [child’s name] was 9 months old, how many times has he/she had an ear infection?” and “How many times has [child’s name] been admitted to hospital because of an ear infection? By admitted to hospital, I mean he/she stayed in hospital at least one night”, repeated for each type of infectious illness (ear, chest, gastroenteritis and skin infections).
Note that chest infections included bronchiolitis, bronchitis, pneumonia, and croup. Skin infections were defined for participants as “where the skin is red and warm, or there are pustules or boils, or crusting or oozing. This does NOT include cradle cap, mild nappy rash, eczema, or dermatitis.”
Binary variables were created as “0 none” or “1 or more” variable at each age. A derived variable of ‘ever admitted to hospital during the preschool period’ – combining data from the 9, 24 and 54 month datasets – was created for each type of infectious illness, and then combined to give hospitalisation for ear, chest or gastro infection during the preschool period (skin infections were removed from this derived variable as they were not found to be associated with early childhood education attendance). The total number of infections (by type or cumulatively) across the preschool period could not be established as the question response categories for number of infections were grouped at each timepoint as 0, 1-3, 4-6, 7-9, 10 or more.
Sociodemographic factors The child’s birthweight was obtained from the antenatal DCW. Low birthweight was defined as a weight of less than 2500 g. Socioeconomic status was measured using the New Zealand Deprivation (NZDep) Index, specifically the NZDep2006 Index at 2 years64 and the NZDep2013 at 54 months.65 This index is an area-level measure of socioeconomic deprivation, assessed at the meshblock level (smallest census tract unit), and is calculated based on the following socioeconomic indicators obtained via the census: income, home ownership, employment, qualifications, family structure, housing, access to transport and communications. The NZDep Index ranges from least deprived (decile 1) to most deprived (decile 10). In the current study, NZDep was categorised into low (deciles 1-3), medium (deciles 4-7) and high (deciles 8-10). Additional sociodemographic factors included the child’s prioritised ethnicity (European, Māori, Pacific, Asian, Other), maternal education (no secondary school, secondary school/diploma/trade certificate, Bachelor’s degree or higher), mother’s employment status, benefit receipt (unemployment or domestic purposes), mother’s age at the antenatal interview (<20, 20–25, 26–30, 31–35, 35+ years), and child sex.
Covariates specific to behavioural outcomes Postnatal depression was measured using the Edinburgh Postnatal Depression scale (EPDS) at 9 months.66 The scale ranges from 0 to 30, with women who scored 13 or greater categorised as having clinically significant depressive symptoms.67 As an indicator of family structure, the number of siblings that lived in the same house as the child (0, 1, 2 or more) was also utilised.
16
Covariates specific to infectious illness outcomes Three home environment variables found in earlier studies68,69 to be related to infectious illness in early childhood were included in the infectious illness models as potential confounders: smokers in the household (available at 9 months and 2 years), crowding and mould or damp in baby’s bedroom (mother-report at 9 months of age only). Number of smokers in the household was dichotomized as none (0) and 1 or more (1+). Household crowding was a derived binary variable, defined as having 2 or more people per bedroom in the household. Mould and/or damp in baby’s bedroom was also a derived binary variable.
Data analysis Behavioural outcomes analyses Bivariate analyses were conducted between SDQ total difficulties at 2 years and 54 months (categorised at normal, borderline and abnormal) and sociodemographic variables, covariates as well as concurrent ECE factors using a chi-square analyses.
Following this, prospective multivariate analyses were conducted using a binary logistic regression for each SDQ outcome at 54 months. Each SDQ outcome variable was dichotomised into normal and abnormal, with this latter category encompassing the borderline group. An initial baseline adjusted binary logistic regression was conducted, which tested the association between ECE variables at 24 months and SDQ outcomes at 54 months (both total difficulties and subscales), while adjusting for the corresponding baseline SDQ score. If the baseline adjusted model was significant, a fully adjusted model was conducted which also controlled for child’s sex, ethnicity, deprivation level, mother’s education, employment status, benefit receipt, mother’s age, and mother’s postnatal depression score. For all models, log-odds were exponentiated to produce odds ratios and 95% confidence intervals. All behavioural outcome analyses were run in R v3.5.2 on the Growing Up in New Zealand external data platform (Guacamole 0.8.4).
Infectious illness analyses Descriptive analyses for the cohort demographic variables, childcare characteristics and infectious illnesses were conducted to obtain counts and proportions. Unadjusted associations were tested using chi-square, and logistic regression with odds ratios were calculated. Complete case analyses, excluding children with at least one missing variable, were used for descriptive and multivariate analyses.
Independent associations were examined using multivariable logistic regression models, which produced odds ratios. Variables were selected for inclusion in the model based on statistical significance (p < 0.1) of the unadjusted association. Separate models were run for variables at each time point (9 months and 2 years) for each infection type (except skin infections due to the lack of a univariate association with childcare). When multiple childcare factors were associated with the infection outcome, two multivariate models were constructed: 1) with associated childcare factors, and 2) childcare, demographic and household characteristics.
17

Results for the regression analyses were presented by odds ratios and 95% confidence intervals. P-values less than 0.05 were considered statistically significant. All infectious illness analyses were run in Stata/SE v15.0 on the Growing Up in New Zealand external data platform (Guacamole 0.8.4).
18
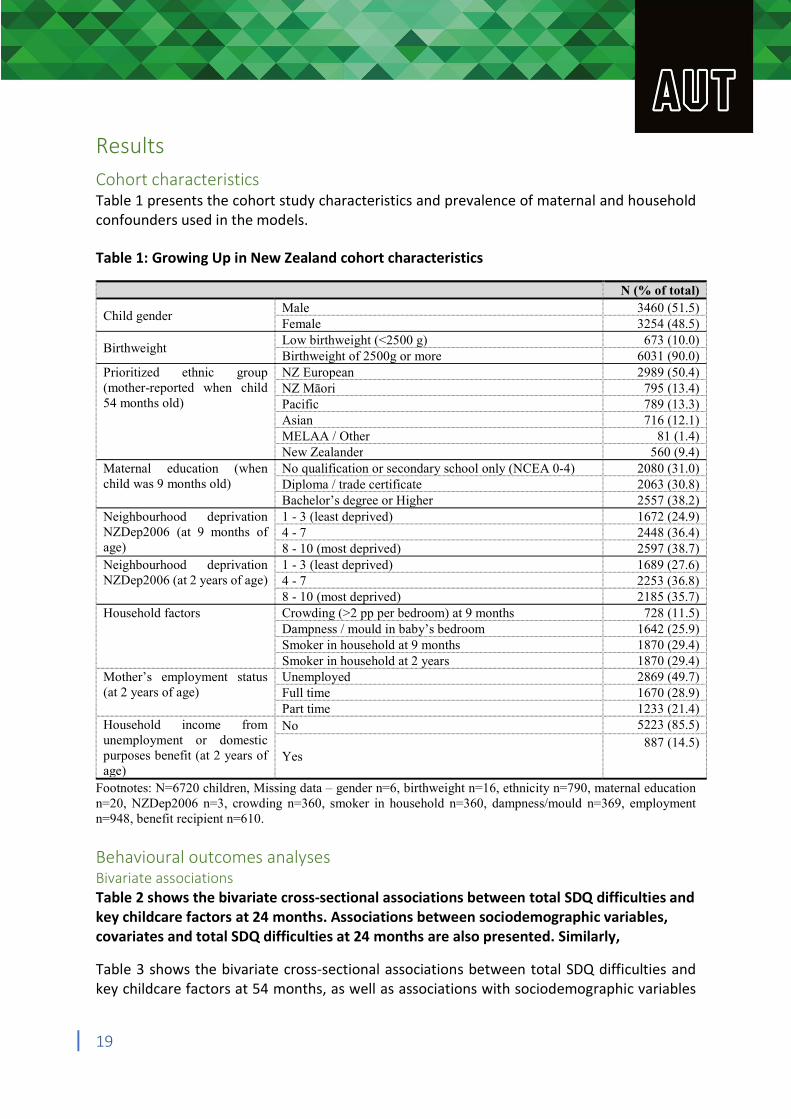
Results Cohort characteristics Table 1 presents the cohort study characteristics and prevalence of maternal and household confounders used in the models. Table 1: Growing Up in New Zealand cohort characteristics
N (% of total)
Child gender Male Female
3460 (51.5) 3254 (48.5)
Birthweight Low birthweight (<2500 g) Birthweight of 2500g or more
673 (10.0) 6031 (90.0)
Prioritized ethnic group NZ European 2989 (50.4) (mother-reported when child NZ Māori 795 (13.4) 54 months old) Pacific 789 (13.3)
Asian 716 (12.1) MELAA / Other 81 (1.4) New Zealander 560 (9.4)
Maternal education (when No qualification or secondary school only (NCEA 0-4) 2080 (31.0) child was 9 months old) Diploma / trade certificate 2063 (30.8)
Bachelor’s degree or Higher 2557 (38.2) Neighbourhood deprivation 1 - 3 (least deprived) 1672 (24.9) NZDep2006 (at 9 months of 4 - 7 2448 (36.4) age) 8 - 10 (most deprived) 2597 (38.7) Neighbourhood deprivation 1 - 3 (least deprived) 1689 (27.6) NZDep2006 (at 2 years of age) 4 - 7 2253 (36.8)
8 - 10 (most deprived) 2185 (35.7) Household factors Crowding (>2 pp per bedroom) at 9 months 728 (11.5)
Dampness / mould in baby’s bedroom 1642 (25.9) Smoker in household at 9 months 1870 (29.4) Smoker in household at 2 years 1870 (29.4)
Mother’s employment status Unemployed 2869 (49.7) (at 2 years of age) Full time 1670 (28.9)
Part time 1233 (21.4) Household income from No 5223 (85.5) unemployment or domestic 887 (14.5) purposes benefit (at 2 years of Yes age)
Footnotes: N=6720 children, Missing data – gender n=6, birthweight n=16, ethnicity n=790, maternal education n=20, NZDep2006 n=3, crowding n=360, smoker in household n=360, dampness/mould n=369, employment n=948, benefit recipient n=610. Behavioural outcomes analyses Bivariate associations Table 2 shows the bivariate cross-sectional associations between total SDQ difficulties and key childcare factors at 24 months. Associations between sociodemographic variables, covariates and total SDQ difficulties at 24 months are also presented. Similarly,
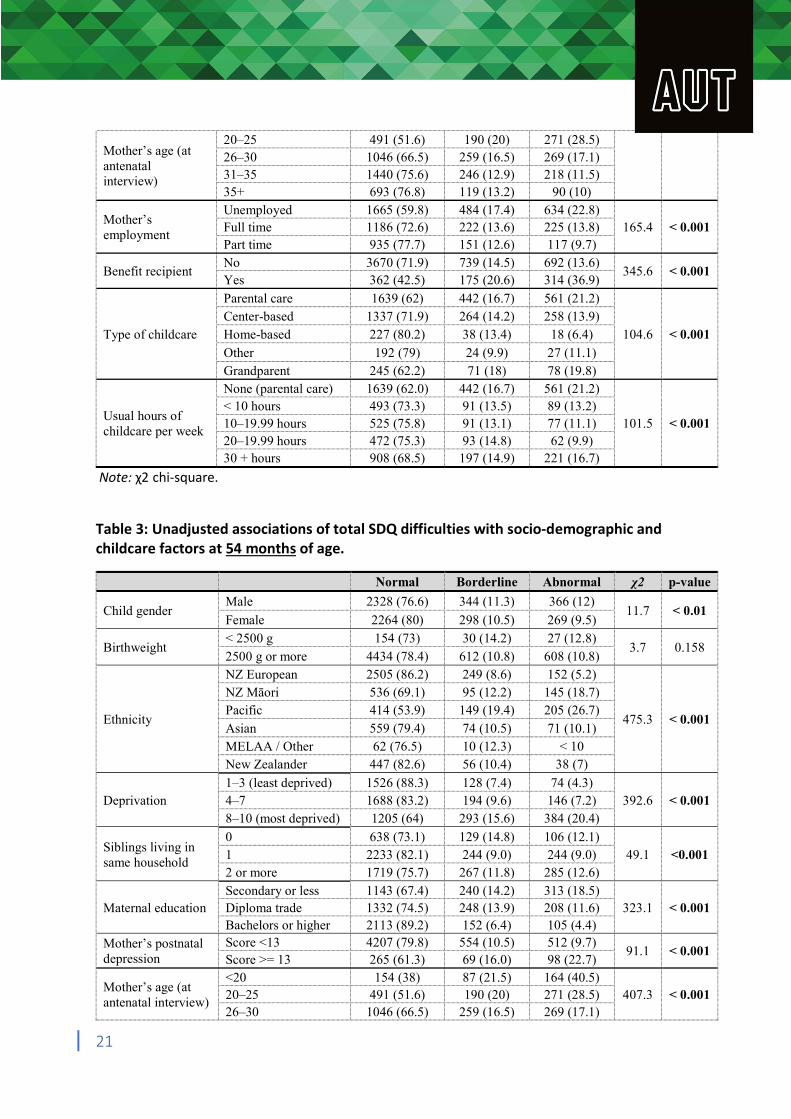
Table 3 shows the bivariate cross-sectional associations between total SDQ difficulties and key childcare factors at 54 months, as well as associations with sociodemographic variables
19
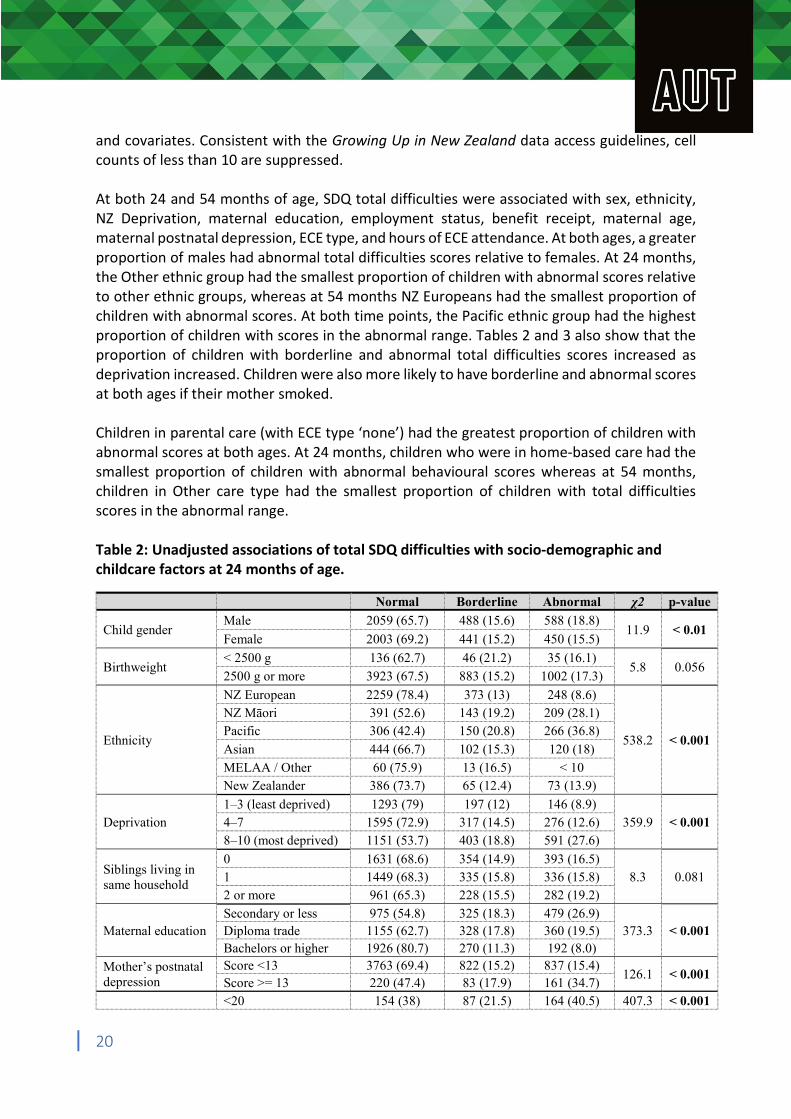
and covariates. Consistent with the Growing Up in New Zealand data access guidelines, cell counts of less than 10 are suppressed. At both 24 and 54 months of age, SDQ total difficulties were associated with sex, ethnicity, NZ Deprivation, maternal education, employment status, benefit receipt, maternal age, maternal postnatal depression, ECE type, and hours of ECE attendance. At both ages, a greater proportion of males had abnormal total difficulties scores relative to females. At 24 months, the Other ethnic group had the smallest proportion of children with abnormal scores relative to other ethnic groups, whereas at 54 months NZ Europeans had the smallest proportion of children with abnormal scores. At both time points, the Pacific ethnic group had the highest proportion of children with scores in the abnormal range. Tables 2 and 3 also show that the proportion of children with borderline and abnormal total difficulties scores increased as deprivation increased. Children were also more likely to have borderline and abnormal scores at both ages if their mother smoked. Children in parental care (with ECE type ‘none’) had the greatest proportion of children with abnormal scores at both ages. At 24 months, children who were in home-based care had the smallest proportion of children with abnormal behavioural scores whereas at 54 months, children in Other care type had the smallest proportion of children with total difficulties scores in the abnormal range. Table 2: Unadjusted associations of total SDQ difficulties with socio-demographic and childcare factors at 24 months of age.
Normal Borderline Abnormal χ2 p-value
Child gender Male
Female
2059 (65.7)
2003 (69.2)
488 (15.6)
441 (15.2)
588 (18.8)
450 (15.5) 11.9 < 0.01
Birthweight < 2500 g
2500 g or more
136 (62.7)
3923 (67.5)
46 (21.2)
883 (15.2)
35 (16.1)
1002 (17.3) 5.8 0.056
NZ European 2259 (78.4) 373 (13) 248 (8.6) NZ Māori 391 (52.6) 143 (19.2) 209 (28.1)
Ethnicity Pacific
Asian
306 (42.4)
444 (66.7)
150 (20.8)
102 (15.3)
266 (36.8)
120 (18) 538.2 < 0.001
MELAA / Other 60 (75.9) 13 (16.5) < 10 New Zealander 386 (73.7) 65 (12.4) 73 (13.9)
1–3 (least deprived) 1293 (79) 197 (12) 146 (8.9) Deprivation 4–7 1595 (72.9) 317 (14.5) 276 (12.6) 359.9 < 0.001
8–10 (most deprived) 1151 (53.7) 403 (18.8) 591 (27.6)
Siblings living in same household
0 1
1631 (68.6) 1449 (68.3)
354 (14.9) 335 (15.8)
393 (16.5) 336 (15.8) 8.3 0.081
2 or more 961 (65.3) 228 (15.5) 282 (19.2)
Secondary or less 975 (54.8) 325 (18.3) 479 (26.9) Maternal education Diploma trade 1155 (62.7) 328 (17.8) 360 (19.5) 373.3 < 0.001
Bachelors or higher 1926 (80.7) 270 (11.3) 192 (8.0)
Mother’s postnatal Score <13 3763 (69.4) 822 (15.2) 837 (15.4) 126.1 < 0.001
depression Score >= 13 220 (47.4) 83 (17.9) 161 (34.7) <20 154 (38) 87 (21.5) 164 (40.5) 407.3 < 0.001
20
Mother’s age (at antenatal interview)
20–25 26–30 31–35 35+
491 (51.6) 1046 (66.5) 1440 (75.6) 693 (76.8)
190 (20) 259 (16.5) 246 (12.9) 119 (13.2)
271 (28.5) 269 (17.1) 218 (11.5)
90 (10)
Mother’s employment
Unemployed Full time Part time
1665 (59.8) 1186 (72.6) 935 (77.7)
484 (17.4) 222 (13.6) 151 (12.6)
634 (22.8) 225 (13.8) 117 (9.7)
165.4 < 0.001
Benefit recipient No Yes
3670 (71.9) 362 (42.5)
739 (14.5) 175 (20.6)
692 (13.6) 314 (36.9)
345.6 < 0.001
Parental care 1639 (62) 442 (16.7) 561 (21.2) Center-based 1337 (71.9) 264 (14.2) 258 (13.9)
Type of childcare Home-based 227 (80.2) 38 (13.4) 18 (6.4) 104.6 < 0.001
Other 192 (79) 24 (9.9) 27 (11.1) Grandparent 245 (62.2) 71 (18) 78 (19.8) None (parental care) 1639 (62.0) 442 (16.7) 561 (21.2)
Usual hours of childcare per week
< 10 hours 10–19.99 hours 20–19.99 hours
493 (73.3) 525 (75.8) 472 (75.3)
91 (13.5) 91 (13.1) 93 (14.8)
89 (13.2) 77 (11.1) 62 (9.9)
101.5 < 0.001
30 + hours 908 (68.5) 197 (14.9) 221 (16.7)
Note: χ2 chi-square.
Table 3: Unadjusted associations of total SDQ difficulties with socio-demographic and childcare factors at 54 months of age.
Normal Borderline Abnormal χ2 p-value
Male 2328 (76.6) 344 (11.3) 366 (12) Child gender 11.7 < 0.01
Female 2264 (80) 298 (10.5) 269 (9.5) < 2500 g 154 (73) 30 (14.2) 27 (12.8)
Birthweight 3.7 0.158 2500 g or more 4434 (78.4) 612 (10.8) 608 (10.8) NZ European 2505 (86.2) 249 (8.6) 152 (5.2) NZ Māori 536 (69.1) 95 (12.2) 145 (18.7) Pacific 414 (53.9) 149 (19.4) 205 (26.7)
Ethnicity 475.3 < 0.001 Asian 559 (79.4) 74 (10.5) 71 (10.1) MELAA / Other 62 (76.5) 10 (12.3) < 10 New Zealander 447 (82.6) 56 (10.4) 38 (7)
1–3 (least deprived) 1526 (88.3) 128 (7.4) 74 (4.3) Deprivation 4–7 1688 (83.2) 194 (9.6) 146 (7.2) 392.6 < 0.001
8–10 (most deprived) 1205 (64) 293 (15.6) 384 (20.4)
0 638 (73.1) 129 (14.8) 106 (12.1) Siblings living in
1 2233 (82.1) 244 (9.0) 244 (9.0) 49.1 <0.001 same household
2 or more 1719 (75.7) 267 (11.8) 285 (12.6) Secondary or less 1143 (67.4) 240 (14.2) 313 (18.5)
Maternal education Diploma trade 1332 (74.5) 248 (13.9) 208 (11.6) 323.1 < 0.001 Bachelors or higher 2113 (89.2) 152 (6.4) 105 (4.4)
Mother’s postnatal Score <13 4207 (79.8) 554 (10.5) 512 (9.7) 91.1 < 0.001
depression Score >= 13 265 (61.3) 69 (16.0) 98 (22.7) <20 154 (38) 87 (21.5) 164 (40.5)
Mother’s age (at 20–25 491 (51.6) 190 (20) 271 (28.5) 407.3 < 0.001
antenatal interview) 26–30 1046 (66.5) 259 (16.5) 269 (17.1)
21
31–35 1440 (75.6) 246 (12.9) 218 (11.5) 35+ 693 (76.8) 119 (13.2) 90 (10)
Mother’s employment
Unemployed Full time Part time
1444 (70.8) 1794 (79.8) 1347 (85.9)
277 (13.6) 232 (10.3) 129 (8.2)
320 (15.7) 223 (9.9) 91 (5.8)
134.1 < 0.001
Benefit recipient No Yes
4287 (80.9) 297 (53.4)
539 (10.2) 101 (18.2)
476 (9) 158 (28.4)
253.6 <0.001
Parental care 125 (63.8) 38 (19.4) 33 (16.8) Center-based 4210 (79) 557 (10.5) 559 (10.5)
Type of childcare Home-based 86 (69.9) 20 (16.3) 17 (13.8) 38.0 < 0.001 Other 78 (83.9) < 10 < 10 Grandparent 70 (70) 14 (14) 16 (16) None (parental care) 1848 (75.4) 304 (12.4) 298 (12.2)
Usual hours of childcare per week
< 10 hours 10–19.99 hours 20–29.99 hours
529 (81.9) 559 (82.6) 520 (85.5)
62 (9.6) 62 (9.2) 40 (6.6)
55 (8.5) 56 (8.3) 48 (7.9)
43.7 < 0.001
30 + hours 998 (78.6) 138 (10.9) 134 (10.6)
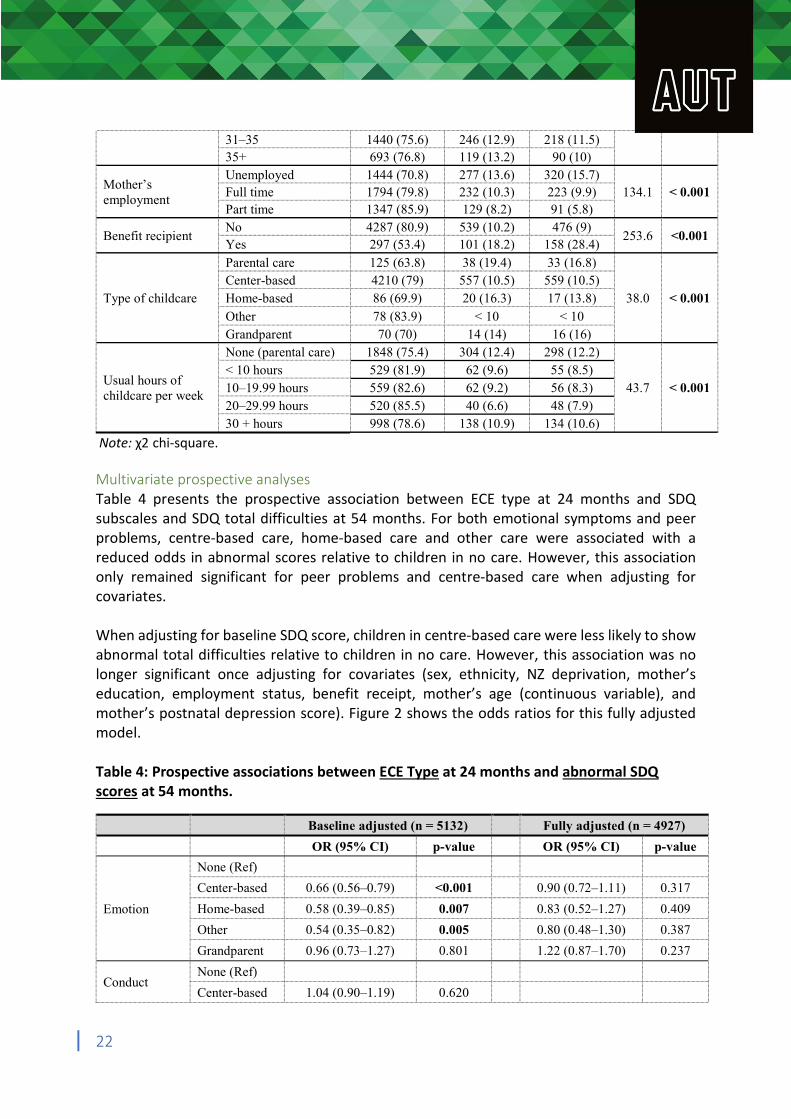
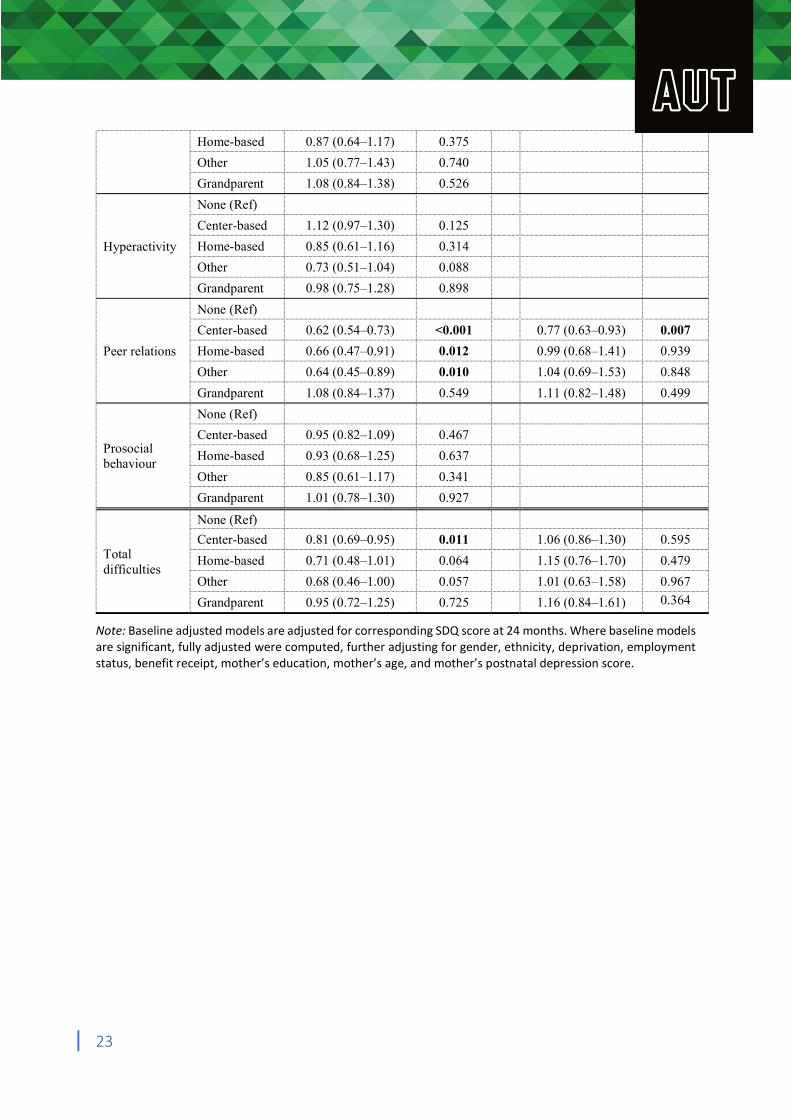
Note: χ2 chi-square. Multivariate prospective analyses Table 4 presents the prospective association between ECE type at 24 months and SDQ subscales and SDQ total difficulties at 54 months. For both emotional symptoms and peer problems, centre-based care, home-based care and other care were associated with a reduced odds in abnormal scores relative to children in no care. However, this association only remained significant for peer problems and centre-based care when adjusting for covariates. When adjusting for baseline SDQ score, children in centre-based care were less likely to show abnormal total difficulties relative to children in no care. However, this association was no longer significant once adjusting for covariates (sex, ethnicity, NZ deprivation, mother’s education, employment status, benefit receipt, mother’s age (continuous variable), and mother’s postnatal depression score). Figure 2 shows the odds ratios for this fully adjusted model. Table 4: Prospective associations between ECE Type at 24 months and abnormal SDQ scores at 54 months.
Baseline adjusted (n = 5132) Fully adjusted (n = 4927)
OR (95% CI) p-value OR (95% CI) p-value
None (Ref)
Center-based 0.66 (0.56–0.79) <0.001 0.90 (0.72–1.11) 0.317
Emotion Home-based 0.58 (0.39–0.85) 0.007 0.83 (0.52–1.27) 0.409
Other 0.54 (0.35–0.82) 0.005 0.80 (0.48–1.30) 0.387
Grandparent 0.96 (0.73–1.27) 0.801 1.22 (0.87–1.70) 0.237
None (Ref) Conduct
Center-based 1.04 (0.90–1.19) 0.620
22
Home-based 0.87 (0.64–1.17) 0.375
Other 1.05 (0.77–1.43) 0.740
Grandparent 1.08 (0.84–1.38) 0.526
None (Ref)
Center-based 1.12 (0.97–1.30) 0.125
Hyperactivity Home-based 0.85 (0.61–1.16) 0.314
Other 0.73 (0.51–1.04) 0.088
Grandparent 0.98 (0.75–1.28) 0.898
None (Ref)
Center-based 0.62 (0.54–0.73) <0.001 0.77 (0.63–0.93) 0.007
Peer relations Home-based 0.66 (0.47–0.91) 0.012 0.99 (0.68–1.41) 0.939
Other 0.64 (0.45–0.89) 0.010 1.04 (0.69–1.53) 0.848
Grandparent 1.08 (0.84–1.37) 0.549 1.11 (0.82–1.48) 0.499
None (Ref)
Center-based 0.95 (0.82–1.09) 0.467 Prosocial behaviour
Home-based 0.93 (0.68–1.25) 0.637
Other 0.85 (0.61–1.17) 0.341
Grandparent 1.01 (0.78–1.30) 0.927
None (Ref)
Center-based 0.81 (0.69–0.95) 0.011 1.06 (0.86–1.30) 0.595 Total difficulties
Home-based 0.71 (0.48–1.01) 0.064 1.15 (0.76–1.70) 0.479
Other 0.68 (0.46–1.00) 0.057 1.01 (0.63–1.58) 0.967
Grandparent 0.95 (0.72–1.25) 0.725 1.16 (0.84–1.61) 0.364
Note: Baseline adjusted models are adjusted for corresponding SDQ score at 24 months. Where baseline models are significant, fully adjusted were computed, further adjusting for gender, ethnicity, deprivation, employment status, benefit receipt, mother’s education, mother’s age, and mother’s postnatal depression score.
23
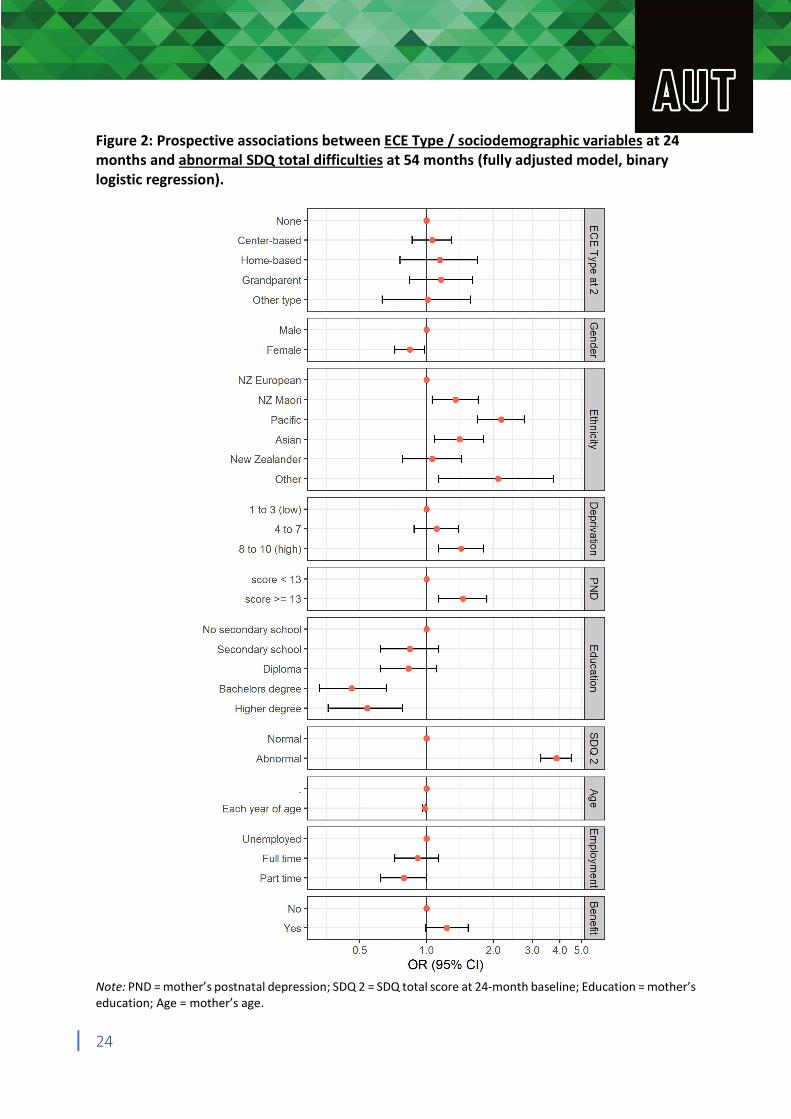
Figure 2: Prospective associations between ECE Type / sociodemographic variables at 24 months and abnormal SDQ total difficulties at 54 months (fully adjusted model, binary logistic regression).
Note: PND = mother’s postnatal depression; SDQ 2 = SDQ total score at 24-month baseline; Education = mother’s education; Age = mother’s age.
24
Table 5 shows the prospective associations between hours of ECE attendance per week at 24 months and SDQ subscales and SDQ total difficulties at 54 months. In the baseline adjusted model, children who spent any time in childcare had a reduced odds of showing abnormal emotional symptoms scores relative to children that spent no time in childcare. However, once covariates were accounted for, this protective effect only remained significant for children who spent 20 to 30 hours in childcare per week.
The baseline adjusted model with peer problems as the outcome indicated that children who spent 30 hours or less in childcare had a reduced odds of obtaining abnormal scores relative to children that spent no time in childcare. However, once adjusting for covariates, this association only remained significant for children who spent 20 to 30 hours per week in childcare.
Children who spent 20-30 hours had a reduced odds of showing abnormal total difficulties scores relative to children that did not attend childcare in the baseline adjusted model. However, this association was no longer significant once further adjusting for covariates. Figure 3 shows the odds ratios for this fully adjusted model.
25
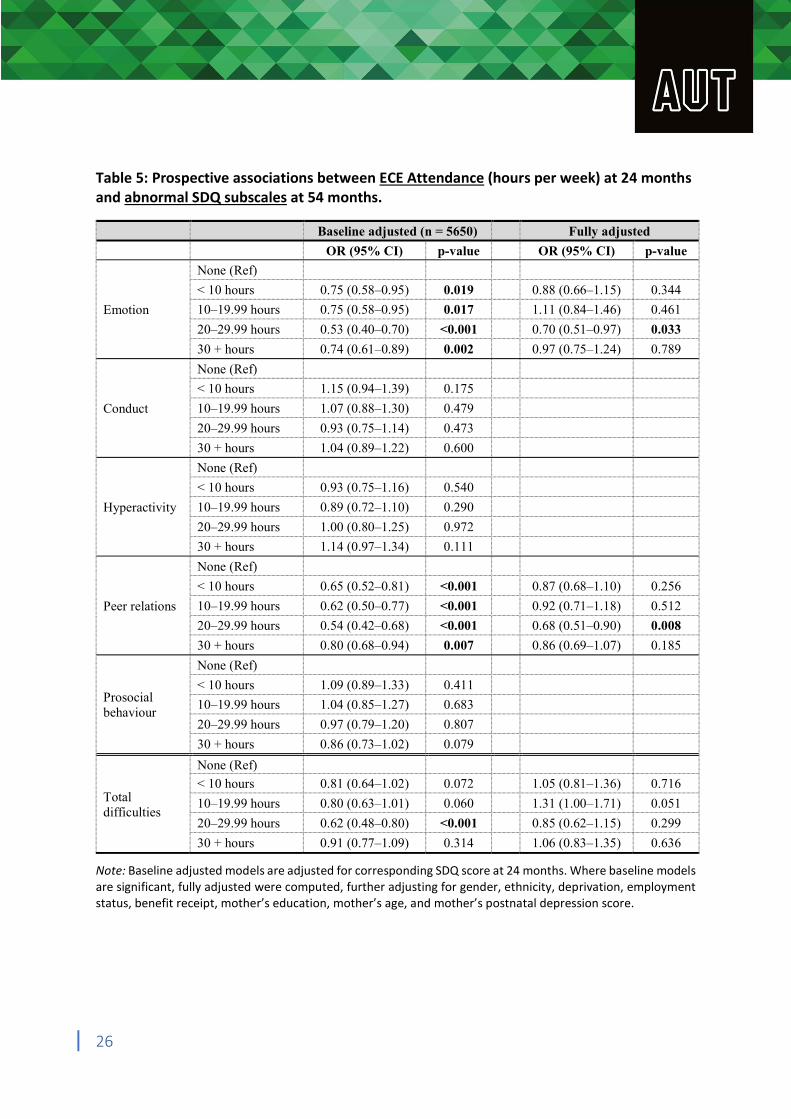
Table 5: Prospective associations between ECE Attendance (hours per week) at 24 months and abnormal SDQ subscales at 54 months.
Baseline adjusted (n = 5650) Fully adjusted
OR (95% CI) p-value OR (95% CI) p-value
None (Ref)
< 10 hours 0.75 (0.58–0.95) 0.019 0.88 (0.66–1.15) 0.344
Emotion 10–19.99 hours 0.75 (0.58–0.95) 0.017 1.11 (0.84–1.46) 0.461
20–29.99 hours 0.53 (0.40–0.70) <0.001 0.70 (0.51–0.97) 0.033
30 + hours 0.74 (0.61–0.89) 0.002 0.97 (0.75–1.24) 0.789
None (Ref)
< 10 hours 1.15 (0.94–1.39) 0.175
Conduct 10–19.99 hours 1.07 (0.88–1.30) 0.479
20–29.99 hours 0.93 (0.75–1.14) 0.473
30 + hours 1.04 (0.89–1.22) 0.600
None (Ref)
< 10 hours 0.93 (0.75–1.16) 0.540
Hyperactivity 10–19.99 hours 0.89 (0.72–1.10) 0.290
20–29.99 hours 1.00 (0.80–1.25) 0.972
30 + hours 1.14 (0.97–1.34) 0.111
None (Ref)
< 10 hours 0.65 (0.52–0.81) <0.001 0.87 (0.68–1.10) 0.256
Peer relations 10–19.99 hours 0.62 (0.50–0.77) <0.001 0.92 (0.71–1.18) 0.512
20–29.99 hours 0.54 (0.42–0.68) <0.001 0.68 (0.51–0.90) 0.008
30 + hours 0.80 (0.68–0.94) 0.007 0.86 (0.69–1.07) 0.185
None (Ref)
Prosocial behaviour
< 10 hours
10–19.99 hours
1.09 (0.89–1.33)
1.04 (0.85–1.27)
0.411
0.683
20–29.99 hours 0.97 (0.79–1.20) 0.807
30 + hours 0.86 (0.73–1.02) 0.079
None (Ref)
< 10 hours 0.81 (0.64–1.02) 0.072 1.05 (0.81–1.36) 0.716 Total difficulties
10–19.99 hours 0.80 (0.63–1.01) 0.060 1.31 (1.00–1.71) 0.051
20–29.99 hours 0.62 (0.48–0.80) <0.001 0.85 (0.62–1.15) 0.299
30 + hours 0.91 (0.77–1.09) 0.314 1.06 (0.83–1.35) 0.636
Note: Baseline adjusted models are adjusted for corresponding SDQ score at 24 months. Where baseline models are significant, fully adjusted were computed, further adjusting for gender, ethnicity, deprivation, employment status, benefit receipt, mother’s education, mother’s age, and mother’s postnatal depression score.
26
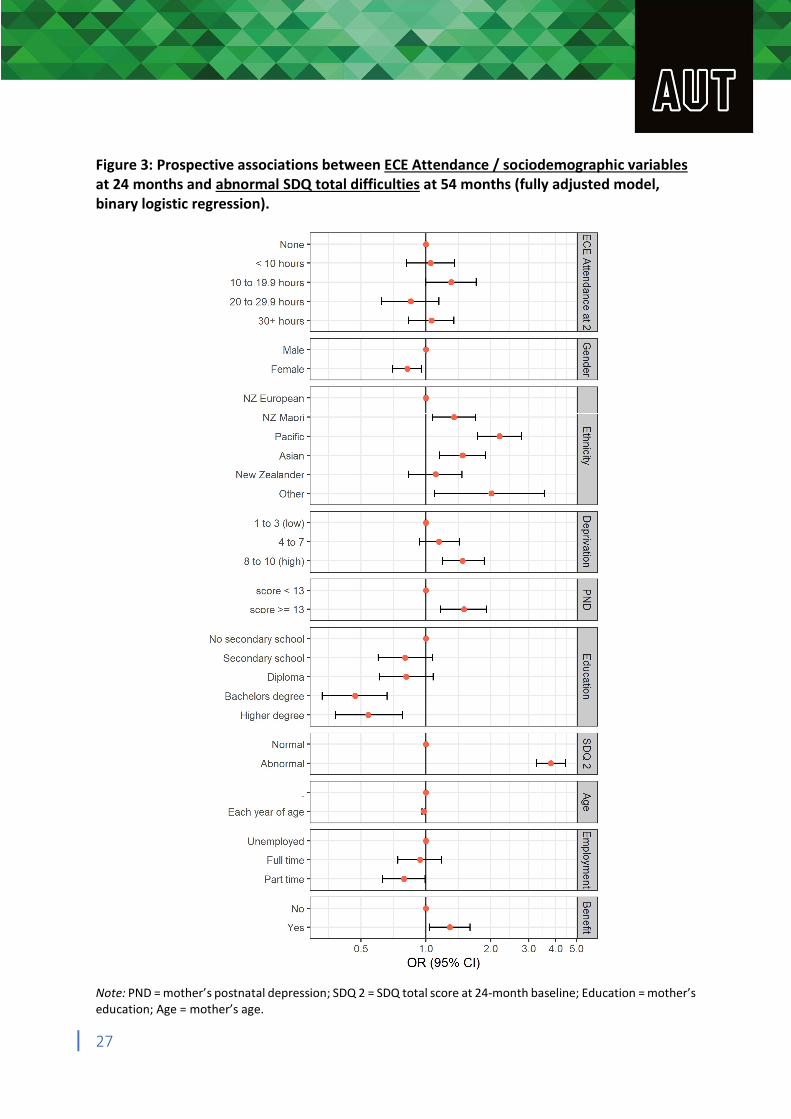
Figure 3: Prospective associations between ECE Attendance / sociodemographic variables at 24 months and abnormal SDQ total difficulties at 54 months (fully adjusted model, binary logistic regression).
Note: PND = mother’s postnatal depression; SDQ 2 = SDQ total score at 24-month baseline; Education = mother’s education; Age = mother’s age.
27
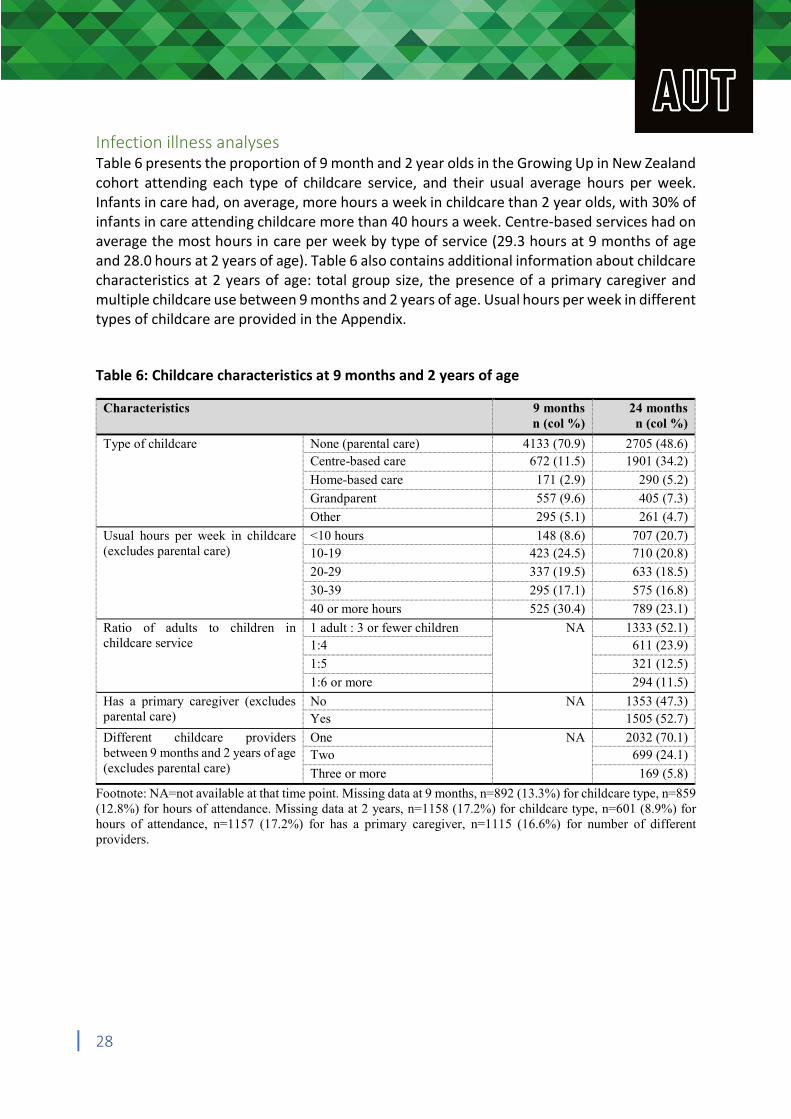
Infection illness analyses Table 6 presents the proportion of 9 month and 2 year olds in the Growing Up in New Zealand cohort attending each type of childcare service, and their usual average hours per week. Infants in care had, on average, more hours a week in childcare than 2 year olds, with 30% of infants in care attending childcare more than 40 hours a week. Centre-based services had on average the most hours in care per week by type of service (29.3 hours at 9 months of age and 28.0 hours at 2 years of age). Table 6 also contains additional information about childcare characteristics at 2 years of age: total group size, the presence of a primary caregiver and multiple childcare use between 9 months and 2 years of age. Usual hours per week in different types of childcare are provided in the Appendix. Table 6: Childcare characteristics at 9 months and 2 years of age
Characteristics 9 months 24 months n (col %) n (col %)
Type of childcare None (parental care) 4133 (70.9) 2705 (48.6) Centre-based care 672 (11.5) 1901 (34.2)
Home-based care 171 (2.9) 290 (5.2)
Grandparent 557 (9.6) 405 (7.3)
Other 295 (5.1) 261 (4.7)
Usual hours per week in childcare <10 hours 148 (8.6) 707 (20.7) (excludes parental care) 10-19 423 (24.5) 710 (20.8)
20-29 337 (19.5) 633 (18.5)
30-39 295 (17.1) 575 (16.8)
40 or more hours 525 (30.4) 789 (23.1)
Ratio of adults to children in 1 adult : 3 or fewer children NA 1333 (52.1) childcare service 1:4 611 (23.9)
1:5 321 (12.5)
1:6 or more 294 (11.5)
Has a primary caregiver (excludes No NA 1353 (47.3) parental care) Yes 1505 (52.7)
Different childcare providers One NA 2032 (70.1) between 9 months and 2 years of age Two 699 (24.1) (excludes parental care) Three or more 169 (5.8)
Footnote: NA=not available at that time point. Missing data at 9 months, n=892 (13.3%) for childcare type, n=859 (12.8%) for hours of attendance. Missing data at 2 years, n=1158 (17.2%) for childcare type, n=601 (8.9%) for hours of attendance, n=1157 (17.2%) for has a primary caregiver, n=1115 (16.6%) for number of different providers.
28
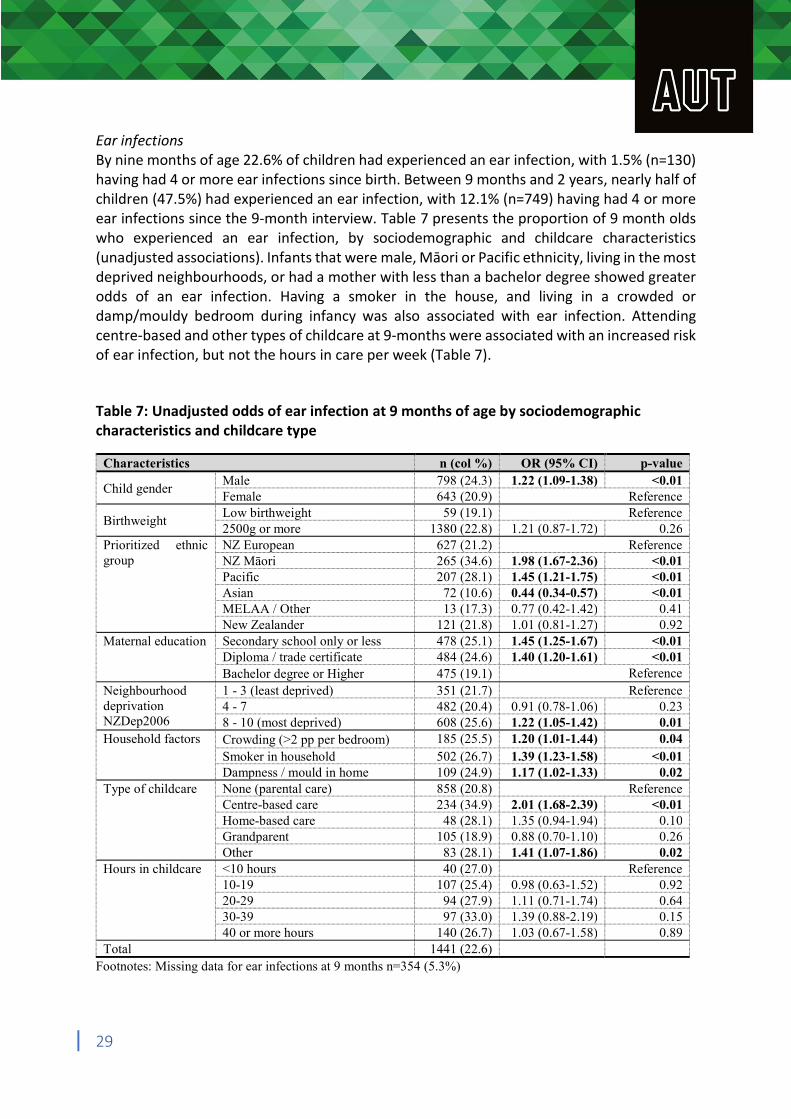
Ear infections By nine months of age 22.6% of children had experienced an ear infection, with 1.5% (n=130) having had 4 or more ear infections since birth. Between 9 months and 2 years, nearly half of children (47.5%) had experienced an ear infection, with 12.1% (n=749) having had 4 or more ear infections since the 9-month interview. Table 7 presents the proportion of 9 month olds who experienced an ear infection, by sociodemographic and childcare characteristics (unadjusted associations). Infants that were male, Māori or Pacific ethnicity, living in the most deprived neighbourhoods, or had a mother with less than a bachelor degree showed greater odds of an ear infection. Having a smoker in the house, and living in a crowded or damp/mouldy bedroom during infancy was also associated with ear infection. Attending centre-based and other types of childcare at 9-months were associated with an increased risk of ear infection, but not the hours in care per week (Table 7). Table 7: Unadjusted odds of ear infection at 9 months of age by sociodemographic characteristics and childcare type
Characteristics n (col %) OR (95% CI) p-value
Child gender Male Female
798 (24.3) 643 (20.9)
1.22 (1.09-1.38) <0.01 Reference
Birthweight Low birthweight 2500g or more
59 (19.1) 1380 (22.8) 1.21 (0.87-1.72)
Reference 0.26
Prioritized ethnic NZ European 627 (21.2) Reference group NZ Māori 265 (34.6) 1.98 (1.67-2.36) <0.01
Pacific 207 (28.1) 1.45 (1.21-1.75) <0.01 Asian 72 (10.6) 0.44 (0.34-0.57) <0.01 MELAA / Other 13 (17.3) 0.77 (0.42-1.42) 0.41 New Zealander 121 (21.8) 1.01 (0.81-1.27) 0.92
Maternal education Secondary school only or less 478 (25.1) 1.45 (1.25-1.67) <0.01 Diploma / trade certificate 484 (24.6) 1.40 (1.20-1.61) <0.01 Bachelor degree or Higher 475 (19.1) Reference
Neighbourhood 1 - 3 (least deprived) 351 (21.7) Reference deprivation 4 - 7 482 (20.4) 0.91 (0.78-1.06) 0.23 NZDep2006 8 - 10 (most deprived) 608 (25.6) 1.22 (1.05-1.42) 0.01 Household factors Crowding (>2 pp per bedroom) 185 (25.5) 1.20 (1.01-1.44) 0.04
Smoker in household 502 (26.7) 1.39 (1.23-1.58) <0.01 Dampness / mould in home 109 (24.9) 1.17 (1.02-1.33) 0.02
Type of childcare None (parental care) 858 (20.8) Reference Centre-based care 234 (34.9) 2.01 (1.68-2.39) <0.01 Home-based care 48 (28.1) 1.35 (0.94-1.94) 0.10 Grandparent 105 (18.9) 0.88 (0.70-1.10) 0.26 Other 83 (28.1) 1.41 (1.07-1.86) 0.02
Hours in childcare <10 hours 40 (27.0) Reference 10-19 107 (25.4) 0.98 (0.63-1.52) 0.92 20-29 94 (27.9) 1.11 (0.71-1.74) 0.64 30-39 97 (33.0) 1.39 (0.88-2.19) 0.15 40 or more hours 140 (26.7) 1.03 (0.67-1.58) 0.89
Total 1441 (22.6) Footnotes: Missing data for ear infections at 9 months n=354 (5.3%)
29
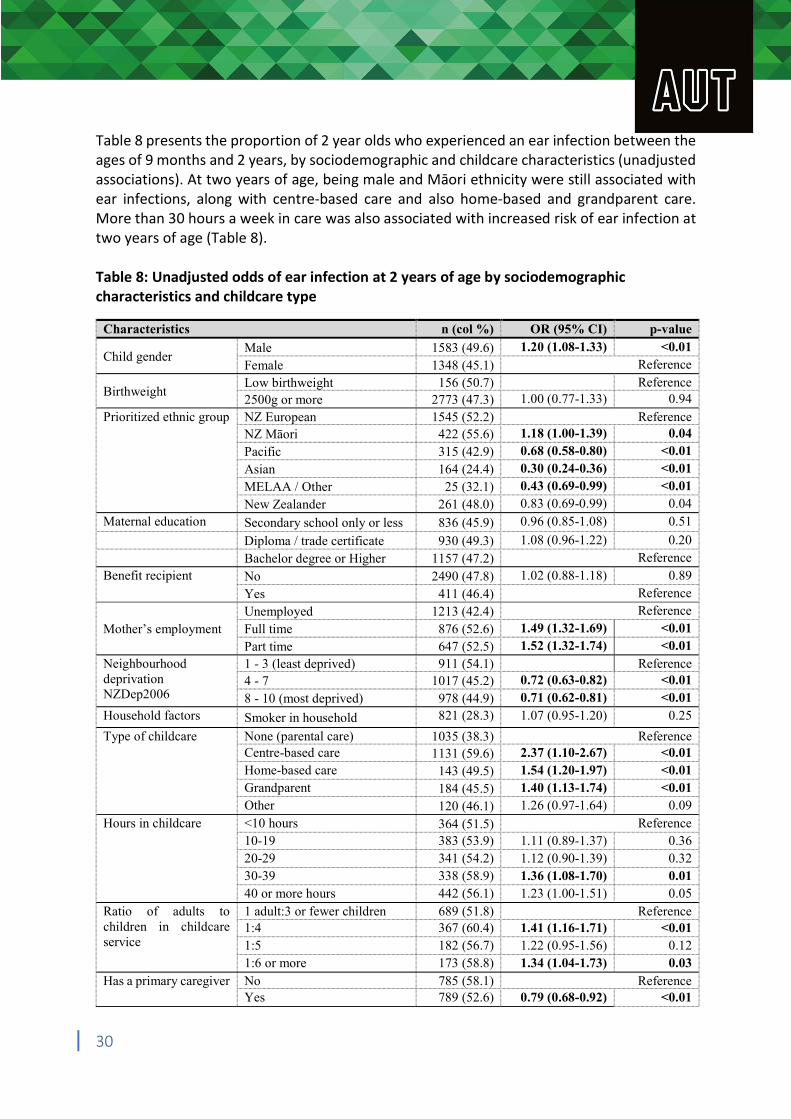
Table 8 presents the proportion of 2 year olds who experienced an ear infection between the ages of 9 months and 2 years, by sociodemographic and childcare characteristics (unadjusted associations). At two years of age, being male and Māori ethnicity were still associated with ear infections, along with centre-based care and also home-based and grandparent care. More than 30 hours a week in care was also associated with increased risk of ear infection at two years of age (Table 8). Table 8: Unadjusted odds of ear infection at 2 years of age by sociodemographic characteristics and childcare type
Characteristics n (col %) OR (95% CI) p-value
Child gender Male Female
1583 (49.6) 1348 (45.1)
1.20 (1.08-1.33) <0.01 Reference
Birthweight Low birthweight 2500g or more
156 (50.7) 2773 (47.3)
1.00 (0.77-1.33)
Reference 0.94
Prioritized ethnic group NZ European 1545 (52.2) Reference NZ Māori 422 (55.6) 1.18 (1.00-1.39) 0.04
Pacific 315 (42.9) 0.68 (0.58-0.80) <0.01
Asian 164 (24.4) 0.30 (0.24-0.36) <0.01
MELAA / Other 25 (32.1) 0.43 (0.69-0.99) <0.01
New Zealander 261 (48.0) 0.83 (0.69-0.99) 0.04 Maternal education Secondary school only or less 836 (45.9) 0.96 (0.85-1.08) 0.51
Diploma / trade certificate 930 (49.3) 1.08 (0.96-1.22) 0.20 Bachelor degree or Higher 1157 (47.2) Reference Benefit recipient No 2490 (47.8) 1.02 (0.88-1.18) 0.89 Yes 411 (46.4) Reference
Unemployed 1213 (42.4) Reference
Mother’s employment Full time 876 (52.6) 1.49 (1.32-1.69) <0.01
Part time 647 (52.5) 1.52 (1.32-1.74) <0.01 Neighbourhood 1 - 3 (least deprived) 911 (54.1) Reference deprivation 4 - 7 1017 (45.2) 0.72 (0.63-0.82) <0.01 NZDep2006 8 - 10 (most deprived) 978 (44.9) 0.71 (0.62-0.81) <0.01 Household factors Smoker in household 821 (28.3) 1.07 (0.95-1.20) 0.25
Type of childcare None (parental care) 1035 (38.3) Reference Centre-based care 1131 (59.6) 2.37 (1.10-2.67) <0.01 Home-based care 143 (49.5) 1.54 (1.20-1.97) <0.01 Grandparent 184 (45.5) 1.40 (1.13-1.74) <0.01 Other 120 (46.1) 1.26 (0.97-1.64) 0.09
Hours in childcare <10 hours 364 (51.5) Reference 10-19 383 (53.9) 1.11 (0.89-1.37) 0.36 20-29 341 (54.2) 1.12 (0.90-1.39) 0.32 30-39 338 (58.9) 1.36 (1.08-1.70) 0.01 40 or more hours 442 (56.1) 1.23 (1.00-1.51) 0.05
Ratio of adults to 1 adult:3 or fewer children 689 (51.8) Reference children in childcare 1:4 367 (60.4) 1.41 (1.16-1.71) <0.01 service 1:5 182 (56.7) 1.22 (0.95-1.56) 0.12
1:6 or more 173 (58.8) 1.34 (1.04-1.73) 0.03 Has a primary caregiver No 785 (58.1) Reference
Yes 789 (52.6) 0.79 (0.68-0.92) <0.01
30
Childcare arrangements 1 1132 (55.9) Reference 9 to 24 months 2 375 (53.7) 0.87 (0.73-1.03) 0.11
3 or more 92 (54.4) 0.95 (0.69-1.30) 0.73 Total 2,931 (47.5)
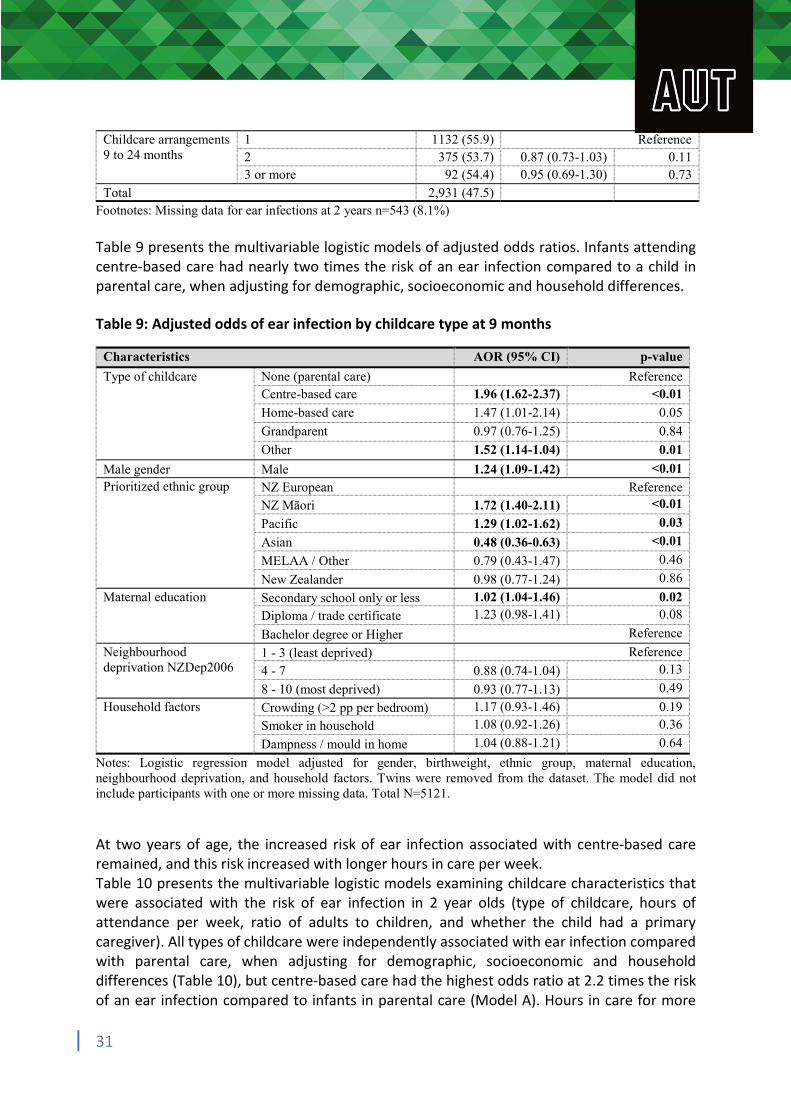
Footnotes: Missing data for ear infections at 2 years n=543 (8.1%) Table 9 presents the multivariable logistic models of adjusted odds ratios. Infants attending centre-based care had nearly two times the risk of an ear infection compared to a child in parental care, when adjusting for demographic, socioeconomic and household differences. Table 9: Adjusted odds of ear infection by childcare type at 9 months
Characteristics AOR (95% CI) p-value
Type of childcare None (parental care) Reference Centre-based care 1.96 (1.62-2.37) <0.01
Home-based care 1.47 (1.01-2.14) 0.05
Grandparent 0.97 (0.76-1.25) 0.84
Other 1.52 (1.14-1.04) 0.01
Male gender Male 1.24 (1.09-1.42) <0.01 Prioritized ethnic group NZ European Reference
NZ Māori 1.72 (1.40-2.11) <0.01
Pacific 1.29 (1.02-1.62) 0.03
Asian 0.48 (0.36-0.63) <0.01
MELAA / Other 0.79 (0.43-1.47) 0.46
New Zealander 0.98 (0.77-1.24) 0.86
Maternal education Secondary school only or less 1.02 (1.04-1.46) 0.02
Diploma / trade certificate 1.23 (0.98-1.41) 0.08
Bachelor degree or Higher Reference
Neighbourhood 1 - 3 (least deprived) Reference deprivation NZDep2006 4 - 7 0.88 (0.74-1.04) 0.13
8 - 10 (most deprived) 0.93 (0.77-1.13) 0.49
Household factors Crowding (>2 pp per bedroom) 1.17 (0.93-1.46) 0.19
Smoker in household 1.08 (0.92-1.26) 0.36
Dampness / mould in home 1.04 (0.88-1.21) 0.64
Notes: Logistic regression model adjusted for gender, birthweight, ethnic group, maternal education, neighbourhood deprivation, and household factors. Twins were removed from the dataset. The model did not include participants with one or more missing data. Total N=5121. At two years of age, the increased risk of ear infection associated with centre-based care remained, and this risk increased with longer hours in care per week. Table 10 presents the multivariable logistic models examining childcare characteristics that were associated with the risk of ear infection in 2 year olds (type of childcare, hours of attendance per week, ratio of adults to children, and whether the child had a primary caregiver). All types of childcare were independently associated with ear infection compared with parental care, when adjusting for demographic, socioeconomic and household differences (Table 10), but centre-based care had the highest odds ratio at 2.2 times the risk of an ear infection compared to infants in parental care (Model A). Hours in care for more
31

than 30 hours a week at 2 years was independently associated with an increased risk of ear infection (Model B). An adult to child ratio of 1:4 had the greatest risk of ear infection (which is not the expected direction of association; Model C). The presence of a primary caregiver at childcare at 2 years old decreased the risk of ear infection (Model D; Table 10).
32
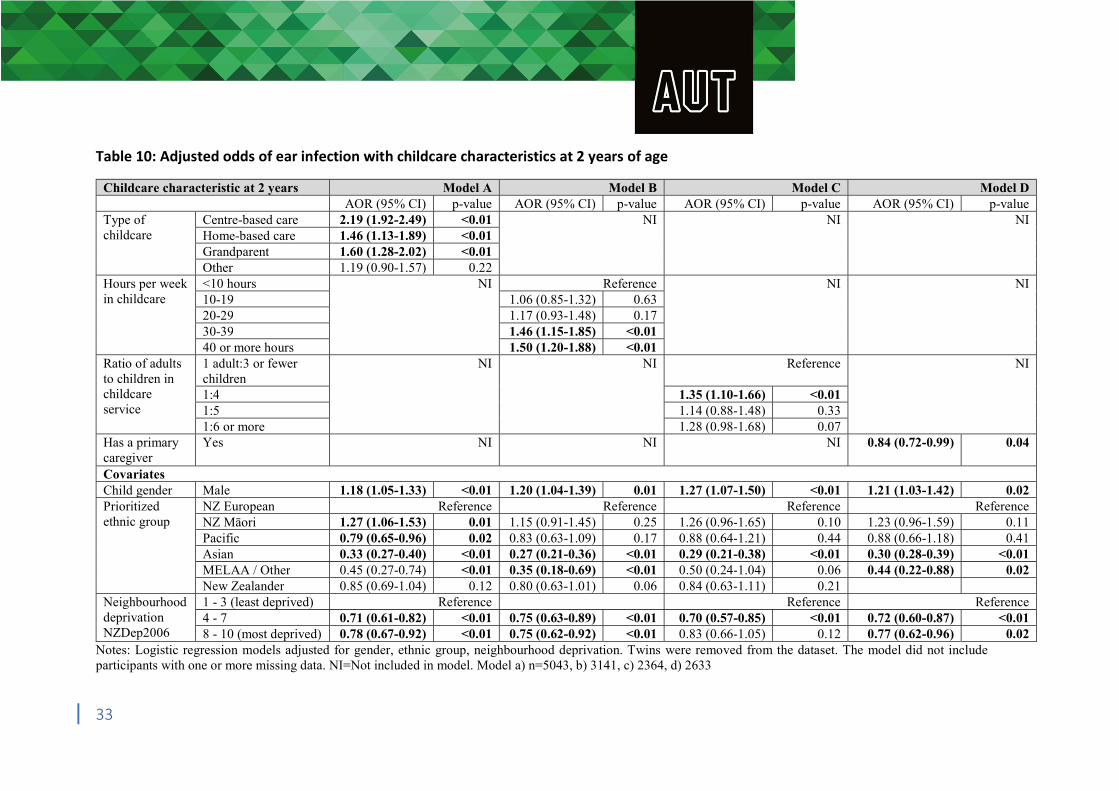
Table 10: Adjusted odds of ear infection with childcare characteristics at 2 years of age
Childcare characteristic at 2 years Model A Model B Model C Model D AOR (95% CI) p-value AOR (95% CI) p-value AOR (95% CI) p-value AOR (95% CI) p-value
Type of childcare
Centre-based care 2.19 (1.92-2.49) <0.01 NI NI NI Home-based care 1.46 (1.13-1.89) <0.01 Grandparent 1.60 (1.28-2.02) <0.01 Other 1.19 (0.90-1.57) 0.22
Hours per week in childcare
<10 hours NI Reference NI NI 10-19 1.06 (0.85-1.32) 0.63 20-29 1.17 (0.93-1.48) 0.17 30-39 1.46 (1.15-1.85) <0.01 40 or more hours 1.50 (1.20-1.88) <0.01
Ratio of adults to children in childcare service
1 adult:3 or fewer children
NI NI Reference NI
1:4 1.35 (1.10-1.66) <0.01 1:5 1.14 (0.88-1.48) 0.33 1:6 or more 1.28 (0.98-1.68) 0.07
Has a primary caregiver
Yes NI NI NI 0.84 (0.72-0.99) 0.04
Covariates Child gender Male 1.18 (1.05-1.33) <0.01 1.20 (1.04-1.39) 0.01 1.27 (1.07-1.50) <0.01 1.21 (1.03-1.42) 0.02 Prioritized ethnic group
NZ European Reference Reference Reference Reference NZ Māori 1.27 (1.06-1.53) 0.01 1.15 (0.91-1.45) 0.25 1.26 (0.96-1.65) 0.10 1.23 (0.96-1.59) 0.11 Pacific 0.79 (0.65-0.96) 0.02 0.83 (0.63-1.09) 0.17 0.88 (0.64-1.21) 0.44 0.88 (0.66-1.18) 0.41 Asian 0.33 (0.27-0.40) <0.01 0.27 (0.21-0.36) <0.01 0.29 (0.21-0.38) <0.01 0.30 (0.28-0.39) <0.01 MELAA / Other 0.45 (0.27-0.74) <0.01 0.35 (0.18-0.69) <0.01 0.50 (0.24-1.04) 0.06 0.44 (0.22-0.88) 0.02 New Zealander 0.85 (0.69-1.04) 0.12 0.80 (0.63-1.01) 0.06 0.84 (0.63-1.11) 0.21
Neighbourhood deprivation NZDep2006
1 - 3 (least deprived) Reference Reference Reference 4 - 7 0.71 (0.61-0.82) <0.01 0.75 (0.63-0.89) <0.01 0.70 (0.57-0.85) <0.01 0.72 (0.60-0.87) <0.01 8 - 10 (most deprived) 0.78 (0.67-0.92) <0.01 0.75 (0.62-0.92) <0.01 0.83 (0.66-1.05) 0.12 0.77 (0.62-0.96) 0.02
Notes: Logistic regression models adjusted for gender, ethnic group, neighbourhood deprivation. Twins were removed from the dataset. The model did not include participants with one or more missing data. NI=Not included in model. Model a) n=5043, b) 3141, c) 2364, d) 2633
33
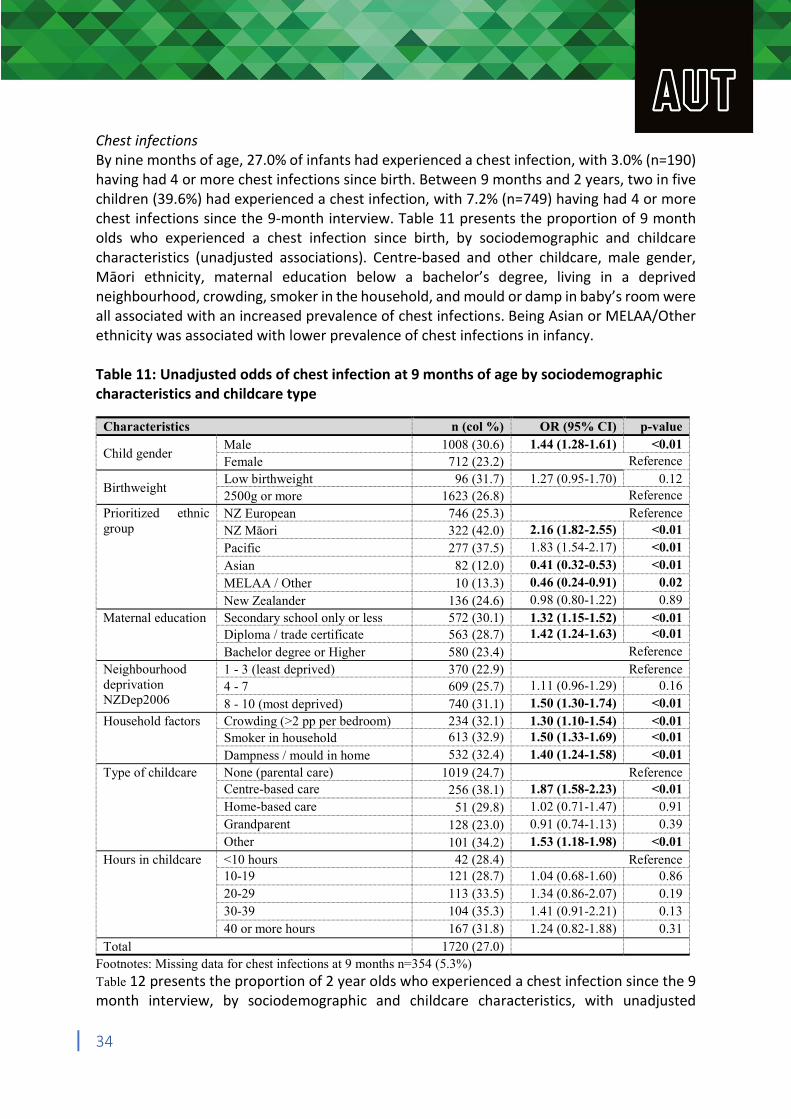
Chest infections By nine months of age, 27.0% of infants had experienced a chest infection, with 3.0% (n=190) having had 4 or more chest infections since birth. Between 9 months and 2 years, two in five children (39.6%) had experienced a chest infection, with 7.2% (n=749) having had 4 or more chest infections since the 9-month interview. Table 11 presents the proportion of 9 month olds who experienced a chest infection since birth, by sociodemographic and childcare characteristics (unadjusted associations). Centre-based and other childcare, male gender, Māori ethnicity, maternal education below a bachelor’s degree, living in a deprived neighbourhood, crowding, smoker in the household, and mould or damp in baby’s room were all associated with an increased prevalence of chest infections. Being Asian or MELAA/Other ethnicity was associated with lower prevalence of chest infections in infancy. Table 11: Unadjusted odds of chest infection at 9 months of age by sociodemographic characteristics and childcare type
Characteristics n (col %) OR (95% CI) p-value
Child gender Male Female
1008 (30.6) 712 (23.2)
1.44 (1.28-1.61) <0.01 Reference
Birthweight Low birthweight 2500g or more
96 (31.7) 1623 (26.8)
1.27 (0.95-1.70) 0.12 Reference
Prioritized ethnic NZ European 746 (25.3) Reference group NZ Māori 322 (42.0) 2.16 (1.82-2.55) <0.01
Pacific 277 (37.5) 1.83 (1.54-2.17) <0.01
Asian 82 (12.0) 0.41 (0.32-0.53) <0.01
MELAA / Other 10 (13.3) 0.46 (0.24-0.91) 0.02
New Zealander 136 (24.6) 0.98 (0.80-1.22) 0.89 Maternal education Secondary school only or less 572 (30.1) 1.32 (1.15-1.52) <0.01
Diploma / trade certificate 563 (28.7) 1.42 (1.24-1.63) <0.01
Bachelor degree or Higher 580 (23.4) Reference Neighbourhood 1 - 3 (least deprived) 370 (22.9) Reference deprivation 4 - 7 609 (25.7) 1.11 (0.96-1.29) 0.16 NZDep2006 8 - 10 (most deprived) 740 (31.1) 1.50 (1.30-1.74) <0.01 Household factors Crowding (>2 pp per bedroom) 234 (32.1) 1.30 (1.10-1.54) <0.01
Smoker in household 613 (32.9) 1.50 (1.33-1.69) <0.01
Dampness / mould in home 532 (32.4) 1.40 (1.24-1.58) <0.01 Type of childcare None (parental care) 1019 (24.7) Reference
Centre-based care 256 (38.1) 1.87 (1.58-2.23) <0.01 Home-based care 51 (29.8) 1.02 (0.71-1.47) 0.91 Grandparent 128 (23.0) 0.91 (0.74-1.13) 0.39 Other 101 (34.2) 1.53 (1.18-1.98) <0.01
Hours in childcare <10 hours 42 (28.4) Reference 10-19 121 (28.7) 1.04 (0.68-1.60) 0.86 20-29 113 (33.5) 1.34 (0.86-2.07) 0.19 30-39 104 (35.3) 1.41 (0.91-2.21) 0.13 40 or more hours 167 (31.8) 1.24 (0.82-1.88) 0.31
Total 1720 (27.0) Footnotes: Missing data for chest infections at 9 months n=354 (5.3%) Table 12 presents the proportion of 2 year olds who experienced a chest infection since the 9 month interview, by sociodemographic and childcare characteristics, with unadjusted
34
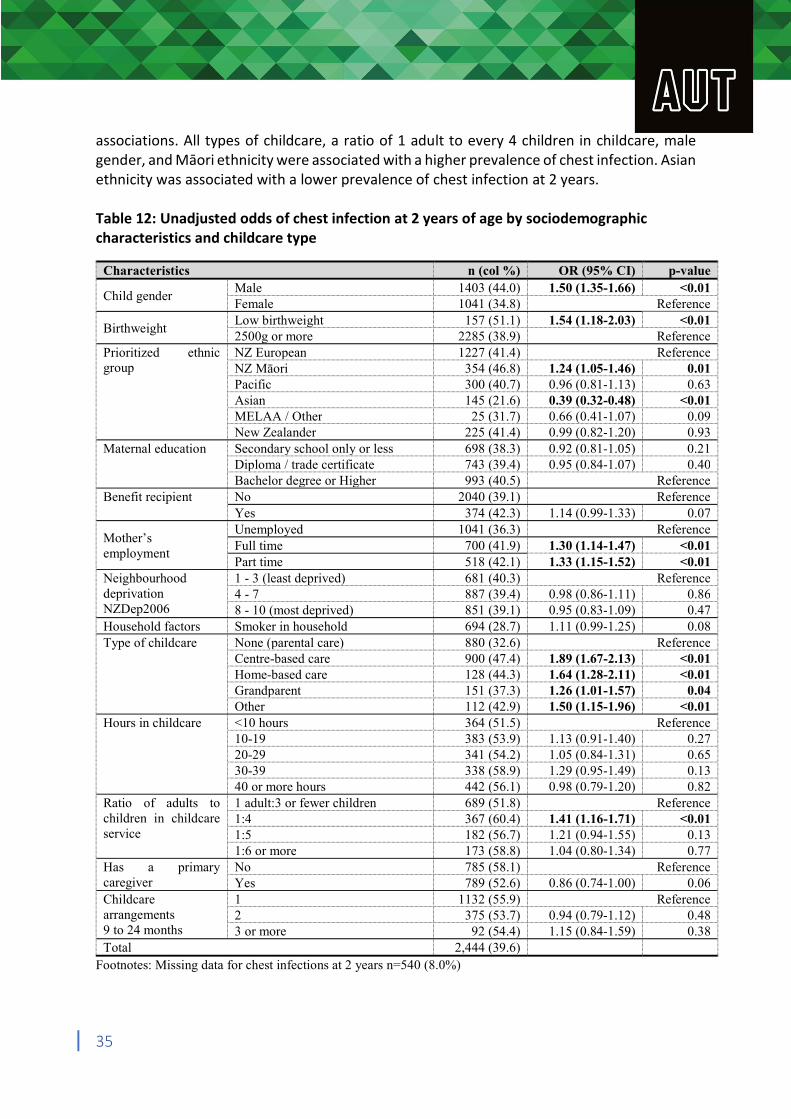
associations. All types of childcare, a ratio of 1 adult to every 4 children in childcare, male gender, and Māori ethnicity were associated with a higher prevalence of chest infection. Asian ethnicity was associated with a lower prevalence of chest infection at 2 years. Table 12: Unadjusted odds of chest infection at 2 years of age by sociodemographic characteristics and childcare type
Characteristics n (col %) OR (95% CI) p-value
Child gender Male Female
1403 (44.0) 1041 (34.8)
1.50 (1.35-1.66) <0.01 Reference
Birthweight Low birthweight 2500g or more
157 (51.1) 2285 (38.9)
1.54 (1.18-2.03) <0.01 Reference
Prioritized ethnic NZ European 1227 (41.4) Reference group NZ Māori 354 (46.8) 1.24 (1.05-1.46) 0.01
Pacific 300 (40.7) 0.96 (0.81-1.13) 0.63 Asian 145 (21.6) 0.39 (0.32-0.48) <0.01 MELAA / Other 25 (31.7) 0.66 (0.41-1.07) 0.09 New Zealander 225 (41.4) 0.99 (0.82-1.20) 0.93
Maternal education Secondary school only or less 698 (38.3) 0.92 (0.81-1.05) 0.21 Diploma / trade certificate 743 (39.4) 0.95 (0.84-1.07) 0.40 Bachelor degree or Higher 993 (40.5) Reference
Benefit recipient No 2040 (39.1) Reference Yes 374 (42.3) 1.14 (0.99-1.33) 0.07
Mother’s employment
Unemployed Full time Part time
1041 (36.3) 700 (41.9) 518 (42.1)
1.30 (1.14-1.47) 1.33 (1.15-1.52)
Reference <0.01 <0.01
Neighbourhood 1 - 3 (least deprived) 681 (40.3) Reference deprivation 4 - 7 887 (39.4) 0.98 (0.86-1.11) 0.86 NZDep2006 8 - 10 (most deprived) 851 (39.1) 0.95 (0.83-1.09) 0.47 Household factors Smoker in household 694 (28.7) 1.11 (0.99-1.25) 0.08 Type of childcare None (parental care) 880 (32.6) Reference
Centre-based care 900 (47.4) 1.89 (1.67-2.13) <0.01 Home-based care 128 (44.3) 1.64 (1.28-2.11) <0.01 Grandparent 151 (37.3) 1.26 (1.01-1.57) 0.04 Other 112 (42.9) 1.50 (1.15-1.96) <0.01
Hours in childcare <10 hours 364 (51.5) Reference 10-19 383 (53.9) 1.13 (0.91-1.40) 0.27 20-29 341 (54.2) 1.05 (0.84-1.31) 0.65 30-39 338 (58.9) 1.29 (0.95-1.49) 0.13 40 or more hours 442 (56.1) 0.98 (0.79-1.20) 0.82
Ratio of adults to 1 adult:3 or fewer children 689 (51.8) Reference children in childcare 1:4 367 (60.4) 1.41 (1.16-1.71) <0.01 service 1:5 182 (56.7) 1.21 (0.94-1.55) 0.13
1:6 or more 173 (58.8) 1.04 (0.80-1.34) 0.77 Has a primary No 785 (58.1) Reference caregiver Yes 789 (52.6) 0.86 (0.74-1.00) 0.06 Childcare 1 1132 (55.9) Reference arrangements 2 375 (53.7) 0.94 (0.79-1.12) 0.48 9 to 24 months 3 or more 92 (54.4) 1.15 (0.84-1.59) 0.38 Total 2,444 (39.6)
Footnotes: Missing data for chest infections at 2 years n=540 (8.0%)
35
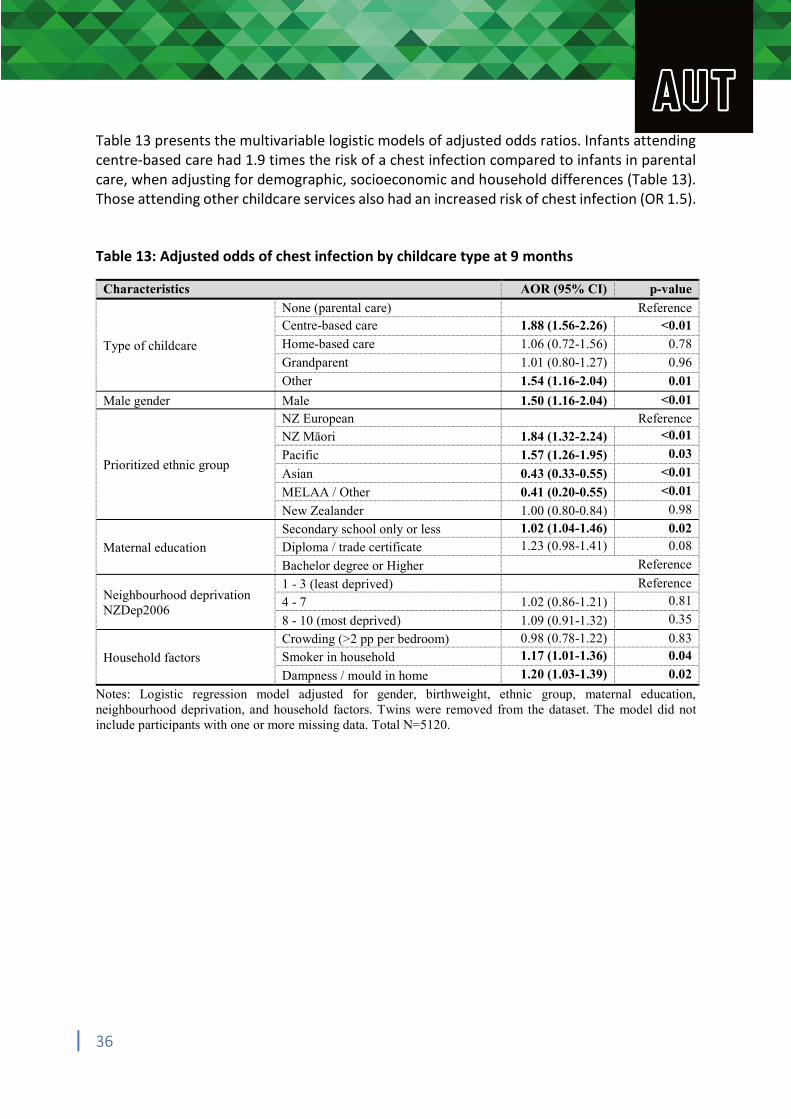
Table 13 presents the multivariable logistic models of adjusted odds ratios. Infants attending centre-based care had 1.9 times the risk of a chest infection compared to infants in parental care, when adjusting for demographic, socioeconomic and household differences (Table 13). Those attending other childcare services also had an increased risk of chest infection (OR 1.5). Table 13: Adjusted odds of chest infection by childcare type at 9 months
Characteristics AOR (95% CI) p-value
None (parental care) Reference Centre-based care 1.88 (1.56-2.26) <0.01
Type of childcare Home-based care 1.06 (0.72-1.56) 0.78
Grandparent 1.01 (0.80-1.27) 0.96
Other 1.54 (1.16-2.04) 0.01
Male gender Male 1.50 (1.16-2.04) <0.01
NZ European Reference NZ Māori 1.84 (1.32-2.24) <0.01
Prioritized ethnic group Pacific
Asian
1.57 (1.26-1.95)
0.43 (0.33-0.55)
0.03
<0.01
MELAA / Other 0.41 (0.20-0.55) <0.01
New Zealander 1.00 (0.80-0.84) 0.98
Secondary school only or less 1.02 (1.04-1.46) 0.02
Maternal education Diploma / trade certificate 1.23 (0.98-1.41) 0.08
Bachelor degree or Higher Reference
Neighbourhood deprivation NZDep2006
1 - 3 (least deprived) 4 - 7
8 - 10 (most deprived)
1.02 (0.86-1.21)
1.09 (0.91-1.32)
Reference 0.81
0.35
Crowding (>2 pp per bedroom) 0.98 (0.78-1.22) 0.83
Household factors Smoker in household 1.17 (1.01-1.36) 0.04
Dampness / mould in home 1.20 (1.03-1.39) 0.02
Notes: Logistic regression model adjusted for gender, birthweight, ethnic group, maternal education, neighbourhood deprivation, and household factors. Twins were removed from the dataset. The model did not include participants with one or more missing data. Total N=5120.
36
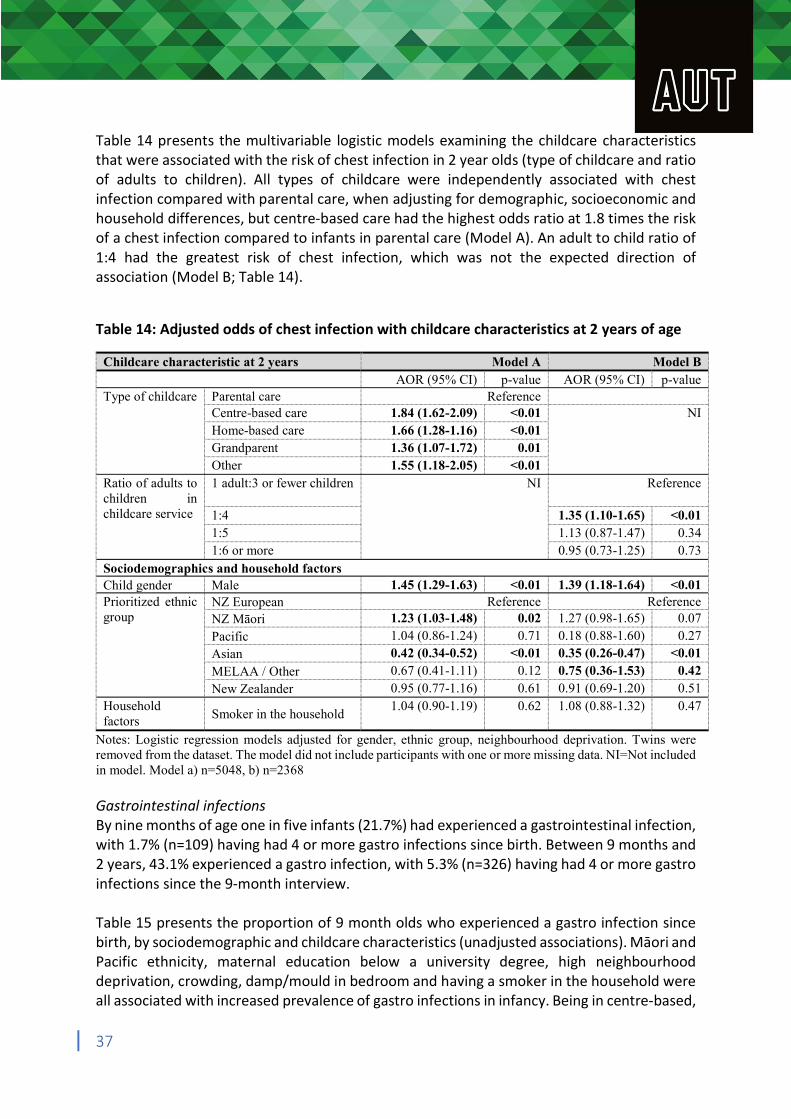
Table 14 presents the multivariable logistic models examining the childcare characteristics that were associated with the risk of chest infection in 2 year olds (type of childcare and ratio of adults to children). All types of childcare were independently associated with chest infection compared with parental care, when adjusting for demographic, socioeconomic and household differences, but centre-based care had the highest odds ratio at 1.8 times the risk of a chest infection compared to infants in parental care (Model A). An adult to child ratio of 1:4 had the greatest risk of chest infection, which was not the expected direction of association (Model B; Table 14).
Table 14: Adjusted odds of chest infection with childcare characteristics at 2 years of age
Childcare characteristic at 2 years Model A Model B AOR (95% CI) p-value AOR (95% CI) p-value Type of childcare Parental care Reference
Centre-based care 1.84 (1.62-2.09) <0.01 NI Home-based care 1.66 (1.28-1.16) <0.01 Grandparent 1.36 (1.07-1.72) 0.01 Other 1.55 (1.18-2.05) <0.01
Ratio of adults to 1 adult:3 or fewer children NI Reference children in childcare service 1:4 1.35 (1.10-1.65) <0.01
1:5 1.13 (0.87-1.47) 0.34 1:6 or more 0.95 (0.73-1.25) 0.73
Sociodemographics and household factors Child gender Male 1.45 (1.29-1.63) <0.01 1.39 (1.18-1.64) <0.01 Prioritized ethnic NZ European Reference Reference group NZ Māori 1.23 (1.03-1.48) 0.02 1.27 (0.98-1.65) 0.07
Pacific 1.04 (0.86-1.24) 0.71 0.18 (0.88-1.60) 0.27 Asian 0.42 (0.34-0.52) <0.01 0.35 (0.26-0.47) <0.01
MELAA / Other 0.67 (0.41-1.11) 0.12 0.75 (0.36-1.53) 0.42 New Zealander 0.95 (0.77-1.16) 0.61 0.91 (0.69-1.20) 0.51
Household factors Smoker in the household
1.04 (0.90-1.19) 0.62 1.08 (0.88-1.32) 0.47
Notes: Logistic regression models adjusted for gender, ethnic group, neighbourhood deprivation. Twins were removed from the dataset. The model did not include participants with one or more missing data. NI=Not included in model. Model a) n=5048, b) n=2368 Gastrointestinal infections By nine months of age one in five infants (21.7%) had experienced a gastrointestinal infection, with 1.7% (n=109) having had 4 or more gastro infections since birth. Between 9 months and 2 years, 43.1% experienced a gastro infection, with 5.3% (n=326) having had 4 or more gastro infections since the 9-month interview. Table 15 presents the proportion of 9 month olds who experienced a gastro infection since birth, by sociodemographic and childcare characteristics (unadjusted associations). Māori and Pacific ethnicity, maternal education below a university degree, high neighbourhood deprivation, crowding, damp/mould in bedroom and having a smoker in the household were all associated with increased prevalence of gastro infections in infancy. Being in centre-based,
37
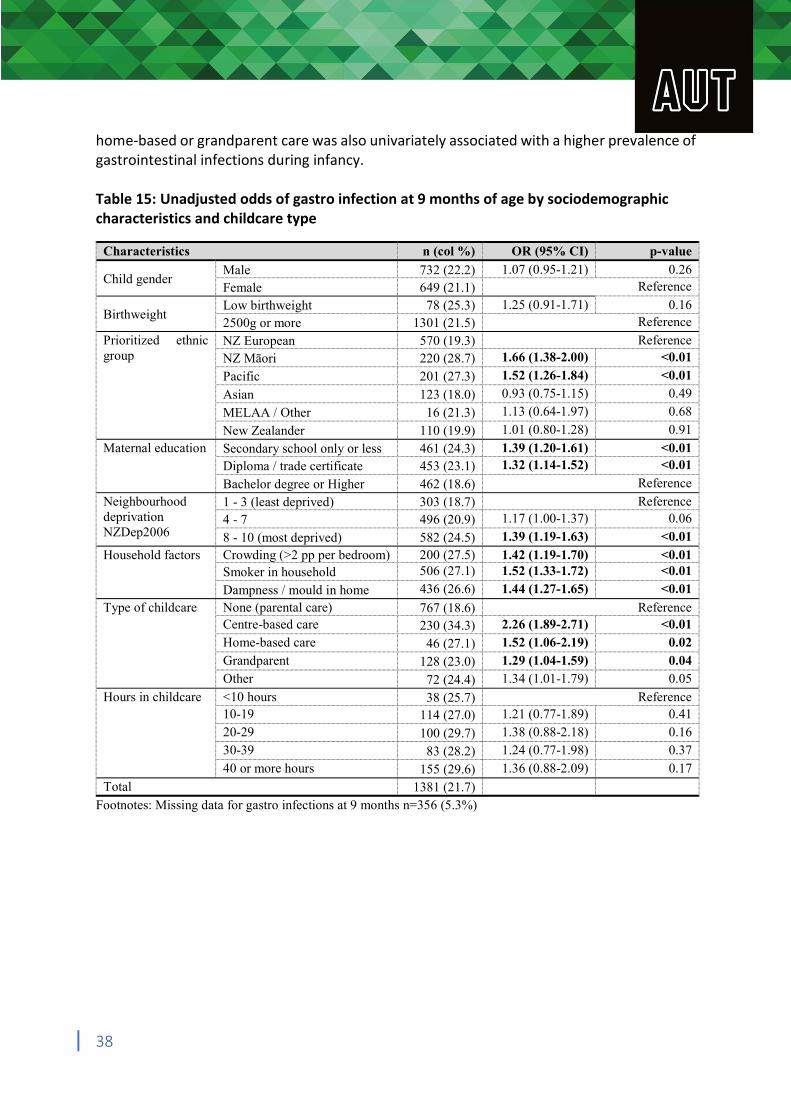
home-based or grandparent care was also univariately associated with a higher prevalence of gastrointestinal infections during infancy. Table 15: Unadjusted odds of gastro infection at 9 months of age by sociodemographic characteristics and childcare type
Characteristics n (col %) OR (95% CI) p-value
Child gender Male Female
732 (22.2) 649 (21.1)
1.07 (0.95-1.21) 0.26 Reference
Birthweight Low birthweight 2500g or more
78 (25.3) 1301 (21.5)
1.25 (0.91-1.71) 0.16 Reference
Prioritized ethnic NZ European 570 (19.3) Reference group NZ Māori 220 (28.7) 1.66 (1.38-2.00) <0.01
Pacific 201 (27.3) 1.52 (1.26-1.84) <0.01
Asian 123 (18.0) 0.93 (0.75-1.15) 0.49
MELAA / Other 16 (21.3) 1.13 (0.64-1.97) 0.68
New Zealander 110 (19.9) 1.01 (0.80-1.28) 0.91
Maternal education Secondary school only or less 461 (24.3) 1.39 (1.20-1.61) <0.01 Diploma / trade certificate 453 (23.1) 1.32 (1.14-1.52) <0.01
Bachelor degree or Higher 462 (18.6) Reference
Neighbourhood 1 - 3 (least deprived) 303 (18.7) Reference deprivation 4 - 7 496 (20.9) 1.17 (1.00-1.37) 0.06 NZDep2006 8 - 10 (most deprived) 582 (24.5) 1.39 (1.19-1.63) <0.01
Household factors Crowding (>2 pp per bedroom) 200 (27.5) 1.42 (1.19-1.70) <0.01 Smoker in household 506 (27.1) 1.52 (1.33-1.72) <0.01
Dampness / mould in home 436 (26.6) 1.44 (1.27-1.65) <0.01
Type of childcare None (parental care) 767 (18.6) Reference Centre-based care 230 (34.3) 2.26 (1.89-2.71) <0.01 Home-based care 46 (27.1) 1.52 (1.06-2.19) 0.02 Grandparent 128 (23.0) 1.29 (1.04-1.59) 0.04 Other 72 (24.4) 1.34 (1.01-1.79) 0.05
Hours in childcare <10 hours 38 (25.7) Reference 10-19 114 (27.0) 1.21 (0.77-1.89) 0.41 20-29 100 (29.7) 1.38 (0.88-2.18) 0.16 30-39 83 (28.2) 1.24 (0.77-1.98) 0.37 40 or more hours 155 (29.6) 1.36 (0.88-2.09) 0.17
Total 1381 (21.7)
Footnotes: Missing data for gastro infections at 9 months n=356 (5.3%)
38
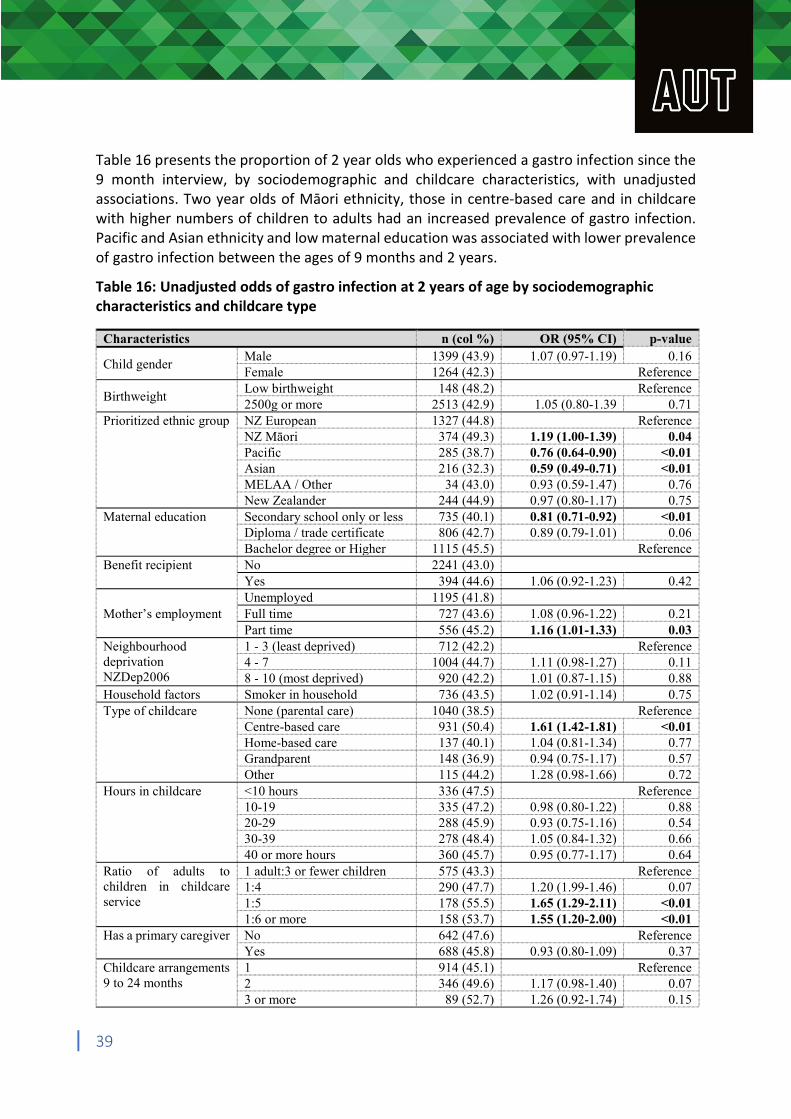
Table 16 presents the proportion of 2 year olds who experienced a gastro infection since the 9 month interview, by sociodemographic and childcare characteristics, with unadjusted associations. Two year olds of Māori ethnicity, those in centre-based care and in childcare with higher numbers of children to adults had an increased prevalence of gastro infection. Pacific and Asian ethnicity and low maternal education was associated with lower prevalence of gastro infection between the ages of 9 months and 2 years.
Table 16: Unadjusted odds of gastro infection at 2 years of age by sociodemographic characteristics and childcare type
Characteristics n (col %) OR (95% CI) p-value
Child gender Male Female
1399 (43.9) 1264 (42.3)
1.07 (0.97-1.19) 0.16 Reference
Birthweight Low birthweight 2500g or more
148 (48.2) 2513 (42.9) 1.05 (0.80-1.39
Reference 0.71
Prioritized ethnic group NZ European 1327 (44.8) Reference NZ Māori 374 (49.3) 1.19 (1.00-1.39) 0.04 Pacific 285 (38.7) 0.76 (0.64-0.90) <0.01 Asian 216 (32.3) 0.59 (0.49-0.71) <0.01 MELAA / Other 34 (43.0) 0.93 (0.59-1.47) 0.76 New Zealander 244 (44.9) 0.97 (0.80-1.17) 0.75
Maternal education Secondary school only or less 735 (40.1) 0.81 (0.71-0.92) <0.01 Diploma / trade certificate 806 (42.7) 0.89 (0.79-1.01) 0.06 Bachelor degree or Higher 1115 (45.5) Reference
Benefit recipient No 2241 (43.0) Yes 394 (44.6) 1.06 (0.92-1.23) 0.42
Unemployed 1195 (41.8) Mother’s employment Full time 727 (43.6) 1.08 (0.96-1.22) 0.21
Part time 556 (45.2) 1.16 (1.01-1.33) 0.03 Neighbourhood 1 - 3 (least deprived) 712 (42.2) Reference deprivation 4 - 7 1004 (44.7) 1.11 (0.98-1.27) 0.11 NZDep2006 8 - 10 (most deprived) 920 (42.2) 1.01 (0.87-1.15) 0.88 Household factors Smoker in household 736 (43.5) 1.02 (0.91-1.14) 0.75 Type of childcare None (parental care) 1040 (38.5) Reference
Centre-based care 931 (50.4) 1.61 (1.42-1.81) <0.01 Home-based care 137 (40.1) 1.04 (0.81-1.34) 0.77 Grandparent 148 (36.9) 0.94 (0.75-1.17) 0.57 Other 115 (44.2) 1.28 (0.98-1.66) 0.72
Hours in childcare <10 hours 336 (47.5) Reference 10-19 335 (47.2) 0.98 (0.80-1.22) 0.88 20-29 288 (45.9) 0.93 (0.75-1.16) 0.54 30-39 278 (48.4) 1.05 (0.84-1.32) 0.66 40 or more hours 360 (45.7) 0.95 (0.77-1.17) 0.64
Ratio of adults to 1 adult:3 or fewer children 575 (43.3) Reference children in childcare 1:4 290 (47.7) 1.20 (1.99-1.46) 0.07 service 1:5 178 (55.5) 1.65 (1.29-2.11) <0.01
1:6 or more 158 (53.7) 1.55 (1.20-2.00) <0.01 Has a primary caregiver No 642 (47.6) Reference
Yes 688 (45.8) 0.93 (0.80-1.09) 0.37 Childcare arrangements 1 914 (45.1) Reference 9 to 24 months 2 346 (49.6) 1.17 (0.98-1.40) 0.07
3 or more 89 (52.7) 1.26 (0.92-1.74) 0.15
39
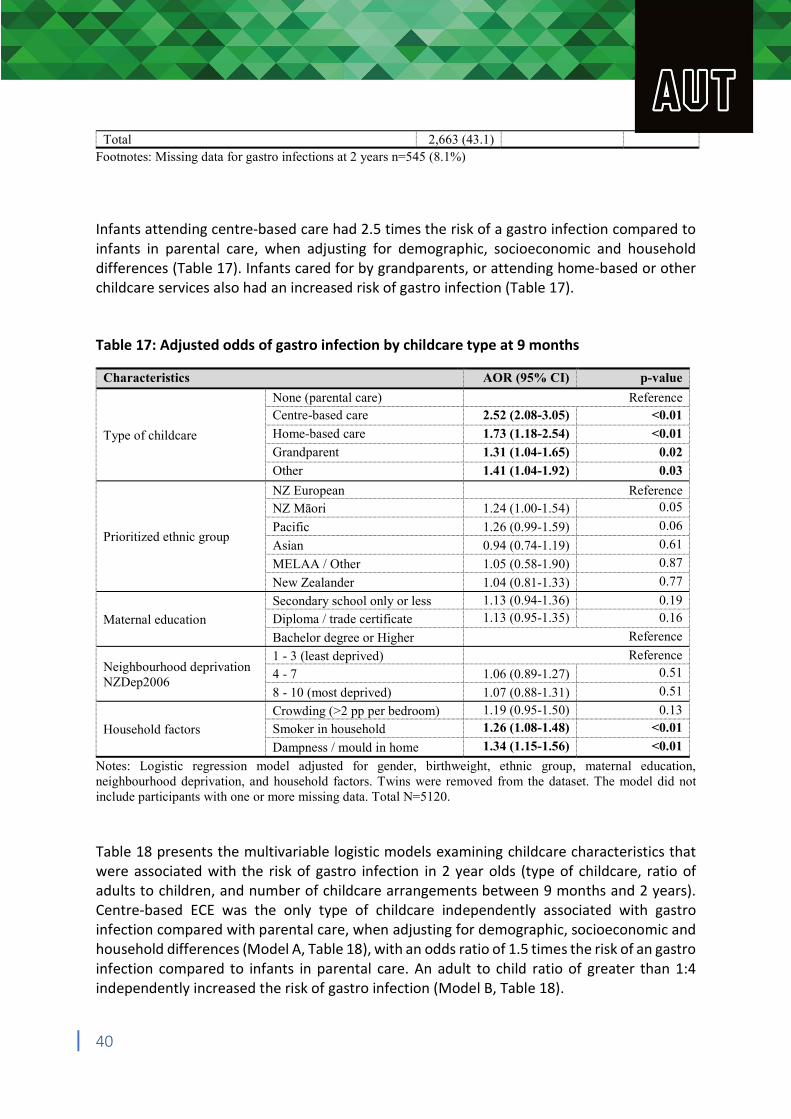
Total 2,663 (43.1) Footnotes: Missing data for gastro infections at 2 years n=545 (8.1%) Infants attending centre-based care had 2.5 times the risk of a gastro infection compared to infants in parental care, when adjusting for demographic, socioeconomic and household differences (Table 17). Infants cared for by grandparents, or attending home-based or other childcare services also had an increased risk of gastro infection (Table 17). Table 17: Adjusted odds of gastro infection by childcare type at 9 months
Characteristics AOR (95% CI) p-value
None (parental care) Reference Centre-based care 2.52 (2.08-3.05) <0.01
Type of childcare Home-based care 1.73 (1.18-2.54) <0.01
Grandparent 1.31 (1.04-1.65) 0.02
Other 1.41 (1.04-1.92) 0.03
NZ European Reference NZ Māori 1.24 (1.00-1.54) 0.05
Prioritized ethnic group Pacific
Asian
1.26 (0.99-1.59)
0.94 (0.74-1.19)
0.06
0.61
MELAA / Other 1.05 (0.58-1.90) 0.87
New Zealander 1.04 (0.81-1.33) 0.77
Secondary school only or less 1.13 (0.94-1.36) 0.19
Maternal education Diploma / trade certificate 1.13 (0.95-1.35) 0.16
Bachelor degree or Higher Reference
Neighbourhood deprivation NZDep2006
1 - 3 (least deprived) 4 - 7
8 - 10 (most deprived)
1.06 (0.89-1.27)
1.07 (0.88-1.31)
Reference 0.51
0.51
Crowding (>2 pp per bedroom) 1.19 (0.95-1.50) 0.13
Household factors Smoker in household 1.26 (1.08-1.48) <0.01
Dampness / mould in home 1.34 (1.15-1.56) <0.01
Notes: Logistic regression model adjusted for gender, birthweight, ethnic group, maternal education, neighbourhood deprivation, and household factors. Twins were removed from the dataset. The model did not include participants with one or more missing data. Total N=5120. Table 18 presents the multivariable logistic models examining childcare characteristics that were associated with the risk of gastro infection in 2 year olds (type of childcare, ratio of adults to children, and number of childcare arrangements between 9 months and 2 years). Centre-based ECE was the only type of childcare independently associated with gastro infection compared with parental care, when adjusting for demographic, socioeconomic and household differences (Model A, Table 18), with an odds ratio of 1.5 times the risk of an gastro infection compared to infants in parental care. An adult to child ratio of greater than 1:4 independently increased the risk of gastro infection (Model B, Table 18).
40
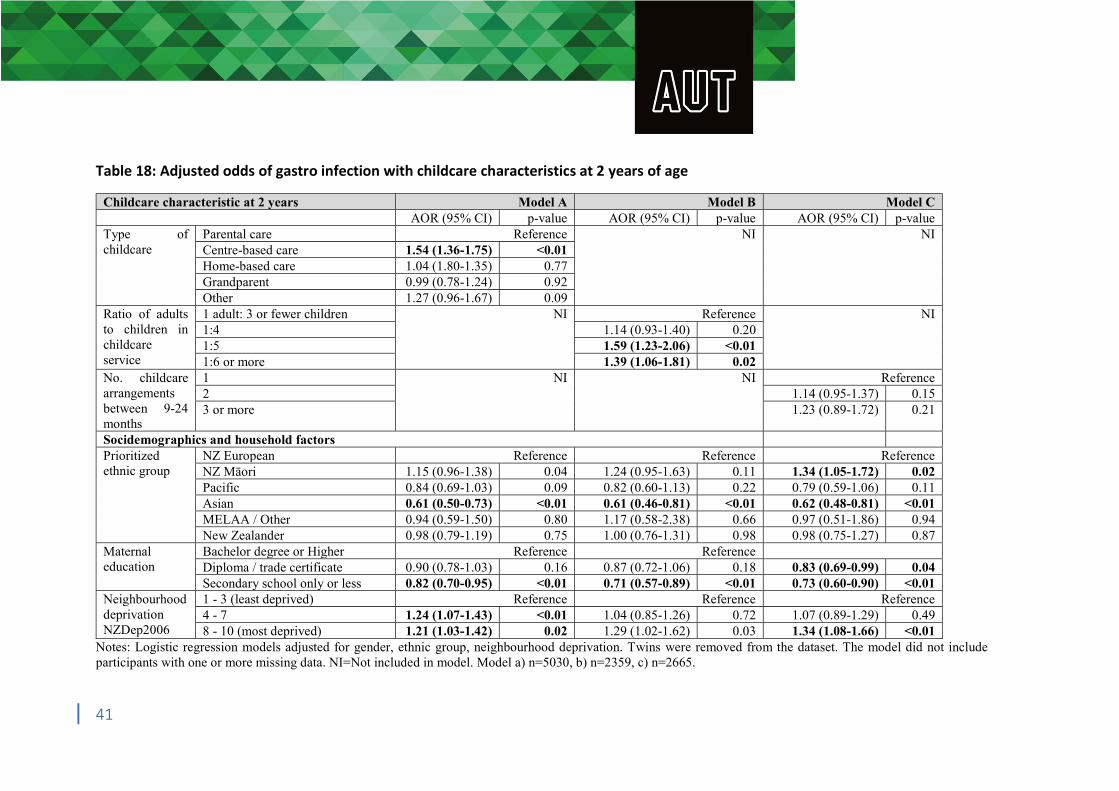
Table 18: Adjusted odds of gastro infection with childcare characteristics at 2 years of age
Childcare characteristic at 2 years Model A Model B Model C AOR (95% CI) p-value AOR (95% CI) p-value AOR (95% CI) p-value
Type of childcare
Parental care Reference NI NI Centre-based care 1.54 (1.36-1.75) <0.01 Home-based care 1.04 (1.80-1.35) 0.77 Grandparent 0.99 (0.78-1.24) 0.92 Other 1.27 (0.96-1.67) 0.09
Ratio of adults to children in childcare service
1 adult: 3 or fewer children NI Reference NI 1:4 1.14 (0.93-1.40) 0.20 1:5 1.59 (1.23-2.06) <0.01 1:6 or more 1.39 (1.06-1.81) 0.02
No. childcare arrangements between 9-24 months
1 NI NI Reference 2 1.14 (0.95-1.37) 0.15 3 or more 1.23 (0.89-1.72) 0.21
Socidemographics and household factors Prioritized ethnic group
NZ European Reference Reference Reference NZ Māori 1.15 (0.96-1.38) 0.04 1.24 (0.95-1.63) 0.11 1.34 (1.05-1.72) 0.02 Pacific 0.84 (0.69-1.03) 0.09 0.82 (0.60-1.13) 0.22 0.79 (0.59-1.06) 0.11 Asian 0.61 (0.50-0.73) <0.01 0.61 (0.46-0.81) <0.01 0.62 (0.48-0.81) <0.01 MELAA / Other 0.94 (0.59-1.50) 0.80 1.17 (0.58-2.38) 0.66 0.97 (0.51-1.86) 0.94 New Zealander 0.98 (0.79-1.19) 0.75 1.00 (0.76-1.31) 0.98 0.98 (0.75-1.27) 0.87
Maternal education
Bachelor degree or Higher Reference Reference Diploma / trade certificate 0.90 (0.78-1.03) 0.16 0.87 (0.72-1.06) 0.18 0.83 (0.69-0.99) 0.04 Secondary school only or less 0.82 (0.70-0.95) <0.01 0.71 (0.57-0.89) <0.01 0.73 (0.60-0.90) <0.01
Neighbourhood deprivation NZDep2006
1 - 3 (least deprived) Reference Reference Reference 4 - 7 1.24 (1.07-1.43) <0.01 1.04 (0.85-1.26) 0.72 1.07 (0.89-1.29) 0.49 8 - 10 (most deprived) 1.21 (1.03-1.42) 0.02 1.29 (1.02-1.62) 0.03 1.34 (1.08-1.66) <0.01
Notes: Logistic regression models adjusted for gender, ethnic group, neighbourhood deprivation. Twins were removed from the dataset. The model did not include participants with one or more missing data. NI=Not included in model. Model a) n=5030, b) n=2359, c) n=2665.
41
Skin infections At the 9 month interview, 8.3% (n=531) of mothers reported that their 9 month old had experienced a skin infection, with only a small number (0.5%, n=33) reporting 4 or more skin infections since birth. At the 2 year interview, 13.7% (n=849) reported a skin infection, with 1.6% (n=100) having had 4 or more skin infections, since the 9 month interview. There was no increased risk of skin infection for infants or toddlers attending any types of childcare at age 9 months and 2 years (data in Appendix).
Hospital admission for infection during the preschool period In total, one in eight (13.3%, n=893) children in the Growing Up in New Zealand cohort were admitted to hospital for an ear, chest, gastro or skin infection before the age of 54 months (4 and a half years old): 1.6% (n=108) with an ear infection, 9.4% (n=628) with a chest infection, 3.4% (n=227) with a gastro infection, and 1.2% (n=79) with a skin infection. Skin infections were excluded from further analyses due to their lack of association with early childhood education attendance.
Table 19 presents the proportion of children admitted to hospital with an ear, chest or gastro infection during the preschool period (n=838, which includes n=125 children experiencing hospitalisations for more than one of these infections), and the unadjusted associations with sociodemographic and childcare type. Ethnicity and neighbourhood deprivation had the largest unadjusted association with hospitalization for infections. Male gender, low maternal education, having a smoker in the household, benefit receipt, part-time employment, household crowding, mould/damp in infant’s bedroom, centre-based childcare at 9 months of age and over 30 hours a week in care at 2 years of age were all associated with increased prevalence of hospitalization for infectious illnesses (Table 19).
42
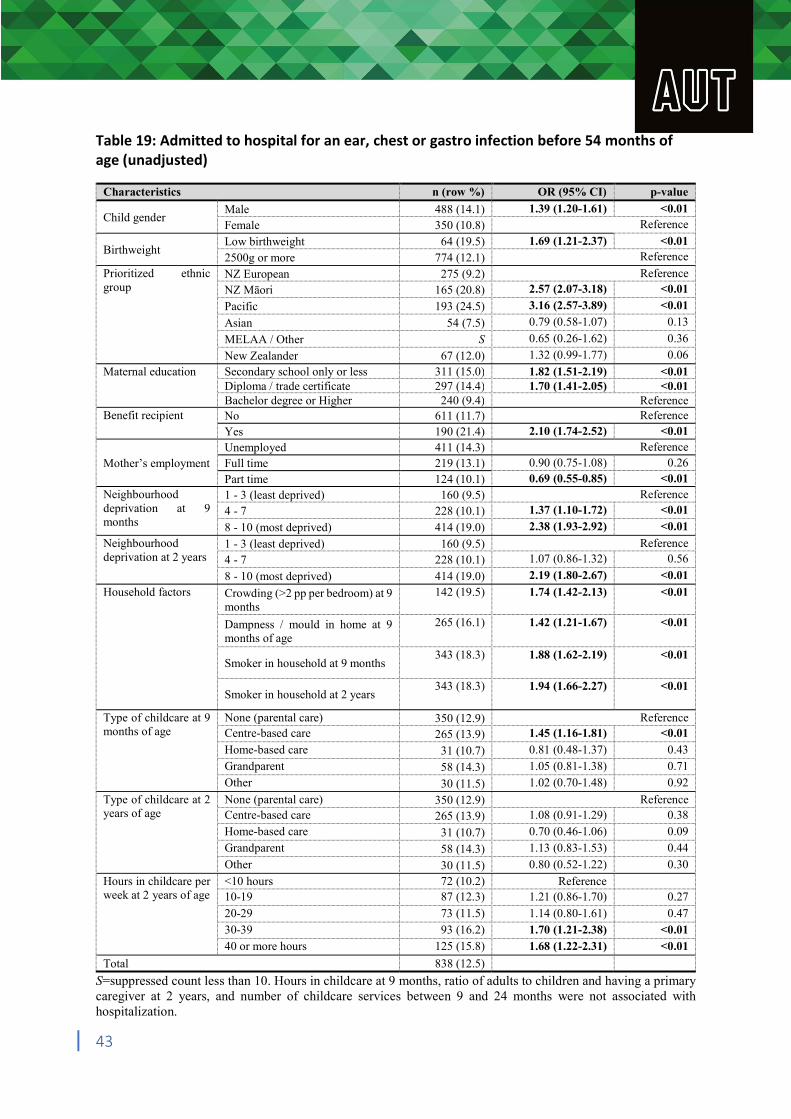
Table 19: Admitted to hospital for an ear, chest or gastro infection before 54 months of age (unadjusted)
Characteristics n (row %) OR (95% CI) p-value
Child gender Male Female
488 (14.1) 350 (10.8)
1.39 (1.20-1.61) <0.01 Reference
Birthweight Low birthweight 2500g or more
64 (19.5) 774 (12.1)
1.69 (1.21-2.37) <0.01 Reference
Prioritized ethnic NZ European 275 (9.2) Reference group NZ Māori 165 (20.8) 2.57 (2.07-3.18) <0.01
Pacific 193 (24.5) 3.16 (2.57-3.89) <0.01
Asian 54 (7.5) 0.79 (0.58-1.07) 0.13
MELAA / Other S 0.65 (0.26-1.62) 0.36
New Zealander 67 (12.0) 1.32 (0.99-1.77) 0.06
Maternal education Secondary school only or less 311 (15.0) 1.82 (1.51-2.19) <0.01 Diploma / trade certificate 297 (14.4) 1.70 (1.41-2.05) <0.01 Bachelor degree or Higher 240 (9.4) Reference
Benefit recipient No 611 (11.7) Reference Yes 190 (21.4) 2.10 (1.74-2.52) <0.01
Unemployed 411 (14.3) Reference Mother’s employment Full time 219 (13.1) 0.90 (0.75-1.08) 0.26
Part time 124 (10.1) 0.69 (0.55-0.85) <0.01 Neighbourhood 1 - 3 (least deprived) 160 (9.5) Reference deprivation at 9 months
4 - 7 8 - 10 (most deprived)
228 (10.1) 414 (19.0)
1.37 (1.10-1.72) 2.38 (1.93-2.92)
<0.01 <0.01
Neighbourhood 1 - 3 (least deprived) 160 (9.5) Reference deprivation at 2 years 4 - 7 228 (10.1) 1.07 (0.86-1.32) 0.56
8 - 10 (most deprived) 414 (19.0) 2.19 (1.80-2.67) <0.01
Household factors Crowding (>2 pp per bedroom) at 9 142 (19.5) 1.74 (1.42-2.13) <0.01 months
Dampness / mould in home at 9 265 (16.1) 1.42 (1.21-1.67) <0.01 months of age
Smoker in household at 9 months 343 (18.3) 1.88 (1.62-2.19) <0.01
Smoker in household at 2 years 343 (18.3) 1.94 (1.66-2.27) <0.01
Type of childcare at 9 None (parental care) 350 (12.9) Reference months of age Centre-based care 265 (13.9) 1.45 (1.16-1.81) <0.01
Home-based care 31 (10.7) 0.81 (0.48-1.37) 0.43 Grandparent 58 (14.3) 1.05 (0.81-1.38) 0.71 Other 30 (11.5) 1.02 (0.70-1.48) 0.92
Type of childcare at 2 None (parental care) 350 (12.9) Reference years of age Centre-based care 265 (13.9) 1.08 (0.91-1.29) 0.38
Home-based care 31 (10.7) 0.70 (0.46-1.06) 0.09 Grandparent 58 (14.3) 1.13 (0.83-1.53) 0.44
Other 30 (11.5) 0.80 (0.52-1.22) 0.30
Hours in childcare per <10 hours 72 (10.2) Reference week at 2 years of age 10-19 87 (12.3) 1.21 (0.86-1.70) 0.27
20-29 73 (11.5) 1.14 (0.80-1.61) 0.47 30-39 93 (16.2) 1.70 (1.21-2.38) <0.01 40 or more hours 125 (15.8) 1.68 (1.22-2.31) <0.01
Total 838 (12.5)
S=suppressed count less than 10. Hours in childcare at 9 months, ratio of adults to children and having a primary caregiver at 2 years, and number of childcare services between 9 and 24 months were not associated with hospitalization.
43
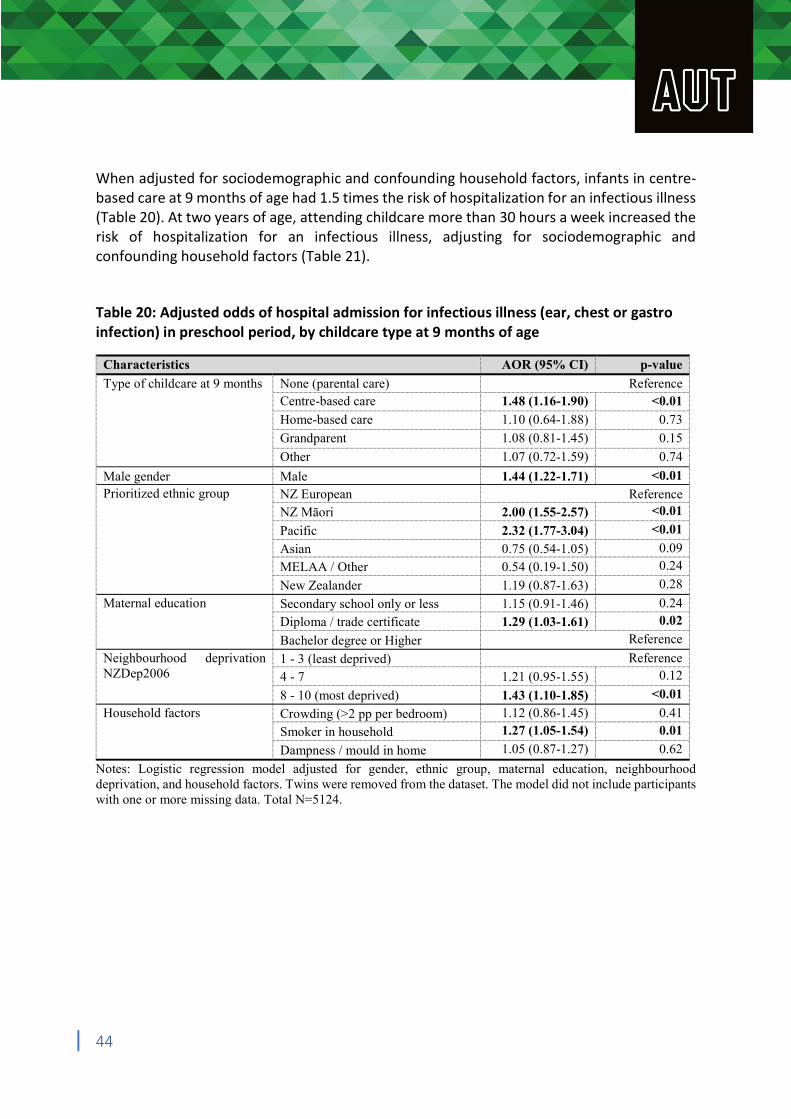
When adjusted for sociodemographic and confounding household factors, infants in centre-based care at 9 months of age had 1.5 times the risk of hospitalization for an infectious illness (Table 20). At two years of age, attending childcare more than 30 hours a week increased the risk of hospitalization for an infectious illness, adjusting for sociodemographic and confounding household factors (Table 21). Table 20: Adjusted odds of hospital admission for infectious illness (ear, chest or gastro infection) in preschool period, by childcare type at 9 months of age
Characteristics AOR (95% CI) p-value
Type of childcare at 9 months None (parental care) Reference Centre-based care 1.48 (1.16-1.90) <0.01
Home-based care 1.10 (0.64-1.88) 0.73
Grandparent 1.08 (0.81-1.45) 0.15
Other 1.07 (0.72-1.59) 0.74
Male gender Male 1.44 (1.22-1.71) <0.01 Prioritized ethnic group NZ European Reference
NZ Māori 2.00 (1.55-2.57) <0.01
Pacific 2.32 (1.77-3.04) <0.01
Asian 0.75 (0.54-1.05) 0.09
MELAA / Other 0.54 (0.19-1.50) 0.24
New Zealander 1.19 (0.87-1.63) 0.28
Maternal education Secondary school only or less 1.15 (0.91-1.46) 0.24
Diploma / trade certificate 1.29 (1.03-1.61) 0.02
Bachelor degree or Higher Reference
Neighbourhood deprivation 1 - 3 (least deprived) Reference NZDep2006 4 - 7 1.21 (0.95-1.55) 0.12
8 - 10 (most deprived) 1.43 (1.10-1.85) <0.01
Household factors Crowding (>2 pp per bedroom) 1.12 (0.86-1.45) 0.41
Smoker in household 1.27 (1.05-1.54) 0.01
Dampness / mould in home 1.05 (0.87-1.27) 0.62
Notes: Logistic regression model adjusted for gender, ethnic group, maternal education, neighbourhood deprivation, and household factors. Twins were removed from the dataset. The model did not include participants with one or more missing data. Total N=5124.
44
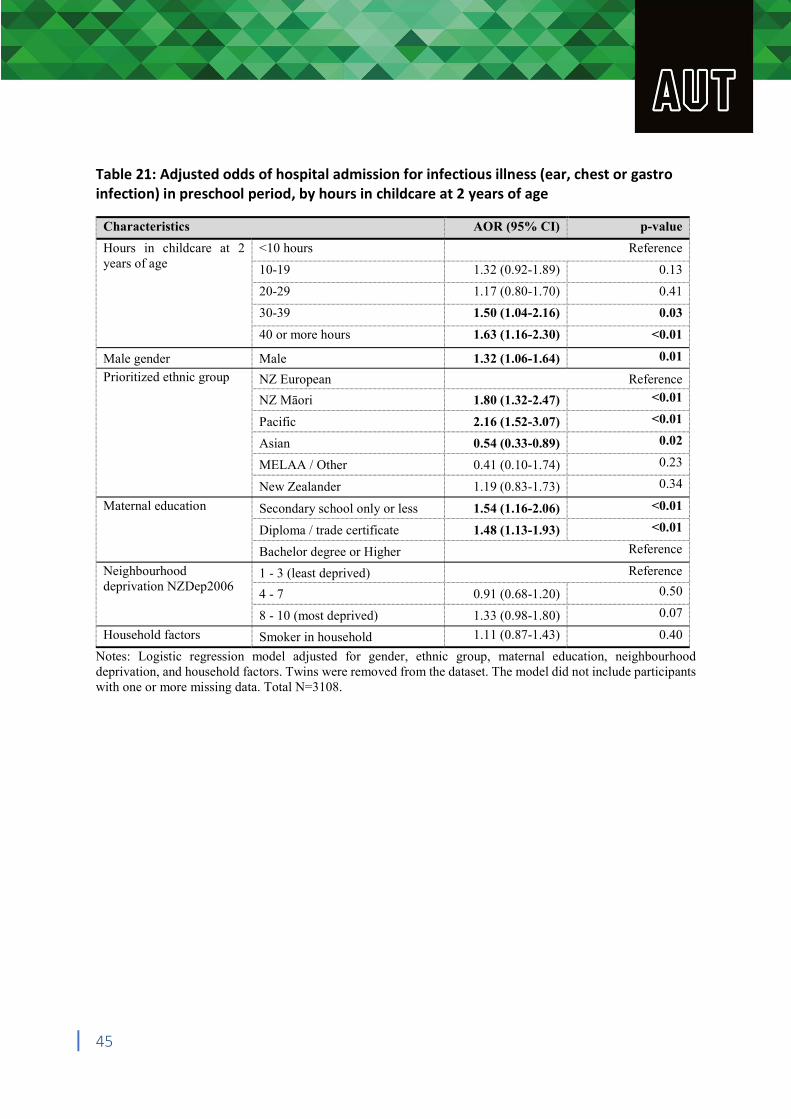
Table 21: Adjusted odds of hospital admission for infectious illness (ear, chest or gastro infection) in preschool period, by hours in childcare at 2 years of age
Characteristics AOR (95% CI) p-value
Hours in childcare at 2 <10 hours Reference years of age 10-19 1.32 (0.92-1.89) 0.13
20-29 1.17 (0.80-1.70) 0.41
30-39 1.50 (1.04-2.16) 0.03
40 or more hours 1.63 (1.16-2.30) <0.01
Male gender Male 1.32 (1.06-1.64) 0.01
Prioritized ethnic group NZ European Reference
NZ Māori 1.80 (1.32-2.47) <0.01
Pacific 2.16 (1.52-3.07) <0.01
Asian 0.54 (0.33-0.89) 0.02
MELAA / Other 0.41 (0.10-1.74) 0.23
New Zealander 1.19 (0.83-1.73) 0.34
Maternal education Secondary school only or less 1.54 (1.16-2.06) <0.01
Diploma / trade certificate 1.48 (1.13-1.93) <0.01
Bachelor degree or Higher Reference
Neighbourhood 1 - 3 (least deprived) Reference deprivation NZDep2006
4 - 7 0.91 (0.68-1.20) 0.50
8 - 10 (most deprived) 1.33 (0.98-1.80) 0.07
Household factors Smoker in household 1.11 (0.87-1.43) 0.40
Notes: Logistic regression model adjusted for gender, ethnic group, maternal education, neighbourhood deprivation, and household factors. Twins were removed from the dataset. The model did not include participants with one or more missing data. Total N=3108.
45
Summary of Key Points The association between ECE and behavioural outcomes Increasing participation in high quality ECE has been a focus of education policy since 2002
with the nation’s first strategic plan for early childhood education. The 2018 draft strategic plan for ECE builds upon gains from the 2002 plan and importantly identifies key goals for addressing concerns regarding child wellbeing. These goals include increasing the number of qualified teachers, improving teacher to child ratios, and developing a stronger ‘wrap-around’ health and education model for service provision. The articulation of the 2018 draft plan’s goals were significant for their recognition of concerns regarding the possible negative effects of ECE participation for infants established in key reports to the Ministry of Education and Office of the Children’s Commissioner. The prioritised focus on child wellbeing in the 2018 draft strategic plan highlights the important contribution of health and wellbeing data from the Growing up in New Zealand study.
Once adjusting for a range of covariates, type of childcare was only associated with peer problems. Specifically, participation in centre-based care was inversely associated with the development of peer problems.
In contrast to previous literature, more time in ECE per week was inversely associated with the development of emotional difficulties and peer problems.
No association with externalising problems and total difficulties (once adjusting for covariates), unlike previous research in other countries.
The association between ECE and infectious illness Infections in early childhood are common and there is strong evidence in international
studies that they may provide some immunity against illnesses later in childhood.
Centre-based care in infancy (9 months of age) was independently associated with approximately 2 times the risk of ear and chest infections, and 2.5 times the risk of gastro illness, compared to children in parental care. There was no association with skin infections.
Infants in other types of care (e.g. nanny, friend, relative other than parents/grandparents) also had a smaller but independently increased risk of gastro infections compared to children in parental care (OR 1.7 in home-based, 1.3 grandparent care and 1.4 other). This relationship was not present for ear or chest infections.
At 2 years of age, centre-based care was independently associated with 2.2 times the risk of ear infection, 1.8 times the risk of chest infection and 1.5 times the risk of gastro infections, compared to children in parental care. There were no independent associations with skin infections.
46
Two year olds attending childcare more than 30 hours per week had an independently increased risk of ear infections (OR:1.5) compared to children attending less than 10 hours a week. Two year olds in a childcare arrangement with an adult to child ratio of 1:5 or more at 2 years of age, had an independently increased risk of gastro infections (OR: 1.4-1.6), compared to childcare with an adult to child ratio of 1:3 or fewer.
Two year olds in home-based, grandparent or other childcare also had an increased risk of ear and chest (but not gastro) infections, compared to children in parental care.
One in 8 children had been admitted to hospital before the age of 4.5 years due to an ear, chest or gastro infection (with chest infections the most common of these). Centre-based care in infancy is independently associated hospitalization in preschool period due to these infections (OR 1.48). More than 30 hours a week in care at 2 years of age was also independently associated with an increased risk of hospitalization due to an ear, chest or gastro infection.
Implications for ECE policy Centre-based care at two-years of age may have independent benefits for children’s
emotional wellbeing and relationships with peers, and these are widely regarded as key elements of child wellbeing and early learning experiences. The hours per week at that age do not appear to impact on behavioural outcomes and more hours may even be positive for emotional development and wellbeing.
Centre-based ECE services should be aware of the increased risk of infectious illness for infants and toddlers in their care and be strongly encouraged to follow public health advice on how to reduce the risk of infections spreading (regular hand-washing with soap, keeping sick children away from the service).
There is a need for public health agencies (such as the Ministry of Health and District Health Board public health units) to work more closely with the early childhood education sector to ensure a reduction in ear, chest and gastro infections related to childcare exposures.
Delaying the start of ECE until after 1 year old may help to avoid serious infections and the prescribing of antibiotics and hospitalization in infancy. If infants do attend group-based childcare, mothers should be encouraged to continue breastfeeding for as long as possible as this aids the immune system and is strongly associated with a decreased risk of gastrointestinal tract and respiratory illnesses (particularly otitis media and diarrhoea).
Strengths and Limitations Two major limitations of this dataset was that there was no measure of ECE process
quality (e.g., children’s daily experiences), and that ECE structural quality could not be effectively analysed due to missing data (e.g., adult-to-child ratio, group size, and caregiver education). Additional research that quantifies the relationships between child behaviour / infectious illness and ECE process / structural quality is therefore warranted.
47

Readers should be aware that the independent associations presented do not represent causation and there may be other factors not measured that could explain the relationship between childcare and infectious illness or child behaviour. The covariates in the present study were selected to enable adjustment for key sociodemographic variables while avoiding excessive model complexity; however, there may be other significant covariates that contribute to the targeted associations.
Related to the preceding point, it should be noted that ECE participation is defined by participant (parental) choice, which could contribute to a selection effect that confounds the relationships among key variables. For example, parents who are employed are more likely to need, afford, and use ECE; this tendency will ‘select’ a particular group of children, many of whom may have different behavioural and health profiles to the converse group.
It is possible that the positive association between child behaviour and ECE is in part due to children with behavioural difficulties being excluded from ECE (reverse causation). Unlike primary school, there is no requirement for early childhood education services to take children who have conduct or peer problems. It is also possible that parents with full time childcare responsibilities of two-year children may rate their behaviour as worse than the parents of children in childcare, because they see them all the time (so may be more aware of their behaviour) and also due to the increased stress of parenting fulltime.
Given limitations in the data collection noted elsewhere, it is not possible to determine why attendance appears to protect against emotional difficulties and peer problems, and hence why this finding contrasts with previous research. It should be noted that much of that research is conducted overseas where there are different process and structural regulations. This includes different emphases in the curriculum and different approaches to the understanding and guidance of children’s behaviours.
There was a relatively high level of missing data for all our exposure and outcome variables, which may have introduced bias and influenced final conclusions.
The census questions used to derive the NZDep cover a range of social determinants of health. If similar variables, such as household crowding, are included with the NZDep in multivariable analyses, this creates a risk of multicollinearity. Also, deprivation is not homogeneous within NZDep deciles, therefore making assumptions about individuals within a given decile could be considered a form of ecological fallacy.
Overall conclusion The benefits of early childhood education for infants and toddlers continue to be debated and frequently contested in New Zealand. The findings in this report provide indicators of the nature of particular possible health and wellbeing benefits of participation in early childhood education. Optimistically, these findings suggest that early childhood services may contribute positively to the complex task of supporting the young child’s healthy relationships with self and peers. While the data on infections indicates cause for concern, addressing these
48

concerns is entirely within the scope of the current draft strategic plan and in particular its attention to improved teacher to child ratios and better cohesion between health and education policy makers and providers. While the findings need to be interpreted within the scope of limitations recognised above, they furnish the early childhood sector with the most comprehensive evidence of the short-term outcomes to date. In addition, these findings indicate elements of practice and provision that can be addressed in order to meet the Ministry of Education’s draft strategic goals for increasing the quality of early childhood education for infants and toddlers.
49
References 1. Ministry of Education. Te Whāriki: He whāriki mātauranga mō ngā mokopuna o Aotearoa:
Early childhood curriculum. (Learning Media Wellington, 1996). 2. Ministry of Education. Pathways to the future: Nga Huarahi Arataki. A 10-year strategic
plan for early childhood education. (Learning Media Wellington, 2002). 3. OECD. Starting Strong III: A Quality Toolbox for Early Childhood Education and Care. (OECD
Publishing, 2011). 4. Ministry of Education. Licensing criteria for early childhood education & care services
2008 and early childhood education curriculum framework. (2018). 5. Ministry of Education. Chapter 2: How the Ministry funds services. in ECE funding
handbook (Ministry of Education, 2016). 6. Ministry of Education. Appendix 1: Funding rates. in ECE funding handbook (Ministry of
Education, 2019). 7. Tyler, J., Davies, M. & Bennett, B. Increasing early childhood education enrolment and
attendance rates in south Auckland, New Zealand. New Zealand International Research in Early Childhood Education 21, 99 (2018).
8. Education Data and Knowledge, Ministry of Education. Overview of attendance at licensed ECE services in 2018. https://www.educationcounts.govt.nz/__data/assets/pdf_file/0009/192942/ECE-Summary-page-1Attendance-in-2018.pdf (2018).
9. Ministry of Education. Understanding attendance; results from the 2017 Early Childhood Education census. https://www.educationcounts.govt.nz/__data/assets/pdf_file/0003/188238/Understan ding-attendance-results-from-the-2017-Early-Childhood-Education-census-v4.pdf (2018).
10. Dalli, C. et al. Quality early childhood education for under-two-year-olds: What should it look like? A literature review. (2011).
11. Carroll-Lind, J. & Angus, J. H. Through their lens: An inquiry into non-parental education and care of infants and toddlers. (Office of the Children’s Commissioner, 2011).
12. Ministry of Education. He taonga te tamaiti | Every child a taonga: Strategic plan for early learning 2019-29 draft for consultation. (2018).
13. Heckman, J. J. The case for investing in disadvantaged young children. CESifo DICE Report 6, 3–8 (2008).
14. Heckman, J. J., Stixrud, J. & Urzua, S. The effects of cognitive and noncognitive abilities on labor market outcomes and social behavior. Journal of Labor economics 24, 411–482 (2006).
15. Heckman, J. J. Skill formation and the economics of investing in disadvantaged children. Science 312, 1900–1902 (2006).
16. NICHD Early Child Care Research Network. Child care and child development: Results from the NICHD study of early child care and youth development. (Guilford Press, 2005).
17. Belsky, J. Early child care and early child development: Major findings of the NICHD study of early child care. European Journal of Developmental Psychology 3, 95–110 (2006).
50
18. Belsky, J. et al. Are there long-term effects of early child care? Child Development 78, 681– 701 (2007).
19. Jacob, J. I. The socio-emotional effects of non-maternal childcare on children in the USA: a critical review of recent studies. Early Child Development and Care 179, 559–570 (2009).
20. Eryigit-Madzwamuse, S. & Barnes, J. Is early center-based child care associated with tantrums and unmanageable behavior over time up to school entry? Child & Youth Care Forum 42, 101–117 (2013).
21. Averdijk, M., Besemer, S., Eisner, M., Bijleveld, C. & Ribeaud, D. The relationship between quantity, type, and timing of external childcare and child problem behaviour in Switzerland. European Journal of Developmental Psychology 8, 637–660 (2011).
22. Gialamas, A., Mittinty, M. N., Sawyer, M. G., Zubrick, S. R. & Lynch, J. Time spent in different types of childcare and children’s development at school entry: an Australian longitudinal study. Archives of Disease in Childhood 100, 226–232 (2015).
23. Babchishin, L. K., Weegar, K. & Romano, E. Early child care effects on later behavioral outcomes using a Canadian nation-wide sample. Journal of Educational and Developmental Psychology 3, p15 (2013).
24. Zachrisson, H. D., Dearing, E., Lekhal, R. & Toppelberg, C. O. Little evidence that time in child care causes externalizing problems during early childhood in Norway. Child Development 84, 1152–1170 (2013).
25. Meissel, K., Peterson, E. R., Thomas, S. & Murray, S. Intentions and decisions about early childhood education: Understanding the determinants and dynamics of households’ early intentions and decisions about ECE and childcare from birth to age two. https://www.msd.govt.nz/documents/about-msd-and-our-work/newsroom/media-releases/2019/children-and-families-research-fund-report-intentions-and-decisions-about-early-childhood-education.pdf (2018).
26. Ministry of Social Development. Childcare subsidy - Work and Income. 27. Duncan, G. J. Modeling the impacts of child care quality on children’s preschool cognitive
development. Child Development 74, 1454–1475 (2003). 28. Gormley Jr., W. T., Gayer, T., Phillips, D. & Dawson, B. The effects of universal pre-K on
cognitive development. Developmental Psychology 41, 872–884 (2005). 29. Loeb, S., Bridges, M., Bassok, D., Fuller, B. & Rumberger, R. W. How much is too much?
The influence of preschool centers on children’s social and cognitive development. Economics of Education Review 26, 52–66 (2007).
30. Magnuson, K., Lahaie, C. & Waldfogel, J. Preschool and school readiness of children of immigrants. Social Science Quarterly 87, 1241–1262 (2006).
31. Goldstein, N. E., Arnold, D. H., Rosenberg, J. L., Stowe, R. M. & Ortiz, C. Contagion of aggression in day care classrooms as a function of peer and teacher responses. Journal of Educational Psychology 93, 708–719 (2001).
32. Duncan, G. J. & Magnuson, K. Investing in preschool programs. Journal of Economic Perspectives 27, 109–132 (2013).
33. Romano, E., Kohen, D. & Findlay, L. C. Associations among child care, family, and behavior outcomes in a nation-wide sample of preschool-aged children. International Journal of Behavioral Development 34, 427–440 (2010).
51
34. NICHD Early Child Care Research Network. Child-care structure → process → outcome: Direct and indirect effects of child-care quality on young children’s development. Psychol Sci 13, 199–206 (2002).
35. Perlman, M. et al. A systematic review and meta-analysis of a measure of staff/child interaction quality (the classroom assessment scoring system) in early childhood education and care settings and child outcomes. PLOS ONE 11, e0167660 (2016).
36. NICHD Early Child Care Research Network. Child outcomes when child care center classes meet recommended standards for quality. American Journal of Public Health 89, 1072– 1077 (1999).
37. Love, J. M. et al. Child care quality matters: How conclusions may vary with context. Child Development 74, 1021–1033 (2003).
38. Votruba-Drzal, E., Coley, R. L. & Chase-Lansdale, P. L. Child care and low-income children’s development: Direct and moderated effects. Child Development 75, 296–312 (2004).
39. Kottelenberg, M. J. & Lehrer, S. F. Do the perils of universal childcare depend on the child’s age? CESifo Econ Stud 60, 338–365 (2014).
40. Lekhal, R. Do type of childcare and age of entry predict behavior problems during early childhood? Results from a large Norwegian longitudinal study. International Journal of Behavioral Development 36, 197–204 (2012).
41. NICHD Early Child Care Research Network. Early child care and self-control, compliance, and problem behavior at twenty-four and thirty-six months. Child Development 69, 1145– 1170 (1998).
42. Youngblade, L. M. Peer and teacher ratings of third- and fourth-grade children’s social behavior as a function of early maternal employment. Journal of Child Psychology and Psychiatry 44, 477–488 (2003).
43. Hurwitz, E. S., Gunn, W. J., Pinsky, P. F. & Schonberger, L. B. Risk of respiratory illness associated with day-care attendance: a nationwide study. Pediatrics 87, 62–69 (1991).
44. Hardy, A. M. & Fowler, M. G. Child care arrangements and repeated ear infections in young children. Am J Public Health 83, 1321–1325 (1993).
45. Holmes, S. J., Morrow, A. L. & Pickering, L. K. Child-care practices: effects of social change on the epidemiology of infectious diseases and antibiotic resistance. Epidemiologic Reviews 18, 10–28 (1996).
46. del Castillo-Aguas, G. et al. Infectious morbidity and resource use in children under 2 years old at childcare centres: Morbidity in children at nursery. J Paediatr Child Health 53, 116– 122 (2017).
47. Kamper-Jørgensen, M., Benn, C. S., Simonsen, J., Thrane, N. & Wohlfahrt, J. Clustering of acute respiratory infection hospitalizations in childcare facilities: Respiratory infections and childcare. Acta Paediatrica 99, 877–882 (2010).
48. Kamper-Jorgensen, M., Wohlfahrt, J., Simonsen, J., Gronbaek, M. & Benn, C. S. Population-based study of the impact of childcare attendance on hospitalizations for acute respiratory infections. PEDIATRICS 118, 1439–1446 (2006).
49. Kamper-Jorgensen, M., Andersen, L. G., Simonsen, J. & Sorup, S. Child care is not a substantial risk factor for gastrointestinal infection hospitalization. PEDIATRICS 122, e1168–e1173 (2008).
50. Warren-Gash, C., Fragaszy, E. & Hayward, A. C. Hand hygiene to reduce community transmission of influenza and acute respiratory tract infection: a systematic review: Hand
52
hygiene and influenza: systematic review. Influenza and Other Respiratory Viruses 7, 738– 749 (2013).
51. Chen, J.-H. Multiple childcare arrangements and health outcomes in early childhood. Matern Child Health J 17, 448–455 (2013).
52. Denny, F. W., Collier, A. M. & Henderson, F. W. Acute respiratory infections in day care. Clinical Infectious Diseases 8, 527–532 (1986).
53. McCutcheon, H. & Woodward, A. Acute respiratory illness in the first year of primary school related to previous attendance at child care. Australian and New Zealand Journal of Public Health 20, 49–53 (1996).
54. Ball, T. M., Holberg, C. J., Aldous, M. B., Martinez, F. D. & Wright, A. L. Influence of attendance at day care on the common cold From birth through 13 years of age. Arch Pediatr Adolesc Med 156, 121 (2002).
55. Zutavern, A. et al. Day care in relation to respiratory-tract and gastrointestinal infections in a German birth cohort study. Acta Paediatrica 96, 1494–1499 (2007).
56. Côté, S. M. et al. Short- and long-term risk of infections as a function of group child care attendance: an 8-year population-based study. Arch Pediatr Adolesc Med 164, (2010).
57. Hobbs, M. R. et al. How differing methods of ascribing ethnicity and socio-economic status affect risk estimates for hospitalisation with infectious disease. Epidemiol. Infect. 147, e40 (2019).
58. Morton, S. M. B. et al. Cohort profile: Growing Up in New Zealand. Int. J. Epidemiol. 42, 65–75 (2013).
59. Morton, S. M. B. et al. How do you recruit and retain a prebirth cohort? Lessons learnt from Growing Up in New Zealand. Eval Health Prof 37, 411–433 (2014).
60. Youth in Mind. SDQ: information for researchers and professionals about the Strengths and Difficulties Questionnaires. (2014).
61. D’Souza, S., Waldie, K. E., Peterson, E. R., Underwood, L. & Morton, S. M. Psychometric properties and normative data for the preschool Strengths and Difficulties Questionnaire in two-year-old children. Journal of abnormal child psychology 45, 345–357 (2017).
62. Goodman, R. The Strengths and Difficulties Questionnaire: a research note. Journal of child psychology and psychiatry 38, 581–586 (1997).
63. Goodman, R., Renfrew, D. & Mullick, M. Predicting type of psychiatric disorder from Strengths and Difficulties Questionnaire (SDQ) scores in child mental health clinics in London and Dhaka. European Child & Adolescent Psychiatry 9, 129–134 (2000).
64. Salmond, C., Crampton, P. & Atkinson, J. NZDep2006 index of deprivation. (University of Otago (Department of Public Health), 2007).
65. Atkinson, J., Salmond, C. & Crampton, P. NZDep2013 index of deprivation. (University of Otago, 2014).
66. Cox, J. L., Holden, J. M. & Sagovsky, R. Detection of postnatal depression. Development of the 10-item Edinburgh Postnatal Depression Scale. The British journal of psychiatry 150, 782–786 (1987).
67. Waldie, K. E. et al. Depression symptoms during pregnancy: Evidence from growing up in New Zealand. Journal of affective disorders 186, 66–73 (2015).
68. Tin Tin, S. et al. Internal living environment and respiratory disease in children: findings from the Growing Up in New Zealand longitudinal child cohort study. Environ Health 15, 120 (2016).
53

69. Hobbs, M. R. et al. Ethnic disparities in infectious disease hospitalisations in the first year of life in New Zealand: Ethnicity and infection in NZ infants. J Paediatr Child Health 53, 223–231 (2017).
54
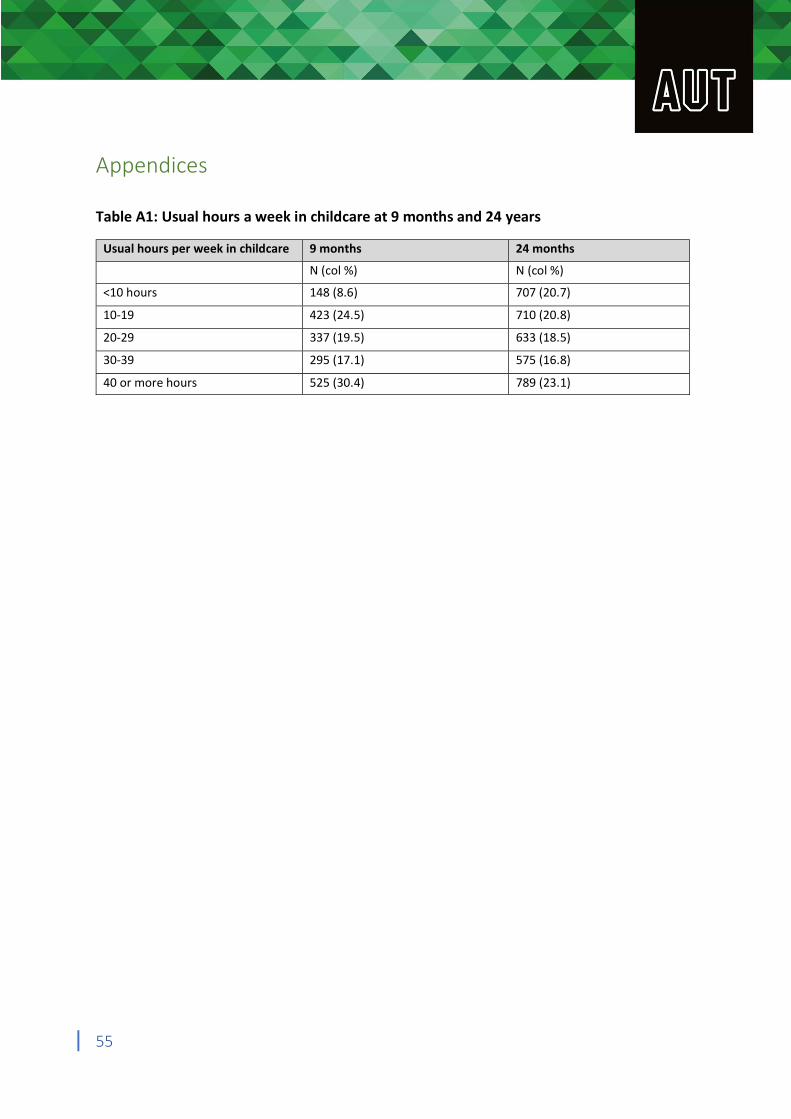
Appendices
Table A1: Usual hours a week in childcare at 9 months and 24 years
Usual hours per week in childcare 9 months 24 months
N (col %) N (col %)
<10 hours 148 (8.6) 707 (20.7)
10-19 423 (24.5) 710 (20.8)
20-29 337 (19.5) 633 (18.5)
30-39 295 (17.1) 575 (16.8)
40 or more hours 525 (30.4) 789 (23.1)
55
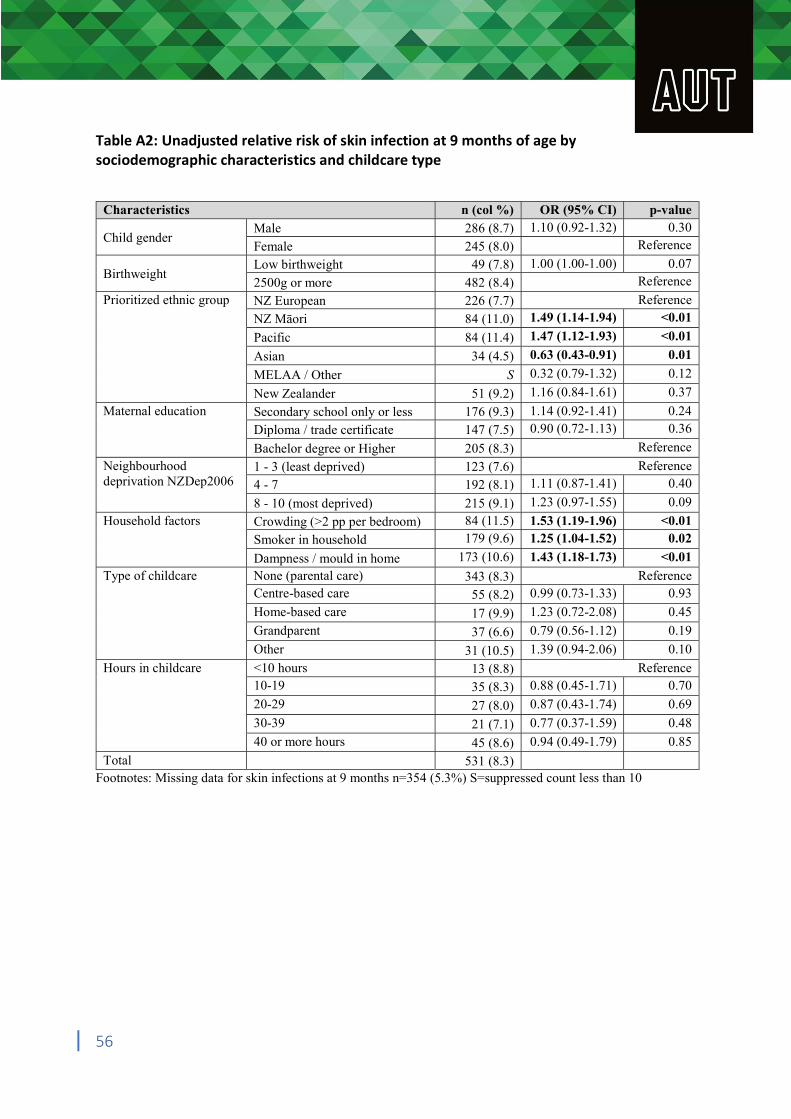
Table A2: Unadjusted relative risk of skin infection at 9 months of age by sociodemographic characteristics and childcare type
Characteristics n (col %) OR (95% CI) p-value
Child gender Male 286 (8.7) 1.10 (0.92-1.32) 0.30
Female 245 (8.0) Reference
Birthweight Low birthweight 49 (7.8) 1.00 (1.00-1.00) 0.07
2500g or more 482 (8.4) Reference
Prioritized ethnic group NZ European 226 (7.7) Reference
NZ Māori 84 (11.0) 1.49 (1.14-1.94) <0.01
Pacific 84 (11.4) 1.47 (1.12-1.93) <0.01
Asian 34 (4.5) 0.63 (0.43-0.91) 0.01
MELAA / Other S 0.32 (0.79-1.32) 0.12
New Zealander 51 (9.2) 1.16 (0.84-1.61) 0.37
Maternal education Secondary school only or less 176 (9.3) 1.14 (0.92-1.41) 0.24
Diploma / trade certificate 147 (7.5) 0.90 (0.72-1.13) 0.36
Bachelor degree or Higher 205 (8.3) Reference
Neighbourhood deprivation NZDep2006
1 - 3 (least deprived) 123 (7.6) Reference
4 - 7 192 (8.1) 1.11 (0.87-1.41) 0.40
8 - 10 (most deprived) 215 (9.1) 1.23 (0.97-1.55) 0.09
Household factors Crowding (>2 pp per bedroom) 84 (11.5) 1.53 (1.19-1.96) <0.01
Smoker in household 179 (9.6) 1.25 (1.04-1.52) 0.02
Dampness / mould in home 173 (10.6) 1.43 (1.18-1.73) <0.01
Type of childcare None (parental care) 343 (8.3) Reference Centre-based care 55 (8.2) 0.99 (0.73-1.33) 0.93
Home-based care 17 (9.9) 1.23 (0.72-2.08) 0.45
Grandparent 37 (6.6) 0.79 (0.56-1.12) 0.19
Other 31 (10.5) 1.39 (0.94-2.06) 0.10
Hours in childcare <10 hours 13 (8.8) Reference 10-19 35 (8.3) 0.88 (0.45-1.71) 0.70
20-29 27 (8.0) 0.87 (0.43-1.74) 0.69
30-39 21 (7.1) 0.77 (0.37-1.59) 0.48
40 or more hours 45 (8.6) 0.94 (0.49-1.79) 0.85
Total 531 (8.3) Footnotes: Missing data for skin infections at 9 months n=354 (5.3%) S=suppressed count less than 10
56
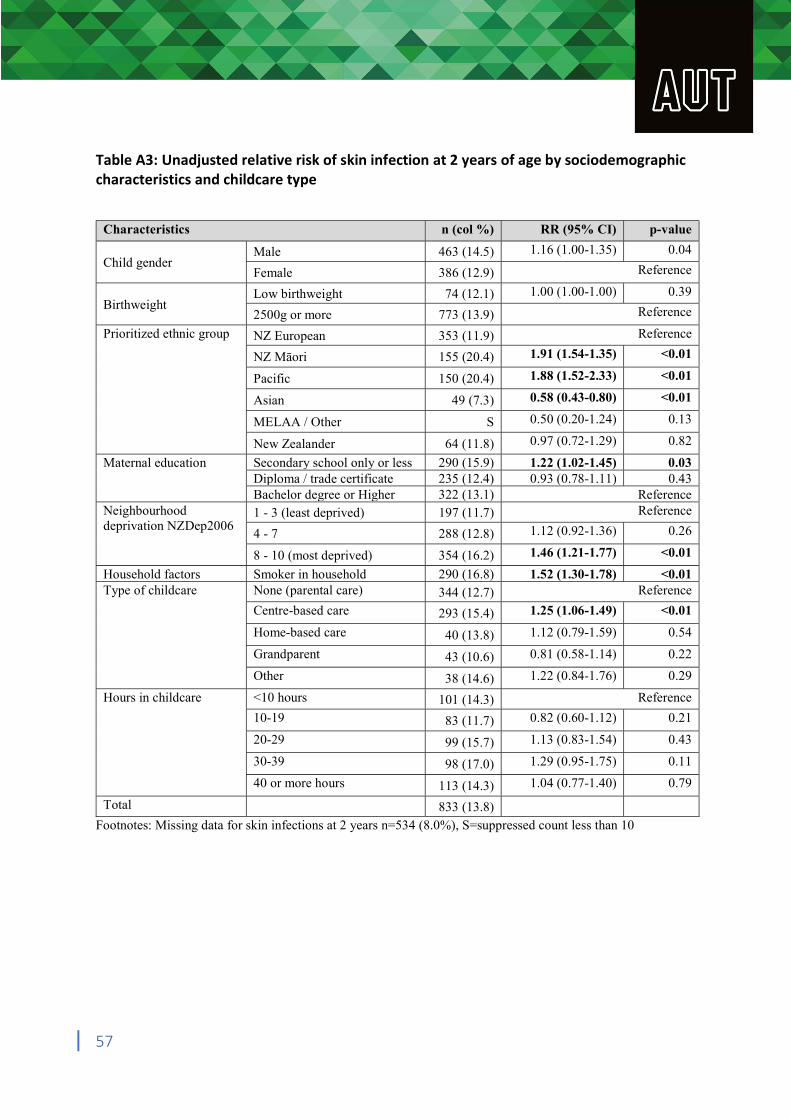
Table A3: Unadjusted relative risk of skin infection at 2 years of age by sociodemographic characteristics and childcare type
Characteristics n (col %) RR (95% CI) p-value
Child gender Male 463 (14.5) 1.16 (1.00-1.35) 0.04
Female 386 (12.9) Reference
Birthweight Low birthweight 74 (12.1) 1.00 (1.00-1.00) 0.39
2500g or more 773 (13.9) Reference
Prioritized ethnic group NZ European 353 (11.9) Reference
NZ Māori 155 (20.4) 1.91 (1.54-1.35) <0.01
Pacific 150 (20.4) 1.88 (1.52-2.33) <0.01
Asian 49 (7.3) 0.58 (0.43-0.80) <0.01
MELAA / Other S 0.50 (0.20-1.24) 0.13
New Zealander 64 (11.8) 0.97 (0.72-1.29) 0.82
Maternal education Secondary school only or less 290 (15.9) 1.22 (1.02-1.45) 0.03 Diploma / trade certificate 235 (12.4) 0.93 (0.78-1.11) 0.43 Bachelor degree or Higher 322 (13.1) Reference
Neighbourhood deprivation NZDep2006
1 - 3 (least deprived) 197 (11.7) Reference
4 - 7 288 (12.8) 1.12 (0.92-1.36) 0.26
8 - 10 (most deprived) 354 (16.2) 1.46 (1.21-1.77) <0.01
Household factors Smoker in household 290 (16.8) 1.52 (1.30-1.78) <0.01 Type of childcare None (parental care) 344 (12.7) Reference
Centre-based care 293 (15.4) 1.25 (1.06-1.49) <0.01
Home-based care 40 (13.8) 1.12 (0.79-1.59) 0.54
Grandparent 43 (10.6) 0.81 (0.58-1.14) 0.22
Other 38 (14.6) 1.22 (0.84-1.76) 0.29
Hours in childcare <10 hours 101 (14.3) Reference
10-19 83 (11.7) 0.82 (0.60-1.12) 0.21
20-29 99 (15.7) 1.13 (0.83-1.54) 0.43
30-39 98 (17.0) 1.29 (0.95-1.75) 0.11
40 or more hours 113 (14.3) 1.04 (0.77-1.40) 0.79
Total 833 (13.8) Footnotes: Missing data for skin infections at 2 years n=534 (8.0%), S=suppressed count less than 10
57