Is ISO 14001 a Gateway to More Advanced Voluntary Action? A Case for Green Supply Chain Management
30
Electronic copy available at: http://ssrn.com/abstract=1368393 Electronic copy available at: http://ssrn.com/abstract=1368393 1616 P St. NW Washington, DC 20036 202-328-5000 www.rff.org March 2009 RFF DP 09-05 Is ISO 14001 a Gateway to More Advanced Voluntary Action? A Case for Green Supply Chain Management Toshi H. Arimura, Nicole Darnall, and Hajime Katayama DISCUSSION PAPER
-
Upload
independent -
Category
Documents
-
view
2 -
download
0
Transcript of Is ISO 14001 a Gateway to More Advanced Voluntary Action? A Case for Green Supply Chain Management

Electronic copy available at: http://ssrn.com/abstract=1368393Electronic copy available at: http://ssrn.com/abstract=1368393
1616 P St. NW Washington, DC 20036 202-328-5000 www.rff.org
March 2009 RFF DP 09-05
Is ISO 14001 a Gateway to More Advanced Voluntary Action?
A Case for Green Supply Chain Management
Tosh i H . Ar imura , N ico le Darna l l , and
Ha j ime Ka ta yama
DIS
CU
SSIO
N P
APE
R

Electronic copy available at: http://ssrn.com/abstract=1368393Electronic copy available at: http://ssrn.com/abstract=1368393
© 2009 Resources for the Future. All rights reserved. No portion of this paper may be reproduced without permission of the authors.
Discussion papers are research materials circulated by their authors for purposes of information and discussion. They have not necessarily undergone formal peer review.
Is ISO 14001 a Gateway to More Advanced Voluntary Action? A Case for Green Supply Chain Management
Toshi H. Arimura, Nicole Darnall, and Hajime Katayama
Abstract Using Japanese facility-level data, we estimate the effects of ISO 14001 certification on the
promotion of more advanced practices, namely green supply chain management (GSCM). Our results show that ISO 14001 promotes GSCM practices, in that facilities with environmental management systems (EMS) certified to ISO 14001 are 40 percent more likely to assess their suppliers’ environmental performance and 50 percent more likely to require that their suppliers undertake specific environmental practices. Further, we find that government approaches that encourage voluntary EMS adoption indirectly promote GSCM practices, in that the probability of facilities’ assessing their suppliers’ environmental performance and requiring them to undertake specific environmental practices increases by 9 percent and 10 percent, respectively, if a government assistance program exists. Combined, these findings suggest that there may be significant but previously unnoticed spillover effects of ISO 14001 and government promotion of voluntary action.
Key Words: voluntary actions, positive spillover, environmental management systems, ISO 14001, green supply chain management, government assistance programs, environmental impacts, discrete choice model, endogeneity
JEL Classification Numbers: C35, Q53, Q58

Electronic copy available at: http://ssrn.com/abstract=1368393Electronic copy available at: http://ssrn.com/abstract=1368393
Contents
1. Introduction ......................................................................................................................... 1
2. ISO 14001 and Green Supply Chain Management .......................................................... 3
2.1 ISO 14001 ..................................................................................................................... 3
2.2 Green Supply Chain Management ................................................................................ 4
2.3 Impacts of ISO 14001 on GSCM .................................................................................. 4
3. Econometric Model ............................................................................................................. 5
4. Data Description.................................................................................................................. 7
4.1 Survey Data ................................................................................................................... 7
4.2 ISO Certification and Measures of GSCM ................................................................... 8
4.3 Exogenous Variables and Instrument ........................................................................... 8
5. Estimation Results ............................................................................................................ 10
5.1. Correlations between Errors ...................................................................................... 10
5.2. ISO Equation .............................................................................................................. 10
5.3. Assess and Require Equations ................................................................................... 11
5.4. Robustness Checks..................................................................................................... 12
5.5. Indirect Effects of Government Assistance Programs ............................................... 13
6. Conclusion ......................................................................................................................... 14
References .............................................................................................................................. 16
Tables and Figures ................................................................................................................ 19
Appendix A: Univariate Probit Results for the Require Equation .................................. 25
Appendix B: Indirect Effects of Assistance Program ........................................................ 27

1
Is ISO 14001 a Gateway to More Advanced Voluntary Action? A Case for Green Supply Chain Management
Toshi H. Arimura, Nicole Darnall, and Hajime Katayama ∗
1. Introduction
An increasing number of governments have started to promote voluntary actions by private corporations to achieve their environmental goals. The popularity of this approach stems from the fact that voluntary actions are more acceptable to the private sector than prescriptive mandates or economic instruments like pollution taxes and emissions trading. Moreover, government-encouraged voluntary approaches are less costly than traditional command-and-control systems, which impose a significant administrative burden on regulators for monitoring and enforcement.
Partly because of governments’ promotion, voluntary actions are becoming more common among industrial facilities. One of the more widely used voluntary actions involves an environmental management system (EMS). Industrial facilities that adopt EMS systematically develop an environmental policy, evaluate their internal processes that affect the environment, create objectives and targets, monitor progress, and undergo management review. In particular, ISO 14001, the EMS standard designed by the International Organization for Standardization (ISO), has received growing attention. By 2005, more than 88,800 facilities worldwide had been certified to the standard (Peglau [23]).
Because of the popularity of ISO 14001, researchers have begun to examine the factors that motivate facilities to adopt ISO 14001 and its effect on their environmental performance. These studies have found that the adoption of ISO 14001 is influenced by firm size, export ratio, debt ratio, stakeholders’ environmental preferences and pressures, and firms’ financial flexibility (Nakamura et al. [21], Nishitani [22] ). They also have found that greater regulatory pressure
∗ Toshi Arimura, corresponding author; Resources for the Future, George Mason University, and Sophia University; 7-1 Kioicho-Chiyoda-ku, Tokyo 102-8554, Japan; [email protected]. Nicole Darnall, Department of Environmental Science and Policy, George Mason University; 10541 School St., Fairfax, VA 22030. Hajime Katayama, Faculty of Economics and Business, University of Sydney; [email protected]. The authors thank the Organisation for Economic Cooperation and Development for funding a portion of this study. An earlier version of this paper was presented at the U.S. Environmental Protection Agency’s National Center for Environmental Economics and the authors are grateful to the seminar participants for their helpful comments and suggestions. Toshi Arimura thanks the Sophia University-wide Collaborative Research for its financial support and Akira Hibiki for the data collection. All conclusions and any errors are the responsibility of the authors.

2
leads to early uptake of ISO 14001 (King et al. [17], Potoski and Prakash [24],[25], Darnall and Edwards [7]).
In terms of the effectiveness of ISO 14001 adoption, the research findings are equivocal. On the one hand, some studies show that ISO 14001 certification can reduce an industrial facility’s environmental impacts (Arimura et al. [2], Potoski and Prakash [24], Melnyk et al. [19]) and improve its compliance with environmental regulations (Potoski and Prakash [25]). On the other hand, some studies find little evidence that ISO 14001 improves facilities’ environmental performance (Barla [3], King et al. [17], Darnall and Sides [9]).1
A commonality among previous studies that assess the effectiveness of ISO 14001 is that they measure environmental performance only for the facility that adopts the EMS standard. However, it is possible that even though an adopter of ISO 14001 may not directly improve its environmental performance, it may implement policies and practices that affect the environmental actions of other organizations. For example, ISO 14001-certified facilities may be more likely to implement green supply chain management (GSCM) practices and thus assess suppliers’ environmental performance when making their purchasing decisions. It is also possible that certified facilities may be more likely to attempt to green their supply chain by requiring that their suppliers undertake particular environmental measures. These potential spillover effects of ISO 14001 have been largely overlooked in the literature. Additionally, although previous studies (Arimura et al. [2]) show that government-promoted voluntary approaches can help reduce facilities’ environmental impacts, they have not considered how ISO 14001 and other programs may indirectly encourage GSCM.
To our knowledge, this is the first paper to examine the relationship between facilities’ ISO 14001 certification and GSCM practices. In particular, using Japanese facility-level data from a survey conducted by the Organisation for Economic Co-operation and Development (OECD), we estimate the effects of ISO 14001 certification on the promotion of GSCM practices. Further, we assess the extent to which government-sponsored assistance programs that encourage facilities to adopt ISO 14001 also influence them to adopt GSCM practices.
We find the effects of ISO 14001 on GSCM practices to be quite large. Facilities with ISO 14001 are about 40 percent are more likely to assess their suppliers’ environmental performance than facilities without ISO 14001 and 50 percent more likely to require that their suppliers undertake specific environmental practices. We also show that policies that encourage
1 One reason for such mixed findings may be related to the methodological complexity of determining the success of facilities’ voluntary environmental efforts (Morgenstern and Pizer [20], Darnall and Sides [9], King et al. [17]).

3
facilities to adopt EMS are indirectly related to the implementation of GSCM practices. Specifically, the availability of government-sponsored programs that encourage facilities to use EMS make it 9 percent more likely that facilities will also assess their suppliers’ environmental performance and make it 10 percent more likely that facilities will also require their suppliers to undertake specific environmental practices.
The fact that ISO 14001 promotes GSCM practices suggests the possibility of ISO 14001’s positive externality: If a firm assesses its suppliers’ environmental performance and requires them to undertake environmental measures, suppliers may subsequently improve their environmental performance. If so, ISO 14001-certified facilities play a role in reducing environmental impacts outside their production process. Additionally, a government policies that promote voluntary EMS adoption may encourage broader environmental improvements within private firms. Our results therefore suggest that the effectiveness of ISO 14001 and the benefit from government-promoted voluntary actions may be far greater than previously considered.
2. ISO 14001 and Green Supply Chain Management
2.1 ISO 14001
Environmental management systems generally consist of internal policies, assessments, plans, and implementation actions (Coglianese and Nash [5] 2001) that affect facilities and their effects on the natural environment. ISO 14001 is an internationally recognized EMS standard that was developed by the International Organization for Standardization, a nongovernmental organization. What differentiates ISO 14001 environmental management from noncertified systems is that ISO 14001 requires external third-party verification to ensure that facilities conform to the ISO standard.2 A certified facility must first commit to reducing its environmental impacts over time. Then it must demonstrate that its EMS meets ISO’s five basic components: conformance to the facility’s environmental policy, environmental planning (referred to in brief as “Plan”), plan implementation and operation (“Do”), periodic monitoring (“Check”), corrective action (“Act”), and management review, which generally occurs on an annual basis). Once certified, a facility must follow this cycle of Plan–Do–Check–Act over time to maintain its registration (Arimura et al. [2]).
2 ISO 14000 series consists of 23 standards constituting the ISO 14000 “family.” One such standard is ISO 14001. This standard requires certification, whereas the others do not. In some instances an organization may claim its EMS conforms to ISO 14001, but does not obtain certification. The focus of this paper is on actual certification.

4
By virtue of undergoing certification, ISO 14001-registered facilities are more likely to formalize their commitment to achieving environmental performance goals (Rondinelli and Vastag [27]). Additionally, these facilities are more likely to embed environmental practices deep within their operational frameworks so that protecting the natural environment becomes an integral element of their operational strategies. For these reasons, ISO 14001 is hypothesized to help facilities reduce their environmental impacts, and this hypothesis has been tested by many studies, as mentioned earlier.
In contrast, the link between ISO 14001 and GSCM practices has drawn little attention. One reason is that the ISO 14001 standard does not require firms to assess the environmental impacts of their supply chain decisions. However, as explained below, firms that have certified ISO 14001 may be able to implement GSCM at a lower cost. This suggests that certified firms may be more likely to implement GSCM practices, thereby engaging suppliers to reduce their own environmental impacts. If so, the environmental benefits of ISO 14001 may be far greater than considered previously.
2.2 Green Supply Chain Management
To understand the relationship between ISO 14001 and GSCM, it is important first to define a firm’s supply chain and its relationship with the natural environment. The supply chain consists of all parties that are involved in fulfilling a customer request, including the suppliers, transporters, warehouses, retailers, and customers themselves (Cox [6]). A facility’s supply chain impacts on the environment stem from inputs that increase waste during product storage, transportation, processing, use, or disposal. These inputs affect a final producer’s products, production waste, and disposal (Handfield et al. [13]). Facilities that purchase inputs from a specific supplier also acquire waste from each supplier up the supply chain (Darnall et al. [8]). One purpose of GSCM, therefore, is to avoid inheriting environmental risks from less environmentally conscious suppliers (Klassen and Whybark [18]). In so doing, facilities assess the environmental performance of their suppliers and require suppliers to undertake measures that ensure the environmental quality of their products (Handfield et al. [14]).
Most facilities implement environmental practices that address their direct environmental impacts. GSCM, in contrast, seeks to affect the environmental behavior of other firms. Because they seek to manage their more environmental impacts throughout their networks, facilities that adopt GSCM practices have a more far-reaching environmental strategy.
2.3 Impacts of ISO 14001 on GSCM
GSCM has potentially significant implications for an organization’s environmental performance because GSCM, together with ISO 14001, offers a more comprehensive means of

5
achieving environmental goals among networks of firms. To the extent that ISO 14001-certified organizations are more likely to green their supply chain, the social benefits of ISO 14001 can be significant if these networks work together to reduce their environmental impacts.
Our view is that ISO 14001 potentially promotes GSCM. At their core, both ISO 14001 and GSCM rely on a continuous improvement model. ISO 14001 requires organizations to continually reduce their impact to the natural environment. Similarly, GSCM practices leverage continual improvement processes to reduce the impact of supplier inputs on the organization’s final product (Preuss [26]). The continual improvement capabilities necessary to maintain ISO 14001 certification also are helpful for GSCM because both practices require facilities to systematically assess about their impacts to the natural environment (Darnall et al. [8]). Moreover, like ISO 14001, GSCM practices require organizations to have strong inventory control systems that reduce redundant stock materials and unnecessary inputs in the production process (Rosenberg and Campbell [28]).
ISO 14001 adopters have knowledge and proficiencies in pollution prevention practices (Darnall and Edwards [7]). They also have invested in training their employees to seek out pollution prevention opportunities. By encouraging their employees to work together in teams, ISO 14001 adopters may be able to leverage their pollution prevention skills and environmental knowledge toward other integrated forms of environmental management, such as GSCM practices. ISO 14001 therefore offers a framework to more readily support GSCM decisions.
In short, because the skills and management practices required to certify to ISO 14001 are similar to those for GSCM, we expect ISO 14001 to reduce the costs of GSCM. Consequently, we anticipate that facilities with ISO 14001 are more likely to adopt GSCM practices.
3. Econometric Model
Our econometric framework is essentially a treatment effects model. A facility’s GSCM practices depend on whether it receives a “treatment”—in our context, whether it adopts ISO 14001. The problem we encounter is that unobserved facility-specific factors, such as managers’ attitudes toward the environment, are likely to be correlated with both GSCM practices and the adoption of ISO 14001. Because of this correlation, the facility’s choice of adoption is potentially an endogenous variable.
Let *iASSESS and *
iREQUIRE be facility i’s net benefits from assessing the
environmental performance of its suppliers and from requiring its suppliers to undertake environmental measures, respectively. They are assumed to depend on the adoption of ISO 14001 as well as a set of control variables. Specifically, we assume that

6
*1 ,i A i A i iAASSESS ISO Xθ ε′= + +δ (1)
*1 ,i R i R i iRREQUIRE ISO Xθ ε′= + +δ (2)
where iISO is an indicator variable for the adoption of ISO 14001, 1iX is a vector of control variables, and ijε ( , )j A R= is an idiosyncratic error. Since both net benefits are likely to
depend on similar unobserved factors, iAε and iRε are expected to be correlated with each other. Hereafter, we call equations (1) and (2) the “assess equation” and the “require equation,” respectively.
*iASSESS and *
iREQUIRE are not observed. What we actually observe is whether the
facility assesses its suppliers in terms of their environmental performance ( iASSESS ) and whether it requires its suppliers to undertake environmental measures ( iREQUIRE ). We assume
that iASSESS equals one if * 0iASSESS ≥ and zero otherwise. That is, the facility assesses its suppliers if the net benefit from doing so is greater than or equal to zero. REQUIRE and
*iREQUIRE are related in an analogous fashion.
If iISO is an exogenous variable (i.e., it is independent of iAε and iRε ) and ( , )iA iRε ε are
normally distributed with zero mean, the model would become a bivariate probit model with certain normalization. However, unobserved facility-specific factors are captured by iAε and iRε while concurrently affecting the adoption of ISO 14001. Because of this correlation, the facility’s choice of ISO 14001 adoption is potentially endogenous, and hence estimation of the bivariate probit model may lead to inconsistent estimates of the ISO 14001 effects. For consistent estimates, we therefore treat iISO as an endogenous dummy variable. This leads us to have an additional binary choice equation (hereafter called the “ISO equation”). Let *iISO be the net benefit from adopting ISO 14001. *iISO is determined by
* ,i ISO i iISOISO X ε′= +δ (3)
where iX is a set of exogenous variables and iISOε is an idiosyncratic error. We assume that the facility will adopt ISO 14001 if its net benefit is greater than or equal to zero; iISO equals one if * 0iISO ≥ and zero otherwise.
The estimation model consists of the three equations, (1)–(3). We assume that ( , , )i iA iR iISOε ε ε ′=ε is normally distributed with zero mean and covariance matrix Σ , thereby
allowing all the error terms to be correlated arbitrarily. Since parameters in this model are not identified without normalization, we set all diagonal terms of Σ equal to 1s; with this

7
normalization, the model results in a standard multivariate probit model.3 As identification is achieved only through the parametric assumption, we impose the following exclusion restrictions: one variable (i.e., an instrumental variable) in iX is excluded from 1iX . The choice of the instrument is explained in the next section.
4. Data Description
4.1 Survey Data
To evaluate our relationships of interest, we relied on data collected from a 12-page survey developed by the Organisation for Economic Co-Operation and Development (OECD) Environment Directorate and academic researchers from Canada, France, Germany, Hungary, Japan, Norway, and the United States. The authors of this study were involved in the development of the survey and in data collection. The objective of the survey was to collect information on environmental practices and performances from manufacturing facilities within these countries. To collect the Japanese data, researchers cooperated with the Japanese Ministry of the Environment. Japanese surveys were sent to individuals who worked in Japanese manufacturing facilities having at least 50 employees and who were responsible for the facility’s environmental activities. Two follow-up mailings were sent to prompt additional responses. A total of 4,757 facility managers were randomly chosen from all Japanese manufacturing facilities. Despite the survey’s length, the response rate was 32 percent (1,499 respondents), which exceeds that of previous assessments of organizations’ voluntary environmental practices: Christmann [4] achieved a response rate of 20.1 percent; Delmas and Keller [10], 11.2 percent; and Melnyk et al. [19], 10.35 percent.
To reduce reporting bias, survey respondents were guaranteed anonymity. Additionally, the OECD examined nonresponse bias by evaluating the general distribution of its survey respondents. It assessed the industry representation and facility size of the survey sample relative to the distribution of facilities in the broader population and found no statistically significant
3 Calculation of the likelihood function involves evaluating three-dimensional integrals over the latent errors iε for which no closed-form solution exists. To overcome this computational difficulty, we use the maximum simulated likelihood along with the GHK simulator (Geweke [12], Hajivassiliou [13], Keane [16]), a standard approach for estimation of multivariate probit models. The number of drawings for the simulator is set to be 100.

8
differences (Johnstone et al. [15]). These results were further confirmed in Arimura et al. [2].4 After removing incomplete responses from the 1,499 replies, our final sample contained either 811 or 945 facilities, depending upon model specifications. The summary statistics of variables used for estimation are presented in Table 1.
4.2 ISO Certification and Measures of GSCM
Examining the extent to which facilities are undertaking GSCM practices is complicated by a lack of secondary data, since measures of GSCM practices generally cannot be obtained without asking facilities directly. We overcame this problem by asking two questions about GSCM practices: “Does your facility regularly assess the environmental performance of its suppliers?” and “Does your facility require its suppliers to undertake environmental measures?” From the responses, we construct ASSESS and REQUIRE, respectively. As Table 1 shows, 40.7 percent of the facilities assess their suppliers, and 39.2 percent require their suppliers to undertake environmental measures.
Table 2 shows stark differences in ASSESS and REQUIRE across ISO 14001 adopters. Specifically, facilities with ISO 14001 are 22.5 percent more likely to assess the environmental performance of their suppliers and 46.9 percent more likely to require that their suppliers undertake environmental measures. These differences are suggestive of the effects of ISO 14001, though one should not interpret them as causal.
4.3 Exogenous Variables and Instrument
A set of exogenous variables is constructed from the information in the survey. They include basic facility and firm characteristics—namely, the number of employees in the facility in logarithm (LNFACEMPL), age of the facility in logarithm (LNFACEMPL), the number of facilities in the firm (FRMFACS), and whether the firm to which the facility belongs is publicly traded (FRMQUOT). We also include a variable indicating whether the facility has a foreign head office (FRMINTL).
The implementation of quality control is known to affect the adoption of ISO 14001 (Nakamura et al, [21], Arimura et al.[2]) because both quality control and ISO 14001 involve similar continual improvement processes. We thus include a dummy variable, OMPQMS, which takes the value of one if the facility implemented quality control.
4 It is possible, however, that there are some important unobservable differences between respondents and non-respondents. This may be a potential caveat to the interpretation of our results. The associated issues are discussed in Arimura et al [2].

9
To capture market concentration, we construct MRKTCONC, which equals one if the number of competitors for the facility’s most commercially important product is fewer than five. We also control for market scope by using three dummy variables. MRKTSCOP1, MRKTSCOP2, and MRKTSCOP3 take the value of one if the scope of the facility’s market is national, regional (neighboring countries), and global, respectively. Here, the reference case is the local market. Furthermore, types of prime customers are controlled for, since they may influence the adoption of ISO 14001 (e.g., Arimura et al. [2]). We use two dummy variables, CUSTEND and CUSTMIDDLE, that take the value of one if the primary customers are households or wholesalers and other manufacturing firms, respectively.
Stakeholders may influence both ISO 14001 and GSCM as well. Influences from various stakeholders were measured by responses to this survey question: “How important do you consider the influence of the following groups or organizations on the environmental practices of your facility?” Respondents ranked the importance of stakeholders by indicating “not important,” “moderately important,” or “very important.” We construct a dummy variable that takes the value of one if the response was “important” or “very important.” The stakeholders were listed as corporate headquarters (INFLCORP), household consumers (INFLCONS), shareholders (INFLINV), banks (INFLBANK), management employees (INFLMGMT), nonmanagement employees (INFLWORK), labor unions (INFLUNIO), industry associations (INFLIND), environmental groups (INFLENGO), and community groups (INFLCOMM).
Since environmental policy can be determining factors for both ISO 14001 and GSCM practices, we control for various types of policy instruments. Specifically, we include 10 dummy variables, each of which takes the value of one if facilities are subject to the following policy instruments: input bans (INPTBAN), technical standards (TECHSTD), performance standards (PERSTD), input taxes (INPTAX), liability for environmental damages (LIAB), demand information measures (INFODMD), supply information measures (INFOSPPL), voluntary agreements (VOLAGR), subsidies (SUBSIDY), and technical assistance (TECHASS).
To capture the heterogeneity of environmental managers, the survey asked facility managers to rank the importance of preventing environmental incidents as part of the facility’s environmental practices: “not important”, “important,” or ”very important.” We construct dummy variables, AMTPREV2 and AMTPREV3, that take the value of one for the responses “important” and “very important,” respectively. Similarly, based on the survey, we construct dummy variables for four other types of motivations: regulatory compliance (AMTRGC2, AMTRGC3), corporate profile or image (AMTIMG2, AMTIMG3), cost savings (AMTSAV2, AMTSAV3), and new technology development or product development (AMTTECH2, AMTTECH3).

10
As an instrument variable, we use a dummy variable that takes the value of one if the facility is encouraged to adopt an EMS through assistance programs (PRGEMP); that is, PRGEMP is included in X (in equation 3) but not X1 (in equations 1 or 2). The choice of this instrument is based on the characteristics of those programs. Some local government assistance programs provide technical and/or financial support for ISO 14001 adoption, and those programs are found to be effective in promoting it (e.g., Arimura et al. [2]). However, the programs do not require facilities to undertake GSCM practices. It is therefore plausible to assume that PRGEMP does not directly affect GSCM practices.
5. Estimation Results
5.1. Correlations between Errors
The estimation results show that the error terms in the assess equation and in the require equation are positively and significantly correlated; the estimated correlation is 0.555 with the standard error of 0.058. These findings suggest that similar unobservables affect both ASSESS and REQUIRE.
The results also indicate the endogeneity of ISO 14001 in the assess equation. The correlation between the error terms in the ISO equation and in the assess equation is estimated to be –0.538 with the standard error of 0.204. The negative correlation is in line with findings in previous studies. For example, Arimura et al. [2] find that ISO 14001 is endogenous in the environmental performance equation. They find a negative correlation between the error terms in the ISO 14001 adoption equation and those in environmental performance.
By contrast, ISO 14001 is found to be exogenous in the require equation; the error term in the ISO equation is not significantly correlated with that in the require equation. These findings suggest that a univariate model indeed suffices for consistent estimates of the require equation. After presenting the results of the multivariate model, we will compare them with the results of the univariate model.
5.2. ISO Equation
Estimated coefficients of the ISO equation and the corresponding average partial effects are presented in Table 3 (Columns (5) and (6), respectively). We summarize these results only briefly here because our focus is on the assess and require equations.
We find that facilities that are large (LNFACEMPL), have a quality management system in place (OMPQMS), or export to foreign countries (MRKTSCOP3) are more likely to adopt ISO 14001. These results are consistent with those in previous studies (e.g., Nakamura et al. [21], Welch et al. [29], Arimura et al. [2]). We also find that facility managers for whom corporate

11
profile or image is an important motivation for environmental practices (AMTIMG3) are more likely to adopt ISO 14001.
5.3. Assess and Require Equations
Columns (1) and (3) of Table 3 present estimated coefficients of the assess equation and the require equation. Columns (2) and (4) of Table 3 show the corresponding average partial effects, respectively. The coefficients on ISO in both equations are positive and highly significant, indicating that the adoption of ISO 14001 increases both the probability of assessing suppliers’ environmental performance and the probability of requiring suppliers to undertake environmental measures. The effects seem to be large; the average partial effects are estimated to be 40.7 percent for ASSESS and 49.2 percent for REQUIRE.
Our findings suggest the possibility of ISO 14001’s positive externality in that a facility’s adoption of ISO 14001 may positively affect the environmental performance of its suppliers. This is because the adoption of ISO 14001 has positive effects on the implementation of GSCM practices, which in turn may make it likely that suppliers reduce their environmental impacts.5
It should be stressed that all previous empirical studies assessing the environmental benefits of ISO 14001 have estimated its impact on the environmental performance of the adopters alone. These studies therefore do not capture the entire effects of ISO 14001 and may underestimate the total environmental benefits of EMS adoption and certification.
In addition to ISO 14001, other variables also influence the probability of assessing suppliers’ environmental performance. For example, the facilities with quality management systems (OMPQMS) are 8.8 percent more likely to assess the environmental performance of their suppliers. Facilities facing input bans (INPTABAN) are also 8.6 percent more likely to assess the environmental performance of their suppliers. These results are consistent with the expectation that facility managers who face input bans will be wary of using noncompliant components in their products. For example, Sony had to recall 1.3 million exported game machines when Dutch authorities determined that cadmium levels in the peripheral cables, provided by suppliers, did not meet environmental standards.6 Since then, numerous manufactures, including Sony, have taken actions to prevent such incidents.
5 Anton et al. [1] showed that the more cpmrehensive environemntal practices lead to the reduction of environemtnal impacts. 6 Sony CSR Report 2004.

12
The results also show that technologically innovative facility managers (AMTTECH2, AMTTECH3) are more likely to assess their suppliers’ environmental performance. These findings are consistent with evidence suggesting that R&D promotes more environmental practices (Anton et al. [1]), since GSCM can be considered one type of environmental practice.
Other results, however, seem counterintuitive. For example, the coefficient of MRKETSOP3 is negative and significant. That is, the facilities exporting to global markets seem to be less likely to assess their suppliers’ environmental performance, an apparent contradiction with the actions taken by Sony and other exporters. However, many global markets do not have input ban policies. The facilities whose headquarters are located in foreign countries are less likely to assess their suppliers’ environmental performance (FRMINTL). Moreover, the coefficient of FRMQUOT is negative and statically significant, suggesting that facilities of publicly traded firms are less likely to assess the environmental performance of their suppliers. However, in each instance, all of these variables are positive and statistically significant coefficients in the ISO equation. Thus, the combined effects of these variables are much smaller than they appear in the ASSESS equation.
In contrast to the ASSESS equation, most of the variables in the REQUIRE equation are statistically insignificant. The only exception is AMTTECH3, which suggests that technologically innovative facilities are more likely to require suppliers to undertake specific environmental measures.
5.4. Robustness Checks
To check the robustness of our results, we estimate the models with different specifications, samples, and estimation methods. First, we examine two different specifications with smaller sets of control variables: (1) Model 1, where neither the influence of groups or organizations nor the motivations for environmental practices are controlled for, and (2) Model 2, where we do not control for the motivations for environmental practices. Model 3 includes all the control variables.
The results are presented in columns (3) and (4) of Table 4. In both models, the effects of ISO 14001 are found to be positive and significant. For example, in Model 2, the probability of assess (require) increases by 40.1 percent (50.6 percent) when the facility adopts ISO 14001.
Actually, the sample we have used is part of the full sample; the full sample contains facilities that do not report their motivations for environmental practices. For this reason, we have more observations available for Models 1 and 2. The estimation results of Models 1 and 2 using the full sample are presented in columns (1) and (2) of Table 4, respectively. Although the estimated effects become slightly smaller in most cases, our main results clearly do not change.
13
Our second robustness check involves examining whether our main findings are driven by the joint estimation. On the one hand, estimating equations (1)–(3) jointly is more efficient than that of each subsystem of two equations—that is, equations (1) and (3) and equations (2) and (3). On the other hand, the three-equation system is less robust than each two-equation system because if there is any misspecification in the assess equation, the misspecification bias will spill over to the require equation and vice versa. This motivates us to estimate two-equation systems: a bivariate probit of equations (1) and (3) and a bivariate probit of equations (2) and (3). For each bivariate probit model, we examine all combinations of the same control variables described in Models 1–3 for the full sample and the subsamples. The outcome is ten bivariate probit model estimations. As Table 4 indicates, our main results appear to be robust. Indeed, in most cases, the estimated effects are larger than the corresponding ones from the multivariate probit.
As a third robustness check, we estimate the following linear probability models:
1 ,i A i A i iAASSESS ISO Xθ ε′= + +δ
1 ,i R i R i iRREQUIRE ISO Xθ ε′= + +δ
where we treat iISO as an endogenous variable. That is, we estimate each equation by two-stage least squares (2SLS) to determine whether the normality assumption is a reason for our main results. As Table 4 shows, the 2SLS estimates of the effects are found to be larger in all cases. These findings suggest that our main results are not driven by the normality assumption.
As discussed previously, iISO is found to be exogenous in the require equation, and thus a univariate probit model can provide consistent estimates. The univariate results are presented in Appendix A. Although the estimated effects are smaller than those in the multivariate probit models, they are all positive and significant. The effect is estimated to be smallest when we use the subsample for Model 2. However, our results still suggest that the adoption of ISO 14001 increases the probability that facilities require their suppliers to undertake specific environmental measures, by 37.7 percent. Overall, our main results appear to be quite robust to different specifications, samples, and estimation methods.
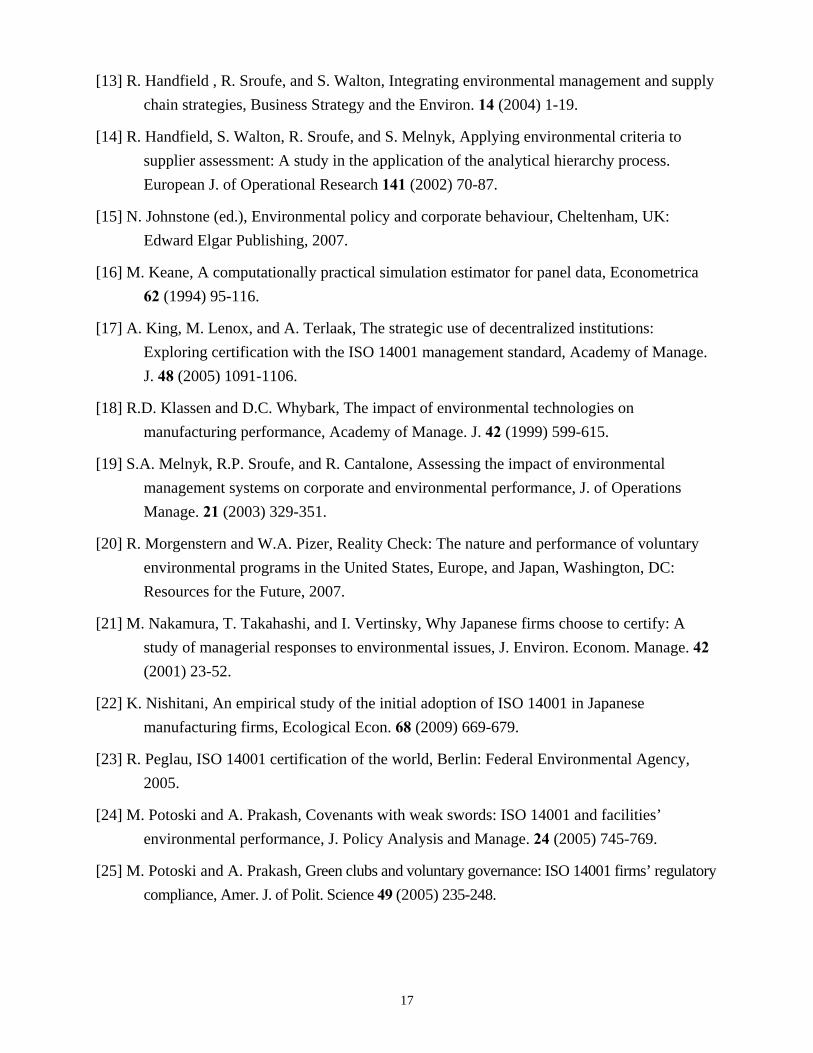
5.5. Indirect Effects of Government Assistance Programs
Using the estimates and the procedure detailed in Appendix B, we computed the effects of government assistance programs on ASSESS and REQUIRE. The results are shown in Table 5. The first two rows exhibit the results with the trivariate model, and the bottom two rows show the results with the bivariate probit models. Each column exhibits the results with different models and sample sizes. For example, column 5 presents the results of Model 3, which is our preferred model. The trivariate (bivariate) probit estimates indicate that an assistance program

14
increases the probability of assessing suppliers’ environmental performance by 9.2 percent (12.5 percent), and assistance increases the probability of requiring suppliers to undertake specific environmental practices by 10.5 percent (14.8 percent).
One may notice that the estimated indirect effects become slightly greater in Models 1 and 2. This is because these models control for fewer variables: the assistance programs in Models 1 and 2 are likely to be correlated with variables excluded from Model 3, and thus the assistance program variable is capturing the effects of those excluded variables as well. The magnitudes of the impacts of the assistance program, however, are in the same range. The effects on ASSESS range from 9.2 percent to 16.5 percent and those on REQUIRE range from 11.9 percent to 17.9 percent. In all the specifications with the two sample sizes, the effects are statistically significant. Thus, we conclude that government assistance programs are effective in promoting GSCM practices. If in fact GSCM practices improve the environmental performance of suppliers, our results also suggest that the effects of assistance programs on environmental performance should be larger than reported in Arimura et al. [2], who only examine the extent to which assistance programs help reduce the environmental impacts of ISO 14001 adopters.
6. Conclusion
Using Japanese facility-level data, we estimated the effects of ISO 14001 certification on the promotion of more advanced environmental practices, namely green supply chain management. We find that ISO 14001 promotes GSCM practices. Facilities with ISO 14001 are 40 percent more likely to assess their suppliers’ environmental performance and 50 percent more likely to require that their suppliers undertake specific environmental practices.
In the presence of the causal link between ISO 14001 and GSCM practices, we have argued that ISO 14001 may positively affect the environmental performance of suppliers by way of GSCM. This argument is valid if suppliers respond to buyers’ environmental performance assessments and requirements that they undertake specific environmental measures. However, there may be reasons why these suppliers’ environmental performance does not improve. For instance, a facility may choose a particular supplier specifically because this supplier already adheres to certain criteria for environmental management. If so, GSCM practices may induce no change in the supplier’s environmental behavior. However, if numerous facilities pursue GSCM, less environmentally conscious suppliers may feel pressure to modify their practices so that they are more environmentally friendly—or risk losing customers. In this regard, GSCM has the possibility of being a positive externality or spillover to ISO 14001 in the long run.
Further, we find that a government policy of encouraging EMS adoption indirectly influences ISO 14001 adopters to implement GSCM practices. Specifically, government

15
assistance programs make it 9 percent more likely that ISO 14001 adopters will assess their suppliers’ environmental performance and 10 percent more likely that ISO 14001 adopters will require their suppliers to undertake specific environmental practices. This evidence supports the idea that encouraging firms to behave in an environmentally friendly way may be effective in addressing environmental problems.
Though our study is the first attempt to shed light on the spillover effects of facilities’ voluntary actions, data limitations make it impossible for us to examine the effects of ISO 14001 on the environmental performance of adopters’ suppliers. Therefore, one fruitful avenue for future research is to examine the environmental performance of facilities operating within the supply chain to determine whether buyers’ GSCM practices lead to measurable improvements among their suppliers. We hope that demonstrating the relationship between ISO 14001 and GSCM stimulates other scholars to consider whether these relationships exist among other international settings and whether ISO 14001 might encourage other types of advanced environmental practices as well.

16
References
[1] W.R.Q. Anton, G. Deltas, and M. Khanna, Incentives for environmental self-regulation and implications for environmental performance, J. Environ. Econom. Manage. 48 (2004) 632-654.
[2] T.H. Arimura, A. Hibiki, and H. Katayama, Is a voluntary approach an effective environmental policy instrument? A case for environmental management systems, J. Environ. Econom. Manage. 55 (2008) 281-295.
[3] P. Barla, ISO 14001 certification and environmental performance in Quebec’s pulp and paper industry, J. Environ. Econom. Manage. 53 (2007) 291–306.
[4] P. Christmann, Effects of ‘best practices’ of environmental management on cost competitiveness: The role of complementary assets. Academy of Manage. J. 43 (2000) 663-880.
[5] C. Coglianese and J. Nash (eds.), Regulating from the inside: Can environmental management systems achieve policy goals? Washington, DC: Resources for the Future, 2001.
[6] A. Cox, Power, value and supply chain management, Supply Chain Manage.: An Int. J. 4 (1999) 167-175.
[7] N. Darnall and D. Edwards Jr., Predicting the cost of environmental management system adoption: The role of capabilities, resources and ownership structure, Strategic Manage. J. 27: (2006) 301-320.
[8] N. Darnall, G.J. Jolley, and R. Handfield, Environmental management systems and green supply chain management: Complements for sustainability? Business Strategy and the Environ. 17 (2008) 30-45.
[9] N. Darnall and S. Sides, Assessing the performance of voluntary environmental programs: Does certification matter? Policy Studies J. 36 (2008) 95-117.
[10] M. Delmas and A. Keller, Free riding in voluntary environmental programs: The case of the U.S. EPA WasteWise program, Policy Sciences 38 (2005) 91-106.
[11] J. Geweke, Bayesian inference in econometric models using Monte Carlo integration, [1] Econometrica 57 (1989) 1317-1340.
[12] V. Hajivassiliou, Smooth simulation estimation of panel data LDV models, Department of Economics, Yale University, 1990.
17
[13] R. Handfield , R. Sroufe, and S. Walton, Integrating environmental management and supply chain strategies, Business Strategy and the Environ. 14 (2004) 1-19.
[14] R. Handfield, S. Walton, R. Sroufe, and S. Melnyk, Applying environmental criteria to supplier assessment: A study in the application of the analytical hierarchy process. European J. of Operational Research 141 (2002) 70-87.
[15] N. Johnstone (ed.), Environmental policy and corporate behaviour, Cheltenham, UK: Edward Elgar Publishing, 2007.
[16] M. Keane, A computationally practical simulation estimator for panel data, Econometrica 62 (1994) 95-116.
[17] A. King, M. Lenox, and A. Terlaak, The strategic use of decentralized institutions: Exploring certification with the ISO 14001 management standard, Academy of Manage. J. 48 (2005) 1091-1106.
[18] R.D. Klassen and D.C. Whybark, The impact of environmental technologies on manufacturing performance, Academy of Manage. J. 42 (1999) 599-615.
[19] S.A. Melnyk, R.P. Sroufe, and R. Cantalone, Assessing the impact of environmental management systems on corporate and environmental performance, J. of Operations Manage. 21 (2003) 329-351.
[20] R. Morgenstern and W.A. Pizer, Reality Check: The nature and performance of voluntary environmental programs in the United States, Europe, and Japan, Washington, DC: Resources for the Future, 2007.
[21] M. Nakamura, T. Takahashi, and I. Vertinsky, Why Japanese firms choose to certify: A study of managerial responses to environmental issues, J. Environ. Econom. Manage. 42 (2001) 23-52.
[22] K. Nishitani, An empirical study of the initial adoption of ISO 14001 in Japanese manufacturing firms, Ecological Econ. 68 (2009) 669-679.
[23] R. Peglau, ISO 14001 certification of the world, Berlin: Federal Environmental Agency, 2005.
[24] M. Potoski and A. Prakash, Covenants with weak swords: ISO 14001 and facilities’ environmental performance, J. Policy Analysis and Manage. 24 (2005) 745-769.
[25] M. Potoski and A. Prakash, Green clubs and voluntary governance: ISO 14001 firms’ regulatory compliance, Amer. J. of Polit. Science 49 (2005) 235-248.

18
[26] L. Preuss, Rhetoric and reality of corporate greening: A view from the supply chain management function, Business Strategy and the Environ. 14 (2005) 123-139.
[27] D.A. Rondinelli and G. Vastag, Panacea, common sense, or just a label? The value of ISO 14001 environmental management systems, European Manage. J. 18 (2000) 499-511.
[28] L.J. Rosenberg and D.P. Campbell, Just-in-time inventory control: A subset of channel management, Academy of Marketing Science J. 13 (1985) 124-133.
[29] E.W. Welch, Y. Mori, and M. Aoyagi-Usui, Voluntary adoption of ISO 14001 in Japan: Mechanism, stages and effects, Business Strategy and the Environ. 11 (2002) 43-62.

19
Tables and Figures
Table 1: Summary Statistics Variable Obs Mean Std. Dev. Min MaxASSESS 945 0.407 0.492 0 1REQUIRE 945 0.392 0.488 0 1ISO 945 0.419 0.494 0 1OMPQMS 945 0.742 0.438 0 1LNFACAGE 945 3.563 0.633 0.693 5.656LNFACEMPL 945 4.933 0.994 1.792 10.26FRMFACS 945 2.724 7.304 0 131FRMQUOT 945 0.114 0.318 0 1FRMINTL 945 0.016 0.125 0 1CUSTEND 945 0.324 0.468 0 1CUSTMIDDLE 945 0.636 0.481 0 1MRKTSCOP1 945 0.683 0.466 0 1MRKTSCOP2 945 0.010 0.097 0 1MRKTSCOP3 945 0.183 0.387 0 1MRKTCONC1 945 0.288 0.453 0 1MRKTCONC2 945 0.345 0.476 0 1INPTBAN 945 0.206 0.405 0 1TECHSTD 945 0.222 0.416 0 1PERFSTD 945 0.620 0.486 0 1INPTAX 945 0.534 0.499 0 1LIAB 945 0.565 0.496 0 1INFODMD 945 0.418 0.493 0 1INFOSPPL 945 0.544 0.498 0 1VOLAGR 945 0.383 0.486 0 1SUBSIDY 945 0.384 0.487 0 1TECHASS 945 0.273 0.446 0 1INFLCORP 945 0.471 0.499 0 1INFLCONS 945 0.450 0.498 0 1INFLINV 945 0.225 0.418 0 1INFLBANK 945 0.219 0.414 0 1INFLMGMT 945 0.621 0.485 0 1INFLWORK 945 0.605 0.489 0 1INFLUNIO 945 0.214 0.410 0 1INFLIND 945 0.262 0.440 0 1INFLENGO 945 0.292 0.455 0 1INFLCOMM 945 0.669 0.471 0 1AMTPREV2 877 0.446 0.497 0 1AMTPREV3 877 0.526 0.500 0 1AMTRGC2 899 0.443 0.497 0 1AMTRGC3 899 0.533 0.499 0 1AMTIMG2 893 0.545 0.498 0 1AMTIMG3 893 0.418 0.493 0 1AMTSAV2 883 0.553 0.498 0 1AMTSAV3 883 0.399 0.490 0 1AMTTECH2 825 0.571 0.495 0 1AMTTECH3 825 0.298 0.458 0 1

20
Table 2: Summary Statistics ISO 14001 Adopter (ISO = 1) ISO 14001 Nonadopter (ISO = 0) Mean Variable Obs Mean Std. Dev. Obs Mean Std. Dev. DifferenceASSESS 396 0.538 0.499 549 0.313 0.464 22.5% REQUIRE 396 0.664 0.473 549 0.195 0.396 46.9%

21
Table 3: Estimation Results ASSESS REQUIRE ISO Variable (1) Coefficient (2) APE (3) Coefficient (4) APE (5) Coefficient (6) APE ISO 1.218 (0.326)*** 0.407 (0.098)*** 1.460 (0.373)*** 0.492 (0.113)*** OMPQMS 0.280 (0.134)** 0.088 (0.042)** 0.099 (0.137) 0.028 (0.039) 0.522 (0.177)*** 0.107 (0.037)*** LNFACAGE 0.014 (0.084) 0.004 (0.026) -0.128 (0.093) -0.036 (0.026) -0.315 (0.099)*** -0.063 (0.020)*** LNFACEMPL -0.075 (0.070) -0.024 (0.022) 0.044 (0.078) 0.012 (0.022) 0.507 (0.080)*** 0.101 (0.015)*** FRMFACS -0.003 (0.006) -0.001 (0.002) -0.003 (0.007) -0.001 (0.002) 0.020 (0.013) 0.004 (0.003) FRMQUOT -0.396 (0.176)** -0.119 (0.049)** -0.140 (0.182) -0.039 (0.049) 0.580 (0.215)*** 0.120 (0.047)*** FRMINTL -1.043 (0.388)*** -0.275 (0.075)*** 0.558 (0.437) 0.162 (0.128) 0.753 (0.589) 0.151 (0.115) CUSTEND 0.027 (0.255) 0.039 (0.044) 0.051 (0.266) 0.046 (0.041) -0.567 (0.332)* -0.038 (0.038) CUSTMIDDLE -0.150 (0.239) -0.050 (0.056) -0.170 (0.250) -0.052 (0.052) -0.549 (0.301)* -0.081 (0.045)* MRKTSCOP1 -0.470 (0.145)*** -0.105 (0.038)*** -0.083 (0.176) -0.004 (0.040) 0.432 (0.210)** 0.043 (0.034) MRKTSCOP2 -0.592 (0.434) -0.044 (0.124) -0.555 (0.502) -0.115 (0.119) 0.789 (0.556) 0.063 (0.112) MRKTSCOP3 -0.658 (0.192)*** -0.102 (0.041)** -0.309 (0.225) -0.067 (0.039)* 1.006 (0.244)*** 0.151 (0.036)*** MRKTCONC1 0.002 (0.122) 0.004 (0.034) -0.022 (0.130) -0.003 (0.032) 0.239 (0.161) 0.024 (0.028) MRKTCONC2 -0.031 (0.117) -0.010 (0.032) -0.035 (0.121) -0.008 (0.030) 0.319 (0.142)** 0.050 (0.025)** INPTBAN 0.268 (0.116)** 0.086 (0.038)** 0.189 (0.129) 0.054 (0.038) 0.089 (0.153) 0.018 (0.031)TECHSTD -0.038 (0.121) -0.012 (0.038) -0.087 (0.136) -0.024 (0.038) 0.157 (0.158) 0.032 (0.032) PERFSTD 0.038 (0.137) 0.012 (0.043) -0.018 (0.143) -0.005 (0.040) 0.498 (0.156)*** 0.103 (0.034)*** INPTAX -0.036 (0.134) -0.011 (0.042) -0.152 (0.140) -0.043 (0.040) -0.834 (0.163)*** -0.157 (0.029)*** LIAB 0.052 (0.126) 0.016 (0.040) 0.083 (0.133) 0.023 (0.038) -0.045 (0.158) -0.009 (0.031) INFODMD 0.020 (0.115) 0.006 (0.036) 0.136 (0.119) 0.039 (0.034) -0.152 (0.146) -0.030 (0.029) INFOSPPL -0.209 (0.128) -0.065 (0.039) -0.033 (0.148) -0.009 (0.041) 0.581 (0.150)*** 0.122 (0.032)*** VOLAGR -0.012 (0.122) -0.004 (0.038) -0.046 (0.131) -0.013 (0.037) 0.231 (0.158) 0.047 (0.032) SUBSIDY -0.148 (0.134) -0.046 (0.042) 0.011 (0.141) 0.003 (0.040) -0.114 (0.172) -0.023 (0.034) TECHASS 0.166 (0.139) 0.053 (0.044) 0.107 (0.147) 0.030 (0.042) -0.316 (0.181)* -0.062 (0.035)* INFLCORP 0.157 (0.107) 0.050 (0.034) 0.099 (0.113) 0.028 (0.033) 0.158 (0.129) 0.032 (0.026) INFLCONS 0.177 (0.109) 0.056 (0.035) 0.034 (0.115) 0.009 (0.032) -0.240 (0.137)* -0.047 (0.027)* INFLINV -0.035 (0.146) -0.011 (0.045) 0.142 (0.158) 0.041 (0.046) -0.040 (0.173) -0.008 (0.034)INFLBANK 0.110 (0.140) 0.035 (0.045) -0.038 (0.150) -0.011 (0.042) 0.098 (0.168) 0.020 (0.034) INFLMGMT -0.014 (0.173) -0.004 (0.054) -0.270 (0.186) -0.074 (0.049) 0.025 (0.217) 0.005 (0.043) INFLWORK -0.041 (0.194) -0.013 (0.060) 0.262 (0.250) 0.075 (0.062) 1.005 (0.220)*** 0.216 (0.049)***

22
INFLUNIO 0.050 (0.130) 0.016 (0.041) 0.066 (0.142) 0.019 (0.040) -0.239 (0.170) -0.047 (0.032) INFLIND 0.053 (0.136) 0.017 (0.043) 0.083 (0.140) 0.024 (0.040) 0.080 (0.165) 0.016 (0.033)INFLENGO -0.070 (0.122) -0.022 (0.038) -0.054 (0.124) -0.015 (0.035) 0.060 (0.159) 0.012 (0.032)INFLCOMM 0.089 (0.125) 0.028 (0.039) 0.021 (0.131) 0.006 (0.037) -0.277 (0.153)* -0.054 (0.029)* AMTIMG2 -0.172 (0.258) -0.049 (0.051) -0.459 (0.294) -0.069 (0.052) 0.395 (0.290) 0.016 (0.034) AMTIMG3 -0.041 (0.276) 0.016 (0.051) -0.510 (0.308)* -0.075 (0.046) 0.692 (0.307)** 0.099 (0.038)*** AMTSAV2 -0.099 (0.242) -0.004 (0.050) -0.299 (0.253) -0.050 (0.047) 0.061 (0.297) -0.006 (0.037) AMTSAV3 -0.215 (0.258) -0.050 (0.047) -0.309 (0.269) -0.041 (0.044) 0.207 (0.319) 0.035 (0.039) AMTTECH2 0.392 (0.147)*** 0.052 (0.034) 0.288 (0.166)* 0.023 (0.034) -0.313 (0.196) -0.036 (0.030) AMTTECH3 0.706 (0.173)*** 0.152 (0.040)*** 0.663 (0.196)*** 0.143 (0.039)*** -0.423 (0.227)* -0.049 (0.032) PRGEMP 0.983 (0.151)*** 0.210 (0.029)*** Note: This table presents the estimation results of the assess, require, and ISO 14001 equations (i.e., equations 1, 2, and 3, respectively) which are jointly estimated by the maximum simulated likelihood. The number of observations is 811. Robust standard errors are in parentheses. Asterisks *, **, and *** indicate the significance at the 10%, 5%, and 1% levels, respectively. APE denotes average partial effect. Industry dummies as well as the constant are included in the model, though their coefficients are not reported here. The log pseudo-likelihood of the model is -1151.96. ( , ),A RCORR ε ε ( , ),A ISOCORR ε ε and ( , )R ISOCORR ε ε are estimated to be 0.555, -0.538, and -0.230, respectively, and the corresponding standard errors are 0.058, 0.204, and 0.232, respectively.

23
Table 4: Robustness Check
(1) Model 1
(N = 945)
(2) Model 2
(N = 945)
(3) Model 1
(N = 811)
(4) Model 2
(N = 811)
(5) Model 3
(N = 811)
Trivariate Probit
ASSESS 0.499 (0.059)*** 0.415 (0.079)*** 0.504 (0.055)*** 0.401 (0.091)*** 0.407 (0.098)***
REQUIRE 0.554 (0.085)*** 0.464 (0.123)*** 0.598 (0.064)*** 0.506 (0.108)*** 0.492 (0.113)***
Bivariate Probit
ASSESS 0.479 (0.065)*** 0.383 (0.085)*** 0.503 (0.056)*** 0.406 (0.082)*** 0.410 (0.086)***
REQUIRE 0.567 (0.098)*** 0.482 (0.121)*** 0.608 (0.089)*** 0.521 (0.110)*** 0.523 (0.126)***
2SLS
ASSESS 0.730 (0.221)*** 0.705 (0.259)*** 0.728 (0.201)*** 0.700 (0.228)*** 0.743 (0.244)***
REQUIRE 0.825 (0.210)*** 0.811 (0.245)*** 0.786 (0.189)*** 0.772 (0.214)*** 0.837 (0.228)***
Note: This table reports the average partial effects (APEs) of ISO 14001 on (1) the probability that the facility assesses the environmental performance of its suppliers and (2) the probability that the facility requires its suppliers to undertake environmental measures. Robust standard errors are in parentheses. *, **, and *** indicate the significance at the 10%, 5%, and 1% levels, respectively. Industry dummies as well as the constant are included into all models. For the variables included in Models 1–3, see the table in Appendix A.
24
Table 5: Indirect Effects of Government Assistance on GSCM (1) Model 1
(N = 945)
(2) Model 2
(N = 945)
(3) Model 1
(N = 811)
(4) Model 2
(N = 811)
(5) Model 3
(N = 811)
Trivariate Probit
ASSESS 0.155 (0.058)*** 0.129 (0.049)*** 0.165 (0.062)*** 0.124 (0.052)** 0.092 (0.049)*
REQUIRE 0.153 (0.058)*** 0.136 (0.055)** 0.170 (0.063)*** 0.148 (0.058)** 0.104 (0.052)**
Bivariate Probit
ASSESS 0.153 (0.059)*** 0.119 (0.048)** 0.179 (0.072)** 0.128 (0.052)** 0.125 (0.053)**
REQUIRE 0.161 (0.064)** 0.142 (0.058)** 0.184 (0.076)** 0.155 (0.063)** 0.148 (0.049)***
Note: This table reports the average partial effects (APEs) of government assistance (PRGEMP) on (1) the probability that the facility assesses its suppliers, Pr(ASSESS = 1) and (2) the probability that the facility requires its suppliers to undertake environmental measures, Pr(REQUIRE = 1). Robust standard errors are in parentheses. For the variables included in Models 1–3, see the table in Appendix A.

25
Appendix A: Univariate Probit Results for the Require Equation
(1) Model 1 (2) Model 2 (3) Model 1 (4) Model 2 (5) Model 3 Variable APE APE APE APE APE ISO 0.411 (0.042)*** 0.380 (0.044)*** 0.404 (0.044)*** 0.377 (0.046)*** 0.389 (0.045)*** OMPQMS 0.034 (0.037) 0.034 (0.037) 0.046 (0.041) 0.046 (0.041) 0.047 (0.040) LNFACAGE -0.032 (0.024) -0.025 (0.024) -0.049 (0.026) -0.040 (0.026) -0.041 (0.027) LNFACEMPL 0.024 (0.018) 0.025 (0.018) 0.024 (0.019) 0.024 (0.019) 0.024 (0.018) FRMFACS -0.001 (0.002) -0.001 (0.002) 0.000 (0.002) -0.001 (0.002) -0.001 (0.002) FRMQUOT -0.018 (0.050) -0.037 (0.050) -0.016 (0.053) -0.042 (0.053) -0.041 (0.052) FRMINTL 0.179 (0.134) 0.158 (0.131) 0.183 (0.135) 0.156 (0.134) 0.175 (0.131) CUSTEND -0.046 (0.066) -0.043 (0.066) 0.016 (0.071) 0.023 (0.073) 0.012 (0.074) CUSTMIDDLE -0.065 (0.061) -0.061 (0.061) -0.045 (0.064) -0.041 (0.066) -0.055 (0.067) MRKTSCOP1 -0.006 (0.044) 0.000 (0.043) -0.014 (0.050) -0.014 (0.049) -0.025 (0.049) MRKTSCOP2 -0.122 (0.134) -0.124 (0.132) -0.130 (0.141) -0.142 (0.139) -0.141 (0.134)MRKTSCOP3 -0.024 (0.055) -0.024 (0.053) -0.044 (0.061) -0.049 (0.059) -0.075 (0.059) MRKTCONC1 -0.016 (0.036) -0.007 (0.035) -0.011 (0.039) -0.002 (0.039) 0.001 (0.039) MRKTCONC2 -0.006 (0.033) 0.000 (0.033) -0.008 (0.036) -0.001 (0.036) 0.000 (0.036) INPTBAN 0.073 (0.039)* 0.071 (0.038)* 0.066 (0.040)* 0.066 (0.040)* 0.064 (0.039) TECHSTD -0.024 (0.037) -0.027 (0.037) -0.025 (0.039) -0.028 (0.039) -0.024 (0.039) PERFSTD -0.003 (0.037) -0.007 (0.037) -0.002 (0.041) -0.005 (0.041) 0.006 (0.041) INPTAX -0.063 (0.035) -0.070 (0.035) -0.060 (0.038) -0.066 (0.038) -0.060 (0.038) LIAB 0.016 (0.037) 0.011 (0.037) 0.022 (0.041) 0.020 (0.041) 0.022 (0.040) INFODMD 0.062 (0.035)* 0.050 (0.035) 0.050 (0.036) 0.041 (0.037) 0.038 (0.037) INFOSPPL 0.005 (0.037) 0.004 (0.038) 0.003 (0.041) 0.003 (0.042) 0.003 (0.041) VOLAGR 0.011 (0.037) 0.000 (0.037) 0.012 (0.039) -0.004 (0.039) -0.010 (0.039) SUBSIDY 0.002 (0.040) 0.004 (0.040) 0.001 (0.042) 0.004 (0.042) 0.006 (0.043)TECHASS 0.048 (0.042) 0.039 (0.041) 0.050 (0.044) 0.042 (0.043) 0.018 (0.043) INFLCORP 0.024 (0.032) 0.044 (0.035) 0.037 (0.034) INFLCONS 0.028 (0.032) 0.014 (0.035) 0.004 (0.034) INFLINV 0.026 (0.045) 0.034 (0.048) 0.043 (0.047) INFLBANK 0.019 (0.042) 0.002 (0.045) -0.008 (0.044)

26
INFLMGMT -0.060 (0.047) -0.068 (0.053) -0.077 (0.053) INFLWORK 0.115 (0.053)** 0.099 (0.057)* 0.101 (0.057)*INFLUNIO -0.001 (0.039) 0.010 (0.042) 0.011 (0.041)INFLIND 0.022 (0.041) 0.039 (0.044) 0.033 (0.043) INFLENGO -0.004 (0.036) -0.019 (0.037) -0.017 (0.037) INFLCOMM -0.025 (0.035) -0.003 (0.039) 0.000 (0.039) AMTIMG2 -0.124 (0.084) AMTIMG3 -0.131 (0.087) AMTSAV2 -0.081 (0.076) AMTSAV3 -0.079 (0.081) AMTTECH2 0.073 (0.049) AMTTECH3 0.184 (0.060)*** Pseudo R-squared 0.209 0.217 0.202 0.210 0.224Log likelihood -500.63 -495.26 -439.51 -435.03 -427.38 Nobs 945 945 811 811 811 Note: This table presents the average partial effects (APEs) of explanatory variables on the probability that the facility requires its suppliers to undertake environmental measures. Robust standard errors are in parentheses. Asterisks *, **, and *** indicate the significance at the 10%, 5%, and 1% levels, respectively. Industry dummies as well as the constant are included in all models, though their coefficients are not reported here.
Resources for the Future Arimura, Darnall, and Katayama
27
Appendix B: Indirect Effects of Assistance Program
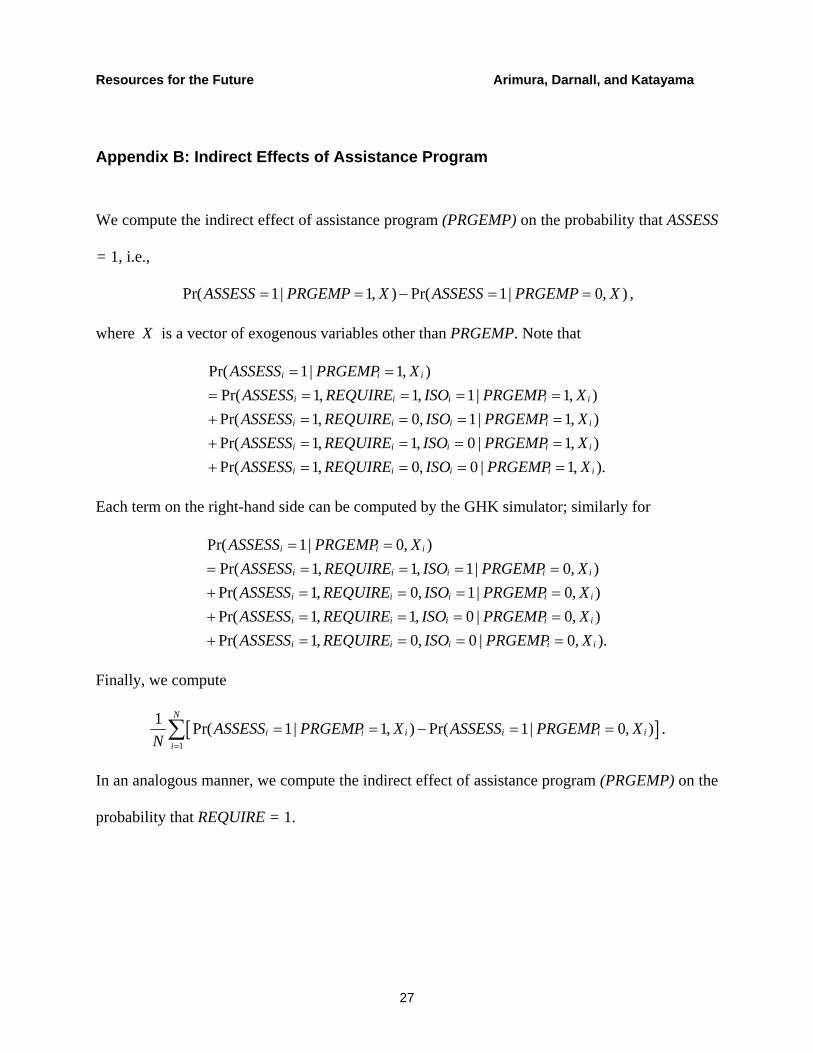
We compute the indirect effect of assistance program (PRGEMP) on the probability that ASSESS
= 1, i.e.,
Pr( 1| 1, ) Pr( 1| 0, )ASSESS PRGEMP X ASSESS PRGEMP X= = − = = ,
where X is a vector of exogenous variables other than PRGEMP. Note that
Pr( 1| 1, )Pr( 1, 1, 1| 1, )Pr( 1, 0, 1| 1, )Pr( 1, 1, 0 | 1, )Pr( 1, 0, 0 |
i i i
i i i i i
i i i i i
i i i i i
i i i i
ASSESS PRGEMP XASSESS REQUIRE ISO PRGEMP XASSESS REQUIRE ISO PRGEMP XASSESS REQUIRE ISO PRGEMP XASSESS REQUIRE ISO PRGEMP
= == = = = =+ = = = =+ = = = =+ = = = 1, ).iX=
Each term on the right-hand side can be computed by the GHK simulator; similarly for
Pr( 1| 0, )Pr( 1, 1, 1| 0, )Pr( 1, 0, 1| 0, )Pr( 1, 1, 0 | 0, )Pr( 1, 0, 0 |
i i i
i i i i i
i i i i i
i i i i i
i i i i
ASSESS PRGEMP XASSESS REQUIRE ISO PRGEMP XASSESS REQUIRE ISO PRGEMP XASSESS REQUIRE ISO PRGEMP XASSESS REQUIRE ISO PRGEMP
= == = = = =+ = = = =+ = = = =+ = = = 0, ).iX=
Finally, we compute
[ ]1
1 Pr( 1| 1, ) Pr( 1| 0, )N
i i i i i ii
ASSESS PRGEMP X ASSESS PRGEMP XN =
= = − = =∑ .
In an analogous manner, we compute the indirect effect of assistance program (PRGEMP) on the
probability that REQUIRE = 1.