Investing in gender equality: Global evidence and the Asia-Pacific setting
60
Asia-Pacific Gender Mainstreaming Programme UNDP Regional Centre in Colombo DISCUSSION PAPER Investing in gender equality: Global evidence and the Asia-Pacific setting
-
Upload
independent -
Category
Documents
-
view
4 -
download
0
Transcript of Investing in gender equality: Global evidence and the Asia-Pacific setting

Asia-Pacific Gender Mainstreaming Programme UNDP Regional Centre in Colombo
DISCUSSION PAPER
Investing in gender equality: Global evidence and the Asia-Pacific setting
UNDP is the UN’s global development network, advocating for change and connecting countries to knowledge, experience and resources to help people build a better life. For further information and your feedback on the publication as well as our work, please write to:
Asia-Pacific Gender Mainstreaming ProgrammeUNDP Regional Centre in Colombo23 Independence Avenue, Colombo 7, Sri LankaTel: (+94-11) 452 6400Fax: (+94-11) 452 6410Email: [email protected] P
rod
uced
by
Co
pyl
ine (P
vt) Ltd

Authored by Patricia Alexander
Photo Credits: Page 3, UNDP Cambodia; page 31, Koh Miyaoi; all others, Reuters
Edited by: Rama Goyal
Published by UNDP Asia-Pacific Regional Centre Colombo*
Design and layout by Copyline (Pvt) Limited
© UNDP Asia-Pacific Regional Centre Colombo, January 2008
Cover photo - Reuters
First Edition
* The views expressed in this publication are those of the author and do not necessarily represent those of the United Nations, including UNDP. The sharing of this paper with the external audience is aimed at generating a constructive debate and does not constitute an endorsement by UNDP or institutions of the United Nations system.
Investing in Gender Equality: Global Evidence and the Asia-Pacific Setting i
Investing In Gender Equality:Global Evidence and the Asia-Pacific Setting
DISCUSSION PAPER
Asia-Pacific Gender Mainstreaming Programme UNDP Regional Centre in Colombo
January 2008

Investing in Gender Equality: Global Evidence and the Asia-Pacific Settingii
Investing in Gender Equality: Global Evidence and the Asia-Pacific Setting iii
Table of Contents
Foreword .................................................................................................................................................................... v
Asia-Pacific: Education in Historical Perspective ............................................................................................... vi
1. Gender Equality: An Economic Case .............................................................................................................. 1 Introduction .................................................................................................................................................................................................................1 Women’s Economic Rights Are Human Rights .......................................................................................................................................2 The Economy–Gender Interaction ................................................................................................................................................................3 Drivers of the Gender–Economy Nexus .....................................................................................................................................................4
2. Theoretical Linkages and Empirical Evidence ............................................................................................. 7 Direct and Indirect Effects of Development Interventions.............................................................................................................7 Historical Debates on the Determinants of Growth, and Contemporary Evidence .......................................................8 The 30-year Datasets ......................................................................................................................................................................................9 The Consensus, and the News Story: ‘Education for Girls—Proof Positive’ ...............................................................10 Measurable Effects .......................................................................................................................................................................................11 Education Gender Gap: A Measure of Gender Inequality ...................................................................................................12 How Much Does Gender Equality Contribute to Growth and Development? ...............................................................12
3. Asia-Pacific Setting: Education and Other Development Outcomes .................................................... 16 Education ...................................................................................................................................................................................................................16 Asia-Pacific Performance—Uneven and Urgent .......................................................................................................................16 Income: Only a Partial Explanation ....................................................................................................................................................18 Secondary Education and Total Fertility ........................................................................................................................................18 Education and Adolescent Fertility ....................................................................................................................................................19 Health ...........................................................................................................................................................................................................................20 Child Mortality ................................................................................................................................................................................................20 Reproductive Health and Policies Supporting Gender Equality......................................................................................22 Women and HIV .............................................................................................................................................................................................22 Gender-based Violence and the Health Sector ..........................................................................................................................23 Labour Force Participation ..............................................................................................................................................................................25 Share of Wage Employment ..................................................................................................................................................................25 ‘Decent Work’ ...................................................................................................................................................................................................27 Political Representation .....................................................................................................................................................................................29
4. Conclusions and Strategic Priorities ............................................................................................................ 32 Conclusions from the Data ..............................................................................................................................................................................32 Making Investment Choices ...........................................................................................................................................................................32 Financing Gender Equality ...............................................................................................................................................................................34
Annex 1: Data For Figures In The Text ................................................................................................................. 36
References................................................................................................................................................................ 46
Abbreviations and Acronyms ............................................................................................................................... 49
Investing in Gender Equality: Global Evidence and the Asia-Pacific Setting iii
Investing in Gender Equality: Global Evidence and the Asia-Pacific Settingiv
Table of Contents
Investing in Gender Equality: Global Evidence and the Asia-Pacific Settingiv
List of FiguresFigure 1: Growth Rate of Per Capita GDP, and Increase in Years of Female Schooling .......................................................... 10Figure 2a: Increasing Gender Equality in Secondary Education: Measured Contribution to Economic Growth .......................................................................................................................................... 15Figure 2b: Increasing Gender Equality in Secondary Education: Measured Contribution to Key Development Goals ............................................................................................................................ 15Figure 3: Secondary School GERs, by Sex, Selected Asia-Pacific Countries .................................................................................. 17Figure 4: Female: Male Ratio of Secondary School Enrolment (GERs) and Per Capita GDP, Selected Asia-Pacific Countries ...................................................................................................................................... 18Figure 5: TFR and Female Secondary Enrolment (GER), Selected Asia-Pacific Countries ..................................................... 19Figure 6: Trends in Adolescent Fertility Rates, Selected Regions, 1990–2000 ........................................................................... 20Figure 7: Adolescent Fertility Rate and Female Secondary GER, Selected Asia-Pacific Countries .................................. 21Figure 8: Child Mortality (U5MR), by Female Secondary Schooling (GER) .................................................................................... 22Figure 9: Women’s Share of Non-Agricultural Wage Employment, Selected Asia-Pacific Countries ............................ 26Figure 10: Share of Seats in National Parliaments, by Sex, Selected Asia-Pacific Countries ............................................... 28Figure 11: Women in National Parliaments, Asia-Pacific and World Averages ............................................................................ 30Figure 12. Do Reservation Systems Help? ........................................................................................................................................................ 31
List of BoxesBox 1: Economic Rights ...................................................................................................................................................................................................2Box 2: Information is a Sound Investment: India’s National Family Health Survey .....................................................................5Box 3: Lower MMRs with Skilled Birth Attendants, and with Lower Fertility Rates .....................................................................6Box 4: The ‘East Asian Miracle’ and Education for Girls ..................................................................................................................................9Box 5: Summary of Empirical Findings of Reviewed Papers .................................................................................................................. 13Box 6: How Education and Other Variables Were Used in the Models ........................................................................................... 14Box 7: Family Life Education in Fiji Schools ....................................................................................................................................................... 20Box 8: The Costs of Gender-Based Violence and the Efficiency of Prevention ........................................................................... 24Box 9: Women Making a Difference in Indian Local Governments ................................................................................................... 30Box 10: Access to Justice in Afghanistan ........................................................................................................................................................... 31

Investing in Gender Equality: Global Evidence and the Asia-Pacific Setting v
Over the years, a mounting body of empirical evidence has emerged, demonstrating that investments in gender equality yield high returns on social and economic development.
This report compiles and reviews evidence from existing studies, exploring the linkages between gender inequality, economic growth and development. The findings suggest that decreasing gender inequalities has the potential of accelerating human development and growth. Impairment of women’s right to equality and empowerment not only denies a human right but also sabotages development. Emphasis on education of girls is related with progress towards the achievement of the Millennium Development Goals and has a positive impact on fertility decline, child mortality and malnutrition. Countries, including Bangladesh, Bhutan, India, Myanmar, and Nepal, where the girls’ secondary enrolment ratio is below 50 percent also suffer from high child mortality. Asian history has shown countries that have invested in gender equality have been able to show early declines in fertility levels, which is vital to development. Thus, the report presents a ‘business and development case’ for equality interventions.
However, severe disparities remain between countries in the Asia Pacific region in female education. Although primary school enrolment is improving in most countries of the Asia-Pacific region, change is slow in some countries and rural areas. Nearly half of the out-of-school girls in the world live in Asia and the Pacific.
The Asia-Pacific setting shows that women have responded to education opportunities with enthusiasm and have made major contributions to the dynamism of the region. In this context, I am sure, this report is timely and would support policy makers in building a case for investment in gender equality.
This report has been authored by Patricia Alexander under the guidance of Hafiz Pasha, Minh Pham and the Gender Steering Committee with invaluable support from Koh Miayoi, James Lang, Radhika Behuria and Roohi Metcalfe. Mention must be made of Richard Leete for the conception of several of the charts on Asia-Pacific data, Bhagya Wickramaratne for sustained administrative support, and David Anandaraj for research assistance with data and chart formats. The Regional Centre in Colombo would also like to thank those who have read earlier drafts of this report and made valuable comments and suggestions, including Anuradha Rajivan, Claire Van der Vaeren, Yumiko Yamamoto, Yubaraj Khatiwada, Kazuyuki Uji, Gry Ballestad, Charmalee Jayasinghe, Caitlin Wiesen, Pramod Kumar and Anuradha Seth among others. Special thanks are due to T. Palanivel and Manisha Mishra for providing additional inputs and editorial coordination and production.
Omar NomanChief of Policies and ProgrammesUNDP Regional Centre in Colombo
Foreword
Investing in Gender Equality: Global Evidence and the Asia-Pacific Settingvi
Asia-Pacific: Education in Historical Perspective*
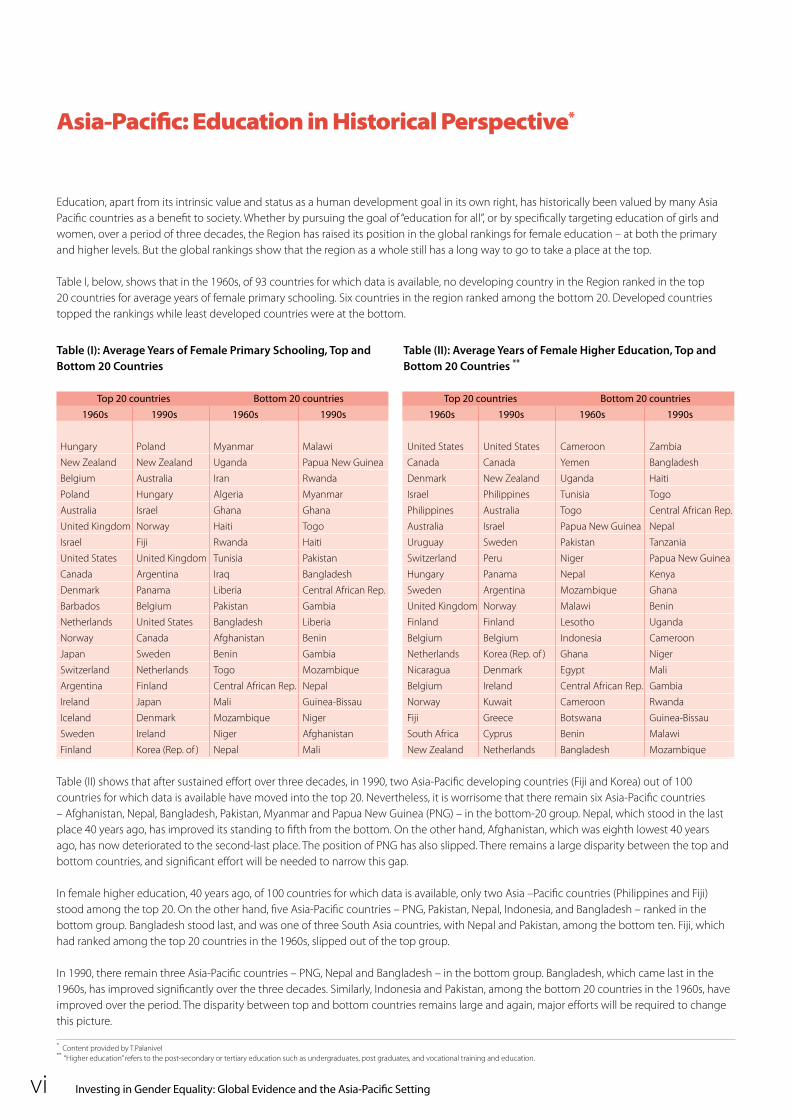
Education, apart from its intrinsic value and status as a human development goal in its own right, has historically been valued by many Asia Pacific countries as a benefit to society. Whether by pursuing the goal of “education for all”, or by specifically targeting education of girls and women, over a period of three decades, the Region has raised its position in the global rankings for female education – at both the primary and higher levels. But the global rankings show that the region as a whole still has a long way to go to take a place at the top.
Table I, below, shows that in the 1960s, of 93 countries for which data is available, no developing country in the Region ranked in the top 20 countries for average years of female primary schooling. Six countries in the region ranked among the bottom 20. Developed countries topped the rankings while least developed countries were at the bottom.
Table (I): Average Years of Female Primary Schooling, Top and Bottom 20 Countries
Top 20 countries Bottom 20 countries 1960s 1990s 1960s 1990s
Hungary Poland Myanmar Malawi
New Zealand New Zealand Uganda Papua New Guinea
Belgium Australia Iran Rwanda
Poland Hungary Algeria Myanmar
Australia Israel Ghana Ghana
United Kingdom Norway Haiti Togo
Israel Fiji Rwanda Haiti
United States United Kingdom Tunisia Pakistan
Canada Argentina Iraq Bangladesh
Denmark Panama Liberia Central African Rep.
Barbados Belgium Pakistan Gambia
Netherlands United States Bangladesh Liberia
Norway Canada Afghanistan Benin
Japan Sweden Benin Gambia
Switzerland Netherlands Togo Mozambique
Argentina Finland Central African Rep. Nepal
Ireland Japan Mali Guinea-Bissau
Iceland Denmark Mozambique Niger
Sweden Ireland Niger Afghanistan
Finland Korea (Rep. of ) Nepal Mali
Table (II) shows that after sustained effort over three decades, in 1990, two Asia-Pacific developing countries (Fiji and Korea) out of 100 countries for which data is available have moved into the top 20. Nevertheless, it is worrisome that there remain six Asia-Pacific countries – Afghanistan, Nepal, Bangladesh, Pakistan, Myanmar and Papua New Guinea (PNG) – in the bottom-20 group. Nepal, which stood in the last place 40 years ago, has improved its standing to fifth from the bottom. On the other hand, Afghanistan, which was eighth lowest 40 years ago, has now deteriorated to the second-last place. The position of PNG has also slipped. There remains a large disparity between the top and bottom countries, and significant effort will be needed to narrow this gap.
In female higher education, 40 years ago, of 100 countries for which data is available, only two Asia –Pacific countries (Philippines and Fiji) stood among the top 20. On the other hand, five Asia-Pacific countries – PNG, Pakistan, Nepal, Indonesia, and Bangladesh – ranked in the bottom group. Bangladesh stood last, and was one of three South Asia countries, with Nepal and Pakistan, among the bottom ten. Fiji, which had ranked among the top 20 countries in the 1960s, slipped out of the top group.
In 1990, there remain three Asia-Pacific countries – PNG, Nepal and Bangladesh – in the bottom group. Bangladesh, which came last in the 1960s, has improved significantly over the three decades. Similarly, Indonesia and Pakistan, among the bottom 20 countries in the 1960s, have improved over the period. The disparity between top and bottom countries remains large and again, major efforts will be required to change this picture.
* Content provided by T.Palanivel ** “Higher education” refers to the post-secondary or tertiary education such as undergraduates, post graduates, and vocational training and education.
Table (II): Average Years of Female Higher Education, Top and Bottom 20 Countries **
Top 20 countries Bottom 20 countries 1960s 1990s 1960s 1990s
United States United States Cameroon Zambia
Canada Canada Yemen Bangladesh
Denmark New Zealand Uganda Haiti
Israel Philippines Tunisia Togo
Philippines Australia Togo Central African Rep.
Australia Israel Papua New Guinea Nepal
Uruguay Sweden Pakistan Tanzania
Switzerland Peru Niger Papua New Guinea
Hungary Panama Nepal Kenya
Sweden Argentina Mozambique Ghana
United Kingdom Norway Malawi Benin
Finland Finland Lesotho Uganda
Belgium Belgium Indonesia Cameroon
Netherlands Korea (Rep. of ) Ghana Niger
Nicaragua Denmark Egypt Mali
Belgium Ireland Central African Rep. Gambia
Norway Kuwait Cameroon Rwanda
Fiji Greece Botswana Guinea-Bissau
South Africa Cyprus Benin Malawi
New Zealand Netherlands Bangladesh Mozambique
Investing in Gender Equality: Global Evidence and the Asia-Pacific Setting 1
1. Gender Equality: An Economic Case
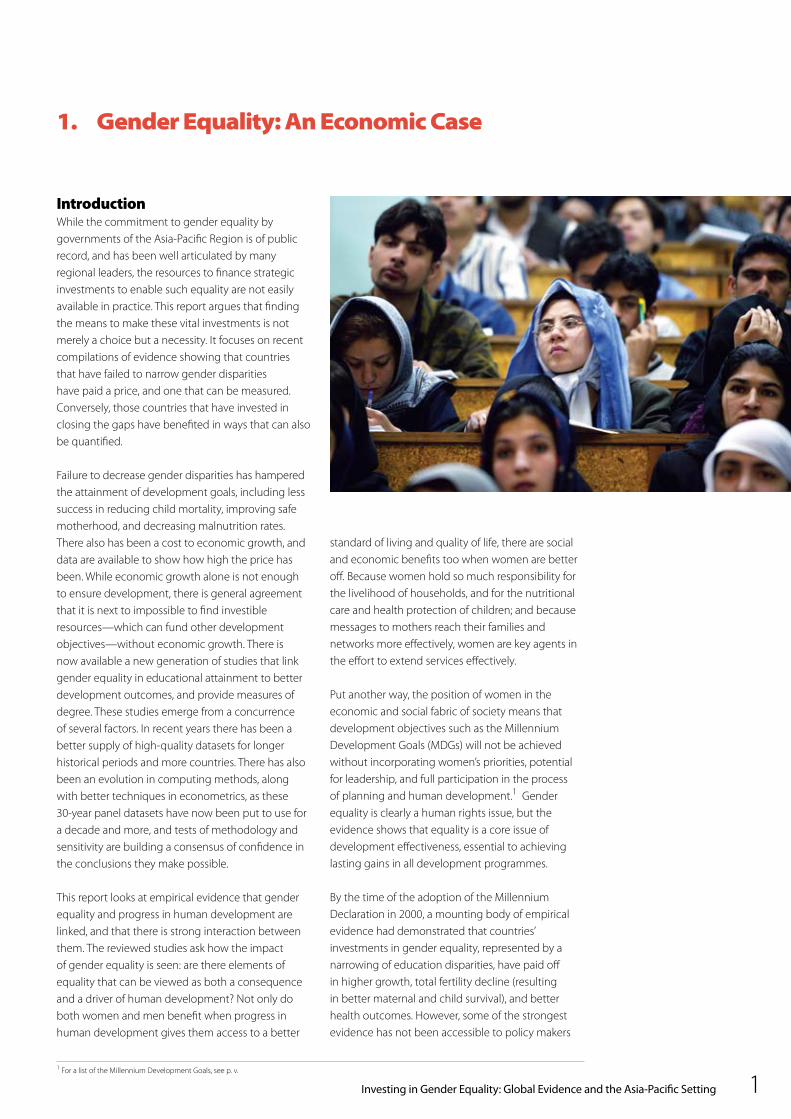
IntroductionWhile the commitment to gender equality by governments of the Asia-Pacific Region is of public record, and has been well articulated by many regional leaders, the resources to finance strategic investments to enable such equality are not easily available in practice. This report argues that finding the means to make these vital investments is not merely a choice but a necessity. It focuses on recent compilations of evidence showing that countries that have failed to narrow gender disparities have paid a price, and one that can be measured. Conversely, those countries that have invested in closing the gaps have benefited in ways that can also be quantified.
Failure to decrease gender disparities has hampered the attainment of development goals, including less success in reducing child mortality, improving safe motherhood, and decreasing malnutrition rates. There also has been a cost to economic growth, and data are available to show how high the price has been. While economic growth alone is not enough to ensure development, there is general agreement that it is next to impossible to find investible resources—which can fund other development objectives—without economic growth. There is now available a new generation of studies that link gender equality in educational attainment to better development outcomes, and provide measures of degree. These studies emerge from a concurrence of several factors. In recent years there has been a better supply of high-quality datasets for longer historical periods and more countries. There has also been an evolution in computing methods, along with better techniques in econometrics, as these 30-year panel datasets have now been put to use for a decade and more, and tests of methodology and sensitivity are building a consensus of confidence in the conclusions they make possible.
This report looks at empirical evidence that gender equality and progress in human development are linked, and that there is strong interaction between them. The reviewed studies ask how the impact of gender equality is seen: are there elements of equality that can be viewed as both a consequence and a driver of human development? Not only do both women and men benefit when progress in human development gives them access to a better
standard of living and quality of life, there are social and economic benefits too when women are better off. Because women hold so much responsibility for the livelihood of households, and for the nutritional care and health protection of children; and because messages to mothers reach their families and networks more effectively, women are key agents in the effort to extend services effectively.
Put another way, the position of women in the economic and social fabric of society means that development objectives such as the Millennium Development Goals (MDGs) will not be achieved without incorporating women’s priorities, potential for leadership, and full participation in the process of planning and human development.1 Gender equality is clearly a human rights issue, but the evidence shows that equality is a core issue of development effectiveness, essential to achieving lasting gains in all development programmes.
By the time of the adoption of the Millennium Declaration in 2000, a mounting body of empirical evidence had demonstrated that countries’ investments in gender equality, represented by a narrowing of education disparities, have paid off in higher growth, total fertility decline (resulting in better maternal and child survival), and better health outcomes. However, some of the strongest evidence has not been accessible to policy makers
1 For a list of the Millennium Development Goals, see p. v.
Investing in Gender Equality: Global Evidence and the Asia-Pacific Setting2
Gender Equality: An Economic Case
and opinion leaders: often it has been couched in complex econometric terminology, and presented in specialized journals that have not caught the attention of the media or of finance ministries in government.
This report takes the most recent econometric results and presents them in some new forms that bring into sharp relief the ‘business case’ for specific equality interventions. The report is organized as follows. The rest of this section provides a discussion of the gender–economy nexus and its drivers. Section 2 looks at the ways in which policy research has hypothesized the links from one factor to the others—what are often termed transmission mechanisms—foreshadowing the empirical evidence. It presents global data that demonstrate that these links are significant and persistent, as evidenced by long-period panel datasets now available. Section 3 relates the global evidence presented in Section 2 to current data for the Asia-Pacific countries. It shows some of the associations that would be expected in light of the
global evidence, and also brings out exceptions linked to policy choices of countries. Some of these exceptions include countries that have been able to decrease gender disparities despite low income levels, and have seen related benefits occur in health and other development outcomes. Conversely, in other cases, countries that might have realized important gains have in some cases failed to capitalize on potential benefits—as a consequence of institutional, traditional, or other factors. Section 4 provides some conclusions and priorities for strategic investments that can support efforts to meet Goal 3, and by integrating awareness of gender dimensions into investment decisions can better the chances of meeting all the MDGs. For convenience, the organization is summarized here:
Women’s Economic Rights Are
Box 1: Economic RightsWhen the equality of men and women was first addressed in the UN covenants, equity was seen by some to be a matter falling exclusively under the rubric of civil and political rights. However, in adopting the Universal Declaration of Human Rights in 1948, the UN member countries had established both components—civil and political rights alongside economic and social rights—as fundamental.
As set out in subsequent agreements, economic, social, and cultural rights (ESCR) include the right to work and to safe working conditions; the right to an adequate standard of living, including food, clothing, social security, and housing; access to the highest attainable standard of physical and mental health; a healthy environment; and the right to education. The Vienna Declaration in 1993 historically recognized that violence against women and girls constitutes a severe violation of rights, and that women’s rights are human rights
The Convention on the Elimination of All Forms of Discrimination against Women (CEDAW), adopted in 1979 by the UN General Assembly,1 defines discrimination against women, commits countries to incorporate the principle of equality of men and women in their legal system, and provides the basis for realizing equality between women and men through ensuring women’s equal access to, and equal opportunities in, political and public life, education, health and employment. It is the only human rights treaty that affirms the reproductive rights of women and targets culture and tradition as influential forces shaping gender roles and family relations.
Through these and various other supporting measures, the UN and its member countries have made it unequivocally clear that gender equality is a human rights issue. The importance of these concepts is their overriding of an earlier interpretation that the right to equality is limited to a civil and political right, which would not encompass the economic and social rights dimensions of women’s inequality; they supersede a notion that the paradigm of ESCR is gender neutrality.
Why is this important? Civil and economic rights are closely intertwined: for example, the right to speak freely means little if citizens do not enjoy a basic education. Similarly, the right to work means little if workers are not allowed to meet and assemble in groups to discuss their working conditions. Women’s land rights intersect with other problems such as discriminatory inheritance patterns, agriculture and development issues, gender-based violence, the appropriation and privatization of communal and indigenous lands, as well as gendered control over economic resources and the right to work. The interdependence of women’s human rights highlights the importance of women being able to claim their rights to adequate housing and land, in order to lessen the threat of discrimination, different forms of violence, denial of political participation, and other violations of their economic human rights.
Referring to economic, social, and cultural issues as ‘rights’ uses the legal framework developed under international law, and gives individuals legitimate claims against state and non-state actors for protection and guarantees. The human rights legal framework provides a way to hold public officials accountable for development policies and priorities.2
1 There are 185 signatories to CEDAW; of these 84 countries have also signed the Optional Protocol.2 The background on the concept and applications of gender rights as economic, social, as well as political rights is taken from the Women’s Economic Equality Project website (Center for Economic and Social Rights 2007), as well as the Australian National University College of Law series online (Bailey 2007).
Section 1 Gender Equality: An Economic CaseSection 2 Theoretical Linkages and Empirical EvidenceSection 3 Asia-Pacific Setting: Education and Other Development OutcomesSection 4 Conclusions and Strategic Priorities

Investing in Gender Equality: Global Evidence and the Asia-Pacific Setting 3
Human RightsBy presenting the economic or ‘efficiency’ arguments for gender equality and women’s empowerment, this report in no way minimizes the importance of human rights or ‘equity’ arguments—these arguments are mutually supporting and not contradictory. The United Nations (UN) and its member countries, through their adoption of the International Covenant on Economic, Social and Cultural Rights, Convention on the Elimination of All Forms of Discrimination against Women (CEDAW), and various other supporting measures, have made it unequivocally clear that gender equality is a human rights issue, and that the right to economic equality is an integral component of the whole panoply of rights to which all people are entitled. The right to equality is not limited to political and civil rights (see Box 1).
By showing that the impairment of women’s right to equality and empowerment both denies a human right and also sabotages development, we strengthen the argument that the right to human development itself is threatened by gender inequality. It is important to make the case, as the report does, for effective policy measures that help implement in practice the rights of all people to both equality and development.
The Economy–Gender InteractionThe interaction between the economy and the nature or form of gender relations is complex. Because the relationships interact, effects may be compounded. Various writers have hypothesized effects in different ways. One way to conceptualize the possible interactions is to distinguish the direction and nature of potential effects. Some basic impact sequences can be formulated, as for example: Economic inequalities and discrimination
(between women and men) harm the development of women and girls, and ultimately do not benefit men and boys
Economic equality between women and men fosters the human development of both sexes
Gender stereotyping and inequalities limit the development of the economy and society, hampering the contributions of women and lowering productivity overall
Greater gender equality can promote economic growth, social development, and policy effectiveness.
These hypotheses are summarized schematically in the Chart, on the basis of the direction and nature
Chart: Effects of Gender Inequality and Equality
Negative effects of inequality
Economic and social
inequality
gender disparity,
negative effects on
women and girls
Gender inequality
economic
development
hampered
Positive effects of equality
Equal economic
rights and
opportunities
raise status of women
More equal status
of women and
girls benefits
for economic and
social development
Economy
gender
Gender
economy
of effects between gender roles and economic outcomes.
The major, though not exclusive, focus of this report is on the lower right-hand cell of the matrix in the Chart. The report draws on studies that have shown how investments in raising the capabilities and access of women and girls (specifically, raising women’s and girls’ attainment in secondary education) have contributed to social and economic outcomes that are of benefit to the whole society.
How are these effects transmitted? Is there empirical evidence to support claims of association and causality? This report is laid out as a response to
Investing in Gender Equality: Global Evidence and the Asia-Pacific Setting4
these two questions, and provides a discussion of the empirical and policy work that has focused on them. To illustrate the mechanisms of transition, the discussion is grouped around several ‘drivers’ of human development that are commonly identified with successful development interventions, namely education, health, labour force participation, and political representation. The driver identified by the report as prime mover to the others is access to education. The report addresses the impacts of education on subsequent outcomes, and looks at the feedback effects of the other factors and the broader implications for investment policy options.
The contribution of the reviewed empirical work has been to zero in on gender gaps in education as the measure of choice for gender inequality as a whole, and to rigorously test the reliability of this measure as a predictor of economic growth, independent of other factors. The evidence then points to the ways in which decreasing disparities in education contributes beyond economic growth to other development objectives, including fertility decline, reduced child mortality, and improved nutritional outcomes—all key targets of governments’ development interventions.
Drivers of the Gender–Economy NexusRaising the status of girls and women, which requires policy measures, interventions in infrastructure and services, and institutional change, brings about changes in economic and other human development outcomes by setting up a number
of ‘virtuous circles’ that continue to impact on the abilities of the target and subsequent generations. We can clarify these numerous virtuous circles by focusing here on several priority ones: four key development interventions that are commonly identified as ‘drivers’ through which changes in conditions for women and girls in turn contribute to development in multiple sectors. These key intervention and investment areas are: education, health, employment, and political participation. (It is recognized that these interventions are not simply the product of financial investment alone. Besides adequate finances, each requires public policy decisions, and changes in the way services are designed, communicated, delivered, and developed over a sustained period.) The virtuous circles are deemed mutually supporting in the following set of feedback loops:
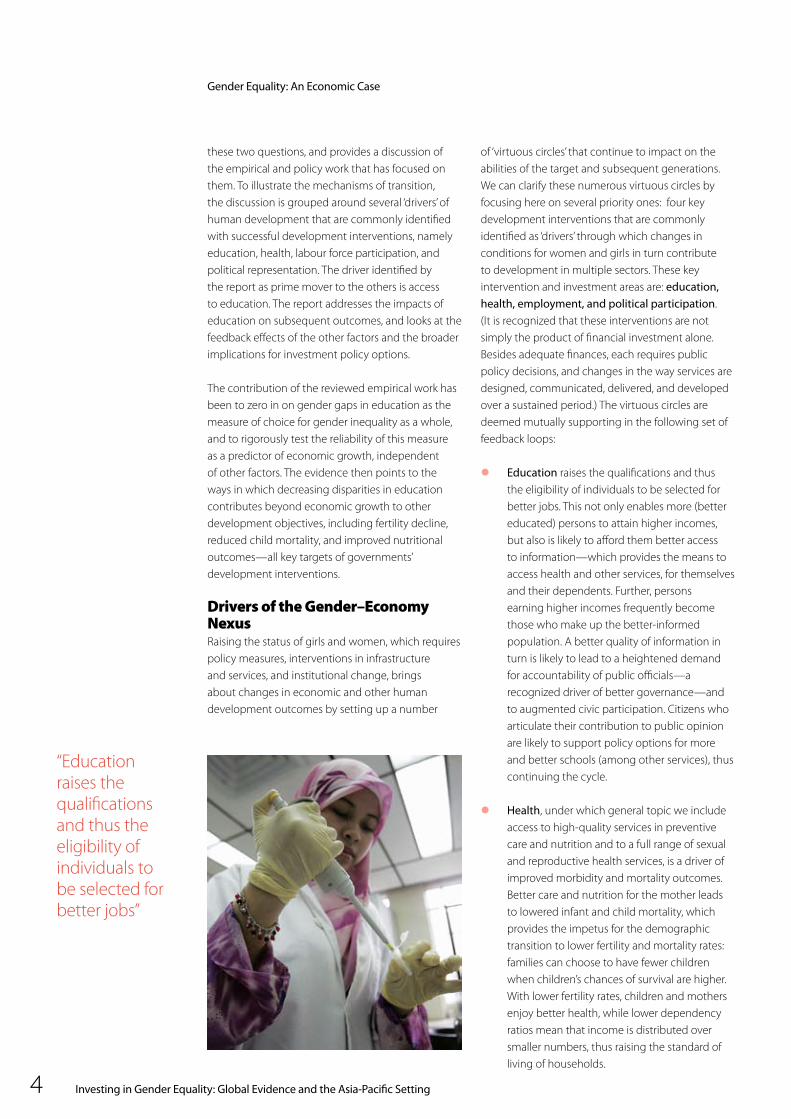
Education raises the qualifications and thus the eligibility of individuals to be selected for better jobs. This not only enables more (better educated) persons to attain higher incomes, but also is likely to afford them better access to information—which provides the means to access health and other services, for themselves and their dependents. Further, persons earning higher incomes frequently become those who make up the better-informed population. A better quality of information in turn is likely to lead to a heightened demand for accountability of public officials—a recognized driver of better governance—and to augmented civic participation. Citizens who articulate their contribution to public opinion are likely to support policy options for more and better schools (among other services), thus continuing the cycle.
Health, under which general topic we include access to high-quality services in preventive care and nutrition and to a full range of sexual and reproductive health services, is a driver of improved morbidity and mortality outcomes. Better care and nutrition for the mother leads to lowered infant and child mortality, which provides the impetus for the demographic transition to lower fertility and mortality rates: families can choose to have fewer children when children’s chances of survival are higher. With lower fertility rates, children and mothers enjoy better health, while lower dependency ratios mean that income is distributed over smaller numbers, thus raising the standard of living of households.
“Education raises the qualifications and thus the eligibility of individuals to be selected for better jobs”
Gender Equality: An Economic Case
Investing in Gender Equality: Global Evidence and the Asia-Pacific Setting 5
The education and health drivers work in tandem towards raising women’s participation in higher-productivity labour force sectors. Better educational attainments and lower maternal and child mortality, with the accompanying reduction of total fertility, provide women with more opportunity to participate in income-earning activities.
A higher participation of women in non-agricultural wage labour may be a parallel occurrence with structural changes in the economy as investments in the industry and services sectors grow, drawing labour from low-productivity, low-income agriculture. A higher participation rate in the higher-productivity sector can be a route to better incomes, which are demonstrated to result in expanded child-related expenditures (such as schooling and better nutrition) when incomes go to women as opposed to incomes flowing to men. In parallel, better incomes provide the means to purchase some commodities and services that previously demanded unpaid labour time of women (such as substituting purchased energy sources for foraged biomass fuels). With more time available, more women can participate in community affairs, and are likely to experience greater civic awareness, to encounter opportunities for labour and community organizing, and to raise the demand for improved transparency in governance.
Participation in community and political affairs not only drives improved governance, but also broader access to services that governments make available to their populations, and therefore a better quality of life overall. There is evidence from many countries that a larger presence of women in national and local government changes the emphasis of public sector programmes (see Box 10), and can lead to augmented and better use of aid flows towards the social sectors.
These drivers interact, and reinforce each other. Linkages between some of these drivers are illustrated in the chart in Box 3, which focuses on three related indicators. The chart suggests an impact of total fertility rates (TFRs) and of the availability of health services (resulting from social infrastructure investments) on mortality outcomes. The chart shows maternal mortality ratios (MMRs—maternal deaths per 100,000 live births), plotted against the percentage of births that are attended by skilled health personnel, for selected Asia-Pacific countries for which data are available in the period 2000–2005. The data indicate a high correspondence between the provision of peri-natal services and the rate of maternal mortality. (The data for the chart are given in Annex 1.) (The reduction of maternal mortality is one of the targets of MDG 6, Improve maternal health.) As expected, where countries are able to bring support services to women giving birth, survival of mothers is significantly better. The
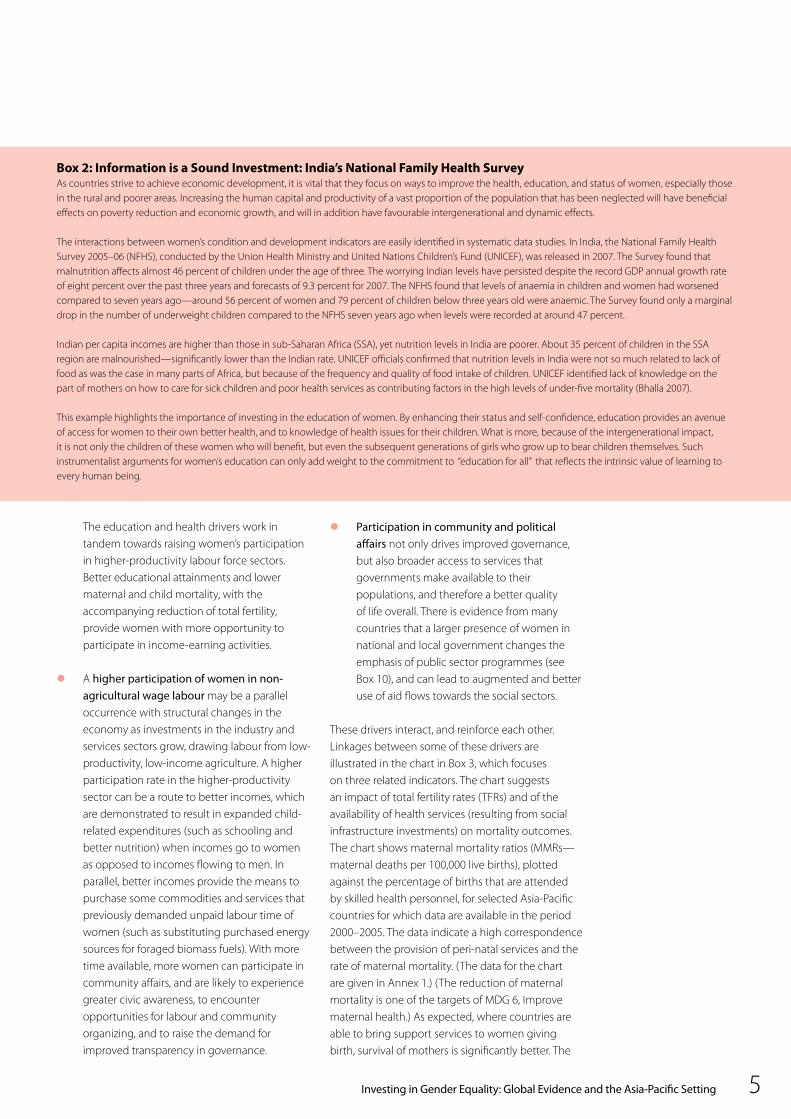
Box 2: Information is a Sound Investment: India’s National Family Health SurveyAs countries strive to achieve economic development, it is vital that they focus on ways to improve the health, education, and status of women, especially those in the rural and poorer areas. Increasing the human capital and productivity of a vast proportion of the population that has been neglected will have beneficial effects on poverty reduction and economic growth, and will in addition have favourable intergenerational and dynamic effects.
The interactions between women’s condition and development indicators are easily identified in systematic data studies. In India, the National Family Health Survey 2005–06 (NFHS), conducted by the Union Health Ministry and United Nations Children’s Fund (UNICEF), was released in 2007. The Survey found that malnutrition affects almost 46 percent of children under the age of three. The worrying Indian levels have persisted despite the record GDP annual growth rate of eight percent over the past three years and forecasts of 9.3 percent for 2007. The NFHS found that levels of anaemia in children and women had worsened compared to seven years ago—around 56 percent of women and 79 percent of children below three years old were anaemic. The Survey found only a marginal drop in the number of underweight children compared to the NFHS seven years ago when levels were recorded at around 47 percent.
Indian per capita incomes are higher than those in sub-Saharan Africa (SSA), yet nutrition levels in India are poorer. About 35 percent of children in the SSA region are malnourished—significantly lower than the Indian rate. UNICEF officials confirmed that nutrition levels in India were not so much related to lack of food as was the case in many parts of Africa, but because of the frequency and quality of food intake of children. UNICEF identified lack of knowledge on the part of mothers on how to care for sick children and poor health services as contributing factors in the high levels of under-five mortality (Bhalla 2007).
This example highlights the importance of investing in the education of women. By enhancing their status and self-confidence, education provides an avenue of access for women to their own better health, and to knowledge of health issues for their children. What is more, because of the intergenerational impact, it is not only the children of these women who will benefit, but even the subsequent generations of girls who grow up to bear children themselves. Such instrumentalist arguments for women’s education can only add weight to the commitment to “education for all” that reflects the intrinsic value of learning to every human being.
Investing in Gender Equality: Global Evidence and the Asia-Pacific Setting6
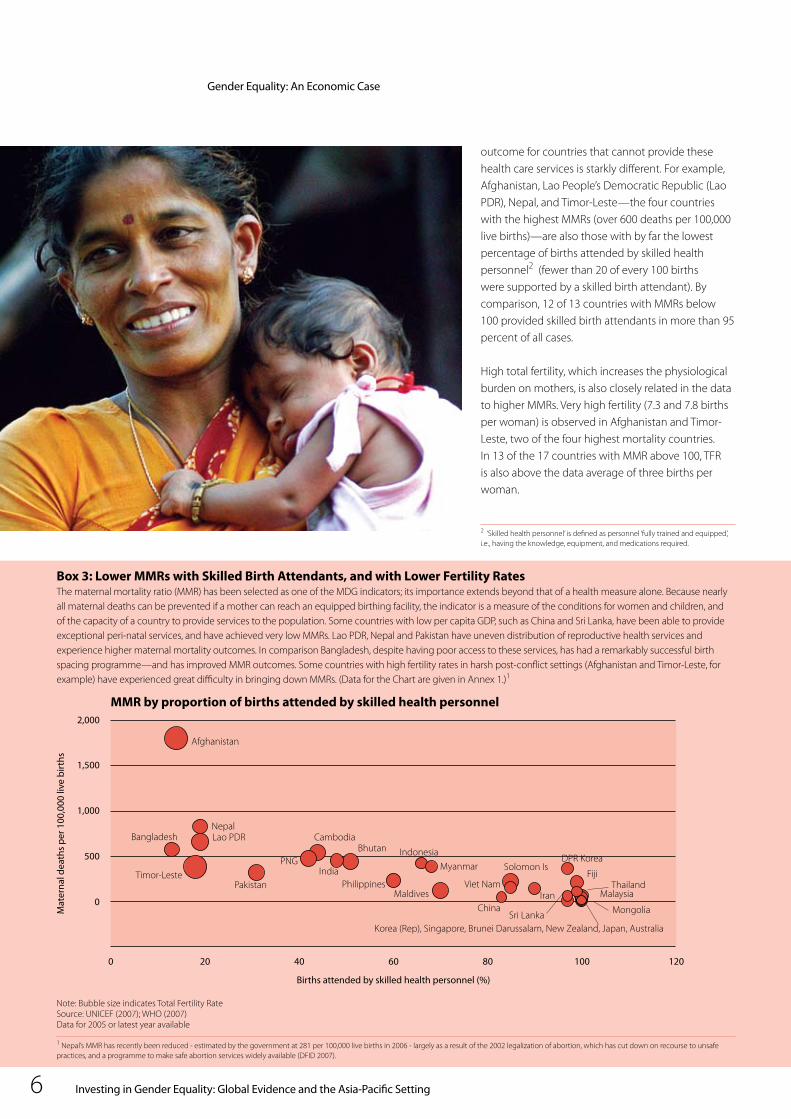
Box 3: Lower MMRs with Skilled Birth Attendants, and with Lower Fertility RatesThe maternal mortality ratio (MMR) has been selected as one of the MDG indicators; its importance extends beyond that of a health measure alone. Because nearly all maternal deaths can be prevented if a mother can reach an equipped birthing facility, the indicator is a measure of the conditions for women and children, and of the capacity of a country to provide services to the population. Some countries with low per capita GDP, such as China and Sri Lanka, have been able to provide exceptional peri-natal services, and have achieved very low MMRs. Lao PDR, Nepal and Pakistan have uneven distribution of reproductive health services and experience higher maternal mortality outcomes. In comparison Bangladesh, despite having poor access to these services, has had a remarkably successful birth spacing programme—and has improved MMR outcomes. Some countries with high fertility rates in harsh post-conflict settings (Afghanistan and Timor-Leste, for example) have experienced great difficulty in bringing down MMRs. (Data for the Chart are given in Annex 1.)1
Note: Bubble size indicates Total Fertility Rate Source: UNICEF (2007); WHO (2007)Data for 2005 or latest year available
1 Nepal’s MMR has recently been reduced - estimated by the government at 281 per 100,000 live births in 2006 - largely as a result of the 2002 legalization of abortion, which has cut down on recourse to unsafe practices, and a programme to make safe abortion services widely available (DFID 2007).
outcome for countries that cannot provide these health care services is starkly different. For example, Afghanistan, Lao People’s Democratic Republic (Lao PDR), Nepal, and Timor-Leste—the four countries with the highest MMRs (over 600 deaths per 100,000 live births)—are also those with by far the lowest percentage of births attended by skilled health personnel2 (fewer than 20 of every 100 births were supported by a skilled birth attendant). By comparison, 12 of 13 countries with MMRs below 100 provided skilled birth attendants in more than 95 percent of all cases.
High total fertility, which increases the physiological burden on mothers, is also closely related in the data to higher MMRs. Very high fertility (7.3 and 7.8 births per woman) is observed in Afghanistan and Timor-Leste, two of the four highest mortality countries. In 13 of the 17 countries with MMR above 100, TFR is also above the data average of three births per woman.
Gender Equality: An Economic Case
2 ‘Skilled health personnel’ is defined as personnel ‘fully trained and equipped’, i.e., having the knowledge, equipment, and medications required.
Investing in Gender Equality: Global Evidence and the Asia-Pacific Setting 7
The discussion of key drivers of development is intuitively appealing. However, policy makers need to work on the basis of evidence. They quite reasonably want to determine which “drivers” have the most impact, which knock-on effects can be expected, and where resources should be directed. Determining that some interventions generate benefits beyond their economic cost, and that some have a measurable effect on economic growth that is stronger than that of other interventions makes possible strategic choices, and eases the challenge of effective allocation of scarce resources.
This section summarizes the theoretical effects that have been hypothesized to explain the impact of increasing gender equality. It then presents empirical results that for the first time have made it feasible to entertain direction-of-causality propositions, to arrive at a quantitative measure of the strength of these effects, and to confirm the robustness of these measures. These results rest on empirical evidence that had partially supported these hypotheses over the past three decades, but more recently has been assembled into a series of multi-country studies. The discussion first introduces the data, and then fills in some details on how the findings were made and tested and the investment coefficients they represent.
Direct and Indirect Effects of Development InterventionsThe effects of investments in education have long been appreciated for the ways they can contribute to productivity and total output. While education is of value in and of itself, and a human right, research has also pointed to the additional instrumental effects—contributions to economic growth, and to various development goals including child mortality, fertility, nutrition, and the education of the next generation.
A decade and a half ago, the classic finding was made by Lawrence Summers, in a review of comprehensive research results, that investment in the education of girls may be the highest return of investment available in the developing world (Summers, 1991).3 His work summarized a number of well-substantiated findings that: (i) higher death rates are symptomatic of the more general pattern of female deprivation in the developing world; (ii) underinvestment in girls is an economic problem resulting from a vicious cycle caused by distorted
2. Theoretical Linkages and Empirical Evidence
incentives; (iii) educated women choose to have fewer children and can provide more for those they do have; (iv) the social benefits alone of increased female education are more than sufficient to cover its costs; and (v) priorities should be to reduce the cost of schooling for girls and make special efforts to accommodate the practical needs of parents. Summers stressed that major initiatives to increase female education can transform society over time. He calculated that if more girls had gone to school a generation previously, millions of infant deaths could have been averted each year, and tens of millions of families could have been healthier and happier.
The econometric literature that followed on Summers’ focus on the key role of female education hypothesized that educational effects operate in direct and indirect ways.4 Three important routes for the transmission of the education effects were most often suggested: via economic growth, reduction of fertility, and improved child survival and health. These are explained below.
Economic growth: As direct effects, by simple logical reasoning, if fewer girls than boys are able to acquire an education (and we assume that the innate abilities of girl and boy children are equivalent), then the society would lose out from inequality in two ways: fewer educated adults enter the workforce, and the average ability of those who go to school would be lower than it would be if the whole pool of children had access to education. A series of positive effects are believed to flow, by this and related reasoning, from female education directly to higher productivity of human capital and higher economic growth (even controlling for prevailing employment rates), and indirectly to higher quality of education through generational and sibling mutual-support effects.4
Fertility: Female education has been shown to have a direct effect on total fertility (and attendant health benefits of birth spacing), which then is believed to support growth via indirect demographic effects. The ‘new household economics’ of the post-WWII era modeled the effects of higher opportunity costs of educated women (of staying at home rather than participating in the wage labour market), and greater bargaining power of women with higher education, and showed that female education is an important determinant of the fertility rate.5
3 This paper was subsequently published in an expanded and updated version in L. H. Summers (1994), ‘Investing in All the People: Educating Women in Developing Countries’, Seminar Paper 45, Economic Development Institute, World Bank, Washington, D.C. 4 This account of the theoretical links draws on the presentations of Abu-Ghaida and Klasen (2004) and Klasen (2002). 5 In the 1960s, American economist Gary Becker and other human capital theorists developed the New Household Economics, which for the first time applied market concepts and models to household production and time allocation analysis. These new tools were used to explain the gendered division of labour, market behaviour of household members, and male–female differences within these. In the 1970s and 1980s, these concepts were applied to further analyses, in both industrialized and developing countries, of labour market discrimination, and to bargaining models of the household which allowed for dimensions of power and conflict in decision making. (Alexander, P. 2000).
Investing in Gender Equality: Global Evidence and the Asia-Pacific Setting8
Indirectly, higher education levels and ratios, by lowering fertility and hence population growth, lower the dependency burden (increase the proportion of income earners). This raises the supply of savings in the economy, and raises investment demand (for physical plant and social infrastructure) as the economy expands. In societies where the expanded workforce is absorbed into employment, per capita economic growth will rise, even if wages and productivity remain at previous levels.6 The demographic effect is temporary, since eventually the working-age population will reach retirement age, and fewer children will have entered the labour force to support them; nevertheless, if the temporary wave of workers is able to find employment, the boon can accelerate growth in an important take-off period. Some economists estimate that 1.1–1.9 percent of the per capita annual growth in East and Southeast Asia between 1966 and 1990 was due to this temporary opportunity, and that the contribution to reduced fertility made by high female education was a large indirect component of the increase—quantifiable in addition to the measured direct contribution of lower fertility and child mortality (discussed further on).7
Child mortality and malnutrition: Child survival rates are higher where mothers are better educated, because the care of children is preponderantly in the hands of mothers. Education increases mothers’ knowledge of important factors in child health, such
as vaccination and nutrition requirements, sanitation practices, and better breastfeeding regimes. Increased bargaining power also increases mothers’ say over the allocation of household resources, and this may result in more expenditure going to child health, nutrition, and schooling.
Historical Debates on the Determinants of Growth, and Contemporary EvidenceSince the Millennium Summit in 2000, discussion on the impact of investments in social interventions has increasingly influenced debates in macroeconomics, specifically on the determinants of economic growth. Economic growth is a complex process. Modern macroeconomics has been largely an effort to identify the forces and settings that spur or hamper it, and to predict the impact that policy can have on the rate of growth. Beginning with Solow and Samuelson in the 1950s and 1960s, technological change and the rate of investment were the focus of attention, and attempts were made to model this relationship. Later theorists focused on the development of ‘human capital’—education and innovation—as additional and important determinants of economic growth. More recently, econometric methods have been used to test and quantify the role of capital investment (initial levels and rates of increase), savings, population growth, and human capital accumulation, as well as geographic factors, political stability, trade openness, and a range of fiscal and monetary policy environments and approaches.
Until recently, few of the ‘growth theories’ had looked at gender and inequality as important contributing factors, although some researchers showed a reverse relationship: that low levels of development and economic growth appeared consistently to present barriers to women’s access to higher educational attainment. They examined how educational decisions are made by households: the costs and benefits that determine how much families invest in educating their daughters and their sons, and the choices poor families make when potential earning outcomes of girls and boys are unequal (King and Hill, 1993).
In the same period, a widely reported study of a growth ‘success story’ in Asia offered not a theoretical but an empirical link with long-term investments. It took note of a possible effect of investments in education for girls. In an exhaustive examination of the ‘East Asian miracle’, which searched for clues to these countries’ success, researchers pointed out
6 Studies reviewed in Abu-Ghaida and Klasen (2004: 6–7 ff.). 7 Klasen (1999: 8; 2002: 352).
Theoretical Linkages and Empirical Evidence
Investing in Gender Equality: Global Evidence and the Asia-Pacific Setting 9
that the high-performing Asian economies (HPAEs) were the earliest to close the gender gap in primary education and to improve girls’ access to secondary education (World Bank, 1993, p. 47) (see Box 4).8
While closing inequality gaps in education is one part of the story, it is clear that many other factors play a role in generating economic growth. The question asked by the current group of studies is, to what extent or by how much does a long-term reduction of gender inequalities contribute to economic growth? Does a better level of female education, in and of itself, have a positive effect on economic growth, and can the impact be measured? Further, to demonstrate a possible direction of causality, it is important to look at countries’ experience over time, and to control for other factors.
Although suitably large datasets were not available until recently to test gender effects within the determinants of long-term growth, this situation has changed in the past decade, with better and more extensive data being put to use by researchers (including 30-year time series, cross-sectional datasets, and panel data).
The 30-year DatasetsThe data referred to in this report are a group of panel datasets that are complete for the years 1960 to about 1992. They were drawn from several sources by independent researchers and used over the period leading up to and since the Millennium Summit. A number of papers using these data have
been presented in conferences and published in academic journals.9
The work over the past decade has particular value because the ongoing development debate has refined the specification of models, making it possible to isolate and test several important factors, and to quantify the contribution of each of them.10 Why, it might be asked, is it useful mid-way through the Millennium commitment, to make reference to datasets that end ten years before the Millennium Summit took place? There are two important reasons. First, these data cover a full generation of investments and development outcomes and thus provide an opportunity to study the results of different kinds of investments over the long term. They make up the first data series that are complete for all indicators and for a large enough number of countries to make comparisons meaningful for every region. This key dataset is in current use by authors in the fields of growth theory, development strategy, gender, and a host of related areas in health, education, public policy, and governance.
Second, in drawing attention to these key data sets, the report focuses on a consensus of evaluations by current authors who have undertaken more than a decade of work. It highlights important conclusions they have drawn with respect to gender equality and the possibilities of meeting the MDGs. It is the synthesis of the studies of the past decade and more that is the real story. It is the consensus on the degree of impact of investments in gender equality, and
Box 4: The ‘East Asian Miracle’ and Education for GirlsThe high-performing Asian economies (HPAEs) closed the gender gap in primary education much earlier than other countries at the same level of per capita income.8 The research found that the extension of education to girls was not necessarily achieved by means of strongly gender-focused policies; however, the national commitment to education as a key means of raising incomes swept all children, boys and girls, onto the enrolment bandwagon.
‘East Asia was faster in eliminating gender gaps in enrollment. … Nearly all societies have historically provided educational opportunities first to boys and only later, usually gradually, to girls. This gender gap in education may have far-reaching effects on development if, for example, the lower educational attainments of women reduce their ability to improve nutrition or sanitation at home or their productivity outside the home. The HPAEs narrowed the gender gap much more quickly than other developing economies, despite cultural norms that put greater value on the education of sons and, in some cases, actively discouraged the education of daughters. … In general, the reduction of gender gaps resulted from a successful push for universal education rather than a deliberate attention to the education of females. Nonetheless … the specific benefits of educating girls appear to have been substantial’ (World Bank 1993: 47).
8 The World Bank’s investigation into the post-WWII success of East Asia designated several East and Southeast Asian economies such as Indonesia, Malaysia, the Republic of Korea, Singapore, and Thailand as ‘high-performing Asian economies (HPAEs)’. The development strategies they discerned in the rapid development of these economies replicated a pattern seen earlier in Meiji Japan, and subsequently in China and Viet Nam. This study and later debate around the success of these economies’ strategies produced a general acknowledgement that the HPAEs had not followed a ‘hands-off’ approach to development, but had actively intervened to guide investment patterns through managed incentive structures, even though the HPAEs all represented market-driven economic systems. 9 Data on incomes and growth generally have been drawn from the Penn World Tables, on employment from NBER and WISTAT, on child mortality and female share of the labour force from World Development Indicators and UNICEF, and schooling from tables compiled by Barro and Lee (1995). WISTAT, see References: United Nations Statistics Division DESA (1999). Periodic sources include National Bureau of Economic Research (NBER), Penn World Tables, Cambridge, MA, www.nber.org; World Bank, World Development Indicators, Washington, D.C.; UNICEF, State of the World’s Children. 30-year panel data on schooling has been assembled by Barro and Lee (1995), ‘International Measures of Educational Attainment’, American Economic Review, Vol. 86, pp. 218-223. 10 The studies summarized in this report are drawn from Abu-Ghaida and Klasen (2004); Dollar and Gatti (1999); Klasen (2002); Knowles, Lorgelly, and Owen (2002); Lagerlöf (2003); and Schultz (1993).
“The high-performing Asian economies closed the gender gap in education much earlier than other countries at the same level of per capita income”
Investing in Gender Equality: Global Evidence and the Asia-Pacific Setting10
on the costs of failing to make these investments, that should be presented, loud and clear, to policy makers and finance departments of every country. The empirical work on the role of gender disparities in education contributes systematic reaffirmation of the use of educational targets and indicators to stand as a proxy for the gender equality goal, in the MDGs and other development strategies.
A core message of these studies is that the education indicator works, not because gender equality in education is sufficient on its own to achieve full equality and empowerment of women, but precisely because the impact of girls’ education, and of the gender gap in education, have been shown by this decade-long discussion to be important factors, consistently and over time, affecting health, mortality, and fertility, as well as economic growth itself.
The Consensus, and the News Story: ‘Education for Girls—Proof Positive’The news story coming out of the data studies is one that should have been broadcast widely. The East Asia and Pacific region has enjoyed higher economic growth than any other region of the world, over a 30-year period—and this success is in significant
measure directly attributable to the contribution of reducing gender disparities in education. The main synthesis studies demonstrate that better education of girls, to higher levels, is a necessary component of consistent economic and development progress.11
Nonetheless, the evidence and the conclusions seem to have passed by almost without a ripple. To be sure, they have been published in symposiums and journals, and republished by some World Bank and UN bodies. One synthesis report has defined the discussion as ‘The economic and human development costs of missing the Millennium Development Goal on Gender Equity’. Nevertheless, it would be safe to say that among the finance departments of Asia-Pacific countries, and the women’s ministries, the number of staff members who have read any of these technical reviews would not be in the double digits. A decade of work on three decades of data has passed under the radar screens of government policy makers and public opinion leaders. It is hoped that this present report will contribute to a wider dissemination, in a popularly accessible form for governments and public choice debates, of the conclusions and policy implications of this important body of research.
11 Abu-Ghaida and Klasen (2004); Klasen (2002).
Theoretical Linkages and Empirical Evidence
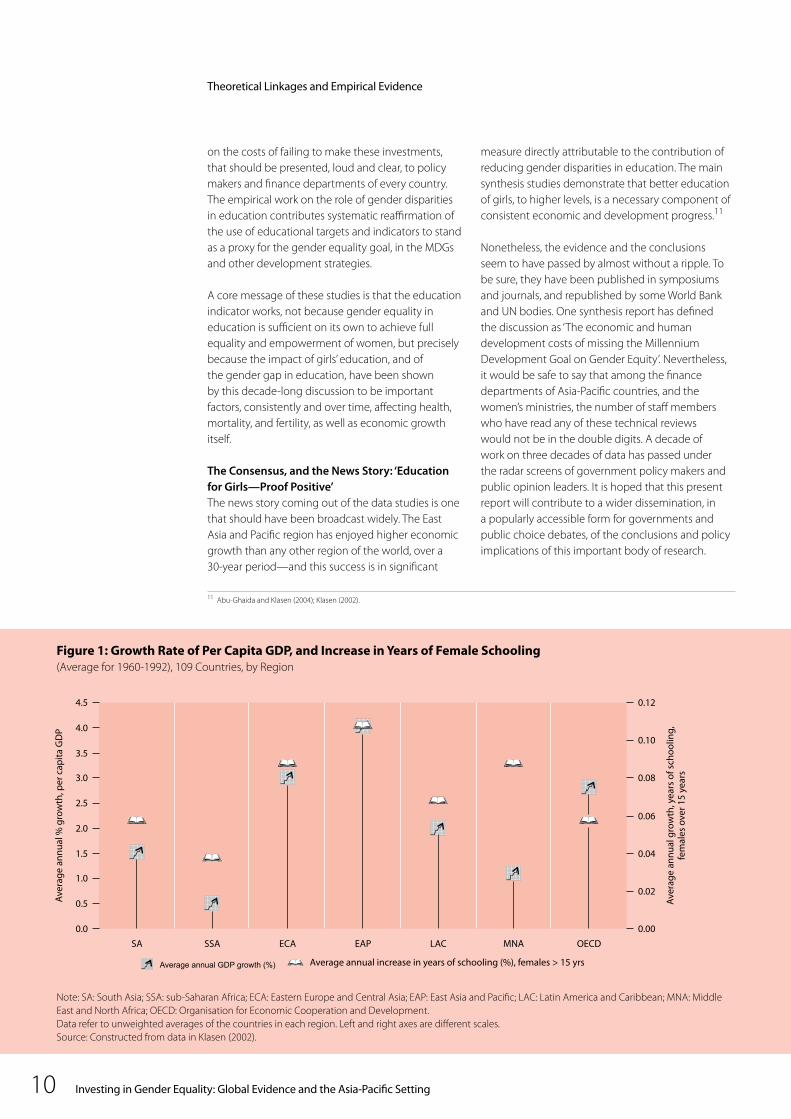
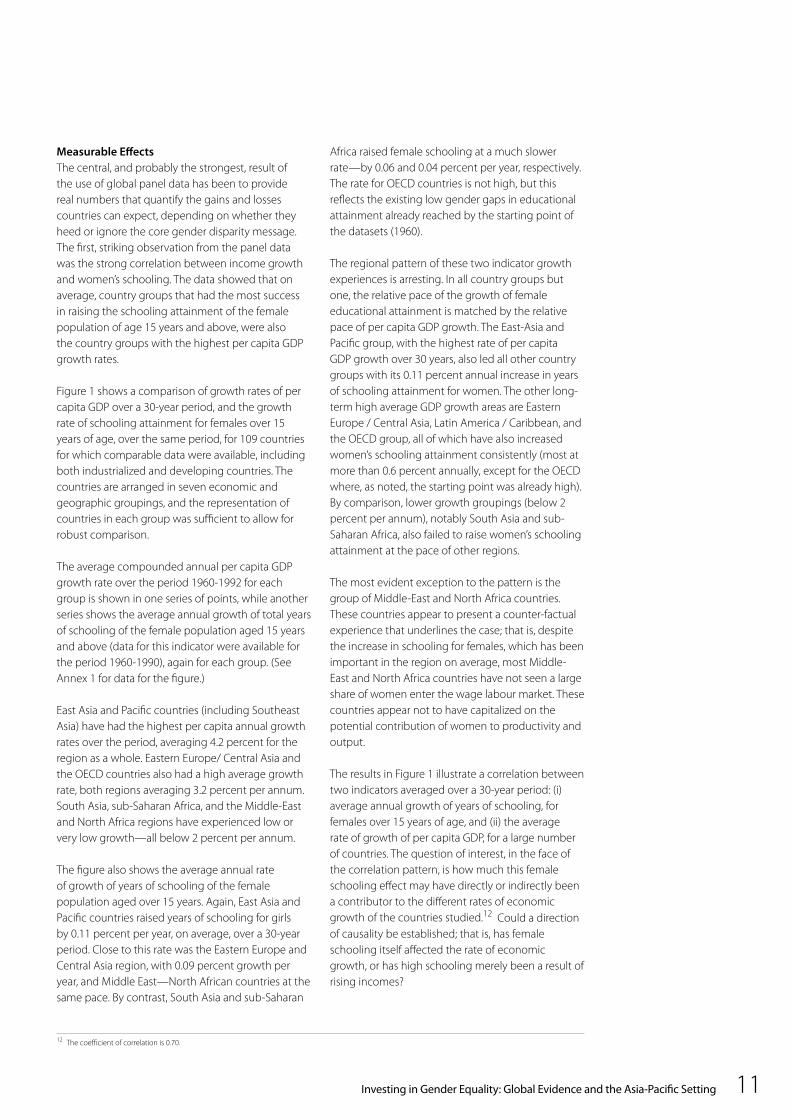
Figure 1: Growth Rate of Per Capita GDP, and Increase in Years of Female Schooling(Average for 1960-1992), 109 Countries, by Region
Note: SA: South Asia; SSA: sub-Saharan Africa; ECA: Eastern Europe and Central Asia; EAP: East Asia and Pacific; LAC: Latin America and Caribbean; MNA: Middle East and North Africa; OECD: Organisation for Economic Cooperation and Development.Data refer to unweighted averages of the countries in each region. Left and right axes are different scales.Source: Constructed from data in Klasen (2002).
Investing in Gender Equality: Global Evidence and the Asia-Pacific Setting 11
Measurable EffectsThe central, and probably the strongest, result of the use of global panel data has been to provide real numbers that quantify the gains and losses countries can expect, depending on whether they heed or ignore the core gender disparity message. The first, striking observation from the panel data was the strong correlation between income growth and women’s schooling. The data showed that on average, country groups that had the most success in raising the schooling attainment of the female population of age 15 years and above, were also the country groups with the highest per capita GDP growth rates.
Figure 1 shows a comparison of growth rates of per capita GDP over a 30-year period, and the growth rate of schooling attainment for females over 15 years of age, over the same period, for 109 countries for which comparable data were available, including both industrialized and developing countries. The countries are arranged in seven economic and geographic groupings, and the representation of countries in each group was sufficient to allow for robust comparison.
The average compounded annual per capita GDP growth rate over the period 1960-1992 for each group is shown in one series of points, while another series shows the average annual growth of total years of schooling of the female population aged 15 years and above (data for this indicator were available for the period 1960-1990), again for each group. (See Annex 1 for data for the figure.)
East Asia and Pacific countries (including Southeast Asia) have had the highest per capita annual growth rates over the period, averaging 4.2 percent for the region as a whole. Eastern Europe/ Central Asia and the OECD countries also had a high average growth rate, both regions averaging 3.2 percent per annum. South Asia, sub-Saharan Africa, and the Middle-East and North Africa regions have experienced low or very low growth—all below 2 percent per annum.
The figure also shows the average annual rate of growth of years of schooling of the female population aged over 15 years. Again, East Asia and Pacific countries raised years of schooling for girls by 0.11 percent per year, on average, over a 30-year period. Close to this rate was the Eastern Europe and Central Asia region, with 0.09 percent growth per year, and Middle East—North African countries at the same pace. By contrast, South Asia and sub-Saharan
Africa raised female schooling at a much slower rate—by 0.06 and 0.04 percent per year, respectively. The rate for OECD countries is not high, but this reflects the existing low gender gaps in educational attainment already reached by the starting point of the datasets (1960).
The regional pattern of these two indicator growth experiences is arresting. In all country groups but one, the relative pace of the growth of female educational attainment is matched by the relative pace of per capita GDP growth. The East-Asia and Pacific group, with the highest rate of per capita GDP growth over 30 years, also led all other country groups with its 0.11 percent annual increase in years of schooling attainment for women. The other long-term high average GDP growth areas are Eastern Europe / Central Asia, Latin America / Caribbean, and the OECD group, all of which have also increased women’s schooling attainment consistently (most at more than 0.6 percent annually, except for the OECD where, as noted, the starting point was already high). By comparison, lower growth groupings (below 2 percent per annum), notably South Asia and sub-Saharan Africa, also failed to raise women’s schooling attainment at the pace of other regions.
The most evident exception to the pattern is the group of Middle-East and North Africa countries. These countries appear to present a counter-factual experience that underlines the case; that is, despite the increase in schooling for females, which has been important in the region on average, most Middle-East and North Africa countries have not seen a large share of women enter the wage labour market. These countries appear not to have capitalized on the potential contribution of women to productivity and output.
The results in Figure 1 illustrate a correlation between two indicators averaged over a 30-year period: (i) average annual growth of years of schooling, for females over 15 years of age, and (ii) the average rate of growth of per capita GDP, for a large number of countries. The question of interest, in the face of the correlation pattern, is how much this female schooling effect may have directly or indirectly been a contributor to the different rates of economic growth of the countries studied.12 Could a direction of causality be established; that is, has female schooling itself affected the rate of economic growth, or has high schooling merely been a result of rising incomes?
12 The coefficient of correlation is 0.70.
Investing in Gender Equality: Global Evidence and the Asia-Pacific Setting12
In the face of this strong result, users of the panel data have made efforts to address the direction of causality issues, and other explanatory factors. Using various forms of growth regression frameworks, they used the data to model the impact of macroeconomic and other factors that might be expected to affect growth rates. They included in the models, among other variables, the initial level of GDP, investment rates and trade openness (as shares of GDP), the level of technology, population as well as labour force growth, dummy variables to represent regional factors, and education specified in various forms. Both female and male schooling, rates of increase, and ratios between these levels and rates of change were modeled, while in several studies total years of schooling at the starting point (1960) was included as a variable.
Considering a range of variables in the model, the result of regression analysis showed that, while initial GDP levels had a strong effect, as did the total increase in schooling for both females and males, the next most important effects were the decrease in gender disparities in education, measured by means of two variables, namely the gender ratio for years of schooling at the starting year, and the growth of that female–male schooling ratio over the period.
Beginning with economic growth as the dependant variable, regression analysis showed the relative impact of each of the factors, controlling for all other factors (including some variables not listed in the summary). In the one study shown (Knowles, Lorgelly and Owen (2002), see Table 2), the impact of gender inequality in education on levels of GDP per capita is estimated. Using average levels of female and male education (in log form) over the 30-year period, the authors find that female education has a significant positive impact on GDP levels. For every 1 percent rise in female education, levels of GDP per capita are shown to be 0.37 percent higher, while the rate of growth of per capita GDP would be 0.21 percent faster. In other parameterizations of the model, they find that gender inequality specifically, modelled as a ratio of female to male educational attainment, significantly reduces per capita income levels.13
The initial educational gender equality ratio (in 1960) is seen to have a strong effect on growth performance over the period, as is the rise in gender equality. In the studies, these two effects are stronger than that of average investment levels, openness to trade, and labour force growth over this 30-year term.
As hypothesized in the discussion on growth and development linkages, population growth (linked to fertility) has a measured negative effect.
In the context of the effort to achieve the MDGs, this body of work has emerged as the economic evidence base for the importance of meeting the MDG targets, and the cost of not meeting them. (The results of six econometric studies that focus on growth, fertility, child mortality, and malnutrition are summarized in table form in Box 5 and the full regression results are given in the source articles.)
As in all empirical growth regressions, these results show strong associations, but cannot prove causality. That said, the body of work, which has produced the most significant quantitative evidence to date, is shown to be robust to sensitivity analysis; that is, these results hold for different periods selected within the 30-year period; for different starting years; when limiting the study to developing countries; and when focusing on African countries alone. (In the case of African countries, the effect of gender disparities in education appears to be even stronger than in other regional developing countries.)14
Education Gender Gap: A Measure of Gender InequalityOne of the features of the research is the use of gender inequality in education as a measurement yardstick, to some degree representing gender inequality overall. This factor has the advantage of being observable and measurable, and one for which data is available for most countries. By contrast, gender inequality as a concept is too broad and general to be specifically measured, while some other components of gender inequality, such as individual poverty, resource allocation within the household, and unpaid (unrecorded) economic activity usually are not captured in country statistical studies such as the census or the household socio-economic survey, and not available in consistent form for more than a few countries. (Box 6 reviews the different variables used in the reviewed studies, and the alternate forms in which education was included as a variable.)
How Much Does Gender Equality Contribute to Growth and Development?In their drafting of MDG-linked investment plans, policy makers facing constrained budgets are concerned to know the following: Are given
13 This can be stated as a 0.37 growth elasticity of female education. Male education is found to have only an insignificant impact (Knowles, Lorgelly and Owen 2002). Re-parameterization based on Klasen (1999), cited in Abu-Ghaida and Klasen (2004). 14 Studies on earlier data that found the impact of female education to be ambiguous (the best known by Dollar and Gatti 1999) have been rejected by several authors because of their use of a shorter time frame (1975-1990) and poor specification of the education variables; see Abu-Ghaida and Klasen (2004: 9) and Klasen (2002: 350, 357-58, 369-70) and Klasen (1999: 19–21).
Theoretical Linkages and Empirical Evidence
Investing in Gender Equality: Global Evidence and the Asia-Pacific Setting 13
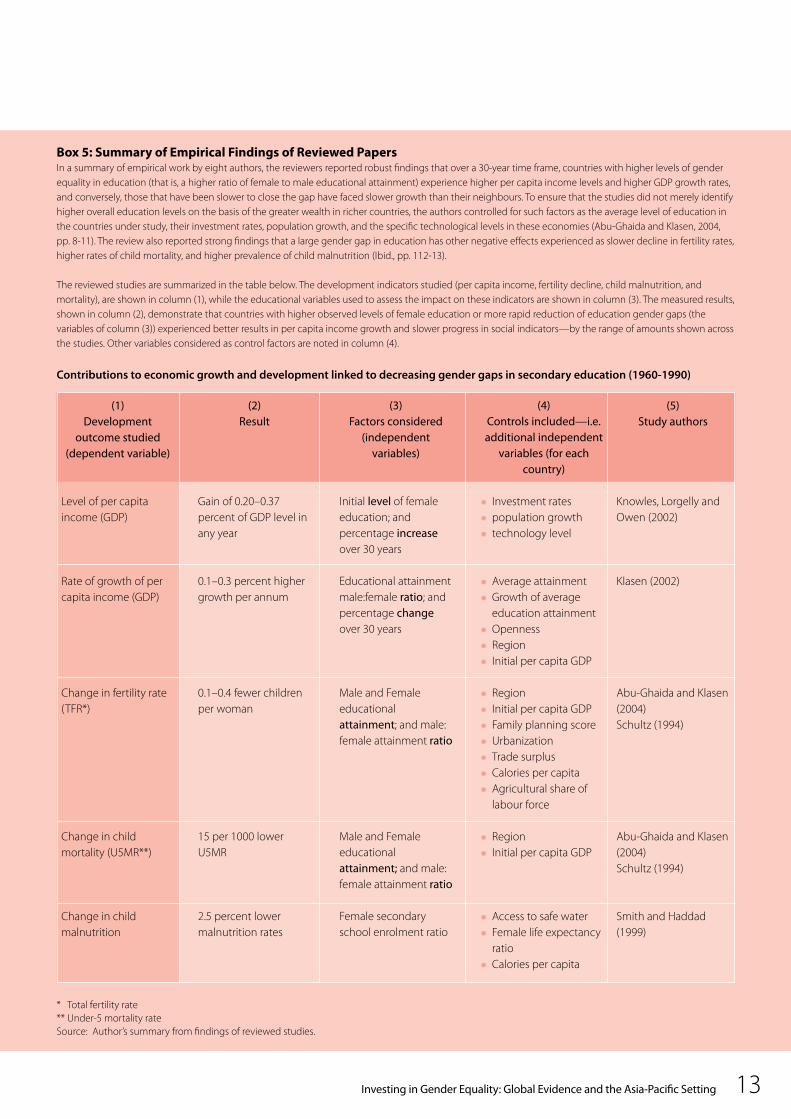
Box 5: Summary of Empirical Findings of Reviewed PapersIn a summary of empirical work by eight authors, the reviewers reported robust findings that over a 30-year time frame, countries with higher levels of gender equality in education (that is, a higher ratio of female to male educational attainment) experience higher per capita income levels and higher GDP growth rates, and conversely, those that have been slower to close the gap have faced slower growth than their neighbours. To ensure that the studies did not merely identify higher overall education levels on the basis of the greater wealth in richer countries, the authors controlled for such factors as the average level of education in the countries under study, their investment rates, population growth, and the specific technological levels in these economies (Abu-Ghaida and Klasen, 2004, pp. 8-11). The review also reported strong findings that a large gender gap in education has other negative effects experienced as slower decline in fertility rates, higher rates of child mortality, and higher prevalence of child malnutrition (Ibid., pp. 112-13).
The reviewed studies are summarized in the table below. The development indicators studied (per capita income, fertility decline, child malnutrition, and mortality), are shown in column (1), while the educational variables used to assess the impact on these indicators are shown in column (3). The measured results, shown in column (2), demonstrate that countries with higher observed levels of female education or more rapid reduction of education gender gaps (the variables of column (3)) experienced better results in per capita income growth and slower progress in social indicators—by the range of amounts shown across the studies. Other variables considered as control factors are noted in column (4).
Contributions to economic growth and development linked to decreasing gender gaps in secondary education (1960-1990)
* Total fertility rate** Under-5 mortality rateSource: Author’s summary from findings of reviewed studies.
(1)Development
outcome studied (dependent variable)
Level of per capita income (GDP)
Rate of growth of per capita income (GDP)
Change in fertility rate (TFR*)
Change in child mortality (U5MR**)
Change in child malnutrition
(2)Result
Gain of 0.20–0.37 percent of GDP level in any year
0.1–0.3 percent higher growth per annum
0.1–0.4 fewer children per woman
15 per 1000 lower U5MR
2.5 percent lower malnutrition rates
(3)Factors considered
(independent variables)
Initial level of female education; and percentage increase over 30 years
Educational attainment male:female ratio; and percentage change over 30 years
Male and Female educational attainment; and male:female attainment ratio
Male and Female educational attainment; and male:female attainment ratio
Female secondary school enrolment ratio
(4)Controls included—i.e. additional independent
variables (for each country)
Investment rates population growth technology level
Average attainment Growth of average
education attainment Openness Region Initial per capita GDP
Region Initial per capita GDP Family planning score Urbanization Trade surplus Calories per capita Agricultural share of
labour force
Region Initial per capita GDP
Access to safe water Female life expectancy
ratio Calories per capita
(5)Study authors
Knowles, Lorgelly and Owen (2002)
Klasen (2002)
Abu-Ghaida and Klasen (2004)Schultz (1994)
Abu-Ghaida and Klasen (2004)Schultz (1994)
Smith and Haddad (1999)
Investing in Gender Equality: Global Evidence and the Asia-Pacific Setting14
interventions going to be effective? Is it possible to quantify the impact of investments in gender equality? While results averaged over many different countries cannot predict impact in any one instance, findings for the group can give an indication of the impact experienced by countries when regarded over time. The studies tested gender equality investments for their impact on several economic and development outcomes, namely GDP level and rate of growth, total fertility, child mortality, and malnutrition rates. Figures 2a and 2b summarize the findings on economic growth—which were consistent in order of magnitude in the work of different authors.
All studies found consistently that increasing gender equality (represented by closing the gender gap in secondary education) corresponded with a positive and significant effect on the level of per capita GDP at any point in time. As shown in Figure 2a, study authors found that for a 1 percent rise in female schooling levels, the level of per capita GDP at any time was 0.37 percent higher (while controlling for all other factors, including investment and initial GDP levels, population and labour force growth). Overall, the empirical results indicate that countries with lower educational attainment for females will suffer lower per capita growth rates of 0.1 to 0.3 percent per year, implying that over the period of the MDG objectives (2000-2015), a country that had
a purchasing power parity based GDP per capita of $1500 in 1995 would have missed out on a 10 percent higher income for every person by the 2015 target year—and the effect would appear to be largest for those countries where the gap is most severe.15
The effect of closing the gender gap in secondary education was tested by several of the studies. Figure 2a shows reported findings that for a 1 percent rise in the ratio of female to male secondary schooling, annual per capita GDP growth rates were higher by 0.30 percent.16
Figure 2b illustrates three additional development outcomes tested by this group of studies including TFR, under-five mortality rate (U5MR), and child malnutrition. All three indicators showed a measured impact from raising female secondary schooling, defined in different ways. For example, a 1-year rise in schooling attainment of females over 15 years of age was found to decrease TFR by 0.36 percent. Looking at child mortality, a 1 percent rise in the female–male secondary schooling ratio was found to decrease U5MR by 1.42 percent. A 1 percent increase in the female secondary enrolment rate decreased child malnutrition rates by 0.17 percent. These are important findings, given that they are reproduced by different authors using different forms of the education disparity indicator.17
Box 6: How Education and Other Variables Were Used in the ModelsEducation, inequality, and change are used in several forms—each of which is a variable in the model. The reviewed studies use female and male years of schooling of the adult population (15 years and above), the female-male ratio of total years of schooling, the average annual growth of the female years of schooling of the same group, and the annual growth of the female-male ratio of years of schooling of these groups.
These variables are measured at the beginning and end of a 30-year period (1960-1990), and at points within that period.Other variables contributing to economic growth in the model, and used as controls on the education factors are: initial per capita income; population growth; investment; openness of the economy; level of technology; women’s share of formal sector employment and the growth of this share; and a series of dummy variables representing the geographic regions.These variables are defined/calculated as follows: investment (as the average investment share of GDP over the same period); openness of the economy (as the average ratio of exports plus imports to GDP over the same period); the share of women in the formal sector of the economy (as the ratio of the share of female formal sector employees in female working age population to share of male employees to male working age population; and the growth of the female share of such employment) (Klasen 1999).
The value of the work of Klasen and others in this group of studies rests on the high quality of the panel data, the repeated testing of the assumptions by many authors, the specifications of the models; that is, what factors are judged to be relevant, and how these factors are used (e.g. as stocks, flows, levels, change and rates of change, etc.), and the sensitivity analysis done on these elements.
15 Abu-Ghaida and Klasen (2004: 19-21). 16 Klasen (2002: 362). 17 Abu-Ghaida and Klasen (2004: 12).
Theoretical Linkages and Empirical Evidence
“For a 1 percent rise in the ratio of female to male secondary schooling, annual per capita GDP growth rates were higher by 0.30 percent”
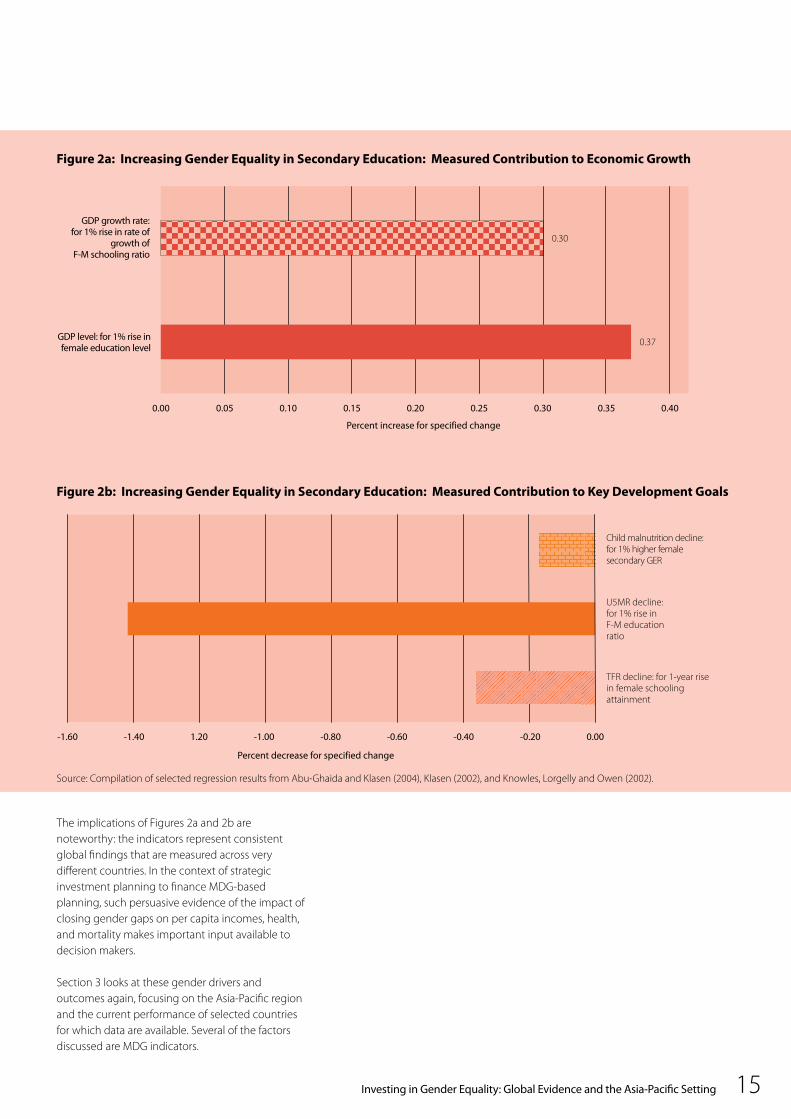
Investing in Gender Equality: Global Evidence and the Asia-Pacific Setting 15
Figure 2a: Increasing Gender Equality in Secondary Education: Measured Contribution to Economic Growth
Figure 2b: Increasing Gender Equality in Secondary Education: Measured Contribution to Key Development Goals
Source: Compilation of selected regression results from Abu-Ghaida and Klasen (2004), Klasen (2002), and Knowles, Lorgelly and Owen (2002).
The implications of Figures 2a and 2b are noteworthy: the indicators represent consistent global findings that are measured across very different countries. In the context of strategic investment planning to finance MDG-based planning, such persuasive evidence of the impact of closing gender gaps on per capita incomes, health, and mortality makes important input available to decision makers.
Section 3 looks at these gender drivers and outcomes again, focusing on the Asia-Pacific region and the current performance of selected countries for which data are available. Several of the factors discussed are MDG indicators.
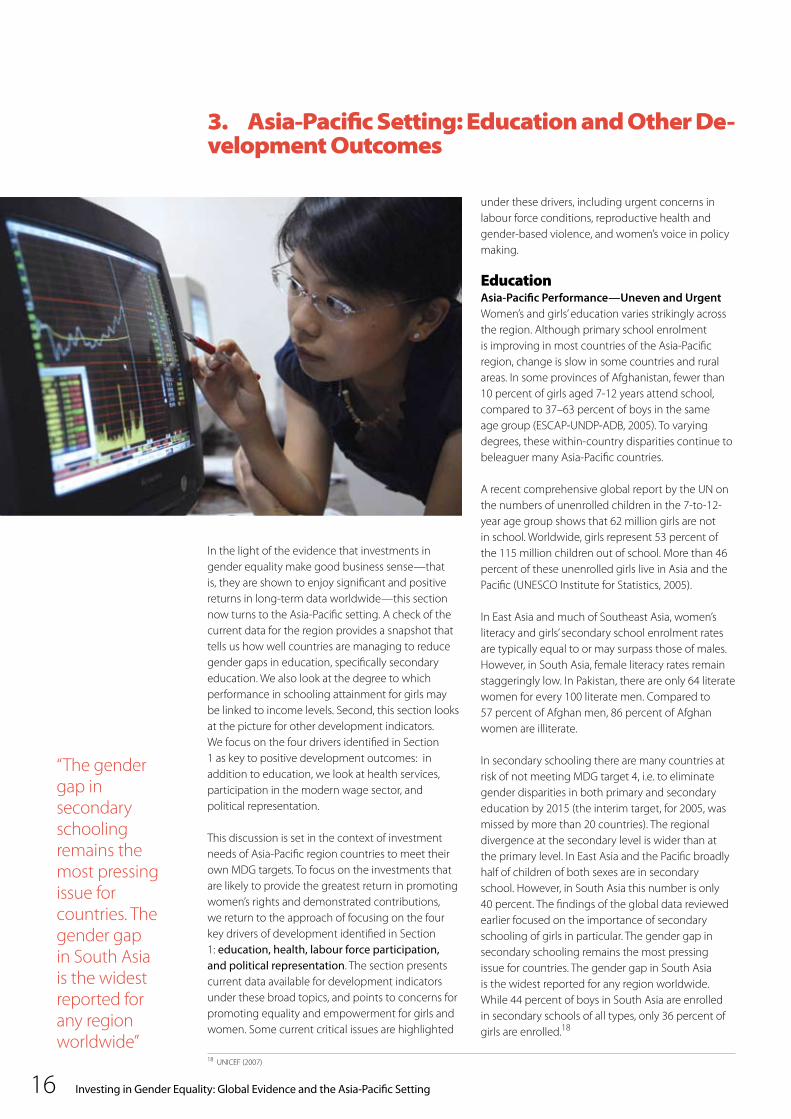
Investing in Gender Equality: Global Evidence and the Asia-Pacific Setting16
In the light of the evidence that investments in gender equality make good business sense—that is, they are shown to enjoy significant and positive returns in long-term data worldwide—this section now turns to the Asia-Pacific setting. A check of the current data for the region provides a snapshot that tells us how well countries are managing to reduce gender gaps in education, specifically secondary education. We also look at the degree to which performance in schooling attainment for girls may be linked to income levels. Second, this section looks at the picture for other development indicators. We focus on the four drivers identified in Section 1 as key to positive development outcomes: in addition to education, we look at health services, participation in the modern wage sector, and political representation.
This discussion is set in the context of investment needs of Asia-Pacific region countries to meet their own MDG targets. To focus on the investments that are likely to provide the greatest return in promoting women’s rights and demonstrated contributions, we return to the approach of focusing on the four key drivers of development identified in Section 1: education, health, labour force participation, and political representation. The section presents current data available for development indicators under these broad topics, and points to concerns for promoting equality and empowerment for girls and women. Some current critical issues are highlighted
3. Asia-Pacific Setting: Education and Other De-velopment Outcomes
under these drivers, including urgent concerns in labour force conditions, reproductive health and gender-based violence, and women’s voice in policy making.
Education Asia-Pacific Performance—Uneven and UrgentWomen’s and girls’ education varies strikingly across the region. Although primary school enrolment is improving in most countries of the Asia-Pacific region, change is slow in some countries and rural areas. In some provinces of Afghanistan, fewer than 10 percent of girls aged 7-12 years attend school, compared to 37–63 percent of boys in the same age group (ESCAP-UNDP-ADB, 2005). To varying degrees, these within-country disparities continue to beleaguer many Asia-Pacific countries.
A recent comprehensive global report by the UN on the numbers of unenrolled children in the 7-to-12-year age group shows that 62 million girls are not in school. Worldwide, girls represent 53 percent of the 115 million children out of school. More than 46 percent of these unenrolled girls live in Asia and the Pacific (UNESCO Institute for Statistics, 2005).
In East Asia and much of Southeast Asia, women’s literacy and girls’ secondary school enrolment rates are typically equal to or may surpass those of males. However, in South Asia, female literacy rates remain staggeringly low. In Pakistan, there are only 64 literate women for every 100 literate men. Compared to 57 percent of Afghan men, 86 percent of Afghan women are illiterate.
In secondary schooling there are many countries at risk of not meeting MDG target 4, i.e. to eliminate gender disparities in both primary and secondary education by 2015 (the interim target, for 2005, was missed by more than 20 countries). The regional divergence at the secondary level is wider than at the primary level. In East Asia and the Pacific broadly half of children of both sexes are in secondary school. However, in South Asia this number is only 40 percent. The findings of the global data reviewed earlier focused on the importance of secondary schooling of girls in particular. The gender gap in secondary schooling remains the most pressing issue for countries. The gender gap in South Asia is the widest reported for any region worldwide. While 44 percent of boys in South Asia are enrolled in secondary schools of all types, only 36 percent of girls are enrolled.18
18 UNICEF (2007)
“The gender gap in secondary schooling remains the most pressing issue for countries. The gender gap in South Asia is the widest reported for any region worldwide”
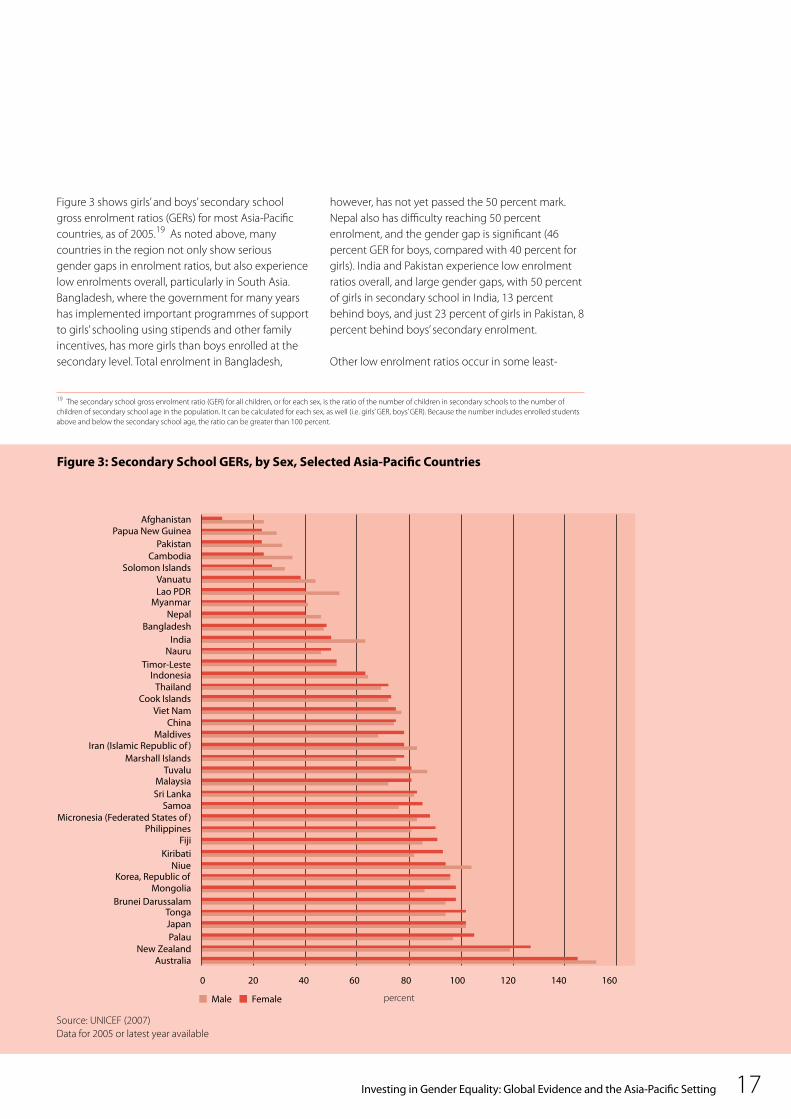
Investing in Gender Equality: Global Evidence and the Asia-Pacific Setting 17
Figure 3 shows girls’ and boys’ secondary school gross enrolment ratios (GERs) for most Asia-Pacific countries, as of 2005.19 As noted above, many countries in the region not only show serious gender gaps in enrolment ratios, but also experience low enrolments overall, particularly in South Asia. Bangladesh, where the government for many years has implemented important programmes of support to girls’ schooling using stipends and other family incentives, has more girls than boys enrolled at the secondary level. Total enrolment in Bangladesh,
19 The secondary school gross enrolment ratio (GER) for all children, or for each sex, is the ratio of the number of children in secondary schools to the number of children of secondary school age in the population. It can be calculated for each sex, as well (i.e. girls’ GER, boys’ GER). Because the number includes enrolled students above and below the secondary school age, the ratio can be greater than 100 percent.
Figure 3: Secondary School GERs, by Sex, Selected Asia-Pacific Countries
Source: UNICEF (2007)Data for 2005 or latest year available
however, has not yet passed the 50 percent mark. Nepal also has difficulty reaching 50 percent enrolment, and the gender gap is significant (46 percent GER for boys, compared with 40 percent for girls). India and Pakistan experience low enrolment ratios overall, and large gender gaps, with 50 percent of girls in secondary school in India, 13 percent behind boys, and just 23 percent of girls in Pakistan, 8 percent behind boys’ secondary enrolment. Other low enrolment ratios occur in some least-
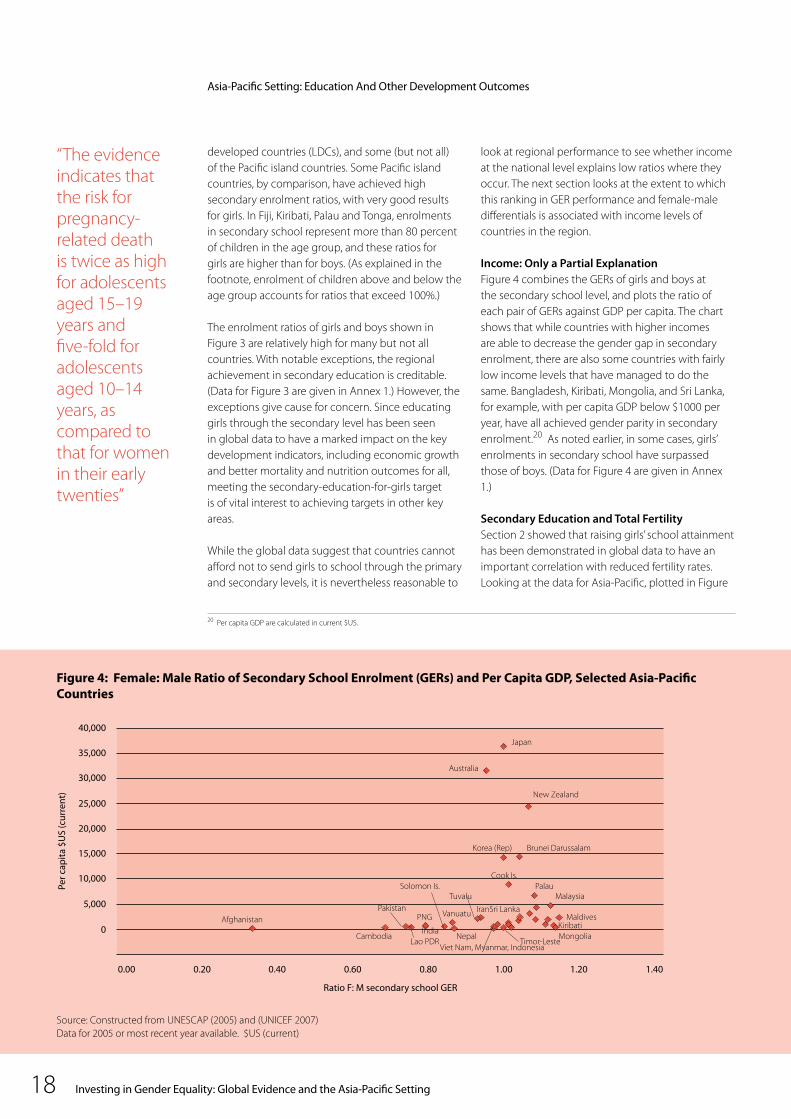
Investing in Gender Equality: Global Evidence and the Asia-Pacific Setting18
developed countries (LDCs), and some (but not all) of the Pacific island countries. Some Pacific island countries, by comparison, have achieved high secondary enrolment ratios, with very good results for girls. In Fiji, Kiribati, Palau and Tonga, enrolments in secondary school represent more than 80 percent of children in the age group, and these ratios for girls are higher than for boys. (As explained in the footnote, enrolment of children above and below the age group accounts for ratios that exceed 100%.)
The enrolment ratios of girls and boys shown in Figure 3 are relatively high for many but not all countries. With notable exceptions, the regional achievement in secondary education is creditable. (Data for Figure 3 are given in Annex 1.) However, the exceptions give cause for concern. Since educating girls through the secondary level has been seen in global data to have a marked impact on the key development indicators, including economic growth and better mortality and nutrition outcomes for all, meeting the secondary-education-for-girls target is of vital interest to achieving targets in other key areas.
While the global data suggest that countries cannot afford not to send girls to school through the primary and secondary levels, it is nevertheless reasonable to
look at regional performance to see whether income at the national level explains low ratios where they occur. The next section looks at the extent to which this ranking in GER performance and female-male differentials is associated with income levels of countries in the region.
Income: Only a Partial ExplanationFigure 4 combines the GERs of girls and boys at the secondary school level, and plots the ratio of each pair of GERs against GDP per capita. The chart shows that while countries with higher incomes are able to decrease the gender gap in secondary enrolment, there are also some countries with fairly low income levels that have managed to do the same. Bangladesh, Kiribati, Mongolia, and Sri Lanka, for example, with per capita GDP below $1000 per year, have all achieved gender parity in secondary enrolment.20 As noted earlier, in some cases, girls’ enrolments in secondary school have surpassed those of boys. (Data for Figure 4 are given in Annex 1.)
Secondary Education and Total Fertility Section 2 showed that raising girls’ school attainment has been demonstrated in global data to have an important correlation with reduced fertility rates. Looking at the data for Asia-Pacific, plotted in Figure
Source: Constructed from UNESCAP (2005) and (UNICEF 2007)Data for 2005 or most recent year available. $US (current)
Figure 4: Female: Male Ratio of Secondary School Enrolment (GERs) and Per Capita GDP, Selected Asia-Pacific Countries
20 Per capita GDP are calculated in current $US.
Asia-Pacific Setting: Education And Other Development Outcomes
“The evidence indicates that the risk for pregnancy-related death is twice as high for adolescents aged 15–19 years and five-fold for adolescents aged 10–14 years, as compared to that for women in their early twenties”
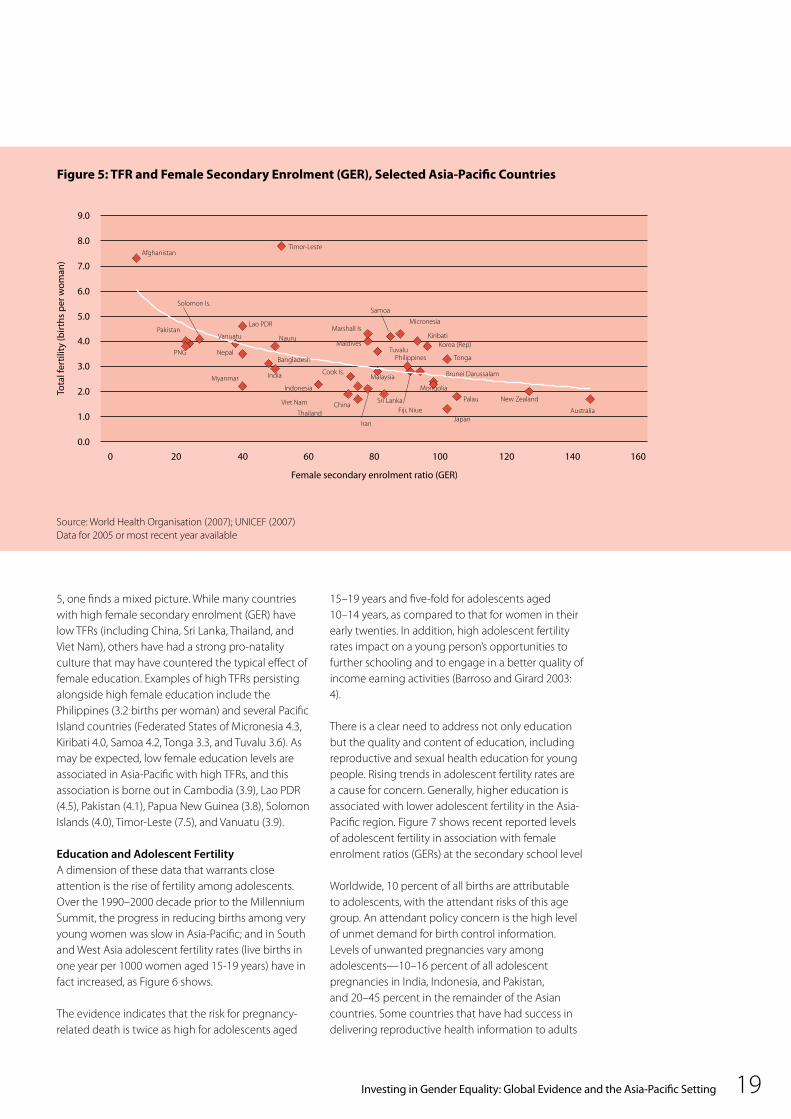
Investing in Gender Equality: Global Evidence and the Asia-Pacific Setting 19
5, one finds a mixed picture. While many countries with high female secondary enrolment (GER) have low TFRs (including China, Sri Lanka, Thailand, and Viet Nam), others have had a strong pro-natality culture that may have countered the typical effect of female education. Examples of high TFRs persisting alongside high female education include the Philippines (3.2 births per woman) and several Pacific Island countries (Federated States of Micronesia 4.3, Kiribati 4.0, Samoa 4.2, Tonga 3.3, and Tuvalu 3.6). As may be expected, low female education levels are associated in Asia-Pacific with high TFRs, and this association is borne out in Cambodia (3.9), Lao PDR (4.5), Pakistan (4.1), Papua New Guinea (3.8), Solomon Islands (4.0), Timor-Leste (7.5), and Vanuatu (3.9). Education and Adolescent FertilityA dimension of these data that warrants close attention is the rise of fertility among adolescents. Over the 1990–2000 decade prior to the Millennium Summit, the progress in reducing births among very young women was slow in Asia-Pacific; and in South and West Asia adolescent fertility rates (live births in one year per 1000 women aged 15-19 years) have in fact increased, as Figure 6 shows.
The evidence indicates that the risk for pregnancy-related death is twice as high for adolescents aged
15–19 years and five-fold for adolescents aged 10–14 years, as compared to that for women in their early twenties. In addition, high adolescent fertility rates impact on a young person’s opportunities to further schooling and to engage in a better quality of income earning activities (Barroso and Girard 2003: 4).
There is a clear need to address not only education but the quality and content of education, including reproductive and sexual health education for young people. Rising trends in adolescent fertility rates are a cause for concern. Generally, higher education is associated with lower adolescent fertility in the Asia-Pacific region. Figure 7 shows recent reported levels of adolescent fertility in association with female enrolment ratios (GERs) at the secondary school level
Worldwide, 10 percent of all births are attributable to adolescents, with the attendant risks of this age group. An attendant policy concern is the high level of unmet demand for birth control information. Levels of unwanted pregnancies vary among adolescents—10–16 percent of all adolescent pregnancies in India, Indonesia, and Pakistan, and 20–45 percent in the remainder of the Asian countries. Some countries that have had success in delivering reproductive health information to adults
Source: World Health Organisation (2007); UNICEF (2007)Data for 2005 or most recent year available
Figure 5: TFR and Female Secondary Enrolment (GER), Selected Asia-Pacific Countries
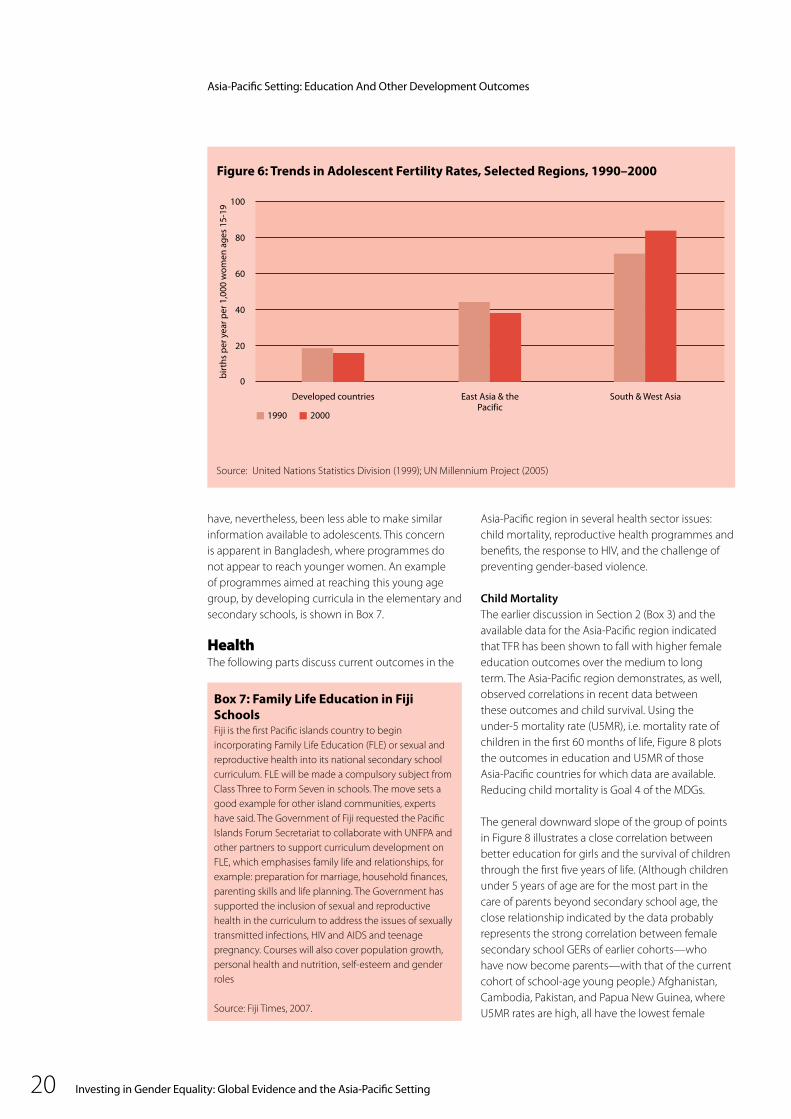
Investing in Gender Equality: Global Evidence and the Asia-Pacific Setting20
Figure 6: Trends in Adolescent Fertility Rates, Selected Regions, 1990–2000
Source: United Nations Statistics Division (1999); UN Millennium Project (2005)
have, nevertheless, been less able to make similar information available to adolescents. This concern is apparent in Bangladesh, where programmes do not appear to reach younger women. An example of programmes aimed at reaching this young age group, by developing curricula in the elementary and secondary schools, is shown in Box 7.
Health The following parts discuss current outcomes in the
Asia-Pacific region in several health sector issues: child mortality, reproductive health programmes and benefits, the response to HIV, and the challenge of preventing gender-based violence.
Child MortalityThe earlier discussion in Section 2 (Box 3) and the available data for the Asia-Pacific region indicated that TFR has been shown to fall with higher female education outcomes over the medium to long term. The Asia-Pacific region demonstrates, as well, observed correlations in recent data between these outcomes and child survival. Using the under-5 mortality rate (U5MR), i.e. mortality rate of children in the first 60 months of life, Figure 8 plots the outcomes in education and U5MR of those Asia-Pacific countries for which data are available. Reducing child mortality is Goal 4 of the MDGs.
The general downward slope of the group of points in Figure 8 illustrates a close correlation between better education for girls and the survival of children through the first five years of life. (Although children under 5 years of age are for the most part in the care of parents beyond secondary school age, the close relationship indicated by the data probably represents the strong correlation between female secondary school GERs of earlier cohorts—who have now become parents—with that of the current cohort of school-age young people.) Afghanistan, Cambodia, Pakistan, and Papua New Guinea, where U5MR rates are high, all have the lowest female
Box 7: Family Life Education in Fiji SchoolsFiji is the first Pacific islands country to begin incorporating Family Life Education (FLE) or sexual and reproductive health into its national secondary school curriculum. FLE will be made a compulsory subject from Class Three to Form Seven in schools. The move sets a good example for other island communities, experts have said. The Government of Fiji requested the Pacific Islands Forum Secretariat to collaborate with UNFPA and other partners to support curriculum development on FLE, which emphasises family life and relationships, for example: preparation for marriage, household finances, parenting skills and life planning. The Government has supported the inclusion of sexual and reproductive health in the curriculum to address the issues of sexually transmitted infections, HIV and AIDS and teenage pregnancy. Courses will also cover population growth, personal health and nutrition, self-esteem and gender roles
Source: Fiji Times, 2007.
Asia-Pacific Setting: Education And Other Development Outcomes

Investing in Gender Equality: Global Evidence and the Asia-Pacific Setting 21
Figure 6: Trends in Adolescent Fertility Rates, Selected Regions, 1990–2000
secondary GERs in the data (see Annex 1 for data), at less than 25. Other countries where the GER is below 50 also suffer high child mortality, including Bangladesh, India, Myanmar, and Nepal. These data recall the outcomes linked to female education over time, shown in Figure 1, which summarized a persistent lag in closing gender gaps in the South Asian sub-region over the 30-year period investigated. (Sri Lanka appears in these data as an exception to the South Asian experience, with female secondary education ratios of 83, and low child mortality of 14 per 1000 births.)
In countries with high female GERs, there is an observed correlation with low child mortality. Fiji, Republic of Korea, Palau, Japan, and Tonga all have GERs for girls above 90, and U5MR below 25 per thousand. These outcomes appear to be not entirely dependent on national income. The per capita annual GDP of these countries ranges from a low of $1930 (Tonga) to a high of $36,500 (Japan). The data may point to human-development-oriented policy choices in health and service delivery programmes (that is, higher human development index results are not strictly related to national income, but to other factors linked to social policies—see UNDP’s Human Development Report, various years).
As the data for Figures 4 and 8 show, China, Sri Lanka, and Viet Nam all have per capita GDPs of less than $1500 per annum, while their child mortality rates are all below 30 per thousand. In these countries,
Source: UNICEF (2007) Data for 2005 or latest year available
Figure 7: Adolescent Fertility Rate and Female Secondary GER, Selected Asia-Pacific Countries
child health programmes combined with education for girls appear to have successfully delivered child health services to populations of very different sizes. This outcome may depend more on past than current policies, since child mortality rates do not display rapid, year-by-year changes, but move fairly slowly. Child mortality rates can be expected to depend on many factors that include not only mothers’ education levels, but also birth spacing, past health and nutrition conditions, health facilities and institutions, and infrastructure.
Health policy and investments have important consequences for maternal mortality, as well as mortality rates of children. The UN Millennium Project compiled current research showing that women’s chances of dying of pregnancy-related causes are almost 50 times higher in developing countries than in developed countries, and that these risks are often linked to poor information, education, and communication (IEC) strategies in the areas concerned. These studies show that an estimated 34 percent of women in South Asia are malnourished, and iron-deficiency anemia affects 50–70 percent of pregnant women in developing countries globally (studies referenced in UN Millennium Project 2005: 57). Some of the outcome data on maternal mortality, natality services, and lower fertility rates, all of which are shown to be linked to the quality of health IEC programmes, were illustrated in Box 3 in the introductory section of this report.
“Child health programmes combined with education for girls appear to have successfully delivered health services to populations of very different sizes”
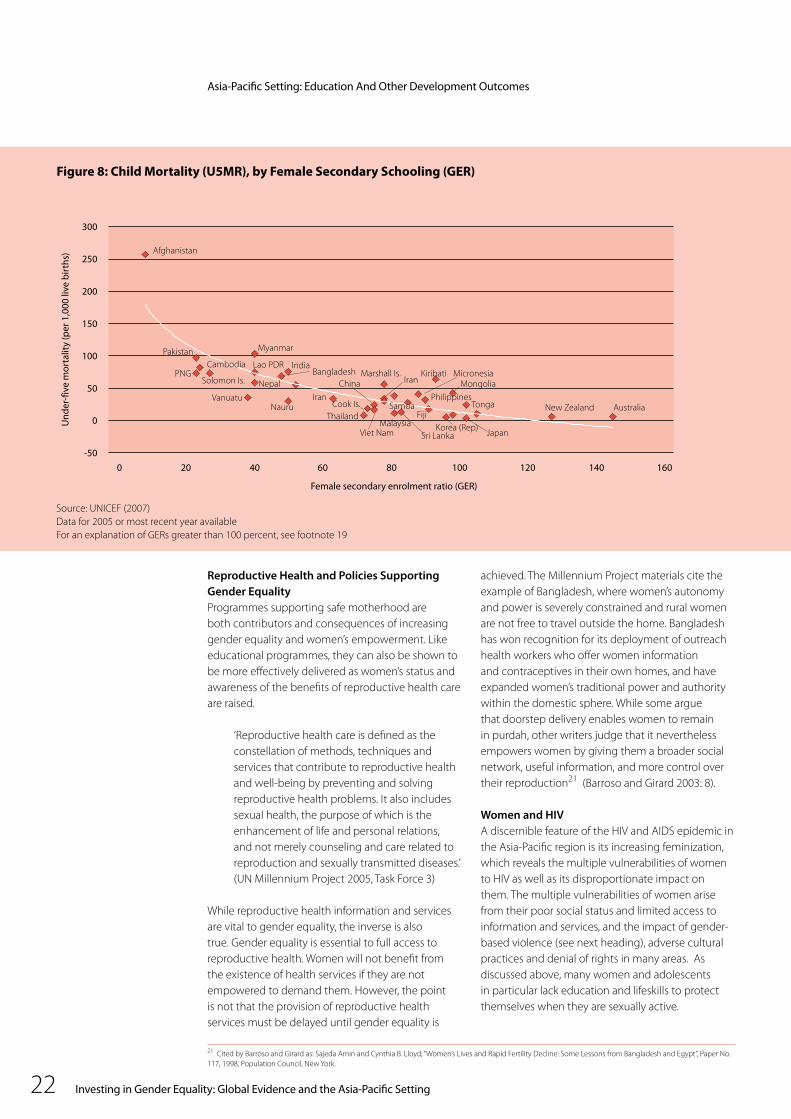
Investing in Gender Equality: Global Evidence and the Asia-Pacific Setting22
Figure 8: Child Mortality (U5MR), by Female Secondary Schooling (GER)
Source: UNICEF (2007)Data for 2005 or most recent year availableFor an explanation of GERs greater than 100 percent, see footnote 19
Reproductive Health and Policies Supporting Gender EqualityProgrammes supporting safe motherhood are both contributors and consequences of increasing gender equality and women’s empowerment. Like educational programmes, they can also be shown to be more effectively delivered as women’s status and awareness of the benefits of reproductive health care are raised.
‘Reproductive health care is defined as the constellation of methods, techniques and services that contribute to reproductive health and well-being by preventing and solving reproductive health problems. It also includes sexual health, the purpose of which is the enhancement of life and personal relations, and not merely counseling and care related to reproduction and sexually transmitted diseases.’ (UN Millennium Project 2005, Task Force 3)
While reproductive health information and services are vital to gender equality, the inverse is also true. Gender equality is essential to full access to reproductive health. Women will not benefit from the existence of health services if they are not empowered to demand them. However, the point is not that the provision of reproductive health services must be delayed until gender equality is
achieved. The Millennium Project materials cite the example of Bangladesh, where women’s autonomy and power is severely constrained and rural women are not free to travel outside the home. Bangladesh has won recognition for its deployment of outreach health workers who offer women information and contraceptives in their own homes, and have expanded women’s traditional power and authority within the domestic sphere. While some argue that doorstep delivery enables women to remain in purdah, other writers judge that it nevertheless empowers women by giving them a broader social network, useful information, and more control over their reproduction21 (Barroso and Girard 2003: 8).
Women and HIVA discernible feature of the HIV and AIDS epidemic in the Asia-Pacific region is its increasing feminization, which reveals the multiple vulnerabilities of women to HIV as well as its disproportionate impact on them. The multiple vulnerabilities of women arise from their poor social status and limited access to information and services, and the impact of gender-based violence (see next heading), adverse cultural practices and denial of rights in many areas. As discussed above, many women and adolescents in particular lack education and lifeskills to protect themselves when they are sexually active.
21 Cited by Barroso and Girard as: Sajeda Amin and Cynthia B. Lloyd, “Women’s Lives and Rapid Fertility Decline: Some Lessons from Bangladesh and Egypt”, Paper No. 117, 1998, Population Council, New York.
Asia-Pacific Setting: Education And Other Development Outcomes
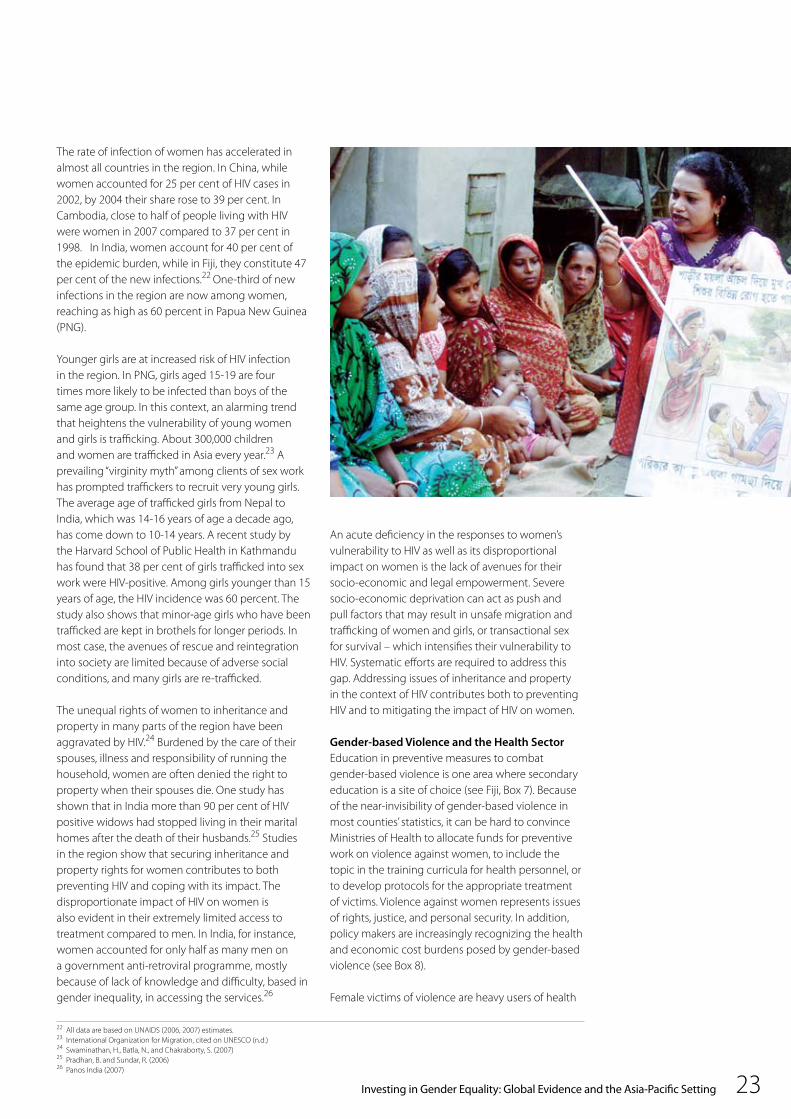
Investing in Gender Equality: Global Evidence and the Asia-Pacific Setting 23
The rate of infection of women has accelerated in almost all countries in the region. In China, while women accounted for 25 per cent of HIV cases in 2002, by 2004 their share rose to 39 per cent. In Cambodia, close to half of people living with HIV were women in 2007 compared to 37 per cent in 1998. In India, women account for 40 per cent of the epidemic burden, while in Fiji, they constitute 47 per cent of the new infections.22 One-third of new infections in the region are now among women, reaching as high as 60 percent in Papua New Guinea (PNG).
Younger girls are at increased risk of HIV infection in the region. In PNG, girls aged 15-19 are four times more likely to be infected than boys of the same age group. In this context, an alarming trend that heightens the vulnerability of young women and girls is trafficking. About 300,000 children and women are trafficked in Asia every year.23 A prevailing “virginity myth” among clients of sex work has prompted traffickers to recruit very young girls. The average age of trafficked girls from Nepal to India, which was 14-16 years of age a decade ago, has come down to 10-14 years. A recent study by the Harvard School of Public Health in Kathmandu has found that 38 per cent of girls trafficked into sex work were HIV-positive. Among girls younger than 15 years of age, the HIV incidence was 60 percent. The study also shows that minor-age girls who have been trafficked are kept in brothels for longer periods. In most case, the avenues of rescue and reintegration into society are limited because of adverse social conditions, and many girls are re-trafficked.
The unequal rights of women to inheritance and property in many parts of the region have been aggravated by HIV.24 Burdened by the care of their spouses, illness and responsibility of running the household, women are often denied the right to property when their spouses die. One study has shown that in India more than 90 per cent of HIV positive widows had stopped living in their marital homes after the death of their husbands.25 Studies in the region show that securing inheritance and property rights for women contributes to both preventing HIV and coping with its impact. The disproportionate impact of HIV on women is also evident in their extremely limited access to treatment compared to men. In India, for instance, women accounted for only half as many men on a government anti-retroviral programme, mostly because of lack of knowledge and difficulty, based in gender inequality, in accessing the services.26
An acute deficiency in the responses to women’s vulnerability to HIV as well as its disproportional impact on women is the lack of avenues for their socio-economic and legal empowerment. Severe socio-economic deprivation can act as push and pull factors that may result in unsafe migration and trafficking of women and girls, or transactional sex for survival – which intensifies their vulnerability to HIV. Systematic efforts are required to address this gap. Addressing issues of inheritance and property in the context of HIV contributes both to preventing HIV and to mitigating the impact of HIV on women. Gender-based Violence and the Health SectorEducation in preventive measures to combat gender-based violence is one area where secondary education is a site of choice (see Fiji, Box 7). Because of the near-invisibility of gender-based violence in most counties’ statistics, it can be hard to convince Ministries of Health to allocate funds for preventive work on violence against women, to include the topic in the training curricula for health personnel, or to develop protocols for the appropriate treatment of victims. Violence against women represents issues of rights, justice, and personal security. In addition, policy makers are increasingly recognizing the health and economic cost burdens posed by gender-based violence (see Box 8).
Female victims of violence are heavy users of health
22 All data are based on UNAIDS (2006, 2007) estimates. 23 International Organization for Migration, cited on UNESCO (n.d.) 24 Swaminathan, H., Batla, N., and Chakraborty, S. (2007) 25 Pradhan, B. and Sundar, R. (2006) 26 Panos India (2007)
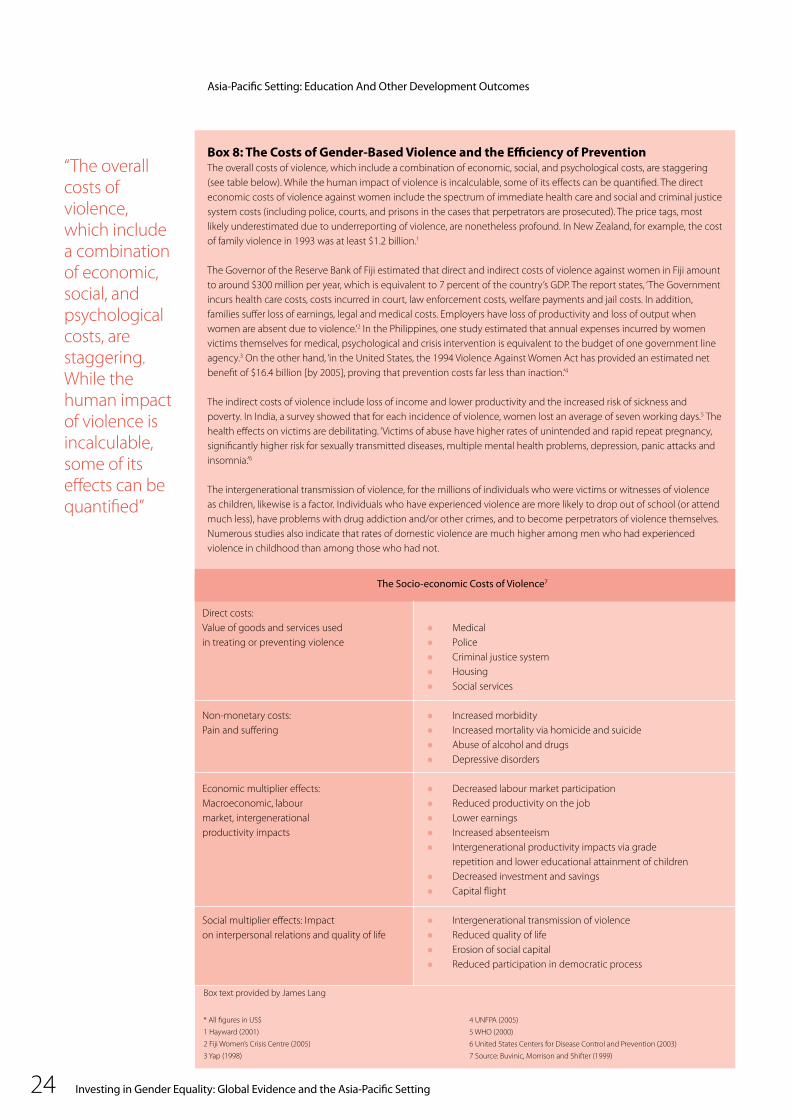
Investing in Gender Equality: Global Evidence and the Asia-Pacific Setting24
Box 8: The Costs of Gender-Based Violence and the Efficiency of PreventionThe overall costs of violence, which include a combination of economic, social, and psychological costs, are staggering (see table below). While the human impact of violence is incalculable, some of its effects can be quantified. The direct economic costs of violence against women include the spectrum of immediate health care and social and criminal justice system costs (including police, courts, and prisons in the cases that perpetrators are prosecuted). The price tags, most likely underestimated due to underreporting of violence, are nonetheless profound. In New Zealand, for example, the cost of family violence in 1993 was at least $1.2 billion.1
The Governor of the Reserve Bank of Fiji estimated that direct and indirect costs of violence against women in Fiji amount to around $300 million per year, which is equivalent to 7 percent of the country’s GDP. The report states, ‘The Government incurs health care costs, costs incurred in court, law enforcement costs, welfare payments and jail costs. In addition, families suffer loss of earnings, legal and medical costs. Employers have loss of productivity and loss of output when women are absent due to violence.’2 In the Philippines, one study estimated that annual expenses incurred by women victims themselves for medical, psychological and crisis intervention is equivalent to the budget of one government line agency.3 On the other hand, ‘in the United States, the 1994 Violence Against Women Act has provided an estimated net benefit of $16.4 billion [by 2005], proving that prevention costs far less than inaction.’4
The indirect costs of violence include loss of income and lower productivity and the increased risk of sickness and poverty. In India, a survey showed that for each incidence of violence, women lost an average of seven working days.5 The health effects on victims are debilitating. ‘Victims of abuse have higher rates of unintended and rapid repeat pregnancy, significantly higher risk for sexually transmitted diseases, multiple mental health problems, depression, panic attacks and insomnia.’6
The intergenerational transmission of violence, for the millions of individuals who were victims or witnesses of violence as children, likewise is a factor. Individuals who have experienced violence are more likely to drop out of school (or attend much less), have problems with drug addiction and/or other crimes, and to become perpetrators of violence themselves. Numerous studies also indicate that rates of domestic violence are much higher among men who had experienced violence in childhood than among those who had not.
The Socio-economic Costs of Violence7
Direct costs: Value of goods and services used Medicalin treating or preventing violence Police Criminal justice system Housing Social services
Non-monetary costs: Increased morbidityPain and suffering Increased mortality via homicide and suicide Abuse of alcohol and drugs Depressive disorders
Economic multiplier effects: Decreased labour market participationMacroeconomic, labour Reduced productivity on the jobmarket, intergenerational Lower earningsproductivity impacts Increased absenteeism Intergenerational productivity impacts via grade repetition and lower educational attainment of children Decreased investment and savings Capital flight
Social multiplier effects: Impact Intergenerational transmission of violenceon interpersonal relations and quality of life Reduced quality of life Erosion of social capital Reduced participation in democratic process
Box text provided by James Lang
* All figures in US$
1 Hayward (2001)
2 Fiji Women’s Crisis Centre (2005)
3 Yap (1998)
4 UNFPA (2005)
5 WHO (2000)
6 United States Centers for Disease Control and Prevention (2003)
7 Source: Buvinic, Morrison and Shifter (1999)
“The overall costs of violence, which include a combination of economic, social, and psychological costs, are staggering. While the human impact of violence is incalculable, some of its effects can be quantified”
Asia-Pacific Setting: Education And Other Development Outcomes

Investing in Gender Equality: Global Evidence and the Asia-Pacific Setting 25
services, but often this does not show up in health service statistics, because administrative units classify users according to their type of injury or illness, not according to its cause. In any case, women often choose to conceal the causes of their injuries, for fear of involvement in legal proceedings and retaliation by their partners.
In large-scale, population-based studies in Papua New Guinea and Fiji, researchers found that approximately one-third of wives who were beaten sought medical treatment for their injuries. A study of wife-beating cases attending a major hospital in Papua New Guinea showed that 6 percent required at least overnight hospitalization. This is a considerable drain on scarce resources, especially considering that these are cases of deliberately inflicted injuries (this account taken from Bradley, 1999).
Despite wider awareness of the extent and cost of gender-based violence, a 2003 survey showed that few countries in the Asia-Pacific region have passed legislation to protect women against four categories of violence considered to be most prevalent: domestic violence, rape, sexual harassment, and rape in marriage. Using a simple indicator that distinguished levels of effectiveness of legislation (presence of general legislation, provision for prosecution for violations, and specific measures in all four areas), only 5 of 50 countries were found to have a high level of legislative provision, while 27 countries had little or no legislation or effective provisions (UN Economic and Social Commission for Asia and the Pacific Statistics Division (UNESCAP-SD) 2004: 19-20).
Labour Force Participation Section 1 showed a strong correlation between high levels of secondary schooling attainment for women, and consistently high average economic growth rates. Section 2 reviewed the explanations economists have suggested for the paths or mechanisms through which the impact of female education is transmitted to other development outcomes, including growth. One of the main direct effects of higher female education may be the flow to higher productivity of “human capital”, leading to higher growth rates (even while wage rates may remain unchanged). To explore the Asia-Pacific experience in drawing women into the labour force, we look now at levels of labour force participation in the wage sector, the contribution of women to the Asia-Pacific role in the global integration of production, and women’s working conditions and needs.
Share of Wage EmploymentWomen’s share of employment in the non-agricultural wage sector is indicator 11 of the MDGs (under Goal 3). The indicator measures the degree to which labour markets are open to women in the industry and service sectors, which not only affects equal employment opportunity for women but also economic efficiency through flexibility of the labour market and, therefore, the economy’s ability to adapt to change. 27
Women’s share of jobs in the modern sector is largely correlated with industrialization and growth. As such, it may be a response to rather than a driver of growth. Important policy and investment concerns, however, demand that development programmes look at whether or not and how women themselves have benefited from their participation in such jobs. (That is, governments must decide what kind of investment they wish to encourage, taking into consideration the labour relations practices of firms, their standards of conduct and accountability.) The current emphasis in development strategy discussions on ‘inclusive growth’ refers largely to the potential for the poor to work their way out of poverty, by finding income-earning opportunities and greater autonomy. However, the jobs that many of the poor are finding are frequently in self-employment and informal work; which are often insecure, dangerous, low-paid, and in the case of women, more poorly rewarded.
27 United Nations Development Group (2003).
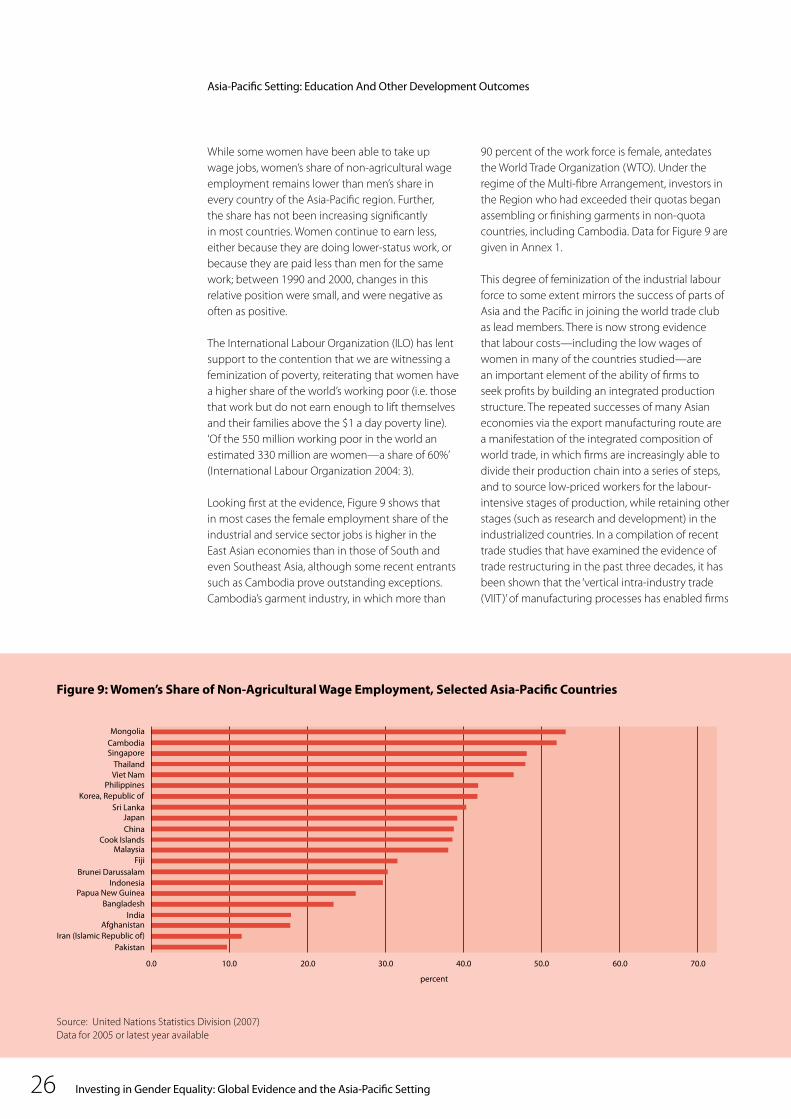
Investing in Gender Equality: Global Evidence and the Asia-Pacific Setting26
While some women have been able to take up wage jobs, women’s share of non-agricultural wage employment remains lower than men’s share in every country of the Asia-Pacific region. Further, the share has not been increasing significantly in most countries. Women continue to earn less, either because they are doing lower-status work, or because they are paid less than men for the same work; between 1990 and 2000, changes in this relative position were small, and were negative as often as positive.
The International Labour Organization (ILO) has lent support to the contention that we are witnessing a feminization of poverty, reiterating that women have a higher share of the world’s working poor (i.e. those that work but do not earn enough to lift themselves and their families above the $1 a day poverty line). ‘Of the 550 million working poor in the world an estimated 330 million are women—a share of 60%’ (International Labour Organization 2004: 3).
Looking first at the evidence, Figure 9 shows that in most cases the female employment share of the industrial and service sector jobs is higher in the East Asian economies than in those of South and even Southeast Asia, although some recent entrants such as Cambodia prove outstanding exceptions. Cambodia’s garment industry, in which more than
90 percent of the work force is female, antedates the World Trade Organization (WTO). Under the regime of the Multi-fibre Arrangement, investors in the Region who had exceeded their quotas began assembling or finishing garments in non-quota countries, including Cambodia. Data for Figure 9 are given in Annex 1.
This degree of feminization of the industrial labour force to some extent mirrors the success of parts of Asia and the Pacific in joining the world trade club as lead members. There is now strong evidence that labour costs—including the low wages of women in many of the countries studied—are an important element of the ability of firms to seek profits by building an integrated production structure. The repeated successes of many Asian economies via the export manufacturing route are a manifestation of the integrated composition of world trade, in which firms are increasingly able to divide their production chain into a series of steps, and to source low-priced workers for the labour-intensive stages of production, while retaining other stages (such as research and development) in the industrialized countries. In a compilation of recent trade studies that have examined the evidence of trade restructuring in the past three decades, it has been shown that the ‘vertical intra-industry trade (VIIT)’ of manufacturing processes has enabled firms
Source: United Nations Statistics Division (2007)Data for 2005 or latest year available
Figure 9: Women’s Share of Non-Agricultural Wage Employment, Selected Asia-Pacific Countries
Asia-Pacific Setting: Education And Other Development Outcomes
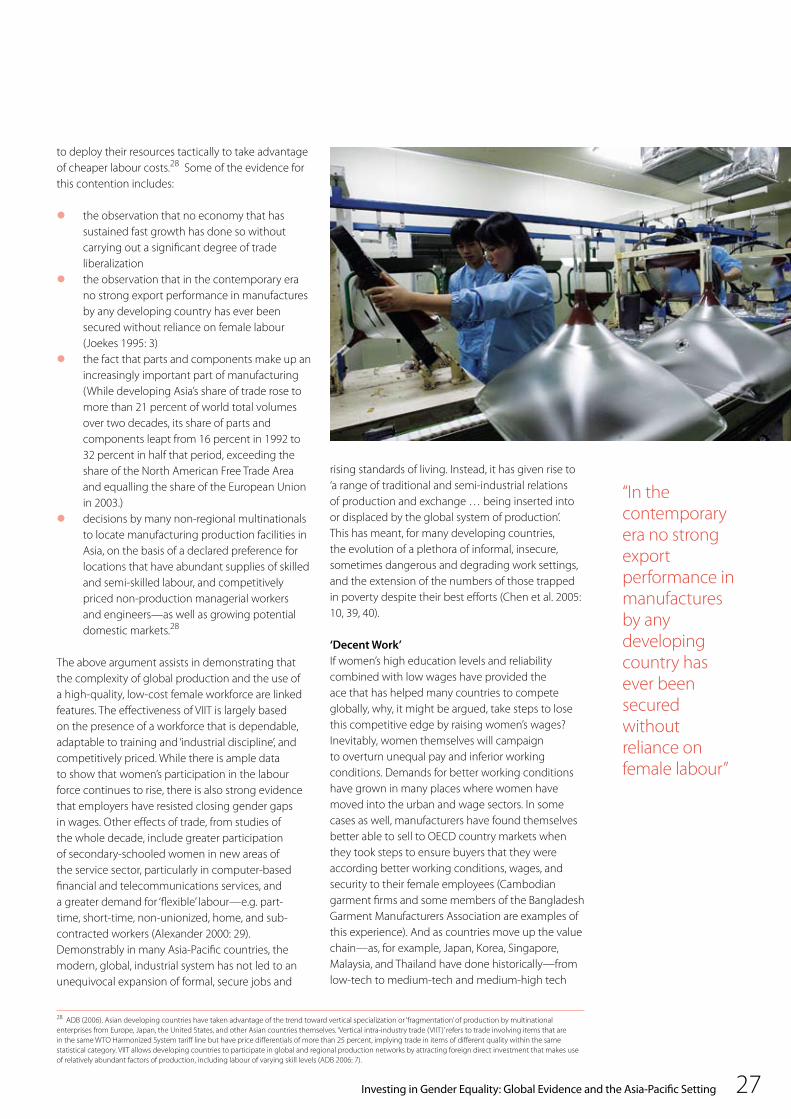
Investing in Gender Equality: Global Evidence and the Asia-Pacific Setting 27
to deploy their resources tactically to take advantage of cheaper labour costs.28 Some of the evidence for this contention includes:
the observation that no economy that has sustained fast growth has done so without carrying out a significant degree of trade liberalization
the observation that in the contemporary era no strong export performance in manufactures by any developing country has ever been secured without reliance on female labour (Joekes 1995: 3)
the fact that parts and components make up an increasingly important part of manufacturing (While developing Asia’s share of trade rose to more than 21 percent of world total volumes over two decades, its share of parts and components leapt from 16 percent in 1992 to 32 percent in half that period, exceeding the share of the North American Free Trade Area and equalling the share of the European Union in 2003.)
decisions by many non-regional multinationals to locate manufacturing production facilities in Asia, on the basis of a declared preference for locations that have abundant supplies of skilled and semi-skilled labour, and competitively priced non-production managerial workers and engineers—as well as growing potential domestic markets.28
The above argument assists in demonstrating that the complexity of global production and the use of a high-quality, low-cost female workforce are linked features. The effectiveness of VIIT is largely based on the presence of a workforce that is dependable, adaptable to training and ‘industrial discipline’, and competitively priced. While there is ample data to show that women’s participation in the labour force continues to rise, there is also strong evidence that employers have resisted closing gender gaps in wages. Other effects of trade, from studies of the whole decade, include greater participation of secondary-schooled women in new areas of the service sector, particularly in computer-based financial and telecommunications services, and a greater demand for ‘flexible’ labour—e.g. part-time, short-time, non-unionized, home, and sub-contracted workers (Alexander 2000: 29).Demonstrably in many Asia-Pacific countries, the modern, global, industrial system has not led to an unequivocal expansion of formal, secure jobs and
rising standards of living. Instead, it has given rise to ‘a range of traditional and semi-industrial relations of production and exchange … being inserted into or displaced by the global system of production’. This has meant, for many developing countries, the evolution of a plethora of informal, insecure, sometimes dangerous and degrading work settings, and the extension of the numbers of those trapped in poverty despite their best efforts (Chen et al. 2005: 10, 39, 40).
‘Decent Work’If women’s high education levels and reliability combined with low wages have provided the ace that has helped many countries to compete globally, why, it might be argued, take steps to lose this competitive edge by raising women’s wages? Inevitably, women themselves will campaign to overturn unequal pay and inferior working conditions. Demands for better working conditions have grown in many places where women have moved into the urban and wage sectors. In some cases as well, manufacturers have found themselves better able to sell to OECD country markets when they took steps to ensure buyers that they were according better working conditions, wages, and security to their female employees (Cambodian garment firms and some members of the Bangladesh Garment Manufacturers Association are examples of this experience). And as countries move up the value chain—as, for example, Japan, Korea, Singapore, Malaysia, and Thailand have done historically—from low-tech to medium-tech and medium-high tech
28 ADB (2006). Asian developing countries have taken advantage of the trend toward vertical specialization or ‘fragmentation’ of production by multinational enterprises from Europe, Japan, the United States, and other Asian countries themselves. ‘Vertical intra-industry trade (VIIT)’ refers to trade involving items that are in the same WTO Harmonized System tariff line but have price differentials of more than 25 percent, implying trade in items of different quality within the same statistical category. VIIT allows developing countries to participate in global and regional production networks by attracting foreign direct investment that makes use of relatively abundant factors of production, including labour of varying skill levels (ADB 2006: 7).
“In the contemporary era no strong export performance in manufactures by any developing country has ever been secured without reliance on female labour”
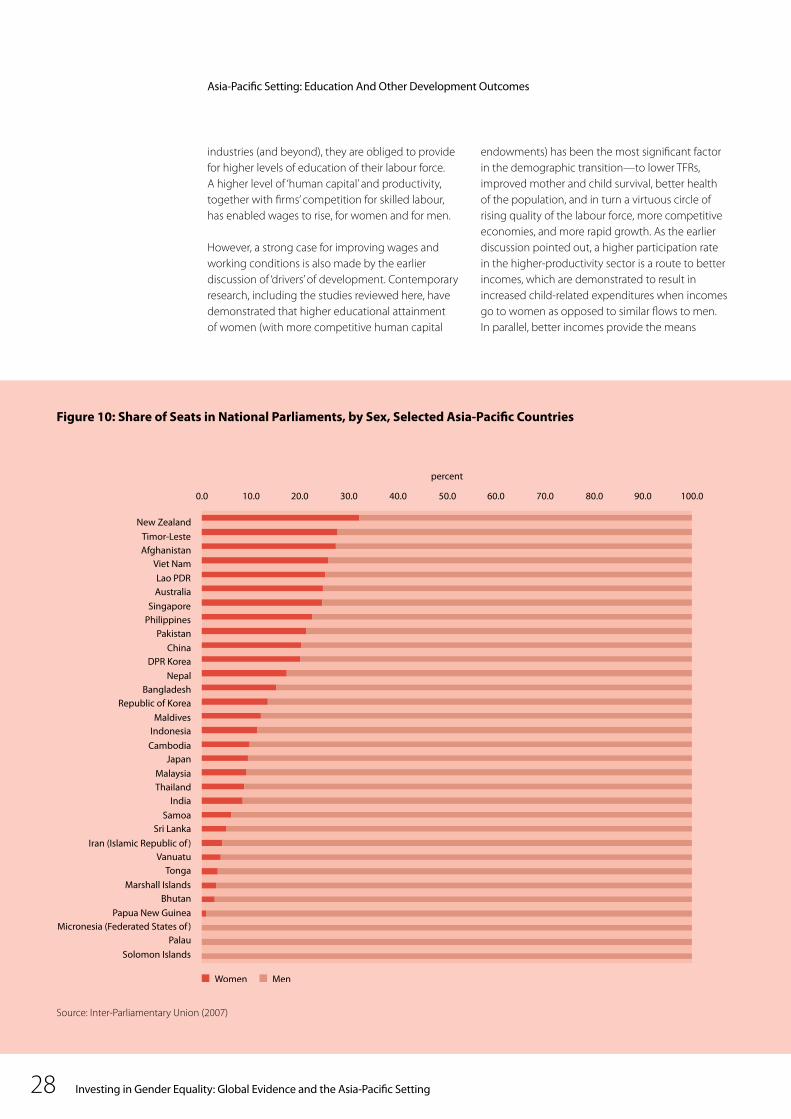
Investing in Gender Equality: Global Evidence and the Asia-Pacific Setting28
industries (and beyond), they are obliged to provide for higher levels of education of their labour force. A higher level of ‘human capital’ and productivity, together with firms’ competition for skilled labour, has enabled wages to rise, for women and for men.
However, a strong case for improving wages and working conditions is also made by the earlier discussion of ‘drivers’ of development. Contemporary research, including the studies reviewed here, have demonstrated that higher educational attainment of women (with more competitive human capital
endowments) has been the most significant factor in the demographic transition—to lower TFRs, improved mother and child survival, better health of the population, and in turn a virtuous circle of rising quality of the labour force, more competitive economies, and more rapid growth. As the earlier discussion pointed out, a higher participation rate in the higher-productivity sector is a route to better incomes, which are demonstrated to result in increased child-related expenditures when incomes go to women as opposed to similar flows to men. In parallel, better incomes provide the means
Source: Inter-Parliamentary Union (2007)
Figure 10: Share of Seats in National Parliaments, by Sex, Selected Asia-Pacific Countries
Asia-Pacific Setting: Education And Other Development Outcomes
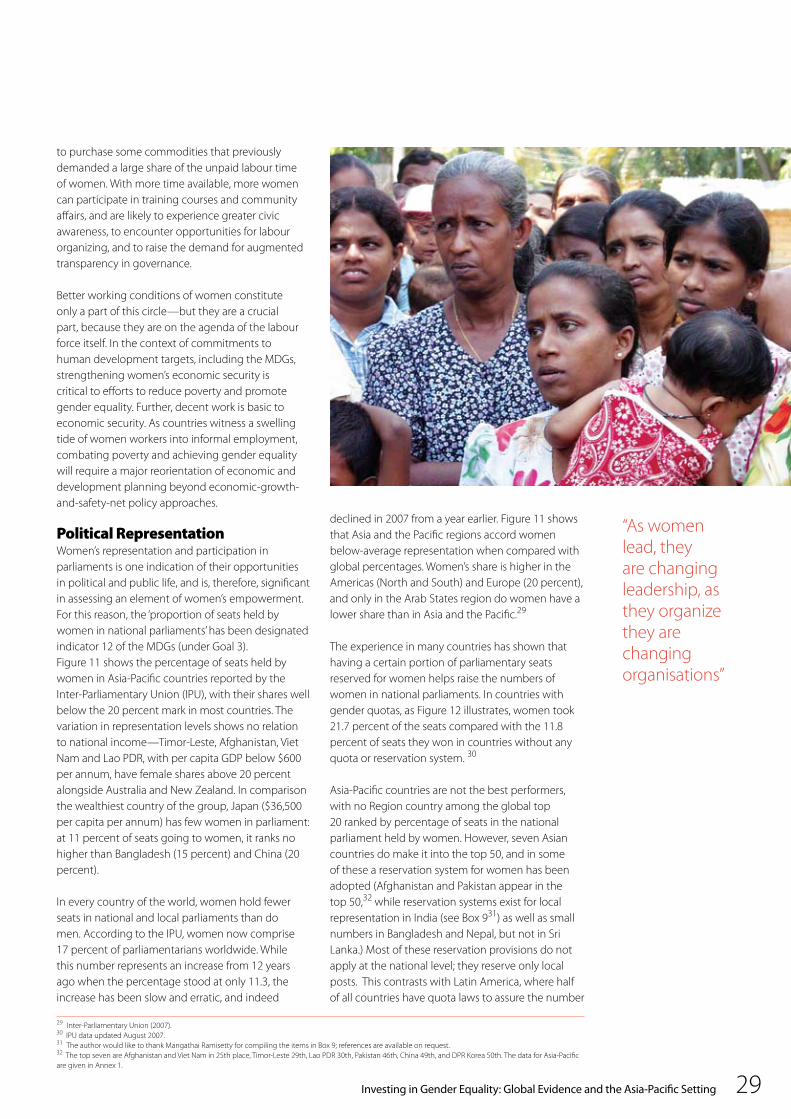
Investing in Gender Equality: Global Evidence and the Asia-Pacific Setting 29
to purchase some commodities that previously demanded a large share of the unpaid labour time of women. With more time available, more women can participate in training courses and community affairs, and are likely to experience greater civic awareness, to encounter opportunities for labour organizing, and to raise the demand for augmented transparency in governance.
Better working conditions of women constitute only a part of this circle—but they are a crucial part, because they are on the agenda of the labour force itself. In the context of commitments to human development targets, including the MDGs, strengthening women’s economic security is critical to efforts to reduce poverty and promote gender equality. Further, decent work is basic to economic security. As countries witness a swelling tide of women workers into informal employment, combating poverty and achieving gender equality will require a major reorientation of economic and development planning beyond economic-growth-and-safety-net policy approaches.
Political RepresentationWomen’s representation and participation in parliaments is one indication of their opportunities in political and public life, and is, therefore, significant in assessing an element of women’s empowerment. For this reason, the ‘proportion of seats held by women in national parliaments’ has been designated indicator 12 of the MDGs (under Goal 3). Figure 11 shows the percentage of seats held by women in Asia-Pacific countries reported by the Inter-Parliamentary Union (IPU), with their shares well below the 20 percent mark in most countries. The variation in representation levels shows no relation to national income—Timor-Leste, Afghanistan, Viet Nam and Lao PDR, with per capita GDP below $600 per annum, have female shares above 20 percent alongside Australia and New Zealand. In comparison the wealthiest country of the group, Japan ($36,500 per capita per annum) has few women in parliament: at 11 percent of seats going to women, it ranks no higher than Bangladesh (15 percent) and China (20 percent).
In every country of the world, women hold fewer seats in national and local parliaments than do men. According to the IPU, women now comprise 17 percent of parliamentarians worldwide. While this number represents an increase from 12 years ago when the percentage stood at only 11.3, the increase has been slow and erratic, and indeed
declined in 2007 from a year earlier. Figure 11 shows that Asia and the Pacific regions accord women below-average representation when compared with global percentages. Women’s share is higher in the Americas (North and South) and Europe (20 percent), and only in the Arab States region do women have a lower share than in Asia and the Pacific.29
The experience in many countries has shown that having a certain portion of parliamentary seats reserved for women helps raise the numbers of women in national parliaments. In countries with gender quotas, as Figure 12 illustrates, women took 21.7 percent of the seats compared with the 11.8 percent of seats they won in countries without any quota or reservation system. 30
Asia-Pacific countries are not the best performers, with no Region country among the global top 20 ranked by percentage of seats in the national parliament held by women. However, seven Asian countries do make it into the top 50, and in some of these a reservation system for women has been adopted (Afghanistan and Pakistan appear in the top 50,32 while reservation systems exist for local representation in India (see Box 931) as well as small numbers in Bangladesh and Nepal, but not in Sri Lanka.) Most of these reservation provisions do not apply at the national level; they reserve only local posts. This contrasts with Latin America, where half of all countries have quota laws to assure the number
“As women lead, they are changing leadership, as they organize they are changing organisations”
29 Inter-Parliamentary Union (2007). 30 IPU data updated August 2007. 31 The author would like to thank Mangathai Ramisetty for compiling the items in Box 9; references are available on request. 32 The top seven are Afghanistan and Viet Nam in 25th place, Timor-Leste 29th, Lao PDR 30th, Pakistan 46th, China 49th, and DPR Korea 50th. The data for Asia-Pacific are given in Annex 1.

Investing in Gender Equality: Global Evidence and the Asia-Pacific Setting30
of seats for women, including at the national level, most of which target 30 percent representation.
The Pacific Islands communities have historically had less success in finding measures to ensure women’s representation. As Figure 13 shows, the average percentage of seats held is well below that of Asia. What is more, as the data for Figure 11 show (for data see Annex 1), this number is boosted by the inclusion of Australia and New Zealand. Many of the smaller islands have no women representatives at all.
In the 2007 national elections in Papua New Guinea, although 100 women ran several strong campaigns for the 109 open seats, only one (already a long-time sitting MP and cabinet minister) was elected. Pacific women’s networks are assessing the reasons for this failure to convince electorates to vote for women. Many are calling for more government action, and the introduction of reservation systems to provide a model of women in political positions, for candidates and for the population as a whole.
Figure 11: Women in National Parliaments, Asia-Pacific and World Averages
Box 9: Women Making a Difference in Indian Local GovernmentsIn 1992, India adopted a Panchayati Raj (local council) system in several states that reserved one-third of seats for women. Women leaders through the Panchayati Raj Initiative (PRI) are transforming local governance by sensitizing their state governments to issues of poverty, inequality, and gender injustice. They are tackling issues that had previously gone virtually unacknowledged, including water supply and safety, alcohol abuse, education, health issues, and domestic violence.
Contrary to fears that the elected women would be rubber-stamp leaders, the success stories that have arisen from the PRI are impressive. A government-financed study, based on field work in 180 villages in the states of Madhya Pradesh, Rajasthan, and Uttar Pradesh and coordinated by the Centre for Women’s Development Studies in New Delhi, has found that a full two-thirds of elected women leaders are actively engaged in learning the ropes and exercising power. In both Karnataka and Tamil Nadu, the proportion of women in local self-government is now 44 percent as compared to the mandatory requirement of 33 percent. Tamil Nadu has 418 women elected from the general constituencies and not from reserved constituencies.
Women are seeing this power as an opportunity for a real change for themselves and for their children and are using it to demand basic facilities such as primary schools and health care centres. Researchers have found that in some states most elected women are housewives, first-time entrants into politics, usually illiterate or educated only to primary level. In 2000 the Indian Institute of Social Science reviewed the progress of 100 elected women in four districts; most of the elected women including younger women were illiterate when elected to office. After two years in office, they demanded literacy training skill and generally felt the need of education for their daughters.
Source: Inter-Parliamentary Union (2007)
“Elected women leaders are tackling issues that had previously gone virtually unacknowledged, including water supply and safety, alcohol abuse, education, health issues, and domestic violence”
Asia-Pacific Setting: Education And Other Development Outcomes

Investing in Gender Equality: Global Evidence and the Asia-Pacific Setting 31
Figure 12. Do Reservation Systems Help?
Box 10: Access to Justice in AfghanistanThere has never been a female justice on the Scholar Council of the Supreme Court, Afghanistan’s highest judicial body. The Afghan Women Judges Association (AWJA) estimates that of roughly 2000 sitting judges in Afghanistan, no more than 70 are female. According to civil society organizations, the need for women to be represented on this body is especially critical for a justice system that has long been criticized for its lack of sensitivity to gender concerns. Advocates have especially targeted the Supreme Court, due to its role in setting precedents and monitoring judges in the lower courts. Afghanistan’s Supreme Court, unlike those of many other countries, does not hear cases. It is instead mandated to monitor judgments in the lower court system and approve sentencing in criminal cases, including capital crimes. Since only the most serious cases pass through the Supreme Court, including criminal cases that invoke the death penalty, it is essential that women’s testimonies be analysed accurately, and without bias, so that irreversible mistakes are not made by the lower courts system.
According to the AWJA, a qualified female justice on the Supreme Court would be able to correctly interpret Shari’a law as it applies to women, and at the same time, incorporate into rulings the international conventions to which Afghanistan is party. While Afghanistan’s constitution makes no specific provision for women’s placement on the Supreme Court, the constitution does include clear articles against discrimination, and gives both women and men equal rights and duties before the law. In March 2003, Afghanistan also became party to the Convention on the Elimination of All Forms of Discrimination against Women (CEDAW) and thus is obliged under international law to ensure that Afghan women do not face discrimination, and can claim their rights as equal to men.
(UNIFEM Project)
Yet there is strong evidence that raising women’s representation in decision-making bodies leads to better outcomes for women and for communities. Research has shown that when women are included in decision-making, governments are more responsive to household needs and community development (see Box 10).
This observation was underlined a decade and a half ago by Mary Robinson, former UN Commissioner of Human Rights, and was cited by Pacific women during recent election campaigns. The Commissioner had pointed out that women were already contributing a valuable approach to governance: ‘As women lead, they are changing leadership, as they organize they are changing organisations. When women lead and articulate their purposes, it seems that they work together not only as individuals but with a great sense of continuity and networking in a healthy way. Women have fresh and imaginative skills of dialogue and are setting a more open, flexible and compassionate style of leadership’ (Speech at the Global Forum of Women 1992, cited in Gina Houng Lee 2006).
Of course, parliaments vary in their independence and authority. As a measure of women’s real political decision making, the percentage-of-seats indicator is not sufficient, because women still face many obstacles in fully and efficiently carrying out their parliamentary mandate. Thus, being a member of parliament, especially in developing countries and emerging democracies, does not guarantee that a woman has the resources, respect, or constituency to exercise significant influence (this indicator is discussed in United Nations Development Group, 2003, pp. 37-8).
Indeed, parliaments are not the only governance institutions where the presence of women makes a difference to outcomes for the population. Governments can expect improved service delivery when they ensure a good gender balance in the courts, regulatory agencies, and public health and education systems. However, without the initial steps by sitting governments to create examples that can influence public opinion, traditional resistance to change may be difficult to overcome. Box 10 provides an example of efforts in this direction in the Afghanistan judicial system.
Source: Inter-Parliamentary Union (2007)
“Parliaments are not the only governance institutions where the presence of women makes a difference. Governments can expect improved service delivery when they ensure a good gender balance in the courts, regulatory agencies, and public health and education systems”
Investing in Gender Equality: Global Evidence and the Asia-Pacific Setting32
Conclusions from the DataThis report has highlighted empirical evidence that investments to achieve gender equality make good economic sense. It presents recent syntheses of a large number of studies conducted and replicated over the past decade. The accumulated results of these studies have provided forceful evidence that countries that have under-invested in gender equality have lost economic output (in measured per capita GDP growth), and those that have narrowed gender gaps have benefited.
The evidence is persuasive in identifying the costs associated with failing to meet the MDG 3 targets on gender equality over the Millennium term. As one synthesis concludes, countries failing to meet the goal of gender equity in education will lose annual per capita output growth at a rate of 0.1–0.3 percent per year (depending on the growth rate of GDP and pace of change in the education disparity). While these amounts may appear small, they can accumulate to significant values. For example, for a country with a PPP-based per capita GDP of $1500 in 1995, the loss of income could be as much as 10 percent for every person by the 2015 MDG target year —and the loss will be greater for countries where the gender gap is most severe. Another study forecasts, on the positive side, that where countries do succeed in meeting the goal of gender equity in secondary enrolments, the effect for the 1985-2015 period could amount to 14 percent larger average per capita GDP levels.33
While the actual cost of gender gaps in education cannot be determined for each country precisely, it is important to recognize that these numbers are not guesses or untested hypotheses. The numbers given in the studies represent empirical evidence from both developing countries and industrialized economies world wide, aggregated country by country in every region, using detailed and comparable data over a 30-year period prior to the Millennium Summit.
These data provide grounds to demonstrate that not only are investments in gender equality (proxied as decreasing gender gaps in secondary education) a contribution to economic growth; they also measurably raise the chances of realizing other development objectives—such as a decrease in total fertility, and improvements in mortality and child nutrition outcomes, themselves the drivers of a sequence of self-reinforcing inputs to quality of
4. Conclusions and Strategic Priorities
life, higher productivity, and greater potential for sustained growth and development.
The data studies demonstrate that the consistent high average per capita growth rates of the East Asia and Pacific economies, outstripping averages for all other country groupings, has paralleled a long-term narrowing of gender disparities in secondary education in the East-Asia-Pacific grouping.
Data presented for the Asia-Pacific region in the current period show that inputs to closing gender gaps have been uneven. They demonstrate some correlation of girls’ secondary education with per capita income (although no claim for any direction of causality is made for cross-sectional data). The data also demonstrate, however, that some countries at lower income levels have managed to perform well in recent years in narrowing these gender disparities, and have at the same time benefited from better health and other outcomes.
Making Investment ChoicesWith the global findings and the regional performance results in hand, there is strong empirical evidence that progress in gender equality plays a key role in development results. The Asia-Pacific setting shows that women have responded to education opportunities with enthusiasm, have made major contributions to the dynamism of the region, and have expressed their willingness to take on leadership responsibilities through local and national representative bodies. The data also show critical areas of concern where better support is needed to help them continue this contribution, and where policy stances and government actions are on the agenda. In every country, policy makers therefore have choices to make. In the context of the urgency of MDG targets that are now at the mid-way point, and a continuing focus on national sustainable development strategy targets, governments face the challenge of identifying the most effective interventions their budgets can support.
For investment planners, this highlighting of the centrality of gender equality becomes enormously significant. The point is not simply the efficacy of education in and of itself, but the derived benefits from education, in providing girls and women with the capacity, means and autonomy to take decisions ensuring the livelihood, health and future well-being of themselves and their households.
33 Both summarized in Abu-Ghaida and Klasen (2004: 19–20), using the growth effects illustrated earlier, pp. 14-15.
“Countries failing to meet the goal of gender equity in secondary education will lose annual per capita output growth at a rate of 0.1–0.3 percent per year”
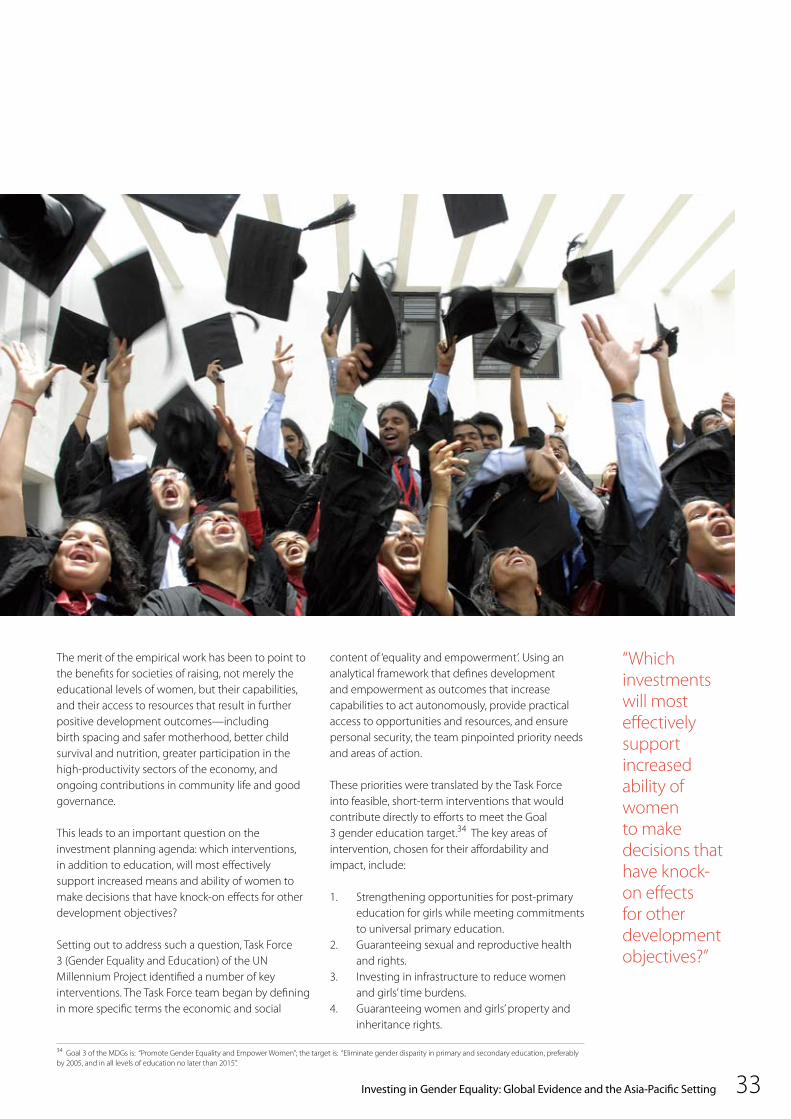
Investing in Gender Equality: Global Evidence and the Asia-Pacific Setting 33
The merit of the empirical work has been to point to the benefits for societies of raising, not merely the educational levels of women, but their capabilities, and their access to resources that result in further positive development outcomes—including birth spacing and safer motherhood, better child survival and nutrition, greater participation in the high-productivity sectors of the economy, and ongoing contributions in community life and good governance.
This leads to an important question on the investment planning agenda: which interventions, in addition to education, will most effectively support increased means and ability of women to make decisions that have knock-on effects for other development objectives?
Setting out to address such a question, Task Force 3 (Gender Equality and Education) of the UN Millennium Project identified a number of key interventions. The Task Force team began by defining in more specific terms the economic and social
content of ‘equality and empowerment’. Using an analytical framework that defines development and empowerment as outcomes that increase capabilities to act autonomously, provide practical access to opportunities and resources, and ensure personal security, the team pinpointed priority needs and areas of action.
These priorities were translated by the Task Force into feasible, short-term interventions that would contribute directly to efforts to meet the Goal 3 gender education target.34 The key areas of intervention, chosen for their affordability and impact, include:
1. Strengthening opportunities for post-primary education for girls while meeting commitments to universal primary education.
2. Guaranteeing sexual and reproductive health and rights.
3. Investing in infrastructure to reduce women and girls’ time burdens.
4. Guaranteeing women and girls’ property and inheritance rights.
“Which investments will most effectively support increased ability of women to make decisions that have knock-on effects for other development objectives?”
34 Goal 3 of the MDGs is: “Promote Gender Equality and Empower Women”; the target is: “Eliminate gender disparity in primary and secondary education, preferably by 2005, and in all levels of education no later than 2015”.
Investing in Gender Equality: Global Evidence and the Asia-Pacific Setting34
35 UN Millennium Project (2005).
Conclusions And Strategic Priorities
5. Eliminating gender inequality in employment by decreasing women’s reliance on informal employment, closing gender gaps in earnings, and reducing occupational segregation.
6. Increasing women’s share of seats in national parliaments and local government bodies.
7. Significantly reducing violence against girls and women.35
The value of this programme of priorities is that it identifies interventions that governments can realistically incorporate into their investment agendas. The proposed measures have in common that they are affordable, and feasible in the short to medium term; that is, these are steps that can realistically be taken within the time period remaining to the 2015 target year for the MDGs, or within the time frame of medium-term expenditure frameworks. At the same time, investments in these areas would impact favourably on the attainment of other MDG-type targets. For example, investments in water supply and local networks to supply cleaner, environmentally sustainable fuels (LPG and kerosene) not only reduce girls’ time burdens and afford them the possibility of attending school; they also reduce the use of environmentally harmful biomass-sourced fuels, and improve air quality and health conditions in the dwellings of poor people, reducing respiratory disease burdens on the health system. Improving legal frameworks that ensure labour rights, and developing vocational training programmes, can bring more women into higher-productivity sectors, raise household incomes, and improve children’s access to immunization programmes and other vital services.
The list, therefore, sets out a basic core of strategic interventions that policy makers would want to maintain in the policy, planning, and financing cycle of the budget programme, not only in the annual calendar, but also in their medium-term expenditure programmes and dialogues with the donor community.
It is important to recognize at the same time that these interventions are not only a question of financial investments. Their full implementation over the long term would demand institutional, legal, and social changes, with a strong political will among policy makers and opinion leaders. As the following section notes, building and maintaining a close relationship between government policy departments and gender equality advocates in civil society as well as government will serve as an important factor in sustaining public support for
continuing gender equality interventions.
Financing Gender EqualityTo deliver a programme that identifies the costs of essential investments in gender equality and carries them through to implementation, governments need to ensure several components of their strategic programme.
i. First, to calculate the financial costs of the investment component of these interventions, countries require a number of inputs into their planning process for financing development objectives. They must identify their populations in need and the unit costs of specific interventions (including facilities, personnel, and delivery programmes), and calculate the costs and savings of scaling up to a target date.
ii. Second, they need to assess which of the possible investments will be most strategic in a context of limited means, choosing those that have synergies with other goals as well as impact on gender equality.
iii. Third, having assessed financial needs in the light of this strategic analysis, they need to link their priorities to an explicit framework within the annual budget estimates, and to defend these priorities through the technical and policy discussions that will shape the eventual expenditure and revenue outcome.
As these points suggest, in the process of identifying, costing, and financing priority interventions for gender equality, it will be important to find synergies with investments in the whole range of mainstream budget expenditures. In a context of budget limitations, not all desirable investments will survive to appear in actual budget lines.
Identifying the priority interventions to finance gender equality must be calculated, therefore, on the basis of explicit assessments in every country and sub-national areas within countries. Looking at the first priority on the list, for example, ‘Strengthening opportunities for post-primary education for girls’, costing the financial investment requires more information than the number of girls out of school, the catchment population of each school, and the unit cost of school facilities and operations. Sectoral needs assessments must be based on accurate information as to the particular impediments to school attendance in different areas of the country. If the obstacle is, for example, the lack of water or efficient cooking fuel supply, so that young women are spending several hours of each day in activity
“Champions of key investments need to defend them through the course of budget estimates and calculation of the financing gap, and to support preservation of the fiscal space for strategic development expenditures”
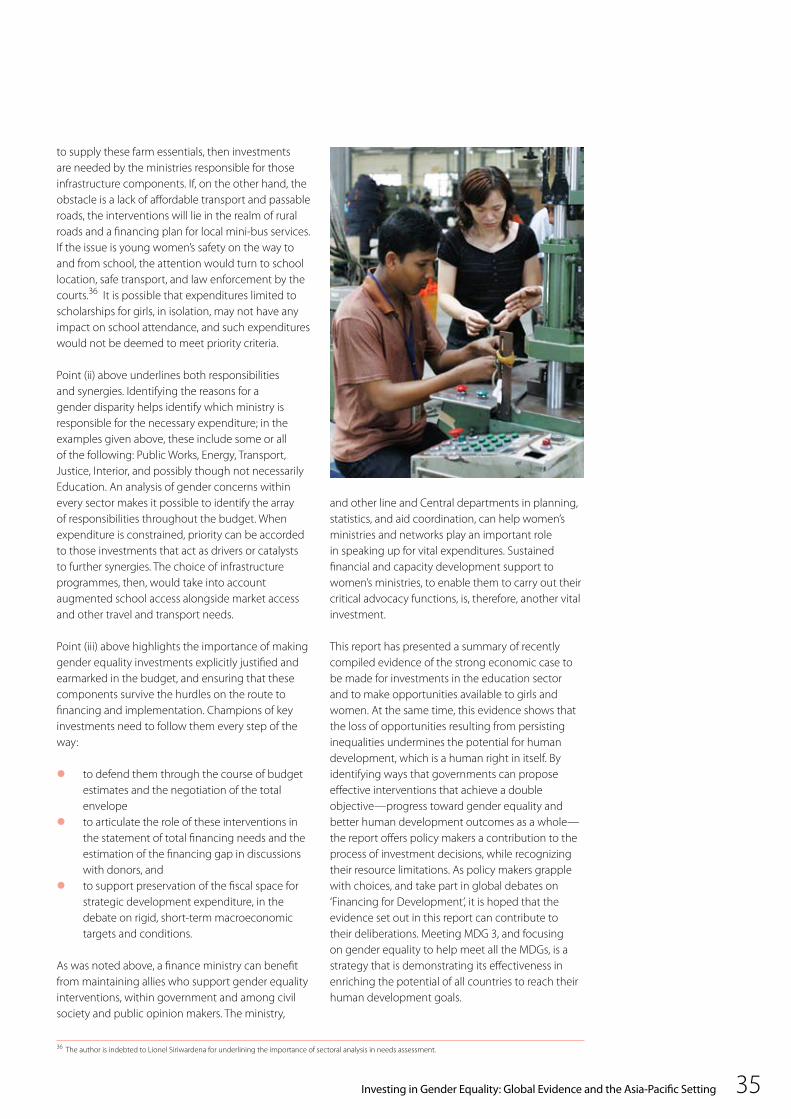
Investing in Gender Equality: Global Evidence and the Asia-Pacific Setting 35
to supply these farm essentials, then investments are needed by the ministries responsible for those infrastructure components. If, on the other hand, the obstacle is a lack of affordable transport and passable roads, the interventions will lie in the realm of rural roads and a financing plan for local mini-bus services. If the issue is young women’s safety on the way to and from school, the attention would turn to school location, safe transport, and law enforcement by the courts.36 It is possible that expenditures limited to scholarships for girls, in isolation, may not have any impact on school attendance, and such expenditures would not be deemed to meet priority criteria.
Point (ii) above underlines both responsibilities and synergies. Identifying the reasons for a gender disparity helps identify which ministry is responsible for the necessary expenditure; in the examples given above, these include some or all of the following: Public Works, Energy, Transport, Justice, Interior, and possibly though not necessarily Education. An analysis of gender concerns within every sector makes it possible to identify the array of responsibilities throughout the budget. When expenditure is constrained, priority can be accorded to those investments that act as drivers or catalysts to further synergies. The choice of infrastructure programmes, then, would take into account augmented school access alongside market access and other travel and transport needs.
Point (iii) above highlights the importance of making gender equality investments explicitly justified and earmarked in the budget, and ensuring that these components survive the hurdles on the route to financing and implementation. Champions of key investments need to follow them every step of the way:
to defend them through the course of budget estimates and the negotiation of the total envelope
to articulate the role of these interventions in the statement of total financing needs and the estimation of the financing gap in discussions with donors, and
to support preservation of the fiscal space for strategic development expenditure, in the debate on rigid, short-term macroeconomic targets and conditions.
As was noted above, a finance ministry can benefit from maintaining allies who support gender equality interventions, within government and among civil society and public opinion makers. The ministry,
and other line and Central departments in planning, statistics, and aid coordination, can help women’s ministries and networks play an important role in speaking up for vital expenditures. Sustained financial and capacity development support to women’s ministries, to enable them to carry out their critical advocacy functions, is, therefore, another vital investment.
This report has presented a summary of recently compiled evidence of the strong economic case to be made for investments in the education sector and to make opportunities available to girls and women. At the same time, this evidence shows that the loss of opportunities resulting from persisting inequalities undermines the potential for human development, which is a human right in itself. By identifying ways that governments can propose effective interventions that achieve a double objective—progress toward gender equality and better human development outcomes as a whole—the report offers policy makers a contribution to the process of investment decisions, while recognizing their resource limitations. As policy makers grapple with choices, and take part in global debates on ‘Financing for Development’, it is hoped that the evidence set out in this report can contribute to their deliberations. Meeting MDG 3, and focusing on gender equality to help meet all the MDGs, is a strategy that is demonstrating its effectiveness in enriching the potential of all countries to reach their human development goals.
36 The author is indebted to Lionel Siriwardena for underlining the importance of sectoral analysis in needs assessment.
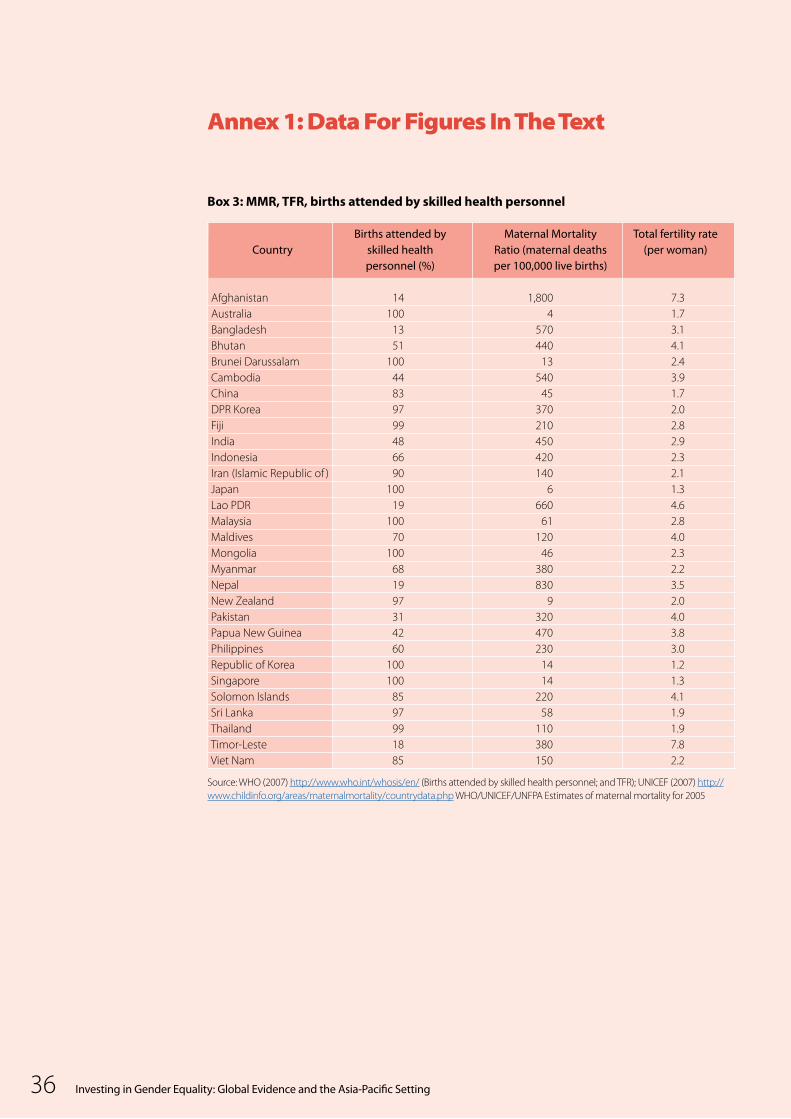
Investing in Gender Equality: Global Evidence and the Asia-Pacific Setting36
Annex 1: Data For Figures In The Text
Box 3: MMR, TFR, births attended by skilled health personnel
Births attended by Maternal Mortality Total fertility rate Country skilled health Ratio (maternal deaths (per woman) personnel (%) per 100,000 live births)
Afghanistan 14 1,800 7.3Australia 100 4 1.7Bangladesh 13 570 3.1Bhutan 51 440 4.1Brunei Darussalam 100 13 2.4Cambodia 44 540 3.9China 83 45 1.7DPR Korea 97 370 2.0Fiji 99 210 2.8India 48 450 2.9Indonesia 66 420 2.3Iran (Islamic Republic of ) 90 140 2.1Japan 100 6 1.3Lao PDR 19 660 4.6Malaysia 100 61 2.8Maldives 70 120 4.0Mongolia 100 46 2.3Myanmar 68 380 2.2Nepal 19 830 3.5New Zealand 97 9 2.0Pakistan 31 320 4.0Papua New Guinea 42 470 3.8Philippines 60 230 3.0Republic of Korea 100 14 1.2Singapore 100 14 1.3Solomon Islands 85 220 4.1Sri Lanka 97 58 1.9Thailand 99 110 1.9Timor-Leste 18 380 7.8Viet Nam 85 150 2.2
Source: WHO (2007) http://www.who.int/whosis/en/ (Births attended by skilled health personnel; and TFR); UNICEF (2007) http://www.childinfo.org/areas/maternalmortality/countrydata.php WHO/UNICEF/UNFPA Estimates of maternal mortality for 2005
Investing in Gender Equality: Global Evidence and the Asia-Pacific Setting36
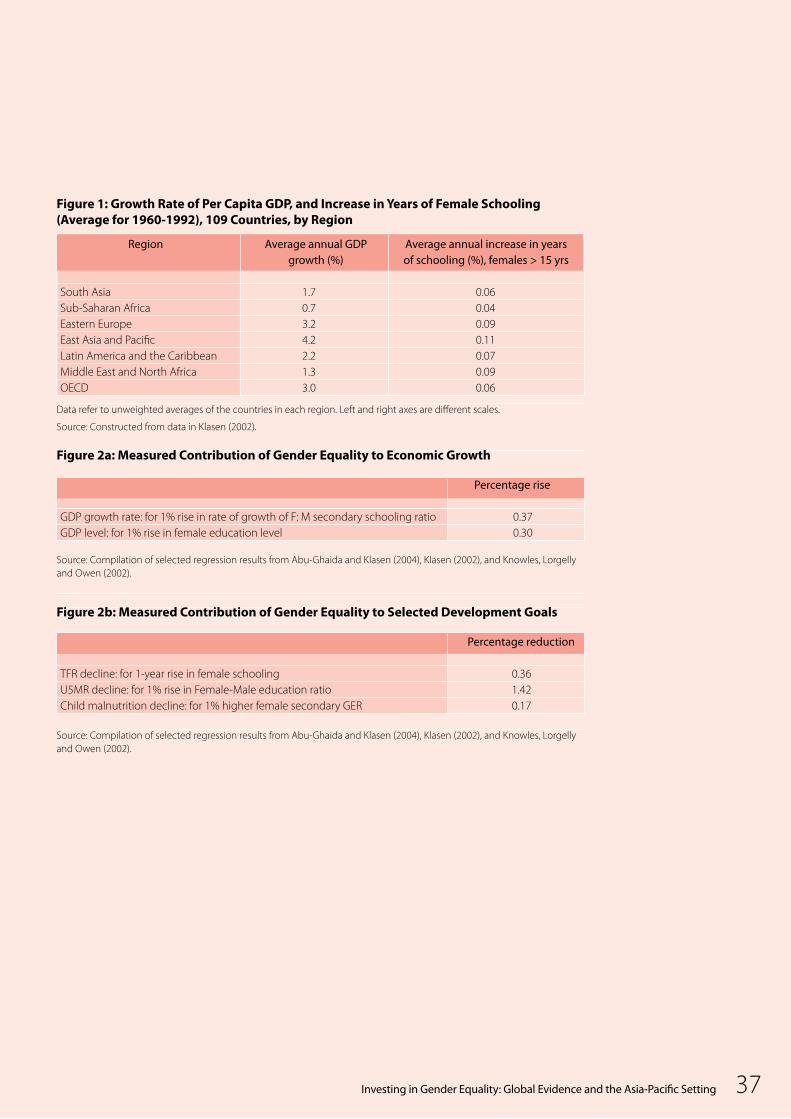
Investing in Gender Equality: Global Evidence and the Asia-Pacific Setting 37
Figure 1: Growth Rate of Per Capita GDP, and Increase in Years of Female Schooling (Average for 1960-1992), 109 Countries, by Region
Region Average annual GDP Average annual increase in years growth (%) of schooling (%), females > 15 yrs
South Asia 1.7 0.06Sub-Saharan Africa 0.7 0.04Eastern Europe 3.2 0.09East Asia and Pacific 4.2 0.11Latin America and the Caribbean 2.2 0.07Middle East and North Africa 1.3 0.09OECD 3.0 0.06
Data refer to unweighted averages of the countries in each region. Left and right axes are different scales.
Source: Constructed from data in Klasen (2002).
Figure 2a: Measured Contribution of Gender Equality to Economic Growth
Percentage rise
GDP growth rate: for 1% rise in rate of growth of F: M secondary schooling ratio 0.37GDP level: for 1% rise in female education level 0.30
Source: Compilation of selected regression results from Abu-Ghaida and Klasen (2004), Klasen (2002), and Knowles, Lorgelly and Owen (2002).
Figure 2b: Measured Contribution of Gender Equality to Selected Development Goals
Percentage reduction
TFR decline: for 1-year rise in female schooling 0.36U5MR decline: for 1% rise in Female-Male education ratio 1.42Child malnutrition decline: for 1% higher female secondary GER 0.17
Source: Compilation of selected regression results from Abu-Ghaida and Klasen (2004), Klasen (2002), and Knowles, Lorgelly and Owen (2002).
Investing in Gender Equality: Global Evidence and the Asia-Pacific Setting 37
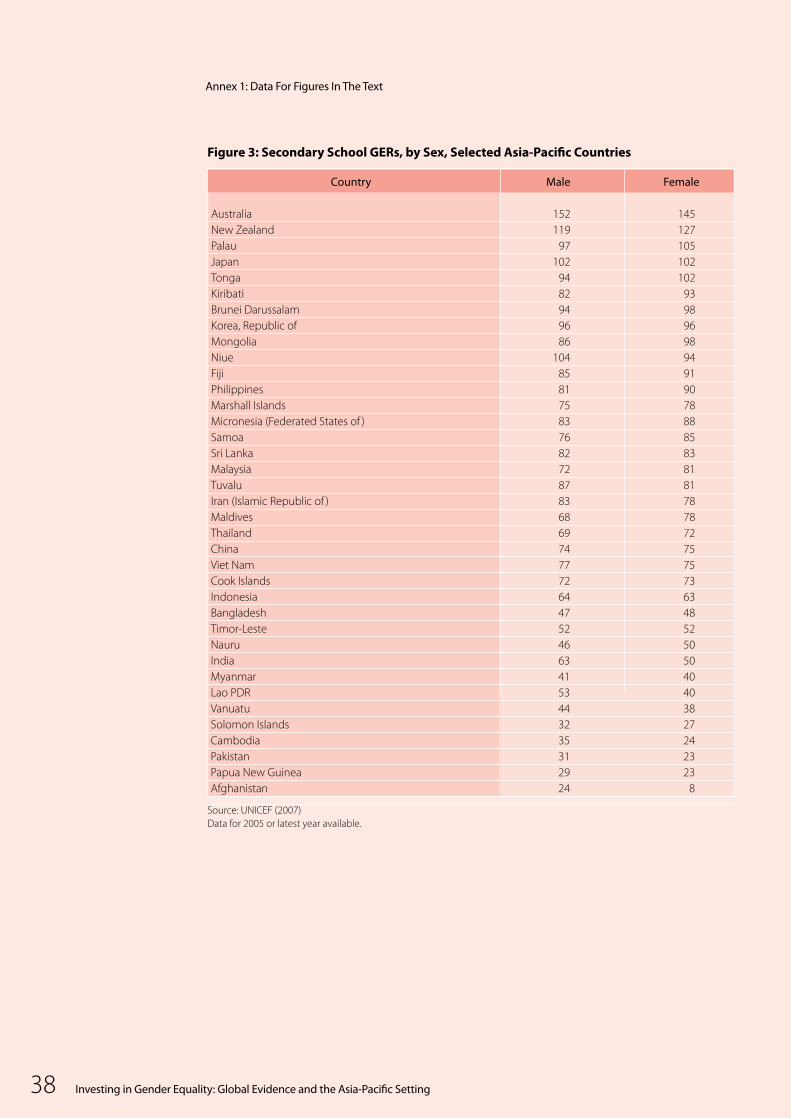
Investing in Gender Equality: Global Evidence and the Asia-Pacific Setting38
Figure 3: Secondary School GERs, by Sex, Selected Asia-Pacific Countries
Country Male Female
Australia 152 145New Zealand 119 127Palau 97 105Japan 102 102Tonga 94 102Kiribati 82 93Brunei Darussalam 94 98Korea, Republic of 96 96Mongolia 86 98Niue 104 94Fiji 85 91Philippines 81 90Marshall Islands 75 78Micronesia (Federated States of ) 83 88Samoa 76 85Sri Lanka 82 83Malaysia 72 81Tuvalu 87 81Iran (Islamic Republic of ) 83 78Maldives 68 78Thailand 69 72China 74 75Viet Nam 77 75Cook Islands 72 73Indonesia 64 63Bangladesh 47 48Timor-Leste 52 52Nauru 46 50India 63 50Myanmar 41 40Lao PDR 53 40Vanuatu 44 38Solomon Islands 32 27Cambodia 35 24Pakistan 31 23Papua New Guinea 29 23Afghanistan 24 8
Source: UNICEF (2007)Data for 2005 or latest year available.
Annex 1: Data For Figures In The Text
Investing in Gender Equality: Global Evidence and the Asia-Pacific Setting38
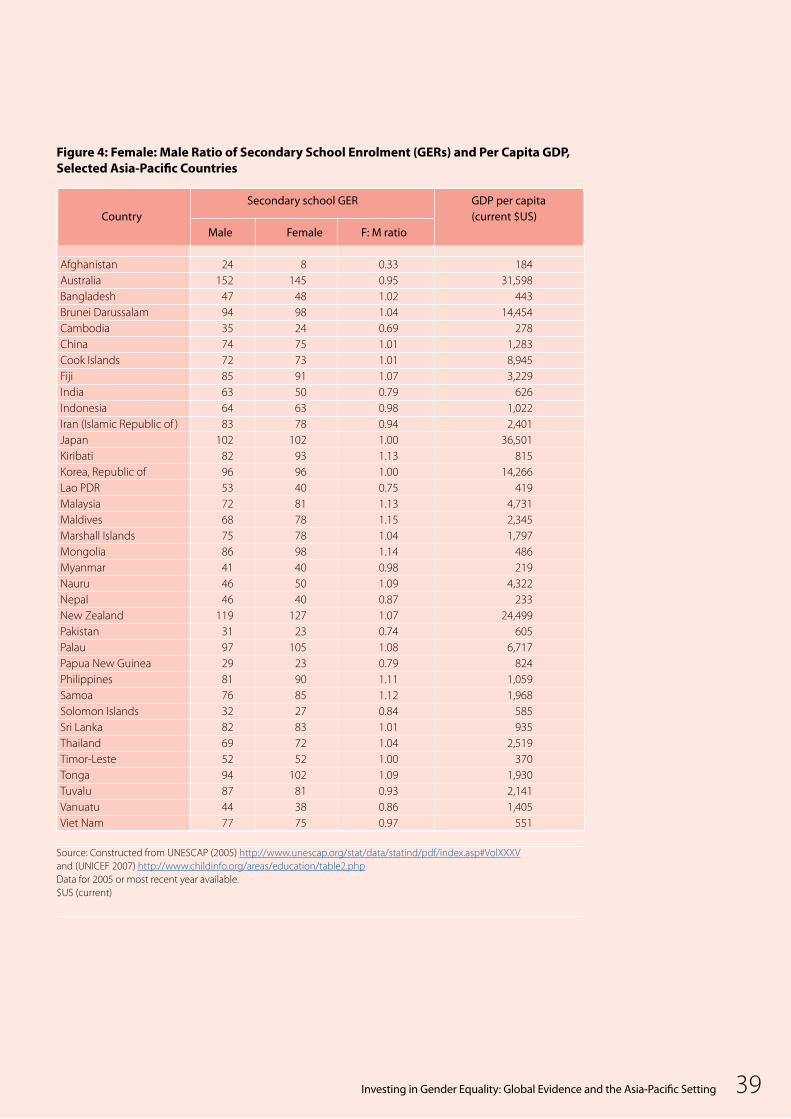
Investing in Gender Equality: Global Evidence and the Asia-Pacific Setting 39
Figure 4: Female: Male Ratio of Secondary School Enrolment (GERs) and Per Capita GDP, Selected Asia-Pacific Countries
Secondary school GER GDP per capita Country (current $US) Male Female F: M ratio
Afghanistan 24 8 0.33 184Australia 152 145 0.95 31,598Bangladesh 47 48 1.02 443Brunei Darussalam 94 98 1.04 14,454Cambodia 35 24 0.69 278China 74 75 1.01 1,283Cook Islands 72 73 1.01 8,945Fiji 85 91 1.07 3,229India 63 50 0.79 626Indonesia 64 63 0.98 1,022Iran (Islamic Republic of ) 83 78 0.94 2,401Japan 102 102 1.00 36,501Kiribati 82 93 1.13 815Korea, Republic of 96 96 1.00 14,266Lao PDR 53 40 0.75 419Malaysia 72 81 1.13 4,731Maldives 68 78 1.15 2,345Marshall Islands 75 78 1.04 1,797Mongolia 86 98 1.14 486Myanmar 41 40 0.98 219Nauru 46 50 1.09 4,322Nepal 46 40 0.87 233New Zealand 119 127 1.07 24,499Pakistan 31 23 0.74 605Palau 97 105 1.08 6,717Papua New Guinea 29 23 0.79 824Philippines 81 90 1.11 1,059Samoa 76 85 1.12 1,968Solomon Islands 32 27 0.84 585Sri Lanka 82 83 1.01 935Thailand 69 72 1.04 2,519Timor-Leste 52 52 1.00 370Tonga 94 102 1.09 1,930Tuvalu 87 81 0.93 2,141Vanuatu 44 38 0.86 1,405Viet Nam 77 75 0.97 551
Source: Constructed from UNESCAP (2005) http://www.unescap.org/stat/data/statind/pdf/index.asp#VolXXXVand (UNICEF 2007) http://www.childinfo.org/areas/education/table2.phpData for 2005 or most recent year available.$US (current)
Investing in Gender Equality: Global Evidence and the Asia-Pacific Setting 39
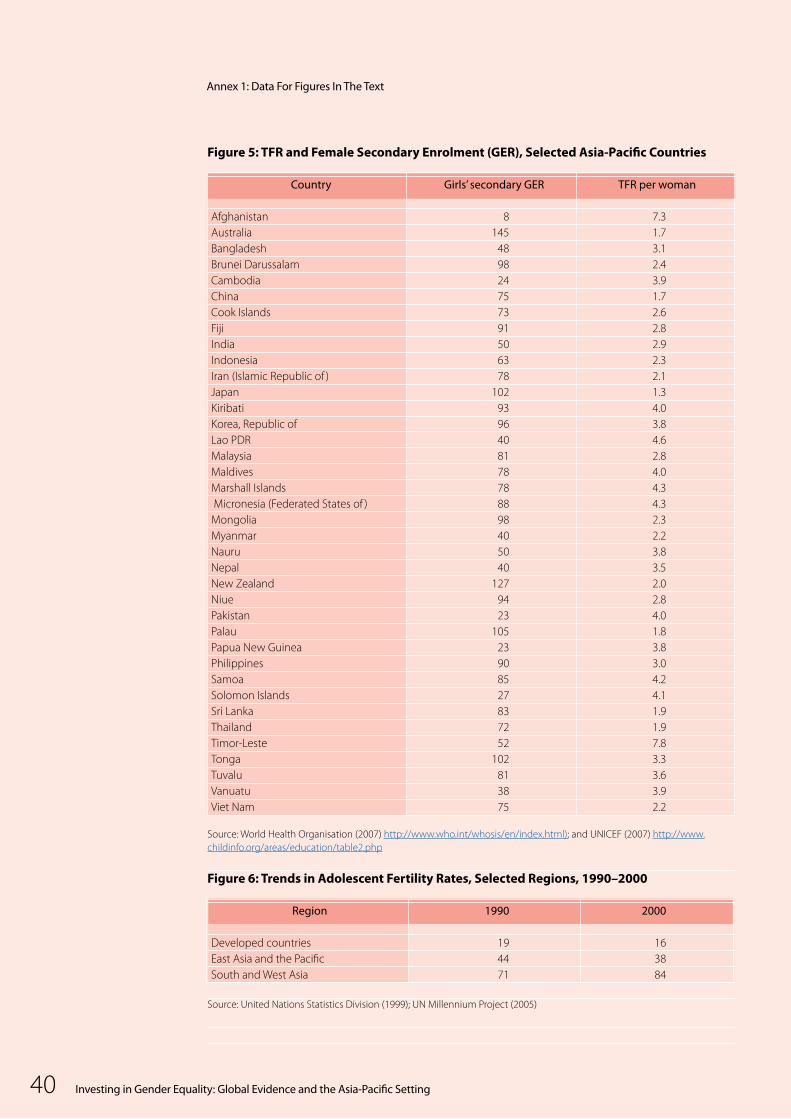
Investing in Gender Equality: Global Evidence and the Asia-Pacific Setting40
Figure 5: TFR and Female Secondary Enrolment (GER), Selected Asia-Pacific Countries
Country Girls’ secondary GER TFR per woman
Afghanistan 8 7.3Australia 145 1.7Bangladesh 48 3.1Brunei Darussalam 98 2.4Cambodia 24 3.9China 75 1.7Cook Islands 73 2.6Fiji 91 2.8India 50 2.9Indonesia 63 2.3Iran (Islamic Republic of ) 78 2.1Japan 102 1.3Kiribati 93 4.0Korea, Republic of 96 3.8Lao PDR 40 4.6Malaysia 81 2.8Maldives 78 4.0Marshall Islands 78 4.3 Micronesia (Federated States of ) 88 4.3Mongolia 98 2.3Myanmar 40 2.2Nauru 50 3.8Nepal 40 3.5New Zealand 127 2.0Niue 94 2.8Pakistan 23 4.0Palau 105 1.8Papua New Guinea 23 3.8Philippines 90 3.0Samoa 85 4.2Solomon Islands 27 4.1Sri Lanka 83 1.9Thailand 72 1.9Timor-Leste 52 7.8Tonga 102 3.3Tuvalu 81 3.6Vanuatu 38 3.9Viet Nam 75 2.2
Source: World Health Organisation (2007) http://www.who.int/whosis/en/index.html); and UNICEF (2007) http://www.childinfo.org/areas/education/table2.php
Figure 6: Trends in Adolescent Fertility Rates, Selected Regions, 1990–2000
Region 1990 2000
Developed countries 19 16East Asia and the Pacific 44 38South and West Asia 71 84
Source: United Nations Statistics Division (1999); UN Millennium Project (2005)
Annex 1: Data For Figures In The Text
Investing in Gender Equality: Global Evidence and the Asia-Pacific Setting40
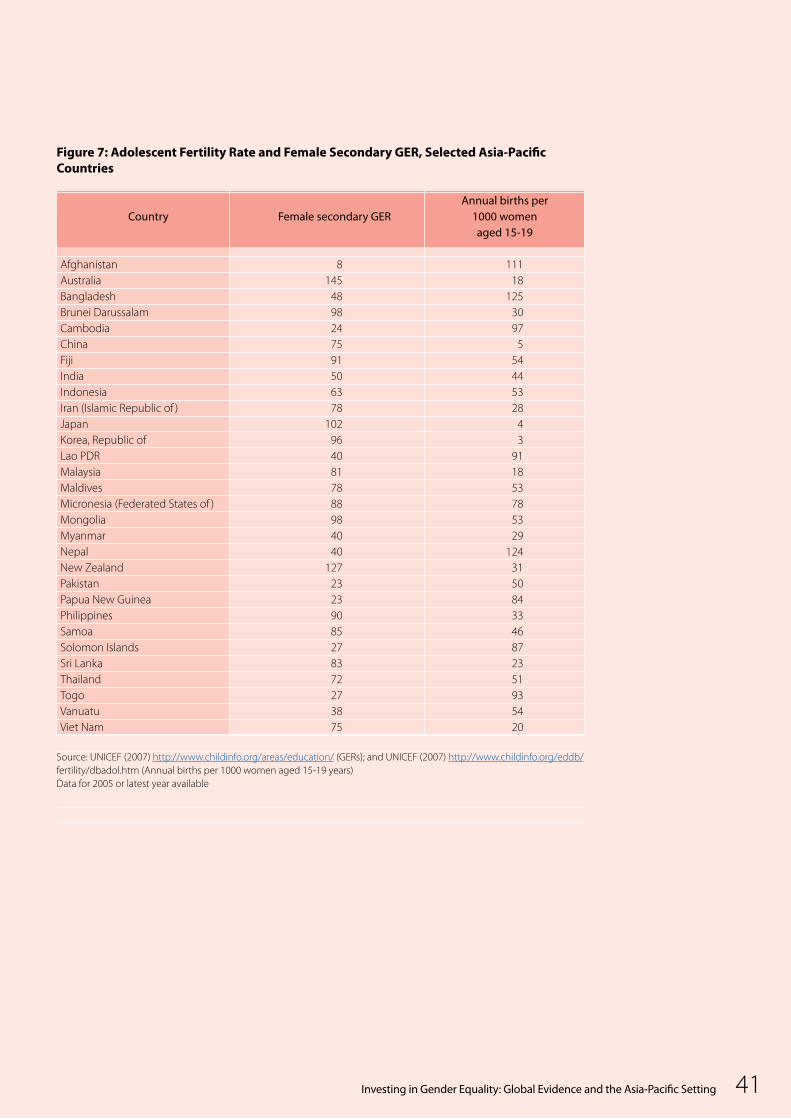
Investing in Gender Equality: Global Evidence and the Asia-Pacific Setting 41
Figure 7: Adolescent Fertility Rate and Female Secondary GER, Selected Asia-Pacific Countries
Annual births per Country Female secondary GER 1000 women aged 15-19
Afghanistan 8 111Australia 145 18Bangladesh 48 125Brunei Darussalam 98 30Cambodia 24 97China 75 5Fiji 91 54India 50 44Indonesia 63 53Iran (Islamic Republic of ) 78 28Japan 102 4Korea, Republic of 96 3Lao PDR 40 91Malaysia 81 18Maldives 78 53Micronesia (Federated States of ) 88 78Mongolia 98 53Myanmar 40 29Nepal 40 124New Zealand 127 31Pakistan 23 50Papua New Guinea 23 84Philippines 90 33Samoa 85 46Solomon Islands 27 87Sri Lanka 83 23Thailand 72 51Togo 27 93Vanuatu 38 54Viet Nam 75 20
Source: UNICEF (2007) http://www.childinfo.org/areas/education/ (GERs); and UNICEF (2007) http://www.childinfo.org/eddb/fertility/dbadol.htm (Annual births per 1000 women aged 15-19 years)Data for 2005 or latest year available
Investing in Gender Equality: Global Evidence and the Asia-Pacific Setting 41
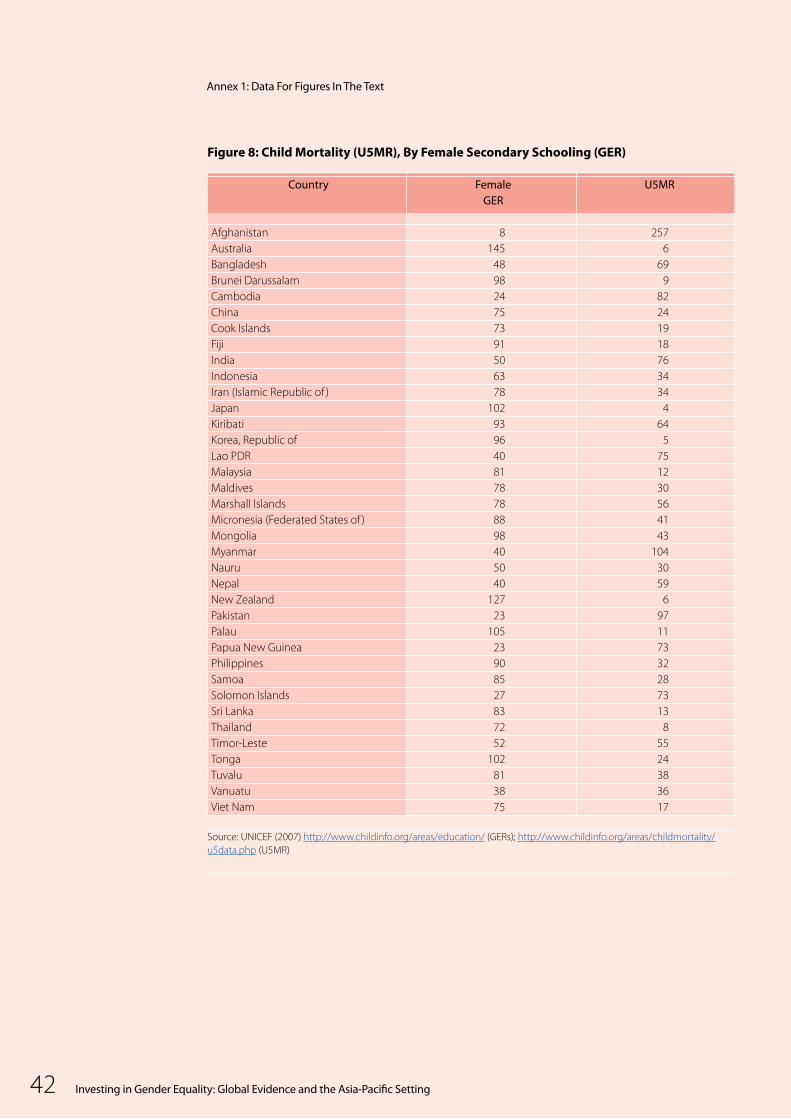
Investing in Gender Equality: Global Evidence and the Asia-Pacific Setting42
Figure 8: Child Mortality (U5MR), By Female Secondary Schooling (GER)
Country Female U5MR GER
Afghanistan 8 257Australia 145 6Bangladesh 48 69Brunei Darussalam 98 9Cambodia 24 82China 75 24Cook Islands 73 19Fiji 91 18India 50 76Indonesia 63 34Iran (Islamic Republic of ) 78 34Japan 102 4Kiribati 93 64Korea, Republic of 96 5Lao PDR 40 75Malaysia 81 12Maldives 78 30Marshall Islands 78 56Micronesia (Federated States of ) 88 41Mongolia 98 43Myanmar 40 104Nauru 50 30Nepal 40 59New Zealand 127 6Pakistan 23 97Palau 105 11Papua New Guinea 23 73Philippines 90 32Samoa 85 28Solomon Islands 27 73Sri Lanka 83 13Thailand 72 8Timor-Leste 52 55Tonga 102 24Tuvalu 81 38Vanuatu 38 36Viet Nam 75 17
Source: UNICEF (2007) http://www.childinfo.org/areas/education/ (GERs); http://www.childinfo.org/areas/childmortality/u5data.php (U5MR)
Annex 1: Data For Figures In The Text
Investing in Gender Equality: Global Evidence and the Asia-Pacific Setting42
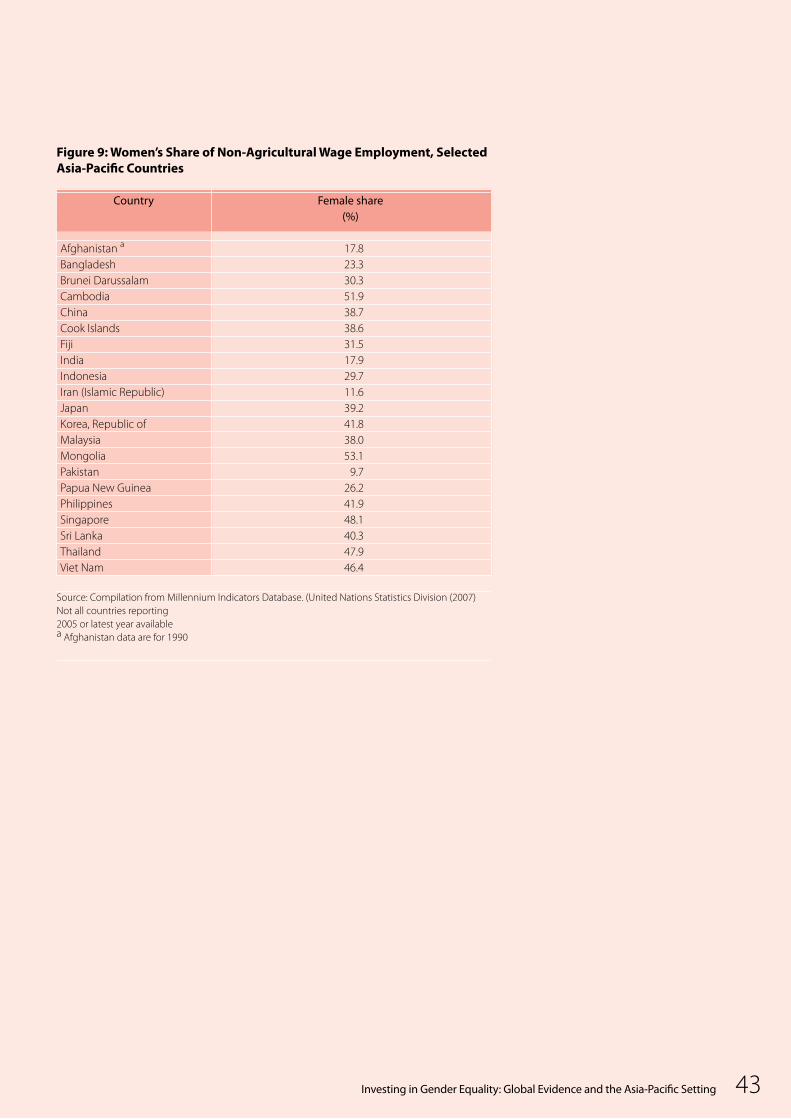
Investing in Gender Equality: Global Evidence and the Asia-Pacific Setting 43
Figure 9: Women’s Share of Non-Agricultural Wage Employment, Selected Asia-Pacific Countries
Country Female share (%)
Afghanistan a 17.8Bangladesh 23.3Brunei Darussalam 30.3Cambodia 51.9China 38.7Cook Islands 38.6Fiji 31.5India 17.9Indonesia 29.7Iran (Islamic Republic) 11.6Japan 39.2Korea, Republic of 41.8Malaysia 38.0Mongolia 53.1Pakistan 9.7Papua New Guinea 26.2Philippines 41.9Singapore 48.1Sri Lanka 40.3Thailand 47.9Viet Nam 46.4
Source: Compilation from Millennium Indicators Database. (United Nations Statistics Division (2007) Not all countries reporting2005 or latest year availablea Afghanistan data are for 1990
Investing in Gender Equality: Global Evidence and the Asia-Pacific Setting 43
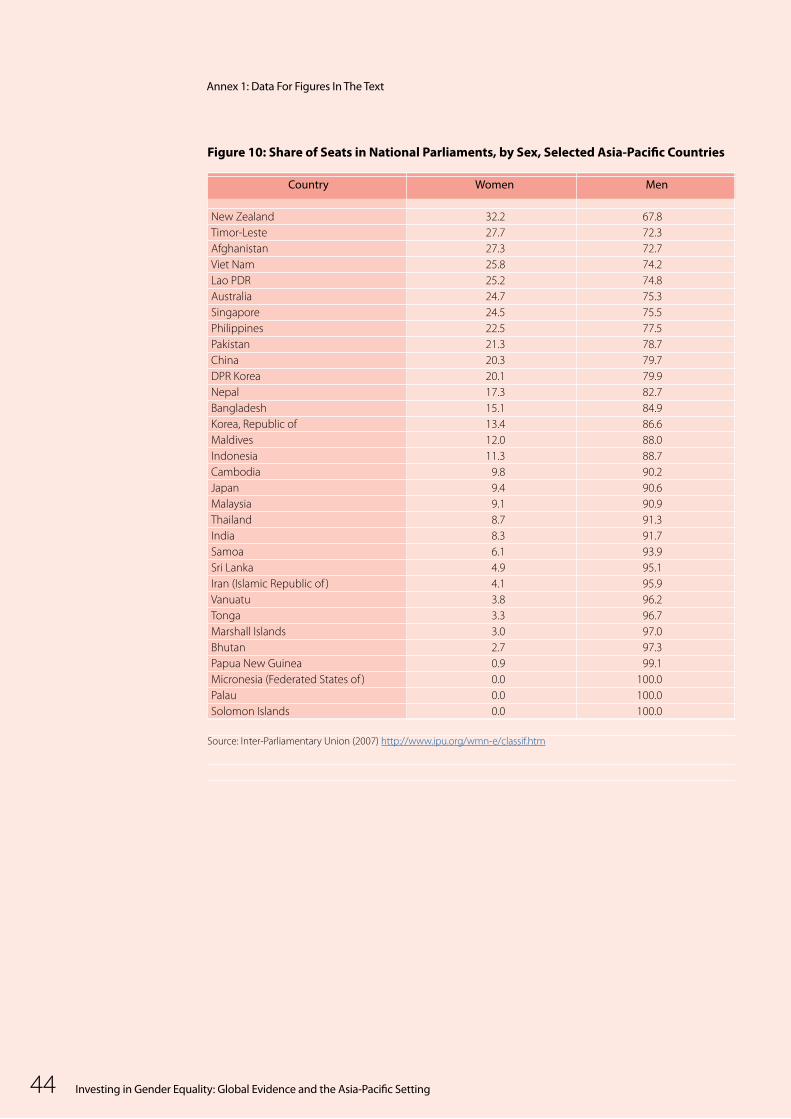
Investing in Gender Equality: Global Evidence and the Asia-Pacific Setting44
Figure 10: Share of Seats in National Parliaments, by Sex, Selected Asia-Pacific Countries
Country Women Men
New Zealand 32.2 67.8Timor-Leste 27.7 72.3Afghanistan 27.3 72.7Viet Nam 25.8 74.2Lao PDR 25.2 74.8Australia 24.7 75.3Singapore 24.5 75.5Philippines 22.5 77.5Pakistan 21.3 78.7China 20.3 79.7DPR Korea 20.1 79.9Nepal 17.3 82.7Bangladesh 15.1 84.9Korea, Republic of 13.4 86.6Maldives 12.0 88.0Indonesia 11.3 88.7Cambodia 9.8 90.2Japan 9.4 90.6Malaysia 9.1 90.9Thailand 8.7 91.3India 8.3 91.7Samoa 6.1 93.9Sri Lanka 4.9 95.1Iran (Islamic Republic of ) 4.1 95.9Vanuatu 3.8 96.2Tonga 3.3 96.7Marshall Islands 3.0 97.0Bhutan 2.7 97.3Papua New Guinea 0.9 99.1Micronesia (Federated States of ) 0.0 100.0Palau 0.0 100.0Solomon Islands 0.0 100.0
Source: Inter-Parliamentary Union (2007) http://www.ipu.org/wmn-e/classif.htm
Annex 1: Data For Figures In The Text
Investing in Gender Equality: Global Evidence and the Asia-Pacific Setting44

Investing in Gender Equality: Global Evidence and the Asia-Pacific Setting 45
Figure 11: Women in National Parliaments, Asia-Pacific and World Averages
Women’s share of seats (%)
World average 16.9Asia 16.4Pacific 14.5Arab states 9.6Sub-Saharan Africa 17.0Europe 20.5Americas 19.5
Source: Inter-Parliamentary Union (2007) http://www.ipu.org/wmn-e/classif.htm
Figure 12: Do Reservation Systems Help?
Women’s share of parliamentary seats (%)
Countries with quotas Countries without quotas 21.7 11.8
Source: Inter-Parliamentary Union (2007) http://www.ipu.org/wmn-e/classif.htm
Investing in Gender Equality: Global Evidence and the Asia-Pacific Setting 45
Investing in Gender Equality: Global Evidence and the Asia-Pacific Setting46
References
Abu-Ghaida, D. and S. Klasen (2004). “The Economic and Human Development Costs of Missing the Millennium Development Goal on Gender Equality”. Discussion Paper 29710, The World Bank, Washington, D.C., http://siteresources.worldbank.org/EDUCATION/Resources/278200-1099079877269/547664-1099079934475/MDG_Gender_Equity.pdf.
Abu-Ghaida, D. and S. Klasen (2004a). “The Costs of Missing the Millennium Development Goal on Gender Equity.” World Development, Vol. 32, No. 7, pp. 1075-1107.
Alexander, P. (with S. Baden) (2000). “Glossary on Macroeconomics from a Gender Perspective.” BRIDGE Report No. 48, Prepared by BRIDGE, Institute of Development Studies, University of Sussex, Brighton, in collaboration with GTZ-German Technical Cooperation (Deutsche Gesellschaft für Technische Zusammenarbeit (GTZ) GmbH), February, http://www.ids.ac.uk/bridge/Reports/re48c.pdf.
Bailey, P. (2007). http://www.universalrights.net/main/creation.htm
Barroso, C. and F. Girard (2003). “Reproductive Health and Gender Equality”. Background paper for the UN Task Force on Education and Gender Equality (final version 02/01/04), New York, http://www.mdgender.net/upload/monographs/ReproductiveHealth_and_GenderEquality_1.doc.
Bhalla, N. (2007). India Child Malnourishment Rates Worse than Africa. Reuters, AlertNet, New Delhi, http://www.alertnet.org/thenews/newsdesk/DEL334973.htm.
Bradley, C. (1999). “Economic Development and Violence Against Women: Some Observations from Papua New Guinea.” in Panel Session on Gender Violence: Costs and Economic Development Impacts, The World Bank Poverty Reduction and Economic Management (PREM) Week Workshop, Washington, D.C.,13–14 July.
Buvinic, M., A. R. Morrison and M. Shifter (1999). “Violence in the Americas: A Framework for Action”. in A. R. Morrison and M. L. Biehl (eds), Too Close to Home: Domestic Violence in the Americas, Washington, D.C.: Inter-American Development Bank.
Chen, M., J. Vanek, F. Lund, J. Heintz, R. Jhabvala and C. Bonner (2005). Progress of the World’s Women 2005: Women, Work and Poverty. United Nations Development Fund for Women (UNIFEM), New York, http://www.un-ngls.org/women-2005.pdf.
DFID (2007). “Maternal deaths in Nepal halved”. Developments Magazine. The Department for Internatioal Development. London. The Limehouse Group. http://www.developments.org.uk/
Dollar, D. and R. Gatti (1999). “Gender Inequality, Income and Growth: Are Good Times Good for Women?” Mimeo, Washington, D.C.: The World Bank.
ESCAP-UNDP-ADB (2005). A Future within Reach. United Nations Economic and Social Commission for Asia and the Pacific, Bangkok.
Fiji Times (2007). “Fiji Praised for Sex Education Classes.” International Planned Parenthood Federation (IPPF), The Fiji Times Online, reported in Push Journal 01/Mar/07, London, http://www.ippf.org/en/News/Intl+news/Fiji+praised+for+sex+education+classes.htm.
Fiji Women’s Crisis Centre (2005). http://www.fijiwomen.com/index.php?id=1621.
Gatti, R. (1999). “A Cross-Country Analysis of Fertility Determinants.” Mimeo., The World Bank, Washington, D.C.
Hayward, Ruth (2001). “Linking an End to Gender Violence with Gains for Additional Human Rights Concerns and Development Goals”. http://www.un-instraw.org/en/research/mensroles/vss/vss_3_3.html.
Investing in Gender Equality: Global Evidence and the Asia-Pacific Setting 47
Inter-Parliamentary Union (IPU) (2007), “Women in National Parliaments.” 30 November. http://www.ipu.org/wmn-e/classif.htm.
International Organization for Migration, cited on UNESCO (no date) http://www2.unescobkk.org/culture/webtraffickingV2/ShowStatistic.aspx?MainID=1012
International Labour Organization (2004). Global Employment Trends for Women 2004. ILO, Geneva, http://kilm.ilo.org/GET2004/DOWNLOAD/trendsw.pdf.
Joekes, S. (1995). “Trade Related Employment for Women in Industry and Services in Developing Countries.” Occasional Paper 5, United Nations Research Institute for Social Development, United Nations Development Programme, Geneva, http://www.unrisd.org/unrisd/website/document.nsf/d2a23ad2d50cb2a280256eb300385855/608f5d4f133083b580256b67005b6b37/$FILE/opb5.pdf.
King, E. M. and M. A. Hill (eds) (1993). Women’s Education in Developing Countries: Barriers, Benefits, and Policies. Johns Hopkins University Press, Baltimore
Klasen, S. (1999). “Does Gender Inequality Reduce Growth and Development?” In Policy Research Report on Gender and Development, Working Paper Series, No. 7, World Bank Development Research Group, Poverty Reduction and Economic Management Network, Washington, D.C.
Klasen, S. (2002). “Low Schooling for Girls, Slower Growth for All? Cross-Country Evidence on the Effect of Gender Inequality”. in World Bank Economic Review, Vol. 16, No. 3, pp. 345-373.
Knowles, S., P. K. Lorgelly, and P. D. Owen (2002). “Are Educational Gender Gaps a Brake on Economic Development? Some Cross-Country Empirical Evidence.” Oxford Economic Papers, Vol. 54, pp. 118–149.
Lagerlöf, N. P. (2003). “Gender Equality and Long-Run Growth.” Journal of Economic Growth, Vol. 8, pp. 403-426.
Panos India (2007) “Antiretrovirals for all? - Obstacles in accessing treatement” New Delhi
Pradhan, B. and R. Sundar (2006) “Gender Impact of HIV and AIDS in India” for NACO, UNDP, NCAER. New Delhi
Schultz, T. P. (1994). “Changing World Prices, Women’s Wages, and the Fertility Transition in Sweden.” Journal of Political Economy, Vol. 101, pp. 1126-1154.
Smith, L. and L. Haddad (1999). “Explaining Child Malnutrition in Developing Countries.” International Food Policy Research Institute Research Report No. 111, Washington, D.C: International Food Policy Research Institute.
Summers, L. H. (1991). “Investing in All the People.” Policy Research Working Paper Series No. 905, World Bank, Washington, D.C., pp. 31.http://www-wds.worldbank.org/servlet/WDSContentServer/WDSP/IB/1992/05/01/000009265_3961003011714/Rendered/PDF/multi_page.pdf.
Swaminathan, H., Batla, N., and Chakraborty. “Women’s property rights as an AIDS response”. ICRW, UNDP and The Global Coalition on Women and AIDS. Washington DC
UN Economic and Social Commission for Asia and the Pacific (2004). “Gender Equality and Empowerment: A Profile of the ESCAP Region.” Prepared for the High-level Intergovernmental Meeting to Review Regional Implementation of the Beijing Platform for Action, and its Regional and Global Outcomes, 7-10 September, E/ESCAP/BPA/, Statistics Division. UNESCAP. Bangkok, http://www.unescap.org/publications/detail.asp?id=1042.

Investing in Gender Equality: Global Evidence and the Asia-Pacific Setting48
UN Economic and Social Commission for Asia and the Pacific (2005). Statistical Indicators for Asia and the Pacific. Volume XXXV. Statistics Division. UNESCAP. Bangkok. http://www.unescap.org/stat/data/statind/pdf/index.asp#VolXXXV
UN Millennium Project (2005). “Taking Action: Achieving Gender Equality and Empowering Women.” Task Force on Education and Gender Equality, Earthscan, London, http://www.unmillenniumproject.org/documents/Gender-complete.pdf.
UNAIDS/WHO (2006, 2007). AIDS Epidemic Update: Special Report on HIV/AIDS. Geneva, December, http://www.unaids.org/en/HIV_data/epi2006/default.asp.
UNESCO Institute for Statistics (2005). Children Out of School: Measuring Exclusion from Primary Education. United Nations Educational, Scientific and Cultural Organisation (UNESCO) and United Nations Children’s Fund (UNICEF), Montreal, http://www.ibe.unesco.org/cops/Animation/UNICEF_%20UESCOrepchild.pdf.
UNICEF (2007). UNICEF Statistics Online Database, 2007 http://www.childinfo.org/areas/education/.
United Nations Development Group (2003). “Indicators for Monitoring the Millennium Development Goals—Definitions, Rationale, Concepts and Sources.” Series F, No. 95, United Nations. New York, http://mdgs.un.org/unsd/mdg/Host.aspx?Content=Indicators/Handbook.htm.
United Nations Development Programme (2006). Human Development Report 2006 – Beyond Scarcity: Power, Poverty and the Global Water Crisis. New York: UNDP, http://hdr.undp.org/en/reports/global/hdr2006/chapters/.
UNFPA (2005). “Gender-Based Violence: A Price Too High.” in UNFPA. State of the World’s Population, http://www.unfpa.org/swp/2005/english/ch7/chap7_page3.htm.
UNFPA (2006). State of the World’s Population. A Passage to Hope: Women and International Migration. United Nations Population Fund. New York, http://www.unfpa.org/swp/2006/english/introduction.html
United Nations Statistics Division (2007). “Millennium Indicators Database.” United Nations, New York, http://mdgs.un.org/unsd/mdg/Default.aspx.
United Nations Statistics Division DESA (1999). “Women’s Indicators and Statistics Database.” Version 4 (WISTAT 4), United Nations, New York, http://unstats.un.org/unsd/demographic/gender/wistat/index.htm.
United States Centers for Disease Control and Prevention (CDC), 2003. Costs of Intimate Partner Violence Against Women in the United States. http://www.cdc.gov/ncipc/pub-res/ipv_cost/ipv.htm.
World Bank (1993). “The East Asian Miracle: Economic Growth and Public Policy.” A World Bank Policy Research Report, Oxford University Press for the World Bank, Washington, D.C., http://www-wds.worldbank.org/external/default/WDSContentServer/WDSP/IB/1993/09/01/000009265_3970716142516/Rendered/PDF/multi_page.pdf.
World Health Organization (WHO) (2000). Violence Against Women. Fact Sheet No. 239, http://www.who.int/mediacentre/factsheets/fs239/en/index.html.
World Health Organisation (2007). WHOSIS (WHO Statistical Information System). http://www.who.int/whosis/en/index.html.
Yap, Ermi Amor Figueroa (1998). The Economic Costs of Violence Against Women. Policy Issue Briefs of the National Commission on the Role of Filipino Women (NCRFW), http://gina.ph/CyberDyaryo/features/cd1999_0520_014.htm.
References
Investing in Gender Equality: Global Evidence and the Asia-Pacific Setting 49
AWJA Afghan Women Judges AssociationCEDAW Convention on the Elimination of All Forms of Discrimination against WomenCO Country OfficeCSO civil society organizationESCR economic, social, and cultural rightsFLE Family Life Education GBV gender-based violenceGDP gross domestic productGER gross enrolment ratioHIPC heavily indebted poor countriesHPAE high-performing Asian economies IEC information, education, and communication ILO International Labour OrganizationIPU Inter-Parliamentary UnionIT information technology Lao PDR Lao People’s Democratic RepublicLDC least-developed countryLHW Lady Health WorkersLPG liquid petroleum gasMDGs Millennium Development GoalsMMR maternal mortality ratioMP (UN) Millennium ProjectNFHS National Family Health Survey NGO non-government organizationNWMs national women’s ministriesODA Overseas Development AssistanceOECD Organisation for Economic Cooperation and Development
PPP-GDP purchasing-power-parity-based gross domestic productPNG Papua New GuineaPRI Panchayati Raj InitiativePRSP Poverty Reduction Strategy PaperRCC Regional Centre, Colombo (UNDP)SSR sub-Saharan AfricaTFR total fertility rateU5MR under-five mortality rateUDHR Universal Declaration of Human RightsUN United NationsUNAIDS Joint United Nations Programme on HIV/AIDSUNCT United Nations Country TeamUNDP United Nations Development Programme UNESCO United Nations Educational, Scientific and Cultural OrganizationUNICEF United Nations Children’s FundUNFPA United Nations Fund for Population VAW violence against womenVIIT vertical intra-industry tradeWB World BankWHO World Health OrganizationWTO World Trade Organization
Note: All currencies in $US
Abbreviations and Acronyms

Investing in Gender Equality: Global Evidence and the Asia-Pacific Setting50

Authored by Patricia Alexander
Photo Credits: Page 3, UNDP Cambodia; page 31, Koh Miyaoi; all others, Reuters
Edited by: Rama Goyal
Published by UNDP Asia-Pacific Regional Centre Colombo*
Design and layout by Copyline (Pvt) Limited
© UNDP Asia-Pacific Regional Centre Colombo, January 2008
Cover photo - Reuters
First Edition
* The views expressed in this publication are those of the author and do not necessarily represent those of the United Nations, including UNDP. The sharing of this paper with the external audience is aimed at generating a constructive debate and does not constitute an endorsement by UNDP or institutions of the United Nations system.

Asia-Pacific Gender Mainstreaming Programme UNDP Regional Centre in Colombo
DISCUSSION PAPER
Investing in gender equality: Global evidence and the Asia-Pacific setting
UNDP is the UN’s global development network, advocating for change and connecting countries to knowledge, experience and resources to help people build a better life. For further information and your feedback on the publication as well as our work, please write to:
Asia-Pacific Gender Mainstreaming ProgrammeUNDP Regional Centre in Colombo23 Independence Avenue, Colombo 7, Sri LankaTel: (+94-11) 452 6400Fax: (+94-11) 452 6410Email: [email protected] P
rod
uced
by
Co
pyl
ine (P
vt) Ltd