INVESTIGATION OF THE PROCESS PARAMETERS USING RESPONSE SURFACE METHODOLOGY ON THE QUALITY OF...
19
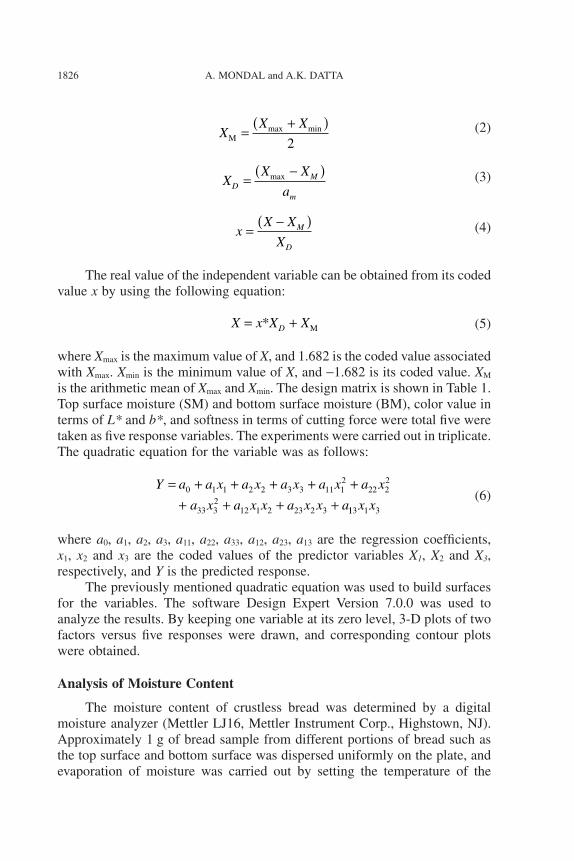
INVESTIGATION OF THE PROCESS PARAMETERS USING RESPONSE SURFACE METHODOLOGY ON THE QUALITY OF CRUSTLESS BREAD BAKED IN AWATER-SPRAYING OVEN ARPITA MONDAL and ASHIS KUMAR DATTA 1 Agricultural and Food Engineering Department Indian Institute of Technology Kharagpur, WB 721302, India Accepted for Publication August 17, 2009 ABSTRACT A special type of water-spraying oven was developed where crustless bread was prepared by gently baking the dough at different combinations of baking temperature and baking time, and spraying water at prefixed intervals on the surface of the dough. Response surface methodology was used to investigate the influence of predictor variables on bread quality in terms of surface moisture, bottom moisture, color value in terms of L*, b* and softness in terms of cutting force. In the study, each predictor variable was varied at three levels. Temperature was varied, at 160C, 170C and 180C, baking time at 25 min, 30 min and 35 min, and water (2 mL)-spraying interval as 6 min, 8 min and 10 min. Quadratic models were developed to fit with experimental data. Higher temperature and time led to a decreased surface, bottom moisture and b*. Shorter water-spraying intervals led to an increased L* and softness. At optimized conditions, when baking temperature, baking time and water- spraying interval were 168.73C, 29.28 min and 8.6 min, respectively, crustless bread was yellowish white. PRACTICAL APPLICATIONS Crustless bread is not a popular item of merchandise as baking of crustless bread is not commonly practiced. In this work, an attempt has been made to optimize the process parameters associated with the baking of crustless bread. The application in the industry is likely to be far-reaching once the outcome of this work is properly documented. Present statistics point to a 45% wastage of bread loaves because of removal of crust at homes. Crustless bread could lead to 1 Corresponding author. TEL: 03222-283118; FAX: 91-3222-282244; EMAIL: akd@ agfe.iitkgp.ernet.in Journal of Food Process Engineering 34 (2011) 1819–1837. All Rights Reserved. © 2010 Wiley Periodicals, Inc. DOI: 10.1111/j.1745-4530.2009.00560.x 1819
Transcript of INVESTIGATION OF THE PROCESS PARAMETERS USING RESPONSE SURFACE METHODOLOGY ON THE QUALITY OF...

jfpe_560 1819..1837
INVESTIGATION OF THE PROCESS PARAMETERS USINGRESPONSE SURFACE METHODOLOGY ON THE QUALITY OF
CRUSTLESS BREAD BAKED IN A WATER-SPRAYING OVEN
ARPITA MONDAL and ASHIS KUMAR DATTA1
Agricultural and Food Engineering DepartmentIndian Institute of TechnologyKharagpur, WB 721302, India
Accepted for Publication August 17, 2009
ABSTRACT
A special type of water-spraying oven was developed where crustlessbread was prepared by gently baking the dough at different combinations ofbaking temperature and baking time, and spraying water at prefixed intervalson the surface of the dough. Response surface methodology was used toinvestigate the influence of predictor variables on bread quality in terms ofsurface moisture, bottom moisture, color value in terms of L*, b* and softnessin terms of cutting force. In the study, each predictor variable was varied atthree levels. Temperature was varied, at 160C, 170C and 180C, baking time at25 min, 30 min and 35 min, and water (2 mL)-spraying interval as 6 min,8 min and 10 min. Quadratic models were developed to fit with experimentaldata. Higher temperature and time led to a decreased surface, bottom moistureand b*. Shorter water-spraying intervals led to an increased L* and softness.At optimized conditions, when baking temperature, baking time and water-spraying interval were 168.73C, 29.28 min and 8.6 min, respectively, crustlessbread was yellowish white.
PRACTICAL APPLICATIONS
Crustless bread is not a popular item of merchandise as baking of crustlessbread is not commonly practiced. In this work, an attempt has been made tooptimize the process parameters associated with the baking of crustless bread.The application in the industry is likely to be far-reaching once the outcome ofthis work is properly documented. Present statistics point to a 45% wastage ofbread loaves because of removal of crust at homes. Crustless bread could lead to
1 Corresponding author. TEL: 03222-283118; FAX: 91-3222-282244; EMAIL: [email protected]
Journal of Food Process Engineering 34 (2011) 1819–1837. All Rights Reserved.© 2010 Wiley Periodicals, Inc.DOI: 10.1111/j.1745-4530.2009.00560.x
1819

a significantly less wastage of loaves as well as better financial return for thebakers. Presently, the crustless bread sold in the market is the result of crustremoval after baking, and it has been established that formation of crust leads tosynthesis of acrylamide, which is a carcinogen. Hence, the baking of crustlessbread can provide the industry with a better quality product as well.
INTRODUCTION
Bread is an ancient food item that covers a large portion of the food guidepyramid. Generally, fresh bread appears with a brownish crust, a pleasantaroma, a soft and elastic crumb and a moist mouthfeel (Giannou et al. 2003).Bread making requires a deep understanding of the many complex raw mate-rial and process interactions that determine final product quality. Baking isthe most important step in bread making. A series of physical, chemical andbiochemical changes such as evaporation of water, formation of porous struc-ture, volume expansion, protein denaturation, starch gelatinization, crust for-mation, etc., take place during bread baking. During baking, crust forms asmaximum evaporation takes place there (Therdthai et al. 2002). The formationof crust and browning during baking appear to be primary contributors to theformation of bread flavor. The browning is mainly the result of a Maillard-typebrowning reaction rather than of caramelization. Crust browning occurs whenthe temperature is greater than 110C and was shown to have an experimentalcorrelation with weight loss during baking and oven temperature. Surfacecolor is an important characteristic of baked products and may be consideredas a critical index of baking (Zanoni et al. 1995). Although Maillard reactionis important for the formation of color and aroma in the bread crust, it is alsoresponsible for the formation of toxic compounds such as acrylamide. Acry-lamide was classified as a probable group 2A carcinogenic compound forhumans by the International Agency for Research on Cancer (IARC) in 1994(Dabrioa et al. 2008). Research programs were initiated, with major findingsbeing the elucidation on the generation of acrylamide by Maillard reactionbetween an amino acid (asparagine) and reducing sugars at temperaturesabove 100C. A significant amount of acrylamide is found in cereal-based foodproducts. Several researchers (Brathen and Knutsen 2005; Granda and Moreira2005; Ahrne et al. 2007) determined the effect of baking time and temperatureon the formation of acrylamide in bread.
Crustless bread is a new concept in the bakery industry. As bread crustcontains acrylamide, which is probable human carcinogen, the applicationof crustless bread in the industry is likely to be far-reaching once theoutcome of this work is properly documented. The British food group RHMlaunched crustless bread baked by proper baking process (http://
1820 A. MONDAL and A.K. DATTA

www.foodnavigator.com). Crustless bread is also available in countriesincluding USA, Italy and Spain but that is made by cutting the crusts offafter baking. Another important consumer research carried out was by theSara Lee Bakery Group in the U.S.A. (http://www.usatoday.com) as itrevealed that 35% of mothers remove the crusts from their children’s sand-wiches. This wastes up to 45% of the actual loaf. So, crustless bread couldlead to significantly lower wastage of loaves as well as better financial returnfor the bakers.
Response Surface Methodology (RSM) is used to evaluate the relativesignificance of several affecting factors even in the presence of complexinteraction. RSM is an empirical statistical modeling technique employed formultiple regression analysis using quantitative data obtained from properlydesigned experiments to solve multivariable equations simultaneously (Raoet al. 2000). In several food research studies, RSM is almost routinely used tooptimize the efficiency of the ingredients such as fibers, improvers (Collaret al. 1999, 2007) and composite flours (Shittu et al. 2007), and the optimiza-tion of various food processes such as extractions, product development,functional food preparation, etc. (Katina et al. 2006; Flander et al. 2007).Ghodke et al. (2009) used RSM to investigate the effects of milling conditionson damaged starch, dough stickiness and chapatti quality.
Until now, there is no commercial oven for the baking of crustless bread.A water-spraying oven was developed (Mondal 2008) where crustless breadwas prepared by gently baking the dough in a controlled temperature andspraying water intermittently during baking, which ensures that the top surfaceof the bread does not get very hot and so no crust is formed. The final qualityof the crustless bread was tested by sensory evaluation, and it was preferredover conventional bread (Mondal 2008). This article was written with theobjective to describe the design and development of water-spraying oven formaking crustless bread and to investigate the influence of baking processparameters, viz. baking temperature, baking time and water-spraying intervalin minutes on the quality of crustless bread in terms of top and bottom surfacemoisture (SM; % wet basis) of crustless bread, color value in terms of L*, b*and softness in terms of cutting force using RSM.
MATERIAL AND METHODS
Development of the Water-Spraying Baking Oven
The developed baking oven was composed of mainly four sections. Thesewere baking chamber, spraying arrangement, water storage tank and instru-mentation panel. The two sides (i.e., inside and outside) of the main baking
QUALITY OF CRUSTLESS BREAD 1821

chamber wall were made with two different materials. The outer wall of thebaking chamber was made with an mild steel (MS) sheet with hammer-tonedpaint. The inner wall of the baking oven was made with stainless steel (SS)sheet 316 grade. The chamber was fully insulated with glass wool. There werefour brass-made stanner-type nozzles (size = 1/4 in.) that were used for spray-ing water at different time intervals. The nozzles were connected to an alumi-num tank that was used for storing water. All the nozzles and pipelines wereinsulated with mica tape. A manually operated lever system was attached to thepipeline for spraying water at different time intervals. A mechanical pressuregauge was connected to the tank to measure the spraying pressure of water. ABiolab-made blower (135 rpm, 0.04 amp.) was used for simultaneous heatdistribution. A digital controller cum indicator with PT 100 sensor indicatedthe chamber temperature. Energy audit was performed when the water-spraying baking oven reached a steady-state condition. During baking, energywas supplied by a 1,500 W heater coil (Kanthal wire 22-gauge) that wasplaced under the bottom wall of the oven. Power was supplied by a three-wayrotary switch. Some part of that energy was used for baking, heating the air andfor the steel elements inside the oven. The remaining part of the heat was lostfrom the six walls of the oven. It was seen by an experiment after reachingsteady-state condition, which means that when the oven air temperaturereached the desirable preset temperature, the heater turns on for 54 s and afterthat, turns off for 3 min to maintain oven air temperature at preset temperature.It occurred repeatedly during 30 min of baking. So energy audit was per-formed for one segment of the steady-state period i.e., at 3 min, 54 s. All thecalculations were performed at optimized baking temperature i.e., at 168C andwhen the outside air temperature of the oven was 30C. To maintain the steadystate during baking, a 1,500-W heater turns on for 54 s. So total energy inputduring the steady-state baking was 81 kJ. After determining heat transfercoefficients at different walls, heat losses from all possible sides were found tototal around 79.04 kJ. The heat transfer coefficients were estimated on anaverage basis, and hence, there is a possibility of assessment error. Heat loss byother mechanisms was not considered and because of this, the sum of utilizedenergy and heat loss was not exactly equal to the total supplied energy. Anisometric view of the baking oven and front view of the baking chamber areshown in Figs. 1 and 2, respectively.
Design of Experiments for Baking of Crustless Bread
An RSM study as described by Montgomery (2001) was conducted todetermine the relative contribution of three predictor variables (temperature,time and water-spraying rate) to the crustless bread quality. The quality wasmeasured in terms of top surface and bottom SM, color value in terms of L*
1822 A. MONDAL and A.K. DATTA

and b*, and softness in terms of cutting force. A central composite rotatabledesign (CCRD) was constructed using the software Design Expert Version7.0.0 (Stat-Ease Corporation, Minneapolis, MN) and was used to analyze theresults. The maximum and minimum predictor variable levels were chosen bycarrying out preliminary trials of baking. Three levels of each predictor vari-ables were incorporated into the design. To study three factors (predictorvariables) at five levels would require 125 experiments, whereas the use ofcentral composite design required 20 runs of experiments. Response variablesmeasuring bread quality in terms of moisture, color and softness are shown inTable 1.
Bread Baking
Flour, yeast, sugar, salt, ghee (evaporated butter) or margarine and waterare the basic ingredients of the bread. These ingredients are mixed accordingto Table 2. Mixing is important for achieving homogenous dough as well as forachieving enough air intakes into the structure. Mixing was performed manu-ally according to straight dough method. The dry ingredients and lukewarmwater were added in a bowl and mixed until the dough was elastic and did not
BakingOven
FlowController
StorageTank
FIG. 1. ISOMETRIC VIEW OF THE BAKING OVEN
FIG. 2. FRONT VIEW OF THE BAKING CHAMBER
QUALITY OF CRUSTLESS BREAD 1823

stretch out excessively. The dough was shaped into a ball and then was pressedsimilar to flat bread so that when its volume increased with its elevation, itresembled a hemisphere on the top. After shaping, the dough was placed intoa bowl for first proofing for about 1 h. A wet cloth was kept upon the bowl ascover to maintain the 80–90% relative humidity. After the first proofing period,
TABLE 1.MEASURED VALUES OF PROCESS PARAMETERS OF CRUSTLESS BREAD BAKED IN
WATER-SPRAYING OVEN
SlNo
Bakingtemperature(in C)
Bakingtime(min)
Watersprayinginterval (min)
Surfacemoisture(%wb)
Bottommoisture(%wb)
L* b* Cuttingforce(N)
1 180 (1) 35 (1) 10 (1) 16.59 23.87 63.41 37.35 0.4122 180 (1) 35 (1) 6 (-1) 20.35 35.4 62.71 32.82 0.2453 180 (1) 25 (-1) 10 (1) 18.59 24.48 64.56 32.92 0.3044 160 (-1) 35 (1) 10 (1) 22.50 26.79 73.27 30.09 0.1725 180 (1) 25 (-1) 6 (-1) 25.35 29.44 75.28 26.57 0.0936 160 (-1) 25 (-1) 10 (1) 33.59 30.96 78.08 20.18 0.0647 160 (-1) 35 (1) 6 (-1) 28.69 29.21 78.85 21.52 0.0938 160 (-1) 25 (-1) 6 (-1) 40.01 32.18 75.51 17.93 0.0499 186.82 (1.682) 30 (0) 8 (0) 16.17 20.37 62.41 37.77 0.294
10 153.18 (-1.682) 30 (0) 8 (0) 41.01 30.72 75.97 16.04 0.04911 170 (0) 38.41 (1.682) 8 (0) 20.15 26.09 70.98 32.20 0.26512 170 (0) 21.59 (-1.682) 8 (0) 29.75 28.62 78.09 21.66 0.08813 170 (0) 30 (0) 11.36 (+1.682) 19.15 24.24 71.94 32.22 0.23014 170 (0) 30 (0) 4.64 (-1.682) 31.15 35.47 77.11 20.52 0.05415 170 (0) 30 (0) 8 (0) 20.96 26.99 78.03 25.95 0.14716 170 (0) 30 (0) 8 (0) 22.85 29.88 78.15 25.16 0.13717 170 (0) 30 (0) 8 (0) 21.19 26.76 77.84 23.07 0.11818 170 (0) 30 (0) 8 (0) 22.45 29.95 78.69 25.55 0.15219 170 (0) 30 (0) 8 (0) 22.91 27.37 76.57 21.09 0.13220 170 (0) 30 (0) 8 (0) 21.06 28.47 74.14 28.74 0.133
Values in the brackets represent the coded values of the independent variables.
TABLE 2.COMPOSITION OF THE BREAD
Ingredients Amount ing (m/m)
Flour 100Water 60Sugar 12.5Salt 1.2Ghee 2.7Yeast 2
1824 A. MONDAL and A.K. DATTA

the dough was punched down and worked lightly to enable the gas to escapeand to redistribute the gas cells. The dough was now divided into balls of 30 geach and shaped to fit lightly in a greased moisture box (diameter 7.5 cm andheight 2.5 cm). The dough was again kept for second proofing for about 1 houruntil its volume became double. The moisture boxes were placed in thecrustless bread-baking oven that was preheated to the set temperature. Duringbaking, temperature was varied at 160C, 170C and 180C, baking time wasvaried at 25 min, 30 min and 35 min, and water (2 mL)-spraying interval wasvaried between 6 min, 8 min and 10 min.
RSM
For each of the response variables, the model summaries and lack of fittests were analyzed for linear or quadratic models. From this information, themost accurate model was chosen via the sequential F-tests, lack of fit tests andother adequacy measures. Three-dimensional (3-D) response surface plotswere generated for each quality parameter. The calculation of optimal process-ing conditions for optimum crustless bread quality was performed using amultiple response method called desirability (Myers and Montgomery 1995).This optimization method incorporates desires and priorities for each of thevariables. In this study, the predictor variables were permitted to be at any levelwithin the range of the design. Statistical experimental design was used tooptimize the baking conditions to obtain acceptable crustless bread. A CCRDwas employed to serve this purpose. The values of X1 (baking temperature)varied between 200C and 220C, X2 (baking time) between 15 min and 21 min,and X3 (water spraying interval) between 3 mL and 5 mL. The representationof variables and analysis of results become easy when the independent vari-ables were coded. In the design, the real values of the independent variables,viz. baking temperature X1, baking time X2 and amount of added water X3 werecoded as x1, x2 and x3, respectively, having values within the range of +am to-am. The values +am and -am were assigned as the maximum and minimumvalues of coded variable x. The values of am and the number of experiments tobe carried out at various combinations of the levels will depend on the numberof independent variables. The value of am is determined by using the followingequation:
amnumber of variables= ( )2
0 25.(1)
In this case, the value of am is 1.682 as in this experiment, the number ofvariables is three. For statistical calculations, the relationship between thecoded values and the actual values are described by the following equation:
QUALITY OF CRUSTLESS BREAD 1825
XX X
M =+( )max min
2(2)
XX X
aDM
m
=−( )max (3)
xX X
XM
D
=−( ) (4)
The real value of the independent variable can be obtained from its codedvalue x by using the following equation:
X x X XD= +* M (5)
where Xmax is the maximum value of X, and 1.682 is the coded value associatedwith Xmax. Xmin is the minimum value of X, and -1.682 is its coded value. XM
is the arithmetic mean of Xmax and Xmin. The design matrix is shown in Table 1.Top surface moisture (SM) and bottom surface moisture (BM), color value interms of L* and b*, and softness in terms of cutting force were total five weretaken as five response variables. The experiments were carried out in triplicate.The quadratic equation for the variable was as follows:
Y a a x a x a x a x a x
a x a x x a x x a
= + + + + ++ + + +
0 1 1 2 2 3 3 11 12
22 22
33 32
12 1 2 23 2 3 113 1 3x x(6)
where a0, a1, a2, a3, a11, a22, a33, a12, a23, a13 are the regression coefficients,x1, x2 and x3 are the coded values of the predictor variables X1, X2 and X3,respectively, and Y is the predicted response.
The previously mentioned quadratic equation was used to build surfacesfor the variables. The software Design Expert Version 7.0.0 was used toanalyze the results. By keeping one variable at its zero level, 3-D plots of twofactors versus five responses were drawn, and corresponding contour plotswere obtained.
Analysis of Moisture Content
The moisture content of crustless bread was determined by a digitalmoisture analyzer (Mettler LJ16, Mettler Instrument Corp., Highstown, NJ).Approximately 1 g of bread sample from different portions of bread such asthe top surface and bottom surface was dispersed uniformly on the plate, andevaporation of moisture was carried out by setting the temperature of the
1826 A. MONDAL and A.K. DATTA

infrared-drying chamber of the instrument at 105C. The moisture content ofthe bread was displayed as percentage moisture in wet basis.
Analysis of Color
Surface color was measured using Minolta Colorimeter (CR-400/410,Konica Minolta Sensing Americas, Inc., Ramsey, NJ). CIE (http://www.answers.com/topic/cie-system) X, Y and Z were the first numericalscales offered to quantify three primary colors red, green and blue, respec-tively. All other scales are derived from the CIE X, Y and Z values. Color wasmeasured in terms of L*, a* and b*. The color was defined by three coordi-nates: L* (lightness), the vertical coordinate that runs from L* = 0 (black) togray, and from gray to L* = 100 (white); a* (redness), the horizontal coordi-nate that runs from -a* (green) to gray, and from gray to +a* (red); and b*(yellowness), another horizontal coordinate that runs from -b* (blue) to gray,and from gray to +b* (yellow).
The values given earlier differ for the color scale because of the way eachrelated to the X, Y and Z values. The relationship between the L, a, b scale andCIE XYZ scale are:
L Y= 10 (7)
a
XY
Y=
−⎡⎣⎢
⎤⎦⎥
17 50 98041
.. (8)
bY
Z
Y=
−⎡⎣⎢
⎤⎦⎥
71 18103. (9)
The relationship between L, a, b scale and L*, a*, b* (Yam and Papadakis2004) scales are the following:
LL
* = ∗255
100 (10)
aa
* = −240
255120 (11)
bb
* = −240
255120 (12)
QUALITY OF CRUSTLESS BREAD 1827

In this studies, only L* and b* were measured to indicate the color of theproduct as a* was not measured because there was no browning in the crust.
Texture Analysis
Force required for cutting the surface of the baked bread was measured bySTEVENS-LFRA Texture Analyzer (Brookfield Engineering, Middleboro,MA). The speed of the cutting needle was fixed at 0.5 mm/s. A needle was fixedwith the texture analyzer probe. The force required by the needle to puncture thebread surface was considered as cutting force. It was measured in newtons.
RESULTS AND DISCUSSION
Effect of Baking Parameters on Crustless Bread Quality
Table 1 shows the levels of selected predictor variables for the centralcomposite design and summarizes the experimental design (actual and codedvalues) for optimization of baking conditions. To examine the combined effectof the three different components (independent variables) on crustless breadmoisture, color and softness, a total number of 20 experiments were carriedout, as evident from Table 1. The experiments were conducted in randomorder. Six repeated experiments were conducted at the central points of thecoded variables to calculate the error sum of squares and lack of fit of thedeveloped regression equations between the responses and the independentvariables (Montgomery 2001). The application of RSM yielded the followingregression equations, which are empirical relations between SM, BM, L*, b*and cutting force, and the test variables (x1 - temperature, x2 - time, x3 - waterspraying interval) in coded units:
SM x x x
x x
= − × − × − ×+ × + × +21 929 6 274 3 335 3 169
2 197 0 911 01 2 3
12
22
. . . .
. . .. .
. .
982 1 926
0 261 0 40332
1 2
1 3 2 3
× + × ×+ × × + × ×
x x x
x x x x
(13)
BM x x x x x= − × − × − × − × + ×+28 188 1 71 0 443 2 855 0 636 0 003
01 2 3 1
222. . . . . .
.8888 1 561 1 604 0 9732
1 2 1 3 2 3× + × × − × × − × ×x x x x x x x. . . (14)
L x x x x x* = − × − × − × − × − ×−77 27 4 58 1 988 1 589 3 059 1 169
1 11 2 3 1
222. . . . . .
. 774 1 531 0 875 0 40832
1 2 1 3 2 3× − × × − × × − × ×x x x x x x x. . . (15)
1828 A. MONDAL and A.K. DATTA

b x x x x x* = + × + × + × + × + ×+24 908 5 6 3 068 3 027 0 821 0 829
0 61 2 3 1
222. . . . . .
. 332 0 352 0 007 0 56232
1 2 1 3 2 3× + × × + × × + × ×x x x x x x x. . . (16)
Cutting force = + × + × + ×+ × +0 131 0 079 0 052 0 056
0 017 01 2 3
12
. . . .
.
x x x
x .. . .
. .
019 0 007 0 013
0 035 0 00222
32
1 2
1 3 2 3
× + × + × ×+ × × + × ×
x x x x
x x x x
(17)
The results of the second order response surface model fitting in the formof ANOVA for SM, BM, L*, b*, and cutting force are given in Tables 3–7,respectively. The analysis of variance (ANOVA) of the quadratic regressionmodel demonstrates that the model is significant, as evident from the Fisher’sF-test value being 45.70, 5.82, 9.06, 14.92 and 60.29 for SM, BM, L*, b* andcutting force, respectively, with a very low probability value for SM(P < 0.0001), BM (P = 0.0055), L* (P = 0.001), b* (P = 0.0001) and cuttingforce (P < 0.0001), respectively. The goodness of fit of the model was checkedby a regression coefficient (R2). In this case, the value of the regressioncoefficient is greater than 0.8397 for all the quality parameters.
The P values were used as a tool to check the significance of each of thecoefficients, which in turn are necessary to understand the pattern of mutualinteractions between the test variables. The smaller the magnitude of the P, themore significant is the corresponding coefficient. Values of P less than 0.05indicate model terms that are significant. The coefficient estimates and the
TABLE 3.ANALYSIS OF VARIANCE FOR SURFACE MOISTURE BY
RESPONSE SURFACE QUADRATIC MODEL
Effect Sum of squares df F value P value
Model 942.35 9 45.70 <0.0001*x1 537.61 1 234.66 <0.0001*x2 151.96 1 66.33 <0.0001*x3 137.36 1 59.96 <0.0001*x1
2 69.67 1 30.41 0.0003*x2
2 11.98 1 5.23 0.0453*x3
2 13.91 1 6.07 0.0334*x1x2 29.68 1 12.96 0.0049*x1x3 0.55 1 0.24 0.6359**x2x3 1.30 1 0.57 0.4680**Lack of fit 18.59 5 4.31 0.0675**R2 0.9763
* Significant; ** not significant.
QUALITY OF CRUSTLESS BREAD 1829

corresponding P values from the ANOVA values shown in Table 3 suggest thatamong the test variables used in the study, temperature, time and water-spraying interval are significant model terms for SM, and all have equal effecton SM as all have a P value less than 0.0001. The square terms of all thepredictor variables such as temperature (P = 0.0003), time (P = 0.0453) and
TABLE 4.ANALYSIS OF VARIANCE FOR BOTTOM MOISTURE BY
RESPONSE SURFACE QUADRATIC MODEL
Effect Sum ofsquares
df F value P value
Model 220.77 9 5.82 0.0055*x1 39.95 1 9.48 0.0117*x2 2.68 1 0.64 0.4440**x3 111.47 1 26.46 0.0004*x1
2 5.83 1 1.38 0.2667**x2
2 0.0002 1 0.00005 0.9943**x3
2 11.36 1 2.70 0.1316**x1x2 19.50 1 4.63 0.0569**x1x3 20.64 1 4.90 0.0513**x2x3 7.55 1 1.79 0.2104**Lack of Fit 31.96 5 3.14 0.1174**R2 0.8397
* Significant; ** not significant.
TABLE 5.ANALYSIS OF VARIANCE FOR L* BY RESPONSE SURFACE
QUADRATIC MODEL
Effect Sum ofsquares
df F value P value
Model 556.36 9 9.06 0.0010*x1 286.53 1 41.98 <0.0001*x2 53.96 1 7.91 0.0184*x3 34.56 1 5.06 0.0482*x1
2 134.94 1 19.77 0.0012*x2
2 19.74 1 2.89 0.1199**x3
2 19.85 1 2.91 0.1189**x1x2 6.14 1 0.90 0.3652**x1x3 0.55 1 0.24 0.6359**x2x3 1.34 1 0.20 0.6675**Lack of Fit 54.28 5 3.88 0.0813**R2 0.8907
* Significant; ** not significant.
1830 A. MONDAL and A.K. DATTA

water-spraying interval (P = 0.0334) were found significant, whereas theabsence of any significant effect of interaction terms between baking tempera-ture and water-spraying interval (P = 0.6359), and baking time and water-spraying interval (P = 0.4680) except interaction of baking temperature andbaking time with P value 0.0049 was found. The fit of the model was also
TABLE 6.ANALYSIS OF VARIANCE FOR b* BY RESPONSE SURFACE
QUADRATIC MODEL
Effect Sum ofsquares
df F value P value
Model 707.14 9 14.92 0.0001*x1 428.36 1 81.32 <0.0001*x2 128.59 1 24.41 0.0006*x3 125.36 1 23.80 0.0006*x1
2 9.72 1 1.85 0.2041**x2
2 9.93 1 1.89 0.1997**x3
2 5.76 1 1.09 0.3203**x1x2 0.99 1 0.19 0.6732**x1x3 0.0004 1 0.00008 0.9928**x2x3 2.53 1 0.48 0.5039**Lack of Fit 18.47 5 0.54 0.7423**R2 0.9307
* Significant; ** not significant.
TABLE 7.ANALYSIS OF VARIANCE FOR CUTTING FORCE BY
RESPONSE SURFACE QUADRATIC MODEL
Effect Sum ofsquares
df F value P value
Model 0.190 9 60.29 <0.0001*x1 0.087 1 199.34 <0.0001*x2 0.037 1 84.81 <0.0001*x3 0.043 1 99.32 <0.0001*x1
2 0.0042 1 9.62 0.0112*x2
2 0.0051 1 11.72 0.0065*x3
2 0.0006 1 1.45 0.2565**x1x2 0.0014 1 3.35 0.0970**x1x3 0.010 1 23.19 0.0007*x2x3 0.00005 1 0.11 0.7416**Lack of Fit 0.0026 5 1.58 0.3140**R2 0.9819
* Significant; ** not significant.
QUALITY OF CRUSTLESS BREAD 1831

expressed by the coefficient of determination R2, which was found to be0.9763, which means 97.63% of the variability in the response could beexplained by the model.
For BM response, shown in Table 4, it is observed that water-sprayinginterval (P = 0.0004) has the largest effect on BM, followed by baking tem-perature (P = 0.0117), whereas the absence of any significant effect of bakingtime, square terms and interaction terms of all the independent parameterswere found.
For L* and b* (shown in Tables 5 and 6), baking temperature has thelargest effect followed by baking time and water-spraying interval. Crust colorwas mostly dominated by baking temperature. Low baking temperature with acombination of lower baking time and lower water-spraying interval canproduce more white bread but that may very well lead to production of breadof unbaked nature and unpalatable moisture levels.
From the ANOVA analysis for cutting force shown in Table 7, it isobserved that all the predictor parameters, viz. baking temperature, bakingtime and water-spraying interval time have equal effect on cutting force as allare significant, with a P value < 0.0001. The square term of baking tempera-ture and baking time were also significant with P values 0.0112 and 0.0065,respectively, whereas absence of any significant effect of square term of waterspraying interval time was found. Absence of any significant effect of inter-action terms of the independent parameters except interaction of baking tem-perature and water spraying interval with P value 0.0007 was found.
So ignoring the insignificant terms SM (Eq. 13), BM (Eq. 14), L*(Eq. 15), b* (Eq. 16) and cutting force (Eq. 17), the equations are reduced tothe following forms
SM x x x x
x12
22
= − × − × − × + ×+ × +21 929 6 274 3 335 3 169 2 197
0 911 01 2 3. . . . .
. .. .982 1 926 1 2× + × ×x x x32 (18)
BM = − × − ×28 188 1 71 2 8551 3. . .x x (19)
L* x x x x12= − × − × − × − ×77 27 4 58 1 988 1 589 3 0591 2 3. . . . . (20)
b* x x x= + × + × + ×24 908 5 6 3 068 3 0271 2 3. . . . (21)
Cutting force x x x
x
= + × + × + ×+ × +0 131 0 079 0 052 0 056
0 017 01 2 3
12
. . . .
. .. .019 0 03522
1 3× + × ×x x x(22)
1832 A. MONDAL and A.K. DATTA

Optimization of process parameters during baking was performed basedon minimizing the SM, BM and b* and maximizing L*, whereas cutting forcewas kept in the range. Satisfying these conditions at an optimized conditiondifferent process parameters, viz. baking temperature, baking time, water-spraying interval time, SM, BM, L*, b* and cutting force were 168.73C,29.28 min, 8.6 min, 22.41% (wet basis), 27.81% (wet basis), 77.47, 24.71 and0.13 N, respectively. So from the optimized conditions, it can be concludedthat baked bread at these conditions was yellowish white as the L* valueindicates toward white and the b* value indicates toward yellow.
The 3-D response plots are generally the graphical representations of theregression equation from which the values of SM, BM, L*, b* and cuttingforce for different settings of variables, respectively, can be predicted. Eachcontour curve represents an infinite number of combinations of the two leastvariables, with the other maintained at zero level. The maximum predictedvalue is indicated by the surface confined in the smallest ellipse in the contourdiagram.
Figure 3 shows the effect of interaction between baking temperature andtime on SM. The response graph showed an increase in baking temperatureand baking time decreases in SM and vice versa. It is obvious that the exposureof bread surface at higher temperature for a long time led to a decreased SMin the bread. Figure 4 shows the interaction effect of baking temperature andwater-spraying interval on BM. Lowest moisture content at the bottom surfaceoccurred at the highest baking temperature (180C) and highest water-sprayinginterval i.e., at 10 min. Figures 5 and 6 shows the response and contour plot for
FIG. 3. RESPONSE SURFACE PLOT OF SURFACE MOISTURE; THE EFFECT OFTEMPERATURE AND TIME ON SURFACE MOISTURE
Other variables are held at zero level.
QUALITY OF CRUSTLESS BREAD 1833

effect of baking time and water-spraying interval on L* and b*, respectively.The highest L*, as well as lowest b*, occurred at the combination of lowerbaking time and lower water-spraying interval. Figure 7 shows the combinedeffect of baking temperature and water-spraying interval on cutting force. Withdecreased baking temperature and water-spraying interval, the softness of thecrustless bread was improved.
FIG. 4. RESPONSE SURFACE PLOT OF BOTTOM MOISTURE: THE EFFECT OFTEMPERATURE AND WATER-SPRAYING INTERVAL ON BOTTOM MOISTURE
Other variables are held at zero level.
FIG. 5. RESPONSE SURFACE PLOT OF L*: THE EFFECT OF BAKING TIME ANDWATER-SPRAYING INTERVAL ON L*
Other variables are held at zero level.
1834 A. MONDAL and A.K. DATTA

CONCLUSIONS
A water-spraying oven was developed for making crustless bread. Theexperiments were carried out with different combinations of baking tempera-ture, baking time and varying water-spraying intervals using RSM. All theresponse variables except BM were significantly affected by the predictor
FIG. 6. RESPONSE SURFACE PLOT OF b*: THE EFFECT OF BAKING TIME ANDWATER-SPRAYING INTERVAL ON b*
Other variables are held at zero level.
FIG. 7. RESPONSE SURFACE PLOT OF CUTTING FORCE: THE EFFECT OF BAKINGTEMPERATURE AND WATER-SPRAYING INTERVAL ON b*
Other variables are held at zero level.
QUALITY OF CRUSTLESS BREAD 1835

variables. BM was significantly affected by baking temperature and water-spraying interval. The developed quadratic models were well-fitted to theexperimental values. The optimization of process parameters was also per-formed by using RSM. At optimized conditions, when baking temperature,baking time and water-spraying interval were 168.73C, 29.28 min and8.6 min, respectively, crustless bread was yellowish white. This study shouldbe useful in deciding the range of crustless bread baking parameters.
REFERENCES
AHRNE, L., ANDERSSON, C., FLOBERG, P., ROSEN, J. and LINGNERT,H. 2007. Effect of crust temperature and water content on acrylamideformation during baking of white bread: Steam and falling temperaturebaking. LWT Food Sci. Technol. 40, 1708–1715.
BRATHEN, E. and KNUTSEN, S.H. 2005. Effect of temperature and time onthe formation of acrylamide in starch based and cereal model system, flatbreads and bread. Food Chem. 92, 693–700.
COLLAR, C., ANDREU, P., MARTINEZ, J.C. and ARMERO, E. 1999.Optimization of hydrocolloid addition to improve wheat bread doughfunctionality: A response surface methodology study. Food Hydrocol-loids 13, 467–475.
COLLAR, C., SANTOS, E. and ROSELL, C.M. 2007. Assessment of therheological profile of fibre-enriched bread doughs by response surfacemethodology. J. Food Eng. 78, 820–826.
DABRIOA, M., SEJERØE-OLSENA, B., MUSSERB, S., EMTEBORGA,H., ULBERTHA, F. and EMONSA, H. 2008. Production of a certifiedreference material for the acrylamide content in toasted bread. FoodChem. 110, 504–511.
FLANDER, L., SALMENKALLIO-MARTTILA, M., SUORTTI, T. andAUTIO, K. 2007. Optimization of ingredients and baking process forimproved wholemeal oat bread quality. Lebensm.-Wiss. Technol. 40,860–870.
GHODKE, S.K., ANANTHANARAYAN, L. and RODRIGUES, L. 2009. Useof response surface methodology to investigate the effects of millingconditions on damaged starch, dough stickiness and chapatti quality.Food Chem. 112, 1010–1015.
GIANNOU, V., KESSOGLOU, V. and TZIA, C. 2003. Quality and safetycharacteristics of bread made from frozen dough. Trends Food Sci.Technol. 14, 99–108.
GRANDA, C. and MOREIRA, R.G. 2005. Kinetics of acrylamide formationduring traditional and vacuum frying of potato chips. J. Food ProcessEng. 28, 478–493.
1836 A. MONDAL and A.K. DATTA

KATINA, K., HEINIÖ, R.L., AUTIO, K. and POUTANEN, K. 2006. Optimi-zation of sourdough process for improved sensory profile and texture ofwheat bread. Lebensm.-Wiss. Technol. 39, 1189–1202.
MONDAL, A. 2008. Development of process technology for baking of crust-less bread. Unpublished PhD Thesis, IIT Kharagpur, India.
MONTGOMERY, D.C. 2001. Design and Analysis of Experiments, 5th Ed.JohnWiley and Sons Inc., New York, NY.
MYERS, R.H. and MONTGOMERY, D.C. 1995. Response Surface Method-ology: Process and Product Optimization Using Designed Experiments.John Wiley & Sons, New York, NY.
RAO, J.K., CHUL-HO, K. and SANG-KI, R. 2000. Statistical optimization ofmedium for the production of recombinant hirudin from Saccharomycescerevisiae using response surface methodology. Process Biochem. 35,639–647.
SHITTU, T.A., RAJI, A.O. and SANNI, L.O. 2007. Bread from compositecassava-wheat flour: I. Effect of baking time and temperature on somephysical properties of bread loaf. Food Res. Int. 40, 280–290.
THERDTHAI, N., ZHOU, W. and ADAMCZAK, T. 2002. Optimisation of thetemperature profile in bread baking. J. Food Eng. 55, 41–48.
YAM, K.L. and PAPADAKIS, S.E. 2004. A simple digital imaging method formeasuring and analyzing color of food surfaces. J. Food Eng. 61, 137–142.
ZANONI, B., PERI, C. and BRUNO, D. 1995. Modelling of browning kineticsof bread crust during baking. Lebensm.-Wiss. Technol. 28, 604–609.
QUALITY OF CRUSTLESS BREAD 1837