Investigation of reproductive toxicity of piperaquine in mice
8
Reproductive Toxicology 29 (2010) 206–213 Contents lists available at ScienceDirect Reproductive Toxicology journal homepage: www.elsevier.com/locate/reprotox Investigation of reproductive toxicity of piperaquine in mice Kevin T. Batty a,b,∗ , Brioni R. Moore a,b , Verity Stirling c , Kenneth F. Ilett c,d , Madhu Page-Sharp a,b,c , Keith B. Shilkin e,f , Ivo Mueller g , Stephen J. Rogerson h , Harin A. Karunajeewa c,i , Timothy M.E. Davis c a School of Pharmacy, Curtin University of Technology, Bentley, Western Australia, Australia b Curtin Health Innovation Research Institute (CHIRI), Curtin University of Technology, Bentley, Western Australia, Australia c School of Medicine and Pharmacology, University of Western Australia, Crawley, Western Australia, Australia d Clinical Pharmacology & Toxicology Laboratory, Path West Laboratory Medicine, Nedlands, Western Australia, Australia e School of Pathology and Laboratory Medicine, University of Western Australia, Crawley, Western Australia, Australia f Anatomical Pathology, Path West Laboratory Medicine, Nedlands, Western Australia, Australia g Papua New Guinea Institute of Medical Research, Goroka, Papua New Guinea h Department of Medicine, The University of Melbourne, Royal Melbourne Hospital, Parkville, Victoria, Australia i Western Health, Footscray, Victoria, Australia article info Article history: Received 28 May 2009 Received in revised form 19 October 2009 Accepted 28 October 2009 Available online 3 November 2009 Keywords: Piperaquine Pregnancy Mouse Toxicology Biochemistry Haematology Pharmacokinetics Malaria abstract Reproductive toxicity data for the antimalarial drug piperaquine (PQ) were obtained in pregnant mice (F 0 ) and their offspring (F 1 and F 2 ). PQ phosphate (0–300 mg/kg/day) was given to pregnant Swiss mice from gestational days 14–18. Two F 1 pups from each litter (one male and one female) proceeded to maturity and were mated within dose groups. Biochemical and haematological indices were determined, and liver and kidney histopathology was assessed in F 1 and F 2 mice at 4 weeks. There were no significant dose- related adverse effects, but leucocytes were mildly elevated (F 1 and F 2 mice) and serum albumin was reduced (F 1 only) in the 300 mg/kg/day group. Low plasma PQ concentrations were detected in F 1 mice at 4 and 8 weeks. Although we found no significant PQ toxicity, clinical data are lacking and monitoring of women and their infants for biochemical and haematological adverse effects is recommended when PQ is used in pregnancy. © 2009 Elsevier Inc. All rights reserved. 1. Introduction Malaria in pregnancy can have dire consequences for both mother and child [1–3]. Pregnant women have an increased suscep- tibility to complications – especially anaemia, cerebral malaria and hypoglycaemia – and death. Foetal development can be impaired, with increased neonatal mortality linked to low birth weight and a higher incidence of pre-term delivery. Due to a paucity of phar- macological and toxicological data, there is a pressing need for detailed safety profiles of antimalarial drugs in pregnant and lac- tating women [1,4–7]. Parasite resistance to conventional drugs such as chloroquine has led to the recommendation that artemisinin-based combina- tion therapy (ACT) is used first-line for acute falciparum malaria ∗ Corresponding author at: School of Pharmacy, Curtin University of Technology, GPO Box U1987, Perth, Western Australia 6845, Australia. Tel.: +61 8 9266 7369; fax: +61 8 9266 2769. E-mail address: [email protected] (K.T. Batty). [4], including women in the second and third trimesters of preg- nancy [1,8–10]. However, based on animal data indicating that artemisinin derivatives can cause adverse effects in the early stages of pregnancy, ACT should be avoided in the first trimester [8,11–13]. Reproductive toxicity data are available for some established ACT partner drugs, such as mefloquine and atovaquone-proguanil, but for several others, including piperaquine (PQ) and amodiaquine, data are scarce [7]. Limited human toxicological data for PQ are available from early pre-clinical and clinical studies [14,15] but additional safety data have been reported from recent clinical trials of fixed-dose for- mulations containing PQ phosphate (PQP) and dihydroartemisinin [14–23]. These studies indicate that, for total doses of PQP up to 60 mg/kg over 2–3 days, the most common adverse effects are a decreased white cell count, elevated serum albumin, elevated serum alanine aminotransferase (ALT), low serum glucose and tran- sient, mild prolongation of the rate-corrected electrocardiographic QT interval [14,15]. Chronic toxicity studies in animal models have shown elevated serum ALT, decreased white cell count, and abnormal liver his- 0890-6238/$ – see front matter © 2009 Elsevier Inc. All rights reserved. doi:10.1016/j.reprotox.2009.10.013
-
Upload
independent -
Category
Documents
-
view
1 -
download
0
Transcript of Investigation of reproductive toxicity of piperaquine in mice

I
KKa
b
c
d
e
f
g
h
i
a
ARRAA
KPPMTBHPM
1
mthwhmdt
ht
GT
0d
Reproductive Toxicology 29 (2010) 206–213
Contents lists available at ScienceDirect
Reproductive Toxicology
journa l homepage: www.e lsev ier .com/ locate / reprotox
nvestigation of reproductive toxicity of piperaquine in mice
evin T. Battya,b,∗, Brioni R. Moorea,b, Verity Stirlingc, Kenneth F. Ilett c,d, Madhu Page-Sharpa,b,c,eith B. Shilkine,f, Ivo Muellerg, Stephen J. Rogersonh, Harin A. Karunajeewac,i, Timothy M.E. Davisc
School of Pharmacy, Curtin University of Technology, Bentley, Western Australia, AustraliaCurtin Health Innovation Research Institute (CHIRI), Curtin University of Technology, Bentley, Western Australia, AustraliaSchool of Medicine and Pharmacology, University of Western Australia, Crawley, Western Australia, AustraliaClinical Pharmacology & Toxicology Laboratory, Path West Laboratory Medicine, Nedlands, Western Australia, AustraliaSchool of Pathology and Laboratory Medicine, University of Western Australia, Crawley, Western Australia, AustraliaAnatomical Pathology, Path West Laboratory Medicine, Nedlands, Western Australia, AustraliaPapua New Guinea Institute of Medical Research, Goroka, Papua New GuineaDepartment of Medicine, The University of Melbourne, Royal Melbourne Hospital, Parkville, Victoria, AustraliaWestern Health, Footscray, Victoria, Australia
r t i c l e i n f o
rticle history:eceived 28 May 2009eceived in revised form 19 October 2009ccepted 28 October 2009vailable online 3 November 2009
eywords:
a b s t r a c t
Reproductive toxicity data for the antimalarial drug piperaquine (PQ) were obtained in pregnant mice (F0)and their offspring (F1 and F2). PQ phosphate (0–300 mg/kg/day) was given to pregnant Swiss mice fromgestational days 14–18. Two F1 pups from each litter (one male and one female) proceeded to maturityand were mated within dose groups. Biochemical and haematological indices were determined, and liverand kidney histopathology was assessed in F1 and F2 mice at 4 weeks. There were no significant dose-related adverse effects, but leucocytes were mildly elevated (F1 and F2 mice) and serum albumin was
iperaquineregnancyouse
oxicologyiochemistryaematology
reduced (F1 only) in the 300 mg/kg/day group. Low plasma PQ concentrations were detected in F1 miceat 4 and 8 weeks. Although we found no significant PQ toxicity, clinical data are lacking and monitoringof women and their infants for biochemical and haematological adverse effects is recommended whenPQ is used in pregnancy.
© 2009 Elsevier Inc. All rights reserved.
harmacokineticsalaria
. Introduction
Malaria in pregnancy can have dire consequences for bothother and child [1–3]. Pregnant women have an increased suscep-
ibility to complications – especially anaemia, cerebral malaria andypoglycaemia – and death. Foetal development can be impaired,ith increased neonatal mortality linked to low birth weight and aigher incidence of pre-term delivery. Due to a paucity of phar-acological and toxicological data, there is a pressing need for
etailed safety profiles of antimalarial drugs in pregnant and lac-
ating women [1,4–7].Parasite resistance to conventional drugs such as chloroquineas led to the recommendation that artemisinin-based combina-ion therapy (ACT) is used first-line for acute falciparum malaria
∗ Corresponding author at: School of Pharmacy, Curtin University of Technology,PO Box U1987, Perth, Western Australia 6845, Australia.el.: +61 8 9266 7369; fax: +61 8 9266 2769.
E-mail address: [email protected] (K.T. Batty).
890-6238/$ – see front matter © 2009 Elsevier Inc. All rights reserved.oi:10.1016/j.reprotox.2009.10.013
[4], including women in the second and third trimesters of preg-nancy [1,8–10]. However, based on animal data indicating thatartemisinin derivatives can cause adverse effects in the early stagesof pregnancy, ACT should be avoided in the first trimester [8,11–13].Reproductive toxicity data are available for some established ACTpartner drugs, such as mefloquine and atovaquone-proguanil, butfor several others, including piperaquine (PQ) and amodiaquine,data are scarce [7].
Limited human toxicological data for PQ are available from earlypre-clinical and clinical studies [14,15] but additional safety datahave been reported from recent clinical trials of fixed-dose for-mulations containing PQ phosphate (PQP) and dihydroartemisinin[14–23]. These studies indicate that, for total doses of PQP up to60 mg/kg over 2–3 days, the most common adverse effects area decreased white cell count, elevated serum albumin, elevated
serum alanine aminotransferase (ALT), low serum glucose and tran-sient, mild prolongation of the rate-corrected electrocardiographicQT interval [14,15].Chronic toxicity studies in animal models have shown elevatedserum ALT, decreased white cell count, and abnormal liver his-

ve Tox
tiI(cht
ipPrm
2
2
K3pp(E
2
E(eafWP
bod
2
AasU
o[Gw5wwmg
2
psotf
1cIr
fawfc
K.T. Batty et al. / Reproducti
ology, with a reported LD50 for PQ of approximately 1100 mg/kgn mice [14]. In a recent murine study [24] that complied withCH Guideline M3 [25], we have shown that high-dose PQP300–600 mg/kg/day for 5 days [26]) caused abnormal white cellounts, elevated ALT and low serum albumin. Liver and kidneyistopathology revealed inflammatory effects and evidence of renaloxicity, respectively [24].
The aim of the present study was to extend our previous tox-cological characterisation of PQ [24] to an investigation of theostnatal development of pups from pregnant mice that were givenQ in the late gestational period. Our study was based on theequirements of ICH Guideline S5 for pre- and postnatal develop-ent studies [27].
. Materials and methods
.1. Materials
PQP (MW = 927.5) was obtained from Yick-Vic Chemicals and Pharmaceuticals,owloon, Hong Kong. Sodium pentobarbitone injection (sodium pentobarbitone0 mg/mL, propylene glycol 40% (v/v), ethanol 10% (v/v) in water; pH 9.5) wasrepared in-house and diluted 50:50 with 0.9% (w/v) sodium chloride injectionrior to use. All general laboratory chemicals and solvents were of analytical gradeSigma–Aldrich Chemical Co., Milwaukee, WI, USA; BDH Laboratory Supplies, Poole,ngland; Merck Pty Limited, Kilsyth, VIC, Australia).
.2. Mice
This study was approved by the Curtin University Animal Experimentationthics Committee. Female Swiss mice (8 weeks old; time-mated; gestational dayGD) 8–9), were obtained from the Animal Resource Centre (ARC; Murdoch, West-rn Australia). Pregnant dams and their litter were individually housed at 22 ◦C in12-h light/dark cycle, as recommended by ARC (personal communication), with
ree access to sterilized commercial food pellets (Glen Forrest Stockfeeders, Perth,estern Australia) and acidified water (pH 2.5). The acclimatisation period prior to
QP dosing was 5 days, at which time pregnancy was confirmed.At the conclusion of experiments, mice were euthanized with sodium pentobar-
itone injection (50–100 mg/kg ip). Pre-determined endpoints for early terminationf experiments included >10% reduction in body weight in 24 h and/or signs ofistress.
.3. Drug treatment
PQP was prepared as a suspension using 5% (w/v) Tragacanth Compound PowderPF [28] and 30% (v/v) Syrup APF in water. The required dose of PQP was mixed instandard 150 �L volume of suspension and administered to the mice using a 1 mL
yringe with an 18G × 38 mm oral gavage needle (Harvard Apparatus, Holliston, MA,SA).
We chose a 5-day PQP regimen of 30–300 mg/kg/day based on our previousbservation of mild toxicity at the upper dose of this range in non-pregnant animals24] and Chinese data indicating that doses up to 360 mg/kg/day for 6 days fromD 9–14 produced no evidence of embryotoxicity or teratogenicity [14]. PQP dosesere sham (water), 0 (vehicle), 30 mg/kg/day, 100 mg/kg/day and 300 mg/kg/day fordays, commencing GD 14 of the 20-day gestation period. This ensured that dosingas completed approximately 2 days pre-partum, during which time the dams (F0)ere not handled to minimise adverse events (personal communication, ARC). Theice were managed in groups of 10–15 pregnant females (2–3 per dose), with new
roups commenced every 3–4 weeks.
.4. First generation (F1)
Dams and pups were monitored daily, but not handled or disturbed, for 3 daysost-partum to minimise adverse events (personal communication, ARC). Litterizes were determined on the fourth post-partum day and the pups were weighedn a daily basis thereafter (5 days per week). Four weeks post-partum, by whichime the pups were expected to be weaned, mice were separated from their damsor the subsequent stages of the study.
Dams were euthanized and blood was collected by cardiac puncture intomL lithium heparin tubes (Vacutainer®; Becton-Dickinson, NJ, USA) which wereentrifuged at 10,000 × g for 5 min (Biofuge Primo, Heraeus Instruments/Kendronstruments Australia Pty Ltd., Lane Cove, NSW, Australia). The plasma was sepa-ated and stored at −80 ◦C until analysed by HPLC to measure PQ concentration.
Three F1 pups from each litter (two female and one male) were housed for aurther 4 weeks (to 8 weeks post-partum), at which time each male was mated withfemale from the same dose group (different litter). One female from each litteras euthanized at this time (8 weeks post-partum) and the blood was harvested
or measurement of plasma PQ concentration, thus providing an estimate of the PQoncentrations in the mated females.
icology 29 (2010) 206–213 207
The remaining 4-week old F1 pups from each litter were divided into threegroups, euthanized and blood was collected by cardiac puncture into: (i) 1 mL EDTAtubes (Vacutainer®; Becton-Dickinson, NJ, USA) for immediate determination ofhaematological indices (Cell-Dyn3200 haematological analyser; Abbott Diagnostics,Illinois, USA); (ii) 1 mL lithium heparin tubes for plasma PQ concentration, stan-dard electrolytes and liver function tests (COBAS Integra®400; Roche DiagnosticSystems, Basel, Switzerland); and (iii) 1 mL fluoride oxalate tubes for measurementof plasma glucose and lactate (COBAS Integra®400). All samples for biochemicalanalysis were centrifuged immediately after collection and the plasma was storedin micro-centrifuge tubes and frozen at −80 ◦C until analysed.
The liver and kidneys were harvested from two mice in each litter, inspectedmacroscopically, washed in 0.9% (w/v) sodium chloride solution and placed in 10%(v/v) formalin in 0.9% (w/v) sodium chloride solution for fixation. The organs from arandom selection of 6 mice in each of the dose groups were dehydrated in increas-ing concentrations of alcohol (0–100%, v/v) and embedded in paraffin blocks whichwere sectioned in 4 �m slices on a Leica rotary microtome (Leica Microsystems,Gladesville, NSW, Australia). The organ sections were stained with haematoxylinand eosin for evaluation of tissue morphology using light microscopy. For liversections, changes in tissue morphology were assessed on a 0–4 scale for nuclearvariations, cytoplasmic eosinophilia, and swelling and vacuolation in both peripor-tal and central areas. All areas of the liver were assessed for Kupffer and sinusoidalcell reactivity and any focal inflammation using the same scale, while kidney sectionswere similarly assessed for proximal and distal tubular cell swelling and vacuolationand for intra-tubular protein.
2.5. Second generation (F2)
The 8-week old F1 generation mice from each original dose group were matedand the females were monitored regularly throughout the pregnancy. Handling pro-cedures were as described for the first generation pups, with mice from each litterbeing monitored and weighed on a daily basis (5 days per week). Four weeks post-partum, the F2 generation pups from each litter were divided into three groups,euthanized and blood was collected by cardiac puncture for determination of plasmaPQ concentration, haematological indices, electrolytes and liver function tests. Theliver, heart and kidneys were harvested from two mice per litter and inspectedmacroscopically. The livers and kidneys from a random selection of 6 mice in eachdose group were prepared and examined microscopically, as described above.
2.6. Plasma PQ concentration
Analysis of the plasma from F0 dams and F1 and F2 generation mice for PQ con-centration was based on a HPLC method for human plasma [29], which was modifiedand validated for mouse plasma (obtained from ARC, Murdoch, Western Aus-tralia). Briefly, mouse plasma samples (0.5 mL) were spiked with chloroquine (CQ;Sigma–Aldrich Chemical Co., Milwaukee, WI, USA) as internal standard (200 ng),alkalinized with 0.1 mL of 1 M NaOH and extracted into 8 mL hexane:isoamyl alco-hol (99:1) by shaking for 10 min. The samples were then centrifuged at 1500 × g for10 min. Supernatant (7 mL) was back extracted into 0.1 mL of 0.05 M HCl by shakingfor 5 min, followed by centrifugation as above. The HCl layer was re-centrifuged at1500 × g for 20 min, after which 50 �L was injected onto the HPLC. Analytes wereseparated on a Chromolith® Performance column (100 mm × 4.6 mm i.d.; E MerckGmbH, Damstadt, Germany) at 30 ◦C with a mobile phase of 6% (v/v) acetonitrile in50 mM KH2PO4 buffer (pH 2.5) pumped at 2 mL/min. Approximate retention timesfor PQ and CQ were 1.4 min and 4.5 min, respectively and the analytes were detectedby UV absorbance at 340 nm. The intra-day relative standard deviations (RSD) of PQwere 6%, 8.1%, and 5.7% at 5 �g/L, 200 �g/L and 1000 �g/L respectively (n = 5), whileinter-day RSDs were 8.8%, 7.4% and 4.8% at 5 �g/L, 200 �g/L and 1000 �g/L respec-tively (n = 15). The limit of quantification and limit of detection were 1.5 �g/L and0.7 �g/L respectively. Mean recoveries of PQ from mouse plasma were 94%, 92% and99.5% at 5 �g/L, 200 �g/L and 2000 �g/L respectively, and were similar to recoveriesfrom human plasma. Quality control samples (5 �g/L and 50 �g/L) were includedfor each sample batch, and the run was accepted provided the values were within±20% of the spiked concentration.
Plasma PQ concentration was determined from a random selection of femaleSwiss mice (F0 dams; n = 14 from each dose group), 5 weeks after administration of0, 30, 100 or 300 mg/kg/day oral PQP from GD 14–18 (parturition was approximately7 days after commencing PQP). Plasma from the 8-week old F1 female pups also wasanalysed by HPLC analysis to provide an estimate of the PQ concentration in themated F1 females. Plasma from the 4-week old (F1 and F2) pups was of insufficientvolume for individual HPLC analysis, hence the plasma from groups of four micewas pooled (150 �L per mouse) for analysis and comparison with pharmacokineticdata reported previously [24].
2.7. Data analysis
Statistical analysis was performed using SigmaStat® version 3.11 andSigmaPlot® version 9.01 (Systat Software, Inc., San Jose, CA, USA). Data are mean ± SDunless otherwise indicated. Water and vehicle control groups were compared usingthe Student’s t-test or Rank Sum test, as appropriate. ANOVA and the Holm-Sidakpost hoc test (for parametric data) or Kruskal–Wallis One Way Analysis of Vari-

208 K.T. Batty et al. / Reproductive Tox
Fig. 1. Weight-time profiles for F1 generation pups from female Swiss mice givenoral PQP. Pregnant (time-mated) F0 mice were given water (�), vehicle (�),3ts
au
3
3
cmoe(
Fmg3a
0 mg/kg/day (�), 100 mg/kg/day (�) and 300 mg/kg/day PQP (©), commencing ges-ational day 14, for five single-daily doses. Number of litters and litter sizes arehown in Table 1. Data are given as mean ± SEM.
nce on Ranks (non-parametric data) were used for comparison of multiple groups,nless otherwise indicated.
. Results
.1. Growth and development
There were no dose-related differences in the number of suc-essful litters in either the F1 or F2 generation mice (Table 1). The
edian number of pups per litter was within the reference rangef normal litter sizes (10–12) and the mean weights of pups inach dose group were similar during the first 4 weeks post-partumTable 1; Figs. 1 and 2). The overall male:female ratio was 1.06:1.
ig. 2. Weight-time profiles for F2 generation pups from F1 generation female Swissice. The F1 generation female mice were mated with males from the same dose
roup (different litters). Dose groups are in regard to F0 mice: water (�), vehicle (�),0 mg/kg/day (�), 100 mg/kg/day (�) and 300 mg/kg/day PQP (©). Number of littersnd litter sizes are shown in Table 1. Data are given as mean ± SEM.
icology 29 (2010) 206–213
In the absence of age-matched comparative data from Swissmice, organ reference ranges were from adult mice. Relative organweights (a more reliable indicator of specific organ weight thanabsolute weight) were similar across all dose groups in F1 and F2generation pups (Tables 2 and 3), except for modest but statisticallysignificant 10% difference between 0 and 30 mg/kg/day groups inproportionate liver weight in the F2 generation pups (Table 3).
3.2. Haematological and biochemical tests
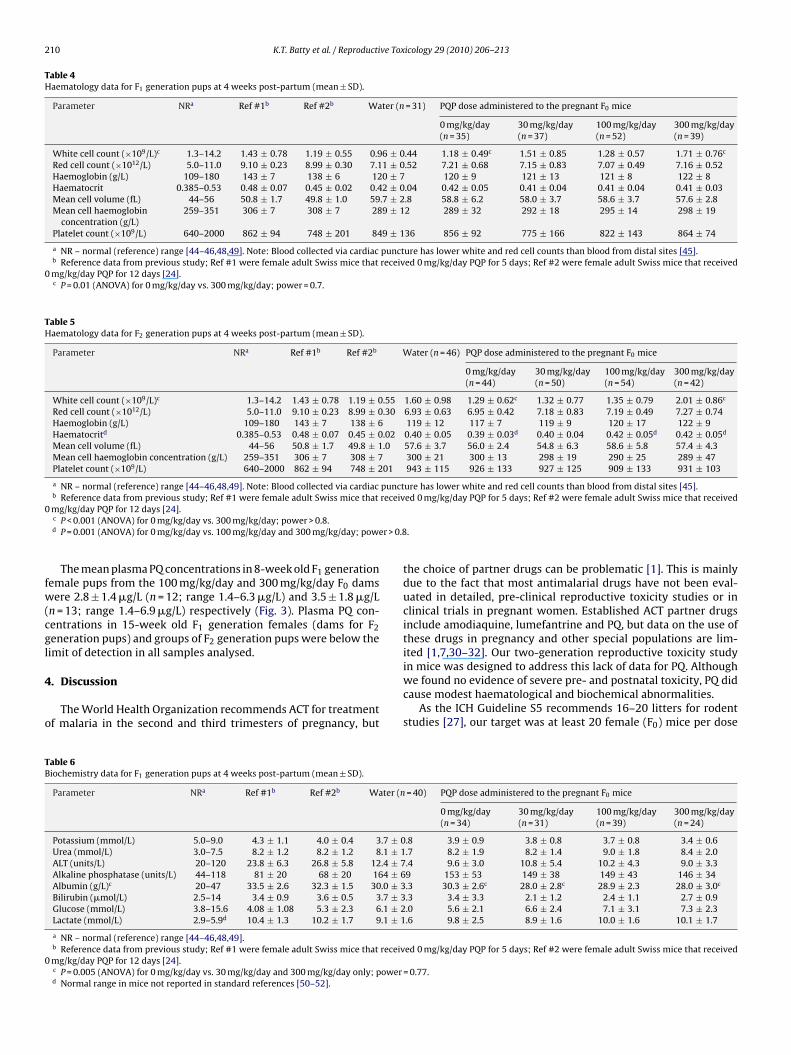
Reference ranges for haematological and biochemical indicesalso were from adult mice. White cell counts in the F1 genera-tion pups were higher in the 300 mg/kg/day group compared tothe vehicle (0 mg/kg/day) group but remained within the refer-ence range. All other haematological indices were similar acrossthe groups and consistent with reported reference ranges (Table 4).In the F2 generation pups, white cell counts were elevated inthe 300 mg/kg/day group but absolute differences between groupswere small and all findings were within reference ranges (Table 5).
Biochemical parameters were similar between groups of F1generation pups, except for a low mean serum albumin concentra-tion in the 30 mg/kg/day and 300 mg/kg/day groups compared tocontrols (Table 6). Electrolyte and glucose concentrations were con-sistent with the reference ranges from adult mice, but some liverfunction tests (e.g., ALT and alkaline phosphatase) were outsidethe reference ranges. Due to the similarity across the dose groupsand in the sham (water) group, these were regarded as age-relateddifferences. All biochemical indices were similar in groups of F2generation pups (Table 7).
3.3. Histopathology
Nuclear variation and cytoplasmic eosinophilia, swelling andvacuolation in both periportal and central areas of the liver weresimilar in F1 and F2 mice from dams treated with either 100 mg/kgor 300 mg/kg PQP during pregnancy and in their respective con-trols (ratings 0–1). There was no evidence of hepatic necrosis andinflammatory changes were unremarkable. Renal histopathologywas similar in F1 and F2 mice and controls, with no evidence ofprotein in the tubules or of abnormalities in tubular cells.
3.4. Plasma PQ concentration
Plasma PQ concentration data and the representation of a two-compartment model from a previous study [24] are shown in Fig. 3.The mean plasma PQ concentration in the female mice (F0 dams)5 weeks after 100 mg/kg/day PQP administration (4 weeks post-partum) was 82 ± 47 �g/L (range 16–203 �g/L). By comparison, theestimated mean PQ concentration was 40 �g/L at the same timein healthy female mice given the same dose of PQP (Fig. 3, fit-ted line; [24]). The mean plasma PQ concentrations in the femalemice (F0 dams) 5 weeks after 30 mg/kg/day and 300 mg/kg/day PQPadministration (4 weeks post-partum) were proportionally appro-priate at 37 ± 29 �g/L (range 4–89 �g/L) and 218 ± 192 �g/L (range31–768 �g/L) respectively.
The plasma PQ concentration in 4-week old F1 generation pupsfrom the 30 mg/kg/day dams (n = 10 pooled samples) was belowthe limit of sensitivity in all samples analysed. The mean plasma PQconcentration in 4-week old F1 generation pups (8 ± 6 �g/L; range3–23 �g/L; n = 11 pooled samples) from the 100 mg/kg/day F0 damswas approximately 10% of the mean maternal plasma PQ concen-
tration (82 �g/L) at the same time (Fig. 3). The mean plasma PQconcentration in 4-week old F1 generation pups (17 ± 5 �g/L; range12–24 �g/L; n = 9 pooled samples) from the 300 mg/kg/day F0 damswas approximately 8% of the mean maternal plasma concentration(218 �g/L) at the same time.
K.T. Batty et al. / Reproductive Toxicology 29 (2010) 206–213 209
Table 1Litters and pup development data following 5 days of PQP administration to pregnant F0 mice (gestational days 14–18).
Parameter Water 0 mg/kg/day 30 mg/kg/day 100 mg/kg/day 300 mg/kg/day
F1 generationNumber of pregnant F0 female mice per group 20 20 21 23 21Weight of pregnant F0 female mice at GD 14 (g; mean ± SD) 36.3 ± 7.9 38.6 ± 4.5 34.9 ± 5.6 36.4 ± 6.2 36.4 ± 5.2Number of successful litters per group (%) 19 (95%) 18 (90%) 20 (95%) 21 (91%) 19 (90%)Median (IQR) number of F1 pups per littera 12 (10–14) 12 (10–14) 10 (8–14) 12 (8–14) 10 (8–11)Mean ± SD number of F1 pups per litterb 11.7 ± 3.2 11.4 ± 3.9 10.2 ± 3.8 11.2 ± 3.9 8.8 ± 3.0Male:female ratioc 1.09:1 1.09:1 0.99:1 1.29:1 1.13:1Mean ± SEM F1 generation pup weight (g) – Day 4 post-partumd 3.06 ± 0.14 2.90 ± 0.12 3.22 ± 0.14 2.97 ± 0.15 2.76 ± 0.18Mean ± SEM F1 generation pup weight (g) – Day 15 post-partumd 6.74 ± 0.26 6.42 ± 0.27 7.13 ± 0.33 6.94 ± 0.36 7.10 ± 0.22Mean ± SEM F1 generation pup weight (g) – Day 25 post-partum d 15.0 ± 0.4 14.5 ± 0.9 15.8 ± 0.7 14.7 ± 0.5 14.6 ± 0.6Median (IQR) day of euthanasia for F1 mice (days post-partum)e 26 (26–29) 29 (26–30) 26 (26–29) 26 (26–29) 26 (25–29)
F2 generationNumber of pregnant F1 female mice per group 13 13 15 15 11Number of successful litters per group (%) 13 (100%) 12 (92%) 15 (100%) 15 (100%) 11 (100%)Median (IQR) number of F2 pups per littera 11 (9–12) 12 (10–13) 11 (9–12) 11 (10–13) 12 (10–14)Mean ± SD number of F2 pups per litterb 10.8 ± 1.7 11.5 ± 1.9 10.8 ± 1.9 11.1 ± 2.8 11.7 ± 1.8Male:female ratioc 1.10:1 1.20:1 1.14:1 0.76:1 0.84:1Mean ± SEM F2 generation pup weight (g) – Day 4 post-partumd 3.58 ± 0.24 3.18 ± 0.13 3.33 ± 0.11 3.39 ± 0.12 3.13 ± 0.19Mean ± SEM F2 generation pup weight (g) – Day 15 post-partumd 6.96 ± 0.23 6.85 ± 0.19 7.01 ± 0.20 7.13 ± 0.27 6.51 ± 0.32Mean ± SEM F2 generation pup weight (g) – Day 23 post-partumd 13.3 ± 0.5 12.1 ± 0.5 12.9 ± 0.6 13.0 ± 0.7 11.5 ± 0.8Median (IQR) day of euthanasia for F2 mice (days post-partum)e 26 (24–28) 27 (25–28) 25 (24–28) 24 (22–26) 25 (23–26)
a Normal litter size is 10–12 pups; range is 2–12 pups [44,45]. Litter size was determined 4 days post-partum; there was no significant difference between groups(Kruskal–Wallis One Way Analysis of Variance on Ranks).
b Normal litter size is 10–12 pups; range is 2–12 pups. Litter size was determined 4 days post-partum; there was no significant difference between groups (One WayAnalysis of Variance).
c No significant difference between dose groups (Chi-square).d No significant difference between dose groups (ANOVA).e No significant difference between groups (Kruskal–Wallis One Way Analysis of Variance on Ranks).
Table 2Organ weight data for F1 generation pups at 4 weeks post-partum (mean ± SD).
Parameter NRa Ref #1b Ref #2b Water (n = 38) PQP dose administered to the pregnant F0 mice
0 mg/kg/day(n = 35)
30 mg/kg/day(n = 38)
100 mg/kg/day(n = 42)
300 mg/kg/day(n = 38)
Total body weight (g) – 27.0 ± 0.8 27.2 ± 1.5 19.4 ± 4.7 19.2 ± 5.8 18.5 ± 5.5 20.2 ± 3.4 19.5 ± 4.1Liver (g) – 1.56 ± 0.06 1.36 ± 0.07 1.19 ± 0.38 1.16 ± 0.42 1.08 ± 0.42 1.15 ± 0.30 1.14 ± 0.31Liver (% total body weight) 4.4–5.8 5.73 ± 0.11 5.01 ± 0.41 6.04 ± 0.60 5.95 ± 0.67 5.73 ± 0.65 5.65 ± 0.66 5.80 ± 0.60Kidney (g) – 0.17 ± 0.02 0.15 ± 0.01 0.12 ± 0.03 0.12 ± 0.04 0.12 ± 0.03 0.12 ± 0.02 0.12 ± 0.03Kidney (% total body weight) c 0.6–0.83 0.62 ± 0.05 0.56 ± 0.05 0.60 ± 0.06c 0.63 ± 0.07c 0.63 ± 0.10 0.60 ± 0.06 0.60 ± 0.08Heart (g) – 0.12 ± 0.01 0.13 ± 0.01 0.12 ± 0.04 0.12 ± 0.05 0.11 ± 0.04 0.13 ± 0.03 0.12 ± 0.04Heart (% total body weight) 0.45–0.67 0.44 ± 0.04 0.47 ± 0.04 0.60 ± 0.09 0.63 ± 0.09 0.61 ± 0.10 0.62 ± 0.08 0.63 ± 0.10
a NR – normal (reference) range for adult mice [45–47].b Reference data from previous study; Ref #1 were female adult Swiss mice that received 0 mg/kg/day PQP for 5 days; Ref #2 were female adult Swiss mice that received
0 mg/kg/day PQP for 12 days [24].c P = 0.04 (t-test) for water and 0 mg/kg/day vehicle; power = 0.4.
Table 3Organ weight data for F2 generation pups at 4 weeks post-partum (mean ± SD).
Parameter NRa Ref #1b Ref #2b Water (n = 26) PQP dose administered to the pregnant F0 mice
0 mg/kg/day(n = 24)
30 mg/kg/day(n = 30)
100 mg/kg/day(n = 30)
300 mg/kg/day(n = 22)
Total body weight (g)c – 27.0 ± 0.8 27.2 ± 1.5 18.7 ± 4.2 19.2 ± 3.3c 17.6 ± 3.5 18.3 ± 3.9 15.8 ± 4.2c
Liver (g)d – 1.56 ± 0.06 1.36 ± 0.07 1.07 ± 0.28 1.13 ± 0.24d 0.93 ± 0.25d 1.03 ± 0.28 0.88 ± 0.30d
Liver (% total body weight)e 4.4–5.8 5.73 ± 0.11 5.01 ± 0.41 5.68 ± 0.48 5.86 ± 0.53e 5.26 ± 0.54e 5.61 ± 0.50 5.50 ± 0.63Kidney (g)f – 0.17 ± 0.02 0.15 ± 0.01 0.12 ± 0.03 0.12 ± 0.02f 0.11 ± 0.02 0.12 ± 0.03 0.10 ± 0.03f
Kidney (% total body weight) 0.6–0.83 0.62 ± 0.05 0.56 ± 0.05 0.62 ± 0.06 0.63 ± 0.07 0.65 ± 0.07 0.64 ± 0.09 0.63 ± 0.05Heart (g) – 0.12 ± 0.01 0.13 ± 0.01 0.11 ± 0.03 0.10 ± 0.01 0.10 ± 0.02 0.11 ± 0.02 0.09 ± 0.02Heart (% total body weight) 0.45–0.67 0.44 ± 0.04 0.47 ± 0.04 0.58 ± 0.09 0.55 ± 0.07 0.60 ± 0.10 0.58 ± 0.08 0.61 ± 0.11
a NR – normal (reference) range for adult mice [45–47].b Reference data from previous study; Ref #1 were female adult Swiss mice that received 0 mg/kg/day PQP for 5 days; Ref #2 were female adult Swiss mice that received
0 mg/kg/day PQP for 12 days [24].c P = 0.02 (ANOVA) for 0 mg/kg/day vs. 300 mg/kg/day only; power = 0.6.d P = 0.008 (ANOVA) for 0 mg/kg/day vs. 30 mg/kg/day and 300 mg/kg/day; power = 0.7.e P < 0.001 (ANOVA) for 0 mg/kg/day vs. 30 mg/kg/day only; power > 0.8.f P = 0.04 (ANOVA) for 0 mg/kg/day vs. 300 mg/kg/day only; power = 0.45.
210 K.T. Batty et al. / Reproductive Toxicology 29 (2010) 206–213
Table 4Haematology data for F1 generation pups at 4 weeks post-partum (mean ± SD).
Parameter NRa Ref #1b Ref #2b Water (n = 31) PQP dose administered to the pregnant F0 mice
0 mg/kg/day(n = 35)
30 mg/kg/day(n = 37)
100 mg/kg/day(n = 52)
300 mg/kg/day(n = 39)
White cell count (×109/L)c 1.3–14.2 1.43 ± 0.78 1.19 ± 0.55 0.96 ± 0.44 1.18 ± 0.49c 1.51 ± 0.85 1.28 ± 0.57 1.71 ± 0.76c
Red cell count (×1012/L) 5.0–11.0 9.10 ± 0.23 8.99 ± 0.30 7.11 ± 0.52 7.21 ± 0.68 7.15 ± 0.83 7.07 ± 0.49 7.16 ± 0.52Haemoglobin (g/L) 109–180 143 ± 7 138 ± 6 120 ± 7 120 ± 9 121 ± 13 121 ± 8 122 ± 8Haematocrit 0.385–0.53 0.48 ± 0.07 0.45 ± 0.02 0.42 ± 0.04 0.42 ± 0.05 0.41 ± 0.04 0.41 ± 0.04 0.41 ± 0.03Mean cell volume (fL) 44–56 50.8 ± 1.7 49.8 ± 1.0 59.7 ± 2.8 58.8 ± 6.2 58.0 ± 3.7 58.6 ± 3.7 57.6 ± 2.8Mean cell haemoglobin
concentration (g/L)259–351 306 ± 7 308 ± 7 289 ± 12 289 ± 32 292 ± 18 295 ± 14 298 ± 19
Platelet count (×109/L) 640–2000 862 ± 94 748 ± 201 849 ± 136 856 ± 92 775 ± 166 822 ± 143 864 ± 74
a NR – normal (reference) range [44–46,48,49]. Note: Blood collected via cardiac puncture has lower white and red cell counts than blood from distal sites [45].b Reference data from previous study; Ref #1 were female adult Swiss mice that received 0 mg/kg/day PQP for 5 days; Ref #2 were female adult Swiss mice that received
0 mg/kg/day PQP for 12 days [24].c P = 0.01 (ANOVA) for 0 mg/kg/day vs. 300 mg/kg/day; power = 0.7.
Table 5Haematology data for F2 generation pups at 4 weeks post-partum (mean ± SD).
Parameter NRa Ref #1b Ref #2b Water (n = 46) PQP dose administered to the pregnant F0 mice
0 mg/kg/day(n = 44)
30 mg/kg/day(n = 50)
100 mg/kg/day(n = 54)
300 mg/kg/day(n = 42)
White cell count (×109/L)c 1.3–14.2 1.43 ± 0.78 1.19 ± 0.55 1.60 ± 0.98 1.29 ± 0.62c 1.32 ± 0.77 1.35 ± 0.79 2.01 ± 0.86c
Red cell count (×1012/L) 5.0–11.0 9.10 ± 0.23 8.99 ± 0.30 6.93 ± 0.63 6.95 ± 0.42 7.18 ± 0.83 7.19 ± 0.49 7.27 ± 0.74Haemoglobin (g/L) 109–180 143 ± 7 138 ± 6 119 ± 12 117 ± 7 119 ± 9 120 ± 17 122 ± 9Haematocritd 0.385–0.53 0.48 ± 0.07 0.45 ± 0.02 0.40 ± 0.05 0.39 ± 0.03d 0.40 ± 0.04 0.42 ± 0.05d 0.42 ± 0.05d
Mean cell volume (fL) 44–56 50.8 ± 1.7 49.8 ± 1.0 57.6 ± 3.7 56.0 ± 2.4 54.8 ± 6.3 58.6 ± 5.8 57.4 ± 4.3Mean cell haemoglobin concentration (g/L) 259–351 306 ± 7 308 ± 7 300 ± 21 300 ± 13 298 ± 19 290 ± 25 289 ± 47Platelet count (×109/L) 640–2000 862 ± 94 748 ± 201 943 ± 115 926 ± 133 927 ± 125 909 ± 133 931 ± 103
a NR – normal (reference) range [44–46,48,49]. Note: Blood collected via cardiac puncture has lower white and red cell counts than blood from distal sites [45].b Reference data from previous study; Ref #1 were female adult Swiss mice that received 0 mg/kg/day PQP for 5 days; Ref #2 were female adult Swiss mice that received
0
r > 0.8
fw(cgl
4
o
TB
0
mg/kg/day PQP for 12 days [24].c P < 0.001 (ANOVA) for 0 mg/kg/day vs. 300 mg/kg/day; power > 0.8.d P = 0.001 (ANOVA) for 0 mg/kg/day vs. 100 mg/kg/day and 300 mg/kg/day; powe
The mean plasma PQ concentrations in 8-week old F1 generationemale pups from the 100 mg/kg/day and 300 mg/kg/day F0 damsere 2.8 ± 1.4 �g/L (n = 12; range 1.4–6.3 �g/L) and 3.5 ± 1.8 �g/L
n = 13; range 1.4–6.9 �g/L) respectively (Fig. 3). Plasma PQ con-entrations in 15-week old F1 generation females (dams for F2eneration pups) and groups of F2 generation pups were below theimit of detection in all samples analysed.
. Discussion
The World Health Organization recommends ACT for treatmentf malaria in the second and third trimesters of pregnancy, but
able 6iochemistry data for F1 generation pups at 4 weeks post-partum (mean ± SD).
Parameter NRa Ref #1b Ref #2b Water (n
Potassium (mmol/L) 5.0–9.0 4.3 ± 1.1 4.0 ± 0.4 3.7 ± 0Urea (mmol/L) 3.0–7.5 8.2 ± 1.2 8.2 ± 1.2 8.1 ± 1ALT (units/L) 20–120 23.8 ± 6.3 26.8 ± 5.8 12.4 ± 7Alkaline phosphatase (units/L) 44–118 81 ± 20 68 ± 20 164 ± 6Albumin (g/L)c 20–47 33.5 ± 2.6 32.3 ± 1.5 30.0 ± 3Bilirubin (�mol/L) 2.5–14 3.4 ± 0.9 3.6 ± 0.5 3.7 ± 3Glucose (mmol/L) 3.8–15.6 4.08 ± 1.08 5.3 ± 2.3 6.1 ± 2Lactate (mmol/L) 2.9–5.9d 10.4 ± 1.3 10.2 ± 1.7 9.1 ± 1
a NR – normal (reference) range [44–46,48,49].b Reference data from previous study; Ref #1 were female adult Swiss mice that receivmg/kg/day PQP for 12 days [24].c P = 0.005 (ANOVA) for 0 mg/kg/day vs. 30 mg/kg/day and 300 mg/kg/day only; powerd Normal range in mice not reported in standard references [50–52].
.
the choice of partner drugs can be problematic [1]. This is mainlydue to the fact that most antimalarial drugs have not been eval-uated in detailed, pre-clinical reproductive toxicity studies or inclinical trials in pregnant women. Established ACT partner drugsinclude amodiaquine, lumefantrine and PQ, but data on the use ofthese drugs in pregnancy and other special populations are lim-ited [1,7,30–32]. Our two-generation reproductive toxicity study
in mice was designed to address this lack of data for PQ. Althoughwe found no evidence of severe pre- and postnatal toxicity, PQ didcause modest haematological and biochemical abnormalities.As the ICH Guideline S5 recommends 16–20 litters for rodentstudies [27], our target was at least 20 female (F0) mice per dose
= 40) PQP dose administered to the pregnant F0 mice
0 mg/kg/day(n = 34)
30 mg/kg/day(n = 31)
100 mg/kg/day(n = 39)
300 mg/kg/day(n = 24)
.8 3.9 ± 0.9 3.8 ± 0.8 3.7 ± 0.8 3.4 ± 0.6
.7 8.2 ± 1.9 8.2 ± 1.4 9.0 ± 1.8 8.4 ± 2.0
.4 9.6 ± 3.0 10.8 ± 5.4 10.2 ± 4.3 9.0 ± 3.39 153 ± 53 149 ± 38 149 ± 43 146 ± 34.3 30.3 ± 2.6c 28.0 ± 2.8c 28.9 ± 2.3 28.0 ± 3.0c
.3 3.4 ± 3.3 2.1 ± 1.2 2.4 ± 1.1 2.7 ± 0.9
.0 5.6 ± 2.1 6.6 ± 2.4 7.1 ± 3.1 7.3 ± 2.3
.6 9.8 ± 2.5 8.9 ± 1.6 10.0 ± 1.6 10.1 ± 1.7
ed 0 mg/kg/day PQP for 5 days; Ref #2 were female adult Swiss mice that received
= 0.77.

K.T. Batty et al. / Reproductive Toxicology 29 (2010) 206–213 211
Table 7Biochemistry data for F2 generation pups at 4 weeks post-partum (mean ± SD).
Parameter NRa Ref #1b Ref #2b Water (n = 31) PQP dose administered to the pregnant F0 mice
0 mg/kg/day(n = 26)
30 mg/kg/day(n = 36)
100 mg/kg/day(n = 34)
300 mg/kg/day(n = 27)
Potassium (mmol/L) 5.0–9.0 4.3 ± 1.1 4.0 ± 0.4 3.9 ± 1.2 3.9 ± 1.2 3.8 ± 0.8 3.7 ± 0.8 3.7 ± 1.0Urea (mmol/L) 3.0–7.5 8.2 ± 1.2 8.2 ± 1.2 8.3 ± 1.4 7.9 ± 1.5 8.4 ± 1.9 8.1 ± 1.2 8.3 ± 1.3ALT (units/L) 20–120 23.8 ± 6.3 26.8 ± 5.8 12.1 ± 6.3 10.5 ± 3.3 9.6 ± 3.6 9.6 ± 3.5 8.1 ± 2.9Alkaline phosphatase
(units/L)44–118 81 ± 20 68 ± 20 144 ± 40 144 ± 31 152 ± 34 160 ± 47 175 ± 54
Albumin (g/L)c 20–47 33.5 ± 2.6 32.3 ± 1.5 30.9 ± 2.4c 29.3 ± 2.0c 30.0 ± 2.2 30.7 ± 2.5 29.0 ± 2.0Bilirubin (�mol/L) 2.5–14 3.4 ± 0.9 3.6 ± 0.5 3.0 ± 1.6 2.4 ± 0.8 2.8 ± 1.5 3.0 ± 2.0 2.8 ± 0.9Glucose (mmol/L) 3.8–15.6 4.08 ± 1.08 5.3 ± 2.3 9.6 ± 1.7 9.4 ± 1.6 9.2 ± 1.5 9.0 ± 1.5 9.0 ± 1.5Lactate (mmol/L) 2.9–5.9d 10.4 ± 1.3 10.2 ± 1.7 6.2 ± 2.3 7.1 ± 2.5 6.4 ± 1.8 6.5 ± 1.9 6.5 ± 2.5
a NR – normal (reference) range [44–46,48,49].receiv
0
gictgbwhPmsds1hhcr
D
Fi(bop51GPtfo
b Reference data from previous study; Ref #1 were female adult Swiss mice thatmg/kg/day PQP for 12 days [24].c P = 0.015 (t-test) for water vs. 0 mg/kg/day; power = 0.6.d Normal range in mice not reported in standard references [50–52].
roup that were at a GD of 8–9. A 5-day acclimatisation periodn the laboratory was followed by a 5-day dosage regimen thatoncluded 2–3 days prior to expected parturition. Successful lit-ers were achieved from at least 90% of the F0 dams in all doseroups. Postnatal development of the F1 generation, as determinedy bodyweight [27], was similar in all dose groups. These findingsere important because our previous repeated-dose toxicity studyad shown that adult female mice administered 300 mg/kg/dayQP for 5 days experienced a mean 8% reduction in body weight andild hepatotoxicity [24]. By comparison, our dose-escalation study
howed significant toxicity in mice given 600 mg/kg/day PQP for 5ays or 300 mg/kg/day PQP for 12 days [24]. Hence, in the presenttudy, a dose regimen of 300 mg/kg/day for 5 days commencing GD4, met the ICH S5 requirement of expected minimal toxicity in theigh-dose dams [27]. Extrapolation from rodent studies to humansas some limitations and there are insufficient PQ data available for
onventional allometric scaling [33–35]. However, using the simpleelationship [35]:oseHuman = DoseAnimal × (WeightHuman/WeightAnimal)0.7
ig. 3. Plasma PQ concentrations in: (i) F0 female Swiss mice, 5 weeks after admin-stration of 30 mg/kg/day (�, n = 14), 100 mg/kg/day (�, n = 14) or 300 mg/kg/day�, n = 14) oral PQP for 5 days (gestational days 14–18), with parturition (↑)eing approximately 7 days after commencing PQP dosage regimen; (ii) 4-weekld F1 pups from F0 dams treated with 100 mg/kg/day (�, n = 11 pooled sam-les from 4 mice each) or 300 mg/kg/day (©, n = 9 pooled samples) oral PQP fordays from GD 14–18; and (iii) 8-week old F1 pups from F0 dams treated with
00 mg/kg/day (�, n = 12) or 300 mg/kg/day (©, n = 13) oral PQP for 5 days fromD 14–18. Data are given as mean ± SD. The line represents the mean plasmaQ concentration–time profile (two-compartment model; ka = 0.1 h−1; t(1/2)� = 0.4 h;
(1/2)� = 16 days; CL/F = 1.36 L/h/kg; Vz/F = 756 L/kg; k12 = 1.12 h−1; k21 = 0.0053 h−1)rom a previous study in which healthy adult female mice were given 100 mg/kg/dayral PQP for 5 days [24].
ed 0 mg/kg/day PQP for 5 days; Ref #2 were female adult Swiss mice that received
our total maximum dose of 1500 mg/kg PQP in mice with amean weight of approximately 36 g (Table 1) could be consid-ered equivalent to 155–197 mg/kg in humans weighing 55–70 kg.Hence, this represents a dose 3–4-fold higher than the cumulative50–55 mg/kg dose given over 3 days that is in common clinical use[19,20,36].
A unique feature of the F2 generation data in the present studywas that the high-dose F1 generation males and females wouldhave had PQ plasma concentrations in the order of 10–20 �g/L atthe time of conception. Although this concentration range wouldbe insufficient for antimalarial efficacy [26,37], these mice hadlow PQ plasma concentrations from parturition to sexual maturity8 weeks later. It was beyond the scope of our study to deter-mine if the F0 to F1 drug transfer was in utero and/or via breastmilk, however data at 4 and 8 weeks post-partum suggest thatthe PQ plasma concentration in F1 generation pups was approx-imately 10% of the F0 maternal plasma concentration. Despite this,the F1 generation dams delivered litters of normal size and theF2 generation pups developed normally, as determined by body-weight. A relevant finding in the present study was that PQ plasmaconcentrations were higher in F0 dams than estimated concentra-tions in non-pregnant female mice from our previous study [24],suggesting that the pharmacokinetic properties of PQ could be dif-ferent in pregnancy and further investigations in clinical studies arewarranted.
Macroscopic observations of the organs from 4-week old F1 gen-eration mice did not reveal any differences across all dose groups(Table 2) but a modest difference in the proportionate liver weightwas observed in the F2 generation mice (Table 3). Biochemical datain the present study were consistent with macroscopic and histo-logical observations of mild adverse effects in the liver in offspringof females exposed to PQ. Mean serum albumin concentrations inthe F1 mice were lower than the vehicle control group, although theabsolute differences were small and the concentrations remainedin the reference range. Low serum albumin levels also were foundin our previous toxicity study [24]. Although we found only mod-est biochemical abnormalities, elevated ALT concentrations havebeen reported in clinical studies [15,17], and it would be prudentto include evaluation of liver function in clinical investigations ofPQ in human pregnancy.
Analysis of the haematological data revealed an increased whitecell count in F1 and F2 generation mice in the high-dose group
(Tables 4 and 5). In our previous toxicology study, one cohort ofmice showed an increased white cell count, whilst another cohortshowed a decreased white cell count which was consistent withclinical reports [15,24]. In all these instances, the changes in whitecell count were mild and of uncertain clinical relevance.
2 ve Tox
iitpwtraFacprtAdtvseadp[
sdnmptpltd[ttvhj
at1bipiahFlpkw
C
A
M
[
[
[
[
[
[
[
[
[
[
[
[
[
[
[
[
[
12 K.T. Batty et al. / Reproducti
Our data indicate that PQ has a good safety profile when usedn the late stages of pregnancy. A limitation of the present studys the absence of early post-partum mortality data. We chose noto not handle or disturb the dams and pups until 4 days post-artum in order to minimise the risk of adverse events. Althoughe cannot exclude a PQ-induced reduction in median litter size in
he 300 mg/kg/day F1 group (Table 1), there were no other dose-elated differences in litter size and postnatal development. Milddverse haematological and hepatic effects were detected in the1 and F2 generation pups, but detailed neurological, endocrinend cardiovascular investigations (including electrocardiographichanges) were beyond the scope of the present study. A furtherotential limitation with all pre-clinical animal toxicity studies iselevance when extrapolated to humans. The antifolate combina-ion of sulfadoxine-pyrimethamine (SP) is a pertinent example.lthough SP causes significant birth defects in rodents [38], humanata indicate that it is safe in the second and third trimester, withhe result that it is preferred by the WHO for intermittent pre-entive treatment in pregnancy [1,5,10,38]. In vitro and animaltudies of artemisinin compounds have shown significant risks ofmbryotoxicity and teratogenicity [11–13,39]. However, since thertemisinins have proven, rapid antimalarial efficacy and clinicalata suggest they are safe in the second and third trimesters ofregnancy, these drugs are now recommended as first-line therapy1,7,9].
A recent observation which may be relevant to the presenttudy is that only the major PQ metabolite (carboxylic acid) of fiveetected in human urine was present in rat urine [40,41]. There areo metabolic data available for mice and it is possible that minor PQetabolites present in humans, but not mice, could lead to unex-
ected reproductive toxicity. Although such metabolites are likelyo be present in low concentrations, we recommend that initialharmacokinetic studies of PQ in human pregnancy include col-
ection of detailed metabolic data. Exposure of pregnant womeno novel antimalarial agents with limited reproductive toxicityata can occur where there is increasing parasite drug resistance6,7,42]. In the case of PQ, a recent study from Thailand showedhat dihydroartemisinin-PQ rescue therapy was effective and wellolerated in 50 pregnant women with malaria [43]. These data pro-ide preliminary evidence that PQ and its metabolites are safe inuman pregnancy and, with the present results, could be used to
ustify further carefully designed human pregnancy studies.Our study has shown no evidence of general developmental
bnormalities or severe adverse effects in the F1 or F2 genera-ion pups from F0 female mice given PQP doses up to a total of500 mg/kg. Bodyweight measurements, general appearance andehaviour indicated that the pups developed normally, progress-
ng to maturity and successful procreation. PQ was detected in thelasma of F1 mice at least 8 weeks post-partum, thus demonstrat-
ng that maternal to offspring transfer of the drug had occurrednd that PQ elimination by the pups was slow. Mild hepatic andaematological changes occurred in F1 and F2 generations from the0 dams given high-dose PQP, suggesting that liver and haemato-ogical monitoring is important in the initial evaluation of PQ inregnant women and their babies. Monitoring infants for othernown adverse effects of PQ, such as electrocardiographic changes,ould also be worthwhile in clinical studies of PQ in pregnancy.
onflict of interest statement
The authors declare that there are no conflicts of interest.
cknowledgements
The authors thank Dr Paul Chubb, PathWest Laboratoryedicine WA, Fremantle Hospital and Health Service, for the
[
[
icology 29 (2010) 206–213
biochemical tests and Dr Richard Parsons, Curtin University, for sta-tistical advice. The present study was supported by a Project Grant(458555) from the National Health and Medical Research Councilof Australia. TMED is supported by a National Health and MedicalResearch Council of Australia Practitioner Fellowship.
References
[1] World Health Organization. Guidelines for the treatment of malaria. Geneva:World Health Organization; 2006.
[2] Rogerson SJ, Mwapasa V, Meshnick SR. Malaria in pregnancy: linking immunityand pathogenesis to prevention. Am J Trop Med Hyg 2007;77(Suppl 6):14–22.
[3] Desai M, ter Kuile FO, Nosten F, McGready R, Asamoa K, Brabin B, et al. Epidemi-ology and burden of malaria in pregnancy. Lancet Infect Dis 2007;7:93–104.
[4] Nyunt MM, Plowe CV. Pharmacologic advances in the global control and treat-ment of malaria: combination therapy and resistance. Clin Pharmacol Ther2007;82:601–5.
[5] Menendez C, d’Alessandro U, ter Kuile FO. Reducing the burden of malaria inpregnancy by preventive strategies. Lancet Infect Dis 2007;7:126–35.
[6] Greenwood B, Alonso P, ter Kuile FO, Hill J, Steketee RW. Malaria in pregnancy:priorities for research. Lancet Infect Dis 2007;7:169–74.
[7] Ward SA, Sevene EJ, Hastings IM, Nosten F, McGready R. Antimalarial drugs andpregnancy: safety, pharmacokinetics, and pharmacovigilance. Lancet Infect Dis2007;7:136–44.
[8] World Health Organization. Assessment of the safety of artemisinin compoundsin pregnancy. Geneva: World Health Organization; 2007.
[9] Nosten F, McGready R, Mutabingwa T. Case management of malaria in preg-nancy. Lancet Infect Dis 2007;7:118–25.
10] World Health Organization. World malaria report 2008. Geneva: World HealthOrganization; 2008.
11] White TE, Bushdid PB, Ritter S, Laffan SB, Clark RL. Artesunate-induced deple-tion of embryonic erythroblasts precedes embryolethality and teratogenicityin vivo. Birth Defects Res (Part B) 2006;77:413–29.
12] Boareto AC, Muller JC, Bufalo AC, Botelho GG, de Araujo SL, Foglio MA, et al. Tox-icity of artemisinin [Artemisia annua L.] in two different periods of pregnancyin Wistar rats. Reprod Toxicol 2008;25:239–46.
13] Longo M, Zanoncelli S, Manera D, Brughera M, Colombo P, Lansen J, et al. Effectsof the antimalarial drug dihydroartemisinin (DHA) on rat embryos in vitro.Reprod Toxicol 2006;21:83–93.
14] Davis TM, Hung TY, Sim IK, Karunajeewa HA, Ilett KF. Piperaquine: a resurgentantimalarial drug. Drugs 2005;65:75–87.
15] Myint HY, Ashley EA, Day NP, Nosten F, White NJ. Efficacy and safety ofdihydroartemisinin-piperaquine. Trans R Soc Trop Med Hyg 2007;101:858–66.
16] Denis MB, Davis TM, Hewitt S, Incardona S, Nimol K, Fandeur T, et al. Effi-cacy and safety of dihydroartemisinin-piperaquine (Artekin) in Cambodianchildren and adults with uncomplicated falciparum malaria. Clin Infect Dis2002;35:1469–76.
17] Ashley EA, Krudsood S, Phaiphun L, Srivilairit S, McGready R, Leowattana W, etal. Randomized, controlled dose-optimization studies of dihydroartemisinin-piperaquine for the treatment of uncomplicated multidrug-resistant falci-parum malaria in Thailand. J Infect Dis 2004;190:1773–82.
18] Ashley EA, McGready R, Hutagalung R, Phaiphun L, Slight T, Proux S,et al. A randomized, controlled study of a simple, once-daily regimenof dihydroartemisinin-piperaquine for the treatment of uncomplicated,multidrug-resistant falciparum malaria. Clin Infect Dis 2005;41:425–32.
19] Smithuis F, Kyaw MK, Phe O, Aye KZ, Htet L, Barends M, et al. Efficacyand effectiveness of dihydroartemisinin-piperaquine versus artesunate-mefloquine in falciparum malaria: an open-label randomised comparison.Lancet 2006;367:2075–85.
20] Ratcliff A, Siswantoro H, Kenangalem E, Maristela R, Wuwung RM, Laihad F,et al. Two fixed-dose artemisinin combinations for drug-resistant falciparumand vivax malaria in Papua, Indonesia: an open label randomised comparison.Lancet 2007;369:757–65.
21] Karunajeewa HA, Lim C, Hung TY, Ilett KF, Denis MB, Socheat D, et al. Safety eval-uation of fixed combination piperaquine plus dihydroartemisinin (Artekin) inCambodian children and adults with malaria. Br J Clin Pharmacol 2004;57:93–9.
22] Mytton OT, Ashley EA, Peto L, Price RN, La Y, Hae R, et al. Electrocardio-graphic safety evaluation of dihydroartemisinin-piperaquine in the treatmentof uncomplicated falciparum malaria. Am J Trop Med Hyg 2007;77:447–50.
23] Ahmed T, Sharma P, Gautam A, Varshney B, Kothari M, Ganguly S, et al. Safety,tolerability, and single and multiple-dose pharmacokinetics of piperaquinephosphate in healthy subjects. J Clin Pharmacol 2008;48:166–75.
24] Batty KT, Moore BR, Stirling V, Ilett KF, Page-Sharp M, Shilkin KB, et al. Toxicol-ogy and pharmacokinetics of piperaquine in mice. Toxicology 2008;249:55–61.
25] International Conference on Harmonisation. Non-clinical safety studies for theconduct of human clinical trials for pharmaceuticals M3 (R1); 2000.
26] Moore BR, Batty KT, Andrzejewski C, Jago JD, Page-Sharp M, Ilett KF. Pharma-
cokinetics and pharmacodynamics of piperaquine in a murine malaria model.Antimicrob Agents Chemother 2008;52:306–11.27] International Conference on Harmonisation. Detection of toxicity to reproduc-tion for medicinal products and toxicity to male fertility S5 (R2); 2005.
28] Sansom L. Australian pharmaceutical formulary and handbook. 20th ed. Aus-tralian Capital Territory: Pharmaceutical Society of Australia; 2006.

ve Tox
[
[
[
[
[
[
[
[
[
[
[
[
[
[[
[
[
[
[
[
[
[
K.T. Batty et al. / Reproducti
29] Karunajeewa HA, Ilett KF, Mueller I, Siba P, Law I, Page-Sharp M, et al.Pharmacokinetics and efficacy of piperaquine and chloroquine in Melanesianchildren with uncomplicated malaria. Antimicrob Agents Chemother 2008;52:237–43.
30] German PI, Aweeka FT. Clinical pharmacology of artemisinin-based combina-tion therapies. Clin Pharmacokinet 2008;47:91–102.
31] Phillips-Howard PA, Wood D. The safety of antimalarial drugs in pregnancy.Drug Safety 1996;14:131–45.
32] Tagbor HK, Chandramohan D, Greenwood B. The safety of amodiaquine use inpregnant women. Expert Opin Drug Saf 2007;6:631–5.
33] Ings RM. Interspecies scaling and comparisons in drug development and toxi-cokinetics. Xenobiotica 1990;20:1201–31.
34] Riviere JE, Martin-Jimenez T, Sundlof SF, Craigmill AL. Interspecies allo-metric analysis of the comparative pharmacokinetics of 44 drugs acrossveterinary and laboratory animal species. J Vet Pharmacol Therap 1997;20:453–63.
35] Mahmood I. Application of allometric principles for the prediction of pharma-cokinetics in human and veterinary drug development. Adv Drug Deliv Rev2007;59:1177–92.
36] Hasugian AR, Purba HL, Wuwung RM, Ebsworth EP, Maristela R, Pentti-nen P, et al. Dihydroartemisinin-piperaquine versus artesunate-amodiaquine:superior efficacy and posttreatment prophylaxis against multidrug-resistantPlasmodium falciparum and Plasmodium vivax malaria. Clin Infect Dis2007;44:1067–74.
37] Price RN, Hasugian AR, Ratcliff A, Siswantoro H, Purba HL, Kenangalem E, etal. Clinical and pharmacological determinants of the therapeutic response todihydroartemisinin-piperaquine for drug-resistant malaria. Antimicrob AgentsChemother 2007;51:4090–7.
38] Peters PJ, Thigpen MC, Parise ME, Newman RD. Safety and toxicity of
sulfadoxine/pyrimethamine: implications for malaria prevention in preg-nancy using intermittent preventive treatment. Drug Safety 2007;30:481–501.39] Clark RL, White TE, Clode SA, Gaunt I, Winstanley P, Ward SA. Developmentaltoxicity of artesunate and an artesunate combination in the rat and rabbit. BirthDefects Res (Part B) 2004;71:380–94.
[
[
icology 29 (2010) 206–213 213
40] Tarning J, Lindegardh N, Sandberg S, Day NP, White NJ, Ashton M. Pharmacoki-netics and metabolism of the antimalarial piperaquine after intravenous andoral single doses to the rat. J Pharm Sci 2008;97:3400–10.
41] Tarning J, Bergqvist Y, Day NP, Bergquist J, Arvidsson B, White NJ, et al. Charac-terization of human urinary metabolites of the antimalarial piperaquine. DrugMetab Dispos 2006;34:2011–9.
42] White NJ. Antimalarial drug resistance. J Clin Invest 2004;113:1084–92.43] Rijken MJ, McGready R, Boel ME, Barends M, Proux S, Pimanpanarak M, et al.
Dihydroartemisinin-piperaquine rescue treatment of multidrug-resistant Plas-modium falciparum malaria in pregnancy: a preliminary report. Am J Trop MedHyg 2008;78:543–5.
44] Suckow MA, Danneman P, Brayton C. The laboratory mouse. Boca Raton: CRCPress; 2001.
45] Hedrich H, Bullock G. The laboratory mouse. London: Elsevier Academic Press;2004.
46] Aleman CL, Noa M, Mas R, Rodeiro I, Mesa R, Menendez R, et al. Reference datafor the principal physiological indicators in three species of laboratory animals.Lab Anim 2000;34:379–85.
47] Lindstedt SL, Schaeffer PJ. Use of allometry in predicting anatomical and phys-iological parameters of mammals. Lab Anim 2002;36:1–19.
48] Wolford ST, Schroer RA, Gohs FX, Gallo PP, Brodeck M, Falk HB, et al. Refer-ence range data base for serum chemistry and hematology values in laboratoryanimals. J Toxicol Environ Health 1986;18:161–88.
49] Schnell MA, Hardy C, Hawley M, Propert KJ, Wilson JM. Effect of blood col-lection technique in mice on clinical pathology parameters. Hum Gene Ther2002;13:155–62.
50] Hanson RL, Ho RS, Wiseberg JJ, Simpson R, Younathan ES, Blair JB. Inhibition ofgluconeogenesis and glycogenolysis by 2,5-anhydro-D-mannitol. J Biol Chem1984;259:218–23.
51] Rajkumar K, Murphy LJ. Enhanced gluconeogenesis and hepatic insulin resis-tance in insulin-like growth factor binding protein-1 transgenic mice. BiochimBiophys Acta 1999;1426:491–7.
52] Suzuki Y, Lanner C, Kim JH, Vilardo PG, Zhang H, Yang J, et al. Insulin controlof glycogen metabolism in knockout mice lacking the muscle-specific proteinphosphatase PP1G/RGL. Mol Cell Biol 2001;21:2683–94.