Investigation of Predatory Practices in the Brazilian Beer Market
19
Investigation of Predatory Practices in the Brazilian Beer Markets Lucia Helena Salgado e Silva IPEA - Instituto de Pesquisa Econômica Aplicada e UERJ - Universidade do Estado do Rio de Janeiro Natália dos Santos Ferreira NECTAR – Núcleo de Economia dos Transportes, Antitruste e Regulação Instituto Tecnológico de Aeronáutica Alessandro V. M. Oliveira NECTAR – Núcleo de Economia dos Transportes, Antitruste e Regulação Instituto Tecnológico de Aeronáutica Abstract: This paper aims at making inference regarding the competitive conduct of beer manufacturers in Brazil and at investigating alleged predatory behavior in the market from data disaggregated at the brand level. By making use of the theoretical framework on predation and of the New Empirical Industrial Organization methodology, we propose a structural model of conduct, based on a game of Bertrand competition with product differentiation, in order to better represent rivalry among players in this important market. Final results revealed that it is not possible to reject the hypothesis that the dominant firm presented over-competitive conduct for some of its brands, and therefore predatory pricing cannot be disregarded. Keywords: Industrial Organization, Competition, Predation, Market Power, Conduct. Email: [email protected] . Este estudo é o resultado do Projeto “Revisão da Regulação do Setor de Transporte Aéreo Brasileiro”, da Coordenação de Estudos em Regulação/DIMAC, no âmbito do REDIPEA/PNUD. Email: [email protected]. Webpage: www.nectar.ita.br . A autora agradece financiamento da Fundação de Amparo à Pesquisa do Estado de São Paulo (FAPESP). Email: [email protected] . Webpage: www.nectar.ita.br . O NECTAR possui financiamento da Fundação de Amparo à Pesquisa do Estado de São Paulo (FAPESP). Agradecimentos a Rachel Oliveira. Com a presente análise dos impactos incorridos por marcos regulatórios alternativos, prestamos uma homenagem aos trinta anos do estudo pioneiro do professor Protógenes Porto (Porto, 1981).
Transcript of Investigation of Predatory Practices in the Brazilian Beer Market

Investigation of Predatory Practices in the Brazilian Beer Markets
Lucia Helena Salgado e Silva
IPEA - Instituto de Pesquisa Econômica Aplicada e
UERJ - Universidade do Estado do Rio de Janeiro
Natália dos Santos Ferreira
NECTAR – Núcleo de Economia dos Transportes, Antitruste e Regulação
Instituto Tecnológico de Aeronáutica
Alessandro V. M. Oliveira
NECTAR – Núcleo de Economia dos Transportes, Antitruste e Regulação
Instituto Tecnológico de Aeronáutica
Abstract: This paper aims at making inference regarding the competitive conduct of beer
manufacturers in Brazil and at investigating alleged predatory behavior in the market from
data disaggregated at the brand level. By making use of the theoretical framework on
predation and of the New Empirical Industrial Organization methodology, we propose a
structural model of conduct, based on a game of Bertrand competition with product
differentiation, in order to better represent rivalry among players in this important market.
Final results revealed that it is not possible to reject the hypothesis that the dominant firm
presented over-competitive conduct for some of its brands, and therefore predatory pricing
cannot be disregarded.
Keywords: Industrial Organization, Competition, Predation, Market Power, Conduct.
Email: [email protected]. Este estudo é o resultado do Projeto “Revisão da Regulação do Setor de
Transporte Aéreo Brasileiro”, da Coordenação de Estudos em Regulação/DIMAC, no âmbito do
REDIPEA/PNUD.
Email: [email protected]. Webpage: www.nectar.ita.br. A autora agradece financiamento da
Fundação de Amparo à Pesquisa do Estado de São Paulo (FAPESP).
Email: [email protected]. Webpage: www.nectar.ita.br. O NECTAR possui financiamento da
Fundação de Amparo à Pesquisa do Estado de São Paulo (FAPESP). Agradecimentos a Rachel Oliveira. Com
a presente análise dos impactos incorridos por marcos regulatórios alternativos, prestamos uma homenagem
aos trinta anos do estudo pioneiro do professor Protógenes Porto (Porto, 1981).
2
1. Introduction
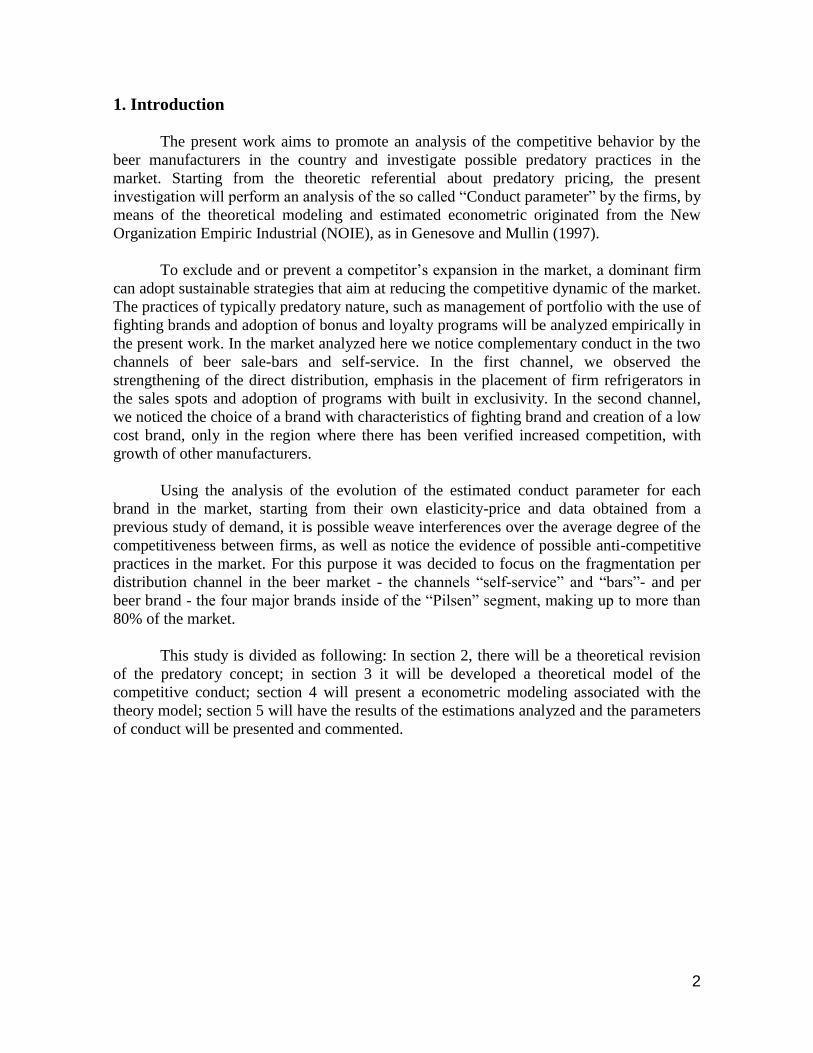
The present work aims to promote an analysis of the competitive behavior by the
beer manufacturers in the country and investigate possible predatory practices in the
market. Starting from the theoretic referential about predatory pricing, the present
investigation will perform an analysis of the so called “Conduct parameter” by the firms, by
means of the theoretical modeling and estimated econometric originated from the New
Organization Empiric Industrial (NOIE), as in Genesove and Mullin (1997).
To exclude and or prevent a competitor’s expansion in the market, a dominant firm
can adopt sustainable strategies that aim at reducing the competitive dynamic of the market.
The practices of typically predatory nature, such as management of portfolio with the use of
fighting brands and adoption of bonus and loyalty programs will be analyzed empirically in
the present work. In the market analyzed here we notice complementary conduct in the two
channels of beer sale-bars and self-service. In the first channel, we observed the
strengthening of the direct distribution, emphasis in the placement of firm refrigerators in
the sales spots and adoption of programs with built in exclusivity. In the second channel,
we noticed the choice of a brand with characteristics of fighting brand and creation of a low
cost brand, only in the region where there has been verified increased competition, with
growth of other manufacturers.
Using the analysis of the evolution of the estimated conduct parameter for each
brand in the market, starting from their own elasticity-price and data obtained from a
previous study of demand, it is possible weave interferences over the average degree of the
competitiveness between firms, as well as notice the evidence of possible anti-competitive
practices in the market. For this purpose it was decided to focus on the fragmentation per
distribution channel in the beer market - the channels “self-service” and “bars”- and per
beer brand - the four major brands inside of the “Pilsen” segment, making up to more than
80% of the market.
This study is divided as following: In section 2, there will be a theoretical revision
of the predatory concept; in section 3 it will be developed a theoretical model of the
competitive conduct; section 4 will present a econometric modeling associated with the
theory model; section 5 will have the results of the estimations analyzed and the parameters
of conduct will be presented and commented.

3
2. A Theoretical Approach to the Practice of Predatory Pricing
One of the classic exclusion conducts dealt with by the antitrust theory, consists in
the practice of predatory pricing, represented by a type of behavior where the prices are low
to the point of influencing the competitive process. Considering that low prices are also a
positive consequence of the competitive process, the antitrust authorities face the difficult
task of defining what is to be considered predatory from healthy competition. The
elimination of inefficient firms is the result of the competitive process, but this process can
be hurtful, if efficient rival firms are also expelled from the market through the excessive
lowering of prices by the dominating firms.
Traditionally, the predatory problem has been identified through the observation
whether the dominating firm has incurred losses, or in the short run in a particular market
forcing the exit (or not allowing the entering) of a rival firm, expecting that its profits above
normal could be obtained in the present or future markets. The more specific test to gauge
the reduction in competitive and non-competitive pricing was introduced by Areeda and
Turner (1975). According to the authors, prices below cost should be considered definitely
illegal. Considering that is rare to find documentation to show statistics of production cost
basis, the authors suggest the use of the average cost as evidence for the test.
It has been 20 years, since Areeda and Turner proposed how to address the
predatory pricing issue, the test raised controversy for years and the debate was particularly
enriched with the use of concepts of the Theory of Games and Strategic behavior in
oligopoly markets. These works are described in Janusz Ordover and Garth Saloner (1990).
The central question in these models is the asymmetry of information between the agents in
the market. The dominating firm is better informed than its competitors in models where
the predator induces market exit of the smaller rivals.
The new literature in industrial organization about predatory behavior, presents
three alternative types of models:
i) There are analyses on the Theory of Games based on the idea of “deep pocket”.
In this line, the most recent contributions show how predatory behavior could
occur in a balanced way if information is imperfect and the financial resources
of the dominating firm are substantially stronger than any present and or future
potential competitor;
ii) There are a second set of articles showing how in the presence of imperfect
information, an incumbent firm could establish a reputation of toughness and
discourage potential new competitors entering the market to go head on with the
stronger incumbent firm;
iii) Finally, a third set of works shows that, when the information is not symmetric
about costs and demand, a predator can use a lower price to let a competitor
know that might be better under the present conditions of demand and cost to
exit the market than to face the stronger dominating firm.

4
The development of the Theory of Games, deepened the understanding of predatory
behavior. It demonstrated that in the presence of asymmetric information (about market
conditions, costs, a particular ”taste” for predation or simple strategy of other firms), or
imperfect flow of information in the financial markets, predation is theoretically possible,
even in the absence of entry barriers that traditionally were thought to be a necessary
condition for such behavior.
Once identified the predatory behavior and anticompetitive conducts adopted by the
dominating firm, it has to be established its abusive nature. In order to accomplish this, one
should compare the advantages and negatives derived from them, as presented by Glais and
Laurent (1983):
“About the market dominated by the firm in question, the competition is
already fragile, even though all the extra barriers cannot be accepted by the
regulating bodies responsible for the good performance of the market. The
negative consequences to the market of the poisoneous as well as
reprehensible behavior of this firm could be considerable for two reasons.
The restrictive practices, as they reduce even more an already restricted
competition, are more damaging because the competitors and partners of
the dominating firm cannot fight back” (op. cit., p. 353) .
Evaluating these particularly serious issues, the advantages provided exclusively
through extra restriction on the side of the dominating firm should be heavy handed in
order to balance the risks to the market. Taking this into consideration, we can assert that
even in the absence of preventive existing laws per se (in the European Union as well as
under French Jurisdiction and others) all anti-competition measures entered by a
dominating firm could be condemned
The question of the monopoly reached through the strategy of predatory pricing is
present in the history of antitrust since its beginning. Sherer and Ross (1990) thought that
the emergency of the rule of reason coincided with the trial through the US Supreme Court
in the cases involving Standard Oil and American Tobacco, both in 1911. In the first case
that implied the use of the rule of reason, Standard Oil was accused of maintaining a
control over 90 % of the industry of oil derivatives (at the time kerosene and burning oil),
status that was obtained through the acquisition of more than 120 rivals, the discriminatory
use of pricing in rail transportation, preventing access to oil supply sources through the
acquisition of Oil Pipes, industrial espionage and finally through the use of pricing wars to
exclude rivals of the market or bring them to sell their businesses. The authors noticed it is
a controversial fact if Standard Oil truly reduced prices in a profound way to destroy rivals
or to teach them a lesson. It is their understanding that the firm used a sophisticated limit-
pricing strategy region-by-region. (p. 450)
In the case of American Tobacco, the Supreme Court accused the Firm of
monopolizing the cigarette market and other tobacco products acting unreasonably like
excluding rivals from accessing distributors, buying out 250 competitors and adopting
predatory pricing.

5
Sherer and Ross (op. cit.) present a strategy of pricing exclusion as an alternative to
long term pricing by the market dominant firm:
“When there is a competitive fringe of appreciable size and when the
dominant firm has a significant unit cost or image advantage over fringe
members, the dominant firm long-run profit-maximizing strategy will often
be to set its price initially below the level of fringe firm unit cost and drive
the rivals out. This is more likely, the larger the dominant firm price-cost
advantage is the lower its time discount rate is, and the more rapidly fringe
Firm’s exit in response to price below their unit cost (…). In many instances,
given its cost advantage, the dominant firm will continue to earn positive
profits as it squeezes rivals out. However, wit sufficiently large initial fringe
out put and values of [unit cost], the dominant firm may rationally cut the
price temporarily below its own unit cost in order to hasten rival’s exit and
enhance its market share. IN either event, as the fringe dwindles, the
dominant firm gradually raises its price, realizing rising profit margins,
while the exit of remaining rivals is slowed down.” (p. 364,).
The authors illustrate their model of strategic pricing in oligopolies with cases of
North-American history that confirms the theory’s consistency. In the case of exclusion
prices, they mention cases in the brewing industry, where the principal nationally
advertized brewers enjoyed an image advantage over local and regional beers and, after
establishing new manufacturing plants during the 1960s, they gained an impressive unit
cost advantage. Their strategy, with Anheuser-Bush playing an increasing dominant role,
was to squeeze the price differential between popular and premium brands. As a result, the
number of beer manufacturers in the USA came down from 404 in 1947 to 108 in 1972 and
16 in 1982. The combined market share of the four leaders went up from 21% in 1947 to
85% in 1987 (p. 371)
As a result of the Industrial Organization’s recent developments, the understanding
of predatory pricing has evolved from the ideas of losses incurred by the firm that adopted
those practices. A modern reading of the practice of predatory pricing is offered through
Edlin and Farrel (2004), to whom:
“Predation occurs when a firm offers consumers favorable deals, usually in
the short run, that get rid of the competition and thereby harm consumers in
the long run.” (p. 502)
According to the authors and in particularly, as pointed out by Edlin (2001), there is
no reason to reduce predatory cases to situations where one can verify pricing below cost, if
prices above cost can also hurt the consumer, by limiting the competition.
The definition of predation centered in the conventional thesis of sacrificed profits
was offered by Bork, during the trial Neumann v. Reinforced Earth Co. (786 F 2nd
424,427, 1986):

6
“Predation involves aggression against business rivals through the use of
business practices that would not be considered profit maximizing except for
the expectations that 1) actual rivals will be driven from the market, or ... 2)
rivals will be chastened sufficiently to abandon competitive behavior the
predator finds threatening to its realization of monopoly profits.” (apud
Edlin e Farrell, p. 510).
At the same time, the sacrifice of profit in the short run is not always present in
predatory pricing. A low-cost monopolist can hurt competition (not only the competitors)
using strategically its advantages to exclude competitors with little or no effort, as Edlin
(2001) explains. Sacrifice has been defined by Bork (1978, p. 145) as an “investment in
monopoly profit”. This voluntary sacrifice, having the damage to competition as
motivation, could also be associated to other legitimate reasons. Today’s production can
generate lower costs in the future in a learning by doing industry or, in a straight forward
form, “sacrifice” in a product could be immediately compensated by raising the profits in a
complementary product. This way, the profit sacrifice in the short run is neither necessary
nor sufficient to create damage and could be distant from both cases.
To monopolization, the sacrifice of profits is not necessary if the dominant firm
detains substantial cost advantages (adding the tax and financial advantages). Edlin (op.cit.)
shows that sometimes an efficient firm uses its advantages to offer good deals in stable
markets, something that is good for consumers and economic efficiency, but occasionally
an efficient firm can do just the opposite, charge high prices or offer services and or
products of low quality while it faces little or no competition and offer the opposite only
when the competition appears.
From a low-cost monopolistic point of view, to offer great deals after the arrival of a
new competitor in order to hurt and even provoke the exit of the newcomer does not
necessarily imply sacrifice. One should change focus from “sacrifice plus financial
recovery” to “exclusion with great damage to the consumer and or efficiency”.
Farrell and Edlin (op. cit.) suggest, at last, a change of focus on predatory behavior,
from profit recovery in the future to damage to the consumer and or economic efficiency.
Taking into consideration the concept of predatory pricing described in this section,
we look to make an empirical analysis about the competitive behavior of brewing
manufactures in Brazil, through the usage of modeling and econometric estimative. This is
the subject purpose in the following sections.

7
3. Modeling Theory of Competitive Behavior
The most common modeling used to analyze competitive behavior of firms in
oligopolistic markets (as in the beer market in Brazil) is the so-called New Empirical
Industrial Organization (NEIO). Bresnahan (1989) promotes a classic description of this
approach, summarizing it in two basic elements:
i) The behavior of the firm as well as the behavior of the industry as a whole in
relation to strategic variables as price and quantity is defined and represented by
unknown parameters to be estimated; in this way the econometric handling of the
market’s basic behavioral equations allows a direct identification of what it is called
“conduct parameter”;
ii) By consequence and utilizing the estimations of conduct, inferences over market
power turn quantitatively feasible and in the simple form of test of hypothesis. In
this way, one has an approach with high demand for statistic data, but that allows
the comparisons among different hypothesis, like perfect competition (lack of
strategic interaction) and of the joint maximization of profit (coordination and
collusion) as well as intermediate hypothesis, typical of oligopolistic models.
We pursued to develop a model with simultaneous equations based on this approach
of Industrial Organization. The model is described below.
Consider a brewing market with product differentiation and static price competition,
hypothesis also found in Hausman, Leonard and Zona (1994), Slade (2004), Pinkse and
Slade (2004).
By notation, qi and pi are the quantity and the own price of each firm, respectively.
As discussed in Oliveira (2004), assuming, as in Hausman, Leonard and Zona (op.cit.), that
the consumption process of beer is represented by the model AIDS (multistage budgeting),
so that we can obtain a matrix of estimated price-elasticity in a flexible fashion. Once that
structure is assumed, the problem of the firm in the market can be narrowed to the
following first-order condition to maximize profits:
, ,i i
i i i i i i ip p
RT CT q p q CT qMax Max (1)
Where CTi is a function of the total cost and is a vector of cost shifters of firm i.
Developing (1), we have the relation in (2):
0i i ii i
i i i
dq dCT dqp q
dp dq dp
(2)
Where dCTi/dqi is the marginal cost of firm i (MCi). Through additional algebraic
manipulation we arrive to the following form of first-order condition:

8
i
i
ii qq
MCp
1
(3)
Where qi’ = dqi/dpi and |qi’| represents the absolute value of qi’. The result in (3) is
representative of Nash equilibrium in a game of price competition (Bertrand-Nash),
becoming this way a reference as far as the rivalry between firms in the market is
concerned.
Let us suppose now as in Slade (op. cit.) there are parameters that measure the
extent of the deviation from the null hypothesis of static Nash-equilibrium behavior for a
given game. These parameters, called “conduct parameters” would be modeled as
following:
i
i
iii qq
MCp
1
(4)
The analysis of i is in the center of studies of NEIO, as presented by Bresnahan
(1989). This happens, because there are important existing values that can be self-assumed,
so that it can clarify the competitive behavior of a certain agent in a particular market
situation. In particular, when i = 1 returns to the result of (3), the so-called non-
cooperative equilibrium. For values below this level, there is the description of increased
competition (so that profits are maximized), something that could occur in certain situations
of imperfect or incomplete information, unexpected surprises in cost and or demand or even
of deliberate over competitive conduct, as in the use of predatory pricing and fighting
brands.
Genesove and Mullin (1997) give up this kind of analysis to deliberate about
predatory behavior in the sugar industry in the USA at the end of the 19th
century. When i
= 0, than pi = Mci, representing the strategy of de marginal-cost pricing. In practice, this
strategy reproduces the result of Bertrand’s game in markets with the homogenous
products, something that in situations of heterogeneous brands, again is only expected in
certain cases of extreme competition (where firms discard their monopoly power in price
wars), or in cases of predation. We have the modeling presented in (4) allowing the analysis
of competitive conditions in the country, as well as being able to evaluate the
anticompetitive practices in the market.
4. Econometric Modeling
The proposal of econometric modeling here implemented was to estimate an
equation of first-order condition as presented in (4) of the previous section, for each market
brand.
A data base for estimation of the linearized AIDS model contains information
collected by Nielsen, bimonthly during the period between the first two months of 2001 and
the last two months of 2003.; the data is distributed from the following regions of the

9
country: reg 1. Northeast; reg 2. Rio de Janeiro Hinterland, Minas Gerais and Espírito
Santo; reg 3. Greater Metropolitan Rio de Janeiro; reg 4. Greater Metropolitan São Paulo;
reg 5. São Paulo Hinterland; reg 6. South; reg 7. Center-West. The total number of
observations is, of 18 twice monthly x 7 regions = 126 points, for each brand in each
distribution channel.
The data is broken up by brand and for analysis purposes, it was desired to mirror
the competition in segment of clear beer (“Pilsen”, as considered “Medium Price” or, as it
is called in the industry, mainstream segment). This segment is dominant in terms of
market revenue aside of being the most traditional in the country. Inside this segment, the
following brands were analyzed: 1. Nova Schin Pilsen (sc); 2. Skol Pilsen (sk); 3. Brahma
Chopp (br); 4. Antartica Pilsen (an). Together they represent approximately 80% of total
volume sold in the segment, be that through distribution “self service” or in Bars1. It was
taken into consideration for estimation purposes, the following empiric relation equivalent
to the first-order condition in (4):
ikrt ikt ikrt ikrtp MC q (5)
Where the indexes i, k, r and t represent, respectively, the brand, the channel of
distribution, the region, and bimonthly from a chosen sample point. MC represents
marginal cost, ikt is a vector of cost shifters, qikrt is the demanded quantity and ikrt is a
unknown parameter, that has the “conduct parameter” built in. In his modeling, the
behavior can be identified as following:
1ikrt ikrt ikrt ikrt ik
ik
(6)
As in the demand study (Oliveira, 2004) we estimated their own price-elasticity,
instead of qi’, to generate a need to find the relationship between the two sources of
information. We have than through the definition of demand elasticity that:
ik ikik ik ik ik
ik ik
p qq q
q p
(7)
Where ikq and ikp are respectively the middle sample of quantities and prices of
firm i in the distribution channel k. Utilizing the relation (7) in (6), we have:
ikikrt ikrt ik ikrt ikrt ik
ik
p
(8)
Where (8) is the relation that allows the identification of parameters of conduct
estimated.
An additional question as far as the identification of parameters of conduct is
concerned relates to indexes i, k, r and t. As in the data basis, there are 4 firms, 2
distribution channels, 7 regions and 18 time frames. The econometrist has in this case the
impossible task to estimate 1008 parameters of conduct. The literature on NEIO solves this
problem reducing the number of parameters to be estimated. In the present case, we should
1 Other brands considered in this segment,but not included in the analysis: Kaiser Pilsen, Bavaria Pilsen,
Itaipava, Crystal, Frevo and Cintra.

10
consider as a matter of procedure a specific parameter for each (4), in each distribution
channel (2), for each sample year (3) and for each region “Nilsen” (7). All together 168
parameters can de identified through this modeling proposal.
The final price equation (first-order condition) is under the following form:
0 1 1 2ikrt ik ik t ik ikrt ik ikrt s ik ikrt rp bim q q ano q reg (9)
Where: bimt represents as dummies of bimonthly (7, base case: first bimonthly of
2001), years represented as dummies of year (3, base case: 2001), and regr represents as
dummies of region (7, base case: reg7).
As it can be analyzed in (9), we assume that the marginal cost of a certain brand
contains two components: one effect that remains unchanged through time and regions, but
which is brand specific in a determined distribution channel (0ik), and an effect that
changes with time, also specific of the brand and channel (bimt). The use of fixed effects to
control the variations of marginal cost is justified by the following reason: variables that
shift costs at brand level are not noticeable by the econometrist in the present work and
therefore the specific effects of the brand and of the bimonthly report work as a proxy to
control the price changes, devaluation in the exchange affecting the purchase of imported
items, changes not noticeable in the structure of plants and product composition etc.
Adding to the above in (9) we see that it is allowed that the conduct varies between
brands, distribution channels, regions and or weather (annually).This allows the
econometric model to capture the varied behavior in firms according to their regional
strategy, changes through out the bi-monthly evaluations (by factors like increased
competition, answer to supply shock etc.) and along the markets (self-service and bars).
To simplify nomenclature, it the following variable list was adopted in addition to
the above referred dummies:
psca = Average price of Nova Schin Pilsen, in self service;
pska = Average price of Skol Pilsen, in self service;
pbra = Average price of Brahma Chopp, in self service;
pana = Average price of Antarctica Pilsen, , in self service: (x100);
pscb = Average price of Nova Schin Pilsen, in bars (x100);
pskb = Average price of Skol Pilsen, in bars (x100);
pbrb = Average price of Brahma Chopp, in bars (x100);
panb = Average price of Antarctica Pilsen, in bars (x100);
qsca = volume of beer commercialized of Nova Schin Pilsen, in self service(in
thousand of liters);
qska = volume of beer commercialized of Skol Pilsen, in self service (in thousand of
liters);
qbra = volume of beer commercialized of Brahma Chopp, in self service(in
thousand of liters);

11
qana = volume of beer commercialized of Antarctica Pilsen, in self service (in
thousand of liters);
qscb = volume of beer commercialized of Nova Schin Pilsen, in bars(in thousand of
liters);
qskb = volume of beer commercialized of Skol Pilsen, in bars (in thousand of
liters);
qbrb = volume of beer commercialized of Brahma Chopp, in bars(in thousand of
liters);
qanb = volume of commercialized beer of Antarctica Pilsen, in bars(in thousand of
liters);
With the aggregate of variables above defined, was than possible to make an
estimate of eight price equations (first-order condition, as seen in the previous section). The
estimated equations are as following:
011 111 111 111 211* *t s rpsca bim qsca qsca ano qsca reg
021 121 121 121 221* *t s rpska bim qska qska ano qska reg
031 131 131 131 231* *t s rpbra bim qbra qbra ano qbra reg
041 141 141 141 241* *t s rpana bim qana qana ano qana reg
012 112 112 112 212* *t s rpscb bim qscb qscb ano qscb reg
022 122 122 122 222* *t s rpskb bim qskb qskb ano qskb reg
032 132 132 132 232* *t s rpbrb bim qbrb qbrb ano qbrb reg
042 142 142 142 242* *t s rpanb bim qanb qanb ano qanb reg
(10)
The eight equations above were estimated through the use of technique 2SLS
controlling the above described effects (FE-2SLS, minimal squares in two stages with fixed
effects).
An important question relates to the used instrumental variables, since endogenous
variables were defined and as such the estimate is subject to the called “bias of
simultaneous equations”, known in text-books of econometrics. In the present work, the
methodology indicated by Hausman, Leonard and Zona (1994), which defined, for
example, as instrumental variable to a city the prices of other town. To the equations in (9),
one has to define instruments towards the demanded quantities (q’s) through literature well
known endogenous. However as a main critic to the approach of those authors is the
existence of common and non noticeable shocks, mainly as a consequence of advertising at
national level, it has been opted to follow it, but with caution not to deprive the potential
instrument in 6 months (3 bi-monthly); adding to that the changed values of firms were
used (for example: quantities of firm x with instruments for quantities of firm y, also with 3
by monthly of discrepancies) The idea of these techniques is that the same would turn the
instruments less prone to correlate with residuals (ortogonality). Some tests of over
12
identifying restrictions were used and demonstrated favorable to the use of instruments so
defined.
5. Analysis of Estimation Results
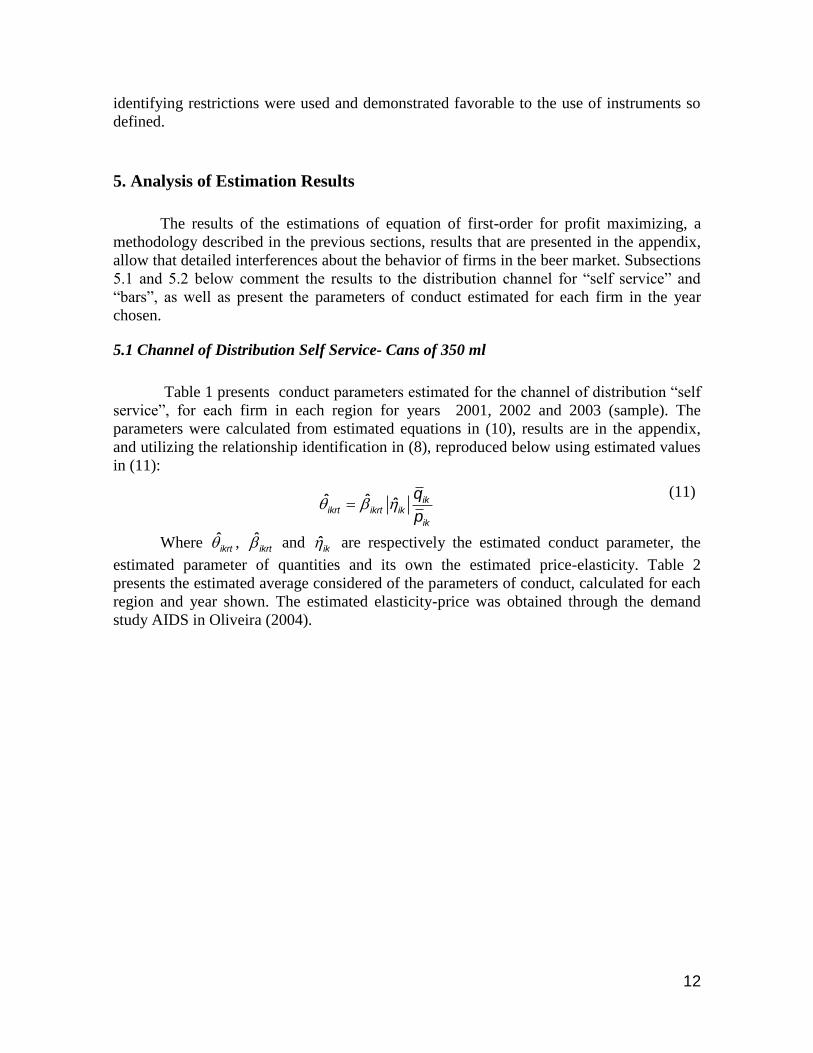
The results of the estimations of equation of first-order for profit maximizing, a
methodology described in the previous sections, results that are presented in the appendix,
allow that detailed interferences about the behavior of firms in the beer market. Subsections
5.1 and 5.2 below comment the results to the distribution channel for “self service” and
“bars”, as well as present the parameters of conduct estimated for each firm in the year
chosen.
5.1 Channel of Distribution Self Service- Cans of 350 ml
Table 1 presents conduct parameters estimated for the channel of distribution “self
service”, for each firm in each region for years 2001, 2002 and 2003 (sample). The
parameters were calculated from estimated equations in (10), results are in the appendix,
and utilizing the relationship identification in (8), reproduced below using estimated values
in (11):
ˆ ˆ ˆ ikikrt ikrt ik
ik
q
p
(11)
Where ˆikrt , ˆ
ikrt and ˆik are respectively the estimated conduct parameter, the
estimated parameter of quantities and its own the estimated price-elasticity. Table 2
presents the estimated average considered of the parameters of conduct, calculated for each
region and year shown. The estimated elasticity-price was obtained through the demand
study AIDS in Oliveira (2004).

13
Table 1 – Conduct Parameters per Brand – Self-Service/Cans 350ml2
Note: ‡, † e *: significant at the level 1%, 5% e 10%, respectively
2 The conduct parameters are to be interpreted as following: the competition as well as firm posture in a
determined brand increases at the lower price ranges. Numbers closer to zero mean a strategy of “marginal-
cost pricing”, translating into intense competition, being this a market with a differentiated product. The same
applies to negative values. Suspicions of predation occur over low conduct parameter, combined with high
market share (of the group).
Region Year
0.069 0.119 * 0.164 0.389 ‡
-0.002 0.046 0.124 0.208 ‡
-0.035 0.052 0.072 0.143 *
-0.229 ‡ 0.117 ‡ 0.100 0.131
-0.175 ‡ 0.044 † 0.033 -0.074
-0.196 ‡ 0.050 * 0.009 -0.133
-0.738 ‡ 0.226 ‡ 0.039 0.340 *
-0.469 ‡ 0.146 ‡ -0.054 0.154
-0.471 ‡ 0.176 ‡ -0.051 0.090
-0.293 † 0.005 0.050 -0.088
-0.211 ‡ -0.060 * -0.039 -0.313 ‡
-0.231 ‡ -0.078 -0.040 -0.368 ‡
-0.034 0.061 † 0.075 -0.102
-0.062 -0.009 -0.003 -0.328 ‡
-0.091 ‡ -0.014 -0.015 -0.383 ‡
0.335 ‡ 0.172 ‡ 0.265 † 0.224 *
0.151 † 0.095 ‡ 0.267 * 0.028
0.108 † 0.114 ‡ 0.171 -0.033
0.586 † 0.221 ‡ 0.615 † 0.726 ‡
0.296 † 0.142 ‡ 0.767 † 0.577 ‡
0.243 * 0.171 ‡ 0.514 † 0.505 ‡ (0.126) (0.036) (0.255) (0.188)
(0.136) (0.026) (0.369) (0.198)
(0.245) (0.040) (0.281) (0.230)
(0.055) (0.041) (0.111) (0.079)
(0.060) (0.030) (0.158) (0.082)
(0.108) (0.044) (0.134) (0.121)
(0.035) (0.027) (0.040) (0.089)
(0.039) (0.018) (0.052) (0.093)
(0.071) (0.031) (0.060) (0.138)
(0.066) (0.049) (0.054) (0.074)
(0.073) (0.036) (0.074) (0.079)
(0.132) (0.050) (0.075) (0.126)
(0.069) (0.052) (0.278) (0.157)
(0.075) (0.038) (0.402) (0.166)
(0.081) (0.140)
(0.135) (0.053) (0.305) (0.197)
(0.038) (0.030)
(0.103) (0.183)
(0.040) (0.020) (0.114) (0.148)
(0.077) (0.033)
(0.105) (0.076)
Schin / Nova Schin
Pilsen Skol Pilsen
Brahma Chopp
Antartica Pilsen
(0.067) (0.063)
(0.032) (0.063)
(0.127) (0.114)
(0.035) (0.048) (0.149) (0.079)
2002
2003
2001
2002
2003
2001
2003
2001
2002
2003
2002
2003
2001
2002
Region 05 - São Paulo Hinterland
Region 06 - South
Region 07 - Center-West
2001
2002
2003
2001
2002
2003
2001
Region 01 - Northeast
Region 02 - Rio de Janeiro Hinterland, Minas Gerais and Espírito Santo
Region 03 -
Region 04 -
Greater Metropolitan Rio de Janeiro
Greater Metropolitan São Paulo

14
Table 2 – Average Conduct Parameters – Self-Service/Cans 350ml
A more detailed analysis of the values presented in tables 1 and 2 allow a reasonable
understanding of the competitive process in the can beer market in the Brazilian
supermarkets. The main issues to be pointed out are as following:
Long-term conduct: We observed that the year 2002 e 2003 presented increased
competition (significant drop in the parameters of conduct, having as a consequence
lower profit margins). The drop started in 2002 and can be attributed to that year’s
exchange devaluation, translating into higher import costs of goods without being
able to pass through the increased cost to consumers. In 2003 there are, in a
majority of cases, situations of higher competitiveness than in 2002, reflecting in
increased rivalry in the market (price wars), specially because that was of bad year
of performance for the Brazilian economy as a whole and particularly for the beer
market.
Regional Conduct: In general we observed that in regions 4 and 5 (that includes all
of Sao Paulo State) are the most competitive, with reduced conduct parameters and
in general negative, regions 6 and 7 (South and Center-West) present higher profit
margins and less competitive conduct. It is important to underline at the same time
that in all cases the estimated parameters are below the reference value = 1
(balance of Bertrand-Nash), meaning a higher tendency for increased competition
(<1) than just collusion (>1);
Conduct between brands: Ceteris paribus, Skol Pilsen’s brand is the one with the
least conduct parameters, since it has the lowest coefficient of estimated quantities
. It is important to observe that the Antartica brand has shown excessively
competitive behavior in the important regions of Sao Paulo State, with values
always lower than other brands (what we strongly note does not occur in other
regions); In fact, the estimated conduct parameters for Antartica in regions 4 and 5
are way lower than in other regions and are negative. To this fact we can add that
the analysis of standards of substitution and complementation between brands
(study of demand in Oliveira, 2004) indicate the higher tendency for the use of the
2001 2002 2003 Mean
Region 01 0.189 0.089 0.055 0.109
Region 02 0.080 0.006 0.001 0.029
Region 03 0.125 0.049 0.085 0.086
Region 04 -0.003 -0.116 -0.147 -0.087
Region 05 0.045 -0.044 -0.061 -0.021
Region 06 0.219 0.122 0.097 0.144
Region 07 0.338 0.254 0.229 0.273
Mean 0.125 0.034 0.022 0.060

15
same brand (Antartica) as fighting brand3. Considering the high market share of
AMBEV’S market (owner of the Antarctica brand) in those regions and through out
he national market, we can demonstrate strong evidence of predatory pricing
practices in those regions for the channel of self-service4.
5.2 Channel of Distribution Bars – Bottles of 600 ml
Tables 3 and 4 present conduct parameters for distribution channel “bars” by firm
and for each region for the years 2001-2003, as well as their respective average values. The
main points of the analysis of conduct in the distribution channel are as following:
Long-Term Conduct: In this distribution channel we also observed a considerable
rivalry increase in the markets, but in general the parameters of conduct in this
channel were superior against the “self service”. This occurs because of the fact that
the price-elasticity in the “bars” is higher that in the “self service”, as shown in
Oliveira (2004). This way with lower price-elasticity there is a smaller incentive for
engaging in increased. In any case, the strongly increased fall in the parameters in
2002 is again as a consequence of the exchange devaluation. The fall in 2003 was
not as dramatic but did lead in the majority of cases to situations of higher
competitiveness than in the previous year.
Regional Conduct: In general regions 1, 2 and 5 are the most competitive, with
smaller conduct parameters than other regions and eventually negative or closer to
zero. Again we have in regions 6 and 7 (South and Midwest) less aggressive
conduct parameter and in some cases with values way = 1. An example would be
Brahma in the Midwest, in 2001-2002, what could be indicative of equivalent or
collusive behavior. This type of behavior in his case, would indicate that AMBEV
could have opted to exercise, its market power as a dominant firm, keeping its profit
margins more or less high for its brands-, according with the particularities and
intensity of the competition in the different regional markets. However we have
again in the majority of cases, a way t observe the estimated parameters below the
balance of Bertrand-Nash;
3 Text in Oliveira (2004): “(...) in particular and having as a base the behavior of the average consumer, the
following brands could be considered complimentary brands: Antartica-Brahma and Nova Schin-Antartica,
Kaiser-Skol3. It is relevant to mention that when there is synergie between other brands that belong to the
same firm (ex: Antarctica-Brahma,with relation to AMBEV), it cand be of more advantage for the same firm
to use from this portfolio to create a “combat brand”(choosing between them probably the one that has the
least loyalty-measured through elasticity-pricing, to compete in pricing as much against the competitors as
against the new comers) we notice than a synergythat can be detrimental to the competiton” In the present
case (channel of distribution “self-service”), Antartica has more elasticity-pricing than Brahma.
4 It is important to notice that the conduct of Schincariol in some markets has also been negative. This should
not be interpreted as anti competitive practice, since its participation in the market during the period of this
study, was reduced to less than 10%. Smaller firms can have difficulties to be positioned in some regional
markets, like having better ways to display their products, something that would lace them in a position to be
extremely competitive as a way to survive. The case of AMBEV is clearly distinct, since the largest market
share of the group as a whole, and also because of its brands individually considered, as well as the lowest
elasticity-pricing associated with its products (Oliveira, 2004), places it in a natural position to exercise
dominance, market as well as predatory power.

16
Conduct among brands: Again and ceteris paribus, the brand Skol Pilsen is the
brand with lowest estimated quantity coefficient (see Appendix 6.5-6.8).
Additionally, this brand represents estimated conduct parameters consistently lower
(closer to zero in some cases) than all the other brands in the AMBEV portfolio.
This behavior cannot be considered normal competition, since it relates to the
leading market brand, with approximately 35% of the volume in sales (average
sample). To his act add the analysis of patterns of possible substitution and
complementation between brands (study of demand in Oliveira 2004), they also
indicate a higher inclination to use of Skol in possible predatory practices: “In the
case of the AMBEV brands, we have again an exception to the standard of synergy,
this time between Skol and Antartica (the two brands with highest levels consumer
loyalty) jumping at us in terms of the “fighting brand” question, potentially
negative to the competition” (Oliveira, 2004). Noticing that in the present case
(distribution channel “bares”), Skol has estimated own-price elasticity higher than
Antarctica.

17
Table 3 – Conduct Parameters – Bars/600ml5
Note: ‡, † e *: significant at the level of 1%, 5% and 10%, respectively.
5 Please see interpretation of conduct parameters on footnote referring to table 1.
Region Year
0.213 ‡ -0.045 ‡ 0.213 ‡ 0.073 ‡
0.110 ‡ -0.051 ‡ 0.156 ‡ 0.035 ‡
0.090 ‡ -0.077 ‡ 0.111 ‡ 0.042 ‡
0.078 0.033 ‡ 0.304 ‡ 0.235 ‡
0.043 -0.001 0.239 ‡ 0.118 ‡
0.031 -0.032 ‡ 0.153 ‡ 0.105 ‡
0.052 0.049 ‡ 1.002 ‡ 0.298 ‡
0.031 0.010 0.875 ‡ 0.151 ‡
0.020 -0.023 † 0.477 ‡ 0.130 ‡
0.463 ‡ 0.124 ‡ 0.313 ‡ 0.314 ‡
0.234 ‡ 0.058 † 0.247 ‡ 0.160 ‡
0.198 ‡ 0.020 0.157 ‡ 0.136 ‡
0.040 -0.003 0.292 ‡ 0.295 ‡
0.025 -0.024 † 0.228 ‡ 0.149 ‡
0.015 -0.053 ‡ 0.148 ‡ 0.129 ‡
0.477 ‡ 0.199 ‡ 0.975 ‡ 0.353 ‡
0.241 ‡ 0.108 ‡ 0.851 ‡ 0.179 ‡
0.204 ‡ 0.063 ‡ 0.464 ‡ 0.151 ‡
1.063 ‡ 0.190 ‡ 1.609 ‡ 0.599 ‡
0.531 ‡ 0.102 ‡ 1.429 ‡ 0.306 ‡
0.457 ‡ 0.058 ‡ 0.758 ‡ 0.247 ‡
Region 01 – Northeast
Region 02 - Rio de Janeiro
Hinterland, Minas Gerais, Espírito Santo
Region 03 - Greater Metropolitan Rio de Janeiro
Region 04 - Greater Metropolitan São Paulo
Region 05 - São Paulo Hinterland
Region 06 - South
Region 07 - Center West
2001
2002
2003
2001
2002
2003
2001
2002
2003
2001
2002
2003
2001
2003
2001
2002
2003
(0.048) (0.017)
(0.017) (0.012)
(0.059) (0.008)
2002
2003
(0.077) (0.011)
(0.030) (0.008)
2001
2002
(0.031) (0.008)
Schin / Nova Schin
Pilsen Skol Pilsen
Brahma Chopp
Antartica Pilsen
(0.083) (0.014)
(0.020) (0.013)
(0.097) (0.048)
(0.034) (0.009) (0.072) (0.026)
(0.037) (0.021)
(0.132) (0.012) (0.330) (0.046)
(0.061) (0.010) (0.284) (0.025)
(0.053) (0.009) (0.145) (0.020)
(0.130) (0.039) (0.072) (0.037)
(0.060) (0.027) (0.048) (0.020)
(0.052) (0.024) (0.026) (0.017)
(0.062) (0.016) (0.087) (0.056)
(0.026) (0.012) (0.063) (0.030)
(0.023) (0.011) (0.033) (0.024)
(0.163) (0.020) (0.209) (0.045)
(0.077) (0.015) (0.173) (0.024)
(0.067) (0.014) (0.089) (0.020)
(0.299) (0.024) (0.410) (0.074)
(0.143) (0.018) (0.356) (0.039)
(0.125) (0.016) (0.182) (0.031)
18
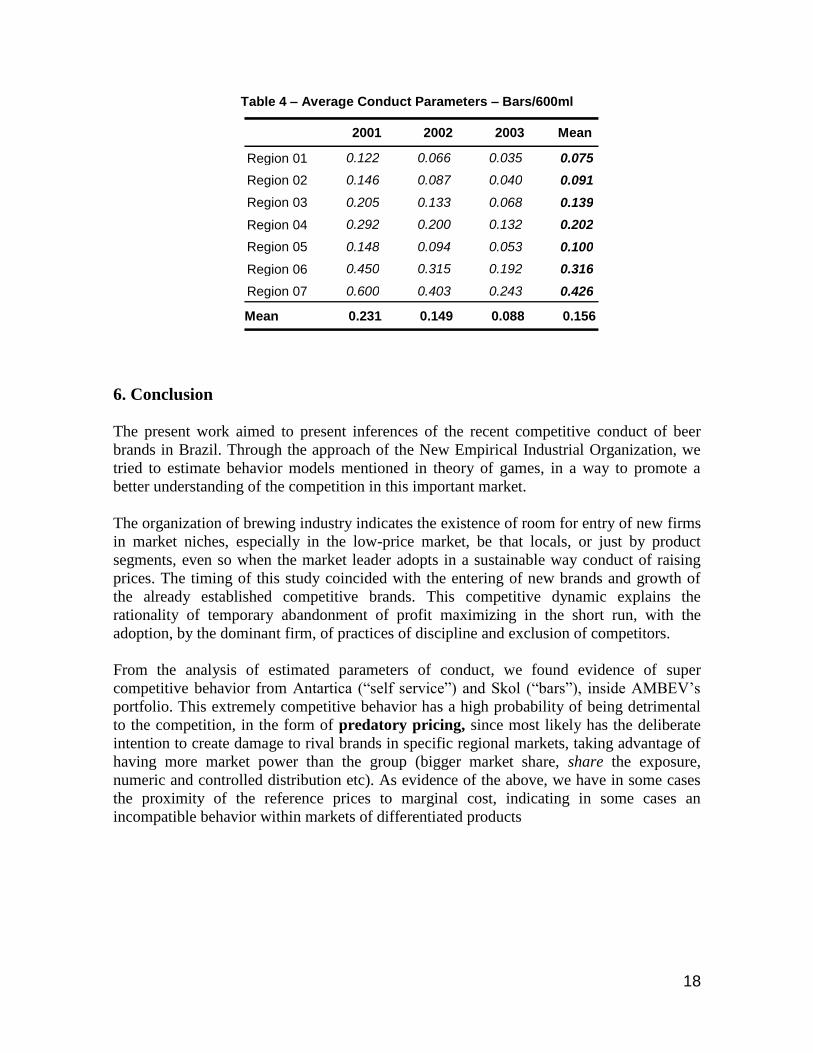
Table 4 – Average Conduct Parameters – Bars/600ml
6. Conclusion
The present work aimed to present inferences of the recent competitive conduct of beer
brands in Brazil. Through the approach of the New Empirical Industrial Organization, we
tried to estimate behavior models mentioned in theory of games, in a way to promote a
better understanding of the competition in this important market.
The organization of brewing industry indicates the existence of room for entry of new firms
in market niches, especially in the low-price market, be that locals, or just by product
segments, even so when the market leader adopts in a sustainable way conduct of raising
prices. The timing of this study coincided with the entering of new brands and growth of
the already established competitive brands. This competitive dynamic explains the
rationality of temporary abandonment of profit maximizing in the short run, with the
adoption, by the dominant firm, of practices of discipline and exclusion of competitors.
From the analysis of estimated parameters of conduct, we found evidence of super
competitive behavior from Antartica (“self service”) and Skol (“bars”), inside AMBEV’s
portfolio. This extremely competitive behavior has a high probability of being detrimental
to the competition, in the form of predatory pricing, since most likely has the deliberate
intention to create damage to rival brands in specific regional markets, taking advantage of
having more market power than the group (bigger market share, share the exposure,
numeric and controlled distribution etc). As evidence of the above, we have in some cases
the proximity of the reference prices to marginal cost, indicating in some cases an
incompatible behavior within markets of differentiated products
2001 2002 2003 Mean
Region 01 0.122 0.066 0.035 0.075
Region 02 0.146 0.087 0.040 0.091
Region 03 0.205 0.133 0.068 0.139
Region 04 0.292 0.200 0.132 0.202
Region 05 0.148 0.094 0.053 0.100
Region 06 0.450 0.315 0.192 0.316
Region 07 0.600 0.403 0.243 0.426
Mean 0.231 0.149 0.088 0.156

19
7. References
Areeda, P and Turner, D (1975). Predatory Prices and Related Practices Under Section 2
of the Sherman Act, Harvard Law Review, 697 (1975).
Bork, R.H (1978). The antitrust paradox : a policy at war with itself .
Edlin, A.S (2001). Stopping Above-Cost Predatory Pricing, Essay, December.
Edlin, A.S and Farrell, J. The American Airlines Case, 2001: A chance to clarify predation
policy” in John E. Kwoka, Jr. and Lawrence White The Antitrust Revolution –
Economics, competition and policy, 4th edition, Oxford University Press, 2004
Ferreira, N. S. (2007) Discussão das Abordagens Teóricas na Investigação de Práticas de
Concorrência Predatória no Transporte Aéreo. Revista de Literatura dos
Transportes, vol. 1, n. 2, pp. 47-69.
Genesove, D. and Mullin, W. (1997). Predation and Its Rate of Return: The Sugar
Industry, 1887-1914 . NBER Working Papers W6032.
Glais, M and Laurent, P (1983). Traité d’économie et de droit de la concurrence, Paris,
PUF.
Hausman, Leonard, and Zona (1994). Competitive Analysis with Differentiated Products.
Annales d’Economie et de Statistique Vol 34, pp159-180.
Oliveira, A. V. M. (2010) A Alocação de Slots em Aeroportos Congestionados e suas
Consequências no Poder de Mercado das Companhias Aéreas. Revista de Literatura
dos Transportes, vol. 4, n. 2, pp. 5-49.
Oliveira, A.V.M. (2004) As Elasticidades-Preço da Demanda por Cerveja no Brasil – Um
Estudo Econométrico. Parecer Econométrico acerca dos impactos sobre o
mercado brasileiro de cerveja da aquisição do controle acionário de AMBEV por
INTERBREW – Maio de 2004. Mimeo.
Ordover, J. and Saloner, G (1990). Predation, Monopolization, and Antitrust in The
Handbook of Industrial Organization., V. I , cap. 9, North Holland, Amsterdam.
Pinkse, J. and Slade, M. (2004). Mergers, Brand Competition, and the Price of a Pint.
European Economic. Review 48, 617-643.
Sherer, F.M and Ross, D (1990). Industrial Market Structure and Economics Performance
3rd edition 1990, Houghton Mifflin Co., Boston.
Slade, M. (2004). Market Power and Joint Dominance in UK Brewing. Journal of
Industrial Economics, 52, 133-163.