
Investigating the Neural Basis for FMRI-Based Functional Connectivity In a Blocked Design:...
11
Original contributions Investigating the neural basis for fMRI-based functional connectivity in a blocked design: application to interregional correlations and psycho-physiological interactions Jieun Kim, Barry Horwitz ⁎ Brain Imaging and Modeling Section, National Institute on Deafness and Other Communication Disorders, National Institutes of Health, Bethesda, MD 20892, USA Received 25 June 2007; revised 17 October 2007; accepted 18 October 2007 Abstract This paper investigates how well different kinds of fMRI functional connectivity analysis reflect the underlying interregional neural interactions. This is hard to evaluate using real experimental data where such relationships are unknown. Rather, we use a biologically realistic neural model to simulate both neuronal activities and multiregional fMRI data from a blocked design. Because we know how every element in the model is related to every other element, we can compare functional connectivity measurements across different spatial and temporal scales. We focus on (1) psycho-physiological interaction (PPI) analysis, which is a simple brain connectivity method that characterizes the activity in one brain region by the interaction between another region's activity and a psychological factor, and (2) interregional correlation analysis. We investigated the neurobiological underpinnings of PPI using simulated neural activities and fMRI signals generated by a large-scale neural model that performs a visual delayed match-to-sample task. Simulated fMRI data are generated by convolving integrated synaptic activities (ISAs) with a hemodynamic response function. The simulation was done under three task conditions: high-attention, low-attention and a control task (‘passive viewing’). We investigated how biological and scanning parameters affect PPI and compared these with functional connectivity measures obtained using correlation analysis. We performed correlational and PPI analyses with three types of time-series data: ISA, fMRI and deconvolved fMRI (which yields estimated neural signals) obtained using a deconvolution algorithm. The simulated ISA can be considered as the ‘gold standard’ because it represents the underlying neural activity. Our main findings show (1) that evaluating the change in an interregional functional connection using the difference in regression coefficients (as is essentially done in the PPI method) produces results that better reflect the underlying changes in neural interrelationships than does evaluating the functional connectivity difference as a change in correlation coefficient; (2) that using fMRI and deconvolved fMRI data led to similar conclusions in the PPI-based functional connectivity results, and these generally agreed with the nature of the underlying neural interactions; and (3) the functional connectivity correlation measures often led to different conclusions regarding significance for different scanning and hemodynamic parameters, but the significances of the PPI regression parameters were relatively robust. These results highlight the way in which neural modeling can be used to help validate the inferences one can make about functional connectivity based on fMRI data. Published by Elsevier Inc. Keywords: Neural modeling; fMRI; Brain; Hemodynamic response function; Deconvolution 1. Introduction Many neuroimaging studies have attempted to evaluate human brain functional interactions from data obtained by various imaging techniques, such as functional magnetic resonance imaging (fMRI), positron emission tomography (PET) or electro-/magneto-encephalography (EEG/MEG). One type of neural functional interactivity is called functional connectivity [1,2]. Two neural entities are functionally connected if their activities show a strong covariance with each other, but functional connectivity does not necessarily imply either a direct anatomical connection Available online at www.sciencedirect.com Magnetic Resonance Imaging 26 (2008) 583 – 593 ⁎ Corresponding author. Tel.: +1 301 594 7755. E-mail address: [email protected] (B. Horwitz). 0730-725X/$ – see front matter. Published by Elsevier Inc. doi:10.1016/j.mri.2007.10.011
Transcript of Investigating the Neural Basis for FMRI-Based Functional Connectivity In a Blocked Design:...
Available online at www.sciencedirect.com
Magnetic Resonance Imaging 26 (2008) 583–593
Original contributions
Investigating the neural basis for fMRI-based functional connectivity in ablocked design: application to interregional correlations and
psycho-physiological interactionsJieun Kim, Barry Horwitz⁎
Brain Imaging and Modeling Section, National Institute on Deafness and Other Communication Disorders, National Institutes of Health,Bethesda, MD 20892, USA
Received 25 June 2007; revised 17 October 2007; accepted 18 October 2007
Abstract
This paper investigates how well different kinds of fMRI functional connectivity analysis reflect the underlying interregional neuralinteractions. This is hard to evaluate using real experimental data where such relationships are unknown. Rather, we use a biologicallyrealistic neural model to simulate both neuronal activities and multiregional fMRI data from a blocked design. Because we know how everyelement in the model is related to every other element, we can compare functional connectivity measurements across different spatial andtemporal scales. We focus on (1) psycho-physiological interaction (PPI) analysis, which is a simple brain connectivity method thatcharacterizes the activity in one brain region by the interaction between another region's activity and a psychological factor, and (2)interregional correlation analysis. We investigated the neurobiological underpinnings of PPI using simulated neural activities and fMRIsignals generated by a large-scale neural model that performs a visual delayed match-to-sample task. Simulated fMRI data are generated byconvolving integrated synaptic activities (ISAs) with a hemodynamic response function. The simulation was done under three taskconditions: high-attention, low-attention and a control task (‘passive viewing’). We investigated how biological and scanning parametersaffect PPI and compared these with functional connectivity measures obtained using correlation analysis. We performed correlational and PPIanalyses with three types of time-series data: ISA, fMRI and deconvolved fMRI (which yields estimated neural signals) obtained using adeconvolution algorithm. The simulated ISA can be considered as the ‘gold standard’ because it represents the underlying neural activity.Our main findings show (1) that evaluating the change in an interregional functional connection using the difference in regressioncoefficients (as is essentially done in the PPI method) produces results that better reflect the underlying changes in neural interrelationshipsthan does evaluating the functional connectivity difference as a change in correlation coefficient; (2) that using fMRI and deconvolved fMRIdata led to similar conclusions in the PPI-based functional connectivity results, and these generally agreed with the nature of the underlyingneural interactions; and (3) the functional connectivity correlation measures often led to different conclusions regarding significance fordifferent scanning and hemodynamic parameters, but the significances of the PPI regression parameters were relatively robust. These resultshighlight the way in which neural modeling can be used to help validate the inferences one can make about functional connectivity based onfMRI data.Published by Elsevier Inc.
Keywords: Neural modeling; fMRI; Brain; Hemodynamic response function; Deconvolution
1. Introduction
Many neuroimaging studies have attempted to evaluatehuman brain functional interactions from data obtained by
⁎ Corresponding author. Tel.: +1 301 594 7755.E-mail address: [email protected] (B. Horwitz).
0730-725X/$ – see front matter. Published by Elsevier Inc.doi:10.1016/j.mri.2007.10.011
various imaging techniques, such as functional magneticresonance imaging (fMRI), positron emission tomography(PET) or electro-/magneto-encephalography (EEG/MEG).One type of neural functional interactivity is calledfunctional connectivity [1,2]. Two neural entities arefunctionally connected if their activities show a strongcovariance with each other, but functional connectivity doesnot necessarily imply either a direct anatomical connection

584 J. Kim, B. Horwitz / Magnetic Resonance Imaging 26 (2008) 583–593
or a directional link. Although there are many measures andalgorithms used to compute quantities that embody theconcept of functional connectivity, very little effort has beenspent determining their neurobiological substrate [3]. More-over, not enough work has been done to establish how thevariously defined notions of functional connectivity arerelated to one another. That is, it is not certain that differentmeasures of functional connectivity will reflect the same setof underlying neural relationships, and because we do notreally understand the neural basis of each definition offunctional connectivity, if differences arise, it is not clearwhich definition, if any, is correct [3].
Among the neuroimaging methods, fMRI has becomeone of the most commonly used techniques for evaluatinginterregional functional connectivity. A major challenge forthis approach is the problem of interpreting the underlyingneural relationships via the observed blood oxygen level-dependent (BOLD) responses, which result in a blurring oftemporally and spatially distinct neural processes. Someinvestigators have chosen to analyze interregional func-tional connectivity using just the fMRI time series (e.g.,Refs. [4–8]), whereas others have employed an algorithmfor deconvolving the fMRI activity, and then evaluatingthe functional connectivity based on the resulting decon-volved data (e.g., Refs. [9,10]). Gitelman et al. [10] used asimple simulation study to illustrate the difference betweenthe interaction of two regional BOLD signals and that ofmultiplying two deconvolved BOLD signals followed byre-convolving it with a hemodynamic response function(HRF). However, how well deconvolved signals expressthe underlying neurofunctional relationships has not yet,to our knowledge, been explored in detail. Consequently,one of the aims of the current study was to investigatethe use of deconvolved fMRI data in functionalconnectivity analyses.
Besides deconvolution, another important issue inanalyzing neuroimaging data is the fact that the experimen-tally obtained BOLD fMRI signals are influenced by thehemodynamic parameters (e.g., the time required for theBOLD signal to reach its maximum value followinginitiation of neural activity) of each brain region, and thescanning parameters used to acquire the fMRI data (e.g., therepetition time, TR, required to collect an entire volume'sworth of data). A second aim of the current paper, therefore,is to examine how the values these parameters have canaffect the measured fMRI functional connectivity.
To address the above two issues, we computed inter-regional functional connectivities using simulated fMRI dataobtained from a biologically realistic computational neuralnetwork model that performs a visual delayed match-to-sample (DMS) task [11,12]. This model, based on neuro-physiological and neuroanatomical data from primate andhuman studies, allowed us to simultaneously simulate bothneuronal and fMRI (or PET) data that closely matchedexperimentally acquired data. Unlike other simple simula-tions, our model generates regional neural activities from
excitatory and inhibitory neuronal populations, has bothfeedforward and feedback connections, and contains neuro-nal populations whose activities show a diverse set ofbehaviors (e.g., some neurons are active only when visualstimuli are presented to the model; others can be active whenno stimuli are present). In this paper, we examine twofunctional connectivity analysis methods for blocked fMRIdata, task-specific correlation comparisons and psycho-physiological interaction (PPI) analysis. Conceptually, thesimplest ways to evaluate interregional functional connec-tivity are to compute either the correlation coefficient or theregression coefficient between the neuroimaging signalsfrom two brain regions (see Ref. [3] for a review). Here, wehave focused on the PPI regression method as implementedin the SPM software package (Wellcome Department ofCognitive Neurology, http://www.fil.ion.ucl.ac.uk/spm),which is one of the most commonly used fMRI analysispackages. SPM includes not only PPI, but also dynamiccausal modeling (DCM), a network connectivity modelingmethod [9]. Deconvolution is explicitly incorporated intoboth PPI and DCM.
It needs to be mentioned that different neuroimaginginvestigators use different terminology to define brainfunctional integrations [2]. Although all use Friston's [1]terminology that functional connectivity represents thecovariance between the activities in two regions, andeffective connectivity represents the influence of one regionon another, we and others (e.g., Refs. [3,8,13]) restrict thedefinition of effective connectivity to the strength of thefunctional linkage between two brain regions mediatedalong a specific anatomical pathway. Although the PPIapproach has been described as a measure of effectiveconnectivity [14], we consider it as a functional connectiv-ity method because PPI detects regionally specificresponses in any brain area in terms of the interactionbetween input from another brain region (the ‘seed’ or‘source’ region) and a task-specific effect through aregression equation; it is not necessary to specify anyanatomical pathways.
2. Issues associated with brain functional interaction
In this section, we shall discuss in detail three importantissues associated with using functional connectivity thatwill be addressed employing our computational neuromo-deling framework. One issue will focus on two differentways to evaluate functional connectivity — interregionalcorrelation vs. regression coefficient. A second issueconcerns whether or not one should utilize deconvolvedfMRI data. The third issue deals with hemodynamic delayand fMRI scanning parameters.
2.1. Correlations and PPI regression
As mentioned in the Introduction, most measures offunctional connectivity use either some type of simple

585J. Kim, B. Horwitz / Magnetic Resonance Imaging 26 (2008) 583–593
correlation coefficient or (univariate/multivariate) regressioncoefficient. One focus of the current paper will be to examinewhether correlation and regression result in similar ordifferent conclusions regarding the functional interactionsbetween brain areas. Specifically, we will compare, using ourcomputational model, simple correlations and PPI regressioncoefficients. Our computational neural model performs aDMS task for visual objects and also a kind of passiveviewing (see below for details). We will compute the changein the functional connectivity between these conditions intwo ways: (1) compute the change in the strengths ofinterregional correlation coefficients for each task condition;(2) perform a PPI analysis; a significant PPI occurs if there isa significant change in the regression coefficient betweentwo conditions.
2.2. Neural signal estimation: hemodynamicdeconvolution
The main objective of brain functional interactionanalysis is to express relationships between regional neuralactivities under designated experimental contexts. As such,PPI analysis employs a hemodynamic deconvolution algo-rithm (which uses a parametric empirical Bayes formulation)that generates an estimated “neural” time course from theBOLD signal in a given volume of interest as thephysiological variable for the PPI analysis [10].
Gitelman et al. [10] showed that there was a differencebetween the interacting signals at the original hemody-namic level and the interacting deconvolved time coursesfollowed by reconvolving with an HRF. The data simulatedin the Gitelman et al. study, however, had severallimitations. First, these data came from a model withonly two regions. Second, the simulated neural activitieswere expressed as simple delta functions. Not considered intheir analysis were such factors as: (i) excitatory andinhibitory synaptic activities both contribute to the neuronalactivity, (ii) multiple neuronal populations are present inany region of interest (including a single voxel) and (iii)local and afferent neuronal activities are combined into asingle signal [3]. The merit of our computational neuralmodel is that the neuronal complexity described above isindeed considered during data generation. We therefore canattempt to assess the use of deconvolution-obtained neuralsignals in PPI connectivity analysis by comparing themwith PPI analysis based on model-based neural activities.As a consequence, this will enable us to begin tounderstand the neural substrates underlying the interpreta-tion of PPI analysis.
2.3. Variability of the scanning parameters andhemodynamic delay parameters
In response to neural activity, the local change inblood oxygenation takes about 4–8 s to reach its peakand a further 10 s or more to return to its baseline value[15,16]. The resulting fMRI data are then obtained by
sampling this blood oxygenation function every TRseconds (TR is the scanner repetition time). To simulatethe fMRI time series, we convolve the integratedsynaptic activity (ISA) with an HRF and down-samplethis every TR [12]. Since TR is the time interval neededto attain a whole volume of brain data, different TRvalues might lead to different results for the interregionalrelationships. For instance, a rapid TR acquisition allowsone to gain more information of quickly changing neuralrelationships. However, to achieve such a rapid TR, onemay have to employ thicker slices, resulting in reducedspatial resolution or brain coverage. This, in turn, maylead to the incorporation of functionally distinct neuronalpopulations into the regions whose functional connectiv-ity we are examining. Here, we will use three TR values(1, 2, 3 s).
Several parameters characterized the HRF, including, forexample, time-to-peak (TP) and duration of the response.Because we can specify the HRF parameters in our model,we can thus investigate in our simulations how sensitive ourmeasures of functional connectivity are to variation in theshape of the HRF. In this paper, we will focus on TP and usethree values (3, 7, 9 s).
3. Neural model
3.1. Regions of the model
We used the large-scale neural computational modelpresented in Horwitz et al. [3] to generate biologicallyrealistic neural activities. This model, an extension of themodel developed by Tagamets and Horwitz [11], performs avisual DMS task for shape (two-dimensional object shape).The DMS task consists of the presentation of a shape, a delay[inter-stimulus interval (ISI)] and the presentation of asecond shape. The model (i.e., a ‘subject,’ defined by valuesof anatomical connection weights in the model) determineswhether the second stimulus is the same as the first. Thecontrol (or passive-viewing) task consists of presenting ascrambled shape as a stimulus, but no subject responseis required.
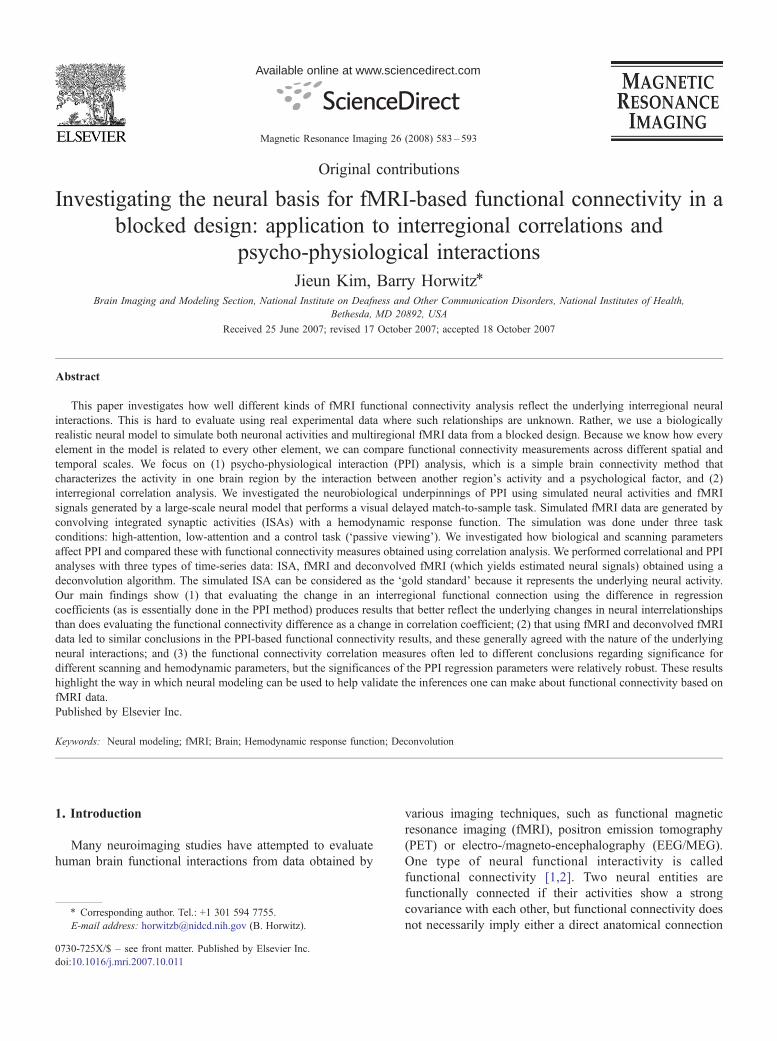
The model incorporates four major brain regionsrepresenting the ventral visual object processing pathway[17]: primary sensory cortex (V1/V2), secondary sensorycortex (V4), a perceptual integration region [inferiortemporal (IT) cortex] and prefrontal cortex (PFC) thatincorporates short-term working memory (Fig. 1). ThePFC of the model has four different types of neuronalunits: FS (stimulus-sensitive units), D1 (units active duringthe ISI), D2 (units active during stimulus presentation andduring the ISI) and FR (units whose activity increases ifthere is a match between the first and second stimuli of atrial). These modules are anatomically linked by bothfeedforward and feedback connections. The neurons thatcomprise these modules are likely to be intermingled inthe same anatomical part of PFC [18,19]. Because the
Fig. 1. Network diagram of the visual object processing model [11]. Four regions (V1, V4, IT and PFC) form a complex network of feedforward and feedbackconnections; connections are either excitatory (solid arrows) or inhibitory (dashed arrows). In the PFC region, FS contains stimulus-sensitive units, D1 containsunits active during the delay period of a DMS task, D2 contains units active during stimulus presentation and during the delay period, and FR contains unitswhose activities increase if there is a match between the first and second stimuli of a trial (see Ref. [3] for more details).
586 J. Kim, B. Horwitz / Magnetic Resonance Imaging 26 (2008) 583–593
anatomical connections between these PFC submodulesare complex (and thus interesting), we will treat them as ifthey are actual brain regions spatially separated fromeach other.
3.2. Task design
The simulated fMRI study we employed consisted of 10blocks, each block containing three DMS trials and threecontrol trials (‘passive viewing’, in which noise patterns arepresented). Each trial of the DMS task consisted ofpresentation for 1 s of the first stimulus, 6 s of delay, 1 sfor presentation of the second stimulus and 5 s for theresponse period (which includes the inter-trial interval). The‘task instructions,’ which inform the model as to which task(DMS or control task) to perform, is implemented by meansof a biasing parameter we call attention (see Fig. 1) thatcontrols how well the model maintains prefrontal activityduring the delay component of each task. The attentionparameter was set to a large value during the DMS task and asmall value during the control task. Among three DMS trials,two trials were match trials in that the first and second stimuliwere the same. As the source of trial-to-trial variability, halfthe population of regional neurons were assigned asnonspecific neurons that receive noise input and arerandomly connected to neurons in other modules (see Ref.[3] for more details).
To simulate block-to-block variability, we applieddifferent values of the attention parameter [3]. The firstfive blocks of the DMS task were devoted to low-attentionconditions (attention parameter has values from 0.08 to0.12 in steps of 0.01), followed by five blocks of high-attention conditions (values from 0.27 to 0.31 in steps of0.01). We fixed the attention level of the control task to0.05 [11].
Considering subject variability, 10 individual networksrepresenting 10 normal subjects were constructed by varyingthe values of the interregional anatomical connectionweights. We employed the same connection weights asused in Tables 1A and 1B of [3].
3.3. fMRI Data simulation
The absolute value of the synaptic activity (ISA) in eachregion was temporally and spatially integrated over a 50-mstime course. ISA can be considered as the ‘gold standard’ inthat it represents the neural signal we would get with anoiseless and fast MRI scanner if there were no hemody-namic delay or other possible confounds affecting therelationship between neural activity and the BOLD signal(see Fig. 2A, which shows the ISA in two regions for arandomly selected subject).
For simulating fMRI, the ISA was convolved with agamma function representing the hemodynamic delay [20] toproduce a temporally smoothed BOLD time series that wasthen down-sampled using an assigned TR to produce thesimulated fMRI time series (Fig. 2B). We employed threedifferent HRF TP values (3, 7, 9 s) during convolution (whichencompasses the known range of approximately 4–8 s). Eachof three sets of smoothed time series (TP=3, 7, 9 s) was thendown-sampled using three different TRs (TR=1, 2, 3 s),resulting in 3×3 fMRI time courses for each region in eachsubject.
To investigate how the evaluation of fMRI functionalconnectivity is affected by the use of a deconvolvedfMRI time series (as suggested by Ref. [10]), we appliedthe empirical Bayesian deconvolution algorithmembedded in the PPI-SPM software package to eachsimulated fMRI time series. The deconvolved time seriesrepresents the ‘estimated’ neural signals (ENS) (Fig. 2C),

Table 1AIT-PFC, IT-D2 and IT-FR correlations of two task conditions (low/high attention) and the results (z-statistic) of their comparison (in parentheses)
Low/high IT-PFC correlations IT-D2 correlations IT-FR correlations
ISA .92/.93 (0.67) .91/.94 (1.42) .93/.93 (0) .91/.92 (0.60) .91/.92 (0.41) .92/.91 (-0.33) .65/.70 (.89) .64/.73 (1.15) .66/.70 (0.40)TR=1 TR=2 TR=3 TR=1 TR=2 TR=3 TR=1 TR=2 TR=3
fMRI TP=3 .96/.92(−3.47)
.95/.91(−2.05)
.96/.91(−2.27)
.82/.80(−0.57)
.78/.79(0.18)
.80/.79(−0.15)
.91/.94(2.05)
.90/.94(1.79)
.91/.95(1.65)
TP=7 .91/.89(−1.03)
.91/.89(−0.71)
.91/.89(−0.57)
.67/.78(2.28)
.67/.78(1.58)
.66/.78(1.37)
.90/.91(0.54)
.90/.92(0.79)
.90/.93(1.1)
TP=9 .90/.89(−0.49)
.90/.89(−0.34)
.90/.89(−0.27)
.63/.78(2.95)
.64/.78(1.94)
.66/.78(1.37)
.90/.91(0.54)
.90/.91(0.37)
.91/.92(0.33)
ENS TP=3 .98/.95(−3.38)
.96/.93(−1.98)
.94/.92(−1.11)
.92/.87(−2.45)
.87/.81(−1.18)
.88/.82(−1.26)
.92/.95(2.33)
.87/.91(1.26)
.82/.79(−0.44)
TP=7 .95/.92(−2.51)
.94/.91(−1.07)
.95/.95(−0.13)
.83/.80(−0.77)
.80/.81(0.13)
.88/.87(−0.22)
.88/.89(0.71)
.87/.89(0.54)
.90/.91(0.12)
TP=9 .93/.91(−1.06)
.91/.91(0)
.95/.95(−0.06)
.78/.79(0.43)
.75/.80(0.91)
.87/.87(−0.13)
.84/.90(2.18)
.83/.88(1.19)
.92/.91(−0.17)
The bold emphasis indicates that the correlation coefficient is significantly bigger (with positive z-values) or smaller (with negative z-values) during the high-compared to the low-attention task at Pb .05. Notation. TR (seconds): repetition time; TP (seconds): HRF time-to-peak.
587J. Kim, B. Horwitz / Magnetic Resonance Imaging 26 (2008) 583–593
which, in turn, can be compared to the ‘gold-standard’ISA (Fig. 2A).
4. Analysis methods
4.1. The interregional connections of interest
Our analysis will focus on two major brain regions, IT andPFC. The IT region plays an important role in the modelbecause it receives feedforward inputs from posterior visualprocessing areas, and its neurons project to the frontal lobe. Italso receives feedback connections from the D2 submodule.Thus, IT represents the main region in the model wherebottom-up and top-down processing converge. For this con-nectivity study, we will specifically examine the IT connec-tions with the two PFC submodules, D2 and FR. Presumably,the functional connection strengths of IT to these twosubmodules in the frontal region should appear stronger
Table 1BCorrelations of the high-attention task and control condition with their z-test statis
Control/high IT-PFC correlations IT-D2
ISA .77/.93(6.20)
.80/.94(4.31)
.69/.93(4.40)
.70/.9(7.02
TR=1 TR=2 TR=3 TR=1
fMRI TP=3 .87/.92(2.49)
.84/.91(2.07)
.85/.91(1.47)
.46/.8(5.85
TP=7 .80/.89(3.14)
.80/.89(2.18)
.79/.89(1.90)
.14/.7(8.79
TP=9 .80/.89(3.14)
.79/.89(2.36)
.78/.89(2.05)
.07/.7(9.48
ENS TP=3 .93/.95(2.21)
.86/.93(2.08)
.83/.92(1.97)
.74/.8(3.17
TP=7 .86/.92(2.63)
.85/.91(2.08)
.92/.95(1.33)
.51/.8(5.22
TP=9 .84/.91(2.90)
.83/.91(2.31)
.92/.95(1.49)
.42/.7(6.04
The bold emphasis indicates that correlation coefficients are significantly bigger d
during the DMS conditions, because (i) D2 neurons receivethe attentional input and they project back to IT (and V4); and(ii) the neurons in FR become active during the DMS taskwhen the second stimulus of a trial matches the first.
4.2. Functional connectivity
Correlation and PPI regression analyses were applied toeach of the three different types of time series [ISA, 3 (TP)×3(TR) sets of fMRI data and 3 (TP)×3 (TR) ENSs that areobtained by deconvolving the fMRI data]. We consideredthree interregional functional connections: the IT connectionwith PFC (represented by an average time course over thefour PFC submodules), the IT-D2 connection and the IT-FRconnection. Two task contrasts were used to test forsignificant connectivity changes: (i) high- vs. low-attention,and (ii) high-attention vs. the control (passive viewing)condition. Correlations were computed for each of the two
tics in parentheses
correlations IT-FR correlations
2)
.71/.92(4.73)
.60/.91(4.53)
.39/.70(4.43)
.43/.73(3.16)
.27/.70(3.21)
TR=2 TR=3 TR=1 TR=2 TR=3
0)
.37/.79(4.61)
.40/.79(3.52)
.93/.94(0.77)
.92/.94(1.01)
.92/.95(1.32)
8)
.15/.78(6.03)
.12/.78(5.02)
.92/.91(−0.6)
.92/.92(0)
.92/.93(0.38)
8)
.07/.78(6.58)
.06/.78(5.35)
.92/.91(−1.6)
.92/.91(−0.41)
.92/.92(0)
7)
.57/.81(3.26)
.64/.82(2.16)
.90/.95(3.36)
.76/.91(3.43)
.69/.79(1.24)
0)
.48/.81(3.91)
.77/.87(1.61)
.82/.89(2.79)
.81/.89(1.87)
.89/.91(0.4)
9)
.42/.80(4.39)
.75/.87(1.80)
.82/.90(2.80)
.80/.88(1.72)
.90/.91(0.35)
uring the high-attention compared to the control condition at Pb .05.
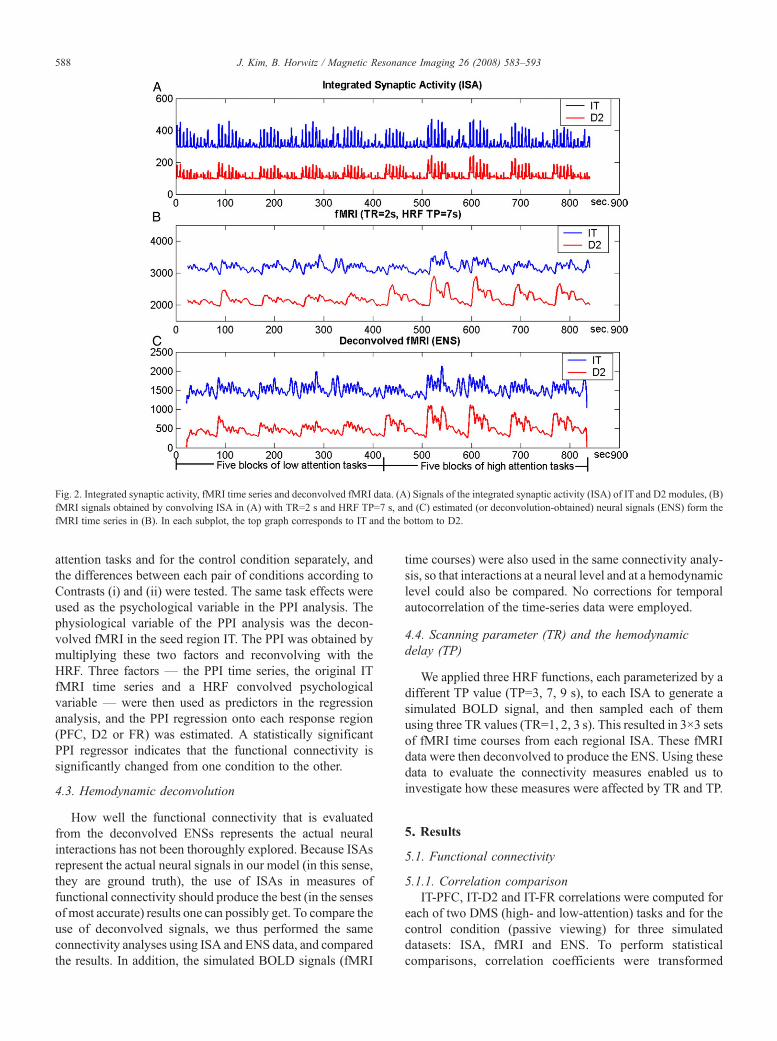
Fig. 2. Integrated synaptic activity, fMRI time series and deconvolved fMRI data. (A) Signals of the integrated synaptic activity (ISA) of IT and D2 modules, (B)fMRI signals obtained by convolving ISA in (A) with TR=2 s and HRF TP=7 s, and (C) estimated (or deconvolution-obtained) neural signals (ENS) form thefMRI time series in (B). In each subplot, the top graph corresponds to IT and the bottom to D2.
588 J. Kim, B. Horwitz / Magnetic Resonance Imaging 26 (2008) 583–593
attention tasks and for the control condition separately, andthe differences between each pair of conditions according toContrasts (i) and (ii) were tested. The same task effects wereused as the psychological variable in the PPI analysis. Thephysiological variable of the PPI analysis was the decon-volved fMRI in the seed region IT. The PPI was obtained bymultiplying these two factors and reconvolving with theHRF. Three factors — the PPI time series, the original ITfMRI time series and a HRF convolved psychologicalvariable — were then used as predictors in the regressionanalysis, and the PPI regression onto each response region(PFC, D2 or FR) was estimated. A statistically significantPPI regressor indicates that the functional connectivity issignificantly changed from one condition to the other.
4.3. Hemodynamic deconvolution
How well the functional connectivity that is evaluatedfrom the deconvolved ENSs represents the actual neuralinteractions has not been thoroughly explored. Because ISAsrepresent the actual neural signals in our model (in this sense,they are ground truth), the use of ISAs in measures offunctional connectivity should produce the best (in the sensesof most accurate) results one can possibly get. To compare theuse of deconvolved signals, we thus performed the sameconnectivity analyses using ISA and ENS data, and comparedthe results. In addition, the simulated BOLD signals (fMRI
time courses) were also used in the same connectivity analy-sis, so that interactions at a neural level and at a hemodynamiclevel could also be compared. No corrections for temporalautocorrelation of the time-series data were employed.
4.4. Scanning parameter (TR) and the hemodynamicdelay (TP)
We applied three HRF functions, each parameterized by adifferent TP value (TP=3, 7, 9 s), to each ISA to generate asimulated BOLD signal, and then sampled each of themusing three TR values (TR=1, 2, 3 s). This resulted in 3×3 setsof fMRI time courses from each regional ISA. These fMRIdata were then deconvolved to produce the ENS. Using thesedata to evaluate the connectivity measures enabled us toinvestigate how these measures were affected by TR and TP.
5. Results
5.1. Functional connectivity
5.1.1. Correlation comparisonIT-PFC, IT-D2 and IT-FR correlations were computed for
each of two DMS (high- and low-attention) tasks and for thecontrol condition (passive viewing) for three simulateddatasets: ISA, fMRI and ENS. To perform statisticalcomparisons, correlation coefficients were transformed

Table 2AEstimated PPI regression parameters for the task contrast high vs. low attention, with the corresponding t values in parentheses
High vs. low IT-PFC connectivity IT-D2 connectivity IT-FR connectivity
ISA 0.03 (2.77) 0.03 (2.11) 0.03 (1.7) 0.08 (5.69) 0.08 (3.92) 0.09 (3.49) 0.02 (1.51) 0.02 (1.48) 0.02 (0.95)TR=1 TR=2 TR=3 TR=1 TR=2 TR=3 TR=1 TR=2 TR=3
fMRI TP=3 0.12 (5.89) 0.16 (4.77) 0.17 (3.8) 0.33 (6.67) 0.46 (5.42) 0.48 (4.35) 0.01 (1.48) 0.01 (1.01) 0.01 (0.65)TP=7 0.19 (8.61) 0.21 (5.81) 0.21 (4.42) 0.56 (9.77) 0.61 (6.68) 0.63 (5.1) 0.006 (0.08) 0.00 (0.97) −0.01 (−0.27)TP=9 0.21 (9.72) 0.23 (6.68) 0.21 (4.42) 0.61 (10.6) 0.65 (7.44) 0.68 (5.83) 0.01 (1.89) 0.01 (0.85) 0.003 (0.22)
ENS TP=3 0.04 (4.88) 0.04 (2.89) 0.05 (2.43) 0.1 (6.21) 0.12 (3.9) 0.14 (2.96) 0.01 (3.18) −0.002 (0.26) 0.01 (0.78)TP=7 0.07 (5.22) 0.08 (3.76) 0.08 (2.63) 0.22 (6.74) 0.27 (4.96) 0.29 (4.03) −0.01 (−1.08) −0.02 (−1.73) −0.05 (−3.59)TP=9 0.09 (5.65) 0.1 (3.97) 0.1 (3.11) 0.28 (7.17) 0.32 (5.28) 0.34 (4.41) −0.01 (−2.08) −0.03 (−2.73) −0.05 (−3.27)
The bold emphasis indicates that the correlation coefficient is significantly bigger (with positive z-values) or smaller (with negative z-values) during the high-attention vs. low-attention task (Pb .05). Notation. TR (seconds): repetition time; TP (seconds): HRF time-to-peak.
589J. Kim, B. Horwitz / Magnetic Resonance Imaging 26 (2008) 583–593
using Fisher's Z-transformation [21]. Tables 1A and 1Bprovide the results of comparing (a) the high- vs. low-attention tasks, and (b) the high-attention task vs. the controlcondition. Table 1A shows that there are not manysignificant differences between high- and low-attentioncorrelations, although a few were found when the fMRIand ENS datasets were used, with some even being negative.
Which correlations differed significantly between thehigh-attention and control conditions depended on whichdataset was used. Specifically, the differences between high-attention and control correlations were significant when ISAwas employed. For the fMRI and ENS data, there weresignificant differences for most of the IT-PFC and IT-D2correlations that agreed with the results for ISA data.Conversely, IT-FR correlation differences for fMRI andsome cases of ENS data were no longer significant and thuswere not consistent with the results for ISA data.
5.1.2. Psycho-physiological interaction regressionWe performed PPI analyses with the same datasets used
above. ITwas selected as the seed region, and its relationshipto each of the response regions — PFC, D2 or FR — wasevaluated in terms of PPI regressors. Each of the two taskcontrasts used in the correlation comparisons was employedas the psychological factor in the PPI analyses: high-attention vs. low-attention contrast (Table 2A and high-attention vs. control condition contrast (Table 2B)).Time-series data obtained by PPI analysis are illustrated in
Table 2BEstimated PPI regression parameters for high-attention vs. control task contrast, w
High vs. control IT-PFC connectivity IT-D2 con
ISA 0.06 (4.26) 0.05 (2.98) 0.06 (2.56) 0.12 (6.7)TR=1 TR=2 TR=3 TR=1
fMRI TP=3 0.17 (8.87) 0.22 (6.87) 0.2 (5.08) 0.45 (8.77TP=7 0.28 (12.7) 0.31 (9.44) 0.33 (7.76) 0.77 (12.8TP=9 0.25 (11.4) 0.3 (8.7) 0.32 (7.44) 0.75 (12.6
ENS TP=3 0.07 (7.61) 0.09 (5.99) 0.09 (4.5) 0.16 (7.1)TP=7 0.1 (5.96) 0.15 (6) 0.16 (5) 0.29 (6.75TP=9 0.08 (4.11) 0.14 (4.94) 0.14 (3.82) 0.26 (5.24
The bold emphasis indicates that the connectivity strengths are significantly bigge
Fig. 3. We note that when using ISA and ENS datasets forPPI analysis, no deconvolution is necessary because ISA isprior to HRF convolution and ENS is indeed ‘deconvolved’fMRI. To prevent statistical significance from being affectedby differences in the number of data points, the ISA and ENSdatasets were down-sampled to every TR, which corre-sponds to what is used with the fMRI datasets.
The estimated PPI regressors for each of two task contrastsare summarized in Tables 2A and 2B. All IT-PFC and IT-D2connection strengths for essentially all three different datasetswere significantly increased for the high-attention relative tothe low-attention task conditions (Table 2A). Although IT-FRconnectivity changes for ISA and fMRI were not significant,we found for the ENS data that some of the PPIs were eitherpositively or negatively significant.
Similarly, almost all connection values were significantlyincreased comparing the high attention to the controlcondition for all three types of datasets (Table 2B), althoughthere were several nonsignificances of IT-FR connectivitiesfor the ISA and ENS datasets, likely due to increasedstandard errors caused by down-sampling to TR=2 or 3 s,which resulted in fewer data points. Fig. 4 illustrates thedifferences of the regression of D2 on IT activity between thehigh- and low-attention task conditions for ISA (top left),fMRI (top right) and ENS (bottom left) data. Thesignificant difference between the two regression slopesin each graph corresponds to the significant PPI parameterin Tables 2A and 2B.
ith the corresponding t values in parentheses
nectivity IT-FR connectivity
0.11 (4.51) 0.13 (3.75) 0.03 (2.48) 0.03 (1.85) 0.04 (1.65)TR=2 TR=3 TR=1 TR=2 TR=3
) 0.57 (6.82) 0.53 (4.94) 0.06 (7.78) 0.07 (5.45) 0.06 (3.75)) 0.86 (10.2) 0.93 (8.33) 0.07 (9.46) 0.07 (6.72) 0.08 (5.25)) 0.84 (9.6) 0.91 (8.18) 0.06 (7.89) 0.07 (6.19) 0.07 (5.26)
0.21 (5.47) 0.23 (4.32) 0.03 (7.65) 0.04 (5.89) 0.03 (3.47)) 0.41 (6.36) 0.47 (5.6) 0.02 (2.96) 0.04 (4.69) 0.03 (2.56)) 0.41 (5.55) 0.42 (4.56) 0.002 (0.29) 0.03 (3.06) 0.01 (0.99)
r for the high-attention vs. control condition at Pb .05.
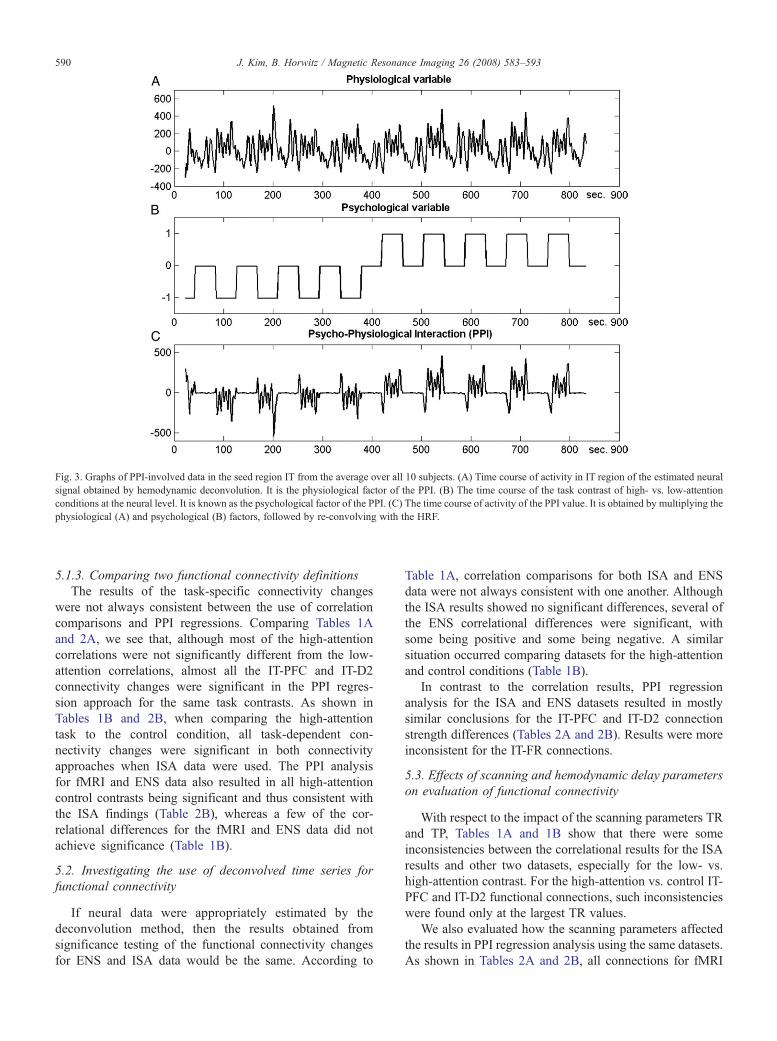
ig. 3. Graphs of PPI-involved data in the seed region IT from the average over all 10 subjects. (A) Time course of activity in IT region of the estimated neuralignal obtained by hemodynamic deconvolution. It is the physiological factor of the PPI. (B) The time course of the task contrast of high- vs. low-attentiononditions at the neural level. It is known as the psychological factor of the PPI. (C) The time course of activity of the PPI value. It is obtained by multiplying thehysiological (A) and psychological (B) factors, followed by re-convolving with the HRF.
590 J. Kim, B. Horwitz / Magnetic Resonance Imaging 26 (2008) 583–593
Fscp
5.1.3. Comparing two functional connectivity definitionsThe results of the task-specific connectivity changes
were not always consistent between the use of correlationcomparisons and PPI regressions. Comparing Tables 1Aand 2A, we see that, although most of the high-attentioncorrelations were not significantly different from the low-attention correlations, almost all the IT-PFC and IT-D2connectivity changes were significant in the PPI regres-sion approach for the same task contrasts. As shown inTables 1B and 2B, when comparing the high-attentiontask to the control condition, all task-dependent con-nectivity changes were significant in both connectivityapproaches when ISA data were used. The PPI analysisfor fMRI and ENS data also resulted in all high-attentioncontrol contrasts being significant and thus consistent withthe ISA findings (Table 2B), whereas a few of the cor-relational differences for the fMRI and ENS data did notachieve significance (Table 1B).
5.2. Investigating the use of deconvolved time series forfunctional connectivity
If neural data were appropriately estimated by thedeconvolution method, then the results obtained fromsignificance testing of the functional connectivity changesfor ENS and ISA data would be the same. According to
Table 1A, correlation comparisons for both ISA and ENSdata were not always consistent with one another. Althoughthe ISA results showed no significant differences, several ofthe ENS correlational differences were significant, withsome being positive and some being negative. A similarsituation occurred comparing datasets for the high-attentionand control conditions (Table 1B).
In contrast to the correlation results, PPI regressionanalysis for the ISA and ENS datasets resulted in mostlysimilar conclusions for the IT-PFC and IT-D2 connectionstrength differences (Tables 2A and 2B). Results were moreinconsistent for the IT-FR connections.
5.3. Effects of scanning and hemodynamic delay parameterson evaluation of functional connectivity
With respect to the impact of the scanning parameters TRand TP, Tables 1A and 1B show that there were someinconsistencies between the correlational results for the ISAresults and other two datasets, especially for the low- vs.high-attention contrast. For the high-attention vs. control IT-PFC and IT-D2 functional connections, such inconsistencieswere found only at the largest TR values.
We also evaluated how the scanning parameters affectedthe results in PPI regression analysis using the same datasets.As shown in Tables 2A and 2B, all connections for fMRI

Fig. 4. Regression of D2 activity on IT activity for each of the high- and low-attention tasks. (Top left) Data points are from ISA data down-sampled to TR=3 s;(top right) data points are from fMRI data with TR=3 s and TP=3 s; (bottom) data points are from ENS data deconvolved from the fMRI data shown on the topright. Slopes correspond to the regressors of high- (red) and low-attention tasks (blue). Slopes are significantly different between the two conditions for all threedatasets; correlation coefficients for the two conditions do not differ significantly for any of the three datasets.
591J. Kim, B. Horwitz / Magnetic Resonance Imaging 26 (2008) 583–593
data were consistent over all TR and TP values for both taskcontrasts. On the other hand, the PPI regressions of IT-FRconnectivity for ENS data demonstrated several inconsis-tencies with respect to the ISA results (see the bottom half ofTables 2A and 2B).
6. Discussion
This is the third study in which we used a large-scale,biologically realistic neural model that simulates both neuraland fMRI data to investigate the neural basis of variousmeasures of functional/effective connectivity. The first [3]examined fMRI functional connectivity as evaluated usingtime-series correlations and the second [22] investigated the
use of effective connectivity as implemented by DCM[9,23]. Recently, it has been argued that functional/effectiveconnectivity analysis should be performed on deconvolvedfMRI data, rather than on the fMRI signals themselves[9,10]. The present study focused on this issue by evaluatingthe following three properties related to the deconvolutionalgorithms incorporated by these approaches, especially PPI:(1) the relationship between two major functional con-nectivity approaches (correlation comparisons and PPIregression analysis) in the use of deconvolved signals(ENS); (2) the validity of using ENS in functionalinteraction analysis by comparing ENS with ‘gold-standard’neural signals (ISA); (3) the impact of the scanningparameter TR with the HRF delay parameter TP on theseconnectivity measures.

592 J. Kim, B. Horwitz / Magnetic Resonance Imaging 26 (2008) 583–593
Our main findings show first that evaluating the change inan interregional functional connection using the difference inregression coefficients (as is essentially done in the PPImethod) produces results that better reflect the underlyingchanges in neural interrelationships than does evaluating thefunctional connectivity difference as a change in correlationcoefficient. Second, we found that using both fMRI anddeconvolved fMRI data (the ENS datasets) led to similarconclusions in the PPI-based functional connectivity results,and these generally agreed with the nature of the underlyingneural interactions. Finally, the functional connectivitycorrelation measures often led to different conclusionsregarding significance for different scanning (TR) andhemodynamic (TP) parameters, at least within the range ofvalues we used. Conversely, the significances of the PPIregression parameters were relatively robust within the samerange of TR and TP values we used.
ISA data represent a kind of ‘gold-standard’ neural signal(uncontaminated by hemodynamic processes and machine-associated noise), and, therefore, its use to test task-relatedfunctional connectivity changes leads to the most accuratesolutions. However, we found that the change in correlationvalue of ISA data, comparing the high- vs. low-attentiontasks, was not significant, whereas the PPI analysis did leadto statistically significant differences (for IT-PFC and IT-D2). These findings may indicate less sensitivity forcorrelation comparisons than for regression coefficientcomparisons. However, the sensitivity of our findingscould be a result of some artificial aspect of our neuralmodel. For instance, the difference between the correlationand regression result may arise from the fact that we chose50% of the neurons in each region to be nonspecific neuronsthat are not engaged in the task, whereas the actualpercentage of such neurons is unknown.
We also noticed that the IT-FR connectivity changes inPPI regressions using ISA for the high- vs. low-attentiontasks were not significant (see Tables 2A and 2B). This islikely due to our experimental design in which only two outof three trials were match trials in which the first and thesecond stimuli were the same; FR neurons increase theiractivity only for matches, and only during the latter part of aDMS trial. Therefore, the IT functional connection to FR isless active in the high-attention condition than some of theother IT-prefrontal links.
How comparable were the connectivity changes obtainedusing fMRI and ENS data with those obtained using ISAdata? The top halves of Tables 1A and 2A show that PPIregressions using fMRI data represented the changes infunctional connectivity better than the correlation compar-isons in the high-/low-attention task contrast, in the sensethat they have similar statistical significances as those usingISA data. The same situation occurred for the high-attentioncontrol contrast (top halves of Tables 1B and 2B), althoughfor this case many of the correlational differences did comeout to be significantly different. Moreover, the twofunctional connectivity measures — correlation differences
and PPI — using ENS data also consistently showedstatistical significances that matched both those found forISA data, and each other. This finding is interesting becauseit has been argued that using deconvolved fMRI time seriesin functional/effective connectivity analysis provides datathat more closely approximate the underlying neural activity.However, our simulation results showed that the connectivityconclusions reached using ENS data did not generally differfrom those found using the corresponding fMRI data.Perhaps this is not surprising because, as shown in Fig. 2,ENS data look very much like fMRI data. Further work isneeded to investigate the neural underpinnings of functionalconnectivity analysis for event-related fMRI designs.
The finding that using deconvolved time series forevaluation of functional/effective connectivity generallyproduces results reflecting the underlying neural interrela-tionships has significant implications. Hemodynamic decon-volution plays an important role in several commonly usedconnectivity methods (e.g., PPI [10], DCM [9]). Forexample, DCM, which investigates network connectivityusing a regression approach somewhat similar to the PPImethod for a group of regions, essentially deconvolves all ofthe regional fMRI time series to measure the connectionstrengths as the estimated neural state variable and itshemodynamic variable. Our findings indicate that employinga deconvolution step did not result in many inconsistencieswith the ISA results, although neither did use of the fMRIdatasets. However, our simulations focused on one of thesimplest interregional relationships in the model. Theadequacy of PPI type of functional connectivity analysisfor more complex interregional relationships still needsinvestigation. Moreover, because neural relationships maychange rapidly in an event-related fMRI design, and becausethere are quite noticeable differences in signal intensityvalues between ENS and ISA data, as Fig. 2 makes clear, theadequacy of deconvolution will require further explorationusing our neural modeling framework.
Another noticeable result in our study is the fact that thescanning parameter TR and the hemodynamic delay para-meter TP do not have much of an impact on the measures offunctional/effective connectivity using fMRI data, especiallywhen using PPI. As one might expect, the least consistentresults occurred for the longest TR. The lack of sensitivity tothe scanning parameters may have come about because weused only blocked designs in our simulations. Thus, futureinvestigations of event-related designs are warranted.
Acknowledgment
The work was supported by the NIDCD/NIH IntramuralResearch Program.
References
[1] Friston KJ. Functional and effective connectivity in neuroimaging: asynthesis. Human Brain Mapp 1994;2:56–78.

593J. Kim, B. Horwitz / Magnetic Resonance Imaging 26 (2008) 583–593
[2] Horwitz B. The elusive concept of brain connectivity. Neuroimage2003;19:466–70.
[3] Horwitz B, Warner B, Fitzer J, Tagamets MA, Husain FT, Long TW.Investigating the neural basis for functional and effective connectivity.Application to fMRI. Philos Trans R Soc Lond B Biol Sci2005;360:1093–108.
[4] Friston KJ, Buechel C, Fink GR, Morris J, Rolls E, Dolan RJ.Psychophysiological and modulatory interactions in neuroimaging.Neuroimage 1997;6:218–29.
[5] Buchel C, Friston KJ. Modulation of connectivity in visual pathwaysby attention: cortical interactions evaluated with structural equationmodelling and fMRI. Cereb Cortex 1997;7:768–78.
[6] Bullmore E, Horwitz B, Honey G, Brammer M, Williams S, Sharma T.How good is good enough in path analysis of fMRI data? Neuroimage2000;11:289–301.
[7] Mechelli A, Penny WD, Price CJ, Gitelman DR, Friston KJ. Effectiveconnectivity and intersubject variability: using a multisubject networkto test differences and commonalities. Neuroimage 2002;17:1459–69.
[8] Kim J, Zhu W, Chang L, Bentler PM, Ernst T. Unified structuralequation modeling approach for the analysis of multisubject, multi-variate functional MRI data. Hum Brain Mapp 2007;28:85–93.
[9] Friston KJ, Harrison L, Penny W. Dynamic causal modelling.Neuroimage 2003;19:1273–302.
[10] Gitelman DR, Penny WD, Ashburner J, Friston KJ. Modeling regionaland psychophysiologic interactions in fMRI: the importance ofhemodynamic deconvolution. Neuroimage 2003;19:200–7.
[11] Tagamets MA, Horwitz B. Integrating electrophysiological andanatomical experimental data to create a large-scale model thatsimulates a delayed match-to-sample human brain imaging study.Cereb Cortex 1998;8:310–20.
[12] Horwitz B, Tagamets MA. Predicting human functional maps withneural net modeling. Hum Brain Mapp 1999;8:137–42.
[13] McIntosh AR. Understanding neural interactions in learning andmemory using functional neuroimaging. Ann N Y Acad Sci1998;855:556–71.
[14] Frackowiak RS, Friston KJ, Frith CD, Dolan RJ, Price CJ, Zeki S, et al.Human brain function. San Diego: Academic Press; 2003.
[15] Bandettini PA, Jesmanowicz AJ, Wong EC, Hyde JS. Processingstrategies for time-course data sets in functional MRI of the humanbrain. Magn Reson Med 1993;30:161–73.
[16] Friston KJ, Jezzard P, Turner R. Analysis of functional MRI time-series. Human Brain Mapp 1994;1:153–71.
[17] Ungerleider LG, Mishkin M. Two cortical visual systems. In: Ingle DJ,Goodale MA, Mansfield RJW, editors. Analysis of Visual Behavior.Cambridge (MA): MIT Press; 1982. p. 549–86.
[18] Funahashi S, Chafee MV, Goldman-Rakic PS. Prefrontal neuronalactivity in rhesus monkeys performing a delayed anti-saccade task.Nature 1993;365:753–6.
[19] Funahashi S, Kubota K. Working memory and prefrontal cortex.Neurosci Res 1994;21:1–11.
[20] Boynton GM, Engel SA, Glover GH, Heeger DJ. Linear systemsanalysis of functional magnetic resonance imaging in human V1. JNeurosci 1996;16:4207–21.
[21] Kleinbaum D, Kupper L, Muller K, Nizam A. AppliedRegression Analysis and Multivariable Methods. Pacific Grove(CA): Duxbury Press; 1997.
[22] Lee L, Friston KJ, Horwitz B. Large-scale neural models and dynamiccausal modelling. Neuroimage 2006;30:1243–54.
[23] Penny WD, Stephan KE, Mechelli A, Friston KJ. Comparing dynamiccausal models. Neuroimage 2004;22:1157–72.