Investigating ESL students’ performance on outcomes assessments in higher education
34
Running head: OUTCOMES ASSESSMENTS AND ESL STUDENTS Investigating ESL Students’ Performance on Outcomes Assessments in Higher Education Joni M. Lakin Auburn University Diane Cardenas Elliott and Ou Lydia Liu Educational Testing Service, Princeton, New Jersey Draft of February 9, 2012 To appear in Educational and Psychological Measurement Author Note Joni M. Lakin, Department of Educational Foundations, Leadership, and Technology, Auburn University; Diane Cardenas Elliott, Educational Testing Service, Princeton, NJ; Ou Lydia Liu, Educational Testing Service, Princeton, NJ. Any opinions expressed in this paper are those of the authors and not necessarily of Educational Testing Service. Joni Lakin was a postdoctoral fellow at Educational Testing Service at the time this work was completed. Correspondence concerning this article should be addressed to Joni Lakin, Department of Educational Foundations, Leadership, and Technology, Auburn University, Auburn, AL 36849. Email: [email protected]
Transcript of Investigating ESL students’ performance on outcomes assessments in higher education

Running head: OUTCOMES ASSESSMENTS AND ESL STUDENTS
Investigating ESL Students’ Performance on Outcomes Assessments in Higher Education
Joni M. Lakin
Auburn University
Diane Cardenas Elliott and Ou Lydia Liu
Educational Testing Service, Princeton, New Jersey
Draft of February 9, 2012
To appear in Educational and Psychological Measurement
Author Note
Joni M. Lakin, Department of Educational Foundations, Leadership, and Technology,
Auburn University; Diane Cardenas Elliott, Educational Testing Service, Princeton, NJ; Ou
Lydia Liu, Educational Testing Service, Princeton, NJ.
Any opinions expressed in this paper are those of the authors and not necessarily of
Educational Testing Service. Joni Lakin was a postdoctoral fellow at Educational Testing
Service at the time this work was completed.
Correspondence concerning this article should be addressed to Joni Lakin, Department of
Educational Foundations, Leadership, and Technology, Auburn University, Auburn, AL 36849.
Email: [email protected]

Running head: OUTCOMES ASSESSMENTS AND ESL STUDENTS 2
Abstract
Outcomes assessments are gaining great attention in higher education due to increased demand
for accountability. These assessments are widely used by U.S. higher education institutions to
measure students’ college-level knowledge and skills, including students who speak English as a
second language (ESL). For the past decade, the increasing number of ESL students has changed
the landscape of U.S. higher education. However, little research exists documenting how ESL
students perform on outcomes assessments. In this study, we investigated ESL students’
performance on the ETS Proficiency Profile in terms of factor structure, predictive validity, and
differential item functioning (DIF). The test showed partial measurement invariance between
ESL and non-ESL students, consistent predictive validity, and few examples of DIF. The results
suggest the critical need for consideration of language background in outcomes assessment
research in higher education.

Running head: OUTCOMES ASSESSMENTS AND ESL STUDENTS 3
Investigating ESL Students’ Performance on Outcomes Assessments in Higher Education
The educational quality and outcomes of U.S. higher education have received heightened
levels of interest as a result of rising college costs, public dissatisfaction with higher education,
and President Obama’s (2010) recent call to produce 8 million graduates by 2020 (Alexander,
2000; Kuh & Ikenberry, 2009). Although the outcomes of interest vary by institutional
characteristics and discipline, there appears to be agreement on core common outcomes for
undergraduate education. These key outcomes, agreed upon by accreditors and educators alike,
include knowledge of academic content in science, social studies, mathematics, humanities, and
arts as well as practical skills such as written and oral communication, critical thinking,
teamwork, quantitative and information literacy, ethnical reasoning, and intercultural knowledge
(Leskes, Shoenberg, Gaff, Tritelli, & Nichols, 2004; Lumina Foundation for Education, 2010).
While institutions use a variety of mechanisms and tools for assessing outcomes, there has been
increasing reliance on standardized assessments to measure students’ general college-level skills.
In evaluating the adequacy of standardized outcomes assessments for this role, special
attention should be given to the rising population of students who speak English as a second
language (ESL1). Over the last half century, rapidly increasing numbers of international and
domestic students whose primary language is not English have contributed to the growing
number of ESL students in higher education (Institute of International Education, 2010; NCES,
2008). In 2008, 3.5% of the total undergraduate population self-reported being ESL students and
nearly 15% did not consider English their primary language. However, both figures may
1 ESL is English as a second language. In the K-12 research literature, the preferred terms for students who are
acquiring English are English-language learners (ELL) or English learners (EL). In the higher education literature,
English as a second language (ESL) is widely used.

Running head: OUTCOMES ASSESSMENTS AND ESL STUDENTS 4
underestimate the number of non-native English speakers in higher education because of students
who may speak English and another language equally well or who choose (for various reasons)
not to identify themselves as non-native English speakers (Bers, 1994; ICAS ESL Task Force,
2006).
Evaluation of the quality of education provided to these students is critical due to their
increasing numbers and their risk of dropout in college (Erisman & Looney, 2007; Gray, Rolph,
& Melamid, 1996; Kanno & Cromley, 2010). Although a range of studies have considered the
validity and fairness of K-12 achievement tests (e.g., Abedi & Lord, 2001), there has been little
work on fairness for higher education outcomes assessments. To address this issue, this study
investigates validity issues related to ESL students’ performance on a general outcomes
assessment in higher education.
The Importance and Prevalence of Outcomes Assessments
The movement towards accountability was propelled with the Commission on the Future
of Higher Education’s report, A Test for Leadership: Charting the Future of US Higher
Education (U.S. Department of Education, 2006). Traditionally, institutions have used peer
review, market choice, standardized admission test scores, graduation rate, student/faculty ratio,
and racial and ethnic student body composition as means of demonstrating efficacy (Alexander,
2000; Gates et al., 2001; Klein et al., 2005). However, the report urged that improvements to
quality would be achievable if higher education institutions embraced and implemented rigorous
accountability measures, including assessments. Consequently, final recommendations included
the creation of a robust “culture of accountability and transparency throughout higher education”
(p.20, U.S. Department of Education, 2006).

Running head: OUTCOMES ASSESSMENTS AND ESL STUDENTS 5
One response to the accountability call to action was the establishment of the Voluntary
System of Accountability (VSA) by the American Association of State Colleges and Universities
(AASCU) and the Association of Public and Land-grant Universities (APLU; formerly
NASULGC). VSA was developed, in part, to help postsecondary institutions demonstrate
accountability through the measurement of educational outcomes (Pascarella, Seifert, & Blaich,
2008). To date, 64% of AASCU and APLU members, or 334 institutions, have joined the VSA
initiative.
To foster institutional evaluation efforts, VSA (2008) has sanctioned the use of three
standardized assessments that measure student knowledge of content areas as well as abilities in
critical thinking, analytical reasoning, and written communication. These assessments are the
ETS Proficiency Profile2, the Collegiate Assessment of Academic Proficiency (CAAP) and the
Collegiate Learning Assessment (CLA). These instruments were specifically chosen because of
their ability to reflect both students’ initial ability and the educational value added by the
institution (McPherson & Shulenburger, 2006). However, research on the measurement of
educational outcomes using such standardized instruments is ongoing and should continue as
student populations and test uses change (Liu, 2011a; McPherson & Shulenburger, 2006).
Validity research on ESL students
A validity argument is based on converging evidence supporting proposed
interpretations, uses, or inferences of test scores (Kane, 2006; 2010). Validity is not just a
property of the test, but an interaction of the properties of the test, the purposes for which is it
being used, and the characteristics of the examinees (AERA, APA, & NCME, 1999). Therefore,
2 VSA refers to the Proficiency Profile by its previous acronym, MAPP.

Running head: OUTCOMES ASSESSMENTS AND ESL STUDENTS 6
validity arguments must be reconstructed for each test, each purpose, and for each group of
examinees to whom the test is administered.
Validity and fairness investigations for ESL students are critical because of their
increasing numbers in both K-12 and higher education institutions (Erisman & Looney, 2007;
NCES, 2008; Striplin, 2000), their particular need for high quality instruction to close
achievement gaps (Fry, 2008), and the unique ways in which their English proficiency interacts
with the constructs measured by many content assessments (Abedi, 2002). The primary concern
with assessing ESL students is that their language proficiency acts as a source of construct-
irrelevant variance that influences their performance on tests intended to measure other
knowledge or skills besides English proficiency (Pitoniak, Young, Martiniello, King, Buteux, &
Ginsburgh, 2009). One issue that pervades research on test fairness regarding ESL students is the
fact that limited English proficiency may impact both true knowledge acquisition and test
performance. The confounding influences are difficult to disentangle when only dealing with
mean differences. However, the validity of the uses of the tests based on correlational data (such
as prediction of later performance) can still be evaluated for ESL students without needing to
precisely pinpoint to origins of mean score differences.
Thus, many validity investigations concerning ESL students in higher education focused
on the prediction of college performance by either admission test scores or high school GPA
(HSGPA) or both. For example, Zwick and Sklar (2005) examined how SAT and HSGPA
predict first-year college GPA and college degree attainment for students in different ethnicity
and language groups using the High School and Beyond data. They found that the SAT scores

Running head: OUTCOMES ASSESSMENTS AND ESL STUDENTS 7
showed overprediction3 for Hispanic students who speak English as their first language, but
underprediction for Hispanic students who speak Spanish as their first language. The finding
suggests that it is important to consider language background in research on educational
attainment. In another study, Zwick and Schlemer (2004) found significant overprediction of
freshman year GPA by high school GPA for language minority students and pronounced
overprediction for Latino students. Including SAT scores in the regression significantly
improved the accuracy of the prediction. The results also vary among different language groups
(e.g., Latino, Asian). Likewise, Patterson, Mattern, and Kobrin’s (2007) analysis of the SAT
highlights the importance of evaluating the validity of tests for ESL students because they found
that SAT total scores led to significant under-prediction of ESL students’ freshman GPA (.28
GPA points lower). In summary, as Zwick (2007) pointed out, it becomes critical to examine the
impact of language status in educational research, including research at the postsecondary level,
when the number of students who are immigrants or children of immigrants increases
substantially.
Previous research outlined the most salient sources of validity evidence for the
assessment of educational outcomes for ESL students (Pitoniak et al., 2009; Young, 2009).
These include (a) demonstrating that the test has adequate psychometric qualities including test
reliability for ESL students; (b) showing that the factor structure underlying test scores are
consistent between ESL and non-ESL students; (c) investigating items for differential
functioning; and (d) verifying that the correlation of test scores with related measures is the same
across ESL and non-ESL students. These types of evidence should be evaluated relative to the
3 Over- and under-prediction was defined in these studies by using a common regression model for all students. Overprediction was the observation of negative regression residuals for a group of students (meaning the model predicted higher scores than students received on average). Underprediction reflects positive residuals.

Running head: OUTCOMES ASSESSMENTS AND ESL STUDENTS 8
educational decisions being made on the basis of test scores—that is, the reliability, structure,
and predictive correlations of the test should be adequate to make consistently accurate and valid
inferences for all examinees regardless of their language backgrounds. As reviewed earlier, these
aspects of validity for ESL students have been evaluated for higher education admissions tests.
However, the published literature on outcomes assessments in sparse, particularly with respect to
ESL students. Thus, one aim of this study was to demonstrate the importance of such research.
Focus of the Study
In this study, we aimed to explore a general model for assessing validity of higher education
outcomes assessment using the ETS Proficiency Profile as an example. Given the increasing
attention that outcomes assessment has received in higher education and the concomitant growth
in the number of ESL college students, it is critical to examine the validity and fairness issues of
ESL students’ performance on outcomes assessment. We focused our investigations on
descriptive statistics, instrument factor structure, differential item functioning analysis, and
predictive validity. We asked four specific research questions:
1. Do the descriptive and psychometric characteristics of the test differ between ESL and
non-ESL students across skill areas?
2. Is the factor structure underlying test scores consistent between ESL and non-ESL
students?
3. Are any items identified as showing differential item functioning (DIF) between ESL and
non-ESL students?
4. Do Proficiency Profile scores show consistent predictive validity between ESL and non-
ESL students?

Running head: OUTCOMES ASSESSMENTS AND ESL STUDENTS 9
Methods
Instrument
The ETS Proficiency Profile, formerly known as the Measure of Academic Proficiency
and Progress (MAPP), measures four skill areas which assess different aspects of academic
achievement in higher education: reading, critical thinking, writing, and mathematics. The stated
purposes of the Proficiency Profile include the evaluation of program and school effectiveness in
promoting achievement in these skill areas (Educational Testing Service [ETS], 2011). As such,
the test should provide fair and valid assessments of students’ achievement in these four areas
regardless of the students’ cultural or linguistic background. Previous analyses of the Proficiency
Profile (Klein et al., 2009; Marr, 1995; Liu, 2008, 2011b) have provided validity evidence for the
use of the Proficiency Profile for measuring higher education outcomes for the general
population of students in higher education. In this paper, we sought to expand the range of
validity evidence to students whose native language is not English.
The Proficiency Profile standard form consists of 27 questions in each of the four skill
areas for a total of 108 multiple-choice questions. The full test can be administered in one or two
testing sessions. Most of the reading and critical thinking questions are grouped in clusters of
two to four items related to a common reading passage, figure, or graph. In order to represent the
domain of college content, the reading and critical thinking questions sample content from the
humanities, social sciences, and natural sciences. The reading and critical thinking questions
were designed to create a common proficiency scale with critical thinking representing the
highest level of reading proficiency (ETS, 2010; Klein et al., 2009). As a result of the overlap in
reading passages and definitions of the two constructs, these two tests are highly correlated (r =
.96 at the school level; Klein et al., 2009). The writing questions measure sentence-level skills

Running head: OUTCOMES ASSESSMENTS AND ESL STUDENTS 10
including grammatical agreement, sentence organization, and sentence revision strategies. The
mathematics test consists of a range of skills from recognizing mathematics terms to interpreting
scientific measurement scales (ETS, 2010). Scaled scores for total score (range 400 to 500) and
four skill scores (each scaled to range from 100 to 130) are reported.
As part of the Proficiency Profile, students also respond to demographic survey
questions. The survey question asking for the student’s “best language” could be answered
“English”, “other language”, or “both equal”. For the purposes of this study, students who
answered “other language” were classified as ESL and students who answered “English” were
considered non-ESL. The few students answering “both equal” were not considered in the study.
Students were also asked about the number of class credits they had accrued. Students could
indicate one of five levels: None (freshman), < 30 hours, 30-60 hours, 61-90 hours, > 90 hours.
Participants
The 68,861 participants analyzed in this study were students who took the Proficiency
Profile at their home institution as part of an accountability program. We excluded 2,850
students who indicated that they were ESL, but reported Caucasian ethnicity. Preliminary
analyses indicated that these students performed as well or better than the non-ESL students and
dissimilarly from ethnic-minority ESL students, who are of primary interest in this study because
their language differences are more likely to be a source of concern for test fairness. The
participants came from 30 institutions (5 community colleges, 15 public four-year institutions,
and 10 private four-year institutions) in 20 states. Table 1 presents a breakdown of the sample in
terms of gender, race/ethnicity, number of credit hours (class standing), and school sector.
[Table 1]
[Table 2]

Running head: OUTCOMES ASSESSMENTS AND ESL STUDENTS 11
Analyses
Descriptive characteristic differences. To understand basic score differences between
ESL and non-ESL students, descriptive statistics, including means, SDs, and Cronbach’s alpha
internal consistency coefficients, were calculated. To support the practice of reporting four skill
area scores, correlations between skill areas (reading, writing, critical thinking, and mathematics)
were also examined. These correlations should be moderate and indicate that distinct, though
related, skills are being measured.
Consistency of factor structure underlying test scores. To investigate whether the
internal structure of the test differs for ESL and non-ESL students, a multi-group confirmatory
factor analysis (MGCFA) was used to investigate the invariance of the measurement model in
terms of factor structure, item loadings on factors, factor variance, or factor covariance. Rather
than analyzing a theoretical model with four broad factors, a model with three factors was
studied. This decision was made for a number of reasons. First, although critical thinking and
reading scores can be reported separately for institutions to have detailed information about each,
they are designed to represent a single proficiency continuum with critical thinking skills
representing the highest level of reading proficiency (ETS, 2010). Second, the assessment design
was supported by empirical finding that the corrected correlation between the reading and critical
thinking scales were nearly 1.0 (see Table 2). Last, our preliminary exploratory factor analyses
revealed that the reading and critical thinking items did not define two distinct factors and that
the item loadings of a four-factor model were not consistent with the theoretical model. Thus, a
single underlying factor was hypothesized for the reading and critical thinking items in the
MGCFA analyses. All 108 dichotomously scored items were included in the analyses. Because
the ESL (n = 2,631) and non-ESL group (n= 53,812) differed greatly in size, the MGCFA was

Running head: OUTCOMES ASSESSMENTS AND ESL STUDENTS 12
conducted using a randomly selected sub-sample of 2,631 non-ESL students to balance the
contributions each group made to the model fit results.
In the MGCFA procedure, we used an iterative multi-group comparison of measurement
models to compare models that were increasingly constrained across the groups (Bollen, 1989;
Brown, 2006). The procedure consisted of the following steps: (1) Fit a common model in each
group (ESL and non-ESL) separately; (2) Fit a common model to both groups simultaneously
with all parameters freely estimated; (3) Constrain factor loadings of items on factors; (4)
Constrain item intercepts (thresholds for categorical variables); (5) Constrain factor variances;
(6) Constrain factor covariances; (7) Constrain latent means.
The analyses were conducted using MPlus 6 (Muthén & Muthén, 1998-2009) and its
WLSMV (Mean- and Variance-adjusted Weighted Least Square) estimator option for categorical
indicators, which allows for the use of dichotomous item variables as indicators. In order to have
an identified model, we fixed factor means to zero in all groups and fixed scale factors
(equivalent to item error variances for categorical variables) to 1 for all groups (Muthén &
Muthén, 1998-2009). Because of these constraints, step 7 entailed releasing the constraints on the
latent means rather than constraining.
The fit of individual models were assessed using Comparative Fit Index (CFI) and Root
Mean Square Error of Approximation (RMSEA). For the CFI index, a value above .90 is
acceptable and a value above .95 is good. For RMSEA, estimates below .05 are optimal (Kline,
2004).4 Improvements in fit for nested models were tested using a change in χ2 test (using the
DIFFTEST option for WLSMV estimators, Muthén & Muthén, 1998-2009).
4 Note that for the WLSMV estimator used for this data, RMSEA confidence intervals have not yet been developed
for MPlus (L. Muthén, 2007).

Running head: OUTCOMES ASSESSMENTS AND ESL STUDENTS 13
Differential item and bundle functioning. When considering the assessment of a group
of examinees who form a minority in the testing population, differential item functioning (DIF)
is a crucial tool for helping test developers identify items that behave differently when
administered to different groups of examinees. In order to explore the existence of DIF in the
Proficiency Profile, we used the SIBTEST procedure to detect DIF for each factor domain
informed by the above factor analysis (Clauser & Mazor, 1998; Shealy & Stout. 1993).
SIBTEST detects DIF by assessing individual items for multidimensionality when the cluster of
items used for matching is assumed to be unidimensional. Thus, separate SIBTEST analyses
were conducted for math, writing, and reading/critical thinking items.
SIBTEST has an additional benefit in that it can detect differential bundle functioning
(DBF). DBF (also known as DIF amplification) is observed when clusters of items behave
differently for two groups of students (the items in the bundle may or may not individually show
DIF; Douglas, Roussos, & Stout, 1996). Because the Reading and Critical Thinking subtests
consist of clusters of items associated with a common reading passage, we used SIBTEST to
evaluate those combined subtests for DBF.
Roussos and Stout (1996) defined cutoff points for increasing problematic levels of DIF
based on the SIBTEST beta metric: negligible or A-level DIF is defined as beta values below
0.059; moderate or B-level DIF is defined as beta values between 0.060 and 0.088; and large or
C-level DIF is defined as beta values is excess of 0.088. As with the MGCFA, the same random
sample of non-ESL students was used to create samples of equal size for consistency across
analyses.
Relationship between Proficiency Profile scores and credit hours. For a test of
academic outcomes (rather than academic inputs), significant relationships should be found
Running head: OUTCOMES ASSESSMENTS AND ESL STUDENTS 14
between test performance and students’ exposure to college coursework. That is, the skills
measured by the test are expected to improve accumulatively from taking a combination of
courses belonging to different disciplinary subjects. Thus, regression analyses were used to
investigate the relationship between students’ Proficiency Profile scores and number of credit
hours taken. Because this question addresses a practical issue for users of such tests, namely
whether they can expect growth with additional credit hours for ESL and non-ESL students on
each reported scale, the four battery-level scores rather than three latent factor scores were used
in these analyses. Separate regression analyses were conducted for the four skill scores. Credit
hours, ESL status, and an interaction of the two variables were added to the predictive model in
successive steps to determine whether Proficiency Profiles varied by credit hours and whether
the trend varied by ESL status.
Results
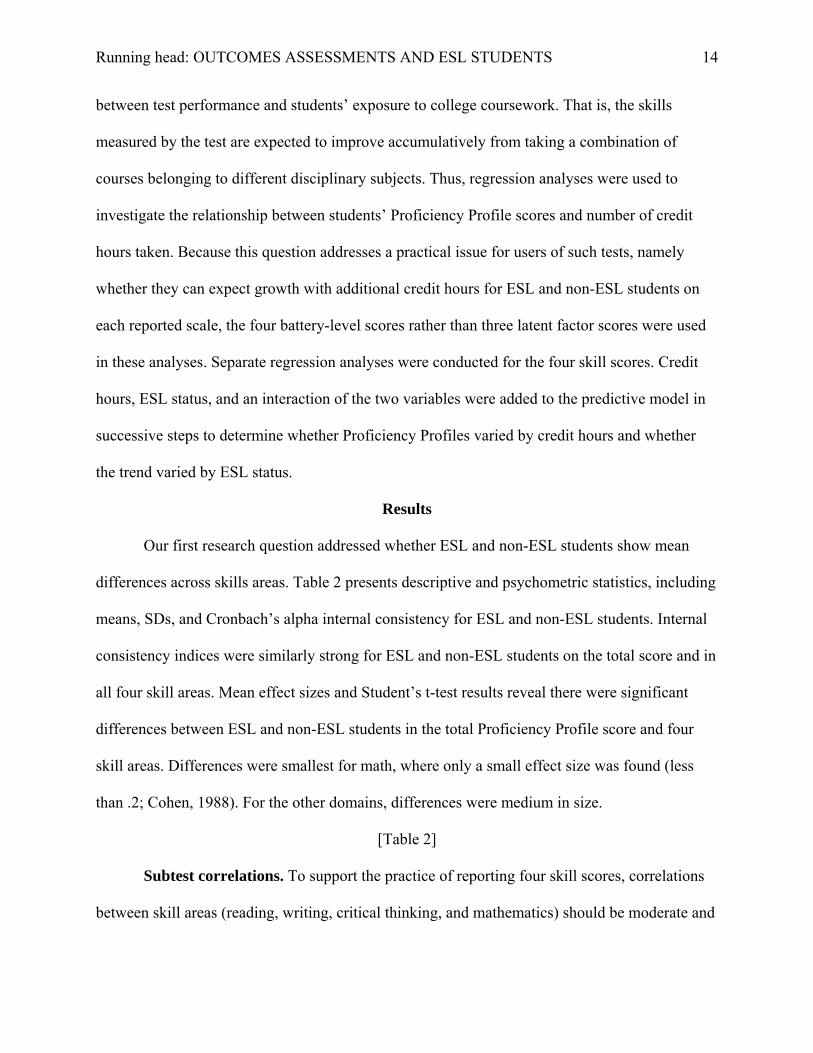
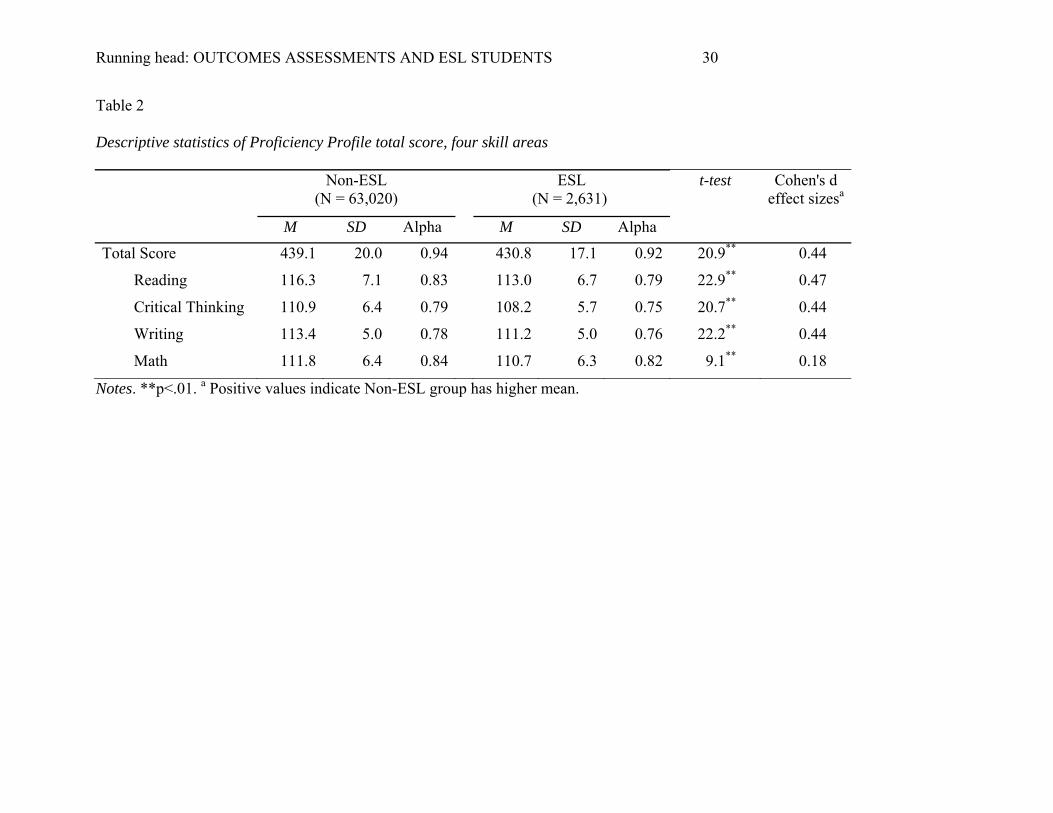
Our first research question addressed whether ESL and non-ESL students show mean
differences across skills areas. Table 2 presents descriptive and psychometric statistics, including
means, SDs, and Cronbach’s alpha internal consistency for ESL and non-ESL students. Internal
consistency indices were similarly strong for ESL and non-ESL students on the total score and in
all four skill areas. Mean effect sizes and Student’s t-test results reveal there were significant
differences between ESL and non-ESL students in the total Proficiency Profile score and four
skill areas. Differences were smallest for math, where only a small effect size was found (less
than .2; Cohen, 1988). For the other domains, differences were medium in size.
[Table 2]
Subtest correlations. To support the practice of reporting four skill scores, correlations
between skill areas (reading, writing, critical thinking, and mathematics) should be moderate and
Running head: OUTCOMES ASSESSMENTS AND ESL STUDENTS 15
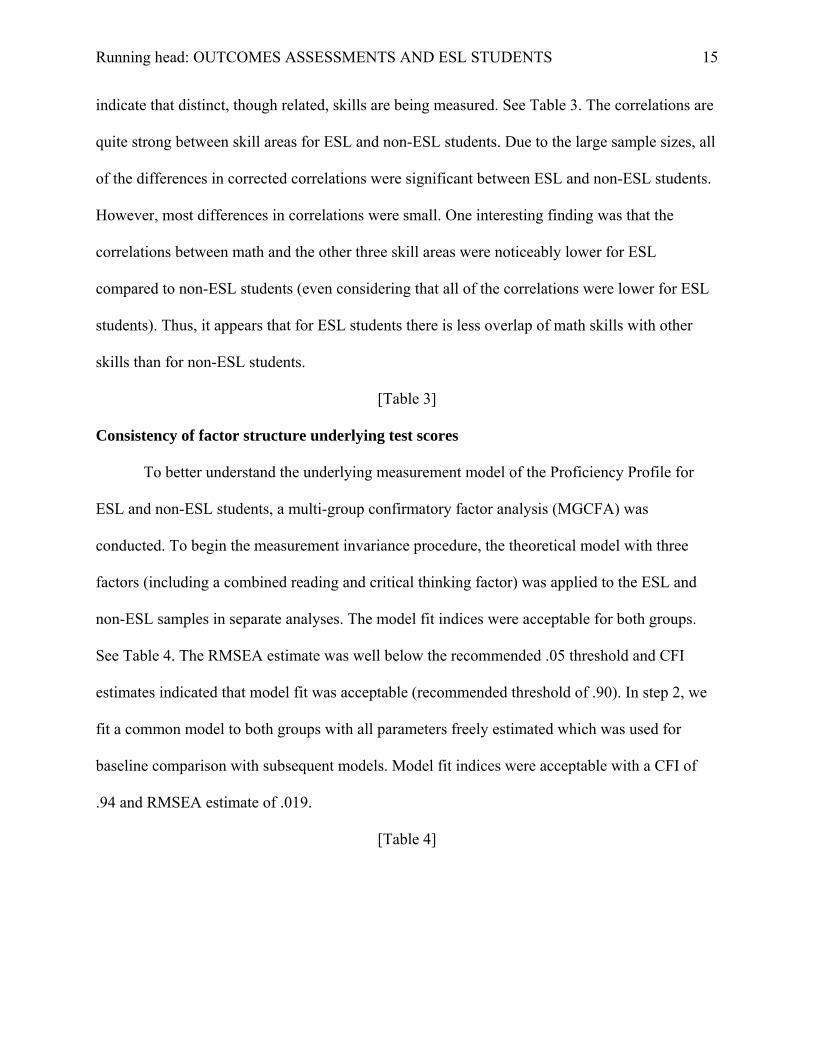
indicate that distinct, though related, skills are being measured. See Table 3. The correlations are
quite strong between skill areas for ESL and non-ESL students. Due to the large sample sizes, all
of the differences in corrected correlations were significant between ESL and non-ESL students.
However, most differences in correlations were small. One interesting finding was that the
correlations between math and the other three skill areas were noticeably lower for ESL
compared to non-ESL students (even considering that all of the correlations were lower for ESL
students). Thus, it appears that for ESL students there is less overlap of math skills with other
skills than for non-ESL students.
[Table 3]
Consistency of factor structure underlying test scores
To better understand the underlying measurement model of the Proficiency Profile for
ESL and non-ESL students, a multi-group confirmatory factor analysis (MGCFA) was
conducted. To begin the measurement invariance procedure, the theoretical model with three
factors (including a combined reading and critical thinking factor) was applied to the ESL and
non-ESL samples in separate analyses. The model fit indices were acceptable for both groups.
See Table 4. The RMSEA estimate was well below the recommended .05 threshold and CFI
estimates indicated that model fit was acceptable (recommended threshold of .90). In step 2, we
fit a common model to both groups with all parameters freely estimated which was used for
baseline comparison with subsequent models. Model fit indices were acceptable with a CFI of
.94 and RMSEA estimate of .019.
[Table 4]

Running head: OUTCOMES ASSESSMENTS AND ESL STUDENTS 16
The constraints on factor loadings (step 3) led to minimal decreases in model fit
according to the χ2 Difference Test.5 However, step 4, constraining item intercepts, led to a
noticeable decline in model fit (Δχ2(108)= 3,072, p < .001). An inspection of modification
indices localized the issue to the factor means, particularly for Critical Thinking/Reading (Δχ2 =
1,408), but also for Writing (Δχ2 = 632) and Math (Δχ2 = 253).The finding that constraining item
intercepts led to factor level misfit indicates that overall differences at the factor level likely
influences most of the test items in terms of apparent item difficulty. The strain at the factor
mean parameters persisted to step 8 where they were freed, which led to appreciable
improvements in fit.
In step 5, where factor variances were constrained, the model fit decreased modestly. The
source of model strain was clear as releasing the variance constraint for Critical
Thinking/Reading would significantly increase model fit. By inspecting the unconstrained factor
variances, we found that the ESL group was considerably less variable than the non-ESL group
on this factor. In Table 4, step 5b shows the modest increase in overall model fit when the
constraint on Critical Thinking/Reading variance was released. Constraining factor covariance is
predicated on invariant factor variances, so step 6 of the MGCFA procedure was skipped and the
covariances of the factors are assumed to be variant because of differences in factor variances.
Finally, releasing the factor means in step 7 led to the largest improvement in model fit,
indicating that the two groups differed significantly on latent factor means. Compared to the non-
ESL sample, whose latent factor means were fixed to zero, ESL students scored -.24SD lower on
5 The other model fit indices seem to indicate that the constrained model in step 3 fits better than step 2. In general, constraining parameters would be expected to decrease fit. However, fit can appear to improve because of differences in the way the indices are calculated. Muthén (2009) recommended relying solely on the χ2 Difference Test for comparing the fit of nested models for the WLSMV estimator.

Running head: OUTCOMES ASSESSMENTS AND ESL STUDENTS 17
Critical Thinking/Reading, -.19SD lower in Mathematics, and -.25SD lower in Writing.6 The
final model, with the Critical Thinking/Reading variance and factor mean constraints freed, had
good overall fit.
Items showing differential item functioning
SIBTEST was also used to investigate items for DIF for each of the three factors
(Writing, Math, and Reading/Critical Thinking) and DBF for Reading/Critical Thinking. The
results indicated that one writing item favored the ESL group with B-level dif (beta = -.08) while
three math items were found to favor non-ESL students with B-level DIF (betas = .06-.07).
Because the four items flagged showed only moderate DIF, it is unlikely that the items are truly
problematic or have significant impacts on student performance at the test level. In most
operational settings, only items with C-level, large DIF are considered to be problematic and are
either removed from the item bank or further studied.
We were able to inspect the mathematics subtest and found that the Proficiency Profile
used math items that varied in the reading load required. Some items were situated in simple
contexts and required relatively low reading levels, while other items had more complex contexts
where the mathematical problem had to be extracted from the context and resulted in higher
reading demands. The three math items we identified as showing moderate DIF seemed to have
more complex contexts, which would explain their differential difficulty for ESL students.
Although the differential difficulty may be traced to linguistic demands, the complex
language of the items may be considered relevant to the construct of interest. The user’s guide
for the Proficiency Profile (ETS, 2010) defines one of the proficiency levels in mathematics as
including the ability to “solve arithmetic problems with some complications, including complex
6 Factor SDs were fixed to unit loading on one item. Item scales (error variances) were fixed to 1, so factor SDs were also 1.
Running head: OUTCOMES ASSESSMENTS AND ESL STUDENTS 18
wording” (p. 10). If this is a skill valued by Proficiency Profile score users, then these
differences at the item level may accurately reflect differences in the reading skills of the ESL
students which impede their ability to solve math problems with complex contexts. In fact, to
solve mathematical problems in real life, one also needs to understand the complex contexts
where the math problems are situated.
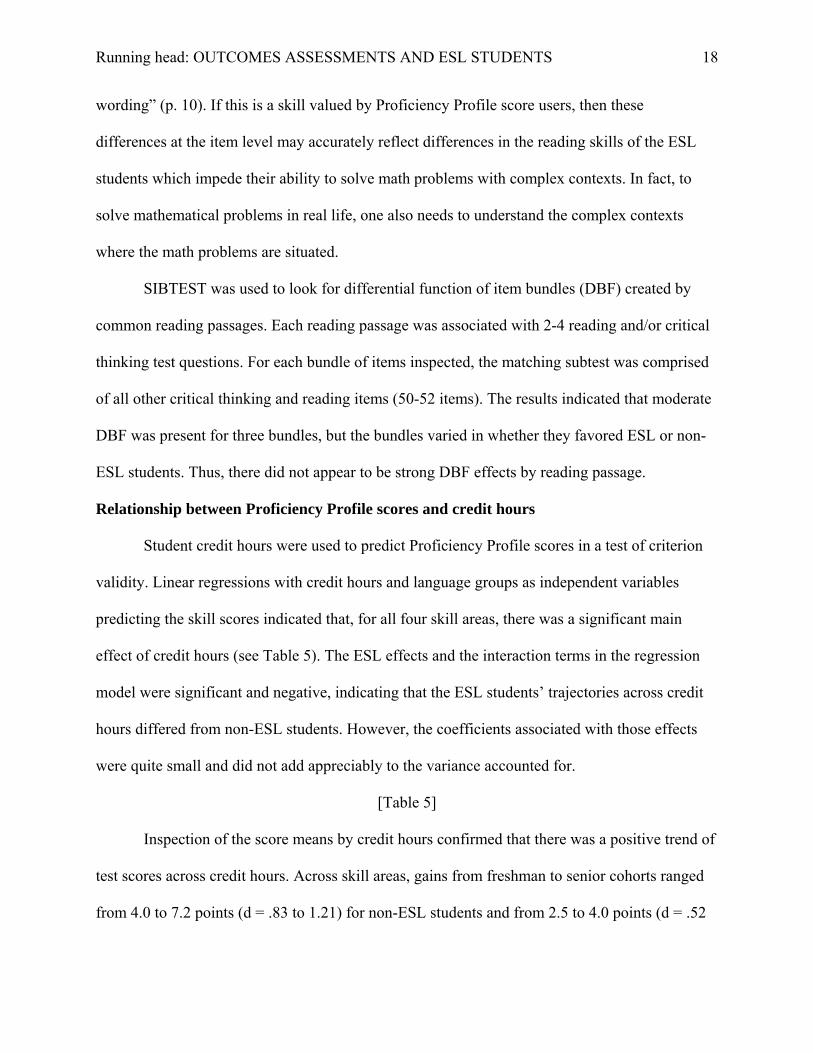
SIBTEST was used to look for differential function of item bundles (DBF) created by
common reading passages. Each reading passage was associated with 2-4 reading and/or critical
thinking test questions. For each bundle of items inspected, the matching subtest was comprised
of all other critical thinking and reading items (50-52 items). The results indicated that moderate
DBF was present for three bundles, but the bundles varied in whether they favored ESL or non-
ESL students. Thus, there did not appear to be strong DBF effects by reading passage.
Relationship between Proficiency Profile scores and credit hours
Student credit hours were used to predict Proficiency Profile scores in a test of criterion
validity. Linear regressions with credit hours and language groups as independent variables
predicting the skill scores indicated that, for all four skill areas, there was a significant main
effect of credit hours (see Table 5). The ESL effects and the interaction terms in the regression
model were significant and negative, indicating that the ESL students’ trajectories across credit
hours differed from non-ESL students. However, the coefficients associated with those effects
were quite small and did not add appreciably to the variance accounted for.
[Table 5]
Inspection of the score means by credit hours confirmed that there was a positive trend of
test scores across credit hours. Across skill areas, gains from freshman to senior cohorts ranged
from 4.0 to 7.2 points (d = .83 to 1.21) for non-ESL students and from 2.5 to 4.0 points (d = .52

Running head: OUTCOMES ASSESSMENTS AND ESL STUDENTS 19
to 0.73) for ESL students. These results suggest that ESL students showed smaller gains in test
scores across credit hours than non-ESL students across all four skill areas. Figures 1a-d
illustrate the relationship between number of credit hours and Proficiency Profile scores for both
ESL and non-ESL students. In contrast to the regression results, which indicated small ESL and
interaction effects, it appeared that several of the significant differences might have practical
importance. For example, the greatest difference was found for students with 30-60 credit hours,
where the difference between ESL and non-ESL students in critical thinking skills was 3.6 scale
points (d=-0.57). Reading scores showed the greatest differences in growth across credit hours,
with ESL students showing considerably less learning growth than non-ESL students. Math
showed the most consistent growth between the two groups of students.
[Figure 1]
Discussion
In this study we investigated ESL students’ performance on the ETS Proficiency Profile
with regard to factor structure, differential functioning analysis and predictive validity. Overall,
the test showed similar descriptive and psychometric qualities for ESL and non-ESL students. In
looking at subtest correlations, we found that although correlations between skill areas were
consistently lower for ESL students, the drop in the correlations between the math subtest and
the language-focused subtests was more pronounced.
In the multi-group CFA analysis, partial measurement invariance was found when
comparing the ESL and non-ESL students. We found that the test items behaved similarly across
ESL and non-ESL students. However, the model required freeing the factor-level Critical
Thinking/Reading parameter to allow for the ESL sample to have smaller variance (which
precluded constraining factor covariances) and freeing factor means for the two groups. Lower

Running head: OUTCOMES ASSESSMENTS AND ESL STUDENTS 20
means for ESL students on all three factors contributed to model misfit, though the strain was
greatest for Critical Thinking/Reading followed by Writing. This finding was consistent with the
observed scores, which indicated moderate mean differences (around .45) between ESL and non-
ESL students on three of the skill scores and small for mathematics (d = .18).
Invariant factor loadings support the conclusion of metric invariance by Horn and
McArdle’s (1992) definition and measurement unit equivalence by van de Vijver and Poortinga’s
definition (2005). However, due to the differences in factor variance identified, full score
equivalence (van de Vijver & Poortinga), was not met. Metric invariance supports the use of test
scores within examinee groups, but indicates that comparisons across groups should be made
with caution.
It was unclear whether differences in observed and latent means and latent factor
variances should be attributed to the effects of construct-irrelevant language proficiency or true
differences in academic skills for ESL and non-ESL students. Additional research that can
disentangle the effect of language proficiency from the effect of academic skill is needed to
understand the reasons for the differences that were found.
In the DIF and DBF analyses, three items and two item bundles with moderate DIF
favoring non-ESL students were identified. That level of DIF is usually not considered
problematic in operational test development. Overall, the results indicate that the behavior of
items was quite consistent across ESL and non-ESL students even at the bundle level.
An analysis of the relationship between Proficiency Profile scores and credit hours
indicated that, in general, students who had completed more course credits had higher
Proficiency Profile scores, which provides predictive validity evidence for the Proficiency
Profile. ESL and non-ESL students showed similar predictive validity. Math showed the most

Running head: OUTCOMES ASSESSMENTS AND ESL STUDENTS 21
overlap in growth trends for ESL and non-ESL groups while reading showed somewhat smaller
differences for ESL students with increasing credit hours. This finding warrants further
investigation to determine whether ESL students have sufficient opportunity and support to
develop their reading skills in college.
Implications
As increasing numbers of immigrants alter the demographic characteristics of the U.S.
college population, it becomes important to study how language background interacts with
college performance. Sensitivity to the unique needs and challenges faced by the ESL population
is necessary for institutions of higher education especially given recent political pressure to
produce more graduates ready to meet the challenges of the 21st century economy. Such pressure
has prompted the development of tools to help higher education institutions ensure graduates at
all levels have mastered the skills and knowledge necessary for demanding and complex job
responsibilities. One such tool gaining prominence in higher education circles is the Degree
Profile framework developed by the Lumina Foundation for Education (2010).
The Degree Profile benchmarks specific learning outcomes for associate, bachelor’s, and
master’s degrees through the provision of clear reference points that demonstrate the incremental
learning that should accompany advanced degrees. Most relevant to our study are Intellectual
Skills which emphasize competencies that transcend disciplinary boundaries including
quantitative fluency (e.g. the ability to present and interpret mathematical computations), use of
information resources (e.g. the ability to synthesize and evaluate information from various
sources) and communication fluency (e.g. abilities related to grammatical competency and
prose). Such skills and knowledge are closely aligned with the constructs measured by many
standardized learning outcomes assessments, including the Proficiency Profile. Thus, as the

Running head: OUTCOMES ASSESSMENTS AND ESL STUDENTS 22
Degree Profile framework is implemented in higher education, learning outcomes assessments
may find continued or increasing use. Thus, the validity and fairness of these tests for intended
purposes should be examined for all major student subgroups.
Additional research is needed to better understand the academic development of ESL
students in higher education. Future validity studies should consider using a more nuanced
determination of ESL status rather than the self-reported “best language” used in this study,
which results in considerable heterogeneity of the ESL group. Using measures that better
represent the continuum of student language ability could provide more detailed results and clear
implications of level of English proficiency on test performance. Similarly, the present study
relied on a sample of students recruited by participating colleges and universities for their
accountability programs. Although institutions are encouraged to recruit a representative sample,
they often rely on a convenience sample which may be influenced by volunteer and dropout
effects. Accordingly, future validity studies could collect data that more accurately reflect the
larger student population by using random sampling.
Overall, this study made clear the importance of exploring validity and fairness for ESL
students taking outcomes assessments in higher education. The results demonstrated the value of
considering language background in research on outcomes assessment. The approach adopted in
this study also applies to other outcomes assessment involving the ESL population. As the
landscape of higher education continues to evolve, such work will play an important role in
promoting the valid use of assessments for evaluating the learning of U.S. college students.

Running head: OUTCOMES ASSESSMENTS AND ESL STUDENTS 23
References
Abedi, J. (2002). Standardized achievement tests and English language learners: Psychometrics
issues. Educational Assessment, 8(3), 231-257.
Abedi, J., & Lord, C. (2001). The language factor in mathematics tests. Applied Measurement in
Education, 14(3), 219-234.
AERA, APA, & NCME (1999). Standards for educational and psychological testing.
Washington, D.C.: Author.
Alexander, F.K. (2000). The changing face of accountability. The Journal of Higher Education,
71, 411-431.
Bers, T. (1994). English proficiency, course patterns, and academic achievements of limited-
English-proficient community college students. Research in Higher Education, 35, 2
209-234.
Bollen, K. A. (1989). Structural equations with latent variables. New York, NY: John Wiley &
Sons.
Brown, T.A. (2006). Confirmatory factor analysis for applied research. New York, NY: The
Guilford Press.
Clauser, B. E., & Mazor, K. M. (1998). Using statistical procedures to identify differentially
functioning test items. Educational Measurement: Issues and Practice, 17(1), 31-44.
Cohen, J. (1988). Statistical power analysis for the behavioral sciences (2nd ed.). Hillsdale, NJ:
Lawrence Erlbaum Associates.
Douglas, J.A., Roussos, L.A., Stout, W. (1996). Item-bundle DIF hypothesis testing: Identifying
suspect bundles and assessing their differential functioning. Journal of Educational
Measurement, 33, 465-484.

Running head: OUTCOMES ASSESSMENTS AND ESL STUDENTS 24
Erisman, W., & Looney, S. (2007). Opening the door to the American Dream: Increasing higher
education access and success for immigrants. Washington, D.C.: Institute for Higher
Education Policy.
Educational Testing Service (2010). ETS Proficiency Profile user’s guide. Princeton, NJ: ETS.
Fry, R. (2008). The role of schools in the English language learner achievement gap.
Washington, D.C.: The Pew Hispanic Center.
Gates, S. M., Augustine, C. H., Benjamin, R., Bikson, T. K., Derghazarian, E., Kaganoff,
T., Levy, D. G., Moini, J. S., & Zimmer, R. W. (2001). Ensuring the quality and
productivity of education and professional development activities: A review of
approaches and lessons for DoD. Santa Monica, CA: National Defense Research
Institute, RAND.
Gray, M.J., Rolph, E., & Melamid, E. (1996). Immigration and higher education: Institutional
responses to changing demographics. Santa Monica, CA: RAND Center for Research on
Immigration Policy.
Horn, J. L., & McArdle, J. J. (1992). A practical and theoretical guide to measurement invariance
in aging research. Experimental Aging Research, 18, 117-144.
ICAS ESL Task Force. (2006). ESL students in California public higher education. Sacramento,
CA: Intersegmental Committee of the Academic Senates.
Institute of International Education (2010). Open Doors 2010 fast facts. Retrieved from
http://www.iie.org/en/Research-and-Publications/Open-Doors.aspx
Kane, M.T. (1992). An argument-based approach to validity. Psychological Bulletin, 112, 527-
535.

Running head: OUTCOMES ASSESSMENTS AND ESL STUDENTS 25
Kanno, Y., & Cromley, J.G. (2010). English Language learners’ access to and attainment in
postsecondary education (Research Report No. RG 09-141) [AIR grant report]. Retrieved
from www.airweb.org/images/Grants2009/Kanno_Final.pdf
Klein, S.P., Kuh, G.D., Chun, M., Hamilton, L., & Shavelson, R. (2005). An approach to
measuring cognitive outcomes across higher education institutions. Research in Higher
Education, 46, 251–76.
Klein, S., Liu, O.L., Sconing, J., Bolus, R., Bridgeman, B., Kugelmass, H., Nemeth, A., Robbins,
S., & Steedle, J. (2009, September). Test Validity Study (TVS) report. Supported by the
Fund for Improvement of Postsecondary Education (FIPSE). Online at:
http://www.voluntarysystem.org/index.cfm?page=research
Kline, R.B. (2004). Principles and practice of structural equation modeling (2nd ed.). New
York, NY: The Guilford Press.
Kuh, G., & Ikenberry, S. (2009). More than you think, less than we need: Learning outcomes
assessment in American higher education. Champaign, IL: National Institution for
Learning Outcomes.
Leskes, A., Shoenberg, R., Gaff, R., Tritelli, D., & Nichols, J. (2004). Taking responsibility for
the quality of the baccalaureate degree. Washington, DC: Association of American
Colleges and Universities.
Liu, O.L. (2008). Measuring learning outcomes in higher education using the Measure of
Academic Proficiency and Progress (MAPP). ETS Research Report Series (RR-08- 047).
Princeton, NJ: ETS.

Running head: OUTCOMES ASSESSMENTS AND ESL STUDENTS 26
Liu, O.L. (2011a). Outcomes assessment in higher education: Challenges and future research in
the context of Voluntary System of Accountability. Educational Measurement: Issues
and Practice, 30(3), 2-9.
Liu, O. L. (2011b). Value-added assessment in higher education: A comparison of two methods.
Higher Education, 61(4), 445-461.
Lumina Foundation for Education (2010). The degree qualifications profile.
http://www.luminafoundation.org/publications/The_Degree_Qualifications_Profile.pdf
Marr, D. (1995). Validity of the Academic Profile. Princeton, NJ: ETS.
McPherson, P., & Shulenburger, D. (2006). Toward a voluntary system of accountability
program (VSA) for public colleges universities and colleges. Washington, DC: National
Association of State Universities and Land-Grant Colleges.
Meade, A.W., & Kroustalis, C.M. (2006). Problems with item parceling for confirmatory factor
analytic tests of measurement invariance. Organizational Research Methods, 9, 369-403.
Muthén, L.K. (2009, April 16). Re: DIFFTEST [Online forum comment]. Retrieved
from http://www.statmodel.com/discussion/messages/9/1865.html
Muthén, L.K., & Muthén, B.O. (1998-2009). Mplus user’s guide (5th edition). Los Angeles, CA:
Muthén & Muthén.
National Center for Educational Statistics (NCES). (2008). National Postsecondary Student Aid
Study (NPSAS) [Data file]. Retrieved from http://nces.ed.gov/datalab/
Obama, B.H. (2010, August 9). Remarks by the president on higher education and the economy.
University of Texas, Austin, TX. Retrieved from http://www.whitehouse.gov/the-press-
office/2010/08/09/remarks-president-higher-education-and-economy-university-texas-
austin
Running head: OUTCOMES ASSESSMENTS AND ESL STUDENTS 27
Pascarella, E.T., Seifert, T.A., & Blaich, C. (2010). How effective are the NSSE benchmarks in
predicting important educational outcomes? Change, 42(1), 16-23.
Patterson, B.F., Mattern, K.D., & Kobrin, J.L. (2007). Validity of the SAT for predicting FYGPA:
2007 SAT validity sample [Statistical Report]. New York, NY: College Board.
Pitoniak, M. J., Young, J. W., Martiniello, M., King, T. C., Buteux, A., & Ginsburgh, M. (2009).
Guidelines for the assessment of English-language learners. Princeton, NJ: ETS.
Roussos, L.A., & Stout, W.F. (1996). Simulation studies of the effects of small sample size and
studied item parameters on SIBTEST and Mantel-Haenszel type I error performance.
Journal of Educational Measurement, 33, 215-230.
Shealy, R., & Stout, W. F. (1993). A model-based standardization approach that separates true
bias/DIF from group ability differences and detects test bias/DTF as well as item
bias/DIF. Psychometrika, 58, 159–194.
Striplin, J.C. (2000). A review of community college curriculum trends. ERIC Clearinghouse for
Community Colleges. (ED438011)
U.S. Department of Education. 2006. A test of leadership: Charting the future of US higher
education. Washington, DC: US Department of Education.
van de Vijver, F.J.R., & Poortinga, Y.H. (2005). Conceptual and methodological issues in
adapting tests. In R.K. Hambleton, P.F. Merenda, & C.D. Spielberger (Eds.), Adapting
Educational and Psychological Tests for Cross-Cultural Assessment (pp. 39-63).
Mahwah, NJ: Lawrence Erlbaum Associates.
Voluntary System of Accountability (VSA). (2008). Background on learning outcomes
measures. Retrieved from http://www.voluntarysystem.org/index.cfm
Running head: OUTCOMES ASSESSMENTS AND ESL STUDENTS 28
Young, J.W. (2009). A framework for test validity research on content assessments taken by
English language learners. Educational Assessment, 14, 122-138.
Zwick, R. (2007). College Admission Tests. Arlington, VA: National Association for College
Admission Counseling.
Zwick, R., & Schlemer, L. (2004). SAT validity for linguistic minorities at the University of
California, Santa Barbara. Educational Measurement: Issues and Practice, 25, 6–16.
Zwick, R., & Sklar, J. C. (2005). Predicting college grades and degree completion using high
school grades and SAT scores: The role of student ethnicity and first language. American
Educational Research Journal, 42, 439-464.

Running head: OUTCOMES ASSESSMENTS AND ESL STUDENTS 29
Table 1
Demographics of sample in percentages
Non-ESL ESL
(N = 63,020) (N = 2,631)
Female 57.7 51.7
Ethnicity Caucasian 57.3 ---
Black 33.0 54.9
Asian/Pacific Islander 1.6 17.5
Latino 3.4 11.9
Native American 0.6 0.9
Other 4.1 14.7
Credit hours None, Freshman 22.6 31.8
< 30 hours 4.5 6.5
30-60 hours 26.0 19.7
61-90 hours 27.9 23.6
>90 hours 19.0 18.4
School sector Community college 18.8 6.3
4 year public 55.8 57.2
4 year private 25.3 36.5
Running head: OUTCOMES ASSESSMENTS AND ESL STUDENTS 30
Table 2
Descriptive statistics of Proficiency Profile total score, four skill areas
Non-ESL (N = 63,020)
ESL (N = 2,631)
t-test Cohen's d effect sizesa
M SD Alpha M SD Alpha
Total Score 439.1 20.0 0.94 430.8 17.1 0.92 20.9** 0.44
Reading 116.3 7.1 0.83 113.0 6.7 0.79 22.9** 0.47
Critical Thinking 110.9 6.4 0.79 108.2 5.7 0.75 20.7** 0.44
Writing 113.4 5.0 0.78 111.2 5.0 0.76 22.2** 0.44
Math 111.8 6.4 0.84 110.7 6.3 0.82 9.1** 0.18
Notes. **p<.01. a Positive values indicate Non-ESL group has higher mean.

Running head: OUTCOMES ASSESSMENTS AND ESL STUDENTS 31
Table 3
Correlations between skill areas
Uncorrected Reliabilities Correcteda
1 2 3 4 Non-
ESL ESL
1 2 3 4 1. Reading 0.74 0.64 0.80 0.84 0.80 0.92 0.76 0.99
2. Writing 0.69 0.61 0.69 0.77 0.76 0.89 0.75 0.88
3. Math 0.46 0.51 0.64 0.85 0.84 0.56 0.64 0.79
4. Critical Thinking
0.74 0.63 0.48 0.79 0.74 0.96 0.84 0.61
Note. Non-ESL above the diagonal; ESL below the diagonal. All Fisher’s z-transformation tests of correlations were significant, p < .001 (Hays, 1990). a Correlations disattenuated for unreliability (Hays, 1990).

Running head: OUTCOMES ASSESSMENTS AND ESLS 32
Table 4
Fit of increasingly constrained models for the ESL-Minority and non-ESL sample
χ2 Test of Model Fit
χ2 Contributions by Group
χ2 Difference Test a
χ2 df p Non-ESL ESL
χ2 df p CFI # Free
Parameters RMSEAb
Step 1 Non-ESL 9,046 5,667 0.00 0.962 219 0.016
ESL 11,227 5,667 0.00
0.906 219 0.021
Step 2 Freely fitting model
20,331 11,334 0.00 8,381 11,950
0.939 438 0.019
Step 3 Constrain factor loading
18,905 11,439 0.00 7,772 11,133
139 105 0.02 0.949 333 0.017
Step 4 Constrain item intercepts
21,402 11,547 0.00 9,139 12,263
3,072 108 0.00 0.933 225 0.019
Step 5 Constrain factor variance
21,758 11,550 0.00 9,378 12,380
379 111 0.00 0.931 222 0.020
Step 5b
Constrain factor variance c
21,375 11,549 0.00 9,142 12,234
11 2 0.00 0.933 223 0.019
Step 7 Free Factor Means d
19,148 11,546 0.00 7,917 11,230
N/Ab 0.948 226 0.017
Notes. RMSEA = Root Mean Square Error of Approximation. N = 2,631for ESL and sub-sample of non-ESL, respectively. a For the WLSMV estimator, the χ2 value of model fit cannot be used directly in the χ2 Difference Test for nested model. Instead, the DIFFTEST option in MPlus was used to calculate appropriate dfs for this test (Muthén & Muthén, 1998-2009). All χ2 differences represent a decrease in model fit. b RMSEA confidence intervals cannot be calculated for the WLSMV estimator. c Factor variance for Critical Thinking/Reading freed. d Freeing parameters yielded a model that was not nested within the previous model.

Running head: OUTCOMES ASSESSMENTS AND ESLS 33
Table 5
Regression results for credit hours and ESL status
Reading Writing Math Critical Thinking R ΔR2 β R ΔR2 β R ΔR2 β R ΔR2 β
Credit hours 0.38 0.15 0.39 0.31 0.10 0.31 0.26 0.07 0.27 0.35 0.12 0.36
ESL 0.39 0.01 -0.01 0.32 0.01 -0.02 0.27 0.00 0.00 0.36 0.01 -0.01Credit hours x ESL 0.39 0.00 -0.08 0.32 0.00 -0.06 0.27 0.00 -0.03 0.36 0.00 -0.07
Notes. All regression coefficients were significant to p < .001. β is the standardized regression coefficient in the final model.

Running head: OUTCOMES ASSESSMENTS AND ESLS 34
Figure 1a-d. Relationship between number of credit hours and Proficiency Profile scores for
ESL and non-ESL students. Significant mean differences within credit hours between ESL and
non-ESL groups are starred.