Inuence of Climate Change on Winter Wheat Growth in North China During 1950-2000
10
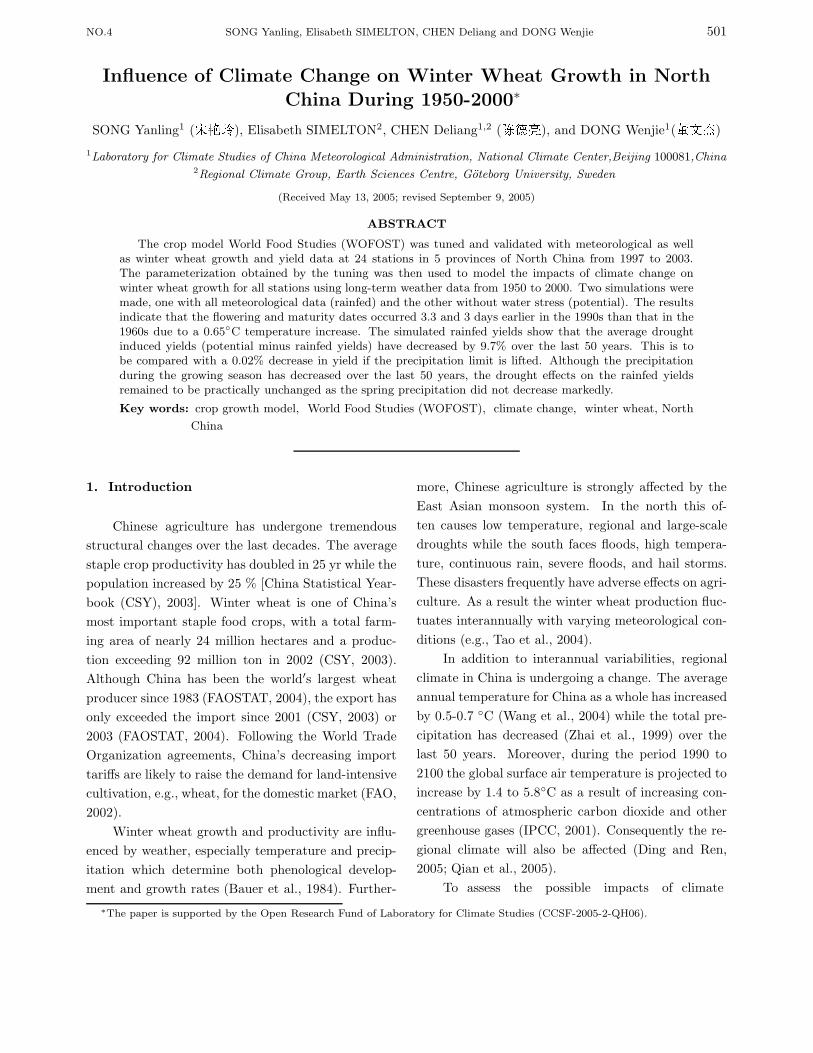
NO.4 SONG Yanling, Elisabeth SIMELTON, CHEN Deliang and DONG Wenjie 501 Influence of Climate Change on Winter Wheat Growth in North China During 1950-2000 * SONG Yanling 1 ( ), Elisabeth SIMELTON 2 , CHEN Deliang 1,2 ( ), and DONG Wenjie 1 ( ) 1 Laboratory for Climate Studies of China Meteorological Administration, National Climate Center,Beijing 100081,China 2 Regional Climate Group, Earth Sciences Centre, G¨ oteborg University, Sweden (Received May 13, 2005; revised September 9, 2005) ABSTRACT The crop model World Food Studies (WOFOST) was tuned and validated with meteorological as well as winter wheat growth and yield data at 24 stations in 5 provinces of North China from 1997 to 2003. The parameterization obtained by the tuning was then used to model the impacts of climate change on winter wheat growth for all stations using long-term weather data from 1950 to 2000. Two simulations were made, one with all meteorological data (rainfed) and the other without water stress (potential). The results indicate that the flowering and maturity dates occurred 3.3 and 3 days earlier in the 1990s than that in the 1960s due to a 0.65 ◦ C temperature increase. The simulated rainfed yields show that the average drought induced yields (potential minus rainfed yields) have decreased by 9.7% over the last 50 years. This is to be compared with a 0.02% decrease in yield if the precipitation limit is lifted. Although the precipitation during the growing season has decreased over the last 50 years, the drought effects on the rainfed yields remained to be practically unchanged as the spring precipitation did not decrease markedly. Key words: crop growth model, World Food Studies (WOFOST), climate change, winter wheat, North China 1. Introduction Chinese agriculture has undergone tremendous structural changes over the last decades. The average staple crop productivity has doubled in 25 yr while the population increased by 25 % [China Statistical Year- book (CSY), 2003]. Winter wheat is one of China’s most important staple food crops, with a total farm- ing area of nearly 24 million hectares and a produc- tion exceeding 92 million ton in 2002 (CSY, 2003). Although China has been the world 0 s largest wheat producer since 1983(FAOSTAT, 2004), the export has only exceeded the import since 2001 (CSY, 2003) or 2003 (FAOSTAT, 2004). Following the World Trade Organization agreements, China’s decreasing import tariffs are likely to raise the demand for land-intensive cultivation, e.g., wheat, for the domestic market (FAO, 2002). Winter wheat growth and productivity are influ- enced by weather, especially temperature and precip- itation which determine both phenological develop- ment and growth rates (Bauer et al., 1984). Further- more, Chinese agriculture is strongly affected by the East Asian monsoon system. In the north this of- ten causes low temperature, regional and large-scale droughts while the south faces floods, high tempera- ture, continuous rain, severe floods, and hail storms. These disasters frequently have adverse effects on agri- culture. As a result the winter wheat production fluc- tuates interannually with varying meteorological con- ditions (e.g., Tao et al., 2004). In addition to interannual variabilities, regional climate in China is undergoing a change. The average annual temperature for China as a whole has increased by 0.5-0.7 ◦ C (Wang et al., 2004) while the total pre- cipitation has decreased (Zhai et al., 1999) over the last 50 years. Moreover, during the period 1990 to 2100 the global surface air temperature is projected to increase by 1.4 to 5.8 ◦ C as a result of increasing con- centrations of atmospheric carbon dioxide and other greenhouse gases (IPCC, 2001). Consequently the re- gional climate will also be affected (Ding and Ren, 2005; Qian et al., 2005). To assess the possible impacts of climate * The paper is supported by the Open Research Fund of Laboratory for Climate Studies (CCSF-2005-2-QH06).
-
Upload
independent -
Category
Documents
-
view
0 -
download
0
Transcript of Inuence of Climate Change on Winter Wheat Growth in North China During 1950-2000
NO.4 SONG Yanling, Elisabeth SIMELTON, CHEN Deliang and DONG Wenjie 501
Influence of Climate Change on Winter Wheat Growth in North
China During 1950-2000∗
SONG Yanling1 (�����
), Elisabeth SIMELTON2, CHEN Deliang1,2 ( ����� ), and DONG Wenjie1( ��� )
1Laboratory for Climate Studies of China Meteorological Administration, National Climate Center,Beijing 100081,China2Regional Climate Group, Earth Sciences Centre, Goteborg University, Sweden
(Received May 13, 2005; revised September 9, 2005)
ABSTRACT
The crop model World Food Studies (WOFOST) was tuned and validated with meteorological as wellas winter wheat growth and yield data at 24 stations in 5 provinces of North China from 1997 to 2003.The parameterization obtained by the tuning was then used to model the impacts of climate change onwinter wheat growth for all stations using long-term weather data from 1950 to 2000. Two simulations weremade, one with all meteorological data (rainfed) and the other without water stress (potential). The resultsindicate that the flowering and maturity dates occurred 3.3 and 3 days earlier in the 1990s than that in the1960s due to a 0.65◦C temperature increase. The simulated rainfed yields show that the average droughtinduced yields (potential minus rainfed yields) have decreased by 9.7% over the last 50 years. This is tobe compared with a 0.02% decrease in yield if the precipitation limit is lifted. Although the precipitationduring the growing season has decreased over the last 50 years, the drought effects on the rainfed yieldsremained to be practically unchanged as the spring precipitation did not decrease markedly.
Key words: crop growth model, World Food Studies (WOFOST), climate change, winter wheat, North
China
1. Introduction
Chinese agriculture has undergone tremendous
structural changes over the last decades. The average
staple crop productivity has doubled in 25 yr while the
population increased by 25 % [China Statistical Year-
book (CSY), 2003]. Winter wheat is one of China’s
most important staple food crops, with a total farm-
ing area of nearly 24 million hectares and a produc-
tion exceeding 92 million ton in 2002 (CSY, 2003).
Although China has been the world′s largest wheat
producer since 1983 (FAOSTAT, 2004), the export has
only exceeded the import since 2001 (CSY, 2003) or
2003 (FAOSTAT, 2004). Following the World Trade
Organization agreements, China’s decreasing import
tariffs are likely to raise the demand for land-intensive
cultivation, e.g., wheat, for the domestic market (FAO,
2002).
Winter wheat growth and productivity are influ-
enced by weather, especially temperature and precip-
itation which determine both phenological develop-
ment and growth rates (Bauer et al., 1984). Further-
more, Chinese agriculture is strongly affected by the
East Asian monsoon system. In the north this of-
ten causes low temperature, regional and large-scale
droughts while the south faces floods, high tempera-
ture, continuous rain, severe floods, and hail storms.
These disasters frequently have adverse effects on agri-
culture. As a result the winter wheat production fluc-
tuates interannually with varying meteorological con-
ditions (e.g., Tao et al., 2004).
In addition to interannual variabilities, regional
climate in China is undergoing a change. The average
annual temperature for China as a whole has increased
by 0.5-0.7 ◦C (Wang et al., 2004) while the total pre-
cipitation has decreased (Zhai et al., 1999) over the
last 50 years. Moreover, during the period 1990 to
2100 the global surface air temperature is projected to
increase by 1.4 to 5.8◦C as a result of increasing con-
centrations of atmospheric carbon dioxide and other
greenhouse gases (IPCC, 2001). Consequently the re-
gional climate will also be affected (Ding and Ren,
2005; Qian et al., 2005).
To assess the possible impacts of climate
∗The paper is supported by the Open Research Fund of Laboratory for Climate Studies (CCSF-2005-2-QH06).
502 ACTA METEOROLOGICA SINICA VOL.19
variability and change on crop production, crop mod-
els have been extensively applied during the recent
decades (Riha et al., 1996; Dai, 1997; Lin et al., 1997;
Zhang and Wang, 1998; Hulme et al., 1999; Mavro-
matis and Jones, 1999; Lal et al., 1999; Alexandrov
and Hoogenboom, 2000; Xiong et al., 2001). While
many studies in China have focused on rice production
(e.g., Ge et al., 2002), relatively few have dealt with
wheat. Recently, Wu (2003) conducted an experiment
for two years (2000-2001) at Yucheng Experiment Sta-
tion (36◦57′N, 116◦36′E), Shandong Province. He re-
trieved a series of parameters for World Food Studies
(WOFOST) model which must be changed according
to different winter wheat cultivars, soil types, and cli-
mate condition. This model will also be used in this
study.
Climate change will doubtless have impacts on the
agricultural productivity and operations in the future.
It is therefore important to investigate how agricul-
ture has responded to historic climate change over the
last 50 years. Climate consists of various variables
such as temperature, precipitation, wind speed, and
solar radiation. It is the combined effect of all the
climatic variables that have the impact on yields. To
understand the relative role played by each climatic
variable, a tool to separate the influences of each cli-
matic variable is needed. A crop model that simulates
crop growth influenced by climate provides an effec-
tive means for this purpose. The aim of this paper is
to tune and validate the WOFOST model with obser-
vations from North China, then to assess the influence
of climate change in winter wheat in 5 provinces of
North China in the latest 50 years. Particularly, the
role played by precipitation will be identified.
2. Material and methods
2.1 Study area
Shandong, Hebei, Shanxi, Shaanxi, and Henan
Provinces are the major winter wheat-growing regions
on the North China Plain. The total arable area is
40.9 million hectares, of which 13.8 million was used
for wheat in 2000 (CSY, 2001). The region encloses
temperate, semi-humid and monsoon-controlled cli-
matic zones with an annual mean temperature of 11.2-
14.4◦C. Summers are rainy and hot (monthly mean
temperature ranges from 22 to 28◦C) whereas winters
are dry and cold (monthly mean temperature ranges
from -10 to 1◦C). The total annual precipitation gen-
erally ranges from 400 to 1000 mm (China Meteoro-
logical Administration, 2000) depending on circulation
patterns and topographic features. For example, that
strong East Asian monsoons bring colder winters (Tao
et al., 2004), dust storms, and droughts are common
in springtime. Moreover, frequent hail and dry-hot
winds damage crops in May and June.
The winter wheat region in northern China is di-
vided into 24 ecological regions based on climate, soils,
land use, and current agriculture practices (China Me-
teorological Administration, 2000). Hence 24 stations,
one representative of each region were selected and
winter wheat growth and yields were simulated for
these stations (Table 1).
2.2 The WOFOST model
WOFOST model belongs to a family of models
developed by the school of C.T. de Wit in Wagenin-
gen, the Netherlands. The model originated in the
framework of interdisciplinary studies on world food
security and on the potential world food production.
The latest version 7.1.2 issued in 2002 is available as
freeware on the internet. Supit et al. (1994) and
Boogaard et al. (1998) described the model in detail.
WOFOST is developed to simulate the effect of culti-
var, planting density, weather, soil water, and nitrogen
on crop growth, development, and yield. The model
has been used for crop growth monitoring (Lanen et
al., 1992), potential yield forecasting on regional and
national scales (Rotter, 1993; Wolf, 1993), as well as
for climate change scenarios (van Diepen et al., 1987;
Wolf and van Diepen, 1991; Wolf, 1993). Further-
more, the model has been applied in different climatic
regions (Wolf et al., 1989; Savin et al., 2001), including
northern China (Wu, 2003).
2.3 Input data required by the model
The input data to run WOFOST include weather,
crop characteristics, and soil data.
The meteorological data required to estimate
NO.4 SONG Yanling, Elisabeth SIMELTON, CHEN Deliang and DONG Wenjie 503
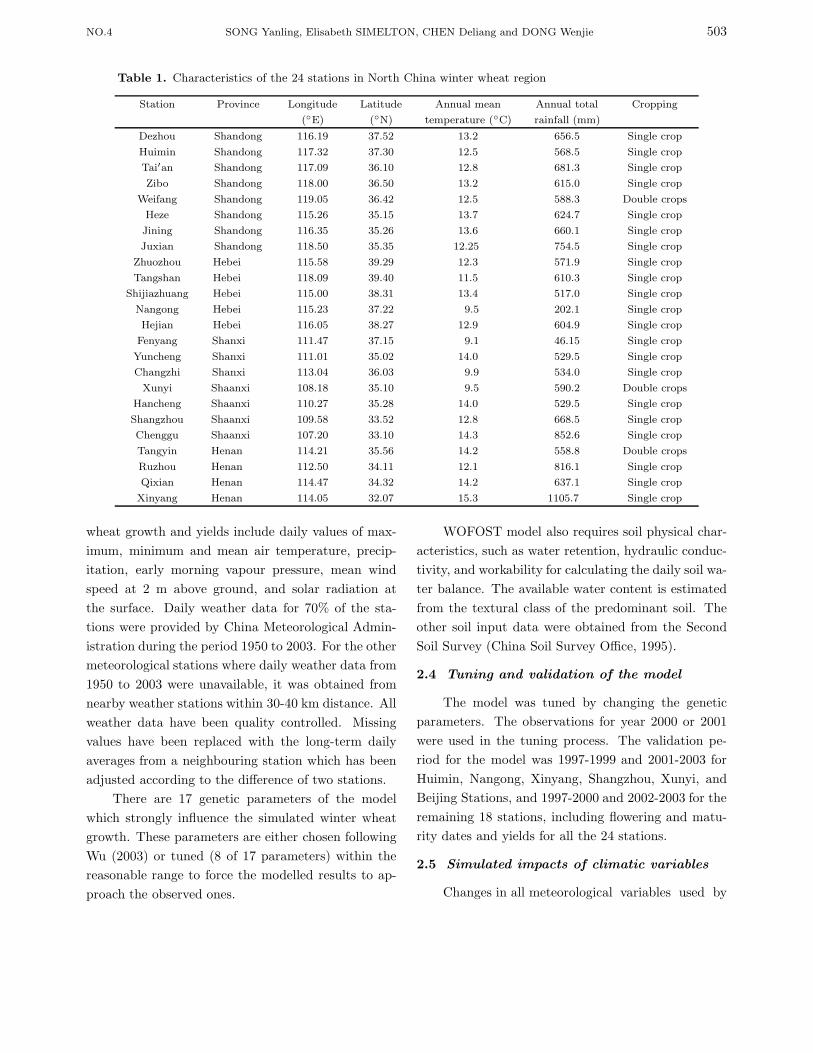
Table 1. Characteristics of the 24 stations in North China winter wheat region
Station Province Longitude Latitude Annual mean Annual total Cropping
(◦E) (◦N) temperature (◦C) rainfall (mm)
Dezhou Shandong 116.19 37.52 13.2 656.5 Single crop
Huimin Shandong 117.32 37.30 12.5 568.5 Single crop
Tai′an Shandong 117.09 36.10 12.8 681.3 Single crop
Zibo Shandong 118.00 36.50 13.2 615.0 Single crop
Weifang Shandong 119.05 36.42 12.5 588.3 Double crops
Heze Shandong 115.26 35.15 13.7 624.7 Single crop
Jining Shandong 116.35 35.26 13.6 660.1 Single crop
Juxian Shandong 118.50 35.35 12.25 754.5 Single crop
Zhuozhou Hebei 115.58 39.29 12.3 571.9 Single crop
Tangshan Hebei 118.09 39.40 11.5 610.3 Single crop
Shijiazhuang Hebei 115.00 38.31 13.4 517.0 Single crop
Nangong Hebei 115.23 37.22 9.5 202.1 Single crop
Hejian Hebei 116.05 38.27 12.9 604.9 Single crop
Fenyang Shanxi 111.47 37.15 9.1 46.15 Single crop
Yuncheng Shanxi 111.01 35.02 14.0 529.5 Single crop
Changzhi Shanxi 113.04 36.03 9.9 534.0 Single crop
Xunyi Shaanxi 108.18 35.10 9.5 590.2 Double crops
Hancheng Shaanxi 110.27 35.28 14.0 529.5 Single crop
Shangzhou Shaanxi 109.58 33.52 12.8 668.5 Single crop
Chenggu Shaanxi 107.20 33.10 14.3 852.6 Single crop
Tangyin Henan 114.21 35.56 14.2 558.8 Double crops
Ruzhou Henan 112.50 34.11 12.1 816.1 Single crop
Qixian Henan 114.47 34.32 14.2 637.1 Single crop
Xinyang Henan 114.05 32.07 15.3 1105.7 Single crop
wheat growth and yields include daily values of max-
imum, minimum and mean air temperature, precip-
itation, early morning vapour pressure, mean wind
speed at 2 m above ground, and solar radiation at
the surface. Daily weather data for 70% of the sta-
tions were provided by China Meteorological Admin-
istration during the period 1950 to 2003. For the other
meteorological stations where daily weather data from
1950 to 2003 were unavailable, it was obtained from
nearby weather stations within 30-40 km distance. All
weather data have been quality controlled. Missing
values have been replaced with the long-term daily
averages from a neighbouring station which has been
adjusted according to the difference of two stations.
There are 17 genetic parameters of the model
which strongly influence the simulated winter wheat
growth. These parameters are either chosen following
Wu (2003) or tuned (8 of 17 parameters) within the
reasonable range to force the modelled results to ap-
proach the observed ones.
WOFOST model also requires soil physical char-
acteristics, such as water retention, hydraulic conduc-
tivity, and workability for calculating the daily soil wa-
ter balance. The available water content is estimated
from the textural class of the predominant soil. The
other soil input data were obtained from the Second
Soil Survey (China Soil Survey Office, 1995).
2.4 Tuning and validation of the model
The model was tuned by changing the genetic
parameters. The observations for year 2000 or 2001
were used in the tuning process. The validation pe-
riod for the model was 1997-1999 and 2001-2003 for
Huimin, Nangong, Xinyang, Shangzhou, Xunyi, and
Beijing Stations, and 1997-2000 and 2002-2003 for the
remaining 18 stations, including flowering and matu-
rity dates and yields for all the 24 stations.
2.5 Simulated impacts of climatic variables
Changes in all meteorological variables used by
504 ACTA METEOROLOGICA SINICA VOL.19
the model will have an impact on the growth. Two
simulations are made, one showing the total effects of
all climatic variables and the other the effects exclud-
ing that from precipitation. The difference of the two
would give information about the importance of pre-
cipitation for the growth in relation to other climatic
variables.
3. Result and discussion
3.1 Tuning and validation
WOFOST model was tuned for Huimin, Nangong,
Xinyang, Shangzhou, Xunyi, and Beijing in 2000. The
other stations were adjusted to 2001 when the weather
conditions were closer to normal and relatively few cli-
mate disasters occurred. The soil parameters were set
for each station according to previous studies (China
Soil Survey Office, 1995). The genetic parameters for
winter wheat were tuned through simulations since
these data were not available for most stations. These
parameters were changed to get close agreement be-
tween the simulated and observed growth stages and
yields. When the simulated flowering and maturity
dates agreed within 10% and the yields within 15%
range of the observed values at same time, the genetic
parameters were set and considered to be reasonable.
If not, the genetic parameters were further adjusted
until the simulated results were within the 10% or 15%
range for the observed date and yield respectively. To
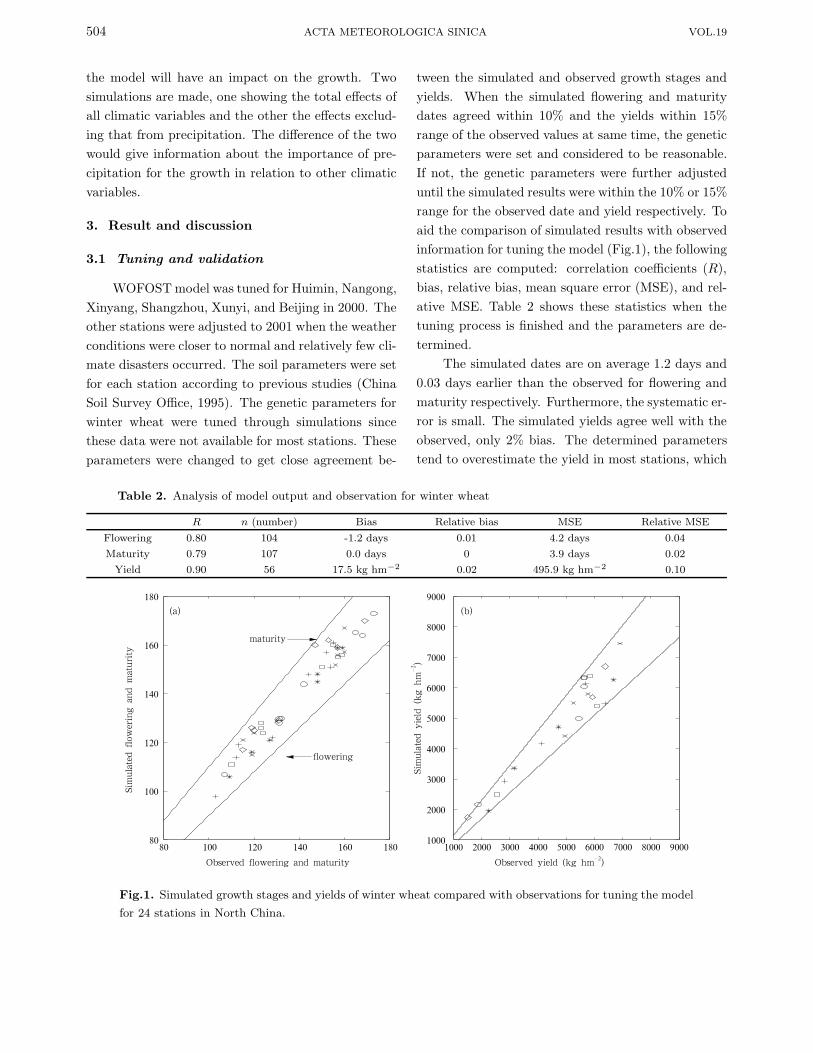
aid the comparison of simulated results with observed
information for tuning the model (Fig.1), the following
statistics are computed: correlation coefficients (R),
bias, relative bias, mean square error (MSE), and rel-
ative MSE. Table 2 shows these statistics when the
tuning process is finished and the parameters are de-
termined.
The simulated dates are on average 1.2 days and
0.03 days earlier than the observed for flowering and
maturity respectively. Furthermore, the systematic er-
ror is small. The simulated yields agree well with the
observed, only 2% bias. The determined parameters
tend to overestimate the yield in most stations, which
Table 2. Analysis of model output and observation for winter wheat
R n (number) Bias Relative bias MSE Relative MSE
Flowering 0.80 104 -1.2 days 0.01 4.2 days 0.04
Maturity 0.79 107 0.0 days 0 3.9 days 0.02
Yield 0.90 56 17.5 kg hm−2 0.02 495.9 kg hm−2 0.10
Fig.1. Simulated growth stages and yields of winter wheat compared with observations for tuning the model
for 24 stations in North China.
NO.4 SONG Yanling, Elisabeth SIMELTON, CHEN Deliang and DONG Wenjie 505
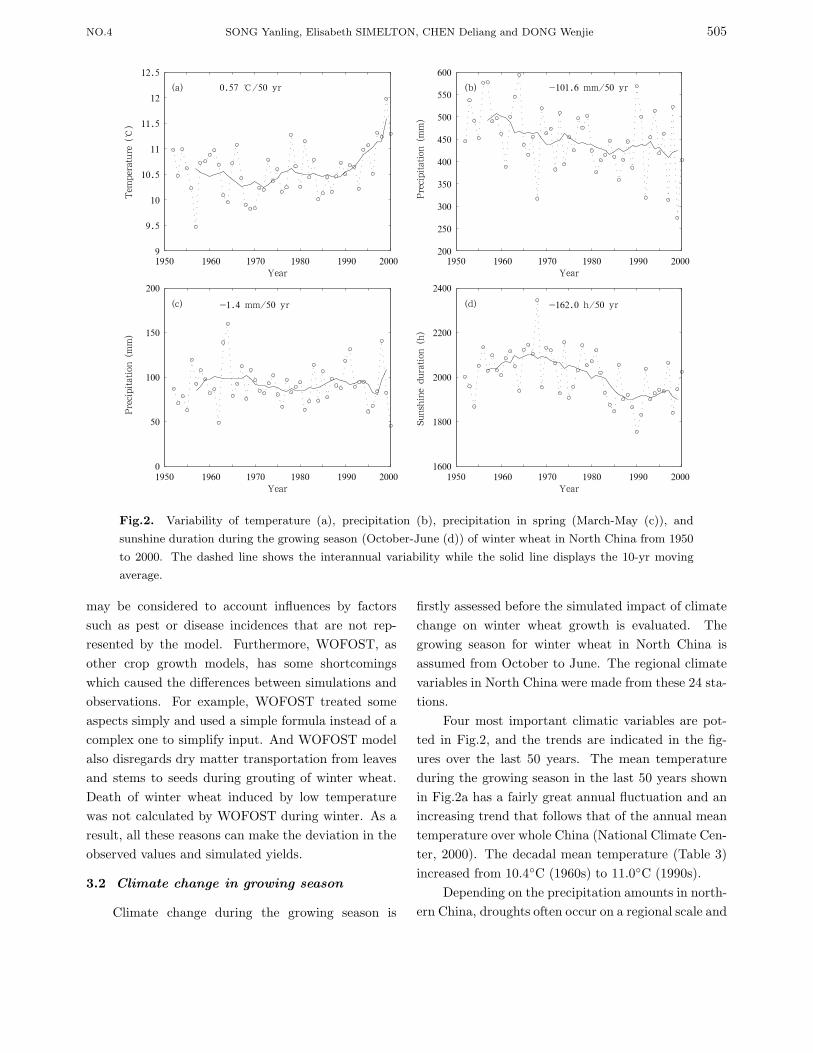
Fig.2. Variability of temperature (a), precipitation (b), precipitation in spring (March-May (c)), and
sunshine duration during the growing season (October-June (d)) of winter wheat in North China from 1950
to 2000. The dashed line shows the interannual variability while the solid line displays the 10-yr moving
average.
may be considered to account influences by factors
such as pest or disease incidences that are not rep-
resented by the model. Furthermore, WOFOST, as
other crop growth models, has some shortcomings
which caused the differences between simulations and
observations. For example, WOFOST treated some
aspects simply and used a simple formula instead of a
complex one to simplify input. And WOFOST model
also disregards dry matter transportation from leaves
and stems to seeds during grouting of winter wheat.
Death of winter wheat induced by low temperature
was not calculated by WOFOST during winter. As a
result, all these reasons can make the deviation in the
observed values and simulated yields.
3.2 Climate change in growing season
Climate change during the growing season is
firstly assessed before the simulated impact of climate
change on winter wheat growth is evaluated. The
growing season for winter wheat in North China is
assumed from October to June. The regional climate
variables in North China were made from these 24 sta-
tions.
Four most important climatic variables are pot-
ted in Fig.2, and the trends are indicated in the fig-
ures over the last 50 years. The mean temperature
during the growing season in the last 50 years shown
in Fig.2a has a fairly great annual fluctuation and an
increasing trend that follows that of the annual mean
temperature over whole China (National Climate Cen-
ter, 2000). The decadal mean temperature (Table 3)
increased from 10.4◦C (1960s) to 11.0◦C (1990s).
Depending on the precipitation amounts in north-
ern China, droughts often occur on a regional scale and
506 ACTA METEOROLOGICA SINICA VOL.19
seriously influence winter wheat yields. Between 1950
and 2000 precipitation decreased by 101.6 mm/50 yr
(17.0%) in the growing season (Fig.2b). For exam-
ple, the total precipitation declined gradually from 464
mm to 421 mm in the 1960s and 1980s, respectively.
In the 1990s the decadal average precipitation during
the growing season was 418 mm, which is equal to a
decrease of 17.0% compared to the 1950s.
Since droughts in North China generally occur in
spring, we have paid extra attention to precipitation
changes in March through May. Figure 2c illustrates
how spring precipitation has decreased with a rate of
-0.3 mm/10 yr, which is much smaller than that of
the whole growing season. However, spring precipita-
tion in the 1970s and 1990s was less than that in 1960s
and 1980s, and 2000 was the driest year of all 50 years,
triggering a number of large scale droughts (National
Climate Center, 2000).
There are three main ways in which radiation is
important for plant life (Jones, 2000). Firstly, some
of the solar radiation absorbed by winter wheat is
used for the synthesis of energy-rich chemical bonds
and reduced carbon compounds. Secondly, radiation
is the major mode of energy exchange between the
wheat plant and the aerial environment. Thirdly, the
amount and spectral distribution of short wave radia-
tion regulate crop growth and development. Sunshine
duration is often used as an indicator of solar radia-
tion. The amount of sunshine duration has decreased
by 30.2 h/10 yr during the growing season across the
North China Plain (Fig.2d). In the 1980s and 1990s,
the sunshine duration decreased by 173.2 h/10 yr and
154.9 h/10 yr compared to that in the 1960s. The
decreasing of sunshine duration will have adverse ef-
fects on winter wheat growth, which we will see in the
following section.
3.3 Simulated influence of climate change on
the growth and yields
Using the parameters determined by the tuning
of the model, observed flowering and maturity dates,
yields and long-term weather data, simulations were
made for all 24 stations in North China from 1950 to
2000. It is assumed that there is no change in win-
ter wheat variety or agricultural management. In that
way the growth and yields can only be influenced by
climate. The simulated potential yields are affected
mainly by temperature and radiation, while the rain-
fed yields are also determined by the actual rain. The
difference between the potential and rainfed yields in-
dicates the role played by the precipitation relative to
other climatic variables.
3.3.1 Impact on the growth
Temperature influences plant growth and devel-
opment through their effects on stomatal opening
and rate of physiological processes. High temper-
ature can speed up the biochemical reactions and
increase transpiration losses. A rise in temperature
leads to increased accumulation of degree-days, hence
growth and development rates boost, resulting in
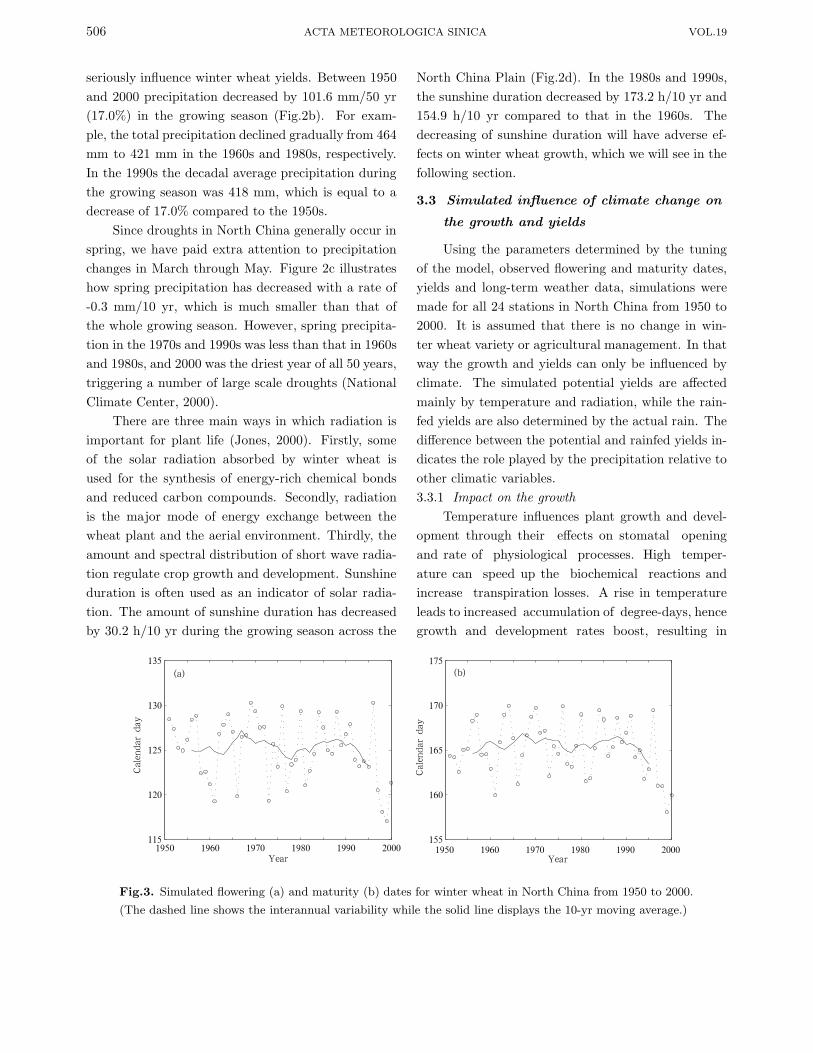
Fig.3. Simulated flowering (a) and maturity (b) dates for winter wheat in North China from 1950 to 2000.
(The dashed line shows the interannual variability while the solid line displays the 10-yr moving average.)
NO.4 SONG Yanling, Elisabeth SIMELTON, CHEN Deliang and DONG Wenjie 507
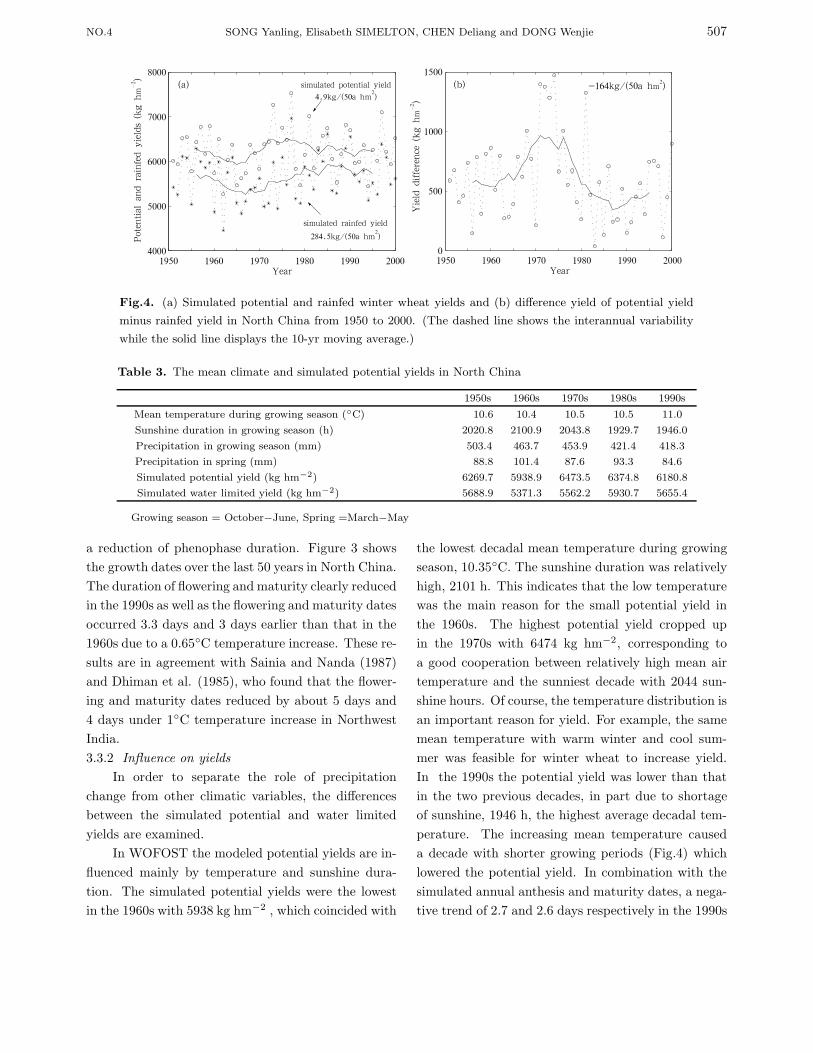
Fig.4. (a) Simulated potential and rainfed winter wheat yields and (b) difference yield of potential yield
minus rainfed yield in North China from 1950 to 2000. (The dashed line shows the interannual variability
while the solid line displays the 10-yr moving average.)
Table 3. The mean climate and simulated potential yields in North China
1950s 1960s 1970s 1980s 1990s
Mean temperature during growing season (◦C) 10.6 10.4 10.5 10.5 11.0
Sunshine duration in growing season (h) 2020.8 2100.9 2043.8 1929.7 1946.0
Precipitation in growing season (mm) 503.4 463.7 453.9 421.4 418.3
Precipitation in spring (mm) 88.8 101.4 87.6 93.3 84.6
Simulated potential yield (kg hm−2) 6269.7 5938.9 6473.5 6374.8 6180.8
Simulated water limited yield (kg hm−2) 5688.9 5371.3 5562.2 5930.7 5655.4
Growing season = October−June, Spring =March−May
a reduction of phenophase duration. Figure 3 shows
the growth dates over the last 50 years in North China.
The duration of flowering and maturity clearly reduced
in the 1990s as well as the flowering and maturity dates
occurred 3.3 days and 3 days earlier than that in the
1960s due to a 0.65◦C temperature increase. These re-
sults are in agreement with Sainia and Nanda (1987)
and Dhiman et al. (1985), who found that the flower-
ing and maturity dates reduced by about 5 days and
4 days under 1◦C temperature increase in Northwest
India.
3.3.2 Influence on yields
In order to separate the role of precipitation
change from other climatic variables, the differences
between the simulated potential and water limited
yields are examined.
In WOFOST the modeled potential yields are in-
fluenced mainly by temperature and sunshine dura-
tion. The simulated potential yields were the lowest
in the 1960s with 5938 kg hm−2 , which coincided with
the lowest decadal mean temperature during growing
season, 10.35◦C. The sunshine duration was relatively
high, 2101 h. This indicates that the low temperature
was the main reason for the small potential yield in
the 1960s. The highest potential yield cropped up
in the 1970s with 6474 kg hm−2, corresponding to
a good cooperation between relatively high mean air
temperature and the sunniest decade with 2044 sun-
shine hours. Of course, the temperature distribution is
an important reason for yield. For example, the same
mean temperature with warm winter and cool sum-
mer was feasible for winter wheat to increase yield.
In the 1990s the potential yield was lower than that
in the two previous decades, in part due to shortage
of sunshine, 1946 h, the highest average decadal tem-
perature. The increasing mean temperature caused
a decade with shorter growing periods (Fig.4) which
lowered the potential yield. In combination with the
simulated annual anthesis and maturity dates, a nega-
tive trend of 2.7 and 2.6 days respectively in the 1990s
508 ACTA METEOROLOGICA SINICA VOL.19
is evident compared with the 1980s. Similar to oth-
ers (e.g., Southworth et al., 2002), we found that a
shorter growing season is inherently detrimental since
there is less time for photosynthesis and accumulation
of biomass and hence potential yield.
The rainfed yields are influenced by temperature,
radiation and rain since non-irrigated agriculture is
affected frequently by spring drought in North China.
The drought effect on yields (the potential minus rain-
fed yields) was 606 kg hm−2 during the 50 years, equal
to 9.7% of the potential yield (Fig.4). The most se-
rious drought in 1974 led to a decrease of 23% of the
potential yield. Furthermore, the drought effect was
in general serious in the 1970s with a 14% decrease of
the potential yield, due to relatively low spring precip-
itation relative to other decades. On the other hand,
the combination of rain and growth stage also plays an
important role. For example, rain shortage during the
tasseling, flowering, and filling periods will have more
negative effects on the yield than during other growth
stages. Although the total precipitation during the
growing season decreased, it seems that the drought
effect on rainfed yield did not change seriously owing
to a stable spring precipitation over the 50 yr period.
4. Conclusions and discussions
The WOFOST model was tuned and validated to
fit the observed flowering and maturity periods as well
as yields in 5 provinces from 1997 to 2003. Most sim-
ulated growth dates and yields agree within a ±15%
range of the observed data, with a slight tendency to
overestimate yields. The modelled trends in winter
wheat yield and growth are in agreement with the ob-
served values from 24 stations. The results demon-
strate that WOFOST model predicts potential win-
ter wheat yields and growth reasonably well in North
China under current climatic conditions.
By assuming constant winter wheat varieties and
agricultural practices, the impacts of climate on win-
ter wheat growth and yields over the last 50 years were
simulated. Two simulations were made to identify the
role played by the precipitation in relation to other cli-
matic variables. The simulated results show that the
winter wheat growing period has reduced by 1.8% ow-
ing to a temperature increase of 0.65◦C. Moreover, the
flowering and maturity dates occurred 3.3 days and 3
days earlier in the 1990s than those in the 1960s. The
drought has a great effect on potential yield from year
to year. On the average, the negative effect is 9.7%
of the potential yield. While the potential yield de-
creased only by 0.02% and rainfed yield increased by
0.07% for 50 years. Although the precipitation during
the growing season has decreased over the five decades,
the rainfed yields were only slightly affected as spring
precipitation did not decrease markedly. This points
out the importance of the spring precipitation for win-
ter wheat production in North China.
REFERENCES
Alexandrov, V. A., and G. Hoogenboom, 2000: The im-
pact of climate variability and change on crop yield
in Bulgaria. Agricultural and Forest Meteorology,
104, 315-327.
Bauer, A., C. Fanning, J. W. Enz, and C. V. Eber-
lein, 1984: Use of growing degree-days to determine
spring wheat growth stages. North Dakota State
Univ. Agricultural Extension Bulletin, EB-37.
Boogaard, H. L., C. A. van Diepen, and R. P. Rotter,
1998: WOFOST 7.1 User’s guide for the WOFOST
7.1 crop growth simulation model and WOFOST
Control Center 1.5, Technical Document 52, DLO
Winand Staring Center, Wageningen.
China Meteorological Administration, 2000: Atlas of
China. Sinomaps Press. (in Chinese)
China Soil Survey Office, 1995: Soil type record of China.
China Agriculture Publishing House.
CSY, 2001: China Statistical Yearbook-2000. National
Bureau of Statistics of China. China Statistics Press.
CSY, 2003: China Statistical Yearbook-2002. National
Bureau of Statistics of China. China Statistics Press.
Dai X., 1997: Potential effects of climatic variation geo-
graphical distribution of wheat in China. Journal of
Applied Meteorology, 8(1), 19-25. (in Chinese)
Dhiman S. D., H. C. Sarma, and D. P. Singh, 1985: Grain
growth of wheat as influenced by time of sowing and
nitrogen fertilization. Haryana Agriculture Univer-
sity Journal Research, 15, 158-163.
Ding, Y. and G. Ren, 2005: National climate change as-
sessment of China. Science Press, Beijing, 566 pp.
(in press)
Fang, J., S. Piao, C. B. Field, Y. Pan, Q. Guo, L. Zhou,
C. Peng, and S. Tao, 2003: Increasing net primary
NO.4 SONG Yanling, Elisabeth SIMELTON, CHEN Deliang and DONG Wenjie 509
production in China from 1982 to 1999. Frontiers
in Ecology and Environment, 1(6), 293-297.
FAO, 2002: The state of food and agriculture. Agri-
culture and global public goods ten years after the
Earth Summit.
FAOSTAT data, 2004: www.faostat.fao.org. Last up-
dated February 2004.
Ge D., Z. Jin, and C. Shi, 2002: Gradual impact of
climate change on rice production and adaptation
strategies in southern China, Jiangsu. Journal of
Agricultural Sciences, 18(1), 1-8. (in Chinese)
Hulme, M., E. M. Barrow, N. W. Arnell, P. A. Harrisson,
T. C. Johns, and T. E. Downing, 1999: Relative im-
pacts of human-induced climate change and natural
climate variability. Nature, 397, 688-691.
IPCC, 2001: Climate Change: Summary for Policymak-
ers and Technical Summary of the Working Group
1 Report, 26.
Jones G. H., 2000: Plants and microclimate (Aquanti-
tative approach to environmental plant physiology).
Cambridge University Press, 9.
Lal, M., K. K. Singh, G. Srinivasan, L. S. Rathore, D.
Naidu, and C. N. Tripathi, 1999: Growth and yield
responses of soybean in Madhya Pradesh, India to
climate variability and change, 93, 53-70.
Lanen, H. A. J., C. A. van Diepen, G. J. Reinds, G. H.
J. de Kening, J. D. Bulens, and A. K. Bregt, 1992:
Physical land evaluation methods and GIS to explore
the crop growth potential and it’s effects within the
European Communities. Agricultural Systems, 39,
307-328.
Lin E., H. Wang, and J. Wang, 1997: Modeling the
impacts of global climate change on Chinese agri-
culture. Beijing, Agriculture Technology Publishing
House, 142. (in Chinese)
Mavromatis, T., and P. D. Jones, 1999: Evaluation of
HADCM2 and direct use of daily GCM data in
impact assessment studies. Climatic Change, 41,
583-614.
Morison, J. I. L., and R. M. Gifford, 1984: Plant growth
and water use with limited water supply in high
CO2 concentration 1. Leaf area, water use and tran-
spiration. Australian Journal of Plant Physiology,
11, 361-374.
National Climate Center, 2000: China Climate Impact
Assessment. China Meteorological Press. (in Chi-
nese)
Polley, H. W., 2002: Implications of atmospheric and cli-
matic change for crop yield and water use efficiency.
Crop Science, 42, 131-140.
Qian, W. -H., D. Chen, Q. Lin, and W. -M. Qin, 2005:
Regional temperature and precipitation trend under
global change. Newsletter for Climate Change, 3,
8-9. (in Chinese)
Riha, S. J., D. S. Wilks, and P. Simoens, 1996: Impact
of temperature and precipitation variability on crop
model predictions. Climatic Change, 32, 293-311.
Rotter, R., 1993: Simulation of the biophysical limita-
tions to maize production under rainfed conditions
in Kenya. Evaluation and application of the model
WOFOST. Materialien zur Ostafrika-Forschung,
Heft 12. Geographischen Gesellschaft Trier.
Sainia A. D., and Nanda R., 1987: Analysis of tempera-
ture and photoperiod response to flowering in wheat.
India Journal of Agriculture Science, 57, 351-359.
Savin, I., V. Stolbovoy, and C. A. van Diepen, 2001:
Crop Growth Simulation Model Wofost and its Ap-
plication for Land Productivity Analysis in Rus-
sia. Russian Academy of Agricultural Science,
V.V. Dokuchaev Soil Science Institute and Alterra
Winand Staring Center for Integrated Land, Soil
and Water Research. 216 pp. ISBN 5-854941-088-3.
Southworth, J., R. A. Pfeifer, M. Habeck, J. C. Randolph,
O. C. Doering, and D. G. Rao, 2002: Sensitivity of
winter wheat yields in the Midwestern United States
to future changes in climate, climate variability, and
CO2 fertilization. Climate Research, 22, 73-86.
Supit, I., A. A. Hooijer, and C. A. van Diepen, 1994:
System description of the WOFOST 6.0 crop growth
simulation model. Joint Research Center, Com-
mission of the European Communities. Brussels,
Luxembourg.
Tao, F. M. Yokozawa, Z. Zhang, Y. Hayashi, H. Grassl,
and C. Fu, 2004: Variability in climatology and agri-
cultural production in China in association with the
East Asian summer monsoon and El Nino Southern
Oscillation. Climate Research, 28, 23-30.
van Diepen, C. A., H. van Keulen, F. W. T. Penning
de Vries, I. G. A. M. Noy, and J. Goudriaan, 1987:
Simulated variability of wheat and rice yields in
current weather conditions and in future weather
when ambient CO2 had doubled. Simulation reports
CABO-TT 14. Wageningen: CABO-DLO, WAU-
TPE.
Wang Z., Y. Ding, J. He, and J. Yu, 2004: An updating
analysis of the climate change in China in recent 50
years, Acta Meteorological Sinica, 62(2), 228-236.
(in Chinese)
510 ACTA METEOROLOGICA SINICA VOL.19
Wolf, J., 1993: Effects of climate change on wheat and
maize production potential in the EC. In: Kenny, G.
J., P. A. Harrison & M. L. Parry (eds). The effect
of climate change on agricultural and horticultural
potential in Europe. Research report 2. Environ-
mental change unit. Oxford: University of Oxford.
93-119.
Wolf, J., J. A. A. Berkhout, C. A. van Diepen, and C. H.
van Immerzeel, 1989: A study on the limitations to
maize production in Zambia using simulation mod-
els and geographic information system. In: Bouma,
J. & A. K. Brecht (eds). Land qualities in space
and time, proceeding of a symposium organized
by the International Society of Soil Science (ISSS),
Wageningen, the Netherlands, 22-26 August 1988.
Wageningen: Pudoc. 209-215.
Wolf, J. and C. A. van Diepen, 1991: Effects of climate
change on crop production in the Rhine basin. Re-
port 52. Wageningen: RIZA, SC-DLO.
Wu D-R, 2003: The applicability research of WOFOST
model in North China Plain. Acta Phytoecologic
Sinica, 27(5), 594-602. (in Chinese)
Xiong W., Tao F, and Y. Xu, 2001: Simulation of rice
yield under climate changes in future in China.
Journal of Agrometeorology, 22(3), 1-5. (in Chinese)
Zhai P., Ren F. M., and Zhang Q., 1999: Detection of
trends in China’s precipitation extremes. Acta Me-
teorological Sinica, 57(2), 208-216. (in Chinese)
Zhang Y., and F. Wang, 1998: The possible impacts of
climate warming on rice production in China. Acta
Meteorologica Sinica, 56(3), 369-376. (in Chinese)
Zhuang Q., 2002: Chinese Wheat Improvement and Pedi-
gree Analysis. China Agriculture Publishing House,
5-6. (in Chinese)