Introductory tail-flick of the Jacky dragon visual display
15
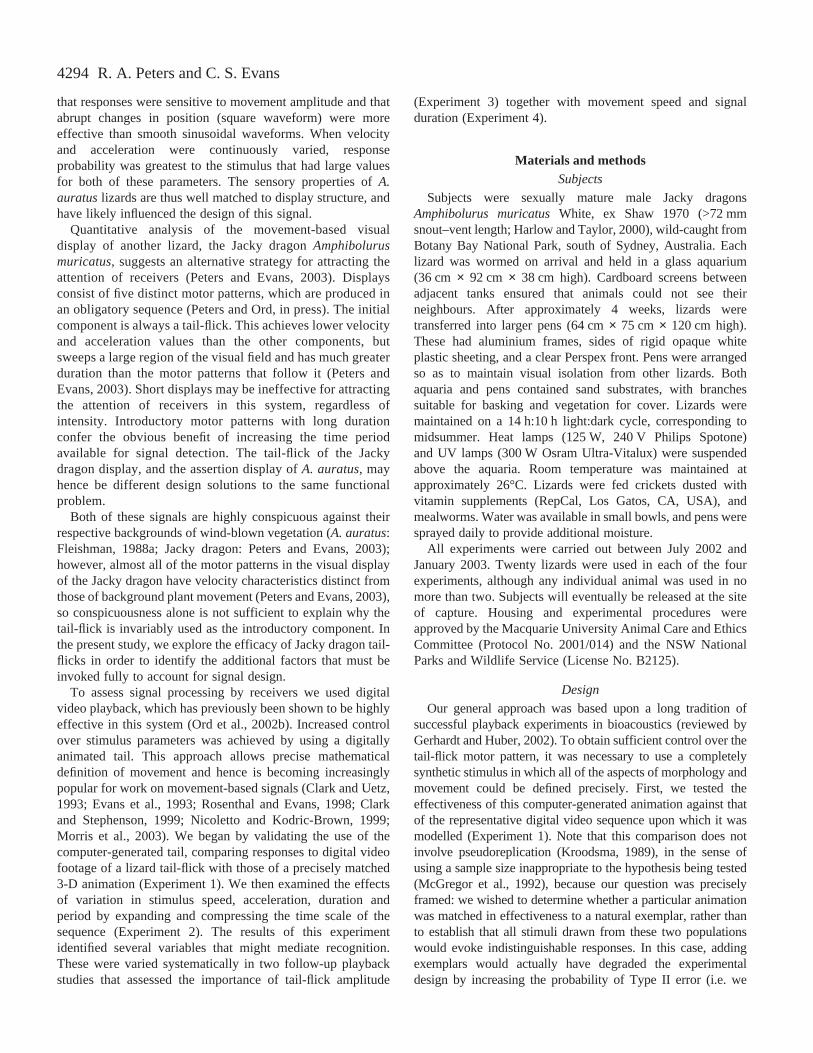
Most theories of animal communication emphasise the importance of conspicuousness in signal design. Effective long-range signals stimulate the sense organs of intended receivers (Capranica, 1965), and degrade slowly and predictably (Morton, 1982) as they propagate through the environment (Whitehead, 1987). The likelihood of detection can also be enhanced by choosing to signal when the receivers’ sensory systems are most sensitive (Aho et al., 1988), when environmental conditions are favourable (Endler, 1991), or when the signals of other species are absent (Greenfield, 1988). In the visual domain, effective signals are likely to be those that contrast with the background against which they are typically seen (Endler, 1992; Fleishman, 1992; Macedonia et al., 2002). The structural correlates of conspicuousness in static visual signals have been studied extensively in recent years (Bernard and Remington, 1991; Endler, 1991; Fleishman et al., 1993; LeBas and Marshall, 2000; Marshall, 2000; Macedonia et al., 2002; Heiling et al., 2003). In contrast, much less is known about movement-based signals, although work by Fleishman (1988a) demonstrates that these, too, are most effective when they stimulate the visual system at frequencies that are absent in the background. Structural differences between the signal and background noise are not always sufficient for reliable detection. Many animal signals also have introductory components, which are designed to alert intended receivers to the elements that follow (Wiley and Richards, 1982; Fleishman, 1992). In songs and calls, the attention of conspecifics is typically engaged by high intensity sounds with simple structure and short duration (Wiley and Richards, 1982). The initial portions of some movement-based visual signals have similar properties (Fleishman, 1988b). Lizards (Anolis auratus) increase the amplitude of push-ups in the first part of their display when the intended receiver is distant and may not be oriented toward them (‘assertion displays’). These initial push-ups have greater velocity and acceleration, but shorter duration, than those that follow and are not accompanied by dewlap extension and contraction. When the receiver is close and detection is straightforward, there is little variation in push-up structure over the course of the display (‘challenge displays’), and the amplitude of these movements is lower than that in assertion displays (Fleishman, 1988b). High amplitude push-ups are required to generate the velocity and acceleration characteristics necessary to engage a visual grasp reflex (Fleishman, 1992). In a series of experiments using artificial lures, Fleishman (1986) showed 4293 The Journal of Experimental Biology 206, 4293-4307 © 2003 The Company of Biologists Ltd doi:10.1242/jeb.00664 Many animal signals have introductory components that alert receivers. Examples from the acoustic and visual domains show that this effect is often achieved with high intensity, a simple structure and a short duration. Quantitative analyses of the Jacky dragon Amphibolurus muricatus visual display reveal a different design: the introductory tail-flick has a lower velocity than subsequent components of the signal, but a longer duration. Here, using a series of video playback experiments with a digitally animated tail, we identify the properties responsible for signal efficacy. We began by validating the use of the computer-generated tail, comparing the responses to digital video footage of a lizard tail-flick with those to a precisely matched 3-D animation (Experiment 1). We then examined the effects of variation in stimulus speed, acceleration, duration and period by expanding and compressing the time scale of the sequence (Experiment 2). The results identified several variables that might mediate recognition. Two follow-up studies assessed the importance of tail-flick amplitude (Experiment 3), movement speed and signal duration (Experiment 4). Lizard responses to this array of stimuli reveal that duration is the most important characteristic of the tail-flick, and that intermittent signalling has the same effect as continuous movement. We suggest that signal design may reflect a trade-off between efficacy and cost. Movies available on-line Key words: Jacky dragon, Amphibolurus muricatus, signal design, visual ecology, movement-based signals, tail-flick. Summary Introduction Introductory tail-flick of the Jacky dragon visual display: signal efficacy depends upon duration Richard A. Peters* and Christopher S. Evans Animal Behaviour Laboratory and Department of Psychology, Macquarie University, Sydney, NSW 2109, Australia *Author for correspondence (e-mail: [email protected]) Accepted 13 August 2003
-
Upload
khangminh22 -
Category
Documents
-
view
1 -
download
0
Transcript of Introductory tail-flick of the Jacky dragon visual display
Most theories of animal communication emphasise theimportance of conspicuousness in signal design. Effectivelong-range signals stimulate the sense organs of intendedreceivers (Capranica, 1965), and degrade slowly andpredictably (Morton, 1982) as they propagate through theenvironment (Whitehead, 1987). The likelihood of detectioncan also be enhanced by choosing to signal when the receivers’sensory systems are most sensitive (Aho et al., 1988), whenenvironmental conditions are favourable (Endler, 1991), orwhen the signals of other species are absent (Greenfield, 1988).In the visual domain, effective signals are likely to be thosethat contrast with the background against which they aretypically seen (Endler, 1992; Fleishman, 1992; Macedonia etal., 2002). The structural correlates of conspicuousness in staticvisual signals have been studied extensively in recent years(Bernard and Remington, 1991; Endler, 1991; Fleishman et al.,1993; LeBas and Marshall, 2000; Marshall, 2000; Macedoniaet al., 2002; Heiling et al., 2003). In contrast, much less isknown about movement-based signals, although work byFleishman (1988a) demonstrates that these, too, are mosteffective when they stimulate the visual system at frequenciesthat are absent in the background.
Structural differences between the signal and background
noise are not always sufficient for reliable detection. Manyanimal signals also have introductory components, which aredesigned to alert intended receivers to the elements that follow(Wiley and Richards, 1982; Fleishman, 1992). In songs andcalls, the attention of conspecifics is typically engaged by highintensity sounds with simple structure and short duration(Wiley and Richards, 1982). The initial portions of somemovement-based visual signals have similar properties(Fleishman, 1988b). Lizards (Anolis auratus) increase theamplitude of push-ups in the first part of their display when theintended receiver is distant and may not be oriented towardthem (‘assertion displays’). These initial push-ups have greatervelocity and acceleration, but shorter duration, than those thatfollow and are not accompanied by dewlap extension andcontraction. When the receiver is close and detection isstraightforward, there is little variation in push-up structureover the course of the display (‘challenge displays’), and theamplitude of these movements is lower than that in assertiondisplays (Fleishman, 1988b).
High amplitude push-ups are required to generate thevelocity and acceleration characteristics necessary to engagea visual grasp reflex (Fleishman, 1992). In a series ofexperiments using artificial lures, Fleishman (1986) showed
4293The Journal of Experimental Biology 206, 4293-4307© 2003 The Company of Biologists Ltddoi:10.1242/jeb.00664
Many animal signals have introductory componentsthat alert receivers. Examples from the acoustic and visualdomains show that this effect is often achieved with highintensity, a simple structure and a short duration.Quantitative analyses of the Jacky dragon Amphibolurusmuricatus visual display reveal a different design: theintroductory tail-flick has a lower velocity thansubsequent components of the signal, but a longerduration. Here, using a series of video playbackexperiments with a digitally animated tail, we identify theproperties responsible for signal efficacy. We began byvalidating the use of the computer-generated tail,comparing the responses to digital video footage of alizard tail-flick with those to a precisely matched 3-Danimation (Experiment 1). We then examined the effectsof variation in stimulus speed, acceleration, duration and
period by expanding and compressing the time scale of thesequence (Experiment 2). The results identified severalvariables that might mediate recognition. Two follow-upstudies assessed the importance of tail-flick amplitude(Experiment 3), movement speed and signal duration(Experiment 4). Lizard responses to this array of stimulireveal that duration is the most important characteristicof the tail-flick, and that intermittent signalling has thesame effect as continuous movement. We suggest thatsignal design may reflect a trade-off between efficacy andcost.
Movies available on-line
Key words: Jacky dragon, Amphibolurus muricatus, signal design,visual ecology, movement-based signals, tail-flick.
Summary
Introduction
Introductory tail-flick of the Jacky dragon visual display: signal efficacy dependsupon duration
Richard A. Peters* and Christopher S. EvansAnimal Behaviour Laboratory and Department of Psychology, Macquarie University, Sydney, NSW 2109, Australia
*Author for correspondence (e-mail: [email protected])
Accepted 13 August 2003
4294
that responses were sensitive to movement amplitude and thatabrupt changes in position (square waveform) were moreeffective than smooth sinusoidal waveforms. When velocityand acceleration were continuously varied, responseprobability was greatest to the stimulus that had large valuesfor both of these parameters. The sensory properties of A.auratuslizards are thus well matched to display structure, andhave likely influenced the design of this signal.
Quantitative analysis of the movement-based visualdisplay of another lizard, the Jacky dragon Amphibolurusmuricatus, suggests an alternative strategy for attracting theattention of receivers (Peters and Evans, 2003). Displaysconsist of five distinct motor patterns, which are produced inan obligatory sequence (Peters and Ord, in press). The initialcomponent is always a tail-flick. This achieves lower velocityand acceleration values than the other components, butsweeps a large region of the visual field and has much greaterduration than the motor patterns that follow it (Peters andEvans, 2003). Short displays may be ineffective for attractingthe attention of receivers in this system, regardless ofintensity. Introductory motor patterns with long durationconfer the obvious benefit of increasing the time periodavailable for signal detection. The tail-flick of the Jackydragon display, and the assertion display of A. auratus, mayhence be different design solutions to the same functionalproblem.
Both of these signals are highly conspicuous against theirrespective backgrounds of wind-blown vegetation (A. auratus:Fleishman, 1988a; Jacky dragon: Peters and Evans, 2003);however, almost all of the motor patterns in the visual displayof the Jacky dragon have velocity characteristics distinct fromthose of background plant movement (Peters and Evans, 2003),so conspicuousness alone is not sufficient to explain why thetail-flick is invariably used as the introductory component. Inthe present study, we explore the efficacy of Jacky dragon tail-flicks in order to identify the additional factors that must beinvoked fully to account for signal design.
To assess signal processing by receivers we used digitalvideo playback, which has previously been shown to be highlyeffective in this system (Ord et al., 2002b). Increased controlover stimulus parameters was achieved by using a digitallyanimated tail. This approach allows precise mathematicaldefinition of movement and hence is becoming increasinglypopular for work on movement-based signals (Clark and Uetz,1993; Evans et al., 1993; Rosenthal and Evans, 1998; Clarkand Stephenson, 1999; Nicoletto and Kodric-Brown, 1999;Morris et al., 2003). We began by validating the use of thecomputer-generated tail, comparing responses to digital videofootage of a lizard tail-flick with those of a precisely matched3-D animation (Experiment 1). We then examined the effectsof variation in stimulus speed, acceleration, duration andperiod by expanding and compressing the time scale of thesequence (Experiment 2). The results of this experimentidentified several variables that might mediate recognition.These were varied systematically in two follow-up playbackstudies that assessed the importance of tail-flick amplitude
(Experiment 3) together with movement speed and signalduration (Experiment 4).
Materials and methodsSubjects
Subjects were sexually mature male Jacky dragonsAmphibolurus muricatus White, ex Shaw 1970 (>72·mmsnout–vent length; Harlow and Taylor, 2000), wild-caught fromBotany Bay National Park, south of Sydney, Australia. Eachlizard was wormed on arrival and held in a glass aquarium(36·cm × 92·cm × 38·cm high). Cardboard screens betweenadjacent tanks ensured that animals could not see theirneighbours. After approximately 4 weeks, lizards weretransferred into larger pens (64·cm × 75·cm × 120·cm high).These had aluminium frames, sides of rigid opaque whiteplastic sheeting, and a clear Perspex front. Pens were arrangedso as to maintain visual isolation from other lizards. Bothaquaria and pens contained sand substrates, with branchessuitable for basking and vegetation for cover. Lizards weremaintained on a 14·h:10·h light:dark cycle, corresponding tomidsummer. Heat lamps (125·W, 240·V Philips Spotone)and UV lamps (300·W Osram Ultra-Vitalux) were suspendedabove the aquaria. Room temperature was maintained atapproximately 26°C. Lizards were fed crickets dusted withvitamin supplements (RepCal, Los Gatos, CA, USA), andmealworms. Water was available in small bowls, and pens weresprayed daily to provide additional moisture.
All experiments were carried out between July 2002 andJanuary 2003. Twenty lizards were used in each of the fourexperiments, although any individual animal was used in nomore than two. Subjects will eventually be released at the siteof capture. Housing and experimental procedures wereapproved by the Macquarie University Animal Care and EthicsCommittee (Protocol No. 2001/014) and the NSW NationalParks and Wildlife Service (License No. B2125).
Design
Our general approach was based upon a long tradition ofsuccessful playback experiments in bioacoustics (reviewed byGerhardt and Huber, 2002). To obtain sufficient control over thetail-flick motor pattern, it was necessary to use a completelysynthetic stimulus in which all of the aspects of morphology andmovement could be defined precisely. First, we tested theeffectiveness of this computer-generated animation against thatof the representative digital video sequence upon which it wasmodelled (Experiment 1). Note that this comparison does notinvolve pseudoreplication (Kroodsma, 1989), in the sense ofusing a sample size inappropriate to the hypothesis being tested(McGregor et al., 1992), because our question was preciselyframed: we wished to determine whether a particular animationwas matched in effectiveness to a natural exemplar, rather thanto establish that all stimuli drawn from these two populationswould evoke indistinguishable responses. In this case, addingexemplars would actually have degraded the experimentaldesign by increasing the probability of Type II error (i.e. we
R. A. Peters and C. S. Evans

4295Duration and tail-flick efficacy of a lizard
would have been more likely to fail to detect a subtledeficiency in the animation). This initial ‘calibration’ test wasfollowed by a series of three further playback experiments(2–4), all using synthetic sequences only. The issue ofpseudoreplication does not arise in these experiments becausethe populations of interest are each fully characterised by thesingle stimulus used to represent them (i.e. there was zerovariance in parameters other than those manipulated).
We varied tail-flick duration, speed, amplitude, numberof direction changes (reversals), period (time elapsedbetween the beginning of successive flicks) and duty cycle(proportion of the stimulus containing movement). Changesin tail-flick speed for stimuli of equal duration necessarilyproduced corresponding changes in acceleration. The tail-flick is a complex movement, and several properties arehighly correlated in natural sequences. Our strategy washence to manipulate a different subset of motion variablesin each experiment (Table·1), so as to isolate the feature(s)responsible for evoking an orienting response.
The simplest description of tail-flick structure is obtainedby tracking the position of the tail tip in each frame, andthen calculating the Euclidean distance between thesecoordinates and the corresponding values in the first frameof the sequence. These data define a display action pattern(DAP; Fig.·1A), which has traditionally been used to depictdisplay structure (Carpenter et al., 1970). The number ofreversals is reflected in the number of peaks in the DAP,while the duty cycle describes the proportion of framescontaining motion.
Playback procedure
Our test setup was based upon one used in a recent videoplayback study (for a detailed description, see Ord et al.,2002b). All stimuli were presented on a Sony PVM-14M2Acolour monitor (resolution >600 lines; screen size 34·cmmeasured diagonally). In Experiment 1, sequences werestored on an Apple PowerBook G3 running Final Cut Pro 2(Apple Computer Inc.). Video was streamed as a digital signalto a Sony GV-D300E mini-DV deck, using an IEEE 1394Firewire interface. The S-video analog output from the deckwas then connected to the Sony monitor. The digital videosequences for Experiments 2, 3 and 4 were too large to storeon the computer, so these were played from digital videotape(Sony DVM60EX2) using the same deck as in Experiment 1. Inboth of these techniques, stimulus resolution was limited only
by the PAL DV standard (5:1 compression; horizontal resolution550 lines; 25·frames·s–1).
Table·1. Manipulation of motion variables in the four experiments
Stimulus parameters
Experiment Manipulation Duration Speed Acceleration Amplitude Reversals Period Duty cycle
1 Calibration – – – – – – –2 Time scale + + + – – + –3 Amplitude – + – + + + –4 Speed and duration + + + – + + +
–, Fixed parameter; +, variable parameter.
A
B C
0
40
80
120
160
200
0
40
80
120
160
200
1 16 31 46 61 76 91 106 121 136 151
Time (frames)
Am
plitu
de (
mm
)
VIDEO
ANIMATED
0
50
100
150
200
250
300
350
Video Animated Video Animated
Spee
d (m
m s–1
)
0
10
20
30
40
50
Acc
eler
atio
n (m
m s–2
)
Fig.·1. Structure of the VIDEO and ANIMATED tail-flick sequences.(A) Plots of the Euclidean distance (mm) between the tip of the tail ineach frame (PAL standard: 40·ms), and its position in the first frame ofthe sequence. (B) Speed and (C) acceleration for each sequence. Valuesare means + S.E.M. (N=162 frames).

4296
Lizard responses were recorded using a Panasonic WV-CP240 CCTV camera with a WV-LZ62/2 lens, connected to aVHS video deck. All stimuli were presented with thesoundtrack muted, but a marker tone (inaudible to the subjectlizard) was dubbed directly to the VHS deck so that responsescould later be scored relative to stimulus onset. We conductedall playback tests between 08:00·h and 12:00·h, whichcorresponds to the period of peak activity in our captivepopulation (Ord, 2001). Presentation time was standardisedwithin each lizard, so that the inter-playback interval wasalways approximately 24·h.
The movie sequences are available in the Supplementarymaterial to this paper and also at: http://galliform.bhs.mq.edu.au/lizard/supplement.html.
Statistical analysis
Our dependent measure was the orienting response, which
we operationally defined as an observable movement of thehead toward the monitor. For each stimulus presentation, wescored whether or not an orienting response occurred andlatency to the nearest frame (temporal resolution 40·ms).Lizards that failed to respond to any of the stimuli in anexperiment were excluded from analyses.
We used Friedman’s analyses of variance (ANOVAs) toassess variation in the probability of response over all stimuli,followed by Wilcoxon signed-ranks tests for pairwisecomparisons between conditions. Formal analyses of responselatencies could only be conducted for Experiments 1 and 3.The stimuli used in Experiments 2 and 4 varied in duration,and this would have introduced a systematic bias in responselatencies if we had considered the whole stimulus presentation.To overcome this, we windowed responses, and consideredonly those that occurred within a period equivalent to theduration of the shortest sequence (42 frames in both
experiments). In addition, only lizards that respondedto all stimuli in our repeated measures design couldbe included in standard statistical models. With bothof these constraints in place, our effective samplesize for latency analysis was reduced to two animalsin Experiment 2 and zero in Experiment 4.
ResultsExperiment 1
Systematic manipulation of tail-flick structurerequires the unique level of control afforded by high-resolution computer animations. In a recent study,we showed that digital video recordings of adisplaying male evoke aggressive responses just aseffectively as the same animal presented live (Ord etal., 2002b). In this experiment, we conducted ananalogous comparison between a computer-generated tail-flick and digital video footage of a reallizard tail-flick.
Stimulus sequences
Videorecorded tail-flick
We randomly selected a digital video sequencefrom an archival collection that depicted a Jackydragon tail-flicking on a wooden perch (Fig.·2). Fulldetails of recording procedure are presented in Ordet al. (2002b). Footage was edited, using Final CutPro 2 software on a Macintosh G4/500 computer(Apple Computer Inc.), to isolate the tail-flick motorpattern. We added fade transitions before and afterthe tail-flick to avoid spurious orienting responsesthat might be caused by an abrupt change in thedisplayed image. The final stimulus (LIVE)consisted of 10·s of an empty perch before thelizard’s tail faded into view (1·s), and then remainedstationary for a further 1·s before a single bout ofcontinuous flicking (162·frames, 6.5·s). The tail thenfaded away (1·s), and an empty perch was presented
R. A. Peters and C. S. Evans
Video Animated
Fig.·2. Representative frames from the VIDEO (left) and ANIMATED (right)sequences. The black mask on the right side of each frame has been cropped.

4297Duration and tail-flick efficacy of a lizard
for a further 10·s. A black mask was added to the right side ofeach video frame to conceal the lizard’s body (Fig.·2).
Animated tail-flick
Construction of the 3-D computer-generated tail-flicksequence (ANIMATED) involved the following steps: (1)building a model with appropriate shape and surface markings,(2) manipulating the model to match the live sequence, (3)adjustments to lighting to match the natural exemplar, followedby sequence rendering and (4) final editing to overlay thesynthetic tail on the same digital video background as in theLIVE tail-flick sequence, and also to add identical fades andmask. The following description provides a brief overview ofprocedure; recent reviews provide additional background onthe use of computer animation to create visual stimuli (Kunzlerand Bakker, 1998; Clark and Stephenson, 1999; Nicoletto andKodric-Brown, 1999; Rosenthal, 1999).
Model construction.Measurements of tail morphology fromthe time of recording were not available, so currentmeasurements were used as an approximation (other physicaldata showed only moderate growth: 3·mm increase insnout–vent length and 3·g mass increase). We measured overalltail length, as well as diameter at equally spaced points alongthe tail. Digital photographs of the tail were taken from aboveand from the sides, using a Panasonic NV-DS15 digital videocamcorder, and then transferred to computer for editing.
We used the modeller module of LightWave 3D v6(NewTek Inc. 2001, San Antonio, TX, USA) to construct thesynthetic tail. Briefly, we began with a cylindrical object scaledto match the length of the real tail, and then modified this usingshaping functions to match the circumference at each point.We then used the digital photographs of real tail skin to createa texture map of the tail in Adobe Photoshop v6 (AdobeSystems Inc.), which was overlaid onto the 3-D wire-framemodel. This process produced a tail structure with shape andsurface characteristics that closely resembled those of theoriginal.
Animating the 3-D model.We used the animation module ofLightWave to define changes in position over time, so that themovement of the synthetic tail matched precisely that of theoriginal. To assist in this process, we added a skeleton, madeup of 24 artificial ‘bones’. These are invisible elements thatfacilitate adjustment of a model in which there is both globaldisplacement and local movement of some sectors, relative toothers. To animate the tail, we used a technique knownas ‘rotoscoping’ (Gatesy et al., 1999). This involvedsuperimposing the computer-generated model over sequentialframes from the original sequence, and then adjusting themodel to match each one.
The LIVE sequence was exported as a series of still imagesusing MovieShop v 5.2 software, on a DraCo nonlinear videoediting workstation (MS MacroSystem Computer GmbH). Thefirst frame was then used to determine the appropriate positionof the animation ‘camera’ in three-dimensional space, so thatthe artificial tail would be rendered from the same perspectiveas the real one. LightWave allows manipulation of the spatial
location of each bone in three planes (x, y and z), as well asorientation and range of movement. To achieve a match, it wasnecessary to utilise this level of control, making judgementsabout how the tail would move that took into account both theshape required in future frames and the mechanical constraintsof the bones. Once the model matched the background image,a ‘key-frame’ was used to save the location of all bones. Wethen advanced to the next animation frame, imported the nextimage in the video tail sequence, and repeated the process forthe whole sequence. Although LightWave has powerfulinterpolation algorithms, manual definition of tail location ineach of 162 frames ensured the closest possible match betweenthe VIDEO and ANIMATED tail-flicks.
Lighting and sequence export. The last stage in theanimation process was to add ‘lights’ to the scene in locationsthat matched those used in the original videorecording setup.We selected a random frame in the original sequence andmeasured Red, Green and Blue values at three different pointson the tail using Photoshop. We then adjusted lightspecifications (angle, intensity and hue), rendered a singleframe to compare model and original values, and iterated thisprocess. The animated tail was then exported as a digital video(DV) stream with a homogenous black background.
Final editing. The DV stream was imported into Final CutPro 2 and then combined with background video footage fromthe original lizard filming setup, so that the only differencebetween the two finished sequences was that the tail wasrecorded in one case and animated in the other. We used achroma-key effect to make the black region of each frametransparent and then combined these with video recordings ofthe empty perch, so that the animated tail was superimposedon the same structure and background as the video exemplar(Fig.·2). A black mask was then added to the right-hand sideof each frame.
Quantitative comparison of movement
In a recent paper (Peters et al., 2002), we describe ourstrategy for exploring the design of dynamic visual signals andshow that local changes in image intensity can be used tomeasure the direction and speed of motion (see also Zeil andZanker, 1997). A summary estimate for speed over time canbe calculated by averaging velocity magnitude (i.e. vectorlength) over the whole sequence (Peters et al., 2002; Peters andEvans, 2003). We compared movement in the two sequencesusing DAP profiles (Fig.·1A), and average speed andacceleration (Fig.·1B,C). These complementary analysesreveal that the video and animated sequences were closelymatched on all parameters. Full details of analysis procedurescan be found elsewhere (Peters et al., 2002; Peters and Evans,2003).
Playback
We presented tail-flick sequences twice each to 20 lizards,over 4 successive days. The first frame of the stimulusdepicted an empty perch in both cases; this appeared on themonitor from the start of the session. We waited until the
4298
lizard was oriented away from the front before cueingthe stimulus (mean 255±75·s, mean ±S.D.). We used arandomised block design in which half of the lizards wereshown the stimuli in the order VIDEO–ANIMATION and theother half ANIMATION–VIDEO. Each group was then re-tested with the reverse sequence. Order effects were thuscontrolled both by random assignment at the group level andby counter-balancing within individual. Two lizards wereexcluded from the analysis because they did not respond toany of the stimuli.
Results
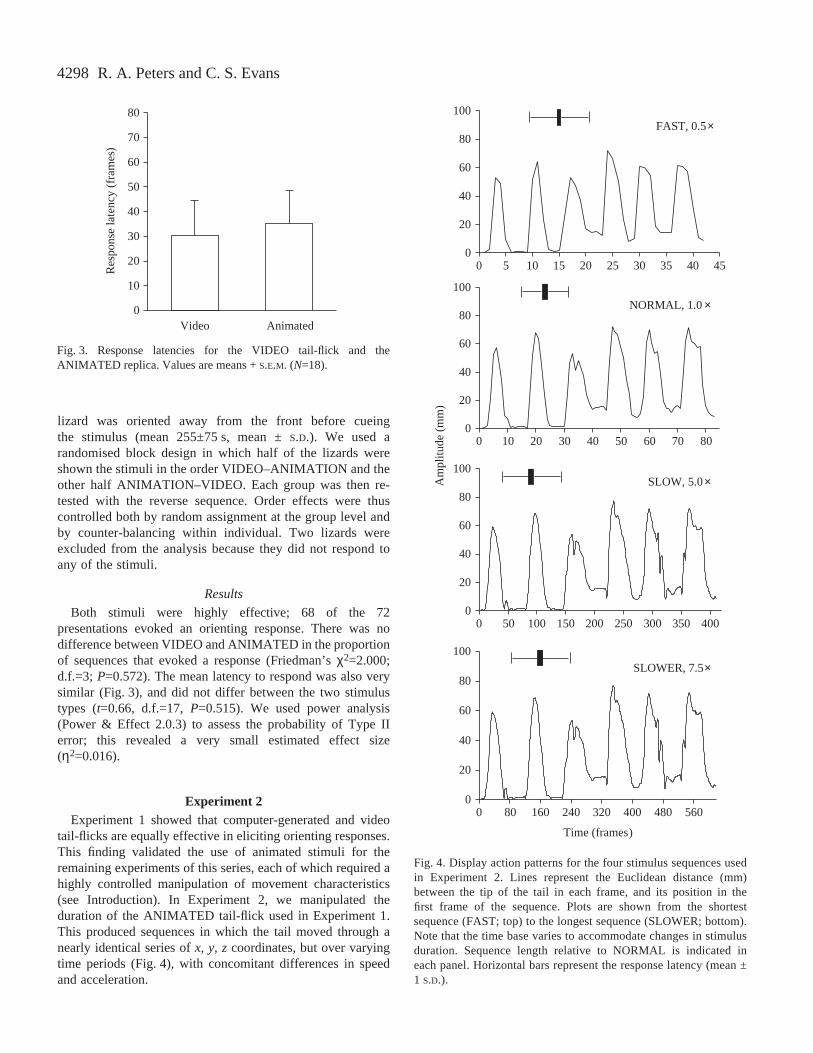
Both stimuli were highly effective; 68 of the 72presentations evoked an orienting response. There was nodifference between VIDEO and ANIMATED in the proportionof sequences that evoked a response (Friedman’s χ2=2.000;d.f.=3; P=0.572). The mean latency to respond was also verysimilar (Fig.·3), and did not differ between the two stimulustypes (t=0.66, d.f.=17, P=0.515). We used power analysis(Power & Effect 2.0.3) to assess the probability of Type IIerror; this revealed a very small estimated effect size(η2=0.016).
Experiment 2Experiment 1 showed that computer-generated and video
tail-flicks are equally effective in eliciting orienting responses.This finding validated the use of animated stimuli for theremaining experiments of this series, each of which required ahighly controlled manipulation of movement characteristics(see Introduction). In Experiment 2, we manipulated theduration of the ANIMATED tail-flick used in Experiment 1.This produced sequences in which the tail moved through anearly identical series of x, y, zcoordinates, but over varyingtime periods (Fig.·4), with concomitant differences in speedand acceleration.
R. A. Peters and C. S. Evans
0
10
20
30
40
50
60
70
80
Video Animated
Res
pons
e la
tenc
y (f
ram
es)
Fig.·3. Response latencies for the VIDEO tail-flick and theANIMATED replica. Values are means + S.E.M. (N=18).
0
20
40
60
80
100
0 5 10 15 20 25 30 35 40 45
0
20
40
60
80
100
0 10 20 30 40 50 60 70 80
0
20
40
60
80
100
0 50 100 150 200 250 300 350 400
0
20
40
60
80
100
0 80 160 240 320 400 480 560
Time (frames)
Am
plitu
de (
mm
)
NORMAL, 1.0 ×
SLOW, 5.0 ×
SLOWER, 7.5 ×
FAST, 0.5 ×
Fig.·4. Display action patterns for the four stimulus sequences usedin Experiment 2. Lines represent the Euclidean distance (mm)between the tip of the tail in each frame, and its position in thefirst frame of the sequence. Plots are shown from the shortestsequence (FAST; top) to the longest sequence (SLOWER; bottom).Note that the time base varies to accommodate changes in stimulusduration. Sequence length relative to NORMAL is indicated ineach panel. Horizontal bars represent the response latency (mean ±1 S.D.).

4299Duration and tail-flick efficacy of a lizard
Stimulus sequences
The response latencies for the ANIMATED tail-flick usedin Experiment 1 indicated that when orienting responses wereevoked, these occurred well before the end of the sequence. Toavoid a ceiling effect, we only used the first half of the originalsequence (82 of 161 frames), and scaled the tail to half itsoriginal size. This represents an apparent distance of 1.50·mfrom the observer. The time scale was then systematicallyvaried using LightWave, without changing other parametersthat define movement, such as amplitude and plane of motion(Fig.·4). Increased duration was achieved by interpolatingbetween the key-frames defined in the original sequence.This technique ensures smooth slow motion and producesmuch better results than the algorithms available in video-editing software, which simply repeat frames, producingdiscontinuous motion.
The time base was expanded to create sequences that werelonger than the original, and compressed to produce shorterones. We selected three stimuli that sampled the natural rangeobserved in our captive population. In addition to the originalsequence (NORMAL), we used sequences that were 0.5×(FAST) and 5.0× (SLOW) the duration of NORMAL. We alsoincluded a sequence 7.5× the original duration (SLOWER),which is probably outside the natural range. This designallowed us to test whether lizard responses are approximatelymatched to the distribution of conspecific tail-flick durations,and also to evaluate the alternative possibility thatexceptionally long signals might prove more effective (i.e.supernormal; Tinbergen, 1951).
In Experiment 1, we used a homogenous background tomaximise stimulus conspicuousness. However, Jacky dragondisplays will usually be seen against wind-blown vegetation(Peters and Evans, 2003), which acts as background noise.We reasoned that lizards are likely to habituate to themovement of wind-blown plants (Fleishman, 1992) and thatsignal efficacy would therefore best be assessed in terms ofability to engage visual processing after a period spentviewing irrelevant background motion. This general approachof using background footage videorecorded in the animal’snatural habitat has recently been advocated by Rosenthal(1999).
Tail-flick animations were overlaid onto footage of wind-
blown plants (Fig.·5), recorded at the site where the subjectlizards had been caught. A continuous 15·min plant sequencewas used, during which wind speed had varied between 0.7 and2.2·m·s–1. Recording procedure and vegetation movementcharacteristics have recently been described (Peters and Evans,2003). The animations and vegetation sequences werecombined using a chroma-key effect in Final Cut Pro, in thesame way as the model tail-flick and background inExperiment 1. The tail appeared at the twelfth and fourteenthminute of each sequence, and commenced flickingimmediately. To assess whether there was an effect of the tailstructure appearing, independent of movement, we added acontrol sequence that depicted a stationary tail of the sameduration as the original stimulus (82 frames).
The five stimuli were presented to 20 lizards on successivedays. We used the stationary tail stimulus to obtain abaseline score on the first day. Each lizard was then shownthe four animated tail-flick stimuli in a unique randomsequence.
Results
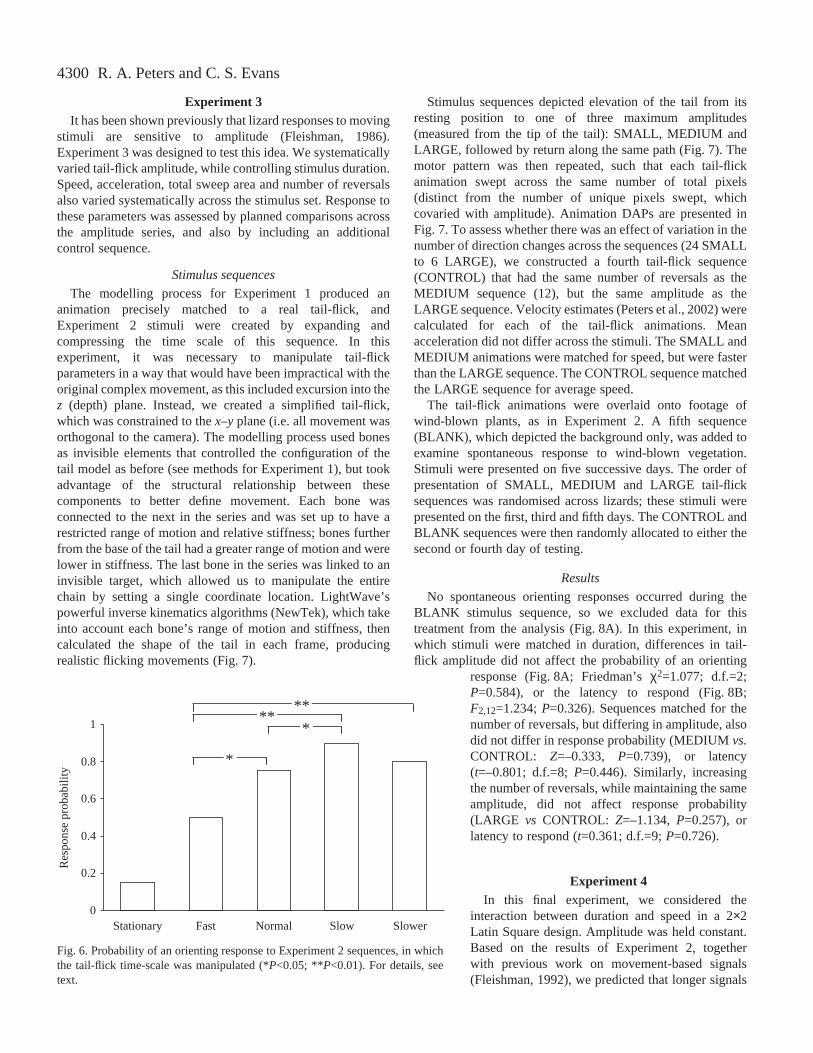
There was significant variation in the probability of anorienting response to the first trial in each sequence (Fig.·6;Friedman’s χ2=35.415; d.f.=4; P=0.000). To ensure that thiswas not simply attributable to a difference between the fourmoving stimuli and the non-moving control sequence, werepeated the analysis with data from the stationary conditionexcluded. This revealed that response probability variedsignificantly as the time base for the tail-flick was expandedand compressed (Friedman’s χ2=12.636; d.f.=3; P=0.005).Pairwise comparisons indicate that the FAST sequence wassignificantly less effective than each of the other sequences(NORMAL: Z=–1.667, P=0.048; SLOW: Z=–2.828,P=0.0025; SLOWER: Z=–2.449, P=0.007). Responses toNORMAL were also significantly different from those to theSLOW stimulus (Z=–1.732, P=0.0415). None of the othercomparisons was significant.
Formal analysis of response latencies was not possible (seeMaterials and methods). However, examination of thedistribution of latencies, relative to tail position, in plots ofamplitude over time reveals a marked correspondence betweenmean response time and the DAP profile (Fig.·4).
Fig.·5. Representative frameshowing the vegetation used as thebackground in Experiments 2–4(left), and an enlarged view of thetail against the background (right).
4300
Experiment 3It has been shown previously that lizard responses to moving
stimuli are sensitive to amplitude (Fleishman, 1986).Experiment 3 was designed to test this idea. We systematicallyvaried tail-flick amplitude, while controlling stimulus duration.Speed, acceleration, total sweep area and number of reversalsalso varied systematically across the stimulus set. Response tothese parameters was assessed by planned comparisons acrossthe amplitude series, and also by including an additionalcontrol sequence.
Stimulus sequences
The modelling process for Experiment 1 produced ananimation precisely matched to a real tail-flick, andExperiment 2 stimuli were created by expanding andcompressing the time scale of this sequence. In thisexperiment, it was necessary to manipulate tail-flickparameters in a way that would have been impractical with theoriginal complex movement, as this included excursion into thez (depth) plane. Instead, we created a simplified tail-flick,which was constrained to the x–y plane (i.e. all movement wasorthogonal to the camera). The modelling process used bonesas invisible elements that controlled the configuration of thetail model as before (see methods for Experiment 1), but tookadvantage of the structural relationship between thesecomponents to better define movement. Each bone wasconnected to the next in the series and was set up to have arestricted range of motion and relative stiffness; bones furtherfrom the base of the tail had a greater range of motion and werelower in stiffness. The last bone in the series was linked to aninvisible target, which allowed us to manipulate the entirechain by setting a single coordinate location. LightWave’spowerful inverse kinematics algorithms (NewTek), which takeinto account each bone’s range of motion and stiffness, thencalculated the shape of the tail in each frame, producingrealistic flicking movements (Fig.·7).
Stimulus sequences depicted elevation of the tail from itsresting position to one of three maximum amplitudes(measured from the tip of the tail): SMALL, MEDIUM andLARGE, followed by return along the same path (Fig.·7). Themotor pattern was then repeated, such that each tail-flickanimation swept across the same number of total pixels(distinct from the number of unique pixels swept, whichcovaried with amplitude). Animation DAPs are presented inFig.·7. To assess whether there was an effect of variation in thenumber of direction changes across the sequences (24 SMALLto 6 LARGE), we constructed a fourth tail-flick sequence(CONTROL) that had the same number of reversals as theMEDIUM sequence (12), but the same amplitude as theLARGE sequence. Velocity estimates (Peters et al., 2002) werecalculated for each of the tail-flick animations. Meanacceleration did not differ across the stimuli. The SMALL andMEDIUM animations were matched for speed, but were fasterthan the LARGE sequence. The CONTROL sequence matchedthe LARGE sequence for average speed.
The tail-flick animations were overlaid onto footage ofwind-blown plants, as in Experiment 2. A fifth sequence(BLANK), which depicted the background only, was added toexamine spontaneous response to wind-blown vegetation.Stimuli were presented on five successive days. The order ofpresentation of SMALL, MEDIUM and LARGE tail-flicksequences was randomised across lizards; these stimuli werepresented on the first, third and fifth days. The CONTROL andBLANK sequences were then randomly allocated to either thesecond or fourth day of testing.
Results
No spontaneous orienting responses occurred during theBLANK stimulus sequence, so we excluded data for thistreatment from the analysis (Fig.·8A). In this experiment, inwhich stimuli were matched in duration, differences in tail-flick amplitude did not affect the probability of an orienting
response (Fig.·8A; Friedman’s χ2=1.077; d.f.=2;P=0.584), or the latency to respond (Fig.·8B;F2,12=1.234; P=0.326). Sequences matched for thenumber of reversals, but differing in amplitude, alsodid not differ in response probability (MEDIUM vs.CONTROL: Z=–0.333, P=0.739), or latency(t=–0.801; d.f.=8; P=0.446). Similarly, increasingthe number of reversals, while maintaining the sameamplitude, did not affect response probability(LARGE vs CONTROL: Z=–1.134, P=0.257), orlatency to respond (t=0.361; d.f.=9; P=0.726).
Experiment 4In this final experiment, we considered the
interaction between duration and speed in a 2×2Latin Square design. Amplitude was held constant.Based on the results of Experiment 2, togetherwith previous work on movement-based signals(Fleishman, 1992), we predicted that longer signals
R. A. Peters and C. S. Evans
0
0.2
0.4
0.6
0.8
1
Stationary Fast Normal Slow Slower
Res
pons
e pr
obab
ility
*
***
**
Fig.·6. Probability of an orienting response to Experiment 2 sequences, in whichthe tail-flick time-scale was manipulated (*P<0.05; **P<0.01). For details, seetext.

4301Duration and tail-flick efficacy of a lizard
would be more effective than shortones, and that the most effectivesignal would be a long duration tail-flick at fast speed. We also wishedto establish whether continuousmovement was necessary foroptimal tail-flick efficacy. Naturaltail-flicks typically have pausesafter each sweep, so we added afifth stimulus designed to testwhether such discontinuous motionhas a cost in terms of reducedreceiver response.
Stimulus sequences
Sequences were constructedusing the same procedure as inExperiment 3. The LARGEamplitude tail-flick formed the basisfor five new stimuli that varied inspeed of movement and sequenceduration. Display action patterns forthese stimuli are presented inFig.·9A. We began with a tail-flickthat had slow speed and shortduration (SLOW,SHORT), andthen increased speed fourfold,while keeping duration constant(FAST,SHORT); this changeproduced a corresponding increasein the number of reversals. Toassess whether any change inresponse was caused by the numberof reversals, rather than speed, wecreated a longer version ofthe SLOW,SHORT stimulus(SLOW,LONG) with a matchednumber of reversals. To test thecombined effect of speed andduration, we created a stimulus(FAST,LONG) which matched theduration of SLOW,LONG, but hada fourfold increase in both speed and number of reversals.
A fifth stimulus (INTERMITTENT) tested the effect ofnaturalistic motion, while controlling duration, matched to thatof the two long stimuli, speed, matched to the two fast stimuli,and number of reversals, which matched FAST,SHORT andSLOW,LONG (Fig.·9B). This was achieved by removing flicksfrom the FAST,LONG sequence and spacing the four remainingmovements at equal intervals so that the stimulus began andended with movement like the others (Fig.·9B). The five tail-flick animations were then overlaid onto footage of wind-blownplants, in the same way as in the previous experiments.
Stimuli were presented on successive days using the sametest procedure as Experiments 2 and 3. Each lizard wasassigned a unique random sequence of the five stimuli.
Statistical analysis
We compared the frequency of response in several ways.First, we determined if there was a main effect for either speedor duration using Wilcoxon signed-ranks tests on the pooleddata from pairs of stimuli differing on these parameters. Nextwe performed an overall Friedman’s test of the fourspeed/duration sequences (Fig.·9A), and conducted plannedpairwise comparisons. We asked if increased signal durationaffected responses within a speed class (SLOW,SHORT vsSLOW,LONG; FAST,SHORT vs FAST,LONG). Thesesequences also differed in number of reversals, so wecompared the SLOW,LONG and FAST,SHORT sequences,which were matched on this parameter. We then comparedresponses to the FAST,LONG sequence with those to the two
0
20
40
60
80
100
0
20
40
60
80
100
0
20
40
60
80
100
0
20
40
60
80
100
1 26 51 76
Am
plitu
de (
mm
)
Time (frames)
SMALL
MEDIUM
LARGE
CONTROL
Fig.·7. Tail-flick sequences used in Experiment 3. All stimuli had the same duration, but theyvaried systematically in tail-flick amplitude and number of reversals. The tail position in eachframe of the upward sweep of the tail-flick is shown together with display action patterns.

4302
slow sequences. Finally, we compared responses to theINTERMITTENT stimulus with those to the other longduration sequences, and with the FAST,SHORT sequence. Thelatter comparison tests for a difference between stimuli with anequal number of reversals, as a consequence of adding pausesto increase duration.
Results
Consistent with results of Experiment 2, responseprobability increased with stimulus duration (Fig.·10). Thelargest values were obtained with the INTERMITTENTstimulus. Faster signals did not improve response probability(Z=–0.943, P=0.346), but longer duration signals were moreeffective than short ones (Z=–2.556, P=0.011).
An overall Friedman’s test revealed sufficient variation inresponse to the four continuous sequences (Fig.·9A;Friedman’s χ2=9.778, d.f.=3, P=0.021). Comparisons betweenshort and long durations within each speed class suggest thatthe duration main effect above was largely due to differences
in response to the two fast signals (Z=–2.530, P=0.011);differences in duration between the slow signals did not affectorienting probabilities (Z=–1.414, P=0.147). The comparisonbetween the FAST,SHORT and SLOW,LONG sequencesrevealed that the increased effectiveness of long signals isunlikely to be a consequence of correlated increase in numberof reversals (Z=–1.265, P=0.206). The FAST,LONG stimulusevoked more orienting responses than SLOW,SHORT(Z=–2.53, P=0.011), but was comparable in effectiveness tothe SLOW,LONG sequence (Z=–1.414, P=0.147). TheINTERMITTENT stimulus was as effective as theFAST,LONG sequence (Z=–0.378, P=0.705), but significantlymore effective than the other three sequences (SLOW,SHORT:Z=–3.00, P=0.003; FAST,SHORT: Z=–3.00, P=0.003;SLOW,LONG: Z=–1.890, P=0.059).
DiscussionPrevious work has shown that digital video playback is a
suitable approach for measuring social responses tomovement-based signals in Jacky dragons (Ord et al., 2002b).The present series of experiments replicates and extends thisfinding by demonstrating that a computer-generated tail-flickcan be used to explore the effects of variation in signalstructure. As several recent papers have argued (Clark andUetz, 1993; Evans et al., 1993; Rosenthal and Evans, 1998;Clark and Stephenson, 1999; Nicoletto and Kodric-Brown,1999; Rosenthal, 1999; Morris et al., 2003), high resolutionanimations modelled on real structures (Fig.·2) provide uniqueflexibility for the examination of visual perceptual processesthat have, until recently, been inaccessible to experimentalanalysis.
In Experiment 2, we performed straightforwardmanipulations of the time scale of a tail-flick sequence,keeping the motor pattern otherwise unchanged. Theappearance of a stationary tail was relatively ineffective(Fig.·6), which emphasises the importance of movement forreliable signal detection. Response probabilities also suggestedthat longer duration tail-flicks were more likely to evoke anorienting response than shorter ones (Fig.·6), even thoughspeed was progressively reduced.
In Experiment 3, we manipulated maximum flick amplitude,while keeping sequence duration constant and controlling otherparameters (speed, acceleration and total sweep area).Amplitude increases did not increase response probability orreduce latency under our testing conditions. Clearly, all tail-flicks used in this experiment exceeded the amplitude thresholdrequired for detection. It is, however, likely that amplitudeinteracts with distance, such that an efficacy benefit of higheramplitudes might only be apparent at longer range. If so, theprincipal advantage gained from having large amplitude motorpatterns would be increased signal active space (i.e. visibilityto more distant opponents; Fleishman, 1988b). Additionalplayback experiments are planned to test for this predictedeffect.
In the final experiment, we explored the interaction between
R. A. Peters and C. S. Evans
0
10
20
30
40
50
60
70
80
Small Medium Large Control
Lat
ency
(fr
ames
)
0
0.2
0.4
0.6
0.8
1
Blank Small Medium Large Control
Res
pons
e pr
obab
ility
A
B
Fig.·8. (A) Probability of an orienting response and (B) latency torespond to Experiment 3 sequences in which tail-flick amplitude wasmanipulated. Values are means + S.E.M.

4303Duration and tail-flick efficacy of a lizard
tail-flick speed and duration (Fig.·9). Resultssuggest that this latter parameter is particularlyimportant (Fig.·10). The probability of aresponse was unaffected by speed, but increasedsignificantly when signal duration wasextended. Furthermore, longer signals wereequally effective, irrespective of speed.Nevertheless, there was some evidence for asubtle interaction between these two variablesbecause the effect of duration, within speedclass, was only significant for the fast tail-flicksequences.
Comparison between the INTERMITTENTstimulus, which depicted realistic pausesbetween tail-flicks, and the FAST,SHORTstimulus, which presented the same number ofmovements without breaks, suggests that pausesincrease the probability of receiver response. Inaddition, the INTERMITTENT stimulus was as
0
30
60
90
120
1 26 51 76 101 126 151 1 26 51 76 101 126 151
0
30
60
90
120A
mpl
itude
(m
m)
Time (frames)
A
B
SLOW, SHORT SLOW, LONG
FAST, SHORT FAST, LONG
INTERMITTENT
Am
plitu
de (
mm
)
0
30
60
90
120
1 26 51 76 101 126 151
Time (frames)
Fig.·9. Display action patterns for the tail-flick sequences used in Experiment 4.(A) These comprised a 2×2 matrix ofduration (columns) and speed (rows). (B) Anadditional stimulus with intermittentmovement was presented to test the effect ofa reduced duty cycle. See text for details.
0
0.2
0.4
0.6
0.8
1
Slow Fast Slow Fast Intermittent
Res
pons
e pr
obab
ility
Short duration Long duration
****
****
*
Fig.·10. Probability of an orienting response to Experiment 4 sequences, which variedin terms of speed, duration and duty cycle (*P<0.05; **P<0.01).
4304
effective as the matched-duration FAST,LONG stimulus,suggesting that large differences in period do not affectresponse probability, and that there does not seem to be a costassociated with reduced duty cycle. Taken together, theseresults are consistent with the idea that intermittent movementis an energetically cheap strategy for achieving the efficacybenefit of increased duration.
The propensity of a signal to attract attention is an importantconsideration for understanding design. Some animals achievethis goal using high intensity, short duration, alertingcomponents (Richards, 1981; Fleishman, 1992). However,both quantitative analyses of display structure (Peters andEvans, 2003), and the results of the present series of playbackexperiments, indicate that Jacky dragons may have evolved analternative approach. The most effective stimulus for elicitingorienting responses was a long duration signal with low dutycycle. This finding suggests that there may be several possiblesolutions to the problem of engaging the intended receiver, andinvites comparative study to identify the ecological andphysiological factors responsible for this variation (e.g. Ord etal., 2001; Ord and Blumstein, 2002; Ord et al., 2002a).
Tail-flick design: a working hypothesis
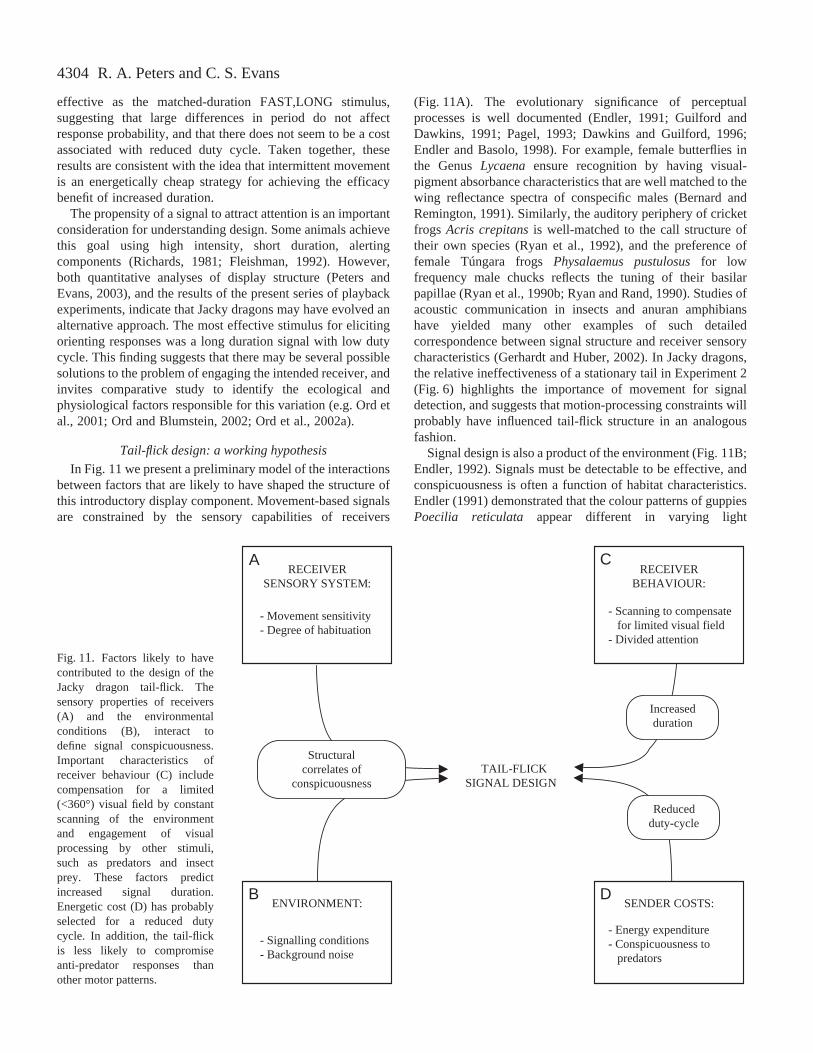
In Fig.·11 we present a preliminary model of the interactionsbetween factors that are likely to have shaped the structure ofthis introductory display component. Movement-based signalsare constrained by the sensory capabilities of receivers
(Fig.·11A). The evolutionary significance of perceptualprocesses is well documented (Endler, 1991; Guilford andDawkins, 1991; Pagel, 1993; Dawkins and Guilford, 1996;Endler and Basolo, 1998). For example, female butterflies inthe Genus Lycaena ensure recognition by having visual-pigment absorbance characteristics that are well matched to thewing reflectance spectra of conspecific males (Bernard andRemington, 1991). Similarly, the auditory periphery of cricketfrogs Acris crepitansis well-matched to the call structure oftheir own species (Ryan et al., 1992), and the preference offemale Túngara frogs Physalaemus pustulosusfor lowfrequency male chucks reflects the tuning of their basilarpapillae (Ryan et al., 1990b; Ryan and Rand, 1990). Studies ofacoustic communication in insects and anuran amphibianshave yielded many other examples of such detailedcorrespondence between signal structure and receiver sensorycharacteristics (Gerhardt and Huber, 2002). In Jacky dragons,the relative ineffectiveness of a stationary tail in Experiment 2(Fig.·6) highlights the importance of movement for signaldetection, and suggests that motion-processing constraints willprobably have influenced tail-flick structure in an analogousfashion.
Signal design is also a product of the environment (Fig.·11B;Endler, 1992). Signals must be detectable to be effective, andconspicuousness is often a function of habitat characteristics.Endler (1991) demonstrated that the colour patterns of guppiesPoecilia reticulata appear different in varying light
R. A. Peters and C. S. Evans
RECEIVERA
SENSORY SYSTEM:
- Movement sensitivity- Degree of habituation
RECEIVERBEHAVIOUR:
- Scanning to compensate for limited visual field- Divided attention
ENVIRONMENT:
- Signall ing conditions- Background noise
Increasedduration
TAIL-FLICKSIGNAL DESIGN
Structural correlates of
conspicuousness
SENDER COSTS:
- Energy expenditure- Conspicuousness to predators
Reducedduty-cycle
C
DB
Fig.·11. Factors likely to havecontributed to the design of theJacky dragon tail-flick. Thesensory properties of receivers(A) and the environmentalconditions (B), interact todefine signal conspicuousness.Important characteristics ofreceiver behaviour (C) includecompensation for a limited(<360°) visual field by constantscanning of the environmentand engagement of visualprocessing by other stimuli,such as predators and insectprey. These factors predictincreased signal duration.Energetic cost (D) has probablyselected for a reduced dutycycle. In addition, the tail-flickis less likely to compromiseanti-predator responses thanother motor patterns.
4305Duration and tail-flick efficacy of a lizard
environments, and that this affects their relativeconspicuousness to females and predators. Similarly, Leal andFleishman (2002) have recently shown that two sympatriclizards Anolis cooki and A. cristatellus occupy differentterrestrial microhabitats that ensure optimal signallingconditions for each. Anolis cristatellus is found inmicrohabitats that have low ultraviolet (UV) radiance(background light). These lizards are sensitive to UV and haveUV-reflecting dewlap regions. Conversely, A. cooki haverelatively low UV spectral sensitivity, no UV-reflectingstructures in their dewlap, and occupy microhabitats that arecharacterised by high UV radiance. Differences betweenmicrohabitats have also promoted divergence in call structurebetween subspecies of cricket frogs Acris crepitanus(Ryan etal., 1990a).
Conspicuousness can also be enhanced through temporaladjustments in signalling behaviour. For example, guppiescourt early and late in the day during conditions of low lightto enhance their conspicuousness to conspecifics, whileminimizing detection by predators (Endler, 1991). Similarly,Panamanian katydids (Genus: Neoconcephalus) adjust theirsinging behaviour to avoid interference from sympatriccongeners (Greenfield, 1988). Sensitivity to environmentalnoise also allows for structural change to suit signallingconditions. Amplitude compensation in noisy environmentsoccurs in the acoustic signals of zebra finches Taeniopygiaguttata (Cynx et al., 1998), white-lipped frogs Leptodactylusalbilabris (Lopez et al., 1988), and budgerigars Melopsittacusundulatus (Manabe et al., 1998). There have been nocomparable reports for movement-based displays. It isintriguing to consider whether Jacky dragons might adjust theirintroductory tail-flicks (e.g. by increasing duration) on windydays; this is a topic for future study.
The environment also defines the state of receiver nervoussystems at the moment of signal production. Consistentbackground movement over long periods will cause selectivehabituation/adaptation. To properly understand signalperception, it is necessary to study receivers in this state, whichwas the rationale for incorporating a baseline period of movingvegetation playback in Experiments 2–4. It follows that signalconspicuousness should not be a simple product of the averagecontrast between structure and background, but rather, willvary with the recent experience of the receiver. For example,tail-flicks may be more easily recognised when recent windconditions have been stable than when they have been variable.These examples illustrate the way in which the structuralcorrelates of conspicuousness are defined by the interactionbetween environmental conditions and receiver sensorysystems.
A particular problem for communication in the visualdomain is that signals are not omni-directional; the probabilityof attracting the attention of conspecifics is constrained byreceiver orientation (Fig.·11C). Physical adaptations such aslaterally placed eyes (Moermond, 1981), and a highconcentration of motion-sensitive cells in the periphery (Steinand Gaither, 1983), increase the likelihood of detecting salient
visual motion. However, constant scanning of theenvironment is also necessary to obtain full coverage of thevisual field. This behaviour is necessary, not only for detectingsignalling conspecifics, but also insect prey and aerialpredators. The attention of receivers will hence often beengaged by other functionally critical tasks. The tail-flickcomponent is typically one or two orders of magnitude longerthan the other motor patterns that comprise the push-updisplay of the Jacky dragon, which are very brief (ca. 500·ms;Peters and Ord, in press). The results of our playbackexperiments suggest that increasing signal duration will be themost effective strategy for enhancing the probability of anorienting response.
However, longer signal durations are also likely to imposecosts (Fig.·11D). In many systems, energetic costs areproportional to signal duration or rate (Taigen and Wells, 1985;Ryan, 1988; Andersson, 1989; Vehrencamp et al., 1989;Eberhardt, 1994; Mappes et al., 1996; Kotiaho et al., 1998).For example, oxygen consumption by Carolina wrensThryothorus carolinensisincreases exponentially with greatersinging rates, and is higher than for other non-flight activities(Eberhardt, 1994). Similarly, Kotiaho et al. (1998) have shownthat the drumming performed by male wolf spidersHygrolycosa rubrofasciataduring sexual displays is moredemanding than locomotion. Another important cost of highlyconspicuous displays is increased predation risk (McKinney,1965; Cade, 1975; Burk, 1982; Ryan et al., 1982; Yasukawa,1989). For example, female Túngara frogs are attracted to thelow frequency chucks of male frogs, but so are fringe-lippedbats Trachops cirrhosus (Ryan et al., 1982).
It seems likely that the tail-flick is better suited to sustainedsignalling than other motor patterns in the Jacky dragon displayrepertoire. The tail is a relatively light structure, butnevertheless able to sweep a large area of the visual field(Peters and Evans, 2003). The only other display motor patternwith structural characteristics that suggest equivalentconspicuousness is the body-rock, which consists of a wavetravelling anterior–posterior down the lizard’s body (Petersand Ord, in press). However, this involves displacing the wholemass of the animal off the substrate and is hence likely to berelatively costly. The strategy of intermittent signalling withthe tail-flick clearly achieves signal efficacy comparable to thatof continuous movement (Fig.·10), so this aspect of signalstructure is consistent with selection for reduced energetic cost(Fig.·11D). Furthermore, because Jacky dragons face predationfrom both terrestrial and aerial predators in their naturalhabitat, they must be ready to respond to impending threats,even while signalling. Unlike other motor patterns, such aspush-ups and body-rocks, which involve the legs (Peters andEvans, 2003; Peters and Ord, in press), tail-flicks probably donot compromise the capacity for rapid flight. We plan tomeasure both the rate of energy consumption and the changesin conspicuousness to predators associated with differentdisplays. We anticipate that the design of this signal, as inmany other systems, will reflect a trade-off between efficacyand cost.
4306
We thank Darren Burke, Alan Taylor and Phil Taylor foruseful discussions about this work, and Paul Carlile, WayneMcTegg and Norbert Lambert for assistance with animal care.R.A.P. was supported by an Australian Postgraduate Award,the Macquarie University Postgraduate Research Fund, thePeter Rankin Trust Fund for Herpetology (AustralianMuseum) and the Animal Behavior Society. C.S.E. wassupported by grants from the Australian Research Council andMacquarie University. Research was conducted in partialfulfilment of the requirements for a doctoral thesis for R.A.P.at Macquarie University.
ReferencesAho, A.-C., Donner, K., Hyden, C., Larsen, L. and Reuter, T.(1988). Low
retinal noise in animals with low body temperature allows high visualsensitivity. Nature334, 348-350.
Andersson, S.(1989). Costs of sexual advertising in the lekking Jackson’swidowbird. Condor96, 1-10.
Bernard, G. D. and Remington, C. L. (1991). Color vision in Lycaenabutterflies: spectral tuning of receptor arrays in relation to behavioralecology. Proc. Natl. Acad. Sci. USA88, 2783-2787.
Burk, T. (1982). Evolutionary significance of predation on sexually signallingmales. Fla. Entomol.65, 90-104.
Cade, W.(1975). Acoustically orienting parasitoids: fly phonotaxis to cricketsong. Science190, 1312-1313.
Capranica, R. R.(1965). The Evoked Vocal Response of the Bullfrog: A studyof communication by sound. Cambridge: MIT Press.
Carpenter, C. C., Badham, J. A. and Kimble, B.(1970). Behavior patternsof three species of Amphibolurus(Agamidae). Copeia1970, 497-505.
Clark, D. L. and Stephenson, K. R.(1999). Response to video and computer-animated images by the Tiger barb, Puntius tetrazona. Environ. Biol. Fishes56, 317-324.
Clark, D. L. and Uetz, G. W. (1993). Signal efficacy and the evolution ofmale dimorphism in the jumping spider, Maevia inclemens. Proc. Natl.Acad. Sci. USA90, 11954-11957.
Cynx, J., Lewis, R., Tavel, B. and Tse, H.(1998). Amplitude regulation ofvocalizations in noise by a songbird, Taeniopygia guttata. Anim. Behav.56,107-113.
Dawkins, M. S. and Guilford, T. (1996). Sensory bias and the adaptivenessof female preference. Am. Nat.148, 937-942.
Eberhardt, L. S. (1994). Oxygen consumption during singing by malecaroline wrens (Thryothorus carolinensis). Auk111, 124-130.
Endler, J. A. (1991). Variation in the appearance of guppy color patterns toguppies and their predators under different visual conditions. Vision Res.31, 587-608.
Endler, J. A. (1992). Signals, signal condition and the direction of evolution.Am. Nat.139, S125-S153.
Endler, J. A. and Basolo, A. L.(1998). Sensory ecology, receiver biases andsexual selection. Trends Ecol. Evol.13, 415-420.
Evans, C. S., Macedonia, J. M. and Marler, P.(1993). Effects of apparentsize and speed on the response of chickens, Gallus gallus, to computer-generated simulations of aerial predators. Anim. Behav.46, 1-11.
Fleishman, L. J. (1986). Motion detection in the presence or absenceof background motion in an Anolis lizard. J. Comp. Physiol. A 159, 711-720.
Fleishman, L. J. (1988a). Sensory and environmental influences on displayform in Anolis auratus, a grass anole of Panama. Behav. Ecol. Sociobiol.22, 309-316.
Fleishman, L. J. (1988b). Sensory influences on physical design of a visualdisplay. Anim. Behav.36, 1420-1424.
Fleishman, L. J. (1992). The influence of the sensory system and theenvironment on motion patterns in the visual displays of anoline lizards andother vetebrates. Am. Nat.139 (Supplement), S36-S61.
Fleishman, L. J., Loew, E. R. and Leal, M.(1993). Ultraviolet vision inlizards. Nature365, 397.
Gatesy, S. M., Middleton, K. M., Jenkins, F. A. and Shubin, N. H.(1999).Three-dimensional preservation of foot movements in Triassic theropoddinosaurs. Nature 399, 141-144.
Gerhardt, H. C. and Huber, F. (2002). Acoustic Communication in Insects
and Anurans: Common problems and diverse solutions. Chicago, IL:University of Chicago Press.
Greenfield, M. D. (1988). Interspecific acoustic interactions among katydidsNeoconocephalus: inhibition induces shifts in diel periodicity. Anim. Behav.36, 684-695.
Guilford, T. and Dawkins, M. S. (1991). Receiver psychology and theevolution of animal signals. Anim. Behav.42, 1-14.
Harlow, P. S. and Taylor, J. E.(2000). Reproductive ecology of the jackydragon (Amphibolurus muricatus): an agamid lizard with temperature-dependent sex determination. Austr. Ecol.25, 640-652.
Heiling, A. M., Herberstein, M. E. and Chittka, L. (2003). Crab-spidersmanipulate flower signals. Nature 421, 334.
Kotiaho, J. S., Alatalo, R. V., Mappes, J., Nielsen, M. G., Parri, S. andRivero, A. (1998). Energetic costs of size and sexual signalling in a wolfspider. Proc. R. Soc. Lond. B 265, 2203-2209.
Kroodsma, D. E.(1989). Suggested experimental designs for song playbacks.Anim. Behav.37, 600-609.
Kunzler, R. and Bakker, T. C. M. (1998). Computer animations as a tool inthe study of mating preferences. Behaviour135, 1137-1159.
Leal, M. and Fleishman, L. J. (2002). Evidence for habitat partitioning basedon adaptation to environmental light in a pair of sympatric lizard species.Proc. R. Soc. Lond. B 269, 351-359.
LeBas, N. R. and Marshall, N. J.(2000). The role of colour in signalling andmale choice in the agamid lizard Ctenophorus ornatus. Proc. R. Soc. Lond.B 267, 445-452.
Lopez, P. T., Narins, P. M., Lewis, E. R. and Moore, S. W.(1988).Acoustically induced modification in the white-lipped frog, Leptodactylusalbilabris. Anim. Behav.36, 1295-1308.
Macedonia, J. M., Brandt, Y. and Clark, D. L.(2002). Sexual dichromatismand differential conspicuousness in two populations of the common collaredlizard (Crotaphytus collaris) from Utah and New Mexico, USA. Biol. J.Linn. Soc.77, 67-85.
Manabe, K., Sadr, E. I. and Dooling, R. J.(1998). Control of vocal intensityin budgerigars (Melopsittacus undulatus): differential reinforcement ofvocal intensity and the Lombard Effect. J. Acoust. Soc. Am.103, 1190-1198.
Mappes, J., Alatalo, R. V., Kotiaho, J. and Parri, S.(1996). Viability costsof condition-dependent sexual male display in a drumming wolf spider.Proc. R. Soc. Lond. B 263, 785-789.
Marshall, N. J. (2000). Communication and camouflage with the same‘bright’ colours in reef fishes. Phil. Trans. R. Soc. Lond. B355, 1243-1248.
McGregor, P. K., Catchpole, C. K., Dabelsteen, T., Falls, B. J., Fusani, L.,Gerhardt, H. G., Gilbert, F., Horn, A. G., Klump, G. M., Kroodsma, D.E. et al. (1992). Design of playback experiments: The Thornbridge HallNATO ARW Consensus. In Playback and Studies of AnimalCommunication(ed. P. K. McGregor), pp. 231. New York: Plenum Press.
McKinney, F. (1965). The spring behavior of wild Steller eiders. Condor67,273-290.
Moermond, T. C. (1981). Prey-attack behavior of Anolis lizards. Z.Tierpsychol.56, 128-136.
Morris, M. R., Nicoletto, P. F. and Hesselman, E.(2003). A polymorphismin female preference for a polymorphic male trait in the swordtail fishXiphophorus cortezi. Anim. Behav.65, 45-52.
Morton, E. S. (1982). Grading, discreteness, redundancy, and motivation-structural rules. In Acoustic Communication in Birds, vol. 1 (ed. D. E.Kroodsma and E. K. Miller), pp. 183-212. New York: Academic Press.
Nicoletto, P. F. and Kodric-Brown, A.(1999). The use of digitally-modifiedvideos to study the function of ornamentation and courtship in the guppy,Poecilia reticulata. Environ. Biol. Fishes56, 333-342.
Ord, T. J. (2001). The evolution and function of visual communication inlizards. PhD thesis, Macquarie University, Sydney, Australia
Ord, T. J. and Blumstein, D. T. (2002). Size constraints and the evolutionof display complexity: why do large lizards have simple displays? Biol. J.Linn. Soc.76, 145-161.
Ord, T. J., Blumstein, D. T. and Evans, C. S.(2001). Intrasexual selectionpredicts the evolution of signal complexity in lizards. Proc. R. Soc. Lond.B 268, 737-744.
Ord, T. J., Blumstein, D. T. and Evans, C. S.(2002a). Ecology and signalevolution in lizards. Biol. J. Linn. Soc.77, 127-148.
Ord, T. J., Peters, R. A., Evans, C. S. and Taylor, A. J.(2002b). Digitalvideo playback and visual communication in lizards. Anim. Behav.63, 879-890.
Pagel, M. (1993). The design of animal signals. Nature361, 18-20.
R. A. Peters and C. S. Evans
4307Duration and tail-flick efficacy of a lizard
Peters, R. A., Clifford, C. W. G. and Evans, C. S.(2002). Measuring thestructure of dynamic visual signals. Anim. Behav.64, 131-146.
Peters, R. A. and Evans, C. S.(2003). Design of the Jacky dragon visualdisplay: signal and noise characteristics in a complex moving environment.J. Comp. Physiol. A 189, 447-459.
Peters, R. A. and Ord, T. J.(in press). Display response of the Jacky dragon,Amphibolurus muricatus (Lacertilia: Agamidae), to intruders: a semi-Markovian process. Austr. Ecol.
Richards, D. G. (1981). Alerting and message components in songs ofRufous-sided Towhees. Behaviour76, 223-249.
Rosenthal, G. G. (1999). Using video playback to study sexualcommunication. Environ. Biol. Fishes56, 307-316.
Rosenthal, G. G. and Evans, C. S.(1998). Female preference for swords inXiphophorus hellerireflects a bias for large apparent size. Proc. Natl. Acad.Sci. USA95, 4431-4436.
Ryan, M. J. (1988). Energy, calling, and selection. Am. Zool.28, 885-898.Ryan, M. J., Cocroft, R. B. and Wilczynski, W. (1990a). The role of
environmental selection in intraspecific divergence of mate recognitionsignals in the cricket frog, Acris crepitans. Evolution44, 1869-1872.
Ryan, M. J., Fox, J. H., Wilczynski, W. and Rand, A. S.(1990b). Sexualselection for sensory exploitation in the frog Physalaemus pustulosus.Nature 343, 66-67.
Ryan, M. J., Perrill, S. A. and Wilczynski, W.(1992). Auditory tuning andcall frequency predict population-based mating preferences in the cricketfrog, Acris crepitans. Am. Nat.139, 1370-1383.
Ryan, M. J. and Rand, A. S.(1990). The sensory bias of sexual selection for
complex calls in the tungara frog, Physalaemus pustulosus(sexual selectionfor sensory exploitation). Evolution44, 305-314.
Ryan, M. J., Tuttle, M. D. and Rand, A. S.(1982). Bat predation and sexualadvertisement in a neotropical anuran. Am. Nat.119, 136-139.
Stein, B. E. and Gaither, N. S.(1983). Receptive-field properties on reptilianoptic tectum: some comparisons with mammals. J. Neurophysiol. 50, 102-124.
Taigen, T. L. and Wells, K. D. (1985). Energetics of vocalization by ananuran amphibian (Hyla versicolor). J. Comp. Physiol. B 155, 163-170.
Tinbergen, N. (1951). The Study of Instinct.Oxford: Oxford UniversityPress.
Vehrencamp, S. L., Bradbury, J. W. and Gibson, R. M. (1989). Theenergetic cost of display in male sage grouse. Anim. Behav.38, 885-896.
Whitehead, J. M. (1987). Vocally mediated reciprocity between neighbouringgroups of mantled howler monkeys, Alouatta palliata palliata. Anim. Behav.35, 1615-1627.
Wiley, R. H. and Richards, D. G. (1982). Adaptations for acousticcommunication in birds: sound transmission and signal detection. InAcoustic Communication in Birds Volume 1: Production, Perception andDesign Features of Sounds(ed. D. E. Kroodsma and E. H. Miller), pp. 131-181. New York: Academic Press.
Yasukawa, K.(1989). Costs and benefits of a vocal signal: the nest-associated‘Chit’ of the female red-winged blackbird, Agelaius phoeniceus. Anim.Behav.38, 866-874.
Zeil, J. and Zanker, J. M. (1997). A glimpse into crabworld. Vision Res.37,3417-3426.