Introduction to edited book Chinese Epigraphic material collected from Hochiminh City
Upload
khangminh22Category
view
0download
0
INTRODUCTION

This Page Left Intentionally Blank

D U R A N D M A S T E R P L A N
3
INTRODUCTIONThe City of Durand Master Plan is intended to guide the community’s future growth and development, which will, in turn, promote the health, safety, welfare, and convenience of the people who live and work in the City. It is both a realistic as-sessment of current conditions, and an expression of the future goals and desired vision of the City, defining the form and character it seeks to achieve. The Plan will provide guidance to both the public and the private sectors regarding a range of topics, including future land use and economic and residential growth decisions. Finally, the Plan will be responsive to the changes that occur within Durand. The development of land can be dynamic and alter significantly over time. Therefore, the Plan must be flexible to these changes while still advancing the goals and aspi-rations of the community.
Authority
The City of Durand derives its authority to Master Plan from Michigan’s Planning Enabling Act, Public Act 33 of 2008 which states:
“A local unit of government may adopt, amend, and implement a master plan as provided in this act. The general purpose of the master plan is to guide and accom-plish, in the planning jurisdiction and its environs, development that satisfies all of the following criteria:
A. Is coordinated, adjusted, harmonious, efficient, and economical.B. Considers the character of the planning jurisdiction and its suitability for par-
ticular uses, judged in terms of such factors as trends in land and population development.
C. Will, in accordance with present and future needs, best promote public health, safety, morals, order, convenience, prosperity, and general welfare.
D. Includes, among other things, promotion of adequate provision for one or more of the following:
i. A system of transportation to lessen congestion on streets and provide for safe and efficient movement of people and goods by motor vehicles, bicycles, pedestrians, and other legal users.
ii. Safety from fire and other dangers.iii. Light and air.iv. Healthful and convenient distribution of population.v. Good civic design and arrangement and wise and efficient expenditure of
public funds. vi. Public utilities such a sewage disposal and water supply and other public
improvements. vii. Recreation.viii. The use of resources in accordance with their character and adaptability.”
Downtown Durand

D U R A N D M A S T E R P L A N
4
Durand Railroad Centennial Monument
The master planning process is cooperative and public. Input from the public and various governmental entities are gathered throughout the process. Public Act 33 requires the Planning Commission distribute the plan to surrounding communities for input prior to holding a public hearing before the final adoption of the Master Plan. Like the previous enabling act, the Planning Commission is required to review the Master Plan every 5 years but allows for changes at any time. This process of-fers the Planning Commission the opportunity to analyze and address any signifi-cant changes to the City that may result in needed modifications to the Plan after the adoption of the plan but prior to the 5-year mandated review. In addition, the process offers an excellent opportunity to enter into communication and collab-orative practices with neighboring, as well as regional governing jurisdictions, to promote greater harmony and increased efficiencies.
PurPose
The planning process is designed to involve the conscious selection of policies relat-ing to growth and development in a community. The Durand Master Plan serves to promote these polices through the following:
1. Provides a general statement of the City’s goals and a comprehensive view of the community’s preferred future.
2. Serves as the primary policy guide for local officials when considering zoning, land division, capital improvement projects, and any other matters related to land development. Thus, the Master Plan provides a stable and consistent basis for decision making.
3. Provides the statutory basis for the City’s Zoning Ordinance, as required by the Michigan Zoning Enabling Act, PA 110 of 2006.
4. Helps to coordinate public improvements and private development activities to assure the judicious and efficient expenditure of public funds.
5. Establishes a common, united set of adopted planning policies, goals, objec-tives, and strategies between City Council and the Planning Commission.
PlAn orgAnizAtion
The Master Plan is divided into six main sections to communicate the most com-plete and accurate picture of the existing conditions within the City, as well as its goals for the future. The initial section details the existing conditions of population characteristics, land use, transportation, regional issues, and public facilities. The future character of the City will be articulated through the redevelopment strategy, goals and objectives, and sustainability and resiliency plan, future land use plan, and strategic implementation plan. Finally, a particular vision for Lansing Road is defined through a specific sub-area plan and a nonmotorized plan is also incorpo-rated through reference.
These sections represent the history and future development within Durand and, therefore, provide a guide for its continuing growth and evolution in the coming years. Visual representations of data, such as tables, maps, and other graphics, are included throughout the Master Plan to supplement the narrative.

REGIONAL ANALYSIS

This Page Left Intentionally Blank

D U R A N D M A S T E R P L A N
7
REGIONAL ANALYSISTo gain a better understanding of the City of Durand’s place within its larger geographic region, this section explores such relevant topics as location, access to transportation, regional land use, and area planning efforts.
locAtion And trAnsPortAtion
The City of Durand (pop. 3,334) is located within the south-eastern quarter of Shiawassee County, in the central lower portion of Michigan’s Lower Peninsula. Major communities within the County include the county seat of Corunna (pop. 3,398), Owosso (pop. 14,641), and Perry (pop. 2,135), all located within 15 miles of Durand (as of the 2017 U.S. Cen-sus American Community Survey). The City is conveniently located along the county’s primary transportation route (Interstate 69) connecting the two larger urban areas of Flint and Lansing. The City of Flint is located approximately 15 miles northeast of Durand while the City of Lansing, Michi-gan’s State Capital, is located approximately 35 miles south-west (see Regional Location Map).
The region’s primary transportation arteries include Inter-state 69, which runs east-west just north of the City, and Interstate 75, which runs north-south, and is located approx-imately 13 miles east of Durand. These freeways effectively connect the City of Durand with the rest of the state, as well as the entire Midwest region. Other major state transporta-tion routes located near Durand include M-71, M-13, M-21, and M-52. The mile-age chart presents approximate driving distances and times between Durand and several major cities.
regionAl lAnd uses
Historically, agriculture and railroad industries have played the greatest role in the development of Durand and the surrounding areas. The City of Durand became a major railroad center and remained primarily a railroad town until the industry started a general decline during the latter half of 20th century. Outside of Durand, agriculture has remained the most significant land use, contributing to the area’s predominantly rural character. Higher density residential neighborhoods are found almost exclusively within the City, while the surrounding areas feature scattered low-density, mostly agricultural uses. Most of the higher intensity, non-residential
City Distance from DurandFlint, MI 20 MilesLansing, MI 40 MilesGrand Rapids, MI 97 MilesDetroit, MI 84 MilesCleveland, OH 227 MilesChicago, IL 257 MilesToronto, ON, CA 268 MilesIndianapolis, IN 288 MilesBuffalo, NY 292 MilesPittsburgh, PA 342 MilesSt. Louis, MO 542 Miles

D U R A N D M A S T E R P L A N
8
land uses remain confined within or just adjacent to the City’s northern boundary. Even with the presence of these higher intensity land uses, the Durand area is still best described as having a small town rural character.
Encroachment by more intensive urban and suburban land uses spreading outward from the larger cities of Flint and Lansing has occurred in a limited fashion within the Durand area. This is evidenced by the minor amount of regional commercial and intensive industrial land uses, as well as some sprawling suburban-style resi-dential developments and newer single-family homes located along the area’s rural roads. Some low-density commercial development, typical of most American cities, has located along Lansing Road in an area that has been mostly annexed into the City as a result of municipal services being extended to serve these developments. With its proximity to two major urban areas and easy access provided by Interstate 69, the City of Durand is a prime location for increased growth and development in the future. To preserve the overall small-town rural character of the area, proper management of this type of development is an important land use goal.
regionAl PlAnning efforts
Regional planning efforts undertaken by the surrounding communities can have a significant influence upon the development of Durand. A basic knowledge of these plans and policies is important when preparing the City’s Master Plan.
The Shiawassee County Master Plan, revised in 2016, identified the protection of the County’s “agricultural land and rural quality of the County while allowing for growth and development” as the most critical issue. The plan contains County-wide goals and objectives along with objectives for residential, agricultural, sensitive lands and natural resources, commercial, and industrial uses. These specific use objectives are intended to encourage appropriate new development while protect-ing natural resources and reducing impacts of development on adjacent properties. The County’s Master Plan operates as the local master plan for those communities within the County that have not adopted their own master planning documents. The document provides guidance to elected officials, administrators, and develop-ers regarding land use decisions and encourages a unified vision for the harmoni-ous and orderly development of the County.
The City of Durand is completely surrounded by the Township of Vernon. Township development is regulated through the Shiawassee County’s Master Plan and Zoning Ordinance and additional guidance is provided by Village’s 2003 Master Plan. The Durand Master Plan conforms with the 2003 Township Plan. The draft 2020 Village of Vernon Master Plan was reviewed and its goals dovetail well into the City’s land use goals.
As stated in the goals and objectives portion of the Plan, the primary Shiawassee County-wide goals are as follows:
1. Aspire to orderly growth. Through orderly growth, the ability of the people to provide support services will not be overextended. Unorganized growth could be costly, wasteful, and hazardous.
2. Recognize the impact of the growth and development of surrounding commu-nities and the benefits of a workable relationship with those governments.
Rural land in adjoining Vernon Township

D U R A N D M A S T E R P L A N
9
3. Promote the use of good planning and management techniques to maximize the capabilities of all lands and features, such as natural resources and its rural agricultural character.
4. Promote orderly growth in the County while maintaining the rural agricultural character.
The County’s Future Land Use Plan designates the majority of the County as agricultural. Township lands adjacent to the City on the east and west are shown as neighborhood residential. The majority of the more intensive future land use categories, such as commercial, industrial, and multi-family residential, are found in the M-71/Lansing Road Corridor. Also included in the Future Land Use Plan are recommended design criteria and traffic circulation improvements for the M-71/Lansing Road Corridor. The corridor recommendations include specifications for landscaping, building orientation, signage, architecture, and access management.
community chArActer And historic PreservAtionThe cultural and development history of a community forms the basis for its cur-rent growth and structure. A thorough understanding of these trends within their historic context will help to ensure that future plans and designs are reflective of and respond to the community’s established character, form, and function.
Community Character
City History
The City of Durand’s agrarian beginnings reflect those of many other Michigan municipalities, but the arrival of the Detroit and Milwaukee railroad in 1856 began to affect a definite change. The rail line ran through Vernon Center, as the 19th century City of Durand was then called. The area had a few businesses, including a sawmill, but few other landmark community facilities. In 1876, the establishment of a U.S. Post Office, in addition to the existing railway, marked the beginning of Durand as a destination center.
On February 7, 1887, the Village of Durand was organized under State require-ments. By 1904, the Village boasted municipal water, two telephone lines, its own electric plant, volunteer fire department, sewers, and cement sidewalks. On July 18, 1932, the City of Durand marked its establishment as a home rule city with the City Charter approved the very next year.
The City of Durand grew markedly after the establishment of the U.S. Post Office. Much of this growth can be attributed to the City’s existing rail infrastructure, as well as its historic promotion and enticement of additional rail facilities. In 1876, after a $500 incentive, the Chicago and Northwestern railroad, running from Flint to Lansing, had service through Durand. The 1880s saw the arrival of the Grand Trunk rail line in Durand. By 1883, over 15 trains ran in and out of the City each day. By the end of the 19th century, the Ann Arbor, Cincinnati, Saginaw, and Mackinac railroads were passing through Durand with an excess of 70 trains per day.
Small-town community character
Railroad history

D U R A N D M A S T E R P L A N
10
During the early part of the 20th century, Durand was the site of some large-scale rail building projects, particularly the Grand Trunk Rail Depot and the Roundhouse. At its peak in 1912, more than 42 passenger trains, 100 freight trains, and 3,000 passengers came in and out of Durand on a daily basis. After this year, the number of trains (passenger and freight) began to slowly decrease until April 30, 1971, the date of the last passenger service on the Grand Trunk line. Passenger service was resumed, however, on September 13, 1974, for Amtrak’s Chicago/Port Huron run. Freight still comes through the City, but the rail traffic does not match the totals of early eras.
City Form
City shape and morphology can be directly tied to preferred uses, landmark events, and natural or man-made features. The City of Durand’s form and development pattern is typical of these parameters.
Due to its location and lack of complex topography, the City of Durand (Vernon Center) was a fortunate spot for the development of an intricate railroad culture. While the area around the City still retains much of its agrarian form, Durand continues to function within and around its rail heritage. In 1877, a landmark year in Durand history, the Village form centered, as expected, along the Detroit and Milwaukee Railroad line. The major cross-streets of the area, Oak and Main Streets, were also present at this time. Soon after Village incorporation, the Durand Land Company purchased two former farm properties west of the rail line and platted them for development. Village incorporation, in addition to the preexisting rail features, marked the beginning of the growth that would eventually form the City of Durand as it stands today.
By 1895, spurred on by the historical growth trends and the addition of other rail lines, the Village of Durand began to exhibit a recognizable city form. Due to its overriding railway culture, the area’s growth was still centered upon the tracks, but more specifically, on the junction of multiple lines. The first train depot, water tow-ers, coal docks, and other rail supporting structures stood at the center of the area. As expected, by their proximity to a transportation hub, Durand businesses and industries located adjacent to this area and the historical downtown commercial form was created. Continued development also occurred along the railroad edges to the north and south of the junction. However, Village growth to the east and west was not as great as its proximity to the railway increases, and thus was not as desirable an area for immediate development.
By this time, a keynote development of Durand city form occurred with the estab-lishment of the public school area centered at the junction of eight streets, a few blocks northwest of the rail junction. Durand has historically been an educational center for the larger regional area; its first school building was constructed in 1845 and is still in use today. The location of a center of public learning at such a place of prominence within the City helped to reestablish and reinforce its residents’ commitment to education through the form and fabric of place. Growth and devel-opment of single-family residential neighborhoods adjacent to the school area rein-forced the dominance of public learning within the community. The historic school buildings were converted into senior housing in 2010.
Downtown Durand
Residential homes near Downtown

D U R A N D M A S T E R P L A N
11
With the residential, commercial, and industrial rail areas firmly established, the majority of the growth Durand saw by 1903 followed previously-established pat-terns. For example, the residential core adjacent to the school continued to grow. Additionally, Village form began to expand west along Main Street. As a Township section line road, Main Street provided direct access from the larger Vernon Town-ship region to a major State transportation hub. At this time, the railway hub also featured the new Grand Trunk Depot, a grand Victorian-inspired structure which further reinforced Durand’s place and dominance in the region.
During World War II and the decades that followed, the form of the City of Durand shifted away from its traditional rail-dominated center. City development began to move north from the rail junction, and away from its traditional residential core. At this time, the prominence of rail traffic industry had diminished and the post-war emphasis on roadways emerged. Lansing Road, located on the northern edge of the City, served as a major connection between two of Michigan’s major industrial centers – Lansing and Flint. Lansing Road was supplanted as the major connection between those two cities when I-69 was constructed just to the north of the route in the early 1960s.
Roadside commercial development near the intersection of I-69, M-71, and Lan-sing Roads followed American trends in locating near traffic generators, creating a second commercial center at its northern boundary of the City along Lansing Road. The City’s northerly expansion away from one historic transportation feature, towards a newer conveyance, illustrates the need for a City to be closely tied to regional transportation accessibility.
The modern city form of Durand today is respectful and representative of its historical roots, as well as changes in modern conveniences. It is representative of preferred uses, landmark events, and natural or man-made features. The develop-ment patterns currently found in the City of Durand will help to form the growth, direction, and form of the Durand of tomorrow.
Historic Preservation
The City of Durand’s role in regional transportation history, particularly within the confines of railway development, yielded notable historic properties and areas that reinforce the City’s historic culture.
Historic Properties
Four sites within the City of Durand are found either on the National Register of Historic Places or in the listing of Michigan Historic Sites. Two sites are tied directly to Durand’s railroad heritage while two are representative of civic traditions.
Durand Union Station
The Grand Trunk Railway System and the Ann Arbor Railroad built Durand Union Station in 1903, at a cost of $60,000, to serve the thousands of passen-gers who came to this railroad center. In 1905, the depot was severely dam-aged by fire; however, within 6 months a near replica had been completed.
Durand Union Station
Durand water tower

D U R A N D M A S T E R P L A N
12
Designed by Detroit architects Spier & Rohns, utilizing an unusual Chateau Romanesque architectural style, the 239-foot-long Grand Trunk Western Union Depot originally featured a spacious waiting room, a popular dining room, a lunch counter, areas for baggage and express mail, and telegraph and railroad offices. It was built of Missouri granite, brick, and Bedford cut limestone and was originally roofed in slate. Later roofs were of red tile and, in more recent years, asphalt. Since being taken over by a non-profit organization, the red tile roof has returned. Once the largest station in out-state Michigan, the Depot remains one of the largest rail centers located in a small town anywhere in the United States.
In 1974, due to the decline of railway traffic, Grand Trunk determined it could no longer justify the cost of maintaining the station, and thus it was aban-doned. The old Depot’s destruction appeared imminent. But, in 1979, the residents of Durand rallied to save this important historical structure and the City was able to purchase the building for only $1. Since then, it has become the State Railroad History Museum. The Amtrak Blue Water line, connecting Chicago and Port Huron, stops twice daily at the Durand Union Station. Thirty or more freight trains continue to pass the station daily.
The State Railroad History Museum gallery features exhibits paying tribute to the colorful heritage of the railroader, and to the contribution of Michigan’s railroads to lumbering, mining, agriculture, and industry. The Museum Infor-mation Center and Archives contains a wealth of railroad information for rail enthusiasts, researchers, and genealogists.
Knights Templar Special
In June 1923, the 67th annual conclave of the Grand Commandery of Michigan Knights Templar was held in Flint. Western Michigan Sir Knights traveling to the Masonic convention commissioned a Grand Trunk Western special train. The train left on June 5 and at 9:30 a.m. it came upon a split track at Clark’s Cross-ing in Durand. The engine and tender left the rails and turned over. The second passenger coach rammed the first; however, the rear cars remained upright. Four Knights Templar, the engineer, and a fireman who was a member of the Corunna Commandery No. 21 stationed at Durand, two individuals from Ionia Commandery No. 11, and one person from Grand Rapids all perished in the ac-cident. The memorial was erected in remembrance of this tragedy.
South Side School
The South Side School was built in 1893 for children living on the south end of Durand. It is a two-story, red-brick, Italianate structure that displays a bro-ken three-bay facade, a rounded arch enframement for the front door, and a wooden cupola. A back addition which more than doubled the sized of the school was completed during the 1930s. The school is now used as a church by the Light of Faith Fellowship.
Former South Side School
Knights Templar Special Historical Marker and Memorial

D U R A N D M A S T E R P L A N
13
Durand High School
The former Durand High School, designed by Detroit architectural firm Van Leyen, Schilling, and Keough, was constructed in 1920 and expanded twice in 1929 and 1954. Rural districts around the City of Durand consolidated into what became Durand Area Schools throughout the middle of the 20th century. By 1965, a new high school was constructed on the northeastern edge of the City to handle all the new students. The school served as the district’s junior high until 1996 when a new junior high was built at the high school complex. In 2009, the former Durand High School building was added to the National Reg-ister of Historic Places and rehabilitated into the Sycamore House Senior Living Apartments in 2010.
Historic Built Environment
As Durand’s shape and morphology reflects a long and varied history, ideas sur-rounding the preservation of existing landmark features or areas would pres-ent a logical step in the evolution of City culture. The City of Durand has already demonstrated its commitment to historic preservation of City assets through the acquisition of the Grand Trunk Western Union Depot. Other features, due to their age, historic prominence, or importance to the Durand community should also be considered worthy of preservation.
Two such areas include, but would not be limited to, the downtown Durand com-mercial district and certain areas of established residential housing stock. Specifi-cally, the main street area and the residential neighborhood directly east of down-town. The main street area has been the historic commercial center of Durand since its inception in the latter part of the 19th century. In addition, the residential areas northeast and east of the downtown contain some of the oldest homes with-in the City, and therefore, many have distinctive architectural features that warrant preservation. Other neighborhoods also have historic homes but more homes may have undergone inappropriate renovations that damaged character-defining origi-nal features and limit the possibility for designation.
While an inclusive assessment of the historic significance of Durand’s built environ-ment is outside the scope of a Master Plan, policies and processes applicable to future historic preservation initiatives do fall under the City’s goals and planning objectives. Historic preservation is a form of land use planning and local historic districts do control future land use and development.
The three general levels of historic designation that exist within Michigan offer dif-ferent benefits and enforcement mechanisms:
• National Register – through the National Park Service• State – through the Michigan Historical Commission• Local – through a local historic district ordinance
Former Durand High School
Potentially historic apartment building

D U R A N D M A S T E R P L A N
14
Listing on the National Register of Historic Places is an honorific designation that does not hinder local control while offering eligibility for grant funds and tax benefits in certain circumstances. National Register listing does provide a certain level of protection from federally-funded or permitted projects through the Section 106 Historic Review Process of the National Historic Preservation Act of 1966. The listing of State Historic Sites is only honorific and since 2011, there is limited ac-cessibility for listing. Local historic districts are enabled under Michigan Public Act 169 of 1970, the Local Historic Districts Act. This law allows for the establishment of local historic districts and local historic district commissions in counties, cities, villages, and townships. These historic district commissions regulate permissible changes to the exteriors of buildings within designated local historic districts.
To ensure the integrity of historic properties is retained within these districts, the historic district commissions utilize the U.S. Secretary of the Interior’s Standards for Rehabilitation to evaluate the impact of all exterior non-maintenance work. These reviews limit the destruction to historic sites.
The three critical steps in this local historic designation process are: photographic inventory and research; evaluation of potential resources using National Register of Historic Places criteria; and a Historic District Study Committee Report. As the Na-tional Register’s criteria is quite lengthy and distinguishes between such things as districts, sites, buildings, structures, and objects that possess exceptional value, the following five documents produced by the National Park Service (available on-line) provide additional detail regarding the necessary information:
• How to Apply the National Register Criteria for Evaluation (National Register Bulletin 15)
• How to Complete the National Register Registration Form (National Register Bulletin 16A)
• Defining Boundaries for National Register Properties (National Register Bulletin 21)
• How to Improve the Quality of Photographs for National Register Nominations (National Register Bulletin 23)
• Researching a Historic Property (National Register Bulletin 39)
In addition, the Michigan State Historic Preservation Office’s (SHPO) guide to writ-ing the Historic District Study Committee Report is also available on-line.
Regulation of historic properties are permitted by those communities which es-tablish ordinances as permitted by PA 169 of 1970. In 1980, the National Historic Preservation Act of 1966 was amended to provide for federal-state-local preserva-tion partnerships. Grant funds were made available by the National Park Service through SHPO to Certified Local Governments (CLGs) to initiate and support his-toric preservation activities at the local level. Once certifying standards are met, a community may receive financial aid and technical assistance that will enhance and promote its historic neighborhoods and/or commercial districts. Michigan’s SHPO operates a CLG grant program that is available to historic properties located within certified local districts throughout the State. Further information regarding Michi-gan’s CLG Program is available through the SHPO.
National Register of Historic Places Plaque Photo Credit: Secretary of the Interior

D U R A N D M A S T E R P L A N
15
Summary of Benefits
• The creation of local districts assists with the protection of investments by owners and residents. With local historic districts established under PA 169 of 1970, buyers understand that the architectural or historic aspects that make a particular area attractive and historic will be protected over time. Real estate agents in many cities use historic district status as a marketing tool to sell or lease properties.
• Local historic districts often encourage better design. It has been shown through comparative studies that there is a greater sense of relatedness, more innovative use of materials, and greater public appeal within historic districts than in areas outside designated historic districts.
• The educational benefits of creating local districts are the same as those derived from any historic preservation effort. Districts help explain the development of a place, the source of inspiration, technological advances, and traditional building techniques, and provide a sense of pride of place.
• A local district can result in a positive economic impact from tourism. A historic district that is aesthetically cohesive and well promoted can be a community’s most important attraction. The retention of historic areas as a way to attract tourist dollars makes good economic sense.
• The protection of local historic districts can enhance business recruitment potential. Companies continually relocate to communities that offer their workers a higher quality of life, which is greatly enhanced by successful lo-cal preservation programs and stable historic districts.
• Local districts provide social and psychological benefits. A sense of em-powerment and confidence develops when community decisions are made through a structured participatory process rather than behind closed doors or without public comment.
Knights Templer Special State Historic Site Informational Marker

D U R A N D M A S T E R P L A N
16
This Page Left Intentionally Blank
EXISTING LAND USE

D U R A N D M A S T E R P L A N
18
This Page Left Intentionally Blank

D U R A N D M A S T E R P L A N
19
EXISTING LAND USEThis section examines current land use patterns, their distinguishing characteris-tics, and their impact on future land development. Identifying the current type of land use activities within the City of Durand will help determine its general char-acter and development potential. Understanding these factors and site conditions enables planners and community leaders to make informed decisions about future residential, commercial, industrial, and public land uses.
The Existing Land Use Map and acreage tabulation chart will serve as key referenc-es for the consideration of future land use and infrastructure improvements.
methodology
To update the 2004 Existing Land Use Map, an aerial image survey of the City was conducted by Wade Trim in April 2019. These land use changes were integrated into the 2020 Existing Land Use Map and confirmed by the Steering Committee and Building Official. In addition to collecting land use data within City limits, land uses were recorded within a 1-mile boundary of the City. This information provides a better understanding of the more regional uses that may impact compatibility of future land use decisions while anticipating urban edge development. For access to municipal services, developers may also request annexation of Vernon Township land into Durand through the 425 Agreement intergovernmental transfer contract process. Because edge development is widespread, planning beyond a commu-nity’s boundaries is permitted under Michigan law, and this planning approach supports continued rational development beyond city borders.
The existing geographic information system (GIS) maps were updated with the new information, and the resulting Existing Land Use Maps were prepared using ESRI ArcGIS software. Acreage tabulations for each land use classification for Durand are provided in Table 1 on the following page.
Industrial land use

D U R A N D M A S T E R P L A N
20
Land UseApproximate
AcreagePercentage
Agriculture 29.69 2.59Single-Family Residential 264.57 23.09Multi-Family Residential 35.16 3.07Local Commercial 8.38 0.73Community Commercial 35.58 3.11Regional Commercial 11.71 1.02Mixed Use 1.14 0.10Office 17.46 1.52Light Industrial 29.40 2.57Heavy Industrial 17.63 1.54Public 153.05 13.36Quasi-Public 26.20 2.29Parks 36.71 3.20Railroad Properties 84.99 7.42Vacant/Open Space 394.12 34.40Mobile Home Park 0.00 0.00
Total: 1,145.79 100.00
Table 1: Durand Land Use Percentages - CityThe entire City encompasses 1,300.5 acres of land; however, existing land use percentage values were calculated against a total of 1,145.8 acres. This value describes total City land minus the acreage for exist-ing road rights-of-way.
Agricultural
Properties designated as Agricultural consist of any land use developed in conjunction with farms or farming-related uses, including associated residences.
This land use occupies 29.69 acres, or 2.6% of the land area within the City.
Single-Family Residential
This category includes single-family detached structures used as per-manent dwellings, and any accessory structures, such as garages, that are related to these units.
Such development occupies 264.6 acres, or 23.1%, of the total City land area. Home sites are equally distributed in all areas of the City of Durand. The Single-Family Residential designation is the second largest land classification found in the City.
A principal problem confronting a few single-family neighborhoods is the intrusion of incompatible land use. Incompatible land use problems are instances where neighboring uses, either by their nature of business or scale of operation, create an environment where they are unsuitable for association with single-family devel-opment. A prime example of this condition is found along Lovejoy Street where residential areas directly abut light industrial uses.
Multi-Family Residential
This land use category is defined by the existence of town houses, multi-family apartment structures, and other group living quarters.
Multi-Family Residential land uses occupy 35.2 acres, or 3.1% of the total land area of the City. This type of land use is most often interspersed throughout traditional single-family neighborhoods, as well as along larger collector streets.
Single-family bungalow

D U R A N D M A S T E R P L A N
21
Office
This category includes structures used as offices for professional and business services. The office land use designation includes small office buildings, as well as larger, regional office structures.
This use designation occupies 17.6 acres, or 1.5%, of the total land area of the City.
Mixed-Use
This land use category is characterized by two or more distinct land use types that complement each other but are contained within a single development. Mixed-Use areas are generally associated with more urban, downtown centers. Mixed-Use combinations may include, but are not limited to, residential, office, commercial, and quasi-public uses.
The Mixed-Use category occupies 1.1 acres, or 0.1% of City land, and is primarily located along Saginaw Street.
Local Commercial
Local Commercial land uses include the land area occupied by retail and service facilities that accommodate day-to-day convenience shopping needs. This commer-cial type includes, but is not limited to, groceries, florists, laundries, and restau-rants.
Such development occupies 8.4, or 0.7%, of the total City land area and is predomi-nately found around Durand’s downtown.
Community Commercial
This land use designation generally serves a population base that is considerably larger than the one served by local commercial areas. Retail users within this cat-egory provide for the needs for both convenience goods and more common and often recurring shopping goods, as well as personal and household services. Com-munity Commercial land uses include, but are not limited to, larger commercial/retail strip developments that contain supermarkets, branch banks, clothing stores, night clubs, etc.
Community Commercial land uses occupy 35.1 acres, or 3.1%, of all land uses within the City.
Mixed Use Downtown Commercial
Community Commercial

D U R A N D M A S T E R P L A N
22
Regional Commercial
The Regional Commercial land classification is defined by those types of uses which normally do not require a shopping center location and do not primarily cater to the convenience needs of adjacent residential areas. Examples of this use include automotive sales and service, commercial lodging, building material sales, etc. This land use category is also defined as retail commercial services dependent on major thoroughfare traffic. The Regional Commercial land use type dominates those par-cels along the Lansing Road corridor on the City’s northern edge.
This use designation occupies 11.7 acres, or 1.0%, of the total land area of the City.
Light Industrial
Light Industrial land use areas are categorized by the existence of wholesale activi-ties, warehouses, and industrial operations whose external physical effects are restricted to the site and do not have detrimental consequences to the surrounding areas.
Light Industrial land uses account for 29.4 acres, or 2.6%, of all land uses and as expected are generally located along the railroad rights-of-way.
Heavy Industrial
Manufacturing, assembling, and fabrication activities whose physical effects are felt to a considerable degree by the surrounding area define Heavy Industrial land use areas.
This use designation is very minimal in the City of Durand and only occupies 17.6 acres, or 1.5%, of the total land area.
Public
This land use category was established to encompass all developed or undeveloped lands owned by various governmental agencies (including public school proper-ties).
Such development occupies 153.0 acres, or 13.4%, of the total City land area and is the third largest land use designation within Durand.
Public
Light Industrial

D U R A N D M A S T E R P L A N
23
Quasi-Public
This land use category includes lands developed for such uses as parochial schools, churches, fraternal organizations, and institutional uses which are considered to have a public purpose but are not generally owned by a governmental entity.
Quasi-Public land uses occupy 26.2 acres, or 2.3%, of the total land area of the City of Durand.
Parkland
This category includes all City, County, State, and any other publicly-owned park and recreation properties and facilities.
There are 36.7 acres, or 3.2%, of the City which are currently designated as parks.
Vacant/Open Space
Vacant/Open Space land uses account for 394.1 acres, or 34.4% of the City of Du-rand’s land uses. This category includes all vacant and/or non-developed property in the City, including all vacated rights-of-way. This land use designation accounts for the largest percentage of total land area and is found mainly on the edges of the City. In total, 154 acres of land is devoted to roads and road rights-of way.
Railway
As a significant land use traversing the City of Durand, the Railway land use clas-sification is defined as the area around, supporting, and including the tracks over which rail traffic passes.
This land use occupies 85.0 acres, or 7.4%, of the total land area of the City.
Trumble Park

D U R A N D M A S T E R P L A N
24
regionAl existing lAnd use
In addition to those land uses present within Durand, land use designations located within a 1-mile boundary of the City limits were examined. Table 2 outlines the land use classifica-tions, total acres associated with each, and their percentage of the total. As expected, the agricultural, single-family resi-dential, and vacant/open space categories were predominate land uses in the area. (See Regional Land Use Map.) Adjacent Land Uses and Compatibility
When analyzed in a more regional context, the land uses within and surrounding the City of Durand provide a proto-typical example of transitional small-town urban develop-ment. The most intense land uses and highest development densities are located in the traditional downtown setting which is central to the larger region. Specifically, local com-mercial and railway uses are found at the core of downtown Durand. Land uses at greater distances from this central core generally shift toward less intense uses like single-family resi-dential or public/quasi public uses.
Broadly, those land uses directly adjacent to City limits continue this trend and are, therefore, compatible with area development typologies and densities. For example, Township agricultural lands border either lower-density, single-family neighborhoods or vacant/open lands. These areas provide successful transitions between the dense urban core and the more rural Township character.
While this development pattern generally holds true for most of the City and adjoining Vernon Township, it deviates from this pattern due to the area’s location adjacent to a significant traffic generator, I-69/Lansing Road/M-71. In the last 50 years, intensive auto-orientated commercial development and large site indus-trial and institutional uses have located on the edge of many urban areas. Several reasons have driven these choices including the availability of larger sites, lower taxes in the adjoining townships, and/or lower regulatory thresholds. For Durand, these developments have chosen to locate along Lansing Road east of the intersec-tion with Interstate-69 and M-71 north of the downtown area, and an auto-centric commercial district has developed near the interchange. Large lot residential de-velopment is also beginning to encroach upon traditionally agricultural areas along Township section line roads, bypassing other vacant areas that are located on the fringes of preexisting development.
Continued development along more traditional lines of new housing within tradi-tional subdivisions adjacent to Durand would help ease regional growth pressures while negating the appearance of sprawl and leap-frog development patterns. Uti-lizing available lands located adjacent to the established urban framework would help to preserve the City and Township’s historic urban and rural character while providing opportunities for new growth.
Land UseApproximate
AcreagePercentage
Agriculture 4,564.4 62.9Single-Family Residential 912.1 12.6Multi-Family Residential 36.6 0.5Local Commercial 10.2 0.1Community Commercial 64.8 0.9Regional Commercial 13.1 0.2Mixed Use 1.1 0.0Office 17.5 0.2Light Industrial 82.3 1.1Heavy Industrial 18.7 0.3Public 155.8 2.1Quasi-Public 262.0 3.6Parks 36.7 0.5Railroad Properties 210.9 2.9Vacant/Open Space 797.5 11.0Mobile Home Park 69.5 1.0
Total: 7,253.3 100.00
Table 2: Durand Land Use Percentages - Regional
Rural agricultural land in Vernon Township

COMMUNITY FACILITIES AND SERVICES

This Page Left Intentionally Blank

D U R A N D M A S T E R P L A N
27
COMMUNITY SERVICES AND FACILITIESThe City of Durand provides many facilities and services to its residents to ensure the continued quality of urban life. These services and facilities have a range of functions including public safety, specialized social services, education, and parks and recreation.
emergency services
Police protection is provided by the Durand Police Department, located in the City Municipal Complex at 215 West Clinton Street. Fire protection service for the City is provided by the Durand Fire Department and based out of the Fire Station located next to the Municipal Complex, in the center of the City. Both fire and police ser-vices can be reached via 911 emergency service. In addition to the police and fire department, Mobile Medical Response (MMR) is contracted by the City to provide ambulance service to the community.
educAtionAl And community fAcilities
Residents of Durand are part of the Durand Area School District. The District fea-tures a total of four schools educating students from preschool through 12th grade. According to the administrative offices of the Durand Area Schools, the current enrollment is 1,380 students with 154 teachers, which is a 43% decline since the 2002-2003 school year. The district’s schools include:
• Durand Area High School (451 students), located on Monroe Street• Durand Middle School (321 students), located on Lansing Road• Bertha Neal Elementary School (255 students), located on Main Street• Robert Kerr Elementary School (353 students), located on Monroe Street
The district administration building is also located in Durand, just north of down-town on the east side of Saginaw Street. With the reduction in the overall number of students, the district is facing financial constraints; however, the number of stu-dents in the lower grades exceeds the enrollment numbers from 2002-2003 school year. Longer range impact on the district will depend on retention of those younger students through graduation and incoming students to equal or nearly equal the current K-4th grades enrollment.
Durand High School

D U R A N D M A S T E R P L A N
28
A large number of religious institutions offer services to Durand residents. Church-es within or just outside of Durand are shown on the Community Facilities Map and include:
• Bethany Bible Baptist • Durand Assembly of God • Durand Church of God• Durand Church of the Nazarene• Faith Baptist • First Baptist • First Congregational • First United Methodist • Free Methodist • Light of Faith Fellowship • New Creation Church • St. Mary Catholic
As shown on the Community Facilities Map, a wide variety of other community fa-cilities (public and quasi-public) are located in or just outside of the City of Durand. The large number of fraternal/service organizations that have facilities in and ad-jacent to the City is a significant community benefit as these groups often support community causes while helping to forge a sense of community and camaraderie. These community facilities include:
• AMVETS Post 2273• Clock Tower Monument• Department of Public Works• Durand Chamber of Commerce• Durand Fraternal Order of the Eagles - #3851• Durand Moose Lodge - 2508• Durand Senior Center• Dutch Hollow Golf Club• Farmer’s Market• Kathy’s School of Dance• Masonic Temple – North Newburg Lodge # 161• Michigan Railroad History Museum• Municipal Complex• Railroad Memorial• Shiawassee District Library – Durand Branch• U.S. Post Office• VFW Hall – Reed-Raymond Post 2272
Kathy’s School of Dance
First Congregational

D U R A N D M A S T E R P L A N
29
PArks, recreAtion, And civic events
Five park facilities are found within the City of Durand. Trumble Park is the City’s premier community park, located at the southeast corner of Saginaw and Monroe Streets north of the downtown district. This park features a picnic pavilion, BBQ grills, picnic tables, horseshoe pits, volleyball net, lighted basketball courts, rest-rooms, playground equipment, softball/baseball field, and a gazebo. Optimist Park is located at the intersection of Fauble and Saginaw Streets at the City’s southern limits. This park is the City’s second community park, featuring two picnic pavilions, BBQ grills, two softball fields, restrooms, playground equipment, lighted basketball courts, and a covered, lighted roller/ice hockey rink. Two mini-parks, both featur-ing playground equipment, are also located in the City: Fitch Park along Fitch Street near Main Street, and Shaw Playground, along Fauble Street. Ironhorse/Lions Park is a special use park located just west of the municipal parking lot on Main Street, west of Shiawassee Street, which includes a memorial to steam power – 1929 steam locomotive GTW Engine #5632 and its tender – a picnic pavilion, and historic train switching house. The City has constructed a stormwater pond in the south-west quadrant of the City at the foot of Holmes Street with the intention of de-veloping a nature walk around the retention pond. The City is also in the planning stages of developing the area located south of E. Main Street between Railroad Street on the east and Saginaw Street on the west, bounded by the railroad tracks on the south side, into the proposed Diamond District Park and event space.
Durand Area Community Schools also have recreational facilities at the main schools complex in the City’s northeastern quadrant and Bertha Neal School on the City’s westerly limits.
In addition to the park facilities, many recreation programs are available to Durand residents. For the City’s youth, many programs are scheduled throughout the year including bowling, soccer, baseball, football, dance lessons, karate lessons, after school activity hour at the elementary schools, summer youth programs in the City parks, and cultural programs at the District Library. Several recreational, education-al, and enrichment programs are available for adults like stage productions through the Owosso Community Players, and softball, bowling, and golf leagues.
One of the major festivals in the area is Durand Railroad Days, held annually on the weekend after Mother’s Day. The 3-day festival pays tribute to the railroad industry, and is planned and promoted by Railroad Days, Inc., a non-profit corporation. Du-rand Union Station offers a variety of events throughout the year. The Durand Area Chamber of Commerce sponsors many events all year long, including promotional events, an annual golf outing, Wednesday Night Live (in conjunction with the DDA and End of Summer Cruisin’). The Chamber also coordinates Small Business Satur-day, Holidaze in Durand, the Hometown Party, and Harvestfest. The Chamber also hosts an annual dinner where Volunteer, Citizen, and Business of the Year awards are announced. The Chamber partners with the Durand Downtown Development Authority to host the Annual Santa’s Light Parade. During Holidaze, the Rotary sponsors Santa at the Depot.
Ironhorse/Lions Park
Trumble Park

D U R A N D M A S T E R P L A N
30
Public WAter
Public water in Durand is provided through the City of Durand Water Department. This department is operated as an enterprise fund, which means it funds its annual operations solely upon the sale of its water services. The department is responsible for supplying quality, State-approved water for its customers to be used for drink-ing, bathing, business operations, etc.
In February 1994, the citizens of Durand passed a general obligation bond issue allowing the City to borrow up to $3.1 million from the Farmer’s Home Administra-tion to improve and expand its water system. The water project provided a new well site located on Goodall Road, 3 miles north of Durand. On this property, two wells have been constructed to increase the supply of water to current custom-ers and allow for expansion. These wells are the City’s main water source, pump-ing water through transmission lines to the new water treatment facility, located at the northwest corner of Lansing and Durand Roads (see Community Facilities Map). This facility has a rated capacity of 1,100,000 gallons per day and is currently treating approximately 400,000 gallons of water per day. The Water Department provides service to approximately 1,450 customers.
The Community Facilities Map shows the City’s existing water main network. Aside from a few of the larger vacant parcels, the majority of the City is well served by this network.
Public seWer
Public sewer service is also provided by the City of Durand. Currently, the City oper-ates its wastewater treatment plant on the same property as the water treatment plant. The wastewater treatment plant has a current capacity of 800,000 gallons per day, with an average daily usage of 400,000 gallons per day. This unused capac-ity of 400,000 gallons per day indicates that the City is able to accept a significant level of additional growth without necessitating expensive upgrades to the treat-ment plant.
The Community Facilities Map shows the City’s existing sanitary sewer network. Similar to the water network, the majority of the City has access to sanitary sewer lines.
Durand’s Water Tower
Durand Wastewater Treatment Plant

TRANSPORTATION ANALYSIS

This Page Left Intentionally Blank

D U R A N D M A S T E R P L A N
33
TRANSPORTATION ANALYSISThe overall development and viability of a community is often based on mobility and the ease of access. Mobility provides opportunities for residents to function effectively within and enjoy the amenities of their community. It also plays a sig-nificant role in the success of business and industry, and allows for outside invest-ment. Finally, the ability to access a community with relative ease is beneficial to attracting visitors, which often aids the local economy.
Mobility is linked to many other key planning elements, such as sustainability, demography, and economy. A solid, efficient transportation network accommodat-ing a variety of modes forms the structure around which settlements are arranged. Transportation is intrinsically linked to land use and regional issues as well. For instance, would the development of industrial land uses in a previously agricultural area have significant impacts on the surrounding surface streets? Can a community accommodate a diverse collection of residents from across age, economic or ethnic groups if the only form of transportation available is private automobiles?
Transportation networks play as crucial a role in urban and rural development as land use, natural features, and public utilities. It is important, for instance, to en-sure that a community accommodates pedestrian and other nonmotorized travel, such as bicycles, in addition to automobiles, to ensure that seniors and young people can access public amenities and requisite goods and services. If warranted by the size and regional position of the community, bus networks or other forms of public transit also become necessary to meet these goals. It is for reasons such as this that we include an analysis of the transportation network in the Master Plan to ensure that future improvements and land use decisions complement the commu-nity’s needs and goals for continued and improved mobility.
trAnsPortAtion netWork
Roads
The Transportation Network Map illustrates the transportation network within and around Durand. For the purposes of this plan, we will use the State of Michigan’s transportation categories for roadway categorization. Michigan’s Public Act 51, PA 51 of 1951, divvies up state gas tax revenues between the State for maintenance of State Highways and State Trunklines and county and local roads. Funds are divided by a set formula based upon miles of each type of road. The act divides the road-ways into five categories: State Trunklines, County Primary Roads, County Local Roads, City Major Streets, and Local Streets. This classification system illustrates local road network hierarchy, as well as road ownership.
Monroe Road

D U R A N D M A S T E R P L A N
34
The City of Durand is advantageously located just off of Interstate-69, which is the primary transportation route connecting the urban centers of Flint and Lan-sing. The Michigan Department of Transportation (MDOT) states that the aver-age annual daily traffic (AADT) counts for 2017 on this portion of Interstate-69 is between 32,879 vehicles per day west of Durand and 37,154 vehicles per day east of Durand. The high visibility provided by the interstate helps contribute to the local economy and gives Durand statewide exposure for the purposes of tourism and other forms of commerce. The other State Trunkline servicing Durand is State Highway 71. Heading northwest from Durand, M-71 leads to the cities of Corunna and Owosso and its AADT in 2017 was 7,449. Control and maintenance of State Trunklines is the responsibility of MDOT.
The County Primary Roads serving Durand include Lansing Road (running through the northern edge of the City), Durand Road (traversing north/south), and New-burg Road (an east/west connector). These County Primary Roads provide access to and from Durand to the other communities in Shiawassee County and surrounding counties. Lansing Road west of Durand Road has an AADT of 8,620 in 2014 while east of Durand Road, its AADT was 6589 in 2014. Durand Road north of Newburg Road had an AADT of 6,560 in 2012 while the count of the Newburg intersection was 4,910 in 2012. Newburg Road west of Durand Road had an AADT of 3,196 in 2012 while the count east of Durand Road is 2,686 in 2014.
The County Local Roads include Monroe Road, Saginaw Street, and Monroe Street. County roads in and around Durand are owned and maintained by the Shiawassee County Road Commission. Only segments of Lansing Road, E. Monroe Street, and Monroe Road are County Local Roads within the City boundaries. Monroe Street east of Saginaw Street had an AADT of 1,962 in 2012 while Saginaw Street north of Monroe Street had an AADT of 2,938 in 2008.
The final two roadway categories of City Major and Local Streets are owned and maintained by the City of Durand. The City Major Streets, which include Brand (portion), Clinton (portion), Genesee, Mackinaw, Main, Mercer (portion), Oak, and Saginaw Streets are the principal means of access within the City. The City Local Streets provide access primarily to and from the residential neighborhoods within the City. Brand Street west of Oak Street had an AADT of 535 in 2012. Clinton Street west of Mercer Street had an AADT of 754 in 2012. Genesee Street near Shiawassee Street had an AADT of 1,036 in 2012. Mackinaw Street near Genesee Street had an AADT of 663 in 2012. Mercer Street north of Main Street had an AADT of 377 in 2012.
In general, the road network within Durand is somewhat fragmented. One of the main reasons for this fragmentation is the presence of numerous railroads traveling through the City. To maneuver from one quadrant of the City to another, vehicular traffic must be channeled to a select number of streets (generally the City Major Streets) that cross the railroad tracks. When trains pass through the City, vehicular access by residents and emergency vehicles is hindered. Also somewhat disjointed is the road access between I-69 and Durand. To get from the interstate into the downtown area, travelers must make multiple turns and cross railroad tracks, which can become confusing, especially for those who are unfamiliar with the area. Vehicular traffic within the City of Durand is predominantly managed with simple
Lansing Road
Mackinac Street

D U R A N D M A S T E R P L A N
35
stop and control signage, in addition to four signalized intersections (either full traffic lights or blinking lights). The locations of these signalized intersections are as follows:
• Lansing Road at Durand Road (blinking lights)• Saginaw Street at Monroe Street (full traffic lights)• Main Street at Durand Road (blinking lights)• Main Street at Saginaw Street (blinking lights)
Railroads
As stated, railroads have played a major role in the history and development of the City of Durand. Major rail lines including the Canadian National (former Grand Trunk Western) Railroad, Huron and Eastern Railway, and the Great Lakes Central Railroad meet at Durand Union Station, which is located at the end of Ann Arbor Street. Approximately 30 trains pass the station daily. Passenger rail service is conveniently available to residents of Durand through the Amtrak Blue Water line, which travels daily from Port Huron, MI, to Chicago, IL, with a stop at the Durand Union Station.
As the City accommodates fairly heavy railroad traffic, signalization at the numer-ous railroad crossings is a significant issue within Durand. Currently, there are eight railroad crossings within the City. Seven crossings are controlled by electronic rail-road signals. Four of these signals have automatic gates preventing the movement of vehicular traffic across the railroad tracks. The type of traffic control device at each of Durand’s railroad crossings is shown on Transportation Network Map.
Mass Transit and Air Travel
No bus lines directly service the City of Durand; however, Indian Trails Bus Lines does have routes with stops in East Lansing, Flint, Owosso, and Perry, allowing Du-rand residents to access the nationwide network of destinations.
Local public transportation service is available to Durand-area residents through the Shiawassee Area Transportation Agency (SATA). Formed by a unique inter-government collaboration of the Cities of Perry, Owosso, Corunna and Durand, plus the Shiawassee Regional Education Service District, SATA began servicing citizens in 2000. Currently, SATA provides approximately 95,000 rides annually. The agency provides curb-to-curb transportation using small cutaway wheelchair-lift equipped buses, on a reservation basis.
Commercial air travel is within easy reach of the City. Two primary airports provide passenger transportation: Capital City Airport, located outside of Lansing; and Flint Bishop International Airport, located in Flint. The Owosso Community Airport, lo-cated outside of Owosso, is a general aviation airport servicing Shiawassee County.
Durand’s Railroader Heritage
SATA

D U R A N D M A S T E R P L A N
36
Nonmotorized Transportation
In 2018, the City of Durand embarked upon the development of a Nonmotorized Transporta-tion Plan to develop a vision for nonmotorized transportation within Durand and into the adja-cent communities, to be implemented over the next 10 to 15 years.
Nonmotorized transportation includes walking, bicycle riding, small-wheeled transport (skates, skateboards, and scooters), and wheelchair travel. Various studies state that between 33% and 40% of all Michiganders do not have authorization or access to a personal vehicle. These individuals are either too young or too old, disabled, unable to afford a car, or have lost their driving privileges. Because of its avail-ability to nearly everyone, a safe, widespread, and convenient nonmotorized network is the most equitable form of transportation invest-ment.
Identified benefits of nonmotorized networks include:
• Safer trips for nonmotorized users• Increased nonmotorized trips due to
the improved convenience and comfort of a widespread network, desire for exercise, and/or reduction of car trips
• Increased property values for proper-ties located near or adjacent to non-motorized networks
• Reduction in vehicular congestion• Reduction in fossil fuel energy con-
sumption and reduction in environ-mental impacts of vehicular trips
• Creation of new spaces that foster community and resident connectivity
Currently, the City has a rather comprehensive sidewalk network, but there are two constraints with this system: sidewalk gaps and sidewalk widths. The Nonmotor-ized Plan identified areas of significant gaps on the northeast, south, and west sides of the City. Most sidewalks in the City are very narrow, often measuring just over 3 feet in width. These sidewalks will not allow for two people to walk side-by-side and they are not Americans with Disabilities Act (ADA) compliant.

D U R A N D M A S T E R P L A N
37
The City has an existing short multiuse path that runs near Lion’s/Iron Horse Park. Besides the City’s undersized sidewalks, there are no other nonmotorized transportation segments located within Durand.
With the coming revolution of personal trans-portation – the expansion of ebikes (bicycles with electrical assist or with fully electric propulsion), electric scooters, and other small-scale personal transportation options – non-motorized networks will become even more vital to the future health and competitiveness of communities.
The Durand Nonmotorized Transportation Plan is incorporated by reference into this master plan, and the proposed routes and types of nonmotorized segments that the plan proposes are included on the Nonmotorized Transportation Plan – Route Plan (see page 40).
The plan’s main goal is to connect major destinations within the City for the various user groups while also connecting the City system to destinations beyond its boundaries. These intra-city connections will be made with Enhanced Sidewalks (between 6 and 8 feet in width) and Multiuse Paths and Sidepaths that measure a minimum of 10 feet wide.
Due to the physical constrictions of the exist-ing road network and to limit system costs, the plan recommends the use of Enhanced Sidewalks for much of the system, which will service the school-age children commuting to school and families that are walking to the downtown, city parks, or other local destina-tions. To make the connections to major traffic generators (the Downtown, Lansing Road, and the school complexes), multiuse paths and sidepaths are proposed in these instances.

D U R A N D M A S T E R P L A N
38
The Nonmotorized Transportation Plan – Route Plan Outside of City Limits (see page 41) illustrates nonmotorized connections to the adjoining communities and the Leisure Lake/Holiday Shores resort communities. A majority of these intercity connections are proposed to be made by widening shoulders on existing roads except for the Durand-Corunna Path that is proposed to be a multiuse path with a brief, separated, two-way bikeway/cycle track segment over I-69. This Durand-Co-runna Path is vital to connecting Durand into the multi-county regional nonmotor-ized network that is forming around the Fred Meijer Clinton-Ionia-Shiawassee Trail system that starts in Owosso.
With the advent of new technologies, personal transportation is expected to sig-nificantly change over the next 20 years. The Durand Nonmotorized Transportation Plan prepares Durand for this coming transportation transformation.
Source: Esri, DigitalGlobe, GeoEye, Earthstar Geographics, CNES/Airbus DS, USDA, USGS, AeroGRID, IGN, and the GIS User Community
§̈¦69
[0 500 1,000Feet
Main
New
Lot
hrup
Newburg
Reed
Lansing
Monroe
Sagi
naw
City of DurandNonmotorized
Transportation PlanProposed Route Plan
Conceptual Connections:Widened Shoulder
Protected Bike Lane/Cycle Track
Enhanced Sidewalk
School Connector
Base Data:Streets
City Boundary
Source: Wade TrimJanuary 2020
Existing Enhanced Sidewalk
\\dt-vs\Projects\Dur6174\01d\GIS-Data\Projects\NonmoRoutesCity
Durand-Corunna Path(North of Map Extent)
#
Brand
Courtland
Fitzgerald
Vinewood
East Perry
East John
East Fauble
Naldrette
East Genessee
Oakland
Kent
Lansing
East Clinton
Tuscola
Huron
Nor
th S
hiaw
asse
e
Mac
kina
w
Dur
and
Sout
h Sa
gina
w
Love
joy
Hag
le
Russ
el
Man
fred
Mar
yette
Hol
mes
Ham
pton
Wic
kshi
re
Obe
rt
Fitc
h
Det
roit
Mar
quet
te
Linc
oln
Dur
and
Wayne
Multiuse/Sidepath SegmentsNorthside LinkDowntown Spine
Durand-Corunna Path

D U R A N D M A S T E R P L A N
39
Road Conditions
The City of Durand has focused on the condition of its streets through an intensive reconstruction program that dates back to 1994. Many of the road improvements from 1994 through the completion of the 2005 Master Plan included new or re-paired water, sewer, and storm sewer mains.
As a part of the Master Plan process, the condition of every road in the City was as-sessed during a field survey completed by Wade Trim in June 2004. Road condition (namely pavement condition) was assessed on a scale of one to four, one being new/like new and four being poor. The extent of surface deterioration is based on the observed amount of pavement cracking, faulting, joint deterioration, wheel tracking, patching, roughness, etc. The four road condition categories are defined as follows:
• New/Like New: No visible pavement deterioration• Good: Very little/occasional pavement deterioration, requiring routine
maintenance operations• Fair: Frequent occurrence of surface deterioration, requiring more exten-
sive maintenance• Poor: Extensive occurrence of surface deterioration, requiring possible
road surface reconstruction
SHIA
WA
SSEE
CO
UN
TY
GEN
ESEE
CO
UN
TYVillage of
Gaines
Village ofLennon
Village ofVernon
Durand
SwartzCreek
Corunna
Village ofBancroft
Caledonia Township Venice Township Clayton Township
Shiawassee Township Vernon Township Gaines Township
Argentine TownshipBurns TownshipAntrim Township
§̈¦69
§̈¦69
71
21
[0 0.5 1Miles
Lansin
g Road
Miller Road
Lans
ing R
oad
Byro
n Ro
ad
Dur
and
Road
Vern
on R
oad
Goodall Road
Lytle Road
Banc
roft
Road
Parmenter Road
Hibbard Road
Prior Road
S Durand Road
New
Lot
hrup
Roa
d
Cole Road
Duf
field
Roa
d
W Grand Blanc Road
Seym
our R
oad
Lennon Road
13
Corunna RoadVern
on R
oad
Bennington Road
Newburg Road
Grand River Road
S St
ate R
oad
Source: Wade TrimJanuary 2020
Route Plan: Outside of City Limits
Base Data:State RoadsRailroadStreetsRivers and Streams
Water Bodies
Village
City
Township
City of DurandNonmotorized
Transportation Plan
Existing Enhanced Sidewalk
School Connector
Multiuse/Sidepath SegmentsNorthside LinkDowntown Spine
Durand-Corunna Path
Conceptual Connections:Widened Shoulder
Protected Bike Lane/Cycle Track
Enhanced Sidewalk

D U R A N D M A S T E R P L A N
40
Two additional categories were included as part of the road condition survey: Gravel and Abandoned Rights-Of-Way (R.O.W.). Road conditions were identified on a map that has assisted the City in planning its roads improvement program.
RoadSoft GIS - a geographic information system (GIS)-based integrated roadway management system developed for local governments in Michigan to use in the analysis and reporting of roadway inventory, safety, and condition data - is now used by Durand to monitor road conditions. This software guides the City’s road improvement program efforts.
City of Durand Road Improvement Program
To maintain and improve the condition of the City’s roads, Durand developed a 6-year intensive maintenance program in 1994. This program was followed with the Master Plan assessment effort in 2005. To continue to fund the road improve-ment program, the City passed a special millage to fund ongoing improvement efforts. The 2010-2019 Street Projects Map illustrates the road maintenance and road repaving programs that have occurred since 2010. Additional roadwork on many of the south side streets will be completed in 2020 while Shiawassee Street, including the first part of the City’s nonmotorized network, is anticipated for 2021.
During the past 10 years, the City of Durand has spent approximately $3.3 million on street improvements. It is the intent of the City to continue to assess the condi-tions of its ROW to prioritize improvement projects within the street improvement plan with the Roadsoft GIS software. This program is able to provide the most up-to-date information to the Director of Public Works, which assists in making the determination as to what improvements will be completed each year.
Durand’s Road Improvement Program

NATURAL FEATURES

This Page Left Intentionally Blank

D U R A N D M A S T E R P L A N
43
NATURAL FEATURESThe natural environment plays an important role when planning for future land de-velopment. Circumstances such as steep slopes or poor soil conditions can prohibit the construction of a structure and features like wetlands may affect the desired layout of a subdivision. Conversely, the natural environment is often adversely impacted by land development. For example, clearing vegetation may increase water runoff and erosion. Thus, when preparing the Master Plan, it is important to examine and have an understanding of the natural environment to determine where development is best suited and where it should be discouraged.
In any environmentally-sensitive area within a community, development should be prevented. Environmentally-sensitive areas are lands whose destruction or distur-bance will affect the life of a community by:
1. Creating hazards such as flooding or slope erosion2. Destroying important public resources such as wetlands, groundwater sup-
plies, and surface water bodies3. Wasting productive lands and non-renewable resources
Each of these effects is detrimental to the general welfare of a community, result-ing in social and economic loss.
The purpose of this section is twofold: • Identify areas in the City best suited for development. The focus is on areas
that will minimize development costs and provide amenities without ad-versely impacting the existing natural systems.
• Identify land that should be conserved in its natural state and is most suit-able for conservation, open space, or recreation purposes.
Climate, geology, woodlands, wetlands, topography, and soil associations are among the most important natural features impacting land use in the City of Du-rand. Descriptions of these natural features found within Durand follow on the next several pages.
Woodland behind Holmes Street Retention Pond

D U R A N D M A S T E R P L A N
44
climAte
The climate of Shiawassee County is seasonal; the region experiences considerable changes in temperatures and precipitation throughout the year. The temperature range for Shiawassee County in January averages between 14 and 29 degrees Fahrenheit while in July, it averages between 59 and 82 degrees Fahrenheit. The average number of days below zero degrees Fahrenheit is 11, while the average number of days above 90 degrees Fahrenheit is nine. The average growing season in Shiawassee County lasts approximately 144 days. In terms of annual precipita-tion, Shiawassee County averages 29 inches of rainfall and 41 inches of snowfall per year. These climate conditions are typical for the central Michigan area.
geology
Geology for the City of Durand can be described in terms of Surface (Quaternary) Geology and Bedrock Geology.
During the last Ice Age, glaciers scoured out the Great Lakes and dumped piles of debris (moraines) along their edges leaving flat plains of clay-rich soils (glacial till) where the glaciers melted in place. Glacial melt waters formed vast rivers that built wide, sandy plains of outwash. Many of our inland lakes were created when blocks of ice fell off the glacier, became covered by debris and eventually left a hole (kettle) when the block melted. Ridges of sand and gravel called eskers show us places where rivers that started under the ice emerged from the front of the glacier. Drumlins, or egg-shaped hills, were carved by the bottom of the glacier after it had moved across older deposits. The study of these surface features and sediments created by glaciation is called Surface Geology.
In the Durand area, as well as the majority of Shiawassee County, the geology con-sists of a mix of three types of surface features: medium textured glacial till; glacial outwash sand and gravel; and end moraines of medium textured till. Glacial till is defined as a deposit of unsorted and unstratified mixtures of clay, silt, sand, gravel, and boulders. Glacial outwash is a term used to refer to the sediment deposited by meltwater streams from a glacier.
Bedrock Geology is the study of solid rock at or near the earth’s surface. Bedrock is generally concealed by an unattached layer of loose fragmented rock. This loose material may have formed in place by decomposition of the underlying parent bedrock or it may be an accumulation of foreign rock fragments deposited by wind, water, or ice (in the form of glaciers). Over most of Michigan, bedrock is buried beneath glacial deposits (drift). In a number of places, however, especially in the western Upper Peninsula and along the Great Lakes shores in the north, bedrock protrudes through the mantle of drift.
The entire Southern Lower Peninsula of Michigan is underlain by rocks of the Paleozoic Era. This era is represented by a wide variety of strictly sedimentary rocks that were deposited during several periods. Together, formations of these periods form a huge regional structure called the Michigan Basin, in which Durand is included. The bedrock of much of the Durand and Shiawassee County area was
Glacial Till - Illinois State Geological Survey
Bedrock - Siyavula Education

D U R A N D M A S T E R P L A N
45
formed during the Pennsylvanian period of the Paleozoic Era. Typical rocks of the Pennsylvanian period include sandstone, siltstone, shale, red shale, underclays, coal, and limestone.
The knowledge and understanding of geology is of fundamental importance to land management. This knowledge helps to make responsible land use decisions con-cerning such things as the availability and use of natural minerals and resources, soil fertility, erosion potential and drainage, suitability of land for agriculture or building construction, and protection of groundwater resources.
WoodlAnds
Woodlands information for the City of Durand is derived from the Michigan Re-sources Information System (MIRIS) 1978 Land Use Cover Data provided by the Michigan Geographic Data Library (MiGDL). Using 2019 aerial photographs, provid-ed by Google, the woodlands information was updated to reflect any new clearing including the construction of the City’s new stormwater pond in the southwestern quadrant of the City at the end of Holmes Street. The MIRIS land use is meant to show the major concentrations of woodland areas, and does not include smaller woodland concentrations or clusters of trees found in urban areas. The MIRIS land use data separates woodlands into several categories based on the woodland types or tree species. Two woodland types currently found in the City include:
• Lowland Hardwood• Central Hardwood
Lowland Hardwood trees include ash, elm, soft maple, cottonwood, aspen, and white birch. Central Hardwood tree species include red oak, white oak, black oak, and hickory.
The Environmental Resources Map shows the general locations of these wood-land types in the City of Durand. In the northeastern portion of the City, south of Lansing Road, an approximately 18.5-acre concentration of Central Hardwood trees can be found. A concentration of Lowland Hardwood trees, totaling 11.3 acres, is located in the southwestern portion of the City. In total, these woodlands comprise approximately 2.6% of the City’s land area.
Because of many benefits associated with wooded areas, woodlands should be seen as a real asset to the City. For human inhabitants, forested areas offer scenic contrasts within the landscape and provide recreational opportunities such as hik-ing and nature enjoyment. In general, woodlands improve the environmental qual-ity of the whole community by reducing pollution through absorption, reducing the chances of flooding through greater rainwater infiltration, stabilizing and enriching soils, moderating the effects of wind and temperature, and providing habitats for wildlife.
Northern Hardwoods - MSU Dept. of Geography
Southern Hardwood Swamp - MNFI - MSU

D U R A N D M A S T E R P L A N
46
WetlAnds
Over the last half century, residents of Michigan have become aware of the value of wetlands and the important role they play in our broader ecosystem. The U.S. Army Corps of Engineers defines wetlands as “those areas inundated or saturated by surface or groundwater at a frequency and duration sufficient to support, and that under normal circumstances do support, a prevalence of vegetation typically adapted for life in saturated soil conditions.” Beyond their aesthetic value, wetlands improve water quality of lakes and streams by filtering polluting nutrients, organic chemicals, and toxic heavy metals. Wetlands are closely related to high groundwa-ter tables and serve to discharge or recharge aquifers. Additionally, wetlands sup-port wildlife, and wetland vegetation protects shorelines from erosion.
Wetlands are extremely variable due to a wide variety of factors that create them. Per the U.S. Fish and Wildlife Service non-regulatory definition, wetlands are de-fined by three important attributes: 1) hydrology – presence of water and/or soil saturation; 2) vegetation – the types of plants that will grow in the environment; and 3) soils – the presence and type of hydric soils that form in a wet environment. Due to the wide array of differing wetland definitions that existed countrywide, a regulatory definition system was established by the U.S. Fish and Wildlife Service in 1979 that has become the international standard for wetland identification. This method identifies five systems, nine subsystems, multiple classes and subclasses, plant dominance types, and numerous special modifiers. This system is able to identify wetland systems anywhere in the world. In Durand, the City’s wetlands are of the Palustrine system (land-based wetlands) of the Wooded Wetland and Shrub/Scrub Wetland vegetative classes.
According to the MIRIS Land Cover Data, two areas of wetlands are located in the southwestern portion of the City. The larger area is defined as a Shrub/Scrub Wetland, measuring approximately 31.5 acres, while the smaller wetland area is defined as a Wooded Wetland, measuring 9.8 acres. In total, these wetlands cover approximately 41.3 acres or 3.6% of the City (see Environmental Resources Map). Wooded Wetlands are wet at least part of the year with water at or near the sur-face and normally possess an overstory of trees at least 20 feet tall, an understory of young trees or shrubs, and an herbaceous layer. Scrub-Shrub Wetland includes woody vegetation less than 20 feet tall that includes true shrubs, young trees, and shrubs or trees stunted by the presence of water.
Wetlands - Michigan Dept of Natural Resources

D U R A N D M A S T E R P L A N
47
toPogrAPhy
Topography, the configuration of a land area’s varying elevations, has very impor-tant planning implications. Land use and required maintenance depend to a large degree on slope, although today there are fewer restrictions on development in steep slope areas due to the use of more intensive construction and engineering techniques. Still, while steep slope developments can provide attractive views and recreational opportunities, building developments in these locations adversely impact the natural topography and may cause wider environmental impacts.
Generally, the topography of Durand is flat. Within the City, only minor topographi-cal features, such as creek beds and gently rolling hills, are found. The Environ-mental Resources Map shows the topography of Durand through the mapping of 10-foot contour lines. A community with steep slopes and significant topographical features will be represented by a large number of tightly-spaced contour lines. As can be seen on the map, the 10-foot contour lines in Durand are not found in any tight concentration, but are fairly spread out. There are only a few areas where steeper slopes are found. In terms of elevation, the lowest elevations of around 770 feet are found in the northern portion of the City near the Holly Drain, while the highest elevations of around 820 feet are found in the southwestern portion of the City.
Aside from a few areas of hills or creek beds, the generally flat topography that characterizes the majority of the City poses few constraints to land development.
Example of limited geographic relief

D U R A N D M A S T E R P L A N
48
soil AssociAtions
Soil characteristics help define the land’s capacity to support certain types of uses. Soils most suitable for development purposes are well drained and are not subject to a high water table. Adequate drainage is important for minimizing stormwa-ter impacts and the efficient operation of septic drain fields. Adequate depth to the water table is necessary to prevent groundwater contamination from septic systems. A high water table also limits the construction of basements. Though civil engineering techniques may be employed to improve drainage and maintain adequate separation from the water table, such techniques are expensive to con-struct and maintain.
According to the State Soil Geographic Database (STATSGO) which is managed by the USDA’s Natural Resource Conservation Service and obtained from the Michigan Geographic Data Library (MiGDL), two soil associations are found in the City of Du-rand. The general locations of these associations are shown on the Environmental Resources Map. The map is not designed for site-specific applications; rather, it can be used to compare general land suitability for larger areas.
Each soil association is composed of several soil series. Each series making up one association may occur in another, but in a different pattern and/or combination. A description of the two soil associations within the City follows.
Conover-Brookston-Parkhill Soil Association
This soil association comprises the vast majority of the City (approximately 75%). As the name implies, three soil series are included in this association: Conover, Brookston, and Parkhill soils. Using data provided by the USDA Natural Resource Conservation Service, a description of each soil series is included below.
The Conover series consists of very deep, somewhat poorly-drained soils. Typical particle size of the soil series is fine-loamy, while water permeability is moderate or moderately slow. Outside of urban land uses, the soils of this series are mostly cultivated with corn, beans, small grain, and hay. Native vegetation on these soils include hardwood forests.
The Brookston series consists of very deep, poorly-drained soils. Permeability is moderate in the subsoil and moderately slow in the underlying material. The depth to the top of an apparent high water table ranges from 0.5 foot above the surface to 1 foot below the surface for some time in normal years. When cultivated, the Brookston soils are mostly used to grow corn, soybeans, oats, wheat, and hay. Na-tive vegetation includes deciduous forest, marsh grasses, and sedges.
The Parkhill series consists of very deep, poorly-drained and very poorly-drained soils with a fine-loamy particle size. Water permeability within this series is mod-erately slow. Depth to the seasonal high water table ranges from 1 foot above the surface to 1 foot below the surface from November to May. A large part of this series is used for cropland with principal crops of corn, small grain, beans, and hay. A small part of the soil series is in permanent pasture or forested.
Farmland in neighboring Vernon Township
Michigan Soil Associations - MSU Geology

D U R A N D M A S T E R P L A N
49
Houghton-Carlisle-Adrian Soil Association
This soil association comprises approximately 25% of the lands in Durand and is found in the northern and southeastern portions of the City.
The Houghton soil series consists of very deep, very poorly-drained soils having moderately-slow to moderately-rapid permeability. Depth to the seasonal high water table ranges from 2 feet above the surface in ponded phases to 1 foot below the surface from September to June. The potential for surface runoff is very slow or ponded. Typical crops include onions, lettuce, potatoes, celery, radishes, carrots, mint, and some corn. Native vegetation includes marsh grasses, sedges, reeds, but-tonbrush, and cattails.
The Carlisle series consists of very deep, very poorly-drained soils with moderately-slow to moderately-rapid permeability rates. Depth to the seasonal high water table ranges from 1 foot above the surface to 1 foot below the surface from Sep-tember to June. Surface runoff is very slow or ponded. When cultivated, the major crops include onions, potatoes, corn, radishes, celery, carrots, and lettuce. Native vegetation includes elm, white ash, red maple, and other tree species.
The Adrian series consists of very deep, very poorly-drained soils with permeabil-ity rates ranging from moderately slow to moderately rapid in the organic mate-rial and rapid in the sandy material. The depth to the top of an apparent seasonal high water table ranges from 1 foot above the surface to 1 foot below the surface from November to May in normal years. In the flooded phase, areas are subject to frequent flooding for long periods between October and June. Most of this soil is in native vegetation. Much of it is in marsh grasses including sedges, reeds, grasses, and shrubs such as willow, alder, quaking aspen, and dogwood.
Michigan History Magazine

D U R A N D M A S T E R P L A N
50
leAking underground storAge tAnk (lust) sites
The Michigan Department of Environment, Great Lakes, and Energy (EGLE) pub-lishes a list of Leaking Underground Storage Tank (LUST) sites throughout Michigan. A LUST site has the following characteristics:
• Sites where a release has occurred from an underground storage tank system
• Sites where chemicals from an underground storage tank have been de-tected in the groundwater, surface water, or subsurface soils
LUST sites are further classified as having a status of “Open” or “Closed.” An open LUST site means that no corrective actions have been completed to remediate the on-site or off-site contamination. A closed LUST site means that corrective actions have been completed in accordance with Part 213, Leaking Underground Storage Tank, of the Natural Resources and Environmental Protection Act, Public Act 451 of 1994, as amended.
There are currently 10 open LUST sites in the City of Durand as shown on the Envi-ronmental Resources Map and listed below. Several of these sites have more than one contaminant release.
1. Amoco/Ed Standard Service, 220 N. Saginaw Street2. B & B Shop/Work Equipment/Grand Trunk Western RR, 209 N. Oak Street3. Bay Petroleum Marketing Corp., 509 N. Saginaw Street4. Delux Monogramming & Screenprinting, Inc., 9070 E. Lansing Road5. Durand Equipment & Mfg. Co., 9026 E. Lansing Road6. Former Durand Feed and Grain Co., 105 W. Clinton Street7. Former Gulf Service Station, 803 N. Saginaw Street8. Frank’s Service, 205 E. Main Street9. Lucy’s Filling Station, 205 E. Main Street10. Monroe Point Shell, 8544 Lansing Road
As of November 21, 2016 (the most recent data available at the time of the writ-ing of the plan), all of these LUST sites were currently open, except for the Durand Equipment & Mfg. Co, which has one open contaminant release and one closed contaminant release. According to Michigan Department of Environment, Great Lakes, and Energy (EGLE) records, there are approximately a dozen other LUST sites that have been “closed” where corrective action has been completed to meet the appropriate land use criteria.
Before any new development on contaminated sites occurs, proper procedures for cleanup and remediation are to be taken. EGLE administers programs that involve the cleanup and redevelopment of contaminated properties to achieve a healthier, cleaner, and more productive environment for Michigan’s citizens. The primary leg-islative authority for the state cleanup program is Part 201, Environmental Reme-diation, of the Natural Resources and Environmental Protection Act (1994 PA 451, as amended). The state program has a unique, causation-based liability scheme, land use based cleanup requirements, and a strong emphasis on redevelopment and reuse of contaminated property.
Lucy’s Filling Station - 205 E. Main Street
Amoco/Ed Standard Service - 220 N. Saginaw St
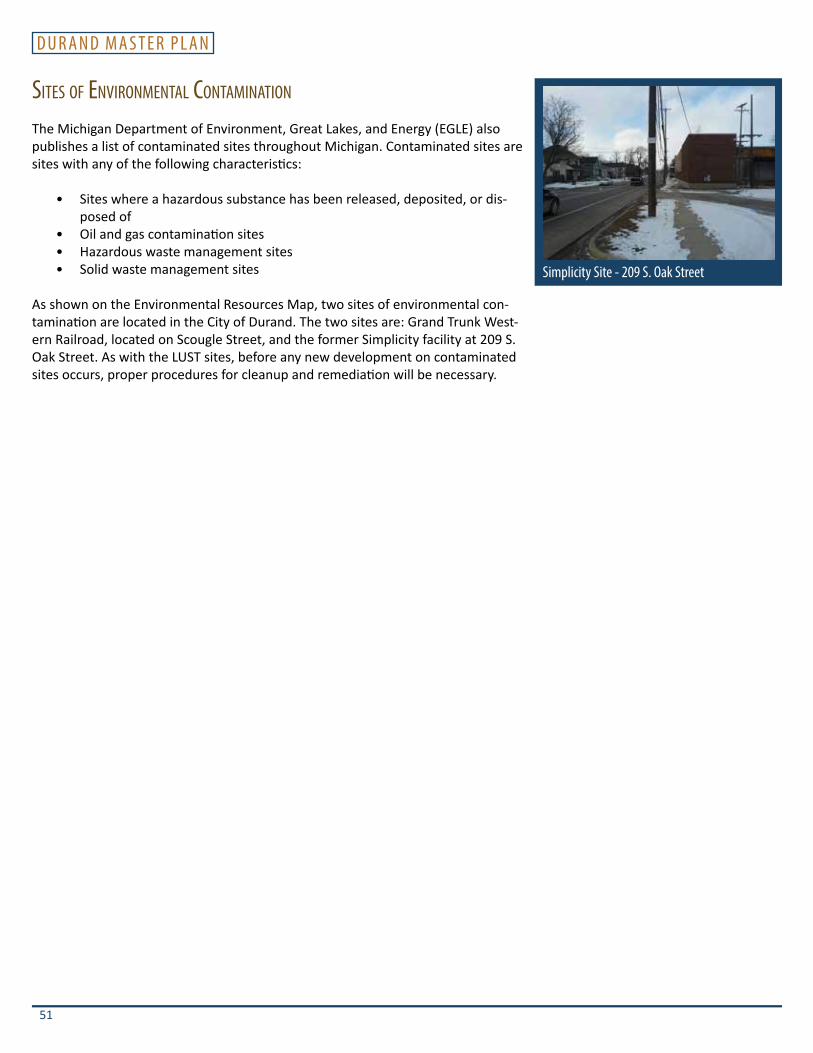
D U R A N D M A S T E R P L A N
51
sites of environmentAl contAminAtion
The Michigan Department of Environment, Great Lakes, and Energy (EGLE) also publishes a list of contaminated sites throughout Michigan. Contaminated sites are sites with any of the following characteristics:
• Sites where a hazardous substance has been released, deposited, or dis-posed of
• Oil and gas contamination sites• Hazardous waste management sites• Solid waste management sites
As shown on the Environmental Resources Map, two sites of environmental con-tamination are located in the City of Durand. The two sites are: Grand Trunk West-ern Railroad, located on Scougle Street, and the former Simplicity facility at 209 S. Oak Street. As with the LUST sites, before any new development on contaminated sites occurs, proper procedures for cleanup and remediation will be necessary.
Simplicity Site - 209 S. Oak Street

This Page Left Intentionally Blank

POPULATION PROFILE

This Page Left Intentionally Blank

D U R A N D M A S T E R P L A N
55
POPULATION PROFILEThe purpose of this analysis is to describe the social characteristics of the City of Durand, which are an essential element in the short- and long-term planning goals of the community. Social characteristics include the size of the population, age, gender, race, ethnicity, employment, and housing value, tenure, and unit age. Compiling and examining data on these elements will help guide City officials in determining future land use needs.
historicAl PoPulAtion groWth
Population trends for City of Durand and its neighboring communities are present-ed in Table 3. The population of the City has decreased by 10.3% (344 residents) since 1970. The three neighboring communities displayed in the table all recorded increases in population during this same period. The growth experienced by both Linden and Perry through 2010 may be attributed to the suburban sprawl growth experienced by their regions of Metro Detroit and Lansing while their declines since 2010 may be associated to the after-effects of the Great Recession.
Shiawassee County and the State of Michigan both saw population increases between 1970 and 2000, but population loss or stagnation since 2010. The 8.1% increase for Shiawassee County mirrors the 10.2% increase of the State for the broader period. However, both have seen impacts from the Great Recession.
Table 3: Population Trends: 1970-2010
Place 1970 1980 1990 2000 2010 2017Change (70-17)
Change (10-17)
City of Durand 3,678 4,206 4,283 3,933 3,446 3,334 -10.3% -3.4%
Shiawassee CountyCorunna 2,829 3,206 3,091 3,381 3,497 3,398 16.7% -2.9%Perry 1,531 2,051 2,163 2,065 2,188 2,135 28.3% -2.5%
Genesee CountyLinden 1,546 2,174 2,415 2,861 3,991 3,877 60.1% -2.9%
Shiawassee County 63,075 71,140 69,770 71,687 70,648 68,617 8.1% -3.0%Michigan 8,875,083 9,262,078 9,295,297 9,938,444 9,883,640 9,883,640 10.2% 0.0%1970, 1980, 1990, 2000, 2010 US Census, 2017 ACS

D U R A N D M A S T E R P L A N
56
PoPulAtion Projections
According to data from the State Demographer, the population of Shiawassee County is expected to decline from a projected population of 68,157 in 2020 to 64,050 in 2045. Their statistical model illustrates that the death rate has already ex-ceeded the birth rate in the county and immigrant migration is slowing the decline. If net migration was placed at zero (in and out migration equaled zero), this decline would slightly accelerate. Currently, Michigan has more in-migration of foreign born over out-migration of Michigan residents to other parts of the country. Utiliz-ing a Constant Share projection that retains Durand’s percentage of Shiawassee County population through 2045, Durand’s estimated population would be 3,124. In this instance, the Shiawassee County growth rate between 2010 and 2045 was utilized (-9.1%) in the Constant Share equation. Using a Linear Projection with base year of 1970, Durand’s estimated population in 2045 would be 3,134 individuals. If Durand was able to perform better than expected in retaining and attracting new residents over the next 25 years, a Constant Share projection based upon the State of Michigan’s demographer’s estimated population for the State, Durand’s 2045 population would be 3,698 residents.
Five projection methods utilized in the 2005 Master Plan estimated Durand’s population ranging between 3,961 to 4,375 persons by the year 2020 with an average increase of 288 people, or 7.3%. In actuality, the City’s estimated popula-tion in 2017 is 3,334 residents, which is far below the most conservative estimates from 2005. As with all population projections, however, these numbers are based on past trends and do not take into consideration any significant developments, economic occurrences, or changing personal habitation preferences that may occur in the future.
Providing population projections in Michigan has been difficult over the last 40 years due to several macro-economic forces that have been impacting the State’s economy and its residents, including: major shifts in the auto industry; reduction in the manufacturing and construction sectors; younger adults desiring to live in vibrant urban communities; and substantial national demographic shifts from the American Midwest to the South and Southwest. There are several external fac-tors including ongoing globalization, impacts of technology, spread of broadband, impacts of climate change, changes in the American family, and changes to U.S. immigration policy that cannot be factored into these projections as well.
Microeconomic factors operating within Mid-Michigan include economic and work-force activities within the cities of Flint and Lansing that impact locational choices in Shiawassee County in general and Durand specifically too.
Current projections for Michigan are for modest growth through 2040 with cer-tain areas growing while other areas in decline. With all of the extenuating factors (inter-US migration and continued shrinking American family) remaining the same, a conservative estimate is that both Durand and Shiawassee County will see mod-est population declines through 2045.
Sycamore House
Durand Area Schools Complex

D U R A N D M A S T E R P L A N
57
Age grouPs
Table 4 illustrates the median age in 2017 for the City of Durand was 45.3 (10.4 years older than 2000), now making its population significantly older than its sur-rounding communities, with Perry the youngest at 35.4 years and Linden at 39.9 years as the next eldest. Approximately 1,690 City residents (49.0%) were over 45 years of age while on the other extreme, only 886 residents (25.7%) were under the age of 25.
The City of Durand school-age population (5 to 19 years) totaled 688, or 20.0% of the City’s population, a full 10 percentage points down from 2000. Like Shiawassee County and Michigan in general, the population has been aging at a faster rate than most of the rest of the country because of a higher out-migration of young Michi-ganders versus in-migration. Of note, in 2000, Durand was the second youngest community behind Perry and now it is the eldest with the median age of 5.4 years older than its nearest peer communities.
Table 4: Age Group Comparison: 2017
Place Under 5
years 5 to 9 years
10 to 14 years
15 to 19 years
20 to 24 years
25 to 34 years
35 to 44 years
City of Durand 149 105 160 274 198 326 431
Shiawassee CountyCorunna 198 238 156 186 287 427 494 Perry 172 163 154 153 195 222 359
Genesee CountyLinden 232 300 388 198 131 313 668
Shiawassee County 3,549 4,012 4,508 4,761 4,151 7,578 8,098 Michigan 571,999 601,601 634,551 674,265 723,180 1,219,595 1,176,764
Place 45 to 54
years 55 to 59
years 60 to 64
years 65 to 74
years 75 to 84
years 85 years and over
Median age (years)
City of Durand 500 232 254 350 219 136 45.3
Shiawassee CountyCorunna 439 177 189 316 156 135 37.2Perry 243 141 94 144 87 18 35.4
Genesee CountyLinden 423 197 259 375 231 162 39.9
Shiawassee County 10,234 5,363 4,755 6,754 3,506 1,348 42.0Michigan 1,370,424 725,670 652,286 909,353 459,497 206,383 39.62017 U.S. Census ACS - DP05

D U R A N D M A S T E R P L A N
58
chAnges in Age structure
The past decade and a half, 2000-2017, Table 5 shows significant changes in the age structure of the City of Durand. The number of school-age chil-dren, under the age of 20, has decreased by almost 42% while the number of family age persons, age 25 to 59 decreased by over 16%. The popula-tion of persons age 55 and older increased by 37.5%. These changes in age structure for the City of Durand indicates a maturing population that is disproportionate to the number of older individuals. This notion is also reinforced by the rising median age which has increased by 23.4% over the past 17 years.
Table 5: Age Group Trends: 1990-2017Age 1990 2000 2017
Under 5 years 364 289 1495 to 9 years 327 309 10510 to 14 years 392 310 16015 to 19 years 348 277 27420 to 24 years 311 251 19825 to 34 years 694 545 32635 to 44 years 628 621 43145 to 54 years 371 465 50055 to 59 years 142 150 23260 to 64 years 125 130 25465 to 74 years 258 223 35075 to 84 years 179 230 21985 years and over 144 133 136
4283 3933 3334Median age (years) 30.9 34.7 45.31990, 2000 US Census - SF1, 2017 US CensusACS 2017 - DP05
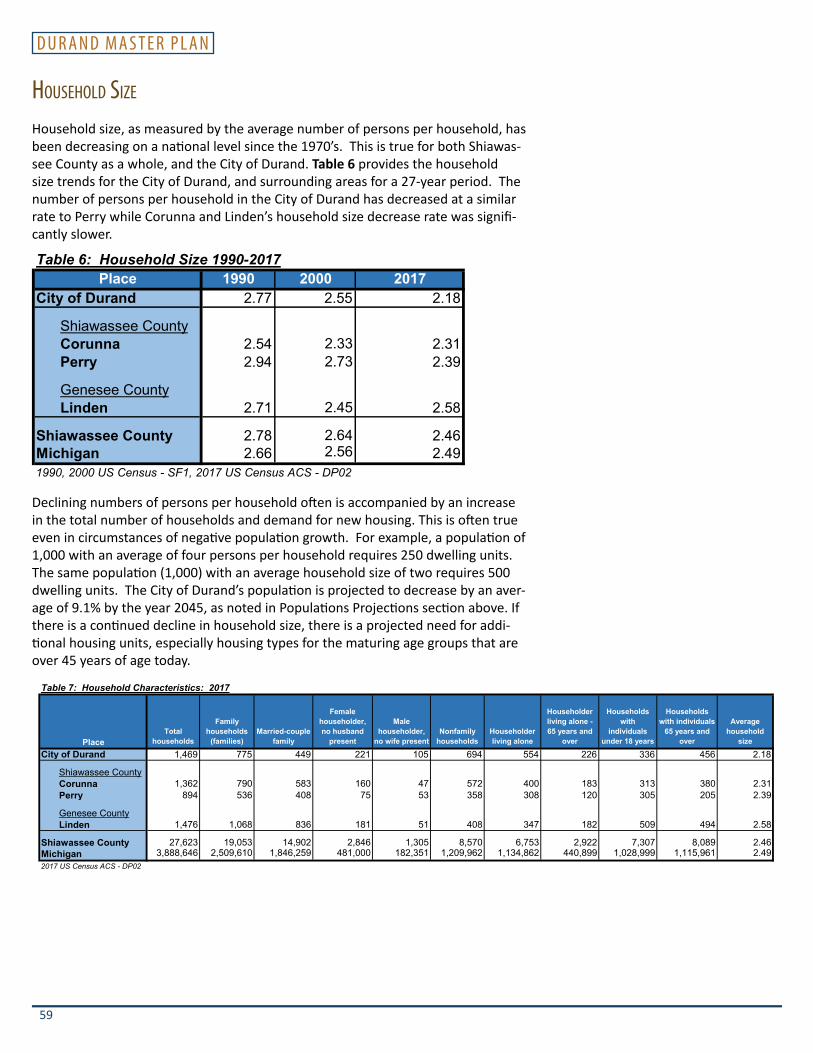
D U R A N D M A S T E R P L A N
59
household size
Household size, as measured by the average number of persons per household, has been decreasing on a national level since the 1970’s. This is true for both Shiawas-see County as a whole, and the City of Durand. Table 6 provides the household size trends for the City of Durand, and surrounding areas for a 27-year period. The number of persons per household in the City of Durand has decreased at a similar rate to Perry while Corunna and Linden’s household size decrease rate was signifi-cantly slower.
Table 6: Household Size 1990-2017Place 1990 2000 2017
City of Durand 2.77 2.55 2.18
Shiawassee CountyCorunna 2.54 2.33 2.31Perry 2.94 2.73 2.39
Genesee CountyLinden 2.71 2.45 2.58
Shiawassee County 2.78 2.64 2.46Michigan 2.66 2.56 2.491990, 2000 US Census - SF1, 2017 US Census ACS - DP02
Declining numbers of persons per household often is accompanied by an increase in the total number of households and demand for new housing. This is often true even in circumstances of negative population growth. For example, a population of 1,000 with an average of four persons per household requires 250 dwelling units. The same population (1,000) with an average household size of two requires 500 dwelling units. The City of Durand’s population is projected to decrease by an aver-age of 9.1% by the year 2045, as noted in Populations Projections section above. If there is a continued decline in household size, there is a projected need for addi-tional housing units, especially housing types for the maturing age groups that are over 45 years of age today.
Table 7: Household Characteristics: 2017
PlaceTotal
households
Family households
(families)Married-couple
family
Female householder, no husband
present
Male householder,
no wife presentNonfamily
householdsHouseholder living alone
Householder living alone - 65 years and
over
Households with
individuals under 18 years
Households with individuals
65 years and over
Average household
size
City of Durand 1,469 775 449 221 105 694 554 226 336 456 2.18
Shiawassee CountyCorunna 1,362 790 583 160 47 572 400 183 313 380 2.31Perry 894 536 408 75 53 358 308 120 305 205 2.39
Genesee CountyLinden 1,476 1,068 836 181 51 408 347 182 509 494 2.58
Shiawassee County 27,623 19,053 14,902 2,846 1,305 8,570 6,753 2,922 7,307 8,089 2.46Michigan 3,888,646 2,509,610 1,846,259 481,000 182,351 1,209,962 1,134,862 440,899 1,028,999 1,115,961 2.492017 US Census ACS - DP02

D U R A N D M A S T E R P L A N
60
rAciAl comPosition
As can be seen on Table 8, Shiawassee County’s current white, non-Hispanic popu-lation, is 96.8% of the total, while minorities comprise 3.2%. The City of Durand, however, has a slightly higher percentage of minorities at 3.6% while it also has 6.5% who identify as some other race or two or more races, which exceeds the county’s rate by 4.5%.
Table 8: Racial Composition 1990-2017
Race* Number Percent of Population Number
Percent of Population Number
Percent of Population Number
Percent of Population Number
Percent of Population Number
Percent of Population
White 4,209 98.3% 68,686 98.4% 3,813 96.9% 69,818 97.4% 3,215 96.4% 66,409 96.8%Black or African American 2 0.0% 93 0.1% 3 0.1% 139 0.2% 11 0.3% 269 0.4%American Indian and Alaska Native 20 0.5% 397 0.6% 26 0.7% 334 0.5% 0 0.0% 334 0.5%Asian or Other Pacific Islander 10 0.2% 223 0.3% 4 0.1% 209 0.3% 0 0.0% 209 0.3%Some other race 42 1.0% 371 0.5% 87 2.2% 1,187 1.7% 218 6.5% 1,406 2.0%
1990, 2000 US Census - SF1, 2017 US Census ACS - DP06
2017 City of Durand 2017 Shiawassee County
*As race definitions were revised for the 2000 US Census, the racial categories in the table were agglomerated to compare population changes across time. Us Census 200 totals for Asian and Native Hawaiian and Other Pacifica Islander were combined. Additionally the Some Other Race and Two or More Races categories were combined to reflect the broader 1990 US Census definitions.
1990 City of Durand 1990 Shiawassee County 2000 City of Durand 2000 Shiawassee County

HOUSING PROFILE

This Page Left Intentionally Blank

D U R A N D M A S T E R P L A N
63
HOUSING PROFILEThe Housing Profile section of the Master Plan describes the housing stock by age, type, value, and tenure for the City of Durand. This analysis will assist the City in determining its future housing needs based on the characteristics of existing struc-tures.
household tyPe
The Household Characteristics table, outlines the total number of households in the City of Durand, surrounding communities, Shiawassee County, and the State of Michigan, as well as a breakdown of family and non-family households.
When comparing the City of Durand to its surrounding areas, we see some signifi-cant percentage differences among the household categories. The City has a lower concentration of married-couple households than average for the surrounding ar-eas, or the State. In addition, the percentage of female-headed households is also slightly higher than that of the majority of surrounding communities and the State. This situation is often typical of city environments which, because convenience and services, attract a wider variety of lifestyles than the more rural areas of a region.
tyPe of structure
Data in Table 9 details the residential structure types found in the City of Durand and surrounding areas. The housing stock is composed mostly of single-family de-tached dwelling units. The 2017 American Community Survey indicates that almost 74% of the housing stock was categorized as one-unit structures. The next largest category of housing units is 10-19 units, which make up 9.9% of the total housing stock. This distribution of structural types is generally consistent with that of the surrounding area. Corunna has a similar number of multi-family units while Linden and Perry have significantly lower percentages of multiple family units.
Table 9: Type of Housing Units: 2017
Place
Total Housing
Units1-unit,
detached1-unit,
attached 2 units 3 or 4 units 5 to 9 units10 to 19
units20 or more
unitsMobile home
Boat, RV, van, etc.
City of Durand 1,568 1,160 0 51 85 42 156 60 14 0
Shiawassee CountyCorunna 1,444 820 7 41 65 214 231 66 0 0Perry 961 689 4 10 28 62 114 43 15 0
Genesee CountyLinden 1,540 1,058 113 63 35 12 15 0 244 0
Shiawassee County 30,240 24,217 372 888 799 709 742 760 1,753 0Michigan 4,568,200 3,304,372 211,705 108,453 116,585 191,398 163,853 229,917 240,784 1,1332017 US Census ACS - DP04

D U R A N D M A S T E R P L A N
64
Age of structure
The age of a dwelling unit is a factor used to evaluate the structural quality of the unit. The average industry standard for the life span of a single-family dwelling unit is generally 50 years. However, this typical life span often depends on the quality of the original construction and continued maintenance of the unit during that time frame. Using this standard, many homes within the City constructed prior to 1970 would be approaching the point when they will require substantial refurbish-ment of their main systems including heating and cooling, windows, and exterior finishes.
Data in Table 10 identifies the age of year-round residential structures for the City of Durand and Shiawassee County. As can be seen, the majority of the units (81.2%) in the City of Durand were built in the decades prior to 1980. Of those homes, approximately 60% were built prior to 1960. When taking into consider-ation the average life span of a dwelling unit, over 60% of the single-family homes in the City are approaching the point when they either require significant overhauls to main systems or significant increases in funds for routine maintenance. The City of Durand is somewhat dissimilar in the age of its structures as compared
to Shiawassee County. The structures in the City are slightly older. Shiawassee County has 53% of its structures built before 1970 while the City of Durand has almost 61%.
Table 10: Age of Structure: 2017
Year Structure Built Number Percent of Total Number Percent of Total2014 or later 0 0.0% 56 0.2%2010 to 2013 20 1.3% 165 0.5%2000 to 2009 50 3.2% 2434 8.0%1990 to 1999 76 4.8% 3611 11.9%1980 to 1989 149 9.5% 2,600 8.6%1970 to 1979 318 20.3% 5,410 17.9%1960 to 1969 169 10.8% 3,778 12.5%1950 to 1959 173 11.0% 3,317 11.0%1940 to 1949 79 5.0% 1,994 6.6%1939 or earlier 534 34.1% 6,875 22.7%
Total Structures 1,568 100.0% 30,240 100.0%2017 US Census ACS - DP04
City of Durand Shiawassee County

D U R A N D M A S T E R P L A N
65
HOUSING TENUREHousing occupancy characteristics are presented in Tables 11 and 12. According to the 2017 Census, 1,469 housing units were occupied in the City of Durand, down 12 units from 2000. Of those homes, housing tenure was split between two-thirds owner occupied (65.4%) and one-third renter occupied (34.6%). These percent-ages mark a modest decrease of 3.3% in owner occupancy housing rates from 2000 figures.
A small portion of the housing stock (99 units) in the City was vacant at the time of the 2017 ACS, an increase of 19 units over 2000. Housing vacancy rates are indica-tive of local housing market conditions. Generally, a 5% vacancy rate is considered necessary to provide an adequate housing selection and to keep home prices from rising faster than inflation. Vacancy rates below 5% indicate a restricted housing market. Based on the 6.3% vacancy rate found in the City of Durand at the time of 2017 U.S. American Community Survey, the supply of housing appears to exceed the rate needed to meet the sale or rental needs of the current local population.
Table 12: Housing Occupancy and Tenure: 2017
Place
Total Housing
Units
Owner-Occupied Housing
Units
Renter-Occupied Housing
Units
Vacant Housing
UnitsCity of Durand 1,568 960 509 99
Shiawassee CountyCorunna 1,444 695 667 82Perry 961 533 361 67
Genesee CountyLinden 1,540 1,174 302 64
Shiawassee County 30,240 20,898 6,725 2,617Michigan 4,568,200 2,760,156 1,128,490 679,5542017 US Census ACS - DP04
Table 11: Housing Occupancy: 1990-20171990 2000 2017
Occupied Housing Units 1,488 1,481 1469
Owner-Occupied Housing Units 958 1,018 960Renter-Occupied Housing Units 530 463 509
1990, 2000 US Census - SF1, 2017 US Census ACS - DP04

D U R A N D M A S T E R P L A N
66
housing vAlues
Concurrent with the boom in residential housing construction beginning in the 1950’s, the dream of home ownership became a reality for many American house-holds. As illustrated in Table 13, the bulk of owner-occupied home values ranged between $50,000 and $150,000 as illustrated in the 2017 U.S. American Commu-nity Survey. Just 4.4% of owner-occupied homes in the City were identified with a value greater than $150,000. The distribution of dwelling units by value found in City of the Durand is somewhat similar to both the cities of Perry and Corunna, but values were higher for the City of Linden.
The median contract rent for Durand was $687, which is lower than that of the surrounding communities and Shiawassee County as a whole; 20.8% of the renter occupied units in the City have a contract rent less than $500. Surrounding peer communities average 19.7% of contract rents under $500, 19.1% for Shiawassee County as a whole, and 13.1% for the State of Michigan.
Table 13: Housing Values: 2017Owner-Occupied
PlaceSpecified
UnitsLess than $50,000
$50,000 to $99,999
$100,000 to $149,999
$150,000 to $199,999
$200,000 to $299,999
$300,000 to $499,999
$500,000 to $999,999
$1,000,000 or more
Median (dollars)
City of Durand 960 221 558 139 22 20 0 0 0 63,800
Shiawassee CountyCorunna 695 51 386 160 45 43 0 10 0 84,200Perry 533 38 301 132 53 4 5 0 0 88,200
Genesee CountyLinden 1,174 108 267 248 331 192 21 6 0 143,800
Shiawassee County 20,898 2,357 6,715 5,158 3,426 2,226 720 218 78 111,000Michigan 2,760,156 392,550 593,012 524,665 450,723 437,614 263,609 80,189 17,794 136,400
Renter-Occupied
PlaceSpecified
Units Less than $500 $500 to $999$1,000 to
$1,499$1,500 to
$1,999 $2,000 or moreMedian (dollars)
City of Durand 499 104 360 29 0 6 687
Shiawassee CountyCorunna 639 97 501 41 0 0 774Perry 361 99 237 25 0 0 690
Genesee CountyLinden 302 61 124 82 0 0 758
Shiawassee County 6,272 1,196 4,132 841 53 27 705Michigan 1,067,206 139,806 603,601 246,120 52,018 25,661 8242017 US Census ACS - DP04

ECONOMIC PROFILE

This Page Left Intentionally Blank

D U R A N D M A S T E R P L A N
69
ECONOMIC PROFILEThe economic strength of the City of Durand is related to the number and type of employment opportunities in the labor market area, as well as the level of educa-tional attainment by its residents. Within a labor market area, some communities’ function as major employment centers while others serve primarily as residential communities. According to the U.S. American Community Survey, 1,412 City of Durand residents sixteen years of age and older were employed in 2017. The fol-lowing text identifies educational attainment levels, which industries employ City of Durand residents, what positions are held, and the wages earned.
educAtionAl AttAinment
Data in Table 14 shows the educational attainment of the residents of the City of Durand, surrounding communities, Shiawassee County, and the State of Michigan. As illustrated, the City of Durand has a higher percentage value for high school graduation levels when compared to the other communities; however, the City of Durand has a significantly lower percentage of persons with a Bachelor’s degree at 5.3% compared to surrounding communities and Shiawassee County.
Table 14: Educational Attainment: 2017
Place
Population 25 Years and
Over
High School Graduate (includes
equivalency)
% of Population 25 Years and
OverBachelor's Degree
% of Population 25 Years and
OverCity of Durand 2,448 1,011 41.3% 129 5.3%
Shiawassee CountyCorunna 2,333 820 35.1% 242 10.4%Perry 1,298 434 33.4% 134 10.3%
Genesee CountyLinden 2,628 917 34.9% 500 19.0%
Shiawassee County 27,636 17,721 64.1% 5,027 18.2%Michigan 6,719,972 1,966,110 29.3% 1,147,842 17.1%2017 US Census ACS - DP02

D U R A N D M A S T E R P L A N
70
emPloyment by occuPAtion And industry
Employment by Occupation and Employment by Industry are two related, yet in-dividually significant indicators of community welfare. Employment by Occupation describes the trades and professions in which City residents are employed, such as a manager or salesperson. Employment by Industry quantifies in what field that manager or sales person may be working. For instance, two sales persons may be present in the “Sales and Office Occupations” category of the Employment by Oc-cupation table, but may be employed in two different fields. That is, a sales person in the manufacturing industry and a sales person in the real estate trade would be categorized within those different classifications in the Employment by Industry table.
Employment by Occupation for the City of Durand, and surrounding areas is de-tailed in Table 15. The City has the lowest percentage of management, business, science and the arts of all surrounding cities, the county, and the state while it is the second highest in sales and office occupations behind Corunna when compared to all surrounding cities, County, and State. In production, transportation, and material moving occupations, the City is comparable to Corunna and the County. This shift is significant in that the City was extremely similar in occupation of its residents as compared to the surrounding communities in the year 2000.
Table 15: Employment by Occupation: 2017
Place
Employed civilian
population 16 years and over
Management, business,
science, and arts
occupationsService
occupationsSales and office
occupations
Natural resources,
construction, and
maintenance occupations
Production, transportation,
and material moving
occupationsCity of Durand 1,412 282 278 370 196 286
Shiawassee CountyCorunna 1,410 373 207 391 148 291Perry 907 280 120 155 190 162
Genesee CountyLinden 1,584 509 375 287 159 229
Shiawassee County 30,786 8,605 5,138 7,016 3,822 6,205Michigan 4,524,874 1,612,577 803,485 1,039,958 356,023 712,8312017 US Census ACS - DP03

D U R A N D M A S T E R P L A N
71
Employment by Industry for the City of Durand and surrounding areas is detailed in Table 16. In most cases, the City is similar in the industry of employment of its residents to those of surrounding communities. However, the U.S. American Com-munity Survey indicates the manufacturing, retail trade, and transportation and warehousing, and utilities industry classifications as being higher for Durand resi-dents than the other comparable communities. Durand residents were employed in lower than the surrounding community percentages in finance, professional, and other services industries.
Table 16: Employment by Industry: 2017Genesee County
Industry City of Durand Corunna Perry LindenShiawassee
County MichiganAgriculture, forestry, fishing and hunting, and mining 14 49 6 6 654 54,586
Construction 130 67 167 148 2,660 228,820
Manufacturing 246 221 146 266 5,601 831,697
Wholesale trade 14 38 27 58 575 108,481
Retail trade 330 240 43 101 4,094 504,181
Transportation and warehousing, and utilities 93 41 24 38 1,427 191,670
Information 27 26 12 8 498 70,046
Finance, insurance, real estate, and rental and leasing 24 53 51 79 1,283 248,678
Professional, scientific, management, administrative, and waste management services 67 75 78 113 2,073 428,576
Educational, health and social services 297 368 246 469 6,611 1,063,347
Arts, entertainment, recreation, accommodation and food services 75 57 42 156 2,190 426,583
Other services (except public administration) 59 109 27 142 1,643 211,081
Public administration 36 66 38 0 1,477 156,8582017 US Census ACS - DP03
Shiawassee County

D U R A N D M A S T E R P L A N
72
income chArActeristics
The data presented in Table 17 describes the income characteristics for the resi-dents of the City of Durand. Data for nearby communities, Shiawassee County, and the State of Michigan are also provided for comparison purposes.
This table describes the median household, median family, and per capita incomes, as well as the percent of persons below the poverty line. A household is defined as all the persons who occupy a dwelling unit. Thus, a household may be one person living alone, two roommates, or a married couple with children. A family is defined, as might be expected, as a householder and one or more other persons living in the same dwelling unit who are related by blood, marriage, or adoption.
In the 2017 U.S. American Community Survey, the City of Durand reported the lowest median household income and second lowest median family income and per capita incomes, just slightly above Corunna. These values were also lower than those for Shiawassee County and the State as a whole. Per capita income, how-ever, was higher for residents in the City of Durand than the city of Corunna while nearly equal to Perry but still lower than the County and State.
Table 17 also details the percentage of persons below the poverty level (of all indi-viduals for whom poverty status was determined) for the City of Durand, surround-ing communities, Shiawassee County, and the State of Michigan. In general, the data indicates that the City has a higher concentration of persons living in poverty when compared to all but one neighboring community, the city of Corunna. Unfor-tunately, due to the continued impacts of the Great Recession, the percentage of persons falling below the poverty level has increased for all areas and specifically by 3.2% for the City of Durand since 2000, which was the highest increase for all communities included in the list.
Table 17: Income and Poverty: 1989*-2017
1989 1999 2017 1989 1999 2017 1989 1999 2017 1989 1999 2017City of Durand 26,868$ 36,563$ 37,765$ 32,869$ 43,306$ 48,925$ 11,401$ 17,273$ $23,461 16.1% 11.3% 14.5%
Shiawassee CountyCorunna 24,784$ 29,831$ 39,077$ 30,521$ 41,705$ 47,115$ 10,724$ 17,053$ $22,373 9.4% 12.0% 14.8%Perry 30,750$ 45,179$ 43,603$ 33,494$ 48,977$ 55,313$ 10,823$ 16,769$ $23,534 12.1% 5.7% 7.8%
Genesee CountyLinden 38,125$ 50,932$ 62,380$ 42,937$ 57,798$ 76,968$ 16,014$ 23,620$ $30,589 7.5% 4.6% 5.7%
Shiawassee County 30,283$ 42,553$ 50,967$ 34,557$ 49,329$ 61,467$ 12,244$ 19,229$ $25,218 10.6% 7.8% 9.8%Michigan 31,020$ 44,667$ 52,668$ 36,652$ 53,457$ 66,653$ 14,154$ 22,168$ $28,938 13.1% 10.5% 10.9%**All individuals for whom poverty status is determined/percent below poverty level1990, 2000 US Census - SF3, 2017 US Census ACS - DP03
Median Household Income Median Family Income Per Capita Income Poverty Level**

D U R A N D M A S T E R P L A N
73
stAte equAlized vAlue
One indicator of the economic strength of a community is the State Equalized Value (SEV) of property. According to Michigan law, the SEV is equal to approximately one-half of the true market value of real property and certain taxable personal property. The taxable value is used for computation of the tax basis for a commu-nity and incorporates any increases or decreases in value associated with annual reassessments with increases limited to the rate of inflation or 5%, whichever is lower.
Historical Data
As illustrated in Table 18, the 2019 state equalized value (SEV) of real prop-erty in the City of Durand was $67,254,730. Relative values have increased only $5,100,000 since the year 2000, and the percentage value of the total real property for each category has remained somewhat constant with commercial percentage of the overall increasing modestly since 2000.
The alarming issue is that City’s Total Real SEV is only $5,100,000 over the City’s 2000 number. Prior to the Great Recession, the City’s SEV had increased in 2005 to over $85,600,000 where it declined to a low of $58,900,000 by 2015. These totals do not reflect inflation so the negative impacts on City revenues are even greater. Since 2015, the City’s SEV has increased $8,400,000, but the increase in taxes col-lected that are associated with these increased values are constrained by Michi-gan’s Headlee Amendment. Because of this amendment, only a small portion of the increase in SEV is actually reflected in increased tax revenues for the City.
Table 18: State Equalized Value (SEV) - Real Property 2000-2019Year Place Total Real
% of % of % of % of % of SEV Total SEV Total SEV Total SEV Total SEV Total SEV
2000 City of Durand 0 0.0% 15,486,720 24.9% 2,087,110 3.4% 44,609,940 71.7% 0 0.0% 62,183,770Shiawassee County 213,313,400 15.5% 128,692,920 9.3% 26,109,410 1.9% 1,012,072,340 73.3% 0 0.0% 1,380,188,070
2005 City of Durand 0 0.0% 21,360,600 25.0% 2,184,100 2.6% 62,042,570 72.5% 0 0.0% 85,587,270Shiawassee County 366,982,150 17.1% 208,709,900 9.7% 34,596,200 1.6% 1,536,180,820 71.6% 0 0.0% 2,146,469,070
2010 City of Durand 0 0.0% 26,547,170 32.4% 2,287,330 2.8% 53,204,670 64.9% 0 0.0% 82,039,170Shiawassee County 385,635,500 19.0% 213,086,970 10.5% 31,701,830 1.6% 1,394,590,770 68.9% 0 0.0% 2,025,015,070
2015 City of Durand 0 0.0% 18,309,950 31.1% 2,469,400 4.2% 38,077,600 64.7% 0 0.0% 58,856,950Shiawassee County 436,091,924 23.8% 175,012,870 9.5% 27,779,000 1.5% 1,196,266,787 65.2% 0 0.0% 1,835,150,581
2019 City of Durand 0 0.0% 18,080,200 26.9% 2,469,400 3.7% 46,705,130 69.4% 0 0.0% 67,254,730Shiawassee County 566,249,100 24.5% 207,668,850 9.0% 37,658,600 1.6% 1,500,403,085 64.9% 0 0.0% 2,311,979,635
Shiawassee County, July 2004; City of Durand, January 2020
Agriculture Commercial Industrial Residential Developmental

D U R A N D M A S T E R P L A N
74
SEV Comparison
In comparison between the City and Shiawassee County, the County has fared much better than the City since 2000. The County’s SEV has increased by $931,800,000, a 67.5% increase while compared to the City’s only increase by 8.2% during the same 19 year period. The County’s agricultural SEV increased by over $353,000,000 from $212,300,000 in 2000 to $566,249,100 while the commercial SEV increased by approximately 60% during the same period while the other cat-egories grew by about 50%. In the case of the City, growth rate for each category averaged between 4.7% and 18.3%. Without the significant increases in agricultural and commercial SEVs, the County however would not have fared as well coming out of the Great Recession as it has.

HOUSING ASSESSMENT

This Page Left Intentionally Blank

D U R A N D M A S T E R P L A N
77
HOUSING ASSESSMENTThe structural quality of a City’s housing stock is a prime indicator of property value, a sign of the overall condition of the City and perhaps one of the most important factors affecting the aesthetics of the area. Deteriorating homes tend to encourage a “domino effect,” propagating additional decline in those homes and buildings that surround them. In cities where significant numbers of deteriorat-ing homes are present, the improvement of residential structural quality should become a primary concern.
In addition to the community-wide impacts of a deteriorating housing stock, this condition can also have a severe impact on the city’s ability to sustain its popula-tion and attract new residents. This survey quantifies deterioration of the housing stock in the City of Durand, and will provide the data and background necessary to pursue programs that will help to begin the renovation process.
survey methodology
In order to determine city-wide structural quality, a basic “windshield survey” was completed in the summer of 2004. This survey was conducted through a cursory examination of the exterior of each single-family residential structure. The proj-ect team looked at a variety of structural elements, including, but not limited to: roof, walls, foundation, windows, doors, porches and steps, chimneys, and lighting when applicable, and assessed each on its own merit. Updating this survey was not included in the work items for the 2020 Master Plan Update.
evAluAtion criteriA And structurAl clAssificAtions
The condition of each structural element was analyzed and specific defects were recorded. Significant or threatening structural defects, such as a sagging roofline or bowed walls, were noted as major structural defects. Less critical defects, such as cracks in walls or deteriorating windows and doors, were noted as minor structural defects.
For each structure, the number of major and minor structural defects were noted. This information was compiled to determine which of three categories each resi-dential structure should be classified. The following classification system was used:
1. Those buildings with no major structural defect and less than five minor structural defects were entered as Standard Structural Quality
2. For buildings with a single major structural defect or more than five minor structural defects, a classification of Deteriorating Structural Quality was recorded
Residential homes near downtown

D U R A N D M A S T E R P L A N
78
3. Those buildings suffering from two or more major structural defects or one major structural defect and five or more minor structural defects, was noted as having Substandard Structural Quality.
residentiAl structurAl quAlity AnAlysis
For the purposes of understanding area-wide trends, and identifying those blocks and sections of the City suffering from the highest levels of structural degradation, the results of the structural quality survey were applied to the Housing Condition Map in units of blocks, rather than individual parcels. The map looks only at the percentage of homes within each block that are characterized as being either in de-teriorated or substandard condition, as those structures and blocks have the most prominent impact on the City of Durand as a whole and are in need of immediate attention. This step is crucial to gaining an understanding of area trends, and pro-viding the information necessary to act to offset the impact a single deteriorated structure may have on a street or block.
City of Durand Residential Structural Quality Survey Checklist
Major Structural Defects Minor Structural Defects
Roof Roof
Sagging/missing materials/holes Less critical sagging/missing over larger area (>25%) of roof ____ materials over small area (<25%) ____
Walls Walls
Bowed walls/holes or missing Holes/open cracks/missing material over large area (>25%) ____ materials over small area (<25%)
chipping paint ____
Foundation Foundation
Lack of proper foundation/ Holes/open cracks, rotted or foundation walls out of plumb/ missing materials over small holes or missing materials area (<25%) ____ over large area (>25%) ____
Windows/Doors
Loose, rotted, frames and sills out of plumb/missing, broken panes. Lacking storms and screens ____
Porches/Steps/Eaves/Troughs and Downspouts
Rotted, worn, missing material, sagging or out of plumb, or pulling away from building ____
Chimney/Flue
Out of plumb, sagging, visible cracks, or loose missing masonry units ____
Porch Light
Missing/broken fixture ____
Total Major Defects ____ Total Minor Defects ____
Assessment
___ Standard: 0 major structural defects and less than 5 minor structural defects ___ Deteriorating: 1 major or 5 or more minor structural defects ___ Substandard: 2 or more major or 1 major + 5 or more minor structural defects

D U R A N D M A S T E R P L A N
79
The deteriorated and substandard structures for each block were tabulated and analyzed, and each block was then assigned a classification in the map legend. Separate categories were established to indicate the percentage of deteriorated or substandard homes on each block. For instance, if only one out of 20 homes on a specific block was classified as deteriorated or substandard, then only 5% of the homes on the block are classified as substandard, earning that block the lowest classification. The categories for the analysis are as follows:
• Less than 15% of the homes on the block are classified as substandard• Between 15% and 25% of the homes on the block are classified as substan-
dard• Between 25% and 35% of the homes on the block are classified as substan-
dard• Between 35% and 45% of the homes on the block are classified as substan-
dard• More than 45% of the homes on the block are classified as substandard
While some of the blocks in the City may suffer from some deteriorating structures, it is those blocks whose housing stock is comprised of greater than 45% deteriorat-ing structures that are in the most immediate need of assistance. A copy of the Housing Condition Map is attached at the end of this document.
Results and Conclusions
There are a total of 120 blocks containing single-family residential structures in the City of Durand. The blocks vary in size and density, ranging from small and nearly vacant to larger and built-out. While there are some deteriorating structures pres-ent throughout the City, there are clear concentrations of housing stocks at risk.
The highest concentrations of declining housing stock are generally centered on or near the railway lines bisecting the City. This result will likely have some correlation to the age of the housing stock with most of the City’s newer housing stock located further from the downtown core. Of the eight blocks categorized as having greater than 45% of substandard or deteriorating structures, four are directly adjacent to rail lines. Those areas located furthest from the railroads have the least amount of deterioration. In the Northeast quadrant of the City, for example, only two of the 56 blocks are categorized as having more than 45% substandard or deteriorating structures. The vast majority of blocks in this location have less than 15% of the homes identified as substandard, the lowest category in the study.
House on Main Street near Holmes Street
Houses east of downtown

D U R A N D M A S T E R P L A N
80
Of the 120 blocks studied and documented, categorization was distributed as fol-lows:
• 67 blocks, or 55.8%, were classified as having less than 15% of their homes categorized as deteriorating or substandard
• 18 blocks, or 15.0%, were classified as having between 15% and 25% of their homes categorized as deteriorating or substandard
• 21 blocks, or 17.5%, were classified as having between 25% and 35% of their homes categorized as deteriorating or substandard
• 6 blocks, or 5.0%, were classified as having between 35% and 45% of their homes categorized as deteriorating or substandard
• 8 blocks, or 6.7%, were classified as having more than 45% of their homes categorized as deteriorating or substandard

DEVELOPMENT NEEDS

This Page Left Intentionally Blank

D U R A N D M A S T E R P L A N
83
DEVELOPMENT NEEDSFuture land use decisions within the City of Durand should be couched with a sound understanding of potential markets within the community. An examination of these existing and prospective markets for residential, commercial, and indus-trial land uses will assist in forecasting possible demand. The City can then respond accordingly in the development of the Future Land Use Map.
To better understand current development opportunities, Table 1 details vacant properties within the City and their zoning designations. In addition, the Redevel-opment Ready Parcels Map outlines the locations of several of these properties. To determine the appropriate recommendations for a mix of land uses, the following analysis will be based upon data collected in our 2019 existing land use survey and historic figures provided by the Urban Land Institute.
residentiAl needs
Residential land uses, including single-family and multiple-family units, currently comprise 26.2% of the total acreage in the City of Durand.
A variety of factors weigh in on current housing trends. Typically, in American communities, households are getting smaller. Today’s families are not having as many children and the senior population is rising as the baby boomer generation is approaching retirement age. The combination of these factors is beginning to have an impact on the demand for housing throughout society, and the City of Durand is no exception. A typical goal of a future land use plan, with respect to housing, is to promote the diversity of lot sizes, housing types, and housing prices. This diver-sity will help to ensure that current and prospective residents have home choices within the City, favorable to their changing economic situation.
Data in Population Projections section describes the projected changes to popu-lation, persons per household, and housing stock through 2045. The Population Profile of the City of Durand predicts that the City’s 2020 population to be approxi-mately 3,124 people. Based on this analysis, it is anticipated that new housing will be necessary to address the aging community members.
In addition to estimating the changes in population and household size, it is crucial to calculate how much of the total housing stock will be vacant, for sale, or rent. According to the Urban Land Institute (ULI), generally 5% of a community’s habit-able housing stock should remain vacant to provide diversity in housing selection, permit housing rehabilitation, or replacement activities. Vacancy rates at or near the recommended 5% ensure that asking prices for housing are indicative of actual market conditions, while protecting private investment. Vacancy rates below 5% demonstrate a restricted housing environment, affording little opportunity for
Housing near downtown

D U R A N D M A S T E R P L A N
84
potential households to be absorbed by available units. The U.S. American Com-munity Survey reports vacancy rate for the City of Durand at 6.3%.
Between 2005 and 2019, three new single family residential units were built within the City. In 2010, the former high school was converted into 40 one and two bed-room senior apartments.
Existing residential land uses comprise 299.7 acres of the City, or 26.2% of the land area and a four acre increase from 2000. Currently, a total of 394.1 acres of land within the City of Durand are classified as vacant, a decrease of 7 acres since 2000. Significant portions of this vacant land are identified for industrial develop-ment, but there are undeveloped residential areas existing within the southern and northwestern quadrants of the City too. In addition, the Master Plan Future Land Use map identifies areas adjacent to the City that are within the planning study area for additional residential development. Over the term of this plan, the Mixed Use categories are also expected to provide additional residential units. All of these lands would meet the potential future housing needs brought about by continued decrease in household size, desire for new larger housing, and any unanticipated future population growth.
commerciAl needs
Commercial uses dictate or significantly impact transportation patterns, residential development patterns, employment levels, and tax base. Commercial develop-ment is also an essential element of a city’s economic base. Commercial establish-ments provide goods and services to consumers, promote economic stability, and generally enhance the quality of life for area residents. However, if commercial dis-tricts are not suitably located, and carefully planned, they can become a disruptive element that ultimately detracts from the larger community. The following analysis details the existing commercial base found in the City of Durand and calculates the likely amount of commercial land that will be consumed by the end of the planning period according to commercial land use standards.
Commercial Land Use Standards
There are many factors that dictate selec-tion of sites for commercial development. In many cases, they respond to preexisting conditions, such as the location of other large retail centers, industrial or residential development, primary transportation cor-ridors or within central business districts. Communities, however, have an important opportunity through the planning process to direct commercial development and concen-trate it in those areas most suited for new development or redevelopment. The criteria included within the adjacent text box pro-vides are some of the primary methods by which commercial developers select sites.

D U R A N D M A S T E R P L A N
85
Also, there are three primary types of shop-ping environments: the neighborhood center, community center, and regional center. The standards associated with each center are presented to the right.
Based on the typical shopping center selection criteria and standards, as well as the current and projected populations and geographic size, the City of Durand can support one such neighborhood shopping center. Many of the other neighborhood service needs could be met by the continued redevelopment and retail focus of the downtown Durand commercial area.
Existing Commercial Base
Currently, 55.7 acres, or 4.9% of the total land area of the City of Durand is used for commercial development.
It is important to note that commercial uses come in a variety of shapes, sizes, and locales from the large mega-malls down to the local corner convenience stores. In addition, not all commercial uses are sited within preplanned shopping centers. Special attention must be given to those uses that are freestanding, independent structures, or which are part of “strip centers”. Some commercial enterprises rely on passerby traffic, like those uses that are often considered highway-oriented businesses, since much of their trade results from exposure and accessibility to passing motorists. While others are more destination-based like a specialty store or a functioning traditional downtown commercial area.
Downtown mixed use commercial

D U R A N D M A S T E R P L A N
86
Data in Table 19 presents market base standards for many of the typi-cal commercial uses found within a city such as food stores, restau-rants, real estate offices, service stations, and hardware stores. With regards to this type of commercial development, the City of Durand has maximized its possible commer-cial capacity in terms of its existing population base.
However, it is important to under-stand that many of the commercial and retail uses established within the City of Durand draw custom-ers from the surrounding area. As identified by the Typical Shopping Center Standards, the present population base of Durand would not support many of the com-mercial properties that currently exist. An example of this would be the existence of two nurseries (each requiring a population base of 16,200 people). The largess of commercial development found within the municipal boundaries proves that more than just the City’s own popula-tion supports the businesses of Durand. However, this assessment should be tem-pered with the realization that traditional retailing is being impacted by changes in American shopping habits including a greater reliance upon on-line shopping and delivery services.
To further establish Durand as a commercial destination area, the City commis-sioned a Downtown Economic Enhancement Strategy which details Durand’s mar-ket draw outside of municipal boundaries.
Table 19: Representative Commercial Uses Enterprized by Type
Business CategoryNeeded Population
Base
Possible
EstablishmentsCurrent Number of
City Establishments DeficiencyFood Stores 4,000 0 2 -2Drug Stores 9,000 0 2 -2Liquor Stores 3,100 1 2 -1Restaurants & Taverns varies 15 -15Laundries (coin-operated) 12,400a 0 1 -1Dry Cleaners 3,000 1 1 0Beauty shops 2,100 1 4 -3Barber Shops 3,300 1 2 -1Television Repair 5,300 0 0 0Branch Banks 4,500 0 3 -3Nurseries 16,200 0 2 -2Travel Agencies varies 0 0Women’s Apparel Stores 6,000 0 2 -2Sporting-Goods Stores 18,000 0 0 0Books & Stationary 6,500 0 1 -1Furniture & Home Furnishings 6,200 0 1 -1Camera Stores 55,100 0 1 -1Automotive Service Stations 2,800 1 5 -4Hardware, Paint & Building Supply 8,700 0 2 -2Convention Hotels b 0 0Bowling Alleys & Billiard Parlors c 0 0
City of Durand Population: 3,933aFigure is approximate, depending on whether residents have their own machinesbNot applicable; does not depend on residential populationcCurrent figures not available. Popularity is declining.(adapted from Darley Gobar Associates)

D U R A N D M A S T E R P L A N
87
city of durAnd doWntoWn economic enhAncement strAtegy
The City of Durand’s Downtown Economic Enhancement Strategy is a five part document which details existing conditions, in terms of community assets and areas of activity; assesses the City’s place in the larger regional economic market; and, makes recommendations as to how the City may take advantage of its regional draw. The results of the Downtown Economic Enhancement Strategy were outside of the scope of the 2019 Master Plan Update and only minor edits have been made to this section to address broad changes in urban development patterns. A 2020 Redevelopment Strategy has been prepared that meets the Michigan Economic Development Corporation’s requirements for the selection of the Redevelopment Ready Sites program.
The Enhancement Strategy report differs from this Chapter in that it defines the City’s market economy in terms of primary and secondary trade areas which, as economic entities, pay no attention to municipal boundaries. This Chapter, on the other hand, outlines potential commercial needs only within the confines of the current and projected population base of Durand. As established by both the outcomes presented in this Chapter and the Enhancement Strategy report, Durand is realizing its beginnings as a commercial destination. Some of the opportunities outlined in the Enhancement report to capitalize on this opportunity include, but are not limited to, maintaining and enhancing the City’s existing historical down-town core, restoring and preserving important views from the historical Depot, providing better access to the downtown through the improvement of “gateways”, and developing some “destination branding.”
Downtown Economic Enhancement Strategy

D U R A N D M A S T E R P L A N
88
office needs
The pattern of office development in metropolitan areas has changed dramatically since the turn-of-the-century. Prior to 2000, office development had shifted away from a focus on downtown areas to a more regional “multiple-nuclei” structure of competing centers. For example, in the Detroit metropolitan region the Cities of Auburn Hills and Troy represented prestigious locations that captured new office development; however, a back-to-the-city movement has been underway since the Millennium with demand for office space increasing in Downtown districts faster than suburban and exurban office parks.
The reasons for this transformation vary. In the previous three decades prior to 2000, development followed the out-migration of population away from city centers. Devel-opers sought less expensive building sites, which offered regional accessibility and on-site parking convenience for tenants. It also reflected a meeting of unmet demand, as Durand’s local economy shifted away from a manufactur-ing-base economy to a service-oriented economy. Due to this changing face of office development, the City of Durand is suited to encourage office growth. Its location along the primary transportation route (Interstate 69) con-necting Flint and Lansing and its emerging market draw potential, demonstrates an ability to support this type of development.
Since 2000, there has been a resurgence of office uses locating in traditional downtowns. Younger adults, at much higher rates than their parents, desire to live and work in downtowns where the need for cars are lessened and a variety of services are conveniently located within easy walking distances. This “back-to-the-city” move-ment is taking place in larger and smaller cities all across the United States.
Not unlike commercial growth, there are a set of very specific standards that make sites of various sizes and locations desirable to potential office markets. The Office Location Factors outlined above illustrates some of these criteria.
Data in Table 20 also documents the population base necessary to support dif-ferent types of office development (doctors, real estate, accounting, legal offices, etc.). As with traditional commercial development, office development needs have maximized their possible capacity in the City of Durand based on existing popula-tion. However, as stated previously, Durand appears to be functioning as a more regional market serving rural areas outside of the City’s boundaries. This conclusion is further supported by the development of more office establishments than would be needed solely for the City’s own population base.
Table 20: Representative Office Uses Enterprized by Type
Business CategoryNeeded
Population BaseCurrent Number of
City EstablishmentsReal-Estate Offices n/a 1Accounting Offices n/a 2Doctors Offices 1,000 4Legal Offices 6,000 1Stock-Brokerage Offices 15,000 1
City of Durand Population: 3,933(adapted from Darley Gobar Associates)

D U R A N D M A S T E R P L A N
89
industriAl needs
There are 47.0 acres, or 4.1%, of the City cur-rently in use for industrial purposes, a slight decrease since 2000.
The quantity of developed industrial land a community will need in the future is dependent upon its current employment base, infrastruc-ture capacity, local political philosophy, as well as a myriad of other factors industries consider when choosing a location for a new facility. The following information will summarize three methodologies commonly used in estimat-ing future industrial land area needs based on population, land use, and employment density ratios. These methodologies are exclusive of any local determining factors, such as geograph-ic location, existing facilities, transportation access, municipal initiative, etc.
The first method, Population Ratios, represents acreage requirements as a proportion of the total population. Data in the Table 21 indicates that a total of 12 acres of industrial land are required for every 1,000 people. The City’s projected population in the year 2020 of 4,221 persons would therefore, require 50.7 acres of industrial land. City industrial acreage currently totals 49.0 acres, demonstrating a need for an additional 1.7 acres. The standard then contin-ues to break down this requirement by light and heavy industry. The majority of the industrial development in Durand is in the light industrial category, at a current total of 31.4 acres. The Population Ratio method determines that this industrial type only requires two acres per 1,000 population or a total of 8.4 acres for the City of Durand. When examining the current 31.46 acres of developed light industrial lands, the City has more than the recommended amount of this type of develop-ment. However, according to this methodology, 42.2 acres of heavy industry would be needed by 2020, constituting an additional 24.6 acres to what is presently in use (17.6 acres). The resulting acreage totals therefore imply the potential for a rearrangement of industrial use types almost entirely within the existing industrial acreage.
Table 21: Population Ratios for Estimating Industrial Land UseCategory Ratio
Total gross land requirement for all industry: 12 acres/1,000 populationLand requirements for light industry: 2 acres/1,000 populationLand requirements for heavy industry: 10 acres/1,000 populationJoseph DeChiara and Lee Kopplemand, Planning Design Criteria.

D U R A N D M A S T E R P L A N
90
Estimating needed acreages of industrial land use can also be accomplished by employing Land Use Ratios. By surveying the amount of land devoted to industrial uses in other communities, an average can be calculated and used as a stan-dard for planning purposes. Using this standard, as seen in Table 22, 8% of the City’s land area should be utilized for indus-trial development. This equates to ap-proximately 90.7 acres, or an additional 41.7 acres of industrial land. Through a comparison of the Existing Land Use Map and the City’s Zoning Map, it was determined that approximately 58 acres of land is currently vacant and zoned industrial. This available acreage could accommodate these greater industrial projections. However, it should be noted that this 8% value is valid for a city population of up to 42,000 people, which is much larger than even the projected population for Durand.
The most specific means of determining future aggregate industrial land use need is achieved through the application of Employment/Density Ratios. This methodol-ogy requires extensive, business specific, employment data records, as well as total employment data over time. The ratios of employees per acre per industry site are calculated, and then all ratios of each industry type are averaged. The value produced is the average number of employees per net site acre. This procedure is repeated over time (usually in ten year increments). The increase in employment over a specified time period, divided by the density equivalent for the industry group, equals the amount of land that is required to meet the new (industrial) employment needs. In simpler terms, this ratio compares employment density trends overtime in order to project future needs. Due to the extensive scope of this estimation procedure, the aggregate employment by industry values were derived from the U.S. Department of Labor: Bureau of Labor Statistics values and applied to the above procedure. By this process, the City of Durand would need approximate-ly 1.02 acres of additional industrial development by the year 2020. This aggregate value, however, does not delineate between light and heavy industrial use types.
Presently, only 49 acres of City property is utilized for industrial purposes. There are however, 58.0 acres of vacant land currently zoned for industrial uses. Depend-ing upon the industrial land use methodology chosen, most seem to demonstrate a slight need for industrial growth (1.02-41.7 acres). This estimated future need, however, is satisfied by the current industrially zoned vacant properties within the City.
Table 22: Community Size for Estimating Industrial Land Use
Community SizePercent Industrial
Land CoverageSmall Cities and Towns (under 42,000 people) 8%Large Cities (over 200,000 people) 12%American Planning Association, PAS Memo: Land Use Ratios , May 1983.
Table 23: Employment/Density Ratios for Estimating Land Use
2000 Existing Industrial Acreage
Employment 2000
Employment Density
Employee/Acre2020
EmploymentaEstimated
Additional Acreage49.00 1,733.00 35.37 1,756.05 1.02
Urban Land Institute, Industrial Development Handbook
a Analysis by Wade-Trim (average rate of change over 3 decade time period - Derived from US Department of Labor: Bureau of Labor Statistics (employment projections). www.bls.gov/emp/home.htm#data. October 2004

D U R A N D M A S T E R P L A N
91
PROPERTY TAX BASE AND FUTURE DEVELOPMENTProperty taxes, which are imposed on the value of homes and businesses, are the revenue that pays for local government and the service government provides. Benefits like police and fire protection, roads and sidewalks, water and sewer lines to name just a few. However, communities often struggle with the ability to provide these services without the continued increase of property taxes. This can be espe-cially true for financially struggling older legacy cities that suffer from tax base and population loss and those bedroom communities that experience only residential development.
While there is no ideal mix between residential and business development, the taxes generated from commercial and industrial properties often comprise as much as half of the cost to provide services to a community. An on-going 20-year study, referenced by the American Planning Association (APA) and conducted by the American Farmland Trust, details the importance of Cost of Community Services (COCS) studies when analyzing land use choices.
COCS studies are a case study approach used to determine the fiscal contribution of existing local land uses. A subset of the much larger field of fiscal analysis, COCS studies have emerged as an inexpensive and reliable tool to measure direct fiscal relationships. COCS studies are a snapshot in time of costs versus revenues for each type of land use. They do provide a baseline of current information to help local officials and citizens make informed land use and policy decisions.
During the study’s 20-year period, 102 communities in 22 states have been as-sessed using the COCS methodology. From this statistical population median, COCS results have been determined. The cost of providing services to commercial and industrial developments yields $0.28 for every dollar of revenue (taxes) raised. However, residential development required $1.15 for that same dollar raised in revenue. In many Michigan communities, residential development can cost up to $1.50 for every dollar in provided services.
Businesses also pay taxes on personal property, as well as real property. Taxes are assessed on equipment needed to run the business, which increases the overall tax base of the community. Without the development of offices, retail stores, industrial plants, etc., communities that want to add or improve services are often forced to raise taxes, which can hinge on voter approval. High taxes can function as a disin-centive for locating a family or business within the community.
Downtown district

D U R A N D M A S T E R P L A N
92
According to the existing land use survey conducted in the summer of 2019, the City of Durand had 102.5 acres of developed industrial/commercial property and 299.7 acres of developed residential property. The fact that the City has begun to show poten-tial as a regional destination center will help to spur continued growth of commercial, industrial, and residential development. This may therefore help to provide added income to the City’s tax revenue. The 2003 tax rolls supplied by the City indicate approximately $16.1 million in real property taxes collected for improved commercial/industrial proper-ties and $40.6 million for residential. Real property taxable values were used for this calculation as they are tied to the land use and not personal property. Table 25 outlines the cost to provide services to these proper-ties per the median COCS methodology.
In 2003, it cost the City approximately $6 million more to provide services to the residential taxpayer than was received in revenue. However, this was recouped by the real property tax gained from the commer-cial/industrial taxpayer.
Based on the sum of tax dollars paid and the amount of vacant land still available in the City, we can extrapolate the cost to serve this land if it was developed under the cur-rent City of Durand Zoning Map. Tables 25 and 26 outline approximately how much real property tax could be collected and the cost to provide needed services.
From the review of this information, we can see that the current zoning of the City continues to provide a surplus in real property tax revenue. In fact, the year 2003 percentage of revenue received after deducting the cost to provide services mirrors the City at a built-out state. Based on the median COCS values to provide services, the City retained about 10% of the tax revenue generated, which has allowed them to improve some existing services and create new programs for City residents. The built-out scenario, however, provides just under a 5.5% difference for the contin-ued fiscal health of the City.
Table 24: Cost to Provide Services 2003
Tax RevenueCost to Provide
Services Total 2003 Cost DifferenceIndustrial 1,506,609.00$ 0.28$ 421,850.52$ 1,084,758.48$ Commercial 14,655,386.00$ 0.28$ 4,103,508.08$ 10,551,877.92$
Total 16,161,995.00$ 0.28$ 4,525,358.60$ 11,636,636.40$
Residential 40,577,369.00$ 1.15$ 46,663,974.35$ (6,086,605.35)$
Total 56,739,364.00$ 51,189,332.95$ 5,550,031.05$ City of Durand Treasurers OfficeAnalysis By Wade-Trim
Table 25: Projected Build Out RevenueTotal 2003 Revenue
Developed Acreage
Revenue per Acre
Vacant Acreage
Total Revenue at Built Out
Industrial 1,506,609.00$ 49.00 30,747.12$ 58.00 3,289,942.10$ Commercial 14,655,386.00$ 55.80 262,641.33$ 29.10 22,298,248.59$
Total 16,161,995.00$ 104.80 293,388.45$ 87.10 25,588,190.69$
Residential 40,577,369.00$ 295.70 137,224.79$ 313.80 83,638,506.61$
Total 56,739,364.00$ 109,226,697.31$ City of Durand Treasurers OfficeAnalysis By Wade-Trim
table 26: Projected Cost to Provide Service (Build Out)Total Build Out
RevenueCost to Provide
ServicesTotal Build Out
Cost DifferenceIndustrial 3,289,942.10$ 0.28$ 921,183.79$ 2,368,758.31$ Commercial 22,298,248.59$ 0.28$ 6,243,509.61$ 16,054,738.99$
Total 25,588,190.69$ 7,164,693.39$ 18,423,497.30$
Residential 83,638,506.61$ 1.15$ 96,184,282.61$ (12,545,775.99)$
Total 109,254,142.26$ 103,348,976.00$ 5,877,721.31$ City of Durand Treasurers OfficeAnalysis By Wade-Trim

D U R A N D M A S T E R P L A N
93
The key is for the City of Durand to find the development balance that will support the services needed for continued residential growth without overburdening the revenue generated. Communities pay a high price for unplanned growth. Scattered development frequently causes traffic congestion, air and water pollution, higher costs to provide city services to disbursed sites, loss of open space, and increased demand for costly public services. This is why it is important for citizens and lo-cal leaders to understand the relationships between residential and commercial growth, agricultural land use, conservation, etc., and their community’s bottom line.
One type of land use is not intrinsically better than another, and COCS studies are not meant to judge the overall public good or long-term merits of any land use or taxing structure. It is up to communities to balance goals such as maintaining affordable housing, creating jobs, and conserving land. With good planning, these goals can complement rather than compete with each other. COCS studies give communities another tool to make decisions about their futures.
The City of Durand has been successful in this regard for many years due, in part, to careful land use planning and the tax programs initiated by the City. Recently, the City has implemented some infrastructure and service improvements that have provided a direct benefit to the residents of Durand, for example, some road pav-ing and recreation projects.

D U R A N D M A S T E R P L A N
94
economic develoPment tools
In order to more fully develop the City’s economic potential, the following econom-ic development tools have been put in place.
City of Durand Downtown Development Authority
The City of Durand Downtown Development Authority, or DDA, was established to promote economic development and foster growth for the downtown area. The DDA has been empowered to utilize tax increment financing to generate financial resources to invest in municipal improvement projects that will beautify, modern-ize, and develop this area to encourage new business development, create new civic facilities, and make the downtown a more pedestrian oriented, viable City destination center.
The DDA, as created under State enabling legislation, includes a Development Plan and a Tax Increment Financing Plan. The Development Plan incorporates physical improvements, potentially including, but not limited to, streetscape improvements, signage, wayfinding, pedestrian amenities, and other commercial improvement programs, as well as promotional and operational improvements such as a business development program. It was the DDA that commissioned the Durand Downtown Economic Enhancement Strategy, intended to guide future downtown initiatives. Since 2000, several projects have been successfully accomplished by the DDA in-cluding new streetscape, wayfinding, and pedestrian amenities that have improved the business climate of the downtown.
The Tax Increment Financing Plan for the DDA is a strategy for the funding and implementation of the improvements set forth in the Development Plan. The Tax Increment Financing Plan established procedures for the capture and expenditure of funds for DDA projects and estimates the projected value of captured taxable dollars available to the DDA for the purposes of planning and long range develop-ment.
Downtown Development Authority District

D U R A N D M A S T E R P L A N
95
conclusions
The principals employed to reach the conclusions outlined within this Chapter are based on sound planning practices. The results of which indicate the City has growth potential that could be effectively handled by the available land under the current zoning model. However, we need to look beyond standard techniques, sta-tistics, and projections and view the development potential of the City of Durand practically, but with an optimistic perspective.
The City has begun to position itself as a regional market draw. Its traditional down-town commercial experiences, as well as the more service-oriented commercial establishments found in the northwest section of the City are encouraging to con-tinued retail development. Efforts are underway to encourage large-scale industrial development to located on property owned by the City. Easy access to major trans-portation corridors and facilities, proximity to employment centers, large parcels of land served by utilities all support Durand’s industrial development efforts. If developed, these sites would significantly alter the tax base and development mix of the City. Finally, the importance of continuing the proactive land planning and fiscal responsibility shown by the City will be needed to support existing services and fund new programs.
While there is no ideal mix of residential and commercial/industrial development, certain trends will provide the City greater financial security to explore future growth markets.
Downtown redevelopment site

This Page Left Intentionally Blank

REDEVELOPMENT STRATEGY - 2020

This Page Left Intentionally Blank

D U R A N D M A S T E R P L A N
99
REDEVELOPMENT STRATEGY - 2020With input from the Master Plan Steering Committee, a redevelopment strategy has been developed that focuses City efforts on several actions. The redevelop-ment strategy is to address many of the over arching goals of this Master Plan including retaining Durand’s small-town character, addressing population decline, reinvigorating the downtown district, addressing blight, improving the resident’s quality of life, and supporting job creation.
One of the key components of this Redevelopment Strategy is utilizing the Michi-gan Economic Development Corporation’s Redevelopment Ready Community (RRC) program to focus redevelopment efforts on key sites within the City. One of the six pillars of the Redevelopment Ready Community program is the self-identification of five or more redevelopment sites (called Redevelopment Ready Sites) within or adjacent to the community’s downtown district. In an effort to address Michigan’s historically declining downtowns and to increase the State’s competitiveness by creating vibrant active downtowns that are attractive to younger adults, the RRC program has been developed to focus its technical assistance, marketing support, and financial programs onto the State’s downtown districts.
This redevelopment strategy is built upon the premise that to support the long-range health of the City, it will be necessary to make it more competitive for development and retaining residents moving forward. In the 2019 Master Plan survey, residents identified that one of their main complaints of the City is the lack of shopping and that the downtown district is not vibrant enough.
As depicted earlier in this plan, the City’s demographic prospects are for constric-tion of residents through 2045. To slow or alter this expected outcome, the City’s Redevelopment Strategy - 2020 is focusing on quality of life and job creation as tools to make the City more economically competitive and desirable for residents and businesses to locate or remain well into the middle of the 21st century.
This redevelopment effort will be based on three major prongs. One will be focused on physical redevelopment efforts within downtown district. The second prong is focused on ensuring that the City is welcoming and able to allow new economy businesses to locate within the Mixed Use Districts identified on the Future Land Use map. The third prong is focused on ensuring that the City is competitive for industrial and manufacturing uses by having significant land available for this type of development in the northeast and southwestern quadrants of the City.

D U R A N D M A S T E R P L A N
100
The redevelopment strategy’s three prongs are:
Prong 1 Six RRC sites have been identified within the City’s downtown district (see the Redevelopment Ready Sites pages at the end of this section). These six sites will be entered into the Michigan Economic Development Corporation’s Redevelopment Ready Sites program that assists with marketing and provid-ing technical assistance for priority redevelopment sites. These sites include a mixture of vacant and underutilized parcels and buildings. The goal of this part of the economic redevelopment strategy is for the redevelopment these six sites to help catalyzes new mixed uses in the downtown. Many of the residents in the Master Plan survey identified a desire to have a more vibrant downtown district, and the creation of or redevelopment of six under performing sites/blocks in or adjacent to the downtown will have a significant impact upon the district’s vitality. To be able to retain the young residents and attract new resi-dents, the City’s core commercial district must be energized with more density, new uses, and new residents.
These newly energized sites will bring residents, new businesses, and jobs into the downtown while attacking blight. These sites will also support the business climate by adding additional residents into the downtown that will frequent these businesses. Having a vibrant downtown district will help Durand remain competitive for residents in Shiawassee County, and the City could become more attractive for commuters from Flint and Lansing who want to choose to live in a small community.
Prong 2Significant portions of the downtown district and areas adjacent to the down-town district have been designated for Mixed Use and Mixed Use Downtown land uses in the Master Plan’s Future Land Use Map. The plan identifies that the U.S. and world economies are transferring from one based on traditional manufacturing towards an economy that utilizes technology and applications to provide a wide array of goods and services. New methods of light manu-facturing are also anticipated that will be a part of the new economy as well. To be able to be competitive for these evolving land uses, the redevelopment strategy proposes that the Zoning Ordinance be amended to support flexibil-ity within the Mixed Use and Mixed Use Downtown land uses. These changes would allow certain light manufacturing and assembly of goods activities that may be manufactured with 3 D (three dimensional) printing equipment within the mixed use districts and also allow for live-work spaces.
Through the creation of mixed use districts, the City becomes more attrac-tive to individuals who want to engage in the new economy activities. It also addresses blight within the downtown by encouraging residents and a variety of non-retail/restaurant uses on the upper floors of existing underutilized downtown buildings. New mixed use buildings will add residents to support the vitality of the downtown district while increasing the quality of life for all of Durand’s residents. An energetic and active downtown will also make Durand a visitor destination for all of Shiawassee and beyond.
Simplicity Redevelopment Ready Site
Mixed Use Rezoning Changes

D U R A N D M A S T E R P L A N
101
The Zoning Ordinance should be evaluated to ensure that new economy manu-facturing activities would also be allowed within the I-1 Industrial districts and by extension the I-2 Heavy Industrial districts as well. To ensure the elimination of Zoning Ordinance hurdles for new economy businesses, revisions should be considered to permit these uses as-a-right.
Prong 3The City of Durand owns large amounts of land on the City’s northeastern and southwestern boundaries of the City. The redevelopment strategy identifies that these areas should be made available for industrial uses and incorporated in all MEDC programs to market these sites and provide incentives to do so (see the Redevelopment Ready Sites attachment). Both sites have ready access to major transportation corridors – I-69 and the railroads. The strategy recom-mended that the southwestern portion of the City be made available for light industrial development while the northeastern portion of the City would be available for heavy industrial development. This prong of the strategy recog-nizes that a large portion the City’s current industrial land is located on smaller industrial sites while new industrial development desires larger sites with good site circulation and easy accessibility to transportation corridors. This industrial portion of the redevelopment strategy builds upon Durand’s location within the industrial heartland of Michigan between the cities of Flint and Lansing. One of the issues concerning today’s industrial companies is if there will be an amply supply of qualified workers. With the City’s close proximity (within 45 minutes of both Flint and Lansing), there is a large pool of qualified manufac-turing workers within an easy commute. The City should also work with area community colleges, including Lansing Community College and Mott Communi-ty College, to ensure that high school students have a route to receive training and apprenticeships in the trades, thus assuring additional skilled workers are available.
To begin preparations for the SW light industrial district, the City should begin the process to upgrade site access by applying for economic development grants to improve Reed Road.
Industrial development would create jobs and be an attractant for people to choose to live in Durand, which would alter the expected downward popula-tion trajectory. An additional benefit is that new workers commuting into Durand will utilize and support local businesses for a variety of their service needs without the costs associated with the City having to provide all of the municipal services necessary for their living within the community.
SW Industrial Redevelopment Ready Site

D U R A N D M A S T E R P L A N
102
Successful implementation of this redevelopment strategy would address several of the concerns identified during the Master Plan survey including:
1. Lack of shopping and entertainment 2. Poor appearance of the downtown and Lansing Road commercial districts
through investment from new development3. Number of commercial and industrial jobs within the community
It will take engagement on all levels of the Durand’s business and community lead-ership to be able to be successfully implement this redevelopment strategy. The City of Durand administration will not be able to implement this effort on its own. To ensure success, an implementation committee should be convened, made up of business leaders, property owners, non-profits, and interested residents, that will guide the implementation of the strategy over the next five years. After five years, the effort should be evaluated and adjustments made to address changing condi-tions, implementation successes, and identify failures and their causes.
See the Appendices for the Redevelopment Ready Community informational fact sheets for Durand’s six downtown and downtown adjacent Redevelopment Ready Sites and two large industrial sites.

COMMUNITY GOALS

This Page Left Intentionally Blank

D U R A N D M A S T E R P L A N
105
COMMUNITY GOALSBefore a community can actively plan for its future growth and development, it must first set certain goals and objectives that define the boundaries of its needs and aspirations. These goals and objectives must reflect the type of community desired and the kind of lifestyle its citizens wish to follow, given realistic economic and social constraints.
In order to appropriately administer goals and objectives, and implement the strategies of each, it is important to understand the role of goals, objectives, and strategies and their relationship to one another. To this end, the following defini-tions shall apply:
Goals
A basic statement that sets a critical path, provides direction, and describes to the organization what the desired outcome should look like. Goals are critical part of the planning process in that they are flexible, defining for the community, and timeless. Goals stay with the municipality until they are achieved. Goals are ambi-tious and general. They address issues and specific needs or challenges, but they are grand in scope and speak to fundamental change and directly serve the mission of the community.
Objectives
These are the means to achieve a goal. An objective is a plan of action that sets a more specific task within a goal, assigns responsibility, sets schedules, and gauges success. Objectives must meet the following criteria:
• An objective must be specific.• An objective must be measurable, that is, there must be no question that
the objective was begun, carried out, and completed and that a tangible result can be produced as a result.
• An objective must be assigned to a responsible party. There must be a party made to be in charge of each objective to ensure that it will be car-ried out and that there is no confusion as to who should answer for the results of the objective.
• An objective must be trackable, or easy to follow. Each objective must be carefully monitored and its status must be known at all times. It is essential that the objective be set to a specific schedule and “landmarks” within it be set to convey its ongoing progress to residents and businesses alike.
Envision Durand Workshop - July 18, 2019

D U R A N D M A S T E R P L A N
106
Strategies
A strategy is a statement that sets forth the specifics for accomplishment of an objective. An objective that requires a series of specific activities to be completed may therefore have multiple strategies attached to it. For instance, an objective re-lating to area redevelopment may include strategies detailing building procedures, transportation, beautification, etc.
Public PArticiPAtion
The process of developing goals, objectives, and strategies for the City of Durand Master Plan involved multiple steps. On April 2, 2019, a Mas-ter Plan Steering Committee that was formed to help guide the Master Plan Update process held its first meeting. This Ad Hoc committee includ-ed the mayor, representatives of the Planning Commission, district library, the public schools, and Chamber of Commerce. These members provided input and direction on public outreach and development of the overall plan.
A public input survey was posted online and available at Durand City Hall from Monday July 1 through Friday August 2, 2019. Over 170 peo-ple completed the survey, which equaled 5.2% of the entire population of the City. In addition, more in-depth comment cards were distributed from June 17 through August 2.
To garner additional public input, an Envision Durand day was held on July 18, 2019. Five facilitated roundtable discussions with topic experts were held during the afternoon. Top-ics included economic development, housing, public amenities, sustainability, and transporta-tion. In the evening, a public workshop was held where group activities were used to gain input and suggestions that were used to guide the development of the master plan update (Refer to Appendix for complete results).
Following the initial workshop, the 2005 Goals and Objectives were presented to the Steering Committee on September 9 after the results of the survey and comment cards were discussed. This information was then used to evaluate the 2005 Goals and Objectives to determine which should remain, be revised, or elimi-nated, and what new Goals and Objectives should be added. These draft goals and objectives were then presented to the Planning Commission on February 4, 2020. The final goals, objectives, and strategy statements are listed on the following pages.
TTHHEE FFUUTTUURREE IISS TTOODDAAYY -- TTOODDAAYY IISS JJUULLYY 1188,, 22003399,, AANNDD TTHHEE 22001199 DDUURRAANNDD MMAASSTTEERR PPLLAANN UUPPDDAATTEE HHAASS SSUUCCCCEESSSSFFUULLLLYY BBEEEENN IIMMPPLLEEMMEENNTTEEDD.. TTEELLLL UUSS AABBOOUUTT TTHHEE CCIITTYY ––
WWHHAATT YYOOUU AARREE DDOOIINNGG TTOODDAAYY?? WWHHEERREE DDOO YYOOUU LLIIVVEE?? IINN WWHHAATT TTYYPPEE OOFF HHOOUUSSIINNGG DDOO YYOOUU LLIIVVEE?? HHOOWW DDOO YYOOUU GGEETT AARROOUUNNDD?? WWHHEERREE DDOO YYOOUU WWOORRKK?? HHOOWW HHAAVVEE TTHHEE RRAAIILLRROOAADDSS BBEECCOOMMEE BBEETTTTEERR NNEEIIGGHHBBOORRSS?? WWHHAATT DDOO YYOOUU DDOO DDOOWWNNTTOOWWNN?? WWHHAATT IISS YYOOUURR FFAAVVOORRIITTEE TTHHIINNGG AABBOOUUTT DDUURRAANNDD??
PPLLEEAASSEE MMAAKKEE SSUURREE TTOO TTEELLLL UUSS IINN TTHHEE PPRREESSEENNTT TTEENNSSEE.. I AM GOING TO GO TO WORK THIS AFTERNOON AT THE NEW DOWNTOWN BUSINESS INCUBATOR THAT WAS BUILT A COUPLE YEARS AGO. THE BUILDING’S SOLAR PANELS ALLOWS IT TO COMPLY WITH THE CITY’S CARBON NEUTRAL REQUIREMENTS. I LOVE THE FACT THAT I AM GOING TO BE ABLE TO USE MY E-SCOOTER ON THE MULTIUSE PATHWAY THAT WAS BUILT TO CONNECT DURAND TO FLINT. THAT PATH MAKES RIDING MY HOVERBOARD THAT MUCH MORE FUN. MY PARENTS ARE LIVING IN THE NEW CONTINUOUS CARE SENIOR CENTER THAT WAS DEVELOPED NEXT TO HISTORIC TRAIN STATION ABOUT TEN YEARS AGO. THEY NOW HAVE THE FULLY ANDROID ROBOTS THAT HELP CARE FOR THE PATIENTS, AND I LIKE HOW WELL THE ROBOTS CARE FOR MY PARENTS.

D U R A N D M A S T E R P L A N
107
Goals, Objectives, and Strategies
The following text represents the set of goals (the ultimate purposes or intent of the plan), objectives (means of attaining community goals), and strategy state-ments (which establish the who, what, when, where, and how of specific actions) that were prepared by the above mentioned community driven process. This process offered planning decision makers an opportunity to intellectualize attitudes and values about community development, and at the same time, establish the parameters around which the Future Land Use Plan was designed.
Achievement of these over arching goals may be accomplished through the ac-ceptance and adherence to the following objectives and strategies related to community derived themes of housing, transportation, and community assets and services.
Goals• Maintain a high quality of life for both present and future Durand residents
that will meet their physical needs, offer variety, choice, opportunity for change, and individual growth.
• Ensure the diversity, stability, and balance of city land uses thereby posi-tively contributing to a community where its residents may live, work, and recreate.
• Provide for a balanced approach to transportation which promotes not only multiple transportation modes (motorized vehicles, biking, public transit, local/regional rail, etc.), But also increases non-motorized transpor-tation thereby allowing for community-wide connectivity.
• Capitalize on existing assets, including but not limited to regional location, transportation assets, and city history and culture to encourage and main-tain business investment and support a positive economic climate.

D U R A N D M A S T E R P L A N
108
objective 1: Promote durAnd As A community for life-long living.
Housing Strategies
• Promote the development and/or redevelopment of single-family residen-tial areas offering a myriad of living locales, environments, and options, including but not limited to, attached condominiums, stacked ranches, townhomes, accessory dwelling units, and traditional single-family de-tached structures.
• Encourage development of a diverse new housing stock appropriate for a range of ages (individuals, young and growing families, empty-nesters) and income levels including downtown mixed-use apartments.
• Encourage development of residential types which provide services and amenities for an aging or disabled population including independent, as-sisted, and convalescent living options.
• Encourage and assist with the clean-up, renovation, and repair of aging residential structures in the City to preserve existing City fabric and quality residential buildings.
Transportation Strategies
• Facilitate development of multi-modal transportation types, including but not limited to pedestrian, bicycles, rail, and public amenities to provide greater accessibility to the City for all current and future residents.
• Encourage mobility and ease of access by establishing a City-wide trans-portation network inclusive of traditional and service-based (for example Dial-A-Ride) amenities.
• Adopt the Durand Nonmotorized Transportation Plan and budget for and complete new nonmotorized transportation projects annually until the system is fully developed.
Community Assets and Services Strategies
• Further build upon City’s rural and rail history as impetus for more regional cultural activities.
• Utilize vacant existing publicly-owned structures and areas as catalysts for redevelopment opportunities.
• Allow for controlled and planned growth through continued enforcement of existing zoning and review procedures and ensure code enforcement is utilized to address blight and substandard property maintenance.
• Encourage creative design and development planning which will produce visual harmony, without monotony, and reflect the City’s historic and cul-tural aesthetic.

D U R A N D M A S T E R P L A N
109
objective 2: fAcilitAte doWntoWn revitAlizAtion As A locAl And regionAl hub for culture And entertAinment.
Housing Strategies
• Encourage continued integration of a variety of residential and commercial types within the traditional downtown area for a true mixed-use environ-ment thereby contributing to its image as a unique visitor destination.
Transportation Strategies
• Link outlying City areas with downtown core through a cohesive way-find-ing program and nonmotorized transportation network, establishing not only transportation continuity but visual clarity for new visitors to the area.
Community Assets and Services Strategies
• Promote and maintain design standards for new development that are complementary to existing sites and structures so as to ensure a high de-gree of aesthetic quality and the endurance of new construction and adopt Zoning Ordinance language that ensures new development complements and enhances the community’s aesthetic appeal.
• Facilitate development of new community facilities aimed at retaining ex-isting residents and making the City more attractive to those looking for an urban alternative in a small city.
• Promote revitalization of public spaces to encourage human interaction and allow for ease of use.
• Continue to invest in marketing and branding efforts that are focused on maintaining and building the image of the Downtown district through City signage, banners, future facilities, marketing materials, etc.

D U R A N D M A S T E R P L A N
110
objective 3: encourAge And fAcilitAte trAditionAl And nontrAditionAl economic develoPment initiAtives.
Housing Strategies
• Facilitate development of new housing inclusive of affordable units so as to provide entry housing opportunities for existing area and new business employees.
• Encourage the rehabilitation of residences, both owner and renter-occu-pied, to further provide varied residential opportunities utilizing the exist-ing housing stock.
Transportation Strategies
• Improve the image of existing commercial areas as an attractive business location through a series of enhancements to streets, sidewalks, and other infrastructure as well as landscaping and signage in rights-of-way.
• Maximize City utilization of area transportation assets through more regionally oriented transportation decisions, including but not limited to maximization of the City’s proximity to Interstate 69, preexisting freight and passenger rail traffic, etc.
Community Assets and Services Strategies
• Create and maintain a marketing strategy for attracting potential develop-ers and to provide a vehicle for positive self-promotion for the City.
• Facilitate public/private partnerships between the City and developers to spearhead new commercial and industrial developments.
• Coordinate with local and regional economic development and educational authorities to ensure continued provision of needed training programs.
• Adopt a sustainability agenda that will ensure Durand is a good environ-mental steward for future generations and encourage residents, business owners, and developers/property owners to follow the City’s efforts within the private sector.
• Recognize the importance of maintaining and enhancing Durand’s small-town character and adjacent rural living by improving relationships with Vernon Township and working jointly on controlling sprawl while focusing auto-centric development along Lansing Road and encouraging smaller unique retail to focus in the Downtown.

D U R A N D M A S T E R P L A N
111
The strategies enumerated above for the City of Durand are guidelines for the future development of the City. If the planning program is to be more than a confu-sion of varied opinions/actions, then it is essential that these goals and objectives be seriously considered. These statements should be viewed as a starting point for City officials. As the implementation process progresses, the goals, objectives, and strategies may be altered and new ones formed. Thus, these recommendations are meant to be flexible and deserve constant assessment and evaluation. It is sug-gested that the goals, objectives, and strategies be reviewed on a regular basis and updated as necessary.

This Page Left Intentionally Blank

IMPROVING SUSTAINABILITY & INCREASING RESILIENCY

This Page Left Intentionally Blank

D U R A N D M A S T E R P L A N
115
IMPROVING SUSTAINABILITY & INCREASING RESILIENCY The most often quoted definition for sustainability comes from the U.N. World Commission on Environment and Development that describes the practice of meet-ing the needs of the current generation without compromising the ability of future generations to meet theirs. In the charter for the UCLA Sustainability Committee, sustainability is defined as: “the physical development and institutional operating practices that meet the needs of present users without compromising the abil-ity of future generations to meet their own needs, particularly with regard to use and waste of natural resources. Sustainable practices support ecological, human, and economic health and vitality. Sustainability presumes that resources are finite, and should be used conservatively and wisely with a view to long-term priorities and consequences of the ways in which resources are used.” Municipalities should make sustainable decisions based on environmental, economic, and social costs that take into account the future costs as well as the current ones.
Resiliency is a measure of a system’s ability to respond to and withstand changes and shocks. For cities, this includes shocks and changes in climate, economy, and other disruptions. A resilient city is better able to respond to major disruptions by being adaptable and able to recover in a more rapid manner to sudden shocks and respond to ongoing challenges. This chapter will focus on efforts that could fos-ter sustainable processes and build climate and economic resilience in the City of Durand.
From NOAA’s National Center for Environmental Information State Summaries, weather trends in Michigan have been changing since 1900. From 1900 to 2017, the average air temperature in Michigan is two degrees higher. The hottest year on record was 2012 when the statewide average temperature was 48.4 degrees Fahrenheit, almost five degrees above the long-term average. According to the weather record, the greatest impacts to the region’s changing climate has been on the warming of the winter and spring seasons while the summers appear to be less impacted by the changes. Between 2003 and 2013, the average annual maximum ice coverage for the Great Lakes was 43% while compared to 1962-2013 average of 52% coverage. In recent years, the region has also seen a below average number of very cold winter nights (minimum temperature below 0 degrees Fahrenheit).
The changing climate has also led to an increase in precipitation with 2010-2014 being the wettest five year period since 1895-1899. During the 2010-2014 five year cycle, Michigan experienced the highest frequency of 2” rain events in its historic record, and this trend has continued since 2014.
Resiliency improvements

D U R A N D M A S T E R P L A N
116
Anticipated impacts of weather change are expected to include:
• Extreme precipitation events, especially in the winter and spring, which may impact farmers ability to plant crops and cause erosion
• Storms becoming more frequent and severe• Less snowfall • Less winter ice on the Great Lakes• Extended growing season• Increased risk for summer drought• Increased risk caused by more frequent and intense severe heat events• Significant shifts in Great Lakes water levels caused by changes in seasonal
and multi-year precipitation, evaporation, and temperature that may cause serious environmental and socioeconomic impacts
Extreme heat events occur when high temperatures and high humidity last for several days. Vulnerable populations, especially the elderly and sick, are the most at risk from heat stroke, heat exhaustion, and even death during these events. They may also impact agricultural production and may also impact infrastructure including roads and utilities. Being located in the center of the State, Durand is more likely to suffer from more extreme heat events than communities abutting the Great Lakes, where the lakes help mitigate temperature extremes. Individuals with access to air conditioning and transportation are less likely to be individually affected than more socioeconomically disadvantaged populations.
To become more sustainable and resilient, the Durand Master Plan recommends a variety of steps focused in eight areas that would significantly increase Durand’s short and long-term sustainability and resiliency.

D U R A N D M A S T E R P L A N
117
1) Environment
a. Educate and promote to the public the value of green infrastructure and utilize public properties as demonstration projects.
b. Work with the Durand Area Schools to promote recycling and teach sus-tainability.
c. Recognize local businesses utilizing sustainable practices.d. Expand recycling services to all residential customers, encourage increasing
private sector solid waste diversions, and encourage corporate and indus-trial clients to implement/expand recycling programs.
e. Expand City composting program.f. Encourage the planting of native species of Mid-Michigan plants that will
thrive within the climate.g. Take the steps necessary to become a Tree City USA city. h. To increase the City’s tree canopy towards a goal of 40% tree coverage,
amend the City’s Zoning Ordinance landscaping requirements to increase the amount of required site and parking lot landscaping.
i. Ensure regular street sweeping that will reduce pollutants in water runoff from City roads.
j. Enhance public access to natural features including pedestrian trails and access to and across creeks, streams, and drains and develop educational programs and signage that teaches residents about the vital role that our man-made environmental plays in the natural water cycle.
k. Revise development standards to increase required buffer setbacks from environmental features including wetlands, creeks, streams, and drains.
l. Encourage all new developments to utilize Low Impact Development (LID)strategies to lessen the impact of new development on the environment through emphasizing conservation and use onsite features to protect water quality and revise the requirements found in Section 1333 of the Zoning Ordinance – Preservation of Environmental Quality. (refer to SEMCOG’s LID guide for additional guidance).
m. Inventory all natural features in the City including woodlands, wetlands, water courses, and other natural features.
n. Ensure all new developments including roadways are designed to slow and treat the stormwater onsite.
o. Identify where flooding is currently taking place in the City and identify areas that may be at risk of flooding due to climate change.
p. Revise Zoning Ordinance Section 1323 – Exterior Lighting to require use of dark-sky friendly fixtures, limits night-time lighting that is in the blue spec-trum, and require the dimming of exterior lighting of parking lots and site lighting when site/facility is not open for use/operating.
q. Encourage residents and business owners to increase their purchase of renewable energy.
r. Take active steps to restore the environment during municipal projects and create new habitat and encourage the private sector to complete similar projects.
s. Take active steps to identify potential conservation areas. t. Develop watershed management plans and identify sources of pollution/
nutrient loads. u. Develop land use design regulations that prevent clearing of land along
riparian corridors and encourages stream shading.
Sustainable paving solutions
Promote urban forestry

D U R A N D M A S T E R P L A N
118
2) Transportation
a. Adopt and work to implement the City’s Nonmotorized Transportation Plan including installing the Enhanced Sidewalks and Multiuse/Side Paths where proposed while encouraging equitable active transportation options that provide a more equal allocation of resources between various modes.
b. Adopt a Complete Streets Ordinance and implement Complete Streets goals wherever appropriate.
c. Revise the City’s required minimum sidewalk width to 60”. d. Develop a program to actively fill in the existing gaps in the City sidewalk
network. e. Ensure new nonmotorized systems are able to accommodate new micro-
mobility platforms. f. Provide traffic calming features to slow vehicles down and increase walking
and bicycle safety. g. Actively encourage Shiawassee County to develop and implement a non-
motorized network County-wide. h. Advocate and support the development of the Durand-Corunna Pathway. i. Support the development of Electric Vehicle charging stations downtown.j. Revise Zoning Ordinance to require installation of bicycle parking at en-
trances to all commercial buildings and industrial facilities.
3) Public Services and Governmental Actions
a. Support efforts by the City’s utility companies to encourage citizens to engage in energy reduction efforts.
b. Ensure that the City purchases the most efficient vehicles possible for its municipal fleet including heavy equipment.
c. Ensure that Water and Wastewater Treatment Plants are utilizing the most environmentally friendly processes while also limiting their energy usage to the greatest extent possible.
d. Ensure that the most energy efficient pumps are used throughout the mu-nicipal water delivery and sewer systems.
e. Institute new purchasing procedures for new/renovated public facilities and capital asset purchases that provide the price differentials between the product’s/service’s lowest standard bid and the most environmentally sound options including clear descriptions of environmental benefits along with cost-benefit analyses of the “greener” options. This approach would enable the City Council to more easily evaluate purchasing the more envi-ronmentally sound option.
f. Continue municipal energy efficiency efforts to reduce the City’s energy costs and energy footprint.
g. For all City renovation and maintenance projects, install or use the most environmentally sustainable choices for new faucets, lights, HVAC systems, non-VOC paints, use of recycle-able materials, etc.
h. Continue to work with the Shiawassee Economic Development Partnership and State of Michigan to diversify the City’s employment base so that a loss of a specific business or industry will not have a systemic shock to the City’s economy.
Renewable energy
Downtown Spine nonmotorized pathway

D U R A N D M A S T E R P L A N
119
i. Increase the City’s purchase or production of renewable energy. j. Set a greenhouse emissions target (e.g. below 2000 levels) and reduce mu-
nicipal greenhouse gas emissions by 20XX to that targeted amount.k. Implement a proactive tree management plan for publicly managed trees
and improve health of public trees from fair to good in 30 years.l. Engage in educational programs for the general public and elected officials
regarding the importance of sustainable actions through seminars, work-shops, print and electronic media.
4) Parks and Recreation
a. Utilize landscape design principles that limit the need for regular mainte-nance and explore the use of grasses in non-playfield locations that require only annual mowing.
b. Develop low cost water features at City parks that will provide relaxation and relief from heat events.
c. Utilize Low Impact Design strategies in the design of parks for both educa-tional and environmental purposes
d. Continue to implement the recommendations of the City’s Parks and Rec-reation Plan by adding at least one Mini-park and one Neighborhood park.
e. Develop programs and events to embrace the winter season. f. Develop nature trail around the Holmes Street Retention Pond and include
interpretive signage that describe the environmental features of the park/facility.
5) Housing
a. Promote higher density housing in the Mixed Use and Mixed Use Down-town districts and in the proposed multiple family districts.
b. Promote and support the renovation, rehabilitation, and energy efficiency upgrades to the City’s existing housing stock throughout the City and ex-plore options with the County and other funders to assist with the funding of these improvements.
c. To support increased residential density and housing choices within the City, develop Accessory Dwelling Unit (ADU) regulations that permit the construction of ADUs on single family lots.
d. Revise the City’s Zoning Ordinance to permit “missing middle” small foot-print multiple family housing options in all Multiple Family and Mixed Use districts and consider identifying where they may be permitted in certain single family areas.
Accessory dwelling units
Interpretive signage

D U R A N D M A S T E R P L A N
120
6) Urban Design
a. To reduce sprawl and cost for providing and maintaining City services, maintain dense urban development patterns wherever possible.
b. Encourage Traditional Neighborhood Design (TND) principles in all new developments.
c. Ensure appropriate landscaping and buffering is provided between uses and encourage these landscaped areas act as environmental assets by serv-ing as stormwater swales, wildlife habitat, and other environmental assets.
d. Evaluate parking requirements to reduce the current standards and revise the standards in anticipation of the deployment of autonomous vehicles and new micromobility platforms.
e. To reduce environmental impacts of new construction and renovation proj-ects, encourage the use of Leadership in Energy and Environmental Design (LEED) design principles, Passive House, or similar standards in all new or renovation projects by municipal and private sector entities.
f. Revise Zoning Ordinance standards to permit the use of solar energy and expand the use of small-scale wind power on all residential, commercial, and industrial properties as as-a-right accessory uses.
g. Consider revising the City’s discretionary approval requirement that would enable the City’s Planning Commission to provide increased density or building height bonuses for the provision of significantly advanced energy efficient building systems that exceed certain base standards or provide benefits for adjacent public areas.
h. Encourage the widespread use of heat-island fighting roofing solutions including green roof and white roof technologies.
i. Develop more rigid standards that reduce the allowable impervious-sur-face lot coverage percentages permitted within each of the districts, except for the Mixed Use Downtown district.
j. Ensure all development complies with the SMART Growth design prin-ciples.
7) Farming and Agriculture
a. Support expansion of access to locally grown produce and support the continued growth of the Durand Farmer’s Market at the Diamond District Park site.
b. Encourage local backyard farming efforts and educational efforts from the Michigan State University Extension.
c. Encourage the development of local small and medium scale food produc-ers, processors, and distributors.
d. Support the development of small food processors by permitting these ac-tivities as home occupations in residential areas and permit them as a right in commercial districts.
e. Support the development of an urban gardening food business incubator. f. Develop Local Food Plan and actively support its implementation.
Community garden
Residential home energy systems

D U R A N D M A S T E R P L A N
121
8) Social Services and Community Health
a. Ensure that all new recreation and municipal facilities are able to function as emergency relief facilities during extreme heat, severe storms, and other natural disasters.
b. Evaluate the City’s hazard mitigation and emergency management pre-paredness planning and ensure that the City administrative staff and com-munity leaders are familiar with these procedures.
c. Ensure City, adjacent municipalities, and the County emergency manage-ment preparedness planning procedures are mutually supportive and interconnected.
d. Encourage local public health agencies and service providers to prepare to address impacts of climate change including incidents of heat stress; water-borne diseases caused by bacteria growth in warmer water; vector-borne diseases caused by increased populations of ticks and mosquitoes; mental and physical impacts caused by increased extreme storms; and other public health issues that may be exacerbated by climate change.
The above Increasing Sustainability and Improving Resiliency action items provide numerous steps that will assist the City of Durand to became significantly more en-vironmentally sustainable while enhancing the City’s resiliency to chronic stresses or extreme events.
Many of these best practices are employed by communities to prepare for such stresses or events. By implementing these recommendations, the City of Durand will be better able to withstand and address a variety of environmental and eco-nomic issues that may occur in the future while acting as a good steward for its current and future generations of residents.
Emergency preparedness planning

This Page Left Intentionally Blank

FUTURE LAND USE

This Page Left Intentionally Blank

D U R A N D M A S T E R P L A N
125
FUTURE LAND USE The Future Land Use Map is the physical result of the master plan development process. It is designed to serve as a guide for the future development of the City. In the creation of a Future Land Use Plan, it is critical that the current profile of the community is thoroughly understood to better predict future conditions. The preceding chapters of this Master Plan provide the background or basis on which the Future Land Use Plan was developed. In particular, the Future Land Use Map was based upon:
• A review and analysis of existing land use conditions• Infrastructure capabilities• Analysis of demographic data• Goals and objectives developed for the Master Plan• Public participation
At the Envision Durand workshop, held on July 18, 2019, City of Durand residents participated in activities with the Master Plan Steering Committee, Planning Com-missioners, and City Council members to develop a series of draft recommenda-tions that were used in the development of the Future Land Use Map. The work-shop consisted of a team building exercise, a small group exercise that evaluated the issues and concerns of the attendees, and a writing exercise designed to elicit what the future of Durand should look like 20 years from now.
During the group presentation segment, certain themes or ideas often recurred. These included:
• The priority nature of the continued development and redevelopment op-tions for downtown Durand
• An acceptance of blended or “mixed-use” development types and variety of housing options
• Address the substandard conditions of some of the properties located within the City including residential, commercial, and industrial buildings and engage in beautification efforts
• Improve nonmotorized connectivity throughout the community• Retain the small-town character of the community in a rural setting• Address the impacts of the railroads traversing the City
The Future Land Use Plan and Map presented is the result of this process. The total acreage distribution for the Map is summarized in Table 27 on the following page.The Future Land Use Map equips City of Durand Planning Commissioners, elected
Envision Durand Workshop - July 18, 2019

D U R A N D M A S T E R P L A N
126
officials, and city administration with a literal depiction of the desired land uses throughout the community. The Future Land Use Map, derived from the Goals and Objectives and created through public comment, represents the vision the City of Durand has estab-lished for itself for the next ten to 20 years. The Map will be a useful tool on which to base zoning and capital improvements decisions, and will allow for consistent and sound planning in the community. The following text describes the categories found on the Future Land Use Map.
Table 27: Future Land Uses within Durand
Community Commercial 41.65Heavy Industrial 80.06Local Commercial 3.31Light Industrial 222.03Multi-Family Residential 58.05Mixed Use 32.22Mixed Use - Downtown 13.10Public/Quasi-Public 245.64Rail 40.31Regional Commerical 67.03Single-Family Residential - Suburban 332.44
TOTAL: 1,135.82 Source: Wade Trim
FLU Acreage - City Limits

D U R A N D M A S T E R P L A N
127
FUTURE LAND USE CATEGORIESsingle-fAmily residentiAl (urbAn)This category includes single-family detached structures used as a permanent dwelling, and accessory structures, such as garages, that are related to these units. Lot sizes generally total less than 10,000 square feet and are characterized by a more traditional urban neighborhood density.
Single-Family Residential – Urban land uses comprise the vast majority of the residential uses planned within the City of Durand, approximately 334 acres, or 29.4% of the City’s total. Continuation of this land use typology is consistent with and helps to reinforce the historical development trends found in Durand. Thus, the planned areas for single-family urban residential development reinforce the traditional neighborhoods and community culture found in the City.
single-fAmily residentiAl (suburbAn)This new category includes single-family detached structures used as a permanent dwelling, and accessory structures, such as garages, that are related to these units. Lot sizes generally range between one half and two acres and are characterized by a more suburban neighborhood density.
Currently no land is mapped as Single-Family Residential – Suburban land uses within the City of Durand. It is expected that some of the land that is included within the Master Plan land use study area beyond the City’s current municipal boundaries will be developed meeting the larger lot characteristics of this land use. This land use will allow residents who want to live in newer suburban homes to live within the City of Durand.
multi-fAmilyThis land uses category is defined by the existence of stacked ranches, multi-family apartment structures, manufactured/mobile home parks, and other group living quarters, including such things as independent and assisted living, and convales-cent care facilities.
Multi-Family residential uses are generally located along both Monroe Road and Main Street. To provide for a mix of living style types, other Multi-Family land uses are interspersed within more single-family dominant neighborhoods. The areas planned for Multi-Family act as transitional land uses between auto-oriented commercial areas and more traditional residential neighborhoods. Additional land adjacent to the City has been added to the Future Land Use map for future growth of Multi-Family. This land use accounts for 42.8 acres, or 3.8% of future land uses.
Single-Family Residential (Urban)

D U R A N D M A S T E R P L A N
128
commerciAl
Local CommercialThe Local Commercial land uses occupy areas that are intended for retail and personal service facilities that accommodate the day-to-day convenience shopping needs of neighboring residential areas. This commercial type includes, but is not limited to: groceries, florists, dry cleaners, drug stores, hardware stores, baker-ies, barber shops, day care centers, repair shops, coffee shops, etc. Only two areas within the City have been identified for this type of development.
Community CommercialThis land use category includes the land area occupied by retail and personal service uses offering commodities which are normally purchased at infrequent intervals, and for which the consumer may typically “shop around”. Community Commercial land uses include, but are not limited to: auto repair, gas stations, larger retail strip developments that contain two or more retail/commercial an-chors including discount department stores and large-scale supermarkets, day spas, health clubs, jewelry stores, restaurants, book stores, dollar stores, picture framing galleries, car shops, heating and cooling, clothing retailers, funeral homes, office supply, paint stores, upholstery, and produce stores.
Regional CommercialThe Regional Commercial land use category is defined by those types of retail that cater to the greater metropolitan region, and are traditionally dependent on major thoroughfare traffic. Examples of this use land use type include: large retail devel-opments that contain two or more larger retail/commercial anchors, discount de-partment stores, big-box retailers, large-scale supermarkets, automotive sales and service, commercial lodging, building material sales, home furnishings, specialty retailers (home theater, cooking supply,) etc. Campus-style developments with high tech users and functions for light manufacturing, telecommunications, medical diagnostic and treatment, and office/research facilities may also locate within the Regional Commercial locations.
Commercial land uses, of all types, are located along primary City transportation routes: the I-69 corridor for Regional Commercial uses, Lansing and Monroe Roads for Community Commercial uses, and Oak Street for Local Commercial uses. Loca-tional attributes, such as these transportation routes, provide access opportuni-ties at various scales, from direct local use to a more regional contact. Commercial opportunities are, therefore, made available to not only the residents of the City of Durand, but to the greater regional community. These commercial areas combine to represent 88.4 acres, or 7.8% of planned uses within Durand.
Community commercial

D U R A N D M A S T E R P L A N
129
mixed useThis land use category is characterized by two or more separate land use types that compliment each other and are contained within a single development.
Mixed UseA combination of uses either contained within an individual structure or among structures, generally housing a mix of residential, commercial, office, and quasi-public uses. Street levels are dominated by commercial, retail, and/or office uses with residential spaces on the floors above.
Mixed Use dominates in the area south and east of the Downtown district. This designation is to provide transitional area between the City’s downtown core and the adjoining residential uses and where industrial uses are present, support the transition of the existing industrial uses over time. These Mixed Use areas account for 216.6 acres, or 19.1% of the City future vision.
Mixed Use DowntownA combination of uses generally located in a traditional downtown setting. This land use type is characterized by zero lot line setbacks, small lot sizes, multiple stories in height and a more pedestrian friendly orientation. The mix of uses gener-ally includes retail and service facilities that accommodate day-to-day convenience shopping, unique shopping opportunities, office and service establishments, and other residential and non-residential uses. Uses benefit from proximity to one an-other and may be housed in individual structures having single or multiple uses.
To encourage the redevelopment of second floor uses and support the density of uses, the majority of the Downtown has been identified ad Mixed Use Downtown use while the areas adjoining to the east and south have been identified as Mixed Use. Mixed Use Downtown is logically located in the area typically defined as “Downtown Durand,” and is aimed at reinforcing the existing culture and character of the area and to provide unique opportunities for expanded growth. The Down-town is comprised of 16.2 acres, or 1.4% of City.
Mixed Use Downtown

D U R A N D M A S T E R P L A N
130
industry
Light IndustryThis land use is categorized by the existence of wholesale activities, warehouses, light manufacturing, and industrial operations whose external physical effects are restricted to the site and do not have a detrimental effect on the surround-ing areas. Campus-style developments with high tech users and functions for light manufacturing, telecommunications, medical diagnostic and treatment, and office/research facilities may also locate within the Light Industrial locations.
Light Industrial locations are located directly adjacent to major transportation corridors. These corridors take the form of both rail and interstate (I-69) thorough-fares and provide much needed access for the movement of industrial goods and services. A large area is located within the southwestern quadrant of the City adja-cent to the CN rail line. Light Industrial land uses account for 93.7 acres, or 8.3% of future land uses within the City.
Heavy IndustryThis land use category is characterized by manufacturing, assembling, fabrication, and processing operations whose physical effects (such as odors, fumes, noise, etc.) are felt beyond the use’s property boundaries. One area of the City is designated within this district; however, additional land to the north of the City in Vernon Township has also been identified for this land use.
Public/quAsi-PublicThis category was established to embrace all developed or undeveloped lands owned by various governmental and public agencies and institutions including school, municipal services, religious uses, and park and recreation properties.
Public/Quasi-Public uses are dispersed throughout the City of Durand and account for 246.3 acres or 21.7% of future City development. In addition, 119.3 acres of land outside the City is planned for this use category, specifically as a golf course. (Please see discussion below regarding Township planning areas).
Light Industrial

D U R A N D M A S T E R P L A N
131
future lAnd use outside of current municiPAl boundAries
As permitted by the Michigan Planning Enabling Act (PA 33 of 2008, as amended):
“The planning jurisdiction may include any areas outside of the municipal boundaries that, in the planning commission’s judgement, are related to the planning of the municipality.”
During the development of the Master Plan, all of the land within one mile of the municipal boundaries of the City of Durand where evaluated to determine if they should be incorporated into the City of Durand’s land use plan. These areas current land uses were identified and future development options assessed. Portions of the Township that abutted the City on the north, east, and western boundaries of the City were determined to be of importance to the future development plans of the City and these areas have been thus enumerated within the City’s Master Plan Study Area. While not currently under City jurisdiction, these parcels should be revisited at such time when significant land use change appears to be imminent.
A Regional Future Land Use Map has been prepared for a portion of the area that falls within the one mile master plan study limits that extend beyond the City’s mu-nicipal boundaries. Only areas immediately adjacent the City’s municipal boundar-ies on the north, east, and west have been identified with future land use desig-nations. The unidentified areas outside of these designated areas have not been incorporated into this land use plan.
summAry
The distribution of land, as delineated in the Future Land Use Map, helps to more clearly define the development vision and goals for the City of Durand by working toward the following:
• The Future Land Use Map ensures stability and balance of land uses: resi-dential areas, public areas, schools and community facilities, and commer-cial and industrial land uses
• Promotes and encourages residential development and retention through the encouragement of different housing types, densities, and locales
• Facilitates safe and efficient access to all areas, essential services and ame-nities of the City
• Facilitates continued local economic development through the use of unique commercial, office, and industrial types which cater to traditional, as well as progressive market segments
• Solidifies and protects the City’s identity and culture

This Page Left Intentionally Blank

ZONING PLAN

This Page Left Intentionally Blank

D U R A N D M A S T E R P L A N
135
ZONING PLANAccording to section 2(d) of the Michigan Planning Enabling Act, PA 33 of 2008, the master plan shall include a “Zoning Plan” - depicting the various zoning districts and their use, as well as standards for height, bulk, location, and use of building and premises. The zoning plan serves as the link between the Master Plan and the Zoning Ordinance, and to ensure consistency between the two documents, it guides the Planning Commission in what to consider updating in the Zoning Ordi-nance.
relAtionshiP to the mAster PlAn
The master plan describes the vision, objectives, and action policies for the de-velopment of the City of Durand. The zoning plan is based upon the results of the master plan, and it allows for a direct correlation between the recommendations of the Master Plan and the regulatory functions of the Zoning Ordinance Map. One goal of the Zoning Plan is to identify areas where the existing zoning is inconsistent with the objectives and strategies of the master plan and guide the amendments and revisions to the Zoning Ordinance.
The following pages (and Regional Future Land Use Map) describe the general purposes and characteristics of the City of Durand Zoning Ordinance. Please note, these descriptions are for reference only.
residentiAl uses
Single-Family Residential The following districts are considered “single-family residential districts” and cor-respond to the Single-Family Residential (Urban) and Single-Family Residential (Suburban) Land Use designations.
R-1: One-Family ResidentialR-2: One-Family Residential R-3: One-Family Residential
The intent of the R-1, R-2, and R-3 One-Family Residential Districts is to provide for an environment of one-family detached dwellings of an urban and suburban nature along with other residentially related facilities which serve the residents in the district.

D U R A N D M A S T E R P L A N
136
Multi-Family Residential The following districts are considered “multiple-family residential districts” and cor-respond to the Multi-Family Residential Land Use and Mixed Use designations.
R-M: Multiple-Family ResidentialR-O: Residential/Office
The R-M, Multiple-Family Residential District, is designed to provide sites for multiple-family dwelling structures and related uses, which will generally serve as a transitional land use between nonresidential districts and lower density one-family districts. The Multiple-Family District is further provided to serve the needs of those that desire or need an apartment unit in an otherwise medium density, one-family community.
The R-O, Residential/Office District was envisioned to be a transitional district from residential districts on the edge of the Downtown district to Office uses. It is the intent of this Master Plan to change this designation to a new Mixed Use zoning district that would allow for additional uses while serving as a transitional district.
commerciAl uses The following districts are considered the “commercial districts” and they corre-spond to the Local Commercial; Community Commercial; Regional Commercial; Mixed Use; and Mixed Use Downtown Land Use designations.
C-1: Central BusinessC-2: Service CommercialC-3: General BusinessR-O: Residential/Office
The basic purpose of the Commercial Districts are to accommodate the specific shopping and/or service needs of the surrounding residential districts and the motoring public. Uses in these districts shall take care to provide adequate screen-ing and landscaping to preserve the City’s small-town character while protecting adjacent uses from the effects of increased activity generated by their very nature.
The Central Business and Mixed Use districts shall permit a mixture of uses on the same lot or mixture of uses across several properties.

D U R A N D M A S T E R P L A N
137
industriAl uses The following districts are considered “industrial districts” and they permit a variety of more intensive uses that should be segregated from other uses and be adequately buffered. These districts directly correspond to the Light Industrial and Heavy Industrial Land Use designations.
I-1: Industrial I-2: Heavy Industrial
The industrial districts are designed so as to primarily accommodate wholesale ac-tivities, warehouses, and industrial operations whose external, physical effects are restricted to the area of the districts and in no manner affect in a detrimental way any of the surrounding districts.
Public/quAsi-Public usesDepending upon the specific site use, the following zoning districts will permit Pub-lic/Quasi-Public land use designations.
R-1: One-Family ResidentialR-2: One-Family Residential R-3: One-Family ResidentialR-O: Residential/Office C-1: Central BusinessC-2: Service CommercialC-3: General ServicesI-1: IndustrialI-2: Heavy Industrial
This land use classification was established to embrace all developed or undevel-oped lands owned by various governmental and public agencies and institutions including schools, municipal services, religious uses, and park and recreation prop-erties.
items for considerAtion in future zoning ordinAnce uPdAtesThis Master Plan does recommend that a zoning audit be conducted to determine what changes may be necessary due to regulatory changes, court cases, and new planning concepts. Not meant to be an exhaustive list, the following issues/items/topics have been identified within this Master Plan and should be evaluated by the Durand Planning Commission for consideration including:
• Adopting new zoning district classifications that meet the standards of the Mixed Use and Mixed Use Downtown land uses described within this Master Plan, which includes flexibility for New Economy manufacturing as-a-right and elimination of the Residential-Office Zoning District
• Identifying and removing any disparities between the Future Land Use Map and the Zoning District Map

D U R A N D M A S T E R P L A N
138
• Considering the revision of the I-1 District to allow New Economy manufac-turing to be permitted as-a-right and ensure low intensity manufacturing uses are also permitted as-a-right
• Evaluating the allowance for Accessory Dwelling Units on certain residen-tially zoned properties within the City
• To support increasing the City’s sustainability and resiliency, evaluating the following items:• Consider providing bonuses to developers who use Low Impact Design
strategies and consider additional modifications to Section 1333 - Pres-ervation of Environmental Quality
• Consider changes to Section 1323 - Exterior Lighting to require Dark-Sky compliant fixtures and additional energy efficiency features
• Consider land use design regulations that discourage land clearance and encourages retention of existing flora and provision of stream shading
• Ensure new Zoning Ordinance language allows small-scale residen-tial solar and wind energy generation as-a-right and consider adding language that would protect adjacent properties from impacting solar access
• Consider allowing small-scale food processors to be allowed as as-a-right home occupations and also be as-a-right uses within commercial districts
• Consider modifying landscaping requirements to increase the required amount of site landscaping
• Evaluating increasing design requirements for commercial and industrial buildings
• Supporting the revision of the City’s construction standards within both the Zoning Ordinance and the General Ordinances to require any development adjacent to public right-of-ways where new nonmotorized facilities are proposed in the City’s Nonmotorized Transportation Plan to be the respon-sibility of the developer
• Evaluating “Missing Middle” housing topologies to determine if they should be allowed as-a-right within the C-1 Central Business, R-O Residen-tial-Office, and R-M Multiple-Family districts and in the Mixed Use districts envisioned by this Master Plan and consider allowing them in lower density residential districts through the special land use process
• Considering instituting the requirement for the use of Traditional Neighbor-hood Design features in all new residential developments
• Increasing the landscaping requirements to improve buffering• Evaluating the City’s existing parking requirements to determine if parking
rates from the Institute of Transportation Engineers are lower, and with the advent of Connected and Autonomous Vehicles (CAV), determine if even lower parking requirements may be warranted

STRATEGIC IMPLEMENTATION PLAN

This Page Left Intentionally Blank

D U R A N D M A S T E R P L A N
141
STRATEGIC IMPLEMENTATION PLANThe City of Durand Master Plan is not a regulatory document that enforces what a community must do, but it provides a 10 to 20 year vision for the City. With many recommendations made within the document, it is necessary to provide a work plan that prioritizes action steps by level of importance. Some items are very im-portant and should be implemented as soon as possible while other items are less of an immediate priority. These strategic action plan implementation tables priori-tize work items that act as “building blocks” for later actions. These earlier actions may make later steps easier to accomplish, more impactful, or both.
Many of the goals of the Master Plan are listed in detail below while the Implemen-tation Summary Tables provide the activities laid out in the most strategic steps.
• Adopt policies to maintain the City’s small-town character• Conduct an intensive Zoning Ordinance audit to determine what changes
are necessary including new landscaping and buffering requirements, site plan review, and use standards
• Take the steps necessary to develop a new Mixed Use Zoning District that replaces the existing R-O Residential/Office District and ensure that the district regulations provide for flexibility that supports new economy uses
• Actively work towards implementing the City’s Nonmotorized Transporta-tion Plan
• Support efforts to direct commercial development into the Downtown. • Adopt a Complete Streets resolution/policy/ordinance • Evaluate municipal sustainability efforts and revise City design guidelines
to ensure construction projects are as sustainable as feasibly possible while encouraging private sector sustainability efforts
• Partner with Vernon Township, Shiawassee County, Shiawassee Economic Development Partnership, and the GLS Region V Planning and Develop-ment Commission on economic development issues
• Take active steps to implement the City’s Redevelopment Strategy• Engage with the Michigan Economic Development Corporation on the
promotion of the City’s six mixed-use Redevelopment Ready Sites and two industrial sites
• Provide continued land use planning training for the City Council, Planning Commission members, and Zoning Board of Appeals officials to ensure that the recommendations made within the Master Plan are adhered to and the Zoning Ordinance requirements are properly enforced
• Prepare a Master Plan graphic pamphlet that illustrates the important concepts of the Master Plan to the general public and role for and how the Zoning Ordinance operates
• Maintain an updated Parks and Recreation Plan that enables the City to apply to the Michigan Department of Natural Resources for recreational grants including the development of the proposed Diamond District Park
Downtown streetscape

D U R A N D M A S T E R P L A N
142
• Enhance the entry points into City and into the downtown district • Step up Code Enforcement efforts to address blighting properties
Public Policy, AdministrAtive Action, And other imProvements
Recommendation Priority Time Frame Responsibility Adopt Complete Streets Policy High Within six months City Council Adopt Policies to Maintain City’s Small-town Character
High Within six months Planning Commission and City Council
Designate a nonmotorized champion and begin to implement the City’s Nonmotorized Transportation Plan
High Within six months Administration
Increase support to Code Enforcement Medium Six months to two years City Council and Administration Support the development of a county-wide non-motorized plan to connect the City to destinations located throughout Shiawassee County
Medium Six months to two years City Council, Administration, Shiawassee County Road Commission and Shiawassee County Commissioners
Review recommendations of the Master Plan and revise appropriate City General Ordinances
Medium Six months to two years City Council and Administration
Evaluate the Plan Implementation Resources chapter of the Master Plan for implementable projects
Medium Six months to two years Administration
Maintain up-to-date Parks and Recreation Plan
Medium Every five years Administration
Develop Master Plan pamphlet Moderate Two to five years Planning Commission Continue land use planning training for City Council, Planning Commissioners, and Zoning Board of Appeals members
Moderate Ongoing Administration
zoning ordinAnce modificAtions
nAturAl feAtures And environmentAl considerAtions
Recommendation Priority Time Frame Responsibility Conduct intensive review of Zoning Ordinance to ensure requirements support the City’s small-town character
High Within six months Planning Commission and City Council
Revise General Provisions for landscaping, parking, buffering and other site design requirements to ensure quality development
High Within six months Planning Commission and City Council
Evaluate making changes to the Zoning Ordinance to increase the City’s sustainability and resiliency efforts
Medium Six months to two years Planning Commission and City Council
Revise Zoning Ordinance to eliminate Residential-Office zoning classification and replace with Mixed Use zoning classification
Medium Six months to two years Planning Commission and City Council

D U R A N D M A S T E R P L A N
143
economic develoPment
Recommendation Priority Time Frame Responsibility Complete the Redevelopment Ready Sites materials and engage with the MEDC to market redevelopment sites
High Within six months Administration
Implement recommendations of the Master Plan’s Redevelopment Strategy
High Within six months Administration and City Council
Revise General Provisions for landscaping, parking, buffering and other site design requirements to ensure quality development
High Within six months Planning Commission and Board of Trustees
Partner with Shiawassee County, Shiawassee Economic Development Partnership, and GLS Region V Planning and Development Commission on business attraction and employment training
Medium Six months to two years Administration and various economic development entities
Improve the entrances into the City and the Downtown
Moderate Two to five years Administration
Recommendation Priority Time Frame Responsibility Evaluate the City’s General Ordinances to identify where sustainability and resiliency provisions may be added into the City’s Code
Medium Six months to two years Administration and City Council
Implement an urban forestry program to increase the City’s tree cover
Moderate Two to five years Planning Commission, Administration, and City Council
Engage in efforts to increase the awareness to the benefits of green building standards with business owners and residents
Moderate Two to five years Planning Commission and Administration

D U R A N D M A S T E R P L A N
144
revisions to the PlAn
Any extension, addition, revision, or other amendment to a basic plan shall be adopted under the same procedure required for a new plan or a successive part of a plan under the procedures stated in Michigan Public Act 33 of 2008, as amended. As required by the Michigan Planning Enabling Act, the Planning Commission every five years shall review the plan and determine whether to commence the procedure to amend the plan, adopt a new plan, or make a determination that the current plan is still applicable. These periodic reviews are necessary in order to be responsive to changes in growth trends and current community attitudes on growth and development within the City.
For all amendments, additions, or revisions, the City must:
1. Notify all adjacent municipalities, public utilities, and other entities its intent to amend/revise its Master Plan
2. Planning Commission prepares the draft revisions and presents the plan to the City Council for authorization to distribute the draft plan to the entities that were noticed under step one
3. A public notice is printed commencing a 63-day review period for the gen-eral public and the plan is distributed to the review agencies
4. At the conclusion of the comment period, a public hearing is held by the Planning Commission after which time, the Planning Commission may adopt the final plan (if the City Council retains its right to adopt the plan, the Planning Commission would then forward the final version of the plan to the City Council for final adoption)
5. Notice is provided to the review agencies that the draft plan has been adopted

MASTER PLAN IMPLEMENTATION RESOURCES

This Page Left Intentionally Blank

D U R A N D M A S T E R P L A N
147
MASTER PLAN IMPLEMENTATION RESOURCESDurand’s Master Plan is a long-range community policy statement comprised of a variety of both graphic and narrative recom-mendations intended to provide guidelines for making reasonable and realistic community development decisions. The Plan is intended to be employed by City officials, by those making private sector investments, and by all citizens interested in the future development of the City.
The completion of the Plan is but one part of the community planning process. Realization, or implementation of the goals, objectives, and recommendations of the Master Plan can only be achieved over an extended period of time and only through the cooperative efforts of both the public and private sectors. This chapter serves as a resource listing for City elected officials, Planning Commission members, and others about various tools that are available and used by other communities.
A. educAtion
A. 1 Knowledgeable Local Officials
Ultimately, the responsibility for implementing the Master Plan falls into the hands of City of Durand’s local officials. This fact is why it is very important that the City Council, Planning Commission, and the various municipal departments be knowledgeable and focused on achieving the implementation of the Master Plan. It is key that these individuals understand the interconnect-edness of the Master Plan and the Zoning Ordinance.
The local officials have to be the catalysts for action, leading the community in the right direction. The Master Plan and Zoning Ordinance are key tools to successfully guide future development, and understanding and utilizing these tools are vital to this success. There are several resources available that offer training including the Michigan Association of Planning and the Michi-gan Municipal League.
A. 2 Master Plan Brochure
It is critical that Durand officials acknowledge, understand, and support the Master Plan. In order to organize public support most effectively, Durand may emphasize the necessity of instituting the Planning Program and encourage citizen participation in the planning process.
Lack of citizen understanding and support could have serious implications for the eventual implementation of planning pro-posals. Failure of the public to support needed bond issues and continuing dissatisfaction concerning taxation, special assess-ments, zoning decisions, and development proposals are some of the results of public misunderstanding and rejection of long range planning efforts.
One of the issues facing the implementation of the Master Plan is that is it long technical document that does not resonate with most residents and developers. Creation of a graphic pamphlet that illustrates the Future Land Use Map, Goals and Objec-tives, and some key items from the Strategic Action Plan would help to ensure that the Master Plan is a living documents that directs future City development.

D U R A N D M A S T E R P L A N
148
A. 3 Design Standards Manual
Visual images are another best practice to convey land use planning issues and goals to the resident or developer. These concepts that could be explored in a manual include building massing and placement, parking lot design, landscaping, lighting, signage, and other items that affect the visual appearance of development. Providing a manual that details the type of de-velopment that supports the City’s small-town character would assist developers and their designers in creating projects that support the community’s character instead of detracting from it.
b. Public Policy
B. 1 Governmental Cooperation
Successful implementation of the Master Plan will require bringing together the resources of many levels of government that Durand interfaces with. This cooperation is necessary because different governmental entities have different responsibilities and roles to play in community development. Vernon Township plays a key role in the future growth of the City as much of the undeveloped land surrounding the City falls within Vernon Township. The County Road Commission and MDOT have jurisdic-tion of adjoining roads and will be vital to the construction of the City’s nonmotorized transportation network outside of the City proper. The Village of Vernon will be an important partner in the development of the Durand-Corunna Nonmotorized Path. GLS Region V is responsible for the planning related to the distribution of Federal road funding.
B. 2 Public/Private Partnerships
Implementing the goals and objectives of the Master Plan requires that the private and public sector work together on de-velopment projects. Co-development is simply the joint public and private investment for a common purpose. Working in a partnership allows for Durand to become involved in such things as site location selection, planning, site design, utilities and other service agreements, and tax incentives and abatements. These partnerships help to foster development friendly envi-ronments, where the City benefits from increased tax revenue, and the private developers can benefit from decreased cost of improvements and easier approvals.
B. 3 Continuous Planning
The Master Plan is a living document that needs to be periodically evaluated and updated when necessary. Per the Michigan Planning Enabling Act, PA 33 of 2008, as amended, community master plans must be updated every five years, but it is recom-mended that the Master Plan be reviewed annually. The Planning Commission and the City Council should be actively engaged with the Master Plan through a joint annual meeting that reviews the goals and objectives and implementation matrix. These reviews will ensure that the Master Plan remains a current document that has currency for the community.
B. 4 Implementation Priorities
At the end of the previous chapter, the Master Plan includes a Strategic Action Plan. Due to staffing, budget constraints, and inability to implement a wide-range of items concurrently, it is necessary to strategically develop an implementation plan that correctly orders projects. This proper prioritization will allow earlier projects to lay the framework for future projects or have earlier projects have “quick wins” that illustrate proof of concept projects.

D U R A N D M A S T E R P L A N
149
B. 5 Capital Improvements Program
The term “capital improvements” generally relates to large-scale municipal projects of a fixed nature, the implementation of which results in new or expanded public facilities and services. Such items as public building construction, park development, sewer installation, waterworks improvements, street construction, land acquisition, and the acquisition of certain large-scale pieces of equipment (graders, sweepers, fire trucks, etc.) are all included in the Capital Improvements Budget.
Few communities are fortunate enough to have sufficient revenues available at any given time to satisfy all demands for new or improved public facilities and services. Consequently, most are faced with the necessity of determining the relative priority of specific projects and establishing a program schedule for their initiation and completion. The orderly programming of these large-scale capital improvements is to be accomplished in conjunction with a long-range plan.
In essence, the Capital Improvements Program is simply a schedule for implementing public capital improvements, which acknowledges current and anticipated demands, and which recognizes present and potential financial resources available to the community. The Capital Improvements Program is a major planning tool for assuring that public improvements proceed to completion in an efficient manner. The Capital Improvements Program is not intended to encourage the spending of additional public monies, but it is simply a means by which an impartial evaluation of needs may be made.
Long-range programming of public improvements is based upon three fundamental considerations. First, the proposed projects must be selected on the basis of community need. Second, the program must be developed within the community’s financial constraints and must be based upon a sound financial plan. Finally, program flexibility must be maintained through the annual review and approval of the capital budget. The strict observance of these conditions requires periodic analysis of various community development factors, as well as a thorough and continuing evaluation of all proposed improvements and related expenditures.
It is essential that in the process of preparing and developing the program, the Planning Commission be assigned a role by City Council in reviewing project proposals to assure conformity with the Master Plan and to make recommendations regarding prioritizing projects and appropriate methods of financing.
c. zoning ordinAnce tools
C. 1 Zoning Ordinance Revisions
To be allowed to regulate private property, communities must first have well considered Master Plans, and Zoning Ordinances are essential in implementing the goals and objectives of the Master Plan. The authority to create a Zoning Ordinance is given to a community by the State for the purpose of promoting community health, safety, and general welfare. Zoning regulations have been strongly supported by the Michigan courts, as well as by the United States Supreme Court.
The intent of zoning is to assure the orderly development of the community. Zoning does this by dividing the community into districts in order to establish population density and regulate the use of land and buildings. Zoning also promotes the general welfare of a community by protecting homes and investments against the potential harmful intrusion of business and industry into residential neighborhoods, requiring the spacing of buildings far enough apart to assure adequate light and air, preventing the overcrowding of land, facilitating the economical provision of essential public facilities, and aiding in the conservation of essential natural resources. This, in turn, helps to protect the property values of the community.

D U R A N D M A S T E R P L A N
150
In addition to protection of land values, zoning also includes development requirements (landscaping, lighting, buffering, park-ing, building design, etc.) that increase property values by requiring attractive quality developments that minimize negative impacts upon neighboring parcels. New zoning techniques and refinements of existing regulations should be evaluated and the City of Durand Zoning Ordinance be amended as appropriate including the review of existing residential zoning classifica-tions to evaluate pertinent differences between and among districts; specifically with regard to overall definition, lot sizes, and development densities. Many of City’s Goals, Objectives, and Strategies detail residential typologies and use varieties not necessarily allowed under the restrictions within existing residential zoning classifications. Give consideration to the addition of new districts and to the possible refinement of other existing zoning categories for the inclusion of more flexible mixed-use regulations including live-work units.
C. 2 Planned Development
The use of Planned Development districts are permitted within Durand’s Zoning Ordinance. Planned development districts are often allowed to provide property owners/developers flexibility to be innovative in their site designs for larger parcels. Planned development districts may permit denser developments, preserve open space or permit cluster zoning, allow for mix-ture of uses, provide for preservation of natural features, or other community goals. To ensure quality and sustainable design, the City may consider increasing the design requirements necessary for developers to take advantage of the PUD benefits while allowing for certain density bonuses for public amenities, affordable units, additional landscaping, etc.
C.3 Site Plan Review Requirements
The Site Plan Review Process included within the City of Durand Zoning Ordinance is designed to ensure that all larger scale development, redevelopments, and renovations within the City comply with the requirements within the ordinance and en-sure that the developments positively contribute to the City’s character. Depending upon the community and its design goals, Site Plan Review requirements can be quite stringent. For Durand, one of the major goals of the community is to preserve the small-town character from inappropriate or poorly designed development. Per the current Zoning Ordinance, Site Plan Review process ensures that: the landscaping and buffering requirements of the community are met; site layout is appropriate to minimize off site impacts; site circulation and parking are safely designed.
An assessment of the City’s recent development projects should be undertaken to determine if additional design requirements are needed to ensure that developments undergoing the process do uphold the desires of the community. Additional design requirements may be necessary to ensure the small-town character of the City is retained.
The Site Plan Review process may also control developments that may affect groundwater, wetlands, or woodlands. Ground-water recharge areas, aquifers, and wellhead protection areas may require protection. It may be in the interest of the City to protect wetlands in excess of Michigan Department of Environmental Quality standards found in Part 303 of the Michigan Natural Resources and Environmental Protection Act (PA 451 of 1994). Three Mile Creek/Holly Drain play an important role in the City, and they should be conserved. Woodlands are found across the City, and they provide habitat and aesthetic benefits to the community. Certain developers do not take into account the vital role that woodlands provide to a community when designing their developments, and a woodlands preservation ordinance that would regulate destruction of woodlands would best be implemented during Site Plan Review process.

D U R A N D M A S T E R P L A N
151
C.4 Subdivision Regulations
When a developer proposes to subdivide land, he or she is in effect, planning a portion of the City. To assure that such a devel-opment is in harmony with Master Plan objectives, a subdivision regulation ordinance may be created in accordance with the Michigan Land Division Act, Public Act 288 of 1967, as amended.
Several direct benefits accrue from the regulation of subdivisions by a local unit of government. By requiring the subdivider to install adequate utilities and improved streets, purchasers of the lots are not later burdened with unexpected expenses. A subdivision without adequate physical improvements is detrimental not only to itself, but it also reduces the opportunity for reasonable development of adjacent parcels. In addition, long-term economic value can be realized only when the subdivider provides adequate improvements.
As a part of its review of proposed subdivisions, the Planning Commission focuses on such features as the arrangement and width of streets, the grading and surfacing of streets; provision of sidewalks; the width and depth of lots; the adequate provi-sion of open space; and the location of easements for utility installations. The subdivision review process is one of the meth-ods of implementing the goals and objectives of the community’s Master Plan.
C.5 Incentive Zoning
The Zoning Ordinance may include provisions for incentive zoning within certain zoning districts. If developers provide ad-ditional items that the City desires, incentive zoning provides them the opportunity to gain additional development rights or density above the mandated maximum requirements allowed within that zoning district. Community goals identified in the Master Plan should be a basis for identifying desires or needs that will be achieved by allowing developers to exceed standard requirements. Public open space, landscaping that significantly exceeds minimum standards, provision of community building, etc. are all items that communities have received as part of an incentive zoning project.
C.6 Setbacks and Other Dimensional Standards
The Zoning Ordinance includes requirements for setbacks and other dimensional standards for landscaping, lighting, parking, fencing, lot coverage, signage, etc. Unattractive structures and uses can be buffered by appropriately sized landscaped buffers. Natural features, shorelines, floodplains, and other features should all be protected by proscribed setbacks that protect these features from damage or inappropriate encroachment.
C.7 Overlay Zoning
This zoning tool allows for a special set of regulations be developed to regulate a specific area within an existing zoning district or extend across multiple districts. Both sets of regulations apply with the Overlay District, and a development can only be completed if it complies with the requirements included within both districts. Regulations for the district must be clearly articulated along with the goals for the added regulation. The added requirements found within Durand’s DDA district and Lansing Road subarea are examples of overlay zoning. Overlay districts have been used to protect historic districts, wellhead protection areas, farmland, open space, and environmentally sensitive areas while retaining the underlying zoning.
C.8 Open Space/Cluster Zoning
For communities with significant suburban development pressures, open space/cluster zoning is an often-used design tool that allows the developer to build homes on lots smaller than permitted within the Zoning Ordinance while permanently pro-tecting natural habitats. Confining the development to a smaller portion of the development site allows for the preservation of open space that is beneficial to the City, the developer, and the residents of the development.

D U R A N D M A S T E R P L A N
152
C.9 Conditional Rezoning
In the 2006 revision of the Michigan Zoning Enabling Act, it granted local communities the ability to conditionally rezone properties. The Conditional Rezoning process allows the developer to rezone a property that the City may not want to tradi-tionally rezone because of the impacts of allowing all of the zoning district uses on that specific parcel. To begin the process, the developer must draft an offer of what uses that would be allowed and what uses they are willing to forego in exchange for the Conditional Rezoning. The developer may also offer the City certain inducements that either limit the development or exceed minimum design standards. This offer is presented to the Planning Commission and approved by the City Council. The City does not have the right to negotiate what the developer is proposing. The municipality may only agree or deny the offer. If approved, a legal agreement is signed between the two parties, and these requirements stay in effect until the developer or future owner asks to have the agreement revised or requests that property return to its original zoning classification.
d. building code enforcement
D.1 Code Enforcement
The ultimate effectiveness of the general ordinances or zoning code depends on the administration and enforcement of the code by elected officials and other administrative staff. If administrative procedures are lax, or if enforcement of regulations is handled in an inconsistent, sporadic manner, the result will be unsatisfactory at best. The Zoning Administrator is often responsible for carrying out zoning/development related functions, including building inspections, ordinance administration, and community/ developer liaison. Each of these functions requires a substantial investment of staff time. If sufficient time is not made available to carry out these critical functions, the tasks may end up only being completed in a cursory manner.
Therefore, the City should provide for adequate staff levels and/or consulting assistance to assure that these essential day-to-day functions will receive the professional attention required to assure quality development through conformity with the municipal codes. One of the major complaints of the citizen survey was the appearance of many properties within the City, and the Code Enforcement Officer is the City official responsible for addressing these issues.
Code Enforcement may also include the enforcement of General Ordinances passed by the community relative property main-tenance. If the City chooses to further address property maintenance and blight issues, the City may adopt the International Property Maintenance Code or portions of the code. This code has been adopted by many communities across the state to help address property maintenance issues that are often visually blighting.
D.2 Rental Inspection Program
The Master Plan’s public survey clearly identified the public’s concern regarding the appearance and maintenance of residen-tial properties within Durand. It is strongly recommended that a comprehensive rental inspection program be instituted to ensure that all rental properties within the City are properly maintained and safe for occupancy.
Two of the Great Recession’s after affects have been widespread loan foreclosures destabilizing formerly sound residential neighborhoods through virtually abandoned homes and the purchase of formerly home-owner occupied homes by investors for rentals. Rental homes are often not maintained to the same standards of owner occupied homes, and exterior deferred maintenance can lead to blight while interior deferred maintenance can lead to significant safety issues. Periodic inspections will ensure that the properties are maintained in a safe and aesthetically pleasing manner while ensuring they are safe for ten-ants and first responders.

D U R A N D M A S T E R P L A N
153
A rental inspection program typically includes the establishment of a rental code which complies with the National Property Maintenance Code, inspections of rental properties every 1-3 years, a fee schedule for inspections, a process for handling complaints about rental units, and penalties for rental code violations. Many communities also require rental inspections when a change of tenants occurs.
e. Public sector imProvements
E.1 Public Realm Enhancements
Local municipalities and utility companies do spend significant funds on infrastructure items within the public rights-of-way. These investments include sidewalks, signage, streetscape furniture, public parking lots, parks, pathways, and public utilities (water towers, manhole covers, utility boxes for electricity and data, etc.). To build a unique sense of place, the City should develop a unified design aesthetic and logo that is utilized on all publicly-owned assets. With the City’s long association with the railroads, the consistent design element should be related in some way to railroading. These unified design cues will help to develop the City’s identity and pride of place for the residents.
Standard utility boxes can easily be clad in artwork, which enhances the public realm. Regular bike racks, benches, garbage cans, and other street furniture can be designed by artists so that they contribute to the public realm as well. These interven-tions do not have to be expensive, and they may even be funded by local philanthropic organizations.
E.2 Public Facilities
Each community invests in its own facilities including: municipal offices, police and fire departments buildings, water/sewer systems, parks, cemeteries, streets and sidewalks, and other facilities. To ensure that costs are being managed and do not exceeded what should be spent to maintain a specific facility, periodic studies should be conducted to ensure that the facilities are be operated in a cost-effective manner and don’t require significant refurbishment.
E.3 Transportation Network Improvements
Well functioning transportation networks are a key aspect to the quality of life within communities. Congestion, interconnect-edness, and condition of the system all impact a community. Ability of handicapped individuals to be able to move around their communities are affected by the quality of the sidewalk and nonmotorized pathway networks. How trucks and freight are able to move around the municipality impact the business friendliness of a community as well. Network improvements include installation of the nonmotorized pathways identified in the City’s Nonmotorized Transportation Plan and installing two signalized pedestrian connections across the railroad tracks near the Durand Union Station have been envisioned in this plan.
E.4 Complete Streets
Complete Streets is a roadway design concept that all roads should be designed and constructed for all users – cars, trucks, public transit riders, bicyclists, and pedestrians and for all ages and abilities. Building streets to the Complete Streets design standards requires the design engineer to consider all potential road users, which will improve a community’s livability. The City of Durand should pass a Complete Streets resolution/ordinance to ensure that its own street projects comply with Com-plete Streets design goals. Adopting a Complete Streets policy will require the Shiawassee County Road Commission to con-sider all prospective users when any reconstruction work is proposed for all County roadways within and abutting the City too.
The City should advocate for a county-wide non-motorized network that would connect all of the commercial and residential nodes within the county. Some of these nearby nodes that would be linked as part of a comprehensive plan includes the vil-lages of Bancroft, Gaines, Lennon, and Vernon and the cities of Corunna and Swartz Creek.

D U R A N D M A S T E R P L A N
154
E.5 Design Enrichments
E.5.1 Commercial Corridor Enhancements
Lansing Road skirts the City’s northern boundary and efforts should be made with Vernon Township to limit commercial devel-opment to the area between the M-71/I-69 intersection on the west to New Lothrop Road on the east. Existing Lansing Road Subarea design requirements should be reviewed so as to improve the general appearance of the community. Augmented design controls would include landscaping requirements, canopy street trees along all street frontages, parking lot enhance-ments, appropriate lighting, access management, and other controls.
E.5.2 Gateways
At the main entrances into the City and the downtown district, new entrance features should be constructed to identify to travelers that they are entering the community. These points are where the community can first “introduce” itself to visitors and provide for a good first impression. The gateway features should include a decorative design feature that uniquely identi-fies the Durand along with some landscaping. These features should be installed along Lansing Road at the M-71/I-69 inter-section and near New Lothrop Road entrances into the City; Newburg Road both east and west of the City limits, and Durand Road from the south. Smaller design features should also be used to welcome visitors into downtown Durand.
E.6 Special Districts
E.6.1 Historic Districts
There are three levels of historic designation available – National, State, and Local. Each of these districts confers different benefits.
Nationally designated properties are listed on the National Register of Historic Places or designated as a National Historic Landmark. These designations do not limit the ability of the property owner to alter their structures. National Register list-ing requires the potential impacts of all Federally funded or permitted projects to be evaluated during a Section 106 Historic Review process. The designation also enables the project to take advantage of Federal Historic Tax Credit program for all re-habilitations that meet the Secretary of the Interiors Standards for Rehabilitation. Twenty percent of eligible expenses may be converted into equity through the tax credit program.
The Michigan listing of State Historic Sites is only an honorific designation at this time. Buildings that are approved for State Historic Markers are added to the State register.
Local designations provide for the most control over potential damage caused by intentional damage or unintentional neglect to historic resources by renovation or demolition. All renovation work and certain maintenance work on buildings located within Local Historic Districts must be approved by the Local Historic District Commission and adhere to the Secretary of the Interior’s Standards for Rehabilitation. The State of Michigan, under Public Act 169 of 1970, authorized communities to estab-lish Local Historic Districts that would be regulated by Local Historic District Commissions.
The City should consider if the residential areas to the north and east of the downtown would merit evaluation for designation on the National Register of Historic Places or protection offered through the establishment of a local historic district.

D U R A N D M A S T E R P L A N
155
E.6.2 Brownfield Districts
Through State records, certain locations within Durand have been contaminated by previous development or contain function-ally obsolete buildings. The State of Michigan recognized that these sites would not likely be redeveloped by traditional means due to costs and liability concerns. These sites were becoming a drag on local units of government because they were often vacant, blighting, and not paying full taxes due to condition. To avoid remediation, property owners were also foregoing own-ership and allowing the properties to proceed through the foreclosure process.
To address these issues, the State of Michigan passed the Brownfield Redevelopment Financing Act, Public Act 381 of 1996, as amended, to address these contaminated properties. Functionally obsolete or contaminated sites are eligible for funding, and eligible activities include site assessment activities, demolition, lead and asbestos abatement, contaminated soil clean-up, infrastructure improvements, and site preparation activities. In 2017, the Transformational Brownfield Plan Acts, PAs 46-50 of 2017, were passed that allows developers to capture a portion of specific incremental taxes generated from large-scale proj-ects to fund specific allowable expenses during a defined recapture period. These developments are intended to be transfor-mative on local economies and fill funding gaps that cannot be financed by other means.
To accomplish the work, a Brownfield Redevelopment Tax Increment Financing Authority (TIF) district is created with a plan that specifies all of the proposed activities and expenses. The future TIF funds are used to pay back the costs associated with the remediation. Once all of the approved expenses have been reimbursed, any additional dollars may go into a revolving fund to pay for additional brownfield work within the municipality.
The City has the ability to establish its own Brownfield authority; however it would likely make more sense to utilize the Shia-wassee County Brownfield Redevelopment Authority, which is operating as a county-wide brownfield authority.
E.6.3 Main Street Program
Durand should consider instituting the National Trust for Historic Preservation’s Main Street Program. The National Main Street Center’s Four Step Approach (Design, Organization, Promotion, and Economic Restructuring) has been successful in communities ranging from a few hundred to cities with populations of hundreds of thousands. Their method is focused on a Main Street Manager who utilizes a committee structure based on the four steps to leverage volunteerism of property and business owners, residents, and volunteers to support district-wide revitalization.
E.7 Financial Tools
E.7.1 Downtown Development Authority (DDA)
A local unit of government may create a Downtown Development Authority, under PA 57 of 2018, Part 2 (formerly under Public Act 197 of 1975), in order to halt property value deterioration, increase property tax valuation, and promote economic growth in a central business district. A DDA is a quasi-public authority that can create development plans, encourage historic preservation, authorize acquisition of property, fund infrastructure projects, and promote economic growth. DDAs utilize Tax Increment Financing as a tool for generating revenue, and they may also obtain operating millages. DDAs may receive grants and donations to also accomplish their downtown management activities. When a DDA is established, a “base year” for the district’s state equalized value is established. Each year after, the DDA captures the incremental tax growth within the district, and these funds are recycled within the district to encourage additional tax growth. Durand has an active and functioning DDA district.

D U R A N D M A S T E R P L A N
156
E.7.2 Corridor Improvement Authority
In an effort to provide a tool for communities to address commercial disinvestment along commercial corridors, the Michigan Legislature passed the Corridor Improvement Authority Act, PA 57 of 2018, Part 6 (formerly Public Act 280 of 2005). This tool is similarly constructed to the DDA legislation with the primary funding tool of Tax Increment Financing, but communities can create more than one CIA district within their boundaries.
CIA districts must be larger than five acres, consist of at least 50% commercial property, and the land must be zoned to allow for mixed uses, including high-density residential. The municipality must expedite local permits and inspections within the CIA district while promoting walking non-motorized interconnections throughout the district.
To fund improvements along Lansing Road, the City may consider establishing a Corridor Improvement Authority in this area.
E.7.3 Local Development Finance Authority (LDFA)
A city, township, or urban township may create a Local Development Finance Authority to finance public facility improve-ments, using Tax Increment Financing. The LDFA act is Public Act 57 of 2018, Part 4 (formerly 281 of 1986). Eligible property consists of property of which the primary purpose is manufacturing, processing of goods and materials by physical or chemical change, agricultural processing, or high technology activity.
For example, upon designation of a LDFA, a community may develop an industrial park and use captured revenues from eli-gible property within the park to pay for public facilities improvements within the park. Communities may only create a single LDFA within their boundaries.
E.7.4 Tax Increment Finance Authority (TIFA)
Local units of government may establish one Tax Increment Finance Authority (TIFA) district within its boundaries to collect tax increment funds that are to be used to prevent property tax deterioration within the community. TIFAs may operate in con-junction with or independent of Downtown Development Authorities. Originally established as a PA 450 of 1980, this tool is now governed by PA 57 of 2018, Park 3.
E.7.5 Neighborhood Improvement Authority
Neighborhood Improvement Authorities may be established under Part 8 of PA 57 of 2018 (formerly PA 61 of 2007), and these authorities utilized tax increment financing to fund residential and economic growth activities within residential neighbor-hoods. The authorities may also issue bonds on the expected tax increment revenues.
E.7.6 Water Resource Improvement Tax Increment Finance Authority
Water Resource Improvement Finance Authorities may be established under PA 57, Part 7 (formerly PA 94 of 2008) allows all local municipalities to create these authorities to prevent deterioration of water resources and to promote water resource improvements or access to inland lakes or both.
E.7.7 Conditional Land Use Transfers
Per PA 425 of 1984, it allows two local units of government to share tax revenues resulting from new or expanding develop-ment. These 425 Agreements are designed to create a less contentious method that avoids the lengthy and often costly an-nexation process. Legally, the land remains in the less-developed community, but the U.S. Census interprets this land covered by the 425 Agreement as transferring to the community that initiated the agreement. Along the City’s boundary with Vernon Township, the City has grown through the use of 425 Agreements, often when properties have been connected to the City of Durand’s public utilities.

D U R A N D M A S T E R P L A N
157
E.7.8 Special Assessment Districts
Special assessments are a fee levied by the community for the financing of local improvements that are of primarily benefit to the landowners, which must pay the assessment. Taxes levied for public improvements within a Special Assessment Dis-trict can be applied to such things as utilities systems, drainage improvements, public roads, rubbish collection, bicycle paths, parks, sidewalks, lighting, and tree maintenance. The costs are apportioned according to the assumed benefits of the proper-ties impacted by the improvements. Street lighting, street repaving, and county drain projects are frequent SAD projects.
E.7.9 Dedicated Millages
After the Great Recession, dedicated millages have been a tool that many municipalities in the State of Michigan have used due to the limits on municipal income growth caused by Headlee and Proposal A laws on local tax growth. Local units of government cannot increase millage rates without a vote of the people, and many residents do not understand the con-straints that the last decade have placed on their local government’s municipal finances so they are less inclined to increase the general millage rate of the community; however, many taxpayers will consider paying for a specific millage. Approval of a special millage reduces the burden on the General Fund revenues of the community by funding a General Fund expense from a dedicated millage. This tool is also used for funding specific projects. Examples include public safety millage, road repair, library, transportation, recreation, and others.
E.7.10 Commercial Rehabilitation Act
The Commercial Rehabilitation Act, Public Act 210 of 2005, as amended, allows local municipalities to create one or more rehabilitation districts where the commercial buildings may receive multiple year tax reductions (up to ten years) for rehabili-tating a building within the district. These projects will limit the taxes received by the community for the period granted by the community; thus, this tool should be well-considered by local units of government prior to approval.
E.7.11 Principal Shopping District/Business Improvement District (Public Act 120 of 1961)
This Act provides for the establishment of principal shopping districts and for the establishment of Business Improvement Districts or Zones. Municipalities are permitted to complete street and pedestrian improvements, acquire property for and construct parking facilities (including parking garages), along with other facilities that “serve the public interest.”The municipality may also create a board for the management of certain ongoing activities, including various initiatives to promote economic development (i.e. market studies, public relations campaigns, and retail and institutional promotions). In addition, the maintenance, security, and operation of the principal shopping district may be carried out through this board. For ease of description, this board is often referred to as a Downtown Management Board (DMB) and the area it represents as the Principal Shopping District (PSD)/Business Improvement District (BID)/Business Improvement Zone (BIZ).
The DMB may be funded through grants and contributions and may also use the proceeds of special assessment levied by the governing body on property within the PSD specifically for maintenance, security, and operation purposes. All assessments are levied in accordance with the City’s special assessment policies and procedures. PSDs are useful for addressing issues such as parking construction and operation by shifting responsibility and accountability to a single entity. The organization is business driven, yet closely linked to the City through the appointment process and funding arrangements, and therefore, it is an orga-nizational expression of the partnership between the City and local business interests.

D U R A N D M A S T E R P L A N
158
E.7.12 Technology Park Development Act
In an effort to support the development of technology parks in Michigan, the Michigan Legislature passed the Technology Park Development Act, Public Act 385 of 1984, as amended, to assist with the development of technology-based businesses within Michigan. The act provided the following desired facilities: research and development; a high technology service such the providing of services including computer, information transfer, communication, distribution, processing, administrative, laboratory, experimental, developmental, technical, or testing services; a high technology service such as activities including the manufacture of goods or materials, the processing of goods or materials by physical or chemical change, computer related activities, communications, robotics, biological or pharmaceutical industrial activity, or technology oriented or emerging indus-trial or business activity not involving heavy manufacturing; and/or, a business activity that has it primary function of develop-ing, improving, or creating new or existing products with certain tax exemptions.
E.7.13 U.S. Department of Housing and Urban Development Programs
The U.S. Department of Housing and Urban Development offers a variety of programs that provide housing support for low and moderate income individuals. Programs include the Section 202, Section 8, Nine Percent Low Income Housing Tax Credit Program, and other funding initiatives. Section 202 provides mortgage and rental subsidies for the construction and main-tenance of elderly housing. Only non-profit, private organizations may take advantage of the Section 202 program. Though tax exempt, these developments often return some revenues to the local jurisdictions through the Payment in Lieu of Taxes (PILOT) fee to pay for emergency services and utility expenses that the development may utilize on a year-to-year basis.
The HUD Community Development Block Grant (CDBG) Program funds are distributed through the Michigan Strategic Fund of behalf of the Michigan’s non-entitlement (entitlement communities receive their CDBG, HOME, ESG, and HOPWA alloca-tions directly from HUD) communities. These funds are distributed to the state based upon population and income. The CDBG program’s three main goals are for the: 1) elimination of slums and blight, 2) benefit of low and moderate income individuals, and 3) addressing emergency situations. The program is managed by the Michigan Economic Development Corporation’s Com-munity Assistance Team (CATeam), and Shiawassee County is located in the CATeam’s East Michigan region. When considering a project, contact should be made with the CATeam member to determine financial viability and likelihood of funding.
E.7.14 Bond Programs
Municipalities will often utilize bond funding to pay for capital expenses that include large construction projects. Types of bond-funded municipal projects include most infrastructure projects (renovation/repairs or construction of water and sewer systems, park facilities, roads and bridges, municipal buildings, airports, marinas, and other large projects).
There are two general categories of municipal bonds: general obligation bonds and revenue bonds. General obligation bonds are backed by the “full faith and credit” of the municipality, which means that the legislative body pledges its municipal taxing authority to repay these bonds. Revenue bonds are repaid with income generated by the facility: a toll bridge or the water and sewerage fees for example. Because of the low risk, general obligation bonds offer the lowest interest rates for investors, but they are also one of the safest forms of investment.
To offer municipal bonds for investment, there are significant up-front fees associated with the sale of the bonds including originating fees, legal fees, rating agency fees, printing fees, and credit enhancements. Smaller municipalities often do not have a clear credit history, and investors know little of the financial situation or the local economy. These issues would drive up the costs of borrowing. To address this issue, the State of Michigan passed Public Act 227 of 1985, creating the Shared Credit Rating Program that is operated by the Michigan Municipal Bond Authority.
This authority pools the State’s smaller bond issues into larger offerings that are more attractive to investors. The investor’s risks are lessened and the State of Michigan has a decades long track record of successfully managing these bond issues. Each municipal within the pooled fund is responsible for their pro rata share of all of the expenses along with repaying their portion of the actual bond amount.

D U R A N D M A S T E R P L A N
159
E.8 Grant and Loan Programs
There are numerous grants and loan programs available through both the State and Federal governments. In addition, area community foundations may also offer grant and loan programs that provide funding to support certain projects that local units of government would qualify for. A State grant program that may be used to support the creative arts in the community is the Michigan Council for the Arts and Cultural Affairs (MCACA) grant program. Below are five of the most readily used eco-nomic development grant programs here in Michigan.
E.8.1 Michigan Department of Natural Resources
The Michigan Department of Resources (DNR) offers a number of grant programs to local municipalities. To be eligible for many of these grant programs, the municipality must have an adopted community recreation plan that has been developed in accordance to the DNR specifications and approved by the State of Michigan. These recreation plans must be current and updated every five years. The City’s current Parks and Recreation Plan runs from 2020-2024.
Three general grant programs for the development of recreational facilities include: 1) Michigan Natural Resources Trust Fund – funds are available for acquisition of land for recreation, scenic beauty, or environmental importance and for construction of recreational facilities. All trust fund dollars must be matching by a 25% local match. Recreational facility projects are limited to $300,000 in funds while the acquisition awards have no maximum. Source of funding is past oil and gas leases on State lands. 2) Recreation Passport Grant program provides grants ranging from $15,000 to $150,000 for the renovation of existing facilities with a minimum of a 25% local match. 3) Land and Water Conservation Fund provides grants ranging from $30,000 to $300,000 for the expansion of recreational activities within local communities.
The DNR has a variety of other specialized grant programs for boating infrastructure, off-road vehicle trail improvements, snowmobile trail improvements, dam management, invasive species control, habitat improvement, urban forestry, marine safety, and recreational law enforcement grants.
E.8.2 Michigan Department of Transportation
The Michigan Department of Transportation (MDOT) provides a variety of grant programs related to infrastructure devel-opment. One of these grant programs is the Transportation Alternatives Program (TAP) that has been used by many local municipalities to fund a variety of streetscape, non-motorized pathway, and historic preservation projects that enhance the community’s intermodal transportation system. The TAP program would be a good source of funding to complete a variety of nonmotorized transportation projects within the City.
MDOT offers a variety of grant programs including Safe Routes to Schools; Transportation Economic Development Fund; Small Urban, Rural Task Force; Freight Economic Development; and Local Bridge programs. Each of these grant programs has differ-ent goals and funding requirements.
E.8.3 Michigan Strategic Fund
The Michigan Strategic Fund’s Community Revitalization Program provides loans and grants to a variety of economic develop-ment projects, including historic preservation projects. PA 252 of 2011 revised the Michigan Strategic Fund Act to allow for job creation grants and loans to contaminated, functional obsolete, blighted, and/or historic resources.

D U R A N D M A S T E R P L A N
160
E.8.4 U.S. Department of Agriculture – Rural Development
The U.S. Department of Agriculture is engaged in rural development activities within each state. Michigan is divided into six districts with local offices located within each district. The Flint Office is the lead office for Durand. Michigan’s Rural Develop-ment office provides a variety of services including: 1) grants and loans for the construction, enlargement, or improvement of essential community facilities (fire and rescue facilities, jails, health clinics, nursing homes, airports, city halls, libraries, com-munity centers, and schools); 2) grants and loans to improve water and sewer facilities in rural communities; 3) housing loans and loan guarantees for rural low income individuals; and 4) business and industry loan guarantees for rural businesses.
E.8.5 Economic Development Administration – U.S. Department of Commerce
The Economic Development Administration (EDA) is an agency of the U.S. Department of Commerce, and the Chicago regional office provides services in the State of Michigan. One of the programs operated by the EDA is their Public Works program that helps distressed communities revitalize, expand, and upgrade their physical infrastructure. This program enables communities to attract new industry; encourage business expansion; diversify local economies; and generate or retain long-term, private-sector jobs and investment through the acquisition or development of land and infrastructure improvements needed for the successful establishment or expansion of industrial or commercial enterprises. This program has funded portions of industrial park developments across the State of Michigan. The EDA also supports the development of economic development strategies through the completion of Comprehensive Economic Development Strategy (CEDS) plans that will assist local governments in qualifying for EDA support.
f. AdditionAl resources
F.1 Michigan Municipal League
A member organization that provides training, newsletters, and consultations to Michigan’s cities and Villages while advocat-ing on behalf of them in Lansing.
1675 Green RoadAnn Arbor, MI 48105(800) 653-2483www.mml.org
F.2 County Extension Services
Across Michigan, extension agents concentrate on assisting communities with land use problems, free of charge and provide advice and training to individual farmers. Agents may serve as meeting facilitators and may be able to access additional help from Michigan State University faculty.
Shiawassee County Extension149 E. Corunna Ave. – 1st Flr.Corunna, MI 48817https://www.canr.msu.edu/shiawassee/county-extension-office

D U R A N D M A S T E R P L A N
161
F.3 County Planning Commission
The Shiawassee County Planning Commission is committed to quality planning through education, information, and advocacy, and it is dedicated to promoting planning practices that benefit the residents of Shiawassee County. One goal of county plan-ning is to ensure coordination between communities so that individual planning goals and objectives within one community support and do not adversely impact land use efforts in adjoining communities.
Shiawassee County Planning Commissionc/o Community Development DepartmentSurbeck Building201 N. Shiawassee Street – 3rd Flr.Corunna, MI 48817www.shiawassee.net/Community-Development/Planning-Commission.aspx
F.4 Regional Planning Agency
Regional planning agencies were formed to ensure regional planning efforts across larger boundaries than cities and counties. In Michigan, many regional planning organizations were formed due to the passage of the Federal-Aid Highway Act of 1962 that mandated the formation of metropolitan planning organizations for any urbanized areas over 50,000. Congress wanted to ensure that transportation funds were being allocated in a continuing, cooperative, and comprehensive planning process. Michigan’s regional planning agencies act as coordinating agencies for the local governmental units they serve. These agencies create development plans, and they now conduct all types of research and studies for their planning region. Local municipali-ties may find their Regional Planning Agency to be a valuable resource for information and guidance. Municipalities in Shia-wassee County may seek guidance from:
GLS Region V Planning and Development Commission1101 Beach St. – Rm. 223Flint, MI 48502-1470(810) 257-3185
F.5 Other Local Officials
Talking with other local units of governments with similar issues and problems can be extremely beneficial in determining suc-cessful land use policies and strategies. Fellow officials from neighboring communities have often faced similar problems, and their experience may provide guidance in avoiding similar pitfalls while providing valuable lessons learned.
G. Additional Opportunities
G.1 Non-Traditional Conservation Efforts – Urban Forestry
The scientific benefits of street trees, rural tree breaks, and site landscaping has developed significantly over the last 25 years. These conservation interventions will positively impact the physical, economic, and mental well-being of Durand residents.
To achieve wide array of benefits, Durand should implement a community-wide forestry program that encourages the devel-opment of a healthy forested canopy that is comprised of a diversity of types of street trees, buffering and greenbelts, and site landscaping. This program values the existence of a dense canopy across the entire community, and it ensures the long-term maintenance of the forest through public and private sector investment and public education.

D U R A N D M A S T E R P L A N
162
Street Canopy TreesStreet trees provide a pleasing charm to residential neighborhoods and commercial districts. Communities with a dense forest canopy support the development of community character and define a unique sense of place.
A multitude of benefits of a fully functioning forestry canopy have been identified and scientifically verified in ground breaking research over the last two decades. A dense forest canopy:
• Decreases stormwater impacts by reducing run-off through capturing rainfall in the canopy, absorbs stormwater through the tree’s root system, and filters water runoff thus improving overall stormwater quality;
• Improves air quality by absorbing a range of airborne pollutants (carbon dioxide, sulphur dioxide, nitrous oxides, and others), reduces ozone emitted from cars, and removes particulate air pollution as well;
• Reduces greenhouse gases by sequestering carbon from the air;• Improves public health by creating greener environments that are associated with improving attention, decreasing
asthma rates, reducing neighborhood noise, and improving physical and mental health; • Reducing road maintenance costs as shaded streets deteriorate less quickly than unshaded streets;• Induces traffic calming effects by reducing traffic speeds and reducing the number and severity of accidents; • Decreases urban heat island effects across the entire community and site specifically (compare a well shaded parking
lot versus an unshaded lot on a sunny day in the middle of summer); • Reduces energy costs for property owners as buildings that are shaded in summer have significant reductions in cool-
ing costs while in winter, properties protected by evergreen screens from cold winds also see cost reductions due to wind breaks afforded by the trees;
• Increases residential property valuations when generous tree cover exists for all properties on the block while indi-vidual homes see benefits from a single mature shade tree located in the parkway area adjacent to the sidewalk;
• Increases the natural habitat for animals and plants along with supporting biodiversity; and • Increases economic activity in commercial districts as studies have found that generous tree cover encourages shop-
pers to visit longer, travel further, and spend more time visiting once they’ve arrived.
Other studies have found that a rich forested urban landscape has several other benefits including lower crime rates, im-proved neighborhood connectivity, and improved resident wellbeing.
Generally accepted urban forestry guidelines recommend that 40% tree cover is generally appropriate for communities in the Eastern portion of the United States. To achieve this rate of cover in Durand, a long-range forestry program is recommended. This program would include public outreach to educate the community as to the benefits of dense forested canopy, amend-ments to development ordinances that require the installation of trees with all new developments (parkway street trees, general site canopy trees and landscaping, greenbelt and buffering areas, and parking-area canopy trees), grant writing pro-gram to raise funds for tree installation, and municipal budgeting to establish a modest annual tree installation and street tree maintenance program.
To assist with the development of an increased tree canopy, Durand should begin the process to become designated as a Tree City USA by the Arbor Day Foundation. The four-step program requires:
1. Establishment of a Tree Board or Department;2. Adoption of a Tree Care Ordinance; 3. Establishment of a Community Forestry Program with an Annual Budget of at least $2 per Capita; and 4. Hosting an Annual Arbor Day Observance and Proclamation.
The forestry program benefits will develop over decades so it is necessary to formulate a plan that is able to be implemented and sustained far into the future. To fund forestry activities, grants are available through the Michigan Depart of Natural Re-sources’ Urban and Community Forestry Program and local utility companies may also offer forestry grants.
Durand Zoning Ordinance landscaping requirements should be revised to require canopy street trees be planted on 40 foot centers along all road rights-of-way.

D U R A N D M A S T E R P L A N
163
Site Landscaping In addition to increasing the urban canopy through the use of street trees, site landscaping is another important tool to increase the City’s urban forest cover. Site landscaping includes all non-grass plantings on a site, excluding the street trees. Site landscaping is often a mixture of: 1) building foundation plantings; 2) general site landscaping that includes a mixture of canopy and decorative deciduous and evergreen trees and shrubs that provide visual interest and aesthetic appeal across an entire development; 3) parking lot island landscaping that is designed to break-up the scale and size of the hard surface while providing some visual buffering of parking uses from the adjoining roadways and properties and environmental benefits; 4) parking lot buffering landscaping; 5) greenbelts between differing properties; and 6) buffering strips – thicker greenbelts that provide a visual break between more intensive uses.
The appropriate amount and location of site landscaping will often provide the necessary visual improvements to nearly any development. Less intensive developments may only require decorative landscaping to be used to aesthetically enhance and soften the development while more intensive uses may require more dense landscape buffering and greenbelts. These land-scaping tools actually shield these sites from the adjoining parcels and adjacent road rights-of-way.
All land uses should have to provide site landscaping that supports the City’s goals to increase its urban forestry tree cover including large commercial and industrial properties. More intensive commercial and industrial uses should have the more concentrated landscape buffering requirements to limit their impacts upon adjoining property owners and passersby. Parking lots for commercial and industrial uses should not be exempted from the parking lot island landscaping and parking lot buffer-ing requirements and all unpaved greenspaces should meet the City’s general site landscaping requirements. These develop-ment requirements should be incorporated into the City’s Zoning Ordinance.
Careful consideration should be given to strike the balance between too intensive regulation while recognizing the off-site impacts that poorly landscaped developments may have upon adjacent properties and the community at large.
G.2 Open Space Protection
Parks and open spaces are a vital tool in improving a community’s quality of life. Many people enjoy active and passive out-door recreation, and well-utilized outdoor spaces also help to build the sense of community. Open space protection is another environmental tool to protect important sites from development or retaining open spaces free from development.
There are a variety of tools to protect open spaces and natural features through public and private action:
Land Trust/ ConservancyLand trusts, also known as land conservancies, are local, regional, state, national, or international nonprofit organiza-tions directly involved in protecting land for its natural, recreational, aesthetic, historical, or agricultural value. These entities may be established to protect a single parcel, while others may actively pursue and manage open space across an entire region. Land trusts employ numerous tools to protect land, including acquisition/purchase, receiving and holding conservation easements, and facilitating the transfer of ownership of conservation easements to other conser-vation groups. Because these groups are non-profits, they can generally act faster than local governments when conser-vation opportunities present themselves.
Conservancies and land trusts may directly purchase and operate preserves for recreational purposes. They can also offer the technical and financial assistance for acquisition of land for conservancy purposes, and often, they work in cooperation with government agencies to plan for open space protection. Some land conservancies also manage land owned by others or advise landowners how to protect and preserve the natural character of their land. Land conservan-cies also accept donations of land or conservation easements. The Mid-Michigan Land Conservancy and the Saginaw Basin Land Conservancy both operate within Shiawassee County.

D U R A N D M A S T E R P L A N
164
Open Space/ Conservation EasementOpen space or conservation easements are legally binding restrictions that run with the land in perpetuity. These ease-ments are either given by donation or sold by property owners, and they limit what may be done on the land forever. Because of the easement, change of ownership does not undermine the original commitment to ensure open space preservation. The easements also provide an economic benefit to the donor/seller by giving a financial benefit (either through cash or value of the donated easement) to them. Easements are a less expensive approach than outright acqui-sition and land remains in private use thus continuing to provide revenue to the municipality.
Although the initiation of easements by the landowner is voluntary, the development rights that are transferred are maintained in a legally binding manner. These development rights that are encumbered by the easements often pre-clude the land from future residential or commercial development. Easements are often donated, but can also be purchased. Those making charitable donations of permanent easement rights can benefit from federal income and es-tate tax relief, provided that the land be used for outdoor recreation, maintenance of natural habitats and ecosystems, scenic enjoyment, or historical significance. The enforcement and monitoring of such easements is often entrusted to a land conservancy. Both the Mid-Michigan Land Conservancy and the Saginaw Basin Land Conservancy serve the region by encouraging landowners to place conservation easements on lands that will protect water quality and sensitive natu-ral areas.
Although they function in a similar manner, open space and conservation easements are somewhat different. Open space easements, which are meant to maintain open space for human use, allow limited activities such as agriculture or recreation to take place on the subject property while keeping the encroachment of development at bay. The conserva-tion easement, on the other hand, is not necessarily meant to protect land for human use, but to protect land that is environmentally sensitive or unique.
Property owners may also voluntarily enter Michigan’s Farmland and Open Space Program (informally known as PA 116) to obtain tax benefits from the State in exchange for preserving the farmland.
Land PurchaseThe most straightforward option to preserve natural areas and open space in a community is through direct purchase. Although this is likely the most expensive option, there are ways to pursue land acquisition in an economically feasible manner, such as land banking (land is systematically purchased and set aside), or lease-back/sell-back, whereby the governmental unit purchases the land and either leases or sells it with deed restrictions. There are also a variety of fi-nancing options and means available to leverage funds available to municipalities. These methods include sale of bonds to raise capital for land purchase, dedicated millages, state and federal grants for acquisition of land for parks and recreation, donations of funds from foundations, and acquisition by a third party, such as a local, regional, statewide or national land trust.
When attempting to purchase property, timing may be an issue. Tools that may be employed to lengthen the time to raise funds to purchase include Options to Buy or Rights-of-First Refusal. Leasing may also be an option.
One concern is that property values are often artificially escalated when property owners suspect that a public entity is interested in trying to purchase their land. Citizen support for public acquisition may be difficult to gain in areas not experiencing intense development pressure because of the perception that the need does not yet exist. A second con-sideration that must be evaluated is that property purchased by the community is property that is no longer on the tax rolls and must now be maintained.

D U R A N D M A S T E R P L A N
165
DonationWhile a community or land trust cannot force a landowner into donating property, interested landowners may donate their property to a land trust, municipality, or other organization. Public education on the critical importance of the community’s natural resource base can go a long way in cultivating landowners to consider land donation. Land can be donated outright, or landowners may opt for the “reserved life estate” option. The “reserved life estate” option allows the property owner to live on the property for the rest of their lifetime, after which time property ownership transfers to the community or land conservancy. A landowner can also sell their land to an organization at less than the fair mar-ket value. The difference in sales price may be claimed as a tax deduction. Because the land is given, this method does not always result in the best land for conservation purposes.
Deed RestrictionRestrictions can be placed upon private property that limits its future uses, including in the form of Subdivision Deed Restrictions and Condominium Documents. Subdivision deed restrictions are used in conventional, platted subdivisions. Site condominium restrictions are usually found in a project’s master deed and by-laws. These restrictions can accom-plish many objectives, such as: wetland and water body buffers, preservation of existing wooded areas, limitations on pesticide and fertilizer application, natural/indigenous landscaping, impervious surface limitations, etc.
While these restrictions can be similar to those of a conservation easement, they are only enforceable by the prior owner or other involved parties. A site condominium’s property owners’ association has the power to assess residents, and each resident is a shareholder in the condominium project. In a site condominium, the restrictions are legally bind-ing, and thus must be recorded with the proper authorities. This offers a stronger mechanism for maintaining these restrictions than is possible in a subdivision plat.
Unfortunately, these restrictions may be canceled at any time upon an agreement between the parties to the agree-ment. Also, like any other development restriction that runs with the land, new landowners must be made aware of the restrictions.
Development Right TransfersTwo types of development right transfer programs exist – Transfer of Development Rights (TDR) and Purchase of De-velopment Rights (PDR). In both instances, the property owners voluntarily enter the program to transfer development rights from their property to preserve natural features, open space, or agricultural uses from future development.
In the instance of TDR programs, the property owner of a site or parcel within an area that has been deemed for pres-ervation voluntarily sells their rights for future development to a developer or other interested party who then transfers these development rights to a parcel(s) that has been designated to accept additional development above the standard zoning maximums. Through the Zoning Ordinance, the municipality identifies both the development and preservation areas.
With PDR programs, funds are raised from governmental, private, and non-profit sources to purchase the develop-ment rights outright. These development rights are then held by the entity in perpetuity. The property owner benefits through reduced carrying costs because the land no longer can be developed to its original highest and most intensive use thus reducing its tax liabilities and future sales value while the municipality and its residents are able to preserve an asset in its undeveloped state. PDRs conservation approach is similar to an easement program.

This Page Left Intentionally Blank

D U R A N D M A S T E R P L A N
167
This Page Left Intentionally Blank

500 Griswold Street - Suite 2500Detroit, MI 48226-4481313.961.3650
Arthur F. Mullen, AICP Project Manager and Professional PlannerCarly Keough Planner and GIS TechnicianMichelle Leppek, AICP Planner and GIS Technician


PREPARED BY:Wade Trim500 Griswold StreetSuite 2500Detroit, MI 48226-4481www.wadetrim.com
PREPARED FOR:City of Durand
Adopted December 7, 2020
MASTER PLAN FOR CITY OF DURAND
SHIAWASSEE COUNTY, MI

Introduction 3Regional Analysis 7Existing Land Use 19Community Facilities and Services 27Transportation Analysis 33Natural Features 43Population Profile 55Housing Profile 63Economic Profile 69Housing Assessment 77Development Needs 83Redevelopment Strategy - 2020 99Community Goals 105Improving Sustainability & Increasing Resiliency 115Future Land Use 125Zoning Plan 135Strategic Implementation Plan 141Master Plan Implementation Resources 147
Appendices
TABLE OF CONTENTSMASTER PLAN FOR CITY OF DURAND, SHIAWASSEE COUNTYDecember 7, 2020

500 Griswold StreetSuite 2500Detroit, MI 48226-4481www.wadetrim.com
Florida • Georgia • Michigan • Missouri • NebraskaNew York • North Carolina • Ohio • Pennsylvania • Texas
Copyright © 2022 FDOKUMEN