International marketing serials: a retrospective
50
International marketing serials 667 International Marketing Review, Vol. 18 No. 6, 2001, pp. 667-716. # MCB University Press, 0265-1335 Received December 1999 Revised May 2000 Accepted July 2000 International marketing serials: a retrospective Michael R. Hyman Department of Marketing, College of Business Administration and Economics, New Mexico State University, Las Cruces, New Mexico, USA, and Zhilin Yang Department of Marketing, City University of Hong Kong, Hong Kong Keywords Literature, Sociology, Science Abstract The content of selected international marketing serials, published from 1985 to 1998, is examined. Results show that the authors published in these serials tend to be affiliated with marketing departments, senior professors, male, and work with a single co-author. Articles often focus on export and import, promotion, consumer behavior, and country of origin. Empirical studies ± often survey research based on one-country convenience samples ± are typically drawn from the USA, UK, Japan, Korea, PRC, Canada, and Hong Kong; South America and Africa are less studied regions. Statistical analysis is often limited to univariate and bivariate methods. Introduction During the last 15 years, growing academician and practitioner interest in international marketing prompted several academic publishers to launch related English-language serials (i.e. double-blind, peer-reviewed scholarly journals) (Aulakh and Kotabe, 1993; Javalgi et al. , 1997). To assess the cumulative content of these serials, which continue to provide valuable insights into international marketing theory and practice, a systematic retrospective is required. Such retrospectives generally reveal how serials evolve, remind editorial review boards and researchers of lacunas between practice and theory, and inform knowledge development efforts (Aulakh and Kotabe, 1993; Inkpen and Beamish, 1994). Clearly, international marketing serials (IMS) published since the mid-1980s contain a substantial body of conceptual and empirical work worthy of a comprehensive retrospective. This retrospective focuses on contributing authors and their institutional affiliations, editorial review board memberships, coauthorship patterns, article domains, samples collected, and primary methodologies. By assessing knowledge development in international marketing, it can inform future research and editorial mandates. Relative to earlier international marketing retrospectives (Albaum and Peterson, 1984; Aulakh and Kotabe, 1993; Boddewyn, 1981; Bradley, 1987; Javalgi et al. , 1997; Li and Cavusgil, 1991), it offers the most comprehensive and recent overview of IMS. Serials surveyed Research on international marketing has appeared in many academic outlets, such as serials, books, and conference proceedings. Nonetheless, this The research register for this journal is available at http://www.mcbup.com/research_registers The current issue and full text archive of this journal is available at http://www.emerald-library.com/ft
Transcript of International marketing serials: a retrospective

Internationalmarketing
serials
667
International Marketing Review,Vol. 18 No. 6, 2001, pp. 667-716.
# MCB University Press, 0265-1335
Received December 1999Revised May 2000
Accepted July 2000
International marketingserials: a retrospective
Michael R. HymanDepartment of Marketing, College of Business Administration and
Economics, New Mexico State University, Las Cruces,New Mexico, USA, and
Zhilin YangDepartment of Marketing, City University of Hong Kong, Hong Kong
Keywords Literature, Sociology, Science
Abstract The content of selected international marketing serials, published from 1985 to 1998,is examined. Results show that the authors published in these serials tend to be affiliated withmarketing departments, senior professors, male, and work with a single co-author. Articles oftenfocus on export and import, promotion, consumer behavior, and country of origin. Empiricalstudies ± often survey research based on one-country convenience samples ± are typically drawnfrom the USA, UK, Japan, Korea, PRC, Canada, and Hong Kong; South America and Africaare less studied regions. Statistical analysis is often limited to univariate and bivariate methods.
IntroductionDuring the last 15 years, growing academician and practitioner interest ininternational marketing prompted several academic publishers to launchrelated English-language serials (i.e. double-blind, peer-reviewed scholarlyjournals) (Aulakh and Kotabe, 1993; Javalgi et al., 1997). To assess thecumulative content of these serials, which continue to provide valuable insightsinto international marketing theory and practice, a systematic retrospective isrequired. Such retrospectives generally reveal how serials evolve, remindeditorial review boards and researchers of lacunas between practice and theory,and inform knowledge development efforts (Aulakh and Kotabe, 1993; Inkpenand Beamish, 1994). Clearly, international marketing serials (IMS) publishedsince the mid-1980s contain a substantial body of conceptual and empiricalwork worthy of a comprehensive retrospective.
This retrospective focuses on contributing authors and their institutionalaffiliations, editorial review board memberships, coauthorship patterns, articledomains, samples collected, and primary methodologies. By assessingknowledge development in international marketing, it can inform futureresearch and editorial mandates. Relative to earlier international marketingretrospectives (Albaum and Peterson, 1984; Aulakh and Kotabe, 1993;Boddewyn, 1981; Bradley, 1987; Javalgi et al., 1997; Li and Cavusgil, 1991), itoffers the most comprehensive and recent overview of IMS.
Serials surveyedResearch on international marketing has appeared in many academicoutlets, such as serials, books, and conference proceedings. Nonetheless, this
The research register for this journal is available at
http://www.mcbup.com/research_registers
The current issue and full text archive of this journal is available at
http://www.emerald-library.com/ft

InternationalMarketingReview18,6
668
retrospective only covers a subset of IMS published in English; non-Englishserials are excluded because they are not `̀ reasonably accessible to bothacademicians and practitioners’’ (Albaum and Peterson, 1984, p. 162). Booksand conference proceedings are excluded because the review process for serialsis more stringent and current serials reflect the current state-of-the-art. Thesampling unit is IMS instead of international marketing articles because thelack of accepted criteria for identifying such articles precludes an unbiasedsample frame; for example, it is unclear if one-country studies published inforeign serials (e.g. an article about French consumers published in a US-basedserial) and methods-centric studies that include tests with foreign data (e.g.an article, published in a UK-based serial, that compares conjoint analysisprograms with data provided by Korean consumers) qualify (cf. Albaum andPeterson, 1984; Aulakh and Kotabe, 1993; Bradley, 1987). Also, chroniclers lessqualmish about sample frame bias report that IMS publish the lion’s shareof such articles: Javalgi et al. (1997) report that 57 per cent of the 4,641international marketing articles they found in 22 marketing serials appeared inthe five IMS that they identified.
The IMS reviewed here were chosen via a two-stage process (see Appendixfor more detail). In stage one, a list of 20 candidate serials was created bypooling data from a recent retrospective (Javalgi et al., 1997), the ABI/Informon-line database, the MCB University Press On-line Journal Portfolio, andmarketing `̀ jump sites’’ on the Web. In stage two, this list was culled based onserial unavailability, immaturity, excessive industry specificity, andinsufficient international marketing orientation (as revealed by close reading ofpublished editorial mandates, and selectively assessing tables of contentsfor the propensity of articles that address `̀ influences on and activitiesinvolved in marketing not only to, but also within foreign countries’’ (Albaumand Peterson, 1984, p. 162)). Ultimately, five IMS qualified for evaluation:International Marketing Review (IMR, from the UK), Journal of Euro-marketing(JE, from the USA), Journal of Global Marketing (JGM, from the USA), Journalof International Consumer Marketing (JICM, from the USA), and Journal ofInternational Marketing (JIM, from the USA).
The editorial mandates of the five reviewed IMS are to explore:
(1) the latest advances in knowledge and practice in internationalmarketing (IMR);
(2) the strategic planning aspects of marketing management in Europe (JE);
(3) cross-national and cultural marketing issues, at both micro and macrolevels, from a global perspective (JGM);
(4) cross-national and cultural marketing issues, including consumer/consumption behavior and organizational purchasing (JICM); and
(5) firm strategy and practice regarding international marketingmanagement (JIM).

Internationalmarketing
serials
669
Their intended audience includes international business persons, policymakers concerned with international trade, marketing academicians, andresearchers. All five serials solicit managerially oriented yet conceptually andmethodologically rigorous articles; multidisciplinary work that exploresthe interrelationship between marketing and other business functions isencouraged. All but JE call for submissions with a global perspective. Moredetailed editorial mandates for these serials, derived from their respective Websites, are:
International Marketing Review (IMR): `̀ is the `International Marketing’Review and not an International `Marketing Review’ . . . [I]t seeksto publish interesting, well-written and academically robust paperswhich communicate clearly on international marketing issues. It isnot a general marketing journal’’ (http://www.mcb.co.uk/portfolio/imr/jourinfo.htm).
Journal of Euro-marketing (JE): `̀ fosters a conceptual understanding ofthe European markets and marketing systems . . . highlight[s] the past,present, and future of European marketing . . . [stresses] the inter- andintra-trade and marketing activities in Europe . . . [and] covers . . . [topicssuch as] [1] functional areas of marketing in Europe and comparisonswith the practices . . . in other regions. . ., [2] the linkage of Europeannational markets into markets of the developing world, North and LatinAmerica, the Far East, and Africa, [3] the best methods . . . for marketinggoods and services in different socioeconomic, cultural, and legal-politicalenvironments of Europe. . ., [4] the . . . environmental factors prevailingin different European countries . . .which force changes in the marketingstructure. . ., [and][ 5] the various stages of market and marketingsystem development in Europe . . . for generalizing . . . developments inmarketing’’ (http://www.haworthpressinc.com).
Journal of Global Marketing (JGM): provides `̀ an examination of cross-cultural marketing issues at both micro and macro levels . . . address[es]marketing challenges, opportunities, and problems encountered byfirms, industries, and governments on a global scale . . . with new andimproved methods, approaches, and techniques of global marketingmanagement. In addition to treating North American and Europeanaspects, the journal places special emphasis on the perspectives ofcontributors from other areas of the globe, particularly Asia, Africa,East and Central Europe, and Australia. Comparative marketing studiesand marketing case studies on individual countries, regions, andindustries [are encouraged]’’ (http://www.haworthpressinc.com).
Journal of International Consumer Marketing (JICM): `̀ satisfies thecurrent information needs of practicing international managers andpublic policymakers by offering greater insight into the workingsof their marketing policies and strategies on a world scale . . . [and]provides fresh ideas and conceptual frameworks/ constructs/theories for

InternationalMarketingReview18,6
670
academic researchers and students of international marketing . . . [by]looking at cross-cultural/national and comparative consumer behaviorissues and concerns’’ (http://www.haworthpressinc.com).
Journal of International Marketing (JIM): `̀ [stresses] mainstream issuesin international marketing management and strategy such as marketentry, segmentation, positioning, pricing, channel development,product/service innovation, customer service, company organization,and globalization. . . . The focus is on firm strategy and practice, notconsumer behavior. . . . [A]rticles that provide holistic views oninternational marketing phenomena . . . [and] explore interrelationshipsbetween marketing and other business functions [are encouraged]’’(http://ciber.bus.msu.edu/jim/editph.htm).
As knowledge development is the main focus here, only articles wereconsidered; book reviews, dissertation abstracts, and letters to editors wereexcluded (Hoverstad et al., 1995; Urbancic, 1994, 1995). A total of 669 articlesin IMS were surveyed. The number of articles published per issue ± ·x ˆ 5:49,s ˆ 0:36 ± was consistent across IMS, which signals the maturity of theseserials (Malhotra, 1996). The mean issues per year was 3.1 (see Table I).
Content measures, coding, and cross-serial comparisonsThe content analysis employed 37 different measures. Coded data includedindexing information (e.g. serial name, year of publication), authordemographics, article domains, samples collected, primary methodologiesused, and editorial review board memberships.
Author demographicsAuthor demographics can provide the following insights:
Identifying the most prolific authors acknowledges the majorcontributors and assesses the concentration of contributions in a field.`̀ Affiliation tally, a respected tool in sociology of science research, ismeaningful because (a) the support and incentives provided byacademic institutions foster article output, and (b) faculty publicationrecord signals the stature and productivity of academic institutions’’(Hyman and Steiner, 1997, p. 3). To establish benchmarks for researchproductivity, many serial retrospectives list the most prolific authorsand their institutional affiliations (Carnaghan et al., 1994; Fields andSwayne, 1988; Hoverstad et al., 1995; Reinsch and Lewis, 1993).
Doctoral training affects the research productivity of academicians(Diamantopoulos, 1996). In addition to assessing the proclivity of someuniversities to produce graduates with specific research interests,tracking authors’ doctoral-granting institutions recognizes theseinstitutions for their graduates’ research contributions.

Internationalmarketing
serials
671
Table I.General information
about selected serials
Ser
ial
Yea
rof
init
ial
publica
tion
No.
yea
rsco
ded
Yea
rsco
ded
No.
ofco
ded
issu
esa
No.
ofar
ticl
esA
rtic
les
per
issu
eM
ean
Std
dev
IMS
Inte
rnationalM
ark
etin
gR
evie
w19
848
1985
-199
332
172
5.38
0.46
Journ
alof
Euro
mark
etin
g19
916
1993
-199
815
795.
270.
57Jo
urn
alof
Glo
bal
Mark
etin
g19
8712
1987
-199
833
188
5.70
0.94
Journ
alof
Inte
rnati
onal
Consu
mer
Mark
etin
g19
888
1991
-199
818
108
6.00
0.94
Journ
alof
Inte
rnati
onal
Mark
etin
g19
936
1993
-199
824
122
5.08
0.13
Tot
al40
122
669
27.4
3M
ean
5.71
17.4
395
.57
5.49
Std
Dev
0.36
Note
:aIf
two
issu
esw
ere
publish
edto
get
her
,th
eyw
ere
counte
das
one
issu
e

InternationalMarketingReview18,6
672
Assessing both the nationality of academicians’ affiliated institutionsand academic areas may suggest why certain topics are pursued andcertain samples are collected. Moreover, these data reveals the degree ofinterdisciplinary, international, industrial, and academic cooperationamong authors.
Assessing authors’ academic rank can reveal the seniority of researcherswho contribute most to knowledge development; such assessments arecommon in serial retrospectives (Clark, 1985; Geistfeld and Key, 1986;Hoverstad et al., 1995; Swan et al., 1991).
Thus, articles were coded for each author’s name, doctoral-granting institution,listed institutional affiliation (with nationality), listed departmental affiliation(e.g. marketing), academic title or rank, and gender. When an article listed twoinstitutions for one author, the first listed institution was coded.
Editorial review board membershipsFaculty publication record is one of several reputation measures. Becauseacademic institutions are also judged by editorial review board memberships(Boone et al., 1988; Kurtz and Boone, 1988; Urbancic, 1989), universityadministrators encourage faculty to serve on such boards. Furthermore, often-published authors are asked to serve on review boards because theyunderstand the serial’s editorial policies and editor’s preferences (Inkpen andBeamish, 1994).
Topics addressedPeriodic assessments of topical trends for serials may spur knowledgedevelopment and offer insights into future research directions (Albaum andPeterson, 1984; Aulakh and Kotabe, 1993; Inkpen and Beamish, 1994; Malhotra,1996; Reisman and Kirschnick, 1994). Nonetheless, the content of publishedmanuscripts is often ignored in serial retrospectives (Javalgi et al., 1997).Because topics covered in IMS mirror current academic interests and currentinternational marketing practice, identifying topical trends can help scholarsand practitioners to recognize key research opportunities.
Samples collectedCountry analysis has been overlooked in previous retrospectives oninternational business. External validity depends on the generalizability of thesample (McGrath and Brinberg, 1983); the more countries covered in empiricalarticles about a given topic, the more generalizable the results (Aulakh andKotabe, 1993). Furthermore, the relative non-coverage of a country maysuggest opportunities for future research.
Methodologies usedCross-cultural business studies have been criticized for their lack of internaland external validity (Cavusgil and Das, 1997; Sekaran, 1983). An analysis of

Internationalmarketing
serials
673
empirical methods used in IMS can highlight methodological strengths andweaknesses in international marketing research. In this regard, empirical IMSarticles were coded for:
primary data collection methods;
sampling design, including population, sample subjects, sample frame,sample type, sample size, and response rate; and
primary data analysis techniques.
Coding methodAlthough the coding rules were predominantly mechanical and relativelystraightforward (e.g. recording multivariate methods used to examine researchquestions), the coding task was burdensome because it required reviewingentire articles rather than mere abstracts (cf. Javalgi et al., 1997). If coderswould be highly consistent, then the coding onus could be eased by assigningone coder per article. Furthermore, if self-fulfilling coding bias is impossible ina descriptive study without hypotheses (i.e. if decisions on borderline casescannot be influenced by knowing the research goals), then the authors couldsafely serve as the motivated and conscientious personnel required for thislaborious coding task.
To ensure that the authors coded with sufficient consistency, both authorsfirst coded the same 100 articles. For all but one variable ± topic covered ± theresults were practically identical; as a result, for the remaining articles theauthors only conferred about the coding of this variable. Thus, the codingburden was eased by having each author code a separate set of articles. (Note:each author also searched for data coded as `̀ missing’’ by the other author, e.g.author gender.)
Cross-serial comparisonsTo provide a richer context for this retrospective of IMS, results were compared± when available ± to reviews published in other business-related serials andconference proceedings (e.g. Fields and Swayne, 1988; Grazer and Stiff, 1987;Hoverstad et al., 1995; Marquardt and Murdock, 1983). Furthermore, the lastdecade of Journal of International Business Studies (JIBS), a leading serial oninternational business (Inkpen and Beamish, 1994; Macmillan, 1994), was alsosurveyed for comparative purposes. As its title suggests, JIBS is aninternationally oriented serial; in addition, 17.5 per cent of articles in the first 25volumes of JIBS concerned marketing (Inkpen and Beamish, 1994). Thus, JIBScan serve as a meaningful benchmark for IMS.
ResultsAuthors’ demographicsAuthors. Table II lists the 19 most prolific authors by weighted authorshipscores, a well-established productivity measure (Clark et al., 1987; Clark andNessim, 1986; Heck et al., 1986; Inkpen and Beamish, 1994; Malhotra, 1996;

InternationalMarketingReview18,6
674
Table II.Authorship in IMS, byauthor
Ran
kA
uth
orA
cadem
icin
stit
uti
onA
cadem
icdep
artm
ent
Unw
eighte
dau
thor
ship
aW
eighte
dau
thor
ship
b
1Shoh
am,A
.Is
rael
Inst
itute
ofT
echnol
ogy
Indust
rial
engin
eeri
ng/m
anag
emen
t11
7.5
2O
kor
oafo
,S.C
.U
niv
ersi
tyof
Tol
edo
Mar
ket
ing
65
3M
ille
r,M
.M.
Mic
hig
anSta
teU
niv
ersi
tyE
xec
uti
ve
54.
54
Atu
ahen
e-G
ima,
K.
Univ
ersi
tyof
Wol
longon
g-A
ust
ralia
Man
agem
ent
44
5C
zinkot
a,M
.R.
Geo
rget
own
Univ
ersi
tyM
arket
ing/i
ntl
.busi
nes
s5
46
Mal
hot
ra,
N.K
.G
eorg
iaT
ech
Mar
ket
ing
54
7H
ill,
J.S.
Univ
ersi
tyof
Ala
bam
aM
anag
emen
t/in
tl.
busi
nes
s8
48
Kay
nak
,E
.P
enn
Sta
teU
niv
ersi
tyM
arket
ing
74
9B
arker
,A
.T.
Bro
ckU
niv
ersi
ty-C
AM
arket
ing
43.
510
Ter
pst
ra,V
.U
niv
ersi
tyof
Mic
hig
anM
arket
ing
53.
511
Husz
agh,S.M
.U
niv
ersi
tyof
Geo
rgia
Mar
ket
ing
83.
3312
Wel
ch,L
.S.
Mon
ash
Univ
ersi
tyM
anag
emen
t6
3.25
13K
atsi
kea
s,C
.S.
Univ
ersi
tyof
Wal
es-U
KM
arket
ing
63.
1714
Chen
,K
.J.
Nat
ional
Open
Univ
ersi
tyB
usi
nes
s/m
anag
emen
t3
315
Ser
inghau
s,F
.H.R
.W
ilfr
idL
auri
er-C
AM
arket
ing
33
16T
hor
elli,
H.B
.In
dia
na
Univ
ersi
tyB
usi
nes
s3
317
Her
big
,P
.A.
Jack
sonville
Sta
teU
niv
ersi
tyM
arket
ing
63
18H
owar
d,
D.G
.U
niv
ersi
tyof
Akro
nM
arket
ing
43
19K
ale,
S.H
.A
rizo
na
Sta
teU
niv
ersi
tyM
arket
ing
43
Tot
al10
371
.75
Note
s:
aIn
com
puti
ng
wei
ghte
dau
thor
ship
,fr
acti
onal
cred
itis
giv
ento
inst
ituti
ons
wit
hau
thor
sof
coau
thor
edar
ticl
es;
one-
hal
fau
thor
ship
iscr
edit
edto
each
contr
ibuto
rof
atw
o-au
thor
arti
cle,
one-
thir
dau
thor
ship
iscr
edit
edto
each
contr
ibuto
rof
ath
ree-
auth
orar
ticl
e,an
dso
onbN
um
ber
ofar
ticl
eson
whic
hnam
eap
pea
rsas
auth
oror
coau
thor

Internationalmarketing
serials
675
Morrison and Inkpen, 1991; Wheatley and Wilson, 1987), of 3.0 or more. Underthe standard weighting scheme, each author of a two-author article receivesone-half of a credit, each author of a three-author article receives one-third of acredit, and so on.
The most prolific author is Aviv Shoham, with 7.5 weighted and 11unweighted authorships. Of the most published authors, 31.6 per cent (six of19) are affiliated with institutions outside of the USA. Regarding departmentaffiliation, 13 of these 19 authors work for a marketing department; theremainder work for a management or business department. These 4.8 per cent(19 of 397) of authors are responsible for 10.7 per cent of the weightedauthorships (71.75 of 669) in the sampled IMS.
Institutional affiliations. Of the 25 most prolific academic institutions,Michigan State University, with 19.2 weighted authorships, ranks first (seeTable III). Representing 10.6 per cent (25 of 235) of academic institutions withcontributing authors, these institutions provided 26.4 per cent (176.4 of 669) ofweighted and 26.1 per cent (330 of 1,265) of unweighted authorships; the top teninstitutions provided 14.2 per cent (95.25 of 669) of both weighted and (179 of1,265) unweighted authorships. In contrast, 56.8 per cent of articles in selectedmarketing serials, published from 1984 to 1993, were from 9.1 per cent ofrepresented institutions (Hoverstad et al., 1995); thus, IMS authorships byinstitutional affiliation are relatively less concentrated.
Non-US institutions comprised 28.0 per cent (seven of 25) of these top 25institutions; relative to their 36.6 per cent (435 of 1,190) of unweightedauthorships (see Table IV), non-US-based institutions are under-represented.Thus, the most prolific institutions are disproportionately from the USA.
Single and multiple authorships. The sampled IMS publish a diverse set ofauthors from diverse institutions (see Table V). For authors, 80 per centappeared once, 12.3 per cent appeared twice, and 7.7 per cent appeared three ormore times. The distribution of unweighted authorships for IMS is similar toJIBS, Journal of Marketing (Hoverstad et al., 1995), Journal of the Academy ofMarketing Science (Hoverstad et al., 1995), and Journal of Business &Entrepreneurship (Hyman and Steiner, 1997).
Regarding institutional affiliations, 41.3 per cent (164 of 397) contributed oneunweighted authorship, 22.4 per cent (89 of 397) contributed two unweightedauthorships, and 36.3 per cent contributed three or more unweightedauthorships. This institutional concentration of authorships is similar toJournal of Business & Entrepreneurship (Hyman and Steiner, 1997), but morethan JIBS. As 80 per cent of authors published only once in IMS, and 58.7 percent of affiliated institutions provide more than one author, then IMS articlesare somewhat concentrated by institution.
Doctoral-granting institutions. For 59.1 per cent (499 of 844) of authors, dataon doctoral-granting institution were available either from their articles or fromThe 1998-1999 Prentice Hall Guide to Marketing Faculty (Hasselback, 1999).Although the 25 top academic institutions by weighted authorships were only10.6 per cent (25 of 235) of academic institutions with contributing authors,

InternationalMarketingReview18,6
676
Table III.Authorship in IMS, byacademic institution
Ran
kIn
stit
uti
onU
nw
eighte
dau
thor
ship
saW
eighte
dau
thor
ship
sbM
ean
auth
ors
per
study
Rev
iew
boa
rdm
ember
ship
sc
1M
ichig
anSta
teU
niv
ersi
ty34
19.1
71.
7310
2C
hin
ese
Univ
ersi
tyof
Hon
gK
ong
1811
.83
1.52
53
Univ
ersi
tyof
Tol
edo
159.
331.
930
4G
eorg
iaSta
teU
niv
ersi
ty20
9.17
2.18
15
Univ
ersi
tyof
Geo
rgia
208.
172.
451
6F
lori
da
Inte
rnat
ional
Univ
ersi
ty16
7.83
2.04
17
Nat
ional
Univ
ersi
tyof
Sin
gap
ore
167.
502.
132
8Is
rael
Inst
itute
ofT
echnol
ogy
117.
501.
470
9U
niv
ersi
tyof
Tex
as-A
ust
in16
7.33
2.18
510
Cal
ifor
nia
Sta
teU
niv
ersi
ty13
7.42
1.75
211
Univ
ersi
tyof
Haw
aii
166.
832.
345
12P
enn
Sta
teU
niv
ersi
ty13
6.83
1.90
113
India
na
Univ
ersi
ty8
6.83
1.17
414
Univ
ersi
tyof
Wal
es-U
K11
6.50
1.69
215
Geo
rgia
Tec
h10
6.33
1.58
116
Hof
stra
Univ
ersi
ty9
5.50
1.64
017
Univ
ersi
tyof
Ala
bam
a13
5.42
2.40
018
Jack
sonville
Sta
teU
niv
ersi
ty10
5.00
2.00
019
Upsa
laU
niv
ersi
ty-S
wed
en8
5.00
1.60
220
Cle
vel
and
Sta
teU
niv
ersi
ty14
4.75
2.95
321
Univ
ersi
tyof
Str
athcl
yde-
UK
74.
671.
454
22G
eorg
etow
nU
niv
ersi
ty6
4.50
1.33
423
Univ
ersi
tyof
Nor
thT
exas
104.
422.
261
24U
niv
ersi
tyof
Del
awar
e9
4.33
2.08
325
Mon
ash
Univ
ersi
ty7
4.20
1.67
2
Tot
al33
017
6.36
1.87
59
No
tes:
aIn
com
puti
ng
wei
ghte
dau
thor
ship
,fr
acti
onal
cred
itis
giv
ento
inst
ituti
ons
wit
hau
thor
sof
coau
thor
edar
ticl
es;on
e-hal
fau
thor
ship
iscr
edit
edto
each
contr
ibuto
rof
atw
o-au
thor
arti
cle,
one-
thir
dau
thor
ship
iscr
edit
edto
each
contr
ibuto
rof
ath
ree-
auth
orar
ticl
e,an
dso
onbN
um
ber
ofar
ticl
eson
whic
hnam
eap
pea
rsas
auth
oror
coau
thor
cN
um
ber
ofac
adem
icia
ns
who
ever
serv
edon
each
ofth
eIM
Sed
itor
ial
revie
wboa
rds
(e.g
.an
acad
emic
ian
who
serv
edon
all
five
boa
rds
wou
ldco
unt
`̀5’’)

Internationalmarketing
serials
677
Table IV.Institutional affiliationof authors, by location
IMS
JIB
S
Ran
kIn
stit
uti
onlo
cati
onU
nw
eighte
dau
thor
ship
aW
eighte
dau
thor
ship
bP
erce
nt
Unw
eighte
dau
thor
ship
aW
eighte
dau
thor
ship
bP
erce
nt
1U
SA
830
428.
0863
.99
397
209.
8766
.63
2C
anad
a63
38.0
85.
6953
28.1
78.
943
Unit
edK
ingdom
7134
.08
5.09
4421
.67
6.88
4A
ust
ralia
3521
.58
3.23
41.
670.
535
Hon
gK
ong
2917
.83
2.67
124.
171.
326
Sin
gap
ore
188.
501.
276
3.33
1.06
7Is
rael
128.
001.
206
2.83
0.90
8T
he
Net
her
lands
167.
501.
126
2.83
0.90
9N
ewZ
eala
nd
106.
500.
971
1.00
0.32
10Sw
eden
116.
500.
9711
4.50
1.43
11N
orw
ay8
4.00
0.60
32.
500.
7912
Turk
ey8
4.00
0.60
00.
000.
0013
Oth
erco
untr
ies/
area
s79
44.6
76.
6855
23.1
37.
3414
Unknow
n75
39.6
85.
9316
.00
9.33
2.96
Tot
al1,
265
669.
0010
0.00
612.
0031
5.00
100.
00
Note
s:
aIn
com
puti
ng
wei
ghte
dau
thor
ship
,fr
acti
onal
cred
itis
giv
ento
inst
ituti
ons
wit
hau
thor
sof
coau
thor
edar
ticl
es;on
e-hal
fau
thor
ship
iscr
edit
edto
each
contr
ibuto
rof
atw
o-au
thor
arti
cle,
one-
thir
dau
thor
ship
iscr
edit
edto
each
contr
ibuto
rof
ath
ree-
auth
orar
ticl
e,an
dso
onbN
um
ber
ofar
ticl
eson
whic
hnam
eap
pea
rsas
auth
oror
coau
thor

InternationalMarketingReview18,6
678
Table V.Single and multipleauthorship for IMS,JIBS, and selectedserials
By
auth
orB
yac
adem
icin
stituti
onIM
SJI
BS
JMa
JMb
JAM
Sb
JCR
bJM
Rb
MS
bJP
PSM
cJM
Ed
Eco
ne
JBC
fJB
Eg
IMS
JIB
SF
req.
%F
req.
%%
%%
%%
%%
%%
%%
Fre
q.
%F
req.
%
Unw
eighte
dau
thor
ship
sO
ne
675
80.0
366
80.4
77.5
77.7
76.6
67.2
70.1
64.0
49.6
90.0
57.7
79.7
77.6
164
41.3
120
51.1
Tw
o10
412
.357
12.5
14.1
14.3
15.4
18.8
15.8
19.0
25.2
9.0
16.4
13.7
15.4
8922
.448
20.4
Thre
e31
3.7
214.
65.
45.
14.
26.
47.
89.
011
.11.
07.
13.
63.
740
10.1
239.
8F
our
192.
35
1.1
1.3
1.3
1.9
3.9
2.7
4.7
7.9
0.0
4.4
3.0
1.4
317.
813
5.5
Fiv
eor
mor
e15
1.8
61.
31.
71.
61.
93.
73.
63.
36.
20.
014
.40.
02.
073
18.4
3113
.2
Num
ber
ofdif
fere
nt
auth
ors
844
100.
045
510
0.0
955
447
520
563
526
300
405
199
13,5
7646
729
939
710
0.0
235
100.
0
Mea
nm
enti
ons
per
auth
or1.
51.
31.
41.
41.
41.
61.
61.
72.
01.
12.
01.
31.
43.
02.
6
Yea
rspublish
ed19
85-1
998
1990
-199
819
60-
1981
1984
-19
9319
84-1
993
1980
-199
019
79-
1985
1963
-19
8819
72-
1992
1989
-19
9619
85-1
998
1990
-199
8
Note
s:
aP
erce
nta
ges
for
Journ
alof
Mark
etin
g(J
M)bas
edon
Mar
quar
dt
and
Murd
ock
(198
3)
bP
erce
nta
ges
for
JM,Jo
urn
alof
the
Aca
dem
yof
Mar
keting
Sci
ence
(JA
MS
),Jo
urn
alof
Con
sum
erM
arke
ting
(JC
R),
Journ
alof
Mark
etin
gR
esea
rch
(JM
R),
and
Mar
keti
ng
Sci
ence
(MS
)bas
edon
Hov
erst
adet
al.(1
995)
c Per
centa
ges
for
Journ
alof
Per
sonal
Sel
ling
&Sal
esM
anag
emen
t(J
PP
SM
)bas
edon
Sw
anet
al.(1
991)
dP
erce
nta
ges
for
Journ
alof
Mar
keting
Educa
tion
(JM
E)bas
edon
Cla
rkan
dN
essi
m(1
986)
e Per
centa
ges
for
top
20ec
onom
ics
seri
als
bas
edon
Chung
etal.
(199
3)
f Per
centa
ges
for
Journ
alof
Busi
nes
sC
omm
unic
atio
n(J
BC
)bas
edon
Rei
nsc
han
dL
ewis
(199
3)
gP
erce
nta
ges
for
Journ
alof
Busi
nes
s&
Entr
epre
neu
rship
(JB
C)bas
edon
Hym
anan
dSte
iner
(199
7)
Internationalmarketing
serials
679
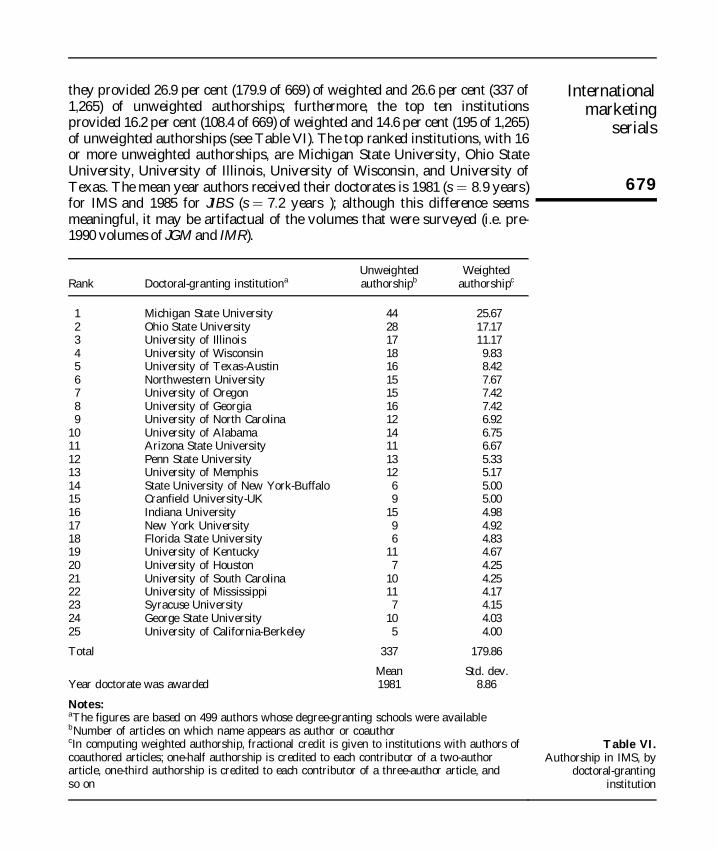
they provided 26.9 per cent (179.9 of 669) of weighted and 26.6 per cent (337 of1,265) of unweighted authorships; furthermore, the top ten institutionsprovided 16.2 per cent (108.4 of 669) of weighted and 14.6 per cent (195 of 1,265)of unweighted authorships (see Table VI). The top ranked institutions, with 16or more unweighted authorships, are Michigan State University, Ohio StateUniversity, University of Illinois, University of Wisconsin, and University ofTexas. The mean year authors received their doctorates is 1981 (s ˆ 8:9 years)for IMS and 1985 for JIBS (s ˆ 7:2 years ); although this difference seemsmeaningful, it may be artifactual of the volumes that were surveyed (i.e. pre-1990 volumes of JGM and IMR).
Table VI.Authorship in IMS, by
doctoral-grantinginstitution
Rank Doctoral-granting institutionaUnweightedauthorshipb
Weightedauthorshipc
1 Michigan State University 44 25.672 Ohio State University 28 17.173 University of Illinois 17 11.174 University of Wisconsin 18 9.835 University of Texas-Austin 16 8.426 Northwestern University 15 7.677 University of Oregon 15 7.428 University of Georgia 16 7.429 University of North Carolina 12 6.92
10 University of Alabama 14 6.7511 Arizona State University 11 6.6712 Penn State University 13 5.3313 University of Memphis 12 5.1714 State University of New York-Buffalo 6 5.0015 Cranfield University-UK 9 5.0016 Indiana University 15 4.9817 New York University 9 4.9218 Florida State University 6 4.8319 University of Kentucky 11 4.6720 University of Houston 7 4.2521 University of South Carolina 10 4.2522 University of Mississippi 11 4.1723 Syracuse University 7 4.1524 George State University 10 4.0325 University of California-Berkeley 5 4.00
Total 337 179.86
Mean Std. dev.Year doctorate was awarded 1981 8.86
Notes:aThe figures are based on 499 authors whose degree-granting schools were availablebNumber of articles on which name appears as author or coauthorcIn computing weighted authorship, fractional credit is given to institutions with authors ofcoauthored articles; one-half authorship is credited to each contributor of a two-authorarticle, one-third authorship is credited to each contributor of a three-author article, andso on

InternationalMarketingReview18,6
680
Academic area. Because academicians tend to research topics within their homedisciplines (Geistfeld and Key, 1986), articles by marketing scholars shoulddominate the selected IMS. For unweighted authorships, 68.6 per cent (747 of1,089) are by scholars in marketing or its related fields, 23.8 per cent (259 of1,089) are by other business scholars, 5.2 per cent (57 of 1,089) are by non-business scholars, and 3.4 per cent (37 of 1,089) are by non-academicians (seeTable VII). In contrast, 55.9 per cent of authors published during the last 25years in Journal of Advertising are scholars in marketing or its related field(Morrison and Curtin, 1999). Thus, IMS are more dominated by marketingscholars than Journal of Advertising, which may be attributable to the latter’sinterdisciplinary breadth.
Institutional affiliation. Scholars affiliated with non-US institutionscontributed 32.0 per cent (201.2 of 629.3) of weighted and 36.6 per cent (435 of1,190) of unweighted authorships (see Table IV). The post-1990 totals for JIBSare similar: 31.3 per cent (95.8 of 305.7) of weighted and 33.4 per cent (199 of596) of unweighted authorships. For JIBS from 1990 to 1994, the percentage ofUS-affiliated authors ± 67 per cent ± is also similar (Inkpen and Beamish, 1994).`̀ On a global basis, the United States is arguably not now, nor will be in thefuture, home to such a high proportion of IB [i.e. international business]scholars writing in the English language as the 67 per cent figure would
Table VII.Academic area of IMSauthors
Academic area Frequency Percent
Marketing/logistics 635 50.20Business/business administration/business operations/commerce 98 7.75Marketing/international business 61 4.82Management/organizational behavior 56 4.43International business 35 2.77Marketing/management 26 2.06Management and other non-marketing area 19 1.50Economics 18 1.42Marketing and other academic area 14 1.11International marketing 11 0.87Commerce 11 0.87Agriculture and agriculture economics 10 0.79Tourism 10 0.79Geography 9 0.71Finance/accounting 8 0.63Management science/operations research/decision sciences/
operations management 6 0.47Law/business law 4 0.32Management information system/information system 4 0.32Forestry 4 0.32Others (including social sciences, textiles, political science, and
other academic areas) 13 1.03Unknown 176 13.91Non-academician (i.e. executives) 37 2.92
Total unweighted authorships 1,265 100.00

Internationalmarketing
serials
681
suggest’’ (Inkpen and Beamish, 1994, p. 707); thus, editors of IMS may also wishto strive for a more internationally balanced authorship.
Rank. For IMS, the percentages of unweighted authorships by academicrank is 34.2 per cent administrators (e.g. deans) and professors, 24.4 per centassociate professors, 22.1 per cent assistant professors, and 19.3 per cent`̀ others’’. In contrast, for JIBS and the mean of 13 other serials listed inTable VIII, the percentages are 32.4 per cent and 29.4 per cent administratorsand professors, 21.2 per cent and 28.5 per cent associate professors, 31.0 percent and 30.0 per cent assistant professors, and 15.3 per cent and 12.1 per cent`̀ others’’. If the unknown ranks for IMS are distributed proportionately, thenprofessors and administrators are disproportionately represented in IMSrelative to other serials. Perhaps the ratio of non-empirical to empirical articles± 0.49 for IMS and 0.23 for JIBS ± explains this anomaly (see Table IX). If seniorfaculty with more seasoned perspectives submit more conceptual manuscripts,and if junior faculty with more state-of-the-art quantitative skills submit moreempirical manuscripts, then serials that publish more conceptual articlesshould publish more senior faculty.
Editorial review board memberships. Of 200 current and previous IMSeditorial review board members, 39.5 per cent (79 of 200) (co)authored one ormore articles in these serials. In contrast, the percentage of serial-relatedauthors (i.e. referees and editors) for 12 educational psychology serials rangedfrom 1.3 per cent to 26.1 per cent (·x ˆ 11:8 per cent) (Campanario, 1996). Themean unweighted authorships per board member is 2.2 (173 articles publishedin IMS by 79 board members), which exceeds the grand mean of 1.5 for theserials summarized in Table V; IMS board members constitute 13.7 per cent ofunweighted (173 of 1,265) and 9.4 per cent (79 of 844) of weighted authorships.
Furthermore, only 37.0 per cent (74 of 200) of these scholars serve(d) onmore than one review board; eight scholars serve(d) on four review boards (i.e.T. Erem, D.A. Ricks, A.C. Samli, J.N. Sheth, K. Simmonds, H.B. Thorelli, L.S.Welch, and I. Wilkinson), 13 scholars serve(d) on three review boards, and 53scholars serve(d) on two review boards. This overlap in board membershipssuggests that the reviewing burden is spread unevenly.
Finally, if Michigan State University is excluded, then weighted authorshipand review board membership for the top 25 institutional affiliations areunrelated (see Table III). Thus, IMS are typical in their propensity to publishthe work of review board members. (Note: Michigan State University providesthe most board members and ranks first by weighted authorship. As home tomuch international marketing research and a recent editor-in-chief of JIM andIMR, it plays an inordinate role in IMS.)
Coauthorship. Business serials exhibit similar coauthorship patterns (seeTable X). For IMS, 63.7 per cent (426 of 669) of articles are co-authored, with amean number of authors per article of 1.89. The numbers for JIBS are similar:67.0 per cent and 1.94 respectively. Consistent with the conclusions of otherserial retrospectives (Durden and Perri, 1995; Hyman and Steiner, 1997;Urbancic, 1992), the percentage of co-authored articles is increasing in IMS.

InternationalMarketingReview18,6
682
Table VIII.Rank and gender ofauthors in IMS, JIBS,and selected serials
IMS
JIB
SC
AR
aJM
Eb
JMR
cJM
dM
ktg
eJA
MS
fJC
Rf
JMf
JMR
fM
Sf
JPP
SM
fJC
Ah
JBE
i
Fre
q.
%F
req.
%%
%%
%%
%%
%%
%%
%%
Ran
k
Adm
inis
trat
or37
2.9
406.
5
Pro
fess
or30
324
.015
024
.528
.424
.726
.427
.828
.931
.927
.532
.629
.433
.935
.825
.234
.9
Ass
oc.pro
fess
or24
319
.212
420
.326
.639
.737
.023
.532
.731
.424
.028
.825
.821
.730
.323
.323
.6
Ass
ist.
pro
fess
or22
017
.418
229
.731
.435
.636
.618
.532
.926
.836
.429
.336
.724
.324
.528
.624
.1
Inst
ruct
or/P
hD
studen
t/
non
-PhD
192
15.2
9014
.713
.66.
55.
56.
48.
63.
73.
86.
29.
410
.76.
9
Non
-aca
dem
ic22
.93.
53.
55.
64.
313
.90.
06.
9
Unknow
n27
021
.326
4.2
0.8
0.0
0.0
0.0
0.0
0.0
0.0
12.1
3.7
Gen
der
Mal
e87
268
.949
881
.488
.591
.480
.3
Fem
ale
167
13.2
7812
.711
.58.
619
.7
Unknow
n22
617
.936
5.9
Tot
alunw
eighte
d
auth
orsh
ips
1,26
561
244
314
31,
243
1,32
713
1371
792
162
282
350
227
820
640
7
Yea
rspublish
ed19
85-1
998
1990
-199
8
1984
-
1994
1979
-
1985
1964
-
1985
1960
-
1981
1980
-
1986
1984
-
1993
1980
-
1990
1980
-
1984
1989
-
1996
Note
s:aP
erce
nta
ges
for
Con
tem
pora
ryA
ccou
nti
ng
Res
earc
h(C
AR
),bas
edon
Car
nag
han
etal
.(1
994),
incl
ude
arti
cles
but
excl
ude
dis
cuss
ions
bP
erce
nta
ges
for
Journ
alof
Mar
keting
Educa
tion
(JM
E)bas
edon
Cla
rkan
dH
anna
(198
6)
c Per
centa
ges
for
Journ
alof
Mark
etin
gR
esea
rch
(JM
R),
bas
edon
Cla
rket
al.(1
987),
refl
ect
only
acad
emic
auth
ors
(82
per
cent
ofunw
eighte
dau
thor
ship
s)dP
erce
nta
ges
for
Journ
alof
Mar
keting
(JM
)bas
edon
Mar
quar
dt
and
Murd
ock
(198
3)
e Per
centa
ges
for
JM,JM
R,an
dJC
R,bas
edon
Fie
lds
and
Sw
ayne
(198
8)
f Per
centa
ges
for
Journ
alof
the
Aca
dem
yof
Mark
etin
gSci
ence
(JA
MS
),JC
R,JM
,JM
R,an
dM
arke
ting
Sci
ence
(MS
)bas
edon
Hov
erst
adet
al.(1
995)
gP
erce
nta
ges
for
Journ
alof
Per
sonalSel
ling
&S
ales
Man
agem
ent
(JP
PSM
)bas
edon
Sw
anet
al.(1
991)
hP
erce
nta
ges
for
Journ
alof
Con
sum
erA
ffai
rs(J
CA
)bas
edon
Gei
stfe
ldan
dK
ey(1
986)
i Per
centa
ges
for
Journ
alof
Busi
nes
s&
Entr
epre
neu
rship
(JB
C)bas
edon
Hym
anan
dSte
iner
(199
7)

Internationalmarketing
serials
683
Table IX.Topics covered in IMS
and JIBS
Ran
kT
opic
IMS
JIB
SA
llst
udie
sE
mpir
ical
studie
sA
llst
udie
sE
mpir
ical
studie
sF
req.
%F
req.
%F
req.
%F
req.
%
1E
xpor
t/im
por
t(a
tco
untr
yle
vel
)65
9.7
5412
.05
1.6
41.
62
Pro
mot
ion
(e.g
.ad
ver
tisi
ng
)45
6.7
4040
.01
0.3
10.
43
Con
sum
ers/
consu
mer
beh
avio
r44
6.6
388.
42
0.6
20.
84
Join
tven
ture
s/st
rate
gic
allian
ces
375.
524
5.3
3410
.830
11.8
5C
ountr
y-o
f-or
igin
355.
234
7.6
61.
95
2.0
6Str
ateg
y31
4.6
184.
020
6.4
145.
57
Chan
nel
s(i.e
.dis
trib
uti
on,
logis
tics
,et
c.)
243.
618
4.0
41.
32
0.8
8M
acro
econ
omic
s(a
tin
dust
ryor
countr
yle
vel
)23
3.4
102.
25
1.6
41.
69
Busi
nes
s/m
arket
ing
rese
arch
223.
313
2.9
113.
56
2.4
10M
arket
entr
y(d
ecis
ion
and
effo
rts)
213.
112
2.7
82.
56
2.4
11Sal
esm
anag
emen
t21
3.1
173.
82
0.6
20.
812
Glo
bal
izat
ion
203.
08
1.8
31.
03
1.2
13Sta
ndar
diz
atio
n(e
xce
pt
adver
tisi
ng
)18
2.7
92.
01
0.3
10.
414
Tou
rism
172.
511
2.4
00.
00
0.0
15P
olit
ical
/gov
ernm
ent
(e.g
.ta
xes
,la
ws)
162.
47
1.6
82.
55
2.0
16C
ounte
rtra
de
(rec
ipro
cal
trad
ebet
wee
nco
mpan
ies/
countr
ies)
142.
18
1.8
10.
31
0.4
17E
thic
s12
1.8
71.
64
1.3
41.
618
Envir
onm
enta
lch
ange
inw
orld
121.
86
1.3
10.
31
0.4
19In
tern
atio
nal
izat
ion
offi
rms
111.
66
1.3
31.
02
0.8
20F
irm
per
form
ance
(fin
anci
alor
mar
ket
ing
per
form
ance
)10
1.5
102.
29
2.9
93.
521
Educa
tion
91.
43
0.7
103.
29
3.5
22C
ross
-cult
ura
ldif
fere
nce
s9
1.4
71.
69
2.9
83.
123
Leg
al9
1.4
51.
13
1.0
31.
224
Pro
duct
s(e
.g.
intr
oduct
ion,
pac
kag
ing
)9
1.4
81.
80
0.0
00.
0(c
onti
nued
)

InternationalMarketingReview18,6
684
Table IX.
Ran
kT
opic
IMS
JIB
SA
llst
udie
sE
mpir
ical
studie
sA
llst
udie
sE
mpir
ical
studie
sF
req.
%F
req.
%F
req.
%F
req.
%
25B
rands
91.
48
1.8
00.
00
0.0
26Ser
vic
es9
1.4
71.
60
0.0
00.
027
Man
agem
ent
(e.g
.non
-sal
esfo
rce,
per
sonnel
issu
es)
81.
26
1.3
5116
.245
17.7
28M
anag
ing
hig
hte
chnol
ogy/t
echnol
ogy
tran
sfer
71.
02
0.4
10.
31
0.4
29F
ranch
isin
g7
1.0
40.
90
0.0
00.
030
Neg
otia
tion
san
dta
ctic
s6
0.9
30.
77
2.2
41.
631
Sin
gle
EC
mar
ket
60.
92
0.4
10.
31
0.4
32F
ree
trad
e/tr
ade
blo
ck6
0.9
00.
00
0.0
00.
033
For
eign
dir
ect
inves
tmen
t5
0.8
40.
926
8.2
249.
434
Nat
ional
innov
ativ
enes
s5
0.8
30.
72
0.6
10.
435
Org
aniz
atio
nal
buyin
gbeh
avio
rs5
0.8
40.
90
0.0
00.
036
Seg
men
tati
on5
0.8
30.
70
0.0
00.
037
Sou
rcin
g4
0.6
20.
47
2.2
62.
438
Gre
enm
arket
ing
40.
63
0.7
00.
00
0.0
39B
usi
nes
s/m
arket
ing
failure
s3
0.4
30.
71
0.3
10.
440
Cas
est
udy
30.
42
0.4
00.
00
0.0
41G
lobal
mar
ket
ing
envir
onm
ent
30.
41
0.2
00.
00
0.0
42C
onsu
mer
ism
30.
42
0.4
00.
00
0.0
43P
rici
ng
30.
43
0.7
00.
00
0.0
44F
inan
ce/f
inan
cial
mar
ket
s2
0.3
00.
027
8.6
259.
845
Acc
ounti
ng
00.
00
0.0
113.
59
3.5
46M
ult
inat
ional
ente
rpri
sein
gen
eral
00.
00
0.0
72.
21
0.4
47O
ther
-mar
ket
ing
(e.g
.lo
cati
ondec
isio
ns,
mar
ket
stru
cture
)17
2.5
92.
010
3.2
62.
448
Oth
ernon
-mar
ket
ing
(e.g
.public
pol
icy,lite
ratu
rere
vie
ws)
101.
52
0.4
103.
26
2.4
49O
ther
econ
omic
s5
0.8
40.
94
1.3
20.
8T
otal
669
100.
045
010
0.0
315
100.
025
410
0.0

Internationalmarketing
serials
685
Table X.Number of authors per
article for IMS, JIBS,and selected serials
IMS
JIB
Sa
JAM
Sb
JFc
JCA
dC
AR
eJA
BR
fJM
gJM
Rg
JCR
gJC
Rh
JMh
JMR
hM
Sh
JPPS
Mi
Mktg
jJM
Ek
JBE
lJE
Pm
%%
%%
%%
%%
%%
%%
%%
%%
%%
%%
%%
No.
ofau
thor
s
One
36.3
33.0
64.3
37.0
41.7
35.1
67.4
43.6
36.1
35.8
33.0
30.8
33.1
28.4
27.9
25.9
42.6
23.4
38.2
56.2
24.3
na
Tw
o41
.747
.030
.843
.044
.639
.416
.938
.440
.846
.246
.547
.450
.448
.546
.550
.041
.442
.345
.337
.041
.3
Thre
e18
.815
.63.
316
.012
.823
.06.
815
.621
.915
.717
.518
.614
.220
.121
.420
.412
.129
.714
.16.
230
.2
Fou
ror
mor
e3.
24.
41.
14.
00.
92.
58.
92.
41.
22.
33.
03.
22.
33.
04.
23.
73.
94.
62.
40.
64.
2
Mea
nno.
of
auth
ors
1.7
1.9
1.4
1.9
2.1
1.9
1.6
1.8
1.9
1.9
1.9
2.0
1.9
2.0
2.0
2.0
1.8
2.2
na
1.5
2.2
1.6
No.
ofar
ticl
es66
931
518
216
134
328
295
821
123
347
826
925
325
446
230
840
628
020
1na
146
189
121
Yea
rs
publish
ed
1985
-
1998
1990
-
1998
1970
-
1979
1990
-
1994
1973
-
1982
1988
-
1995
1976
-
1985
1975
-
1984
1984
-
1994
1985
-
1993
1980
-198
619
84-1
993
1980
-
1990
1980
-
1985
1979
-
1985
1989
-
1996
1981
-
1986
Note
s:aP
erce
nta
ges
for
Journ
alof
Inte
rnat
ionalB
usi
nes
sStu
dies
(JIB
S)fo
r19
70-1
979
and
1990
-199
4bas
edon
Inkpen
and
Bea
mis
h(1
994)
bPer
centa
ges
for
Journ
alof
the
Aca
dem
yof
Mar
keting
Sci
ence
(JA
MS
)bas
edon
Mal
hot
ra(1
996)
c Per
centa
ges
for
Journ
alof
Fin
ance
(JF
)bas
edon
Hec
ket
al.(1
986)
dPer
centa
ges
for
Journ
alof
Con
sum
erA
ffai
rs(J
CA
)bas
edon
Gei
stfe
ldan
dK
ey(1
986).
e Per
centa
ges
for
Con
tem
pora
ryA
ccou
nting
Res
earc
h(C
AR
),bas
edon
Car
nag
han
etal
.(1
994),
incl
ude
arti
cles
but
excl
ude
dis
cuss
ions
f Per
centa
ges
for
Journ
alof
App
lied
Busi
nes
sR
esea
rch
(JA
BR
)bas
edon
Urb
anci
c(1
994/
1995
)gPer
centa
ges
for
Journ
alof
Mar
keting
(JM
),Jo
urn
alof
Mar
keting
Res
earc
h(J
MR
),an
dJo
urn
alof
Con
sum
erR
esea
rch
(JC
R),
bas
edon
Fie
lds
and
Sw
ayne
(198
8)
hPer
centa
ges
for
JCR
,JM
,JM
R,an
dM
arke
ting
Sci
ence
(MS
),bas
edon
Hov
erst
adet
al.(1
995)
i Per
centa
ges
for
Journ
alof
Per
sonal
Sel
ling
&Sal
esM
anag
emen
t(J
PP
SM
)bas
edon
Sw
anet
al.
(199
1)
j Bas
edon
Whea
tley
and
Wilso
n(1
987),
per
centa
ges
for
JM,JM
R,JC
R,Jo
urn
alof
Adve
rtis
ing
Res
earc
h,Jo
urn
alof
Ret
ailin
g,A
mer
ican
Mar
keting
Ass
ocia
tion
Pro
ceed
ings
,an
d
Ass
ocia
tion
for
Con
sum
erR
esea
rch
Pro
ceed
ings
kPer
centa
ges
for
Journ
alof
Mar
keting
Educa
tion
(JM
E)bas
edon
Cla
rkan
dN
essi
m(1
986)
l Per
centa
ges
for
Journ
alof
Busi
nes
s&
Entr
epre
neu
rshi
p(J
BE
)bas
edon
Hym
anan
dSte
iner
(199
7)
mD
ata
for
Journ
alof
Eco
nom
icP
sych
olog
y(J
EP
)bas
edon
van
Raa
ij(1
986)
na
ˆnot
applica
ble
/avai
lable

InternationalMarketingReview18,6
686
This trend also holds for other serials; for example, the proportion of single-authored articles in JIBS has decreased from 64.3 per cent (from 1970 to 1979) to37.0 per cent (from 1990 to 1994) to 33.0 per cent (from 1995 to 1998). For all butone serial listed in Table X, dual authorship was the most prevalent.
Authors affiliated with Indiana University, Georgetown University,University of Strathclyde, Israel Institute of Technology, and Chinese Universityof Hong Kong, had the fewest co-authors (1.17, 1.33, 1.45, 1.47, and 1.52respectively); authors affiliated with Cleveland State University, University ofGeorgia, University of Alabama, University of Hawaii, and University of NorthTexas, had the most co-authors (2.95, 2.45, 2.40, 2.34, and 2.26 respectively) (seeTable III).
By gender. Female authors comprised 16.1 per cent (167 of 1,039) ofunweighted (see Table VIII) and 14.6 per cent (78.45 of 539) of weightedauthorships. Like economists, do IMS authors tend to choose coauthors of thesame gender (McDowell and Smith, 1992)? Assuming the obverse, and giventhe 539 IMS articles for which authors’ gender was identified, and a roughly 6-to-1 ratio of male-to-female authors (see Table VIII), then IMS should containroughly 8.2 per cent ([1/7 £ 237 single-authored articles] + [(1/7)2 £ 206 two-authored articles] + [(1/7)3 £ 82 three-authored articles] + [(1/7)4 £ 14 four-authored articles], or 44 of 539) female-exclusive articles, 74.2 per cent (400 of539) male-exclusive articles, and 17.6 per cent (95 of 539) mixed-gender articles(see Table XI). In fact, 6.5 per cent (35 of 539) were written solely by femaleauthors, 76.1 per cent (410 of 539) were written solely by male authors, and 17.4per cent (94 of 539) were written by authors of mixed genders; thus, IMSauthors do not tend to choose coauthors of the same gender. The percentagesfor JIBS are comparable.
By country, institution, and department. For IMS articles, 25.0 per cent (167 of669) involved at least one non-US author and 13.0 per cent (87 of 669) involvednon-US co-authors from different countries (see Table XII). Regardinginstitutional affiliations, 59.1 per cent (247 of 418) of articles involved authors fromat least two institutions (59.0 per cent and 59.3 per cent for US and non-UScoauthorships respectively). For departmental affiliations, 25.1 per cent (101 of402) of articles involved co-authors from different academic departments (e.g.marketing). Finally, only 4.7 per cent (19 of 402) of articles were written by a mixof academicians and professionals. These results suggest that editors of IMScould broaden the perspective of their serials by encouraging more multi-country,interdisciplinary, and joint academician-professional submissions (Daniels, 1991).
Article domainsClassifying articles by topic addressed is difficult because articles oftenfocus on multiple, non-mutually exclusive topics (Jones, 1992). Articles wereclassified via a three-step procedure. First, the underlying theoreticalframework, the advanced technique or process, and the substantive issue, wereidentified. Then, the resulting topics were grouped by business discipline,subdiscipline, and special topics. Finally, preliminary groupings of themes

Internationalmarketing
serials
687
were conjoined (for more detail, see Hyman and Steiner (1997)). Following thisprocedure, 47 categories emerged for IMS and 37 categories for JIBS; in total,49 categories were identified. Each article was assigned to its primary topiccategory.
Topics covered. Articles published in IMS address a diverse set of topics. Thefive most commonly addressed topics are exporting and importing (9.7 percent), promotion (6.7 per cent; with a heavy focus on advertising), consumerand consumer behavior (6.6 per cent), joint ventures and strategic alliances(5.5 per cent), and country-of-origin (5.2 per cent) (see Table IX). Results aresimilar for empirical articles only, except for the abundant promotion studiesin IMS. (Note: although different classification schemes make a completecomparison impossible, percentages for `̀ promotion’’ and `̀ consumer andconsumer behavior’’ are similar to Aulakh and Kotabe (1993).)
IMS and JIBS cover similar topics, but with different propensities: IMSpublish a greater percentage of articles on export and import, promotion,consumer behavior, country of origin, channels, and sales management; JIBSpublishes a greater percentage of articles on management/strategy and finance.Both serials publish many articles on joint venture, strategy, business/marketing research, and firm performance. Given the marketing focus of IMS,
Table XI.Authorship mixes in
IMS and JIBS, bygender
Total number ofarticle authors
Number ofmale authors
Number offemale authors
IMS JIBSFreq. % Freq. %
One 1 0 211 31.54 88 27.90 1 26 3.89 12 3.8
Unknown 6 0.90 4 1.3Subtotal 243 36.32 104 33.0
Two 2 0 150 22.42 97 30.80 2 8 1.20 2 0.61 1 48 7.17 37 11.7
Unknown 73 10.91 12 3.8Subtotal 279 41.70 148 47.0
Three 3 0 43 6.43 30 9.50 3 1 0.15 0 0.02 1 27 4.04 11 3.51 2 11 1.64 3 1.0
Unknown 44 6.58 5 1.6Subtotal 126 18.83 49 15.6
Four 4 0 6 0.90 8 2.50 4 0 0.00 0 0.03 1 6 0.90 6 1.91 3 1 0.15 0 0.02 2 1 0.15 0 0.0
Unknown or more than four 7 1.05 0 0.0Subtotal 21 3.14 14 4.4
Total 669 100.00 315 100.00

InternationalMarketingReview18,6
688
this difference in topical mix is unsurprising. Nevertheless, timely topics, suchas managing high technology, market segmentation, green marketing, pricing,consumerism, and the Internet, are seldom covered in IMS. These neglectedareas suggest opportunities for future research.
Topic trends. Table XIII shows the annual percentage of IMS articles pertopic for the 14 most-addressed topics since 1990. Special issues causedoccasional marked increases within a given year (e.g. 13 of 17 articles on tourismappeared during 1994; 22.4 per cent of articles published during 1991 concernedjoint ventures and strategic alliances). Nonetheless, the only clear trend is anincrease in articles on consumers and consumer behavior, which may bepartially due to the evermore critical role of consumers to marketing practiceand the recent increase in consumer behavior researchers (Wang, 1996).
Samples collectedEmpirical and non-empirical articles. Empirical articles comprised 67.3 per cent(450 of 669) of IMS articles, which is similar to the 66 per cent published inJournal of Economic Psychology (from 1981 to 1986), the 63.5 per cent publishedin Journal of Business & Entrepreneurship (from 1989 to1996) (Hyman andSteiner, 1997), and the 59.7 per cent published in six leading marketing andadvertising serials (from 1980 to 1986) (Waheeduzzaman and Krampf, 1992),
Table XII.Author affiliations inIMS
Author affiliations NumberUSA International Total
Freq. % Freq. % Freq. % Freq. %
Number of differentcountries
1 80 47.9 80 12.02 84 50.3 84 12.63 3 1.8 3 0.4
4 or more 0 0.0 0 0.0Total 167 100.0 167 25.0
Number of differentinstitutions/organizations
1 103 41.0 68 40.7 171 25.62 124 49.4 80 47.9 204 30.53 18 7.2 19 11.4 37 5.5
4 or more 6 2.4 0 0.0 6 0.9Total 251 100.0 167 100.0 418 62.5
Number of differentacademicdepartments
1 301 45.02 93 13.93 7 1.0
4 or more 1 0.1Total 402 60.1
Mix of academiciansand professionals 19 2.8
Total articles withco-authors 426 63.7
Total articles 669 100.0
Note: Percentage does not include coauthors with unknown institutional affiliations

Internationalmarketing
serials
689
but less than the 80.6 per cent published in JIBS (from 1990 to1998) (seeTable XIV). However, it is more than the 37.5 per cent of internationalmarketing articles published in the 21 journals reviewed by Aulakh and Kotabe(1993); this markedly lower percentage is likely attributable to the highproportion of managerially-oriented serials (e.g. Business Horizons, HarvardBusiness Review) surveyed.
For IMS, the mean authors per empirical article (·x ˆ 2:02) differs from themean authors per non-empirical article (·x ˆ 1:63). The same is true of JIBS,with means of 2.06 and 1.48 respectively. If a more diverse set of skills isrequired of empirical articles, then the greater mean authors per such articles isreasonable.
Finally, the ratio of empirical-to-non-empirical articles in IMS has increasedfrom 1985-1993 to 1994-1998. Because this ratio was already high for JIBS from1990 to 1994, it did not undergo the same shift from 1994 to 1998.
By country and continent. Although overlooked in previous IMS and JIBSretrospectives (e.g. Javalgi et al., 1997; Inkpen and Beamish, 1994), a country-of-sample analysis indicates which populations provide the most data for modeland hypothesis testing. Because cultural factors are instrumental to societies ingeneral and businesses in particular (Hofstede, 1980), country-of-sampleinfluences the generalizability and applicability of research results. A country-of-sample analysis allows us to assess whether or not the models andhypotheses posited in IMS are tested over adequately diverse populations.
Unfortunately, the distribution of sampled countries is skewed in IMS. Theten countries researched in at least 2.0 per cent of empirical studies are the USA
Table XIII.Topical trends in
articles published inIMS, by percent
TopicPublication year
1990 1991 1992 1993 1994 1995 1996 1997 1998
Import/export 17.5 10.2 9.3 11.4 5.7 11.5 10.0 6.5 14.7Promotion (i.e.
advertising) 2.5 8.2 9.3 2.5 10.5 11.5 8.8 2.6 9.3Consumers/consumer
behavior 0.0 4.1 1.9 5.1 2.3 6.6 17.5 11.7 7.4Sales management 0.0 2.0 13.0 3.8 0.0 1.6 1.3 5.2 5.6Joint ventures/strategy
alliance 0.0 22.4 5.6 3.8 5.8 9.8 1.3 6.5 3.7Country-of-origin 2.5 2.0 5.6 12.7 3.5 4.9 2.5 7.8 3.7Channels 7.5 4.1 1.9 3.8 5.8 3.3 1.3 5.2 3.7Strategy 7.5 8.2 5.6 6.3 8.1 1.6 1.3 2.6 1.9Macroeconomics 5.0 2.0 13.0 2.5 0.0 0.0 3.8 3.9 1.9Business/marketing
research 2.5 6.1 1.9 2.5 5.8 4.9 2.5 1.3 0.0Marketing entry 10.0 0.0 0.0 3.8 3.5 1.6 5.0 2.6 1.9Globalization 0.0 2.0 0.0 2.5 4.7 4.9 2.5 7.8 0.0Standardization 2.5 2.0 3.7 3.8 3.5 1.6 2.5 3.9 0.0Tourism 0.0 2.0 1.9 0.0 15.1 0.0 0.0 0.0 1.0
Total articles (count) 40 49 54 79 86 61 80 77 54

InternationalMarketingReview18,6
690
Table XIV.Empirical and non-empirical articles inIMS and JIBS
IMS
JIB
S19
85-1
998
1985
-199
319
94-1
998
1990
-199
8
1990
-199
419
95-1
998
Types
Fre
q.
%N
o.of
auth
ors
No.
ofau
thor
sper
arti
cle
Fre
q.
%N
o.of
auth
ors
No.
ofau
thor
sper
arti
cle
Fre
q.
%F
req.
%F
req.
%F
req.
%
Em
pir
ical
arti
cles
450
0.67
909
2.02
180
0.58
269
0.75
254
0.81
522
2.06
135
0.84
119
0.77
Non
-em
pir
ical
arti
cles
219
0.33
356
1.63
131
0.42
890.
2561
0.19
901.
4826
0.16
350.
23
Tot
al66
91.
001,
265
1.89
311
1.00
358
1.00
315
1.00
612
1.94
161
1.00
154
1.00

Internationalmarketing
serials
691
(27.7 per cent), UK (6.2 per cent), Japan (5.7 per cent), Korea (3.6 per cent), PRC(3.5 per cent), Canada (3.3 per cent), Hong Kong (2.9 per cent), Australia (2.7 percent), India (2.1 per cent), and Turkey (2.1 per cent) (see Table XV). Becauseresearchers often draw samples from their current country of residence, and
Table XV.Countries studied in
empirical articles
Rank Country/area nameIMS JIBS
Frequency Percent Frequency Percent
1 USA 184 27.67 127 17.492 United Kingdom 41 6.17 39 5.373 Japan 38 5.71 51 7.024 Korea 24 3.61 15 2.075 China 23 3.46 17 2.346 Canada 22 3.31 30 4.137 Hong Kong 19 2.86 13 1.798 Australia 18 2.71 12 1.659 India 14 2.11 7 0.96
10 Turkey 14 2.11 3 0.4111 General World 13 1.95 39 5.3712 New Zealand 12 1.80 10 1.3813 Mexico 12 1.80 12 1.6514 Holland 11 1.65 19 2.6215 Taiwan 11 1.65 9 1.2416 Germany 11 1.65 26 3.5817 Thailand 10 1.50 5 0.6918 General Europe 10 1.50 13 1.7919 Greece 9 1.35 5 0.6920 Singapore 9 1.35 12 1.6521 Denmark 8 1.20 9 1.2422 Saudi Arabia 7 1.05 1 0.1423 Hungary 7 1.05 3 0.4124 France 7 1.05 25 3.4425 Russia/USSR 7 1.05 4 0.5526 Philippines 6 0.90 8 1.1027 Nigeria 6 0.90 2 0.2828 Belgium 6 0.90 11 1.5229 Austria 6 0.90 7 0.9630 Israel 6 0.90 7 0.9631 Poland 6 0.90 0 0.0032 Indonesia 5 0.75 3 0.4133 Sweden 5 0.75 14 1.9334 Finland 5 0.75 8 1.1035 Kenya 4 0.60 0 0.0036 Romania 4 0.60 1 0.1437 Italy 3 0.45 17 2.3438 Ireland 3 0.45 9 1.2439 Malaysia 3 0.45 8 1.1040 Spain 3 0.45 14 1.9341 Norway 3 0.45 13 1.7942 General North America 3 0.45 4 0.5543 Others 47 7.07 94 12.95
Total 665 100.00 726 100.00

InternationalMarketingReview18,6
692
researchers who study international marketing are concentrated in only a fewcountries, the distribution of sampled countries is skewed. Hence, the greaterfrequency of samples from the USA, UK, China, Hong Kong, and Australia isunsurprising (see Table IV for institutional affiliation by country). Ironically,since 1982 the proportion of studies involving the USA as a market area hasincreased from 31 per cent (Albaum and Peterson, 1984) to 40.8 per cent (184of 450).
Even at the continent/regional level, the distribution of sampled countries isskewed. North America and Europe, relative to their market potential, havebeen overstudied (see Table XVI). In contrast, Africa, Central America, andSouth America have been understudied. Although Africa’s less developedeconomies and data collection barriers may explain the dearth of Africanstudies, proximity to many researchers and extensive investments bymultinational firms should have boosted the proportion of Central and SouthAmerican studies.
By number of countries. The reasons for sampling only a few countriesinclude the expense of surveying populations from multiple countries and thelack of international cooperation among researchers (Aulakh and Kotabe,1993). Of the empirical studies in IMS, 73.4 per cent (317 of 432) are limited toone-country samples, 15.5 per cent (67 of 432) are limited to two-countrysamples, and 11.1 per cent involve three-or-more-country samples (seeTable XVII). Also, the mean number of countries studied per empirical article is1.55 (s ˆ 0:52) in IMS, which is lower than JIBS (·x ˆ 3:05 and s ˆ 4:43respectively). Due to the greater propensity of financial studies, which oftenrely on published multinational data sets, JIBS contains a lower percentage ofone-country studies (59.7 per cent) (see Table XVIII). (Note: for this purpose,country is defined as `̀ nations, specific areas, or regions’’. For example, the UK,Hong Kong, and Puerto Rico are each coded as one country. The few cases of
Table XVI.Countries studied inIMS and JIBS, byregion
IMS JIBS
Regions Freq.
No. ofcountries or
areas
No. ofsamples per
country Freq.
No. ofcountries or
areas
No. ofsamples per
country
North America 222 5 44.40 174 5 34.80Asia 200 22 9.09 158 17 9.29Europe 173 23 7.52 268 26 10.31Oceania (Australia
and New Zealand) 33 4 8.25 23 3 7.67Africa 18 11 1.64 16 9 1.78Central and South
America 6 4 1.50 45 12 3.75General or
unspecified regions 13 11 42 3
Total 443 75 552 70

Internationalmarketing
serials
693
researcher-identified regions, such as General Europe or Middle Asia, also werecoded as one country.)
By research topic. Empirical research that tends to sample from at leasttwo countries concerns organizational buying behavior (·x ˆ 3:0), nationalinnovativeness (·x ˆ 2:7), pricing (·x ˆ 2:7), business/marketing failures(·x ˆ 2:5), franchising (·x ˆ 2:25), macroeconomics (·x ˆ 2:2), consumers/consumer behavior (·x ˆ 2:18), cross-cultural differences (·x ˆ 2:0), and legalissues (·x ˆ 2:0) (see Table XIX). For empirical studies, only 22.2 per cent (ten of45) of research topics in IMS and 42.9 per cent of research topics (13 of 31) inJIBS analyze samples drawn from an average of two or more countries. Clearly,overly narrow samples have been drawn to study topics such as greenmarketing, sourcing, segmentation, the global marketing environment, andproducts. Researchers may wish to address this shortcoming in their futurestudies.
By population. The mean countries studied per empirical article, by primarypopulation sampled, are as follows: financial data (·x ˆ 2:8), advertisements(·x ˆ 2:4), students (·x ˆ 2:1), government data (·x ˆ 1:9), serial articles(·x ˆ 1:6), newspaper articles (·x ˆ 1:5), general population (·x ˆ 1:5), andmanagers (·x ˆ 1:3) (see Table XX). Studies of managers cover fewer countriesthan studies of ads, the general population, or students. Moreover, studies ofstudents involve more countries than studies of general populations.
Table XVII.Number of countriesstudied in IMS and
JIBS
Number ofcountriessampled
IMS JIBSFrequency Percent Frequency Percent
1 317 73.38 142 59.662 67 15.51 35 14.713 19 4.40 24 10.084 13 3.01 10 4.205 9 2.08 5 2.106 2 0.46 1 0.427 1 0.23 3 1.268 3 0.69 3 1.26
10 0 0.00 3 1.2611 0 0.00 1 0.4213 0 0.00 2 0.8414 0 0.00 1 0.4217 1 0.23 0 0.0018 0 0.00 1 0.4224 0 0.00 1 0.4227 0 0.00 1 0.4229 0 0.00 1 0.4231 0 0.00 1 0.4234 0 0.00 2 0.8448 0 0.00 1 0.42
Total 432 100.00 238 100.00

InternationalMarketingReview18,6
694
Table XVIII.Profile of empiricalarticles in IMS andJIBS
IMS
JIB
SP
rofi
levar
iable
Med
ian
Mea
nStd
.D
ev.
Fre
q.
%M
edia
nM
ean
Std
.D
ev.
Fre
q.
%
Art
icle
sbas
edon
sam
ple
dat
a43
565
.024
878
.7Sam
ple
type
Con
ven
ience
113
25.9
828
11.3
Sam
ple
size
205
216
Res
pon
sera
te0.
540.
250.
640.
23F
inan
cial
dat
a9
2.07
4317
.3Sam
ple
size
17,1
9143
,575
207
318
Gov
ernm
ent
dat
a15
3.45
2811
.3Sam
ple
size
12R
espon
sera
te0.
520.
22Ju
dgem
ent
6013
.79
207
3212
.9Sam
ple
size
89R
espon
sera
te0.
570.
190.
590.
20Sam
ple
bas
edon
list
supplied
by
other
s13
631
.26
8032
.3Sam
ple
size
185
222
Res
pon
sera
te0.
400.
210.
340.
17P
robab
ilit
y84
19.3
115
415
6.0
Sam
ple
size
367
Res
pon
sera
te0.
440.
210.
310.
13C
ensu
s2
0.46
93.
6R
espon
den
ts30
219
Res
pon
sera
te1.
000.
600.
36N
ewsp
aper
arti
cles
20.
467
2.8
Sam
ple
size
2115
279
Res
pon
sera
te0.
710.
28O
ther
s7
1.61
696
2.4
Sam
ple
size
450
Res
pon
sera
te0.
570.
180.
51U
nsp
ecif
ied
71.
61Sam
ple
size
229
Tot
al43
510
024
810
0.0

Internationalmarketing
serials
695
Table XIX.Number of countriesstudied per article in
IMS and JIBS, bytopics
IMS JIBS
Rank Covered topic
No. ofcountries/areas per
articleStandarddeviation
No. ofcountries/areas per
articleStandarddeviation
1 Organizational buying behavior 3.00 1.83 0.00 0.002 National innovativeness 2.67 2.08 27.00 0.003 Pricing 2.67 2.08 0.00 0.004 Business/marketing failures 2.50 2.12 1.00 0.005 Franchising 2.25 2.50 0.00 0.006 Macroeconomics 2.20 2.30 1.25 0.507 Consumers/consumer behavior 2.18 2.80 6.50 4.958 Cross-cultural differences 2.00 0.58 3.62 2.889 Legal issues 2.00 2.00 1.33 0.58
10 Other-non marketing 2.00 1.41 0.00 0.0011 Promotion (i.e.advertising) 1.82 1.45 3.00 0.0012 Business/marketing research 1.73 1.42 2.25 0.9613 Negotiations 1.67 0.58 1.75 0.5014 Firm performance 1.60 1.26 1.50 0.9315 Services 1.57 1.51 0.00 0.0016 Country-of-origin 1.56 1.37 1.50 1.0017 Joint ventures/strategic alliances 1.50 0.72 3.27 5.6618 Foreign direct investment 1.50 0.58 0.00 0.0019 Brands 1.50 1.07 0.00 0.0020 Consumerism 1.50 0.71 0.00 0.0021 Ethics 1.43 0.53 3.50 0.5822 Sales management 1.38 0.72 2.50 0.7123 Strategy 1.38 0.89 1.17 0.3924 Tourism 1.36 1.21 0.00 0.0025 Human resource management 1.33 0.52 2.75 4.0826 Environmental change in world 1.33 0.82 1.00 0.0027 Standardization (except advertising) 1.29 0.76 1.00 0.0028 Channels 1.28 0.57 1.50 0.7129 Other marketing 1.22 0.44 1.50 1.2230 Import/export 1.19 0.65 1.33 0.5831 Marketing entry 1.18 0.60 1.33 0.8232 Products 1.14 0.38 0.00 0.0033 Globalization 1.12 0.35 3.00 2.0034 Countertrade 1.12 0.35 0.00 0.0035 Managing high tech/tech transfer 1.00 0.00 7.00 0.0036 Sourcing 1.00 0.00 1.50 0.8437 Political 1.00 0.00 1.25 0.5038 Education 1.00 0.00 1.00 0.0039 Internationalization of firms 1.00 0.00 1.00 0.0040 Other economics 1.00 0.00 1.00 0.0041 Single EC market 1.00 0.00 1.00 0.0042 Segmentation 1.00 0.00 0.00 0.0043 Green marketing 1.00 0.00 0.00 0.0044 Case study 1.00 0.00 0.00 0.0045 Global marketing environment 1.00 0.00 0.00 0.0046 Finance/financial markets 0.00 0.00 5.48 7.9247 Accounting 0.00 0.00 4.78 9.1848 Multinational enterprise in general 0.00 0.00 1.00 0.0049 Free trade/trade block 0.00 0.00 0.00 0.00
Total 1.55 0.52 3.05 4.43

InternationalMarketingReview18,6
696
As financial data, advertising data, and government data are more readilyavailable and typically less expensive than survey data drawn from aprobability sample of respondents, their position at the top of this list isunsurprising. Also, student samples, convenience or otherwise, are morereadily available and less expensive. In contrast to JIBS, studies in IMS coverfewer countries when they concern ads, government data, and managers.
Methodologies usedSample types. For the 65.0 per cent (435 of 669) of IMS articles involving sampledata, 26.0 per cent (113 of 435) rely on convenience samples and 31.3 per cent(84 of 435) rely on lists supplied by outside organizations or agencies (seeTable XVIII). Only 19.3 per cent of these articles rely on probability samples,with a mean sample size of 367 (appreciably higher than the 184.8 reported inAulakh and Kotabe (1993)) and mean response rate is 40.0 per cent (similar tothe 40.5 per cent reported in Aulakh and Kotabe (1993)). JIBS authors,especially those in finance-related areas, used more archival data. Futurecontributors to IMS should consider such archival data because, relative tosurvey data, they are longitudinal, cover more countries, and cost less.
Concerning its international scope of study, the high mean response rates ±greater than 40.0 per cent for IMS and 31.0 per cent for JIBS ± are encouragingyet surprising. Possible reasons for this high rate include use of carefully selectsample frames (e.g. commercial lists), prompt survey follow-ups, andpersonally managed questionnaire collection.
Method types of study. Relative to JIBS, Journal of the Academy of MarketingScience (JAMS), Journal of Marketing (JM), Journal of Marketing Research(JMR), and Journal of Consumer Research (JCR), empirical articles in IMS aremore likely to rely on survey data and less likely to depend on experimentaldata (see Table XXI). The relative frequency of experimental studies in IMSis similiar to JIBS and Journal of Business & Entrepreneurship, but less
Table XX.Mean number ofcountries sampled, bytype of data
Type of data
IMS JIBSMean
number ofcountriessampled
Standarddeviation
Meannumber ofcountriessampled
Standarddeviation
Financial data 2.77 4.34 3.92 6.99Advertisements 2.38 1.78 3.50 0.71Students 2.05 1.45 3.33 2.65Government data 1.90 1.83 5.69 11.36Serial articles 1.57 0.98 1.00 0.00Newspaper articles 1.50 0.71 1.00 0.00Individuals (e.g. consumers, citizens) 1.47 1.02 3.55 7.80Managers/CEOs/VPs 1.31 0.85 2.28 3.27Other (including sales and product
data, salespeople) 2.00 1.54 2.13 1.46

Internationalmarketing
serials
697
Table XXI.Type of empirical
study for IMS, JIBS,and selected serials
IMS
aJI
BS
aJA
MS
bJM
bJM
Rb
JCR
bJB
Ec
Type
ofem
pir
ical
study
Fre
q.
%F
req.
%%
%%
%%
Surv
ey33
774
.913
050
.249
.759
.537
.631
.984
.2M
ail
204
45.3
9335
.928
.335
.117
.516
.358
.7A
dm
inis
tere
d66
14.7
238.
9na
na
na
na
19.8
Per
sonal
6013
.313
5.0
17.0
19.9
16.1
13.9
5.8
Tel
ephon
e7
1.6
10.
44.
44.
54.
01.
70.
8Sec
ondar
ydat
a(e
.g.
dat
abas
e)37
8.2
100
38.6
16.4
27.0
22.1
12.9
8.3
Oth
er(e
.g.se
rial
arti
cles
,fl
yer
s,pan
els)
8819
.624
9.3
4.4
4.5
6.7
7.3
5.0
Exper
imen
t9
2.0
51.
929
.69.
933
.648
.32.
5N
um
ber
ofar
ticl
es45
025
415
989
149
178
1200
Yea
rspublish
ed19
85-1
998
1990
-199
819
80-
1985
1980
-19
8519
80-
1985
1980
-19
8519
89-
1996
No
tes:
aP
erce
nta
ges
are
bas
edon
empir
ical
arti
cles
only
;tw
osu
rvey
-bas
edst
udie
suse
dtw
odat
aco
llec
tion
met
hod
sbP
erce
nta
ges
for
Journ
al
ofth
eA
cadem
yof
Mark
etin
gS
cien
ce(J
AM
S),
Journ
alof
Mark
etin
g(J
M),
Journ
alof
Mark
etin
gR
esea
rch
(JM
R),
and
Journ
alof
Con
sum
erR
esea
rch
(JC
R)ar
ebas
edon
Gra
zer
and
Sti
ff(1
987).
Sum
ofco
lum
nper
centa
ges
may
exce
ed10
0.0
bec
ause
som
est
udie
suse
dm
ore
than
one
dat
aco
llec
tion
met
hod
cP
erce
nta
ges
for
Journ
al
ofB
usi
nes
s&
Entr
epre
neu
rship
(JB
E)bas
edon
Hym
anan
dSte
iner
(199
7)
na
ˆnot
applica
ble
/avai
lable

InternationalMarketingReview18,6
698
than JAMS, JM, JMR, and JCR. More mature serials ± such as JM, JMR, and JCR± contain relatively more articles that rely on secondary data andexperimentation. International marketing scholars tend to rely on surveydata and overlook longitudinal databases and experimental designs, perhapsdue to a lack of available databases and established theories and measures(Hyman and Steiner, 1997). As international marketing practice and researchcontinues to mature, the dominance of survey-based studies in IMS shoulddecline.
The mix of methods, sample types, and populations. Mail surveys,predominantly of managers and CEOs, often rely on sample frames providedby organizations (e.g. London Times, US Department of Commerce, KoreanForeign Trade Association). Administered questionnaires often rely on college± especially business ± students and the general population. Personalinterviews are most used for non-probability (i.e. convenience or judgment)samples of managers. Database studies tend to use government and financialdata. Content analyses often rely on judgment samples of ads and journalarticles. To maximize convenience and minimize costs, experiments oftenanalyze convenience samples of students; unfortunately, results derived fromsuch samples have limited external validity because background variables`̀ might affect the behavior of interest’’ (Lynch, 1982, p. 229). Case studies,based on authors’ judgment, often rely on information from managers inorganizations. Intercept methods are most used for convenience samples ofconsumers and the like. Other useful methods, such as Delphi or panels, arerarely used by IMS authors (see Table XXII).
Regarding the correlation between data collection method and sample type:
mail surveys often involve samples based on lists and probabilitysamples;
administered surveys often involve convenience samples;
personal interviews and content analyses often rely on judgmentsamples; and
longitudinal studies tend to rely on government and financial data.
This method-sample relationship suggests that researchers consider availablesample types before designing their studies.
Analysis statistic techniques. For empirical articles, univariate and bivariatestatistical methods are popular in both IMS (68.9 per cent) and JIBS (62.6 percent) (see Table XXIII; percentage similar to 73.3 per cent reported in Aulakhand Kotabe (1993)). To test hypotheses, mean difference tests and ANOVA arethe two most common statistical methods.
The most-used multivariate methods in IMS are regression (in 17.6 per centof articles), factor analysis (in 12.4 per cent of articles), and MANOVA/ANCOVA (in 7.1 per cent of articles). Path or structural analysis has becomepopular and is used in comparable propensity to other journals (5.1 per centin IMS, 9.1 per cent in JIBS, and 9.7 per cent in Journal of Macromarketing.)
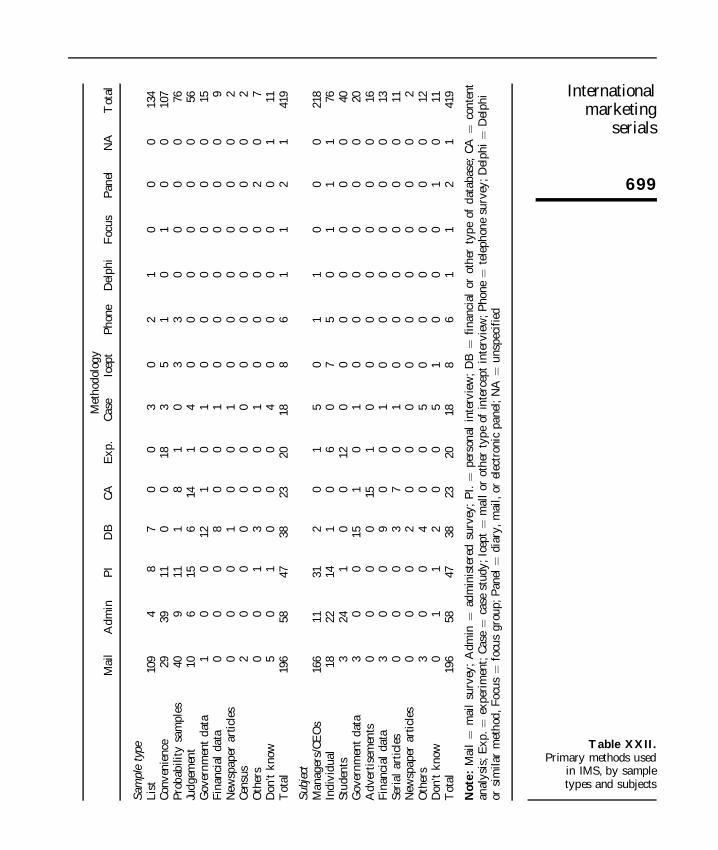
Internationalmarketing
serials
699
Table XXII.Primary methods used
in IMS, by sampletypes and subjects
Met
hod
olog
yM
ail
Adm
inP
ID
BC
AE
xp.
Cas
eIc
ept
Phon
eD
elphi
Foc
us
Pan
elN
AT
otal
Sam
ple
type
Lis
t10
94
87
00
30
21
00
013
4C
onven
ience
2939
110
018
35
10
10
010
7P
robab
ilit
ysa
mple
s40
911
18
10
33
00
00
76Ju
dgem
ent
106
156
141
40
00
00
056
Gov
ernm
ent
dat
a1
00
121
01
00
00
00
15F
inan
cial
dat
a0
00
80
01
00
00
00
9N
ewsp
aper
arti
cles
00
01
00
10
00
00
02
Cen
sus
20
00
00
00
00
00
02
Oth
ers
00
13
00
10
00
02
07
Don
’tknow
50
10
00
40
00
00
111
Tot
al19
658
4738
2320
188
61
12
141
9
Subj
ect
Man
ager
s/C
EO
s16
611
312
01
50
11
00
021
8In
div
idual
1822
141
06
07
50
11
176
Stu
den
ts3
241
00
120
00
00
00
40G
over
nm
ent
dat
a3
00
151
01
00
00
00
20A
dver
tise
men
ts0
00
015
10
00
00
00
16F
inan
cial
dat
a3
00
90
01
00
00
00
13Ser
ial
arti
cles
00
03
70
10
00
00
011
New
spap
erar
ticl
es0
00
20
00
00
00
00
2O
ther
s3
00
40
05
00
00
00
12D
on’t
know
01
12
00
51
00
01
011
Tot
al19
658
4738
2320
188
61
12
141
9
Note
:M
ail
ˆm
ail
surv
ey;
Adm
inˆ
adm
inis
tere
dsu
rvey
;P
I.ˆ
per
sonal
inte
rvie
w;
DB
ˆfi
nan
cial
orot
her
type
ofdat
abas
e;C
Aˆ
conte
nt
anal
ysi
s;E
xp.ˆ
exper
imen
t;C
ase
ˆca
sest
udy;Ic
ept
ˆm
all
orot
her
type
ofin
terc
ept
inte
rvie
w;P
hon
eˆ
tele
phon
esu
rvey
;D
elphi
ˆD
elphi
orsi
milar
met
hod
,F
ocus
ˆfo
cus
gro
up;P
anel
ˆdia
ry,
mai
l,or
elec
tron
icpan
el;
NA
ˆunsp
ecif
ied

InternationalMarketingReview18,6
700
Table XXIII.Statistical methodsused in IMS andselected serials
Met
hod
aIM
SIM
SJI
BS
JAM
Sb
JMb
JMR
bJC
Rb
Intl
cJM
Md
Mktg
e
Fre
q%
Fre
q%
%%
.%
%%
%%
Univ
aria
tean
dB
ivari
ate
310
68.9
159
62.6
73.3
26f
Des
crip
tive
130
28.9
7830
.7na
na
na
na
na
na
na
Mea
ndif
fere
nce
test
9821
.834
13.4
na
na
na
na
15.2
10.0
9.0
AN
OV
Ag
7917
.642
16.5
32.7
23.6
30.2
36.5
11.5
10.0
39.6
Cor
rela
tion
5612
.439
15.4
13.8
21.3
23.5
19.7
10.7
10.0
5.2
Chi-sq
uar
ete
st54
12.0
187.
124
.524
.712
.813
.5na
5.0
9.0
Mult
ivar
iate
211
46.9
163
64.2
52.2
Reg
ress
ion
(i.e
.m
ult
iple
,lo
git
,pro
bit
)79
17.6
115
45.3
23.3
49.4
71.8
38.8
7.8
36.0
15.7
Fac
tor
anal
ysi
s(P
CA
)56
12.4
228.
710
.715
.722
.18.
415
.23.
03.
7M
AN
OV
A/A
NC
OV
A32
7.1
166.
3na
na
na
na
5.9
na
na
Dis
crim
inan
tanal
ysi
s28
6.2
83.
211
.36.
73.
46.
26.
30.
02.
2P
ath/s
truct
ura
lan
alysi
s23
5.1
239.
10.
00.
00.
00.
03.
00.
09.
7C
lust
eranal
ysi
s19
4.2
103.
92.
54.
56.
01.
13.
70.
01.
5C
onjo
int
anal
ysi
s/M
DS/M
CA
/AID
71.
61
0.4
3.1
3.4
8.1
2.8
0.7
0.0
1.5
Can
onic
alco
rrel
atio
n4
0.9
10.
44.
43.
40.
70.
6na
0.0
0.0
Cor
resp
onden
ce3
0.7
10.
40.
00.
00.
00.
00.
00.
00.
0
Var
iety
ofadvan
ced
met
hod
sper
arti
cle
013
2.9
93.
51
221
49.1
125
49.2
215
233
.877
30.3
351
11.3
3614
.24+
132.
97
2.8
No.
ofem
pir
ical
arti
cles
450
254
159
8914
917
8270
104
134
Yea
rspublish
ed19
85-1
998
1990
-199
819
80-
198
519
80-
1985
1980
-19
8519
80-
1985
1980
-19
9019
80-
1991
1989
No
tes:
aM
ost
studie
suse
dm
ult
iple
stat
isti
cal
met
hod
s;th
us
the
sum
ofper
centa
ges
for
met
hod
suse
dof
ten
exce
eds
100
per
cent.
Per
centa
ges
inth
ela
sttw
oco
lum
ns
conce
rnth
epri
nci
ple
stat
isti
cal
tech
niq
ue
use
d;per
centa
ges
inth
ese
colu
mns
sum
to10
0per
cent
bP
erce
nta
ges
for
Journ
alof
the
Aca
dem
yof
Mark
etin
gS
cien
ce(J
AM
S),
Journ
al
ofM
ark
etin
g(J
M),
Journ
alof
Mar
keting
Res
earc
h(J
MR
),an
dJo
urn
alof
Con
sum
erR
esea
rch
(JC
R),
base
don
Gra
zer
and
Sti
ff(1
987)
c Bas
edon
Aula
kh
and
Kot
abe
(199
3),
per
centa
ges
are
for
inte
rnat
ional
mar
ket
ing
arti
cles
publish
edin
21se
rial
sdP
erce
nta
ges
for
Journ
al
ofM
acr
omark
etin
g(J
MM
)bas
edon
Fin
nan
dM
cQuit
ty(1
994)
e Bas
edon
Wah
eeduzz
aman
and
Kra
mpf
(199
2),
per
centa
ges
are
for
Journ
alof
the
Aca
dem
yof
Mark
etin
gS
cien
ce,
Journ
al
ofM
ark
etin
g,Jo
urn
alof
Mark
etin
gR
esea
rch,
Journ
al
ofC
onsu
mer
Res
earc
h,
Journ
al
ofA
dve
rtis
ing,
and
Journ
al
ofA
dve
rtis
ing
Res
earc
h.
f Con
sist
sof
arti
cles
that
sole
lyem
plo
ydes
crip
tive
stat
isti
cs.
gP
erce
nta
ges
for
Journ
alof
the
Aca
dem
yof
Mark
etin
gS
cien
ce(J
AM
S),
Journ
al
ofM
ark
etin
g(J
M),
Journ
alof
Mar
keting
Res
earc
h(J
MR
),Jo
urn
al
ofC
onsu
mer
Res
earc
h(J
CR
),an
dJo
urn
alof
Mac
rom
ark
etin
g(J
MM
)ar
efo
rA
NO
VA
/MA
NO
VA
/AN
CO
VA
Per
centa
ges
bas
edon
empir
ical
art
icle
son
lyna
ˆnot
applica
ble
/avai
lable

Internationalmarketing
serials
701
Methods such as cluster analysis, conjoint analysis, correspondence analysis,and canonical correlation, seldom appear in IMS or other serials. For IMS, 97.1per cent (437 of 450) of empirical articles used at least one statistical method,82.9 per cent (373 of 450) used one or two methods, and 14.2 per cent (54 of 450)used more than two methods. Relative to JIBS, IMS contain fewer articles withmultivariate statistical methods. These propensities, which are similar to JIBS,show that
univariate and bivariate statistical methods remain the most frequentlyused methods; and
most manuscripts rely on one or two statistical methods.
Perhaps the practitioner sub-audience for IMS motivate the lower incidence ofthese methods (Hyman and Steiner, 1997).
Most prolific academic institutions. Authors affiliated with the 20 mostprolific institutions tended to publish empirical studies (76.2 per cent, or 221 of290, which exceeds the overall 67.0 per cent). Authors affiliated with differentinstitutions focused on different topics; for example, authors at ChineseUniversity of Hong Kong often studied advertising, firm performance, and jointventure, but authors at Michigan State University often studied globalization,exporting, marketing strategy, and marketing channels (see Table XXIV).The only pattern in the countries they studied: an unsurprising tendency toinclude a local subsample (e.g. authors affiliated with Chinese University ofHong Kong often included a Hong Kong subsample). Although mail and thenadministered surveys generally prevailed regardless of affiliation, case studiesprevailed at Michigan State University, content analysis prevailed at ClevelandState University, database analyses were popular at University of Texas-Austin and University of Georgia, and experiments were popular at GeorgiaState University.
Most prolific doctoral-granting institutions. Authors affiliated with the 21most prolific doctoral-granting institutions also tended to publish empiricalstudies (79.9 per cent, or 239 of 299, which exceeds the overall 67.0 per cent).Authors awarded degrees from different institutions focused on differenttopics; for example, graduates of Michigan State University and Ohio StateUniversity often studied export and import issues, but graduates ofNorthwestern University and University of Oregon often conducted consumerresearch (see Table XXV). Regarding the countries studied:
the USA was the most popular country studied by graduates of all 21institutions;
southeast Asian countries were especially popular with graduates ofUniversity of Oregon, University of Mississippi, Ohio State University,Michigan State University, and University of Wisconsin; and
African countries were especially popular with graduates of GeorgiaState University.

InternationalMarketingReview18,6
702
Table XXIV.Article profile for mostprolific academicinstitutions
Ran
kIn
stit
uti
onM
ain
topic
(#;al
lar
ticl
es)
Em
pir
ical
arti
cles
only
Unw
eighte
dau
thor
ship
sM
ain
countr
ies
studie
d(#
)P
rim
ary
rese
arch
met
hod
(#)
1C
hin
ese
Univ
ersi
tyof
Hon
gK
ong
Adver
tisi
ng
(4)
Fir
mper
form
ance
(3)
Join
tven
ture
(2)
18H
ong
Kon
g(8
)U
SA
(5)
PR
C(3
)
Mai
lsu
rvey
(7)
Adm
in.
surv
ey(3
)C
onte
nt
anal
ysi
s(2
)
1M
ichig
anSta
teU
niv
ersi
tyG
lobal
izat
ion
(6)
Expor
t(4
)Str
ateg
y(4
)C
han
nel
s/L
ogis
tics
(3)
18K
orea
(8)
USA
(5)
Cas
est
udy
(7)
Mai
lsu
rvey
(5)
3G
eorg
iaSta
teU
niv
ersi
tyC
han
nel
(5)
Adver
tisi
ng
(3)
Join
tven
ture
(2)
Str
ateg
y(2
)
16U
SA
(9)
Net
her
lands
(3)
PR
C(3
)
Mai
lsu
rvey
(9)
Exper
imen
t(4
)
4F
lori
da
Inte
rnat
ional
Univ
ersi
tyC
onsu
mer
(3)
Expor
ting
(3)
Soc
ieta
lm
arket
ing
(3)
14U
SA
(9)
India
(3)
UK
(3)
Mai
lsu
rvey
(5)
Adm
in.
surv
ey(4
)P
erso
nal
inte
rvie
w(3
)
4U
niv
ersi
tyof
Haw
aii
Con
sum
erbeh
avio
r(4
)E
xpor
ting
(3)
14U
SA
(10)
Kor
ea(5
)P
RC
(5)
Mai
lsu
rvey
(6)
Adm
insu
rvey
(5)
4C
level
and
Sta
teU
niv
ersi
tyA
dver
tisi
ng
(7)
Sou
rcin
g(2
)U
nio
ns
(2)
14U
SA
(11)
Kor
ea(7
)T
aiw
an(5
)H
ong
Kon
g(5
)Ja
pan
(5)
Con
tent
anal
ysi
s(7
)M
ail
surv
ey(6
)
4U
niv
ersi
tyof
Tex
as-A
ust
inStr
ateg
y(3
)G
lobal
izat
ion
(2)
14D
enm
ark
(4)
USA
(4)
Japan
(3)
Mai
lsu
rvey
(9)
Dat
abas
e(5
)
(con
tinued
)

Internationalmarketing
serials
703
Table XXIV.
Ran
kIn
stit
uti
onM
ain
topic
(#;al
lar
ticl
es)
Em
pir
ical
arti
cles
only
Unw
eighte
dau
thor
ship
sM
ain
countr
ies
studie
d(#
)P
rim
ary
rese
arch
met
hod
(#)
8U
niv
ersi
tyof
Ala
bam
aG
lobal
izat
ion
(4)
Chan
nel
s(2
)C
onsu
mer
(2)
Pro
duct
(2)
Sal
esm
anag
emen
t(2
)
13U
SA
(11)
India
(2)
Mai
lsu
rvey
(13)
9U
niv
ersi
tyof
Tol
edo
Cou
nte
rtr
ade
(3)
Join
tven
ture
(3)
12N
iger
ia(4
)P
RC
(4)
USA
(3)
Mai
lsu
rvey
(8)
Adm
in.su
rvey
(3)
10Is
rael
Inst
itute
ofT
echnol
ogy
Expor
t(6
)Sta
ndar
diz
atio
n(2
)11
Den
mar
k(3
)U
SA
(2)
Mai
lsu
rvey
(9)
10C
alif
ornia
Sta
teU
niv
ersi
tyC
han
nel
s(2
)C
onsu
mer
s(2
)11
USA
(6)
Mex
ico
(4)
Philip
pin
e(2
)
Mai
lsu
rvey
(7)
Exper
imen
t(2
)
10U
niv
ersi
tyof
Wal
es-U
KE
xpor
t/im
por
t(7
)P
roduct
(2)
11U
K(4
)U
SA
(2)
Mai
lsu
rvey
(3)
Con
tent
anal
ysi
s(2
)P
erso
nal
inte
rvie
w(2
)
13U
niv
ersi
tyof
Geo
rgia
Mac
roec
onom
ics
(7)
Glo
bal
izat
ion
(4)
10U
SA
(5)
Ger
man
y(3
)P
hilip
pin
es(2
)
Dat
abas
e(5
)M
ail
surv
ey(3
)
13N
atio
nal
Univ
ersi
tyof
Sin
gap
ore
Con
sum
erbeh
avio
r(5
)Im
por
ting
(3)
10Sin
gap
ore
(3)
USA
(3)
Japan
(2)
PR
C(2
)
Adm
in.su
rvey
(6)
Exper
imen
t(2
) (continued
)

InternationalMarketingReview18,6
704
Table XXIV.
Ran
kIn
stit
uti
onM
ain
topic
(#;al
lar
ticl
es)
Em
pir
ical
arti
cles
only
Unw
eighte
dau
thor
ship
sM
ain
countr
ies
studie
d(#
)P
rim
ary
rese
arch
met
hod
(#)
15H
ofst
raU
niv
ersi
tySal
esm
anag
emen
t(3
)C
onsu
mer
beh
avio
r(2
)G
lobal
izat
ion
(2)
9U
SA
(4)
KO
R(2
)M
ail
surv
ey(5
)A
dm
in.su
rvey
(3)
16P
enn
Sta
teU
niv
ersi
tyC
onsu
mer
s(2
)C
ountr
y-o
f-or
igin
(2)
Join
tven
ture
s(2
)
7T
urk
ey(5
)B
angla
des
h(2
)A
dm
in.su
rvey
(3)
Inte
rcep
t(2
)
17U
psa
laU
niv
ersi
ty-S
wed
enC
onsu
mer
beh
avio
r(2
)In
tern
atio
nal
izat
ion
offi
rms
(2)
Mar
ket
entr
y(2
)
5Sw
eden
(4)
Per
sonal
inte
rvie
w(2
)C
ase
study
(2)
18G
eorg
iaT
ech
Mktg
rese
arch
(2)
Sta
ndar
diz
atio
n(2
)5
USA
(4)
Mai
lsu
rvey
(3)
18U
niv
ersi
tyof
Str
athcl
yde-
UK
Fiv
eunre
late
dto
pic
s5
No
countr
ym
ore
than
once
Mai
lsu
rvey
(3)
Per
sonal
inte
rvie
w(2
)
20In
dia
na
Univ
ersi
tyC
onsu
mer
(2)
4U
SA
(2)
Mai
lsu
rvey
(3)
No
te:
Num
ber
sin
par
enth
eses
inco
lum
ns
hea
ded
Mai
nto
pic
,M
ain
countr
ies
studie
d,an
dP
rim
ary
rese
arch
met
hod
are
counts

Internationalmarketing
serials
705
Table XXV.Article profile for most
prolific doctoral-granting institutions
Ran
kIn
stit
uti
onM
ain
topic
(#;al
lar
ticl
es)
Em
pir
ical
arti
cles
only
Unw
eighte
dau
thor
ship
sM
ain
countr
ies
studie
d(#
)P
rim
ary
rese
arch
met
hod
(#)
1M
ichig
anSta
teU
niv
ersi
tyE
xpor
t(7
)Jo
int
ven
ture
s(4
)Sta
ndar
diz
atio
n(4
)C
han
nel
s(3
)C
ounte
rtra
de
(3)
Sou
rcin
g(3
)
33U
SA
(21)
Japan
(5)
Ger
man
y(3
)C
anad
a(3
)K
orea
(4)
Nig
eria
(3)
Mai
lsu
rvey
(10)
2O
hio
Sta
teU
niv
ersi
tyE
xpor
t(5
)C
ountr
y-o
f-or
igin
(3)
Mac
roec
onom
ics
(2)
Str
ateg
y(2
)
20U
SA
(12)
Japan
(6)
PR
C(4
)P
hilip
pin
es(3
)K
orea
(3)
Mai
lsu
rvey
(9)
Per
sonal
inte
rvie
w(2
)
3U
niv
ersi
tyof
Geo
rgia
Glo
bal
izat
ion
(3)
Sal
esm
gm
t(2
)15
USA
(10)
India
(2)
Mai
lsu
rvey
(8)
Adm
in.su
rvey
(3)
3In
dia
na
Univ
ersi
tyA
dver
tisi
ng
(3)
Con
sum
ers
(2)
Cou
ntr
y-o
f-or
igin
(2)
15U
SA
(8)
India
(4)
Nig
eria
(2)
Aust
ralia
(2)
Sin
gap
ore
(2)
Kor
ea(2
)C
anad
a(2
)
Mai
lsu
rvey
(8)
Adm
in.su
rvey
(3)
5U
niv
ersi
tyof
Illinoi
sE
xpor
t/im
por
t(3
)A
dver
tisi
ng
(2)
Chan
nel
s(2
)C
ountr
y-o
f-or
igin
(2)
Sal
esm
gm
t(2
)
13U
SA
(6)
Ban
gla
des
h(2
)Ja
pan
(2)
Mai
lsu
rvey
(3)
Dat
abas
e(2
)E
xper
imen
t(2
) (con
tinued
)
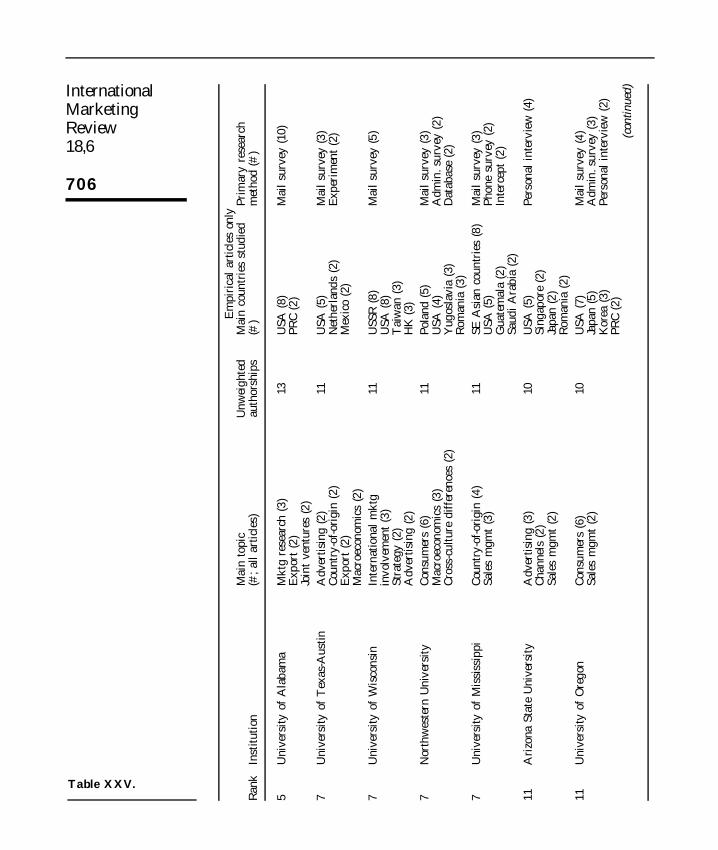
InternationalMarketingReview18,6
706
Table XXV.
Ran
kIn
stit
uti
onM
ain
topic
(#;al
lar
ticl
es)
Em
pir
ical
arti
cles
only
Unw
eighte
dau
thor
ship
sM
ain
countr
ies
studie
d(#
)P
rim
ary
rese
arch
met
hod
(#)
5U
niv
ersi
tyof
Ala
bam
aM
ktg
rese
arch
(3)
Expor
t(2
)Jo
int
ven
ture
s(2
)
13U
SA
(8)
PR
C(2
)M
ail
surv
ey(1
0)
7U
niv
ersi
tyof
Tex
as-A
ust
inA
dver
tisi
ng
(2)
Cou
ntr
y-o
f-or
igin
(2)
Expor
t(2
)M
acro
econ
omic
s(2
)
11U
SA
(5)
Net
her
lands
(2)
Mex
ico
(2)
Mai
lsu
rvey
(3)
Exper
imen
t(2
)
7U
niv
ersi
tyof
Wis
consi
nIn
tern
atio
nal
mktg
invol
vem
ent
(3)
Str
ateg
y(2
)A
dver
tisi
ng
(2)
11U
SSR
(8)
USA
(8)
Tai
wan
(3)
HK
(3)
Mai
lsu
rvey
(5)
7N
orth
wes
tern
Univ
ersi
tyC
onsu
mer
s(6
)M
acro
econ
omic
s(3
)C
ross
-cult
ure
dif
fere
nce
s(2
)
11P
olan
d(5
)U
SA
(4)
Yugos
lavia
(3)
Rom
ania
(3)
Mai
lsu
rvey
(3)
Adm
in.su
rvey
(2)
Dat
abas
e(2
)
7U
niv
ersi
tyof
Mis
siss
ippi
Cou
ntr
y-o
f-or
igin
(4)
Sal
esm
gm
t(3
)11
SE
Asi
anco
untr
ies
(8)
USA
(5)
Guat
emal
a(2
)Sau
di
Ara
bia
(2)
Mai
lsu
rvey
(3)
Phon
esu
rvey
(2)
Inte
rcep
t(2
)
11A
rizo
na
Sta
teU
niv
ersi
tyA
dver
tisi
ng
(3)
Chan
nel
s(2
)Sal
esm
gm
t(2
)
10U
SA
(5)
Sin
gap
ore
(2)
Japan
(2)
Rom
ania
(2)
Per
sonal
inte
rvie
w(4
)
11U
niv
ersi
tyof
Ore
gon
Con
sum
ers
(6)
Sal
esm
gm
t(2
)10
USA
(7)
Japan
(5)
Kor
ea(3
)P
RC
(2)
Mai
lsu
rvey
(4)
Adm
in.su
rvey
(3)
Per
sonal
inte
rvie
w(2
)
(con
tinued
)

Internationalmarketing
serials
707
Table XXV.
Ran
kIn
stit
uti
onM
ain
topic
(#;al
lar
ticl
es)
Em
pir
ical
arti
cles
only
Unw
eighte
dau
thor
ship
sM
ain
countr
ies
studie
d(#
)P
rim
ary
rese
arch
met
hod
(#)
11P
enn
Sta
teU
niv
ersi
tyC
ountr
y-o
f-or
igin
(2)
Eth
ics
(2)
Mac
roec
onom
ics
(2)
10U
SA
(5)
Dat
abas
e(3
)E
xper
imen
t(2
)
14U
niv
ersi
tyof
Sou
thC
arol
ina
Con
sum
erbeh
avio
r(4
)C
ountr
y-o
f-or
igin
(2)
Mac
roec
onom
ics
(2)
9U
SA
(5)
Pol
and
(2)
Russ
ia(2
)
Adm
in.su
rvey
(2)
Inte
rcep
t(2
)
14U
niv
ersi
tyof
Nor
thC
arol
ina
Cou
ntr
y-o
f-or
igin
(2)
Mac
roec
onom
ics
(2)
Mktg
rese
arch
(2)
9U
SA
(6)
Mai
lsu
rvey
(3)
14G
eorg
iaSta
teU
niv
ersi
tySal
esm
gm
t(2
)M
ktg
rese
arch
(2)
9U
SA
(5)
Ghan
a(2
)K
enya
(2)
Sau
di
Ara
bia
(2)
Mai
lsu
rvey
(7)
17U
niv
ersi
tyof
Hou
ston
Adver
tisi
ng
(2)
7U
SA
(4)
UK
(3)
Adm
in.su
rvey
(2)
17U
niv
ersi
tyof
Mem
phis
Eth
ics
(3)
Mar
ket
entr
y(2
)N
atio
nal
iden
tity
(2)
7U
SA
(3)
Sw
eden
(2)
Hon
gK
ong
(2)
Japan
(2)
Inte
rcep
t(3
)M
ail
surv
ey(2
)A
dm
in.su
rvey
(2)
19N
ewY
ork
Univ
ersi
tyP
olit
ical
/gov
t(2
)5
USA
(4)
No
met
hod
mor
eth
anon
ce
19U
niv
ersi
tyof
Ken
tuck
yC
ountr
y-o
f-or
igin
(2)
Gre
enm
ktg
(2)
Mac
roec
onom
ics
(2)
Mktg
rese
arch
(2)
Sal
esm
gm
t(2
)
5U
SA
(2)
Mai
lsu
rvey
(2)
19Syra
cuse
Univ
ersi
tyA
dver
tisi
ng
(3)
5U
SA
(2)
Gre
ece
(2)
Adm
in.su
rvey
(2)
No
te:
Num
ber
sin
par
enth
eses
inco
lum
ns
hea
ded
Mai
nto
pic
,M
ain
countr
ies
studie
d,an
dP
rim
ary
rese
arch
met
hod
are
counts

InternationalMarketingReview18,6
708
Again, mail surveys generally prevailed regardless of an author’s degree-granting institution.
Comparisons among the IMS. The IMS focused on different researchdomains (see Table XXVI). Specifically, the preponderance of articles publishedin each serial concerned the following topics:
IMR ± export/import, macroeconomics, strategy, political/government,market entry, and countertrade;
JE ± joint venture/strategy alliance and consumer-related issues;
JGM ± export/import, joint venture/strategy alliance, strategy, channels,and sales management;
JICM ± consumer-related issues and country-of-origin (with thedominance on tourism attributable to one special issue on the topic);and
JIM ± export/import, joint venture/ strategy alliance, globalization, andeducation.
The mix of articles is generally consistent with the editorial mandates of theIMS. For example, IMR covered the broadest range of topics, JICM focused onconsumer-related topics, and JIM focused on marketing strategy rather thanconsumer behavior.
Other noteworthy inter-serial differences include the following (seeTable XXVII):
Nonempirical articles are more common in IMR (47.1 per cent) than inJICM (17.6 per cent).
One-country studies are more common in JGM (84.6 per cent) than inJICM (69.6 per cent).
Mail surveys are more common in JGM and IMR (64.9 per cent and 54.9per cent respectively) than in JE or JICM (34.0 per cent and 21.7 per centrespectively); alternatively, administered surveys are more common inJE and JICM.
Non-survey-based articles are more common in JIM, JICM, and JE (40.8per cent, 37.3 per cent, and 36.3 per cent respectively) than in JGM andIMR (16.0 per cent and 21.9 per cent respectively).
Although JGM encourages case studies (see list of editorial mandates),only 2.3 per cent of empirical studies in JGM relied on this researchmethod.
Consistent with its editorial mandate, articles in JICM typically describea sample of individuals or students (73.2 per cent) or advertisements(10.5 per cent).
On average, articles published in JICM have the most authors (2.2); also,single-author articles are far less common in JICM (21.3 per cent).

Internationalmarketing
serials
709
Table XXVI.Main topics by IMS
Main topic IMR JE JGM JICM JIM Total
Export/import (at country level) 20 25 1 19 65Promotion (i.e. advertising) 8 7 8 19 3 45Consumers/consumer behavior 7 7 2 25 3 44Joint ventures/strategy alliance 1 10 15 11 37Country-of-origin 6 2 8 13 6 35Strategy 12 3 13 1 2 31Channels (i.e. distribution, logistics, etc.) 5 1 11 7 24Macroeconomics 13 4 4 2 23Business/marketing research 6 4 5 5 2 22Sales management 5 11 2 3 21Market entry 8 2 7 4 21Globalization 3 3 4 1 9 20Standardization (except advertising) 4 1 8 1 4 18Tourism 2 15 17Other marketing (e.g. location declensions,
market structure) 4 1 5 2 5 17Political/government (e.g. taxes, laws) 9 1 6 16Countertrade (reciprocal trade between
companies/countries) 7 6 1 14Ethics 1 5 3 1 2 12Environment change in world 4 2 5 1 12Internationalization of firms 2 4 5 11Firm performance (financial or marketing
performance) 2 2 2 1 3 10Other non-marketing 5 1 2 1 1 10Cross-cultural difference 2 3 4 9Education 1 8 9Products (e.g. introduction, packaging) 1 5 2 1 9Brands 1 6 2 9Legal 3 1 5 9Service 2 3 2 1 1 9Management (e.g. non-salesforce, personnel
issues) 4 3 1 8Franchising 3 3 1 7Managing high technology/technology
transfer 1 4 2 7Negotiations and tactics 4 1 1 6Single EC market 1 2 1 1 1 6Free trade/trade block 2 3 1 6Foreign direct investment 3 2 5Other economics 1 2 1 1 5National innovativeness 2 3 5Organizational buying behaviors 5 5Segmentation 1 2 1 1 5Others (e.g. sourcing, green marketing,
consumerism) 4 8 4 3 6 25
Total 172 79 188 108 122 669
Note: All numbers are counts

InternationalMarketingReview18,6
710
Table XXVII.Selective comparisonsamong IMS
IMR JE JGM JICM JIM n
Type of articleEmpirical studies 52.9% 65.8% 71.8% 82.4% 68.0% 450Nonempirical studies 47.1 34.2 28.2 17.6 32.0 219n 172 79 188 108 122 669
Countries studiedOne 72.6% 70.6% 84.6% 62.5% 69.6% 317Two 14.3 19.6 6.9 25.0 17.7 67Three 4.8 3.9 3.8 1.1 8.9 19Four 2.4 3.9 0.8 8.0 1.3 13Five or more 6.0 2.0 3.8 3.4 2.6 16Mean 1.6 1.5 1.3 1.7 1.6n 84 51 130 88 79 432
MethodsMail questionnaire 54.9% 34.0% 64.9% 21.7% 42.1% 196Administered questionnaire 11.0 19.1 9.2 27.7 6.6 58Personal Interview 12.2 10.6 9.9 13.3 10.5 47Database (Govt. or other pre-existing
source) 9.8 12.8 5.3 6.0 15.8 38Content analysis 4.9 8.5 3.1 10.8 2.6 23Experiment 2.4 2.1 1.5 10.8 7.9 20Case study 0.0 8.5 2.3 1.2 13.2 18Intercept (mall or otherwise) 1.2 2.1 0.8 4.8 1.3 8Other (includes delphi, focus group, panel) 3.6 2.1 3.0 3.6 0.0 11n 82 47 131 83 76 419
Sample typeManagers/CEOs/VPs 63.1% 47.1% 72.5% 11.6% 56.4% 218Individuals (e.g. consumers, citizens) 13.1 21.6 11.7 48.8 9.0 85Students 8.3 11.8 1.7 24.4 7.7 42Government data 4.8 5.9 5.0 2.3 6.4 20Advertisements 3.6 3.9 1.7 10.5 0.0 16Financial data 3.6 3.9 4.2 0.0 3.8 13Serial articles 1.2 3.9 1.7 0.0 7.7 11Others (includes sales/product data,
salespeople, newspaper) 2.4 2.0 1.7 2.3 9.0 14n 84 51 120 86 78 419
AuthorshipOne 41.9% 39.2% 38.3% 21.3% 36.9% 243Two 41.9 38.0 39.9 47.2 41.8 279Three 14.0 22.8 20.7 22.2 17.2 126Four or more 2.3 0.0 1.0 9.3 4.1 21Mean 1.77 1.84 1.85 2.19 1.89n 172 79 188 108 122 669
Sample size1-100 32.1% 34.8% 32.5% 12.8% 34.6% 120101-250 41.0 17.4 31.0 19.8 25.6 116251-500 14.1 23.9 15.1 30.2 19.2 82501-1,000 6.4 15.2 15.1 22.1 10.3 58More than 1,000 6.4 8.7 6.3 15.1 10.3 38Mean 303 489 371 531 330n 78 46 126 86 78 414

Internationalmarketing
serials
711
For empirical articles, the mean sample size in JICM and JE (531 and 489respectively) exceeds the mean sample size in JGM, JIM, and IMR (371,330, and 303 respectively).
Implications and limitationsThe implications of this retrospective, which provides a macro view of IMS,are fivefold. First, practitioners account for only 2.9 per cent (37 of 1,265) ofunweighted authorships; thus, articles may not adequately mirror currentmarketing practice. Perhaps this lack of practitioner representation is mitigatedby the frequent study of managers and employees, who served as subjects in52.0 per cent (218 of 419) of empirical studies. Regardless, marketingacademicians and practitioners would benefit from increased contributionsfrom practitioners.
Second, non-US-based authors have much to contribute to internationalmarketing research; nonetheless, they constitute only 30.3 per cent ofunweighted authorships in IMS. The cultural and educational background ofUS-based authors may narrow the prevailing view and reduce thegeneralizability of research results (Hofstede, 1980). Two ways to overcomesuch ethnocentrism in IMS are editor-encouraged cooperation amongresearchers from different countries (Albaum and Peterson, 1984) and serial-provided translators (e.g. to translate Spanish manuscripts into English).
Third, more multi-country studies, especially if they include countries fromunder-researched regions, would enhance the generalizability of internationalmarketing theories. Despite recent and massive corporate investments,empirical studies of South America have been minimal; furthermore, Africa hasbeen long neglected. Perhaps language is a barrier; more than 80 per cent ofauthors are from English-speaking countries. One way to overcome thislanguage barrier is to ask international students studying in the USA to collectdata whenever they return home or via personal networks in their homecountries.
Fourth, some topics, such as the effect of e-commerce on internationalmarketing, have been understudied. As a result, the application of newmarketing theories to emerging domains (e.g. high technology, especiallyinformation technology) and consumer interests (e.g. consumerism, greenmarketing, marketing segmentation) continues to lag current marketingpractice. Greater efforts in these understudied arenas can both enhance thegeneralizability of marketing theory and help practitioners to make betterdecisions.
Fifth, mail and administered surveys dominate the empirical research ininternational marketing (60.8 per cent or 254 of 418 studies). For many researchproblems in international marketing, case studies (Paliwoda, 1999), secondarydata, and experimental designs may prove more reliable and valid. Archivaldata, including statistical records and other government or organizationalrecords (such as census data), survey archives (such as the General Social

InternationalMarketingReview18,6
712
Survey) and written records (such as newspapers), are certainly suitable forlongitudinal and multi-country studies (Judd et al., 1991).
Finally, this retrospective is limited in at least three ways. First, the scopewas limited to only five IMS. Future retrospectives might include a broaderrange of international marketing publications, especially those publishedoutside the USA and UK. Second, the three-stage procedure for classifying thetopics addressed in articles did not account for multi-topic articles (cf. Aulakhand Kotabe, 1993). Third, several analyses reported in retrospective studies,such as citation analysis (e.g. Clark and Nessim, 1986; Hoffman and Holbrook,1993; Zinkhan et al., 1992), assessment of measure and sampling equivalence incomparative studies (Aulakh and Kotabe, 1993), and assessment of measurereliability (Aulakh and Kotabe, 1993), were beyond the scope of thisretrospective.
References
Albaum, G. and Peterson, R.A. (1984), `̀ Empirical research in international marketing’’, Journal ofInternational Business Studies, Vol. 15, Spring/Summer, pp. 61-173.
Aulakh, P.S. and Kotabe, M. (1993), `̀An assessment of theoretical and methodologicaldevelopment in international marketing: 1980-1990’’, Journal of International Marketing,Vol. 1, Summer, pp. 5-28.
Boddewyn, J.J. (1981), `̀ Comparative marketing: the first twenty-five years’’, Journal ofInternational Business Studies, Vol. 13, Spring/Summer, pp. 1-79.
Boone, L.E., Gibson, D.R. and Kurtz, D.L. (1988), `̀ Rating logistics and transportation faculties onthe basis of editorial review board memberships’’, Logistics and Transportation Review,Vol. 24, December, pp. 384-90.
Bradley, M.F. (1987), `̀Nature and significance of international marketing: a review’’, Journal ofBusiness Research, Vol. 15, pp. 205-19.
Campanario, J.M. (1996), `̀ The competition for journal space among referees, editors, and otherauthors and its influence on journals’ impact factors’’, Journal of the American Society forInformation Science, Vol. 47, March, pp. 184-92.
Carnaghan, C., Flower-Gyepesi, J. and Gibbins, M. (1994), `̀ A profile of contemporary accountingresearch: fall 1984-spring 1994’’, Contemporary Accounting Research, Vol. 11, Summer,pp. 251-70.
Cavusgil, S.T. and Das, A. (1997), `̀ Methodological issues in empirical cross-cultural research: asurvey of the management literature and a framework’’, Management InternationalReview, Vol. 37, 1st quarter, pp. 71-96
Chung, K.H., Cox, R.A.K. and Okunade, A.A. (1993), `̀ Publishing behavior of individuals andmost prolific authors in the economics literature’’, Quarterly Journal of Business &Economics, Vol. 32, Summer, pp. 32-42.
Clark, G.L. (1985), `̀Productivity ratings of institutions based on publication in eight marketingjournals: 1983-1984’’, Journal of Marketing Education, Vol. 7, Fall, pp. 12-23.
Clark, G. L. and Nessim, H. (1986), `̀An analysis of the sources of articles in the `Journal ofMarketing Education’ since its foundation in 1979’’, Journal of Marketing Education, Vol. 8,Summer, pp. 71-4.
Clark, G.L., Hancock, W. and Kaminski, P.F. (1987), `̀An analysis of leading contributors to theJournal of Marketing Research: 1964-1985’’, in Douglas et al. (Eds), 1987 AMA SummerEducators’ Conference Proceedings, American Marketing Association, Chicago, IL,pp. 250-3.

Internationalmarketing
serials
713
Daniels, J.D. (1991), `̀ Relevance in international business research: a need for more linkage’’,Journal of International Business Studies, Vol. 21, 2nd quarter, pp. 177-86.
Diamantopoulos, A. (1996), `̀A model of the publication performance of marketing academics’’,International Journal of Research in Marketing, Vol. 13, April, pp. 163-80.
Durden, G.C. and Perri, T.J. (1995), `̀ Coauthorship and publication efficiency’’, Atlantic EconomicJournal, Vol. 23, March, pp. 69-76.
Fields, D.M. and Swayne, L.E. (1988), `̀Publication in major marketing journals: 1960-1986’’,Journal of Marketing Education, Vol. 10, Fall, pp. 36-48.
Finn, A. and McQuitty, S. (1994), `̀ Empirical research in macromarketing’’, Journal ofMacromarketing , Vol. 14, Fall, pp. 63-8.
Geistfeld, L.V. and Key, R. (1986), `̀A decade in perspective 1975-84: focus and trends in theJournal of Consumer Affairs’’, Journal of Consumer Affairs, Vol. 20, Summer, pp. 65-76.
Grazer, W.F. and Stiff, M.R. (1987), `̀ Statistical analysis and design in marketing journal articles’’,Journal of the Academy of Marketing Science, Vol. 15, Spring, pp. 70-3.
Hasselback, J.R. (1999), The 1998-1999 Prentice Hall Guide to Marketing Faculty, Prentice-Hall,Upper Saddle River, NJ.
Heck, J.L., Cooley, P. and Hubbard, C.M. (1986), `̀ Contributing authors and institutions to theJournal of Finance: 1946-1985’’, Journal of Finance, Vol. 41, December, pp. 1129-40.
Hoffman, D.L. and Holbrook, M.B. (1993), `̀The intellectual structure of consumer research: abibliometric study of author cocitations in the first 15 years of the Journal of ConsumerResearch’’, Journal of Consumer Research, Vol. 19, March, pp. 505-17.
Hofstede, G. (1980), Culture’s Consequences: International Differences in Work-related Values,abridged ed., Sage, Beverly Hills, CA.
Hoverstad, R., Shipp, S.H. and Higgins, S. (1995), `̀ Productivity, collaboration, and diversity inmajor marketing journals: 1984-1993’’, Marketing Education Review, Vol. 5, Summer,pp. 57-65.
Hyman, M.R. and Steiner, S.D. (1997), `̀The Journal of Business & Entrepreneurship: the firsteight years’’, Journal of Business & Entrepreneurship, Vol. 9, March, pp. 1-31.
Inkpen, A. and Beamish, P. (1994), `̀An analysis of twenty-five years of research in the Journal ofInternational Business Studies’’, Journal of International Business Studies, Vol. 24, 4thquarter, pp. 703-14.
Javalgi, R.G., Cutler, D.R., Rao, S.R. and White, D.S. (1997), `̀ The international marketingliterature: topics, trends and contributors’’, Journal of Teaching in International Business,Vol. 8, Fall, pp. 21-43.
Jones, J.R. (1992), `̀ Transportation: retrospective and prospective’’, Journal of Marketing Theoryand Practice, Vol. 1, Winter, pp. 40-51.
Judd, C.M., Smith, E.R. and Kidder, L.H. (1991), Research Methods in Social Relations, 6th ed.,Holt, Rinehart, and Winston, Orlando, FL.
Kurtz, D.L. and Boone, L.E. (1988), `̀Rating marketing faculties on the basis of editorial reviewboard memberships’’, Journal of Marketing Education, Vol. 10, Spring, pp. 64-7.
Li, T. and Cavusgil, S.T. (1991), `̀ International marketing: a classification of research streamsand assessment of their development from 1982 to 1990’’, in Gilley, M. et al. (Eds), 1991AMA Summer Educators’ Conference, American Marketing Association, Chicago, IL,pp. 592-607.
Lynch, J.G. (1982), `̀ On the external validity of experiments in consumer research’’, Journal ofConsumer Research, Vol. 9, December, pp. 225-39.
McDowell, J.M. and Smith, J.K. (1992), `̀ The effect of gender-sorting on propensity to coauthor:implications for academic promotion’’, Economic Inquiry, Vol. 30, January, pp. 68-82.

InternationalMarketingReview18,6
714
McGrath, J.E. and Brinberg, D. (1983), `̀ External validity and the research process: a comment onthe Calder/Lynch dialogue’’, Journal of Consumer Research, Vol. 10, June, pp. 115-24.
MacMillan, I.C. (1994), `̀The emerging forum for business policy scholars’’, Journal of BusinessVenturing, Vol. 9, March, pp. 85-9.
Malhotra, N.K. (1996), `̀ The impact of the Academy of Marketing Science on marketingscholarship: an analysis of the research published in JAMS’’, Journal of the Academy ofMarketing Science, Vol. 24, Fall, pp. 291-8.
Marquardt, R.A. and Murdock, G.W. (1983), `̀Analysis of authorship in the Journal of Marketing1960-1981’’, Journal of Marketing Education, Vol. 5, Fall, pp. 53-7.
Morrison, A.J. and Inkpen, A.C. (1991), `̀An analysis of significant contributions to theinternational business literature’’, Journal of International Business Studies, Vol. 21,1st quarter, pp. 143-53.
Morrison, M.A. and Curtin, P.A. (1999), `̀Multidisciplinary promise ± limited disciplinary reality:a content analysis of Journal of Advertising Authorship’’, in Roberts, M.S. et al. (Eds),Proceedings of the 1999 Conference of the American Academy of Advertising, AmericanAcademy of Advertising, Gainesville, FL, pp. 139-46.
Paliwoda, S.J. (1999), `̀Viewpoint international marketing: an assessment’’, InternationalMarketing Review, Vol. 16, Spring, pp. 8-17.
Reinsch, N.L. Jr and Lewis, P.V. (1993), `̀Author and citation patterns for The Journal of BusinessCommunication , 1978-1992’’, Journal of Business Communication, Vol. 30, October,pp. 435-62.
Reisman, A. and Kirschnick, F. (1994), `̀ The devolution of OR/MS: implications from a statisticalcontent analysis of papers in flagship journals’’, Operations Research, Vol. 42, July-August,pp. 577-88.
Sekaran, U. (1983), `̀Methodological and theoretical issues and advancements in cross-culturalresearch’’, Journal of International Business Studies, Vol. 14, Fall, pp. 61-73.
Swan, J.E., Powers, T.L. and Sobczak, P.M. (1991), `̀ Utilization of sales management knowledgeand identification of contributors: an analysis of JPSSM 1980-1990’’, Journal of PersonalSelling & Sales Management, Vol. 11, Winter, pp. 5-16.
Urbancic, F.R. (1989), `̀Measuring the eminence of business schools: a longitudinal analysis’’,Akron Business and Economic Review, Vol. 20, Fall, pp. 29-39.
Urbancic, F.R. (1992), `̀ The extent of collaboration in the production of accounting research’’,Accounting Educators’ Journal, Vol. 4, Fall, pp. 47-61.
Urbancic, F.R. (1994/1995), `̀An analysis of the institutional and individual authorship sources ofarticles in the Journal of Applied Business Research: 1985-1993’’, Journal of AppliedBusiness Research, Vol. 11, Winter, pp. 108-16.
van Raaij, W.F. (1986), `̀ The first five years of the Journal of Economic Psychology’’, Journal ofEconomic Psychology, Vol. 7, March, pp. 1-15.
Waheeduzzaman, A.N.M. and Krampf, R.F. (1992), `̀Use of quantitative techniques in marketingresearch: the past twenty-five years’’, in Allen, C.T. and Madden, T.J. (Eds), Proceedings ofthe 1992 AMA Winter Educators’ Conference: Marketing Theory and Applications,American Marketing Association, Chicago, IL, pp. 285-94.
Wang, C.L. (1996), `̀ The evolution of international consumer research: a historical assessmentfrom the 1960s to mid-1990s’’, Journal of Euromarketing, Vol. 5, Spring, pp. 57-81.
Wheatley, J.J. and Wilson, L.C. (1987), `̀ The origins of published marketing research in the1980s’’, in Douglas, S. et al. (Eds), 1987 AMA Summer Educators’ Conference Proceedings,American Marketing Association, Chicago, IL, pp. 260-5.

Internationalmarketing
serials
715
Zinkhan, G.M., Roth, M.S. and Saxton, M.J. (1992), `̀ Knowledge development and scientific statusin consumer-behavior research: a social exchange perspective’’, Journal of ConsumerResearch, Vol. 19, September, pp. 282-91.
Appendix. Journal selection processThe reviewed IMS were chosen via a two-stage process. In stage one, the list of candidate serialswas generated. The four sources for this list were a recent retrospective, the ABI/Inform on-linedatabase, the MCB University Press On-line Journal Portfolio, and marketing `̀ jump sites’’ on theWeb.
The recent retrospective (Javalgi et al., 1997) suggested seven serials that were identified ashigh in international marketing orientation:
(1) European Journal of Marketing (EJM, from the UK);
(2) International Journal of Advertising (IJA, from the UK);
(3) International Marketing Review (IMR, from the UK);
(4) Journal of Euro-marketing (JE, from the USA);
(5) Journal of Global Marketing (JGM, from the USA);
(6) Journal of International Consumer Marketing (JICM, from the USA); and
(7) Journal of International Marketing (JIM, from the USA).
The current (i.e, 1997 to 1999) ABI/Inform on-line database, scanned for serial titles thatcontained the keywords {marketing} and {`international’ or `global’} , suggested two serials:
(1) International Journal of Research in Marketing (IJRM, from The Netherlands); and
(2) Journal of International Marketing and Marketing Research (JIMMR, from the UK).
The MCB University Press On-line Journal Portfolio suggested two serials:
(1) International Journal of Bank Marketing (IJBM, from the UK); and
(2) International Journal of Retail and Distribution Management (IJRDM, from the UK).
(Because MCB University Press claims to be `̀ the leading specialist publisher of academic andprofessional management titles in the English’’ (http://www.mcb.co.uk/portfolio/home.htm,),its publications were considered.) Finally, several marketing `̀ jump sites’’ on the Web (e.g.http://www.ualberta.ca/~ppopkows/journals.html#other; http://marketing.kub.nl/journal1.htm)suggested these nine serials:
(1) Asia Pacific International Journal of Marketing and Logistics (APIJML);
(2) Asian Journal of Marketing (AJM, from Singapore);
(3) Australasian Marketing Journal (AAMJ, from Australia);
(4) International Journal of Electronic Commerce (IJEC, from the USA);
(5) International Journal of Retailing (IJR );
(6) International Journal of Wine Marketing (IJWM);
(7) International Review of Retail, Distribution and Consumer Research (IRRDCR, from theUK);
(8) Journal of International Food and Agribusiness Marketing (JIFAM, from the USA); and
(9) Journal of International Marketing and Exporting (JIME, from Australia).
In stage two, this list was culled based on general availability, maturity, degree of industryspecificity, and degree of international marketing orientation. Serials were excluded for thefollowing reasons.

InternationalMarketingReview18,6
716
APIJM, IJR, and IJWM: no information was available (e.g. all efforts to visit the Websites of these journals failed).
AJM: an annual, in-house serial published by the Marketing Institute of Singapore (i.e.not double-blind reviewed and draws from limited author pool).
AAMJ: fewer than 20 per cent of articles in this annual, which is dominated by specialissues (three of eight since its inception in 1993), concern international marketing.
JIME: only three issues have appeared since its launch in August 1996.
IJA, IJBM, JIFAM, and IRRDCR: focus on only a single industry (i.e. overly narrowfocus).
IJRDM and IJEC: of limited scope and international predominantly in name only. (Incontrast, articles in JICM explore most marketing areas as well as consumer andconsumer behavior issues, so it was retained.)
IJRM and EJM: international predominantly in name only. IJRM has a somewhatinternational marketing orientation, yet its article mix is similar to Journal of MarketingResearch. EJM: `̀ provides a platform for new ideas in marketing. . . and a forum fordebating issues that arise. Authors are encouraged to contribute articles which emanatefrom Europe, or focus on Europe in the global context’’ (http://www.mcb.co.uk/portfolio/ejm/jourinfo.htm.). Given its editorial mandate and predominantly conceptual articles,EJM is a European Journal of Marketing.
JIMMR: not reasonably accessible to both academicians and practitioners (cf. Albaumand Peterson, 1984). For example, the ABI/Inform database contains only articleabstracts, CARL UnCover contains no listing, and most (if not all) major universitylibraries in the USA do not subscribe (e.g. Big Ten, University of California system,University of Texas system, Harvard).
Thus, the five IMS surveyed in this retrospective are IMR, JE, JGM, JICM, and JIM.