Applicants Participating in the Qualifying Applicant Lottery
Upload
independentCategory
view
0download
0
Working Paper Series WP 2011-2
School of Economic Sciences
Interest Group Incentives for Post-
lottery Trade Restrictions By
Adrienne M. Ohler, Hayley H. Chouinard,
and Jonathan K. Yoder
April 2011

Interest group incentives for post-lottery trade restrictions
Adrienne M. Ohlera, Hayley H. Chouinardb, Jonathan K. Yoderc
aIllinois State University, aohler@ ilstu. edubWashington State University, chouinard@ wsu. edu
cWashington State University, yoder@ wsu. edu
Abstract
The rights to use publicly-managed natural resources are sometimes distributed by lottery,
and typically these rights are non-transferable. Prohibition of post-lottery permit transfers
discourages applicants from entering the lottery solely for profitable permit sale, so only
those who personally value the use of the resource apply. However, because permits are
distributed randomly and trade is restricted, permits may not be used by those who value
them most. We examine a possible rationale for restrictions on permit transfers based on
the distribution of welfare across interest groups, and characterize the economic conditions
under which post-lottery prohibitions on trade are likely to arise. We develop our model
using the specific case of the Four Rivers Lottery used to allocate rafting permits on four
river sections in Idaho and Oregon.
Keywords: lottery, trade prohibition, interest groups
JEL classification: D45, D61.
1. Introduction
Lotteries are used to allocate rights to use, access, or consume a variety of publicly
managed natural resources. Hunting permits for elk in Montana, moose in Maine, waterfowl
in Maryland, and wild turkey in Minnesota are distributed by lottery. Ohio randomly draws
winners for the right to fish trout from Cold Creek; and rafting permits for the Yampa River
in Colorado are also distributed through a lottery.
Common among these lotteries is a restriction on the transfer of the lottery-allocated
rights to other parties. In these cases, only the initial winner of a lottery permit is allowed
to actually execute the associated right. The permit cannot be transferred or traded for use
Preprint submitted to SES Working Paper Series April 8, 2011

by someone else, and this restriction is generally monitored and enforced.
The prohibition on trade of lottery-allocated rights comes at a cost. When rights are
distributed randomly and must be used by the winner, the resource may not end up in the
hands of those who value it most. The result is that the aggregate rents accrued from the
use of the resource are not as high as they would be if trade were allowed (Boyce, 1994; Oi,
1967). Loomis (1980, 1982) examines distribution methods for private rafting permits for
the Colorado River. He estimates that rafters face a 43% reduction in welfare when using a
lottery with transfer restrictions relative to a pricing system.
If welfare losses from restrictions on right transfers are substantial for resource users,
then why are post-lottery transfer restrictions so common? To respond to this question,
we consider the primary resource users as an important interest group who potentially has
substantial influence on natural resource policy design, and we focus on the objectives of this
group and how they might shape the design of natural resource related lotteries. We develop
this discussion around Idaho’s Four Rivers Lottery, which is a mechanism for distributing
permits for private whitewater rafting on four wilderness river sections in Idaho.
A large literature exists that elucidates the economic relationships between regulators
and regulated interest groups. In his seminal paper, Stigler (1971) observes that regulated
groups themselves are often the beneficiaries of regulation, and as such strive to influence
regulatory design. Peltzman (1976) extends Stigler’s argument, focusing on the importance
of the distributive effects of regulation. One of the primary implications of this work is that
interest groups with concentrated benefits from regulation tend to invest more resources into
affecting regulation, whereas groups with diffuse benefits (even very large groups), tend to
invest less and therefore tend to be less effective at affecting regulatory change in their favor.
We provide a public choice perspective on the reasons for the current lottery structure
based on interest group influence, and the conditions under which implementing transfer
restrictions makes economic sense from the perspective of the primary user group. We further
illustrate that the root of the rent distribution problem for transferable permits is an inability
to identify the members of the primary interest group. We provide examples in which the
problem of member identification is more easily overcome and transfer restrictions are not
imposed. This is the first effort to our knowledge that develops a model to characterize the
2

tradeoff faced by a primary user group between the loss of welfare from prohibiting trade
versus the loss of resource rents to non-users from allowing post-lottery trade.
Boyce (1994) provides an extensive analysis of lottery structure, which we use as a foun-
dation for our analysis. Boyce examines the welfare costs of restricting permit trade as we
do. However, his model is restricted to the case where the number of applicants is no greater
than the number of people who positively value the resource, which disallows exactly the
type of rent seeking and rent distribution effects that we examine here. If post-lottery trade
is allowed, the (endogenous) number of applicants can be larger than the number of indi-
viduals that personally value the resource, and some of the rents may be extracted from the
primary user group. Chouinard and Yoder (2004) discusses some of the tradeoffs inherent
in post-lottery trade restrictions in the context of rafting permit lotteries, but their analysis
is more limited in scope and does not develop an underlying formal modeling framework.
The idea that groups with highly concentrated benefits often disproportionately influence
policy design may lie at the heart of why post-lottery prohibitions on trade are common.
We examine the tradeoffs faced by users from restricting trade and consider the outcomes
with various types of trade. In section 2 we develop a model and apply it to three lottery
structures: one with no trade allowed, an open lottery with tradable permits and a lottery
where those who don’t value the resource are excluded and trade is allowed.1 In section 3,
we compare the welfare implications of these policy options. We illustrate our argument
that the fundamental underlying information barrier to the political/economic viability of
post-lottery permit trade in section 4. Section 5 concludes.
2. The value of a lottery application
The value of the right to submit a lottery application depends on the value of the permit
that might be won, which in turn is a function of the rules governing the use of the permit and
the lottery itself. It is useful to categorize potential lottery applicants into two overlapping
dichotomous pairings. The first pair of categories is users and nonusers. The second pair
of categories is sellers and buyers. These shorthand terms are defined as subsets of lottery
1For our purposes, the terms “transfer” and “trade” are synonyms.
3

participants under nontradable and tradable permits as follows:
Users: Individuals who positively value personal use of the resource (willingness to pay
(WTP) > 0).
Nonusers: Individuals who receive no value from personal use of the resource (WTP = 0).
Buyers: People who would buy a tradable permit at an equilibrium market price if they
had not won a permit in the initial lottery.
Sellers: People who would sell their permit at the market price if they were to win a permit.
Based on these definitions, sellers is a group potentially comprised of users and nonusers.
User/sellers have positive but relatively low willingness to pay (WTP) for a permit. Nonuser/
sellers place no practical value on using a permit, and would not apply to a lottery except to
sell the permit for a profit if trading were allowed. The distinction between user/seller and
nonuser/seller becomes important in our discussion of welfare distribution across interest
groups and its relation to lottery design. Buyers are always users, and nonusers who enter
the lottery are always sellers.2 We consistently and specifically use these definitions anytime
we refer to users, nonusers, sellers or buyers.
The distribution of consumers across these groups is central to our hypotheses about
observed lottery design. The aggregate demand for the rights to use the resource (net of
the non-permit costs) is equivalent to the demand for permits, and is the foundation for the
entire analysis that follows.
2.1. The value of a permit
We use specifics of the Four Rivers Lottery for whitewater rafting permits to focus and
illustrate our model and results. The U.S. Forest Service (USFS) uses this lottery to dis-
tribute rafting permits for portions of the Selway River, Snake River, Main Fork of the
Salmon River, and Middle Fork of the Salmon (“Middle Fork”) during the summer (Martin,
2Despite this bit of redundancy, we will use the full terms user/buyer and nonuser/seller for clarity and
consistency.
4

1987; Michalson, 1977). The USFS ostensibly limits use to reduce congestion on limited
camping beaches and the river corridor in general, and to reduce pressure on wildlife habitat
and other management objectives (USFS, 2008b).
Rafting permits won in the lottery are nontransferrable. Permit winners from the Four
Rivers Lottery do not have the right to sell their permits, and USFS park rangers verify
that the permit winner accompanies each rafting group at river launch sites USFS (2008b).
If permit transfer were allowed, a secondary market for these permits would likely exist
because the market value of these permits would be quite high. Almost ten thousand people
applied for a noncommercial permit to float the Middle Fork in 2010, and under four percent
of applicants won permits USFS (2008a). Four commercial launches are allowed per day,
and commercial guide companies charge between $1,500 and $2,000 per person for a six-day
raft trip. This fee covers food and services provided by commercial outfits, but undoubtedly
embodies substantial scarcity rents as well.
An individual can submit one application to the lottery per river per year during the
application period (usually December through January) for the upcoming summer rafting
season. The application form requires the applicant to rank the top four preferred river and
date combinations. The USFS awards permits from the pool of applicants on a day-by-day
basis. For any given river/day, a name is drawn from the pool of names for which that
river/day was listed as their first choice. Only if there are more permits than first choices
submitted for a given river/day will the drawing move to that pool of applicants who listed
that day as a second choice. There are fewer permits than applicants in the first-choice pool
for almost all river/days, so the second-choice pool is of almost no practical relevance. We
therefore assume that each applicant applies for one river/day per year.
Private (noncommercial) lottery applicants pay a $6 non-refundable application fee, and
permit winners (and their groups) pay $4 per boater for launching (USFS, 2007). Scrogin
(2009) compares the welfare results from lotteries with nontradable permits and two types
of payment schemes, an “all pay” format in which all applicants pay an application fee to
enter the lottery, and a “user pay” format, in which only winners pay. In light of the Four
Rivers Lottery fee structure, we examine the case in which application fees and permit fees
for winners are both imposed, and examine the welfare implications of adjusting these two
5

instruments for both transferable and non-transferable lottery regimes.
Consider the demand for a permit for one river-date combination.3 Since each individual
can only enter the lottery once, the demand for permits on that river and date is based on
each individual’s value for one rafting trip net trip costs (Boyce, 1994; Scrogin et al., 2000).
Aggregate demand for a given river/day is the value of permits ranked from the individual
with the highest WTP to the individual with the lowest WTP. We assume this aggregate
demand for permits has the following linear structure:
v(q) = α− βq − γq̄ +η
q̄M, (1)
where
M = s ·G,
G = fa · qa + fp · q̄.
The variable q is the rank of an individual in terms of WTP ( q = 1⇒ highest WTP), q̄ ≥ 0
is the number of permits to be awarded, M is river maintenance expenditures, s is the share
of lottery revenue spent on river maintenance, G is total lottery revenue, qa is the number
of applicants, fa is the application fee, and fp is the permit fee. The parameter β represents
the marginal difference in WTP between ranked individuals, and accounts for differences in
preferences, travel costs, and budget constraints across individuals. Although rafters differ
in their WTP, we assume that all individuals equally dislike congestion, and equally value
maintenance. The parameters α, β, γ, and η are non-negative.
As the number of permits increases, the number of boats and people increases. The term
γq̄ accounts for congestion on the river. We assume congestion negatively affects a person’s
value of rafting because more rafters cause crowding of the launch site, river, and campsites,
so γ > 0.
We assume river maintenance, M , increases a user’s value for rafting, and may increase
the pool of users.4 Maintenance depends on the share of government revenue spent on
3River days are substitutes for each other and therefore characteristics and permit availability for one
river day of affect demand for permits on other river days. We abstract from this complication by focusing
on only one river day. The availability of substitutes nonetheless is implicit in the demand structure.4Boyce (1994) assumes that the fees collected from a lottery are rebated to the population. To be
6

improvements, s · G, where the share is set to at least keep a balanced budget, 0 ≤ s ≤ 1.
Lottery revenue G is comprised of application fees, fa, collected from all applicants, qa, and
permit fees, fp, paid only by permit winners, q̄. Maintenance can come in the form of non-
rivalrous services (e.g. up-to-date river condition information or road maintenance to river
access points), or rivalrous services such as personal attention by managment personnel at
the launch site. The term ηq̄
is the marginal value of maintenance to an individual. The
denominator allows for rivalry in maintenance benefits, but the magnitude of the numerator
can be interpreted to reflect non-rivalrous benefits of maintenance.
Resource users place a positive value on the resource, and are therefore defined as q > q0,
where q0 is that user who is just indifferent to rafting:
q0 = {q|v(qa(fa, fp, q̄, s)) = 0}
=1
β
(α− γq̄ +
ηs
q̄(faqa + fpq̄)
).
All else constant, maintenance expenditures increase with the number of applicants, so the
number of users increases as the number of applicants increase (∂q0/∂qa = (ηsfa)/(βq̄) > 0).
This is important as the endogenous nature of the number of applicants and maintenance
expenditures causes the number of users to vary between lottery types.
Below we derive user surplus for three cases: a lottery with a permit transfer prohibition,
an open lottery where permit transfer is allowed, and a lottery for transferable permits that
excludes nonusers.
2.2. Lottery for nontradable permits
In a lottery setting, winners and losers are unknown ex ante. We therefore examine the
expected surplus rather than post-lottery actual surplus.5 No nonusers apply for nontradable
permits, and expected user surplus for nontradable permits is the sum over permit winners
consistent with our example of the Four Rivers Lottery and most other natural resource lotteries, we assume
that fees are only rebated back to the resource users in the form of resource maintenance.5This subsection provides results analogous to results presented in Boyce (1994) and Scrogin et al. (2000).
7

and applicants who don’t win a permit:
E[Sn] = [winner surplus] + [loser surplus]
= [E[v(q)|qna ]− (fp + fa)q̄]− [fa(qna − q̄)]
=
∫ qna
0
q̄
qnav(q)dq − q̄
(fp + fa
qnaq̄
), (2)
where qna is the equilibrium number of applicants given tradable permits, q̄/qna is the proba-
bility of winning a permit, and q̄(fp + fa
qnaq̄
)= q̄fp + qnafa are total fee expenditures.
To find the equilibrium number of applicants, consider an individual’s decision to apply
to the lottery. An individual will apply if her expected benefit is greater than her expected
cost of applying. The expected benefit from applying is the probability of winning times
her personal willingness to pay for a permit, q̄qnav(q), where the probability of winning is the
number of permits divided by the number of applicants. The individual’s expected cost of
applying is the sum of the application fee and the probability-weighted cost of a permit paid
by winners only: fa + q̄qnafp. Each applicant can enter the lottery only once, so the rank of
the marginal applicant equals the number of applicants for the restricted lottery, qna . For the
marginal applicant, the expected net benefit of applying equals zero:
v(qna ) = fp +qnaq̄fa, (3)
which implies that the value of a permit to the marginal applicant just equals the revenues
received by the agency per available permit. Substituting the right hand side of Equation 1
for v(q) and solving provides the number of applicants for the restricted lottery:
qna =q̄(α− γq̄ − fpψ)
βq̄ + faψ, (4)
where ψ = 1− η · s ≥ 0.6 We focus on the case of a binding permit quota such that qna > q̄,
where the equilibrium number of applicants is greater than the number of permits.
6The assumption that ψ = η · s ≤ 1 is not strictly necessary, but it eases interpretation and could be
justified as follows: The total contribution to v(q) associated with G through maintenance can be written
as ηsGq̄ , where Gq̄ is government expenditures per permit holder. If these dollars were given directly back
to permit holders instead of used for maintenance, the willingness to pay for this reimbursement would be
exactly 1 · Gq̄ . The assumption ψ = η · s ≤ 1 implies that a dollar spent on maintenance provides no more
than a dollar’s worth of benefit to a permit holder.
8

It is shown in the Appendix section Appendix A.1.1 that the number of applicants for the
restricted lottery, qna , is a subset of the number of users, qn0 , such that qna < qn0 . No nonusers
apply for this lottery because the buying and selling of permits is prohibited, and potential
users who value the resource but do not apply due to the fee structure, receive no rents from
the resource. The expected surplus for users for a lottery over nontradable permits is
E[Sn] =βq̄2(α− γq̄ − fpψ)
2(βq̄ + faψ)
=βq̄
2qna . (5)
The first line is derived by substituting the right hand side of v(q) from Equation 1 into
Equation 2, and the second line by substituting qna from Equation 4.
[Figure 1 about here.]
Figure 1 illustrates surplus for the three types of lotteries we examine. Subfigure 1a illustrates
user surplus for the nontradable lottery as area A, which is the difference between average
expected benefits and expected costs for each permit.7
This expected surplus can also be broken down into two groups that become important
in terms of surplus distribution in relation to lotteries with tradable permits examined in the
next subsection: (a) those users who would buy a permit if trade were allowed and they did
not win, and (b) those users who would sell if trade were allowed and they won a permit.
As discussed below, these two groups are determined by the number of permits, q̄:
E[Sn] = E[Sn|buy] + E[Sn|sell]
=
[∫ q̄
0
q̄
qna(v(q)− fp)− fadq
]+
[∫ qna
q̄
qna − q̄qna
(v(q)− fp)− fadq]. (6)
For a given number of permits and applicants, potential buyers expect to receive more
surplus per person than potential sellers because their personal valuation of the resource,
and therefore the value of a winning application, is higher.
7Boyce (1994) derives and illustrates the same surplus measure, but in a different form. Our representation
provides easier comparison for the types of lottery structures we examine here.
9
2.3. Nonexclusive lottery for tradable permits
We now consider a lottery open to anyone for permits that are tradable after initial
lottery allocation. Assume zero transaction and information costs (in both the lottery and
in the post-lottery market), and that anyone willing to buy a permit also participates in
the lottery and would have paid the application fee for a chance to win. For accounting
purposes, assume that a lottery winner pays the permit fee to acquire the right to use or sell
the permit. Therefore, a buyer pays the equilibrium permit price and the application fee,
but does not pay the permit fee directly to the permit winner.
There is one equilibrium market price for permits, v̄ = v(q̄), which is equal to the WTP
of the q̄th individual. There are q̄ potential buyers willing to bid up to this price for a permit,
and any winner with a valuation below this price will be better off selling. The expected
surplus is
E[St] =
∫ q̄
0
(v(q)− fp)dq − faqta, (7)
where qta is the number of applicants given tradable permits.8
With trade, the worst a winner can do is sell for price v(q̄), and the marginal applicant
breaks even in expected value terms: q̄qta· v(q̄) = fa + q̄
qtafp. This can be written as
v(q̄) =qtaq̄fa + fp, (8)
which means that the equilibrium market price equals the per-permit fee revenues in equi-
librium, so total revenues equal the area v̄ · q̄. Substituting parameters from Equation 1 and
rearranging provides
qta =q̄ (α− βq̄ − γq̄ − fpψ)
faψ. (9)
The number of applicants for tradable permits qta is always larger than qna , the number of
applicants given no trade (See Appendix section Appendix A.1.2). Further, for reasonable
specifications, qta > qt0, where qt0 is the number of users given tradable permits. That is
to say, there are more applicants than people who value personal use of the resource given
8Although initial lottery allocation is random, the aggregate post-trade surplus is actually known with
certainty when trade is allowed. However, we maintain the “expected surplus” terminology for consistency
across lottery regimes.
10

equilibrium maintenance expenditures (see Appendix section Appendix A.1.3). This implies
some nonusers apply to the lottery.9
Substituting Equation 9 into Equation 7, integrating, and simplifying shows that total
user surplus simplifies to
E[St] =βq̄
2q̄, for q̄ ≤ qt0. (10)
This area is illustrated as area B in Figure 1b.10 The zero profit condition for sellers implies
that all of the expected net profits due to the difference in permit price and application fees
is zero. See Appendix section Appendix A.2.1 for a more detailed breakdown of surplus.
2.4. Exclusive lottery for tradable permits
We now consider the case in which a mechanism is assumed to exists that allows easy
exclusion of nonusers from lottery eligibility. To implement this exclusion, suppose that only
users, who in equilibrium place a positive value on the resource are eligible. Total welfare
accruing to users is∫ q̄
0v(q)− fp dq − faqea, which can be written as∫ q̄
0
v(q) dq − q̄(fp +
qeaq̄fa
). (11)
The applicant pool, qea, is defined to be equal to the user pool, qe0. Solving Equation 1
for v(q0) = 0 with the equality qea = qe0 imposed provides
qea =q̄(α− q̄γ + fpsη)
q̄β − fasη= qe0. (12)
Although the number of users changes with the number applicants because of the mainte-
nance feedback, this particular definition of users will be useful for later comparisons.
Substituting equation 12 into equation 11 provides a surplus measure for the exclusive
lottery with tradable permits. We show in Appendix section Appendix A.2.2 that this surplus
can be written as
E[Se] = 2E[Sn] + E[St]− faψ (qea − qna ) . (13)
9The number of users given no trade, qn0 , is generally less than the number of users given trade, qt0, because
the increased number of applications when trade is allowed increases the expenditures on maintenance, which
in turn increases the number of users, q0.10For q̄ ≥ qt0, the lottery is non-binding, and total surplus would thereafter be (β/2)q̄qt0.
11

Figure 1c illustrates the surplus for excludable/tradable lottery as area (B+C).11
3. Comparisons across lottery types
The application fee, permit fee, number of permits, and share of revenue spent on quality
improvements are exogenous policy instruments set prior to the lottery. In this section,
we examine how surplus received by interest groups is affected by changes in the policy
instruments under tradable and nontradable permit regimes. There are three groups of
particular interest: users as a whole, potential buyers (q ≤ q̄), who are the subset of users
who place the highest value on the resource, and potential sellers (q̄ < q ≤ qa). The
two subgroups differ in the expected surplus across lottery types, and therefore may have
different preferences for lottery structure. We examine differences in the outcomes of the
lottery types including the number of applicants, the number of users, the win rates and
welfare implications.
Although a limited set of unambiguous results follow from the model presented in the
previous section, a more complete set of implications can be examined with simulations. To
do so, we utilize the base-case parameters given in Table 1, and alter policy parameters for
examination:
[Table 1 about here.]
This parameterization is designed to approximate some key statistics for the lottery
structure applied to the Middle Fork of the Salmon river. The average application success
rate for the Middle Fork is usually about 4 percent, though this has a high variance depending
on the day of the season (the most popular dates are the weeks around the beginning of July).
For our base case the success rate is 4.3 percent. The application fee is $6. The permit fee
is $4 per person/per day, so we set the total permit fee paid by the ultimate permit user
to be $20.12 The standard number of permits issued per day on the Middle Fork of the
11We show in Appendix section Appendix A.1.4 that qea > qna .12Note that the $4 permit fee is paid for each member of the rafting group. We assume that each of them
pays their own permit fees, and that every applicant makes their application decision independently of other
potential members of their group.
12

Salmon in 2010 was 4. As mentioned earlier, commercial guides charge up to $2,000 per
person for a Middle Fork raft trip. These include services such as meals, logistics, and guide
expertise that are provided by private groups themselves. The intercept value of α = 1000
is meant to represent an approximate choke price for private willingness to pay. The other
parameters are approximations that provide reasonable results consistent with the limited
metadata available for specification.
[Table 2 about here.]
Results for the base case are presented in Table 2. We will begin with a discussion of win
rates, and follow with a discussion of user surplus.
3.1. Win rates across lottery types
The win rate is the number of permits divided by the number of applicants. As shown in
Table 2, there are four to five times the number of applicants for the nonexclusive lottery for
tradable permits than for the other two lottery types, and the win rate under this lottery type
is smallest accordingly. The table also shows that there are over three times the number of
applicants (464) for the nonexclusive lottery than there are users (147). Nonusers represent
almost 70% of applicants, and when these applicants win, they keep a substantial surplus in
the form of a permit sale price.
The win rate for all the lotteries increases with the number of permits as seen in Figure
2.a. The win rate for the nontradable lottery is always higher than the others. Increasing
the application fee or the permit fee in Figures 2.b and 2.c increases the win rate for the non-
tradable and tradable lotteries as the number of applications goes down. The nonexclusive
tradable permit lottery is everywhere below the nontradable lottery win rates as implied by
the general analytical finding that qna < qta.
[Figure 2 about here.]
The number of applicants increases in the exclusive lottery for tradable permits because
of the increase in willingness to pay due to maintenance, which reduces the win rate. Note
that the permit fee, which is currently set at $4/person/day, could increase substantially
with relatively limited impact on win rates for nontradable permits.
13

3.2. User surplus comparisons
Table 2 also provides the base case expected surplus measures for all users and each
lottery structure. User surplus is almost 25 times larger for nontradable permits than the
nonexclusive tradable permits. The losses due to the trade prohibition for nontradable
permits are far outweighed by the losses to users from nonusers applying, winning, and
selling permits to user/buyers.
In contrast, the surplus received by users under exclusive tradable permits are about 1.8
times larger than the surplus for nontradable permits. This difference stems from several
sources. First and foremost are the gains from trade that allow permits to be used by those
that value them most highly (see Figure 1 again for reference). Second, there are fewer
applicants for nontradable permits, so the average expected cost per application (including
the permit fee) is higher. The number of users is smaller (qn0 < qe0) because there are less
maintenance funds, and this reduces the aggregate user willingness to pay.
The user surplus from exclusive tradable permits is over 40 times that from nonexclusive
tradable permits. The surplus losses due to the acquisition and sale by nonusers dominates
any surplus received by users from the much higher application revenues supporting main-
tenance. Note also that users who would sell their permits (q̄ < q < qe0 < qt0) receive no
surplus under an unrestricted lottery, because nonusers enter until the expected net benefits
of applying exactly equal the costs of applying. For the exclusive tradable permits however,
sellers are better off because they have a higher probability of winning, and therefore a higher
expected return from winning and selling a permit.
Figure 3 provides several other perspectives on these differences in surplus. First consider
the effects of application and permit fees, shown in Figures 3a and 3b. In both cases, surplus
from exclusive tradable permits is initially higher than surplus from nontradable permits,
but at higher fee levels nontradable permits are better. Nonexcludable permits are poor
performers throughout.
[Figure 3 about here.]
Figure 3c compares expected surplus for all three lottery regimes for a range of q̄. For the
most part, surplus is highest for the exclusive tradable permits, intermediate for nontradable
14
permits, and lowest for the nonexclusive tradable permits.13
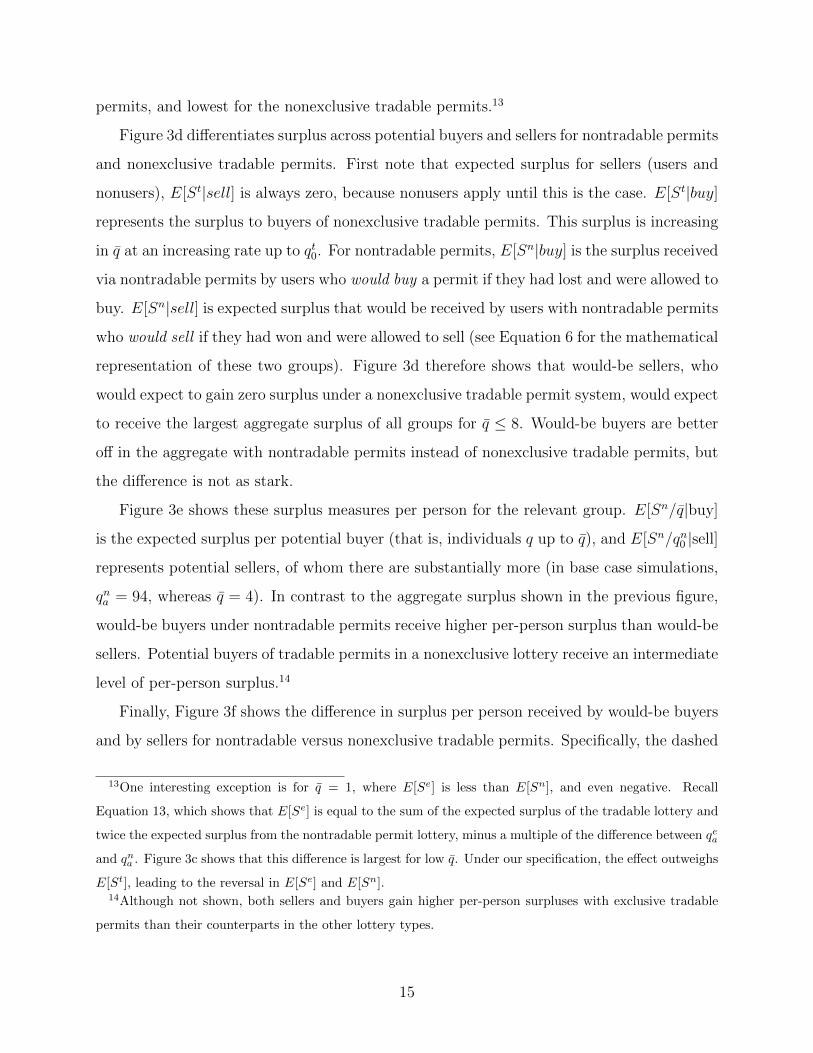
Figure 3d differentiates surplus across potential buyers and sellers for nontradable permits
and nonexclusive tradable permits. First note that expected surplus for sellers (users and
nonusers), E[St|sell] is always zero, because nonusers apply until this is the case. E[St|buy]
represents the surplus to buyers of nonexclusive tradable permits. This surplus is increasing
in q̄ at an increasing rate up to qt0. For nontradable permits, E[Sn|buy] is the surplus received
via nontradable permits by users who would buy a permit if they had lost and were allowed to
buy. E[Sn|sell] is expected surplus that would be received by users with nontradable permits
who would sell if they had won and were allowed to sell (see Equation 6 for the mathematical
representation of these two groups). Figure 3d therefore shows that would-be sellers, who
would expect to gain zero surplus under a nonexclusive tradable permit system, would expect
to receive the largest aggregate surplus of all groups for q̄ ≤ 8. Would-be buyers are better
off in the aggregate with nontradable permits instead of nonexclusive tradable permits, but
the difference is not as stark.
Figure 3e shows these surplus measures per person for the relevant group. E[Sn/q̄|buy]
is the expected surplus per potential buyer (that is, individuals q up to q̄), and E[Sn/qn0 |sell]
represents potential sellers, of whom there are substantially more (in base case simulations,
qna = 94, whereas q̄ = 4). In contrast to the aggregate surplus shown in the previous figure,
would-be buyers under nontradable permits receive higher per-person surplus than would-be
sellers. Potential buyers of tradable permits in a nonexclusive lottery receive an intermediate
level of per-person surplus.14
Finally, Figure 3f shows the difference in surplus per person received by would-be buyers
and by sellers for nontradable versus nonexclusive tradable permits. Specifically, the dashed
13One interesting exception is for q̄ = 1, where E[Se] is less than E[Sn], and even negative. Recall
Equation 13, which shows that E[Se] is equal to the sum of the expected surplus of the tradable lottery and
twice the expected surplus from the nontradable permit lottery, minus a multiple of the difference between qea
and qna . Figure 3c shows that this difference is largest for low q̄. Under our specification, the effect outweighs
E[St], leading to the reversal in E[Se] and E[Sn].14Although not shown, both sellers and buyers gain higher per-person surpluses with exclusive tradable
permits than their counterparts in the other lottery types.
15

line labeled “Potential sellers” represents E[Sn/qn0 |q̄ < q ≤ qn0 ] − E[St/qt0|q̄ < q ≤ qt0], and
the solid line labeled “Potential buyers” is E[Sn/qn0 |q ≤ q̄] − E[St/qt0|q ≤ q̄]. This figure
shows that both potential buyers and potential sellers do better with nontradable permits,
but sellers will gain more over what they expect to receive for nonexclusive tradable permits,
which is zero on average.
In summary, users who place a relatively lower (but positive) value on personal use of the
resource likely stand to gain the most, per person and in the aggregate, from maintaining a
nontradable permit system instead of a nonexclusive lottery. They have a strong incentive
to lobby for and maintain such a system. Further, for all but q̄ = 1, potential buyers and
sellers are both better off in the aggregate under excludable tradable permits compared to
nontradable permits (and nonexclusive tradable permits), but again sellers receive the most
surplus under an excludable lottery with tradable permits.15 For sellers in particular, non-
tradable permits are much better than nonexclusive tradable permits, but exclusive lottery
with tradable permits would be better for users if an effective and low cost mechanism for
excluding nonusers were available.
4. User identification and tradable permits
Exclusion of nonusers is often difficult. Nonusers have no incentive to disclose the fact
that they place no value on personal use, and nonuser self-selection out of a lottery for
tradable permits with an unenforced exclusion policy is not likely when rents are to be had
from market participation. However, there are circumstances in which users and nonusers
can be distinguished via incentive compatible revelation of preferences. Boyce (1994) notes
the ability to informally trade moose hunting permits in Maine. More recently, the Moose
Permit Swap has become formalized through an internet website and monitored by the
Department of Inland Fisheries and Wildlife (DIFW). Swapping of permits can only occur
between winners, and the DIFW must be notified of the swap 5 days before the season starts.
15The expected surplus for exclusive tradable permits is not illustrated with an additional figure, but it
looks essentially the same as the E[Sn|buy] and E[Sn|sell] functions in Figure 3d, but larger in magnitude
for both potential buyers and sellers.
16
In the 2009 season, 3,015 permits were allocated and 334 swaps occurred. Allowing permit
trading among winners potentially increases the surplus, because only mutually beneficial
trades occur. However, non-hunters are unable to extract rents as effectively, because they
cannot sell a permit outright.16
From 2000 through 2007, Kansas resident landowners could apply for a transferable
permit to hunt whitetail deer (Taylor and Marsh, 2003). In this case, landowners were
an interest group that provided wildlife habitat, and therefore had both the capacity to
contribute to the welfare and management of wildlife and had a stake in its management
(Lueck and Yoder, 1997). Additionally, landowners were an easily identifiable group, and all
permit transfers were monitored by the Kansas Department of Wildlife and Parks (KDWP).
Implementing a landowner requirement presumably decreased speculation and lottery entry
by nonusers and allowed landowners to capture rents from the resale of permits. Interestingly,
however, KDWP eliminated the transferable permit system in 2008 stating that it had
become “burdensome and confusing to both landowners and hunters.”
Up until 2005, wild turkey permits in Maine were allocated through a lottery.footnoteAfter
2005, the number of permits exceeded the number of applicants, making the lottery unnec-
essary. Hunters could transfer their wild turkey permits to junior hunters or hunters over
65 years old, but the permit holder and transferee must all possess a valid big game hunting
license. If turkey hunters are also more likely to participate in big game hunting than people
with no interest in turkey hunting, these nonusers would bear a higher net cost of holding
a big game license. This additional cost, plus the low value of a turkey permit relative
to other large game would likely limit the potential profits from the sale by nonusers of
lottery-allocated turkey permits.
16Note that in principle an individual could provide or accept a side payment for the difference in the
value of two permits being swapped. However, even in this case the value of the least valuable permit would
be lost.
17

5. Conclusion
Lotteries are often implemented to distribute the rights to use publicly held resources,
and prohibitions on the trading of these rights are common. We demonstrate that user
groups who value personal use of the resource face a welfare tradeoff inherent in restriction.
In a system that allows post-lottery permit trade, users with a high willingness to pay may
purchase the right to access the resource from a lottery winner in a mutually beneficial
transaction, thereby increasing welfare. However, nonusers have an incentive to enter the
lottery solely to sell a permit if the benefits of doing so justify the costs. When users buy
from nonusers, the surplus from the sale of the permit is lost from the perspective of the
user group.
We show that users as a whole prefer the prohibition of post-lottery trade when nonusers
are not excludable from the lottery. We also show, interestingly, that low-value users — those
who would sell a permit if trade were allowed — stand to gain the most from restricting
trade. We also show that users would prefer the ability to transfer rights among themselves
if nonusers can be prohibited from entering the lottery. The ability to identify members of
the user group becomes vitally important in order to prohibit nonusers from entering the
lottery. Mechanisms that can be used to distinguish users from nonusers can increase the
surplus of the user interest group, and allow this type of limited transferable lottery to exist.
We provide some examples of this type of limited transfer, when even limited but systematic
and low cost identification is possible.
Users represent the group who stand to gain the highest concentration of rents from the
use of the resource, and so have a relatively strong incentive to exert effort to affect the
design of a lottery system. Martin (1987) evaluates several alternative lottery structures
for the four river sections now operated under the Four Rivers Lottery. Not surprisingly,
the documented discussion and analysis of the Four Rivers Lottery design by policymakers
revolves entirely around the resource users. There is basically no recognition that nonusers
might have some interest in the design of such lotteries. Public comment opportunities on
potential lottery designs were targeted exclusively toward prior permit applicants for the
various predecessors of the Four Rivers Lottery (Martin, 1987).
River management agencies clearly pay attention to users in particular. Users are also
18

likely to be motivated to provide input about their preferences. As an example of active
interest group activity, American Whitewater (AW) (http://americanwhitewater.org/) is
a nonprofit organization representing whitewater enthusiasts, including individuals and over
100 local paddling clubs across the U.S. Among other content, AW’s website includes news on
river access, dam development, hydroelectric dam water release information, water quality,
and other issues of interest to boaters. It also includes a “River Stewardship toolkit” that
provides guidance for how to effectively contact and influence public representatives. Further,
the AW staff writes position papers and provides public testimony, and also organizes river
cleanups and other events, among other things. Beyond organized influence, however, the
very act of using the resource and interacting directly with managers themselves is likely
to lower the costs of conveying preferences and exerting influence on resource management.
Thus, individual river users are likely to be in a better position to influence river management
than any other group.
In the Four River’s Lottery, users would likely prefer an exclusive lottery with tradable
permits, but no mechanism currently exists to identify and exclude nonusers from entering
the lottery. Policies such as requiring lottery applicants to demonstrate a knowledge of
rafting, ownership of rafting equipments, or past rafting experience, may help to identify
users, but the effectiveness of such policies is questionable. One potential welfare-enhancing
option would be to allow in-kind permit trading among winners only as was previously done
for moose hunting permits in Maine, as discussed above. However, the gains from trade in
these cases would stem from post-lottery changes in circumstances among winners that lead
to different preferences over the timing or river for a rafting trip, and as such, our model
does not directly address this situation. Such a system would introduce the possibility for
side-payments in trade. Side payments would tend to be lower because giving up the initial
permit would in most cases represent an opportunity cost to the initial winner.
19
6. References
Boyce, J., 1994. Allocation of goods by lottery. Economic Inquiry 32 (3), 457–476.
Chouinard, H., Yoder, J., 2004. The political economy of river rats and idaho’s four rivers
whitewater rafting lottery. Western Economics Forum April, 17–24.
Loomis, J., 1980. Monetizing benefits under alternative river recreation use allocation sys-
tems. Water Resources Research 16 (1), 28–32.
Loomis, J., 1982. Effect of non-price rationing on benefit estimates from publicly provided
recreation. Journal of Environmental Management 14, 283–289.
Lueck, D., Yoder, J., 1997. Federalism and wildlife conservation in the west. Environmental
federalism, 89–131.
Martin, R. H., June 1987. Centralized river reservation system. Master’s thesis, Clemson.
Michalson, E., 1977. An attempt to quantify the esthetics of wild and scenic rivers in Idaho.
Proceedings: River Recreation Management and Research Symposium.
Oi, W., 1967. The economic cost of the draft. The American Economic Review 57 (2), 39–62.
Peltzman, S., 1976. Toward a more general theory of regulation. Journal of law and economics
19 (2), 211–240.
Scrogin, D., 2009. Underpricing in public lotteries: a critique of user-pay and all-pay tariffs.
Economic Inquiry 47 (3), 500–511.
Scrogin, D., Berrens, R., Bohara, A., 2000. Policy Changes and the Demand for Lottery-
Rationed Big Game Hunting Licenses. Journal of Agricultural and Resource Economics
25 (2), 501–519.
Stigler, G., 1971. The theory of economic regulation. The Bell journal of economics and
management science 2 (1), 3–21.
Taylor, J., Marsh, T., 2003. Valuing Characteristics of Transferable Deer Hunting Permits in
Kansas. In: Western Agricultural Economics Association Annual Meetings, Denver CO.
20
USFS, 2007. Four Rivers Lottery System Float Reservation Application Information. United
States Forest Service http://www.fs.fed.us/r4/sc/recreation/4rivers/info letter 06.pdf, ac-
cessed: August 14, 2007.
USFS, 2008a. Four Rivers Lottery Application Statistics. United States Forest
Service http://www.fs.fed.us/r4/sc/recreation/4rivers/2007 app statistics05-07.doc, ac-
cessed: January 26, 2008.
USFS, 2008b. Mission, Motto, Vision, and Guiding Principles. United States Forest Service
http://www.fs.fed.us/aboutus/mission.shtml, accessed: February 2, 2008.
21
Appendix A.
This appendix provides derivations of several results referred to in the text.
Appendix A.1. Comparisons of Number of Applicants
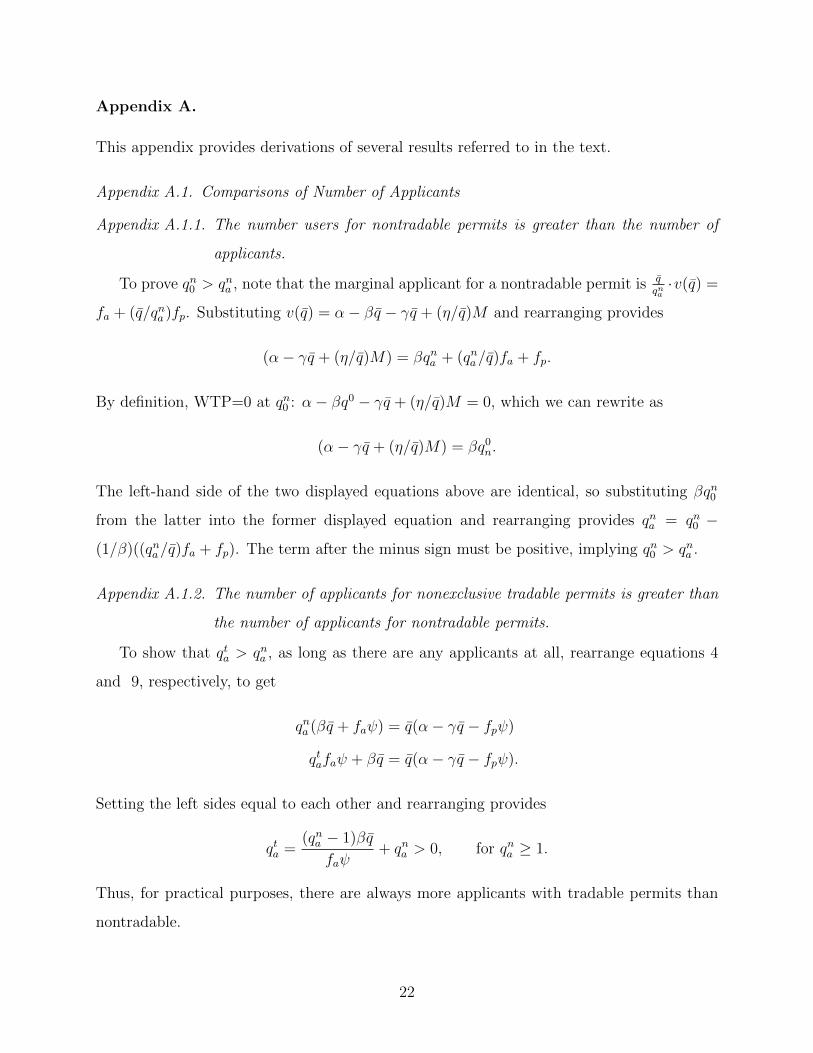
Appendix A.1.1. The number users for nontradable permits is greater than the number of
applicants.
To prove qn0 > qna , note that the marginal applicant for a nontradable permit is q̄qna·v(q̄) =
fa + (q̄/qna )fp. Substituting v(q̄) = α− βq̄ − γq̄ + (η/q̄)M and rearranging provides
(α− γq̄ + (η/q̄)M) = βqna + (qna/q̄)fa + fp.
By definition, WTP=0 at qn0 : α− βq0 − γq̄ + (η/q̄)M = 0, which we can rewrite as
(α− γq̄ + (η/q̄)M) = βq0n.
The left-hand side of the two displayed equations above are identical, so substituting βqn0
from the latter into the former displayed equation and rearranging provides qna = qn0 −
(1/β)((qna/q̄)fa + fp). The term after the minus sign must be positive, implying qn0 > qna .
Appendix A.1.2. The number of applicants for nonexclusive tradable permits is greater than
the number of applicants for nontradable permits.
To show that qta > qna , as long as there are any applicants at all, rearrange equations 4
and 9, respectively, to get
qna (βq̄ + faψ) = q̄(α− γq̄ − fpψ)
qtafaψ + βq̄ = q̄(α− γq̄ − fpψ).
Setting the left sides equal to each other and rearranging provides
qta =(qna − 1)βq̄
faψ+ qna > 0, for qna ≥ 1.
Thus, for practical purposes, there are always more applicants with tradable permits than
nontradable.
22

Appendix A.1.3. The number of users compared to the number of applicants for tradable
permits.
For qt0 ≷ qta, consider the marginal applicant’s decision condition q̄qta· v(q̄) = fa + q̄
qtafp.
Manipulation and providesq̄
fa
(β(qt0 − q̄)− fp
)= qta.
So the relationship between qt0 and is qta ambiguous. However, For our simulations, qta is
larger than qt0 for reasonable ranges of the policy parameters, as illustrated in Figures 4:
[Figure 4 about here.]
In fact, a comparison with Figures 4a through 4c show that qta is larger than qt0 for
approximately the entire positive surplus space for exclusive tradable lotteries.
Appendix A.1.4. The number of applicants for exclusive tradable permits is greater than the
number of applicants for nontradable permits.
Equation 12 representing qea can be rewritten as
qea =[q̄(α− q̄γ + fpψ]− q̄fp
[βq̄ + faψ]− fa.
A comparison to qna in equation 4 shows that the contents of the brackets in the numerator and
denominator are the numerator and denominator of qna , respectively. Thus, the numerator
of qea is bigger than that of qna and the denominator is smaller, implying qea > qna .
Appendix A.2. User Surplus
Appendix A.2.1. Surplus for nonexclusive tradable permits
For nonexclusive, tradable permits, total surplus can be broken down into six categories:
E[St] = [winning buyers] + [losing buyers]
+ [winning user/sellers] + [losing user/sellers]
+ [winning nonusers] + [losing nonusers].
23

Letting π = q̄/qta equal the probability of winning, and maintaining brackets above,
E[St] =
[π
∫ q̄
0
v(q)− fp − fadq]
+
[(1− π)
∫ q̄
0
v(q)− v̄ − fadq]
+[π(qt0 − q̄)(v̄ − fp − fa)
]+[(1− π)(qt0 − q̄)(−fa)
]+[π(qta − qt0)(v̄ − fp − fa)
]+[(1− π)(qta − qt0)(−fa)
].
This can also be simplified to
E[St] = [user buyers] + [user/sellers] + [nonusers]
=
[∫ q̄
0
v(q)dq − q̄(πfp + (1− π)v̄ − fa)]
+[(qt0 − q̄)(π(v̄ − fp)− fa)
]+[(qta − qt0)(π(v̄ − fp)− fa)
].
Appendix A.2.2. Surplus for exclusive tradable permits
Without substituting the parameterized version of qea, which, after some minor manipu-
lation provides
E[Se] = −(1/2)(β + 2γ)q̄2 + αq̄ + fp(sη − 1)q̄ − faqea + faqeasη)
= (β/2)q̄2 + q̄(α− γq̄ − fpψ)− faqeaψ)
= (β/2)q̄2 + qnaβq̄ + (qnafaψ − faqeaψ)
= E[St] + 2E[Sn] + faψ(qna − qea).
24

Figure 1: User surplus for nontradable, tradable, and exclusive/tradable permit lotteries.
(a) User surplus for nontradablelottery
(b) User surplus for nonexclusivelottery with tradable permits
(c) User surplus for exclusivelottery with tradable permits
25

Figure 2: Win rates q̄/qa for nontradable (n), tradable (t), and exclusive tradable (e) permits.Base case parameters shown in Table 2.
(a) Win rates q̄/qa as a function ofq̄.
(b) Win rates q̄/qa as a function ofapplication fees.
(c) Win rates q̄/qa as a function ofpermit fees.
26

Figure 3: Simulated user surplus for nontradable, tradable, and exclusive/tradable permitlotteries. Base case parameters shown in Table 2.
(a) Surplus as a function of application fees. (b) Surplus as a function of permit fees.
(c) Surplus as a function of q̄. (d) Surplus by user group as a function of q̄. Forthe nontradable lottery, E[Sn|buy] is thesurplus of individuals who would buy if theycould. E[Sn|sell] is the surplus of individualswho would sell if they could.
(e) Surplus per user by user group as a functionof q̄. For the nontradable lottery,E[Sn/q̄|buy] is the surplus of individuals whowould buy if they could. E[Sn/qn0 |sell] is thesurplus of individuals who would sell if theycould.
(f) Difference in per person surplus received bywould-be buyers and sellers for nontradableversus nonexclusive tradable permits, as afunction of q̄.
27
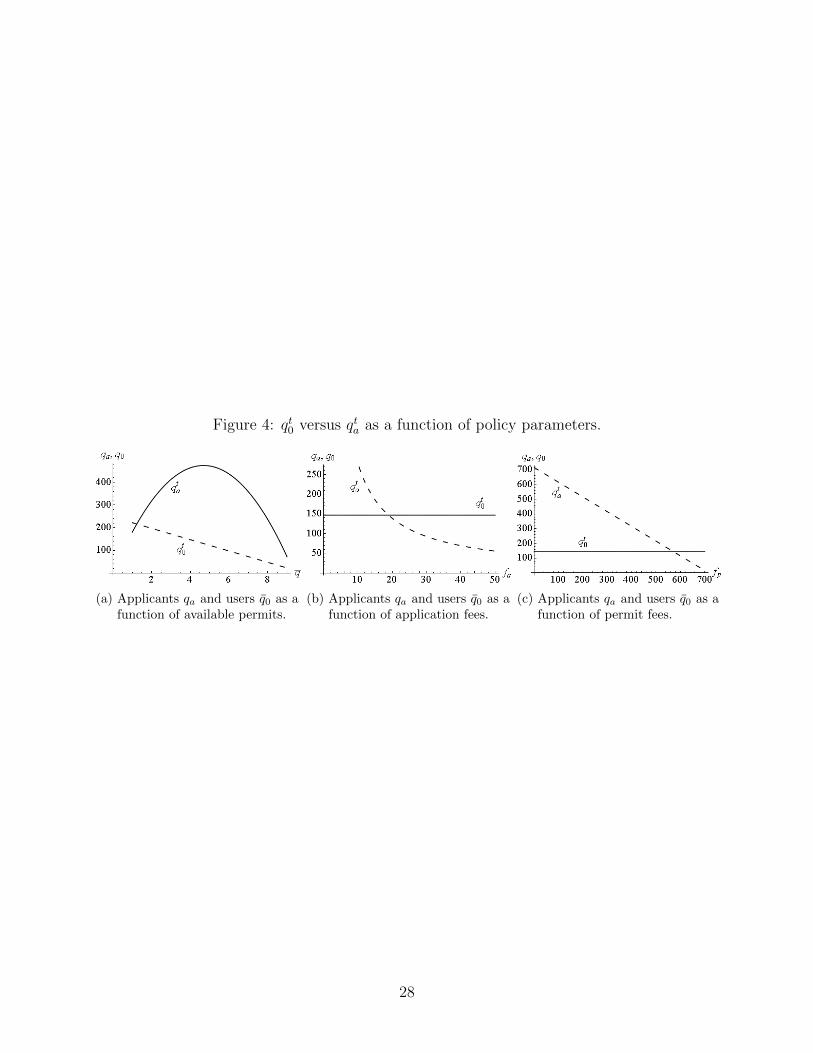
Figure 4: qt0 versus qta as a function of policy parameters.
(a) Applicants qa and users q̄0 as afunction of available permits.
(b) Applicants qa and users q̄0 as afunction of application fees.
(c) Applicants qa and users q̄0 as afunction of permit fees.
28

Table 1: Simulation parameters.
Parameter α β γ η s q̄ fa fp
Value 1000 5 100 0.2 0.95 4 6 20
29
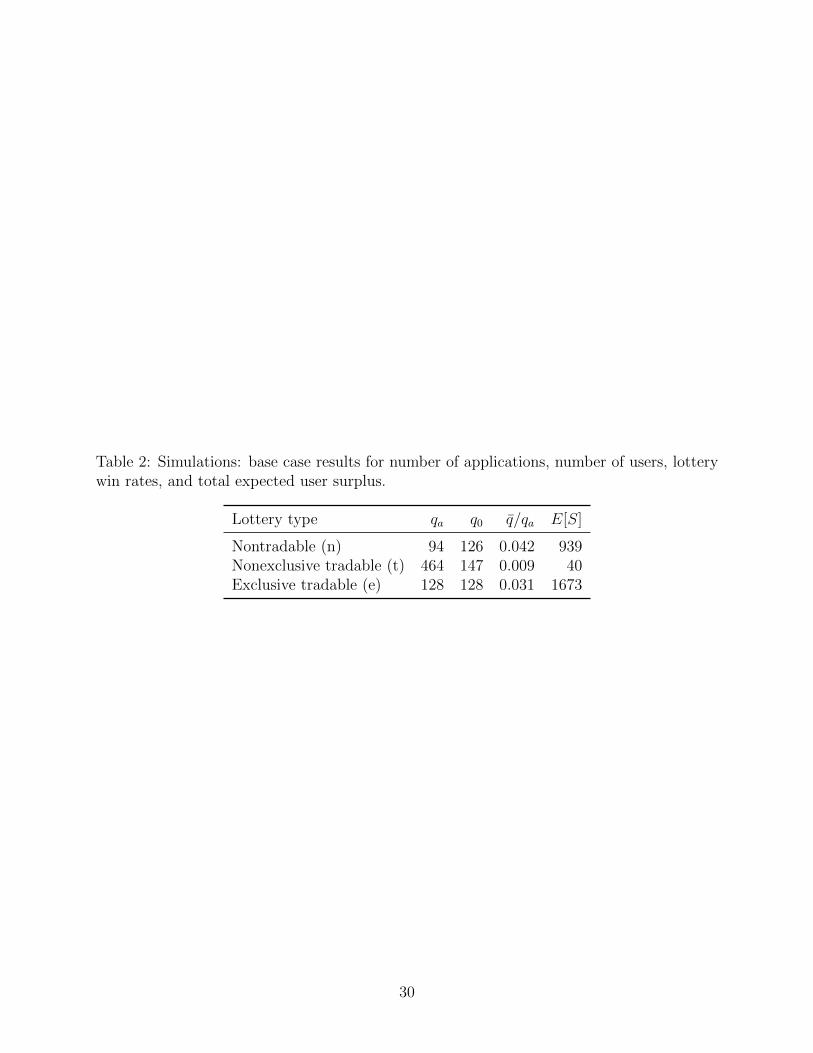
Table 2: Simulations: base case results for number of applications, number of users, lotterywin rates, and total expected user surplus.
Lottery type qa q0 q̄/qa E[S]
Nontradable (n) 94 126 0.042 939Nonexclusive tradable (t) 464 147 0.009 40Exclusive tradable (e) 128 128 0.031 1673
30
Copyright © 2022 FDOKUMEN