Intelligence and the brain: A model-based approach
9
Intelligence and the brain: A model-based approach Rogier A. Kievit 1 , Hilko van Rooijen 1 , Jelte M. Wicherts 1 , Lourens J. Waldorp 1 , Kees-Jan Kan 2 , H. Steven Scholte 1 , and Denny Borsboom 1 1 Department of Psychology, University of Amsterdam, Amsterdam, The Netherlands 2 Department of Biological Psychology, Free University, Amsterdam, The Netherlands Various biological correlates of general intelligence (g) have been reported. Despite this, however, the relationship between neurological measurements and g is not fully clear. We use structural equation modeling to model the relationship between behavioral Wechsler Adult Intelligence Scale (WAIS) estimates of g and neurological measurements (voxel-based morphometry and diffusion tensor imaging of eight regions of interest). We discuss psychometric models that explicate the relationship between g and the brain in a manner in line with the scientific study of g. Fitting the proposed models to the data, we find that a MIMIC model (for multiple indicators, multiple causes), where the contributions of different brain regions to a unidimensional g are estimated separately, provides the best fit against the data. Keywords: Intelligence; Cognitive neuroscience; g; Structural equation modeling; Neuro g; Psychometrics. Although technological advances have expanded the possibilities for empirical research, the nature of the relationship between intelligence and the brain remains a contentious topic. This is partly an embarrassment of riches, as the list of properties that correlate with gen- eral intelligence is daunting. Research has shown that gray matter density, white matter integrity, skull volume, cortical thickness, uric acid levels, height, lower amplitude in the averaged evoked potential (a measure derived from the EEG signal), increased and decreased neural activity, functional efficiency, and nerve conduction velocity are associated with g (Deary, Penke, & Johnson, 2010; Jensen, 1998; Jung & Haier, 2007; and references therein). In this paper, we aim to structure these findings by proposing a new modeling framework for studying the relationship between behavioral measurements of general intelli- gence and neurological measurements of the brain. The interpretation of the term “intelligence” is itself the topic of several long-standing debates (Mackintosh, 1998). For purposes of clarity, we focus on the interpretation of intelligence that is statistically most clearly defined, namely as the general factor of intelligence (also known as “g”). We consider g to represent a common source of variance in general cognitive ability. Studying the brain in relation to g, some researchers have coined the phrase “neuro g” (Haier et al., 2009). This suggests a strong thesis, namely that there is some fundamental biological sub- strate that acts as a common cause of individual varia- bility in performance on a wide variety of cognitive tests. From this point of view, we could consider the search for neuro g a quest for “[t]he substrate of human intelligence” (Luders, Narr, Thompson, & Toga, 2009, p. 156), undertaken “[t]o capture the essence of a neural basis of intelligence” (Jung & Haier, 2007, p. 178). The above suggests that the aim of neuroscien- tific research on intelligence is not just to find some (neurological) property that correlates with a common factor extracted from a battery of IQ-test scores, but rather showing g to be a physical property of the brain. Recent studies have extended the focus from single measures to integrating multiple lines of evidence. These approaches have combined structural and COGNITIVE NEUROSCIENCE, 2012, iFirst,1–9 Correspondence should be addressed to: Rogier A. Kievit, Department of Psychological Methods, University of Amsterdam, Roetersstraat 15, 1018WB Amsterdam, The Netherlands. E-mail: [email protected] © 2012 Psychology Press, an imprint of the Taylor & Francis Group, an Informa business www.psypress.com/cognitiveneuroscience http://dx.doi.org/10.1080/17588928.2011.628383 Downloaded by [University of Southampton Highfield] at 08:55 18 January 2012
Transcript of Intelligence and the brain: A model-based approach
Intelligence and the brain: A model-based approach
Rogier A. Kievit1, Hilko van Rooijen1, Jelte M. Wicherts1, Lourens J. Waldorp1,Kees-Jan Kan2, H. Steven Scholte1, and Denny Borsboom1
1Department of Psychology, University of Amsterdam, Amsterdam, The Netherlands2Department of Biological Psychology, Free University, Amsterdam, The Netherlands
Various biological correlates of general intelligence (g) have been reported. Despite this, however, the relationshipbetween neurological measurements and g is not fully clear. We use structural equation modeling to model therelationship between behavioral Wechsler Adult Intelligence Scale (WAIS) estimates of g and neurologicalmeasurements (voxel-based morphometry and diffusion tensor imaging of eight regions of interest). We discusspsychometric models that explicate the relationship between g and the brain in a manner in line with the scientificstudy of g. Fitting the proposed models to the data, we find that a MIMIC model (for multiple indicators, multiplecauses), where the contributions of different brain regions to a unidimensional g are estimated separately, providesthe best fit against the data.
Keywords: Intelligence; Cognitive neuroscience; g; Structural equation modeling; Neuro g; Psychometrics.
Although technological advances have expanded thepossibilities for empirical research, the nature of therelationship between intelligence and the brain remainsa contentious topic. This is partly an embarrassment ofriches, as the list of properties that correlate with gen-eral intelligence is daunting. Research has shown thatgray matter density, white matter integrity, skullvolume, cortical thickness, uric acid levels, height,lower amplitude in the averaged evoked potential (ameasure derived from the EEG signal), increased anddecreased neural activity, functional efficiency, andnerve conduction velocity are associated with g(Deary, Penke, & Johnson, 2010; Jensen, 1998; Jung& Haier, 2007; and references therein). In this paper,we aim to structure these findings by proposing a newmodeling framework for studying the relationshipbetween behavioral measurements of general intelli-gence and neurological measurements of the brain.
The interpretation of the term “intelligence” isitself the topic of several long-standing debates(Mackintosh, 1998). For purposes of clarity, we focuson the interpretation of intelligence that is statistically
most clearly defined, namely as the general factor ofintelligence (also known as “g”). We consider g torepresent a common source of variance in generalcognitive ability. Studying the brain in relation to g,some researchers have coined the phrase “neuro g”(Haier et al., 2009). This suggests a strong thesis,namely that there is some fundamental biological sub-strate that acts as a common cause of individual varia-bility in performance on a wide variety of cognitivetests. From this point of view, we could consider thesearch for neuro g a quest for “[t]he substrate of humanintelligence” (Luders, Narr, Thompson, & Toga, 2009,p. 156), undertaken “[t]o capture the essence of aneural basis of intelligence” (Jung & Haier, 2007,p. 178). The above suggests that the aim of neuroscien-tific research on intelligence is not just to find some(neurological) property that correlates with a commonfactor extracted from a battery of IQ-test scores, butrather showing g to be a physical property of the brain.
Recent studies have extended the focus from singlemeasures to integrating multiple lines of evidence.These approaches have combined structural and
COGNITIVE NEUROSCIENCE, 2012, iFirst, 1–9
Correspondence should be addressed to: Rogier A. Kievit, Department of Psychological Methods, University of Amsterdam, Roetersstraat 15,1018WB Amsterdam, The Netherlands. E-mail: [email protected]
© 2012 Psychology Press, an imprint of the Taylor & Francis Group, an Informa businesswww.psypress.com/cognitiveneuroscience http://dx.doi.org/10.1080/17588928.2011.628383
Dow
nloa
ded
by [U
nive
rsity
of S
outh
ampt
on H
ighf
ield
] at 0
8:55
18
Janu
ary
2012
functional data (Choi et al., 2008), structural and func-tional networks (Li et al., 2009; van den Heuvel, Stam,Kahn, & Hulshoff Pol, 2009), and genetic modeling(Chiang et al., 2009). These approaches show that thesynthesis of different techniquesmay be necessary to geta handle on the nature of g and the brain. Despite manyadvances, however, the identification of a neural prop-erty that could be identified with g has not been forth-coming. This has led some scholars to question whetherany simple identification should be expected. Forinstance,Bartholomew (2004) suggests thatg is not itselfa physical characteristic of the brain, but rather a functionof a set of distinct brain characteristics.
The distinction is comparable to the distinctionbetween the length (height) of a person and his or herphysical fitness. If g is similar to “length” (albeit moredifficult to measure), then what we have to discover ishow to best measure g in the brain, with the leastamount of measurement error. However, if g is moresimilar to something akin to “physical fitness,” thensearching for a single physical property is ill-advised:Although physical fitness depends on a range of phy-sical properties (e.g., lung capacity, metabolic rates,energy efficiency), the construct of “physical fitness”is best seen as a composite function of these character-istics, and cannot be identified with any single char-acteristic. If the latter perspective is more accurate, thenneuroscientific research on g should not be interpretedas an attempt to find out what g is (i.e., which neuralproperty uniquely defines g), but as a search for apossibly large and heterogeneous set of propertiesthat together determine g.
Clearly, the relationship between g and the braincan be studied from a wide range of assumptions andhypotheses. However, these assumptions are notalways made explicit. In this paper, we show howdifferent assumptions and interpretations can be trans-lated into testable psychometric models. Structuralequation models (SEM) have been used profitably inanalyzing functional neural systems (e.g., McIntosh &Gonzalez-Lima, 1994). Excellent introductions in theapplication and interpretation of SEM include Bollen(1989) and Kline (2005). We use SEM in a new wayby modeling various competing hypotheses for therelationship between observed and latent variablesof g and the brain. We will examine the relationshipbetween a set of representative regions of interest(ROIs) to study which models, with which implica-tions, best represent the empirical data. We first dis-cuss a number of candidate models for representingthe relationship between neurological and psycholo-gical measurements.
METHODS
Models
We use SEM to fit the following candidate modelsrepresenting different assumptions and interpretationsagainst the data.
Neuro g 1: Same concept, new measures
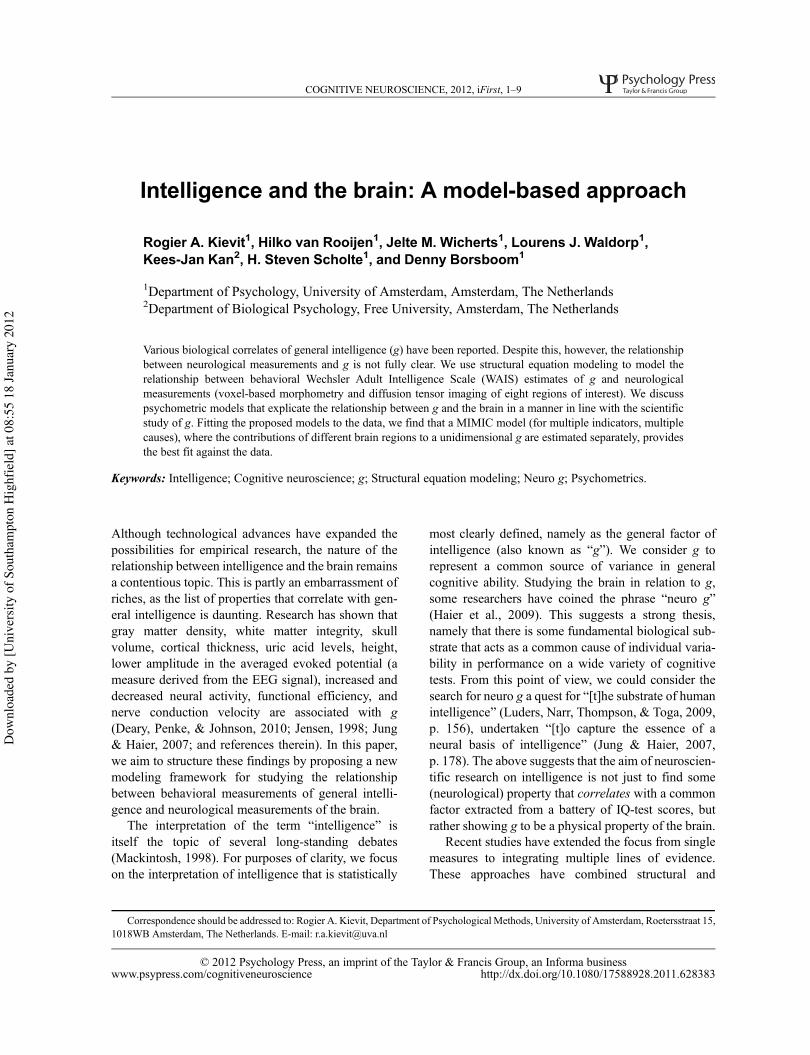
The first psychometric interpretation of neuro gconsiders neurological measurements to depend onthe same property as has traditionally been measuredwith psychometric instruments (i.e., g, as measuredthrough IQ tests). Themeasurement model correspond-ing to this interpretation is shown in Figure 1.
From this perspective, one can consider neurologi-cal measurements (by means of brain scans) to be anew, potentially more precise way of measuring thesame property (in this case, g). This model entailsseveral statistical characteristics and conceptual impli-cations explained in more detail in Kievit et al. (2011).This is the simplest model considered here, and is mostin line with terminology stressing “the neural substrateof g”or the “biological essence of g.”
Neuro g 2 and Neuro g 3: Different properties,different measures
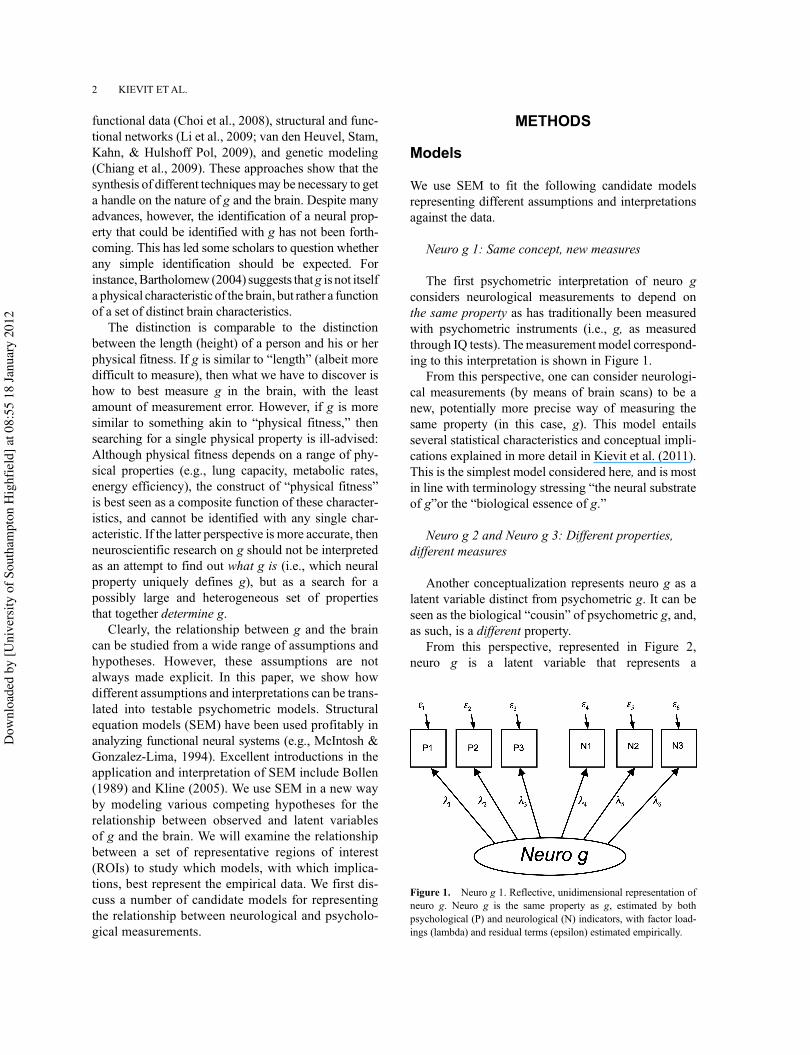
Another conceptualization represents neuro g as alatent variable distinct from psychometric g. It can beseen as the biological “cousin” of psychometric g, and,as such, is a different property.
From this perspective, represented in Figure 2,neuro g is a latent variable that represents a
Figure 1. Neuro g 1. Reflective, unidimensional representation ofneuro g. Neuro g is the same property as g, estimated by bothpsychological (P) and neurological (N) indicators, with factor load-ings (lambda) and residual terms (epsilon) estimated empirically.
2 KIEVIT ETAL.
Dow
nloa
ded
by [U
nive
rsity
of S
outh
ampt
on H
ighf
ield
] at 0
8:55
18
Janu
ary
2012
unidimensional neurological factor, measured by a setof neurological variables. This neuro g can be seen as a“property of the brain” that is relevantwith respect to g,but not identical to it.
Hence, this model offers a different interpreta-tion of the term “neuro g”: namely, as a property of thebrain that can be estimated by neurological measure-ments, and that correlates with g to an extent assessableby empirical study. The purpose of empirical research
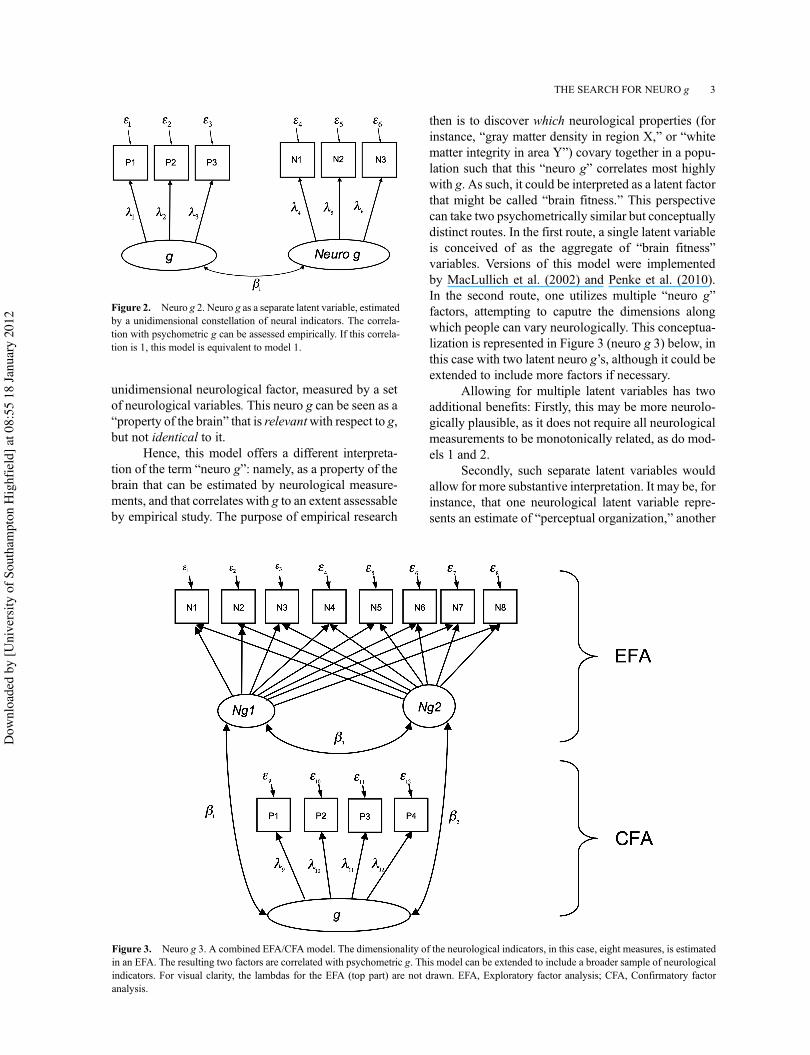
then is to discover which neurological properties (forinstance, “gray matter density in region X,” or “whitematter integrity in area Y”) covary together in a popu-lation such that this “neuro g” correlates most highlywith g. As such, it could be interpreted as a latent factorthat might be called “brain fitness.” This perspectivecan take two psychometrically similar but conceptuallydistinct routes. In the first route, a single latent variableis conceived of as the aggregate of “brain fitness”variables. Versions of this model were implementedby MacLullich et al. (2002) and Penke et al. (2010).In the second route, one utilizes multiple “neuro g”factors, attempting to caputre the dimensions alongwhich people can vary neurologically. This conceptua-lization is represented in Figure 3 (neuro g 3) below, inthis case with two latent neuro g’s, although it could beextended to include more factors if necessary.
Allowing for multiple latent variables has twoadditional benefits: Firstly, this may be more neurolo-gically plausible, as it does not require all neurologicalmeasurements to be monotonically related, as do mod-els 1 and 2.
Secondly, such separate latent variables wouldallow for more substantive interpretation. It may be, forinstance, that one neurological latent variable repre-sents an estimate of “perceptual organization,” another
Figure 2. Neuro g 2. Neuro g as a separate latent variable, estimatedby a unidimensional constellation of neural indicators. The correla-tion with psychometric g can be assessed empirically. If this correla-tion is 1, this model is equivalent to model 1.
Figure 3. Neuro g 3. A combined EFA/CFA model. The dimensionality of the neurological indicators, in this case, eight measures, is estimatedin an EFA. The resulting two factors are correlated with psychometric g. This model can be extended to include a broader sample of neurologicalindicators. For visual clarity, the lambdas for the EFA (top part) are not drawn. EFA, Exploratory factor analysis; CFA, Confirmatory factoranalysis.
THE SEARCH FOR NEURO g 3
Dow
nloa
ded
by [U
nive
rsity
of S
outh
ampt
on H
ighf
ield
] at 0
8:55
18
Janu
ary
2012
represents “processing speed,” and yet another repre-sents “verbal ability.” Attempting to model such latentvariables may allow researchers to get a grip on thestructure of different neurological dimensions alongwhich people differ, and this would in turn facilitateinterpretation and comparability across studies. Thismethod may also be particularly appropriate for study-ing lower order factors such as spatial or verbal ability.Previous research suggests that although cognitiveabilities are positively correlated, they may rely ondifferent neural subsystems. If this is the case, it isworth examining the psychometric structure of neuro-logical variables at the level of these lower-order fac-tors. Those neural indicators that covary positivelywith a lower order factor may be especially insightful.For instance, Henson (2005) discusses how neurologi-cal and behavioral measurements may together be ableto distinguish between theories that propose either aunitary short-term memory factor or more than onelower-order memory factor, based on convergence ofneuroimaging and behavioral data.
Of course, the structure of covariation betweendifferent neurological measurements and their relationto higher- or lower-order ability factors will depend onthe nature of those indicators. For instance, that thedevelopment of white matter in different regions of thebrain, at least in early life, is based on similar geneticmechanisms may suggest that there will be a higherdegree of similarity between such measurementswithin an individual than between, say, white andgray matter values in the same brain region. Suchconsiderations need to be taken into account whenmodeling. However, the structure of covariation ofneurological measurements is ultimately an empiricalquestion, and it is exactly the study of such covariancethat may provide valuable insights regarding the neu-rophysiology of the brain and g.
Neuro g 4: The brain determines differences in g
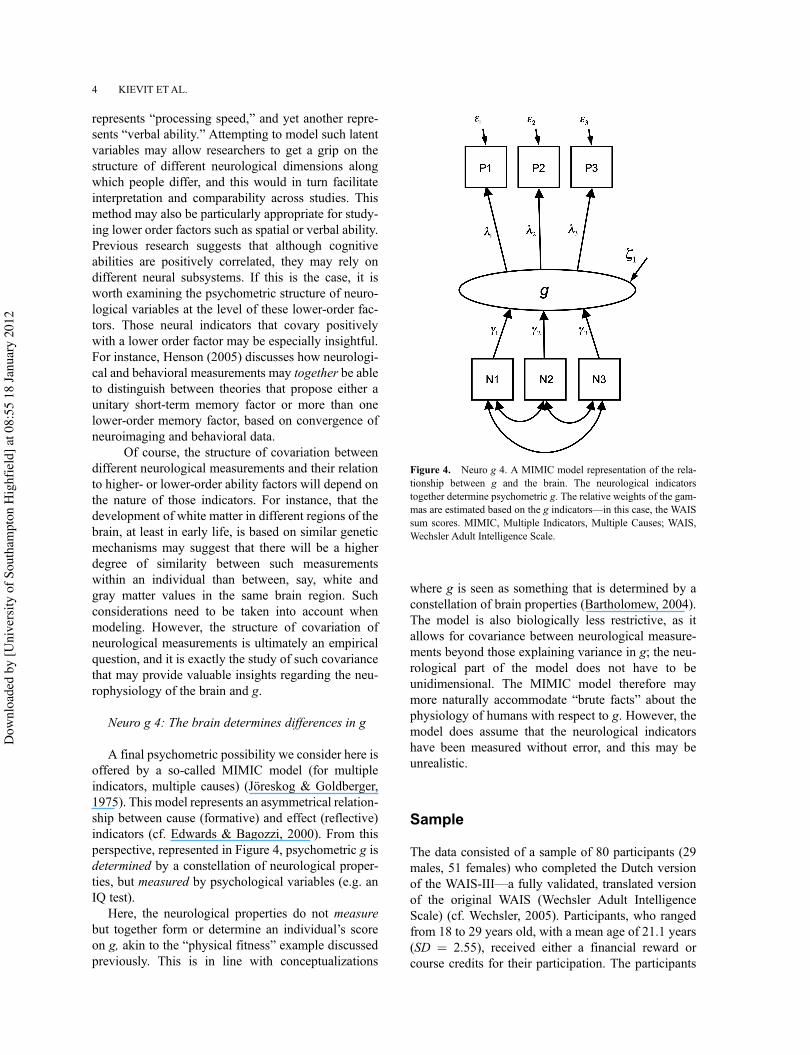
A final psychometric possibility we consider here isoffered by a so-called MIMIC model (for multipleindicators, multiple causes) (Jöreskog & Goldberger,1975). This model represents an asymmetrical relation-ship between cause (formative) and effect (reflective)indicators (cf. Edwards & Bagozzi, 2000). From thisperspective, represented in Figure 4, psychometric g isdetermined by a constellation of neurological proper-ties, but measured by psychological variables (e.g. anIQ test).
Here, the neurological properties do not measurebut together form or determine an individual’s scoreon g, akin to the “physical fitness” example discussedpreviously. This is in line with conceptualizations
where g is seen as something that is determined by aconstellation of brain properties (Bartholomew, 2004).The model is also biologically less restrictive, as itallows for covariance between neurological measure-ments beyond those explaining variance in g; the neu-rological part of the model does not have to beunidimensional. The MIMIC model therefore maymore naturally accommodate “brute facts” about thephysiology of humans with respect to g. However, themodel does assume that the neurological indicatorshave been measured without error, and this may beunrealistic.
Sample
The data consisted of a sample of 80 participants (29males, 51 females) who completed the Dutch versionof the WAIS-III––a fully validated, translated versionof the original WAIS (Wechsler Adult IntelligenceScale) (cf. Wechsler, 2005). Participants, who rangedfrom 18 to 29 years old, with a mean age of 21.1 years(SD ! 2.55), received either a financial reward orcourse credits for their participation. The participants
Figure 4. Neuro g 4. A MIMIC model representation of the rela-tionship between g and the brain. The neurological indicatorstogether determine psychometric g. The relative weights of the gam-mas are estimated based on the g indicators––in this case, the WAISsum scores. MIMIC, Multiple Indicators, Multiple Causes; WAIS,Wechsler Adult Intelligence Scale.
4 KIEVIT ETAL.
Dow
nloa
ded
by [U
nive
rsity
of S
outh
ampt
on H
ighf
ield
] at 0
8:55
18
Janu
ary
2012
were tested in accordance with the ethical guidelinesof the American Psychological Association, and thestudy was approved by the University of AmsterdamEthics Committee. The behavioral measurements con-sisted of four domain indices (Verbal Comprehension,Perceptual Organization, Working Memory, andProcessing Speed) of the WAIS-III. In addition tothe completion of the WAIS-III, all participants werescanned in a 3 Tesla Philips Intera MRI scanner toestimate white matter, gray matter density, and brainvolume measurements in eight ROIs.
Image acquisition
Participants were scanned on a 3-T Philips Intera scan-ner, and all data were analyzed using FSL (Smith et al.,2004), MATLAB (Version 7.10.0, The Mathworks,Inc., Natick, MA, USA), and Mplus (Muthén &Muthén, 1998–2007). A structural MRI scan of eachparticipant was acquired by using a T1-weighted 3Dsequence (Turbo Field Echo, TE 4.6 ms, TR 9.6 ms, FA8!, 182 sagittal slices of 1.2 mm, FOV 2502 mm,reconstruction matrix 2562).
Image analysis
The structural data were analyzed with voxel-basedmorphometry (VBM) carried out with FSL (Smithet al., 2004). First, structural images were brain-extracted (Smith, 2002). Next, tissue-type segmenta-tion was carried out with FAST4 (Zhang, 2001). The soobtained gray-matter partial volumes were then alignedto MNI 152 standard space using the affine registra-tion. The resulting images were averaged to create astudy-specific template, to which the native gray-matter images were then nonlinearly reregistered witha method that uses a b-spline representation of theregistration warp field (Andersson, Jenkinson, &Smith, 2007; Rueckert et al. 1999). The registeredpartial volume images were modulated (to correct forlocal expansion or contraction) by dividing by the
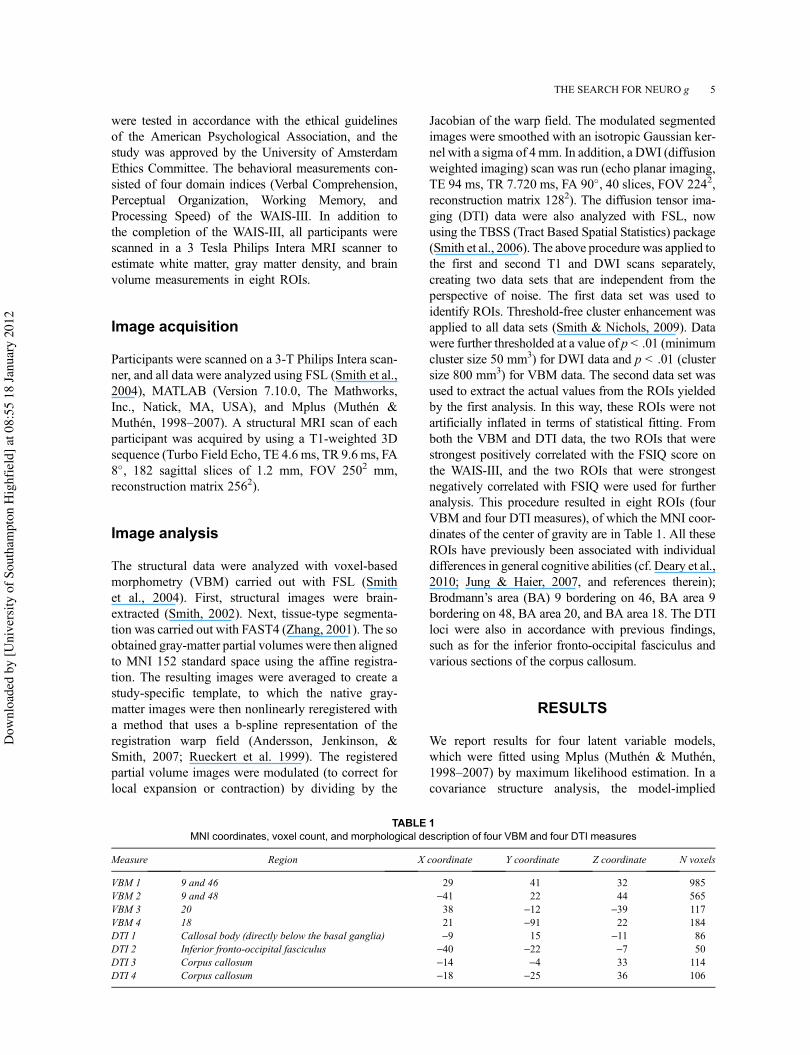
Jacobian of the warp field. The modulated segmentedimages were smoothed with an isotropic Gaussian ker-nel with a sigma of 4mm. In addition, a DWI (diffusionweighted imaging) scan was run (echo planar imaging,TE 94 ms, TR 7.720 ms, FA 90!, 40 slices, FOV 2242,reconstruction matrix 1282). The diffusion tensor ima-ging (DTI) data were also analyzed with FSL, nowusing the TBSS (Tract Based Spatial Statistics) package(Smith et al., 2006). The above procedure was applied tothe first and second T1 and DWI scans separately,creating two data sets that are independent from theperspective of noise. The first data set was used toidentify ROIs. Threshold-free cluster enhancement wasapplied to all data sets (Smith & Nichols, 2009). Datawere further thresholded at a value of p < .01 (minimumcluster size 50 mm3) for DWI data and p < .01 (clustersize 800 mm3) for VBM data. The second data set wasused to extract the actual values from the ROIs yieldedby the first analysis. In this way, these ROIs were notartificially inflated in terms of statistical fitting. Fromboth the VBM and DTI data, the two ROIs that werestrongest positively correlated with the FSIQ score onthe WAIS-III, and the two ROIs that were strongestnegatively correlated with FSIQ were used for furtheranalysis. This procedure resulted in eight ROIs (fourVBM and four DTI measures), of which the MNI coor-dinates of the center of gravity are in Table 1. All theseROIs have previously been associated with individualdifferences in general cognitive abilities (cf. Deary et al.,2010; Jung & Haier, 2007, and references therein);Brodmann’s area (BA) 9 bordering on 46, BA area 9bordering on 48, BA area 20, and BA area 18. The DTIloci were also in accordance with previous findings,such as for the inferior fronto-occipital fasciculus andvarious sections of the corpus callosum.
RESULTS
We report results for four latent variable models,which were fitted using Mplus (Muthén & Muthén,1998–2007) by maximum likelihood estimation. In acovariance structure analysis, the model-implied
TABLE 1MNI coordinates, voxel count, and morphological description of four VBM and four DTI measures
Measure Region X coordinate Y coordinate Z coordinate N voxels
VBM 1 9 and 46 29 41 32 985VBM 2 9 and 48 -41 22 44 565VBM 3 20 38 -12 -39 117VBM 4 18 21 -91 22 184DTI 1 Callosal body (directly below the basal ganglia) -9 15 -11 86DTI 2 Inferior fronto-occipital fasciculus -40 -22 -7 50DTI 3 Corpus callosum -14 -4 33 114DTI 4 Corpus callosum -18 -25 36 106
THE SEARCH FOR NEURO g 5
Dow
nloa
ded
by [U
nive
rsity
of S
outh
ampt
on H
ighf
ield
] at 0
8:55
18
Janu
ary
2012
covariances are compared to the observed covariances.Fit indices represent the deviation or misfit of theobserved covariance structure. We evaluate model fitby means of the chi-square test of model fit, the rootmean square error of approximation (RMSEA), thecomparative fit index (CFI), and the Bayesian informa-tion criterion (BIC). For discussions on the relativemerits of these fit indices, see Schermelleh-Engel,Moosbrugger, and Müller (2003).
For the SEM analyses, a total of 12 observed vari-ables were modeled: four domain scores of the WAIS-III, and measurements of four VBM, and four DTIROIs. The WAIS sum scores were as follows: VerbalComprehension (M ! 117.16, SD ! 9.78), PerceptualOrganization (M ! 112.10, SD ! 11.31), WorkingMemory (M ! 111.32, SD ! 13.11), and ProcessingSpeed (M ! 116.38, SD ! 14.80). We implement asimplified, nonhierarchical g model here for purposesof simplicity and model fitting. This model may beextended to include latent first-order factors withoutaffecting the core ideas of the models.
To ensure that the indicators of g variables arepsychometrically adequate, we first fit a confirmatory
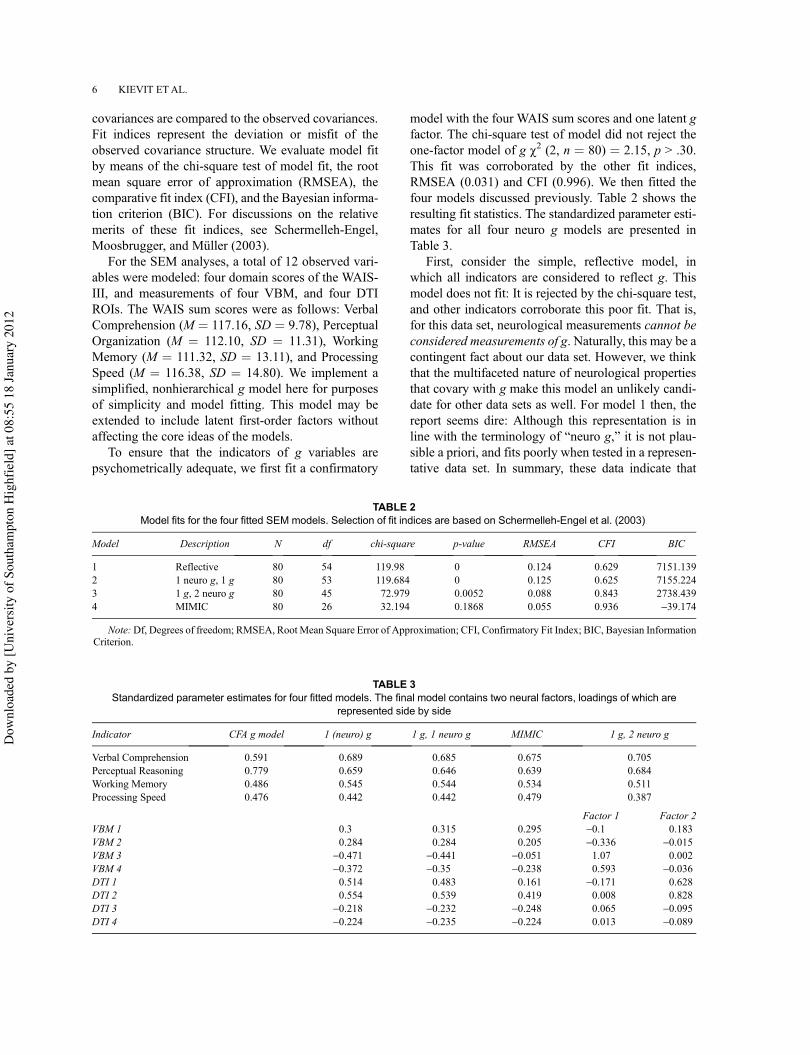
model with the four WAIS sum scores and one latent gfactor. The chi-square test of model did not reject theone-factor model of g !2 (2, n ! 80) ! 2.15, p > .30.This fit was corroborated by the other fit indices,RMSEA (0.031) and CFI (0.996). We then fitted thefour models discussed previously. Table 2 shows theresulting fit statistics. The standardized parameter esti-mates for all four neuro g models are presented inTable 3.
First, consider the simple, reflective model, inwhich all indicators are considered to reflect g. Thismodel does not fit: It is rejected by the chi-square test,and other indicators corroborate this poor fit. That is,for this data set, neurological measurements cannot beconsidered measurements of g. Naturally, this may be acontingent fact about our data set. However, we thinkthat the multifaceted nature of neurological propertiesthat covary with g make this model an unlikely candi-date for other data sets as well. For model 1 then, thereport seems dire: Although this representation is inline with the terminology of “neuro g,” it is not plau-sible a priori, and fits poorly when tested in a represen-tative data set. In summary, these data indicate that
TABLE 3Standardized parameter estimates for four fitted models. The final model contains two neural factors, loadings of which are
represented side by side
Indicator CFA g model 1 (neuro) g 1 g, 1 neuro g MIMIC 1 g, 2 neuro g
Verbal Comprehension 0.591 0.689 0.685 0.675 0.705Perceptual Reasoning 0.779 0.659 0.646 0.639 0.684Working Memory 0.486 0.545 0.544 0.534 0.511Processing Speed 0.476 0.442 0.442 0.479 0.387
Factor 1 Factor 2VBM 1 0.3 0.315 0.295 -0.1 0.183VBM 2 0.284 0.284 0.205 -0.336 -0.015VBM 3 -0.471 -0.441 -0.051 1.07 0.002VBM 4 -0.372 -0.35 -0.238 0.593 -0.036DTI 1 0.514 0.483 0.161 -0.171 0.628DTI 2 0.554 0.539 0.419 0.008 0.828DTI 3 -0.218 -0.232 -0.248 0.065 -0.095DTI 4 -0.224 -0.235 -0.224 0.013 -0.089
TABLE 2Model fits for the four fitted SEM models. Selection of fit indices are based on Schermelleh-Engel et al. (2003)
Model Description N df chi-square p-value RMSEA CFI BIC
1 Reflective 80 54 119.98 0 0.124 0.629 7151.1392 1 neuro g, 1 g 80 53 119.684 0 0.125 0.625 7155.2243 1 g, 2 neuro g 80 45 72.979 0.0052 0.088 0.843 2738.4394 MIMIC 80 26 32.194 0.1868 0.055 0.936 -39.174
Note:Df, Degrees of freedom; RMSEA, Root Mean Square Error of Approximation; CFI, Confirmatory Fit Index; BIC, Bayesian InformationCriterion.
6 KIEVIT ETAL.
Dow
nloa
ded
by [U
nive
rsity
of S
outh
ampt
on H
ighf
ield
] at 0
8:55
18
Janu
ary
2012
neuro g should not be taken to refer to a unidimensionalconstellation of neural properties identical to g.Whether or not other constellations of neural indicatorsnot explored in this study will fit such a unidimensionalfactor coincident with g is an empirical question that isstill open, but, for the reasons we give above, we do notconsider it very likely.
Model 2, shown in Figure 2, represents neuro g as aseparate latent variable that correlates with g.As can beseen in Table 2, this model was also rejected for ourdata set, reflecting the lack of unidimensionality in theneurological measurements. That is, at least in this dataset, a constellation of neurological measurements can-not be considered a unidimensional property of indivi-duals, akin to a kind of “brain fitness factor.” Despitethe fact that these measures correlate independentlywith g, they do not intercorrelate positively.
Model 3 (shown in Figure 3) estimates multiple (inthis case, two) latent neural factors that correlate withg. To fit this model, we implemented a new methodavailable in Mplus, namely a combined exploratoryand confirmatory factor analysis. As Table 2 shows(model 3), this model is also rejected, although the fitis considerably less poor than the fit of models 1 and 2.This model, although rejected for this data set, seemsmore intuitively plausible and offers more in the way ofinterpretation, and in our view may well be an optionworth considering for further research.
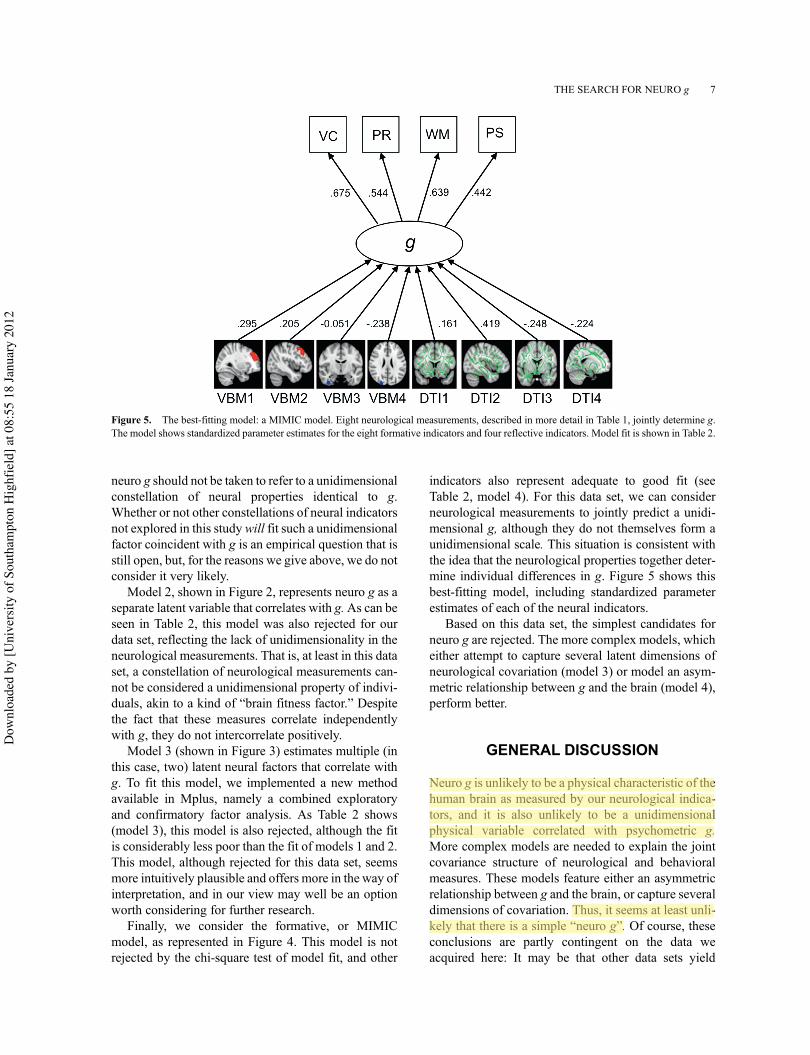
Finally, we consider the formative, or MIMICmodel, as represented in Figure 4. This model is notrejected by the chi-square test of model fit, and other
indicators also represent adequate to good fit (seeTable 2, model 4). For this data set, we can considerneurological measurements to jointly predict a unidi-mensional g, although they do not themselves form aunidimensional scale. This situation is consistent withthe idea that the neurological properties together deter-mine individual differences in g. Figure 5 shows thisbest-fitting model, including standardized parameterestimates of each of the neural indicators.
Based on this data set, the simplest candidates forneuro g are rejected. The more complex models, whicheither attempt to capture several latent dimensions ofneurological covariation (model 3) or model an asym-metric relationship between g and the brain (model 4),perform better.
GENERAL DISCUSSION
Neuro g is unlikely to be a physical characteristic of thehuman brain as measured by our neurological indica-tors, and it is also unlikely to be a unidimensionalphysical variable correlated with psychometric g.More complex models are needed to explain the jointcovariance structure of neurological and behavioralmeasures. These models feature either an asymmetricrelationship between g and the brain, or capture severaldimensions of covariation. Thus, it seems at least unli-kely that there is a simple “neuro g”. Of course, theseconclusions are partly contingent on the data weacquired here: It may be that other data sets yield
Figure 5. The best-fitting model: a MIMIC model. Eight neurological measurements, described in more detail in Table 1, jointly determine g.The model shows standardized parameter estimates for the eight formative indicators and four reflective indicators. Model fit is shown in Table 2.
THE SEARCH FOR NEURO g 7
Dow
nloa
ded
by [U
nive
rsity
of S
outh
ampt
on H
ighf
ield
] at 0
8:55
18
Janu
ary
2012
Scott Barry Kaufman
Scott Barry Kaufman
different conclusions regarding the models. Moreover,there is always the possibility that unobserved thirdfactors are the source of covariation between neurolo-gical indicators and intelligence (e.g., white matter,cardiovascular factors, and cognitive ability; Markset al., 2007), although this problem is not unique forSEM. More generally, although SEM has many statis-tical benefits over traditional techniques, there areissues that require careful attention, including modelequivalence (Lee & Hershberger, 1990), model selec-tion (Myung & Pitt, 1997), and judging model fit(Schermelleh-Engel et al., 2003). In addition, SEMgenerally requires larger sample sizes than otherapproaches, although required samples are not prohi-bitive (e.g., Marsh & Hau, 1999). Nonetheless, SEMoffers various essential benefits over more traditionalmethods. Most importantly, they allow for the flexiblecomparison of various models in such a way that theycan be compared across studies. In this paper, we wereable to compare various competing hypotheses, rejectcertain alternatives, and tentatively conclude that theMIMIC perspective currently offers the best explana-tion of the data analyzed here. Moreover, SEM is aflexible tool: It could be extended by focusing ondifferent neural indicators (that may show higher factorloadings or fit to stricter models), or by examininghierarchical models of g (e.g., Carroll, 1993).
This finding is in line with recent work in otherfields, such as that of emotion research. Lindquist,Wager, Kober, Bliss-Moreau, & Barrett (in press)show that, for the relation between emotions and thebrain, a model similar to the MIMIC model is bettersupported empirically than the essentialist view (wherethe activity of one specialized subsystem is consideredthe core feature of a particular emotion, as in model 1).In addition, the statistical and conceptual properties ofthe MIMIC model are most compatible with contem-porary perspectives on the genetic influences on g (cf.Penke, Denissen, & Miller, 2007). In terms of theMIMIC model, genetic effects may therefore featureas predictors alongside the neurological variables.
Our approach emphasizes the importance of con-ceptual and statistical clarity for neuroscientificresearch in intelligence. Neuroscientific findingsshould, whenever possible, go beyond simple mea-sures of association. Psychometric modeling techni-ques, as discussed in this paper, allow us to seebeyond simple correlations. This enables the investiga-tion of conceptual hypotheses on the relation betweenintelligence and the brain that were hitherto the pro-vince of mere speculation. By explicitly representing,modeling, and testing competing hypotheses, we maybe able to finally get a grip on this complex problem.We can only hope that, as was the case in the history of
general intelligence and the development of factoranalytic methods, competing methods and modelswill lead the way to new conceptual and empiricaldevelopments. We think that this will prove to be themost interesting, insightful, and productive road to abetter understanding of the neurological basis ofintelligence.
Original manuscript received 22 June 2011Revised manuscript accepted 27 September 2011
First published online 18 January 2012
REFERENCES
Andersson, J. L. R., Jenkinson, M., & Smith, S. M. (2007).Non-linear registration, aka spatial normalisation. FMRIBtechnical report TR07JA2. Retrieved from: www.fmrib.ox.ac.uk/analysis/techrep/tr07ja2/tr07ja2.pdf (accessedMarch 12, 2009).
Bartholomew, D. J. (2004). Measuring intelligence: Factsand fallacies. Cambridge, UK: Cambridge UniversityPress.
Bollen, K. A. (1989). Structural equations with latent vari-ables. New York, NY: Wiley.
Carroll, J. B. (1993). Human cognitive abilities: A survey offactor analytic studies. New York, NY: CambridgeUniversity Press.
Chiang, M. C., Barysheva, M., Shattuck, D. W., Lee, A. D.,Madsen, S. K., Avedissian, C., . . . Thompson, P. M.(2009). Genetics of brain fiber architecture and intel-lectual performance. Journal of Neuroscience, 29,2212–2224.
Choi, Y. Y., Shamosh, N. A., Cho, S. H., DeYoung, C. G.,Lee, M. J., Lee, J. M., . . . Lee, K. H. (2008). Multiplebases of human intelligence revealed by cortical thicknessand neural activation. Journal of Neuroscience, 28,10323–10329.
Deary, I. J., Penke, L., & Johnson, W. (2010). The neu-roscience of human intelligence differences. NatureReviews Neuroscience, 11, 201–211.
Edwards, J. R., & Bagozzi, R. P. (2000). On the nature anddirection of relationships between constructs and mea-sures. Psychological Methods, 5, 155–174.
Haier, R. J., Colom, R., Schroeder, D. H., Condon, C. A.,Tang, C., Eaves, E., et al. (2009). Gray matter and intelli-gence factors: Is there a neuro-g? Intelligence, 37,136–144.
Henson, R. (2005). What can functional neuroimaging tellthe experimental psychologist? Quarterly Journal ofExperimental Psychology, 58, 193–233.
Jensen, A. R. (1998). The g factor: The science of mentalability. Westport, CT: Praeger/Greenwood.
Jöreskog, K., & Goldberger, A. S. (1975). Estimation of amodel with multiple indicators and multiple causes of asingle latent variable. Journal of the American StatisticalAssociation, 70, 631–639.
Jung, R. E., & Haier, R. J. (2007). The parieto-frontal inte-gration theory (P-FIT) of intelligence: Converging neu-roimaging evidence. Behavioral and Brain Sciences, 30,135–187.
Kievit, R. A., Romeijn, J. W., Waldorp, L. J., Scholte, H. S.,Wicherts, J. M., & Borsboom, D. (2011). Mind the gap: A
8 KIEVIT ETAL.
Dow
nloa
ded
by [U
nive
rsity
of S
outh
ampt
on H
ighf
ield
] at 0
8:55
18
Janu
ary
2012
Scott Barry Kaufman
Scott Barry Kaufman
Scott Barry Kaufman
psychometric approach to the reduction problem.Psychological Inquiry, 22, 67–87.
Kline, R. B. (2005). Principles and practice of structuralequation modeling. New York, NY: Guilford.
Lee, S., & Hershberger, S. (1990). A simple rule for generat-ing equivalent models in covariance structure modeling.Multivariate Behavioral Research, 25, 313–334.
Li, Y., Liu, Y., Li, J., Qin, W., Li, K., Yu, C., et al. (2009).Brain anatomical network and intelligence. PLoSComputational Biology, 5, e1000395.
Lindquist, K. A., Wager, T. D., Kober, H., Bliss-Moreau, E.,& Barrett, L. F. (in press). The brain basis of emotion: Ameta-analytic review. Behavioral and Brain Sciences.
Luders, E., Narr, K. L., Thompson, P. M., & Toga, A. W.(2009). Neuroanatomical correlates of intelligence.Intelligence, 37, 156–163.
Mackintosh, N. J. (1998). IQ and human intelligence. NewYork, NY: Oxford University Press.
MacLullich, A. M. J., Ferguson, K. J., Deary, I. J., Seckl,J. R., Starr, J. M., & Wardlaw, J. M. (2002). Intracranialcapacity and brain volumes are associated with cognitionin healthy elderly men. Neurology, 59, 169–174.
Marks, B. L., Madden, D. J., Bucur, B., Provenzale, J. M.,White, L. E., Cabeza, R.,, et al. (2007). Role of aerobicfitness and aging on cerebral white matter integrity.Annals of the New York Academy of Sciences, 1097,171–174.
Marsh, H. W., & Hau, K.-T. (1999). Confirmatory factoranalysis: Strategies for small sample sizes. In R. H.Hoyle (Ed.), Statistical strategies for small sampleresearch (pp. 251–306). Thousand Oaks, CA: Sage.
McIntosh, A. R., & Gonzalez-Lima, F. (1994). Structuralequation modeling and its application to network ana-lysis in functional brain imaging. Human BrainMapping, 2, 2–22.
Muthén, L. K., Muthén, B. O. (1998–2007). Mplus user’sguide (5th ed.). Los Angeles, CA: Muthén & Muthén.
Myung, I. J., & Pitt, M. A. (1997). Applying Occam’s razor inmodeling cognition: A Bayesian approach. PsychonomicBulletin and Review, 4, 79–95.
Penke, L., Denissen, J. J. A., & Miller, G. F. (2007). Theevolutionary genetics of personality. European Journal ofPersonality, 21, 549–587.
Penke, L., Muñoz Maniega, S., Murray, C., Gow, A. J.,Valdés Hernández, M. C., Clayden, J. D., . . . Deary, I. J.(2010). A general factor of brain white matter integritypredicts information processing speed in healthy olderpeople. Journal of Neuroscience, 30, 7569–7574.
Rueckert, D., Sonoda, L. I., Hayes, C., Hill, D. L. G., Leach,M. O., & Hawkes, D. J. (1999). Nonrigid registration usingfree-form deformations: Application to breast MR images.IEEE Transactions on Medical Imaging, 18, 712–721.
Schermelleh-Engel, K.,Moosbrugger,H.,&Müller, H. (2003).Evaluating the fit of structural equation models: Tests ofsignificance and descriptive goodness-of fit measures.Methods of Psychological Research Online, 8, 23–74.
Smith, S. E., & Nichols, T. E. (2009). Threshold-free clusterenhancement: Addressing problems of smoothing, thresh-old dependence and localisation in cluster inference.NeuroImage, 44, 83–98.
Smith, S. M. (2002). Fast robust automated brain extraction.Human Brain Mapping, 17, 143–155.
Smith, S. M., Jenkinson, M., Johansen-Berg, H., Rueckert,D., Nichols, T. E., & Behrens, T. E. J. (2006). Tract-basedspatial statistics: Voxelwise analysis of multi-subject dif-fusion data. NeuroImage, 31, 1487–1505.
Smith, S. M., Jenkinson, M., Woolrich, M. W., Beckmann,C. F., Behrens, T. E. J., Johansen-Berg, H., et al. (2004).Advances in functional and structural MR image analysisand implementation as FSL. NeuroImage, 23, 208–219.
van den Heuvel, M. P., Stam, C. J., Kahn, R. S., & HulshoffPol, H. E. (2009). Efficiency of functional brain networksand intellectual performance. Journal of Neuroscience,29, 7619–7624.
Wechsler, D. (2005). WAIS-III Nederlandstalige bewerking.Amsterdam, The Netherlands: Harcourt Assessment.
Zhang, Y., Brady, M., & Smith, S. (2001). Segmentation ofbrain MR images through a hidden Markov random fieldmodel and the expectation-maximization algorithm. IEEETransactions on Medical Imaging, 20, 45–57.
THE SEARCH FOR NEURO g 9
Dow
nloa
ded
by [U
nive
rsity
of S
outh
ampt
on H
ighf
ield
] at 0
8:55
18
Janu
ary
2012