Integrating an ICT carbon calculator tool into procurement processes at De Montfort University
15
Research suggests that procurement supply chain GHG emissions, when measured from a consumption-based perspective, are a significant component of an organi- zation’s carbon footprint [1–4] . In the UK public sec- tor, various studies support this assertion, with such emissions estimated to account for 33% of the total carbon footprint in the schools of England [5] , 37% in the higher education (HE) sector in England [6] , approximately 50% in the UK central government [7] and 60% in the National Health Service organizations in England [8,9] . Within the specific case of the HE sector in England, the importance of these embedded emissions has been recognized and now all HE institu- tions (HEIs) have a legal duty to measure their Scope 3 emissions (including procurement) in accordance with the GHG Protocol [10] and set reduction targets. This is believed to be the first such requirement for institutions in a public sector anywhere in the world. This paper describes the main results and lessons learned from a Jisc-funded project entitled ‘Reengi- neering Procurement by Reducing Carbon Dioxide Emissions and Enabling Sustainability’ (PROCO 2 ) [101] . It followed the results and recommendations for improved procurement decisions to lower supply chain emissions highlighted in a previous consumption-based carbon footprint study conducted at De Montfort Uni- versity (DMU) [11] . PROCO 2 ’s aim was to reduce the procurement emissions of DMU by linking financial and GHG accounting through an information com- munication technology (ICT)-based decision-making tool, enabling staff to understand the environmental impact of these activities and support decision-making towards sustainable procurement. This project also aimed to understand the organizational learning and change management issues surrounding such a change. Following this introductory section, the definition of sustainable procurement is provided in the first section, including some main barriers for its implementation within institutions. The emissions calculation approach used in the development of the ICT tool is then dis- cussed in the ‘Methodology’ section, as well as the methods employed for staff engagement. The ‘Results’ section describes the final design and components of the tool and the evaluation of the project in terms of Carbon Management (2013) 4(2), 143–157 Integrating an ICT carbon calculator tool into procurement processes at De Montfort University: lessons learned Richard Bull* 1 , Leticia Ozawa-Meida 1 , Paul Brockway 2,3 & Carl Holland 1 Background: This paper presents lessons learnt from a Jisc-funded research project that developed and implemented an information communication technology tool enabling staff to understand the environmental impact of their activities and support sustainable procurement across De Montfort University (Leicester, UK). Results: An environmentally extended input–output calculation approach was adopted to calculate the emissions and a ‘dashboard style’ approach was used to present the information. While the tool was developed successfully, its institutional impact was limited by numerous barriers. Conclusion: These challenges provided several key learning points: cost remains the main priority in procurement teams much higher than environmental aspects; committed ‘champions’ are key to organizational change; and information communication technology carbon/sustainability tools need to be an integral part of an organization’s existing procurement systems. RESEARCH ARTICLE 1 Institute of Energy & Sustainable Development, De Montfort University, Leicester, LE1 9BH, UK 2 Arup, 13 Fitzroy Street, London, W1T 4BQ, UK 3 School of Earth & Environment, University of Leeds, Leeds, LS2 9JT, UK *Author for correspondence: Tel.: +44 116 207 8063; E-mail: [email protected] future science group 143 ISSN 1758-3004 10.4155/CMT.13.10 © 2013 Future Science Ltd
-
Upload
nottinghamtrent -
Category
Documents
-
view
2 -
download
0
Transcript of Integrating an ICT carbon calculator tool into procurement processes at De Montfort University
Research suggests that procurement supply chain GHG emissions, when measured from a consumption-based perspective, are a significant component of an organi-zation’s carbon footprint [1–4]. In the UK public sec-tor, various studies support this assertion, with such emissions estimated to account for 33% of the total carbon footprint in the schools of England [5], 37% in the higher education (HE) sector in England [6], approximately 50% in the UK central government [7] and 60% in the National Health Service organizations in England [8,9]. Within the specific case of the HE sector in England, the importance of these embedded emissions has been recognized and now all HE institu-tions (HEIs) have a legal duty to measure their Scope 3 emissions (including procurement) in accordance with the GHG Protocol [10] and set reduction targets. This is believed to be the first such requirement for institutions in a public sector anywhere in the world.
This paper describes the main results and lessons learned from a Jisc-funded project entitled ‘Reengi-neering Procurement by Reducing Carbon Dioxide Emissions and Enabling Sustainability’ (PROCO
2)
[101]. It followed the results and recommendations for improved procurement decisions to lower supply chain emissions highlighted in a previous consumption-based carbon footprint study conducted at De Montfort Uni-versity (DMU) [11]. PROCO
2’s aim was to reduce the
procurement emissions of DMU by linking financial and GHG accounting through an information com-munication technology (ICT)-based decision-making tool, enabling staff to understand the environmental impact of these activities and support decision-making towards sustainable procurement. This project also aimed to understand the organizational learning and change management issues surrounding such a change.
Following this introductory section, the definition of sustainable procurement is provided in the first section, including some main barriers for its implementation within institutions. The emissions calculation approach used in the development of the ICT tool is then dis-cussed in the ‘Methodology’ section, as well as the methods employed for staff engagement. The ‘Results’ section describes the final design and components of the tool and the evaluation of the project in terms of
Carbon Management (2013) 4(2), 143–157
Integrating an ICT carbon calculator tool into procurement processes at De Montfort University: lessons learned
Richard Bull*1, Leticia Ozawa-Meida1, Paul Brockway2,3 & Carl Holland1
Background: This paper presents lessons learnt from a Jisc-funded research project that developed and implemented an information communication technology tool enabling staff to understand the environmental impact of their activities and support sustainable procurement across De Montfort University (Leicester, UK). Results: An environmentally extended input–output calculation approach was adopted to calculate the emissions and a ‘dashboard style’ approach was used to present the information. While the tool was developed successfully, its institutional impact was limited by numerous barriers. Conclusion: These challenges provided several key learning points: cost remains the main priority in procurement teams much higher than environmental aspects; committed ‘champions’ are key to organizational change; and information communication technology carbon/sustainability tools need to be an integral part of an organization’s existing procurement systems.
ReseaRch aRticle
1Institute of Energy & Sustainable Development, De Montfort University, Leicester, LE1 9BH, UK 2Arup, 13 Fitzroy Street, London, W1T 4BQ, UK 3School of Earth & Environment, University of Leeds, Leeds, LS2 9JT, UK
*Author for correspondence: Tel.: +44 116 207 8063; E-mail: [email protected]
future science group 143ISSN 1758-300410.4155/CMT.13.10 © 2013 Future Science Ltd
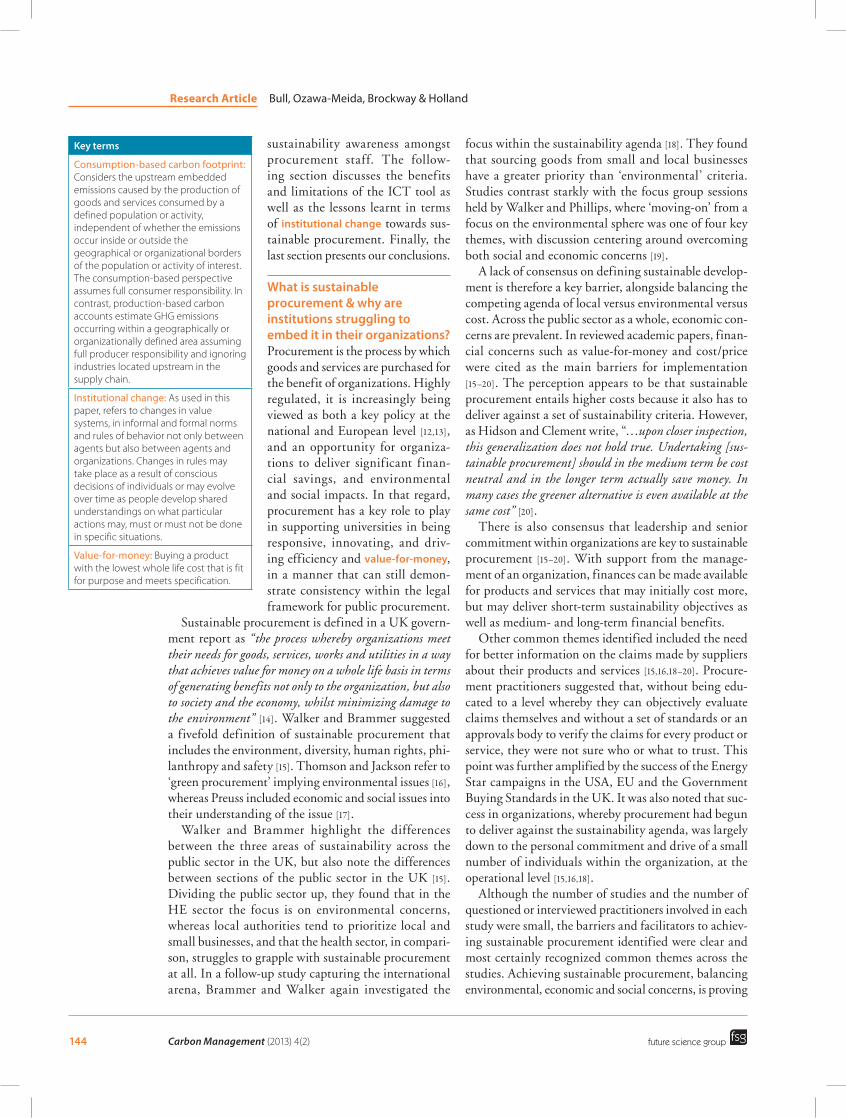
sustainability awareness amongst procurement staff. The follow-ing section discusses the benefits and limitations of the ICT tool as well as the lessons learnt in terms of institutional change towards sus-tainable procurement. Finally, the last section presents our conclusions.
What is sustainable procurement & why are institutions struggling to embed it in their organizations?Procurement is the process by which goods and services are purchased for the benefit of organizations. Highly regulated, it is increasingly being viewed as both a key policy at the national and European level [12,13], and an opportunity for organiza-tions to deliver significant finan-cial savings, and environmental and social impacts. In that regard, procurement has a key role to play in supporting universities in being responsive, innovating, and driv-ing efficiency and value-for-money, in a manner that can still demon-strate consistency within the legal framework for public procurement.
Sustainable procurement is defined in a UK govern-ment report as “the process whereby organizations meet their needs for goods, services, works and utilities in a way that achieves value for money on a whole life basis in terms of generating benefits not only to the organization, but also to society and the economy, whilst minimizing damage to the environment” [14]. Walker and Brammer suggested a fivefold definition of sustainable procurement that includes the environment, diversity, human rights, phi-lanthropy and safety [15]. Thomson and Jackson refer to ‘green procurement’ implying environmental issues [16], whereas Preuss included economic and social issues into their understanding of the issue [17].
Walker and Brammer highlight the differences between the three areas of sustainability across the public sector in the UK, but also note the differences between sections of the public sector in the UK [15]. Dividing the public sector up, they found that in the HE sector the focus is on environmental concerns, whereas local authorities tend to prioritize local and small businesses, and that the health sector, in compari-son, struggles to grapple with sustainable procurement at all. In a follow-up study capturing the international arena, Brammer and Walker again investigated the
focus within the sustainability agenda [18]. They found that sourcing goods from small and local businesses have a greater priority than ‘environmental’ criteria. Studies contrast starkly with the focus group sessions held by Walker and Phillips, where ‘moving-on’ from a focus on the environmental sphere was one of four key themes, with discussion centering around overcoming both social and economic concerns [19].
A lack of consensus on defining sustainable develop-ment is therefore a key barrier, alongside balancing the competing agenda of local versus environmental versus cost. Across the public sector as a whole, economic con-cerns are prevalent. In reviewed academic papers, finan-cial concerns such as value-for-money and cost/price were cited as the main barriers for implementation [15–20]. The perception appears to be that sustainable procurement entails higher costs because it also has to deliver against a set of sustainability criteria. However, as Hidson and Clement write, “…upon closer inspection, this generalization does not hold true. Undertaking [sus-tainable procurement] should in the medium term be cost neutral and in the longer term actually save money. In many cases the greener alternative is even available at the same cost” [20].
There is also consensus that leadership and senior commitment within organizations are key to sustainable procurement [15–20]. With support from the manage-ment of an organization, finances can be made available for products and services that may initially cost more, but may deliver short-term sustainability objectives as well as medium- and long-term financial benefits.
Other common themes identified included the need for better information on the claims made by suppliers about their products and services [15,16,18–20]. Procure-ment practitioners suggested that, without being edu-cated to a level whereby they can objectively evaluate claims themselves and without a set of standards or an approvals body to verify the claims for every product or service, they were not sure who or what to trust. This point was further amplified by the success of the Energy Star campaigns in the USA, EU and the Government Buying Standards in the UK. It was also noted that suc-cess in organizations, whereby procurement had begun to deliver against the sustainability agenda, was largely down to the personal commitment and drive of a small number of individuals within the organization, at the operational level [15,16,18].
Although the number of studies and the number of questioned or interviewed practitioners involved in each study were small, the barriers and facilitators to achiev-ing sustainable procurement identified were clear and most certainly recognized common themes across the studies. Achieving sustainable procurement, balancing environmental, economic and social concerns, is proving
Key terms
Consumption-based carbon footprint: Considers the upstream embedded emissions caused by the production of goods and services consumed by a defined population or activity, independent of whether the emissions occur inside or outside the geographical or organizational borders of the population or activity of interest. The consumption-based perspective assumes full consumer responsibility. In contrast, production-based carbon accounts estimate GHG emissions occurring within a geographically or organizationally defined area assuming full producer responsibility and ignoring industries located upstream in the supply chain.
Institutional change: As used in this paper, refers to changes in value systems, in informal and formal norms and rules of behavior not only between agents but also between agents and organizations. Changes in rules may take place as a result of conscious decisions of individuals or may evolve over time as people develop shared understandings on what particular actions may, must or must not be done in specific situations.
Value-for-money: Buying a product with the lowest whole life cost that is fit for purpose and meets specification.
Carbon Management (2013) 4(2) future science group144
Research Article Bull, Ozawa-Meida, Brockway & Holland

a challenge too, with different sections of the public sector prioritizing and making in-roads with different objectives.
MethodologyThe objectives of this research project were not only to implement a ‘user-friendly’ ICT tool that provides information about the GHG emissions associated to goods or services being purchased, but also to engage staff in behavior change initiatives towards sustainable consumption by informing system users of the environ-mental impact of decisions related to procurement. The following subsections describe the development of the ICT tool and the staff engagement.
� Development of the ICT toolPROCO2 vision The vision for the PROCO
2 project was to develop an
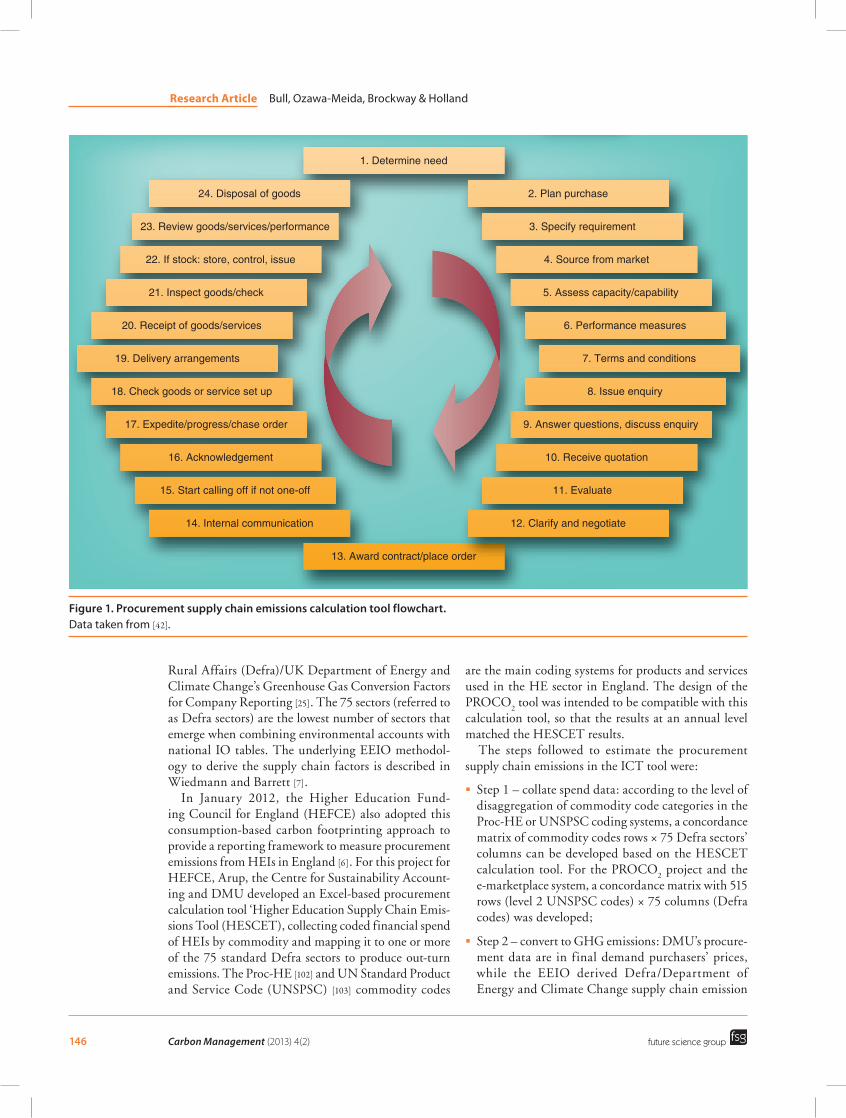
ICT tool that would allow staff to assess the carbon impact of their purchasing decision within the pro-curement cycle; that is, embed a culture of sustainable procurement through an ICT tool as part of DMU’s purchase workflow. To develop the ICT interface that would allow DMU’s procurement staff to view the carbon impact of their purchase decision, either at the sourcing stages (steps 4–12; Figure 1) or after their pur-chase (steps 14 onwards; Figure 1), two potential options were proposed: a real-time prerequisition webpage or a post-event GHG calculator and sustainability feedback. Figure 1 illustrates the complete cycle for a generic pro-curement (from a request of stationery to the business plan for major works).
Unfortunately, at the same time PROCO2 com-
menced, DMU purchased an e-marketplace web- platform procurement system (referred to as e-market-place), to provide DMU staff members with a ‘one-stop shop’ to raise requisitions and invoicing. Conflicting timescales and commercial conflicts of interest meant that integrating the PROCO
2 ICT tool within the new
e-marketplace system was not possible, leaving the only feasible solution as a stand-alone ICT webpage display-ing GHG and financial data and custom user-focused reports.
Procurement supply chain emissions estimation approachProcurement supply chain emissions are commonly estimated using either a life cycle assessment (LCA) approach or an environmentally extended input–output (EEIO) ana lysis. LCA or process ana lysis is generally used for the assessment of individual prod-ucts [21], where each product has a separate emissions calculation based on particular characteristics of the specific manufacturing processes, such as fuel mix or
types of materials used in produc-tion. In contrast to this ‘bottom-up’ approach, an EEIO ana lysis is an economy-wide, top-down approach [22], which is more typically applied to organizational carbon footprints due to its breadth of coverage [1,4]. It utilizes economic environmental accounting frameworks to map the structural components of the direct and indirect demand of resources, and attributes the resource use to the final demand. An EEIO model follows the flow of environmental footprints along upstream supply and production chains in a similar manner that an economic input–output (IO) model follows the flow of money or costs from production to consumption, leading to a con-sumption-based carbon footprint [22]. Both methods have disadvan-tages – EEIO offers a good overview of an organization’s footprint but lacks detailed granularity as it cal-culates emissions at product group level, while LCA is more time con-suming and can involve systematic errors caused by the truncation of the life cycle system by a finite boundary [23]. To help solve these issues, more recent attention has been focused on ‘hybrid’ EEIO–LCA approaches [22,24]. For example, a tiered hybrid approach combines the greater granularity of bottom-up primary and secondary LCA process data in the lower order stages of the product system (direct emissions and some key inputs), while higher order requirements are covered by the IO data that consider large numbers of supply chain systems in an entire economic system, thereby significantly reducing the systematic truncation problem in LCA [24].
The EEIO calculation approach was adopted in this research project as the innovation of the PROCO
2 proj-
ect was centered on the adoption and integration of a carbon ICT tool in the procurement department, rather than developing a pioneering calculation methodology; therefore, the EEIO approach was already established in the university sector [1,6] and considered the most practical to use covering the wide range of products and services required. The basis of emissions estima-tions was to convert DMU’s expenditure on goods and services to equivalent GHG emissions using the pub-licly available (an annually updated) supply chain emis-sions factors for 75 sectors provided in the guidelines to the UK Department for Environment, Food and
Key terms
Procurement cycle: Constituted by a series of steps that must take place to supply a production line or to replenish stock in an organization. Key stages within the cycle are sourcing, deciding for what, by whom, when and through which suppliers to approach markets for goods and services; contract management aimed at ensuring that suppliers deliver as required by the contract potentially involving different stages, such as pretender/tender stage, specifications stage, award stage and the execution of the contract; ‘purchase to pay’, the set of processes which communicate approval to spend, the specification, timing and pricing, which effects invoicing, receipt and payment; and supplier relationship management, which defines the set of behaviors to adopt with each supplier or set of suppliers.
Organizational carbon footprint: The amount of GHG emissions directly and indirectly emitted by an organization, considering all relevant sources in both consumption and production within a specified spatial and temporal system boundary. All six GHGs of the Kyoto Protocol are included and expressed in CO
2-e.
Integrating an ICT carbon calculator tool into procurement processes Research Article
future science group www.future-science.com 145
Rural Affairs (Defra)/UK Department of Energy and Climate Change’s Greenhouse Gas Conversion Factors for Company Reporting [25]. The 75 sectors (referred to as Defra sectors) are the lowest number of sectors that emerge when combining environmental accounts with national IO tables. The underlying EEIO methodol-ogy to derive the supply chain factors is described in Wiedmann and Barrett [7].
In January 2012, the Higher Education Fund-ing Council for England (HEFCE) also adopted this consumption-based carbon footprinting approach to provide a reporting framework to measure procurement emissions from HEIs in England [6]. For this project for HEFCE, Arup, the Centre for Sustainability Account-ing and DMU developed an Excel-based procurement calculation tool ‘Higher Education Supply Chain Emis-sions Tool (HESCET), collecting coded financial spend of HEIs by commodity and mapping it to one or more of the 75 standard Defra sectors to produce out-turn emissions. The Proc-HE [102] and UN Standard Product and Service Code (UNSPSC) [103] commodity codes
are the main coding systems for products and services used in the HE sector in England. The design of the PROCO
2 tool was intended to be compatible with this
calculation tool, so that the results at an annual level matched the HESCET results.
The steps followed to estimate the procurement supply chain emissions in the ICT tool were:
� Step 1 – collate spend data: according to the level of disaggregation of commodity code categories in the Proc-HE or UNSPSC coding systems, a concordance matrix of commodity codes rows × 75 Defra sectors’ columns can be developed based on the HESCET calculation tool. For the PROCO
2 project and the
e-marketplace system, a concordance matrix with 515 rows (level 2 UNSPSC codes) × 75 columns (Defra codes) was developed;
� Step 2 – convert to GHG emissions: DMU’s procure-ment data are in final demand purchasers’ prices, while the EEIO derived Defra/Department of Energy and Climate Change supply chain emission
1. Determine need
13. Award contract/place order
14. Internal communication
15. Start calling off if not one-off
16. Acknowledgement
17. Expedite/progress/chase order
18. Check goods or service set up
19. Delivery arrangements
20. Receipt of goods/services
21. Inspect goods/check
22. If stock: store, control, issue
23. Review goods/services/performance
24. Disposal of goods 2. Plan purchase
3. Specify requirement
4. Source from market
5. Assess capacity/capability
6. Performance measures
7. Terms and conditions
8. Issue enquiry
9. Answer questions, discuss enquiry
10. Receive quotation
11. Evaluate
12. Clarify and negotiate
Figure 1. Procurement supply chain emissions calculation tool flowchart. Data taken from [42].
Carbon Management (2013) 4(2) future science group146
Research Article Bull, Ozawa-Meida, Brockway & Holland
factors are in 2006 basic prices. To transform procurement data from purchasers’ into basic prices, the DMU spend data was first def lated to 2006 prices (by removing year on year average UK infla-tion) and then UK direct taxes and distribution mar-gins (same average factor across all sectors) were removed, to translate prices to basic expenditure values;
� Step 3 – output emissions: spend data are then multiplied by their corresponding supply chain emission factors to obtain the emissions. Finally, they are aggregated in relevant procurement categories for the HE sector: construction; business services; ICT; paper products; food and catering; manufactured fuels, chemicals and gases; pharmaceutical, medical and precision instruments; other manufactured products; and other procurement.
� Staff engagementThe methods used to engage staff around the devel-opment of the ICT tool and explore the awareness of sustainability amongst procurement staff were through using a ‘champion’, reference group and survey.
ChampionThe language of the ‘champion’ can be linked to theo-ries of the ‘change agent’ [26]. Key characteristics of a champion are someone willing to take risks, be enthu-siastic and be creative with resources [26,27]. The role is certainly one that encompasses a complex interplay of personal characteristics, experience and network-ing opportunities. The champion must have the right personality and be in the right position. DMU’s Head of Procurement was willing to act as our champion as he very clearly had both passion for this agenda, as well the authority to take decisions.
Reference groupA reference group is defined as an individual or group of people that can significantly influence an individu-al’s behavior [28]. In this research, the reference group was used as the main method of staff engagement based on the premise that engaging all those involved in the specific issue, the decision-making process is enhanced; and decisions are more legitimate and lead to better results [29,30]. Reference groups may be able to influ-ence the decision-making related to a new practice in an organization depending on the phase of its diffusion process [31], where actors are both seeking and evaluat-ing the information in order to reduce the uncertainty associated with the new practice.
The reference group consisted of eight DMU staff predominantly from central finance and procurement departments, and staff from three pilot departments
(Estate Department, Student Services and Finance Department) already involved in the implementation of the new e-marketplace system. The reference group were recruited to input into the design of the ICT tool and outline the features they would find useful and relevant in the interface. These users would be the primary end-users of the PROCO
2 tool.
Three reference group meetings were held at differ-ent stages of the project with the following high-level objectives: to explore the end-users’ aspirations for an ICT tool that provides feedback on the GHG impact of procurement decisions (meeting 1), obtain feedback on the content and appearance of the first iteration of the tool (meeting 2) and discuss the ability of the tool to achieve the objectives set out in the previous refer-ence group meetings as well as raise awareness about the rollout of the final tool (meeting 3).
Eight participants attended the first reference group meeting, which was essential to gain views on the target end-user audience and their requirements. Key themes identified in this first meeting are displayed in Table 1. On the basis of the feedback provided by the reference group, a number of design points were considered and incorporated into the tool, prior to the second reference group session.
The second reference group meeting provided a dem-onstration for the eight attendees of the first iteration of the PROCO
2 tool. Participants perceived that the
tool was simple to use and the reports allowed moni-toring performance improvements across time and across faculties/departments. However, they suggested incorporating a status indicator for the emissions figure produced by the calculator and further information on how to interpret emissions data. In terms of end-users, participants recommended that the tool should be used by those who request the purchase in the first place, not just the ones that procure the product through the sys-tem. Ultimately, the reference group wanted to be able to compare products and suppliers, which was not pos-sible as the 75 Defra carbon factors are product aver-ages and therefore do not allow differentiation between different products in the same category, except on the basis of spend. On the basis of the feedback received, the following changes were incorporated in the final version of tool: a carbon intensity gauge, beside the absolute emissions, to visually indicate where the com-modity being procured stands in terms of GHG emis-sions per pound spent; combined reports containing more of the information that users wanted in a single document; and provision of a simple, nontechnical ‘frequently asked questions’ section that can answer questions that new users to the tool were likely to have, both in relation to the purpose of the tool and how to use it and interpret the information.
Integrating an ICT carbon calculator tool into procurement processes Research Article
future science group www.future-science.com 147

The final reference group meeting provided feedback on how the group’s suggestions from the previous two meetings were incorporated and trained end-users (five attendees) on how to navigate the tool.
SurveyA survey was developed by the behavior change experts in the PROCO
2 team to explore the awareness of sus-
tainability amongst a pilot group of the procurement team in the three departments. The same survey was applied prior to the PROCO
2 tool going live to provide
a baseline assessment and then again after the tool had been live for 2 months to assess any changes in their attitudes towards sustainable procurement after using the tool.
The survey asked respondents to rate from the most important to the least important six factors that cur-rently inf luence their procurement decisions: cost, supplier, delivery time, performance of the product, product brand and environmental considerations. They were then asked to re-evaluate the same six factors, but this time to give their opinion on the importance of each for future procurement decisions. The survey also asked about the respondents’ awareness of existing pro-curement tools for sustainable procurement decision- making, such as the Government Buying Standards [104], the Forum for the Future’s Sustainable Procure-ment Toolkit [105], Jisc Procureweb [106], the Sustainable
Procurement Centre for Excellence [107], the Energy Star Rating [108] and DMU’s internal Sustainable Pro-curement Policy. Finally, the survey also explored the attitudes of the respondents towards environmental issues and procurement by asking them to subjectively evaluate their perceptions of the statements shown in Box 1 in a Likert scale ranging from strongly disagree to strongly agree.
ResultsThe following subsections describe the final design of the tool based on the feedback received from the reference group and changes in the awareness of sustainability amongst procurement staff based on the survey responses.
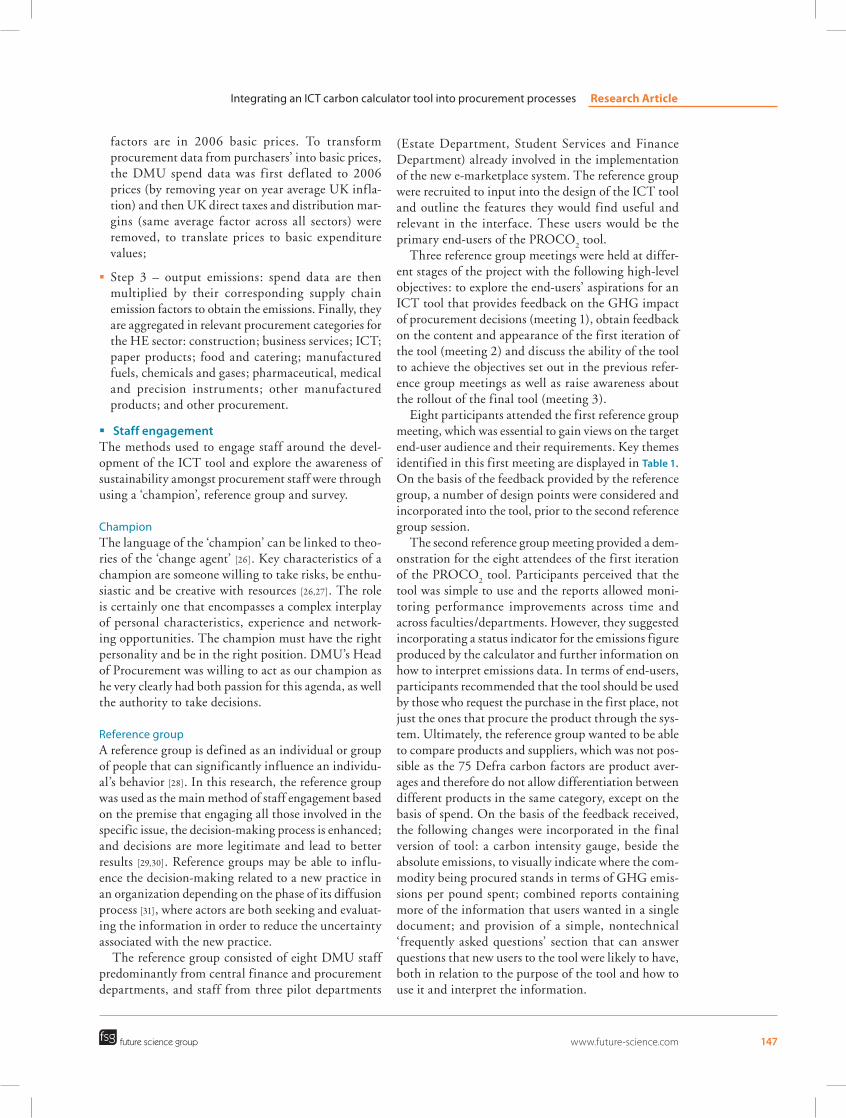
� Final design of the ICT toolFollowing the staff engagement exercises and from the feedback received it was decided to develop a web application interface multiplatform, compatible with all web browsers and have a user-friendly interface that resembled a ‘tachograph’ ranging from green (good) to red (bad). This interface was made available as a webpage and accessible to all members of staff, stu-dents and the public (a screenshot of the webpage is illustrated in Figure 2) [109]. The main outputs were a simplified GHG procurement emissions calculator and user-focused reports. Data outputs were provided in
Table 1. Key themes identified in the first reference group meeting.
Questions Key themes
What information would you like the tool to display?
� A simple tool that is user-friendly � Cost versus green information displayed side by side to enable
comparisons of products � Choice of other, greener products � Information on the green credentials of suppliers � Interdepartmental performance to enable comparisons across
departments in the university to be drawn How would you like information to be displayed?
� Simple data, in layman terms easily understandable by someone with no prior knowledge of carbon emission calculations
� Monthly reporting with both inter- and intra-departmental dataWhere/how would you like to access this information/system?
� Ideally in the e-marketplace system � As part of the authorization process of the purchase orders in the
procurement cycle � Standalone page on De Montfort University’s intranet
Who has the most influence over procurement decisions?
� Centralized departments (e.g., procurement office) � Strategic (e.g., Vice Chancellor and Heads of Department) � Operational (e.g., academic budget holders, finance administrators) � Other (e.g., technical budget holders)
What are the most influential factors driving procurement decisions?
� Cost � Product capability/performance � Speed of service/delivery � Brand � List of preferred suppliers
Carbon Management (2013) 4(2) future science group148
Research Article Bull, Ozawa-Meida, Brockway & Holland
many different representations including comparative (between departments, procurement categories) and independent (per commodity code, per order).
Following widely accepted guidelines and protocols, emissions related to energy and water are calculated using known energy consumption (kWh) and water used (m3), while travel emissions calculations are based on estimates of distance traveled (km or passenger-km) [10,32–36]. These emissions are estimated separately from the ICT tool.
Emissions calculatorThe ‘calculate your emissions’ was a simple but fast cal-culator function that allowed users to select a particular commodity from a predefined selection dropdown list (based on the UNSPSC level 2 codes), allowing the user to enter the amount of spend and get the emissions results by a click of a button. The results were shown
in absolute emissions in kg CO2-e and in a graphical
representation showing the carbon intensity of the selected commodity in kgCO
2-e/£ spent.
A comparison of absolute emissions associated with common activities was provided in order that the users can relate the magnitude of the procurement supply chain emissions of the commodity they are purchas-ing. For example, procurement emissions are compared with energy- or transport-related emissions from days of continuous use of a PC, return flights from London to New York, boiling water for cups of tea and return train journeys from Leicester to London.
The carbon calculator also showed the car-bon intensity of the goods or services purchased. A green/amber/red ‘tachometer’ gauge system was used to illustrate the carbon intensities of the commodi-ties. In the case of DMU, the carbon intensities of the frequently procured commodities range from 0.12 to
Box 1. Survey questions related to attitudes towards environmental issues and procurement.
� Q1. GHGs are emitted in the manufacture and supply of goods and services that DMU procures. � Q2. Where possible, I feel personally obliged to choose energy efficient, recycled, locally sourced, organic and/or fair trade products. � Q3. I feel morally obliged to consider environmental issues when making procurement decisions. � Q4. If I thought that DMU was considering environmental issues in procurement, then I would be motivated to do the same. � Q5. I want to do more to help DMU consider environmental issues when making procurement decisions, but I can’t. � Q6. When DMU procures goods and services, environmental damage is caused. � Q7. I feel personally responsible to bear environmental issues in mind when making procurement decisions. � Q8. I do not have the information available to consider environmental issues when making procurement decisions.
DMU: De Montfort University; Q: Question.
Figure 2. Screenshot of the information communication technology tool.
Integrating an ICT carbon calculator tool into procurement processes Research Article
future science group www.future-science.com 149
3.37 kg CO2-e/£ spend. Boundaries between the gauge
system colors (green, amber and red) were set according to the 25th, 50th and 75th percentiles of the carbon intensities of the commodities bought by DMU. The system worked as follows:
� The green light range (below 0.4 kg CO2-e/£)
depicted commodities with low carbon intensities, usually associated with business services such as legal services and consultancies;
� The amber light range (0.4–1.15 kg CO2-e/£)
showed low and medium carbon-intensive products such as cleaning equipment and supplies, laboratory and scientific equipment, office supplies, food and beverages, and low-carbon modes of transport (e.g., rail);
� The red light range (1.15–2 kg CO2-e/£) illustrated
high carbon intensive products such as plastics, glass and ceramics, meat and poultry products, tools and hardware, and modes of transport (e.g., road);
� The purple light range (above 2 kg CO2-e/£) pointed
out the commodities and modes of transport with the highest carbon intensities such as chemicals, fer-tilizers, alloys and basic metals, and air transport, among others.
ReportsIt was decided that the best way of representing the data and getting the staff members engaged was to provide relevant user-focused reports that covered all hierarchies of different possible users of PROCO
2
reports, such as the Environmental and Sustainability Officer, the Estates Director, the Head of Procurement and Faculties’ Deans, among others. To align with other reporting mechanisms, the design of the reports was made as compatible as possible with periodic environmental reports provided to DMU staff, such as the Quarterly Energy Reports.
A web-analytics tool was used to track the num-ber of visitors using the PROCO
2 webpage (emissions
calculator and reports). The total number of visits to the webpage since its launch on 15 March 2012 up to 17 May 2012 were 141 visits from approximately 80 people (76.8% of the visits were conducted in Leices-ter and 47.5% were returning visitors). During the same period, 211 purchase orders were raised in the e-marketplace system by 21 authorized staff. However, it was not possible to know if the staff investigated the carbon content of their purchases before or after plac-ing the order, as the web-analytics tool only provided general details of the visits. Although participants of the reference group suggested reviewing the carbon content within the authorization process of purchase
orders (Table 1), this step was not included to avoid administrative burdens or delays in the procurement workflow.
� Awareness of sustainability amongst procurement staffEvaluation of the project in terms of awareness raising and behavior change on the DMU staff was measured by conducting a survey to a pilot group of procure-ment users prior (baseline) and after (follow-up) the ICT tool was available, to see if attitudes towards sus-tainable procurement had changed in any way. The questionnaire used in the baseline survey was the same as was used for the follow-up survey, verbatim. The survey was published online in both occasions and the link was sent by email to 50 staff of the three pilot departments. The baseline survey received 16 responses (32% response rate), while the follow-up survey elicited eight responses (16%). Due to the low response rates, particularly for the follow-up survey, reminder emails were sent to the 50 staff on two further occasions.
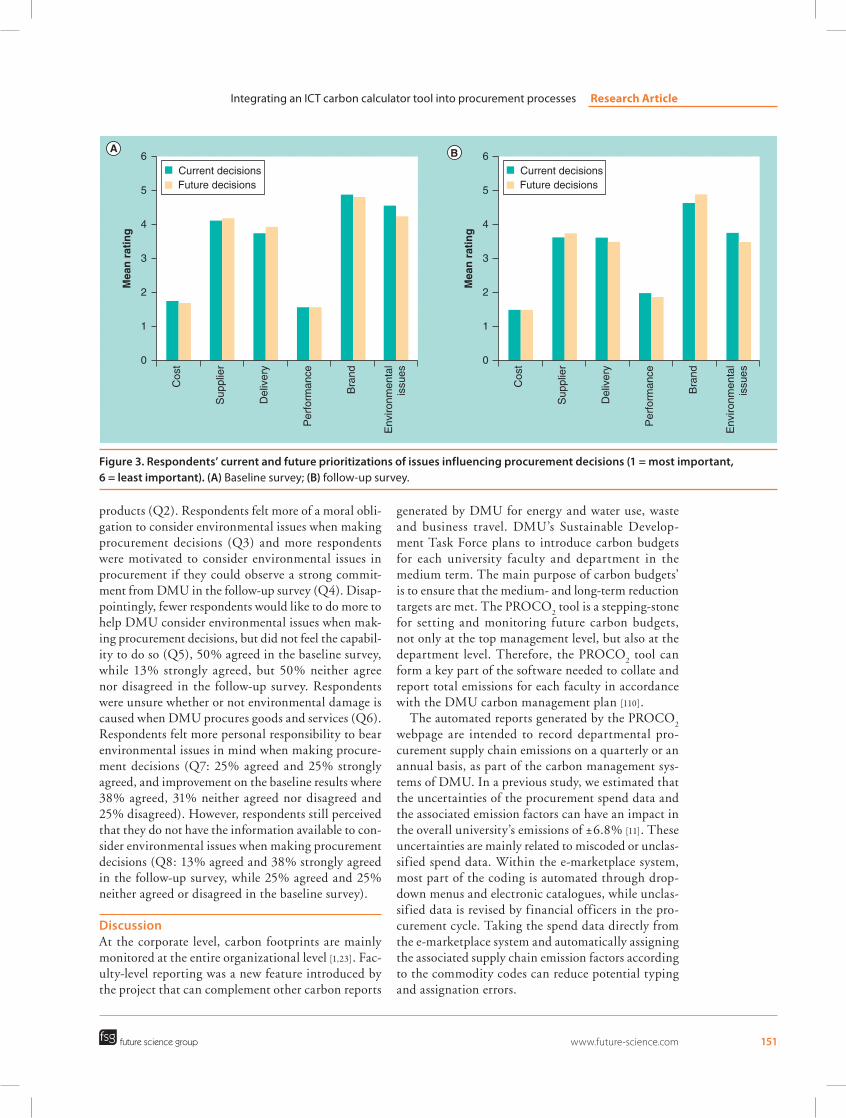
Exploring both current and future prioritizations of factors that influence procurement decisions, such as cost, supplier, delivery, performance, brand and envi-ronmental issues, provided an opportunity to explore staff attitudes towards the importance of these issues, unconstrained by circumstances. Figure 3 illustrates that environmental aspects were considered the second least important factor in procurement decisions now and in the future in the baseline survey. The pattern of responses was very similar in the follow-up survey. Again, cost and performance appeared to be the prior-ity both in current and future scenarios. An interesting change in the follow-up survey was that respondents believed that environmental issues should be a joint third priority along supply and delivery. Brand was considered the least important factor.
With regards to sustainable procurement tools, respondents were aware of the UK Government Buy-ing Standards and the Jisc Procureweb, but the most popular in terms of awareness and use were the Energy Star Rating and DMU’s Sustainable Procurement Policy.
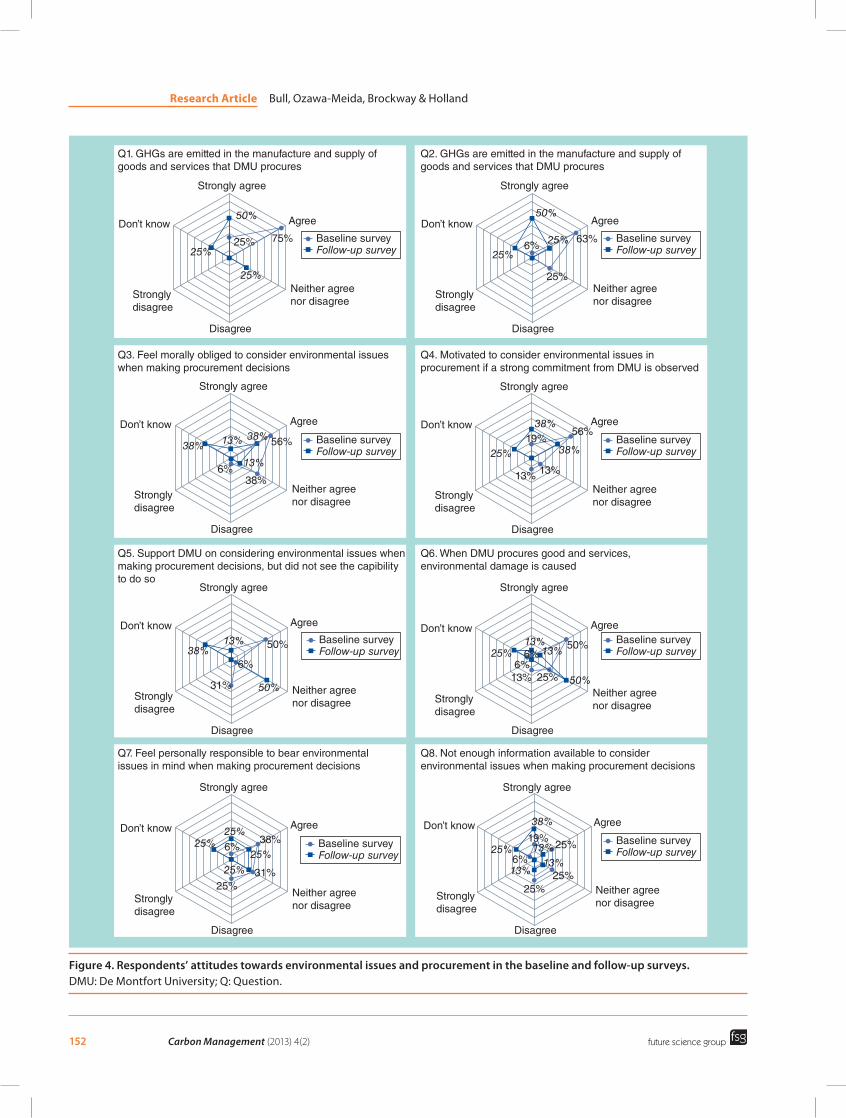
Finally, some changes were observed in the attitudes of the respondents towards environmental issues and procurement before and after the online tool was avail-able (Figure 4). In the follow-up survey, respondents agreed more strongly about the emissions of GHGs in the manufacture and supply of goods and services that DMU procures (Question [Q]1; see Box 1 for all). Overall, all respondents agreed slightly stronger about considering the purchase of energy efficient, recycled, locally sourced, organic and/or fair trade
Carbon Management (2013) 4(2) future science group150
Research Article Bull, Ozawa-Meida, Brockway & Holland
products (Q2). Respondents felt more of a moral obli-gation to consider environmental issues when making procurement decisions (Q3) and more respondents were motivated to consider environmental issues in procurement if they could observe a strong commit-ment from DMU in the follow-up survey (Q4). Disap-pointingly, fewer respondents would like to do more to help DMU consider environmental issues when mak-ing procurement decisions, but did not feel the capabil-ity to do so (Q5), 50% agreed in the baseline survey, while 13% strongly agreed, but 50% neither agree nor disagreed in the follow-up survey. Respondents were unsure whether or not environmental damage is caused when DMU procures goods and services (Q6). Respondents felt more personal responsibility to bear environmental issues in mind when making procure-ment decisions (Q7: 25% agreed and 25% strongly agreed, and improvement on the baseline results where 38% agreed, 31% neither agreed nor disagreed and 25% disagreed). However, respondents still perceived that they do not have the information available to con-sider environmental issues when making procurement decisions (Q8: 13% agreed and 38% strongly agreed in the follow-up survey, while 25% agreed and 25% neither agreed or disagreed in the baseline survey).
DiscussionAt the corporate level, carbon footprints are mainly monitored at the entire organizational level [1,23]. Fac-ulty-level reporting was a new feature introduced by the project that can complement other carbon reports
generated by DMU for energy and water use, waste and business travel. DMU’s Sustainable Develop-ment Task Force plans to introduce carbon budgets for each university faculty and department in the medium term. The main purpose of carbon budgets’ is to ensure that the medium- and long-term reduction targets are met. The PROCO
2 tool is a stepping-stone
for setting and monitoring future carbon budgets, not only at the top management level, but also at the department level. Therefore, the PROCO
2 tool can
form a key part of the software needed to collate and report total emissions for each faculty in accordance with the DMU carbon management plan [110].
The automated reports generated by the PROCO2
webpage are intended to record departmental pro-curement supply chain emissions on a quarterly or an annual basis, as part of the carbon management sys-tems of DMU. In a previous study, we estimated that the uncertainties of the procurement spend data and the associated emission factors can have an impact in the overall university’s emissions of ±6.8% [11]. These uncertainties are mainly related to miscoded or unclas-sified spend data. Within the e-marketplace system, most part of the coding is automated through drop-down menus and electronic catalogues, while unclas-sified data is revised by financial officers in the pro-curement cycle. Taking the spend data directly from the e-marketplace system and automatically assigning the associated supply chain emission factors according to the commodity codes can reduce potential typing and assignation errors.
Cos
t
Sup
plie
r
Del
iver
y
Per
form
ance
Bra
nd
Env
ironm
enta
lis
sues
Mea
n r
atin
g
A B6
5
4
3
2
1
0
Cos
t
Sup
plie
r
Del
iver
y
Per
form
ance
Bra
nd
Env
ironm
enta
lis
sues
Mea
n r
atin
g
6
5
4
3
2
1
0
Current decisionsFuture decisions
Current decisionsFuture decisions
Figure 3. Respondents’ current and future prioritizations of issues influencing procurement decisions (1 = most important, 6 = least important). (A) Baseline survey; (B) follow-up survey.
Integrating an ICT carbon calculator tool into procurement processes Research Article
future science group www.future-science.com 151
Strongly agree
Don’t know
Stronglydisagree
Disagree
Neither agreenor disagree
Agree
Strongly agree
Don’t know
Stronglydisagree
Disagree
Neither agreenor disagree
Agree
Strongly agree
Don’t know
Stronglydisagree
Disagree
Neither agreenor disagree
Agree
Strongly agree
Don’t know
Stronglydisagree
Disagree
Neither agreenor disagree
Agree
Baseline surveyFollow-up survey
Baseline surveyFollow-up survey
Baseline surveyFollow-up survey
Baseline surveyFollow-up survey
Baseline surveyFollow-up survey
Baseline surveyFollow-up survey
Baseline surveyFollow-up survey
Baseline surveyFollow-up survey
Q3. Feel morally obliged to consider environmental issueswhen making procurement decisions
Q4. Motivated to consider environmental issues inprocurement if a strong commitment from DMU is observed
Q6. When DMU procures good and services,environmental damage is caused
Q5. Support DMU on considering environmental issues whenmaking procurement decisions, but did not see the capibilityto do so
Q7. Feel personally responsible to bear environmental issues in mind when making procurement decisions
Q8. Not enough information available to consider environmental issues when making procurement decisions
Strongly agree
Don’t know
Stronglydisagree
Disagree
Neither agreenor disagree
Agree
38%
6%
13% 38%
13%
56%
38%
38%
25%
13% 13%
19%38%
56%
13%25%
6%13% 25% 50%
50%13%
25%25%
25%
25%6%
38%
31%25%
38%
25%
25%25%
13%13%
13%25%19%
6%
6%
Strongly agree
Don’t know
Stronglydisagree
Disagree
Neither agreenor disagree
Agree
13%38%
31% 50%
50%
6%
Strongly agree
Don’t know
Stronglydisagree
Disagree
Neither agreenor disagree
Agree
Strongly agree
Don’t know
Stronglydisagree
Disagree
Neither agreenor disagree
Agree50%
25% 75%
25%
25%
Q1. GHGs are emitted in the manufacture and supply ofgoods and services that DMU procures
Q2. GHGs are emitted in the manufacture and supply ofgoods and services that DMU procures
25%25%
50%
63%
25%
6%
Figure 4. Respondents’ attitudes towards environmental issues and procurement in the baseline and follow-up surveys. DMU: De Montfort University; Q: Question.
Carbon Management (2013) 4(2) future science group152
Research Article Bull, Ozawa-Meida, Brockway & Holland
Several key limitations in the calculator tool and estimation methodology remain. First, the calculator uses ‘product-average’ emission factors, which means that variation in the emissions of products within a product group remain hidden. For example, one cat-egory is paper, meaning it is not possible to distinguish between paper from virgin forests and recycled paper. Another way of viewing this limitation of the con-sumption-based carbon footprint approach is to mean ‘more money, more emissions’. Second, the tool used UK Defra factors, which are ‘weighted’ factors for products consumed in the UK considering domestic production and overseas imports for intermediate con-sumption using a two-region IO model (UK and rest of the world) [7,25]. The two-region IO model accounts for international supply chain contributions and allo-cates all trade to final consumption [7,37,38]. The future ability to choose overseas factors (when country of origin for specific products is known) would be useful. Third, and most importantly in this project, was that the calculator did not suggest alternative (lower car-bon) alternatives within a product group. Therefore, the tool became seen as a useful awareness-raising tool rather than for decision-making. A solution to these issues lies in the development of more sophisticated hybrid EEIO–LCA models, to allow differentiation by product and country while retaining the EEIO sec-tor hierarchy. Calculation tools can then be designed to suggest alternative products to match given sus-tainability criteria (e.g., recycled versus virgin paper). However, currently even hybrid models would not give the level of detail to distinguish brands within precise products (i.e., emissions difference between suppliers of recycled paper).
In terms of institutional change, three aspects became evident for ‘re-engineering’ organizational processes towards sustainable procurement. First, the need to incorporate sustainability into the mainstream direction and management tools of an organization, an ‘add-on’ such as the PROCO
2 tool running alongside
the mainstream procurement system is always going to have limited effect. Second, the implementation of the e-marketplace system was a massive change in several aspects of the procurement processes and prac-tices within DMU, including the elimination of paper requisition forms, changes from the commodity code systems, revision of work f lows, engaging with suppli-ers for their registration in the new system, commu-nication of the new system with the existing financial system and the ability to change from paper invoices to e-invoicing, among other changes. Although we perceived this massive change as an opportunity to embed sustainability issues in the new system and in the revised workf lows, the change was complex
within the procurement practices and sometimes end-users were confused regarding the e-marketplace implementation and the PROCO
2 project.
Finally, the support of the champion, particularly in the Procurement Department, was a key issue in dif-ferent projects related to DMU’s carbon footprint [11] and the HEFCE guidelines to measure and report pro-curement supply chain emissions [6]. The close interac-tion of the team with the Senior Advocate champion allowed us to learn about the procurement practices not only within the university, but also at the purchasing consortium level and the HE sector. The involvement and guidance of the Head of Procurement (our cham-pion) in these projects, including the PROCO
2 project,
were crucial as various recommendations provided in several project reports were embedded in the procure-ment processes and operations of DMU. It was also observed that through the ‘lead by example’ attitude of the champion, procurement staff at different levels increased their awareness on environmental initiatives as well as practices towards sustainable procurement. This leadership and senior commitment has been high-lighted by other procurement practitioners as key to sustainable procurement [15–20].
Unfortunately, due to unforeseen circumstances, the Head of Procurement left the university midway through the project and was replaced by a consultant on a temporary contract. This had a significantly det-rimental impact on the success of the project and some of the initiatives lost momentum. Subsequently, the implementation of the new e-marketplace system was cancelled before it was fully rolled-out in the university and the outcomes of the PROCO
2 are at risk of losing
continuity.
ConclusionThe PROCO
2 project’s original aim was to re-engineer
procurement and re-imagine DMU by reducing the carbon footprint of our procurement supply chain emissions. Several challenges were encountered, but these served to illustrate how this aim should serve as an ultimate goal for the sector and re-enforce the value of our findings. Key outcomes included the design of an online carbon calculator enabling staff to view the carbon emissions of their purchasing decisions, a reporting tool allowing departments to compare their procurement supply chain emissions by department and spend category, and valuable insights into the nature of institutional change for sustainability.
The ICT tool was able to be developed based on an accepted procurement supply chain emissions calculation methodology, which is currently being used by HEIs across England to monitor their procurement-related emissions [6]. Launch of the ICT tool was over-shadowed
Integrating an ICT carbon calculator tool into procurement processes Research Article
future science group www.future-science.com 153
by the significant change in procurement processes and practices within the university; the complexity and fatigue of this change may have reduced staff use of the stand-alone webpage separated from the e-marketplace system. This change, coupled with our inability (due to commercial conflict of interests) to embed the tool within the user’s new procurement processes/procure-ment cycle impacted on the take-up of the tool. It is essential that the carbon accounting upstream is rooted within the existing or future procurement and financial systems of the organizations. This systems’ integration requires cross-sector collaboration with the main soft-ware providers, so that the carbon element is embedded in their tools through dynamic and real-time interfaces.
Similar to the findings of procurement practitioners [15–20], it was also observed that cost is the main driver in procurement teams and environmental aspects still have a very low priority. Sustainable procurement is not part of the agenda of procurement teams yet and an informa-tion tool may not be enough to affect change without work first to educate procurement staff. Leadership and senior commitment are key to sustainable procurement. Top management can create more effective awareness for new ICT systems and environmental initiatives by communicating their benefits to their staff. Through the ‘lead by example’ attitude of senior management, practices towards sustainable procurement may be better promoted.
Future perspectiveIn line with the targets for the HE sector in England as a whole, universities have set reduction targets for their energy-related emissions occurring in their owned or controlled sources (Scope 1 and 2 emissions). Setting departmental carbon budgets may aim to limit the total GHG emissions that institutions emit over a specified time, similar to the current UK GHG accounting and reporting framework that includes 5-year carbon budget periods. Carbon budgets’ main purpose is to establish a pathway to ensure that the medium- and long-term reduction targets are met. Once a system of carbon bud-gets has been established, every tonne of GHG emissions counts and needs to be rigorously monitored. If some emissions increase in particular sources (e.g., buildings or departments) or categories (e.g., energy or business travel), other emissions would need to decrease. Depart-mental carbon budgeting may become a strategy for embedding sustainability into the organization’s man-agement practices. Equity concerns, administrative fea-sibility and staff acceptance need to be considered when allocating emissions limits to different departments.
It is important to recognize the limitations of the EEIO carbon footprint methodology in terms of using national ‘product-average’ emission factors that do not
reflect ‘product-level’ differences in carbon emissions, such as the purchase of recycled or virgin paper. For changing practices in the long term towards the con-sumption of less carbon-intensive products, it is required to collect bottom-up data from manufacturers and sup-pliers. An integrated hybrid approach can be used to collect these data in a systematic manner, start using spe-cific data for products considered relevant for the institu-tion and filling the inputs with IO data [24]. Gradually, when process-specific LCA data become available, these data can substitute the IO data to gain better resolution. Although the number of global databases of life cycle carbon footprints is growing [111], local data of suppliers procuring commodities to institutions and the HE sec-tor would be preferred, highlighting the need of engag-ing with suppliers to estimate the embodied emissions of the products or services they manufacture, source or sup-ply according to approved methodologies and standards to calculate the product carbon footprints of goods and services [39–41]. Some members of the reference group mentioned that environmentally friendly staff would be motivated to select suppliers on the basis of their green credentials or through environmental information of their products if the information is available.
AcknowledgementsThis project would not have been possible without the funding from Jisc and the willingness and belief of our trusted project manager, R Bristow. We would like to thank the professional work of members of the PROCO
2 team that provided significant contributions to the
project, including F Faruk, L Bache and K Letten. We would also like to thank the former Head of Procurement, K Dobson, and De Montfort University’s e-procurement project management team along with everyone who attended the reference group meetings. We would also like to thank the higher education experts in the procure-ment area, J Hamilton from the Sustainable Procurement Centre for Excellence and S Butcher from the Higher Education Funding Council for England, who provided project support and critical reviews of research reports.
DisclaimerThe accuracy of the reported research and the conclusions reached are the responsibility of the authors alone and not of Jisc, De Montfort University or Arup.
Financial & competing interests disclosureThe research reported on in this manuscript was funded by Jisc. The authors are contributing researchers. The authors have no other rel-evant affiliations or financial involvement with any organization or entity with a financial interest in or financial conflict with the subject matter or materials discussed in the manuscript apart from those disclosed.
No writing assistance was utilized in the production of this manuscript.
Carbon Management (2013) 4(2) future science group154
Research Article Bull, Ozawa-Meida, Brockway & Holland
Executive summary
Objectives � The aim of the ‘Reengineering Procurement by Reducing Carbon Dioxide Emissions and Enabling Sustainability’ (PROCO2) research
project was to re-engineer procurement and re-imagine De Montfort University (DMU) by reducing GHG emissions, mainly related to the procurement supply chain of products and services consumed in the university, through the development and implementation of an information communication technology (ICT) tool and database that links financial and environmental accounting for procurement.
� The project had the objective of engaging senior managers and procurement staff in behavior change initiatives towards sustainable consumption by informing system users of the environmental impact (in terms of GHG emissions) of decisions related to procurement and understand issues of organizational learning and institutional change.
Procurement supply chain emissions calculation approach � An environmentally extended input–output (EEIO) calculation approach was adopted to estimate emissions as it is easy to use and it is
currently the most practical to use covering a wide range of products and services. � A life cycle assessment or process ana lysis approach is particularly time-consuming and currently impractical for the higher education
sector, which would require ana lysis of many thousands of products and services that have been purchased in any year. � A key limitation of the EEIO approach is that ‘product-average’ emission factor values are used. This means they do not reflect ‘product-
level’ differences in consumption such as consumption of ‘ecofriendly’ products. In due course more sophisticated hybrid EEIO–life cycle assessment models may allow product-level differences to be identified, removing the average carbon intensity current limitation.
� For changing practices in the long term towards the consumption of less carbon intensive products, more specific methodologies considering the product carbon footprints of goods and services would be required.
The ICT tool � The ICT tool was developed as a post-event GHG calculator and sustainability feedback in a ‘stand alone’ web application interface. � A reference group consisting of DMU staff, predominantly from central finance and procurement departments as well as staff from three
pilot departments, guided the design and content of the ICT tool. � The main outputs of the ICT tool are a simplified GHG procurement emissions calculator (providing the absolute emissions and carbon
intensities of the selected commodity) and user focused reports (allowing comparison of emissions between time periods, departments and procurement categories).
� The automation of reports is useful functionality of the tool for monitoring consistently and more accurately the procurement supply chain emissions in an annual basis for the updates of the overall university’s carbon footprint.
� The tool is also a stepping-stone for setting and monitoring future carbon budgets in DMU, not only at the top management level, but also at the department level.
� The uptake of the ICT tool from staff for their procurement decisions was limited due to unforeseen internal complexities and because it was outside the main e-marketplace and financial system. A real-time prerequisition information tool is recommendable requiring cross-sector collaboration with the main software providers, so that the carbon element is embedded in their tools.
Staff awareness & institutional change � Cost/price is currently the main driver in procurement teams and environmental aspects are still not part of their agenda. As sustainable
procurement is not part of the agenda of procurement teams yet, an information tool may not be enough to affect change without work first to educate procurement staff.
� Leadership and senior commitment is a key to sustainable procurement. � There is a need to incorporate sustainability into the mainstream direction and management tools of an organization.
ReferencesPapers of special note have been highlighted as:n of interestnn of considerable interest
1 Baboulet O, Lenzen M. Evaluating the environmental performance of a university. J. Cleaner Prod. 18(12), 1134–1141 (2010).
2 Huang YA, Lenzen M, Weber CL, Murray J, Matthews HS. The role of input–output ana lysis for the screening of corporate carbon footprints. Econ. Syst. Res. 21(3), 217–242 (2009).
3 Huang YA, Weber CL, Matthews HS. Categorization of Scope 3 emissions for streamlined enterprise carbon footprinting. Environ. Sci. Technol. 43(22), 8509–8515 (2009).
4 Larsen H, Hertwich EG. Implementing carbon-footprint-based calculation tools in municipal greenhouse gas inventories. J. Ind. Ecol. 14(6), 965–977 (2010).
5 Sustainable Development Commission. Schools Carbon Footprinting. Scoping Study – Final Report. Sustainable Development Commission, London, UK (2006).
6 Arup, Centre for Sustainability Accounting, De Montfort University. Measuring Scope 3 Carbon Emissions – Supply Chain (Procurement). Higher Education Funding Council for England, London, UK (2012).
n Presents estimates of the supply chain procurement GHG emissions for the
higher education sector in England, using a consumption-based approach that includes the embedded emissions of the goods/services procured by the sector.
7 Wiedmann T, Barrett J. A greenhouse gas footprint ana lysis of UK Central Government. Environ. Sci. Policy 14(8), 1041–1051 (2011).
8 Brockway P. Carbon Measurement in the NHS: Calculating the First Consumption-Based Total Carbon Footprint of an NHS Trust. MSc dissertation, Institute of Energy and Sustainable Development, De Montfort University, Leicester, UK (2009).
Integrating an ICT carbon calculator tool into procurement processes Research Article
future science group www.future-science.com 155
9 Stockholm Environmental Institute, Arup. NHS England Carbon Emissions: Carbon Footprint Modelling to 2020. Stockholm Environmental Institute, Arup and NHS Sustainable Development Unit, London, UK (2009).
10 World Resources Institute, World Business Council for Sustainable Development. Corporate Value Chain (Scope 3) Accounting and Reporting Standard, Supplement to the GHG Protocol Corporate Accounting and Reporting Standard. World Resources Institute, Washington, DC, USA (2011).
11 Ozawa-Meida L, Brockway P, Letten K, Davies J, Fleming P. Measuring carbon performance in a UK University through a consumption-based carbon footprint: De Montfort University case study. J. Cleaner Prod. doi:10.1016/j.jclepro.09.028 (2011) (In press).
12 EC. Directive 2004/17/EC of the European Parliament and of the Council of 31 March 2004 coordinating the procurement procedures of entities operating in the water, energy, transport and postal services sectors. OJEU L 134, 1–113 (2004).
13 EC. Directive 2004/18/EC of the European Parliament and of the Council of 31 March 2004 on the coordination of procedures for the award of public works contracts, public supply contracts and public service contracts. OJEU L 134, 114–240 (2004).
n Directives 2004/17/EC and 2004/18/EC are the main pieces of EU procurement legislation that simplified and consolidated existing regulations for public supplies, works and service contracts, including how environmental and social criteria can be applied in awarding contracts. These directives apply only to purchases over high value thresholds.
14 Department for Environment, Food and Rural Affairs. Procuring the Future. Sustainable Procurement National Action Plan: Recommendations from the Sustainable Procurement Task Force. Department for Environment, Food and Rural Affairs, London, UK (2006).
n Explains the role of procurement in achieving sustainable development, what constitutes sustainable procurement and how to achieve it.
15 Walker H, Brammer S. Sustainable procurement in the United Kingdom public sector. Supply Chain Manage. 14(2), 128–137 (2009).
16 Thomson J, Jackson T. Sustainable procurement in practice: lessons in local
government. J. Environ. Plan. Manage. 50(3), 421–444 (2007).
n Provides an excellent overview of the history of policy and legislation on sustainable procurement.
17 Preuss L. Buying into our future: sustainability initiatives in local government procurement. Bus. Strat. Environ. 16, 354–365 (2007).
18 Brammer S, Walker H. Sustainable Procurement in the public sector: an international comparative study. Int. J. Oper. Prod. Manage. 31 (4) 452–476 (2011).
19 Walker H, Phillips W. Sustainable procurement: emerging issues. In: International Public Procurement Conference Proceedings. International Public Procurement Conference, Rome, Italy (2006).
20 Hidson M, Clement S. Driving sustainability through procurement: the Procura+ campaign. In: Third International Public Procurement Conference Proceedings. International Public Procurement Conference, Amsterdam, The Netherlands (2008).
21 Espinosa N, García-Valverde R, Krebs F. Life-cycle ana lysis of product integrated polymer solar cells. Energy Environ. Sci. 4, 1547–1557 (2011).
22 Wiedmann T. Carbon footprint and input–output analysis – an introduction. Econ. Syst. Res. 21(3), 175–186 (2009).
23 Wiedmann T, Lenzen M, Barrett J. Companies on the scale – comparing and benchmarking the sustainability performance of businesses. J. Ind. Ecol. 13(3), 361–383 (2009).
24 Suh S, Lenzen M, Treloar GJ et al. System boundary selection in life-cycle inventories using hybrid approaches. Environ. Sci. Technol. 38(3), 657–664 (2004).
25 Department for Environment, Food and Rural Affairs, Department of Energy and Climate Change. 2012 Guidelines to Defra/DECC’s GHG Conversion Factors for Company Reporting. Department for Environment, Food and Rural Affairs, Department of Energy and Climate Change, London, UK (2012).
nn Provides publicly available and free-of-charge annually updated UK country-specific emissions factors for different emissions sources. Supply chain (environmentally extended input–output derived) emission factors are presented in Annex 13.
26 Buchanan D, Boddy D. The Expertise of the Change Agent. Prentice Hall, London, UK (1992).
27 Chess C, Johnson B. Organizational learning about public participation: ‘Tiggers’ and ‘Eeyores’. Hum. Ecol. Rev. 13(2), 182–192 (2006).
28 Bearden WO, Etzel MJ. Reference group inf luence on product and brand purchase decisions. J. Cons. Res. 9, 183–194 (1982).
29 Apostolakis G, Pickett S. Deliberation: integrating analytical results into environmental decisions involving multiple stakeholders. Risk Anal. 18(5), 621–635 (1998).
30 Fioriono DJ. Citizen participation and environmental risk: a survey of institutional mechanisms. Sci. Technol. Hum. Values 15(2), 226–243 (1990).
31 Jokisaari M, Vuori J. The role of reference groups and network position in the timing of employment service adoption. J. Pub. Admin. Res. Theory 20(1), 137–156 (2010).
32 World Resources Institute, World Business Council for Sustainable Development. The Greenhouse Gas Protocol: A Corporate Accounting and Reporting Standard (Revised Edition). World Resources Institute, Washington, DC, USA (2004).
33 Department for Environment, Food and Rural Affairs, Department of Energy and Climate Change. Guidance on How To Measure and Report Your Greenhouse Gas Emissions. Department for Environment, Food and Rural Affairs, Department of Energy and Climate Change, London, UK (2009).
34 Higher Education Funding Council for England. Carbon Management Strategies and Plans. A Guide to Good Practice. Higher Education Funding Council for England, London, UK (2010).
35 Higher Education Funding Council for England. Measuring Scope 3 Carbon Emissions: Transport. A Guide to Good Practice. Higher Education Funding Council for England, London, UK (2012).
36 Higher Education Funding Council for England. Measuring Scope 3 Carbon Emissions: Water and Waste. A Guide to Good Practice. Higher Education Funding Council for England, London, UK (2012).
37 Wiedmann T. A review of recent multi-region input–output models used for consumption-based emission and resource accounting. Ecol. Econ. 69, 211–222 (2009).
38 Peters G. From production-based to consumption-based national emission
Carbon Management (2013) 4(2) future science group156
Research Article Bull, Ozawa-Meida, Brockway & Holland
inventories. Ecol. Econ. 65(1), 13–23 (2008).
39 World Resources Institute, World Business Council for Sustainable Development. Product Life Cycle Accounting and Reporting Standard. World Resources Institute, Washington, DC, USA (2011).
40 British Standards Institution. PAS 2050: 2011 Specification for the Assessment of the Life Cycle Greenhouse Gas Emissions of Goods and Services. British Standards Institution, London, UK (2011).
41 British Standards Institution. The Guide to PAS 2011. How to Carbon Footprint Your Products, Identify Hotspots and Reduce Emissions in your Supply Chain. British Standards Institution, London, UK (2012).
42 De Montfort University. Financial Regulations. Version August 2007. De Montfort University, Leicester, UK (2007).
Websites101 Jisc Greening ICT Programme.
www.jisc.ac.uk/whatwedo/programmes/greeningict.aspx
102 Proc-HE Code Mapping. http://procureweb.ac.uk/code-mapping-search.aspx
103 UN Standard Product and Service Code Coding System. www.unspsc.org
104 Defra’s Government Buying Standards. http://sd.defra.gov.uk/advice/public/buying
105 Forum for the Future’s Sustainable Procurement Toolkit. www.forumforthefuture.org/project/buying-better-world-sustainable-procurement/overview
106 Jisc Procureweb. www.procureweb.ac.uk
107 Sustainable Procurement Centre for Excellence. http://spce.ac.uk
108 Energy Star. www.energystar.gov/index.cfm?c=home.index
109 PROCO2 webpage.
http://proco2.iesd.dmu.ac.uk/proco2
110 De Montfort University Carbon Management Plan. www.dmu.ac.uk/documents/about-dmu-documents/dmu-estate/environmental/dmu-carbon-management-plan.pdf
111 The Greenhouse Gas Protocol. Third party databases. www.ghgprotocol.org/Third-Party-Databases
nn Provides a list of available databases of emission factors and life cycle inventories of materials, products and services derived from process ana lysis life cycle assessment approach or input–output ana lysis applicable to different regions in the world.
Integrating an ICT carbon calculator tool into procurement processes Research Article
future science group www.future-science.com 157