INTEGRATED BUILDING ENERGY AND LIGHTING SIMULATION IN THE FRAMEWORK OF EU PV-LIGHT PROJECT
7
INTEGRATED BUILDING ENERGY AND LIGHTING SIMULATION IN THE FRAMEWORK OF EU PV–LIGHT PROJECT Milan Janak 1 and Reinhard Kainberger 2 1 Slovak University of Technology, Civil Engineering Faculty, Department of Building Constructions, Radlinského 11, 813 68 Bratislava, Slovakia E-mail: [email protected] , Tel: +421 2 59274 459, Fax: +421 2 52920 482 2 TAS Bauphysik, Welser Straße 35-39, 4060 Leonding, Austria E-mail: [email protected] , Tel: 0732 / 67 51 67-0, Fax: 0732 / 67 51 67-5 ABSTRACT In the paper we describe an integrated building lighting and thermal simulation activities carried out in the support of EU PV-Light Project. A part of the project has focused on an experimental quantification of a moveable PV solar shading façade modules fitted to the external test cells. An experimental data has been used to calibrate building energy and daylighting simulation models. The calibrated integrated building energy and daylighting models have been used to carry out a multiple runs with the different facades options under a range of the European climate conditions. The simulations have focused on the prediction of building heating, cooling and lighting demands that are used to assess an individual PV façades performance. INTRODUCTION The goal of the simulation work described in this paper was to evaluate three different types of moveable PV shading devices that should mainly be used for office buildings. It was examined how these different types influence the energy consumption of typical office room especially in cooling, heating energy and the energy needed for artificial lighting. The solar shading and daylight effects of these devices were simulated with global illumination simulation tool Radiance (Ward, 1992). The results of these pre-calculations were used for the whole building energy simulations using the simulation tool ESP-r (Clarke, 2001). This simulation algorithm for both light and energy was calibrated by a comparison with experimental measurement results. These measurements were carried out on the ZSW test area in Widderstall (Germany). The method used in this simulation work is the one described in details in (Janak, et. al. 1997, 1999 and 2003). The solar shading effect direct and diffuse (i.e. global vertical irradiance) of the moveable PV external shading devices on the building energy model has been pre-calculated with the global illumination tool Radiance on the hourly bases as described in (Janak, 2003). The artificial electrical lighting energy demand and resulting casual heat gains where simulated with the method of direct conflation between Radiance and ESP-r as described in (Janak, et. al., 1999). MOVEABLE PV SHADING DEVICES Three Louvers Canopy System – model 1 The figure 1 shows the side view of this canopy system. The figure shows the zero-position (horizontal) for the overcast sky conditions. For clear sky the louvers are perpendicular to the sun position (in the vertical projection). The louvers are more or less completely covered with PV cells imbedded in a transparent plastic foil. (look at right picture of figure 4) This system is intended to be used for façades with windows and parapets. Figure 1 A section view of 3 louver canopy system Synchronous Tracking Louvre (STL) – model 2 Figure 2 above shows the STL system. In the zero- position for overcast sky conditions all louvers are horizontal. For clear sky the louvers are perpendicular to the sun position (in the vertical projection). The lower part of the single louvers contain the PV cells (opaque region) the upper part is a clear transparent foil. This system is intended to be used for the rooms with high glass facades. Counter Tracking Louvre (CTL) – model 3 Figure 3 below shows the CTL system. At overcast sky condition the system goes into the position as drawn in the figure. For clear sky the louvers are perpendicular to the sun position (in the vertical projection). The PV louver is more or less completely covered with PV cells imbedded in the transparent foil and Eleventh International IBPSA Conference Glasgow, Scotland July 27-30, 2009 - 1671 -
-
Upload
independent -
Category
Documents
-
view
7 -
download
0
Transcript of INTEGRATED BUILDING ENERGY AND LIGHTING SIMULATION IN THE FRAMEWORK OF EU PV-LIGHT PROJECT
INTEGRATED BUILDING ENERGY AND LIGHTING SIMULATION IN THE FRAMEWORK OF EU PV–LIGHT PROJECT
Milan Janak1and Reinhard Kainberger2
1Slovak University of Technology, Civil Engineering Faculty, Department of Building Constructions, Radlinského 11, 813 68 Bratislava, Slovakia
E-mail: [email protected], Tel: +421 2 59274 459, Fax: +421 2 52920 482 2TAS Bauphysik, Welser Straße 35-39, 4060 Leonding, Austria
E-mail: [email protected], Tel: 0732 / 67 51 67-0, Fax: 0732 / 67 51 67-5
ABSTRACT
In the paper we describe an integrated building lighting and thermal simulation activities carried out in the support of EU PV-Light Project. A part of the project has focused on an experimental quantification of a moveable PV solar shading façade modules fitted to the external test cells. An experimental data has been used to calibrate building energy and daylighting simulation models. The calibrated integrated building energy and daylighting models have been used to carry out a multiple runs with the different facades options under a range of the European climate conditions. The simulations have focused on the prediction of building heating, cooling and lighting demands that are used to assess an individual PV façades performance.
INTRODUCTION The goal of the simulation work described in this paper was to evaluate three different types of moveable PV shading devices that should mainly be used for office buildings. It was examined how these different types influence the energy consumption of typical office room especially in cooling, heating energy and the energy needed for artificial lighting.
The solar shading and daylight effects of these devices were simulated with global illumination simulation tool Radiance (Ward, 1992). The results of these pre-calculations were used for the whole building energy simulations using the simulation tool ESP-r (Clarke, 2001). This simulation algorithm for both light and energy was calibrated by a comparison with experimental measurement results. These measurements were carried out on the ZSW test area in Widderstall (Germany).
The method used in this simulation work is the one described in details in (Janak, et. al. 1997, 1999 and 2003). The solar shading effect direct and diffuse (i.e. global vertical irradiance) of the moveable PV external shading devices on the building energy model has been pre-calculated with the global illumination tool Radiance on the hourly bases as described in (Janak, 2003). The artificial electrical lighting energy demand and resulting casual heat gains where simulated with the method of direct conflation between Radiance and ESP-r as described in (Janak, et. al., 1999).
MOVEABLE PV SHADING DEVICES
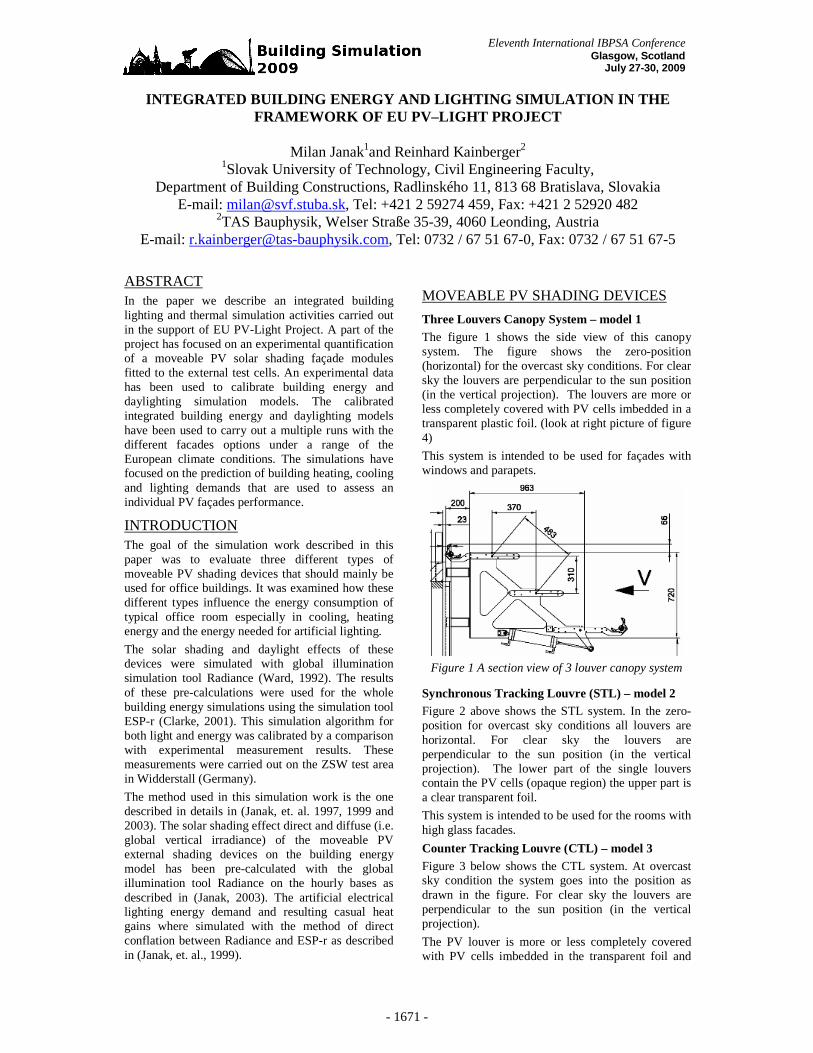
Three Louvers Canopy System – model 1 The figure 1 shows the side view of this canopy system. The figure shows the zero-position (horizontal) for the overcast sky conditions. For clear sky the louvers are perpendicular to the sun position (in the vertical projection). The louvers are more or less completely covered with PV cells imbedded in a transparent plastic foil. (look at right picture of figure 4)
This system is intended to be used for façades with windows and parapets.
Figure 1 A section view of 3 louver canopy system
Synchronous Tracking Louvre (STL) – model 2 Figure 2 above shows the STL system. In the zero-position for overcast sky conditions all louvers are horizontal. For clear sky the louvers are perpendicular to the sun position (in the vertical projection). The lower part of the single louvers contain the PV cells (opaque region) the upper part is a clear transparent foil.
This system is intended to be used for the rooms with high glass facades.
Counter Tracking Louvre (CTL) – model 3 Figure 3 below shows the CTL system. At overcast sky condition the system goes into the position as drawn in the figure. For clear sky the louvers are perpendicular to the sun position (in the vertical projection).
The PV louver is more or less completely covered with PV cells imbedded in the transparent foil and
Eleventh International IBPSA Conference Glasgow, Scotland
July 27-30, 2009
- 1671 -

the counter louver is a shading device covered with the foil with a light diffusing fabric inlay (see left figure 4.)
Figure 2 A section view of synchronous tracking
louvre
Figure 3 A section view of counter tracking louvre
Figure 4 PV louvre and the fabric of the counter
shading panel
The PV louver is more or less complete covered with PV cells imbedded in a transparent foil and the counter louver is a shading device which is a foil with a light diffusing fabric inlay.
EXPERIMENTAL MEASUREMENTS AND MODEL CALIBRATION In order to compare the lighting and energy simulation models and approaches two containers were installed on the solar test field of ZSW (see figure 5). On one of the two containers the CTL system was installed, that is the most complex system for simulation. The second container was used for calibration of the container model only and there was no shading device installed. Illuminance and temperature sensors were placed in both boxes and weather data (temperature, solar radiation and wind) were measured at the site. Measurement data are available from 11.10.2006 to 12.12.2006 where two different container orientations have been evaluated.
Figure 5 Containers without and with CTL moveable
PV louvre shading panels
Figure 6 shows an example of the measured and simulated illuminances at the sensors L13 (4.36 m behind the façade) over two simulated and measured days (container without shading device). At hour 17 there is visible the typical effect of the random clouds movement that can not be captured with the current mean sky models (Perez, 1999) that has been used as the boundary condition for daylighting simulations. Figure 7 shows the similar results for the case with container with moveable PV shading device.
Figure 8 and figure 9 show comparison of measured and simulated container mean air temperature. For this configuration the simulated values are about 1°C
TS : solar transmittance TL: light transmittance
TS and TL = 0.06
Foil: TS = 0.73 TL = 0.78
- 1672 -
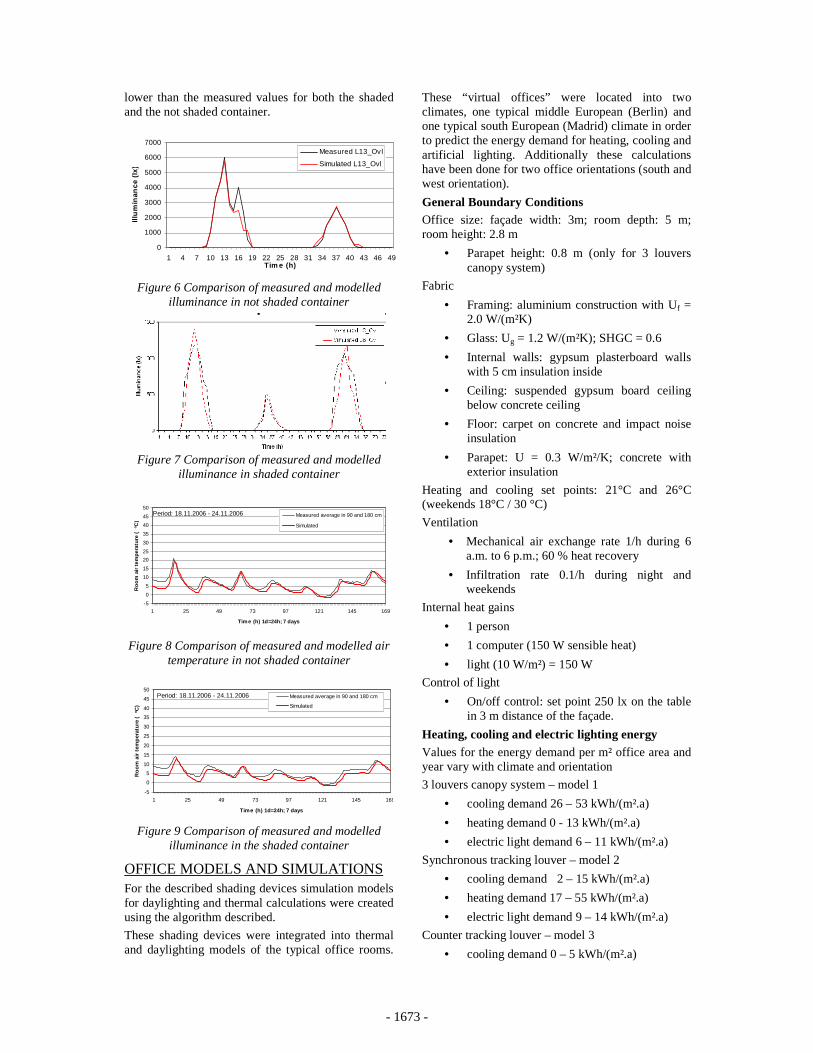
lower than the measured values for both the shaded and the not shaded container.
0
1000
2000
3000
4000
5000
6000
7000
1 4 7 10 13 16 19 22 25 28 31 34 37 40 43 46 49Tim e (h)
Illu
min
anc
e (l
x)
Measured L13_Ovl
Simulated L13_Ovl
Figure 6 Comparison of measured and modelled
illuminance in not shaded container
Figure 7 Comparison of measured and modelled
illuminance in shaded container
-5
0
5
10
15
20
25
30
35
40
45
50
1 25 49 73 97 121 145 169
Time (h) 1d=24h; 7 days
Ro
om
air
tem
per
atu
re (
o C)
Measured average in 90 and 180 cm
Simulated
Period: 18.11.2006 - 24.11.2006
Figure 8 Comparison of measured and modelled air
temperature in not shaded container
-5
0
5
10
15
20
25
30
35
40
45
50
1 25 49 73 97 121 145 169
Time (h) 1d=24h; 7 days
Ro
om
air
tem
per
atu
re (
o C)
Measured average in 90 and 180 cm
Simulated
Period: 18.11.2006 - 24.11.2006
Figure 9 Comparison of measured and modelled illuminance in the shaded container
OFFICE MODELS AND SIMULATIONS For the described shading devices simulation models for daylighting and thermal calculations were created using the algorithm described.
These shading devices were integrated into thermal and daylighting models of the typical office rooms.
These “virtual offices” were located into two climates, one typical middle European (Berlin) and one typical south European (Madrid) climate in order to predict the energy demand for heating, cooling and artificial lighting. Additionally these calculations have been done for two office orientations (south and west orientation).
General Boundary Conditions Office size: façade width: 3m; room depth: 5 m; room height: 2.8 m
• Parapet height: 0.8 m (only for 3 louvers canopy system)
Fabric
• Framing: aluminium construction with Uf = 2.0 W/(m²K)
• Glass: Ug = 1.2 W/(m²K); SHGC = 0.6
• Internal walls: gypsum plasterboard walls with 5 cm insulation inside
• Ceiling: suspended gypsum board ceiling below concrete ceiling
• Floor: carpet on concrete and impact noise insulation
• Parapet: U = 0.3 W/m²/K; concrete with exterior insulation
Heating and cooling set points: 21°C and 26°C (weekends 18°C / 30 °C)
Ventilation
• Mechanical air exchange rate 1/h during 6 a.m. to 6 p.m.; 60 % heat recovery
• Infiltration rate 0.1/h during night and weekends
Internal heat gains
• 1 person
• 1 computer (150 W sensible heat)
• light (10 W/m²) = 150 W
Control of light
• On/off control: set point 250 lx on the table in 3 m distance of the façade.
Heating, cooling and electric lighting energy Values for the energy demand per m² office area and year vary with climate and orientation
3 louvers canopy system – model 1
• cooling demand 26 – 53 kWh/(m².a)
• heating demand 0 - 13 kWh/(m².a)
• electric light demand 6 – 11 kWh/(m².a)
Synchronous tracking louver – model 2
• cooling demand 2 – 15 kWh/(m².a)
• heating demand 17 – 55 kWh/(m².a)
• electric light demand 9 – 14 kWh/(m².a)
Counter tracking louver – model 3
• cooling demand 0 – 5 kWh/(m².a)
- 1673 -
• heating demand 35 – 64 kWh/(m².a)
• electric light demand 16 - 21 kWh/(m².a)
All demands are transferred to energy by using a simple conversion factor in order that the models could be inter compared. The spread of the values is again varying with the climate and the office orientation:
• model 1 - 64 – 73 kWh/(m².a)
• model 2 - 53 – 101 kWh/(m².a)
• model 3 - 88 – 120 kWh/(m².a)
These figures are of course the theoretical values and could be used only for model relative inter comparison.
VISUAL COMFORT For the design of a typical visual display terminal working environment the following rules could be considered for the assessment:
10 : 1 - criterion:
In the view of the person in front of the monitor there should be no surfaces which are brighter the 10 times the mean luminance of the computer screen. That means for example about not more than 850 cd/m² for typical “windows desktop”.
3 : 1 - criterion
Surfaces which are very close to the screen (keyboard, paper beside keyboard, table surface, …) should not have a higher luminance than 3-times the mean luminance of the screen (again approximately. not more than 250 cd/m² for typical windows application). This criterion is also valid for reflections directly on the screen from other surfaces.
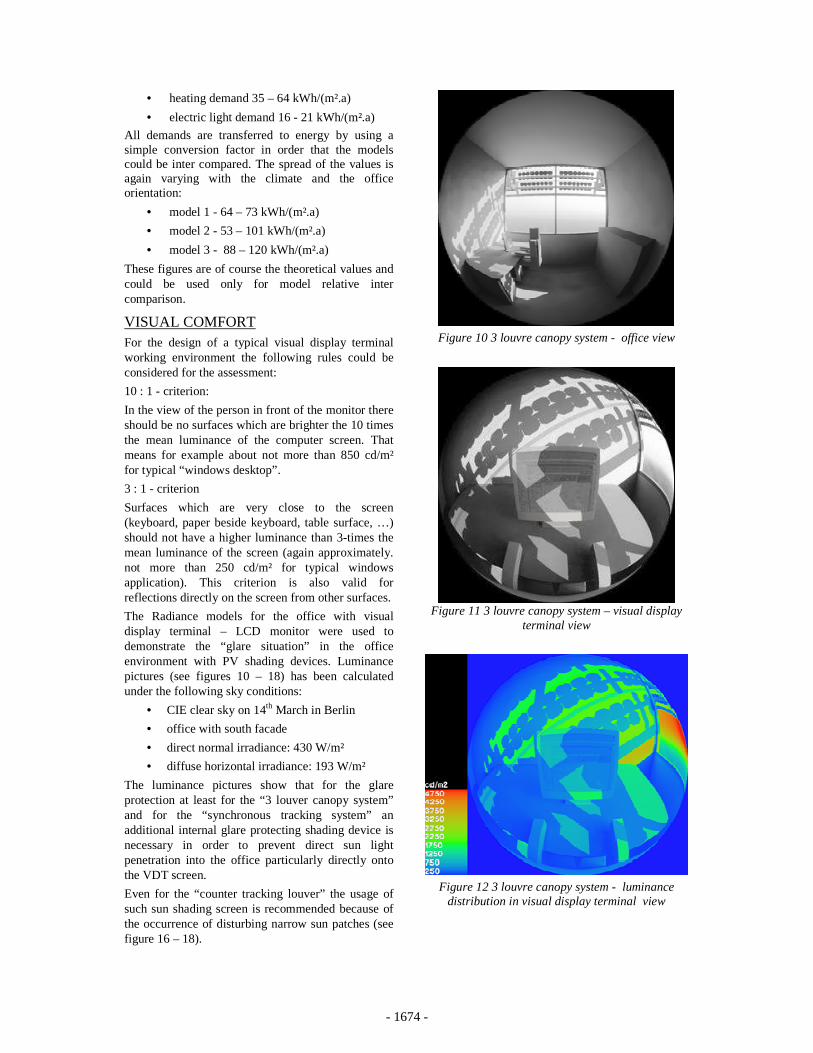
The Radiance models for the office with visual display terminal – LCD monitor were used to demonstrate the “glare situation” in the office environment with PV shading devices. Luminance pictures (see figures 10 – 18) has been calculated under the following sky conditions:
• CIE clear sky on 14th March in Berlin
• office with south facade
• direct normal irradiance: 430 W/m²
• diffuse horizontal irradiance: 193 W/m²
The luminance pictures show that for the glare protection at least for the “3 louver canopy system” and for the “synchronous tracking system” an additional internal glare protecting shading device is necessary in order to prevent direct sun light penetration into the office particularly directly onto the VDT screen.
Even for the “counter tracking louver” the usage of such sun shading screen is recommended because of the occurrence of disturbing narrow sun patches (see figure 16 – 18).
Figure 10 3 louvre canopy system - office view
Figure 11 3 louvre canopy system – visual display terminal view
Figure 12 3 louvre canopy system - luminance
distribution in visual display terminal view
- 1674 -
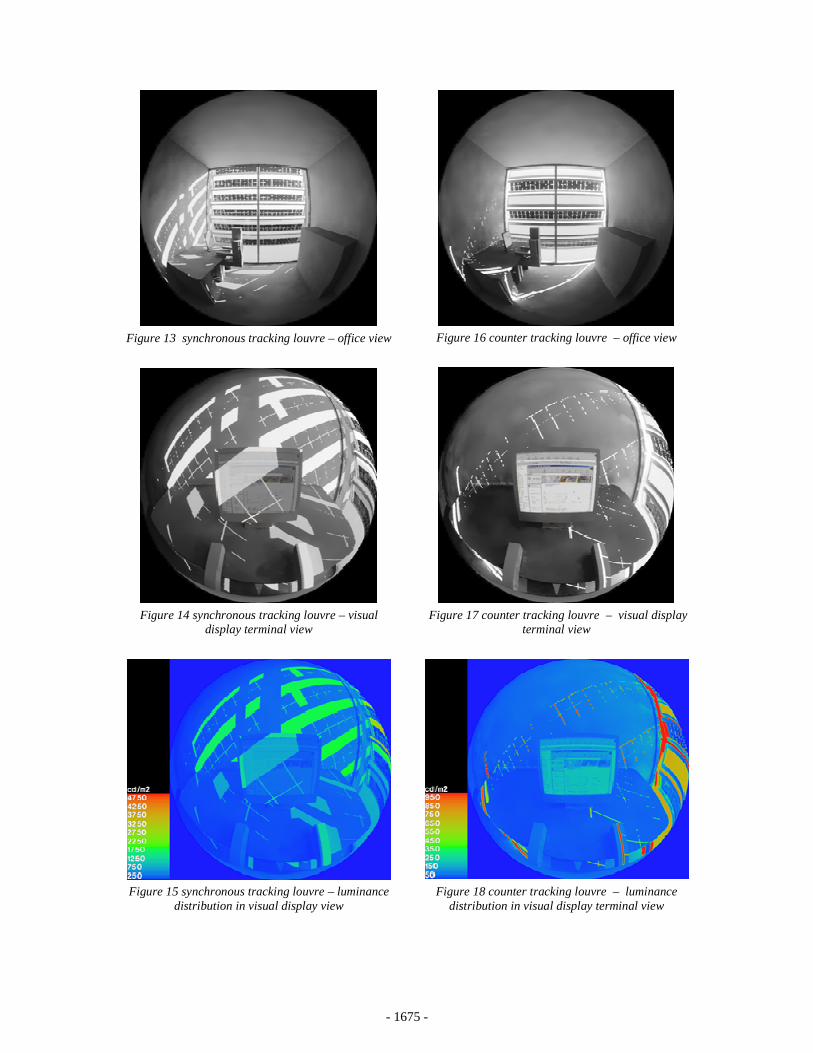
Figure 13 synchronous tracking louvre – office view
Figure 14 synchronous tracking louvre – visual
display terminal view
Figure 15 synchronous tracking louvre – luminance
distribution in visual display view
Figure 16 counter tracking louvre – office view
Figure 17 counter tracking louvre – visual display
terminal view
Figure 18 counter tracking louvre – luminance
distribution in visual display terminal view
- 1675 -
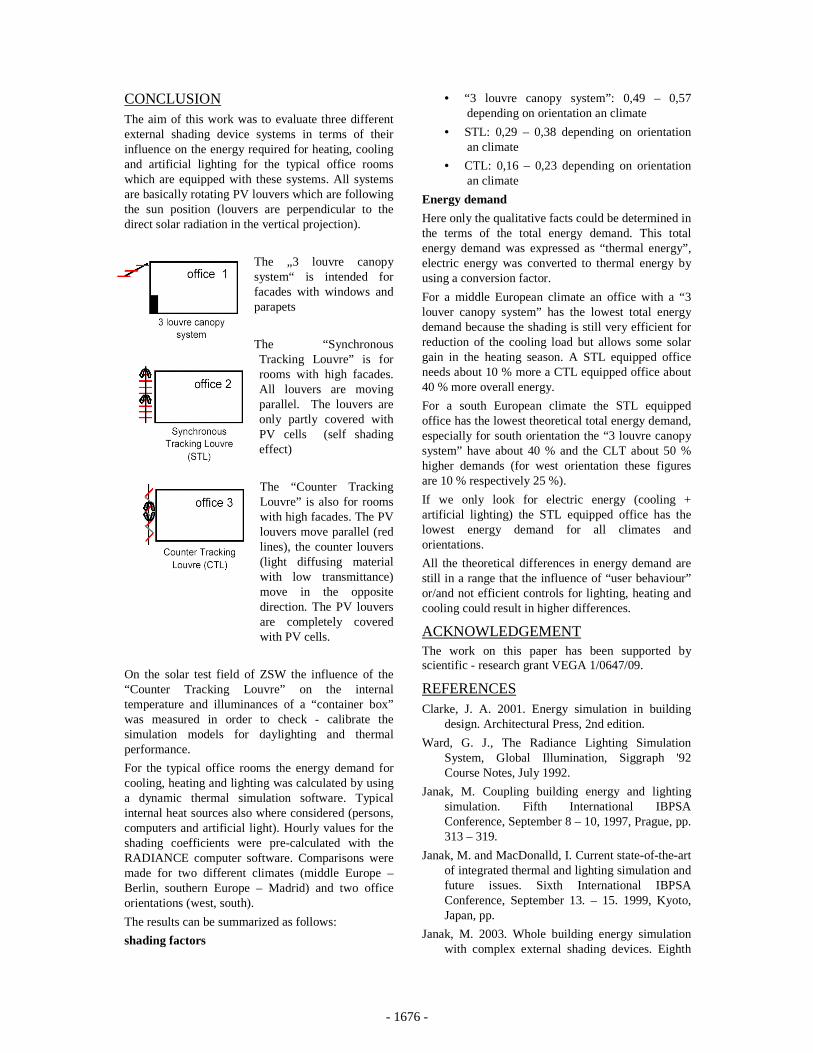
CONCLUSION The aim of this work was to evaluate three different external shading device systems in terms of their influence on the energy required for heating, cooling and artificial lighting for the typical office rooms which are equipped with these systems. All systems are basically rotating PV louvers which are following the sun position (louvers are perpendicular to the direct solar radiation in the vertical projection).
The „3 louvre canopy system“ is intended for facades with windows and parapets
The “Synchronous Tracking Louvre” is for rooms with high facades. All louvers are moving parallel. The louvers are only partly covered with PV cells (self shading effect)
The “Counter Tracking Louvre” is also for rooms with high facades. The PV louvers move parallel (red lines), the counter louvers (light diffusing material with low transmittance) move in the opposite direction. The PV louvers are completely covered with PV cells.
On the solar test field of ZSW the influence of the “Counter Tracking Louvre” on the internal temperature and illuminances of a “container box” was measured in order to check - calibrate the simulation models for daylighting and thermal performance.
For the typical office rooms the energy demand for cooling, heating and lighting was calculated by using a dynamic thermal simulation software. Typical internal heat sources also where considered (persons, computers and artificial light). Hourly values for the shading coefficients were pre-calculated with the RADIANCE computer software. Comparisons were made for two different climates (middle Europe – Berlin, southern Europe – Madrid) and two office orientations (west, south).
The results can be summarized as follows:
shading factors
• “3 louvre canopy system”: 0,49 – 0,57 depending on orientation an climate
• STL: 0,29 – 0,38 depending on orientation an climate
• CTL: 0,16 – 0,23 depending on orientation an climate
Energy demand
Here only the qualitative facts could be determined in the terms of the total energy demand. This total energy demand was expressed as “thermal energy”, electric energy was converted to thermal energy by using a conversion factor.
For a middle European climate an office with a “3 louver canopy system” has the lowest total energy demand because the shading is still very efficient for reduction of the cooling load but allows some solar gain in the heating season. A STL equipped office needs about 10 % more a CTL equipped office about 40 % more overall energy.
For a south European climate the STL equipped office has the lowest theoretical total energy demand, especially for south orientation the “3 louvre canopy system” have about 40 % and the CLT about 50 % higher demands (for west orientation these figures are 10 % respectively 25 %).
If we only look for electric energy (cooling + artificial lighting) the STL equipped office has the lowest energy demand for all climates and orientations.
All the theoretical differences in energy demand are still in a range that the influence of “user behaviour” or/and not efficient controls for lighting, heating and cooling could result in higher differences.
ACKNOWLEDGEMENT The work on this paper has been supported by scientific - research grant VEGA 1/0647/09.
REFERENCES Clarke, J. A. 2001. Energy simulation in building
design. Architectural Press, 2nd edition.
Ward, G. J., The Radiance Lighting Simulation System, Global Illumination, Siggraph '92 Course Notes, July 1992.
Janak, M. Coupling building energy and lighting simulation. Fifth International IBPSA Conference, September 8 – 10, 1997, Prague, pp. 313 – 319.
Janak, M. and MacDonalld, I. Current state-of-the-art of integrated thermal and lighting simulation and future issues. Sixth International IBPSA Conference, September 13. – 15. 1999, Kyoto, Japan, pp.
Janak, M. 2003. Whole building energy simulation with complex external shading devices. Eighth
- 1676 -

International IBPSA Conference, August 11. - 14., 2003, Eindhoven, Netherlands, pp. 571 – 576.
Perez, R. at al. 1993. All-weather model for sky luminance distribution – preliminary configuration and validation. Solar Energy 50(3), pp. 235 – 2
- 1677 -