instituto de biociências - Lume - UFRGS
151
1 INSTITUTO DE BIOCIÊNCIAS PROGRAMA DE PÓS-GRADUAÇÃO EM BIOLOGIA ANIMAL DISSERTAÇÃO DE MESTRADO ANÁLISE COMPARATIVA DA FAUNA DE ARANHAS DE SOLO EM ÁREAS DE CAMPO COM E SEM PASTEJO NO PAMPA GAÚCHO Autor: Guilherme Oyarzabal da Silva Orientador: Dr. Ricardo Ott Linha de Pesquisa: Biodiversidade Porto Alegre Fevereiro/2017
-
Upload
khangminh22 -
Category
Documents
-
view
1 -
download
0
Transcript of instituto de biociências - Lume - UFRGS

1
INSTITUTO DE BIOCIÊNCIAS
PROGRAMA DE PÓS-GRADUAÇÃO EM BIOLOGIA ANIMAL
DISSERTAÇÃO DE MESTRADO
ANÁLISE COMPARATIVA DA FAUNA DE ARANHAS DE SOLO EM ÁREAS
DE CAMPO COM E SEM PASTEJO NO PAMPA GAÚCHO
Autor: Guilherme Oyarzabal da Silva
Orientador: Dr. Ricardo Ott
Linha de Pesquisa: Biodiversidade
Porto Alegre
Fevereiro/2017

2
Guilherme Oyarzabal da Silva
ANÁLISE COMPARATIVA DA FAUNA DE ARANHAS DE SOLO EM ÁREAS
DE CAMPO COM E SEM PASTEJO NO PAMPA GAÚCHO
Dissertação apresentada ao Programa de
Pós-Graduação em Biologia Animal, da
Universidade Federal do rio Grande do Sul
como requisito para obtenção do grau de
Mestre em Biologia Animal.
Aprovada em 17 fevereiro de 2017.
Dr: Ricardo Ott – Orientador
Dr: Adalberto José dos Santos – Universidade Federal de Minas Gerais
Dra: Ana Paula Ott – Universidade Federal do Rio Grande do Sul
Dra: Simone Mundstock Jahnke – Universidade Federal do Rio Grande do Sul

3
UNIVERSIDADE FEDERAL DO RIO GRANDE DO SUL
Reitor: Rui Vicente Oppermann
Vice-Reitora: Jane Fraga Tutikian
INSTITUTO DE BIOCIÊNCIAS
Diretor: João Ito Bergonci
Vice-Diretora: Lavinia Schüler Faccini
Silva, Guilherme Oyarzabal
Análise comparativa da fauna de aranhas de solo
em áreas de campo com e sem pastejo no Pampa
Gaúcho. Guilherme Oyarzabal da Silva. – Porto
Alegre: IBIO/UFRGS, 2017, [151 pp.].
Dissertação (Mestrado). – Universidade Federal do
Rio Grande do Sul. Instituto de Biociências,
Programa de Pós-Graduação em Biologia Animal.
Porto Alegre, RS - BR, 2017.
Orientador: Ricardo Ott
_____________________________ Universidade Federal do Rio Grande do Sul – Instituto de Biociências; Campus do Vale Av. Bento Gonçalves,
9500 - Porto Alegre - RS - Brasil CEP: 91501-970 Fone: +55 51 3308-7676
Fax: +55 51 3308-7675
E-mail: [email protected]

4
DEDICATÓRIA
Aos que acreditam que educação e conhecimento podem salvar esse mundo
Aos que acreditam numa ciência sem barreiras e fronteiras
Aos que tem senso crítico e empatia
Aos que se atrevem e ousam
Aos que não cansam de tentar
“You think you’re any different from
me, or your friends, or this tree? If
you listen hard enough, you can
hear every living thing breathing
together. You can feel everything
growing. We’re all living together,
even if most folks don’t act like it.
We all have the same root, and we
are all branches of the same tree”.
-Huu. Avatar, The Last Airbender.

5
AGRADECIMENTOS
Espero não cometer nenhuma injustiça ao nomear quem preciso agradecer por
terem participado, de alguma forma, na construção deste trabalho e de minha jornada
até aqui.
Obrigado mãe, Angelita e pai, Salvador, por terem me dado vida e seus
exemplos. A tanta coisa pra agradecer que nem sei por onde começar. Vou simplificar:
Amo vocês.
Obrigado minha mana, Mariucha. Sem você, eu não seria metade do homem que
sou hoje. Sem você, eu não seria professor. Sem você, eu não acreditaria na educação.
Mesmo longe, vou te amar pra sempre!
Obrigado, vó Zoel e vô Vitor. Por trabalharem tanto para me dar a educação que
tenho hoje. Não estaria aqui se não fossem vocês.
Obrigado aos meus amigos mais próximos, aqueles que já constroem amizades
de 10-15-20 anos. Clarissa Dreon, Claudia Gomes, Débora Aguiar, Fernando Cardoso,
Germano Rosa, Letícia Nieto, Paula Ramos, Thomas Gandini, em ordem alfabética pra
não colocar ninguém na frente! Mesmo longe e vivendo essa vida adulta louca, ainda
sinto que somos aqueles colegas de escola. Nossa amizade não se explica só se sente.
Obrigado Lana Resende. Pelo colo, cafés da manhã, abraços apertados, puxões
de orelha, maquinas do sacode. Pelo sorriso sem compromisso, pela risada sincera, pelo
olho brilhando, pelo cafuné. Por me dar esperança e estender a mão quando caio. O
chão não combina com a gente.
Obrigado ao meu orientador de anos, Ricardo Ott. Pelas conversas que
começavam sobre aranhas e terminavam em política. Pelos devaneios sobre se existe
aleatoriedade nesse universo. Pelos ensinamentos, sobre ecologia, sobre aranhas, sobre
pesquisa, sobre ciência.

6
Obrigado a minhas colegas de laboratório. Edna Velhino, pelo turotia inicial na
aracnologia, por tirar aquelas duvidas mais bestas. Patrícia Rodrigues, pelas conversas
no almoço sobre ciência, vida e carreira. Kimberly Marta, pelas loucuras sobre aranhas
e a indignação com o mundo lá fora.
Obrigado Equipe Alfa, Danielle Franco, Joana Tomazelli e Lana Resende. Pelas
conversas profundas sobre biologia, sobre a vida, sobre nossos projetos. Por me
apresentarem organismos completamente diferentes dos meus. Ainda quero aprender
muito com vocês.
Obrigado aos meus professores, mestres e doutores da escola, do colégio, da
universidade. O conhecimento de vocês me impulsionou até aqui.
Obrigado ao Programa de Pós-Graduação em Biologia Animal da Universidade
Federal do Rio Grande do Sul (UFRGS), a Fundação Zoobotânica do Rio Grande do Sul
(FZB) e ao Museu de Ciências Naturias do Rio Grande do Sul (MCN) pelas estruturas
físicas e pessoais. Suas lutas são justas.
Obrigado Coordenação de Aperfeiçoamento de Pessoal de Nível Superior
(CAPES) pela concessão da bolsa de mestrado.
Obrigado a todxs! Vocês fazem parte desta conquista.

7
SUMÁRIO
DEDICATÓRIA.................................................................................................................... 4
AGRADECIMENTOS ......................................................................................................... 5
SUMÁRIO ............................................................................................................................. 7
RESUMO ............................................................................................................................... 8
ABSTRACT ........................................................................................................................ 10
LISTA DE FIGURAS E TABELAS ................................................................................. 12
INTRODUÇÃO GERAL.................................................................................................... 17
O Pampa ............................................................................................................................. 17
Os impactos ........................................................................................................................ 18
A conservação e a pecuária ................................................................................................. 19
Métodos e modelos de estudo no Pampa .............................................................................. 20
Aranhas como modelos ....................................................................................................... 22
A dissertação....................................................................................................................... 23
OBJETIVOS ........................................................................................................................ 26
RESULTADOS GERAIS ................................................................................................... 27
Dados gerais ....................................................................................................................... 27
Das primaveras (2011, 2012, 2013) ..................................................................................... 27
Da biomassa........................................................................................................................ 28
Da sazonalidade (2015/2016) .............................................................................................. 29
LITERATURA CITADA ................................................................................................... 30
ARTIGO I ............................................................................................................................ 48
Short-Term spider community monitoring after cattle removal in grazed grassland .............. 48
ARTIGO II........................................................................................................................... 73
Grazing affects ground spider (Arachnida: Araneae) biomass and body size at Pampa biome?
........................................................................................................................................... 73
ARTIGO III ......................................................................................................................... 98
Seasonal spider diversity and species phenology in grazed and ungrazed areas in Southern
America Grasslands ............................................................................................................ 98
CONSIDERAÇÕES FINAIS ........................................................................................... 134
ANEXO ............................................................................................................................. 136

8
RESUMO
O Pampa é um bioma do tipo savana exclusivo da região Neotropical, situado na porção
sul da América do Sul, cobrindo a Argentina, o Uruguai e o Brasil. O clima é quente
temperado e úmido, com temperaturas anuais que variam de 0° C no inverno e mais de
24° C no verão. Os grandes distúrbios no Pampa se iniciaram a cerca de 300 anos com a
chegada da colonização Europeia na região e o advento da agricultura, silvicultura,
manejo sem controle pelo fogo e a criação de gado, leiteiro e de corte. Apesar de
contribuir para a falta de heterogeneidade vegetal e perda na diversidade de fauna, a
pecuária ainda é extensivamente indicada como manejo sustentável do Pampa. Com
pesquisas e trabalhos por vezes mais focados no aumento da produtividade do rebanho
que na manutenção da biodiversidade, a conservação do Pampa vem sendo
negligenciada. O monitoramento de diferentes metodologias de pastejo, tradicional, em
mosaico e exclusão total do gado, se faz necessário para um maior entendimento de
como a diversidade de plantas e animais se comportam nestes sistemas. Para isso, são
necessários bons modelos ecológicos para testes de hipóteses e diferentes manejos, o
que sustenta a utilização de aranhas para estes estudos. Aranhas são rápidas
colonizadoras, ótimas dispersoras, predadoras generalistas, além de estarem
estritamente relacionadas à estrutura vegetal. Suscetíveis a impactos bióticos e
abióticos, aranhas são ótimas medidoras de qualidade ambiental e, sendo de fácil
amostragem, podem ser envolvidas em estudos sobre diversidade de espécies e
indivíduos. Para tanto, este estudo foi realizado na APA do Ibirapuitã, na Campanha do
Rio Grande do Sul, Brasil. Seis parcelas, de um hectare cada, foram distribuídas em
pares em três fazendas. Cada par é constituído de uma parcela com pastejo, demarcadas
apenas por estacas, onde o gado tem livre acesso, e uma parcela sem pastejo, cercadas
desde Agosto de 2012 onde o pastejo do gado foi excluído por completo. A principal
expectativa principal é que a abundancia, riqueza, biomassa e composição de aranhas
serão diferentes quando áreas com e sem pastejo são comparadas forem comparados. As
amostragens foram realizadas com o uso de armadilhas de queda do tipo “Pitfall traps”
nas primaveras de 2011, 2012 e 2013, e sazonalmente no outono (maio), inverno
(setembro) e primavera (novembro) de 2015 e verão (fevereiro) de 2016 para a captura
de aranhas de hábito epígeo. Para análises estatísticas, Testes T, ANOVA e ANOSIM
foram realizadas. Linyphiidae e Lycosidae foram as famílias mais abundantes e ricas em
todas as coletas realizadas. Os resultados obtidos em 2011, 2012 e 2013 não

9
demonstraram diferença significativa na fauna de aranhas, abundância e riqueza quando
áreas com e sem pastejo foram comparadas. Contudo, os resultados apresentaram
valores maiores nas áreas com pastejo quando comparando com áreas sem pastejo. Em
2015/2016 a abundância e a riqueza de aranhas também não foram significativamente
diferentes nos dados coletados, contudo, os valores brutos também apresentaram
maiores abundância e riqueza em áreas com pastejo do que nas sem pastejo.
Analisando-se as estações como um todo, juntando áreas com e sem pastejo, o verão foi
a estação com mais riqueza geral. Contudo, analisando as áreas com e sem pastejo
separadamente, o inverno foi a estação mais rica e abundante em cada uma destas áreas.
Apesar dos resultados anteriores, as espécies mais abundantes demonstraram diferença
significativa em suas abundancias em cada estação do ano quando áreas com e sem
pastejo foram comparados. A biomassa das aranhas não foi significativamente diferente
para todos os anos entre áreas com e sem pastejo, com valores maiores em áreas com
pastejo. Entretanto, espécies mais abundantes demonstraram diferenças significativas
em sua biomassa sazonalmente nos anos de 2015 e 2016, com valores maiores em áreas
com pastejo. Áreas com e sem pastejo ainda se mantém similares mesmo após quase
quatro anos de exclusão do gado em termos de abundância total de aranhas. Apenas
aranhas mais abundantes demonstram diferença entre áreas com e sem pastejo em
termos de abundância e biomassa.
Palavras-Chave – Neotropical; Aracnídeos; Diversidade; Biomassa; Campo

10
ABSTRACT
Pampa is a savanna-like biome, exclusively of Neotropical region, lying in southern part
o South America, covering Argentina, Uruguay and Brazil. The climate is hot temperate
and humid, with annual temperatures ranging of 0° C in winter and higher than 24° C in
summer. The increase of disturbance at Pampa began around 300 years after Europian
colonization and the advent of agriculture, silviculture, uncontrolled fire management
and creation of dairy and beef cattle. Even livestock causing loss of vegetal
heterogeneity and fauna diversity, it is a widely recommended methodology for
sustainable management of Pampa. With studies more focused in forage properties and
beef production than diversity maintenance, the Pampa conservation has been neglected.
Monitoring different livestock methodologies are necessary to improve knowledge of
how diversity of plants and animals change during this impact. Thus, using great
ecological models, like spiders, are necessary to test hypotheses and different
managements. Spiders are quick settlers, great dispersers, generalist predators and are
much correlated with vegetal structure. Susceptible to biotic and abiotic impacts, spiders
are great environmental quality meters, being easy to sample and to measure abundance,
diversity and richness. This study was conduct at Ibirapuitã River Environmental
Federal Protection Area “Área de Proteção Ambiental – APA do Rio Ibirapuitã” in Rio
Grande do Sul state, Brazil. Six plots, of one hectare each, were distributed in pars in
three farms. Each pair is constituted of a closed plot, a fenced plots since August 2012,
with total exclusion of cattle graze; and a opened plot with only poles in the corners to
demarcate the place, and cattle have free access for graze. Our main expectative is that
abundance, richness, biomass and composition of arenofauna will be different when
grazed and ungrazed areas were compared. Ground dwelling spiders were sampled with
Pitfall traps in springs of 2011, 2012 and 2013, and seasonally in autumn (May), winter
(September) and spring (November) 2015 and summer (February) 2016. Statistical
analyses were performed using Stundents’ Test, ANOVA and ANOSIM. Linyphiidae
and Lycosidae were the most abundant and richer families. Results of 2011, 2012 and
2013 were no significant different in spider abundance and richness when grazed and
ungrazed plots were compared. However, raw data suggest higher values of abundance
in grazed areas than ungrazed ones. In 2015/2016 samples, spider abundance and
richness were not significant different between grazed and ungrazed areas. Raw data
suggest that grazed areas abundance and richness was higher than in ungrazed though.

11
Although summer was the richer season in general, winter was the richer season
separately in grazed and ungrazed areas. Despite the previous results, abundance of the
most abundant species were significant different between grazed and ungrazed areas in
general and in each season. Spider biomass was not significant different in any year
when grazed and ungrazed areas were compared. However, biomass of most abundant
species were significant different seasonally and in each season in 2015/2016. Grazed
and ungrazed areas are still very similar even after almost four years of cattle exclusion
in terms of spider abundance and biomass. Only most abundant species demonstrate a
significant difference between grazed and ungrazed areas in terms of abundance and
biomass, with higher values in grazed plots.
Keywords – Neotropical; Arachnids; Diversity; Biomass; Grassland

12
LISTA DE FIGURAS E TABELAS
Figura 1 –Bioma Pampa no sul da América do Sul. Triângulo vermelho índica a APA do
Ibirapuitã, local de amostragem para esta pesquisa. Imagem adaptada de de Andrade et al. (2015). ........ 45
Figura 2 – Vegetação em aéras com e sem pastejo na APA do Ibirapuitã. À esquerda, áreas com
pastejo e à direita áreas sem pastejo. Foto tirada em Maio de 2015. .......................................................... 46
Figura 3 – Vegetação em áreas sem pastejo na APA do Ibirapuitã. Foto tirada em Maio de 2015
.................................................................................................................................................................... 46
Figura 4 – Vegetação em áreas com pastejo na APA do Ibirapuitã. Foto tirada em Maio de 2015
.................................................................................................................................................................... 47
Figura 5 – Pampa Biome at Neotropical region. Red triangle indicates APA do Ibirapuitã’s
localization. Map adpted from Andrade et al. (2015). ................................................................................ 68
Figura 6 – Pitfall traps used to collect ground spiders at APA do Ibirapuitã used in November of
2011, 2012 and 2013. A – Trap filled with formal 2%. B – Trap after one week of exposal with
invertebrates captured. ................................................................................................................................ 68
Figura 7 – Format used for exposal of pitfall traps in APA do Ibirapuitã during the campaign of
2011, 2012 and 2013. Red diamonds indicates the places of the traps. Traps were placed around 20 m
from each other. Traps were least 10 m from the fence or border of each plot. ......................................... 69
Figura 8 – Richness based rarefaction curves for spiders in ungrazed plots trough 2011, 2012 and
2013. Adjacent lines indicates 95% confidence intervals. .......................................................................... 69
Figura 9 – Vegetation in grazed and ungrazed plots at APA do Ibirapuitã. Picture taken in May
2015. A – Grazed plots; B – Ungrazed plots; C – Comparison of graze and ungrazed plots. .................... 91
Figura 10 – Hahniidae, Neohania sp.1, showing how was measured the total body length. From
clypeus (excluding chelicerae) to the end of the abdomen (excluding the spinnerets). .............................. 92
Figura 11 – Hahniidae, Neohania sp.1, showing how was measured the total carapace length.
From clypeus (excluding chelicerae) to the end of the carapace (excluding pedicel). ............................... 92
Figura 12 – Pitfall traps used to collect ground spiders at APA do Ibirapuitã, used in May,
September and November of 2015 and February of 2016. A – PVC guide. B – Trap filled with formal 2%.
.................................................................................................................................................................. 126
Figura 13 – Format used for exposal of pitfall traps in APA do Ibirapuitã during the campaign of
2015 and 2016. Red diamonds represent traps. ....................................................................................... 126

13
Figura 14 – Richness based rarefaction curves for spiders in grazed plots trough seasons of 2015
and 2016. Adjacent lines indicates 95% confidence intervals. ................................................................. 127
Figura 15 – Richness based rarefaction curves for spiders in ungrazed plots trough seasons of
2015 and 2016. Adjacent lines indicates 95% confidence intervals. ........................................................ 127
Figura 16 – Agyneta sp. 1 phenology curve. Each line demonstrate male or female abundance
trough season in grazed and ungrazed plots. ............................................................................................ 128
Figura 17 – Neohania sp. 1 phenology curve. Each line demonstrate male or female abundance
trough season in grazed and ungrazed plots. ........................................................................................... 128
Figura 18 – Erigone sp. 1 phenology curve. Each line demonstrate male or female abundance
trough season in grazed and ungrazed plots. ........................................................................................... 129
Figura 19 – Neohania sp. 2 phenology curve. Each line demonstrate male or female abundance
trough season in grazed and ungrazed plots. ........................................................................................... 129
Figura 20 – Agyneta sp. 2 phenology curve. Each line demonstrate male or female abundance
trough season in grazed and ungrazed plots. ............................................................................................ 130
Figura 21 – Localização da APA do Ibirapuitã no Rio Grande do Sul, Brasil. APA localizada nos
municípios de Alegrete, Quaraí, Rosário do Sul e Sant’Ana do Livramento. Autor: Comitê Ibicuí. ....... 136
Tabela 1 – Total numbers of ground dweling spider individuals of families, species and
morphospecies collected at APA do Ibirapuitã in November of 2011, 2012 and 2013. Juvenils identified
only at family level and totals, indicated as: adult/juvenils. ....................................................................... 70
Tabela 2 – Ground dweling spider biomass, in grams, of Pampa biome, southern Brazil. Biomass
obtained by Mass-Length regression using Fresh Mass coefficient. Species listed here are separated in
Grazed and Ungrazed plots and are from November 2011, 2012 and 2013, May, September and
November 2015 and February 2016. Taxa are separate in families, genus and species. “Ind” – Number of
individuals captured; “L mm” – Total length of each specie; “Me g” – Mean of total biomass of each
speciemen in grams; “Mx g” – Maximum value obtained of biomass of each specie in grams; “Mn g” –
Minimum value obtained of biomass of each specie in grams; “SD” – Biomass standard deviation of each
species in each methodology. ..................................................................................................................... 93
Tabela 3 – Ground dweling spider carapace length, in millimeters, of Pampa biome, southern
Brazil. Species listed here are from Control of November 2011, 2012 and 2013, May, September and

14
November 2015 and February 2016. Taxa are separate in families, genus and species. “Indiv” – Number
of individuals captured; “Mean Len” – Mean of carapace length per specie in millimeters. “Min Len” –
Minimum value obtained of carapace length per specie in millimeters; “Max Len” – Maximum value
obtained of carapace length per specie in millimeters; “SD” – Length standard deviation of each species.
.................................................................................................................................................................... 96
Tabela 4 – Ground dweling spider carapace length, in millimeters, of Pampa biome, southern
Brazil. Species listed here are from Ungrazed plots of November 2011, 2012 and 2013, May, September
and November 2015 and February 2016. Taxa are separate in families, genus and species. “Indiv” –
Number of individuals captured; “Mean Len” – Mean of carapace length per specie in millimeters. “Min
Len” – Minimum value obtained of carapace length per specie in millimeters; “Max Len” – Maximum
value obtained of carapace length per specie in millimeters; “SD” – Length standard deviation of each
species. ....................................................................................................................................................... 97
Tabela 5 – Ground dweling spider species of Pampa biome, southern Brazil. Species listed here
are from Autumn (Aut, May), Winter (Win, Sep), Spring (Spr, Nov) of 2015 and Summer (Sum, Feb) of
2016. Taxa are separate in families, genus and species. Numbers indicate the quantity of individuals,
males and females. Juveniles identified only at family level and totals, indicated as adult/juveniles. ..... 131
Tabela 6 – Aranhas de solo coletadas no experimento realizado em novembro de 2011 na APA
do Ibirapuitã, Bioma Pampa, RS, Brasil. Taxa indica famílias de aranhas. Cada família contém espécies,
morfoespécies e jovens respectivos. Números em jovens indicam indivíduos, em espécies e
morfoespécies indicam indivíduos adultos, machos e fêmeas. C1: Com Pastejo da Estância do Açude; C2:
Com Pastejo da Fazenda Rincão dos Moraes; C3: Com Pastejo da Fazenda Bela Vista. T1: Sem Pastejo
da Estância do Açude; T2: Sem Pastejo da Fazenda Rincão dos Moraes; T3: Sem Pastejo da Fazenda Bela
Vista. ........................................................................................................................................................ 136
Tabela 7 – Aranhas de solo coletadas no experimento realizado em novembro de 2012 na APA
do Ibirapuitã, Bioma Pampa, RS, Brasil. Taxa indica famílias de aranhas. Cada família contém espécies,
morfoespécies e jovens respectivos. Números em jovens indicam indivíduos, em espécies e
morfoespécies indicam indivíduos adultos, machos e fêmeas. C1: Com Pastejo da Estância do Açude; C2:
Com Pastejo da Fazenda Rincão dos Moraes; C3: Com Pastejo da Fazenda Bela Vista. T1: Sem Pastejo
da Estância do Açude; T2: Sem Pastejo da Fazenda Rincão dos Moraes; T3: Sem Pastejo da Fazenda Bela
Vista. ........................................................................................................................................................ 138

15
Tabela 8 – Aranhas de solo coletadas no experimento realizado em novembro de 2013 na APA
do Ibirapuitã, Bioma Pampa, RS, Brasil. Taxa indica famílias de aranhas. Cada família contém espécies,
morfoespécies e jovens respectivos. Números em jovens indicam indivíduos, em espécies e
morfoespécies indicam indivíduos adultos, machos e fêmeas. C1: Com Pastejo da Estância do Açude; C2:
Com Pastejo da Fazenda Rincão dos Moraes; C3: Com Pastejo da Fazenda Bela Vista. T1: Sem Pastejo
da Estância do Açude; T2: Sem Pastejo da Fazenda Rincão dos Moraes; T3: Sem Pastejo da Fazenda Bela
Vista. ........................................................................................................................................................ 140
Tabela 9 – Aranhas de solo coletadas no experimento realizado em maio de 2015 na APA do
Ibirapuitã, Bioma Pampa, RS, Brasil. Taxa indica famílias de aranhas. Cada família contém espécies,
morfoespécies e jovens respectivos. Números em jovens indicam indivíduos, em espécies e
morfoespécies indicam indivíduos adultos, machos e fêmeas. C1: Com Pastejo da Estância do Açude; C2:
Com Pastejo da Fazenda Rincão dos Moraes; C3: Com Pastejo da Fazenda Bela Vista. T1: Sem Pastejo
da Estância do Açude; T2: Sem Pastejo da Fazenda Rincão dos Moraes; T3: Sem Pastejo da Fazenda Bela
Vista. ........................................................................................................................................................ 142
Tabela 10 – Aranhas de solo coletadas no experimento realizado em setembro de 2015 na APA
do Ibirapuitã, Bioma Pampa, RS, Brasil. Taxa indica famílias de aranhas. Cada família contém espécies,
morfoespécies e jovens respectivos. Números em jovens indicam indivíduos, em espécies e
morfoespécies indicam indivíduos adultos, machos e fêmeas. C1: Com Pastejo da Estância do Açude; C2:
Com Pastejo da Fazenda Rincão dos Moraes; C3: Com Pastejo da Fazenda Bela Vista. T1: Sem Pastejo
da Estância do Açude; T2: Sem Pastejo da Fazenda Rincão dos Moraes; T3: Sem Pastejo da Fazenda Bela
Vista. ........................................................................................................................................................ 144
Tabela 11 – Aranhas de solo coletadas no experimento realizado em novembro de 2015 na APA
do Ibirapuitã, Bioma Pampa, RS, Brasil. Taxa indica famílias de aranhas. Cada família contém espécies,
morfoespécies e jovens respectivos. Números em jovens indicam indivíduos, em espécies e
morfoespécies indicam indivíduos adultos, machos e fêmeas. C1: Com Pastejo da Estância do Açude; C2:
Com Pastejo da Fazenda Rincão dos Moraes; C3: Com Pastejo da Fazenda Bela Vista. T1: Sem Pastejo
da Estância do Açude; T2: Sem Pastejo da Fazenda Rincão dos Moraes; T3: Sem Pastejo da Fazenda Bela
Vista. ........................................................................................................................................................ 146
Tabela 12 – Aranhas de solo coletadas no experimento realizado em fevereiro de 2016 na APA
do Ibirapuitã, Bioma Pampa, RS, Brasil. Taxa indica famílias de aranhas. Cada família contém espécies,

16
morfoespécies e jovens respectivos. Números em jovens indicam indivíduos, em espécies e
morfoespécies indicam indivíduos adultos, machos e fêmeas. C1: Com Pastejo da Estância do Açude; C2:
Com Pastejo da Fazenda Rincão dos Moraes; C3: Com Pastejo da Fazenda Bela Vista. T1: Sem Pastejo
da Estância do Açude; T2: Sem Pastejo da Fazenda Rincão dos Moraes; T3: Sem Pastejo da Fazenda Bela
Vista. ........................................................................................................................................................ 149

17
INTRODUÇÃO GERAL
O Pampa
O Pampa é um bioma Neotropical do tipo savana, onde a paisagem é dominada
por extensas pastagens e prados, com a predominância de gramíneas formando vastos
campos, e além desses, matas ciliares, de encosta e capões de mato (Overbeck et al.
2007; Beheling et al. 2009; Boldrini 2009). A denominação bioma (bio = vida; oma =
proliferação) refere-se a locais que reúnem diferentes ecossistemas em uma unidade
geográfica contínua, sendo o termo ratificado ao Pampa apenas em 2004, pelo
Ministério do Meio Ambiente brasileiro (Suertegaray & Silva 2009). Como bioma, o
Pampa é a reunião de formações únicas relacionadas a ecossistemas e paisagens, que
articula conceitos também geográficos, com particularidades próprias em termos de
tráfego de energia e matéria (IBGE 2004).
O Bioma Pampa é exclusivo da porção meridional da América do Sul e cobre
uma área com cerca de 75.000 km2 (Vélez et al. 2009) em partes da Argentina, todo o
território do Uruguai e o extremo sul do Brasil (Fig. 1). É formado por vastas planícies e
coxilhas e sua altitude máxima não ultrapassa os 200 m (Suertegaray & Silva 2009). O
Rio Grande do Sul é o único estado com ocorrência do Pampa, no Brasil, cobrindo cerca
de 63% do território do mesmo e apenas cerca de 2,07 % do território brasileiro
(Suertegaray & Silva 2009).
O Pampa situa-se na Zona Temperada Sul, com quatro estações bem
caracterizadas (Suertegaray & Silva 2009), e tem, segundo a classificação de Köppen-
Geiger, um clima do tipo “Cfa”, temperado, úmido e com verões quentes (Kottek et al.
2006). As temperaturas mínimas no inverno chegam até 0°C e variam de 22°C a mais
de 24°C nos meses de verão (Nimer 1977; Suertegaray 1998). A precipitação anual
varia de 1.250 e 1.500 mm sem estações seca (Cordeiro & Soares 1977).

18
Os impactos
A presença humana na região se inicia-se por volta de 13.000-10.000 (A.P.) no
início do Pleistoceno, com culturas pré-colombianas que colonizaram a região (Consens
2009; Cruz & Guadagnin 2010). O clima nesta época era mais frio e seco, com o nível
do mar mais baixo do que o de hoje (Carvalho 2003). Os campos eram dominados por
animais da megafauna como mastodontes, tatus e preguiças gigantes (Scherer & da
Rosa 2003; Alberdi & Prado, 2008) além da vegetação predominante de poaceae e ervas
como Cyperaceae e Asteraceae (Behling et al. 2005). A megafauna era responsável pelo
controle da sucessão dos campos para floresta, transformando a paisagem em mosaicos
com diferentes intensidades de pisoteio e pastoreio, que por conseqüência, também
diminuía a probabilidade de incêndios espontâneos (Cruz & Guadagnin 2010).
Os primeiros habitantes humanos do Pampa ocupavam e caçavam em lugares
abertos (Cruz & Guadagnin 2010). Essas comunidades provavelmente não dominavam
o polimento de rochas, mas já se utilizavam do fogo, inclusive para caçadas (Carvalho
2003; Suertegaray & Silva, 2009). O fogo em caçadas funcionava para direcionar os
animais para locais mais propícios para o abate, reduzindo o gasto de energia e
aumentando a eficiência, além de manter o campo baixo e propiciar um melhor
avistamento de ameaças (Behling et al. 2009, Overbeck et al. 2009). A extinção da
megafauna, por volta de 8.000 (A.P.), e o aumento da incidência de partículas
carbonizadas, registrado em testemunhos em turfeiras, por volta de 10.000 (A.P.),
convergem para uma provável responsabilidade humana nestas atividades (Behling et
al. 2005; Cruz & Guadagnin 2010).
É muito difícil relacionar com certeza quais foram os fatores que extinguiram a
megafauna e quais os que mantiveram o Pampa predominantemente como um Bioma
campestre. Há evidencias para mudanças climáticas (Burney & Flannery 2005), e como

19
já citadas, atividades humanas, principalmente a ação de queimadas controladas (Cruz
& Guadagnin 2010). Entretanto, não se sabe ao certo como o Pampa era antes de mais
de 300 anos atrás. A partir dessa data a perturbação humana aumentou dramaticamente
com a chegada da colonização Européia e, principalmente, após a introdução de gado,
manejo sem controle do fogo, seguindo-se da agricultura e mais recentemente a
silvicultura (Suertegaray & Silva 2009; Podgaiski et al. 2014; Ferrando et al. 2016).
A conservação e a pecuária
A conservação do Pampa vem sendo negligenciada (Overbeck et al. 2013), e a
transformação dos campos para fins agro-econômicos tem mudado suas características
originais, causando grandes perdas em biodiversidade, devido à falta de regulação e
manejo apropriado (Andrade et al. 2015; Winck et al 2016). Apesar de, por exemplo,
pastejo intenso de gado diminuir a diversidade de habitats, animais e plantas (Van Klink
et al. 2013, 2015; Niba & Yekwayo 2016), esta atividade é amplamente recomendada
para a conservação de campos e pastagens (Dennis et al. 2015; Evans et al. 2015;
Polchaninova et al. 2015; Gómez 2016). Alguns autores afirmam que o fogo também é
indicado para a manutenção do Pampa, apesar de afetar diretamente a fauna relacionada
ao solo, diminuir as taxas de decomposição e detritivoria e alterar propriedades do solo,
como absorção de água (Laterra et al. 2003; Vogelmann et al. 2012; Podgaiski et al.
2014). Apesar do impacto gerado, estudos indicam que a recuperação da fauna, depois
do fogo, é rápida e que a vegetação já estaria adaptada a esse distúrbio, o que
incentivaria o uso do método (Fidelis et al. 2010; Podgaiski et al. 2013; Ferrando et al.
2016). Ademais, pastejo e fogo teriam funções e efeitos semelhantes no Pampa, como
reduzir a competição entre gramíneas, reduzir o avanço da floresta sobre o campo e
promover a renovação dos nutrientes no solo (Bogino et al. 2015; Bernardi et al. 2016).

20
Focando em pecuária, a maior parte dos estudos ressalta o aumento da
produtividade, na qualidade da carne e no melhoramento do forrageamento do gado
(Pinto et al. 2008; Kamali et al. 2014; Pelegrini et al. 2016; Ruviaro et al. 2016). Esses
estudos ignoram aspectos importantes como o dano causado às espécies nativas e ao
solo, devido ao pisoteio e herbivoria excessivos (Soares et al. 2011; Bella et al. 2014;
Gantchoffet al. 2014; Bella et al. 2015; Van Klink et al. 2015). Áreas com sobre-pastejo
são conhecidas por disporem de plantas com baixa qualidade forrageira, e perdas na
biodiversidade (Pallarés et al., 2005; Nabinger et al. 2009; Evans et al. 2015), o que
poderia ser evitado com o uso de carga mais indicada para a área de campo.
A Pecuária em Mosaico propõe uma alternativa para o uso moderado do campo,
onde gado seria movido de área em área evitando o pastejo excessivo (Diaz et al., 2007;
Nabinger et al. 2009). Esta metodologia tende a aumentar a heterogeneidade do campo,
favorecendo a maior complexidade de fauna e flora (Andrade et al. 2015; Bolaños 2015;
Dassou et al. 2015; Hertzog et al. 2016; Modernel 2016). Outra metodologia, mais
complexa, seria realizar uma auto-recuperação periódica do ambiente, no qual se
excluiria e cessaria todo impacto e manejo ocorrido, deixando o Pampa retornar a sua
forma “original” através de a sua própria resiliência (Andrade et al. 2015).
Métodos e modelos de estudo no Pampa
Muitos estudos no Pampa focam na diversidade e abundancia da fauna de
vertebrados (Bertaco & Azevedo 2013; Bencke 2016; Entiauspe-Neto et al. 2016;
Espinosa et al. 2016; Jardim et al. 2016), da flora (Poggio et al. 2013; Oliveira et al.
2015; Oliveira 2016) e de microorganismos (Lupatini et al. 2013; Vargas et al. 2015;
D’Acunto et al. 2016). Cada táxon possui suas próprias metodologias de coleta e
avaliação e, por vezes, os trabalhos relacionam seus resultados com impactos gerados
por atividade humana.

21
Outro método de estudo pouco convencional é a análise da biomassa de seres
vivos por área (Bornebusch 1930; Edwards 1966), uma metodologia pouco utilizada
para estudos no Pampa. O estudo da biomassa é um importante conceito ecológico
aplicado para diferentes organismos (Hooper 1996; Kirchman 2001; Borer et al. 2012) e
que analisa tamanho populacional, taxas decrescimento, quantidade de energia no
sistema e reciclagem de nutrientes (Ganihar 1997). Geralmente, plantas são os modelos
mais utilizados, devido à facilidade da pesagem de material fresco e seco; mensura-se a
biomassa aérea (galhos, arbustos e plantas lenhosas) e/ou biomassa do solo (raízes,
gramíneas) (Pinto et al. 2008; Fidelis et al. 2009; Risio et al. 2014; Guimaraes et al.
2015). Todavia, medir a biomassa de organismos pequenos, como invertebrados,
consome muito tempo, geralmente destrói o material e é, por vezes, impreciso (Work et
al. 2002; Motobayashi et al. 2006; Indicatti et al. 2008). Desta forma, apesar das
diferentes morfologias corpóreas em invertebrados, regressões de massa-comprimento
tem se provado ótimos métodos para mensurar biomassa (Brady & Noske 2006; Höfer
& Ott 2009; Wardhaugh 2013).
A comunidade de invertebrados é amplamente utilizada na avaliação de áreas
campestres. Para coleta destes invertebrados, as metodologias divergem na captura da
fauna mais ligada ao extrato arbóreo/aéreo (Pereira et al. 2015; Rodrigues et al. 2014;
Carvalho et al. 2015) ou ao solo (Cortelezzi et al. 2015; Frasson et al. 2015). Um
método comumente utilizado para captura da fauna de solo são as armadilhas do tipo
“Pitfall Traps” (Siqueira et al. 2016; Winck et al. 2016). Tratam-se de um recipientes
coletors (copos ou potes), preenchidos com um líquido conservante e mortífero (Formol
2% ou Álcool), deixados ao nível do solo para a captura indireta dos organismos
(Paschetta et al. 2013). Por vezes, podem-se utilizar iscas para a atração dos
invertebrados (Silva et al. 2012; Garcia et al. 2016). A captura feita por essas

22
armadilhas está muito relacionada à atividade e a densidade das espécies, sendo que as
menos ativas costumam ser menos capturadas (Topping & Sunderland 1992; Patrick &
Hansen, 2013), o que pode causar, por vezes, resultados não conclusivos em relação a
diversidade (Gotelli & Colwell 2001; Bedano & Domínguez 2016). Entretanto, a
metodologia é muito utilizada na captura de invertebrados como, por exemplo, as
aranhas onde se captura grande riqueza e abundancia de espécies (Curtis 1980; Ferreti et
al. 2011; Rodrigues et al. 2014; Pompozzi et al. 2014; Polchaninova et al. 2015).
Aranhas como modelos
Aranhas (Araneae) são o segundo grupo mais rico de Arachnida, contando,
atualmente, com mais de 46 mil espécies descritas em 113 famílias (World Spider
Catalog 2016). Ocupam quase a totalidade dos ambientes terrestres, não sendo
encontradas apenas na Antártida (Foelix 2011). Os aracnídeos, como predadores do
topo de cadeia da fauna de invertebrados, têm grande capacidade de resposta a fatores e
perturbações bióticas e abióticas (Podgaiski et al. 2013; Herrmann et al. 2015; Lin et al.
2016; Niba & Yekwayo 2016; Peterson et al. 2016).
Aranhas são ótimas dispersoras e colonizadoras (Bishop & Riechert 1990;
Rodrigues et al. 2009; Lin et al. 2016); são predadoras vorazes, consumindo altas taxas
de biomassa (Nyfeller 2000; Ott 2016), em diferentes níveis tróficos (Dennis et al.,
2015; Rodriguez-Artigas et al. 2016). Consomem até mesmo outras aranhas (Wise,
2006) sem afetar plantas hospedeiras (Fritz et al.2011; Norma-Rashid et al. 2014);
sendo que espécies construtoras de teias estão muito relacionadas a estrutura vegetal
disponível, apresentando grandes diferenças na composição das assembléias, por
exemplo, entre a araneofauna arbórea e a que vive sobre o solo (Uetz 1999; Baldissera,
2004; Rodrigues et al. 2009; Andrade et al. 2015; Nogueira & Pinto-da-Rocha, 2016);

23
Todos estes aspectos fazem deste grup grandes modelos experimentais em ecologia
(Coddington & Levi 1991).
Aranhas já foram amplamente estudas em diversos biomas. Contudo, estudos em
diferentes campos e pastagens envolvendo riqueza, composição, abundância e
resiliência destes organismos, sob diferentes impactos e manejos, ainda se fazem
necessários (McDonald 2007; Haddad et al. 2015; Horváth et al. 2015). Aranhas são
conhecidas por reocuparem rapidamente ambientes impactados pelo fogo (Podgaiski et
al. 2013) e agroecosisstemas (Rodrigues et al. 2009; Lee et al. 2014; Baba & Tanaka
2016). Todavia, estas nunca foram utilizadas como modelos em resiliência no Pampa,
desta forma, suas capacidades ecológicas e esta brecha no conhecimento, as tornam
grandes candidatas para este estudo.
A dissertação
Esta dissertação está apresentada em três capítulos em formatos de artigos.
Todos os trabalhos foram realizados na APA do Ibirapuitã (Fig.1), localizada na região
da Campanha gaúcha, abrangendo os municípios de Alegrete, Quaraí, Rosário do Sul e
Sant’Ana do Livramento.
Três fazendas foram selecionadas para o experimento. Em cada uma das
fazendas, um par de hectares (100 m x 100 m) foi selecionado em 2011 sendo um
denominados como áreas com pastejo e sem pastejo. As áreas com pastejo são parcelas
com livre acesso para o pastejo do gado, com apenas estacas demarcando os vértices do
perímetro de um hectare. As áreas sem pastejo são parcelas de mesmos tamanhos
cercados e com total exclusão de gado e consequentemente sem pastejo. O cercamento
efetivo das áeras e exclusão do gado ocorreram em apenas em agosto de 2012. A
vegetação dominante nas áreas, à época do fechamento e ainda encontrada atualmente
nas áreas pastejadas era de gramíneas baixas intercaladas com capim caninha

24
(Andropogon lateralis Nees). Ao longo do período de fechamento (43 meses ao final
desta dissertação) foi ocorrendo uma modificação na morfologia da vegetação entre
áreas com e sem pastejo, claramente visível conparando-se ambos os lados da cerca
(Fig. 2). Atualmente as áreas sem pastejo possuem uma vegetação compostas por
gramíneas altas e arbustos (Baccharis spp.) que chegam a ultrapassar 1,7 m de altura no
caso de plantas Baccharis dracunculifolia DC (Fig. 3). Nas áreas com pastejo a
vegetação é basicamente composta de gramíneas rasteiras não ultrapassa os 15 cm de
altura à excessão da toiceiras de capim caninha (Fig. 4). Durante nossa pesquisa
consideramos sempre estas áreas sem pastejo como sendo o mesmo estado ambiental de
quando a pesquisa foi iniciada em 2011.
O primeiro artigo proposto é intitulado: “Short-term spider community
monitoring after cattle removal in grazed grassland”. Este artigo compreende os
levantamentos ocorridos nas primaveras de 2011, 2012 e 2013 na APA do Ibirapuitã.
Aborda aspectos da diversidade como riqueza, composição e abundância das famílias e
espécies da assembleia de aranhas ativas junto ao solo nas áreas pastejadas e nas áreas
sem pastejo. As amostragens ocorreram em três momentos distintos, a primeira antes do
cercamento (2011) e em dois momentos ao longo dos primeiros meses após o
cercamento e exclusão do pastejo, aos 03 meses (2012) e aos 15 meses (2013).
O segundo artigo proposto é intitulado: “Grazing affects ground spider
(Arachnida: Araneae) biomass and body size at Pampa biome?”. Este artigo
compreende os levantamentos ocorridos nas primaveras de 2011, 2012 e 2013 e os
levantamentos sazonais no outono (Maio), inverno (Setembro), primavera (Novembro)
de 2015 e verão (Fevereiro) de 2016 na APA do Ibirapuitã. Aborda a diferenciação da
biomassa total de aranhas, das espécies mais abundantes e dos machos mais abundantes
entre áreas com e sem pastejo após três anos de exclusão.

25
O terceiro artigo proposto é intitulado: “Seasonal spider diversity and species
phenology in grazed and ungrazed areas in Southern America Grasslands”.Este artigo
compreende levantamentos sazonais no outono (Maio), inverno (Setembro), primavera
(Novembro) de 2015 e verão (Fevereiro) de 2016, na APA do Ibirapuitã. Aborda
aspectos da diversidade como riqueza, composição e abundância sazonais de aranhas
entre 30 meses e 39 meses após exclusão do pastejo comparada com áreas ainda com
pastejo de gado.
O primeiro artigo aqui proposto é apresentado na formatação da revista Iheringia
Série Zoologia. Outrostextos, tabelas, figuras, referências e literaturas citadas são
apresentadas na formatação da revista Journal of Arachnology e

26
OBJETIVOS
Objetivo geral
Avaliar a variação da assembléia de aranhas em áreas com e sem pastejo na
APA do Ibirapuitã, inserida no Bioma Pampa, no sul do Brasil ao longo de 43 meses.
Objetivos específicos
1. Realizar uma análise comparativa da araneofauna entre áreas com pastejo
e sem pastejo, avaliando riqueza e abundância relativa temporal e sazonal.
2. Testar diferenças na Biomassa de aranhas em áreas com a sem pastejo.
3. Apresentar listas de famílias, espécies e morfo-espécies de aranhas
ocorrentes no bioma Pampa.

27
RESULTADOS GERAIS
Dados gerais
Foram coletados um no total de 3.243 aranhas (1.437 machos, 500
fêmeas e 1.306 jovens). Destas, 1.315 foram coletas nas primaveras de 2011, 2012 e
2013 (576 machos, 199 fêmeas e 540 jovens) e 1.928 sazonalmente em 2015 e 2016
(861 machos, 301 fêmeas e 766 jovens).
Um total de 1.784 indivíduos foi coletado em áreas com pastejo
(Primaveras, 685; Sazonalmente 1.099) e 1.459 indivíduos em áreas sem pastejo
(Primaveras 630; Sazonalmente 829).
Um total de 117 espécies foi identificado, 44 nominalmente, 53
classificadas em nível de gênero e 20 em nível de morfoespécie. A riqueza entre áreas
com pastjo e áreas sem pastejo foi aproximada. Foram registradas 95 espécies nas aeras
com pastejo e e 91 nas áreas sem pastejo.
Destas espécies, 22 foram exclusivas das áreas sem pastejo, 26
exclusivas das áreas com pastejo e 69 foram compartilhadas entre ambas as
metodologias. Para as áreas com pastejo, 39 espécies foram singletons e 11 doubletons.
Nas áreas sem pastejo, 32 singletons e 14 doubletons foram registrados.
Das primaveras (2011, 2012, 2013)
Teste T baseado em apenas aranhas adultas revelou diferença não
significativa entre áreas com e sem pastejo em 2012/2013 (p=0.4782), em apenas 2012
com três meses de cercamento (p=0.2807) e em apenas 2013 com 15 meses de
cercamento (p=0.8465). O mesmo Teste T baseado apenas nas espécies mais
abundantes revelou diferença não significativa entre áreas com e sem pastejo nos
mesmos parâmetros, 2012/2013 (p=0.5744), apenas 2012 (p=0.2086) e apenas 2013
(p=0.7550).

28
Apesar da disposição das armadilhas nos coletas de 2013, ANOSIM
revelou diferença não significativa entre os grupos de pitfall quando adultos (Morisita:
R= -0.0298 p= 0.7978; Bray-Curtis: R= -0.0073 p= 0.5322; Jaccard: R= -0.0210 p=
0.7046) e espécies mais abundantes (Morisita: R= -0.0379 p= 0.8833; Bray-Curtis: R= -
0.0400 p= 0.8508; Jaccard: R= -0.0361 p= 0.8694) foram testadas.
Da biomassa
A biomassa média de aranhas nas áreas com pastejo, foi superior a
medida nas áreas com pastejo. Entretanto, Teste T revelou diferença não significativa
entre entre áreas com e sem pastejo quando as Primaveras (2012, 2013 e 2015) foram
testadas (todas as aranhas p=0.6447; machos mais abundantes p=0.91096). Teste T
revelou diferença significativa entre áreas com e sem pastejo, com valores maiores nas
áreas com pastejo, sazonalmente (2015/2016) quando todas as aranhas foram testadas
(p=0.013882). Entretanto, machos mais abundantes ainda revelaram diferença não
significativa (p=0.87517).
Usando a biomassa das espécies mais abundantes sazonais (2015/2016),
Teste T revelou diferença significativa entre áreas com e sem pastejo, com valores
maiores nas áreas com pastejo para Agyneta sp. 1 (p = 0.0101), Neohania sp. 1 (p =
3.4204E-06), Erigone sp. 1 (p = 5.751E-11), Tutaibo sp. 1 (p = 0.0038). Glenognatha
lacteovittata (p = 3.7013E-07) teve valores maiores nas áreas sem pastejo. A biomassas
de Neohania sp. 2 (p = 0.4971), Agyneta sp. 2 (p = 0.0928), Guaraniella mahnerti (p =
0.8514) não foram significativamente diferentes.
Teste T baseado nas médias do comprimento da carapaça dos machos
mais abundantes revelou diferença não significativa entre áreas com e sem pastejo com
todos os dados, excluindo 2011 (p = 0.9369), apenas nas primaveras, excluindo 2011 (p
= 0.9609) e sazonalmente (p = 0.9867).

29
Da sazonalidade (2015/2016)
Teste T performado comparando áreas com e sem pastejo, utilizando a
abundância das espécies mais abundantes, revelou diferença significativa para todas elas
(p = 0.0070) e individualmente, Agyneta sp. 1 (p = 0.0009), Neohania sp. 1 (p =
2.0799E-07), Erigone sp. 1 (p = 1.9777E-07), Neohania sp. 2 (p = 0.0252) e Agyneta sp.
2 (p = 0.0168), com valores maiores nas áreas com pastejo.
O inverno foi a estação com mais abundancia de indivíduos adultos (198
nas áreas com pastejo; 154 áreas sem pastejo), seguido da primavera (215; 112), outono
(182; 112) e verão (143; 63). As curvas de fenologia das espécies mais abundantes não
demonstram uma estação de preferência, contudo, demonstram maior atividade destas
espécies nas áreas scom pastejo.
As curvas de fenologia demonstraram maior atividade das aranhas nos
nas áreas com do que nas áreas sem pastejo.

30
LITERATURA CITADA
Alberdi, M. & J. Prado. 2008. Presencia de Stegomastodon (Gomphotheriidae,
Proboscidea) en el Pleistoceno Superior de La zona costera de Santa Clara Del
Mar (Argentina). Estudios Geológicos, 64(2)175-185. doi:
10.3989/egeol.08642.044
Andrade, B.O., C. Kock, I.I. Boldrini, E. Vélez-Martin, H. Hasenack, J.M. Hermann et
al. 2015. Grassland degradation and restoration: a conceptual framework of
stages and thresholds illustrated by southern Brazilian grasslands. Natureza &
Conservação, 0:10. doi: 10.1016/j.ncon.2015.08.002.
Baba, Y.G. & K. Tanaka. 2016. Factors affecting abundance and species composition
ofgeneralistpreda tors (Tetragnathaspiders)in agricultural ditches adjacent to rice
paddy fields. Biological Control, 32 p. doi:
http://dx.doi.org/10.1016/j.biocontrol.2016.09.004.
Baldissera, R.; Ganade, G.; Fontoura, S. B. 2004. Web spider community response
along an edge between pasture and Araucaria forest. Biological Conservation,
118:403–409.
Bedano, J. C. & A. Domínguez. 2016. Large-Scale agricultural management and soil
meso- and macrofauna conservation in the argentine pampas. Sustainability,
8(653):1-25. doi:10.3390/su8070653.
Behling, H., V.D. Pillar, S.G. Bauermann. 2005. Late Quaternary grassland (Campos),
gallery forest, fire and climate dynamics, studied by pollen, charcoal and
multivariate analysis of the São Francisco de Assis core in western Rio Grande
do Sul (southern Brazil). Review of Palaeobotany and Palynology, 133:235-248.
Beheling, H., V. Jeske-Pieruschka, L. Schüler, V.P.Pillar. 2009. Dinâmica dos campos
no sul do Brasil durante o quaternário tardio, Pp. 13-25. In Pillar, V.P., S.C.

31
Müller, Z.M.S. Castilhos, A.V.A. Jacques. Campos sulinos: conservação e uso
sustentável da biodiversidade, 1° edition, Brasília: MMA.
Bella, C.E.D., E. Jacobo, R.A. Golluscio, A.M. Rodriguez. 2014. Effects of cattle
grazing on soil salinity and vegetation composition along an elevation gradient
in a temperate coastal salt marsh of Sambotombón Bay (Argentina). Wet lands
Ecology and Management, 22:1-13.
Bella, C.E.D., A.M. Rodriguez, E. Jacobo, R.A. Golluscio, M.A. Taboada. 2015. Impact
of cattle grazing on temperate coastal salt marsh soils. Soil Use and
Management, 31:299-307.
Bencke, G.A. 2016. Aves; Pp. 48-51. In Moura, L.A., L. Chomenko, M.A. Azevedo.
Natureza em Revista, 14, RS Biodiversidade, Porto Alegre: Fundação
Zoobotânica do Rio Grande do Sul.
Bernardi, R.E., M. Holmgren, M. Arim, M. Scheffer. 2016. Why are forests so scarce in
subtropical South America? The shaping roles of climate, fire and livestock.
Forest Ecology and Management, 363:212–217.
Bertaco, V.A. & M.A. Azevedo. 2013. Fishes from rio Ibirapuitã basin, Environmental
Protection Area of Ibirapuitã, Pampa Biome. Check List, 9(5):966–972.
Bishop, L. & Riechert, S. E. 1990. Spider colonization of Agroecosystems: Mode and
Source. Entomological Society of America, 19:1738-1745.
Bogino, S., S.C. Roa-Giménez, A.T. Velasco-Sastre, M.L. Cangiano, L. Risio-Allione,
V. Rozas. 2015. Synergetic effects of fire, climate, and management history on
Prosopis caldenia recruitment in the Argentinean pampas. Journal of Arid
Environments, 117:59-66.

32
Bolaños, V.A., M.C. Vecchio, R.A. Golluscio. 2015. Dormición y tipo de suelo como
determinantes de La germinación y establecimento de Chloris berroi em La
Pampa Deprimida. Ecologia Austral, 25:75-80.
Boldrini, I.I. A flora dos campos do Rio Grande do Sul. 2009. Pp.63-77. In Pillar, V.P.,
S.C. Müller, Z.M.S. Castilhos, A.V.A. Jacques. Campos sulinos: conservação e
uso sustentável da biodiversidade, 1° edition, Brasília: MMA.
Borer, E.T., E.W. Seabloom, D. Tilman. 2012. Plant diversity controls arthropod
biomass and temporal stability. Ecology Letters, 15:1457-1464.
Bornebusch, C.H. 1930. The Fauna of Forest Soil. Nielsen and Lydiche, Copenhagen.
Brady, C.J. & R.A. Noske. 2006. Generalised regression provide good estimates of
insect and spider biomass in the monsoonal tropics of Australia. Australian
Journal of Entomology 45:187-191.
Burney, D.A. & Flannery, T.F. 2005. Fifty millennia of catastrophic extinctions after
human contact. Trends in Ecology and Evolution, 20(7):395-401.
Carvalho, F.L. 2003. A Pré-História Sergipana. Aracaju: Universidade Federal de
Sergipe.
Carvalho, A.P.S., G. Piovesan, A.B.B. Morais. 2015. Butterflies (Lepidoptera:
Papilionoidea) of grassland areas in the Pampa biome, southern Brazil. Check
List 11(5):1-6. doi: http://dx.doi.org/10.15560/11.5.1772
Coddington, J.A. & Levi, H.W. 1991. Systematics and evolution of spiders (Araneae).
Annual Review of Ecology and Systematics, 22:565-592.
Consens, M. 2009. Prehistoria del Uruguay: realidad y fantasía. Montevideo, Del Sur
Ediciones.
Cordeiro, C.A. & L.C. Soares. 1977. A erosão nos solos da região sudoeste do Rio
Grande do Sul. Revista Brasileira de Geografia, 39:82-150.

33
Cortelezzi, A., C. Ocón, M.V.L. van Oosterom, R. Cepeda, A.R. Capítulo. 2015.
Nutrient enrichment effect on macroinvertebrates in a lowland stream of
Argentina. Iheringia, Série Zoologia, 105(2):228-234.
Cruz, R.C., D.L. Guadagnin. 2010. Uma pequena história ambiental do pampa:
proposta de uma abordagem baseada na relação entre perturbação e mudança. In
A sustentabilidade da Região da Campanha-RS: práticas e teorias a respeito das
relações entre ambiente, sociedade, cultura e políticas públicas, Pp. 155-179. In
Costa, B.C., J.H. Quoos, M.E.G. Dickel. Universidade Federal de Santa Maria,
Programa de Pós-Graduação em Geografia e Geociências, Departamento de
Geociências.
Curtis, D.J. 1980. Pitfalls in spider community studies (Arachnida, Araneae). The
Journal of Arachnology, 8:(2)271-280.
Dassou, A.G.,S. Dépigny, E. Canard, F. Vinatier, D. Carval,P. Tixier. 2015. Contrasting
effects of plant diversity across arthropod trophic group in plantain-based
agroecosystems. Basic and Applied Ecology, 17:11-20.
D’Acunto, L., M. Smmartin, C.M. Ghersa. 2016. Uncultivated margins are source of
soil microbial diversity in an agricultural landscape. Agriculture, Ecosystems
and Environment, 220:1–7
Dennis, P., J. Skartveit, A. Kunaver, D.I. McCracken. 2015. The response of spider
(Araneae) assemblages to structural heterogeneity and prey abundance in sub-
montane vegetation modified by conservation grazing. Global Ecology and
Conservation, 3:715–728.
Diaz, S., S. Lavorel, S. McIntyre, V. Falczuk, F. Casanoves, D.G. Milchunas et al.
2007.Plant trait responses to grazing – a globalsynthesis. Global Change Biology
13:313–341.

34
Edwards, C.A. 1966. Relationships between weights, volumes and numbers of soil
animals. Colloquium on Dynamics of Soil Sommunities, 93:5–10.
Espinosa, C.C., D. GalianO, B B. Kubiak, J.R. Marinho.2016. Medium- and large-sized
mammals in a steppic savanna area of the Brazilian Pampa: survey and
conservation issues of a poorly known fauna. Brazialin Journal of Biology,
76:(1)73-79.
Evans, D.M., N. Villar, N.A. Littlewood, R.J. Pakeman, S.A. Evans, P. Dennis et al.
2015.The cascading impacts of livestock grazing in upland ecosystems: a 10-
year experiment. Ecosphere, 6(3):1-15.
Entiauspe-Neto, O.M., T.D. Perleberg, M.A. Freitas. 2016. Herpetofauna from an urban
Pampa fragment in southern Brazil: composition, structure and conservation.
Check List 12(5):1-15. doi: http://dx.doi.org/10.15560/12.5.1964
Ferrando, C.P., L.R. Podgaiski,M.K. Costa, M.D.S. Mendonça Jr. 2016. Taxonomic and
Functional Resilience of Grasshoppers (Orthoptera, Caelifera) to Fire in South
Brazilian Grasslands. Neotropical Entomology, 45(4):374-381. doi:
10.1007/s13744-016-0380-3.
Ferretti, N., G. Pompozzi, S. Copperi, F. Pérez-Miles, A. González. 2011.
Mygalomorph spider community of a natural reserve in a hilly system in central
Argentina. Journal of Insect Science, 12(31): 1-16.
Fidelis, A., B. Appezzato-da-Glória, J. Pfadenhauer. 2009. A importância da biomassa e
das estruturas subterrâneas nos Campos Sulinos, Pp. 88-100. In Pillar, V.P., S.C.
Müller, Z.M.S. Castilhos, A.V.A. Jacques. Campos sulinos: conservação e uso
sustentável da biodiversidade, 1° edition, Brasília: MMA.

35
Fidelis, A., S.C. Müller, D.V. Pillar, J. Pfadenhauer. 2010. Population biology and
regeneration of forbs and shrubs after fire in Brazilian Campos grasslands. Plant
Ecology, 211:107–117.
Foelix, R.F. 2011.Biology of Spiders. 3. ed. Oxford: Oxford University Press.
Frasson, J.M.F., J.L.O. Rosado, S.G. Elias, B. Harter-Marques. 2015. Litter
Decomposition of Two Pioneer Tree Species and Associated Soil Fauna in Areas
Reclaimed after Surface Coal Mining in Southern Brazil. Revista Brasileira de
Ciências de Solo, 40:1-13.
Fritz, L.L., E.A. Heinrichs, V. Machado, T.F. Andreis, M. Pandolfo, S.M. Salles, J.V.
Oliveira, L.M. Fiuza. 2011. Diversity and abundance of arthropods in
subtropical rice growing areas in the Brazilian south. Biodiversity and
Conservation 20(10):2211-2224.
Ganihar, S.R. 1997. Biomass estimates of terrestrial arthropods based on body length.
Journal of Biosciences, 22:219-224.
Gantchoff, M.G.,J. L. Belant, D.A. Masson. 2014. Land use affects mammal
community composition in a multiple-use protected area, East-Central
Argentina. Revista Latinoamericana de Conservación, 1:7-13.
Garcia, L.E., R.M. Moraes, É.E.S. Vianna. 2016. Levantamento de besouros copro-
necrófagos (Coleoptera: Scarabaeidae: Scarabaeinae) do Bioma Pampa
Evaluation of dung beetles (Coleoptera: Scarabaeidae: Scarabaeinae) in the
Pampa Biome. Revista de Ciências Agroveterinárias, 15(2)144-154. doi:
10.5965/223811711522016144
Gómez, J.E. J. Lohmiller, A. Joern. Importance of vegetation structure to the assembly
of an aerial web-building spider community in North American open grassland.

36
The Journal of Arachnology, 44(1):28-35. doi: http://dx.doi.org/10.1636/P14-
58.1.
Green, A.J. 2001. Mass/Length Residuals: Measures of body condition or generators of
spurious results? Ecology, 82(5):1473-1483.
Gotelli, N.J. & R.K. Colwell. 2001. Quantifying biodiversity: procedures and pitfalls in
the measurement and comparison of species richness. Ecology Letters, 4:379–
391.
Guimaraes, C.C., M.V. Schumacher, R. Witshoreck, H.P. Souza, J.C. Santo. 2015.
Biomassa e nutrientes em povoamento de eucalyptus dunnii maiden no Pampa
Gaúcho. Revista Árvore, 39(5):873-882.
Haddad, C.R., S. H. Foord, R. Fourie, A.S. Dippenaar-Schoeman. 2015. Effects of fast-
burning spring fire on the ground-dwelling spider assemblages (Arachnida:
Araneae) in a central South Africa grassland habitat. African Zoology, 50(4):
281-292. doi: http://dx.doi.org/10.1080/15627020.2015.1088400.
Herrmann, J.D.,I. Opatovsky, Y. Lubin, T. Pluess, E. Gavish-Regev, M. H. Entling.
2015. Effects of non-native Eucalyptus plantations on epigeal spider
communities in thenorthern Negev desert, Israel. The Journal of Aracnology,
43:101–106.
Hertzog, L.R.,S.T. Meyer, W.W. Weisser, A. Ebeling. 2016. Experimental manipulation
of grassland plant diversity induces complex shifts in aboveground arthropod
diversity. PLoS one, 11(2)1-16.doi: 10.1371/journals;pone.0148768.
Hooper, R.G. 1996. Arthropod biomass in winter and the age of longleaf pines. Forest
Ecology and Management 82:115-131.
Horváth, R., T. Magura, C. Szinetár, B. Tóthemérész. 2009. Spiders are not less diverse
in small and isolated grasslands, but less diverse in overgrazed grasslands: A

37
field study (East Hungary, Nyérség). Agriculture, Ecosystems and Environment
130:16–22.
IBGE. Instituto Brasileiro de Geografia e Estatística. 2004. Produção Agrícola
Municipal. Tabela 1612 - Área plantada, área colhida, quantidade produzida e
valor da produção da lavoura temporária. Disponível em:
http://www.sidra.ibge.gov.br/bda/. Acesso em: 06/12/2016.
Indicatti, R.P., S.M. Lucas, R. Ott, A.D. Brescovit. 2008. Litter dwelling mygalomorph
spiders (Araneae: Microstigmatidae, Nemesiidae) from Araucaria forests in
southern Brazil, with the description of five new species. RevistaBrasileira de
Zoologia 25 (3):529-546.
Jardim, M.M.A., T.C. Trigo, J. Reck Jr., U.A. Souza, T. Michel, E. Pasa et al. 2016.
Maníferos; Pp. 52-55. In Moura, L.A., L. Chomenko, M.A. Azevedo. Natureza
em Revista, 14, RS Biodiversidade, Porto Alegre: Fundação Zoobotânica do Rio
Grande do Sul.
Kamali, F.P.,M.P.M. Meuwissen, A.G.J.M.O. Lansink. 2014. Evaluation of beef
sustainability in conventional, organic, and mixed crop-beef supply chains.
Proceedings of the 9th
International Conference on Life Cycle Assessment in the
Agri-Food Sector, 1-11.
Kirchman, D. 2001. Measuring bacterial biomass production and growth rates from
Leucine Incorporation in natural aquatic environments. Methodos in
Microbiology, 30:227-237.
Kottek, M.; J. Griser,C. Beck,B. Rudolf,F. Rubel. 2006. World map of the Köppen-
Geiger climate classification updated. Meteorologische Zeitschrift,15(3):259-
263.

38
Krebs, C.J. & G.R. Singleton. 1993. Indices of Condition for Small Mammals.
Australian Journal of Zoology, 41:317-23.
Laterra, P., O.R. Vignolio, M.P. Linares, A. Giaquinta, N. Maceira. 2003. Cumulative
effects of fire on a tussock pampa grassland. Journal of Vegetation Science, 14:
43-54.
Lee, S.Y., S.T. Kim, J.K. Jung, J. Lee. 2014. A Comparison of Spider Communities in
Bt and Non-Bt Rice Fields Environmental Entomology, 43(3):819-827. doi:
http://dx.doi.org/10.1603/EN12259.
Lin, S., L. Vasseur, M., S. You. 2016. Seasonal Variability in Spider Assemblages in
Traditional and Transgenic Rice Fields. Environmental Entomology, 0:1–10.doi:
10.1093/ee/nvw00.
Lupatini, M., A.K.A. Suleiman, R.J.S. Jacques, Z.I. Antoniolli, E.E. Kuramae, F.A.O.
Camargo et al. 2013. Soil-Borne Bacterial Structure and Diversity Does Not
Reflect Community Activity in Pampa Biome. PLoS ONE, 8(10):1-9.
doi:10.1371/journal.pone.0076465.
McDonald, B. 2007. Effects of vegetation structure on foliage dwelling spider
assemblages in native and non-native Oklahoma grasslands habitats.
Proceedings of the Oklahoma Academy of Science, 87:85-88.
Modernel, P. W.A. Rossing, M. Corbeels, S. Dogliotti, V. Picasso, P. Tittonell. Land
use change and ecosystem service provision in Pampas and Campos grasslands
of southern South America. Environmental Reaserch Letters, 11:1-21. doi:
10.1088/1748-9326/11/11/113002.
Motobayashi, T., C. Ishijima, M. Takagi, M. Murakami, A. Taguchi, K. Hidake et al.
2006.Effects of tillage practices on spider assemblage in rice paddy fields.
Applied Entomology and Zoology, 41(2):371-381.

39
Nabinger, C., E.T. Ferreira, A.K. Freitas, P.C.F. Carvalho, D.M. Sant’Anna. 2009.
Produção animal com base no campo nativo: aplicações de resultados de
pesquisa, Pp. 175–198. In Pillar, V.P., S.C. Müller, Z.M.S. Castilhos, A.V.A.
Jacques. Campos sulinos: conservação e uso sustentável da biodiversidade, 1°
edition, Brasília: MMA.
Niba, A.S. &I. Yekwayo. 2016. Epiganic invertebrate community structure in two
subtropical nature reserves, Eastern Cape, South Africa: Implications for
conservation management. ArachnologischeMitteilungen, Arachnology Letters,
52: 7-15.
Nimer, E. 1977. Clima. In IBGE - Geografia do Brasil, Região Sul. SERGRAF-IBGE,
Rio de Janeiro, 35-79pp.
Nogueira, A.A. & R. Pinto-da-Rocha. 2016. The effects of habitat size and quality on
the orb-weaving spider guild (Arachnida: Araneae) in an Atlantic Forest
fragmented landscape. The Journal of Arachnology, 44:36–45.
Norma-Rashid, Y., W.M.A.W. Zainudin, M.N. Dzulhelmi, N. Masduki. 2014. Spiders
as Potential Ecofriendly Predators Against Pests, Pp. 245-254. In Sahayaraj,
K. Basic and Applied Aspects of Biopesticides.
Nyfeller, M. 2000. Ecological impact of spiders predation: a critical assessment of
Britowe’s and Tunbull’s estimates. Bulletin of the British Arachnological
Society, 11:367-373.
Oliveira, M.L.A.A., M. Grings, F.S. Richter, A.R. Backes. 2015. Composição, estrutura
e fatores edáficos condicionantes da distribuição das espécies do componente
arbóreo em floresta ribeirinha do rio Ibirapuitã, Bioma Pampa. Iheringia,
70(2):245 – 263.

40
Oliveira, M.L.A.A. 2016. Flora e vegetação. Pp. 44-45. In Moura L.A., L. Chomenko,
M.A. Azevedo. Natureza em Revista, 14, RS Biodiversidade, Porto Alegre:
Fundação Zoobotânica do Rio Grande do Sul.
Ott, R. 2016. Invertebrados terrestres – Aranhas; Pp. 46-47. In Moura, L.A., L.
Chomenko, M.A. Azevedo. Natureza em Revista, 14, RS Biodiversidade, Porto
Alegre: Fundação Zoobotânica do Rio Grande do Sul.
Overbeck, G.E., S.C. Müller, A. Fidelis, J. Pfadenhauer, V.D. Pillar, C.C. Blancoet al.,
2007. Brazil’s neglected biome: the SouthBrazilian Campos. Perspectives in
Plant Ecology, Evolution and Systematics, 9:101–116.
Overbeck, G.E., S. C. Müller, A. Fidelis, J. Pfadenhauer, V.P. Pillar, C.C. Blanco et al.
2009. Os Campos Sulinos: um bioma negligenciado; pp. Pp. 26-41. In: Pillar,
V.P., S.C. Müller, Z.M.S. Castilhos, A.V.A. Jacques. Campos sulinos:
conservação e uso sustentável da biodiversidade, 1° edition, Brasília: MMA.
Overbeck, G.E., J. Hermann, B.O. Andrade, I.I. Boldrini, K. Kiehl, A. Kirmer et al.,
2013. Restoration ecology in Brazil – time to step out of the forest. Natureza &
Conservação, 11, 92–95.
Pallarés, O.R.,E.J. Berretta, G.E. Maraschin.2005. The South American campos
ecosystem, Pp. 171-219. In Suttie, J., S.G. Reynolds, C. Batello. Grasslands of
the World. FAO, Rome.
Paschetta, M., V. La Morgia, D. Masante, M. Negro, A. Rolando, M. Isaia. 2012.
Grazing history influences biodiversity: a case study on ground-dwelling
arachnids (Arachnida: Araneae, Opiliones) in the Natural Park of Alpi Marittime
(NW Italy). Journal of Insect Conservation, 17:339–356.
Patrick, B., A. Hansen. 2013. Comparing ramp and pitfall traps for capturing wandering
spiders. The Journal of Arachnology, 41:404-406.

41
Pelegrini, C.B., R.B. Medeiros, S.B. Carlotto, R.P.A. Garcia, C.V. Lisboa, G. Bruning.
2016. Valor nutritivo de uma pastagem nativa dominada por Eragrotis plana
Nees e sua relação com o perfil metabólico de vacas primíparas suplementadas
da gestação ao pós-parto. Ciência Animal Brasileira, 17(20):154-163.
Pereira, A.G, R.B. Silva, M.M. Dias, A.M. Penteado-Dias. 2015. Study on the
Hymenoptera parasitoid associated with Lepidoptera larvae in reforestation and
agrosilvopastoral systems at Fazenda Canchim (Embrapa Pecuária Sudeste) São
Carlos, SP, Brazil. Brazilian Journal of Biology, 75(4):783-789.
Peterson, J. A., J.J. Obrycki, J.D. Hardwood. 2016. Spiders from multiple functional
guilds are exposedto Bt-endotoxins in transgenic corn fields via preyand pollen
consumption. Biocontrol Science and Technology, 26(9):1230–1248.
Pinto, C.E.; J.A.S. Fontoura Jr, A. Frizzo, T.M.S. Freitas, C. Nabinger, P.C.F. Carvalho.
2008. Produções primária e secundária de uma pastagem natural da Depressão
Central do RS submetida a diversas ofertas de fitomassa aérea total. Revista
Brasileira de Zootecnia, 37:1737–1741.
Podgaiski L.R., F. Joner, S. Lavorel,M. Moretti,S. Ibanez, M.S. Mendonça Jr et al.
2013. Spider trait assembly patterns and resilience under fire-induced vegetation
change in south Brazilian Grasslands. PLoS ONE 8(3):1-11.
doi:10.1371/journal.pone.0060207.
Podgaisk, L.R., C.S. GoldaS, C.P.R. Ferrando, F.S. Silveira, F. Joner, G.E. Overbeck et
al. 2014. Burning effects on detritivory and litter decay in Campos grasslands.
Austral Ecology, 39:686–695.
Poggio, S.L., E.J. Chanetonb, C.M. Ghersab. 2013. The arable plant diversity of
intensively managed farmland: Effects of field position and crop type at local
and landscape scales. Agriculture, Ecosystems and Environment, 166:55– 64.

42
Polchaninova, N., G. Savchenko, A. Drogvalenko, V. Ronkin, D. Shabanov. 2016. The
impact of cattle grazing on cursorial spiders (Aranei) and true bugs (Heteroptera)
in steppe gullies of northeastern Ukraine. Agriculture, Ecosystems &
Environment, 234:65-71.
Pompozzi, G., S. Copperi, L. Schwerdt, N. Ferretti. 2014. On the ecology of the
cursorial spider Odo bruchi (Araneae: Zoridae) in a grassland natural reserve
from central Argentina. Revista de Biología Tropical, 62(1):87-93.
Risio, L., C. Herrero, S.M. Bogino, F. Bravo. 2014. Aboveground and belowground
biomass allocation in native Prosopis caldenia Burkart secondaries woodlands in
the semi-arid Argentinean pampas. Biomass and Bioenergy, 66:249-260.
Rodrigues, E.N.L., M.S. Mendonça Jr, R. Ott. 2009. Spider diversity in a rice
agroecosystem and adjacent areas in southern Brazil.Revista Colombiana de
Entomología, 35:78-86.
Rodrigues, E.N.L., M.S. Mendonça Jr, L.E. Costa-Schimidt. 2014. Spider diversity
responds strongly to edge effects but weakly to vegetation structure in riparian
forests of Southern Brazil. Arthropod-PlantInteractions, 8:123–133. doi:
10.1007/s11829-014-9294-3.
Rodriguez-Artigas, S.M., R. Ballester, J.A. Corronca. 2016. Factors that influence the
beta-diversity of spider communities in northwestern Argentinean Grasslands.
PeerJ 4:e1946. doi: 10.7717/peerj.1946.
Ruviaro, C.F., J.S. Costa, T.J. Florindo, W. Rodrigues, G.I.B. Medeiros, P.S.
Vasconcelos. 2016. Economic and environmental feasibility of beef production
in different feed management systems in the Pampa biomes, southern Brazil.
Ecological Indicators, 60:930-939.

43
Schulte-Hostedde, A.I., B. Zinner, J.S. Millar, G. Hickling. 2005. Restitution of mass-
size residuals: Validating body condition indices. Ecology, 86(1):155-163.
Sherer, C.S. & A.A.S. da Ross. 2003. Um Eqüídeo Fóssil do Pleistoceno de Alegrete,
RS, Brasil. Pesquisas em Geociências, 30(2)33-38.
Silva, P.G., L.D. Audino, J.M. Nogueira, L.P. Moraes, F.Z. Vaz-de-Mello.
Escarabeíneos (Coleoptera: Scarabaeidae: Scarabaeinae) de uma área de campo
nativo no bioma Pampa, Rio Grande do Sul, Brasil. Biota Neotropica, 12(3):246-
253.
Siqueira, G.M., Ê.F.F. Silva, M.M. Moreira, G.A.A. Santos, R.A. Silva. 2016. Diversity
of soil macrofauna under sugarcane monoculture and two different natural
vegetation types African Journal of Agricultural Research, 11(30):2669-2677.
Soares, A.B., P.C.F. Carvalho, C. Nabinger, J.P.P. Trindade, J.K. Trindade, J.C.
Mezzalira. 2011. Dinâmica da composição botânica numapastagem natural sob
efeito de diferentes ofertas de forragem.Ciência Rural, 41:1459–1465.
Suertegaray, D.M.A. 1998. Deserto Grande do Sul: Controvérsia. Editora da
Universidade/UFRGS, 2 ed., Porto Alegre.
Suertegaray, D.M.A & L.A.P. Silva. 2009. Tchê Pampa: histórias da natureza gaúcha,
Pp. 42-59. In Pillar, V.P., S.C. Müller, Z.M.S. Castilhos, A.V.A. Jacques.
Campos sulinos: conservação e uso sustentável da biodiversidade, 1° edition,
Brasília: MMA.
Topping, C.J. & K.D. Sunderland. 1992. Limitations to the use of pitfall traps in
ecological studies exemplified by a study of spiders in a field of winter wheat.
Journal of Applied Ecology, 29:485-491.
Uetz, G.W., J. Halaj, A.B. Cady. 1999. Guild structure of spiders in major crops. The
Journal of Arachnology, 27:270–280.

44
Van Klink, R., C. Rickert, R. Vermeulen, O. Vorst, M.F. WallisDeVries, J.P. Bakker.
2013. Grazed vegetation mosaics do not maximize arthropod diversity: evidence
from salt marshes. Biological Conservation, 164:150–157.
Van Klink, R., F. van der Plas, C.G.E. van Noordwijk, M.F. WallisDeVries, H. Olffi.
2015. Effects of large herbivores on grassland arthropod diversity. Biological
Reviews 90:347–366. doi: 10.1111/brv.12113
Van Valkenburgh, B. 1990. Skeletal and dental predictors of body mass in carnivores,
Pp. 181-203. In Damuth, J.; B.J. MacFadden. Body size in mammalian
paleobiology: Estimation and biological implications. Cambridge University
Press.
Vargas, R.S., R. Bataiolli, P.B. Costa, B. Lisboa, L.M.P. Passaglia, A.Beneduzi et al.
2015. Microbial quality of soil from the Pampa biome in response to different
grazing pressures Genetics and Molecular Biology, 38(2):205-212.
Vélez, E.; L. Chomenko, W. Schaffer, M. Madeira. 2009. Um panorama sobre as
iniciativas de conservação dos Campos Sulinos, p. 356-379. In Pillar, V.P., S.C.
Müller, Z.M.S. Castilhos, A.V.A. Jacques. Campos sulinos: conservação e uso
sustentável da biodiversidade, 1° edition, Brasília: MMA.
Vogelmann, E.S., J.M. Reichert, J. Prevedello, C.A.P. Barros, F.L.F. Quadros, J.
Mataix-Solera. 2012. Soil hydro-physical changes in natural grassland of
southern Brazil subjected to burning management. Soil & Tillage Research,
50:465–72.
Wardhaugh, C.W. 2013.Estimation of biomass from body length and width for tropical
rainforest canopy invertebrates. Australian Journal of Entomology, 52:291-298.
Wise, D.H. 2006. Cannibalism, food limitation, intraspecific competition, and the
regulation of spider populations. Annual Review of Entomology, 51:441–65.
doi: 10.1146/annurev.ento.51.110104.150947.

45
Winck, B.R., E.L.S. Sá, V.M. Rigotti, M. Chauvat. Relationship between land-use types
and functional diversity of epigeic Collembola in Southern Brazil. Applied Soil
Ecology, 109:49–59.
Work, T.T., C.M. Buddle, L.M. Korinus, J.R. Spence. 2002. Pitfall trap size and capture
of three taxa of Litter-Dwelling arthropods: Implications for biodiversity studies.
Community and Ecosystem Ecology, 31(3):438-448.
World Spider Catalog. 2016. World Spider Catalog. Natural History Museum Bern.
Disponível em: >http://www.wsc.nmbe.ch/<, version 17.5 Acesso em:
05.12.2016.
Zanetti, N.I. 2016. Records of epigeal spiders in Bahía Blanca in the temperate region of
Argentina. Acta Zoológica Mexicana, 32(1):32-44.
MATERIAL SUPLEMENTAR
Figura 1 –Bioma Pampa no sul da América do Sul. Triângulo vermelho índica a APA do Ibirapuitã, local de
amostragem para esta pesquisa. Imagem adaptada de de Andrade et al. (2015).

46
Figura 2 – Vegetação em aéras com e sem pastejo na APA do Ibirapuitã. À esquerda, áreas com pastejo e à
direita áreas sem pastejo. Foto tirada em Maio de 2015.
Figura 3 – Vegetação em áreas sem pastejo na APA do Ibirapuitã. Foto tirada em Maio de 2015

47
Figura 4 – Vegetação em áreas com pastejo na APA do Ibirapuitã. Foto tirada em Maio de 2015

48
ARTIGO I
Short-Term spider community monitoring after cattle
removal in grazed grassland
Submetido a Revista Iheringia: Série Zoologia

49
SHORT-TERM SPIDER COMMUNITY MONITORING AFTER CATTLE
REMOVAL IN GRAZED GRASSLAND
Guilherme O. da Silva1,2
*and Ricardo Ott1
1Fundação Zoobotânica do Rio Grande do Sul – FZB-RS. Rua: Dr Salvador França, CEP 90690-000, Porto Alegre, RS, Brazil.
2Universidade Federal do Rio Grande do Sul – UFRGS. Avenida Bento Gonçalves, 9500, CEP 91509-900, Porto Alegre, RS, Brazil.
ABSTRACT. At the Pampa Biome, grazing, like others disturbances, affects fauna,
flora, creating heterogeneity in the environment. Little is known about how the diversity
and richness of arthropods change during this impact. To improve the knowledge of
how spider diversity is affected by grazing, experiments were realized at Pampa. The
hypothesis is that abundance of spider will be different when comparing grazed and
ungrazed areas. A paired block, with two areas of one hectare each, was established in
three areas in APA do Ibirapuitã. One of these hectares was closed with fences,
excluding the catle grazing, in August of 2012. Samplings were realized in November
of 2011, 2012 and 2013 using Pitfall traps filled with formol 4% and disposed in an “X”
format in each plot. For statistical analyses, T test, ANOSIM, ANOVA and Rarefaction
were performed. A total of 1.315 spiders were captured, comprising 77 species and
morphospecies of 21 families. The most abundant family was Lycosidae followed by
Hahniidae, Linyphiidae and Theridiidae. Linyphiidae was the richest family with 14
species and morphospecies identified. All spiders, adults and juveniles, only adults in
species and morphospecies, and most abundant species were used as models for
statistics. These models revealed no significant difference between grazed and ungrazed
areas after three and 15 months of cattle exclusion.
KEY WORDS: Neotropical; Pampa; Diversity; Arachnids;
RESUMO. Monitoramento de curto prazo da comunidade de aranhas após a
remoção do gado em campos pastejados. No Pampa, o pastejo, como outros
disturbios, afeta a fauna e flora, criando uma maior heterogeneidade no ambiente. Pouco
se sabe como a diversidade e riqueza de artrópodes muda durante este impacto. Para
aprimorar o conhecimento de como a diversidade de aranhas é afetada pelo pastejo,
experimentos foram realizados no Pampa. A hipótese é que a abundancia de aranhas
será diferente quando áreas pastejadas e sem pastejo são comparadas. Um bloco de duas
parcelas, cada uma com um hectare, foi estabelecido em três fazendas na APA do
Ibirapuitã. Um destes hectares foi fechado com cercas, excluindo o pastejo do gado, em
agosto de 2012. As amostragens foram realizadas em novembro de 2011, 2012 e 2013
usando “Pitfall traps” preenchidas com formol 4% e disposta em formato de “X” em
cada hectare. Foram utilizados para análise estatística, Teste T, ANOSIM, ANOVA e
Rarefação. Um total de 1,315 aranhas foram amostradas, compreendendo 77 espécies e
morfoespécies de 21 familias. A família mais abundante é Lycosidae, seguida de
Hahniidae, Linyphiidae e Theridiidae. Linyphiidae é família mais rica, com 14 espécies
e morfoespécies identificadas. A soma das abundancias de aranhas jovens e adultas, a
abundancia de apenas aranhas adultas e a abundancia das espécies mais abundantes,
foram utilizadas como modelos estatísticos. Estes modelos não revelaram diferença
significativa entre áreas com e sem pastejo mesmo após três ou 15 meses de exclusão do
gado.
PALAVRAS-CHAVE: Neotropical; Pampa; Diversidade; Aracnideos;

50
SHORT-TERM SPIDER COMMUNITY MONITORING AFTER CATTLE
REMOVAL IN GRAZED GRASSLAND
Guilherme O. da Silva1,2
*and Ricardo Ott1
1Fundação Zoobotânica do Rio Grande do Sul – FZB-RS. Rua: Dr Salvador França, CEP 90690-000, Porto Alegre, RS, Brazil.
2Universidade Federal do Rio Grande do Sul – UFRGS. Avenida Bento Gonçalves, 9500, CEP 91509-900, Porto Alegre, RS, Brazil.
ABSTRACT. At the Pampa Biome, grazing, like others disturbances, affects fauna,
flora, creating heterogeneity in the environment. Little is known about how the diversity
and richness of arthropods change during this impact. To improve the knowledge of
how spider diversity is affected by grazing, experiments were realized at Pampa. The
hypothesis is that abundance of spider will be different when comparing grazed and
ungrazed areas. A paired block, with two areas of one hectare each, was established in
three areas in APA do Ibirapuitã. One of these hectares was closed with fences,
excluding the catle grazing, in August of 2012. Samplings were realized in November
of 2011, 2012 and 2013 using Pitfall traps filled with formol 4% and disposed in an “X”
format in each plot. For statistical analyses, T test, ANOSIM, ANOVA and Rarefaction
were performed. A total of 1.315 spiders were captured, comprising 77 species and
morphospecies of 21 families. The most abundant family was Lycosidae followed by
Hahniidae, Linyphiidae and Theridiidae. Linyphiidae was the richest family with 14
species and morphospecies identified. All spiders, adults and juveniles, only adults in
species and morphospecies, and most abundant species were used as models for
statistics. These models revealed no significant difference between grazed and ungrazed
areas after three and 15 months of cattle exclusion.
KEY WORDS: Neotropical; Pampa; Diversity; Arachnids;
RESUMO. Monitoramento de curto prazo da comunidade de aranhas após a
remoção do gado em campos pastejados. No Pampa, o pastejo, como outros
disturbios, afeta a fauna e flora, criando uma maior heterogeneidade no ambiente. Pouco
se sabe como a diversidade e riqueza de artrópodes muda durante este impacto. Para
aprimorar o conhecimento de como a diversidade de aranhas é afetada pelo pastejo,
experimentos foram realizados no Pampa. A hipótese é que a abundancia de aranhas
será diferente quando áreas pastejadas e sem pastejo são comparadas. Um bloco de duas
parcelas, cada uma com um hectare, foi estabelecido em três fazendas na APA do
Ibirapuitã. Um destes hectares foi fechado com cercas, excluindo o pastejo do gado, em
agosto de 2012. As amostragens foram realizadas em novembro de 2011, 2012 e 2013
usando “Pitfall traps” preenchidas com formol 4% e disposta em formato de “X” em
cada hectare. Foram utilizados para análise estatística, Teste T, ANOSIM, ANOVA e
Rarefação. Um total de 1,315 aranhas foram amostradas, compreendendo 77 espécies e
morfoespécies de 21 familias. A família mais abundante é Lycosidae, seguida de
Hahniidae, Linyphiidae e Theridiidae. Linyphiidae é família mais rica, com 14 espécies
e morfoespécies identificadas. A soma das abundancias de aranhas jovens e adultas, a
abundancia de apenas aranhas adultas e a abundancia das espécies mais abundantes,
foram utilizadas como modelos estatísticos. Estes modelos não revelaram diferença
significativa entre áreas com e sem pastejo mesmo após três ou 15 meses de exclusão do
gado.
PALAVRAS-CHAVE: Neotropical; Pampa; Diversidade; Aracnideos;

51
The Pampa is a Neotropical region biome localized in meridional South
America, including south Brazil, Uruguay and part of Argentina, covering 750,000 km2
(VÉLEZ et al., 2009) (Fig. 1). It is composed originally of areas with grasslands and
meadows areas (BEHELING et al., 2009) and according to Köppen-Geiger classification,
the climate is considered as “Cfa” (humid temperate with hot summers; KOTTEK et al.,
2006). In conformity to SUERTEGARAY & SILVA (2009) the Pampa is located in the
Southern Temperate Zone with four well-characterized seasons and has a maximum
altitude of 200 m.
The human presence in this region began around 10,000 (B.P.) with pre-
columbian cultures (SUERTEGARAY & SILVA, 2009). In general it is not exactly know
how the Pampa was before more than some 300 years ago, when disturbance increases
dramatically after the European colonization due cattle introduction, uncontrolled fire
management, farming and silvicultural activities (SUERTEGARAY & SILVA, 2009;
RODRIGUES et al., 2010; PODGAISKI et al., 2014; FERRANDO et al., 2016). Considering
theses disturbances, many components of the biota, as also the invertebrate fauna,
should be directly affected. However, these fauna and its level of endemism are poorly
known for this region (LEWINSOHN, 2006), and the enhancement of studies on
biodiversity and biogeography of insects, arachnids, crustaceans as for other
invertebrates groups are still necessary (BENCKE, 2009).
Spiders are the second species richest group of Arachnida counting with more
than 46,000 valid species distributed in 3,988 genera and 114 families (WORLD SPIDER
CATALOG, 2016). The official number of spiders for Brazil is unknown but they could
easily reach more than 4,000 species (BRESCOVIT, 1999; 2011). In terms of grasslands,
richness and abundance of spider vary. For African grassland, Ammoxenidae,
Lycosidae and Salticidae families seems to be the most abundant (HADDAD et al., 2015;

52
JANSEN et al., 2013; FOORD et al., 2016) as Gnaphosidae, Salticidae and Thomisidae
families were the richest (FOORD et al., 2011; HADDAD et al., 2015; FOORD &
DIPPENAAR-SCHOEMAN, 2016) in most recent studies. For South American grasslands
Linyphiidae, Lycosidae, Salticidae seems to be the most abundant and rich families
(RODRIGUES et al., 2010; POMPOZZI et al., 2011; PODGAISKI et al., 2013; CUNHA et al.,
2015; ZANETTI, 2016), however, spider diversity is still poorly known at Pampa.
Spider has their diversity dependent of many factors (FOELIX, 2011) like vegetal
structure (BALDISSERA et al., 2004; NOGUEIRA & PINTO-DA-ROCHA, 2016), capacity of
dispersal and settlement (HORVÁTH et al., 2009; RODRIGUES et al., 2009; LIN et al.,
2016), prey availability and competitive exclusion (DENNIS et al., 2015; RODRIGUEZ-
ARTIGAS et al., 2016). Moreover, spider are capable of consume high biomass
(NYFELLER, 2000; OTT, 2016), are generalist predators in different trophic levels, even
eating other spiders (WISE, 2006) and occupying nearly all terrestrial habitats (FOELIX,
2011), making up great ecological models (WISE, 1993; UNYAL, 2004). Their high
recolonization capacity (PODGAISKI et al., 2013), would make them a great model for
testing the absence of cattle graze impact.
The objective of this work is to present a list of families, species or
morphoespecies of ground dwelling spider of Pampa biome. Moreover, compare the
areneofauna in areas with and without cattle graze after three and 15 months of total
exclusion of this impact at Pampa. The hypothesis is that abundance, composition and
richness of spider fauna will be different when comparing grazed and ungrazed areas. It
is expected that abundance and richness of spider will be higher in ungrazed areas.
MATERIAL AND METHODS

53
Study Site
The experiments were carried out at Área de Proteção Ambiental – APA do Rio
Ibirapuitã, located at Western Pampas Areas of Rio Grande do Sul state, Brazil. Six
plots of one hectare each, located at three different farms in the municipality of
Sant’Ana do Livramento and georeferenced at 30º28’50.57” S; 055
o33’10.21” W
(Estância do Açude; Farm 1), 30º28’54.97” S; 055º34’14.05” W (Fazenda Rincão dos
Moraes ; Farm 2) and 30º25’54.78” S; 055
º38’39.75” W (Fazenda Bela Vista; Farm 3)
were selected for the sampling. In each farm a block of two plots, placed close to 200 m
far from each other, were established, being one of them closed with fences in August
of 2012, excluding totally the cattle grazing access; the second plot was defined only by
poles placed at its corners and the cattle was allowed to graze in the area. Closed plots
without grazing were defined here as ungrazed and cattle free grazing access plots were
defined as grazed.
Data Collection
The plots were sampled using pitfall traps made by ordinary beer plastic cups of
500 ml (15 cm depth, 10 cm diameter) inserted into a 10 cm diameter PVC guide (Fig.
2; adapted from UETZ & UZICKER, 1976), exposed during seven days. Twelve traps
were installed disposed in “X” format from corner to corner of each plot (72 in total).
To measure possible border effects, the traps were separated in three different ptfall
groups regarding the distance to the border (Edge, Middle and Center) of four traps.
Traps were placed around 20 m apart from each other and at least 10 m from the fence
or border line of each plot (Fig. 3). Sampling periods occur in three different years: 8 to
15 November 2011 (no fences), 8 to 16 November 2012 (3 months fences enclosure)
and 26 November to 3 December 2013 (15 months fence enclosure), fulfilling 1512 trap

54
days. Traps were filled around 1/3 of total volume with formol at 4% concentration with
some drops of liquid soap to break superficial tension.
Data Analysis
Spiders collected at samples were sorted out manually and placed in vials
containing 80% ethanol and examined using a stereo microscope. For determination in
the lowest possible taxonomic level, dichotomous key were used for families
(DIPPENAAR-SCHOEMANN & JOCQUÉ, 1997; BRESCOVIT et al., 2002) and papers,
available on-line at NMBE World Spider Catalog (WORLD SPIDER CATALOG 2016), for
genera and species. Adult and juveniles were identified at family level and only adult
were at morphospecies and species level. All adult spiders were deposited at the
aracnological collection of Museu de Ciências Naturais da Fundação Zoobotânica do
Rio Grande do Sul (MCN).
Most abundant species were defined by their dominance, as those making up
≥2% of the total of all individuals (adapted from SPILLER & SCHORNER, 1998;
PETCHARAD et al., 2016). For analysis, these species were separated in three ways: Most
abundant species in general, with abundance of all individuals of 2011, 2012 and 2013;
Most abundant species with abundance of all individuals of 2012 and 2013, for testing
grazed and ungrazed plots differences; and Most abundant species after 15 months of
enclosure, with only abundance of all individuals of 2013, for testing border effect.
For statistical analysis, Student’s tests were performed to compare differences in
abundance between grazed and ungrazed plots using, as models, all spiders, only adults
in species/morphospecies and the most abundant species. Three categories of tests were
applied with these models: (i) Sum of 2012 and 2013 abundance; (ii) only 2012
abundance to test 3 months of enclosure in fenced areas; and (iii) only 2013 abundance
to test 15 months of enclosure in fenced areas. Analysis of similarities (ANOSIM) was

55
performed based in Morisita, Bray-Curtis and Jaccard measures. Abundance of 2013
families, all spiders, only adults in species/morphospecies and most abundant species
were used as models to test difference between pitfall groups in ungrazed plots. Analysis
of variance (ANOVA) was performed to test differences between pitfall groups in 2013
using medians of abundance of all spiders, only adults in species/morphospecies and
most abundant species. Rarefaction curves were performed to plot spider richness in
ungrazed plots trough the years, using ANOVA for testing significance. All statistical
analyses were made using Past Program (Paleontological Statistics 3.13, HAMMER et
al., 2001). The significance level utilized was p<0.05.
RESULTS
A total of 1,315 spiders (775 adults, 576 males, 199 females; 540 juveniles)
were sampled, 685 in grazed plots and 630 in ungrazed plots. A total of 26 families
were identified considering juveniles and adults; 77 species and morphospecies of 21
families were identified, of these, 33 nominal species, 32 morphospecies at genera level
and 12 morphospecies at only family level (Tab. I). The most abundant families were
Lycosidae (433 individuals), Hahniidae (359), Linyphiidae (143), Theridiidae (94).
Hahniidae followed by Lycosidae, Linyphiidae and Theridiidae were the most abundant
families in ungrazed plots. Lycosidae followed by Hahniidae, Linyphiidae and
Theridiidae were the most abundant families in grazed plots. Adults in grazed plots sum
360 individuals (271 males; 89 females) and in ungrazed plots sum 415 individuals (305
males; 110 females) (Tab. I).
Linyphiidae was the richest family (14 species and morphospecies), followed by
Lycosidae (13), Gnaphosidae (9), Salticidae (8) and Theridiidae (8) (Tab. I). The
families Amphinectidae, Anyphaenidae, Araneidae, Caponiidae, Ctenidae, Miturgidae,
Nemesiidae, Oonopidae, Oxyopidae, Phrurolithidae, Tetragnathidae and Theraphosidae

56
were represented by only one species or morphospecies (Tab. I). Only juveniles of
Microstigmathidae, Philodromidae, Pholcidae, Sparassidae and Tengelidae were
sampled. Anyphaenidae, Philodromidae, Pholcidae, Tetragnathidae and Trechalidae
were exclusively found in ungrazed plots. Caponiidae, Microstigmathidae, Oxyopidae,
Sparassidae and Tengelidae were exclusively found in grazed plots.
The most abundant species in general represent 34% of the total of spiders. They
were Neohania sp. 1 (186 individuals), Neohania sp. 2 (155), Guaraniella mahnerti
Baert, 1984 (45), Agyneta sp. 2 (35), Schizocosa malitiosa (Tullgren, 1905) (30).
Twenty-six species are exclusively from ungrazed plots and 14 are exclusively from
grazed plots. Twenty-seven species were singletons and 13 were doubletons.
A total of 918 spiders were sampled in 2012 and 2013. Of these, the most
represent 33% of total and were, Neohania sp. 1 (104 individuals), Neohania sp. 2 (96),
G. mahnerti (31), S. malitiosa (25), Agyneta sp. 2 (24) and Birabenia sp. 1 (21). A total
of 459 spiders were sampled in only 2012. Of these, the most abundant species
represent 31% of total and were Neohania sp. 2 (63), Neohania sp. 1 (33), S. malitiosa
(22), G. mahnerti (19), Agyneta sp. 2 (8). A total of 459 spiders were sampled in only
2013. Of these, the most abundant species represent 39% of total spiders and were
Neohania sp. 1 (71), Neohania sp. 2 (33), Agyneta sp. 2 (16), Birabenia sp. 1 (15),
Erigone sp. 1 (12), G. mahnerti (12), Semiopyla cataphracta Simon, 1901 (11) and
Lycosa thorelli (Keyserling, 1877) (10).
Students’ test revealed no significant difference between grazed and ungrazed
plots regarding all spiders in 2012 and 2013 (p= 0.8047), only 2012 with three months
of enclosure (p= 0.7888) and only 2013 with 15 months of enclosure (p= 0.8413). The
test wasn´t significant different regarding only adults in species/morphospecies in 2012
and 2013 (p= 0.4782), only 2012 with three months of enclosure (p= 0.2807) and only

57
2013 with 15 months of enclosure (p= 0.8465). Also, most abundant species weren´t
significant different in the same parameters 2012 and 2013 (p= 0.5744), only 2012 with
three months of enclosure (p= 0.2086) and only 2013 with 15 months of enclosure (p=
0.7550).
Regarding the distance of the traps to the border of ungrazed plots, the Analysis
of Similarity (ANOSIM) revealed no significant difference for families (Morisita: R=
0.0036 p= 0.4095; Bray-Curtis: R= 0.0060 p= 0.3943; Jaccard: R= 0.0064 p= 0.3923),
all spiders (Morisita: R= -0.0519 p= 0.9174; Bray-Curtis: R= -0.0322 p= 0.7674;
Jaccard: R= -0.0427 p= 0.8608), only adults in species/morphospecies (Morisita: R= -
0.0298 p= 0.7978; Bray-Curtis: R= -0.0073 p= 0.5322; Jaccard: R= -0.0210 p= 0.7046)
and most abundant species (Morisita: R= -0.0379 p= 0.8833; Bray-Curtis: R= -0.0400
p= 0.8508; Jaccard: R= -0.0361 p= 0.8694) between pitfall groups in 2013.
Also, Analysis of Variance (ANOVA), based in the means of spiders abundance,
demonstrated no significant difference between pitfall groups in 2013 when all spiders
(p= 0.6737), only adults in species/morphospecies (p= 0.7392) and most abundant
species (p=0.7365) were used as models.
Regarding the rarefaction curves a higher richness was presented in T1 than in
T3 and T2 (Fig. 4) trough years. However, ANOVA reveled no significant difference
between ungrazed plots (p= 0.08305).
DISCUSSION
Comparing our species list with lists of spider species from Uruguay
(CAPOCASALE, 1990) (144 listed species and morphospecies), Argiope argentata
(Fabricius, 1775), Caponina notabilis (Mello-Leitão, 1939), L. thorelli, Metaltella
simoni Keyserling, 1878, S. malitiosa and Teminius insularis (Lucas, 1857) are shared
between both lists. For Brazil, São Paulo state has listed 875 species, sharing with our

58
list eight species: A. argentata, Camillina pulchra (Keyserling, 1891) Lycosa
erythrognatha Lucas, 1836, L. thorelli, Oxyopes salticus Hentz, 1845, Parabatinga
brevipes (Keyserling, 1891), S. cataphracta and T. insularis (BRESCOVIT et al., 2011).
Rio Grande do Sul state has 808 listed species, sharing 19 species with our list: A.
argentata, C. notabilis, C. pulchra, Castianeira chrysura Mello-Leitão, 1943,
Castianeira gaucha Mello-Leitão, 1943, Eilica obscura (Keyserling, 1891), Eilica
trilineata (Mello-Leitão, 1941) Euryopis camis Levi, 1963, Euryopis spinifera Mello-
Leitão, 1944, Glenognatha lacteovittata (Mello-Leitão, 1944) G. mahnerti, L.
erythrognatha, L. thorelli, M. simoni, P. brevipes, Psilocymbium lineatum (Millidge,
1991), S. malitiosa, O. salticus and T. insularis (BUCKUP et al., 2010). A. argentata, L.
thorelli and T. insularis were present in all lists, and can be considered species with
very broad range distribution. Moreover, the low quantity of shared species indicates
that composition of spider fauna can be very variable even comparing close regions.
Our data suggest that grazed and ungrazed areas are still very similar in terms of
abundance and species composition of ground spiders, even 15 months after the
removal of the cattle. However the findings presented here could be affected by at last
two sample design negative effects as stressed below. First, considering the size of the
ungrazed plots (just one hectare) added to the fact that our fenced areas are all
surrounded by not-fenced areas, could cause a presumable edge effect over the entire
ungrazed plots (MURCIA, 1995; RODRIGUES et al., 2014). Second, the low quantity of
traps, it size or total trapping days, in other words the low “sample effort”, could lead to
a very low power outcome of statistical tests and therefore no significant difference was
found (TOPPING & SUNDERLAND, 1992; BRENNAN et al., 1999; WORK et al., 2002).
However, it is also very likely that in this case, ground spider fauna is not really being
affected by grazing, at least in the first 15 months after enclosure and cattle removal.

59
The absence, due our methodology, of spiders most commonly found in aerial
vegetation, like orb-web builders (A. argentata sampled are totally occasional), could be
another factor that led us to no significant difference between grazed and ungrazed
plots. As spiders’ diversity seems to be much correlated to vegetal structure
(CADENASSO & PICKETT, 2001; SOUZA, 2007; RODRIGUES et al., 2010), in short time the
ground spider fauna seems to be less affected by grazing disturbance. Experiments with
fire, where the vegetation is completely removed (PODGAISKI et al., 2013) demonstrate
that web-builders take more time to occupy recent disturbed areas, due its need of tri-
dimensional structures for establish a webs (HALAJ et al., 1998; PFISTER et al., 2015;
NOGUEIRA & PINTO-DA-ROCHA, 2016). Therefore, aerial vegetation correlated spiders
and web-builders, would be more sensitive and respond more strongly to absence of
cattle grazing.
Spiders are usually considered as a useful group to monitory management
studies, due to quickly occupancy of altered habitats (UETZ et al., 1999) and its
important role as predators (FOELIX, 2011; BECK et al., 1997; RODRIGUES et al., 2010;
LAWS & JOERN, 2015). But ground spiders provide only piece of information (GIBSON et
al., 1992). It is very possible that spiders living in the vegetation and other
invertebrates, such as beetles (GRANDCHAMP et al., 2005; WOODCOK et al., 2005), ants
(RED & ANDERSEN, 2000; CALCATERRA et al., 2010) and grasshoppers (HOLMES et al.,
1979; FERRANDO et al., 2016) could respond quicker and intensively to grassland
management. Moreover, correlating abundance of these arthropods, spiders and other
invertebrates would allow a better overview of how the fauna change without grazing
perturbation.

60
Acknowledgements. We thank the Federal University of Rio Grande do Sul, for
providing us with fieldwork infrastructure. This work was supported also by Guilherme
Oyarzabal da Silva Masters Scholarship from CAPES, Brazil (process1478689).
REFERENCES
ANDRADE, B. O.; KOCK, C.; BOLDRINI, I. I.; VÉLEZ-MARTIN, E.; HASENACK, H.; HERMANN, J.
M.; KOLLMANN, J.; PILLAR, V. P.; OVERBECK, G. E. 2015. Grassland degradation and
restoration: a conceptual framework of stages and thresholds illustrated by southern
Brazilian grasslands. Natureza & Conservação, 0:10. doi: 10.1016/j.ncon.2015.08.002.
BALDISSERA, R.; GANADE, G.; FONTOURA, S. B. 2004. Web spider community response along
an edge between pasture and Araucaria forest. Biological Conservation, 118:403–409.
BECK , L.; HÖFER H.; MARTIUS C.; RÖMBKE J.; VERHAAGH M. 1997. Bodenbiologie tropischer
Regenwälder. Geogrephische Rundschau 49(1):24-31.
BEHELING, H.; JESKE-PIERUSCHKA V.; SCHÜLER L.; PILLAR, V. P. 2009. Dinâmica dos campos
no sul do Brasil durante o Quaternário Tardio, p.13-25. In: PILLAR, V.P., MÜLLER S. C.;
CASTILHOS Z. M. S.; JACQUES A. V. A. Campos sulinos: conservação e uso sustentável
da biodiversidade, 1° edition, Brasília: MMA. 403p.
BENCKE G. A. 2009. Diversidade e conservação da fauna dos Campos do Sul do Brasil; pp.101-
121, In: PILLAR, V.P., MÜLLER S. C.; CASTILHOS Z. M. S.; JACQUES A. V. A. Campos
sulinos: conservação e uso sustentável da biodiversidade, 1° edition, Brasília: MMA.
403p.
BRENNAN, K. E. C.; MAJER, J. D.; REYGAERT, N. 1999. Determination of an optimal pitfall trap
size for sampling spiders in a Western Australian Jarrah forest. Journal of Insect
Conservation, 3:297–307.

61
BRESCOVIT, A. D.; OLIVEIRA U.; SANTOS A. J. 2011. Spiders (Araneae, Arachnida) from São
Paulo State, Brazil: diversity, sampling efforts, and state-of-art. Biota Neotropica.
11(1a): 32.
BRESCOVIT, A. D.; RHEIMS C. A.; BONALDO A. B. 2002. Araneomorphae - Chave de
identificação para famílias de aranhas brasileiras. Available at:
<http://pt.scribd.com/doc/123853696/Chave-de-Familias-de-Aranhas>. Accessed on: 19
May 2016.
BRESCOVIT A. D. 1999. Araneae. pp. 47-56. In Biodiversidade do Estado de São Paulo, Brasil:
síntese do conhecimento ao final do século XX. Vol5, Invertebrados Terrestres, (C.A.
Joly & C.E.M. Bicudo, orgs.) FAPESP, São Paulo.
BUCKUP, E. H.; MARQUES M. A. L.; RODRIGUES E. N. L.; OTT R. 2010. Lista das espécies de
aranhas (Arachnida, Araneae) do estado do Rio Grande do Sul, Brasil. Iheringia,
SérieZoológica., Porto Alegre, 100(4):483-518.
CADENASSO, M. L. & PICKETT S. 2001. Effect of edge structure on the fluxof species into forest
interiors. Conservation Biology 15(1):91–97.
CALCATERRA, L. A.; CABRERA, S. M.; CUEZZO, F.; PEREZ, I. J.; BRIANO, J. A. 2010 Habitat and
grazing influence on terrestrial ants in subtropical grasslands and savannas of Argentina.
Entomological Society of America, 103(4): 635-646. doi: 10.1603/AN09173
CAPOCASALE, R. M. 1990. An annotated checklist of Uruguayan spiders. Aracnología, 11:1-23.
CUNHA, J. A. S.; ANDRADE, E. B.; SILVA, P. R. R.; BARROS, R. F. B. 2015. Araneofauna
(Arachnida, Araneae) in conventional and organic crops of watermelon (Citrullus
lanatus) in northeastern Brazil. Revista Colombiana de Entomología, 41(1):68-75.
DENNIS, P.; YOUNG, M. R.; GORDON, I. J. 1998. Distribution and abundance of small insects and
arachnids in relation of structural heterogeneity of grazed, indigenous grasslands.
Ecological Entomology, 23:253-264.

62
DENNIS, P.; SKARTVEIT, J. KUNAVER, A.; MCCRACKEN, D. I. 2015. The response of spider
(Araneae) assemblages to structural heterogeneity and prey abundance in sub-montane
vegetation modified by conservation grazing. Global Ecology and Conservation, 3:715–
728.
DIPPENAAR-SCHOEMAN, A. S. & JOCQUÉ R. 1997. African Spiders: An Indetification Manual.
Plant Protection. Research institute Handbook, 391p.
FERRANDO, C. P. R.; PODGAISKI L. R.; COSTA M. K. M.; MENDONÇA JR M. D. S. 2016.
Taxonomic and Functional Resilience of Grasshoppers (Orthoptera, Caelifera) to Fire in
South Brazilian Grasslands. Neotropical Entomology, 1-8, doi: 10.1007/s13744-016-
0380-3.
FOELIX, R. F. 2011. Biology of Spiders. 3. ed. Oxford: Oxford University Press. 423p.
FOORD, S. H.; DIPPENAAR-SCHOEMAN, A. S.; HADDAD, C. R.; LOTZ, L. N.; LYLE, R. 2011. The
faunistic diversity of spiders (Arachnida: Araneae) of the Savanna Biome in South
Africa. Transactions of the Royal Society of South Africa 66:170–201. doi:
http://dx.doi.org/10.1080/0035919X.2011.639406
FOORD, S. H.; DIPPENAAR-SCHOEMAN, A. S.; JOCQUÉ, R.; HADDAD, C. R.; LYLE, R.; WEBB, P.
2016. South African National Survey of Arachnida: A checklist of the spiders
(Arachnida, Araneae) of the Lekgalameetse Nature Reserve, Limpopo province, South
Africa. Koedoe, 58(1):1405-1403.
FOORD, S. H. & DIPPENAAR-SCHOEMAN, A. S. 2016. The effect of elevation and time on
mountain spider diversity: a view of two aspects in the Cederberg mountains of South
Africa. Journal of Biogeography, p. 1-12. doi: 10.1111/jbi.12817
GIBSON, C. W. D.; HAMBLER C.; BROWN V. K. 1992. Changes in spider (Araneae) assemblages
in relation to succession and grazing management. Journal of Applied Ecology, 29:132-
142.

63
GRANDCHAMP, A. C.; BERGAMINI, A.; STOFER, S.; NIEMELA, J.; DUELLI, P.; SCHEIDEGGER, C.
2005. The influence of grassland management on ground beetles (Carabidae,
Coleoptera) in Swiss montane meadows. Agriculture, Ecosystems and Environment
110:307–317.
HALAJ, J; ROSS, D. W.; MOLDENKEL, A. R. 1998. Habitat structure and prey availability as
predictors of the abundance and community organization of spiders in Western Oregon
forest canopies. The Journal of Arachnology, 26:203–220.
HADDAD, C. R.; FOORD, S. H.; FOURIE, R.; DIPPENAAR-SCHOEMAN, A. S. 2015. Effects of fast-
burning spring fire on the ground-dwelling spider assemblages (Arachnida: Araneae) in
a central South Africa grassland habitat. African Zoology, 50(4):281-292 doi:
http://dx.doi.org/10.1080/15627020.2015.1088400.
HAMMER, Ø.; HARPER D. A. T.; RYAN P. D. 2001. PAST: Paleontological Statistics package for
education and data analysis. Paleontologia Eletronica 4(1):1-9.
HOLMES, N. D.; SMITH, D. S.; JOHNSTON A. 1979. Effect of grazing by cattle on the abundance
of grasshoppers on fescue grassland. Journal of range management 32(4):1-2.
JANSEN, R.; MAKAKA, L.; LITTLE, I. T.; DIPPENAAR-SCHOEMAN, A. S. 2013. Response of
ground-dwelling spider assemblages (Arachnida, Araneae) to montane grassland
management practices in South Africa. Journal of Insect Conservation, p. 1-50.
JOCQUÉ, R. & ALDERWEIRELDTH, M. 2005. Lycosidae: the grassland spiders. Acta zoologica
bulgarica, 1:125-130.
KOTTEK M.; GRISER J.; BECK C.; RUDOLF B.; RUBEL F. 2006. World map of the Köppen-Geiger
climate classification updated. Meteorologische Zeitschrift, v.15, p.259-263.
LAWS, A.N. & JOERN, A. 2015. Predator–prey interactions are context dependent in a grassland
plant–grasshopper–wolf spider food chain. Environmental Entomology, 1–10. doi:
10.1093/ee/nvv033

64
LEWINSOHN, T. M. 2006. Avaliação do estado do conhecimento da biodiversidade brasileira.
Brasília: MMA. Série Biodiversidade, 15p.
LIN, S.; VASSEUR, L. M.; YOU, S. 2016. Seasonal Variability in Spider Assemblages in
Traditional and Transgenic Rice Fields. Environmental Entomology, 0:1–10.doi:
10.1093/ee/nvw00.
MURCIA, C. 1995. Edge effect in fragmented forests: implications for conservation. Trends
Ecology Evolution 10:58–62.
NOGUEIRA, A. A.; PINTO-DA-ROCHA, R. 2016. The effects of habitat size and quality on the orb-
weaving spider guild (Arachnida: Araneae) in an Atlantic Forest fragmented landscape.
The Journal of Arachnology, 44:36–45.
NYFELLER, M. 2000. Ecological impact of spiders predation: a critical assessment of Britowe’s
and Tunbull’s estimates. Bulletin of the British Arachnological Society, 11:367-373.
OTT, R. 2016. Invertebrados terrestres – Aranhas; p.46-47, In: Moura L.A., L. Chomenko, M.
A. Azevedo. Natureza em Revista, 14, RS Biodiversidade, Porto Alegre: Fundação
Zoobotânica do Rio Grande do Sul. 110p.
PETCHARAD, B.; MIYASHITA T.; GALE, G. A.; SOTTHIBANDHU, S.; BUMRUNGSRI, S. 2016.
Spatial patterns and environmental determinants of community composition of web-
building spiders in understory across edges between rubber plantations and forests. The
Journal of Arachnology 44:182–193.
PFISTER, S. C.; SCHÄFER, R. B.; SCHIRMEL, J.; ENTLING, M. H. 2015. Effects of hedgerows and
riparian margins on aerial web-building spiders in cereal fields. The Journal of
Arachnology 43:400–405.
PODGAISK, L. R.; GOLDAS, C. S.; FERRANDO, C. P. R.; SILVEIRA, F. S.; JONER, F., G.E.
OVERBECK G. E.; MENDONÇA JR M. S.; PILLAR V. D. 2014. Burning effects on

65
detritivory and litter decay in Campos grasslands. Austral Ecology, 39:686–695. doi:
10.1111/aec.12132.
PODGAISKI L. R.; JONER F.; LAVOREL S.; MORETTI M.; IBANEZ S.; MENDONÇA JR M. S.; PILLAR
V. D. 2013. Spider trait assembly patterns and resilience under fire-induced vegetation
change in south Brazilian Grasslands. PLoS ONE 8(3):1-11.
doi:10.1371/journal.pone.0060207.
POMPOZZI, G. A.; TIZÓN, F. R.; PELAÉZ, D. V. 2011. Effects of different frequencies of fire on
an epigeal spider community in Southern Caldenal, Argentina. Zoological Studies,
50(6):718-724.
RED, J. L. & ANDERSEN, A. N. 2000. The value of ants as early warning bioindicators:
responses to pulsed cattle grazing at an Australian arid zone locality. Journal of Arid
Environments, 45:231–251. doi:10.1006/jare.2000.0634.
RODRIGUES, E. N. L.; MENDONÇA JR. M. S.; OTT, R. 2009. Spider diversity in a rice
agroecosystem and adjacent areas in southern Brazil. Revista Colombiana de
Entomología, 35:78-86.
RODRIGUES, E. N. L.; ROSADO J. L. O.; LOECK A. E. 2010. Soil spiders in differing
environments: Eucalyptus plantations and grasslands in the Pampa biome, southern
Brazil. Revista Colombiana de Entomología, 36(2):277-284.
RODRIGUES, E. N. L.; MENDONÇA JR. M. S.; COSTA-SCHIMIDT L. E. 2014. Spider diversity
responds strongly to edge effects but weakly to vegetation structure in riparian forests of
Southern Brazil. Arthropod-Plant Interactions, 8:123–133. doi: 10.1007/s11829-014-
9294-3.
RODRIGUEZ-ARTIGAS, S. M.; BALLESTER, R.; CORRONCA, J. A. 2016. Factors that influence the
beta-diversity of spider communities in northwestern Argentinean Grasslands. PeerJ
4:19-46. doi: 10.7717/peerj.1946.

66
SOUZA, A. L. T. 2007. Influência da estrutura do habitat na abundância e diversidade de
aranhas; p.25-44, In: GONZAGA, M. O., SANTOS, A. J., JAPYASSÚ, H. F.. Ecologia e
comportamento de aranhas. Rio de Janeiro, Interciência Editora. 300p.
SUERTEGARAY, D. M. A & SILVA, L. A. P. 2009. Tchê Pampa: histórias da natureza gaúcha;
p.42-59. In: PILLAR, V.P., MÜLLER S. C.; CASTILHOS Z. M. S.; JACQUES A. V. A.
Campos sulinos: conservação e uso sustentável da biodiversidade, 1° edition, Brasília:
MMA. 403p.
SPILLER, D.A. & SCHOENER, T.W. 1998. Lizard reduce spider species richness by excluding
rare species. Ecology, 79:503-516.
TOPPING, C. J.; & SUNDERLAND, K. D. 1992. Limitations to the use of pitfall traps in ecological
studies exemplified by a study of spiders in a field of winter wheat. Journal of Applied
Ecology. 29:485-491.
UETZ, G. W. & UNZICKER J. D. 1976. Pitfall Trapping in Ecological Studies of Wandering
Spiders. The Journal of Arachnology. 3:101-111.
UETZ, G. W.; HALAJ J.; CADY A. B. 1999. Guild structure of spiders in major crops. The Journal
of Arachnology 27:270-280.
UNIYAL, V. P. 2004. Spiders as conservation monitoring tools. Building Pests and Mycology
Laboratory, CBRI, Rookee, 102-108
VÉLEZ, E.; CHOMENKO, L.; SCHAFFER, W.; MADEIRA, M. 2009. Um panorama sobre as
iniciativas de conservação dos Campos Sulinos, p.356-379. In: PILLAR, V.P., MÜLLER S.
C.; CASTILHOS Z. M. S.; JACQUES A. V. A. Campos sulinos: conservação e uso
sustentável da biodiversidade, 1° edition, Brasília: MMA. 403p.
WISE, D. H. 1993. Spiders in ecological webs. The Journal of Arachnology. 23:48-50.

67
WISE, D. H. 2006. Cannibalism, food limitation, intraspecific competition, and the regulation of
spider populations. Annual Review of Entomology, 51:441–65. doi:
10.1146/annurev.ento.51.110104.150947.
WORK, T. T.; BUDDLE, C. M.; KORINUS, L. M.; SPENCE, J. R. 2002. Pitfall trap size and capture
of three taxa of litter-dwelling arthropods: implications for biodiversity studies.
Entomological Societyof America, 31(3):438-448. doi:0046-
225X/02/0438Ð0448$02.00/0.
WOODCOCK, B. A.; PYWELL R. F.; ROY, D. B.; ROSE R. J.; BELL, D. 2005. Grazing management
of calcareous grasslands and its implications for the conservation of beetle
communities. Biological Conservation 125:193–202.
WORLD SPIDER CATALOG. 2016. World Spider Catalog. Natural History Museum Bern.
Available at: >http://www.wsc.nmbe.ch/<, version 17.5 Accessed on: 10.11.2016.
ZANETTI, N. I. 2016. Records of epigeal spiders in Bahía Blanca in the temperate region of
Argentina. Acta Zoológica Mexicana, 32(1):32-44.

68
SUPPLEMENTAL MATERIAL
Figura 5 – Pampa Biome at Neotropical region. Red triangle indicates APA do Ibirapuitã’s localization. Map
adpted from Andrade et al. (2015).
Figura 6 – Pitfall traps used to collect ground spiders at APA do Ibirapuitã used in November of 2011, 2012
and 2013. A – Trap filled with formal 2%. B – Trap after one week of exposal with invertebrates captured.

69
Figura 7 – Format used for exposal of pitfall traps in APA do Ibirapuitã during the campaign of 2011, 2012
and 2013. Red diamonds indicates the places of the traps. Traps were placed around 20 m from each other.
Traps were least 10 m from the fence or border of each plot.
Figura 8 – Richness based rarefaction curves for spiders in ungrazed plots trough 2011, 2012 and 2013.
Adjacent lines indicates 95% confidence intervals.

70
Tabela 1 – Total numbers of ground dweling spider individuals of families, species and morphospecies
collected at APA do Ibirapuitã in November of 2011, 2012 and 2013. Juvenils identified only at family level
and totals, indicated as: adult/juvenils.
Grazed Ungrazed Total
Taxa Nov-
2011
Nov-
2012
Nov-
2013
Nov-
2011
Nov-
2012
Nov-
2013
Amphinectidae 3 8 0 1 2 2 16/16
Metaltella simoni Keyserling, 1878 3 4 1 1 2 5 16
Anyphaenidae 0 0 0 0 0 0 2/0
Arachosia sp. 0 0 0 0 1 1 2
Araneidae 0 0 3 1 4 7 2/15
Argiope argentata (Fabricius, 1775) 0 0 0 0 0 2 2
Caponiidae 1 0 0 0 0 0 1/1 Caponina notabilis (Mello-Leitão,
1939)
1 0 0 0 0 0 1
Corinnidae 3 1 0 1 8 1 17/14 Castianeira chrysura Mello-Leitão,
1943
0 1 0 0 1 0 2
Castianeira gaucha Mello-Leitão,
1943
0 1 0 0 0 0 1
Castianeira sp. 1 1 0 0 0 0 0 1
Castianeira sp. 2 2 1 0 2 6 0 11
Mazax sp. 0 0 0 0 2 0 2
Ctenidae 2 0 1 1 3 0 1/7 Parabatinga brevipes (Keyserling,
1891)
0 0 0 0 0 1 1
Gnaphosidae 0 2 0 2 4 2 1/10 Apopyllus sp. 0 0 0 0 2 0 2
Camillina galianoae Platnick &
Murphy, 1987
1 0 0 0 1 3 5
Camillina pulchra (Keyserling, 1891) 0 3 0 0 1 0 4
Camillina sp. 1 1 0 1 0 0 3
Eilica obscura (Keyserling, 1891) 0 0 1 0 0 0 1
Eilica aff. trilineata 0 0 0 1 1 0 2
Eilica trilineata (Mello-Leitão, 1941) 0 1 0 0 0 0 1
Gen? sp. 1 1 0 0 1 0 3
Neodrassex ibirapuita Ott, 2013 0 0 0 0 0 1 1
Hahniidae 4 2 2 5 2 2 342/17 Intihuatana sp. 0 1 0 0 0 0 1
Neohania sp. 1 37 8 51 45 25 20 186
Neohania sp. 2 32 14 17 27 49 16 155
Linyphiidae 7 2 4 6 8 5 111/32 Agyneta sp. 1 0 0 0 0 1 2 3
Agyneta sp. 2 5 0 5 6 8 11 35
Erigone sp .1 9 2 9 1 1 3 25
Laminacauda sp. 1 0 0 1 0 0 0 1
Moyosi sp. 1 3 1 1 1 0 3 9
Neomaso sp. 2 2 1 2 1 1 4 11
Neomaso sp. 3 0 0 1 1 0 1 3

71
Pseudotyphistes sp. 2 0 0 1 0 0 0 1
Psilocymbium lineatum (Millidge,
1991)
1 0 0 0 0 0 1
Sphecozone sp. 2 1 0 0 1 0 0 2
Tutaibo aff. phoeniceus 1 1 0 1 1 0 4
Tutaibo sp. 1 3 0 0 3 4 3 13
Tutaibo sp. 2 2 0 0 0 0 0 2
Tutaibo sp. 3 0 0 1 0 0 0 1
Lycosidae 88 94 67 9 40 27
108/32
5 Agalenocosa sp. 0 0 0 0 0 1 1
Allocosa sp. 0 0 0 0 0 1 1
Birabenia sp. 1 0 2 1 0 4 14 21
Birabenia vittata (Mello-Leitão, 1945) 0 0 0 0 1 1 2
Gen? sp. 1 0 1 0 0 0 0 1
Gen? sp. 3 1 1 3 1 1 4 11
Hogna bivittata (Mello-Leitão, 1939) 3 3 0 2 0 1 9
Lobizon humilis (Mello-Leitão, 1944) 0 0 0 0 1 4 5
Lycosa erythrognatha Lucas, 1836 2 0 3 0 2 0 7
Lycosa thorelli (Keyserling, 1877) 0 2 9 0 3 1 15
Navira naguan Piancentini &
Grismado, 2009
0 1 1 0 0 1 3
Schizocosa malitiosa (Tullgren, 1905) 2 15 3 3 7 0 30
Trochosa sp. 0 0 0 0 1 1 2
Microstigmatidae 0 0 1 0 0 0 0/1
Miturgidae 2 2 0 1 4 2 9/11 Teminius insularis (Lucas, 1857) 1 1 4 1 0 2 9
Nemesiidae 0 0 0 0 0 0 6/0
Pycnothele sp. 0 4 0 0 2 0 6
Oonopidae 0 0 0 0 2 0 6/2 Neotrops aff. tucumanus 2 2 0 0 1 1 6
Oxyopidae 0 0 2 0 0 0 1/2 Oxyopes salticus Hentz, 1845 1 0 0 0 0 0 1
Philodromidae 0 0 0 0 1 0 0/1
Pholcidae 0 0 0 1 0 0 0/1
Phrurolithidae 0 0 0 0 0 11 12/11 Orthobula sp. 0 2 1 2 1 6 12
Salticidae 1 0 0 0 6 20 26/27 aff. Phiale sp. 0 0 0 0 0 1 1
Gen? sp. 1 0 0 0 0 0 1 1
Gen? sp. 3 0 0 0 0 1 0 1
Gen? sp. 4 0 0 0 1 0 0 1
Gen? sp. 8 0 0 0 1 0 0 1
Neonella minuta Galiano, 1965 1 1 1 0 0 1 4
Neonella montana Galiano, 1988 0 0 1 0 1 0 2
Semiopyla cataphracta Simon, 1901 2 0 0 1 1 11 15
Sparassidae 0 1 0 0 0 0 0/1
Tengelidae 0 6 0 0 0 0 0/6
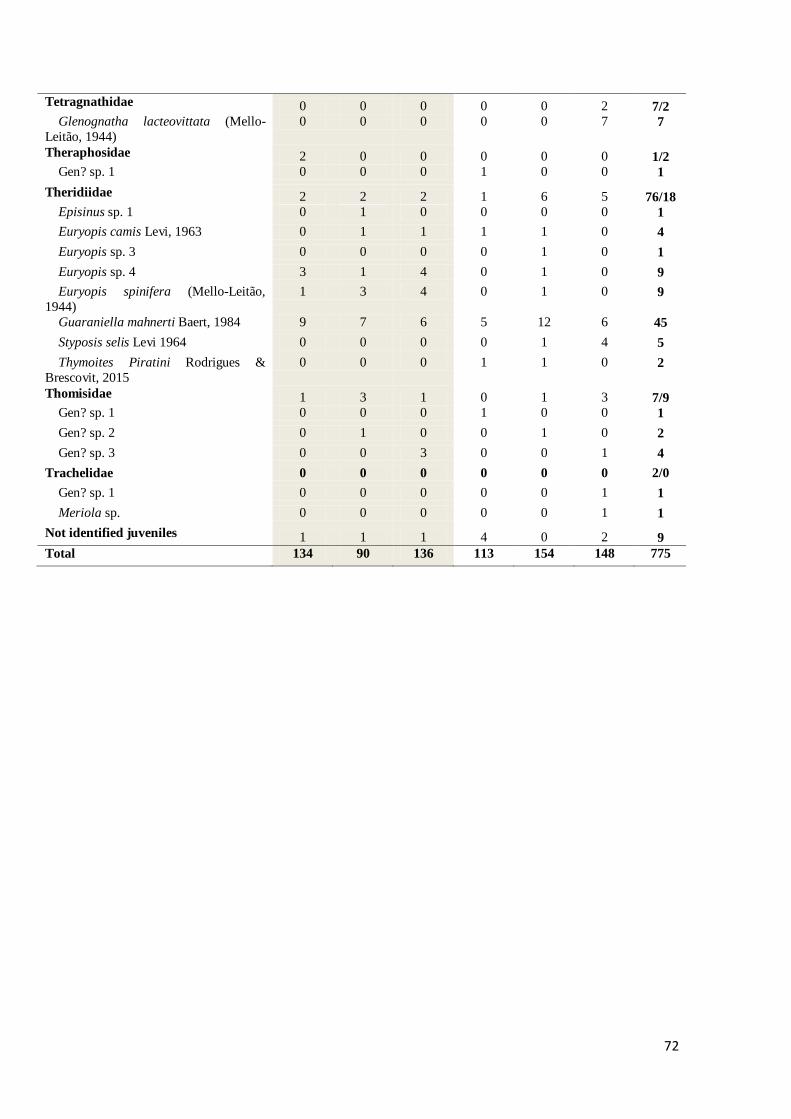
72
Tetragnathidae 0 0 0 0 0 2 7/2 Glenognatha lacteovittata (Mello-
Leitão, 1944)
0 0 0 0 0 7 7
Theraphosidae 2 0 0 0 0 0 1/2 Gen? sp. 1 0 0 0 1 0 0 1
Theridiidae 2 2 2 1 6 5 76/18 Episinus sp. 1 0 1 0 0 0 0 1
Euryopis camis Levi, 1963 0 1 1 1 1 0 4
Euryopis sp. 3 0 0 0 0 1 0 1
Euryopis sp. 4 3 1 4 0 1 0 9
Euryopis spinifera (Mello-Leitão,
1944)
1 3 4 0 1 0 9
Guaraniella mahnerti Baert, 1984 9 7 6 5 12 6 45
Styposis selis Levi 1964 0 0 0 0 1 4 5
Thymoites Piratini Rodrigues &
Brescovit, 2015
0 0 0 1 1 0 2
Thomisidae 1 3 1 0 1 3 7/9 Gen? sp. 1 0 0 0 1 0 0 1
Gen? sp. 2 0 1 0 0 1 0 2
Gen? sp. 3 0 0 3 0 0 1 4
Trachelidae 0 0 0 0 0 0 2/0
Gen? sp. 1 0 0 0 0 0 1 1
Meriola sp. 0 0 0 0 0 1 1
Not identified juveniles 1 1 1 4 0 2 9
Total 134 90 136 113 154 148 775

73
ARTIGO II
Grazing affects ground spider (Arachnida: Araneae)
biomass and body size at Pampa biome?

74
GRAZING AFFECTS GROUND SPIDERS (ARACHNIDA: ARANEAE)
BIOMASS AND BODY SIZE AT PAMPA BIOME?
Guilherme O. da Silva1,2
*and Ricardo Ott1
1Fundação Zoobotânica do Rio Grande do Sul – FZB-RS. Rua: Dr Salvador França, CEP 90690-000, Porto Alegre, RS, Brazil.
2Universidade Federal do Rio Grande do Sul – UFRGS. Avenida Bento Gonçalves, 9500, CEP 91509-900, Porto Alegre, RS, Brazil.
ABSTRACT. Biomass is a fundamental ecological concept, being an important
parameter for community size. Measure invertebrate’s biomass, takes too much time
and can destroy the material, thus, ends up not being widely used. This dilemma was
solved with a variety of methodologies that use Mass-Length regression to estimate
biomass. Most studies at the Pampa biome are correlated to the impact of cattle graze in
ground and aerial plant biomass. However, researches with invertebrates, more
precisely, spiders, impacted by the same factor, are very scarce. In this ways, this
experiment was realized at APA do Ibirapuitã, southern Brazil. Six plots of one hectare
were utilized for the experiment; Three ungrazed plots and three grazed plots. Spiders
were sampled with Pitfall traps in November 2011, 2012 and 2013; and seasonally in
May 2015 to February 2016. Adult spiders were identified in the lowest possible
taxonomic level and measured in total body length to calculate individual biomass.
Most abundant males were measured in total carapace length, for specie relative size
between areas. In most species, the raw data of means of biomass were higher in grazed
plots than ungrazed plots, being only significant different between them seasonally,
with higher value in grazed plots. Carapace length didn´t was significant different
between grazed and ungrazed plots. Spiders are bigger and heavier in grazed plots
probably caused for higher abundance of preys where cattle graze. In counterpart, the
shortening or partition of niches in closed plots could be causing a decrease in
individual biomass.
KEYWORDS: Neotropical; Diversity; Mass-length relationship; Arachnida.
RESUMO. Biomassa é um conceito ecologico fundamental, importante na
mensuração do tamanho de comunidades. Medir a biomassa de invertebrados,
geralmente, consome muito tempo e destroi o material, sendo pouco utilizada. O uso de
metodologias como regressões massa-comprimento surge para solucionar este dilema.
Muitos estudos no Pampa correlacionam a biomassa de plantas com o impacto gerado
pela herbivoria e pisoteio do gado. Contudo, o envolvimento do gado e seu impacto
sobre invertebrados, mais precisamente aranhas, é escarço. Neste sentido, este
experimento foi realizado na APA do Ibirapuitã, sul do Brasil. Seis parcelas, de um
hectare cada, foram utilizadas para o experimento; três hectares sem pastejo e três
hectares com pastejo. Aranhas foram amostradas com o uso de “Pitfall traps” em
novembro de 2011, 2012 e 2013; e sazonalmente em maio de 2015 a fevereiro de 2016.
Aranhas adultas foram identificadas no mais baixo nível taxonômico possível e seu
comprimento total foi medido para calculo da biomassa individual. Machos mais
abundantes tiveram sua carapaça medida em comprimento total para calcular o tamanho
relativo da espécie. Os dados brutos demonstraram maiores médias de biomassa em
áreas pastejadas que nas sem pastejo, sendo apenas significativamente diferentes apenas
sazonalmente, sendo maiores em áreas com pastejol. Comprimento das carapaças não
foi significativamente diferente entre áreas com e sem pastejo. Provavelmente, aranhas
tem mais biomassa em áreas com pastejo devido à maior abundancia de prezas. Em

75
contrapartida, o encurtamento ou partição de nichos em áreas sem pastejo pode estar
causando a redução da biomassa individual.
PALAVRAS-CHAVE: Neotropical; Diversidade; Relação Comprimento-Massa;
Arachnida
Biomass, the mass of living beings per area (Bornebusch 1930; Edwards 1966),
is a fundamental ecological concept, based and applied in different organisms (Schaller
1983; Hooper 1996; Kirchman 2001; Borer et al. 2012). It is an important parameter for
population size, growth rate, quantity of energy and recycle of nutrients in a system
(Ganihar 1997). However, measuring invertebrate’s biomass consumes too much time,
due the need to dry the specimens, what usually destroys the material and could be,
frequently, inaccurate (Pekár 2002; Work et al. 2002; Motobayashi et al. 2006; Indicatti
et al. 2008). Therefore, biomass is rarely used in ecological works. This impasse caused
the advent of a variety of methodologies for measuring invertebrate’s biomass, such as
mass-length regressions (Ganihar 1997; Brady & Noske 2006; Höfer&Ott 2009;
Wardhaugh 2013).
For Pampa biome, a few studies were realized involving biomass. Usually,
plants are used as models and biomass is measured in two ways: ground biomass, using
manly grasses and roots; and aerial biomass, using shrubs and other woody plants (Pinto
et al. 2008; Fidelis et al. 2009). In this way, there is a lack of knowledge in terms of
invertebrates’ biomass at Pampa. The Pampa is known to suffer with disturbance like
grazing, fire and farming for the past 300 years (Suertegaray & Silva 2009; Rodrigues et
al. 2010; Ferrando et al. 2016), affecting directly the ground and removing biomass
(Evans et al. 2015). Moreover, these activities would not permit the growing of shrubs,
lowering the diversity and the vegetal structure (Overbeck et al. 2009; Kilnk et al.
2015), and in addition, the accumulation of dry biomass in the ground becomes highly
flammable (Gonçalves et al. 1997; Pillar & Quadros 1997; Behling et al. 2009). The

76
exclusion of all disturbances could lead to an increase of diversity and richness of
different species (Benck 2009; Fidelis et al. 2009), what would effects invertebrates,
herbivore and predators, like spiders (Podgaiski et al. 2014).
Spiders (Araneae) are the second richest group in Arachnida counting with more
than 45,000 described species (Miller et al. 2010; Brescovit et al. 2011; World Spider
Catalog 2016). Spiders have distinct predatory behaviors, commonly generalists and
varying from web-builders or predatory wanders, being strongly correlated to the
vegetal structure (Turnbull 1973; Baldissera, 2004; Souza, 2007; Foelix, 2011; Pfister et
al. 2015; Nogueira & Pinto-da-Rocha 2016). An assembly of spiders can pray in
different kinds of invertebrates, even other spiders, in distinct trophic levels, being able
to eat an equivalent of 200 kg per hectare year (Nyfeller 2000; Souza 2007; Ott 2016).
A complex heterogeneity of vegetal formation, not being affected by graze, with
grasses, bushes, shrubs and trees, could lead a higher diversity and biomass of spiders
(Souza 2007; Rodrigues et al. 2010; Andrade et al. 2015). In this way, considering its
biology, spiders’ biomass could be an excellent aspect to measure the impact of cattle
graze at Pampa.
The objective of this work is investigate the difference occurred in ground
spiders biomass in areas where the cattle grazing was excluded compared with areas
where the cattle has free access for grazing. The hypothesis is that the absence of
grazing impact will not just differ but will raise the ground spider biomass.
METHODS
Study Site – The Pampa is a southern Neotropical biome that covers 750,000
km2, covering parts of Brazil, Argentina and Uruguay (Fig. 9). To test how the cattle
grazing affects ground spider biomass, experiments were carried out in three farms, at
southern part of Ibirapuitã River Environmental Federal Protection Area (Área de

77
Proteção Ambiental – APA do Ibirapuitã). Estância do Açude (30º28’50.57”S;
055o33’10.21” W), Fazenda Rincão dos Moraes (30
º28’899” S; 055º34’263” W) and
Fazenda Bela Vista (30º25’54.78” S; 055
º38’39.75” W), were utilized for sampling.
Two plots of one hectare, far 200 m for each other, were selected in each farm.
One plot was closed with fences in August of 2012 excluding all the cattle grazing as a
ungrazed plots (total of three hectares); the other plot was used as a grazed plot, with
only poles in the corners to delimit the hectare, with free access for cattle grazing (total
of three hectares). Nowadays, the size and height of plants differ in each plot, grazed
and ungrazed. In graed plots most part of vegetation is constituted by grasses and
bushes not transposing 15 cm of height. In ungrazed plots the vegetation is constituted
by grasses and bushes not transposing 50 cm of height and shrubs reaching up to 1.7 m
of height (Fig. 10).
Data Collection – The campaigns were realized in springs (November) of 2011,
2012 and 2013; and seasonally in autumn (May), winter (September), spring
(November) of 2015 and summer (February) 2016.
Two different methodologies were applied using pitfall traps, in both, traps were
exposed during one week. The traps were filled around 1/3 with a mix of formol 2%
concentration and some drops of liquid soap to break superficial tension. Each trap was
an independent unity of sampling (adapted from Uetz & Uzicker 1976). In 2011
(ungrazed plots were not closed yet), 2012 and 2013 were used 12 traps disposed corner
to corner in an “X” format inside each plot, 24 per farm, 36 in grazed plots and 36 in
ungrazed plots, summing 72 in total (G. O. Silva & R. Ott unpublished data). In 2015
and 2016 the traps are disposed in a “Y” format in opposite corners, been installed eight
pitfall traps in each plot, 16 per farm, 24 in grazed plots and 24 in ungrazed plots,
summing 48 in total (G. O. Silva & R. Ott unpublished data).

78
Data Analysis – Spiders were individually examined and only adults were
identified in the lowest possible taxonomic level, due the difficulty to identify juvenile.
Spiders were measured using a stereo microscope with a 10x ocular with a scale
attached. The zoom level varied according and adjusting to the size of the individual.
All measures were made in dorsal view and in a millimeter scale. All spiders are
deposited at the aracnological collection of Museu de Ciências Naturais do Rio Grande
do Sul (MCN) preserved in 80% ethanol.
All adults, males and females, were measured in total body length, from clypeus
(excluding chelicerae), to the end of the abdomen (excluding the spinnerets) (Fig. 11).
Most abundant species were defined as those making up ≥2 % of the total of individuals
(adapted from Spiller & Schorner 1998; Petcharad et al. 2016). Only males, due it´s
higher activity, were measured in total carapace length, from clypeus (excluding
chelicerae) to the end of the carapace (excluding pedicel) (Fig. 12). These males choose
for carapace length measures are defined as the most abundant, summing together, more
than 50% of all adults.
Estimated spider biomass were obtained by Mass-Length regression, utilizing
Fresh Mass coefficients (Höfer & Ott 2009). Power model was performed for ≥8 mm
spiders total body length. Linear model was performed for <8 mm spiders total body
length. Amazonia regression coefficients were used separately for Ctenidae and
Lycosidae (Ctenidade coefficient), Gnaphosidae and Miturgidae (Hunting spiders
coefficient), Araneidae, Hahniidae, Linyphiidae, Tetragnathidae and Theridiidae (Web-
builder coefficient) and Oonopidae (Oonopidae coefficient); Mata Atlântica regression
coefficient was used for all other spiders biomass estimative.
Student´s Tests were performed to test significant difference on spiders biomass
comparing grazed and ungrazed plots in 2011, 2012, 2013, 2015 and 2016; significant

79
difference on spiders biomass comparing springs, November 2011, 2012, 2013 and
2015; and significant difference on spiders biomass seasonally in autumn (may) 2015 to
summer (february) 2016. Analysis of Variance (ANOVA) was performed to test
significant difference on spider biomass between ungrazed plots, combining all the
same periods above. Each comparison was performed with means of mass in grams.
Means were estipulated with the sum of all masses of each species divided by their
abundance. All spiders, most abundant males and their carapace length were used as
models in every analysis. Year 2011, on occasion, was removed from the analysis, due
to ungrazed plots were not closed yet. The most abundant species were only used in
seasonal statistical analysis due to the differential number of traps in previous
experiments. Data were analyzed using Past 3.5 (Hammer et al 2001).
RESULTS
A total of 1.921 adult spiders (1.424 males and 496 females) were measured in
total body length. A total of 968 males of the most abundant species were measured in
carapace total length. Adults measured only in springs were 1085 (808 males and 277
females), with 573 most abundant males. Adults measured seasonally in 2015 and 2016
were 1162 (861 males and 301 females), with 558 most abundant males.
The most abundant species were Agyneta sp. 1 (167 individuals: 125 in grazed
plots, 42 in ungrazed plots), Neohania sp. 1 (154: 134, 20), Erigone sp. 1 (94: 90, 4),
Neohania sp. 2 (74: 57, 17), Agyneta sp. 2 (64: 42, 22), Guaraniella mahnerti Baert (47:
23, 24), Tutaibo sp. 1 (42: 29, 13) and Glenognatha lacteovittata (Mello-Leitão) (41: 3,
38). These species represent 35.5 % of all spiders. The most abundant males were
Neohania sp. 1 (124 individuals: 111 in grazed plots, 13 in ungrazed plots), Agyneta sp.
1 (120: 90, 30), Erigone sp. 1 (73: 71, 2), Neohania sp. 2 (59: 48, 11), Agyneta sp. 2

80
(55: 34, 21), G. lacteovittata (39: 3, 36), Tutaibo sp. 1 (37: 24, 13), G. mahnerti (35: 18,
17) and Schizocosa malitiosa (Tullgren) (16: 15, 1).
In most part of species, the means of biomass were higher in grazed plots than
ungrazed plots (Table 2). However, Student´s Tests revealed no significant difference in
biomass between grazed and ungrazed plots in general (2011, 2012, 2013, 2015 and
2016) when all spiders (p = 0.50551) and most abundant males (p = 0.95795) were used
as models, even removing 2011 of the equation (all spiders p = 0.61685; most abundant
males p = 0.9186). Spring grazed and ungrazed plots (2011, 2012, 2013 and 2015)
weren´t significant different too, using the same models, all spiders (p = 0.49196) and
most abundant males (p = 0.95747), even removing 2011 (all spiders p = 0.6447; most
abundant males p = 0.91096). Student´s Tests revealed significant difference between
grazed and ungrazed plots seasonally (2015 and 2016), with higher values in grazed
plots, when all spiders (p = 0.013882) were tested, most abundant males (p = 0.87517)
still revealed no significant difference though.
Also, Student´s Tests revealed significant difference between grazed and
ungrazed plots in biomass seasonally, with higher values in grazed plots, when Agyneta
sp. 1 (p = 0.010105), Neohania sp. 1 (p = 3.4204E-06), Erigone sp. 1 (p = 5.751E-11),
Tutaibo sp. 1 (p = 0.003871) and G. lacteovittata(p = 3.7013E-07) were used as models.
The abundance of Neohania sp. 2 (p = 0.49716), Agyneta sp. 2 (p = 0.092833), G.
mahnerti (p = 0.85141) were not significantly different.
Analysis of Variance (ANOVA) reveled significant difference in biomass
between ungrazed plots in general (2011, 2012, 2013, 2015 and 2016) when all spiders
(p = 0.01643) and all spider without 2011 (p =0.01861) was used as models. Most
abundant males wasn’t significant different with (p = 0.7961) and without (p = 0.8152)
2011. Spring ungrazed plots (2011, 2012, 2013 and 2015) weren´t significant different

81
using the same models, all spiders (p = 0.3705) and most abundant males (p = 0.5889),
even without 2011 (all spiders p = 0.3917; most abundant males p = 0.5897).
ANOVA reveled significant difference between ungrazed plots when all spiders
(p = 0.0151) was models, being most abundant males no significant different (p =
0.7257). Moreover, G. lacteovittata (p = 0,01751) was the only species that ANOVA
demonstrate significant difference between ungrazed plots. ANOVA wasn’t significant
different between ungrazed plots when tested with all most abundant species (p =
0,9016) and separately with, Agyneta sp. 1 (p =0,3324), Neohania sp. 1 (p = 0,3297),
Neohania sp. 2 (p = 0,2378), G. mahnerti (p = 0,07926), Tutaibo sp. 1 (p = 0,4965).
Agyneta sp. 2, Erigone sp. 1 couldn’t be test due the absence of individuals captured in
autumn (May) 2015.
The carapace length of most abundant males in grazed and ungrazed plots, were
quite close to each other, with very lows standard deviations (Table 3, 4). Thus,
Student’s test based in the means of carapace lengths revealed no significant difference
between grazed and ungrazed plots in any analysis, in general with all sampled material
(p = 0.9962) and all material without 2011 (p = 0.9750), in only sampled springs, with
(p = 0.9369) and without 2011 (p = 0.9609) and seasonally in 2015/2016 (p = 0.9867).
ANOVA revealed no significant difference between ungrazed plots, in any analysis, in
general with all sampled material (p = 0.8166) and all material without 2011 (p =
0.7905), in only sampled springs, with (p = 0.5575) and without 2011 (p = 0.4426) and
seasonally in 2015/2016 (p = 0.6817).
DISCUSSION
Our data infers that in cattle grazed plots the abundance and biomass of spider is
higher than where cattle do not graze. It suggests that, for spiders, the offer of preys in
grazed areas probably is higher than in ungrazed ones being able to get bigger and

82
heavier even intensively grazing destroying spider assemblage (Delchev & Kajak 1974;
Bell et al. 2001). Spiders are a generalist predator group (Turnbull 1973; Nentwig
1986), however, ground dwelling ground spiders are more related to preying
Collembola than other invertebrates (Alderweireldt 1994; Bell et al. 2001; Sanders &
Platner 2007). For Collembola, the quality of food rather than quantity and number of
functional groups of plants influence more their abundance (Salamon et al. 2004 It is
possible that in ungrazed plots certain plants were reduced in numbers or climatic
conditions were more homogeneous, what would lead to lower abundance of
Collembola (Querner & Bruckner 2010; Winck et al. 2016). Consequently, factors like
these could affect abundance and biomass of spiders, lowering it at the ungrazed plots.
On the other hand, even if no data of Collembolas was presented in our results, some
studies shows that Collembola abundance can also increase after partially removing
sheep grazing (Bardgett et al. 1993).
The contrasts between grazed and ungrazed plots biomass could occur due a
possible shortening or partition of niches (Rodrigues et al. 2009), more competition with
other spiders (even cannibalism) and also other invertebrates, like ants (Sanders & Platner
2007) or a differentiation in types of potential preys inside the ungrazed areas. Spiders
diversity are more related to vegetal structure than prey availability, been food not a
necessarily limiting factor (Greenstone 1984; Wise 1993). However, the vegetal structure
could be affecting other invertebrates (eg. removing nectar sources) and indirectly affecting
spiders growth rate and capture success (Vollrath 1988), since grazers remove vegetal
structures complexity and biomass (Evans et al. 2015).
Although these factors could answer differences in biomass, only a few species
are really responding to ungrazed plots. Only total biomass is changing and not
relatively size of the specie, given by carapace mass of the most abundant males.
According to size-grain hypothesis (Kaspari & Weiser 1999) a smaller body could help

83
in locomotion in a place where grass is higher and denser, what could lead to smaller
total body length in ungrazed areas (Farji-Brener et al. 2004; Müller et al. 2014). In the
meantime, this differential in total length could be not influencing the relatively size of
the specie, being the size of carapace no different in grazed and ungrazed plots.
Moreover, web-builders spiders could respond better to ungrazed plots, due its need for
tridimensional structures to build a web (Horváth et al. 2009; Nogueira & Pinto-da-
Rocha 2016). Unfortunately, our data cannot answer this question.
Unfortunately, the absence of studies about biomass productivity at Pampa
probably underestimated the real ground and aerial biomass, involving animals and
plants (Fidelis et al. 2009). Furthermore, the correlation with other invertebrates and
plants, would allow a more certainly answer of what is really happing, granting more
consistent results (Bell et al. 2001). Ground invertebrate fauna is poorly know according
to some specialists in Brazilian biodiversity (Brandão et al. 2006; Bencke 2009), being
this study with spider only a little piece of information.
ACKNOWLEDGEMENT
We thank the Federal University of Rio Grande do Sul for providing us with
fieldwork infrastructure. Guilherme Oyarzabal da Silva Masters Scholarship from
CAPES, Brazil (process 1478689).
LITERATURE CITED
Alderweireldt, M. & De Keer, R. 1990. Field and laboratory observations on the life
cycle of Pachygnatha degeeri Sundervall, 1830 and Pachygnatha clercki
Sundervall, 1823. Acta Zoologica Fennica, 190:35-39.
Andrade, B.O., C. Kock, I.I. Boldrini, E. Vélez-Martin, H. Hasenack, J.M. Hermann et
al. 2015. Grassland degradation and restoration: a conceptual framework of

84
stages and thresholds illustrated by southern Brazilian grasslands. Natureza &
Conservação, 0:10. doi: 10.1016/j.ncon.2015.08.002
Baldissera, R.,G. Ganade, S.B. Fontoura. 2004. Web spider community response along
an edge between pasture and Araucaria forest. Biological Conservation,
118:403–409.
Bardgett, R.D.,J.B. Whittaker, J.C. Frankland. 1993. The diet and food preferences
of Onychiurus procampatus (Collembola) from upland grassland soils. Biology
and Fertility of Soils, 16(4):296-298.
Brady, C.J., R.A. Noske. 2006. Generalised regression provide good estimates of insect
and spider biomass in the monsoonal tropics of Australia. Australian Journal of
Entomology 45:187-191.
Bell, J.R.,C.P. Whether, W.R. Cullens. 2001 The implications of grassland and heath
land management for the conservation of spider communities: a review. Journal
of Zoology 255:377-387.
Beheling, H., V. Jeske-Pieruschka, L. Schüler, V.P.Pillar. 2009. Dinâmica dos campos
no sul do Brasil durante o Quaternário Tardio, Pp. 13-25. In: Pillar, V.P., S.C.
Müller, Z.M.S. Castilhos, A.V.A. Jacques. Campos sulinos: conservação e uso
sustentável da biodiversidade, 1° edition, Brasília: MMA.
Bencke, G.A. 2009. Diversidade e conservação da fauna dos Campos do Sul do Brasil;
Pp. 101-121. In: Pillar, V.P., S.C. Müller, Z.M.S. Castilhos, A.V.A. Jacques.
Campos sulinos: conservação e uso sustentável da biodiversidade, 1° edition,
Brasília: MMA.
Brandão, C.R., E,M. Cancello, C.I. Yamamoto. 2000. Invertebrados terrestres. In:
Lewinsohn, TM. Avaliação do estado do conhecimento da diversidade biológica
do Brasil. MMA, Brasília. Série Biodiversidade.

85
Brescovit, A.D., U. Oliveira, A.J. Santos. 2011. Spiders (Araneae, Arachnida) from São
Paulo State, Brazil: diversity, sampling efforts, and state-of-art. Biota
Neotropica. 11(1a):718-747.
Borer, E.T., E.W. Seabloom, D. Tilman. 2012. Plant diversity controls arthropod
biomass and temporal stability. Ecology Letters, 15:1457-1464.
Bornebusch, C.H. 1930. The Fauna of Forest Soil. Nielsen and Lydiche, Copenhagen.
Carter, P.E., A.L. Rypstra. 1995. Top-down effects in soybean agroecosystems: spider
density affects herbivore damage. Oikos, 72:433-439.
Delchev, K., A. Kajak. 1974. Analysis of a sheep pasture ecosystem Pieniny Mountains
(The Carpathians). XVI. Effect of pasture management on the number and
biomass of spiders (Araneae) in two climatic regions (the Pieniny and the Sredna
Gora Mountains). Polish Journal of Ecology, 22:693–710.
Edwards, C.A. 1966. Relationships between weights, volumes and numbers of soil
animals. Colloquium on Dynamics of Soil Sommunities, 93:5–10.
Evans, D.M., N. Villar, N.A. Littlewood, R.J. Pakeman, S.A. Evans, P. Dennis et al.
2015.The cascading impacts of livestock grazing in upland ecosystems: a 10-
year experiment. Ecosphere, 6(3):1-15.
Farji-Brener, A.G., G. Barrantes, A. Ruggiero. 2004. Environmental rugosity, body size
and access to food: a test of the size-grain hypothesis in tropical litter ants.
Oikos, 104:165-171
Ferrando, C.P., L.R. Podgaiski, M.K. Costa, M.D.S. Mendonça Jr. 2016. Taxonomic
and Functional Resilience of Grasshoppers (Orthoptera, Caelifera) to Fire in
South Brazilian Grasslands. Neotropical Entomology, 45(4):374-381. doi:
10.1007/s13744-016-0380-3.
Foelix, R.F. 2011.Biology of Spiders. 3. ed. Oxford: Oxford University Press.

86
Fidelis A., B. Appezzato-da-Glória, J. Pfadenhauer. 2009. A importância da biomassa e
das estruturas subterrâneas nos Campos Sulinos, Pp. 88-100. In: Pillar, V.P.,
S.C. Müller, Z.M.S. Castilhos, A.V.A. Jacques. Campos sulinos: conservação e
uso sustentável da biodiversidade, 1° edition, Brasília: MMA.
Ganihar, S.R. 1997. Biomass estimates of terrestrial arthropods based on body length.
Journal of Biosciences, 22:219-224.
Gonçalves, J.O.N., A.M. Girardi-Deiro, A.F. Mota. 1997. Limpeza de campo na Serra
do Sudeste, RS.Efeito do corte e queima de plantas lenhosas, visando aumentar
as áreas de pastoreio. EMBRAPA CPP-SUL, Bagé.
Hammer, Ø., D.A.T. Harper, P.D. Ryan. 2001. PAST: Paleontological Statistics
package for education and data analysis. PaleontologiaEletronica 4(1):9.
Höfer, H., R. Ott. 2009. Estimating biomass of Neotropical spiders and other arachnids
(Araneae, Opiliones, Pseudoscorpiones,Ricinulei) by mass-length regressions.
The Journal of Arachnology 37:160–169.
Hooper, R.G. 1996. Arthropod biomass in winter and the age of longleaf pines. Forest
Ecology and Management 82:115-131.
Horváth, R., T. Magura, C. Szineta, B. Tóthmérész. 2009. Spiders are not less diverse in
small and isolated grasslands, but lessdiverse in overgrazed grasslands: A field
study (East Hungary, Nyírség). Agriculture, Ecosystems and Environment,
130:16–22.
Indicatti, R.P., S.M. Lucas, R. Ott, A.D. Brescovit. 2008. Litter dwelling mygalomorph
spiders (Araneae: Microstigmatidae, Nemesiidae) from Araucaria forests in
southern Brazil, with the description of five new species. Revista Brasileira de
Zoologia 25 (3):529-546.

87
Kaspari, M., M.D. Weiser. 1999. The size–grain hypothesis and interspecific scaling in
ants. Functional Ecology, 13: 530–538.
Kirchman, D. 2001. Measuring bacterial biomass production and growth rates from
Leucine Incorporation in natural aquatic environments. Methodos in
Microbiology, 30:227-237.
Klink, R., F. van der Plas, C.G.E. van Noordwijk, M.F. WallisDeVries, H. Olffi. 2015.
Effects of large herbivores on grassland arthropod diversity. Biological Reviews
90:347–366. doi: 10.1111/brv.12113
Miller, J.A., A. Carmichael, M.J. Ramírez, J.C. Spagna, C.R. Haddad, M. Rezaket al.
2010. Phylogeny of entelegyne spiders: affinities of the family Penestomidae
(NEW RANK), generic phylogeny of Eresidae, and asymmetric rates of change
in spinning organ evolution (Araneae,Araneoidea, Entelegynae). Molecular
Phylogenetics and Evolution, 55:786-804.
Motobayashi, T., C. Ishijima, M. Takagi, M. Murakami, A. Taguchi, K. Hidake et al.
2006.Effects of tillage practices on spider assemblage in rice paddy fields.
Applied Entomology and Zoology, 41(2):371-381.
Müller, J., S. Bae, J. Roder, A. Chao, R.K. Didham. 2014. Airborne LiDAR reveals
context dependence in the effects of canopy architecture on arthropod diversity.
Forest Ecology and Management, 312:129–137.
Nentwig, W. 1986. Non-webbuilding spiders: prey specialists or generalists? Oecologia,
69:571-576.
Nogueira, A.A. & Pinto-da-Rocha, R. 2016. The effects of habitat size and quality on
the orb-weaving spider guild (Arachnida: Araneae) in an Atlantic Forest
fragmented landscape. Journal of Arachnology, 44:36–45.

88
Nyfeller, M. 2000. Ecological impact of spiders predation: a critical assessment of
Britowe’s and Tunbull’s estimates. Bulletin of the British Arachnological
Society, 11:367-373.
Ott, R. 2016. Invertebrados terrestres – Aranhas; Pp. 46-47. In: Moura L.A., L.
Chomenko, M.A. Azevedo. Natureza em Revista, 14, RS Biodiversidade, Porto
Alegre: Fundação Zoobotânica do Rio Grande do Sul.
Overbeck, G.E., S. C. Müller, A. Fidelis, J. Pfadenhauer, V.P. Pillar, C.C. Blanco et al.
2009. Os Campos Sulinos: um bioma negligenciado; pp. Pp. 26-41. In Pillar,
V.P., S.C. Müller, Z.M.S. Castilhos, A.V.A. Jacques. Campos sulinos:
conservação e uso sustentável da biodiversidade, 1° edition, Brasília: MMA.
Pekár, S. 2002. Differential effects of formaldehyde concentration and detergent on the
catching efficiency of surface active arthropods by pitfall traps. Pedobiologia,
46:539-547.
Petcharad, B., T. Miyashita, G.A. Gale, S. Sotthibandhu, S. Bumrungsri. 2016. Spatial
patterns and environmental determinants of community composition of web-
building spiders in understory across edges between rubber plantations and
forests. Journal of Arachnology 44:182–193.
Pfister, S.C., R.B. Schäfer, J. Schirmel, M.H. Entling. 2015. Effects of hedgerows and
riparian margins on aerial web-building spiders in cereal fields. Journal of
Arachnology 43:400–405.
Pillar, V.D. & F.L.F. Quadros. 1997. Grassland-forest boundaries in southern Brazil.
Coenoses, 12:119-126.
Pinto, C.E., J.A.S. Fontoura Jr., A. Frizzo, T.M.S. Freitas, C. Nabinger, P.C.F.
Carvalho. 2008. Produções primária e secundária de uma pastagem natural da
Depressão Central do RS submetida a diversas ofertas de fitomassa aérea total.
Revista Brasileira de Zootecnia, 37:1737–1741.

89
Podgaiski, L.R., C.S. Goldas, C.P.R. Ferrando, F.S. Silveira, F. Joner, G.E. Overbeck, et
al. 2014. Burningeffects on detritivory and litter decay in Campos grasslands.
Austral Ecology, 39(6):686-695. doi: 10.1111/aec.12132.
Querner, P. & A. Bruckner. 2010. Combining pitfall traps and soil samples to collect
Collembola for site scale biodiversity assessments. Applied Soil Ecology,
45:293-297. doi:http://dx.doi.org/10.1016/j.apsoil.2010.05.005.
Rodrigues, E.N.L., M.S. Mendonça Jr, R. Ott. 2009. Spider diversity in a rice
agroecosystem and adjacent areas in southern Brazil. Revista Colombiana de
Entomología, 35:78-86.
Rodrigues, E.N.L., M.S. Mendonça Jr., J.L.O. Rosado, A.E. Loeck. 2010. Soil spiders
in differing environments: Eucalyptus plantations and grasslands in the Pampa
biome, southern Brazil. Revista Colombiana de Entomología 36(2):277-284.
Roesch, L.F.W., F.C.B. Vieira, V.A. Pereira, A.L. Schünemann, I.F. Teixeira, A.J.T.
Senna et al. 2009. The Brazilian Pampa: A Fragile Biome. Diversity, 1:182-198.
doi: 10.3390/d1020182.
Salamon, J.A., M. Schaefer, J. Alphei, B. Schimid, S.Scheu. 2004. Effects of plant
diversity on Collembola in an experimental grassland ecosystem. Oikos, 106:51-
60.
Sanders, D. & Platner, C. 2007.Intraguild interactions between spiders and ants and top-
down control in a grassland food web. Oecologia, 150:611-624.
Schaller, G.B. 1983. Mammals and their biomass on Brazilian ranch. Arquivos de
Zoologia, 31(1):1-36.
Spiller, D.A. & T.W. Schoener. 1998. Lizard reduce spider species richness by
excluding rare species. Ecology, 79:503-516.

90
Souza, A.L.T. 2007. Influência da estrutura do habitat na abundância e diversidade de
aranhas, Pp. 25-44. In Gonzaga, M.O., A.J. Santos, H.F. Japyassú. Ecologia e
comportamento de aranhas. Rio de Janeiro, Interciência Editora.
Suertegaray, D.M.A & L.A.P. Silva. 2009. Tchê Pampa: histórias da natureza gaúcha;
Pp. 42-59. In Pillar, V.P., S.C. Müller, Z.M.S. Castilhos, A.V.A. Jacques.
Campos sulinos: conservação e uso sustentável da biodiversidade, 1° edition,
Brasília: MMA.
Turnbull, A.L. 1973. Ecology of true spiders (Araneomorphae).Annual Review of
Entomology, 18:305-348.
Uetz, G.W. & J.D. Unzicker. 1976. Pitfall trapping in ecological studies of wandering
spiders. Journal of Arachnology. 3:101-111.
Vollrath, F. 1988. Spider growth as an indicator of habitat quality. British
Arachnological Society, 7:217-219.
Wardhaugh, C.W. 2013.Estimation of biomass from body length and width for tropical
rainforest canopy invertebrates. Australian Journal of Entomology, 52:291-298.
Winck, B.R., E.L.S. Sá, V.M. Rigotti, M. Chauvat. Relationship between land-use types
and functional diversity of epigeic Collembola in Southern Brazil. Applied Soil
Ecology, 109:49–59.
Work, T.T., C.M. Buddle, L.M. Korinus, J.R. Spence. 2002. Pitfall trap size and capture
of three taxa of Litter-Dwelling arthropods: Implications for biodiversity studies.
Community and Ecosystem Ecology, 31(3):438-448.
World Spider Catalog. 2016. World Spider Catalog. Version 17.5.Natural History
Museum Bern. Online at: http://www.wsc.nmbe.ch/.

91
SUPPLEMENTAL MATERIAL
Figura 9 – Vegetation in grazed and ungrazed plots at APA do Ibirapuitã. Picture taken in May 2015. A –
Grazed plots; B – Ungrazed plots; C – Comparison of graze and ungrazed plots.

92
Figura 10 – Hahniidae, Neohania sp.1, showing how was measured the total body length. From clypeus
(excluding chelicerae) to the end of the abdomen (excluding the spinnerets).
Figura 11 – Hahniidae, Neohania sp.1, showing how was measured the total carapace length. From clypeus
(excluding chelicerae) to the end of the carapace (excluding pedicel).

93
Tabela 2 – Ground dweling spider biomass, in grams, of Pampa biome, southern Brazil. Biomass obtained by
Mass-Length regression using Fresh Mass coefficient. Species listed here are separated in Grazed and
Ungrazed plots and are from November 2011, 2012 and 2013, May, September and November 2015 and
February 2016. Taxa are separate in families, genus and species. “Ind” – Number of individuals captured; “L
mm” – Total length of each specie; “Me g” – Mean of total biomass of each speciemen in grams; “Mx g” –
Maximum value obtained of biomass of each specie in grams; “Mn g” – Minimum value obtained of biomass
of each specie in grams; “SD” – Biomass standard deviation of each species in each methodology.
Grazed Ungrazed
Taxa Ind L mm Me g Mx g Mn g SD Id L mm Me g Mx g Mn g SD
Actinopodidae
Actinopus sp. 1 8.8700 0.0653 0.0653 0.0653 0 0 0 0 0 0 0
Amphinectidae
Metaltella simoni Keyserling,
1878
14 7.0064 0.0446 0.0727 0.0186 0.0123 31 7.3452 0.0534 0.2045 0.0282 0.0310
Anyphaenidae
Arachosia sp. 1 3.7700 0.0708 0.0708 0.0708 0 6 3.6483 0.0649 0.0814 0.0417 0.0152
Gen? sp. 1 0 0 0 0 0 0 2 7.4450 0.6094 0.6623 0.5565 0.0748
Araneidae
Alpaida sp. 1 6.6000 0.0118 0.0118 0.0118 0 0 0 0 0 0 0
Argiope argentata (Fabricius,
1775)
0 0 0 0 0 0 2 9.7900 0.3599 0.4930 0.2269 0.1881
Caponiidae
Caponina notabilis (Mello-
Leitão, 1939)
1 3.2200 0.0033 0.0033 0.0033 0 0 0 0 0 0 0
Corinnidae
Castianeira chrysura Mello-
Leitão, 1943
10 5.5030 0.0159 0.0242 0.0089 0.0053 4 3.7775 0.0084 0.0204 0.0006 0.0094
Castianeira gaucha Mello-Leitão,
1943
1 4.0800 0.0065 0.0065 0.0065 0 14 5.6379 0.0173 0.0265 0.0070 0.0062
Castianeira sp. 1 1 5.8200 0.0180 0.0180 0.0180 0 0 0 0 0 0 0
Castianeira sp. 2 3 2.2933 0.0013 0.0021 0.0008 0.0007 8 2.1475 0.0011 0.0019 0.0009 0.0003
Mazax sp. 0 0 0 0 0 0 2 4.1650 0.0069 0.0073 0.0065 0.0006
Ctenidae
Asthenoctenus borellii Simon,
1897
0 0 0 0 0 0 5 10.648
0
0.1727 0.2556 0.0606 0.0725
Isoctenus minusculus
(Keyserling, 1891)
3 8.7700 0.1956 0.3608 0.0902 0.1449 5 9.5620 0.1231 0.1797 0.0728 0.0401
Parabatinga brevipes
(Keyserling, 1891)
3 11.283
3
0.1942 0.2211 0.1567 0.0335 9 11.582
2
0.2220 0.3730 0.0784 0.0945
Gnaphosidae
Apopyllus cf. iheringi 2 6.1350 0.0294 0.0361 0.0228 0.0094 0 0 0 0 0 0
Apopyllus sp. 1 7.1400 0.0457 0.0457 0.0457 0 0 0 0 0 0 0
Camillina galianoae Platnick &
Murphy, 1987
0 0 0 0 0 0 4 3.3125 0.0046 0.0060 0.0026 0.0015
Camillina pulchra (Keyserling,
1891)
5 4.4860 0.0135 0.0247 0.0034 0.0101 2 3.4150 0.0049 0.0052 0.0047 0.0004
Echemos sp. 1 4.0400 0.0082 0.0082 0.0082 0 0 0 0 0 0 0
Eilica aff. trilineata 0 0 0 0 0 0 2 3.2900 0.0045 0.0051 0.0038 0.0010
Eilica trilineata (Mello-Leitão,
1941)
1 3.0900 0.0037 0.0037 0.0037 0 0 0 0 0 0 0
Eilica cf. obscura 1 4.2500 0.0096 0.0096 0.0096 0 0 0 0 0 0 0
Neodrassex ibirapuita Ott, 2013 0 0 0 0 0 0 1 1.9900 0.0010 0.0010 0.0010 0
Hahniidae
Gen? sp. 1 1 1.9900 0.0008 0.0008 0.0008 0 6 2.2700 0.0011 0.0014 0.0008 0.0002
Neohania sp. 1 230 1.4961 0.0004 0.0007 0.0002 0.0001 110 1.4852 0.0004 0.0008 0.0002 0.0001
Neohania sp. 2 120 1.0708 0.0002 0.0004 0.0001 0.0000 109 1.0594 0.0002 0.0004 0.0001 0.0000

94
Neohania sp. 3 2 1.9000 0.0007 0.0008 0.0006 0.0002 17 2.1682 0.0010 0.0026 0.0006 0.0004
Linyphiidae
Agyneta sp. 1 125 1.8110 0.0006 0.0009 0.0004 0.0001 45 1.7060 0.0006 0.0009 0.0003 0.0001
Agyneta sp. 2 52 1.5065 0.0004 0.0009 0.0003 0.0001 47 1.4774 0.0004 0.0007 0.0002 0.0001
Erigone sp. 1 110 1.2526 0.0003 0.0005 0.0001 0.0001 9 1.2000 0.0003 0.0003 0.0002 0.0000
Erigone sp. 2 4 1.4325 0.0004 0.0005 0.0003 0.0001 0 0 0 0 0 0
Fissiscapus pusillus Millidge,
1991
1 1.7600 0.0006 0.0006 0.0006 0 0 0 0 0 0 0
Labicymbium sp. 1 3 1.6067 0.0005 0.0006 0.0003 0.0001 1 1.4700 0.0004 0.0004 0.0004 0
Labicymbium sp. 2 6 1.8083 0.0006 0.0008 0.0005 0.0001 4 1.5675 0.0005 0.0008 0.0003 0.0002
Laminacauda sp. 1 1 1.5500 0.0005 0.0005 0.0005 0 0 0 0 0 0 0
Laminacauda sp. 2 0 0 0 0 0 0 1 1.9300 0.0007 0.0007 0.0007 0
Moyosi sp. 1 13 1.9692 0.0008 0.0011 0.0005 0.0002 8 1.8750 0.0007 0.0008 0.0006 0.0001
Moyosi sp. 2 1 1.8700 0.0007 0.0007 0.0007 0 0 0 0 0 0 0
Neomaso sp. 2 16 1.2044 0.0003 0.0004 0.0002 0.0001 29 1.1562 0.0002 0.0003 0.0002 0.0000
Neomaso sp. 3 1 1.6800 0.0005 0.0005 0.0005 0 2 1.4150 0.0004 0.0004 0.0003 0.0000
Neomaso sp. 4 2 1.3300 0.0003 0.0003 0.0003 0.0000 26 1.6792 0.0005 0.0008 0.0003 0.0001
Pseudotyphistes sp. 1 1 1.5700 0.0005 0.0005 0.0005 0 6 1.5900 0.0005 0.0006 0.0003 0.0001
Pseudotyphistes sp. 2 1 1.3600 0.0003 0.0003 0.0003 0 1 1.1500 0.0002 0.0002 0.0002 0
Psilocymbium lineatum (Millidge,
1991)
16 1.4681 0.0004 0.0006 0.0002 0.0001 3 1.4100 0.0004 0.0004 0.0003 0.0000
Scolecura parilis Millidge, 1991 1 1.8900 0.0007 0.0007 0.0007 0 6 1.6933 0.0006 0.0009 0.0002 0.0002
Sphecozone sp.1 3 1.6933 0.0006 0.0006 0.0005 0.0001 0 0 0 0 0 0
Sphecozone sp.2 2 1.3850 0.0004 0.0004 0.0003 0.0001 1 1.3600 0.0003 0.0003 0.0003 0
Tutaibo aff. phoeniceus 12 1.5025 0.0004 0.0005 0.0003 0.0000 4 1.6050 0.0005 0.0008 0.0004 0.0002
Tutaibo sp. 1 32 1.9116 0.0007 0.0011 0.0003 0.0002 23 1.8787 0.0007 0.0009 0.0005 0.0001
Tutaibo sp. 2 6 1.8800 0.0007 0.0008 0.0006 0.0001 0 0 0 0 0 0
Tutaibo sp. 3 2 2.4650 0.0013 0.0016 0.0010 0.0004 0 0 0 0 0 0
Vesicapalpus sp. 0 0 0 0 0 0 6 1.8683 0.0007 0.0014 0.0004 0.0004
Lycosidae
Agalenocosa sp. 0 0 0 0 0 0 1 3.5100 0.0065 0.0065 0.0065 0
Allocosa sp. 1 6.9100 0.0463 0.0463 0.0463 0 1 5.2000 0.0204 0.0204 0.0204 0
Birabenia sp. 1 5 6.5400 0.0397 0.0426 0.0320 0.0044 23 6.4774 0.0391 0.0622 0.0282 0.0094
Birabenia vittata (Mello-Leitão,
1945)
1 7.1400 0.0509 0.0509 0.0509 0 2 9.4850 0.1344 0.2158 0.0530 0.1151
Hogna bivittata (Mello-Leitão,
1939)
8 8.4250 0.0842 0.1243 0.0558 0.0198 3 8.3400 0.0822 0.0963 0.0539 0.0245
Lobizon humilis (Mello-Leitão,
1944)
2 4.5150 0.0141 0.0191 0.0091 0.0071 18 4.4789 0.0136 0.0268 0.0087 0.0044
Lycosa erythrognatha Lucas,
1836
7 18.134
3
0.7947 1.3424 0.3074 0.3055 2 20.640
0
1.1974 1.7696 0.6253 0.8091
Lycosa sp.1 1 13.050
0
0.2935 0.2935 0.2935 0 0 0 0 0 0 0
Lycosa thorelli (Keyserling,
1877)
18 10.743
3
0.1810 0.3573 0.0840 0.0910 4 9.8675 0.1349 0.1997 0.0902 0.0478
Gen? sp. 1 2 4.7700 0.0168 0.0234 0.0101 0.0094 0 0 0 0 0 0
Gen? sp. 2 1 1.9500 0.0012 0.0012 0.0012 0 0 0 0 0 0 0
Gen? sp. 3 7 8.0414 0.0733 0.0963 0.0574 0.0167 14 8.0636 0.0745 0.1167 0.0509 0.0214
Navira naguan Piancentini &
Grismado, 2009
4 6.4200 0.0380 0.0463 0.0261 0.0085 1 5.2000 0.0204 0.0204 0.0204 0
Schizocosa malitiosa (Tullgren,
1905)
43 18.887
9
0.8999 2.7939 0.3730 0.4097 13 18.367
7
0.8418 2.2107 0.4278 0.4625
Trochosa sp. 2 10.455
0
0.1550 0.1659 0.1441 0.0154 2 9.1250 0.1065 0.1319 0.0812 0.0358
Microstigmatidae

95
Xenomesia platensis Goloboff,
1989
0 0 0 0 0 0 1 8.3600 0.0542 0.0542 0.0542 0
Miturgidae
Teminius insularis (Lucas, 1857) 18 7.3450 0.0557 0.1088 0.0171 0.0282 3 7.5033 0.0588 0.0990 0.0297 0.0360
Mysmenidae
Mysmena sp. 0 0 0 0 0 0 1 0.8800 0.0001 0.0001 0.0001 0
Nesticidae
Nesticus sp. 0 0 0 0 0 0 1 2.9900 0.0027 0.0027 0.0027 0
Oonopidae
Neotrops aff. tucumanus 4 1.7800 0.0006 0.0007 0.0005 0.0001 4 1.7125 0.0005 0.0006 0.0005 0.0001
Opopaea concolor (Blackwall,
1859)
0 0 0 0 0 0 1 1.4700 0.0004 0.0004 0.0004 0
Oxyopidae
Oxyopes salticus Hentz, 1845 7 4.4771 0.0096 0.0277 0.0061 0.0080 2 3.9600 0.0060 0.0065 0.0055 0.0007
Palpimanidae
Otiothops birabeni Mello-Leitão,
1945
1 4.5900 0.0091 0.0091 0.0091 0 0 0 0 0 0 0
Phrurolithidae
Orthobula sp. 6 1.7050 0.0005 0.0007 0.0004 0.0002 11 1.7882 0.0006 0.0008 0.0004 0.0001
Salticidae
aff. Phiale sp. 1 9.4800 0.0806 0.0806 0.0806 0 1 10.300
0
0.1047 0.1047 0.1047 0
Mopiopia sp. 1 5.3000 0.0138 0.0138 0.0138 0 0 0 0 0 0 0
Neonella minuta Galiano, 1965 3 1.2433 0.0002 0.0002 0.0002 0.0000 1 2.2000 0.0011 0.0011 0.0011 0
Neonella montana Galiano, 1988 3 1.4333 0.0003 0.0004 0.0002 0.0001 1 1.7400 0.0006 0.0006 0.0006 0
Gen? sp. 1 1 5.0400 0.0119 0.0119 0.0119 0 1 5.9300 0.0190 0.0190 0.0190 0
Gen? sp. 2 1 2.9400 0.0025 0.0025 0.0025 0 1 2.8600 0.0023 0.0023 0.0023 0
Gen? sp. 3 0 0 0 0 0 0 2 5.3300 0.0142 0.0167 0.0116 0.0036
Gen? sp. 4 0 0 0 0 0 0 1 3.9100 0.0058 0.0058 0.0058 0
Gen? sp. 5 1 5.1500 0.0127 0.0127 0.0127 0 0 0 0 0 0 0
Gen? sp. 6 1 1.7800 0.0006 0.0006 0.0006 0 0 0 0 0 0 0
Gen? sp. 7 0 0 0 0 0 0 1 2.54 0.0016
67
0.001667 0.001667 0
Gen? sp. 8 0 0 0 0 0 0 1 4.94 0.0112
64
0.011264 0.011264 0
Sarinda nigra Peckham &
Peckham, 1892
1 4.2500 0.0073 0.0073 0.0073 0 0 0 0 0 0 0
Semiopyla cataphracta Simon,
1901
3 2.3500 0.0013 0.0013 0.0013 0 18 2.3189 0.0013 0.0024 0.0009 0.0004
Tetragnathidae
Glenognatha lacteovittata
(Mello-Leitão, 1944)
3 2.7733 0.0017 0.0021 0.0012 0.0005 45 2.7449 0.0017 0.0032 0.0009 0.0005
Theraphosidae
Gen? sp. 1 0 0 0 0 0 0 1 15.980
0
0.4196 0.4196 0.4196 0
Theridiidae
Dipoena pumicata (Keyserling,
1886)
7 2.2757 0.0011 0.0013 0.0009 0.0002 6 2.1217 0.0009 0.0011 0.0007 0.0001
Episinus sp. 1 1 1.4900 0.0004 0.0004 0.0004 0 1 1.4900 0.0004 0.0004 0.0004 0
Episinus sp. 2 1 2.6200 0.0015 0.0015 0.0015 0 1 1.6800 0.0005 0.0005 0.0005 0
Euryopis camis Levi, 1963 10 2.2760 0.0011 0.0012 0.0009 0.0001 2 2.1050 0.0009 0.0010 0.0008 0.0001
Euryopis sp. 1 5 2.3160 0.0011 0.0013 0.0010 0.0001 0 0 0 0 0 0
Euryopis sp. 3 0 0 0 0 0 0 3 2.8233 0.0018 0.0020 0.0014 0.0003
Euryopis sp. 4 11 1.4445 0.0004 0.0005 0.0003 0.0001 1 1.4700 0.0004 0.0004 0.0004 0
Euryopis spinifera (Mello-Leitão, 21 2.8519 0.0018 0.0022 0.0012 0.0002 1 2.4800 0.0013 0.0013 0.0013 0

96
1944)
Guaraniella mahnerti Baert, 1984 45 1.4673 0.0004 0.0011 0.0002 0.0002 47 1.4357 0.0004 0.0011 0.0002 0.0002
Steatoda ancorata (Holmberg,
1876)
1 4.2500 0.0044 0.0044 0.0044 0 0 0 0 0 0 0
Styposis selis Levi 1964 2 1.4050 0.0004 0.0004 0.0003 0.0000 10 1.3800 0.0003 0.0004 0.0003 0.0000
Theridion sp. 1 2.0400 0.0008 0.0008 0.0008 0 1 1.6200 0.0005 0.0005 0.0005 0
Thymoites piratini Rodrigues &
Brescovit, 2015
6 1.4917 0.0004 0.0005 0.0004 0.0001 3 1.3867 0.0004 0.0004 0.0003 0.0000
Thomisidae
Gen? sp. 1 0 0 0 0 0 0 1 3.6700 0.0048 0.0048 0.0048 0
Gen? sp. 2 1 6.2400 0.0220 0.0220 0.0220 0 1 5.7200 0.0172 0.0172 0.0172 0
Gen? sp. 3 3 4.0867 0.0067 0.0087 0.0049 0.0019 1 4.0100 0.0062 0.0062 0.0062 0
Tmarus sp. 0 0 0 0 0 0 3 4.4233 0.0092 0.0150 0.0030 0.0060
Trachelidae
Gen? sp. 1 1 2.4600 0.0015 0.0015 0.0015 0 3 2.8400 0.0024 0.0034 0.0016 0.0009
Gen? sp. 2 1 3.7400 0.0051 0.0051 0.0051 0 4 3.7975 0.0053 0.0065 0.0041 0.0011
Tabela 3 – Ground dweling spider carapace length, in millimeters, of Pampa biome, southern Brazil. Species
listed here are from Grazed plots of November 2011, 2012 and 2013, May, September and November 2015 and
February 2016. Taxa are separate in families, genus and species. “Indiv” – Number of individuals captured;
“Mean Len” – Mean of carapace length per specie in millimeters. “Min Len” – Minimum value obtained of
carapace length per specie in millimeters; “Max Len” – Maximum value obtained of carapace length per
specie in millimeters; “SD” – Length standard deviation of each species.
Grazed
Taxa Indiv Mean Len Min Len Max Len SD
Hahniidae
Neohania sp.1 192 0.704219 0.82 0.63 0.02478
Neohania sp.2 106 0.503585 0.56 0.46 0.018475
Linyphiidae
Agyneta sp.1 90 0.842889 1.01 0.73 0.033562
Agyneta sp.2 41 0.68122 0.94 0.61 0.073082
Erigone sp.1 83 0.641205 0.75 0.52 0.039429
Tutaibo sp.1 25 0.958 1.05 0.84 0.057446
Lycosidae
Schizocosa malitiosa (Tullgren, 1905) 31 9.559677 11.12 7.44 1.011667
Tetragnathidae
Glenognatha lacteovittata (Mello-
Leitão, 1944) 3 1.333333 1.57 1.17 0.209841
Theridiidae
Guaraniella mahnerti Baert, 1984 36 0.616667 0.86 0.48 0.093869

97
Tabela 4 – Ground dweling spider carapace length, in millimeters, of Pampa biome, southern Brazil. Species
listed here are from Ungrazed plots of November 2011, 2012 and 2013, May, September and November 2015
and February 2016. Taxa are separate in families, genus and species. “Indiv” – Number of individuals
captured; “Mean Len” – Mean of carapace length per specie in millimeters. “Min Len” – Minimum value
obtained of carapace length per specie in millimeters; “Max Len” – Maximum value obtained of carapace
length per specie in millimeters; “SD” – Length standard deviation of each species.
Ungrazed
Taxa Indiv Mean Len Min Len Max Len SD
Hahniidae
Neohania sp.1 85 0.705882 0.8 0.63 0.022746
Neohania sp.2 96 0.509896 0.78 0.46 0.035049
Linyphiidae
Agyneta sp.1 32 0.805938 0.92 0.61 0.065346
Agyneta sp.2 35 0.668571 0.84 0.52 0.066869
Erigone sp.1 5 0.65 0.67 0.61 0.028284
Tutaibo sp.1 23 0.898696 1.05 0.8 0.065734
Lycosidae
Schizocosa malitiosa (Tullgren, 1905) 11 9.663636 11.12 8.06 0.970673
Tetragnathidae
Glenognatha lacteovittata (Mello-
Leitão, 1944) 40 1.28125 1.7 1.13 0.144083
Theridiidae
Guaraniella mahnerti Baert, 1984 34 0.597059 0.94 0.46 0.135256

98
ARTIGO III
Seasonal spider diversity and species phenology in
grazed and ungrazed areas in Southern America
Grasslands

99
SEASONAL SPIDER DIVERSITY AND SPECIES PHENOLOGY IN GRAZED
AND UNGRAZED AREAS IN SOUTHERN AMERICA GRASSLANDS
Guilherme O. da Silva1,2
*and Ricardo Ott1
1Fundação Zoobotânica do Rio Grande do Sul – FZB-RS. Rua: Dr Salvador França, CEP 90690-000, Porto Alegre, RS, Brazil.
2Universidade Federal do Rio Grande do Sul – UFRGS. Avenida Bento Gonçalves, 9500, CEP 91509-900, Porto Alegre, RS, Brazil.
ABSTRACT. Pampa is a savanna-like Biome nowadays dominated by livestock
farming. Besides that, Pampa still also suffers with crop farming, silviculture and fire,
being extremely neglected in terms of management and conservation. Although cattle
grazing is widely recommended for Pampa conservation, this methodology still affects
biodiversity of plants and arthropods. An alternative of conservation would be the use
of resilience of Pampa itself, in a self-recovery management, where all impact is
removed priodically. Spiders were used in many ecological works at Pampa, however, it
were never used as models for self-recovery managements. Spiders are a diverse and
rich group, are well-know to respond to biotic and abiotic perturbation. Considering
that, samplings using pitfall traps were realized in autumn, winter and spring of 2015
and summer of 2016 to improve the knowledge of how spider diversity change in areas
with and without cattle grazing at Pampa. We expected that spider abundance will be
higher in ungrazed plots. Although grazed and ungrazed spider abundance weren´t
significant difference when all spiders (juveniles and adults) were used as models (p =
0.6885), abundance of most abundant species revealed difference (p = 0.0070).
Ungrazed plots had some effect in spiders’ abundance, even though this was smaller
compared to grazed plots, refusing our hypothesis.
KEYWORDS: Neotropical; Diversity; Arachnids; Pampa
RESUMO. O Pampa é um bioma do tipo savana hoje dominado por criação
de rebanhos. Além disso, o Pampa ainda sofre com a agricultura, silvicultura e
queimadas, sendo extremamente negligenciado em termos de manejo e conservação.
Apesar do pastejo do gado ser muito recomendado para a conservação do Pampa, essa
prática afeta a biodiversidade de plantas e artrópodes. Uma alternativa de conservação
seria a própria resiliência do Pampa, em manejos de auto-recuperação, nas quais todo o
impacto é cessado. Aranhas são usadas como exemplos em muitos trabalhos no Pampa,
contudo, nunca foram utilizadas em manejos de auto-recuperação. Aranhas são ótimos
modelos ecológicos, sendo um grupo diverso e rico, conhecidas por responder a
perturbações bióticas e abióticas. Amostragens usando “Pitfall traps” foram realizadas
no outono, inverno e primavera de 2015 e verão de 2016 para incrementar o
conhecimento sobre como a diversidade de aranhas se altera em áreas com e sem
pastejo de gado no bioma Pampa. Esperamos que a abundancia de aranhas será maior
em áreas sem pastejo. Quando aranhas jovens e adultas foram usadas como modelos, a
abundância de aranhas não foi significativamente diferente entre áreas com e sem
pastejo (p = 0.6885). Já a abundancia das espécies mais abundantes revelou diferença
significativa entre áreas com e sem pastejo (p = 0.0070). As áreas sem pastejo tiveram
alguma influencia na abundância de aranhas, apesar desta ser menor quando comparada
com áreas com pastejo, refutando nossa hipótese.
PALAVRAS-CHAVE: Neotropical; Diversidade; Arachnida; Pampa

100
Spiders (Araneae) are a diverse group, nowadays with more than 46,000
described species, being the second richest group of Arachnida (World Spider Catalog
2016) and nearly exploiting all terrestrial habitats, excluding Antarctica (Foelix 2011).
Spiders are worldwide used in many ecological works due its strong response to biotic
and abiotic perturbations (Bishop & Riechert 1990; Podgaiski et al. 2013; Rodrigues et.
al. 2014; Herrmann et al. 2015; Lin et al. 2016; Niba & Yekwayo 2016; Peterson et al.
2016). Fast occupation of new habitats, strong correlation with vegetal structure, the
characteristic of being generalist predators (even eating other spider) and the property to
consume high biomass rate made spiders great experimental models (Uetz et al. 1999;
Wise 2006; Souza 2007; Foelix 2011; Silvey et al. 2015; Ott 2016).
Although spiders have been well studied in many ecosystems and biomes,
specific research on grasslands spiders are still of poor knowledge. There is a high
demand to know how diversity, richness and composition of these arthropods are in
these ecossistems and how these parameters change under different impacts and
managements (McDonald 2007; Haddad et al. 2015; Horváth et al. 2015). In southern
South America grasslands, known as “Campos Sulinos”, studies have been conduct
involving spider and impacts like fire (Podgaiski et al. 2013), silvicultures (Rodrigues et
al. 2010), farming (Liljesthröm et al. 2002; Rodrigues et al. 2009; Fritz et al. 2011) and
graze (Alejandro et al. 2010). However, studies with Araneofauna and the self-recovery
of the Pampa biome are a lack of knowledge.
The Pampa is a savanna-like biome originally composed by a landscape
dominated by grasslands and meadows (Overbeck et al. 2007; Beheling et al. 2009).
Restricted to the Neotropical region, the Pampa covers 750,000 km2 (Vélez et al. 2009)
of south Brazil, northern Argentina and whole Uruguay (Andrade et al. 2015). The
Köppen-Geiger climatic classification indicates a “Cfa” climates (warm temperate

101
clime, humid, with hot summers; Kottek et al. 2006), lying in a South Temperate Zone
with four well-characterized seasons (Suertegaray & Silva 2009).
For the past 300 years, after the begining of the European colonization, the
Pampa has been subjected to a number of different impacts, very differently from the
last 10.000 years period, since the final of the Pleistocene. Uncontrolled fire
management, introduction of many agricultural practices, livestock farming and
silviculture are nowadays extremely associated with this biome (Suertegaray & Silva
2009; Podgaiski et al. 2014; Ferrando et al. 2016). All these impacts have a large effect
on the Pampa, improving degradation and neglecting conservation processes (Overbeck
et al. 2013). The transformaton of grasslands for agricultural proposes, without
regulation or controlled management, lead to an entire change in its original properties,
causing an unmeasurable impact on native biodiversity (Andrade et al. 2015; Winck et
al 2016).
Most studies focused on livestock activity are more concentrated in forage
properties and meat production (Pinto et al. 2008; Kamali et al. 2014; Pelegrini et al.
2016; Ruviaro et al. 2016;), other than analyze in effects on native species and soil
damage (Soares et al. 2011; Gantchoffet al. 2014; Bella et al. 2014; 2015; Van Klink et
al. 2015). Overgrazed areas are known to suffer under high impact of herbivory, cattle
trampling, lacking to forage plants quality and biodiversity (Pallarés et al., 2005;
Nabinger et al. 2009; Evans et al. 2015). In the other hand, moderate grazed areas,
formed by mosaics of low and high grazing intensities, are known to improve plant
diversity and quality (Diaz et al., 2007; Nabinger et al. 2009). The simple maintenance
of heterogeneity in grasslands like the Pampa could lead to positive enhancement of
their complexity and diversity (Andrade et al. 2015; Dassou et al. 2015; Hertzog et al.
2016).

102
Considering that the Pampa still maintains certain original properties and seeds
banks, it is possible that its resilience, as in a self-recovery system, will show some of
his “original characteristics” as an alternative to the actual grassland management. This
system could allow a gradually change in quality, complexity and diversity of the biota
(Andrade et al. 2015). The objective of this work is to compare the ground dwelling
spider’s fauna in areas with and without grazing and cattle presence considering
seasonality aspects in the Pampa biome, correlating abundance and richness with the
proposed managements. As spiders are usually well used as ecological models, we
propose to study his abundance and richness in different sazonal periods intending to
enhance knowledge of this fauna and the changes in the community related to the
presence and absence of cattle and grazing activities.
METHODS
Study Site - The experiments were carried out at Ibirapuitã River Environmental
Federal Protection Area “Área de Proteção Ambiental – APA do Rio Ibirapuitã” located
at Western Pampas Areas of Rio Grande do Sul state, Brazil (Fig. 10). Three farms,
georeferenced at 30º28’50.57” S; 055
o33’10.21” W (Estancia do Açude), 30
º28’899” S;
055º34’263” W (Fazendo Rincão dos Morais) and 30º25’54.78” S; 055
º38’39.75” W
(Fazenda Rincão Bonito) were selected for sample. In each farm a pair of plots, with
one hectare and around 200 m far from each other, were established in November 2011.
Each pair is constituted of a closed plot (fenced plot with total exclusion of cattle graze)
and an opened plot (plot with poles in the corners to demarcate the place, cattle has free
access for graze). Fenced plots have been closed since August 2012.
Nowadays the vegetation in fenced plots is complete different, in terms of height
(Fig. 11), compared with the vegetation in opened plots. Fenced-Ungrazed plots are
constituted of grasses and bushes that can reach up to 70 cm of height and shrubs that

103
can reach up 1,7 m of height. In opened plots the vegetation is constituted by grasses
and bushes that not transpose 15 cm of height. Opened-Grazed plots are still considered
in the same environmental stage that the closed plots were before facing.
Data Collection - The sampling periods were seasonally in autumn (12 to 19
May 2015), winter (25 August to 01 September 2015), spring (17 to 24 November
2015) and summer (16 to 23 February of 2016).
The traps were made of ordinary plastic ice cream pots of 1L (10 cm depth, 20
cm diameter) inserted in a 20 cm PVC guide (Fig. 12), adapted from Uetz & Uzicker
(1976) and filled 1/3 of volumen with formol 2% (preservative sampling fluid) adding
some drops of neutral liquid soap for breaking superficial tension. The traps were
disposed in a “Y” format, been installed eight pitfall traps in each area, four traps per
“Y” (48 in total). The traps were distant 10 m of each other, 15 m distant from fences
corner and diagonally at last 10 m distant from the border of the one hectare plot (Fig.
13). After each sampling event spiders were sorted out and transfereed to 80% ethanol
as preservative.
Data Analysis - Spiders were examined using a stereo microscope and separated
in vials containing 80% ethanol. Spiders were determinate using dichotomous key for
families (Dipenaar-Schoemann & Jocqué 1997; Brescovit et al. 2002) and, in the lowest
possible taxonomic level, with papers available on-line at NMBE World Spider Catalog
(2016). Most abundant species were defined by their dominance, as those making up
≥3% of the total of individuals (adapted from Spiller & Schorner 1998; Petcharad et al.
2016). All adult spiders are deposited at the aracnological collection of Museu de
Ciências Naturais do Rio Grande do Sul (MCN, R. Ott).
For statistical analysis, Student’s tests were performed with all spiders, juveniles
and adults, most abundant species and only adults’ spiders excluding singletons and

104
doubletons. These analyses were to test if abundance was significantly different
between ungrazed and grazed plots in whole year and in each season. Individually, each
of most abundant species was used as model for testing the same factors.
Rarefaction curves were performed to demonstrate spider richness difference
between grazed and ungrazed plots trough seasons, and an Analysis of Variance
(ANOVA) was performed to test significance of this result. Phenology curves for the
most abundant species were performed to demonstrate seasonal activity; an ANOVA
was performed to test significantly difference between curves. All statistical analyses
were made in PASt (Paleontological Statistics 3.13 Hammer et al. 2001).
RESULTS
A total of 1,928 spiders of 29 families were sampled, 1.099 individuals in grazed
plots (557 males; 181 females; 361 juveniles) and 829 in ungrazed plots (304 males;
120 females; 405 juveniles). Ninety-two species and morphospecies of 23 families were
identified, being 36 nominal species, 43 in genera level and 13 only at family level
(Table 5). Regarding Amaurobiidae, Idiopidae, Philodromidae, Pholcidae, Tengelidae
and Theraphosidae only juveniles were sampled. Actinopodidae, Amaurobiidae,
Palpimanidae, Philodromidae and Pholcidae were exclusively sampled in grazed plots.
Idiopidae, Microstigmatidae, Mysmenidae, Nesticidae, Tengelidae and Thomisidae
were exclusively sampled in ungrazed plots. Linyphiidae was the most abundant family
in general with a total of 676 juveniles and adults, followed by Lycosidae (305),
Hahniidae (273) and Theridiidae (198). In grazed plots, Linyphiidae was the most
abundant family with 453 juveniles and adults, followed by Haniidae (207), Lycosidae
(194) and Theridiidae (92). In ungrazed plots, Linyphiidae was the most abundant
family with 223 juveniles and adults, followed by Lycosidae (111), Theriidiiae (106)
and Haniidae (66). The five most abundant species were Agyneta sp. 1 (167 individuals:

105
125 in grazed plots, 42 in ungrazed plots), Neohania sp. 1 (154: 134, 20), Erigone sp. 1
(94: 90, 4), Neohania sp. 2 (74: 57, 17), Agyneta sp. 2 (64: 42, 22) and represent 28.7%
of all spiders.
Linyphiidae was the richest family too, with 23 species and morphospecies, 20
in grazed plots and 16 in ungrazed plots, followed by Lycosidae (14: 14, 4), Theridiidae
(13: 11, 8) and Salticidae (11: 9, 4) (Table 5). In terms of species richness, grazed plots
registered 76 morphospecies and ungrazed plots 56. Thirty-six morphospecies were
exclusively found in grazed plots and sixteen were exclusively found in ungrazed plots
(Table 5).
Summer was the season with largest number of morphospecies (53), followed by
winter (52); spring and autumn (both with 46). However, in grazed plots, winter was
richer season with 41 registered morphospecies, followed by summer (37), autumn (33)
and spring (32); this was also true for ungrazed plots in which the winter registered 35
species, followed by spring (34), summer (27) and autumn (26). Thirty morphospecies
were singletons and 12 were doubletons. Regarding rarefaction curves, both grazed and
ungrazed plots appear to have reached the asymptote in species accumulation (Fig. 14;
15). Moreover, Test T demonstrate significant difference between grazed and ungrazed
plots richness (p = 7.94E-05), with higher richness in grazed plots.
Winter was the most abundant season with 352 adult individuals (198 in grazed
plots and 154 in ungrazed plots), followed by spring (215; 112), autumn (182; 95) and
summer (143; 63). The most abundant species, Agyneta sp. 1 registered higher
abundance in autumn (65 individuals, 44 in grazed plots and 21 in ungrazed plots) (Fig.
16); Neohania sp. 1 registered higher abundance in spring (54: 51, 3) (Fig. 17); Erigone
sp. 1 registered higher abundance in winter (31: 28, 3) (Fig. 18); Neohania sp. 2

106
registered higher abundance in spring (31: 22, 9) (Fig. 18) and Agyneta sp. 2 registered
higher abundance in winter (24: 10, 14) (Fig. 20) for other seasons, see Table 5.
The T Test performance, based in all adults, revealed no significant abundance
difference between grazed and ungrazed plots in autumn (p = 0.1651), winter (p =
0.5234) and spring (p = 0.1312), being only significantly different in summer (p =
0.0481; higher abundance in grazed plots). The same test, based in the most abundant
species, revealed significant abundance difference between grazed and ungrazed plots
in autumn (p = 0.0442), winter (p = 0.0294), spring (p = 0.0252) and summer (p =
0.0194), always with higher abundance in grazed plots. Abundance, between grazed and
ungrazed plots, considering all seasons summed revealed no significant difference using
as models all spiders (p = 0.6885), only adults (p = 0.1802) and adults without
singletons and doubletons (p = 0.1813); most abundant species, though, revealed
significant difference, with more richness in grazed plots (p = 0.0070).
T Test was performed also with each of the most abundant species separately,
comparing grazed and ungrazed plots. Agyneta sp. 1 reveled significant difference in
abundance between grazed and ungrazed plots with the sum of seasons (p = 0.0009),
winter (p = 0.0018) and spring (p = 0.0099) with higher abundance in grazed plots;
autumn (p = 0.0578) and summer (p = 0.1044) weren’t significant different. Neohania
sp. 1 revealed significant difference in abundance between grazed and ungrazed plots in
all parameters: the sum of seasons (p = 2.0799E-07), autumn (p = 0.0020), winter (p =
0.0316), spring (p = 5.3047E-06) and summer (p = 0.0004), with higher abundance in
grazed plots. Erigone sp. 1 was significant different in abundance between grazed and
ungrazed plots with the sum of seasons (p = 1.9777E-07), winter (p = 0.0001) and
spring (p = 0.0198) with higher abundance in grazed plots; autumn and summer
statistics couldn’t be performed due the absence of variation in the raw data. Neohania

107
sp. 2 revealed significant difference in abundance between grazed and ungrazed plots
with the sum of seasons (p = 0.0252) and winter (p = 0.0278) with higher abundance in
grazed plots; autumn (p = 0.3831), spring (p = 0.0826) and summer (p = 0.1012)
weren’t significant different. Agyneta sp. 2 revealed significant different in abundance
between grazed and ungrazed plots with the sum of seasons (p = 0.0168); winter (p =
0.3818) with higher abundance in grazed plots; spring (p = 0.7979 and summer (p =
0.0854) showed no significant difference; PASt programam could´t performed Agyneta
sp. 2 autumn statistics due the absence of variation on the raw data.
Most phenology curves demonstrate higher male activity trough seasons, more
pronounced in grazed plots (Fig. 16, 17, 18; 19, 20). Males of Agyneta sp. 1 (Fig. 16)
exhibit a consistent curve that follow a very close parameter in both, grazed and
ungrazed plots; females present distinct curves, both decreasing in spring; however
ANOVA demonstrate no significant difference in these results (p = 0.5203). Males of
Neohania sp. 1 (Fig. 17), in spring, demonstrate a great abundance peak in grazed plots,
not followed by any other curve; Abundance of grazed plots females raised in summer;
Curves of males and females in ungrazed plots are very close related and ANOVA
demonstrate no significant difference in these results (p = 0.8519). Grazed plots males
of Erigone sp. 1 (Fig. 18) maintain practically the same abundance trough seasons, only
decaying abundance in summer; Grazed plots females do the same, practically
maintaining the same abundance trough seasons; Ungrazed plots males and females
registered correlated curves, changing abundance of each other in winter to spring;
ANOVA demonstrate no significant difference in these results (p = 0.6836). Grazed
plots males and females of Neohania sp. 2 (Fig. 19) increase their abundance until
spring, decaying it in summer; Ungrazed plots females raised their abundance in autumn
to winter, maintaining it until summer; Ungrazed plots males oscillated their abundance

108
trough seasons; ANOVA demonstrate no significant difference in these curves (p =
0.634); Grazed plots males of Agyneta sp. 2 (Fig. 20) decay their abundance in autumn
to winter, maintaining practically the same in spring and raising it in summer; Grazed
plots females, ungrazed plots males and females registered the same parameter of
curves, with low abundance in autumn, appearing to be more abundant in spring and
decaying their abundance until summer; however, ANOVA demonstrate no significant
difference in these curves (p = 0.6407).
DISCUSSION
In the raw data, in all the cases apresented here (abundance of families,
abundance of most abundant species, richeness and exclusive species), grazed plots
registered higher values than ungrazed ones. However, grazed and ungrazed plots
abundance was only significant different when tested with most abundant species.
Spiders respond differently from other arthropods when the impact is correlated with
grazing (Ferrando et al. 2016; Woodcok et al. 2005; Polchaninova et al. 2016), being
diversity directly affected by habitat structure, prey availability and competitive
exclusion (Dennis et al. 2015; Rodriguez-Artigas 2016). The size-grain hypotheses
(Kaspari & Weiser 1999) suggest that absence of grazing and a higher density of
vegetation structure could lead, as shown in ungrazed plots, to an araneofauna
dominated by smaller species. Some Lycosids species could represent exactly this case.
The family is classified as cursorial/wandering spiders (Moring & Stewart 1994; Uetz et
al. 1999) and is know to be much correlated with grasslands (Jocqué & Alderweireldt
2005). Althoug this family is richer and more abundant in grazed plots, Lobizon humilis
(Mello-Leitão, 1944), a very small species of Lycosidae compared with Schizocosa
malitiosa (Tullgren, 1905), was more abundant in ungrazed plots. In the other hand

109
many of the most abundant spiders represented by small species of hahniids and
linyphiids were significantly more abundant in grazed plots.
Two possible explanations can be used here. First, regarding that pitfall traping
is based in activity, it is possible that the simple increment of vegetation density could
have a deep impact on the mobility of some spiders, mainly ground web builders and
ground runners in this case, and in this way the sampling methodology efficience of
pitfall trapping could be deeply affected by vegetation density factor. This would
represent a reduction on the mobility or activity but not necessarily a reduction in the
density of these spiders. Second it is to consider that these hahniids and linyphiids
species indeed have a large preference for open areas, and in this case they are much
more represented in grazed plots as in ungrazed ones.
Considering the edge effect, closed plots are surrounded by massive grazed areas
and spiders are good dispersers and colonizers (Bishop & Riechert 1990; Uetz et
al.1999; Rodrigues et al. 2009; Baba & Tanaka 2016; Rodriguez-Artigas 2016). In this
way, if closed plots would be always recolonized from the outside species since the
begin of isolation, spider richness rather than abundance could be not greatly affected
by the cattle absence in isolated grassland fragments (Horváth et al. 2009). Supposedly
outside ungrazed plots species will be always present, even if in smaller abundance
(Polchaninova et al. 2016). However, some species will be, probably, more related to
the edge of the hectare, since vegetation density would hinder spider mobility (Kaspari
& Weiser 1999).
About sampled species, Actinopus sp. was the only adult Mygalomorphae
sampled. Metaltella simoni Keyserling, 1878 is a species commonly registered in many
papers dealing with the Pampa region araneofauna (Costa & Simó, 2014; Zapata &
Grismado 2015; Zanetti 2016) being recently introduced in USA and Canada (Dean

110
2016; World Spider Catalog 2017). This species showed higher abundance in ungrazed
plots being even present in grazed ones. Castianeira gaucha Mello-Leitão, 1943 is only
known for its type-locality, Rio Grande do sul state, Brazil (Buckup et al. 2010),
Asthenoctenus borellii Simon, 1897 is known to inhabit periurban zones, being widely
distribuited in Altantic Rain Forest and Pampa biomes (Simó et al. 2000; Buckup et al.
2010; Brescovit et al. 2011) and Vesicapalpus sp. were know to inhabit the south of
Brazil (Rodrigues & Ott 2006); these three species were exclusively found in ungrazed
plots. Glenognatha lacteovittata (Mello-Leitão, 1944), widely distribuited in South
America (World Spider Catalog 2017), was here more related to ungrazed plots,
showing a supposedly preference for areas with lass impact and higher vegetation
structure, in accordance to its guild of web-builders (Battirola et al. 2016).
In contrast, S. malitiosa, is another widely distribuited specie (World Spider
Catalog 2017) was more related to grazed plots showing a supposedly preference for
open grasslands, also in accordance to the guild of wanderers (Uetz et al. 1999).
Agyneta sp. 1, Agyneta sp. 2 and Erigone sp. are small species of linyphiidae. Species of
these genus could be correlated with grasslands (Zapata & Grismado 2015) and riparian
forests (Rodrigues et al. 2016). Here, they seems to be linked with grasslands, beeing
more abundant in grazed areas. Guaraniella mahnerti Baert, 1984 is known from
souther South America (Zapata & Grismado 2015; World Spider Catalog 2017); this
species has already been sampled in impacted areas like silviculture and grasslands with
cattle (Rodrigues et al. 2010). Here, it was the only species that presented a very similar
abundance in both grazed ans ungrazed plots. Although abundant here, hahniids species
(Neohania sp. 1 and Neohania sp. 2) are not well studied (Buckup et al. 2010;
Pompozzi et al. 2011; Zapata & Grismado 2015). This family is widely sampled in
many works (Rodrigues et al. 2010; Zapata & Grismado 2015; Podgaiski & Rodrigues
111
2016); however, in these papers its abundance was every time low and cannot be
compared to the high abundance presented here and also found in primary and
secondary Araucaria forests, and in Pinus spp. silvicultures at São Francisco de Paula
(R. Ott personal observation). The higher abundance of hahniids can be simply related,
in this case, to the high effectiveness of pitfall sampling methodology (Topping &
Sunderland 1992; Patrick & Hansen, 2013).
Most spiders are usually active during warms seasons, like spring and summer
(Neimelä et al. 1994; Gibb et al. 2014; Haddad et al. 2015; Nekhaeva 2015). However,
spiders with higher winter-actity patterns are reported as well (Aitchison 1984, Boreau
de Roicé et al. 2013; Whitey et al. 2014). In part, the main period of activity of males is
usually related to the reproductive season (Schmitt et al. 1990; Salvestrini & Gasnier
2001; Clark et al. 2015). In our results it is possible to see both patterns of activity;
considering males based phenograms two main patterns seems to present: autumn active
males as in Agyneta sp. 1 and Agyneta sp. 2, and spring active males as in Neohahnia
sp. 1 and Neohahnia sp. 2. However, all species shows the lower activity peaks in the
summer.
In the region summer can be a very hot and dry season (Suertegaray & Silva
2009) and in this way not very suitable for reproductive activities or any activity at all,
at last for small spider species. Moreover, Neohahnia sp. 1 (Fig. 17) and Agyneta sp. 2
(Fig. 20) seens to reverse their male activity pattern when grazed and ungrazed plots are
compared. This result may be related to some abiotic factor like humidity or
temperature resilience (Hatley & Macmahon 1980; Gajdos & Toft 2000; Gibb et al.
2014), wich could induce these species to delay or precipitate reproductive activity
depending on the available microhabitat conditions (Jones and Parker 2000; Roberts &
Uetz 2005; Moskalik & Uetz 2016).

112
Futhermore, Linyphiidae species (Agyneta sp. 1, Agyneta sp. 2 and Erigone sp.)
seens to be activy trough the whole year, with peaks in autumn and winter; typically,
species of erigonnines and linyphiinies have biennial life cycles (Aitchison 1984).
These same linyphiids patterns has been registered in many different locations as
Canada (Aitchison 1984), UK (Thorbek et al. 2004) and Uruguay (Costa & Simó 2014).
However, Topping & Sunderland (1992) found for species of the linyphiids genera
Agyneta and Erigone a higher activity peak in the summer. Despite of been from the
same family, phenology is particular outcome of each species (Niemela et al. 1994;
Thorbek et al. 2003; Santana 2015; Houser et al. 2016). A wise tip would be prudent
and careful with any phenology generalization with these spiders.
ACKNOWLEDGEMENT
We thank the Federal University of Rio Grande do Sul, for providing us with
fieldwork infrastructure. This work was supported also by Guilherme Oyarzabal da
Silva Masters Scholarship from CAPES, Brazil (process1478689).
LITERATURE CITED
Aitchison, C.W. 1984. The phenology of winter-active spiders. The Journal of
Arachnology, 12:249-271.
Alejandro, L., R.A. Distel, S.M. Zalba. 2010. Large herbivore grazing and non-native
plant invasion in Montane grassland of central Argentina. Natural Areas Journal,
30(2):148-155. doi: http://dx.doi.org/10.3375/043.030.0203.
Andrade, B.O., C. Kock, I.I. Boldrini, E. Vélez-Martin, H. Hasenack, J.M. Hermann et
al. 2015. Grassland degradation and restoration: a conceptual framework of
stages and thresholds illustrated by southern Brazilian grasslands. Natureza &
Conservação, 0:10. doi: 10.1016/j.ncon.2015.08.002.

113
Alvarado-Castro, J.A., M.L. Jiménez. 2016. Phenology of the Sonoran desert-endemic
populations of Homalonychus selenopoides (Araneae: Homalonychidae). The
Journal of Arachnology, 44(1):58-64.
Baba, Y.G. & K. Tanaka. 2016. Factors affecting abundance and species composition of
generalist predators (Tetragnathaspiders) in agricultural ditches adjacent to rice
paddy fields. Biological Control, 32 p. doi:
http://dx.doi.org/10.1016/j.biocontrol.2016.09.004.
Barnett, K.L., & S.L. Facey. 2016. Grassland, invertebrates, and precipitation: A review
of the effects of climate change. Frontiers in Plant Science, 7:1196.
Battirola, L.D., D.A. Batistella, G.H. Rosado-Neto, A.D. Brescovit, M.I. Masques.
2016. Spider assemblage (Arachnida: Araneae) associated with canopies of
Vochysia divergens (Vochysiaceae) in the northern region of the Brazilian
Pantanal. Zoologia, 33(4): 1-9. doi: 10.1590/S1984-4689zool-20150170.
Beheling, H., V. Jeske-Pieruschka, L.Schüler, V.P. Pillar. 2009. Dinâmica dos campos
no sul do Brasil durante o quaternário tardio, Pp. 13-25. In Pillar, V.P., S.C.
Müller, Z.M.S. Castilhos, A.V.A. Jacques. Campos sulinos: conservação e uso
sustentável da biodiversidade, 1° edition, Brasília: MMA.
Bella, C.E.D., E. Jacobo, R.A. Golluscio, A.M. Rodriguez. 2014. Effects of cattle
grazing on soil salinity and vegetation composition along an elevation gradient
in a temperate coastal salt marsh of Sambotombón Bay (Argentina). Wet lands
Ecology and Management, 22:1-13.
Bella, C.E.D., A.M. Rodriguez, E. Jacobo, R.A. Golluscio, M.A. Taboada. 2015. Impact
of cattle grazing on temperate coastal salt marsh soils. Soil Use and
Management, 31:299-307.

114
Bishop, L. & Riechert, S. E. 1990. Spider colonization of Agroecosystems: Mode and
Source. Entomological Society of America, 19:1738-1745.
Brescovit, A.D.,C.A. Rheims,A.B.Bonaldo.2002. Araneomorphae - Chave de
identificação para famílias de aranhas brasileiras. Online at:
http://pt.scribd.com/doc/123853696/Chave-de-Familias-de-Aranhas.
Bolaños, V.A., M.C. Vecchio, R.A. Golluscio. 2015. Dormición y tipo de suelo como
determinantes de La germinación y establecimento de Chloris berroi em La
Pampa Deprimida. Ecologia Austral, 25:75-80.
Boreau de Roicé C., C. Lavigne, J.F. Mandrin, C. Rollard, W.O.C. Symondson. 2013.
Early-season predation on aphids by winter-active spiders in apple orchads
revealed by diagnostic PCR. Bulletin of Entomological Reaserch, 103:148-154.
Bulot, A., E. Provost, T. Dutoit. 2016. Refuse pile turnover by harvester ants
(Hymenoptera: Formicidae) increases seed density and seedling species richness
in dry grasslands. Myrmecological News, 23:91-100.
Carvalho, L.S., N. Sebastian, H.F.P. Araújo, S.C. Dias, E. Venticinque, A.D. Brescovit
et al. 2015. Climatic variables do not directly predict spider richness and
abundance in semiarid Caatinga vegetation, Brazil. Environmental Entomology,
1-10.
Chatazaki, M. A., Trichas, G. Markakis, M. Mylonas. 1998. Seasonal activity of the
ground spider fauna in a Mediterranean ecosystem (Mt Youchtas, Crete,
Greece). Proceedings of the 17th European Colloquium of Arachnology,
Edinburgh 1997.
Clark, D.L., C.K. Zeef, A. Karson, J.A. Roberts, G.W. Uetz. 2015. Risky courtship:
Background contrast, ornamentation and display behavior of wolf spiders affects
visual detection by toad predators. Ethology, 122:1-12.

115
Dassou, A.G., S. Dépigny, E. Canard, F. Vinatier, D. Carval,P. Tixier. 2015.
Contrasting effects of plant diversity across arthropod trophic group in plantain-
based agroecosystems. Basic and Applied Ecology, 17:11-20.
Dennis, P., J. Skartveit, A. Kunaver, D.I. McCracken. 2015. The response of spider
(Araneae) assemblages to structural heterogeneity and prey abundance in sub-
montane vegetation modified by conservation grazing. Global Ecology and
Conservation, 3:715–728.
Dias, S.C., A.D. Brescovit, E.C.G. Couto, C.F. Martins. 2006. Species richness and
seasonality of spiders (Arachnida, Araneae) in an urban Atlantic Forest fragment
in Northeastern Brazil. Urban Ecosyst, 9:323–335.
Diaz, S., S. Lavorel, S. McIntyre, V. Falczuk, F. Casanoves, D.G. Milchunas et al.
2007.Plant trait responses to grazing – a globalsynthesis. Global Change Biology
13:313–341.
Dippenaar-Schoeman, A.S. & R. Jocqué.1997. African Spiders: An Indetification
Manual. Plant Protection.Research institute Handbook.
Evans, D.M., N. Villar, N.A. Littlewood, R.J. Pakeman, S.A. Evans, P. Dennis et al.
2015.The cascading impacts of livestock grazing in upland ecosystems: a 10-
year experiment. Ecosphere, 6(3):1-15.
Ferrando, C.P.,L.R. Podgaiski,M.K. Costa, M.D.S. Mendonça Jr. 2016. Taxonomic and
Functional Resilience of Grasshoppers (Orthoptera, Caelifera) to Fire in South
Brazilian Grasslands. Neotropical Entomology, 45(4):374-381. doi:
10.1007/s13744-016-0380-3.
Fritz, L.L., E.A. Heinrichs, V. Machado, T.F. Andreis, M. Pandolfo, S.M. Salles, J.V.
Oliveira, L.M. Fiuza. 2011. Diversity and abundance of arthropods in

116
subtropical rice growing areas in the Brazilian south. Biodiversity and
Conservation 20(10):2211-2224.
Foelix, R.F. 2011.Biology of Spiders. 3. ed. Oxford: Oxford University Press.
Gajdos, P. & S. Toft. 2000. A twenty-year comparison of epigeic spider communities
(Aranae) of Danish coastal heath habitats. The Journal of Arachnology, 28:90–
96.
Gantchoff, M.G.,J. L. Belant, D.A. Masson. 2014. Land use affects mammal
community composition in a multiple-use protected area, East-Central
Argentina. Revista Latinoamericana de Conservación, 1:7-13.
Gibb, H. D. Muscat, M.R. Binns, C.J. Silvey, R.A. Peters, D.I. Warton, N.R. Andrew.
2014. Responses of foliage-living spider assemblage composition and traits to a
climatic gradient in Themeda grasslands. Austral Ecology, 40(3):225-237. doi:
10.1111/aec.12195.
Gómez, J.E. J. Lohmiller, A. Joern. Importance of vegetation structure to the assembly
of an aerial web-building spider community in North American open grassland.
The Journal of Arachnology, 44(1):28-35. doi: http://dx.doi.org/10.1636/P14-
58.1.
Haddad, C.R., S. H. Foord, R. Fourie, A.S. Dippenaar-Schoeman. 2015. Effects of fast-
burning spring fire on the ground-dwelling spider assemblages (Arachnida:
Araneae) in a central South Africa grassland habitat. African Zoology, 50(4):
281-292. doi: http://dx.doi.org/10.1080/15627020.2015.1088400.
Halaj J., D.W. Ross, A.R. Moldenkel. 1998. Habitat structure and prey availability as
predictors of the abundance and community organization of spiders in Western
Oregon forest canopies. The Journal of Arachnology, 26:203–220.

117
Hatley, C.L. & J.A. Macmahon. 1980. Spider community organization: seasonal
variation and the role of vegetation architecture. Environmental Entomology,
9(5): 632-639.
Herrmann, J.D., I. Opatovsky, Y. Lubin, T. Pluess, E. Gavish-Regev, M. H. Entling.
2015. Effects of non-native Eucalyptus plantations on epigeal spider
communities in thenorthern Negev desert, Israel. The Journal of Aracnology,
43:101–106.
Hertzog, L.R., S.T. Meyer, W.W. Weisser, A. Ebeling. 2016. Experimental
manipulation of grassland plant diversity induces complex shifts in aboveground
arthropod diversity. PLoS one, 11(2)1-16.doi: 10.1371/journals;pone.0148768.
Hammer, Ø., D.A.T. Harper, P.D. Ryan. 2001. PASt: Paleontological Statistics package
for education and data analysis. Paleontologia Eletronica 4(1):1-9.
Houser, J.D., A.H. Porter, H.S. Ginsberg, E.M. Jakob. 2016. Effect of phenology on
agonistic competitive interactions between invasive and native sheet-web
spiders. Canadian Journal of Zoology, 94:427–434. doi: dx.doi.org/10.1139/cjz-
2015-0221
Horváth, R., T. Magura, C. Szinetár, B. Tóthemérész. 2009. Spiders are not less diverse
in small and isolated grasslands, but less diverse in overgrazed grasslands: A
field study (East Hungary, Nyérség). Agriculture, Ecosystems and Environment
130:16–22.
Horváth, R., T. Magura, C. Szinetár, J. Eichardt, É. Kovács, B. Tóthmérész. 2015. In
stable, unmanaged grasslands local factors are more important than landscape-
level factors in shaping spider assemblages. Agriculture, Ecossystems and
Environment, 208:106-113.

118
Inmet – Istituto Nacional de Metereologia. 2015. Boletim climático – agosto – setembro
– outubro. Estado do Rio Grande do Sul, 13(07):1-6. Online at:
http://www.inmet.gov.br/portal/portal_antigo/clima/prog_clima_rs/pdf/bol_jul20
15.pdf.
Inmet – Istituto Nacional de Metereologia. 2015. Boletim climático – setembro –
outubro – novembro. Estado do Rio Grande do Sul, 13(08):1-6. Online at:
http://www.inmet.gov.br/portal/portal_antigo/clima/prog_clima_rs/pdf/bol_ago2
015.pdf.
Inmet – Istituto Nacional de Metereologia. 2015. Boletim climático – novembro –
dezembro – janeiro. Estado do Rio Grande do Sul, 13(10):1-6. Online at:
http://www.inmet.gov.br/portal/portal_antigo/clima/prog_clima_rs/pdf/bol_out2
015.pdf
Kamali, F.P., M.P.M. Meuwissen, A.G.J.M.O. Lansink. 2014. Evaluation of beef
sustainability in conventional, organic, and mixed crop-beef supply chains.
Proceedings of the 9th
International Conference on Life Cycle Assessment in the
Agri-Food Sector, 1-11.
Kaspari, M., M.D. Weiser. 1999. The size–grain hypothesis and interspecific scaling in
ants. Functional Ecology, 13: 530–538.
Kottek M.; J. Griser,C. Beck,B. Rudolf,F. Rubel. 2006. World map of the Köppen-
Geiger climate classification updated. Meteorologische Zeitschrift,15(3):259-
263.
Laws, A.N. & A. Joern. 2015. Predator–prey interactions are context dependent in a
grassland plant–grasshopper–wolf spider food chain. Environmental
Entomology, 1–10. doi: 10.1093/ee/nvv033

119
Liljesthröm, G., E. Minervino, D. Castro, A. Gonzalez. 2002. La comunidade de arañas
del cultivo de soja em la província de Buenos Aires, Argentina. Neotropical
Entomology, 31(2):197-209.
Lin, S., L. Vasseur, M., S. You. 2016. Seasonal Variability in Spider Assemblages in
Traditional and Transgenic Rice Fields. Environmental Entomology, 0:1–10.doi:
10.1093/ee/nvw00.
Lubin, Y.D. 1978. Seasonal abundance and diversity of web-building spiders in relation
to habitat structure on Barro Colorado Island, Panama. The Journal of
Arachnology, 6:31–51.
Machado, I.C.S., L.M. Barros, E.V.S.B. Sampaio. 1997. Phenology of Caatinga species
at Serra Talhada, PE, northeastern Brazil. Biotropica, 29:57-68.
McDonald, B. 2007. Effects of vegetation structure on foliage dwelling spider
assemblages in native and non-native Oklahoma grasslands habitats.
Proceedings of the Oklahoma Academy of Science, 87:85-88.
Modernel, P., W.A. Rossing, M. Corbeels, S. Dogliotti, V. Picasso, P. Tittonell. Land
use change and ecosystem service provision in Pampas and Campos grasslands
of southern South America. Environmental Reaserch Letters, 11:1-21. doi:
10.1088/1748-9326/11/11/113002.
Nabinger, C., E.T. Ferreira, A.K. Freitas, P.C.F. Carvalho, D.M. Sant’Anna. 2009.
Produção animal com base no campo nativo: aplicações de resultados de
pesquisa, Pp. 175–198. In Pillar, V.P., S.C. Müller, Z.M.S. Castilhos, A.V.A.
Jacques. Campos sulinos: conservação e uso sustentável da biodiversidade, 1°
edition, Brasília: MMA.
Nekhaeva, A.A. 2015. Spider (Arachnida, Aranei) assemblages of some habitats from
Kola gulf coast: Phenological aspect. Entomological Review, 95(4):544-556.

120
Niba, A.S. &I. Yekwayo. 2016. Epiganic invertebrate community structure in two
subtropical nature reserves, Eastern Cape, South Africa: Implications for
conservation management. ArachnologischeMitteilungen, Arachnology Letters,
52: 7-15.
Niemela, J. T. Pajunen, Y. Haila, P. Punttila, E. Halme. 1994. Seasonal activity of
boreal forest-floor spiders (Araneae). The Journal of Arachnology, 22:23–31.
Nogueira, A.A. & R. Pinto-da-Rocha. 2016. The effects of habitat size and quality on
the orb-weaving spider guild (Arachnida: Araneae) in an Atlantic Forest
fragmented landscape. The Journal of Arachnology, 44:36–45.
Ott, R. 2016. Invertebrados terrestres – Aranhas; Pp. 46-47. In Moura L.A., L.
Chomenko, M.A. Azevedo. Natureza em Revista, 14, RS Biodiversidade, Porto
Alegre: Fundação Zoobotânica do Rio Grande do Sul.
Overbeck, G.E., S.C. Müller, A. Fidelis, J. Pfadenhauer, V.D. Pillar, C.C. Blancoet al.,
2007. Brazil’s neglected biome: the SouthBrazilian Campos. Perspectives in
Plant Ecology, Evolution and Systematics, 9:101–116.
Overbeck, G.E., J. Hermann, B.O. Andrade, I.I. Boldrini, K. Kiehl, A. Kirmer et al.,
2013. Restoration ecology in Brazil – time to step out of the forest. Natureza &
Conservação, 11, 92–95.
Pallarés, O.R.,E.J. Berretta, G.E. Maraschin.2005. The South American campos
ecosystem, Pp. 171-219.In: Suttie, J., S.G. Reynolds, C. Batello. Grasslands of
the World. FAO, Rome.
Pelegrini, C.B., R.B. Medeiros, S.B. Carlotto, R.P.A. Garcia, C.V. Lisboa, G. Bruning.
2016. Valor nutritivo de uma pastagem nativa dominada por Eragrotis plana
Nees e sua relação com o perfil metabólico de vacas primíparas suplementadas
da gestação ao pós-parto. Ciência Animal Brasileira, 17(20):154-163.

121
Petcharad, B., T. Miyashita, G.A. Gale, S. Sotthibandhu, S. Bumrungsri. 2016. Spatial
patterns and environmental determinants of community composition of web-
building spiders in understory across edges between rubber plantations and
forests. The Journal of Arachnology 44:182–193.
Peters, V.E., K.U. Campbell, G. Dienno, M. García, E. Leak, C. Loyke et al. 2016. Ants
and plants as indicators of biodiversity, ecosystem services, and conservation
value in constructed grasslands. Biodiversity and Conservation, 1-21. doi:
10.1007/s10531-016-1120-z.
Peterson, J. A., J.J. Obrycki, J.D. Hardwood. 2016. Spiders from multiple functional
guilds are exposedto Bt-endotoxins in transgenic corn fields via preyand pollen
consumption. Biocontrol Science and Technology, 26(9):1230–1248.
Pfister, S.C., R.B. Schäfer, J. Schirmel, M.H. Entling. 2015. Effects of hedgerows and
riparian margins on aerial web-building spiders in cereal fields. The Journal of
Arachnology, 43:400–405.
Pinto, C.E.; J.A.S. Fontoura Jr., A. Frizzo, T.M.S. Freitas, C. Nabinger, P.C.F.
Carvalho. 2008. Produções primária e secundária de uma pastagem natural da
Depressão Central do RS submetida a diversas ofertas de fitomassa aérea total.
Revista Brasileira de Zootecnia 37:1737–1741.
Podgaiski, L.R., F. Joner, S. Lavorel, M. Moretti, S. Ibanez, M.S. Mendonça Jr. et al.
2013. Spider trait assembly patterns and resilience under fire-induced vegetation
change in south Brazilian Grasslands. PLoS ONE 8(3):1-11.
doi:10.1371/journal.pone.0060207.
Podgaisk, L.R., C.S. GoldaS, C.P.R. Ferrando, F.S. Silveira, F. Joner, G.E. Overbeck et
al. 2014. Burning effects on detritivory and litter decay in Campos grasslands.
Austral Ecology, 39:686–695.

122
Polchaninova, N., G. Savchenko, A. Drogvalenko, V. Ronkin, D. Shabanov. 2016. The
impact of cattle grazing on cursorial spiders (Aranei) and true bugs (Heteroptera)
in steppe gullies of northeastern Ukraine. Agriculture, Ecosystems &
Environment, 234:65-71.
Pryke, J.S., F.R. Roets, M.J. Samways. 2016. Wild herbivore grazing enhances insect
diversity over livestock grazing in an African grassland system. PLoS ONE,
11(10):1-15. doi: 10.1371/journal.pone.0164198.
Rodrigues, E.N.L., M.S. Mendonça Jr, R. Ott. 2009. Spider diversity in a rice
agroecosystem and adjacent areas in southern Brazil. Revista Colombiana de
Entomología, 35:78-86.
Rodrigues, E.N.L., M.S. Mendonça Jr, J.L.O. Rosado, A.E. Loeck. 2010. Soil spiders in
differing environments: Eucalyptus plantations and grasslands in the Pampa
biome, southern Brazil. Revista Colombiana de Entomología, 36(2):277-284.
Rodrigues, E.N.L., M.S. Mendonça Jr, L.E. Costa-Schimidt. 2014. Spider diversity
responds strongly to edge effects but weakly to vegetation structure in riparian
forests of Southern Brazil. Arthropod-PlantInteractions, 8:123–133. doi:
10.1007/s11829-014-9294-3.
Rodriguez-Artigas, S.M., R. Ballester, J.A. Corronca. 2016. Factors that influence the
beta-diversity of spider communities in northwestern Argentinean Grasslands.
PeerJ 4:e1946. doi: 10.7717/peerj.1946.
Ruviaro, C.F., J.S. Costa, T.J. Florindo, W. Rodrigues, G.I.B. Medeiros, P.S.
Vasconcelos. 2016. Economic and environmental feasibility of beef production
in different feed management systems in the Pampa biomes, southern Brazil.
Ecological Indicators, 60:930-939.

123
Salvestrini, F.M.D. & T.R. Gasnier. 2001. Differences in the activity of juveniles,
females and males of two hunting spiders of genus Ctenus (Aranea, Ctenidae):
Active males or inactive females? The Journal of Arachnology, 29:276-278.
Santana, R.C. 2015. Community structure and composition of litter spiders (Arachnida:
Araneae) and influence of macro-climatic factors on Parque Ecológico Jatobá
Centenário, Morrinhos, Goiás, Brazil. Journal of Threatened Taxa, 7(10):7612-
7624. doi: 10.11609/JoTT.o4030.7612-24.
Schmitt, A., M. Schuster, F.G. Barth. 1990. Daily locomotor activity patterns in three
species of Cupiennius (Araneae, Ctenidae): The males are the wandering
spiders. The Journal of Arachnology, 18:249-255.
Silvey C.J., M.W. Hayward, H. Gibb. 2015. Effects of reconstruction of a pre-European
vertebrate assemblage on ground-dwelling arachnids in arid Australia.
Oecologia, 178:497–509. doi: 10.1007/s00442-014-3189-y.
Simó, M., V. Vázquez, G. Useta. 2000. Estudio comparativo de la fenología y hábitat de
Ctenus taeniatus Keyserling y Asthenoctenus borellii Simon (Araneae,
Ctenidae). Bol. Soc. Zool. Uruguay, 12:32-40.
Slade, E.M., T. Reiutta, T. Roslin, H.L. Tuomisto. 2016. The role of dung beetles in
reducing greenhouse gas emissions from cattle farming. Scientific Reports, 6:1-
9. doi: 10.1038/srep18140.
Soares, A.B.,P.C.F. Carvalho, C. Nabinger, J.P.P. Trindade, J.K. Trindade, J.C.
Mezzalira. 2011. Dinâmica da composição botânica numapastagem natural sob
efeito de diferentes ofertas de forragem.Ciência Rural, 41:1459–1465.
Souza, A.L.T. 2007. Influência da estrutura do habitat na abundância e diversidade de
aranhas; Pp. 25-44. In Gonzaga, M.O., A.J. Santos, H.F. Japyassú. Ecologia e
comportamento de aranhas. Rio de Janeiro, Interciência Editora.

124
Spiller, D.A. & T.W. Schoener. 1998. Lizard reduce spider species richness by
excluding rare species. Ecology, 79:503-516.
Suertegaray, D.M.A & L.A.P. Silva. 2009. Tchê Pampa: histórias da natureza gaúcha,
Pp. 42-59. In Pillar, V.P., S.C. Müller, Z.M.S. Castilhos, A.V.A. Jacques.
Campos sulinos: conservação e uso sustentável da biodiversidade, 1° edition,
Brasília: MMA.
Swift, M.J., O.W. Heal, J.M. Anderson. 1979. Decomposition in terrestrial ecosystems.
Blackwell Scientific Publications, London.
Sylvain, Z.A., D.H. Wall, K.L. Cherwin, D.P. Peters, L.G. Reichmann, O.E. Sala. 2014.
Soil animal responde to moisture availability are largely scale, not ecosystem
dependent: insight from a cross-site study. Global Change Biology, 20:2641-
2643. doi: 10.1111/gcb.12522.
Thorbek, P., K.D. Sunderland, C.J. Topping. 2003. Eggsac development rates and
phenology of agrobiont linyphiid spiders in relation to temperature. Entomologia
Experimentalis et Applicata, 109:89–100.
Uetz, G.W. & J.D. Unzicker.1976. Pitfall Trapping in Ecological Studies of Wandering
Spiders. The Journal of Arachnology. 3:101-111.
Uetz, G.W., J. Halaj, A.B. Cady. 1999. Guild structure of spiders in major crops. The
Journal of Arachnology, 27:270–280.
Van Klink, R., C. Rickert, R. Vermeulen, O. Vorst, M.F. WallisDeVries, J.P. Bakker.
2013. Grazed vegetation mosaics do not maximize arthropod diversity: evidence
from salt marshes. Biological Conservation, 164:150–157.
Van Klink, R., F. van der Plas, C.G.E. van Noordwijk, M.F. WallisDeVries, H. Olffi.
2015. Effects of large herbivores on grassland arthropod diversity. Biological
Reviews 90:347–366. doi: 10.1111/brv.12113

125
Vélez, E., L. Chomenko, W. Schaffer, M. Madeira. 2009. Um panorama sobre as
iniciativas de conservação dos Campos Sulinos, Pp. 356-379. In Pillar, V.P.,
S.C. Müller, Z.M.S. Castilhos, A.V.A. Jacques. Campos sulinos: conservação e
uso sustentável da biodiversidade, 1° edition, Brasília: MMA.
Whitney, T.D., B.N. Philip, J.D. Hardwood. 2014. Tradoff in two winter-active wolf
spiders: Increased mortality for increased growth. Entomologia Experimentalis
et Applicata, 153:191–980.
Winck, B.R., E.L.S. Sá, V.M. Rigotti, M. Chauvat. Relationship between land-use types
and functional diversity of epigeic Collembola in Southern Brazil. Applied Soil
Ecology, 109:49–59.
Wise, D.H. 2006. Cannibalism, food limitation, intraspecific competition, and the
regulation of spider populations. Annual Review of Entomology, 51:441–65.
doi: 10.1146/annurev.ento.51.110104.150947.
Woodcock, B.A., R.F. Pywell, D.B. Roy, R.J. Rose, D. Bell. 2005. Grazing
management of calcareous grasslands and its implications for the conservation
of beetle communities. Biological Conservation 125: 193–202.
World Spider Catalog. 2017. World Spider Catalog. Version 17.5.Natural History
Museum Bern.Online at: http://www.wsc.nmbe.ch/.
SUPPLEMENTAL MATERIAL

126
Figura 12 – Pitfall traps used to collect ground spiders at APA do Ibirapuitã, used in May, September and
November of 2015 and February of 2016. A – PVC guide. B – Trap filled with formal 2%.
Figura 13 – Format used for exposal of pitfall traps in APA do Ibirapuitã during the campaign of 2015 and
2016. Red diamonds represent traps.

127
Figura 14 – Richness based rarefaction curves for spiders in grazed plots trough seasons of 2015 and 2016.
Adjacent lines indicates 95% confidence intervals.
Figura 15 – Richness based rarefaction curves for spiders in ungrazed plots trough seasons of 2015 and 2016.
Adjacent lines indicates 95% confidence intervals.

128
Figura 16 – Agyneta sp. 1 phenology curve. Each line demonstrate male or female abundance trough season in
grazed and ungrazed plots.
Figura 17 – Neohania sp. 1 phenology curve. Each line demonstrate male or female abundance trough season
in grazed and ungrazed plots.

129
Figura 18 – Erigone sp. 1 phenology curve. Each line demonstrate male or female abundance trough season in
grazed and ungrazed plots.
Figura 19 – Neohania sp. 2 phenology curve. Each line demonstrate male or female abundance trough season
in grazed and ungrazed plots.

130
Figura 20 – Agyneta sp. 2 phenology curve. Each line demonstrate male or female abundance trough season in
grazed and ungrazed plots.

131
Tabela 5 – Ground dweling spider species of Pampa biome, southern Brazil. Species listed here are from
Autumn (Aut, May), Winter (Win, Sep), Spring (Spr, Nov) of 2015 and Summer (Sum, Feb) of 2016. Taxa are
separate in families, genus and species. Numbers indicate the quantity of individuals, males and females.
Juveniles identified only at family level and totals, indicated as adult/juveniles.
Grazed Ungrazed
Taxa Aut Win Spr Sum Aut Win Spr Sum Total
Actinopodidae 0 0 0 0 0 0 0 0 1/0
Actinopus sp. 0 0 0 1 0 0 0 0 1
Amaurobiidae 1 0 0 0 0 0 0 0 0/1
Amphinectidae 0 0 0 1 1 7 3 1 29/13 Metaltella simoni Keyserling, 1878 0 2 2 2 1 13 6 3 29
Anyphaenidae 0 0 0 1 0 0 2 2 7/5 Arachosia sp. 0 0 0 1 0 2 2 0 5
Gen? sp. 1 0 0 0 0 0 0 0 2 2
Araneidae 1 4 0 4 3 9 8 2 1/31 Alpaida sp. 0 1 0 0 0 0 0 0 1
Corinnidae 0 1 2 1 5 2 0 1 26/12 Castianeira chrysura Mello-Leitão, 1943 1 1 6 1 0 1 2 0 12
Castianeira gaucha Mello-Leitão, 1943 0 0 0 0 9 2 1 2 14
Ctenidae 1 0 6 3 2 2 2 19 24/35 Asthenoctenus borellii Simon, 1897 0 0 0 0 0 0 2 3 5
Isoctenus minusculus (Keyserling, 1891) 3 0 0 0 5 0 0 0 8
Parabatinga brevipes (Keyserling, 1891) 1 2 0 0 1 5 0 2 11
Gnaphosidae 0 0 0 1 0 1 4 2 7/8 Apopyllus iheringi (Mello-Leitão, 1943) 0 0 2 0 0 0 0 0 2
Apopyllus sp. 0 0 0 1 0 0 0 0 1
Camillina pulchra (Keyserling, 1891) 0 0 2 0 0 0 1 0 3
Echemos sp. 1 0 0 0 0 0 0 0 1
Hahniidae 3 0 5 5 0 1 1 4 254/19 Gen? sp. 1 0 1 0 0 0 6 0 0 7
Neohania sp. 1 19 30 51 34 2 11 3 4 154
Neohania sp. 2 6 13 22 16 3 3 9 2 74
Neohania sp. 3 1 1 0 0 1 15 1 0 19
Idiopidae 0 0 0 0 1 0 0 0 1
Linyphiidae 27 45 20 3 23 13 17 6 522/154 Agyneta sp. 1 44 42 23 16 21 9 5 7 167 Agyneta sp. 2 19 10 5 8 0 14 6 2 64 Erigone sp. 1 26 28 26 10 0 3 1 0 94 Erigone sp. 2 0 1 0 3 0 0 0 0 4 Fissiscapus pusillus Millidge, 1991 0 0 1 0 0 0 0 0 1 Labicymbium sp. 1 0 3 0 0 0 1 0 0 4 Labicymbium sp. 2 3 1 2 0 0 2 0 2 10 Laminacauda sp. 2 0 0 0 0 0 0 1 0 1 Moyosi sp. 1 2 0 6 0 1 1 1 1 12 Moyosi sp. 2 1 0 0 0 0 0 0 0 1 Neomaso sp. 2 3 3 5 0 4 4 10 5 34 Neomaso sp. 4 0 1 1 0 0 9 12 5 28

132
Pseudotyphistes sp. 1 0 0 0 1 2 1 2 1 7 Pseudotyphistes sp. 2 0 0 0 0 0 0 1 0 1 Psilocymbium lineatum (Millidge, 1991) 6 6 0 3 0 1 2 0 18 Scolecura parilis Millidge, 1991 0 1 0 0 4 1 1 0 7 Sphecozone sp. 1 2 1 0 0 0 0 0 0 3 Sphecozone sp. 2 0 1 0 0 0 0 0 0 1 Tutaibo aff. phoeniceus 3 1 5 1 1 1 0 0 12 Tutaibo sp. 1 5 9 15 0 3 5 3 2 42 Tutaibo sp. 2 0 3 0 1 0 0 0 0 4 Tutaibo sp. 3 0 0 1 0 0 0 0 0 1 Vesicapalpus sp. 0 0 0 0 1 3 0 2 6
Lycosidae 30 24 43 48 18 19 29 16 78/227 Allocosa sp. 0 0 1 0 0 0 0 0 1 Birabenia sp. 1 0 0 2 0 2 0 3 0 7 Birabenia vittata (Mello-Leitão, 1945) 0 1 0 0 0 0 0 0 1 Hogna bivittata (Mello-Leitão, 1939) 0 2 0 0 0 0 0 0 2 Lobizon humilis (Mello-Leitão, 1944) 0 1 1 0 3 6 3 1 15 Lycosa erythrognatha Lucas, 1836 1 0 0 1 0 0 0 0 2 Lycosa sp. 1 1 0 0 0 0 0 0 0 1 Lycosa thorelli (Keyserling, 1877) 0 0 1 6 0 0 0 0 7 Gen? sp. 1 0 0 0 1 0 0 0 0 1
Gen? sp. 2 1 0 0 0 0 0 0 0 1
Gen? sp. 3 0 0 2 0 0 5 3 0 10
Navira naguan Piancentini & Grismado, 2009 0 0 2 0 0 0 0 0 2 Schizocosa malitiosa (Tullgren, 1905) 9 2 7 5 0 0 2 1 26 Trochosa sp. 0 0 0 2 0 0 0 0 2
Microstigmatidae 0 0 0 0 0 0 0 0 1/0
Xenomesia platensis Goloboff, 1989 0 0 0 0 0 1 0 0 1
Miturgidae 7 4 5 6 4 2 3 2 12/33 Teminius insularis (Lucas, 1857) 0 0 8 4 0 0 0 0 12
Mysmenidae 0 0 0 0 0 0 0 0 1/0
Mysmena sp. 0 0 0 0 1 0 0 0 1
Nesticidae 0 0 0 0 0 0 0 0 1/0
Nesticus sp. 0 0 0 0 0 1 0 0 1
Oonopidae 0 1 0 0 2 2 4 3 3/12 Neotrops aff. tucumanus 0 0 0 0 2 0 0 0 2
Opopaea concolor (Blackwall, 1859) 0 0 0 0 1 0 0 0 1
Oxyopidae 0 0 2 0 1 1 0 0 8/4 Oxyopes salticus Hentz, 1845 0 3 0 3 0 0 0 2 8
Palpimanidae 0 0 0 0 0 0 0 0 1/0
Otiothops birabeni Mello-Leitão, 1945 0 0 1 0 0 0 0 0 1
Philodromidae 0 0 1 0 0 0 0 0 0/1
Pholcidae 0 0 0 1 0 0 0 0 0/1
Phrurolithidae 0 0 0 0 0 0 3 0 5/3 Orthobula sp. 1 0 1 1 0 0 1 1
Salticidae 0 2 1 4 0 1 2 1 18/11

133
aff. Phiale sp. 0 0 1 0 0 0 0 0 1 Mopiopia sp. 0 0 0 1 0 0 0 0 1 Neonella montana Galiano, 1988 0 0 0 2 0 0 0 0 2 Gen? sp. 1 0 0 0 1 0 0 0 0 1 Gen? sp. 2 0 0 0 1 1 0 0 0 2 Gen? sp. 3 0 0 0 0 1 0 0 0 1 Gen? sp. 5 0 0 0 1 0 0 0 0 1 Gen? sp. 6 0 1 0 0 0 0 0 0 1 Gen? sp. 7 0 0 0 0 0 0 0 1 1 Sarinda nigra Peckham & Peckham, 1892 0 1 0 0 0 0 0 0 1 Semiopyla cataphracta Simon, 1901 0 0 0 1 0 0 5 0 6
Tengelidae 1 0 0 0 4 4 5 0 0/14
Tetragnathidae 1 0 0 0 4 4 5 0 41/14 Glenognatha lacteovittata (Mello-Leitão,
1944)
1 2 0 0 10 11 14 3 41
Theridiidae 7 5 2 8 26 22 9 8 111/87 Dipoena pumicata (Keyserling, 1886) 3 3 1 0 1 2 2 1 13 Episinus sp. 1 0 0 0 0 0 0 1 0 1 Episinus sp. 2 0 0 0 1 0 0 0 1 2 Euryopis camis Levi, 1963 2 5 0 1 0 0 0 0 8 Euryopis sp. 1 2 1 0 2 0 0 0 0 5 Euryopis sp. 2 0 0 0 0 0 1 1 0 2 Euryopis sp. 3 1 1 0 1 0 0 0 0 3 Euryopis spinifera (Mello-Leitão, 1944) 2 3 4 4 0 0 0 0 13 Guaraniella mahnerti Baert, 1984 9 4 7 3 10 6 3 5 47 Steatoda ancorata (Holmberg, 1876) 0 0 0 1 0 0 0 0 1 Styposis selis Levi 1964 1 1 0 0 0 3 1 1 7 Theridion sp. 0 1 0 0 0 1 0 0 2 Thymoites piratini Rodrigues & Brescovit,
2015
1 3 1 1 0 0 1 0
7
Thomisidae 0 0 0 0 1 1 2 1 3/5 Tmarus sp. 0 0 0 0 0 2 0 1 3
Trachelidae 0 0 1 0 0 0 0 1 8/2 Gen? sp. 1 1 0 0 0 0 2 0 0 3
Gen? sp. 2 0 1 0 0 4 0 0 0 5
Juveniles not identified 0 10 5 6 5 32 19 5 82
Total 261 294 308 235 195 277 112 137 1928

134
CONSIDERAÇÕES FINAIS
Contrariando nossas hipóteses, não houve diferença significativa entre as áreas
com pastejo e sem pastejo. As áreas de exclusão do gado, não demonstraram maior
riqueza e abundância de aranhas. Contudo, seria precoce afirmar que este resultado
permanecerá o mesmo dando-se continuidade à retirada do gado das áreas.
Muitos trabalhos afirmam que o pastoreio do gado, se mantido de maneira
moderada, aumenta a complexidade vegetal e consequentemente, a complexidade da
fauna, devido à estrita ligação desta com a vegetação. Contudo, foi empiricamente
observado que as áreas fechadas também apresentam alta complexidade de vegetação,
com arbustos e gramíneas que se diferenciam, principalmente em relação à altura, das
áreas com pastejo. Desta forma, o argumento da complexidade vegetal também haveria
de ser usado para a remoção total ou parcial do pastejo. Infelizmente, dados de
diversidade e abundancia da flora não foram levantados para que corrobora-se com os
dados apresentados neste trabalho.
Ressaltamos que as áreas sem pastejo são pequenas (1 ha), em pouco número
(apenas três), distantes uma da outra e cercadas por vastos campos pastejados. Assim, as
áreas de exclusão, mesmo se mantidas desta forma, provavelmente, nunca serão
estritamente diferentes das áreas sem exclusão. Mesmo levando em consideração a Size-
Grain Hypotheses citada nos artigos, com a rugosidade da vegetação aumentada, o
efeito de borda sempre estará presente, permitindo espécies das áreas pastejadas
permanecerem com certa abundancia nas áreas sem pastejo. A dispersão
(emigração/imigração), própria de cada grupo taxômico ou espécie, sempre influenciara
na abundancia destes organismos.
A exclusão do gado ainda é recente, ocorrendo a partir de Agosto de 2012.
Tendo apenas pouco menos de quatro anos de exclusão, o ambiente ainda em

135
modificação e auto-regeneração. Portanto, consideramos que os estudos sobre a
exclusão do pastejo ainda devem ser aprimorados, com levantamentos anuais da fauna,
além da expansão das áreas sem pastejo, aumentando as que já existem e adicionando
novas áreas a pesquisa. Ademais, uma meta-análises envolvendo a fauna e a flora se faz
urgente. Sem isto, uma visão geral e mais acurada sobre ausência do gado no Pampa
não é possível.

136
ANEXO
Figura 21 – Localização da APA do Ibirapuitã no Rio Grande do Sul, Brasil. APA localizada nos municípios
de Alegrete, Quaraí, Rosário do Sul e Sant’Ana do Livramento. Autor: Comitê Ibicuí.
Tabela 6 – Aranhas de solo coletadas no experimento realizado em novembro de 2011 na APA do Ibirapuitã,
Bioma Pampa, RS, Brasil. Taxa indica famílias de aranhas. Cada família contém espécies, morfoespécies e
jovens respectivos. Números em jovens indicam indivíduos, em espécies e morfoespécies indicam indivíduos
adultos, machos e fêmeas. C1: Com Pastejo da Estância do Açude; C2: Com Pastejo da Fazenda Rincão dos
Moraes; C3: Com Pastejo da Fazenda Bela Vista. T1: Sem Pastejo da Estância do Açude; T2: Sem Pastejo da
Fazenda Rincão dos Moraes; T3: Sem Pastejo da Fazenda Bela Vista.
Taxa C1 C2 C3 T1 T2 T3 Total
Amphinectidae
Metaltella simoni Keyserling, 1878 1 2 0 0 1 0 4
Jovem 2 1 0 0 1 0 4
Araneidae
Jovem 0 0 0 1 0 0 1
Caponiidae
Caponina notabilis (Mello-Leitão, 1939) 0 0 1 0 0 0 1
Jovem 0 1 0 0 0 0 1
Corinnidae
Castianeira sp. 1 1 0 0 0 0 0 1
Castianeira sp. 2 0 0 2 0 0 2 4
Jovem 0 2 1 0 0 1 4
Ctenidae
Jovem 2 0 0 0 0 1 3
Gnaphosidae
Camillina galianoae Platnick & Murphy,
1987
0 1 0 0 0 0 1
Camillina sp. 1 0 0 1 0 0 2
Eilica aff. trilineata 0 0 0 0 1 0 1
Gen? sp. 1 1 0 0 0 0 0 1
Jovem 0 0 0 1 1 0 2
Hahniidae
Neohania sp. 1 20 6 11 22 10 13 82
Neohania sp. 2 19 6 7 10 11 6 59

137
Jovem 3 0 1 3 0 2 9
Linyphiidae
Agyneta sp. 2 3 2 0 4 1 1 11
Erigone sp. 1 7 2 0 1 0 0 10
Moyosi sp. 1 0 2 1 0 0 1 4
Neomaso sp. 2 2 0 0 1 0 0 3
Neomaso sp. 3 0 0 0 0 0 1 1
Psilocymbium lineatum (Millidge, 1991) 1 0 0 0 0 0 1
Sphecozone sp. 2 1 0 0 1 0 0 2
Tutaibo aff. phoeniceus 0 1 0 1 0 0 2
Tutaibo sp. 1 1 1 1 1 0 2 6
Tutaibo sp. 2 1 1 0 0 0 0 2
Jovem 4 2 1 6 0 0 13
Lycosidae
Gen? sp. 2 0 0 1 0 0 1 2
Hogna bivittata (Mello-Leitão, 1939) 1 2 0 2 0 0 5
Lycosa erythrognatha Lucas, 1836 0 1 1 0 0 0 2
Schizocosa malitiosa (Tullgren, 1905) 0 1 1 0 0 3 5
Jovem 13 71 4 2 5 2 97
Miturgidae
Teminius insularis (Lucas, 1857) 1 0 0 1 0 0 2
Jovem 1 1 0 0 0 1 3
Oonopidae
Neotrops aff. tucumanus 0 1 1 0 0 0 2
Oxyopidae
Oxyopes salticus Hentz, 1845 0 1 0 0 0 0 1
Pholcidae
Jovem 0 0 0 0 0 1 1
Phrurolithidae
Orthobula sp. 0 0 0 0 1 1 2
Salticidae
Neonella minuta Galiano, 1965 0 1 0 0 0 0 1
Gen? sp. 4 0 0 0 1 0 0 1
Gen? sp. 8 0 0 0 1 0 0 1
Semiopyla cataphracta Simon, 1901 2 0 0 0 0 1 3
Jovem 1 0 0 0 0 0 1
Theraphosidae
Gen? sp. 1 0 0 0 0 0 1 1
Jovem 2 0 0 0 0 0 2
Theridiidae
Euryopis camis Levi, 1963 0 0 0 0 1 0 1
Euryopis sp. 4 3 0 0 0 0 0 3
Euryopis spinifera (Mello-Leitão, 1944) 0 1 0 0 0 0 1
Guaraniella mahnerti Baert, 1984 8 1 0 3 2 0 14
Thymoites piratini Rodrigues & Brescovit,
2015
0 0 0 0 0 1 1

138
Jovem 1 1 0 0 1 0 3
Thomisidae
Gen? sp. 1 0 0 0 1 0 0 1
Jovem 0 0 1 0 0 0 1
Jovens não determinados 1 0 0 3 1 0 5
Total 104 112 35 67 37 42 397
Tabela 7 – Aranhas de solo coletadas no experimento realizado em novembro de 2012 na APA do Ibirapuitã,
Bioma Pampa, RS, Brasil. Taxa indica famílias de aranhas. Cada família contém espécies, morfoespécies e
jovens respectivos. Números em jovens indicam indivíduos, em espécies e morfoespécies indicam indivíduos
adultos, machos e fêmeas. C1: Com Pastejo da Estância do Açude; C2: Com Pastejo da Fazenda Rincão dos
Moraes; C3: Com Pastejo da Fazenda Bela Vista. T1: Sem Pastejo da Estância do Açude; T2: Sem Pastejo da
Fazenda Rincão dos Moraes; T3: Sem Pastejo da Fazenda Bela Vista.
Taxa C1 C2 C3 T1 T2 T3 Total
Amphinectidae
Metaltella simoni Keyserling, 1878 4 0 0 2 0 0 6
Jovem 6 2 0 2 0 0 10
Anyphaenidae
Arachosia sp. 0 0 0 1 0 0 1
Araneidae
Jovem 0 0 0 3 1 0 4
Corinnidae
Castianeira chrysura Mello-Leitão, 1943 0 1 0 0 1 0 2
Castianeira gaucha Mello-Leitão, 1943 0 0 1 0 0 0 1
Castianeira sp. 2 0 0 1 0 0 6 7
Mazax sp. 0 0 0 1 0 1 2
Jovem 0 1 0 6 0 2 9
Ctenidae
Jovem 0 0 0 3 0 0 3
Gnaphosidae
Apopyllus sp. 0 0 0 0 0 2 2
Camillina galianoae Platnick & Murphy,
1987
0 0 0 1 0 0 1
Camillina pulchra (Keyserling, 1891) 2 1 0 1 0 0 4
Camillina sp. 0 0 1 0 0 0 1
Eilica aff. trilineata 0 0 0 0 1 0 1
Eilica trilineata (Mello-Leitão, 1941) 0 1 0 0 0 0 1
Gen? sp. 1 0 0 1 3 0 1 5
Jovem 0 1 1 1 0 0 3
Hahniidae
Neohania sp. 1 4 0 4 9 7 9 33
Neohania sp. 2 1 9 4 16 20 13 63
Gen? sp. 1 0 0 1 0 0 0 1
Jovem 1 1 0 0 2 0 4
Linyphiidae
Agyneta sp. 1 0 0 0 0 1 0 1
Agyneta sp. 2 0 0 0 2 5 1 8

139
Erigone sp. 1 0 2 0 1 0 0 3
Moyosi sp. 1 1 0 0 0 0 0 1
Neomaso sp. 2 1 0 0 1 0 0 2
Tutaibo aff. phoeniceus 0 1 0 1 0 0 2
Tutaibo sp. 1 0 0 0 4 0 0 4
Jovem 1 0 1 5 1 2 10
Lycosidae
Birabenia sp. 1 1 1 0 4 0 0 6
Birabenia vittata (Mello-Leitão, 1945) 0 0 0 0 1 0 1
Gen? sp. 1 1 0 0 0 0 0 1
Gen? sp. 2 0 1 0 1 0 0 2
Hogna bivittata (Mello-Leitão, 1939) 1 1 1 0 0 0 3
Lobizon humilis (Mello-Leitão, 1944) 0 0 0 1 0 0 1
Lycosa erythrognatha Lucas, 1836 0 0 0 0 2 0 2
Lycosa thorelli (Keyserling, 1877) 2 0 0 0 3 0 5
Navira naguan Piancentini & Grismado,
2009
1 0 0 0 0 0 1
Schizocosa malitiosa (Tullgren, 1905) 4 5 6 0 4 3 22
Trochosa sp. 0 0 0 1 0 0 1
Jovem 72 14 7 18 8 14 133
Ooteca 0 0 1 0 0 0 1
Miturgidae
Teminius insularis (Lucas, 1857) 0 1 0 0 0 0 1
Jovem 0 0 2 2 0 2 6
Nemesiidae
Pycnothele sp. 3 1 0 2 0 0 6
Oonopidae
Neotrops aff. tucumanus 0 0 2 0 0 1 3
Jovem 0 0 0 1 0 1 2
Philodromidae
Jovem 0 0 0 1 0 0 1
Phrurolithidae
Orthobula sp. 1 0 1 0 0 1 3
Salticidae
Gen? sp. 3 0 0 0 0 0 1 1
Neonella minuta Galiano, 1965 1 0 0 0 0 0 1
Neonella montana Galiano, 1988 0 0 0 1 0 0 1
Semiopyla cataphracta Simon, 1901 0 0 0 1 0 0 1
Jovem 0 0 0 1 3 2 6
Sparassidae
Jovem 0 1 0 0 0 0 1
Tengelidae
Jovem 5 0 1 0 0 0 6
Theridiidae
Episinus sp. 1 0 0 1 0 0 0 1
Euryopis camis Levi, 1963 0 1 0 0 1 0 2

140
Euryopis sp. 3 0 0 0 1 0 0 1
Euryopis sp. 4 1 0 0 1 0 0 2
Euryopis spinifera (Mello-Leitão, 1944) 2 1 0 1 0 0 4
Guaraniella mahnerti Baert, 1984 5 2 0 9 0 3 19
Styposis selis Levi 1964 0 0 0 1 0 0 1
Thymoites piratini Rodrigues &
Brescovit, 2015
0 0 0 0 1 0 1
Jovem 1 0 1 3 0 3 8
Thomisidae
Gen? sp. 2 1 0 0 1 0 0 2
Jovem 1 2 0 0 0 1 4
Jovens não determinados 1 0 0 0 0 0 1
Total 125 51 38 114 62 69 459
Tabela 8 – Aranhas de solo coletadas no experimento realizado em novembro de 2013 na APA do Ibirapuitã,
Bioma Pampa, RS, Brasil. Taxa indica famílias de aranhas. Cada família contém espécies, morfoespécies e
jovens respectivos. Números em jovens indicam indivíduos, em espécies e morfoespécies indicam indivíduos
adultos, machos e fêmeas. C1: Com Pastejo da Estância do Açude; C2: Com Pastejo da Fazenda Rincão dos
Moraes; C3: Com Pastejo da Fazenda Bela Vista. T1: Sem Pastejo da Estância do Açude; T2: Sem Pastejo da
Fazenda Rincão dos Moraes; T3: Sem Pastejo da Fazenda Bela Vista.
Taxa C1 C2 C3 T1 T2 T3 Total
Amphinectidae
Metaltella simoni Keyserling, 1878 0 1 0 2 3 0 6
Jovem 0 0 0 2 0 0 2
Anyphaenidae
Arachosia sp. 0 0 0 0 0 1 1
Araneidae
Argiope argentata (Fabricius, 1775) 0 0 0 0 2 0 2
Jovem 3 0 0 0 3 4 10
Corinnidae
Jovem 0 0 0 0 1 0 1
Ctenidae
Parabatinga brevipes (Keyserling, 1891) 0 0 0 1 0 0 1
Jovem 0 1 0 0 0 0 1
Gnaphosidae
Camillina galianoae Platnick & Murphy,
1987
0 0 0 3 0 0 3
Eilica cf. obscura 0 0 1 0 0 0 1
Neodrassex ibirapuita Ott, 2013 0 0 0 0 0 1 1
Jovem 0 0 0 1 0 1 2
Hahniidae
Neohania sp. 1 39 4 8 4 8 8 71
Neohania sp. 2 8 4 5 4 4 8 33
Jovem 2 0 0 0 1 1 4
Linyphiidae
Agyneta sp. 1 0 0 0 0 0 2 2
Agyneta sp. 2 0 1 4 2 3 6 16

141
Erigone sp. 1 5 2 2 0 3 0 12
Laminacauda sp. 1 0 0 1 0 0 0 1
Moyosi sp. 1 0 0 1 1 1 1 4
Neomaso sp. 2 1 1 0 1 1 2 6
Neomaso sp. 3 1 0 0 0 0 1 2
Pseudotyphistes sp. 2 1 0 0 0 0 0 1
Tutaibo sp. 1 0 0 0 0 2 1 3
Tutaibo sp. 3 1 0 0 0 0 0 1
Jovem 3 0 1 1 0 4 9
Lycosidae
Agalenocosa sp. 0 0 0 0 0 1 1
Allocosa sp. 0 0 0 1 0 0 1
Birabenia sp. 1 0 1 0 11 1 2 15
Birabenia vittata (Mello-Leitão, 1945) 0 0 0 0 1 0 1
Gen? sp. 2 3 0 0 1 3 0 7
Hogna bivittata (Mello-Leitão, 1939) 0 0 0 0 1 0 1
Lobizon humilis (Mello-Leitão, 1944) 0 0 0 3 1 0 4
Lycosa erythrognatha Lucas, 1836 0 0 3 0 0 0 3
Lycosa thorelli (Keyserling, 1877) 6 3 0 0 1 0 10
Navira naguan Piancentini & Grismado,
2009
0 1 0 1 0 0 2
Schizocosa malitiosa (Tullgren, 1905) 0 1 2 0 0 0 3
Trochosa sp. 0 0 0 1 0 0 1
Jovem 10 11 46 18 8 1 94
Microstigmatidae
Jovem 0 1 0 0 0 0 1
Miturgidae
Teminius insularis (Lucas, 1857) 2 2 0 0 2 0 6
Jovem 0 0 0 0 1 1 2
Oonopidae
Neotrops aff. tucumanus 0 0 0 0 0 1 1
Oxyopidae
Jovem 1 0 1 0 0 0 2
Phrurolithidae
Orthobula sp. 0 1 0 3 0 3 7
Jovem 0 0 0 6 3 2 11
Salticidae
aff. Phiale sp. 0 0 0 0 1 0 1
Gen? sp. 1 0 0 0 1 0 0 1
Neonella minuta Galiano, 1965 0 1 0 1 0 0 2
Neonella montana Galiano, 1988 0 1 0 0 0 0 1
Semiopyla cataphracta Simon, 1901 0 0 0 5 5 1 11
Jovem 0 0 0 6 6 8 20
Tetragnathidae
Glenognatha lacteovittata (Mello-Leitão,
1944)
0 0 0 1 1 5 7

142
Jovem 0 0 0 1 1 0 2
Theridiidae
Euryopis camis Levi, 1963 0 1 0 0 0 0 1
Euryopis sp. 4 4 0 0 0 0 0 4
Euryopis spinifera (Mello-Leitão, 1944) 4 0 0 0 0 0 4
Guaraniella mahnerti Baert, 1984 5 0 1 5 0 1 12
Styposis selis Levi 1964 0 0 0 1 3 0 4
Jovem 0 2 0 2 3 0 7
Thomisidae
Gen? sp. 3 2 1 0 0 1 0 4
Jovem 1 0 0 0 1 2 4
Trachelidae
Meriola sp. 0 0 0 0 0 1 1
Gen? sp. 1 0 0 0 1 0 0 1
Jovens não determinados 1 0 0 1 1 0 3
Total 103 41 76 92 77 70 459
Tabela 9 – Aranhas de solo coletadas no experimento realizado em maio de 2015 na APA do Ibirapuitã, Bioma
Pampa, RS, Brasil. Taxa indica famílias de aranhas. Cada família contém espécies, morfoespécies e jovens
respectivos. Números em jovens indicam indivíduos, em espécies e morfoespécies indicam indivíduos adultos,
machos e fêmeas. C1: Com Pastejo da Estância do Açude; C2: Com Pastejo da Fazenda Rincão dos Moraes;
C3: Com Pastejo da Fazenda Bela Vista. T1: Sem Pastejo da Estância do Açude; T2: Sem Pastejo da Fazenda
Rincão dos Moraes; T3: Sem Pastejo da Fazenda Bela Vista.
Taxa C1 C2 C3 T1 T2 T3 Total
Amaurobiidae
Jovem 1 0 0 0 0 0 1
Amphinectidae
Metaltella simoni Keyserling, 1878 0 0 0 0 0 1 1
Jovem 0 0 0 0 1 0 1
Araneidae
Jovem 0 0 1 0 1 2 4
Corinnidae
Castianeira chrysura Mello-Leitão, 1943 0 0 1 0 0 0 1
Castianeira gaucha Mello-Leitão, 1943 0 0 0 0 0 9 9
Jovem 0 0 0 1 0 4 5
Ctenidae
Isoctenus minusculus (Keyserling, 1891) 1 2 0 1 0 4 8
Parabatinga brevipes (Keyserling, 1891) 0 1 0 0 1 0 2
Jovem 1 0 0 0 1 1 3
Gnaphosidae
Echemos sp. 0 0 1 0 0 0 1
Hahniidae
Neohania sp. 1 5 3 11 0 1 1 21
Neohania sp. 2 4 0 2 1 2 0 9
Neohania sp. 3 0 1 0 0 1 0 2
Jovem 0 1 2 0 0 0 3

143
Idiopidae
Jovem 0 0 0 1 0 0 1
Linyphiidae
Agyneta sp. 1 8 11 25 7 7 7 65
Agyneta sp. 2 8 5 6 0 0 0 19
Erigone sp. 1 7 12 7 0 0 0 26
Labicymbium sp. 2 0 3 0 0 0 0 3
Moyosi sp. 1 0 0 2 0 1 0 3
Moyosi sp. 2 0 1 0 0 0 0 1
Neomaso sp. 2 1 1 1 1 2 1 7
Pseudotyphistes sp. 1 0 0 0 0 1 1 2
Psilocymbium lineatum (Millidge, 1991) 0 1 5 0 0 0 6
Scolecura parilis Millidge, 1991 0 0 0 1 3 0 4
Sphecozone sp. 1 2 0 0 0 0 0 2
Tutaibo aff. phoeniceus 0 3 0 0 0 1 4
Tutaibo sp. 1 0 2 3 2 0 1 8
Vesicapalpus sp. 0 0 0 0 1 0 1
Jovem 2 13 12 9 9 5 50
Lycosidae
Birabenia sp. 1 0 0 0 0 0 2 2
Gen? sp. 2 0 1 0 0 0 0 1
Lobizon humilis (Mello-Leitão, 1944) 0 0 0 0 1 2 3
Lycosa erythrognatha Lucas, 1836 0 1 0 0 0 0 1
Lycosa sp.1 0 0 1 0 0 0 1
Schizocosa malitiosa (Tullgren, 1905) 2 4 3 0 0 0 9
Jovem 5 2 23 12 3 3 48
Miturgidae
Jovem 1 3 3 2 1 1 11
Mysmenidae
Mysmena sp. 0 0 0 1 0 0 1
Oonopidae
Neotrops aff. tucumanus 0 0 0 1 0 1 2
Opopaea concolor (Blackwall, 1859) 0 0 0 0 1 0 1
Oonopidae_jovem 0 0 0 1 0 1 2
Oxyopidae
Jovem 0 0 0 0 1 0 1
Phrurolithidae
Orthobula sp. 0 1 0 0 0 0 1
Salticidae
Gen? sp. 2 0 0 0 1 0 0 1
Gen? sp. 3 0 0 0 0 1 0 1
Tengelidae
Jovem 0 0 0 1 0 0 1
Tetragnathidae
Glenognatha lacteovittata (Mello-Leitão,
1944)
0 1 0 4 1 5 11

144
Jovem 0 1 0 2 0 2 5
Theridiidae
Dipoena pumicata (Keyserling, 1886) 1 1 1 0 0 1 4
Euryopis camis Levi, 1963 2 0 0 0 0 0 2
Euryopis sp. 1 1 1 0 0 0 0 2
Euryopis sp. 4 1 0 0 0 0 0 1
Euryopis spinifera (Mello-Leitão, 1944) 2 0 0 0 0 0 2
Guaraniella mahnerti Baert, 1984 4 4 1 5 2 3 19
Styposis selis Levi 1964 1 0 0 0 0 0 1
Thymoites piratini Rodrigues & Brescovit,
2015
0 1 0 0 0 0 1
Jovem 0 7 0 7 10 9 33
Thomisidae
Jovem 0 0 0 1 0 0 1
Trachelidae
Gen? sp. 1 1 0 0 0 0 0 1
Gen? sp. 2 0 0 0 1 1 2 4
Jovens não determinados 0 0 0 2 2 1 5
Total 61 88 111 65 56 71 452
Tabela 10 – Aranhas de solo coletadas no experimento realizado em setembro de 2015 na APA do Ibirapuitã,
Bioma Pampa, RS, Brasil. Taxa indica famílias de aranhas. Cada família contém espécies, morfoespécies e
jovens respectivos. Números em jovens indicam indivíduos, em espécies e morfoespécies indicam indivíduos
adultos, machos e fêmeas. C1: Com Pastejo da Estância do Açude; C2: Com Pastejo da Fazenda Rincão dos
Moraes; C3: Com Pastejo da Fazenda Bela Vista. T1: Sem Pastejo da Estância do Açude; T2: Sem Pastejo da
Fazenda Rincão dos Moraes; T3: Sem Pastejo da Fazenda Bela Vista.
Taxa C1 C2 C3 T1 T2 T3 Total
Amphinectidae
Metaltella simoni Keyserling, 1878 2 0 0 3 8 2 15
Jovem 0 0 0 1 3 3 7
Anyphaenidae
Arachosia sp. 0 0 0 0 2 0 2
Araneidae
Alpaida sp. 0 0 1 0 0 0 1
Jovem 0 2 2 2 3 4 13
Corinnidae
Castianeira chrysura Mello-Leitão, 1943 0 1 0 1 0 0 2
Castianeira gaucha Mello-Leitão, 1943 0 0 0 0 2 0 2
Jovem 1 0 0 0 2 0 3
Ctenidae
Parabatinga_brevipes (Keyserling, 1891) 1 1 0 1 2 2 7
Jovem 0 0 0 1 1 0 2
Gnaphosidae
Jovem 0 0 0 0 1 0 1
Hahniidae
Gen? sp. 1 1 0 0 4 1 1 7
Neohania sp. 1 2 12 16 1 3 7 41

145
Neohania sp. 2 5 2 6 0 1 2 16
Neohania sp. 3 0 1 0 6 9 0 16
Jovem 0 0 0 0 0 1 1
Linyphiidae
Agyneta sp. 1 3 18 21 2 4 3 51
Agyneta sp. 2 3 5 2 4 5 5 24
Erigone sp. 1 8 12 8 0 1 2 31
Erigone sp. 2 0 1 0 0 0 0 1
Labicymbium sp. 1 1 2 0 0 1 0 4
Labicymbium sp. 2 0 0 1 1 1 0 3
Moyosi sp. 1 0 0 0 0 1 0 1
Neomaso sp. 2 2 1 0 0 1 3 7
Neomaso sp. 4 1 0 0 2 3 4 10
Pseudotyphistes sp. 1 0 0 0 0 1 0 1
Psilocymbium lineatum (Millidge, 1991) 1 1 4 0 0 1 7
Scolecura parilis Millidge, 1991 0 1 0 0 1 0 2
Sphecozone sp. 1 1 0 0 0 0 0 1
Sphecozone sp. 2 0 0 1 0 0 0 1
Tutaibo aff. phoeniceus 0 1 0 0 0 1 2
Tutaibo sp. 1 1 4 4 2 2 1 14
Tutaibo sp. 2 2 1 0 0 0 0 3
Vesicapalpus sp. 0 0 0 0 1 2 3
Jovem 10 22 13 1 11 1 58
Lycosidae
Birabenia vittata (Mello-Leitão, 1945) 1 0 0 0 0 0 1
Gen? sp. 3 0 0 0 0 5 0 5
Hogna bivittata (Mello-Leitão, 1939) 0 1 1 0 0 0 2
Lobizon humilis (Mello-Leitão, 1944) 0 0 1 2 3 1 7
Schizocosa malitiosa (Tullgren, 1905) 1 0 1 0 0 0 2
Jovem 5 5 14 3 7 9 43
Microstigmatidae
Xenomesia platensis Goloboff, 1989 0 0 0 1 0 0 1
Miturgidae
Jovem 0 1 3 2 0 0 6
Nesticidae
Nesticus sp. 0 0 0 0 1 0 1
Oonopidae
Jovem 0 1 0 1 0 1 3
Oxyopidae
Oxyopes salticus Hentz, 1845 2 0 1 0 0 0 3
Jovem 0 0 0 1 0 0 1
Salticidae
Gen? sp. 6 0 1 0 0 0 0 1
Sarinda nigra Peckham & Peckham, 1892 1 0 0 0 0 0 1
Jovem 2 0 0 0 0 1 3
Tetragnathidae

146
Glenognatha lacteovittata (Mello-Leitão,
1944)
0 1 1 5 5 1 13
Jovem 0 0 0 1 1 2 4
Theraphosidae
Jovem 0 0 0 0 1 0 1
Theridiidae
Dipoena pumicata (Keyserling, 1886) 0 2 1 0 2 0 5
Euryopis camis Levi, 1963 5 0 0 0 0 0 5
Euryopis sp. 1 0 1 0 0 0 0 1
Euryopis sp. 3 0 0 0 0 0 1 1
Euryopis sp. 4 1 0 0 0 0 0 1
Euryopis spinifera (Mello-Leitão, 1944) 1 2 0 0 0 0 3
Guaraniella mahnerti Baert, 1984 2 0 2 1 1 4 10
Styposis selis Levi 1964 1 0 0 2 1 0 4
Theridion sp. 0 0 1 0 0 1 2
Thymoites piratini Rodrigues & Brescovit,
2015
0 1 2 0 0 0 3
Jovem 1 3 1 1 12 9 27
Thomisidae
Tmarus sp. 0 0 0 0 0 2 2
Jovem 0 0 0 0 1 0 1
Trachelidae
Gen? sp. 1 0 0 0 0 0 2 2
Gen? sp. 2 0 0 1 0 0 0 1
Jovens não determinados 1 9 0 7 12 13 42
Total 69 116 109 59 123 92 568
Tabela 11 – Aranhas de solo coletadas no experimento realizado em novembro de 2015 na APA do Ibirapuitã,
Bioma Pampa, RS, Brasil. Taxa indica famílias de aranhas. Cada família contém espécies, morfoespécies e
jovens respectivos. Números em jovens indicam indivíduos, em espécies e morfoespécies indicam indivíduos
adultos, machos e fêmeas. C1: Com Pastejo da Estância do Açude; C2: Com Pastejo da Fazenda Rincão dos
Moraes; C3: Com Pastejo da Fazenda Bela Vista. T1: Sem Pastejo da Estância do Açude; T2: Sem Pastejo da
Fazenda Rincão dos Moraes; T3: Sem Pastejo da Fazenda Bela Vista.
Taxa C1 C2 C3 T1 T2 T3 Total
Amphinectidae
Metaltella simoni Keyserling, 1878 1 1 0 0 6 0 8
Jovem 0 0 0 0 1 2 3
Anyphaenidae
Arachosia sp. 0 0 0 1 1 0 2
Jovem 0 0 0 0 2 0 2
Araneidae
Jovem 0 0 0 0 2 6 8
Corinnidae
Castianeira chrysura Mello-Leitão, 1943 0 3 3 1 0 1 8
Castianeira gaucha Mello-Leitão, 1943 0 0 0 0 0 1 1
Jovem 0 2 0 0 0 0 2
Ctenidae

147
Asthenoctenus borellii Simon, 1897 0 0 0 2 0 0 2
Jovem 3 3 0 1 0 1 8
Gnaphosidae
Apopyllus cf. iheringi (Mello-Leitão, 1943) 1 1 0 0 0 0 2
Camillina pulchra (Keyserling, 1891) 0 2 0 0 1 0 3
Jovem 0 0 0 2 0 2 4
Hahniidae
Neohania sp. 1 14 10 27 0 0 3 54
Neohania sp. 2 7 3 12 2 7 0 31
Neohania sp. 3 0 0 0 1 0 0 1
Jovem 1 0 4 0 0 1 6
Linyphiidae
Agyneta sp. 1 4 3 16 1 0 4 28
Agyneta sp. 2 1 1 3 6 0 0 11
Erigone sp. 1 7 9 10 0 1 0 27
Fissiscapus pusillus Millidge, 1991 1 0 0 0 0 0 1
Labicymbium sp. 2 1 1 0 0 0 0 2
Laminacauda sp. 2 0 0 0 0 1 0 1
Moyosi sp. 1 2 0 4 0 1 0 7
Neomaso sp. 2 2 2 1 7 0 3 15
Neomaso sp. 4 1 0 0 3 1 8 13
Pseudotyphistes sp. 1 0 0 0 0 1 1 2
Pseudotyphistes sp. 2 0 0 0 0 0 1 1
Psilocymbium lineatum (Millidge, 1991) 0 0 0 2 0 0 2
Scolecura parilis Millidge, 1991 0 0 0 0 1 0 1
Tutaibo aff. phoeniceus 0 2 3 0 0 0 5
Tutaibo sp. 1 3 1 11 0 2 1 18
Tutaibo sp. 3 0 1 0 0 0 0 1
Jovem 5 7 8 1 9 7 37
Lycosidae
Allocosa sp. 0 1 0 0 0 0 1
Birabenia sp. 1 2 0 0 0 0 3 5
Gen? sp. 3 0 2 0 1 2 0 5
Lobizon humilis (Mello-Leitão, 1944) 1 0 0 0 1 2 4
Lycosa thorelli (Keyserling, 1877) 1 0 0 0 0 0 1
Navira naguan Piancentini & Grismado,
2009
1 1 0 0 0 0 2
Schizocosa malitiosa (Tullgren, 1905) 3 1 3 1 1 0 9
Jovem 10 12 21 4 22 3 72
Miturgidae
Teminius insularis (Lucas, 1857) 4 3 1 0 0 0 8
Jovem 2 1 2 2 1 0 8
Oonopidae
Jovem 0 0 0 0 3 1 4
Oxyopidae

148
Jovem 0 1 1 0 0 0 2
Palpimanidae
Otiothops birabeni Mello-Leitão, 1945 1 0 0 0 0 0 1
Philodromidae
Jovem 1 0 0 0 0 0 1
Phrurolithidae
Orthobula sp. 1 0 0 1 0 0 2
Jovem 0 0 0 2 1 0 3
Salticidae
aff. Phiale sp. 1 0 0 0 0 0 1
Jovem 1 0 0 0 0 2 3
Semiopyla cataphracta Simon, 1901 0 0 0 0 3 2 5
Tetragnathidae
Glenognatha lacteovittata (Mello-Leitão,
1944)
0 0 0 5 1 8 14
Jovem 0 0 0 3 0 2 5
Theraphosidae
Jovem 0 0 0 0 0 1 1
Theridiidae
Dipoena pumicata (Keyserling, 1886) 0 0 1 0 1 1 3
Episinus sp. 1 0 0 0 0 0 1 1
Euryopis sp. 3 0 0 0 0 1 0 1
Euryopis spinifera (Mello-Leitão, 1944) 3 1 0 0 0 0 4
Guaraniella mahnerti Baert, 1984 3 1 3 0 2 1 10
Styposis selis Levi 1964 0 0 0 1 0 0 1
Thymoites piratini Rodrigues & Brescovit,
2015
0 0 1 0 0 1 2
Jovem 1 0 1 2 3 4 11
Thomisidae
Jovem 0 0 0 0 0 2 2
Trachelidae
Jovem 1 0 0 0 0 0 1
Jovens não determinados 1 2 2 3 9 7 24
Total 92 78 138 55 88 83 534

149
Tabela 12 – Aranhas de solo coletadas no experimento realizado em fevereiro de 2016 na APA do Ibirapuitã,
Bioma Pampa, RS, Brasil. Taxa indica famílias de aranhas. Cada família contém espécies, morfoespécies e
jovens respectivos. Números em jovens indicam indivíduos, em espécies e morfoespécies indicam indivíduos
adultos, machos e fêmeas. C1: Com Pastejo da Estância do Açude; C2: Com Pastejo da Fazenda Rincão dos
Moraes; C3: Com Pastejo da Fazenda Bela Vista. T1: Sem Pastejo da Estância do Açude; T2: Sem Pastejo da
Fazenda Rincão dos Moraes; T3: Sem Pastejo da Fazenda Bela Vista.
Taxa C1 C2 C3 T1 T2 T3 Total
Actinopodidae
Actinopus sp. 0 1 0 0 0 0 1
Amphinectidae
Metaltella simoni Keyserling, 1878 0 2 0 1 2 0 5
Jovem 0 1 0 0 1 0 2
Anyphaenidae
Arachosia sp. 1 0 0 0 0 0 1
Gen? sp. 1 0 0 0 0 0 2 2
Jovem 1 0 0 1 1 0 3
Araneidae
Jovem 2 2 0 2 0 0 6
Corinnidae
Castianeira chrysura Mello-Leitão, 1943 0 1 0 0 0 0 1
Castianeira gaucha Mello-Leitão, 1943 0 0 0 0 1 1 2
Jovem 0 1 0 1 0 0 2
Ctenidae
Asthenoctenus borellii Simon, 1897 0 0 0 0 2 1 3
Parabatinga brevipes (Keyserling, 1891) 0 0 0 0 2 0 2
Jovem 1 1 1 6 8 5 22
Gnaphosidae
Apopyllus sp. 0 1 0 0 0 0 1
Jovem 0 0 1 1 0 1 3
Hahniidae
Neohania sp. 1 13 11 10 3 1 0 38
Neohania sp. 2 6 1 9 0 2 0 18
Jovem 0 2 3 3 0 1 9
Linyphiidae
Agyneta sp. 1 1 7 8 4 1 2 23
Agyneta sp. 2 5 3 0 1 1 0 10
Erigone sp. 1 3 3 4 0 0 0 10
Erigone sp. 2 0 3 0 0 0 0 3
Labicymbium sp. 2 0 0 0 0 2 0 2
Moyosi sp. 1 0 0 0 1 0 0 1
Neomaso sp. 2 0 0 0 0 5 0 5
Neomaso sp. 4 0 0 0 4 1 0 5
Pseudotyphistes sp. 1 1 0 0 0 0 1 2
Psilocymbium lineatum (Millidge, 1991) 1 1 1 0 0 0 3
Tutaibo aff. phoeniceus 0 1 0 0 0 0 1
Tutaibo sp.1 0 0 0 1 1 0 2
Tutaibo sp.2 1 0 0 0 0 0 1

150
Vesicapalpus sp. 0 0 0 0 1 1 2
Jovem 0 1 2 1 2 3 9
Lycosidae
Gen? sp. 1 0 1 0 0 0 0 1
Lobizon humilis (Mello-Leitão, 1944) 0 0 0 1 0 0 1
Lycosa erythrognatha Lucas, 1836 0 1 0 0 0 0 1
Lycosa thorelli (Keyserling, 1877) 0 5 1 0 0 0 6
Schizocosa malitiosa (Tullgren, 1905) 1 3 1 1 0 0 6
Trochosa sp. 2 0 0 0 0 0 2
Jovem 12 25 11 11 4 1 64
Miturgidae
Teminius insularis (Lucas, 1857) 1 0 3 0 0 0 4
Jovem 0 4 2 0 2 0 8
Oonopidae
Jovem 0 0 0 0 2 1 3
Oxyopidae
Oxyopes salticus Hentz, 1845 1 2 0 2 0 0 5
Pholcidae
Jovem 0 0 1 0 0 0 1
Phrurolithidae
Orthobula sp. 0 1 0 0 1 0 2
Salticidae
Mopiopia sp. 1 0 0 0 0 0 1
Neonella montana Galiano, 1988 0 0 2 0 0 0 2
Gen? sp. 1 1 0 0 0 0 0 1
Gen? sp. 2 1 0 0 0 0 0 1
Gen? sp. 5 0 1 0 0 0 0 1
Gen? sp. 7 0 0 0 0 1 0 1
Semiopyla cataphracta Simon, 1901 0 1 0 0 0 0 1
Jovem 1 0 3 0 1 0 5
Tetragnathidae
Glenognatha lacteovittata (Mello-Leitão,
1944)
0 0 0 0 0 3 3
Theraphosidae
Jovem 1 0 1 0 0 0 2
Theridiidae
Dipoena pumicata (Keyserling, 1886) 0 0 0 0 1 0 1
Episinus sp.2 0 1 0 0 1 0 2
Euryopis camis Levi, 1963 1 0 0 0 0 0 1
Euryopis sp. 1 0 2 0 0 0 0 2
Euryopis sp. 4 1 0 0 0 0 0 1
Euryopis spinifera (Mello-Leitão, 1944) 2 2 0 0 0 0 4
Guaraniella mahnerti Baert, 1984 1 2 0 1 0 4 8
Steatoda ancorata (Holmberg, 1876) 0 1 0 0 0 0 1
Styposis selis Levi 1964 0 0 0 1 0 0 1

151
Thymoites piratini Rodrigues & Brescovit,
2015
0 0 1 0 0 0 1
Jovem 1 7 0 5 3 0 16
Thomisidae
Tmarus sp. 0 0 0 0 1 0 1
Jovem 0 0 0 0 1 0 1
Trachelidae
Jovem 0 0 0 1 0 0 1
Jovens não determinados 0 2 4 0 0 5 11
Total 64 104 69 53 52 32 374