Institutional Presentation - Itaú Corpbanca
69
4Q19 Institutional Presentation Itaú Corpbanca
-
Upload
khangminh22 -
Category
Documents
-
view
0 -
download
0
Transcript of Institutional Presentation - Itaú Corpbanca

4Q19
Institutional Presentation
Itaú Corpbanca
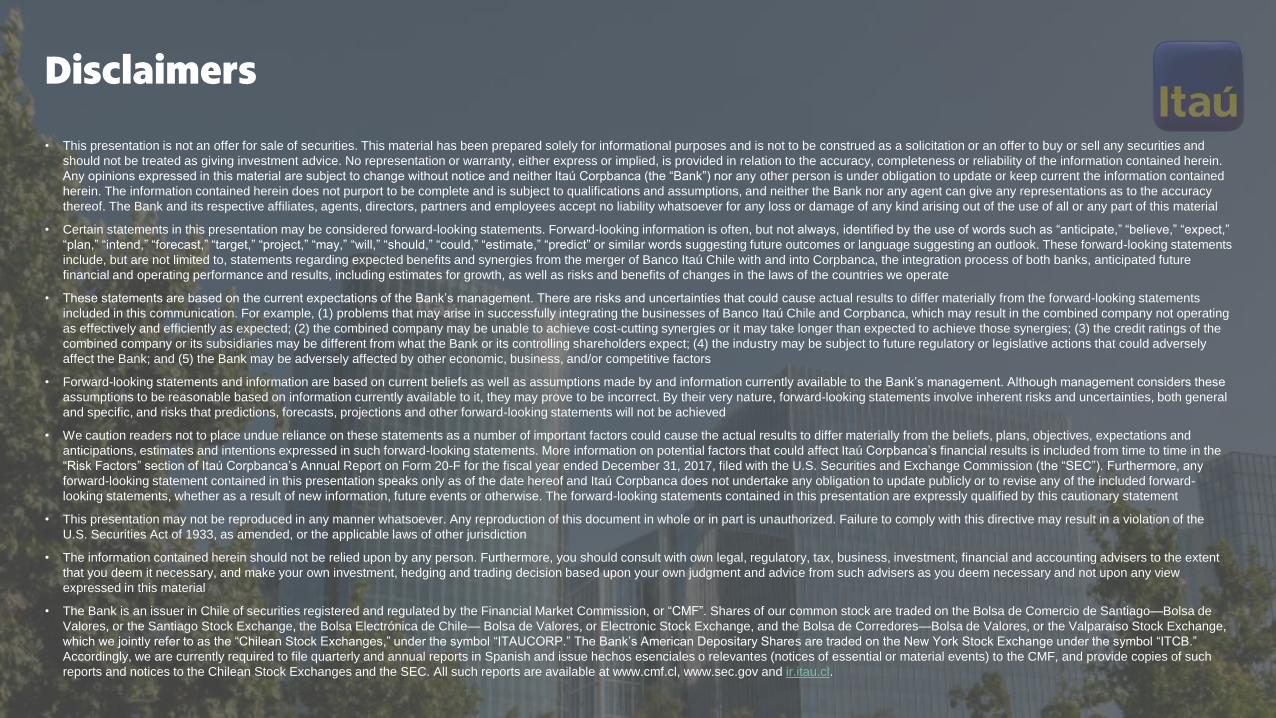
Disclaimers
• This presentation is not an offer for sale of securities. This material has been prepared solely for informational purposes and is not to be construed as a solicitation or an offer to buy or sell any securities and
should not be treated as giving investment advice. No representation or warranty, either express or implied, is provided in relation to the accuracy, completeness or reliability of the information contained herein.
Any opinions expressed in this material are subject to change without notice and neither Itaú Corpbanca (the “Bank”) nor any other person is under obligation to update or keep current the information contained
herein. The information contained herein does not purport to be complete and is subject to qualifications and assumptions, and neither the Bank nor any agent can give any representations as to the accuracy
thereof. The Bank and its respective affiliates, agents, directors, partners and employees accept no liability whatsoever for any loss or damage of any kind arising out of the use of all or any part of this material
• Certain statements in this presentation may be considered forward-looking statements. Forward-looking information is often, but not always, identified by the use of words such as “anticipate,” “believe,” “expect,”
“plan,” “intend,” “forecast,” “target,” “project,” “may,” “will,” “should,” “could,” “estimate,” “predict” or similar words suggesting future outcomes or language suggesting an outlook. These forward-looking statements
include, but are not limited to, statements regarding expected benefits and synergies from the merger of Banco Itaú Chile with and into Corpbanca, the integration process of both banks, anticipated future
financial and operating performance and results, including estimates for growth, as well as risks and benefits of changes in the laws of the countries we operate
• These statements are based on the current expectations of the Bank’s management. There are risks and uncertainties that could cause actual results to differ materially from the forward-looking statements
included in this communication. For example, (1) problems that may arise in successfully integrating the businesses of Banco Itaú Chile and Corpbanca, which may result in the combined company not operating
as effectively and efficiently as expected; (2) the combined company may be unable to achieve cost-cutting synergies or it may take longer than expected to achieve those synergies; (3) the credit ratings of the
combined company or its subsidiaries may be different from what the Bank or its controlling shareholders expect; (4) the industry may be subject to future regulatory or legislative actions that could adversely
affect the Bank; and (5) the Bank may be adversely affected by other economic, business, and/or competitive factors
• Forward-looking statements and information are based on current beliefs as well as assumptions made by and information currently available to the Bank’s management. Although management considers these
assumptions to be reasonable based on information currently available to it, they may prove to be incorrect. By their very nature, forward-looking statements involve inherent risks and uncertainties, both general
and specific, and risks that predictions, forecasts, projections and other forward-looking statements will not be achieved
• We caution readers not to place undue reliance on these statements as a number of important factors could cause the actual results to differ materially from the beliefs, plans, objectives, expectations and
anticipations, estimates and intentions expressed in such forward-looking statements. More information on potential factors that could affect Itaú Corpbanca’s financial results is included from time to time in the
“Risk Factors” section of Itaú Corpbanca’s Annual Report on Form 20-F for the fiscal year ended December 31, 2017, filed with the U.S. Securities and Exchange Commission (the “SEC”). Furthermore, any
forward-looking statement contained in this presentation speaks only as of the date hereof and Itaú Corpbanca does not undertake any obligation to update publicly or to revise any of the included forward-
looking statements, whether as a result of new information, future events or otherwise. The forward-looking statements contained in this presentation are expressly qualified by this cautionary statement
• This presentation may not be reproduced in any manner whatsoever. Any reproduction of this document in whole or in part is unauthorized. Failure to comply with this directive may result in a violation of the
U.S. Securities Act of 1933, as amended, or the applicable laws of other jurisdiction
• The information contained herein should not be relied upon by any person. Furthermore, you should consult with own legal, regulatory, tax, business, investment, financial and accounting advisers to the extent
that you deem it necessary, and make your own investment, hedging and trading decision based upon your own judgment and advice from such advisers as you deem necessary and not upon any view
expressed in this material
• The Bank is an issuer in Chile of securities registered and regulated by the Financial Market Commission, or “CMF”. Shares of our common stock are traded on the Bolsa de Comercio de Santiago—Bolsa de
Valores, or the Santiago Stock Exchange, the Bolsa Electrónica de Chile— Bolsa de Valores, or Electronic Stock Exchange, and the Bolsa de Corredores—Bolsa de Valores, or the Valparaiso Stock Exchange,
which we jointly refer to as the “Chilean Stock Exchanges,” under the symbol “ITAUCORP.” The Bank’s American Depositary Shares are traded on the New York Stock Exchange under the symbol “ITCB.”
Accordingly, we are currently required to file quarterly and annual reports in Spanish and issue hechos esenciales o relevantes (notices of essential or material events) to the CMF, and provide copies of such
reports and notices to the Chilean Stock Exchanges and the SEC. All such reports are available at www.cmf.cl, www.sec.gov and ir.itau.cl.

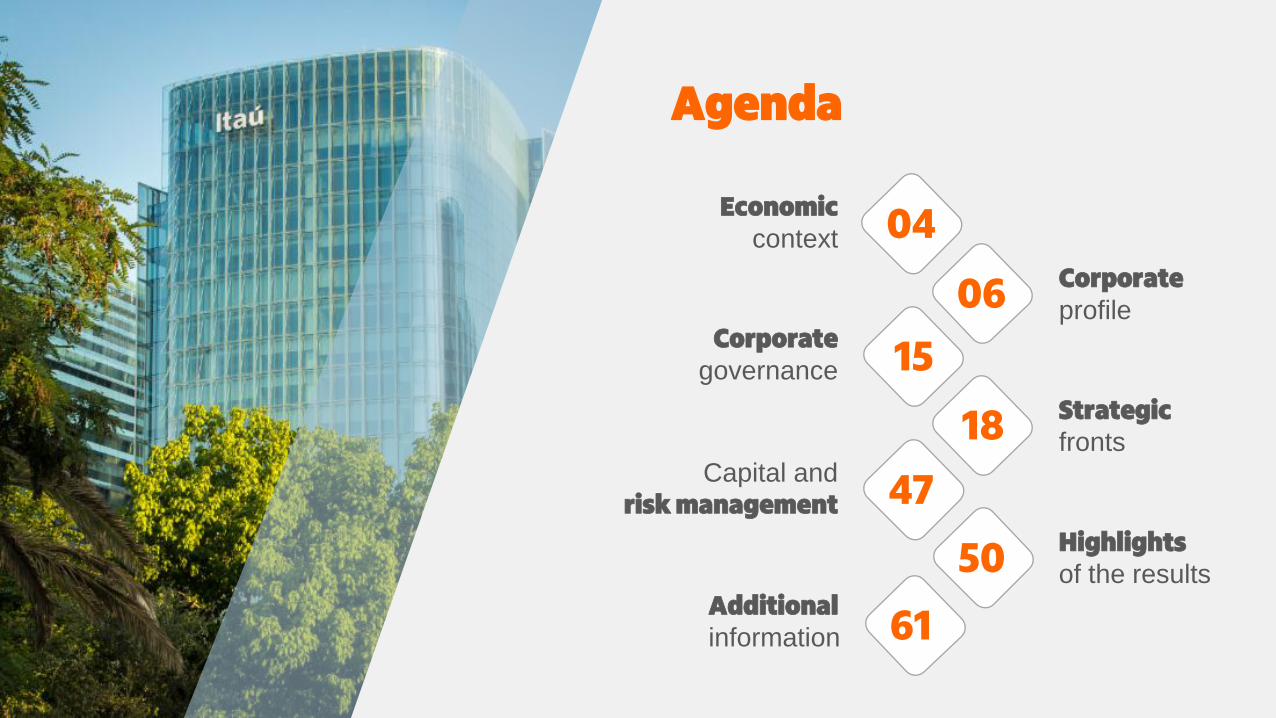
Agenda
Economiccontext
Corporate governance
Corporate profile
Strategicfronts
Capital and
risk management
04
06
15
18
47
50 Highlightsof the results
61Additionalinformation

Macroeconomic backdropEconomic context
GDP Growth (%) Interest Rates (EOP) - %
Inflation (CPI) - %
Source: Central Bank of Chile, Central Bank of Colombia and Itaú’s projections.(updated as of March 11, 2020).
Exchange rates – CLP/USD & CLP/COP
5.8 6.1 5.3
4.0
1.8 2.3
1.71.3
4.0
1.2 1.2
4.0
7.4
3.9
4.6 4.7
3.0
2.11.4
2.63.3 3.1
2010 2011 2012 2013 2014 2015 2016 2017 2018 2019(e) 2020(e)
Chile Colombia
3.3
5.3 5.0 4.5
3.0 3.5 3.5
2.5 2.8
1.8 1.3
3.0
4.8 4.3
3.3
4.5
5.8
7.5
4.8 4.3 4.3 4.3
2010 2011 2012 2013 2014 2015 2016 2017 2018 2019(e) 2020(e)
Chile Colombia
3.0
4.4
1.5
3.0
4.6 4.4
2.72.3 2.6
3.03.3 3.2
3.7
2.4 1.9
3.7
6.8
5.8
4.1
3.23.8
3.3
2010 2011 2012 2013 2014 2015 2016 2017 2018 2019(e) 2020(e)
Chile Colombia
0.20
0.21
0.22
0.23
0.24
0.25
0.26
0.27
580
630
680
730
780
830
880
CLP/USD CLP/COP
4

Agenda
Economiccontext
Corporate governance
Corporate profile
Strategicfronts
Capital and
risk management
04
06
15
18
47
50 Highlightsof the results
61Additionalinformation
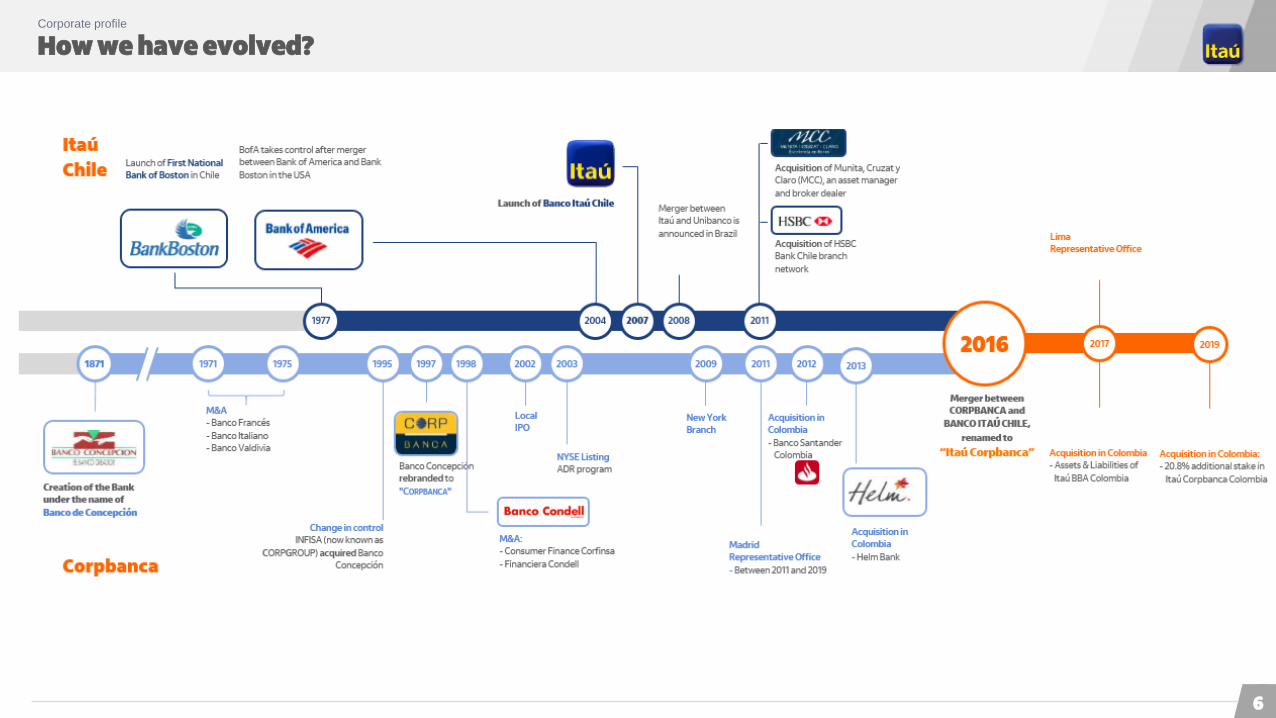
How we have evolved?Corporate profile
6

Our visionCorporate profile
To be the leading bank in sustainable performance and customer satisfaction
1. Implement a customer satisfaction-oriented culture, that is business-driven, through a simplified operational structure
2. Maximize sustainable shareholder returns, aiming at firm-wide growth
3. We aspire to be the preferred bank for top talents at every level
• Attract and retain committed professionals with high ethical standards and strong organizational pride
• Shared leadership, conquered through talent and commitment to excellence, focused on meritocracy
4. Create an atmosphere that inspires creativity, entrepreneurialism and the exchange of ideas
5. Pursue a cutting-edge technology, striving to best serve our client needs, ultimately creating value
6. Uphold the highest ethical standards in the relationship with clients, employees, regulators, society and the markets
7

Our wayCorporate profile
We seek to create a culture based on seven attitudes that define our identityand identify us in the way we do business
Each one of them represents the core of what we focus on as institution
1. It´s only good for us if it’s good for the client
We are people providing service to people, with passion and excellence. We work with the client and for the client –because they are the main reason behind why we do what we do
2. We’re passionate about performance
Generating sustainable results is in our DNA. The continuous challenge of seeking leadership in performance has brought us to where we are –and will continue guiding our company towards our objectives
3. People mean everything to us
Everything we do is carried out by people. Talented people who enjoy working in a collaborative atmosphere, based on meritocracy and high performance.
4. The best argument is the one that matters
We encourage a challenging work environment, which is open to questioning and constructive discussion. For us, the hierarchy which counts is the hierarchy of the best idea
5. Simple. Always
We believe that simplicity is the best path to efficiency. That’s why we strive not to mistake depth for complexity, and simplicity for simpleness
6. We think and act like owners
We always think like business owners, leading by example and putting collective objectives before personal ambition
7. Ethics is non-negotiable
We do what is right, without using shortcuts or devious ways to do business. We exercise leadership in a transparent and responsible way, fully committed to society and the best governance and management practices
8
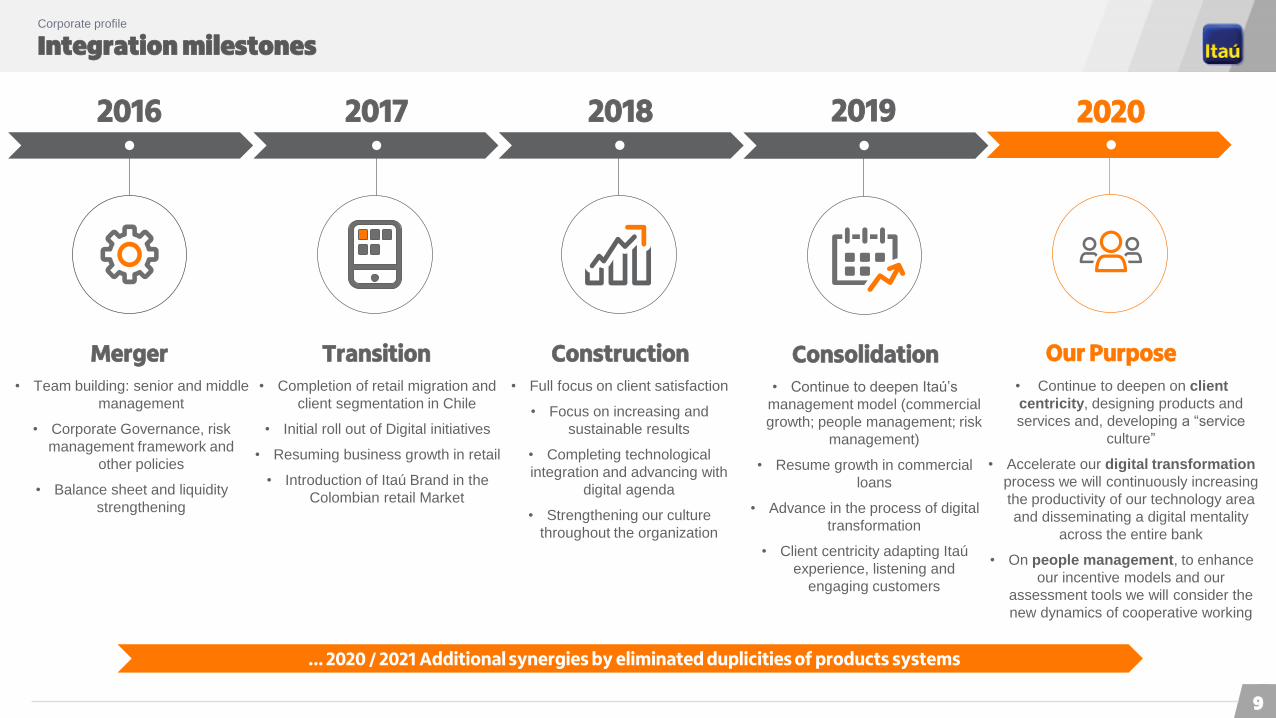
Integration milestonesCorporate profile
201820172016
Merger Transition Construction• Team building: senior and middle
management
• Corporate Governance, risk
management framework and
other policies
• Balance sheet and liquidity
strengthening
• Full focus on client satisfaction
• Focus on increasing and
sustainable results
• Completing technological
integration and advancing with
digital agenda
• Strengthening our culture
throughout the organization
• Completion of retail migration and
client segmentation in Chile
• Initial roll out of Digital initiatives
• Resuming business growth in retail
• Introduction of Itaú Brand in the
Colombian retail Market
Our Purpose• Continue to deepen on client
centricity, designing products and
services and, developing a “service
culture”
• Accelerate our digital transformation
process we will continuously increasing
the productivity of our technology area
and disseminating a digital mentality
across the entire bank
• On people management, to enhance
our incentive models and our
assessment tools we will consider the
new dynamics of cooperative working
2020
… 2020 / 2021 Additional synergies by eliminated duplicities of products systems
Consolidation• Continue to deepen Itaú’s
management model (commercial
growth; people management; risk
management)
• Resume growth in commercial
loans
• Advance in the process of digital
transformation
• Client centricity adapting Itaú
experience, listening and
engaging customers
2019
9
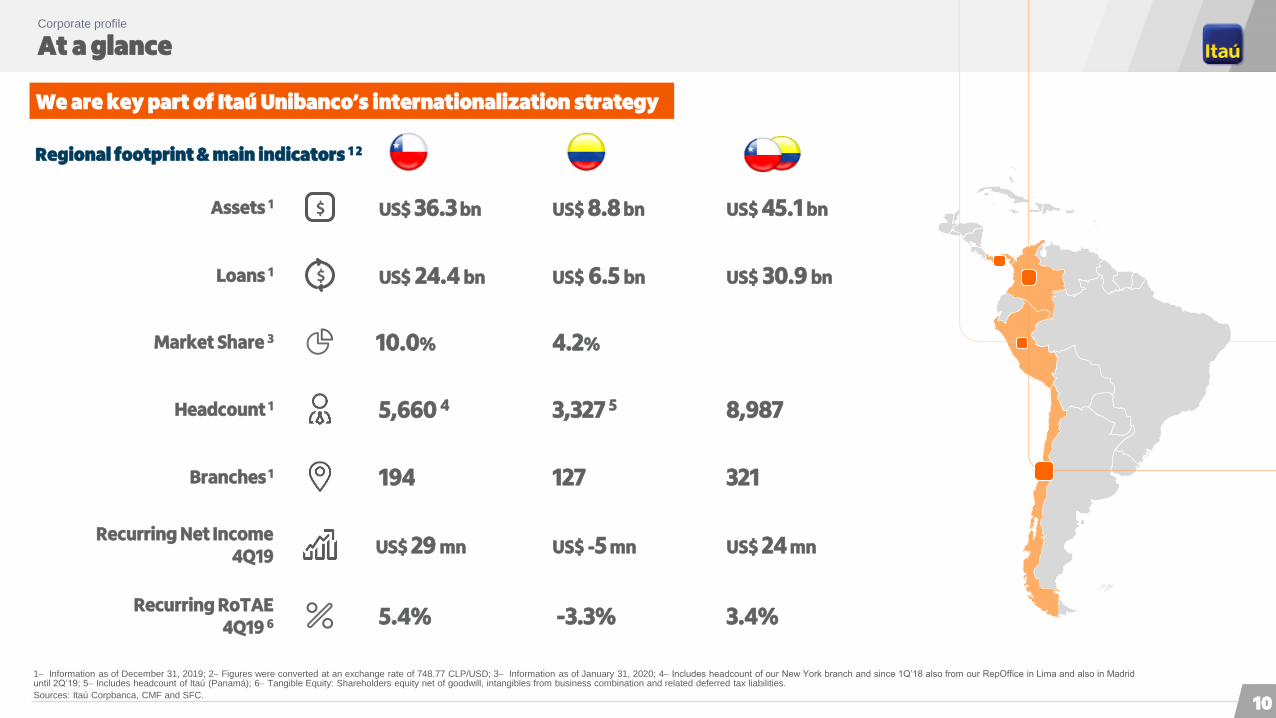
At a glanceCorporate profile
We are key part of Itaú Unibanco’s internationalization strategy
Regional footprint & main indicators 1 2
10.0% 4.2%Market Share 3
US$ 24.4 bn US$ 6.5 bn Loans 1 US$ 30.9 bn
5,660 4 3,327 5Headcount 1 8,987
194 127 Branches 1 321
US$ 36.3 bn US$ 8.8 bnAssets 1 US$ 45.1 bn
US$ 29 mn US$ -5 mn Recurring Net Income
4Q19 US$ 24 mn
5.4% -3.3% Recurring RoTAE
4Q19 6 3.4%
1 Information as of December 31, 2019; 2 Figures were converted at an exchange rate of 748.77 CLP/USD; 3 Information as of January 31, 2020; 4 Includes headcount of our New York branch and since 1Q’18 also from our RepOffice in Lima and also in Madrid until 2Q’19; 5 Includes headcount of Itaú (Panamá); 6 Tangible Equity: Shareholders equity net of goodwill, intangibles from business combination and related deferred tax liabilities.
Sources: Itaú Corpbanca, CMF and SFC.
10

Relevance across Latin AmericaCorporate profile
US$ Bn
(US$ Bn)
US$ Bn
4
Caixa
Bci
Santander
Bradesco
Citibank
Banco do Brasil
BBVA
Scotiabank
1
2
3
4
5
6
7
8
9
16
Bci
Grupo Aval
BBVA
Santander
Scotiabank
Banco del Estado de Chile
1
2
3
5
6
7 Banco de Chile
Bancolombia
Itaú Corpbanca3
9
8
Itaú Corpbanca represents 21% of Itaú Unibanco’s consolidated
loan portfolio6
Itaú Unibanco2
10Itaú Corpbanca3
Itaú LatAm5
1 Data as of September 30, 2019. Includes Brasil, México, Colombia, Chile, Argentina, Paraguay, Peru and Uruguay; 2 Includes Brasil, México, Argentina, Peru, Uruguay, Paraguay, Chile and Colombia; 3 Includes Chile and Colombia (Itaú Corpbanca Chile
with ~US$36MMM in assets); 4 Data as of September 30, 2019. Includes Colombia, Chile, Argentina, Paraguay, Peru and Uruguay; 5 Includes Colombia, Chile, Argentina, Paraguay, Peru and Uruguay; 6– Considering the consolidated loan portfolios of Itaú
Unibanco and Itaú Corpbanca reported in their respective 4Q’19 MD&As at a R$ 4.0199 / US$ and a Ch$ 748.77 / US$ foreign exchange rates as of 31.12.2019.
Source: Central Banks, local regulators, companies filings, Itaú Corpbanca.
Itaú Corpbanca is currently the 5th largest private bank in Chile and we contribute to position Itaú LatAm as the 10th and 6th
largest bank in terms of assets within South America (ex-Brazil)
360
418
313
107
358
76
328
160
65
45
54
55
57
49
79
82
59
55
49
45
11
Banks by Assets in Latin America1 Banks by Assets in South America (ex-Brazil)4
Loan portfolio as of Dec. 31, 2019
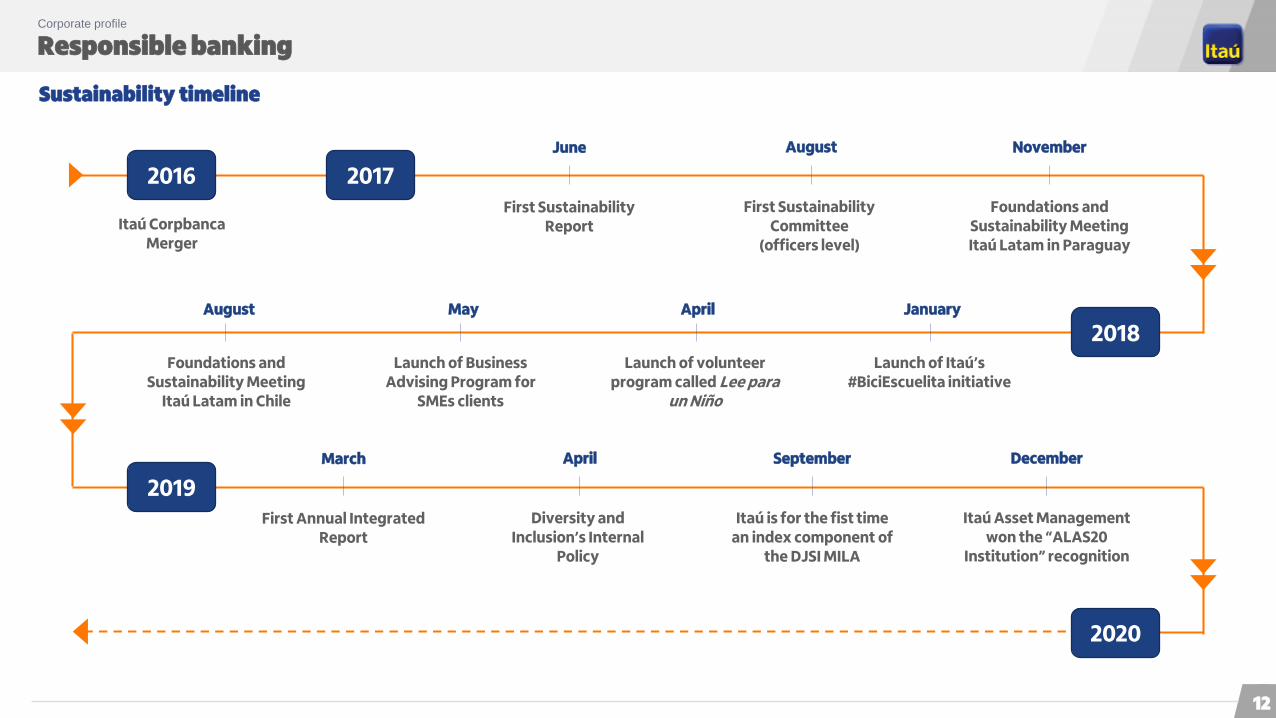
Responsible banking Corporate profile
Sustainability timeline
2016
Itaú CorpbancaMerger
2018
2019
2020
First Sustainability Report
June
First Sustainability Committee
(officers level)
August
Foundations and Sustainability Meeting Itaú Latam in Paraguay
November
Launch of Itaú’s #BiciEscuelita initiative
January
2017
First Annual Integrated Report
March
Diversity and Inclusion’s Internal
Policy
April
Itaú is for the fist time an index component of
the DJSI MILA
September
Launch of volunteer program called Lee para
un Niño
April
Launch of Business Advising Program for
SMEs clients
May
Foundations and Sustainability Meeting
Itaú Latam in Chile
August
Itaú Asset Management won the “ALAS20
Institution” recognition
December
12
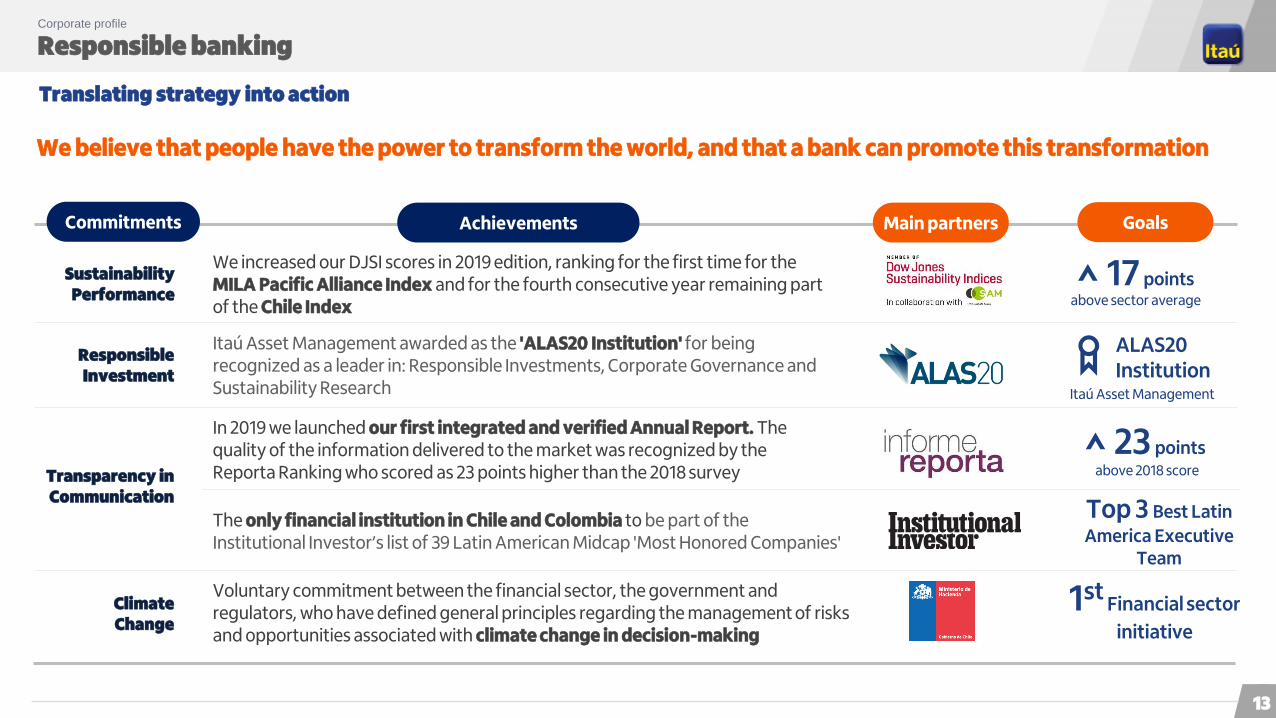
Responsible banking Corporate profile
Translating strategy into action
1stFinancial sector
initiative
The only financial institution in Chile and Colombia to be part of the Institutional Investor’s list of 39 Latin American Midcap 'Most Honored Companies'
We increased our DJSI scores in 2019 edition, ranking for the first time for the MILA Pacific Alliance Index and for the fourth consecutive year remaining part of the Chile Index
Sustainability Performance
Itaú Asset Management awarded as the 'ALAS20 Institution' for being recognized as a leader in: Responsible Investments, Corporate Governance and Sustainability Research
Responsible Investment
Commitments Achievements Main partners
In 2019 we launched our first integrated and verified Annual Report. The quality of the information delivered to the market was recognized by the Reporta Ranking who scored as 23 points higher than the 2018 surveyTransparency in
Communication
Voluntary commitment between the financial sector, the government and regulators, who have defined general principles regarding the management of risks and opportunities associated with climate change in decision-making
Climate Change
17 pointsabove sector average
ALAS20 Institution
23 pointsabove 2018 score
Top 3 Best Latin
America Executive Team
Goals
Itaú Asset Management
We believe that people have the power to transform the world, and that a bank can promote this transformation
13

Agenda
Economiccontext
Corporate governance
Corporate profile
Strategicfronts
Capital and
risk management
04
06
15
18
47
50 Highlightsof the results
61Additionalinformation
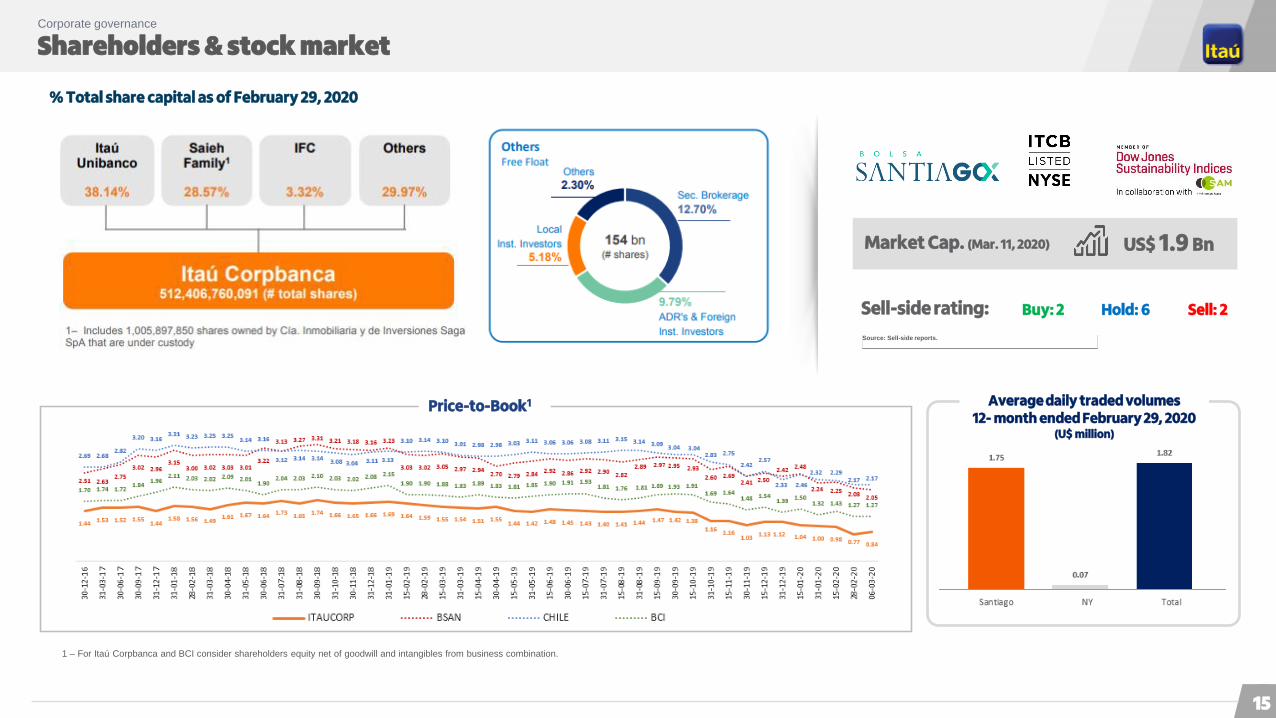
Shareholders & stock marketCorporate governance
US$ 1.9 BnMarket Cap. (Mar. 11, 2020)
Source: Sell-side reports.
1 – For Itaú Corpbanca and BCI consider shareholders equity net of goodwill and intangibles from business combination.
Buy: 2 Hold: 6 Sell: 2Sell-side rating:
% Total share capital as of February 29, 2020
Average daily traded volumes12- month ended February 29, 2020
(U$ million)
Price-to-Book1
15

Experienced senior management to implement strategyCorporate governance
Board Chile
Wholesale
Gabriel Moura
Treasury Marketing &
Products
IT Human
ResourcesRetailCRO Legal
Álvaro Pimentel
Treasury
Daniel
Brasil
CRO
Juan Ignacio
Castro• Credit Risk:
Frederico Quaggio
IT
Bernardo
Alba
Legal & General
Secretary
Dolly
Murcia
Human
Resources
María Lucía
Ospina
Wholesale
Jorge
Villa
Communications &
Institutional Relations
Carolina
Velasco
Operations
Liliana
Suárez
Retail
Hernando
Osorio
Chairman
Gabriel Moura
Matrix reporting to CEO Colombia and
functional reporting to ITCB
Functional reporting to CEO Colombia
and matrix reporting to ITCB for
coordination of specific themes
Board Colombia
Board Colombia
Mónica Aparicio Smith
Roberto Brigard Holguín
Cristián Toro Cañas
Juan Echeverría González
Chairman
Gabriel Amado de Moura
Colombia
Pedro
Silva
Mauricio
Baeza
Luciana
HildebrandiÁlvaro
Pimentel
Christian
TauberJulián
Acuña
Marcela
JiménezCristián
Toro
Luis
Rodrigues
Itaú Corpbanca Colombia CEO
Itaú Corpbanca CEO
Board Chile 1 2
Chairman
Jorge Andrés Saieh Guzmán
Ricardo Villela Marino
Caio Ibrahim David
Milton Maluhy Filho
Andrés Bucher Cepeda
Pedro Samhan Escandar
Fernando Concha Ureta
Jorge Selume Zaror
Fernando Aguad Dagach
Gustavo Arriagada Morales
Bernard Pasquier
1 Itaú Unibanco and CorpGroup appoint the majority of the members of the board of directors; 2 Pursuant to the Shareholders Agreement, the Directors appointed by Itaú Unibanco and CorpGroup shall vote together as a single block according to
Itaú Unibanco’s recommendation.
Audit Committee
CAE
Emerson Bastián
Franchise,
Products & Digital
Jorge
Miranda
CFO
n.d.
CFO
Juan Pablo
Michelsen
Operations
Jorge
Novis
16

Agenda
Economiccontext
Corporate governance
Corporate profile
Strategicfronts
Capital and
risk management
04
06
15
18
47
50 Highlightsof the results
61Additionalinformation
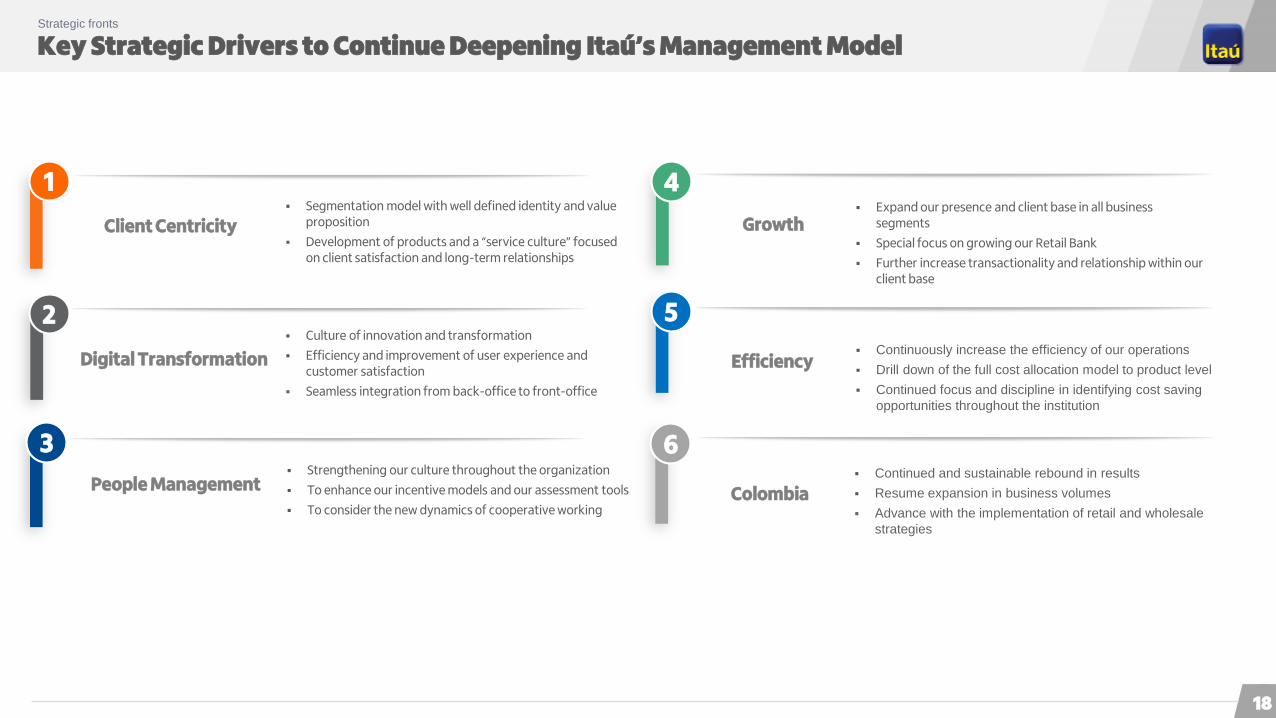
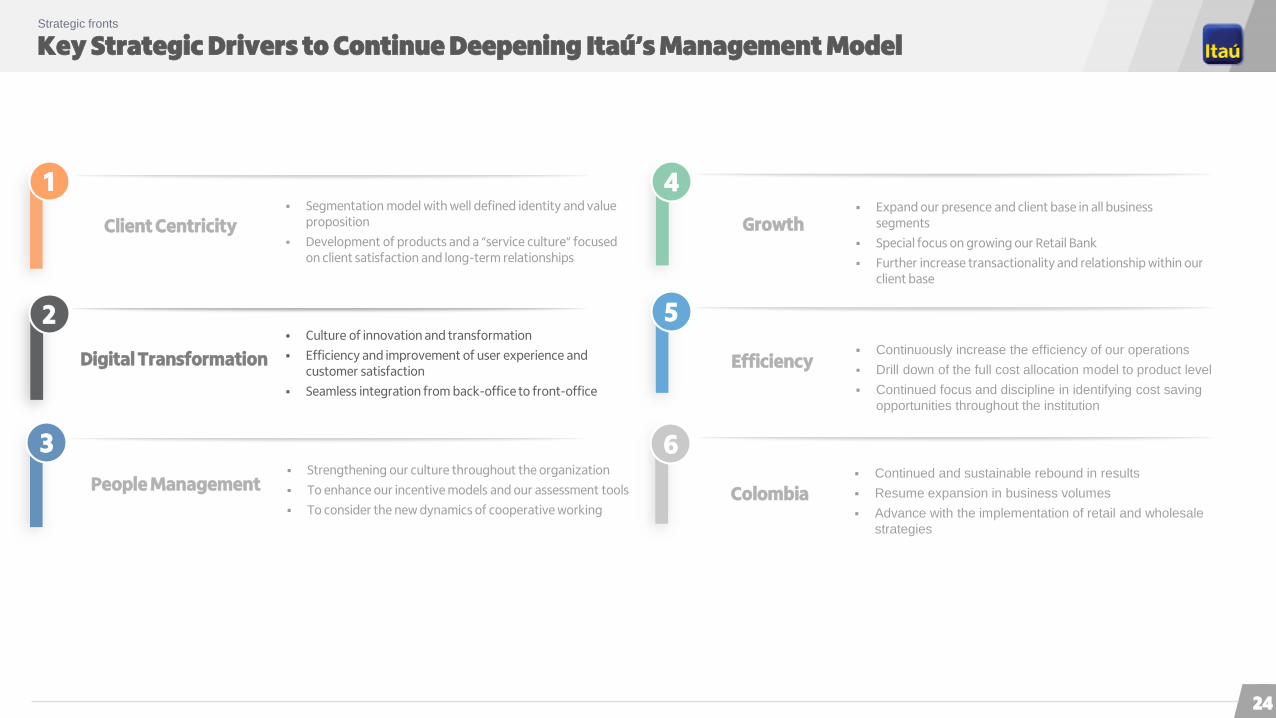
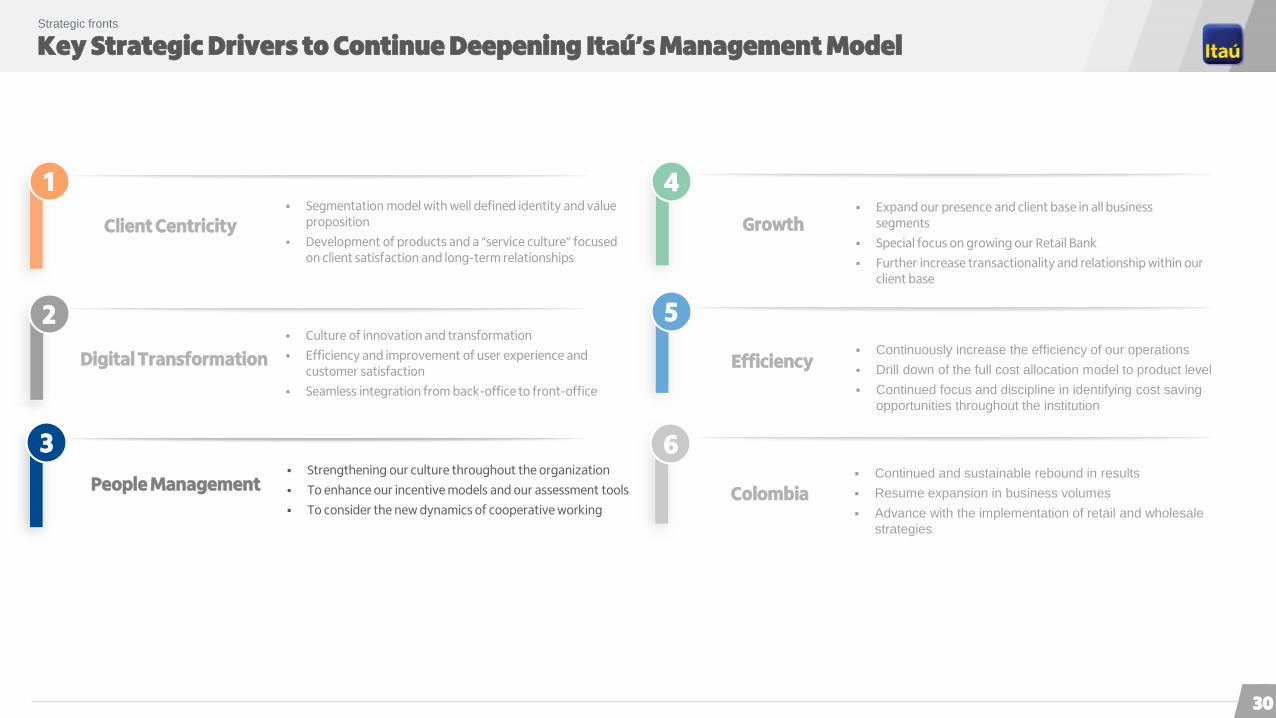
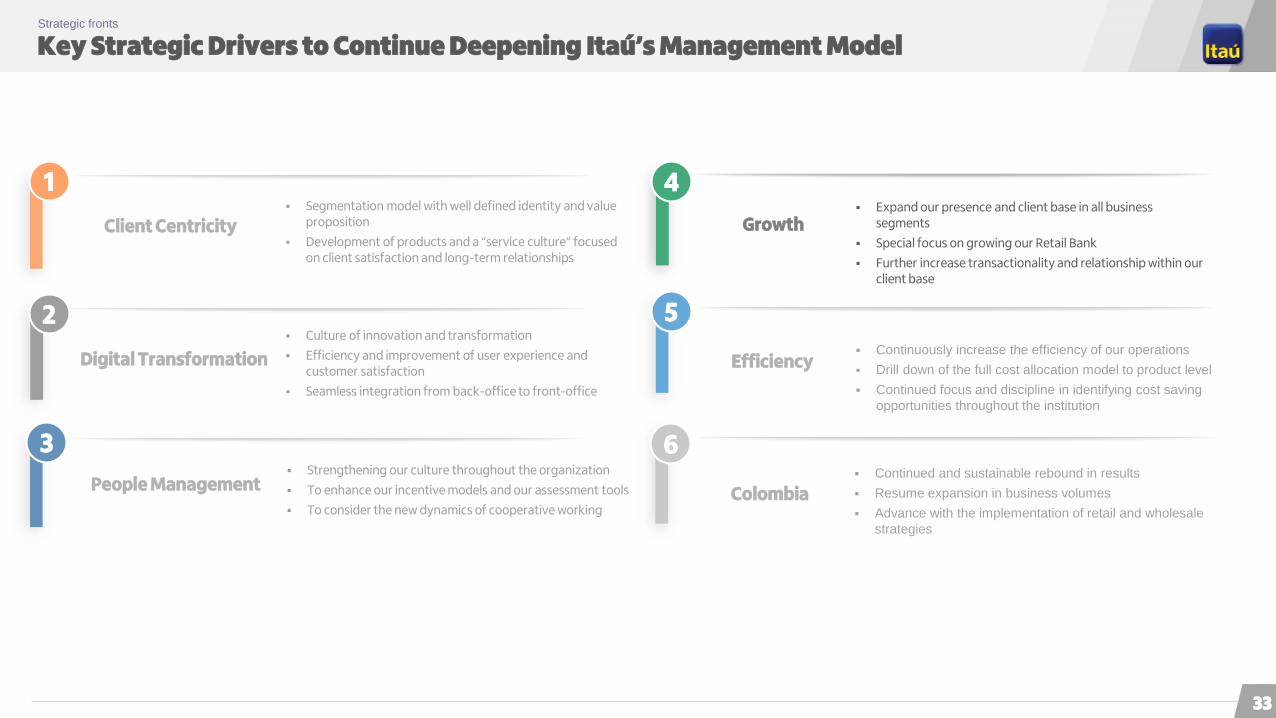
Key Strategic Drivers to Continue Deepening Itaú’s Management ModelStrategic fronts
Segmentation model with well defined identity and value proposition
Development of products and a “service culture” focused on client satisfaction and long-term relationships
Client Centricity
Culture of innovation and transformation
Efficiency and improvement of user experience and customer satisfaction
Seamless integration from back-office to front-office
Strengthening our culture throughout the organization
To enhance our incentive models and our assessment tools
To consider the new dynamics of cooperative working
2
1
3
4 Expand our presence and client base in all business
segments
Special focus on growing our Retail Bank
Further increase transactionality and relationship within our client base
People Management
Digital Transformation
Growth
5
Efficiency
6 Continued and sustainable rebound in results
Resume expansion in business volumes
Advance with the implementation of retail and wholesale
strategies
Colombia
Continuously increase the efficiency of our operations
Drill down of the full cost allocation model to product level
Continued focus and discipline in identifying cost saving
opportunities throughout the institution
18

Key Strategic Drivers to Continue Deepening Itaú’s Management ModelStrategic fronts
Segmentation model with well defined identity and value proposition
Development of products and a “service culture” focused on client satisfaction and long-term relationships
Client Centricity
Culture of innovation and transformation
Efficiency and improvement of user experience and customer satisfaction
Seamless integration from back-office to front-office
Strengthening our culture throughout the organization
To enhance our incentive models and our assessment tools
To consider the new dynamics of cooperative working
2
1
3
4 Expand our presence and client base in all business
segments
Special focus on growing our Retail Bank
Further increase transactionality and relationship within our client base
People Management
Digital Transformation
Growth
5
Efficiency
6 Continued and sustainable rebound in results
Resume expansion in business volumes
Advance with the implementation of retail and wholesale
strategies
Colombia
Continuously increase the efficiency of our operations
Drill down of the full cost allocation model to product level
Continued focus and discipline in identifying cost saving
opportunities throughout the institution
19
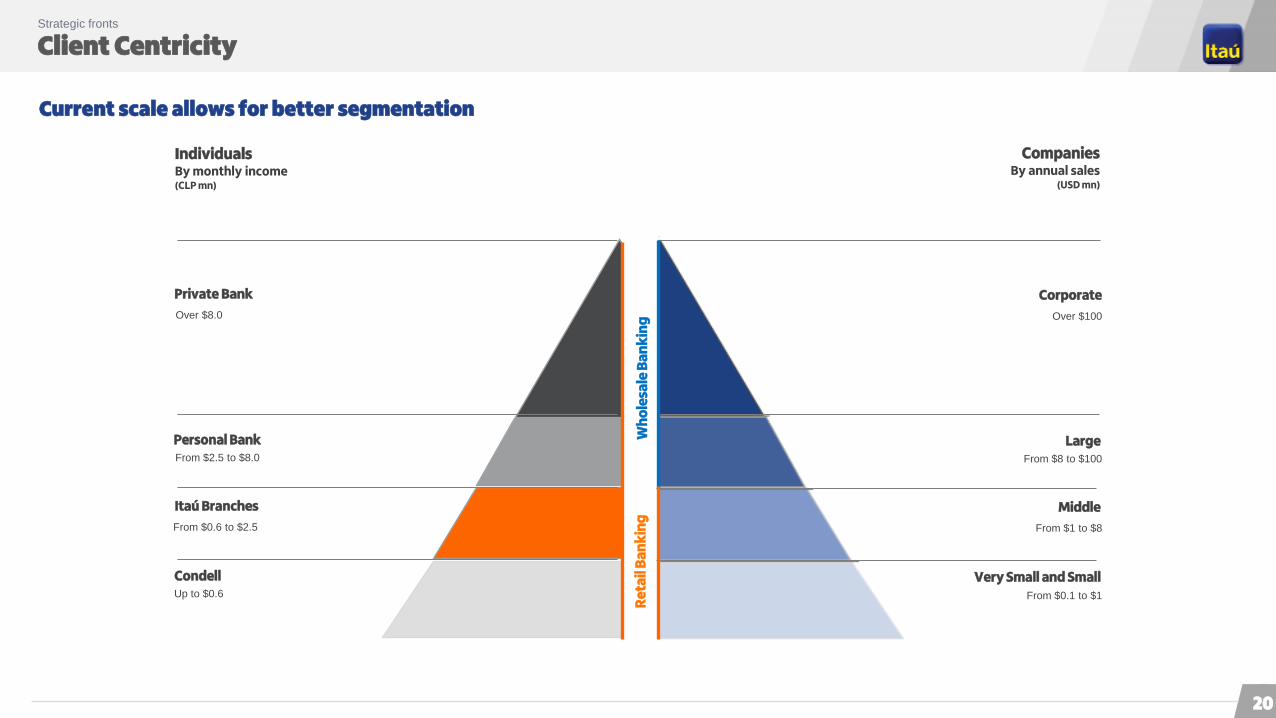
Client Centricity Strategic fronts
IndividualsBy monthly income(CLP mn)
CompaniesBy annual sales
(USD mn)
Over $8.0
From $2.5 to $8.0
From $0.6 to $2.5
Up to $0.6
Private Bank
Personal Bank
Itaú Branches
Condell
Over $100
From $8 to $100
From $1 to $8
From $0.1 to $1
Corporate
Large
Middle
Very Small and Small
Wh
ole
sale
Ba
nk
ing
Re
tail
Ba
nk
ing
Current scale allows for better segmentation
20
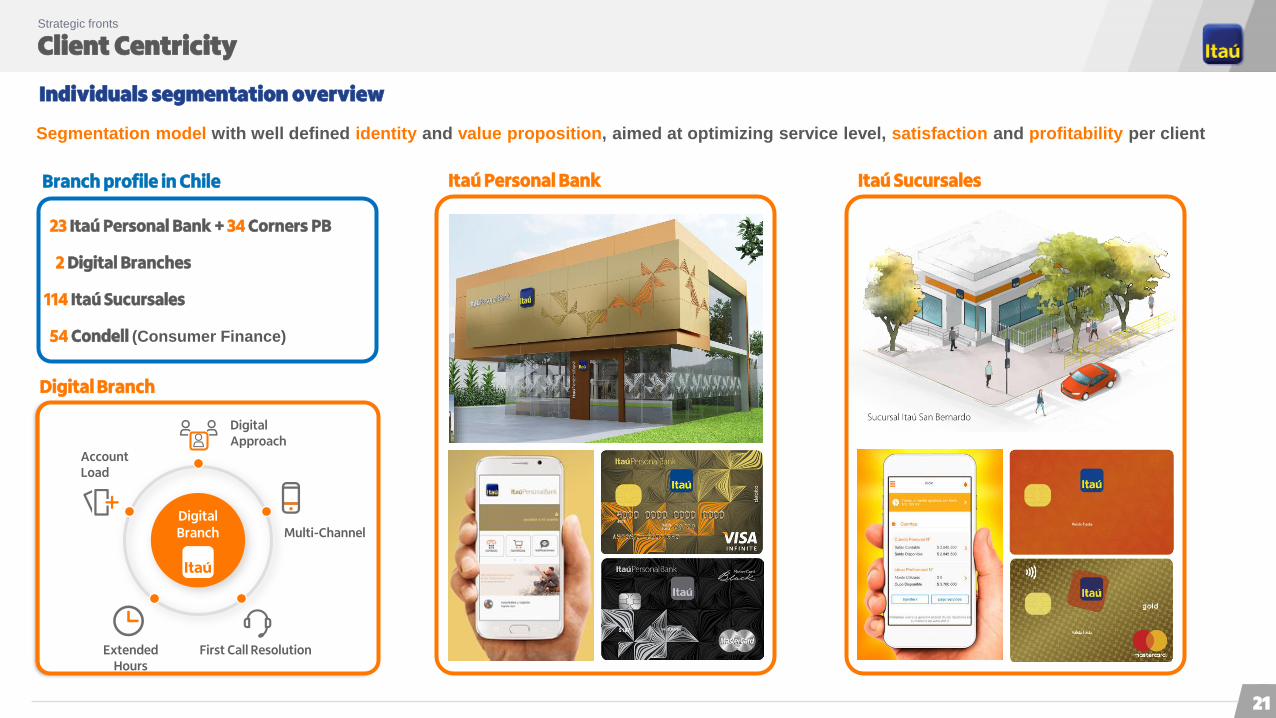
Client Centricity Strategic fronts
Individuals segmentation overview
Segmentation model with well defined identity and value proposition, aimed at optimizing service level, satisfaction and profitability per client
23 Itaú Personal Bank + 34 Corners PB
2 Digital Branches
114 Itaú Sucursales
54 Condell (Consumer Finance)
Itaú Personal Bank Itaú SucursalesBranch profile in Chile
DigitalApproach
Multi-Channel
First Call ResolutionExtendedHours
AccountLoad
DigitalBranch
Digital Branch
21
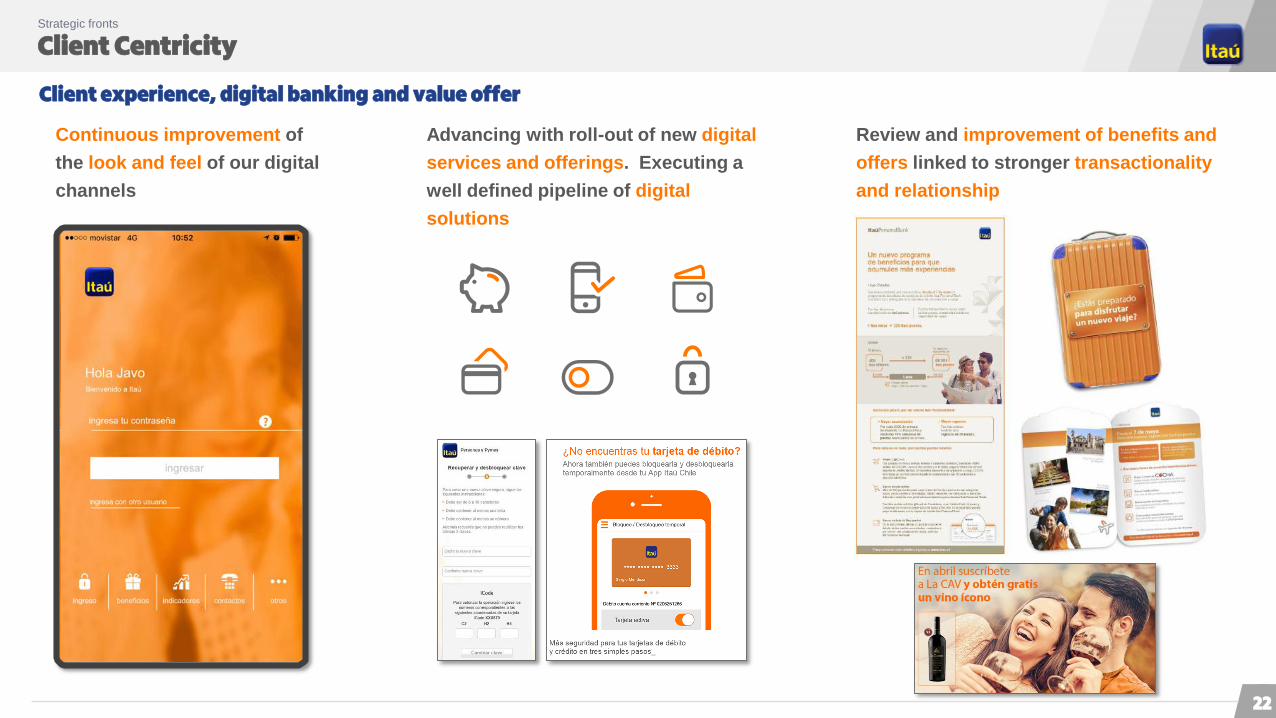
Client Centricity Strategic fronts
Client experience, digital banking and value offer
Continuous improvement of
the look and feel of our digital
channels
Review and improvement of benefits and
offers linked to stronger transactionality
and relationship
Advancing with roll-out of new digital
services and offerings. Executing a
well defined pipeline of digital
solutions
22
Client Centricity Strategic fronts
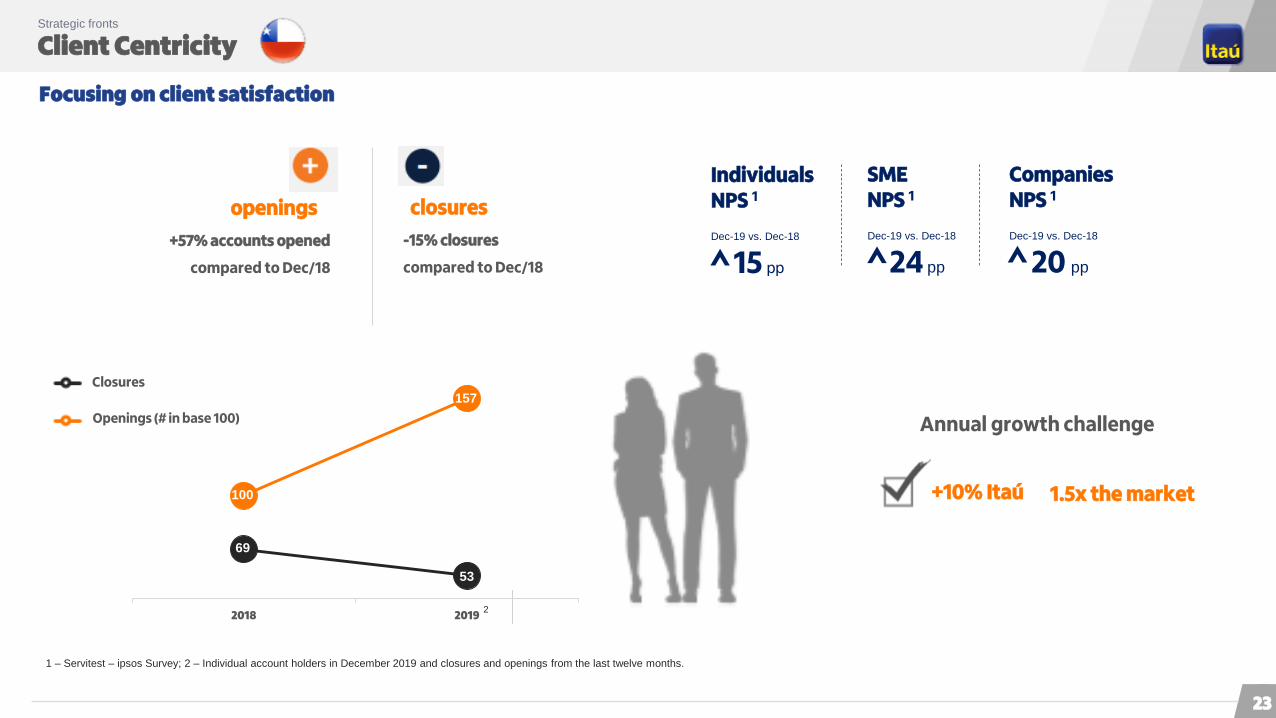
Focusing on client satisfaction
openings
+57% accounts opened
compared to Dec/18
closures
-15% closures
compared to Dec/18
2
1 – Servitest – ipsos Survey; 2 – Individual account holders in December 2019 and closures and openings from the last twelve months.
Annual growth challenge
+10% Itaú 1.5x the market
2018 2019
100
69
157
53
Closures
Openings (# in base 100)
IndividualsNPS 1
Dec-19 vs. Dec-18
15 pp
SMENPS 1
Dec-19 vs. Dec-18
24 pp
CompaniesNPS 1
Dec-19 vs. Dec-18
20 pp
23
Key Strategic Drivers to Continue Deepening Itaú’s Management ModelStrategic fronts
Segmentation model with well defined identity and value proposition
Development of products and a “service culture” focused on client satisfaction and long-term relationships
Client Centricity
Culture of innovation and transformation
Efficiency and improvement of user experience and customer satisfaction
Seamless integration from back-office to front-office
Strengthening our culture throughout the organization
To enhance our incentive models and our assessment tools
To consider the new dynamics of cooperative working
2
1
3
4 Expand our presence and client base in all business
segments
Special focus on growing our Retail Bank
Further increase transactionality and relationship within our client base
People Management
Digital Transformation
Growth
5
Efficiency
6 Continued and sustainable rebound in results
Resume expansion in business volumes
Advance with the implementation of retail and wholesale
strategies
Colombia
Continuously increase the efficiency of our operations
Drill down of the full cost allocation model to product level
Continued focus and discipline in identifying cost saving
opportunities throughout the institution
24
Digital Transformation Strategic fronts
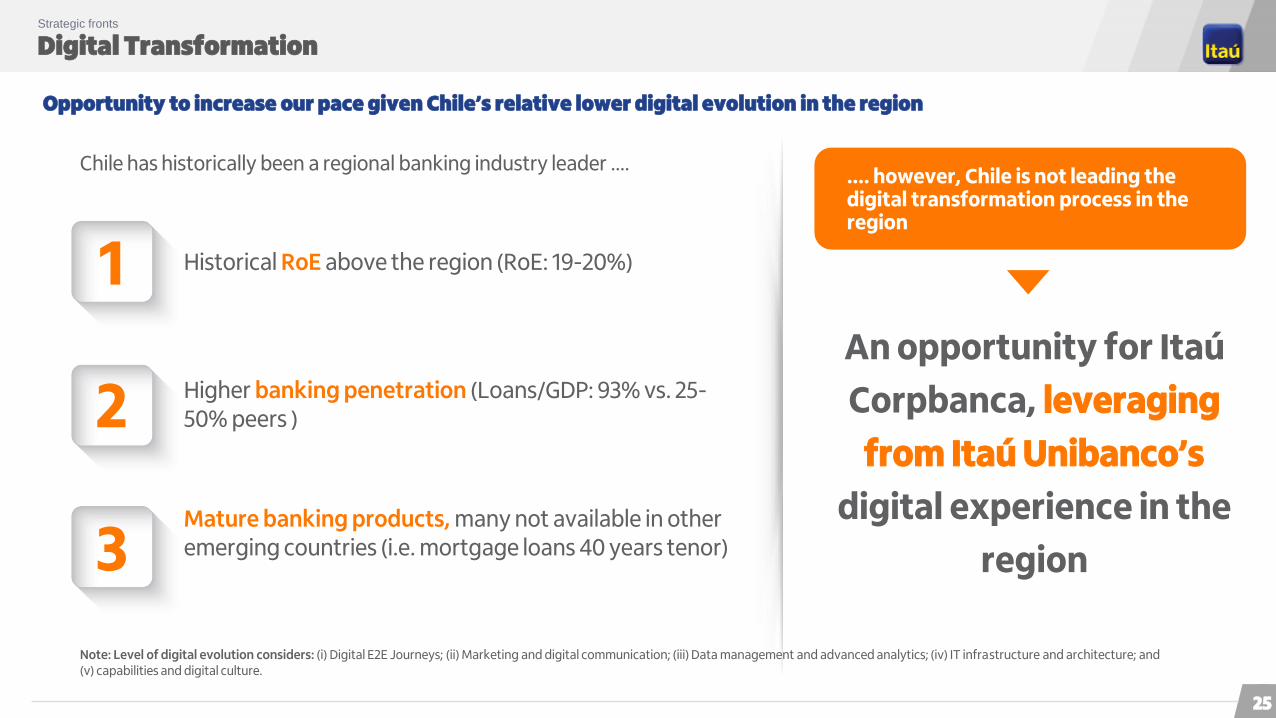
Opportunity to increase our pace given Chile’s relative lower digital evolution in the region
Chile has historically been a regional banking industry leader ….
Mature banking products, many not available in other emerging countries (i.e. mortgage loans 40 years tenor)
Higher banking penetration (Loans/GDP: 93% vs. 25-50% peers )
Historical RoE above the region (RoE: 19-20%)
…. however, Chile is not leading the digital transformation process in the region
1
2
3
Note: Level of digital evolution considers: (i) Digital E2E Journeys; (ii) Marketing and digital communication; (iii) Data management and advanced analytics; (iv) IT infrastructure and architecture; and (v) capabilities and digital culture.
An opportunity for Itaú
Corpbanca, leveraging
from Itaú Unibanco’s
digital experience in the
region
25
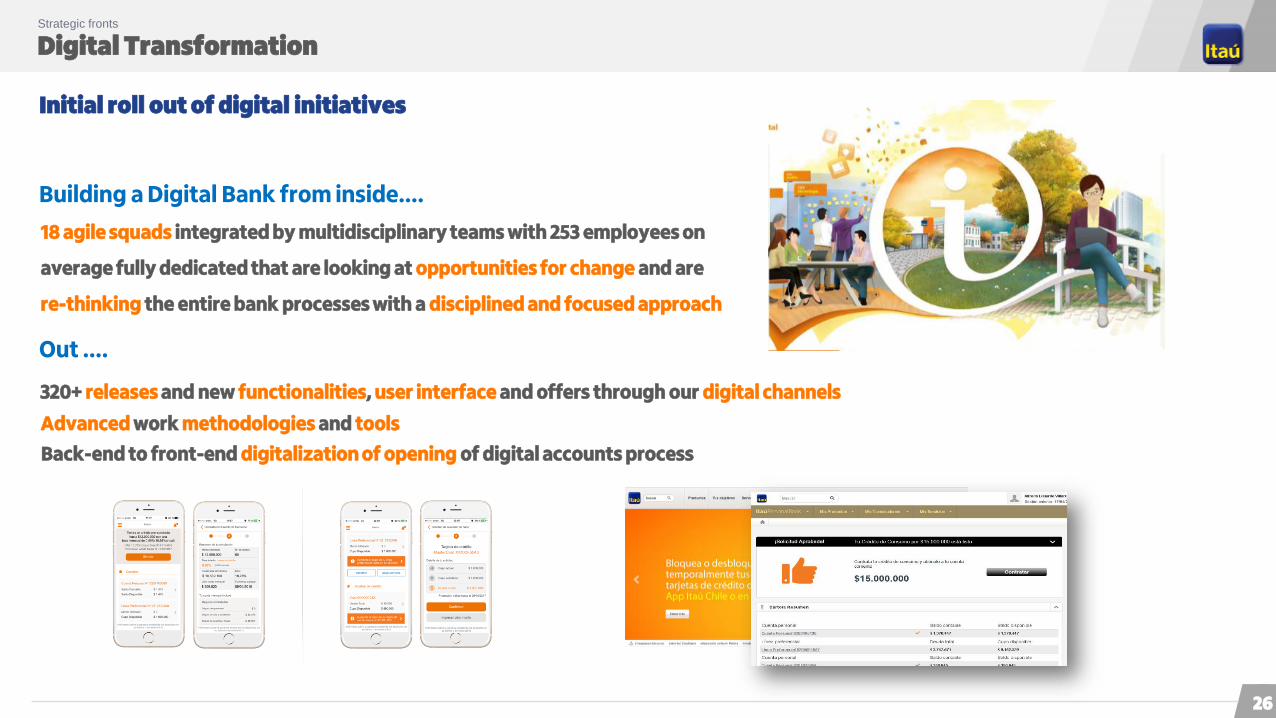
Digital Transformation Strategic fronts
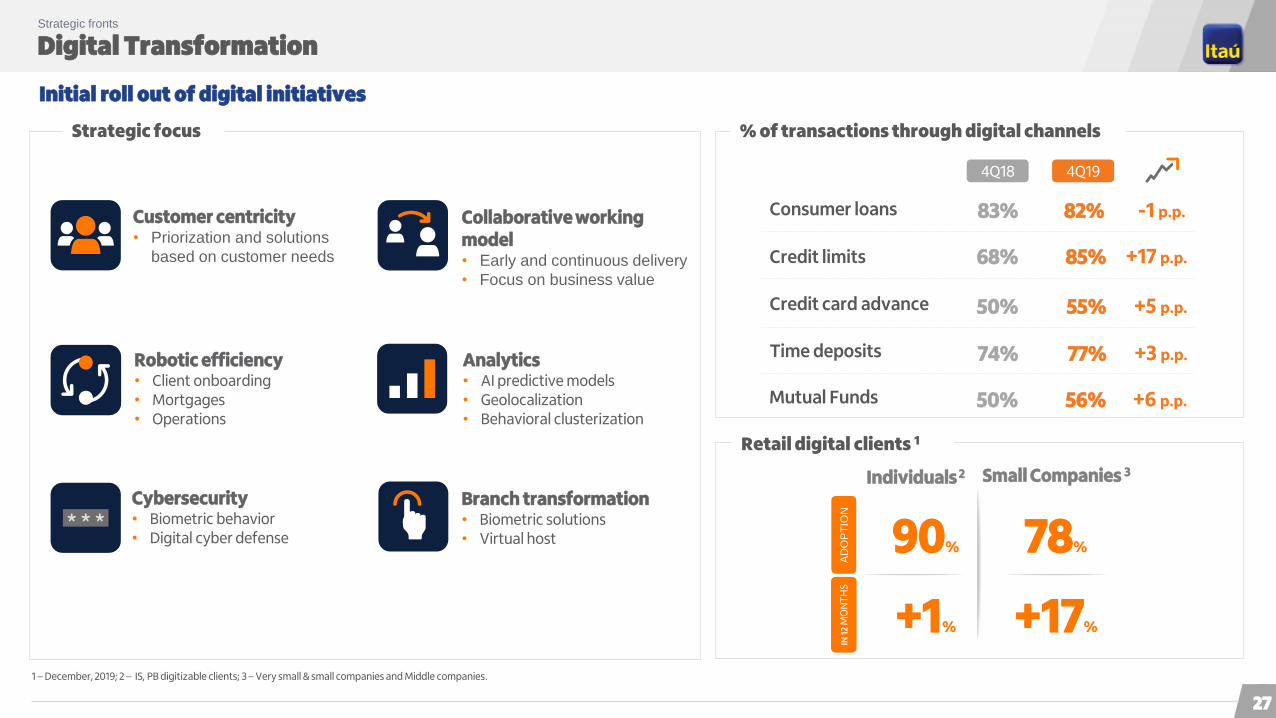
Initial roll out of digital initiatives
18 agile squads integrated by multidisciplinary teams with 253 employees on
average fully dedicated that are looking at opportunities for change and are
re-thinking the entire bank processes with a disciplined and focused approach
Building a Digital Bank from inside….
Out ....
320+ releases and new functionalities, user interface and offers through our digital channels
Advanced work methodologies and tools
Back-end to front-end digitalization of opening of digital accounts process
26
Digital Transformation Strategic fronts
Initial roll out of digital initiatives
% of transactions through digital channels
Retail digital clients 1
Individuals 2
Consumer loans
Credit limits
Credit card advance
82%
85%
55%
4Q19
83%
68%
50%
4Q18
Time deposits 77%74%
-1 p.p.
+17 p.p.
+5 p.p.
+3 p.p.
90%
+1%
AD
OP
TIO
NIN
12
MO
NT
HS
78%
+17%
Small Companies 3
1 – December, 2019; 2 – IS, PB digitizable clients; 3 – Very small & small companies and Middle companies.
Collaborative working model• Early and continuous delivery
• Focus on business value
Customer centricity• Priorization and solutions
based on customer needs
Branch transformation• Biometric solutions• Virtual host
Cybersecurity• Biometric behavior• Digital cyber defense
Robotic efficiency• Client onboarding• Mortgages• Operations
Analytics• AI predictive models• Geolocalization• Behavioral clusterization
Strategic focus
Mutual Funds 56%50% +6 p.p.
27

Digital Transformation Strategic fronts
Investment platform
“Know our products” section
Investment summary Investment proposalConsolidated investment statement
Improving customer experienceEasing investment process for better and faster decisions
Releases
Individuals Products Website
May-19 Jun-19 Dec-19
50%
56%
2018 2019
Mutual funds transactions throughdigital channels
Oct-19
▲ 6 p.p.
28
Digital Transformation Strategic fronts
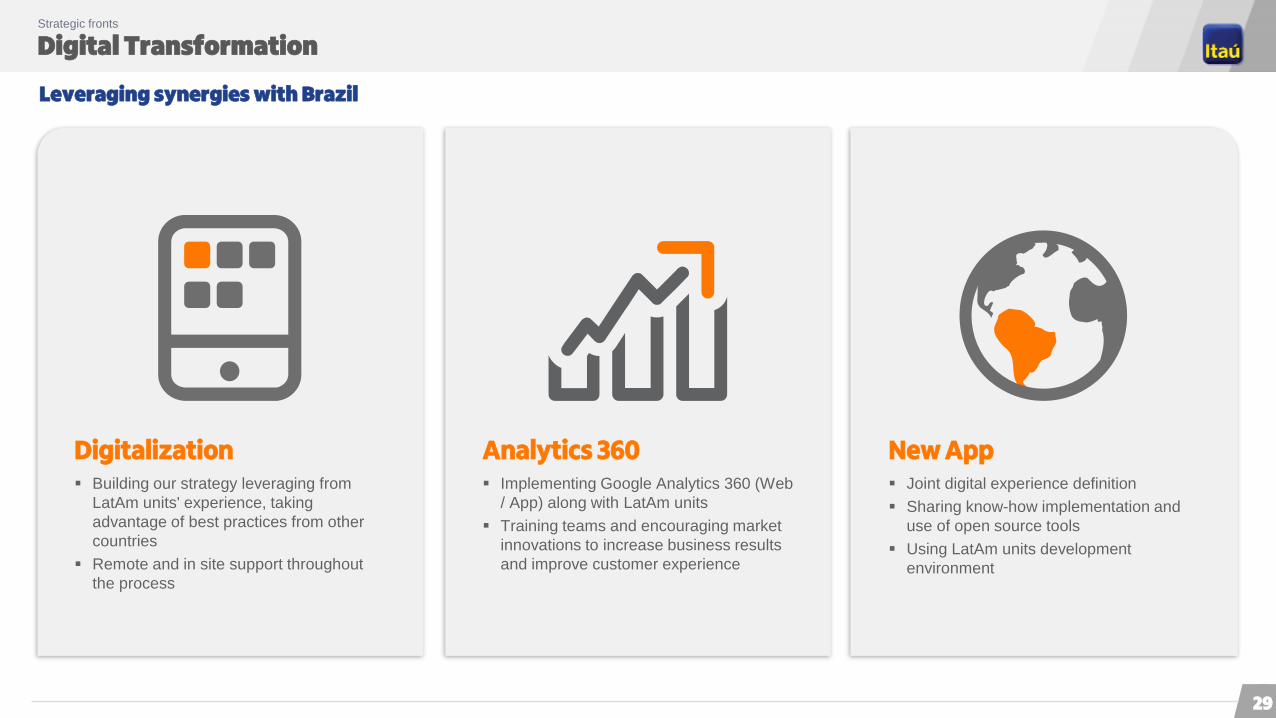
Leveraging synergies with Brazil
Analytics 360 Implementing Google Analytics 360 (Web
/ App) along with LatAm units
Training teams and encouraging market
innovations to increase business results
and improve customer experience
New App Joint digital experience definition
Sharing know-how implementation and
use of open source tools
Using LatAm units development
environment
Digitalization Building our strategy leveraging from
LatAm units' experience, taking
advantage of best practices from other
countries
Remote and in site support throughout
the process
29
Key Strategic Drivers to Continue Deepening Itaú’s Management ModelStrategic fronts
Segmentation model with well defined identity and value proposition
Development of products and a “service culture” focused on client satisfaction and long-term relationships
Client Centricity
Culture of innovation and transformation
Efficiency and improvement of user experience and customer satisfaction
Seamless integration from back-office to front-office
Strengthening our culture throughout the organization
To enhance our incentive models and our assessment tools
To consider the new dynamics of cooperative working
2
1
3
4 Expand our presence and client base in all business
segments
Special focus on growing our Retail Bank
Further increase transactionality and relationship within our client base
People Management
Digital Transformation
Growth
5
Efficiency
6 Continued and sustainable rebound in results
Resume expansion in business volumes
Advance with the implementation of retail and wholesale
strategies
Colombia
Continuously increase the efficiency of our operations
Drill down of the full cost allocation model to product level
Continued focus and discipline in identifying cost saving
opportunities throughout the institution
30
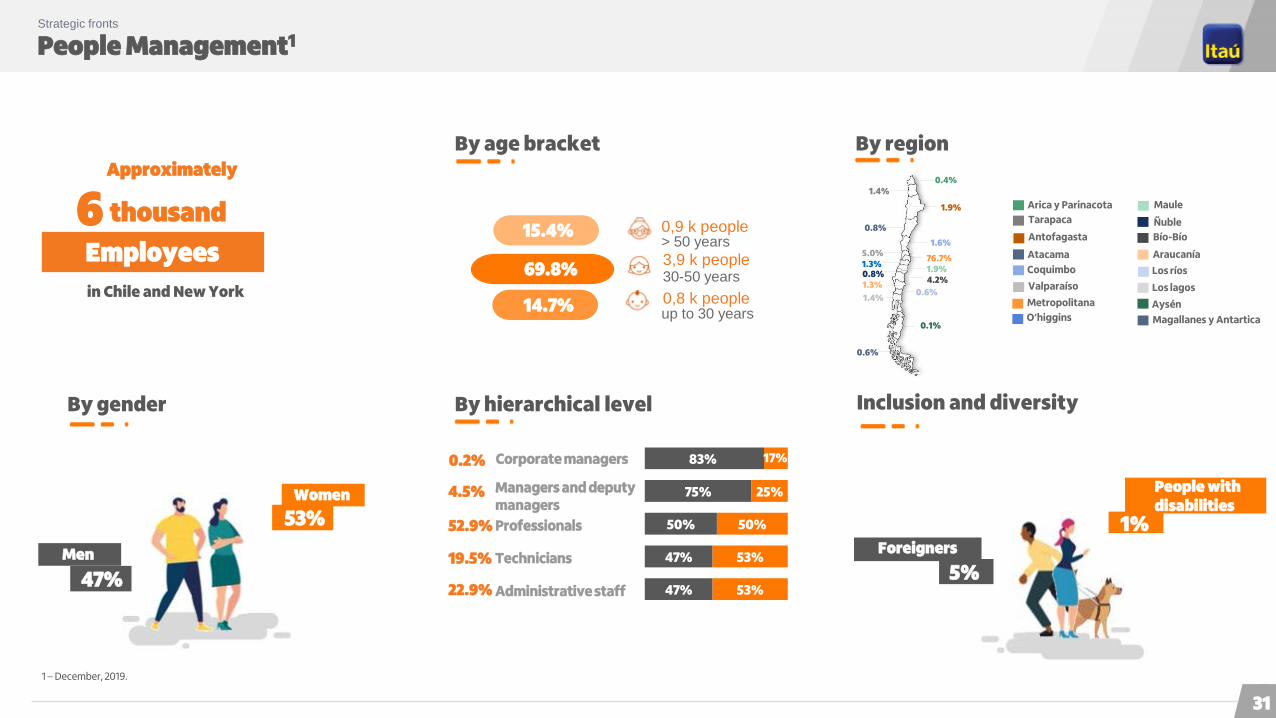
People Management1Strategic fronts
By hierarchical level Inclusion and diversityBy gender
By age bracket By region
thousand
Employees
6
in Chile and New York
Approximately
0,9 k people
3,9 k people
0,8 k people
> 50 years
30-50 years
up to 30 years
Arica y Parinacota
69.8%
14.7%
0.2%
47%
53%
Men
Women
1 – December, 2019.
5%
1%
People with disabilities
Foreigners
0.4%1.4%
1.9%
0.8%
1.6%5.0%1.3%
1.9%4.2%
1.3%
1.4%
0.6%
76.7%
0.6%
0.1%
Tarapaca
Antofagasta
Atacama
Coquimbo
Valparaíso
O’higgins
Maule
Bío-Bío
Araucanía
Los ríos
Los lagos
Aysén
Magallanes y Antartica
Metropolitana
Ñuble
0.8%
47%
47%
50%
75%
83%
53%
53%
50%
25%
17%Corporate managers
4.5% Managers and deputy managers
52.9% Professionals
19.5% Technicians
22.9% Administrative staff
15.4%
31

People Management Strategic fronts
We are people providing service to people, with passion and excellence
Organizational Climate(hable francamente)
9 p.p.of 2019 employees satisfaction
Dress Code Flexibility for Employees
Go As I Am
Lideramore than 14,000 training hours in our program for leaders
Escuela Itaú+400,000 training hours for employees
(regulatory and languages workshops, Crece
program, Diploma at Universidad Católica for 60
managers, among others)
Recognized as the 9th best company in Chile in Attraction and Retention of Talentby Merco
32
Key Strategic Drivers to Continue Deepening Itaú’s Management ModelStrategic fronts
Segmentation model with well defined identity and value proposition
Development of products and a “service culture” focused on client satisfaction and long-term relationships
Client Centricity
Culture of innovation and transformation
Efficiency and improvement of user experience and customer satisfaction
Seamless integration from back-office to front-office
Strengthening our culture throughout the organization
To enhance our incentive models and our assessment tools
To consider the new dynamics of cooperative working
2
1
3
4 Expand our presence and client base in all business
segments
Special focus on growing our Retail Bank
Further increase transactionality and relationship within our client base
People Management
Digital Transformation
Growth
5
Efficiency
6 Continued and sustainable rebound in results
Resume expansion in business volumes
Advance with the implementation of retail and wholesale
strategies
Colombia
Continuously increase the efficiency of our operations
Drill down of the full cost allocation model to product level
Continued focus and discipline in identifying cost saving
opportunities throughout the institution
33
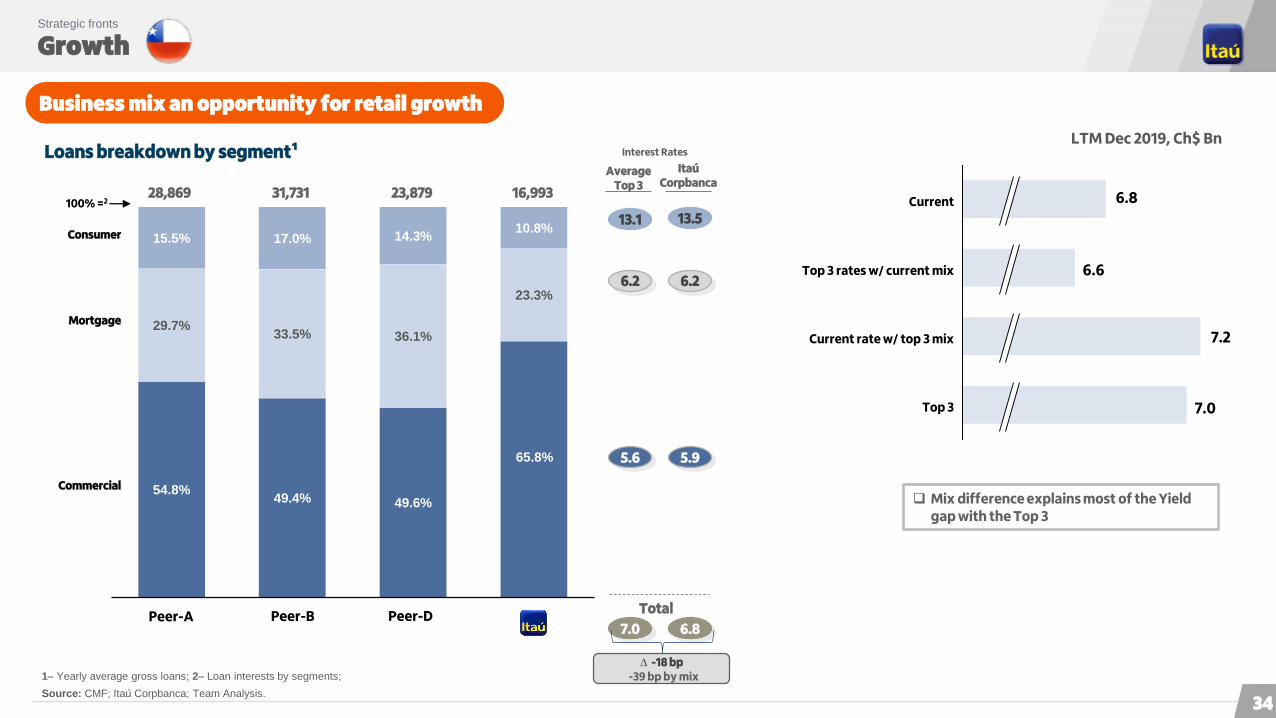
Growth Strategic fronts
Business mix an opportunity for retail growth
1 Yearly average gross loans; 2 Loan interests by segments;
Source: CMF; Itaú Corpbanca; Team Analysis.
Loans breakdown by segment¹LTM Dec 2019, Ch$ Bn
13.1
7.0
13.5
6.8
Total
6.2 6.2
5.6 5.9
ItaúCorpbanca
AverageTop 3
Interest Rates
28,869
Consumer
Commercial
16,99323,879
Mortgage
31,731
∆ -18 bp-39 bp by mix
Peer-A Peer-B Peer-D
Current rate w/ top 3 mix
Current
Top 3
Top 3 rates w/ current mix
Mix difference explains most of the Yield gap with the Top 3
100% =2
54.8%49.4% 49.6%
65.8%
29.7%33.5% 36.1%
23.3%
15.5% 17.0% 14.3%10.8%
7.0
7.2
6.8
6.6
34

Growth Strategic fronts
Loan Portfolio
Portfolio Mix (%)
Retail: 32.5%
Retail: 33.6%
Market Share (2019)
7.2%
Commercial
Mortgage
Consumer
7.9%
12.0%
Total Loans
10.1%
29 bp
14 bp
21 bp
10 bp
Share 12-month
Commercial
67.5%
Mortgage
22.8%
Consumer9.7%
Commercial
66.5%
Mortgage
23.0%
Consumer
10.5%
2017
2019
107 bp
Consumer growth
1.8x Market
2019 vs. 2018
35

Growth Strategic fronts
Credit portfolio growth rate
(1) Ex Student loans portfolio
Commercial1
Mortgage Consumer
8.7%
9.7%
dic-16 mar-17 jun-17 sep-17 dic-17 mar-18 jun-18 sep-18 dec-18 mar-19 jun-19 sep-19 dic-19
Convergence
Total Loans
9.0%10.3%
dic-16 mar-17 jun-17 sep-17 dic-17 mar-18 jun-18 sep-18 dec-18 mar-19 jun-19 sep-19 dic-19
Convergence
9.3%
11.2%
dic-16 mar-17 jun-17 sep-17 dic-17 mar-18 jun-18 sep-18 dec-18 mar-19 jun-19 sep-19 dic-19
Reducing the gap
9.9%
5.5%
dic-16 mar-17 jun-17 sep-17 dic-17 mar-18 jun-18 sep-18 dec-18 mar-19 jun-19 sep-19 dic-19
1.8x Market
36
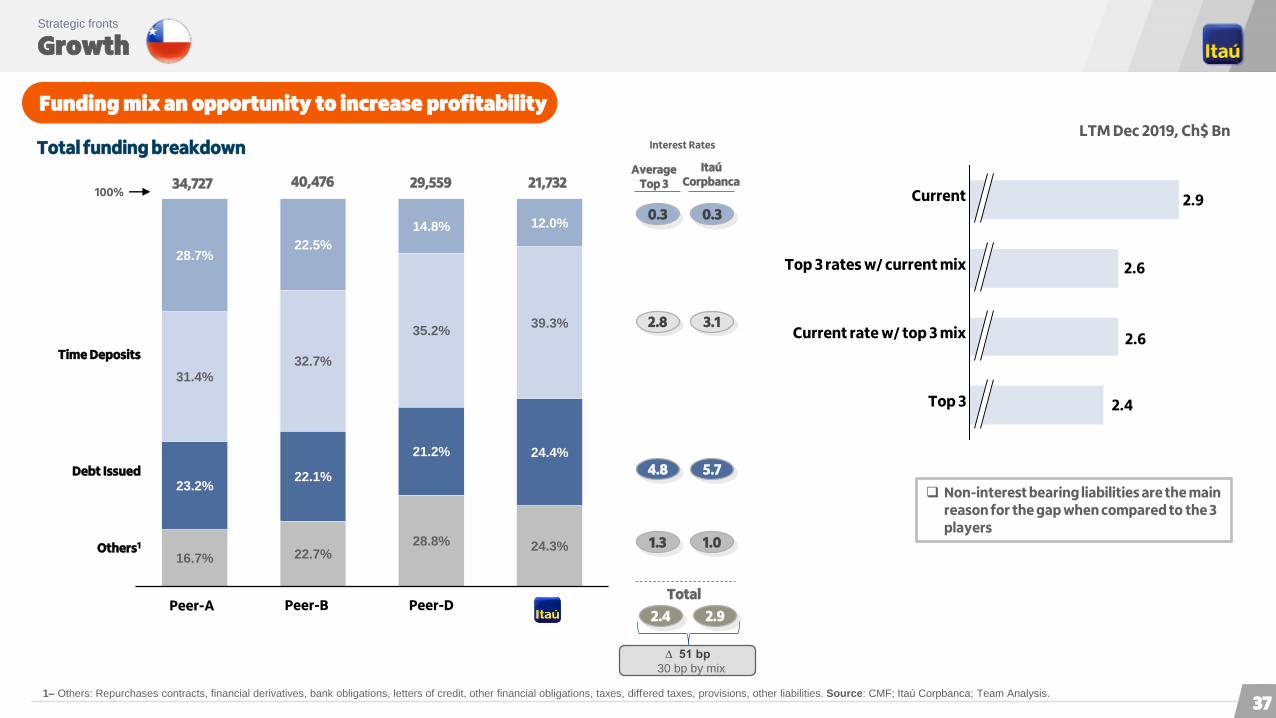
Growth Strategic fronts
Funding mix an opportunity to increase profitability
Total funding breakdown Interest Rates
34,727 21,732
Debt Issued
40,476
Others1
100%29,559
2.8
2.4
3.1
2.9
Total
0.3 0.3
4.8 5.7
Itaú Corpbanca
1.3 1.0
Average Top 3
∆ 51 bp
30 bp by mix
Peer-A Peer-B Peer-D
Top 3 rates w/ current mix
Current rate w/ top 3 mix
Non-interest bearing liabilities are the main reason for the gap when compared to the 3 players
Time Deposits
1 Others: Repurchases contracts, financial derivatives, bank obligations, letters of credit, other financial obligations, taxes, differed taxes, provisions, other liabilities. Source: CMF; Itaú Corpbanca; Team Analysis.
LTM Dec 2019, Ch$ Bn
Top 3
Current
16.7% 22.7%28.8% 24.3%
23.2%22.1%
21.2% 24.4%
31.4%
32.7%
35.2%39.3%
28.7%22.5%
14.8% 12.0%
2.6
2.9
2.6
2.4
37
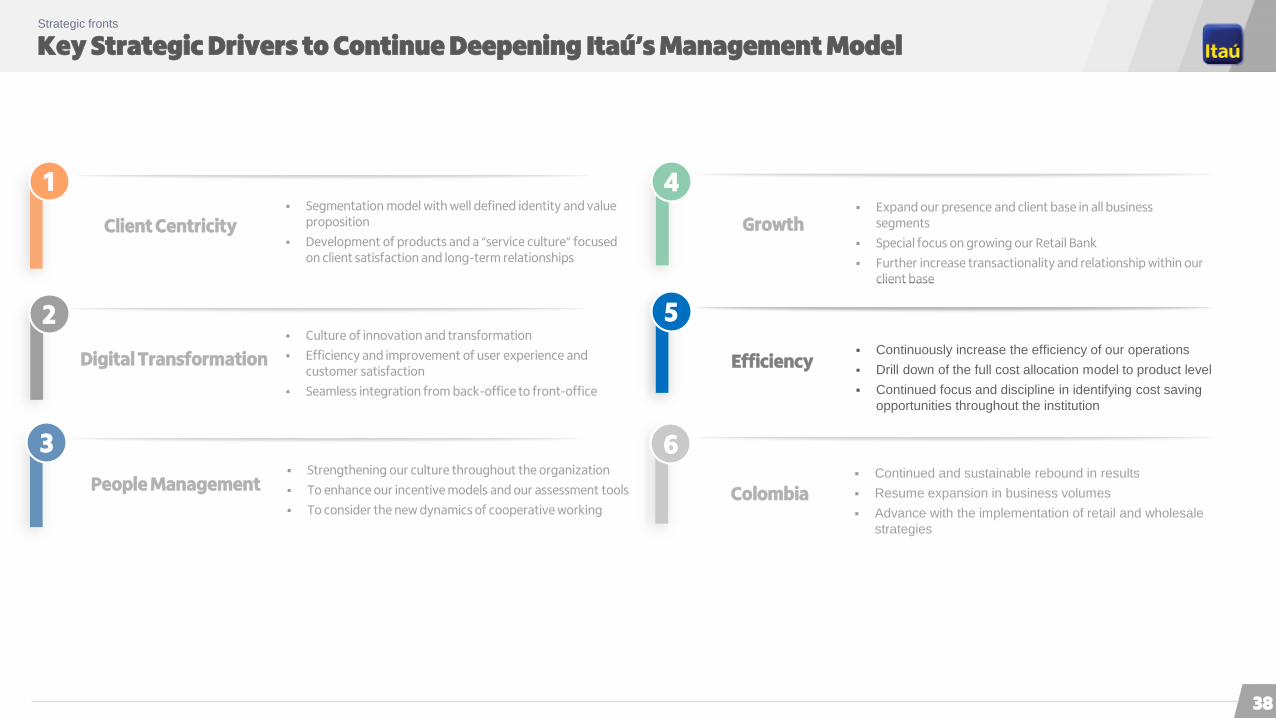
Key Strategic Drivers to Continue Deepening Itaú’s Management ModelStrategic fronts
Segmentation model with well defined identity and value proposition
Development of products and a “service culture” focused on client satisfaction and long-term relationships
Client Centricity
Culture of innovation and transformation
Efficiency and improvement of user experience and customer satisfaction
Seamless integration from back-office to front-office
Strengthening our culture throughout the organization
To enhance our incentive models and our assessment tools
To consider the new dynamics of cooperative working
2
1
3
4 Expand our presence and client base in all business
segments
Special focus on growing our Retail Bank
Further increase transactionality and relationship within our client base
People Management
Digital Transformation
Growth
5
Efficiency
6 Continued and sustainable rebound in results
Resume expansion in business volumes
Advance with the implementation of retail and wholesale
strategies
Colombia
Continuously increase the efficiency of our operations
Drill down of the full cost allocation model to product level
Continued focus and discipline in identifying cost saving
opportunities throughout the institution
38
Efficiency Strategic fronts
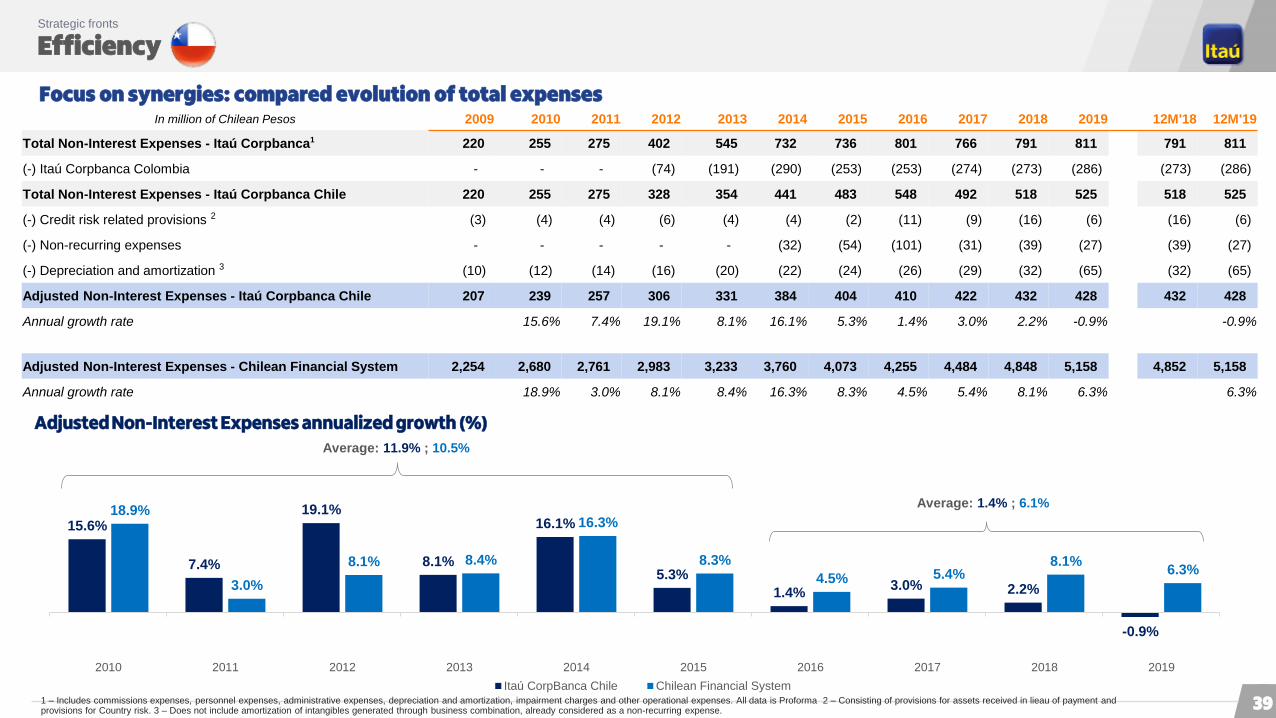
Focus on synergies: compared evolution of total expenses
Average: 11.9% ; 10.5%
Adjusted Non-Interest Expenses annualized growth (%)
1 – Includes commissions expenses, personnel expenses, administrative expenses, depreciation and amortization, impairment charges and other operational expenses. All data is Proforma 2 – Consisting of provisions for assets received in lieau of payment andprovisions for Country risk. 3 – Does not include amortization of intangibles generated through business combination, already considered as a non-recurring expense.
Average: 1.4% ; 6.1%
In million of Chilean Pesos 2009 2010 2011 2012 2013 2014 2015 2016 2017 2018 2019 12M'18 12M'19
Total Non-Interest Expenses - Itaú Corpbanca1 220 255 275 402 545 732 736 801 766 791 811 791 811
(-) Itaú Corpbanca Colombia - - - (74) (191) (290) (253) (253) (274) (273) (286) (273) (286)
Total Non-Interest Expenses - Itaú Corpbanca Chile 220 255 275 328 354 441 483 548 492 518 525 518 525
(-) Credit risk related provisions 2 (3) (4) (4) (6) (4) (4) (2) (11) (9) (16) (6) (16) (6)
(-) Non-recurring expenses - - - - - (32) (54) (101) (31) (39) (27) (39) (27)
(-) Depreciation and amortization 3 (10) (12) (14) (16) (20) (22) (24) (26) (29) (32) (65) (32) (65)
Adjusted Non-Interest Expenses - Itaú Corpbanca Chile 207 239 257 306 331 384 404 410 422 432 428 432 428
Annual growth rate 15.6% 7.4% 19.1% 8.1% 16.1% 5.3% 1.4% 3.0% 2.2% -0.9% -0.9%
Adjusted Non-Interest Expenses - Chilean Financial System 2,254 2,680 2,761 2,983 3,233 3,760 4,073 4,255 4,484 4,848 5,158 4,852 5,158
Annual growth rate 18.9% 3.0% 8.1% 8.4% 16.3% 8.3% 4.5% 5.4% 8.1% 6.3% 6.3%
15.6%
7.4%
19.1%
8.1%
16.1%
5.3%
1.4%3.0% 2.2%
-0.9%
18.9%
3.0%
8.1% 8.4%
16.3%
8.3%
4.5% 5.4%8.1%
6.3%
2010 2011 2012 2013 2014 2015 2016 2017 2018 2019
Itaú CorpBanca Chile Chilean Financial System
39
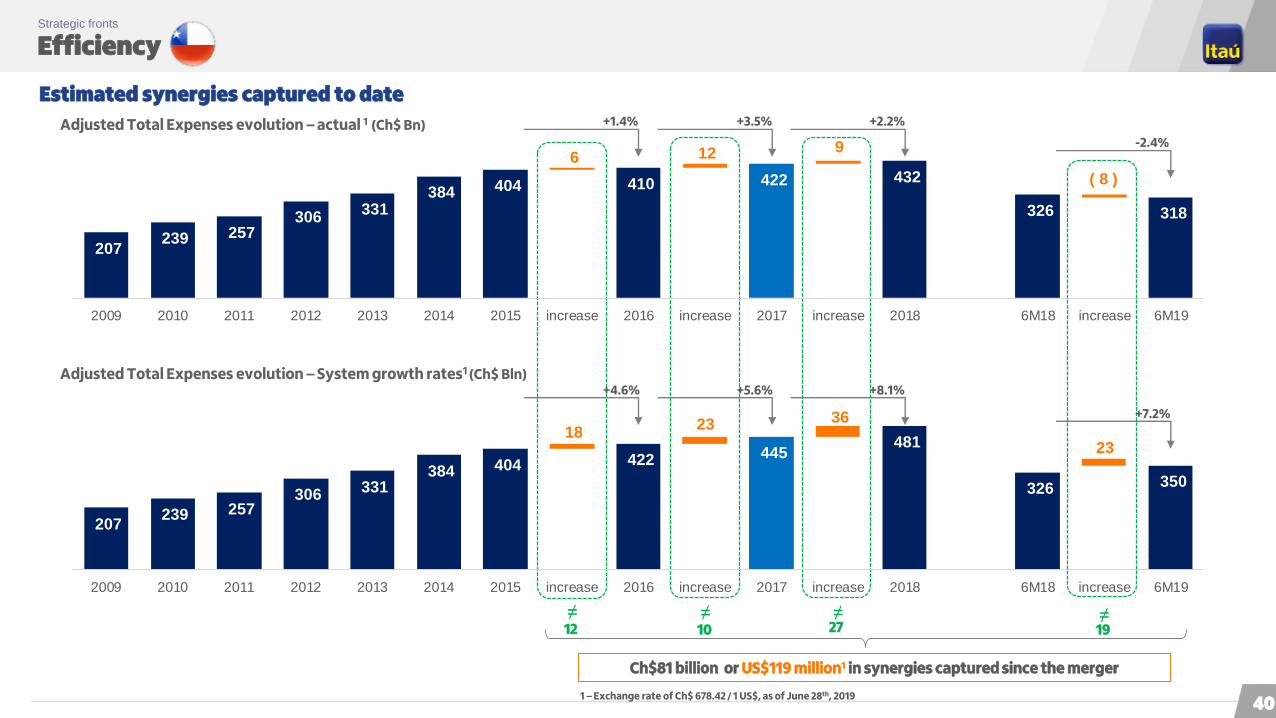
Efficiency Strategic fronts
Estimated synergies captured to date
≠10 27
Ch$81 billion or US$119 million1 in synergies captured since the merger
Adjusted Total Expenses evolution – actual 1 (Ch$ Bn)
Adjusted Total Expenses evolution – System growth rates1 (Ch$ Bln)
≠19≠
1 – Exchange rate of Ch$ 678.42 / 1 US$, as of June 28th, 2019
+1.4%
+4.6%
+3.5%
+5.6%
+2.2%
+8.1%
≠12
207 239 257
306 331
384 404 410 422 432
326 318
6 12 9
( 8 )
2009 2010 2011 2012 2013 2014 2015 increase 2016 increase 2017 increase 2018 6M18 increase 6M19
207 239 257
306 331 384 404 422 445
481
326 350
18 23 36
23
2009 2010 2011 2012 2013 2014 2015 increase 2016 increase 2017 increase 2018 6M18 increase 6M19
-2.4%
+7.2%
40

Key Strategic Drivers to Continue Deepening Itaú’s Management ModelStrategic fronts
Segmentation model with well defined identity and value proposition
Development of products and a “service culture” focused on client satisfaction and long-term relationships
Client Centricity
Culture of innovation and transformation
Efficiency and improvement of user experience and customer satisfaction
Seamless integration from back-office to front-office
Strengthening our culture throughout the organization
To enhance our incentive models and our assessment tools
To consider the new dynamics of cooperative working
2
1
3
4 Expand our presence and client base in all business
segments
Special focus on growing our Retail Bank
Further increase transactionality and relationship within our client base
People Management
Digital Transformation
Growth
5
Efficiency
6 Continued and sustainable rebound in results
Resume expansion in business volumes
Advance with the implementation of retail and wholesale
strategies
Colombia
Continuously increase the efficiency of our operations
Drill down of the full cost allocation model to product level
Continued focus and discipline in identifying cost saving
opportunities throughout the institution
41
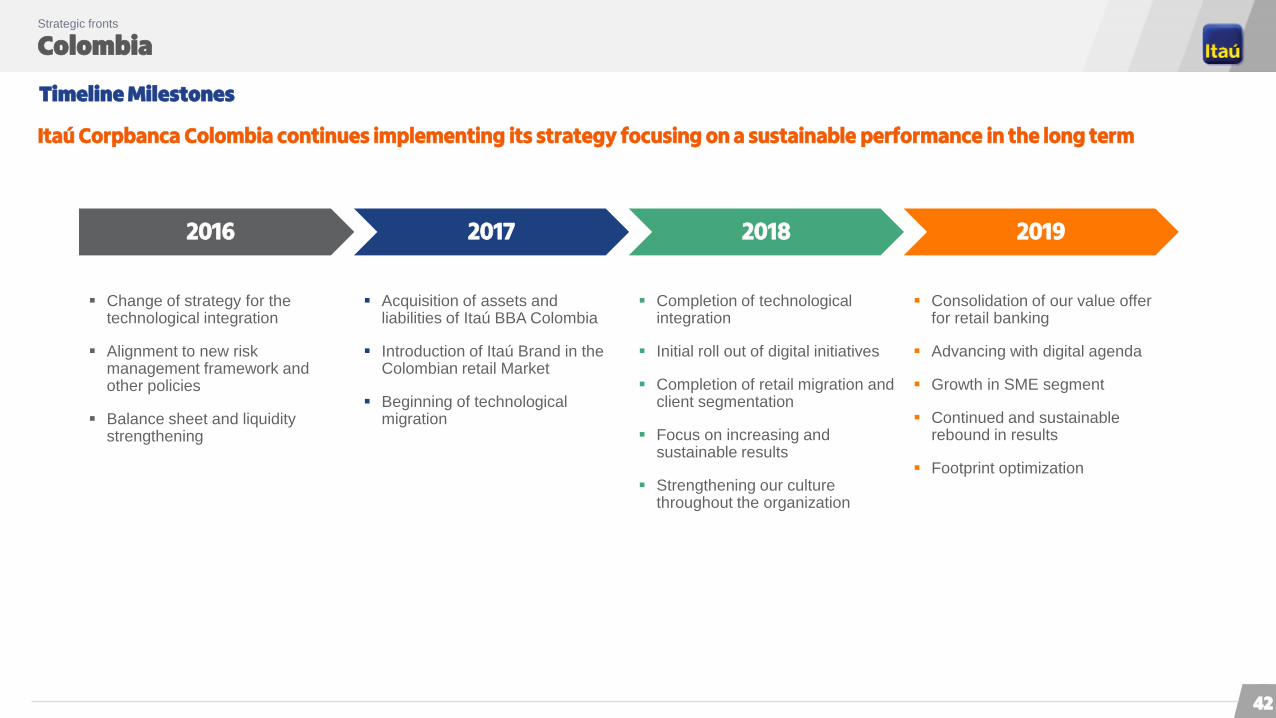
Colombia Strategic fronts
Timeline Milestones
2016 2017 2018 2019
Change of strategy for the technological integration
Alignment to new risk management framework and other policies
Balance sheet and liquidity strengthening
Acquisition of assets and liabilities of Itaú BBA Colombia
Introduction of Itaú Brand in the Colombian retail Market
Beginning of technological migration
Completion of technological integration
Initial roll out of digital initiatives
Completion of retail migration and client segmentation
Focus on increasing and sustainable results
Strengthening our culture throughout the organization
Consolidation of our value offer for retail banking
Advancing with digital agenda
Growth in SME segment
Continued and sustainable rebound in results
Footprint optimization
Itaú Corpbanca Colombia continues implementing its strategy focusing on a sustainable performance in the long term
42
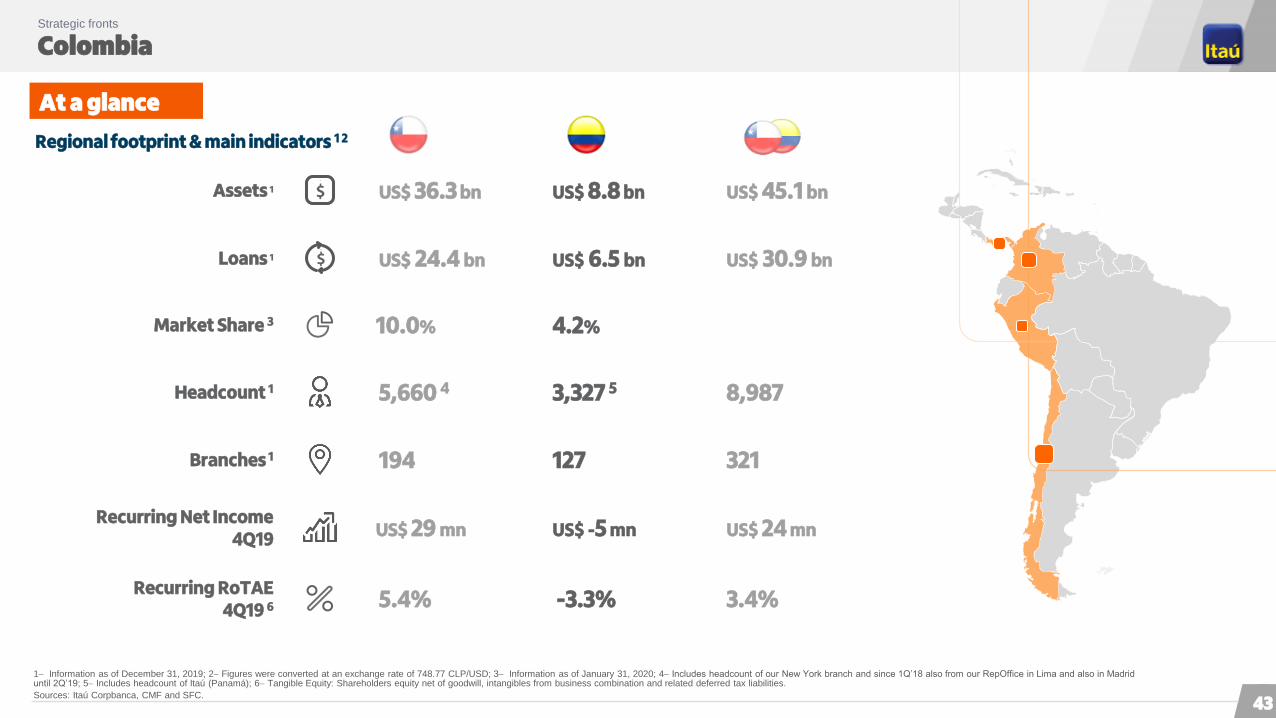
ColombiaStrategic fronts
Regional footprint & main indicators 1 2
10.0% 4.2%Market Share 3
US$ 24.4 bn US$ 6.5 bn Loans 1 US$ 30.9 bn
5,660 4 3,327 5Headcount 1 8,987
194 127 Branches 1 321
US$ 36.3 bn US$ 8.8 bnAssets 1 US$ 45.1 bn
US$ 29 mn US$ -5 mn Recurring Net Income
4Q19 US$ 24 mn
5.4% -3.3% Recurring RoTAE
4Q19 6 3.4%
1 Information as of December 31, 2019; 2 Figures were converted at an exchange rate of 748.77 CLP/USD; 3 Information as of January 31, 2020; 4 Includes headcount of our New York branch and since 1Q’18 also from our RepOffice in Lima and also in Madrid until 2Q’19; 5 Includes headcount of Itaú (Panamá); 6 Tangible Equity: Shareholders equity net of goodwill, intangibles from business combination and related deferred tax liabilities.
Sources: Itaú Corpbanca, CMF and SFC.
At a glance
43
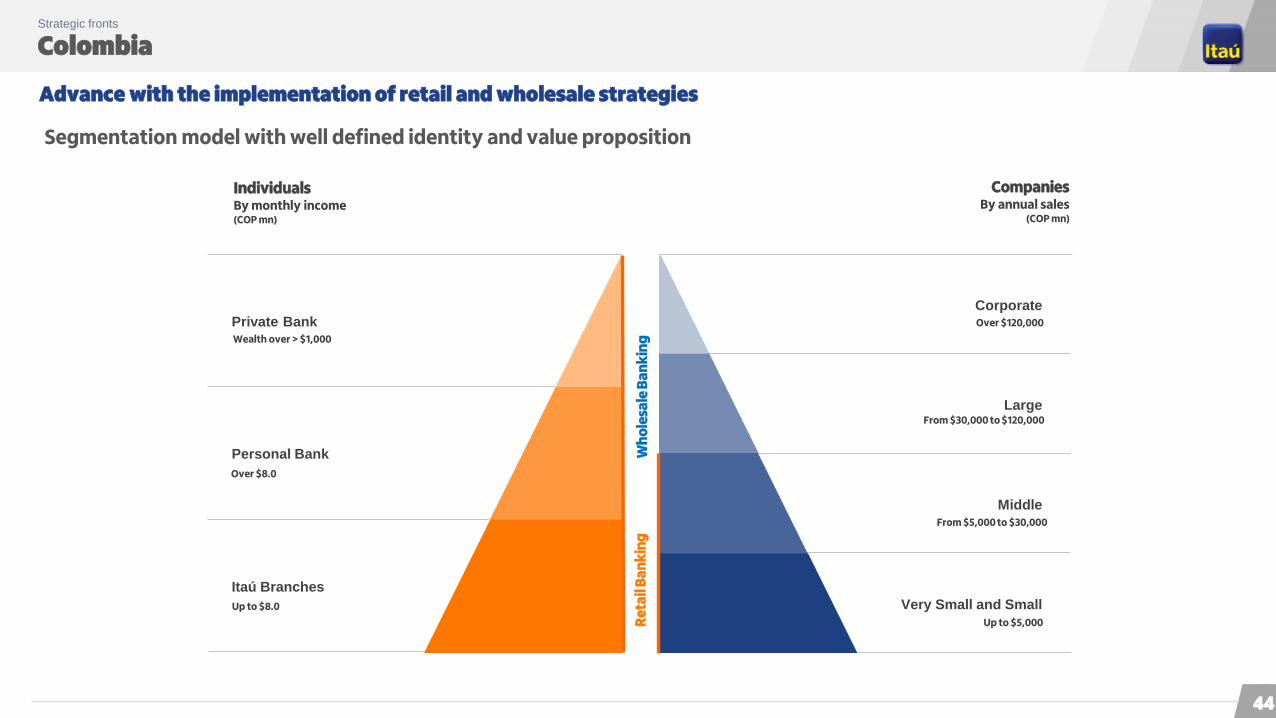
Colombia Strategic fronts
Advance with the implementation of retail and wholesale strategies
Segmentation model with well defined identity and value proposition
Private Bank
Personal Bank
Itaú Branches
Corporate
Large
Middle
Very Small and Small
Wh
ole
sale
Ba
nk
ing
Re
tail
Ba
nk
ing
Wealth over > $1,000
Over $8.0
Up to $8.0
Over $120,000
From $30,000 to $120,000
Up to $5,000
From $5,000 to $30,000
IndividualsBy monthly income(COP mn)
CompaniesBy annual sales
(COP mn)
44
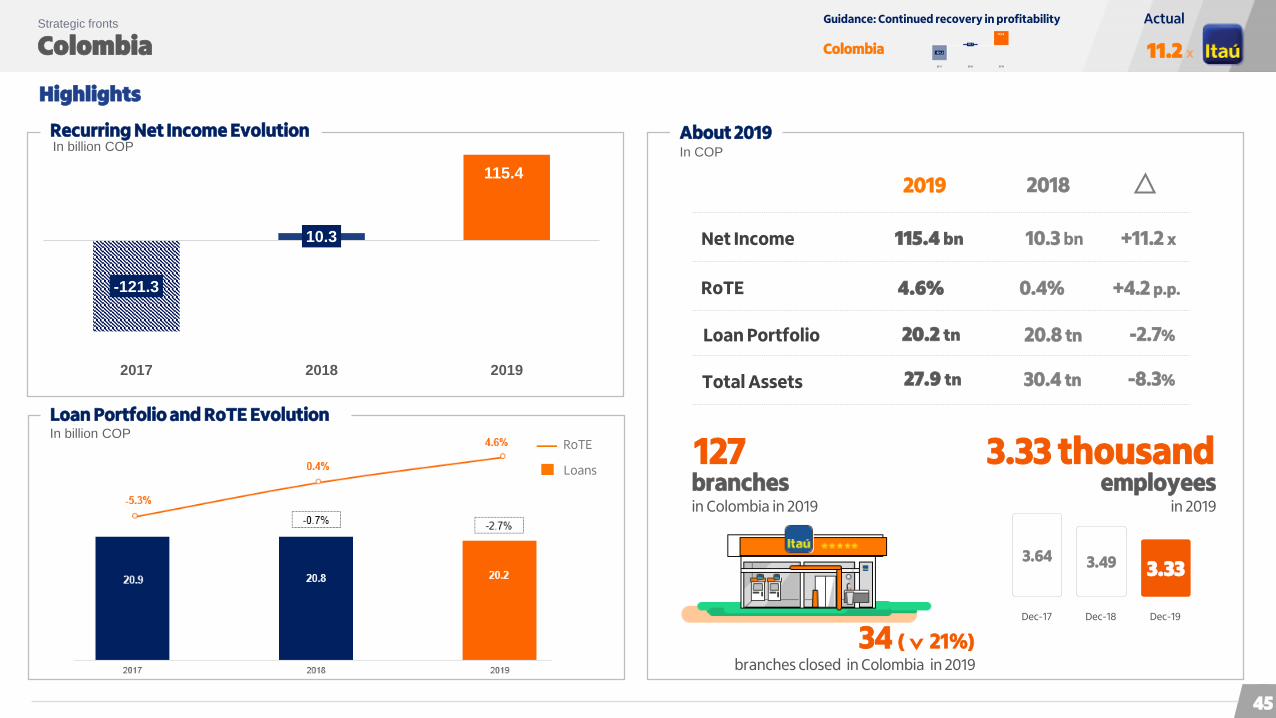
Colombia Strategic fronts
Highlights
About 2019In COP
-121.3
10.3
115.4
2017 2018 2019
Recurring Net Income EvolutionIn billion COP
RoTE
Loans
Loan Portfolio and RoTE EvolutionIn billion COP
branches closed in Colombia in 2019
3.33 thousandemployees
in 2019
10.3 bn
0.4%
20.8 tn
30.4 tn
2019 2018
115.4 bn
4.6%
20.2 tn
27.9 tn
Net Income
RoTE
Loan Portfolio
Total Assets
(443.1)(451.5)
+11.2 x
+4.2 p.p.
-2.7%
-8.3%
1.9%3.49 3.33
3.64
Dec-18 Dec-19Dec-17
127branches in Colombia in 2019
34 ( 21%)
Colombia
ActualGuidance: Continued recovery in profitability
11.2 x
45

Agenda
Economiccontext
Corporate governance
Corporate profile
Strategicfronts
Capital and
risk management
04
06
15
18
47
50 Highlightsof the results
61Additionalinformation

Capital Capital and risk management
Estimated BIS III capital ratio
CET 1
New LGB
(Dec. 2024)
SIFI (est.)
CCB
AT1
Total Capital
Tier II
CET 1
Tier I9.0% -1.8%
-0.2% 7.0%
Regulatory CapitalRatio (Dec. 19)
Other Intangible Assets/ Net Deferred Taxes
Net effectof changes in RWA
Estimated Fully LoadedBIS III Capital
4.1%
13.1%
4.5%
11.5%
1.5%
1.0%
2.5%
8.0%
9.5%
2.0%3.5%
10.5%
-0.7%
Max use of Tier II
Regulatory Capital Ratio
(Dec. 2019)
Tier II
Tier I
47
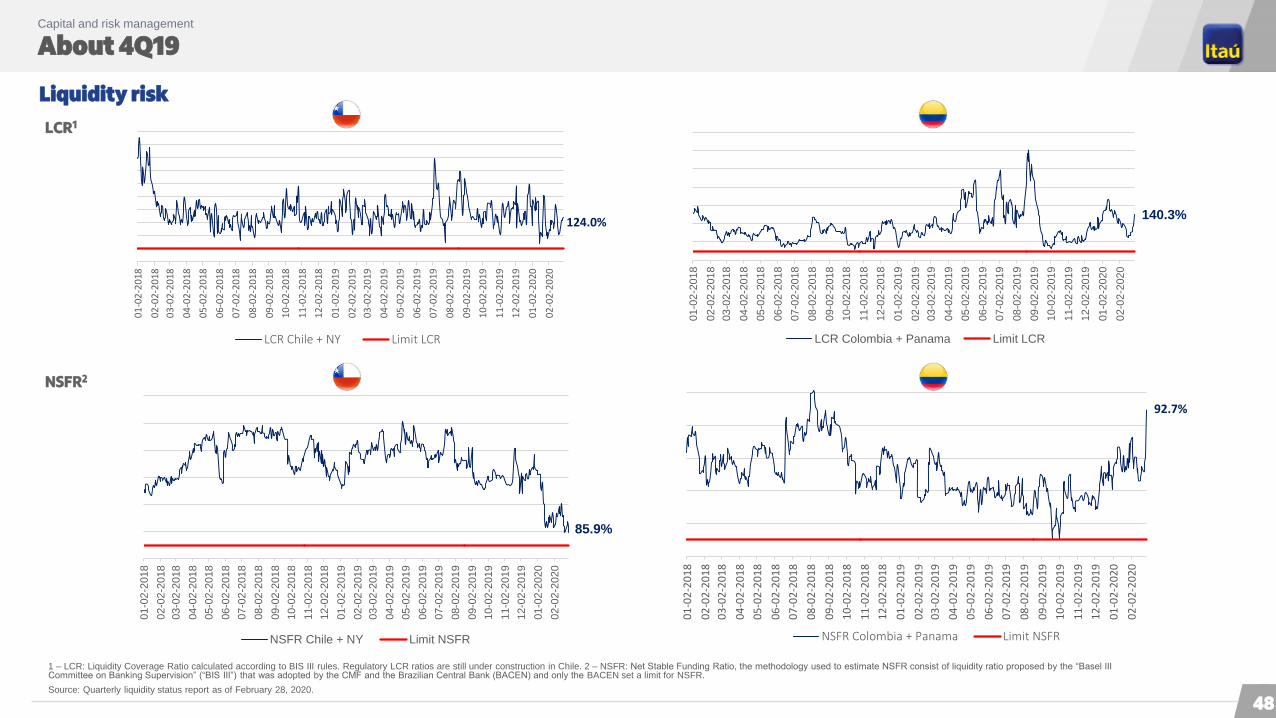
About 4Q19 Capital and risk management
Liquidity risk
1 – LCR: Liquidity Coverage Ratio calculated according to BIS III rules. Regulatory LCR ratios are still under construction in Chile. 2 – NSFR: Net Stable Funding Ratio, the methodology used to estimate NSFR consist of liquidity ratio proposed by the “Basel III Committee on Banking Supervision” (“BIS III”) that was adopted by the CMF and the Brazilian Central Bank (BACEN) and only the BACEN set a limit for NSFR.
Source: Quarterly liquidity status report as of February 28, 2020.
48
LCR1
NSFR2
124.0%
01
-02
-20
18
02
-02
-20
18
03
-02
-20
18
04
-02
-20
18
05
-02
-20
18
06
-02
-20
18
07
-02
-20
18
08
-02
-20
18
09
-02
-20
18
10
-02
-20
18
11
-02
-20
18
12
-02
-20
18
01
-02
-20
19
02
-02
-20
19
03
-02
-20
19
04
-02
-20
19
05
-02
-20
19
06
-02
-20
19
07
-02
-20
19
08
-02
-20
19
09
-02
-20
19
10
-02
-20
19
11
-02
-20
19
12
-02
-20
19
01
-02
-20
20
02
-02
-20
20
LCR Chile + NY Limit LCR
85.9%
01-0
2-2
018
02-0
2-2
018
03-0
2-2
018
04-0
2-2
018
05-0
2-2
018
06-0
2-2
018
07-0
2-2
018
08-0
2-2
018
09-0
2-2
018
10-0
2-2
018
11-0
2-2
018
12-0
2-2
018
01-0
2-2
019
02-0
2-2
019
03-0
2-2
019
04-0
2-2
019
05-0
2-2
019
06-0
2-2
019
07-0
2-2
019
08-0
2-2
019
09-0
2-2
019
10-0
2-2
019
11-0
2-2
019
12-0
2-2
019
01-0
2-2
020
02-0
2-2
020
NSFR Chile + NY Limit NSFR
140.3%
01-0
2-2
018
02-0
2-2
018
03-0
2-2
018
04-0
2-2
018
05-0
2-2
018
06-0
2-2
018
07-0
2-2
018
08-0
2-2
018
09-0
2-2
018
10-0
2-2
018
11-0
2-2
018
12-0
2-2
018
01-0
2-2
019
02-0
2-2
019
03-0
2-2
019
04-0
2-2
019
05-0
2-2
019
06-0
2-2
019
07-0
2-2
019
08-0
2-2
019
09-0
2-2
019
10-0
2-2
019
11-0
2-2
019
12-0
2-2
019
01-0
2-2
020
02-0
2-2
020
LCR Colombia + Panama Limit LCR
92.7%
01
-02
-20
18
02
-02
-20
18
03
-02
-20
18
04
-02
-20
18
05
-02
-20
18
06
-02
-20
18
07
-02
-20
18
08
-02
-20
18
09
-02
-20
18
10
-02
-20
18
11
-02
-20
18
12
-02
-20
18
01
-02
-20
19
02
-02
-20
19
03
-02
-20
19
04
-02
-20
19
05
-02
-20
19
06
-02
-20
19
07
-02
-20
19
08
-02
-20
19
09
-02
-20
19
10
-02
-20
19
11
-02
-20
19
12
-02
-20
19
01
-02
-20
20
02
-02
-20
20
NSFR Colombia + Panama Limit NSFR
Agenda
Economiccontext
Corporate governance
Corporate profile
Strategicfronts
Capital and
risk management
04
06
15
18
47
50 Highlightsof the results
61Additionalinformation
Financials Highlights of the results
Financial Information
The financial information included in this Management Discussion & Analysis presentation is based on our managerial model which is based on our managerial model
that we adjust for non-recurring events and we apply managerial criteria to disclose our income statements. Starting in the first quarter of 2019, we have been
disclosing our income statement in the same manner as we do internally, incorporating additional P&L reclassifications, fully converging to the format presented by Itaú
Unibanco.
This managerial financial model reflects how we measure, analyze and discuss financial results by segregating: (i) commercial performance; (ii) financial risk
management; (iii) credit risk management; and (iv) costs efficiency.
We believe this form of communicating our results will give you a clearer and better view of how we fare under these different perspectives. Please refer to pages 9 to
12 of our Management Discussion & Analysis Report (“MD&A Report”) for further details, available at ir.itau.cl.
50
About our year Highlights of the results
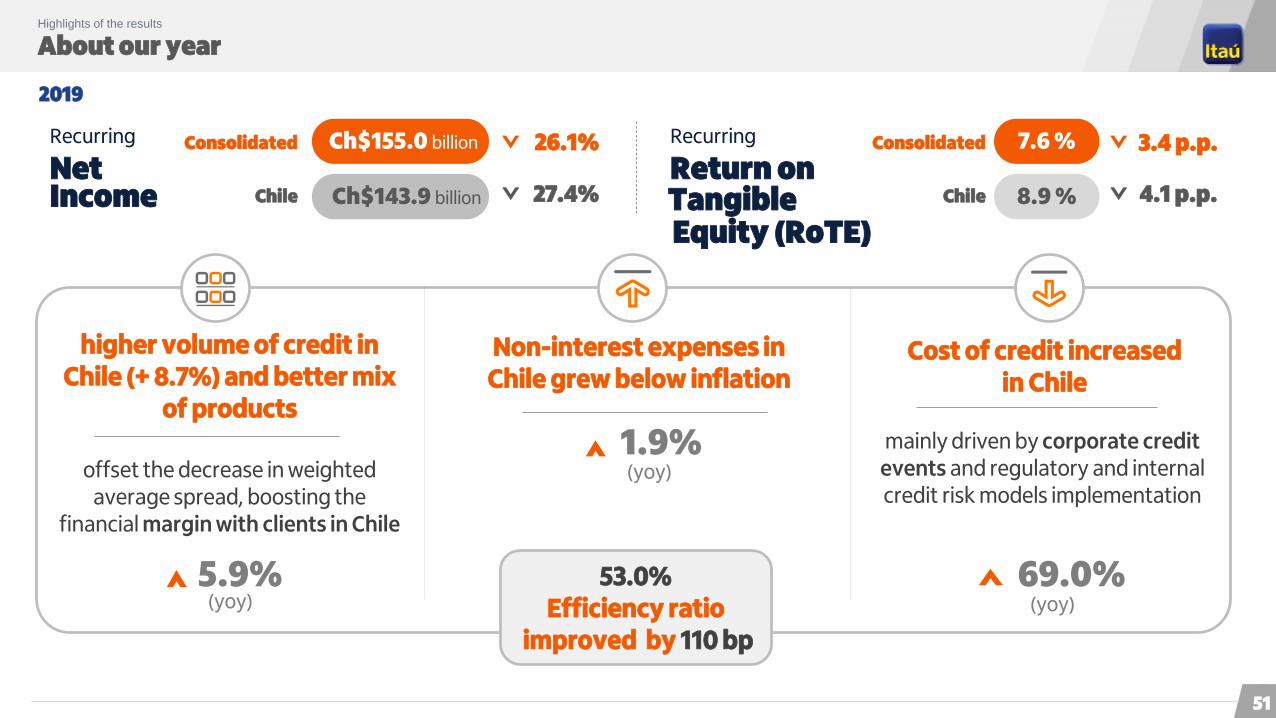
2019
higher volume of credit in Chile (+ 8.7%) and better mix
of products
offset the decrease in weighted average spread, boosting the
financial margin with clients in Chile
Cost of credit increased in Chile
69.0%
Non-interest expenses in Chile grew below inflation
1.9% mainly driven by corporate credit events and regulatory and internal credit risk models implementation
53.0% Efficiency ratio
improved by 110 bp
Recurring
Net
5.9%
Ch$155.0 billion
Ch$143.9 billion
Consolidated
Chile
26.1%
27.4%
3.4 p.p.Consolidated
Chile 4.1 p.p.
7.6 %
8.9 %Income
Recurring
Return onTangible
(yoy)
(yoy)
(yoy)
Equity (RoTE)
51

52
Recurring RoTE NPL 90+ daysLoansRecurring net income
Cost of credit Non-Interest expenses
Consolidated
Ch$17.9 bn
Chile
Ch$21.7 bn
-58.0 %
-46.0 %
Consolidated
3.4%
Chile
5.4%
108.5 %
169.0 %
11.5 %
5.5 %
Margin with clients
Consolidated
Ch$220.3 bn
Chile
Ch$161.3 bn
9.2 %
12.0 %
Commission and fees
Consolidated
Ch$50.6 bn
Chile
Ch$40.0 bn
9.1 %
10.1 %
4Q18 1Q19 2Q19 3Q19 4Q19 4Q18 1Q19 2Q19 3Q19 4Q19
4Q18 1Q19 2Q19 3Q19 4Q19 4Q18 1Q19 2Q19 3Q19 4Q19 4Q18 1Q19 2Q19 3Q19 4Q19 4Q18 1Q19 2Q19 3Q19 4Q19
Consolidated
2.8%
Chile
2.5%
4Q18 1Q19 2Q19 3Q19 4Q19
Consolidated
Ch$23.2 bn
4Q18
Chile
Ch$18.3 bn
1Q19 2Q19 3Q19 4Q19
2.9 %
2.5 %
36.0 29.2 52.8 40.2 21.7 9.1 7.3 13.0 9.6 5.4 1.8 1.9 1.9 1.8 2.5
157.4 140.8 146.5 144.0 161.3 40.7 39.2 41.1 36.3 40.0 50.7 36.6 41.9 40.9 110.1 113.4 111.2 112.5 110.8 116.9
16.8 16.9 17.3 17.8 18.3
4Q19 vs. 3Q194Q19 vs. 3Q194Q19 vs. 3Q19
4Q19 vs. 3Q194Q19 vs. 3Q194Q19 vs. 3Q194Q19 vs. 3Q19
-4.7 p.p.
-4.2 p.p.
0.7 p.p.
0.7 p.p.
Chile
Ch$110 bn
Consolidated
Ch$134 bnConsolidated
Ch$174.6 bn
Chile
Ch$116.9 bn
4Q19 vs. 3Q19
Highlights4th Quarter 2019
About 4Q19 Highlights of the results
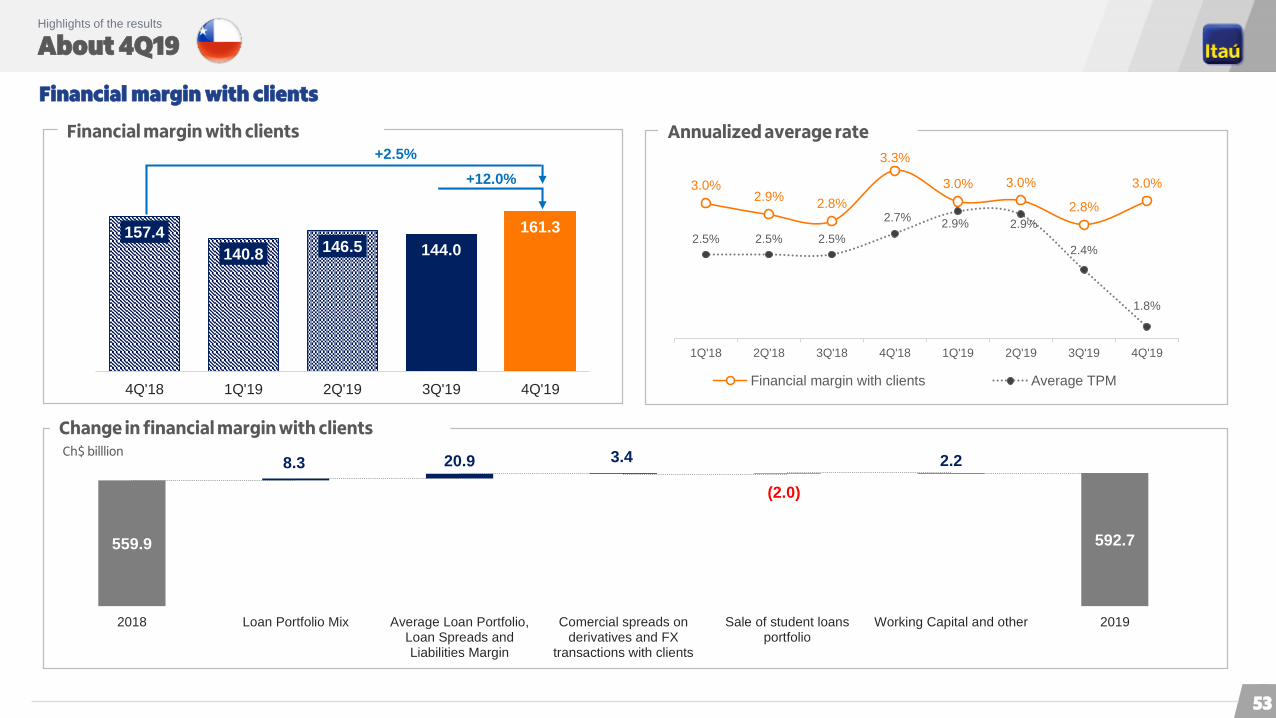
Financial margin with clients
157.4
140.8146.5 144.0
161.3
4Q'18 1Q'19 2Q'19 3Q'19 4Q'19
Ch$ billlion
Change in financial margin with clients
Annualized average rateFinancial margin with clients
+12.0%
+2.5%
3.0%2.9%
2.8%
3.3%
3.0% 3.0%
2.8%
3.0%
2.5% 2.5% 2.5%
2.7%2.9% 2.9%
2.4%
1.8%
1Q'18 2Q'18 3Q'18 4Q'18 1Q'19 2Q'19 3Q'19 4Q'19
Financial margin with clients Average TPM
559.9 592.7
8.3 20.9 3.4
(2.0)
2.2
2018 Loan Portfolio Mix Average Loan Portfolio,Loan Spreads andLiabilities Margin
Comercial spreads onderivatives and FX
transactions with clients
Sale of student loansportfolio
Working Capital and other 2019
53
About 4Q19 Highlights of the results
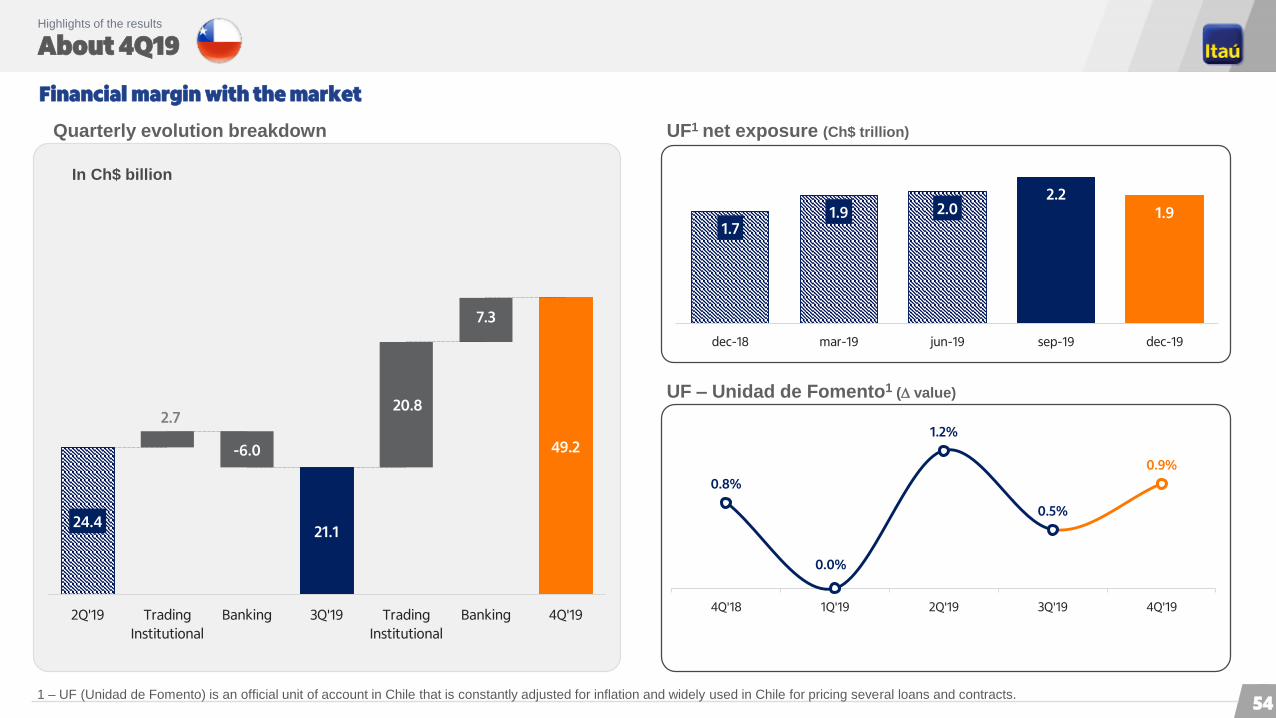
Financial margin with the market
In Ch$ billion
Quarterly evolution breakdown UF1 net exposure (Ch$ trillion)
UF – Unidad de Fomento1 ( value)
1 – UF (Unidad de Fomento) is an official unit of account in Chile that is constantly adjusted for inflation and widely used in Chile for pricing several loans and contracts.
0.8%
0.0%
1.2%
0.5%
0.9%
4Q'18 1Q'19 2Q'19 3Q'19 4Q'19
1.71.9 2.0
2.21.9
dec-18 mar-19 jun-19 sep-19 dec-19
24.421.1
49.2
2.7
-6.0
20.8
7.3
2Q'19 Trading
Institutional
Banking 3Q'19 Trading
Institutional
Banking 4Q'19
54
About 4Q19 Highlights of the results
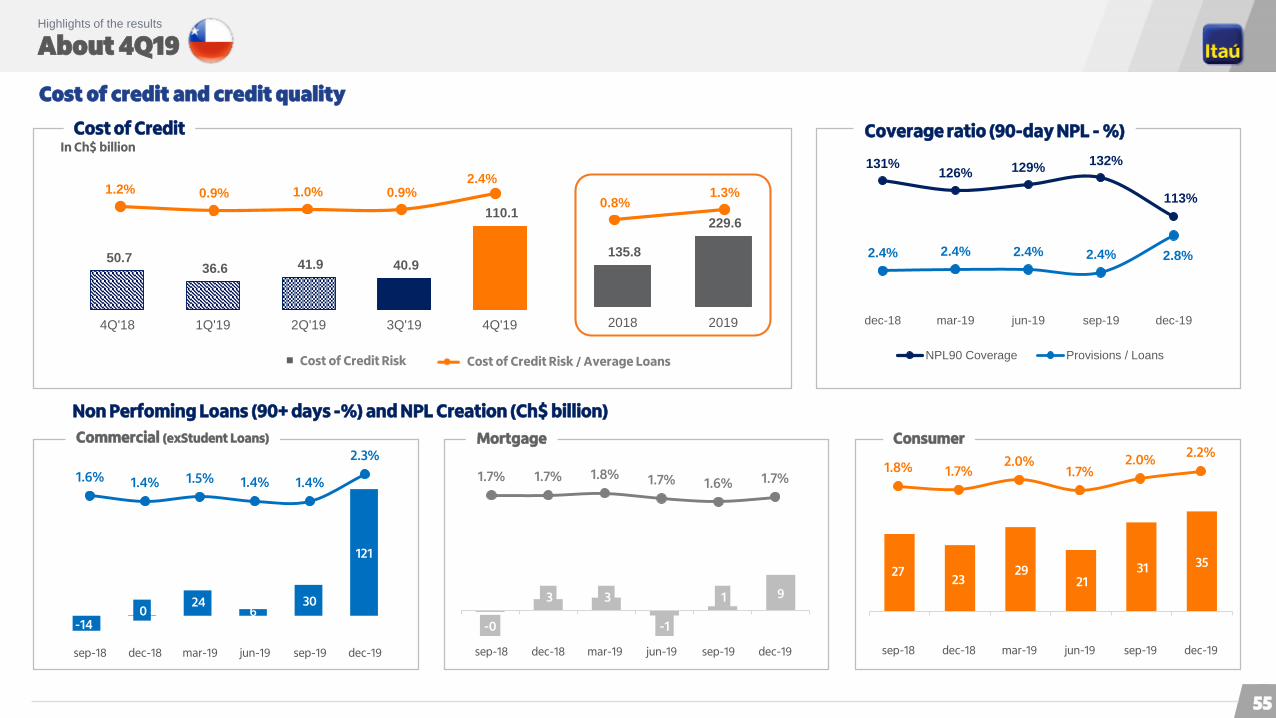
Cost of credit and credit quality
Cost of Credit Coverage ratio (90-day NPL - %)
Non Perfoming Loans (90+ days -%) and NPL Creation (Ch$ billion)
In Ch$ billion
Commercial (exStudent Loans) Mortgage Consumer
135.8
229.6
2018 2019
0.8%1.3%
Cost of Credit Risk
50.7 36.6 41.9 40.9
110.1
4Q'18 1Q'19 2Q'19 3Q'19 4Q'19
1.2% 0.9% 1.0% 0.9%2.4%
Cost of Credit Risk / Average Loans
131%126% 129%
132%
113%
2.4% 2.4% 2.4% 2.4% 2.8%
70%
80%
90%
100%
110%
120%
130%
dec-18 mar-19 jun-19 sep-19 dec-19
NPL90 Coverage Provisions / Loans
1.7% 1.7% 1.8% 1.7% 1.6% 1.7%
sep-18 dec-18 mar-19 jun-19 sep-19 dec-19
1.8% 1.7%2.0%
1.7%2.0%
2.2%
sep-18 dec-18 mar-19 jun-19 sep-19 dec-19
-14 0
24 6
30
121
1.6% 1.4% 1.5% 1.4% 1.4%
2.3%
sep-18 dec-18 mar-19 jun-19 sep-19 dec-19
-0
3 3
-1
1 9
27 23
29 21
31 35
55
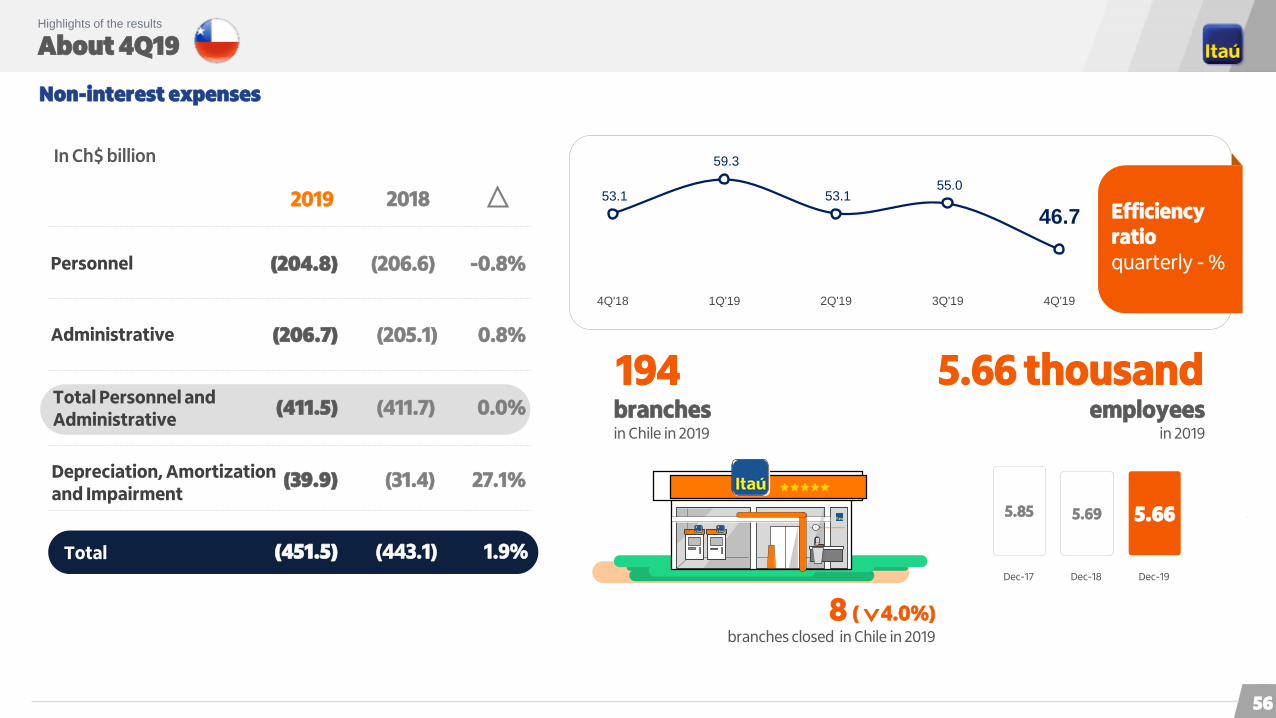
About 4Q19 Highlights of the results
Non-interest expenses
branches closed in Chile in 2019
Efficiency ratioquarterly - %
In Ch$ billion
Total
(206.6)
(205.1)
(411.7)
(31.4)
2019 2018
(204.8)
(206.7)
(411.5)
(39.9)
Personnel
Administrative
Total Personnel and Administrative
Depreciation, Amortization and Impairment
(443.1)(451.5)
-0.8%
0.8%
0.0%
27.1%
1.9%
194branches in Chile in 2019
5.69 5.665.85
Dec-18 Dec-19Dec-17
5.66 thousandemployees
in 2019
8 ( 4.0%)
53.1
59.3
53.1 55.0
46.7
4Q'18 1Q'19 2Q'19 3Q'19 4Q'19
56
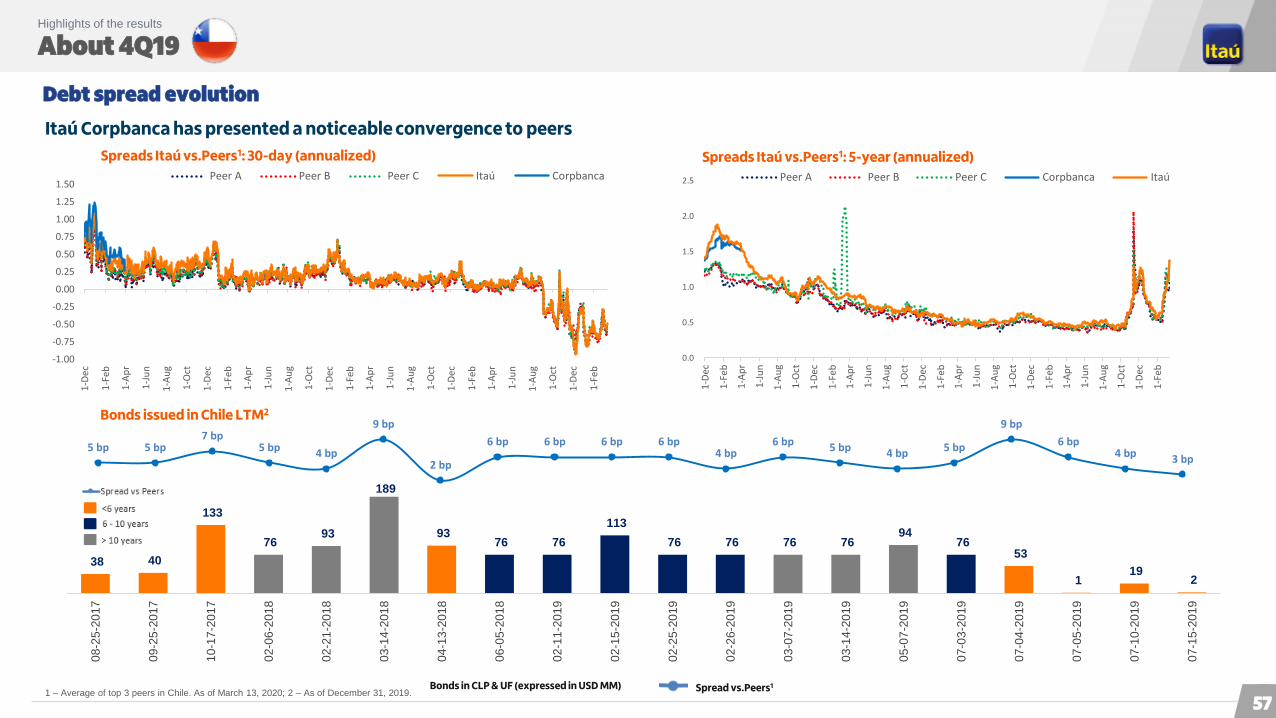
About 4Q19 Highlights of the results
Debt spread evolution
Itaú Corpbanca has presented a noticeable convergence to peers
Spreads Itaú vs.Peers1: 30-day (annualized)
1 – Average of top 3 peers in Chile. As of March 13, 2020; 2 – As of December 31, 2019.Bonds in CLP & UF (expressed in USD MM) Spread vs.Peers1
Bonds issued in Chile LTM2
Spreads Itaú vs.Peers1: 5-year (annualized)
5 bp 5 bp7 bp
5 bp 4 bp
9 bp
2 bp
6 bp 6 bp 6 bp 6 bp4 bp
6 bp 5 bp 4 bp 5 bp
9 bp
6 bp4 bp 3 bp
0.0
0.5
1.0
1.5
2.0
2.5
1-D
ec
1-F
eb
1-A
pr
1-J
un
1-A
ug
1-O
ct
1-D
ec
1-F
eb
1-A
pr
1-J
un
1-A
ug
1-O
ct
1-D
ec
1-F
eb
1-A
pr
1-J
un
1-A
ug
1-O
ct
1-D
ec
1-F
eb
1-A
pr
1-J
un
1-A
ug
1-O
ct
1-D
ec
1-F
eb
Peer A Peer B Peer C Corpbanca Itaú
-1.00
-0.75
-0.50
-0.25
0.00
0.25
0.50
0.75
1.00
1.25
1.50
1-D
ec
1-F
eb
1-A
pr
1-J
un
1-A
ug
1-O
ct
1-D
ec
1-F
eb
1-A
pr
1-J
un
1-A
ug
1-O
ct
1-D
ec
1-F
eb
1-A
pr
1-J
un
1-A
ug
1-O
ct
1-D
ec
1-F
eb
1-A
pr
1-J
un
1-A
ug
1-O
ct
1-D
ec
1-F
eb
Peer A Peer B Peer C Itaú Corpbanca
38 40
133
76 93
189
93 76 76
113
76 76 76 76 94
76 53
1 19
2
08-2
5-2
01
7
09-2
5-2
01
7
10-1
7-2
01
7
02-0
6-2
01
8
02-2
1-2
01
8
03-1
4-2
01
8
04-1
3-2
01
8
06-0
5-2
01
8
02-1
1-2
01
9
02-1
5-2
01
9
02-2
5-2
01
9
02-2
6-2
01
9
03-0
7-2
01
9
03-1
4-2
01
9
05-0
7-2
01
9
07-0
3-2
01
9
07-0
4-2
01
9
07-0
5-2
01
9
07-1
0-2
01
9
07-1
5-2
01
9
57
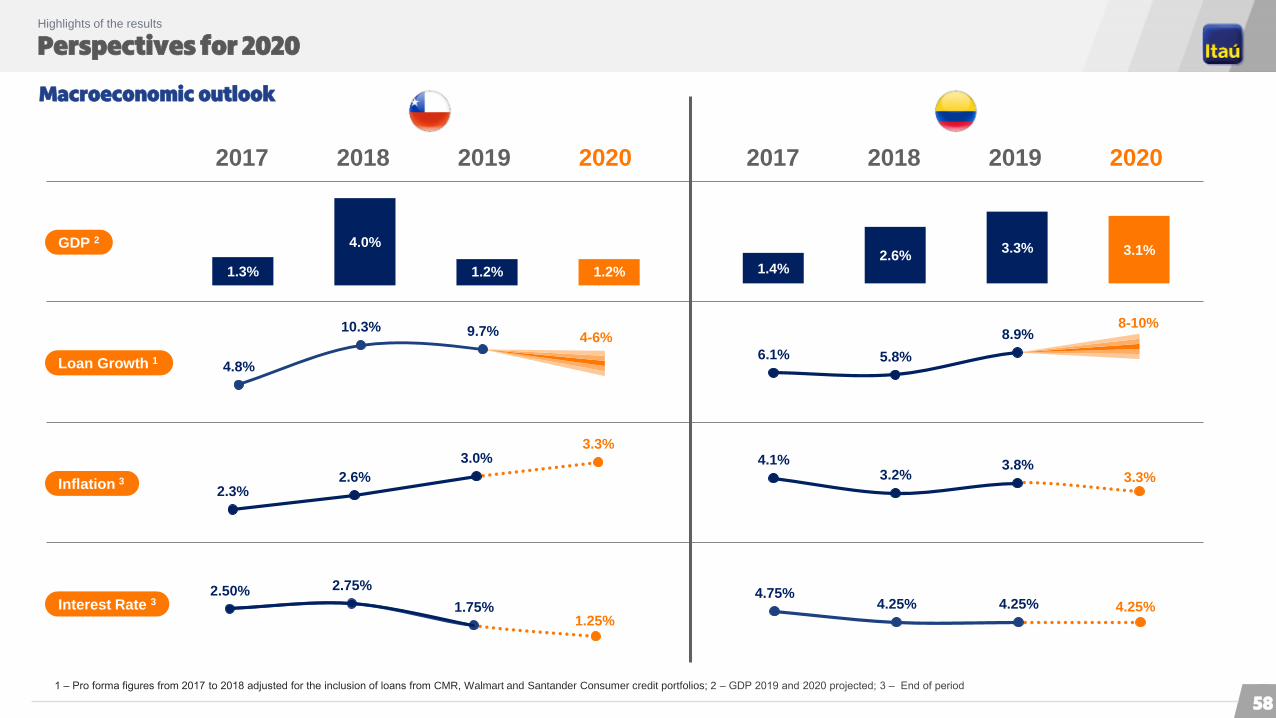
Perspectives for 2020 Highlights of the results
Macroeconomic outlook
2017
GDP 2
Loan Growth 1
Inflation 3
Interest Rate 3
2018 2019 2020 2017 2018 2019 2020
1 ‒ Pro forma figures from 2017 to 2018 adjusted for the inclusion of loans from CMR, Walmart and Santander Consumer credit portfolios; 2 ‒ GDP 2019 and 2020 projected; 3 ‒ End of period
4.8%
10.3% 9.7% 4-6%
2.3%2.6%
3.0%3.3%
2.50% 2.75%
1.75%1.25%
1.3%
4.0%
1.2% 1.2%
6.1% 5.8%
8.9%8-10%
4.75%4.25% 4.25% 4.25%
4.1%3.2%
3.8%3.3%
1.4%2.6%
3.3% 3.1%
58
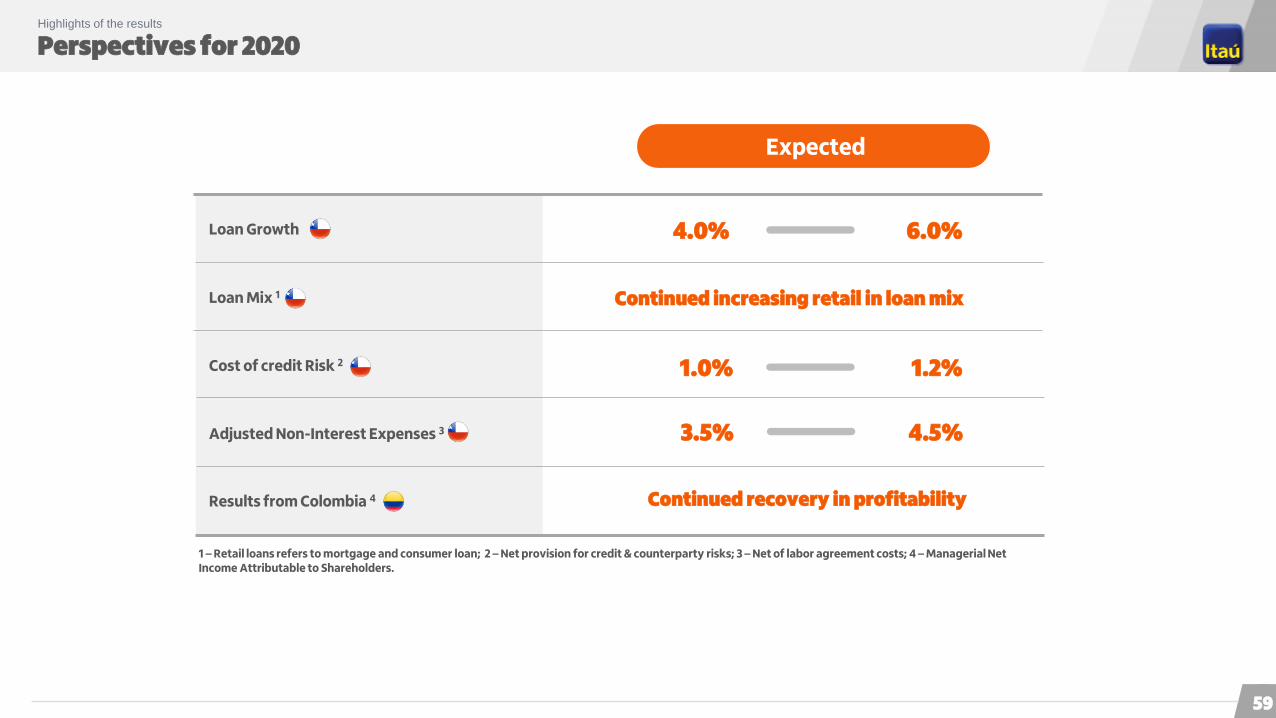
Perspectives for 2020 Highlights of the results
Expected
Loan Growth
Loan Mix 1
Cost of credit Risk 2
Adjusted Non-Interest Expenses 3
Results from Colombia 4
6.0%4.0%
Continued increasing retail in loan mix
1.2%1.0%
Continued recovery in profitability
1 – Retail loans refers to mortgage and consumer loan; 2 – Net provision for credit & counterparty risks; 3 – Net of labor agreement costs; 4 – Managerial Net Income Attributable to Shareholders.
4.5%3.5%
59

Agenda
Economiccontext
Corporate governance
Corporate profile
Strategicfronts
Capital and
risk management
04
06
15
18
47
50 Highlightsof the results
61Additionalinformation
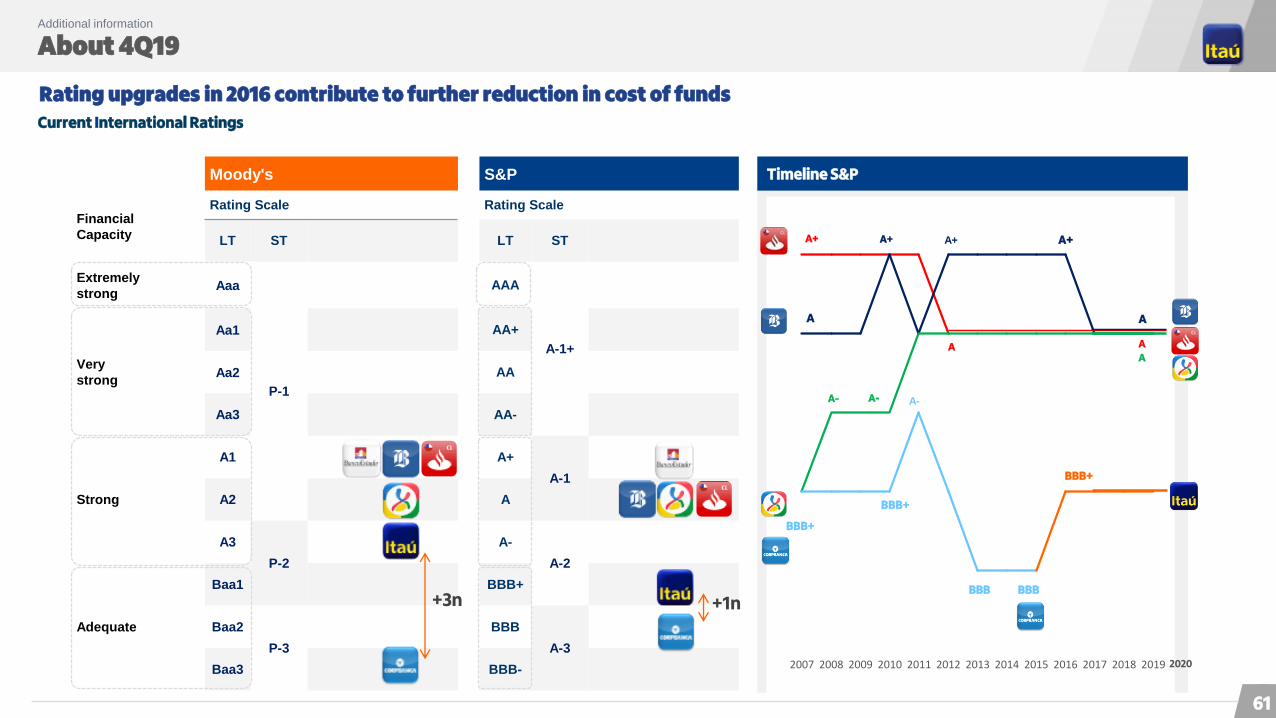
About 4Q19 Additional information
Rating upgrades in 2016 contribute to further reduction in cost of funds
Current International Ratings
Moody's S&P
Financial
Capacity
Rating Scale Rating Scale
LT ST LT ST
Extremely
strongAaa
P-1
AAA
A-1+Very
strong
Aa1 AA+
Aa2 AA
Aa3 AA-
Strong
A1 A+
A-1
A2 A
A3
P-2
A-
A-2
Adequate
Baa1 BBB+
Baa2
P-3
BBB
A-3
Baa3 BBB-
+3n +1n
Timeline S&P
2007 2008 2009 2010 2011 2012 2013 2014 2015 2016 2017 2018 2019
A+
A-
A+
AA
A+
A
A+
A
A
A-A-
BBB+
BBB+
BBB BBB
BBB+
2020
61
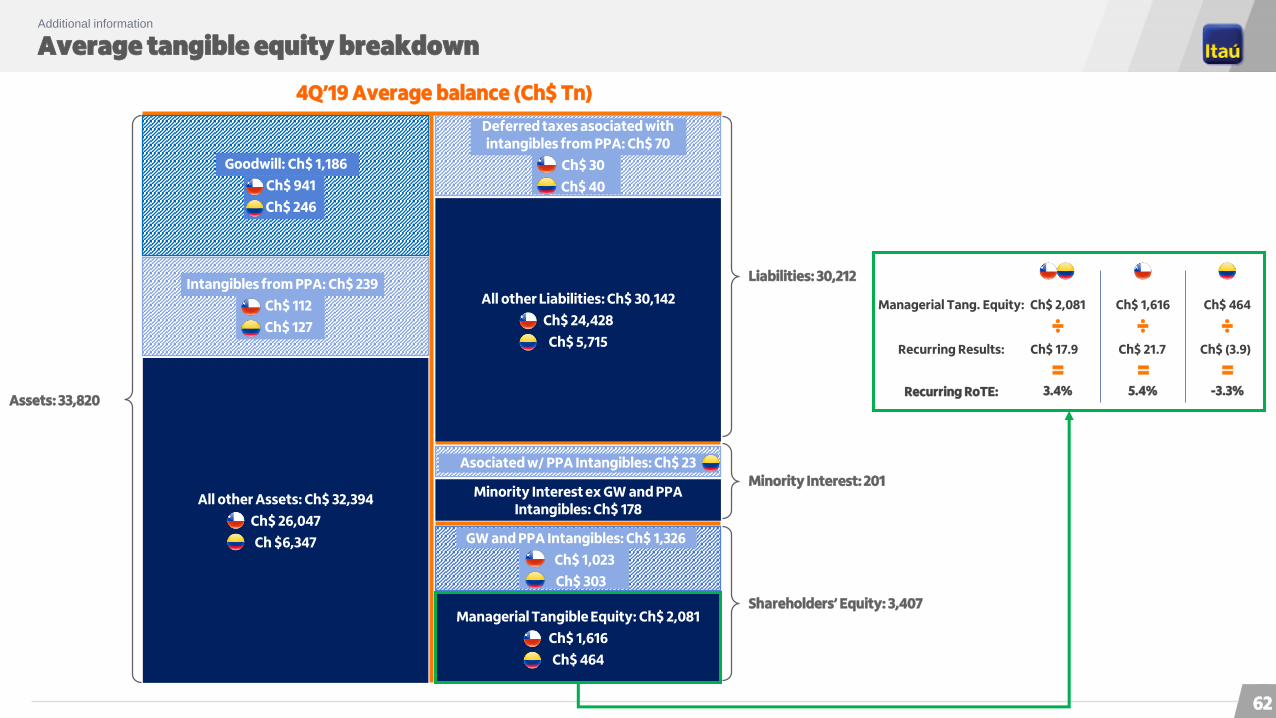
Average tangible equity breakdownAdditional information
All other Assets: Ch$ 32,394
Ch$ 26,047
Ch $6,347
All other Liabilities: Ch$ 30,142
Ch$ 24,428
Ch$ 5,715
Asociado a Intangibles PPA: Ch$ 40
Minority Interest ex GW and PPAIntangibles: Ch$ 178
Assets: 33,820
Liabilities: 30,212
Minority Interest: 201
4Q’19 Average balance (Ch$ Tn)
Managerial Tangible Equity: Ch$ 2,081
Ch$ 1,616
Ch$ 464
Shareholders’ Equity: 3,407
Managerial Tang. Equity:
Recurring Results:
Recurring RoTE:
Ch$ 2,081 Ch$ 1,616 Ch$ 464
Ch$ 17.9 Ch$ 21.7 Ch$ (3.9)
÷ ÷ ÷
3.4% 5.4% -3.3%
= = =
Goodwill: Ch$ 1,186
Ch$ 941
Ch$ 246
Intangibles from PPA: Ch$ 239
Ch$ 112
Ch$ 127
Deferred taxes asociated with intangibles from PPA: Ch$ 70
Ch$ 30
Ch$ 40
Asociated w/ PPA Intangibles: Ch$ 23
GW and PPA Intangibles: Ch$ 1,326
Ch$ 1,023
Ch$ 303
62
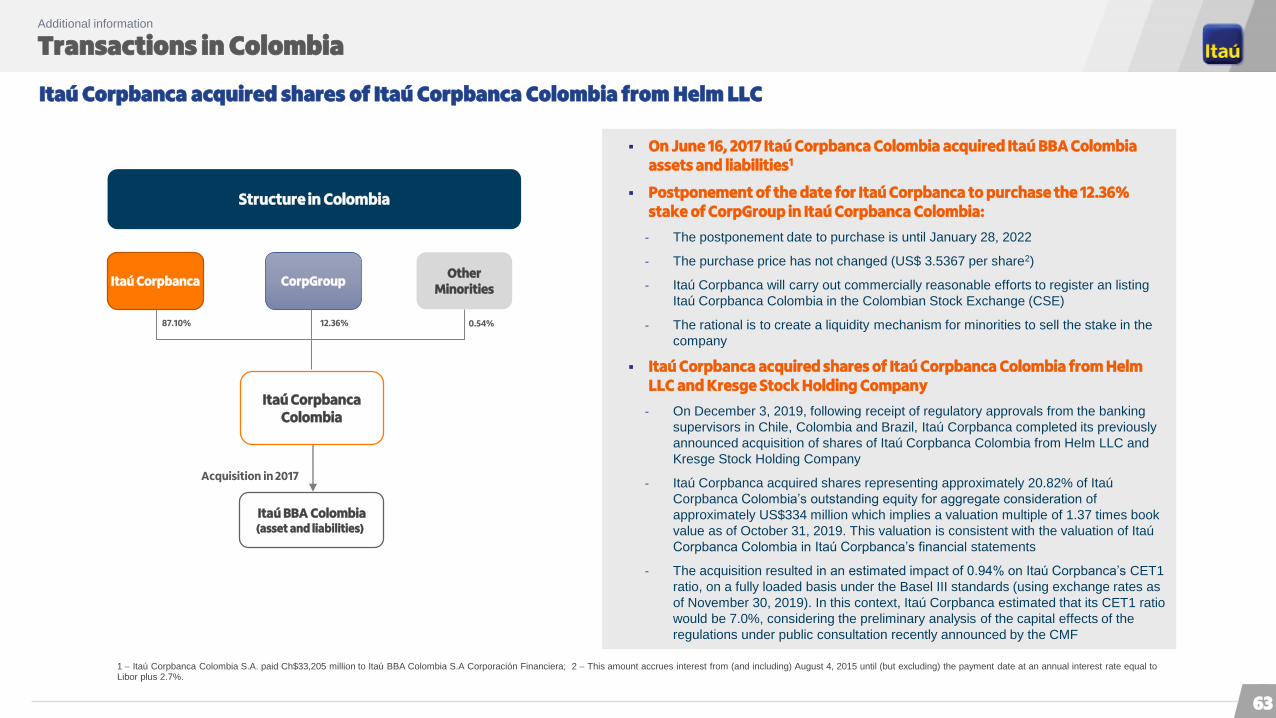
Transactions in ColombiaAdditional information
Itaú Corpbanca acquired shares of Itaú Corpbanca Colombia from Helm LLC
Structure in Colombia
Itaú Corpbanca
Itaú CorpbancaColombia
On June 16, 2017 Itaú Corpbanca Colombia acquired Itaú BBA Colombia assets and liabilities1
Postponement of the date for Itaú Corpbanca to purchase the 12.36% stake of CorpGroup in Itaú Corpbanca Colombia:
‐ The postponement date to purchase is until January 28, 2022
‐ The purchase price has not changed (US$ 3.5367 per share2)
‐ Itaú Corpbanca will carry out commercially reasonable efforts to register an listing
Itaú Corpbanca Colombia in the Colombian Stock Exchange (CSE)
‐ The rational is to create a liquidity mechanism for minorities to sell the stake in the
company
Itaú Corpbanca acquired shares of Itaú Corpbanca Colombia from Helm LLC and Kresge Stock Holding Company
‐ On December 3, 2019, following receipt of regulatory approvals from the banking
supervisors in Chile, Colombia and Brazil, Itaú Corpbanca completed its previously
announced acquisition of shares of Itaú Corpbanca Colombia from Helm LLC and
Kresge Stock Holding Company
‐ Itaú Corpbanca acquired shares representing approximately 20.82% of Itaú
Corpbanca Colombia’s outstanding equity for aggregate consideration of
approximately US$334 million which implies a valuation multiple of 1.37 times book
value as of October 31, 2019. This valuation is consistent with the valuation of Itaú
Corpbanca Colombia in Itaú Corpbanca’s financial statements
‐ The acquisition resulted in an estimated impact of 0.94% on Itaú Corpbanca’s CET1
ratio, on a fully loaded basis under the Basel III standards (using exchange rates as
of November 30, 2019). In this context, Itaú Corpbanca estimated that its CET1 ratio
would be 7.0%, considering the preliminary analysis of the capital effects of the
regulations under public consultation recently announced by the CMF
CorpGroupOther
Minorities
Itaú BBA Colombia (asset and liabilities))
87.10% 12.36% 0.54%
Acquisition in 2017
1 Itaú Corpbanca Colombia S.A. paid Ch$33,205 million to Itaú BBA Colombia S.A Corporación Financiera; 2 This amount accrues interest from (and including) August 4, 2015 until (but excluding) the payment date at an annual interest rate equal to Libor plus 2.7%.
63
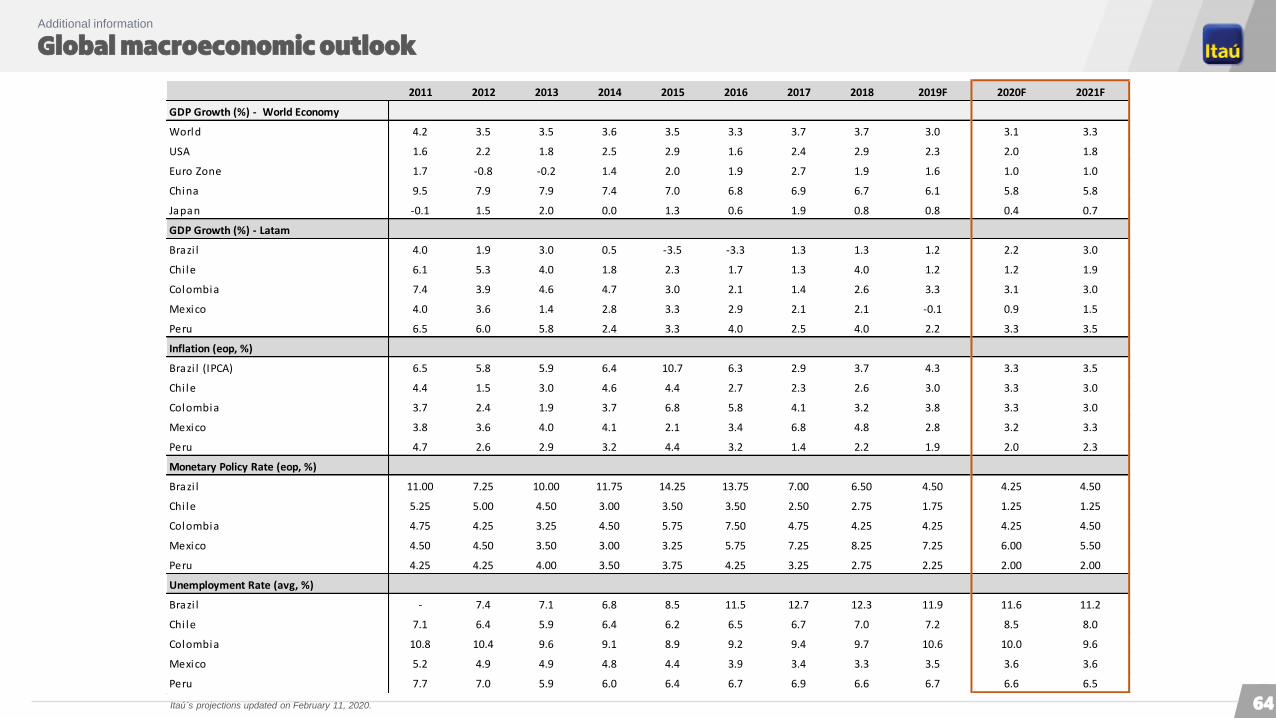
Global macroeconomic outlookAdditional information
2011 2012 2013 2014 2015 2016 2017 2018 2019F 2020F 2021F
GDP Growth (%) - World Economy
World 4.2 3.5 3.5 3.6 3.5 3.3 3.7 3.7 3.0 3.1 3.3
USA 1.6 2.2 1.8 2.5 2.9 1.6 2.4 2.9 2.3 2.0 1.8
Euro Zone 1.7 -0.8 -0.2 1.4 2.0 1.9 2.7 1.9 1.6 1.0 1.0
China 9.5 7.9 7.9 7.4 7.0 6.8 6.9 6.7 6.1 5.8 5.8
Japan -0.1 1.5 2.0 0.0 1.3 0.6 1.9 0.8 0.8 0.4 0.7
GDP Growth (%) - Latam
Brazi l 4.0 1.9 3.0 0.5 -3.5 -3.3 1.3 1.3 1.2 2.2 3.0
Chi le 6.1 5.3 4.0 1.8 2.3 1.7 1.3 4.0 1.2 1.2 1.9
Colombia 7.4 3.9 4.6 4.7 3.0 2.1 1.4 2.6 3.3 3.1 3.0
Mexico 4.0 3.6 1.4 2.8 3.3 2.9 2.1 2.1 -0.1 0.9 1.5
Peru 6.5 6.0 5.8 2.4 3.3 4.0 2.5 4.0 2.2 3.3 3.5
Inflation (eop, %)
Brazi l (IPCA) 6.5 5.8 5.9 6.4 10.7 6.3 2.9 3.7 4.3 3.3 3.5
Chi le 4.4 1.5 3.0 4.6 4.4 2.7 2.3 2.6 3.0 3.3 3.0
Colombia 3.7 2.4 1.9 3.7 6.8 5.8 4.1 3.2 3.8 3.3 3.0
Mexico 3.8 3.6 4.0 4.1 2.1 3.4 6.8 4.8 2.8 3.2 3.3
Peru 4.7 2.6 2.9 3.2 4.4 3.2 1.4 2.2 1.9 2.0 2.3
Monetary Policy Rate (eop, %)
Brazi l 11.00 7.25 10.00 11.75 14.25 13.75 7.00 6.50 4.50 4.25 4.50
Chi le 5.25 5.00 4.50 3.00 3.50 3.50 2.50 2.75 1.75 1.25 1.25
Colombia 4.75 4.25 3.25 4.50 5.75 7.50 4.75 4.25 4.25 4.25 4.50
Mexico 4.50 4.50 3.50 3.00 3.25 5.75 7.25 8.25 7.25 6.00 5.50
Peru 4.25 4.25 4.00 3.50 3.75 4.25 3.25 2.75 2.25 2.00 2.00
Unemployment Rate (avg, %)
Brazi l - 7.4 7.1 6.8 8.5 11.5 12.7 12.3 11.9 11.6 11.2
Chi le 7.1 6.4 5.9 6.4 6.2 6.5 6.7 7.0 7.2 8.5 8.0
Colombia 10.8 10.4 9.6 9.1 8.9 9.2 9.4 9.7 10.6 10.0 9.6
Mexico 5.2 4.9 4.9 4.8 4.4 3.9 3.4 3.3 3.5 3.6 3.6
Peru 7.7 7.0 5.9 6.0 6.4 6.7 6.9 6.6 6.7 6.6 6.5
Itaú´s projections updated on February 11, 2020. 64

ChileAdditional information
Macroeconomic Outlook GDP Growth | % (YoY) Per Capita GDP | US$ Thousand
Unemployment rate | % Inflation and Policy Rate | %
5.1
3.32.7
3.8
7.0
6.25.7
5.2
3.5
-1.6
5.8 6.15.3
4.0
1.82.3
1.71.3
4.0
1.2 1.2
-2
-1
0
1
2
3
4
5
6
7
8
00 05 10 15 20
5.1 4.6 4.5 4.86.2
7.6
9.510.510.710.6
12.914.2
15.3 15.614.5
13.314.0
15.215.9
14.513.7
0
2
4
6
8
10
12
14
16
18
00 05 10 15 20
9.7 9.9 9.8 9.510.0
9.3
8.0
7.0
7.8
10.8
8.3
7.2
6.56.0
6.3 6.3 6.5 6.77.0 7.2
8.5
4
5
6
7
8
9
10
11
12
00 05 10 15 20
4.5
2.6 2.8
1.1
2.4
3.7
2.6
7.8 7.1
-1.4
3.0
4.4
1.5
3.0
4.6 4.4
2.72.3 2.6 3.0
3.3
-2
0
2
4
6
8
10
00 05 10 15 20
Inflation Policy RateItaú´s projections updated on February 11, 2020. 65
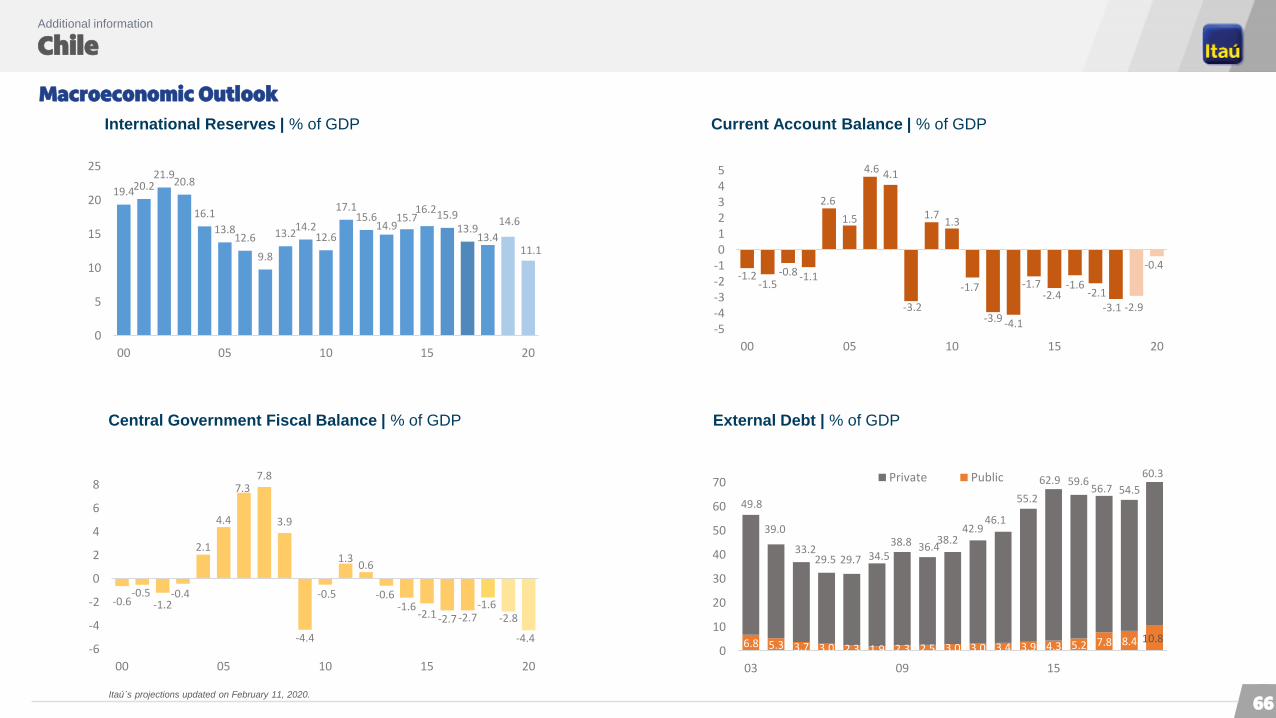
ChileAdditional information
Macroeconomic Outlook
International Reserves | % of GDP Current Account Balance | % of GDP
Central Government Fiscal Balance | % of GDP External Debt | % of GDP
19.420.221.9
20.8
16.1
13.812.6
9.8
13.214.2
12.6
17.115.6
14.915.7
16.215.913.9
13.4
14.6
11.1
0
5
10
15
20
25
00 05 10 15 20
-1.2-1.5
-0.8 -1.1
2.6
1.5
4.6 4.1
-3.2
1.71.3
-1.7
-3.9 -4.1
-1.7-2.4
-1.6-2.1
-3.1 -2.9
-0.4
-5-4-3-2-1012345
00 05 10 15 20
-0.6-0.5
-1.2-0.4
2.1
4.4
7.37.8
3.9
-4.4
-0.5
1.30.6
-0.6-1.6
-2.1 -2.7 -2.7-1.6
-2.8
-4.4-6
-4
-2
0
2
4
6
8
00 05 10 15 20
6.8 5.3 3.7 3.0 2.3 1.9 2.3 2.5 3.0 3.0 3.4 3.9 4.3 5.2 7.8 8.4 10.8
49.8
39.0
33.229.5 29.7 34.5
38.8 36.438.2
42.946.1
55.2
62.9 59.656.7 54.5
60.3
0
10
20
30
40
50
60
70
03 09 15
Private Public
Itaú´s projections updated on February 11, 2020.
66
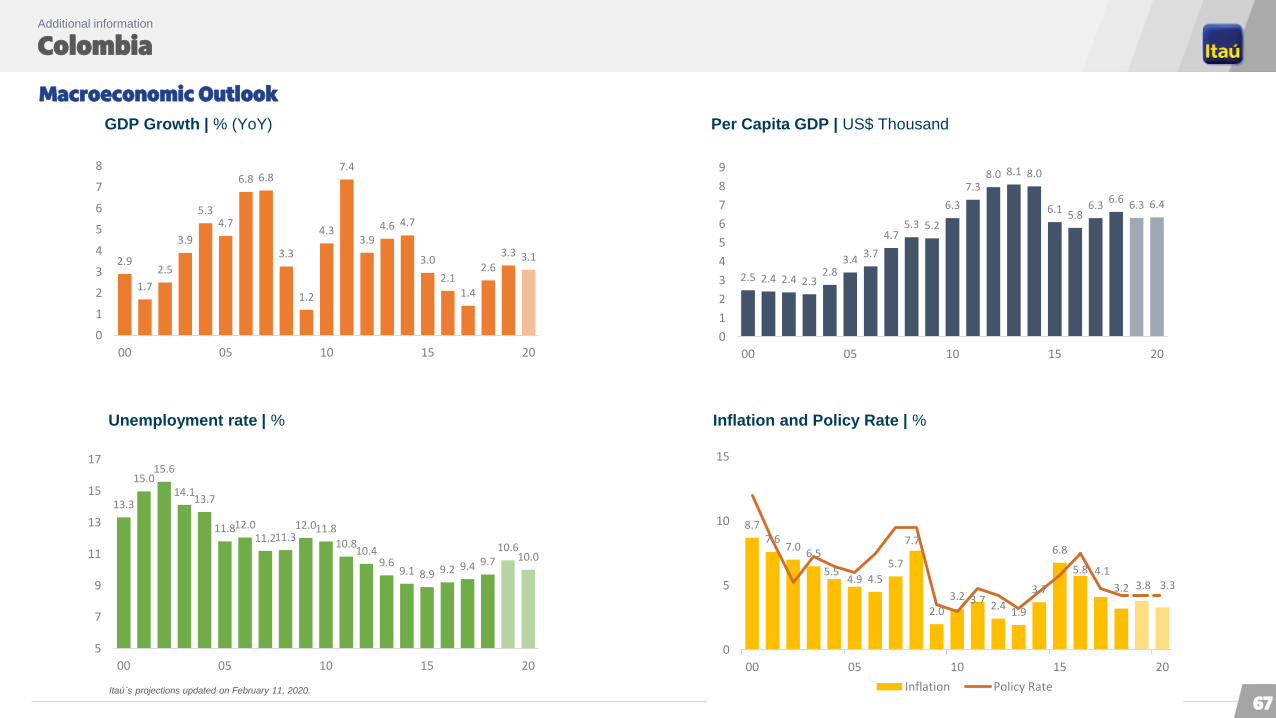
ColombiaAdditional information
Macroeconomic Outlook
GDP Growth | % (YoY) Per Capita GDP | US$ Thousand
Unemployment rate | % Inflation and Policy Rate | %
2.9
1.7
2.5
3.9
5.34.7
6.8 6.8
3.3
1.2
4.3
7.4
3.94.6 4.7
3.0
2.11.4
2.63.3 3.1
0
1
2
3
4
5
6
7
8
00 05 10 15 20
2.5 2.4 2.4 2.32.8
3.43.7
4.75.3 5.2
6.3
7.38.0 8.1 8.0
6.1 5.86.3
6.6 6.3 6.4
0
1
2
3
4
5
6
7
8
9
00 05 10 15 20
13.3
15.015.6
14.113.7
11.812.011.211.3
12.011.8
10.810.4
9.69.1 8.9 9.2 9.4 9.7
10.610.0
5
7
9
11
13
15
17
00 05 10 15 20
8.77.6
7.06.5
5.54.9 4.5
5.7
7.7
2.0
3.2 3.7 2.41.9
3.7
6.8
5.8 4.1
3.2 3.8 3.3
0
5
10
15
00 05 10 15 20
Inflation Policy RateItaú´s projections updated on February 11, 2020.
67

ColombiaAdditional information
Macroeconomic Outlook
International Reserves | % of GDP Current Account Balance | % of GDP
Central Government Fiscal Balance | % of GDP External Debt | % of GDP
-5.0-5.5
-5.7
-4.7-4.9
-4.3-3.7
-3.0-2.3
-4.1-3.9
-2.8-2.3-2.3 -2.4
-3.0
-4.0-3.6
-3.1-2.5
-2.2
-8
-6
-4
-2
0
00 05 10 15 20
20.824.023.326.022.0
16.616.314.012.115.813.812.712.413.715.7
22.525.123.122.0
15.615.9
14.814.2
11.6
9.9 8.57.6
7.07.1 8.8 9.9 8.8
10.4
11.0
15.517.4
16.9 17.7
0
5
10
15
20
25
30
35
40
45
50
00 05 10 15
Private Public
10.411.111.511.6
10.29.5 10.110.210.8
9.9 9.6 10.111.4
12.4
15.916.615.3
14.6
16.7 16.8
0
2
4
6
8
10
12
14
16
18
01 06 11 16
0.9
-1.1 -1.3-1.0 -0.7
-1.3-1.8
-2.9-2.9
-2.0
-3.0-2.9-3.1-3.3
-5.2
-6.3
-4.3
-3.3-3.9
-4.5 -4.4
-8
-6
-4
-2
0
2
00 05 10 15 20
Itaú´s projections updated on February 11, 2020.
68
4Q19
Institutional Presentation
Itaú Corpbanca