Innovative Mobile Application for Measuring Big Data Maturity
20
Paper—Innovative Mobile Application for Measuring Big Data Maturity: Case of SMEs in Thailand Innovative Mobile Application for Measuring Big Data Maturity Case of SMEs in Thailand https://doi.org/10.3991/ijim.v14i18.16295 Santisook Limpeeticharoenchot, Nagul Cooharojananone () , Thira Chavarnakul Chulalongkorn University, Bangkok, Thailand [email protected] Nuengwong Tuaycharoen Dhurakij Pundit University, Bangkok, Thailand Kanokwan Atchariyachanvanich King Mongkut's Institute of Technology Ladkrabang, Bangkok, Thailand Abstract—A Big Data maturity model (BDMM) is one of the key tools for Big Data assessment and monitoring, and a guideline for maximizing the usage and opportunity of Big Data in organizations. The development of a BDMM for SMEs is a new concept and is challenging in terms of development, application, and adoption. This article aims to create the novel online adaptive BDMM via responsive web application for SMEs. We develop the BDMM API and a respon- sive web application for easy access via mobile phone. We developed a model by analyzing the factors impacting the success of implementing Big Data Analytics (BDA) in SMEs based on literature reviews. The model was verified by conduct- ing a survey of 180 SMEs in Thailand, interviewed against four extracted do- mains. Then, the scoring and classified levels for the model was developed through Latent Class Analysis (LCA) to depict four levels of each domain and four final maturity levels to create an adaptive model. As the experimental results with 33 users including executive officers, managers, IT, and data analytic offic- ers. The user acceptance for our mobile application using TAM indicates that executive officer’s group and non-executive group satisfied perceived usefulness, perceived ease of use, and intention to use factor. Use cases of the application include SMEs monitoring for their Big Data Analytics capability for improve- ment, and the Government Agency providing proper support on SMEs’ level of competency. Keywords—Big Data Maturity Model, Big Data SMEs, BDMM mobile appli- cation iJIM ‒ Vol. 14, No. 18, 2020 87
-
Upload
khangminh22 -
Category
Documents
-
view
0 -
download
0
Transcript of Innovative Mobile Application for Measuring Big Data Maturity
Paper—Innovative Mobile Application for Measuring Big Data Maturity: Case of SMEs in Thailand
Innovative Mobile Application for Measuring Big Data
Maturity
Case of SMEs in Thailand
https://doi.org/10.3991/ijim.v14i18.16295
Santisook Limpeeticharoenchot, Nagul Cooharojananone (),
Thira Chavarnakul Chulalongkorn University, Bangkok, Thailand
Nuengwong Tuaycharoen Dhurakij Pundit University, Bangkok, Thailand
Kanokwan Atchariyachanvanich King Mongkut's Institute of Technology Ladkrabang, Bangkok, Thailand
Abstract—A Big Data maturity model (BDMM) is one of the key tools for
Big Data assessment and monitoring, and a guideline for maximizing the usage
and opportunity of Big Data in organizations. The development of a BDMM for
SMEs is a new concept and is challenging in terms of development, application,
and adoption. This article aims to create the novel online adaptive BDMM via
responsive web application for SMEs. We develop the BDMM API and a respon-
sive web application for easy access via mobile phone. We developed a model by
analyzing the factors impacting the success of implementing Big Data Analytics
(BDA) in SMEs based on literature reviews. The model was verified by conduct-
ing a survey of 180 SMEs in Thailand, interviewed against four extracted do-
mains. Then, the scoring and classified levels for the model was developed
through Latent Class Analysis (LCA) to depict four levels of each domain and
four final maturity levels to create an adaptive model. As the experimental results
with 33 users including executive officers, managers, IT, and data analytic offic-
ers. The user acceptance for our mobile application using TAM indicates that
executive officer’s group and non-executive group satisfied perceived usefulness,
perceived ease of use, and intention to use factor. Use cases of the application
include SMEs monitoring for their Big Data Analytics capability for improve-
ment, and the Government Agency providing proper support on SMEs’ level of
competency.
Keywords—Big Data Maturity Model, Big Data SMEs, BDMM mobile appli-
cation
iJIM ‒ Vol. 14, No. 18, 2020 87

Paper—Innovative Mobile Application for Measuring Big Data Maturity: Case of SMEs in Thailand
1 Introduction
Data are an extremely valuable asset in every business from large-scale enterprises
to small and medium-sized enterprises (SMEs) and are considered the new oil [1]. An-
alytics is applied to data for actionable decision making and competitive advantages.
The term “Big Data” was initially defined in [2] to address the challenges of size, speed,
and different formats of data that cannot be handled or processed by conventional meth-
ods. Since then, this term has been increasingly used in the fields of media, technology,
and academics [3, 4]. Big Data analytics (BDA) comprises multiple technologies and
usually requires high investments in various fields, such as IT, databases, data inges-
tion, machine learning, and data visualization.
SMEs are the lifeblood of Thailand and crucial for its economic growth. They are
defined by the number of employees and assets or revenue. Thailand comprises about
3 million SMEs, which generate 43% of the country’s GDP, as of 2019. Many studies
have been conducted to determine the factors affecting the successful implementation
of BDA in SMEs [5-7]. Big Data maturity models (BDMMs) have been developed by
multiple technology companies, researchers, and consulting firms. However, most of
the existing BDMMs develop a set of assessment questions suitable for large-size com-
panies, which invest in high technology, have many business units, and possess a large
amount of staff to adopt the technology. Therefore, the existing BDMMs are ineffective
for SME assessment, as the assessment could result in a low score and they cannot
provide suggestions or recommendations for improvements in SMEs which is a guide-
line for using such a technology. Since BDA is a state-of-the-art technology, some
BDMMs with static model cannot satisfy the fast-growing nature of the technology and
the rapid changes in the SME’s industries. Therefore, an adaptive model would more
appropriate in the scenario.
We developed an adaptive BDMM model for SMEs. First, we designed a question-
naire for determining the effects of existing BDMMs for SMEs based on factors against
various challenges of BDA faced by SMEs in literatures, such as the adoption of BDA,
data analytics (DA), and business analytics (BA) in SMEs. The questionnaire was pro-
vided both in the online and offline manner to business owners and management staff
of SMEs, IT department staff, data analysts, and business users in various industries.
Then, a latent class analysis (LCA) method has been applied to classify the SME’s
levels according to the answers received to each domain and the final maturity level.
Therefore, the model is adaptive depending on the questionnaire data gathered.
Since the model is adaptive, its usefulness would be greater if more assessment data
from SMEs is accumulated. Therefore, we introduced an idea to develop an online
model to gather data as much as possible. Consequently, in this article, we have devel-
oped the adaptive responsive web application for general SME users. We also have
conducted a survey for the user’s technological acceptance for validating the user atti-
tude through using application. Finally, we have discussed the usage scenarios of this
mobile web application.
The remainder of this paper is structured into the following four sections. In Section
2, an overview of the existing background literature on BDMMs is provided. Section 3
88 http://www.i-jim.org
Paper—Innovative Mobile Application for Measuring Big Data Maturity: Case of SMEs in Thailand
presents the proposed methodology of the mobile web application development. Sec-
tion 4 presents the discussions on the results obtained and research output of the mobile
web application. Finally, in Section 5, discussions and conclusions are provided.
2 Literature Review
2.1 BDA-based challenges for SMEs
The earlier version of BDA initially considered the factors of volume, velocity, and
variety, which were defined as the 3 Vs of BDA [8]. Later, Seddon and Currie [9] pro-
posed the consideration of value, variability, visualization, and veracity in BDA, thus
achieving the 7 Vs. The success of BDA involves not only the consideration of multiple
technologies, such as IT infrastructure, application data sources, storage, data analysis,
predictive analysis, and data visualization [5] but also the staff’s ability, and learning
culture [10]. Many researchers have evaluated the problems and challenges in adopting
BDA in organizations [11]. Iqbal et al. [12] and Coleman et al. [5] addressed this chal-
lenge and put forward a path for implementing BDA in SMEs, which involved improv-
ing people skills, building analytic capability, determining use cases, and management
support. The availability of multiple data sources in an organization is related to success
in SMEs [13]. Agrawal [14] proposed the technology-organization-environment frame-
work for adoption of BDA and found that complexity, organizational size, and environ-
mental uncertainty were the influencing factors for BDA.
2.2 Impact of factors on BDMMs in SMEs
We propose a BDMM for SMEs based on existing models and literature to provide
effective questions, domains, and results of assessment to SMEs. The assessment was
based on four domains: organization and management attitude (OA), IT, analytic tech-
nology (AT), and people readiness (PP).
a) Organization and management attitude (OA): OA are one of the most critical
factors for BDAs in SMEs. In Thailand, we found that power, experience and culture
accelerate innovativeness in family SMEs[15]. BDA challenge comprises the lack
of business use cases or benefit of investment as parameters of its determination [5,
16], along with the willingness to change or experiment [17]. The predictive analyses
of use cases for customer analytics have been performed to identify factors that im-
pact the value-perceived attitude [18]. Noonpakdee et al. [19] reported that the fi-
nancial performance of SMEs is also a key factor into utilizing BDA in Thailand.
b) Information Technology (IT): The IT system is comprised of applications, such as
Enterprise Resource Planning (ERP), customer relationship management (CRM) soft-
ware, accounting software, databases, and Microsoft Excel, which are frequently used
in organizations. The IT system is an essential part of any infrastructure for collecting,
storing, and analyzing data. As a part of the 3 Vs, the variety of data is strongly related
to software currently being used in a company, such as ERP and data analysis process
iJIM ‒ Vol. 14, No. 18, 2020 89
Paper—Innovative Mobile Application for Measuring Big Data Maturity: Case of SMEs in Thailand
[20]. Multiple studies have reported on data sources for BDAs, for example, websites,
ERP, human resources, and accounting [19]. Olszak and Mach-Król [1] studied sales
management, CRM, marketing, and digital marketing to generate data. In addition,
supply chain data in an industrial enterprise is used for decision making [5].
Data stores comprising spreadsheet applications, such as Excel, Excel online, and
Google Sheets were surveyed in [21]. Database technology, data warehouse, and BD-
Hadoop have also been used in BD research in SMEs [21], along with NoSQL and
BD-Hadoop [22, 23]. Coleman et al. and El-Seoud et al [5, 23] suggested the use of
cloud platform or software as a service. The data volume for SMEs is different than
that for larger enterprises because SMEs have limited sources of data. Almeida and
Bernardino [21] reported that 1 GB of data is the size limit for open-source software;
however, this was contradicted by Iqbal et al. [12], who determined that many SMEs
use several terabytes of data.
The velocity of transaction data, social media data, and Internet-of-Things was found
to be a challenge [20]. Internal and financial data were considered by Ahlemeyer-
Stubbe and Coleman [24], while Schmarzo [25] considered demographic, behavioral,
and environmental data. In [26], customer satisfaction, feedback survey, and market
data were studied in terms of BDA. Junqué de Fortuny [27] used a combination of
multiple types of data from web pages, including visitor behavior, location, and feed-
back support for various types of businesses.
c) Analytic Technology (AT): Analytic software conducts analyses through conven-
tional Excel or spreadsheets, which are widely used by general users. These include
analysis reports obtained from ERP or CRM [28] [20], as well as business intelli-
gence and data visualization or Dashboard in BA [29] [16]. Cloud computing is a
cost-effective approach for SMEs in terms of infrastructure, computing, and storage.
It also helps to reduce the required number of IT staff for administration [30]. Al-
meida and Bernardino [31] studied the use of open-source software for data mining,
predictive analysis, and prescriptive analysis for SMEs.
d) People (PP): People are the most important resource in SMEs and for the success of
DA. Education, including training and seminars, is a key activity for driving the
learning of new technologies[32]. Experience-centered approach, including learning
by doing has been proposed to fill the gap of education in practice [33]. The number
of employees with multiple skills, such as business intelligence, data visualization,
statistical analysis, advanced Excel, advanced analytics, or predictive modelling,
was included as part of the experience in the DA technology. Online learning is also
an effective way of learning for BDA [34].
2.3 Review of existing BDMMs
Many researchers and business consulting firm have introduced the BDDM to help
organization to improve a capability in big data technology through assessment tools.
Some researchers have conducted systematic reviews of existing BDMMs [35-37].
Braun [35] compared multiple maturity models (MMs) and provided the evaluation
score for the top two highest performing MMs, i.e., TDWI [38] and International Data
Corporation (IDC 2013). The top performer models are easy to use, extensive, well-
90 http://www.i-jim.org
Paper—Innovative Mobile Application for Measuring Big Data Maturity: Case of SMEs in Thailand
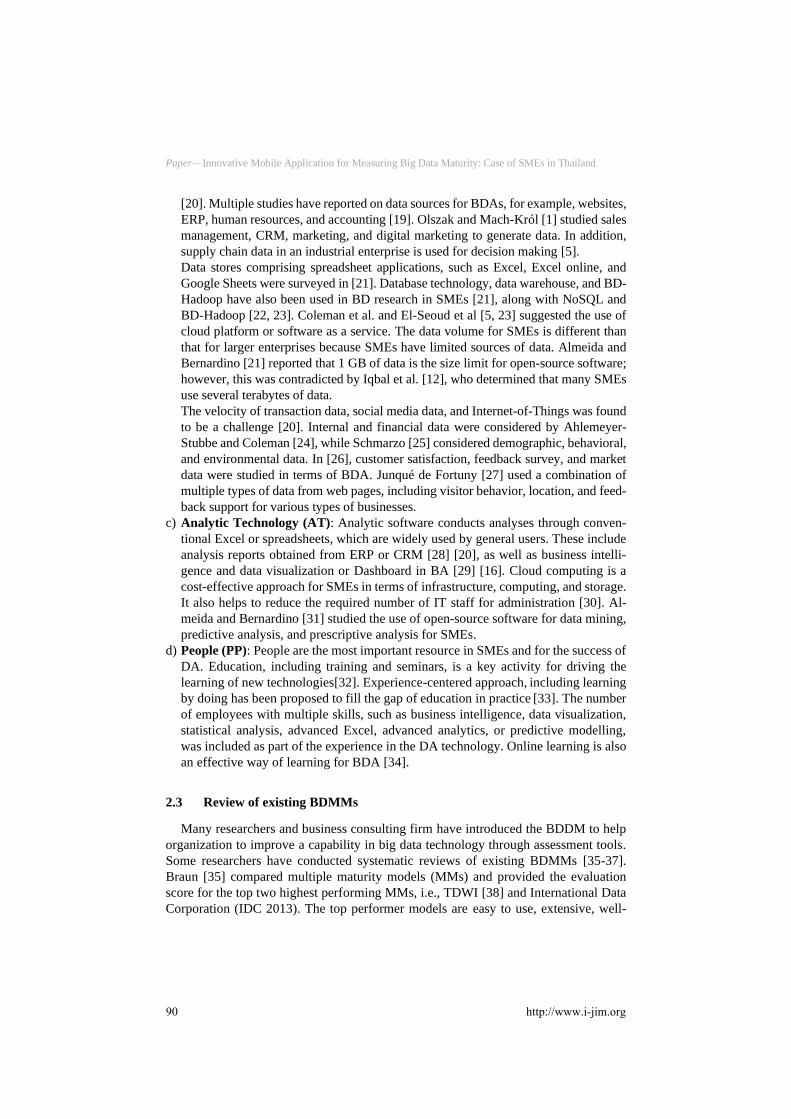
documented. The comparison of BDMMs with major characteristics are discussed and
we extracted as shown in Table 1.Braun [35] also provided a negative report on lack of
theoretical soundness, rigorous testing, and wide acceptance. Al-Sai and Abdullah [37]
reported the limitation that most of models have been developed in industry, by either
technology vendors or consulting partners that might expose them to biases Most of the
currently used BDMMs are old, and a few have been developed recently.
Table 1. Big Data Maturity Model Comparison.
Primary Source IDC
(2013)
Halper &
Krishnan
(2013)
Infotech
(2013)
Knowledgent
(2014)
Betteridge
(2014)
Our BDMM
Domain 5 5 4 5 6 4
Domain Question
Intent, Data, Tech-
nology,
People, Process
Org., Infra., Data Mgmt.,
Analytic, Gov-
ernance
Staff, Busi-ness, Data
Management,
Tech., Data
Business, Tech., Operat-
ing, Analytics,
discipline
Strategy, In-formation,
Culture, Ar-
chitecture, Governance
Organization and Attitude,
IT, Analytic
Technology, People
Level 5 6 4 5 5 4
Target
Company
Enterprise Enterprise Enterprise Enterprise Enterprise SME
Assessment
Instrument Web
based
Web based Traditional
Questionnaire
Web based Text
document
Responsive
Web
Score scale Static Static Static Static Static Adaptive
Score level Rule Rule Rule Rule Rule Cluster
Recommendation Yes No No No No Yes
This article introduces the novel online mobile adaptive BDMM for SMEs. As the
BDA technology is fast growing, the model was developed in our previous works to be
an adaptive model as described below.
2.4 Our BDMMs for SMEs
To develop our adaptive BDMMs for SMEs, we proceed the following three stages.
Questionnaire and validation: We analyzed challenging factors from the literature
review of BDAs in SME and gathered the domain’s name and questions from BDMM,
then we iteratively validated the questionnaires and grouped them into four domains by
academic experts and BDA experts in Thailand who are familiar with SMEs. Then we
conducted a final questionnaire-based survey for SMEs in Thailand by involving vari-
ous groups of respondents, from business owners; executive managers or managing
directors; operation leaders, such as business analysts, or data analysts; to IT managers.
After we conducted a quantitative survey data to obtain model-development data for
BDMMs. Fours domains must be considered as factors for developing a BDMM for
SME: OA (6 questions), IT (5 main questions, 26 sub-questions), AT (4 main questions,
17 sub-questions), and PP (4 questions).
Sampling and data collection: The survey was conducted incorporate with the Of-
fice of Small and Medium Enterprise Promotion (OSMEP), Thailand. We did sampling
SMEs by 3 sectors which are services, manufacturing, and trading. Moreover, we sent
iJIM ‒ Vol. 14, No. 18, 2020 91

Paper—Innovative Mobile Application for Measuring Big Data Maturity: Case of SMEs in Thailand
mail to the list we received from OSMEP and sent online survey by using www.sur-
veymonkey.com to others SMEs by snowball sampling. The questionnaire consisted of
five sections. The first section gathered demographic information of the organization
and respondents. The respondents' information included age, education, and position in
the organization. The second to the fifth sections gathered the factors and attitudes of
BDA in SMEs that were used for developing our MM. The survey was conducted in
the SMEs both online and offline from August 2019 to September 2019, with 180 re-
spondents and 135 questionnaires completed. Majority of the respondents is 60.4%
graduated in master degree and 29.63% in bachelor degree. Position of managing di-
rector or business owner Respondents are 52.59%, IT and Data Analyst are 33.34%. In
industry point of view, the respondents were from Trading at 23.70%, Service at
61.48%, and Manufacturing business at 14.82%. Their companies’ revenue is varied
from less than 50 million baht to more than 500 million baht. The number of IT staff in
the company ranges from none to more than 20 staffs.
Model development through cluster analysis: Model development through ma-
chine learning is considered using latent class analytics (LCA) because of the LCA char-
acteristic of clustering categorical variables. The comparison between multiple cluster-
ing methods and LCAs have been analyzed in [46]. Moreover, the LCA approach has
been considerably used by researchers for conducting latent subgroup analyses in edu-
cation, health, and behavioral research [47] [48]. Therefore, in this study, the authors
used LCA to conduct clustering of multiple domains and classification of maturity lev-
els.
We conducted a cluster analysis for building the BDMM through LCA by using the
Proc LCA software [49] and R package v.1.4.1 [50]. The number of groups that were
tested ranged from three to six, as BDMMs, in general, comprise four-six groups [34].
We also studied characteristic of each group by validating the comparison of the low-
est number of The Akaike and Bayesian information criteria (AIC and BIC, respectively,
[39, 40]). Based on the general assessment, a single number of groups was required for
all domains. We selected to use N = 4 in balancing of multiple two lowest AIC/BIC
values as shown in Table2.
Table 2. Comparison of the AIC and BIC analysis for N = 3–6 for each question domain.
N = 3 N = 4 N = 5 N = 6 AIC BIC AIC BIC AIC BIC AIC BIC
OA 2,001 2,225 1,989 2,288 1,989 2,364 1,999 2,450
IT 7,158 7,681 7,062 7,760 7,004 7,878 6,962 8,011
AT 4,011 4,380 3,918 4,411 3,859 4,476 3,919 4,660
PP 1,495 1,656 1,498 1,713 1,508 1,777 1,520 1,844
The highlighted numbers are the two lowest AIC and BIC values
We clustered the result of each domain, i.e., OA, IT, AT, and PP, into four groups,
and run LCA again for clustering each domain to determine the number of final ma-
turity level by AIC/BIC. Four maturity level were selected based on the same process.
Moreover, we provide validation by analyzing the demographic separation of each ma-
turity level. The model development uses a clustering technique to reduce the cost and
92 http://www.i-jim.org

Paper—Innovative Mobile Application for Measuring Big Data Maturity: Case of SMEs in Thailand
time required for the multiple steps and MM that is developed manually by experts. The
data collected from 135 SMEs can be used to predict new organization assessment, and
we can also provide the recommendation and model monitoring for model adjustment
in the future.
The model was validated through descriptive analysis for the separation of demo-
graphic data, which are number of staffs, number of IT staffs, and revenue, interpret
that the model can classify the domains into four different maturity levels as shown in
figure 1.
Fig. 1. Classification of maturity level versus domains and demographic
We classified each maturity level according to their characteristics as follows: 1)
Low OA, IT and analytic; 2) High OA and IT, but low analytic and people; 3) High OA
and Analytic but medium for IT and people; 4) High mature for all domains.
This developed model is adaptive. When more SMEs assess themselves via this
model, some technologies, such as Business Intelligence, data mining, and predictive
analytic, may gain popularity over time. In contrast, some technologies, such as CRM
and ERP, may become fundamental for SMEs. The scoring of such technologies may
decrease gradually. However, if the scoring increases continuously, we can retrain the
model to cluster new groups and levels. Moreover, when many firms self-assess, they
could observe the average score of the same domain type in detail and desire to improve
themselves to increase their competitiveness.
2.5 TAM
Technology acceptance for intention and behavior in information technology was
introduced by [41] [42]. TAM was the first proposed and the most popular model by
Fred Davis in 1985. Davis proposed that the intention to use directly influenced by the
system’s capabilities and features. TAM was adjusted with the theory of reasoned ac-
tion(TRA) [43] The TAM model consists of behavioral intention to use, which is meas-
ured users’ attitudes by the perceived ease of use and perceived usefulness. Relevant
studies confirmed that TAM was used as the core framework for analysis the acceptance
iJIM ‒ Vol. 14, No. 18, 2020 93
Paper—Innovative Mobile Application for Measuring Big Data Maturity: Case of SMEs in Thailand
of the mobile system. Many studies investigated users attitude on mobile technology
through adoption of tools or consumer application such as mobile banking [44], google
translation [45], e-learning in university system [46, 47] and mobile commerce adop-
tion via mobile applications [48]. TAM model also used for organization assessment
for the evaluate e-commerce assessment for SMEs [49] and university assessment [50]
in Thailand. In summary, TAM is the most effective model and can be used as a tool to
collect user’s comments for improving the system. Thus, for this research study, TAM
was used as a core model to understand SMEs’ attitude in using an Big Data Maturity
model of SMEs in Thailand.
3 Methodology
3.1 API and mobile web development
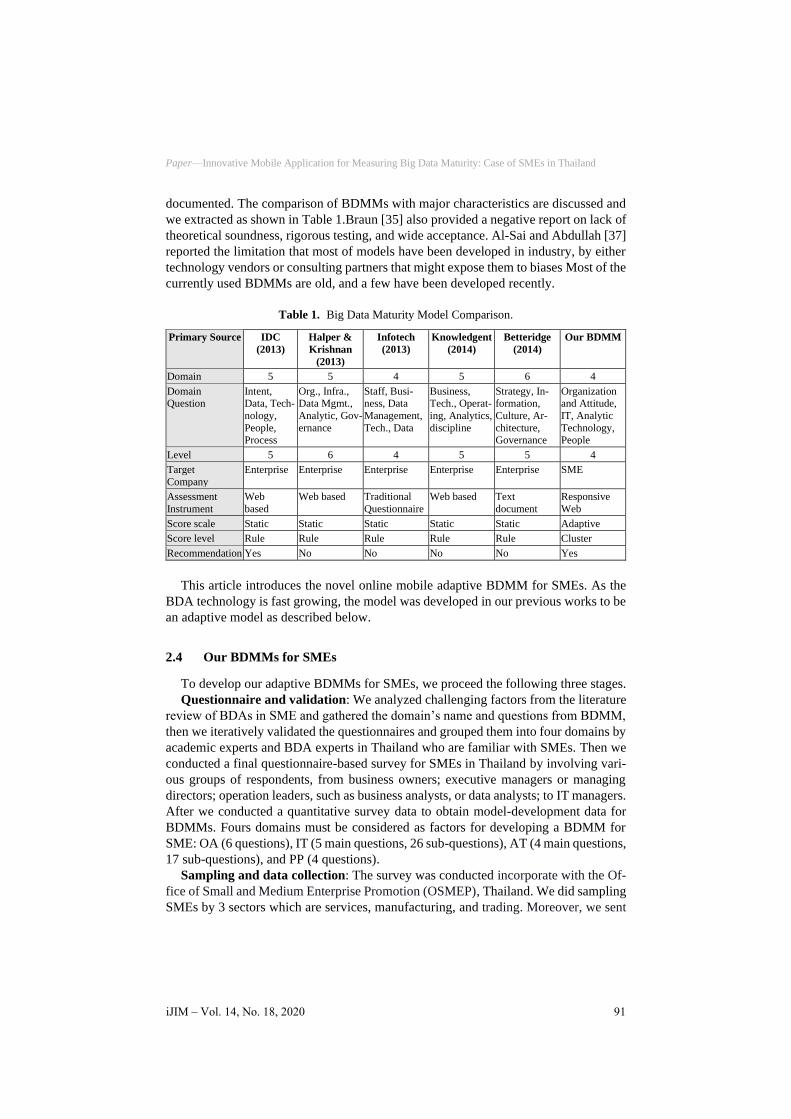
The proposed conceptual framework of the mobile web development consists of
three phases, as shown in Figure 2: literature review of factors impacting the BDA for
SMEs, model development, and model application and innovation acceptance. In our
previous works, we already finished literature review and the model development.
Therefore, in this section we explain about the application and innovation acceptance.
Fig. 2. Conceptual framework for the development of a BDMM for SMEs
We developed a BDMM-based web application by using .NET core framework with
C#, an SQL Server as the DBMS, and a clustering model by using ProLCA with R
package v.1.4.1. The model was developed using Alteryx desktop and ProLCA was
embedded into the workflow. It was published to run on the Alteryx Server. Microsoft
Azure was used at the front-end to connect the model clustering through API. The sys-
tem architecture is shown in Figure 3.
94 http://www.i-jim.org

Paper—Innovative Mobile Application for Measuring Big Data Maturity: Case of SMEs in Thailand
Fig. 3. System Architecture
3.2 Technology acceptance test
We conducted a technology acceptance test by using TAM for analyzing the result
of our web application based on perceived usefulness, perceived ease of use, and the
intention to use. The technology acceptance test was conducted from May 2020 to June
2020 to test the acceptance rate of the BDMM by collecting data from 33 respondents,
including business owners, managing directors, managers, data analyst, IT, and busi-
ness users. All of them have important roles in the decision making of using data anal-
ysis in the organization.
Questionnaire reliability: The questionnaire consists of 2 parts: demographic and
opinions on using the system. The survey opinion was categorized into 6 dimensions
with 26 variables, which uses a 5-point Likert Scale. The questionnaire was validated
for reliability by using Cronbach’s alpha coefficient, which result show reliable for all
dimensions with value higher than 0.7. The reliability analysis is shown in Table 3.
Table 3. Cronbach’s Alpha Coefficient for reliability analysis
Dimension Number of variables Internal Consistency
System Efficiency 5 0.746
Usage 5 0.811
Data Security 5 0.931
Perceived Usefulness 5 0.847
Perceived Ease of Use 3 0.831
Intention to Use 3 0.714
Data analysis: The survey data were analyzed with descriptive statistics tools for
means and standard deviation using Statistical Package for Social Sciences Program
(SPSS), Version 26.
iJIM ‒ Vol. 14, No. 18, 2020 95
Paper—Innovative Mobile Application for Measuring Big Data Maturity: Case of SMEs in Thailand
4 Results
(a) (b)
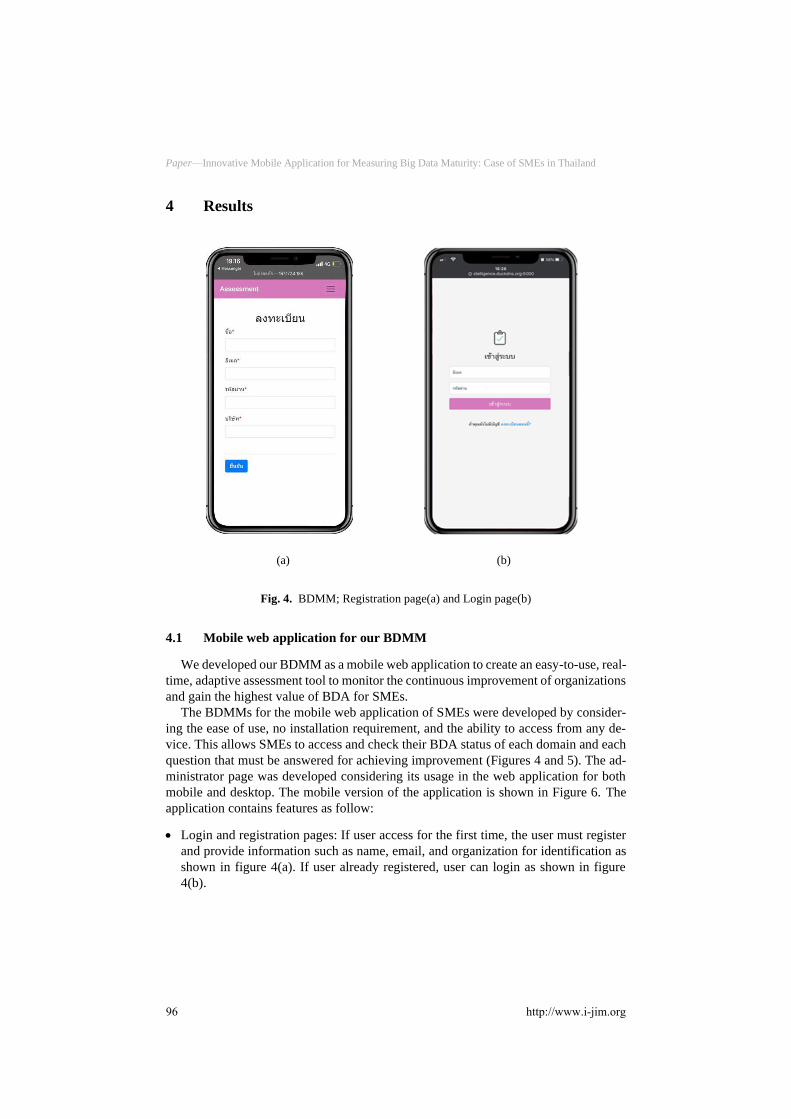
Fig. 4. BDMM; Registration page(a) and Login page(b)
4.1 Mobile web application for our BDMM
We developed our BDMM as a mobile web application to create an easy-to-use, real-
time, adaptive assessment tool to monitor the continuous improvement of organizations
and gain the highest value of BDA for SMEs.
The BDMMs for the mobile web application of SMEs were developed by consider-
ing the ease of use, no installation requirement, and the ability to access from any de-
vice. This allows SMEs to access and check their BDA status of each domain and each
question that must be answered for achieving improvement (Figures 4 and 5). The ad-
ministrator page was developed considering its usage in the web application for both
mobile and desktop. The mobile version of the application is shown in Figure 6. The
application contains features as follow:
• Login and registration pages: If user access for the first time, the user must register
and provide information such as name, email, and organization for identification as
shown in figure 4(a). If user already registered, user can login as shown in figure
4(b).
96 http://www.i-jim.org
Paper—Innovative Mobile Application for Measuring Big Data Maturity: Case of SMEs in Thailand
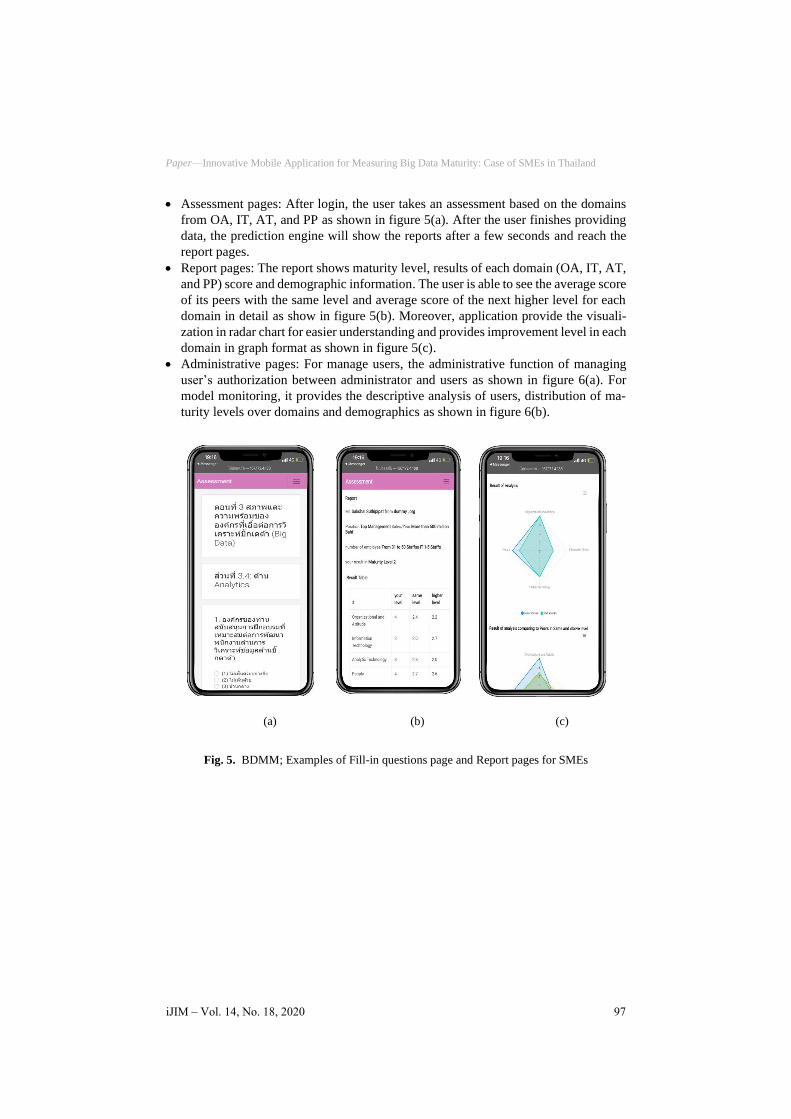
• Assessment pages: After login, the user takes an assessment based on the domains
from OA, IT, AT, and PP as shown in figure 5(a). After the user finishes providing
data, the prediction engine will show the reports after a few seconds and reach the
report pages.
• Report pages: The report shows maturity level, results of each domain (OA, IT, AT,
and PP) score and demographic information. The user is able to see the average score
of its peers with the same level and average score of the next higher level for each
domain in detail as show in figure 5(b). Moreover, application provide the visuali-
zation in radar chart for easier understanding and provides improvement level in each
domain in graph format as shown in figure 5(c).
• Administrative pages: For manage users, the administrative function of managing
user’s authorization between administrator and users as shown in figure 6(a). For
model monitoring, it provides the descriptive analysis of users, distribution of ma-
turity levels over domains and demographics as shown in figure 6(b).
(a) (b) (c)
Fig. 5. BDMM; Examples of Fill-in questions page and Report pages for SMEs
iJIM ‒ Vol. 14, No. 18, 2020 97

Paper—Innovative Mobile Application for Measuring Big Data Maturity: Case of SMEs in Thailand
(a) (b)
Fig. 6. BDMM; Example of Admin pages for user management and model monitoring
4.2 Technology acceptance of BDMM mobile web
The technology acceptance model was applied to test the acceptance rate of the
BDMM by collecting data from 33 respondents, which are business owners, managing
directors, managers, data analyst, IT and business users who have involved the decision
making of using data analyst in the organization from May 2020 to June 2020 as shown
in Table 4.
98 http://www.i-jim.org
Paper—Innovative Mobile Application for Measuring Big Data Maturity: Case of SMEs in Thailand
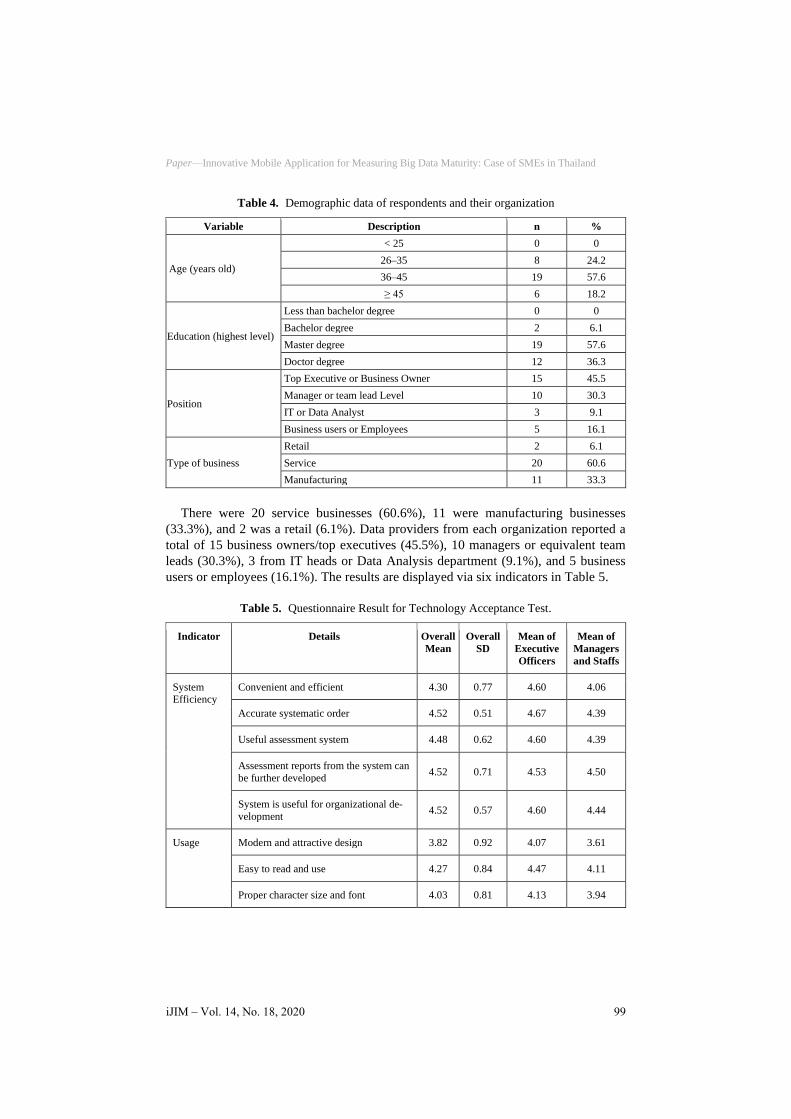
Table 4. Demographic data of respondents and their organization
Variable Description n %
Age (years old)
< 25 0 0
26–35 8 24.2
36–45 19 57.6
≥ 45 6 18.2
Education (highest level)
Less than bachelor degree 0 0
Bachelor degree 2 6.1
Master degree 19 57.6
Doctor degree 12 36.3
Position
Top Executive or Business Owner 15 45.5
Manager or team lead Level 10 30.3
IT or Data Analyst 3 9.1
Business users or Employees 5 16.1
Type of business
Retail 2 6.1
Service 20 60.6
Manufacturing 11 33.3
There were 20 service businesses (60.6%), 11 were manufacturing businesses
(33.3%), and 2 was a retail (6.1%). Data providers from each organization reported a
total of 15 business owners/top executives (45.5%), 10 managers or equivalent team
leads (30.3%), 3 from IT heads or Data Analysis department (9.1%), and 5 business
users or employees (16.1%). The results are displayed via six indicators in Table 5.
Table 5. Questionnaire Result for Technology Acceptance Test.
Indicator Details Overall
Mean
Overall
SD
Mean of
Executive
Officers
Mean of
Managers
and Staffs
System Efficiency
Convenient and efficient 4.30 0.77 4.60 4.06
Accurate systematic order 4.52 0.51 4.67 4.39
Useful assessment system 4.48 0.62 4.60 4.39
Assessment reports from the system can
be further developed 4.52 0.71 4.53 4.50
System is useful for organizational de-
velopment 4.52 0.57 4.60 4.44
Usage Modern and attractive design 3.82 0.92 4.07 3.61
Easy to read and use 4.27 0.84 4.47 4.11
Proper character size and font 4.03 0.81 4.13 3.94
iJIM ‒ Vol. 14, No. 18, 2020 99
Paper—Innovative Mobile Application for Measuring Big Data Maturity: Case of SMEs in Thailand
Indicator Details Overall
Mean
Overall
SD
Mean of
Executive
Officers
Mean of
Managers
and Staffs
Appropriate pattern of assessment 4.27 0.57 4.47 4.11
Appropriate pattern of report 4.24 0.87 4.47 4.06
Data
Security
Reliable system 4.09 0.84 4.07 4.11
Secure setting up of username and pass-
word for logging in 3.97 0.81 3.93 4.00
Terms are specified prior to usage 4.09 0.95 4.33 3.89
Usage is controlled according to terms 4.18 0.92 4.33 4.06
Data collection is accurate and secure 4.03 0.91 4.13 4.06
Perceived Usefulness
Useful to assess maturity level of Big Data
4.39 0.61 4.40 4.39
Can be assessed and re-assessed online 4.42 0.61 4.60 4.28
Able to comprehend weaknesses,
strengths, and potential systematically 4.48 0.62 4.40 4.56
Scoring reflects actual results depend-ing on assessors
4.27 0.63 4.33 4.22
System results can be assessed over
time compared to technology and inno-
vation
4.39 0.66 4.47 4.33
Perceived
Ease of Use
Easily accessible and usable 4.30 0.85 4.53 4.11
Clear and easy to use menu/directions 4.36 0.74 4.47 4.28
Reporting system is clear and easy to
comprehend 4.39 0.61 4.47 4.33
Intention
to Use
Usage of system is proven useful 4.39 0.61 4.40 4.39
Confident in the accuracy of assessment 4.33 0.65 4.47 4.22
Feeling secure while using the system 4.24 0.79 4.27 4.22
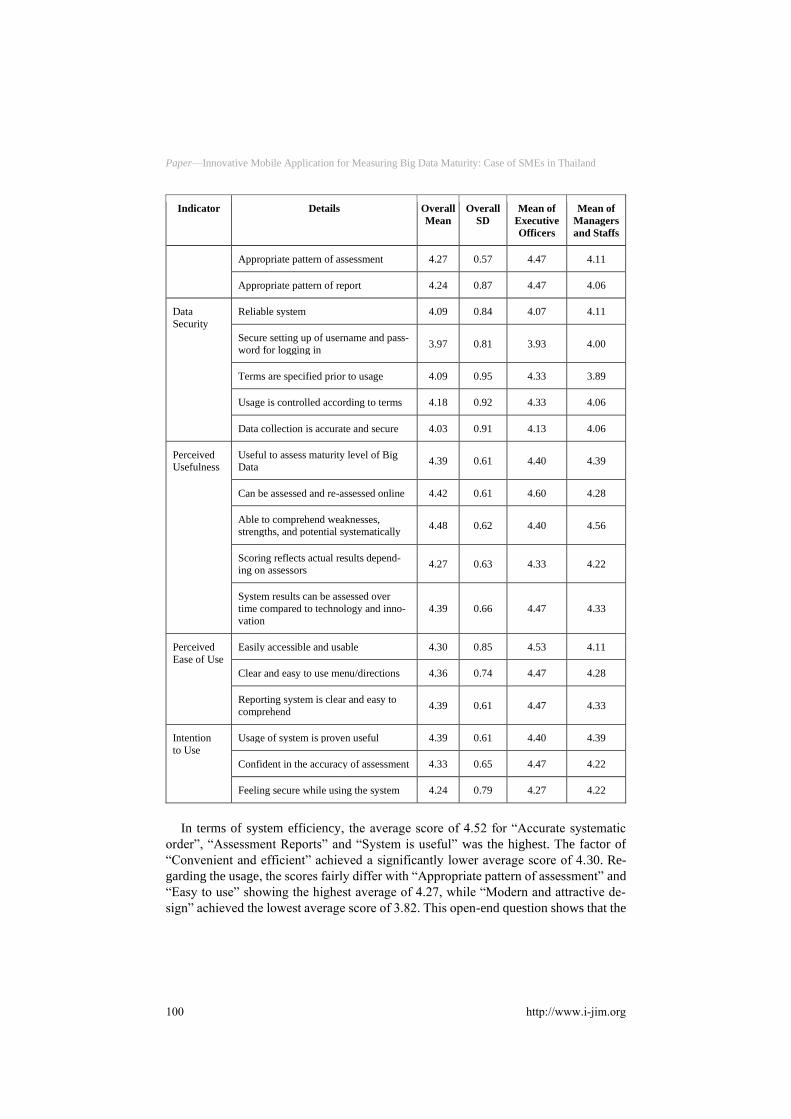
In terms of system efficiency, the average score of 4.52 for “Accurate systematic
order”, “Assessment Reports” and “System is useful” was the highest. The factor of
“Convenient and efficient” achieved a significantly lower average score of 4.30. Re-
garding the usage, the scores fairly differ with “Appropriate pattern of assessment” and
“Easy to use” showing the highest average of 4.27, while “Modern and attractive de-
sign” achieved the lowest average score of 3.82. This open-end question shows that the
100 http://www.i-jim.org
Paper—Innovative Mobile Application for Measuring Big Data Maturity: Case of SMEs in Thailand
user interface should be redesigned for a better score of modern and attractive. In terms
of data security, “Usage is controlled according to terms” achieved the highest average
score of 4.18, whereas “Secure setting up of username and password for logging in”
achieved the lowest average of 3.97. This insight shows that improvement is needed in
the overall data security as its average score is significantly lower than the other five
indicators.
The assessment of perceived usefulness achieved a relatively high score for “Able
to comprehend weaknesses, strengths, and potential systematically” at 4.48, while
achieving the lowest average of 4.27 for “Scoring reflects actual results depending on
assessors”. The assessment of perceived ease of use also has a relatively high overall
score, while the scores are barely dispersed for the Reporting system is clear and easy
to comprehend” achieving the highest average of 4.39 points and “Easily accessible and
usable” scoring the lowest average of 4.30. Regarding the intention to use, “Usage of
system is proven useful” scored the highest average of 4.39, while “Confident in the
accuracy of assessment” scored a lower mean of 4.33 and “Feeling secure while using
the system” scored the minimum at 4.24.
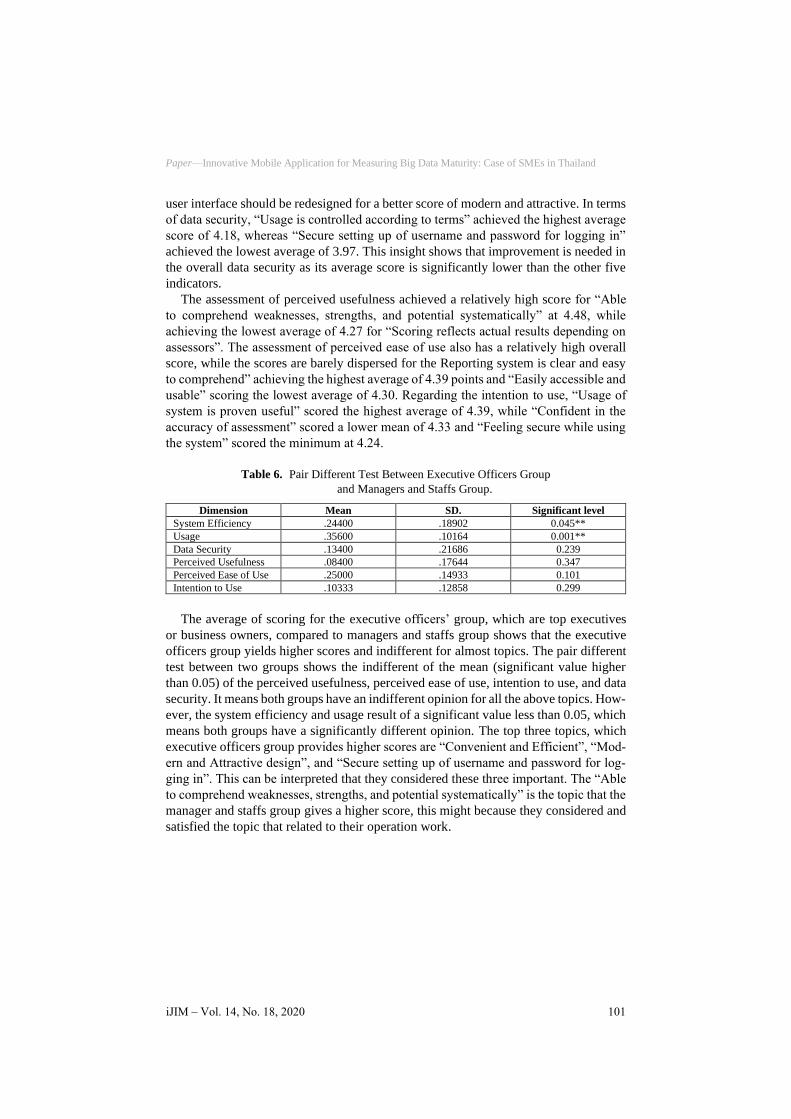
Table 6. Pair Different Test Between Executive Officers Group
and Managers and Staffs Group.
Dimension Mean SD. Significant level
System Efficiency .24400 .18902 0.045**
Usage .35600 .10164 0.001**
Data Security .13400 .21686 0.239
Perceived Usefulness .08400 .17644 0.347
Perceived Ease of Use .25000 .14933 0.101
Intention to Use .10333 .12858 0.299
The average of scoring for the executive officers’ group, which are top executives
or business owners, compared to managers and staffs group shows that the executive
officers group yields higher scores and indifferent for almost topics. The pair different
test between two groups shows the indifferent of the mean (significant value higher
than 0.05) of the perceived usefulness, perceived ease of use, intention to use, and data
security. It means both groups have an indifferent opinion for all the above topics. How-
ever, the system efficiency and usage result of a significant value less than 0.05, which
means both groups have a significantly different opinion. The top three topics, which
executive officers group provides higher scores are “Convenient and Efficient”, “Mod-
ern and Attractive design”, and “Secure setting up of username and password for log-
ging in”. This can be interpreted that they considered these three important. The “Able
to comprehend weaknesses, strengths, and potential systematically” is the topic that the
manager and staffs group gives a higher score, this might because they considered and
satisfied the topic that related to their operation work.
iJIM ‒ Vol. 14, No. 18, 2020 101

Paper—Innovative Mobile Application for Measuring Big Data Maturity: Case of SMEs in Thailand
5 Conclusion and Discussion
In this study, we proposed a BDMM for SMEs based on previous models and liter-
ature review to provide effective questions, domain, and results of assessment for
SMEs. The model consists of the assessment of four domains, including OA, IT, AT,
and PP. Our model, which was developed via LCA, could identify subgroups, and pro-
vide an insight into the behavior of multiple organizations during their assessment. In
addition, the model provides an adaptive scoring, and it is dynamic in the sense that if
more data becomes available or market behavior changes owing to the adoption of new
technologies, the threshold of each level adapts based on the peers in a dynamic cluster.
The BDMM of SMEs in terms of the mobile Web application was also developed con-
sidering the ease of use and ability to access from any mobile type. This allows SMEs
to access their BDA status of each domain and review each question for implementing
improvements. The technology acceptance model was applied to test the acceptance
rate of the BDMM Web application by collecting data from 33 respondents. The result
shows that the executive officers group provide higher mean scores for most of topics.
Moreover, both groups show the statistically indifferent of attitude toward satisfaction
of intention to use, perceived usefulness, perceived ease of use and data security. It
shows that our application can be used for any level of staffs in SMEs. However, both
groups confirm that the data security of the system and the user interface can be im-
proved.
There are many possible use case scenarios for this BDDM mobile application for
SMEs. We concluded that there are at least two possible customers for BDDMs: 1) End
users take assessment themselves or consulting firms conduct an assessment for end-
users and provide interpreting and consulting to their customers. This group of custom-
ers will use it for monitoring, controlling, or as a guideline to improve the capability of
Big Data Analytics in SMEs. 2) Government Agency, who is responsible for promoting
or supporting of digital technology to SMEs in Thailand, such as DEPA
(www.depa.or.th) or OSMEP (www.sme.go.th). The Government Agencies can sub-
scribe to the BDDM application and let SMEs measure their levels of competency. The
Government Agencies can further provide proper support depending on SMEs’ level of
competency.
6 References
[1] Olszak, C.M. and M. Mach-Król, A conceptual framework for assessing an organization’s
readiness to adopt big data. Sustainability, 2018. 10(10): p. 3734. https://doi.org/10.3390/
su10103734
[2] Douglas, L., 3d data management: Controlling data volume, velocity, and variety. Gartner.
Retrieved, 2001. 6(2001): p. 6.
[3] Ward, J.S. and A. Barker, Undefined by data: a survey of big data definitions. arXiv preprint
arXiv:1309.5821, 2013.
[4] Kusuma, S. and D. Kasi Viswanath, IOT and big data analytics in e-learning: a technological
perspective and review. Int J Eng Technol, 2018. 7(18): p. 164-167. https://doi.org/10.
14419/ijet.v7i1.8.11540
102 http://www.i-jim.org
Paper—Innovative Mobile Application for Measuring Big Data Maturity: Case of SMEs in Thailand
[5] Coleman, S., et al., How can SMEs benefit from big data? Challenges and a path forward.
Quality and Reliability Engineering International, 2016. 32(6): p. 2151-2164. https://doi.org/
10.1002/qre.2008
[6] Kalan, R.S. and M.O. Ünalir. Leveraging big data technology for small and medium-sized
enterprises (SMEs). 2016. Institute of Electrical and Electronics Engineers Inc. https://doi.
org/10.1109/iccke.2016.7802106
[7] Coleman, S.Y., Data-Mining Opportunities for Small and Medium Enterprises with Official
Statistics in the UK. Journal of Official Statistics (JOS), 2016. 32(4): p. 849-865. https://doi.
org/10.1515/jos-2016-0044
[8] Chen, C.P. and C.-Y. Zhang, Data-intensive applications, challenges, techniques, and tech-
nologies: A survey on Big Data. Information sciences, 2014. 275: p. 314-347. https://
doi.org/10.1016/j.ins.2014.01.015
[9] Seddon, J.J. and W.L. Currie, A model for unpacking big data analytics in high-frequency
trading. Journal of Business Research, 2017. 70: p. 300-307. https://doi.org/10.1016/j.
jbusres.2016.08.003
[10] Mikalef, P., et al., Big data analytics capabilities: a systematic literature re-view and research
agenda. Information Systems and e-Business Management, 2017: p. 1-32.
[11] LaValle, S., et al., Big data, analytics, and the path from insights to value. MIT sloan man-
agement review, 2011. 52(2): p. 21-32.
[12] Iqbal, M., et al. A study of big data for business growth in SMEs: Opportunities & chal-
lenges. in 2018 International Conference on Computing, Mathematics and Engineering
Technologies (iCoMET). 2018. IEEE.
[13] Rusaneanu, A.-E. and V. Lavric, Developing the SMEs' Innovative Capacity Using a Big
Data Approach. Academy of Economic Studies. Economy Informatics, 2014. 14(1): p. 55.
[14] Agrawal, K., Investigating the determinants of Big Data Analytics (BDA) adoption in Asian
emerging economies. 2015.
[15] Pitchayadol, P., et al., Innovativeness in Thai family SMEs: An exploratory case study. Jour-
nal of Small Business Strategy, 2018. 28(1): p. 38-48.
[16] Comuzzi, M. and A. Patel, How organisations leverage Big Data: a maturity model. Indus-
trial Management & Data Systems, 2016. 116(8): p. 1468-1492. https://doi.org/10.
1108/imds-12-2015-0495
[17] Vidgen, R., S. Shaw, and D.B. Grant, Management challenges in creating value from busi-
ness analytics. European Journal of Operational Research, 2017. 261(2): p. 626-639. https://doi.org/10.1016/j.ejor.2017.02.023
[18] Limpeeticharoenchot, S., et al., Classifying Attitudes of Thai Business Organizations To-
ward the Perceived Benefit of Customer Predictive Analytics, in 2018 Joint 10th Interna-
tional Conference on Soft Computing and Intelligent Systems (SCIS) and 19th International
Symposium on Advanced Intelligent Systems (ISIS). 2018. p. 698-703. https://doi.org/10.1109/scis-isis.2018.00118
[19] Noonpakdee, W., A. Phothichai, and T. Khunkornsiri. Big data implementation for small
and medium enterprises. in 2018 27th Wireless and Optical Communication Conference
(WOCC). 2018. IEEE. https://doi.org/10.1109/wocc.2018.8372725
[20] Shi, Z. and G. Wang, Integration of big-data ERP and business analytics (BA). The Journal
of High Technology Management Research, 2018. 29(2): p. 141-150. https://doi.org/10.
1016/j.hitech.2018.09.004
[21] Almeida, P. and J. Bernardino, A Survey on Open Source Data Mining Tools for SMEs, in
New Advances in Information Systems and Technologies. 2016. p. 253-262. https://doi.org/
10.1007/978-3-319-31232-3_24
iJIM ‒ Vol. 14, No. 18, 2020 103

Paper—Innovative Mobile Application for Measuring Big Data Maturity: Case of SMEs in Thailand
[22] Gupta, M., and J.F. George, Toward the development of a big data analytics capability. In-
formation & Management, 2016. 53(8): p. 1049-1064. https://doi.org/10.1016/j.im.2016.
07.004
[23] El-Seoud, S.A., et al., Big Data and Cloud Computing: Trends and Challenges. International
Journal of Interactive Mobile Technologies, 2017. 11(2).
[24] Ahlemeyer-Stubbe, A. and S. Coleman, A practical guide to data mining for business and
industry. 2014: John Wiley & Sons. https://doi.org/10.1002/9781118763704
[25] Schmarzo, B., Big Data: Understanding how data powers big business. 2013: John Wiley &
Sons.
[26] Ogbuokiri, B., C. Udanor, and M. Agu, Implementing bigdata analytics for small and me-
dium enterprise (SME) regional growth. IOSR Journal of Computer Engineering, 2015.
17(6): p. 35-43.
[27] Junqué de Fortuny, E., D. Martens, and F. Provost, Predictive modeling with big data: is
bigger really better? Big Data, 2013. 1(4): p. 215-226. https://doi.org/10.1089/big.2013.
0037
[28] Alshawi, S., F. Missi, and Z. Irani, Organisational, technical and data quality factors in CRM
adoption—SMEs perspective. Industrial Marketing Management, 2011. 40(3): p. 376-383. https://doi.org/10.1016/j.indmarman.2010.08.006
[29] Cosic, R., G. Shanks, and S. Maynard. Towards a business analytics capability maturity
model. in ACIS 2012: Location, Location, Location: Proceedings of the 23rd Australasian
Conference on Information Systems 2012. 2012. ACIS.
[30] Sen, D., M. Ozturk, and O. Vayvay, An overview of big data for growth in SMEs. Procedia-
Social and Behavioral Sciences, 2016. 235: p. 159-167. https://doi.org/10.1016/j.sbspro.
2016.11.011
[31] Almeida, P. and J. Bernardino, A survey on open source data mining tools for SMEs. Ad-
vances in Intelligent Systems and Computing. Vol. 444. 2016: Springer Verlag. 253-262. https://doi.org/10.1007/978-3-319-31232-3_24
[32] Knobbout, J. and E. van der Stappen, A Capability Model for Learning Analytics Adoption:
Identifying organizational capabilities from literature on big data analytics, business analyt-
ics, and learning analytics. International Journal of Learning Analytics and Artificial Intel-
ligence for Education (iJAI), 2020. 2(1): p. 47-66. https://doi.org/10.3991/ijai.v2i1.
12793
[33] Rodolfa, K.T., et al., An Experience-Centered Approach to Training Effective Data Scien-
tists. Big Data, 2019. 7(4): p. 249-261. https://doi.org/10.1089/big.2019.0100
[34] Kusuma, S. and D. Kasi Viswanath, IOT And Big Data Analytics In E-Learning: A Tech-
nological Perspective and Review. International Journal of Engineering & Technology,
2018. 7(1.8). https://doi.org/10.14419/ijet.v7i1.8.11540
[35] Braun, H.T., Evaluation of Big Data maturity models–a benchmarking study to support Big
Data maturity assessment in organizations. 2015.
[36] Adrian, C., et al., Towards developing strategic assessment model for big data implementa-
tion: a systematic literature review. Int. J. Adv. Soft Compu. Appl, 2016. 8(3).
[37] Al-Sai, Z.A. and R. Abdullah. A Review on Big Data Maturity Models. in 2019 IEEE Jordan
International Joint Conference on Electrical Engineering and Information Technology
(JEEIT). 2019. IEEE. https://doi.org/10.1109/jeeit.2019.8717398
[38] Halper, F., and K. Krishnan, TDWI big data maturity model guide. RDWi Research, 2013.
2014: p. 1-20.
[39] Akaike, H., A new look at the statistical model identification. IEEE T Auto-mat Contr 19
(6): 716–723. 1974. https://doi.org/10.1109/tac.1974.1100705
104 http://www.i-jim.org
Paper—Innovative Mobile Application for Measuring Big Data Maturity: Case of SMEs in Thailand
[40] Schwarz, G., Estimating the dimension of a model. The annals of statistics, 1978. 6(2): p.
461-464.
[41] Fishbein, M. and I. Ajzen, Intention and Behavior: An introduction to theory and research.
1975, Addison-Wesley, Reading, MA.
[42] Davis, F.D., Perceived usefulness, perceived ease of use, and user acceptance of information
technology. MIS quarterly, 1989: p. 319-340. https://doi.org/10.2307/249008
[43] Davis, F.D., R.P. Bagozzi, and P.R. Warshaw, User acceptance of computer technology: a
comparison of two theoretical models. Management science, 1989. 35(8): p. 982-1003. https://doi.org/10.1287/mnsc.35.8.982
[44] Jaradat, M.-I.R. and N.M. Twaissi, Assessing the Introduction of Mobile Banking in Jordan
Using Technology Acceptance Model. International Journal of Interactive Mobile Technol-
ogies, 2010. 4(1). https://doi.org/10.3991/ijim.v4i1.1057
[45] Al-Maroof, R.S., et al., Understanding an Extension Technology Acceptance Model of
Google Translation: A Multi-Cultural Study in United Arab Emirates. International Journal
of Interactive Mobile Technologies (iJIM), 2020. 14(03): p. 157-178. https://doi.org/10.
3991/ijim.v14i03.11110
[46] Rojas-Osorio, M. and A. Alvarez-Risco, Intention to use smartphones among Peruvian Uni-
versity students. 2019.
[47] Al Mulhem, A., Exploring the Key Factors in the Use of an E-Learning System Among
Students at King Faisal University, Saudi Arabia. 2020.
[48] Singh, S., I.A. Zolkepli, and C.W. Kit, New wave in mobile commerce adoption via mobile
applications in Malaysian market: investigating the relationship be-tween consumer ac-
ceptance, trust, and self-efficacy. International Journal of Interactive Mobile Technologies
(iJIM), 2018. 12(7): p. 112-128. https://doi.org/10.3991/ijim.v12i7.8964
[49] Wongkhamdi, T., N. Cooharojananone, and J. Khlaisang, E-Commerce Competence Assess-
ment Mobile Application Development for SMEs in Thailand. International Journal of In-
teractive Mobile Technologies, 2020. 14(11). https://doi.org/10.3991/ijim.v14i11.
11358
[50] Kongsoontornkijkul, K., et al., Developing A Mobile Web for Innovative University Assess-
ment System: Thailand Talent Mobility Programme. 2019. https://doi.org/10.3991/
ijim.v13i11.10924
7 Authors
Santisook Limpeeticharoenchot is currently a PhD candidate from Technopreneur-
ship and Innovation Management Program, Chulalongkorn University. He received his
B.Eng degree with honours in Electrical Engineering, master degree in business and
economics from Chulalongkorn University. At present, he is doing research in the field
of Big Data Analytic, Business Analytic and Maturity Model. santisook.l@stu-
dent.chula.ac.th
Nagul Cooharojananone is an associate professor at Chulalongkorn University,
Thailand. He received his B.S. degree In Computer Science from Mahidol University.
He received his M.Eng and Ph.D. in Information and Communication Engineering from
the University of Tokyo. His research interests include Multimedia Technology and
Mobile Application.
iJIM ‒ Vol. 14, No. 18, 2020 105

Paper—Innovative Mobile Application for Measuring Big Data Maturity: Case of SMEs in Thailand
Thira Chanvanakul received his B.E. in civil engineering and M.B.A. from
Chulalongkorn University, Thailand, and his M.Sc. and Ph.D. in Engineering Manage-
ment from University of Missouri-Rolla (which is now the Missouri University of Sci-
ence and Technology), USA. He is currently Assistant Professor and Head of Depart-
ment of Commerce at Chulalongkorn Business School, Chulalongkorn University,
Thailand. His research interests are in the areas of ̄financial engineering, operations
management, quantitative analysis, applications of artificial intelligence, particularly
neural networks, fuzzy logic, and expert systems for business, ̄financial forecasting and
investment. His research has been published in journals such as Expert Systems with
Applications, Neurocomputing and Journal of Energy Engineering.
Nuengwong Tuaycharoen is an assistant professor in Computer Engineering and a
director of the Center of Learning and Teaching Innovation at Dhurakij Pundit Univer-
sity (DPU), Thailand. She received her B.Eng degree with honours in Computer Engi-
neering from Chulalongkorn University, Thailand. She received her M.S and Ph.D. in
Electrical and Computer Engineering from University of Maryland, College Park, USA.
Her interests are in Software Development, Web and Mobile Application Development,
Agile Methods, and Online and Active Learning. [email protected]
Kanokwan Atchariyachanvanich received the B.Sc. degree in information tech-
nology from Assumption University, the M.S. degree in information management from
the Asian Institute of Technology, the M.P.A. degree in international development from
Tsinghua University, and the Ph.D. degree in informatics from the Graduate University
for Advanced Studies, Japan. She is currently an Assistant Professor with the Faculty
of Information Technology, King Mongkut’s Institute of Technology Ladkrabang,
Thailand. Her prior research has been published in international journals and interna-
tional conferences, such as ACM SIGecom Exchanges, the International Journal of
Electronic Customer Relationship Management, E-business and Telecommunications,
the International Conference on Electronic Commerce, and the International Confer-
ence on Computer and Information Science. Her research interests include e-learning,
information technology adoption, e-business management, and consumer behavior in
the digital market, [email protected]
Article submitted 2020-06-14. Resubmitted 2020-08-05. Final acceptance 2020-08-05. Final version pub-lished as submitted by the authors.
106 http://www.i-jim.org