Initial Environmental Examination - 51337-001: Tamil Nadu ...
466
Initial Environmental Examination Project Number: P51337-001 December 2020 India: Tamil Nadu Industrial Connectivity Project Cheyyur–Vandavasi–Polur (C-V-P) Road & ECR LINK: Cheyyur–Panaiyur (ODR)Road (SH115) Prepared by Highways and Minor Ports Department (TNHD), Government of Tamil Nadu for the Asian Development Bank.
-
Upload
khangminh22 -
Category
Documents
-
view
0 -
download
0
Transcript of Initial Environmental Examination - 51337-001: Tamil Nadu ...
Initial Environmental Examination Project Number: P51337-001 December 2020
India: Tamil Nadu Industrial Connectivity Project Cheyyur–Vandavasi–Polur (C-V-P) Road & ECR LINK: Cheyyur–Panaiyur (ODR)Road (SH115)
Prepared by Highways and Minor Ports Department (TNHD), Government of Tamil Nadu for the Asian Development Bank.
CURRENCY EQUIVALENTS (as of 30 November 2020)
Currency unit Re1.00 $1.00
= = =
Indian rupee/s (Re/Rs) $0.013 Rs.74.9311
ABBREVIATION
AADT - Annual Average Daily Traffic AAQM - Ambient air quality monitoring ADB - Asian Development Bank AMSL - Above Mean Sea Level ASI - Archaeological Survey of India BDL - Below detectable limit BGL - Below ground level BOD - Biochemical oxygen demand BOQ - Bill of quantity CGWA - Central Ground Water Authority CKICP - Chennai Kanyakumari Industrial Corridor Project CO - Carbon monoxide COD - Chemical oxygen demand CPCB - Central Pollution Control Board CSC - Construction Supervision Consultant DFO - Divisional Forest Officer DG - Diesel generating set DO - Dissolved oxygen DPR - Detailed project report E&S - Environment and social EA - Executing agency EAC - Expert Appraisal Committee EFP - Environmental Focal Person EHS - Environment Health and Safety EIA - Environmental impact assessment EMOP - Environmental monitoring plan EMP - Environmental management plan FIU - Field Implementation Unit FRL - Finished Road Level GHG - Greenhouse gas GIS - Geographical information system GOI - Government of India GRC - Grievance redress committee GRM - Grievance redress mechanism HFL - Highest flood level IA - Implementing Agency IEE - Initial Environmental Examination IMD - Indian Meteorological Department IRC - Indian Road Congress IUCN - International Union for Conservation of Nature LHS - Left hand side LPG - Liquefied petroleum gas MOEFCC - Ministry of Environment, Forest and Climate Change MORTH - Ministry of Road Transport and Highways
N, S, E, W, NE, SW, NW
- Wind Directions (North, South, East, West or combination of Two directions like South West, North West)
NGO - Non-governmental organization NH - National Highway NOC - No Objection Certificate NOx - Oxides of nitrogen PAP - Project Affected Persons PAs - Protected Areas PCR - Public Community Resources PCU - Passenger Car Units PD - Project Director PM - Particulate Matter PIU - Project Implementation Unit PPE - Personal protective equipment PPT - Parts per trillion PUC - Pollution Under Control R & R - Rehabilitation and Resettlement RHS - Right hand side ROB - Road Over Bridge ROW - Right of way SEIAA - State Environmental Impact Assessment Authority SH - State highway SO2 - Sulphur Dioxide SOI - Survey of India SPCB - State Pollution Control Board SPL - Sound Pressure Level SPM - Suspended Particulate Matter SPS - ADB Safeguard Policy Statement, 2009 ST - Scheduled Tribes TA - Technical assistance TDS - Total dissolved solids TNRSP - Tamil Nadu Road Sector Project TSS - Total Suspended Solids ZSI - Zoological survey of India
WEIGHTS AND MEASURES
dB(A) – A-weighted decibel ha – hectare km – kilometer µg – microgram m – meter MW (megawatt) – megawatt PM 2.5 or 10 – Particulate Matter of 2.5 micron or 10 micron size
NOTE
In this report, "$" refers to US dollars.
This initial environmental examination is a document of the borrower. The views expressed herein do not necessarily represent those of ADB's Board of Directors, Management, or staff and may be preliminary in nature. Your attention is directed to the “terms of use” section of this website. In preparing any country program or strategy, financing any project, or by making any designation of or reference to a particular territory or geographic area in this document, the Asian Development Bank does not intend to make any judgments as to the legal or other status of any territory or area.

TABLE OF CONTENTS
Executive Summary ............................................................................................................. i
I. INTRODUCTION ............................................................................................................ 1
A. Project Background .................................................................................................... 1 B. Nature, Size and Location of Project Road ................................................................. 2 C. Background of the Present Report .............................................................................. 3 D. Objective and Scope of the Study ............................................................................... 3 E. Methodology Adopted for IEE Study ........................................................................... 4 F. Structure of the Report ................................................................................................ 6
II. POLICY, LEGAL AND ADMINISTRATIVE FRAMEWORK ........................................... 8
A. National (India) Environmental Policy Framework ....................................................... 8 B. Social Regulatory Requirements of India and Tamil Nadu ........................................ 12 C. International Treaties and Relevance to the Project .................................................. 12 D. Project Standards ..................................................................................................... 13 E. ADB’s Safeguard Policy Statement Requirements .................................................... 13 F. Category of the Project ............................................................................................. 13
III. PROJECT DESCRIPTION ........................................................................................... 14
A. Type and Features of Project .................................................................................... 14 B. Location of the Project Road ..................................................................................... 15 C. Engineering Surveys and Investigations ................................................................... 18 D. Design Standards ..................................................................................................... 19 E. Proposed Improvement ............................................................................................. 25 F. Construction Camps ................................................................................................. 47 G. Project Cost .............................................................................................................. 47 H. Construction Packaging and Implementation Schedule ............................................ 47 I. Project Benefits......................................................................................................... 47
IV. DESCRIPTION OF THE ENVIRONMENT .................................................................... 49
A. Introduction ............................................................................................................... 49 B. Physical Environment ............................................................................................... 51 C. Coastal and Marine Resources in Project Influence Area ......................................... 76 D. Biological Environment ............................................................................................. 77 E. Socio-economic Environment ................................................................................... 86
V. ANALYSIS OF ALTERNATIVES ................................................................................. 92
A. With Project’ and ‘Without Project’ Scenario ............................................................. 92 B. Location and Alignment Alternatives ......................................................................... 96 C. Design Decision Constraints For Various Alternatives ............................................ 103 D. Alignment Modifications due to Environmental Considerations ............................... 103 E. Engineering / Technological Alternatives ................................................................ 104
VI. ANTICIPATED ENVIRONMENTAL IMPACTS AND MITIGATION MEASURES ....... 105
A. Introduction ............................................................................................................. 105 B. Screening of Impacts .............................................................................................. 109 C. Typical Potential Adverse Impacts .......................................................................... 113 D. Impacts on Physical Environment ........................................................................... 113
E. Impacts on Biological environment ......................................................................... 128 F. Impacts on Social Environment ............................................................................... 131 G. Physical and Cultural Resources ............................................................................ 149 H. Induced and Cumulative Impacts ............................................................................ 149 I. Expected benefits from the Project ........................................................................ 149
VII. CONSULTATION, PARTICIPATION AND INFORMATION DISCLOSURE ............... 150
A. Meaningful Consultation ......................................................................................... 150 B. Objectives of the Consultations ............................................................................... 150 C. Methodology for Consultations ................................................................................ 150 D. Interaction with NGOs ............................................................................................. 155 E. Public Disclosure and Further Consultations ........................................................... 155
VIII. GRIEVANCE REDRESS MECHANISM ..................................................................... 156
IX. ENVIRONMENTAL MANAGEMENT PLAN ............................................................... 158
A. Introduction ............................................................................................................. 158 B. Objectives of Environmental Management Plan ...................................................... 158 C. Environmental Management Plan Matrix................................................................. 158 D. Environmental Monitoring and Reporting Program .................................................. 158 E. Institutional Requirements ...................................................................................... 185 F. Environmental Reporting System ............................................................................ 191 G. Environmental Management Budget ....................................................................... 192
X. CONCLUSIONS AND RECOMMENDATIONS .......................................................... 199
APPENDICES ................................................................................................................... 201
LIST OF TABLES Table 1: Project road details (SH-115) 1 Table 2: Location Details of Project Road Sections 2 Table 3: Primary and Secondary Information Sources 5 Table 4: Applicable Environmental National and State Requirements 9 Table 5: Cheyyur to Polur Project Road (SH-115) Road Features 14 Table 6: Annual Average Daily Traffic Volume along Homogenous Road Sections 16 Table 7: Villages and Urban Built Up Locations on Project Road and RoW 17 Table 8: Radius for Horizontal Curves 20 Table 9: Sight Distance 22 Table 10: Junction Improvement with Transverse Rumble Strip 40 Table 11: Environmental Attributes and Frequency of Monitoring 49 Table 12: Average Annual Rainfall (mm) in Project Districts 52 Table 13: Quality Monitoring Results for the Project Road 60 Table 14: Details of Waterbodies along the Project Road 63 Table 15: Details of Drainage along Project Road 64 Table 16: Water Quality Monitoring Locations 65 Table 17: Surface Water Quality Characteristics along the Project Road 65 Table 18: Ground Water Quality Characteristics along the Project Road 68 Table 19: Details of Ambient Air Quality Monitoring Locations along Project Road 71 Table 20: Techniques Used for Ambient Air Quality Monitoring 72 Table 21: Summary of AAQM Results along the Project Road 72 Table 22: Details of Noise Level Monitoring Locations 74 Table 23: Ambient Noise Level in dB(A) along the Project Road 75 Table 24: Forest Cover in Project Districts (Km2) 78 Table 25: Forest areas along the Project Road 78 Table 26: Tree Enumeration within Formation Width of Project Road (>30 cm) 79 Table 27: IUCN status of Major Tree Species within Formation Width (>30 cm) 80 Table 28: Protected areas of Tamil Nadu 80 Table 29: List of Fauna in the influence area of project road 85 Table 30: Physical /Sensitive Features along the Project Road 88 Table 31: Comparison of Positive and Negative Impacts of ‘With’ and ‘Without’ Project
Scenario 94 Table 32: Comparison of Alternative Alignments of Proposed Bypass For Vandavasi Town
(SH-115) 97 Table 33: Comparison of Alternative Alignments of Proposed Bypass for Chetpet Town (SH-
115) 101 Table 34: Sensitivity of VECs in the Project Area 107 Table 35: Criteria for Rating the Significance of Impacts 109 Table 36: Screening of Environmental Impacts 110 Table 37: Impact on Air Quality during Construction Stage 114 Table 38: Annual Average Daily Motorized Traffic Data 115 Table 39: Emission Factors for Different Types of Vehicle (ARAI, 2007) 116 Table 40: Meteorological Parameters used for Modelling 116 Table 41: Average Background Concentration of Pollutants along the Project Road 117 Table 42: CO Predicted Concentrations (ppm) along the Proposed Road 118 Table 43: PM2.5 Predicted Concentrations (µg/m3) along the Proposed Road 118 Table 44: PM10 Predicted Concentrations (µg/m3) along the Proposed Road 118 Table 45: NOx Predicted Concentrations (µg/m3) along the Proposed Road 119 Table 46: SO2 Predicted Concentrations (µg/m3) along the Proposed Road 119
Table 47: Construction Noise / Distance Relationship 133 Table 48: Likely Impact on Noise Quality in the Vicinity of Project Area 133 Table 49: Typical Noise Levels of Principal Construction Equipment (Noise Level in dB (A)
at 50 Feet) 134 Table 50: List of Sensitive Recepator along the Project Road 135 Table 51: Annual Average Daily Motorized Traffic Data 140 Table 52: Equivalent Background Noise levels 140 Table 53: Predicted Noise Levels along the Project Road 142 Table 54: Vibration Generated from Different Construction Equipment 143 Table 55: Building Vibration Damage Assessment Criteria 144 Table 56: The details of Public Consultation for Project Road 151 Table 57: Summary of Issues Discussed and Measures Taken 153 Table 58: Environmental Management Plan 161 Table 59: Environmental Monitoring Plan (EMoP) 181 Table 60: Environmental Reporting System 192 Table 61: Environmental Management Cost Estimates* 193
LIST OF FIGURES
Figure 1: Location of Project Road Alignment on Map 3 Figure 2: Typical Road Cross Sections 26 Figure 3: Environmental Monitoring Locations along the Project Road 50 Figure 4: Rainfall Distribution in the State of Tamil Nadu 52 Figure 5: Temperature Distribution Map of Tamil Nadu 53 Figure 6: Humidity Map of Tamil Nadu 54 Figure 7: Topographic map of Tamil Nadu 55 Figure 8: Elevation Map of Project Road and District 56 Figure 9: Geological Map of Tamil Nadu 57 Figure 10: Soil Texture Map of Tamil Nadu 58 Figure 11: Soil Order Map of Tamil Nadu 59 Figure 12: Soil Type Based on Water Retention Properties 59 Figure 13: Seismic Map of Tamil Nadu State 62 Figure 14: River Basins and Water Resources Map of Tamil Nadu 63 Figure 15: Coastal Zone Management Plan of Tamil Nadu 77 Figure 16: Forest Cover Map of Tamil Nadu showing Project Road 79 Figure 17: Protected Area Map of Tamil Nadu 83 Figure 18: Alternative Alignments of Proposed Bypass For Vandavasi Town (SH-115) 96 Figure 19: Alternative Alignments of Proposed Bypass For Chetpet Town (SH-115) 100 Figure 20: Photographs of Public Consultation 152 Figure 21: Grievance Redress Mechanism 157
EXECUTIVE SUMMARY
A. Introduction
1. The Government of Tamil Nadu proposes to upgrade its road network falling in the conceptual influence area of the Chennai Kanyakumari Industrial Corridor (CKIC), which aims at improving the transport infrastructure, such as the connectivity of industrial nodes to ports, urban areas and critical hinterland areas. The Highways and Minor Ports Department (TNHD) of Tamil Nadu has been mandated to undertake improvement and upgradation of various State Highways at different locations in the State and will serve as the Executing Agency (EA) under this project. As part of this mandate, the Construction and Maintenance (C&M) Wing of TNHD has identified the 16 road sections for improvement totaling about 590 km spread across the State. The project will be financed through a project loan from the Asian Development Bank (ADB) under Tamil Nadu Industrial Connectivity Project (TNICP). The Project Implementation Unit (PIU) formed within TNHD will be the Implementing Agency (IA).
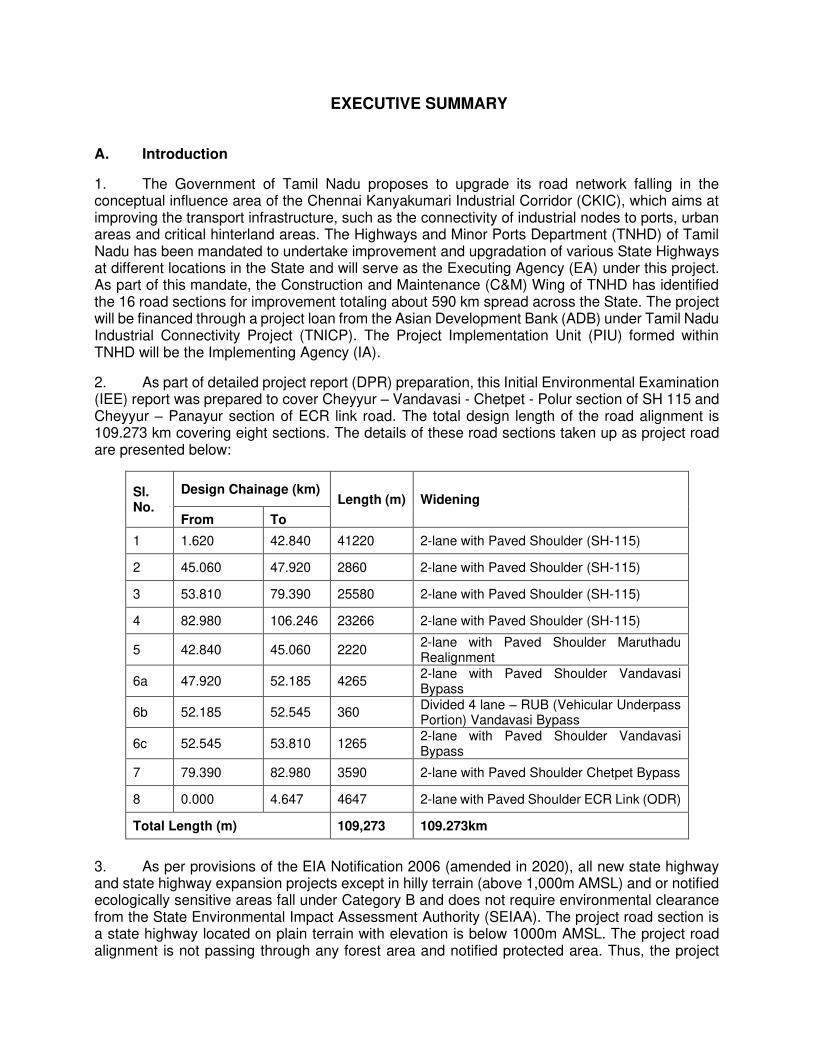
2. As part of detailed project report (DPR) preparation, this Initial Environmental Examination (IEE) report was prepared to cover Cheyyur – Vandavasi - Chetpet - Polur section of SH 115 and Cheyyur – Panayur section of ECR link road. The total design length of the road alignment is 109.273 km covering eight sections. The details of these road sections taken up as project road are presented below:
Sl. No.
Design Chainage (km) Length (m) Widening
From To
1 1.620 42.840 41220 2-lane with Paved Shoulder (SH-115)
2 45.060 47.920 2860 2-lane with Paved Shoulder (SH-115)
3 53.810 79.390 25580 2-lane with Paved Shoulder (SH-115)
4 82.980 106.246 23266 2-lane with Paved Shoulder (SH-115)
5 42.840 45.060 2220 2-lane with Paved Shoulder Maruthadu Realignment
6a 47.920 52.185 4265 2-lane with Paved Shoulder Vandavasi Bypass
6b 52.185 52.545 360 Divided 4 lane – RUB (Vehicular Underpass Portion) Vandavasi Bypass
6c 52.545 53.810 1265 2-lane with Paved Shoulder Vandavasi Bypass
7 79.390 82.980 3590 2-lane with Paved Shoulder Chetpet Bypass
8 0.000 4.647 4647 2-lane with Paved Shoulder ECR Link (ODR)
Total Length (m) 109,273 109.273km
3. As per provisions of the EIA Notification 2006 (amended in 2020), all new state highway and state highway expansion projects except in hilly terrain (above 1,000m AMSL) and or notified ecologically sensitive areas fall under Category B and does not require environmental clearance from the State Environmental Impact Assessment Authority (SEIAA). The project road section is a state highway located on plain terrain with elevation is below 1000m AMSL. The project road alignment is not passing through any forest area and notified protected area. Thus, the project
ii
road does not fall under the purview of environmental clearance under EIA notification 2006 of MOEFCC.
4. IEE has been prepared in accordance with relevant policies and regulations of the Government of India, Government of Tamil Nadu (GoTN), and the ADB’s Safeguard Policy Statement 2009 (SPS). This IEE report will be disclosed in the office of TNHD and on the ADB website. The project road sections are located in Chengalpattu (Kanchipuram bifurcated into Chengalpattu and Kanchipuram districts) and Thiruvannamalai districts of Tamil Nadu.
B. Description of the Project
5. The length of the project road section is 109.273 km. This Project road, the State Highway 115 originates from Cheyyur and ends with NH-234 in Polur (design km 1.620 to 106.246 and existing km1.620 km to km103.780) and the link road from Cheyyur to East Coast Road (ECR) is other district road section originates from Cheyyur at km 0.000 and terminates at km (4.720) with ECR (design chainage 0.000 km to 4.647 km and existing chainage 0.000 km to 4.720 km). The existing road sections are of mostly 2-lane confirguration without proper shoulders, and poor pavement condition.
6. The existing road section is planned to be widened to 2 lane configuration with paved shoulders in this project. The road section will be widened following existing alignment and twonew bypasses are proposed for Vandvasi and Chetpet towns and One Maruthadu realignment. The road section traverses through plain terrain. The project road alignment is linear in nature.
7. The landuse along the project road is mostly agriculture and passes through 59 builtup/villages. Around 6% of project road passes through forest area (RoW excluded from RF), 43% passes through builtup/habitation areas and 51% passes through agricultural areas.
8. One realignment at Marudharu Village and two bypasses are proposed for Vandavasi and Chetpet towns for free movement of the traffic. Vandavasi bypass starts from km 47+920 and ends at km 53+810. Total length of this bypass is 5.89 km. Chetpet bypass starts from km 79+390 and ends at km 82+980. Total length of this bypass is 3.59 km. Additionally geometric improvement is proposed at Maruthadu Village which starts at km 42+84 and ends at km 45+06 for a length of 2.22 km.
9. The bridge and culvert inventory was carried out to assess the existing condition and hydrological adequacy. There are existing 214 culverts along the project road. 94 culverts will be reconstructed, 30 are retained, 68 will be widened and additional 52 new culverts are proposed depending on the hydrological requirements along along SH-115 and ECR link project road sections. There are 5 major bridges, 12 minor bridges, and 1 RUB and 1 railway level crossing existing along the road.
10. The proposed RoW for the 2-lane configuration has been fixed as 16.0m in urban built-up areas and 30m in open and rural areas. For the bypass section in green field it has been fixed as 30m. For realignment and bypass following existing alignment of village road PRoW is 16 m for in urban and built up areas and 23 m in rural areas. A total of 41.9833 ha. additional land will be acquired for realignment and for proposed bypass sections. C. Description of the Environment
i. Physical Environment 11. Meteorological Conditions: The climate of Tamil Nadu state is tropical, with distinct wet and dry seasons. According to Agro-ecological classification, the state has a hot and semi-arid
iii
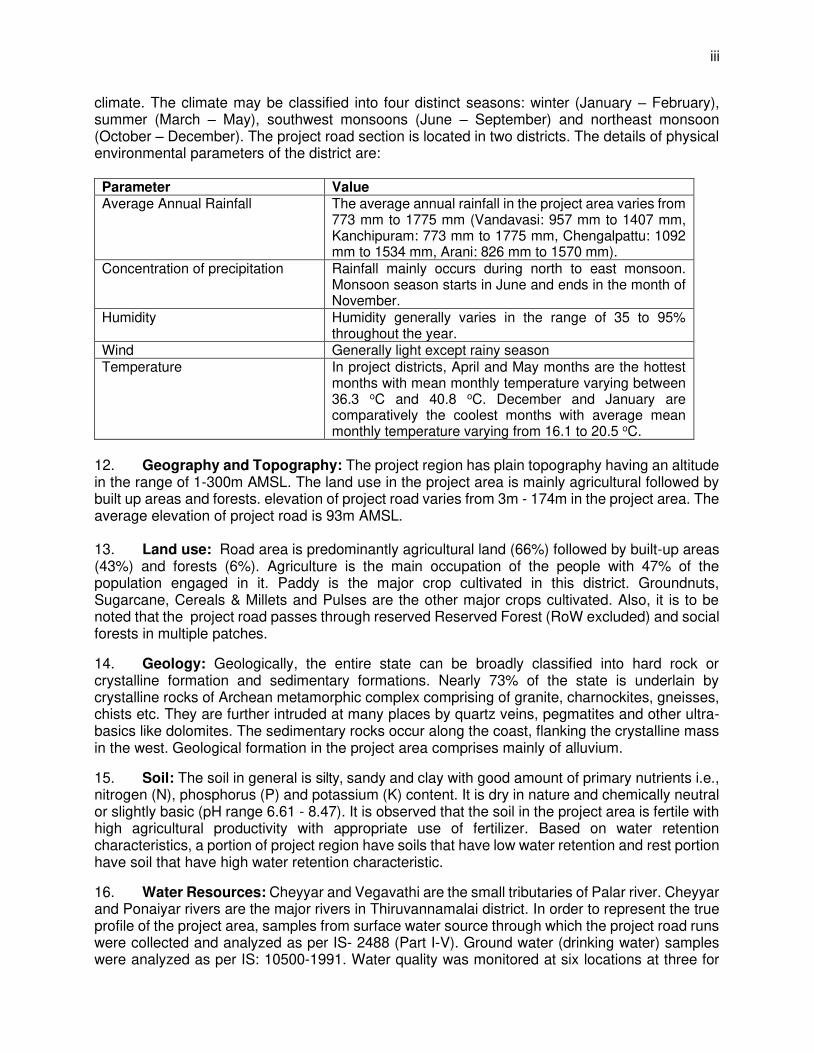
climate. The climate may be classified into four distinct seasons: winter (January – February), summer (March – May), southwest monsoons (June – September) and northeast monsoon (October – December). The project road section is located in two districts. The details of physical environmental parameters of the district are: Parameter Value Average Annual Rainfall The average annual rainfall in the project area varies from
773 mm to 1775 mm (Vandavasi: 957 mm to 1407 mm, Kanchipuram: 773 mm to 1775 mm, Chengalpattu: 1092 mm to 1534 mm, Arani: 826 mm to 1570 mm).
Concentration of precipitation Rainfall mainly occurs during north to east monsoon. Monsoon season starts in June and ends in the month of November.
Humidity Humidity generally varies in the range of 35 to 95% throughout the year.
Wind Generally light except rainy season Temperature In project districts, April and May months are the hottest
months with mean monthly temperature varying between 36.3 oC and 40.8 oC. December and January are comparatively the coolest months with average mean monthly temperature varying from 16.1 to 20.5 oC.
12. Geography and Topography: The project region has plain topography having an altitude in the range of 1-300m AMSL. The land use in the project area is mainly agricultural followed by built up areas and forests. elevation of project road varies from 3m - 174m in the project area. The average elevation of project road is 93m AMSL. 13. Land use: Road area is predominantly agricultural land (66%) followed by built-up areas (43%) and forests (6%). Agriculture is the main occupation of the people with 47% of the population engaged in it. Paddy is the major crop cultivated in this district. Groundnuts, Sugarcane, Cereals & Millets and Pulses are the other major crops cultivated. Also, it is to be noted that the project road passes through reserved Reserved Forest (RoW excluded) and social forests in multiple patches.
14. Geology: Geologically, the entire state can be broadly classified into hard rock or crystalline formation and sedimentary formations. Nearly 73% of the state is underlain by crystalline rocks of Archean metamorphic complex comprising of granite, charnockites, gneisses, chists etc. They are further intruded at many places by quartz veins, pegmatites and other ultra-basics like dolomites. The sedimentary rocks occur along the coast, flanking the crystalline mass in the west. Geological formation in the project area comprises mainly of alluvium.
15. Soil: The soil in general is silty, sandy and clay with good amount of primary nutrients i.e., nitrogen (N), phosphorus (P) and potassium (K) content. It is dry in nature and chemically neutral or slightly basic (pH range 6.61 - 8.47). It is observed that the soil in the project area is fertile with high agricultural productivity with appropriate use of fertilizer. Based on water retention characteristics, a portion of project region have soils that have low water retention and rest portion have soil that have high water retention characteristic.
16. Water Resources: Cheyyar and Vegavathi are the small tributaries of Palar river. Cheyyar and Ponaiyar rivers are the major rivers in Thiruvannamalai district. In order to represent the true profile of the project area, samples from surface water source through which the project road runs were collected and analyzed as per IS- 2488 (Part I-V). Ground water (drinking water) samples were analyzed as per IS: 10500-1991. Water quality was monitored at six locations at three for
iv
surface and three for ground water. Results show that the pH of the drinking water in the region is well within permissible limits (6.5 – 7.5). The samples collected from ground water shows the parameter is well within the permissible standards, except TDS and Total Hardness for drinking water. Other parameters analyzed like chloride, sulphate, fluorides are found well within standards. Overall, the ground water quality in the project area is good.
17. Air Quality: Ambient air quality in the state is quite pure compared to other neighboring states. Ambient air quality for particulate matters (PM10 and PM2.5), SO2, NOx and CO was monitored at five locations along the project road. It is found from the results that PM10 concentration at both monitoring locations were well within the permissible limits for residential zone i.e. 100 μg/m3 prescribed by the Ministry of Environment, Forest and Climate Change (MOEFCC) but slightly higher than IFC EHS guideline limit of 50 μg/m3. The highest value of PM10 is observed at Govt Primary School, Kattuthevathur (71.2μg/m3 ), which is well within permissible limits. Similarly, PM2.5 concentration is highest at Govt Primary School, Kattuthevathur and is 24.5 μg/m3 well within the permissible limit i.e. 60 μg/m3 prescribed by MOEFCC and within limits of of 25 μg/m3 as mentioned in the IFC EHS guideline. Other parameters monitored i.e. NOx, SO2 were found within the permissible limits for all the locations. Overall, the air quality in the project area is good.
18. Noise Levels: Noise levels were monitored at twelve locations along the project road. It is found that hourly day equivalent noise level varies from 54.43 dB(A) to 72.14 dB(A), whereas hourly night equivalent noise level ranges from 49.35 dB (A ) to 63.81 dB(A). The recorded noise level is higher than the Central Pollution Control Board (CPCB) as well as IFC permissible limits for residential area of 55 dB(A) and 45 dB(A) for daytime and nighttime, respectively. This noise is mainly from vehicular traffic and local domestic/commercial activities.
ii. Biological Environment 19. There is no protected area (National Park, Wildlife Sanctuary, Biosphere Reserve, Wetland) directly falling within the proposed RoW of project road. However, small section of the project road passes through social forests and reserved forests but the RoW has already been excluded from forests. Total 6.977 km length of project road passes through forest areas. However, the existing RoW of the project road is available for improvement works in the forest area and no forest land diversion is required for project. Thus does not attract forest clearance.
20. The dominant tree species along project road are Mango, Tamarind, Palm, Neem, Coconut, Peepal, Indian beech, Siris and Black Plum. Other observed species are either Least Concerned or not yet been assessed for the IUCN Red List. There are no vulnerable/ endangered or rare species fauna around the project site. There is no presence of any fauna species listed in Schedule I of the Wild Life (Protection).
iii. Socio-economic Environment
21. The project road passes through two districts of Tamil Nadu namely Kanchipuram and Tiruvannamalai. Kanchipuram: According to 2011 census, Kanchipuram district had a population of 3,998,252 with male population of 2012958 and female population of 1985294. Sex-ratio of district is 986 females for every 1,000 males, much above the national average of 929. Male and female literacy rate in the district is 89.89% and 79.02% respectively. The population density in the district is 892 persons per sq.km. Scheduled Castes and Scheduled Tribes accounted for 23.71% and 1.03% of the population respectively. The average literacy of the district was 75.37%, compared to the national average of 72.99%. The district had a total of 1,006,245 households. There was a total of 1,673,814 workers, comprising 74,761 cultivators, 162,494 main agricultural labourers, 41,149 in house hold industries, 1,088,974 other workers, 306,436 marginal workers,
v
14,582 marginal cultivators, 110,020 marginal agricultural labourers, 13,583 marginal workers in household industries and 168,251 other marginal workers.
22. According to 2011 census, Tiruvannamalai District had a population of 2,464,875 with a sex-ratio of 994 females for every 1,000 males, much above the national average of 929. A total of 272,569 were under the age of six, constituting 141,205 males and 131,364 females. Scheduled Castes and Scheduled Tribes accounted for 22.94% and 3.69% of the population respectively. The average literacy of the district was 66 %, compared to the national average of 72.99%. The district had a total of 588,836 households. There was a total of 1,238,177 workers, comprising 265,183 cultivators, 351,310 main agricultural labourers, 37,020 in house hold industries, 316,559 other workers, 268,105 marginal workers, 27,458 marginal cultivators, 173,753 marginal agricultural labourers, 9,700 marginal workers in household industries and 57,194 other marginal workers.
23. Most of the land surrounding the project road are agricultural fields with intermittent rural/urban build up structures. The major land use along the project roads is agriculture, followed by rural settlement, urban settlement, open and forest land. There are important community structures along the project road, which has cultural and sociological importance.
24. There are 108 sensitive receptors/structures present within 50 m from center line of the road. No archaeological sites or historical monuments notified under Tamil Nadu State importance under “Ancient and Historical Monument and Archaeological Sites and Remains Act, 1966 of Tamil Nadu and National importance under “The Ancient Monuments and Archaeological Sites and Remains Act 1958 of India are located along the project road section.
D. Analysis of Alternatives 25. Since the proposed project is an improvement of the existing road section of SH-115 from design chainage km 1+620 to km 106+246 in plain terrain, except in the proposed bypass sections. Two bypasses are proposed for Vandavasi and Chetpet towns and one realignmnent in Maruthadu for free movement of the traffic and saving in travel time and fuel. The project road alignment is linear in nature.
26. Vandavasi bypass starts from km 47+920 and ends at km 53+810. Total length of this bypass is 5.89 km. Chetpet bypass starts from km 79+390 and ends at km 82+980. Total length of this bypass is 3.59 km. Additionally geometric improvement is proposed at Maruthadu Village which starts at km 42+84 and ends at km 45+06 for a length of 2.22 km.
27. Three options for each proposed bypasses were considered and studied with merits and demerits for selection of one feasible option. There are few sharp and blind curves along the project road for which curve improvements have been proposed to improve the geometry and safety. The improvement of curves on existing state highway section was determined to be the best possible within existing RoW or minimal additional land acquisition.
28. The alternatives were considered in road design such as cross sections, soil erosion and slope protections, drainage structures, flexible pavement etc. The analysis of alternatives has also been made on the basis of “with and without project scenarios” in terms of potential environmental impacts. On the basis of the analysis, we can say that “with project” scenario will provide beneficial impacts, greatly improve the environment and enhance social and economic development of the region compared to “without project” scenario, which will further deteriorate the existing environment and quality of life.
vi
E. Consultation, Disclosure and Grievance Redress Mechanism 29. In accordance with ADB’s Safeguard Policy Statement (SPS) 2009, public consultations were held as part of the IEE study. Consultations were undertaken with project beneficiaries, local/ government officials, community leaders, women groups, stakeholders in corridor of impact and people likely to be affected by the project. Various measures pertaining to environmental issues were incorporated based on the responses from the people. Both formal and informal modes of consultation were used in the public consultation process for the project.
30. Consultations were carried out using standard structured questionnaires as well as unstructured questionnaires. In addition, focused group discussions (FGDs) and personal discussions with officials from key line agencies, on-site discussion with project affected stakeholders, and reconnaissance visits have also been made to the project areas. The attempts were made to encourage participation in the consultation process of the Government officials from different departments that have relevance to the project. Same way, local people from different socio-economic backgrounds in the villages as well as urban areas along the road alignment and at detours, residents near the existing road, women representatives, local commuters, and other concerned were also consulted.
31. The consultations were conducted during preparation of the IEE. Six consultations with the key stakeholders were undertaken in the months of September 2019 and January 2020 at Karaipondi, Vadavankkambadi and Cheyyur as part of DPR preparation. Various officials consulted include TNHD Officials, Forest Officers, Environmental Officers from pollution control board, statistical officer in the project areas etc. Besides interview surveys, FGDs were organized at key locations along the project road. In total 50 people were involved in the consultations. Most of the people interviewed strongly support the project. The people living in the entire project area expect the different project elements to facilitate transport, employment, boost economic development and thereby provide direct, and indirect benefits to them.
32. In compliance with ADB’s SPS requirements consultation will be continued throughout the project process. Prior to finalization of detailed engineering design, the contractor, with the assistance of the PIU should consult affected persons. Further, project consultations will be organized by the FIU in coordination with Construction Supervision Consultant (CSC) and with the presence of representatives from the contractor. These should be done at least quarterly during construction period.
33. A Grievance Redress Mechanism (GRM) will be established by TNHD prior to mobilization of contractors to address grievances related to the implementation of the project, particularly regarding the EMP. Through the GRM, responsible parties will acknowledge, evaluate, and respond to the complainant with corrective action proposed using understandable and transparent processes that are gender responsive, culturally appropriate, and readily accessible to all segments of the affected people.
34. Records of grievances received, corrective actions taken, and their outcomes will be properly maintained and form part of the quarterly progress reports (QPR) and semi-annual environmental monitoring report to ADB. The Project GRM will be established to evaluate and facilitate the resolution of affected persons concerns, complaints, and grievances related to environmental aspects of the project. The GRM will aim to provide a time-bound and transparent mechanism to voice and to resolve the concerns linked with the project. Depending on the nature and significance of the grievances or complaints, the grievance redress mechanism (GRM) will comprise procedures to address grievances at several levels. A two-tier GRM will be established. Regional Level Project GRC will be chaired by the TNHD Divisional Engineer concerned and would comprise of TNHD Environment Wing Assistant Environment Specialist, Project Manager
vii
of EPC contractor and Resident Engineer of CSC concerned. Complaints that cannot be resolved at the field level within 7 days will be elevated to the State Level Project GRC. It will serve as appellate authority and will be chaired by the Chief Engineer and will comprise the Superintending Engineer concerned, Environment Specialist, Team Leader of CSC concerned, Project Manager from Project Management Services of CSC-01 and Authorized Representative from EPC contractors, as needed. Grievance response period for all GRCs is 3 weeks.
35. As project executing agency, TNHD will be responsible for the disclosure of this IEE in compliance to ADB’s Access to Information Policy 2019 and ADB SPS 2009. The report will be made available to interested parties on request from the office of the TNHD. Since this is environment Category B project, the IEE report will be disclosed to the public through the ADB and CKICP websites.
F. Project Benefits 36. The key positive environmental impacts of the project include improved vegetation cover, increase in area of good quality habitat by tree plantation 1:10 tree removed for the project through compensatory afforestation, which will be fully realized in 10-15 years and improvement of infrastructure along the project area. Further, the implementation of various project items is envisaged to have the following direct benefits:
• better connectivity to key locations within State;
• smooth flow of traffic on State Highway Network;
• improved quality of life for the rural population in the project influence: this as a result of better access to markets, health, education and other facilities; and the derived stimulus for local economic activity;
• a more efficient and safe road transport system: through reduced travel times, reduced road accidents, reduced vehicle operating and maintenance costs and reduced transportation costs for goods;
• the facilitation of tourism.
G. Anticipated Environmental Impacts and Mitigation Measures 37. Based on analysis of project activities and environmental baseline conditions, various valued environmental components (VECs) under physical, biological and social environment were identified. Assessment of the impacts on each of these VECs during pre-construction and design stage, construction stage and operation stage was carried out. Impacts were determined to be minor, moderate or major based on a rating criterion of sensitivity of the VEC, duration of impact, area of impact and severity of impact.
38. Most negative impacts are of minor to moderate risk. There is no potential impact with high risk in involved in the project implementation. Negative impacts with moderate risks include removal of trees, noise and impacts on air quality during construction and operation stages, and occupational and community health and safety. These impacts are largely short term and expected to occur during construction, with some minor induced and residual impacts expected to occur during operation.
39. The acquiring of 41.9833 ha of private land and felling of 4770 trees will be compensated under a mandatory compensatory scheme under the government wherein total 47700 trees (1:10 ratio) will be planted. This mandatory compensation scheme is expected to result in the creation of good vegetation cover along the road section in the long-term (>10 years).
viii
40. Other moderate and minor negative environmental impacts include dust; pollution of air and water; impacts on 567 private structures and 50 common property resources; inconveniences caused by shifting of utilities; soil erosion; contamination and siltation of surface water, waste and spoils disposal.
41. These will be addressed through various mitigation measures included in the EMP such as regular sprinkling of water; enforcement of construction time limits; regular monitoring of air, water and noise; payment of compensation to affected people in accordance with the entitlement matrix in the Resettlement Plan (RP); regular public communication on shifting of utilities; enforcement of health and safety requirements in the work sites and camps; implementation of slope stabilization measures; management of solid and liquid waste and chemicals and other measures.
H. Environmental Management Plan 42. A fully budgeted EMP has been prepared for mitigation/management/ avoidance of the potential adverse impacts and enhancement of various environmental components along the project road section. For each mitigation measures to be carried out, its location, timeframe, implementation and overseeing/ supervising responsibilities have been identified. Monitoring plan for construction and operation phase has been framed to ensure effective implementation of EMP.
43. The monitoring plan includes performance indicators for wildlife, water, air, and noise level monitoring, frequency of monitoring, and institutional arrangements of the project in the construction and operation stages, along with the estimated cost. The reporting system includes roles and responsibilities of each party involved in the project implementation i.e. PIU, CSC, Contractor (s), external monitor and reporting mechanisms during implementation and operation phases.
44. The monitoring plan also includes regular site inspections and checks by the PIU and FIU under TNHD. The CSC will conduct weekly and joint PIU quarterly site inspections to monitor implementation of the EMP. The CSC Environmental Specialist will monitor implementation of the EMP while the Biodiversity Specialist from external monitor consultant will monitor implementation of the biodiversity management measures.
45. An environmental management budget of INR 193.50 million (USD 2.58 million) has been estimated for implementation of the EMP. This budget also includes cost of environmental monitoring and associated trainings.
I. Conclusions and Recommendations 46. The proposed project road Cheyyur to Polur (SH-115) and ECR link is classified as environment Category B project as per ADB SPS requirements. Environmental screening and assessment of likely impacts and rating of risks shows that with implementation of mitigation measures and road improvement activities the project will not result in significant residual environmental impacts.
47. A number of potential adverse impacts have been identified on issues related to dust, noise, pollution, soil erosion, waste, occupational health and safety, community health and safety, and biodiversity. Most impacts were assessed to be of low to moderate risk. Potential impacts on biodiversity were assessed to be of medium risk. Biodiversity impacts include loss of about 4770 trees due to widening of road and proposed bypass alignment, potential mortality and destruction of habitat for wildlife species, mainly birds. However, project area does not trigger critical habitat.
ix
48. Mitigation measures have been proposed and budgeted to address all the above identified impacts and risks in the EMP. As part of the EMP, environment management actions have also been recommended to mitigate environment related risks related to social, physical and biological aspects.
49. The EMP is a living document and will be subject to revision following finalization of the detailed design by the EPC. The EMP may undergo further revision during project construction if there is any change in project design and occurrence of unanticipated impacts. The environmental mitigation measures are itemized in the EMP and the Executing Agency (TNHD) shall ensure that the most recent EMP and EMoP are included in the civil works contract agreement.

I. INTRODUCTION
A. Project Background
1. The Government of Tamil Nadu proposes to upgrade its road network falling in the conceptual influence area of the Chennai Kanyakumari Industrial Corridor (CKIC), which aims at improving the transport infrastructure, such as the connectivity of industrial nodes to ports, urban areas and critical hinterland areas. The Highways and Minor Ports Department (TNHD) of Tamil Nadu has been mandated to undertake improvement and upgradation of various State Highways at different locations in the State under this project and will serve as the Executing Agency (EA). As part of this mandate, the Construction and Maintenance (C&M) Wing of TNHD has identified the 16 road sections for improvement totally totaling about 590 km spread across the State. The project will be financed through a project loan from the Asian Development Bank (ADB) under Tamil Nadu Industrial Connectivity Project (TNICP). The Project Implementation Unit (PIU) formed within TNHD will be the Implementing Agency (IA).
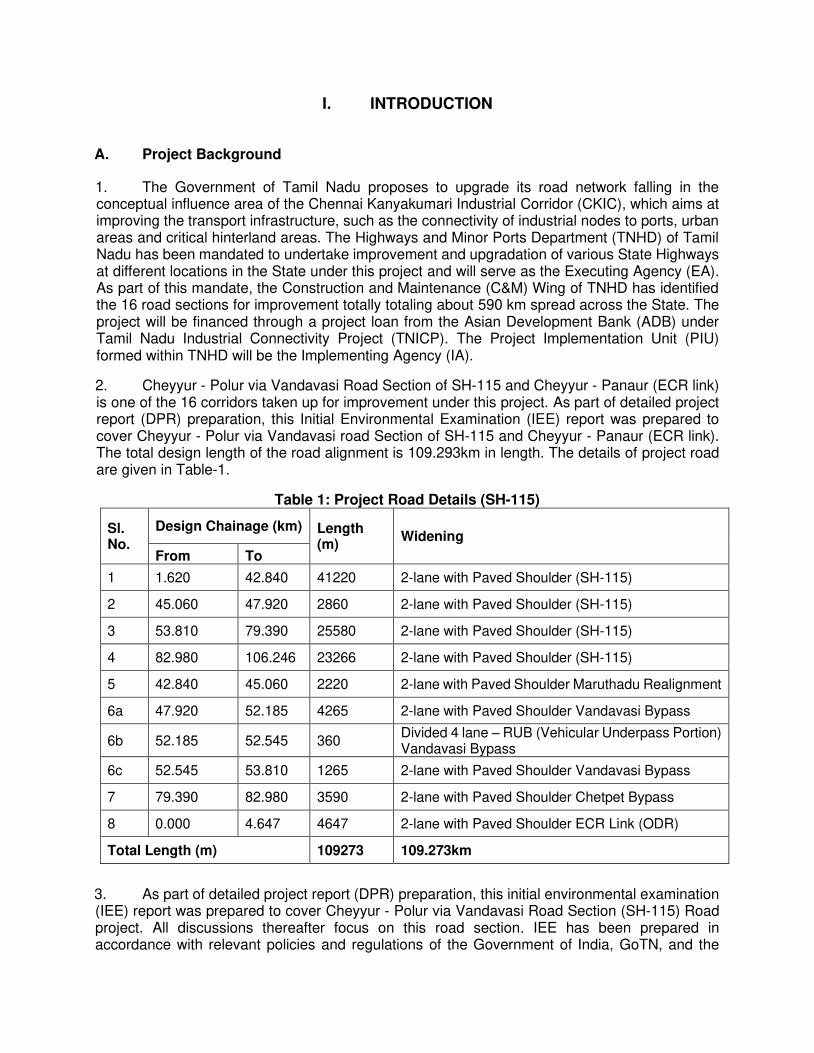
2. Cheyyur - Polur via Vandavasi Road Section of SH-115 and Cheyyur - Panaur (ECR link) is one of the 16 corridors taken up for improvement under this project. As part of detailed project report (DPR) preparation, this Initial Environmental Examination (IEE) report was prepared to cover Cheyyur - Polur via Vandavasi road Section of SH-115 and Cheyyur - Panaur (ECR link). The total design length of the road alignment is 109.293km in length. The details of project road are given in Table-1.
Table 1: Project Road Details (SH-115)
Sl. No.
Design Chainage (km) Length (m)
Widening
From To
1 1.620 42.840 41220 2-lane with Paved Shoulder (SH-115)
2 45.060 47.920 2860 2-lane with Paved Shoulder (SH-115)
3 53.810 79.390 25580 2-lane with Paved Shoulder (SH-115)
4 82.980 106.246 23266 2-lane with Paved Shoulder (SH-115)
5 42.840 45.060 2220 2-lane with Paved Shoulder Maruthadu Realignment
6a 47.920 52.185 4265 2-lane with Paved Shoulder Vandavasi Bypass
6b 52.185 52.545 360 Divided 4 lane – RUB (Vehicular Underpass Portion) Vandavasi Bypass
6c 52.545 53.810 1265 2-lane with Paved Shoulder Vandavasi Bypass
7 79.390 82.980 3590 2-lane with Paved Shoulder Chetpet Bypass
8 0.000 4.647 4647 2-lane with Paved Shoulder ECR Link (ODR)
Total Length (m) 109273 109.273km
3. As part of detailed project report (DPR) preparation, this initial environmental examination (IEE) report was prepared to cover Cheyyur - Polur via Vandavasi Road Section (SH-115) Road project. All discussions thereafter focus on this road section. IEE has been prepared in accordance with relevant policies and regulations of the Government of India, GoTN, and the
2
ADB’s Safeguard Policy Statement 2009 (SPS). This IEE report will be disclosed in the office of Tamil Nadu Highways Department and on the CKICP and ADB website.
B. Nature, Size and Location of Project Road
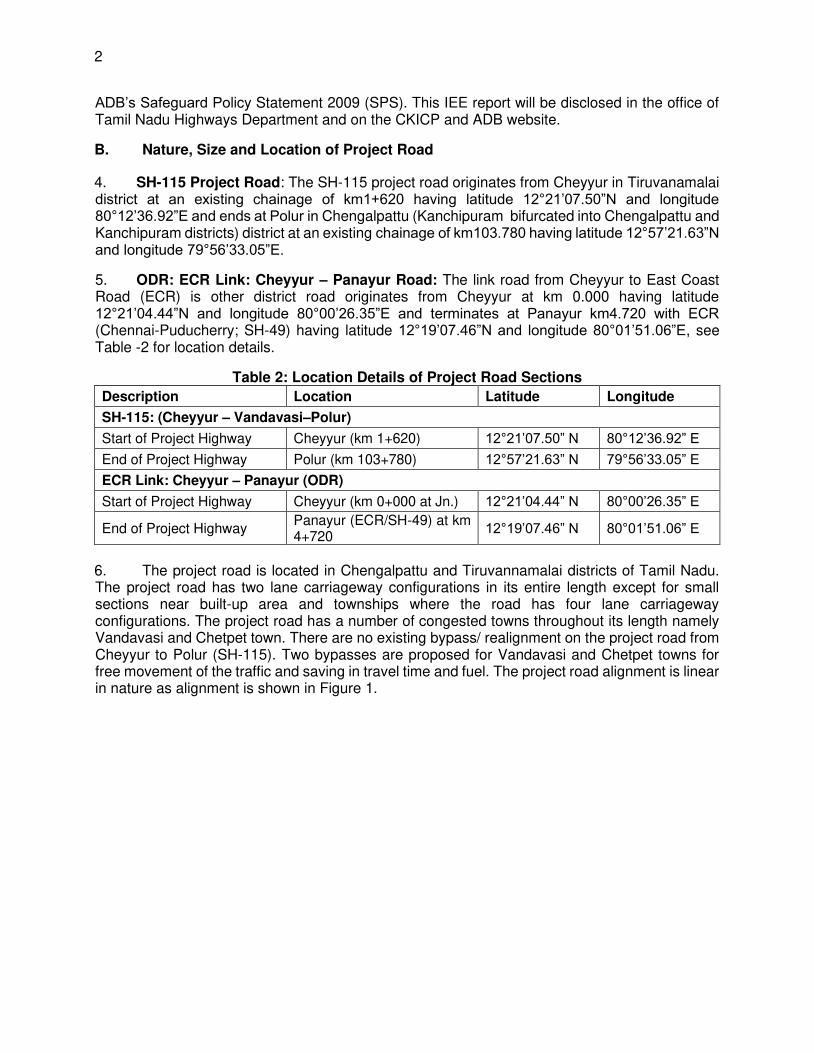
4. SH-115 Project Road: The SH-115 project road originates from Cheyyur in Tiruvanamalai district at an existing chainage of km1+620 having latitude 12°21’07.50”N and longitude 80°12’36.92”E and ends at Polur in Chengalpattu (Kanchipuram bifurcated into Chengalpattu and Kanchipuram districts) district at an existing chainage of km103.780 having latitude 12°57’21.63”N and longitude 79°56’33.05”E.
5. ODR: ECR Link: Cheyyur – Panayur Road: The link road from Cheyyur to East Coast Road (ECR) is other district road originates from Cheyyur at km 0.000 having latitude 12°21’04.44”N and longitude 80°00’26.35”E and terminates at Panayur km4.720 with ECR (Chennai-Puducherry; SH-49) having latitude 12°19’07.46”N and longitude 80°01’51.06”E, see Table -2 for location details.
Table 2: Location Details of Project Road Sections
Description Location Latitude Longitude
SH-115: (Cheyyur – Vandavasi–Polur)
Start of Project Highway Cheyyur (km 1+620) 12°21’07.50” N 80°12’36.92” E
End of Project Highway Polur (km 103+780) 12°57’21.63” N 79°56’33.05” E
ECR Link: Cheyyur – Panayur (ODR)
Start of Project Highway Cheyyur (km 0+000 at Jn.) 12°21’04.44” N 80°00’26.35” E
End of Project Highway Panayur (ECR/SH-49) at km 4+720
12°19’07.46” N 80°01’51.06” E
6. The project road is located in Chengalpattu and Tiruvannamalai districts of Tamil Nadu. The project road has two lane carriageway configurations in its entire length except for small sections near built-up area and townships where the road has four lane carriageway configurations. The project road has a number of congested towns throughout its length namely Vandavasi and Chetpet town. There are no existing bypass/ realignment on the project road from Cheyyur to Polur (SH-115). Two bypasses are proposed for Vandavasi and Chetpet towns for free movement of the traffic and saving in travel time and fuel. The project road alignment is linear in nature as alignment is shown in Figure 1.
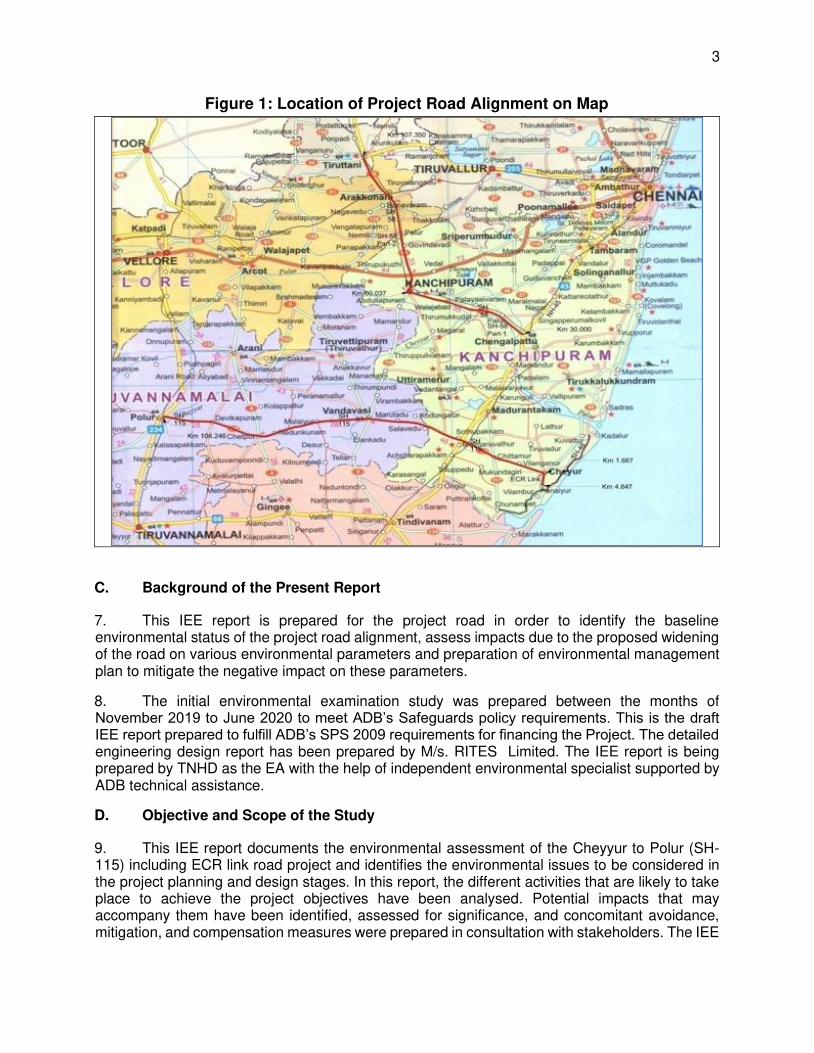
3
Figure 1: Location of Project Road Alignment on Map
C. Background of the Present Report
7. This IEE report is prepared for the project road in order to identify the baseline environmental status of the project road alignment, assess impacts due to the proposed widening of the road on various environmental parameters and preparation of environmental management plan to mitigate the negative impact on these parameters.
8. The initial environmental examination study was prepared between the months of November 2019 to June 2020 to meet ADB’s Safeguards policy requirements. This is the draft IEE report prepared to fulfill ADB’s SPS 2009 requirements for financing the Project. The detailed engineering design report has been prepared by M/s. RITES Limited. The IEE report is being prepared by TNHD as the EA with the help of independent environmental specialist supported by ADB technical assistance.
D. Objective and Scope of the Study
9. This IEE report documents the environmental assessment of the Cheyyur to Polur (SH-115) including ECR link road project and identifies the environmental issues to be considered in the project planning and design stages. In this report, the different activities that are likely to take place to achieve the project objectives have been analysed. Potential impacts that may accompany them have been identified, assessed for significance, and concomitant avoidance, mitigation, and compensation measures were prepared in consultation with stakeholders. The IEE
4
addresses the environmental management requirements of the Government of India (GOI) and ADB. Specifically, this report-
• provides information about the baseline environmental setting of the project. • provides information on potential environmental impacts of the proposed project
activities with its magnitude, distribution and duration and sensitivity of receptors. • provides information on required mitigation measures with cost to minimize the
impacts. • analyses the alternatives options considering alternative locations, designs,
management approaches for selection of most feasible and environmental acceptable options.
• provides details of stakeholder’s consultations. • designs an environmental management and monitoring plan with institutional
responsibilities measures for effective implementation of mitigation measures proposed and provides addressing grievances.
10. The environmental studies have been confined to the situation around the deemed project area of influence caused by constructional and operational facilities along the proposed road sections. The IEE is based on proposed road alignment and key construction activities involved such as site clearing, removal of trees, excavation, filling, grading and embankment formation, excavation for utility trenches, subgrade preparation, base course and asphalt overlay, shoulder, and construction of permanent structures like retaining walls, culverts and drains. The IEE also covered ancillary activities like camp site establishment and maintenance, sourcing of materials, and operation of equipment like rock crusher and hot mix plants . The corridor of impact is taken as 10 meters either side of the proposed alignment (from edge of the proposed road) including RoW of 16 meters for urban stretches, 23 meters for rural areas, and 30 meters for bypasses. However, the study area impact zone is considered up to 10 km aerial distance on both sides of road alignment to allow for coverage of indirect and induced impacts and a larger analysis of land use and other environmental features. Assessment is carried out on the following environment components: terrestrial and aquatic ecology, soil, water, air, noise, and socio-economic aspects. The project area of influence (PAI) was determined as the ROW plus 500m on either side of the road.
11. The following sections of the report discusses the methodology adopted by the consultants in conducting the IEE study and presents the results of the same.
E. Methodology Adopted for IEE Study
12. The Initial Environmental Examination (IEE) study has been carried out in accordance with the requirements of the ADB’s Safeguard Policy Statement (SPS 2009). The Government of India guidelines for Rail/Road/Highway projects; EIA notification 2006 and its amendment of MOEFCC and the Highway Sector EIA guidance manual 2010 have also been followed in the process of this environmental assessment. The study methodology has been adopted in such a manner to ensure that environmental concerns are given adequate weightage in the selection of alignment and design of proposed road improvements. The study in this project employs an iterative approach in which potential environmental issues have been examined at successive levels in detail and specificity, at each step in the process.
13. The environmental assessment is based on the information collected from primary as well as secondary sources on various environmental attributes. Monitoring of air, water, noise and soil
5
quality was also carried out within the ROW and significant issues were examined during field surveys to determine the magnitude of significant environmental impacts.
14. The major steps in the IEE process for the project were as follows:
1. Collection and Analysis of Data
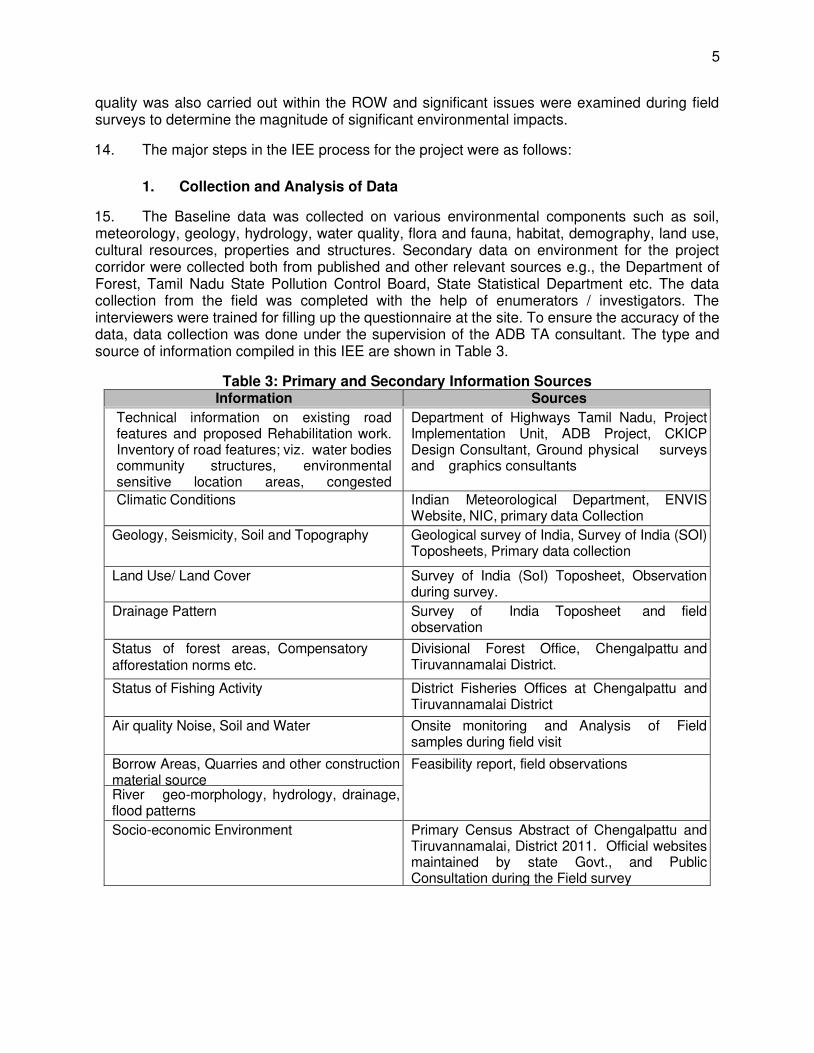
15. The Baseline data was collected on various environmental components such as soil, meteorology, geology, hydrology, water quality, flora and fauna, habitat, demography, land use, cultural resources, properties and structures. Secondary data on environment for the project corridor were collected both from published and other relevant sources e.g., the Department of Forest, Tamil Nadu State Pollution Control Board, State Statistical Department etc. The data collection from the field was completed with the help of enumerators / investigators. The interviewers were trained for filling up the questionnaire at the site. To ensure the accuracy of the data, data collection was done under the supervision of the ADB TA consultant. The type and source of information compiled in this IEE are shown in Table 3.
Table 3: Primary and Secondary Information Sources Information Sources
Technical information on existing road features and proposed Rehabilitation work. Inventory of road features; viz. water bodies community structures, environmental sensitive location areas, congested
Department of Highways Tamil Nadu, Project Implementation Unit, ADB Project, CKICP Design Consultant, Ground physical surveys and graphics consultants
Climatic Conditions Indian Meteorological Department, ENVIS Website, NIC, primary data Collection
Geology, Seismicity, Soil and Topography Geological survey of India, Survey of India (SOI) Toposheets, Primary data collection
Land Use/ Land Cover Survey of India (SoI) Toposheet, Observation during survey.
Drainage Pattern Survey of India Toposheet and field observation
Status of forest areas, Compensatory afforestation norms etc.
Divisional Forest Office, Chengalpattu and Tiruvannamalai District.
Status of Fishing Activity District Fisheries Offices at Chengalpattu and Tiruvannamalai District
Air quality Noise, Soil and Water Onsite monitoring and Analysis of Field samples during field visit
Borrow Areas, Quarries and other construction material source
Feasibility report, field observations
River geo-morphology, hydrology, drainage, flood patterns
Socio-economic Environment Primary Census Abstract of Chengalpattu and Tiruvannamalai, District 2011. Official websites maintained by state Govt., and Public Consultation during the Field survey
6
2. Environmental Monitoring and Analysis
16. Different locations were identified for monitoring and analysis of noise level, ambient air and water quality. The monitoring and analysis of water quality, air quality and noise level has been done by M/s Global Lab and Consultancy Services, Salem a leading environmental research laboratory. Air quality monitoring has been carried out as per MOEFCC notification of November 2009 the revised Air Quality standards and the on-site monitoring results are incorporated in Chapter- 4 of this IEE report.
17. Vegetation and Wildlife Surveys: In order to assess presence of flora and fauna along the proposed alignment field surveys have been carried out with the help of field officers of the state forest department Specific attention was given to collect the data on presence of Wildlife and birds. Findings are incorporated in Chapter- 4 of this IEE report.
3. Analysis of Alternative
18. Alternative analysis for the present project road alignment has been made on the basis of “with-” and “without project” scenarios. The parameters considered for the analysis are the environmental as well as social features and their likely impact on the natural ecosystem.
4. Stakeholder and Public Consultations
19. Extensive consultations were held during different stages (reconnaissance, detailed design and design review) with key stakeholders that includes local and beneficiary population, government departments/agencies, road users, and project-affected persons. These consultations allowed the interaction between the stakeholders and road designers to identify road features and construction methods that will enhance road upgrading and minimize potential impacts. Information gathered was integrated in the project design and used in formulating mitigation measures and environmental management plan. Detailed description of public consultation is presented in Chapter-7 of this IEE report.
5. Assessment of Potential Impacts
20. Potential impacts were identified on the basis of analytical review of baseline data; review of environmental conditions at site and analytical review of the underlying socio-economic conditions with the project influence area.
6. Preparation of the Environment Management Plan
21. An EMP for the project contract packages has been prepared to specify the steps required to ensure that the necessary measures have been taken and the same will be incorporated during construction and operation stage of the project. The EMP includes the monitoring plan giving details of the resources budgeted and the implementation arrangements.
F. Structure of the Report
22. This IEE report has been presented as per requirements of the ADB’s Safeguard Policy Statement (SPS) 2009. The report is organized into following ten chapters, a brief of each chapter is described below:
• Chapter 1 - Introduction: This section describes the background information about the project and IEE study.
7
• Chapter 2 - Policy, Legal, and Administrative Frameworks: this section summarizes the national and local legal and institutional frameworks that guided the conduct of the assessment as well as applicable international conventions and protocols.
• Chapter 3 - Project Description: This section presents the key features and components of the proposed project.
• Chapter 4 - Description of the Environment: This section discusses the relevant physical, biological, and socioeconomic features that may be affected by the proposed project.
• Chapter 5 - Analysis of Alternatives: This section covers analysis of various alternatives considered to minimize the overall impacts of proposed development and suggest most appropriate alternatives based on detailed analysis of impact and risk associated with each alternative.
• Chapter 6 - Anticipated Environmental Impacts and Mitigation Measures: This section presents the environmental assessment of likely positive and adverse impacts attributed to the proposed project and concomitant mitigation measures.
• Chapter 7 - Consultation, Participation and Information Disclosure: This section describes the consultation process undertaken during the environmental examination and its results, their consideration in the project design, and manner of compliance to the ADB’s Publication Policy and related national laws.
• Chapter 8 - Grievance Redress Mechanism: This section describes the formal and informal redress procedures for registering, resolving, and reporting complaints.
• Chapter 9 - Environmental Management Plan: This section discusses the lessons from the impact assessment and translated into action plans to avoid, reduce, mitigate or compensate adverse impacts and reinforces beneficial impacts. This plan is divided into three sub-sections: mitigation, monitoring, and implementation arrangements
• Chapter 10 - Conclusion and Recommendation: This section states whether there is a need for further detailed environmental studies / assessments and highlights key findings and recommendations to be implemented by the borrower.
23. An Executive Summary is also prepared and presented in the beginning of the report.
8
II. POLICY, LEGAL AND ADMINISTRATIVE FRAMEWORK
24. India has well defined institutional and legislative framework. The legislation covers all components of environment such as air, water, soil, terrestrial and aquatic flora and fauna, natural resources, and sensitive habitats. India is also signatory to various international conventions and protocols. The environmental legislations in India are framed to protect the valued environmental components and comply with its commitment to the international community under above conventions and protocols. Asian Development Bank (ADB) has also defined its Environmental and Social Safeguard policies. This assessment is about the applicability of above laws and regulations, conventions, protocols, and safeguards. This section summaries the following:
• National (India) Environmental Legislation and Legal Administrative Framework, • Social Safeguard Regulatory Requirements, • ADB safeguard policies and categorization of the project, and • Summary of international treaties and applicability to the project
A. National (India) Environmental Policy Framework
25. The legal framework of the country consists of several acts, notifications, rules and regulations to protect environment and wildlife. In 1976, the 42nd Constitutional Amendment created Article 48A and 51A, placing an obligation on every citizen of the country to conserve the environment. The national legislations are broadly divided under following categories:
• Environmental Protection, • Forests Conservation, and • Wild Life Protection.
26. The umbrella legislation under each of above category is highlighted below:
• The Environment (Protection) Act 1986 was enacted with the objective of providing for the protection and improvement of the environment. It empowers the Central Government to establish authorities charged with the mandate of preventing environmental pollution in all its forms and to tackle specific environmental problems that are peculiar to different parts of the country. Various rules are framed under this Act for grant of environmental clearance for any developmental project, resources conservation and waste management.
• The Forest Conservation Act 1980 was enacted to help conserve the country's forests. It strictly restricts and regulates the de-reservation of forests or use of forest land for non-forest purposes without the prior approval of Central Government. To this end the Act lays down the pre-requisites for the diversion of forest land for non-forest purposes.
• Wildlife (Protection) Act 1972 amended in 2003 was enacted with the objective of effectively protecting the wild life of this country and to control poaching, smuggling and illegal trade in wildlife and its derivatives. It defines rules for the protection of wild life and ecologically important protected areas.
27. State Pollution Control Boards (SPCBs) together form the regulatory and administrative core of the government for managing environmental impacts. Other Ministries/ Statutory Bodies/ Departments responsible for ensuring environmental compliance and granting various clearances
9
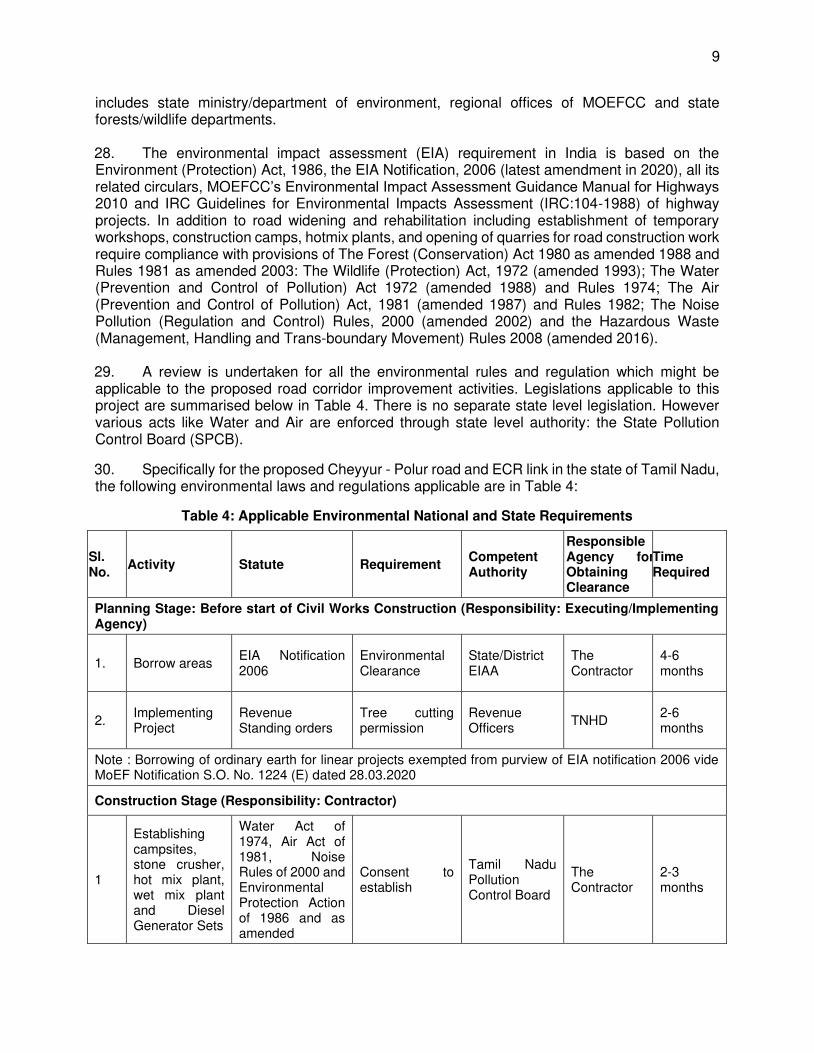
includes state ministry/department of environment, regional offices of MOEFCC and state forests/wildlife departments. 28. The environmental impact assessment (EIA) requirement in India is based on the Environment (Protection) Act, 1986, the EIA Notification, 2006 (latest amendment in 2020), all its related circulars, MOEFCC’s Environmental Impact Assessment Guidance Manual for Highways 2010 and IRC Guidelines for Environmental Impacts Assessment (IRC:104-1988) of highway projects. In addition to road widening and rehabilitation including establishment of temporary workshops, construction camps, hotmix plants, and opening of quarries for road construction work require compliance with provisions of The Forest (Conservation) Act 1980 as amended 1988 and Rules 1981 as amended 2003: The Wildlife (Protection) Act, 1972 (amended 1993); The Water (Prevention and Control of Pollution) Act 1972 (amended 1988) and Rules 1974; The Air (Prevention and Control of Pollution) Act, 1981 (amended 1987) and Rules 1982; The Noise Pollution (Regulation and Control) Rules, 2000 (amended 2002) and the Hazardous Waste (Management, Handling and Trans-boundary Movement) Rules 2008 (amended 2016). 29. A review is undertaken for all the environmental rules and regulation which might be applicable to the proposed road corridor improvement activities. Legislations applicable to this project are summarised below in Table 4. There is no separate state level legislation. However various acts like Water and Air are enforced through state level authority: the State Pollution Control Board (SPCB).
30. Specifically for the proposed Cheyyur - Polur road and ECR link in the state of Tamil Nadu, the following environmental laws and regulations applicable are in Table 4:
Table 4: Applicable Environmental National and State Requirements
Sl. No.
Activity Statute Requirement Competent Authority
Responsible Agency forObtaining Clearance
Time Required
Planning Stage: Before start of Civil Works Construction (Responsibility: Executing/Implementing Agency)
1. Borrow areas EIA Notification 2006
Environmental Clearance
State/District EIAA
The Contractor
4-6 months
2. Implementing Project
Revenue Standing orders
Tree cutting permission
Revenue Officers
TNHD 2-6 months
Note : Borrowing of ordinary earth for linear projects exempted from purview of EIA notification 2006 vide MoEF Notification S.O. No. 1224 (E) dated 28.03.2020
Construction Stage (Responsibility: Contractor)
1
Establishing campsites, stone crusher, hot mix plant, wet mix plant and Diesel Generator Sets
Water Act of 1974, Air Act of 1981, Noise Rules of 2000 and Environmental Protection Action of 1986 and as amended
Consent to establish
Tamil Nadu Pollution Control Board
The Contractor
2-3 months
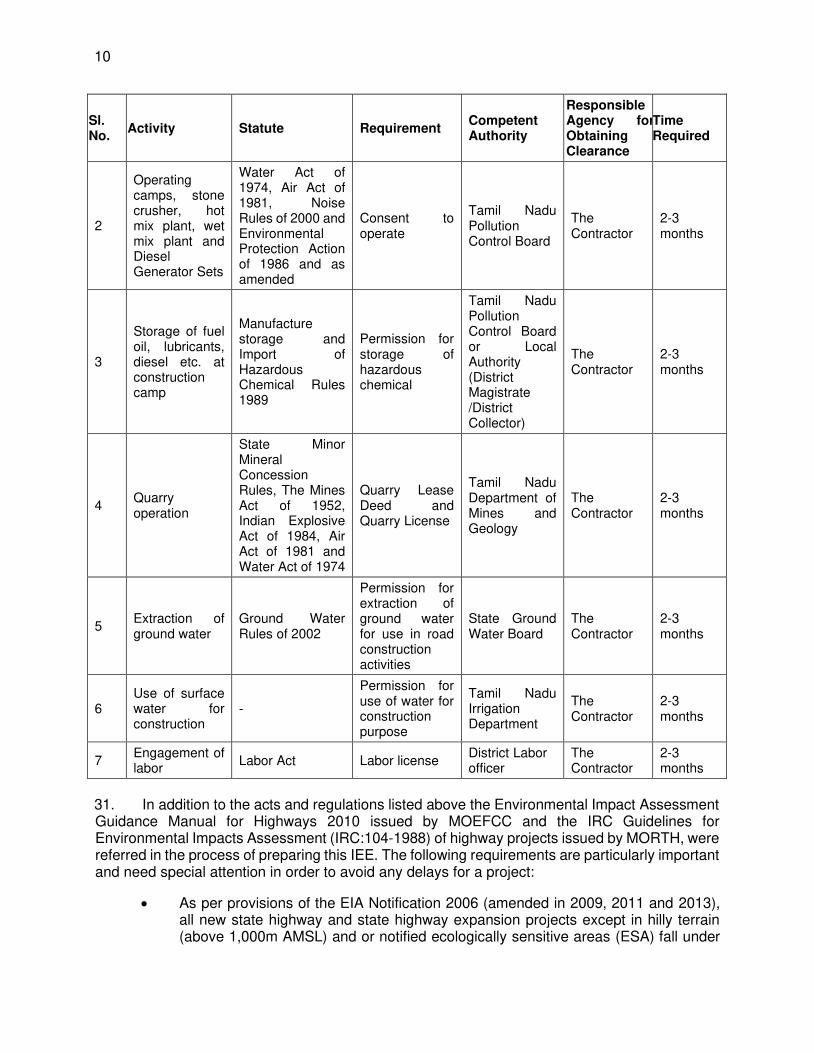
10
Sl. No.
Activity Statute Requirement Competent Authority
Responsible Agency forObtaining Clearance
Time Required
2
Operating camps, stone crusher, hot mix plant, wet mix plant and Diesel Generator Sets
Water Act of 1974, Air Act of 1981, Noise Rules of 2000 and Environmental Protection Action of 1986 and as amended
Consent to operate
Tamil Nadu Pollution Control Board
The Contractor
2-3 months
3
Storage of fuel oil, lubricants, diesel etc. at construction camp
Manufacture storage and Import of Hazardous Chemical Rules 1989
Permission for storage of hazardous chemical
Tamil Nadu Pollution Control Board or Local Authority (District Magistrate /District Collector)
The Contractor
2-3 months
4 Quarry operation
State Minor Mineral Concession Rules, The Mines Act of 1952, Indian Explosive Act of 1984, Air Act of 1981 and Water Act of 1974
Quarry Lease Deed and Quarry License
Tamil Nadu Department of Mines and Geology
The Contractor
2-3 months
5 Extraction of ground water
Ground Water Rules of 2002
Permission for extraction of ground water for use in road construction activities
State Ground Water Board
The Contractor
2-3 months
6 Use of surface water for construction
-
Permission for use of water for construction purpose
Tamil Nadu Irrigation Department
The Contractor
2-3 months
7 Engagement of labor
Labor Act Labor license District Labor officer
The Contractor
2-3 months
31. In addition to the acts and regulations listed above the Environmental Impact Assessment Guidance Manual for Highways 2010 issued by MOEFCC and the IRC Guidelines for Environmental Impacts Assessment (IRC:104-1988) of highway projects issued by MORTH, were referred in the process of preparing this IEE. The following requirements are particularly important and need special attention in order to avoid any delays for a project:
• As per provisions of the EIA Notification 2006 (amended in 2009, 2011 and 2013), all new state highway and state highway expansion projects except in hilly terrain (above 1,000m AMSL) and or notified ecologically sensitive areas (ESA) fall under
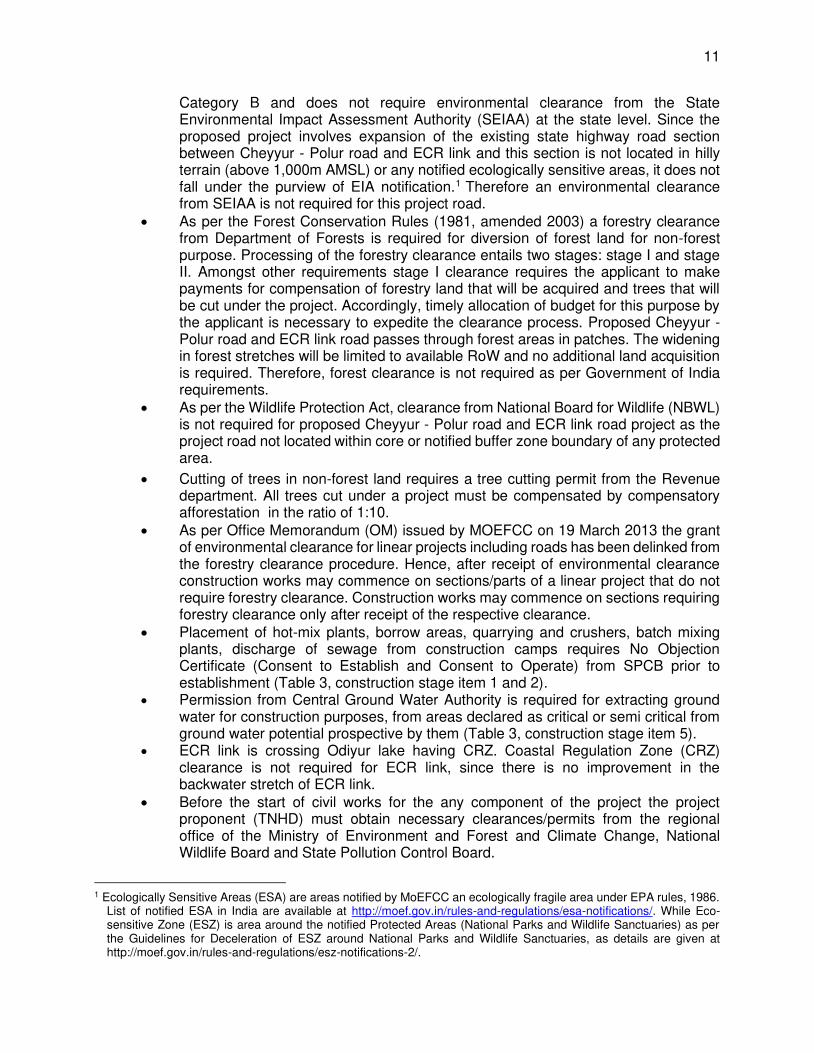
11
Category B and does not require environmental clearance from the State Environmental Impact Assessment Authority (SEIAA) at the state level. Since the proposed project involves expansion of the existing state highway road section between Cheyyur - Polur road and ECR link and this section is not located in hilly terrain (above 1,000m AMSL) or any notified ecologically sensitive areas, it does not fall under the purview of EIA notification.1 Therefore an environmental clearance from SEIAA is not required for this project road.
• As per the Forest Conservation Rules (1981, amended 2003) a forestry clearance from Department of Forests is required for diversion of forest land for non-forest purpose. Processing of the forestry clearance entails two stages: stage I and stage II. Amongst other requirements stage I clearance requires the applicant to make payments for compensation of forestry land that will be acquired and trees that will be cut under the project. Accordingly, timely allocation of budget for this purpose by the applicant is necessary to expedite the clearance process. Proposed Cheyyur - Polur road and ECR link road passes through forest areas in patches. The widening in forest stretches will be limited to available RoW and no additional land acquisition is required. Therefore, forest clearance is not required as per Government of India requirements.
• As per the Wildlife Protection Act, clearance from National Board for Wildlife (NBWL) is not required for proposed Cheyyur - Polur road and ECR link road project as the project road not located within core or notified buffer zone boundary of any protected area.
• Cutting of trees in non-forest land requires a tree cutting permit from the Revenue department. All trees cut under a project must be compensated by compensatory afforestation in the ratio of 1:10.
• As per Office Memorandum (OM) issued by MOEFCC on 19 March 2013 the grant of environmental clearance for linear projects including roads has been delinked from the forestry clearance procedure. Hence, after receipt of environmental clearance construction works may commence on sections/parts of a linear project that do not require forestry clearance. Construction works may commence on sections requiring forestry clearance only after receipt of the respective clearance.
• Placement of hot-mix plants, borrow areas, quarrying and crushers, batch mixing plants, discharge of sewage from construction camps requires No Objection Certificate (Consent to Establish and Consent to Operate) from SPCB prior to establishment (Table 3, construction stage item 1 and 2).
• Permission from Central Ground Water Authority is required for extracting ground water for construction purposes, from areas declared as critical or semi critical from ground water potential prospective by them (Table 3, construction stage item 5).
• ECR link is crossing Odiyur lake having CRZ. Coastal Regulation Zone (CRZ) clearance is not required for ECR link, since there is no improvement in the backwater stretch of ECR link.
• Before the start of civil works for the any component of the project the project proponent (TNHD) must obtain necessary clearances/permits from the regional office of the Ministry of Environment and Forest and Climate Change, National Wildlife Board and State Pollution Control Board.
1 Ecologically Sensitive Areas (ESA) are areas notified by MoEFCC an ecologically fragile area under EPA rules, 1986.
List of notified ESA in India are available at http://moef.gov.in/rules-and-regulations/esa-notifications/. While Eco-sensitive Zone (ESZ) is area around the notified Protected Areas (National Parks and Wildlife Sanctuaries) as per the Guidelines for Deceleration of ESZ around National Parks and Wildlife Sanctuaries, as details are given at http://moef.gov.in/rules-and-regulations/esz-notifications-2/.

12
B. Social Regulatory Requirements of India and Tamil Nadu
32. There are many rules and regulations framed by the Government of India for the protection of workers. Most of these legislations will be applicable to contractors in charge of construction. EA will ensure compliance to these social legislations through contractual obligation and regular checks and penalties. These legislations include the Building and Other Construction Workers (Regulation of Employment and Conditions of Service) Act, 1996, Child Labour (prohibition and Regulation) Act, 1986; Minimum Wages Act, 1948; Workmen Compensation Act, 1923; Payment of Gratuity Act, 1972; Employee State Insurance Act; Employees P.F. and Miscellaneous Provision Act, 1952; Maternity Benefit Act, 1951; Payment of Wages Act, 1936; Equal Remuneration Act, 1979; Inter-State Migrant Workmen’s (Regulation of Employment & Conditions of Service) Act, 1979; Equal Remuneration Act, 1979 etc.
C. International Treaties and Relevance to the Project
33. Government of India has signed many international treaties. GOI has also framed various laws, regulations and guidelines to meet country’s obligations under these treaties. Projects of this magnitude may contribute in meeting country’s obligation directly or indirectly. A screening was carried out of these treaties regarding its applicability to this project. The relevant international treaties are:
• Kyoto Protocol to the United Nations Framework Convention on Climate Change (Ratified by India in 1997): The Kyoto Protocol is an international agreement linked to the United Nations Framework Convention on Climate Change. The major feature of the Kyoto Protocol is that it sets binding targets for 37 industrialized countries and the European community for reducing greenhouse gas (GHG) emissions. These amount to an average of five per cent against 1990 levels over the five-year period 2008-2012.
• The Paris Agreement 2015: The Paris Agreement is an international agreement by 196 parties which aims at limiting global warming to 1.5 to 2 degrees C above pre-industrial levels. Through this, the parties also agreed to a long-term goal for adaptation through nationally determined contributions (NDCs), which is requested to be submitted every 5 years. India submitted its first NDC on October 2, 2016.
• Convention Concerning the Protection of the World Cultural and Natural Heritage (Ratified by India in 1972): The most significant feature of the 1972 World Heritage Convention is that it links together in a single document the concepts of nature conservation and the preservation of cultural properties. The Convention recognizes the way in which people interact with nature, and the fundamental need to preserve the balance between the two.
• Convention on International Trade in Endangered Species of Wild Fauna and Flora (Washington, 1973): Seek to avoid poaching by construction workers especially in environmentally sensitive areas.
• Convention on Migratory Species of Wild Animals (Bonn, 1979): Ensure potential impacts on any migratory species supported by the project area of influence assessed and managed.
• Convention Relative to the Preservation of Fauna and Flora in the Natural State (1933): Preservation of Flora and Fauna.
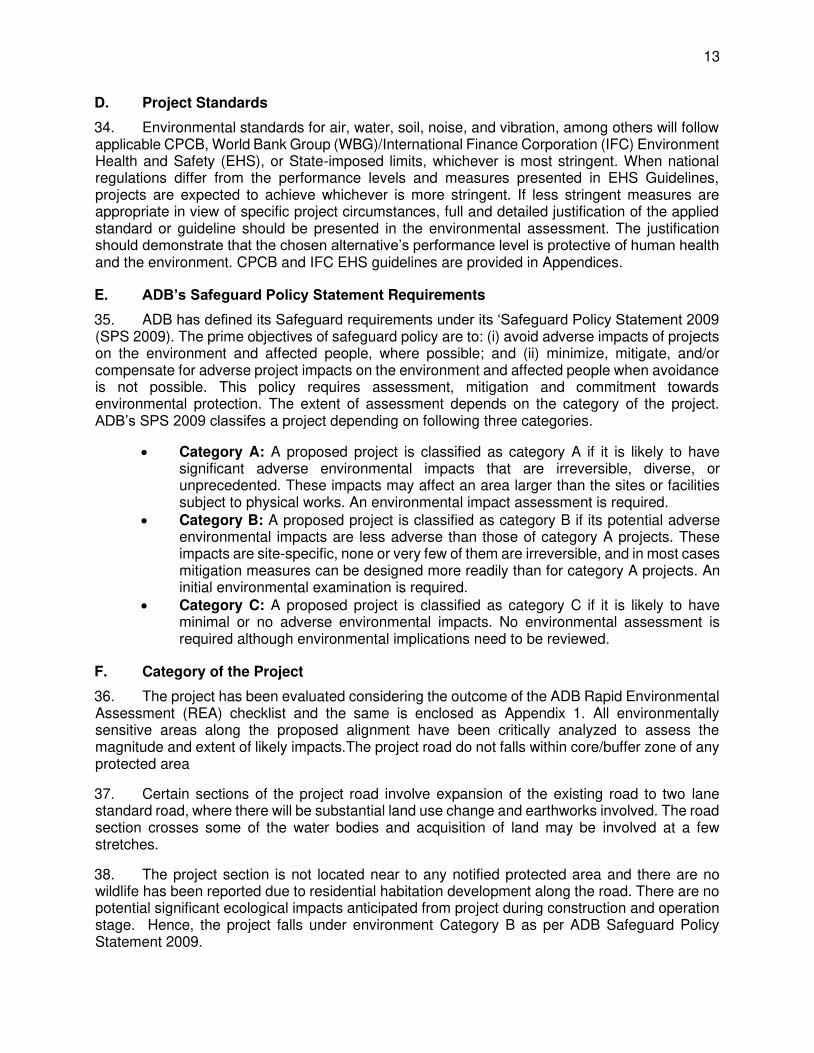
13
D. Project Standards
34. Environmental standards for air, water, soil, noise, and vibration, among others will follow applicable CPCB, World Bank Group (WBG)/International Finance Corporation (IFC) Environment Health and Safety (EHS), or State-imposed limits, whichever is most stringent. When national regulations differ from the performance levels and measures presented in EHS Guidelines, projects are expected to achieve whichever is more stringent. If less stringent measures are appropriate in view of specific project circumstances, full and detailed justification of the applied standard or guideline should be presented in the environmental assessment. The justification should demonstrate that the chosen alternative’s performance level is protective of human health and the environment. CPCB and IFC EHS guidelines are provided in Appendices.
E. ADB’s Safeguard Policy Statement Requirements
35. ADB has defined its Safeguard requirements under its ‘Safeguard Policy Statement 2009 (SPS 2009). The prime objectives of safeguard policy are to: (i) avoid adverse impacts of projects on the environment and affected people, where possible; and (ii) minimize, mitigate, and/or compensate for adverse project impacts on the environment and affected people when avoidance is not possible. This policy requires assessment, mitigation and commitment towards environmental protection. The extent of assessment depends on the category of the project. ADB’s SPS 2009 classifes a project depending on following three categories.
• Category A: A proposed project is classified as category A if it is likely to have significant adverse environmental impacts that are irreversible, diverse, or unprecedented. These impacts may affect an area larger than the sites or facilities subject to physical works. An environmental impact assessment is required.
• Category B: A proposed project is classified as category B if its potential adverse environmental impacts are less adverse than those of category A projects. These impacts are site-specific, none or very few of them are irreversible, and in most cases mitigation measures can be designed more readily than for category A projects. An initial environmental examination is required.
• Category C: A proposed project is classified as category C if it is likely to have minimal or no adverse environmental impacts. No environmental assessment is required although environmental implications need to be reviewed.
F. Category of the Project
36. The project has been evaluated considering the outcome of the ADB Rapid Environmental Assessment (REA) checklist and the same is enclosed as Appendix 1. All environmentally sensitive areas along the proposed alignment have been critically analyzed to assess the magnitude and extent of likely impacts.The project road do not falls within core/buffer zone of any protected area
37. Certain sections of the project road involve expansion of the existing road to two lane standard road, where there will be substantial land use change and earthworks involved. The road section crosses some of the water bodies and acquisition of land may be involved at a few stretches.
38. The project section is not located near to any notified protected area and there are no wildlife has been reported due to residential habitation development along the road. There are no potential significant ecological impacts anticipated from project during construction and operation stage. Hence, the project falls under environment Category B as per ADB Safeguard Policy Statement 2009.
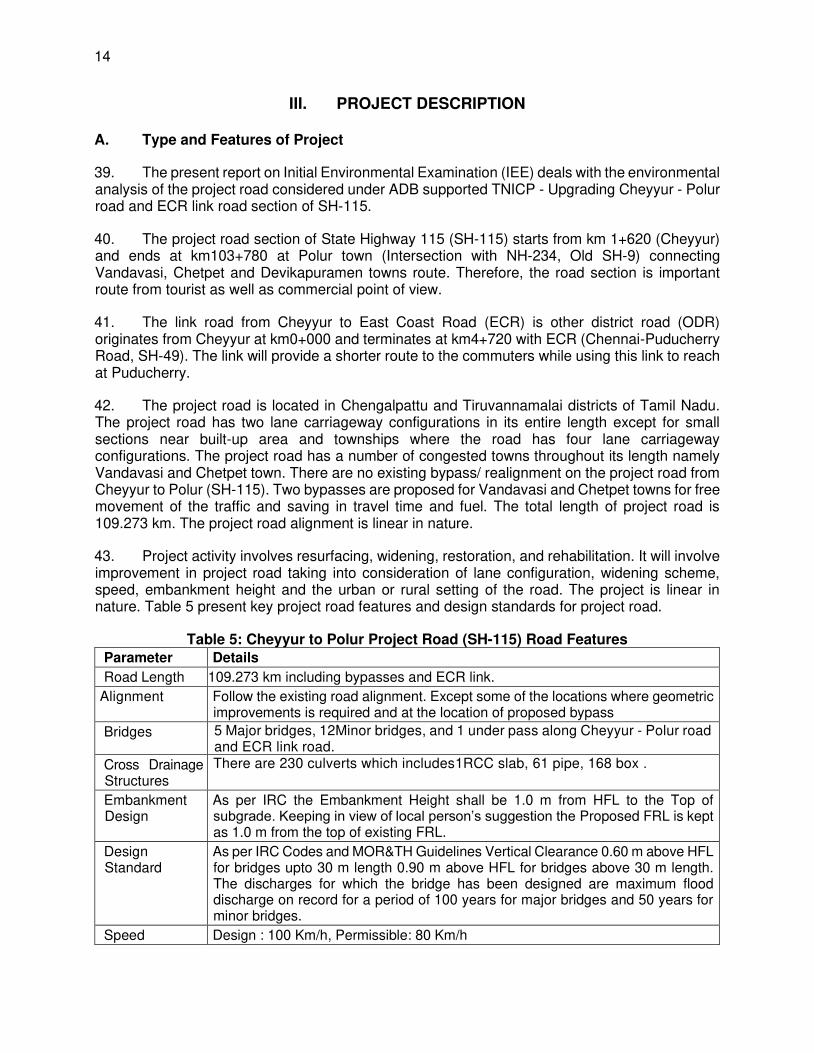
14
III. PROJECT DESCRIPTION
A. Type and Features of Project
39. The present report on Initial Environmental Examination (IEE) deals with the environmental analysis of the project road considered under ADB supported TNICP - Upgrading Cheyyur - Polur road and ECR link road section of SH-115.
40. The project road section of State Highway 115 (SH-115) starts from km 1+620 (Cheyyur) and ends at km103+780 at Polur town (Intersection with NH-234, Old SH-9) connecting Vandavasi, Chetpet and Devikapuramen towns route. Therefore, the road section is important route from tourist as well as commercial point of view.
41. The link road from Cheyyur to East Coast Road (ECR) is other district road (ODR) originates from Cheyyur at km0+000 and terminates at km4+720 with ECR (Chennai-Puducherry Road, SH-49). The link will provide a shorter route to the commuters while using this link to reach at Puducherry.
42. The project road is located in Chengalpattu and Tiruvannamalai districts of Tamil Nadu. The project road has two lane carriageway configurations in its entire length except for small sections near built-up area and townships where the road has four lane carriageway configurations. The project road has a number of congested towns throughout its length namely Vandavasi and Chetpet town. There are no existing bypass/ realignment on the project road from Cheyyur to Polur (SH-115). Two bypasses are proposed for Vandavasi and Chetpet towns for free movement of the traffic and saving in travel time and fuel. The total length of project road is 109.273 km. The project road alignment is linear in nature.
43. Project activity involves resurfacing, widening, restoration, and rehabilitation. It will involve improvement in project road taking into consideration of lane configuration, widening scheme, speed, embankment height and the urban or rural setting of the road. The project is linear in nature. Table 5 present key project road features and design standards for project road.
Table 5: Cheyyur to Polur Project Road (SH-115) Road Features
Parameter Details
Road Length 109.273 km including bypasses and ECR link.
Alignment Follow the existing road alignment. Except some of the locations where geometric improvements is required and at the location of proposed bypass
Bridges 5 Major bridges, 12Minor bridges, and 1 under pass along Cheyyur - Polur road and ECR link road.
Cross Drainage Structures
There are 230 culverts which includes1RCC slab, 61 pipe, 168 box .
Embankment Design
As per IRC the Embankment Height shall be 1.0 m from HFL to the Top of subgrade. Keeping in view of local person’s suggestion the Proposed FRL is kept as 1.0 m from the top of existing FRL.
Design Standard
As per IRC Codes and MOR&TH Guidelines Vertical Clearance 0.60 m above HFL for bridges upto 30 m length 0.90 m above HFL for bridges above 30 m length. The discharges for which the bridge has been designed are maximum flood discharge on record for a period of 100 years for major bridges and 50 years for minor bridges.
Speed Design : 100 Km/h, Permissible: 80 Km/h
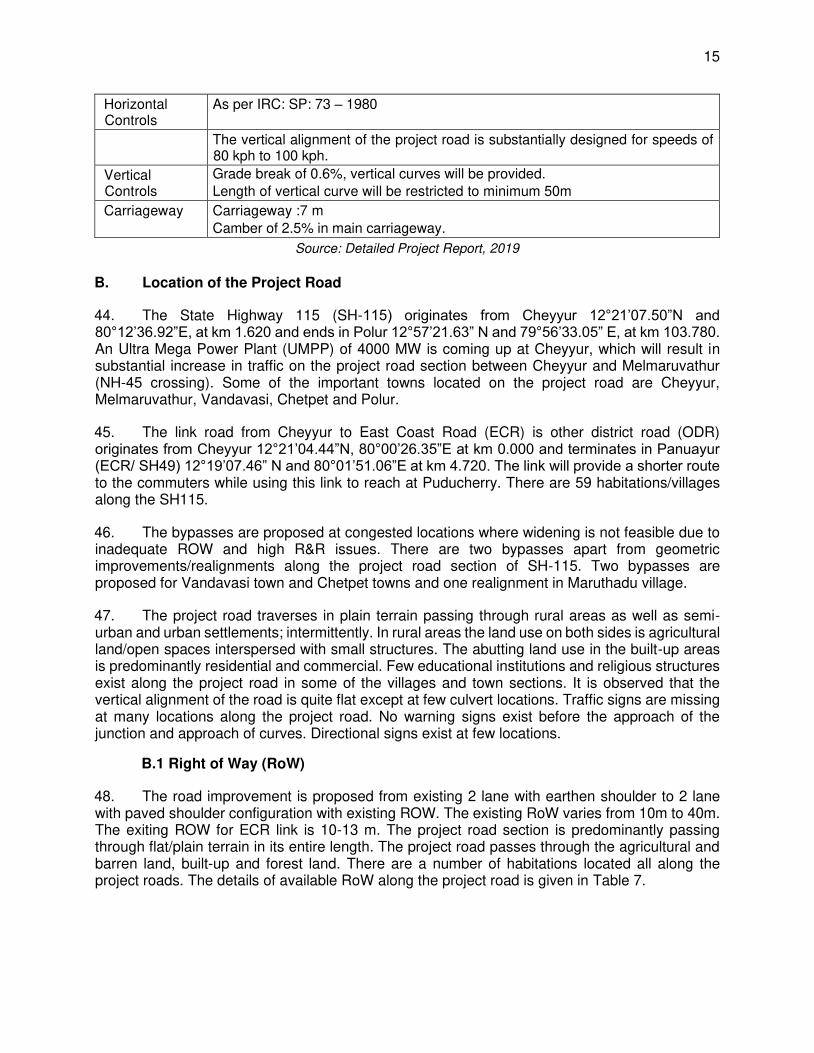
15
Horizontal Controls
As per IRC: SP: 73 – 1980
The vertical alignment of the project road is substantially designed for speeds of 80 kph to 100 kph.
Vertical Controls
Grade break of 0.6%, vertical curves will be provided.
Length of vertical curve will be restricted to minimum 50m
Carriageway Carriageway :7 m
Camber of 2.5% in main carriageway.
Source: Detailed Project Report, 2019
B. Location of the Project Road
44. The State Highway 115 (SH-115) originates from Cheyyur 12°21’07.50”N and 80°12’36.92”E, at km 1.620 and ends in Polur 12°57’21.63” N and 79°56’33.05” E, at km 103.780. An Ultra Mega Power Plant (UMPP) of 4000 MW is coming up at Cheyyur, which will result in substantial increase in traffic on the project road section between Cheyyur and Melmaruvathur (NH-45 crossing). Some of the important towns located on the project road are Cheyyur, Melmaruvathur, Vandavasi, Chetpet and Polur.
45. The link road from Cheyyur to East Coast Road (ECR) is other district road (ODR) originates from Cheyyur 12°21’04.44”N, 80°00’26.35”E at km 0.000 and terminates in Panuayur (ECR/ SH49) 12°19’07.46” N and 80°01’51.06”E at km 4.720. The link will provide a shorter route to the commuters while using this link to reach at Puducherry. There are 59 habitations/villages along the SH115.
46. The bypasses are proposed at congested locations where widening is not feasible due to inadequate ROW and high R&R issues. There are two bypasses apart from geometric improvements/realignments along the project road section of SH-115. Two bypasses are proposed for Vandavasi town and Chetpet towns and one realignment in Maruthadu village.
47. The project road traverses in plain terrain passing through rural areas as well as semi-urban and urban settlements; intermittently. In rural areas the land use on both sides is agricultural land/open spaces interspersed with small structures. The abutting land use in the built-up areas is predominantly residential and commercial. Few educational institutions and religious structures exist along the project road in some of the villages and town sections. It is observed that the vertical alignment of the road is quite flat except at few culvert locations. Traffic signs are missing at many locations along the project road. No warning signs exist before the approach of the junction and approach of curves. Directional signs exist at few locations.
B.1 Right of Way (RoW)
48. The road improvement is proposed from existing 2 lane with earthen shoulder to 2 lane with paved shoulder configuration with existing ROW. The existing RoW varies from 10m to 40m. The exiting ROW for ECR link is 10-13 m. The project road section is predominantly passing through flat/plain terrain in its entire length. The project road passes through the agricultural and barren land, built-up and forest land. There are a number of habitations located all along the project roads. The details of available RoW along the project road is given in Table 7.

16
B.2 Cross Drainage Structures
49. There are 230 culverts which includes 1 RCC slab, 61 pipe, 168 box, 5 Major bridges, 12 Minor bridges, and 1 underpass along Cheyyur - Polur road and ECR link road.
B.3 Traffic Scenario
50. The 7-day 24-hour directional classified Traffic Volume Count (TVC) was carried out at two different locations on the project road section during DPR preparation. The average daily traffic volumes are given below in Table 6. Traffic projections are in Table 51 in Chapter 6 of this report.
Table 6: Annual Average Daily Traffic Volume along Homogenous Road Sections
Vehicle Type L1151 L1152 L1153 L1154 L1155
2W 2747 2572 2801 2087 3164
3W 242 93 243 78 353
Car 700 312 1093 659 334
Bus 211 59 918 648 298
LCV 248 329 624 553 304
Truck 390 148 288 429 333
Other Fast Moving Vehicle 33 13 47 67 75
All Fast 4572 3526 6014 4521 4861
All Slow 83 204 159 203 1158
AADT (in Nos.) 4655 3730 6173 4724 6019
AADT (In PCUs) 4618 2856 7362 6056 5453 L1151: Cheyyur - Chitamur, L1152: Chitamur-NH45 Jn., L1153: NH45 Jn - Vandavasi, L1154: Vandavasi-Chetpet, L1155: Chetpet - Polur
Source: Traffic volume Survey by the DPR Consultant
B.4 Road Width
51. This project road has 7.0m carriageway with earthen shoulder width varying between 0.5m to 1m in the entire length except at built up sections.
B.5 Villages and Urban-Built Up Sections
52. This project road passes through many villages and towns. The major builtup locations along the project road are Cheyyur Town, Mudaliyarkuppam, Nallur, Vallarai, Onampakkam, Kathudhevathur, Kepkoshikarai, Nallamur, Chittamur, Kolampakkam, Polambakkam, Mazhubkadu, Sothupakkam, Agili, Sandivakkam, Ramapuram, Salavedu, Mamandur, Kilkodungaloore/, Kallankuthu, Kaveripakkam, Maruthadu, Kodaisikulam, Biridhur, Chinnavaram, Vandavasi Town, Karajar Nagar, Mampattu, Ramraj Nagar, Kilnanthyambadi, Thirumarithanaga, Vadavarakkamba, Kilvelliyur, Periyar Nagar, Thirukarai, Mazhaiyur, Earthal, Ettithangal, Chinna, Arasumpattu, Nedugunam, Chetpet Town, Nirmala Nagar, Ideyankulam, Muthuswami, Nambedu, Pandiyapuram,Thachanbadi, Cheyarandal, Devikapuram, Modiyur, Mattaperiyar, Pulivardal, Komanandal, Karaipondi, Vermani and Polur Town.

17
Table 7: Villages and Urban Built Up Locations on Project Road and RoW
Sl. No. Ext. Chainage (km)
Village Name Land Use Available
ROW (in m) From To Left Right
1 1+620 3+000 Cheyyur Town AR AR 16.4 – 40.9
2 3+200 4+647 Mudaliyarkuppam AB AB 10.2
3 4+400 5+400 Nallur AB AB 34.3 - 43.5
4 5+400 7+000 Vallarai AB AB 34.3 - 43.5
5 7+000 8+000 Onampakkam AB AB 16.3
6 9+900 10+700 Kathudhevathur ACR ACR 17.1
7 11+800 12+300 Kepkoshikarai AB AB 36-55
8 13+000 13+400 Nallamur 36-41 --
9 16+000 16+800 Chittamur ACR ARG 34.5
10 18+000 18+300 Kolampakkam AB AB 30
11 19+000 19+400 Polambakkam ABR ABR 20-23
12 20+000 20+400 Mazhubkadu AB AB 22-65
13 22+700 24+800 Sothupakkam AR AR 35-56
14 24+900 25+000 Agili AR AR 21.6
15 27+300 27+600 Sandivakkam AR ARB 17
16 31+400 32+900 Ramapuram ARB ARB 23
17 35+200 36+200 Salavedu ARB ARB 101.6
18 38+900 39+100 Mamandur ARB ARB 16
19 39+100 39+700 Kilkodungaloore/ ARB ARB 20.5
20 40+800 41+800 Kallankuthu ARB ARB 20.2-41
21 42+200 42+500 Kaveripakkam ABC AB 25-94
22 42+000 43+300 Maruthadu ABRC ACR 15-53
23 45+100 45+400 Kodaisikulam ABR AB 20-35
24 47+100 47+400 Biridhur ABR BR 18-40
25 48+500 49+300 Chinnavaram AR AC 20-65
26 49+300 50+500 Vandavasi Town AR AR 20-42
27 50+500 50+650 Karajar Nagar AR AR 40-47
28 54+000 55+000 Mampattu AR AR 32-40
29 56+000 56+500 Ramraj Nagar ABR ABR 20-61
30 59+000 59+800 Kilnanthyambadi BR BR 27
31 60+000 60+400 Thirumarithanaga AB B 18-71
32 61+100 61+600 Vadavarakkamba A A 18-35
33 61+800 62+300 Kilvelliyur AR AR 20-32
34 63+600 63+800 Periyar Nagar ABR ABR 22-40
35 64+100 64+300 Thirukarai AB AB 35-111
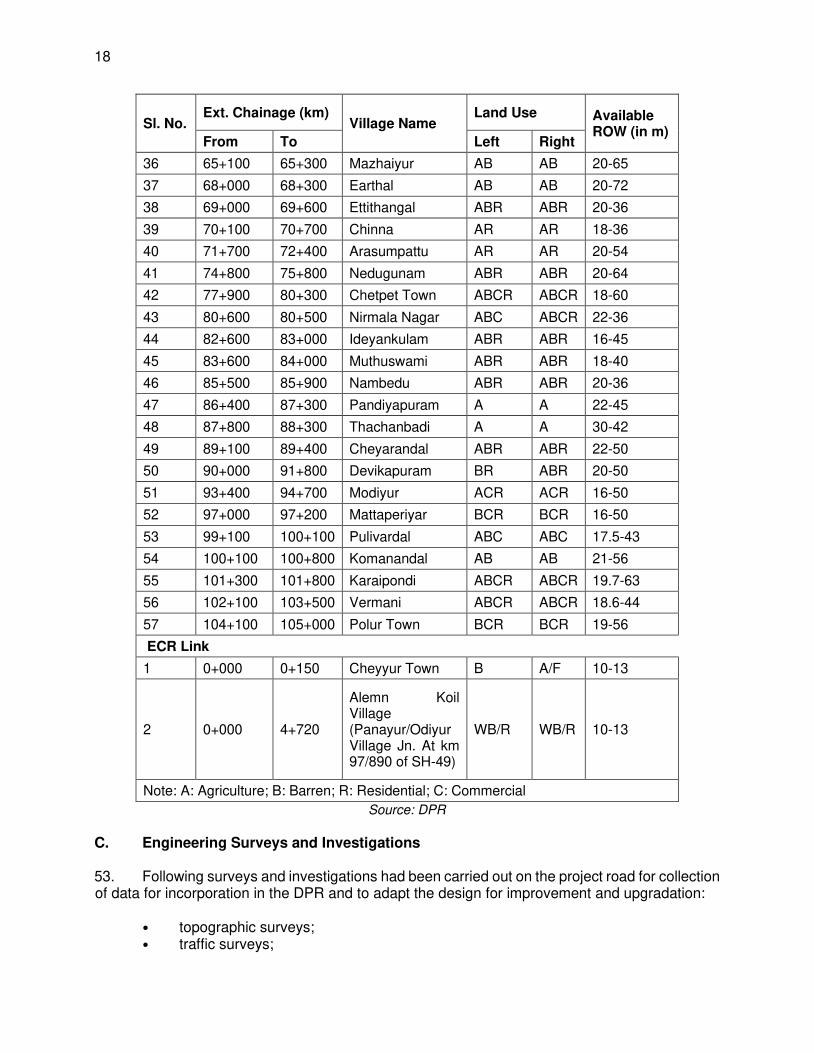
18
Sl. No. Ext. Chainage (km)
Village Name Land Use Available
ROW (in m) From To Left Right
36 65+100 65+300 Mazhaiyur AB AB 20-65
37 68+000 68+300 Earthal AB AB 20-72
38 69+000 69+600 Ettithangal ABR ABR 20-36
39 70+100 70+700 Chinna AR AR 18-36
40 71+700 72+400 Arasumpattu AR AR 20-54
41 74+800 75+800 Nedugunam ABR ABR 20-64
42 77+900 80+300 Chetpet Town ABCR ABCR 18-60
43 80+600 80+500 Nirmala Nagar ABC ABCR 22-36
44 82+600 83+000 Ideyankulam ABR ABR 16-45
45 83+600 84+000 Muthuswami ABR ABR 18-40
46 85+500 85+900 Nambedu ABR ABR 20-36
47 86+400 87+300 Pandiyapuram A A 22-45
48 87+800 88+300 Thachanbadi A A 30-42
49 89+100 89+400 Cheyarandal ABR ABR 22-50
50 90+000 91+800 Devikapuram BR ABR 20-50
51 93+400 94+700 Modiyur ACR ACR 16-50
52 97+000 97+200 Mattaperiyar BCR BCR 16-50
53 99+100 100+100 Pulivardal ABC ABC 17.5-43
54 100+100 100+800 Komanandal AB AB 21-56
55 101+300 101+800 Karaipondi ABCR ABCR 19.7-63
56 102+100 103+500 Vermani ABCR ABCR 18.6-44
57 104+100 105+000 Polur Town BCR BCR 19-56
ECR Link
1 0+000 0+150 Cheyyur Town B A/F 10-13
2 0+000 4+720
Alemn Koil Village (Panayur/Odiyur Village Jn. At km 97/890 of SH-49)
WB/R WB/R 10-13
Note: A: Agriculture; B: Barren; R: Residential; C: Commercial
Source: DPR
C. Engineering Surveys and Investigations 53. Following surveys and investigations had been carried out on the project road for collection of data for incorporation in the DPR and to adapt the design for improvement and upgradation:
• topographic surveys; • traffic surveys;

19
• road and pavement condition survey and inventory; • culverts and bridges condition survey and inventories; • material surveys; • hydrology studies for new bridge structures; • Geotechnical investigations & subsoil exploration for structures; and • existing utilities surveys. D. Design Standards
54. This section describes the design standards and principles based on which the various designs have been carried out. The formulation of the design standards is required in order to avoid any inconsistency in design from one section to the other and to provide a desired level of service and safety. These proposed standards are consistent with the parameters recommended in the relevant standards of the Indian Roads Congress (IRC). The relevant IRC/ MORT&H design standards adopted for the Engineering Design are given below.
• Manual of Specifications and Standards for Two Laning of State Highways: IRC SP 73– 2015
• Manual of Specifications and Standards for Four Laning of State Highways: IRC SP 84 – 2014
• Ministry of Road Transport & Highways (MoRTH) specifications and circulars – Fifth edition.
1. Geometric Design
55. While doing the geometric design, the following have been taken into consideration:
• The designed facility shall not become obsolescent before the design year. • Design shall be consistent and the standards followed for different elements shall
be compatible with one another. • The design shall cover all geometric aspects of road including road, safety features,
road furniture, signages, grade separated structures, etc. • The design will be done aiming at minimizing the vehicle operating cost including
initial cost, cost of maintenance etc. • The design will take into consideration the environmental, aesthetic and landscaping
aspects of the project road.
2. Geometric Design Control
56. The detailed design for geometric elements covered, but were not limited to the following major aspects:
• Horizontal alignment • Longitudinal profile or vertical alignment • Cross-sectional elements • Junctions, intersections and Interchanges
57. The detailed analysis of traffic flow and level of service for the existing road has been made and traffic flow capacity for the project road was worked out. This analysis establishes the widening requirements with respect to the different horizon period.
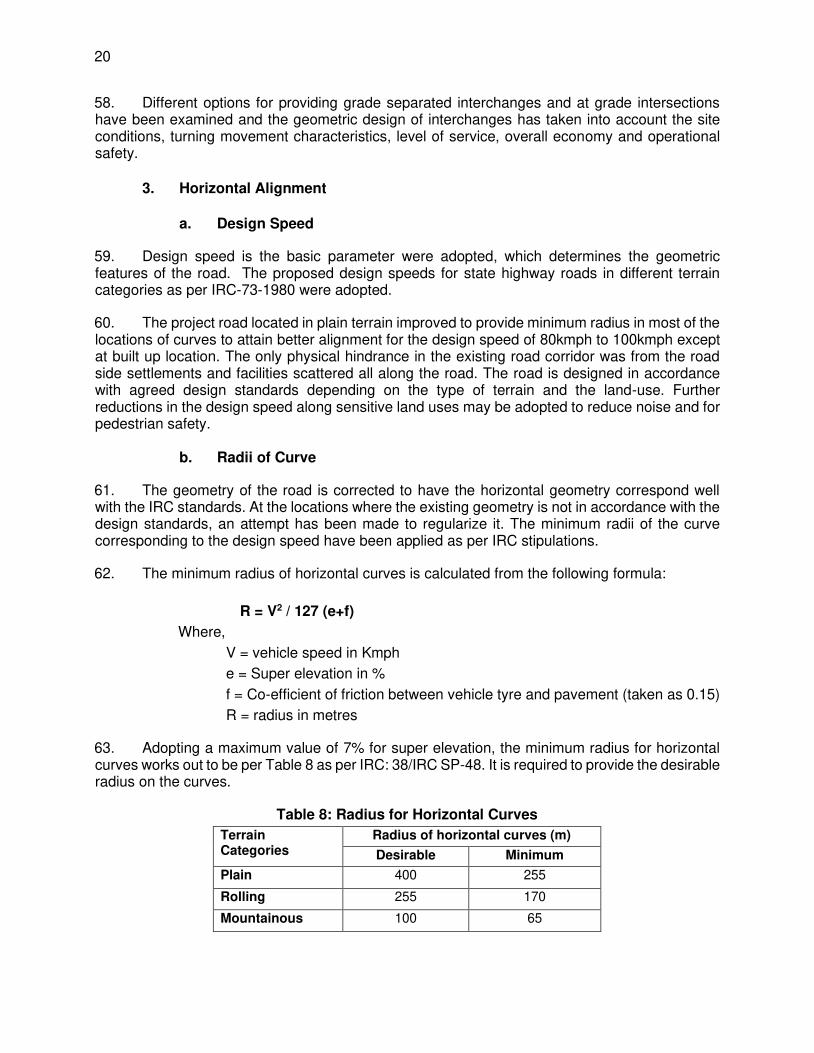
20
58. Different options for providing grade separated interchanges and at grade intersections have been examined and the geometric design of interchanges has taken into account the site conditions, turning movement characteristics, level of service, overall economy and operational safety.
3. Horizontal Alignment
a. Design Speed
59. Design speed is the basic parameter were adopted, which determines the geometric features of the road. The proposed design speeds for state highway roads in different terrain categories as per IRC-73-1980 were adopted.
60. The project road located in plain terrain improved to provide minimum radius in most of the locations of curves to attain better alignment for the design speed of 80kmph to 100kmph except at built up location. The only physical hindrance in the existing road corridor was from the road side settlements and facilities scattered all along the road. The road is designed in accordance with agreed design standards depending on the type of terrain and the land-use. Further reductions in the design speed along sensitive land uses may be adopted to reduce noise and for pedestrian safety.
b. Radii of Curve
61. The geometry of the road is corrected to have the horizontal geometry correspond well with the IRC standards. At the locations where the existing geometry is not in accordance with the design standards, an attempt has been made to regularize it. The minimum radii of the curve corresponding to the design speed have been applied as per IRC stipulations.
62. The minimum radius of horizontal curves is calculated from the following formula:
R = V2 / 127 (e+f)
Where,
V = vehicle speed in Kmph
e = Super elevation in %
f = Co-efficient of friction between vehicle tyre and pavement (taken as 0.15)
R = radius in metres
63. Adopting a maximum value of 7% for super elevation, the minimum radius for horizontal curves works out to be per Table 8 as per IRC: 38/IRC SP-48. It is required to provide the desirable radius on the curves.
Table 8: Radius for Horizontal Curves
Terrain Categories
Radius of horizontal curves (m)
Desirable Minimum
Plain 400 255
Rolling 255 170
Mountainous 100 65
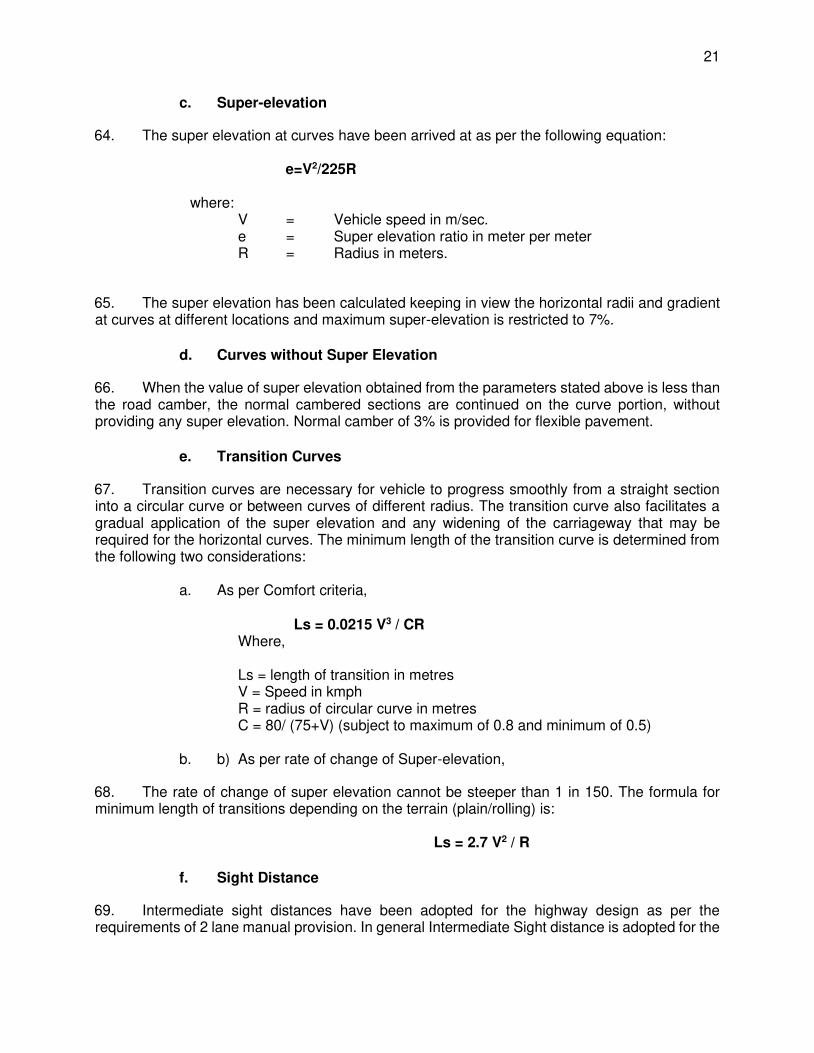
21
c. Super-elevation
64. The super elevation at curves have been arrived at as per the following equation: e=V2/225R
where: V = Vehicle speed in m/sec. e = Super elevation ratio in meter per meter R = Radius in meters.
65. The super elevation has been calculated keeping in view the horizontal radii and gradient at curves at different locations and maximum super-elevation is restricted to 7%.
d. Curves without Super Elevation
66. When the value of super elevation obtained from the parameters stated above is less than the road camber, the normal cambered sections are continued on the curve portion, without providing any super elevation. Normal camber of 3% is provided for flexible pavement.
e. Transition Curves
67. Transition curves are necessary for vehicle to progress smoothly from a straight section into a circular curve or between curves of different radius. The transition curve also facilitates a gradual application of the super elevation and any widening of the carriageway that may be required for the horizontal curves. The minimum length of the transition curve is determined from the following two considerations:
a. As per Comfort criteria, Ls = 0.0215 V3 / CR
Where, Ls = length of transition in metres V = Speed in kmph R = radius of circular curve in metres C = 80/ (75+V) (subject to maximum of 0.8 and minimum of 0.5)
b. b) As per rate of change of Super-elevation,
68. The rate of change of super elevation cannot be steeper than 1 in 150. The formula for minimum length of transitions depending on the terrain (plain/rolling) is: Ls = 2.7 V2 / R
f. Sight Distance
69. Intermediate sight distances have been adopted for the highway design as per the requirements of 2 lane manual provision. In general Intermediate Sight distance is adopted for the
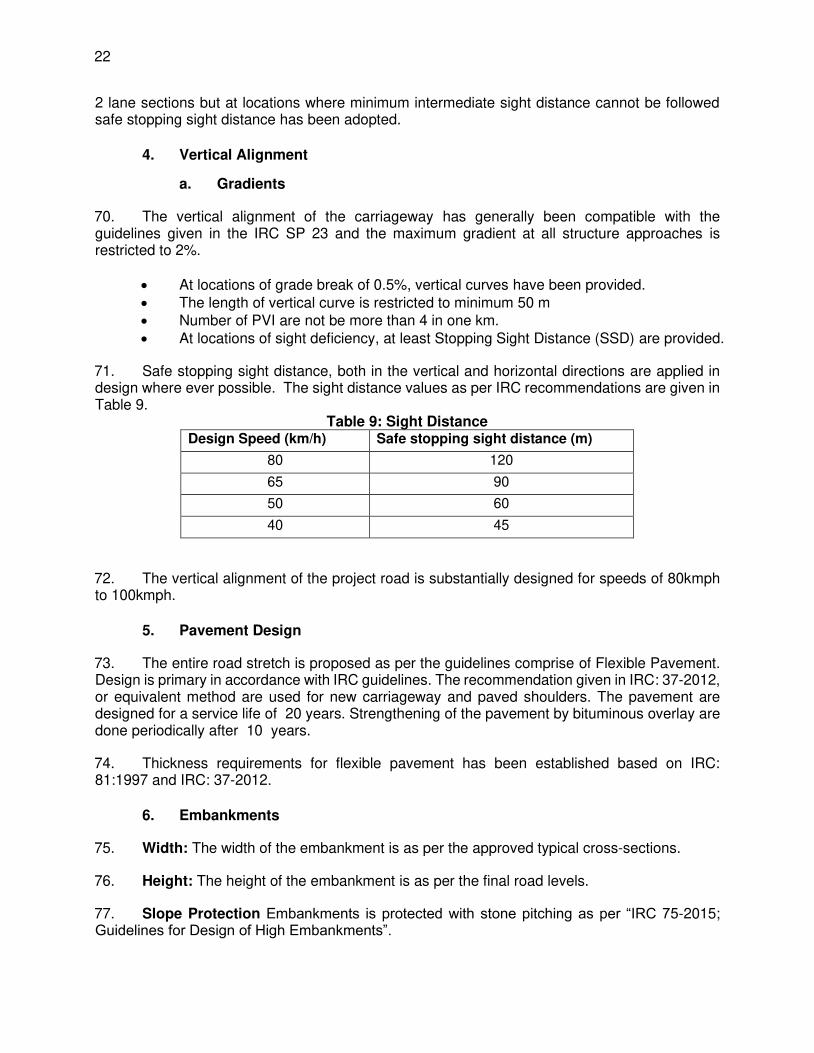
22
2 lane sections but at locations where minimum intermediate sight distance cannot be followed safe stopping sight distance has been adopted.
4. Vertical Alignment
a. Gradients
70. The vertical alignment of the carriageway has generally been compatible with the guidelines given in the IRC SP 23 and the maximum gradient at all structure approaches is restricted to 2%.
• At locations of grade break of 0.5%, vertical curves have been provided. • The length of vertical curve is restricted to minimum 50 m • Number of PVI are not be more than 4 in one km. • At locations of sight deficiency, at least Stopping Sight Distance (SSD) are provided.
71. Safe stopping sight distance, both in the vertical and horizontal directions are applied in design where ever possible. The sight distance values as per IRC recommendations are given in Table 9.
Table 9: Sight Distance Design Speed (km/h) Safe stopping sight distance (m)
80 120
65 90
50 60
40 45
72. The vertical alignment of the project road is substantially designed for speeds of 80kmph to 100kmph.
5. Pavement Design
73. The entire road stretch is proposed as per the guidelines comprise of Flexible Pavement. Design is primary in accordance with IRC guidelines. The recommendation given in IRC: 37-2012, or equivalent method are used for new carriageway and paved shoulders. The pavement are designed for a service life of 20 years. Strengthening of the pavement by bituminous overlay are done periodically after 10 years.
74. Thickness requirements for flexible pavement has been established based on IRC: 81:1997 and IRC: 37-2012.
6. Embankments
75. Width: The width of the embankment is as per the approved typical cross-sections.
76. Height: The height of the embankment is as per the final road levels.
77. Slope Protection Embankments is protected with stone pitching as per “IRC 75-2015; Guidelines for Design of High Embankments”.
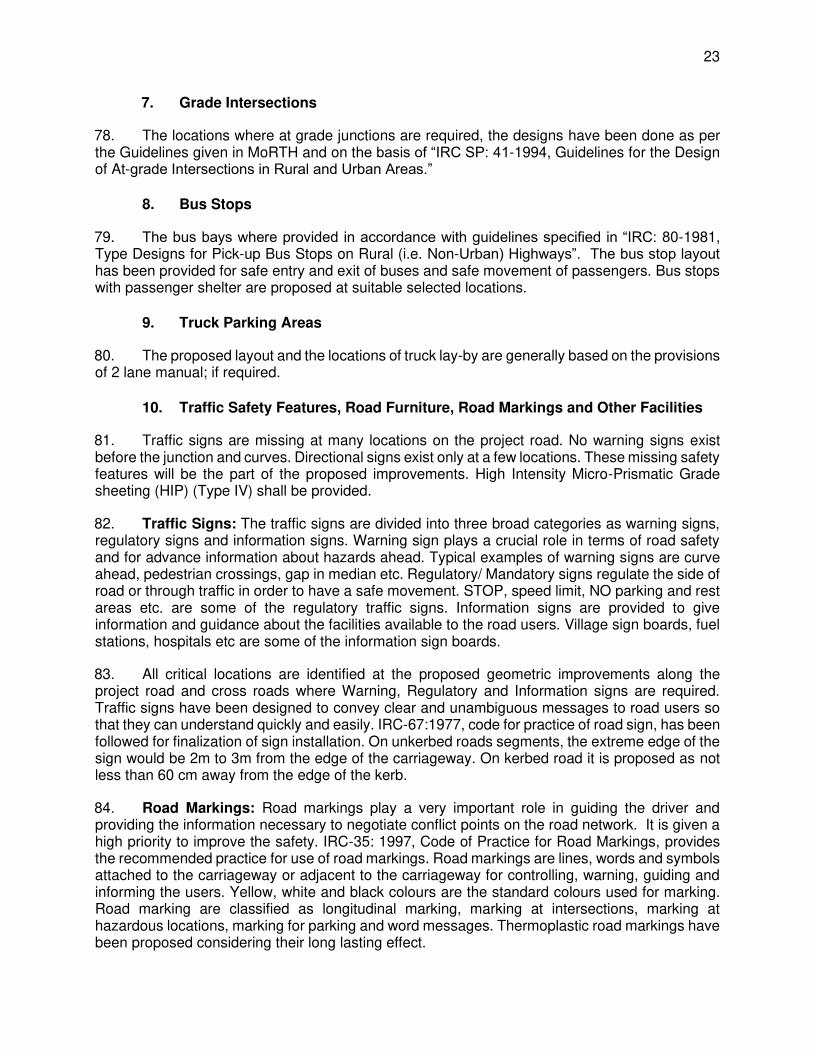
23
7. Grade Intersections
78. The locations where at grade junctions are required, the designs have been done as per the Guidelines given in MoRTH and on the basis of “IRC SP: 41-1994, Guidelines for the Design of At-grade Intersections in Rural and Urban Areas.”
8. Bus Stops
79. The bus bays where provided in accordance with guidelines specified in “IRC: 80-1981, Type Designs for Pick-up Bus Stops on Rural (i.e. Non-Urban) Highways”. The bus stop layout has been provided for safe entry and exit of buses and safe movement of passengers. Bus stops with passenger shelter are proposed at suitable selected locations.
9. Truck Parking Areas
80. The proposed layout and the locations of truck lay-by are generally based on the provisions of 2 lane manual; if required.
10. Traffic Safety Features, Road Furniture, Road Markings and Other Facilities
81. Traffic signs are missing at many locations on the project road. No warning signs exist before the junction and curves. Directional signs exist only at a few locations. These missing safety features will be the part of the proposed improvements. High Intensity Micro-Prismatic Grade sheeting (HIP) (Type IV) shall be provided.
82. Traffic Signs: The traffic signs are divided into three broad categories as warning signs, regulatory signs and information signs. Warning sign plays a crucial role in terms of road safety and for advance information about hazards ahead. Typical examples of warning signs are curve ahead, pedestrian crossings, gap in median etc. Regulatory/ Mandatory signs regulate the side of road or through traffic in order to have a safe movement. STOP, speed limit, NO parking and rest areas etc. are some of the regulatory traffic signs. Information signs are provided to give information and guidance about the facilities available to the road users. Village sign boards, fuel stations, hospitals etc are some of the information sign boards.
83. All critical locations are identified at the proposed geometric improvements along the project road and cross roads where Warning, Regulatory and Information signs are required. Traffic signs have been designed to convey clear and unambiguous messages to road users so that they can understand quickly and easily. IRC-67:1977, code for practice of road sign, has been followed for finalization of sign installation. On unkerbed roads segments, the extreme edge of the sign would be 2m to 3m from the edge of the carriageway. On kerbed road it is proposed as not less than 60 cm away from the edge of the kerb.
84. Road Markings: Road markings play a very important role in guiding the driver and providing the information necessary to negotiate conflict points on the road network. It is given a high priority to improve the safety. IRC-35: 1997, Code of Practice for Road Markings, provides the recommended practice for use of road markings. Road markings are lines, words and symbols attached to the carriageway or adjacent to the carriageway for controlling, warning, guiding and informing the users. Yellow, white and black colours are the standard colours used for marking. Road marking are classified as longitudinal marking, marking at intersections, marking at hazardous locations, marking for parking and word messages. Thermoplastic road markings have been proposed considering their long lasting effect.
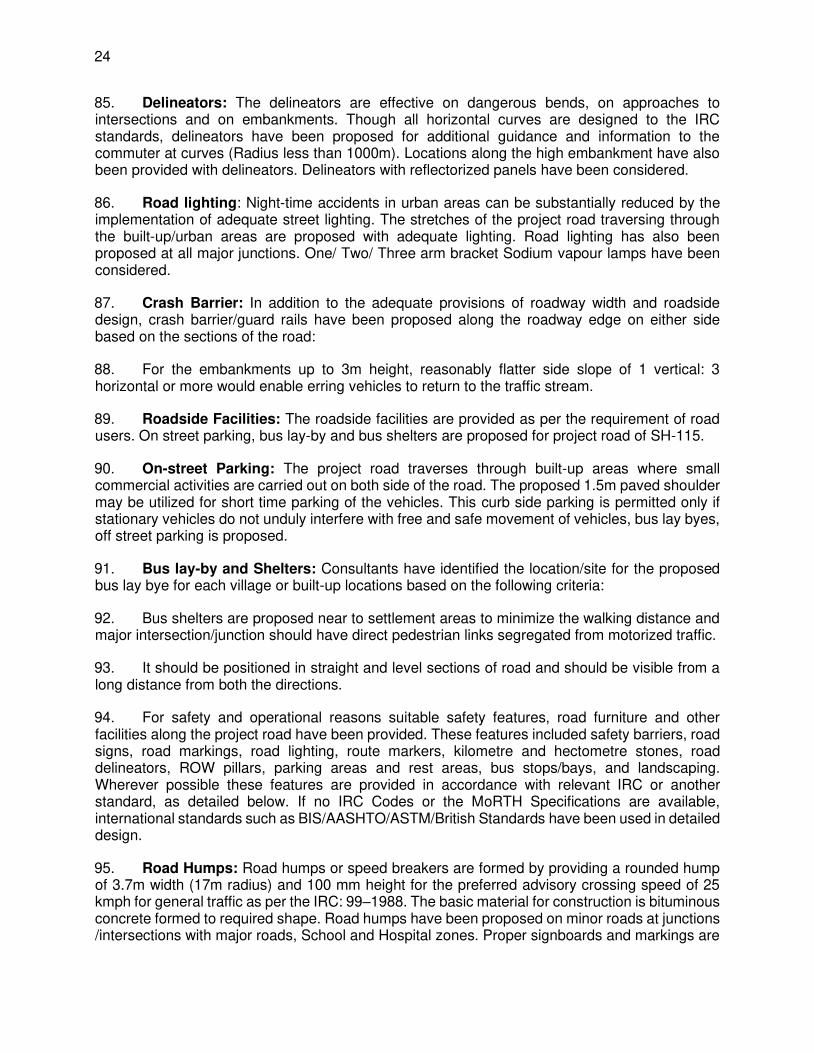
24
85. Delineators: The delineators are effective on dangerous bends, on approaches to intersections and on embankments. Though all horizontal curves are designed to the IRC standards, delineators have been proposed for additional guidance and information to the commuter at curves (Radius less than 1000m). Locations along the high embankment have also been provided with delineators. Delineators with reflectorized panels have been considered.
86. Road lighting: Night-time accidents in urban areas can be substantially reduced by the implementation of adequate street lighting. The stretches of the project road traversing through the built-up/urban areas are proposed with adequate lighting. Road lighting has also been proposed at all major junctions. One/ Two/ Three arm bracket Sodium vapour lamps have been considered.
87. Crash Barrier: In addition to the adequate provisions of roadway width and roadside design, crash barrier/guard rails have been proposed along the roadway edge on either side based on the sections of the road:
88. For the embankments up to 3m height, reasonably flatter side slope of 1 vertical: 3 horizontal or more would enable erring vehicles to return to the traffic stream.
89. Roadside Facilities: The roadside facilities are provided as per the requirement of road users. On street parking, bus lay-by and bus shelters are proposed for project road of SH-115.
90. On-street Parking: The project road traverses through built-up areas where small commercial activities are carried out on both side of the road. The proposed 1.5m paved shoulder may be utilized for short time parking of the vehicles. This curb side parking is permitted only if stationary vehicles do not unduly interfere with free and safe movement of vehicles, bus lay byes, off street parking is proposed.
91. Bus lay-by and Shelters: Consultants have identified the location/site for the proposed bus lay bye for each village or built-up locations based on the following criteria:
92. Bus shelters are proposed near to settlement areas to minimize the walking distance and major intersection/junction should have direct pedestrian links segregated from motorized traffic.
93. It should be positioned in straight and level sections of road and should be visible from a long distance from both the directions.
94. For safety and operational reasons suitable safety features, road furniture and other facilities along the project road have been provided. These features included safety barriers, road signs, road markings, road lighting, route markers, kilometre and hectometre stones, road delineators, ROW pillars, parking areas and rest areas, bus stops/bays, and landscaping. Wherever possible these features are provided in accordance with relevant IRC or another standard, as detailed below. If no IRC Codes or the MoRTH Specifications are available, international standards such as BIS/AASHTO/ASTM/British Standards have been used in detailed design.
95. Road Humps: Road humps or speed breakers are formed by providing a rounded hump of 3.7m width (17m radius) and 100 mm height for the preferred advisory crossing speed of 25 kmph for general traffic as per the IRC: 99–1988. The basic material for construction is bituminous concrete formed to required shape. Road humps have been proposed on minor roads at junctions /intersections with major roads, School and Hospital zones. Proper signboards and markings are
25
provided to advise the drivers in advance of the situation. Road humps are extended across carriageway up to the edge of paved shoulder.
96. Rumble Strips: Rumble strips are formed by a sequence of transverse strips laid across a carriageway with maximum permitted height of 20 mm. These rumble devices produce audible and vibratory effects to alert drivers to take greater care and do not normally reduce traffic speeds in themselves. The typical design details of rumble strips proposed are transverse strips of Pre-mix bituminous concrete 500 mm wide and overall thickness 20 mm laid across a carriageway up to the end of paved shoulder. There will be 6 such transverse strips spaced at 0.5 m c/c. Proper signboards and marking are proposed to caution the drivers in advance of the situation. Rumble strips are proposed.
a. Sharp curves with radius less than 170m.
b. Transition zones (speed limit zones).
c. Village/built-up approaches.
d. Sensitive receptors (schools and hospitals)
E. Proposed Improvement
97. The project road will receive the following upgrades under the project:
a. Proposed ROW b. Embankment Height c. Bus Bays d. Cross Sectional Details e. Realignment and Bypasses f. Culverts and Bridges g. Geometric Design h. Intersections
1. Proposed Right of Way
98. The proposed RoW for the 2 lane configuration has been fixed as 16.0m in urban built-up areas, 23m in open and rural areas. The proposed RoW for bypasses has been fixed at 23 m. Widening in forest stretches will be carried out in within available RoW. There is a need for land acquisition for road widening and at the location of realignments and for bypass section. The total land (private & Govt.) acquisition for the project road improvement has been estimated as 43.74 hectares.
2. Embankment Height
99. As per IRC the embankment height shall be 1.0m from HFL to the top of sub grade. Keeping in view of local person's suggestion the proposed FRL is kept as 1.0m from the top of existing FRL.
3. Bus Bays
100. With various road improvement works, there are total 126 bus bays and passenger shelters are proposed along SH115 and ECR link. This includes 74 bus bays along SH115 road and 2 bus bays along ECR link .
4. Cross Sectional Details
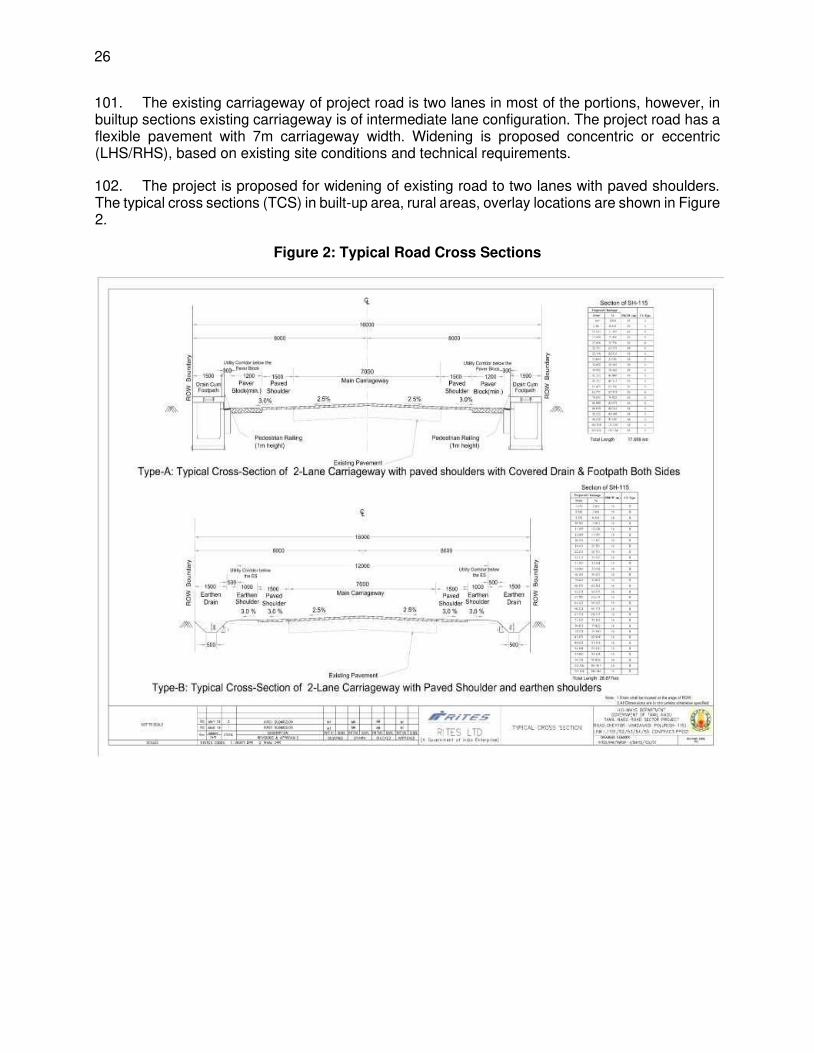
26
101. The existing carriageway of project road is two lanes in most of the portions, however, in builtup sections existing carriageway is of intermediate lane configuration. The project road has a flexible pavement with 7m carriageway width. Widening is proposed concentric or eccentric (LHS/RHS), based on existing site conditions and technical requirements.
102. The project is proposed for widening of existing road to two lanes with paved shoulders. The typical cross sections (TCS) in built-up area, rural areas, overlay locations are shown in Figure 2.
Figure 2: Typical Road Cross Sections
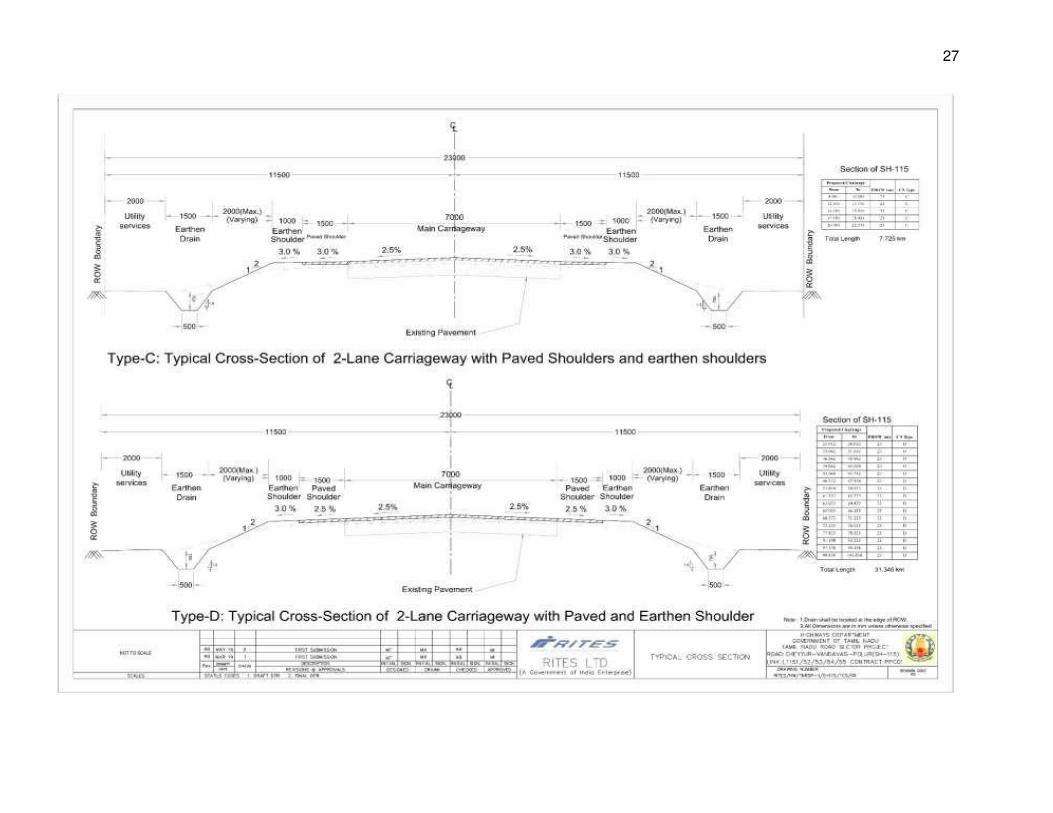
27
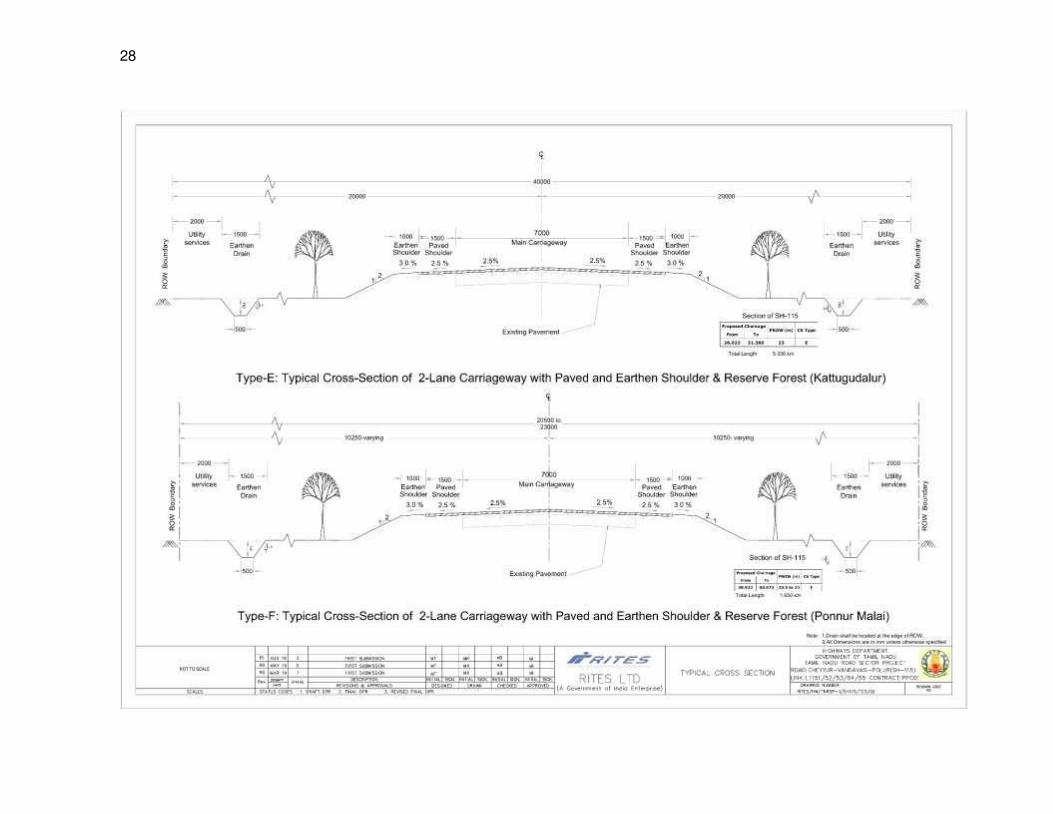
28
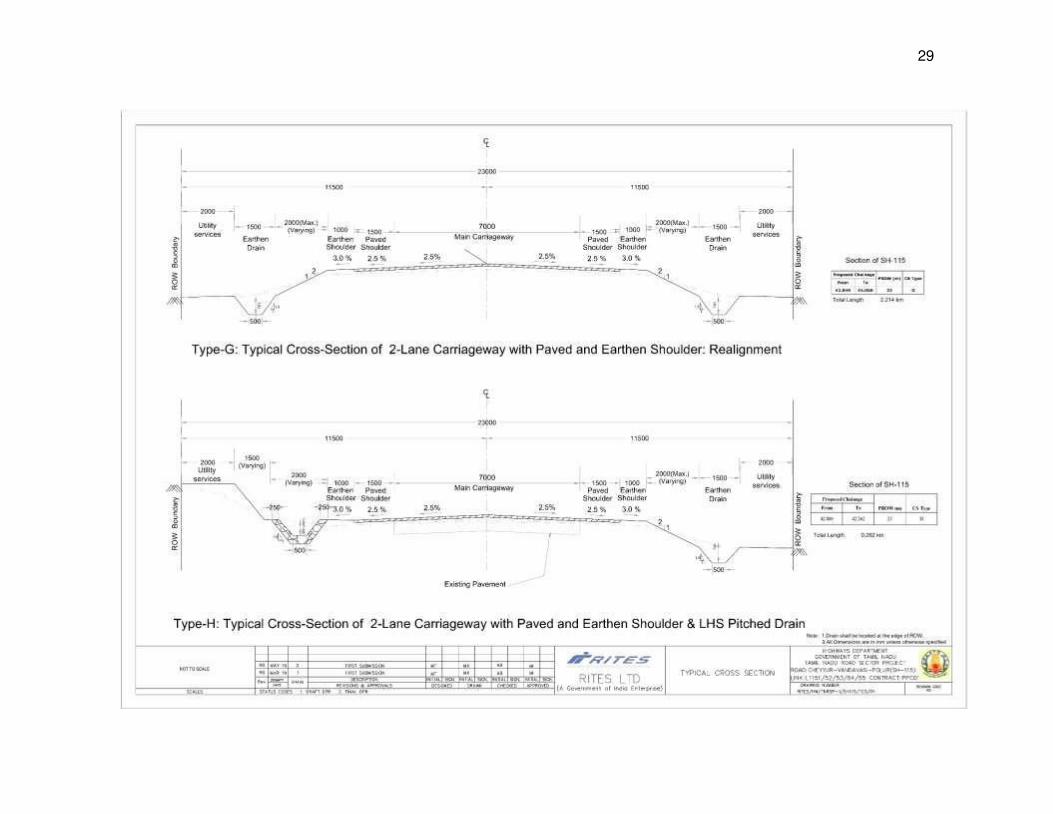
29
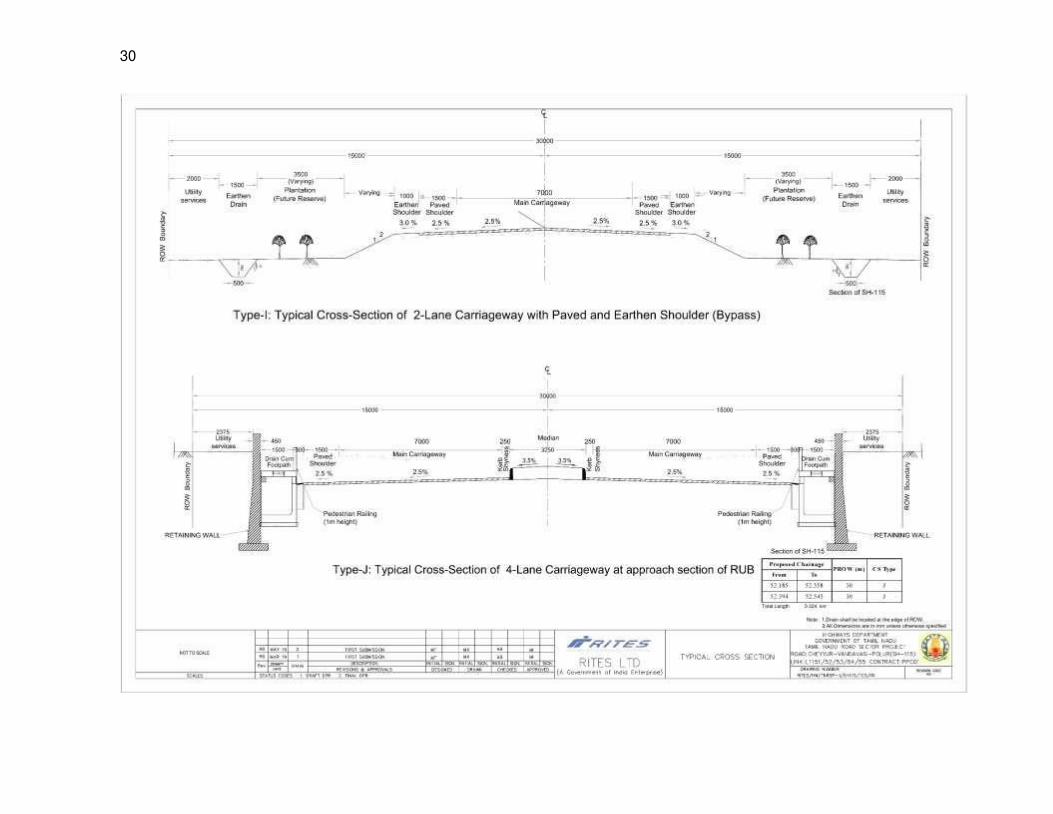
30
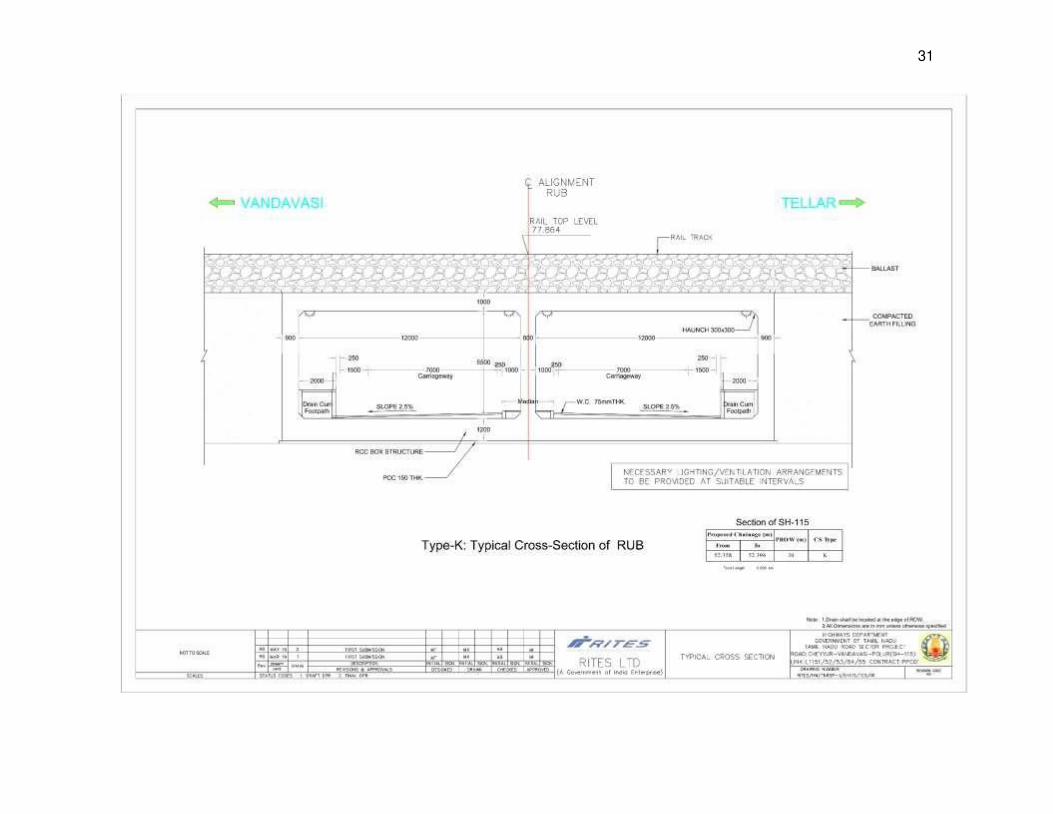
31
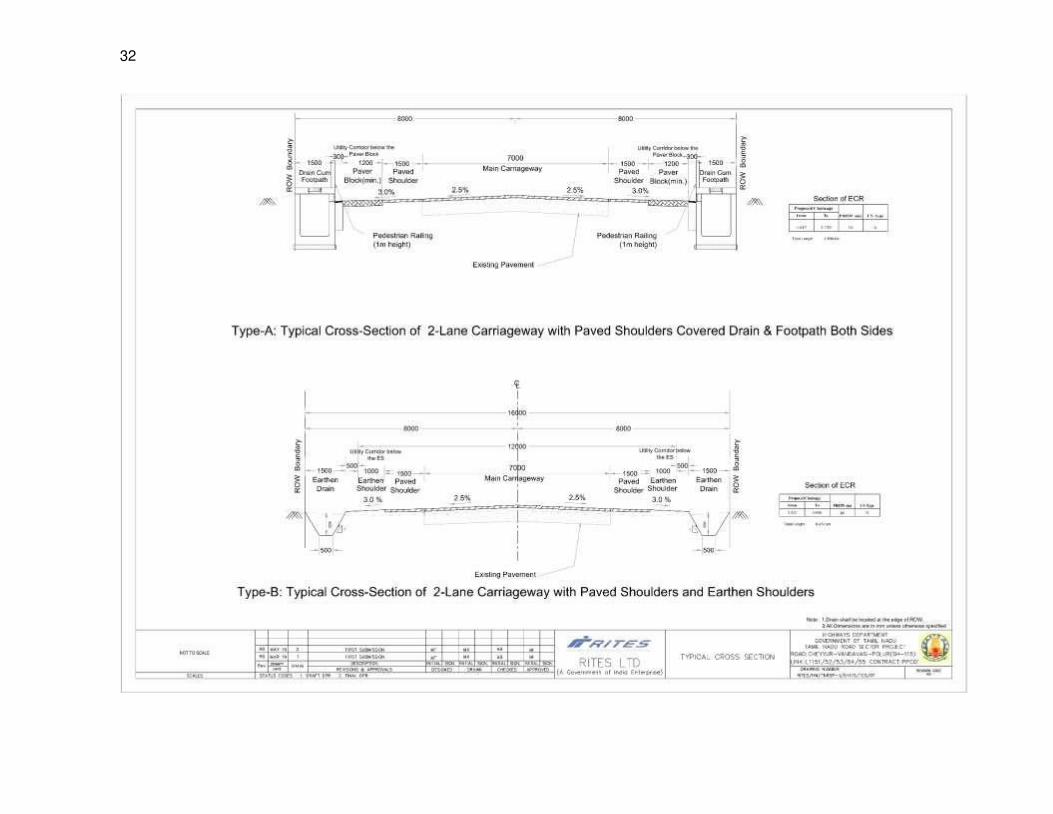
32

33
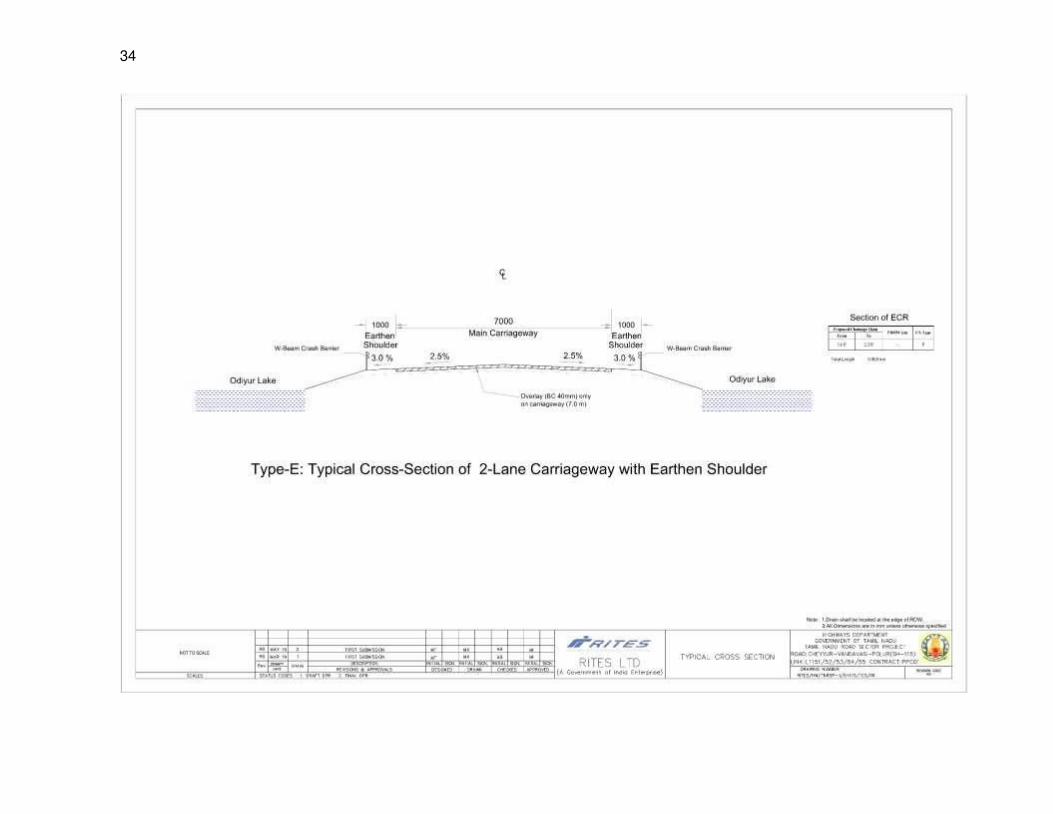
34
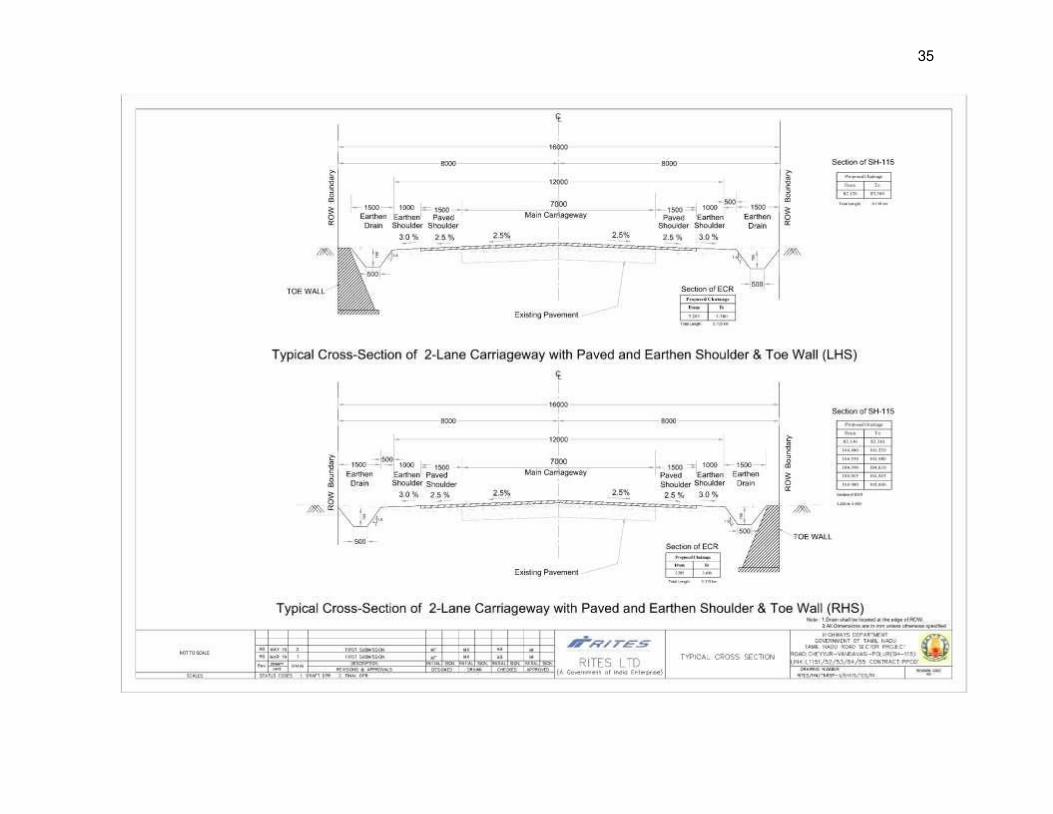
35
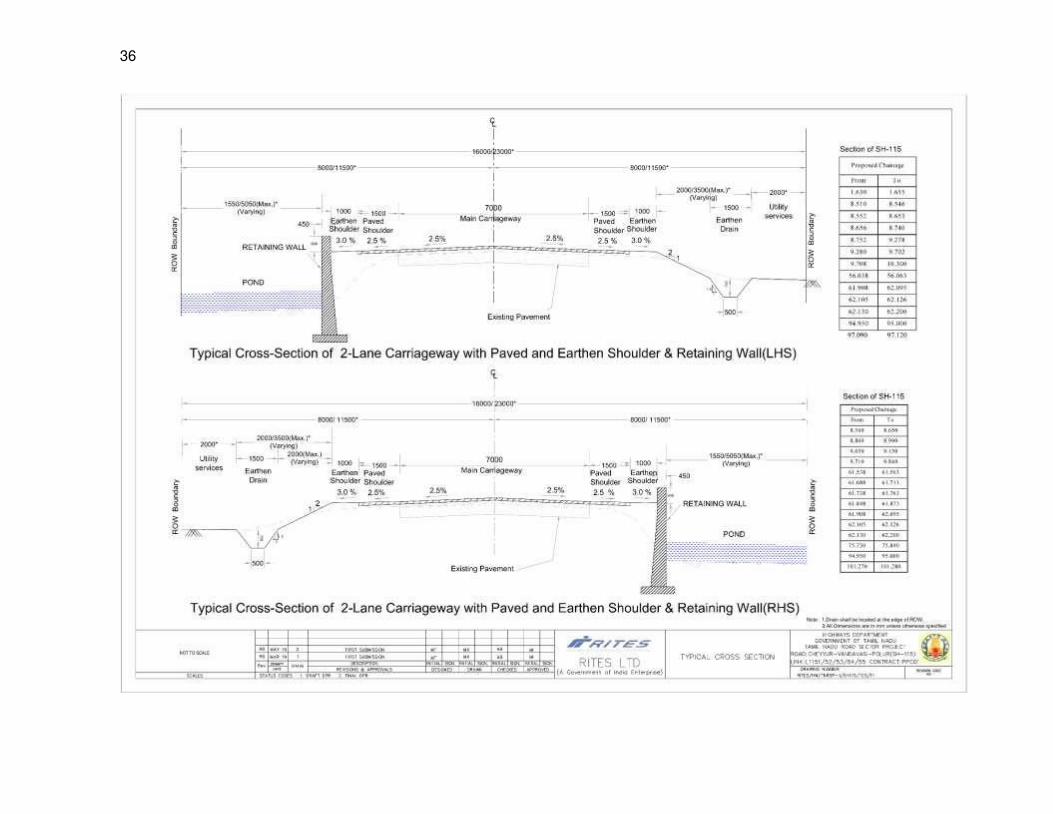
36
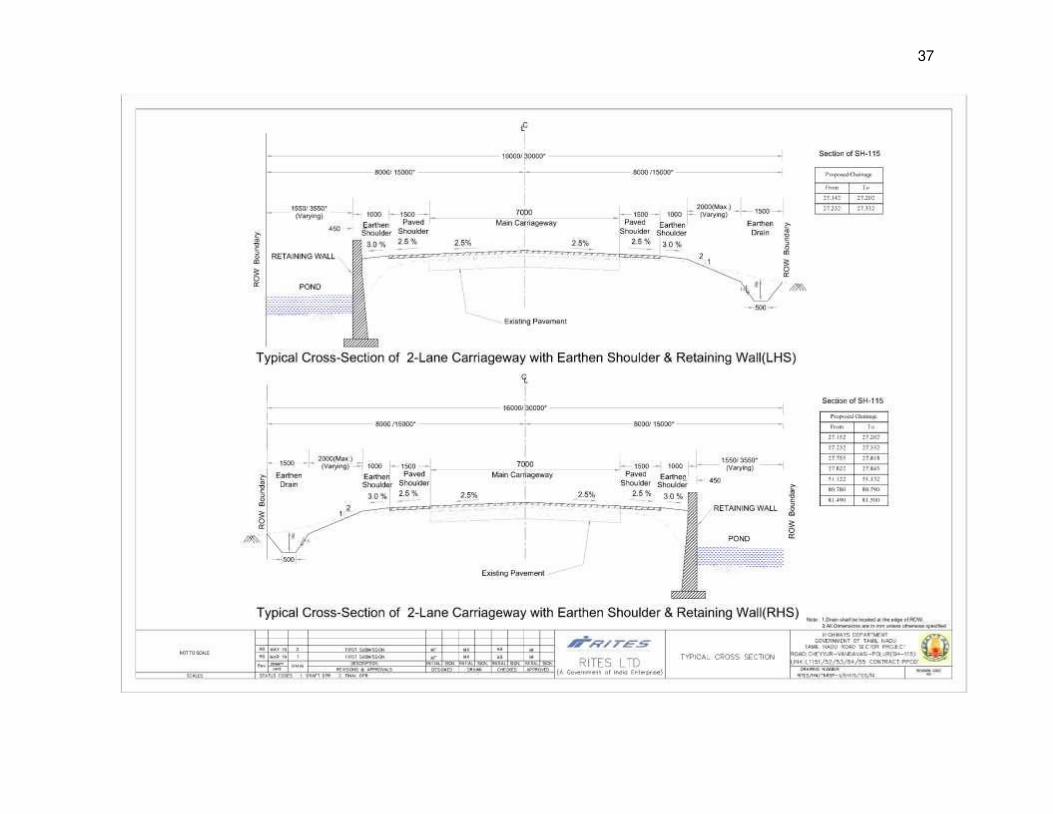
37

38
39
5. Realignment and Bypasses
103. The project road has a number of congested towns throughout its length namely Vandavasi and Chetpet town. There are no existing bypass/ realignment on the project road from Cheyyur to Polur (SH-115) for the congested area. Two bypasses are proposed for one each for Vandavasi and Chetpet towns for free movement of the traffic and saving in travel time and fuel. The project road alignment is linear in nature.
104. Vandavasi bypass starts from km47+920 and ends at km53+810. Total length of this bypass is 5.89km. Chetpet bypass starts from km79+390 and ends at km82+980. Total length of this bypass is 3.59km. Additionally geometric improvement along the existing alignment is proposed at Maruthadu Village which starts at km42+84 and ends at km45+06 for a length of 2.22 km.
6. Culverts and Bridges
105. There are 3 major bridge, 15 minor bridges and one flyover existing on the project road section. Total 94 culverts will be reconstructed as new box culverts, 30 are retained/rehabilitated, 68 are proposed for widening and 68 new culverts are proposed along Cheyyur - Polur road and ECR link.
7. Borrow and Quarry Materials Sourcing
106. About 1,026,200 cum of borrow earth, 70,000 cum of fine aggregate and 7,28,000 cum of coarse aggregates is estimated to be required for the constructional activities of road section. The information about existing stone Quarries, Morum Quarries/ Borrow pits, Sand Quarries was collected from local PWD Divisional Offices and Sub divisional Offices, local construction contractors and local material suppliers throughout the project area, from other sources and from direct observation and by site visits. Location maps and type of material available in each project road were also collected and produced. The suitability of the materials sources is evaluated based on laboratory testing. After analyzing the suitability of those material sources quantitatively and qualitatively, the lead chart is prepared. The Locations of borrow area for the project road has been shown in Appendix 2.
8. Geometric Design
107. All the geometric design elements proposed in this project is carried out as per the design standards stipulated in IRC code provisions. Comprehensive design standards have been utilized linking individual design elements to best estimates of actual speed. The emphasis has been given on maintaining continuity or giving adequate warning where it could not be made. The realignment locations identified to improve the horizontal geometrics of the project road.
108. Plan and profile has been designed keeping in view the considerations such as design speed appropriate for the terrain and site constraints. The finished road level (FRL) given in the profile shall be followed as a minimum. However, the Contractor shall improve upon the plan and profile to the extent possible within the site (proposed ROW) with prior approval of CSC.
109. Except in the following curve locations the design speed all along the project road is designed as 80 kmph to 100 kmph and will be kept as the operational speed..
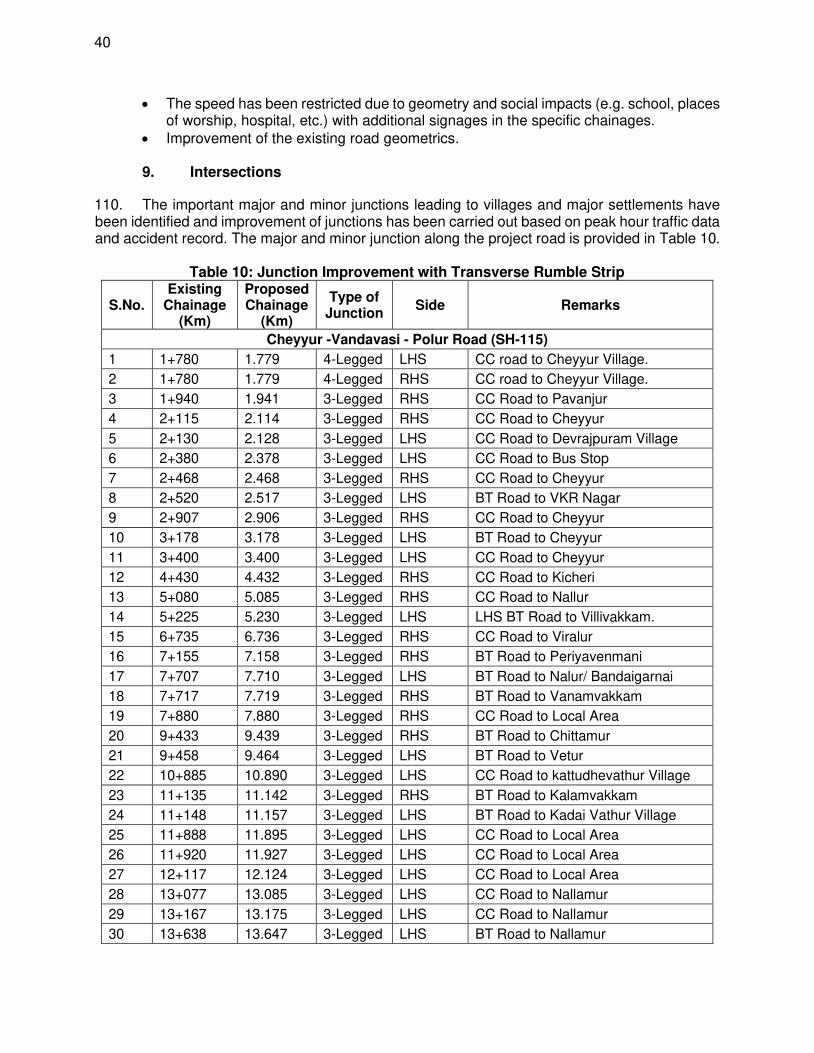
40
• The speed has been restricted due to geometry and social impacts (e.g. school, places of worship, hospital, etc.) with additional signages in the specific chainages.
• Improvement of the existing road geometrics.
9. Intersections
110. The important major and minor junctions leading to villages and major settlements have been identified and improvement of junctions has been carried out based on peak hour traffic data and accident record. The major and minor junction along the project road is provided in Table 10.
Table 10: Junction Improvement with Transverse Rumble Strip
S.No. Existing
Chainage (Km)
Proposed Chainage
(Km)
Type of Junction
Side Remarks
Cheyyur -Vandavasi - Polur Road (SH-115)
1 1+780 1.779 4-Legged LHS CC road to Cheyyur Village.
2 1+780 1.779 4-Legged RHS CC road to Cheyyur Village.
3 1+940 1.941 3-Legged RHS CC Road to Pavanjur
4 2+115 2.114 3-Legged RHS CC Road to Cheyyur
5 2+130 2.128 3-Legged LHS CC Road to Devrajpuram Village
6 2+380 2.378 3-Legged LHS CC Road to Bus Stop
7 2+468 2.468 3-Legged RHS CC Road to Cheyyur
8 2+520 2.517 3-Legged LHS BT Road to VKR Nagar
9 2+907 2.906 3-Legged RHS CC Road to Cheyyur
10 3+178 3.178 3-Legged LHS BT Road to Cheyyur
11 3+400 3.400 3-Legged LHS CC Road to Cheyyur
12 4+430 4.432 3-Legged RHS CC Road to Kicheri
13 5+080 5.085 3-Legged RHS CC Road to Nallur
14 5+225 5.230 3-Legged LHS LHS BT Road to Villivakkam.
15 6+735 6.736 3-Legged RHS CC Road to Viralur
16 7+155 7.158 3-Legged RHS BT Road to Periyavenmani
17 7+707 7.710 3-Legged LHS BT Road to Nalur/ Bandaigarnai
18 7+717 7.719 3-Legged RHS BT Road to Vanamvakkam
19 7+880 7.880 3-Legged RHS CC Road to Local Area
20 9+433 9.439 3-Legged RHS BT Road to Chittamur
21 9+458 9.464 3-Legged LHS BT Road to Vetur
22 10+885 10.890 3-Legged LHS CC Road to kattudhevathur Village
23 11+135 11.142 3-Legged RHS BT Road to Kalamvakkam
24 11+148 11.157 3-Legged LHS BT Road to Kadai Vathur Village
25 11+888 11.895 3-Legged LHS CC Road to Local Area
26 11+920 11.927 3-Legged LHS CC Road to Local Area
27 12+117 12.124 3-Legged LHS CC Road to Local Area
28 13+077 13.085 3-Legged LHS CC Road to Nallamur
29 13+167 13.175 3-Legged LHS CC Road to Nallamur
30 13+638 13.647 3-Legged LHS BT Road to Nallamur

41
S.No. Existing
Chainage (Km)
Proposed Chainage
(Km)
Type of Junction
Side Remarks
31 13+648 13.655 3-Legged RHS CC Road to Graveyard
32 13+785 13.791 3-Legged RHS CC Road to Graveyard
33 13+860 13.867 3-Legged LHS CC Road to Local Area
34 13+867 13.874 3-Legged RHS BT Road to Kolathur
35 14+498 14.509 3-Legged LHS BT Road to Tonadu
36 15+927 15.940 3-Legged RHS BT Road to Sarvambakkam
37 16+195 16.219 3-Legged RHS CC Road to Chitamur Village
38 16+308 16.332 3-Legged LHS CC Road to Chitamur Village
39 18+068 18.085 3-Legged LHS BT Road to Perambakkam
40 18+285 18.305 3-Legged RHS BT Road to Polupakkam
41 20+203 20.230 3-Legged RHS CC Road to Village
42 20+365 20.390 3-Legged RHS CC Road to Kurumpirai Village
43 20+500 22.537 3-Legged RHS BT Road to kurumpirai Village
44 21+310 21.344 3-Legged LHS BT Road to Irumbili Village
45 21+800 21.837 3-Legged RHS BT Road to Poraiyur Village
46 22+155 22.194 4-Legged LHS Gravel Road to Keelmaruvathur
47 22+155 22.194 4-Legged RHS BT Road to Pakkami.
48 22+340 22.378 3-Legged LHS CC Road to Poraiyur
49 22+685 22.725 3-Legged LHS BT Road to Keelmaruvathur
50 22+775 22.813 3-Legged LHS CC Road to Sothupakkam
51 22+875 22.914 3-Legged RHS CC Road to Sothupakkam
52 22+950 22.989 3-Legged LHS CC Road to Sothupakkam
53 23+185 23.231 3-Legged RHS CC Road to Sothupakkam
54 23+725 23.747 3-Legged LHS CC Road to Sothupakkam
55 23+900 23.921 3-Legged LHS CC Road to Sothupakkam
56 23+1010 24.032 3-Legged LHS CC Road to Sothupakkam
57 23+1085 24.108 3-Legged LHS CC Road to Sothupakkam
58 24+165 24.288 3-Legged RHS BT Road to Village
59 24+190 24.315 3-Legged RHS CC Road to Sothupakkam
60 24+285 24.408 3-Legged LHS CC Road to Adhipara Sakthy Institute
61 24+340 24.464 3-Legged RHS CC Road to Sothupakkam
62 24+445 24.567 3-Legged RHS BT Road to MelmaduVillage
63 24+880 25.005 3-Legged RHS BT Road to Chinthamani
64 24+995 25.119 3-Legged RHS BT Road to Chinthamani
65 25+725 25.858 3-Legged RHS CC Road to Private Land
66 26+405 26.539 3-Legged RHS BT Road to Agili Village
67 26+830 26.960 3-Legged LHS BT Road to Neman Athivakkam
68 27+280 27.414 3-Legged RHS BT Road to Sandyvakkam
69 27+590 27.722 3-Legged LHS BT Road to Sandyvakkam
70 27+645 27.779 3-Legged RHS BT Road to Sandyvakkam
71 29+680 29.826 3-Legged RHS BT Road to Kizhamur

42
S.No. Existing
Chainage (Km)
Proposed Chainage
(Km)
Type of Junction
Side Remarks
72 31+460 31.608 3-Legged RHS BT Road to Pasuvankranai
73 31+600 31.750 3-Legged RHS CC Road to Padrikeera more
74 31+625 31.776 3-Legged LHS BT Road to Kattukarnai
75 31+705 31.854 3-Legged LHS CC Road to Factory
76 31+775 31.923 3-Legged LHS CC Road to Velamur
77 31+785 31.932 3-Legged RHS CC Road to Ramapuram
78 32+235 32.386 3-Legged LHS BT Road to Mogalvadi/Alapakkam
79 32+431 32.594 3-Legged RHS BT Road to Ramapuram
80 32+655 32.814 3-Legged LHS CC Road to Mogalvadi
81 32+835 32.994 3-Legged LHS CC Road to Bardas Nagar
82 32+955 33.111 3-Legged LHS CC Road to Bardoss Nagar
83 33+385 33.555 3-Legged RHS BT Road to Redypalayam
84 34+130 34.300 3-Legged LHS BT Road to Karudapuram
85 34+950 35.119 3-Legged RHS BT Road to Mettupalayam/Ottakoil Lake
86 35+185 35.353 3-Legged LHS CC Road to Salavedu Village
87 35+275 35.445 3-Legged LHS CC Road to Salavedu Village
88 35+675 35.848 4-Legged LHS BT Road to Salavedu Village.
89 35+675 35.848 4-Legged RHS BT Road to Salavedu Village.
90 35+700 35.858 3-Legged LHS CC Road to Salavedu Village
91 35+760 35.917 3-Legged LHS CC Road to Salavedu Village
92 35+825 35.983 3-Legged LHS CC Road to Salavedu Village
93 35+980 36.120 3-Legged LHS CC Road to Salavedu Village
94 36+100 36.258 3-Legged LHS CC Road to Salavedu Village
95 36+660 36.821 3-Legged RHS BT Road to Salavedu Village
96 38+895 39.058 3-Legged RHS CC Road to Mamandur Village
97 39+280 39.450 4-Legged LHS BT Road to Mamandur Village
98 39+280 39.450 4-Legged RHS CC Road to Uthiramerur
99 40+675 40.850 3-Legged LHS BT Road to Katai Village
100 40+800 40.973 3-Legged RHS BT Road to Melkugadathur Village
101 41+620 41.800 4-Legged LHS CC Road to Kallankuttu Kaveripakkam Village
102 41+620 41.800 4-Legged RHS CC Road to Kallankuttu Kaveripakkam Village
103 41+658 41.838 3-Legged LHS CC Road to Maruthadu Realignment
104 41+720 41.904 3-Legged LHS CC Road to Kallankattu Kaveripakkam
105 41+830 41.984 3-Legged RHS BT Road to kallankuttu Kaveripakkam
106 42+205 42.386 3-Legged RHS CC Road to Kaveripakkam
107 42+420 42.600 3-Legged RHS CC Road to Village
108 42+425 42.605 3-Legged LHS BT Road to Aadha ManglamVillage
109 42+498 42.675 3-Legged LHS CC Road to Kallankattu
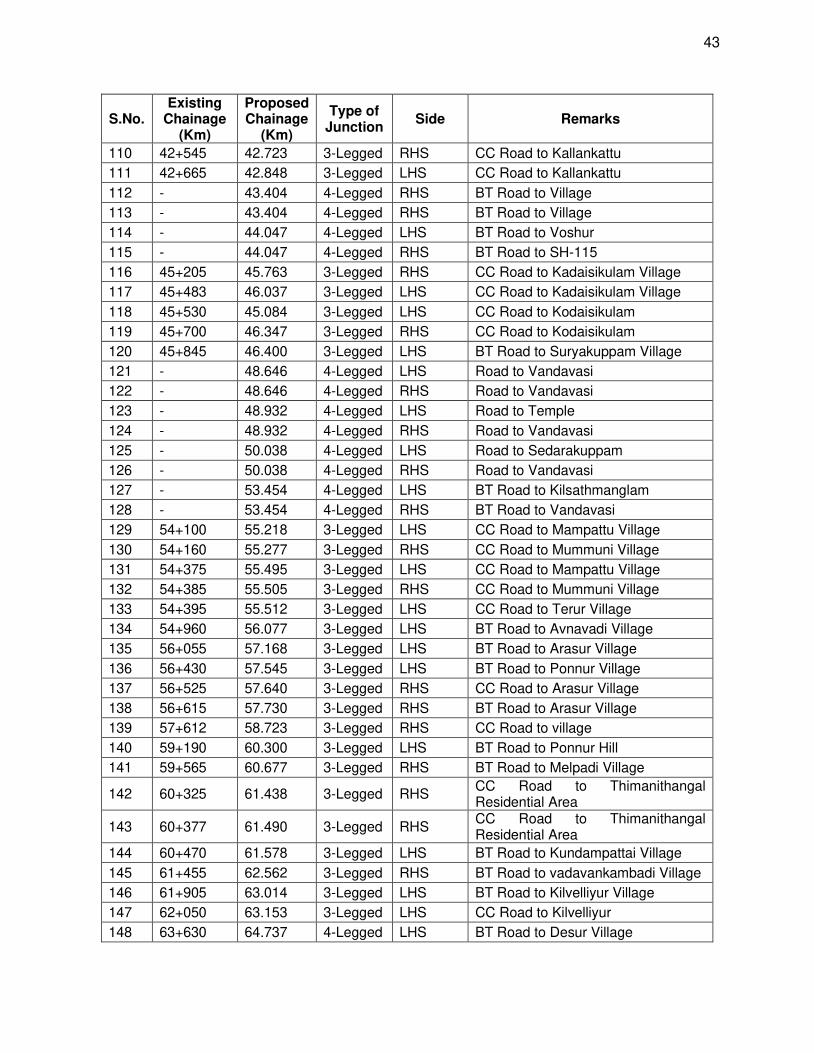
43
S.No. Existing
Chainage (Km)
Proposed Chainage
(Km)
Type of Junction
Side Remarks
110 42+545 42.723 3-Legged RHS CC Road to Kallankattu
111 42+665 42.848 3-Legged LHS CC Road to Kallankattu
112 - 43.404 4-Legged RHS BT Road to Village
113 - 43.404 4-Legged RHS BT Road to Village
114 - 44.047 4-Legged LHS BT Road to Voshur
115 - 44.047 4-Legged RHS BT Road to SH-115
116 45+205 45.763 3-Legged RHS CC Road to Kadaisikulam Village
117 45+483 46.037 3-Legged LHS CC Road to Kadaisikulam Village
118 45+530 45.084 3-Legged LHS CC Road to Kodaisikulam
119 45+700 46.347 3-Legged RHS CC Road to Kodaisikulam
120 45+845 46.400 3-Legged LHS BT Road to Suryakuppam Village
121 - 48.646 4-Legged LHS Road to Vandavasi
122 - 48.646 4-Legged RHS Road to Vandavasi
123 - 48.932 4-Legged LHS Road to Temple
124 - 48.932 4-Legged RHS Road to Vandavasi
125 - 50.038 4-Legged LHS Road to Sedarakuppam
126 - 50.038 4-Legged RHS Road to Vandavasi
127 - 53.454 4-Legged LHS BT Road to Kilsathmanglam
128 - 53.454 4-Legged RHS BT Road to Vandavasi
129 54+100 55.218 3-Legged LHS CC Road to Mampattu Village
130 54+160 55.277 3-Legged RHS CC Road to Mummuni Village
131 54+375 55.495 3-Legged LHS CC Road to Mampattu Village
132 54+385 55.505 3-Legged RHS CC Road to Mummuni Village
133 54+395 55.512 3-Legged LHS CC Road to Terur Village
134 54+960 56.077 3-Legged LHS BT Road to Avnavadi Village
135 56+055 57.168 3-Legged LHS BT Road to Arasur Village
136 56+430 57.545 3-Legged LHS BT Road to Ponnur Village
137 56+525 57.640 3-Legged RHS CC Road to Arasur Village
138 56+615 57.730 3-Legged RHS BT Road to Arasur Village
139 57+612 58.723 3-Legged RHS CC Road to village
140 59+190 60.300 3-Legged LHS BT Road to Ponnur Hill
141 59+565 60.677 3-Legged RHS BT Road to Melpadi Village
142 60+325 61.438 3-Legged RHS CC Road to Thimanithangal Residential Area
143 60+377 61.490 3-Legged RHS CC Road to Thimanithangal Residential Area
144 60+470 61.578 3-Legged LHS BT Road to Kundampattai Village
145 61+455 62.562 3-Legged RHS BT Road to vadavankambadi Village
146 61+905 63.014 3-Legged LHS BT Road to Kilvelliyur Village
147 62+050 63.153 3-Legged LHS CC Road to Kilvelliyur
148 63+630 64.737 4-Legged LHS BT Road to Desur Village
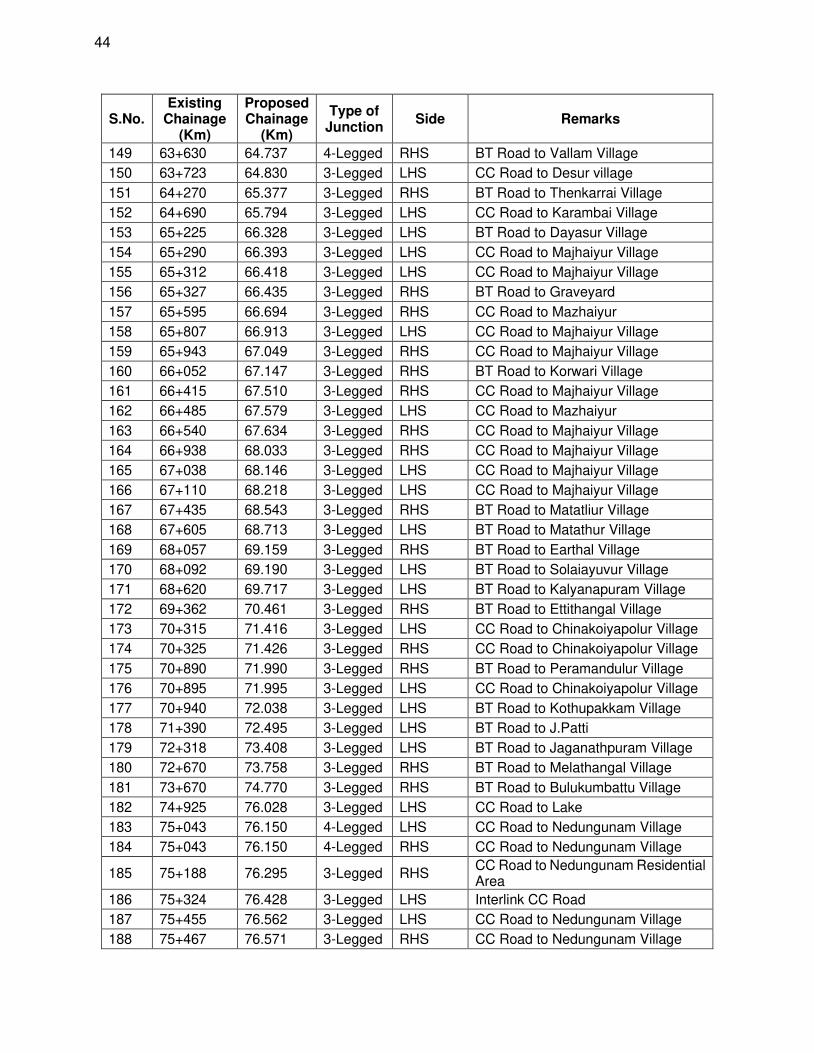
44
S.No. Existing
Chainage (Km)
Proposed Chainage
(Km)
Type of Junction
Side Remarks
149 63+630 64.737 4-Legged RHS BT Road to Vallam Village
150 63+723 64.830 3-Legged LHS CC Road to Desur village
151 64+270 65.377 3-Legged RHS BT Road to Thenkarrai Village
152 64+690 65.794 3-Legged LHS CC Road to Karambai Village
153 65+225 66.328 3-Legged LHS BT Road to Dayasur Village
154 65+290 66.393 3-Legged LHS CC Road to Majhaiyur Village
155 65+312 66.418 3-Legged LHS CC Road to Majhaiyur Village
156 65+327 66.435 3-Legged RHS BT Road to Graveyard
157 65+595 66.694 3-Legged RHS CC Road to Mazhaiyur
158 65+807 66.913 3-Legged LHS CC Road to Majhaiyur Village
159 65+943 67.049 3-Legged RHS CC Road to Majhaiyur Village
160 66+052 67.147 3-Legged RHS BT Road to Korwari Village
161 66+415 67.510 3-Legged RHS CC Road to Majhaiyur Village
162 66+485 67.579 3-Legged LHS CC Road to Mazhaiyur
163 66+540 67.634 3-Legged RHS CC Road to Majhaiyur Village
164 66+938 68.033 3-Legged RHS CC Road to Majhaiyur Village
165 67+038 68.146 3-Legged LHS CC Road to Majhaiyur Village
166 67+110 68.218 3-Legged LHS CC Road to Majhaiyur Village
167 67+435 68.543 3-Legged RHS BT Road to Matatliur Village
168 67+605 68.713 3-Legged LHS BT Road to Matathur Village
169 68+057 69.159 3-Legged RHS BT Road to Earthal Village
170 68+092 69.190 3-Legged LHS BT Road to Solaiayuvur Village
171 68+620 69.717 3-Legged LHS BT Road to Kalyanapuram Village
172 69+362 70.461 3-Legged RHS BT Road to Ettithangal Village
173 70+315 71.416 3-Legged LHS CC Road to Chinakoiyapolur Village
174 70+325 71.426 3-Legged RHS CC Road to Chinakoiyapolur Village
175 70+890 71.990 3-Legged RHS BT Road to Peramandulur Village
176 70+895 71.995 3-Legged LHS CC Road to Chinakoiyapolur Village
177 70+940 72.038 3-Legged LHS BT Road to Kothupakkam Village
178 71+390 72.495 3-Legged LHS BT Road to J.Patti
179 72+318 73.408 3-Legged LHS BT Road to Jaganathpuram Village
180 72+670 73.758 3-Legged RHS BT Road to Melathangal Village
181 73+670 74.770 3-Legged RHS BT Road to Bulukumbattu Village
182 74+925 76.028 3-Legged LHS CC Road to Lake
183 75+043 76.150 4-Legged LHS CC Road to Nedungunam Village
184 75+043 76.150 4-Legged RHS CC Road to Nedungunam Village
185 75+188 76.295 3-Legged RHS CC Road to Nedungunam Residential Area
186 75+324 76.428 3-Legged LHS Interlink CC Road
187 75+455 76.562 3-Legged LHS CC Road to Nedungunam Village
188 75+467 76.571 3-Legged RHS CC Road to Nedungunam Village
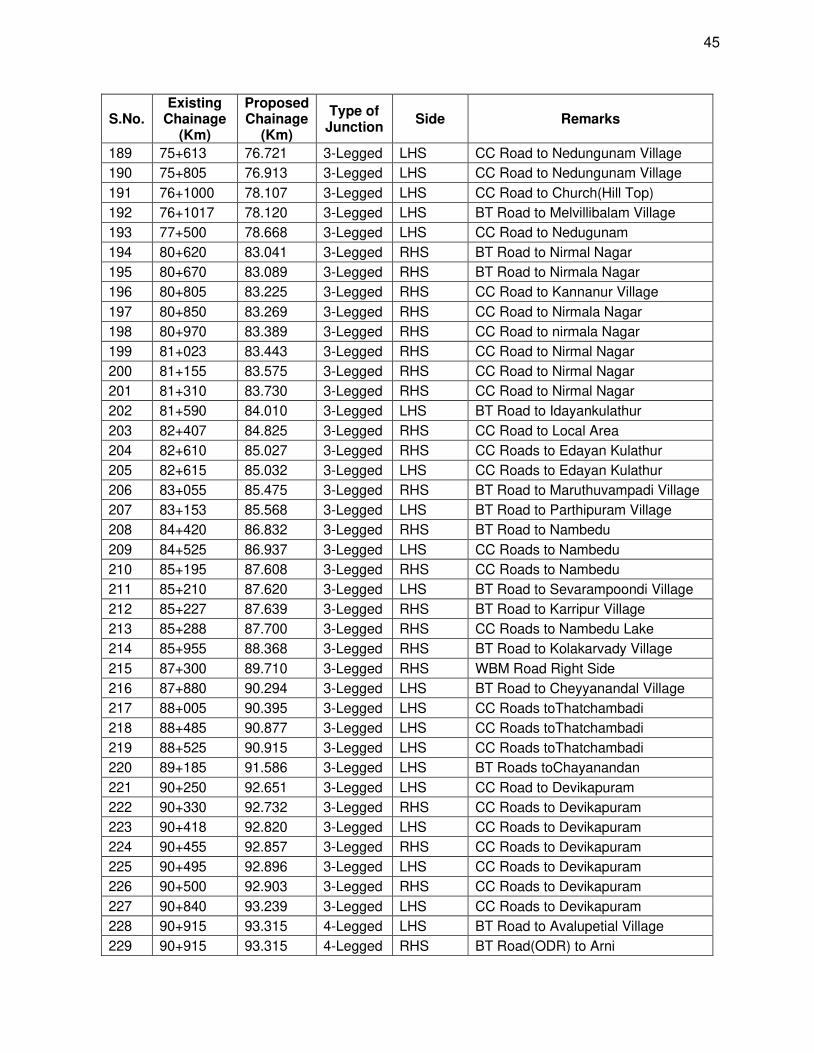
45
S.No. Existing
Chainage (Km)
Proposed Chainage
(Km)
Type of Junction
Side Remarks
189 75+613 76.721 3-Legged LHS CC Road to Nedungunam Village
190 75+805 76.913 3-Legged LHS CC Road to Nedungunam Village
191 76+1000 78.107 3-Legged LHS CC Road to Church(Hill Top)
192 76+1017 78.120 3-Legged LHS BT Road to Melvillibalam Village
193 77+500 78.668 3-Legged LHS CC Road to Nedugunam
194 80+620 83.041 3-Legged RHS BT Road to Nirmal Nagar
195 80+670 83.089 3-Legged RHS BT Road to Nirmala Nagar
196 80+805 83.225 3-Legged RHS CC Road to Kannanur Village
197 80+850 83.269 3-Legged RHS CC Road to Nirmala Nagar
198 80+970 83.389 3-Legged RHS CC Road to nirmala Nagar
199 81+023 83.443 3-Legged RHS CC Road to Nirmal Nagar
200 81+155 83.575 3-Legged RHS CC Road to Nirmal Nagar
201 81+310 83.730 3-Legged RHS CC Road to Nirmal Nagar
202 81+590 84.010 3-Legged LHS BT Road to Idayankulathur
203 82+407 84.825 3-Legged RHS CC Road to Local Area
204 82+610 85.027 3-Legged RHS CC Roads to Edayan Kulathur
205 82+615 85.032 3-Legged LHS CC Roads to Edayan Kulathur
206 83+055 85.475 3-Legged RHS BT Road to Maruthuvampadi Village
207 83+153 85.568 3-Legged LHS BT Road to Parthipuram Village
208 84+420 86.832 3-Legged RHS BT Road to Nambedu
209 84+525 86.937 3-Legged LHS CC Roads to Nambedu
210 85+195 87.608 3-Legged RHS CC Roads to Nambedu
211 85+210 87.620 3-Legged LHS BT Road to Sevarampoondi Village
212 85+227 87.639 3-Legged RHS BT Road to Karripur Village
213 85+288 87.700 3-Legged RHS CC Roads to Nambedu Lake
214 85+955 88.368 3-Legged RHS BT Road to Kolakarvady Village
215 87+300 89.710 3-Legged RHS WBM Road Right Side
216 87+880 90.294 3-Legged LHS BT Road to Cheyyanandal Village
217 88+005 90.395 3-Legged LHS CC Roads toThatchambadi
218 88+485 90.877 3-Legged LHS CC Roads toThatchambadi
219 88+525 90.915 3-Legged LHS CC Roads toThatchambadi
220 89+185 91.586 3-Legged LHS BT Roads toChayanandan
221 90+250 92.651 3-Legged LHS CC Road to Devikapuram
222 90+330 92.732 3-Legged RHS CC Roads to Devikapuram
223 90+418 92.820 3-Legged LHS CC Roads to Devikapuram
224 90+455 92.857 3-Legged RHS CC Roads to Devikapuram
225 90+495 92.896 3-Legged LHS CC Roads to Devikapuram
226 90+500 92.903 3-Legged RHS CC Roads to Devikapuram
227 90+840 93.239 3-Legged LHS CC Roads to Devikapuram
228 90+915 93.315 4-Legged LHS BT Road to Avalupetial Village
229 90+915 93.315 4-Legged RHS BT Road(ODR) to Arni
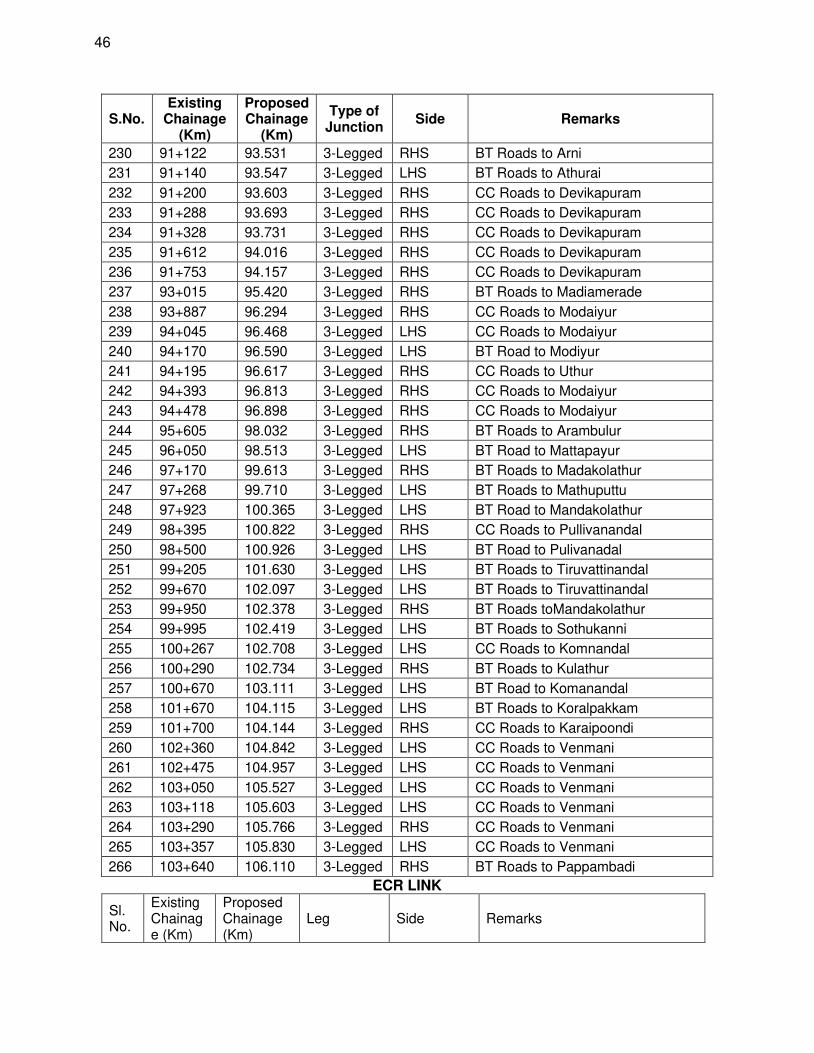
46
S.No. Existing
Chainage (Km)
Proposed Chainage
(Km)
Type of Junction
Side Remarks
230 91+122 93.531 3-Legged RHS BT Roads to Arni
231 91+140 93.547 3-Legged LHS BT Roads to Athurai
232 91+200 93.603 3-Legged RHS CC Roads to Devikapuram
233 91+288 93.693 3-Legged RHS CC Roads to Devikapuram
234 91+328 93.731 3-Legged RHS CC Roads to Devikapuram
235 91+612 94.016 3-Legged RHS CC Roads to Devikapuram
236 91+753 94.157 3-Legged RHS CC Roads to Devikapuram
237 93+015 95.420 3-Legged RHS BT Roads to Madiamerade
238 93+887 96.294 3-Legged RHS CC Roads to Modaiyur
239 94+045 96.468 3-Legged LHS CC Roads to Modaiyur
240 94+170 96.590 3-Legged LHS BT Road to Modiyur
241 94+195 96.617 3-Legged RHS CC Roads to Uthur
242 94+393 96.813 3-Legged RHS CC Roads to Modaiyur
243 94+478 96.898 3-Legged RHS CC Roads to Modaiyur
244 95+605 98.032 3-Legged RHS BT Roads to Arambulur
245 96+050 98.513 3-Legged LHS BT Road to Mattapayur
246 97+170 99.613 3-Legged RHS BT Roads to Madakolathur
247 97+268 99.710 3-Legged LHS BT Roads to Mathuputtu
248 97+923 100.365 3-Legged LHS BT Road to Mandakolathur
249 98+395 100.822 3-Legged RHS CC Roads to Pullivanandal
250 98+500 100.926 3-Legged LHS BT Road to Pulivanadal
251 99+205 101.630 3-Legged LHS BT Roads to Tiruvattinandal
252 99+670 102.097 3-Legged LHS BT Roads to Tiruvattinandal
253 99+950 102.378 3-Legged RHS BT Roads toMandakolathur
254 99+995 102.419 3-Legged LHS BT Roads to Sothukanni
255 100+267 102.708 3-Legged LHS CC Roads to Komnandal
256 100+290 102.734 3-Legged RHS BT Roads to Kulathur
257 100+670 103.111 3-Legged LHS BT Road to Komanandal
258 101+670 104.115 3-Legged LHS BT Roads to Koralpakkam
259 101+700 104.144 3-Legged RHS CC Roads to Karaipoondi
260 102+360 104.842 3-Legged LHS CC Roads to Venmani
261 102+475 104.957 3-Legged LHS CC Roads to Venmani
262 103+050 105.527 3-Legged LHS CC Roads to Venmani
263 103+118 105.603 3-Legged LHS CC Roads to Venmani
264 103+290 105.766 3-Legged RHS CC Roads to Venmani
265 103+357 105.830 3-Legged LHS CC Roads to Venmani
266 103+640 106.110 3-Legged RHS BT Roads to Pappambadi
ECR LINK
Sl. No.
Existing Chainage (Km)
Proposed Chainage (Km)
Leg Side Remarks
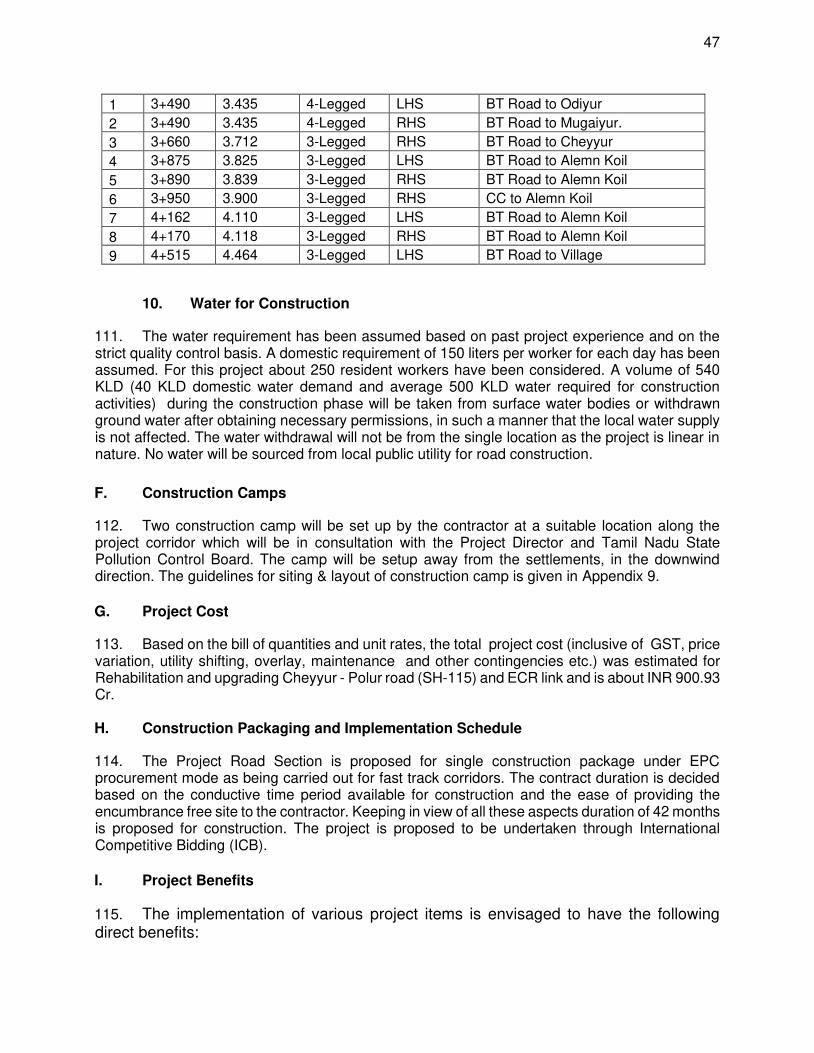
47
1 3+490 3.435 4-Legged LHS BT Road to Odiyur
2 3+490 3.435 4-Legged RHS BT Road to Mugaiyur.
3 3+660 3.712 3-Legged RHS BT Road to Cheyyur
4 3+875 3.825 3-Legged LHS BT Road to Alemn Koil
5 3+890 3.839 3-Legged RHS BT Road to Alemn Koil
6 3+950 3.900 3-Legged RHS CC to Alemn Koil
7 4+162 4.110 3-Legged LHS BT Road to Alemn Koil
8 4+170 4.118 3-Legged RHS BT Road to Alemn Koil
9 4+515 4.464 3-Legged LHS BT Road to Village
10. Water for Construction
111. The water requirement has been assumed based on past project experience and on the strict quality control basis. A domestic requirement of 150 liters per worker for each day has been assumed. For this project about 250 resident workers have been considered. A volume of 540 KLD (40 KLD domestic water demand and average 500 KLD water required for construction activities) during the construction phase will be taken from surface water bodies or withdrawn ground water after obtaining necessary permissions, in such a manner that the local water supply is not affected. The water withdrawal will not be from the single location as the project is linear in nature. No water will be sourced from local public utility for road construction.
F. Construction Camps
112. Two construction camp will be set up by the contractor at a suitable location along the project corridor which will be in consultation with the Project Director and Tamil Nadu State Pollution Control Board. The camp will be setup away from the settlements, in the downwind direction. The guidelines for siting & layout of construction camp is given in Appendix 9.
G. Project Cost
113. Based on the bill of quantities and unit rates, the total project cost (inclusive of GST, price variation, utility shifting, overlay, maintenance and other contingencies etc.) was estimated for Rehabilitation and upgrading Cheyyur - Polur road (SH-115) and ECR link and is about INR 900.93 Cr. H. Construction Packaging and Implementation Schedule
114. The Project Road Section is proposed for single construction package under EPC procurement mode as being carried out for fast track corridors. The contract duration is decided based on the conductive time period available for construction and the ease of providing the encumbrance free site to the contractor. Keeping in view of all these aspects duration of 42 months is proposed for construction. The project is proposed to be undertaken through International Competitive Bidding (ICB). I. Project Benefits
115. The implementation of various project items is envisaged to have the following direct benefits:
48
• better connectivity to key locations within State;
• smooth flow of traffic on State Highway Network;
• improved quality of life for the rural population in the project influence: this as a result of better access to markets, health, education and other facilities; and the derived stimulus for local economic activity;
• a more efficient and safe road transport system: through reduced travel times, reduced road accidents, reduced vehicle operating and maintenance costs and reduced transportation costs for goods; and
• the facilitation of tourism.
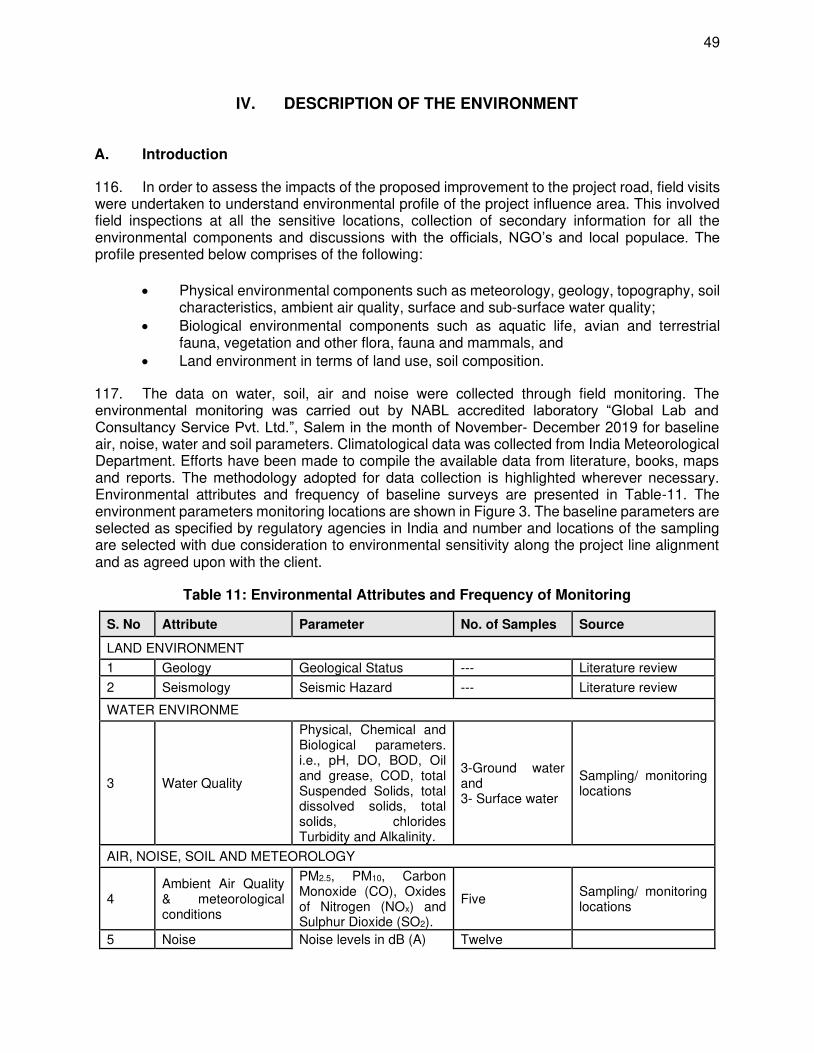
49
IV. DESCRIPTION OF THE ENVIRONMENT
A. Introduction
116. In order to assess the impacts of the proposed improvement to the project road, field visits were undertaken to understand environmental profile of the project influence area. This involved field inspections at all the sensitive locations, collection of secondary information for all the environmental components and discussions with the officials, NGO’s and local populace. The profile presented below comprises of the following:
• Physical environmental components such as meteorology, geology, topography, soil
characteristics, ambient air quality, surface and sub-surface water quality;
• Biological environmental components such as aquatic life, avian and terrestrial fauna, vegetation and other flora, fauna and mammals, and
• Land environment in terms of land use, soil composition.
117. The data on water, soil, air and noise were collected through field monitoring. The environmental monitoring was carried out by NABL accredited laboratory “Global Lab and Consultancy Service Pvt. Ltd.”, Salem in the month of November- December 2019 for baseline air, noise, water and soil parameters. Climatological data was collected from India Meteorological Department. Efforts have been made to compile the available data from literature, books, maps and reports. The methodology adopted for data collection is highlighted wherever necessary. Environmental attributes and frequency of baseline surveys are presented in Table-11. The environment parameters monitoring locations are shown in Figure 3. The baseline parameters are selected as specified by regulatory agencies in India and number and locations of the sampling are selected with due consideration to environmental sensitivity along the project line alignment and as agreed upon with the client.
Table 11: Environmental Attributes and Frequency of Monitoring
S. No Attribute Parameter No. of Samples Source
LAND ENVIRONMENT
1 Geology Geological Status --- Literature review
2 Seismology Seismic Hazard --- Literature review
WATER ENVIRONME
3 Water Quality
Physical, Chemical and Biological parameters. i.e., pH, DO, BOD, Oil and grease, COD, total Suspended Solids, total dissolved solids, total solids, chlorides Turbidity and Alkalinity.
3-Ground water and 3- Surface water
Sampling/ monitoring locations
AIR, NOISE, SOIL AND METEOROLOGY
4 Ambient Air Quality & meteorological conditions
PM2.5, PM10, Carbon Monoxide (CO), Oxides of Nitrogen (NOx) and Sulphur Dioxide (SO2).
Five Sampling/ monitoring locations
5 Noise Noise levels in dB (A) Twelve
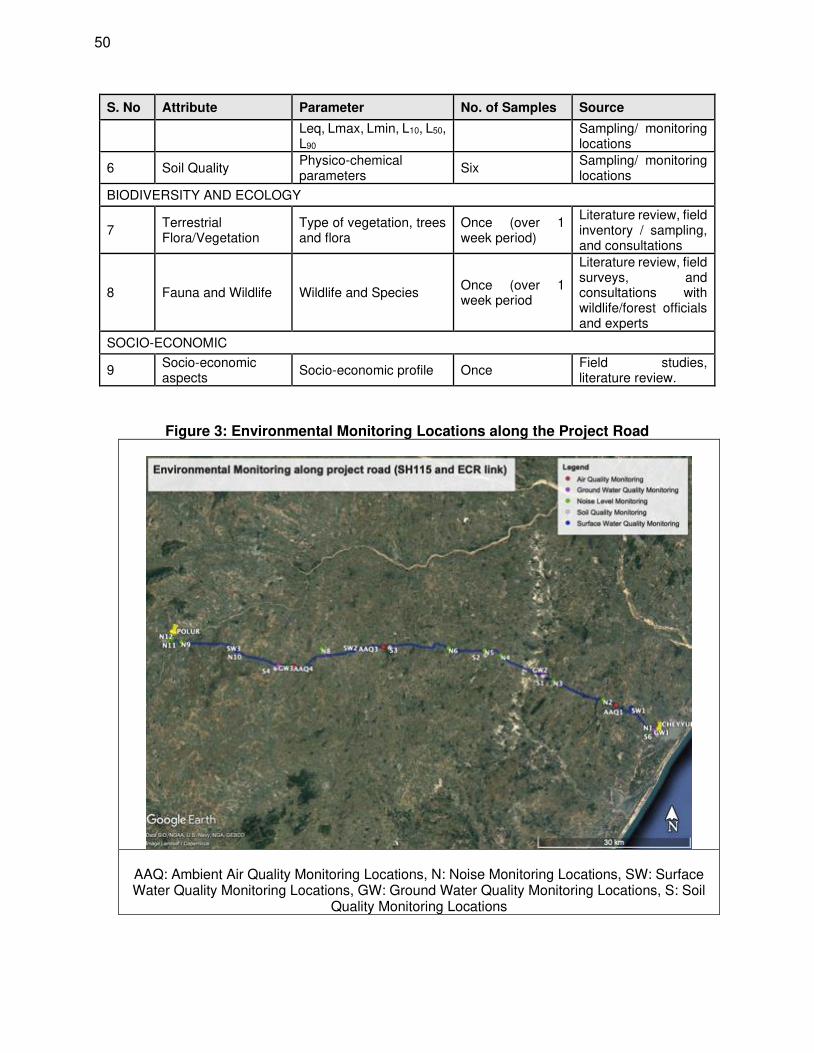
50
S. No Attribute Parameter No. of Samples Source
Leq, Lmax, Lmin, L10, L50, L90
Sampling/ monitoring locations
6 Soil Quality Physico-chemical parameters
Six Sampling/ monitoring locations
BIODIVERSITY AND ECOLOGY
7 Terrestrial Flora/Vegetation
Type of vegetation, trees and flora
Once (over 1 week period)
Literature review, field inventory / sampling, and consultations
8 Fauna and Wildlife Wildlife and Species Once (over 1 week period
Literature review, field surveys, and consultations with wildlife/forest officials and experts
SOCIO-ECONOMIC
9 Socio-economic aspects
Socio-economic profile Once Field studies, literature review.
Figure 3: Environmental Monitoring Locations along the Project Road
AAQ: Ambient Air Quality Monitoring Locations, N: Noise Monitoring Locations, SW: Surface Water Quality Monitoring Locations, GW: Ground Water Quality Monitoring Locations, S: Soil
Quality Monitoring Locations
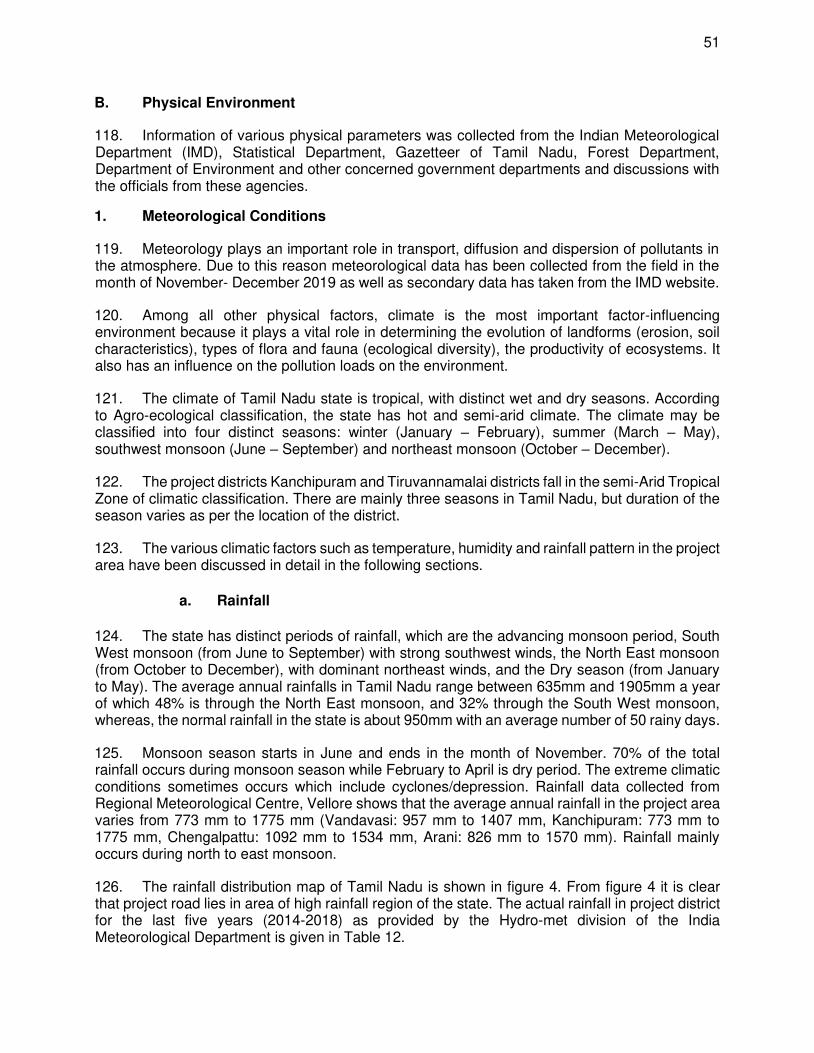
51
B. Physical Environment
118. Information of various physical parameters was collected from the Indian Meteorological Department (IMD), Statistical Department, Gazetteer of Tamil Nadu, Forest Department, Department of Environment and other concerned government departments and discussions with the officials from these agencies.
1. Meteorological Conditions
119. Meteorology plays an important role in transport, diffusion and dispersion of pollutants in the atmosphere. Due to this reason meteorological data has been collected from the field in the month of November- December 2019 as well as secondary data has taken from the IMD website.
120. Among all other physical factors, climate is the most important factor-influencing environment because it plays a vital role in determining the evolution of landforms (erosion, soil characteristics), types of flora and fauna (ecological diversity), the productivity of ecosystems. It also has an influence on the pollution loads on the environment.
121. The climate of Tamil Nadu state is tropical, with distinct wet and dry seasons. According to Agro-ecological classification, the state has hot and semi-arid climate. The climate may be classified into four distinct seasons: winter (January – February), summer (March – May), southwest monsoon (June – September) and northeast monsoon (October – December).
122. The project districts Kanchipuram and Tiruvannamalai districts fall in the semi-Arid Tropical Zone of climatic classification. There are mainly three seasons in Tamil Nadu, but duration of the season varies as per the location of the district.
123. The various climatic factors such as temperature, humidity and rainfall pattern in the project area have been discussed in detail in the following sections.
a. Rainfall
124. The state has distinct periods of rainfall, which are the advancing monsoon period, South West monsoon (from June to September) with strong southwest winds, the North East monsoon (from October to December), with dominant northeast winds, and the Dry season (from January to May). The average annual rainfalls in Tamil Nadu range between 635mm and 1905mm a year of which 48% is through the North East monsoon, and 32% through the South West monsoon, whereas, the normal rainfall in the state is about 950mm with an average number of 50 rainy days.
125. Monsoon season starts in June and ends in the month of November. 70% of the total rainfall occurs during monsoon season while February to April is dry period. The extreme climatic conditions sometimes occurs which include cyclones/depression. Rainfall data collected from Regional Meteorological Centre, Vellore shows that the average annual rainfall in the project area varies from 773 mm to 1775 mm (Vandavasi: 957 mm to 1407 mm, Kanchipuram: 773 mm to 1775 mm, Chengalpattu: 1092 mm to 1534 mm, Arani: 826 mm to 1570 mm). Rainfall mainly occurs during north to east monsoon.
126. The rainfall distribution map of Tamil Nadu is shown in figure 4. From figure 4 it is clear that project road lies in area of high rainfall region of the state. The actual rainfall in project district for the last five years (2014-2018) as provided by the Hydro-met division of the India Meteorological Department is given in Table 12.
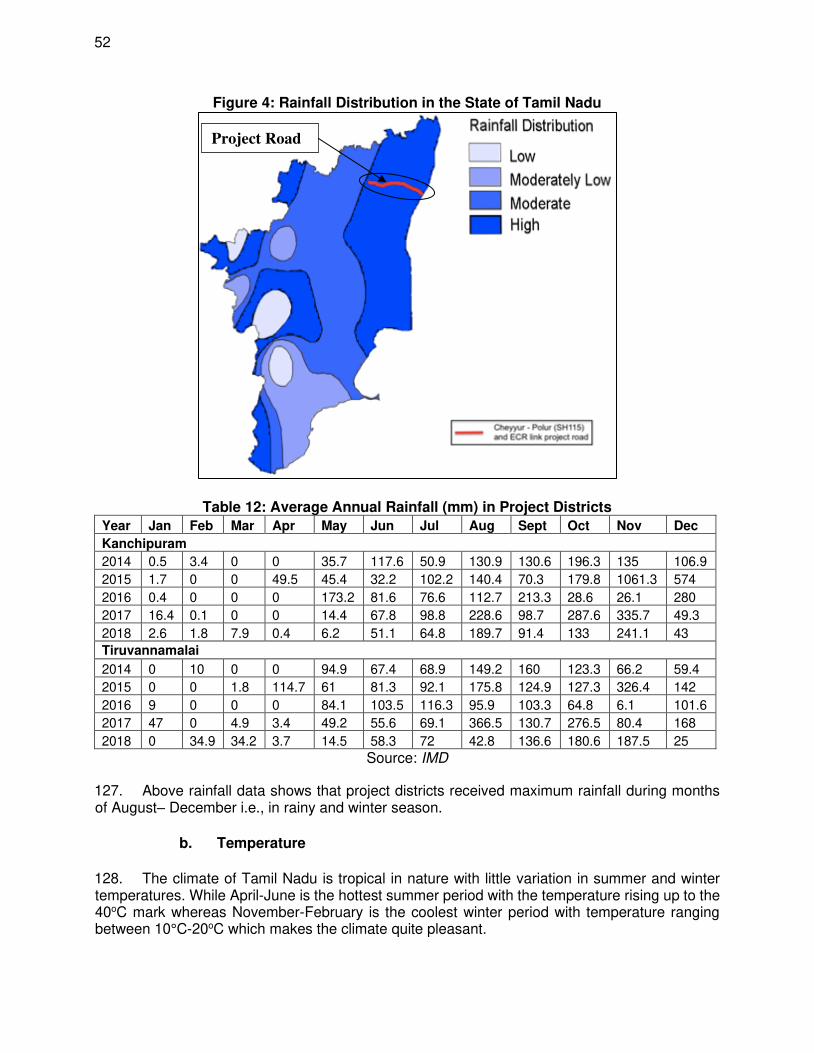
52
Figure 4: Rainfall Distribution in the State of Tamil Nadu
Table 12: Average Annual Rainfall (mm) in Project Districts
Year Jan Feb Mar Apr May Jun Jul Aug Sept Oct Nov Dec
Kanchipuram
2014 0.5 3.4 0 0 35.7 117.6 50.9 130.9 130.6 196.3 135 106.9
2015 1.7 0 0 49.5 45.4 32.2 102.2 140.4 70.3 179.8 1061.3 574
2016 0.4 0 0 0 173.2 81.6 76.6 112.7 213.3 28.6 26.1 280
2017 16.4 0.1 0 0 14.4 67.8 98.8 228.6 98.7 287.6 335.7 49.3
2018 2.6 1.8 7.9 0.4 6.2 51.1 64.8 189.7 91.4 133 241.1 43
Tiruvannamalai
2014 0 10 0 0 94.9 67.4 68.9 149.2 160 123.3 66.2 59.4
2015 0 0 1.8 114.7 61 81.3 92.1 175.8 124.9 127.3 326.4 142
2016 9 0 0 0 84.1 103.5 116.3 95.9 103.3 64.8 6.1 101.6
2017 47 0 4.9 3.4 49.2 55.6 69.1 366.5 130.7 276.5 80.4 168
2018 0 34.9 34.2 3.7 14.5 58.3 72 42.8 136.6 180.6 187.5 25
Source: IMD
127. Above rainfall data shows that project districts received maximum rainfall during months of August– December i.e., in rainy and winter season.
b. Temperature
128. The climate of Tamil Nadu is tropical in nature with little variation in summer and winter temperatures. While April-June is the hottest summer period with the temperature rising up to the 40oC mark whereas November-February is the coolest winter period with temperature ranging between 10°C-20oC which makes the climate quite pleasant.
Project Road

53
129. In project districts, April and May months are the hottest months with mean monthly temperature varying between 36.3oC and 40.8oC. December and January are comparatively the coolest months with average mean monthly temperature varying from 16.1 oC to 20.5 oC. The minimum monthly temperature is 16 oC in the project area.
130. The minimum, maximum and average temperature recorded during the study period (November- December 2019) were 23.5 °C, 37.5 °C and 30.5 °C; respectively. However the average temperature recorded was along the project road. Project region falls in strong hyperthermic zone as per temperature distribution map of Tamil Nadu State. The temperature distribution map of Tamil Nadu is presented in figure 5.
Figure 5: Temperature Distribution Map of Tamil Nadu
131. The project influenced area (PIA) has humid and sub-humid climate as shown in Figure 6. The analysis of five year humidity data taken at 8.30 am and 5.30 pm indicates the maximum humidity value of 93% and minimum as 35%. The humidity decides the nature and characteristics of pollution in the atmosphere. Fog helps in coalescence of suspended particles and enhances the chemical reaction of gaseous pollutants. Humidity is high during the monsoon season and rest of the year, air is generally dry.
132. The minimum and maximum humidity recorded during the study period (November- December 2019) were 51 % and 96 %. However the average humidity recorded was 75.9 % along the project road.
Project Road
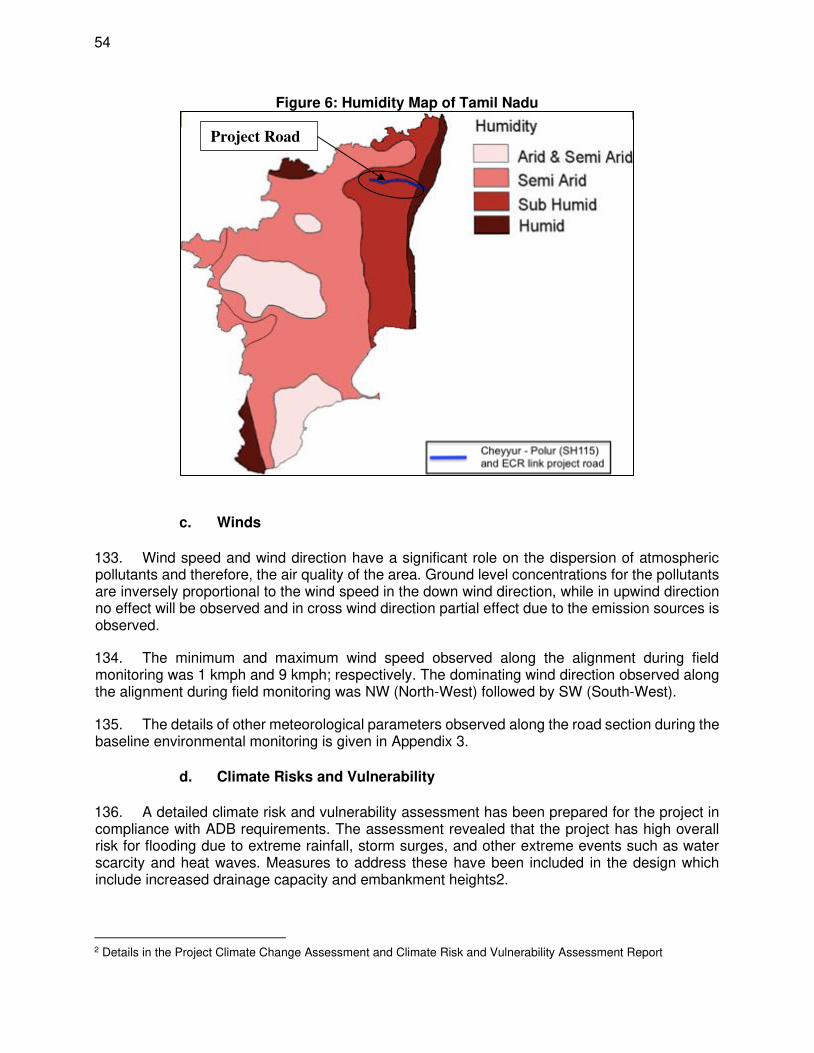
54
Figure 6: Humidity Map of Tamil Nadu
c. Winds
133. Wind speed and wind direction have a significant role on the dispersion of atmospheric pollutants and therefore, the air quality of the area. Ground level concentrations for the pollutants are inversely proportional to the wind speed in the down wind direction, while in upwind direction no effect will be observed and in cross wind direction partial effect due to the emission sources is observed.
134. The minimum and maximum wind speed observed along the alignment during field monitoring was 1 kmph and 9 kmph; respectively. The dominating wind direction observed along the alignment during field monitoring was NW (North-West) followed by SW (South-West).
135. The details of other meteorological parameters observed along the road section during the baseline environmental monitoring is given in Appendix 3.
d. Climate Risks and Vulnerability
136. A detailed climate risk and vulnerability assessment has been prepared for the project in compliance with ADB requirements. The assessment revealed that the project has high overall risk for flooding due to extreme rainfall, storm surges, and other extreme events such as water scarcity and heat waves. Measures to address these have been included in the design which include increased drainage capacity and embankment heights2.
2 Details in the Project Climate Change Assessment and Climate Risk and Vulnerability Assessment Report
Project Road
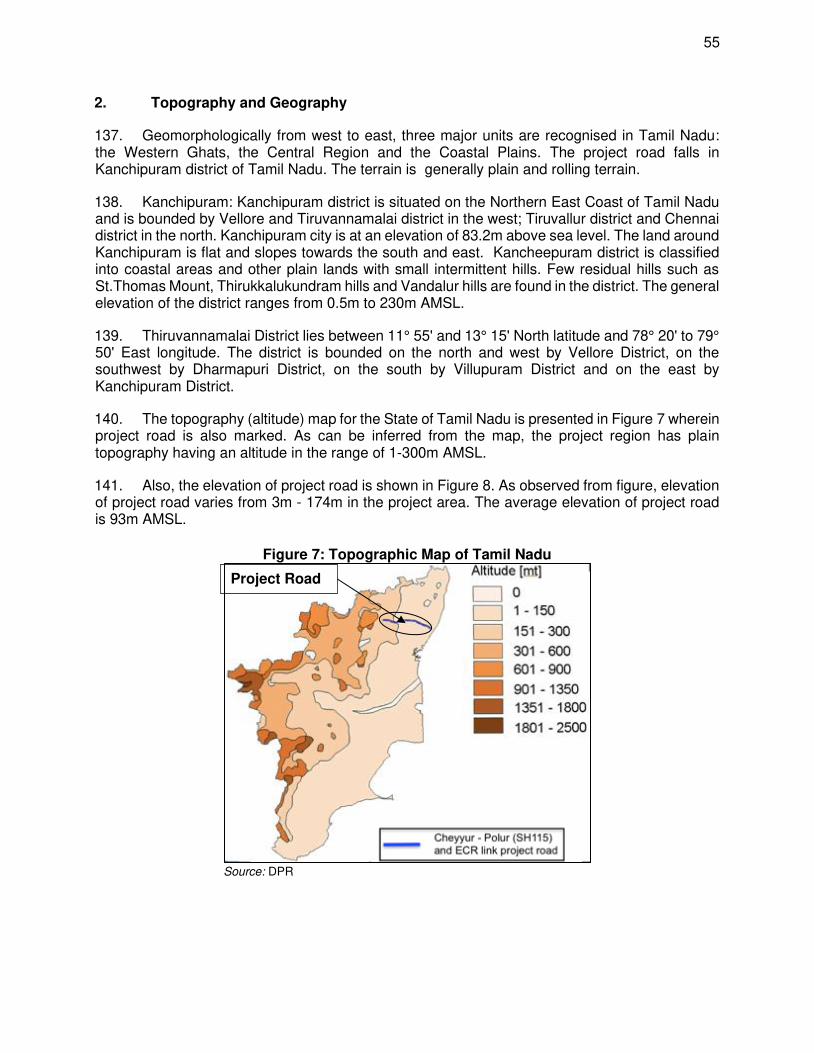
55
2. Topography and Geography
137. Geomorphologically from west to east, three major units are recognised in Tamil Nadu: the Western Ghats, the Central Region and the Coastal Plains. The project road falls in Kanchipuram district of Tamil Nadu. The terrain is generally plain and rolling terrain.
138. Kanchipuram: Kanchipuram district is situated on the Northern East Coast of Tamil Nadu and is bounded by Vellore and Tiruvannamalai district in the west; Tiruvallur district and Chennai district in the north. Kanchipuram city is at an elevation of 83.2m above sea level. The land around Kanchipuram is flat and slopes towards the south and east. Kancheepuram district is classified into coastal areas and other plain lands with small intermittent hills. Few residual hills such as St.Thomas Mount, Thirukkalukundram hills and Vandalur hills are found in the district. The general elevation of the district ranges from 0.5m to 230m AMSL.
139. Thiruvannamalai District lies between 11° 55' and 13° 15' North latitude and 78° 20' to 79° 50' East longitude. The district is bounded on the north and west by Vellore District, on the southwest by Dharmapuri District, on the south by Villupuram District and on the east by Kanchipuram District.
140. The topography (altitude) map for the State of Tamil Nadu is presented in Figure 7 wherein project road is also marked. As can be inferred from the map, the project region has plain topography having an altitude in the range of 1-300m AMSL.
141. Also, the elevation of project road is shown in Figure 8. As observed from figure, elevation of project road varies from 3m - 174m in the project area. The average elevation of project road is 93m AMSL.
Figure 7: Topographic Map of Tamil Nadu
Source: DPR
Project Road
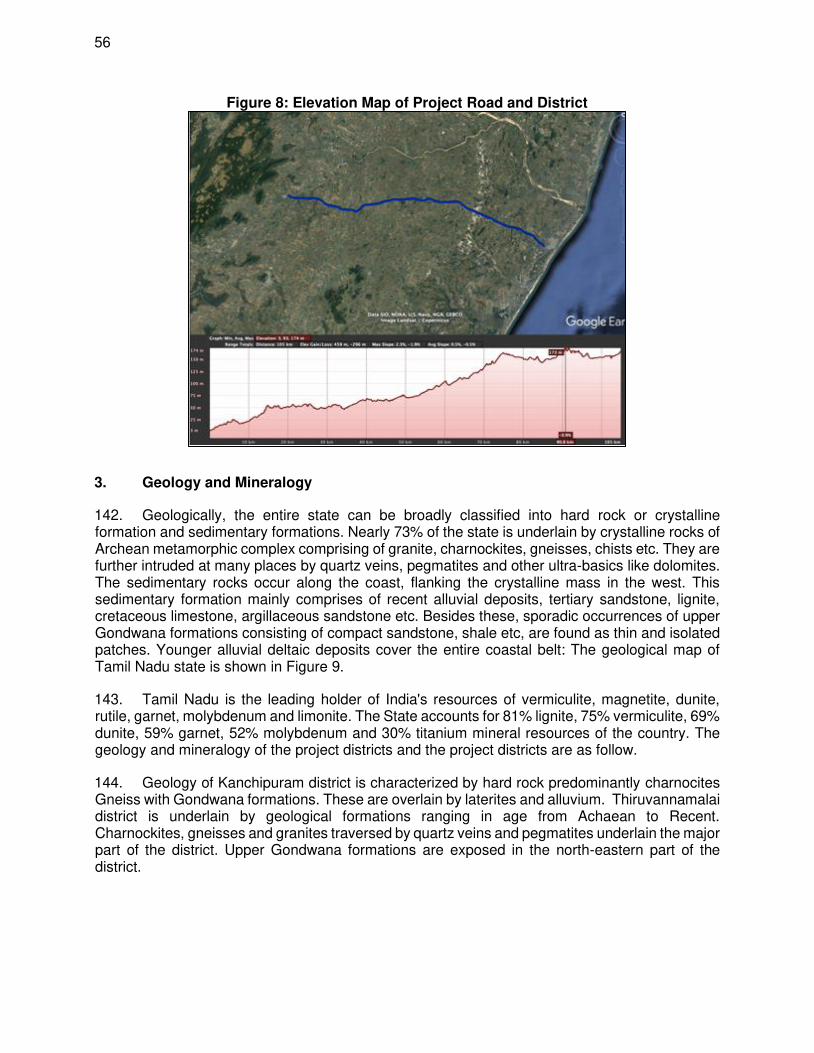
56
Figure 8: Elevation Map of Project Road and District
3. Geology and Mineralogy
142. Geologically, the entire state can be broadly classified into hard rock or crystalline formation and sedimentary formations. Nearly 73% of the state is underlain by crystalline rocks of Archean metamorphic complex comprising of granite, charnockites, gneisses, chists etc. They are further intruded at many places by quartz veins, pegmatites and other ultra-basics like dolomites. The sedimentary rocks occur along the coast, flanking the crystalline mass in the west. This sedimentary formation mainly comprises of recent alluvial deposits, tertiary sandstone, lignite, cretaceous limestone, argillaceous sandstone etc. Besides these, sporadic occurrences of upper Gondwana formations consisting of compact sandstone, shale etc, are found as thin and isolated patches. Younger alluvial deltaic deposits cover the entire coastal belt: The geological map of Tamil Nadu state is shown in Figure 9.
143. Tamil Nadu is the leading holder of India's resources of vermiculite, magnetite, dunite, rutile, garnet, molybdenum and limonite. The State accounts for 81% lignite, 75% vermiculite, 69% dunite, 59% garnet, 52% molybdenum and 30% titanium mineral resources of the country. The geology and mineralogy of the project districts and the project districts are as follow.
144. Geology of Kanchipuram district is characterized by hard rock predominantly charnocites Gneiss with Gondwana formations. These are overlain by laterites and alluvium. Thiruvannamalai district is underlain by geological formations ranging in age from Achaean to Recent. Charnockites, gneisses and granites traversed by quartz veins and pegmatites underlain the major part of the district. Upper Gondwana formations are exposed in the north-eastern part of the district.
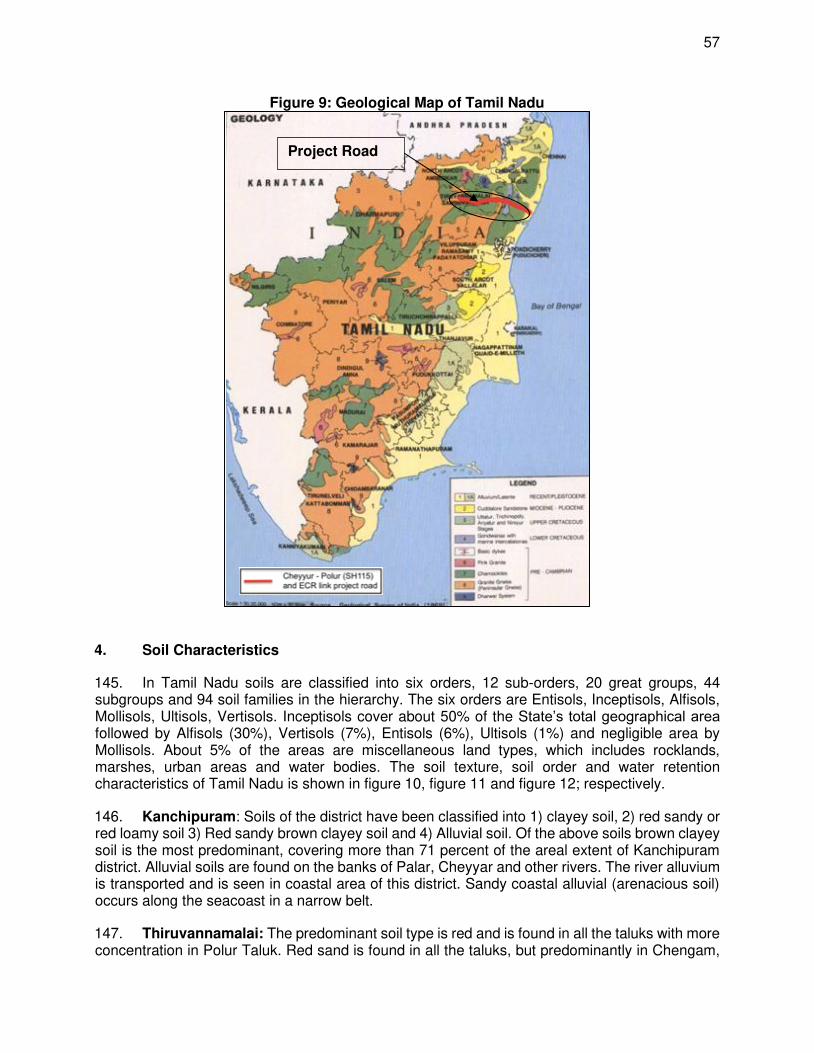
57
Figure 9: Geological Map of Tamil Nadu
4. Soil Characteristics
145. In Tamil Nadu soils are classified into six orders, 12 sub-orders, 20 great groups, 44 subgroups and 94 soil families in the hierarchy. The six orders are Entisols, Inceptisols, Alfisols, Mollisols, Ultisols, Vertisols. Inceptisols cover about 50% of the State’s total geographical area followed by Alfisols (30%), Vertisols (7%), Entisols (6%), Ultisols (1%) and negligible area by Mollisols. About 5% of the areas are miscellaneous land types, which includes rocklands, marshes, urban areas and water bodies. The soil texture, soil order and water retention characteristics of Tamil Nadu is shown in figure 10, figure 11 and figure 12; respectively.
146. Kanchipuram: Soils of the district have been classified into 1) clayey soil, 2) red sandy or red loamy soil 3) Red sandy brown clayey soil and 4) Alluvial soil. Of the above soils brown clayey soil is the most predominant, covering more than 71 percent of the areal extent of Kanchipuram district. Alluvial soils are found on the banks of Palar, Cheyyar and other rivers. The river alluvium is transported and is seen in coastal area of this district. Sandy coastal alluvial (arenacious soil) occurs along the seacoast in a narrow belt.
147. Thiruvannamalai: The predominant soil type is red and is found in all the taluks with more concentration in Polur Taluk. Red sand is found in all the taluks, but predominantly in Chengam,
Project Road
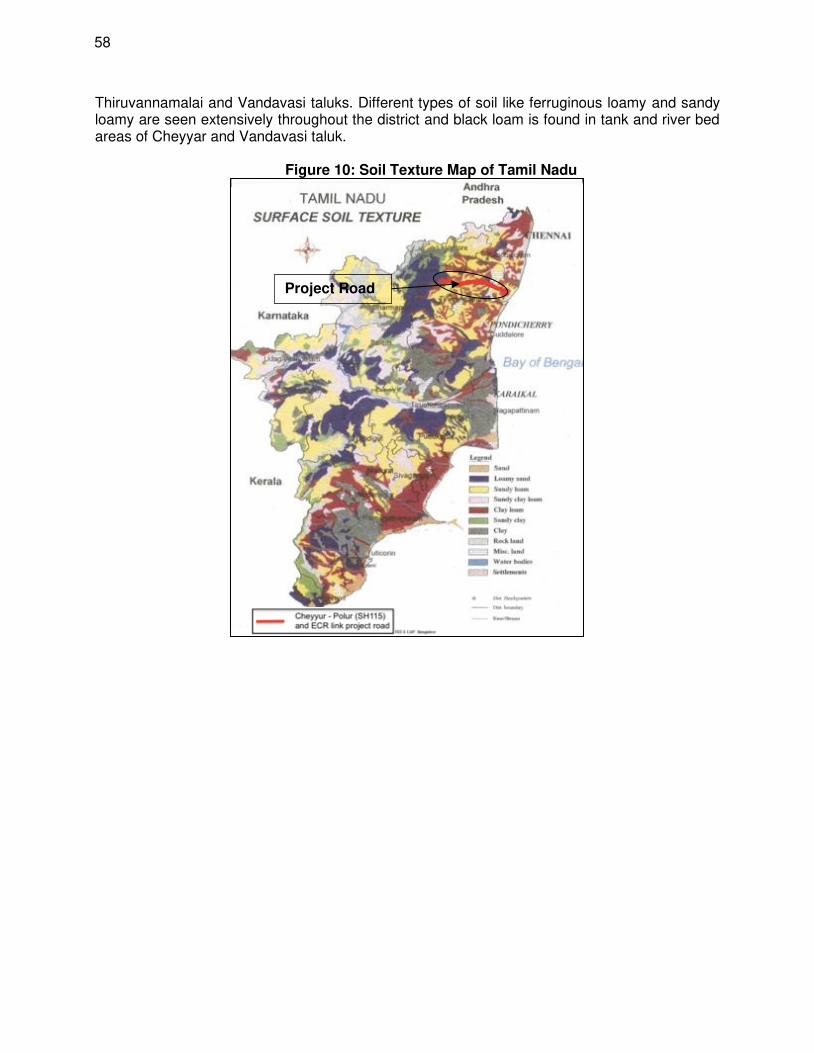
58
Thiruvannamalai and Vandavasi taluks. Different types of soil like ferruginous loamy and sandy loamy are seen extensively throughout the district and black loam is found in tank and river bed areas of Cheyyar and Vandavasi taluk.
Figure 10: Soil Texture Map of Tamil Nadu
Project Road
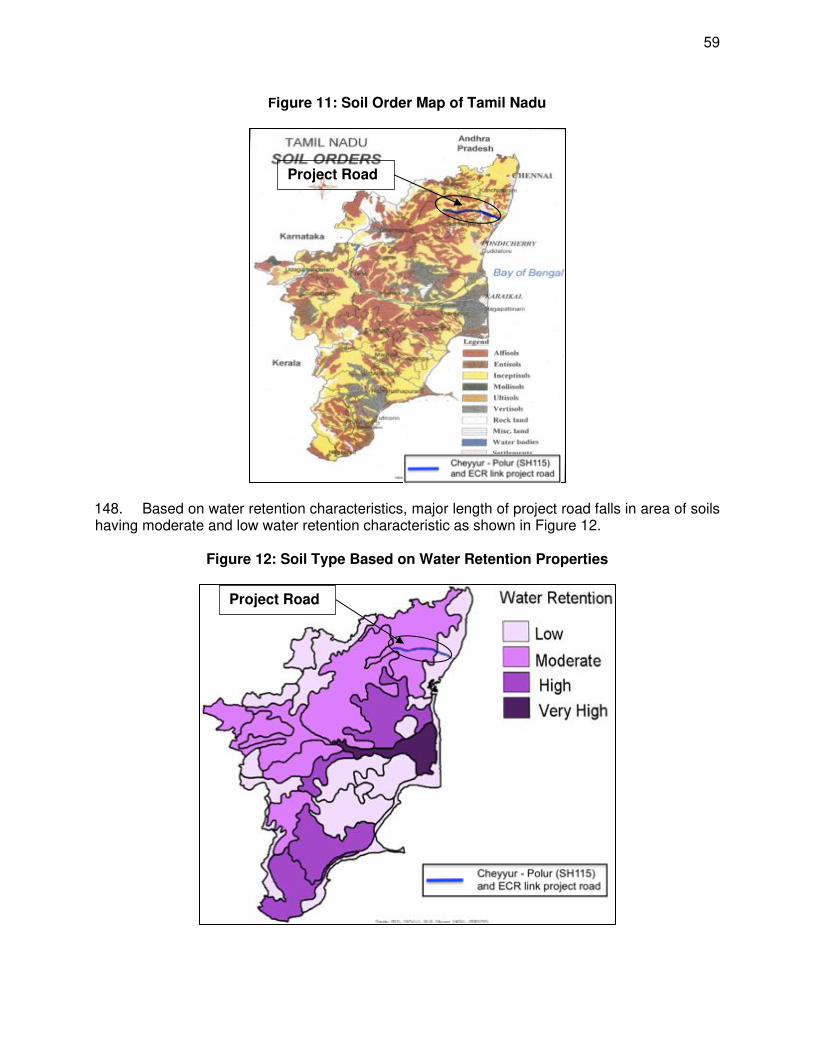
59
Figure 11: Soil Order Map of Tamil Nadu
148. Based on water retention characteristics, major length of project road falls in area of soils having moderate and low water retention characteristic as shown in Figure 12.
Figure 12: Soil Type Based on Water Retention Properties
Project Road
Project Road

60
149. Soil samples were collected at 6 locations, along the project road during DPR preparation. These soil samples were analysed for physical characteristics (colour, texture, water retention capacity, infiltration rate and density), particle size distribution, chemical characteristics (pH, electrical conductivity and organic carbon), and nutrient contents (NPK). The results of the soil sample analysis for the project roads are given in Table 13.
Table 13: Quality Monitoring Results for the Project Road
Sl. No.
Parameters Units S1 (Km
26)
S2 (Km 39.2)
S3 (Km 59.5)
S4 (Km 81.2)
S5 (Km 105)
S6 (ECR
Link Km 0)
1 pH - 6.61 7.31 7.39 7.06 8.47 6.85
2 Moisture Content % 5.93 1.86 2.65 3.26 2.94 9.08
3 Soil Classification /Texture
(a)Sand % 47.0 70.20 49 61.60 50.40 62.20
(b)Silt % 12.0 2.80 22 16.40 12.60 4.60
(c)Clay % 41.0 27.0 29 22 37.0 33.20
(d) Soil classification -
Sandy Clay
Sand clay
Sandy clay
Sand clay
Sandy clay
Sandy clay
4
Electrical Conductivity (1:5 Soil Extract)
µmhos / cm
122 180 133
36
198
82
5 Sodium Absorption Ratio(SAR)
- 1.07 6.30 3.80 4.60
0.31 0.82
6 Cation Meq/ 12.50 13.80 22.18 11.40 12.40 13.50
Exchange capacity 100g
7 Calcium mg/Kg 1925 1270 1155 1581 1853 902
8 Potassium mg/Kg 1656 1836 1842 1608 997 300
9 Sodium mg/Kg 206.4 162.1 158.70 161.2 75 172
10 Magnesium mg/Kg 677 2652 526 602 1541 1480
11 Chlorides mg/Kg 534 1229 1243 9330 1150 1260
12 Total Nitrogen mg/Kg 110 120 730 210 1150 280
13 Total Phosphorus
mg/Kg 94 210 630 150
820 160
14 Available Phosphorus
mg/Kg 1 6 9 1
20 34
15 Organic Matter mg/Kg 5480 7690 7860 8250 20880 10065
16 Carbonate mg/Kg Nil Nil Nil Nil 0.18 Nil
17 Sulphur mg/Kg 112 210 138 185 164 139
18 Arsenic mg/Kg Nil Nil Nil Nil Nil Nil
19 Boron mg/Kg 2 6.70 40 1 9.2 8.7

61
Sl. No.
Parameters Units S1 (Km
26)
S2 (Km 39.2)
S3 (Km 59.5)
S4 (Km 81.2)
S5 (Km 105)
S6 (ECR
Link Km 0)
20 Iron mg/Kg 48 28 23.0 32 43 22
21 Lead mg/Kg 1.45 1.40 1.62 1.62 1.80 1.72
22 Manganese mg/Kg 0.10 1.20 0.87 0.92 Nil 1.20
23 Zinc mg/Kg 80 180 95 110 80 75
Source: Monitoring undertaken during DPR preparation
150. The pH of the soils ranges between 6.61 - 8.47. Based on soil texture, soils can be classified as sandy clay at monitoring locations. The nutrient status of soil is also a key element in agriculture. Above results also shows that the soils of the study area have good amount of primary nutrients i.e., Nitrogen (N), Phosphorus (P) and Potassium (K) content. From the results it can be observed that the soil in the project area is fertile with high agricultural productivity with appropriate use of fertilizer. The soil has good electrical conductivity. 5. Seismicity and Volcanic Activity
151. The State of Tamil Nadu is a zone of low to moderate seismic activity with a sparse historical record of significant earthquakes. Seismicity / Effect due to earthquake have been accounted for by considering the seismic load in longitudinal and transverse direction. For the purpose of determining the seismic forces the country is divided into four zones (Zone II to Zone V) based on the intensity of earthquakes that a particular area may be subjected to, with Zone V comprising of areas which have been subjected to severe earthquakes & Zone-II comprising areas least liable to earthquakes. The seismic loads are calculated using Response Spectrum method as per Modified clause of IRC 6: 2010. The seismic force depends upon several factors like zone factor, Period of vibration, Soil type etc. The whole project area falls in the vast volcanic basalt beds of Deccan plate, which formed towards the end of Cretaceous period, between 65 and 67 million years ago. There is no recent seismic and volcanic activity reported along the project area.
152. The major length of project road fall under zone II (Low risk zone) and relevant provisions in IRC- 6:2010 have been adopted in the design. The seismic map of Tamil Nadu has been shown in Figure 13.
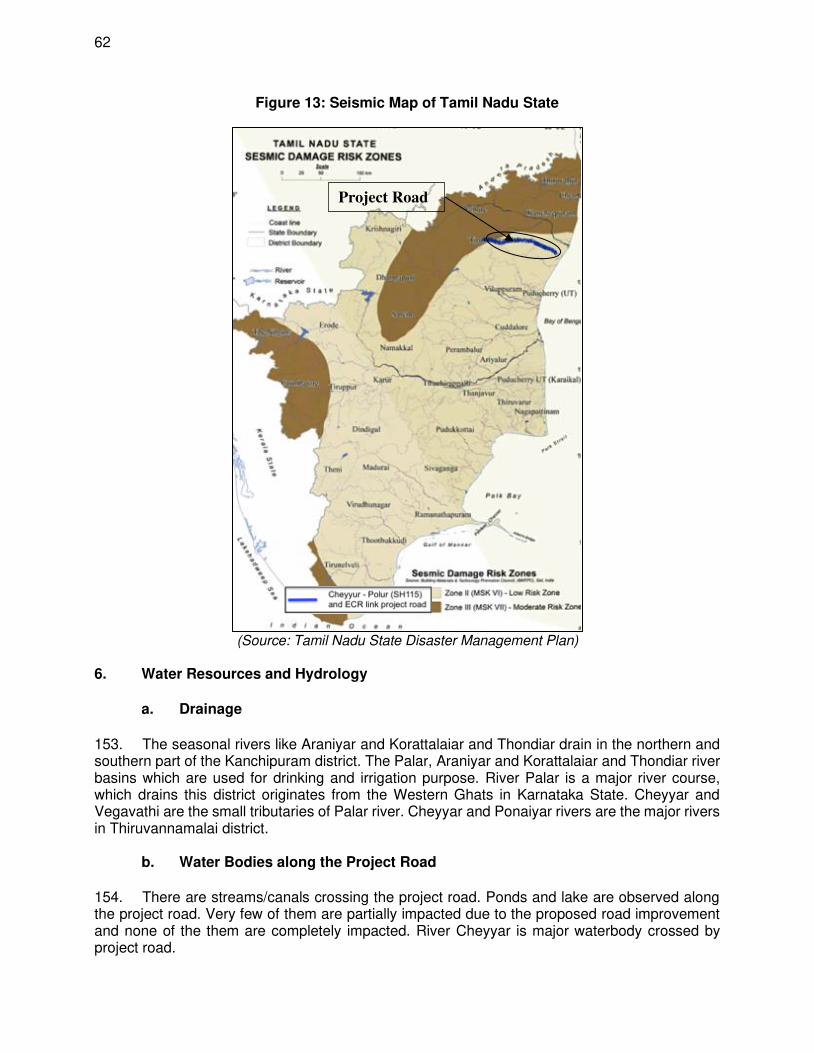
62
Figure 13: Seismic Map of Tamil Nadu State
(Source: Tamil Nadu State Disaster Management Plan)
6. Water Resources and Hydrology
a. Drainage
153. The seasonal rivers like Araniyar and Korattalaiar and Thondiar drain in the northern and southern part of the Kanchipuram district. The Palar, Araniyar and Korattalaiar and Thondiar river basins which are used for drinking and irrigation purpose. River Palar is a major river course, which drains this district originates from the Western Ghats in Karnataka State. Cheyyar and Vegavathi are the small tributaries of Palar river. Cheyyar and Ponaiyar rivers are the major rivers in Thiruvannamalai district.
b. Water Bodies along the Project Road
154. There are streams/canals crossing the project road. Ponds and lake are observed along the project road. Very few of them are partially impacted due to the proposed road improvement and none of the them are completely impacted. River Cheyyar is major waterbody crossed by project road.
Project Road
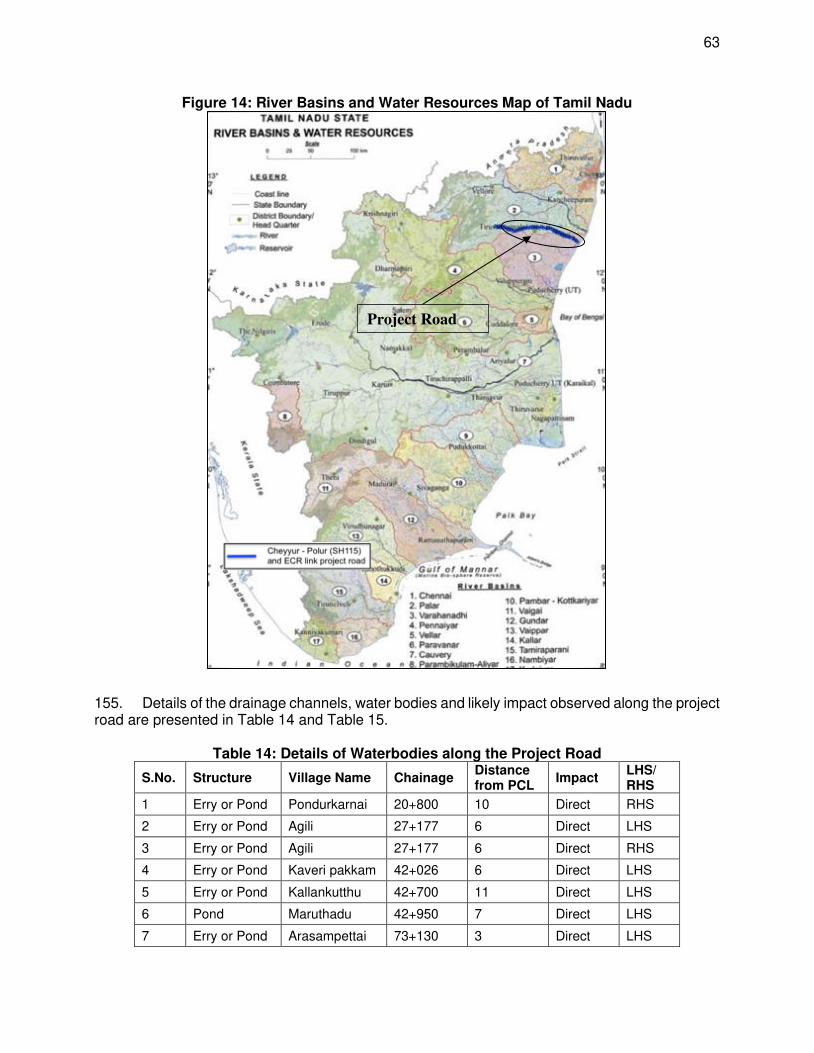
63
Figure 14: River Basins and Water Resources Map of Tamil Nadu
155. Details of the drainage channels, water bodies and likely impact observed along the project road are presented in Table 14 and Table 15.
Table 14: Details of Waterbodies along the Project Road
S.No. Structure Village Name Chainage Distance from PCL
Impact LHS/ RHS
1 Erry or Pond Pondurkarnai 20+800 10 Direct RHS
2 Erry or Pond Agili 27+177 6 Direct LHS
3 Erry or Pond Agili 27+177 6 Direct RHS
4 Erry or Pond Kaveri pakkam 42+026 6 Direct LHS
5 Erry or Pond Kallankutthu 42+700 11 Direct LHS
6 Pond Maruthadu 42+950 7 Direct LHS
7 Erry or Pond Arasampettai 73+130 3 Direct LHS
Project Road
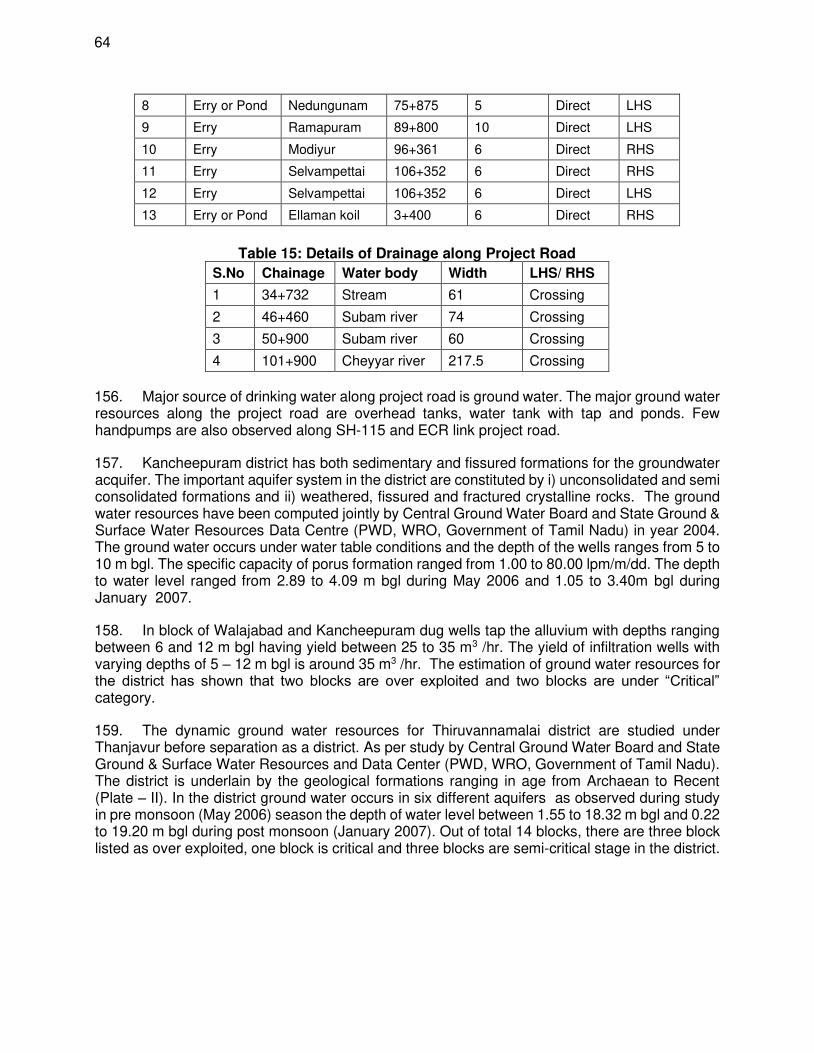
64
8 Erry or Pond Nedungunam 75+875 5 Direct LHS
9 Erry Ramapuram 89+800 10 Direct LHS
10 Erry Modiyur 96+361 6 Direct RHS
11 Erry Selvampettai 106+352 6 Direct RHS
12 Erry Selvampettai 106+352 6 Direct LHS
13 Erry or Pond Ellaman koil 3+400 6 Direct RHS
Table 15: Details of Drainage along Project Road
S.No Chainage Water body Width LHS/ RHS
1 34+732 Stream 61 Crossing
2 46+460 Subam river 74 Crossing
3 50+900 Subam river 60 Crossing
4 101+900 Cheyyar river 217.5 Crossing
156. Major source of drinking water along project road is ground water. The major ground water resources along the project road are overhead tanks, water tank with tap and ponds. Few handpumps are also observed along SH-115 and ECR link project road.
157. Kancheepuram district has both sedimentary and fissured formations for the groundwater acquifer. The important aquifer system in the district are constituted by i) unconsolidated and semi consolidated formations and ii) weathered, fissured and fractured crystalline rocks. The ground water resources have been computed jointly by Central Ground Water Board and State Ground & Surface Water Resources Data Centre (PWD, WRO, Government of Tamil Nadu) in year 2004. The ground water occurs under water table conditions and the depth of the wells ranges from 5 to 10 m bgl. The specific capacity of porus formation ranged from 1.00 to 80.00 lpm/m/dd. The depth to water level ranged from 2.89 to 4.09 m bgl during May 2006 and 1.05 to 3.40m bgl during January 2007.
158. In block of Walajabad and Kancheepuram dug wells tap the alluvium with depths ranging between 6 and 12 m bgl having yield between 25 to 35 m3 /hr. The yield of infiltration wells with varying depths of 5 – 12 m bgl is around 35 m3 /hr. The estimation of ground water resources for the district has shown that two blocks are over exploited and two blocks are under “Critical” category.
159. The dynamic ground water resources for Thiruvannamalai district are studied under Thanjavur before separation as a district. As per study by Central Ground Water Board and State Ground & Surface Water Resources and Data Center (PWD, WRO, Government of Tamil Nadu). The district is underlain by the geological formations ranging in age from Archaean to Recent (Plate – II). In the district ground water occurs in six different aquifers as observed during study in pre monsoon (May 2006) season the depth of water level between 1.55 to 18.32 m bgl and 0.22 to 19.20 m bgl during post monsoon (January 2007). Out of total 14 blocks, there are three block listed as over exploited, one block is critical and three blocks are semi-critical stage in the district.
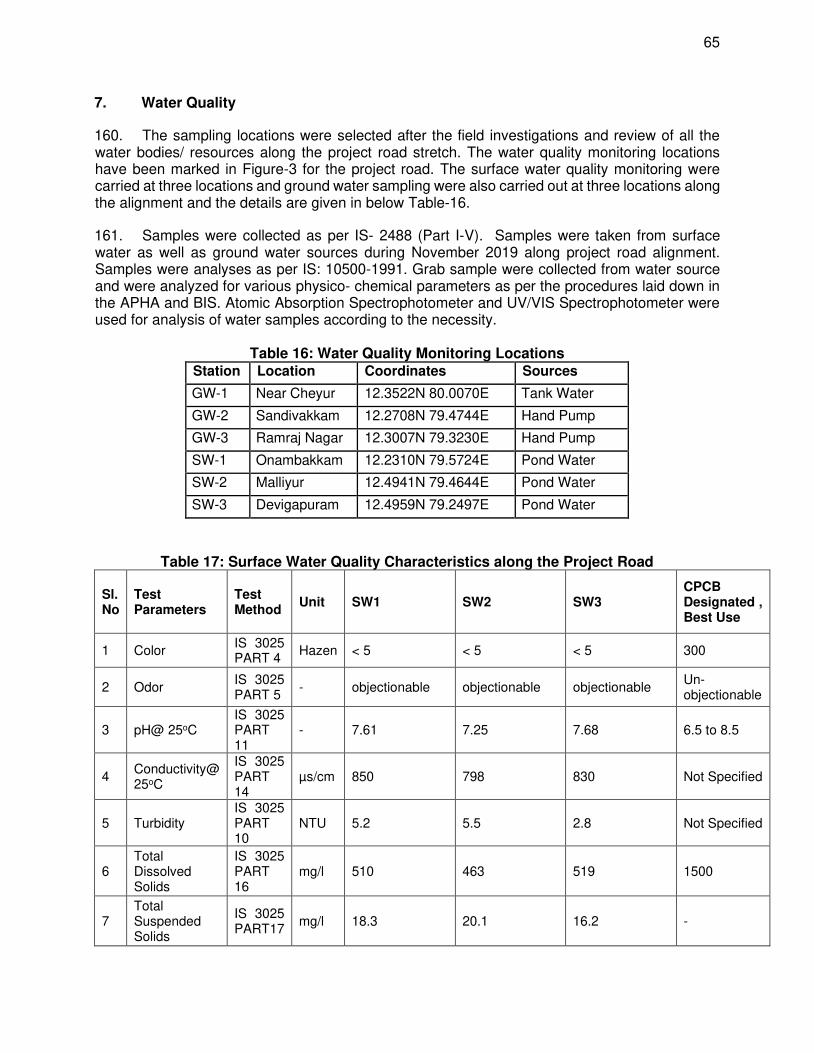
65
7. Water Quality
160. The sampling locations were selected after the field investigations and review of all the water bodies/ resources along the project road stretch. The water quality monitoring locations have been marked in Figure-3 for the project road. The surface water quality monitoring were carried at three locations and ground water sampling were also carried out at three locations along the alignment and the details are given in below Table-16.
161. Samples were collected as per IS- 2488 (Part I-V). Samples were taken from surface water as well as ground water sources during November 2019 along project road alignment. Samples were analyses as per IS: 10500-1991. Grab sample were collected from water source and were analyzed for various physico- chemical parameters as per the procedures laid down in the APHA and BIS. Atomic Absorption Spectrophotometer and UV/VIS Spectrophotometer were used for analysis of water samples according to the necessity.
Table 16: Water Quality Monitoring Locations Station Location Coordinates Sources
GW-1 Near Cheyur 12.3522N 80.0070E Tank Water
GW-2 Sandivakkam 12.2708N 79.4744E Hand Pump
GW-3 Ramraj Nagar 12.3007N 79.3230E Hand Pump
SW-1 Onambakkam 12.2310N 79.5724E Pond Water
SW-2 Malliyur 12.4941N 79.4644E Pond Water
SW-3 Devigapuram 12.4959N 79.2497E Pond Water
Table 17: Surface Water Quality Characteristics along the Project Road
Sl. No
Test Parameters
Test Method
Unit SW1 SW2 SW3 CPCB Designated , Best Use
1 Color IS 3025 PART 4
Hazen < 5 < 5 < 5 300
2 Odor IS 3025 PART 5
- objectionable objectionable objectionable Un-objectionable
3 pH@ 25oC IS 3025 PART 11
- 7.61 7.25 7.68 6.5 to 8.5
4 Conductivity@ 25oC
IS 3025 PART 14
µs/cm 850 798 830 Not Specified
5 Turbidity IS 3025 PART 10
NTU 5.2 5.5 2.8 Not Specified
6 Total Dissolved Solids
IS 3025 PART 16
mg/l 510 463 519 1500
7 Total Suspended Solids
IS 3025 PART17
mg/l 18.3 20.1 16.2 -
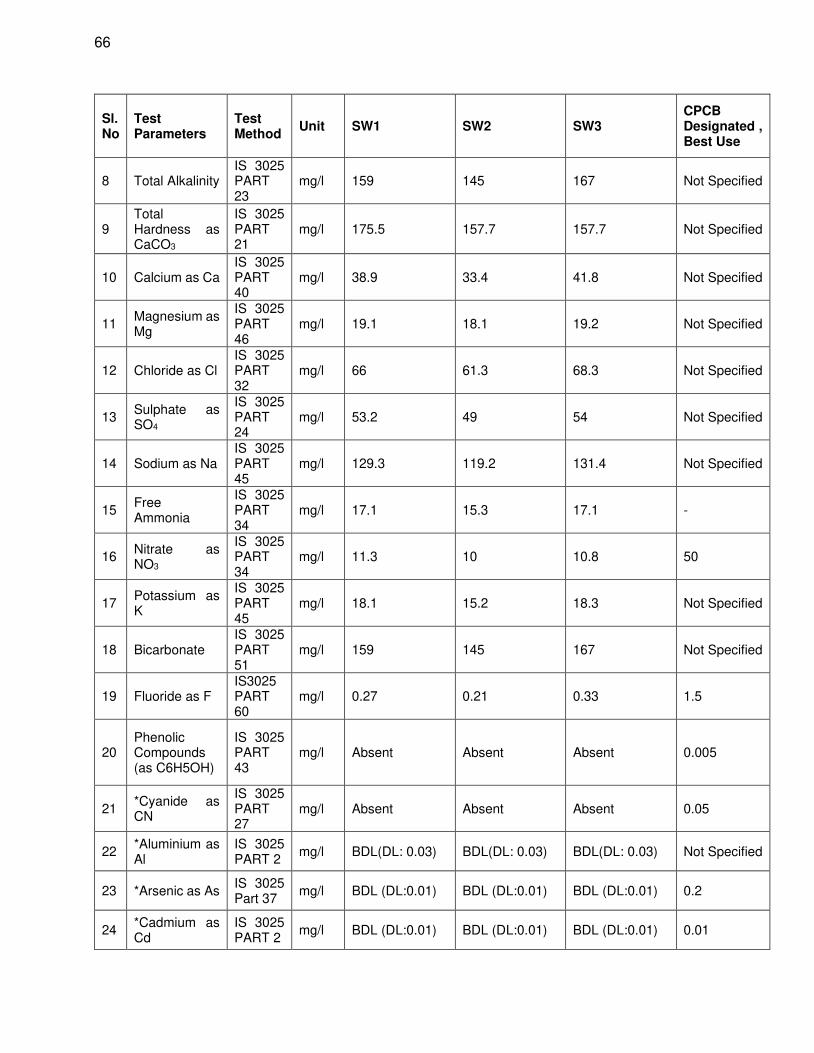
66
Sl. No
Test Parameters
Test Method
Unit SW1 SW2 SW3 CPCB Designated , Best Use
8 Total Alkalinity IS 3025 PART 23
mg/l 159 145 167 Not Specified
9 Total Hardness as CaCO3
IS 3025 PART 21
mg/l 175.5 157.7 157.7 Not Specified
10 Calcium as Ca IS 3025 PART 40
mg/l 38.9 33.4 41.8 Not Specified
11 Magnesium as Mg
IS 3025 PART 46
mg/l 19.1 18.1 19.2 Not Specified
12 Chloride as Cl IS 3025 PART 32
mg/l 66 61.3 68.3 Not Specified
13 Sulphate as SO4
IS 3025 PART 24
mg/l 53.2 49 54 Not Specified
14 Sodium as Na IS 3025 PART 45
mg/l 129.3 119.2 131.4 Not Specified
15 Free Ammonia
IS 3025 PART 34
mg/l 17.1 15.3 17.1 -
16 Nitrate as NO3
IS 3025 PART 34
mg/l 11.3 10 10.8 50
17 Potassium as K
IS 3025 PART 45
mg/l 18.1 15.2 18.3 Not Specified
18 Bicarbonate IS 3025 PART 51
mg/l 159 145 167 Not Specified
19 Fluoride as F IS3025 PART 60
mg/l 0.27 0.21 0.33 1.5
20 Phenolic Compounds (as C6H5OH)
IS 3025 PART 43
mg/l Absent Absent Absent 0.005
21 *Cyanide as CN
IS 3025 PART 27
mg/l Absent Absent Absent 0.05
22 *Aluminium as Al
IS 3025 PART 2
mg/l BDL(DL: 0.03) BDL(DL: 0.03) BDL(DL: 0.03) Not Specified
23 *Arsenic as As IS 3025 Part 37
mg/l BDL (DL:0.01) BDL (DL:0.01) BDL (DL:0.01) 0.2
24 *Cadmium as Cd
IS 3025 PART 2
mg/l BDL (DL:0.01) BDL (DL:0.01) BDL (DL:0.01) 0.01
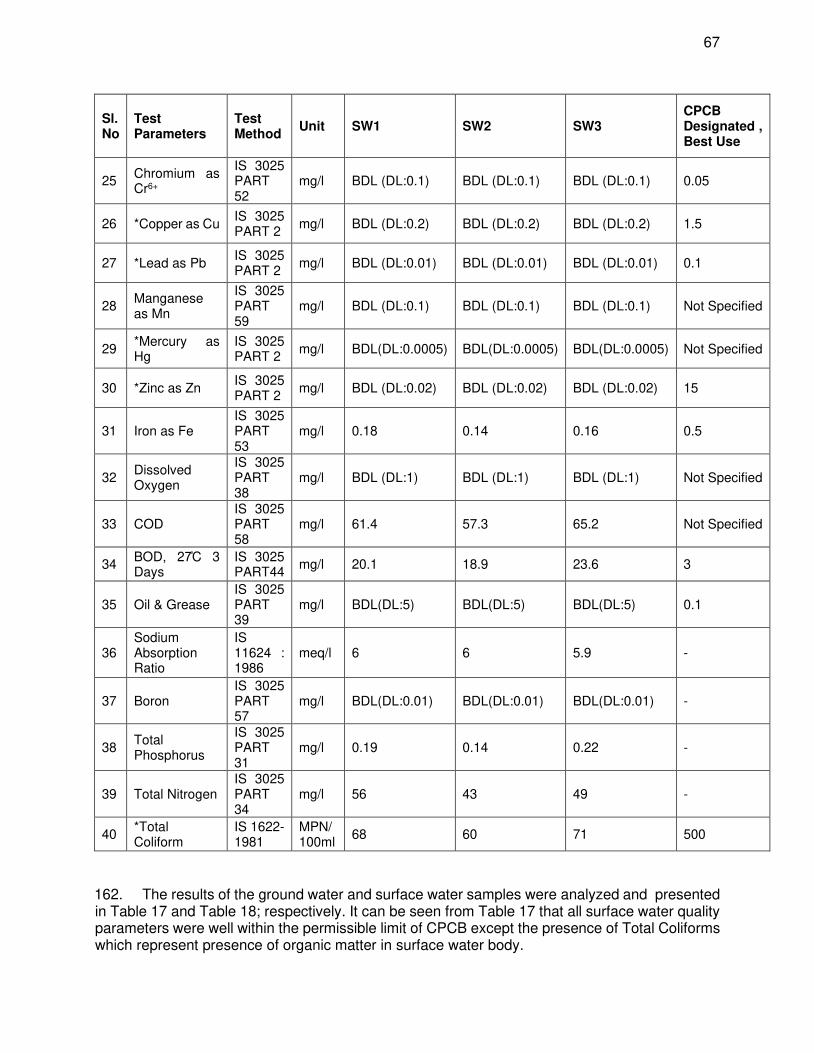
67
Sl. No
Test Parameters
Test Method
Unit SW1 SW2 SW3 CPCB Designated , Best Use
25 Chromium as Cr6+
IS 3025 PART 52
mg/l BDL (DL:0.1) BDL (DL:0.1) BDL (DL:0.1) 0.05
26 *Copper as Cu IS 3025 PART 2
mg/l BDL (DL:0.2) BDL (DL:0.2) BDL (DL:0.2) 1.5
27 *Lead as Pb IS 3025 PART 2
mg/l BDL (DL:0.01) BDL (DL:0.01) BDL (DL:0.01) 0.1
28 Manganese as Mn
IS 3025 PART 59
mg/l BDL (DL:0.1) BDL (DL:0.1) BDL (DL:0.1) Not Specified
29 *Mercury as Hg
IS 3025 PART 2
mg/l BDL(DL:0.0005) BDL(DL:0.0005) BDL(DL:0.0005) Not Specified
30 *Zinc as Zn IS 3025 PART 2
mg/l BDL (DL:0.02) BDL (DL:0.02) BDL (DL:0.02) 15
31 Iron as Fe IS 3025 PART 53
mg/l 0.18 0.14 0.16 0.5
32 Dissolved Oxygen
IS 3025 PART 38
mg/l BDL (DL:1) BDL (DL:1) BDL (DL:1) Not Specified
33 COD IS 3025 PART 58
mg/l 61.4 57.3 65.2 Not Specified
34 BOD, 27̊C 3 Days
IS 3025 PART44
mg/l 20.1 18.9 23.6 3
35 Oil & Grease IS 3025 PART 39
mg/l BDL(DL:5) BDL(DL:5) BDL(DL:5) 0.1
36 Sodium Absorption Ratio
IS 11624 : 1986
meq/l 6 6 5.9 -
37 Boron IS 3025 PART 57
mg/l BDL(DL:0.01) BDL(DL:0.01) BDL(DL:0.01) -
38 Total Phosphorus
IS 3025 PART 31
mg/l 0.19 0.14 0.22 -
39 Total Nitrogen IS 3025 PART 34
mg/l 56 43 49 -
40 *Total Coliform
IS 1622-1981
MPN/ 100ml
68 60 71 500
162. The results of the ground water and surface water samples were analyzed and presented in Table 17 and Table 18; respectively. It can be seen from Table 17 that all surface water quality parameters were well within the permissible limit of CPCB except the presence of Total Coliforms which represent presence of organic matter in surface water body.
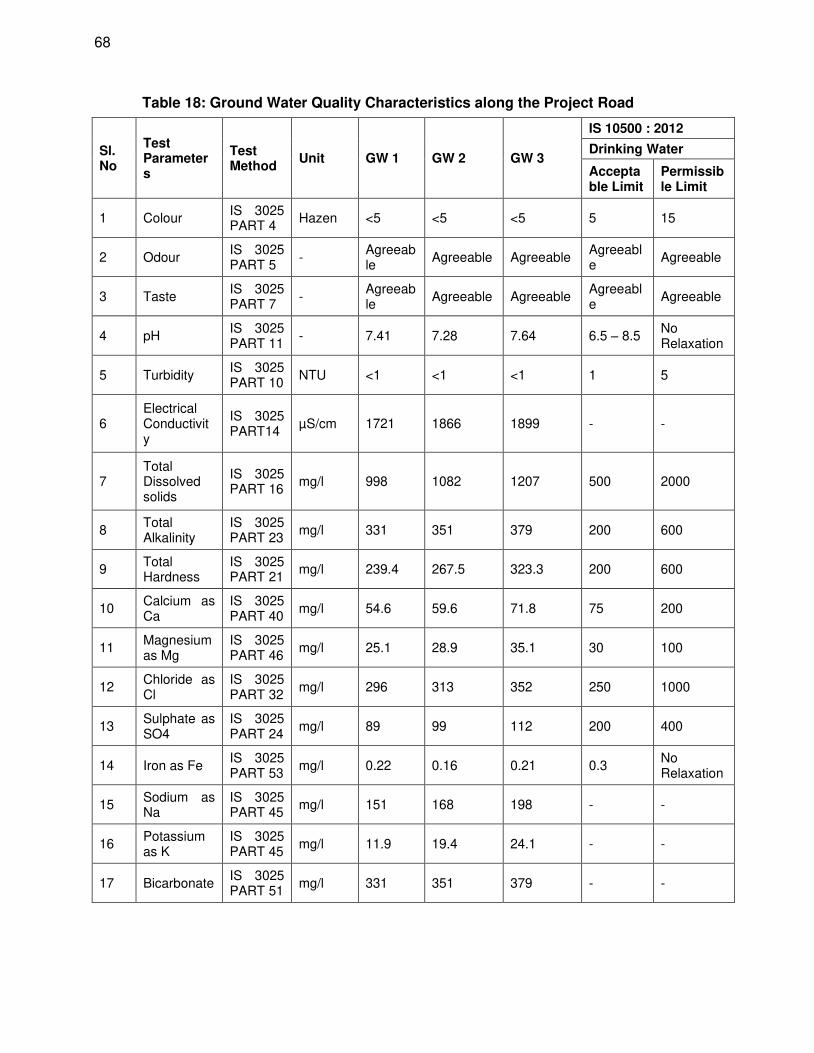
68
Table 18: Ground Water Quality Characteristics along the Project Road
Sl. No
Test Parameters
Test Method
Unit GW 1 GW 2 GW 3
IS 10500 : 2012
Drinking Water
Acceptable Limit
Permissible Limit
1 Colour IS 3025 PART 4
Hazen <5 <5 <5 5 15
2 Odour IS 3025 PART 5
- Agreeable
Agreeable Agreeable Agreeable
Agreeable
3 Taste IS 3025 PART 7
- Agreeable
Agreeable Agreeable Agreeable
Agreeable
4 pH IS 3025 PART 11
- 7.41 7.28 7.64 6.5 – 8.5 No Relaxation
5 Turbidity IS 3025 PART 10
NTU <1 <1 <1 1 5
6 Electrical Conductivity
IS 3025 PART14
µS/cm 1721 1866 1899 - -
7 Total Dissolved solids
IS 3025 PART 16
mg/l 998 1082 1207 500 2000
8 Total Alkalinity
IS 3025 PART 23
mg/l 331 351 379 200 600
9 Total Hardness
IS 3025 PART 21
mg/l 239.4 267.5 323.3 200 600
10 Calcium as Ca
IS 3025 PART 40
mg/l 54.6 59.6 71.8 75 200
11 Magnesium as Mg
IS 3025 PART 46
mg/l 25.1 28.9 35.1 30 100
12 Chloride as Cl
IS 3025 PART 32
mg/l 296 313 352 250 1000
13 Sulphate as SO4
IS 3025 PART 24
mg/l 89 99 112 200 400
14 Iron as Fe IS 3025 PART 53
mg/l 0.22 0.16 0.21 0.3 No Relaxation
15 Sodium as Na
IS 3025 PART 45
mg/l 151 168 198 - -
16 Potassium as K
IS 3025 PART 45
mg/l 11.9 19.4 24.1 - -
17 Bicarbonate IS 3025 PART 51
mg/l 331 351 379 - -
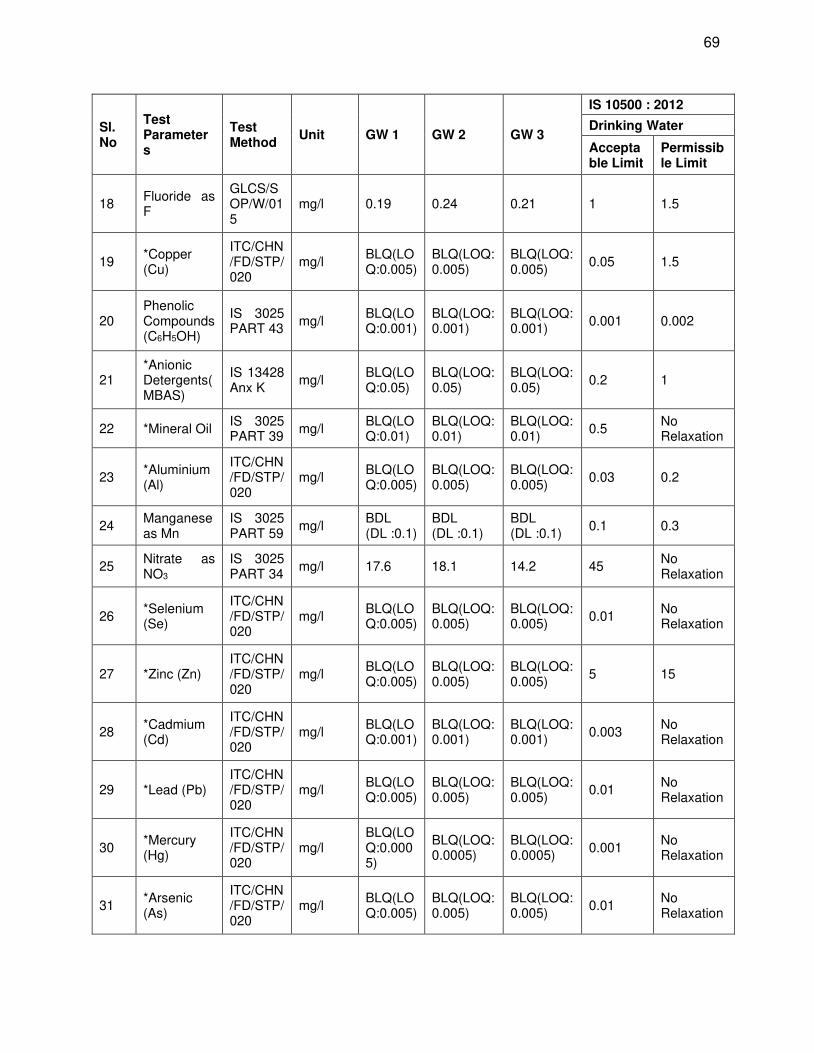
69
Sl. No
Test Parameters
Test Method
Unit GW 1 GW 2 GW 3
IS 10500 : 2012
Drinking Water
Acceptable Limit
Permissible Limit
18 Fluoride as F
GLCS/SOP/W/015
mg/l 0.19 0.24 0.21 1 1.5
19 *Copper (Cu)
ITC/CHN/FD/STP/020
mg/l BLQ(LOQ:0.005)
BLQ(LOQ:0.005)
BLQ(LOQ:0.005)
0.05 1.5
20 Phenolic Compounds(C6H5OH)
IS 3025 PART 43
mg/l BLQ(LOQ:0.001)
BLQ(LOQ:0.001)
BLQ(LOQ:0.001)
0.001 0.002
21 *Anionic Detergents(MBAS)
IS 13428 Anx K
mg/l BLQ(LOQ:0.05)
BLQ(LOQ:0.05)
BLQ(LOQ:0.05)
0.2 1
22 *Mineral Oil IS 3025 PART 39
mg/l BLQ(LOQ:0.01)
BLQ(LOQ:0.01)
BLQ(LOQ:0.01)
0.5 No Relaxation
23 *Aluminium (Al)
ITC/CHN/FD/STP/020
mg/l BLQ(LOQ:0.005)
BLQ(LOQ:0.005)
BLQ(LOQ:0.005)
0.03 0.2
24 Manganese as Mn
IS 3025 PART 59
mg/l BDL (DL :0.1)
BDL (DL :0.1)
BDL (DL :0.1)
0.1 0.3
25 Nitrate as NO3
IS 3025 PART 34
mg/l 17.6 18.1 14.2 45 No Relaxation
26 *Selenium (Se)
ITC/CHN/FD/STP/020
mg/l BLQ(LOQ:0.005)
BLQ(LOQ:0.005)
BLQ(LOQ:0.005)
0.01 No Relaxation
27 *Zinc (Zn) ITC/CHN/FD/STP/020
mg/l BLQ(LOQ:0.005)
BLQ(LOQ:0.005)
BLQ(LOQ:0.005)
5 15
28 *Cadmium (Cd)
ITC/CHN/FD/STP/020
mg/l BLQ(LOQ:0.001)
BLQ(LOQ:0.001)
BLQ(LOQ:0.001)
0.003 No Relaxation
29 *Lead (Pb) ITC/CHN/FD/STP/020
mg/l BLQ(LOQ:0.005)
BLQ(LOQ:0.005)
BLQ(LOQ:0.005)
0.01 No Relaxation
30 *Mercury (Hg)
ITC/CHN/FD/STP/020
mg/l BLQ(LOQ:0.0005)
BLQ(LOQ:0.0005)
BLQ(LOQ:0.0005)
0.001 No Relaxation
31 *Arsenic (As)
ITC/CHN/FD/STP/020
mg/l BLQ(LOQ:0.005)
BLQ(LOQ:0.005)
BLQ(LOQ:0.005)
0.01 No Relaxation
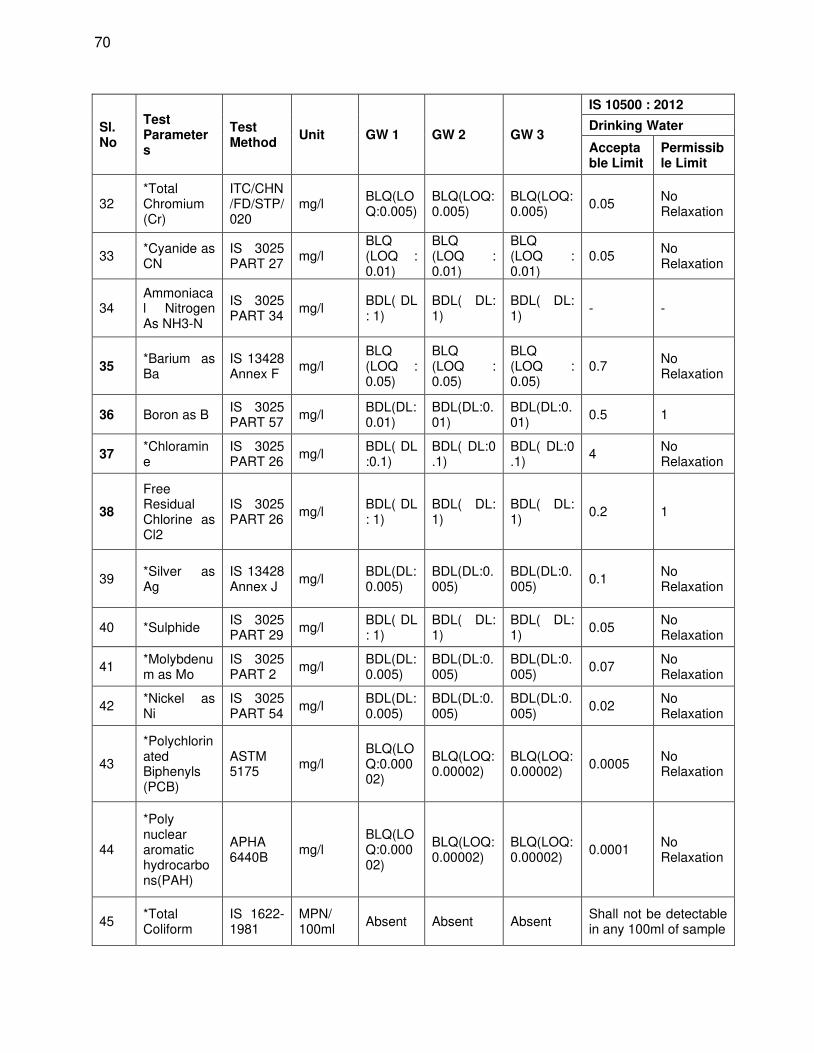
70
Sl. No
Test Parameters
Test Method
Unit GW 1 GW 2 GW 3
IS 10500 : 2012
Drinking Water
Acceptable Limit
Permissible Limit
32 *Total Chromium (Cr)
ITC/CHN/FD/STP/020
mg/l BLQ(LOQ:0.005)
BLQ(LOQ:0.005)
BLQ(LOQ:0.005)
0.05 No Relaxation
33 *Cyanide as CN
IS 3025 PART 27
mg/l BLQ (LOQ : 0.01)
BLQ (LOQ : 0.01)
BLQ (LOQ : 0.01)
0.05 No Relaxation
34 Ammoniacal Nitrogen As NH3-N
IS 3025 PART 34
mg/l BDL( DL: 1)
BDL( DL: 1)
BDL( DL: 1)
- -
35 *Barium as Ba
IS 13428 Annex F
mg/l BLQ (LOQ : 0.05)
BLQ (LOQ : 0.05)
BLQ (LOQ : 0.05)
0.7 No Relaxation
36 Boron as B IS 3025 PART 57
mg/l BDL(DL:0.01)
BDL(DL:0.01)
BDL(DL:0.01)
0.5 1
37 *Chloramine
IS 3025 PART 26
mg/l BDL( DL:0.1)
BDL( DL:0.1)
BDL( DL:0.1)
4 No Relaxation
38
Free Residual Chlorine as Cl2
IS 3025 PART 26
mg/l BDL( DL: 1)
BDL( DL: 1)
BDL( DL: 1)
0.2 1
39 *Silver as Ag
IS 13428 Annex J
mg/l BDL(DL:0.005)
BDL(DL:0.005)
BDL(DL:0.005)
0.1 No Relaxation
40 *Sulphide IS 3025 PART 29
mg/l BDL( DL: 1)
BDL( DL: 1)
BDL( DL: 1)
0.05 No Relaxation
41 *Molybdenum as Mo
IS 3025 PART 2
mg/l BDL(DL:0.005)
BDL(DL:0.005)
BDL(DL:0.005)
0.07 No Relaxation
42 *Nickel as Ni
IS 3025 PART 54
mg/l BDL(DL:0.005)
BDL(DL:0.005)
BDL(DL:0.005)
0.02 No Relaxation
43
*Polychlorinated Biphenyls (PCB)
ASTM 5175
mg/l BLQ(LOQ:0.00002)
BLQ(LOQ:0.00002)
BLQ(LOQ:0.00002)
0.0005 No Relaxation
44
*Poly nuclear aromatic hydrocarbons(PAH)
APHA 6440B
mg/l BLQ(LOQ:0.00002)
BLQ(LOQ:0.00002)
BLQ(LOQ:0.00002)
0.0001 No Relaxation
45 *Total Coliform
IS 1622-1981
MPN/ 100ml
Absent Absent Absent Shall not be detectable in any 100ml of sample
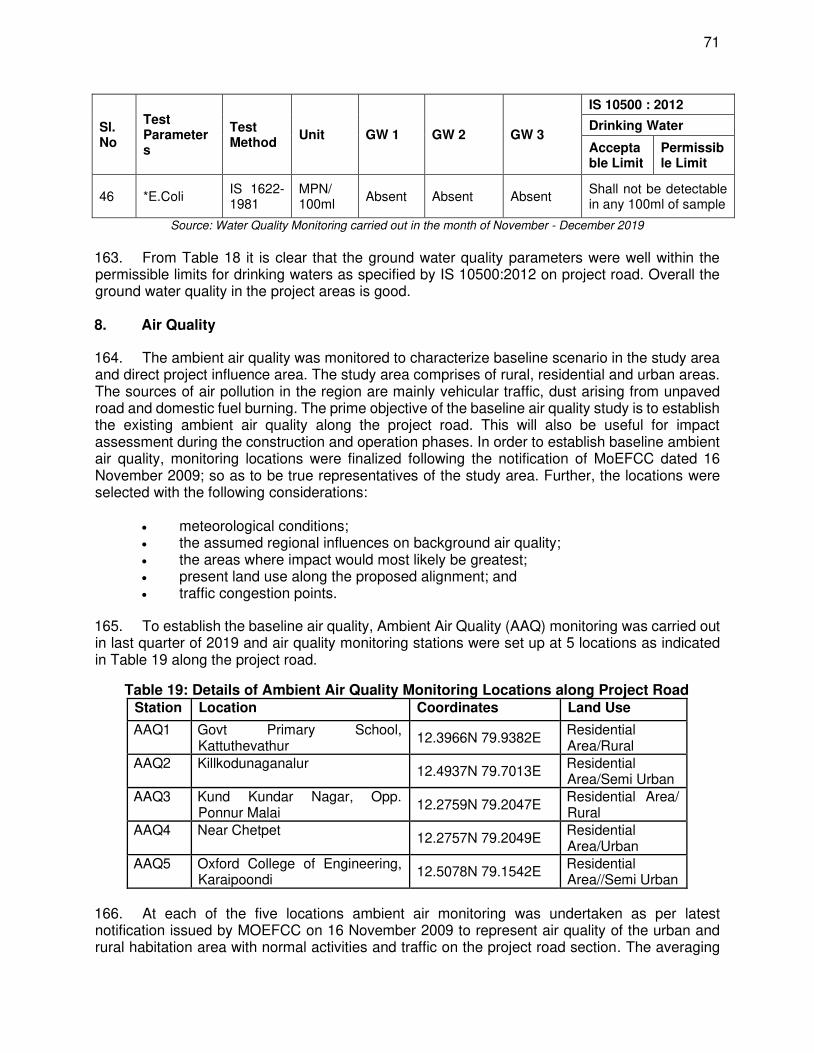
71
Sl. No
Test Parameters
Test Method
Unit GW 1 GW 2 GW 3
IS 10500 : 2012
Drinking Water
Acceptable Limit
Permissible Limit
46 *E.Coli IS 1622-1981
MPN/ 100ml
Absent Absent Absent Shall not be detectable in any 100ml of sample
Source: Water Quality Monitoring carried out in the month of November - December 2019
163. From Table 18 it is clear that the ground water quality parameters were well within the permissible limits for drinking waters as specified by IS 10500:2012 on project road. Overall the ground water quality in the project areas is good. 8. Air Quality
164. The ambient air quality was monitored to characterize baseline scenario in the study area and direct project influence area. The study area comprises of rural, residential and urban areas. The sources of air pollution in the region are mainly vehicular traffic, dust arising from unpaved road and domestic fuel burning. The prime objective of the baseline air quality study is to establish the existing ambient air quality along the project road. This will also be useful for impact assessment during the construction and operation phases. In order to establish baseline ambient air quality, monitoring locations were finalized following the notification of MoEFCC dated 16 November 2009; so as to be true representatives of the study area. Further, the locations were selected with the following considerations:
• meteorological conditions; • the assumed regional influences on background air quality; • the areas where impact would most likely be greatest; • present land use along the proposed alignment; and • traffic congestion points.
165. To establish the baseline air quality, Ambient Air Quality (AAQ) monitoring was carried out in last quarter of 2019 and air quality monitoring stations were set up at 5 locations as indicated in Table 19 along the project road.
Table 19: Details of Ambient Air Quality Monitoring Locations along Project Road Station Location Coordinates Land Use
AAQ1 Govt Primary School, Kattuthevathur
12.3966N 79.9382E Residential Area/Rural
AAQ2 Killkodunaganalur 12.4937N 79.7013E
Residential Area/Semi Urban
AAQ3 Kund Kundar Nagar, Opp. Ponnur Malai
12.2759N 79.2047E Residential Area/ Rural
AAQ4 Near Chetpet 12.2757N 79.2049E
Residential Area/Urban
AAQ5 Oxford College of Engineering, Karaipoondi
12.5078N 79.1542E Residential Area//Semi Urban
166. At each of the five locations ambient air monitoring was undertaken as per latest notification issued by MOEFCC on 16 November 2009 to represent air quality of the urban and rural habitation area with normal activities and traffic on the project road section. The averaging
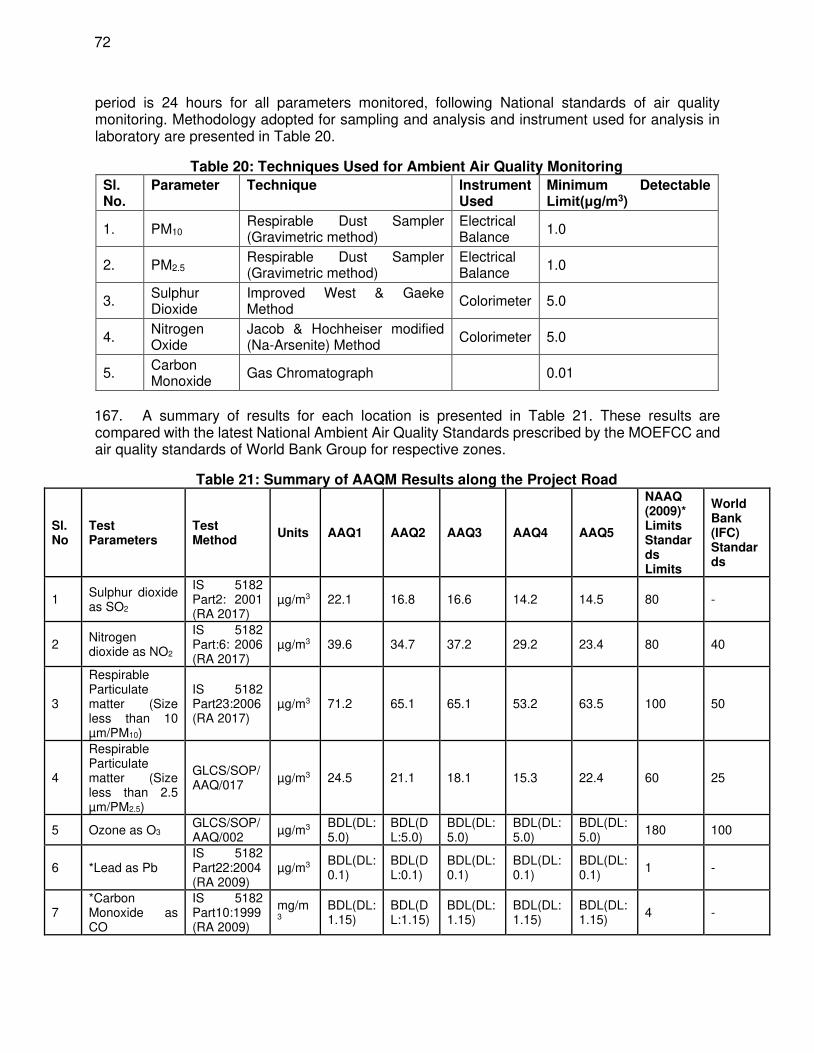
72
period is 24 hours for all parameters monitored, following National standards of air quality monitoring. Methodology adopted for sampling and analysis and instrument used for analysis in laboratory are presented in Table 20.
Table 20: Techniques Used for Ambient Air Quality Monitoring
Sl. No.
Parameter Technique Instrument Used
Minimum Detectable Limit(μg/m3)
1. PM10 Respirable Dust Sampler (Gravimetric method)
Electrical Balance
1.0
2. PM2.5 Respirable Dust Sampler (Gravimetric method)
Electrical Balance
1.0
3. Sulphur Dioxide
Improved West & Gaeke Method
Colorimeter 5.0
4. Nitrogen Oxide
Jacob & Hochheiser modified (Na-Arsenite) Method
Colorimeter 5.0
5. Carbon Monoxide
Gas Chromatograph 0.01
167. A summary of results for each location is presented in Table 21. These results are compared with the latest National Ambient Air Quality Standards prescribed by the MOEFCC and air quality standards of World Bank Group for respective zones.
Table 21: Summary of AAQM Results along the Project Road
Sl.No
Test Parameters
Test Method
Units AAQ1 AAQ2 AAQ3 AAQ4 AAQ5
NAAQ (2009)* Limits Standards Limits
World Bank (IFC) Standards
1 Sulphur dioxide as SO2
IS 5182 Part2: 2001 (RA 2017)
µg/m3 22.1 16.8 16.6 14.2 14.5 80 -
2 Nitrogen dioxide as NO2
IS 5182 Part:6: 2006 (RA 2017)
µg/m3 39.6 34.7 37.2 29.2 23.4 80 40
3
Respirable Particulate matter (Size less than 10 µm/PM10)
IS 5182 Part23:2006 (RA 2017)
µg/m3 71.2 65.1 65.1 53.2 63.5 100 50
4
Respirable Particulate matter (Size less than 2.5 µm/PM2.5)
GLCS/SOP/AAQ/017
µg/m3 24.5 21.1 18.1 15.3 22.4 60 25
5 Ozone as O3 GLCS/SOP/AAQ/002
µg/m3 BDL(DL:5.0)
BDL(DL:5.0)
BDL(DL:5.0)
BDL(DL:5.0)
BDL(DL:5.0)
180 100
6 *Lead as Pb IS 5182 Part22:2004 (RA 2009)
µg/m3 BDL(DL:0.1)
BDL(DL:0.1)
BDL(DL:0.1)
BDL(DL:0.1)
BDL(DL:0.1)
1 -
7 *Carbon Monoxide as CO
IS 5182 Part10:1999 (RA 2009)
mg/m3
BDL(DL:1.15)
BDL(DL:1.15)
BDL(DL:1.15)
BDL(DL:1.15)
BDL(DL:1.15)
4 -
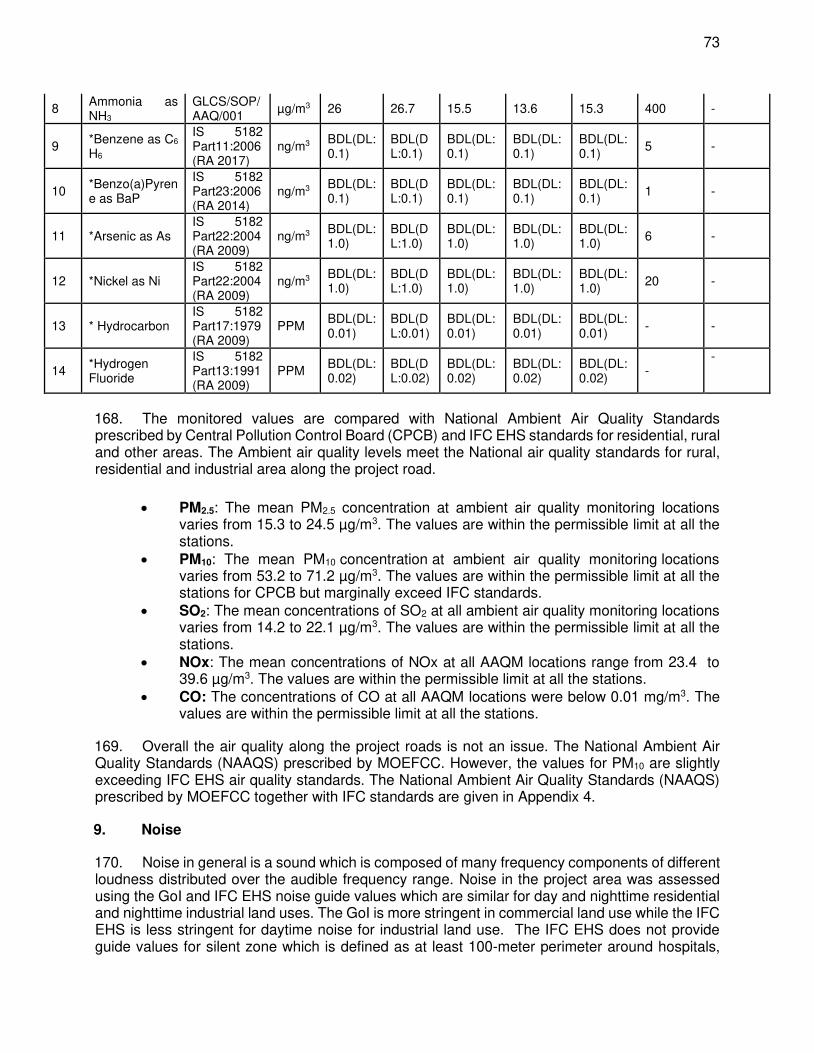
73
8 Ammonia as NH3
GLCS/SOP/AAQ/001
µg/m3 26 26.7 15.5 13.6 15.3 400 -
9 *Benzene as C6 H6
IS 5182 Part11:2006 (RA 2017)
ng/m3 BDL(DL:0.1)
BDL(DL:0.1)
BDL(DL:0.1)
BDL(DL:0.1)
BDL(DL:0.1)
5 -
10 *Benzo(a)Pyrene as BaP
IS 5182 Part23:2006 (RA 2014)
ng/m3 BDL(DL:0.1)
BDL(DL:0.1)
BDL(DL:0.1)
BDL(DL:0.1)
BDL(DL:0.1)
1 -
11 *Arsenic as As IS 5182 Part22:2004 (RA 2009)
ng/m3 BDL(DL:1.0)
BDL(DL:1.0)
BDL(DL:1.0)
BDL(DL:1.0)
BDL(DL:1.0)
6 -
12 *Nickel as Ni IS 5182 Part22:2004 (RA 2009)
ng/m3 BDL(DL:1.0)
BDL(DL:1.0)
BDL(DL:1.0)
BDL(DL:1.0)
BDL(DL:1.0)
20 -
13 * Hydrocarbon IS 5182 Part17:1979 (RA 2009)
PPM BDL(DL:0.01)
BDL(DL:0.01)
BDL(DL:0.01)
BDL(DL:0.01)
BDL(DL:0.01)
- -
14 *Hydrogen Fluoride
IS 5182 Part13:1991 (RA 2009)
PPM BDL(DL:0.02)
BDL(DL:0.02)
BDL(DL:0.02)
BDL(DL:0.02)
BDL(DL:0.02)
- -
168. The monitored values are compared with National Ambient Air Quality Standards prescribed by Central Pollution Control Board (CPCB) and IFC EHS standards for residential, rural and other areas. The Ambient air quality levels meet the National air quality standards for rural, residential and industrial area along the project road.
• PM2.5: The mean PM2.5 concentration at ambient air quality monitoring locations varies from 15.3 to 24.5 µg/m3. The values are within the permissible limit at all the stations.
• PM10: The mean PM10 concentration at ambient air quality monitoring locations varies from 53.2 to 71.2 µg/m3. The values are within the permissible limit at all the stations for CPCB but marginally exceed IFC standards.
• SO2: The mean concentrations of SO2 at all ambient air quality monitoring locations varies from 14.2 to 22.1 µg/m3. The values are within the permissible limit at all the stations.
• NOx: The mean concentrations of NOx at all AAQM locations range from 23.4 to 39.6 µg/m3. The values are within the permissible limit at all the stations.
• CO: The concentrations of CO at all AAQM locations were below 0.01 mg/m3. The values are within the permissible limit at all the stations.
169. Overall the air quality along the project roads is not an issue. The National Ambient Air Quality Standards (NAAQS) prescribed by MOEFCC. However, the values for PM10 are slightly exceeding IFC EHS air quality standards. The National Ambient Air Quality Standards (NAAQS) prescribed by MOEFCC together with IFC standards are given in Appendix 4. 9. Noise
170. Noise in general is a sound which is composed of many frequency components of different loudness distributed over the audible frequency range. Noise in the project area was assessed using the GoI and IFC EHS noise guide values which are similar for day and nighttime residential and nighttime industrial land uses. The GoI is more stringent in commercial land use while the IFC EHS is less stringent for daytime noise for industrial land use. The IFC EHS does not provide guide values for silent zone which is defined as at least 100-meter perimeter around hospitals,
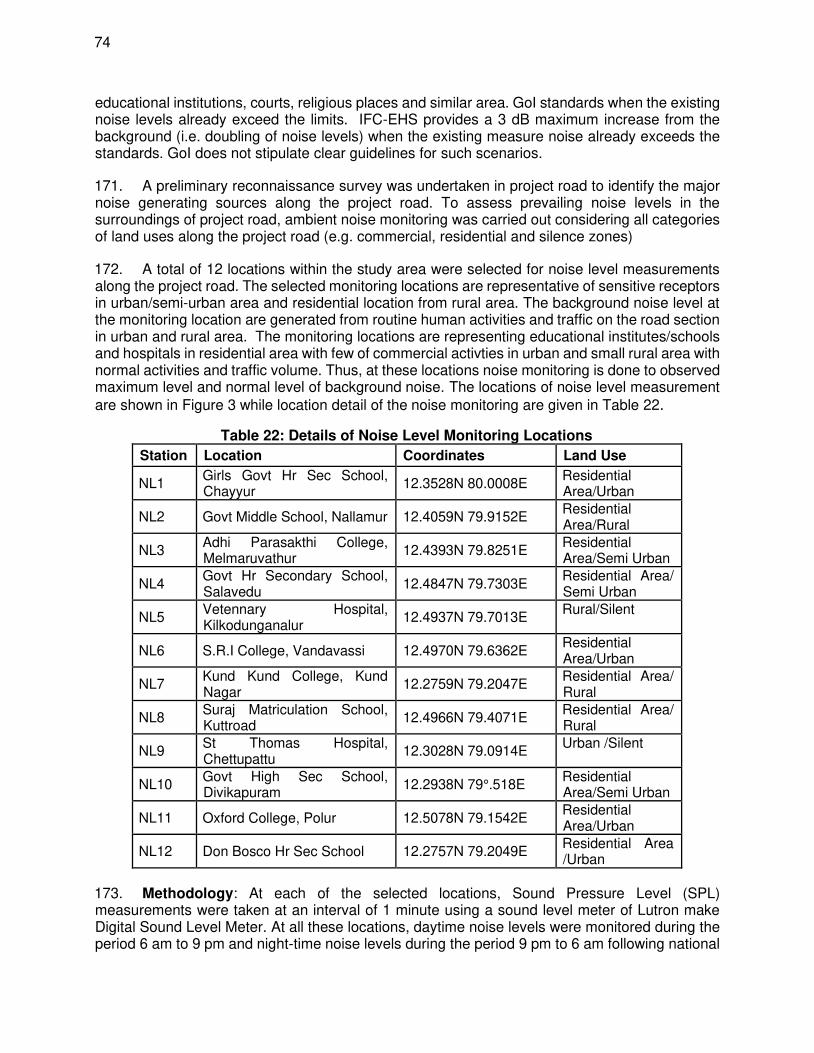
74
educational institutions, courts, religious places and similar area. GoI standards when the existing noise levels already exceed the limits. IFC-EHS provides a 3 dB maximum increase from the background (i.e. doubling of noise levels) when the existing measure noise already exceeds the standards. GoI does not stipulate clear guidelines for such scenarios.
171. A preliminary reconnaissance survey was undertaken in project road to identify the major noise generating sources along the project road. To assess prevailing noise levels in the surroundings of project road, ambient noise monitoring was carried out considering all categories of land uses along the project road (e.g. commercial, residential and silence zones)
172. A total of 12 locations within the study area were selected for noise level measurements along the project road. The selected monitoring locations are representative of sensitive receptors in urban/semi-urban area and residential location from rural area. The background noise level at the monitoring location are generated from routine human activities and traffic on the road section in urban and rural area. The monitoring locations are representing educational institutes/schools and hospitals in residential area with few of commercial activties in urban and small rural area with normal activities and traffic volume. Thus, at these locations noise monitoring is done to observed maximum level and normal level of background noise. The locations of noise level measurement are shown in Figure 3 while location detail of the noise monitoring are given in Table 22.
Table 22: Details of Noise Level Monitoring Locations
Station Location Coordinates Land Use
NL1 Girls Govt Hr Sec School, Chayyur
12.3528N 80.0008E Residential Area/Urban
NL2 Govt Middle School, Nallamur 12.4059N 79.9152E Residential Area/Rural
NL3 Adhi Parasakthi College, Melmaruvathur
12.4393N 79.8251E Residential Area/Semi Urban
NL4 Govt Hr Secondary School, Salavedu
12.4847N 79.7303E Residential Area/ Semi Urban
NL5 Vetennary Hospital, Kilkodunganalur
12.4937N 79.7013E Rural/Silent
NL6 S.R.I College, Vandavassi 12.4970N 79.6362E Residential Area/Urban
NL7 Kund Kund College, Kund Nagar
12.2759N 79.2047E Residential Area/ Rural
NL8 Suraj Matriculation School, Kuttroad
12.4966N 79.4071E Residential Area/ Rural
NL9 St Thomas Hospital, Chettupattu
12.3028N 79.0914E Urban /Silent
NL10 Govt High Sec School, Divikapuram
12.2938N 79°.518E Residential Area/Semi Urban
NL11 Oxford College, Polur 12.5078N 79.1542E Residential Area/Urban
NL12 Don Bosco Hr Sec School 12.2757N 79.2049E Residential Area /Urban
173. Methodology: At each of the selected locations, Sound Pressure Level (SPL) measurements were taken at an interval of 1 minute using a sound level meter of Lutron make Digital Sound Level Meter. At all these locations, daytime noise levels were monitored during the period 6 am to 9 pm and night-time noise levels during the period 9 pm to 6 am following national
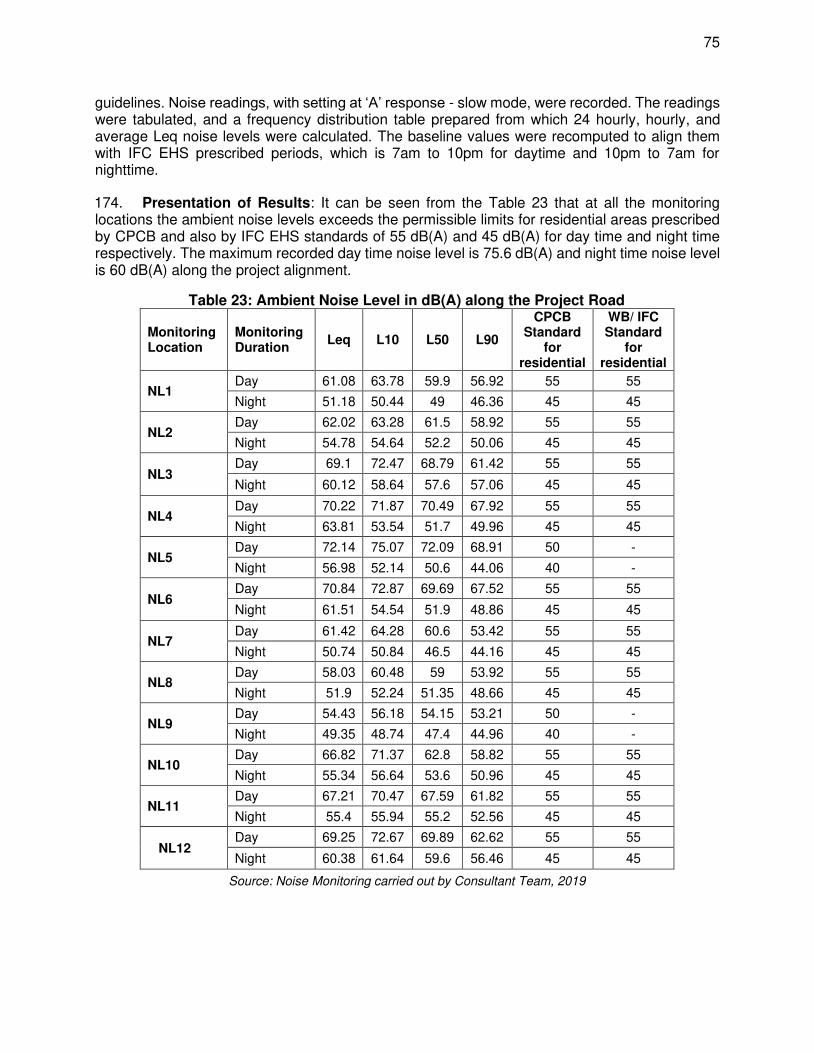
75
guidelines. Noise readings, with setting at ‘A’ response - slow mode, were recorded. The readings were tabulated, and a frequency distribution table prepared from which 24 hourly, hourly, and average Leq noise levels were calculated. The baseline values were recomputed to align them with IFC EHS prescribed periods, which is 7am to 10pm for daytime and 10pm to 7am for nighttime.
174. Presentation of Results: It can be seen from the Table 23 that at all the monitoring locations the ambient noise levels exceeds the permissible limits for residential areas prescribed by CPCB and also by IFC EHS standards of 55 dB(A) and 45 dB(A) for day time and night time respectively. The maximum recorded day time noise level is 75.6 dB(A) and night time noise level is 60 dB(A) along the project alignment.
Table 23: Ambient Noise Level in dB(A) along the Project Road
Monitoring Location
Monitoring Duration
Leq L10 L50 L90
CPCB Standard
for residential
WB/ IFC Standard
for residential
NL1 Day 61.08 63.78 59.9 56.92 55 55
Night 51.18 50.44 49 46.36 45 45
NL2 Day 62.02 63.28 61.5 58.92 55 55
Night 54.78 54.64 52.2 50.06 45 45
NL3 Day 69.1 72.47 68.79 61.42 55 55
Night 60.12 58.64 57.6 57.06 45 45
NL4 Day 70.22 71.87 70.49 67.92 55 55
Night 63.81 53.54 51.7 49.96 45 45
NL5 Day 72.14 75.07 72.09 68.91 50 -
Night 56.98 52.14 50.6 44.06 40 -
NL6 Day 70.84 72.87 69.69 67.52 55 55
Night 61.51 54.54 51.9 48.86 45 45
NL7 Day 61.42 64.28 60.6 53.42 55 55
Night 50.74 50.84 46.5 44.16 45 45
NL8 Day 58.03 60.48 59 53.92 55 55
Night 51.9 52.24 51.35 48.66 45 45
NL9 Day 54.43 56.18 54.15 53.21 50 -
Night 49.35 48.74 47.4 44.96 40 -
NL10 Day 66.82 71.37 62.8 58.82 55 55
Night 55.34 56.64 53.6 50.96 45 45
NL11 Day 67.21 70.47 67.59 61.82 55 55
Night 55.4 55.94 55.2 52.56 45 45
NL12 Day 69.25 72.67 69.89 62.62 55 55
Night 60.38 61.64 59.6 56.46 45 45
Source: Noise Monitoring carried out by Consultant Team, 2019
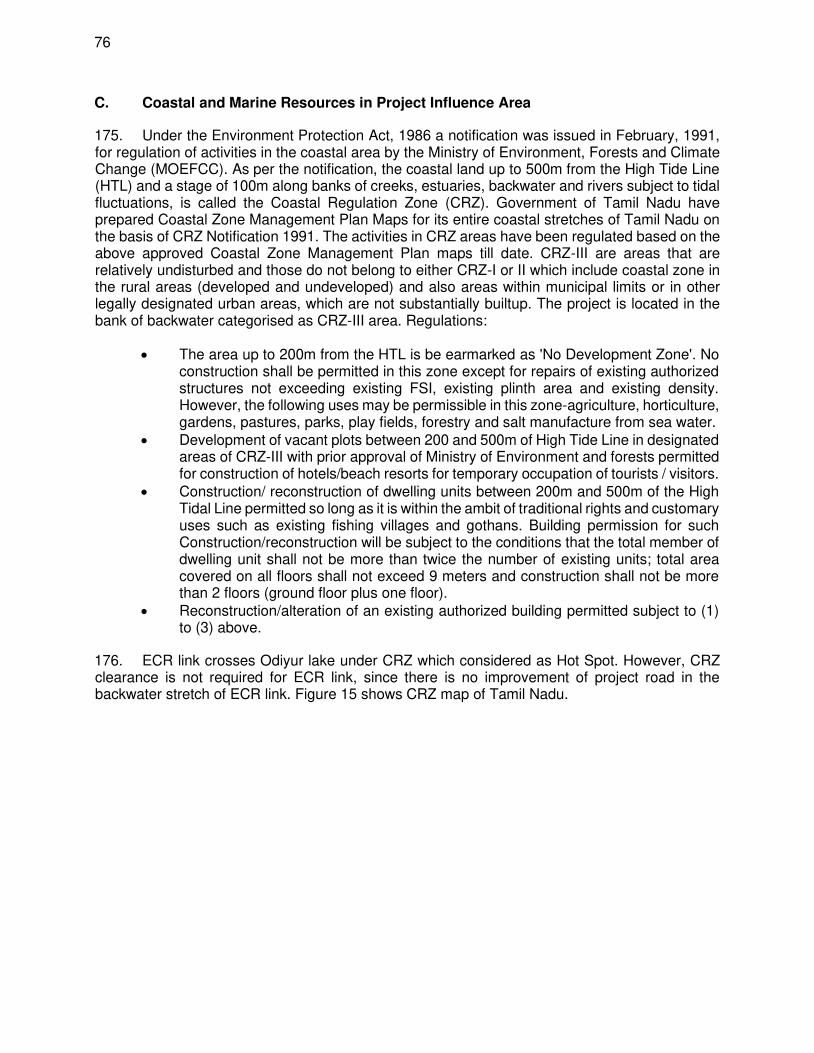
76
C. Coastal and Marine Resources in Project Influence Area
175. Under the Environment Protection Act, 1986 a notification was issued in February, 1991, for regulation of activities in the coastal area by the Ministry of Environment, Forests and Climate Change (MOEFCC). As per the notification, the coastal land up to 500m from the High Tide Line (HTL) and a stage of 100m along banks of creeks, estuaries, backwater and rivers subject to tidal fluctuations, is called the Coastal Regulation Zone (CRZ). Government of Tamil Nadu have prepared Coastal Zone Management Plan Maps for its entire coastal stretches of Tamil Nadu on the basis of CRZ Notification 1991. The activities in CRZ areas have been regulated based on the above approved Coastal Zone Management Plan maps till date. CRZ-III are areas that are relatively undisturbed and those do not belong to either CRZ-I or II which include coastal zone in the rural areas (developed and undeveloped) and also areas within municipal limits or in other legally designated urban areas, which are not substantially builtup. The project is located in the bank of backwater categorised as CRZ-III area. Regulations:
• The area up to 200m from the HTL is be earmarked as 'No Development Zone'. No construction shall be permitted in this zone except for repairs of existing authorized structures not exceeding existing FSI, existing plinth area and existing density. However, the following uses may be permissible in this zone-agriculture, horticulture, gardens, pastures, parks, play fields, forestry and salt manufacture from sea water.
• Development of vacant plots between 200 and 500m of High Tide Line in designated areas of CRZ-III with prior approval of Ministry of Environment and forests permitted for construction of hotels/beach resorts for temporary occupation of tourists / visitors.
• Construction/ reconstruction of dwelling units between 200m and 500m of the High Tidal Line permitted so long as it is within the ambit of traditional rights and customary uses such as existing fishing villages and gothans. Building permission for such Construction/reconstruction will be subject to the conditions that the total member of dwelling unit shall not be more than twice the number of existing units; total area covered on all floors shall not exceed 9 meters and construction shall not be more than 2 floors (ground floor plus one floor).
• Reconstruction/alteration of an existing authorized building permitted subject to (1) to (3) above.
176. ECR link crosses Odiyur lake under CRZ which considered as Hot Spot. However, CRZ clearance is not required for ECR link, since there is no improvement of project road in the backwater stretch of ECR link. Figure 15 shows CRZ map of Tamil Nadu.
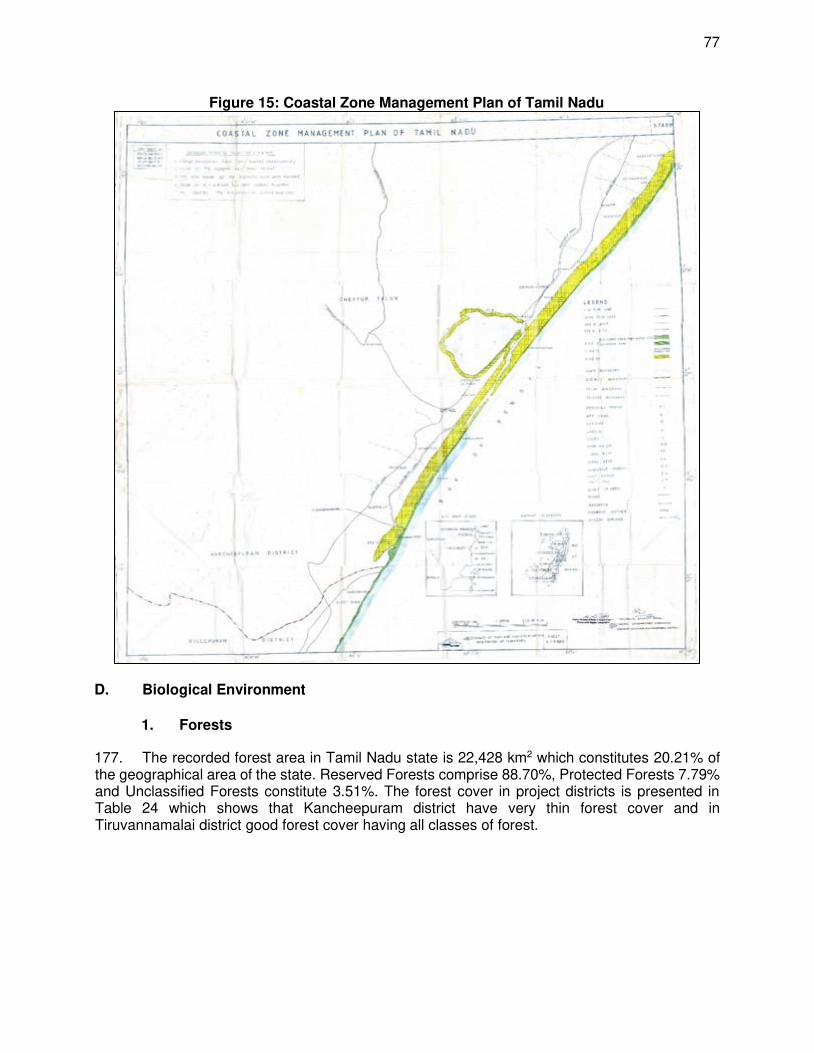
77
Figure 15: Coastal Zone Management Plan of Tamil Nadu
D. Biological Environment
1. Forests
177. The recorded forest area in Tamil Nadu state is 22,428 km2 which constitutes 20.21% of the geographical area of the state. Reserved Forests comprise 88.70%, Protected Forests 7.79% and Unclassified Forests constitute 3.51%. The forest cover in project districts is presented in Table 24 which shows that Kancheepuram district have very thin forest cover and in Tiruvannamalai district good forest cover having all classes of forest.
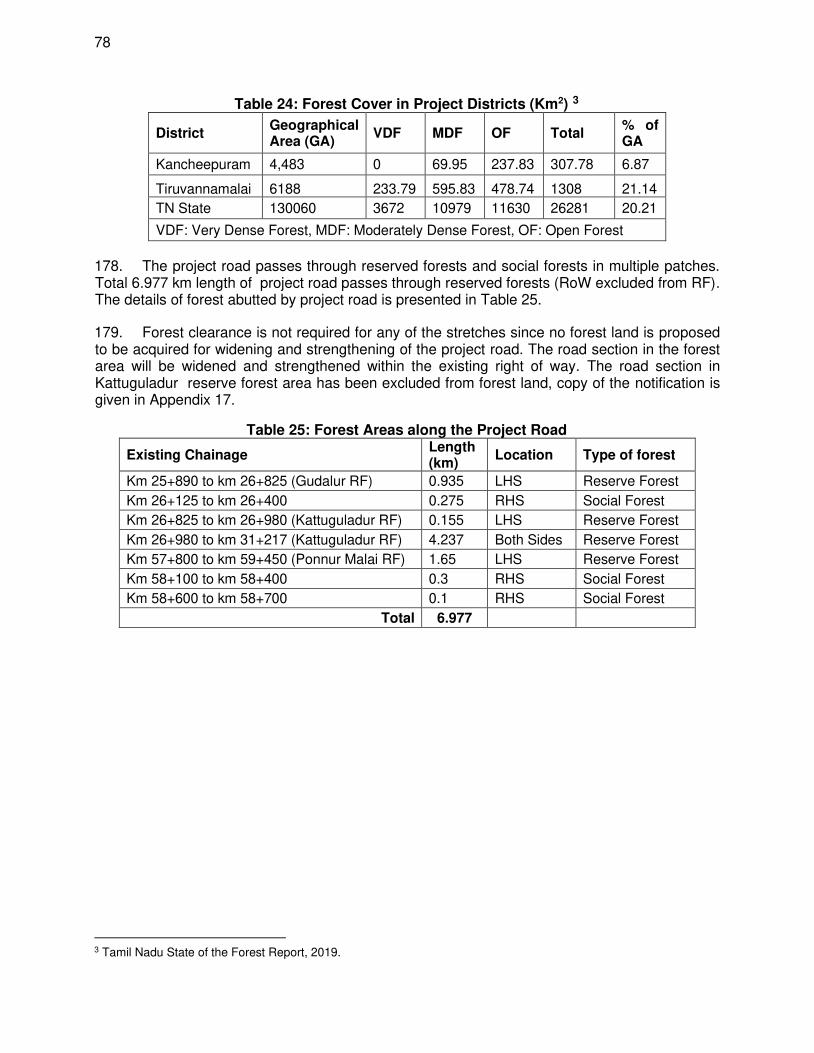
78
Table 24: Forest Cover in Project Districts (Km2) 3
District Geographical Area (GA)
VDF MDF OF Total % of GA
Kancheepuram 4,483 0 69.95 237.83 307.78 6.87
Tiruvannamalai 6188 233.79 595.83 478.74 1308 21.14
TN State 130060 3672 10979 11630 26281 20.21
VDF: Very Dense Forest, MDF: Moderately Dense Forest, OF: Open Forest
178. The project road passes through reserved forests and social forests in multiple patches. Total 6.977 km length of project road passes through reserved forests (RoW excluded from RF). The details of forest abutted by project road is presented in Table 25.
179. Forest clearance is not required for any of the stretches since no forest land is proposed to be acquired for widening and strengthening of the project road. The road section in the forest area will be widened and strengthened within the existing right of way. The road section in Kattuguladur reserve forest area has been excluded from forest land, copy of the notification is given in Appendix 17.
Table 25: Forest Areas along the Project Road
Existing Chainage Length (km)
Location Type of forest
Km 25+890 to km 26+825 (Gudalur RF) 0.935 LHS Reserve Forest
Km 26+125 to km 26+400 0.275 RHS Social Forest
Km 26+825 to km 26+980 (Kattuguladur RF) 0.155 LHS Reserve Forest
Km 26+980 to km 31+217 (Kattuguladur RF) 4.237 Both Sides Reserve Forest
Km 57+800 to km 59+450 (Ponnur Malai RF) 1.65 LHS Reserve Forest
Km 58+100 to km 58+400 0.3 RHS Social Forest
Km 58+600 to km 58+700 0.1 RHS Social Forest
Total 6.977
3 Tamil Nadu State of the Forest Report, 2019.
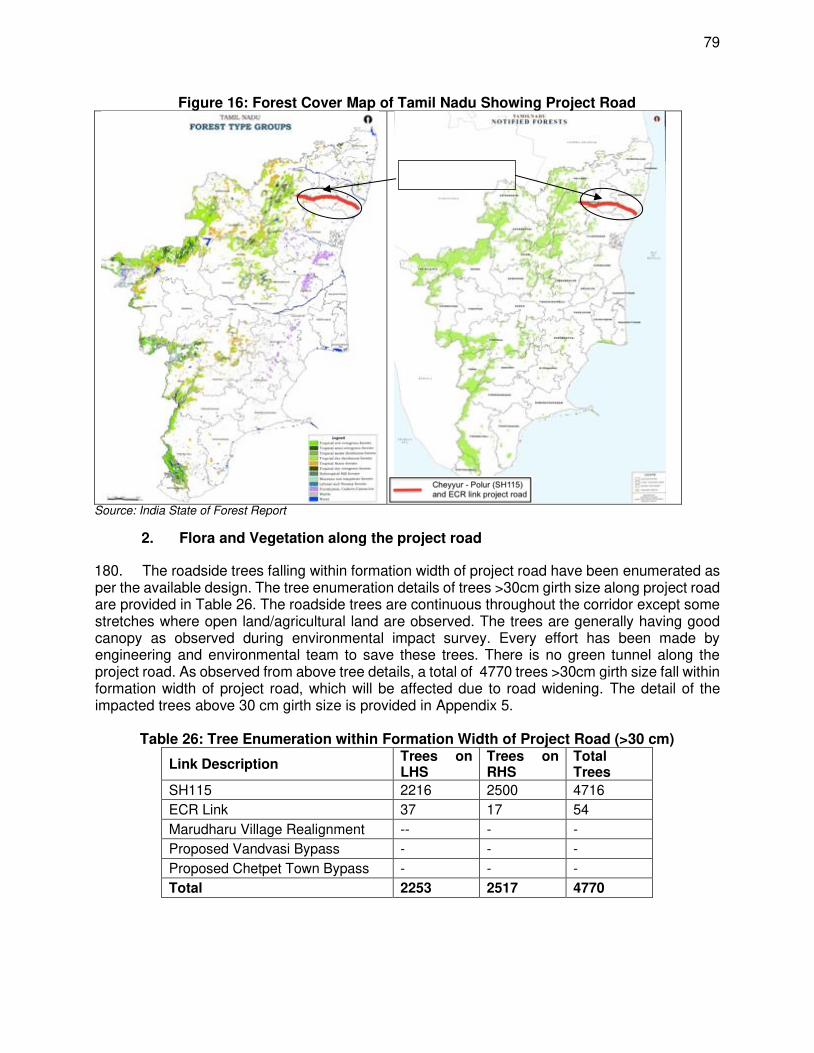
79
Figure 16: Forest Cover Map of Tamil Nadu Showing Project Road
Source: India State of Forest Report
2. Flora and Vegetation along the project road
180. The roadside trees falling within formation width of project road have been enumerated as per the available design. The tree enumeration details of trees >30cm girth size along project road are provided in Table 26. The roadside trees are continuous throughout the corridor except some stretches where open land/agricultural land are observed. The trees are generally having good canopy as observed during environmental impact survey. Every effort has been made by engineering and environmental team to save these trees. There is no green tunnel along the project road. As observed from above tree details, a total of 4770 trees >30cm girth size fall within formation width of project road, which will be affected due to road widening. The detail of the impacted trees above 30 cm girth size is provided in Appendix 5.
Table 26: Tree Enumeration within Formation Width of Project Road (>30 cm)
Link Description Trees on LHS
Trees on RHS
Total Trees
SH115 2216 2500 4716
ECR Link 37 17 54
Marudharu Village Realignment -- - -
Proposed Vandvasi Bypass - - -
Proposed Chetpet Town Bypass - - -
Total 2253 2517 4770

80
181. The local and scientific names of tree species observed along the project road with their CITES and IUCN status are listed in Table 27. The dominant tree species along project road are Mango, Tamarind, Palm, Neem, Coconut, Peepal, Indian beech, Siris and Black Plum.. Other observed species are either Least Concerned or have not yet been assessed for the IUCN Red List.
Table 27: IUCN Status of Major Tree Species within Formation Width (>30 cm)
Common Name
Tamil Name
Scientific Name IUCN Status
Banyan Alamaram Ficus benghalensis -
Peepal Arasan Ficus religiosa -
Coconut Coconut Cocos nucifera -
Mango Mango Mangifera indica -
Black Plum Naval Syzygium cumini LC
Neem Neem Azadirachta indica LC
Palm Palm Borassus flabellifer
-
Indian Beech
Pungai Millettia pinnata LC
Tamarind Tamarind Tamarindus indica LC
Siris Vagai Albizia lebbeck -
3. Protected Areas
182. There are five national parks, four tiger reserves, fifteen wildlife sanctuaries, fifteen bird sanctuaries, three biosphere reserves, (four) zoological park, three crocodile farms and two conservation reserve in the State of Tamil Nadu. (Source: Tamil Nadu Forest Department).
183. There is no protected area within 10 km aerial distance of the project site. The area did not record the presence of any critically threatened species. The field survey and investigation also indicates the absence of any high endemic or vulnerable species in this area. There is no critical habitat within the project area of influence. The project area can also be considered to be entirely modified habitat. The list of protected area within Tamil Nadu are shown in Table 28.
Table 28: Protected Areas of Tamil Nadu S. No.
Name District Area in ha Year Decl.
Major Animals Found
Wildlife Sanctuaries
1 Mudumalai Wildlife Sanctuary
Nilgiris 21,776.00 1940 Elephant, Gaur, Sambar, Chital, Panther, Tiger, Birds, Reptiles
2 Indira Gandhi Wildlife Sanctuary
Coimbatore 84,149.00 1976 Elephant, Gaur, Tiger, Panther, Sloth bear, Wild boar
3 Mundanthurai Wildlife Sanctuary
Tirunelveli 58,207.58 1962 Tiger, Bonnet Macaque, Langurs, Slender Loris, Sloth Bear, Sambar, Chital, Wild Dog
4 Kalakad Wildlife Sanctuary
Tirunelveli 22,358.00 1976 Lion Tailed Macaque, Nilgiri Tahr, Sambar, Sloth Bear, Elephant, Panther, Tiger
5 Srivilliputhur Grizzled Squirrel Wildlife Sanctuary
Virudhunagar 48,520.00 1988 Grizzled Giant Squirrel, Flying Squirrel, Nilgiri Tahr, Elephant, Lion Tailed Macaque
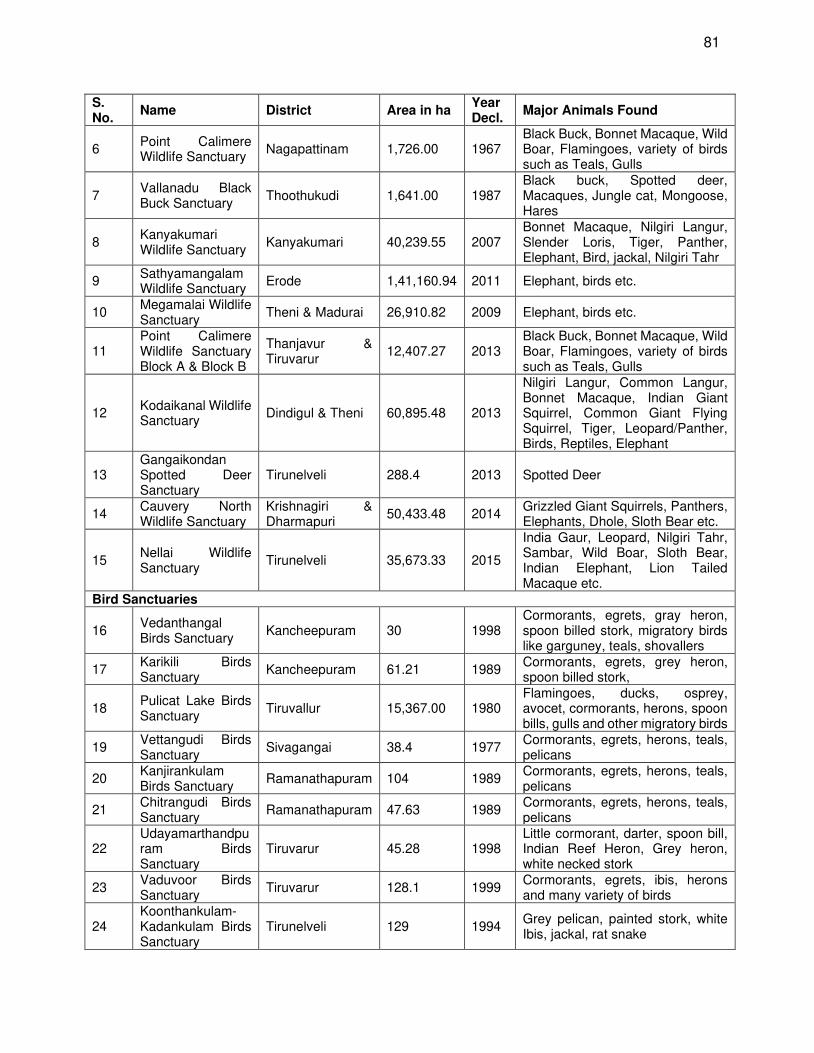
81
S. No.
Name District Area in ha Year Decl.
Major Animals Found
6 Point Calimere Wildlife Sanctuary
Nagapattinam 1,726.00 1967 Black Buck, Bonnet Macaque, Wild Boar, Flamingoes, variety of birds such as Teals, Gulls
7 Vallanadu Black Buck Sanctuary
Thoothukudi 1,641.00 1987 Black buck, Spotted deer, Macaques, Jungle cat, Mongoose, Hares
8 Kanyakumari Wildlife Sanctuary
Kanyakumari 40,239.55 2007 Bonnet Macaque, Nilgiri Langur, Slender Loris, Tiger, Panther, Elephant, Bird, jackal, Nilgiri Tahr
9 Sathyamangalam Wildlife Sanctuary
Erode 1,41,160.94 2011 Elephant, birds etc.
10 Megamalai Wildlife Sanctuary
Theni & Madurai 26,910.82 2009 Elephant, birds etc.
11 Point Calimere Wildlife Sanctuary Block A & Block B
Thanjavur & Tiruvarur
12,407.27 2013 Black Buck, Bonnet Macaque, Wild Boar, Flamingoes, variety of birds such as Teals, Gulls
12 Kodaikanal Wildlife Sanctuary
Dindigul & Theni 60,895.48 2013
Nilgiri Langur, Common Langur, Bonnet Macaque, Indian Giant Squirrel, Common Giant Flying Squirrel, Tiger, Leopard/Panther, Birds, Reptiles, Elephant
13 Gangaikondan Spotted Deer Sanctuary
Tirunelveli 288.4 2013 Spotted Deer
14 Cauvery North Wildlife Sanctuary
Krishnagiri & Dharmapuri
50,433.48 2014 Grizzled Giant Squirrels, Panthers, Elephants, Dhole, Sloth Bear etc.
15 Nellai Wildlife Sanctuary
Tirunelveli 35,673.33 2015
India Gaur, Leopard, Nilgiri Tahr, Sambar, Wild Boar, Sloth Bear, Indian Elephant, Lion Tailed Macaque etc.
Bird Sanctuaries
16 Vedanthangal Birds Sanctuary
Kancheepuram 30 1998 Cormorants, egrets, gray heron, spoon billed stork, migratory birds like garguney, teals, shovallers
17 Karikili Birds Sanctuary
Kancheepuram 61.21 1989 Cormorants, egrets, grey heron, spoon billed stork,
18 Pulicat Lake Birds Sanctuary
Tiruvallur 15,367.00 1980 Flamingoes, ducks, osprey, avocet, cormorants, herons, spoon bills, gulls and other migratory birds
19 Vettangudi Birds Sanctuary
Sivagangai 38.4 1977 Cormorants, egrets, herons, teals, pelicans
20 Kanjirankulam Birds Sanctuary
Ramanathapuram 104 1989 Cormorants, egrets, herons, teals, pelicans
21 Chitrangudi Birds Sanctuary
Ramanathapuram 47.63 1989 Cormorants, egrets, herons, teals, pelicans
22 Udayamarthandpu ram Birds Sanctuary
Tiruvarur 45.28 1998 Little cormorant, darter, spoon bill, Indian Reef Heron, Grey heron, white necked stork
23 Vaduvoor Birds Sanctuary
Tiruvarur 128.1 1999 Cormorants, egrets, ibis, herons and many variety of birds
24 Koonthankulam-Kadankulam Birds Sanctuary
Tirunelveli 129 1994 Grey pelican, painted stork, white Ibis, jackal, rat snake

82
S. No.
Name District Area in ha Year Decl.
Major Animals Found
25 Karaivetti Birds Sanctuary
Ariyalur 453.71 1999 Egrets, pelican, grey heron, white ibis, spoon bill
26 Vellode Birds Sanctuary
Erode 77.18 2000 Spoon bill, teals, pintail ducks, darter
27 Melaselvanur- Kilaselvanur Birds Sanctuary
Ramanathapuram 593.08 1998 Grey pelican, painted stork
28 Theerthangal Bird Sanctuary
Ramanathapuram 29.29 2010 White-breasted kingfisher, spot- billed pelican, brahminy kite
29 Sakkarakottai Tank Birds Sanctuary
Ramanathapuram 230.49 2012 Spot-billed pelican, egret, common myna, grey heron, little cormorant, black kite, etc.
30 Oussudu Lake Birds Sanctuary
Villupuram 331.79 2015 Spot-billed pelican, egret, common myna, grey heron, little cormorant, black kite, etc.
National Parks
31 Mudumalai National Park
Nilgiris 10,323.00 2005 Elephant, Gaur, Sambar, Chital, Tiger, Birds, and reptiles
32 Indira Gandhi National Park
Coimbatore 11,710.00 1989 Elephant, Gaur, Tiger, Panther, Sloth Bear, Wild Boar
33 Mukurthi National Park
Nilgiris 7,846.00 2001 Nilgiri Tahr, Jackal, Otter, Jungle cat, Sambar, Barking deer.
34 Guindy National Park
Chennai 270.57 1978 Black Buck, Chital, Jackal, Pangolin and variety of birds
35
Gulf of Mannar Marine National Park (21 Islands) and biosphere reserve
Ramanathapuram & Thoothukudi
52,602.00 1986 Characteristic tropical flora & fauna of coral reefs, Dugong, Turtles, Dolphins and Balanoglossus
Conservation Reserves
36
Thiruppudaimaruth ur Birds Conservation Reserve
Tirunelveli 2.84 2005 Birds
37
Suchindrum- Theroor-Managudi Conservation Reserve
Kaninyakumari 484.77 2015 Birds
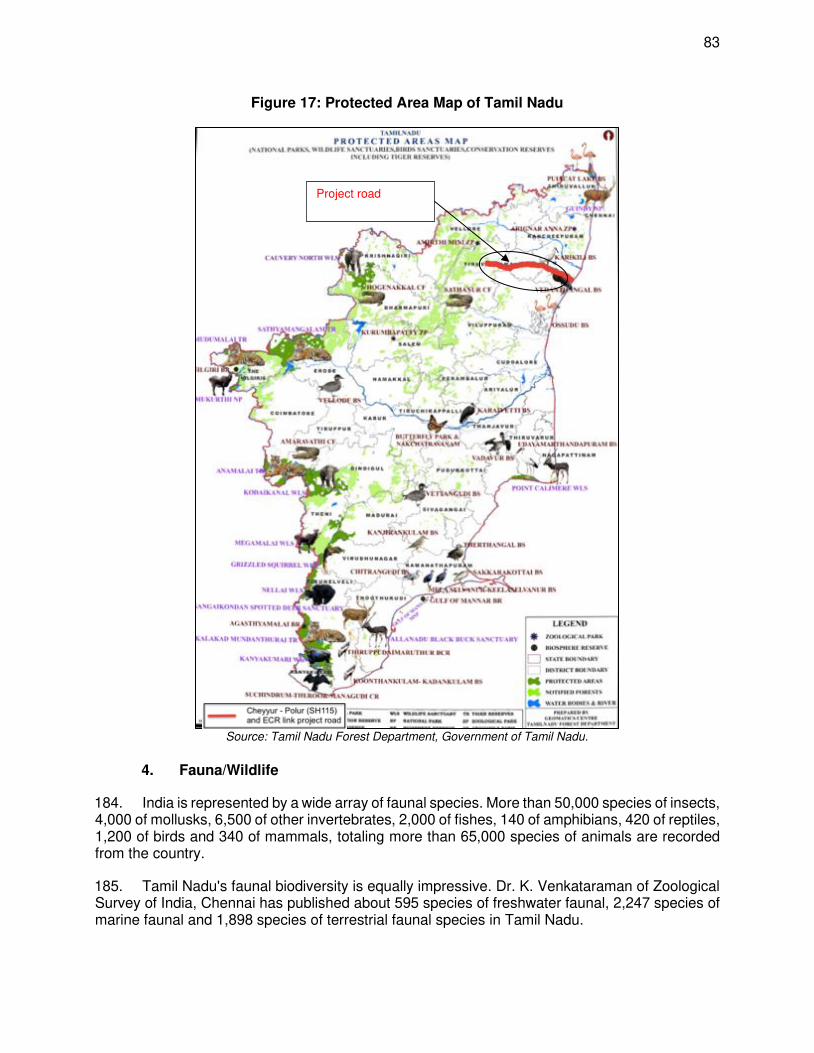
83
Figure 17: Protected Area Map of Tamil Nadu
Source: Tamil Nadu Forest Department, Government of Tamil Nadu.
4. Fauna/Wildlife
184. India is represented by a wide array of faunal species. More than 50,000 species of insects, 4,000 of mollusks, 6,500 of other invertebrates, 2,000 of fishes, 140 of amphibians, 420 of reptiles, 1,200 of birds and 340 of mammals, totaling more than 65,000 species of animals are recorded from the country.
185. Tamil Nadu's faunal biodiversity is equally impressive. Dr. K. Venkataraman of Zoological Survey of India, Chennai has published about 595 species of freshwater faunal, 2,247 species of marine faunal and 1,898 species of terrestrial faunal species in Tamil Nadu.
Project road
84
186. The faunal diversity of the State includes 165 species of fresh water fishes, 76 species of amphibians, 177 species of reptiles, 454 species of birds and 187 species of mammals. According to the CAMP reports the red-listed species include 126 species of fishes, 56 species of amphibians, 77 species of reptiles, 32 species of birds and 40 species of mammals.
187. The endemic fauna includes 36 species of amphibians, 63 species of reptiles, 17 species of birds and 24 species of mammals. Many faunal species have been included in the various schedules of the Wild Life Protection Act 1972, considering their endangered status. Schedule I animals include 22 species of mammals, 42 species of birds and 9 species of reptiles.
188. Schedule II includes 13 species of mammals. Schedule III includes 5 species of mammals and Schedule IV includes 5 species of mammals, 367 species of birds, 109 species of reptiles and 23 species of amphibians. Schedule V incorporates 13 species of mammals and 1 species of birds4.
a. Assessment of Fauna along the Project Road
189. In order to establish baseline data on the presence of important wildlife and faunal habitats in the project area, a field assessment has been carried using field surveys (walkover surveys and consultations with local forestry and wildlife officials and local communities). The main findings of this Wildlife Study are summarized herewith.
190. The main objectives of the biodiversity study were to assess and document wildlife and faunal habitats in the project area and along the proposed alignment in particular. The study has been carried out in the months of January-February 2020. The methods including literature review, direct field sightings by transect walk, discussions with local communities, consultations with local (field level) forest officials etc. were used to collect data on presence of wildlife and avifauna in protected areas along the project road.
191. The fauna along and surrounding the project road incudes mammals such Porcupine, Mongoose, Wild boar, Common monkey, Hare and Jackal. Birds include Little cormorant, Eastern purple heron, Night heron, Paddy bird, Little Egret, Cattle Egret, Brahmny kite, Pariah kite, Koel, Southern Indian roller, Common myna, Ceylon house crow, Indian house sparrow, Tailor bird, Common teal, Jungle bush quail, Satone curlew, Spotted dove, Parakeet and Crow pheasant. Butterflies includes Indian common crow, Indian red grass and Tailed jay. Reptiles includes House Lizard, Common garden lizard, Indian chameleon, Krait and Indian cobra. Amphibians includes common frog and Toad. There are no vulnerable/ endangered or rare species fauna around the project site. There is no presence of any fauna species listed in Schedule I of the Wild Life (Protection) Act, 1972 of Government of India. The fauna along the project road is presented in below Table 29.
4 Tamil Nadu Forest Department. http://tnenvis.nic.in/Database/SoilResources_1171.aspx
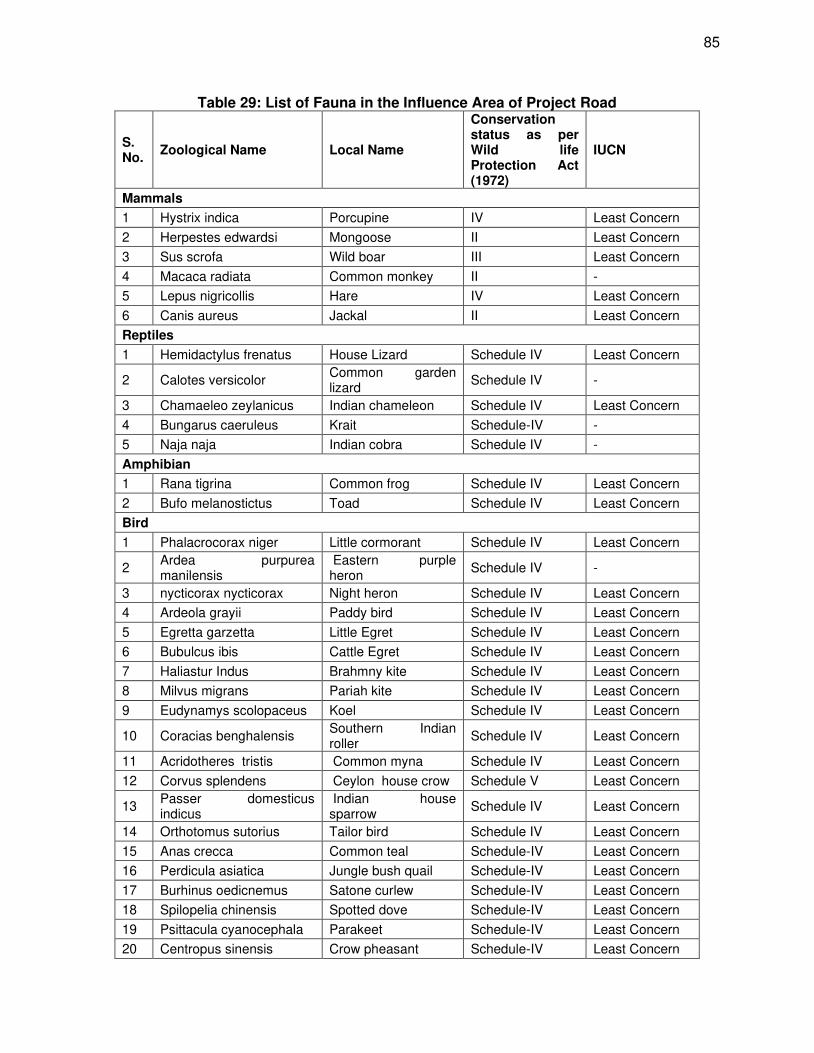
85
Table 29: List of Fauna in the Influence Area of Project Road
S. No.
Zoological Name Local Name
Conservation status as per Wild life Protection Act (1972)
IUCN
Mammals
1 Hystrix indica Porcupine IV Least Concern
2 Herpestes edwardsi Mongoose II Least Concern
3 Sus scrofa Wild boar III Least Concern
4 Macaca radiata Common monkey II -
5 Lepus nigricollis Hare IV Least Concern
6 Canis aureus Jackal II Least Concern
Reptiles
1 Hemidactylus frenatus House Lizard Schedule IV Least Concern
2 Calotes versicolor Common garden lizard
Schedule IV -
3 Chamaeleo zeylanicus Indian chameleon Schedule IV Least Concern
4 Bungarus caeruleus Krait Schedule-IV -
5 Naja naja Indian cobra Schedule IV -
Amphibian
1 Rana tigrina Common frog Schedule IV Least Concern
2 Bufo melanostictus Toad Schedule IV Least Concern
Bird
1 Phalacrocorax niger Little cormorant Schedule IV Least Concern
2 Ardea purpurea manilensis
Eastern purple heron
Schedule IV -
3 nycticorax nycticorax Night heron Schedule IV Least Concern
4 Ardeola grayii Paddy bird Schedule IV Least Concern
5 Egretta garzetta Little Egret Schedule IV Least Concern
6 Bubulcus ibis Cattle Egret Schedule IV Least Concern
7 Haliastur Indus Brahmny kite Schedule IV Least Concern
8 Milvus migrans Pariah kite Schedule IV Least Concern
9 Eudynamys scolopaceus Koel Schedule IV Least Concern
10 Coracias benghalensis Southern Indian roller
Schedule IV Least Concern
11 Acridotheres tristis Common myna Schedule IV Least Concern
12 Corvus splendens Ceylon house crow Schedule V Least Concern
13 Passer domesticus indicus
Indian house sparrow
Schedule IV Least Concern
14 Orthotomus sutorius Tailor bird Schedule IV Least Concern
15 Anas crecca Common teal Schedule-IV Least Concern
16 Perdicula asiatica Jungle bush quail Schedule-IV Least Concern
17 Burhinus oedicnemus Satone curlew Schedule-IV Least Concern
18 Spilopelia chinensis Spotted dove Schedule-IV Least Concern
19 Psittacula cyanocephala Parakeet Schedule-IV Least Concern
20 Centropus sinensis Crow pheasant Schedule-IV Least Concern
86
Butterfly
1 Euploea core Indian common crow Schedule-IV Least Concern
2 Euploea crassa Indian red grass Schedule-IV -
3 Graphium agamemnon Tailed jay Schedule-IV -
b) Threatened Species
192. The field survey results and consultation with stakeholder confirm that in the PAI for the road section there is no habitat of globally threatened species or migratory species visiting the protected area.
E. Socio-economic Environment
1. Demography
193. The project road passes through two districts of Tamil Nadu namely Kanchipuram and Tiruvannamalai.
194. Kanchipuram: According to 2011 census, Kancheepuram district had a population of 3,998,252 with male population of 2,012,958 and female population of 1,985,294. Sex-ratio of district is 986 females for every 1,000 males, much above the national average of 929. Male and female literacy rate in the district is 89.89% and 79.02% respectively. The population density in the district is 892 persons per sq.km. Scheduled Castes and Scheduled Tribes accounted for 23.71% and 1.03% of the population respectively. The average literacy of the district was 75.37%, compared to the national average of 72.99%. The district had a total of 1,006,245 households. There was a total of 1,673,814 workers, comprising 74,761 cultivators, 162,494 main agricultural labourers, 41,149 in house hold industries, 1,088,974 other workers, 306,436 marginal workers, 14,582 marginal cultivators, 110,020 marginal agricultural labourers, 13,583 marginal workers in household industries and 168,251 other marginal workers.
195. According to 2011 census, Tiruvannamalai District had a population of 2,464,875 with a sex-ratio of 994 females for every 1,000 males, much above the national average of 929. A total of 272,569 were under the age of six, constituting 141,205 males and 131,364 females. Scheduled Castes and Scheduled Tribes accounted for 22.94% and 3.69% of the population respectively. The average literacy of the district was 66.%, compared to the national average of 72.99%. The district had a total of 588,836 households. There were a total of 1,238,177 workers, comprising 265,183 cultivators, 351,310 main agricultural labourers, 37,020 in house hold industries, 316,559 other workers, 268,105 marginal workers, 27,458 marginal cultivators, 173,753 marginal agricultural labourers, 9,700 marginal workers in household industries and 57,194 other marginal workers.
2. Land Use
196. The land use distribution along the 500 m of project road is predominantly Agricultural land followed by Settlement followed by open dry land. The land use along the project road is mostly arable land. Around 6% of project road passes through and along forest area, and social forestry plantations 43% passes through builtup/habitation areas and 51% passes through agricultural areas.
87
3. Economic Development
197. The economy of Tamil Nadu has grown steadily from a plan allocation of about ₹280 billion during 2012–2013, to about ₹606 billion during 2016–2017. The plan expenditure has grown by over 20% per annum during this period. Gross state domestic product and net state domestic product have been growing at over 10% from 2011–2012 to 2016–2017, though there is an expectation in the budget for 2017–2018 that these may drop below 10% in view of the impact of demonetization and introduction of the goods and services tax regime. From 2017– 2018, the concept of plan and non-plan expenditure is no longer followed and a substitute measure could be the capital expenditure as a proportion of the budget. The state budget mentions that it is paying special attention to capital expenditure. The allocation for capital expenditure is about 15% of the total budget expenditure for 2017–2018.
4. Agriculture
198. Agriculture plays a vital role in the State’s economy. The major source of economy along the project road is agriculture and livestock. Agriculture is the main occupation of the people with 47% of the population engaged in it. Paddy is the major crop cultivated in this district. Groundnuts, sugarcane, cereals, millets and pulses are the other major crops cultivated. 76.50 Metric Tonnes of fuel wood and 8.039 Tonnes of cashew are produced from cultivated lands. Palar river along with tanks and wells are the main sources of irrigation in this district.
5. Archaeological and Historical Monuments
199. Road survey during DPR and preparation of this report revealed that there are no archaeological or historical monuments or physical cultural resources present along the road. No archaeological sites or historical monuments of state importance notified under Ancient and Historical Monument and Archaeological Sites and Remains Act, 1966 of Tamil Nadu nor of national importance notified under The Ancient Monuments and Archaeological Sites and Remains Act 1958 of India are located along the project road section.
6. Sensitive Receptors
200. Road survey during DPR and preparation of this report revealed that there are no archaeological or historical monuments or physical cultural resources present along the road. During the environmental and social screening survey, number of sensitive receptors such as school, temple etc. are located along the alignment.
201. The list of sensitive receptors/structures on either side within 50m from center line of the road is presented in Table 30. These sensitive features along the road will be updated following the finalization of the resettlement plan by TNHD and the final detailed engineering design by the EPC contractor of the project road.
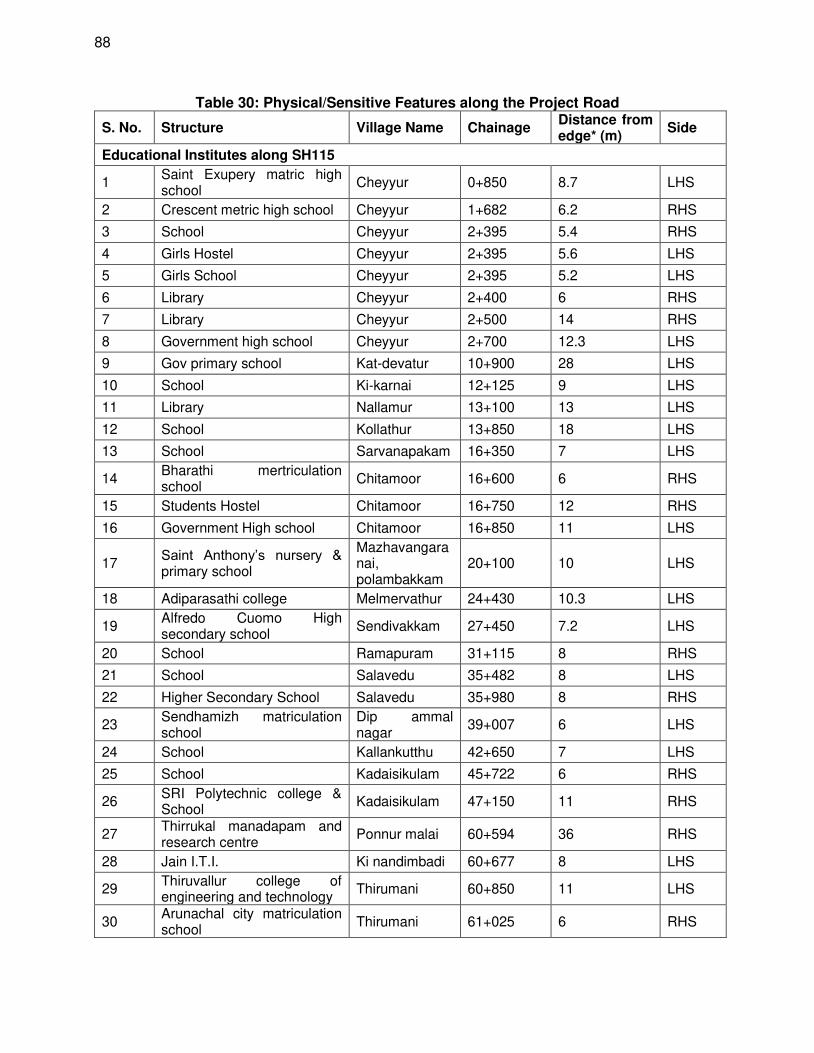
88
Table 30: Physical/Sensitive Features along the Project Road
S. No. Structure Village Name Chainage Distance from edge* (m)
Side
Educational Institutes along SH115
1 Saint Exupery matric high school
Cheyyur 0+850 8.7 LHS
2 Crescent metric high school Cheyyur 1+682 6.2 RHS
3 School Cheyyur 2+395 5.4 RHS
4 Girls Hostel Cheyyur 2+395 5.6 LHS
5 Girls School Cheyyur 2+395 5.2 LHS
6 Library Cheyyur 2+400 6 RHS
7 Library Cheyyur 2+500 14 RHS
8 Government high school Cheyyur 2+700 12.3 LHS
9 Gov primary school Kat-devatur 10+900 28 LHS
10 School Ki-karnai 12+125 9 LHS
11 Library Nallamur 13+100 13 LHS
12 School Kollathur 13+850 18 LHS
13 School Sarvanapakam 16+350 7 LHS
14 Bharathi mertriculation school
Chitamoor 16+600 6 RHS
15 Students Hostel Chitamoor 16+750 12 RHS
16 Government High school Chitamoor 16+850 11 LHS
17 Saint Anthony’s nursery & primary school
Mazhavangaranai, polambakkam
20+100 10 LHS
18 Adiparasathi college Melmervathur 24+430 10.3 LHS
19 Alfredo Cuomo High secondary school
Sendivakkam 27+450 7.2 LHS
20 School Ramapuram 31+115 8 RHS
21 School Salavedu 35+482 8 LHS
22 Higher Secondary School Salavedu 35+980 8 RHS
23 Sendhamizh matriculation school
Dip ammal nagar
39+007 6 LHS
24 School Kallankutthu 42+650 7 LHS
25 School Kadaisikulam 45+722 6 RHS
26 SRI Polytechnic college & School
Kadaisikulam 47+150 11 RHS
27 Thirrukal manadapam and research centre
Ponnur malai 60+594 36 RHS
28 Jain I.T.I. Ki nandimbadi 60+677 8 LHS
29 Thiruvallur college of engineering and technology
Thirumani 60+850 11 LHS
30 Arunachal city matriculation school
Thirumani 61+025 6 RHS
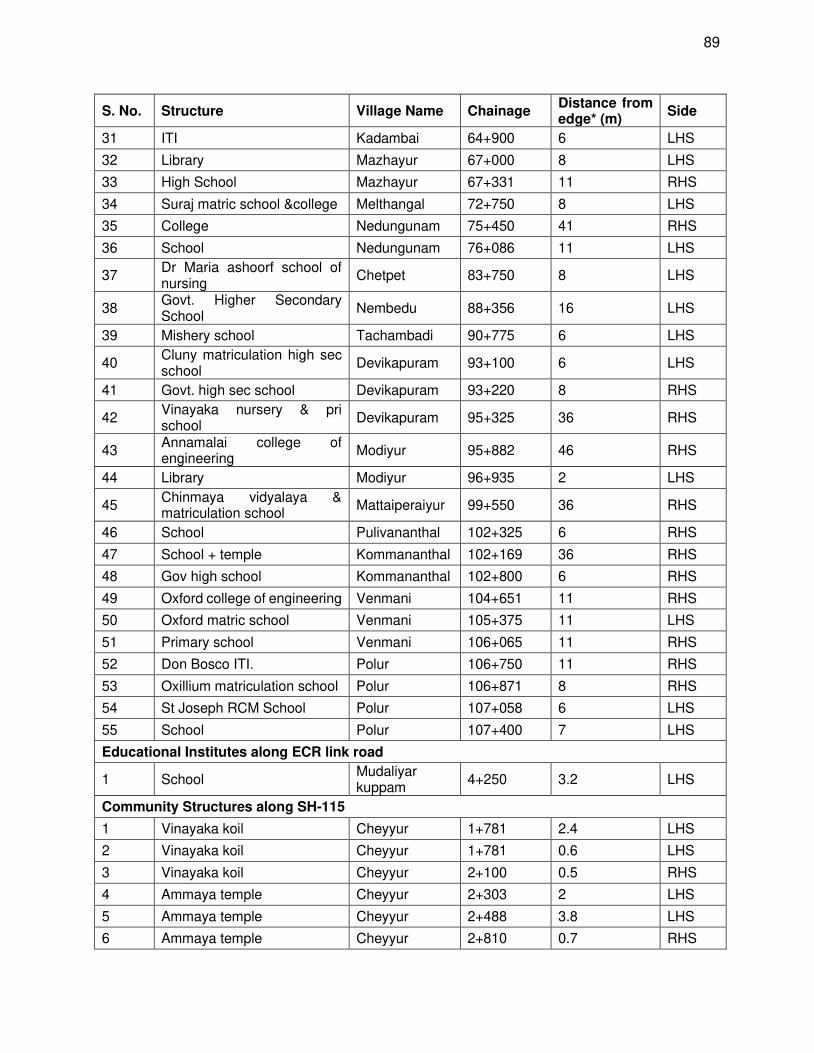
89
S. No. Structure Village Name Chainage Distance from edge* (m)
Side
31 ITI Kadambai 64+900 6 LHS
32 Library Mazhayur 67+000 8 LHS
33 High School Mazhayur 67+331 11 RHS
34 Suraj matric school &college Melthangal 72+750 8 LHS
35 College Nedungunam 75+450 41 RHS
36 School Nedungunam 76+086 11 LHS
37 Dr Maria ashoorf school of nursing
Chetpet 83+750 8 LHS
38 Govt. Higher Secondary School
Nembedu 88+356 16 LHS
39 Mishery school Tachambadi 90+775 6 LHS
40 Cluny matriculation high sec school
Devikapuram 93+100 6 LHS
41 Govt. high sec school Devikapuram 93+220 8 RHS
42 Vinayaka nursery & pri school
Devikapuram 95+325 36 RHS
43 Annamalai college of engineering
Modiyur 95+882 46 RHS
44 Library Modiyur 96+935 2 LHS
45 Chinmaya vidyalaya & matriculation school
Mattaiperaiyur 99+550 36 RHS
46 School Pulivananthal 102+325 6 RHS
47 School + temple Kommananthal 102+169 36 RHS
48 Gov high school Kommananthal 102+800 6 RHS
49 Oxford college of engineering Venmani 104+651 11 RHS
50 Oxford matric school Venmani 105+375 11 LHS
51 Primary school Venmani 106+065 11 RHS
52 Don Bosco ITI. Polur 106+750 11 RHS
53 Oxillium matriculation school Polur 106+871 8 RHS
54 St Joseph RCM School Polur 107+058 6 LHS
55 School Polur 107+400 7 LHS
Educational Institutes along ECR link road
1 School Mudaliyar kuppam
4+250 3.2 LHS
Community Structures along SH-115
1 Vinayaka koil Cheyyur 1+781 2.4 LHS
2 Vinayaka koil Cheyyur 1+781 0.6 LHS
3 Vinayaka koil Cheyyur 2+100 0.5 RHS
4 Ammaya temple Cheyyur 2+303 2 LHS
5 Ammaya temple Cheyyur 2+488 3.8 LHS
6 Ammaya temple Cheyyur 2+810 0.7 RHS
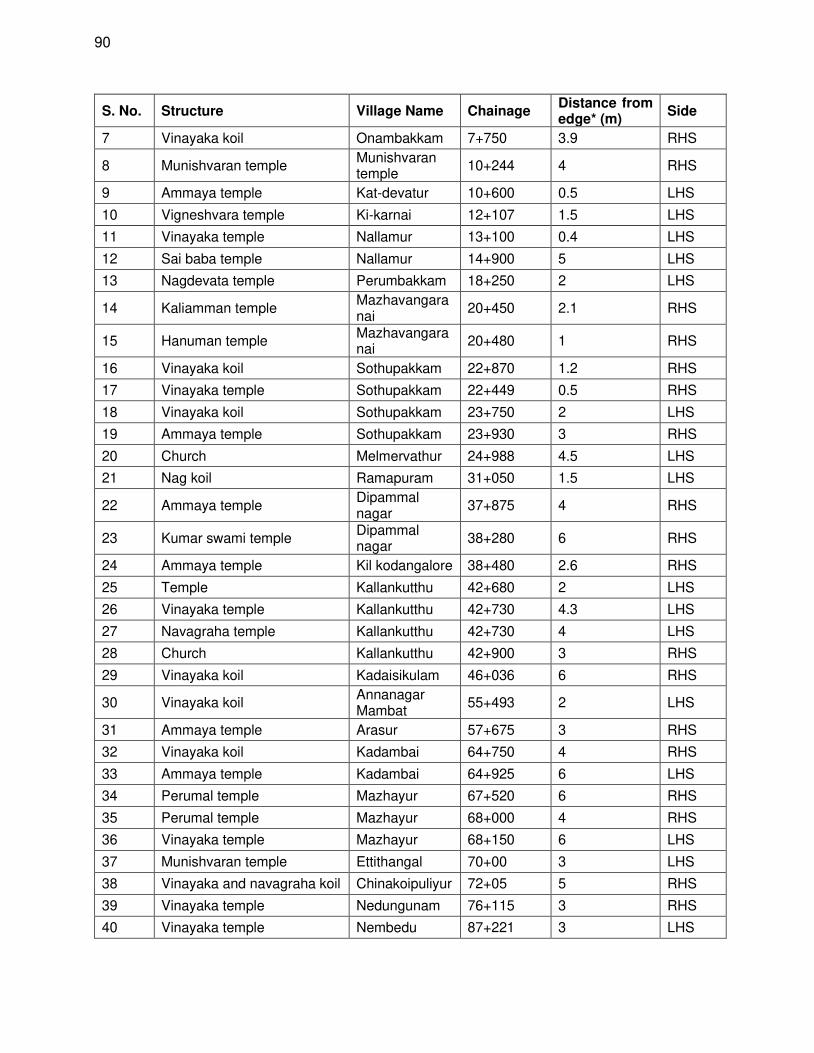
90
S. No. Structure Village Name Chainage Distance from edge* (m)
Side
7 Vinayaka koil Onambakkam 7+750 3.9 RHS
8 Munishvaran temple Munishvaran temple
10+244 4 RHS
9 Ammaya temple Kat-devatur 10+600 0.5 LHS
10 Vigneshvara temple Ki-karnai 12+107 1.5 LHS
11 Vinayaka temple Nallamur 13+100 0.4 LHS
12 Sai baba temple Nallamur 14+900 5 LHS
13 Nagdevata temple Perumbakkam 18+250 2 LHS
14 Kaliamman temple Mazhavangaranai
20+450 2.1 RHS
15 Hanuman temple Mazhavangaranai
20+480 1 RHS
16 Vinayaka koil Sothupakkam 22+870 1.2 RHS
17 Vinayaka temple Sothupakkam 22+449 0.5 RHS
18 Vinayaka koil Sothupakkam 23+750 2 LHS
19 Ammaya temple Sothupakkam 23+930 3 RHS
20 Church Melmervathur 24+988 4.5 LHS
21 Nag koil Ramapuram 31+050 1.5 LHS
22 Ammaya temple Dipammal nagar
37+875 4 RHS
23 Kumar swami temple Dipammal nagar
38+280 6 RHS
24 Ammaya temple Kil kodangalore 38+480 2.6 RHS
25 Temple Kallankutthu 42+680 2 LHS
26 Vinayaka temple Kallankutthu 42+730 4.3 LHS
27 Navagraha temple Kallankutthu 42+730 4 LHS
28 Church Kallankutthu 42+900 3 RHS
29 Vinayaka koil Kadaisikulam 46+036 6 RHS
30 Vinayaka koil Annanagar Mambat
55+493 2 LHS
31 Ammaya temple Arasur 57+675 3 RHS
32 Vinayaka koil Kadambai 64+750 4 RHS
33 Ammaya temple Kadambai 64+925 6 LHS
34 Perumal temple Mazhayur 67+520 6 RHS
35 Perumal temple Mazhayur 68+000 4 RHS
36 Vinayaka temple Mazhayur 68+150 6 LHS
37 Munishvaran temple Ettithangal 70+00 3 LHS
38 Vinayaka and navagraha koil Chinakoipuliyur 72+05 5 RHS
39 Vinayaka temple Nedungunam 76+115 3 RHS
40 Vinayaka temple Nembedu 87+221 3 LHS
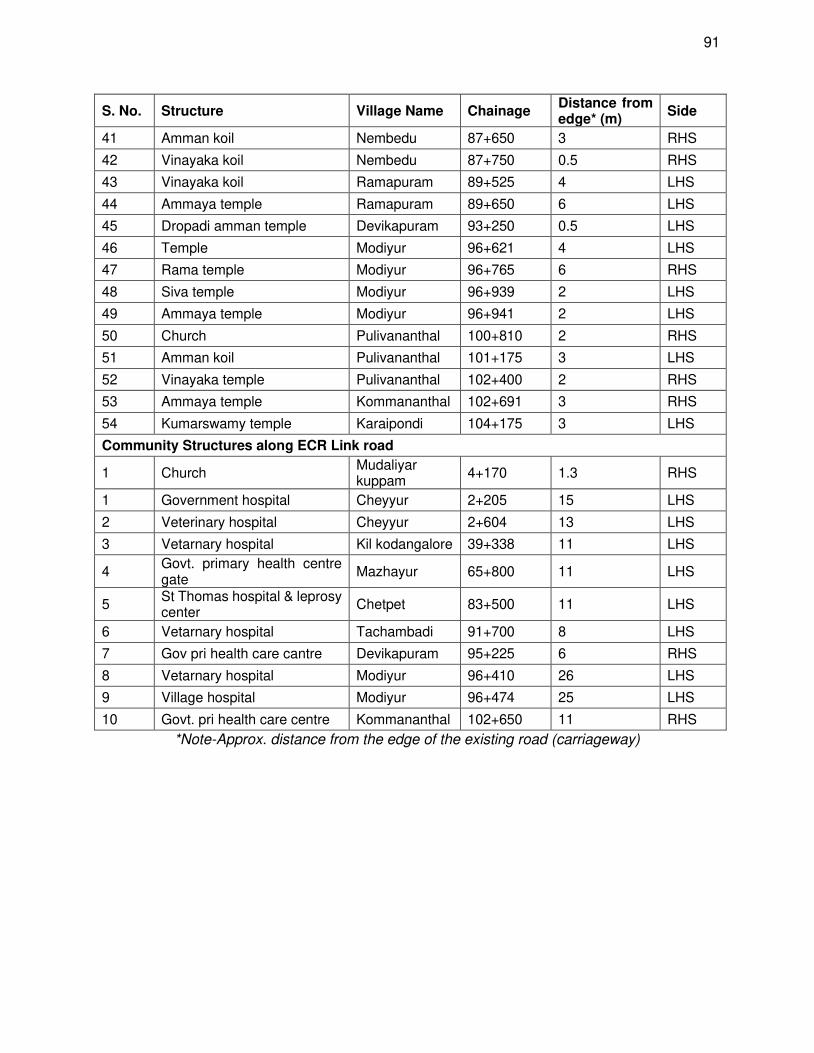
91
S. No. Structure Village Name Chainage Distance from edge* (m)
Side
41 Amman koil Nembedu 87+650 3 RHS
42 Vinayaka koil Nembedu 87+750 0.5 RHS
43 Vinayaka koil Ramapuram 89+525 4 LHS
44 Ammaya temple Ramapuram 89+650 6 LHS
45 Dropadi amman temple Devikapuram 93+250 0.5 LHS
46 Temple Modiyur 96+621 4 LHS
47 Rama temple Modiyur 96+765 6 RHS
48 Siva temple Modiyur 96+939 2 LHS
49 Ammaya temple Modiyur 96+941 2 LHS
50 Church Pulivananthal 100+810 2 RHS
51 Amman koil Pulivananthal 101+175 3 LHS
52 Vinayaka temple Pulivananthal 102+400 2 RHS
53 Ammaya temple Kommananthal 102+691 3 RHS
54 Kumarswamy temple Karaipondi 104+175 3 LHS
Community Structures along ECR Link road
1 Church Mudaliyar kuppam
4+170 1.3 RHS
1 Government hospital Cheyyur 2+205 15 LHS
2 Veterinary hospital Cheyyur 2+604 13 LHS
3 Vetarnary hospital Kil kodangalore 39+338 11 LHS
4 Govt. primary health centre gate
Mazhayur 65+800 11 LHS
5 St Thomas hospital & leprosy center
Chetpet 83+500 11 LHS
6 Vetarnary hospital Tachambadi 91+700 8 LHS
7 Gov pri health care cantre Devikapuram 95+225 6 RHS
8 Vetarnary hospital Modiyur 96+410 26 LHS
9 Village hospital Modiyur 96+474 25 LHS
10 Govt. pri health care centre Kommananthal 102+650 11 RHS
*Note-Approx. distance from the edge of the existing road (carriageway)
92
V. ANALYSIS OF ALTERNATIVES
202. This chapter presents the feasible alternatives to the proposed project with respect to site, design, technology etc. Since, the proposed project is an improvement of the existing road, no alternative alignments were considered for alternate route. Hence, an evaluation has been carried out for the ‘with’ and ‘without’ project situation in terms of the potential environmental impacts for the justification of the project. This chapter discusses how environmental parameters were assigned due importance and were carefully considered in the analysis of alternatives. The alternate alignment options for proposed bypasses were analysed based on technical, social, environmental and economic aspects
A. With Project’ and ‘Without Project’ Scenario
(i) ‘With Project’ Scenario
203. The ‘with project’ scenario includes the widening of road section to two lane carriageway with paved shoulders configurations of the existing road section of Cheyyur - Polur section of SH 115 and ECR Link in Tamil Nadu. The ‘with project’ scenario has been assessed to be economically viable and will alleviate the existing conditions. It would thereby, contribute to the development goals envisaged by State Government, and enhance the growth potential of the state through Chennai-Kanyakumari Industrial Corridor as well as the region. 204. To avoid the large-scale acquisition of land and properties, the project envisages the widening of existing road to two-lane with paved shoulders configuration and mostly along the existing alignment to minimize the loss of properties and livelihood of the PAPs.
(ii) ‘Without Project’ Scenario
205. In the case of ‘without project’ scenario the existing road with narrow carriageway width will be considered as it is. Considering the present traffic volume and potential for growth in near future, the capacity of the present road is insufficient for handling expected traffic volume and calls for immediate improvements.
206. The existing road section has poor riding condition, drainage, and geometry. Poor drainage is seriously impacting and deteriorating the road surface. The poor road conditions, population growth, increase in traffic volumes and the economic development along the project corridor would further exacerbate the already critical situation. The existing unsafe conditions and the adverse environmental consequences, in terms of the environmental quality along the roads, would continue to worsen in the absence of the proposed improvements.
207. Therefore, the no-action alternative is neither a reasonable nor a prudent course of action for the proposed project, as it would amount to failure to initiate any further improvements and impede economic development. Keeping in view the site conditions and the scope of development of the area, the ‘With-’ and ‘Without project’ scenarios have been compared as shown in Table 31. By looking at the table it can be concluded that “With project” scenario with positive/beneficial impacts will vastly improve the environment and enhance social and economic development of the region compared to the “Without project” scenario, which will further deteriorate the present environmental setup and quality of life. Hence the “With project” scenario with minor reversible impacts is an acceptable option than the “Without project” scenario. The implementation of the

93
project therefore will be definitely advantageous to achieve the holistic development of the economy and progress of the State.
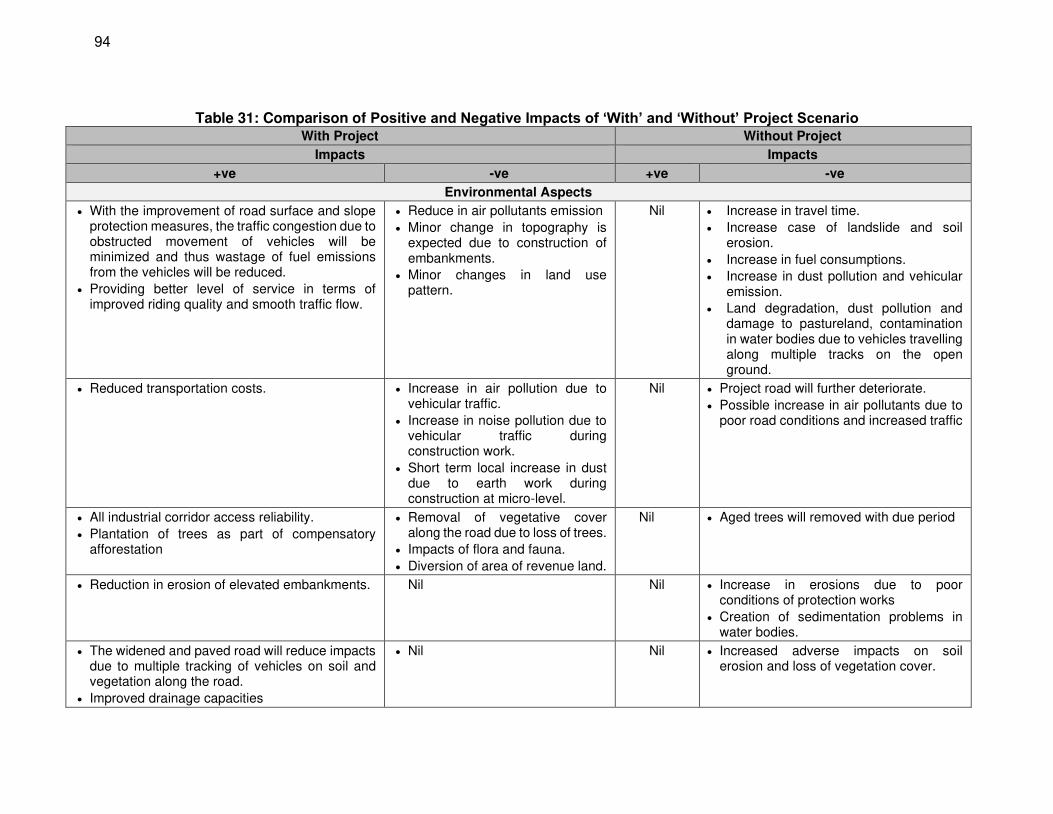
94
Table 31: Comparison of Positive and Negative Impacts of ‘With’ and ‘Without’ Project Scenario With Project Without Project
Impacts Impacts
+ve -ve +ve -ve
Environmental Aspects
• With the improvement of road surface and slope protection measures, the traffic congestion due to obstructed movement of vehicles will be minimized and thus wastage of fuel emissions from the vehicles will be reduced.
• Providing better level of service in terms of improved riding quality and smooth traffic flow.
• Reduce in air pollutants emission
• Minor change in topography is expected due to construction of embankments.
• Minor changes in land use pattern.
Nil • Increase in travel time.
• Increase case of landslide and soil erosion.
• Increase in fuel consumptions.
• Increase in dust pollution and vehicular emission.
• Land degradation, dust pollution and damage to pastureland, contamination in water bodies due to vehicles travelling along multiple tracks on the open ground.
• Reduced transportation costs. • Increase in air pollution due to vehicular traffic.
• Increase in noise pollution due to vehicular traffic during construction work.
• Short term local increase in dust due to earth work during construction at micro-level.
Nil • Project road will further deteriorate.
• Possible increase in air pollutants due to poor road conditions and increased traffic
• All industrial corridor access reliability.
• Plantation of trees as part of compensatory afforestation
• Removal of vegetative cover along the road due to loss of trees.
• Impacts of flora and fauna.
• Diversion of area of revenue land.
Nil • Aged trees will removed with due period
• Reduction in erosion of elevated embankments. Nil Nil • Increase in erosions due to poor conditions of protection works
• Creation of sedimentation problems in water bodies.
• The widened and paved road will reduce impacts due to multiple tracking of vehicles on soil and vegetation along the road.
• Improved drainage capacities
• Nil Nil • Increased adverse impacts on soil erosion and loss of vegetation cover.
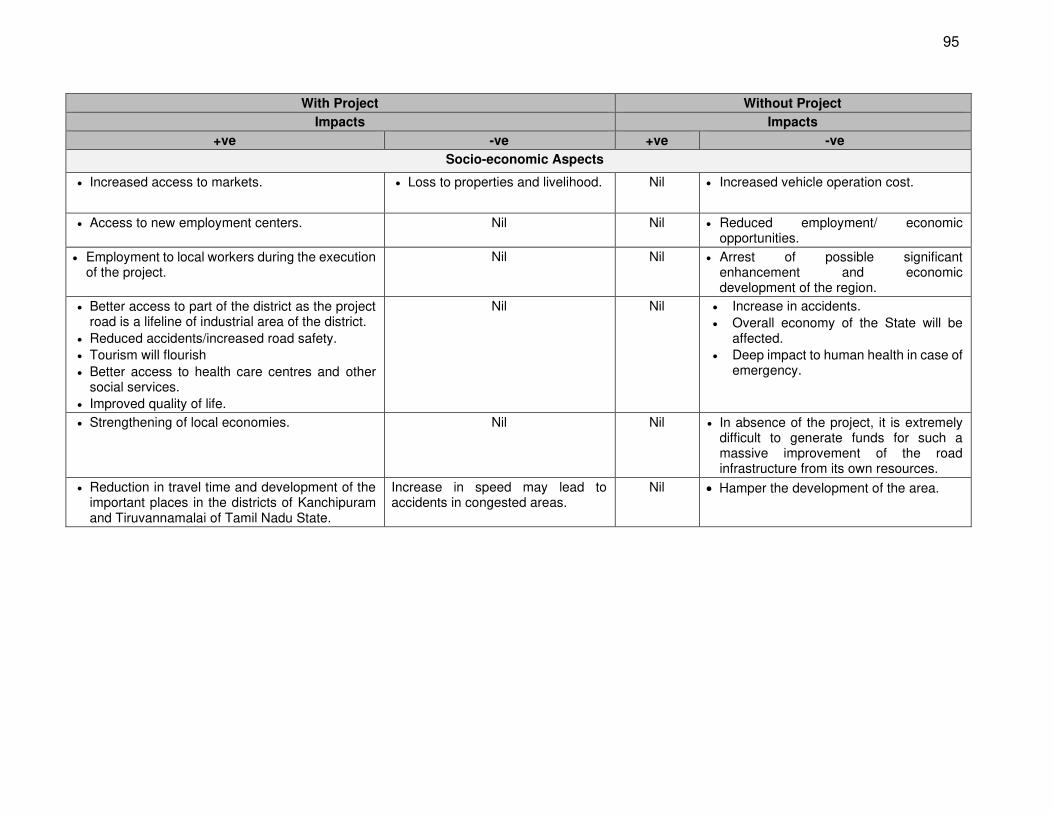
95
With Project Without Project
Impacts Impacts
+ve -ve +ve -ve
Socio-economic Aspects
• Increased access to markets. • Loss to properties and livelihood. Nil • Increased vehicle operation cost.
• Access to new employment centers. Nil Nil • Reduced employment/ economic opportunities.
• Employment to local workers during the execution of the project.
Nil Nil • Arrest of possible significant enhancement and economic development of the region.
• Better access to part of the district as the project road is a lifeline of industrial area of the district.
• Reduced accidents/increased road safety.
• Tourism will flourish
• Better access to health care centres and other social services.
• Improved quality of life.
Nil Nil • Increase in accidents.
• Overall economy of the State will be affected.
• Deep impact to human health in case of emergency.
• Strengthening of local economies. Nil Nil • In absence of the project, it is extremely difficult to generate funds for such a massive improvement of the road infrastructure from its own resources.
• Reduction in travel time and development of the important places in the districts of Kanchipuram and Tiruvannamalai of Tamil Nadu State.
Increase in speed may lead to accidents in congested areas.
Nil • Hamper the development of the area.
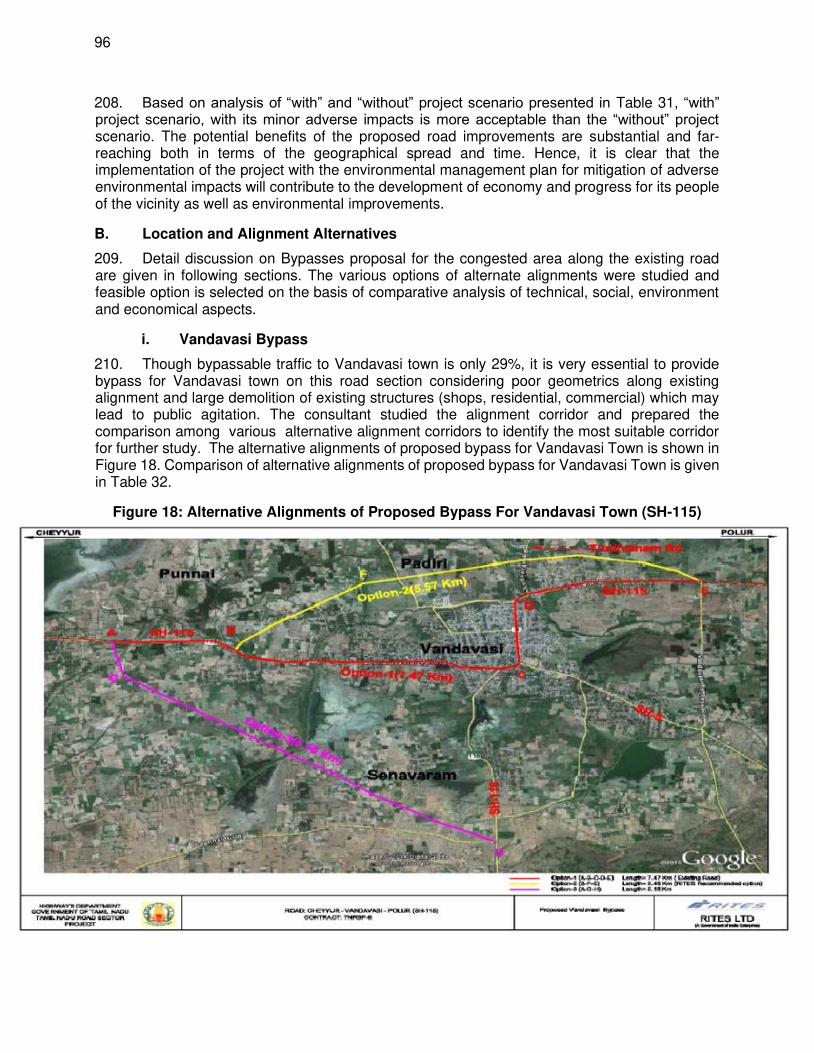
96
208. Based on analysis of “with” and “without” project scenario presented in Table 31, “with” project scenario, with its minor adverse impacts is more acceptable than the “without” project scenario. The potential benefits of the proposed road improvements are substantial and far-reaching both in terms of the geographical spread and time. Hence, it is clear that the implementation of the project with the environmental management plan for mitigation of adverse environmental impacts will contribute to the development of economy and progress for its people of the vicinity as well as environmental improvements.
B. Location and Alignment Alternatives
209. Detail discussion on Bypasses proposal for the congested area along the existing road are given in following sections. The various options of alternate alignments were studied and feasible option is selected on the basis of comparative analysis of technical, social, environment and economical aspects.
i. Vandavasi Bypass
210. Though bypassable traffic to Vandavasi town is only 29%, it is very essential to provide bypass for Vandavasi town on this road section considering poor geometrics along existing alignment and large demolition of existing structures (shops, residential, commercial) which may lead to public agitation. The consultant studied the alignment corridor and prepared the comparison among various alternative alignment corridors to identify the most suitable corridor for further study. The alternative alignments of proposed bypass for Vandavasi Town is shown in Figure 18. Comparison of alternative alignments of proposed bypass for Vandavasi Town is given in Table 32.
Figure 18: Alternative Alignments of Proposed Bypass For Vandavasi Town (SH-115)

97
Table 32: Comparison of Alternative Alignments of Proposed Bypass For Vandavasi
Town (SH-115)
Sl. No.
Feature/Description
Existing Alignment Option-1 Alternative Option - 2 Alternative Option - 3
Existing Road (A-B-C-D-E) New Alignment (B-F-E) New Alignment (A-G-H)
1 Road Length (km)
7.47km (km 45.200 to km 52.670)
5.46km (km 45.200 to km 52.670)
5.18km (km 45.850 of SH-115 to km 36.930 of SH-116)
2 Existing ROW
10 - -
3 Proposed ROW
16 30 30
4 Geometrics / Horizontal Curve
(i) Number of curves
33 5 2
(ii) Radius (m)
20 (R<40); 13(R<150) 5 (R>360) 2 (R>360)
5 Divertible Traffic (Car, Bus, Truck)
3076 Nos. 902 Nos. (29.32*%); 1871 PCU
1238 Nos. (29.32*%); 1871 PCU
6 Cross Drainage
(i) Major (no. & length)
1 (1-70m) 1 (1-80m) 1 (1-90m)
(ii) Minor (no. & length)
1 (1-15m) 2 (1-35m) 1 (1-50)
(iii) Culverts (nos.)
14 17 18
(iv) ROB/RUB
- - -
7 Major Junction Improvements
14 4 5
8 Environmental Issues
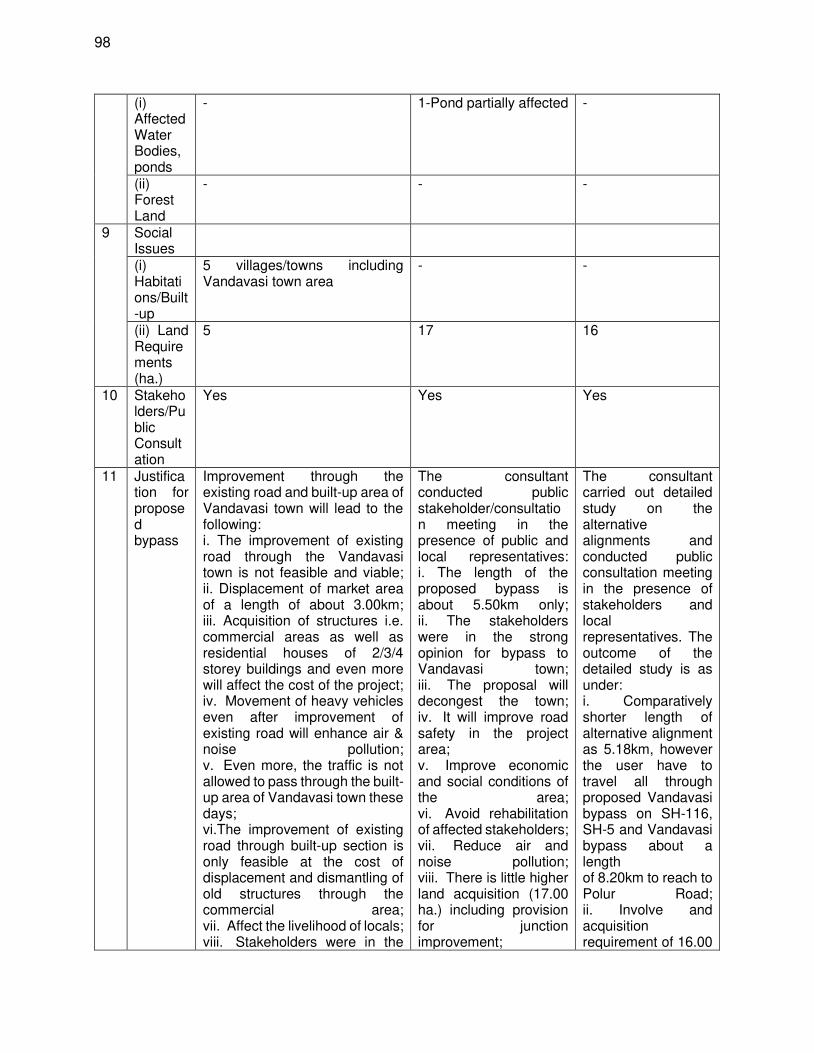
98
(i) Affected Water Bodies, ponds
- 1-Pond partially affected -
(ii) Forest Land
- - -
9 Social Issues
(i) Habitations/Built-up
5 villages/towns including Vandavasi town area
- -
(ii) Land Requirements (ha.)
5 17 16
10 Stakeholders/Public Consultation
Yes Yes Yes
11 Justification for proposed bypass
Improvement through the existing road and built-up area of Vandavasi town will lead to the following: i. The improvement of existing road through the Vandavasi town is not feasible and viable; ii. Displacement of market area of a length of about 3.00km; iii. Acquisition of structures i.e. commercial areas as well as residential houses of 2/3/4 storey buildings and even more will affect the cost of the project; iv. Movement of heavy vehicles even after improvement of existing road will enhance air & noise pollution; v. Even more, the traffic is not allowed to pass through the built- up area of Vandavasi town these days; vi.The improvement of existing road through built-up section is only feasible at the cost of displacement and dismantling of old structures through the commercial area; vii. Affect the livelihood of locals; viii. Stakeholders were in the
The consultant conducted public stakeholder/consultation meeting in the presence of public and local representatives: i. The length of the proposed bypass is about 5.50km only; ii. The stakeholders were in the strong opinion for bypass to Vandavasi town; iii. The proposal will decongest the town; iv. It will improve road safety in the project area; v. Improve economic and social conditions of the area; vi. Avoid rehabilitation of affected stakeholders; vii. Reduce air and noise pollution; viii. There is little higher land acquisition (17.00 ha.) including provision for junction improvement;
The consultant carried out detailed study on the alternative alignments and conducted public consultation meeting in the presence of stakeholders and local representatives. The outcome of the detailed study is as under: i. Comparatively shorter length of alternative alignment as 5.18km, however the user have to travel all through proposed Vandavasi bypass on SH-116, SH-5 and Vandavasi bypass about a length of 8.20km to reach to Polur Road; ii. Involve and acquisition requirement of 16.00
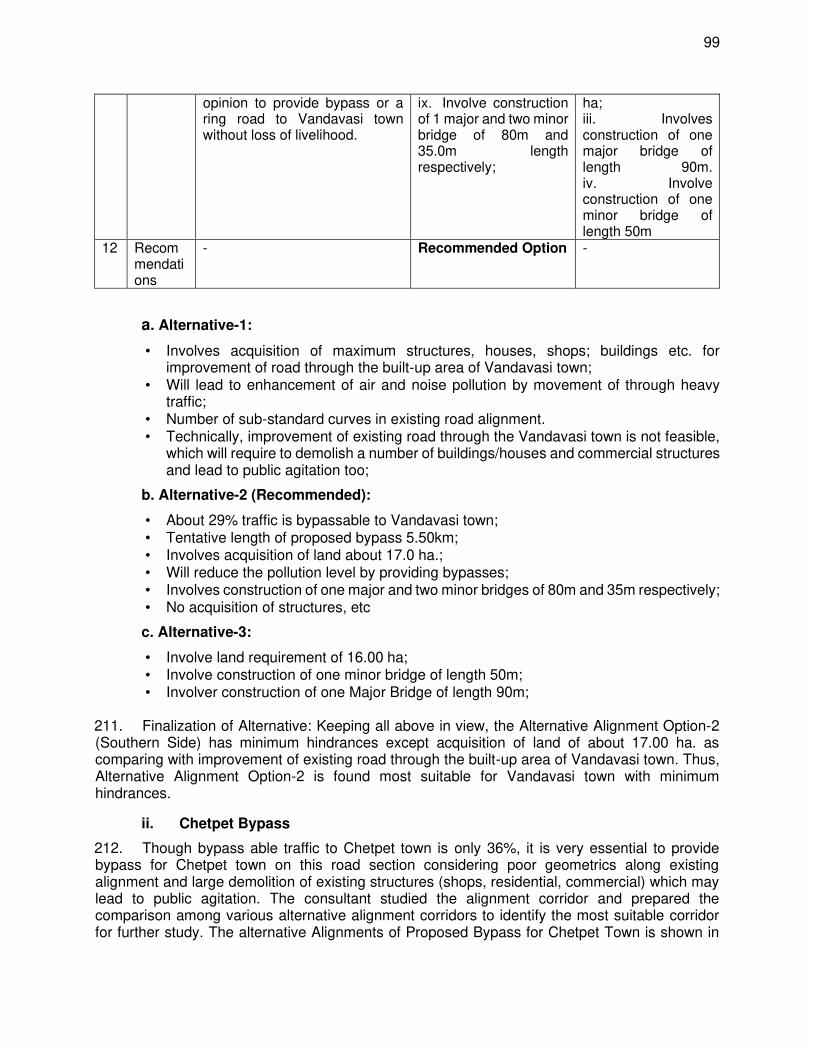
99
opinion to provide bypass or a ring road to Vandavasi town without loss of livelihood.
ix. Involve construction of 1 major and two minor bridge of 80m and 35.0m length respectively;
ha; iii. Involves construction of one major bridge of length 90m. iv. Involve construction of one minor bridge of length 50m
12 Recommendations
- Recommended Option -
a. Alternative-1:
• Involves acquisition of maximum structures, houses, shops; buildings etc. for improvement of road through the built-up area of Vandavasi town;
• Will lead to enhancement of air and noise pollution by movement of through heavy traffic;
• Number of sub-standard curves in existing road alignment. • Technically, improvement of existing road through the Vandavasi town is not feasible,
which will require to demolish a number of buildings/houses and commercial structures and lead to public agitation too;
b. Alternative-2 (Recommended):
• About 29% traffic is bypassable to Vandavasi town; • Tentative length of proposed bypass 5.50km; • Involves acquisition of land about 17.0 ha.; • Will reduce the pollution level by providing bypasses; • Involves construction of one major and two minor bridges of 80m and 35m respectively; • No acquisition of structures, etc
c. Alternative-3:
• Involve land requirement of 16.00 ha; • Involve construction of one minor bridge of length 50m; • Involver construction of one Major Bridge of length 90m;
211. Finalization of Alternative: Keeping all above in view, the Alternative Alignment Option-2 (Southern Side) has minimum hindrances except acquisition of land of about 17.00 ha. as comparing with improvement of existing road through the built-up area of Vandavasi town. Thus, Alternative Alignment Option-2 is found most suitable for Vandavasi town with minimum hindrances.
ii. Chetpet Bypass
212. Though bypass able traffic to Chetpet town is only 36%, it is very essential to provide bypass for Chetpet town on this road section considering poor geometrics along existing alignment and large demolition of existing structures (shops, residential, commercial) which may lead to public agitation. The consultant studied the alignment corridor and prepared the comparison among various alternative alignment corridors to identify the most suitable corridor for further study. The alternative Alignments of Proposed Bypass for Chetpet Town is shown in
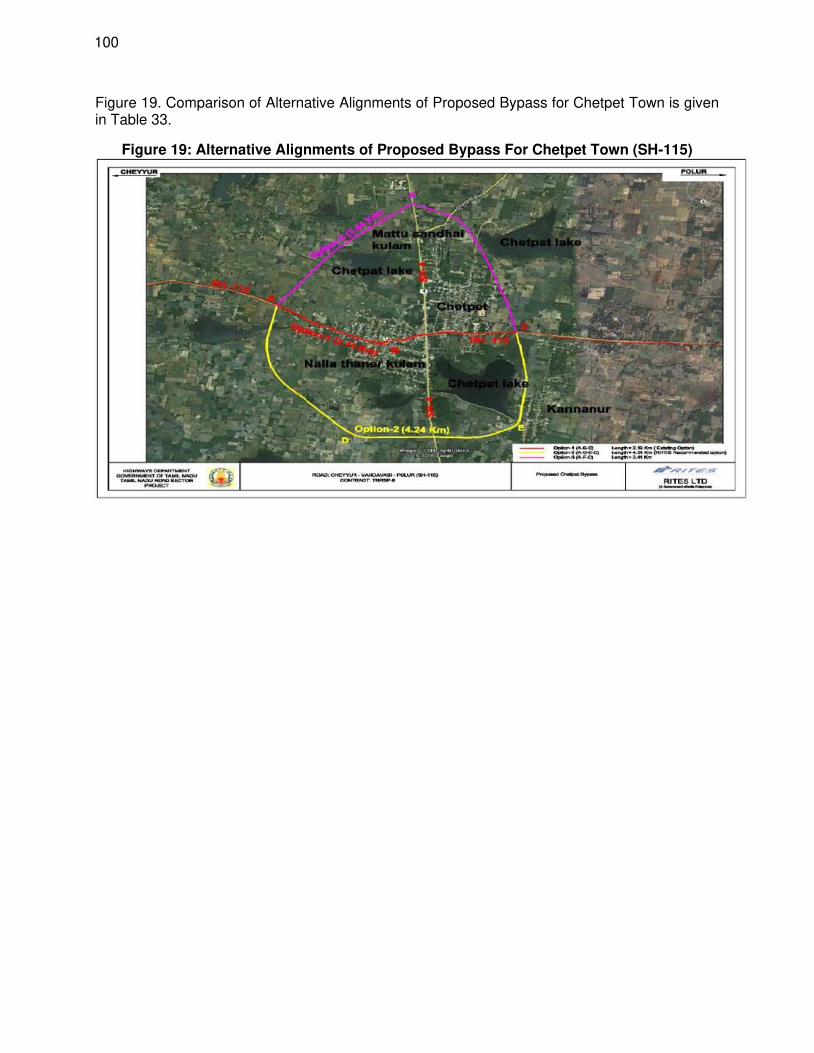
100
Figure 19. Comparison of Alternative Alignments of Proposed Bypass for Chetpet Town is given in Table 33.
Figure 19: Alternative Alignments of Proposed Bypass For Chetpet Town (SH-115)
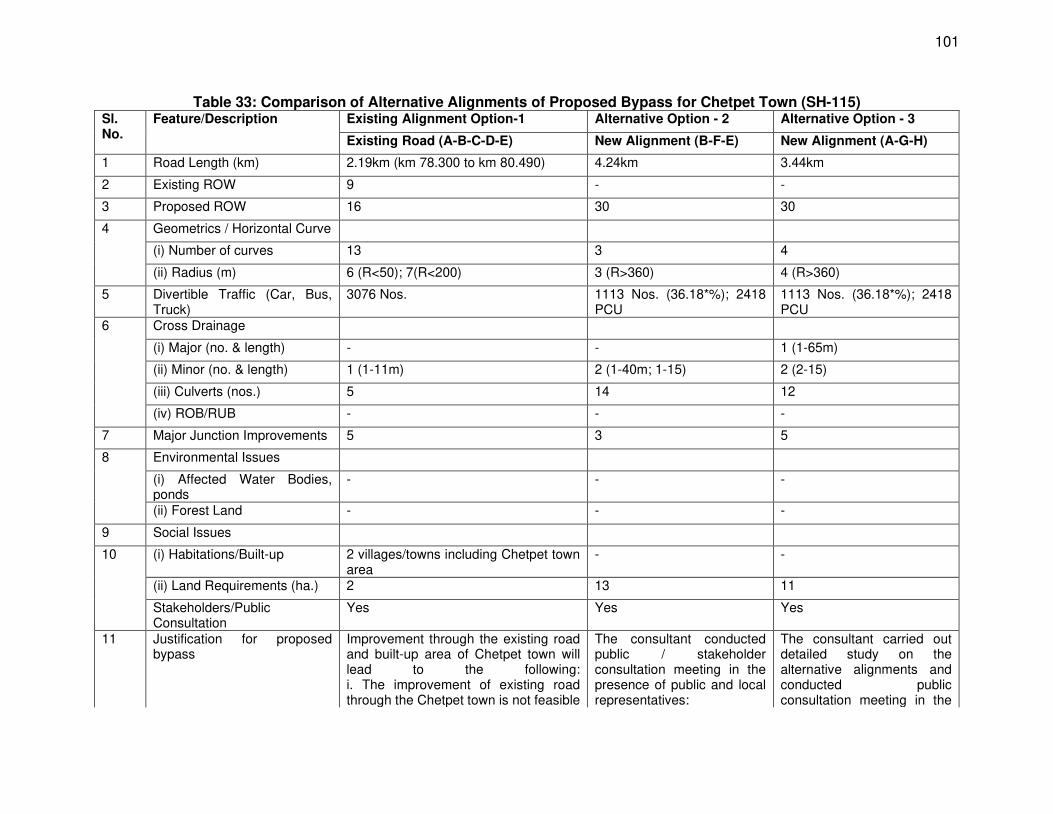
101
Table 33: Comparison of Alternative Alignments of Proposed Bypass for Chetpet Town (SH-115) Sl. No.
Feature/Description Existing Alignment Option-1 Alternative Option - 2 Alternative Option - 3
Existing Road (A-B-C-D-E) New Alignment (B-F-E) New Alignment (A-G-H)
1 Road Length (km) 2.19km (km 78.300 to km 80.490) 4.24km 3.44km
2 Existing ROW 9 - -
3 Proposed ROW 16 30 30
4 Geometrics / Horizontal Curve
(i) Number of curves 13 3 4
(ii) Radius (m) 6 (R<50); 7(R<200) 3 (R>360) 4 (R>360)
5 Divertible Traffic (Car, Bus, Truck)
3076 Nos. 1113 Nos. (36.18*%); 2418 PCU
1113 Nos. (36.18*%); 2418 PCU
6 Cross Drainage
(i) Major (no. & length) - - 1 (1-65m)
(ii) Minor (no. & length) 1 (1-11m) 2 (1-40m; 1-15) 2 (2-15)
(iii) Culverts (nos.) 5 14 12
(iv) ROB/RUB - - -
7 Major Junction Improvements 5 3 5
8 Environmental Issues
(i) Affected Water Bodies, ponds
- - -
(ii) Forest Land - - -
9 Social Issues
10 (i) Habitations/Built-up 2 villages/towns including Chetpet town area
- -
(ii) Land Requirements (ha.) 2 13 11
Stakeholders/Public Consultation
Yes Yes Yes
11 Justification for proposed bypass
Improvement through the existing road and built-up area of Chetpet town will lead to the following: i. The improvement of existing road through the Chetpet town is not feasible
The consultant conducted public / stakeholder consultation meeting in the presence of public and local representatives:
The consultant carried out detailed study on the alternative alignments and conducted public consultation meeting in the
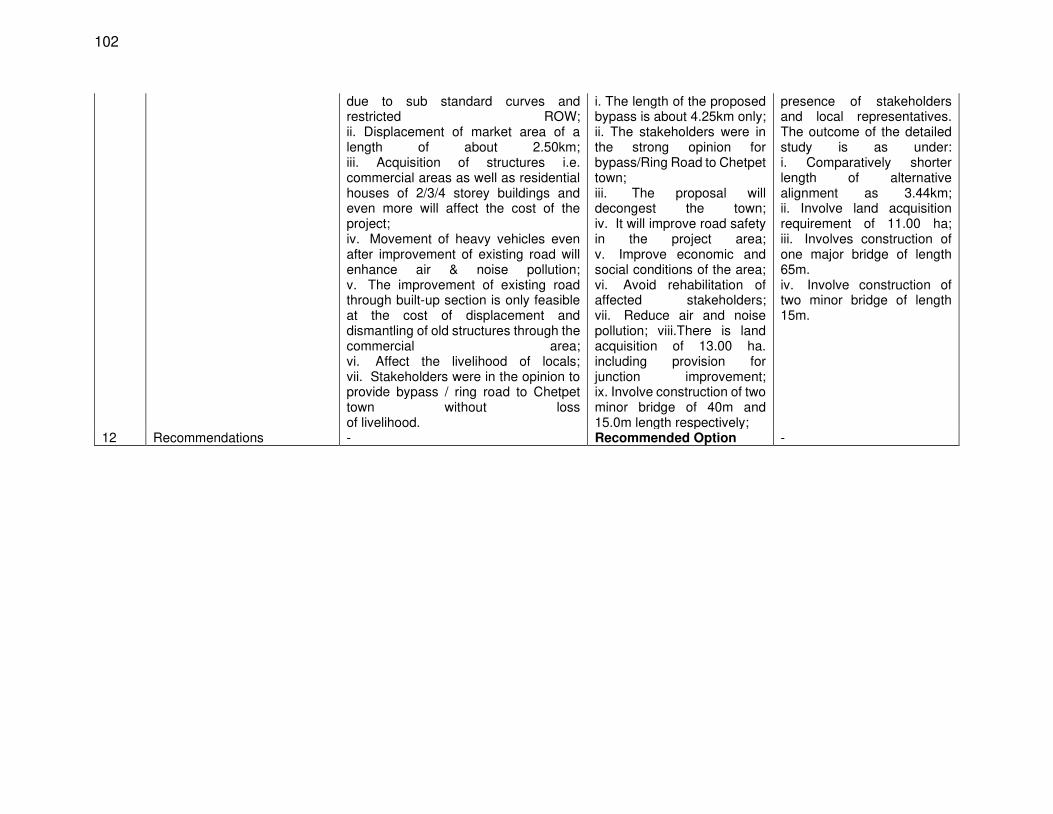
102
due to sub standard curves and restricted ROW; ii. Displacement of market area of a length of about 2.50km; iii. Acquisition of structures i.e. commercial areas as well as residential houses of 2/3/4 storey buildings and even more will affect the cost of the project; iv. Movement of heavy vehicles even after improvement of existing road will enhance air & noise pollution; v. The improvement of existing road through built-up section is only feasible at the cost of displacement and dismantling of old structures through the commercial area; vi. Affect the livelihood of locals; vii. Stakeholders were in the opinion to provide bypass / ring road to Chetpet town without loss of livelihood.
i. The length of the proposed bypass is about 4.25km only; ii. The stakeholders were in the strong opinion for bypass/Ring Road to Chetpet town; iii. The proposal will decongest the town; iv. It will improve road safety in the project area; v. Improve economic and social conditions of the area; vi. Avoid rehabilitation of affected stakeholders; vii. Reduce air and noise pollution; viii.There is land acquisition of 13.00 ha. including provision for junction improvement; ix. Involve construction of two minor bridge of 40m and 15.0m length respectively;
presence of stakeholders and local representatives. The outcome of the detailed study is as under: i. Comparatively shorter length of alternative alignment as 3.44km; ii. Involve land acquisition requirement of 11.00 ha; iii. Involves construction of one major bridge of length 65m. iv. Involve construction of two minor bridge of length 15m.
12 Recommendations - Recommended Option -
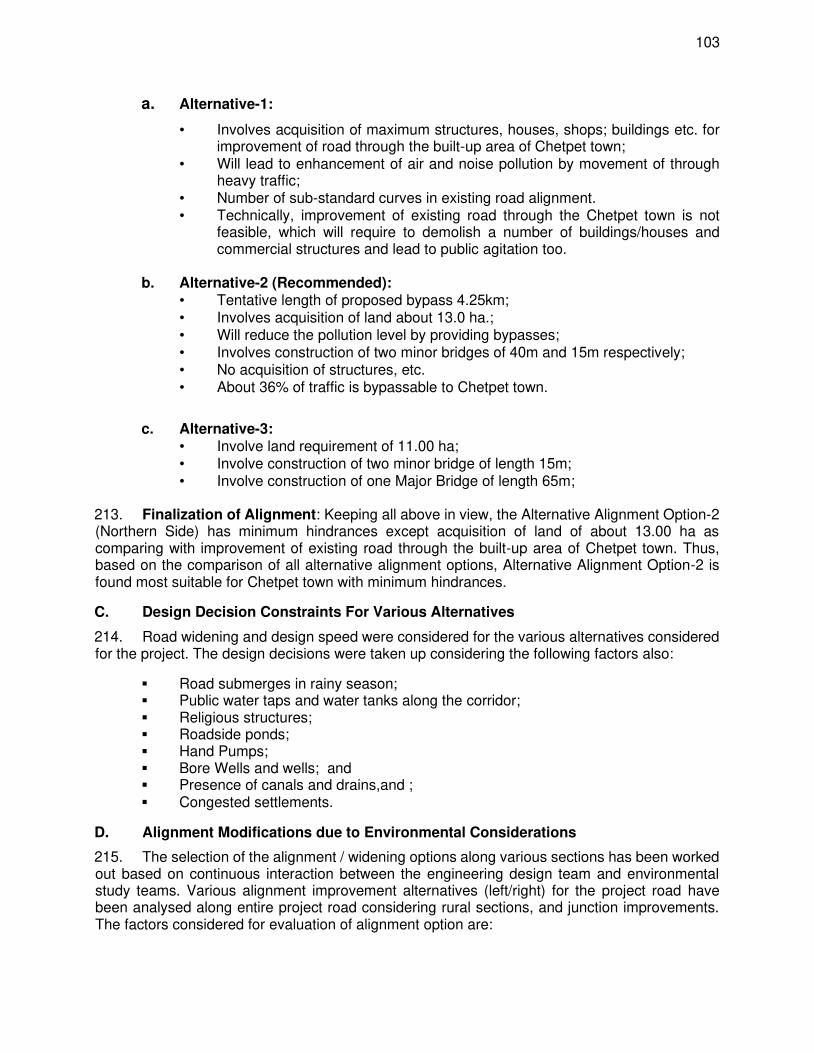
103
a. Alternative-1:
• Involves acquisition of maximum structures, houses, shops; buildings etc. for improvement of road through the built-up area of Chetpet town;
• Will lead to enhancement of air and noise pollution by movement of through heavy traffic;
• Number of sub-standard curves in existing road alignment. • Technically, improvement of existing road through the Chetpet town is not
feasible, which will require to demolish a number of buildings/houses and commercial structures and lead to public agitation too.
b. Alternative-2 (Recommended):
• Tentative length of proposed bypass 4.25km; • Involves acquisition of land about 13.0 ha.; • Will reduce the pollution level by providing bypasses; • Involves construction of two minor bridges of 40m and 15m respectively; • No acquisition of structures, etc. • About 36% of traffic is bypassable to Chetpet town.
c. Alternative-3: • Involve land requirement of 11.00 ha; • Involve construction of two minor bridge of length 15m; • Involve construction of one Major Bridge of length 65m;
213. Finalization of Alignment: Keeping all above in view, the Alternative Alignment Option-2 (Northern Side) has minimum hindrances except acquisition of land of about 13.00 ha as comparing with improvement of existing road through the built-up area of Chetpet town. Thus, based on the comparison of all alternative alignment options, Alternative Alignment Option-2 is found most suitable for Chetpet town with minimum hindrances.
C. Design Decision Constraints For Various Alternatives
214. Road widening and design speed were considered for the various alternatives considered for the project. The design decisions were taken up considering the following factors also:
▪ Road submerges in rainy season; ▪ Public water taps and water tanks along the corridor; ▪ Religious structures; ▪ Roadside ponds; ▪ Hand Pumps; ▪ Bore Wells and wells; and ▪ Presence of canals and drains,and ; ▪ Congested settlements.
D. Alignment Modifications due to Environmental Considerations
215. The selection of the alignment / widening options along various sections has been worked out based on continuous interaction between the engineering design team and environmental study teams. Various alignment improvement alternatives (left/right) for the project road have been analysed along entire project road considering rural sections, and junction improvements. The factors considered for evaluation of alignment option are:
104
• Flora and fauna likely to be impacted;
• Productive agricultural land likely to be impacted;
• Impact on water resources and surface water bodies;
• Environmental quality;
• Land availability;
• Land uses along the alignment;
• Residential / Commercial structures Impacted;
• Utilities likely to be impacted;
• Common property resources likely to be impacted; and
• Religious structures affected.
E. Engineering/Technological Alternatives
216. The formulation and analysis of engineering alternatives have been undertaken in terms of alternative cross-sections of road, highway-design principles (such as embankments for soil erosion and slope protections, hill cuttings, minimum width of road ride drainage, adequacy of roadway width at cross drainage structures, minimum gradient, etc.), comparison between flexible and rigid pavements (cement-concrete built rigid pavement as being environmentally superior then traditional flexible pavement), and selection of environmental friendly road construction methods.
105
VI. ANTICIPATED ENVIRONMENTAL IMPACTS AND MITIGATION MEASURES
A. Introduction
217. This chapter presents key environmental issues associated with various aspects of the proposed project. The environmental impacts caused due to the development of the project road section were assessed on the basis of nature, extent and magnitude of likely changes due to project activities during all stages of the project cycle, i.e. preconstruction, construction and operation. Potential cumulative and induced impacts were also considered. Beneficial impacts are mostly long-term and permanent whereas adverse impacts are localized and temporary in nature and are likely to occur mostly during construction stage.
218. The methodology of assessing environmental impacts from the project entailed clearly identifying the environmental components that will impacted, type of impacts, assessment area where the impacts will be felt and defining the criteria for assessing the significance of each type of impact. After defining these aspects, a screening of project impacts during design and preconstruction, construction and operation stages of the project was carried out to identify the minor, moderate and major impacts to guide development of mitigation measures and ensure that there are no or minimal residual impacts.
219. Identification of impacts: This includes identifying the valued environmental components (VEC) of the physical, biological, and human environments that are at risk of being impacted by the project. The VECs for this project which are based on the environmental baseline are:
a. Physical environment: air quality and greenhouse gas emissions, land and soil, and groundwater quality and quantity
b. Biological environment: terrestrial and aquatic vegetation, mammals, avifauna, and ecologically important areas
c. Human environment: private land and buildings, public infrastructure including utility structures, noise and vibration levels, cultural/heritage buildings, and occupational health and safety for the construction workers and local community living within the vicinity of the project area.
220. Type of impact on the VECs: The type of impact can be described as:
a. Positive: Improvement in the quality of the VECs because of the project, b. Negative: Degradation or reduction in the quality of the VECs because of the project, c. Neutral: No noticeable change in VECs
221. Area of impact assessment. The area covered for assessing direct impacts include:
a. The right of way of project road section is taken as 16 meters for urban stretches, 23 meters for rural areas, and 30 meters for bypasses 30m corridor. This includes 10m on either side studied for direct impacts (corridor of impact).
b. Project area of influence is defined as ROW plus 500m on either side; c. In addition, a 10 km buffer was studied for indirect impacts. Other indirect impact
area covers location of quarries; borrow areas, storage area of construction material etc.
222. Significance of impacts. The assessment of the significance of the impacts on the VECs requires understanding the duration of impact, area of impact and severity of impact as follow
106
(i) Duration of the impact: Duration means the time dimension of the impact on the VECs. The terms permanent, temporary and short-loved are used to describe the duration of impact:
a. Short-lived: The impact is limited to particular activity/ies or phase/s of the project lifecycle
b. Temporary: The impact is felt during one project activity or, at most, during the construction period of the project
c. Permanent: The impacts are felt throughout the life of the infrastructure
223. Area of impact: The area of impact entails the spatial scale of impact on one or more of the VECs. The terms regional, local and limited are used to describe the area of impact:
a. Limited: The impact is felt within the corridor of impact
b. Local: The impact is felt within the project area of influence
c. Regional: The impact is felt beyond the project area of influence but within the 10km buffer
(ii) Sensitivity of VEC: The sensitivity of a VEC can be determined by the existing
conditions of the VEC within the project area and existence of important VECs within the project areas. Sensitivity of each VEC is described as high, medium or low as described below.
a. Low: No environmentally important areas (such as protected areas, natural or
critical habitat areas, heritage sites, places of worship etc.) are located within the direct and indirect impact zone. The quality of existing conditions of VECs is good or fair;
b. Medium: There are one or more environmentally important areas within the indirect impact zone of the project area. The quality of existing conditions of VECs is good or fair; and
c. High: There are one or more environmentally important areas within the direct impact zone of the project area. The quality of existing conditions of the VECs is poor or degraded (such as poor air quality, high noise levels, poor water quality) which makes the VEC highly susceptible to further deterioration.
224. Based on baseline conditions in the project area and sensitivity criteria, the level of sensitivity of each VEC is provided in Table 34.

107
Table 34: Sensitivity of VECs in the Project Area
VEC Sensitivity Level
Remarks
Physical environment
Air quality
Medium The overall the air quality in the project area is average and within national permissible levels for the monitored parameters. However, the monitored values exceeds the World Bank group standards for ambient air quality.
GHG emissions
Medium Firewood burning is the major contributor in the ambient pollution load. Vehicular pollution is a secondary source of pollution in the state as the traffic density is average.
Surface water quality
Medium Overall, the surface water quality in the project area is good, permissible levels are not exceeded for the monitored parameters. Natural river streams, many village ponds and lake, Irrigation Canal are main water bodies in CoI of the project.
Surface water quantity
Low The state has good water resources in the form of lakes, ponds, rivers and streams. The project area has sources of water potential both ground as well as surface water.
Ground water quality
Low Overall, the ground water quality in the project area is good, permissible levels are not exceeded for the monitored parameters.
Ground water quantity
Low Since the project area has good surface water resources the project will have sufficient sources of water for construction and groundwater abstraction will be negligible if needed at all..
Land degradation and pollution
Low There is no forest along the project road section, land use mainly agriculture and built-up. Land degradation and pollution is low.
Biological environment
Trees, terrestrial and aquatic vegetation
Low The project road passes through reserved and social forests in multiple patches.
The road in these forest stretches will be widened and strengthen within the existing right of way and no land acquisition is required in this stretch.
Also, there are no endangered flora species which are likely to be affected by the proposed project.
Fauna (mammals, birds, fishes, reptiles, amphibians)
Low There are no vulnerable/ endangered or rare species fauna around the project site. There is no presence of any fauna species listed in Schedule I of the Wild Life (Protection) Act, 1972 of Government of India.
Ecologically important areas
Low The project is not located in core/ buffer zone of ecologically sensitive areas.
Social environment
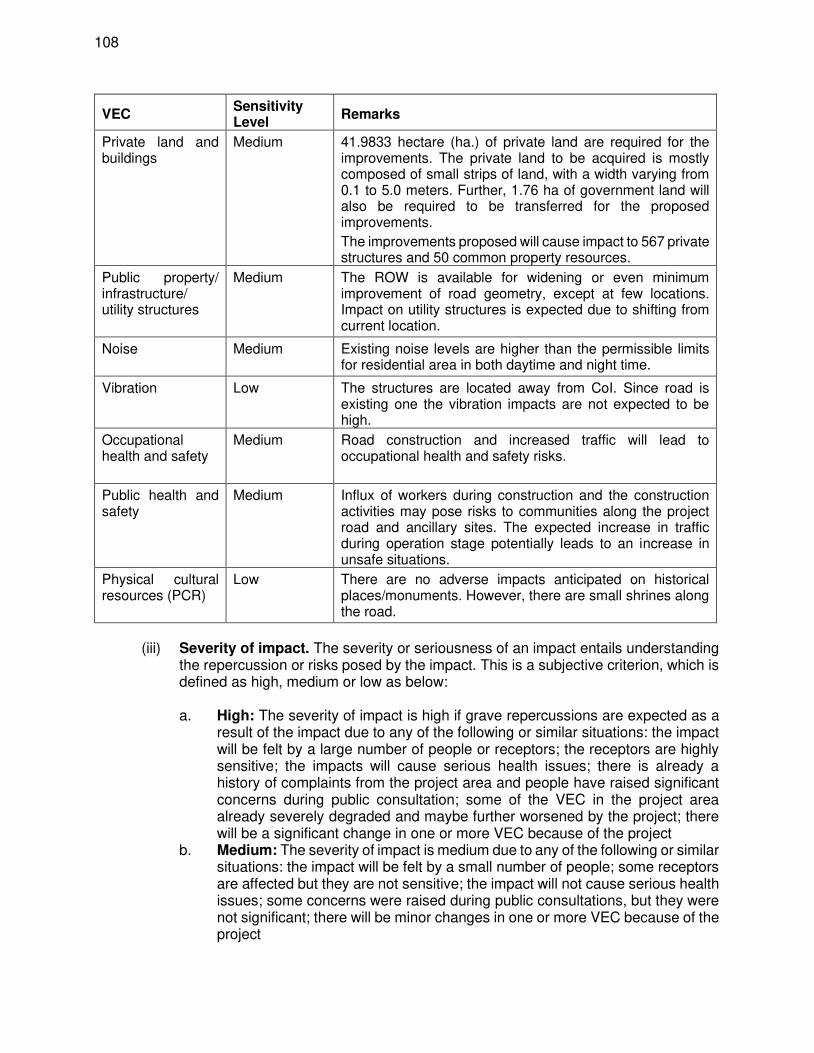
108
VEC Sensitivity Level
Remarks
Private land and buildings
Medium 41.9833 hectare (ha.) of private land are required for the improvements. The private land to be acquired is mostly composed of small strips of land, with a width varying from 0.1 to 5.0 meters. Further, 1.76 ha of government land will also be required to be transferred for the proposed improvements.
The improvements proposed will cause impact to 567 private structures and 50 common property resources.
Public property/ infrastructure/ utility structures
Medium The ROW is available for widening or even minimum improvement of road geometry, except at few locations. Impact on utility structures is expected due to shifting from current location.
Noise
Medium Existing noise levels are higher than the permissible limits for residential area in both daytime and night time.
Vibration Low The structures are located away from CoI. Since road is existing one the vibration impacts are not expected to be high.
Occupational health and safety
Medium Road construction and increased traffic will lead to occupational health and safety risks.
Public health and safety
Medium Influx of workers during construction and the construction activities may pose risks to communities along the project road and ancillary sites. The expected increase in traffic during operation stage potentially leads to an increase in unsafe situations.
Physical cultural resources (PCR)
Low There are no adverse impacts anticipated on historical places/monuments. However, there are small shrines along the road.
(iii) Severity of impact. The severity or seriousness of an impact entails understanding the repercussion or risks posed by the impact. This is a subjective criterion, which is defined as high, medium or low as below:
a. High: The severity of impact is high if grave repercussions are expected as a
result of the impact due to any of the following or similar situations: the impact will be felt by a large number of people or receptors; the receptors are highly sensitive; the impacts will cause serious health issues; there is already a history of complaints from the project area and people have raised significant concerns during public consultation; some of the VEC in the project area already severely degraded and maybe further worsened by the project; there will be a significant change in one or more VEC because of the project
b. Medium: The severity of impact is medium due to any of the following or similar situations: the impact will be felt by a small number of people; some receptors are affected but they are not sensitive; the impact will not cause serious health issues; some concerns were raised during public consultations, but they were not significant; there will be minor changes in one or more VEC because of the project
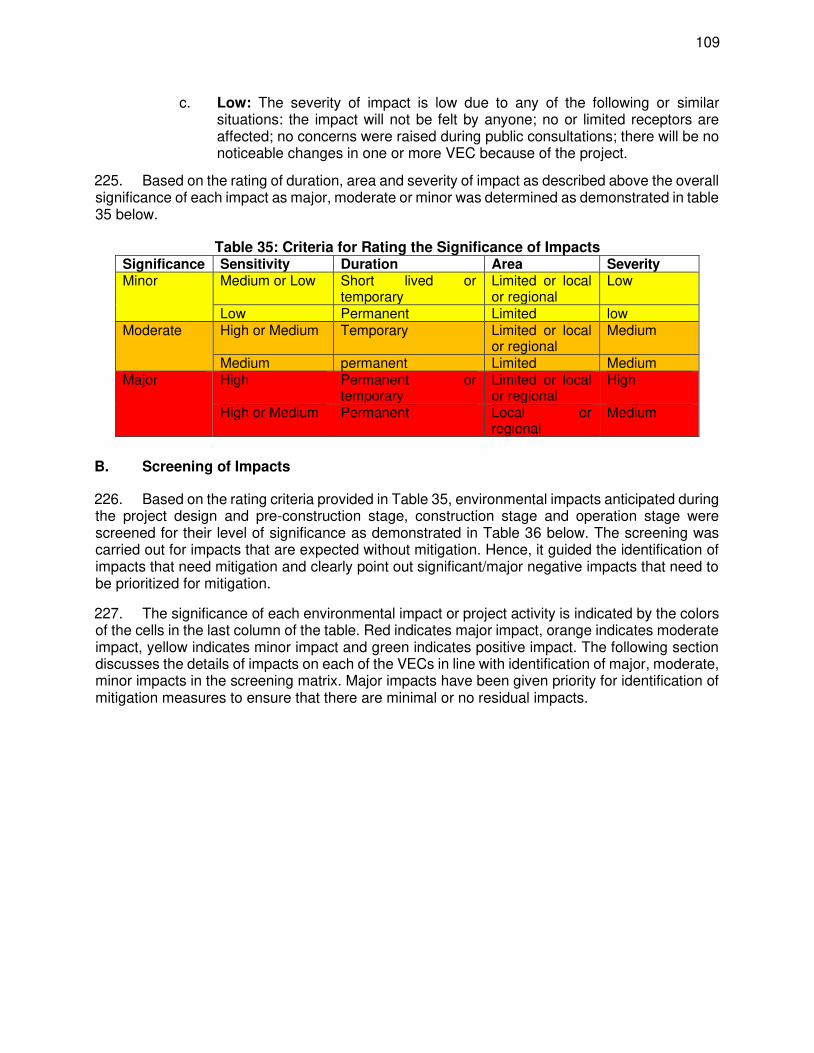
109
c. Low: The severity of impact is low due to any of the following or similar situations: the impact will not be felt by anyone; no or limited receptors are affected; no concerns were raised during public consultations; there will be no noticeable changes in one or more VEC because of the project.
225. Based on the rating of duration, area and severity of impact as described above the overall significance of each impact as major, moderate or minor was determined as demonstrated in table 35 below.
Table 35: Criteria for Rating the Significance of Impacts Significance Sensitivity Duration Area Severity Minor Medium or Low Short lived or
temporary Limited or local or regional
Low
Low Permanent Limited low Moderate High or Medium Temporary Limited or local
or regional Medium
Medium permanent Limited Medium Major High Permanent or
temporary Limited or local or regional
High
High or Medium Permanent Local or regional
Medium
B. Screening of Impacts
226. Based on the rating criteria provided in Table 35, environmental impacts anticipated during the project design and pre-construction stage, construction stage and operation stage were screened for their level of significance as demonstrated in Table 36 below. The screening was carried out for impacts that are expected without mitigation. Hence, it guided the identification of impacts that need mitigation and clearly point out significant/major negative impacts that need to be prioritized for mitigation.
227. The significance of each environmental impact or project activity is indicated by the colors of the cells in the last column of the table. Red indicates major impact, orange indicates moderate impact, yellow indicates minor impact and green indicates positive impact. The following section discusses the details of impacts on each of the VECs in line with identification of major, moderate, minor impacts in the screening matrix. Major impacts have been given priority for identification of mitigation measures to ensure that there are minimal or no residual impacts.

110
Table 36: Screening of Environmental Impacts VEC/Sensitivity Impact/Activity Stag
e Duration Area Severity Significance
1. Physical environment
1.1 Air quality (Medium sensitivity)
No impact due to design D N N N N
Vegetation clearing and removal of trees quarrying, material transport and storage, drilling, hill cutting, Pavement works, use of construction equipment
C -ve temporary
-ve limited -ve medium -ve moderate
Emissions from increased road traffic O -ve permanent
-ve limited -ve low -ve minor
1.2 GHG emissions (Medium sensitivity) GHG Emissions
D, C, O
N N N N
1.3 Surface water quality (Medium sensitivity) Disruptions to the natural hydrology D
-ve temporary
-ve limited -ve medium -ve moderate
Construction near sensitive areas, culvert and bridge construction, use of construction equipment, pavement works, Labour camp activities
C -ve temporary
-ve limited -ve medium -ve moderate
No anticipated impacts O N N N N
1.4 Surface water quantity (Low sensitivity) Disruptions to the natural hydrology D
-ve temporary
-ve limited -ve medium -ve moderate
Construction near sensitive areas (RoW excluded from Reserve Forest) and sensitive areas Culvert and bridge construction, Drainage work, Earthwork, Quarrying, Debris generation
C -ve permanent
-ve limited -ve low -ve minor
No anticipated impacts O N N N N
1.5 Ground water quality (Low sensitivity)
No anticipated impacts D N N N N
Groundwater pollution due to labour camp activities C -ve temporary
-ve local -ve low -ve minor
No anticipated impacts O N N N N
1.6 Ground water quantity (Low sensitivity)
None D N N N N
Construction water requirement (avg. 500 KLD and peak 800 KLD and 40 KLD for workers)
C -ve permanent
-ve limited -ve low -ve minor
None O N N N N
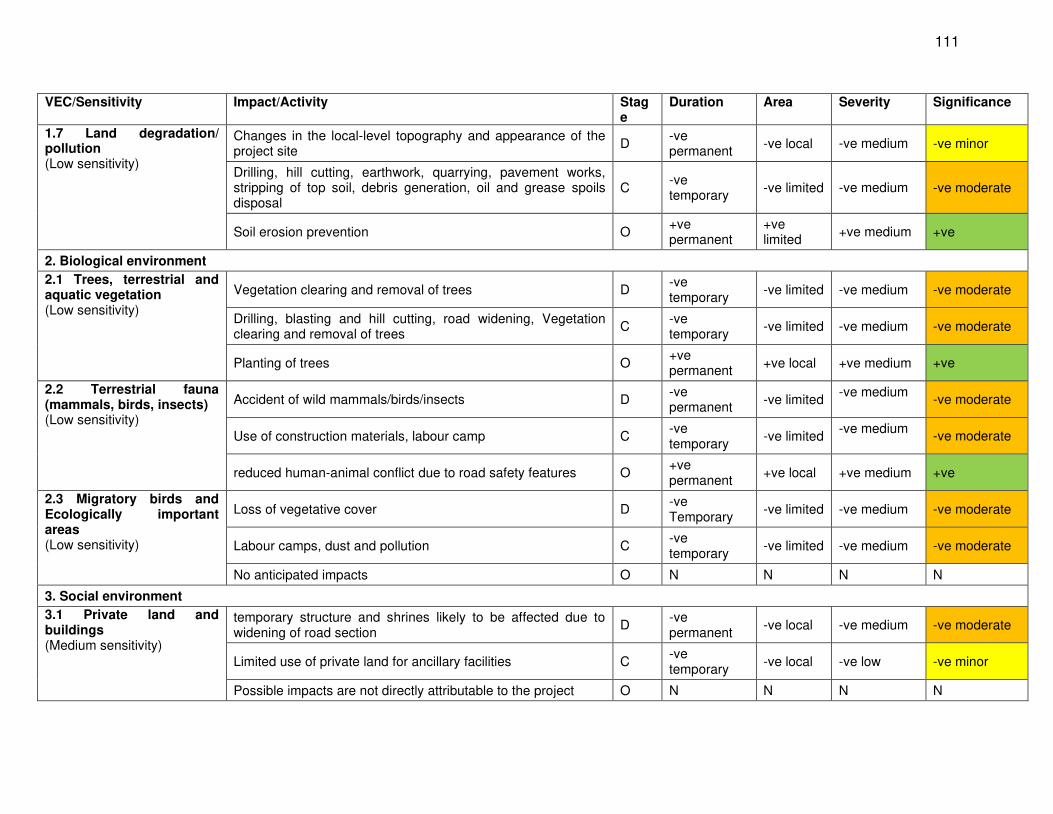
111
VEC/Sensitivity Impact/Activity Stage
Duration Area Severity Significance
1.7 Land degradation/ pollution (Low sensitivity)
Changes in the local-level topography and appearance of the project site
D -ve permanent
-ve local -ve medium -ve minor
Drilling, hill cutting, earthwork, quarrying, pavement works, stripping of top soil, debris generation, oil and grease spoils disposal
C -ve temporary
-ve limited -ve medium -ve moderate
Soil erosion prevention O +ve permanent
+ve limited
+ve medium +ve
2. Biological environment
2.1 Trees, terrestrial and aquatic vegetation (Low sensitivity)
Vegetation clearing and removal of trees D -ve temporary
-ve limited -ve medium -ve moderate
Drilling, blasting and hill cutting, road widening, Vegetation clearing and removal of trees
C -ve temporary
-ve limited -ve medium -ve moderate
Planting of trees O +ve permanent
+ve local +ve medium +ve
2.2 Terrestrial fauna (mammals, birds, insects) (Low sensitivity)
Accident of wild mammals/birds/insects D -ve permanent
-ve limited -ve medium
-ve moderate
Use of construction materials, labour camp C -ve temporary
-ve limited -ve medium
-ve moderate
reduced human-animal conflict due to road safety features O +ve permanent
+ve local +ve medium +ve
2.3 Migratory birds and Ecologically important areas (Low sensitivity)
Loss of vegetative cover D -ve Temporary
-ve limited -ve medium -ve moderate
Labour camps, dust and pollution C -ve temporary
-ve limited -ve medium -ve moderate
No anticipated impacts O N N N N
3. Social environment
3.1 Private land and buildings (Medium sensitivity)
temporary structure and shrines likely to be affected due to widening of road section
D -ve permanent
-ve local -ve medium -ve moderate
Limited use of private land for ancillary facilities C -ve temporary
-ve local -ve low -ve minor
Possible impacts are not directly attributable to the project O N N N N
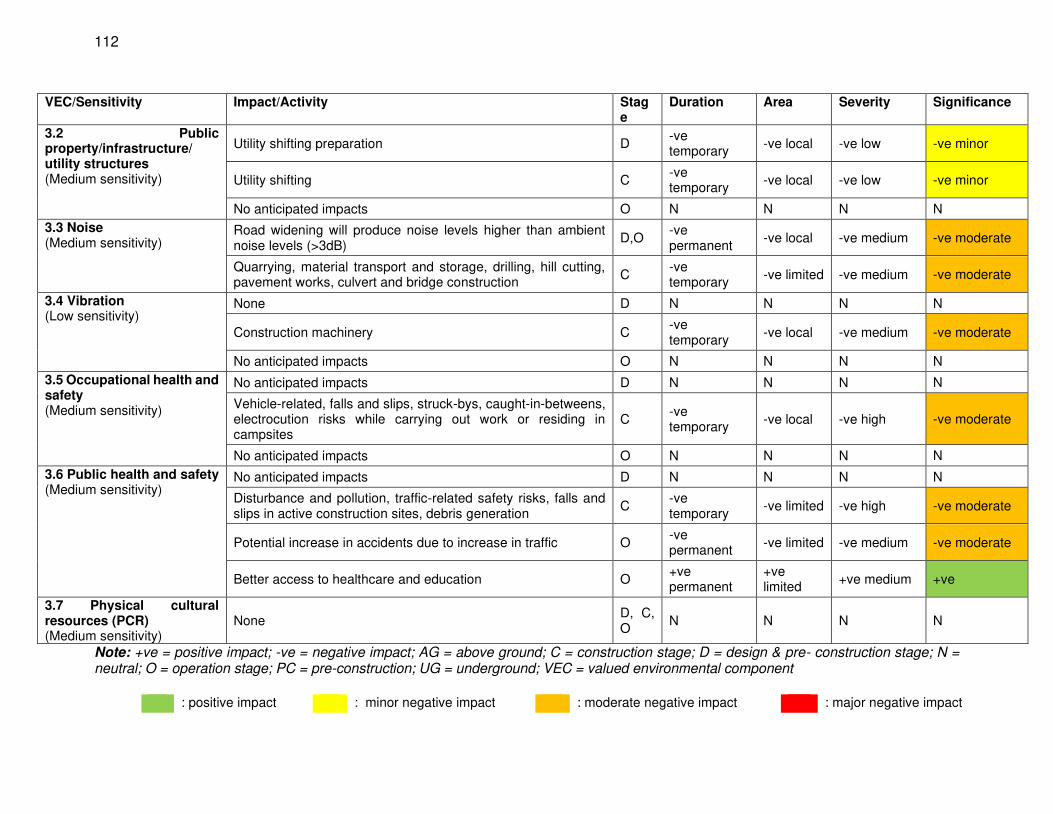
112
VEC/Sensitivity Impact/Activity Stage
Duration Area Severity Significance
3.2 Public property/infrastructure/ utility structures (Medium sensitivity)
Utility shifting preparation D -ve temporary
-ve local -ve low -ve minor
Utility shifting C -ve temporary
-ve local -ve low -ve minor
No anticipated impacts O N N N N
3.3 Noise (Medium sensitivity)
Road widening will produce noise levels higher than ambient noise levels (>3dB)
D,O -ve permanent
-ve local -ve medium -ve moderate
Quarrying, material transport and storage, drilling, hill cutting, pavement works, culvert and bridge construction
C -ve temporary
-ve limited -ve medium -ve moderate
3.4 Vibration (Low sensitivity)
None D N N N N
Construction machinery C -ve temporary
-ve local -ve medium -ve moderate
No anticipated impacts O N N N N
3.5 Occupational health and safety (Medium sensitivity)
No anticipated impacts D N N N N
Vehicle-related, falls and slips, struck-bys, caught-in-betweens, electrocution risks while carrying out work or residing in campsites
C -ve temporary
-ve local -ve high -ve moderate
No anticipated impacts O N N N N
3.6 Public health and safety (Medium sensitivity)
No anticipated impacts D N N N N
Disturbance and pollution, traffic-related safety risks, falls and slips in active construction sites, debris generation
C -ve temporary
-ve limited -ve high -ve moderate
Potential increase in accidents due to increase in traffic O -ve permanent
-ve limited -ve medium -ve moderate
Better access to healthcare and education O +ve permanent
+ve limited
+ve medium +ve
3.7 Physical cultural resources (PCR) (Medium sensitivity)
None D, C, O
N N N N
Note: +ve = positive impact; -ve = negative impact; AG = above ground; C = construction stage; D = design & pre- construction stage; N = neutral; O = operation stage; PC = pre-construction; UG = underground; VEC = valued environmental component
: positive impact : minor negative impact : moderate negative impact : major negative impact
113
C. Typical Potential Adverse Impacts
228. Identification and assessment of the potential environmental impacts are based on secondary information supplemented by field visits. Impacts on various environmental components have been assessed at four different stages, namely:
• the project location; • design and pre-construction; • construction; and • operation stages.
D. Impacts on Physical Environment
1. Air quality and Greenhouse gas emissions
Design and pre-construction stage – minor negativeimpact
229. The project aims to improve a section of 109.273 km of the existing state highway no. 115 from Cheyyur – Vandavasi – Polur Road. Based on the capacity augmentation the present road section is proposed for improvement and upgrading to a two lane configuration with shoulders and side drains. TNHD considered minimum clearing of trees and vegetation and will have minimal impact on the air quality and GHG emissions. A total of 4,770 trees >30 cm girth will be cleared for the road widening which is about 40% less than standard clearing requirements for the scale of widening since extra care was taken to minimize impacts on trees. Carbon sequestration capacity lost through clearing of trees is roughly 21 kg CO2/year per mature tree. These will be replaced with 10 saplings per cut tree whose survival (70%) will be ensured through monitoring and replacement. Each sapling has the ability to absorb roughly 5 kg CO2/year which largely offsets carbon sequestration capacity lost. More details on afforestation are under the section on Trees and Vegetation.
Construction stage – moderate negative impact
230. Impact: During construction air quality may be negatively impacted for short periods due to (i) the exhaust emissions from the operation of construction equipment and machinery; (ii) fugitive emissions from brick, concrete, and asphalt plants; (iii) the dust generated from the haulage of materials, exposed soils and material stockpiles, fugitive dust from earth-moving operations and demolition; (iv) cutting and filling of hill slope; (v) cleaning of the road; (vi) material loading; (vii) unloading; and (viii) increased traffic congestion in construction areas. The impact is expected to be localized, temporary and confined to construction areas. Care should, however, be taken at sensitive habitation locations so that harmful impacts can be minimized. The adverse impacts on air quality during construction stage were classified and presented in Table 37. There are two types of pollution i.e. dust pollution and pollution from harmful gases.
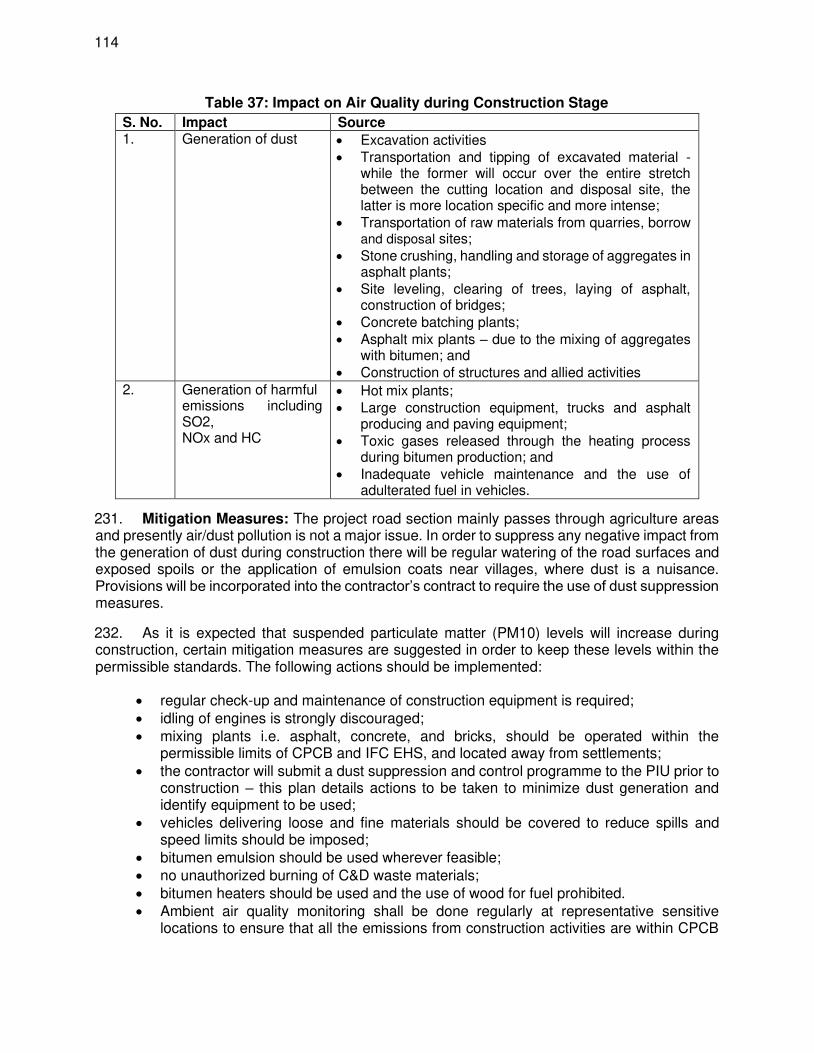
114
Table 37: Impact on Air Quality during Construction Stage
S. No. Impact Source 1. Generation of dust • Excavation activities
• Transportation and tipping of excavated material - while the former will occur over the entire stretch between the cutting location and disposal site, the latter is more location specific and more intense;
• Transportation of raw materials from quarries, borrow and disposal sites;
• Stone crushing, handling and storage of aggregates in asphalt plants;
• Site leveling, clearing of trees, laying of asphalt, construction of bridges;
• Concrete batching plants; • Asphalt mix plants – due to the mixing of aggregates
with bitumen; and • Construction of structures and allied activities
2. Generation of harmful emissions including SO2, NOx and HC
• Hot mix plants; • Large construction equipment, trucks and asphalt
producing and paving equipment; • Toxic gases released through the heating process
during bitumen production; and • Inadequate vehicle maintenance and the use of
adulterated fuel in vehicles.
231. Mitigation Measures: The project road section mainly passes through agriculture areas and presently air/dust pollution is not a major issue. In order to suppress any negative impact from the generation of dust during construction there will be regular watering of the road surfaces and exposed spoils or the application of emulsion coats near villages, where dust is a nuisance. Provisions will be incorporated into the contractor’s contract to require the use of dust suppression measures.
232. As it is expected that suspended particulate matter (PM10) levels will increase during construction, certain mitigation measures are suggested in order to keep these levels within the permissible standards. The following actions should be implemented:
• regular check-up and maintenance of construction equipment is required; • idling of engines is strongly discouraged; • mixing plants i.e. asphalt, concrete, and bricks, should be operated within the
permissible limits of CPCB and IFC EHS, and located away from settlements; • the contractor will submit a dust suppression and control programme to the PIU prior to
construction – this plan details actions to be taken to minimize dust generation and identify equipment to be used;
• vehicles delivering loose and fine materials should be covered to reduce spills and speed limits should be imposed;
• bitumen emulsion should be used wherever feasible; • no unauthorized burning of C&D waste materials; • bitumen heaters should be used and the use of wood for fuel prohibited. • Ambient air quality monitoring shall be done regularly at representative sensitive
locations to ensure that all the emissions from construction activities are within CPCB
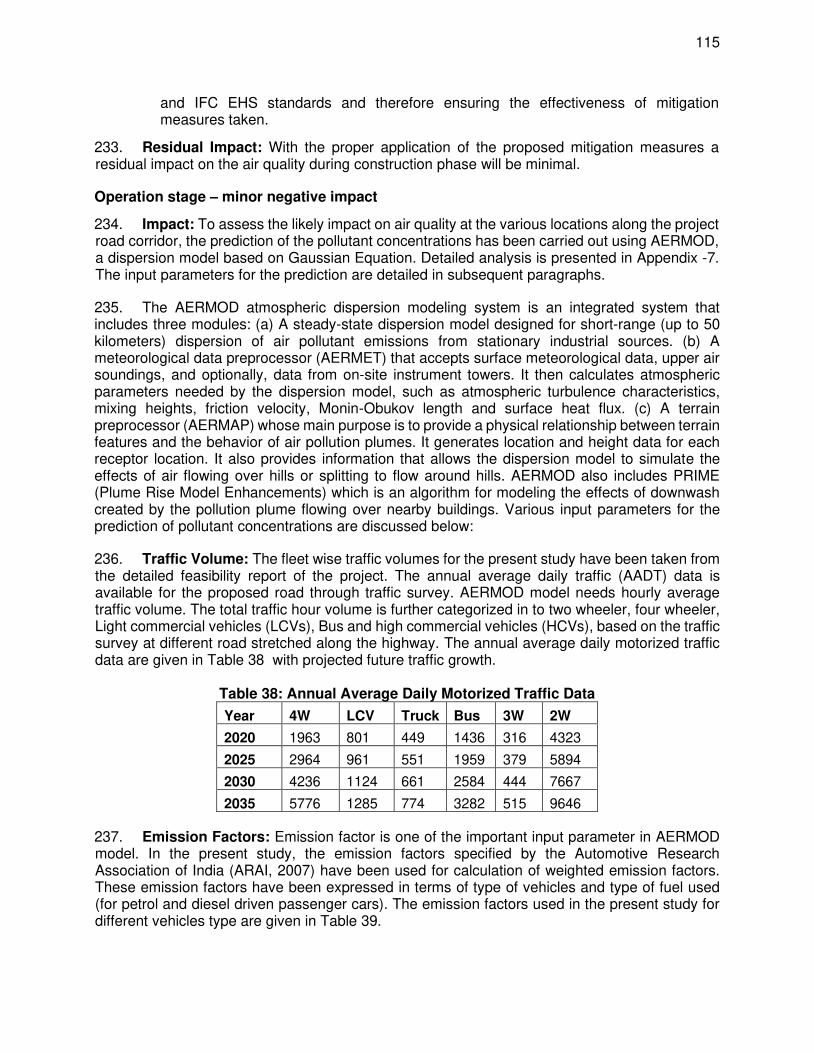
115
and IFC EHS standards and therefore ensuring the effectiveness of mitigation measures taken.
233. Residual Impact: With the proper application of the proposed mitigation measures a residual impact on the air quality during construction phase will be minimal.
Operation stage – minor negative impact
234. Impact: To assess the likely impact on air quality at the various locations along the project road corridor, the prediction of the pollutant concentrations has been carried out using AERMOD, a dispersion model based on Gaussian Equation. Detailed analysis is presented in Appendix -7. The input parameters for the prediction are detailed in subsequent paragraphs.
235. The AERMOD atmospheric dispersion modeling system is an integrated system that includes three modules: (a) A steady-state dispersion model designed for short-range (up to 50 kilometers) dispersion of air pollutant emissions from stationary industrial sources. (b) A meteorological data preprocessor (AERMET) that accepts surface meteorological data, upper air soundings, and optionally, data from on-site instrument towers. It then calculates atmospheric parameters needed by the dispersion model, such as atmospheric turbulence characteristics, mixing heights, friction velocity, Monin-Obukov length and surface heat flux. (c) A terrain preprocessor (AERMAP) whose main purpose is to provide a physical relationship between terrain features and the behavior of air pollution plumes. It generates location and height data for each receptor location. It also provides information that allows the dispersion model to simulate the effects of air flowing over hills or splitting to flow around hills. AERMOD also includes PRIME (Plume Rise Model Enhancements) which is an algorithm for modeling the effects of downwash created by the pollution plume flowing over nearby buildings. Various input parameters for the prediction of pollutant concentrations are discussed below:
236. Traffic Volume: The fleet wise traffic volumes for the present study have been taken from the detailed feasibility report of the project. The annual average daily traffic (AADT) data is available for the proposed road through traffic survey. AERMOD model needs hourly average traffic volume. The total traffic hour volume is further categorized in to two wheeler, four wheeler, Light commercial vehicles (LCVs), Bus and high commercial vehicles (HCVs), based on the traffic survey at different road stretched along the highway. The annual average daily motorized traffic data are given in Table 38 with projected future traffic growth.
Table 38: Annual Average Daily Motorized Traffic Data
Year 4W LCV Truck Bus 3W 2W
2020 1963 801 449 1436 316 4323
2025 2964 961 551 1959 379 5894
2030 4236 1124 661 2584 444 7667
2035 5776 1285 774 3282 515 9646
237. Emission Factors: Emission factor is one of the important input parameter in AERMOD model. In the present study, the emission factors specified by the Automotive Research Association of India (ARAI, 2007) have been used for calculation of weighted emission factors. These emission factors have been expressed in terms of type of vehicles and type of fuel used (for petrol and diesel driven passenger cars). The emission factors used in the present study for different vehicles type are given in Table 39.
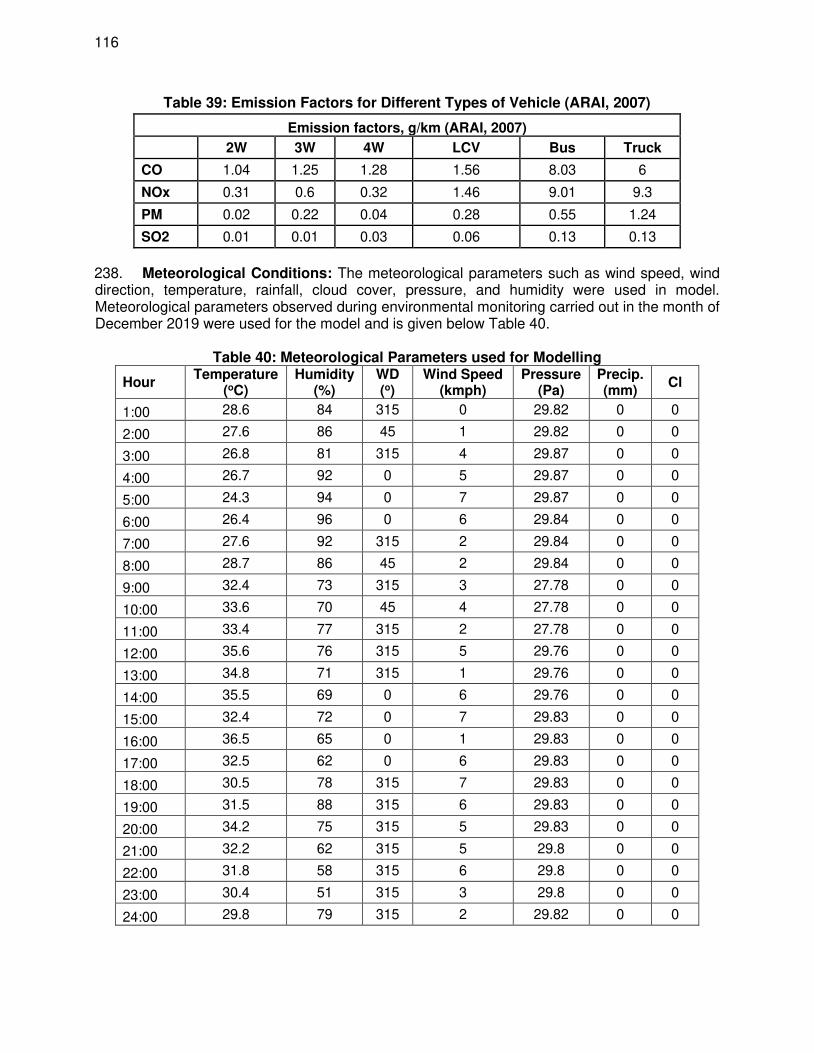
116
Table 39: Emission Factors for Different Types of Vehicle (ARAI, 2007)
Emission factors, g/km (ARAI, 2007)
2W 3W 4W LCV Bus Truck
CO 1.04 1.25 1.28 1.56 8.03 6
NOx 0.31 0.6 0.32 1.46 9.01 9.3
PM 0.02 0.22 0.04 0.28 0.55 1.24
SO2 0.01 0.01 0.03 0.06 0.13 0.13
238. Meteorological Conditions: The meteorological parameters such as wind speed, wind direction, temperature, rainfall, cloud cover, pressure, and humidity were used in model. Meteorological parameters observed during environmental monitoring carried out in the month of December 2019 were used for the model and is given below Table 40.
Table 40: Meteorological Parameters used for Modelling
Hour Temperature
(oC) Humidity
(%) WD (o)
Wind Speed (kmph)
Pressure (Pa)
Precip. (mm)
Cl
1:00 28.6 84 315 0 29.82 0 0
2:00 27.6 86 45 1 29.82 0 0
3:00 26.8 81 315 4 29.87 0 0
4:00 26.7 92 0 5 29.87 0 0
5:00 24.3 94 0 7 29.87 0 0
6:00 26.4 96 0 6 29.84 0 0
7:00 27.6 92 315 2 29.84 0 0
8:00 28.7 86 45 2 29.84 0 0
9:00 32.4 73 315 3 27.78 0 0
10:00 33.6 70 45 4 27.78 0 0
11:00 33.4 77 315 2 27.78 0 0
12:00 35.6 76 315 5 29.76 0 0
13:00 34.8 71 315 1 29.76 0 0
14:00 35.5 69 0 6 29.76 0 0
15:00 32.4 72 0 7 29.83 0 0
16:00 36.5 65 0 1 29.83 0 0
17:00 32.5 62 0 6 29.83 0 0
18:00 30.5 78 315 7 29.83 0 0
19:00 31.5 88 315 6 29.83 0 0
20:00 34.2 75 315 5 29.83 0 0
21:00 32.2 62 315 5 29.8 0 0
22:00 31.8 58 315 6 29.8 0 0
23:00 30.4 51 315 3 29.8 0 0
24:00 29.8 79 315 2 29.82 0 0
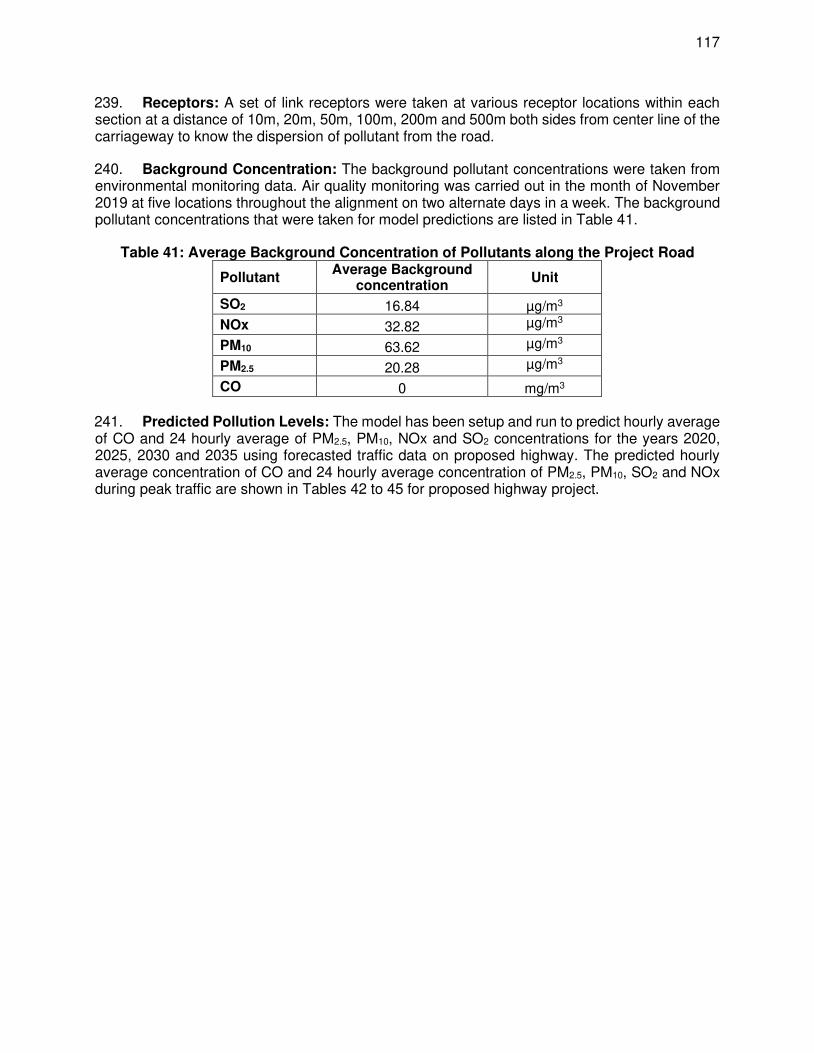
117
239. Receptors: A set of link receptors were taken at various receptor locations within each section at a distance of 10m, 20m, 50m, 100m, 200m and 500m both sides from center line of the carriageway to know the dispersion of pollutant from the road.
240. Background Concentration: The background pollutant concentrations were taken from environmental monitoring data. Air quality monitoring was carried out in the month of November 2019 at five locations throughout the alignment on two alternate days in a week. The background pollutant concentrations that were taken for model predictions are listed in Table 41.
Table 41: Average Background Concentration of Pollutants along the Project Road
Pollutant Average Background
concentration Unit
SO2 16.84 µg/m3
NOx 32.82 µg/m3
PM10 63.62 µg/m3
PM2.5 20.28 µg/m3
CO 0 mg/m3
241. Predicted Pollution Levels: The model has been setup and run to predict hourly average of CO and 24 hourly average of PM2.5, PM10, NOx and SO2 concentrations for the years 2020, 2025, 2030 and 2035 using forecasted traffic data on proposed highway. The predicted hourly average concentration of CO and 24 hourly average concentration of PM2.5, PM10, SO2 and NOx during peak traffic are shown in Tables 42 to 45 for proposed highway project.
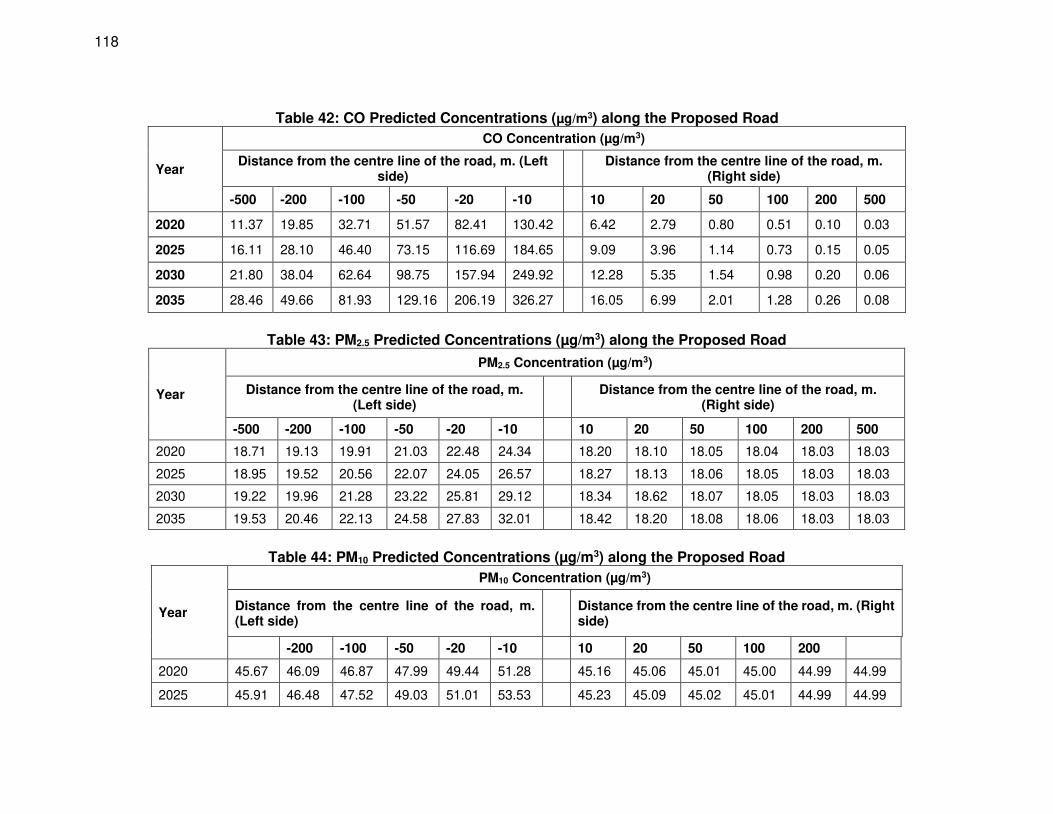
118
Table 42: CO Predicted Concentrations (µg/m3) along the Proposed Road
Year
CO Concentration (µg/m3)
Distance from the centre line of the road, m. (Left side)
Distance from the centre line of the road, m. (Right side)
-500 -200 -100 -50 -20 -10 10 20 50 100 200 500
2020 11.37 19.85 32.71 51.57 82.41 130.42 6.42 2.79 0.80 0.51 0.10 0.03
2025 16.11 28.10 46.40 73.15 116.69 184.65 9.09 3.96 1.14 0.73 0.15 0.05
2030 21.80 38.04 62.64 98.75 157.94 249.92 12.28 5.35 1.54 0.98 0.20 0.06
2035 28.46 49.66 81.93 129.16 206.19 326.27 16.05 6.99 2.01 1.28 0.26 0.08
Table 43: PM2.5 Predicted Concentrations (µg/m3) along the Proposed Road
Year
PM2.5 Concentration (µg/m3)
Distance from the centre line of the road, m. (Left side)
Distance from the centre line of the road, m. (Right side)
-500 -200 -100 -50 -20 -10 10 20 50 100 200 500
2020 18.71 19.13 19.91 21.03 22.48 24.34 18.20 18.10 18.05 18.04 18.03 18.03
2025 18.95 19.52 20.56 22.07 24.05 26.57 18.27 18.13 18.06 18.05 18.03 18.03
2030 19.22 19.96 21.28 23.22 25.81 29.12 18.34 18.62 18.07 18.05 18.03 18.03
2035 19.53 20.46 22.13 24.58 27.83 32.01 18.42 18.20 18.08 18.06 18.03 18.03
Table 44: PM10 Predicted Concentrations (µg/m3) along the Proposed Road
Year
PM10 Concentration (µg/m3)
Distance from the centre line of the road, m. (Left side)
Distance from the centre line of the road, m. (Right side)
-200 -100 -50 -20 -10 10 20 50 100 200
2020 45.67 46.09 46.87 47.99 49.44 51.28 45.16 45.06 45.01 45.00 44.99 44.99
2025 45.91 46.48 47.52 49.03 51.01 53.53 45.23 45.09 45.02 45.01 44.99 44.99
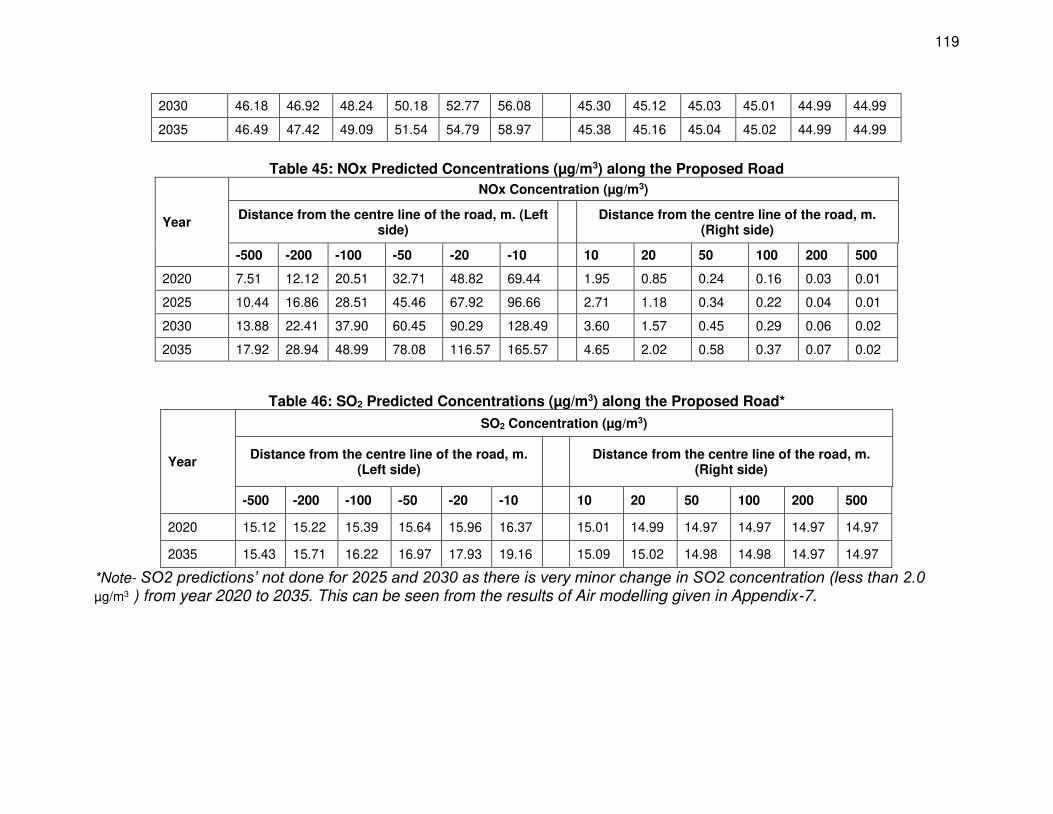
119
2030 46.18 46.92 48.24 50.18 52.77 56.08 45.30 45.12 45.03 45.01 44.99 44.99
2035 46.49 47.42 49.09 51.54 54.79 58.97 45.38 45.16 45.04 45.02 44.99 44.99
Table 45: NOx Predicted Concentrations (µg/m3) along the Proposed Road
Year
NOx Concentration (µg/m3)
Distance from the centre line of the road, m. (Left side)
Distance from the centre line of the road, m. (Right side)
-500 -200 -100 -50 -20 -10 10 20 50 100 200 500
2020 7.51 12.12 20.51 32.71 48.82 69.44 1.95 0.85 0.24 0.16 0.03 0.01
2025 10.44 16.86 28.51 45.46 67.92 96.66 2.71 1.18 0.34 0.22 0.04 0.01
2030 13.88 22.41 37.90 60.45 90.29 128.49 3.60 1.57 0.45 0.29 0.06 0.02
2035 17.92 28.94 48.99 78.08 116.57 165.57 4.65 2.02 0.58 0.37 0.07 0.02
Table 46: SO2 Predicted Concentrations (µg/m3) along the Proposed Road*
Year
SO2 Concentration (µg/m3)
Distance from the centre line of the road, m. (Left side)
Distance from the centre line of the road, m. (Right side)
-500 -200 -100 -50 -20 -10 10 20 50 100 200 500
2020 15.12 15.22 15.39 15.64 15.96 16.37 15.01 14.99 14.97 14.97 14.97 14.97
2035 15.43 15.71 16.22 16.97 17.93 19.16 15.09 15.02 14.98 14.98 14.97 14.97
*Note- SO2 predictions’ not done for 2025 and 2030 as there is very minor change in SO2 concentration (less than 2.0
µg/m3 ) from year 2020 to 2035. This can be seen from the results of Air modelling given in Appendix-7.
120
242. Green House Gases Emissions: Upgrading and strengthening the surface condition of existing SH-115 road under project will bring about a change in vehicle operation speeds, traffic composition on the highway. Such changes with respect to present conditions will have an impact on emission levels of the gases emitted by vehicles travelling along the section of SH-115
highway. Most common types of vehicles that would move on the particular section are motor cycles, three wheelers, cars, vans, buses, light and heavy commercial vehicles. Thus, emission
of Carbon Dioxide (CO2) from motorized vehicles which is a GHG needs to be analyzed to
evaluate the overall contribution of this investment program in terms of the change in CO2 emissions.
243. Evaluation Knowledge Brief has developed a set of spreadsheet-based models to evaluate
the CO2 impacts of rural roads. These Transport Emissions Evaluation Model for projects (TEEMP)
consider passenger and freight travel activity, the shares of trips by different modes and vehicle types (structure), fuel CO2 efficiency (intensity), and fuel type, validated by more detailed emission
factor models. The models directly estimate CO2 emissions for a business-as-usual case (a no-action alternative) vs. alternative including improvement to road pavement and calculate scenario differences.
244. The TEEMP model for rural/urban roads was used for the analysis with using default parameters for base fuel consumption, emission factor and upstream emission percentage. Occupancy-loading, average trip lengths of each type of vehicle, vehicle type growth and roughness factors (before and after improvements) were fed to the model based on the details of traffic and economic analysis for the two sections of SH-115 road. The model was run separately for the road sections. The traffic data used in the model is given in Table-38.
245. Model output includes CO2 emissions at Business as Usual (BAU) or without project; with project (i.e. with improvements) and with induced traffic; and with project and without induced traffic.
Parameters Emission of CO2 in Ton/km/year
BAU 525.34
Project with induced traffic 516.75
Project without induced traffic 516.75
Net reduction in CO2 emission 8.58
246. As indicated in the model output as summarized above, the proposed improvement to existing highway pavements will bring a reduction in CO2 emission even with a growth of traffic. However, this analysis is based on the assumption that the roughness of improved highway pavement surface will be maintained during the project life. Therefore, it is important that the road maintenance program is maintained throughout the project life. The total length of SH-115 to be improved is 109.273 km. Based on the net change in CO2 emissions or CO2 savings of the sections is 8.58 Tons/km/year, and thus the proposed investment program of SH-115 and ECR link as will save emissions of 944.84 Tons CO2/year.
247. Mitigation Measures: It has been observed from the model output that when the traffic volume increases, the concentration of air pollutants also increases correspondingly. However, the maximum predicted pollutant concentrations of PM2.5, PM10, and SO2 over the existing ambient air quality are found to be within the National Ambient Air Quality Standards of CPCB, except CO
121
and NOx but higher than the IFC EHS guideline limits for PM2.5, PM10 and NOx parameters. Increases from the baseline values are not significant based on the modeling. Since the project will improve the road conditions, it is not expected to cause significant increases in existing concentrations of pollutants. Majority of these will be contributed by vehicle emissions and reanimation of dust from roads. Proper and regular maintenance of roads will decrease these indirect impacts. The details of air quality modelling and pollutant dispersion along the alignment is given in Appendix 7.
248. Residual Impact: The project is projected to have minor residual impact on the air quality. It is expected that with proper and regular road maintenance, the road improvement will not have significant negative residual and cumulative impacts on road quality.
2. Surface water quality and quantity
Design and pre-construction stage – moderate negative impact
249. During preliminary planning and design of this project, the Consultant has taken into account the need for:
• reduced incidence of embankment erosion due to inadequate drainage; • providing adequate culverts/drains; • providing side-drainage structures.
250. Impact: Given the presence of river, canal, backwater and ponds along the project road and some of the seasonal stream crossing the project road, improvement of road may result in disruptions to the natural hydrology and water mismanagement and lead to further problems of soil erosion.
251. Mitigation Measures: The natural courses of rivers/streams will be maintained. Appropriate temporary diversions of streams will be made and brought back to their natural course as soon works are completed in that section. No disposal of construction debris in streams and rivers is allowed. Regarding design, the following should be followed:
• drainage structures are properly designed to accommodate forecast discharges; • side drain waters must be discharged at every available stream crossing to minimize
volume and prevent erosion at discharge point; • provide lined drainage structures; • where an increased discharge of surface water endangers the stability of the water
outlet, erosion protection measures such as bioengineering measures, ripraps, and check dams are incorporated; and
• in areas with high water tables, seepage may occur, and side drains and up-slope catch drains must always be lined to avoid percolation.
252. Residual impact: With the proper application of the proposed mitigation measures residual impacts on the surface water quality and quantity will be minimal.
Construction stage - moderate negative impact
122
253. Impact: Minor impacts on water resources are expected during the construction phase construction site runoff, wastewater discharge, etc. The rehabilitation of existing bridges may also cause soil erosion and turbidity in downstream water bodies.
254. The likely impacts of surface water movements are changes in the natural drainage systems, downstream scour, and erosion due to constriction in flows. If suspended solid concentrations in the water are affected, this could also affect aquatic river ecology. However, these impacts are expected to be minor as there are no perennial rivers along the proposed road alignment and construction will take place during dry period.
255. Mitigation Measures: To mitigate this, river-bank slope stabilities will be monitored and, if necessary, appropriate remedial measures applied throughout the construction period. Construction work at bridges during rainy season will be minimized to avoid erosion and sedimentation.
256. To mitigate these impacts the following measures should be implemented:
• maintain adequate vegetative cover on unpaved shoulders of the road; • maintain the natural course of water bodies (as much as possible) and • no throwing of C&D spoils into water bodies; • chemicals and oils are stored in secure, impermeable containers, and disposed of
well away from surface waters In an environmentally sound manner while adhering to applicable laws and regulations;
• no vehicle repair/cleaning activity is allowed within 300m of water bodies/drains; • construction camps are equipped with sanitary latrines (septic tanks); • construction establishments such as construction camps, labor camps,
asphalt/concrete mixing stations, stone crushing units should be located away from the water bodies. Domestic and sewage wastes from labor camps shall be treated with a sewage treatment system (septic tanks) to comply with the standards specified by CPCB and WBG before disposal. Testing of effluent has to be done in accordance with the rules and regulations of CPCB and SCPB;
• drainage structures are properly designed to accommodate forecast discharges; • side drain waters must be discharged at every available stream crossing to minimize
volume and prevent erosion at discharge point; • provide lined drainage structures; • where an increased discharge of surface water endangers the stability of the water
outlet, erosion protection measures such as bioengineering measures, ripraps, and check dams are incorporated;
• in areas with high water tables, seepage may occur, and side drains and up-slope catch drains must always be lined to avoid percolation; and
• all debris and vegetation, clogging culverts are regularly cleared.
257. Residual Impact: With the proper application of the proposed mitigation measures a residual impact on the surface water quality and quantity during construction will be minimal to moderate.
Operation stage – neutral impact
258. Once construction is finished no impact on the surface water quality and quantity is expected. In order to check if unexpected erosion and siltation (including accidental spillage of
123
pollutants from vehicles) in major water bodies is happening periodic surveillance will be conducted and mitigation measures will be taken, if necessary.
3. Groundwater quality and quantity
Design and pre-construction stage – neutral impact
259. No impacts are envisaged during design and preconstruction stage.
Construction stage - minor negative impact
260. Impact: The quality of the groundwater could be impacted at sites where process water or wastewater is generated and disposed of in an improper manner. This could be the case at labor camps, at temporary construction sites and at fuel stations. Quantity may be affected if construction water requirement is obtained from groundwater sources.
261. Mitigation Measures: Sewage generated at labour camps will be disposed in septic tanks which may be emptied periodically through local sewage disposal system. Latrines should be located away and downstream of any source for drinking water in order to prevent accidental contamination of drinking water sources. All latrines will be connected with a septic tank to ensure sewage is not released into the environment. Locations for fueling and/or maintenance should be fitted with impervious flooring and a drainage system connected to an oil/water separator and settling tank to treat sewage before being discharged. Fuel tanks shall be placed in a catch basin large enough to hold the entire contents of the tank and an additional ten percent. More detail on the layout and requirements for labour camps and construction sites can be found in Appendix 8: Plant Management and Appendix 9: Camp Site Management.
262. Construction water requirement (avg. 500 KLD and peak 800 KLD) will be met through CGWB approved ground water source. Domestic water requirement (40 KLD) for workers will also be met mainly through approved sources only. Necessary permits will be obtained prior to water abstraction and only when there is no other viable option so as not to compete with local domestic demand. It is envisaged that groundwater will be utilized for camp domestic water requirement if there are no other viable sources or if the safety of workers will be at risk. Water abstraction will be included in monitoring.
263. Residual Impact: With the proper application of the proposed mitigation measures a residual impact on the groundwater quality will be minimal during construction.
Operation stage – neutral impact
264. During the operation stage of the project no impacts on groundwater quality or quantity are foreseen.
4. Land degradation and pollution
Design and pre-construction stage – minor negative impact
265. Impact: Construction activities of the project road will bring permanent changes in the local-level topography and appearance of the project site. There will be a change in aesthetic beauty of the project area mainly due to the earthwork.
124
266. The use of proper sources for stone and aggregates has become a major issue in most of the region. Historically, stone has been collected from the roadside or from shallow surface workings. Small quarries on steep slopes are often enlarged by blasting or excavation at the base. This is dangerous and can cause slope failures. Roadside stone collection continues in some districts despite its proven negative impacts on road safety and stability.
267. Sand and gravel are often obtained from river deposits. Jurisdiction over stone and aggregates is shared between the Geological Survey of India and the State Forest Department. The Geological Survey of India issues licenses for major mineral developments while the for stone quarrying and for sand and gravel extraction. This is largely because these are mostly found on forest lands. Roadside quarrying is officially discouraged, but unofficially continues, invariably by petty contractors.
268. The engineering team as part of material survey has identified and recommended sources of the construction materials. Details of these sources are provided in Volume 1 (Material survey chapter) of Detailed Project Report. As a prior requirement of project, every new quarry and borrow area should also be subjected to a site-specific environmental investigation work according to an approved plan; and should be left in a safe condition or restored to a productive land use. Subject to these conditions, obtaining construction materials for projects will not cause unacceptable impacts.
269. Mitigation Measures: During preliminary planning and design of this project, the Consultant has taken into account the need for:
• optimization of the center line so that embankment raised on both side; • temporary and permanent drainage systems to minimize soil erosion; • optimum siting and control of quarries; • mechanized construction methods.
270. The following should be considered during finalization of detailed engineering design:
• Minimize permanent and temporary land take for development • Optimize balance between cut and fill and avoid deep cuts and high embankments
to minimize earthworks • Maximize reuse of spoils and old asphalt paving material within the construction • Agree on spoils disposal sites, management and rehabilitation plan with relevant
local agencies • Specify vegetation that serves specific bioengineering functions.
271. Adequate earth material is available from barren land in the vicinity. About 1,026,200 cum of borrow earth, 86,000 cum of sand and 130,000 cum of aggregates are estimated to be required for the constructional activities of road section and will be mostly sourced from licensed quarries available locally. Tentatively it is proposed that the aggregates and boulders will be sources from previously approved quarry area located near to the project road. Earth cut materials will be maximized for reuse in backfilling on the same rural road to minimize the quantities of borrow materials and spoil disposal. Borrow earth material will still be required but this will be taken from quarries or riverbeds after prior permission from competent authority.
272. There is a need to establish construction camps and related facilities, such as borrow pits and quarries. These must be located in environmentally sound and socially safe areas. It is

125
expected that construction materials for the road works will be mined mostly from approved quarries. The following criteria are applied for locating the borrow areas:
• If new borrow areas are opened for the project, they should obtain necessary clearances;
• borrow areas are not established in ecologically sensitive areas; • villagers are consulted in regard to the design and location of all borrow areas –
these should ensure the safety of local communities and, if possible, should incorporate beneficial post construction features for the villages;
• located away from the road as well as the road, so as to minimize visual and slope stability impacts;
• construction facilities such as temporary workers camp, hot mix plants, and concrete batching plant and stone crushers will not be established in reserve / protected forests. Local forest department / village panchayat committees should be consulted before locating these temporary project facilities;
• construction camps for labourers should be located at a suitable distance away from settlements in accordance with relevant national or state regulations such as the State Pollution Control Board and in a manner to avoid stressing local resources (water, electricity etc.) and away from forest/protected areas as per recommendations of local forest department;
• living accommodation and ancillary facilities should be erected and maintained to standards and scales approved by the CSC; and
• toilets and urinals should be provided in accessible places away from the asphalt plant and mixing yard.
273. Residual Impact: With the proper implementation of the proposed mitigation measures and low likelihood of the project requiring opening of new quarry sites the project is not expected to have a significant residual impact on the soil and local topography.
Construction stage - moderate negative impact
274. Impact: There may be permanent changes in the landscape. Disposal of excavated soils and debris at improper locations such as low laying area will make the area look untidy and unattractive. Disposal of waste and litter at improper locations and deforestation for firewood will make the area look dirty and unattractive.
275. During the improvement works for the road section, the cutting of trees, stone quarrying, and construction of structures, the micro-level topography may change. With proper planning, these topographical impacts can be kept within acceptable limits and sometimes even used to enhance local aesthetics. Any negative impacts on topography (existing or new), particularly soil erosion due to a lack of drainage facilities, will be minimized with the provision of proper drainage facilities such as culverts etc. The overall impact on topography is, therefore, anticipated to be insignificant.
276. The terrain and geological conditions of area is plain, hence the interaction between proposed road features and existing land features will not reveal/result in significant land instabilities.
277. Given the existence of low gradient slope and proper drainage in almost entire project area, it is inevitable that the project site will face problems of erosion. Unstable, uncompacted
126
road embankment materials and exposed material can result to soil erosion, clogging of side drains and the spill-over of rainwater runoff onto the road surface. These problems can be mitigated by maintaining the batter gradients as specified in the MORTH guidelines. The existing vegetation on embankment slopes the immediate area of construction must remain undisturbed during construction and/or upgrading. Grass seeding will be used to prevent barren embankment and to stop soil erosion. Support structures will be installed where slope failures are anticipated or may have occurred previously.
278. Construction work in the project road section will be virtually through plain terrain and stable slopes. Much of areas in this section are surrounded by agriculture fields with adequate natural drainage of storm, resulting in stable substrates.
279. The project will require large amounts of bitumen or bitumen emulsion usually stored in drums. These empty bitumen drums are generally recycled as steel sheeting or used in road construction as parapets or for riverbank stabilization. When supplied and used in this manner, bitumen, if not containing Polycyclic Aromatic Hydrocarbons (PAH), is not regarded as a significant environmental hazard.
280. The project will require the import, transport, and use of fuel and oils. Minor diesel spills are common in region, especially around fuel stations.
281. Mitigation Measures: During the construction phase the existing vegetation including shrubs and grasses along the road (except within the strip directly under embankments or cuttings) should be properly maintained. Sites for quarrying, borrowing and disposal of spoils are to be confirmed according to the applicable laws and regulations in the state and the practices followed in recent/ongoing internationally funded road projects. Major excavation and earthworks should only be undertaken during the dry season.
282. Quarry and borrow pits may be filled with rejected construction waste such as top soil etc. and afterwards should be given a vegetative cover. If this is not possible, then the excavated slopes will be filled in such a way that they resemble an original ground surface.
283. Mitigation measures for quarries are:
• aggregates will be first sourced from licensed quarry sites (which are in operation) that comply with environmental and other applicable regulations;
• quarries must use controlled and environmentally friendly quarrying techniques in order to minimize erosions and landslides (Appendix 12 provides guidelines for quarry management);
• occupational safety procedures/practices for the work force will be adhered to in all quarries;
• quarry and crushing units will be provided with adequate dust suppression measures; and
• regular monitoring of the quarries by concerned authorities to ensure compliance with environmental management and monitoring measures.
284. Mitigation measures for borrow areas are:
• prior approval will be obtained from concerned authorities and all local environmental regulations be complied with;
127
• within all identified borrow areas, the actual extent of area to be excavated will be demarcated with signs and access to the operational area controlled;
• borrow pit plant and machinery will conform to CPCB and IFC EHS noise emission regulations;
• protective gear will be provided to the workforce exposed to noise levels beyond threshold limits and there should be proper rotation of such personnel; and
• all operation areas will be water sprinkled to control dust levels to national ambient air quality standards, and
• borrow areas are provided with gentle side slope that are connected to the nearest drainage channel to avoid the formation of cess pools during the rainy season.
285. Other mitigation measures to be taken during the construction phase are:
• Any temporary lands required for labour camps or any other sites required for the project shall be transferred back to the owner after the land has been restored to its original state before the completion of construction works. Contractor has to collect baseline data on the quality of ambient air, ambient noise, soil, surface water and groundwater before establishing and after decommissioning the camps or sites.
• excavated material shall be stockpiled and covered in such a way the soil will not erode away and should be used to widen the road or disposed of at proper disposal sites following spoil disposal management guidelines (Appendix 10);
• Removal of bituminous wastes from existing roads should not be disposed of in nearby water bodies, open spaces and parks and wastes should not be left unmanaged on the road sides. Bituminous material should be examined for PAH to establish if it can be recycled /reused for road construction. If not, the bitumen shall be treated as hazardous waste and disposed of in pre-identified and approved disposal sites”
• Any construction and demolition waste generated during the construction phase should be managed in accordance with the C&D Waste Management Rules, 2016. As far as possible, demolition and construction waste should be segregated and recycled. The unserviceable waste left after recycling should be dumped in pre-identified and approved pits as per Construction & Demolition Waste Management Rules. All required permissions shall be obtained from the concerned authorities before disposal of the debris”
• cut slopes should be re-vegetated immediately after widening activities; • cut material should be disposed of in suitable depressions.
286. To mitigate the impacts of possible fuel spills the following measures will be applied:
• secondary containment around fuel tanks large enough to hold the entire contents of the tank and an additional ten percent and at fueling stations will be built;
• oil and fuel spills, and other runoff from contaminated areas will be controlled; and • equipment and fuel depots will be placed in safe zones away from drinking water
sources and riverbanks;
287. Appendix -8 to Appendix -12 of this IEE Report presents good environmental management practices and guide documents in the following aspects of road construction:
• Plant Management – Appendix 8;
128
• Camp Site Management – Appendix 9; • Debris and Spil Disposal Management – Appendix 10; • Borrow Area Management – Appendix 11; • Quarry Area Management – Appendix 12.
288. Residual Impact: With the proper application of the proposed mitigation measures the construction phase should not have any significant residual impact (except minor impacts for the initial years) on the soil or the local topography.
Operation stage – positive impact
289. Repairs to culverts and new drainage work will eliminate/reduce the soil erosion problems presently caused by poor cross drainage. The situation will remain good because this road passes through an area that is largely agriculture fields and trees and plants have the capacity to stabilize the soil and prevent soil erosion.
E. Impacts on Biological environment
1. Trees and vegetation
Design and pre-construction stage – moderate negative impact
290. Impact: The improvement work will be kept limited to existing ROW with minimal additional land acquisition. Nonetheless, land clearing will involve cutting of trees and horticulture shrubs within the ROW along the road.. The improvement of the proposed road is largely confined on the existing alignment. However, improvements to the geometry may involve excavation and filling and the need to clear vegetation.
291. Mitigation Measures: To minimize loss of trees, the following mitigation measures have been adopted during the detailed design and construction stage of the project:
• widening proposal considered option with minimal tree cutting; • adopting Environmentally Friendly Road Construction (EFRC) methods; • Budget provisions for following the mandatory afforestation program which requires
planting native trees (in consultation with forest people) at the rate of 1:10 for trees cut and improving vegetation cover in the project area.
• The plantation under compensatory afforestation plan will be scheduled within 15 months of the construction works, as preparation of seedlings in the approved nursery will start with commencement of construction work for the project road.
292. Residual Impact: As a result of the proposed afforestation program and additional improvement activities it is expected that there will be a net gain of trees and vegetation under the project.
Construction stage – moderate negative impact
293. Impact: Removal of trees for road widening etc. will result in temporary loss of habitat and associated biodiversity. The project will not require diversion of any forest land for widening of the road. Only vegetation within ROW will be cleared after approval from revenue department.
129
294. Another impact from road construction activities and deriving from the vehicle movement, quarrying, preparation and transfer of material and other earthwork is the accumulation of dust on the surrounding vegetation. This leads to deterioration of the vegetative health, which in turn will affect the ecology as well as the aesthetic beauty of the area. Induced impacts may also result from the following:
• increased tree harvesting for firewood, construction timber, forage, medicinal plants, and other products;
• increased earth and rock extraction; • construction crew demands for wood as a fuel and for building materials.
295. Invasive Species: Soil brought into the project area from outside may contain seeds of alien invasive species. Also, the construction machinery and vehicles can accidentally introduce seeds of such plants if used without proper cleaning. This will negatively affect both the natural and manmade habitats. Securing soil from locations close to the project area will reduce the chances of transporting any seeds of alien invasive species to the project area.
296. Mitigation measures. Compensatory afforestation plan will be developed in consultation with local forest department. In detail, the recommended mitigation measures include:
• Compensatory afforestation plans • Cut only trees which are necessary. Ensure that the vegetation is cleared as per
terms and conditions of tree cutting permit • Compliance with guidelines issued by the Indian Road Congress • all wood building material for workers’ housing should be brought from outside the
project area; • workers should be supplied with non-wood fuels such as kerosene or liquefied
petroleum gas for the duration of the contract; • Prohibit collection, sale or purchase of timber/firewood by staff and contractors,
with heavy penalties applied • all contract equipment and plants should be cleaned to the satisfaction of the CSC
in charge prior to their relocation to project sites; • during site clearance, care should be taken to ensure that the minimum area of
vegetation area is affected; and • water sprinkling of trucks used as construction vehicles should be properly and
regularly undertaken, so that dust deposition problem on vegetation are minimized. Cleaning/washing of construction vehicles arriving in the project areaSecuring soil from locations close to the project area will reduce the chances of transporting any seeds of alien invasive species to the project area.
297. Residual Impact: With the implementation of the measures above, minimal residual impacts on trees and vegetation is expected.
Operation stage – positive impact
298. Impact: A net gain of good vegetation cover is expected as a result of the mandatory compensatory afforestation program. It is expected that vegetation such as shrubs, herbs and bushes will reestablish themselves within one to two years after project construction. However, the trees will take longer 5-10 years to attain substantial growth. Hence, there will be no residual
130
impacts in relation to smaller vegetation species such as shrubs, bushes etc. Residual impacts in relation to mature trees will be mitigated eventually after 5-10 years after project construction.
Operation stage – positive impact
2. Ecologically important areas
Design and pre-construction stage – moderate negative impact
299. Impact: The project road section passes though plain terrain with agriculture areas residential areas in between. Road section is not passing through any forest and protected area. Ecologically important areas within the project area includes water bodies. There may also be a low risk of disturbance to wildlife from traffic noise of the project road.
300. Mitigation Measures: Measures to protect surface water resources such as appropriate drainage design to accommodate predicted water volume and minimize impacts on existing waterways will help address these impacts on ecologically important areas and wildlife. Undertaking pre-construction survey along the alignment to identify the section required for protection measures by the EPC contractor will further address fragmentation effects of the road improvement.
301. Residual Impact: If the above mitigation measures get implemented as planned, minimal residual impacts are expected due to project design.
302. Construction stage - moderate negative impact
303. Impact: Temporary sedimentation and water quality deterioration is expected during the construction stage. Increase in turbidity due to erosion will lead to reduction of light penetration and make it an undesirable place for aquatic fauna and flora. Further due to the reduced light penetration to the water body, the primary productivity of the biota in the water body will be reduced resulting in increased mortality. The impact is insignificant since construction of road section in the area will be mostly during summer and short-term only. Siltation will be avoided by measures suggested above in impact on surface water resource section. Construction crew demands for food and recreational hunting and fishing may also result to poaching during construction.
304. Impacts on Protected Area: The project road does not pass through any reserved/protected area. There is no species in the area qualifying the project area as Critical Habitat. The protected area is a natural habitat for wildlife having core zone deep inside the protected fragmented by physical barriers, restricting wildlife movement towards road alignment.
305. Mitigation Measures: To minimize negative impacts on ecologically important features in the project area the following should be followed:
• If any wild animal (except birds) come within the vicinity of 100m from the construction site, construction works must immediately stop and resume only after the wild animals have moved away.
• Employment agreements should specify heavy penalties for illegal hunting, fishing, trapping and wildlife trading (as per Wildlife Act 1972)– all other ancillary works should also agree not to participate in such activities.
• Strict anti-poaching surveillance measures will be implemented, especially during project construction phase.
131
• Use only existing licensed quarries for sourcing aggregates. Further, any newly-established quarries – whether inside or outside of rivers and streams – have potential to clear Natural Habitat. These risks can be simply and effectively avoided by sourcing of all aggregates only from existing licensed quarries outside of rivers and streams.
• Avoid borrow pits in areas of Natural Habitat (Water reservoir/Stream) and within 200 m of waterways. No borrow pits will be allowed at least 200 m next to waterways. This will help avoid risks of runoff and sedimentation impacting aquatic Habitat. Further, to avoid additional Project impacts on Natural Habitat, no borrow pits will be established in areas of Natural Habitat.
• Installation of speed limits caution boards and speed breakers at identified location, informatory boards for road users.
306. Residual Impact: Considering the above measures, the project road meets the requirements of para 28 (page 35) of the SPS – no measurable adverse impacts, no reduction in population of threatened species etc. Hence, the project works will be in compliance with the SPS and residual impacts on wildlife are expected to be insignificant.
Operation stage – positive impact
307. If the habitat improvement activities described above are implemented as planned an overall positive impact of more sustainable use of natural resources and habitat improvementis expected..
F. Impacts on Social Environment
308. The sensitive location such as places of worship, school, college and hospital along project road within 100 meters from the edge of the existing road has been identified as given in Table 30. These structures are kept unaffected by the proposed improvement proposal. Short term impacts during the construction stage are expected. Measures such as timely scheduling of construction activities in these areas, provision of sign boards, appropriate barriers such as planting trees and / or raised boundary walls are adopted to minimize impacts.
1. Private land and buildings
Design and pre-construction stage – moderate negative impact
309. Impact: There will be moderate impacts due to acquisition of 41.9833 ha private land acquisition as the proposed widening will be accommodated within existing ROW. Community impacts are mostly due to the resettlement of people due to widening of the project road to 2 lanes.
310. Resettlement plan for the project road has been prepared for 567 private structures.
311. Mitigation Measures: A resettlement plan is prepared to address this issue. The affected people will be compensated and rehabilitated as per the provisions of the Resettlement Plan.
312. Residual Impact: Since any foreseen impact on private land and buildings will be addressed in a separate resettlement plan no residual impacts are envisaged.
Construction stage – minor negative impact
132
313. Impact: At certain locations on the road, particularly at bridge/culvert sites, traffic will be temporarily diverted from the existing carriageway while construction is in progress and temporary traffic diversions will be managed within the ROW. In other instances, traffic may have to be diverted across adjacent private land.
314. Mitigation Measures: In case private land is temporarily used during construction compensation will be paid for any loss of crops or the replacement of damaged structures. Most construction will be undertaken during the dry season when few crops are planted. Losses should be minimized during construction. After completion of the construction works the used land will be reinstated to the state it had before commencement of the works. Access to adjacent properties and agricultural land will be maintained, as necessary. Any damage to areas and infrastructure outside the agreed work sites (Corridor of Impact assessed in project RP) will be restored to pre-construction conditions and will be subject to compensation at contractor cost and through written agreement with the land owner, as applicable.
315. Residual Impact: With adequate compensation for any damages resulting from using private land during construction no residual impacts are to be expected from construction.
Operation stage – neutral impact
316. The likely impacts on land use and settlement patterns are limited. Improved access will lead to increased migration, but this will occur gradually and over a prolonged period. There will be time for expansion of residential areas to be established. However, there will be a need to control ribbon development.
2. Public infrastructure and utility structures
Design and pre-construction stage – minor negative impact
317. Impact: On the project road, utilities interfere with the ROW at few locations that will have to be shifted / removed prior to construction.
318. Mitigation Measures: Before construction commences a detailed survey has to be carried out in order to list all utilities that will interfere with the road works. These utilities will have to be shifted before the works in close cooperation with the respective owners of the utilities.
319. Residual Impact: With proper preparation no residual impacts are to be expected.
Construction stage –minor negative impact
320. Impact: Traffic may experience minor delays when diverted around active construction areas but will be more severely hampered at the locations where temporary road closures are necessary. There are also likely impacts on communities from the construction activities.
321. Mitigation Measures: Contractor will prepare and implement traffic management plan. Key hazard points will have proper signs indicating the nature of the problem envisaged. Road closures / diversions must comply with the guidelines laid out in IRC:SP:55.2014: Guidelines on Traffic Management in work zones. Contractor will ensure that information on the timing of construction works and notifications of road closure (if any) is provided via the local media (radio, TV, newspaper etc.) or through the local community heads.
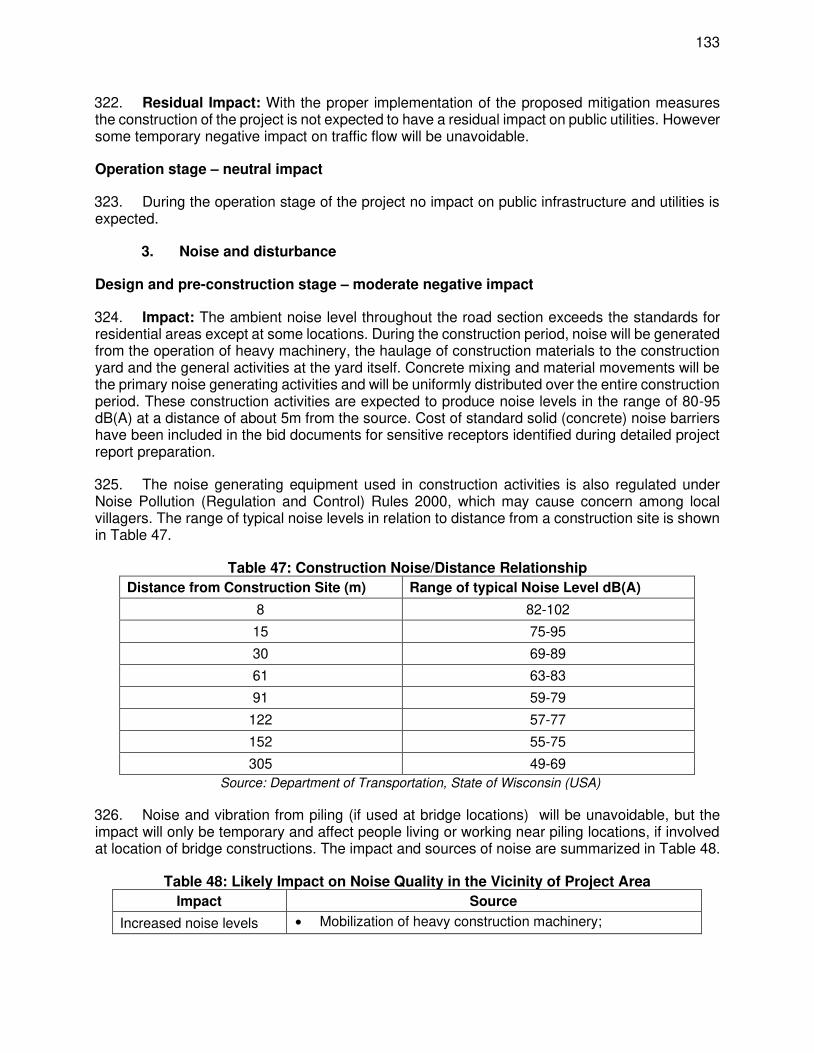
133
322. Residual Impact: With the proper implementation of the proposed mitigation measures the construction of the project is not expected to have a residual impact on public utilities. However some temporary negative impact on traffic flow will be unavoidable.
Operation stage – neutral impact
323. During the operation stage of the project no impact on public infrastructure and utilities is expected.
3. Noise and disturbance
Design and pre-construction stage – moderate negative impact
324. Impact: The ambient noise level throughout the road section exceeds the standards for residential areas except at some locations. During the construction period, noise will be generated from the operation of heavy machinery, the haulage of construction materials to the construction yard and the general activities at the yard itself. Concrete mixing and material movements will be the primary noise generating activities and will be uniformly distributed over the entire construction period. These construction activities are expected to produce noise levels in the range of 80-95 dB(A) at a distance of about 5m from the source. Cost of standard solid (concrete) noise barriers have been included in the bid documents for sensitive receptors identified during detailed project report preparation.
325. The noise generating equipment used in construction activities is also regulated under Noise Pollution (Regulation and Control) Rules 2000, which may cause concern among local villagers. The range of typical noise levels in relation to distance from a construction site is shown in Table 47.
Table 47: Construction Noise/Distance Relationship
Distance from Construction Site (m) Range of typical Noise Level dB(A)
8 82-102
15 75-95
30 69-89
61 63-83
91 59-79
122 57-77
152 55-75
305 49-69
Source: Department of Transportation, State of Wisconsin (USA)
326. Noise and vibration from piling (if used at bridge locations) will be unavoidable, but the impact will only be temporary and affect people living or working near piling locations, if involved at location of bridge constructions. The impact and sources of noise are summarized in Table 48.
Table 48: Likely Impact on Noise Quality in the Vicinity of Project Area
Impact Source
Increased noise levels • Mobilization of heavy construction machinery;
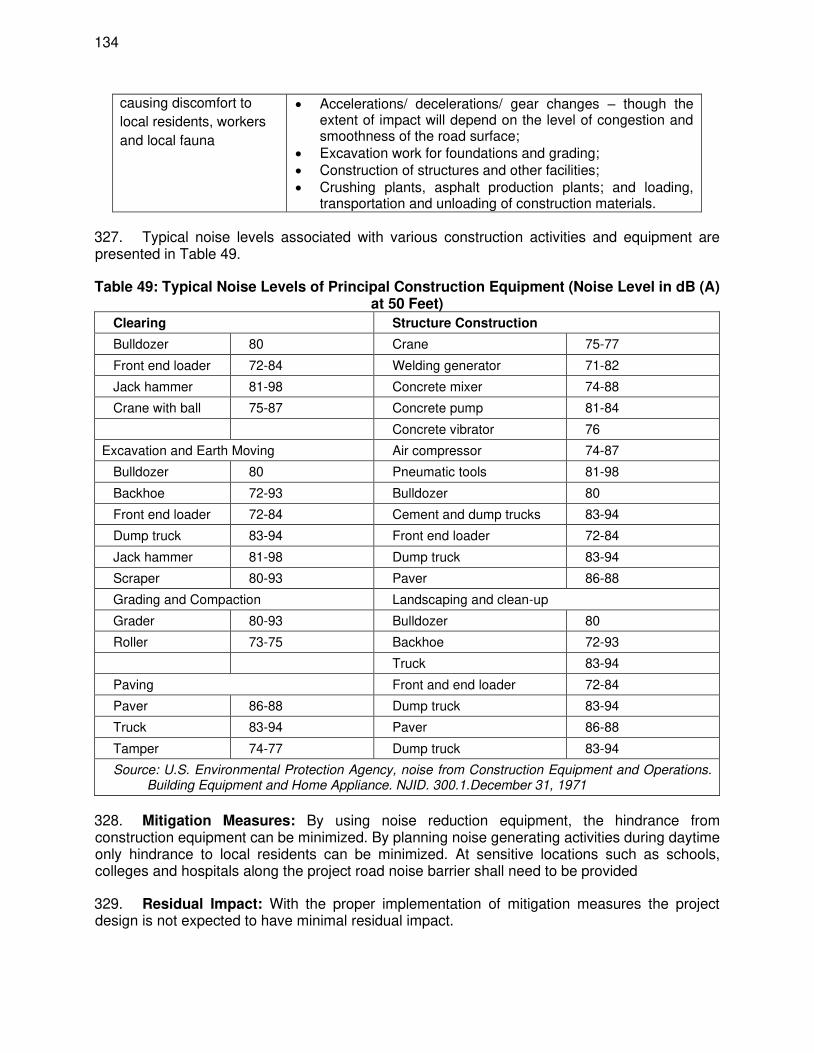
134
causing discomfort to
local residents, workers
and local fauna
• Accelerations/ decelerations/ gear changes – though the extent of impact will depend on the level of congestion and smoothness of the road surface;
• Excavation work for foundations and grading; • Construction of structures and other facilities; • Crushing plants, asphalt production plants; and loading,
transportation and unloading of construction materials.
327. Typical noise levels associated with various construction activities and equipment are presented in Table 49.
Table 49: Typical Noise Levels of Principal Construction Equipment (Noise Level in dB (A) at 50 Feet)
Clearing Structure Construction
Bulldozer 80 Crane 75-77
Front end loader 72-84 Welding generator 71-82
Jack hammer 81-98 Concrete mixer 74-88
Crane with ball 75-87 Concrete pump 81-84
Concrete vibrator 76
Excavation and Earth Moving Air compressor 74-87
Bulldozer 80 Pneumatic tools 81-98
Backhoe 72-93 Bulldozer 80
Front end loader 72-84 Cement and dump trucks 83-94
Dump truck 83-94 Front end loader 72-84
Jack hammer 81-98 Dump truck 83-94
Scraper 80-93 Paver 86-88
Grading and Compaction Landscaping and clean-up
Grader 80-93 Bulldozer 80
Roller 73-75 Backhoe 72-93
Truck 83-94
Paving Front and end loader 72-84
Paver 86-88 Dump truck 83-94
Truck 83-94 Paver 86-88
Tamper 74-77 Dump truck 83-94
Source: U.S. Environmental Protection Agency, noise from Construction Equipment and Operations. Building Equipment and Home Appliance. NJID. 300.1.December 31, 1971
328. Mitigation Measures: By using noise reduction equipment, the hindrance from construction equipment can be minimized. By planning noise generating activities during daytime only hindrance to local residents can be minimized. At sensitive locations such as schools, colleges and hospitals along the project road noise barrier shall need to be provided
329. Residual Impact: With the proper implementation of mitigation measures the project design is not expected to have minimal residual impact.
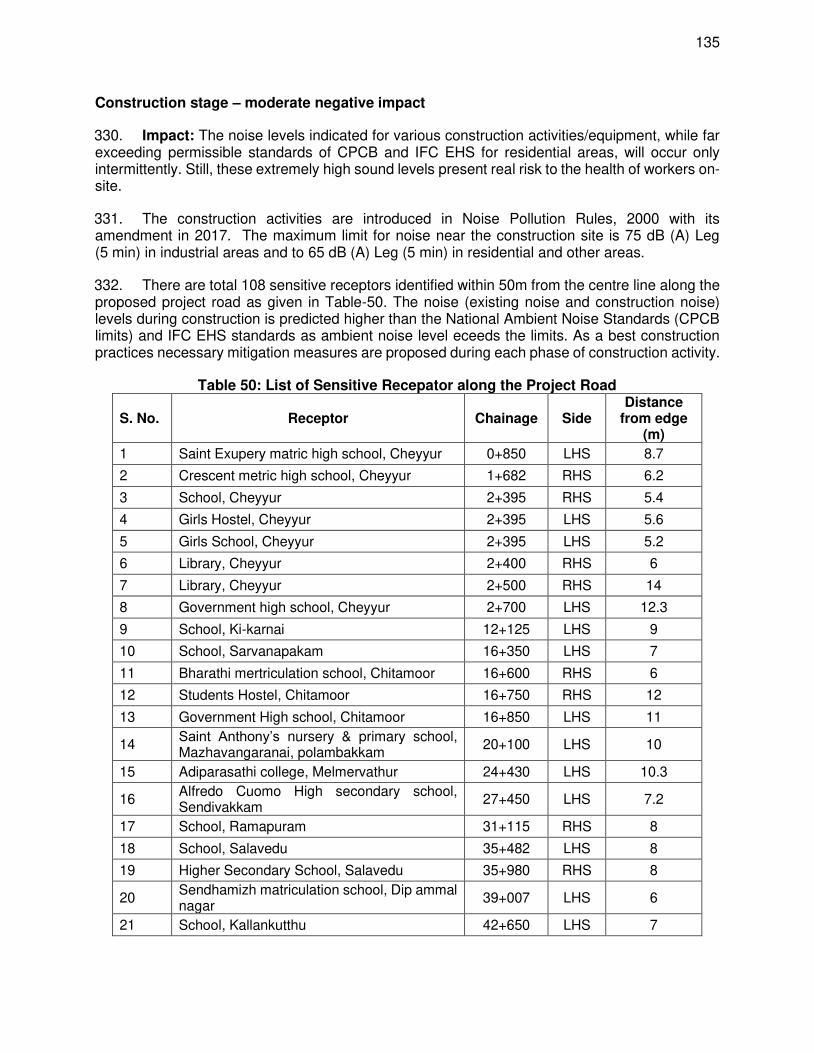
135
Construction stage – moderate negative impact
330. Impact: The noise levels indicated for various construction activities/equipment, while far exceeding permissible standards of CPCB and IFC EHS for residential areas, will occur only intermittently. Still, these extremely high sound levels present real risk to the health of workers on- site.
331. The construction activities are introduced in Noise Pollution Rules, 2000 with its amendment in 2017. The maximum limit for noise near the construction site is 75 dB (A) Leg (5 min) in industrial areas and to 65 dB (A) Leg (5 min) in residential and other areas.
332. There are total 108 sensitive receptors identified within 50m from the centre line along the proposed project road as given in Table-50. The noise (existing noise and construction noise) levels during construction is predicted higher than the National Ambient Noise Standards (CPCB limits) and IFC EHS standards as ambient noise level eceeds the limits. As a best construction practices necessary mitigation measures are proposed during each phase of construction activity.
Table 50: List of Sensitive Recepator along the Project Road
S. No. Receptor Chainage Side Distance
from edge (m)
1 Saint Exupery matric high school, Cheyyur 0+850 LHS 8.7
2 Crescent metric high school, Cheyyur 1+682 RHS 6.2
3 School, Cheyyur 2+395 RHS 5.4
4 Girls Hostel, Cheyyur 2+395 LHS 5.6
5 Girls School, Cheyyur 2+395 LHS 5.2
6 Library, Cheyyur 2+400 RHS 6
7 Library, Cheyyur 2+500 RHS 14
8 Government high school, Cheyyur 2+700 LHS 12.3
9 School, Ki-karnai 12+125 LHS 9
10 School, Sarvanapakam 16+350 LHS 7
11 Bharathi mertriculation school, Chitamoor 16+600 RHS 6
12 Students Hostel, Chitamoor 16+750 RHS 12
13 Government High school, Chitamoor 16+850 LHS 11
14 Saint Anthony’s nursery & primary school, Mazhavangaranai, polambakkam
20+100 LHS 10
15 Adiparasathi college, Melmervathur 24+430 LHS 10.3
16 Alfredo Cuomo High secondary school, Sendivakkam
27+450 LHS 7.2
17 School, Ramapuram 31+115 RHS 8
18 School, Salavedu 35+482 LHS 8
19 Higher Secondary School, Salavedu 35+980 RHS 8
20 Sendhamizh matriculation school, Dip ammal nagar
39+007 LHS 6
21 School, Kallankutthu 42+650 LHS 7
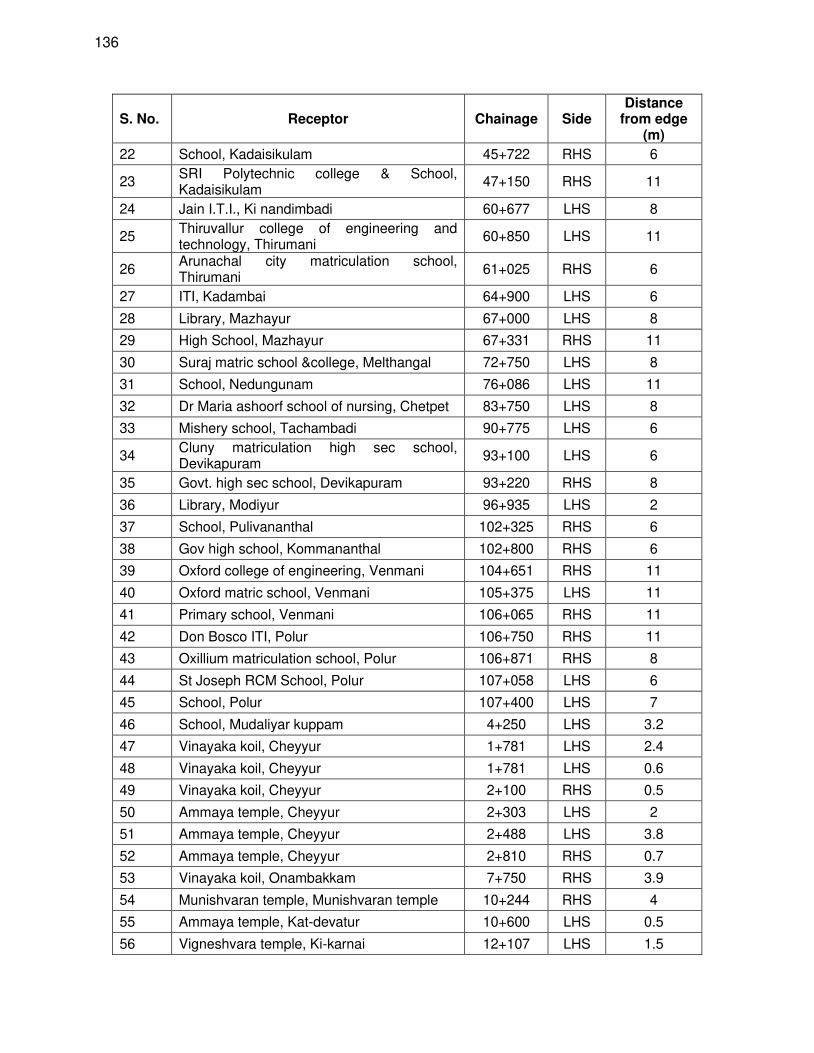
136
S. No. Receptor Chainage Side Distance
from edge (m)
22 School, Kadaisikulam 45+722 RHS 6
23 SRI Polytechnic college & School, Kadaisikulam
47+150 RHS 11
24 Jain I.T.I., Ki nandimbadi 60+677 LHS 8
25 Thiruvallur college of engineering and technology, Thirumani
60+850 LHS 11
26 Arunachal city matriculation school, Thirumani
61+025 RHS 6
27 ITI, Kadambai 64+900 LHS 6
28 Library, Mazhayur 67+000 LHS 8
29 High School, Mazhayur 67+331 RHS 11
30 Suraj matric school &college, Melthangal 72+750 LHS 8
31 School, Nedungunam 76+086 LHS 11
32 Dr Maria ashoorf school of nursing, Chetpet 83+750 LHS 8
33 Mishery school, Tachambadi 90+775 LHS 6
34 Cluny matriculation high sec school, Devikapuram
93+100 LHS 6
35 Govt. high sec school, Devikapuram 93+220 RHS 8
36 Library, Modiyur 96+935 LHS 2
37 School, Pulivananthal 102+325 RHS 6
38 Gov high school, Kommananthal 102+800 RHS 6
39 Oxford college of engineering, Venmani 104+651 RHS 11
40 Oxford matric school, Venmani 105+375 LHS 11
41 Primary school, Venmani 106+065 RHS 11
42 Don Bosco ITI, Polur 106+750 RHS 11
43 Oxillium matriculation school, Polur 106+871 RHS 8
44 St Joseph RCM School, Polur 107+058 LHS 6
45 School, Polur 107+400 LHS 7
46 School, Mudaliyar kuppam 4+250 LHS 3.2
47 Vinayaka koil, Cheyyur 1+781 LHS 2.4
48 Vinayaka koil, Cheyyur 1+781 LHS 0.6
49 Vinayaka koil, Cheyyur 2+100 RHS 0.5
50 Ammaya temple, Cheyyur 2+303 LHS 2
51 Ammaya temple, Cheyyur 2+488 LHS 3.8
52 Ammaya temple, Cheyyur 2+810 RHS 0.7
53 Vinayaka koil, Onambakkam 7+750 RHS 3.9
54 Munishvaran temple, Munishvaran temple 10+244 RHS 4
55 Ammaya temple, Kat-devatur 10+600 LHS 0.5
56 Vigneshvara temple, Ki-karnai 12+107 LHS 1.5
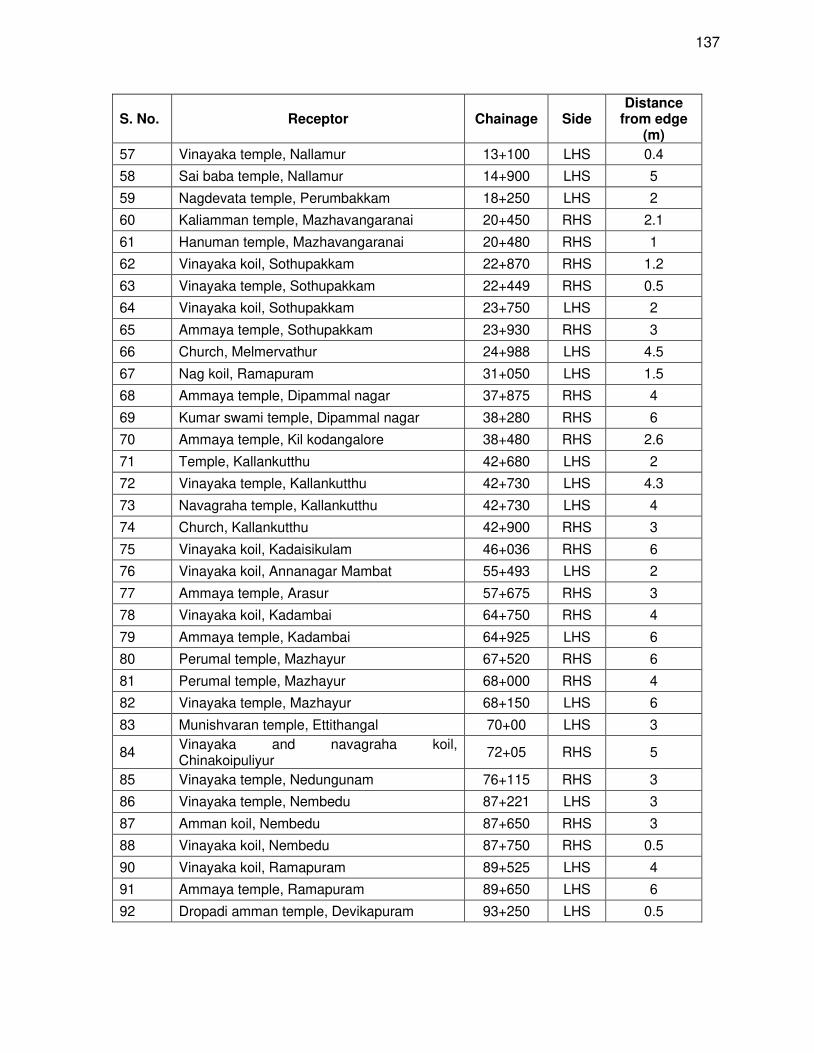
137
S. No. Receptor Chainage Side Distance
from edge (m)
57 Vinayaka temple, Nallamur 13+100 LHS 0.4
58 Sai baba temple, Nallamur 14+900 LHS 5
59 Nagdevata temple, Perumbakkam 18+250 LHS 2
60 Kaliamman temple, Mazhavangaranai 20+450 RHS 2.1
61 Hanuman temple, Mazhavangaranai 20+480 RHS 1
62 Vinayaka koil, Sothupakkam 22+870 RHS 1.2
63 Vinayaka temple, Sothupakkam 22+449 RHS 0.5
64 Vinayaka koil, Sothupakkam 23+750 LHS 2
65 Ammaya temple, Sothupakkam 23+930 RHS 3
66 Church, Melmervathur 24+988 LHS 4.5
67 Nag koil, Ramapuram 31+050 LHS 1.5
68 Ammaya temple, Dipammal nagar 37+875 RHS 4
69 Kumar swami temple, Dipammal nagar 38+280 RHS 6
70 Ammaya temple, Kil kodangalore 38+480 RHS 2.6
71 Temple, Kallankutthu 42+680 LHS 2
72 Vinayaka temple, Kallankutthu 42+730 LHS 4.3
73 Navagraha temple, Kallankutthu 42+730 LHS 4
74 Church, Kallankutthu 42+900 RHS 3
75 Vinayaka koil, Kadaisikulam 46+036 RHS 6
76 Vinayaka koil, Annanagar Mambat 55+493 LHS 2
77 Ammaya temple, Arasur 57+675 RHS 3
78 Vinayaka koil, Kadambai 64+750 RHS 4
79 Ammaya temple, Kadambai 64+925 LHS 6
80 Perumal temple, Mazhayur 67+520 RHS 6
81 Perumal temple, Mazhayur 68+000 RHS 4
82 Vinayaka temple, Mazhayur 68+150 LHS 6
83 Munishvaran temple, Ettithangal 70+00 LHS 3
84 Vinayaka and navagraha koil, Chinakoipuliyur
72+05 RHS 5
85 Vinayaka temple, Nedungunam 76+115 RHS 3
86 Vinayaka temple, Nembedu 87+221 LHS 3
87 Amman koil, Nembedu 87+650 RHS 3
88 Vinayaka koil, Nembedu 87+750 RHS 0.5
90 Vinayaka koil, Ramapuram 89+525 LHS 4
91 Ammaya temple, Ramapuram 89+650 LHS 6
92 Dropadi amman temple, Devikapuram 93+250 LHS 0.5
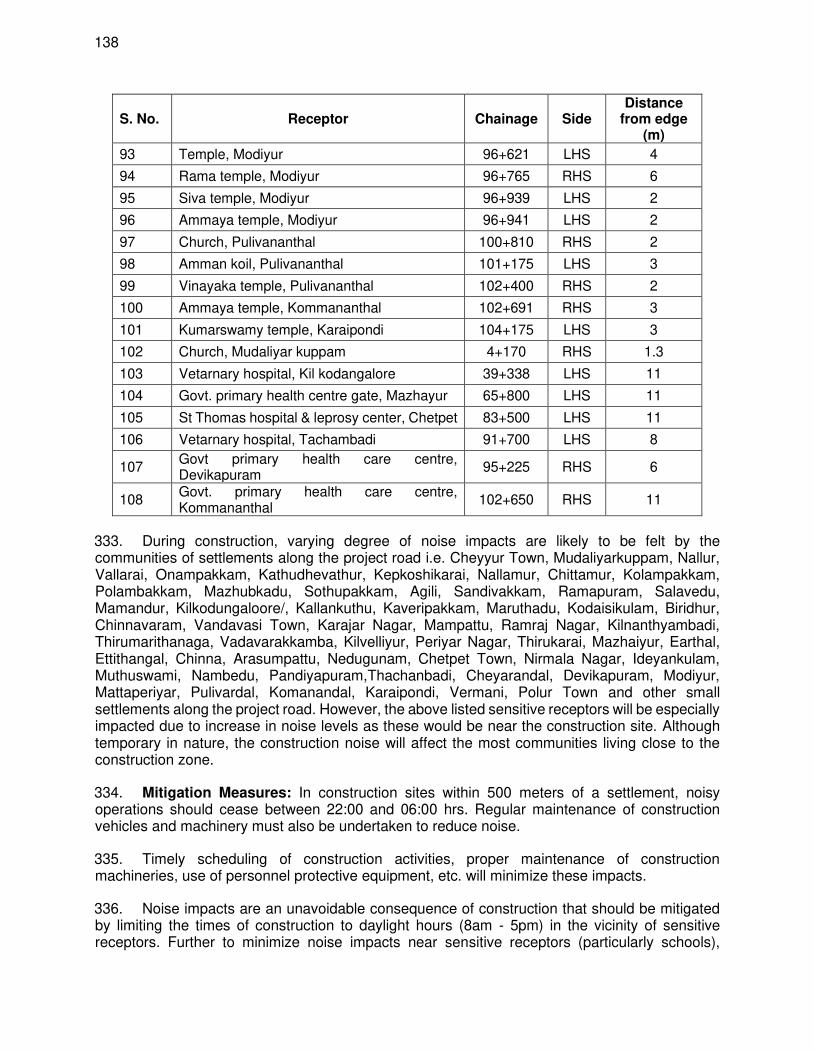
138
S. No. Receptor Chainage Side Distance
from edge (m)
93 Temple, Modiyur 96+621 LHS 4
94 Rama temple, Modiyur 96+765 RHS 6
95 Siva temple, Modiyur 96+939 LHS 2
96 Ammaya temple, Modiyur 96+941 LHS 2
97 Church, Pulivananthal 100+810 RHS 2
98 Amman koil, Pulivananthal 101+175 LHS 3
99 Vinayaka temple, Pulivananthal 102+400 RHS 2
100 Ammaya temple, Kommananthal 102+691 RHS 3
101 Kumarswamy temple, Karaipondi 104+175 LHS 3
102 Church, Mudaliyar kuppam 4+170 RHS 1.3
103 Vetarnary hospital, Kil kodangalore 39+338 LHS 11
104 Govt. primary health centre gate, Mazhayur 65+800 LHS 11
105 St Thomas hospital & leprosy center, Chetpet 83+500 LHS 11
106 Vetarnary hospital, Tachambadi 91+700 LHS 8
107 Govt primary health care centre, Devikapuram
95+225 RHS 6
108 Govt. primary health care centre, Kommananthal
102+650 RHS 11
333. During construction, varying degree of noise impacts are likely to be felt by the communities of settlements along the project road i.e. Cheyyur Town, Mudaliyarkuppam, Nallur, Vallarai, Onampakkam, Kathudhevathur, Kepkoshikarai, Nallamur, Chittamur, Kolampakkam, Polambakkam, Mazhubkadu, Sothupakkam, Agili, Sandivakkam, Ramapuram, Salavedu, Mamandur, Kilkodungaloore/, Kallankuthu, Kaveripakkam, Maruthadu, Kodaisikulam, Biridhur, Chinnavaram, Vandavasi Town, Karajar Nagar, Mampattu, Ramraj Nagar, Kilnanthyambadi, Thirumarithanaga, Vadavarakkamba, Kilvelliyur, Periyar Nagar, Thirukarai, Mazhaiyur, Earthal, Ettithangal, Chinna, Arasumpattu, Nedugunam, Chetpet Town, Nirmala Nagar, Ideyankulam, Muthuswami, Nambedu, Pandiyapuram,Thachanbadi, Cheyarandal, Devikapuram, Modiyur, Mattaperiyar, Pulivardal, Komanandal, Karaipondi, Vermani, Polur Town and other small settlements along the project road. However, the above listed sensitive receptors will be especially impacted due to increase in noise levels as these would be near the construction site. Although temporary in nature, the construction noise will affect the most communities living close to the construction zone.
334. Mitigation Measures: In construction sites within 500 meters of a settlement, noisy operations should cease between 22:00 and 06:00 hrs. Regular maintenance of construction vehicles and machinery must also be undertaken to reduce noise.
335. Timely scheduling of construction activities, proper maintenance of construction machineries, use of personnel protective equipment, etc. will minimize these impacts.
336. Noise impacts are an unavoidable consequence of construction that should be mitigated by limiting the times of construction to daylight hours (8am - 5pm) in the vicinity of sensitive receptors. Further to minimize noise impacts near sensitive receptors (particularly schools),
139
operation of excavator and other heavy machineries will be carried out mostly during off-hours (10.00 am to 3.30 pm) and on holidays (Saturday and Sundays). The schedule will be prepared/modified in consultation with the community and relevant local authorities. Baseline noise will be established for all sensitive areas prior to construction and follow up noise monitoring will be carried out during the construction.
337. Implementation of suitable mitigation measures will reduce the construction noise to acceptable limits. Mitigation measures should include:
• Installations of noise barriers; • construction machinery should be located away from settlements. If noise levels
exceed the prescribed Leq, suitable mitigation measures like using additional silencers in noise generating equipment; erecting additional noise barriers and the use of proper PPEs shall be implemented;
• Construction machinery and equipment must properly maintained and designed with built-in silencers, mufflers and enclosures. This will reduce the noise by 5 to 10 dB(A);
• careful planning of machinery operation and the scheduling of such operations, no idling of machinery;
• controlled blasting should only be carried out with prior approval from the Engineer in charge;
• contractors should be required to fit noise shields on construction machinery and to provide earplugs to the operators of heavy machines.
338. Residual Impact: With the proper implementation of the proposed mitigation measures the project construction is not expected to have any significant residual impact.
Operation stage – moderate impact
339. The current low traffic flows along the project road are expected to increase because of improved economic activities associated with better access. The larger numbers of vehicles will be an additional source of noise and gaseous emissions.
340. Federal Highway Administration's Traffic Noise Model (FHWA TNM) helps for highway traffic noise prediction and analysis. Detailed analysis is presented in Appendix-13. TNM computes highway traffic noise at nearby receivers. As sources of noise, it includes noise emission levels for the following vehicle types:
• Automobiles: all vehicles with two axles and four tires -- primarily designed to carry nine or fewer people (passenger cars, vans) or cargo (vans, light trucks) -- generally with gross vehicle weight less than 4,500 kg (9,900 lb);
• Medium trucks: all cargo vehicles with two axles and six tires -- generally with gross vehicle weight between 4,500 kg (9,900 lb) and 12,000 kg (26,400 lb);
• Heavy trucks: all cargo vehicles with three or more axles -- generally with gross vehicle weight more than 12,000 kg (26,400 lb);
• Buses: all vehicles designed to carry more than nine passengers; and • Motorcycles: all vehicles with two or three tires and an open-air driver / passenger
compartment.
341. The procedure for prediction of noise levels involves the following steps:
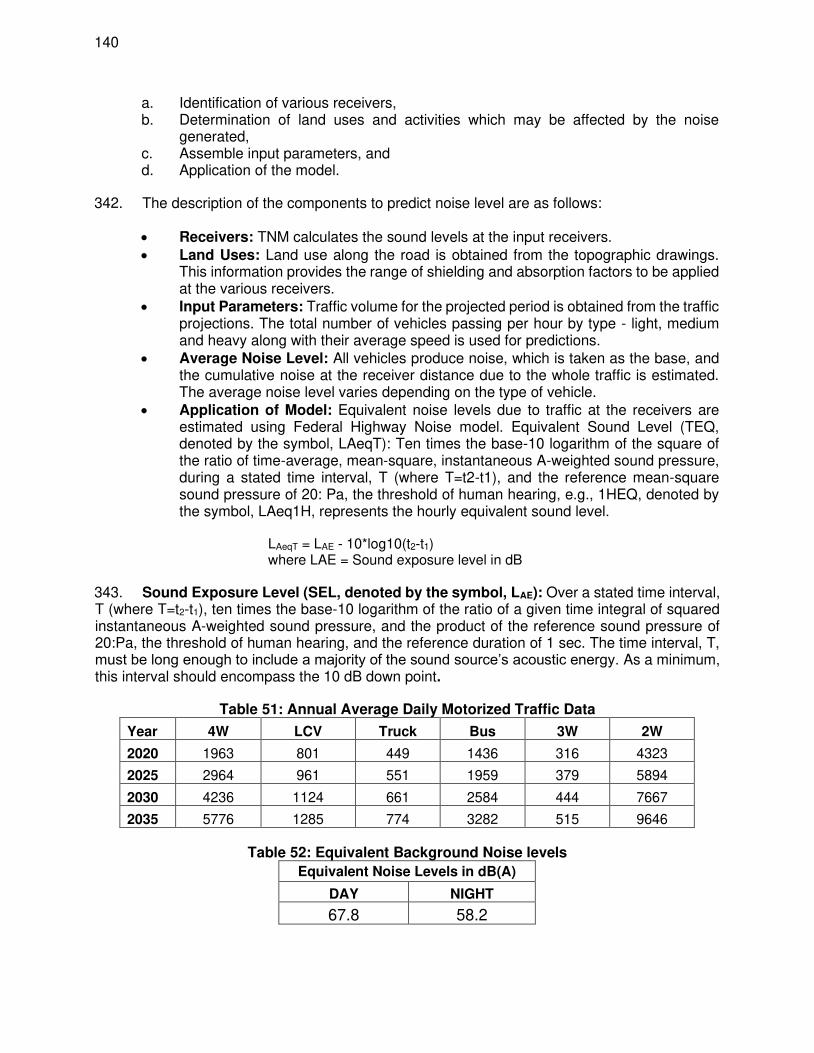
140
a. Identification of various receivers, b. Determination of land uses and activities which may be affected by the noise
generated, c. Assemble input parameters, and d. Application of the model.
342. The description of the components to predict noise level are as follows:
• Receivers: TNM calculates the sound levels at the input receivers. • Land Uses: Land use along the road is obtained from the topographic drawings.
This information provides the range of shielding and absorption factors to be applied at the various receivers.
• Input Parameters: Traffic volume for the projected period is obtained from the traffic projections. The total number of vehicles passing per hour by type - light, medium and heavy along with their average speed is used for predictions.
• Average Noise Level: All vehicles produce noise, which is taken as the base, and the cumulative noise at the receiver distance due to the whole traffic is estimated. The average noise level varies depending on the type of vehicle.
• Application of Model: Equivalent noise levels due to traffic at the receivers are estimated using Federal Highway Noise model. Equivalent Sound Level (TEQ, denoted by the symbol, LAeqT): Ten times the base-10 logarithm of the square of the ratio of time-average, mean-square, instantaneous A-weighted sound pressure, during a stated time interval, T (where T=t2-t1), and the reference mean-square sound pressure of 20: Pa, the threshold of human hearing, e.g., 1HEQ, denoted by the symbol, LAeq1H, represents the hourly equivalent sound level.
LAeqT = LAE - 10*log10(t2-t1) where LAE = Sound exposure level in dB
343. Sound Exposure Level (SEL, denoted by the symbol, LAE): Over a stated time interval, T (where T=t2-t1), ten times the base-10 logarithm of the ratio of a given time integral of squared instantaneous A-weighted sound pressure, and the product of the reference sound pressure of 20:Pa, the threshold of human hearing, and the reference duration of 1 sec. The time interval, T, must be long enough to include a majority of the sound source’s acoustic energy. As a minimum, this interval should encompass the 10 dB down point.
Table 51: Annual Average Daily Motorized Traffic Data
Year 4W LCV Truck Bus 3W 2W
2020 1963 801 449 1436 316 4323
2025 2964 961 551 1959 379 5894
2030 4236 1124 661 2584 444 7667
2035 5776 1285 774 3282 515 9646
Table 52: Equivalent Background Noise levels
Equivalent Noise Levels in dB(A)
DAY NIGHT
67.8 58.2

141

142
Table 53: Predicted Noise Levels along the Project Road Day
LHS RHS
200 100 50 20 10 10 20 50 100 200
2020 67.8 67.9 68.3 69.7 70.9 70.9 69.7 68.3 67.8 67.8
2025 67.8 67.9 68.5 70.3 71.6 71.6 70.3 68.5 67.9 67.8
2030 67.8 67.9 68.7 70.8 72.3 72.3 70.8 68.6 67.9 67.8
2035 67.8 68.0 68.9 71.3 73.0 73.0 71.3 68.8 67.9 67.8
Night
LHS RHS
200 100 50 20 10 10 20 50 100 200
2020 58.4 59.2 61.7 66.2 68.4 68.4 66.2 61.6 59.0 58.4
2025 58.5 59.5 62.5 67.3 69.6 69.6 67.3 62.4 59.3 58.5
2030 58.6 59.8 63.2 68.3 70.7 70.7 68.3 63.1 59.5 58.6
2035 58.6 60.1 63.9 69.1 71.6 71.6 69.1 63.8 59.8 58.6
344. The IFC Environmental Health and Safety Guidelines – “General EHS Guidelines (Environmental Noise Management”) and the World Health Organization (WHO, 1999) states that noise levels from a project should not result in a maximum increase in background levels of 3 dB(A) at the nearest receptor location off-site.
345. The Indian standard requires noise levels for the 12 hour Leq-dB(A) not to exceed 65 dB(A) and 55 dB(A) at commercial building during the daytime and at nighttime respectively. This is also the IFC standard. Indian standards require noise levels for the 12 hour Leq-dB(A) not to exceed 55dB(A) in daytime and not to exceed 45dB(A) nighttime at residential property.
346. From Table 53, it is observed that predicted noise levels (Leq) near the receivers within 20m from the centre line of the road are found to exceed the permissible limit of 3 dB(A) during day time however noise levels (Leq) near the receivers within 50m from the centre line of the road are found to exceed the permissible limit of 3 dB(A) during night time for the respective landuse categories. The baseline noise levels (2019) are marginally higher than the permissible limits of CPCB for different landuse categories for day and night. The predicted levels based on noise modelling show increase in noise levels for future years at all receivers (including sensitive receptors listed above) considering increase in traffic volume.
347. Mitigation Measures: The incremental noise levels for future years exceed the allowable limit of 3 dB (A) from the baseline levels. There are several measures that can be explored for the road, particularly along sensitive land uses such as solid noise barriers, establishment of greenbelt along the road edge, imposing speed limits, use of noise reducing pavements along built up portions, noise insulation of sensitive receivers, among others. One or a combination of these measures may be able to bring down the noise within acceptable range. These measures can be incorporated in the final detailed engineering by the contractor after consultation with affected persons so that the most suitable mitigation measures are considered. For example, solid noise barriers can reduce noise by 8- 9 dB which will bring noise levels down within permissible limits, but these can be obstructive especially along market areas or storefronts where sensitive receptors may also be located. The final measures considered will be reviewed and approved by the CSC and the PIU.
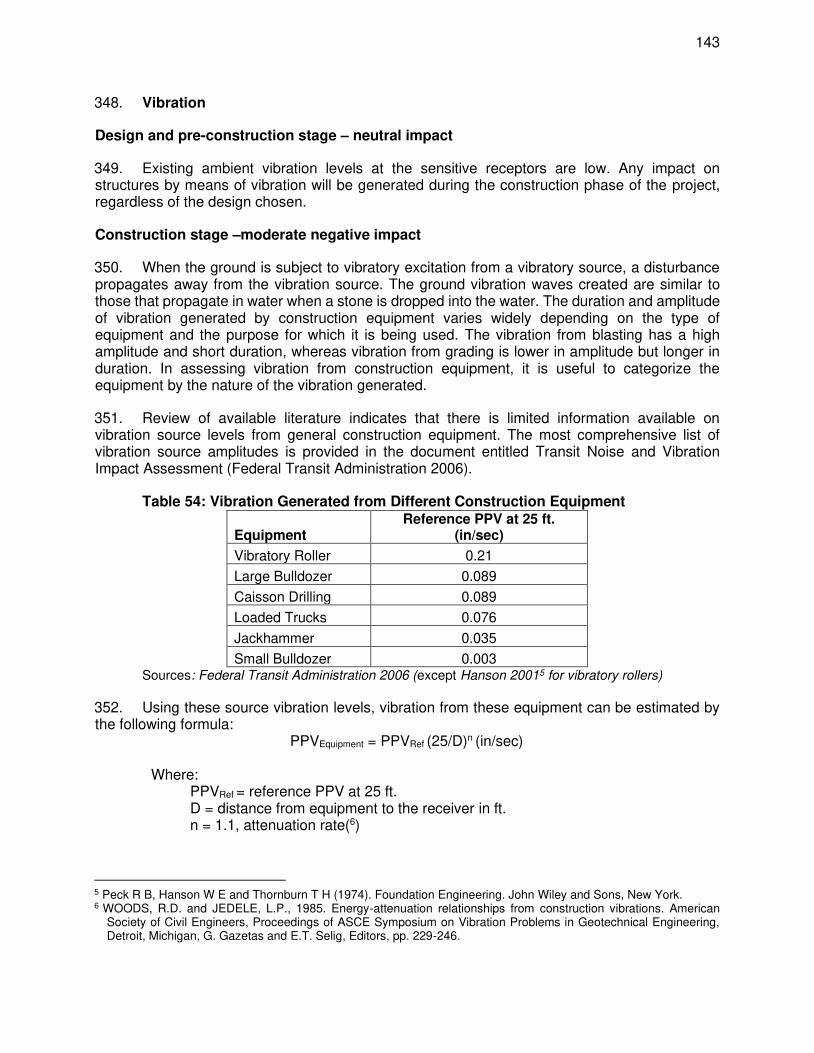
143
348. Vibration
Design and pre-construction stage – neutral impact
349. Existing ambient vibration levels at the sensitive receptors are low. Any impact on structures by means of vibration will be generated during the construction phase of the project, regardless of the design chosen.
Construction stage –moderate negative impact
350. When the ground is subject to vibratory excitation from a vibratory source, a disturbance propagates away from the vibration source. The ground vibration waves created are similar to those that propagate in water when a stone is dropped into the water. The duration and amplitude of vibration generated by construction equipment varies widely depending on the type of equipment and the purpose for which it is being used. The vibration from blasting has a high amplitude and short duration, whereas vibration from grading is lower in amplitude but longer in duration. In assessing vibration from construction equipment, it is useful to categorize the equipment by the nature of the vibration generated.
351. Review of available literature indicates that there is limited information available on vibration source levels from general construction equipment. The most comprehensive list of vibration source amplitudes is provided in the document entitled Transit Noise and Vibration Impact Assessment (Federal Transit Administration 2006).
Table 54: Vibration Generated from Different Construction Equipment
Equipment Reference PPV at 25 ft.
(in/sec)
Vibratory Roller 0.21
Large Bulldozer 0.089
Caisson Drilling 0.089
Loaded Trucks 0.076
Jackhammer 0.035
Small Bulldozer 0.003 Sources: Federal Transit Administration 2006 (except Hanson 20015 for vibratory rollers)
352. Using these source vibration levels, vibration from these equipment can be estimated by the following formula:
PPVEquipment = PPVRef (25/D)n (in/sec)
Where: PPVRef = reference PPV at 25 ft. D = distance from equipment to the receiver in ft. n = 1.1, attenuation rate(6)
5 Peck R B, Hanson W E and Thornburn T H (1974). Foundation Engineering. John Wiley and Sons, New York. 6 WOODS, R.D. and JEDELE, L.P., 1985. Energy-attenuation relationships from construction vibrations. American
Society of Civil Engineers, Proceedings of ASCE Symposium on Vibration Problems in Geotechnical Engineering, Detroit, Michigan, G. Gazetas and E.T. Selig, Editors, pp. 229-246.
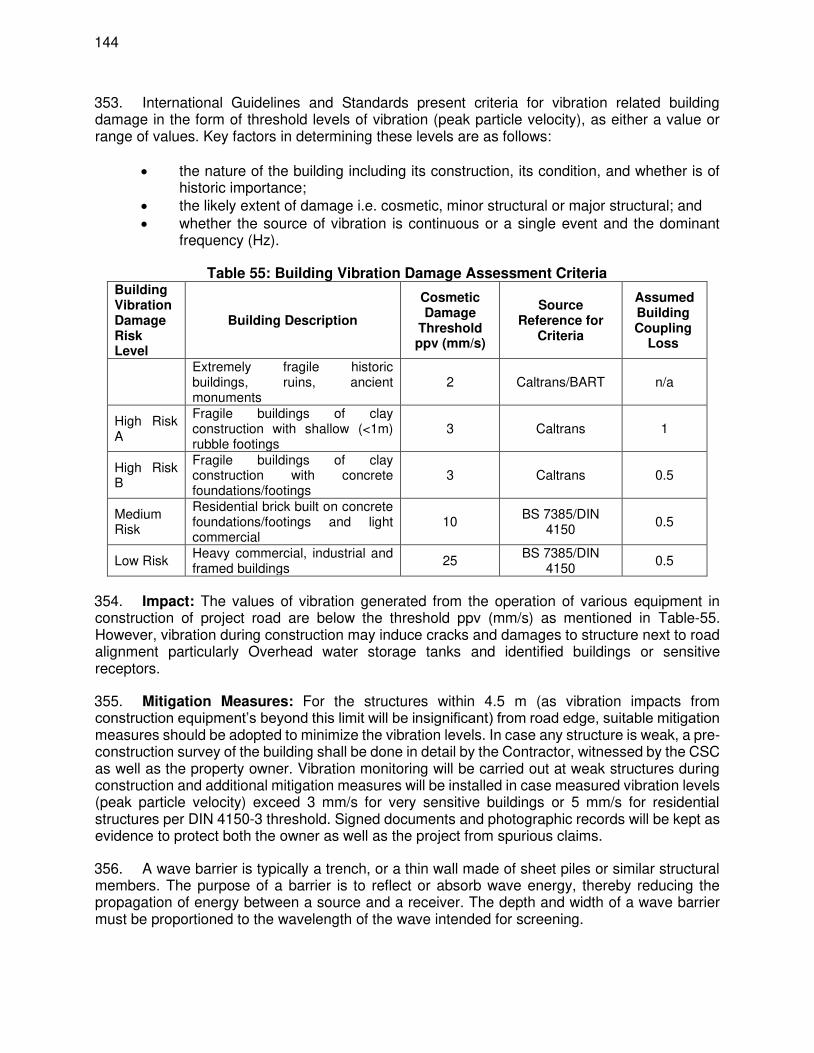
144
353. International Guidelines and Standards present criteria for vibration related building damage in the form of threshold levels of vibration (peak particle velocity), as either a value or range of values. Key factors in determining these levels are as follows:
• the nature of the building including its construction, its condition, and whether is of
historic importance; • the likely extent of damage i.e. cosmetic, minor structural or major structural; and • whether the source of vibration is continuous or a single event and the dominant
frequency (Hz).
Table 55: Building Vibration Damage Assessment Criteria Building Vibration Damage Risk Level
Building Description
Cosmetic Damage
Threshold ppv (mm/s)
Source Reference for
Criteria
Assumed Building Coupling
Loss
Extremely fragile historic buildings, ruins, ancient monuments
2 Caltrans/BART n/a
High Risk A
Fragile buildings of clay construction with shallow (<1m) rubble footings
3 Caltrans 1
High Risk B
Fragile buildings of clay construction with concrete foundations/footings
3 Caltrans 0.5
Medium Risk
Residential brick built on concrete foundations/footings and light commercial
10 BS 7385/DIN
4150 0.5
Low Risk Heavy commercial, industrial and framed buildings
25 BS 7385/DIN
4150 0.5
354. Impact: The values of vibration generated from the operation of various equipment in construction of project road are below the threshold ppv (mm/s) as mentioned in Table-55. However, vibration during construction may induce cracks and damages to structure next to road alignment particularly Overhead water storage tanks and identified buildings or sensitive receptors.
355. Mitigation Measures: For the structures within 4.5 m (as vibration impacts from construction equipment’s beyond this limit will be insignificant) from road edge, suitable mitigation measures should be adopted to minimize the vibration levels. In case any structure is weak, a pre-construction survey of the building shall be done in detail by the Contractor, witnessed by the CSC as well as the property owner. Vibration monitoring will be carried out at weak structures during construction and additional mitigation measures will be installed in case measured vibration levels (peak particle velocity) exceed 3 mm/s for very sensitive buildings or 5 mm/s for residential structures per DIN 4150-3 threshold. Signed documents and photographic records will be kept as evidence to protect both the owner as well as the project from spurious claims.
356. A wave barrier is typically a trench, or a thin wall made of sheet piles or similar structural members. The purpose of a barrier is to reflect or absorb wave energy, thereby reducing the propagation of energy between a source and a receiver. The depth and width of a wave barrier must be proportioned to the wavelength of the wave intended for screening.
145
357. Adverse human response to construction vibration can be mitigated by good communication between the contractor and local residents. If occupiers of dwellings are informed of their nature, duration, and potential vibration effects prior to the works, then adverse response will be less. Generally, the main concern relating to construction vibration is of damage to property and if this is not likely to occur, then this point should be made clear to residents.
358. Residual Impact: With the proper implementation of the proposed mitigation measures the construction of the project is not expected to have a residual impact due to vibration.
Operation stage – minor negative impact
359. Impact: Because vehicles travelling on highway are supported on flexible suspension systems and pneumatic tires, these vehicles are not an efficient source of ground vibration. They can, however, impart vibration into the ground when they roll over pavement that is not smooth. Continuous traffic travelling on a smooth highway creates a fairly continuous but relatively low level of vibration. Where discontinuities exist in the pavement, heavy truck passages can be the primary source of localized, intermittent vibration peaks. These peaks typically last no more than a few seconds and often for only a fraction of a second. Because vibration drops off rapidly with distance, there is rarely a cumulative increase in ground vibration from the presence of multiple trucks. In general, more trucks result in more vibration peaks, though not necessarily higher peaks. Automobile traffic normally generates vibration amplitudes that are one-fifth to one-tenth the amplitude of truck vibration amplitudes. Accordingly, ground vibration generated by automobile traffic is usually overshadowed by vibration from heavy trucks.
360. Mitigation Measures: Because vibration from vehicle operations is almost always the result of pavement discontinuities, the solution is to smoothen the pavement to eliminate the discontinuities. This step will eliminate perceptible vibration from vehicle operations in virtually all cases.
361. Residual Impact: The impact of vibrations due to road traffic will be negligible given the highway pavement is maintained at good condition.
4. Occupational health and safety
Design and pre-construction stage – neutral impact
362. No impacts on occupational health and safety are expected to arise from the design phase of the project. Road design proposed standards are consistent with the parameters recommended in the relevant standards of the IRC and are detailed in Chapter III of this report.
Construction stage - moderate negative impact
363. Impact: Transportation incidents accounted for majority of fatal roadway worksite incidents.7 In India, Tamil Nadu has recorded the highest rate of road accident fatalities at 23 fatalities/lakh persons.8 As such, particular attention to transportation-related work hazards should be given under the project. Among other construction-related risks in highway projects are:
7 https://www.dbkrieginc.com/onsite-work-safety.php; data taken from US Bureau of Labor Statistics 8 Policy Research Studies (PRS) Legislative Research, India. https://www.prsindia.org/policy/vital-stats/overview-road-
accidents-india
146
• falls and slips due to uneven surfaces, edges of elevated ground with no proper barricading;
• struck-bys falling debris or flying objects; • caught-in-betweens due to rotating equipment or unguarded parts of construction
machinery; and • electrocution risks while carrying out work or residing in campsites
364. The construction camps are anticipated to house up to 250 people for about three years. With this concentration of people, the potential for the transmission of diseases and illnesses will increase. The main health and safety risks during construction will arise from:
• inadequate sanitation facilities in worker camps; • introduction of sexually transmitted, and other diseases, by immigrant workers; • outbreaks of malaria, typhoid, cholera etc. amongst the labour force; and given the
current COVID-19 pandemic there is also a risk of construction workers being exposed to this and other communicable viral diseases, particularly given construction is directly within the community and the transient nature of the construction workforce.
365. Mitigation Measures: The following shall be followed before, during, and after construction activities, as applicable:
• The Contractor will be required to conduct workplace risk assessment to identify potential risks to workers.
• The Health and Safety Officer shall also conduct regular training on health and safety.
• The contractor is responsible for instituting measures and procedures to maintain cleanliness and order in campsites and construction sites.
• The Contractor will provide facilities such as dust bins and collectors for the temporary storage of all waste. This waste should be adequately stored to avoid pollution of water supplies and water sources and to avoid dust formation.
• The Contractor will be responsible for the safe removal and/or storage of all waste in order to prevent environmental pollution of any type that may be harmful to people or animals.
• All necessary safeguards should be taken to ensure the safety, welfare and good health of all persons entitled to be on the sites and to ensure that works are carried out in a safe and efficient manner.
• All personnel working at vulnerable site locations will wear safety helmets and strong footwear (OSHA recommended PPE).
• It should be ensured that all workmen and staff employed on site use proper safety equipment – for example, eye protectors, ear plugs, safety helmets, the designated safety equipment when working over water – and that proper rescue equipment is available.
• Fire extinguishers and first-aid equipment will be kept at all sites.
• Additional health and safety protocols for prevention and control of the spread of COVID 19 and other communicable diseases shall be put in place in accordance with local/national guidelines and international best practices.
• To ensure safe construction, lighting devices and safety signals shall be installed and traffic rules and regulations to be strictly followed.

147
• The electrical equipment should be checked regularly to avoid risks to workers. Adhere to strict schedule for completion of road works and avoid prolonged construction and disturbance
• Implement SEMP Sub-plans (e.g. Health and Safety Plan, Traffic and Road Management Plan, Camp Management Plan)
• Provide barricade fencing to mitigate trespassing
• Provide barricade to temporarily enclose open excavated slopes / foundations
• Provide sufficient lights, clear warning signs and danger signals
• Assign security personnel to prevent accidents,
• Warning signs and cones will be installed in and around the work site and along haul roads, with clearly marked danger zones
• Safety flags and flag persons will be used, as needed
• Record of incidents /accidents / near-miss/ fatalities associated with the project will be maintained
• Records of issues raised will be maintained in accordance with the project GRM
366. Outreach to local communities and information disseminate e.g. on project implementation schedule, health & safety and ERPs will be provided via information disclosure and meaningful consultation activities) in local language in the project area of influence..
367. The following actions will be undertaken at construction camps and stipulated in construction contracts:
• submit and obtain approval for a health and safety plan prior to the commencement of work;
• provision of adequate health care facilities and healthcare staff; • ensure adequate security is provided to construction staff on site and at worker
accommodation; • workers will be required to undergo pre-employment medical screening and
treatment (if required) and periodic health checks thereafter; and • For COVID-19 related health and safety risk, the contractor will be required to
prepare and implement a COVID-19 Action Plan9.
368. The project will support a public health education programme for workers and villagers covering road safety, malaria, hygiene, endemic and communicable diseases such as COVID-19 and sexually transmitted diseases. The district health departments will also be invited to participate in monitoring and educating communities and workers affected by the project.
369. Residual Impact: With proper implementation of the proposed mitigation measures the residual impact on occupational health and safety is expected to be low.
Operation stage – neutral impact
9 For COVID-19 national restrictions for containing the spread of COVID-19 must be complied with and in developing
the health and safety management plan Government of India (https://www.mygov.in/covid-19) and World Health Organization guidance (https://www.who.int/emergencies/diseases/novel-coronavirus-2019/technical-guidance) should be followed ensuring adequate sanitation and welfare facilities including for hand washing and personal protective equipment are provided to construction workers. Given the specialist nature of responding to COVID-19 public health officials/experts to be consulted.
148
370. No impact on occupational health and safety is envisaged during operation phase of the project. Road safety features are included in the project design as discussed in Chapter III of this report.
5. Community health and safety and local resources
Design and pre-construction stage – neutral impact
371. No impacts on community health and safety are expected to derive from the design phase of the project. Improving overall safety during operation is a major consideration in the design of the road. Road safety features are included in the project design as discussed in Chapter III of this report.
Construction stage – moderate negative and positive impacts
372. Impact: Construction camps may put stress on local resources and the infrastructure in nearby communities resulting to people raising grievances. This sometimes leads to conflict between residents and migrant workers. The construction activities may also potentially result in adverse impacts to community health and safety such as construction traffic and accidents, and accidental spills of liquid materials. There are also chances of exposure to communicable diseases from migrant workers.
373. Mitigation Measures: To prevent problems between construction workers and the local communities, the contractor should provide the construction camps with facilities such as health care clinics, places of worship, and occasional entertainment. During construction, benefits to local people can be maximized if the contractor recruit construction workers locally regardless of gender. Contractor should also not discriminate in the employment of women. The contractor will be required to develop a community health and safety plan which will also include emergency response and preparedness procedures.
374. The project will support a public health education programme for workers and villagers covering road safety, hygiene, malaria and other endemic diseases, and communicable diseases such as COVID-19 and sexually transmitted diseases. The district health departments will also be invited to participate in monitoring and educating communities and workers affected by the project.
375. Residual impact. With proper implementation of the proposed mitigation measures no residual impact is expected on the community health and safety.
Operation stage – positive impact
376. The improvements of the project road are expected to benefit the socio-economic conditions of communities in and around the project area. Improved access and reduced travel time and cost will be major stimuli to economic growth, health and education, particularly in rural areas. Better access of agricultural goods to market will be important and a major contributor to poverty reduction. These benefits are likely to have a positive impact on community health. Some risks associated with improved road such as accidents etc. are however anticipated. Implementation of road safety measures will minimize these risks. Section 10 under Design Standards of Chapter III deals with traffic safety features, road furniture, road markings and other facilities which shall contribute to increased safety, not only for vehicles but also pedestrians and
149
other road users. Geometric and sight distance improvement considered in the road designs used during bidding are also meant to improve fundamental features of the road to increase safety.
G. Physical and Cultural Resources
377. There are no adverse impacts anticipated on historical places/monuments. However, there are few small shrines along the road. Care must be taken to clearly identify these structures before construction and avoid any damage to these structures. If necessary, these structures maybe moved after carrying out proper consultation with the local community people. Earthworks, as associated with the road construction/improvement works, or deriving from secondary sites such as quarries or borrow pits, may reveal sites or artefacts of cultural/archaeological significance. In the event of such discovery, the concerned authorities should be informed and the requirement to take such action should be incorporated in contract documents.
H. Induced and Cumulative Impacts
378. According to the ADB Environment Safeguards Sourcebook Cumulative Impacts is described as: “The combination of multiple impacts from existing projects, the proposed project, and anticipated future projects that may result in significant adverse and/or beneficial impacts that cannot be expected in the case of a stand-alone project.” The sourcebook also describes Induced Impacts as: “Adverse and/or beneficial impacts on areas and communities from unintended but predictable developments caused by a project, which may occur at later or at a different location.
379. The road upgrading will improve the travel speed and travel condition along the project road corridor and is expected to generate a road user cost saving and this will result in additional traffic generation along the corridor. Currently there is no other information on future development projects along the project road. Hence, it is difficult to assess other cumulative impacts from other projects which may get implemented in the project area.
380. The improved road is expected to increase transport through the project region but is unlikely to trigger exponential development in this region. Setting up few new industries and increase in trade volume though cannot be ruled out. Noise and air quality impacts due to increased traffic volume are also envisaged. Mitigation measures are available for noise impacts while air quality impacts are considered insignificant. As such no significant induced environmental impact is anticipated due to proposed project activity.
I. Expected benefits from the Project
381. The immediate benefits of road construction and improvement will come in the form of direct employment opportunities during construction for the roadside communities engaged as wage laborer, petty contractors and suppliers of raw materials. During operation stage, road-side economic activities supporting transport like gasoline stations, automotive repair shops, lodging, and restaurants will increase due to increased number of vehicles. The project road section is part of connecting industrial zones to enhance transportation services for raw material and products. Increase in agro-industrial activities are also expected to take advantage of improved access to urban centers where there are higher demands and better prices for agricultural products. Project will accelerate the economic opportunities resulting in reduced migration. Other benefits of project road improvement are: (i) reduction in travel time, (ii) better mode and frequency of transport, (iii) access to quality health care, educational, and other infrastructural facilities (iv) improved quality
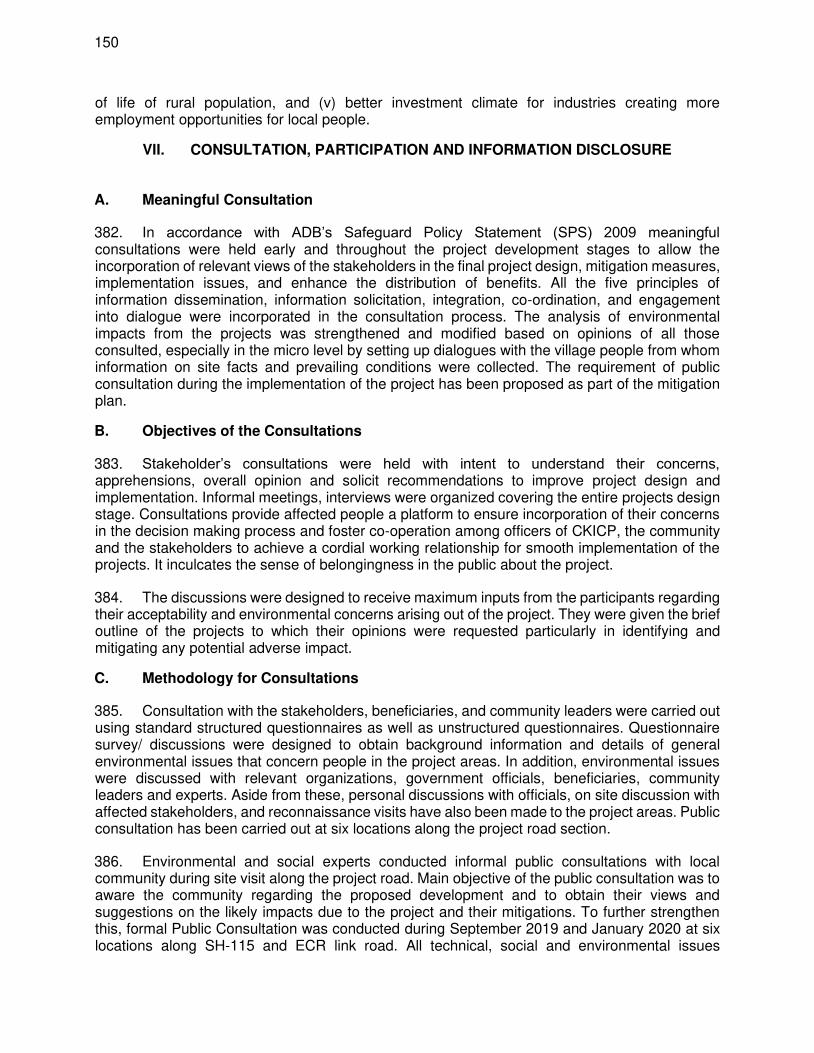
150
of life of rural population, and (v) better investment climate for industries creating more employment opportunities for local people.
VII. CONSULTATION, PARTICIPATION AND INFORMATION DISCLOSURE
A. Meaningful Consultation
382. In accordance with ADB’s Safeguard Policy Statement (SPS) 2009 meaningful consultations were held early and throughout the project development stages to allow the incorporation of relevant views of the stakeholders in the final project design, mitigation measures, implementation issues, and enhance the distribution of benefits. All the five principles of information dissemination, information solicitation, integration, co-ordination, and engagement into dialogue were incorporated in the consultation process. The analysis of environmental impacts from the projects was strengthened and modified based on opinions of all those consulted, especially in the micro level by setting up dialogues with the village people from whom information on site facts and prevailing conditions were collected. The requirement of public consultation during the implementation of the project has been proposed as part of the mitigation plan. B. Objectives of the Consultations
383. Stakeholder’s consultations were held with intent to understand their concerns, apprehensions, overall opinion and solicit recommendations to improve project design and implementation. Informal meetings, interviews were organized covering the entire projects design stage. Consultations provide affected people a platform to ensure incorporation of their concerns in the decision making process and foster co-operation among officers of CKICP, the community and the stakeholders to achieve a cordial working relationship for smooth implementation of the projects. It inculcates the sense of belongingness in the public about the project.
384. The discussions were designed to receive maximum inputs from the participants regarding their acceptability and environmental concerns arising out of the project. They were given the brief outline of the projects to which their opinions were requested particularly in identifying and mitigating any potential adverse impact. C. Methodology for Consultations
385. Consultation with the stakeholders, beneficiaries, and community leaders were carried out using standard structured questionnaires as well as unstructured questionnaires. Questionnaire survey/ discussions were designed to obtain background information and details of general environmental issues that concern people in the project areas. In addition, environmental issues were discussed with relevant organizations, government officials, beneficiaries, community leaders and experts. Aside from these, personal discussions with officials, on site discussion with affected stakeholders, and reconnaissance visits have also been made to the project areas. Public consultation has been carried out at six locations along the project road section.
386. Environmental and social experts conducted informal public consultations with local community during site visit along the project road. Main objective of the public consultation was to aware the community regarding the proposed development and to obtain their views and suggestions on the likely impacts due to the project and their mitigations. To further strengthen this, formal Public Consultation was conducted during September 2019 and January 2020 at six locations along SH-115 and ECR link road. All technical, social and environmental issues
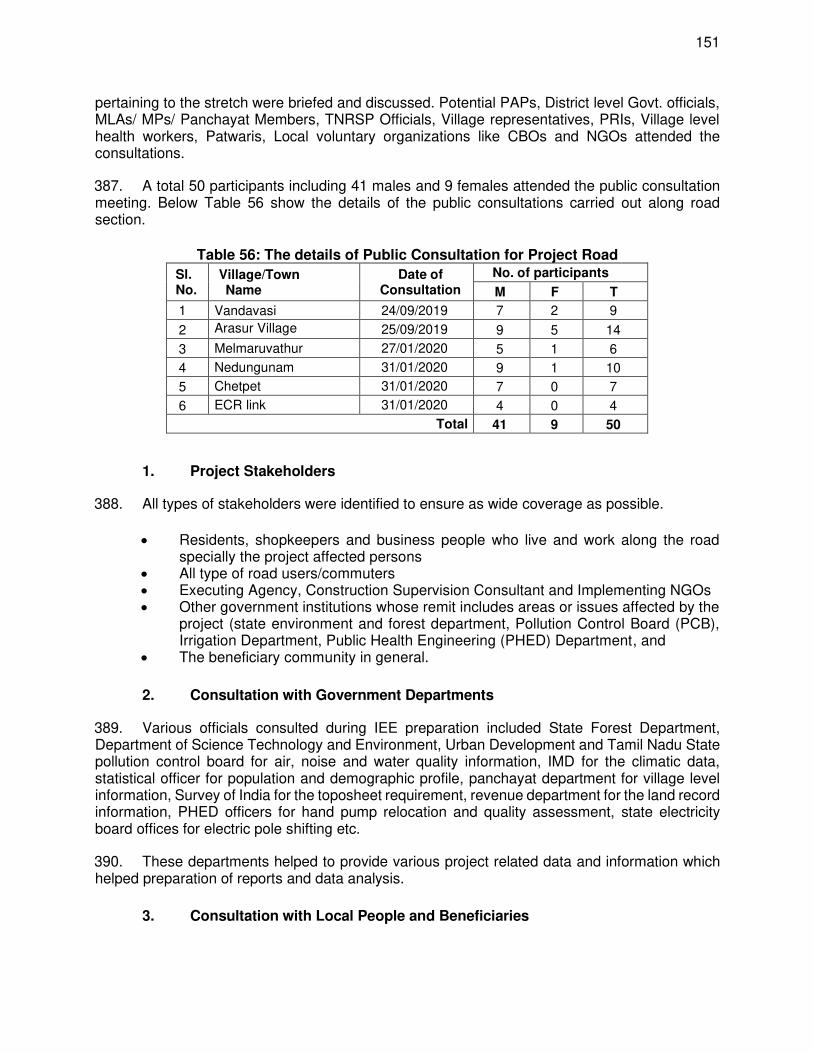
151
pertaining to the stretch were briefed and discussed. Potential PAPs, District level Govt. officials, MLAs/ MPs/ Panchayat Members, TNRSP Officials, Village representatives, PRIs, Village level health workers, Patwaris, Local voluntary organizations like CBOs and NGOs attended the consultations.
387. A total 50 participants including 41 males and 9 females attended the public consultation meeting. Below Table 56 show the details of the public consultations carried out along road section.
Table 56: The details of Public Consultation for Project Road
Sl. No.
Village/Town Name
Date of Consultation
No. of participants
M F T
1 Vandavasi 24/09/2019 7 2 9
2 Arasur Village 25/09/2019 9 5 14
3 Melmaruvathur 27/01/2020 5 1 6
4 Nedungunam 31/01/2020 9 1 10
5 Chetpet 31/01/2020 7 0 7
6 ECR link 31/01/2020 4 0 4
Total 41 9 50
1. Project Stakeholders
388. All types of stakeholders were identified to ensure as wide coverage as possible.
• Residents, shopkeepers and business people who live and work along the road specially the project affected persons
• All type of road users/commuters • Executing Agency, Construction Supervision Consultant and Implementing NGOs • Other government institutions whose remit includes areas or issues affected by the
project (state environment and forest department, Pollution Control Board (PCB), Irrigation Department, Public Health Engineering (PHED) Department, and
• The beneficiary community in general.
2. Consultation with Government Departments
389. Various officials consulted during IEE preparation included State Forest Department, Department of Science Technology and Environment, Urban Development and Tamil Nadu State pollution control board for air, noise and water quality information, IMD for the climatic data, statistical officer for population and demographic profile, panchayat department for village level information, Survey of India for the toposheet requirement, revenue department for the land record information, PHED officers for hand pump relocation and quality assessment, state electricity board offices for electric pole shifting etc.
390. These departments helped to provide various project related data and information which helped preparation of reports and data analysis.
3. Consultation with Local People and Beneficiaries
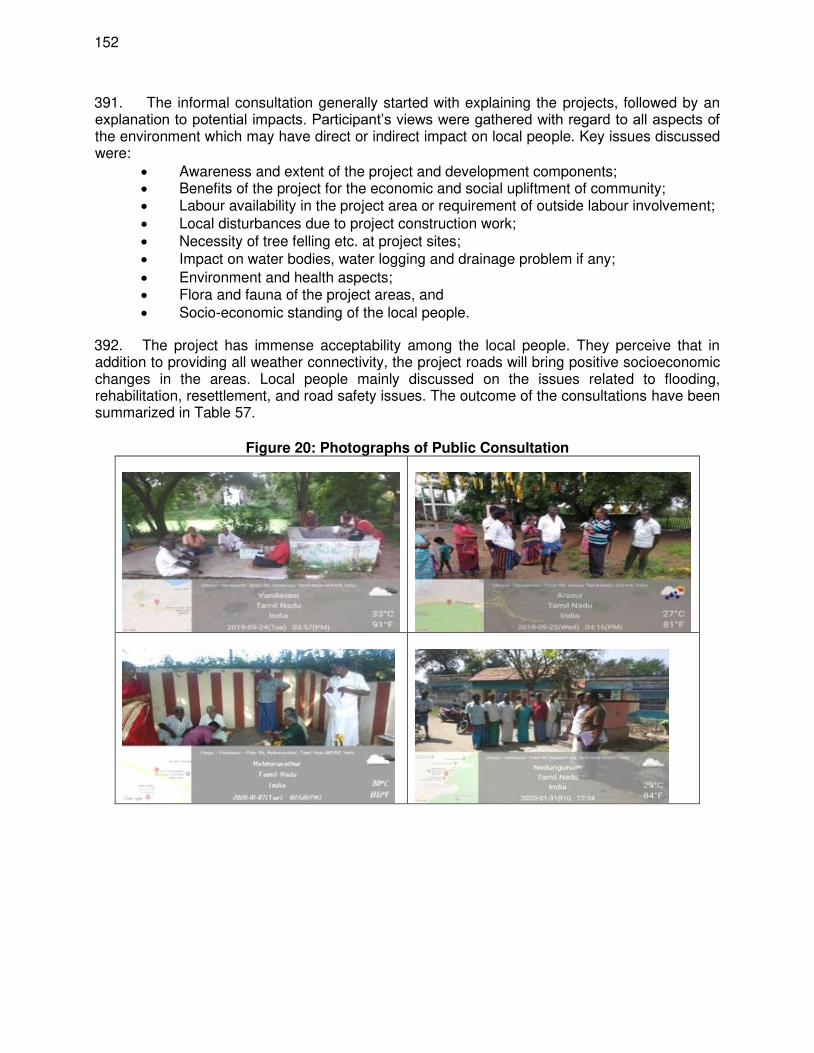
152
391. The informal consultation generally started with explaining the projects, followed by an explanation to potential impacts. Participant’s views were gathered with regard to all aspects of the environment which may have direct or indirect impact on local people. Key issues discussed were:
• Awareness and extent of the project and development components; • Benefits of the project for the economic and social upliftment of community; • Labour availability in the project area or requirement of outside labour involvement; • Local disturbances due to project construction work; • Necessity of tree felling etc. at project sites; • Impact on water bodies, water logging and drainage problem if any; • Environment and health aspects; • Flora and fauna of the project areas, and • Socio-economic standing of the local people.
392. The project has immense acceptability among the local people. They perceive that in addition to providing all weather connectivity, the project roads will bring positive socioeconomic changes in the areas. Local people mainly discussed on the issues related to flooding, rehabilitation, resettlement, and road safety issues. The outcome of the consultations have been summarized in Table 57.
Figure 20: Photographs of Public Consultation
153
393. The details of participants and public consultation attendance list are attached in Appendix 14. In addition information on the GRM procedures and formats in local language i.e. Tamil was shared with the local people.
Table 57: Summary of Issues Discussed and Measures Taken
Location and Date
Issues Discussed Measures Taken Participant
Vandavasi:
24/09/2019
Arasur Village:
25/09/2019
Melmaruvathur: 27/01/2020
Nedungunam: 31/01/2020
Chetpet: 31/01/2020
ECR link: 31/01/2020
• People are facing acute problem related to poor condition of the road.
• Where the road passing through the settlements there should be
• provision of Speed breakers Suggestion viz. (i) design shall take into hydrological aspects into consideration (ii) minimal loss of structures (iii) adequate settlement and rehabilitation measures including provision of jobs to land losers
• Local people informed that present road in some sections of this area submerges during normal rainfall also. Adequate measures shall be taken to avoid water logging during normal rainfall.
• They suggested that existing alignment shall also be improved and maintained properly.
• Suggestion viz., Minimal loss of structures, Adequate rehabilitation and resettlement ,measures
• Area is one of the congested stretches due to that problem of traffic jam and
Proposed widening and strengthening of the road will provide better level of services in terms of improved riding quality and smooth traffic flow.
• There will be considerable reduction in the number of accident and level of pollution.
• Accessibility to social health and educational infrastructure will increase through all-weather road.
• Generation of employment during construction phase of the road.
• The discussion generates.
• considerable awareness of the project .
• As the proposed road shall be a widened one, it shall provide an efficient public transportation system besides.
• ensuring reduction in congestion level
• The title holders shall also be compensated as per ADB guidelines.
• Drainage system is mention in built-up area and earthen drainage for rural area.
• Drainage system is mention in built-up area and earthen
Total 50 Participant was attended the consultation meetings which includes 41 male and 9 female participants.
154
Location and Date
Issues Discussed Measures Taken Participant
accident is common.
• Stress was put by the community on adequate safety provisions to be made along the road particularly at locations of school,
• cattle underpass, provision of bus stop and provision of green belt development Compensation should be as per market value.
drainage for rural area. Road safety features like traffic signs, Overhead Sign Boards, Road Illumination, Delineators,
• pavement marking, pedestrian path and rumble strips has been included in the design.
• Proper Rehabilitation measures will be taken for . Affected Household’s and compensation will be as per market rate.
394. Most of the people interviewed were well aware of the environmental conditions in and around their villages. A major percentage are not aware of any foreseen deterioration in the air and noise quality due to expansion of existing highway. The villagers are quite enthusiastic about the proposed project as it will give fillip to rural economy and present them many employment opportunities during construction of project road. Overall positive approach towards the project is observed.
4. Results of Consultation with Local People
395. Most of the people interviewed strongly support the project work. The people living in the entire project area expect the different project elements to facilitate transport, employment, tourism, boost economic development and thereby provide direct, or indirect, benefits to them. In order to access the existing environment and likely impacts on surrounding population, an interview survey was carried out. A priority of the population was interviewed through a designed questionnaire. Precaution has been exercised during the survey to ensure that the priority interviewed is truly representative of the affected groups and the questions are worded so as not to generate a bias response.
396. Overall, most of the people interviewed strongly support the project. The people living in the entire project area expect the different project elements to facilitate transport, employment, tourism, boost economic development and thereby provide direct, or indirect, benefits to them. Construction camps may, however, put stress on local resources and the infrastructure in nearby communities. In addition, local people raised construction-process related grievances with the workers. This sometimes leads to aggression between residents and migrant workers. To prevent such problems, the contractor should provide the construction camps with facilities such as proper housing, health care clinics, proper drinking water and timely payment. The use of local laborers during the construction will, of course, increase benefits to local peoples and minimise these problems. Wherever possible, such people should be employed.
397. Design considerations have been made to incorporate most of the suggestions and demands of the local people except those which are beyond the scope of the project like improvement of already deteriorated water quality, drinking water facility and reconstruction of link roads, etc.
155
D. Interaction with NGOs
398. In order to get independent views on the likely impacts of the project, non-government organizations at local as well as regional level were consulted during the IEE process. Aspects such as conservation activities, presence of flora and fauna, likely project impacts and possible mitigation measures were discussed and views and suggestions from these NGO’s were incorporated in the EMP. Consultation will continue with these NGO’s during project implementation and operation.
E. Public Disclosure and Further Consultations
399. The TNICP will be responsible for the disclosure of this IEE in compliance to ADB’s Access to Information Policy 2019 and ADB’s SPS 2009. The IEE will be disclosed in the English language in the office of TNICP. The report will also be made available to interested parties on request from the office of the TNICP. Since this is Category B project, this IEE report will be disclosed to the public through the ADB and CKICP website. This IEE report will also be made available to all stakeholders as part of the consultation process required under the SPS 2009.
400. Prior to finalization of detailed engineering design, the contractor, with the assistance of the PIU should consult affected persons along sensitive receptors identified during survey on structural and institutional mitigation measures for impacts such as, but not limited to, noise. Further, project consultations will be organized by the FIU in coordination with CSC and with the presence of representatives from the contractor. Participation of women and FGDs with women and vulnerable groups will be prioritized and conducted to the extent feasible. These should be done at least quarterly during construction period.
156
VIII. GRIEVANCE REDRESS MECHANISM
401. Project grievance redress mechanism (GRM) will be established to evaluate and facilitate the resolution of affected persons concerns, complaints, and grievances related to social and environmental issues of the project. The GRM will provide a time-bound and transparent mechanism to voice and resolve social and environmental concerns linked to the project.
402. GRM Information: Information on the availability of GRM shall be disclosed to public through the TNICP website and through information boards by TNICP along the project road. The setup GRM shall have the system of records keeping of details such as contact details of complainant, date of the complaint received nature of grievance, etc. for the project road and shall take necessary action to address the complaint. The concerned grievance redress committee (GRC) will determine the merit of each grievance and resolve grievances within an outer time limit of three months of receiving the complaint. All complaints determined to be within the purview of land acquisition, rehabilitation and resettlement will be dealt with under the LARR GRC detailed in the RPs. Otherwise, all other social and environmental related complaints will be coursed through the grievance redress process detailed below.
403. Grievance Redress Process: The grievance redress process will be a two-tier process for both LARR and all other project-related complaints. In case of grievances that are immediate and urgent in the perception of the complainant, the contractor and Construction Supervision Consultant (CSC) on-site personnel will provide the most easily accessible or first level of contact for quick resolution of grievances. Contact phone numbers and names of the concerned Divisional Engineer, Assistant Environment Specialist, contractors, and CSC will be posted at all construction sites at visible locations. The PIU safeguard officers will be responsible to see through the process of redressal of each grievance.
(i) 1st Level Grievance: The Regional level Project GRC will be chaired by the concerned Divisional Engineer and would comprise the Assistant Environment Specialist, Project Manager of EPC contractor and Resident Engineer of CSC concerned. The Regional level GRC can immediately resolve relatively simple, on-site concerns and grievances in consultation with each other. Grievances at this level will be addressed within 7 days of receipt of a complaint/grievance.
(ii) 2nd Level Grievance: All grievances that cannot be redressed within 7 days at the Regional level will be reviewed by the State level Project GRC. It will serve as appellate authority and will be chaired by the Chief Engineer and will comprise the Superintending Engineer concerned, Environment Specialist, Team Leader of CSC concerned, Project Manager from Project Management Services of CSC-01 and Authorized Representative from EPC contractors, as needed. Grievance response period for all GRCs is 3 weeks.
404. Complaints Register with EPC Contractor: The contractor shall keep and maintain a complaint register report at their site office along the project road as well as project facilities like construction camp, labour camp etc., for public to register their complaints. The EPC Contractor, after taking necessary action based on the complaint, will also incorporate the same in the complaint register. This report will also be part of the monthly report, to be submitted to the Regional GRC and for CSC to monitor and take necessary action, if needed. It is to be noted that, inaction upon the complaint of the public will be considered as a major lapse from the side of the EPC contractor, leading to invoking of penalty clause which is given in bid document/EMP.
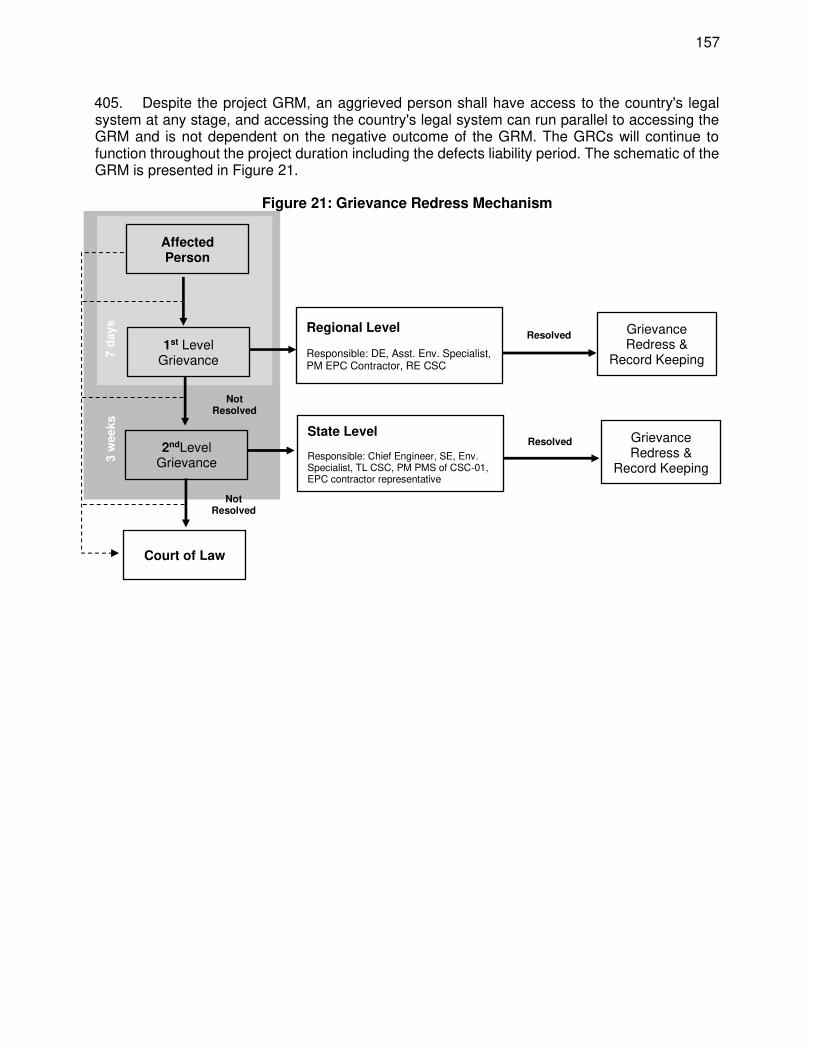
157
3
wee
ks
7 d
ay
s
405. Despite the project GRM, an aggrieved person shall have access to the country's legal system at any stage, and accessing the country's legal system can run parallel to accessing the GRM and is not dependent on the negative outcome of the GRM. The GRCs will continue to function throughout the project duration including the defects liability period. The schematic of the GRM is presented in Figure 21.
Figure 21: Grievance Redress Mechanism
Affected Person
1st Level Grievance
2ndLevel Grievance
Court of Law
Regional Level Responsible: DE, Asst. Env. Specialist, PM EPC Contractor, RE CSC
State Level Responsible: Chief Engineer, SE, Env. Specialist, TL CSC, PM PMS of CSC-01, EPC contractor representative
Not Resolved
Grievance Redress &
Record Keeping
Grievance Redress &
Record Keeping
Not Resolved
Resolved
Resolved
158
IX. ENVIRONMENTAL MANAGEMENT PLAN
A. Introduction
406. The Environmental Management Plan (EMP) is the synthesis of all proposed mitigation and monitoring actions, set to a time-frame with specific responsibility assigned and follow-up actions defined. It contains all the information for the proponent, the contractor and the regulatory agencies to implement the projects within a specified time-frame.
407. This EMP consists of a set of mitigation, monitoring and institutional measures to be taken for the project to avoid, minimize and mitigate adverse environmental impacts and enhance positive impacts. The plan also includes the actions needed for the implementation of these measures. The major components of the Environmental Management Plan are:
• Mitigation of potentially adverse impacts; • Monitoring of EMP implementation during project construction and operation; and • Institutional arrangements to implement the EMP.
408. Prior to start of construction work Environmental Expert of the CSC team in coordination with Contractor will update this EMP to make it site specific in the form of Construction EMP (CEMP).
B. Objectives of Environmental Management Plan
409. The main objectives of this EMP are:
• To ensure compliance with Asian Development Bank’s applicable safeguard policies, and regulatory requirements of the Government of Tamil Nadu and India;
• To formulate avoidance, mitigation and compensation measures for anticipated adverse environmental impacts during construction and operation, and ensure that environmentally sound, sustainable and good practices are adopted;
• To stipulate monitoring and institutional requirements for ensuring safeguard compliance; and
• The project road should be environmentally sustainable.
C. Environmental Management Plan Matrix
410. The EMP matrix provided in Table 58 (prepared section wise as per contract package) follows the environmental impacts and proposed mitigation measures for the identified Valued Environmental Components (VECs) identified and discussed in Chapter VI. The matrix provides an implementable plan with recommended mitigation measures for each anticipated impact and also assigns responsibilities for implementation, supervision and monitoring. D. Environmental Monitoring and Reporting Program
411. The environmental monitoring program has the underlying objective to ensure that the intended environmental mitigations are realized and these results in desired benefits to the target population causing minimal deterioration to the environmental parameters. Such program targets proper implementation of the EMP. The broad objectives are:
• To evaluate the performance of mitigation measures proposed in the EMP.
159
• To evaluate the adequacy of environmental assessment. • To suggest ongoing improvements in management plan based on the monitoring and
to devise fresh monitoring on the basis of the improved EMP. • To enhance environmental quality through proper implementation of suggested
mitigation measures. • To meet the requirements of the existing environmental regulatory framework and
community obligations.
412. The EMOP matrix covering various performance indicators, frequency and institutional arrangements of the project in the construction and operation stages, along with the estimated cost, is summarized in Table 59. Key features of the EMOP are described in the following paragraphs.
1. Performance Indicators
413. The potential physical, biological and social components affecting the environment at critical locations serve as wider/overall Performance Indicators. However, the following specific environmental parameters can be quantitatively measured and compared over a period of time and are, therefore, selected as specific Performance Indicators (PIs) for monitoring because of their regulatory importance and the availability of standardized procedures and relevant expertise.
• Air Quality with respect to PM2.5, PM10, CO, NOx and SO2 at selected location. • Water Quality with reference to pH, DO, BOD, Oil and grease, COD, Suspended
Solids, total dissolved solids, total solids, chlorides Turbidity and Alkalinity at crossing points on rivers/streams at selected points.
• Noise and vibration levels at sensitive receptors (schools, hospitals, community/religious places and weak structures).
• Survival rates of trees planted as compensatory plantation should not be less than 70 percent and compensatory plantation raised for removal of roadside trees.
414. Ambient Air Quality (AAQ) Monitoring: Ambient air quality parameters recommended for monitoring road development projects are PM2.5, PM10, Carbon Monoxide (CO), Oxides of Nitrogen (NOx) and Sulphur Dioxide (SO2). These are to be monitored, right from the commencement of construction activity at selected locations of plants and machinery, crushers on sites, excavation works etc. Data should be generated quarterly excluding monsoon at the monitoring locations in accordance with the revised National Ambient Air Quality Standards formulated by MOEFCC in 2009 as well as IFC air quality standards (Appendix-4).
415. Water Quality Monitoring: The physical and chemical parameters recommended for analysis of water quality relevant to road development project are pH, DO, BOD, Oil and grease, COD, total Suspended Solids, total dissolved solids, total solids, chlorides Turbidity and Alkalinity. The location, duration and the pollution parameters to be monitored and the responsible institutional arrangements are given in the Environmental Monitoring Plan. The monitoring of the water quality is to be carried out at locations identified along the project road during construction and operation phase. The Indian Standard Specifications – IS 10500: 1991 and IS 2296: 1992 is given in Appendix 15.
416. Noise and Vibration Level Monitoring: The measurements for monitoring noise and vibration levels would be carried out at sensitive receptors, construction sites and at weak
160
structures locations along the project road. The Ambient Noise Standards prescribed in the Noise pollution (Regulation and Control), Rules 2000 issued by the MOEFCC, GoI as well as IFC noise standards will be followed. Sound pressure levels would be monitored on a 24-hour basis. Noise should be recorded at “A” weighted frequency using a “slow time response mode” of the measuring instrument. Differences between IFC EHS and MOEFCC daytime and nighttime periods should be accounted for in establishing baseline noise levels prior to start of works. The CPCB standards are given in Appendix – 16.
417. Success of Re-vegetation: The project involves widening and up-gradation including construction of cross drainage structures hence these will require felling of trees. Such lost vegetation will be required to be replaced by compensatory plantation. As per policy of the State Government 10 trees have to be planted for each tree removed. These compensatory plantations will have to be monitored for 70% survival rate for three years by the implementing agency with the help of the Forest Department. Such monitoring will be conducted through random samples. Such sampling should cover at least 5% of the area planted up.

161
Table 58: Environmental Management Plan Activity/Valued Environment Component
Negative Impact Mitigation Measure Responsibility Implementation Supervision
A. DESIGN AND PRE-CONSTRUCTION STAGE
I. Physical environment
1. Surface water quality and quantity
- Construction of culverts and bridges.
- Disruptions to the natural hydrology
- Worsening of erosion problems
- Maintain natural courses of rivers and streams - Identify temporary diversions required and ensure that
these are restored to their natural course as soon as possible
- drainage structures to be properly designed to accommodate forecast discharges;
- side drain waters must be discharged at every available stream crossing to minimize volume and prevent erosion at discharge point;
- provide lined drainage structures; and - where an increased discharge of surface water
endangers the stability of the water outlet, erosion protection measures such as bioengineering measures, ripraps, and check dams are incorporated
- in areas with high water tables, seepage may occur, and side drains and up-slope catch drains must always be lined to avoid percolation
-
Contractor PIU / CSC
2. Land degradation and pollution
- Road widening and related earthworks;
- Collection, quarrying and use of stone, aggregates and sand.
- Construction of sharp curves
- Permanent changes in the local-level topography and appearance of the project site.
- Slope failure at quarry sites;
- Road side instability due to stone collection;
- The construction of sharp curve may add to instability in
- Optimization of the centre line so that embankment raised on both sides;
- Temporary and permanent drainage systems to minimize soil erosion;
- Optimum siting and control of quarries; and - mechanized construction methods. - Minimize land take for development - Optimize balance between cut and fill and avoid deep
cuts and high embankments to minimize earthworks - Maximize reuse of spoils and old asphalt paving material
within the construction - Agree on spoils disposal sites, management and
rehabilitation plan with relevant local agencies
Contractor PIU / CSC
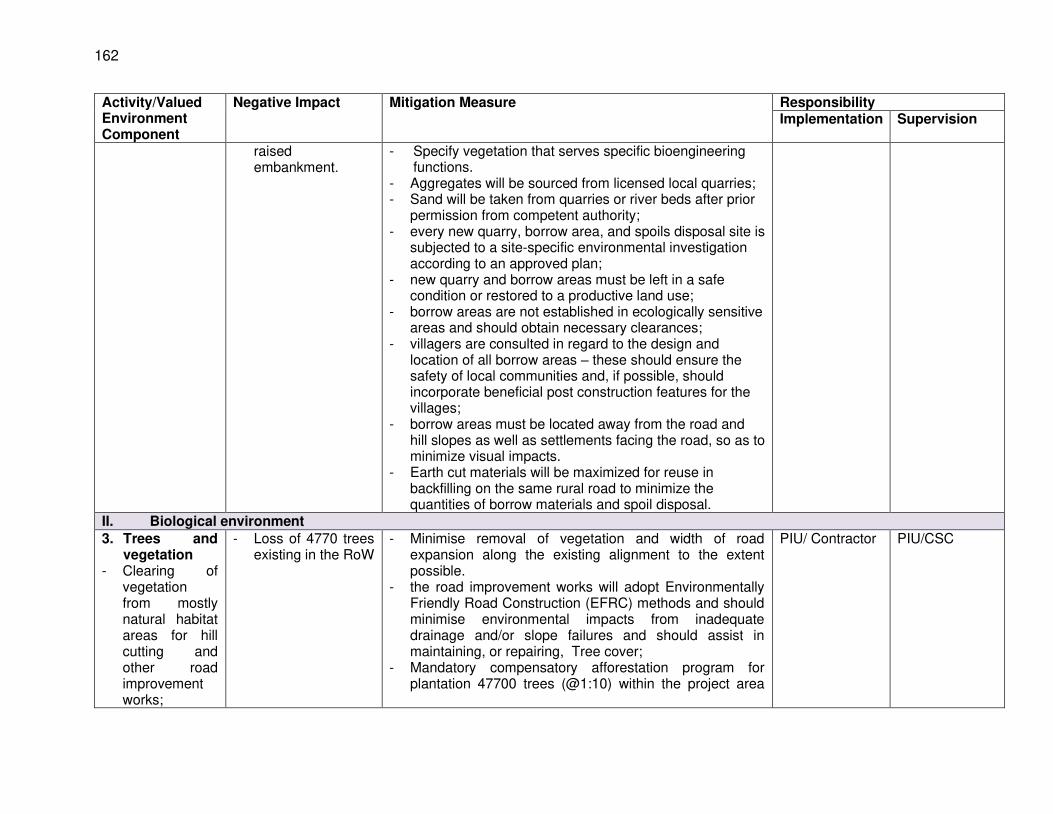
162
Activity/Valued Environment Component
Negative Impact Mitigation Measure Responsibility Implementation Supervision
raised embankment.
- Specify vegetation that serves specific bioengineering functions.
- Aggregates will be sourced from licensed local quarries; - Sand will be taken from quarries or river beds after prior
permission from competent authority; - every new quarry, borrow area, and spoils disposal site is
subjected to a site-specific environmental investigation according to an approved plan;
- new quarry and borrow areas must be left in a safe condition or restored to a productive land use;
- borrow areas are not established in ecologically sensitive areas and should obtain necessary clearances;
- villagers are consulted in regard to the design and location of all borrow areas – these should ensure the safety of local communities and, if possible, should incorporate beneficial post construction features for the villages;
- borrow areas must be located away from the road and hill slopes as well as settlements facing the road, so as to minimize visual impacts.
- Earth cut materials will be maximized for reuse in backfilling on the same rural road to minimize the quantities of borrow materials and spoil disposal.
II. Biological environment
3. Trees and vegetation
- Clearing of vegetation from mostly natural habitat areas for hill cutting and other road improvement works;
- Loss of 4770 trees existing in the RoW
- Minimise removal of vegetation and width of road expansion along the existing alignment to the extent possible.
- the road improvement works will adopt Environmentally Friendly Road Construction (EFRC) methods and should minimise environmental impacts from inadequate drainage and/or slope failures and should assist in maintaining, or repairing, Tree cover;
- Mandatory compensatory afforestation program for plantation 47700 trees (@1:10) within the project area
PIU/ Contractor PIU/CSC
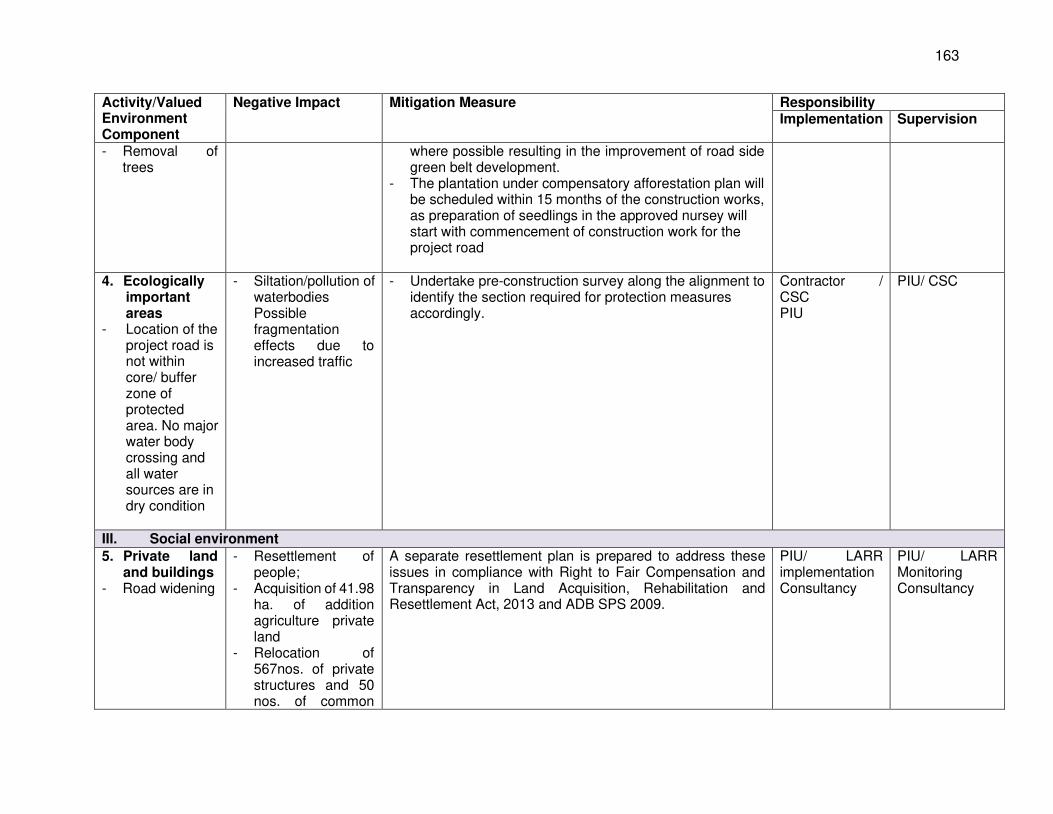
163
Activity/Valued Environment Component
Negative Impact Mitigation Measure Responsibility Implementation Supervision
- Removal of trees
where possible resulting in the improvement of road side green belt development.
- The plantation under compensatory afforestation plan will be scheduled within 15 months of the construction works, as preparation of seedlings in the approved nursey will start with commencement of construction work for the project road
4. Ecologically important areas
- Location of the project road is not within core/ buffer zone of protected area. No major water body crossing and all water sources are in dry condition
- Siltation/pollution of waterbodies Possible fragmentation effects due to increased traffic
- Undertake pre-construction survey along the alignment to identify the section required for protection measures accordingly.
Contractor / CSC PIU
PIU/ CSC
III. Social environment
5. Private land and buildings
- Road widening
- Resettlement of people;
- Acquisition of 41.98 ha. of addition agriculture private land
- Relocation of 567nos. of private structures and 50 nos. of common
A separate resettlement plan is prepared to address these issues in compliance with Right to Fair Compensation and Transparency in Land Acquisition, Rehabilitation and Resettlement Act, 2013 and ADB SPS 2009.
PIU/ LARR implementation Consultancy
PIU/ LARR Monitoring Consultancy
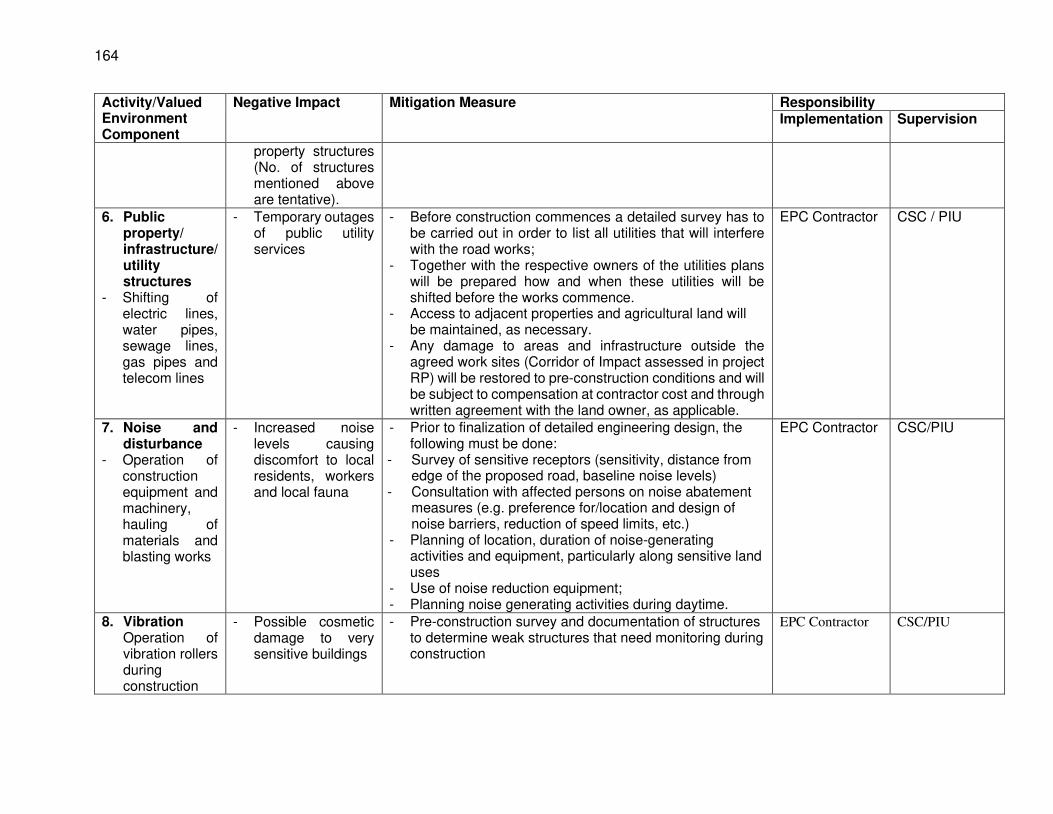
164
Activity/Valued Environment Component
Negative Impact Mitigation Measure Responsibility Implementation Supervision
property structures (No. of structures mentioned above are tentative).
6. Public property/ infrastructure/ utility structures
- Shifting of electric lines, water pipes, sewage lines, gas pipes and telecom lines
- Temporary outages of public utility services
- Before construction commences a detailed survey has to be carried out in order to list all utilities that will interfere with the road works;
- Together with the respective owners of the utilities plans will be prepared how and when these utilities will be shifted before the works commence.
- Access to adjacent properties and agricultural land will be maintained, as necessary.
- Any damage to areas and infrastructure outside the agreed work sites (Corridor of Impact assessed in project RP) will be restored to pre-construction conditions and will be subject to compensation at contractor cost and through written agreement with the land owner, as applicable.
EPC Contractor CSC / PIU
7. Noise and disturbance
- Operation of construction equipment and machinery, hauling of materials and blasting works
- Increased noise levels causing discomfort to local residents, workers and local fauna
- Prior to finalization of detailed engineering design, the following must be done:
- Survey of sensitive receptors (sensitivity, distance from edge of the proposed road, baseline noise levels)
- Consultation with affected persons on noise abatement measures (e.g. preference for/location and design of noise barriers, reduction of speed limits, etc.)
- Planning of location, duration of noise-generating activities and equipment, particularly along sensitive land uses
- Use of noise reduction equipment; - Planning noise generating activities during daytime.
EPC Contractor CSC/PIU
8. Vibration Operation of vibration rollers during construction
- Possible cosmetic damage to very sensitive buildings
- Pre-construction survey and documentation of structures to determine weak structures that need monitoring during construction
EPC Contractor CSC/PIU
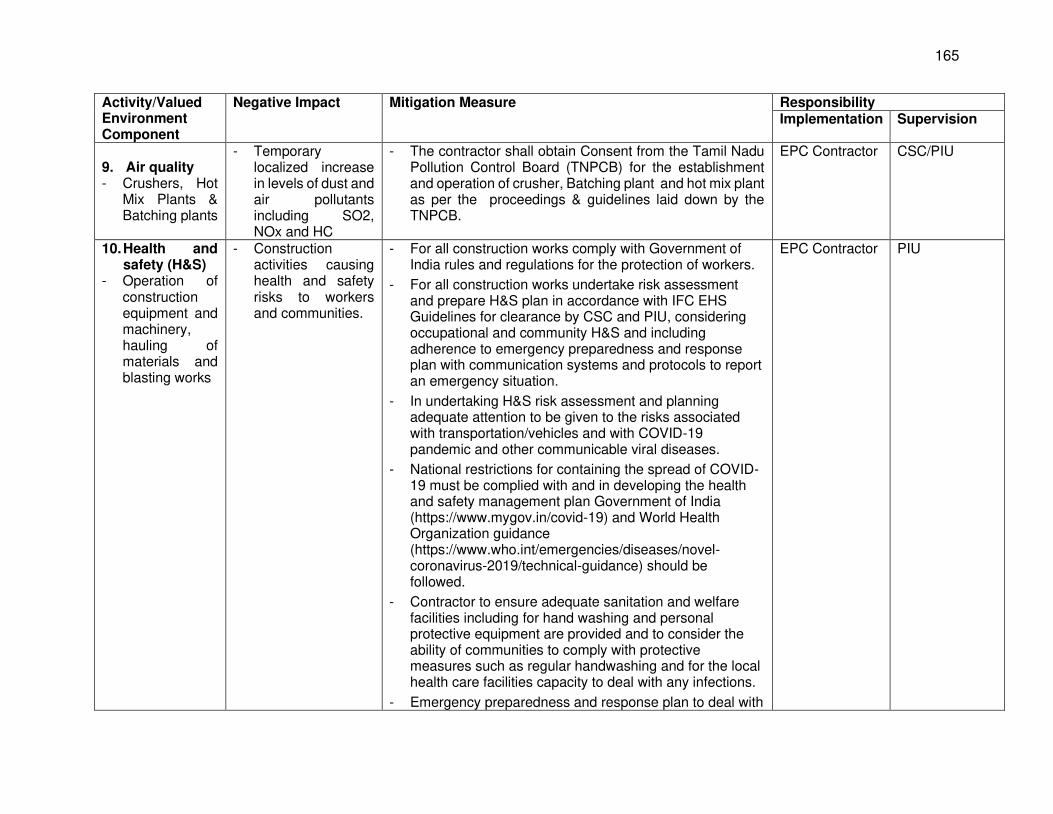
165
Activity/Valued Environment Component
Negative Impact Mitigation Measure Responsibility Implementation Supervision
9. Air quality - Crushers, Hot
Mix Plants & Batching plants
- Temporary localized increase in levels of dust and air pollutants including SO2, NOx and HC
- The contractor shall obtain Consent from the Tamil Nadu Pollution Control Board (TNPCB) for the establishment and operation of crusher, Batching plant and hot mix plant as per the proceedings & guidelines laid down by the TNPCB.
EPC Contractor CSC/PIU
10. Health and safety (H&S)
- Operation of construction equipment and machinery, hauling of materials and blasting works
- Construction activities causing health and safety risks to workers and communities.
- For all construction works comply with Government of India rules and regulations for the protection of workers.
- For all construction works undertake risk assessment and prepare H&S plan in accordance with IFC EHS Guidelines for clearance by CSC and PIU, considering occupational and community H&S and including adherence to emergency preparedness and response plan with communication systems and protocols to report an emergency situation.
- In undertaking H&S risk assessment and planning adequate attention to be given to the risks associated with transportation/vehicles and with COVID-19 pandemic and other communicable viral diseases.
- National restrictions for containing the spread of COVID-19 must be complied with and in developing the health and safety management plan Government of India (https://www.mygov.in/covid-19) and World Health Organization guidance (https://www.who.int/emergencies/diseases/novel-coronavirus-2019/technical-guidance) should be followed.
- Contractor to ensure adequate sanitation and welfare facilities including for hand washing and personal protective equipment are provided and to consider the ability of communities to comply with protective measures such as regular handwashing and for the local health care facilities capacity to deal with any infections.
- Emergency preparedness and response plan to deal with
EPC Contractor PIU
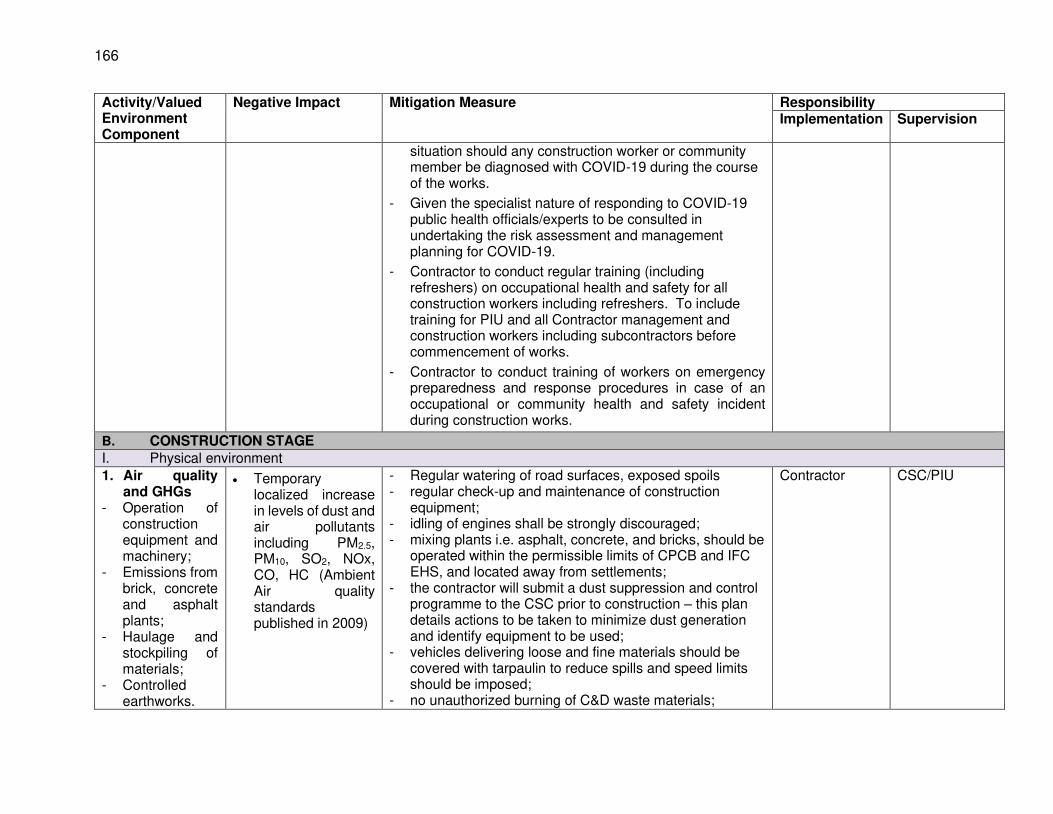
166
Activity/Valued Environment Component
Negative Impact Mitigation Measure Responsibility Implementation Supervision
situation should any construction worker or community member be diagnosed with COVID-19 during the course of the works.
- Given the specialist nature of responding to COVID-19 public health officials/experts to be consulted in undertaking the risk assessment and management planning for COVID-19.
- Contractor to conduct regular training (including refreshers) on occupational health and safety for all construction workers including refreshers. To include training for PIU and all Contractor management and construction workers including subcontractors before commencement of works.
- Contractor to conduct training of workers on emergency preparedness and response procedures in case of an occupational or community health and safety incident during construction works.
B. CONSTRUCTION STAGE I. Physical environment
1. Air quality and GHGs
- Operation of construction equipment and machinery;
- Emissions from brick, concrete and asphalt plants;
- Haulage and stockpiling of materials;
- Controlled earthworks.
• Temporary localized increase in levels of dust and air pollutants including PM2.5, PM10, SO2, NOx, CO, HC (Ambient Air quality standards published in 2009)
- Regular watering of road surfaces, exposed spoils - regular check-up and maintenance of construction
equipment; - idling of engines shall be strongly discouraged; - mixing plants i.e. asphalt, concrete, and bricks, should be
operated within the permissible limits of CPCB and IFC EHS, and located away from settlements;
- the contractor will submit a dust suppression and control programme to the CSC prior to construction – this plan details actions to be taken to minimize dust generation and identify equipment to be used;
- vehicles delivering loose and fine materials should be covered with tarpaulin to reduce spills and speed limits should be imposed;
- no unauthorized burning of C&D waste materials;
Contractor CSC/PIU
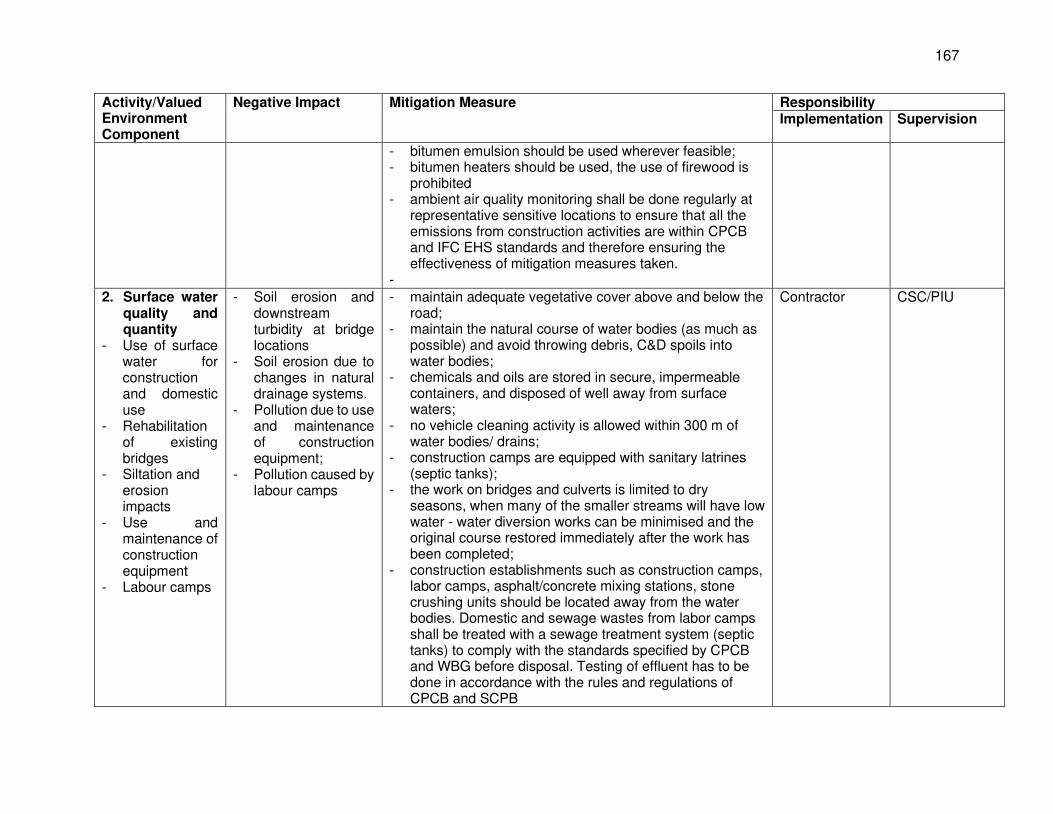
167
Activity/Valued Environment Component
Negative Impact Mitigation Measure Responsibility Implementation Supervision
- bitumen emulsion should be used wherever feasible; - bitumen heaters should be used, the use of firewood is
prohibited - ambient air quality monitoring shall be done regularly at
representative sensitive locations to ensure that all the emissions from construction activities are within CPCB and IFC EHS standards and therefore ensuring the effectiveness of mitigation measures taken.
- 2. Surface water
quality and quantity
- Use of surface water for construction and domestic use
- Rehabilitation of existing bridges
- Siltation and erosion impacts
- Use and maintenance of construction equipment
- Labour camps
- Soil erosion and downstream turbidity at bridge locations
- Soil erosion due to changes in natural drainage systems.
- Pollution due to use and maintenance of construction equipment;
- Pollution caused by labour camps
- maintain adequate vegetative cover above and below the road;
- maintain the natural course of water bodies (as much as possible) and avoid throwing debris, C&D spoils into water bodies;
- chemicals and oils are stored in secure, impermeable containers, and disposed of well away from surface waters;
- no vehicle cleaning activity is allowed within 300 m of water bodies/ drains;
- construction camps are equipped with sanitary latrines (septic tanks);
- the work on bridges and culverts is limited to dry seasons, when many of the smaller streams will have low water - water diversion works can be minimised and the original course restored immediately after the work has been completed;
- construction establishments such as construction camps, labor camps, asphalt/concrete mixing stations, stone crushing units should be located away from the water bodies. Domestic and sewage wastes from labor camps shall be treated with a sewage treatment system (septic tanks) to comply with the standards specified by CPCB and WBG before disposal. Testing of effluent has to be done in accordance with the rules and regulations of CPCB and SCPB
Contractor CSC/PIU

168
Activity/Valued Environment Component
Negative Impact Mitigation Measure Responsibility Implementation Supervision
- drivers are made aware of diversions and other works at bridge construction site to avoid accidents;
- all debris and vegetation, clogging culverts must be regularly cleared.
- Prior to use of surface water by workers it has to be established the water quality meets the standards for drinking water. Also regular monitoring of the quality shall be done.
3. Ground water quality and quantity
- Operation of labour camps, temporary construction sites and fuelling stations
- Groundwater abstraction and potential impacts on local sources
- Pollution of groundwater at sites where process water or wastewater is generated and disposed of in an improper manner.
- Construction water requirement (avg. 500KLD and peak 800 KLD) will be met through local surface water sources and other canals in the project area. Domestic water requirement (40 KLD) for workers will also be met mainly through local streams
- Sewage generated at labour camps should be disposed of in an environmentally sound manner.
- construction camps should be equipped with sanitary mobile toilets or toilets with treatment and disposal arrangement by means of septic tank followed by soak pit that do not pollute groundwater;
- Latrines should be located away and downstream of any source for drinking water in order to prevent contamination of drinking water sources.
- Locations for fuelling and/or maintenance should be fitted with impervious flooring and a drainage system connected to an oil/water separator and settling tank to treat sewage before being discharged.
- The layout of labour camps and construction sites should comply with the requirements in appendix 8: Plant Management and appendix 9: Camp Site Management as given in the IEE.
- If groundwater sources will be used for construction, it should be obtained from licensed sources. Domestic water requirement (30 KLD) for workers will also be met through approved sources only. Necessary permits will be obtained prior to water abstraction and only when
Contractor CSC/PIU
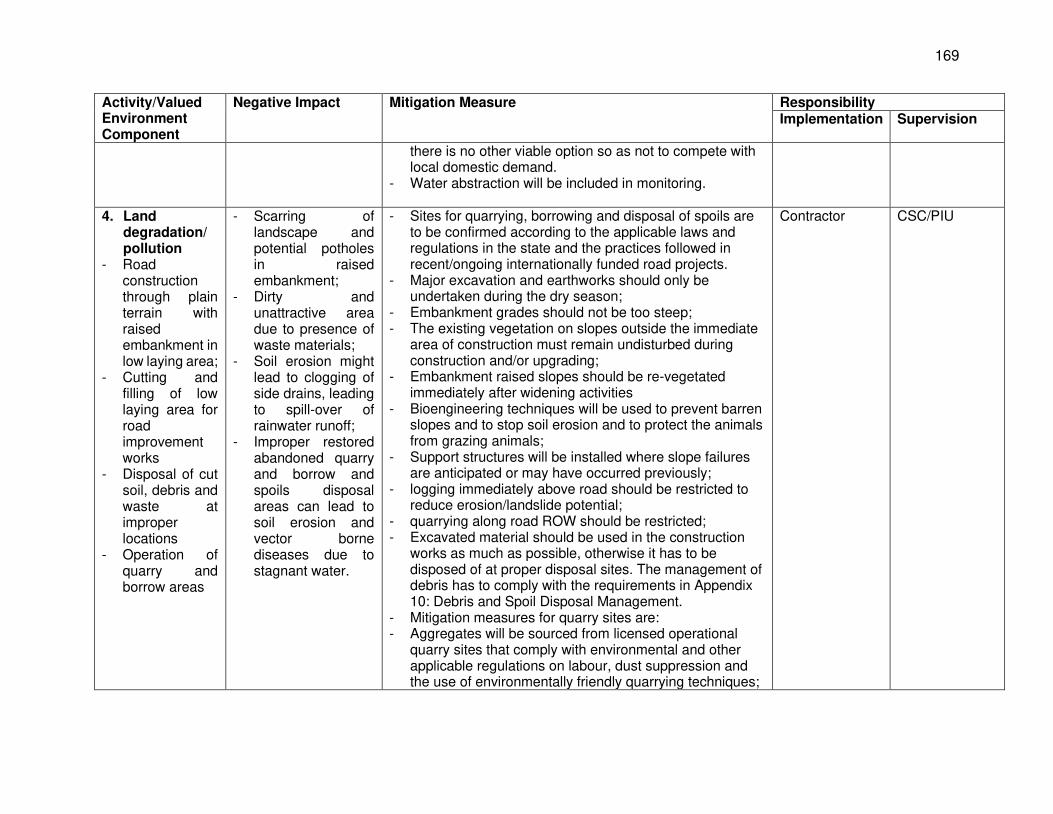
169
Activity/Valued Environment Component
Negative Impact Mitigation Measure Responsibility Implementation Supervision
there is no other viable option so as not to compete with local domestic demand.
- Water abstraction will be included in monitoring.
4. Land degradation/ pollution
- Road construction through plain terrain with raised embankment in low laying area;
- Cutting and filling of low laying area for road improvement works
- Disposal of cut soil, debris and waste at improper locations
- Operation of quarry and borrow areas
- Scarring of landscape and potential potholes in raised embankment;
- Dirty and unattractive area due to presence of waste materials;
- Soil erosion might lead to clogging of side drains, leading to spill-over of rainwater runoff;
- Improper restored abandoned quarry and borrow and spoils disposal areas can lead to soil erosion and vector borne diseases due to stagnant water.
- Sites for quarrying, borrowing and disposal of spoils are to be confirmed according to the applicable laws and regulations in the state and the practices followed in recent/ongoing internationally funded road projects.
- Major excavation and earthworks should only be undertaken during the dry season;
- Embankment grades should not be too steep; - The existing vegetation on slopes outside the immediate
area of construction must remain undisturbed during construction and/or upgrading;
- Embankment raised slopes should be re-vegetated immediately after widening activities
- Bioengineering techniques will be used to prevent barren slopes and to stop soil erosion and to protect the animals from grazing animals;
- Support structures will be installed where slope failures are anticipated or may have occurred previously;
- logging immediately above road should be restricted to reduce erosion/landslide potential;
- quarrying along road ROW should be restricted; - Excavated material should be used in the construction
works as much as possible, otherwise it has to be disposed of at proper disposal sites. The management of debris has to comply with the requirements in Appendix 10: Debris and Spoil Disposal Management.
- Mitigation measures for quarry sites are: - Aggregates will be sourced from licensed operational
quarry sites that comply with environmental and other applicable regulations on labour, dust suppression and the use of environmentally friendly quarrying techniques;
Contractor CSC/PIU

170
Activity/Valued Environment Component
Negative Impact Mitigation Measure Responsibility Implementation Supervision
- regular monitoring of the quarries by concerned authorities to ensure compliance with environmental management and monitoring measures;
- Mitigation measures for borrow areas are: - Demarcation of the actual extent of area to be excavated; - borrow pit plant and machinery will conform to
CPCB/SPCB and IFC EHS noise emission regulations; - protective gear will be provided to the workforce exposed
to noise levels beyond threshold limits and there should be proper rotation of such personnel; and
- all operation areas will be water sprinkled to control dust levels to national ambient air quality standards.
- borrow areas are provided with gentle side slope that are re-vegetated and connected to the nearest drainage channel to avoid the formation of cess pools during the rainy season:
- To mitigate the impacts of possible fuel spills the following measures will be applied:
- secondary containment around fuel tanks and at fuelling stations will be built;
- oil and fuel spills, and other runoff from contaminated areas will be controlled; and
- equipment and fuel depots will be placed in safe zones away from drinking water sources and canal and lake;
- the project will provide an opportunity to assist the contractors in improving fuel handling practices so as to minimize future fuel spillage.
Other measures on land and C&D disposal:
• Any temporary lands required for labour camps or any other sites required for the project shall be transferred back to the owner after the land has been restored to its original state before the completion of construction works.
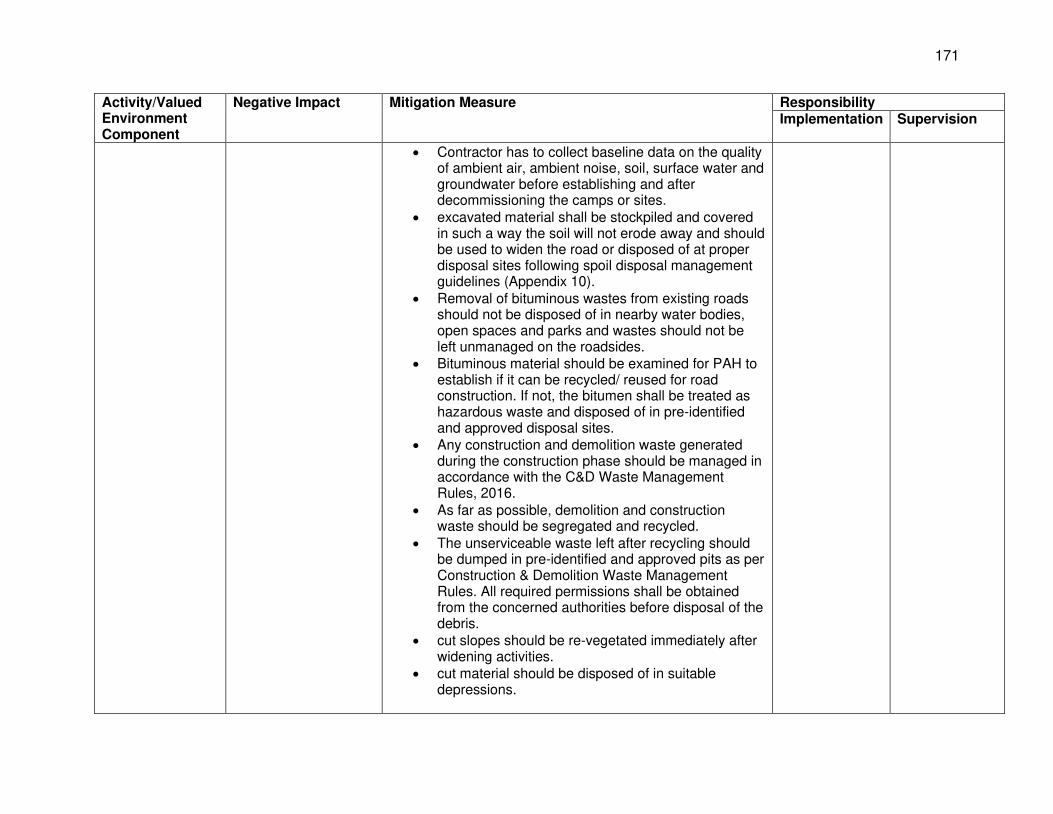
171
Activity/Valued Environment Component
Negative Impact Mitigation Measure Responsibility Implementation Supervision
• Contractor has to collect baseline data on the quality of ambient air, ambient noise, soil, surface water and groundwater before establishing and after decommissioning the camps or sites.
• excavated material shall be stockpiled and covered in such a way the soil will not erode away and should be used to widen the road or disposed of at proper disposal sites following spoil disposal management guidelines (Appendix 10).
• Removal of bituminous wastes from existing roads should not be disposed of in nearby water bodies, open spaces and parks and wastes should not be left unmanaged on the roadsides.
• Bituminous material should be examined for PAH to establish if it can be recycled/ reused for road construction. If not, the bitumen shall be treated as hazardous waste and disposed of in pre-identified and approved disposal sites.
• Any construction and demolition waste generated during the construction phase should be managed in accordance with the C&D Waste Management Rules, 2016.
• As far as possible, demolition and construction waste should be segregated and recycled.
• The unserviceable waste left after recycling should be dumped in pre-identified and approved pits as per Construction & Demolition Waste Management Rules. All required permissions shall be obtained from the concerned authorities before disposal of the debris.
• cut slopes should be re-vegetated immediately after widening activities.
• cut material should be disposed of in suitable depressions.
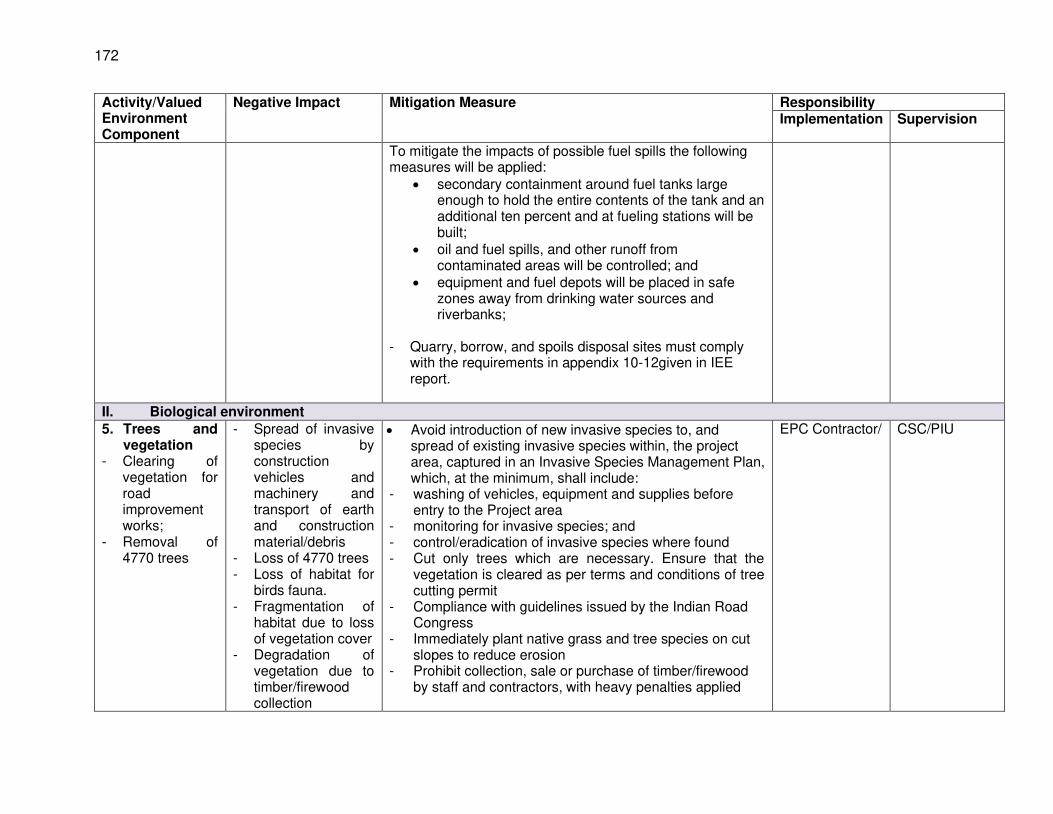
172
Activity/Valued Environment Component
Negative Impact Mitigation Measure Responsibility Implementation Supervision
To mitigate the impacts of possible fuel spills the following measures will be applied:
• secondary containment around fuel tanks large enough to hold the entire contents of the tank and an additional ten percent and at fueling stations will be built;
• oil and fuel spills, and other runoff from contaminated areas will be controlled; and
• equipment and fuel depots will be placed in safe zones away from drinking water sources and riverbanks;
- Quarry, borrow, and spoils disposal sites must comply
with the requirements in appendix 10-12given in IEE report.
II. Biological environment
5. Trees and vegetation
- Clearing of vegetation for road improvement works;
- Removal of 4770 trees
- Spread of invasive species by construction vehicles and machinery and transport of earth and construction material/debris
- Loss of 4770 trees - Loss of habitat for
birds fauna. - Fragmentation of
habitat due to loss of vegetation cover
- Degradation of vegetation due to timber/firewood collection
• Avoid introduction of new invasive species to, and spread of existing invasive species within, the project area, captured in an Invasive Species Management Plan, which, at the minimum, shall include:
- washing of vehicles, equipment and supplies before entry to the Project area
- monitoring for invasive species; and - control/eradication of invasive species where found - Cut only trees which are necessary. Ensure that the
vegetation is cleared as per terms and conditions of tree cutting permit
- Compliance with guidelines issued by the Indian Road Congress
- Immediately plant native grass and tree species on cut slopes to reduce erosion
- Prohibit collection, sale or purchase of timber/firewood by staff and contractors, with heavy penalties applied
EPC Contractor/
CSC/PIU
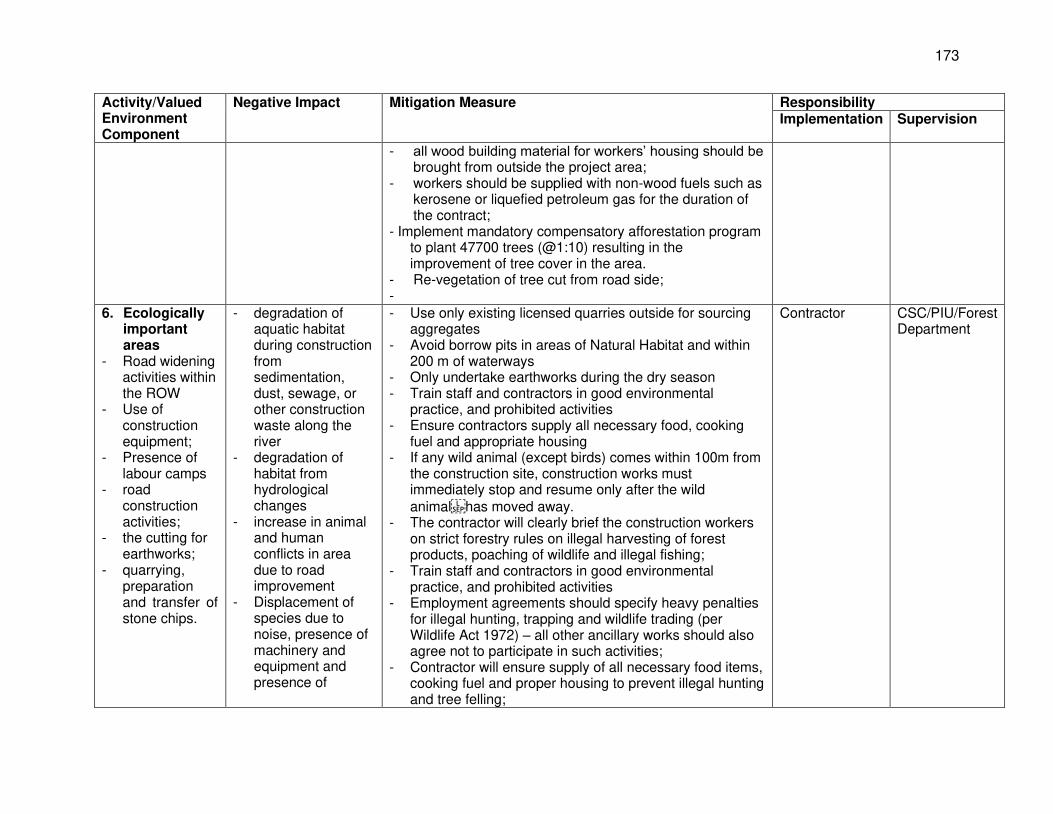
173
Activity/Valued Environment Component
Negative Impact Mitigation Measure Responsibility Implementation Supervision
- all wood building material for workers’ housing should be brought from outside the project area;
- workers should be supplied with non-wood fuels such as kerosene or liquefied petroleum gas for the duration of the contract;
- Implement mandatory compensatory afforestation program to plant 47700 trees (@1:10) resulting in the improvement of tree cover in the area.
- Re-vegetation of tree cut from road side; -
6. Ecologically important areas
- Road widening activities within the ROW
- Use of construction equipment;
- Presence of labour camps
- road construction activities;
- the cutting for earthworks;
- quarrying, preparation and transfer of stone chips.
- degradation of aquatic habitat during construction from sedimentation, dust, sewage, or other construction waste along the river
- degradation of habitat from hydrological changes
- increase in animal and human conflicts in area due to road improvement
- Displacement of species due to noise, presence of machinery and equipment and presence of
- Use only existing licensed quarries outside for sourcing aggregates
- Avoid borrow pits in areas of Natural Habitat and within 200 m of waterways
- Only undertake earthworks during the dry season - Train staff and contractors in good environmental
practice, and prohibited activities - Ensure contractors supply all necessary food, cooking
fuel and appropriate housing - If any wild animal (except birds) comes within 100m from
the construction site, construction works must immediately stop and resume only after the wild animalhas moved away.
- The contractor will clearly brief the construction workers on strict forestry rules on illegal harvesting of forest products, poaching of wildlife and illegal fishing;
- Train staff and contractors in good environmental practice, and prohibited activities
- Employment agreements should specify heavy penalties for illegal hunting, trapping and wildlife trading (per Wildlife Act 1972) – all other ancillary works should also agree not to participate in such activities;
- Contractor will ensure supply of all necessary food items, cooking fuel and proper housing to prevent illegal hunting and tree felling;
Contractor CSC/PIU/Forest Department
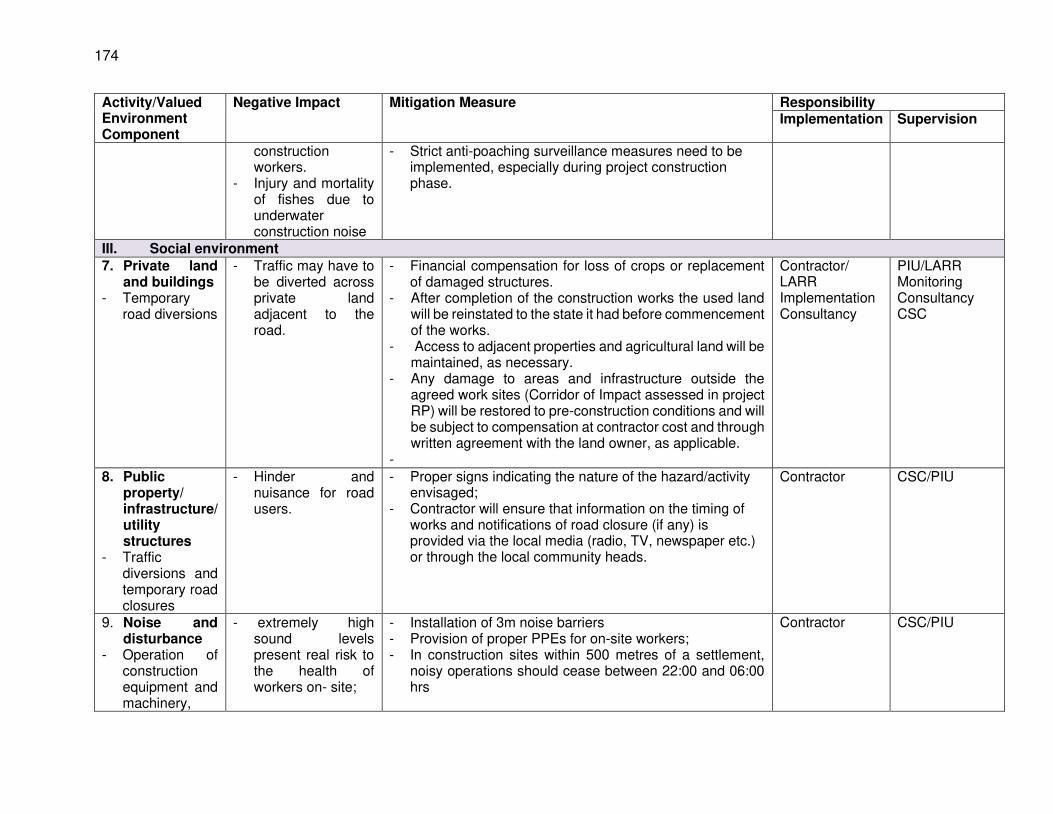
174
Activity/Valued Environment Component
Negative Impact Mitigation Measure Responsibility Implementation Supervision
construction workers.
- Injury and mortality of fishes due to underwater construction noise
- Strict anti-poaching surveillance measures need to be implemented, especially during project construction phase.
III. Social environment
7. Private land and buildings
- Temporary road diversions
- Traffic may have to be diverted across private land adjacent to the road.
- Financial compensation for loss of crops or replacement of damaged structures.
- After completion of the construction works the used land will be reinstated to the state it had before commencement of the works.
- Access to adjacent properties and agricultural land will be maintained, as necessary.
- Any damage to areas and infrastructure outside the agreed work sites (Corridor of Impact assessed in project RP) will be restored to pre-construction conditions and will be subject to compensation at contractor cost and through written agreement with the land owner, as applicable.
-
Contractor/ LARR Implementation Consultancy
PIU/LARR Monitoring Consultancy CSC
8. Public property/ infrastructure/ utility structures
- Traffic diversions and temporary road closures
- Hinder and nuisance for road users.
- Proper signs indicating the nature of the hazard/activity envisaged;
- Contractor will ensure that information on the timing of works and notifications of road closure (if any) is provided via the local media (radio, TV, newspaper etc.) or through the local community heads.
Contractor CSC/PIU
9. Noise and disturbance
- Operation of construction equipment and machinery,
- extremely high sound levels present real risk to the health of workers on- site;
- Installation of 3m noise barriers - Provision of proper PPEs for on-site workers; - In construction sites within 500 metres of a settlement,
noisy operations should cease between 22:00 and 06:00 hrs
Contractor CSC/PIU
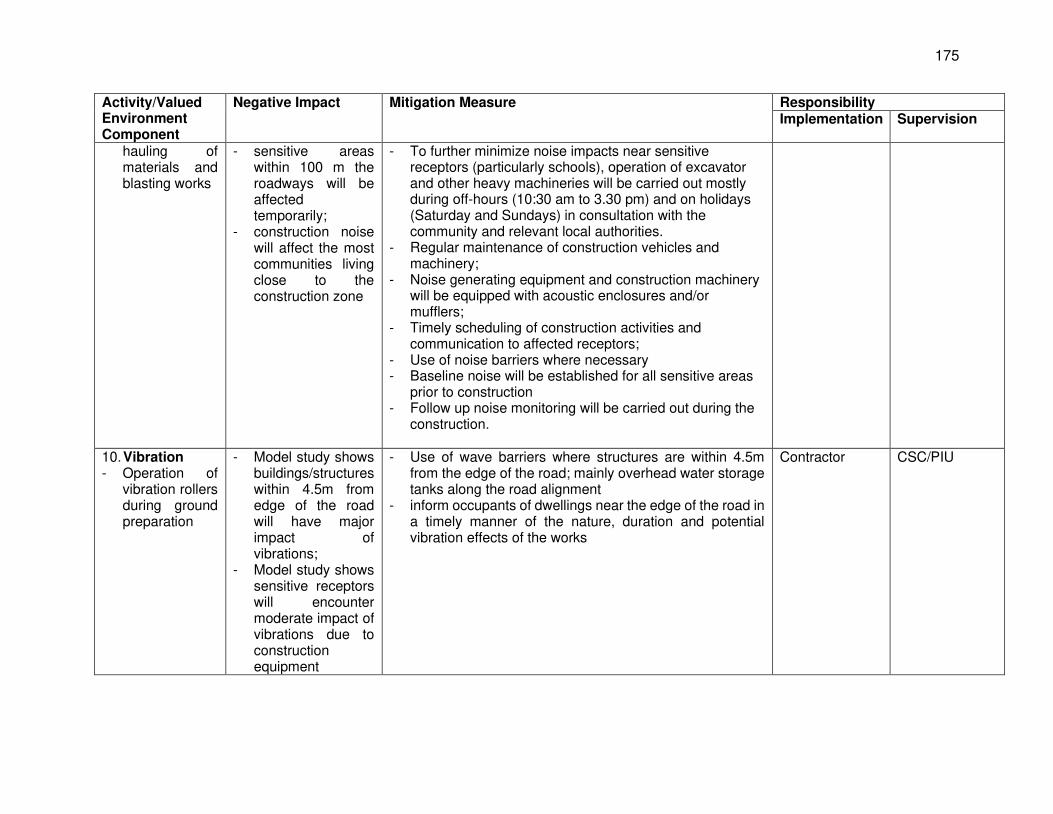
175
Activity/Valued Environment Component
Negative Impact Mitigation Measure Responsibility Implementation Supervision
hauling of materials and blasting works
- sensitive areas within 100 m the roadways will be affected temporarily;
- construction noise will affect the most communities living close to the construction zone
- To further minimize noise impacts near sensitive receptors (particularly schools), operation of excavator and other heavy machineries will be carried out mostly during off-hours (10:30 am to 3.30 pm) and on holidays (Saturday and Sundays) in consultation with the community and relevant local authorities.
- Regular maintenance of construction vehicles and machinery;
- Noise generating equipment and construction machinery will be equipped with acoustic enclosures and/or mufflers;
- Timely scheduling of construction activities and communication to affected receptors;
- Use of noise barriers where necessary - Baseline noise will be established for all sensitive areas
prior to construction - Follow up noise monitoring will be carried out during the
construction.
10. Vibration - Operation of
vibration rollers during ground preparation
- Model study shows buildings/structures within 4.5m from edge of the road will have major impact of vibrations;
- Model study shows sensitive receptors will encounter moderate impact of vibrations due to construction equipment
- Use of wave barriers where structures are within 4.5m from the edge of the road; mainly overhead water storage tanks along the road alignment
- inform occupants of dwellings near the edge of the road in a timely manner of the nature, duration and potential vibration effects of the works
Contractor CSC/PIU
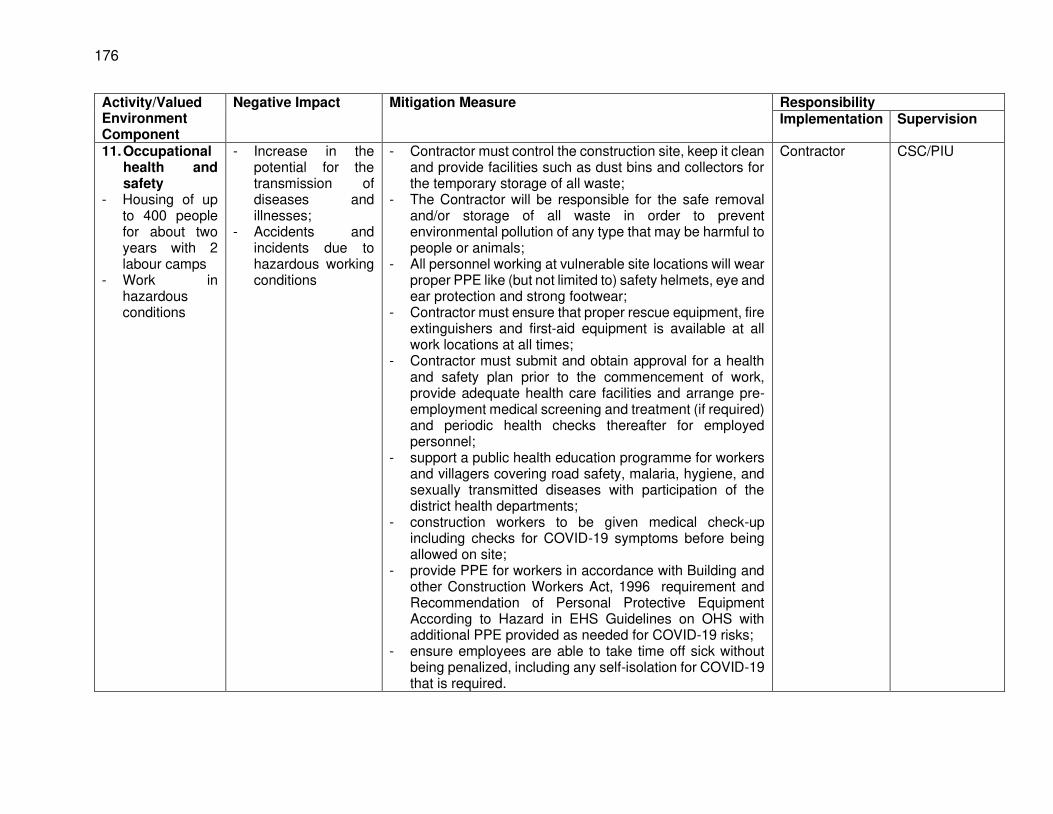
176
Activity/Valued Environment Component
Negative Impact Mitigation Measure Responsibility Implementation Supervision
11. Occupational health and safety
- Housing of up to 400 people for about two years with 2 labour camps
- Work in hazardous conditions
- Increase in the potential for the transmission of diseases and illnesses;
- Accidents and incidents due to hazardous working conditions
- Contractor must control the construction site, keep it clean and provide facilities such as dust bins and collectors for the temporary storage of all waste;
- The Contractor will be responsible for the safe removal and/or storage of all waste in order to prevent environmental pollution of any type that may be harmful to people or animals;
- All personnel working at vulnerable site locations will wear proper PPE like (but not limited to) safety helmets, eye and ear protection and strong footwear;
- Contractor must ensure that proper rescue equipment, fire extinguishers and first-aid equipment is available at all work locations at all times;
- Contractor must submit and obtain approval for a health and safety plan prior to the commencement of work, provide adequate health care facilities and arrange pre-employment medical screening and treatment (if required) and periodic health checks thereafter for employed personnel;
- support a public health education programme for workers and villagers covering road safety, malaria, hygiene, and sexually transmitted diseases with participation of the district health departments;
- construction workers to be given medical check-up including checks for COVID-19 symptoms before being allowed on site;
- provide PPE for workers in accordance with Building and other Construction Workers Act, 1996 requirement and Recommendation of Personal Protective Equipment According to Hazard in EHS Guidelines on OHS with additional PPE provided as needed for COVID-19 risks;
- ensure employees are able to take time off sick without being penalized, including any self-isolation for COVID-19 that is required.
Contractor CSC/PIU

177
Activity/Valued Environment Component
Negative Impact Mitigation Measure Responsibility Implementation Supervision
- The used face mask for COVID-19 should be properly collected from the workers/ labours and same shall be handed over to the local body to dispose through Common Bio Medical Waste Treatment and Disposal Facility.
12. Community health and safety
- Presence of labour camps
- Conflict between community and migrant workers
- the contractor should provide the construction camps with facilities such as health care clinics, places of worship, and occasional entertainment;
- Contractor should maximize recruitment of local construction workers regardless of gender;
- Contractor will ensure affected communities are pre-informed of emergency procedures included in the agreed community health and safety plan and as appropriate given proximity of residents to works included in their mock drills etc.
- contractors staff and local communities will also be given awareness raising in COVID-19, HIV/AIDS, other communicable diseases, and sexual, exploitation, abuse and harassment with strict penalties (e.g. immediate removal from site) for any non-compliance of workers to an agreed code of practice
- display posters to promote handwashing and respiratory hygiene etc.
- wherever possible, the contractor should not discriminate and should proactively encourage the employment of suitably skilled women on the project.
Contractor CSC/PIU
C. OPERATION STAGE
I. Physical environment
1. Air quality and GHGs
- Increase in traffic volume
- Atmospheric dispersion modelling
- Increased levels of emission of typical transport related pollutants (PM 2.5, PM10, CO, SO2 and NOx)
- Proper and regular maintenance of roads to minimize air pollution due to reanimation of dust from the road
Contractor PIU
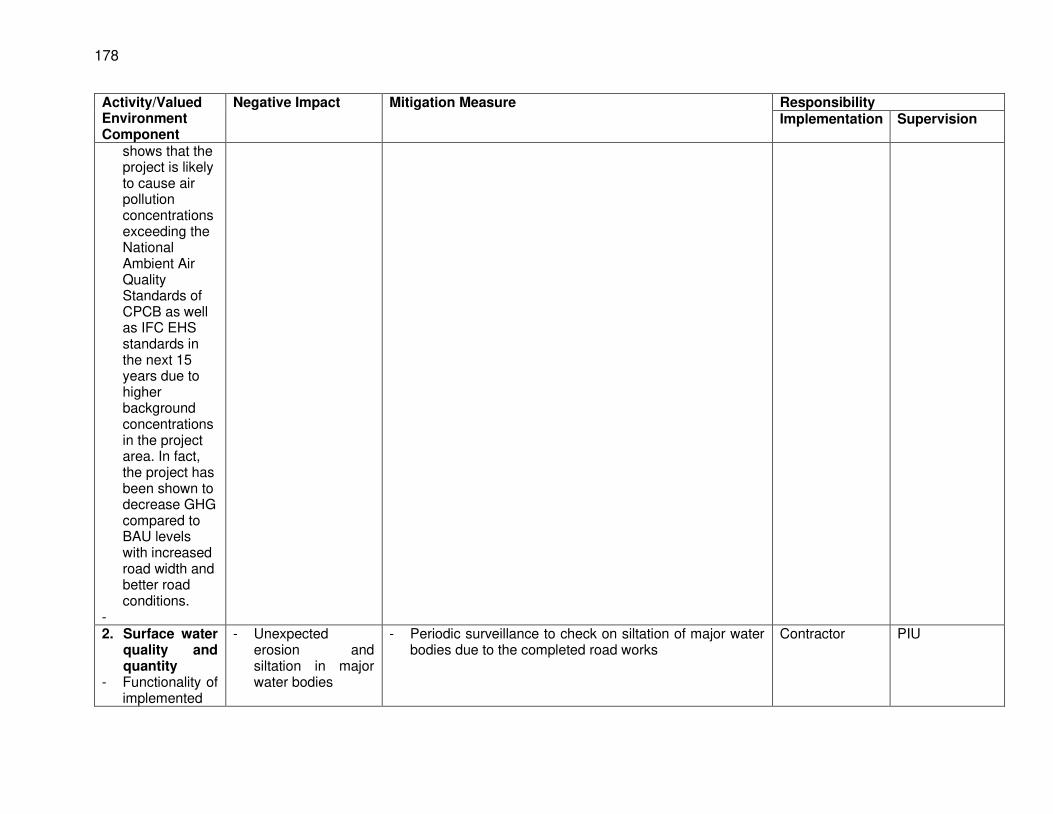
178
Activity/Valued Environment Component
Negative Impact Mitigation Measure Responsibility Implementation Supervision
shows that the project is likely to cause air pollution concentrations exceeding the National Ambient Air Quality Standards of CPCB as well as IFC EHS standards in the next 15 years due to higher background concentrations in the project area. In fact, the project has been shown to decrease GHG compared to BAU levels with increased road width and better road conditions.
- 2. Surface water
quality and quantity
- Functionality of implemented
- Unexpected erosion and siltation in major water bodies
- Periodic surveillance to check on siltation of major water bodies due to the completed road works
Contractor PIU
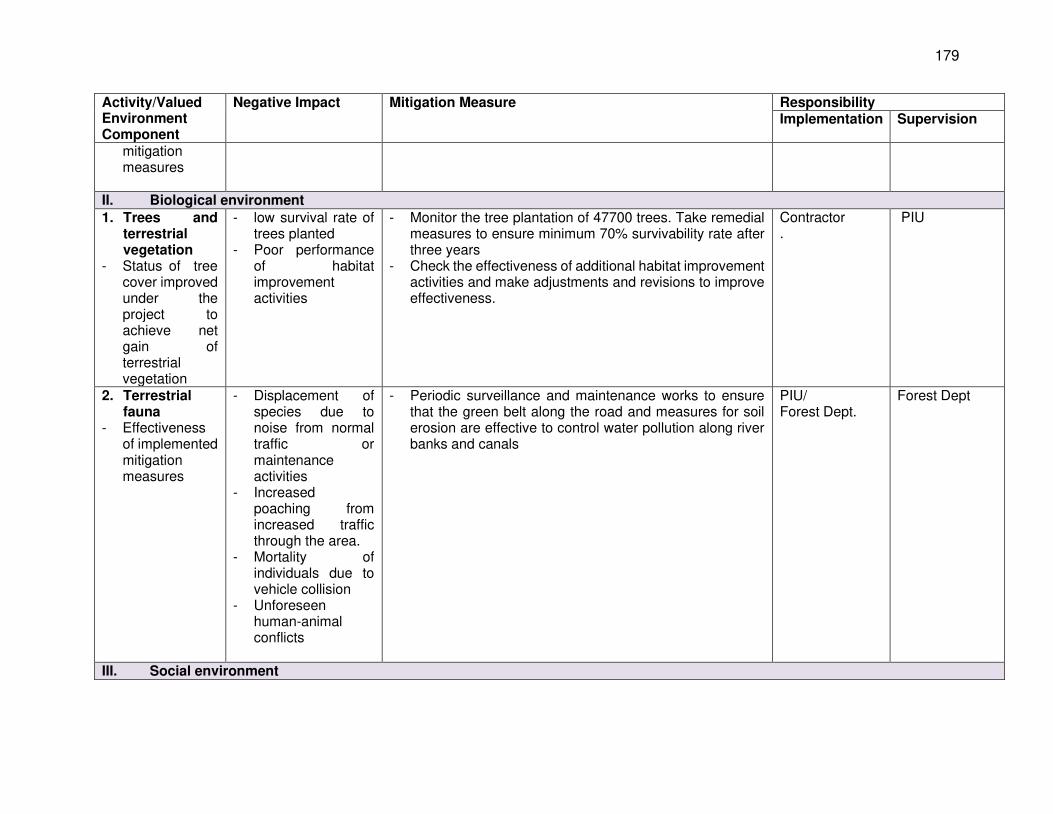
179
Activity/Valued Environment Component
Negative Impact Mitigation Measure Responsibility Implementation Supervision
mitigation measures
II. Biological environment
1. Trees and terrestrial vegetation
- Status of tree cover improved under the project to achieve net gain of terrestrial vegetation
- low survival rate of trees planted
- Poor performance of habitat improvement activities
- Monitor the tree plantation of 47700 trees. Take remedial measures to ensure minimum 70% survivability rate after three years
- Check the effectiveness of additional habitat improvement activities and make adjustments and revisions to improve effectiveness.
Contractor .
PIU
2. Terrestrial fauna
- Effectiveness of implemented mitigation measures
- Displacement of species due to noise from normal traffic or maintenance activities
- Increased poaching from increased traffic through the area.
- Mortality of individuals due to vehicle collision
- Unforeseen human-animal conflicts
- Periodic surveillance and maintenance works to ensure that the green belt along the road and measures for soil erosion are effective to control water pollution along river banks and canals
PIU/ Forest Dept.
Forest Dept
III. Social environment
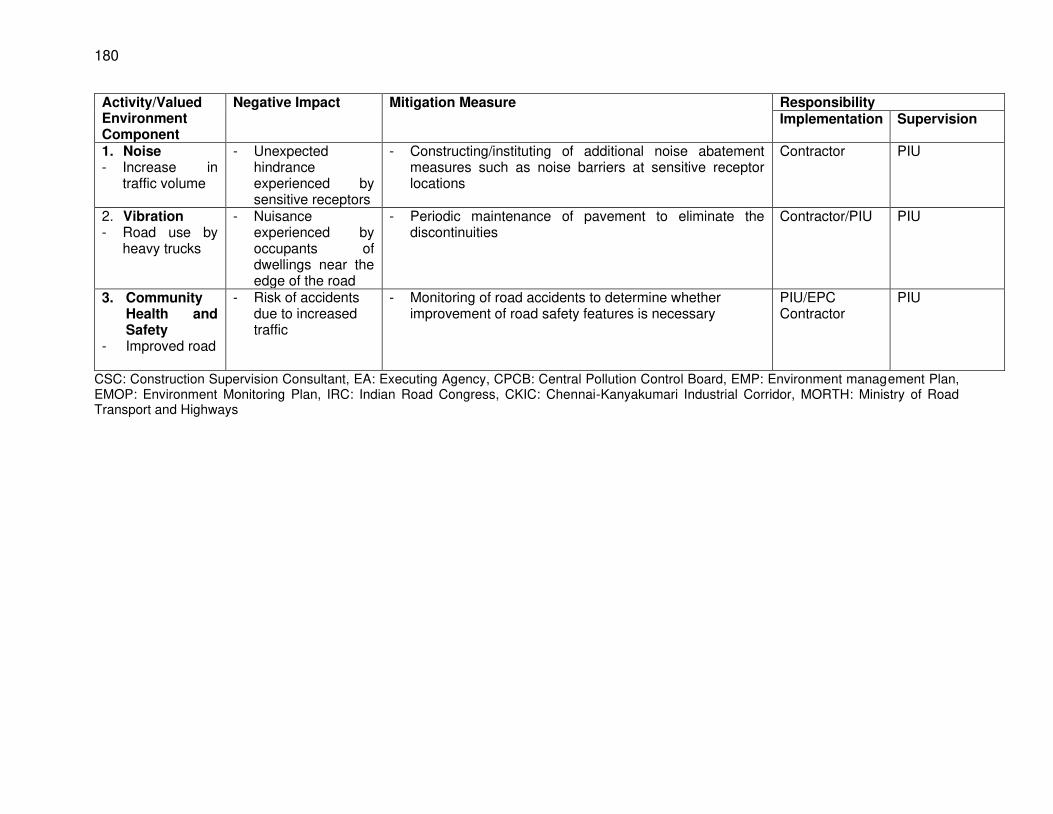
180
Activity/Valued Environment Component
Negative Impact Mitigation Measure Responsibility Implementation Supervision
1. Noise - Increase in
traffic volume
- Unexpected hindrance experienced by sensitive receptors
- Constructing/instituting of additional noise abatement measures such as noise barriers at sensitive receptor locations
Contractor PIU
2. Vibration - Road use by
heavy trucks
- Nuisance experienced by occupants of dwellings near the edge of the road
- Periodic maintenance of pavement to eliminate the discontinuities
Contractor/PIU PIU
3. Community Health and Safety
- Improved road
- Risk of accidents due to increased traffic
- Monitoring of road accidents to determine whether improvement of road safety features is necessary
PIU/EPC Contractor
PIU
CSC: Construction Supervision Consultant, EA: Executing Agency, CPCB: Central Pollution Control Board, EMP: Environment management Plan, EMOP: Environment Monitoring Plan, IRC: Indian Road Congress, CKIC: Chennai-Kanyakumari Industrial Corridor, MORTH: Ministry of Road Transport and Highways
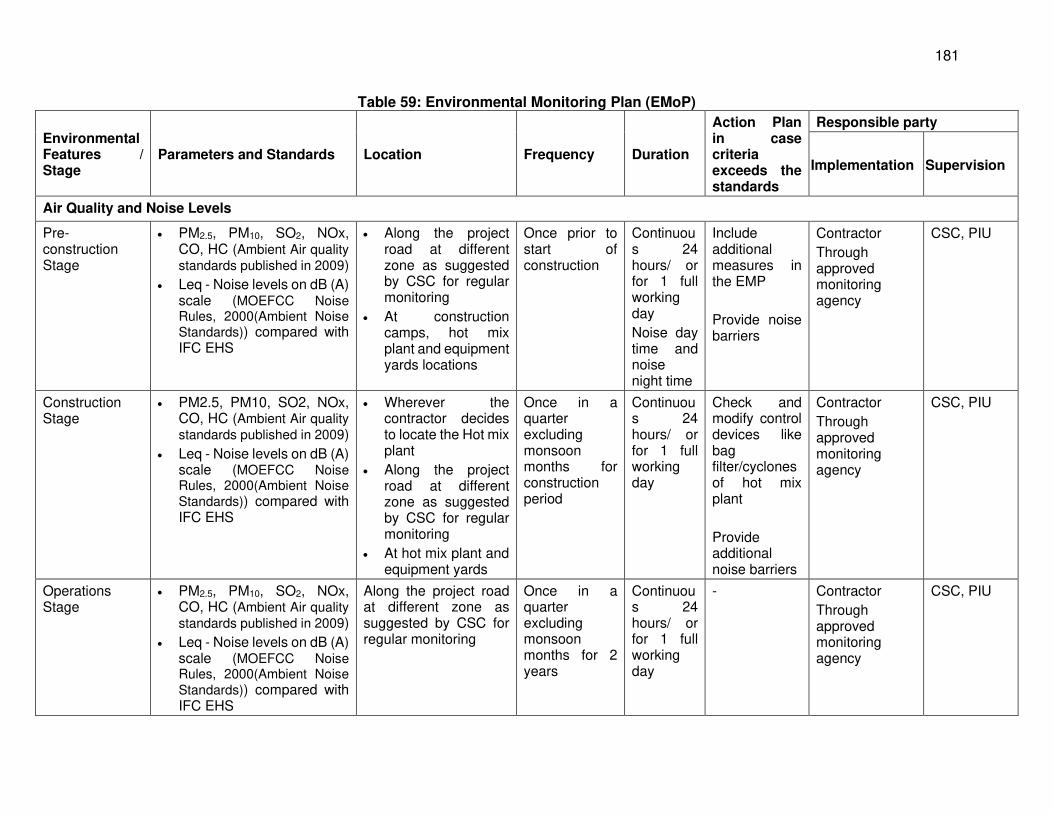
181
Table 59: Environmental Monitoring Plan (EMoP)
Environmental Features / Stage
Parameters and Standards Location Frequency Duration
Action Plan in case criteria exceeds the standards
Responsible party
Implementation Supervision
Air Quality and Noise Levels
Pre-construction Stage
• PM2.5, PM10, SO2, NOx, CO, HC (Ambient Air quality standards published in 2009)
• Leq - Noise levels on dB (A) scale (MOEFCC Noise Rules, 2000(Ambient Noise Standards)) compared with IFC EHS
• Along the project road at different zone as suggested by CSC for regular monitoring
• At construction camps, hot mix plant and equipment yards locations
Once prior to start of construction
Continuous 24 hours/ or for 1 full working day
Noise day time and noise night time
Include additional measures in the EMP
Provide noise barriers
Contractor
Through approved monitoring agency
CSC, PIU
Construction Stage
• PM2.5, PM10, SO2, NOx, CO, HC (Ambient Air quality standards published in 2009)
• Leq - Noise levels on dB (A) scale (MOEFCC Noise Rules, 2000(Ambient Noise Standards)) compared with IFC EHS
• Wherever the contractor decides to locate the Hot mix plant
• Along the project road at different zone as suggested by CSC for regular monitoring
• At hot mix plant and equipment yards
Once in a quarter excluding monsoon months for construction period
Continuous 24 hours/ or for 1 full working day
Check and modify control devices like bag filter/cyclones of hot mix plant
Provide additional noise barriers
Contractor
Through approved monitoring agency
CSC, PIU
Operations Stage
• PM2.5, PM10, SO2, NOx, CO, HC (Ambient Air quality standards published in 2009)
• Leq - Noise levels on dB (A) scale (MOEFCC Noise Rules, 2000(Ambient Noise Standards)) compared with IFC EHS
Along the project road at different zone as suggested by CSC for regular monitoring
Once in a quarter excluding monsoon months for 2 years
Continuous 24 hours/ or for 1 full working day
- Contractor
Through approved monitoring agency
CSC, PIU
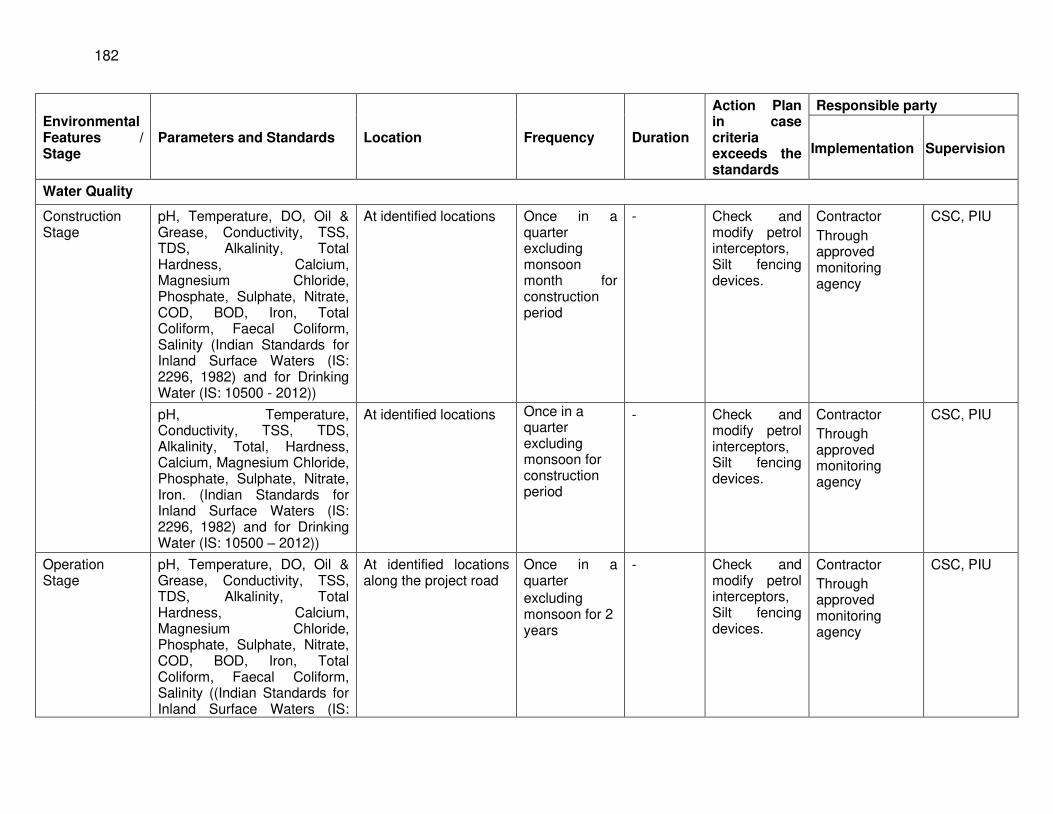
182
Environmental Features / Stage
Parameters and Standards Location Frequency Duration
Action Plan in case criteria exceeds the standards
Responsible party
Implementation Supervision
Water Quality
Construction Stage
pH, Temperature, DO, Oil & Grease, Conductivity, TSS, TDS, Alkalinity, Total Hardness, Calcium, Magnesium Chloride, Phosphate, Sulphate, Nitrate, COD, BOD, Iron, Total Coliform, Faecal Coliform, Salinity (Indian Standards for Inland Surface Waters (IS: 2296, 1982) and for Drinking Water (IS: 10500 - 2012))
At identified locations Once in a quarter excluding monsoon month for construction period
- Check and modify petrol interceptors, Silt fencing devices.
Contractor
Through approved monitoring agency
CSC, PIU
pH, Temperature, Conductivity, TSS, TDS, Alkalinity, Total, Hardness, Calcium, Magnesium Chloride, Phosphate, Sulphate, Nitrate, Iron. (Indian Standards for Inland Surface Waters (IS: 2296, 1982) and for Drinking Water (IS: 10500 – 2012))
At identified locations Once in a quarter excluding monsoon for construction period
- Check and modify petrol interceptors, Silt fencing devices.
Contractor
Through approved monitoring agency
CSC, PIU
Operation Stage
pH, Temperature, DO, Oil & Grease, Conductivity, TSS, TDS, Alkalinity, Total Hardness, Calcium, Magnesium Chloride, Phosphate, Sulphate, Nitrate, COD, BOD, Iron, Total Coliform, Faecal Coliform, Salinity ((Indian Standards for Inland Surface Waters (IS:
At identified locations along the project road
Once in a quarter
excluding monsoon for 2 years
- Check and modify petrol interceptors, Silt fencing devices.
Contractor
Through approved monitoring agency
CSC, PIU
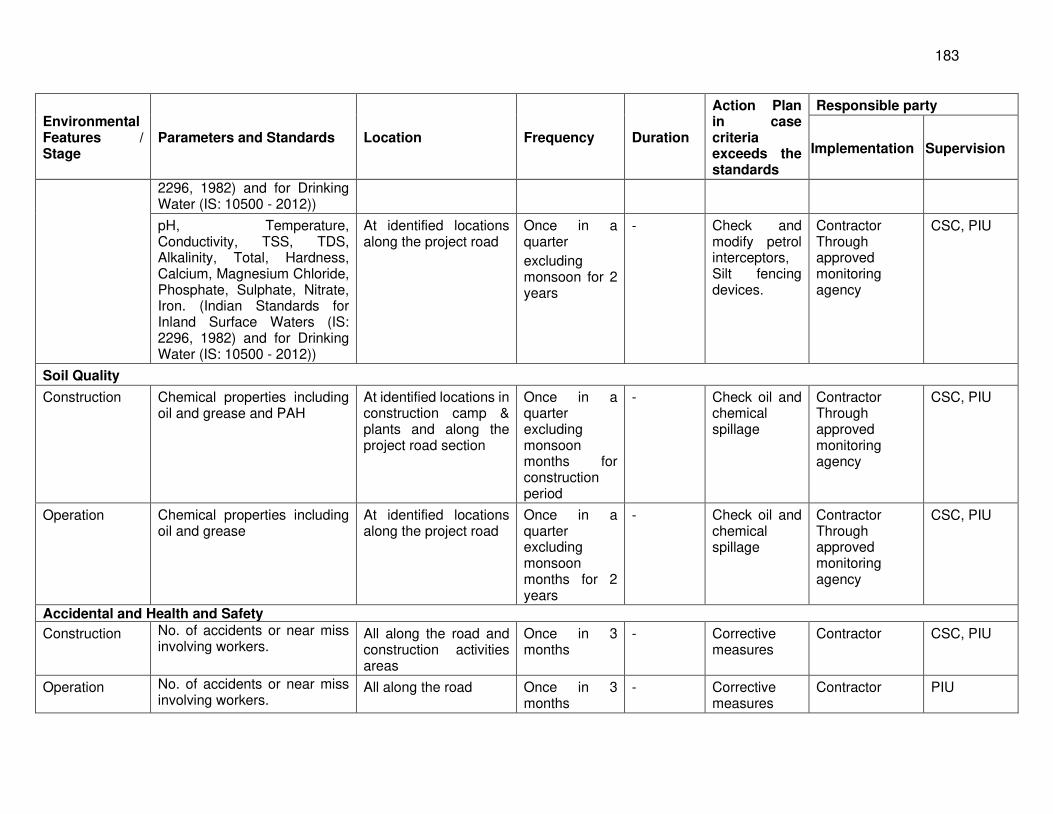
183
Environmental Features / Stage
Parameters and Standards Location Frequency Duration
Action Plan in case criteria exceeds the standards
Responsible party
Implementation Supervision
2296, 1982) and for Drinking Water (IS: 10500 - 2012))
pH, Temperature, Conductivity, TSS, TDS, Alkalinity, Total, Hardness, Calcium, Magnesium Chloride, Phosphate, Sulphate, Nitrate, Iron. (Indian Standards for Inland Surface Waters (IS: 2296, 1982) and for Drinking Water (IS: 10500 - 2012))
At identified locations along the project road
Once in a quarter
excluding monsoon for 2 years
- Check and modify petrol interceptors, Silt fencing devices.
Contractor Through approved monitoring agency
CSC, PIU
Soil Quality
Construction Chemical properties including oil and grease and PAH
At identified locations in construction camp & plants and along the project road section
Once in a quarter excluding monsoon months for construction period
- Check oil and chemical spillage
Contractor Through approved monitoring agency
CSC, PIU
Operation Chemical properties including oil and grease
At identified locations along the project road
Once in a quarter excluding monsoon months for 2 years
- Check oil and chemical spillage
Contractor Through approved monitoring agency
CSC, PIU
Accidental and Health and Safety
Construction No. of accidents or near miss involving workers.
All along the road and construction activities areas
Once in 3 months
- Corrective measures
Contractor CSC, PIU
Operation No. of accidents or near miss involving workers.
All along the road Once in 3 months
- Corrective measures
Contractor PIU
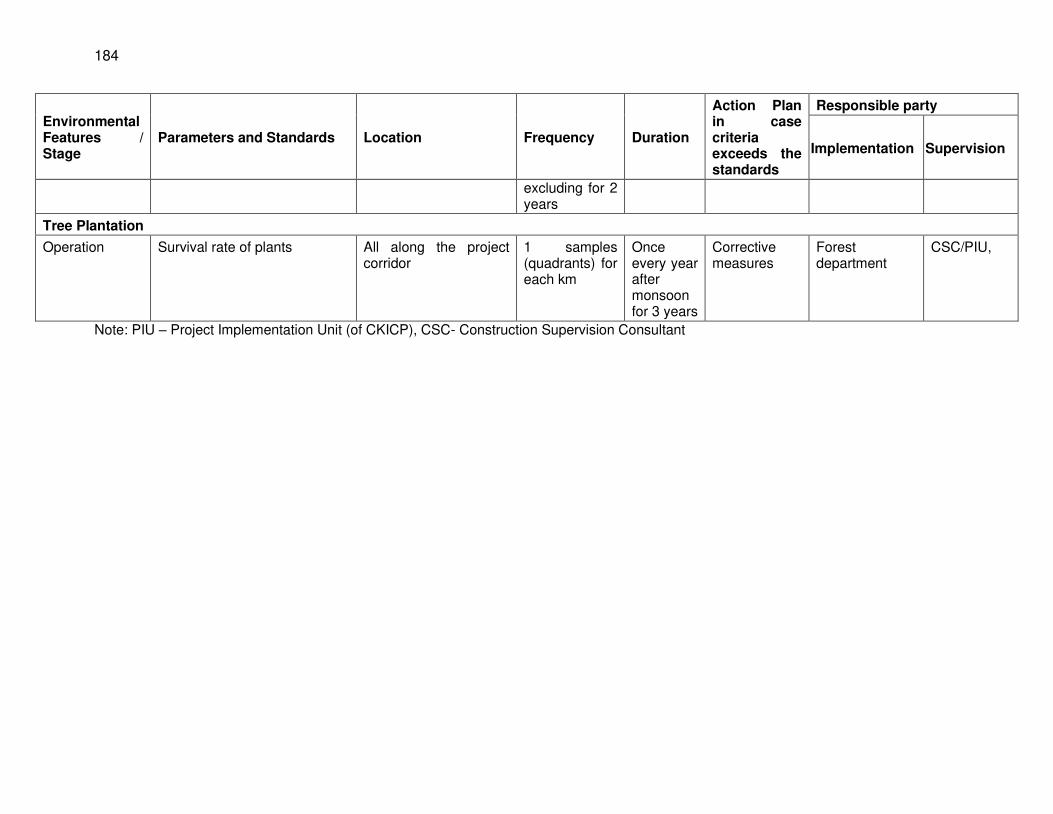
184
Environmental Features / Stage
Parameters and Standards Location Frequency Duration
Action Plan in case criteria exceeds the standards
Responsible party
Implementation Supervision
excluding for 2 years
Tree Plantation
Operation Survival rate of plants All along the project corridor
1 samples (quadrants) for each km
Once every year after monsoon for 3 years
Corrective measures
Forest department
CSC/PIU,
Note: PIU – Project Implementation Unit (of CKICP), CSC- Construction Supervision Consultant
185
E. Institutional Requirements
418. The Highways and Minor Ports Department (TNHD) of Government of Tamil Nadu will be the Executing Agency (EA) for the project and the Implementing Agency (IA) will be the CKICP. A Project Implementation Unit (PIU) has been established within CKICP to implement the project. EA together with IA will be responsible for the implementation of the Project. The Project Director of PIU will be overall responsible for EMP implementation. The following key players are involved in EMP implementation during construction stage:
• TNHD as Project executing agency • CKICP-PIU as project PIU and its environmental wing; • Project Management Services (PMS) and Construction Supervision Consultants
(CSC) and their representatives; and • Contractors.
419. The PIU is headed by a Project Director and supported by Chief Engineer and Superintending Engineer, and Engineering unit, Land Acquisition And Resettlement & Rehabilitation (LARR) unit, Environmental wing, and Audit/ Finance unit. The environment wing has an Environmental Cell and Forest Wing headed by an Environment Specialist and Assistant Conservator of Forests, respectively. The environmental wing is composed of Assistant Environment Specialist, Forest Ranger, and Foresters, along with support staff to conduct monitoring and provide support to the Field Implementation Units (FIU) to ensure the quality of EMP implementation. The PIU Environmental Wing shall be responsible for the review and final approval of Health and Safety Plans based on the latest guidelines issued by concerned government agencies as well as national and international best practices. The PIU will conduct at least quarterly site monitoring or more frequently as the need arises. The PIU with the support of the PMS of construction supervision consultants will review all environmental monitoring reports prepared by the contractor and the consultants. The PIU will ensure that semi-annual environmental monitoring reports are submitted within 3 calendar months from the end of the respective reporting period to ADB for disclosure on the ADB website. FIUs will have one nominated social and environmental safeguards focal who will be will be present on site on a day-to-day basis and shall ensure the reports submitted by the contractor and the construction supervision consultants are consistent with site conditions.
420. PMS team will include environment, health and safety (EHS) Specialist whose role will be to support the PIU in monitoring the implementation of environmental safeguards under the project. The CSC will have an Environmental Specialist (ES) in its team, and it will liaise with PIU environmental wing through the FIU to ensure that Contractor complies with the requirements of various environmental safeguard measures through supervision, monitoring and reporting on the same. Efforts must be made by the CSC to ensure that environmental mitigation and good-construction-practices are not only considered but actually implemented as integral component of each civil activity. It should be considered as day-to-day activity. Implementation of wildlife and environmental safeguard measures needs team effort and as such the Team Leader of CSC will delegate the responsibilities to each member of the supervision team with respect to their core responsibilities. The project should have a provision of Environmental Specialist within CSC to supervise implementation of safeguard measures. ES role would be more on advisory. He will assist the Team Leader of CSC on the following:
• Advise PIU through the FIU and PMS on preparing reports to ADB and other statutory
bodies; • Preparing procedures for implementing EMP;
186
• Review Contractor’s Construction EMP (CEMP), traffic management plan and safety plan and recommend for its approval / improvements, to the Team Leader;
• Provide training to FIU, PIU, CSC and Contractors’ staff on implementing environmental safeguard measures;
• Advise on obtaining various statutory environmental clearances on time; • Conduct at least weekly field visits to examine environmental compliances and
suggest corrective actions; and • Address any other issues as will be required to ensure environmental compliance.
421. The Environmental Expert within CSC will be responsible for monitoring implementation of the biodiversity conservation activities to be implemented by the contractor during project construction and until the end of the contractor’s defect liability period. He/she will conduct quarterly monitoring during project construction and provide inputs to the semi-annual environmental monitoring reports.
422. Besides, the Team Leader of CSC will nominate a senior engineer from the site office for being directly responsible for day-to-day supervision of implementation of stipulated safeguard measures, to ensure accountability. He will provide guidance to the field staff of CSC and Contractor for implementing each of the activities as per the EMP. He will be responsible for record keeping, providing instructions through the Engineer for corrective actions, ensuring compliance of various statutory and legislative requirements and assist Engineer for submitting reports to PIU. He will maintain a close co-ordination with the Contractor and PIU for successful implementation of the environmental safeguard measures.
423. An external monitoring agency will be engaged to conduct third party monitoring on implementation of environment safeguards and biodiversity related activities for the sensitive roads (SH191, SH63, and SH40-II).
424. Responsibilities of various agencies involved in the project implementation are described in following paragraphs.
425. Highways and Minor Ports Department (TNHD): As the executing agency TNHD’s responsibilities will mainly be focused on addressing national or state level environment safeguard issues and decisions concerning the projects. Specific responsibilities on environment safeguards at the executing agency level are:
• Ensure that all environment safeguard requirements as given in ADB SPS 2009, and applicable laws and rules under MOEFCC are being complied with during all stages of respective project under the loan.
426. Project Implementation Unit (PIU): TNHD CKICP will be the implementing agency for the project. A PIU within CKICP will be responsible for implementing environment safeguard requirements in accordance with the IEE and EMP at the project level whereas site level work will be monitored by Field Implementation Units (FIU). Specific responsibilities on environment safeguards of the PIU and FIUs are (both if not specified):
• The PIU will ensure timely recruitment and mobilization of the environmental
specialist as well as health and safety officer under the CSC and the external monitor. • The PIU and FIUs will coordinate to ensure timely processing of forestry clearances,
tree cutting permits, and other similar clearances and permits required for the project.

187
• primary responsibility per jurisdiction will fall on respective FIU. • FIU will coordinate with the Forestry Department on biodiversity monitoring and
habitat improvement activities. • PIU will review the budgetary needs for complying with the Government’s and ADB’s
requirements on environment safeguards and ensure the proposed budget is available.
• Prepare forms, reports and all documents, etc. for processing of environmental, forestry and related clearances in a timely manner and submit them for further review and signing to the authorized officer in the respective executing agency office.
• If any problems or long delays are encountered when processing the clearance documents, immediately alert the authorized officer at the executing agency level and seek ways resolve the problem at the soonest.
• Ensure that all necessary regulatory clearances are obtained prior to commencing any civil work of the respective road section.
• The PIU will ensure that the most recent version of the EMP (including biodiversity conservation measures) and EMOP which include required mitigation measures and monitoring requirements with defined Bill of Quantity (BOQ), forms part of contractor’s agreement.
• Ensure that contractor have access to the IEE report including EMP, and EMOP. • The FIU will ensure that the Engineering Procurement and Construction (EPC)
contractor updates the EMP, EMOP based on detailed design and prepare CEMP. • Ensure that contractor understand their responsibilities to mitigate environmental
problems associated with their construction activities. • The FIU will ensure and monitor that all required permits, no objection certificates
etc. are obtained by the contractor for establishment and operation of equipment and facilities as detailed in the IEE.
• The FIU, with the support of the environmental Engineer of the contractor and CSC ensure that the contractor implements the EMP (including biodiversity conservation measures) and EMOP as given in the latest version of the IEE report.
• In case of unanticipated environmental impacts during project implementation stage, with the support of CSC prepare and implement an updated EMP to account for such impacts after seeking concurrence from ADB. The updating shall be carried out after due consultation with the stakeholders and concerned government agencies.
• In case during project implementation if the project needs to be redesigned or there are unanticipated environmental impacts, the PIU will immediately inform ADB and jointly agree on whether the IEE needs to be revised or whether only the EMP and/or EMOP needs to be revised.
• Conduct regular (at least quarterly for PIU and at least weekly for FIUs) site visits to ensure that the contractor is complying with the EMP, EMOP and the CSC is conducting regular supervision and monitoring as outlined below in the next paragraph.
• Ensure effective implementation of Grievance Redress Mechanism to address affected people’s concerns and complaints.
• With the support of CSC and contractor, conduct public consultations during project construction to seek feedback of the local community people and ensure that the project is not having adverse impacts on them.
• The PIU, with the help of respective FIU, will review, verify and endorse the monthly, quarterly and semi-annual environmental monitoring reports submitted by the CSC and PMS.
188
• The PIU, with the help of respective FIU, will review and endorse the semi-annual environmental monitoring reports submitted by the external monitor.
• Once deemed satisfactory, the PIU will submit consolidated semi-annual environmental monitoring reports submitted by the PMS and external monitor to ADB and make these reports available for public disclosure.
• The FIU will review and approve all environment safeguards related documents such as updated IEE, monitoring reports etc. prepared for project with recommendations and clarifications from the implementing agency where necessary.
• The PIU will ensure timely endorsement and signing of key documents and forwarding to the respective agency such as those required for processing of wildlife clearance, forestry clearance etc. and disclosure on ADB website.
• Take proactive and timely measures to address any environment safeguards related challenges at the national or state level such as delays in processing of clearances (during pre-construction stage), significant grievances (during construction stage).
• The PIU will recruit an external monitor to conduct third party environmental monitoring for the project.
• The PIU will submit all reports including consolidated semi-annual environmental monitoring report and external monitoring reports to ADB.
• Safeguards focals of FIUs will inspect field work at field level.
427. Project Management Service (PMS): Project management support, including safeguards implementation, will be provided to the PIU by one of the construction supervision consultants (CSC-01). The project management service (PMS) team of CSC-01 will include environment, health and safety (EHS) expert and resettlement specialists whose role will be to support the PIU in monitoring the implementation of environmental and social safeguards under the project. Details of EHS related responsibilities of the PMS are provided below.
• Support the PIU in monitoring the implementation of environmental and social
safeguards under the project • Review and clear contractors’ Health and Safety Plans which shall include COVID19
measures and submit it to the PIU for further assessment and final approval; • Review the environmental monitoring reports submitted by the construction
supervision consultants and the contractors; and • Consolidate the monitoring reports submitted by the CSCs into semi-annual
environmental monitoring reports for submission to PIU for their review and endorsement for further submission to ADB.
428. Construction Supervision Consultant (CSC): The CSC will support the PIU to supervise and monitor environment safeguard requirements in accordance with the IEE, EMP, and EMOP. The CSC will include an environmental specialist. Details of environment safeguards related responsibilities of the CSC are provided below.
• Conduct continuous check on the status of environment safeguards in relation to air,
noise, water, soil, occupational health and safety, and ecological activities and mitigation measures.
• Based on site visits (monthly) and monthly reports submitted by the contractor prepare monthly environmental monitoring reports for the review and approval of PIU.
189
• Compile the monthly monitoring reports into semi-annual environmental monitoring reports and submitted and further submission to ADB for disclosure on the ADB website.
• In coordination with PIU through FIU, ensure that all necessary regulatory clearances are obtained prior to commencing any civil work of the respective road section.
• Ensure that the EPC contractor updates the EMP and EMoP based on detailed design, prepares CEMP, and implements them properly.
• Ensure that the EPC contractor updates the biodiversity components of the EMP and EMoP based on detailed design and implements them properly.
• Ensure that the EPC contractor designs and constructs measures suggested in the road section in areas near to protected areas.
• Review and approve environment related sub plans such as camp layout plan, traffic management plan, borrow area management plan, construction debris management plan etc. to be submitted by the contractor.
• Provide technical guidance to the contractor to ensure they understand their responsibilities to mitigate environmental problems associated with their construction activities.
• Provide training to FIU, PIU, CSC and Contractors’ staff on implementing environmental safeguard measures.
• Ensure and monitor that all required permits, no objection certificates etc. are obtained by the contractor for establishment and operation of equipment and facilities as detailed in IEE.
• In case of non-compliances with the EMP and EMOP prepare a corrective action plan and ensure it is implemented
• In case during project implementation if the project needs to be redesigned or there are unanticipated environmental impacts immediately inform the PIU and provide recommendation on whether the IEE and EMP and EMOP needs to be revised.
• Support the PIU to ensure effective implementation of Grievance Redress Mechanism to address affected people’s concerns and complaints.
• Ensure regular consultations are taking place with affected communities and key stakeholders during construction as well as operation phases of the project.
• Review and verify all environmental reports prepared by contractor. Based on site inspections and environmental reports from the contractors, prepare quarterly environmental monitoring reports for submission to the PIU. Consolidated quarterly reports into a semi-annual environmental monitoring report and submit it to the PIU.
429. External Monitor: The External Monitor will conduct third party monitoring of environment safeguard and biodiversity conservation activities. The following are a summary of the key responsibilities of the External Monitor.
• Review the IEE, EMP and Biodiversity Action Plans with the Biodiversity and Critical
Habitat Assessment report to understand the background environmental and biodiversity issues of the project.
• Conduct third party monitoring of the implementation of the EMP, EMOP and biodiversity conservation activities by the contractor and supervisory activities of the CSC through quarterly site visits and review of environment safeguard and biodiversity conservation related documents maintained by the contractor, CSC and PIU.
• Advise the PIU on the need for corrective actions if any.
190
• The External Monitor must not be involved in the day to day implementation and supervision of environment safeguards and biodiversity conservation activities under the project.
• Based on the observations from the site visits and review of documents and monitoring reports prepared by the contractor and CSC, prepare semi-annual reports for submission to the PIU and onward to ADB for disclosure on the ADB website.
430. ADB: ADB is responsible for the following:
• Review IEE report and disclose the draft and final reports on the ADB website as required;
• Issue project’s approval based on IEE report; • Monitor implementation of the EMP through due diligence missions; • Provide assistance to the executing agency and implementing agency of project, if
required, in carrying out itsresponsibilities and for building capacity for safeguard compliance; and
• If necessary provide further guidance to the implementing agency on the format, content, and scope of semi-annual monitoring reports for submission to ADB.
431. Contractor: For ensuring that EMP is properly implemented, Contractor shall appoint a full time qualified and experienced Environmental Officer (EO) and a Health and Safety Officer (HSO) from the commencement to completion of the project. These experts will be recruited within 30 days of contract signing.
432. The responsibilities of EO&HSO of Contractor will include the following:
• Directly reporting to the Project Engineer of the Contractor; • Discussing various environmental issues and environmental mitigation,
enhancement and monitoring actions with all concerned directly or indirectly; • Prepare Contractor’s Construction EMP (CEMP), traffic management plan and safety
plan and other environmental subplans, as part of their Work Program; • Ensure contractor’s compliance with the EMP stipulations and conditions of statutory
bodies; • Assisting his project Engineer to ensure environmentally sound and safe construction
practices; • Assisting the project Engineer to ensure the timely procurement of materials that are
included in the Bill of Quantities relating to environmental mitigation and enhancement measures;
• Conducting periodic environmental and safety training for contractor’s engineers, supervisors and workers;
• Preparing a registers for material sources, labour, pollution monitoring results, public complaint and as may be directed by the Engineer;
• Coordinate closely with the construction supervision consultants on climate and disaster risk adaptation measures;
• Assisting the PIU on various environmental monitoring and control activities including pollution monitoring;
• Preparing and submitting monthly reports to CSC on status of implementation safeguard measures; and
191
• SHO will be responsible for H&S Plan preparation and implementation, with particular attention to COVID 19.
433. As mentioned above, there will be a need for capacity building of PIU on various environmental and social aspects of the project through various environmental training. Recently, there has been change of statutory requirements for these similar projects based on new EIA Notification. This has changed the landscape of legal and administrative framework for implementing the projects. Thus, there is a need for the PIU staff to updating the information and keeping abreast with the changing legal and administrative requirement, and requirements of various statutory permits and clearances. For successful implementation of EMP, it is essential to orient engineers of PIU, FIUs, CSC and Contractor who would be mobilized for this project. One day environmental orientation workshop will be organized by the PIU (with support from ADB TA consultant, if required) after most staff of the CSC and contractor has been mobilized.
F. Environmental Reporting System
434. The reporting system will operate linearly with the contractor who is at the ground level of the implementation system reporting to the CSC, who in turn shall report to the PIU and FIUs. All reporting by the contractor and CSC shall be on a monthly basis. The CSC will compile the monthly reports into quarterly reports and then semi-annual environmental monitoring reports and submit them to the PIU. The PIU shall be responsible for preparing targets for each of the identified EMP activities. The environmental specialist of the PMS will consolidate semi-annual monitoring reports submitted of CSCs into semi-annual environmental monitoring reports for submission to PIU for their review and endorsement for further submission to ADB.
435. The PIU will review and endorse the monthly and semi-annual environmental monitoring reports submitted by the PMS and CSC. The PIU through TNHW will forward the consolidated semi-annual environmental monitoring reports to ADB for disclosure on the ADB website during the project construction period. The PIU will compile and submit consolidated annual environmental monitoring reports to ADB during the project operation stage until the Project Completion Report (PCR) is finalized.
436. During the implementation period, a compliance report may include description of the items of EMP, which were not complied with by any of the responsible agencies. It would also report to the management about actions taken to enforce compliance. It may, however, be noted that certain items of the EMP might not be possibly complied with for a variety of reasons. The intention of the compliance report is not to suppress these issues but to bring out the circumstances and reasons for which compliance was not possible (such as jurisdictional issues). This would help in reinforcing the implementation of the EMP. Photographic records will also be established to provide useful environmental monitoring tools. A full record will be kept as part of normal contract monitoring. Reporting and Monitoring Systems for various stages of construction and related activities have been proposed to ensure timely and effective implementation of the EMP.
437. A summary of the key environment safeguards activities and reporting system to be followed under the project is provided in the Table 60 below.
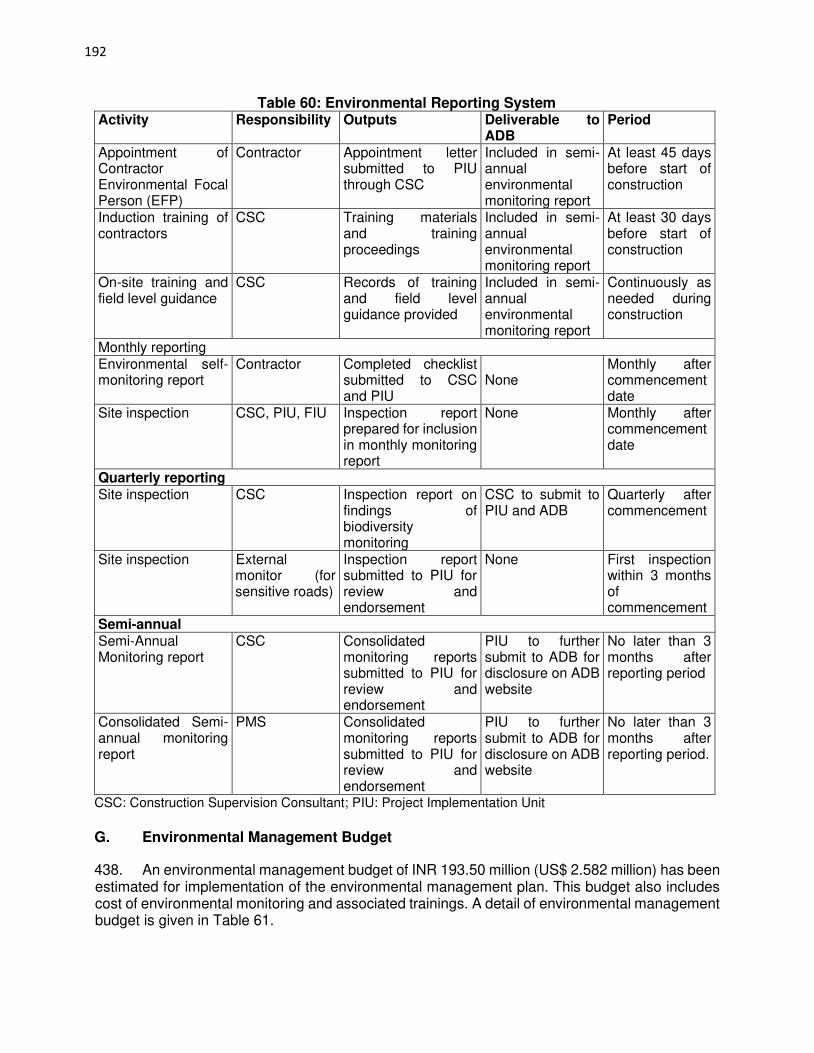
192
Table 60: Environmental Reporting System Activity Responsibility Outputs Deliverable to
ADB Period
Appointment of Contractor Environmental Focal Person (EFP)
Contractor Appointment letter submitted to PIU through CSC
Included in semi-annual environmental monitoring report
At least 45 days before start of construction
Induction training of contractors
CSC
Training materials and training proceedings
Included in semi-annual environmental monitoring report
At least 30 days before start of construction
On-site training and field level guidance
CSC
Records of training and field level guidance provided
Included in semi-annual environmental monitoring report
Continuously as needed during construction
Monthly reporting Environmental self-monitoring report
Contractor Completed checklist submitted to CSC and PIU
None
Monthly after commencement date
Site inspection
CSC, PIU, FIU
Inspection report prepared for inclusion in monthly monitoring report
None Monthly after commencement date
Quarterly reporting Site inspection CSC Inspection report on
findings of biodiversity monitoring
CSC to submit to PIU and ADB
Quarterly after commencement
Site inspection
External monitor (for sensitive roads)
Inspection report submitted to PIU for review and endorsement
None
First inspection within 3 months of commencement
Semi-annual Semi-Annual Monitoring report
CSC
Consolidated monitoring reports submitted to PIU for review and endorsement
PIU to further submit to ADB for disclosure on ADB website
No later than 3 months after reporting period
Consolidated Semi-annual monitoring report
PMS Consolidated monitoring reports submitted to PIU for review and endorsement
PIU to further submit to ADB for disclosure on ADB website
No later than 3 months after reporting period.
CSC: Construction Supervision Consultant; PIU: Project Implementation Unit G. Environmental Management Budget
438. An environmental management budget of INR 193.50 million (US$ 2.582 million) has been estimated for implementation of the environmental management plan. This budget also includes cost of environmental monitoring and associated trainings. A detail of environmental management budget is given in Table 61.
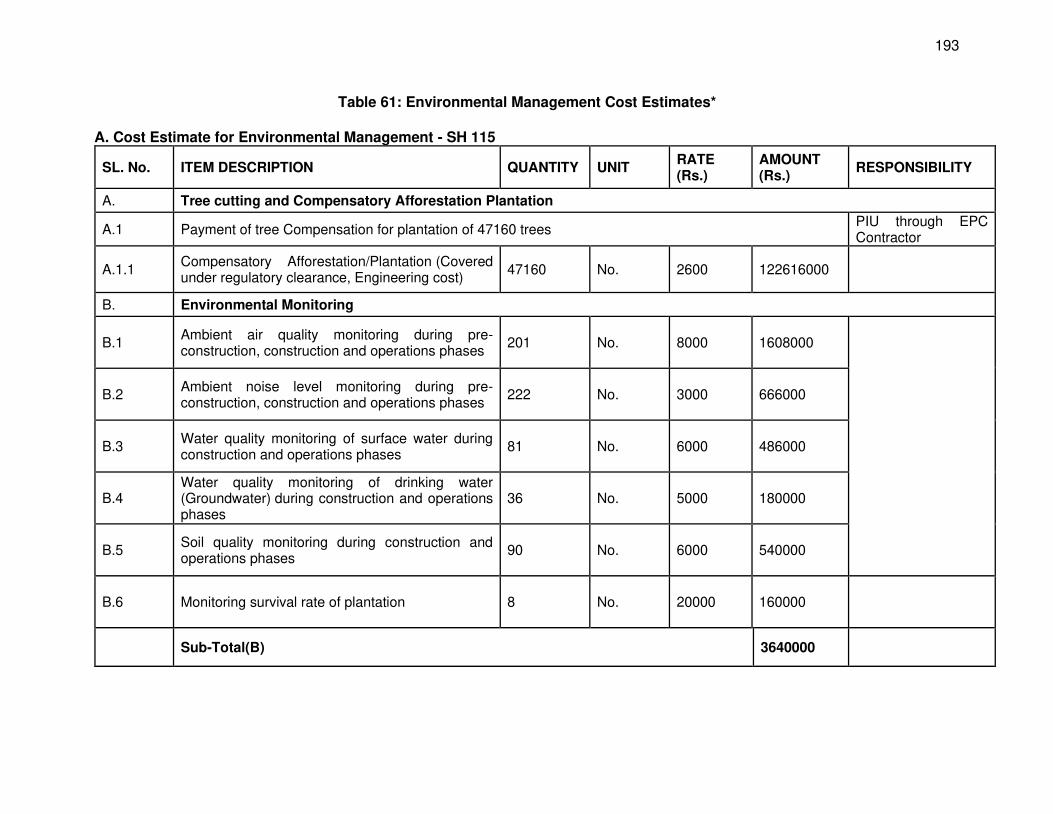
193
Table 61: Environmental Management Cost Estimates*
A. Cost Estimate for Environmental Management - SH 115
SL. No. ITEM DESCRIPTION QUANTITY UNIT RATE (Rs.)
AMOUNT (Rs.)
RESPONSIBILITY
A. Tree cutting and Compensatory Afforestation Plantation
A.1 Payment of tree Compensation for plantation of 47160 trees PIU through EPC Contractor
A.1.1 Compensatory Afforestation/Plantation (Covered under regulatory clearance, Engineering cost)
47160 No. 2600 122616000
B. Environmental Monitoring
B.1 Ambient air quality monitoring during pre-construction, construction and operations phases
201 No. 8000 1608000
B.2 Ambient noise level monitoring during pre-construction, construction and operations phases
222 No. 3000 666000
B.3 Water quality monitoring of surface water during construction and operations phases
81 No. 6000 486000
B.4 Water quality monitoring of drinking water (Groundwater) during construction and operations phases
36 No. 5000 180000
B.5 Soil quality monitoring during construction and operations phases
90 No. 6000 540000
B.6 Monitoring survival rate of plantation 8 No. 20000 160000
Sub-Total(B) 3640000
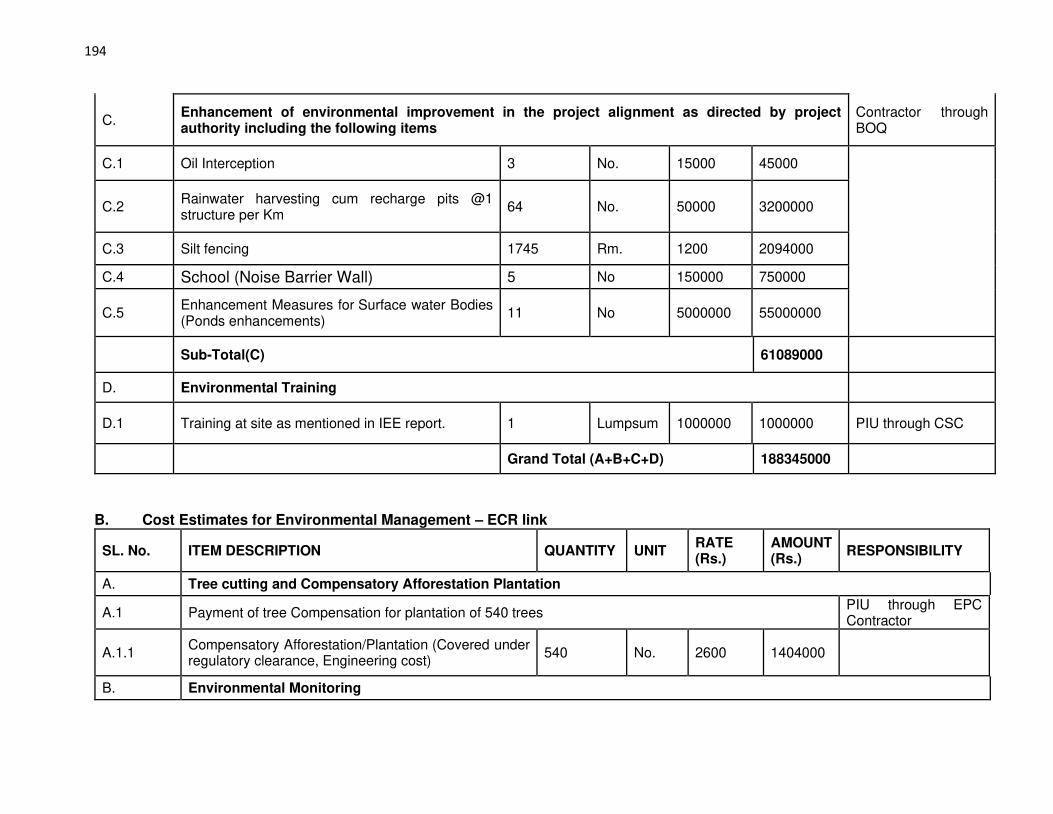
194
C. Enhancement of environmental improvement in the project alignment as directed by project authority including the following items
Contractor through BOQ
C.1 Oil Interception 3 No. 15000 45000
C.2 Rainwater harvesting cum recharge pits @1 structure per Km
64 No. 50000 3200000
C.3 Silt fencing 1745 Rm. 1200 2094000
C.4 School (Noise Barrier Wall) 5 No 150000 750000
C.5 Enhancement Measures for Surface water Bodies (Ponds enhancements)
11 No 5000000 55000000
Sub-Total(C) 61089000
D. Environmental Training
D.1 Training at site as mentioned in IEE report. 1 Lumpsum 1000000 1000000 PIU through CSC
Grand Total (A+B+C+D) 188345000
B. Cost Estimates for Environmental Management – ECR link
SL. No. ITEM DESCRIPTION QUANTITY UNIT RATE (Rs.)
AMOUNT (Rs.)
RESPONSIBILITY
A. Tree cutting and Compensatory Afforestation Plantation
A.1 Payment of tree Compensation for plantation of 540 trees PIU through EPC Contractor
A.1.1 Compensatory Afforestation/Plantation (Covered under regulatory clearance, Engineering cost)
540 No. 2600 1404000
B. Environmental Monitoring
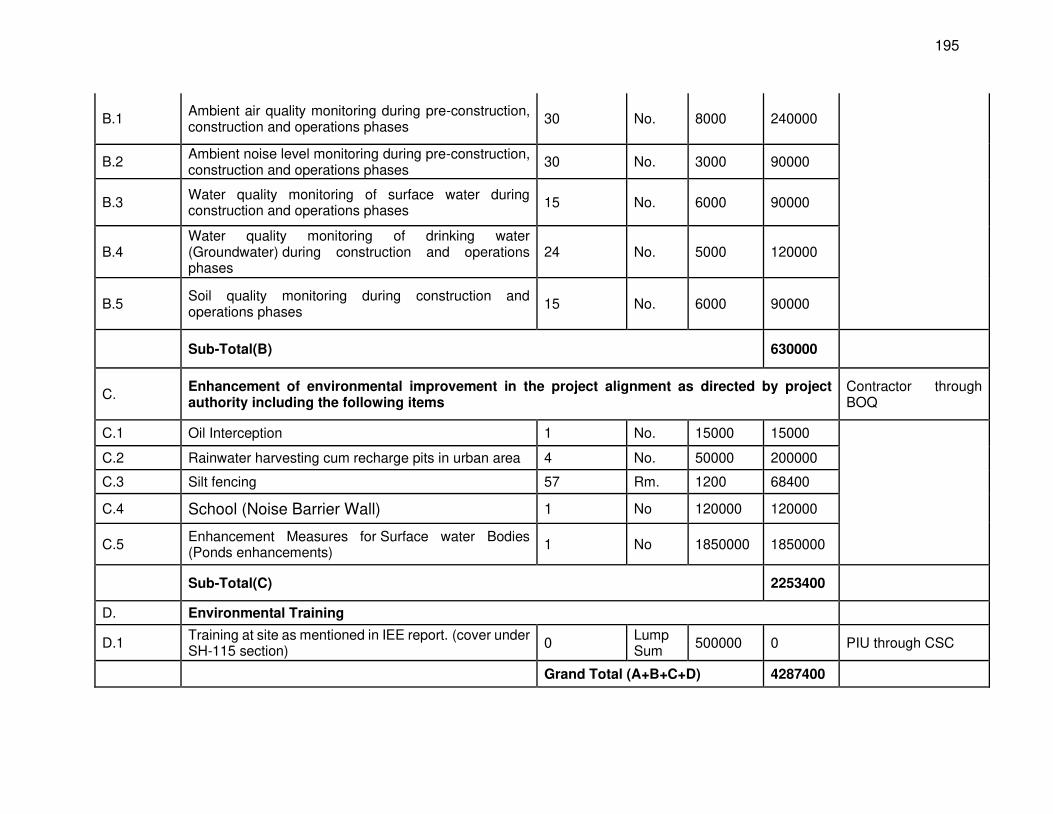
195
B.1 Ambient air quality monitoring during pre-construction, construction and operations phases
30 No. 8000 240000
B.2 Ambient noise level monitoring during pre-construction, construction and operations phases
30 No. 3000 90000
B.3 Water quality monitoring of surface water during construction and operations phases
15 No. 6000 90000
B.4 Water quality monitoring of drinking water (Groundwater) during construction and operations phases
24 No. 5000 120000
B.5 Soil quality monitoring during construction and operations phases
15 No. 6000 90000
Sub-Total(B) 630000
C. Enhancement of environmental improvement in the project alignment as directed by project authority including the following items
Contractor through BOQ
C.1 Oil Interception 1 No. 15000 15000
C.2 Rainwater harvesting cum recharge pits in urban area 4 No. 50000 200000
C.3 Silt fencing 57 Rm. 1200 68400
C.4 School (Noise Barrier Wall) 1 No 120000 120000
C.5 Enhancement Measures for Surface water Bodies (Ponds enhancements)
1 No 1850000 1850000
Sub-Total(C) 2253400
D. Environmental Training
D.1 Training at site as mentioned in IEE report. (cover under SH-115 section)
0 Lump Sum
500000 0 PIU through CSC
Grand Total (A+B+C+D) 4287400
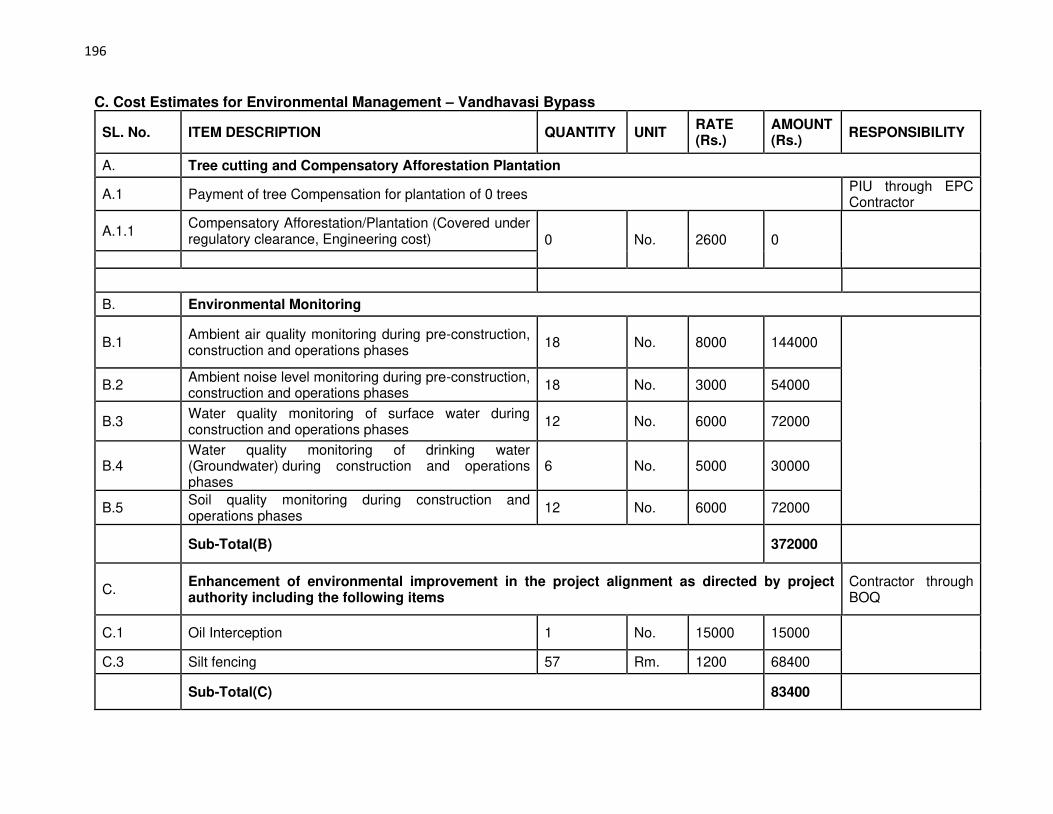
196
C. Cost Estimates for Environmental Management – Vandhavasi Bypass
SL. No. ITEM DESCRIPTION QUANTITY UNIT RATE (Rs.)
AMOUNT (Rs.)
RESPONSIBILITY
A. Tree cutting and Compensatory Afforestation Plantation
A.1 Payment of tree Compensation for plantation of 0 trees PIU through EPC Contractor
A.1.1 Compensatory Afforestation/Plantation (Covered under regulatory clearance, Engineering cost) 0 No. 2600 0
B. Environmental Monitoring
B.1 Ambient air quality monitoring during pre-construction, construction and operations phases
18 No. 8000 144000
B.2 Ambient noise level monitoring during pre-construction, construction and operations phases
18 No. 3000 54000
B.3 Water quality monitoring of surface water during construction and operations phases
12 No. 6000 72000
B.4 Water quality monitoring of drinking water (Groundwater) during construction and operations phases
6 No. 5000 30000
B.5 Soil quality monitoring during construction and operations phases
12 No. 6000 72000
Sub-Total(B) 372000
C. Enhancement of environmental improvement in the project alignment as directed by project authority including the following items
Contractor through BOQ
C.1 Oil Interception 1 No. 15000 15000
C.3 Silt fencing 57 Rm. 1200 68400
Sub-Total(C) 83400
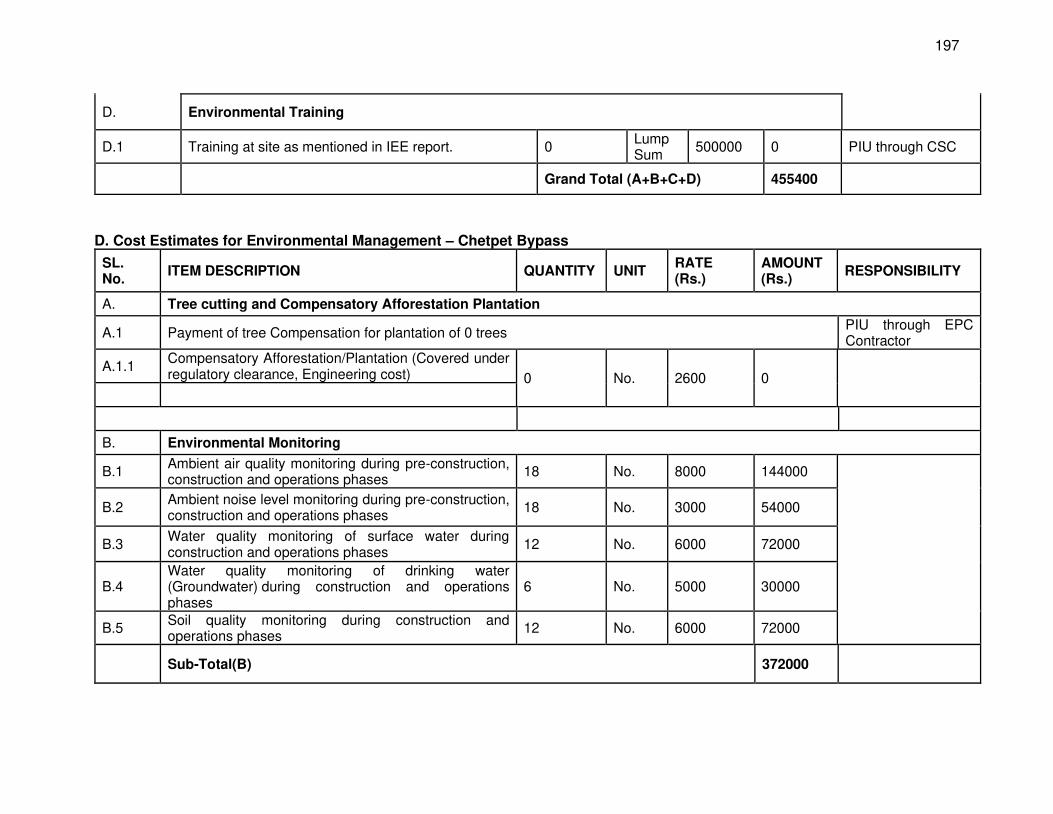
197
D. Environmental Training
D.1 Training at site as mentioned in IEE report. 0 Lump Sum
500000 0 PIU through CSC
Grand Total (A+B+C+D) 455400
D. Cost Estimates for Environmental Management – Chetpet Bypass
SL. No.
ITEM DESCRIPTION QUANTITY UNIT RATE (Rs.)
AMOUNT (Rs.)
RESPONSIBILITY
A. Tree cutting and Compensatory Afforestation Plantation
A.1 Payment of tree Compensation for plantation of 0 trees PIU through EPC Contractor
A.1.1 Compensatory Afforestation/Plantation (Covered under regulatory clearance, Engineering cost) 0 No. 2600 0
B. Environmental Monitoring
B.1 Ambient air quality monitoring during pre-construction, construction and operations phases
18 No. 8000 144000
B.2 Ambient noise level monitoring during pre-construction, construction and operations phases
18 No. 3000 54000
B.3 Water quality monitoring of surface water during construction and operations phases
12 No. 6000 72000
B.4 Water quality monitoring of drinking water (Groundwater) during construction and operations phases
6 No. 5000 30000
B.5 Soil quality monitoring during construction and operations phases
12 No. 6000 72000
Sub-Total(B) 372000

198
C. Enhancement of environmental improvement in the project alignment as directed by project authority including the following items
Contractor through BOQ
C.1 Oil Interception 1 No. 15000 15000
C.2 Silt fencing 24 Rm. 1200 28800
Sub-Total(C) 43800
D. Environmental Training
D.1 Training at site as mentioned in IEE report. 0 Lumpsum
500000 0 PIU through CSC
Grand Total (A+B+C+D) 415800
E. Summary of Cost Estimates for Environmental Management
Sl. No. Component Amount (Rs.)
1. SH-115 (Cheyyur - Vandavasi - Polur Road Section 188345000
2. ECR Link (Cheyyur - Panayur Road) 4287400 3. Vandavasi Bypass 455400 4. Chetpet Bypass 415800
Total Amount (Rs.) 1,93,503,600
* Cost estimate is preliminary based on the current unit rates. Therefore, this estimate is tentative only.
199
X. CONCLUSIONS AND RECOMMENDATIONS
439. The project proposed for the improvement is classified as environment Category B project as per ADB SPS requirements. As per GOI requirements state highway road do not fall in the purview of EIA Notification 2006 of MOEFCC, therefore as per GOI norms environmental clearance is not required for this project. For ADB the categorization has been done based on environmental screening and assessment of likely impacts. While the environmental assessment ascertains that it is unlikely to cause any major significant environmental impacts, some impacts were identified attributable to the proposed project, all of which are localized and temporary in nature and easy to mitigate.
440. Road widening will be confined within the available RoW with minimum additional land acquisition. There is no presence sensitive environmental issue like wildlife sanctuary, national park, bio reserve, along the project road alignment and most of water body crossed by the road are non-perennial in nature.
441. The road section does not pass through any protected area, wildlife sanctuary, national park. There are no ecologically sensitive areas along the project road neither there are any archaeological/protected monument located in the vicinity of project corridor. The land use pattern around the proposed alignment is predominantly agricultural except in patches of section where land use predominantly mix of built-up and agriculture land.
442. The potential adverse impacts of the road sections upgrading are:
• Impacts on surrounding area due to tree cutting (4,770) for the proposed widening; • Impacts due to conversion of about 41.983 hectare of private land for road widening
purpose • Temporary impact on land and air environment due to locating construction camp; • Temporary impact on land, air and water environment due to establishing and
operating construction plants (Hot Mix Plant and Diesel Generator [DG] sets); • Impacts on trees due to removal on section of road with realignment and proposed
bypass; • Impact on air quality, water quality, drainage, road users due to construction activities
of project road; • Impact on land and water environment due to improper disposal waste water and
improper disposal of solid waste generated from camps and construction activities; and
• Impact on occupational health and safety due to all on-site and off-site construction works, and
• Induced cumulative impact on noise levels and air quality due to increase in traffic.
443. Measures such as use of EFRC i.e. slope protection measures are proposed to minimize the impacts of slope instability, compensatory afforestation @ 1:10 ratio, engineering alternatives to limit impacts on forest areas etc. are proposed to minimize the potential impacts.
444. Besides, series of mitigation measures have been proposed that are described in the IEE Report and addressed comprehensively in the environmental management plan. These include use of spoil disposal areas to minimize destruction of land forms along the alignment, proper sizing of hydraulic structures to assure adequate capacity and prevent destruction of adjacent land, provision of sign boards and noise barriers at sensitive receptor’s locations, identification of
200
vulnerable community infrastructure that must be preserved or replaced under construction contracts, identification of sensitive receptors and consultation of affected persons prior to finalization of road design to incorporate noise abatement measures, limits on location and access of workers and other provisions regarding construction to assure minimum impact, and other basic provisions on air pollution control, noise control, waste management as found in the EMP. All the above observations and mitigation measures will be included in the tender documents for contract works and the final contract agreement.
445. Application of these measures in parallel with MoRTH environmentally friendly road construction practices will reduce significantly any potential environmental impact. Impacts remaining on the physical environment (air and water pollution) are temporary and often occur away from the presence of people.
446. A systematic approach for surveillance and monitoring is provided by means of a management framework, and monitoring and reporting protocol. In general, the project received good support from local people. The local people appreciated that besides providing an all-weather efficient connectivity to large rural populations and improving the traffic scenario in the region, it will bear out several other socio-economic positive benefits. Follow-up public consultation is intended to provide future input to the identification of environmental impact during the construction phase as well as a grievance redress mechanism for project affected persons. The EMP is a living document and the same will be revised if necessary during project implementation or if there is any change in the project design and with approval of ADB during the construction period. The environmental mitigation measures are itemized in the EMP and the PIU shall ensure that EMP and EMoP are included in Bill of Quantity (BOQ) and forms part of bid document and civil works contracts for each package.
447. Before the start of civil works for the any section of the project road, the project proponent (TNHD and CKICP-PIU-ADB) must obtain necessary clearances / permits from statutory authorities.
448. Environmental benefits of the proposed road improvement and long-term project objectives far outweigh the manageable and temporary negative impacts that will arise during project construction and any residual or induced impacts during project operation phase. Provided the EMP is properly implemented there will be no significant negative impacts arising from the project.

201
APPENDICES
(Provided in a Separate Volume) List of Appendices: 1. ADB’s Rapid Environmental Assessment (REA) Checklist 2. Locations of borrow and Quarries area for the project road 3. Baseline Environmental Parameter monitoring results 4. National Ambient Air Quality Standards (MoEFCC, 2009) 5. Tree inventory within formation width of the project road 6. Details of Protected Areas in Tamil Nadu 7. Detailed Analysis of Air Modeling 8. Guidelines For Plant Management 9. Guidelines for Camp Site Management 10. Guidelines for Waste (Debris) Disposal and Management 11. Guidelines for Borrow Area Management 12. Guidelines for Quarry Area Management 13. Noise Modeling Details 14. Details of Participants and Public Consultation attendance list 15. Indian Standard Drinking Water Specification: IS 10500:1991 and IS 2296:1992 16. National Ambient Noise Level Standards 17. Copy of Forest Notification for Kattuguladur and Gudalur RF
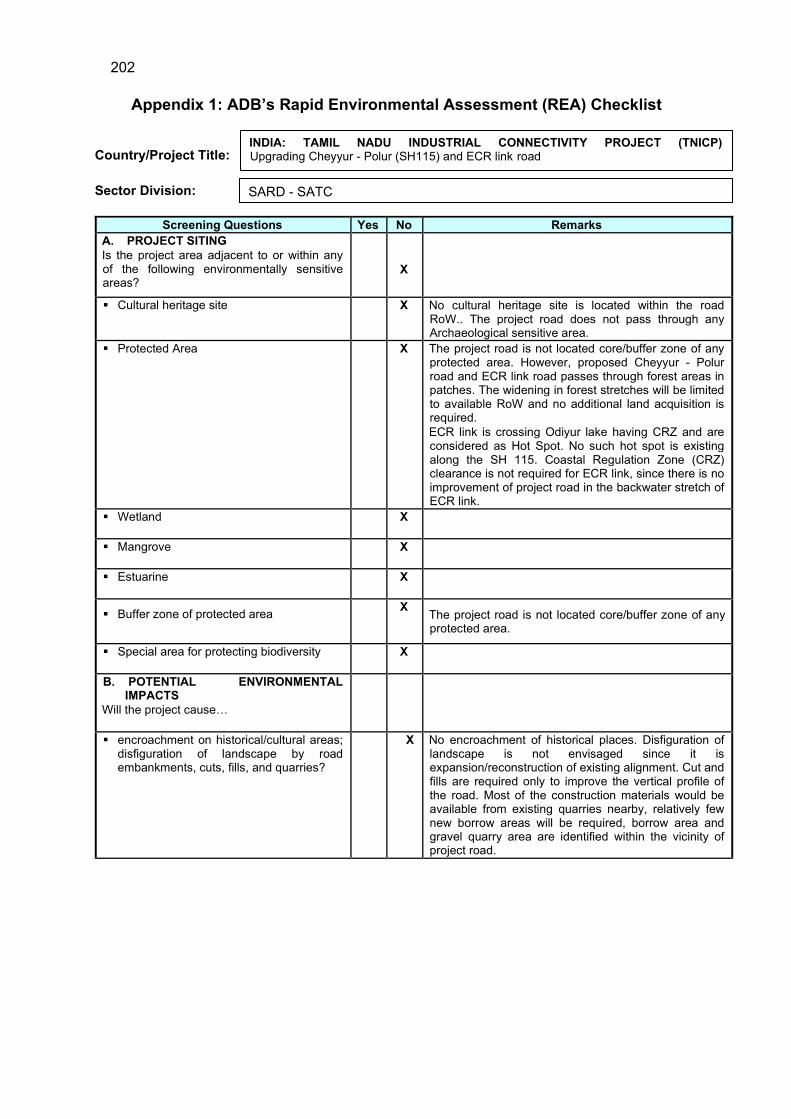
202
Appendix 1: ADB’s Rapid Environmental Assessment (REA) Checklist
Country/Project Title:
Sector Division:
Screening Questions Yes No Remarks
A. PROJECT SITING
Is the project area adjacent to or within any of the following environmentally sensitive areas?
X
Cultural heritage site
X No cultural heritage site is located within the road RoW.. The project road does not pass through any Archaeological sensitive area.
Protected Area X The project road is not located core/buffer zone of any protected area. However, proposed Cheyyur - Polur road and ECR link road passes through forest areas in patches. The widening in forest stretches will be limited to available RoW and no additional land acquisition is required.
ECR link is crossing Odiyur lake having CRZ and are considered as Hot Spot. No such hot spot is existing along the SH 115. Coastal Regulation Zone (CRZ) clearance is not required for ECR link, since there is no improvement of project road in the backwater stretch of ECR link.
Wetland X
Mangrove
X
Estuarine
X
Buffer zone of protected area
X The project road is not located core/buffer zone of any protected area.
Special area for protecting biodiversity
X
B. POTENTIAL ENVIRONMENTAL IMPACTS
Will the project cause…
encroachment on historical/cultural areas; disfiguration of landscape by road embankments, cuts, fills, and quarries?
X No encroachment of historical places. Disfiguration of landscape is not envisaged since it is expansion/reconstruction of existing alignment. Cut and fills are required only to improve the vertical profile of the road. Most of the construction materials would be available from existing quarries nearby, relatively few new borrow areas will be required, borrow area and gravel quarry area are identified within the vicinity of project road.
INDIA: TAMIL NADU INDUSTRIAL CONNECTIVITY PROJECT (TNICP) Upgrading Cheyyur - Polur (SH115) and ECR link road
SARD - SATC
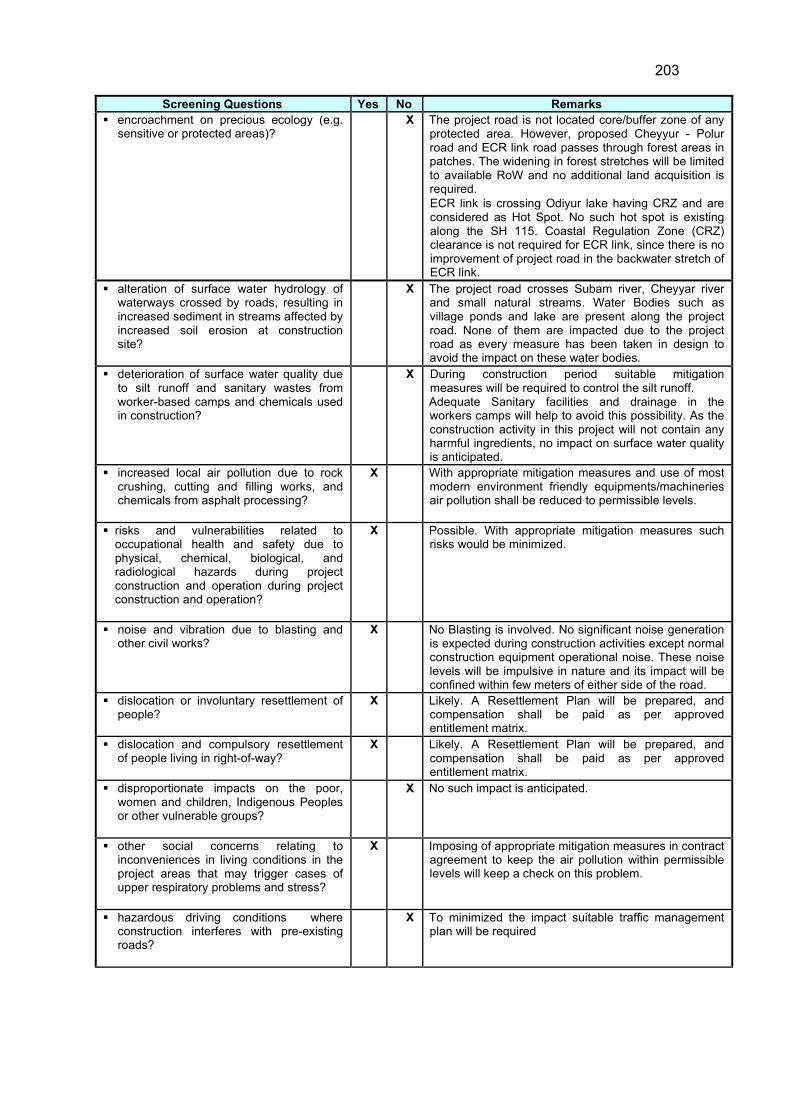
203
Screening Questions Yes No Remarks
encroachment on precious ecology (e.g. sensitive or protected areas)?
X The project road is not located core/buffer zone of any protected area. However, proposed Cheyyur - Polur road and ECR link road passes through forest areas in patches. The widening in forest stretches will be limited to available RoW and no additional land acquisition is required.
ECR link is crossing Odiyur lake having CRZ and are considered as Hot Spot. No such hot spot is existing along the SH 115. Coastal Regulation Zone (CRZ) clearance is not required for ECR link, since there is no improvement of project road in the backwater stretch of ECR link.
alteration of surface water hydrology of waterways crossed by roads, resulting in increased sediment in streams affected by increased soil erosion at construction site?
X The project road crosses Subam river, Cheyyar river and small natural streams. Water Bodies such as village ponds and lake are present along the project road. None of them are impacted due to the project road as every measure has been taken in design to avoid the impact on these water bodies.
deterioration of surface water quality due to silt runoff and sanitary wastes from worker-based camps and chemicals used in construction?
X During construction period suitable mitigation measures will be required to control the silt runoff. Adequate Sanitary facilities and drainage in the workers camps will help to avoid this possibility. As the construction activity in this project will not contain any harmful ingredients, no impact on surface water quality is anticipated.
increased local air pollution due to rock crushing, cutting and filling works, and chemicals from asphalt processing?
X With appropriate mitigation measures and use of most modern environment friendly equipments/machineries air pollution shall be reduced to permissible levels.
risks and vulnerabilities related to occupational health and safety due to physical, chemical, biological, and radiological hazards during project construction and operation during project construction and operation?
X Possible. With appropriate mitigation measures such risks would be minimized.
noise and vibration due to blasting and other civil works?
X No Blasting is involved. No significant noise generation is expected during construction activities except normal construction equipment operational noise. These noise levels will be impulsive in nature and its impact will be confined within few meters of either side of the road.
dislocation or involuntary resettlement of people?
X Likely. A Resettlement Plan will be prepared, and compensation shall be paid as per approved entitlement matrix.
dislocation and compulsory resettlement of people living in right-of-way?
X Likely. A Resettlement Plan will be prepared, and compensation shall be paid as per approved entitlement matrix.
disproportionate impacts on the poor, women and children, Indigenous Peoples or other vulnerable groups?
X No such impact is anticipated.
other social concerns relating to inconveniences in living conditions in the project areas that may trigger cases of upper respiratory problems and stress?
X Imposing of appropriate mitigation measures in contract agreement to keep the air pollution within permissible levels will keep a check on this problem.
hazardous driving conditions where construction interferes with pre-existing roads?
X To minimized the impact suitable traffic management plan will be required
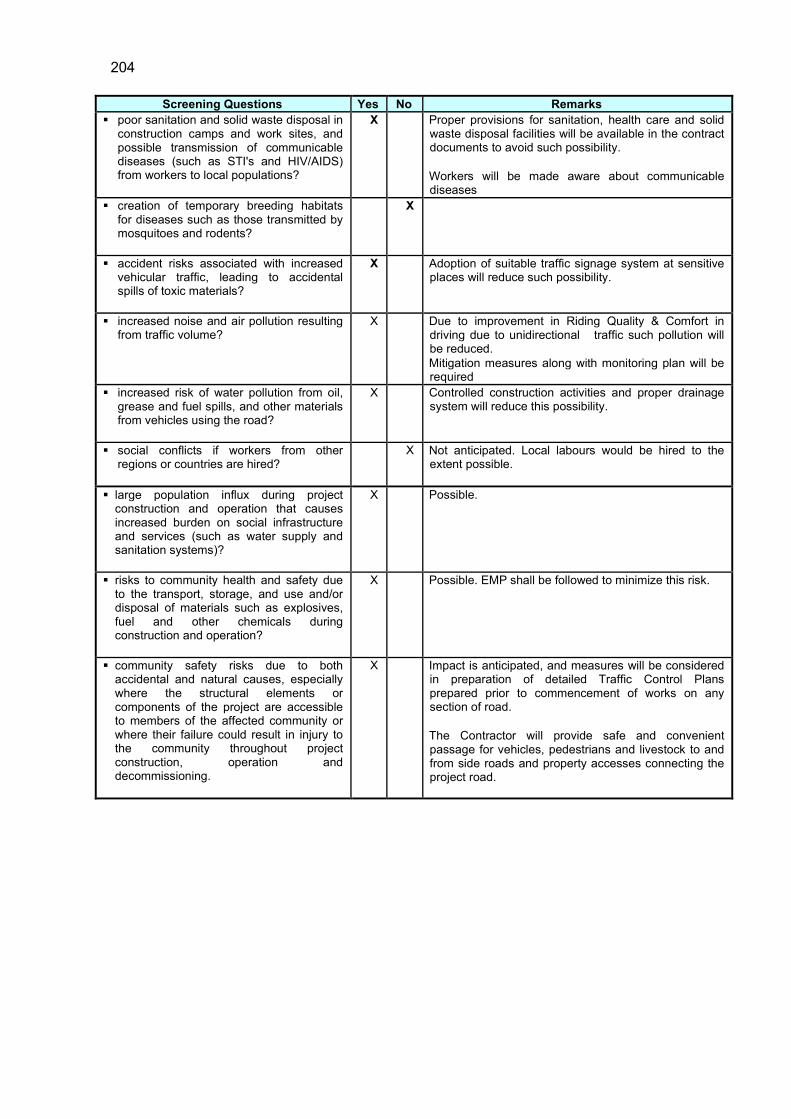
204
Screening Questions Yes No Remarks
poor sanitation and solid waste disposal in construction camps and work sites, and possible transmission of communicable diseases (such as STI's and HIV/AIDS) from workers to local populations?
X Proper provisions for sanitation, health care and solid waste disposal facilities will be available in the contract documents to avoid such possibility.
Workers will be made aware about communicable diseases
creation of temporary breeding habitats for diseases such as those transmitted by mosquitoes and rodents?
X
accident risks associated with increased vehicular traffic, leading to accidental spills of toxic materials?
X Adoption of suitable traffic signage system at sensitive places will reduce such possibility.
increased noise and air pollution resulting from traffic volume?
X Due to improvement in Riding Quality & Comfort in driving due to unidirectional traffic such pollution will be reduced.
Mitigation measures along with monitoring plan will be required
increased risk of water pollution from oil, grease and fuel spills, and other materials from vehicles using the road?
X Controlled construction activities and proper drainage system will reduce this possibility.
social conflicts if workers from other regions or countries are hired?
X Not anticipated. Local labours would be hired to the extent possible.
large population influx during project construction and operation that causes increased burden on social infrastructure and services (such as water supply and sanitation systems)?
X Possible.
risks to community health and safety due to the transport, storage, and use and/or disposal of materials such as explosives, fuel and other chemicals during construction and operation?
X Possible. EMP shall be followed to minimize this risk.
community safety risks due to both accidental and natural causes, especially where the structural elements or components of the project are accessible to members of the affected community or where their failure could result in injury to the community throughout project construction, operation and decommissioning.
X Impact is anticipated, and measures will be considered in preparation of detailed Traffic Control Plans prepared prior to commencement of works on any section of road.
The Contractor will provide safe and convenient passage for vehicles, pedestrians and livestock to and from side roads and property accesses connecting the project road.
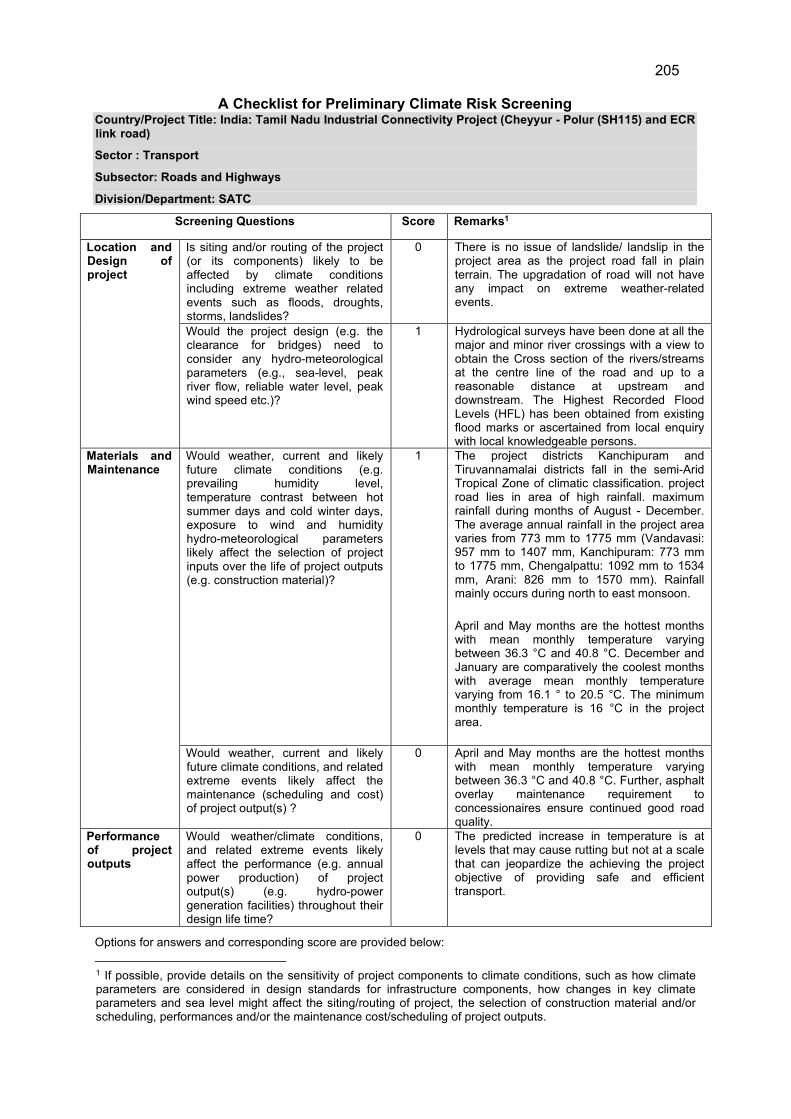
205
A Checklist for Preliminary Climate Risk Screening
Country/Project Title: India: Tamil Nadu Industrial Connectivity Project (Cheyyur - Polur (SH115) and ECR link road)
Sector : Transport
Subsector: Roads and Highways
Division/Department: SATC
Screening Questions Score Remarks1
Location and Design of project
Is siting and/or routing of the project (or its components) likely to be affected by climate conditions including extreme weather related events such as floods, droughts, storms, landslides?
0 There is no issue of landslide/ landslip in the project area as the project road fall in plain terrain. The upgradation of road will not have any impact on extreme weather-related events.
Would the project design (e.g. the clearance for bridges) need to consider any hydro-meteorological parameters (e.g., sea-level, peak river flow, reliable water level, peak wind speed etc.)?
1 Hydrological surveys have been done at all the major and minor river crossings with a view to obtain the Cross section of the rivers/streams at the centre line of the road and up to a reasonable distance at upstream and downstream. The Highest Recorded Flood Levels (HFL) has been obtained from existing flood marks or ascertained from local enquiry with local knowledgeable persons.
Materials and Maintenance
Would weather, current and likely future climate conditions (e.g. prevailing humidity level, temperature contrast between hot summer days and cold winter days, exposure to wind and humidity hydro-meteorological parameters likely affect the selection of project inputs over the life of project outputs (e.g. construction material)?
1 The project districts Kanchipuram and Tiruvannamalai districts fall in the semi-Arid Tropical Zone of climatic classification. project road lies in area of high rainfall. maximum rainfall during months of August - December. The average annual rainfall in the project area varies from 773 mm to 1775 mm (Vandavasi: 957 mm to 1407 mm, Kanchipuram: 773 mm to 1775 mm, Chengalpattu: 1092 mm to 1534 mm, Arani: 826 mm to 1570 mm). Rainfall mainly occurs during north to east monsoon.
April and May months are the hottest months with mean monthly temperature varying between 36.3 °C and 40.8 °C. December and January are comparatively the coolest months with average mean monthly temperature varying from 16.1 ° to 20.5 °C. The minimum monthly temperature is 16 °C in the project area.
Would weather, current and likely future climate conditions, and related extreme events likely affect the maintenance (scheduling and cost) of project output(s) ?
0 April and May months are the hottest months with mean monthly temperature varying between 36.3 °C and 40.8 °C. Further, asphalt overlay maintenance requirement to concessionaires ensure continued good road quality.
Performance of project outputs
Would weather/climate conditions, and related extreme events likely affect the performance (e.g. annual power production) of project output(s) (e.g. hydro-power generation facilities) throughout their design life time?
0 The predicted increase in temperature is at levels that may cause rutting but not at a scale that can jeopardize the achieving the project objective of providing safe and efficient transport.
Options for answers and corresponding score are provided below:
1 If possible, provide details on the sensitivity of project components to climate conditions, such as how climate parameters are considered in design standards for infrastructure components, how changes in key climate parameters and sea level might affect the siting/routing of project, the selection of construction material and/or scheduling, performances and/or the maintenance cost/scheduling of project outputs.

206
Response Score
Not Likely 0
Likely 1
Very Likely 2
Responses when added that provide a score of 0 will be considered low risk project. If adding all responses will result to a score of 1-4 and that no score of 2 was given to any single response, the project will be assigned a medium risk category. A total score of 5 or more (which include providing a score of 1 in all responses) or a 2 in any single response, will be categorized as high risk project.
Result of Initial Screening (Low, Medium, High): Medium
Other Comments:______________________________________________________________ _________________________________________________________________________
Prepared by: ________________
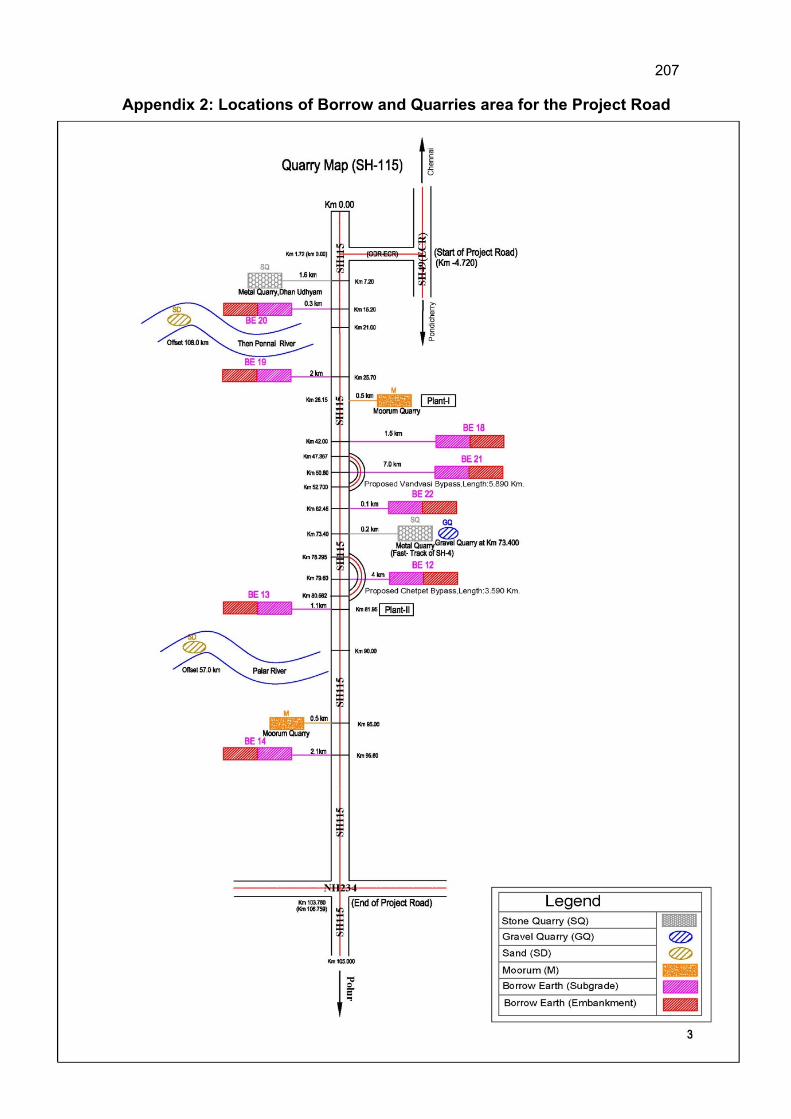
207
Appendix 2: Locations of Borrow and Quarries area for the Project Road
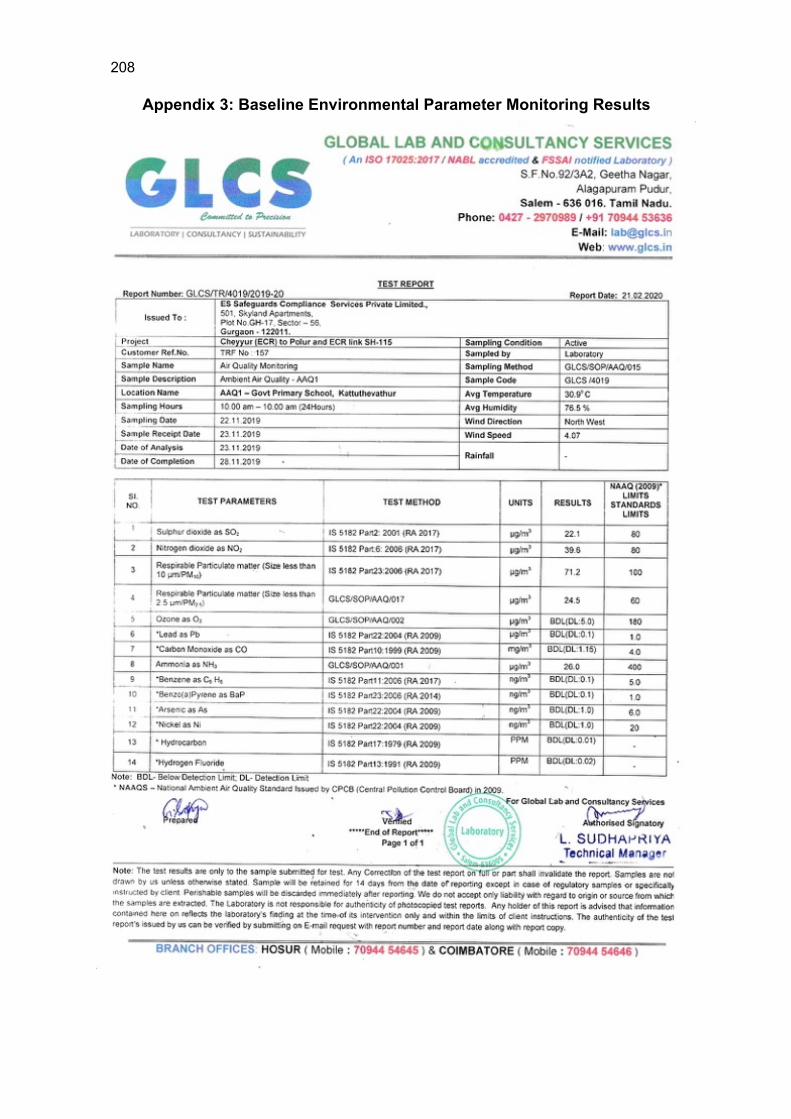
208
Appendix 3: Baseline Environmental Parameter Monitoring Results
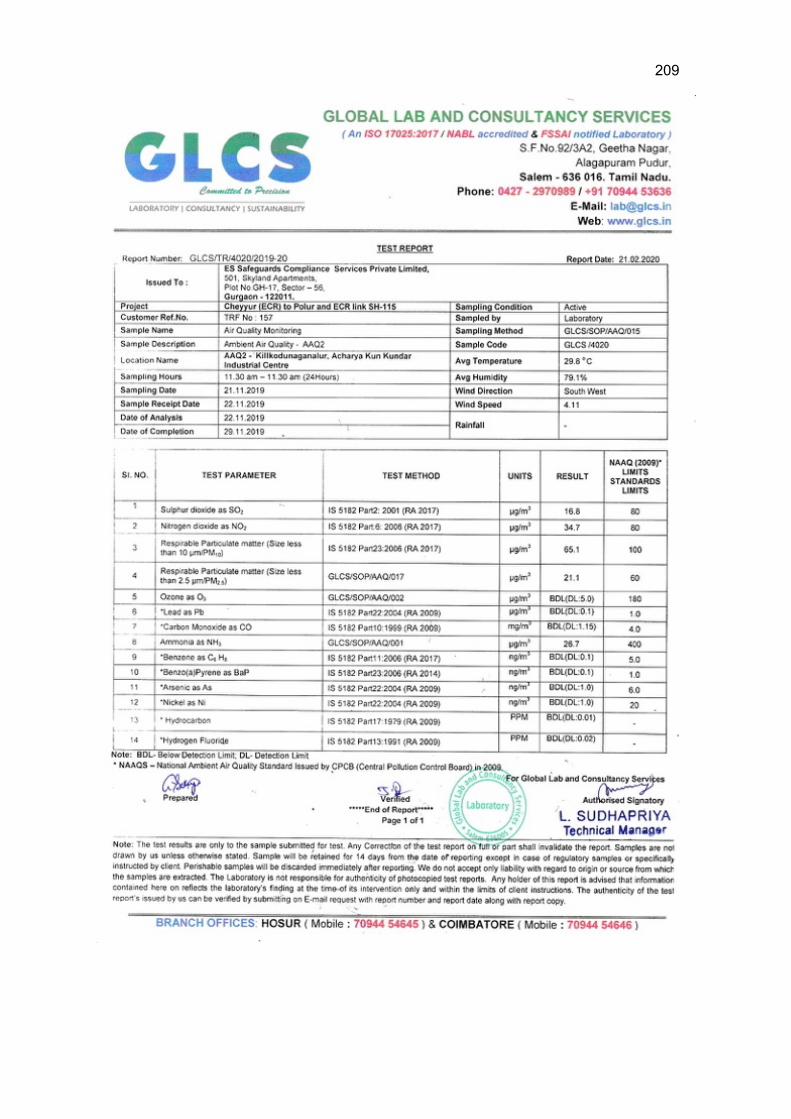
209
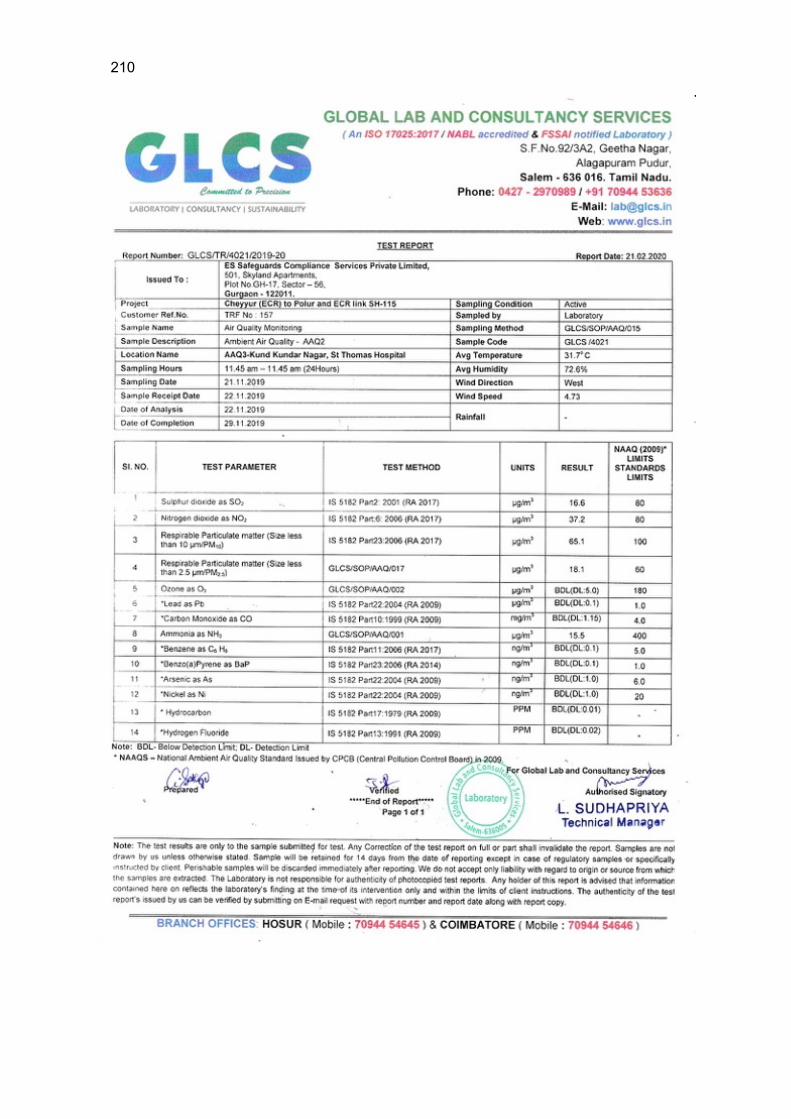
210
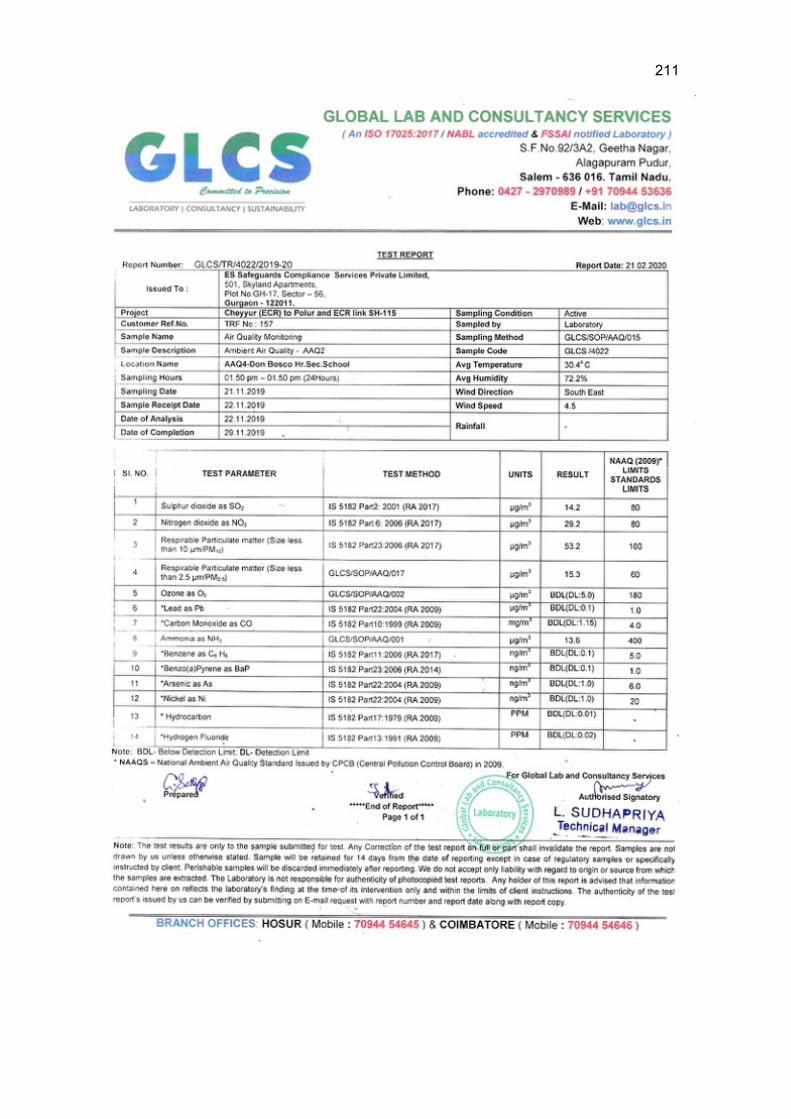
211
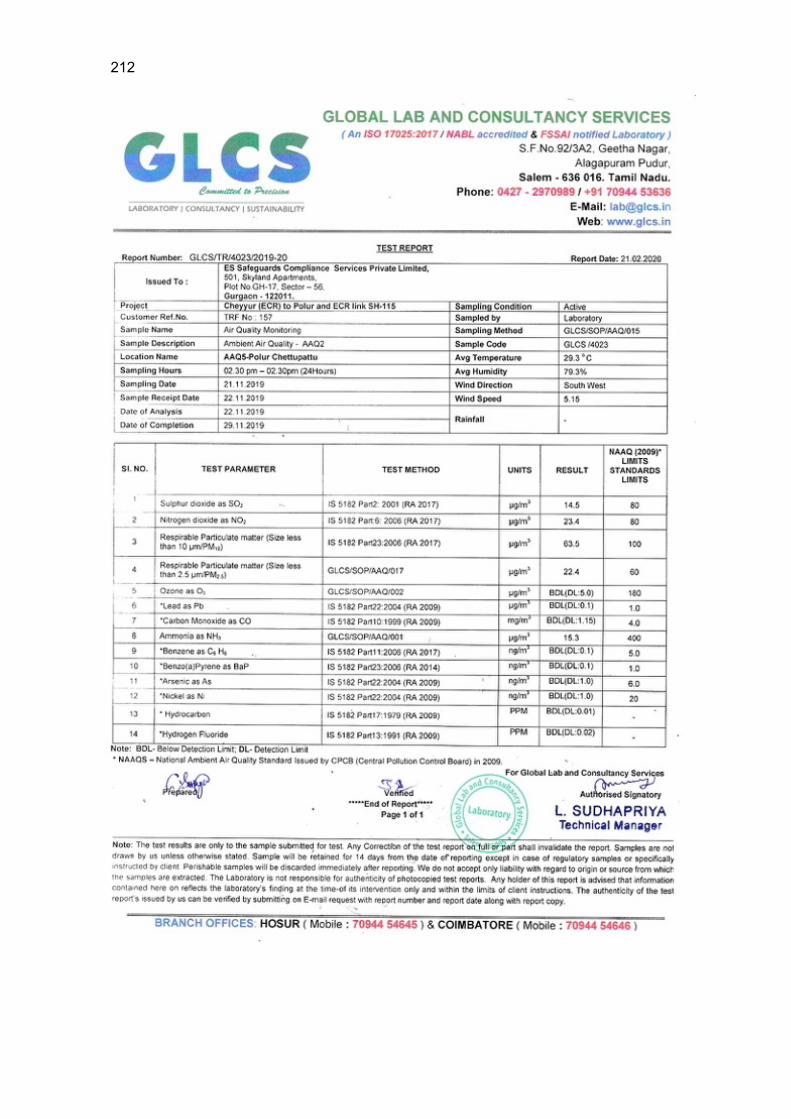
212
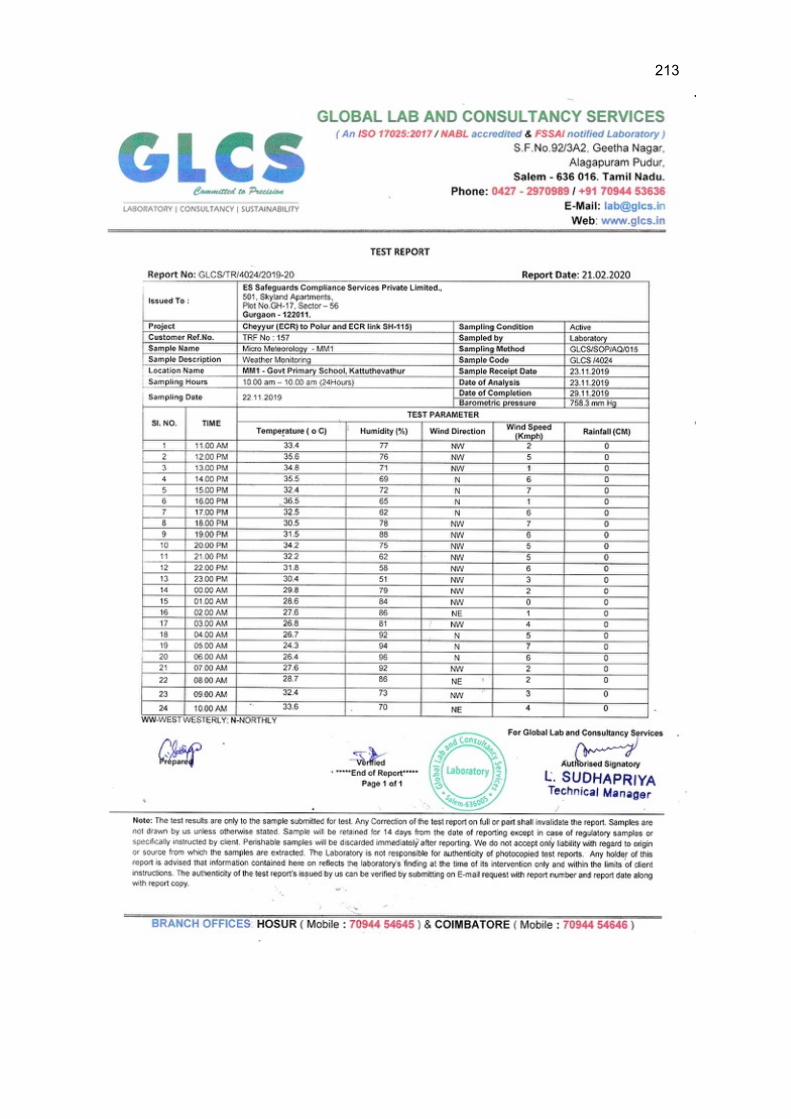
213
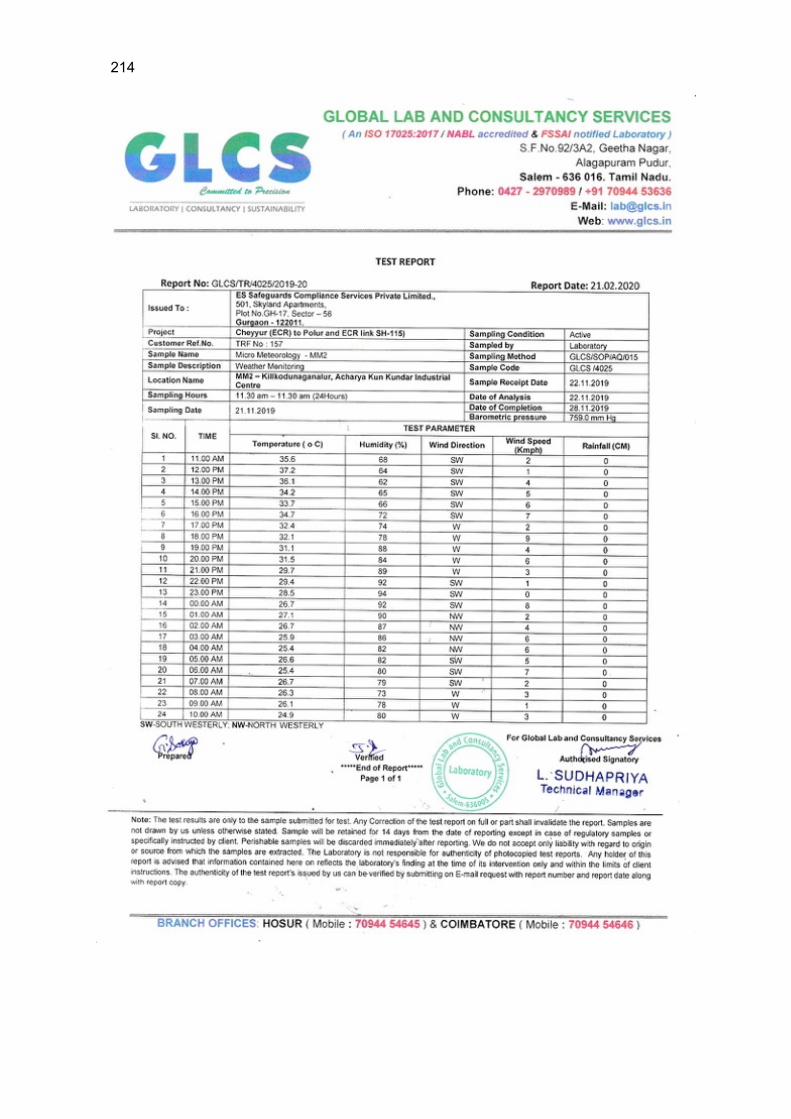
214
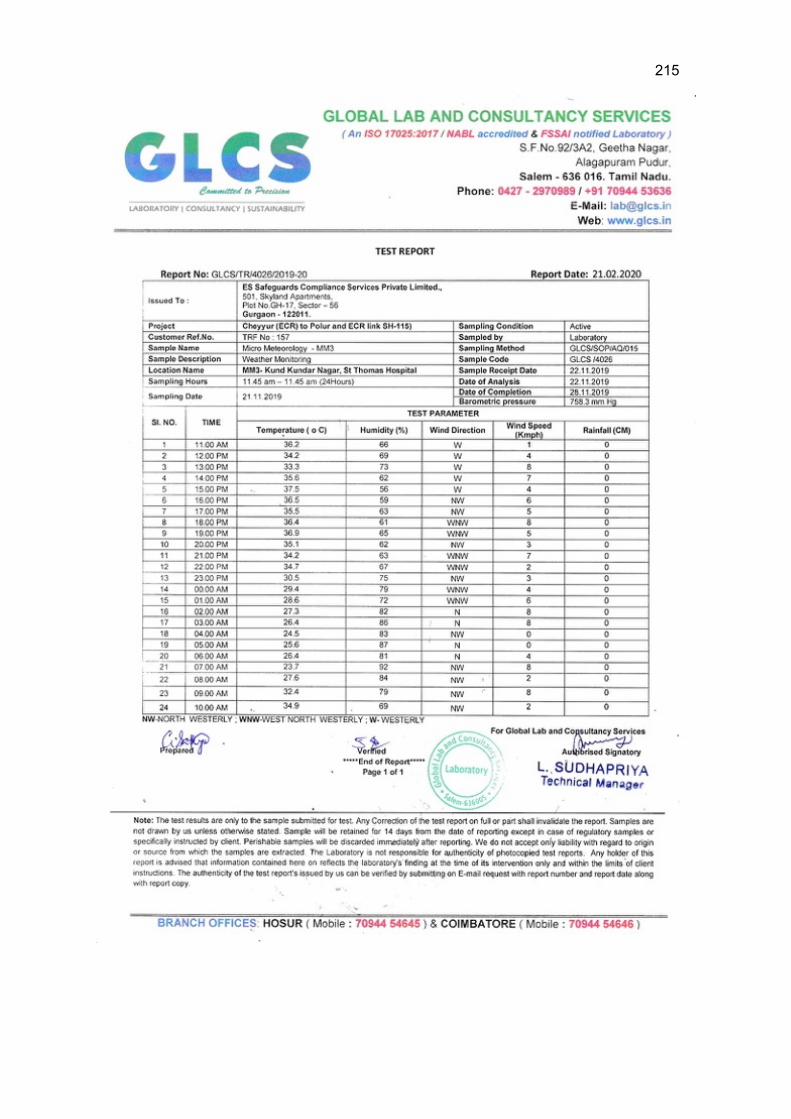
215
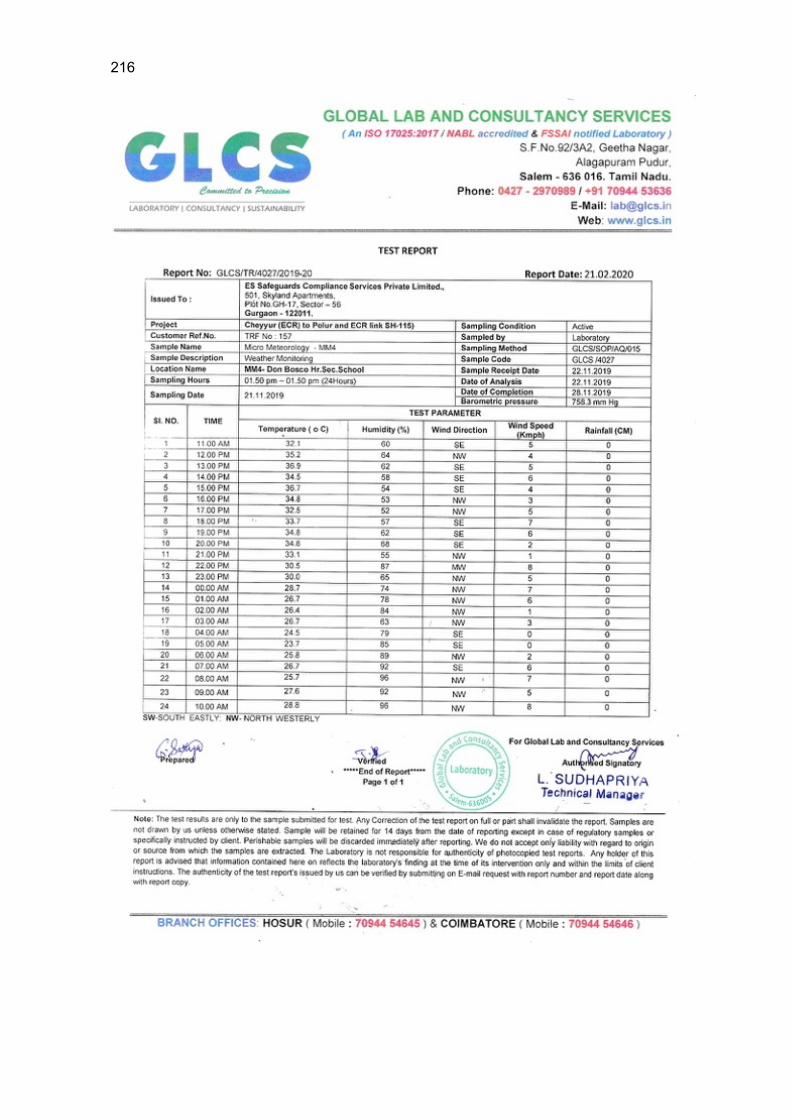
216
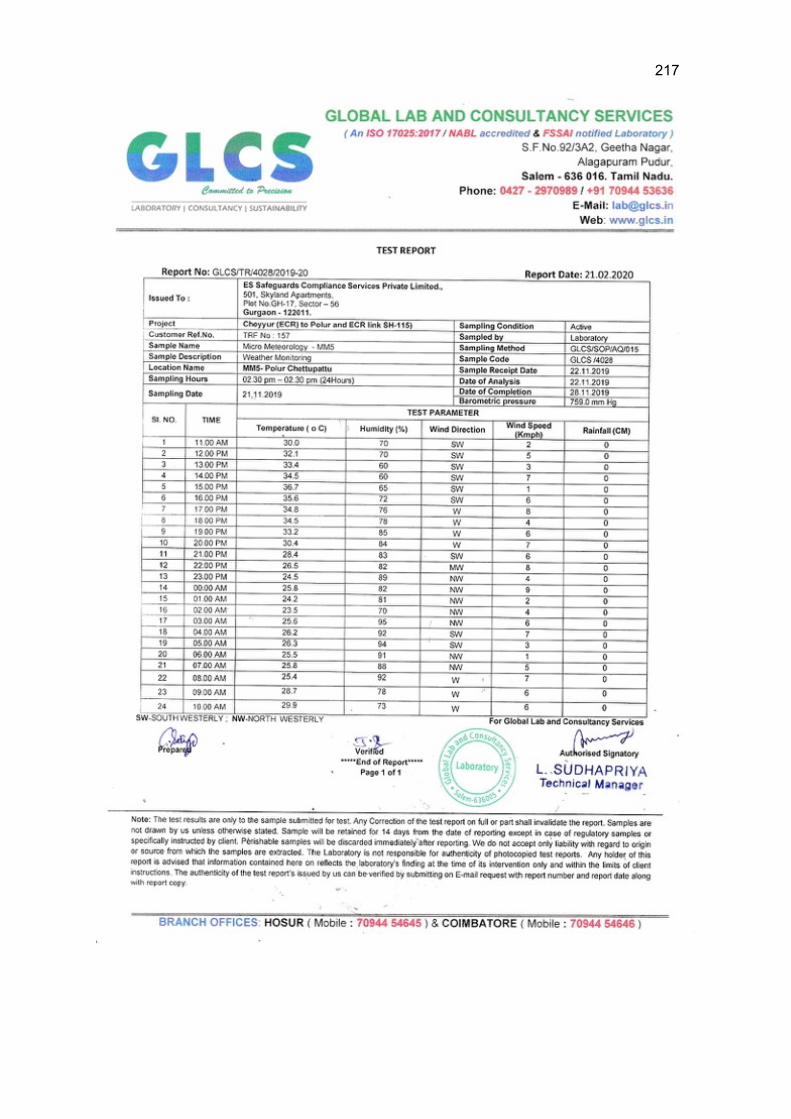
217

218
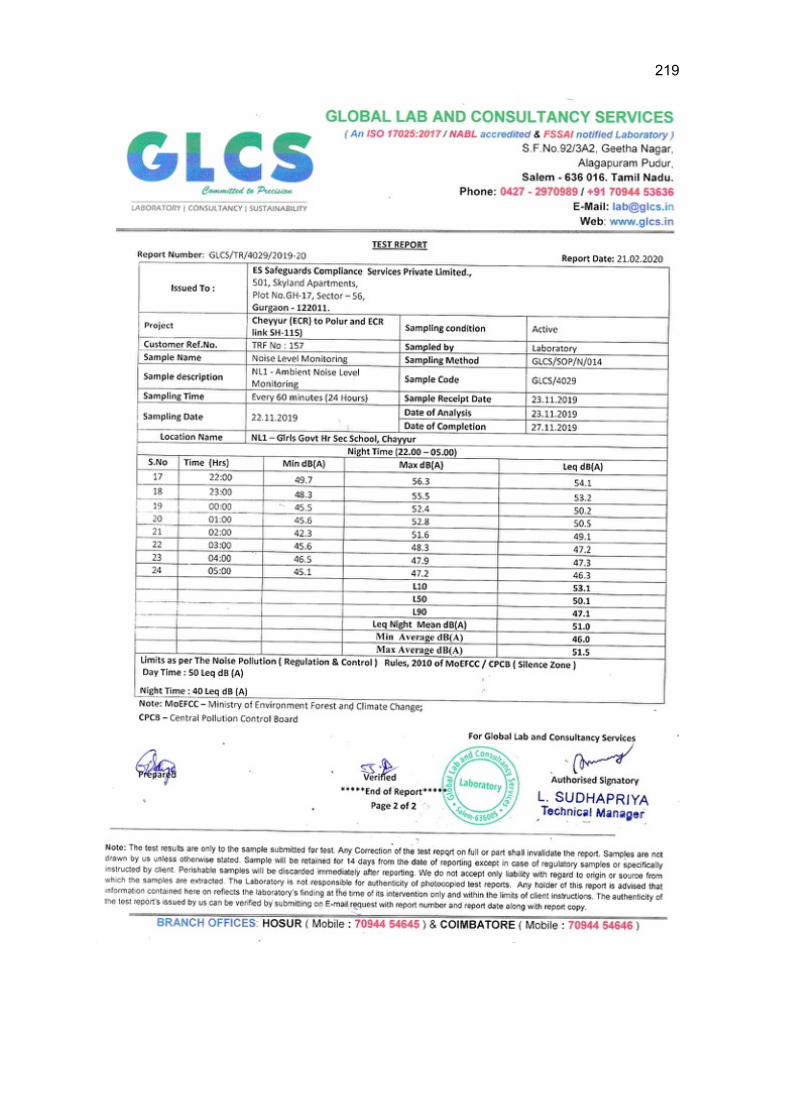
219
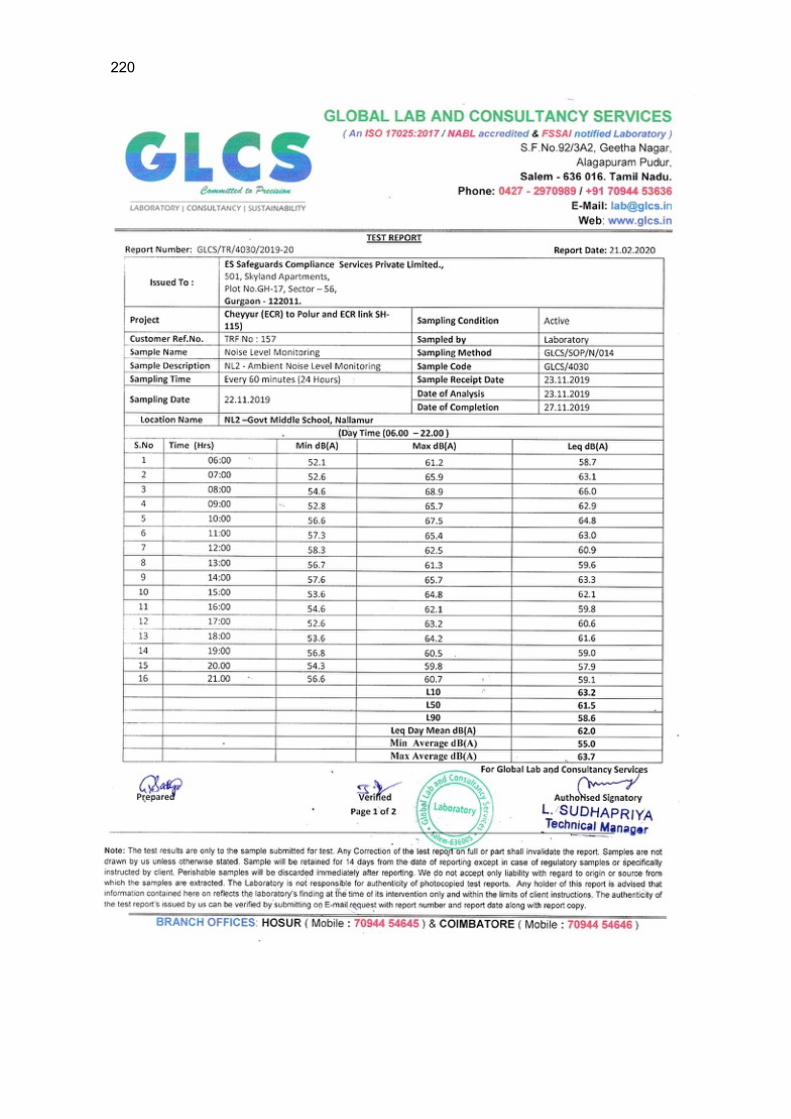
220
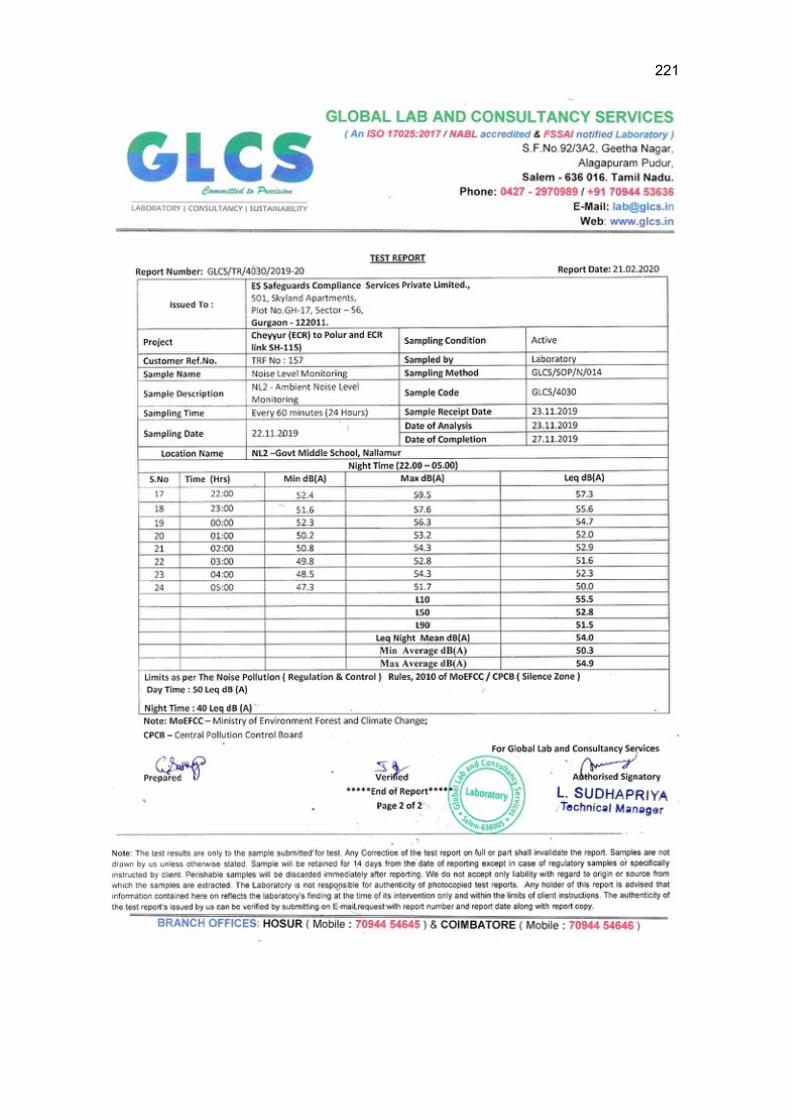
221
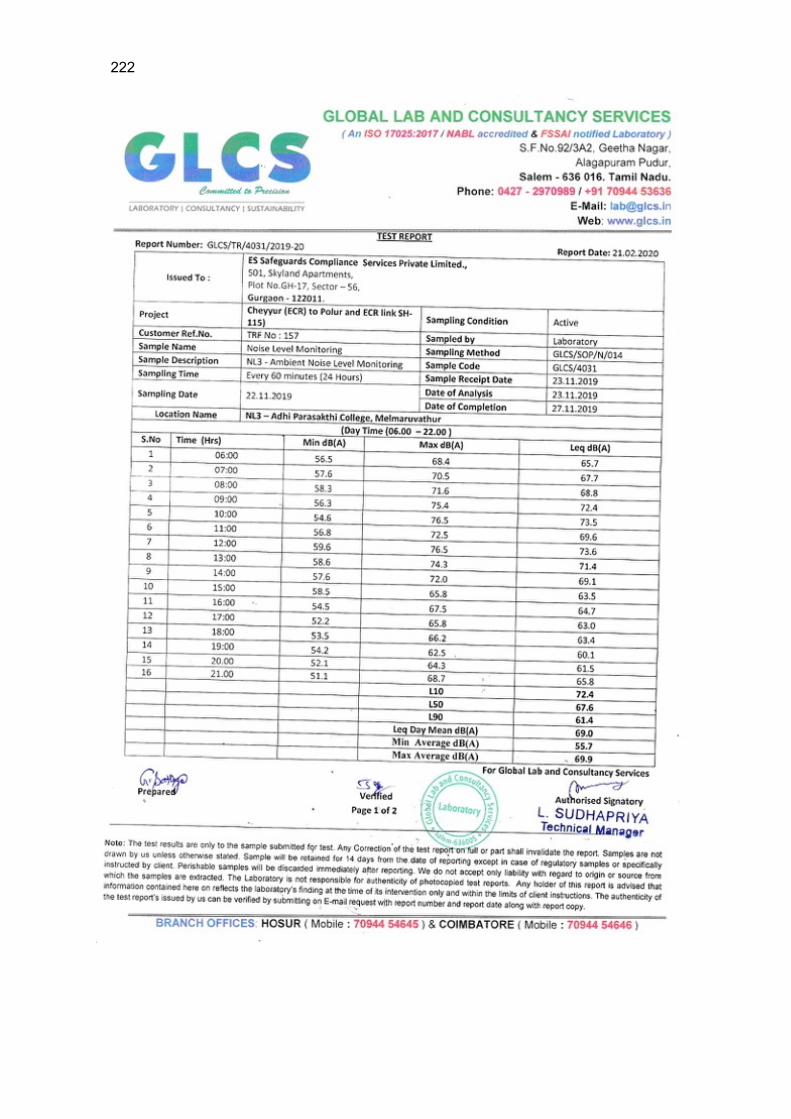
222
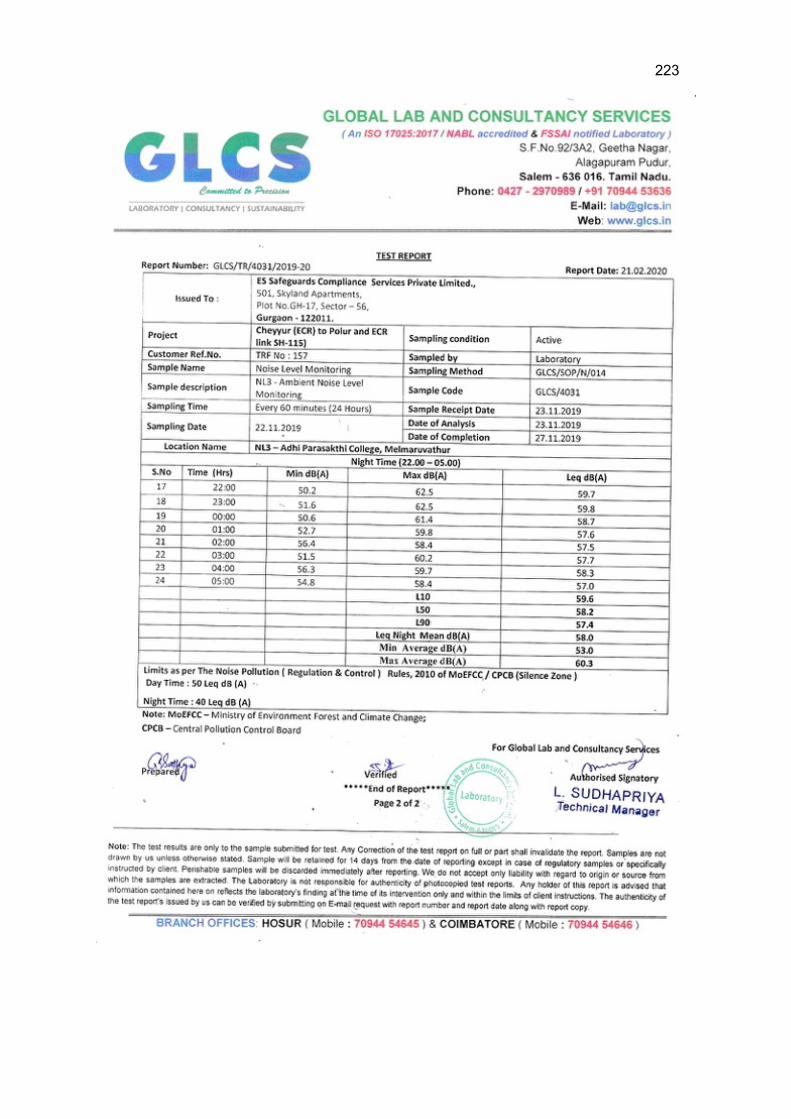
223
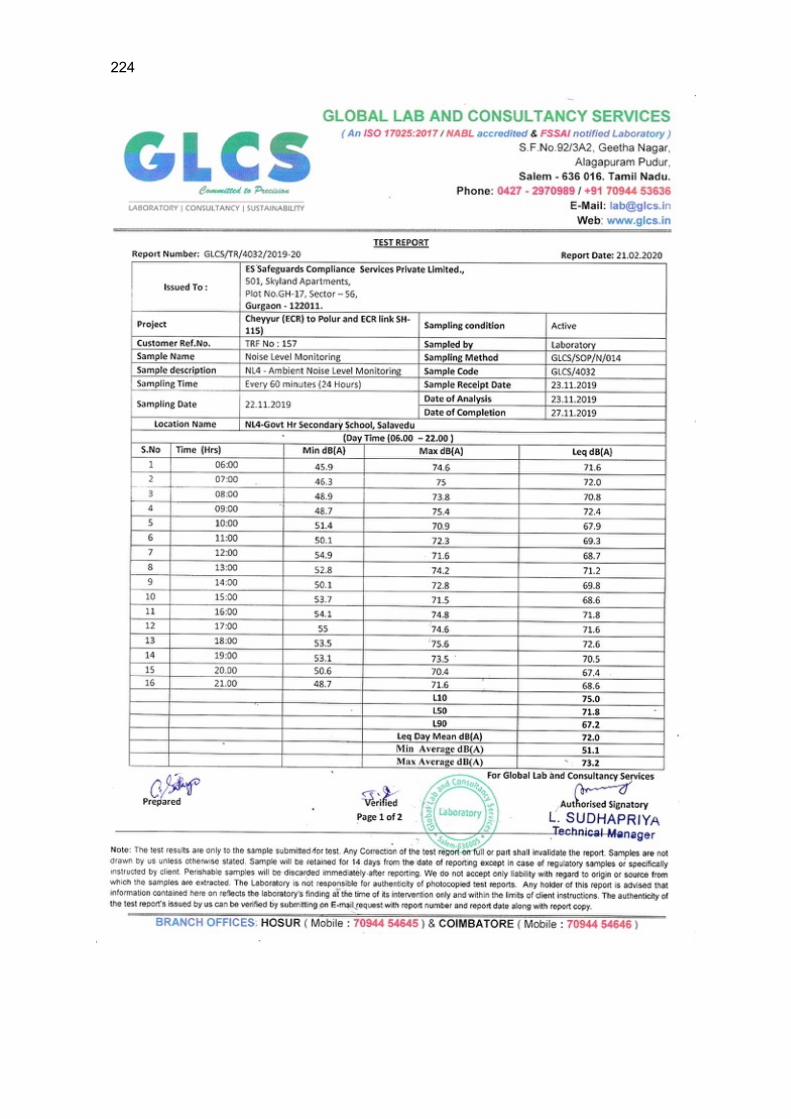
224

225
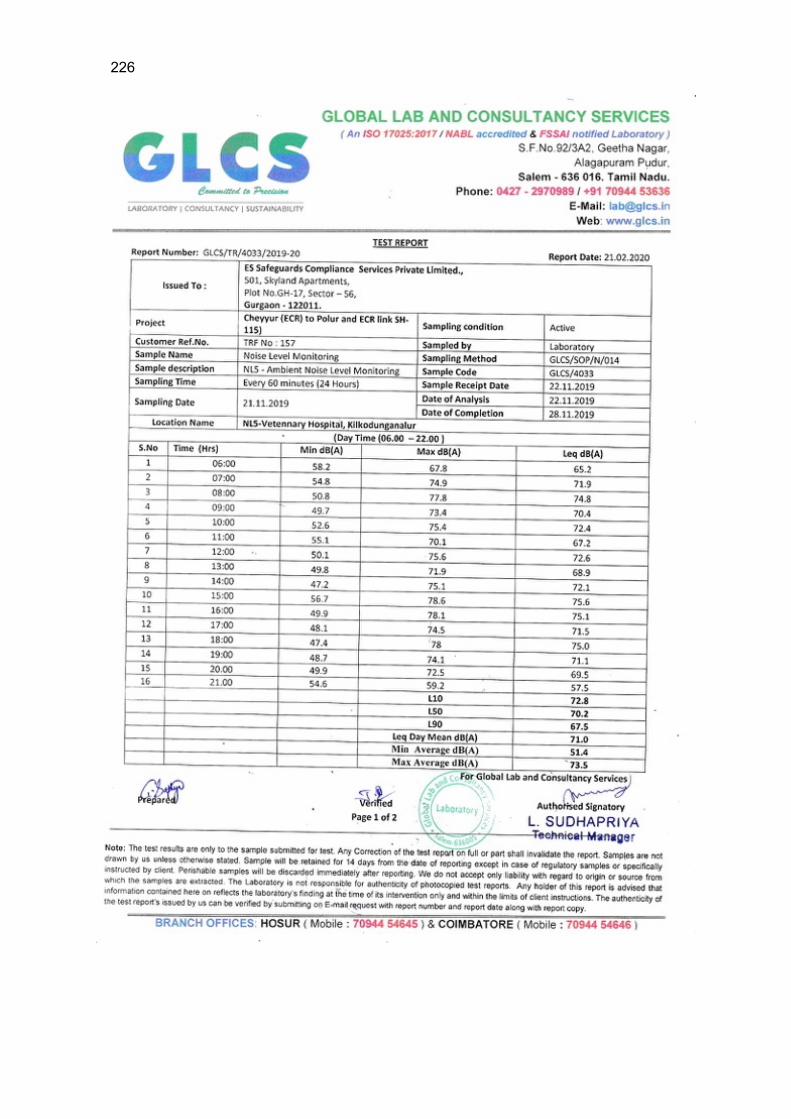
226
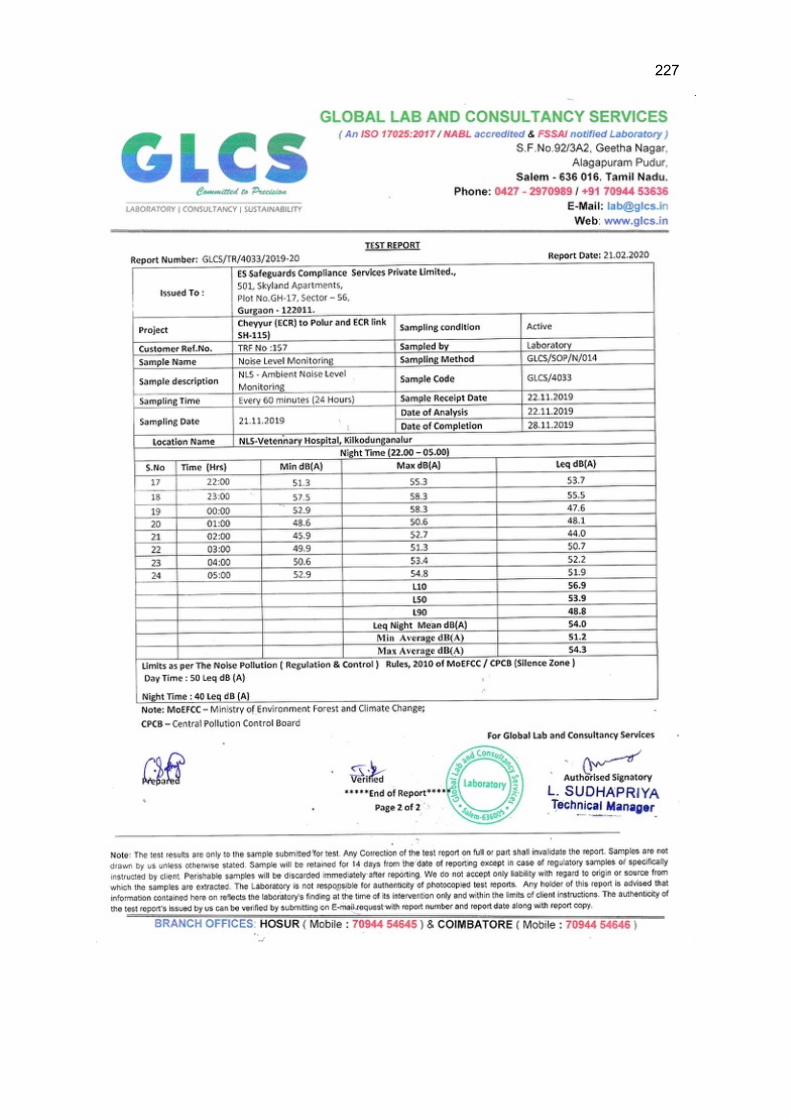
227
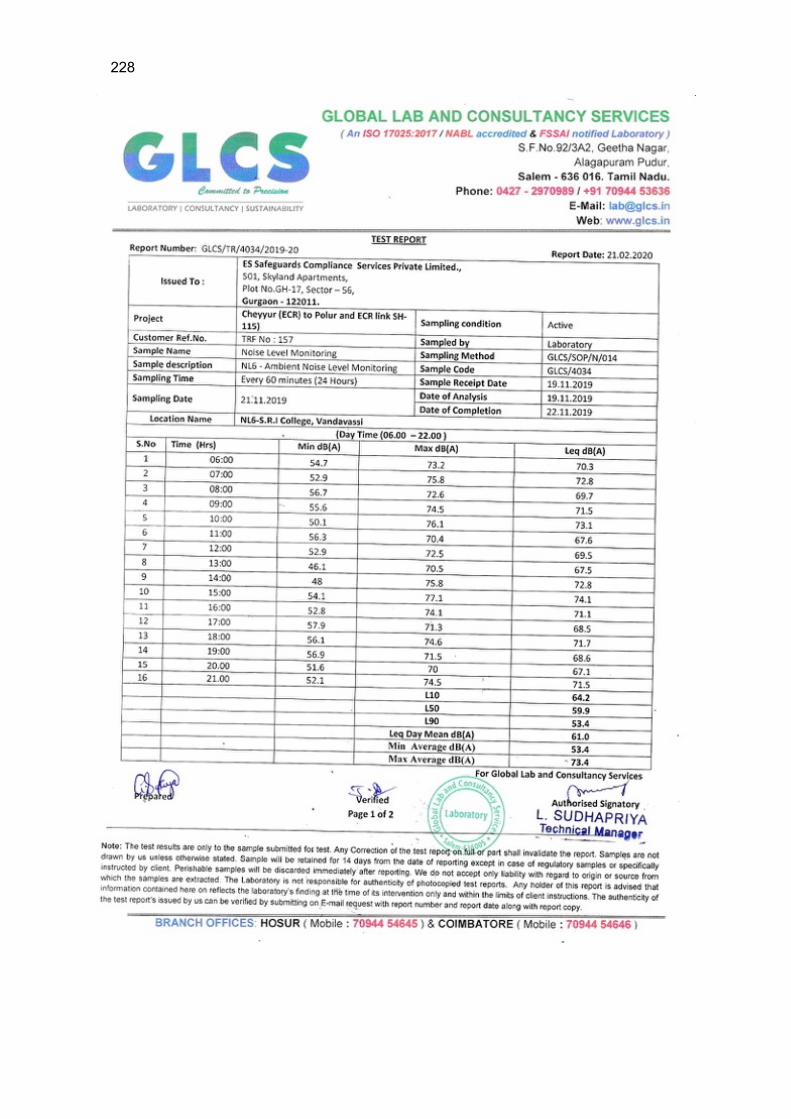
228
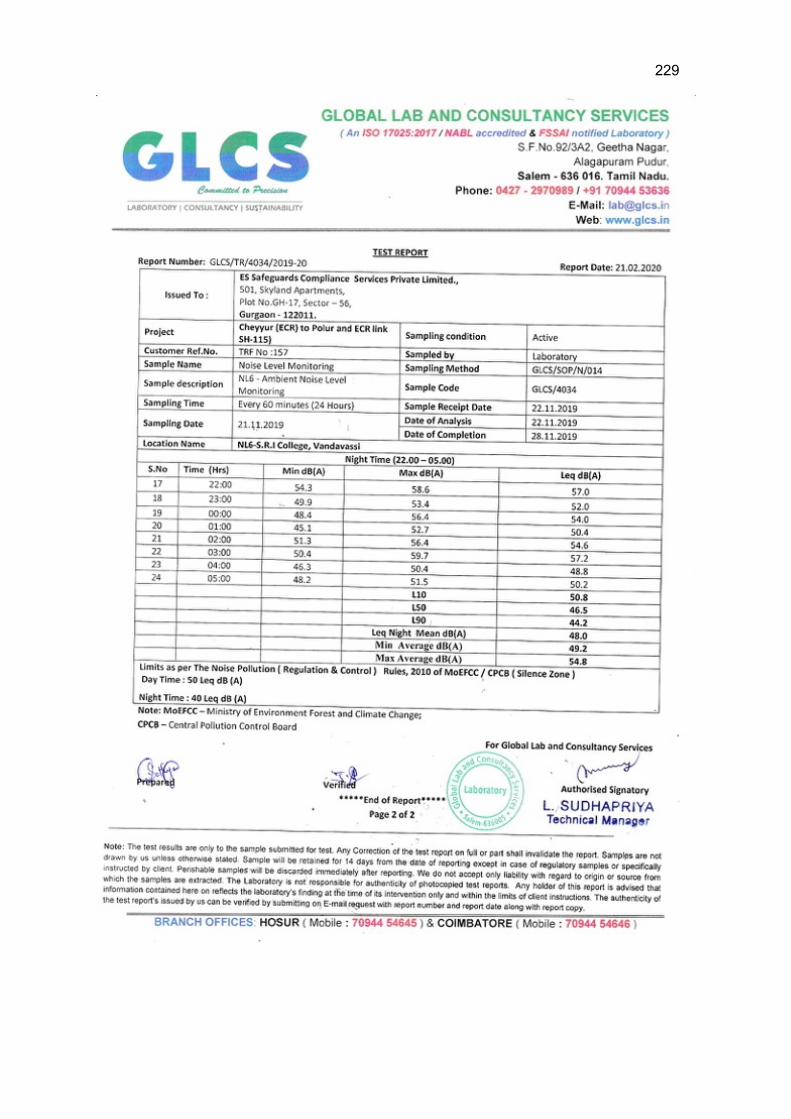
229
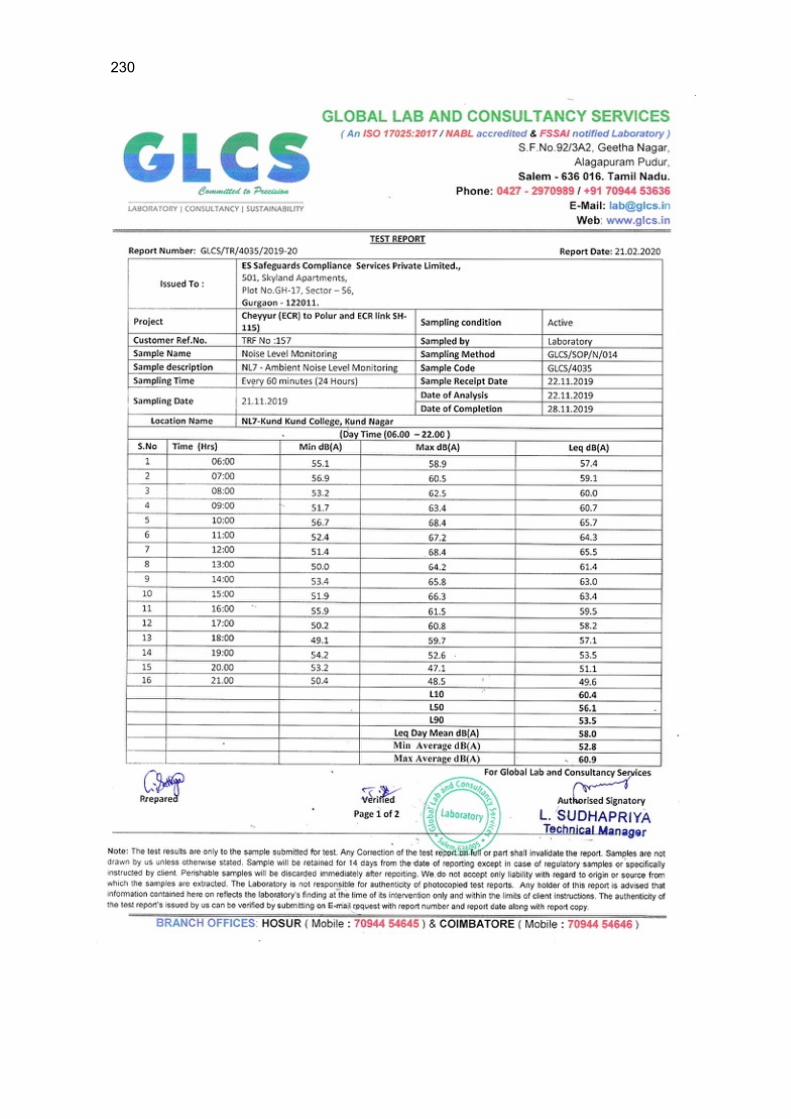
230
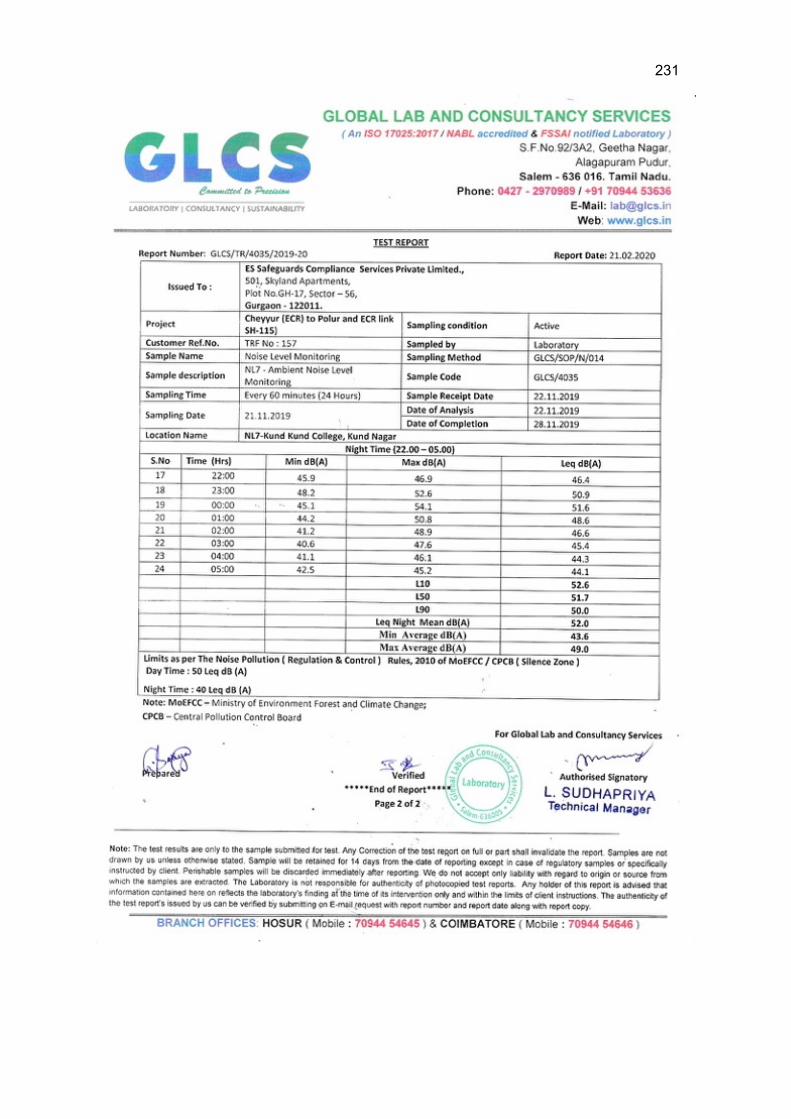
231

232
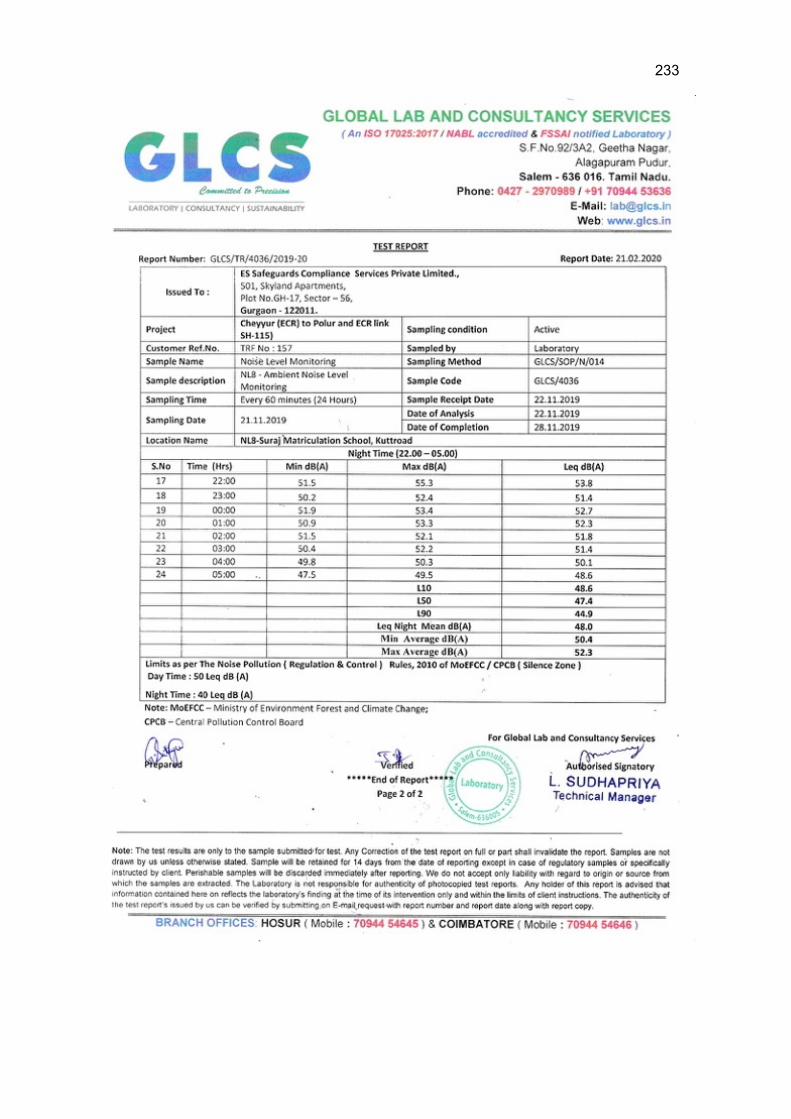
233
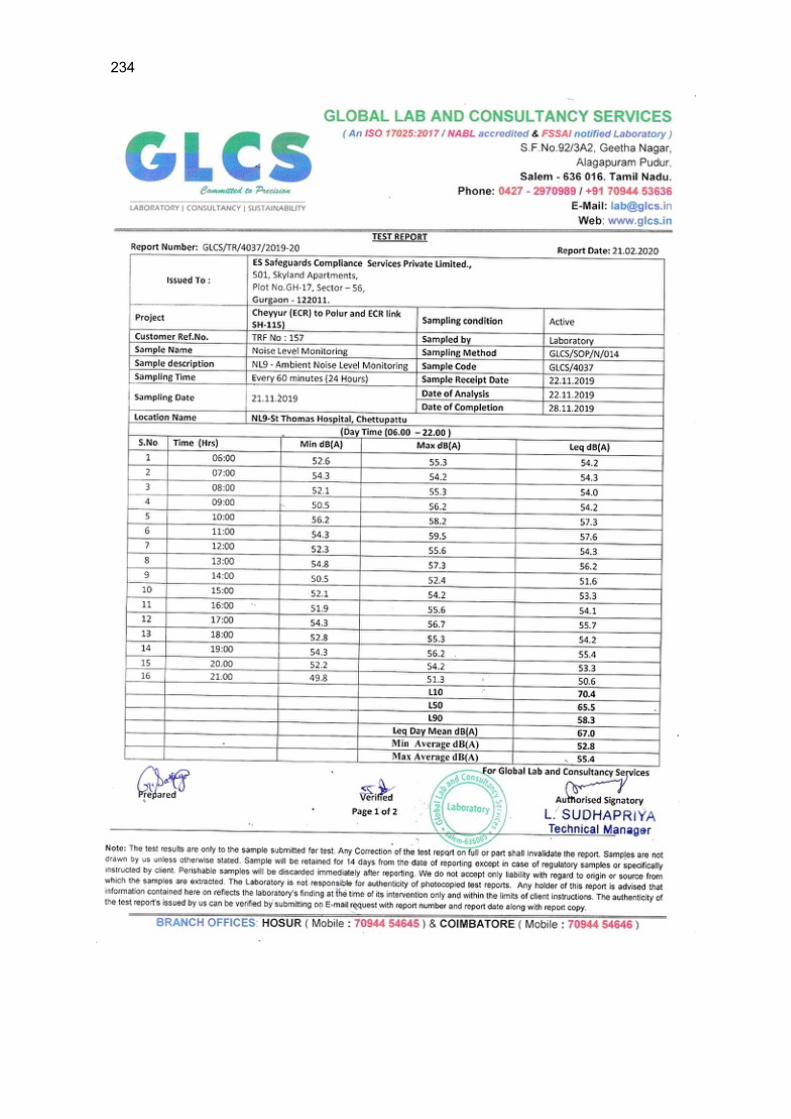
234
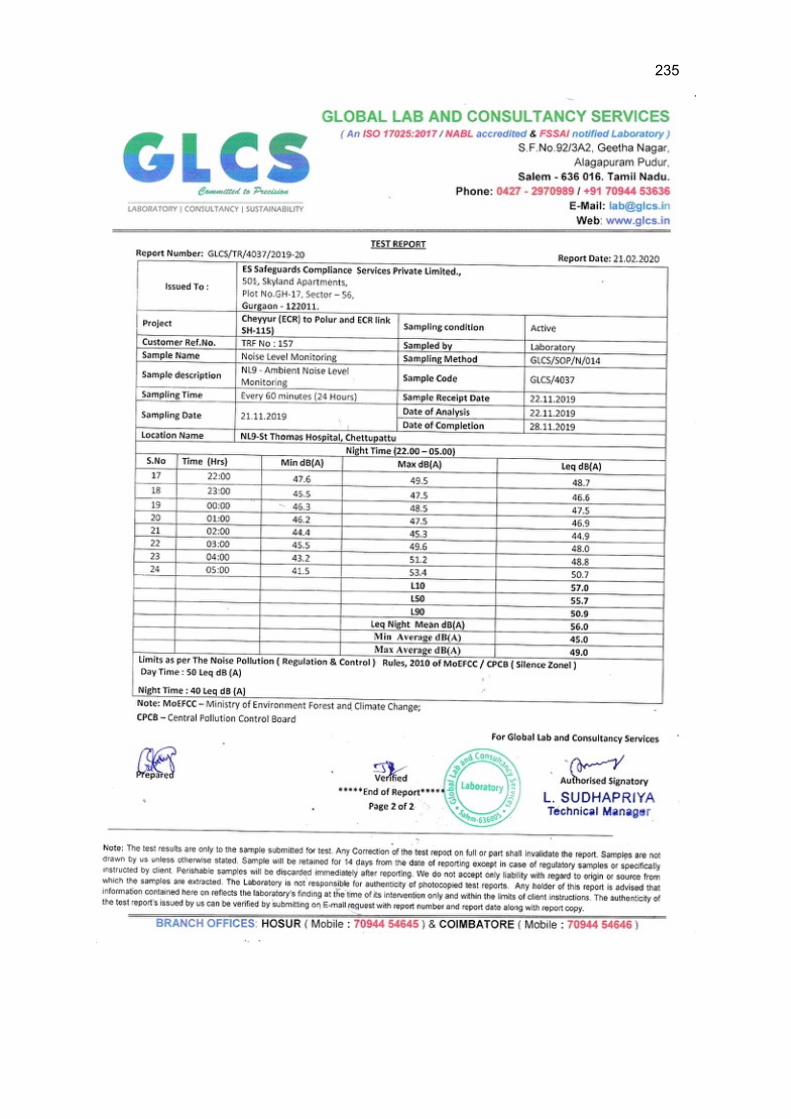
235
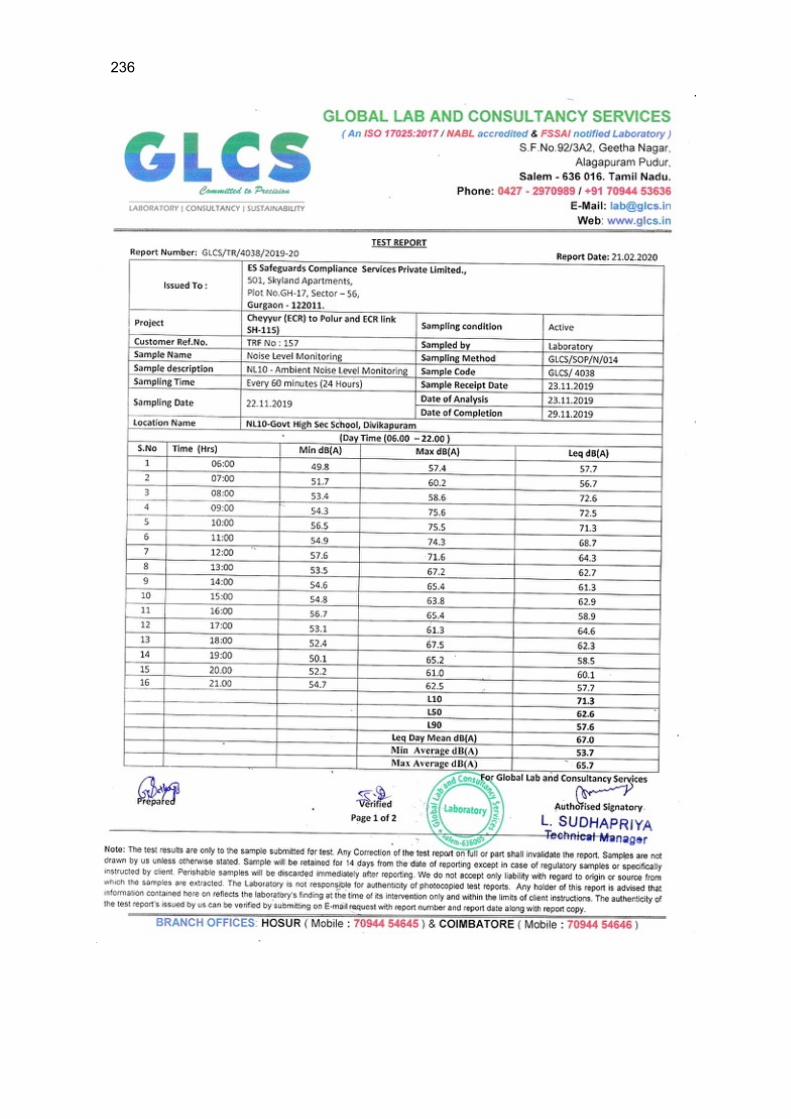
236
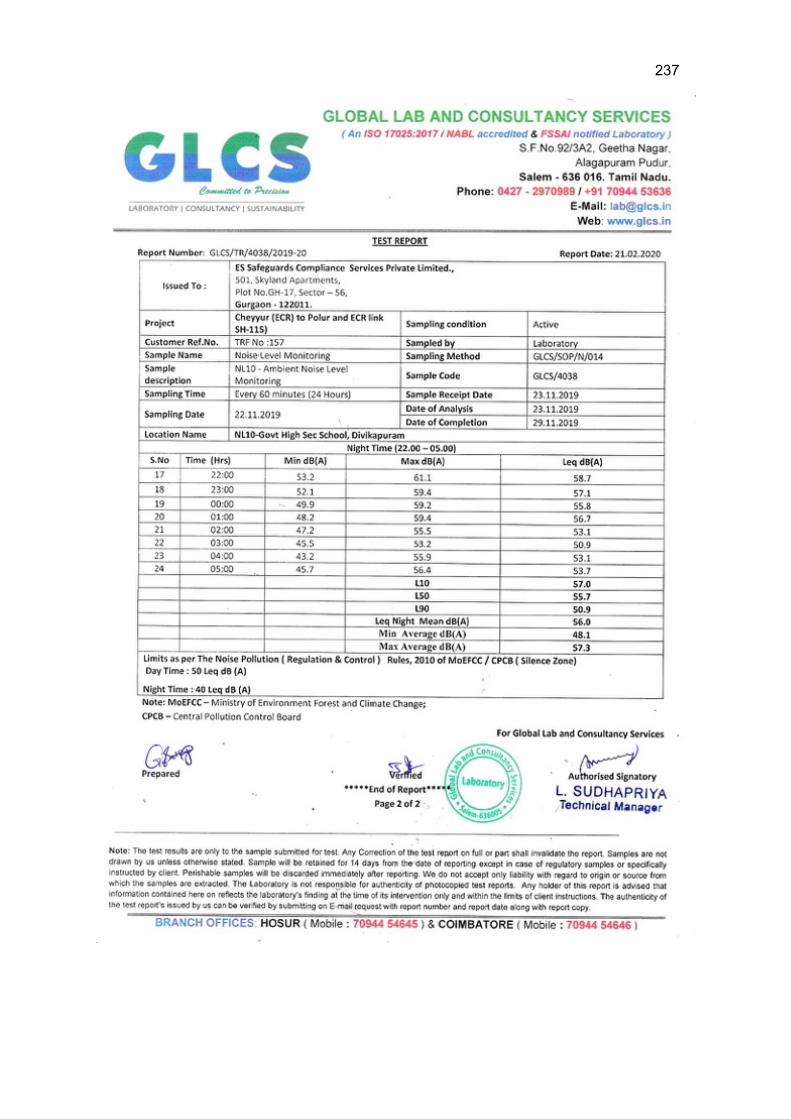
237

238
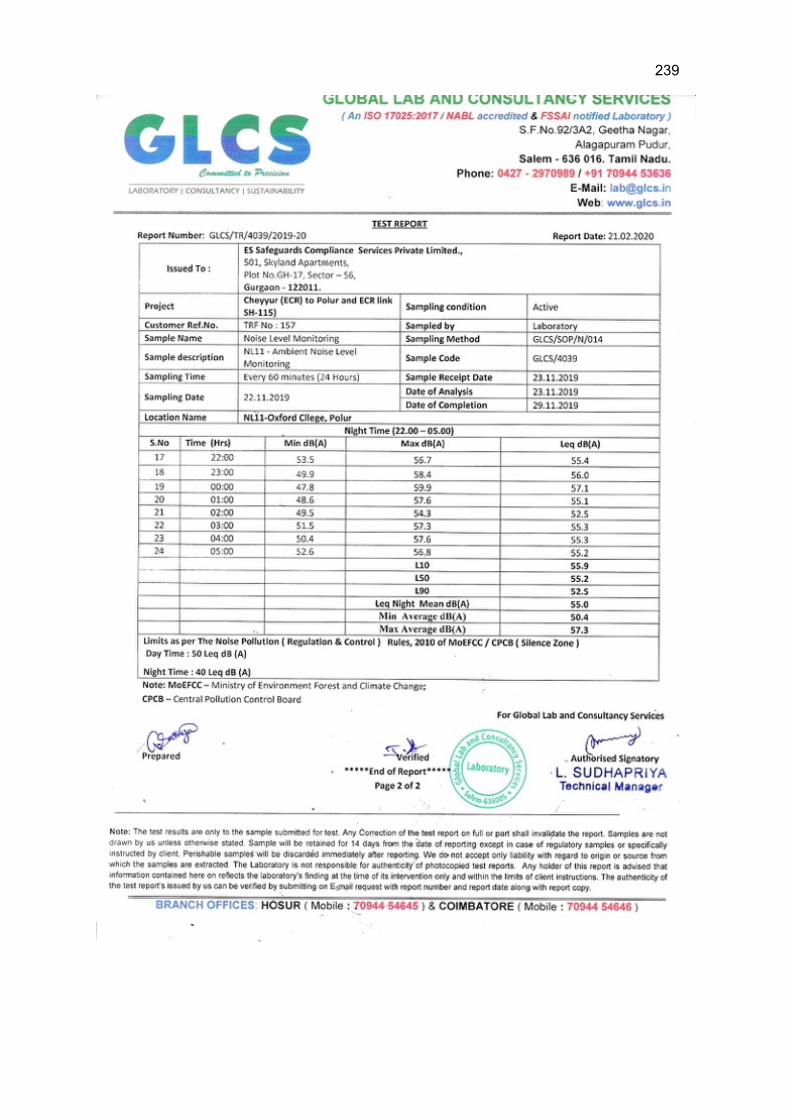
239
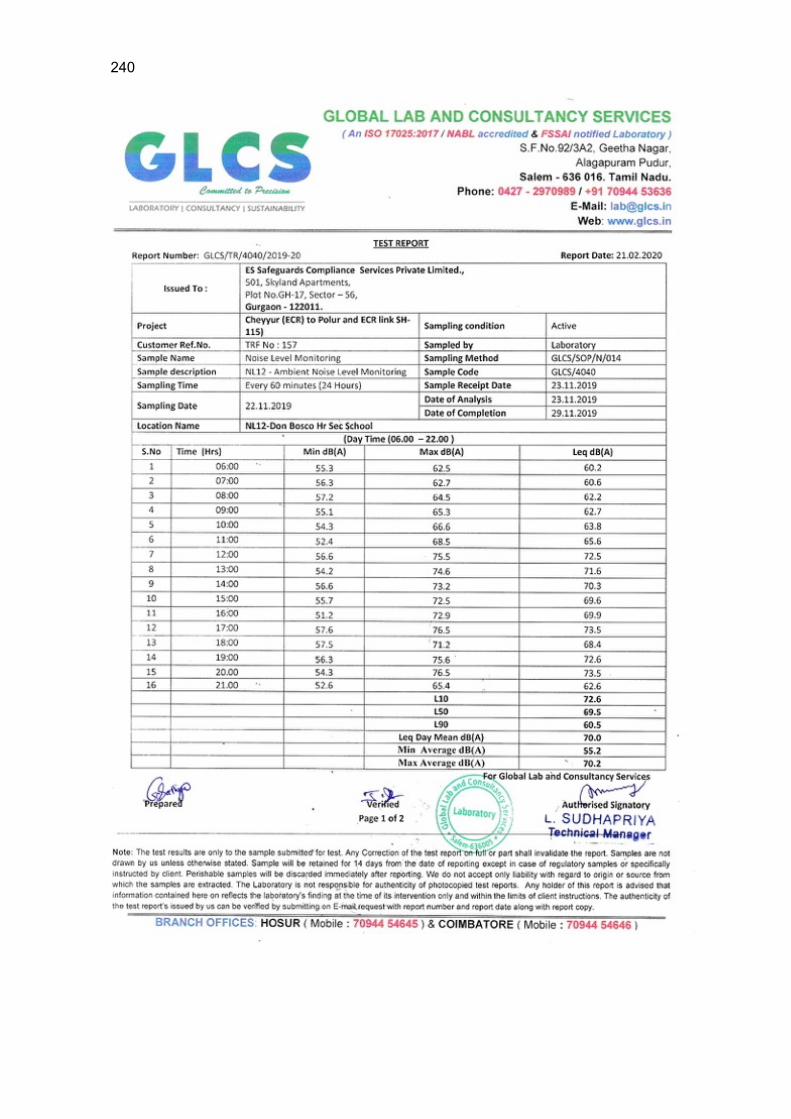
240
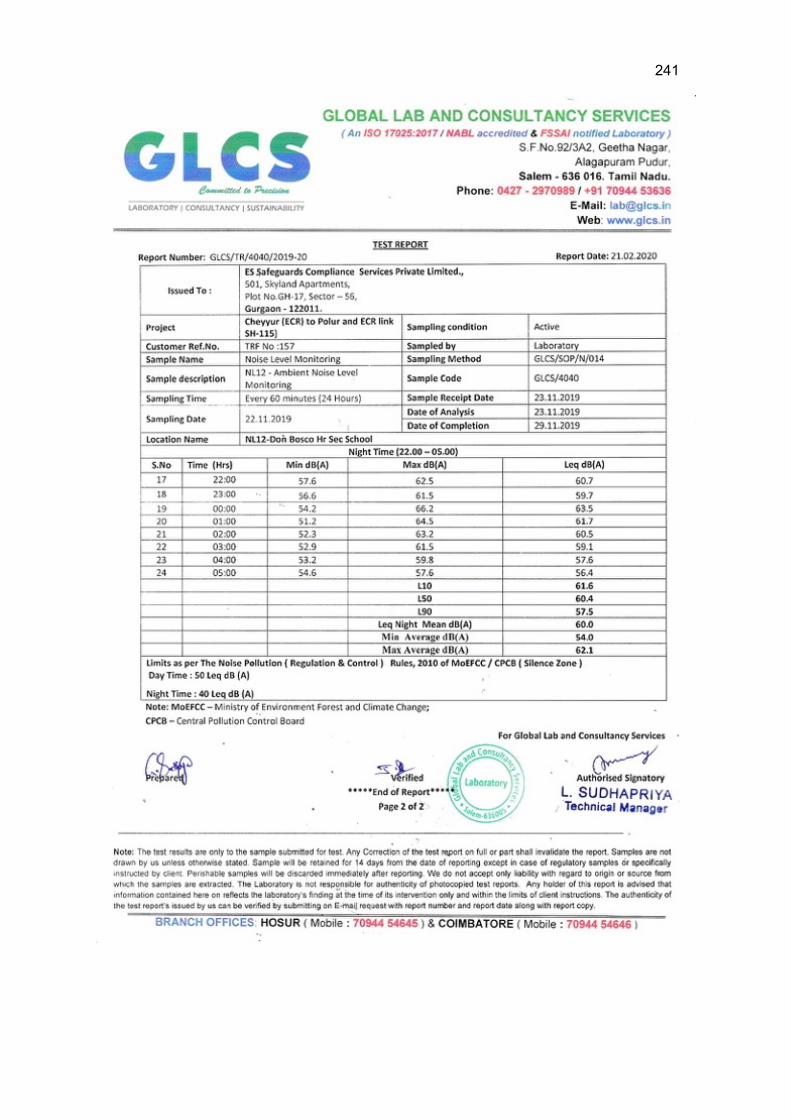
241
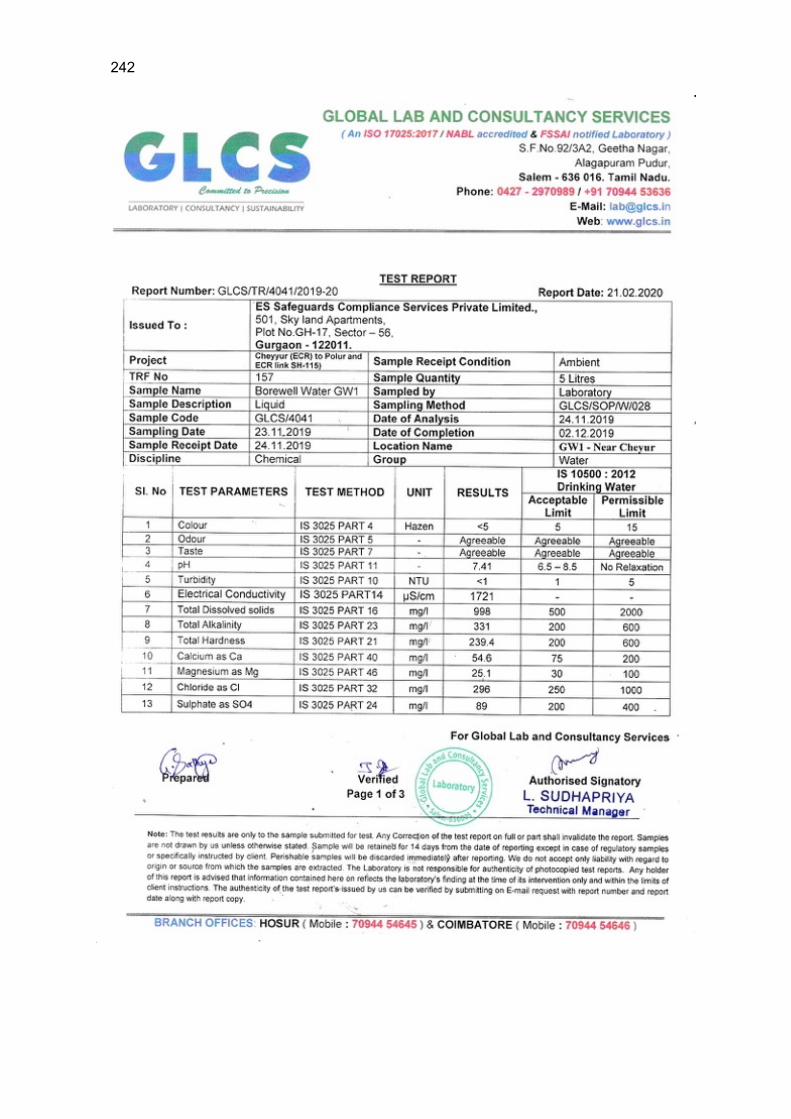
242
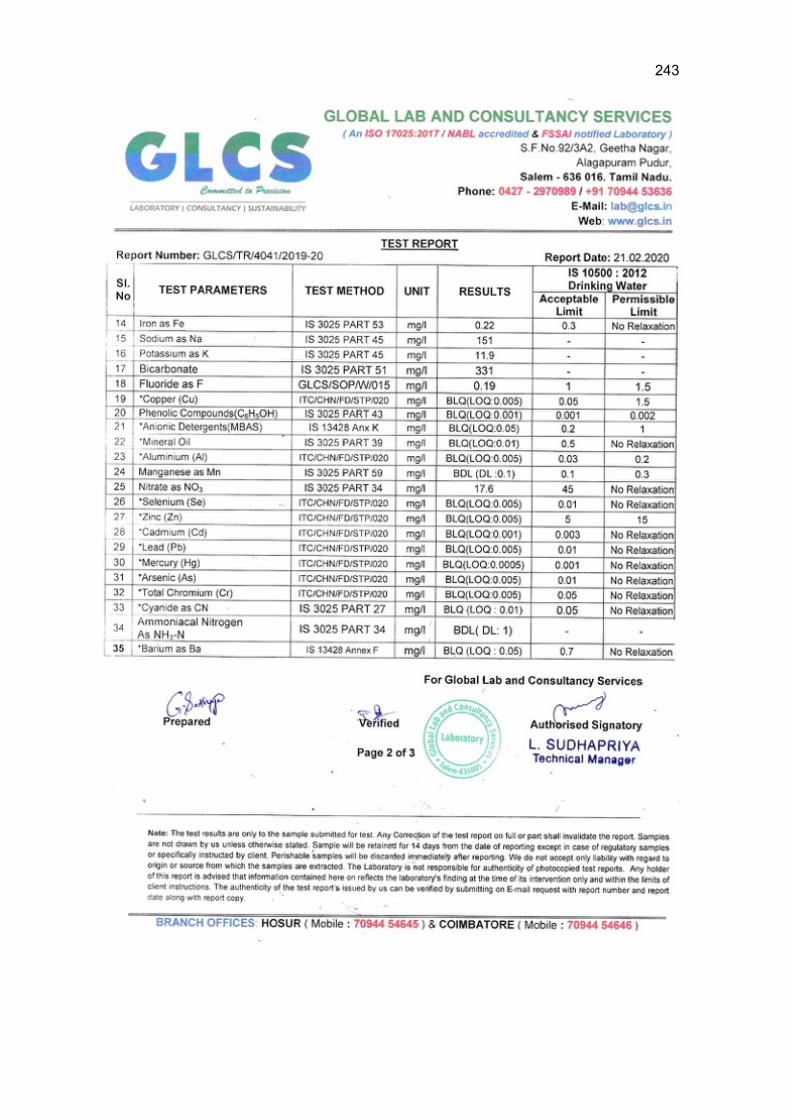
243
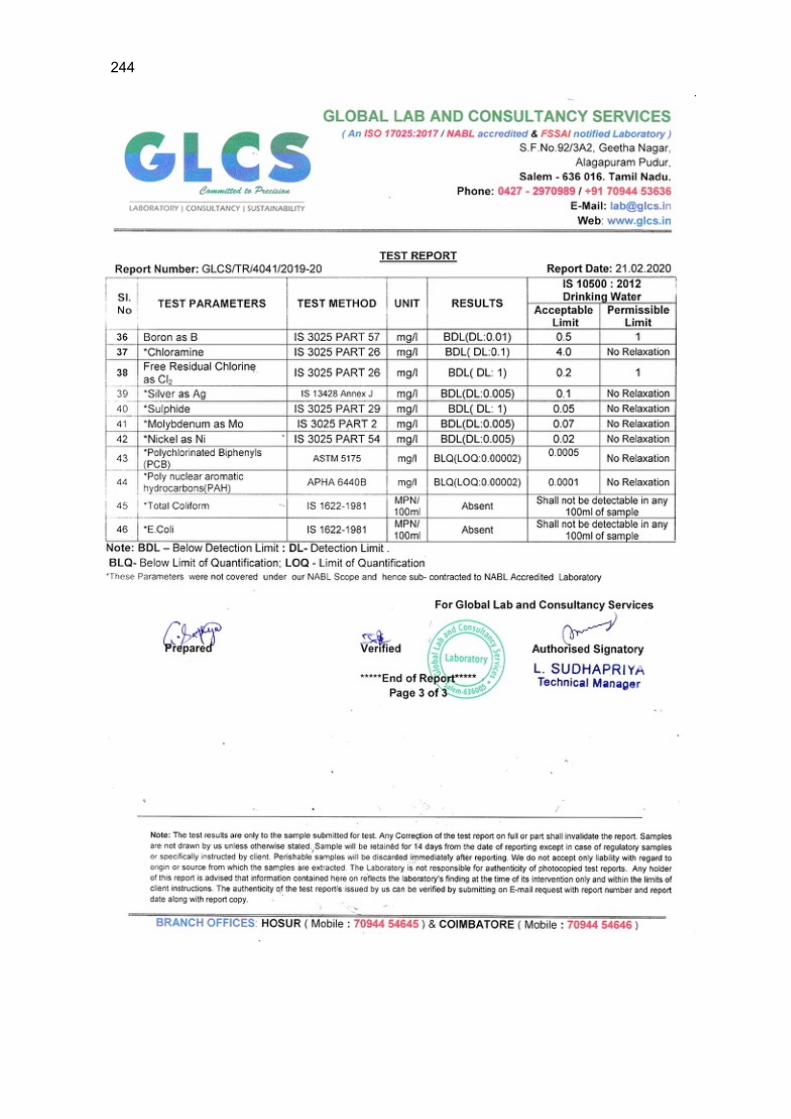
244
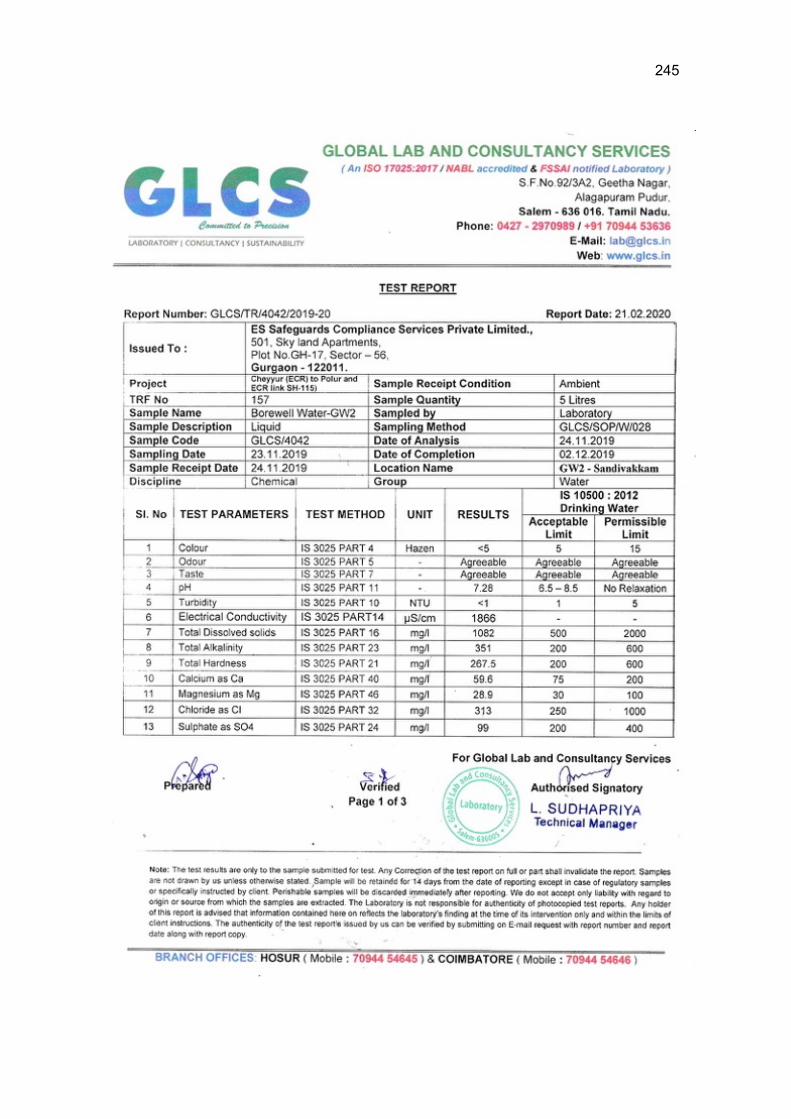
245
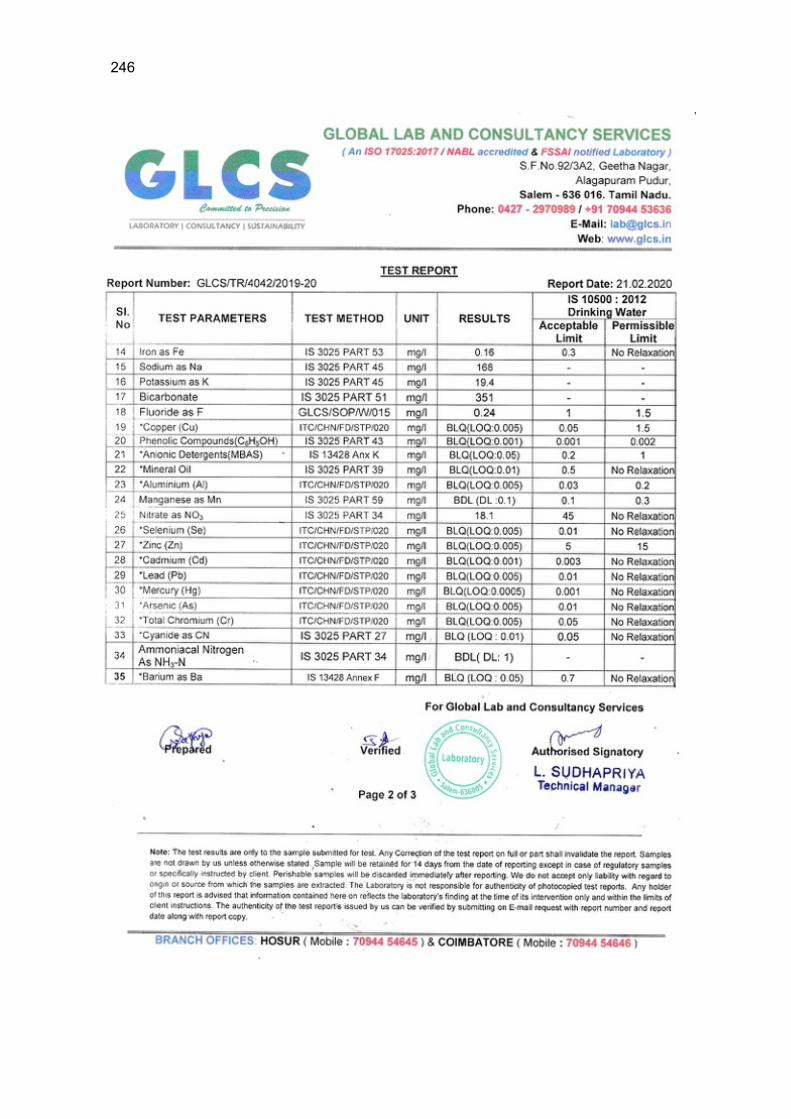
246
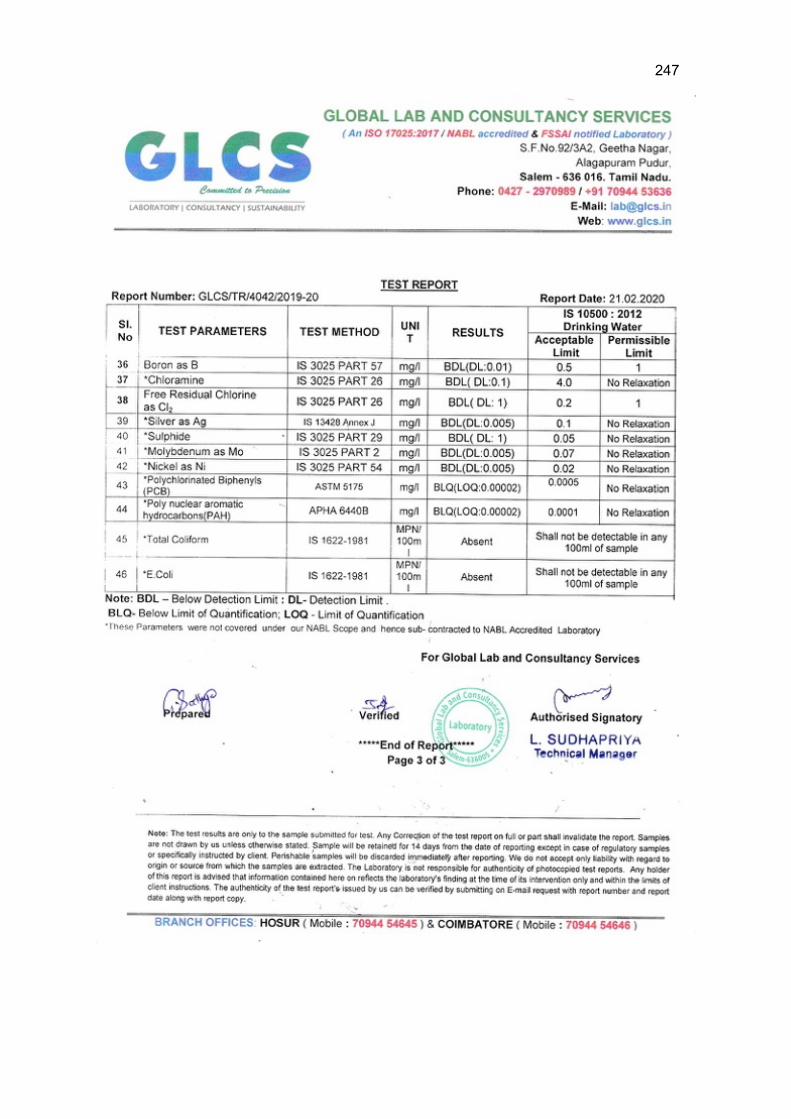
247
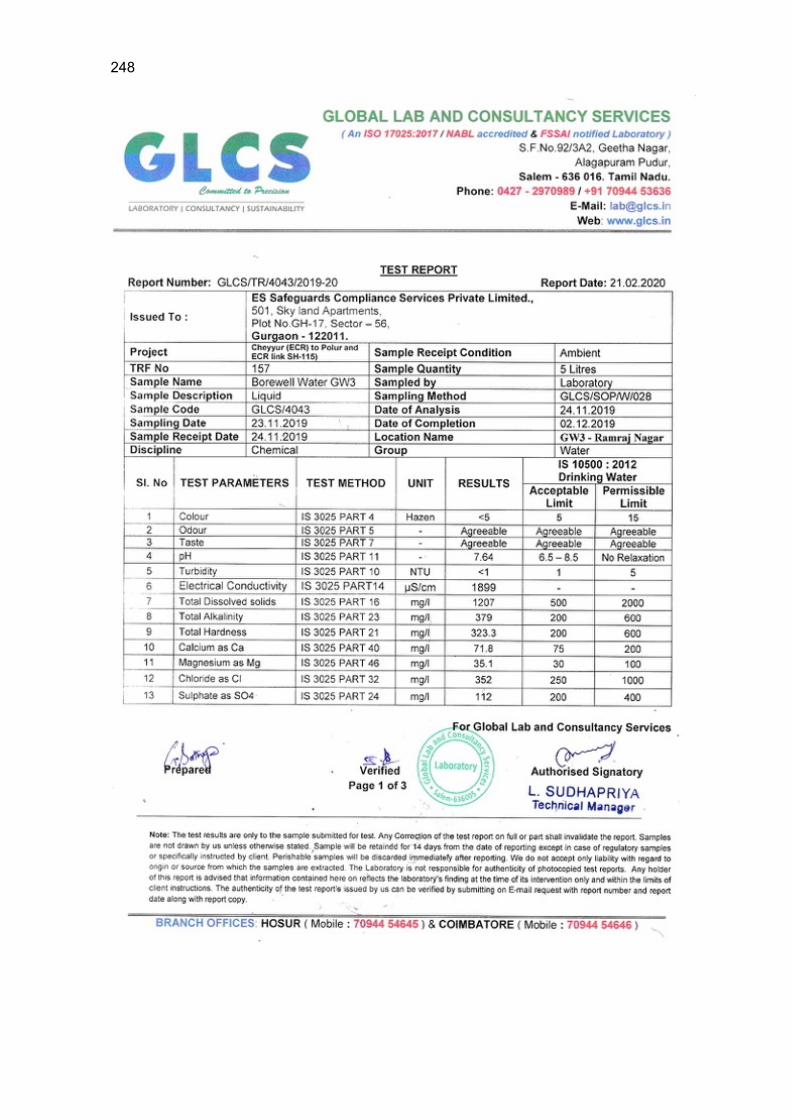
248
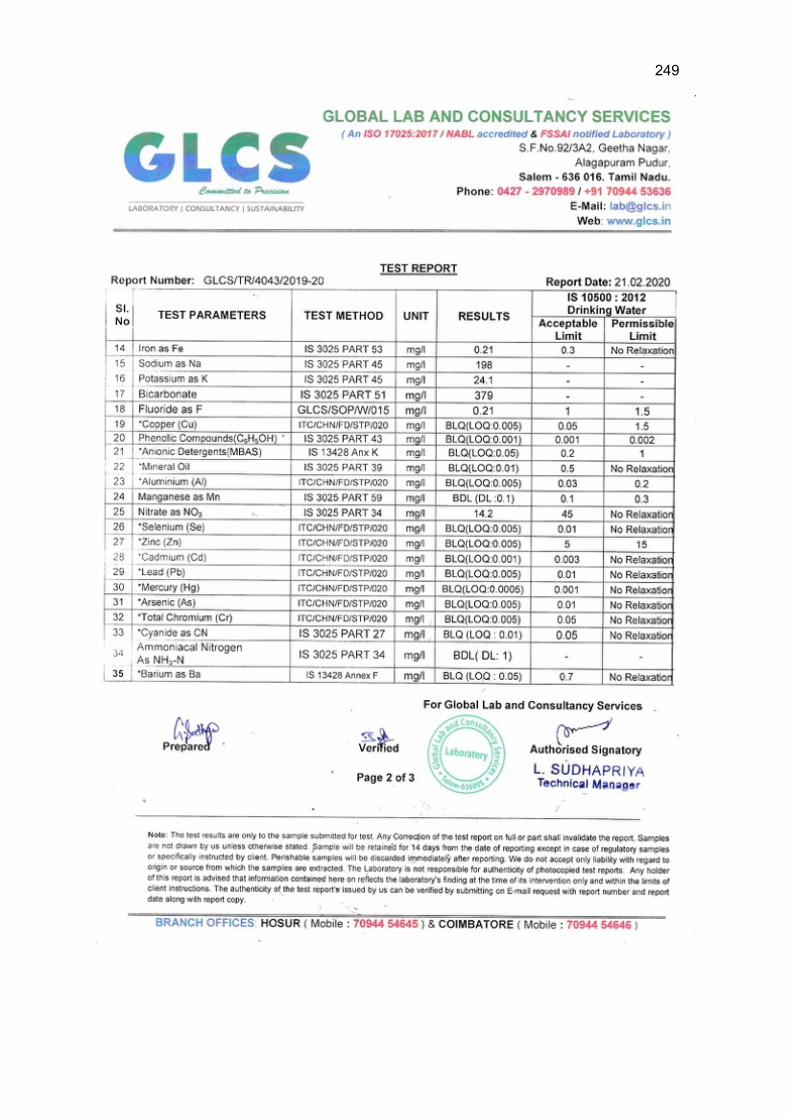
249
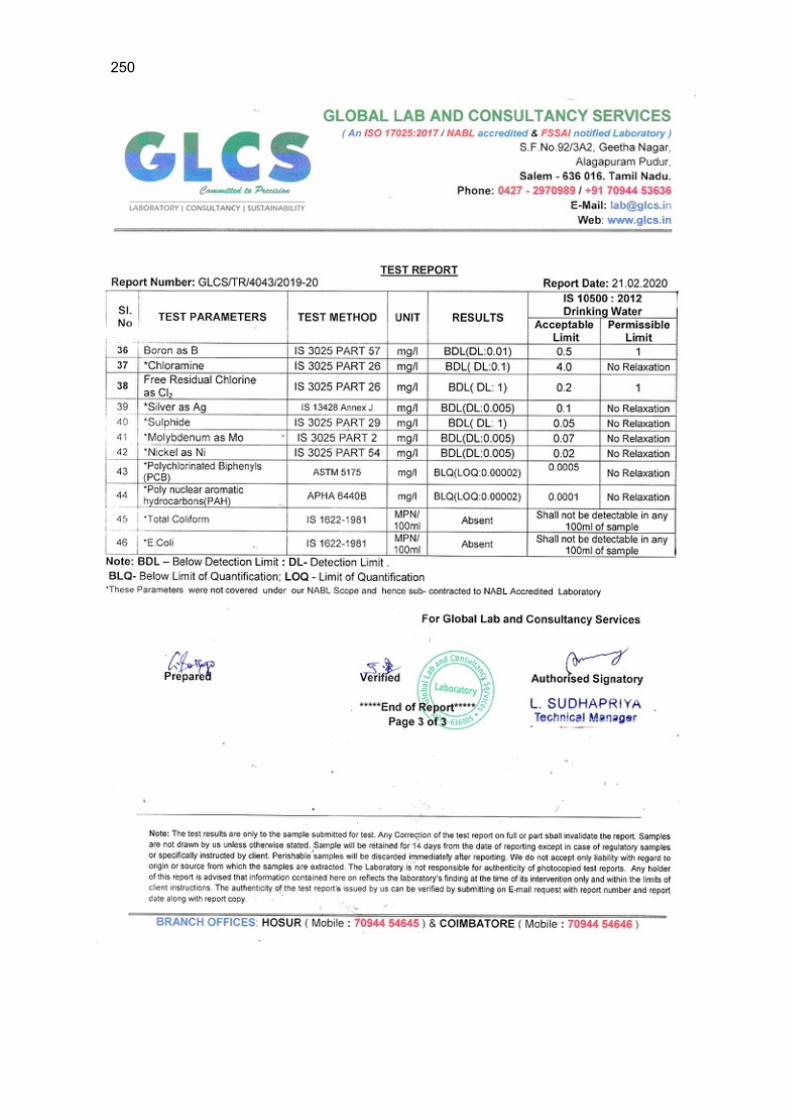
250
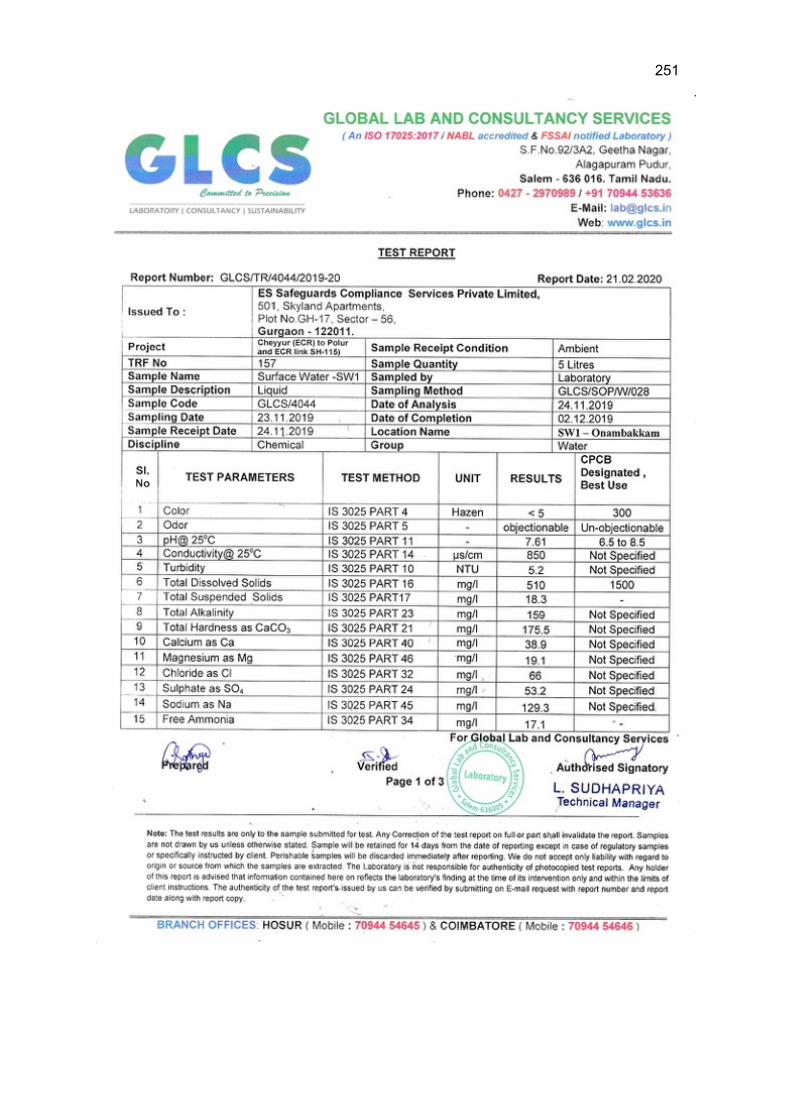
251
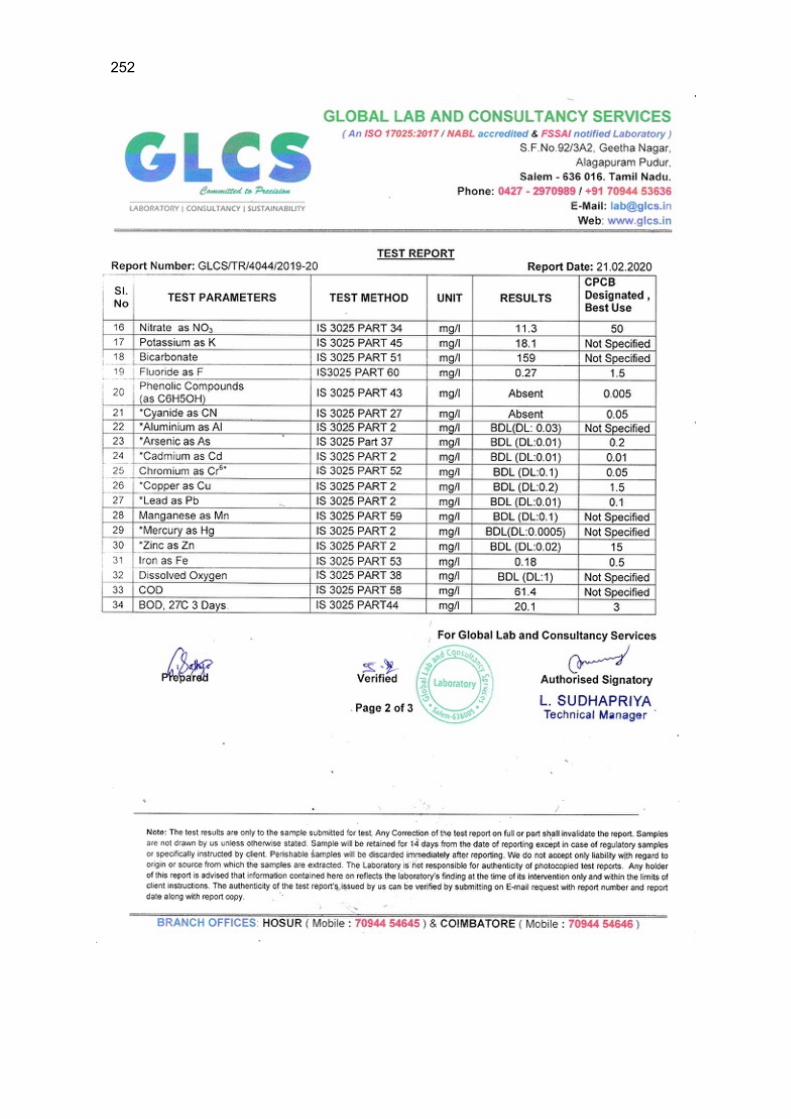
252
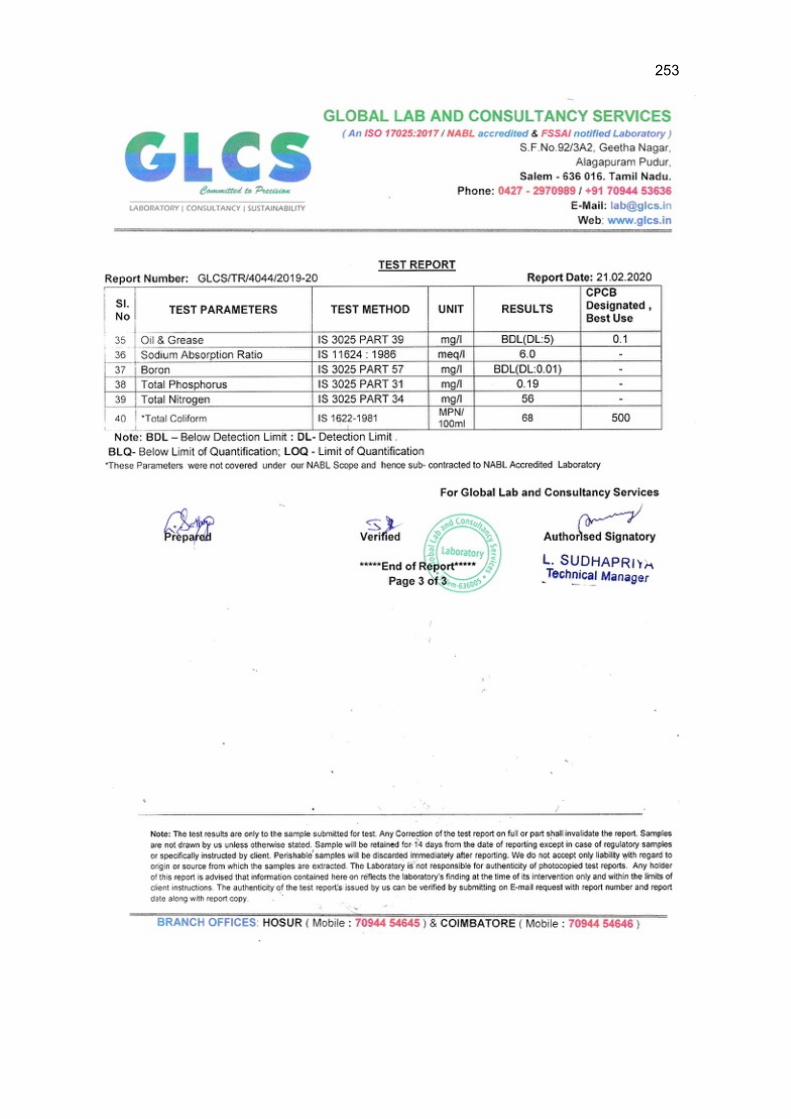
253
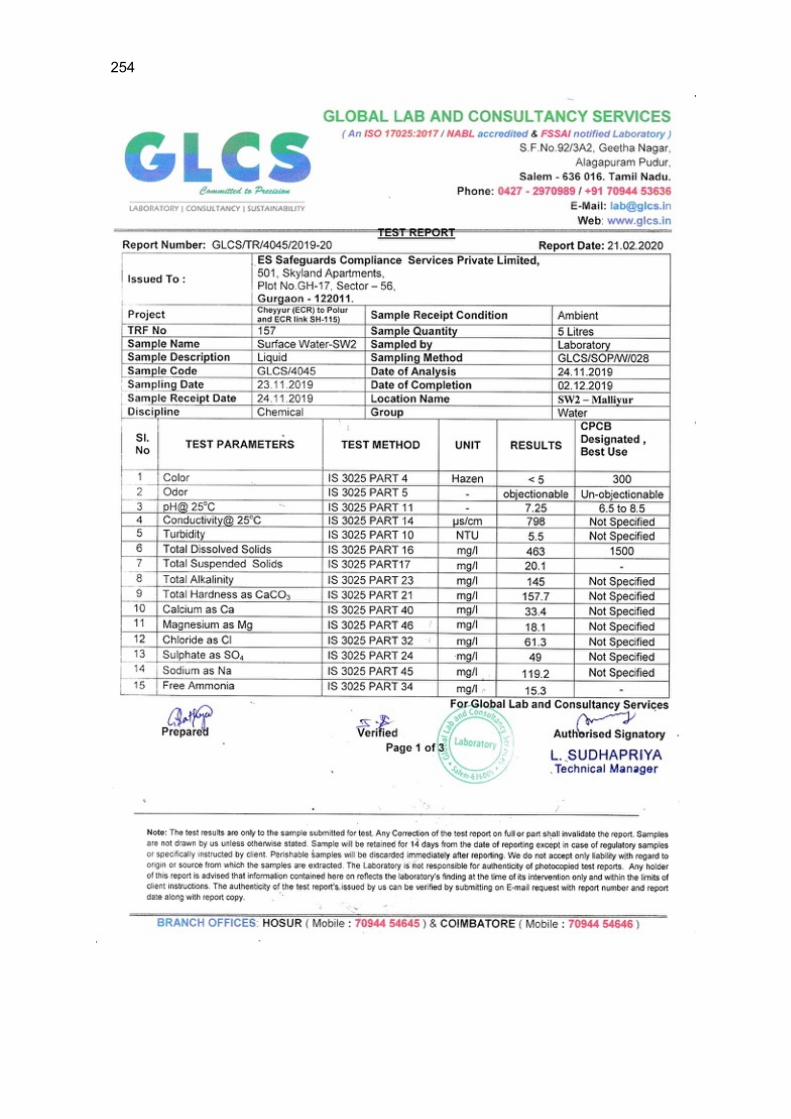
254
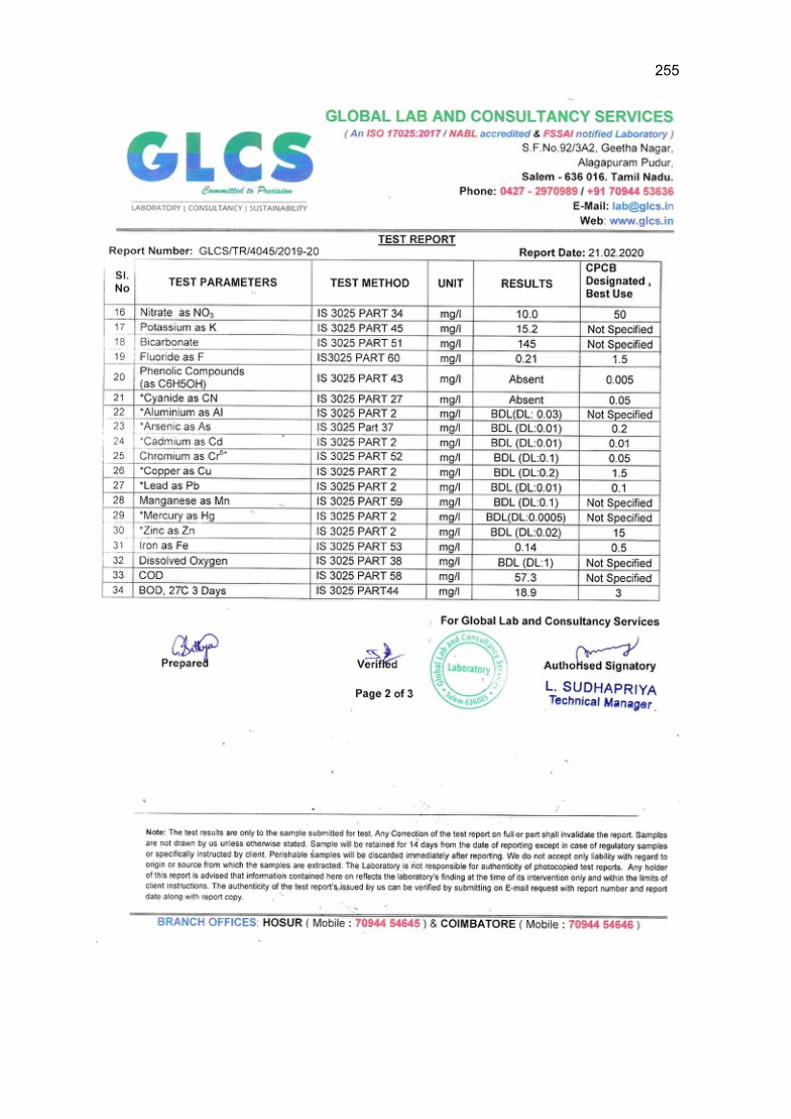
255
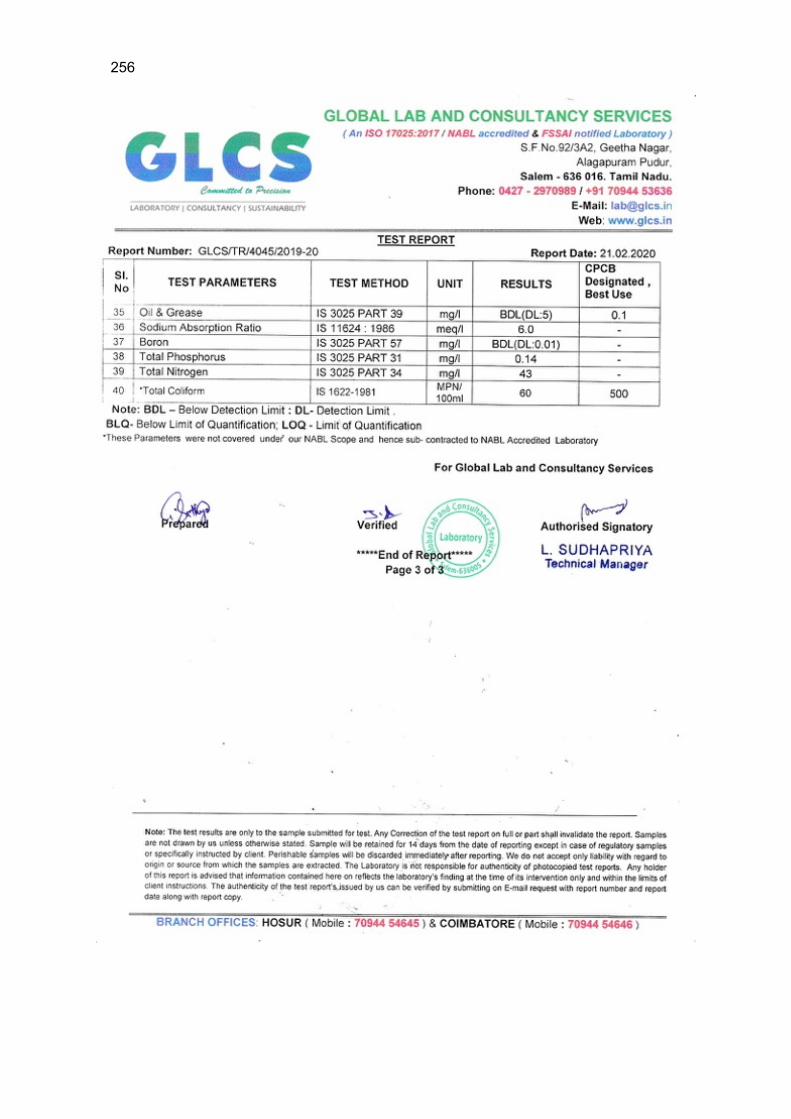
256
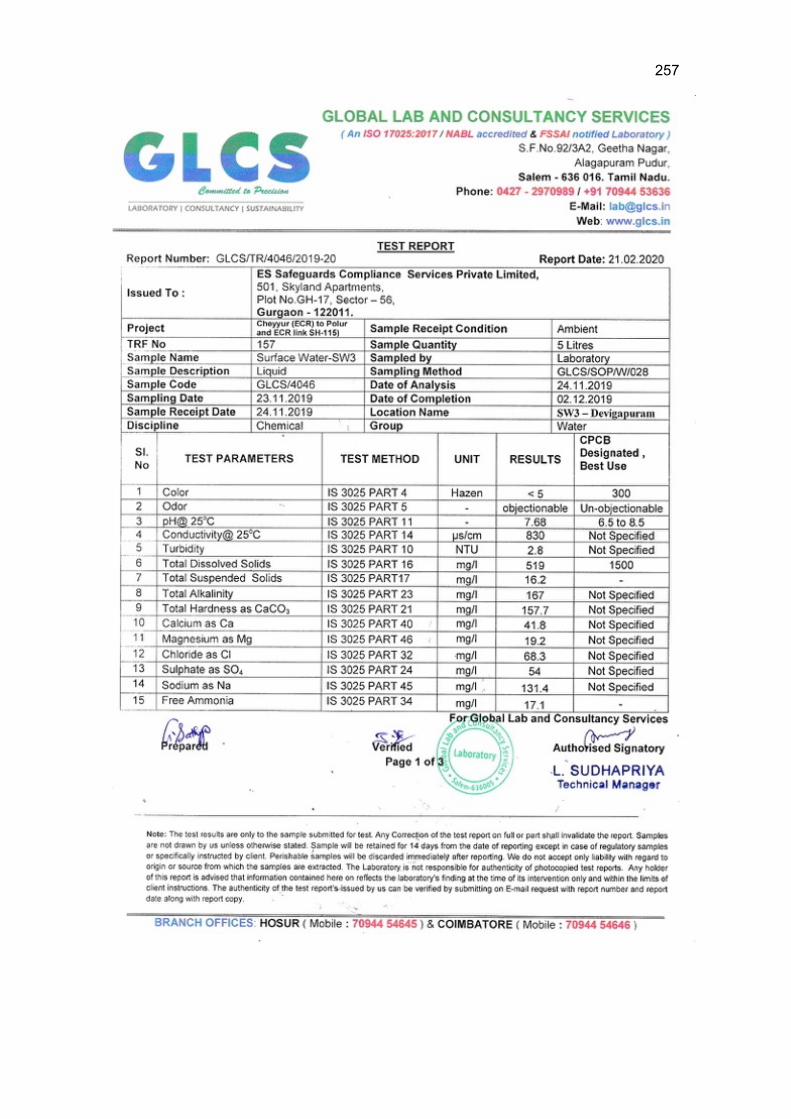
257

258
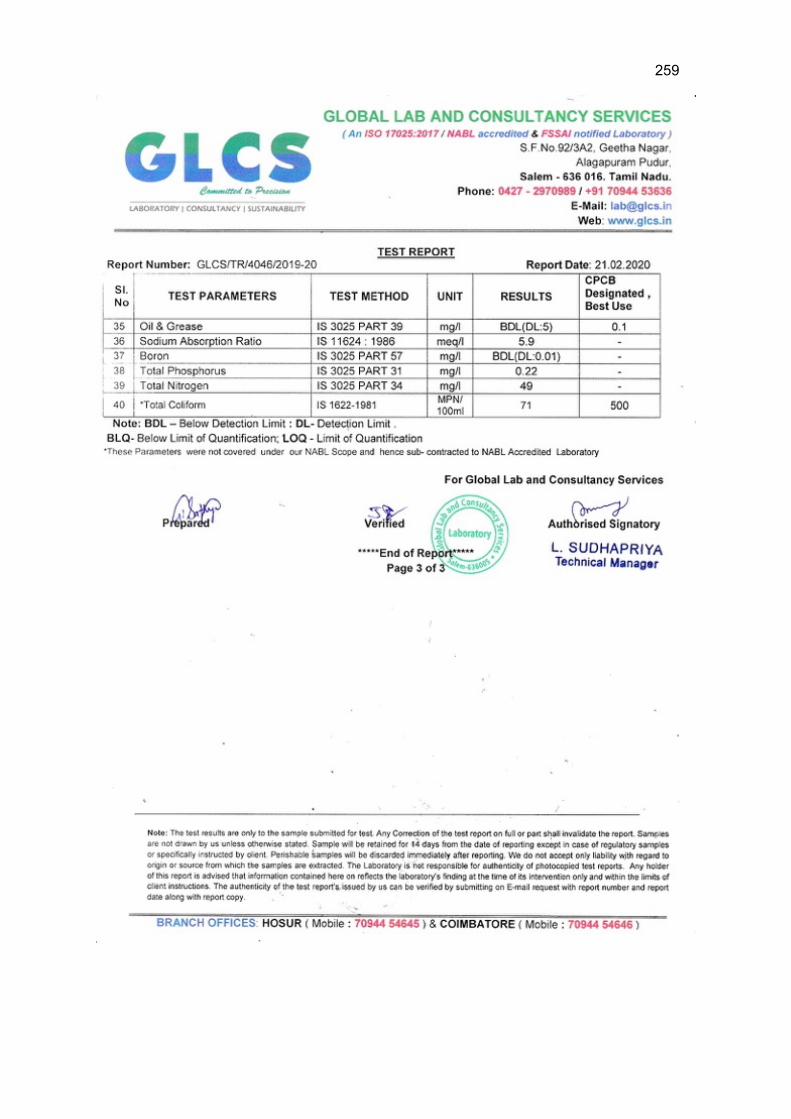
259

260
Appendix 4: Comparison of World Bank and GoI Ambient Air Quality Standards
A comparison between the ambient air quality requirements between the World Bank (WB) Environment, Health and Safety (EHS) guidelines and the National Ambient Air Quality standards (NAAQS) under the Air (Prevention and Control of Pollution) Act, 1981 of GOI as given in table below shows that the NAAQS has requirements on three more parameters (Pb, Co and NH3) in comparison to the WB EHS. The NAAQS has differentiated standards for two types of areas: i) industrial, residential, rural and other areas and ii) ecologically sensitive areas. The WB EHS has guidelines values which are the required standards but allows for gradual compliance to the guideline values through staged interim targets. Most WB EHS guideline requirements are more stringent than NAAQS except for the NOx one year average in ecologically sensitive areas where the NAAQS requirements are more stringent.
Table 1: Ambient Air Quality standards of WB EHS Vs. the GOI NAAQS Ambient Air
Quality Parameter
Averaging Period
WB Guideline Value GOI Standards for Industrial,
Residential, Rural and Other Areas
GoI Ecologically Sensitive Area
(notified by Central Government)
Sulfur dioxide
(SO2) (ug/m3) 24-hr
125 (Interim target 1)
80
80
50 (Interim target 2)
20 (guideline)
10 min 500 (guideline)
Annual None 50 20
Nitrogen dioxide (NO2) (ug/m3)
1 Year 40 (guideline) 40 30
24 Hour None 80 80
1 Hour 200 (guideline)
PM10
(ug/m3) 1 Year
70 (Interim target 1)
50 (Interim target 2)
30 (Interim target 3)
20 (guideline) 60 60
24-hr
150 (Interim target 1)
100 (Interim target 2)
75 (Interim target 3)
50 (guideline) 100 100
PM2.5 (ug/m3) 1 year
35 (Interim target 1)
25 (Interim target 2)
15 (Interim target 3)
10 (guideline) 40 40
24-Hour
75 (Interim target 1)
50 (Interim target 2)
37.5 (Interim target 3)
25 (guideline) 60 60
Ozone (O3) (ug/m3)
8-hr daily max 160 (Interim target 1)
100 (guideline) 100 100
Lead (Pb) µg/m3)
Annual 0.5 0.5
24 hours 1.0 1.0
Carbon Monoxide (CO) µg/m3
8 hours 2000 2000
1 hour 4000 4000
Ammonia (NH3) µ/m3
Annual 100 100
24 hours 400 400
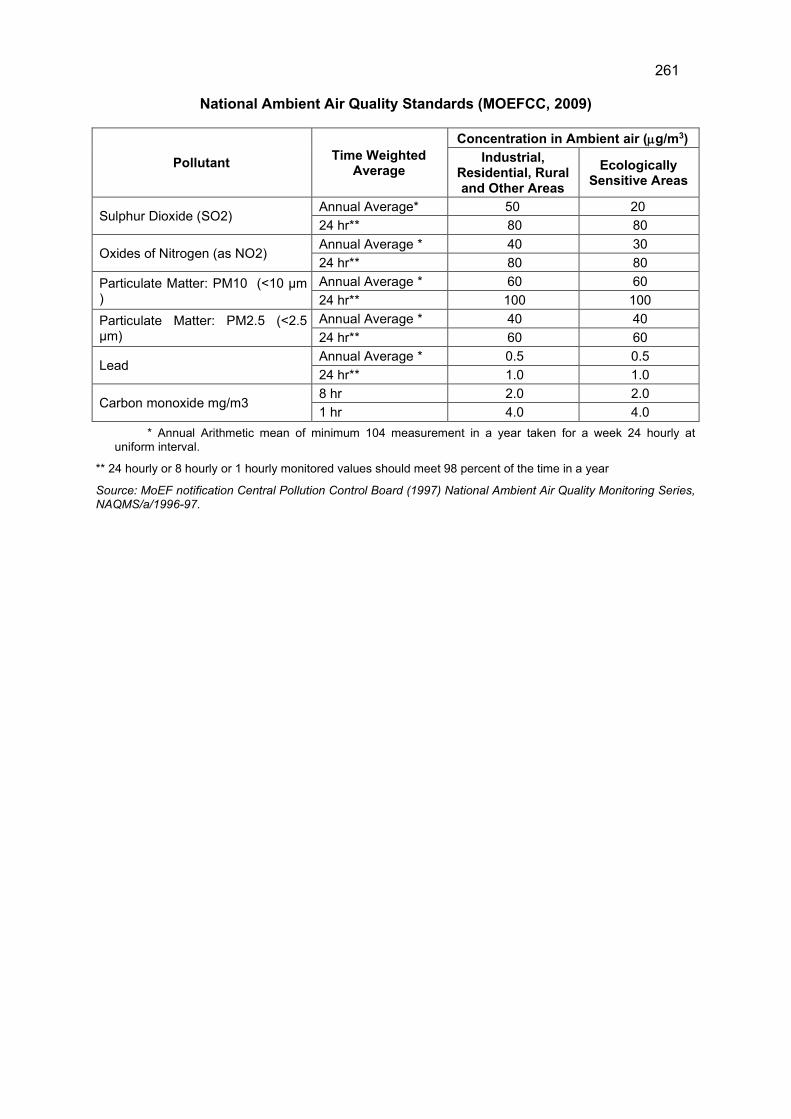
261
National Ambient Air Quality Standards (MOEFCC, 2009)
Pollutant Time Weighted
Average
Concentration in Ambient air (g/m3)
Industrial, Residential, Rural and Other Areas
Ecologically Sensitive Areas
Sulphur Dioxide (SO2) Annual Average* 50 20
24 hr** 80 80
Oxides of Nitrogen (as NO2) Annual Average * 40 30
24 hr** 80 80
Particulate Matter: PM10 (<10 μm )
Annual Average * 60 60
24 hr** 100 100
Particulate Matter: PM2.5 (<2.5 μm)
Annual Average * 40 40
24 hr** 60 60
Lead Annual Average * 0.5 0.5
24 hr** 1.0 1.0
Carbon monoxide mg/m3 8 hr 2.0 2.0
1 hr 4.0 4.0
* Annual Arithmetic mean of minimum 104 measurement in a year taken for a week 24 hourly at uniform interval.
** 24 hourly or 8 hourly or 1 hourly monitored values should meet 98 percent of the time in a year
Source: MoEF notification Central Pollution Control Board (1997) National Ambient Air Quality Monitoring Series, NAQMS/a/1996-97.
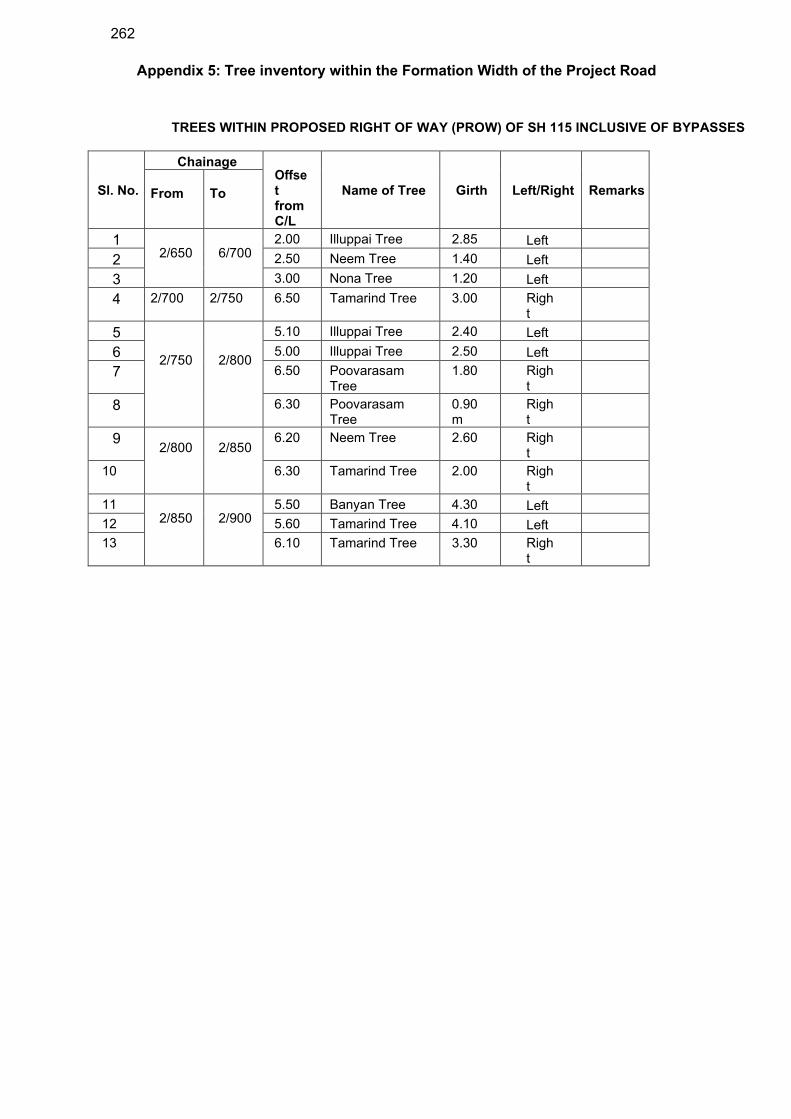
262
Appendix 5: Tree inventory within the Formation Width of the Project Road
TREES WITHIN PROPOSED RIGHT OF WAY (PROW) OF SH 115 INCLUSIVE OF BYPASSES
Sl. No.
Chainage Offset from C/L
Name of Tree
Girth
Left/Right
Remarks
From
To
1 2/650
6/700
2.00 Illuppai Tree 2.85 Left
2 2.50 Neem Tree 1.40 Left
3 3.00 Nona Tree 1.20 Left
4 2/700 2/750 6.50 Tamarind Tree 3.00 Right
5
2/750
2/800
5.10 Illuppai Tree 2.40 Left
6 5.00 Illuppai Tree 2.50 Left
7 6.50 Poovarasam Tree
1.80 Right
8 6.30 Poovarasam Tree
0.90m
Right
9 2/800 2/850
6.20 Neem Tree 2.60 Right
10 6.30 Tamarind Tree 2.00 Right
11 2/850
2/900
5.50 Banyan Tree 4.30 Left
12 5.60 Tamarind Tree 4.10 Left
13 6.10 Tamarind Tree 3.30 Right
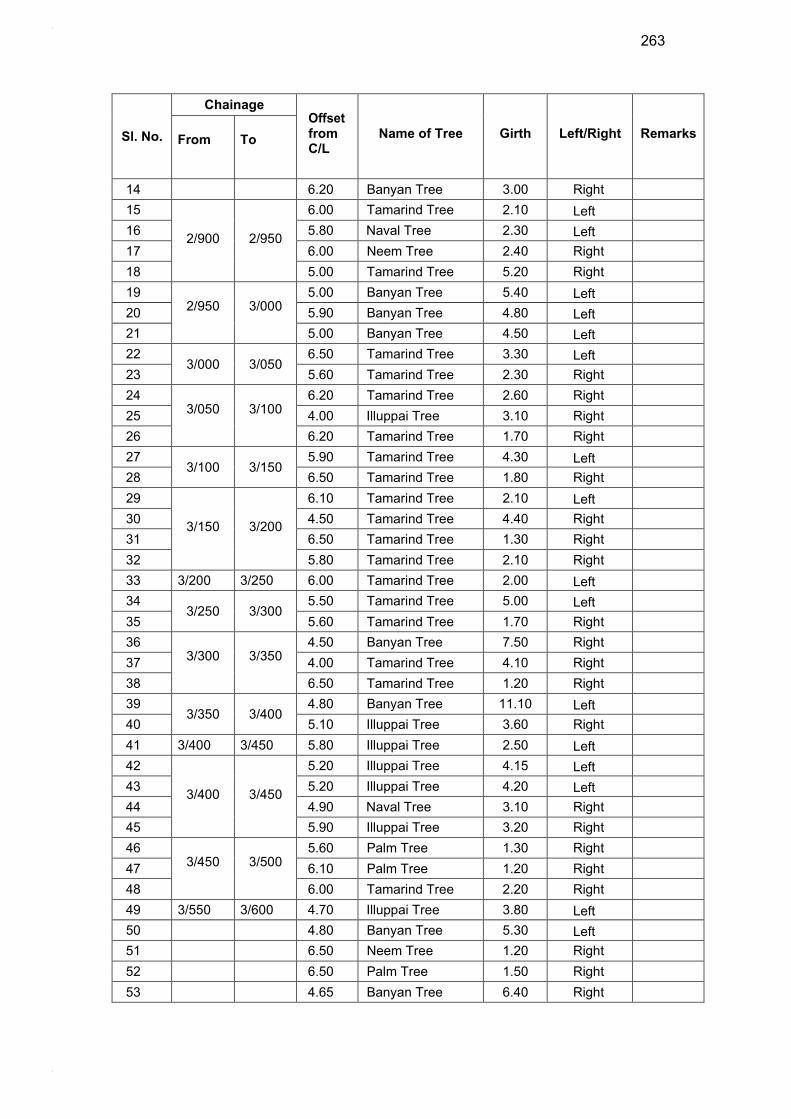
2.
3.
263
Sl. No.
Chainage Offset from C/L
Name of Tree
Girth
Left/Right
Remarks
From
To
14 6.20 Banyan Tree 3.00 Right
15
2/900
2/950
6.00 Tamarind Tree 2.10 Left
16 5.80 Naval Tree 2.30 Left
17 6.00 Neem Tree 2.40 Right
18 5.00 Tamarind Tree 5.20 Right
19 2/950
3/000
5.00 Banyan Tree 5.40 Left
20 5.90 Banyan Tree 4.80 Left
21 5.00 Banyan Tree 4.50 Left
22 3/000 3/050
6.50 Tamarind Tree 3.30 Left
23 5.60 Tamarind Tree 2.30 Right
24 3/050
3/100
6.20 Tamarind Tree 2.60 Right
25 4.00 Illuppai Tree 3.10 Right
26 6.20 Tamarind Tree 1.70 Right
27 3/100 3/150
5.90 Tamarind Tree 4.30 Left
28 6.50 Tamarind Tree 1.80 Right
29
3/150
3/200
6.10 Tamarind Tree 2.10 Left
30 4.50 Tamarind Tree 4.40 Right
31 6.50 Tamarind Tree 1.30 Right
32 5.80 Tamarind Tree 2.10 Right
33 3/200 3/250 6.00 Tamarind Tree 2.00 Left
34 3/250 3/300
5.50 Tamarind Tree 5.00 Left
35 5.60 Tamarind Tree 1.70 Right
36 3/300
3/350
4.50 Banyan Tree 7.50 Right
37 4.00 Tamarind Tree 4.10 Right
38 6.50 Tamarind Tree 1.20 Right
39 3/350 3/400
4.80 Banyan Tree 11.10 Left
40 5.10 Illuppai Tree 3.60 Right
41 3/400 3/450 5.80 Illuppai Tree 2.50 Left
42
3/400
3/450
5.20 Illuppai Tree 4.15 Left
43 5.20 Illuppai Tree 4.20 Left
44 4.90 Naval Tree 3.10 Right
45 5.90 Illuppai Tree 3.20 Right
46 3/450
3/500
5.60 Palm Tree 1.30 Right
47 6.10 Palm Tree 1.20 Right
48 6.00 Tamarind Tree 2.20 Right
49 3/550 3/600 4.70 Illuppai Tree 3.80 Left
50 4.80 Banyan Tree 5.30 Left
51 6.50 Neem Tree 1.20 Right
52 6.50 Palm Tree 1.50 Right
53 4.65 Banyan Tree 6.40 Right
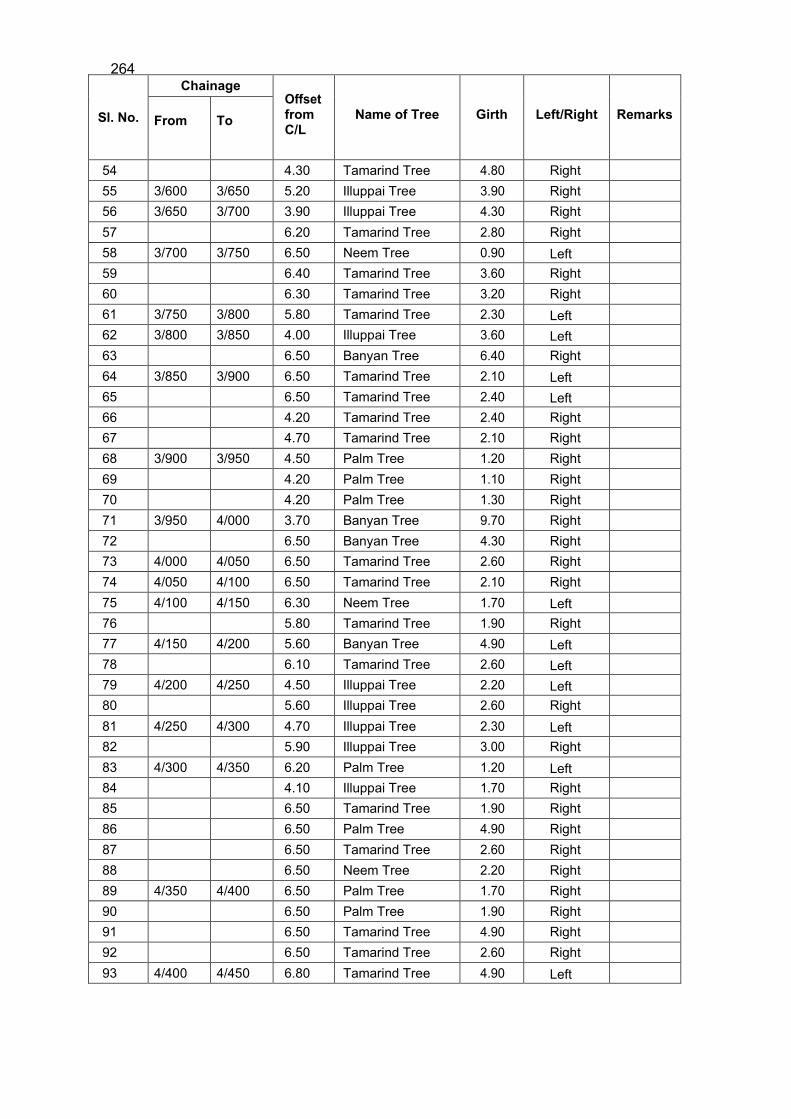
264
Sl. No.
Chainage Offset from C/L
Name of Tree
Girth
Left/Right
Remarks
From
To
54 4.30 Tamarind Tree 4.80 Right
55 3/600 3/650 5.20 Illuppai Tree 3.90 Right
56 3/650 3/700 3.90 Illuppai Tree 4.30 Right
57 6.20 Tamarind Tree 2.80 Right
58 3/700 3/750 6.50 Neem Tree 0.90 Left
59 6.40 Tamarind Tree 3.60 Right
60 6.30 Tamarind Tree 3.20 Right
61 3/750 3/800 5.80 Tamarind Tree 2.30 Left
62 3/800 3/850 4.00 Illuppai Tree 3.60 Left
63 6.50 Banyan Tree 6.40 Right
64 3/850 3/900 6.50 Tamarind Tree 2.10 Left
65 6.50 Tamarind Tree 2.40 Left
66 4.20 Tamarind Tree 2.40 Right
67 4.70 Tamarind Tree 2.10 Right
68 3/900 3/950 4.50 Palm Tree 1.20 Right
69 4.20 Palm Tree 1.10 Right
70 4.20 Palm Tree 1.30 Right
71 3/950 4/000 3.70 Banyan Tree 9.70 Right
72 6.50 Banyan Tree 4.30 Right
73 4/000 4/050 6.50 Tamarind Tree 2.60 Right
74 4/050 4/100 6.50 Tamarind Tree 2.10 Right
75 4/100 4/150 6.30 Neem Tree 1.70 Left
76 5.80 Tamarind Tree 1.90 Right
77 4/150 4/200 5.60 Banyan Tree 4.90 Left
78 6.10 Tamarind Tree 2.60 Left
79 4/200 4/250 4.50 Illuppai Tree 2.20 Left
80 5.60 Illuppai Tree 2.60 Right
81 4/250 4/300 4.70 Illuppai Tree 2.30 Left
82 5.90 Illuppai Tree 3.00 Right
83 4/300 4/350 6.20 Palm Tree 1.20 Left
84 4.10 Illuppai Tree 1.70 Right
85 6.50 Tamarind Tree 1.90 Right
86 6.50 Palm Tree 4.90 Right
87 6.50 Tamarind Tree 2.60 Right
88 6.50 Neem Tree 2.20 Right
89 4/350 4/400 6.50 Palm Tree 1.70 Right
90 6.50 Palm Tree 1.90 Right
91 6.50 Tamarind Tree 4.90 Right
92 6.50 Tamarind Tree 2.60 Right
93 4/400 4/450 6.80 Tamarind Tree 4.90 Left
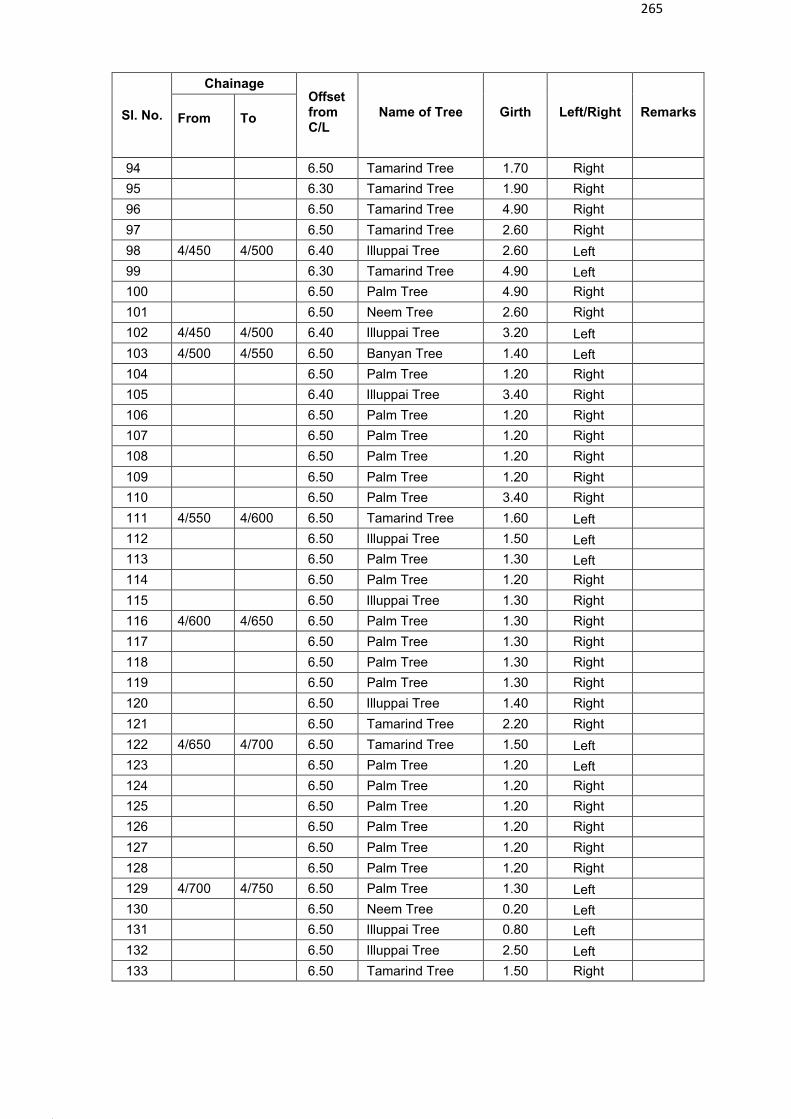
5.
265
Sl. No.
Chainage Offset from C/L
Name of Tree
Girth
Left/Right
Remarks
From
To
94 6.50 Tamarind Tree 1.70 Right
95 6.30 Tamarind Tree 1.90 Right
96 6.50 Tamarind Tree 4.90 Right
97 6.50 Tamarind Tree 2.60 Right
98 4/450 4/500 6.40 Illuppai Tree 2.60 Left
99 6.30 Tamarind Tree 4.90 Left
100 6.50 Palm Tree 4.90 Right
101 6.50 Neem Tree 2.60 Right
102 4/450 4/500 6.40 Illuppai Tree 3.20 Left
103 4/500 4/550 6.50 Banyan Tree 1.40 Left
104 6.50 Palm Tree 1.20 Right
105 6.40 Illuppai Tree 3.40 Right
106 6.50 Palm Tree 1.20 Right
107 6.50 Palm Tree 1.20 Right
108 6.50 Palm Tree 1.20 Right
109 6.50 Palm Tree 1.20 Right
110 6.50 Palm Tree 3.40 Right
111 4/550 4/600 6.50 Tamarind Tree 1.60 Left
112 6.50 Illuppai Tree 1.50 Left
113 6.50 Palm Tree 1.30 Left
114 6.50 Palm Tree 1.20 Right
115 6.50 Illuppai Tree 1.30 Right
116 4/600 4/650 6.50 Palm Tree 1.30 Right
117 6.50 Palm Tree 1.30 Right
118 6.50 Palm Tree 1.30 Right
119 6.50 Palm Tree 1.30 Right
120 6.50 Illuppai Tree 1.40 Right
121 6.50 Tamarind Tree 2.20 Right
122 4/650 4/700 6.50 Tamarind Tree 1.50 Left
123 6.50 Palm Tree 1.20 Left
124 6.50 Palm Tree 1.20 Right
125 6.50 Palm Tree 1.20 Right
126 6.50 Palm Tree 1.20 Right
127 6.50 Palm Tree 1.20 Right
128 6.50 Palm Tree 1.20 Right
129 4/700 4/750 6.50 Palm Tree 1.30 Left
130 6.50 Neem Tree 0.20 Left
131 6.50 Illuppai Tree 0.80 Left
132 6.50 Illuppai Tree 2.50 Left
133 6.50 Tamarind Tree 1.50 Right
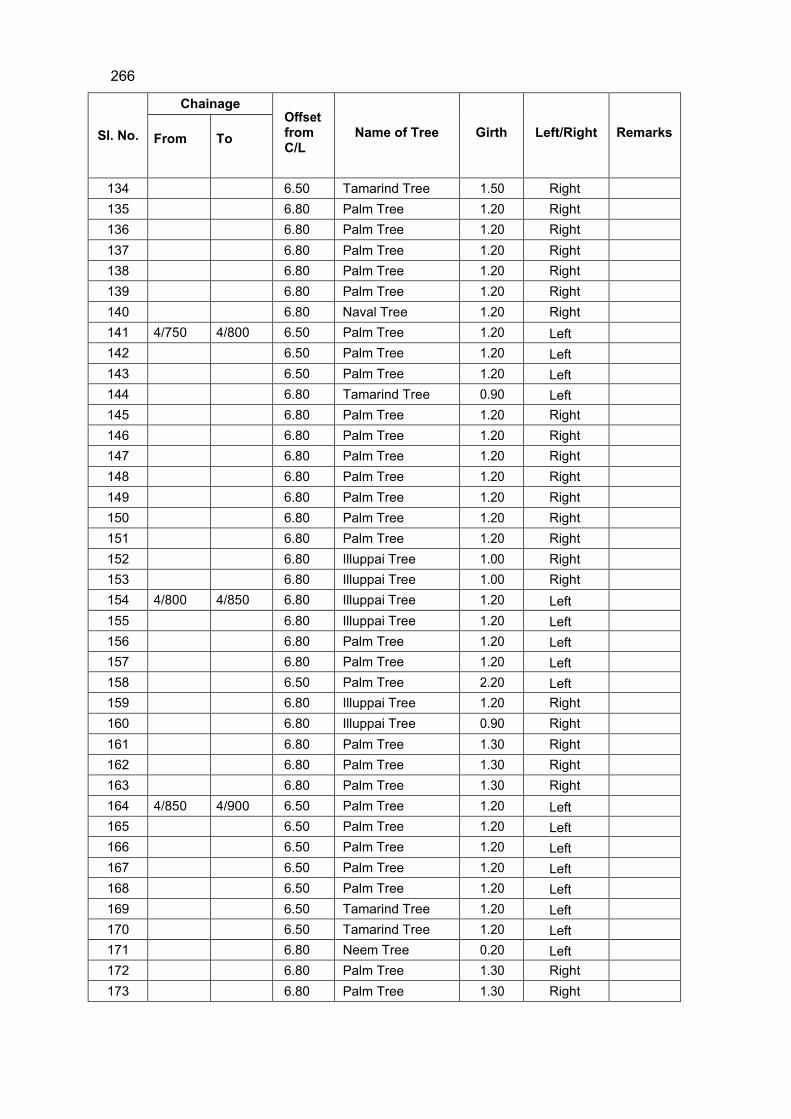
266
Sl. No.
Chainage Offset from C/L
Name of Tree
Girth
Left/Right
Remarks
From
To
134 6.50 Tamarind Tree 1.50 Right
135 6.80 Palm Tree 1.20 Right
136 6.80 Palm Tree 1.20 Right
137 6.80 Palm Tree 1.20 Right
138 6.80 Palm Tree 1.20 Right
139 6.80 Palm Tree 1.20 Right
140 6.80 Naval Tree 1.20 Right
141 4/750 4/800 6.50 Palm Tree 1.20 Left
142 6.50 Palm Tree 1.20 Left
143 6.50 Palm Tree 1.20 Left
144 6.80 Tamarind Tree 0.90 Left
145 6.80 Palm Tree 1.20 Right
146 6.80 Palm Tree 1.20 Right
147 6.80 Palm Tree 1.20 Right
148 6.80 Palm Tree 1.20 Right
149 6.80 Palm Tree 1.20 Right
150 6.80 Palm Tree 1.20 Right
151 6.80 Palm Tree 1.20 Right
152 6.80 Illuppai Tree 1.00 Right
153 6.80 Illuppai Tree 1.00 Right
154 4/800 4/850 6.80 Illuppai Tree 1.20 Left
155 6.80 Illuppai Tree 1.20 Left
156 6.80 Palm Tree 1.20 Left
157 6.80 Palm Tree 1.20 Left
158 6.50 Palm Tree 2.20 Left
159 6.80 Illuppai Tree 1.20 Right
160 6.80 Illuppai Tree 0.90 Right
161 6.80 Palm Tree 1.30 Right
162 6.80 Palm Tree 1.30 Right
163 6.80 Palm Tree 1.30 Right
164 4/850 4/900 6.50 Palm Tree 1.20 Left
165 6.50 Palm Tree 1.20 Left
166 6.50 Palm Tree 1.20 Left
167 6.50 Palm Tree 1.20 Left
168 6.50 Palm Tree 1.20 Left
169 6.50 Tamarind Tree 1.20 Left
170 6.50 Tamarind Tree 1.20 Left
171 6.80 Neem Tree 0.20 Left
172 6.80 Palm Tree 1.30 Right
173 6.80 Palm Tree 1.30 Right
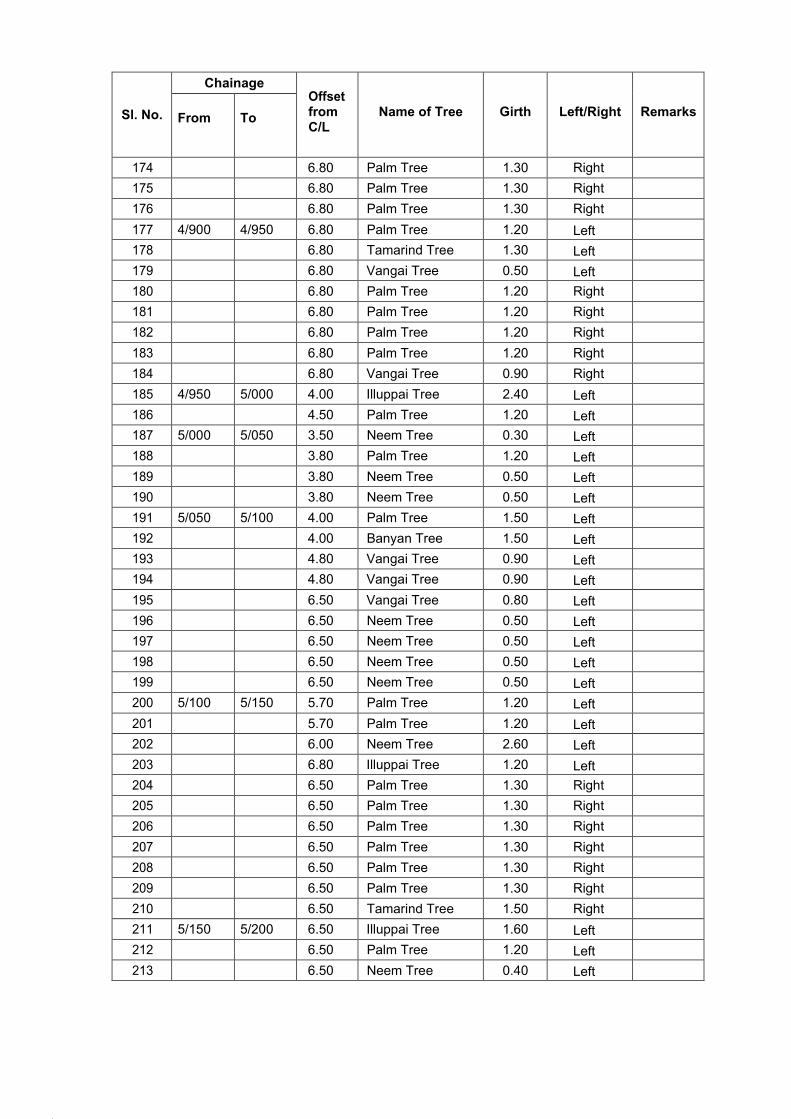
7.
8.
Sl. No.
Chainage Offset from C/L
Name of Tree
Girth
Left/Right
Remarks
From
To
174 6.80 Palm Tree 1.30 Right
175 6.80 Palm Tree 1.30 Right
176 6.80 Palm Tree 1.30 Right
177 4/900 4/950 6.80 Palm Tree 1.20 Left
178 6.80 Tamarind Tree 1.30 Left
179 6.80 Vangai Tree 0.50 Left
180 6.80 Palm Tree 1.20 Right
181 6.80 Palm Tree 1.20 Right
182 6.80 Palm Tree 1.20 Right
183 6.80 Palm Tree 1.20 Right
184 6.80 Vangai Tree 0.90 Right
185 4/950 5/000 4.00 Illuppai Tree 2.40 Left
186 4.50 Palm Tree 1.20 Left
187 5/000 5/050 3.50 Neem Tree 0.30 Left
188 3.80 Palm Tree 1.20 Left
189 3.80 Neem Tree 0.50 Left
190 3.80 Neem Tree 0.50 Left
191 5/050 5/100 4.00 Palm Tree 1.50 Left
192 4.00 Banyan Tree 1.50 Left
193 4.80 Vangai Tree 0.90 Left
194 4.80 Vangai Tree 0.90 Left
195 6.50 Vangai Tree 0.80 Left
196 6.50 Neem Tree 0.50 Left
197 6.50 Neem Tree 0.50 Left
198 6.50 Neem Tree 0.50 Left
199 6.50 Neem Tree 0.50 Left
200 5/100 5/150 5.70 Palm Tree 1.20 Left
201 5.70 Palm Tree 1.20 Left
202 6.00 Neem Tree 2.60 Left
203 6.80 Illuppai Tree 1.20 Left
204 6.50 Palm Tree 1.30 Right
205 6.50 Palm Tree 1.30 Right
206 6.50 Palm Tree 1.30 Right
207 6.50 Palm Tree 1.30 Right
208 6.50 Palm Tree 1.30 Right
209 6.50 Palm Tree 1.30 Right
210 6.50 Tamarind Tree 1.50 Right
211 5/150 5/200 6.50 Illuppai Tree 1.60 Left
212 6.50 Palm Tree 1.20 Left
213 6.50 Neem Tree 0.40 Left

268
Sl. No.
Chainage Offset from C/L
Name of Tree
Girth
Left/Right
Remarks
From
To
214 6.50 Neem Tree 0.40 Left
215 6.50 Pungai Tree 0.40 Right
216 5/150 5/200 6.50 Illuppai Tree 1.60 Left
217 6.50 Palm Tree 1.20 Left
218 6.50 Neem Tree 0.40 Left
219 6.50 Neem Tree 0.40 Left
220 5/200 5/250 6.50 Palm Tree 1.20 Left
221 6.50 Neem Tree 0.50 Right
222 5/250 5/300 6.50 Neem Tree 2.90 Left
223 6.50 Palm Tree 1.20 Left
224 5/300 5/350 6.80 Palm Tree 1.20 Left
225 6.50 Tamarind Tree 2.00 Left
226 6.80 Neem Tree 2.40 Left
227 5.50 Palm Tree 13.00 Right
228 5.50 Palm Tree 13.00 Right
229 5.50 Palm Tree 13.00 Right
230 5/350 5/400 6.80 Banyan Tree 4.80 Left
231 6.80 Naval Tree 2.10 Right
232 6.80 Palm Tree 1.30 Right
233 6.80 Neem Tree 1.40 Right
234 6.80 Palm Tree 1.20 Right
235 6.80 Palm Tree 1.20 Right
236 5/400 5/450 6.80 Palm Tree 1.20 Left
237 6.80 Palm Tree 1.20 Left
238 6.50 Illuppai Tree 1.90 Left
239 6.80 Neem Tree 3.50 Right
240 6.80 Illuppai Tree 3.60 Right
241 5/450 5/500 6.80 Illuppai Tree 5.30 Left
242 6.80 Illuppai Tree 2.20 Left
243 6.80 Illuppai Tree 4.20 Right
244 6.80 Illuppai Tree 5.70 Right
245 5/500 5/550 6.00 Illuppai Tree 2.40 Left
246 6.80 Tamarind Tree 4.40 Right
247 5/550 5/600 6.80 Tamarind Tree 1.60 Left
248 6.80 Tamarind Tree 3.90 Right
249 5/600 5/650 6.80 Tamarind Tree 3.50 Left
250 6.80 Illuppai Tree 1.60 Left
251 6.80 Tamarind Tree 3.20 Right
252 6.80 Illuppai Tree 3.40 Right
253 6.80 Neem Tree 0.80 Right
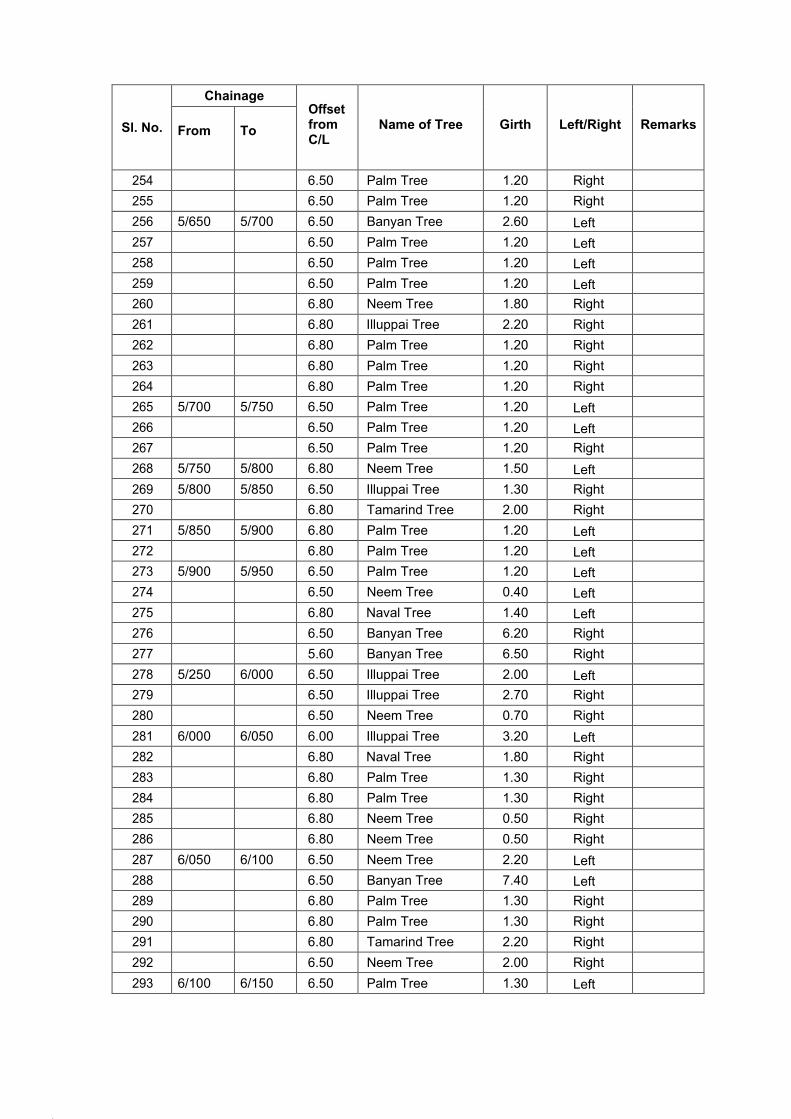
11.
12.
Sl. No.
Chainage Offset from C/L
Name of Tree
Girth
Left/Right
Remarks
From
To
254 6.50 Palm Tree 1.20 Right
255 6.50 Palm Tree 1.20 Right
256 5/650 5/700 6.50 Banyan Tree 2.60 Left
257 6.50 Palm Tree 1.20 Left
258 6.50 Palm Tree 1.20 Left
259 6.50 Palm Tree 1.20 Left
260 6.80 Neem Tree 1.80 Right
261 6.80 Illuppai Tree 2.20 Right
262 6.80 Palm Tree 1.20 Right
263 6.80 Palm Tree 1.20 Right
264 6.80 Palm Tree 1.20 Right
265 5/700 5/750 6.50 Palm Tree 1.20 Left
266 6.50 Palm Tree 1.20 Left
267 6.50 Palm Tree 1.20 Right
268 5/750 5/800 6.80 Neem Tree 1.50 Left
269 5/800 5/850 6.50 Illuppai Tree 1.30 Right
270 6.80 Tamarind Tree 2.00 Right
271 5/850 5/900 6.80 Palm Tree 1.20 Left
272 6.80 Palm Tree 1.20 Left
273 5/900 5/950 6.50 Palm Tree 1.20 Left
274 6.50 Neem Tree 0.40 Left
275 6.80 Naval Tree 1.40 Left
276 6.50 Banyan Tree 6.20 Right
277 5.60 Banyan Tree 6.50 Right
278 5/250 6/000 6.50 Illuppai Tree 2.00 Left
279 6.50 Illuppai Tree 2.70 Right
280 6.50 Neem Tree 0.70 Right
281 6/000 6/050 6.00 Illuppai Tree 3.20 Left
282 6.80 Naval Tree 1.80 Right
283 6.80 Palm Tree 1.30 Right
284 6.80 Palm Tree 1.30 Right
285 6.80 Neem Tree 0.50 Right
286 6.80 Neem Tree 0.50 Right
287 6/050 6/100 6.50 Neem Tree 2.20 Left
288 6.50 Banyan Tree 7.40 Left
289 6.80 Palm Tree 1.30 Right
290 6.80 Palm Tree 1.30 Right
291 6.80 Tamarind Tree 2.20 Right
292 6.50 Neem Tree 2.00 Right
293 6/100 6/150 6.50 Palm Tree 1.30 Left
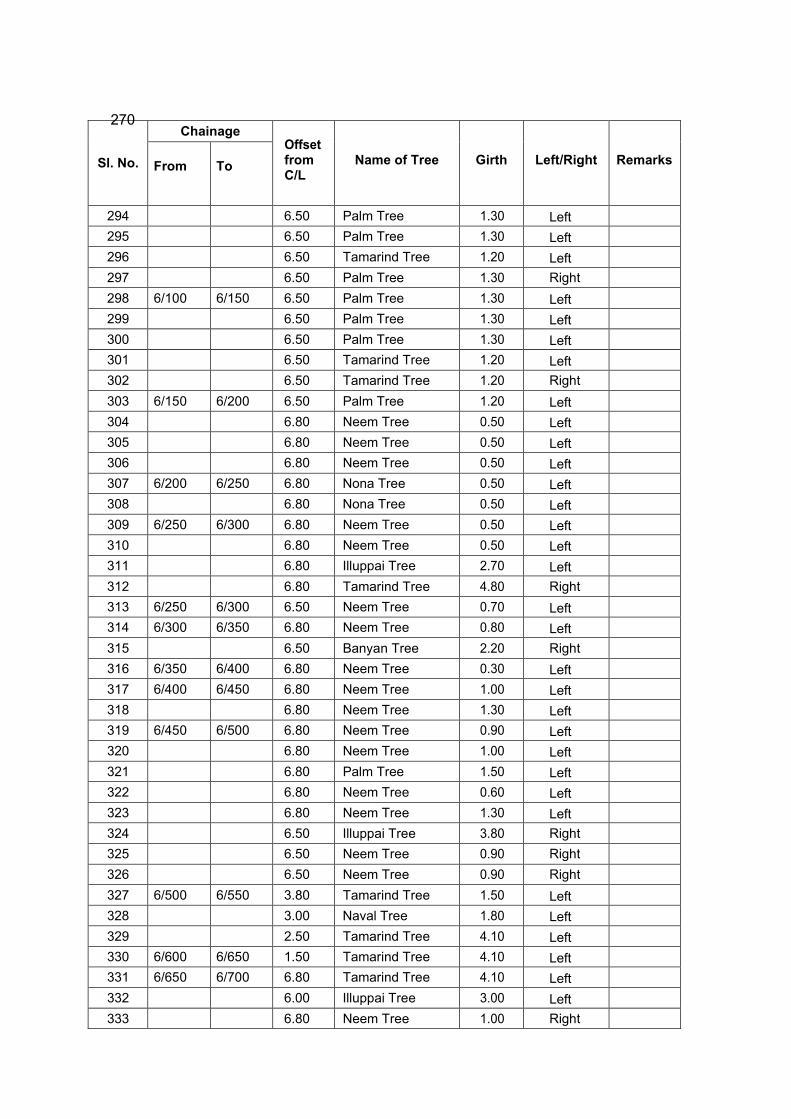
270
Sl. No.
Chainage Offset from C/L
Name of Tree
Girth
Left/Right
Remarks
From
To
294 6.50 Palm Tree 1.30 Left
295 6.50 Palm Tree 1.30 Left
296 6.50 Tamarind Tree 1.20 Left
297 6.50 Palm Tree 1.30 Right
298 6/100 6/150 6.50 Palm Tree 1.30 Left
299 6.50 Palm Tree 1.30 Left
300 6.50 Palm Tree 1.30 Left
301 6.50 Tamarind Tree 1.20 Left
302 6.50 Tamarind Tree 1.20 Right
303 6/150 6/200 6.50 Palm Tree 1.20 Left
304 6.80 Neem Tree 0.50 Left
305 6.80 Neem Tree 0.50 Left
306 6.80 Neem Tree 0.50 Left
307 6/200 6/250 6.80 Nona Tree 0.50 Left
308 6.80 Nona Tree 0.50 Left
309 6/250 6/300 6.80 Neem Tree 0.50 Left
310 6.80 Neem Tree 0.50 Left
311 6.80 Illuppai Tree 2.70 Left
312 6.80 Tamarind Tree 4.80 Right
313 6/250 6/300 6.50 Neem Tree 0.70 Left
314 6/300 6/350 6.80 Neem Tree 0.80 Left
315 6.50 Banyan Tree 2.20 Right
316 6/350 6/400 6.80 Neem Tree 0.30 Left
317 6/400 6/450 6.80 Neem Tree 1.00 Left
318 6.80 Neem Tree 1.30 Left
319 6/450 6/500 6.80 Neem Tree 0.90 Left
320 6.80 Neem Tree 1.00 Left
321 6.80 Palm Tree 1.50 Left
322 6.80 Neem Tree 0.60 Left
323 6.80 Neem Tree 1.30 Left
324 6.50 Illuppai Tree 3.80 Right
325 6.50 Neem Tree 0.90 Right
326 6.50 Neem Tree 0.90 Right
327 6/500 6/550 3.80 Tamarind Tree 1.50 Left
328 3.00 Naval Tree 1.80 Left
329 2.50 Tamarind Tree 4.10 Left
330 6/600 6/650 1.50 Tamarind Tree 4.10 Left
331 6/650 6/700 6.80 Tamarind Tree 4.10 Left
332 6.00 Illuppai Tree 3.00 Left
333 6.80 Neem Tree 1.00 Right
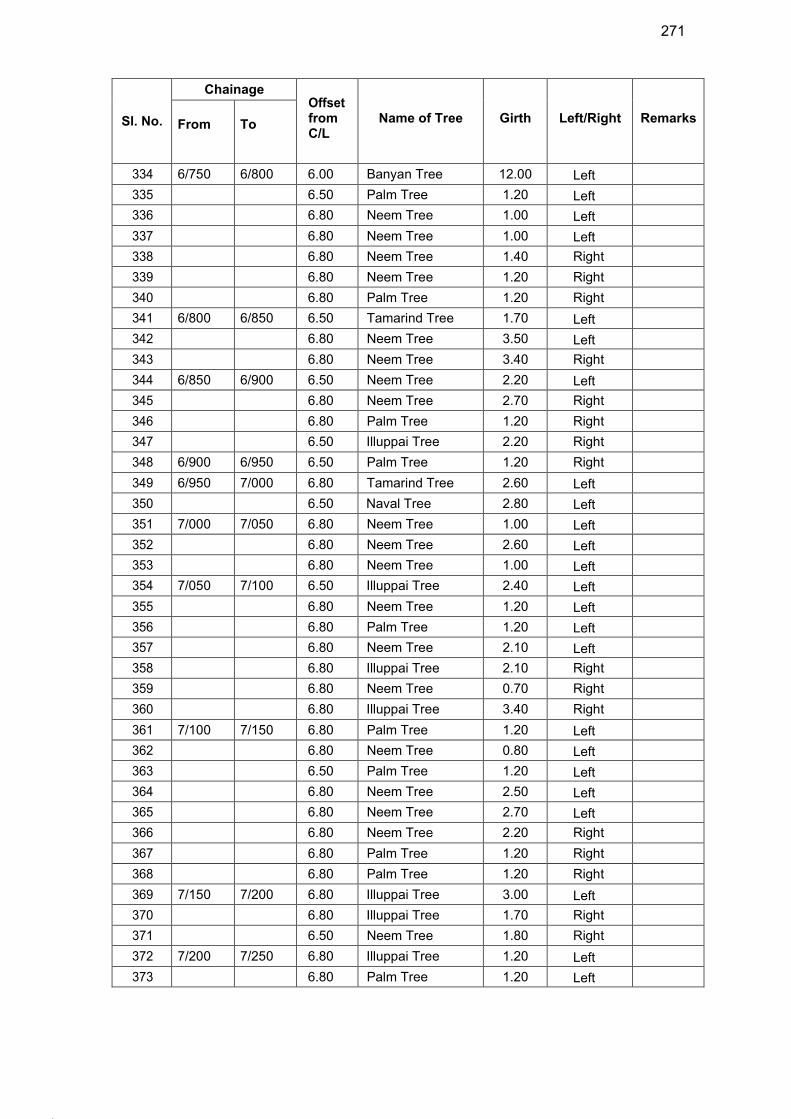
15.
16.
271
Sl. No.
Chainage Offset from C/L
Name of Tree
Girth
Left/Right
Remarks
From
To
334 6/750 6/800 6.00 Banyan Tree 12.00 Left
335 6.50 Palm Tree 1.20 Left
336 6.80 Neem Tree 1.00 Left
337 6.80 Neem Tree 1.00 Left
338 6.80 Neem Tree 1.40 Right
339 6.80 Neem Tree 1.20 Right
340 6.80 Palm Tree 1.20 Right
341 6/800 6/850 6.50 Tamarind Tree 1.70 Left
342 6.80 Neem Tree 3.50 Left
343 6.80 Neem Tree 3.40 Right
344 6/850 6/900 6.50 Neem Tree 2.20 Left
345 6.80 Neem Tree 2.70 Right
346 6.80 Palm Tree 1.20 Right
347 6.50 Illuppai Tree 2.20 Right
348 6/900 6/950 6.50 Palm Tree 1.20 Right
349 6/950 7/000 6.80 Tamarind Tree 2.60 Left
350 6.50 Naval Tree 2.80 Left
351 7/000 7/050 6.80 Neem Tree 1.00 Left
352 6.80 Neem Tree 2.60 Left
353 6.80 Neem Tree 1.00 Left
354 7/050 7/100 6.50 Illuppai Tree 2.40 Left
355 6.80 Neem Tree 1.20 Left
356 6.80 Palm Tree 1.20 Left
357 6.80 Neem Tree 2.10 Left
358 6.80 Illuppai Tree 2.10 Right
359 6.80 Neem Tree 0.70 Right
360 6.80 Illuppai Tree 3.40 Right
361 7/100 7/150 6.80 Palm Tree 1.20 Left
362 6.80 Neem Tree 0.80 Left
363 6.50 Palm Tree 1.20 Left
364 6.80 Neem Tree 2.50 Left
365 6.80 Neem Tree 2.70 Left
366 6.80 Neem Tree 2.20 Right
367 6.80 Palm Tree 1.20 Right
368 6.80 Palm Tree 1.20 Right
369 7/150 7/200 6.80 Illuppai Tree 3.00 Left
370 6.80 Illuppai Tree 1.70 Right
371 6.50 Neem Tree 1.80 Right
372 7/200 7/250 6.80 Illuppai Tree 1.20 Left
373 6.80 Palm Tree 1.20 Left
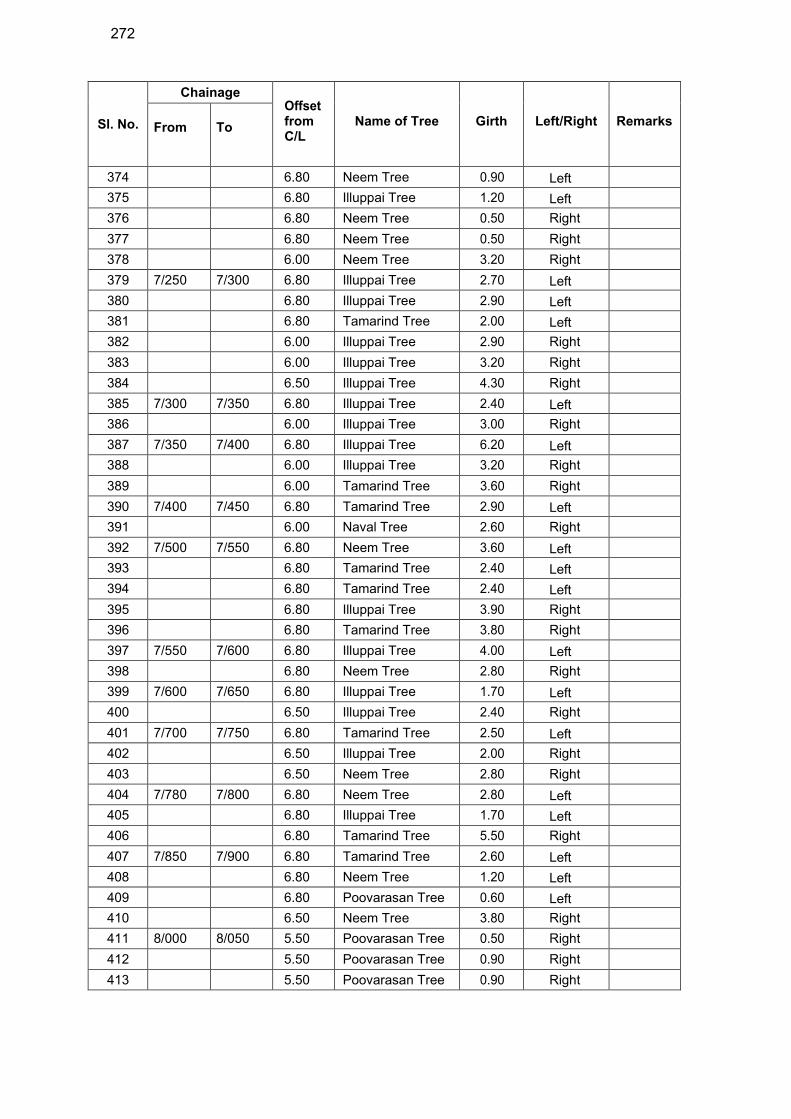
272
Sl. No.
Chainage Offset from C/L
Name of Tree
Girth
Left/Right
Remarks
From
To
374 6.80 Neem Tree 0.90 Left
375 6.80 Illuppai Tree 1.20 Left
376 6.80 Neem Tree 0.50 Right
377 6.80 Neem Tree 0.50 Right
378 6.00 Neem Tree 3.20 Right
379 7/250 7/300 6.80 Illuppai Tree 2.70 Left
380 6.80 Illuppai Tree 2.90 Left
381 6.80 Tamarind Tree 2.00 Left
382 6.00 Illuppai Tree 2.90 Right
383 6.00 Illuppai Tree 3.20 Right
384 6.50 Illuppai Tree 4.30 Right
385 7/300 7/350 6.80 Illuppai Tree 2.40 Left
386 6.00 Illuppai Tree 3.00 Right
387 7/350 7/400 6.80 Illuppai Tree 6.20 Left
388 6.00 Illuppai Tree 3.20 Right
389 6.00 Tamarind Tree 3.60 Right
390 7/400 7/450 6.80 Tamarind Tree 2.90 Left
391 6.00 Naval Tree 2.60 Right
392 7/500 7/550 6.80 Neem Tree 3.60 Left
393 6.80 Tamarind Tree 2.40 Left
394 6.80 Tamarind Tree 2.40 Left
395 6.80 Illuppai Tree 3.90 Right
396 6.80 Tamarind Tree 3.80 Right
397 7/550 7/600 6.80 Illuppai Tree 4.00 Left
398 6.80 Neem Tree 2.80 Right
399 7/600 7/650 6.80 Illuppai Tree 1.70 Left
400 6.50 Illuppai Tree 2.40 Right
401 7/700 7/750 6.80 Tamarind Tree 2.50 Left
402 6.50 Illuppai Tree 2.00 Right
403 6.50 Neem Tree 2.80 Right
404 7/780 7/800 6.80 Neem Tree 2.80 Left
405 6.80 Illuppai Tree 1.70 Left
406 6.80 Tamarind Tree 5.50 Right
407 7/850 7/900 6.80 Tamarind Tree 2.60 Left
408 6.80 Neem Tree 1.20 Left
409 6.80 Poovarasan Tree 0.60 Left
410 6.50 Neem Tree 3.80 Right
411 8/000 8/050 5.50 Poovarasan Tree 0.50 Right
412 5.50 Poovarasan Tree 0.90 Right
413 5.50 Poovarasan Tree 0.90 Right
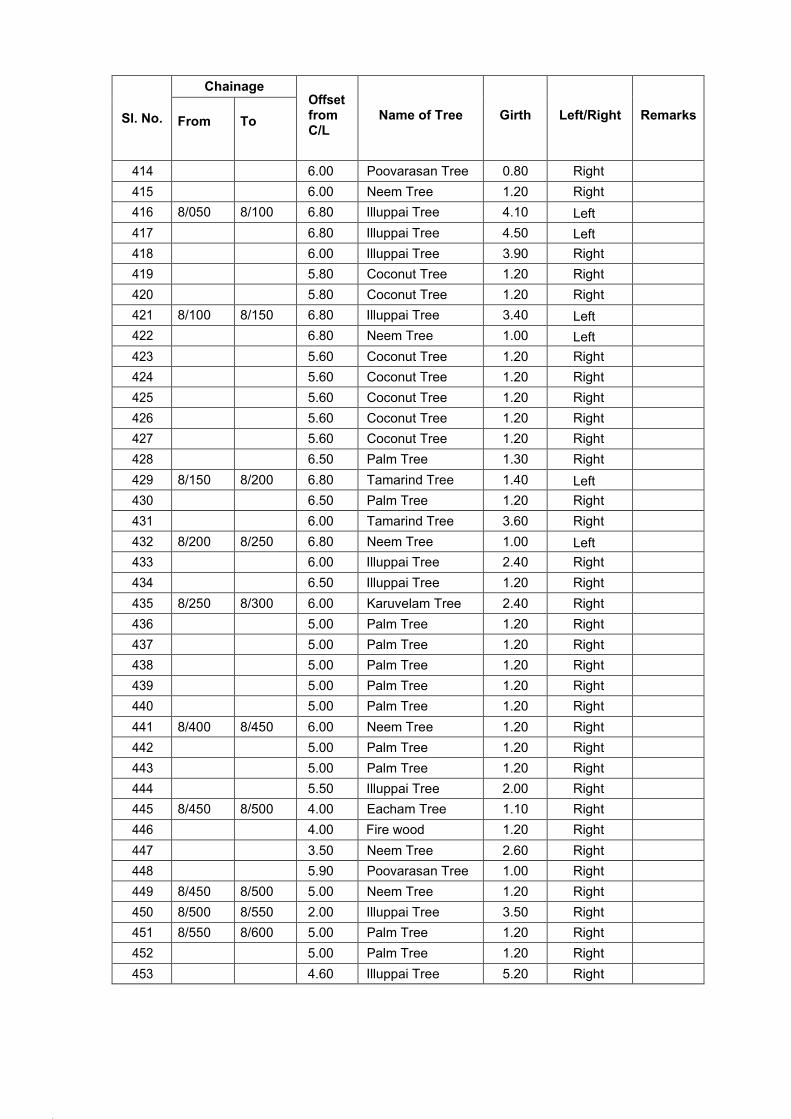
18.
19.
Sl. No.
Chainage Offset from C/L
Name of Tree
Girth
Left/Right
Remarks
From
To
414 6.00 Poovarasan Tree 0.80 Right
415 6.00 Neem Tree 1.20 Right
416 8/050 8/100 6.80 Illuppai Tree 4.10 Left
417 6.80 Illuppai Tree 4.50 Left
418 6.00 Illuppai Tree 3.90 Right
419 5.80 Coconut Tree 1.20 Right
420 5.80 Coconut Tree 1.20 Right
421 8/100 8/150 6.80 Illuppai Tree 3.40 Left
422 6.80 Neem Tree 1.00 Left
423 5.60 Coconut Tree 1.20 Right
424 5.60 Coconut Tree 1.20 Right
425 5.60 Coconut Tree 1.20 Right
426 5.60 Coconut Tree 1.20 Right
427 5.60 Coconut Tree 1.20 Right
428 6.50 Palm Tree 1.30 Right
429 8/150 8/200 6.80 Tamarind Tree 1.40 Left
430 6.50 Palm Tree 1.20 Right
431 6.00 Tamarind Tree 3.60 Right
432 8/200 8/250 6.80 Neem Tree 1.00 Left
433 6.00 Illuppai Tree 2.40 Right
434 6.50 Illuppai Tree 1.20 Right
435 8/250 8/300 6.00 Karuvelam Tree 2.40 Right
436 5.00 Palm Tree 1.20 Right
437 5.00 Palm Tree 1.20 Right
438 5.00 Palm Tree 1.20 Right
439 5.00 Palm Tree 1.20 Right
440 5.00 Palm Tree 1.20 Right
441 8/400 8/450 6.00 Neem Tree 1.20 Right
442 5.00 Palm Tree 1.20 Right
443 5.00 Palm Tree 1.20 Right
444 5.50 Illuppai Tree 2.00 Right
445 8/450 8/500 4.00 Eacham Tree 1.10 Right
446 4.00 Fire wood 1.20 Right
447 3.50 Neem Tree 2.60 Right
448 5.90 Poovarasan Tree 1.00 Right
449 8/450 8/500 5.00 Neem Tree 1.20 Right
450 8/500 8/550 2.00 Illuppai Tree 3.50 Right
451 8/550 8/600 5.00 Palm Tree 1.20 Right
452 5.00 Palm Tree 1.20 Right
453 4.60 Illuppai Tree 5.20 Right
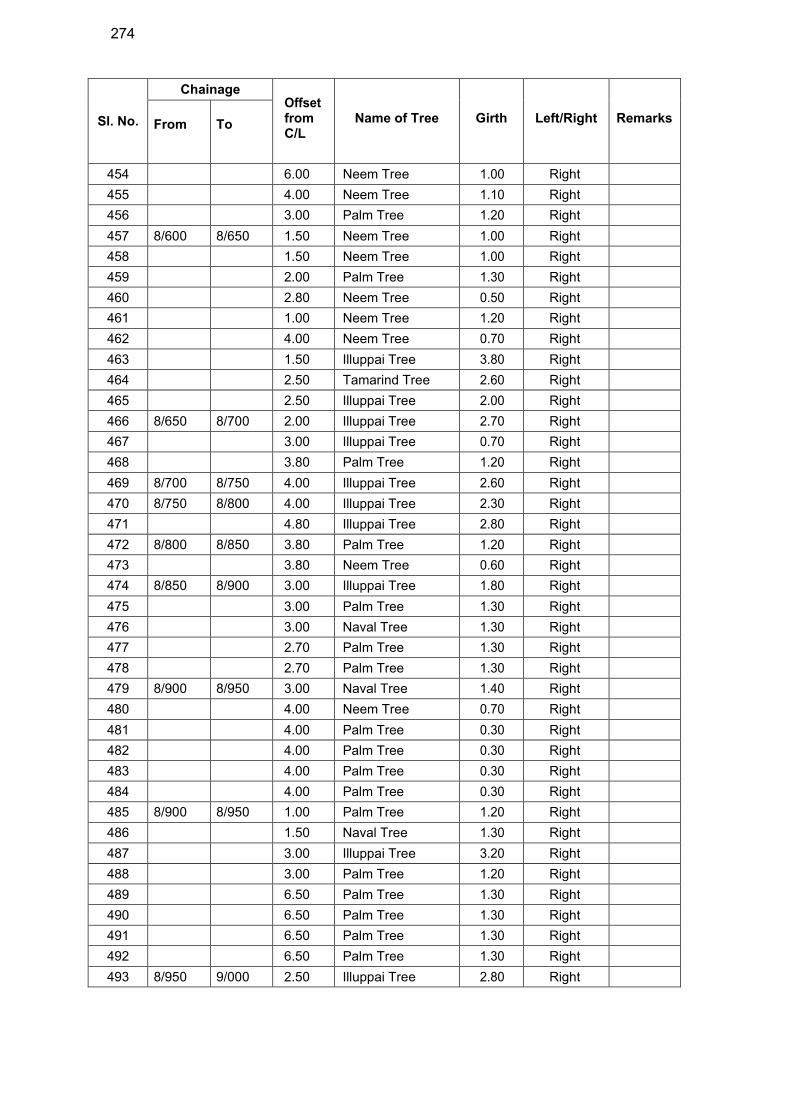
274
Sl. No.
Chainage Offset from C/L
Name of Tree
Girth
Left/Right
Remarks
From
To
454 6.00 Neem Tree 1.00 Right
455 4.00 Neem Tree 1.10 Right
456 3.00 Palm Tree 1.20 Right
457 8/600 8/650 1.50 Neem Tree 1.00 Right
458 1.50 Neem Tree 1.00 Right
459 2.00 Palm Tree 1.30 Right
460 2.80 Neem Tree 0.50 Right
461 1.00 Neem Tree 1.20 Right
462 4.00 Neem Tree 0.70 Right
463 1.50 Illuppai Tree 3.80 Right
464 2.50 Tamarind Tree 2.60 Right
465 2.50 Illuppai Tree 2.00 Right
466 8/650 8/700 2.00 Illuppai Tree 2.70 Right
467 3.00 Illuppai Tree 0.70 Right
468 3.80 Palm Tree 1.20 Right
469 8/700 8/750 4.00 Illuppai Tree 2.60 Right
470 8/750 8/800 4.00 Illuppai Tree 2.30 Right
471 4.80 Illuppai Tree 2.80 Right
472 8/800 8/850 3.80 Palm Tree 1.20 Right
473 3.80 Neem Tree 0.60 Right
474 8/850 8/900 3.00 Illuppai Tree 1.80 Right
475 3.00 Palm Tree 1.30 Right
476 3.00 Naval Tree 1.30 Right
477 2.70 Palm Tree 1.30 Right
478 2.70 Palm Tree 1.30 Right
479 8/900 8/950 3.00 Naval Tree 1.40 Right
480 4.00 Neem Tree 0.70 Right
481 4.00 Palm Tree 0.30 Right
482 4.00 Palm Tree 0.30 Right
483 4.00 Palm Tree 0.30 Right
484 4.00 Palm Tree 0.30 Right
485 8/900 8/950 1.00 Palm Tree 1.20 Right
486 1.50 Naval Tree 1.30 Right
487 3.00 Illuppai Tree 3.20 Right
488 3.00 Palm Tree 1.20 Right
489 6.50 Palm Tree 1.30 Right
490 6.50 Palm Tree 1.30 Right
491 6.50 Palm Tree 1.30 Right
492 6.50 Palm Tree 1.30 Right
493 8/950 9/000 2.50 Illuppai Tree 2.80 Right
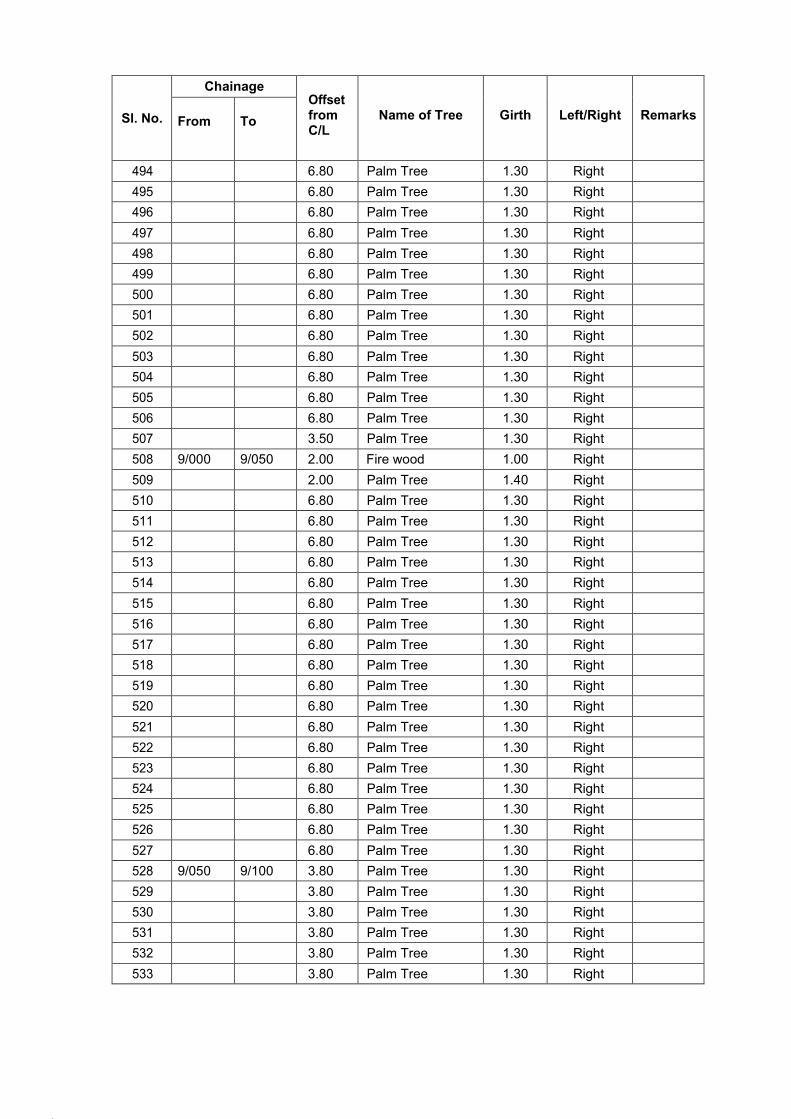
22.
23.
Sl. No.
Chainage Offset from C/L
Name of Tree
Girth
Left/Right
Remarks
From
To
494 6.80 Palm Tree 1.30 Right
495 6.80 Palm Tree 1.30 Right
496 6.80 Palm Tree 1.30 Right
497 6.80 Palm Tree 1.30 Right
498 6.80 Palm Tree 1.30 Right
499 6.80 Palm Tree 1.30 Right
500 6.80 Palm Tree 1.30 Right
501 6.80 Palm Tree 1.30 Right
502 6.80 Palm Tree 1.30 Right
503 6.80 Palm Tree 1.30 Right
504 6.80 Palm Tree 1.30 Right
505 6.80 Palm Tree 1.30 Right
506 6.80 Palm Tree 1.30 Right
507 3.50 Palm Tree 1.30 Right
508 9/000 9/050 2.00 Fire wood 1.00 Right
509 2.00 Palm Tree 1.40 Right
510 6.80 Palm Tree 1.30 Right
511 6.80 Palm Tree 1.30 Right
512 6.80 Palm Tree 1.30 Right
513 6.80 Palm Tree 1.30 Right
514 6.80 Palm Tree 1.30 Right
515 6.80 Palm Tree 1.30 Right
516 6.80 Palm Tree 1.30 Right
517 6.80 Palm Tree 1.30 Right
518 6.80 Palm Tree 1.30 Right
519 6.80 Palm Tree 1.30 Right
520 6.80 Palm Tree 1.30 Right
521 6.80 Palm Tree 1.30 Right
522 6.80 Palm Tree 1.30 Right
523 6.80 Palm Tree 1.30 Right
524 6.80 Palm Tree 1.30 Right
525 6.80 Palm Tree 1.30 Right
526 6.80 Palm Tree 1.30 Right
527 6.80 Palm Tree 1.30 Right
528 9/050 9/100 3.80 Palm Tree 1.30 Right
529 3.80 Palm Tree 1.30 Right
530 3.80 Palm Tree 1.30 Right
531 3.80 Palm Tree 1.30 Right
532 3.80 Palm Tree 1.30 Right
533 3.80 Palm Tree 1.30 Right
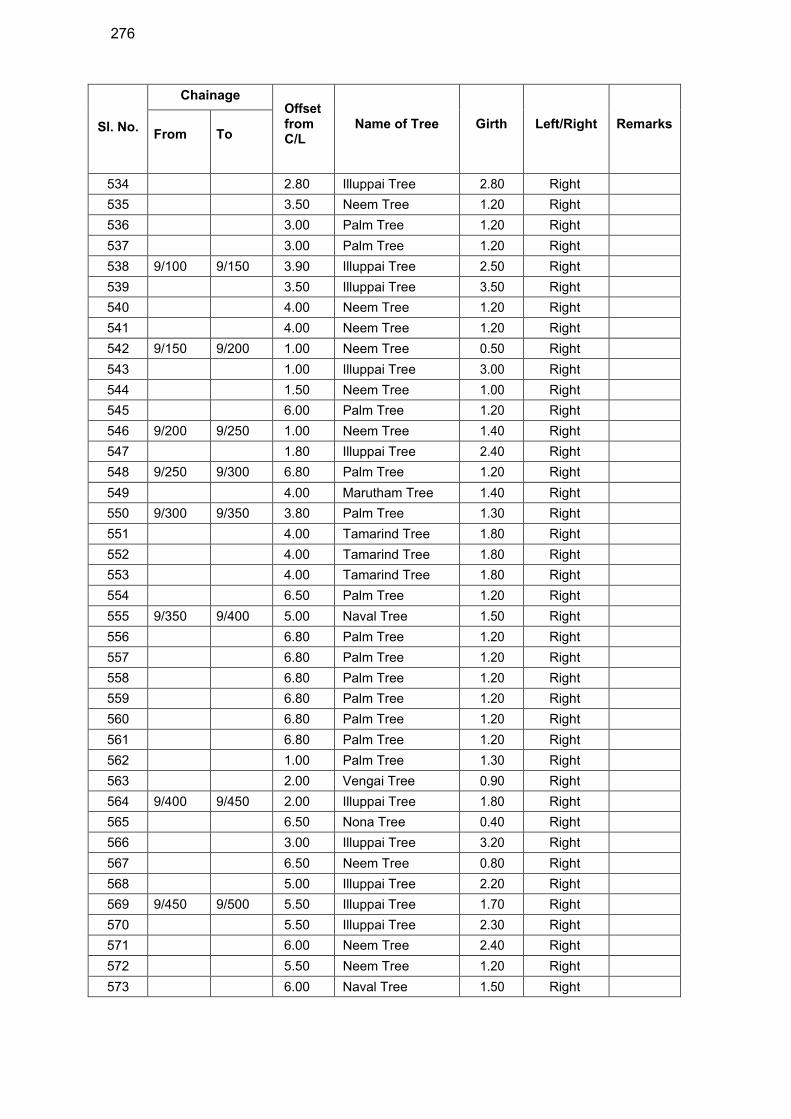
276
Sl. No.
Chainage Offset from C/L
Name of Tree
Girth
Left/Right
Remarks
From To
534 2.80 Illuppai Tree 2.80 Right
535 3.50 Neem Tree 1.20 Right
536 3.00 Palm Tree 1.20 Right
537 3.00 Palm Tree 1.20 Right
538 9/100 9/150 3.90 Illuppai Tree 2.50 Right
539 3.50 Illuppai Tree 3.50 Right
540 4.00 Neem Tree 1.20 Right
541 4.00 Neem Tree 1.20 Right
542 9/150 9/200 1.00 Neem Tree 0.50 Right
543 1.00 Illuppai Tree 3.00 Right
544 1.50 Neem Tree 1.00 Right
545 6.00 Palm Tree 1.20 Right
546 9/200 9/250 1.00 Neem Tree 1.40 Right
547 1.80 Illuppai Tree 2.40 Right
548 9/250 9/300 6.80 Palm Tree 1.20 Right
549 4.00 Marutham Tree 1.40 Right
550 9/300 9/350 3.80 Palm Tree 1.30 Right
551 4.00 Tamarind Tree 1.80 Right
552 4.00 Tamarind Tree 1.80 Right
553 4.00 Tamarind Tree 1.80 Right
554 6.50 Palm Tree 1.20 Right
555 9/350 9/400 5.00 Naval Tree 1.50 Right
556 6.80 Palm Tree 1.20 Right
557 6.80 Palm Tree 1.20 Right
558 6.80 Palm Tree 1.20 Right
559 6.80 Palm Tree 1.20 Right
560 6.80 Palm Tree 1.20 Right
561 6.80 Palm Tree 1.20 Right
562 1.00 Palm Tree 1.30 Right
563 2.00 Vengai Tree 0.90 Right
564 9/400 9/450 2.00 Illuppai Tree 1.80 Right
565 6.50 Nona Tree 0.40 Right
566 3.00 Illuppai Tree 3.20 Right
567 6.50 Neem Tree 0.80 Right
568 5.00 Illuppai Tree 2.20 Right
569 9/450 9/500 5.50 Illuppai Tree 1.70 Right
570 5.50 Illuppai Tree 2.30 Right
571 6.00 Neem Tree 2.40 Right
572 5.50 Neem Tree 1.20 Right
573 6.00 Naval Tree 1.50 Right
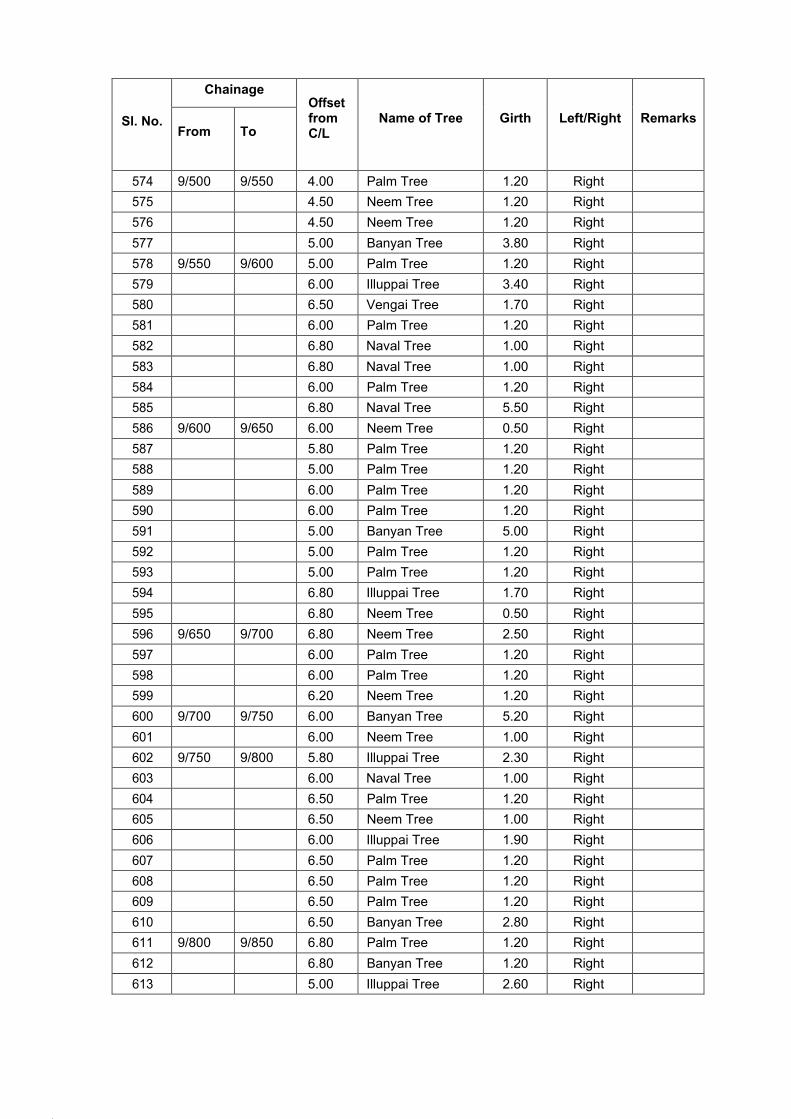
26.
27.
Sl. No.
Chainage Offset from C/L
Name of Tree
Girth
Left/Right
Remarks
From To
574 9/500 9/550 4.00 Palm Tree 1.20 Right
575 4.50 Neem Tree 1.20 Right
576 4.50 Neem Tree 1.20 Right
577 5.00 Banyan Tree 3.80 Right
578 9/550 9/600 5.00 Palm Tree 1.20 Right
579 6.00 Illuppai Tree 3.40 Right
580 6.50 Vengai Tree 1.70 Right
581 6.00 Palm Tree 1.20 Right
582 6.80 Naval Tree 1.00 Right
583 6.80 Naval Tree 1.00 Right
584 6.00 Palm Tree 1.20 Right
585 6.80 Naval Tree 5.50 Right
586 9/600 9/650 6.00 Neem Tree 0.50 Right
587 5.80 Palm Tree 1.20 Right
588 5.00 Palm Tree 1.20 Right
589 6.00 Palm Tree 1.20 Right
590 6.00 Palm Tree 1.20 Right
591 5.00 Banyan Tree 5.00 Right
592 5.00 Palm Tree 1.20 Right
593 5.00 Palm Tree 1.20 Right
594 6.80 Illuppai Tree 1.70 Right
595 6.80 Neem Tree 0.50 Right
596 9/650 9/700 6.80 Neem Tree 2.50 Right
597 6.00 Palm Tree 1.20 Right
598 6.00 Palm Tree 1.20 Right
599 6.20 Neem Tree 1.20 Right
600 9/700 9/750 6.00 Banyan Tree 5.20 Right
601 6.00 Neem Tree 1.00 Right
602 9/750 9/800 5.80 Illuppai Tree 2.30 Right
603 6.00 Naval Tree 1.00 Right
604 6.50 Palm Tree 1.20 Right
605 6.50 Neem Tree 1.00 Right
606 6.00 Illuppai Tree 1.90 Right
607 6.50 Palm Tree 1.20 Right
608 6.50 Palm Tree 1.20 Right
609 6.50 Palm Tree 1.20 Right
610 6.50 Banyan Tree 2.80 Right
611 9/800 9/850 6.80 Palm Tree 1.20 Right
612 6.80 Banyan Tree 1.20 Right
613 5.00 Illuppai Tree 2.60 Right
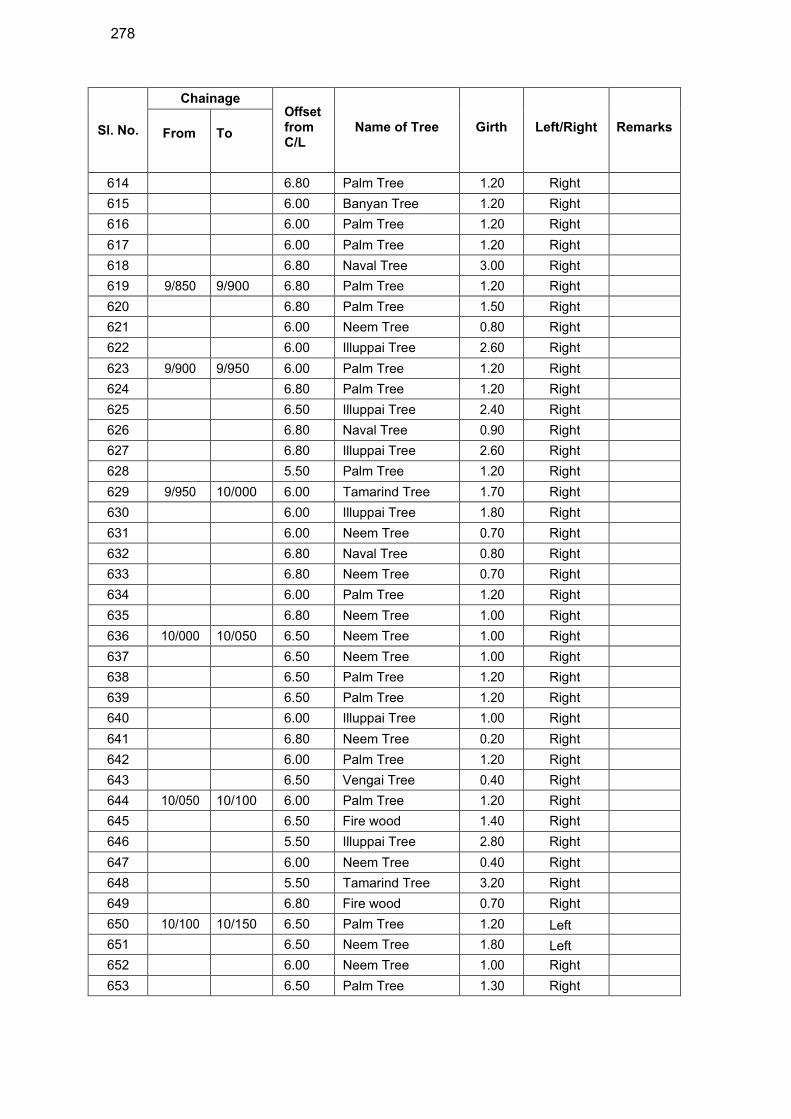
278
Sl. No.
Chainage Offset from C/L
Name of Tree
Girth
Left/Right
Remarks
From
To
614 6.80 Palm Tree 1.20 Right
615 6.00 Banyan Tree 1.20 Right
616 6.00 Palm Tree 1.20 Right
617 6.00 Palm Tree 1.20 Right
618 6.80 Naval Tree 3.00 Right
619 9/850 9/900 6.80 Palm Tree 1.20 Right
620 6.80 Palm Tree 1.50 Right
621 6.00 Neem Tree 0.80 Right
622 6.00 Illuppai Tree 2.60 Right
623 9/900 9/950 6.00 Palm Tree 1.20 Right
624 6.80 Palm Tree 1.20 Right
625 6.50 Illuppai Tree 2.40 Right
626 6.80 Naval Tree 0.90 Right
627 6.80 Illuppai Tree 2.60 Right
628 5.50 Palm Tree 1.20 Right
629 9/950 10/000 6.00 Tamarind Tree 1.70 Right
630 6.00 Illuppai Tree 1.80 Right
631 6.00 Neem Tree 0.70 Right
632 6.80 Naval Tree 0.80 Right
633 6.80 Neem Tree 0.70 Right
634 6.00 Palm Tree 1.20 Right
635 6.80 Neem Tree 1.00 Right
636 10/000 10/050 6.50 Neem Tree 1.00 Right
637 6.50 Neem Tree 1.00 Right
638 6.50 Palm Tree 1.20 Right
639 6.50 Palm Tree 1.20 Right
640 6.00 Illuppai Tree 1.00 Right
641 6.80 Neem Tree 0.20 Right
642 6.00 Palm Tree 1.20 Right
643 6.50 Vengai Tree 0.40 Right
644 10/050 10/100 6.00 Palm Tree 1.20 Right
645 6.50 Fire wood 1.40 Right
646 5.50 Illuppai Tree 2.80 Right
647 6.00 Neem Tree 0.40 Right
648 5.50 Tamarind Tree 3.20 Right
649 6.80 Fire wood 0.70 Right
650 10/100 10/150 6.50 Palm Tree 1.20 Left
651 6.50 Neem Tree 1.80 Left
652 6.00 Neem Tree 1.00 Right
653 6.50 Palm Tree 1.30 Right
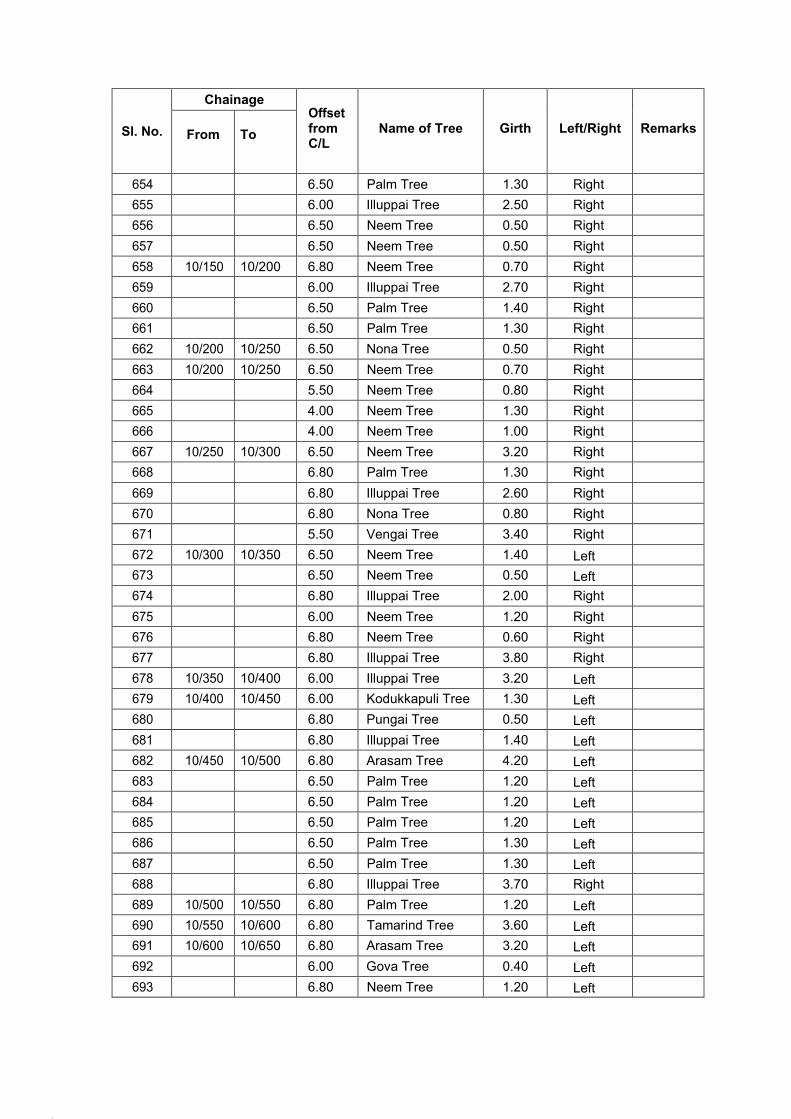
30.
31.
Sl. No.
Chainage Offset from C/L
Name of Tree
Girth
Left/Right
Remarks
From
To
654 6.50 Palm Tree 1.30 Right
655 6.00 Illuppai Tree 2.50 Right
656 6.50 Neem Tree 0.50 Right
657 6.50 Neem Tree 0.50 Right
658 10/150 10/200 6.80 Neem Tree 0.70 Right
659 6.00 Illuppai Tree 2.70 Right
660 6.50 Palm Tree 1.40 Right
661 6.50 Palm Tree 1.30 Right
662 10/200 10/250 6.50 Nona Tree 0.50 Right
663 10/200 10/250 6.50 Neem Tree 0.70 Right
664 5.50 Neem Tree 0.80 Right
665 4.00 Neem Tree 1.30 Right
666 4.00 Neem Tree 1.00 Right
667 10/250 10/300 6.50 Neem Tree 3.20 Right
668 6.80 Palm Tree 1.30 Right
669 6.80 Illuppai Tree 2.60 Right
670 6.80 Nona Tree 0.80 Right
671 5.50 Vengai Tree 3.40 Right
672 10/300 10/350 6.50 Neem Tree 1.40 Left
673 6.50 Neem Tree 0.50 Left
674 6.80 Illuppai Tree 2.00 Right
675 6.00 Neem Tree 1.20 Right
676 6.80 Neem Tree 0.60 Right
677 6.80 Illuppai Tree 3.80 Right
678 10/350 10/400 6.00 Illuppai Tree 3.20 Left
679 10/400 10/450 6.00 Kodukkapuli Tree 1.30 Left
680 6.80 Pungai Tree 0.50 Left
681 6.80 Illuppai Tree 1.40 Left
682 10/450 10/500 6.80 Arasam Tree 4.20 Left
683 6.50 Palm Tree 1.20 Left
684 6.50 Palm Tree 1.20 Left
685 6.50 Palm Tree 1.20 Left
686 6.50 Palm Tree 1.30 Left
687 6.50 Palm Tree 1.30 Left
688 6.80 Illuppai Tree 3.70 Right
689 10/500 10/550 6.80 Palm Tree 1.20 Left
690 10/550 10/600 6.80 Tamarind Tree 3.60 Left
691 10/600 10/650 6.80 Arasam Tree 3.20 Left
692 6.00 Gova Tree 0.40 Left
693 6.80 Neem Tree 1.20 Left
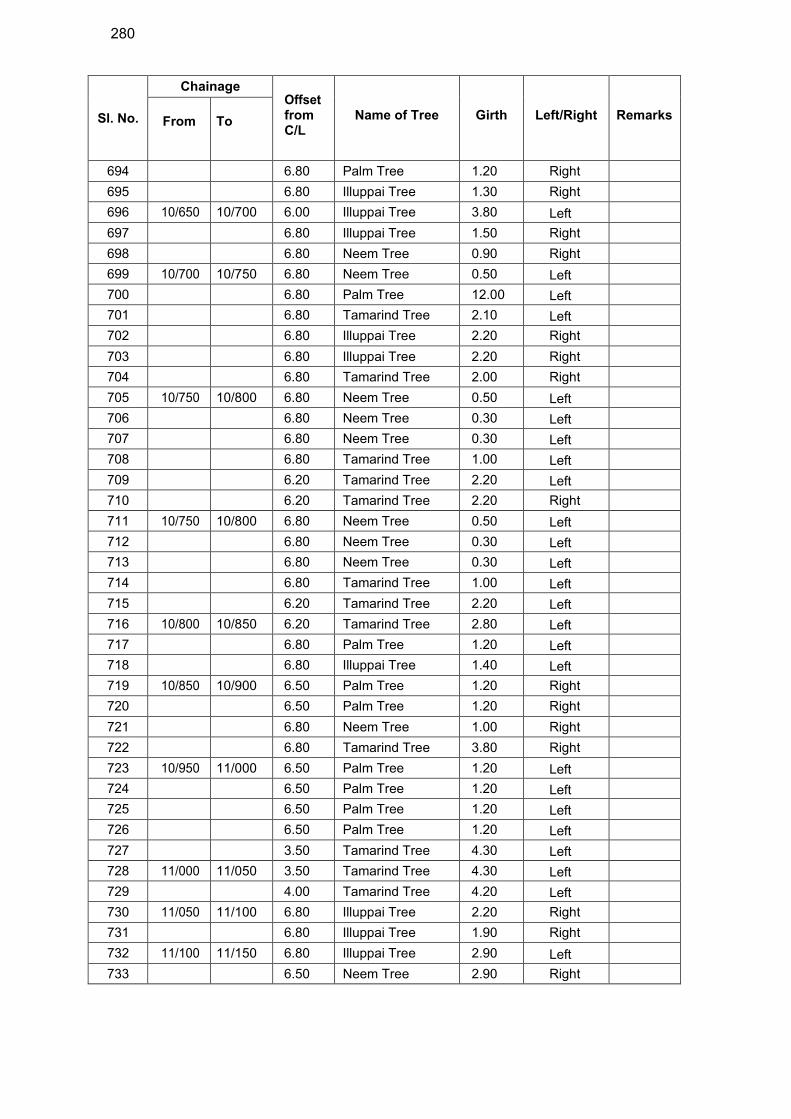
280
Sl. No.
Chainage Offset from C/L
Name of Tree
Girth
Left/Right
Remarks
From
To
694 6.80 Palm Tree 1.20 Right
695 6.80 Illuppai Tree 1.30 Right
696 10/650 10/700 6.00 Illuppai Tree 3.80 Left
697 6.80 Illuppai Tree 1.50 Right
698 6.80 Neem Tree 0.90 Right
699 10/700 10/750 6.80 Neem Tree 0.50 Left
700 6.80 Palm Tree 12.00 Left
701 6.80 Tamarind Tree 2.10 Left
702 6.80 Illuppai Tree 2.20 Right
703 6.80 Illuppai Tree 2.20 Right
704 6.80 Tamarind Tree 2.00 Right
705 10/750 10/800 6.80 Neem Tree 0.50 Left
706 6.80 Neem Tree 0.30 Left
707 6.80 Neem Tree 0.30 Left
708 6.80 Tamarind Tree 1.00 Left
709 6.20 Tamarind Tree 2.20 Left
710 6.20 Tamarind Tree 2.20 Right
711 10/750 10/800 6.80 Neem Tree 0.50 Left
712 6.80 Neem Tree 0.30 Left
713 6.80 Neem Tree 0.30 Left
714 6.80 Tamarind Tree 1.00 Left
715 6.20 Tamarind Tree 2.20 Left
716 10/800 10/850 6.20 Tamarind Tree 2.80 Left
717 6.80 Palm Tree 1.20 Left
718 6.80 Illuppai Tree 1.40 Left
719 10/850 10/900 6.50 Palm Tree 1.20 Right
720 6.50 Palm Tree 1.20 Right
721 6.80 Neem Tree 1.00 Right
722 6.80 Tamarind Tree 3.80 Right
723 10/950 11/000 6.50 Palm Tree 1.20 Left
724 6.50 Palm Tree 1.20 Left
725 6.50 Palm Tree 1.20 Left
726 6.50 Palm Tree 1.20 Left
727 3.50 Tamarind Tree 4.30 Left
728 11/000 11/050 3.50 Tamarind Tree 4.30 Left
729 4.00 Tamarind Tree 4.20 Left
730 11/050 11/100 6.80 Illuppai Tree 2.20 Right
731 6.80 Illuppai Tree 1.90 Right
732 11/100 11/150 6.80 Illuppai Tree 2.90 Left
733 6.50 Neem Tree 2.90 Right
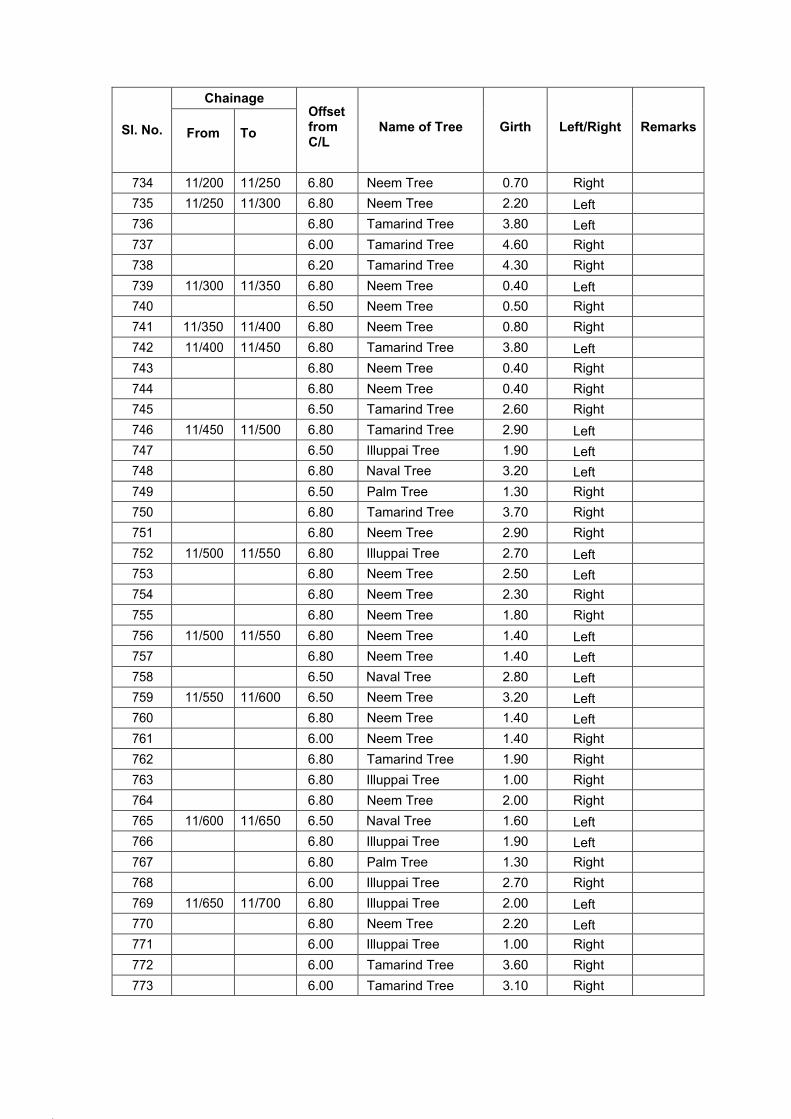
34.
35.
Sl. No.
Chainage Offset from C/L
Name of Tree
Girth
Left/Right
Remarks
From
To
734 11/200 11/250 6.80 Neem Tree 0.70 Right
735 11/250 11/300 6.80 Neem Tree 2.20 Left
736 6.80 Tamarind Tree 3.80 Left
737 6.00 Tamarind Tree 4.60 Right
738 6.20 Tamarind Tree 4.30 Right
739 11/300 11/350 6.80 Neem Tree 0.40 Left
740 6.50 Neem Tree 0.50 Right
741 11/350 11/400 6.80 Neem Tree 0.80 Right
742 11/400 11/450 6.80 Tamarind Tree 3.80 Left
743 6.80 Neem Tree 0.40 Right
744 6.80 Neem Tree 0.40 Right
745 6.50 Tamarind Tree 2.60 Right
746 11/450 11/500 6.80 Tamarind Tree 2.90 Left
747 6.50 Illuppai Tree 1.90 Left
748 6.80 Naval Tree 3.20 Left
749 6.50 Palm Tree 1.30 Right
750 6.80 Tamarind Tree 3.70 Right
751 6.80 Neem Tree 2.90 Right
752 11/500 11/550 6.80 Illuppai Tree 2.70 Left
753 6.80 Neem Tree 2.50 Left
754 6.80 Neem Tree 2.30 Right
755 6.80 Neem Tree 1.80 Right
756 11/500 11/550 6.80 Neem Tree 1.40 Left
757 6.80 Neem Tree 1.40 Left
758 6.50 Naval Tree 2.80 Left
759 11/550 11/600 6.50 Neem Tree 3.20 Left
760 6.80 Neem Tree 1.40 Left
761 6.00 Neem Tree 1.40 Right
762 6.80 Tamarind Tree 1.90 Right
763 6.80 Illuppai Tree 1.00 Right
764 6.80 Neem Tree 2.00 Right
765 11/600 11/650 6.50 Naval Tree 1.60 Left
766 6.80 Illuppai Tree 1.90 Left
767 6.80 Palm Tree 1.30 Right
768 6.00 Illuppai Tree 2.70 Right
769 11/650 11/700 6.80 Illuppai Tree 2.00 Left
770 6.80 Neem Tree 2.20 Left
771 6.00 Illuppai Tree 1.00 Right
772 6.00 Tamarind Tree 3.60 Right
773 6.00 Tamarind Tree 3.10 Right
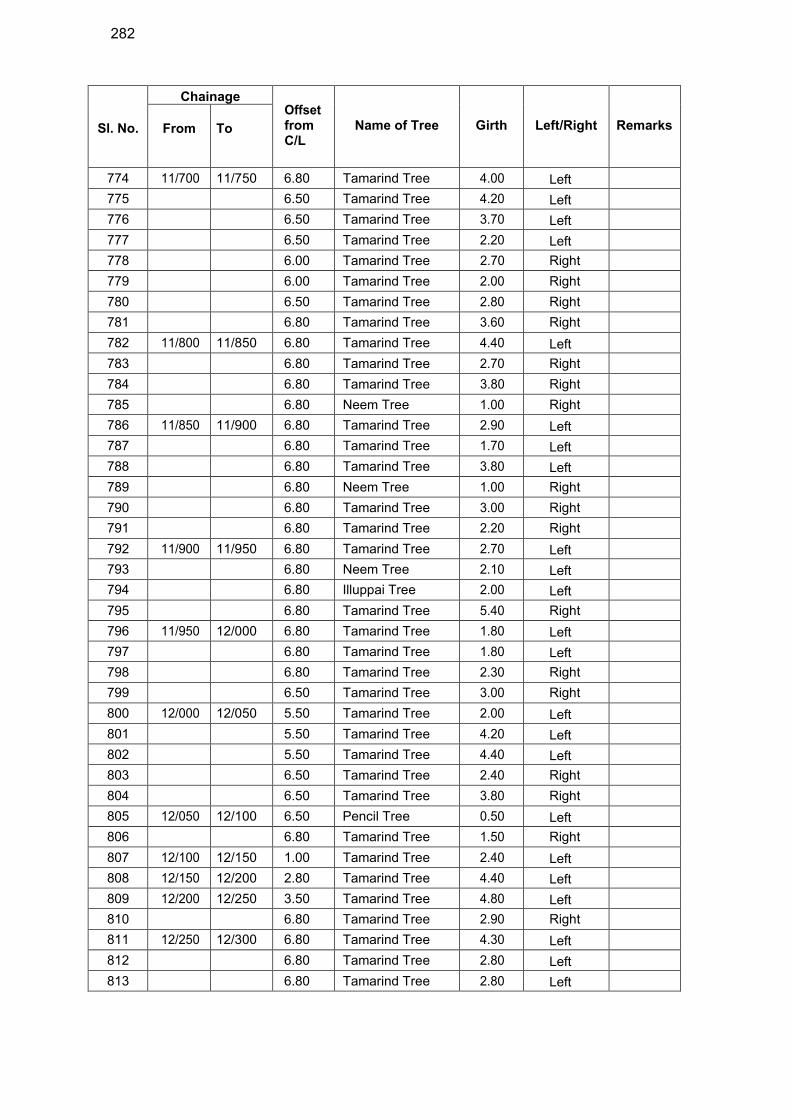
282
Sl. No.
Chainage Offset from C/L
Name of Tree
Girth
Left/Right
Remarks
From
To
774 11/700 11/750 6.80 Tamarind Tree 4.00 Left
775 6.50 Tamarind Tree 4.20 Left
776 6.50 Tamarind Tree 3.70 Left
777 6.50 Tamarind Tree 2.20 Left
778 6.00 Tamarind Tree 2.70 Right
779 6.00 Tamarind Tree 2.00 Right
780 6.50 Tamarind Tree 2.80 Right
781 6.80 Tamarind Tree 3.60 Right
782 11/800 11/850 6.80 Tamarind Tree 4.40 Left
783 6.80 Tamarind Tree 2.70 Right
784 6.80 Tamarind Tree 3.80 Right
785 6.80 Neem Tree 1.00 Right
786 11/850 11/900 6.80 Tamarind Tree 2.90 Left
787 6.80 Tamarind Tree 1.70 Left
788 6.80 Tamarind Tree 3.80 Left
789 6.80 Neem Tree 1.00 Right
790 6.80 Tamarind Tree 3.00 Right
791 6.80 Tamarind Tree 2.20 Right
792 11/900 11/950 6.80 Tamarind Tree 2.70 Left
793 6.80 Neem Tree 2.10 Left
794 6.80 Illuppai Tree 2.00 Left
795 6.80 Tamarind Tree 5.40 Right
796 11/950 12/000 6.80 Tamarind Tree 1.80 Left
797 6.80 Tamarind Tree 1.80 Left
798 6.80 Tamarind Tree 2.30 Right
799 6.50 Tamarind Tree 3.00 Right
800 12/000 12/050 5.50 Tamarind Tree 2.00 Left
801 5.50 Tamarind Tree 4.20 Left
802 5.50 Tamarind Tree 4.40 Left
803 6.50 Tamarind Tree 2.40 Right
804 6.50 Tamarind Tree 3.80 Right
805 12/050 12/100 6.50 Pencil Tree 0.50 Left
806 6.80 Tamarind Tree 1.50 Right
807 12/100 12/150 1.00 Tamarind Tree 2.40 Left
808 12/150 12/200 2.80 Tamarind Tree 4.40 Left
809 12/200 12/250 3.50 Tamarind Tree 4.80 Left
810 6.80 Tamarind Tree 2.90 Right
811 12/250 12/300 6.80 Tamarind Tree 4.30 Left
812 6.80 Tamarind Tree 2.80 Left
813 6.80 Tamarind Tree 2.80 Left
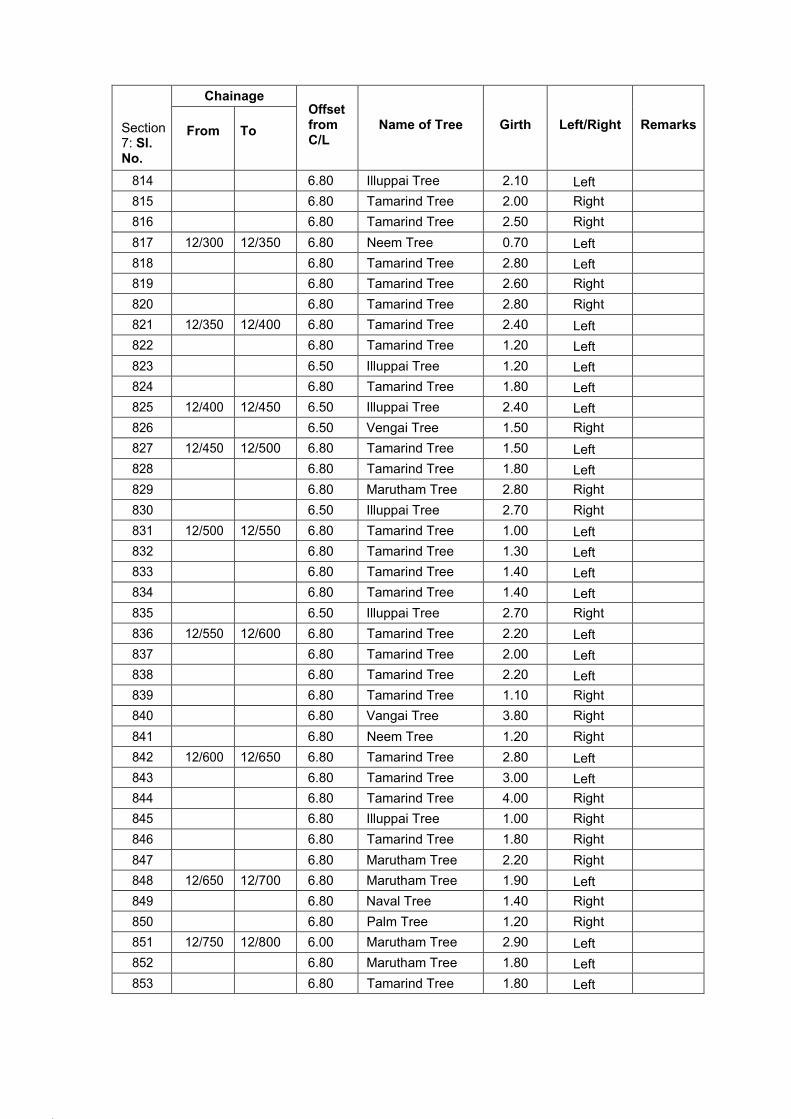
38.
39.
Section 7: Sl. No.
Chainage Offset from C/L
Name of Tree
Girth
Left/Right
Remarks
From
To
814 6.80 Illuppai Tree 2.10 Left
815 6.80 Tamarind Tree 2.00 Right
816 6.80 Tamarind Tree 2.50 Right
817 12/300 12/350 6.80 Neem Tree 0.70 Left
818 6.80 Tamarind Tree 2.80 Left
819 6.80 Tamarind Tree 2.60 Right
820 6.80 Tamarind Tree 2.80 Right
821 12/350 12/400 6.80 Tamarind Tree 2.40 Left
822 6.80 Tamarind Tree 1.20 Left
823 6.50 Illuppai Tree 1.20 Left
824 6.80 Tamarind Tree 1.80 Left
825 12/400 12/450 6.50 Illuppai Tree 2.40 Left
826 6.50 Vengai Tree 1.50 Right
827 12/450 12/500 6.80 Tamarind Tree 1.50 Left
828 6.80 Tamarind Tree 1.80 Left
829 6.80 Marutham Tree 2.80 Right
830 6.50 Illuppai Tree 2.70 Right
831 12/500 12/550 6.80 Tamarind Tree 1.00 Left
832 6.80 Tamarind Tree 1.30 Left
833 6.80 Tamarind Tree 1.40 Left
834 6.80 Tamarind Tree 1.40 Left
835 6.50 Illuppai Tree 2.70 Right
836 12/550 12/600 6.80 Tamarind Tree 2.20 Left
837 6.80 Tamarind Tree 2.00 Left
838 6.80 Tamarind Tree 2.20 Left
839 6.80 Tamarind Tree 1.10 Right
840 6.80 Vangai Tree 3.80 Right
841 6.80 Neem Tree 1.20 Right
842 12/600 12/650 6.80 Tamarind Tree 2.80 Left
843 6.80 Tamarind Tree 3.00 Left
844 6.80 Tamarind Tree 4.00 Right
845 6.80 Illuppai Tree 1.00 Right
846 6.80 Tamarind Tree 1.80 Right
847 6.80 Marutham Tree 2.20 Right
848 12/650 12/700 6.80 Marutham Tree 1.90 Left
849 6.80 Naval Tree 1.40 Right
850 6.80 Palm Tree 1.20 Right
851 12/750 12/800 6.00 Marutham Tree 2.90 Left
852 6.80 Marutham Tree 1.80 Left
853 6.80 Tamarind Tree 1.80 Left
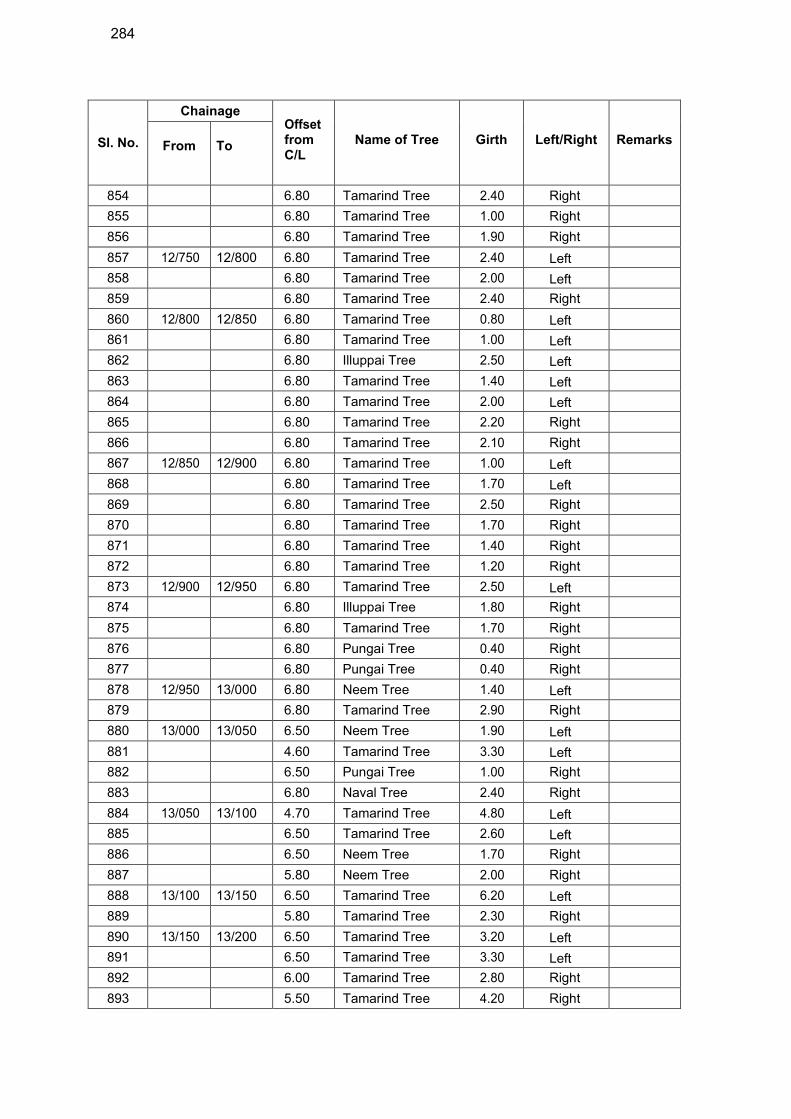
284
Sl. No.
Chainage Offset from C/L
Name of Tree
Girth
Left/Right
Remarks
From
To
854 6.80 Tamarind Tree 2.40 Right
855 6.80 Tamarind Tree 1.00 Right
856 6.80 Tamarind Tree 1.90 Right
857 12/750 12/800 6.80 Tamarind Tree 2.40 Left
858 6.80 Tamarind Tree 2.00 Left
859 6.80 Tamarind Tree 2.40 Right
860 12/800 12/850 6.80 Tamarind Tree 0.80 Left
861 6.80 Tamarind Tree 1.00 Left
862 6.80 Illuppai Tree 2.50 Left
863 6.80 Tamarind Tree 1.40 Left
864 6.80 Tamarind Tree 2.00 Left
865 6.80 Tamarind Tree 2.20 Right
866 6.80 Tamarind Tree 2.10 Right
867 12/850 12/900 6.80 Tamarind Tree 1.00 Left
868 6.80 Tamarind Tree 1.70 Left
869 6.80 Tamarind Tree 2.50 Right
870 6.80 Tamarind Tree 1.70 Right
871 6.80 Tamarind Tree 1.40 Right
872 6.80 Tamarind Tree 1.20 Right
873 12/900 12/950 6.80 Tamarind Tree 2.50 Left
874 6.80 Illuppai Tree 1.80 Right
875 6.80 Tamarind Tree 1.70 Right
876 6.80 Pungai Tree 0.40 Right
877 6.80 Pungai Tree 0.40 Right
878 12/950 13/000 6.80 Neem Tree 1.40 Left
879 6.80 Tamarind Tree 2.90 Right
880 13/000 13/050 6.50 Neem Tree 1.90 Left
881 4.60 Tamarind Tree 3.30 Left
882 6.50 Pungai Tree 1.00 Right
883 6.80 Naval Tree 2.40 Right
884 13/050 13/100 4.70 Tamarind Tree 4.80 Left
885 6.50 Tamarind Tree 2.60 Left
886 6.50 Neem Tree 1.70 Right
887 5.80 Neem Tree 2.00 Right
888 13/100 13/150 6.50 Tamarind Tree 6.20 Left
889 5.80 Tamarind Tree 2.30 Right
890 13/150 13/200 6.50 Tamarind Tree 3.20 Left
891 6.50 Tamarind Tree 3.30 Left
892 6.00 Tamarind Tree 2.80 Right
893 5.50 Tamarind Tree 4.20 Right
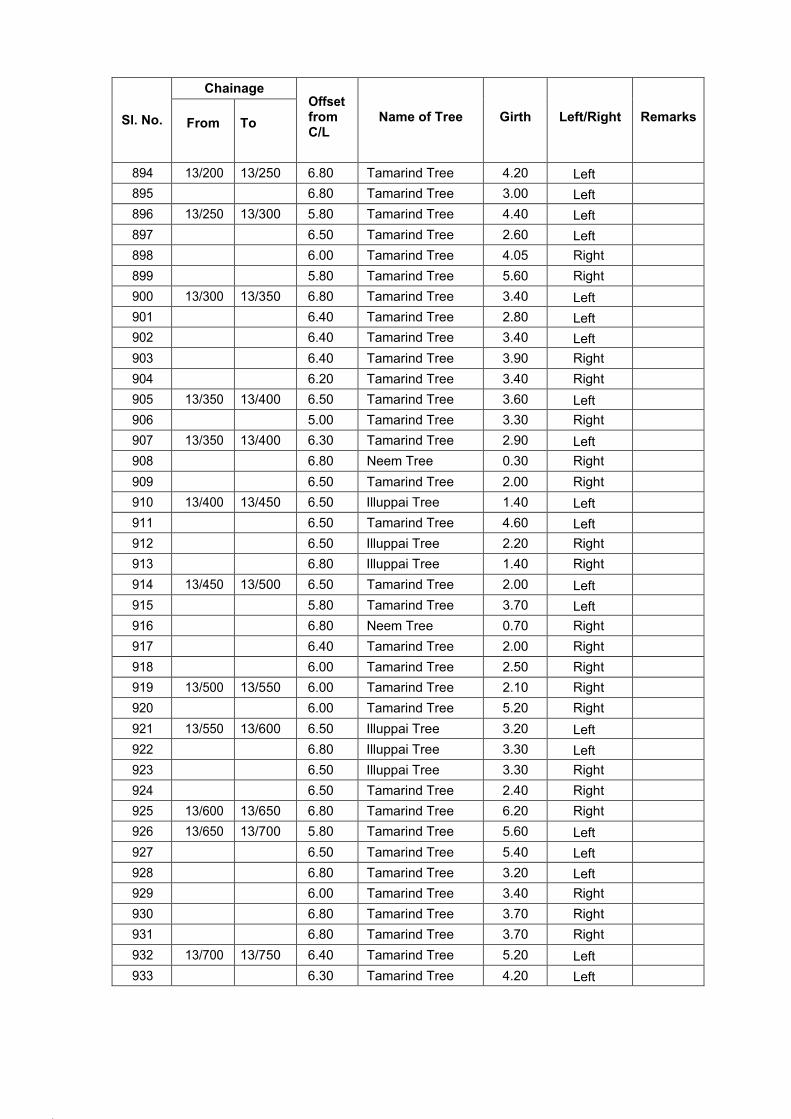
42.
43.
Sl. No.
Chainage Offset from C/L
Name of Tree
Girth
Left/Right
Remarks
From
To
894 13/200 13/250 6.80 Tamarind Tree 4.20 Left
895 6.80 Tamarind Tree 3.00 Left
896 13/250 13/300 5.80 Tamarind Tree 4.40 Left
897 6.50 Tamarind Tree 2.60 Left
898 6.00 Tamarind Tree 4.05 Right
899 5.80 Tamarind Tree 5.60 Right
900 13/300 13/350 6.80 Tamarind Tree 3.40 Left
901 6.40 Tamarind Tree 2.80 Left
902 6.40 Tamarind Tree 3.40 Left
903 6.40 Tamarind Tree 3.90 Right
904 6.20 Tamarind Tree 3.40 Right
905 13/350 13/400 6.50 Tamarind Tree 3.60 Left
906 5.00 Tamarind Tree 3.30 Right
907 13/350 13/400 6.30 Tamarind Tree 2.90 Left
908 6.80 Neem Tree 0.30 Right
909 6.50 Tamarind Tree 2.00 Right
910 13/400 13/450 6.50 Illuppai Tree 1.40 Left
911 6.50 Tamarind Tree 4.60 Left
912 6.50 Illuppai Tree 2.20 Right
913 6.80 Illuppai Tree 1.40 Right
914 13/450 13/500 6.50 Tamarind Tree 2.00 Left
915 5.80 Tamarind Tree 3.70 Left
916 6.80 Neem Tree 0.70 Right
917 6.40 Tamarind Tree 2.00 Right
918 6.00 Tamarind Tree 2.50 Right
919 13/500 13/550 6.00 Tamarind Tree 2.10 Right
920 6.00 Tamarind Tree 5.20 Right
921 13/550 13/600 6.50 Illuppai Tree 3.20 Left
922 6.80 Illuppai Tree 3.30 Left
923 6.50 Illuppai Tree 3.30 Right
924 6.50 Tamarind Tree 2.40 Right
925 13/600 13/650 6.80 Tamarind Tree 6.20 Right
926 13/650 13/700 5.80 Tamarind Tree 5.60 Left
927 6.50 Tamarind Tree 5.40 Left
928 6.80 Tamarind Tree 3.20 Left
929 6.00 Tamarind Tree 3.40 Right
930 6.80 Tamarind Tree 3.70 Right
931 6.80 Tamarind Tree 3.70 Right
932 13/700 13/750 6.40 Tamarind Tree 5.20 Left
933 6.30 Tamarind Tree 4.20 Left

286
Sl. No.
Chainage Offset from C/L
Name of Tree
Girth
Left/Right
Remarks
From To
934 6.00 Tamarind Tree 3.10 Right
935 13/750 13/800 6.80 Tamarind Tree 3.80 Left
936 6.00 Tamarind Tree 1.20 Left
937 6.80 Tamarind Tree 2.40 Right
938 6.80 Tamarind Tree 2.00 Right
939 13/800 13/850 6.50 Tamarind Tree 2.80 Left
940 6.80 Tamarind Tree 2.30 Left
941 6.80 Tamarind Tree 2.30 Left
942 6.80 Tamarind Tree 2.20 Right
943 6.80 Tamarind Tree 3.20 Right
944 6.80 Tamarind Tree 2.90 Right
945 13/850 13/900 6.80 Tamarind Tree 2.00 Left
946 6.50 Tamarind Tree 2.00 Left
947 6.50 Tamarind Tree 2.30 Left
948 6.80 Tamarind Tree 2.20 Right
949 6.80 Tamarind Tree 2.40 Right
950 6.80 Tamarind Tree 2.80 Right
951 13/900 13/950 6.50 Tamarind Tree 2.90 Left
952 6.50 Tamarind Tree 3.40 Left
953 6.50 Tamarind Tree 2.90 Right
954 6.10 Tamarind Tree 6.20 Right
955 13/950 14/000 5.50 Illuppai Tree 1.50 Left
956 5.80 Tamarind Tree 3.20 Left
957 6.00 Tamarind Tree 5.30 Left
958 5.70 Tamarind Tree 6.40 Right
959 14/000 14/050 5.50 Tamarind Tree 3.50 Left
960 6.80 Tamarind Tree 3.10 Right
961 6.80 Neem Tree 1.10 Right
962 6.80 Illuppai Tree 1.40 Right
963 14/050 14/100 6.80 Tamarind Tree 3.40 Left
964 6.50 Illuppai Tree 1.70 Left
965 6.50 Vangai Tree 1.20 Right
966 5.40 Tamarind Tree 2.60 Right
967 5.50 Tamarind Tree 2.50 Right
968 14/100 14/150 6.50 Tamarind Tree 3.40 Left
969 6.50 Illuppai Tree 1.60 Left
970 6.50 Illuppai Tree 2.20 Left
971 5.00 Tamarind Tree 7.20 Right
972 6.00 Tamarind Tree 1.80 Right
973 6.00 Tamarind Tree 2.30 Right
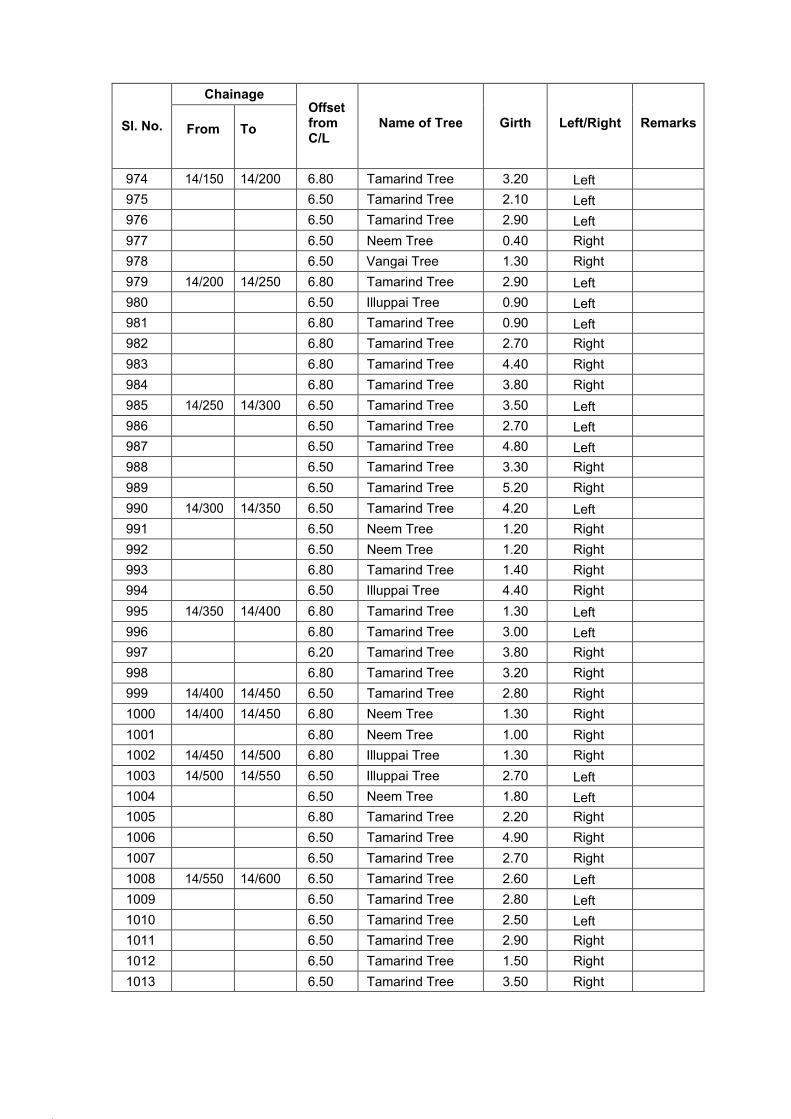
46.
47.
Sl. No.
Chainage Offset from C/L
Name of Tree
Girth
Left/Right
Remarks
From
To
974 14/150 14/200 6.80 Tamarind Tree 3.20 Left
975 6.50 Tamarind Tree 2.10 Left
976 6.50 Tamarind Tree 2.90 Left
977 6.50 Neem Tree 0.40 Right
978 6.50 Vangai Tree 1.30 Right
979 14/200 14/250 6.80 Tamarind Tree 2.90 Left
980 6.50 Illuppai Tree 0.90 Left
981 6.80 Tamarind Tree 0.90 Left
982 6.80 Tamarind Tree 2.70 Right
983 6.80 Tamarind Tree 4.40 Right
984 6.80 Tamarind Tree 3.80 Right
985 14/250 14/300 6.50 Tamarind Tree 3.50 Left
986 6.50 Tamarind Tree 2.70 Left
987 6.50 Tamarind Tree 4.80 Left
988 6.50 Tamarind Tree 3.30 Right
989 6.50 Tamarind Tree 5.20 Right
990 14/300 14/350 6.50 Tamarind Tree 4.20 Left
991 6.50 Neem Tree 1.20 Right
992 6.50 Neem Tree 1.20 Right
993 6.80 Tamarind Tree 1.40 Right
994 6.50 Illuppai Tree 4.40 Right
995 14/350 14/400 6.80 Tamarind Tree 1.30 Left
996 6.80 Tamarind Tree 3.00 Left
997 6.20 Tamarind Tree 3.80 Right
998 6.80 Tamarind Tree 3.20 Right
999 14/400 14/450 6.50 Tamarind Tree 2.80 Right
1000 14/400 14/450 6.80 Neem Tree 1.30 Right
1001 6.80 Neem Tree 1.00 Right
1002 14/450 14/500 6.80 Illuppai Tree 1.30 Right
1003 14/500 14/550 6.50 Illuppai Tree 2.70 Left
1004 6.50 Neem Tree 1.80 Left
1005 6.80 Tamarind Tree 2.20 Right
1006 6.50 Tamarind Tree 4.90 Right
1007 6.50 Tamarind Tree 2.70 Right
1008 14/550 14/600 6.50 Tamarind Tree 2.60 Left
1009 6.50 Tamarind Tree 2.80 Left
1010 6.50 Tamarind Tree 2.50 Left
1011 6.50 Tamarind Tree 2.90 Right
1012 6.50 Tamarind Tree 1.50 Right
1013 6.50 Tamarind Tree 3.50 Right
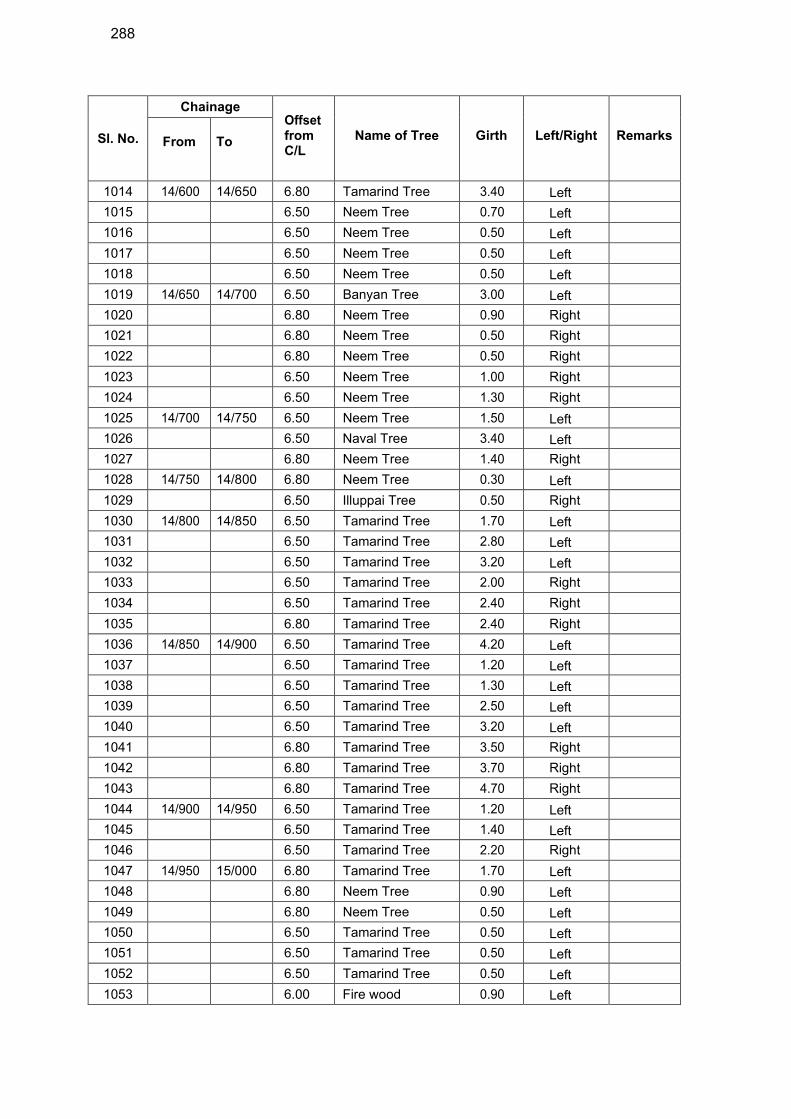
288
Sl. No.
Chainage Offset from C/L
Name of Tree
Girth
Left/Right
Remarks
From
To
1014 14/600 14/650 6.80 Tamarind Tree 3.40 Left
1015 6.50 Neem Tree 0.70 Left
1016 6.50 Neem Tree 0.50 Left
1017 6.50 Neem Tree 0.50 Left
1018 6.50 Neem Tree 0.50 Left
1019 14/650 14/700 6.50 Banyan Tree 3.00 Left
1020 6.80 Neem Tree 0.90 Right
1021 6.80 Neem Tree 0.50 Right
1022 6.80 Neem Tree 0.50 Right
1023 6.50 Neem Tree 1.00 Right
1024 6.50 Neem Tree 1.30 Right
1025 14/700 14/750 6.50 Neem Tree 1.50 Left
1026 6.50 Naval Tree 3.40 Left
1027 6.80 Neem Tree 1.40 Right
1028 14/750 14/800 6.80 Neem Tree 0.30 Left
1029 6.50 Illuppai Tree 0.50 Right
1030 14/800 14/850 6.50 Tamarind Tree 1.70 Left
1031 6.50 Tamarind Tree 2.80 Left
1032 6.50 Tamarind Tree 3.20 Left
1033 6.50 Tamarind Tree 2.00 Right
1034 6.50 Tamarind Tree 2.40 Right
1035 6.80 Tamarind Tree 2.40 Right
1036 14/850 14/900 6.50 Tamarind Tree 4.20 Left
1037 6.50 Tamarind Tree 1.20 Left
1038 6.50 Tamarind Tree 1.30 Left
1039 6.50 Tamarind Tree 2.50 Left
1040 6.50 Tamarind Tree 3.20 Left
1041 6.80 Tamarind Tree 3.50 Right
1042 6.80 Tamarind Tree 3.70 Right
1043 6.80 Tamarind Tree 4.70 Right
1044 14/900 14/950 6.50 Tamarind Tree 1.20 Left
1045 6.50 Tamarind Tree 1.40 Left
1046 6.50 Tamarind Tree 2.20 Right
1047 14/950 15/000 6.80 Tamarind Tree 1.70 Left
1048 6.80 Neem Tree 0.90 Left
1049 6.80 Neem Tree 0.50 Left
1050 6.50 Tamarind Tree 0.50 Left
1051 6.50 Tamarind Tree 0.50 Left
1052 6.50 Tamarind Tree 0.50 Left
1053 6.00 Fire wood 0.90 Left
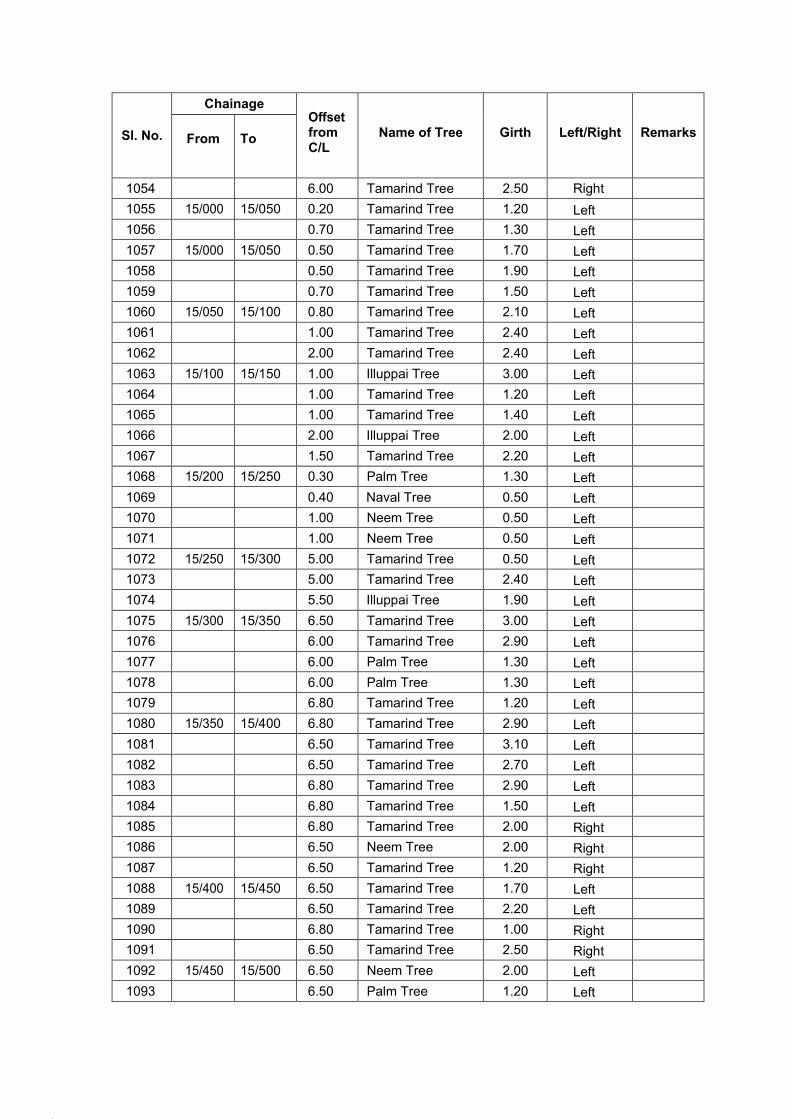
50.
51.
Sl. No.
Chainage Offset from C/L
Name of Tree
Girth
Left/Right
Remarks
From
To
1054 6.00 Tamarind Tree 2.50 Right
1055 15/000 15/050 0.20 Tamarind Tree 1.20 Left
1056 0.70 Tamarind Tree 1.30 Left
1057 15/000 15/050 0.50 Tamarind Tree 1.70 Left
1058 0.50 Tamarind Tree 1.90 Left
1059 0.70 Tamarind Tree 1.50 Left
1060 15/050 15/100 0.80 Tamarind Tree 2.10 Left
1061 1.00 Tamarind Tree 2.40 Left
1062 2.00 Tamarind Tree 2.40 Left
1063 15/100 15/150 1.00 Illuppai Tree 3.00 Left
1064 1.00 Tamarind Tree 1.20 Left
1065 1.00 Tamarind Tree 1.40 Left
1066 2.00 Illuppai Tree 2.00 Left
1067 1.50 Tamarind Tree 2.20 Left
1068 15/200 15/250 0.30 Palm Tree 1.30 Left
1069 0.40 Naval Tree 0.50 Left
1070 1.00 Neem Tree 0.50 Left
1071 1.00 Neem Tree 0.50 Left
1072 15/250 15/300 5.00 Tamarind Tree 0.50 Left
1073 5.00 Tamarind Tree 2.40 Left
1074 5.50 Illuppai Tree 1.90 Left
1075 15/300 15/350 6.50 Tamarind Tree 3.00 Left
1076 6.00 Tamarind Tree 2.90 Left
1077 6.00 Palm Tree 1.30 Left
1078 6.00 Palm Tree 1.30 Left
1079 6.80 Tamarind Tree 1.20 Left
1080 15/350 15/400 6.80 Tamarind Tree 2.90 Left
1081 6.50 Tamarind Tree 3.10 Left
1082 6.50 Tamarind Tree 2.70 Left
1083 6.80 Tamarind Tree 2.90 Left
1084 6.80 Tamarind Tree 1.50 Left
1085 6.80 Tamarind Tree 2.00 Right
1086 6.50 Neem Tree 2.00 Right
1087 6.50 Tamarind Tree 1.20 Right
1088 15/400 15/450 6.50 Tamarind Tree 1.70 Left
1089 6.50 Tamarind Tree 2.20 Left
1090 6.80 Tamarind Tree 1.00 Right
1091 6.50 Tamarind Tree 2.50 Right
1092 15/450 15/500 6.50 Neem Tree 2.00 Left
1093 6.50 Palm Tree 1.20 Left
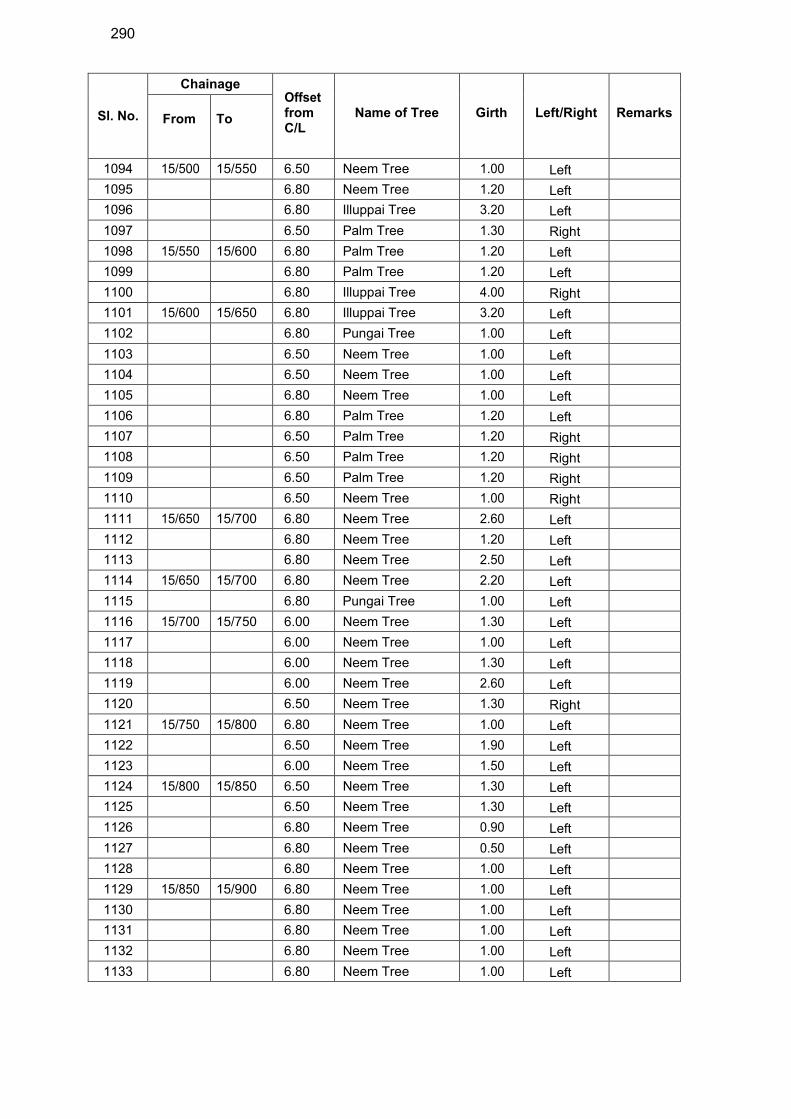
290
Sl. No.
Chainage Offset from C/L
Name of Tree
Girth
Left/Right
Remarks
From
To
1094 15/500 15/550 6.50 Neem Tree 1.00 Left
1095 6.80 Neem Tree 1.20 Left
1096 6.80 Illuppai Tree 3.20 Left
1097 6.50 Palm Tree 1.30 Right
1098 15/550 15/600 6.80 Palm Tree 1.20 Left
1099 6.80 Palm Tree 1.20 Left
1100 6.80 Illuppai Tree 4.00 Right
1101 15/600 15/650 6.80 Illuppai Tree 3.20 Left
1102 6.80 Pungai Tree 1.00 Left
1103 6.50 Neem Tree 1.00 Left
1104 6.50 Neem Tree 1.00 Left
1105 6.80 Neem Tree 1.00 Left
1106 6.80 Palm Tree 1.20 Left
1107 6.50 Palm Tree 1.20 Right
1108 6.50 Palm Tree 1.20 Right
1109 6.50 Palm Tree 1.20 Right
1110 6.50 Neem Tree 1.00 Right
1111 15/650 15/700 6.80 Neem Tree 2.60 Left
1112 6.80 Neem Tree 1.20 Left
1113 6.80 Neem Tree 2.50 Left
1114 15/650 15/700 6.80 Neem Tree 2.20 Left
1115 6.80 Pungai Tree 1.00 Left
1116 15/700 15/750 6.00 Neem Tree 1.30 Left
1117 6.00 Neem Tree 1.00 Left
1118 6.00 Neem Tree 1.30 Left
1119 6.00 Neem Tree 2.60 Left
1120 6.50 Neem Tree 1.30 Right
1121 15/750 15/800 6.80 Neem Tree 1.00 Left
1122 6.50 Neem Tree 1.90 Left
1123 6.00 Neem Tree 1.50 Left
1124 15/800 15/850 6.50 Neem Tree 1.30 Left
1125 6.50 Neem Tree 1.30 Left
1126 6.80 Neem Tree 0.90 Left
1127 6.80 Neem Tree 0.50 Left
1128 6.80 Neem Tree 1.00 Left
1129 15/850 15/900 6.80 Neem Tree 1.00 Left
1130 6.80 Neem Tree 1.00 Left
1131 6.80 Neem Tree 1.00 Left
1132 6.80 Neem Tree 1.00 Left
1133 6.80 Neem Tree 1.00 Left
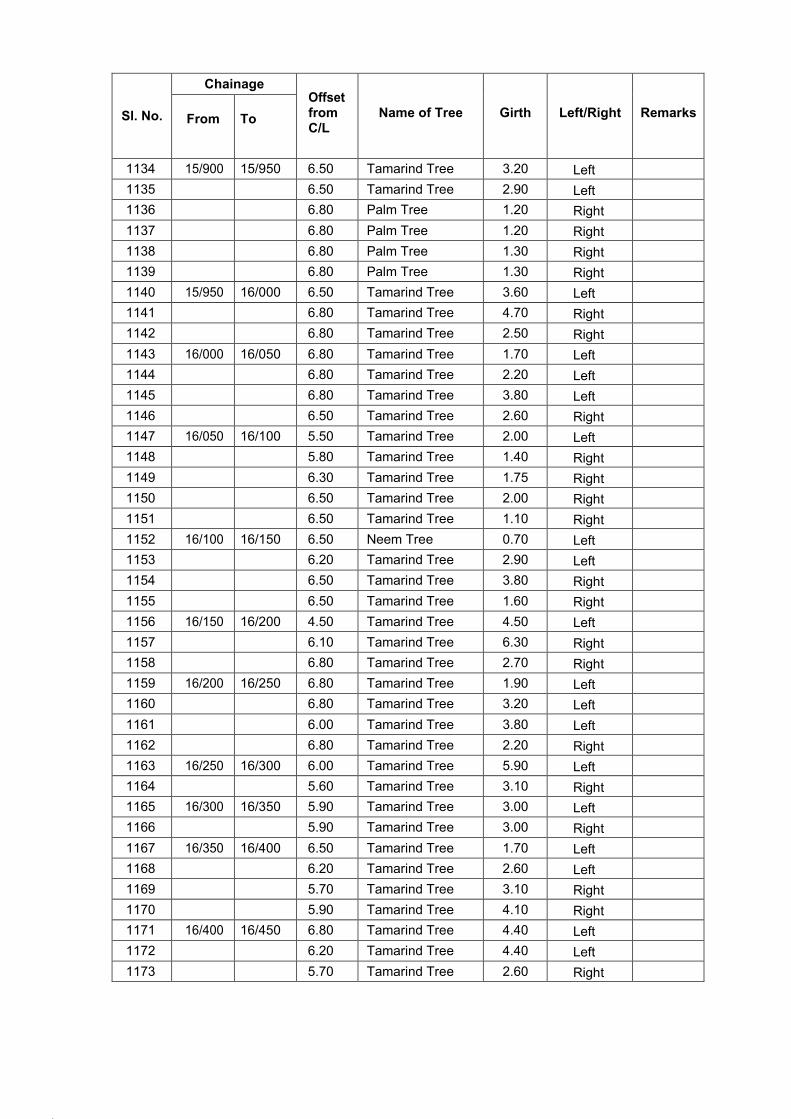
54.
55.
Sl. No.
Chainage Offset from C/L
Name of Tree
Girth
Left/Right
Remarks
From
To
1134 15/900 15/950 6.50 Tamarind Tree 3.20 Left
1135 6.50 Tamarind Tree 2.90 Left
1136 6.80 Palm Tree 1.20 Right
1137 6.80 Palm Tree 1.20 Right
1138 6.80 Palm Tree 1.30 Right
1139 6.80 Palm Tree 1.30 Right
1140 15/950 16/000 6.50 Tamarind Tree 3.60 Left
1141 6.80 Tamarind Tree 4.70 Right
1142 6.80 Tamarind Tree 2.50 Right
1143 16/000 16/050 6.80 Tamarind Tree 1.70 Left
1144 6.80 Tamarind Tree 2.20 Left
1145 6.80 Tamarind Tree 3.80 Left
1146 6.50 Tamarind Tree 2.60 Right
1147 16/050 16/100 5.50 Tamarind Tree 2.00 Left
1148 5.80 Tamarind Tree 1.40 Right
1149 6.30 Tamarind Tree 1.75 Right
1150 6.50 Tamarind Tree 2.00 Right
1151 6.50 Tamarind Tree 1.10 Right
1152 16/100 16/150 6.50 Neem Tree 0.70 Left
1153 6.20 Tamarind Tree 2.90 Left
1154 6.50 Tamarind Tree 3.80 Right
1155 6.50 Tamarind Tree 1.60 Right
1156 16/150 16/200 4.50 Tamarind Tree 4.50 Left
1157 6.10 Tamarind Tree 6.30 Right
1158 6.80 Tamarind Tree 2.70 Right
1159 16/200 16/250 6.80 Tamarind Tree 1.90 Left
1160 6.80 Tamarind Tree 3.20 Left
1161 6.00 Tamarind Tree 3.80 Left
1162 6.80 Tamarind Tree 2.20 Right
1163 16/250 16/300 6.00 Tamarind Tree 5.90 Left
1164 5.60 Tamarind Tree 3.10 Right
1165 16/300 16/350 5.90 Tamarind Tree 3.00 Left
1166 5.90 Tamarind Tree 3.00 Right
1167 16/350 16/400 6.50 Tamarind Tree 1.70 Left
1168 6.20 Tamarind Tree 2.60 Left
1169 5.70 Tamarind Tree 3.10 Right
1170 5.90 Tamarind Tree 4.10 Right
1171 16/400 16/450 6.80 Tamarind Tree 4.40 Left
1172 6.20 Tamarind Tree 4.40 Left
1173 5.70 Tamarind Tree 2.60 Right
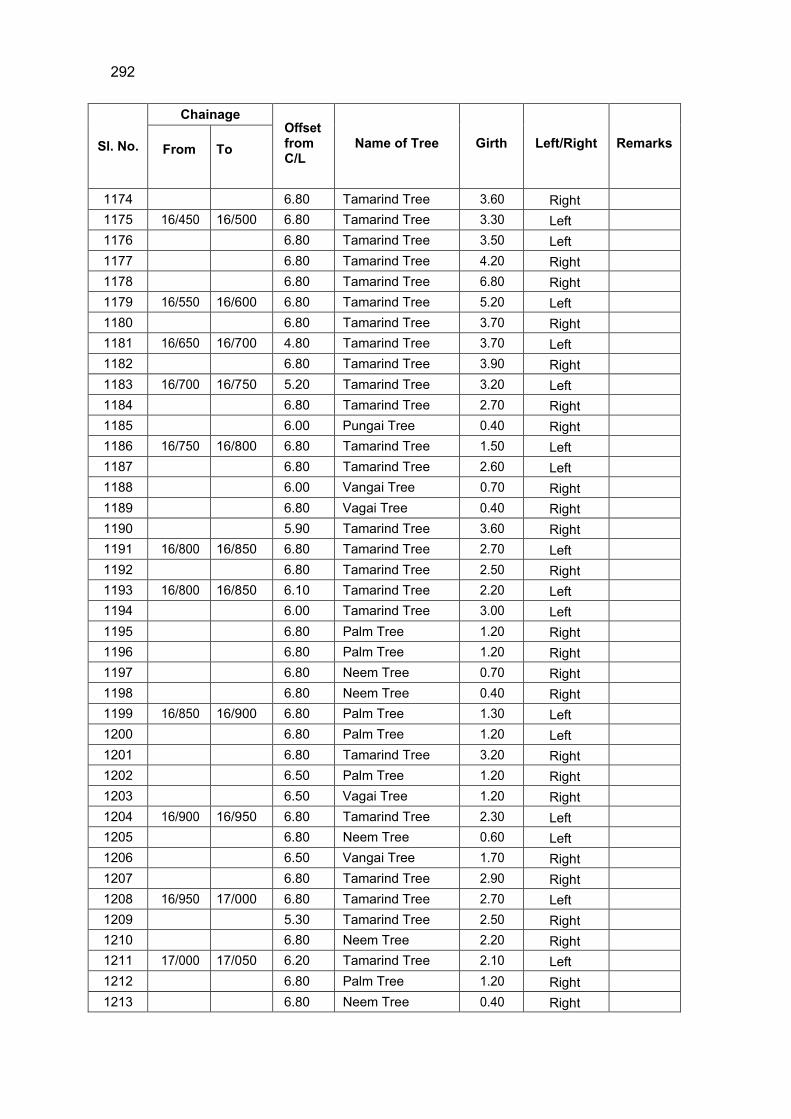
292
Sl. No.
Chainage Offset from C/L
Name of Tree
Girth
Left/Right
Remarks
From
To
1174 6.80 Tamarind Tree 3.60 Right
1175 16/450 16/500 6.80 Tamarind Tree 3.30 Left
1176 6.80 Tamarind Tree 3.50 Left
1177 6.80 Tamarind Tree 4.20 Right
1178 6.80 Tamarind Tree 6.80 Right
1179 16/550 16/600 6.80 Tamarind Tree 5.20 Left
1180 6.80 Tamarind Tree 3.70 Right
1181 16/650 16/700 4.80 Tamarind Tree 3.70 Left
1182 6.80 Tamarind Tree 3.90 Right
1183 16/700 16/750 5.20 Tamarind Tree 3.20 Left
1184 6.80 Tamarind Tree 2.70 Right
1185 6.00 Pungai Tree 0.40 Right
1186 16/750 16/800 6.80 Tamarind Tree 1.50 Left
1187 6.80 Tamarind Tree 2.60 Left
1188 6.00 Vangai Tree 0.70 Right
1189 6.80 Vagai Tree 0.40 Right
1190 5.90 Tamarind Tree 3.60 Right
1191 16/800 16/850 6.80 Tamarind Tree 2.70 Left
1192 6.80 Tamarind Tree 2.50 Right
1193 16/800 16/850 6.10 Tamarind Tree 2.20 Left
1194 6.00 Tamarind Tree 3.00 Left
1195 6.80 Palm Tree 1.20 Right
1196 6.80 Palm Tree 1.20 Right
1197 6.80 Neem Tree 0.70 Right
1198 6.80 Neem Tree 0.40 Right
1199 16/850 16/900 6.80 Palm Tree 1.30 Left
1200 6.80 Palm Tree 1.20 Left
1201 6.80 Tamarind Tree 3.20 Right
1202 6.50 Palm Tree 1.20 Right
1203 6.50 Vagai Tree 1.20 Right
1204 16/900 16/950 6.80 Tamarind Tree 2.30 Left
1205 6.80 Neem Tree 0.60 Left
1206 6.50 Vangai Tree 1.70 Right
1207 6.80 Tamarind Tree 2.90 Right
1208 16/950 17/000 6.80 Tamarind Tree 2.70 Left
1209 5.30 Tamarind Tree 2.50 Right
1210 6.80 Neem Tree 2.20 Right
1211 17/000 17/050 6.20 Tamarind Tree 2.10 Left
1212 6.80 Palm Tree 1.20 Right
1213 6.80 Neem Tree 0.40 Right
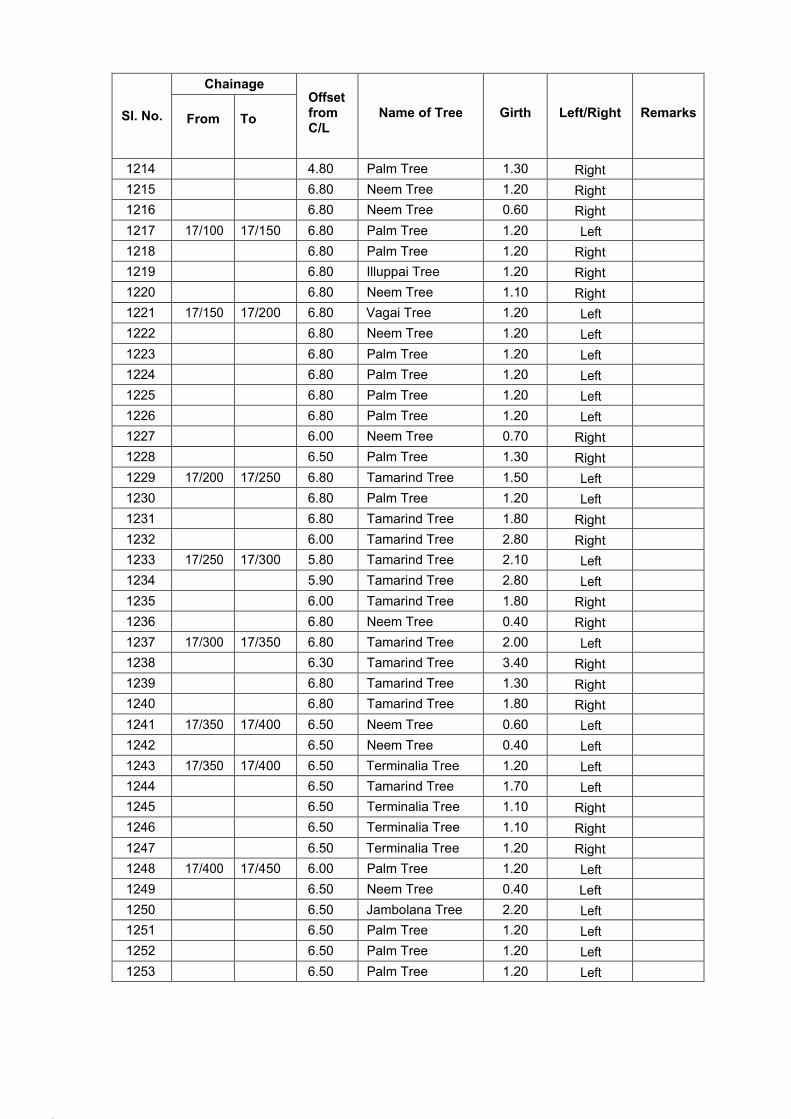
58.
59.
Sl. No.
Chainage Offset from C/L
Name of Tree
Girth
Left/Right
Remarks
From
To
1214 4.80 Palm Tree 1.30 Right
1215 6.80 Neem Tree 1.20 Right
1216 6.80 Neem Tree 0.60 Right
1217 17/100 17/150 6.80 Palm Tree 1.20 Left
1218 6.80 Palm Tree 1.20 Right
1219 6.80 Illuppai Tree 1.20 Right
1220 6.80 Neem Tree 1.10 Right
1221 17/150 17/200 6.80 Vagai Tree 1.20 Left
1222 6.80 Neem Tree 1.20 Left
1223 6.80 Palm Tree 1.20 Left
1224 6.80 Palm Tree 1.20 Left
1225 6.80 Palm Tree 1.20 Left
1226 6.80 Palm Tree 1.20 Left
1227 6.00 Neem Tree 0.70 Right
1228 6.50 Palm Tree 1.30 Right
1229 17/200 17/250 6.80 Tamarind Tree 1.50 Left
1230 6.80 Palm Tree 1.20 Left
1231 6.80 Tamarind Tree 1.80 Right
1232 6.00 Tamarind Tree 2.80 Right
1233 17/250 17/300 5.80 Tamarind Tree 2.10 Left
1234 5.90 Tamarind Tree 2.80 Left
1235 6.00 Tamarind Tree 1.80 Right
1236 6.80 Neem Tree 0.40 Right
1237 17/300 17/350 6.80 Tamarind Tree 2.00 Left
1238 6.30 Tamarind Tree 3.40 Right
1239 6.80 Tamarind Tree 1.30 Right
1240 6.80 Tamarind Tree 1.80 Right
1241 17/350 17/400 6.50 Neem Tree 0.60 Left
1242 6.50 Neem Tree 0.40 Left
1243 17/350 17/400 6.50 Terminalia Tree 1.20 Left
1244 6.50 Tamarind Tree 1.70 Left
1245 6.50 Terminalia Tree 1.10 Right
1246 6.50 Terminalia Tree 1.10 Right
1247 6.50 Terminalia Tree 1.20 Right
1248 17/400 17/450 6.00 Palm Tree 1.20 Left
1249 6.50 Neem Tree 0.40 Left
1250 6.50 Jambolana Tree 2.20 Left
1251 6.50 Palm Tree 1.20 Left
1252 6.50 Palm Tree 1.20 Left
1253 6.50 Palm Tree 1.20 Left
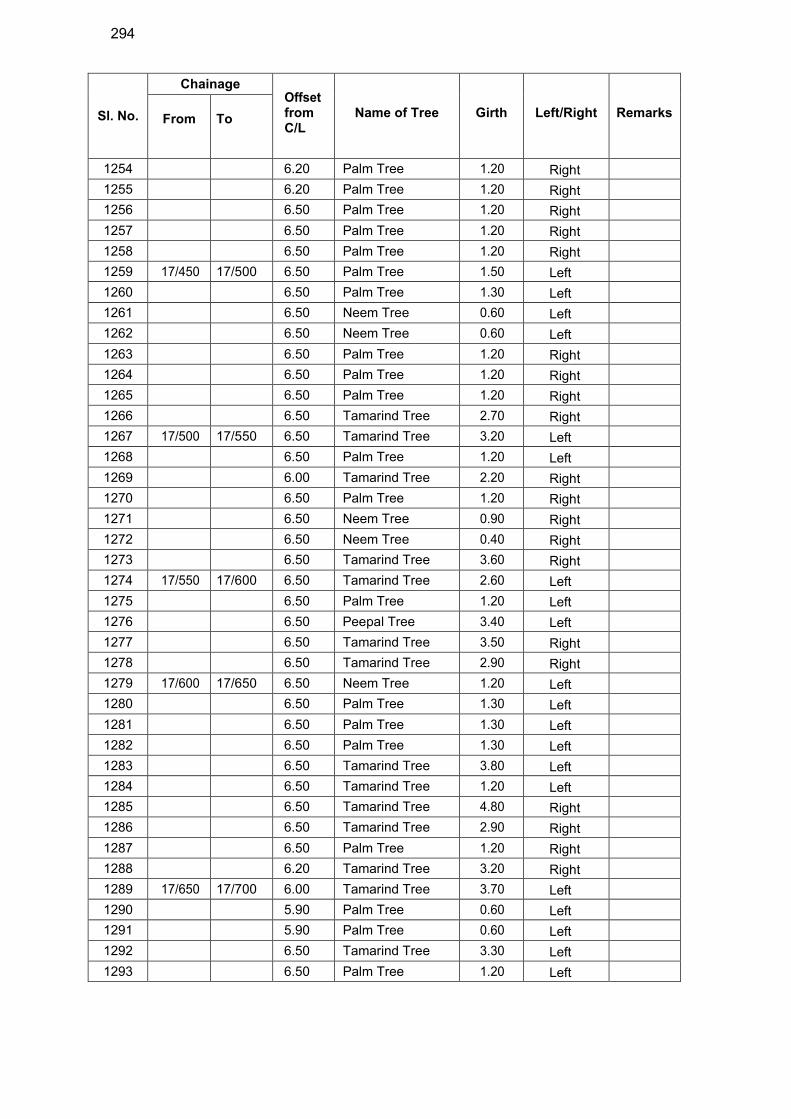
294
Sl. No.
Chainage Offset from C/L
Name of Tree
Girth
Left/Right
Remarks
From
To
1254 6.20 Palm Tree 1.20 Right
1255 6.20 Palm Tree 1.20 Right
1256 6.50 Palm Tree 1.20 Right
1257 6.50 Palm Tree 1.20 Right
1258 6.50 Palm Tree 1.20 Right
1259 17/450 17/500 6.50 Palm Tree 1.50 Left
1260 6.50 Palm Tree 1.30 Left
1261 6.50 Neem Tree 0.60 Left
1262 6.50 Neem Tree 0.60 Left
1263 6.50 Palm Tree 1.20 Right
1264 6.50 Palm Tree 1.20 Right
1265 6.50 Palm Tree 1.20 Right
1266 6.50 Tamarind Tree 2.70 Right
1267 17/500 17/550 6.50 Tamarind Tree 3.20 Left
1268 6.50 Palm Tree 1.20 Left
1269 6.00 Tamarind Tree 2.20 Right
1270 6.50 Palm Tree 1.20 Right
1271 6.50 Neem Tree 0.90 Right
1272 6.50 Neem Tree 0.40 Right
1273 6.50 Tamarind Tree 3.60 Right
1274 17/550 17/600 6.50 Tamarind Tree 2.60 Left
1275 6.50 Palm Tree 1.20 Left
1276 6.50 Peepal Tree 3.40 Left
1277 6.50 Tamarind Tree 3.50 Right
1278 6.50 Tamarind Tree 2.90 Right
1279 17/600 17/650 6.50 Neem Tree 1.20 Left
1280 6.50 Palm Tree 1.30 Left
1281 6.50 Palm Tree 1.30 Left
1282 6.50 Palm Tree 1.30 Left
1283 6.50 Tamarind Tree 3.80 Left
1284 6.50 Tamarind Tree 1.20 Left
1285 6.50 Tamarind Tree 4.80 Right
1286 6.50 Tamarind Tree 2.90 Right
1287 6.50 Palm Tree 1.20 Right
1288 6.20 Tamarind Tree 3.20 Right
1289 17/650 17/700 6.00 Tamarind Tree 3.70 Left
1290 5.90 Palm Tree 0.60 Left
1291 5.90 Palm Tree 0.60 Left
1292 6.50 Tamarind Tree 3.30 Left
1293 6.50 Palm Tree 1.20 Left
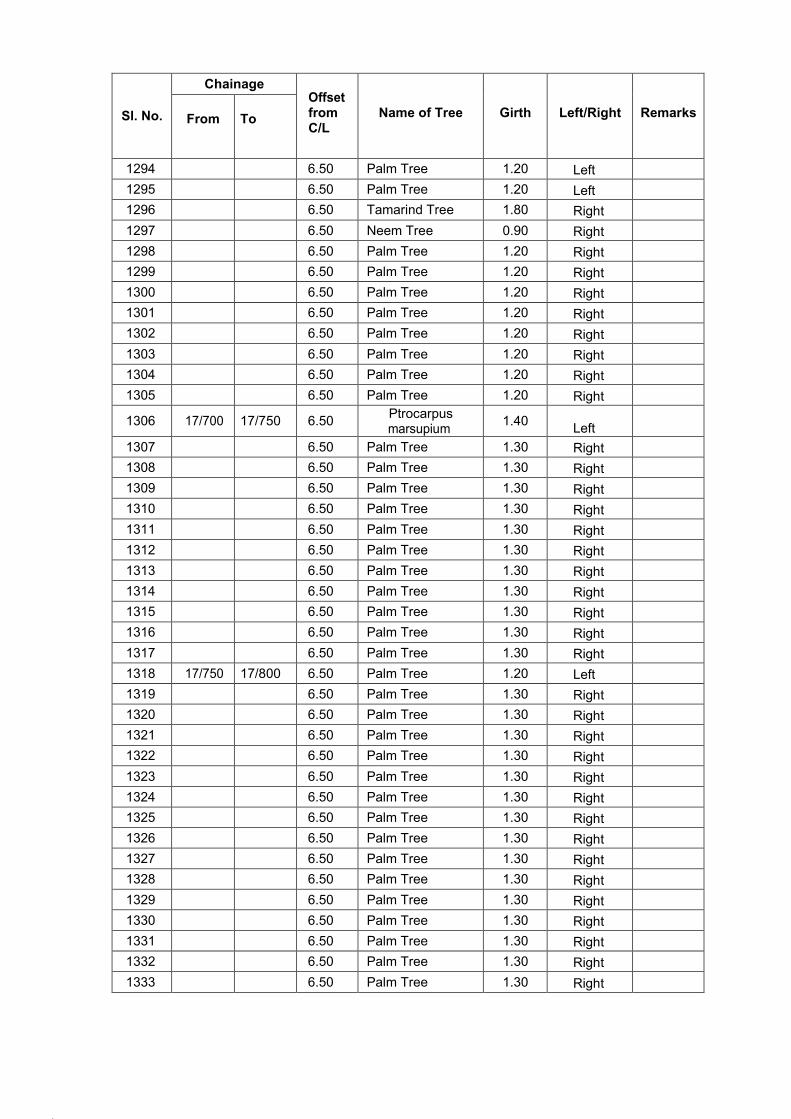
62.
63.
Sl. No.
Chainage Offset from C/L
Name of Tree
Girth
Left/Right
Remarks
From
To
1294 6.50 Palm Tree 1.20 Left
1295 6.50 Palm Tree 1.20 Left
1296 6.50 Tamarind Tree 1.80 Right
1297 6.50 Neem Tree 0.90 Right
1298 6.50 Palm Tree 1.20 Right
1299 6.50 Palm Tree 1.20 Right
1300 6.50 Palm Tree 1.20 Right
1301 6.50 Palm Tree 1.20 Right
1302 6.50 Palm Tree 1.20 Right
1303 6.50 Palm Tree 1.20 Right
1304 6.50 Palm Tree 1.20 Right
1305 6.50 Palm Tree 1.20 Right
1306 17/700 17/750 6.50 Ptrocarpus marsupium
1.40
Left
1307 6.50 Palm Tree 1.30 Right
1308 6.50 Palm Tree 1.30 Right
1309 6.50 Palm Tree 1.30 Right
1310 6.50 Palm Tree 1.30 Right
1311 6.50 Palm Tree 1.30 Right
1312 6.50 Palm Tree 1.30 Right
1313 6.50 Palm Tree 1.30 Right
1314 6.50 Palm Tree 1.30 Right
1315 6.50 Palm Tree 1.30 Right
1316 6.50 Palm Tree 1.30 Right
1317 6.50 Palm Tree 1.30 Right
1318 17/750 17/800 6.50 Palm Tree 1.20 Left
1319 6.50 Palm Tree 1.30 Right
1320 6.50 Palm Tree 1.30 Right
1321 6.50 Palm Tree 1.30 Right
1322 6.50 Palm Tree 1.30 Right
1323 6.50 Palm Tree 1.30 Right
1324 6.50 Palm Tree 1.30 Right
1325 6.50 Palm Tree 1.30 Right
1326 6.50 Palm Tree 1.30 Right
1327 6.50 Palm Tree 1.30 Right
1328 6.50 Palm Tree 1.30 Right
1329 6.50 Palm Tree 1.30 Right
1330 6.50 Palm Tree 1.30 Right
1331 6.50 Palm Tree 1.30 Right
1332 6.50 Palm Tree 1.30 Right
1333 6.50 Palm Tree 1.30 Right
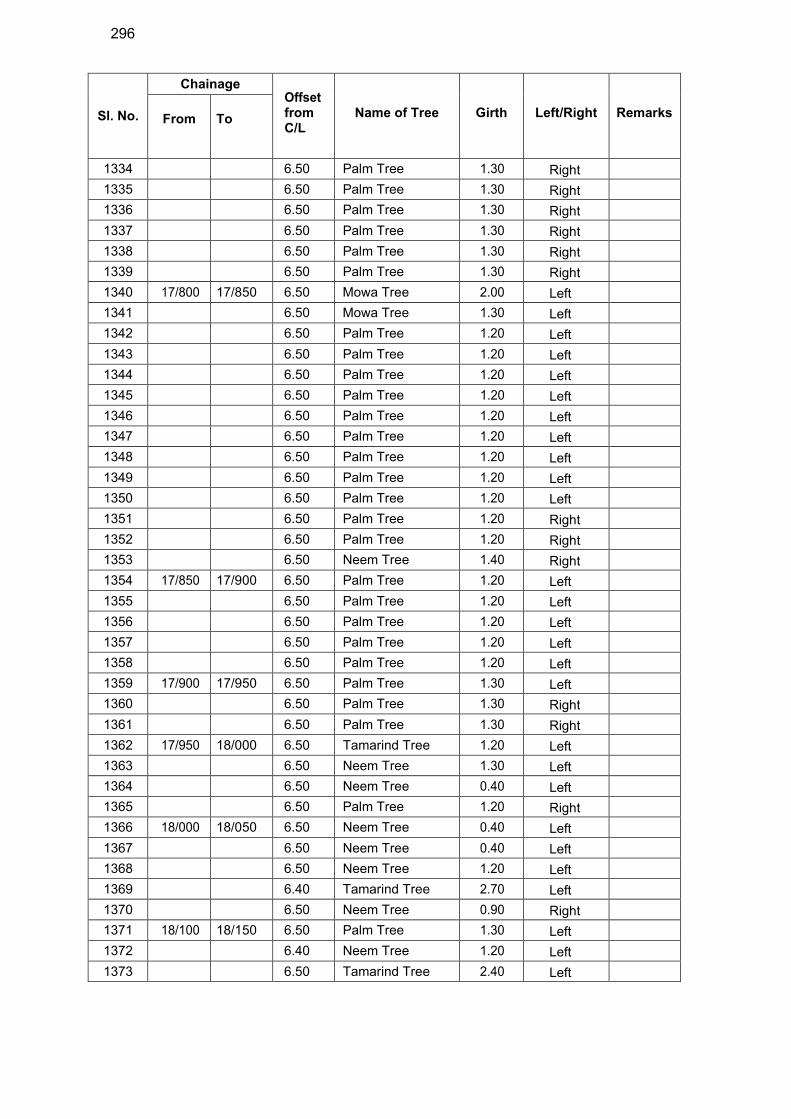
296
Sl. No.
Chainage Offset from C/L
Name of Tree
Girth
Left/Right
Remarks
From
To
1334 6.50 Palm Tree 1.30 Right
1335 6.50 Palm Tree 1.30 Right
1336 6.50 Palm Tree 1.30 Right
1337 6.50 Palm Tree 1.30 Right
1338 6.50 Palm Tree 1.30 Right
1339 6.50 Palm Tree 1.30 Right
1340 17/800 17/850 6.50 Mowa Tree 2.00 Left
1341 6.50 Mowa Tree 1.30 Left
1342 6.50 Palm Tree 1.20 Left
1343 6.50 Palm Tree 1.20 Left
1344 6.50 Palm Tree 1.20 Left
1345 6.50 Palm Tree 1.20 Left
1346 6.50 Palm Tree 1.20 Left
1347 6.50 Palm Tree 1.20 Left
1348 6.50 Palm Tree 1.20 Left
1349 6.50 Palm Tree 1.20 Left
1350 6.50 Palm Tree 1.20 Left
1351 6.50 Palm Tree 1.20 Right
1352 6.50 Palm Tree 1.20 Right
1353 6.50 Neem Tree 1.40 Right
1354 17/850 17/900 6.50 Palm Tree 1.20 Left
1355 6.50 Palm Tree 1.20 Left
1356 6.50 Palm Tree 1.20 Left
1357 6.50 Palm Tree 1.20 Left
1358 6.50 Palm Tree 1.20 Left
1359 17/900 17/950 6.50 Palm Tree 1.30 Left
1360 6.50 Palm Tree 1.30 Right
1361 6.50 Palm Tree 1.30 Right
1362 17/950 18/000 6.50 Tamarind Tree 1.20 Left
1363 6.50 Neem Tree 1.30 Left
1364 6.50 Neem Tree 0.40 Left
1365 6.50 Palm Tree 1.20 Right
1366 18/000 18/050 6.50 Neem Tree 0.40 Left
1367 6.50 Neem Tree 0.40 Left
1368 6.50 Neem Tree 1.20 Left
1369 6.40 Tamarind Tree 2.70 Left
1370 6.50 Neem Tree 0.90 Right
1371 18/100 18/150 6.50 Palm Tree 1.30 Left
1372 6.40 Neem Tree 1.20 Left
1373 6.50 Tamarind Tree 2.40 Left
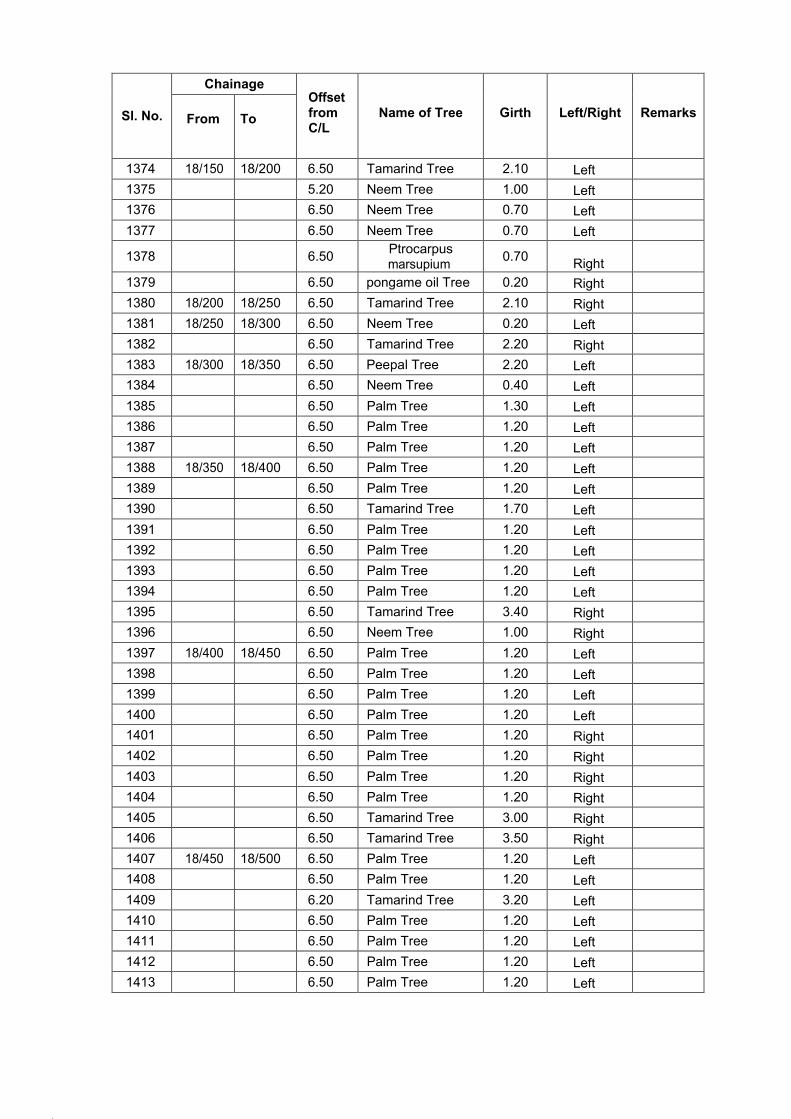
66.
67.
Sl. No.
Chainage Offset from C/L
Name of Tree
Girth
Left/Right
Remarks
From
To
1374 18/150 18/200 6.50 Tamarind Tree 2.10 Left
1375 5.20 Neem Tree 1.00 Left
1376 6.50 Neem Tree 0.70 Left
1377 6.50 Neem Tree 0.70 Left
1378
6.50 Ptrocarpus marsupium
0.70
Right
1379 6.50 pongame oil Tree 0.20 Right
1380 18/200 18/250 6.50 Tamarind Tree 2.10 Right
1381 18/250 18/300 6.50 Neem Tree 0.20 Left
1382 6.50 Tamarind Tree 2.20 Right
1383 18/300 18/350 6.50 Peepal Tree 2.20 Left
1384 6.50 Neem Tree 0.40 Left
1385 6.50 Palm Tree 1.30 Left
1386 6.50 Palm Tree 1.20 Left
1387 6.50 Palm Tree 1.20 Left
1388 18/350 18/400 6.50 Palm Tree 1.20 Left
1389 6.50 Palm Tree 1.20 Left
1390 6.50 Tamarind Tree 1.70 Left
1391 6.50 Palm Tree 1.20 Left
1392 6.50 Palm Tree 1.20 Left
1393 6.50 Palm Tree 1.20 Left
1394 6.50 Palm Tree 1.20 Left
1395 6.50 Tamarind Tree 3.40 Right
1396 6.50 Neem Tree 1.00 Right
1397 18/400 18/450 6.50 Palm Tree 1.20 Left
1398 6.50 Palm Tree 1.20 Left
1399 6.50 Palm Tree 1.20 Left
1400 6.50 Palm Tree 1.20 Left
1401 6.50 Palm Tree 1.20 Right
1402 6.50 Palm Tree 1.20 Right
1403 6.50 Palm Tree 1.20 Right
1404 6.50 Palm Tree 1.20 Right
1405 6.50 Tamarind Tree 3.00 Right
1406 6.50 Tamarind Tree 3.50 Right
1407 18/450 18/500 6.50 Palm Tree 1.20 Left
1408 6.50 Palm Tree 1.20 Left
1409 6.20 Tamarind Tree 3.20 Left
1410 6.50 Palm Tree 1.20 Left
1411 6.50 Palm Tree 1.20 Left
1412 6.50 Palm Tree 1.20 Left
1413 6.50 Palm Tree 1.20 Left
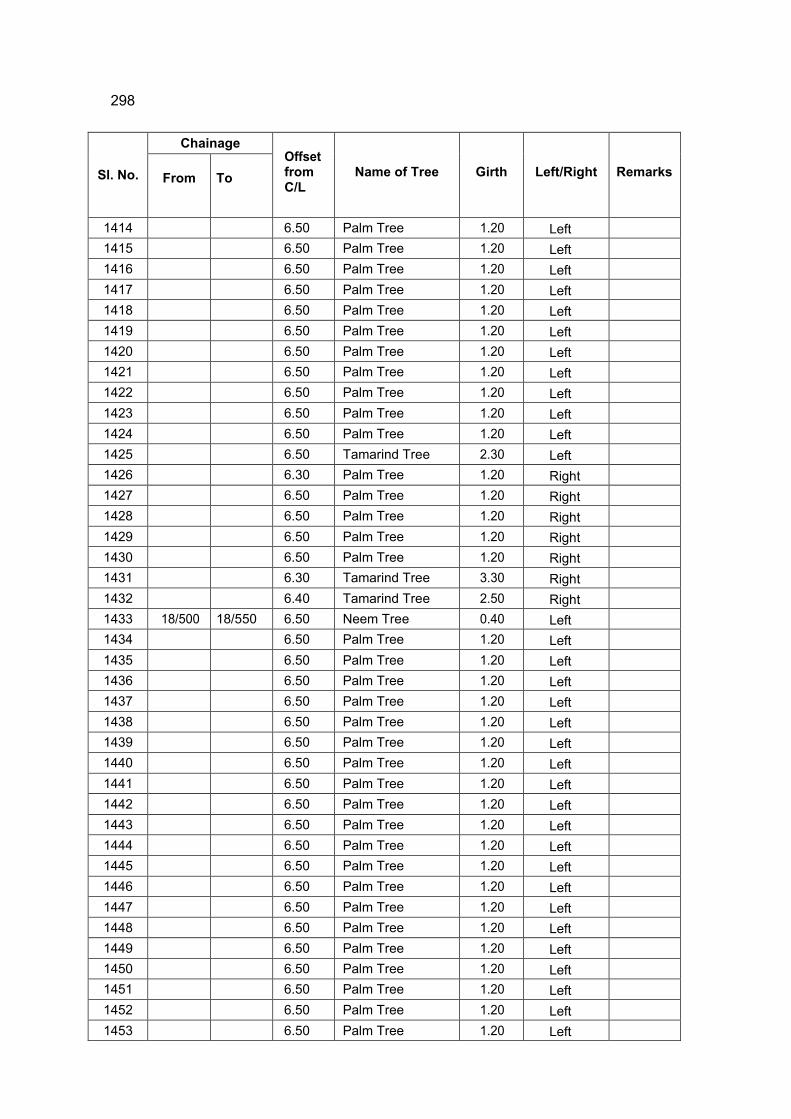
298
Sl. No.
Chainage Offset from C/L
Name of Tree
Girth
Left/Right
Remarks
From
To
1414 6.50 Palm Tree 1.20 Left
1415 6.50 Palm Tree 1.20 Left
1416 6.50 Palm Tree 1.20 Left
1417 6.50 Palm Tree 1.20 Left
1418 6.50 Palm Tree 1.20 Left
1419 6.50 Palm Tree 1.20 Left
1420 6.50 Palm Tree 1.20 Left
1421 6.50 Palm Tree 1.20 Left
1422 6.50 Palm Tree 1.20 Left
1423 6.50 Palm Tree 1.20 Left
1424 6.50 Palm Tree 1.20 Left
1425 6.50 Tamarind Tree 2.30 Left
1426 6.30 Palm Tree 1.20 Right
1427 6.50 Palm Tree 1.20 Right
1428 6.50 Palm Tree 1.20 Right
1429 6.50 Palm Tree 1.20 Right
1430 6.50 Palm Tree 1.20 Right
1431 6.30 Tamarind Tree 3.30 Right
1432 6.40 Tamarind Tree 2.50 Right
1433 18/500 18/550 6.50 Neem Tree 0.40 Left
1434 6.50 Palm Tree 1.20 Left
1435 6.50 Palm Tree 1.20 Left
1436 6.50 Palm Tree 1.20 Left
1437 6.50 Palm Tree 1.20 Left
1438 6.50 Palm Tree 1.20 Left
1439 6.50 Palm Tree 1.20 Left
1440 6.50 Palm Tree 1.20 Left
1441 6.50 Palm Tree 1.20 Left
1442 6.50 Palm Tree 1.20 Left
1443 6.50 Palm Tree 1.20 Left
1444 6.50 Palm Tree 1.20 Left
1445 6.50 Palm Tree 1.20 Left
1446 6.50 Palm Tree 1.20 Left
1447 6.50 Palm Tree 1.20 Left
1448 6.50 Palm Tree 1.20 Left
1449 6.50 Palm Tree 1.20 Left
1450 6.50 Palm Tree 1.20 Left
1451 6.50 Palm Tree 1.20 Left
1452 6.50 Palm Tree 1.20 Left
1453 6.50 Palm Tree 1.20 Left
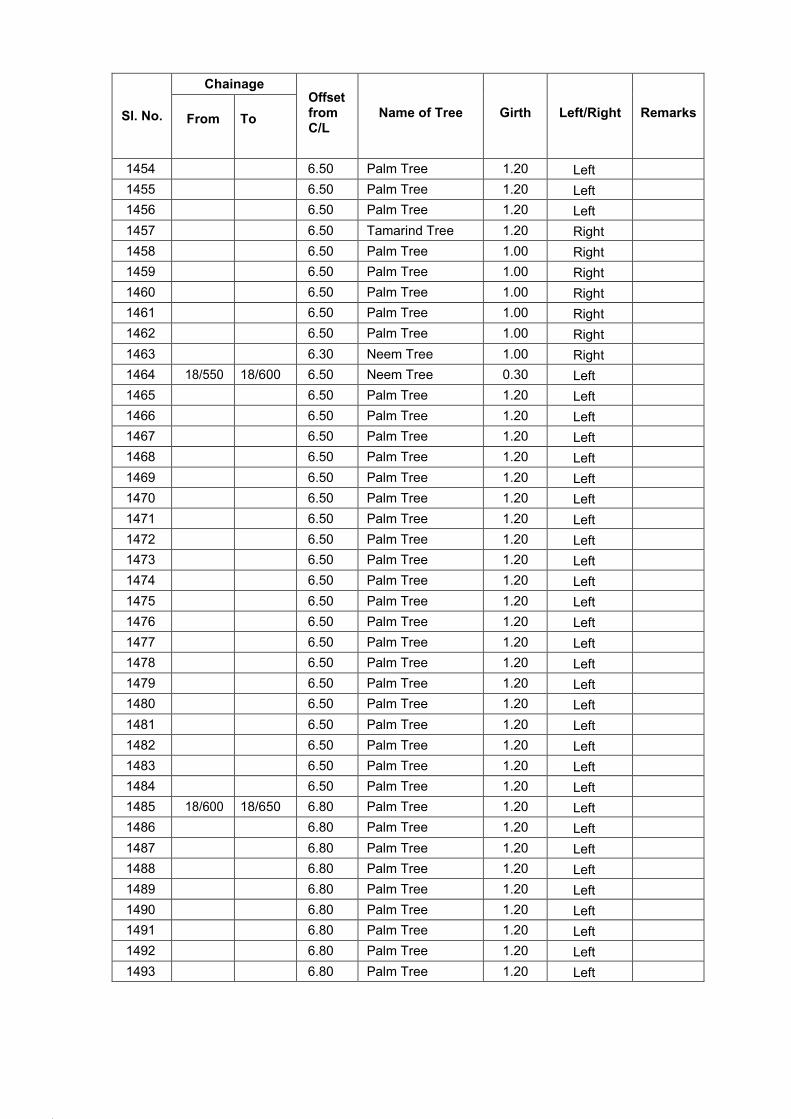
70.
71.
Sl. No.
Chainage Offset from C/L
Name of Tree
Girth
Left/Right
Remarks
From
To
1454 6.50 Palm Tree 1.20 Left
1455 6.50 Palm Tree 1.20 Left
1456 6.50 Palm Tree 1.20 Left
1457 6.50 Tamarind Tree 1.20 Right
1458 6.50 Palm Tree 1.00 Right
1459 6.50 Palm Tree 1.00 Right
1460 6.50 Palm Tree 1.00 Right
1461 6.50 Palm Tree 1.00 Right
1462 6.50 Palm Tree 1.00 Right
1463 6.30 Neem Tree 1.00 Right
1464 18/550 18/600 6.50 Neem Tree 0.30 Left
1465 6.50 Palm Tree 1.20 Left
1466 6.50 Palm Tree 1.20 Left
1467 6.50 Palm Tree 1.20 Left
1468 6.50 Palm Tree 1.20 Left
1469 6.50 Palm Tree 1.20 Left
1470 6.50 Palm Tree 1.20 Left
1471 6.50 Palm Tree 1.20 Left
1472 6.50 Palm Tree 1.20 Left
1473 6.50 Palm Tree 1.20 Left
1474 6.50 Palm Tree 1.20 Left
1475 6.50 Palm Tree 1.20 Left
1476 6.50 Palm Tree 1.20 Left
1477 6.50 Palm Tree 1.20 Left
1478 6.50 Palm Tree 1.20 Left
1479 6.50 Palm Tree 1.20 Left
1480 6.50 Palm Tree 1.20 Left
1481 6.50 Palm Tree 1.20 Left
1482 6.50 Palm Tree 1.20 Left
1483 6.50 Palm Tree 1.20 Left
1484 6.50 Palm Tree 1.20 Left
1485 18/600 18/650 6.80 Palm Tree 1.20 Left
1486 6.80 Palm Tree 1.20 Left
1487 6.80 Palm Tree 1.20 Left
1488 6.80 Palm Tree 1.20 Left
1489 6.80 Palm Tree 1.20 Left
1490 6.80 Palm Tree 1.20 Left
1491 6.80 Palm Tree 1.20 Left
1492 6.80 Palm Tree 1.20 Left
1493 6.80 Palm Tree 1.20 Left
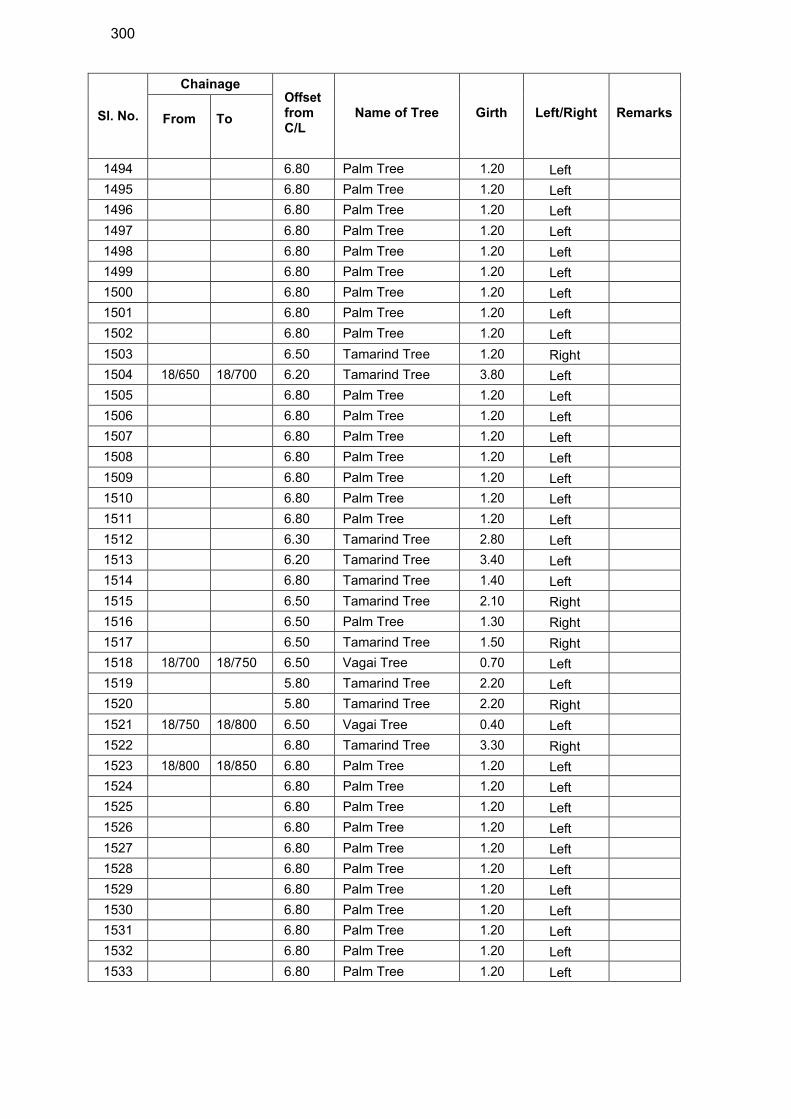
300
Sl. No.
Chainage Offset from C/L
Name of Tree
Girth
Left/Right
Remarks
From
To
1494 6.80 Palm Tree 1.20 Left
1495 6.80 Palm Tree 1.20 Left
1496 6.80 Palm Tree 1.20 Left
1497 6.80 Palm Tree 1.20 Left
1498 6.80 Palm Tree 1.20 Left
1499 6.80 Palm Tree 1.20 Left
1500 6.80 Palm Tree 1.20 Left
1501 6.80 Palm Tree 1.20 Left
1502 6.80 Palm Tree 1.20 Left
1503 6.50 Tamarind Tree 1.20 Right
1504 18/650 18/700 6.20 Tamarind Tree 3.80 Left
1505 6.80 Palm Tree 1.20 Left
1506 6.80 Palm Tree 1.20 Left
1507 6.80 Palm Tree 1.20 Left
1508 6.80 Palm Tree 1.20 Left
1509 6.80 Palm Tree 1.20 Left
1510 6.80 Palm Tree 1.20 Left
1511 6.80 Palm Tree 1.20 Left
1512 6.30 Tamarind Tree 2.80 Left
1513 6.20 Tamarind Tree 3.40 Left
1514 6.80 Tamarind Tree 1.40 Left
1515 6.50 Tamarind Tree 2.10 Right
1516 6.50 Palm Tree 1.30 Right
1517 6.50 Tamarind Tree 1.50 Right
1518 18/700 18/750 6.50 Vagai Tree 0.70 Left
1519 5.80 Tamarind Tree 2.20 Left
1520 5.80 Tamarind Tree 2.20 Right
1521 18/750 18/800 6.50 Vagai Tree 0.40 Left
1522 6.80 Tamarind Tree 3.30 Right
1523 18/800 18/850 6.80 Palm Tree 1.20 Left
1524 6.80 Palm Tree 1.20 Left
1525 6.80 Palm Tree 1.20 Left
1526 6.80 Palm Tree 1.20 Left
1527 6.80 Palm Tree 1.20 Left
1528 6.80 Palm Tree 1.20 Left
1529 6.80 Palm Tree 1.20 Left
1530 6.80 Palm Tree 1.20 Left
1531 6.80 Palm Tree 1.20 Left
1532 6.80 Palm Tree 1.20 Left
1533 6.80 Palm Tree 1.20 Left
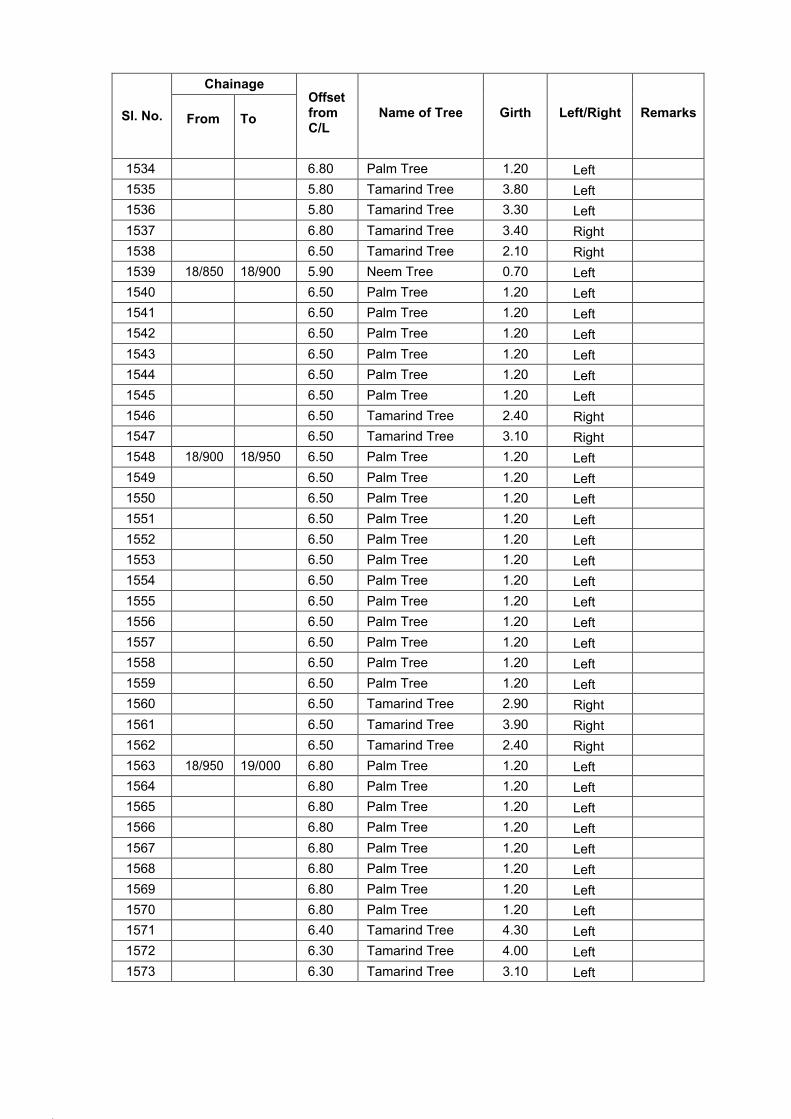
75.
76.
Sl. No.
Chainage Offset from C/L
Name of Tree
Girth
Left/Right
Remarks
From
To
1534 6.80 Palm Tree 1.20 Left
1535 5.80 Tamarind Tree 3.80 Left
1536 5.80 Tamarind Tree 3.30 Left
1537 6.80 Tamarind Tree 3.40 Right
1538 6.50 Tamarind Tree 2.10 Right
1539 18/850 18/900 5.90 Neem Tree 0.70 Left
1540 6.50 Palm Tree 1.20 Left
1541 6.50 Palm Tree 1.20 Left
1542 6.50 Palm Tree 1.20 Left
1543 6.50 Palm Tree 1.20 Left
1544 6.50 Palm Tree 1.20 Left
1545 6.50 Palm Tree 1.20 Left
1546 6.50 Tamarind Tree 2.40 Right
1547 6.50 Tamarind Tree 3.10 Right
1548 18/900 18/950 6.50 Palm Tree 1.20 Left
1549 6.50 Palm Tree 1.20 Left
1550 6.50 Palm Tree 1.20 Left
1551 6.50 Palm Tree 1.20 Left
1552 6.50 Palm Tree 1.20 Left
1553 6.50 Palm Tree 1.20 Left
1554 6.50 Palm Tree 1.20 Left
1555 6.50 Palm Tree 1.20 Left
1556 6.50 Palm Tree 1.20 Left
1557 6.50 Palm Tree 1.20 Left
1558 6.50 Palm Tree 1.20 Left
1559 6.50 Palm Tree 1.20 Left
1560 6.50 Tamarind Tree 2.90 Right
1561 6.50 Tamarind Tree 3.90 Right
1562 6.50 Tamarind Tree 2.40 Right
1563 18/950 19/000 6.80 Palm Tree 1.20 Left
1564 6.80 Palm Tree 1.20 Left
1565 6.80 Palm Tree 1.20 Left
1566 6.80 Palm Tree 1.20 Left
1567 6.80 Palm Tree 1.20 Left
1568 6.80 Palm Tree 1.20 Left
1569 6.80 Palm Tree 1.20 Left
1570 6.80 Palm Tree 1.20 Left
1571 6.40 Tamarind Tree 4.30 Left
1572 6.30 Tamarind Tree 4.00 Left
1573 6.30 Tamarind Tree 3.10 Left
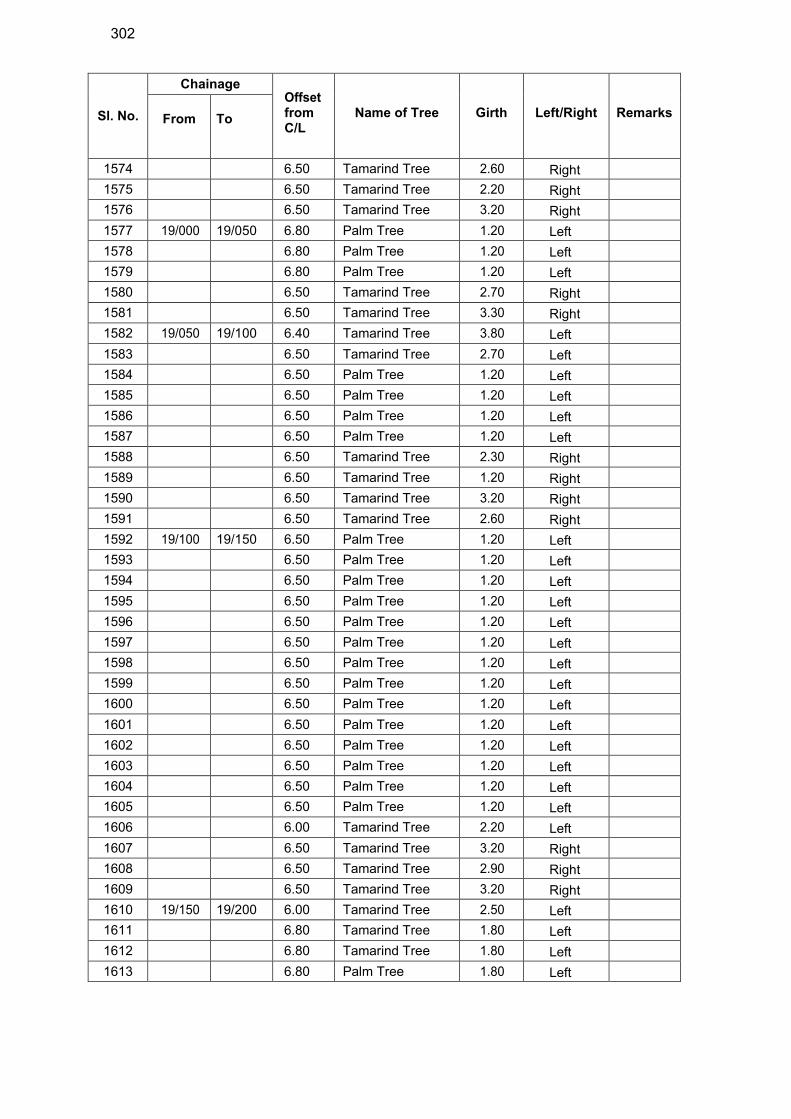
302
Sl. No.
Chainage Offset from C/L
Name of Tree
Girth
Left/Right
Remarks
From
To
1574 6.50 Tamarind Tree 2.60 Right
1575 6.50 Tamarind Tree 2.20 Right
1576 6.50 Tamarind Tree 3.20 Right
1577 19/000 19/050 6.80 Palm Tree 1.20 Left
1578 6.80 Palm Tree 1.20 Left
1579 6.80 Palm Tree 1.20 Left
1580 6.50 Tamarind Tree 2.70 Right
1581 6.50 Tamarind Tree 3.30 Right
1582 19/050 19/100 6.40 Tamarind Tree 3.80 Left
1583 6.50 Tamarind Tree 2.70 Left
1584 6.50 Palm Tree 1.20 Left
1585 6.50 Palm Tree 1.20 Left
1586 6.50 Palm Tree 1.20 Left
1587 6.50 Palm Tree 1.20 Left
1588 6.50 Tamarind Tree 2.30 Right
1589 6.50 Tamarind Tree 1.20 Right
1590 6.50 Tamarind Tree 3.20 Right
1591 6.50 Tamarind Tree 2.60 Right
1592 19/100 19/150 6.50 Palm Tree 1.20 Left
1593 6.50 Palm Tree 1.20 Left
1594 6.50 Palm Tree 1.20 Left
1595 6.50 Palm Tree 1.20 Left
1596 6.50 Palm Tree 1.20 Left
1597 6.50 Palm Tree 1.20 Left
1598 6.50 Palm Tree 1.20 Left
1599 6.50 Palm Tree 1.20 Left
1600 6.50 Palm Tree 1.20 Left
1601 6.50 Palm Tree 1.20 Left
1602 6.50 Palm Tree 1.20 Left
1603 6.50 Palm Tree 1.20 Left
1604 6.50 Palm Tree 1.20 Left
1605 6.50 Palm Tree 1.20 Left
1606 6.00 Tamarind Tree 2.20 Left
1607 6.50 Tamarind Tree 3.20 Right
1608 6.50 Tamarind Tree 2.90 Right
1609 6.50 Tamarind Tree 3.20 Right
1610 19/150 19/200 6.00 Tamarind Tree 2.50 Left
1611 6.80 Tamarind Tree 1.80 Left
1612 6.80 Tamarind Tree 1.80 Left
1613 6.80 Palm Tree 1.80 Left
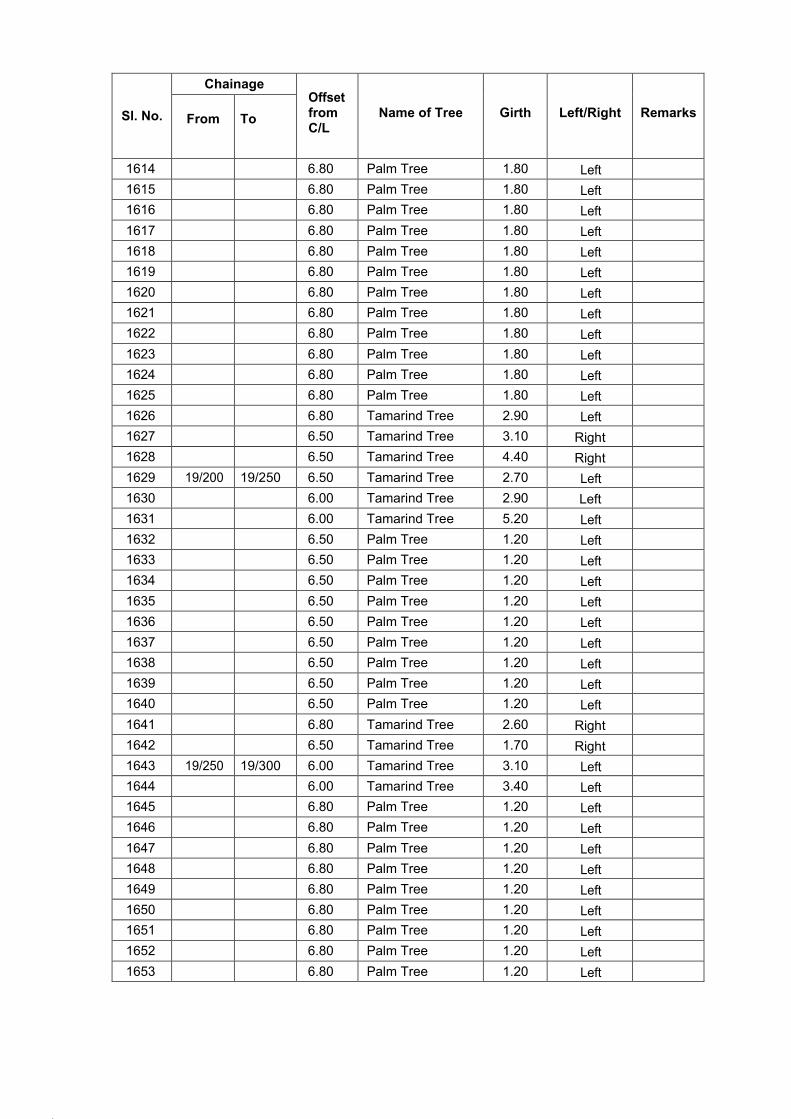
79.
80.
Sl. No.
Chainage Offset from C/L
Name of Tree
Girth
Left/Right
Remarks
From
To
1614 6.80 Palm Tree 1.80 Left
1615 6.80 Palm Tree 1.80 Left
1616 6.80 Palm Tree 1.80 Left
1617 6.80 Palm Tree 1.80 Left
1618 6.80 Palm Tree 1.80 Left
1619 6.80 Palm Tree 1.80 Left
1620 6.80 Palm Tree 1.80 Left
1621 6.80 Palm Tree 1.80 Left
1622 6.80 Palm Tree 1.80 Left
1623 6.80 Palm Tree 1.80 Left
1624 6.80 Palm Tree 1.80 Left
1625 6.80 Palm Tree 1.80 Left
1626 6.80 Tamarind Tree 2.90 Left
1627 6.50 Tamarind Tree 3.10 Right
1628 6.50 Tamarind Tree 4.40 Right
1629 19/200 19/250 6.50 Tamarind Tree 2.70 Left
1630 6.00 Tamarind Tree 2.90 Left
1631 6.00 Tamarind Tree 5.20 Left
1632 6.50 Palm Tree 1.20 Left
1633 6.50 Palm Tree 1.20 Left
1634 6.50 Palm Tree 1.20 Left
1635 6.50 Palm Tree 1.20 Left
1636 6.50 Palm Tree 1.20 Left
1637 6.50 Palm Tree 1.20 Left
1638 6.50 Palm Tree 1.20 Left
1639 6.50 Palm Tree 1.20 Left
1640 6.50 Palm Tree 1.20 Left
1641 6.80 Tamarind Tree 2.60 Right
1642 6.50 Tamarind Tree 1.70 Right
1643 19/250 19/300 6.00 Tamarind Tree 3.10 Left
1644 6.00 Tamarind Tree 3.40 Left
1645 6.80 Palm Tree 1.20 Left
1646 6.80 Palm Tree 1.20 Left
1647 6.80 Palm Tree 1.20 Left
1648 6.80 Palm Tree 1.20 Left
1649 6.80 Palm Tree 1.20 Left
1650 6.80 Palm Tree 1.20 Left
1651 6.80 Palm Tree 1.20 Left
1652 6.80 Palm Tree 1.20 Left
1653 6.80 Palm Tree 1.20 Left
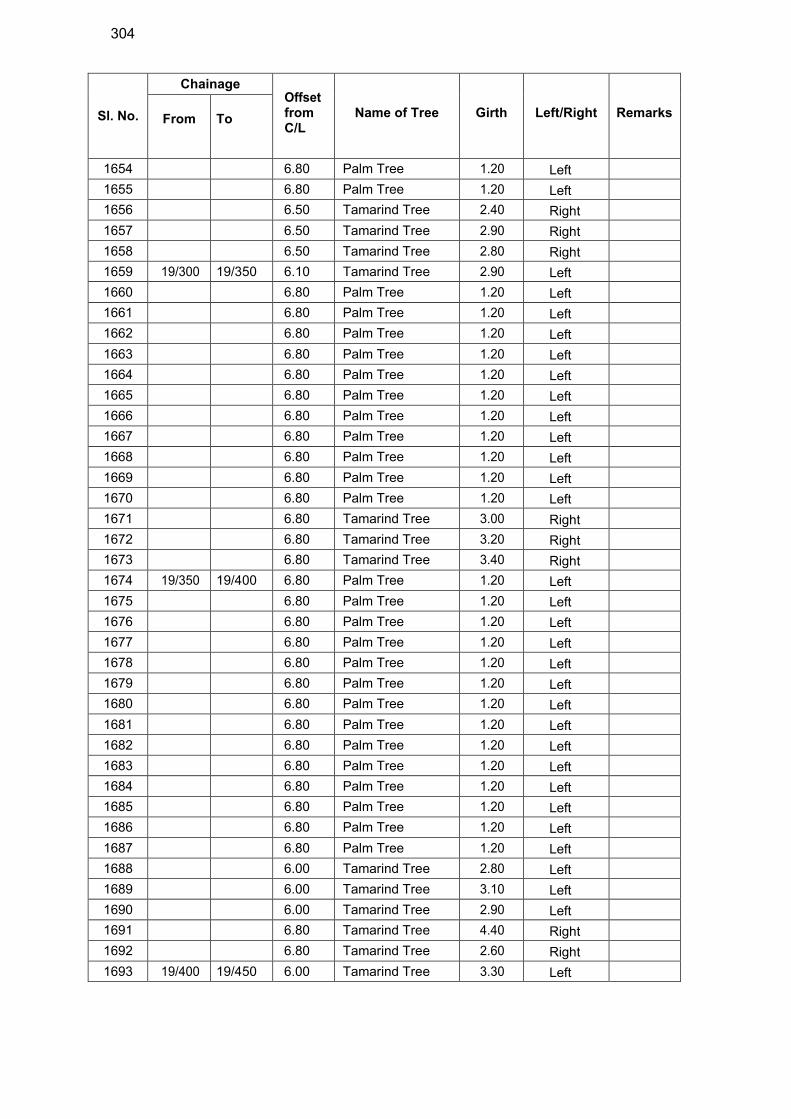
304
Sl. No.
Chainage Offset from C/L
Name of Tree
Girth
Left/Right
Remarks
From
To
1654 6.80 Palm Tree 1.20 Left
1655 6.80 Palm Tree 1.20 Left
1656 6.50 Tamarind Tree 2.40 Right
1657 6.50 Tamarind Tree 2.90 Right
1658 6.50 Tamarind Tree 2.80 Right
1659 19/300 19/350 6.10 Tamarind Tree 2.90 Left
1660 6.80 Palm Tree 1.20 Left
1661 6.80 Palm Tree 1.20 Left
1662 6.80 Palm Tree 1.20 Left
1663 6.80 Palm Tree 1.20 Left
1664 6.80 Palm Tree 1.20 Left
1665 6.80 Palm Tree 1.20 Left
1666 6.80 Palm Tree 1.20 Left
1667 6.80 Palm Tree 1.20 Left
1668 6.80 Palm Tree 1.20 Left
1669 6.80 Palm Tree 1.20 Left
1670 6.80 Palm Tree 1.20 Left
1671 6.80 Tamarind Tree 3.00 Right
1672 6.80 Tamarind Tree 3.20 Right
1673 6.80 Tamarind Tree 3.40 Right
1674 19/350 19/400 6.80 Palm Tree 1.20 Left
1675 6.80 Palm Tree 1.20 Left
1676 6.80 Palm Tree 1.20 Left
1677 6.80 Palm Tree 1.20 Left
1678 6.80 Palm Tree 1.20 Left
1679 6.80 Palm Tree 1.20 Left
1680 6.80 Palm Tree 1.20 Left
1681 6.80 Palm Tree 1.20 Left
1682 6.80 Palm Tree 1.20 Left
1683 6.80 Palm Tree 1.20 Left
1684 6.80 Palm Tree 1.20 Left
1685 6.80 Palm Tree 1.20 Left
1686 6.80 Palm Tree 1.20 Left
1687 6.80 Palm Tree 1.20 Left
1688 6.00 Tamarind Tree 2.80 Left
1689 6.00 Tamarind Tree 3.10 Left
1690 6.00 Tamarind Tree 2.90 Left
1691 6.80 Tamarind Tree 4.40 Right
1692 6.80 Tamarind Tree 2.60 Right
1693 19/400 19/450 6.00 Tamarind Tree 3.30 Left
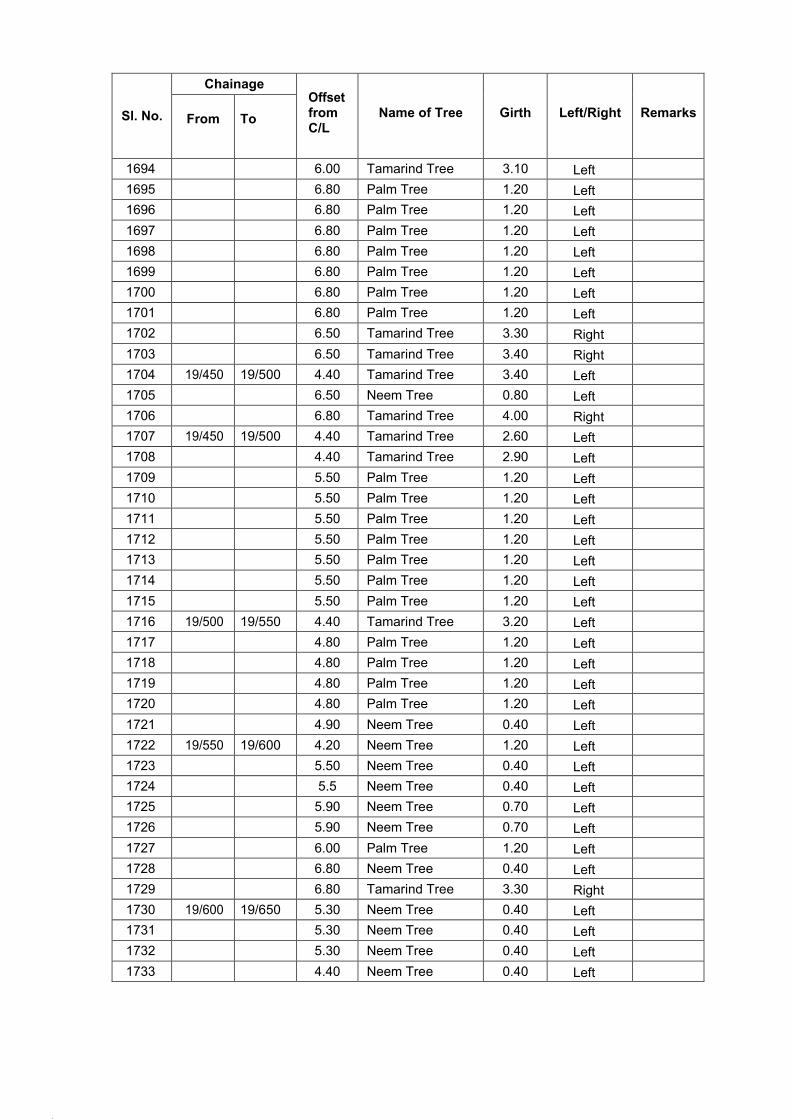
83.
84.
Sl. No.
Chainage Offset from C/L
Name of Tree
Girth
Left/Right
Remarks
From
To
1694 6.00 Tamarind Tree 3.10 Left
1695 6.80 Palm Tree 1.20 Left
1696 6.80 Palm Tree 1.20 Left
1697 6.80 Palm Tree 1.20 Left
1698 6.80 Palm Tree 1.20 Left
1699 6.80 Palm Tree 1.20 Left
1700 6.80 Palm Tree 1.20 Left
1701 6.80 Palm Tree 1.20 Left
1702 6.50 Tamarind Tree 3.30 Right
1703 6.50 Tamarind Tree 3.40 Right
1704 19/450 19/500 4.40 Tamarind Tree 3.40 Left
1705 6.50 Neem Tree 0.80 Left
1706 6.80 Tamarind Tree 4.00 Right
1707 19/450 19/500 4.40 Tamarind Tree 2.60 Left
1708 4.40 Tamarind Tree 2.90 Left
1709 5.50 Palm Tree 1.20 Left
1710 5.50 Palm Tree 1.20 Left
1711 5.50 Palm Tree 1.20 Left
1712 5.50 Palm Tree 1.20 Left
1713 5.50 Palm Tree 1.20 Left
1714 5.50 Palm Tree 1.20 Left
1715 5.50 Palm Tree 1.20 Left
1716 19/500 19/550 4.40 Tamarind Tree 3.20 Left
1717 4.80 Palm Tree 1.20 Left
1718 4.80 Palm Tree 1.20 Left
1719 4.80 Palm Tree 1.20 Left
1720 4.80 Palm Tree 1.20 Left
1721 4.90 Neem Tree 0.40 Left
1722 19/550 19/600 4.20 Neem Tree 1.20 Left
1723 5.50 Neem Tree 0.40 Left
1724 5.5 Neem Tree 0.40 Left
1725 5.90 Neem Tree 0.70 Left
1726 5.90 Neem Tree 0.70 Left
1727 6.00 Palm Tree 1.20 Left
1728 6.80 Neem Tree 0.40 Left
1729 6.80 Tamarind Tree 3.30 Right
1730 19/600 19/650 5.30 Neem Tree 0.40 Left
1731 5.30 Neem Tree 0.40 Left
1732 5.30 Neem Tree 0.40 Left
1733 4.40 Neem Tree 0.40 Left
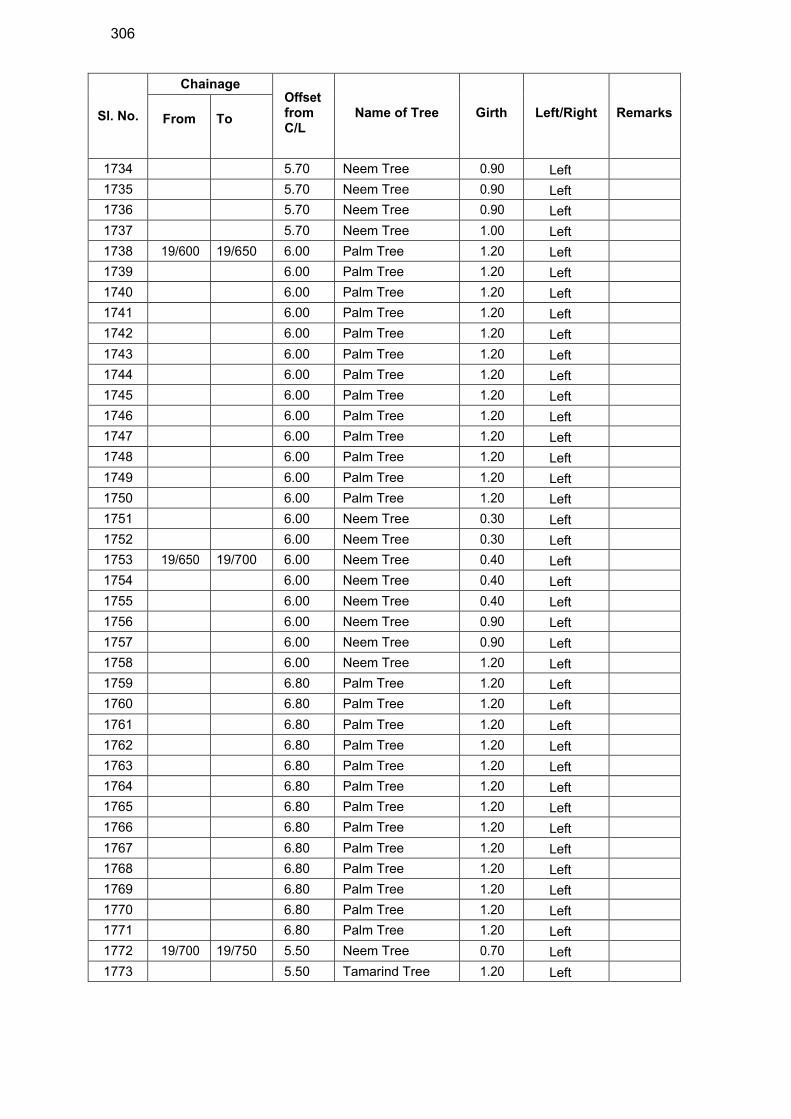
306
Sl. No.
Chainage Offset from C/L
Name of Tree
Girth
Left/Right
Remarks
From
To
1734 5.70 Neem Tree 0.90 Left
1735 5.70 Neem Tree 0.90 Left
1736 5.70 Neem Tree 0.90 Left
1737 5.70 Neem Tree 1.00 Left
1738 19/600 19/650 6.00 Palm Tree 1.20 Left
1739 6.00 Palm Tree 1.20 Left
1740 6.00 Palm Tree 1.20 Left
1741 6.00 Palm Tree 1.20 Left
1742 6.00 Palm Tree 1.20 Left
1743 6.00 Palm Tree 1.20 Left
1744 6.00 Palm Tree 1.20 Left
1745 6.00 Palm Tree 1.20 Left
1746 6.00 Palm Tree 1.20 Left
1747 6.00 Palm Tree 1.20 Left
1748 6.00 Palm Tree 1.20 Left
1749 6.00 Palm Tree 1.20 Left
1750 6.00 Palm Tree 1.20 Left
1751 6.00 Neem Tree 0.30 Left
1752 6.00 Neem Tree 0.30 Left
1753 19/650 19/700 6.00 Neem Tree 0.40 Left
1754 6.00 Neem Tree 0.40 Left
1755 6.00 Neem Tree 0.40 Left
1756 6.00 Neem Tree 0.90 Left
1757 6.00 Neem Tree 0.90 Left
1758 6.00 Neem Tree 1.20 Left
1759 6.80 Palm Tree 1.20 Left
1760 6.80 Palm Tree 1.20 Left
1761 6.80 Palm Tree 1.20 Left
1762 6.80 Palm Tree 1.20 Left
1763 6.80 Palm Tree 1.20 Left
1764 6.80 Palm Tree 1.20 Left
1765 6.80 Palm Tree 1.20 Left
1766 6.80 Palm Tree 1.20 Left
1767 6.80 Palm Tree 1.20 Left
1768 6.80 Palm Tree 1.20 Left
1769 6.80 Palm Tree 1.20 Left
1770 6.80 Palm Tree 1.20 Left
1771 6.80 Palm Tree 1.20 Left
1772 19/700 19/750 5.50 Neem Tree 0.70 Left
1773 5.50 Tamarind Tree 1.20 Left
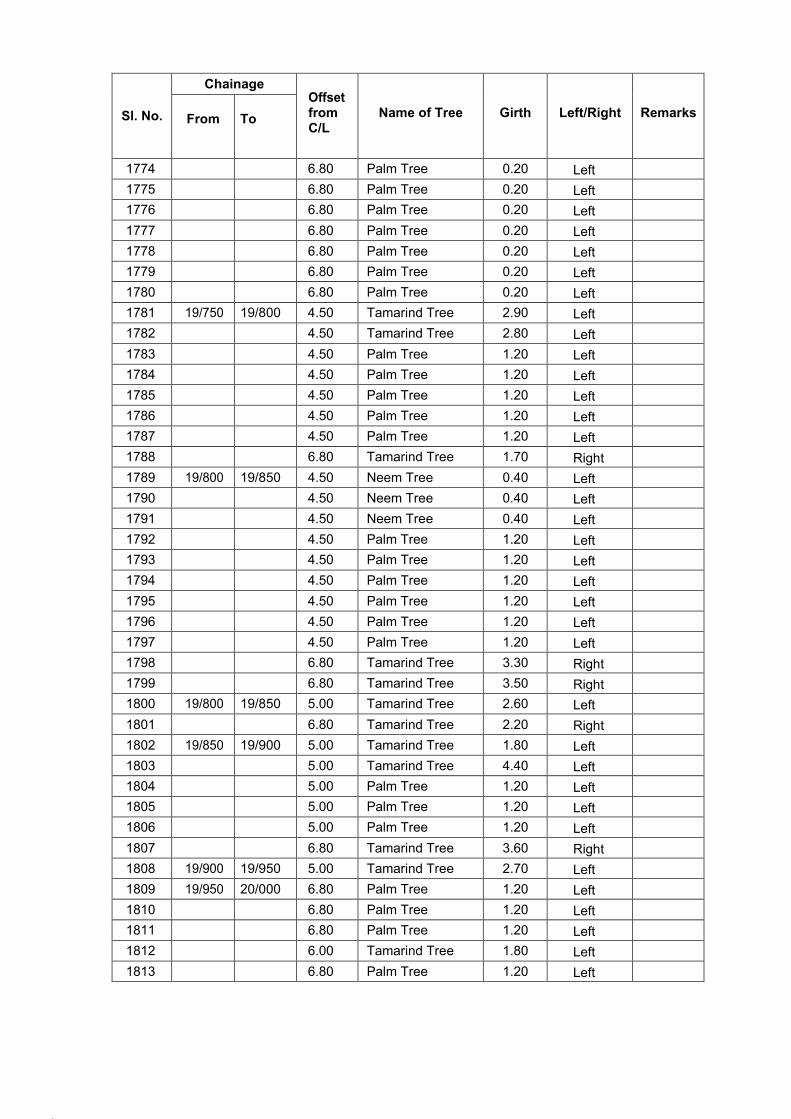
87.
88.
Sl. No.
Chainage Offset from C/L
Name of Tree
Girth
Left/Right
Remarks
From
To
1774 6.80 Palm Tree 0.20 Left
1775 6.80 Palm Tree 0.20 Left
1776 6.80 Palm Tree 0.20 Left
1777 6.80 Palm Tree 0.20 Left
1778 6.80 Palm Tree 0.20 Left
1779 6.80 Palm Tree 0.20 Left
1780 6.80 Palm Tree 0.20 Left
1781 19/750 19/800 4.50 Tamarind Tree 2.90 Left
1782 4.50 Tamarind Tree 2.80 Left
1783 4.50 Palm Tree 1.20 Left
1784 4.50 Palm Tree 1.20 Left
1785 4.50 Palm Tree 1.20 Left
1786 4.50 Palm Tree 1.20 Left
1787 4.50 Palm Tree 1.20 Left
1788 6.80 Tamarind Tree 1.70 Right
1789 19/800 19/850 4.50 Neem Tree 0.40 Left
1790 4.50 Neem Tree 0.40 Left
1791 4.50 Neem Tree 0.40 Left
1792 4.50 Palm Tree 1.20 Left
1793 4.50 Palm Tree 1.20 Left
1794 4.50 Palm Tree 1.20 Left
1795 4.50 Palm Tree 1.20 Left
1796 4.50 Palm Tree 1.20 Left
1797 4.50 Palm Tree 1.20 Left
1798 6.80 Tamarind Tree 3.30 Right
1799 6.80 Tamarind Tree 3.50 Right
1800 19/800 19/850 5.00 Tamarind Tree 2.60 Left
1801 6.80 Tamarind Tree 2.20 Right
1802 19/850 19/900 5.00 Tamarind Tree 1.80 Left
1803 5.00 Tamarind Tree 4.40 Left
1804 5.00 Palm Tree 1.20 Left
1805 5.00 Palm Tree 1.20 Left
1806 5.00 Palm Tree 1.20 Left
1807 6.80 Tamarind Tree 3.60 Right
1808 19/900 19/950 5.00 Tamarind Tree 2.70 Left
1809 19/950 20/000 6.80 Palm Tree 1.20 Left
1810 6.80 Palm Tree 1.20 Left
1811 6.80 Palm Tree 1.20 Left
1812 6.00 Tamarind Tree 1.80 Left
1813 6.80 Palm Tree 1.20 Left
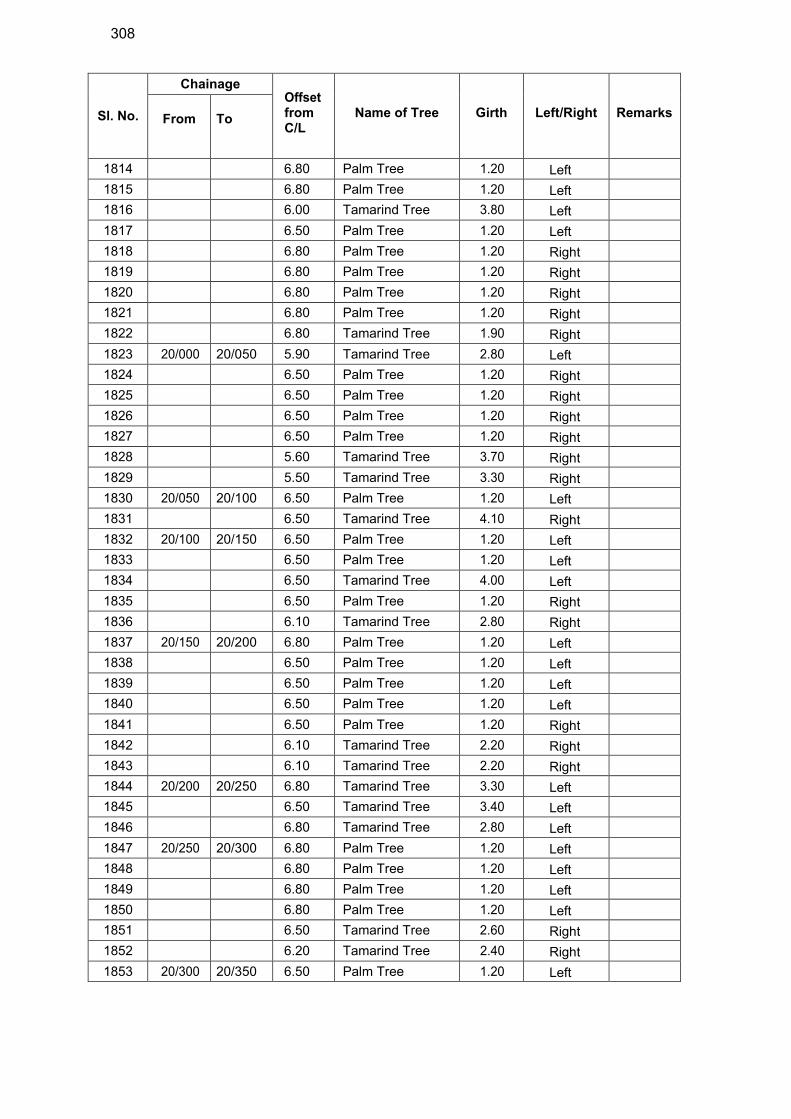
308
Sl. No.
Chainage Offset from C/L
Name of Tree
Girth
Left/Right
Remarks
From
To
1814 6.80 Palm Tree 1.20 Left
1815 6.80 Palm Tree 1.20 Left
1816 6.00 Tamarind Tree 3.80 Left
1817 6.50 Palm Tree 1.20 Left
1818 6.80 Palm Tree 1.20 Right
1819 6.80 Palm Tree 1.20 Right
1820 6.80 Palm Tree 1.20 Right
1821 6.80 Palm Tree 1.20 Right
1822 6.80 Tamarind Tree 1.90 Right
1823 20/000 20/050 5.90 Tamarind Tree 2.80 Left
1824 6.50 Palm Tree 1.20 Right
1825 6.50 Palm Tree 1.20 Right
1826 6.50 Palm Tree 1.20 Right
1827 6.50 Palm Tree 1.20 Right
1828 5.60 Tamarind Tree 3.70 Right
1829 5.50 Tamarind Tree 3.30 Right
1830 20/050 20/100 6.50 Palm Tree 1.20 Left
1831 6.50 Tamarind Tree 4.10 Right
1832 20/100 20/150 6.50 Palm Tree 1.20 Left
1833 6.50 Palm Tree 1.20 Left
1834 6.50 Tamarind Tree 4.00 Left
1835 6.50 Palm Tree 1.20 Right
1836 6.10 Tamarind Tree 2.80 Right
1837 20/150 20/200 6.80 Palm Tree 1.20 Left
1838 6.50 Palm Tree 1.20 Left
1839 6.50 Palm Tree 1.20 Left
1840 6.50 Palm Tree 1.20 Left
1841 6.50 Palm Tree 1.20 Right
1842 6.10 Tamarind Tree 2.20 Right
1843 6.10 Tamarind Tree 2.20 Right
1844 20/200 20/250 6.80 Tamarind Tree 3.30 Left
1845 6.50 Tamarind Tree 3.40 Left
1846 6.80 Tamarind Tree 2.80 Left
1847 20/250 20/300 6.80 Palm Tree 1.20 Left
1848 6.80 Palm Tree 1.20 Left
1849 6.80 Palm Tree 1.20 Left
1850 6.80 Palm Tree 1.20 Left
1851 6.50 Tamarind Tree 2.60 Right
1852 6.20 Tamarind Tree 2.40 Right
1853 20/300 20/350 6.50 Palm Tree 1.20 Left
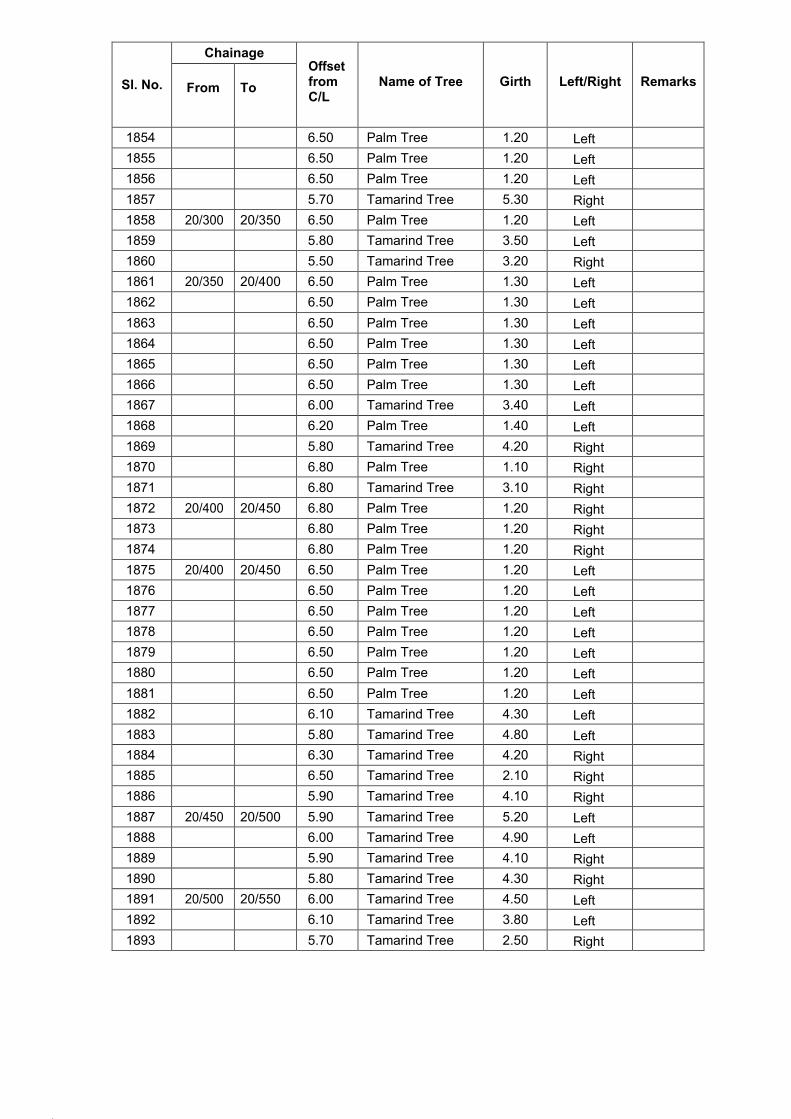
91.
92.
Sl. No.
Chainage Offset from C/L
Name of Tree
Girth
Left/Right
Remarks
From
To
1854 6.50 Palm Tree 1.20 Left
1855 6.50 Palm Tree 1.20 Left
1856 6.50 Palm Tree 1.20 Left
1857 5.70 Tamarind Tree 5.30 Right
1858 20/300 20/350 6.50 Palm Tree 1.20 Left
1859 5.80 Tamarind Tree 3.50 Left
1860 5.50 Tamarind Tree 3.20 Right
1861 20/350 20/400 6.50 Palm Tree 1.30 Left
1862 6.50 Palm Tree 1.30 Left
1863 6.50 Palm Tree 1.30 Left
1864 6.50 Palm Tree 1.30 Left
1865 6.50 Palm Tree 1.30 Left
1866 6.50 Palm Tree 1.30 Left
1867 6.00 Tamarind Tree 3.40 Left
1868 6.20 Palm Tree 1.40 Left
1869 5.80 Tamarind Tree 4.20 Right
1870 6.80 Palm Tree 1.10 Right
1871 6.80 Tamarind Tree 3.10 Right
1872 20/400 20/450 6.80 Palm Tree 1.20 Right
1873 6.80 Palm Tree 1.20 Right
1874 6.80 Palm Tree 1.20 Right
1875 20/400 20/450 6.50 Palm Tree 1.20 Left
1876 6.50 Palm Tree 1.20 Left
1877 6.50 Palm Tree 1.20 Left
1878 6.50 Palm Tree 1.20 Left
1879 6.50 Palm Tree 1.20 Left
1880 6.50 Palm Tree 1.20 Left
1881 6.50 Palm Tree 1.20 Left
1882 6.10 Tamarind Tree 4.30 Left
1883 5.80 Tamarind Tree 4.80 Left
1884 6.30 Tamarind Tree 4.20 Right
1885 6.50 Tamarind Tree 2.10 Right
1886 5.90 Tamarind Tree 4.10 Right
1887 20/450 20/500 5.90 Tamarind Tree 5.20 Left
1888 6.00 Tamarind Tree 4.90 Left
1889 5.90 Tamarind Tree 4.10 Right
1890 5.80 Tamarind Tree 4.30 Right
1891 20/500 20/550 6.00 Tamarind Tree 4.50 Left
1892 6.10 Tamarind Tree 3.80 Left
1893 5.70 Tamarind Tree 2.50 Right
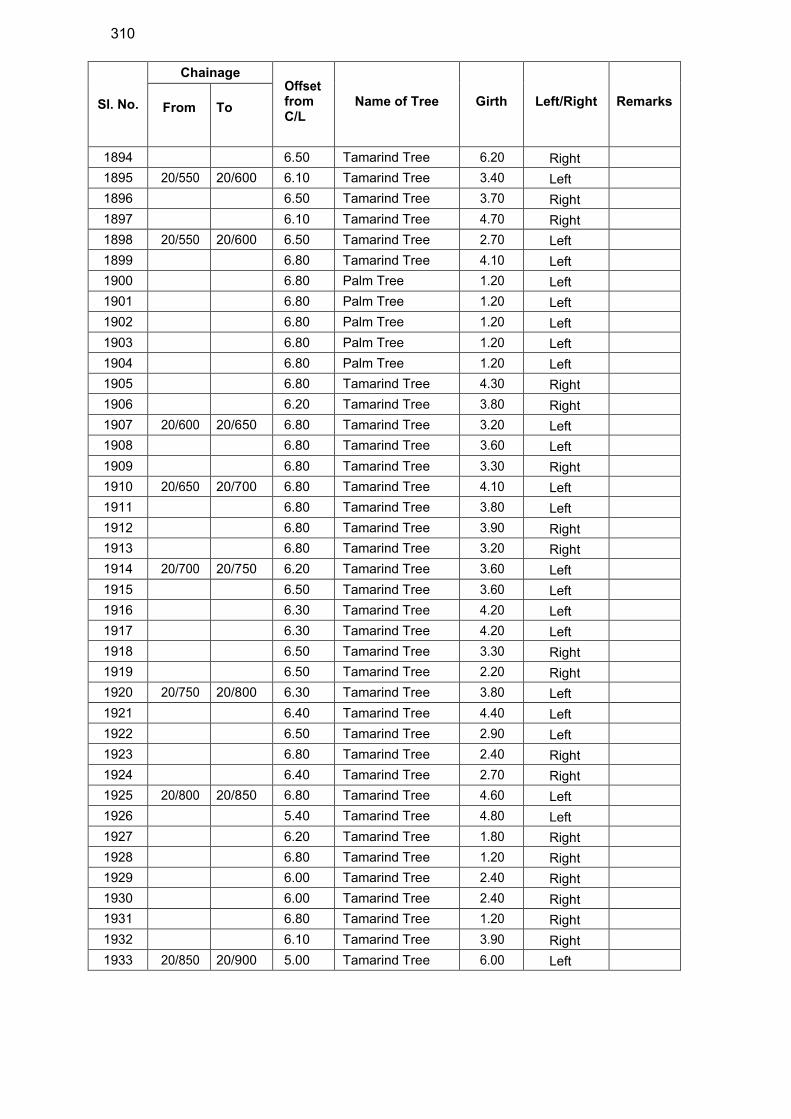
310
Sl. No.
Chainage Offset from C/L
Name of Tree
Girth
Left/Right
Remarks
From
To
1894 6.50 Tamarind Tree 6.20 Right
1895 20/550 20/600 6.10 Tamarind Tree 3.40 Left
1896 6.50 Tamarind Tree 3.70 Right
1897 6.10 Tamarind Tree 4.70 Right
1898 20/550 20/600 6.50 Tamarind Tree 2.70 Left
1899 6.80 Tamarind Tree 4.10 Left
1900 6.80 Palm Tree 1.20 Left
1901 6.80 Palm Tree 1.20 Left
1902 6.80 Palm Tree 1.20 Left
1903 6.80 Palm Tree 1.20 Left
1904 6.80 Palm Tree 1.20 Left
1905 6.80 Tamarind Tree 4.30 Right
1906 6.20 Tamarind Tree 3.80 Right
1907 20/600 20/650 6.80 Tamarind Tree 3.20 Left
1908 6.80 Tamarind Tree 3.60 Left
1909 6.80 Tamarind Tree 3.30 Right
1910 20/650 20/700 6.80 Tamarind Tree 4.10 Left
1911 6.80 Tamarind Tree 3.80 Left
1912 6.80 Tamarind Tree 3.90 Right
1913 6.80 Tamarind Tree 3.20 Right
1914 20/700 20/750 6.20 Tamarind Tree 3.60 Left
1915 6.50 Tamarind Tree 3.60 Left
1916 6.30 Tamarind Tree 4.20 Left
1917 6.30 Tamarind Tree 4.20 Left
1918 6.50 Tamarind Tree 3.30 Right
1919 6.50 Tamarind Tree 2.20 Right
1920 20/750 20/800 6.30 Tamarind Tree 3.80 Left
1921 6.40 Tamarind Tree 4.40 Left
1922 6.50 Tamarind Tree 2.90 Left
1923 6.80 Tamarind Tree 2.40 Right
1924 6.40 Tamarind Tree 2.70 Right
1925 20/800 20/850 6.80 Tamarind Tree 4.60 Left
1926 5.40 Tamarind Tree 4.80 Left
1927 6.20 Tamarind Tree 1.80 Right
1928 6.80 Tamarind Tree 1.20 Right
1929 6.00 Tamarind Tree 2.40 Right
1930 6.00 Tamarind Tree 2.40 Right
1931 6.80 Tamarind Tree 1.20 Right
1932 6.10 Tamarind Tree 3.90 Right
1933 20/850 20/900 5.00 Tamarind Tree 6.00 Left
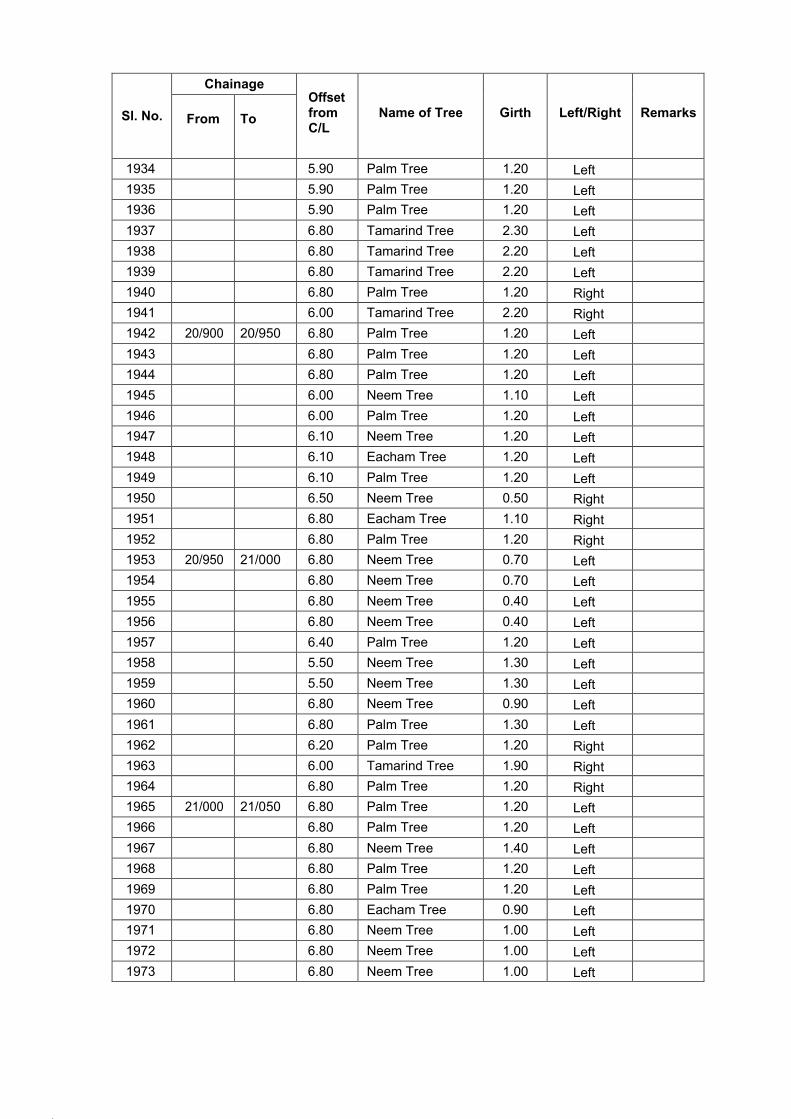
95.
96.
Sl. No.
Chainage Offset from C/L
Name of Tree
Girth
Left/Right
Remarks
From
To
1934 5.90 Palm Tree 1.20 Left
1935 5.90 Palm Tree 1.20 Left
1936 5.90 Palm Tree 1.20 Left
1937 6.80 Tamarind Tree 2.30 Left
1938 6.80 Tamarind Tree 2.20 Left
1939 6.80 Tamarind Tree 2.20 Left
1940 6.80 Palm Tree 1.20 Right
1941 6.00 Tamarind Tree 2.20 Right
1942 20/900 20/950 6.80 Palm Tree 1.20 Left
1943 6.80 Palm Tree 1.20 Left
1944 6.80 Palm Tree 1.20 Left
1945 6.00 Neem Tree 1.10 Left
1946 6.00 Palm Tree 1.20 Left
1947 6.10 Neem Tree 1.20 Left
1948 6.10 Eacham Tree 1.20 Left
1949 6.10 Palm Tree 1.20 Left
1950 6.50 Neem Tree 0.50 Right
1951 6.80 Eacham Tree 1.10 Right
1952 6.80 Palm Tree 1.20 Right
1953 20/950 21/000 6.80 Neem Tree 0.70 Left
1954 6.80 Neem Tree 0.70 Left
1955 6.80 Neem Tree 0.40 Left
1956 6.80 Neem Tree 0.40 Left
1957 6.40 Palm Tree 1.20 Left
1958 5.50 Neem Tree 1.30 Left
1959 5.50 Neem Tree 1.30 Left
1960 6.80 Neem Tree 0.90 Left
1961 6.80 Palm Tree 1.30 Left
1962 6.20 Palm Tree 1.20 Right
1963 6.00 Tamarind Tree 1.90 Right
1964 6.80 Palm Tree 1.20 Right
1965 21/000 21/050 6.80 Palm Tree 1.20 Left
1966 6.80 Palm Tree 1.20 Left
1967 6.80 Neem Tree 1.40 Left
1968 6.80 Palm Tree 1.20 Left
1969 6.80 Palm Tree 1.20 Left
1970 6.80 Eacham Tree 0.90 Left
1971 6.80 Neem Tree 1.00 Left
1972 6.80 Neem Tree 1.00 Left
1973 6.80 Neem Tree 1.00 Left
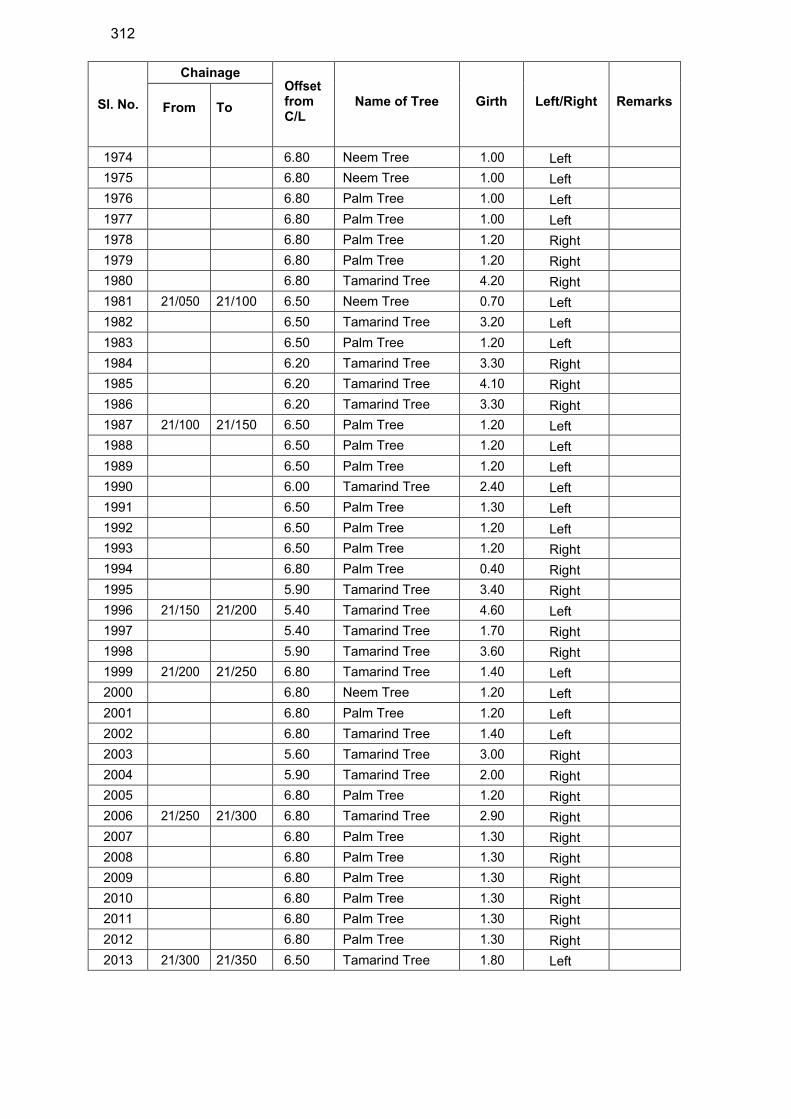
312
Sl. No.
Chainage Offset from C/L
Name of Tree
Girth
Left/Right
Remarks
From
To
1974 6.80 Neem Tree 1.00 Left
1975 6.80 Neem Tree 1.00 Left
1976 6.80 Palm Tree 1.00 Left
1977 6.80 Palm Tree 1.00 Left
1978 6.80 Palm Tree 1.20 Right
1979 6.80 Palm Tree 1.20 Right
1980 6.80 Tamarind Tree 4.20 Right
1981 21/050 21/100 6.50 Neem Tree 0.70 Left
1982 6.50 Tamarind Tree 3.20 Left
1983 6.50 Palm Tree 1.20 Left
1984 6.20 Tamarind Tree 3.30 Right
1985 6.20 Tamarind Tree 4.10 Right
1986 6.20 Tamarind Tree 3.30 Right
1987 21/100 21/150 6.50 Palm Tree 1.20 Left
1988 6.50 Palm Tree 1.20 Left
1989 6.50 Palm Tree 1.20 Left
1990 6.00 Tamarind Tree 2.40 Left
1991 6.50 Palm Tree 1.30 Left
1992 6.50 Palm Tree 1.20 Left
1993 6.50 Palm Tree 1.20 Right
1994 6.80 Palm Tree 0.40 Right
1995 5.90 Tamarind Tree 3.40 Right
1996 21/150 21/200 5.40 Tamarind Tree 4.60 Left
1997 5.40 Tamarind Tree 1.70 Right
1998 5.90 Tamarind Tree 3.60 Right
1999 21/200 21/250 6.80 Tamarind Tree 1.40 Left
2000 6.80 Neem Tree 1.20 Left
2001 6.80 Palm Tree 1.20 Left
2002 6.80 Tamarind Tree 1.40 Left
2003 5.60 Tamarind Tree 3.00 Right
2004 5.90 Tamarind Tree 2.00 Right
2005 6.80 Palm Tree 1.20 Right
2006 21/250 21/300 6.80 Tamarind Tree 2.90 Right
2007 6.80 Palm Tree 1.30 Right
2008 6.80 Palm Tree 1.30 Right
2009 6.80 Palm Tree 1.30 Right
2010 6.80 Palm Tree 1.30 Right
2011 6.80 Palm Tree 1.30 Right
2012 6.80 Palm Tree 1.30 Right
2013 21/300 21/350 6.50 Tamarind Tree 1.80 Left

99.
100.
Sl. No.
Chainage Offset from C/L
Name of Tree
Girth
Left/Right
Remarks
From
To
2014 6.80 Palm Tree 1.30 Right
2015 6.80 Palm Tree 1.30 Right
2016 6.80 Palm Tree 1.30 Right
2017 6.80 Palm Tree 1.30 Right
2018 6.80 Palm Tree 1.30 Right
2019 6.80 Palm Tree 1.30 Right
2020 21/350 21/400 6.80 Palm Tree 1.30 Left
2021 6.80 Palm Tree 1.30 Left
2022 6.80 Neem Tree 1.20 Right
2023 6.00 Palm Tree 1.20 Right
2024 6.00 Palm Tree 1.20 Right
2025 6.00 Palm Tree 1.20 Right
2026 6.00 Palm Tree 1.20 Right
2027 21/400 21/450 6.80 Palm Tree 1.20 Left
2028 6.80 Palm Tree 1.20 Left
2029 6.80 Palm Tree 1.20 Left
2030 6.80 Palm Tree 1.20 Left
2031 6.80 Palm Tree 1.20 Left
2032 6.80 Palm Tree 1.20 Left
2033 6.80 Palm Tree 1.20 Left
2034 6.80 Palm Tree 1.20 Left
2035 6.80 Neem Tree 0.70 Left
2036 6.20 Palm Tree 1.30 Right
2037 6.20 Palm Tree 1.30 Right
2038 6.20 Palm Tree 1.30 Right
2039 6.20 Palm Tree 1.30 Right
2040 6.20 Palm Tree 1.30 Right
2041 6.20 Palm Tree 1.30 Right
2042 6.20 Palm Tree 1.30 Right
2043 6.20 Palm Tree 1.30 Right
2044 6.20 Palm Tree 1.30 Right
2045 6.20 Palm Tree 1.30 Right
2046 6.20 Palm Tree 1.30 Right
2047 6.20 Palm Tree 1.30 Right
2048 6.50 Tamarind Tree 5.20 Right
2049 21/450 21/500 6.80 Palm Tree 1.20 Left
2050 6.80 Neem Tree 0.40 Left
2051 6.30 Tamarind Tree 2.80 Right
2052 6.30 Tamarind Tree 2.00 Right
2053 21/500 21/550 6.80 Neem Tree 0.40 Left
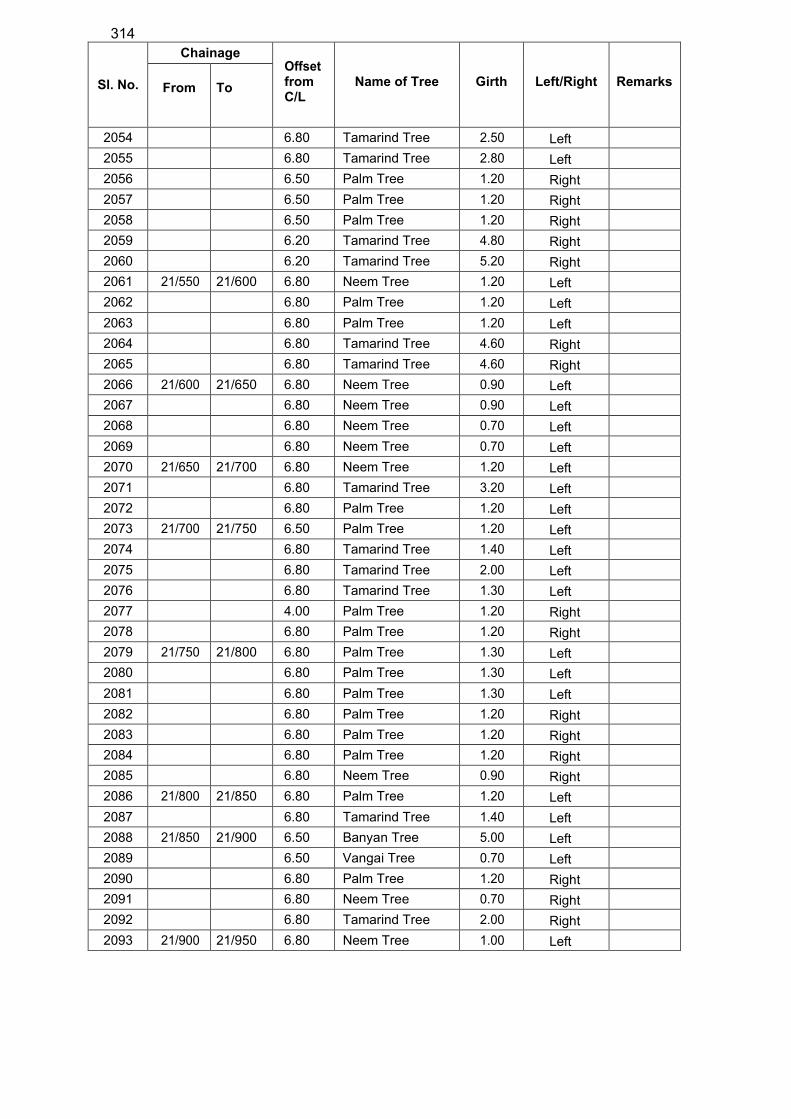
314
Sl. No.
Chainage Offset from C/L
Name of Tree
Girth
Left/Right
Remarks
From
To
2054 6.80 Tamarind Tree 2.50 Left
2055 6.80 Tamarind Tree 2.80 Left
2056 6.50 Palm Tree 1.20 Right
2057 6.50 Palm Tree 1.20 Right
2058 6.50 Palm Tree 1.20 Right
2059 6.20 Tamarind Tree 4.80 Right
2060 6.20 Tamarind Tree 5.20 Right
2061 21/550 21/600 6.80 Neem Tree 1.20 Left
2062 6.80 Palm Tree 1.20 Left
2063 6.80 Palm Tree 1.20 Left
2064 6.80 Tamarind Tree 4.60 Right
2065 6.80 Tamarind Tree 4.60 Right
2066 21/600 21/650 6.80 Neem Tree 0.90 Left
2067 6.80 Neem Tree 0.90 Left
2068 6.80 Neem Tree 0.70 Left
2069 6.80 Neem Tree 0.70 Left
2070 21/650 21/700 6.80 Neem Tree 1.20 Left
2071 6.80 Tamarind Tree 3.20 Left
2072 6.80 Palm Tree 1.20 Left
2073 21/700 21/750 6.50 Palm Tree 1.20 Left
2074 6.80 Tamarind Tree 1.40 Left
2075 6.80 Tamarind Tree 2.00 Left
2076 6.80 Tamarind Tree 1.30 Left
2077 4.00 Palm Tree 1.20 Right
2078 6.80 Palm Tree 1.20 Right
2079 21/750 21/800 6.80 Palm Tree 1.30 Left
2080 6.80 Palm Tree 1.30 Left
2081 6.80 Palm Tree 1.30 Left
2082 6.80 Palm Tree 1.20 Right
2083 6.80 Palm Tree 1.20 Right
2084 6.80 Palm Tree 1.20 Right
2085 6.80 Neem Tree 0.90 Right
2086 21/800 21/850 6.80 Palm Tree 1.20 Left
2087 6.80 Tamarind Tree 1.40 Left
2088 21/850 21/900 6.50 Banyan Tree 5.00 Left
2089 6.50 Vangai Tree 0.70 Left
2090 6.80 Palm Tree 1.20 Right
2091 6.80 Neem Tree 0.70 Right
2092 6.80 Tamarind Tree 2.00 Right
2093 21/900 21/950 6.80 Neem Tree 1.00 Left
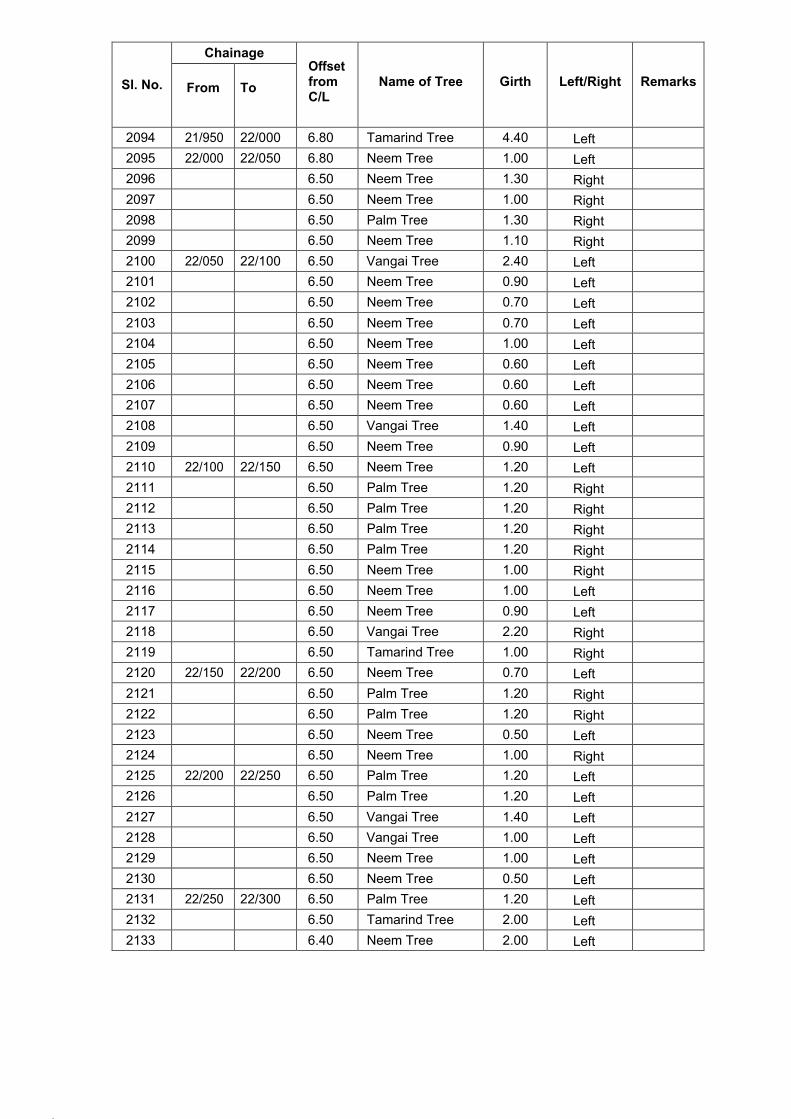
103.
104.
Sl. No.
Chainage Offset from C/L
Name of Tree
Girth
Left/Right
Remarks
From
To
2094 21/950 22/000 6.80 Tamarind Tree 4.40 Left
2095 22/000 22/050 6.80 Neem Tree 1.00 Left
2096 6.50 Neem Tree 1.30 Right
2097 6.50 Neem Tree 1.00 Right
2098 6.50 Palm Tree 1.30 Right
2099 6.50 Neem Tree 1.10 Right
2100 22/050 22/100 6.50 Vangai Tree 2.40 Left
2101 6.50 Neem Tree 0.90 Left
2102 6.50 Neem Tree 0.70 Left
2103 6.50 Neem Tree 0.70 Left
2104 6.50 Neem Tree 1.00 Left
2105 6.50 Neem Tree 0.60 Left
2106 6.50 Neem Tree 0.60 Left
2107 6.50 Neem Tree 0.60 Left
2108 6.50 Vangai Tree 1.40 Left
2109 6.50 Neem Tree 0.90 Left
2110 22/100 22/150 6.50 Neem Tree 1.20 Left
2111 6.50 Palm Tree 1.20 Right
2112 6.50 Palm Tree 1.20 Right
2113 6.50 Palm Tree 1.20 Right
2114 6.50 Palm Tree 1.20 Right
2115 6.50 Neem Tree 1.00 Right
2116 6.50 Neem Tree 1.00 Left
2117 6.50 Neem Tree 0.90 Left
2118 6.50 Vangai Tree 2.20 Right
2119 6.50 Tamarind Tree 1.00 Right
2120 22/150 22/200 6.50 Neem Tree 0.70 Left
2121 6.50 Palm Tree 1.20 Right
2122 6.50 Palm Tree 1.20 Right
2123 6.50 Neem Tree 0.50 Left
2124 6.50 Neem Tree 1.00 Right
2125 22/200 22/250 6.50 Palm Tree 1.20 Left
2126 6.50 Palm Tree 1.20 Left
2127 6.50 Vangai Tree 1.40 Left
2128 6.50 Vangai Tree 1.00 Left
2129 6.50 Neem Tree 1.00 Left
2130 6.50 Neem Tree 0.50 Left
2131 22/250 22/300 6.50 Palm Tree 1.20 Left
2132 6.50 Tamarind Tree 2.00 Left
2133 6.40 Neem Tree 2.00 Left
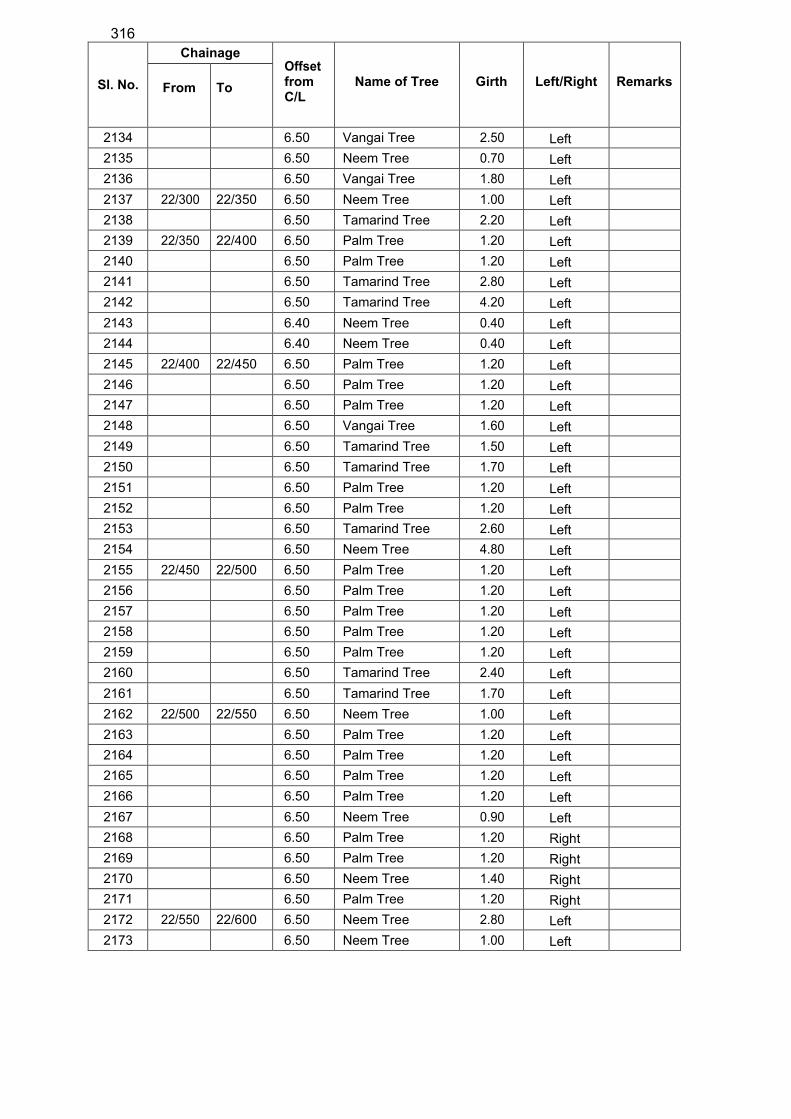
316
Sl. No.
Chainage Offset from C/L
Name of Tree
Girth
Left/Right
Remarks
From
To
2134 6.50 Vangai Tree 2.50 Left
2135 6.50 Neem Tree 0.70 Left
2136 6.50 Vangai Tree 1.80 Left
2137 22/300 22/350 6.50 Neem Tree 1.00 Left
2138 6.50 Tamarind Tree 2.20 Left
2139 22/350 22/400 6.50 Palm Tree 1.20 Left
2140 6.50 Palm Tree 1.20 Left
2141 6.50 Tamarind Tree 2.80 Left
2142 6.50 Tamarind Tree 4.20 Left
2143 6.40 Neem Tree 0.40 Left
2144 6.40 Neem Tree 0.40 Left
2145 22/400 22/450 6.50 Palm Tree 1.20 Left
2146 6.50 Palm Tree 1.20 Left
2147 6.50 Palm Tree 1.20 Left
2148 6.50 Vangai Tree 1.60 Left
2149 6.50 Tamarind Tree 1.50 Left
2150 6.50 Tamarind Tree 1.70 Left
2151 6.50 Palm Tree 1.20 Left
2152 6.50 Palm Tree 1.20 Left
2153 6.50 Tamarind Tree 2.60 Left
2154 6.50 Neem Tree 4.80 Left
2155 22/450 22/500 6.50 Palm Tree 1.20 Left
2156 6.50 Palm Tree 1.20 Left
2157 6.50 Palm Tree 1.20 Left
2158 6.50 Palm Tree 1.20 Left
2159 6.50 Palm Tree 1.20 Left
2160 6.50 Tamarind Tree 2.40 Left
2161 6.50 Tamarind Tree 1.70 Left
2162 22/500 22/550 6.50 Neem Tree 1.00 Left
2163 6.50 Palm Tree 1.20 Left
2164 6.50 Palm Tree 1.20 Left
2165 6.50 Palm Tree 1.20 Left
2166 6.50 Palm Tree 1.20 Left
2167 6.50 Neem Tree 0.90 Left
2168 6.50 Palm Tree 1.20 Right
2169 6.50 Palm Tree 1.20 Right
2170 6.50 Neem Tree 1.40 Right
2171 6.50 Palm Tree 1.20 Right
2172 22/550 22/600 6.50 Neem Tree 2.80 Left
2173 6.50 Neem Tree 1.00 Left
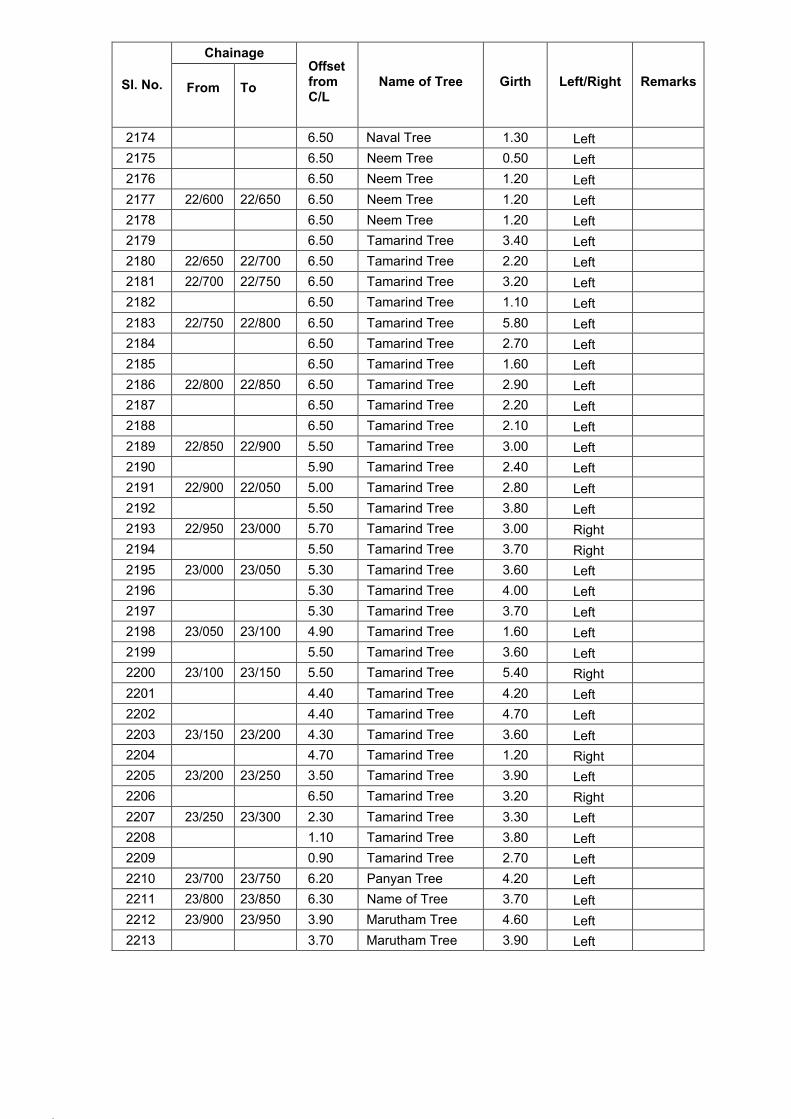
107.
108.
Sl. No.
Chainage Offset from C/L
Name of Tree
Girth
Left/Right
Remarks
From
To
2174 6.50 Naval Tree 1.30 Left
2175 6.50 Neem Tree 0.50 Left
2176 6.50 Neem Tree 1.20 Left
2177 22/600 22/650 6.50 Neem Tree 1.20 Left
2178 6.50 Neem Tree 1.20 Left
2179 6.50 Tamarind Tree 3.40 Left
2180 22/650 22/700 6.50 Tamarind Tree 2.20 Left
2181 22/700 22/750 6.50 Tamarind Tree 3.20 Left
2182 6.50 Tamarind Tree 1.10 Left
2183 22/750 22/800 6.50 Tamarind Tree 5.80 Left
2184 6.50 Tamarind Tree 2.70 Left
2185 6.50 Tamarind Tree 1.60 Left
2186 22/800 22/850 6.50 Tamarind Tree 2.90 Left
2187 6.50 Tamarind Tree 2.20 Left
2188 6.50 Tamarind Tree 2.10 Left
2189 22/850 22/900 5.50 Tamarind Tree 3.00 Left
2190 5.90 Tamarind Tree 2.40 Left
2191 22/900 22/050 5.00 Tamarind Tree 2.80 Left
2192 5.50 Tamarind Tree 3.80 Left
2193 22/950 23/000 5.70 Tamarind Tree 3.00 Right
2194 5.50 Tamarind Tree 3.70 Right
2195 23/000 23/050 5.30 Tamarind Tree 3.60 Left
2196 5.30 Tamarind Tree 4.00 Left
2197 5.30 Tamarind Tree 3.70 Left
2198 23/050 23/100 4.90 Tamarind Tree 1.60 Left
2199 5.50 Tamarind Tree 3.60 Left
2200 23/100 23/150 5.50 Tamarind Tree 5.40 Right
2201 4.40 Tamarind Tree 4.20 Left
2202 4.40 Tamarind Tree 4.70 Left
2203 23/150 23/200 4.30 Tamarind Tree 3.60 Left
2204 4.70 Tamarind Tree 1.20 Right
2205 23/200 23/250 3.50 Tamarind Tree 3.90 Left
2206 6.50 Tamarind Tree 3.20 Right
2207 23/250 23/300 2.30 Tamarind Tree 3.30 Left
2208 1.10 Tamarind Tree 3.80 Left
2209 0.90 Tamarind Tree 2.70 Left
2210 23/700 23/750 6.20 Panyan Tree 4.20 Left
2211 23/800 23/850 6.30 Name of Tree 3.70 Left
2212 23/900 23/950 3.90 Marutham Tree 4.60 Left
2213 3.70 Marutham Tree 3.90 Left
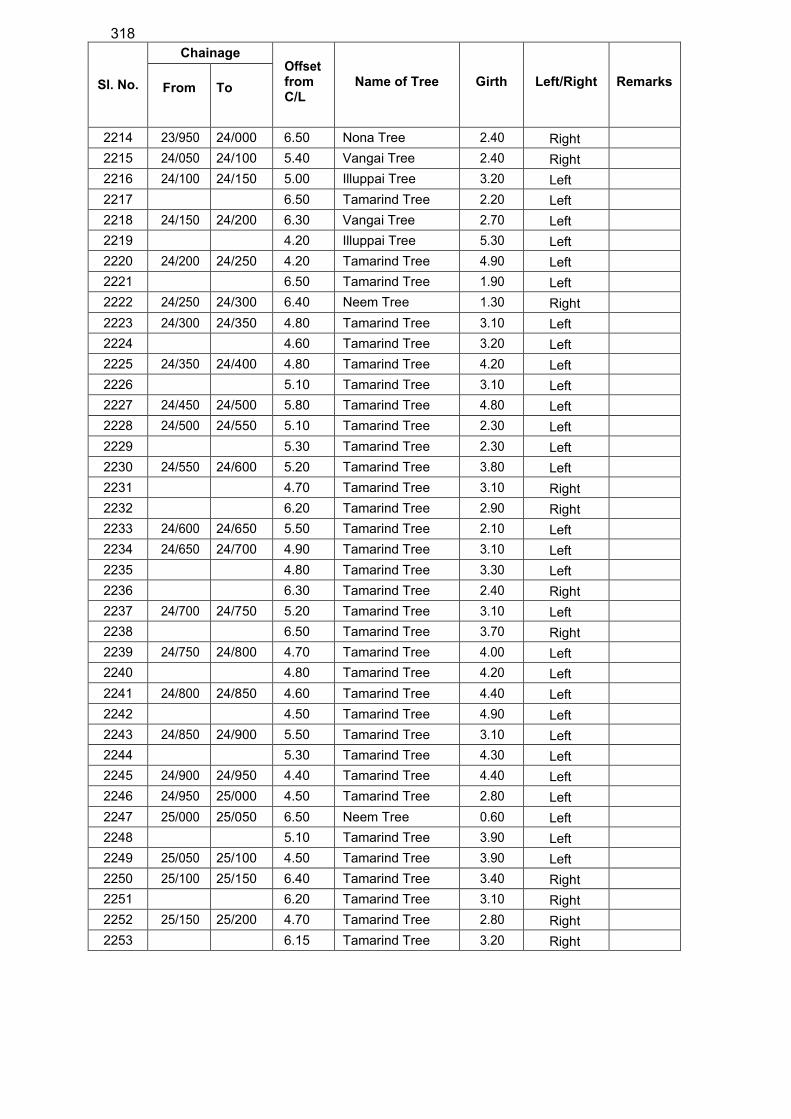
318
Sl. No.
Chainage Offset from C/L
Name of Tree
Girth
Left/Right
Remarks
From
To
2214 23/950 24/000 6.50 Nona Tree 2.40 Right
2215 24/050 24/100 5.40 Vangai Tree 2.40 Right
2216 24/100 24/150 5.00 Illuppai Tree 3.20 Left
2217 6.50 Tamarind Tree 2.20 Left
2218 24/150 24/200 6.30 Vangai Tree 2.70 Left
2219 4.20 Illuppai Tree 5.30 Left
2220 24/200 24/250 4.20 Tamarind Tree 4.90 Left
2221 6.50 Tamarind Tree 1.90 Left
2222 24/250 24/300 6.40 Neem Tree 1.30 Right
2223 24/300 24/350 4.80 Tamarind Tree 3.10 Left
2224 4.60 Tamarind Tree 3.20 Left
2225 24/350 24/400 4.80 Tamarind Tree 4.20 Left
2226 5.10 Tamarind Tree 3.10 Left
2227 24/450 24/500 5.80 Tamarind Tree 4.80 Left
2228 24/500 24/550 5.10 Tamarind Tree 2.30 Left
2229 5.30 Tamarind Tree 2.30 Left
2230 24/550 24/600 5.20 Tamarind Tree 3.80 Left
2231 4.70 Tamarind Tree 3.10 Right
2232 6.20 Tamarind Tree 2.90 Right
2233 24/600 24/650 5.50 Tamarind Tree 2.10 Left
2234 24/650 24/700 4.90 Tamarind Tree 3.10 Left
2235 4.80 Tamarind Tree 3.30 Left
2236 6.30 Tamarind Tree 2.40 Right
2237 24/700 24/750 5.20 Tamarind Tree 3.10 Left
2238 6.50 Tamarind Tree 3.70 Right
2239 24/750 24/800 4.70 Tamarind Tree 4.00 Left
2240 4.80 Tamarind Tree 4.20 Left
2241 24/800 24/850 4.60 Tamarind Tree 4.40 Left
2242 4.50 Tamarind Tree 4.90 Left
2243 24/850 24/900 5.50 Tamarind Tree 3.10 Left
2244 5.30 Tamarind Tree 4.30 Left
2245 24/900 24/950 4.40 Tamarind Tree 4.40 Left
2246 24/950 25/000 4.50 Tamarind Tree 2.80 Left
2247 25/000 25/050 6.50 Neem Tree 0.60 Left
2248 5.10 Tamarind Tree 3.90 Left
2249 25/050 25/100 4.50 Tamarind Tree 3.90 Left
2250 25/100 25/150 6.40 Tamarind Tree 3.40 Right
2251 6.20 Tamarind Tree 3.10 Right
2252 25/150 25/200 4.70 Tamarind Tree 2.80 Right
2253 6.15 Tamarind Tree 3.20 Right
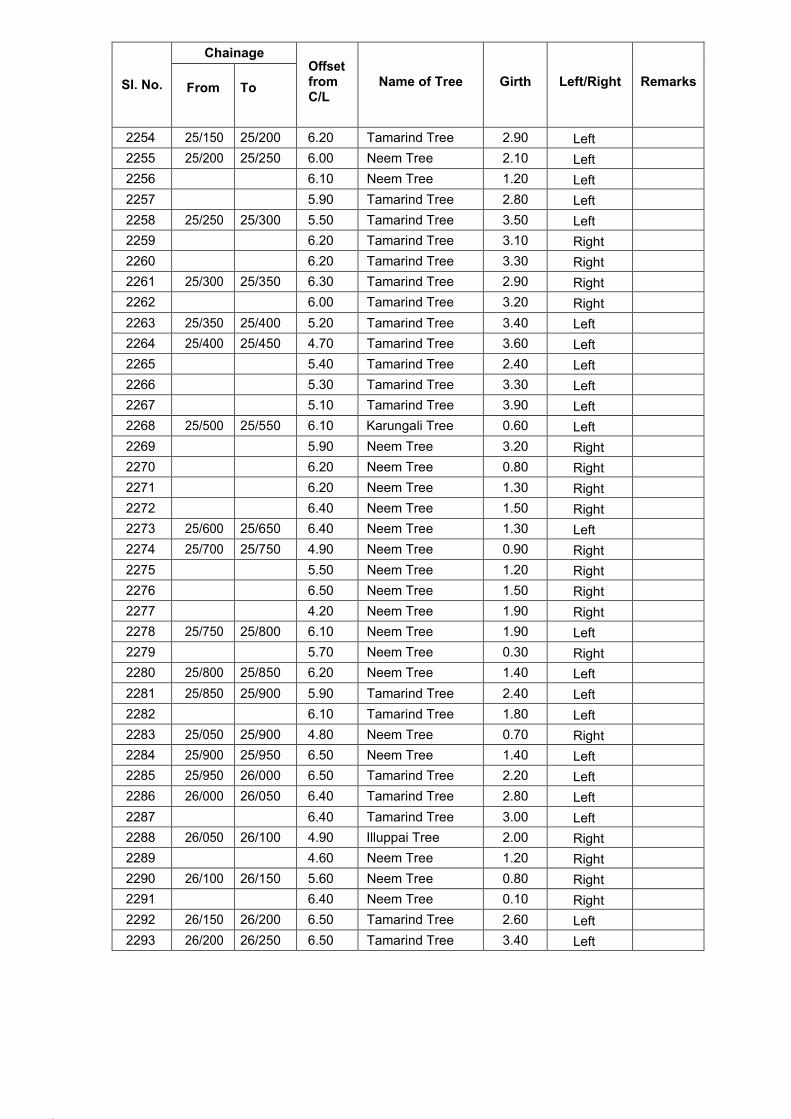
111.
112.
Sl. No.
Chainage Offset from C/L
Name of Tree
Girth
Left/Right
Remarks
From
To
2254 25/150 25/200 6.20 Tamarind Tree 2.90 Left
2255 25/200 25/250 6.00 Neem Tree 2.10 Left
2256 6.10 Neem Tree 1.20 Left
2257 5.90 Tamarind Tree 2.80 Left
2258 25/250 25/300 5.50 Tamarind Tree 3.50 Left
2259 6.20 Tamarind Tree 3.10 Right
2260 6.20 Tamarind Tree 3.30 Right
2261 25/300 25/350 6.30 Tamarind Tree 2.90 Right
2262 6.00 Tamarind Tree 3.20 Right
2263 25/350 25/400 5.20 Tamarind Tree 3.40 Left
2264 25/400 25/450 4.70 Tamarind Tree 3.60 Left
2265 5.40 Tamarind Tree 2.40 Left
2266 5.30 Tamarind Tree 3.30 Left
2267 5.10 Tamarind Tree 3.90 Left
2268 25/500 25/550 6.10 Karungali Tree 0.60 Left
2269 5.90 Neem Tree 3.20 Right
2270 6.20 Neem Tree 0.80 Right
2271 6.20 Neem Tree 1.30 Right
2272 6.40 Neem Tree 1.50 Right
2273 25/600 25/650 6.40 Neem Tree 1.30 Left
2274 25/700 25/750 4.90 Neem Tree 0.90 Right
2275 5.50 Neem Tree 1.20 Right
2276 6.50 Neem Tree 1.50 Right
2277 4.20 Neem Tree 1.90 Right
2278 25/750 25/800 6.10 Neem Tree 1.90 Left
2279 5.70 Neem Tree 0.30 Right
2280 25/800 25/850 6.20 Neem Tree 1.40 Left
2281 25/850 25/900 5.90 Tamarind Tree 2.40 Left
2282 6.10 Tamarind Tree 1.80 Left
2283 25/050 25/900 4.80 Neem Tree 0.70 Right
2284 25/900 25/950 6.50 Neem Tree 1.40 Left
2285 25/950 26/000 6.50 Tamarind Tree 2.20 Left
2286 26/000 26/050 6.40 Tamarind Tree 2.80 Left
2287 6.40 Tamarind Tree 3.00 Left
2288 26/050 26/100 4.90 Illuppai Tree 2.00 Right
2289 4.60 Neem Tree 1.20 Right
2290 26/100 26/150 5.60 Neem Tree 0.80 Right
2291 6.40 Neem Tree 0.10 Right
2292 26/150 26/200 6.50 Tamarind Tree 2.60 Left
2293 26/200 26/250 6.50 Tamarind Tree 3.40 Left
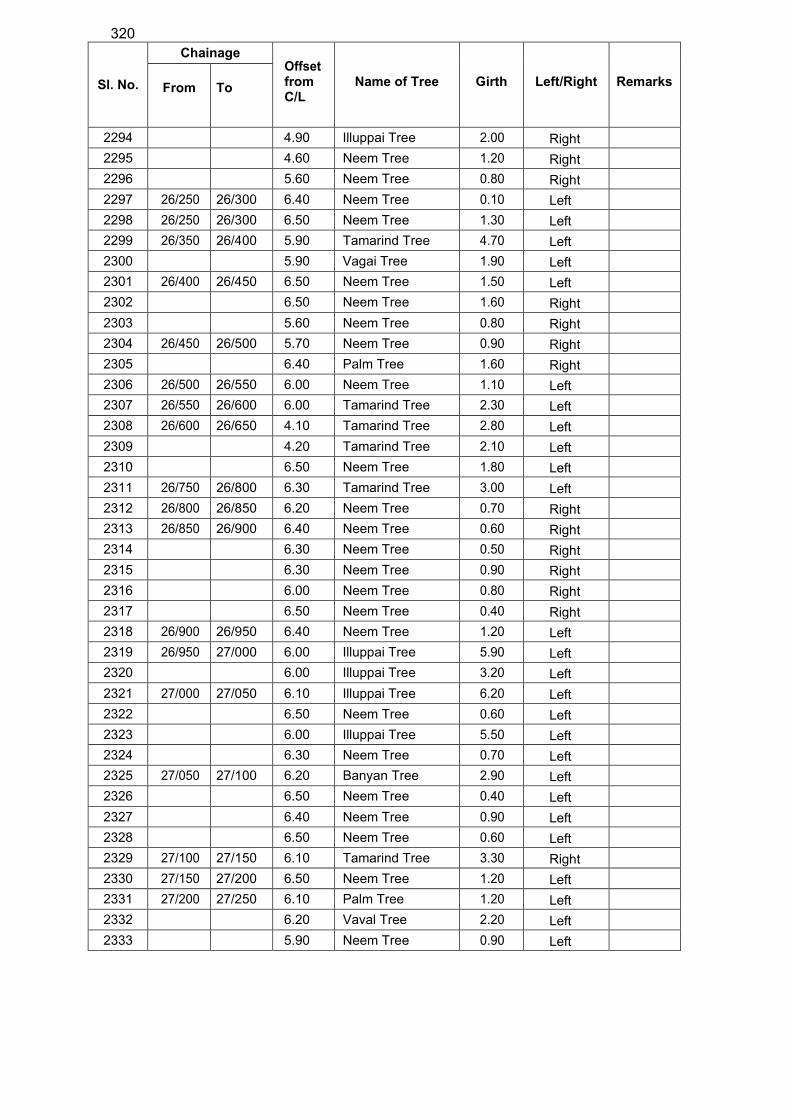
320
Sl. No.
Chainage Offset from C/L
Name of Tree
Girth
Left/Right
Remarks
From
To
2294 4.90 Illuppai Tree 2.00 Right
2295 4.60 Neem Tree 1.20 Right
2296 5.60 Neem Tree 0.80 Right
2297 26/250 26/300 6.40 Neem Tree 0.10 Left
2298 26/250 26/300 6.50 Neem Tree 1.30 Left
2299 26/350 26/400 5.90 Tamarind Tree 4.70 Left
2300 5.90 Vagai Tree 1.90 Left
2301 26/400 26/450 6.50 Neem Tree 1.50 Left
2302 6.50 Neem Tree 1.60 Right
2303 5.60 Neem Tree 0.80 Right
2304 26/450 26/500 5.70 Neem Tree 0.90 Right
2305 6.40 Palm Tree 1.60 Right
2306 26/500 26/550 6.00 Neem Tree 1.10 Left
2307 26/550 26/600 6.00 Tamarind Tree 2.30 Left
2308 26/600 26/650 4.10 Tamarind Tree 2.80 Left
2309 4.20 Tamarind Tree 2.10 Left
2310 6.50 Neem Tree 1.80 Left
2311 26/750 26/800 6.30 Tamarind Tree 3.00 Left
2312 26/800 26/850 6.20 Neem Tree 0.70 Right
2313 26/850 26/900 6.40 Neem Tree 0.60 Right
2314 6.30 Neem Tree 0.50 Right
2315 6.30 Neem Tree 0.90 Right
2316 6.00 Neem Tree 0.80 Right
2317 6.50 Neem Tree 0.40 Right
2318 26/900 26/950 6.40 Neem Tree 1.20 Left
2319 26/950 27/000 6.00 Illuppai Tree 5.90 Left
2320 6.00 Illuppai Tree 3.20 Left
2321 27/000 27/050 6.10 Illuppai Tree 6.20 Left
2322 6.50 Neem Tree 0.60 Left
2323 6.00 Illuppai Tree 5.50 Left
2324 6.30 Neem Tree 0.70 Left
2325 27/050 27/100 6.20 Banyan Tree 2.90 Left
2326 6.50 Neem Tree 0.40 Left
2327 6.40 Neem Tree 0.90 Left
2328 6.50 Neem Tree 0.60 Left
2329 27/100 27/150 6.10 Tamarind Tree 3.30 Right
2330 27/150 27/200 6.50 Neem Tree 1.20 Left
2331 27/200 27/250 6.10 Palm Tree 1.20 Left
2332 6.20 Vaval Tree 2.20 Left
2333 5.90 Neem Tree 0.90 Left
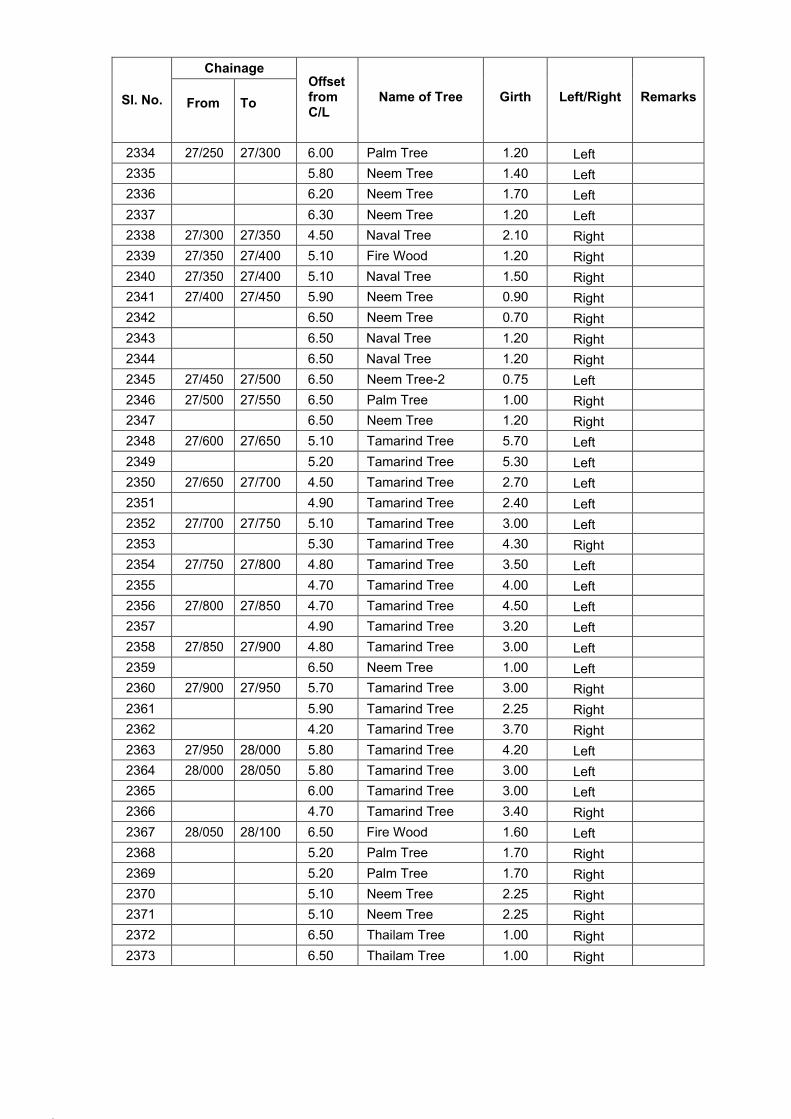
115.
116.
Sl. No.
Chainage Offset from C/L
Name of Tree
Girth
Left/Right
Remarks
From
To
2334 27/250 27/300 6.00 Palm Tree 1.20 Left
2335 5.80 Neem Tree 1.40 Left
2336 6.20 Neem Tree 1.70 Left
2337 6.30 Neem Tree 1.20 Left
2338 27/300 27/350 4.50 Naval Tree 2.10 Right
2339 27/350 27/400 5.10 Fire Wood 1.20 Right
2340 27/350 27/400 5.10 Naval Tree 1.50 Right
2341 27/400 27/450 5.90 Neem Tree 0.90 Right
2342 6.50 Neem Tree 0.70 Right
2343 6.50 Naval Tree 1.20 Right
2344 6.50 Naval Tree 1.20 Right
2345 27/450 27/500 6.50 Neem Tree-2 0.75 Left
2346 27/500 27/550 6.50 Palm Tree 1.00 Right
2347 6.50 Neem Tree 1.20 Right
2348 27/600 27/650 5.10 Tamarind Tree 5.70 Left
2349 5.20 Tamarind Tree 5.30 Left
2350 27/650 27/700 4.50 Tamarind Tree 2.70 Left
2351 4.90 Tamarind Tree 2.40 Left
2352 27/700 27/750 5.10 Tamarind Tree 3.00 Left
2353 5.30 Tamarind Tree 4.30 Right
2354 27/750 27/800 4.80 Tamarind Tree 3.50 Left
2355 4.70 Tamarind Tree 4.00 Left
2356 27/800 27/850 4.70 Tamarind Tree 4.50 Left
2357 4.90 Tamarind Tree 3.20 Left
2358 27/850 27/900 4.80 Tamarind Tree 3.00 Left
2359 6.50 Neem Tree 1.00 Left
2360 27/900 27/950 5.70 Tamarind Tree 3.00 Right
2361 5.90 Tamarind Tree 2.25 Right
2362 4.20 Tamarind Tree 3.70 Right
2363 27/950 28/000 5.80 Tamarind Tree 4.20 Left
2364 28/000 28/050 5.80 Tamarind Tree 3.00 Left
2365 6.00 Tamarind Tree 3.00 Left
2366 4.70 Tamarind Tree 3.40 Right
2367 28/050 28/100 6.50 Fire Wood 1.60 Left
2368 5.20 Palm Tree 1.70 Right
2369 5.20 Palm Tree 1.70 Right
2370 5.10 Neem Tree 2.25 Right
2371 5.10 Neem Tree 2.25 Right
2372 6.50 Thailam Tree 1.00 Right
2373 6.50 Thailam Tree 1.00 Right
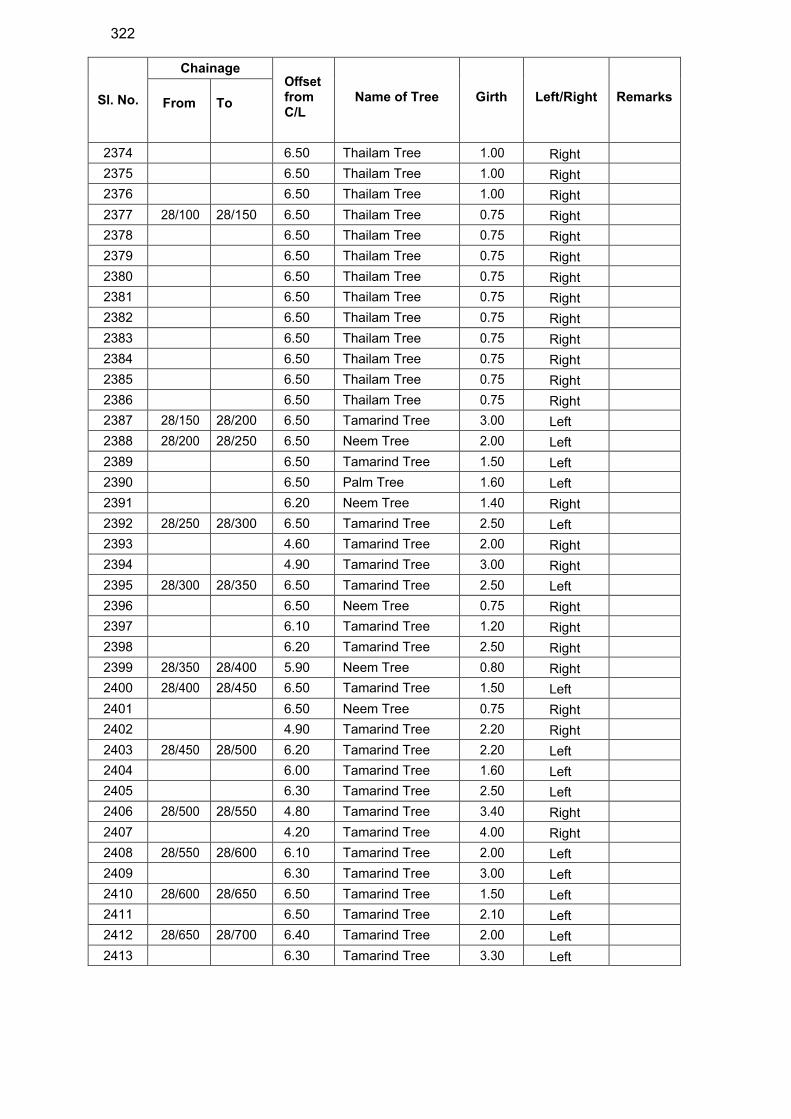
322
Sl. No.
Chainage Offset from C/L
Name of Tree
Girth
Left/Right
Remarks
From
To
2374 6.50 Thailam Tree 1.00 Right
2375 6.50 Thailam Tree 1.00 Right
2376 6.50 Thailam Tree 1.00 Right
2377 28/100 28/150 6.50 Thailam Tree 0.75 Right
2378 6.50 Thailam Tree 0.75 Right
2379 6.50 Thailam Tree 0.75 Right
2380 6.50 Thailam Tree 0.75 Right
2381 6.50 Thailam Tree 0.75 Right
2382 6.50 Thailam Tree 0.75 Right
2383 6.50 Thailam Tree 0.75 Right
2384 6.50 Thailam Tree 0.75 Right
2385 6.50 Thailam Tree 0.75 Right
2386 6.50 Thailam Tree 0.75 Right
2387 28/150 28/200 6.50 Tamarind Tree 3.00 Left
2388 28/200 28/250 6.50 Neem Tree 2.00 Left
2389 6.50 Tamarind Tree 1.50 Left
2390 6.50 Palm Tree 1.60 Left
2391 6.20 Neem Tree 1.40 Right
2392 28/250 28/300 6.50 Tamarind Tree 2.50 Left
2393 4.60 Tamarind Tree 2.00 Right
2394 4.90 Tamarind Tree 3.00 Right
2395 28/300 28/350 6.50 Tamarind Tree 2.50 Left
2396 6.50 Neem Tree 0.75 Right
2397 6.10 Tamarind Tree 1.20 Right
2398 6.20 Tamarind Tree 2.50 Right
2399 28/350 28/400 5.90 Neem Tree 0.80 Right
2400 28/400 28/450 6.50 Tamarind Tree 1.50 Left
2401 6.50 Neem Tree 0.75 Right
2402 4.90 Tamarind Tree 2.20 Right
2403 28/450 28/500 6.20 Tamarind Tree 2.20 Left
2404 6.00 Tamarind Tree 1.60 Left
2405 6.30 Tamarind Tree 2.50 Left
2406 28/500 28/550 4.80 Tamarind Tree 3.40 Right
2407 4.20 Tamarind Tree 4.00 Right
2408 28/550 28/600 6.10 Tamarind Tree 2.00 Left
2409 6.30 Tamarind Tree 3.00 Left
2410 28/600 28/650 6.50 Tamarind Tree 1.50 Left
2411 6.50 Tamarind Tree 2.10 Left
2412 28/650 28/700 6.40 Tamarind Tree 2.00 Left
2413 6.30 Tamarind Tree 3.30 Left
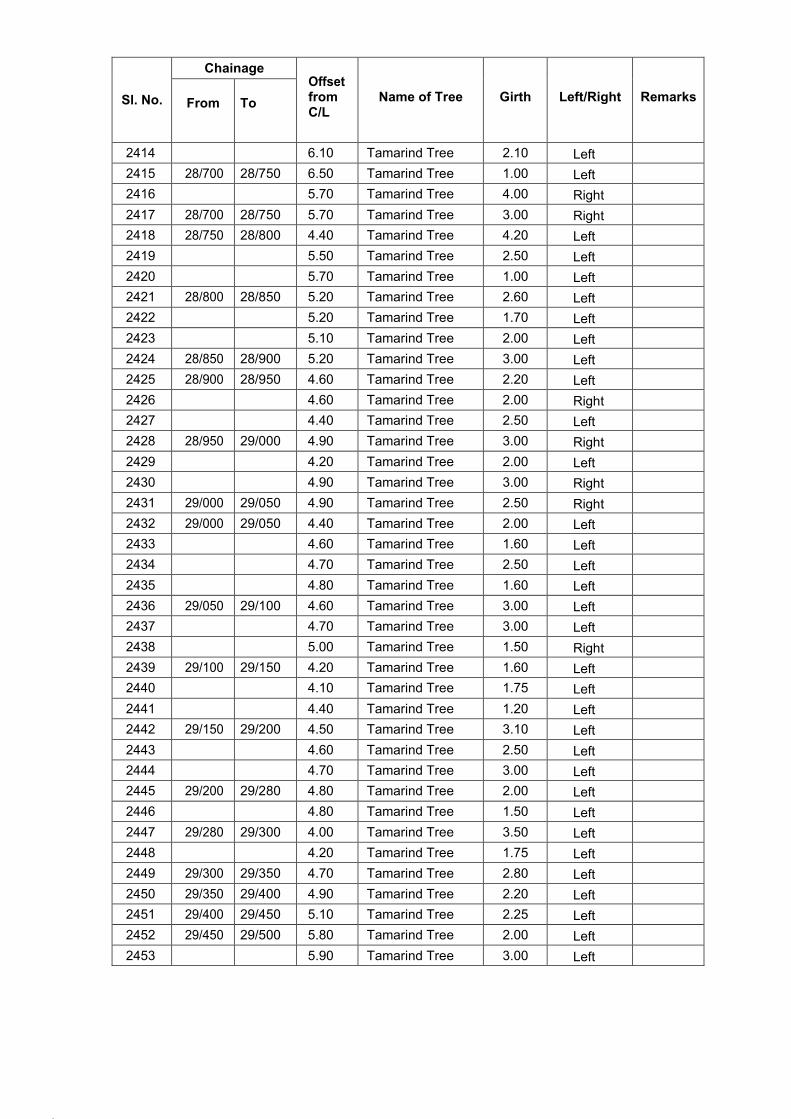
119.
120.
Sl. No.
Chainage Offset from C/L
Name of Tree
Girth
Left/Right
Remarks
From
To
2414 6.10 Tamarind Tree 2.10 Left
2415 28/700 28/750 6.50 Tamarind Tree 1.00 Left
2416 5.70 Tamarind Tree 4.00 Right
2417 28/700 28/750 5.70 Tamarind Tree 3.00 Right
2418 28/750 28/800 4.40 Tamarind Tree 4.20 Left
2419 5.50 Tamarind Tree 2.50 Left
2420 5.70 Tamarind Tree 1.00 Left
2421 28/800 28/850 5.20 Tamarind Tree 2.60 Left
2422 5.20 Tamarind Tree 1.70 Left
2423 5.10 Tamarind Tree 2.00 Left
2424 28/850 28/900 5.20 Tamarind Tree 3.00 Left
2425 28/900 28/950 4.60 Tamarind Tree 2.20 Left
2426 4.60 Tamarind Tree 2.00 Right
2427 4.40 Tamarind Tree 2.50 Left
2428 28/950 29/000 4.90 Tamarind Tree 3.00 Right
2429 4.20 Tamarind Tree 2.00 Left
2430 4.90 Tamarind Tree 3.00 Right
2431 29/000 29/050 4.90 Tamarind Tree 2.50 Right
2432 29/000 29/050 4.40 Tamarind Tree 2.00 Left
2433 4.60 Tamarind Tree 1.60 Left
2434 4.70 Tamarind Tree 2.50 Left
2435 4.80 Tamarind Tree 1.60 Left
2436 29/050 29/100 4.60 Tamarind Tree 3.00 Left
2437 4.70 Tamarind Tree 3.00 Left
2438 5.00 Tamarind Tree 1.50 Right
2439 29/100 29/150 4.20 Tamarind Tree 1.60 Left
2440 4.10 Tamarind Tree 1.75 Left
2441 4.40 Tamarind Tree 1.20 Left
2442 29/150 29/200 4.50 Tamarind Tree 3.10 Left
2443 4.60 Tamarind Tree 2.50 Left
2444 4.70 Tamarind Tree 3.00 Left
2445 29/200 29/280 4.80 Tamarind Tree 2.00 Left
2446 4.80 Tamarind Tree 1.50 Left
2447 29/280 29/300 4.00 Tamarind Tree 3.50 Left
2448 4.20 Tamarind Tree 1.75 Left
2449 29/300 29/350 4.70 Tamarind Tree 2.80 Left
2450 29/350 29/400 4.90 Tamarind Tree 2.20 Left
2451 29/400 29/450 5.10 Tamarind Tree 2.25 Left
2452 29/450 29/500 5.80 Tamarind Tree 2.00 Left
2453 5.90 Tamarind Tree 3.00 Left
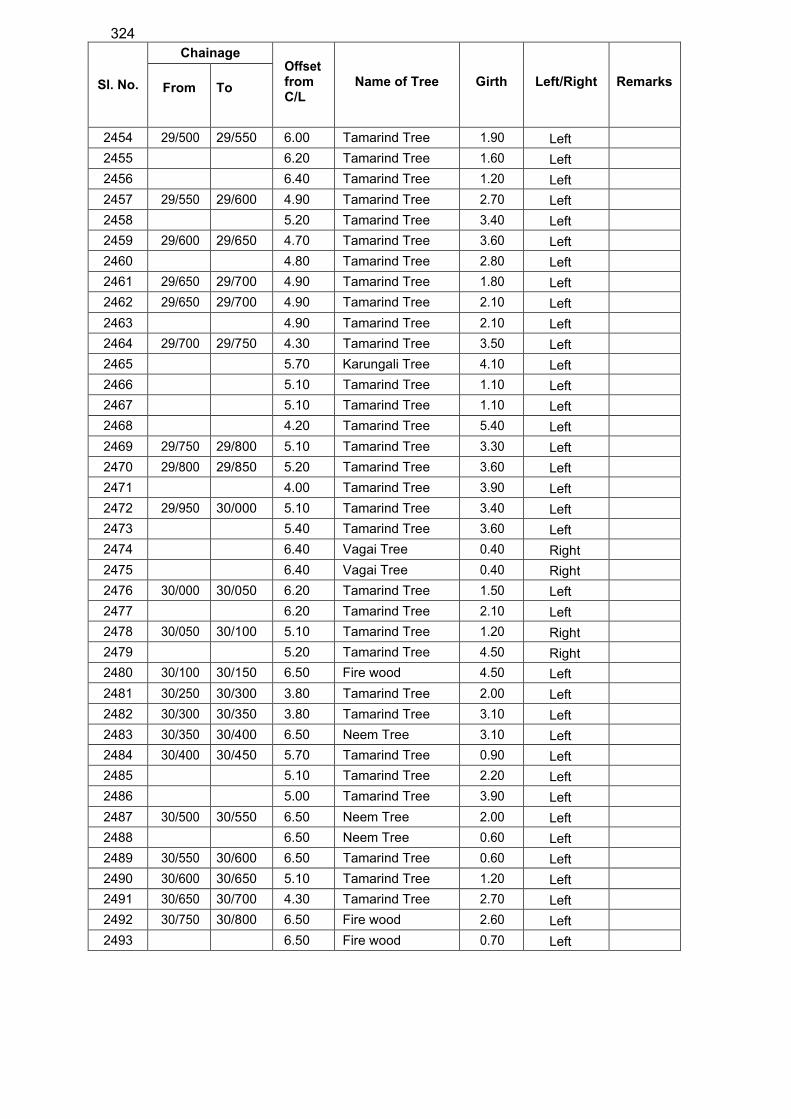
324
Sl. No.
Chainage Offset from C/L
Name of Tree
Girth
Left/Right
Remarks
From
To
2454 29/500 29/550 6.00 Tamarind Tree 1.90 Left
2455 6.20 Tamarind Tree 1.60 Left
2456 6.40 Tamarind Tree 1.20 Left
2457 29/550 29/600 4.90 Tamarind Tree 2.70 Left
2458 5.20 Tamarind Tree 3.40 Left
2459 29/600 29/650 4.70 Tamarind Tree 3.60 Left
2460 4.80 Tamarind Tree 2.80 Left
2461 29/650 29/700 4.90 Tamarind Tree 1.80 Left
2462 29/650 29/700 4.90 Tamarind Tree 2.10 Left
2463 4.90 Tamarind Tree 2.10 Left
2464 29/700 29/750 4.30 Tamarind Tree 3.50 Left
2465 5.70 Karungali Tree 4.10 Left
2466 5.10 Tamarind Tree 1.10 Left
2467 5.10 Tamarind Tree 1.10 Left
2468 4.20 Tamarind Tree 5.40 Left
2469 29/750 29/800 5.10 Tamarind Tree 3.30 Left
2470 29/800 29/850 5.20 Tamarind Tree 3.60 Left
2471 4.00 Tamarind Tree 3.90 Left
2472 29/950 30/000 5.10 Tamarind Tree 3.40 Left
2473 5.40 Tamarind Tree 3.60 Left
2474 6.40 Vagai Tree 0.40 Right
2475 6.40 Vagai Tree 0.40 Right
2476 30/000 30/050 6.20 Tamarind Tree 1.50 Left
2477 6.20 Tamarind Tree 2.10 Left
2478 30/050 30/100 5.10 Tamarind Tree 1.20 Right
2479 5.20 Tamarind Tree 4.50 Right
2480 30/100 30/150 6.50 Fire wood 4.50 Left
2481 30/250 30/300 3.80 Tamarind Tree 2.00 Left
2482 30/300 30/350 3.80 Tamarind Tree 3.10 Left
2483 30/350 30/400 6.50 Neem Tree 3.10 Left
2484 30/400 30/450 5.70 Tamarind Tree 0.90 Left
2485 5.10 Tamarind Tree 2.20 Left
2486 5.00 Tamarind Tree 3.90 Left
2487 30/500 30/550 6.50 Neem Tree 2.00 Left
2488 6.50 Neem Tree 0.60 Left
2489 30/550 30/600 6.50 Tamarind Tree 0.60 Left
2490 30/600 30/650 5.10 Tamarind Tree 1.20 Left
2491 30/650 30/700 4.30 Tamarind Tree 2.70 Left
2492 30/750 30/800 6.50 Fire wood 2.60 Left
2493 6.50 Fire wood 0.70 Left

123.
124.
Sl. No.
Chainage Offset from C/L
Name of Tree
Girth
Left/Right
Remarks
From
To
2494 30/800 30/850 6.50 Fire wood 0.40 Left
2495 30/800 30/850 4.90 Tamarind Tree 2.80 Left
2496 5.10 Tamarind Tree 3.20 Left
2497 30/850 30/900 6.10 Tamarind Tree 1.70 Left
2498 30/900 30/950 4.90 Tamarind Tree 2.40 Left
2499 30/950 31/000 6.50 Fire wood 1.10 Right
2500 31/000 31/050 3.70 Tamarind Tree 3.00 Left
2501 31/050 31/100 3.90 Tamarind Tree 3.50 Left
2502 31/100 31/150 5.10 Tamarind Tree 5.30 Left
2503 4.50 Tamarind Tree 2.00 Right
2504 31/150 31/200 4.70 Tamarind Tree 2.70 Left
2505 31/200 31/250 4.90 Tamarind Tree 3.80 Right
2506 31/250 31/300 4.80 Tamarind Tree 2.80 Left
2507 4.90 Tamarind Tree 3.60 Left
2508 5.10 Tamarind Tree 3.10 Left
2509 5.20 Tamarind Tree 4.30 Left
2510 31/300 31/350 4.90 Tamarind Tree 5.90 Right
2511 5.20 Tamarind Tree 3.40 Right
2512 31/350 31/400 4.10 Tamarind Tree 6.60 Left
2513 4.10 Tamarind Tree 6.60 Left
2514 31/400 31/450 3.70 Tamarind Tree 5.90 Left
2515 3.90 Tamarind Tree 6.40 Left
2516 31/450 31/500 3.60 Tamarind Tree 3.90 Left
2517 31/500 31/550 5.50 Neem Tree 1.70 Left
2518 5.30 Tamarind Tree 4.10 Left
2519 5.10 Illuppai Tree 4.20 Left
2520 31/650 31/700 4.90 Illuppai Tree 3.70 Left
2521 31/700 31/750 3.70 Illuppai Tree 2.20 Right
2522 4.20 Illuppai Tree 2.80 Right
2523 3.60 Tamarind Tree 5.60 Right
2524 31/750 31/800 4.90 Tamarind Tree 3.90 Left
2525 4.80 Tamarind Tree 4.20 Right
2526 4.20 Tamarind Tree 5.10 Right
2527 31/800 31/850 4.40 Tamarind Tree 5.20 Left
2528 3.90 Tamarind Tree 4.80 Left
2529 31/800 31/850 4.20 Tamarind Tree 4.30 Left
2530 3.80 Tamarind Tree 3.70 Left
2531 31/850 31/900 4.20 Tamarind Tree 3.90 Left
2532 31/900 31/950 3.90 Tamarind Tree 3.20 Left
2533 4.20 Tamarind Tree 3.40 Left
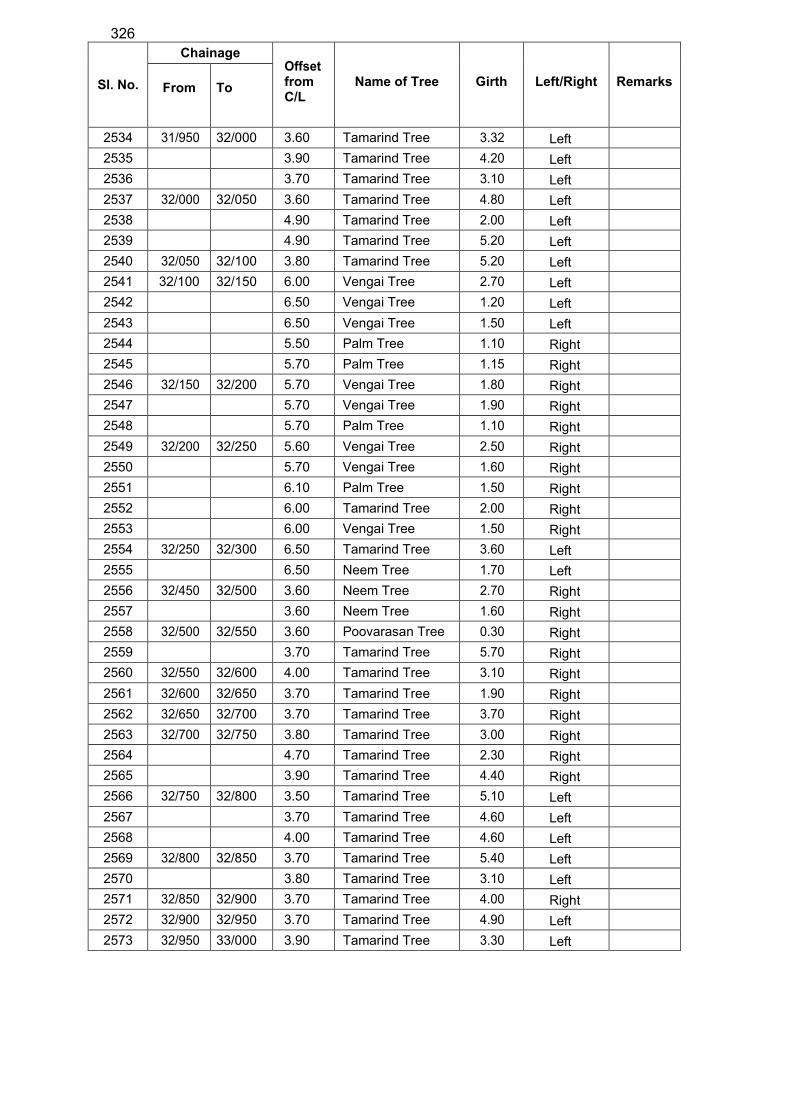
326
Sl. No.
Chainage Offset from C/L
Name of Tree
Girth
Left/Right
Remarks
From
To
2534 31/950 32/000 3.60 Tamarind Tree 3.32 Left
2535 3.90 Tamarind Tree 4.20 Left
2536 3.70 Tamarind Tree 3.10 Left
2537 32/000 32/050 3.60 Tamarind Tree 4.80 Left
2538 4.90 Tamarind Tree 2.00 Left
2539 4.90 Tamarind Tree 5.20 Left
2540 32/050 32/100 3.80 Tamarind Tree 5.20 Left
2541 32/100 32/150 6.00 Vengai Tree 2.70 Left
2542 6.50 Vengai Tree 1.20 Left
2543 6.50 Vengai Tree 1.50 Left
2544 5.50 Palm Tree 1.10 Right
2545 5.70 Palm Tree 1.15 Right
2546 32/150 32/200 5.70 Vengai Tree 1.80 Right
2547 5.70 Vengai Tree 1.90 Right
2548 5.70 Palm Tree 1.10 Right
2549 32/200 32/250 5.60 Vengai Tree 2.50 Right
2550 5.70 Vengai Tree 1.60 Right
2551 6.10 Palm Tree 1.50 Right
2552 6.00 Tamarind Tree 2.00 Right
2553 6.00 Vengai Tree 1.50 Right
2554 32/250 32/300 6.50 Tamarind Tree 3.60 Left
2555 6.50 Neem Tree 1.70 Left
2556 32/450 32/500 3.60 Neem Tree 2.70 Right
2557 3.60 Neem Tree 1.60 Right
2558 32/500 32/550 3.60 Poovarasan Tree 0.30 Right
2559 3.70 Tamarind Tree 5.70 Right
2560 32/550 32/600 4.00 Tamarind Tree 3.10 Right
2561 32/600 32/650 3.70 Tamarind Tree 1.90 Right
2562 32/650 32/700 3.70 Tamarind Tree 3.70 Right
2563 32/700 32/750 3.80 Tamarind Tree 3.00 Right
2564 4.70 Tamarind Tree 2.30 Right
2565 3.90 Tamarind Tree 4.40 Right
2566 32/750 32/800 3.50 Tamarind Tree 5.10 Left
2567 3.70 Tamarind Tree 4.60 Left
2568 4.00 Tamarind Tree 4.60 Left
2569 32/800 32/850 3.70 Tamarind Tree 5.40 Left
2570 3.80 Tamarind Tree 3.10 Left
2571 32/850 32/900 3.70 Tamarind Tree 4.00 Right
2572 32/900 32/950 3.70 Tamarind Tree 4.90 Left
2573 32/950 33/000 3.90 Tamarind Tree 3.30 Left
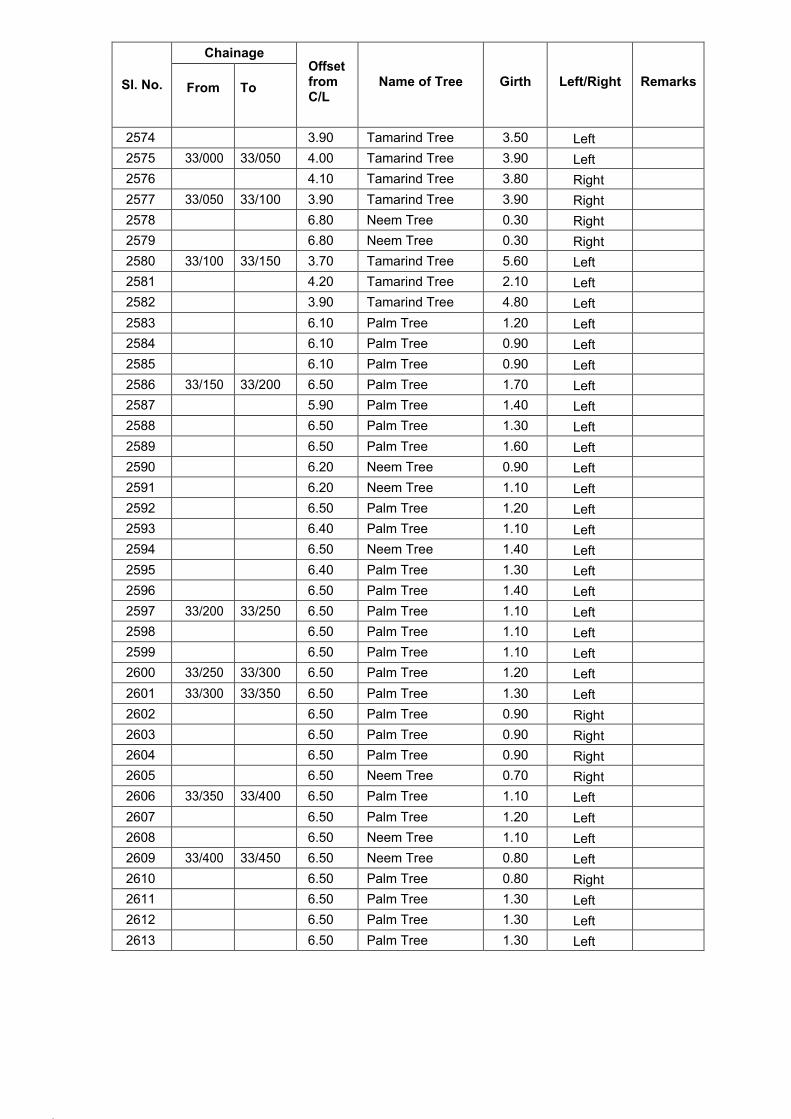
127.
128.
Sl. No.
Chainage Offset from C/L
Name of Tree
Girth
Left/Right
Remarks
From
To
2574 3.90 Tamarind Tree 3.50 Left
2575 33/000 33/050 4.00 Tamarind Tree 3.90 Left
2576 4.10 Tamarind Tree 3.80 Right
2577 33/050 33/100 3.90 Tamarind Tree 3.90 Right
2578 6.80 Neem Tree 0.30 Right
2579 6.80 Neem Tree 0.30 Right
2580 33/100 33/150 3.70 Tamarind Tree 5.60 Left
2581 4.20 Tamarind Tree 2.10 Left
2582 3.90 Tamarind Tree 4.80 Left
2583 6.10 Palm Tree 1.20 Left
2584 6.10 Palm Tree 0.90 Left
2585 6.10 Palm Tree 0.90 Left
2586 33/150 33/200 6.50 Palm Tree 1.70 Left
2587 5.90 Palm Tree 1.40 Left
2588 6.50 Palm Tree 1.30 Left
2589 6.50 Palm Tree 1.60 Left
2590 6.20 Neem Tree 0.90 Left
2591 6.20 Neem Tree 1.10 Left
2592 6.50 Palm Tree 1.20 Left
2593 6.40 Palm Tree 1.10 Left
2594 6.50 Neem Tree 1.40 Left
2595 6.40 Palm Tree 1.30 Left
2596 6.50 Palm Tree 1.40 Left
2597 33/200 33/250 6.50 Palm Tree 1.10 Left
2598 6.50 Palm Tree 1.10 Left
2599 6.50 Palm Tree 1.10 Left
2600 33/250 33/300 6.50 Palm Tree 1.20 Left
2601 33/300 33/350 6.50 Palm Tree 1.30 Left
2602 6.50 Palm Tree 0.90 Right
2603 6.50 Palm Tree 0.90 Right
2604 6.50 Palm Tree 0.90 Right
2605 6.50 Neem Tree 0.70 Right
2606 33/350 33/400 6.50 Palm Tree 1.10 Left
2607 6.50 Palm Tree 1.20 Left
2608 6.50 Neem Tree 1.10 Left
2609 33/400 33/450 6.50 Neem Tree 0.80 Left
2610 6.50 Palm Tree 0.80 Right
2611 6.50 Palm Tree 1.30 Left
2612 6.50 Palm Tree 1.30 Left
2613 6.50 Palm Tree 1.30 Left
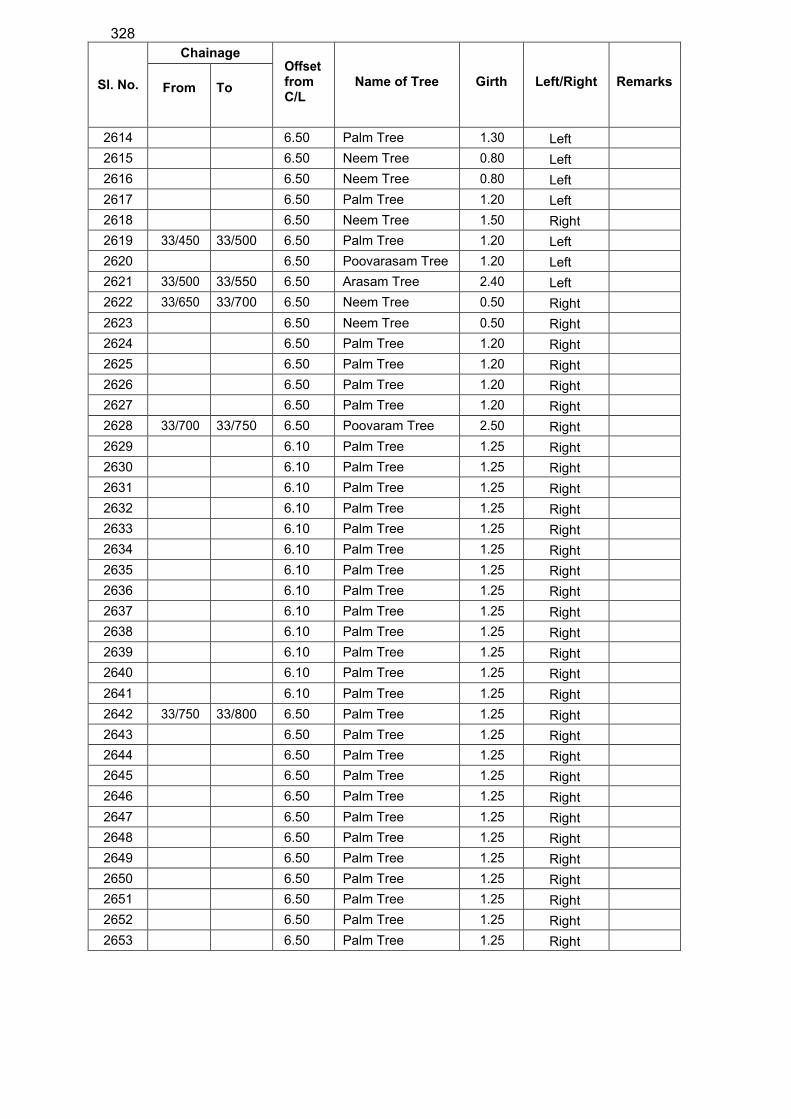
328
Sl. No.
Chainage Offset from C/L
Name of Tree
Girth
Left/Right
Remarks
From
To
2614 6.50 Palm Tree 1.30 Left
2615 6.50 Neem Tree 0.80 Left
2616 6.50 Neem Tree 0.80 Left
2617 6.50 Palm Tree 1.20 Left
2618 6.50 Neem Tree 1.50 Right
2619 33/450 33/500 6.50 Palm Tree 1.20 Left
2620 6.50 Poovarasam Tree 1.20 Left
2621 33/500 33/550 6.50 Arasam Tree 2.40 Left
2622 33/650 33/700 6.50 Neem Tree 0.50 Right
2623 6.50 Neem Tree 0.50 Right
2624 6.50 Palm Tree 1.20 Right
2625 6.50 Palm Tree 1.20 Right
2626 6.50 Palm Tree 1.20 Right
2627 6.50 Palm Tree 1.20 Right
2628 33/700 33/750 6.50 Poovaram Tree 2.50 Right
2629 6.10 Palm Tree 1.25 Right
2630 6.10 Palm Tree 1.25 Right
2631 6.10 Palm Tree 1.25 Right
2632 6.10 Palm Tree 1.25 Right
2633 6.10 Palm Tree 1.25 Right
2634 6.10 Palm Tree 1.25 Right
2635 6.10 Palm Tree 1.25 Right
2636 6.10 Palm Tree 1.25 Right
2637 6.10 Palm Tree 1.25 Right
2638 6.10 Palm Tree 1.25 Right
2639 6.10 Palm Tree 1.25 Right
2640 6.10 Palm Tree 1.25 Right
2641 6.10 Palm Tree 1.25 Right
2642 33/750 33/800 6.50 Palm Tree 1.25 Right
2643 6.50 Palm Tree 1.25 Right
2644 6.50 Palm Tree 1.25 Right
2645 6.50 Palm Tree 1.25 Right
2646 6.50 Palm Tree 1.25 Right
2647 6.50 Palm Tree 1.25 Right
2648 6.50 Palm Tree 1.25 Right
2649 6.50 Palm Tree 1.25 Right
2650 6.50 Palm Tree 1.25 Right
2651 6.50 Palm Tree 1.25 Right
2652 6.50 Palm Tree 1.25 Right
2653 6.50 Palm Tree 1.25 Right
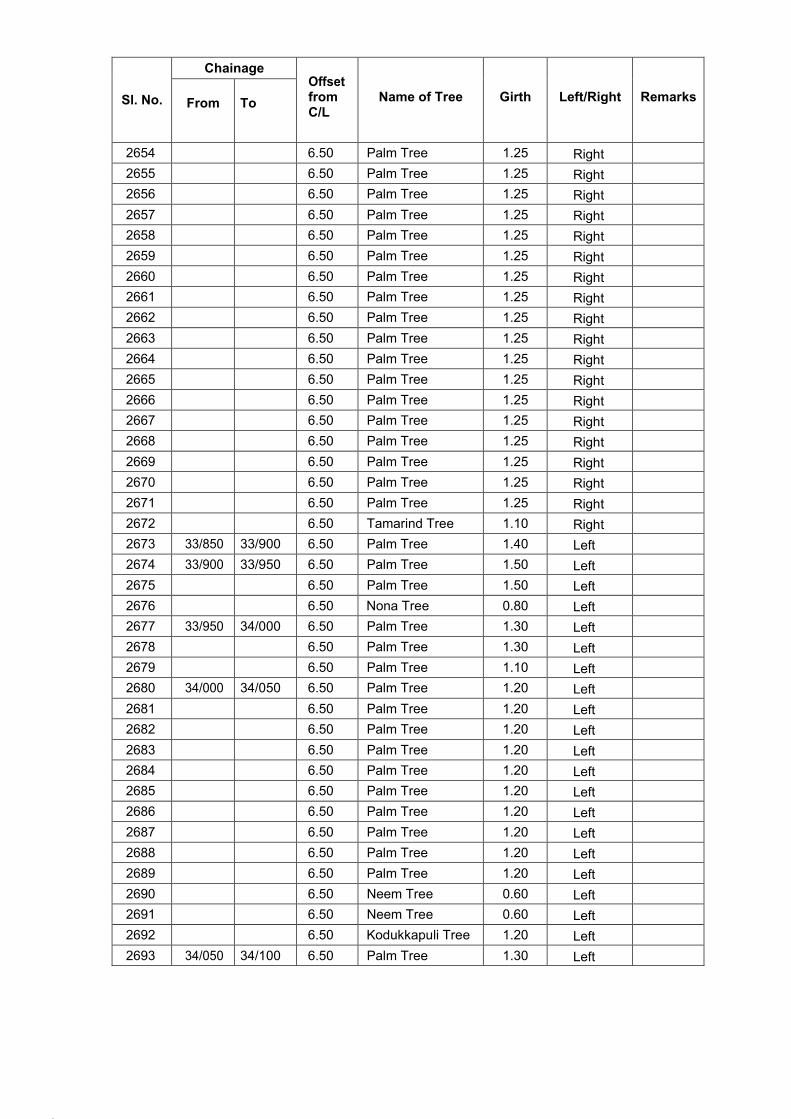
131.
132.
Sl. No.
Chainage Offset from C/L
Name of Tree
Girth
Left/Right
Remarks
From
To
2654 6.50 Palm Tree 1.25 Right
2655 6.50 Palm Tree 1.25 Right
2656 6.50 Palm Tree 1.25 Right
2657 6.50 Palm Tree 1.25 Right
2658 6.50 Palm Tree 1.25 Right
2659 6.50 Palm Tree 1.25 Right
2660 6.50 Palm Tree 1.25 Right
2661 6.50 Palm Tree 1.25 Right
2662 6.50 Palm Tree 1.25 Right
2663 6.50 Palm Tree 1.25 Right
2664 6.50 Palm Tree 1.25 Right
2665 6.50 Palm Tree 1.25 Right
2666 6.50 Palm Tree 1.25 Right
2667 6.50 Palm Tree 1.25 Right
2668 6.50 Palm Tree 1.25 Right
2669 6.50 Palm Tree 1.25 Right
2670 6.50 Palm Tree 1.25 Right
2671 6.50 Palm Tree 1.25 Right
2672 6.50 Tamarind Tree 1.10 Right
2673 33/850 33/900 6.50 Palm Tree 1.40 Left
2674 33/900 33/950 6.50 Palm Tree 1.50 Left
2675 6.50 Palm Tree 1.50 Left
2676 6.50 Nona Tree 0.80 Left
2677 33/950 34/000 6.50 Palm Tree 1.30 Left
2678 6.50 Palm Tree 1.30 Left
2679 6.50 Palm Tree 1.10 Left
2680 34/000 34/050 6.50 Palm Tree 1.20 Left
2681 6.50 Palm Tree 1.20 Left
2682 6.50 Palm Tree 1.20 Left
2683 6.50 Palm Tree 1.20 Left
2684 6.50 Palm Tree 1.20 Left
2685 6.50 Palm Tree 1.20 Left
2686 6.50 Palm Tree 1.20 Left
2687 6.50 Palm Tree 1.20 Left
2688 6.50 Palm Tree 1.20 Left
2689 6.50 Palm Tree 1.20 Left
2690 6.50 Neem Tree 0.60 Left
2691 6.50 Neem Tree 0.60 Left
2692 6.50 Kodukkapuli Tree 1.20 Left
2693 34/050 34/100 6.50 Palm Tree 1.30 Left
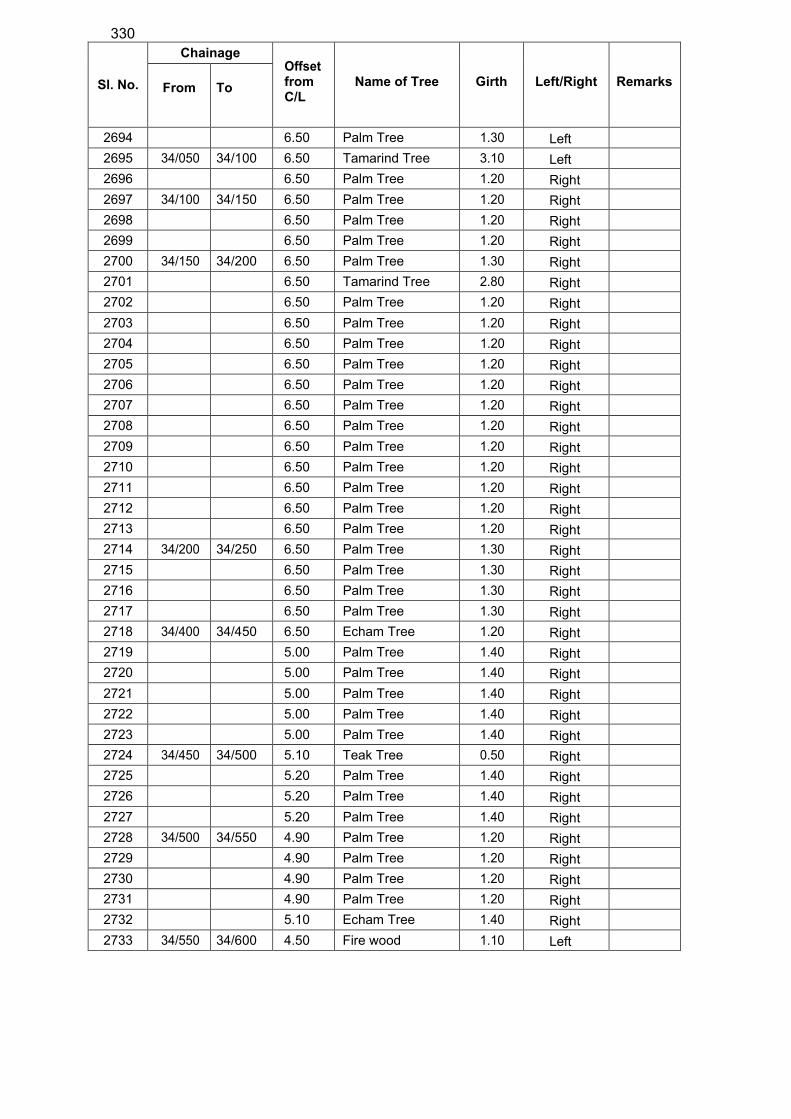
330
Sl. No.
Chainage Offset from C/L
Name of Tree
Girth
Left/Right
Remarks
From
To
2694 6.50 Palm Tree 1.30 Left
2695 34/050 34/100 6.50 Tamarind Tree 3.10 Left
2696 6.50 Palm Tree 1.20 Right
2697 34/100 34/150 6.50 Palm Tree 1.20 Right
2698 6.50 Palm Tree 1.20 Right
2699 6.50 Palm Tree 1.20 Right
2700 34/150 34/200 6.50 Palm Tree 1.30 Right
2701 6.50 Tamarind Tree 2.80 Right
2702 6.50 Palm Tree 1.20 Right
2703 6.50 Palm Tree 1.20 Right
2704 6.50 Palm Tree 1.20 Right
2705 6.50 Palm Tree 1.20 Right
2706 6.50 Palm Tree 1.20 Right
2707 6.50 Palm Tree 1.20 Right
2708 6.50 Palm Tree 1.20 Right
2709 6.50 Palm Tree 1.20 Right
2710 6.50 Palm Tree 1.20 Right
2711 6.50 Palm Tree 1.20 Right
2712 6.50 Palm Tree 1.20 Right
2713 6.50 Palm Tree 1.20 Right
2714 34/200 34/250 6.50 Palm Tree 1.30 Right
2715 6.50 Palm Tree 1.30 Right
2716 6.50 Palm Tree 1.30 Right
2717 6.50 Palm Tree 1.30 Right
2718 34/400 34/450 6.50 Echam Tree 1.20 Right
2719 5.00 Palm Tree 1.40 Right
2720 5.00 Palm Tree 1.40 Right
2721 5.00 Palm Tree 1.40 Right
2722 5.00 Palm Tree 1.40 Right
2723 5.00 Palm Tree 1.40 Right
2724 34/450 34/500 5.10 Teak Tree 0.50 Right
2725 5.20 Palm Tree 1.40 Right
2726 5.20 Palm Tree 1.40 Right
2727 5.20 Palm Tree 1.40 Right
2728 34/500 34/550 4.90 Palm Tree 1.20 Right
2729 4.90 Palm Tree 1.20 Right
2730 4.90 Palm Tree 1.20 Right
2731 4.90 Palm Tree 1.20 Right
2732 5.10 Echam Tree 1.40 Right
2733 34/550 34/600 4.50 Fire wood 1.10 Left
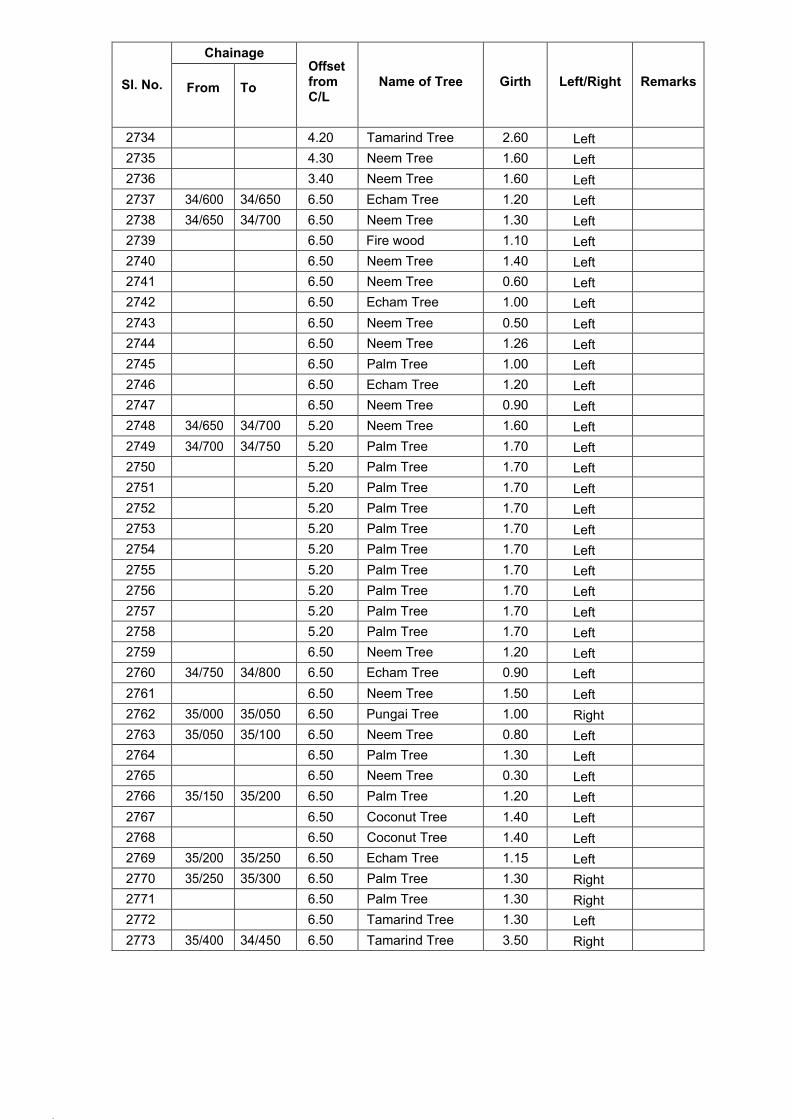
135.
136.
Sl. No.
Chainage Offset from C/L
Name of Tree
Girth
Left/Right
Remarks
From
To
2734 4.20 Tamarind Tree 2.60 Left
2735 4.30 Neem Tree 1.60 Left
2736 3.40 Neem Tree 1.60 Left
2737 34/600 34/650 6.50 Echam Tree 1.20 Left
2738 34/650 34/700 6.50 Neem Tree 1.30 Left
2739 6.50 Fire wood 1.10 Left
2740 6.50 Neem Tree 1.40 Left
2741 6.50 Neem Tree 0.60 Left
2742 6.50 Echam Tree 1.00 Left
2743 6.50 Neem Tree 0.50 Left
2744 6.50 Neem Tree 1.26 Left
2745 6.50 Palm Tree 1.00 Left
2746 6.50 Echam Tree 1.20 Left
2747 6.50 Neem Tree 0.90 Left
2748 34/650 34/700 5.20 Neem Tree 1.60 Left
2749 34/700 34/750 5.20 Palm Tree 1.70 Left
2750 5.20 Palm Tree 1.70 Left
2751 5.20 Palm Tree 1.70 Left
2752 5.20 Palm Tree 1.70 Left
2753 5.20 Palm Tree 1.70 Left
2754 5.20 Palm Tree 1.70 Left
2755 5.20 Palm Tree 1.70 Left
2756 5.20 Palm Tree 1.70 Left
2757 5.20 Palm Tree 1.70 Left
2758 5.20 Palm Tree 1.70 Left
2759 6.50 Neem Tree 1.20 Left
2760 34/750 34/800 6.50 Echam Tree 0.90 Left
2761 6.50 Neem Tree 1.50 Left
2762 35/000 35/050 6.50 Pungai Tree 1.00 Right
2763 35/050 35/100 6.50 Neem Tree 0.80 Left
2764 6.50 Palm Tree 1.30 Left
2765 6.50 Neem Tree 0.30 Left
2766 35/150 35/200 6.50 Palm Tree 1.20 Left
2767 6.50 Coconut Tree 1.40 Left
2768 6.50 Coconut Tree 1.40 Left
2769 35/200 35/250 6.50 Echam Tree 1.15 Left
2770 35/250 35/300 6.50 Palm Tree 1.30 Right
2771 6.50 Palm Tree 1.30 Right
2772 6.50 Tamarind Tree 1.30 Left
2773 35/400 34/450 6.50 Tamarind Tree 3.50 Right
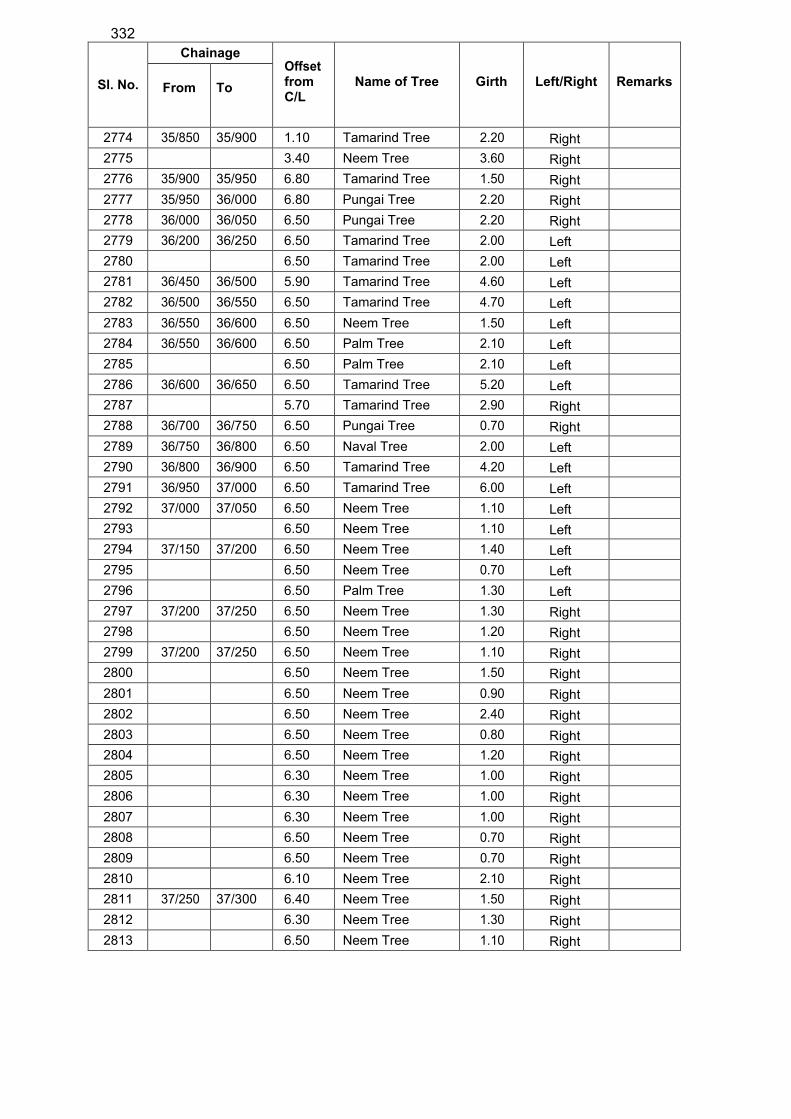
332
Sl. No.
Chainage Offset from C/L
Name of Tree
Girth
Left/Right
Remarks
From
To
2774 35/850 35/900 1.10 Tamarind Tree 2.20 Right
2775 3.40 Neem Tree 3.60 Right
2776 35/900 35/950 6.80 Tamarind Tree 1.50 Right
2777 35/950 36/000 6.80 Pungai Tree 2.20 Right
2778 36/000 36/050 6.50 Pungai Tree 2.20 Right
2779 36/200 36/250 6.50 Tamarind Tree 2.00 Left
2780 6.50 Tamarind Tree 2.00 Left
2781 36/450 36/500 5.90 Tamarind Tree 4.60 Left
2782 36/500 36/550 6.50 Tamarind Tree 4.70 Left
2783 36/550 36/600 6.50 Neem Tree 1.50 Left
2784 36/550 36/600 6.50 Palm Tree 2.10 Left
2785 6.50 Palm Tree 2.10 Left
2786 36/600 36/650 6.50 Tamarind Tree 5.20 Left
2787 5.70 Tamarind Tree 2.90 Right
2788 36/700 36/750 6.50 Pungai Tree 0.70 Right
2789 36/750 36/800 6.50 Naval Tree 2.00 Left
2790 36/800 36/900 6.50 Tamarind Tree 4.20 Left
2791 36/950 37/000 6.50 Tamarind Tree 6.00 Left
2792 37/000 37/050 6.50 Neem Tree 1.10 Left
2793 6.50 Neem Tree 1.10 Left
2794 37/150 37/200 6.50 Neem Tree 1.40 Left
2795 6.50 Neem Tree 0.70 Left
2796 6.50 Palm Tree 1.30 Left
2797 37/200 37/250 6.50 Neem Tree 1.30 Right
2798 6.50 Neem Tree 1.20 Right
2799 37/200 37/250 6.50 Neem Tree 1.10 Right
2800 6.50 Neem Tree 1.50 Right
2801 6.50 Neem Tree 0.90 Right
2802 6.50 Neem Tree 2.40 Right
2803 6.50 Neem Tree 0.80 Right
2804 6.50 Neem Tree 1.20 Right
2805 6.30 Neem Tree 1.00 Right
2806 6.30 Neem Tree 1.00 Right
2807 6.30 Neem Tree 1.00 Right
2808 6.50 Neem Tree 0.70 Right
2809 6.50 Neem Tree 0.70 Right
2810 6.10 Neem Tree 2.10 Right
2811 37/250 37/300 6.40 Neem Tree 1.50 Right
2812 6.30 Neem Tree 1.30 Right
2813 6.50 Neem Tree 1.10 Right

139.
140.
Sl. No.
Chainage Offset from C/L
Name of Tree
Girth
Left/Right
Remarks
From
To
2814 6.50 Neem Tree 1.70 Right
2815 6.50 Neem Tree 1.20 Right
2816 6.50 Neem Tree 1.10 Right
2817 6.50 Neem Tree 1.10 Right
2818 6.50 Neem Tree 0.90 Right
2819 6.50 Neem Tree 1.30 Right
2820 6.50 Neem Tree 0.70 Right
2821 37/300 37/350 6.50 Palm Tree 1.50 Right
2822 6.50 Palm Tree 1.50 Right
2823 6.50 Nona Tree 0.80 Right
2824 6.50 Neem Tree 0.90 Right
2825 6.50 Neem Tree 0.90 Right
2826 6.50 Pungai Tree 1.10 Right
2827 6.50 Palm Tree 1.10 Right
2828 6.50 Neem Tree 1.30 Right
2829 6.50 Neem Tree 1.30 Right
2830 37/350 37/400 6.50 Tamarind Tree 2.80 Right
2831 37/450 37/500 6.50 Fire wood 2.50 Left
2832 6.50 Echam Tree 1.10 Left
2833 6.50 Mango Tree 1.00 Left
2834 37/500 37/550 6.50 Echam Tree 1.10 Left
2835 6.50 Tamarind Tree 3.70 Left
2836 37/550 37/600 6.50 Neem Tree 2.10 Left
2837 6.50 Palm Tree 1.20 Left
2838 37/600 37/650 6.50 Palm Tree 1.10 Left
2839 6.50 Palm Tree 1.20 Left
2840 6.50 Palm Tree 1.20 Left
2841 6.50 Palm Tree 1.20 Left
2842 6.50 Palm Tree 1.30 Left
2843 6.50 Teak Tree 0.50 Left
2844 6.50 Teak Tree 0.50 Left
2845 6.50 Nona Tree 0.40 Left
2846 5.70 Banyan Tree 5.50 Left
2847 37/650 37/700 6.50 Neem Tree 1.20 Left
2848 6.50 Neem Tree 2.10 Left
2849 6.50 Palm Tree 0.80 Left
2850 37/700 37/750 5.70 Neem Tree 2.00 Left
2851 6.50 Neem Tree 1.60 Left
2852 37/700 37/750 6.50 Palm Tree 1.50 Left
2853 37/750 37/800 6.50 Palm Tree 1.20 Right
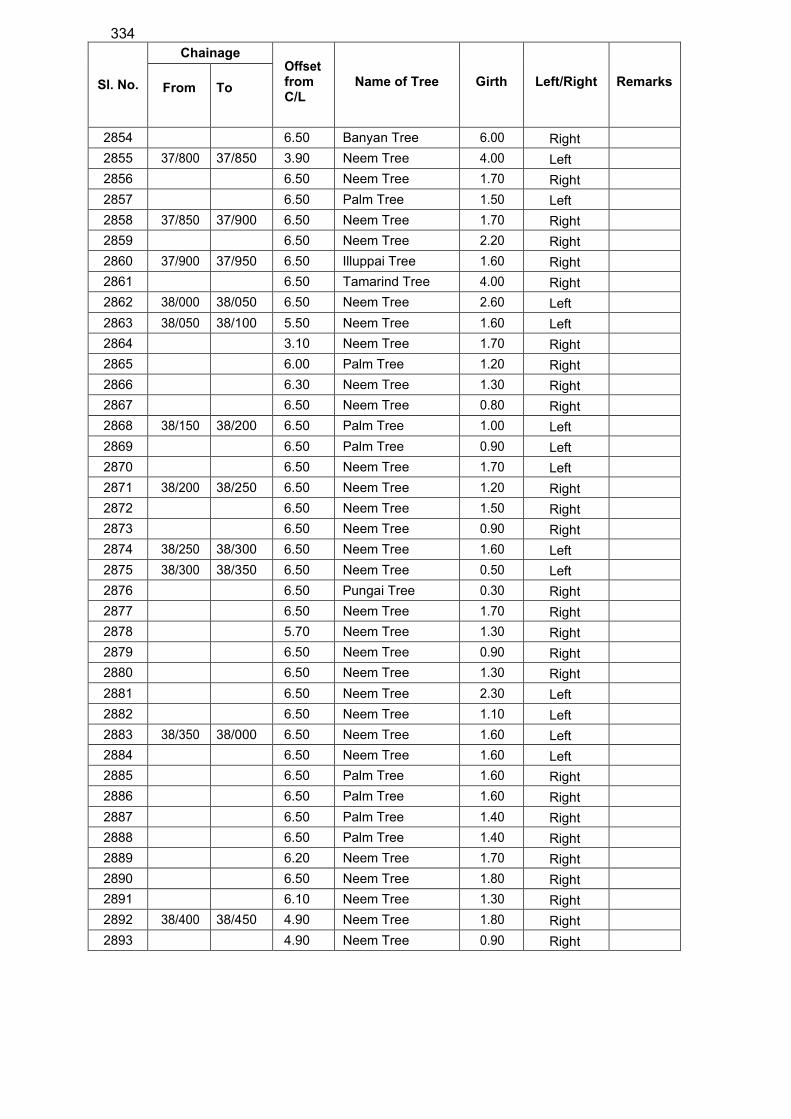
334
Sl. No.
Chainage Offset from C/L
Name of Tree
Girth
Left/Right
Remarks
From
To
2854 6.50 Banyan Tree 6.00 Right
2855 37/800 37/850 3.90 Neem Tree 4.00 Left
2856 6.50 Neem Tree 1.70 Right
2857 6.50 Palm Tree 1.50 Left
2858 37/850 37/900 6.50 Neem Tree 1.70 Right
2859 6.50 Neem Tree 2.20 Right
2860 37/900 37/950 6.50 Illuppai Tree 1.60 Right
2861 6.50 Tamarind Tree 4.00 Right
2862 38/000 38/050 6.50 Neem Tree 2.60 Left
2863 38/050 38/100 5.50 Neem Tree 1.60 Left
2864 3.10 Neem Tree 1.70 Right
2865 6.00 Palm Tree 1.20 Right
2866 6.30 Neem Tree 1.30 Right
2867 6.50 Neem Tree 0.80 Right
2868 38/150 38/200 6.50 Palm Tree 1.00 Left
2869 6.50 Palm Tree 0.90 Left
2870 6.50 Neem Tree 1.70 Left
2871 38/200 38/250 6.50 Neem Tree 1.20 Right
2872 6.50 Neem Tree 1.50 Right
2873 6.50 Neem Tree 0.90 Right
2874 38/250 38/300 6.50 Neem Tree 1.60 Left
2875 38/300 38/350 6.50 Neem Tree 0.50 Left
2876 6.50 Pungai Tree 0.30 Right
2877 6.50 Neem Tree 1.70 Right
2878 5.70 Neem Tree 1.30 Right
2879 6.50 Neem Tree 0.90 Right
2880 6.50 Neem Tree 1.30 Right
2881 6.50 Neem Tree 2.30 Left
2882 6.50 Neem Tree 1.10 Left
2883 38/350 38/000 6.50 Neem Tree 1.60 Left
2884 6.50 Neem Tree 1.60 Left
2885 6.50 Palm Tree 1.60 Right
2886 6.50 Palm Tree 1.60 Right
2887 6.50 Palm Tree 1.40 Right
2888 6.50 Palm Tree 1.40 Right
2889 6.20 Neem Tree 1.70 Right
2890 6.50 Neem Tree 1.80 Right
2891 6.10 Neem Tree 1.30 Right
2892 38/400 38/450 4.90 Neem Tree 1.80 Right
2893 4.90 Neem Tree 0.90 Right

143.
144.
Sl. No.
Chainage Offset from C/L
Name of Tree
Girth
Left/Right
Remarks
From
To
2894 5.90 Neem Tree 2.80 Right
2895 6.50 Neem Tree 1.20 Right
2896 38/450 38/500 6.50 Neem Tree 2.20 Right
2897 6.50 Neem Tree 1.80 Right
2898 38/450 38/500 5.10 Neem Tree 2.80 Right
2899 6.50 Neem Tree 0.90 Right
2900 6.50 Neem Tree 1.10 Right
2901 38/500 38/550 6.50 Neem Tree 0.90 Left
2902 6.50 Neem Tree 0.40 Left
2903 6.50 Neem Tree 0.70 Left
2904 6.50 Neem Tree 1.20 Left
2905 5.90 Neem Tree 1.80 Right
2906 5.80 Neem Tree 0.60 Right
2907 6.50 Neem Tree 0.80 Right
2908 6.50 Neem Tree 1.10 Right
2909 38/550 38/600 6.50 Neem Tree 1.00 Left
2910 6.50 Neem Tree 1.40 Left
2911 6.20 Neem Tree 1.20 Right
2912 38/600 38/650 6.20 Tamarind Tree 3.90 Left
2913 6.50 Tamarind Tree 3.20 Right
2914 38/650 38/700 6.50 Neem Tree 1.50 Left
2915 6.50 Neem Tree 3.30 Left
2916 38/700 38/750 4.30 Neem Tree 1.50 Right
2917 38/750 38/800 6.50 Neem Tree 2.00 Right
2918 38/700 38/800 5.50 Neem Tree 1.90 Left
2919 5.50 Neem Tree 0.90 Left
2920 5.50 Neem Tree 1.30 Left
2921 5.50 Neem Tree 1.90 Right
2922 38/800 38/850 6.50 Neem Tree 2.40 Left
2923 6.50 Neem Tree 1.20 Left
2924 6.50 Neem Tree 1.60 Left
2925 38/850 38/900 6.50 Neem Tree 1.10 Left
2926 6.50 Neem Tree 1.50 Left
2927 6.50 Neem Tree 1.00 Left
2928 38/900 38/950 6.50 Neem Tree 2.50 Left
2929 39/050 39/100 5.50 Tamarind Tree 2.50 Right
2930 39/150 39/200 5.70 Vagai Tree 1.00 Right
2931 39/150 39/200 6.50 Neem Tree 1.20 Left
2932 39/200 39/250 6.50 Neem Tree 1.30 Left
2933 5.90 Tamarind Tree 3.50 Right
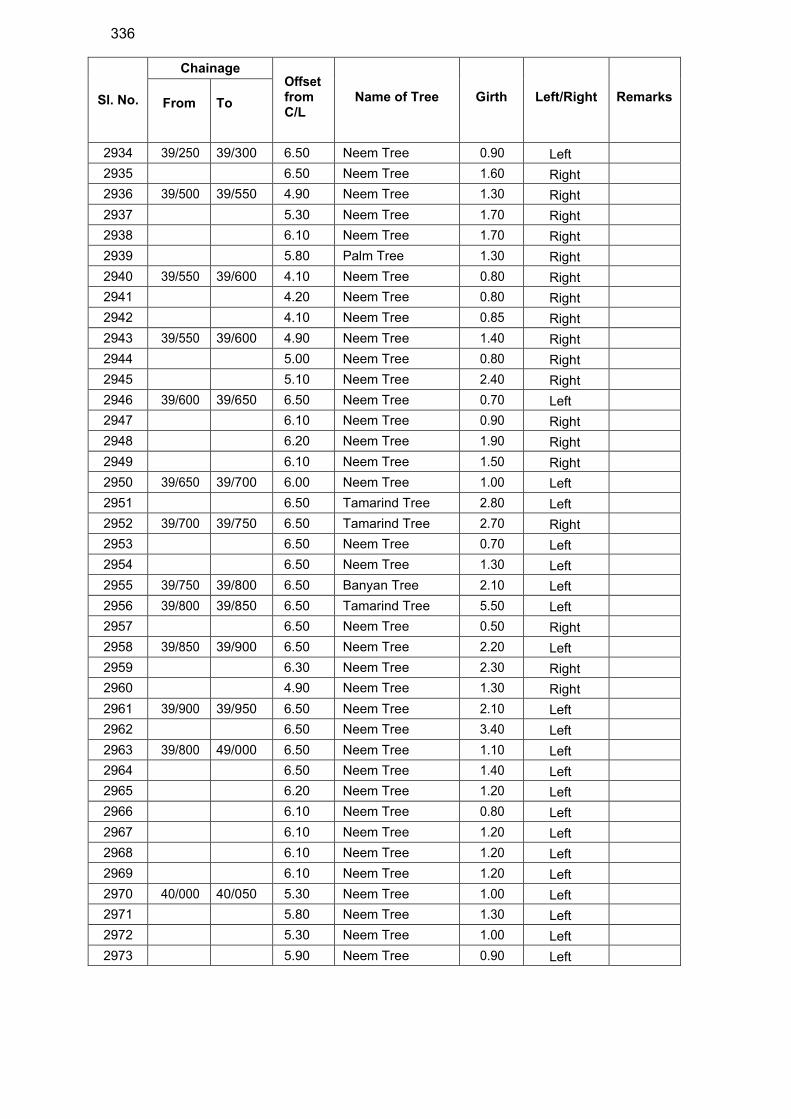
336
Sl. No.
Chainage Offset from C/L
Name of Tree
Girth
Left/Right
Remarks
From
To
2934 39/250 39/300 6.50 Neem Tree 0.90 Left
2935 6.50 Neem Tree 1.60 Right
2936 39/500 39/550 4.90 Neem Tree 1.30 Right
2937 5.30 Neem Tree 1.70 Right
2938 6.10 Neem Tree 1.70 Right
2939 5.80 Palm Tree 1.30 Right
2940 39/550 39/600 4.10 Neem Tree 0.80 Right
2941 4.20 Neem Tree 0.80 Right
2942 4.10 Neem Tree 0.85 Right
2943 39/550 39/600 4.90 Neem Tree 1.40 Right
2944 5.00 Neem Tree 0.80 Right
2945 5.10 Neem Tree 2.40 Right
2946 39/600 39/650 6.50 Neem Tree 0.70 Left
2947 6.10 Neem Tree 0.90 Right
2948 6.20 Neem Tree 1.90 Right
2949 6.10 Neem Tree 1.50 Right
2950 39/650 39/700 6.00 Neem Tree 1.00 Left
2951 6.50 Tamarind Tree 2.80 Left
2952 39/700 39/750 6.50 Tamarind Tree 2.70 Right
2953 6.50 Neem Tree 0.70 Left
2954 6.50 Neem Tree 1.30 Left
2955 39/750 39/800 6.50 Banyan Tree 2.10 Left
2956 39/800 39/850 6.50 Tamarind Tree 5.50 Left
2957 6.50 Neem Tree 0.50 Right
2958 39/850 39/900 6.50 Neem Tree 2.20 Left
2959 6.30 Neem Tree 2.30 Right
2960 4.90 Neem Tree 1.30 Right
2961 39/900 39/950 6.50 Neem Tree 2.10 Left
2962 6.50 Neem Tree 3.40 Left
2963 39/800 49/000 6.50 Neem Tree 1.10 Left
2964 6.50 Neem Tree 1.40 Left
2965 6.20 Neem Tree 1.20 Left
2966 6.10 Neem Tree 0.80 Left
2967 6.10 Neem Tree 1.20 Left
2968 6.10 Neem Tree 1.20 Left
2969 6.10 Neem Tree 1.20 Left
2970 40/000 40/050 5.30 Neem Tree 1.00 Left
2971 5.80 Neem Tree 1.30 Left
2972 5.30 Neem Tree 1.00 Left
2973 5.90 Neem Tree 0.90 Left
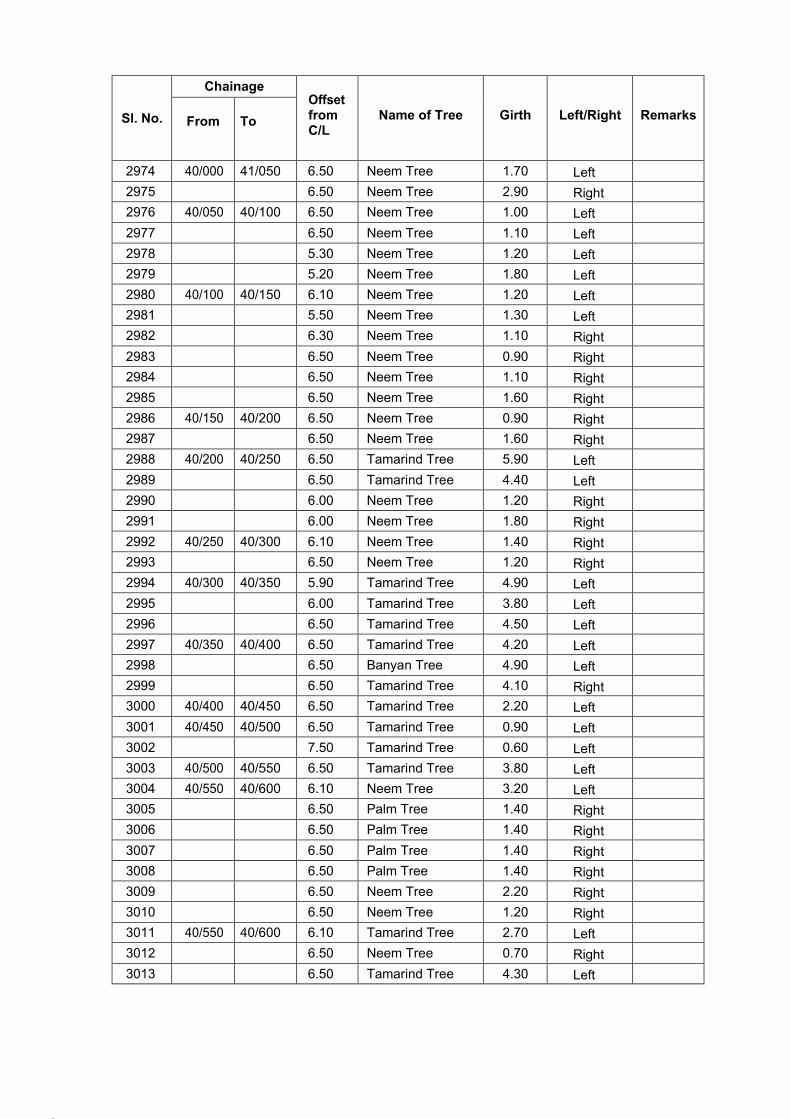
147.
148.
Sl. No.
Chainage Offset from C/L
Name of Tree
Girth
Left/Right
Remarks
From
To
2974 40/000 41/050 6.50 Neem Tree 1.70 Left
2975 6.50 Neem Tree 2.90 Right
2976 40/050 40/100 6.50 Neem Tree 1.00 Left
2977 6.50 Neem Tree 1.10 Left
2978 5.30 Neem Tree 1.20 Left
2979 5.20 Neem Tree 1.80 Left
2980 40/100 40/150 6.10 Neem Tree 1.20 Left
2981 5.50 Neem Tree 1.30 Left
2982 6.30 Neem Tree 1.10 Right
2983 6.50 Neem Tree 0.90 Right
2984 6.50 Neem Tree 1.10 Right
2985 6.50 Neem Tree 1.60 Right
2986 40/150 40/200 6.50 Neem Tree 0.90 Right
2987 6.50 Neem Tree 1.60 Right
2988 40/200 40/250 6.50 Tamarind Tree 5.90 Left
2989 6.50 Tamarind Tree 4.40 Left
2990 6.00 Neem Tree 1.20 Right
2991 6.00 Neem Tree 1.80 Right
2992 40/250 40/300 6.10 Neem Tree 1.40 Right
2993 6.50 Neem Tree 1.20 Right
2994 40/300 40/350 5.90 Tamarind Tree 4.90 Left
2995 6.00 Tamarind Tree 3.80 Left
2996 6.50 Tamarind Tree 4.50 Left
2997 40/350 40/400 6.50 Tamarind Tree 4.20 Left
2998 6.50 Banyan Tree 4.90 Left
2999 6.50 Tamarind Tree 4.10 Right
3000 40/400 40/450 6.50 Tamarind Tree 2.20 Left
3001 40/450 40/500 6.50 Tamarind Tree 0.90 Left
3002 7.50 Tamarind Tree 0.60 Left
3003 40/500 40/550 6.50 Tamarind Tree 3.80 Left
3004 40/550 40/600 6.10 Neem Tree 3.20 Left
3005 6.50 Palm Tree 1.40 Right
3006 6.50 Palm Tree 1.40 Right
3007 6.50 Palm Tree 1.40 Right
3008 6.50 Palm Tree 1.40 Right
3009 6.50 Neem Tree 2.20 Right
3010 6.50 Neem Tree 1.20 Right
3011 40/550 40/600 6.10 Tamarind Tree 2.70 Left
3012 6.50 Neem Tree 0.70 Right
3013 6.50 Tamarind Tree 4.30 Left
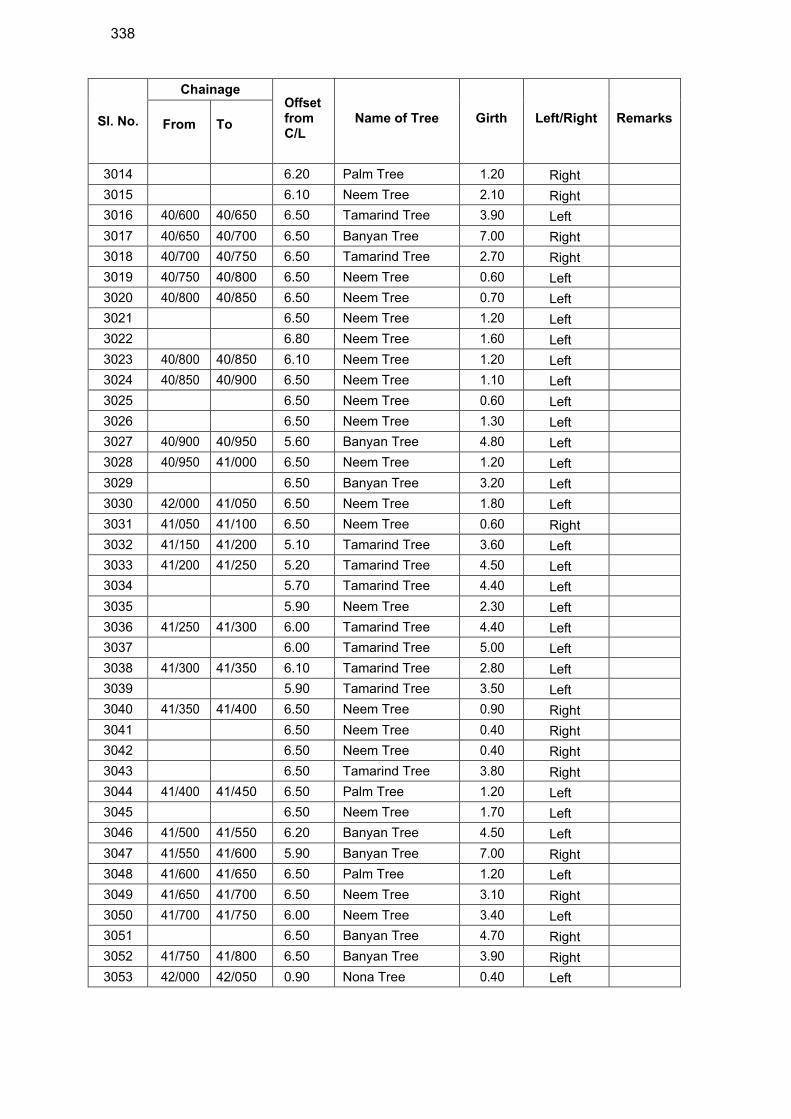
338
Sl. No.
Chainage Offset from C/L
Name of Tree
Girth
Left/Right
Remarks
From
To
3014 6.20 Palm Tree 1.20 Right
3015 6.10 Neem Tree 2.10 Right
3016 40/600 40/650 6.50 Tamarind Tree 3.90 Left
3017 40/650 40/700 6.50 Banyan Tree 7.00 Right
3018 40/700 40/750 6.50 Tamarind Tree 2.70 Right
3019 40/750 40/800 6.50 Neem Tree 0.60 Left
3020 40/800 40/850 6.50 Neem Tree 0.70 Left
3021 6.50 Neem Tree 1.20 Left
3022 6.80 Neem Tree 1.60 Left
3023 40/800 40/850 6.10 Neem Tree 1.20 Left
3024 40/850 40/900 6.50 Neem Tree 1.10 Left
3025 6.50 Neem Tree 0.60 Left
3026 6.50 Neem Tree 1.30 Left
3027 40/900 40/950 5.60 Banyan Tree 4.80 Left
3028 40/950 41/000 6.50 Neem Tree 1.20 Left
3029 6.50 Banyan Tree 3.20 Left
3030 42/000 41/050 6.50 Neem Tree 1.80 Left
3031 41/050 41/100 6.50 Neem Tree 0.60 Right
3032 41/150 41/200 5.10 Tamarind Tree 3.60 Left
3033 41/200 41/250 5.20 Tamarind Tree 4.50 Left
3034 5.70 Tamarind Tree 4.40 Left
3035 5.90 Neem Tree 2.30 Left
3036 41/250 41/300 6.00 Tamarind Tree 4.40 Left
3037 6.00 Tamarind Tree 5.00 Left
3038 41/300 41/350 6.10 Tamarind Tree 2.80 Left
3039 5.90 Tamarind Tree 3.50 Left
3040 41/350 41/400 6.50 Neem Tree 0.90 Right
3041 6.50 Neem Tree 0.40 Right
3042 6.50 Neem Tree 0.40 Right
3043 6.50 Tamarind Tree 3.80 Right
3044 41/400 41/450 6.50 Palm Tree 1.20 Left
3045 6.50 Neem Tree 1.70 Left
3046 41/500 41/550 6.20 Banyan Tree 4.50 Left
3047 41/550 41/600 5.90 Banyan Tree 7.00 Right
3048 41/600 41/650 6.50 Palm Tree 1.20 Left
3049 41/650 41/700 6.50 Neem Tree 3.10 Right
3050 41/700 41/750 6.00 Neem Tree 3.40 Left
3051 6.50 Banyan Tree 4.70 Right
3052 41/750 41/800 6.50 Banyan Tree 3.90 Right
3053 42/000 42/050 0.90 Nona Tree 0.40 Left
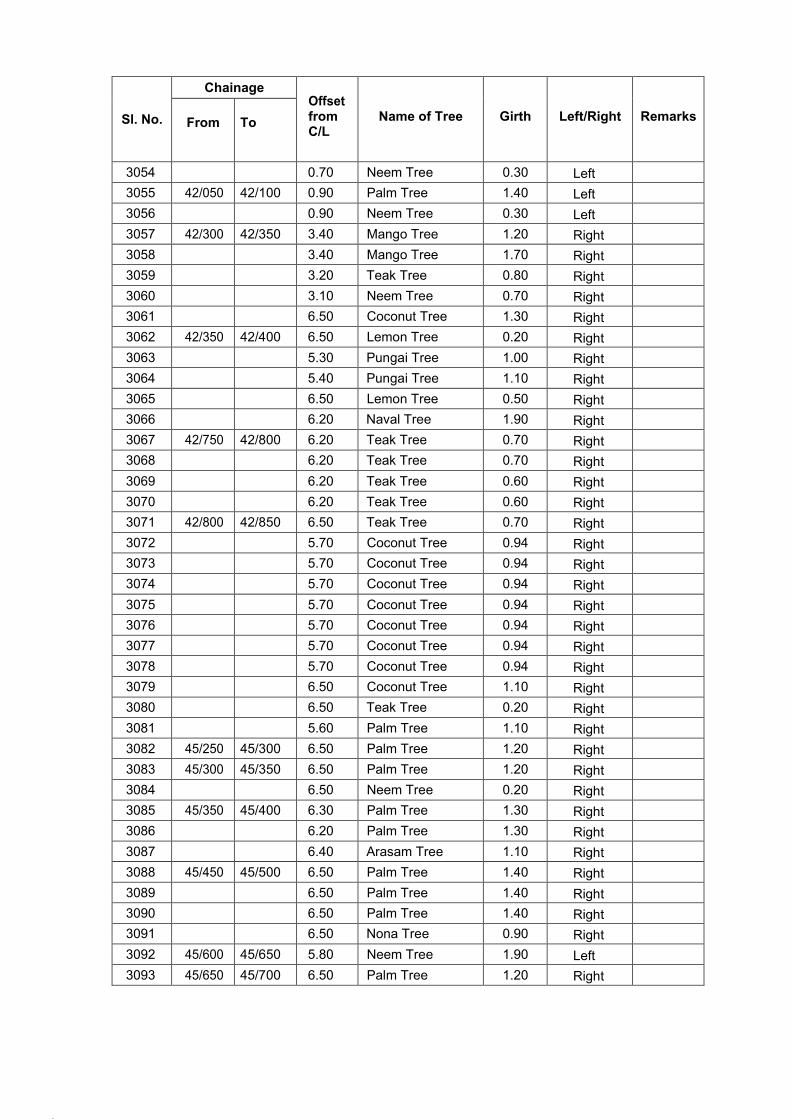
151.
152.
Sl. No.
Chainage Offset from C/L
Name of Tree
Girth
Left/Right
Remarks
From
To
3054 0.70 Neem Tree 0.30 Left
3055 42/050 42/100 0.90 Palm Tree 1.40 Left
3056 0.90 Neem Tree 0.30 Left
3057 42/300 42/350 3.40 Mango Tree 1.20 Right
3058 3.40 Mango Tree 1.70 Right
3059 3.20 Teak Tree 0.80 Right
3060 3.10 Neem Tree 0.70 Right
3061 6.50 Coconut Tree 1.30 Right
3062 42/350 42/400 6.50 Lemon Tree 0.20 Right
3063 5.30 Pungai Tree 1.00 Right
3064 5.40 Pungai Tree 1.10 Right
3065 6.50 Lemon Tree 0.50 Right
3066 6.20 Naval Tree 1.90 Right
3067 42/750 42/800 6.20 Teak Tree 0.70 Right
3068 6.20 Teak Tree 0.70 Right
3069 6.20 Teak Tree 0.60 Right
3070 6.20 Teak Tree 0.60 Right
3071 42/800 42/850 6.50 Teak Tree 0.70 Right
3072 5.70 Coconut Tree 0.94 Right
3073 5.70 Coconut Tree 0.94 Right
3074 5.70 Coconut Tree 0.94 Right
3075 5.70 Coconut Tree 0.94 Right
3076 5.70 Coconut Tree 0.94 Right
3077 5.70 Coconut Tree 0.94 Right
3078 5.70 Coconut Tree 0.94 Right
3079 6.50 Coconut Tree 1.10 Right
3080 6.50 Teak Tree 0.20 Right
3081 5.60 Palm Tree 1.10 Right
3082 45/250 45/300 6.50 Palm Tree 1.20 Right
3083 45/300 45/350 6.50 Palm Tree 1.20 Right
3084 6.50 Neem Tree 0.20 Right
3085 45/350 45/400 6.30 Palm Tree 1.30 Right
3086 6.20 Palm Tree 1.30 Right
3087 6.40 Arasam Tree 1.10 Right
3088 45/450 45/500 6.50 Palm Tree 1.40 Right
3089 6.50 Palm Tree 1.40 Right
3090 6.50 Palm Tree 1.40 Right
3091 6.50 Nona Tree 0.90 Right
3092 45/600 45/650 5.80 Neem Tree 1.90 Left
3093 45/650 45/700 6.50 Palm Tree 1.20 Right

340
Sl. No.
Chainage Offset from C/L
Name of Tree
Girth
Left/Right
Remarks
From
To
3094 45/700 45/750 6.50 Coconut Tree 1.20 Left
3095 6.50 Coconut Tree 1.20 Left
3096 45/750 45/800 5.00 Tamarind Tree 3.00 Left
3097 5.00 Neem Tree 0.90 Left
3098 45/850 45/900 1.20 Pungai Tree 1.30 Right
3099 45/900 45/950 6.50 Tamarind Tree 4.00 Left
3100 46/000 46/050 6.50 Neem Tree 2.70 Right
3101 46/100 46/150 6.50 Tamarind Tree 4.00 Right
3102 6.50 Tamarind Tree 4.00 Right
3103 46/150 46/200 6.50 Tamarind Tree 1.40 Right
3104 6.50 Tamarind Tree 1.20 Right
3105 6.10 Tamarind Tree 3.50 Right
3106 6.50 Tamarind Tree 3.00 Right
3107 46/250 46/300 6.50 Tamarind Tree 2.25 Right
3108 6.50 Tamarind Tree 3.00 Left
3109 46/300 46/350 6.50 Neem Tree 0.90 Right
3110 46/350 46/400 5.50 Tamarind Tree 3.00 Left
3111 46/400 46/450 6.50 Neem Tree 1.10 Left
3112 46/450 46/500 6.50 Neem Tree 2.00 Right
3113 46/750 46/800 6.50 Neem Tree 0.50 Right
3114 6.50 Neem Tree 0.50 Right
3115 46/900 46/950 6.50 Palm Tree 1.10 Right
3116 47/000 47/050 6.50 Teak Tree 0.85 Left
3117 47/050 47/100 6.50 Teak Tree 0.60 Right
3118 6.50 Palm Tree 0.90 Right
3119 6.50 Neem Tree 0.20 Right
3120 47/100 47/150 6.50 Teak Tree 0.50 Left
3121 47/150 47/200 6.50 Teak Tree 0.60 Left
3122 47/200 47/250 6.50 Neem Tree 0.90 Right
3123 47/250 47/300 6.50 Neem Tree 1.10 Right
3124 6.50 Neem Tree 1.10 Right
3125 6.50 Neem Tree 1.10 Right
3126 6.50 Pungai Tree 0.65 Right
3127 6.50 Neem Tree 1.80 Right
3128 47/400 47/450 6.50 Pungai Tree 1.00 Right
3129 6.50 Pungai Tree 1.00 Right
3130 47/450 47/500 6.50 Pungai Tree 1.10 Right
3131 6.50 Pungai Tree 1.10 Right
3132 47/550 47/600 6.50 Pungai Tree 1.10 Right
3133 6.50 Palm Tree 1.30 Right
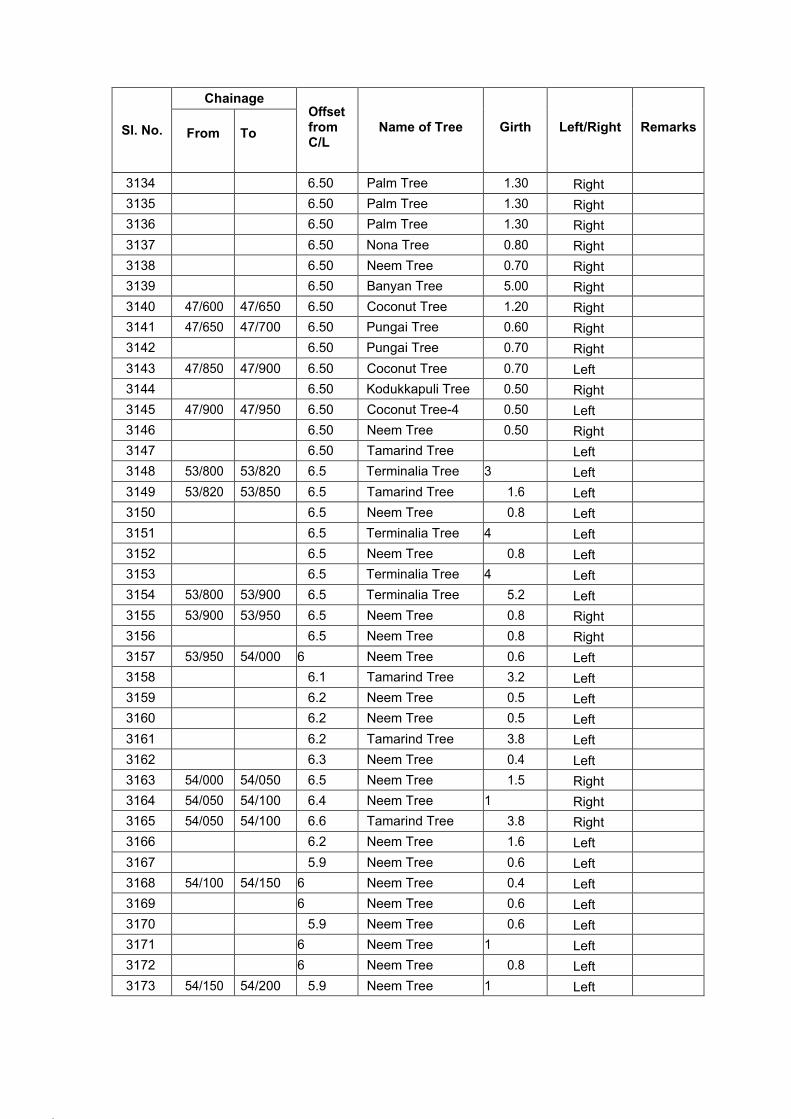
155.
156.
Sl. No.
Chainage Offset from C/L
Name of Tree
Girth
Left/Right
Remarks
From
To
3134 6.50 Palm Tree 1.30 Right
3135 6.50 Palm Tree 1.30 Right
3136 6.50 Palm Tree 1.30 Right
3137 6.50 Nona Tree 0.80 Right
3138 6.50 Neem Tree 0.70 Right
3139 6.50 Banyan Tree 5.00 Right
3140 47/600 47/650 6.50 Coconut Tree 1.20 Right
3141 47/650 47/700 6.50 Pungai Tree 0.60 Right
3142 6.50 Pungai Tree 0.70 Right
3143 47/850 47/900 6.50 Coconut Tree 0.70 Left
3144 6.50 Kodukkapuli Tree 0.50 Right
3145 47/900 47/950 6.50 Coconut Tree-4 0.50 Left
3146 6.50 Neem Tree 0.50 Right
3147 6.50 Tamarind Tree Left
3148 53/800 53/820 6.5 Terminalia Tree 3 Left
3149 53/820 53/850 6.5 Tamarind Tree 1.6 Left
3150 6.5 Neem Tree 0.8 Left
3151 6.5 Terminalia Tree 4 Left
3152 6.5 Neem Tree 0.8 Left
3153 6.5 Terminalia Tree 4 Left
3154 53/800 53/900 6.5 Terminalia Tree 5.2 Left
3155 53/900 53/950 6.5 Neem Tree 0.8 Right
3156 6.5 Neem Tree 0.8 Right
3157 53/950 54/000 6 Neem Tree 0.6 Left
3158 6.1 Tamarind Tree 3.2 Left
3159 6.2 Neem Tree 0.5 Left
3160 6.2 Neem Tree 0.5 Left
3161 6.2 Tamarind Tree 3.8 Left
3162 6.3 Neem Tree 0.4 Left
3163 54/000 54/050 6.5 Neem Tree 1.5 Right
3164 54/050 54/100 6.4 Neem Tree 1 Right
3165 54/050 54/100 6.6 Tamarind Tree 3.8 Right
3166 6.2 Neem Tree 1.6 Left
3167 5.9 Neem Tree 0.6 Left
3168 54/100 54/150 6 Neem Tree 0.4 Left
3169 6 Neem Tree 0.6 Left
3170 5.9 Neem Tree 0.6 Left
3171 6 Neem Tree 1 Left
3172 6 Neem Tree 0.8 Left
3173 54/150 54/200 5.9 Neem Tree 1 Left
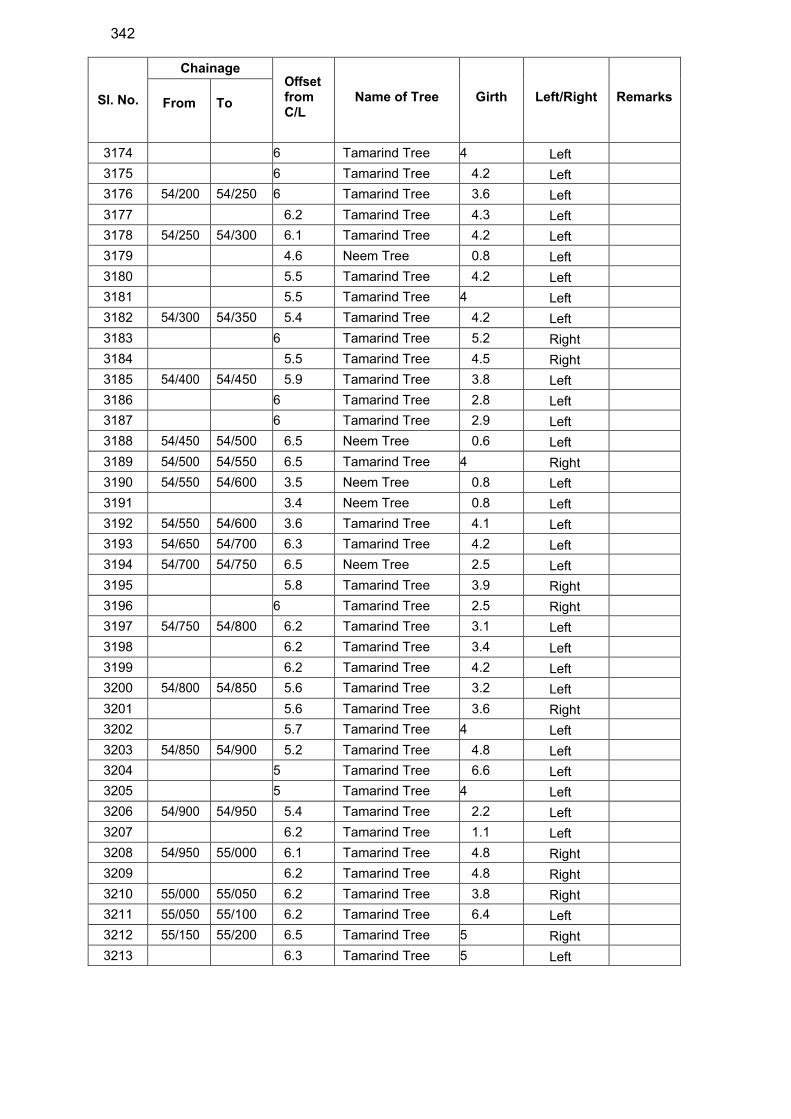
342
Sl. No.
Chainage Offset from C/L
Name of Tree
Girth
Left/Right
Remarks
From
To
3174 6 Tamarind Tree 4 Left
3175 6 Tamarind Tree 4.2 Left
3176 54/200 54/250 6 Tamarind Tree 3.6 Left
3177 6.2 Tamarind Tree 4.3 Left
3178 54/250 54/300 6.1 Tamarind Tree 4.2 Left
3179 4.6 Neem Tree 0.8 Left
3180 5.5 Tamarind Tree 4.2 Left
3181 5.5 Tamarind Tree 4 Left
3182 54/300 54/350 5.4 Tamarind Tree 4.2 Left
3183 6 Tamarind Tree 5.2 Right
3184 5.5 Tamarind Tree 4.5 Right
3185 54/400 54/450 5.9 Tamarind Tree 3.8 Left
3186 6 Tamarind Tree 2.8 Left
3187 6 Tamarind Tree 2.9 Left
3188 54/450 54/500 6.5 Neem Tree 0.6 Left
3189 54/500 54/550 6.5 Tamarind Tree 4 Right
3190 54/550 54/600 3.5 Neem Tree 0.8 Left
3191 3.4 Neem Tree 0.8 Left
3192 54/550 54/600 3.6 Tamarind Tree 4.1 Left
3193 54/650 54/700 6.3 Tamarind Tree 4.2 Left
3194 54/700 54/750 6.5 Neem Tree 2.5 Left
3195 5.8 Tamarind Tree 3.9 Right
3196 6 Tamarind Tree 2.5 Right
3197 54/750 54/800 6.2 Tamarind Tree 3.1 Left
3198 6.2 Tamarind Tree 3.4 Left
3199 6.2 Tamarind Tree 4.2 Left
3200 54/800 54/850 5.6 Tamarind Tree 3.2 Left
3201 5.6 Tamarind Tree 3.6 Right
3202 5.7 Tamarind Tree 4 Left
3203 54/850 54/900 5.2 Tamarind Tree 4.8 Left
3204 5 Tamarind Tree 6.6 Left
3205 5 Tamarind Tree 4 Left
3206 54/900 54/950 5.4 Tamarind Tree 2.2 Left
3207 6.2 Tamarind Tree 1.1 Left
3208 54/950 55/000 6.1 Tamarind Tree 4.8 Right
3209 6.2 Tamarind Tree 4.8 Right
3210 55/000 55/050 6.2 Tamarind Tree 3.8 Right
3211 55/050 55/100 6.2 Tamarind Tree 6.4 Left
3212 55/150 55/200 6.5 Tamarind Tree 5 Right
3213 6.3 Tamarind Tree 5 Left
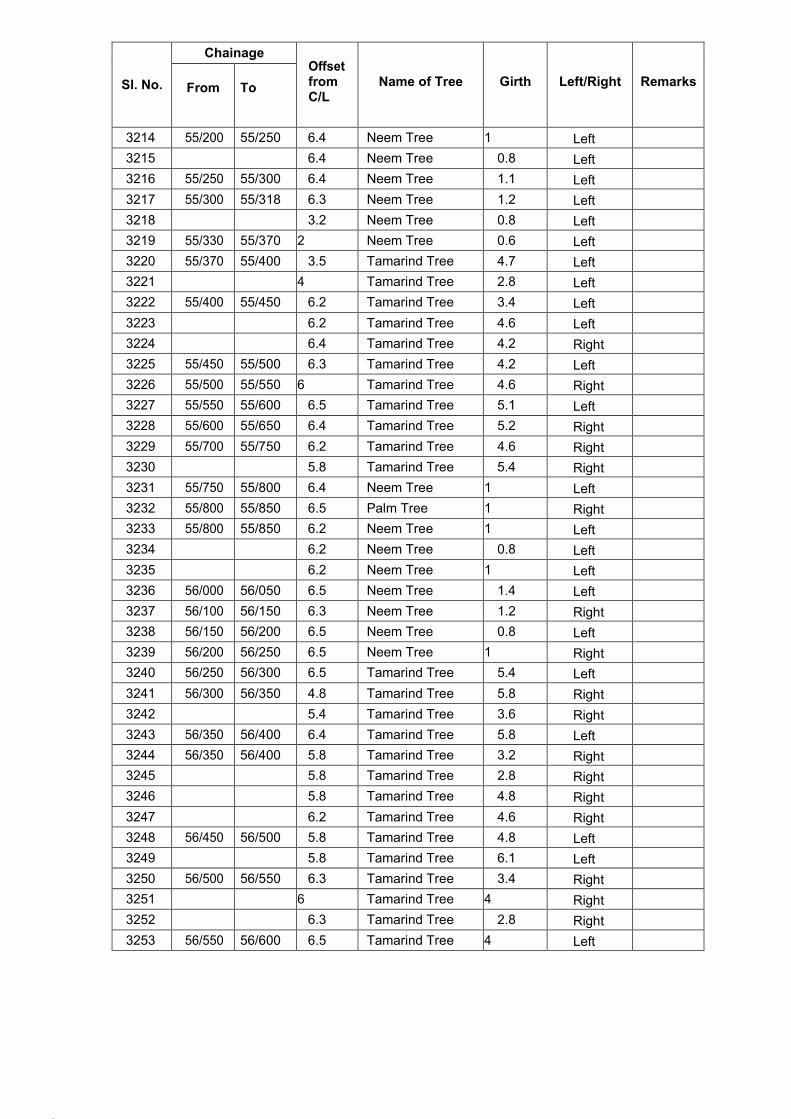
159.
160.
Sl. No.
Chainage Offset from C/L
Name of Tree
Girth
Left/Right
Remarks
From
To
3214 55/200 55/250 6.4 Neem Tree 1 Left
3215 6.4 Neem Tree 0.8 Left
3216 55/250 55/300 6.4 Neem Tree 1.1 Left
3217 55/300 55/318 6.3 Neem Tree 1.2 Left
3218 3.2 Neem Tree 0.8 Left
3219 55/330 55/370 2 Neem Tree 0.6 Left
3220 55/370 55/400 3.5 Tamarind Tree 4.7 Left
3221 4 Tamarind Tree 2.8 Left
3222 55/400 55/450 6.2 Tamarind Tree 3.4 Left
3223 6.2 Tamarind Tree 4.6 Left
3224 6.4 Tamarind Tree 4.2 Right
3225 55/450 55/500 6.3 Tamarind Tree 4.2 Left
3226 55/500 55/550 6 Tamarind Tree 4.6 Right
3227 55/550 55/600 6.5 Tamarind Tree 5.1 Left
3228 55/600 55/650 6.4 Tamarind Tree 5.2 Right
3229 55/700 55/750 6.2 Tamarind Tree 4.6 Right
3230 5.8 Tamarind Tree 5.4 Right
3231 55/750 55/800 6.4 Neem Tree 1 Left
3232 55/800 55/850 6.5 Palm Tree 1 Right
3233 55/800 55/850 6.2 Neem Tree 1 Left
3234 6.2 Neem Tree 0.8 Left
3235 6.2 Neem Tree 1 Left
3236 56/000 56/050 6.5 Neem Tree 1.4 Left
3237 56/100 56/150 6.3 Neem Tree 1.2 Right
3238 56/150 56/200 6.5 Neem Tree 0.8 Left
3239 56/200 56/250 6.5 Neem Tree 1 Right
3240 56/250 56/300 6.5 Tamarind Tree 5.4 Left
3241 56/300 56/350 4.8 Tamarind Tree 5.8 Right
3242 5.4 Tamarind Tree 3.6 Right
3243 56/350 56/400 6.4 Tamarind Tree 5.8 Left
3244 56/350 56/400 5.8 Tamarind Tree 3.2 Right
3245 5.8 Tamarind Tree 2.8 Right
3246 5.8 Tamarind Tree 4.8 Right
3247 6.2 Tamarind Tree 4.6 Right
3248 56/450 56/500 5.8 Tamarind Tree 4.8 Left
3249 5.8 Tamarind Tree 6.1 Left
3250 56/500 56/550 6.3 Tamarind Tree 3.4 Right
3251 6 Tamarind Tree 4 Right
3252 6.3 Tamarind Tree 2.8 Right
3253 56/550 56/600 6.5 Tamarind Tree 4 Left
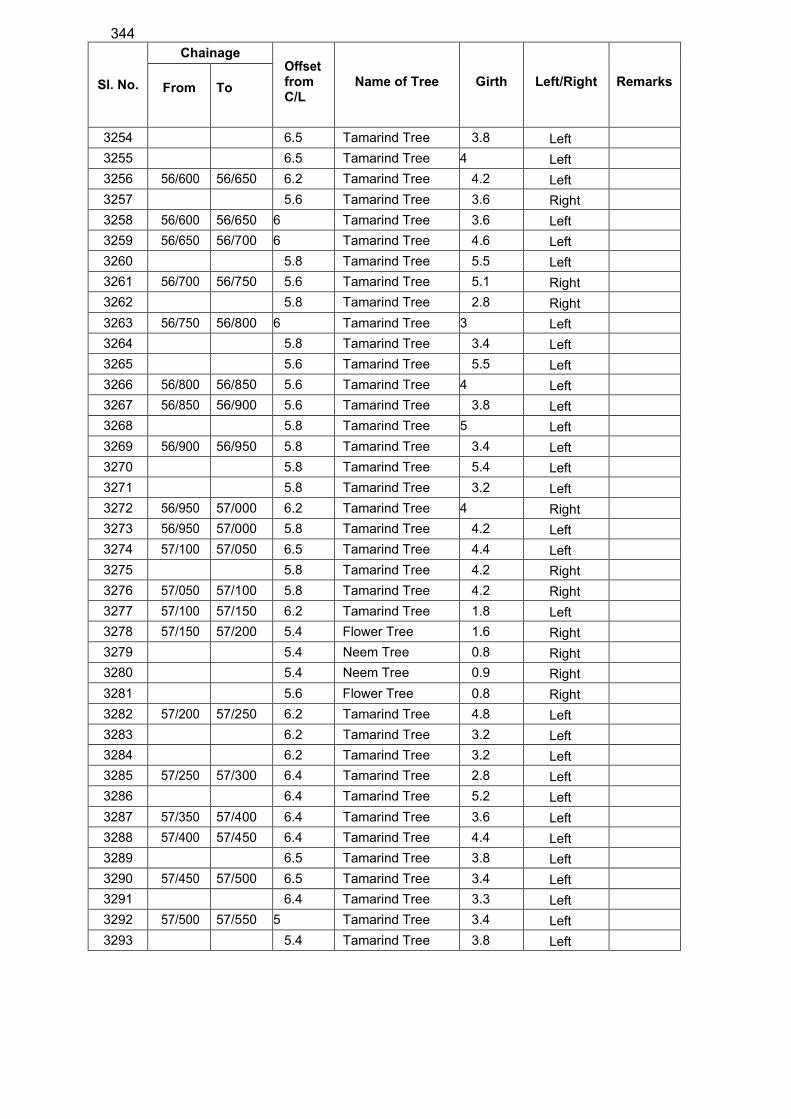
344
Sl. No.
Chainage Offset from C/L
Name of Tree
Girth
Left/Right
Remarks
From
To
3254 6.5 Tamarind Tree 3.8 Left
3255 6.5 Tamarind Tree 4 Left
3256 56/600 56/650 6.2 Tamarind Tree 4.2 Left
3257 5.6 Tamarind Tree 3.6 Right
3258 56/600 56/650 6 Tamarind Tree 3.6 Left
3259 56/650 56/700 6 Tamarind Tree 4.6 Left
3260 5.8 Tamarind Tree 5.5 Left
3261 56/700 56/750 5.6 Tamarind Tree 5.1 Right
3262 5.8 Tamarind Tree 2.8 Right
3263 56/750 56/800 6 Tamarind Tree 3 Left
3264 5.8 Tamarind Tree 3.4 Left
3265 5.6 Tamarind Tree 5.5 Left
3266 56/800 56/850 5.6 Tamarind Tree 4 Left
3267 56/850 56/900 5.6 Tamarind Tree 3.8 Left
3268 5.8 Tamarind Tree 5 Left
3269 56/900 56/950 5.8 Tamarind Tree 3.4 Left
3270 5.8 Tamarind Tree 5.4 Left
3271 5.8 Tamarind Tree 3.2 Left
3272 56/950 57/000 6.2 Tamarind Tree 4 Right
3273 56/950 57/000 5.8 Tamarind Tree 4.2 Left
3274 57/100 57/050 6.5 Tamarind Tree 4.4 Left
3275 5.8 Tamarind Tree 4.2 Right
3276 57/050 57/100 5.8 Tamarind Tree 4.2 Right
3277 57/100 57/150 6.2 Tamarind Tree 1.8 Left
3278 57/150 57/200 5.4 Flower Tree 1.6 Right
3279 5.4 Neem Tree 0.8 Right
3280 5.4 Neem Tree 0.9 Right
3281 5.6 Flower Tree 0.8 Right
3282 57/200 57/250 6.2 Tamarind Tree 4.8 Left
3283 6.2 Tamarind Tree 3.2 Left
3284 6.2 Tamarind Tree 3.2 Left
3285 57/250 57/300 6.4 Tamarind Tree 2.8 Left
3286 6.4 Tamarind Tree 5.2 Left
3287 57/350 57/400 6.4 Tamarind Tree 3.6 Left
3288 57/400 57/450 6.4 Tamarind Tree 4.4 Left
3289 6.5 Tamarind Tree 3.8 Left
3290 57/450 57/500 6.5 Tamarind Tree 3.4 Left
3291 6.4 Tamarind Tree 3.3 Left
3292 57/500 57/550 5 Tamarind Tree 3.4 Left
3293 5.4 Tamarind Tree 3.8 Left
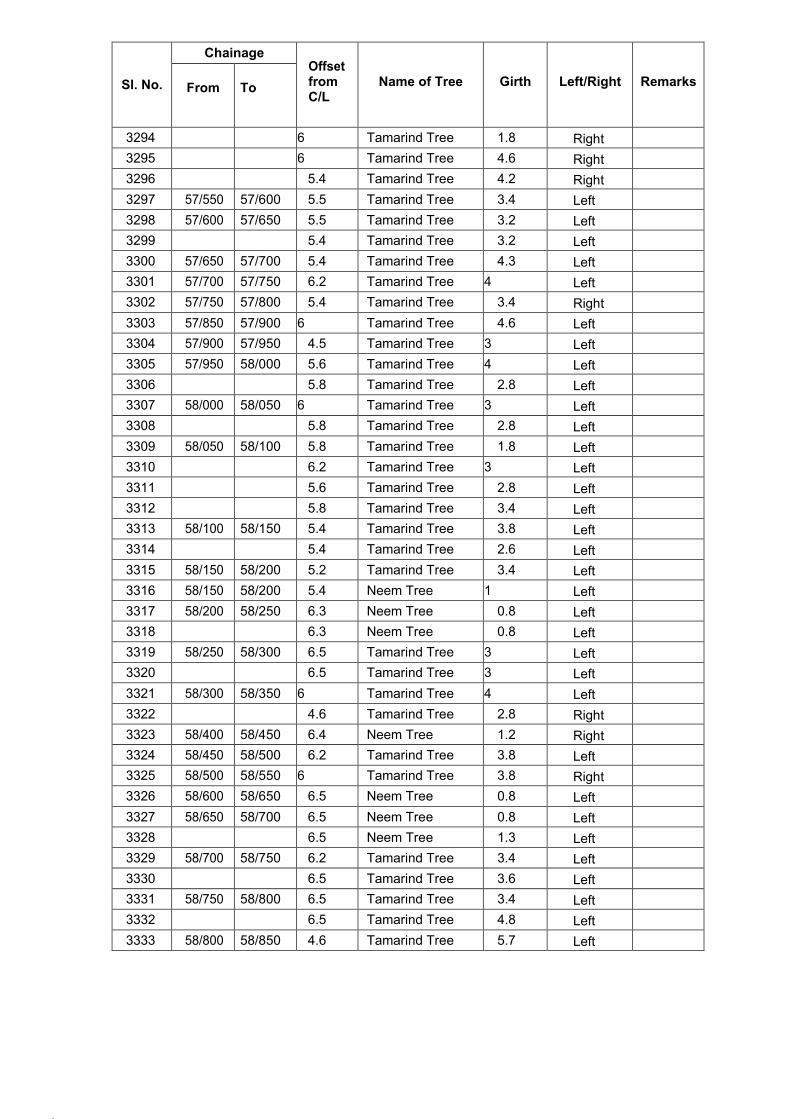
163.
164.
Sl. No.
Chainage Offset from C/L
Name of Tree
Girth
Left/Right
Remarks
From
To
3294 6 Tamarind Tree 1.8 Right
3295 6 Tamarind Tree 4.6 Right
3296 5.4 Tamarind Tree 4.2 Right
3297 57/550 57/600 5.5 Tamarind Tree 3.4 Left
3298 57/600 57/650 5.5 Tamarind Tree 3.2 Left
3299 5.4 Tamarind Tree 3.2 Left
3300 57/650 57/700 5.4 Tamarind Tree 4.3 Left
3301 57/700 57/750 6.2 Tamarind Tree 4 Left
3302 57/750 57/800 5.4 Tamarind Tree 3.4 Right
3303 57/850 57/900 6 Tamarind Tree 4.6 Left
3304 57/900 57/950 4.5 Tamarind Tree 3 Left
3305 57/950 58/000 5.6 Tamarind Tree 4 Left
3306 5.8 Tamarind Tree 2.8 Left
3307 58/000 58/050 6 Tamarind Tree 3 Left
3308 5.8 Tamarind Tree 2.8 Left
3309 58/050 58/100 5.8 Tamarind Tree 1.8 Left
3310 6.2 Tamarind Tree 3 Left
3311 5.6 Tamarind Tree 2.8 Left
3312 5.8 Tamarind Tree 3.4 Left
3313 58/100 58/150 5.4 Tamarind Tree 3.8 Left
3314 5.4 Tamarind Tree 2.6 Left
3315 58/150 58/200 5.2 Tamarind Tree 3.4 Left
3316 58/150 58/200 5.4 Neem Tree 1 Left
3317 58/200 58/250 6.3 Neem Tree 0.8 Left
3318 6.3 Neem Tree 0.8 Left
3319 58/250 58/300 6.5 Tamarind Tree 3 Left
3320 6.5 Tamarind Tree 3 Left
3321 58/300 58/350 6 Tamarind Tree 4 Left
3322 4.6 Tamarind Tree 2.8 Right
3323 58/400 58/450 6.4 Neem Tree 1.2 Right
3324 58/450 58/500 6.2 Tamarind Tree 3.8 Left
3325 58/500 58/550 6 Tamarind Tree 3.8 Right
3326 58/600 58/650 6.5 Neem Tree 0.8 Left
3327 58/650 58/700 6.5 Neem Tree 0.8 Left
3328 6.5 Neem Tree 1.3 Left
3329 58/700 58/750 6.2 Tamarind Tree 3.4 Left
3330 6.5 Tamarind Tree 3.6 Left
3331 58/750 58/800 6.5 Tamarind Tree 3.4 Left
3332 6.5 Tamarind Tree 4.8 Left
3333 58/800 58/850 4.6 Tamarind Tree 5.7 Left
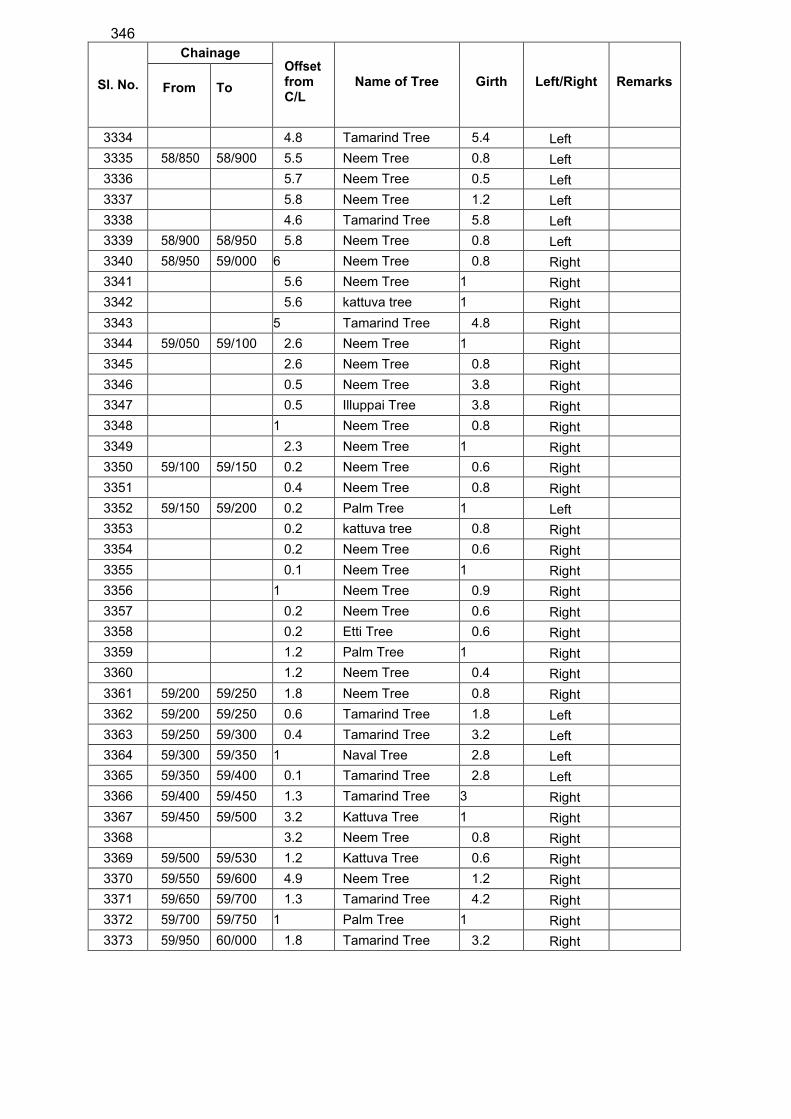
346
Sl. No.
Chainage Offset from C/L
Name of Tree
Girth
Left/Right
Remarks
From
To
3334 4.8 Tamarind Tree 5.4 Left
3335 58/850 58/900 5.5 Neem Tree 0.8 Left
3336 5.7 Neem Tree 0.5 Left
3337 5.8 Neem Tree 1.2 Left
3338 4.6 Tamarind Tree 5.8 Left
3339 58/900 58/950 5.8 Neem Tree 0.8 Left
3340 58/950 59/000 6 Neem Tree 0.8 Right
3341 5.6 Neem Tree 1 Right
3342 5.6 kattuva tree 1 Right
3343 5 Tamarind Tree 4.8 Right
3344 59/050 59/100 2.6 Neem Tree 1 Right
3345 2.6 Neem Tree 0.8 Right
3346 0.5 Neem Tree 3.8 Right
3347 0.5 Illuppai Tree 3.8 Right
3348 1 Neem Tree 0.8 Right
3349 2.3 Neem Tree 1 Right
3350 59/100 59/150 0.2 Neem Tree 0.6 Right
3351 0.4 Neem Tree 0.8 Right
3352 59/150 59/200 0.2 Palm Tree 1 Left
3353 0.2 kattuva tree 0.8 Right
3354 0.2 Neem Tree 0.6 Right
3355 0.1 Neem Tree 1 Right
3356 1 Neem Tree 0.9 Right
3357 0.2 Neem Tree 0.6 Right
3358 0.2 Etti Tree 0.6 Right
3359 1.2 Palm Tree 1 Right
3360 1.2 Neem Tree 0.4 Right
3361 59/200 59/250 1.8 Neem Tree 0.8 Right
3362 59/200 59/250 0.6 Tamarind Tree 1.8 Left
3363 59/250 59/300 0.4 Tamarind Tree 3.2 Left
3364 59/300 59/350 1 Naval Tree 2.8 Left
3365 59/350 59/400 0.1 Tamarind Tree 2.8 Left
3366 59/400 59/450 1.3 Tamarind Tree 3 Right
3367 59/450 59/500 3.2 Kattuva Tree 1 Right
3368 3.2 Neem Tree 0.8 Right
3369 59/500 59/530 1.2 Kattuva Tree 0.6 Right
3370 59/550 59/600 4.9 Neem Tree 1.2 Right
3371 59/650 59/700 1.3 Tamarind Tree 4.2 Right
3372 59/700 59/750 1 Palm Tree 1 Right
3373 59/950 60/000 1.8 Tamarind Tree 3.2 Right
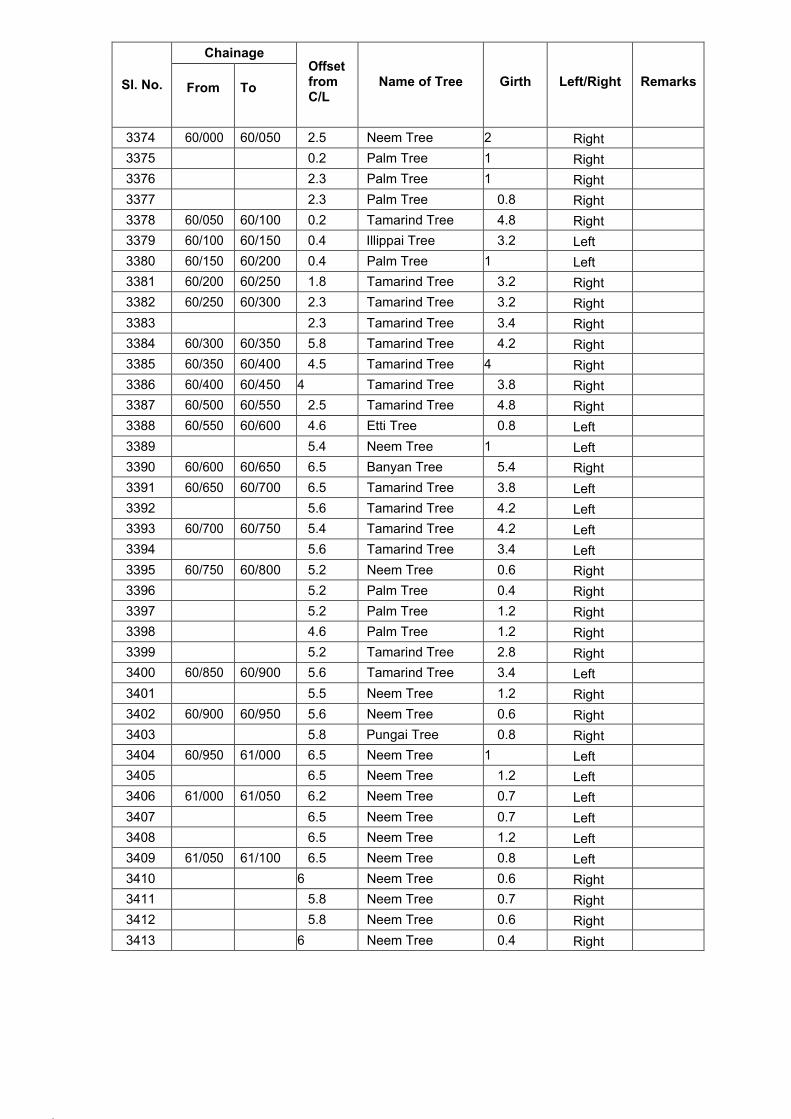
167.
168.
Sl. No.
Chainage Offset from C/L
Name of Tree
Girth
Left/Right
Remarks
From
To
3374 60/000 60/050 2.5 Neem Tree 2 Right
3375 0.2 Palm Tree 1 Right
3376 2.3 Palm Tree 1 Right
3377 2.3 Palm Tree 0.8 Right
3378 60/050 60/100 0.2 Tamarind Tree 4.8 Right
3379 60/100 60/150 0.4 Illippai Tree 3.2 Left
3380 60/150 60/200 0.4 Palm Tree 1 Left
3381 60/200 60/250 1.8 Tamarind Tree 3.2 Right
3382 60/250 60/300 2.3 Tamarind Tree 3.2 Right
3383 2.3 Tamarind Tree 3.4 Right
3384 60/300 60/350 5.8 Tamarind Tree 4.2 Right
3385 60/350 60/400 4.5 Tamarind Tree 4 Right
3386 60/400 60/450 4 Tamarind Tree 3.8 Right
3387 60/500 60/550 2.5 Tamarind Tree 4.8 Right
3388 60/550 60/600 4.6 Etti Tree 0.8 Left
3389 5.4 Neem Tree 1 Left
3390 60/600 60/650 6.5 Banyan Tree 5.4 Right
3391 60/650 60/700 6.5 Tamarind Tree 3.8 Left
3392 5.6 Tamarind Tree 4.2 Left
3393 60/700 60/750 5.4 Tamarind Tree 4.2 Left
3394 5.6 Tamarind Tree 3.4 Left
3395 60/750 60/800 5.2 Neem Tree 0.6 Right
3396 5.2 Palm Tree 0.4 Right
3397 5.2 Palm Tree 1.2 Right
3398 4.6 Palm Tree 1.2 Right
3399 5.2 Tamarind Tree 2.8 Right
3400 60/850 60/900 5.6 Tamarind Tree 3.4 Left
3401 5.5 Neem Tree 1.2 Right
3402 60/900 60/950 5.6 Neem Tree 0.6 Right
3403 5.8 Pungai Tree 0.8 Right
3404 60/950 61/000 6.5 Neem Tree 1 Left
3405 6.5 Neem Tree 1.2 Left
3406 61/000 61/050 6.2 Neem Tree 0.7 Left
3407 6.5 Neem Tree 0.7 Left
3408 6.5 Neem Tree 1.2 Left
3409 61/050 61/100 6.5 Neem Tree 0.8 Left
3410 6 Neem Tree 0.6 Right
3411 5.8 Neem Tree 0.7 Right
3412 5.8 Neem Tree 0.6 Right
3413 6 Neem Tree 0.4 Right
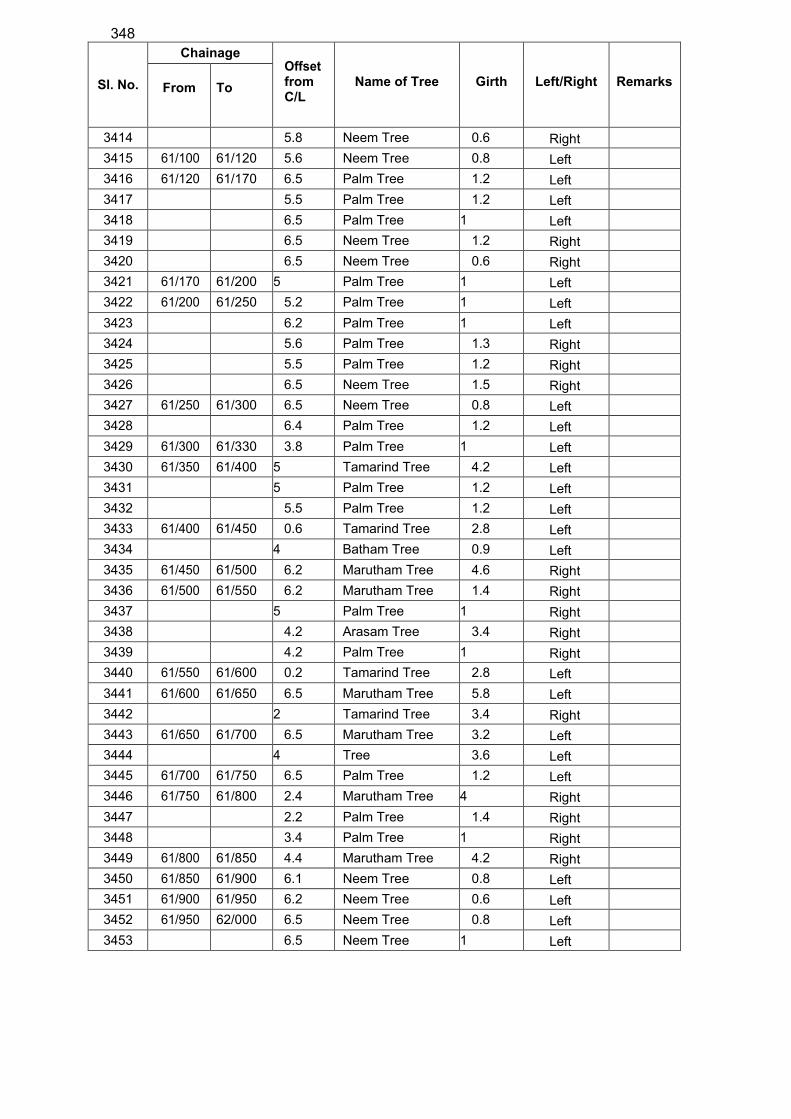
348
Sl. No.
Chainage Offset from C/L
Name of Tree
Girth
Left/Right
Remarks
From
To
3414 5.8 Neem Tree 0.6 Right
3415 61/100 61/120 5.6 Neem Tree 0.8 Left
3416 61/120 61/170 6.5 Palm Tree 1.2 Left
3417 5.5 Palm Tree 1.2 Left
3418 6.5 Palm Tree 1 Left
3419 6.5 Neem Tree 1.2 Right
3420 6.5 Neem Tree 0.6 Right
3421 61/170 61/200 5 Palm Tree 1 Left
3422 61/200 61/250 5.2 Palm Tree 1 Left
3423 6.2 Palm Tree 1 Left
3424 5.6 Palm Tree 1.3 Right
3425 5.5 Palm Tree 1.2 Right
3426 6.5 Neem Tree 1.5 Right
3427 61/250 61/300 6.5 Neem Tree 0.8 Left
3428 6.4 Palm Tree 1.2 Left
3429 61/300 61/330 3.8 Palm Tree 1 Left
3430 61/350 61/400 5 Tamarind Tree 4.2 Left
3431 5 Palm Tree 1.2 Left
3432 5.5 Palm Tree 1.2 Left
3433 61/400 61/450 0.6 Tamarind Tree 2.8 Left
3434 4 Batham Tree 0.9 Left
3435 61/450 61/500 6.2 Marutham Tree 4.6 Right
3436 61/500 61/550 6.2 Marutham Tree 1.4 Right
3437 5 Palm Tree 1 Right
3438 4.2 Arasam Tree 3.4 Right
3439 4.2 Palm Tree 1 Right
3440 61/550 61/600 0.2 Tamarind Tree 2.8 Left
3441 61/600 61/650 6.5 Marutham Tree 5.8 Left
3442 2 Tamarind Tree 3.4 Right
3443 61/650 61/700 6.5 Marutham Tree 3.2 Left
3444 4 Tree 3.6 Left
3445 61/700 61/750 6.5 Palm Tree 1.2 Left
3446 61/750 61/800 2.4 Marutham Tree 4 Right
3447 2.2 Palm Tree 1.4 Right
3448 3.4 Palm Tree 1 Right
3449 61/800 61/850 4.4 Marutham Tree 4.2 Right
3450 61/850 61/900 6.1 Neem Tree 0.8 Left
3451 61/900 61/950 6.2 Neem Tree 0.6 Left
3452 61/950 62/000 6.5 Neem Tree 0.8 Left
3453 6.5 Neem Tree 1 Left

171.
172.
Sl. No.
Chainage Offset from C/L
Name of Tree
Girth
Left/Right
Remarks
From
To
3454 62/000 62/050 4 Echam Tree 1.2 Right
3455 6.5 Neem Tree 1.2 Right
3456 6.5 Kattuva Tree 3.2 Right
3457 6.2 Neem Tree 0.8 Right
3458 62/130 62/150 1.5 Neem Tree 1.2 Right
3459 1.6 Neem Tree 0.6 Right
3460 1 Neem Tree 0.8 Right
3461 62/150 62/200 2.5 Tamarid Tree 3.4 Right
3462 5.5 Palm Tree 1.2 Right
3463 62/200 62/250 5.5 Palm Tree 1.2 Right
3464 62/250 62/300 5.8 Palm Tree 1.2 Right
3465 5.8 Naval Tree 1 Right
3466 62/300 62/350 6 Nona Tree 1 Right
3467 4 Tamarid Tree 4 Right
3468 62/350 62/400 5.8 Neem Tree 1.2 Right
3469 62/450 62/500 6 Arasam Tree 4 Left
3470 62/500 62/550 5.8 Tamarid Tree 6.2 Left
3471 62/550 62/600 4.6 Tamarid Tree 5.6 Right
3472 62/600 62/650 5.8 Tamarid Tree 5 Left
3473 6 Pungai Tree 1.2 Left
3474 62/650 62/700 6.2 Tamarid Tree 2.5 Left
3475 62/700 62/750 6.2 Tamarid Tree 4.4 Left
3476 5.8 Tamarid Tree 6.2 Left
3477 62/750 62/800 5.4 Neem Tree 1 Right
3478 62/800 62/850 6 Illippai Tree 4.8 Left
3479 62/850 62/900 6 Illippai Tree 2.6 Left
3480 6.2 Illippai Tree 4.2 Left
3481 62/900 62/950 4.5 Tamarind Tree 3.8 Right
3482 4.5 Illippai Tree 5.2 Right
3483 4.2 Illippai Tree 4.4 Right
3484 63/000 63/050 6 Neem Tree 1.2 Right
3485 63/050 63/100 6.4 Illippai Tree 5.2 Right
3486 6.2 Illippai Tree 5.2 Right
3487 63/100 63/150 6.2 Illippai Tree 4.2 Left
3488 6.5 Tamarind Tree 3.2 Left
3489 63/200 63/250 5.6 Illippai Tree 3 Left
3490 63/250 63/300 6.2 Illippai Tree 2.8 Left
3491 63/250 63/300 6.4 Illippai Tree 3.2 Left
3492 6.4 Illippai Tree 2.8 Left
3493 63/300 63/350 6.4 Neem Tree 0.8 Left
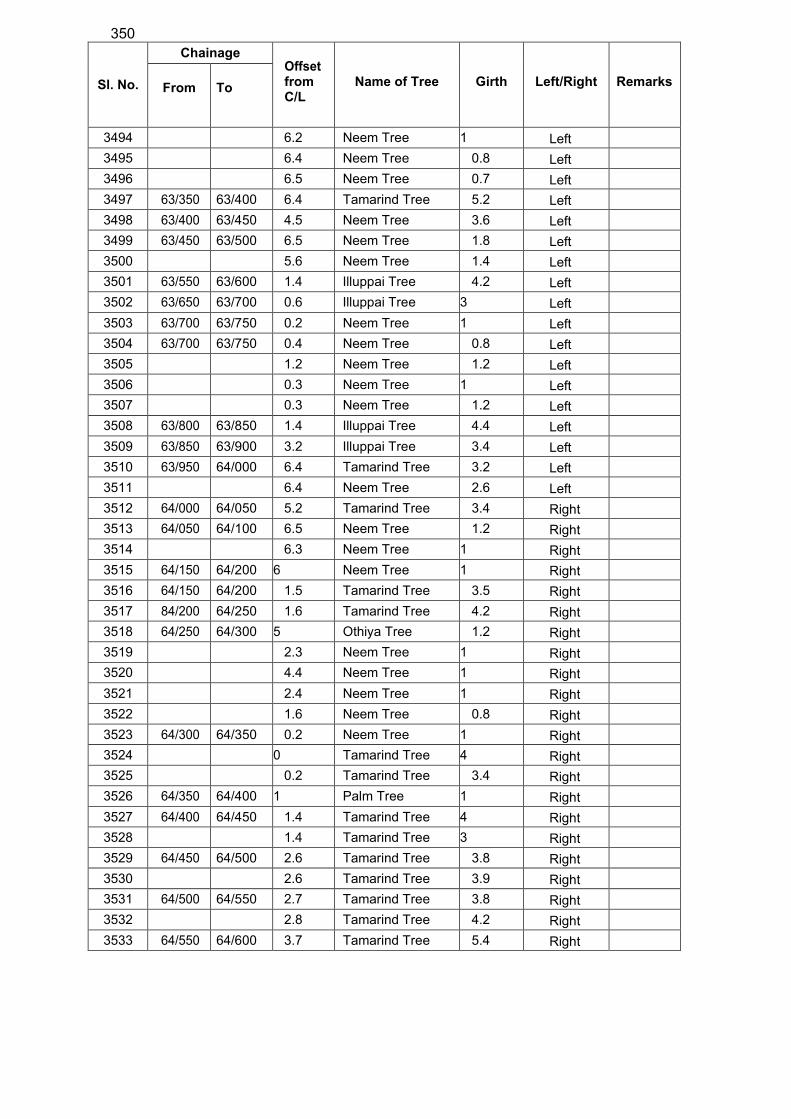
350
Sl. No.
Chainage Offset from C/L
Name of Tree
Girth
Left/Right
Remarks
From
To
3494 6.2 Neem Tree 1 Left
3495 6.4 Neem Tree 0.8 Left
3496 6.5 Neem Tree 0.7 Left
3497 63/350 63/400 6.4 Tamarind Tree 5.2 Left
3498 63/400 63/450 4.5 Neem Tree 3.6 Left
3499 63/450 63/500 6.5 Neem Tree 1.8 Left
3500 5.6 Neem Tree 1.4 Left
3501 63/550 63/600 1.4 Illuppai Tree 4.2 Left
3502 63/650 63/700 0.6 Illuppai Tree 3 Left
3503 63/700 63/750 0.2 Neem Tree 1 Left
3504 63/700 63/750 0.4 Neem Tree 0.8 Left
3505 1.2 Neem Tree 1.2 Left
3506 0.3 Neem Tree 1 Left
3507 0.3 Neem Tree 1.2 Left
3508 63/800 63/850 1.4 Illuppai Tree 4.4 Left
3509 63/850 63/900 3.2 Illuppai Tree 3.4 Left
3510 63/950 64/000 6.4 Tamarind Tree 3.2 Left
3511 6.4 Neem Tree 2.6 Left
3512 64/000 64/050 5.2 Tamarind Tree 3.4 Right
3513 64/050 64/100 6.5 Neem Tree 1.2 Right
3514 6.3 Neem Tree 1 Right
3515 64/150 64/200 6 Neem Tree 1 Right
3516 64/150 64/200 1.5 Tamarind Tree 3.5 Right
3517 84/200 64/250 1.6 Tamarind Tree 4.2 Right
3518 64/250 64/300 5 Othiya Tree 1.2 Right
3519 2.3 Neem Tree 1 Right
3520 4.4 Neem Tree 1 Right
3521 2.4 Neem Tree 1 Right
3522 1.6 Neem Tree 0.8 Right
3523 64/300 64/350 0.2 Neem Tree 1 Right
3524 0 Tamarind Tree 4 Right
3525 0.2 Tamarind Tree 3.4 Right
3526 64/350 64/400 1 Palm Tree 1 Right
3527 64/400 64/450 1.4 Tamarind Tree 4 Right
3528 1.4 Tamarind Tree 3 Right
3529 64/450 64/500 2.6 Tamarind Tree 3.8 Right
3530 2.6 Tamarind Tree 3.9 Right
3531 64/500 64/550 2.7 Tamarind Tree 3.8 Right
3532 2.8 Tamarind Tree 4.2 Right
3533 64/550 64/600 3.7 Tamarind Tree 5.4 Right
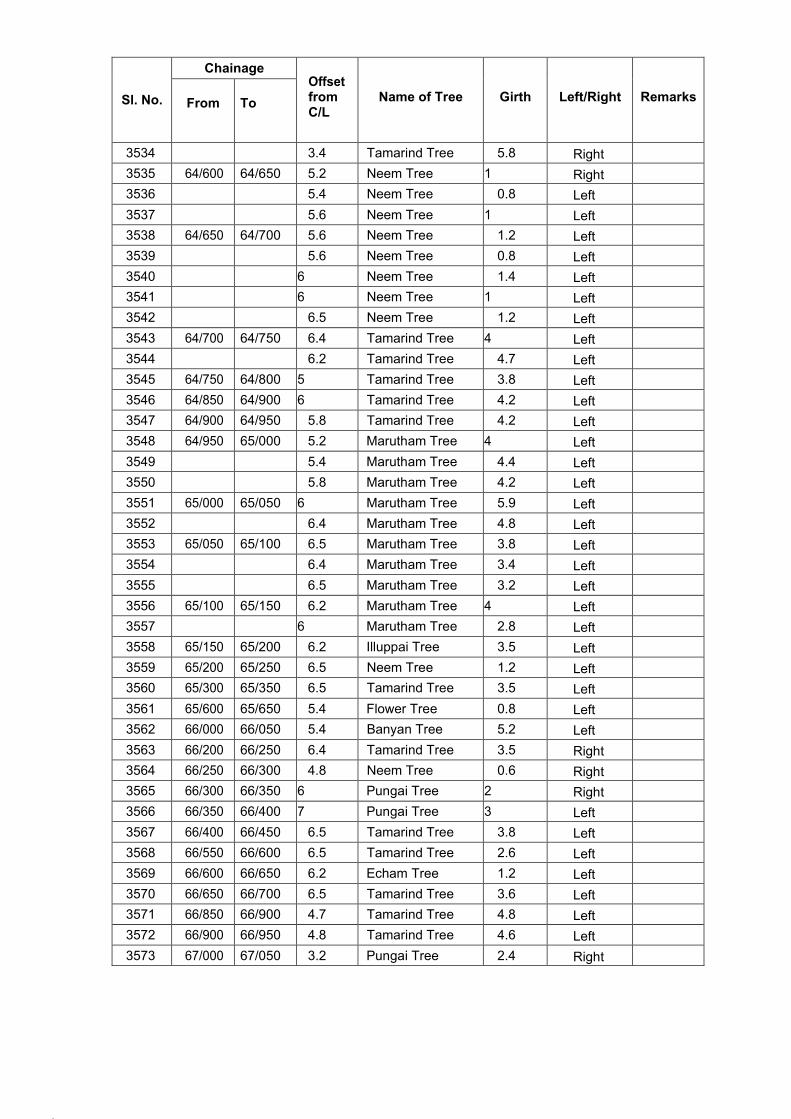
175.
176.
Sl. No.
Chainage Offset from C/L
Name of Tree
Girth
Left/Right
Remarks
From
To
3534 3.4 Tamarind Tree 5.8 Right
3535 64/600 64/650 5.2 Neem Tree 1 Right
3536 5.4 Neem Tree 0.8 Left
3537 5.6 Neem Tree 1 Left
3538 64/650 64/700 5.6 Neem Tree 1.2 Left
3539 5.6 Neem Tree 0.8 Left
3540 6 Neem Tree 1.4 Left
3541 6 Neem Tree 1 Left
3542 6.5 Neem Tree 1.2 Left
3543 64/700 64/750 6.4 Tamarind Tree 4 Left
3544 6.2 Tamarind Tree 4.7 Left
3545 64/750 64/800 5 Tamarind Tree 3.8 Left
3546 64/850 64/900 6 Tamarind Tree 4.2 Left
3547 64/900 64/950 5.8 Tamarind Tree 4.2 Left
3548 64/950 65/000 5.2 Marutham Tree 4 Left
3549 5.4 Marutham Tree 4.4 Left
3550 5.8 Marutham Tree 4.2 Left
3551 65/000 65/050 6 Marutham Tree 5.9 Left
3552 6.4 Marutham Tree 4.8 Left
3553 65/050 65/100 6.5 Marutham Tree 3.8 Left
3554 6.4 Marutham Tree 3.4 Left
3555 6.5 Marutham Tree 3.2 Left
3556 65/100 65/150 6.2 Marutham Tree 4 Left
3557 6 Marutham Tree 2.8 Left
3558 65/150 65/200 6.2 Illuppai Tree 3.5 Left
3559 65/200 65/250 6.5 Neem Tree 1.2 Left
3560 65/300 65/350 6.5 Tamarind Tree 3.5 Left
3561 65/600 65/650 5.4 Flower Tree 0.8 Left
3562 66/000 66/050 5.4 Banyan Tree 5.2 Left
3563 66/200 66/250 6.4 Tamarind Tree 3.5 Right
3564 66/250 66/300 4.8 Neem Tree 0.6 Right
3565 66/300 66/350 6 Pungai Tree 2 Right
3566 66/350 66/400 7 Pungai Tree 3 Left
3567 66/400 66/450 6.5 Tamarind Tree 3.8 Left
3568 66/550 66/600 6.5 Tamarind Tree 2.6 Left
3569 66/600 66/650 6.2 Echam Tree 1.2 Left
3570 66/650 66/700 6.5 Tamarind Tree 3.6 Left
3571 66/850 66/900 4.7 Tamarind Tree 4.8 Left
3572 66/900 66/950 4.8 Tamarind Tree 4.6 Left
3573 67/000 67/050 3.2 Pungai Tree 2.4 Right
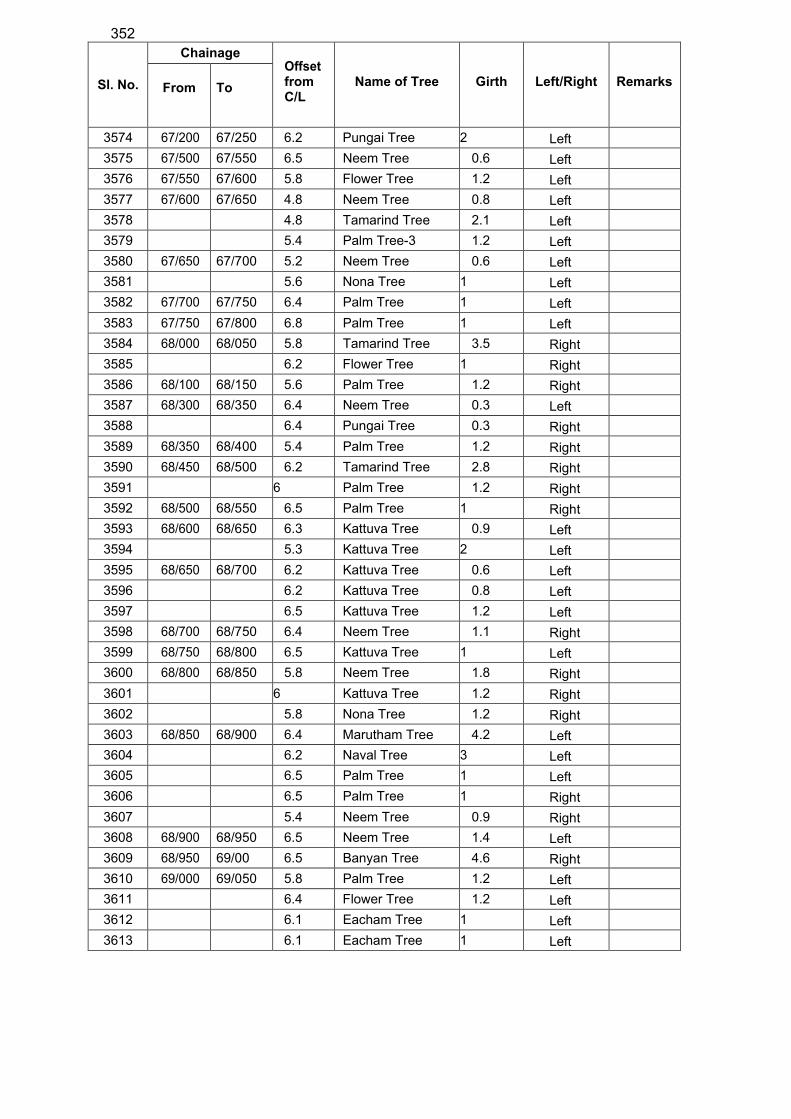
352
Sl. No.
Chainage Offset from C/L
Name of Tree
Girth
Left/Right
Remarks
From
To
3574 67/200 67/250 6.2 Pungai Tree 2 Left
3575 67/500 67/550 6.5 Neem Tree 0.6 Left
3576 67/550 67/600 5.8 Flower Tree 1.2 Left
3577 67/600 67/650 4.8 Neem Tree 0.8 Left
3578 4.8 Tamarind Tree 2.1 Left
3579 5.4 Palm Tree-3 1.2 Left
3580 67/650 67/700 5.2 Neem Tree 0.6 Left
3581 5.6 Nona Tree 1 Left
3582 67/700 67/750 6.4 Palm Tree 1 Left
3583 67/750 67/800 6.8 Palm Tree 1 Left
3584 68/000 68/050 5.8 Tamarind Tree 3.5 Right
3585 6.2 Flower Tree 1 Right
3586 68/100 68/150 5.6 Palm Tree 1.2 Right
3587 68/300 68/350 6.4 Neem Tree 0.3 Left
3588 6.4 Pungai Tree 0.3 Right
3589 68/350 68/400 5.4 Palm Tree 1.2 Right
3590 68/450 68/500 6.2 Tamarind Tree 2.8 Right
3591 6 Palm Tree 1.2 Right
3592 68/500 68/550 6.5 Palm Tree 1 Right
3593 68/600 68/650 6.3 Kattuva Tree 0.9 Left
3594 5.3 Kattuva Tree 2 Left
3595 68/650 68/700 6.2 Kattuva Tree 0.6 Left
3596 6.2 Kattuva Tree 0.8 Left
3597 6.5 Kattuva Tree 1.2 Left
3598 68/700 68/750 6.4 Neem Tree 1.1 Right
3599 68/750 68/800 6.5 Kattuva Tree 1 Left
3600 68/800 68/850 5.8 Neem Tree 1.8 Right
3601 6 Kattuva Tree 1.2 Right
3602 5.8 Nona Tree 1.2 Right
3603 68/850 68/900 6.4 Marutham Tree 4.2 Left
3604 6.2 Naval Tree 3 Left
3605 6.5 Palm Tree 1 Left
3606 6.5 Palm Tree 1 Right
3607 5.4 Neem Tree 0.9 Right
3608 68/900 68/950 6.5 Neem Tree 1.4 Left
3609 68/950 69/00 6.5 Banyan Tree 4.6 Right
3610 69/000 69/050 5.8 Palm Tree 1.2 Left
3611 6.4 Flower Tree 1.2 Left
3612 6.1 Eacham Tree 1 Left
3613 6.1 Eacham Tree 1 Left
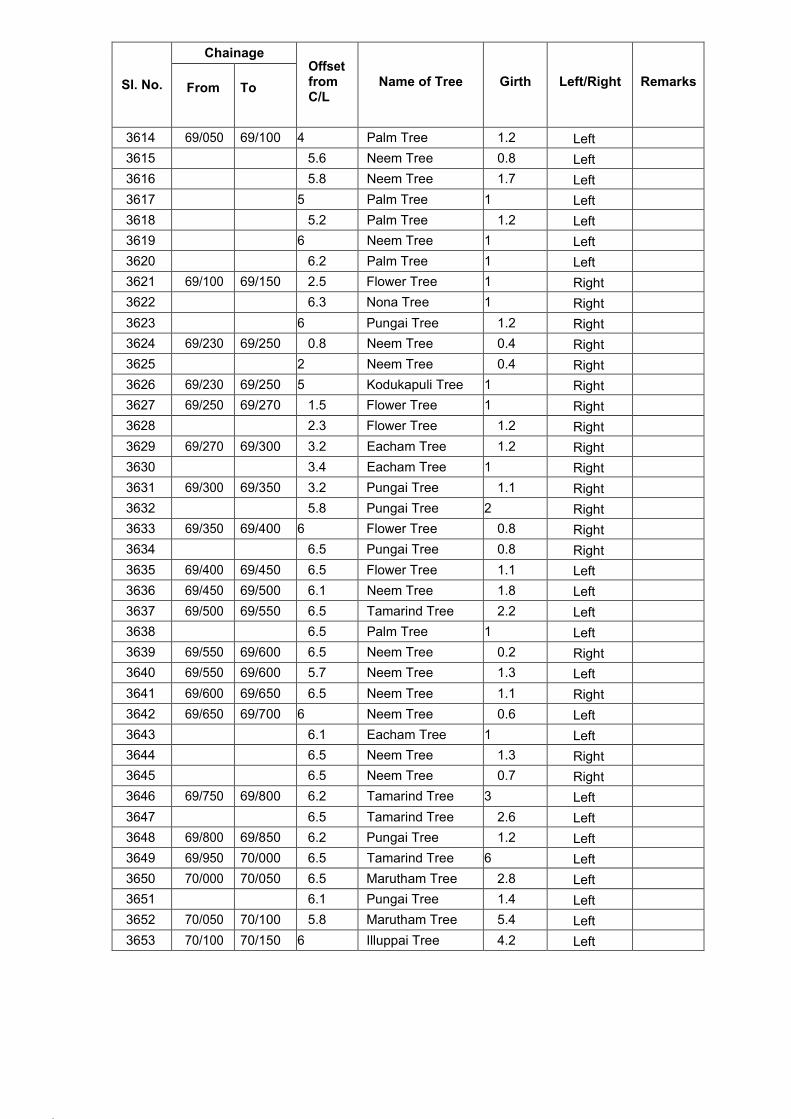
179.
180.
Sl. No.
Chainage Offset from C/L
Name of Tree
Girth
Left/Right
Remarks
From
To
3614 69/050 69/100 4 Palm Tree 1.2 Left
3615 5.6 Neem Tree 0.8 Left
3616 5.8 Neem Tree 1.7 Left
3617 5 Palm Tree 1 Left
3618 5.2 Palm Tree 1.2 Left
3619 6 Neem Tree 1 Left
3620 6.2 Palm Tree 1 Left
3621 69/100 69/150 2.5 Flower Tree 1 Right
3622 6.3 Nona Tree 1 Right
3623 6 Pungai Tree 1.2 Right
3624 69/230 69/250 0.8 Neem Tree 0.4 Right
3625 2 Neem Tree 0.4 Right
3626 69/230 69/250 5 Kodukapuli Tree 1 Right
3627 69/250 69/270 1.5 Flower Tree 1 Right
3628 2.3 Flower Tree 1.2 Right
3629 69/270 69/300 3.2 Eacham Tree 1.2 Right
3630 3.4 Eacham Tree 1 Right
3631 69/300 69/350 3.2 Pungai Tree 1.1 Right
3632 5.8 Pungai Tree 2 Right
3633 69/350 69/400 6 Flower Tree 0.8 Right
3634 6.5 Pungai Tree 0.8 Right
3635 69/400 69/450 6.5 Flower Tree 1.1 Left
3636 69/450 69/500 6.1 Neem Tree 1.8 Left
3637 69/500 69/550 6.5 Tamarind Tree 2.2 Left
3638 6.5 Palm Tree 1 Left
3639 69/550 69/600 6.5 Neem Tree 0.2 Right
3640 69/550 69/600 5.7 Neem Tree 1.3 Left
3641 69/600 69/650 6.5 Neem Tree 1.1 Right
3642 69/650 69/700 6 Neem Tree 0.6 Left
3643 6.1 Eacham Tree 1 Left
3644 6.5 Neem Tree 1.3 Right
3645 6.5 Neem Tree 0.7 Right
3646 69/750 69/800 6.2 Tamarind Tree 3 Left
3647 6.5 Tamarind Tree 2.6 Left
3648 69/800 69/850 6.2 Pungai Tree 1.2 Left
3649 69/950 70/000 6.5 Tamarind Tree 6 Left
3650 70/000 70/050 6.5 Marutham Tree 2.8 Left
3651 6.1 Pungai Tree 1.4 Left
3652 70/050 70/100 5.8 Marutham Tree 5.4 Left
3653 70/100 70/150 6 Illuppai Tree 4.2 Left
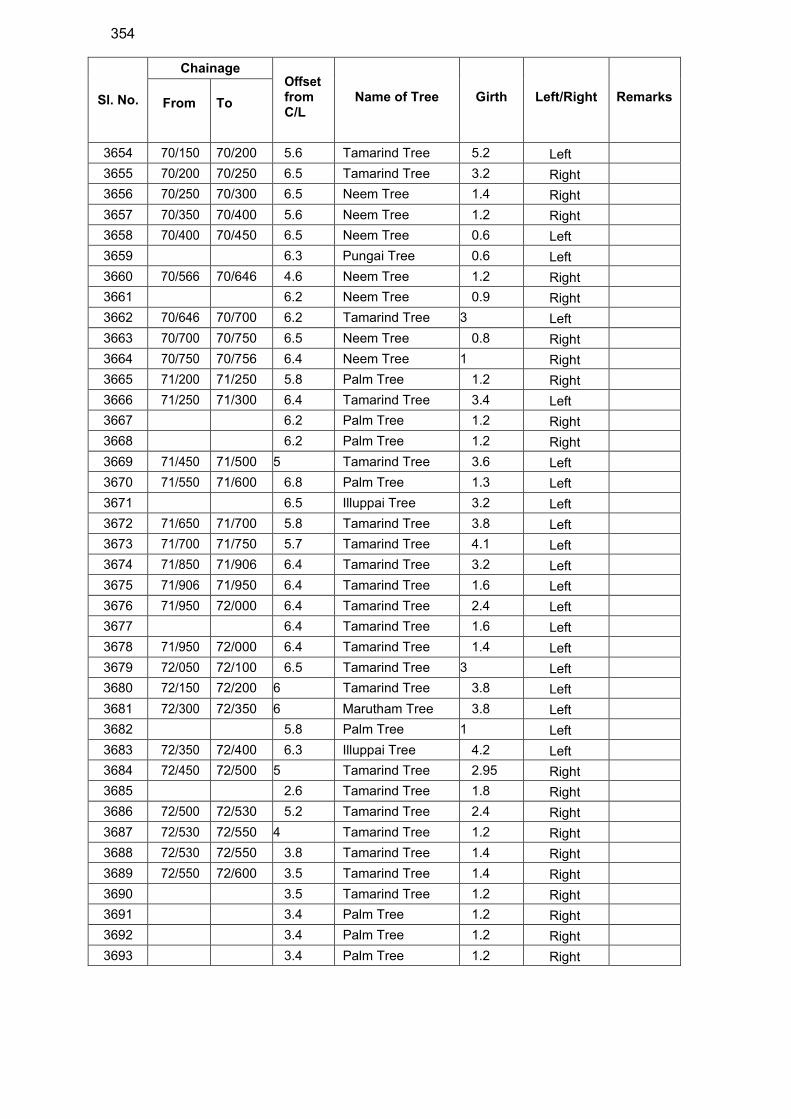
354
Sl. No.
Chainage Offset from C/L
Name of Tree
Girth
Left/Right
Remarks
From
To
3654 70/150 70/200 5.6 Tamarind Tree 5.2 Left
3655 70/200 70/250 6.5 Tamarind Tree 3.2 Right
3656 70/250 70/300 6.5 Neem Tree 1.4 Right
3657 70/350 70/400 5.6 Neem Tree 1.2 Right
3658 70/400 70/450 6.5 Neem Tree 0.6 Left
3659 6.3 Pungai Tree 0.6 Left
3660 70/566 70/646 4.6 Neem Tree 1.2 Right
3661 6.2 Neem Tree 0.9 Right
3662 70/646 70/700 6.2 Tamarind Tree 3 Left
3663 70/700 70/750 6.5 Neem Tree 0.8 Right
3664 70/750 70/756 6.4 Neem Tree 1 Right
3665 71/200 71/250 5.8 Palm Tree 1.2 Right
3666 71/250 71/300 6.4 Tamarind Tree 3.4 Left
3667 6.2 Palm Tree 1.2 Right
3668 6.2 Palm Tree 1.2 Right
3669 71/450 71/500 5 Tamarind Tree 3.6 Left
3670 71/550 71/600 6.8 Palm Tree 1.3 Left
3671 6.5 Illuppai Tree 3.2 Left
3672 71/650 71/700 5.8 Tamarind Tree 3.8 Left
3673 71/700 71/750 5.7 Tamarind Tree 4.1 Left
3674 71/850 71/906 6.4 Tamarind Tree 3.2 Left
3675 71/906 71/950 6.4 Tamarind Tree 1.6 Left
3676 71/950 72/000 6.4 Tamarind Tree 2.4 Left
3677 6.4 Tamarind Tree 1.6 Left
3678 71/950 72/000 6.4 Tamarind Tree 1.4 Left
3679 72/050 72/100 6.5 Tamarind Tree 3 Left
3680 72/150 72/200 6 Tamarind Tree 3.8 Left
3681 72/300 72/350 6 Marutham Tree 3.8 Left
3682 5.8 Palm Tree 1 Left
3683 72/350 72/400 6.3 Illuppai Tree 4.2 Left
3684 72/450 72/500 5 Tamarind Tree 2.95 Right
3685 2.6 Tamarind Tree 1.8 Right
3686 72/500 72/530 5.2 Tamarind Tree 2.4 Right
3687 72/530 72/550 4 Tamarind Tree 1.2 Right
3688 72/530 72/550 3.8 Tamarind Tree 1.4 Right
3689 72/550 72/600 3.5 Tamarind Tree 1.4 Right
3690 3.5 Tamarind Tree 1.2 Right
3691 3.4 Palm Tree 1.2 Right
3692 3.4 Palm Tree 1.2 Right
3693 3.4 Palm Tree 1.2 Right
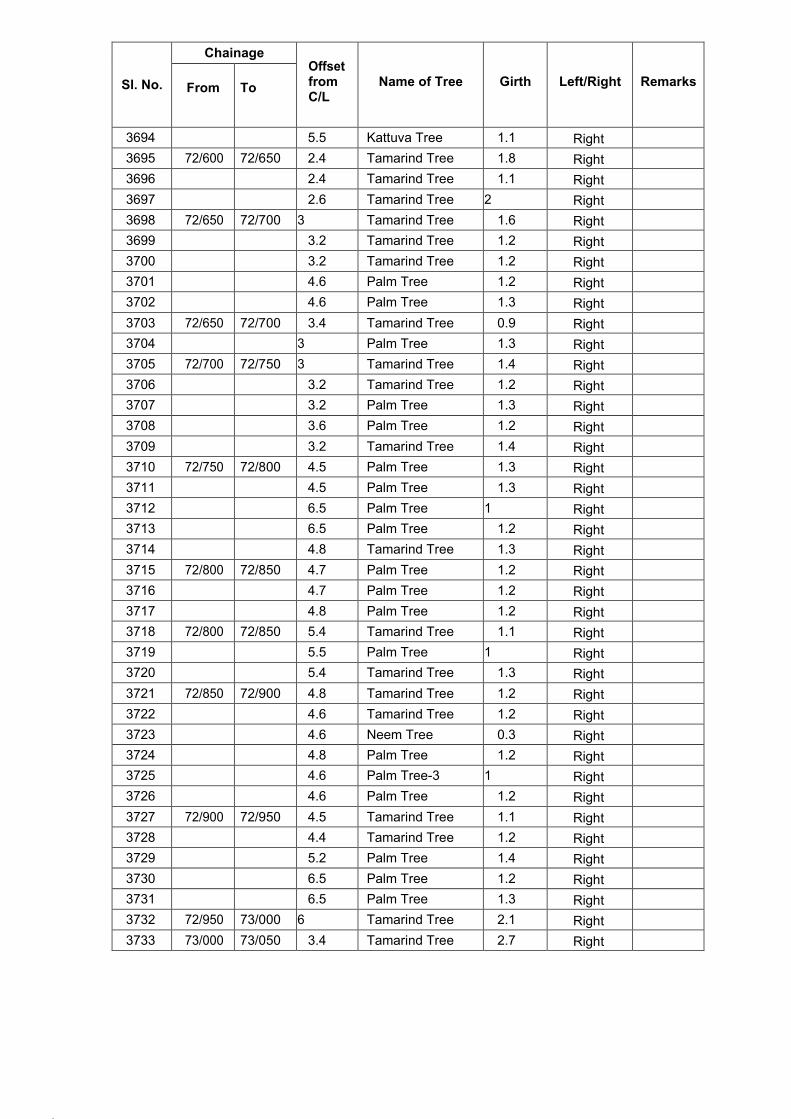
183.
184.
Sl. No.
Chainage Offset from C/L
Name of Tree
Girth
Left/Right
Remarks
From
To
3694 5.5 Kattuva Tree 1.1 Right
3695 72/600 72/650 2.4 Tamarind Tree 1.8 Right
3696 2.4 Tamarind Tree 1.1 Right
3697 2.6 Tamarind Tree 2 Right
3698 72/650 72/700 3 Tamarind Tree 1.6 Right
3699 3.2 Tamarind Tree 1.2 Right
3700 3.2 Tamarind Tree 1.2 Right
3701 4.6 Palm Tree 1.2 Right
3702 4.6 Palm Tree 1.3 Right
3703 72/650 72/700 3.4 Tamarind Tree 0.9 Right
3704 3 Palm Tree 1.3 Right
3705 72/700 72/750 3 Tamarind Tree 1.4 Right
3706 3.2 Tamarind Tree 1.2 Right
3707 3.2 Palm Tree 1.3 Right
3708 3.6 Palm Tree 1.2 Right
3709 3.2 Tamarind Tree 1.4 Right
3710 72/750 72/800 4.5 Palm Tree 1.3 Right
3711 4.5 Palm Tree 1.3 Right
3712 6.5 Palm Tree 1 Right
3713 6.5 Palm Tree 1.2 Right
3714 4.8 Tamarind Tree 1.3 Right
3715 72/800 72/850 4.7 Palm Tree 1.2 Right
3716 4.7 Palm Tree 1.2 Right
3717 4.8 Palm Tree 1.2 Right
3718 72/800 72/850 5.4 Tamarind Tree 1.1 Right
3719 5.5 Palm Tree 1 Right
3720 5.4 Tamarind Tree 1.3 Right
3721 72/850 72/900 4.8 Tamarind Tree 1.2 Right
3722 4.6 Tamarind Tree 1.2 Right
3723 4.6 Neem Tree 0.3 Right
3724 4.8 Palm Tree 1.2 Right
3725 4.6 Palm Tree-3 1 Right
3726 4.6 Palm Tree 1.2 Right
3727 72/900 72/950 4.5 Tamarind Tree 1.1 Right
3728 4.4 Tamarind Tree 1.2 Right
3729 5.2 Palm Tree 1.4 Right
3730 6.5 Palm Tree 1.2 Right
3731 6.5 Palm Tree 1.3 Right
3732 72/950 73/000 6 Tamarind Tree 2.1 Right
3733 73/000 73/050 3.4 Tamarind Tree 2.7 Right
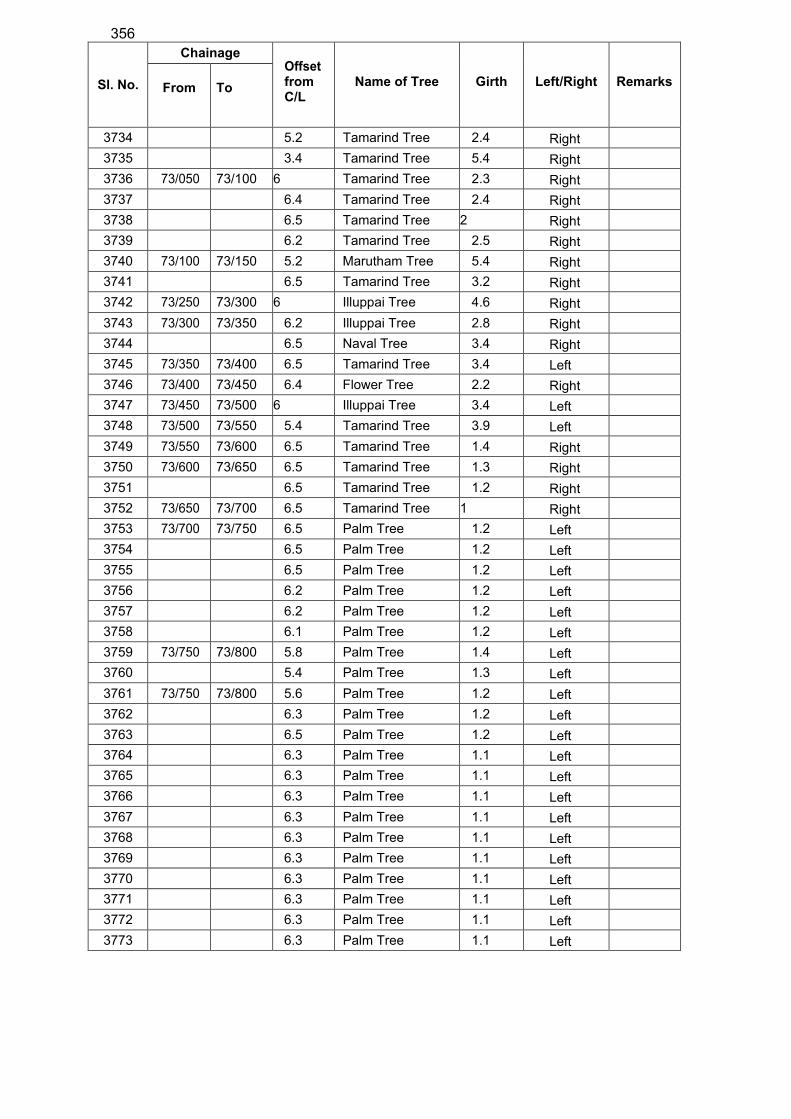
356
Sl. No.
Chainage Offset from C/L
Name of Tree
Girth
Left/Right
Remarks
From
To
3734 5.2 Tamarind Tree 2.4 Right
3735 3.4 Tamarind Tree 5.4 Right
3736 73/050 73/100 6 Tamarind Tree 2.3 Right
3737 6.4 Tamarind Tree 2.4 Right
3738 6.5 Tamarind Tree 2 Right
3739 6.2 Tamarind Tree 2.5 Right
3740 73/100 73/150 5.2 Marutham Tree 5.4 Right
3741 6.5 Tamarind Tree 3.2 Right
3742 73/250 73/300 6 Illuppai Tree 4.6 Right
3743 73/300 73/350 6.2 Illuppai Tree 2.8 Right
3744 6.5 Naval Tree 3.4 Right
3745 73/350 73/400 6.5 Tamarind Tree 3.4 Left
3746 73/400 73/450 6.4 Flower Tree 2.2 Right
3747 73/450 73/500 6 Illuppai Tree 3.4 Left
3748 73/500 73/550 5.4 Tamarind Tree 3.9 Left
3749 73/550 73/600 6.5 Tamarind Tree 1.4 Right
3750 73/600 73/650 6.5 Tamarind Tree 1.3 Right
3751 6.5 Tamarind Tree 1.2 Right
3752 73/650 73/700 6.5 Tamarind Tree 1 Right
3753 73/700 73/750 6.5 Palm Tree 1.2 Left
3754 6.5 Palm Tree 1.2 Left
3755 6.5 Palm Tree 1.2 Left
3756 6.2 Palm Tree 1.2 Left
3757 6.2 Palm Tree 1.2 Left
3758 6.1 Palm Tree 1.2 Left
3759 73/750 73/800 5.8 Palm Tree 1.4 Left
3760 5.4 Palm Tree 1.3 Left
3761 73/750 73/800 5.6 Palm Tree 1.2 Left
3762 6.3 Palm Tree 1.2 Left
3763 6.5 Palm Tree 1.2 Left
3764 6.3 Palm Tree 1.1 Left
3765 6.3 Palm Tree 1.1 Left
3766 6.3 Palm Tree 1.1 Left
3767 6.3 Palm Tree 1.1 Left
3768 6.3 Palm Tree 1.1 Left
3769 6.3 Palm Tree 1.1 Left
3770 6.3 Palm Tree 1.1 Left
3771 6.3 Palm Tree 1.1 Left
3772 6.3 Palm Tree 1.1 Left
3773 6.3 Palm Tree 1.1 Left
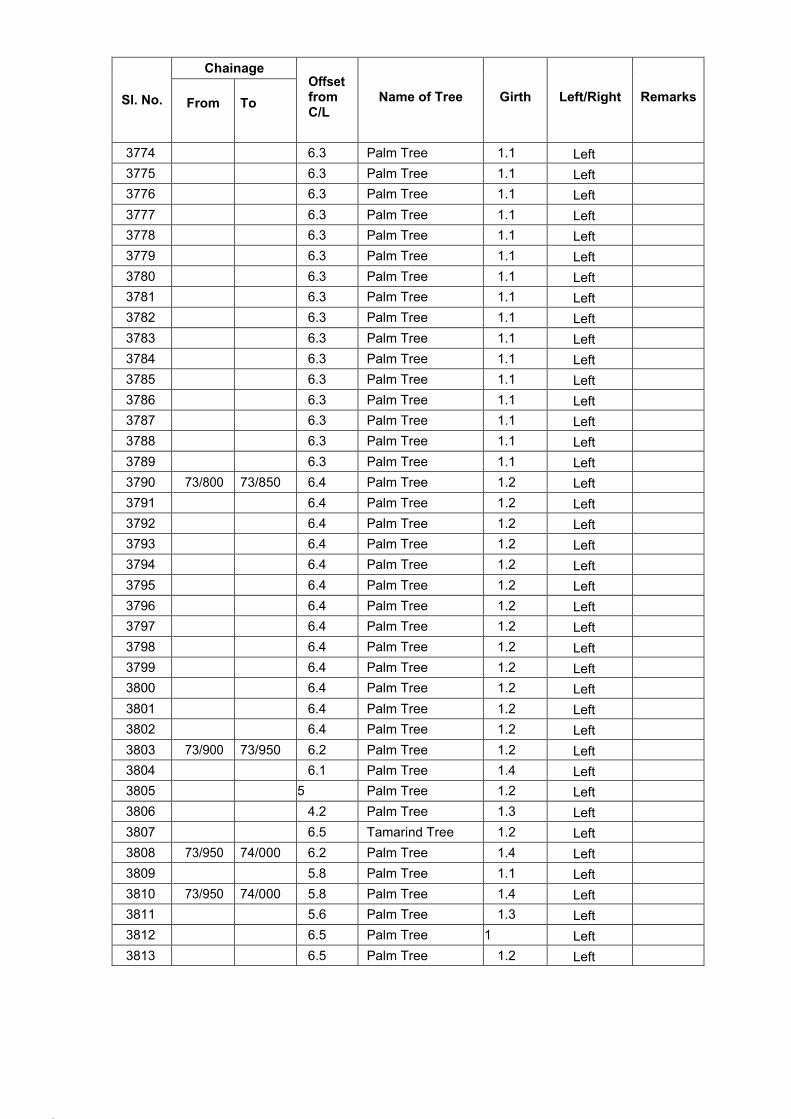
187.
188.
Sl. No.
Chainage Offset from C/L
Name of Tree
Girth
Left/Right
Remarks
From
To
3774 6.3 Palm Tree 1.1 Left
3775 6.3 Palm Tree 1.1 Left
3776 6.3 Palm Tree 1.1 Left
3777 6.3 Palm Tree 1.1 Left
3778 6.3 Palm Tree 1.1 Left
3779 6.3 Palm Tree 1.1 Left
3780 6.3 Palm Tree 1.1 Left
3781 6.3 Palm Tree 1.1 Left
3782 6.3 Palm Tree 1.1 Left
3783 6.3 Palm Tree 1.1 Left
3784 6.3 Palm Tree 1.1 Left
3785 6.3 Palm Tree 1.1 Left
3786 6.3 Palm Tree 1.1 Left
3787 6.3 Palm Tree 1.1 Left
3788 6.3 Palm Tree 1.1 Left
3789 6.3 Palm Tree 1.1 Left
3790 73/800 73/850 6.4 Palm Tree 1.2 Left
3791 6.4 Palm Tree 1.2 Left
3792 6.4 Palm Tree 1.2 Left
3793 6.4 Palm Tree 1.2 Left
3794 6.4 Palm Tree 1.2 Left
3795 6.4 Palm Tree 1.2 Left
3796 6.4 Palm Tree 1.2 Left
3797 6.4 Palm Tree 1.2 Left
3798 6.4 Palm Tree 1.2 Left
3799 6.4 Palm Tree 1.2 Left
3800 6.4 Palm Tree 1.2 Left
3801 6.4 Palm Tree 1.2 Left
3802 6.4 Palm Tree 1.2 Left
3803 73/900 73/950 6.2 Palm Tree 1.2 Left
3804 6.1 Palm Tree 1.4 Left
3805 5 Palm Tree 1.2 Left
3806 4.2 Palm Tree 1.3 Left
3807 6.5 Tamarind Tree 1.2 Left
3808 73/950 74/000 6.2 Palm Tree 1.4 Left
3809 5.8 Palm Tree 1.1 Left
3810 73/950 74/000 5.8 Palm Tree 1.4 Left
3811 5.6 Palm Tree 1.3 Left
3812 6.5 Palm Tree 1 Left
3813 6.5 Palm Tree 1.2 Left
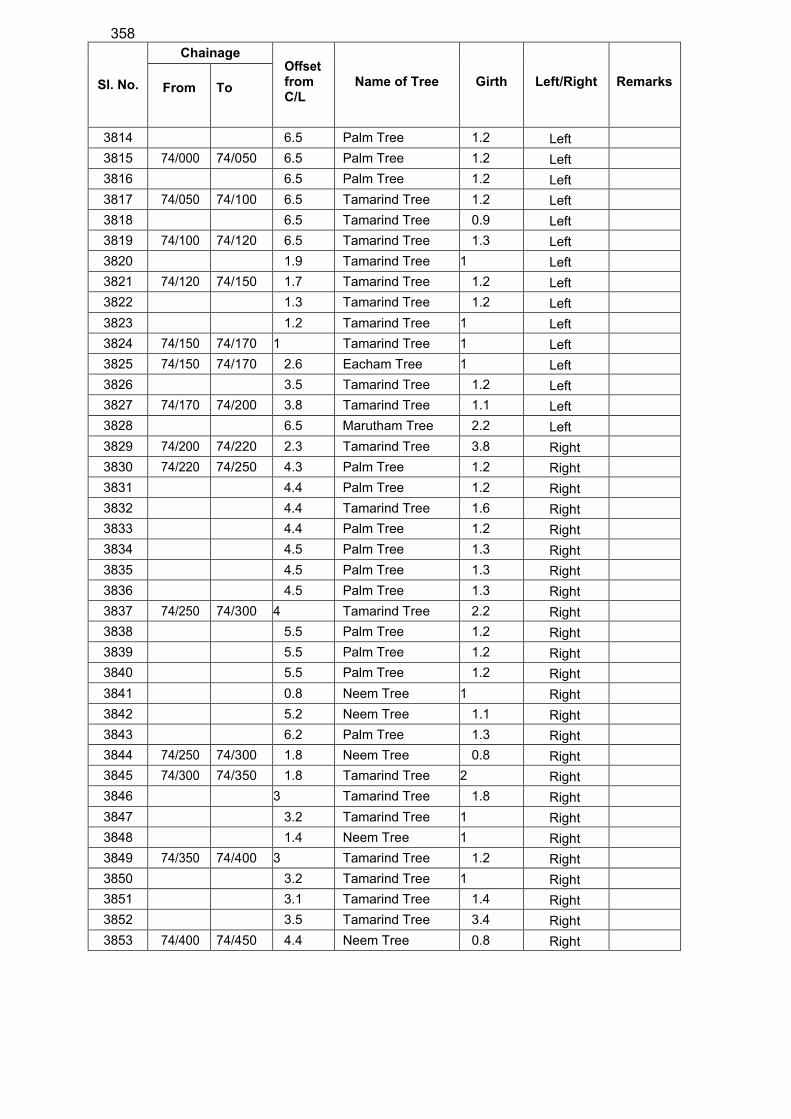
358
Sl. No.
Chainage Offset from C/L
Name of Tree
Girth
Left/Right
Remarks
From
To
3814 6.5 Palm Tree 1.2 Left
3815 74/000 74/050 6.5 Palm Tree 1.2 Left
3816 6.5 Palm Tree 1.2 Left
3817 74/050 74/100 6.5 Tamarind Tree 1.2 Left
3818 6.5 Tamarind Tree 0.9 Left
3819 74/100 74/120 6.5 Tamarind Tree 1.3 Left
3820 1.9 Tamarind Tree 1 Left
3821 74/120 74/150 1.7 Tamarind Tree 1.2 Left
3822 1.3 Tamarind Tree 1.2 Left
3823 1.2 Tamarind Tree 1 Left
3824 74/150 74/170 1 Tamarind Tree 1 Left
3825 74/150 74/170 2.6 Eacham Tree 1 Left
3826 3.5 Tamarind Tree 1.2 Left
3827 74/170 74/200 3.8 Tamarind Tree 1.1 Left
3828 6.5 Marutham Tree 2.2 Left
3829 74/200 74/220 2.3 Tamarind Tree 3.8 Right
3830 74/220 74/250 4.3 Palm Tree 1.2 Right
3831 4.4 Palm Tree 1.2 Right
3832 4.4 Tamarind Tree 1.6 Right
3833 4.4 Palm Tree 1.2 Right
3834 4.5 Palm Tree 1.3 Right
3835 4.5 Palm Tree 1.3 Right
3836 4.5 Palm Tree 1.3 Right
3837 74/250 74/300 4 Tamarind Tree 2.2 Right
3838 5.5 Palm Tree 1.2 Right
3839 5.5 Palm Tree 1.2 Right
3840 5.5 Palm Tree 1.2 Right
3841 0.8 Neem Tree 1 Right
3842 5.2 Neem Tree 1.1 Right
3843 6.2 Palm Tree 1.3 Right
3844 74/250 74/300 1.8 Neem Tree 0.8 Right
3845 74/300 74/350 1.8 Tamarind Tree 2 Right
3846 3 Tamarind Tree 1.8 Right
3847 3.2 Tamarind Tree 1 Right
3848 1.4 Neem Tree 1 Right
3849 74/350 74/400 3 Tamarind Tree 1.2 Right
3850 3.2 Tamarind Tree 1 Right
3851 3.1 Tamarind Tree 1.4 Right
3852 3.5 Tamarind Tree 3.4 Right
3853 74/400 74/450 4.4 Neem Tree 0.8 Right
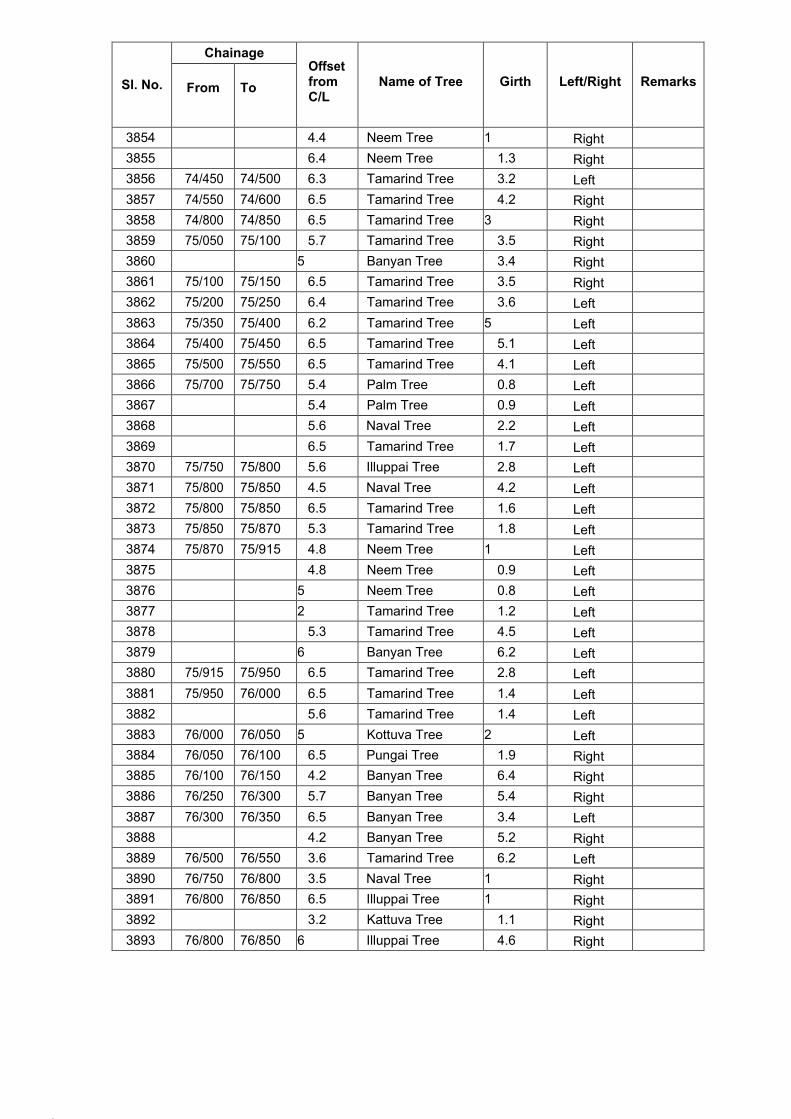
191.
192.
Sl. No.
Chainage Offset from C/L
Name of Tree
Girth
Left/Right
Remarks
From
To
3854 4.4 Neem Tree 1 Right
3855 6.4 Neem Tree 1.3 Right
3856 74/450 74/500 6.3 Tamarind Tree 3.2 Left
3857 74/550 74/600 6.5 Tamarind Tree 4.2 Right
3858 74/800 74/850 6.5 Tamarind Tree 3 Right
3859 75/050 75/100 5.7 Tamarind Tree 3.5 Right
3860 5 Banyan Tree 3.4 Right
3861 75/100 75/150 6.5 Tamarind Tree 3.5 Right
3862 75/200 75/250 6.4 Tamarind Tree 3.6 Left
3863 75/350 75/400 6.2 Tamarind Tree 5 Left
3864 75/400 75/450 6.5 Tamarind Tree 5.1 Left
3865 75/500 75/550 6.5 Tamarind Tree 4.1 Left
3866 75/700 75/750 5.4 Palm Tree 0.8 Left
3867 5.4 Palm Tree 0.9 Left
3868 5.6 Naval Tree 2.2 Left
3869 6.5 Tamarind Tree 1.7 Left
3870 75/750 75/800 5.6 Illuppai Tree 2.8 Left
3871 75/800 75/850 4.5 Naval Tree 4.2 Left
3872 75/800 75/850 6.5 Tamarind Tree 1.6 Left
3873 75/850 75/870 5.3 Tamarind Tree 1.8 Left
3874 75/870 75/915 4.8 Neem Tree 1 Left
3875 4.8 Neem Tree 0.9 Left
3876 5 Neem Tree 0.8 Left
3877 2 Tamarind Tree 1.2 Left
3878 5.3 Tamarind Tree 4.5 Left
3879 6 Banyan Tree 6.2 Left
3880 75/915 75/950 6.5 Tamarind Tree 2.8 Left
3881 75/950 76/000 6.5 Tamarind Tree 1.4 Left
3882 5.6 Tamarind Tree 1.4 Left
3883 76/000 76/050 5 Kottuva Tree 2 Left
3884 76/050 76/100 6.5 Pungai Tree 1.9 Right
3885 76/100 76/150 4.2 Banyan Tree 6.4 Right
3886 76/250 76/300 5.7 Banyan Tree 5.4 Right
3887 76/300 76/350 6.5 Banyan Tree 3.4 Left
3888 4.2 Banyan Tree 5.2 Right
3889 76/500 76/550 3.6 Tamarind Tree 6.2 Left
3890 76/750 76/800 3.5 Naval Tree 1 Right
3891 76/800 76/850 6.5 Illuppai Tree 1 Right
3892 3.2 Kattuva Tree 1.1 Right
3893 76/800 76/850 6 Illuppai Tree 4.6 Right
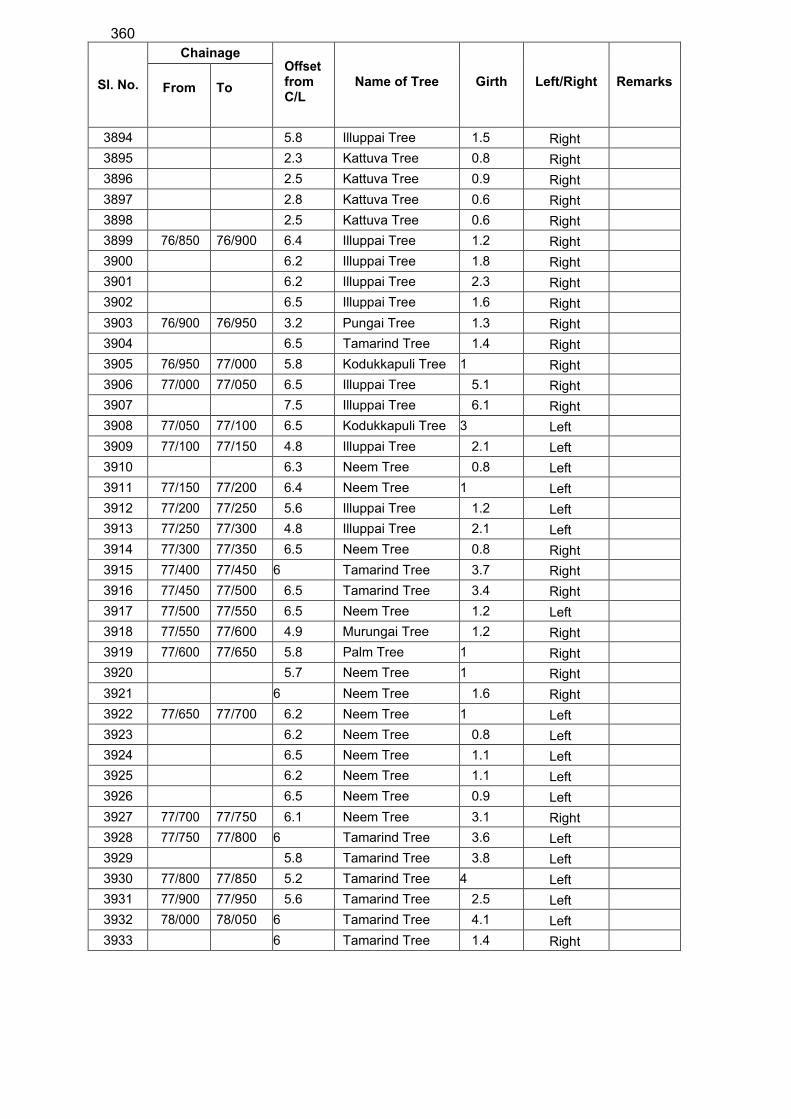
360
Sl. No.
Chainage Offset from C/L
Name of Tree
Girth
Left/Right
Remarks
From
To
3894 5.8 Illuppai Tree 1.5 Right
3895 2.3 Kattuva Tree 0.8 Right
3896 2.5 Kattuva Tree 0.9 Right
3897 2.8 Kattuva Tree 0.6 Right
3898 2.5 Kattuva Tree 0.6 Right
3899 76/850 76/900 6.4 Illuppai Tree 1.2 Right
3900 6.2 Illuppai Tree 1.8 Right
3901 6.2 Illuppai Tree 2.3 Right
3902 6.5 Illuppai Tree 1.6 Right
3903 76/900 76/950 3.2 Pungai Tree 1.3 Right
3904 6.5 Tamarind Tree 1.4 Right
3905 76/950 77/000 5.8 Kodukkapuli Tree 1 Right
3906 77/000 77/050 6.5 Illuppai Tree 5.1 Right
3907 7.5 Illuppai Tree 6.1 Right
3908 77/050 77/100 6.5 Kodukkapuli Tree 3 Left
3909 77/100 77/150 4.8 Illuppai Tree 2.1 Left
3910 6.3 Neem Tree 0.8 Left
3911 77/150 77/200 6.4 Neem Tree 1 Left
3912 77/200 77/250 5.6 Illuppai Tree 1.2 Left
3913 77/250 77/300 4.8 Illuppai Tree 2.1 Left
3914 77/300 77/350 6.5 Neem Tree 0.8 Right
3915 77/400 77/450 6 Tamarind Tree 3.7 Right
3916 77/450 77/500 6.5 Tamarind Tree 3.4 Right
3917 77/500 77/550 6.5 Neem Tree 1.2 Left
3918 77/550 77/600 4.9 Murungai Tree 1.2 Right
3919 77/600 77/650 5.8 Palm Tree 1 Right
3920 5.7 Neem Tree 1 Right
3921 6 Neem Tree 1.6 Right
3922 77/650 77/700 6.2 Neem Tree 1 Left
3923 6.2 Neem Tree 0.8 Left
3924 6.5 Neem Tree 1.1 Left
3925 6.2 Neem Tree 1.1 Left
3926 6.5 Neem Tree 0.9 Left
3927 77/700 77/750 6.1 Neem Tree 3.1 Right
3928 77/750 77/800 6 Tamarind Tree 3.6 Left
3929 5.8 Tamarind Tree 3.8 Left
3930 77/800 77/850 5.2 Tamarind Tree 4 Left
3931 77/900 77/950 5.6 Tamarind Tree 2.5 Left
3932 78/000 78/050 6 Tamarind Tree 4.1 Left
3933 6 Tamarind Tree 1.4 Right
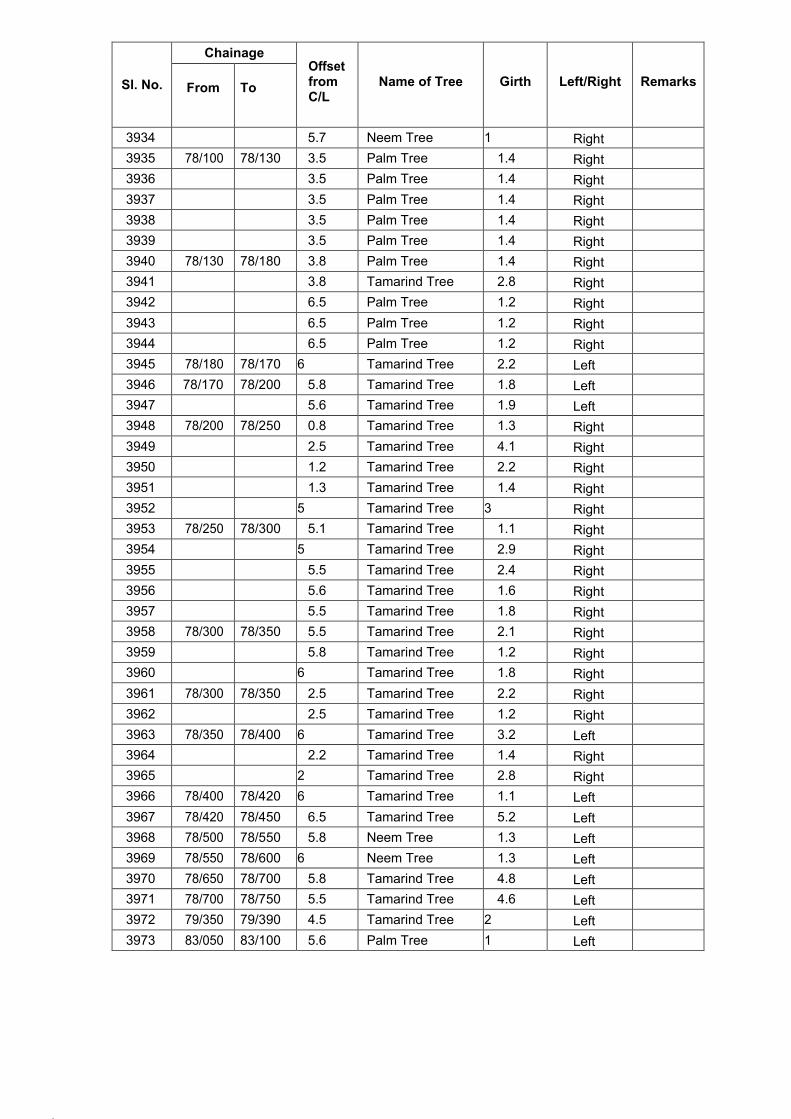
195.
196.
Sl. No.
Chainage Offset from C/L
Name of Tree
Girth
Left/Right
Remarks
From
To
3934 5.7 Neem Tree 1 Right
3935 78/100 78/130 3.5 Palm Tree 1.4 Right
3936 3.5 Palm Tree 1.4 Right
3937 3.5 Palm Tree 1.4 Right
3938 3.5 Palm Tree 1.4 Right
3939 3.5 Palm Tree 1.4 Right
3940 78/130 78/180 3.8 Palm Tree 1.4 Right
3941 3.8 Tamarind Tree 2.8 Right
3942 6.5 Palm Tree 1.2 Right
3943 6.5 Palm Tree 1.2 Right
3944 6.5 Palm Tree 1.2 Right
3945 78/180 78/170 6 Tamarind Tree 2.2 Left
3946 78/170 78/200 5.8 Tamarind Tree 1.8 Left
3947 5.6 Tamarind Tree 1.9 Left
3948 78/200 78/250 0.8 Tamarind Tree 1.3 Right
3949 2.5 Tamarind Tree 4.1 Right
3950 1.2 Tamarind Tree 2.2 Right
3951 1.3 Tamarind Tree 1.4 Right
3952 5 Tamarind Tree 3 Right
3953 78/250 78/300 5.1 Tamarind Tree 1.1 Right
3954 5 Tamarind Tree 2.9 Right
3955 5.5 Tamarind Tree 2.4 Right
3956 5.6 Tamarind Tree 1.6 Right
3957 5.5 Tamarind Tree 1.8 Right
3958 78/300 78/350 5.5 Tamarind Tree 2.1 Right
3959 5.8 Tamarind Tree 1.2 Right
3960 6 Tamarind Tree 1.8 Right
3961 78/300 78/350 2.5 Tamarind Tree 2.2 Right
3962 2.5 Tamarind Tree 1.2 Right
3963 78/350 78/400 6 Tamarind Tree 3.2 Left
3964 2.2 Tamarind Tree 1.4 Right
3965 2 Tamarind Tree 2.8 Right
3966 78/400 78/420 6 Tamarind Tree 1.1 Left
3967 78/420 78/450 6.5 Tamarind Tree 5.2 Left
3968 78/500 78/550 5.8 Neem Tree 1.3 Left
3969 78/550 78/600 6 Neem Tree 1.3 Left
3970 78/650 78/700 5.8 Tamarind Tree 4.8 Left
3971 78/700 78/750 5.5 Tamarind Tree 4.6 Left
3972 79/350 79/390 4.5 Tamarind Tree 2 Left
3973 83/050 83/100 5.6 Palm Tree 1 Left
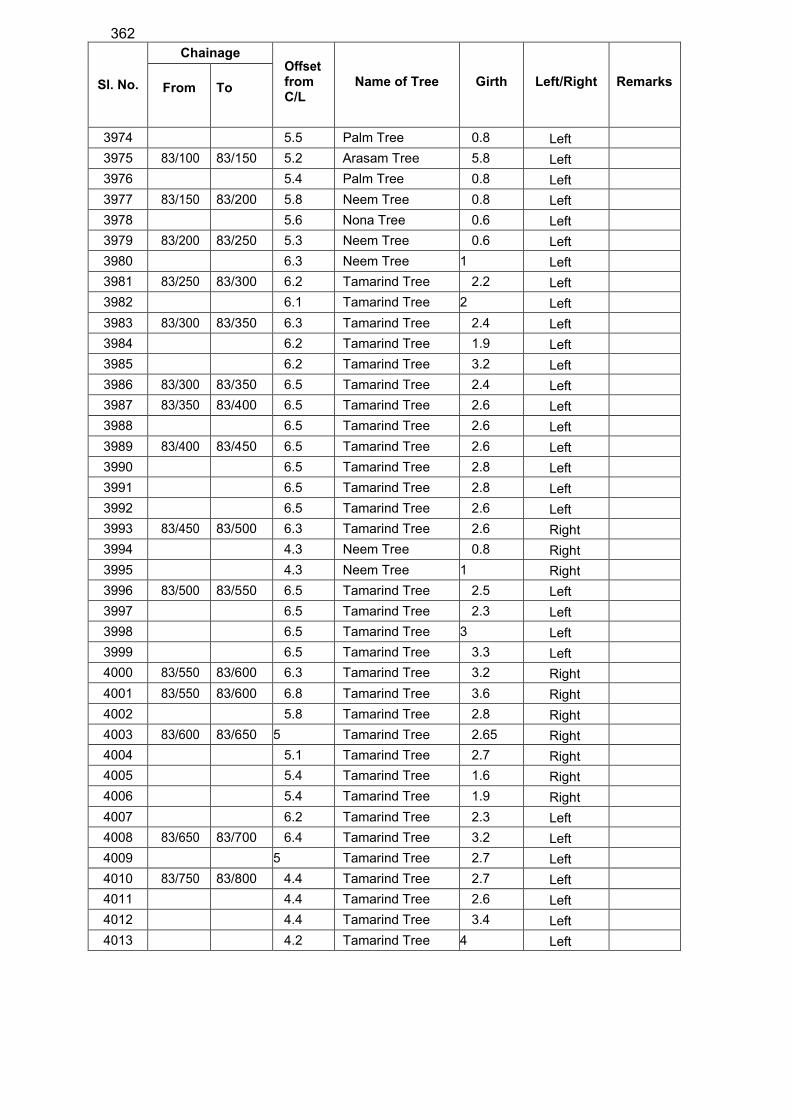
362
Sl. No.
Chainage Offset from C/L
Name of Tree
Girth
Left/Right
Remarks
From
To
3974 5.5 Palm Tree 0.8 Left
3975 83/100 83/150 5.2 Arasam Tree 5.8 Left
3976 5.4 Palm Tree 0.8 Left
3977 83/150 83/200 5.8 Neem Tree 0.8 Left
3978 5.6 Nona Tree 0.6 Left
3979 83/200 83/250 5.3 Neem Tree 0.6 Left
3980 6.3 Neem Tree 1 Left
3981 83/250 83/300 6.2 Tamarind Tree 2.2 Left
3982 6.1 Tamarind Tree 2 Left
3983 83/300 83/350 6.3 Tamarind Tree 2.4 Left
3984 6.2 Tamarind Tree 1.9 Left
3985 6.2 Tamarind Tree 3.2 Left
3986 83/300 83/350 6.5 Tamarind Tree 2.4 Left
3987 83/350 83/400 6.5 Tamarind Tree 2.6 Left
3988 6.5 Tamarind Tree 2.6 Left
3989 83/400 83/450 6.5 Tamarind Tree 2.6 Left
3990 6.5 Tamarind Tree 2.8 Left
3991 6.5 Tamarind Tree 2.8 Left
3992 6.5 Tamarind Tree 2.6 Left
3993 83/450 83/500 6.3 Tamarind Tree 2.6 Right
3994 4.3 Neem Tree 0.8 Right
3995 4.3 Neem Tree 1 Right
3996 83/500 83/550 6.5 Tamarind Tree 2.5 Left
3997 6.5 Tamarind Tree 2.3 Left
3998 6.5 Tamarind Tree 3 Left
3999 6.5 Tamarind Tree 3.3 Left
4000 83/550 83/600 6.3 Tamarind Tree 3.2 Right
4001 83/550 83/600 6.8 Tamarind Tree 3.6 Right
4002 5.8 Tamarind Tree 2.8 Right
4003 83/600 83/650 5 Tamarind Tree 2.65 Right
4004 5.1 Tamarind Tree 2.7 Right
4005 5.4 Tamarind Tree 1.6 Right
4006 5.4 Tamarind Tree 1.9 Right
4007 6.2 Tamarind Tree 2.3 Left
4008 83/650 83/700 6.4 Tamarind Tree 3.2 Left
4009 5 Tamarind Tree 2.7 Left
4010 83/750 83/800 4.4 Tamarind Tree 2.7 Left
4011 4.4 Tamarind Tree 2.6 Left
4012 4.4 Tamarind Tree 3.4 Left
4013 4.2 Tamarind Tree 4 Left
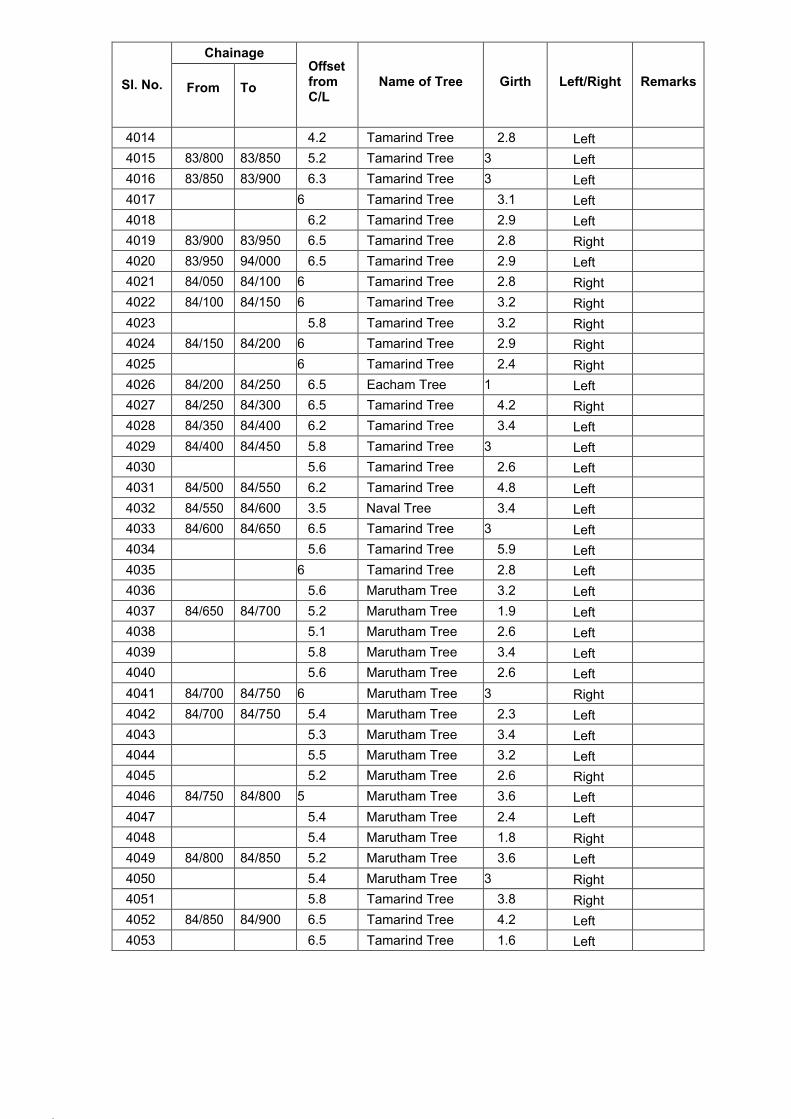
199.
200.
Sl. No.
Chainage Offset from C/L
Name of Tree
Girth
Left/Right
Remarks
From
To
4014 4.2 Tamarind Tree 2.8 Left
4015 83/800 83/850 5.2 Tamarind Tree 3 Left
4016 83/850 83/900 6.3 Tamarind Tree 3 Left
4017 6 Tamarind Tree 3.1 Left
4018 6.2 Tamarind Tree 2.9 Left
4019 83/900 83/950 6.5 Tamarind Tree 2.8 Right
4020 83/950 94/000 6.5 Tamarind Tree 2.9 Left
4021 84/050 84/100 6 Tamarind Tree 2.8 Right
4022 84/100 84/150 6 Tamarind Tree 3.2 Right
4023 5.8 Tamarind Tree 3.2 Right
4024 84/150 84/200 6 Tamarind Tree 2.9 Right
4025 6 Tamarind Tree 2.4 Right
4026 84/200 84/250 6.5 Eacham Tree 1 Left
4027 84/250 84/300 6.5 Tamarind Tree 4.2 Right
4028 84/350 84/400 6.2 Tamarind Tree 3.4 Left
4029 84/400 84/450 5.8 Tamarind Tree 3 Left
4030 5.6 Tamarind Tree 2.6 Left
4031 84/500 84/550 6.2 Tamarind Tree 4.8 Left
4032 84/550 84/600 3.5 Naval Tree 3.4 Left
4033 84/600 84/650 6.5 Tamarind Tree 3 Left
4034 5.6 Tamarind Tree 5.9 Left
4035 6 Tamarind Tree 2.8 Left
4036 5.6 Marutham Tree 3.2 Left
4037 84/650 84/700 5.2 Marutham Tree 1.9 Left
4038 5.1 Marutham Tree 2.6 Left
4039 5.8 Marutham Tree 3.4 Left
4040 5.6 Marutham Tree 2.6 Left
4041 84/700 84/750 6 Marutham Tree 3 Right
4042 84/700 84/750 5.4 Marutham Tree 2.3 Left
4043 5.3 Marutham Tree 3.4 Left
4044 5.5 Marutham Tree 3.2 Left
4045 5.2 Marutham Tree 2.6 Right
4046 84/750 84/800 5 Marutham Tree 3.6 Left
4047 5.4 Marutham Tree 2.4 Left
4048 5.4 Marutham Tree 1.8 Right
4049 84/800 84/850 5.2 Marutham Tree 3.6 Left
4050 5.4 Marutham Tree 3 Right
4051 5.8 Tamarind Tree 3.8 Right
4052 84/850 84/900 6.5 Tamarind Tree 4.2 Left
4053 6.5 Tamarind Tree 1.6 Left
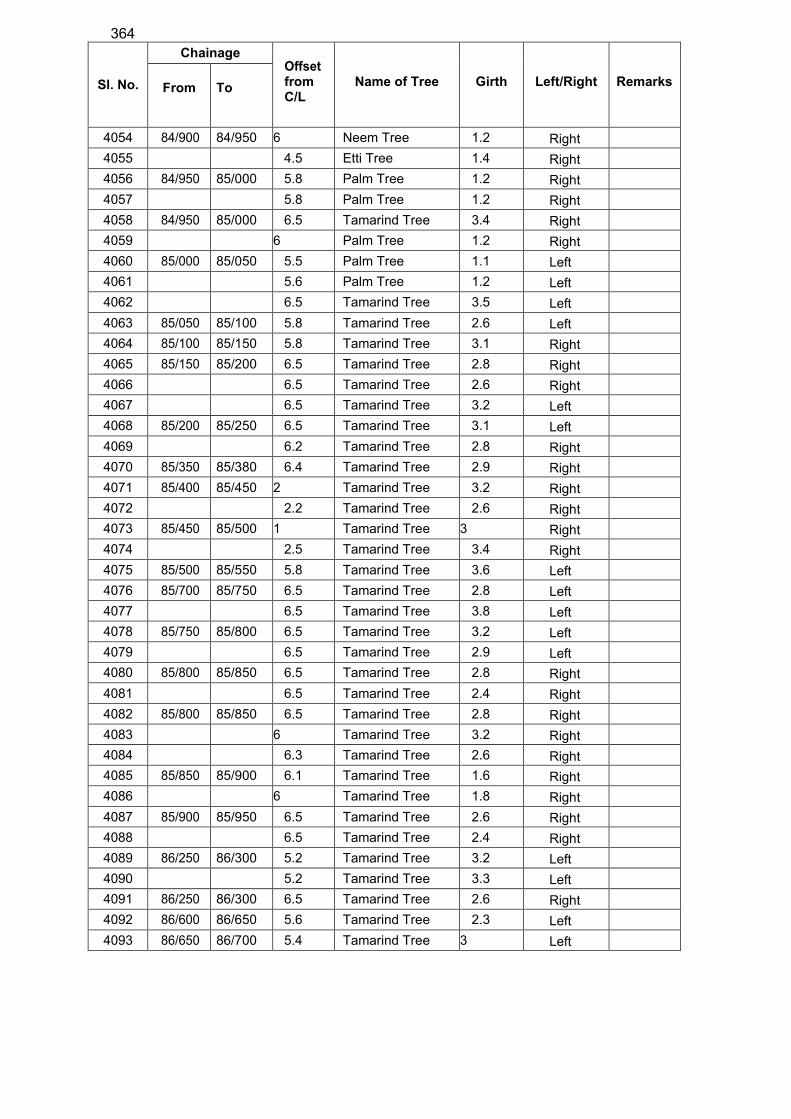
364
Sl. No.
Chainage Offset from C/L
Name of Tree
Girth
Left/Right
Remarks
From
To
4054 84/900 84/950 6 Neem Tree 1.2 Right
4055 4.5 Etti Tree 1.4 Right
4056 84/950 85/000 5.8 Palm Tree 1.2 Right
4057 5.8 Palm Tree 1.2 Right
4058 84/950 85/000 6.5 Tamarind Tree 3.4 Right
4059 6 Palm Tree 1.2 Right
4060 85/000 85/050 5.5 Palm Tree 1.1 Left
4061 5.6 Palm Tree 1.2 Left
4062 6.5 Tamarind Tree 3.5 Left
4063 85/050 85/100 5.8 Tamarind Tree 2.6 Left
4064 85/100 85/150 5.8 Tamarind Tree 3.1 Right
4065 85/150 85/200 6.5 Tamarind Tree 2.8 Right
4066 6.5 Tamarind Tree 2.6 Right
4067 6.5 Tamarind Tree 3.2 Left
4068 85/200 85/250 6.5 Tamarind Tree 3.1 Left
4069 6.2 Tamarind Tree 2.8 Right
4070 85/350 85/380 6.4 Tamarind Tree 2.9 Right
4071 85/400 85/450 2 Tamarind Tree 3.2 Right
4072 2.2 Tamarind Tree 2.6 Right
4073 85/450 85/500 1 Tamarind Tree 3 Right
4074 2.5 Tamarind Tree 3.4 Right
4075 85/500 85/550 5.8 Tamarind Tree 3.6 Left
4076 85/700 85/750 6.5 Tamarind Tree 2.8 Left
4077 6.5 Tamarind Tree 3.8 Left
4078 85/750 85/800 6.5 Tamarind Tree 3.2 Left
4079 6.5 Tamarind Tree 2.9 Left
4080 85/800 85/850 6.5 Tamarind Tree 2.8 Right
4081 6.5 Tamarind Tree 2.4 Right
4082 85/800 85/850 6.5 Tamarind Tree 2.8 Right
4083 6 Tamarind Tree 3.2 Right
4084 6.3 Tamarind Tree 2.6 Right
4085 85/850 85/900 6.1 Tamarind Tree 1.6 Right
4086 6 Tamarind Tree 1.8 Right
4087 85/900 85/950 6.5 Tamarind Tree 2.6 Right
4088 6.5 Tamarind Tree 2.4 Right
4089 86/250 86/300 5.2 Tamarind Tree 3.2 Left
4090 5.2 Tamarind Tree 3.3 Left
4091 86/250 86/300 6.5 Tamarind Tree 2.6 Right
4092 86/600 86/650 5.6 Tamarind Tree 2.3 Left
4093 86/650 86/700 5.4 Tamarind Tree 3 Left
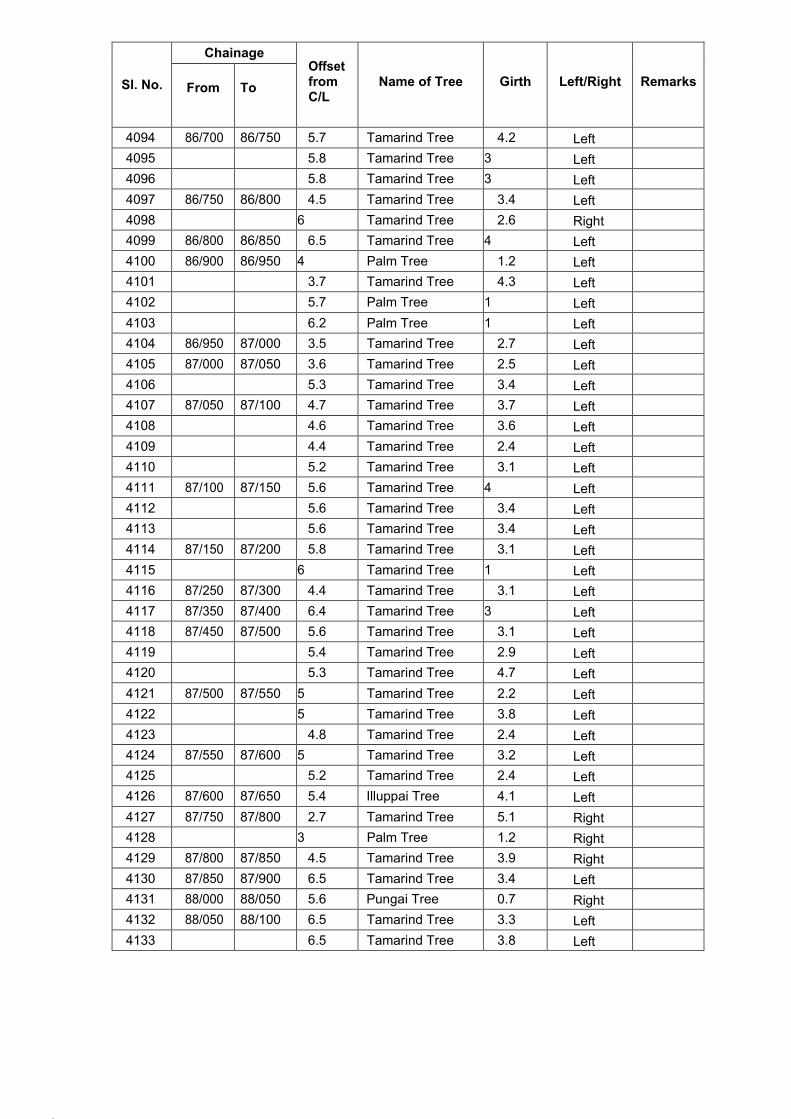
203.
204.
Sl. No.
Chainage Offset from C/L
Name of Tree
Girth
Left/Right
Remarks
From
To
4094 86/700 86/750 5.7 Tamarind Tree 4.2 Left
4095 5.8 Tamarind Tree 3 Left
4096 5.8 Tamarind Tree 3 Left
4097 86/750 86/800 4.5 Tamarind Tree 3.4 Left
4098 6 Tamarind Tree 2.6 Right
4099 86/800 86/850 6.5 Tamarind Tree 4 Left
4100 86/900 86/950 4 Palm Tree 1.2 Left
4101 3.7 Tamarind Tree 4.3 Left
4102 5.7 Palm Tree 1 Left
4103 6.2 Palm Tree 1 Left
4104 86/950 87/000 3.5 Tamarind Tree 2.7 Left
4105 87/000 87/050 3.6 Tamarind Tree 2.5 Left
4106 5.3 Tamarind Tree 3.4 Left
4107 87/050 87/100 4.7 Tamarind Tree 3.7 Left
4108 4.6 Tamarind Tree 3.6 Left
4109 4.4 Tamarind Tree 2.4 Left
4110 5.2 Tamarind Tree 3.1 Left
4111 87/100 87/150 5.6 Tamarind Tree 4 Left
4112 5.6 Tamarind Tree 3.4 Left
4113 5.6 Tamarind Tree 3.4 Left
4114 87/150 87/200 5.8 Tamarind Tree 3.1 Left
4115 6 Tamarind Tree 1 Left
4116 87/250 87/300 4.4 Tamarind Tree 3.1 Left
4117 87/350 87/400 6.4 Tamarind Tree 3 Left
4118 87/450 87/500 5.6 Tamarind Tree 3.1 Left
4119 5.4 Tamarind Tree 2.9 Left
4120 5.3 Tamarind Tree 4.7 Left
4121 87/500 87/550 5 Tamarind Tree 2.2 Left
4122 5 Tamarind Tree 3.8 Left
4123 4.8 Tamarind Tree 2.4 Left
4124 87/550 87/600 5 Tamarind Tree 3.2 Left
4125 5.2 Tamarind Tree 2.4 Left
4126 87/600 87/650 5.4 Illuppai Tree 4.1 Left
4127 87/750 87/800 2.7 Tamarind Tree 5.1 Right
4128 3 Palm Tree 1.2 Right
4129 87/800 87/850 4.5 Tamarind Tree 3.9 Right
4130 87/850 87/900 6.5 Tamarind Tree 3.4 Left
4131 88/000 88/050 5.6 Pungai Tree 0.7 Right
4132 88/050 88/100 6.5 Tamarind Tree 3.3 Left
4133 6.5 Tamarind Tree 3.8 Left
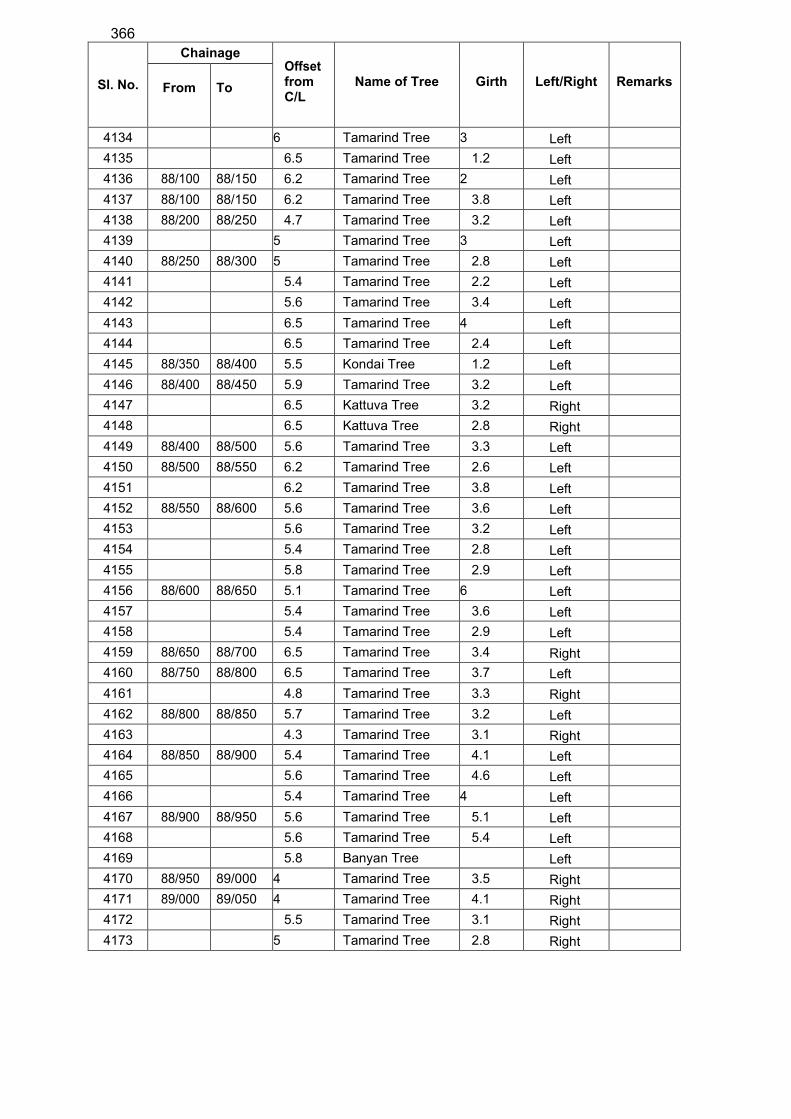
366
Sl. No.
Chainage Offset from C/L
Name of Tree
Girth
Left/Right
Remarks
From
To
4134 6 Tamarind Tree 3 Left
4135 6.5 Tamarind Tree 1.2 Left
4136 88/100 88/150 6.2 Tamarind Tree 2 Left
4137 88/100 88/150 6.2 Tamarind Tree 3.8 Left
4138 88/200 88/250 4.7 Tamarind Tree 3.2 Left
4139 5 Tamarind Tree 3 Left
4140 88/250 88/300 5 Tamarind Tree 2.8 Left
4141 5.4 Tamarind Tree 2.2 Left
4142 5.6 Tamarind Tree 3.4 Left
4143 6.5 Tamarind Tree 4 Left
4144 6.5 Tamarind Tree 2.4 Left
4145 88/350 88/400 5.5 Kondai Tree 1.2 Left
4146 88/400 88/450 5.9 Tamarind Tree 3.2 Left
4147 6.5 Kattuva Tree 3.2 Right
4148 6.5 Kattuva Tree 2.8 Right
4149 88/400 88/500 5.6 Tamarind Tree 3.3 Left
4150 88/500 88/550 6.2 Tamarind Tree 2.6 Left
4151 6.2 Tamarind Tree 3.8 Left
4152 88/550 88/600 5.6 Tamarind Tree 3.6 Left
4153 5.6 Tamarind Tree 3.2 Left
4154 5.4 Tamarind Tree 2.8 Left
4155 5.8 Tamarind Tree 2.9 Left
4156 88/600 88/650 5.1 Tamarind Tree 6 Left
4157 5.4 Tamarind Tree 3.6 Left
4158 5.4 Tamarind Tree 2.9 Left
4159 88/650 88/700 6.5 Tamarind Tree 3.4 Right
4160 88/750 88/800 6.5 Tamarind Tree 3.7 Left
4161 4.8 Tamarind Tree 3.3 Right
4162 88/800 88/850 5.7 Tamarind Tree 3.2 Left
4163 4.3 Tamarind Tree 3.1 Right
4164 88/850 88/900 5.4 Tamarind Tree 4.1 Left
4165 5.6 Tamarind Tree 4.6 Left
4166 5.4 Tamarind Tree 4 Left
4167 88/900 88/950 5.6 Tamarind Tree 5.1 Left
4168 5.6 Tamarind Tree 5.4 Left
4169 5.8 Banyan Tree Left
4170 88/950 89/000 4 Tamarind Tree 3.5 Right
4171 89/000 89/050 4 Tamarind Tree 4.1 Right
4172 5.5 Tamarind Tree 3.1 Right
4173 5 Tamarind Tree 2.8 Right
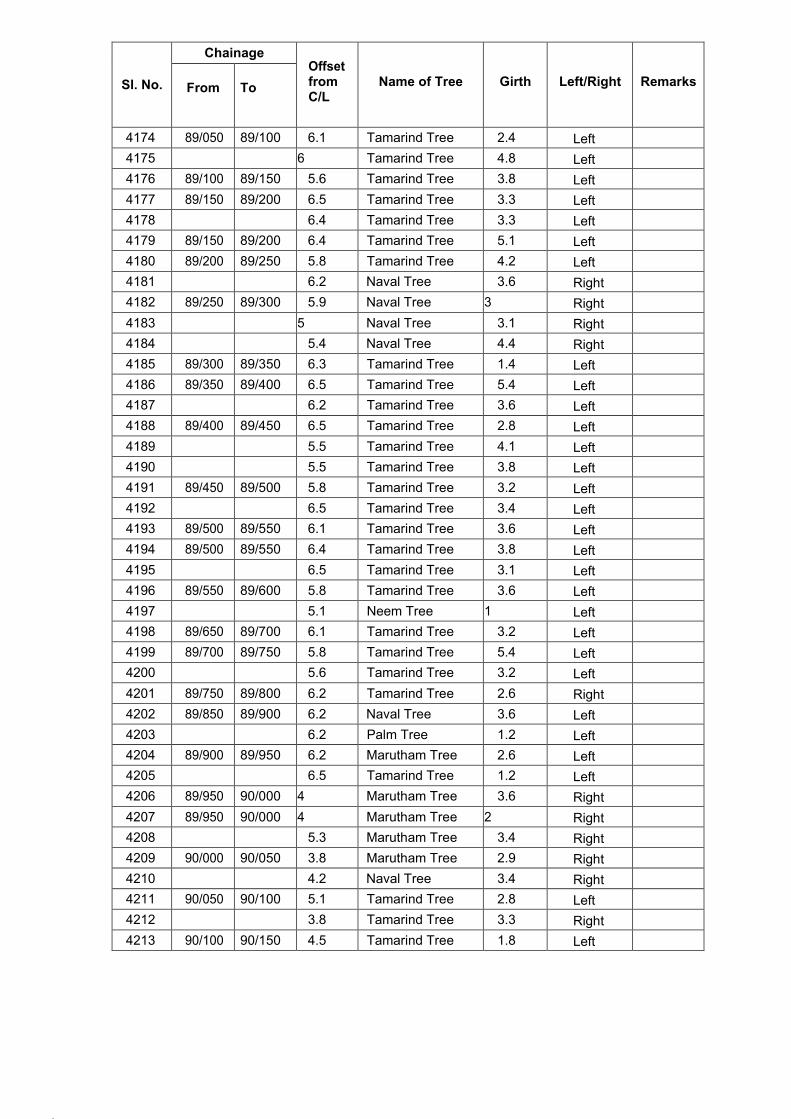
207.
208.
Sl. No.
Chainage Offset from C/L
Name of Tree
Girth
Left/Right
Remarks
From
To
4174 89/050 89/100 6.1 Tamarind Tree 2.4 Left
4175 6 Tamarind Tree 4.8 Left
4176 89/100 89/150 5.6 Tamarind Tree 3.8 Left
4177 89/150 89/200 6.5 Tamarind Tree 3.3 Left
4178 6.4 Tamarind Tree 3.3 Left
4179 89/150 89/200 6.4 Tamarind Tree 5.1 Left
4180 89/200 89/250 5.8 Tamarind Tree 4.2 Left
4181 6.2 Naval Tree 3.6 Right
4182 89/250 89/300 5.9 Naval Tree 3 Right
4183 5 Naval Tree 3.1 Right
4184 5.4 Naval Tree 4.4 Right
4185 89/300 89/350 6.3 Tamarind Tree 1.4 Left
4186 89/350 89/400 6.5 Tamarind Tree 5.4 Left
4187 6.2 Tamarind Tree 3.6 Left
4188 89/400 89/450 6.5 Tamarind Tree 2.8 Left
4189 5.5 Tamarind Tree 4.1 Left
4190 5.5 Tamarind Tree 3.8 Left
4191 89/450 89/500 5.8 Tamarind Tree 3.2 Left
4192 6.5 Tamarind Tree 3.4 Left
4193 89/500 89/550 6.1 Tamarind Tree 3.6 Left
4194 89/500 89/550 6.4 Tamarind Tree 3.8 Left
4195 6.5 Tamarind Tree 3.1 Left
4196 89/550 89/600 5.8 Tamarind Tree 3.6 Left
4197 5.1 Neem Tree 1 Left
4198 89/650 89/700 6.1 Tamarind Tree 3.2 Left
4199 89/700 89/750 5.8 Tamarind Tree 5.4 Left
4200 5.6 Tamarind Tree 3.2 Left
4201 89/750 89/800 6.2 Tamarind Tree 2.6 Right
4202 89/850 89/900 6.2 Naval Tree 3.6 Left
4203 6.2 Palm Tree 1.2 Left
4204 89/900 89/950 6.2 Marutham Tree 2.6 Left
4205 6.5 Tamarind Tree 1.2 Left
4206 89/950 90/000 4 Marutham Tree 3.6 Right
4207 89/950 90/000 4 Marutham Tree 2 Right
4208 5.3 Marutham Tree 3.4 Right
4209 90/000 90/050 3.8 Marutham Tree 2.9 Right
4210 4.2 Naval Tree 3.4 Right
4211 90/050 90/100 5.1 Tamarind Tree 2.8 Left
4212 3.8 Tamarind Tree 3.3 Right
4213 90/100 90/150 4.5 Tamarind Tree 1.8 Left
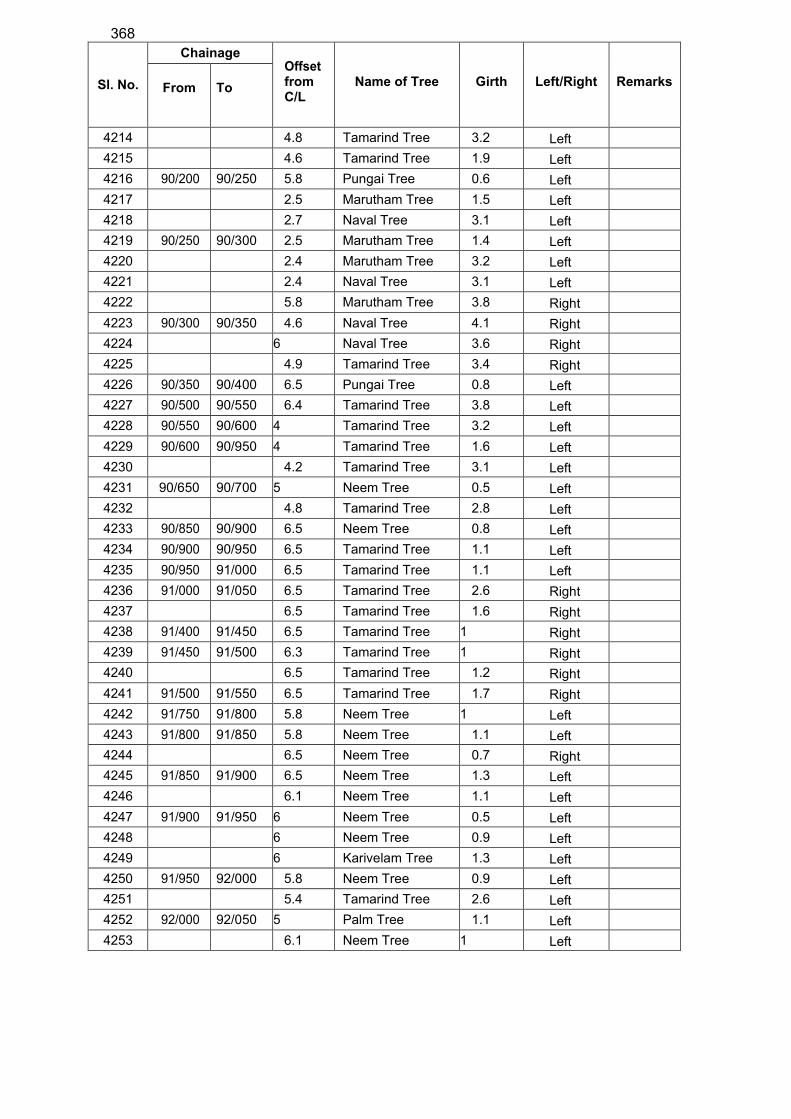
368
Sl. No.
Chainage Offset from C/L
Name of Tree
Girth
Left/Right
Remarks
From
To
4214 4.8 Tamarind Tree 3.2 Left
4215 4.6 Tamarind Tree 1.9 Left
4216 90/200 90/250 5.8 Pungai Tree 0.6 Left
4217 2.5 Marutham Tree 1.5 Left
4218 2.7 Naval Tree 3.1 Left
4219 90/250 90/300 2.5 Marutham Tree 1.4 Left
4220 2.4 Marutham Tree 3.2 Left
4221 2.4 Naval Tree 3.1 Left
4222 5.8 Marutham Tree 3.8 Right
4223 90/300 90/350 4.6 Naval Tree 4.1 Right
4224 6 Naval Tree 3.6 Right
4225 4.9 Tamarind Tree 3.4 Right
4226 90/350 90/400 6.5 Pungai Tree 0.8 Left
4227 90/500 90/550 6.4 Tamarind Tree 3.8 Left
4228 90/550 90/600 4 Tamarind Tree 3.2 Left
4229 90/600 90/950 4 Tamarind Tree 1.6 Left
4230 4.2 Tamarind Tree 3.1 Left
4231 90/650 90/700 5 Neem Tree 0.5 Left
4232 4.8 Tamarind Tree 2.8 Left
4233 90/850 90/900 6.5 Neem Tree 0.8 Left
4234 90/900 90/950 6.5 Tamarind Tree 1.1 Left
4235 90/950 91/000 6.5 Tamarind Tree 1.1 Left
4236 91/000 91/050 6.5 Tamarind Tree 2.6 Right
4237 6.5 Tamarind Tree 1.6 Right
4238 91/400 91/450 6.5 Tamarind Tree 1 Right
4239 91/450 91/500 6.3 Tamarind Tree 1 Right
4240 6.5 Tamarind Tree 1.2 Right
4241 91/500 91/550 6.5 Tamarind Tree 1.7 Right
4242 91/750 91/800 5.8 Neem Tree 1 Left
4243 91/800 91/850 5.8 Neem Tree 1.1 Left
4244 6.5 Neem Tree 0.7 Right
4245 91/850 91/900 6.5 Neem Tree 1.3 Left
4246 6.1 Neem Tree 1.1 Left
4247 91/900 91/950 6 Neem Tree 0.5 Left
4248 6 Neem Tree 0.9 Left
4249 6 Karivelam Tree 1.3 Left
4250 91/950 92/000 5.8 Neem Tree 0.9 Left
4251 5.4 Tamarind Tree 2.6 Left
4252 92/000 92/050 5 Palm Tree 1.1 Left
4253 6.1 Neem Tree 1 Left
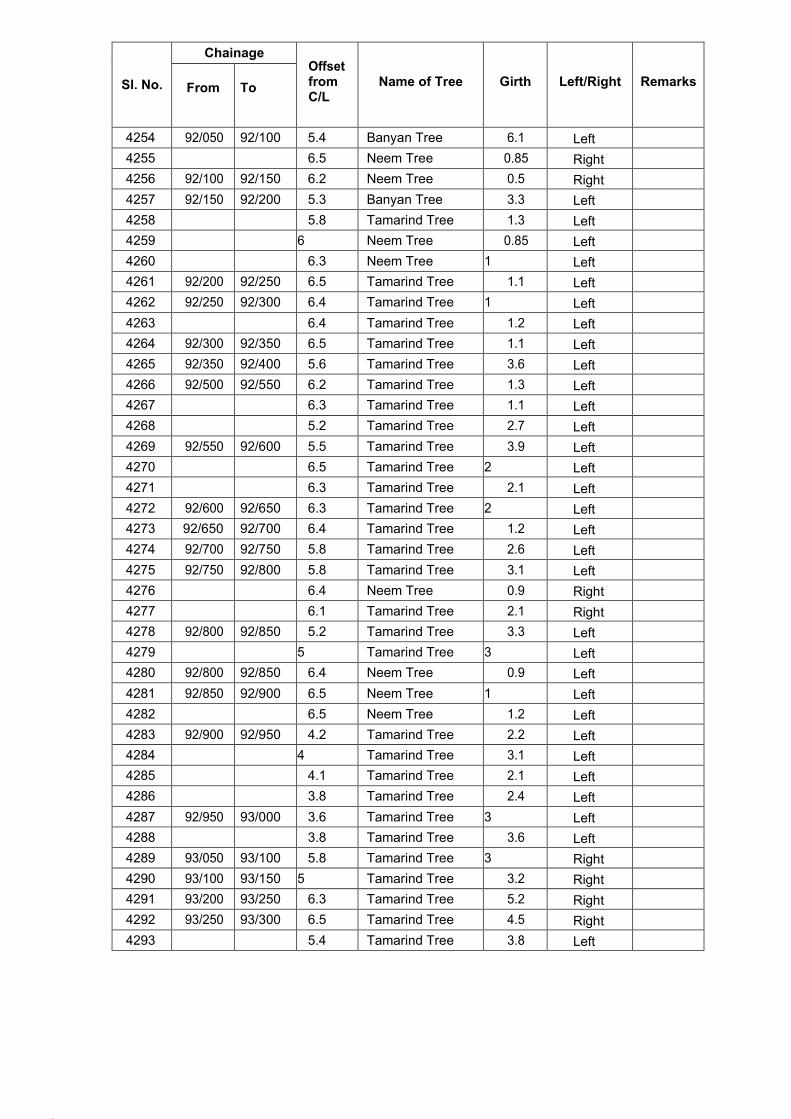
211.
212.
Sl. No.
Chainage Offset from C/L
Name of Tree
Girth
Left/Right
Remarks
From
To
4254 92/050 92/100 5.4 Banyan Tree 6.1 Left
4255 6.5 Neem Tree 0.85 Right
4256 92/100 92/150 6.2 Neem Tree 0.5 Right
4257 92/150 92/200 5.3 Banyan Tree 3.3 Left
4258 5.8 Tamarind Tree 1.3 Left
4259 6 Neem Tree 0.85 Left
4260 6.3 Neem Tree 1 Left
4261 92/200 92/250 6.5 Tamarind Tree 1.1 Left
4262 92/250 92/300 6.4 Tamarind Tree 1 Left
4263 6.4 Tamarind Tree 1.2 Left
4264 92/300 92/350 6.5 Tamarind Tree 1.1 Left
4265 92/350 92/400 5.6 Tamarind Tree 3.6 Left
4266 92/500 92/550 6.2 Tamarind Tree 1.3 Left
4267 6.3 Tamarind Tree 1.1 Left
4268 5.2 Tamarind Tree 2.7 Left
4269 92/550 92/600 5.5 Tamarind Tree 3.9 Left
4270 6.5 Tamarind Tree 2 Left
4271 6.3 Tamarind Tree 2.1 Left
4272 92/600 92/650 6.3 Tamarind Tree 2 Left
4273 92/650 92/700 6.4 Tamarind Tree 1.2 Left
4274 92/700 92/750 5.8 Tamarind Tree 2.6 Left
4275 92/750 92/800 5.8 Tamarind Tree 3.1 Left
4276 6.4 Neem Tree 0.9 Right
4277 6.1 Tamarind Tree 2.1 Right
4278 92/800 92/850 5.2 Tamarind Tree 3.3 Left
4279 5 Tamarind Tree 3 Left
4280 92/800 92/850 6.4 Neem Tree 0.9 Left
4281 92/850 92/900 6.5 Neem Tree 1 Left
4282 6.5 Neem Tree 1.2 Left
4283 92/900 92/950 4.2 Tamarind Tree 2.2 Left
4284 4 Tamarind Tree 3.1 Left
4285 4.1 Tamarind Tree 2.1 Left
4286 3.8 Tamarind Tree 2.4 Left
4287 92/950 93/000 3.6 Tamarind Tree 3 Left
4288 3.8 Tamarind Tree 3.6 Left
4289 93/050 93/100 5.8 Tamarind Tree 3 Right
4290 93/100 93/150 5 Tamarind Tree 3.2 Right
4291 93/200 93/250 6.3 Tamarind Tree 5.2 Right
4292 93/250 93/300 6.5 Tamarind Tree 4.5 Right
4293 5.4 Tamarind Tree 3.8 Left

370
Sl. No.
Chainage Offset from C/L
Name of Tree
Girth
Left/Right
Remarks
From
To
4294 93/300 93/350 4 Tamarind Tree 4.2 Right
4295 5.6 Tamarind Tree 4.3 Right
4296 6.4 Tamarind Tree 3.6 Right
4297 93/350 93/400 6.5 Tamarind Tree 2.9 Left
4298 93/400 93/450 5 Tamarind Tree 3.1 Right
4299 93/450 93/500 4.2 Tamarind Tree 2.7 Left
4300 3.8 Tamarind Tree 2.4 Left
4301 94/250 94/300 6.5 Naval Tree 2 Right
4302 5.8 Palm Tree 1.4 Right
4303 5.9 Palm Tree 1.1 Right
4304 94/350 94/400 0.5 Palm Tree 1.1 Right
4305 2 Palm Tree 1.1 Right
4306 2 Palm Tree 1.1 Right
4307 1 Palm Tree 1.2 Right
4308 94/350 94/400 3 Palm Tree 1.2 Left
4309 3 Neem Tree 1 Left
4310 3.7 Tamarind Tree 1.3 Left
4311 94/400 94/450 3.3 Palm Tree 1.3 Left
4312 3.3 Tamarind Tree 1.4 Left
4313 3.6 Neem Tree 1 Left
4314 3.4 Neem Tree 1.1 Left
4315 4 Palm Tree 1.4 Left
4316 6 Palm Tree 1.2 Left
4317 6 Neem Tree 1.3 Left
4318 6.5 Palm Tree-3 1.2 Left
4319 6 Neem Tree 0.9 Left
4320 94/550 94/600 5.8 Palm Tree 1.1 Right
4321 94/600 94/650 5.8 Palm Tree 1.4 Right
4322 6.4 Palm Tree 1.2 Right
4323 6.4 Palm Tree 1.2 Right
4324 94/650 94/700 5.7 Palm Tree 1.2 Right
4325 5.7 Palm Tree 1.2 Right
4326 5.8 Palm Tree 1.3 Right
4327 4.6 Tamarind Tree 1.2 Right
4328 94/700 94/750 4.6 Palm Tree 1.4 Right
4329 94/750 94/800 5.8 Neem Tree 1.1 Right
4330 94/800 94/850 6.3 Palm Tree 1.3 Right
4331 94/850 94/900 6.3 Palm Tree 1.1 Right
4332 6.4 Palm Tree 1.1 Right
4333 6.4 Palm Tree 1.1 Right
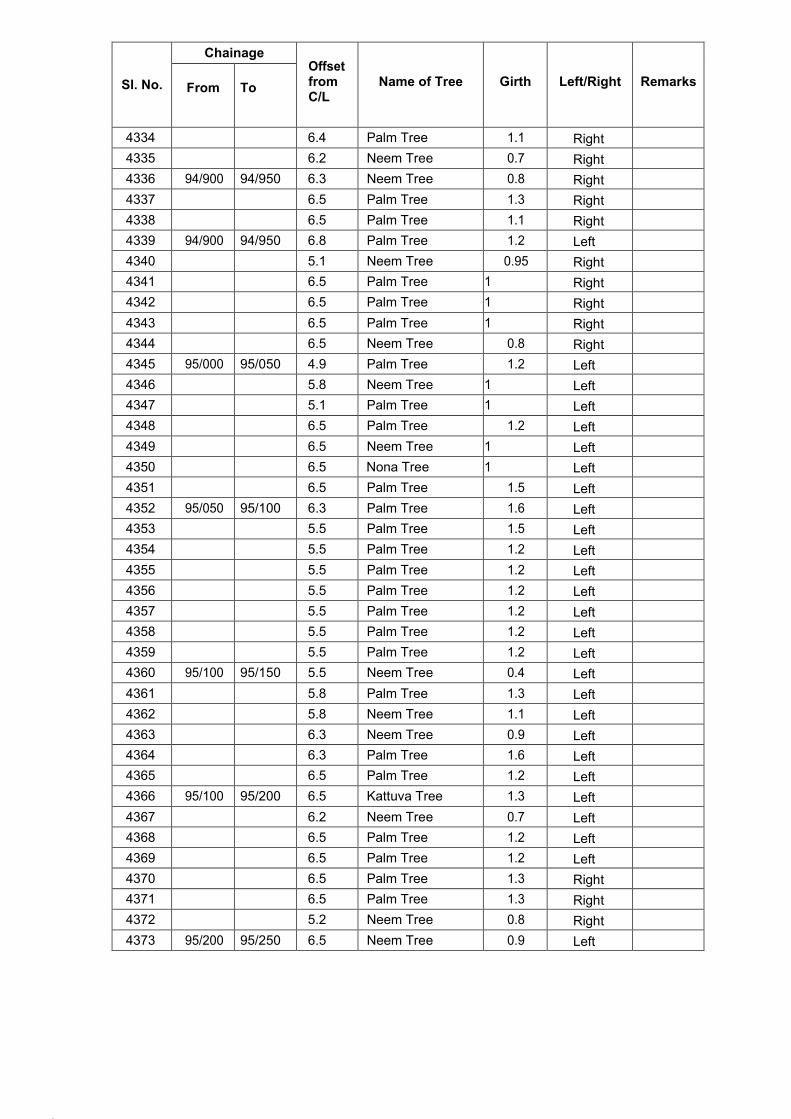
215.
216.
Sl. No.
Chainage Offset from C/L
Name of Tree
Girth
Left/Right
Remarks
From
To
4334 6.4 Palm Tree 1.1 Right
4335 6.2 Neem Tree 0.7 Right
4336 94/900 94/950 6.3 Neem Tree 0.8 Right
4337 6.5 Palm Tree 1.3 Right
4338 6.5 Palm Tree 1.1 Right
4339 94/900 94/950 6.8 Palm Tree 1.2 Left
4340 5.1 Neem Tree 0.95 Right
4341 6.5 Palm Tree 1 Right
4342 6.5 Palm Tree 1 Right
4343 6.5 Palm Tree 1 Right
4344 6.5 Neem Tree 0.8 Right
4345 95/000 95/050 4.9 Palm Tree 1.2 Left
4346 5.8 Neem Tree 1 Left
4347 5.1 Palm Tree 1 Left
4348 6.5 Palm Tree 1.2 Left
4349 6.5 Neem Tree 1 Left
4350 6.5 Nona Tree 1 Left
4351 6.5 Palm Tree 1.5 Left
4352 95/050 95/100 6.3 Palm Tree 1.6 Left
4353 5.5 Palm Tree 1.5 Left
4354 5.5 Palm Tree 1.2 Left
4355 5.5 Palm Tree 1.2 Left
4356 5.5 Palm Tree 1.2 Left
4357 5.5 Palm Tree 1.2 Left
4358 5.5 Palm Tree 1.2 Left
4359 5.5 Palm Tree 1.2 Left
4360 95/100 95/150 5.5 Neem Tree 0.4 Left
4361 5.8 Palm Tree 1.3 Left
4362 5.8 Neem Tree 1.1 Left
4363 6.3 Neem Tree 0.9 Left
4364 6.3 Palm Tree 1.6 Left
4365 6.5 Palm Tree 1.2 Left
4366 95/100 95/200 6.5 Kattuva Tree 1.3 Left
4367 6.2 Neem Tree 0.7 Left
4368 6.5 Palm Tree 1.2 Left
4369 6.5 Palm Tree 1.2 Left
4370 6.5 Palm Tree 1.3 Right
4371 6.5 Palm Tree 1.3 Right
4372 5.2 Neem Tree 0.8 Right
4373 95/200 95/250 6.5 Neem Tree 0.9 Left
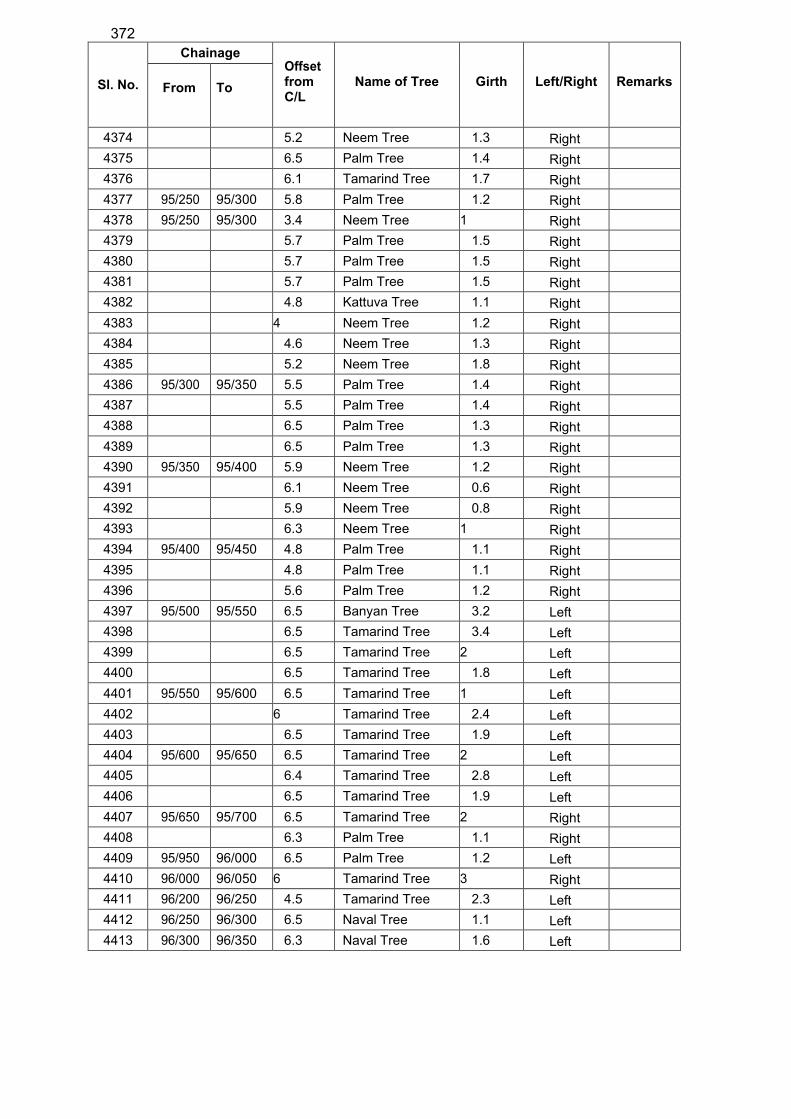
372
Sl. No.
Chainage Offset from C/L
Name of Tree
Girth
Left/Right
Remarks
From
To
4374 5.2 Neem Tree 1.3 Right
4375 6.5 Palm Tree 1.4 Right
4376 6.1 Tamarind Tree 1.7 Right
4377 95/250 95/300 5.8 Palm Tree 1.2 Right
4378 95/250 95/300 3.4 Neem Tree 1 Right
4379 5.7 Palm Tree 1.5 Right
4380 5.7 Palm Tree 1.5 Right
4381 5.7 Palm Tree 1.5 Right
4382 4.8 Kattuva Tree 1.1 Right
4383 4 Neem Tree 1.2 Right
4384 4.6 Neem Tree 1.3 Right
4385 5.2 Neem Tree 1.8 Right
4386 95/300 95/350 5.5 Palm Tree 1.4 Right
4387 5.5 Palm Tree 1.4 Right
4388 6.5 Palm Tree 1.3 Right
4389 6.5 Palm Tree 1.3 Right
4390 95/350 95/400 5.9 Neem Tree 1.2 Right
4391 6.1 Neem Tree 0.6 Right
4392 5.9 Neem Tree 0.8 Right
4393 6.3 Neem Tree 1 Right
4394 95/400 95/450 4.8 Palm Tree 1.1 Right
4395 4.8 Palm Tree 1.1 Right
4396 5.6 Palm Tree 1.2 Right
4397 95/500 95/550 6.5 Banyan Tree 3.2 Left
4398 6.5 Tamarind Tree 3.4 Left
4399 6.5 Tamarind Tree 2 Left
4400 6.5 Tamarind Tree 1.8 Left
4401 95/550 95/600 6.5 Tamarind Tree 1 Left
4402 6 Tamarind Tree 2.4 Left
4403 6.5 Tamarind Tree 1.9 Left
4404 95/600 95/650 6.5 Tamarind Tree 2 Left
4405 6.4 Tamarind Tree 2.8 Left
4406 6.5 Tamarind Tree 1.9 Left
4407 95/650 95/700 6.5 Tamarind Tree 2 Right
4408 6.3 Palm Tree 1.1 Right
4409 95/950 96/000 6.5 Palm Tree 1.2 Left
4410 96/000 96/050 6 Tamarind Tree 3 Right
4411 96/200 96/250 4.5 Tamarind Tree 2.3 Left
4412 96/250 96/300 6.5 Naval Tree 1.1 Left
4413 96/300 96/350 6.3 Naval Tree 1.6 Left
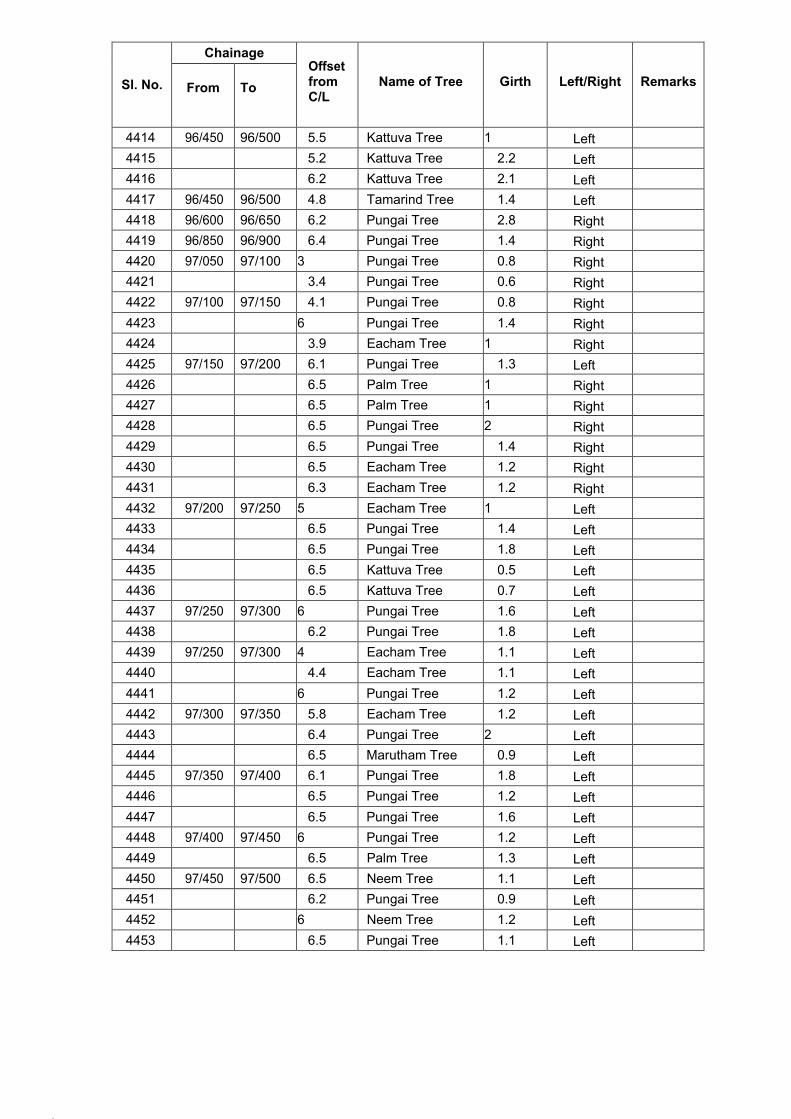
219.
220.
Sl. No.
Chainage Offset from C/L
Name of Tree
Girth
Left/Right
Remarks
From
To
4414 96/450 96/500 5.5 Kattuva Tree 1 Left
4415 5.2 Kattuva Tree 2.2 Left
4416 6.2 Kattuva Tree 2.1 Left
4417 96/450 96/500 4.8 Tamarind Tree 1.4 Left
4418 96/600 96/650 6.2 Pungai Tree 2.8 Right
4419 96/850 96/900 6.4 Pungai Tree 1.4 Right
4420 97/050 97/100 3 Pungai Tree 0.8 Right
4421 3.4 Pungai Tree 0.6 Right
4422 97/100 97/150 4.1 Pungai Tree 0.8 Right
4423 6 Pungai Tree 1.4 Right
4424 3.9 Eacham Tree 1 Right
4425 97/150 97/200 6.1 Pungai Tree 1.3 Left
4426 6.5 Palm Tree 1 Right
4427 6.5 Palm Tree 1 Right
4428 6.5 Pungai Tree 2 Right
4429 6.5 Pungai Tree 1.4 Right
4430 6.5 Eacham Tree 1.2 Right
4431 6.3 Eacham Tree 1.2 Right
4432 97/200 97/250 5 Eacham Tree 1 Left
4433 6.5 Pungai Tree 1.4 Left
4434 6.5 Pungai Tree 1.8 Left
4435 6.5 Kattuva Tree 0.5 Left
4436 6.5 Kattuva Tree 0.7 Left
4437 97/250 97/300 6 Pungai Tree 1.6 Left
4438 6.2 Pungai Tree 1.8 Left
4439 97/250 97/300 4 Eacham Tree 1.1 Left
4440 4.4 Eacham Tree 1.1 Left
4441 6 Pungai Tree 1.2 Left
4442 97/300 97/350 5.8 Eacham Tree 1.2 Left
4443 6.4 Pungai Tree 2 Left
4444 6.5 Marutham Tree 0.9 Left
4445 97/350 97/400 6.1 Pungai Tree 1.8 Left
4446 6.5 Pungai Tree 1.2 Left
4447 6.5 Pungai Tree 1.6 Left
4448 97/400 97/450 6 Pungai Tree 1.2 Left
4449 6.5 Palm Tree 1.3 Left
4450 97/450 97/500 6.5 Neem Tree 1.1 Left
4451 6.2 Pungai Tree 0.9 Left
4452 6 Neem Tree 1.2 Left
4453 6.5 Pungai Tree 1.1 Left
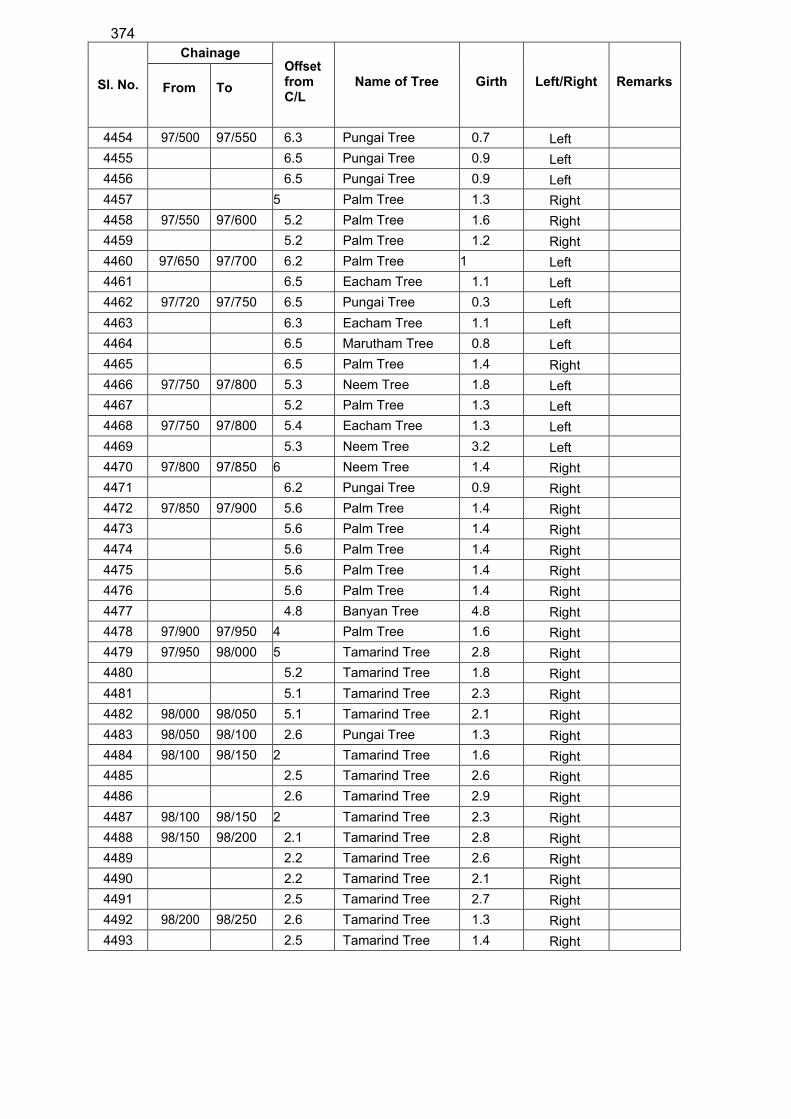
374
Sl. No.
Chainage Offset from C/L
Name of Tree
Girth
Left/Right
Remarks
From
To
4454 97/500 97/550 6.3 Pungai Tree 0.7 Left
4455 6.5 Pungai Tree 0.9 Left
4456 6.5 Pungai Tree 0.9 Left
4457 5 Palm Tree 1.3 Right
4458 97/550 97/600 5.2 Palm Tree 1.6 Right
4459 5.2 Palm Tree 1.2 Right
4460 97/650 97/700 6.2 Palm Tree 1 Left
4461 6.5 Eacham Tree 1.1 Left
4462 97/720 97/750 6.5 Pungai Tree 0.3 Left
4463 6.3 Eacham Tree 1.1 Left
4464 6.5 Marutham Tree 0.8 Left
4465 6.5 Palm Tree 1.4 Right
4466 97/750 97/800 5.3 Neem Tree 1.8 Left
4467 5.2 Palm Tree 1.3 Left
4468 97/750 97/800 5.4 Eacham Tree 1.3 Left
4469 5.3 Neem Tree 3.2 Left
4470 97/800 97/850 6 Neem Tree 1.4 Right
4471 6.2 Pungai Tree 0.9 Right
4472 97/850 97/900 5.6 Palm Tree 1.4 Right
4473 5.6 Palm Tree 1.4 Right
4474 5.6 Palm Tree 1.4 Right
4475 5.6 Palm Tree 1.4 Right
4476 5.6 Palm Tree 1.4 Right
4477 4.8 Banyan Tree 4.8 Right
4478 97/900 97/950 4 Palm Tree 1.6 Right
4479 97/950 98/000 5 Tamarind Tree 2.8 Right
4480 5.2 Tamarind Tree 1.8 Right
4481 5.1 Tamarind Tree 2.3 Right
4482 98/000 98/050 5.1 Tamarind Tree 2.1 Right
4483 98/050 98/100 2.6 Pungai Tree 1.3 Right
4484 98/100 98/150 2 Tamarind Tree 1.6 Right
4485 2.5 Tamarind Tree 2.6 Right
4486 2.6 Tamarind Tree 2.9 Right
4487 98/100 98/150 2 Tamarind Tree 2.3 Right
4488 98/150 98/200 2.1 Tamarind Tree 2.8 Right
4489 2.2 Tamarind Tree 2.6 Right
4490 2.2 Tamarind Tree 2.1 Right
4491 2.5 Tamarind Tree 2.7 Right
4492 98/200 98/250 2.6 Tamarind Tree 1.3 Right
4493 2.5 Tamarind Tree 1.4 Right
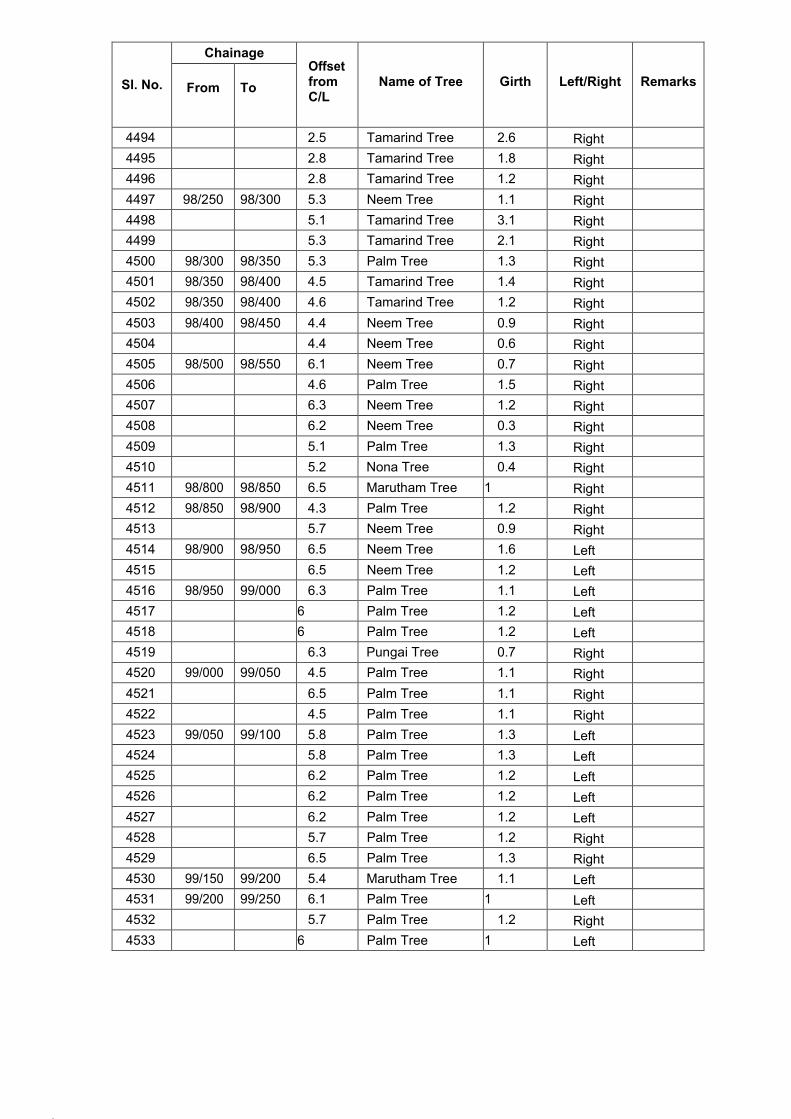
223.
224.
Sl. No.
Chainage Offset from C/L
Name of Tree
Girth
Left/Right
Remarks
From
To
4494 2.5 Tamarind Tree 2.6 Right
4495 2.8 Tamarind Tree 1.8 Right
4496 2.8 Tamarind Tree 1.2 Right
4497 98/250 98/300 5.3 Neem Tree 1.1 Right
4498 5.1 Tamarind Tree 3.1 Right
4499 5.3 Tamarind Tree 2.1 Right
4500 98/300 98/350 5.3 Palm Tree 1.3 Right
4501 98/350 98/400 4.5 Tamarind Tree 1.4 Right
4502 98/350 98/400 4.6 Tamarind Tree 1.2 Right
4503 98/400 98/450 4.4 Neem Tree 0.9 Right
4504 4.4 Neem Tree 0.6 Right
4505 98/500 98/550 6.1 Neem Tree 0.7 Right
4506 4.6 Palm Tree 1.5 Right
4507 6.3 Neem Tree 1.2 Right
4508 6.2 Neem Tree 0.3 Right
4509 5.1 Palm Tree 1.3 Right
4510 5.2 Nona Tree 0.4 Right
4511 98/800 98/850 6.5 Marutham Tree 1 Right
4512 98/850 98/900 4.3 Palm Tree 1.2 Right
4513 5.7 Neem Tree 0.9 Right
4514 98/900 98/950 6.5 Neem Tree 1.6 Left
4515 6.5 Neem Tree 1.2 Left
4516 98/950 99/000 6.3 Palm Tree 1.1 Left
4517 6 Palm Tree 1.2 Left
4518 6 Palm Tree 1.2 Left
4519 6.3 Pungai Tree 0.7 Right
4520 99/000 99/050 4.5 Palm Tree 1.1 Right
4521 6.5 Palm Tree 1.1 Right
4522 4.5 Palm Tree 1.1 Right
4523 99/050 99/100 5.8 Palm Tree 1.3 Left
4524 5.8 Palm Tree 1.3 Left
4525 6.2 Palm Tree 1.2 Left
4526 6.2 Palm Tree 1.2 Left
4527 6.2 Palm Tree 1.2 Left
4528 5.7 Palm Tree 1.2 Right
4529 6.5 Palm Tree 1.3 Right
4530 99/150 99/200 5.4 Marutham Tree 1.1 Left
4531 99/200 99/250 6.1 Palm Tree 1 Left
4532 5.7 Palm Tree 1.2 Right
4533 6 Palm Tree 1 Left
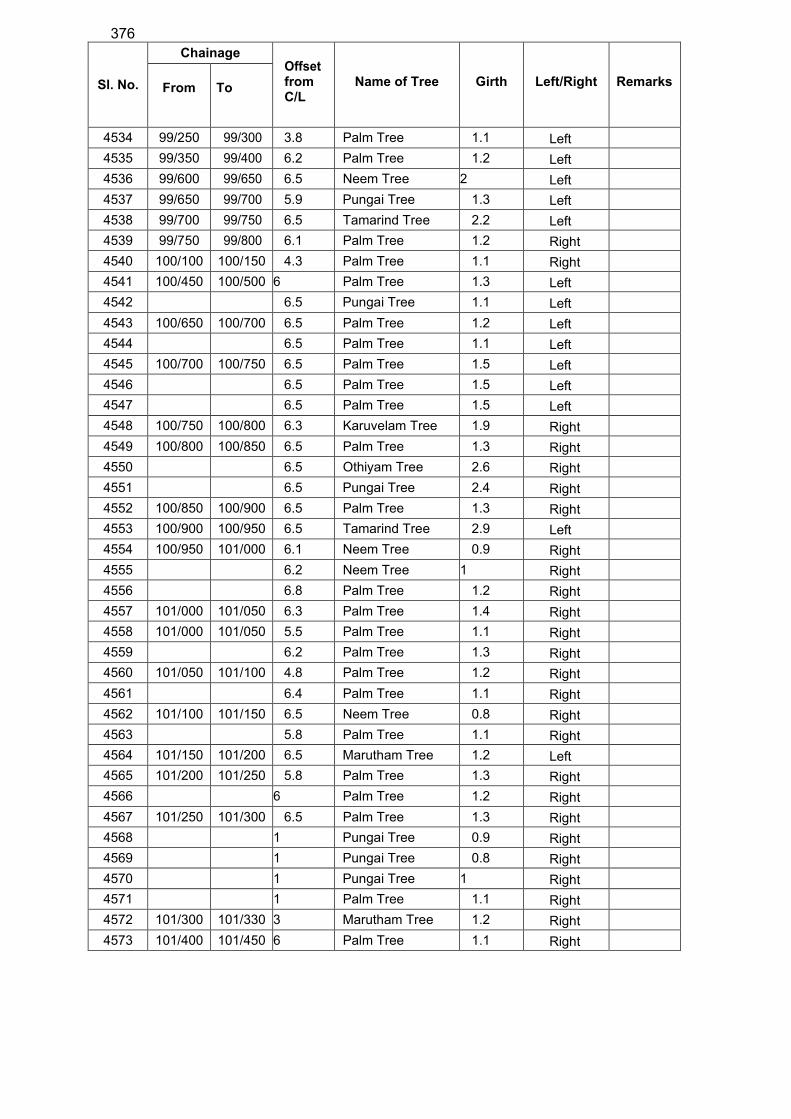
376
Sl. No.
Chainage Offset from C/L
Name of Tree
Girth
Left/Right
Remarks
From
To
4534 99/250 99/300 3.8 Palm Tree 1.1 Left
4535 99/350 99/400 6.2 Palm Tree 1.2 Left
4536 99/600 99/650 6.5 Neem Tree 2 Left
4537 99/650 99/700 5.9 Pungai Tree 1.3 Left
4538 99/700 99/750 6.5 Tamarind Tree 2.2 Left
4539 99/750 99/800 6.1 Palm Tree 1.2 Right
4540 100/100 100/150 4.3 Palm Tree 1.1 Right
4541 100/450 100/500 6 Palm Tree 1.3 Left
4542 6.5 Pungai Tree 1.1 Left
4543 100/650 100/700 6.5 Palm Tree 1.2 Left
4544 6.5 Palm Tree 1.1 Left
4545 100/700 100/750 6.5 Palm Tree 1.5 Left
4546 6.5 Palm Tree 1.5 Left
4547 6.5 Palm Tree 1.5 Left
4548 100/750 100/800 6.3 Karuvelam Tree 1.9 Right
4549 100/800 100/850 6.5 Palm Tree 1.3 Right
4550 6.5 Othiyam Tree 2.6 Right
4551 6.5 Pungai Tree 2.4 Right
4552 100/850 100/900 6.5 Palm Tree 1.3 Right
4553 100/900 100/950 6.5 Tamarind Tree 2.9 Left
4554 100/950 101/000 6.1 Neem Tree 0.9 Right
4555 6.2 Neem Tree 1 Right
4556 6.8 Palm Tree 1.2 Right
4557 101/000 101/050 6.3 Palm Tree 1.4 Right
4558 101/000 101/050 5.5 Palm Tree 1.1 Right
4559 6.2 Palm Tree 1.3 Right
4560 101/050 101/100 4.8 Palm Tree 1.2 Right
4561 6.4 Palm Tree 1.1 Right
4562 101/100 101/150 6.5 Neem Tree 0.8 Right
4563 5.8 Palm Tree 1.1 Right
4564 101/150 101/200 6.5 Marutham Tree 1.2 Left
4565 101/200 101/250 5.8 Palm Tree 1.3 Right
4566 6 Palm Tree 1.2 Right
4567 101/250 101/300 6.5 Palm Tree 1.3 Right
4568 1 Pungai Tree 0.9 Right
4569 1 Pungai Tree 0.8 Right
4570 1 Pungai Tree 1 Right
4571 1 Palm Tree 1.1 Right
4572 101/300 101/330 3 Marutham Tree 1.2 Right
4573 101/400 101/450 6 Palm Tree 1.1 Right
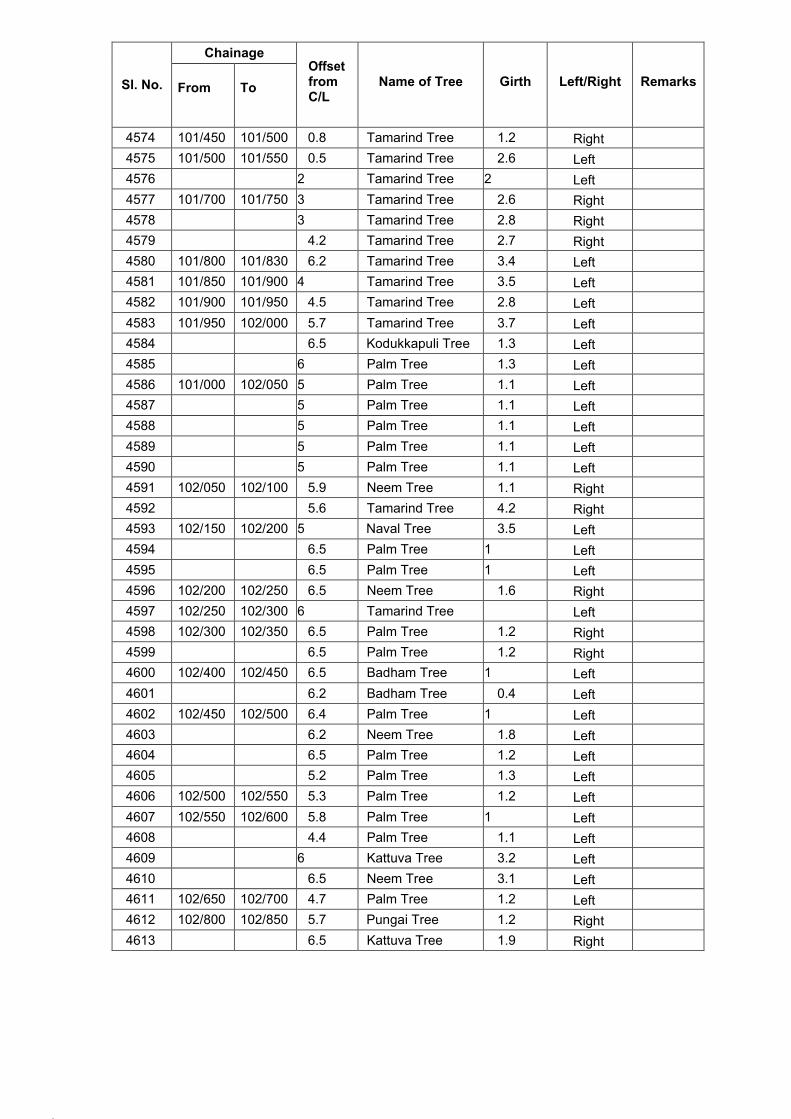
227.
228.
Sl. No.
Chainage Offset from C/L
Name of Tree
Girth
Left/Right
Remarks
From
To
4574 101/450 101/500 0.8 Tamarind Tree 1.2 Right
4575 101/500 101/550 0.5 Tamarind Tree 2.6 Left
4576 2 Tamarind Tree 2 Left
4577 101/700 101/750 3 Tamarind Tree 2.6 Right
4578 3 Tamarind Tree 2.8 Right
4579 4.2 Tamarind Tree 2.7 Right
4580 101/800 101/830 6.2 Tamarind Tree 3.4 Left
4581 101/850 101/900 4 Tamarind Tree 3.5 Left
4582 101/900 101/950 4.5 Tamarind Tree 2.8 Left
4583 101/950 102/000 5.7 Tamarind Tree 3.7 Left
4584 6.5 Kodukkapuli Tree 1.3 Left
4585 6 Palm Tree 1.3 Left
4586 101/000 102/050 5 Palm Tree 1.1 Left
4587 5 Palm Tree 1.1 Left
4588 5 Palm Tree 1.1 Left
4589 5 Palm Tree 1.1 Left
4590 5 Palm Tree 1.1 Left
4591 102/050 102/100 5.9 Neem Tree 1.1 Right
4592 5.6 Tamarind Tree 4.2 Right
4593 102/150 102/200 5 Naval Tree 3.5 Left
4594 6.5 Palm Tree 1 Left
4595 6.5 Palm Tree 1 Left
4596 102/200 102/250 6.5 Neem Tree 1.6 Right
4597 102/250 102/300 6 Tamarind Tree Left
4598 102/300 102/350 6.5 Palm Tree 1.2 Right
4599 6.5 Palm Tree 1.2 Right
4600 102/400 102/450 6.5 Badham Tree 1 Left
4601 6.2 Badham Tree 0.4 Left
4602 102/450 102/500 6.4 Palm Tree 1 Left
4603 6.2 Neem Tree 1.8 Left
4604 6.5 Palm Tree 1.2 Left
4605 5.2 Palm Tree 1.3 Left
4606 102/500 102/550 5.3 Palm Tree 1.2 Left
4607 102/550 102/600 5.8 Palm Tree 1 Left
4608 4.4 Palm Tree 1.1 Left
4609 6 Kattuva Tree 3.2 Left
4610 6.5 Neem Tree 3.1 Left
4611 102/650 102/700 4.7 Palm Tree 1.2 Left
4612 102/800 102/850 5.7 Pungai Tree 1.2 Right
4613 6.5 Kattuva Tree 1.9 Right
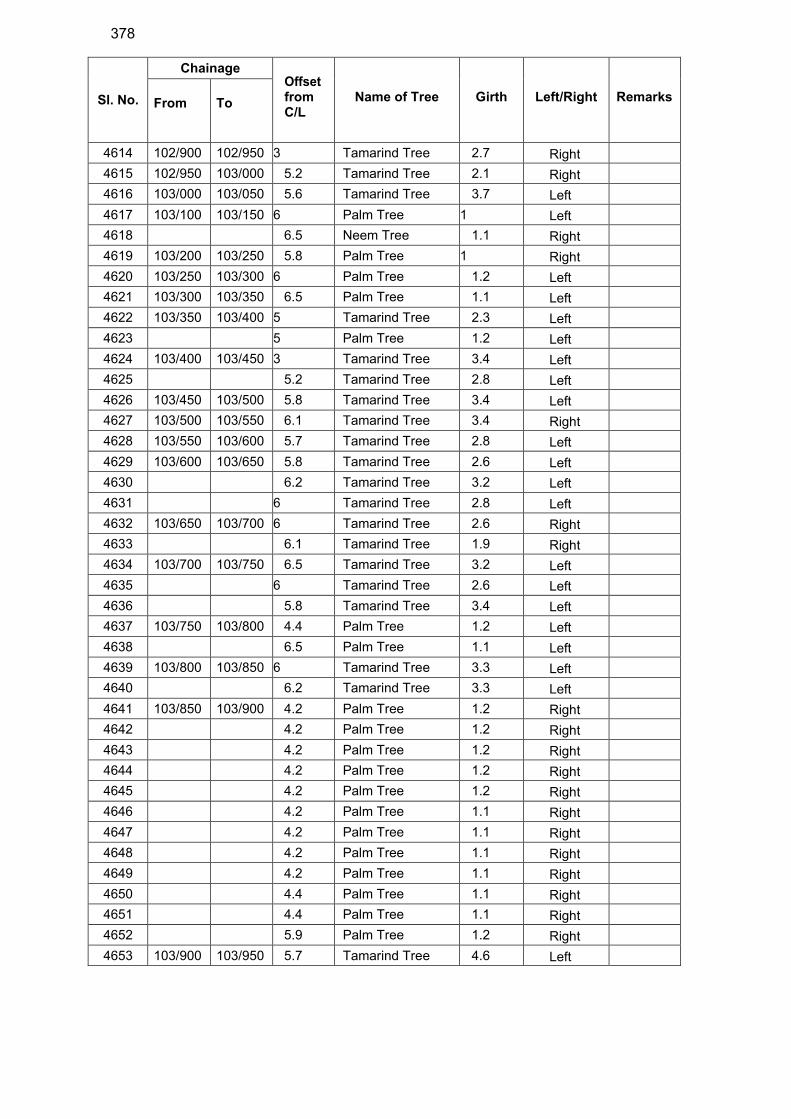
378
Sl. No.
Chainage Offset from C/L
Name of Tree
Girth
Left/Right
Remarks
From
To
4614 102/900 102/950 3 Tamarind Tree 2.7 Right
4615 102/950 103/000 5.2 Tamarind Tree 2.1 Right
4616 103/000 103/050 5.6 Tamarind Tree 3.7 Left
4617 103/100 103/150 6 Palm Tree 1 Left
4618 6.5 Neem Tree 1.1 Right
4619 103/200 103/250 5.8 Palm Tree 1 Right
4620 103/250 103/300 6 Palm Tree 1.2 Left
4621 103/300 103/350 6.5 Palm Tree 1.1 Left
4622 103/350 103/400 5 Tamarind Tree 2.3 Left
4623 5 Palm Tree 1.2 Left
4624 103/400 103/450 3 Tamarind Tree 3.4 Left
4625 5.2 Tamarind Tree 2.8 Left
4626 103/450 103/500 5.8 Tamarind Tree 3.4 Left
4627 103/500 103/550 6.1 Tamarind Tree 3.4 Right
4628 103/550 103/600 5.7 Tamarind Tree 2.8 Left
4629 103/600 103/650 5.8 Tamarind Tree 2.6 Left
4630 6.2 Tamarind Tree 3.2 Left
4631 6 Tamarind Tree 2.8 Left
4632 103/650 103/700 6 Tamarind Tree 2.6 Right
4633 6.1 Tamarind Tree 1.9 Right
4634 103/700 103/750 6.5 Tamarind Tree 3.2 Left
4635 6 Tamarind Tree 2.6 Left
4636 5.8 Tamarind Tree 3.4 Left
4637 103/750 103/800 4.4 Palm Tree 1.2 Left
4638 6.5 Palm Tree 1.1 Left
4639 103/800 103/850 6 Tamarind Tree 3.3 Left
4640 6.2 Tamarind Tree 3.3 Left
4641 103/850 103/900 4.2 Palm Tree 1.2 Right
4642 4.2 Palm Tree 1.2 Right
4643 4.2 Palm Tree 1.2 Right
4644 4.2 Palm Tree 1.2 Right
4645 4.2 Palm Tree 1.2 Right
4646 4.2 Palm Tree 1.1 Right
4647 4.2 Palm Tree 1.1 Right
4648 4.2 Palm Tree 1.1 Right
4649 4.2 Palm Tree 1.1 Right
4650 4.4 Palm Tree 1.1 Right
4651 4.4 Palm Tree 1.1 Right
4652 5.9 Palm Tree 1.2 Right
4653 103/900 103/950 5.7 Tamarind Tree 4.6 Left
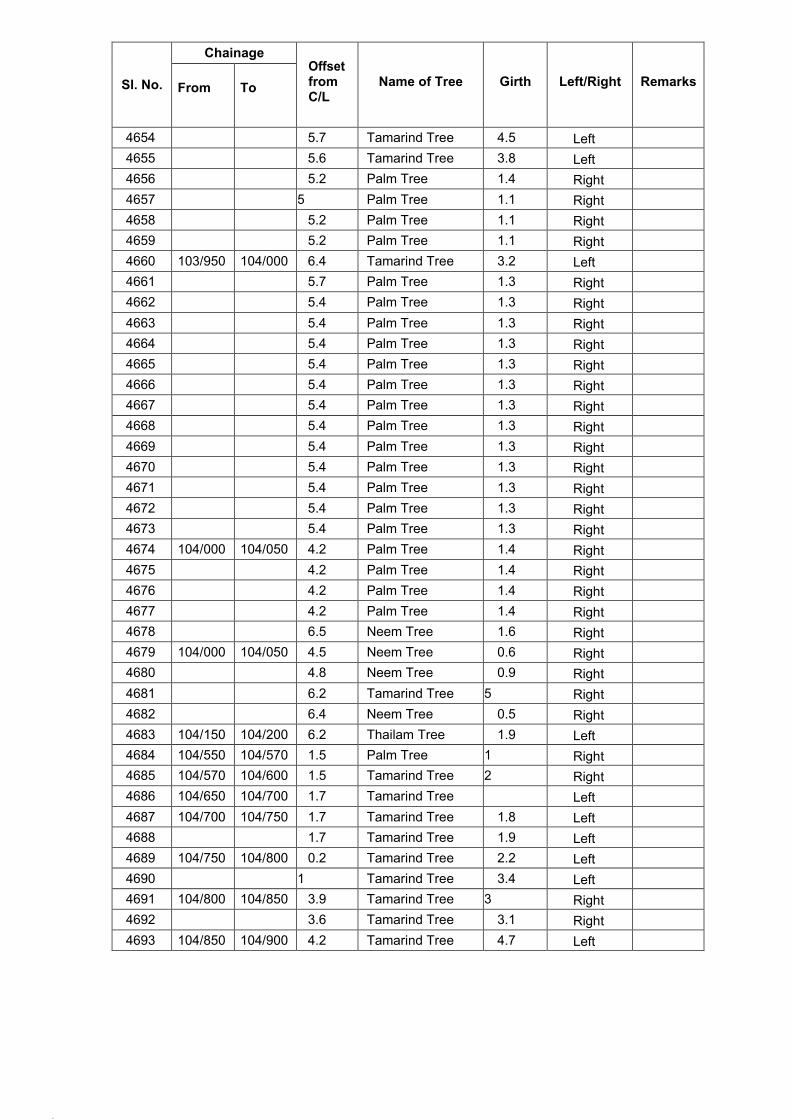
231.
232.
Sl. No.
Chainage Offset from C/L
Name of Tree
Girth
Left/Right
Remarks
From
To
4654 5.7 Tamarind Tree 4.5 Left
4655 5.6 Tamarind Tree 3.8 Left
4656 5.2 Palm Tree 1.4 Right
4657 5 Palm Tree 1.1 Right
4658 5.2 Palm Tree 1.1 Right
4659 5.2 Palm Tree 1.1 Right
4660 103/950 104/000 6.4 Tamarind Tree 3.2 Left
4661 5.7 Palm Tree 1.3 Right
4662 5.4 Palm Tree 1.3 Right
4663 5.4 Palm Tree 1.3 Right
4664 5.4 Palm Tree 1.3 Right
4665 5.4 Palm Tree 1.3 Right
4666 5.4 Palm Tree 1.3 Right
4667 5.4 Palm Tree 1.3 Right
4668 5.4 Palm Tree 1.3 Right
4669 5.4 Palm Tree 1.3 Right
4670 5.4 Palm Tree 1.3 Right
4671 5.4 Palm Tree 1.3 Right
4672 5.4 Palm Tree 1.3 Right
4673 5.4 Palm Tree 1.3 Right
4674 104/000 104/050 4.2 Palm Tree 1.4 Right
4675 4.2 Palm Tree 1.4 Right
4676 4.2 Palm Tree 1.4 Right
4677 4.2 Palm Tree 1.4 Right
4678 6.5 Neem Tree 1.6 Right
4679 104/000 104/050 4.5 Neem Tree 0.6 Right
4680 4.8 Neem Tree 0.9 Right
4681 6.2 Tamarind Tree 5 Right
4682 6.4 Neem Tree 0.5 Right
4683 104/150 104/200 6.2 Thailam Tree 1.9 Left
4684 104/550 104/570 1.5 Palm Tree 1 Right
4685 104/570 104/600 1.5 Tamarind Tree 2 Right
4686 104/650 104/700 1.7 Tamarind Tree Left
4687 104/700 104/750 1.7 Tamarind Tree 1.8 Left
4688 1.7 Tamarind Tree 1.9 Left
4689 104/750 104/800 0.2 Tamarind Tree 2.2 Left
4690 1 Tamarind Tree 3.4 Left
4691 104/800 104/850 3.9 Tamarind Tree 3 Right
4692 3.6 Tamarind Tree 3.1 Right
4693 104/850 104/900 4.2 Tamarind Tree 4.7 Left
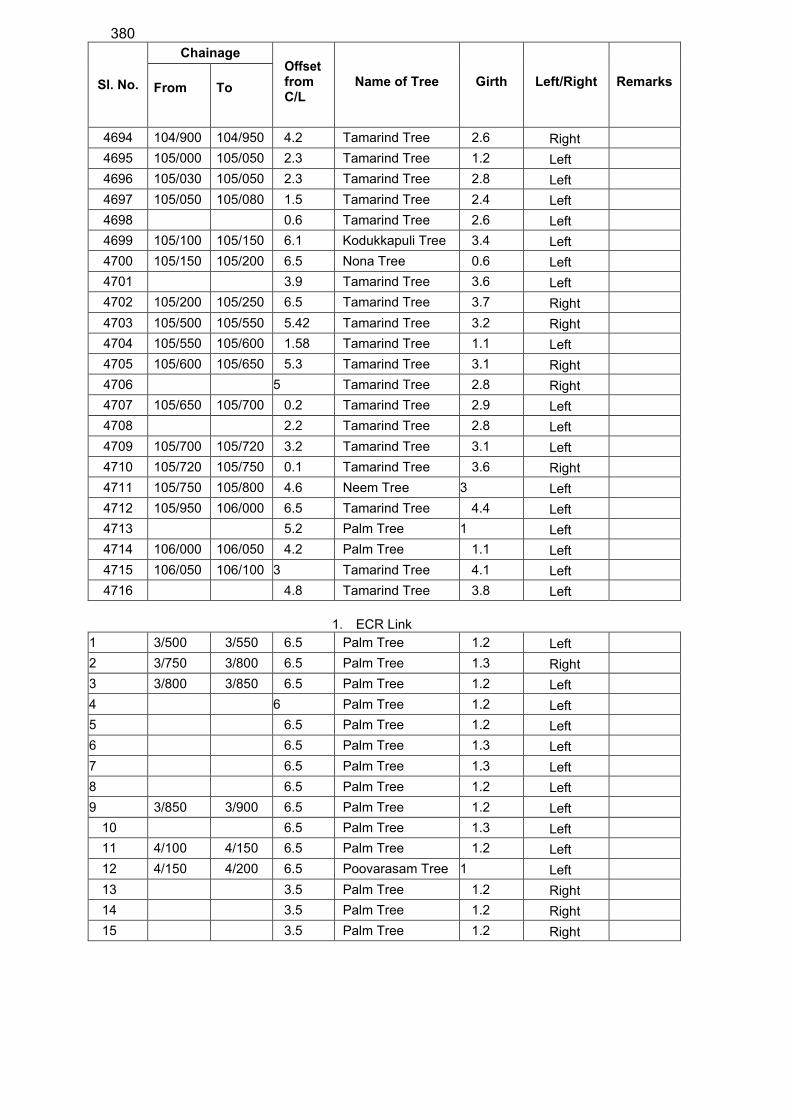
380
Sl. No.
Chainage Offset from C/L
Name of Tree
Girth
Left/Right
Remarks
From
To
4694 104/900 104/950 4.2 Tamarind Tree 2.6 Right
4695 105/000 105/050 2.3 Tamarind Tree 1.2 Left
4696 105/030 105/050 2.3 Tamarind Tree 2.8 Left
4697 105/050 105/080 1.5 Tamarind Tree 2.4 Left
4698 0.6 Tamarind Tree 2.6 Left
4699 105/100 105/150 6.1 Kodukkapuli Tree 3.4 Left
4700 105/150 105/200 6.5 Nona Tree 0.6 Left
4701 3.9 Tamarind Tree 3.6 Left
4702 105/200 105/250 6.5 Tamarind Tree 3.7 Right
4703 105/500 105/550 5.42 Tamarind Tree 3.2 Right
4704 105/550 105/600 1.58 Tamarind Tree 1.1 Left
4705 105/600 105/650 5.3 Tamarind Tree 3.1 Right
4706 5 Tamarind Tree 2.8 Right
4707 105/650 105/700 0.2 Tamarind Tree 2.9 Left
4708 2.2 Tamarind Tree 2.8 Left
4709 105/700 105/720 3.2 Tamarind Tree 3.1 Left
4710 105/720 105/750 0.1 Tamarind Tree 3.6 Right
4711 105/750 105/800 4.6 Neem Tree 3 Left
4712 105/950 106/000 6.5 Tamarind Tree 4.4 Left
4713 5.2 Palm Tree 1 Left
4714 106/000 106/050 4.2 Palm Tree 1.1 Left
4715 106/050 106/100 3 Tamarind Tree 4.1 Left
4716 4.8 Tamarind Tree 3.8 Left
1. ECR Link
1 3/500 3/550 6.5 Palm Tree 1.2 Left
2 3/750 3/800 6.5 Palm Tree 1.3 Right
3 3/800 3/850 6.5 Palm Tree 1.2 Left
4 6 Palm Tree 1.2 Left
5 6.5 Palm Tree 1.2 Left
6 6.5 Palm Tree 1.3 Left
7 6.5 Palm Tree 1.3 Left
8 6.5 Palm Tree 1.2 Left
9 3/850 3/900 6.5 Palm Tree 1.2 Left
10 6.5 Palm Tree 1.3 Left
11 4/100 4/150 6.5 Palm Tree 1.2 Left
12 4/150 4/200 6.5 Poovarasam Tree 1 Left
13 3.5 Palm Tree 1.2 Right
14 3.5 Palm Tree 1.2 Right
15 3.5 Palm Tree 1.2 Right
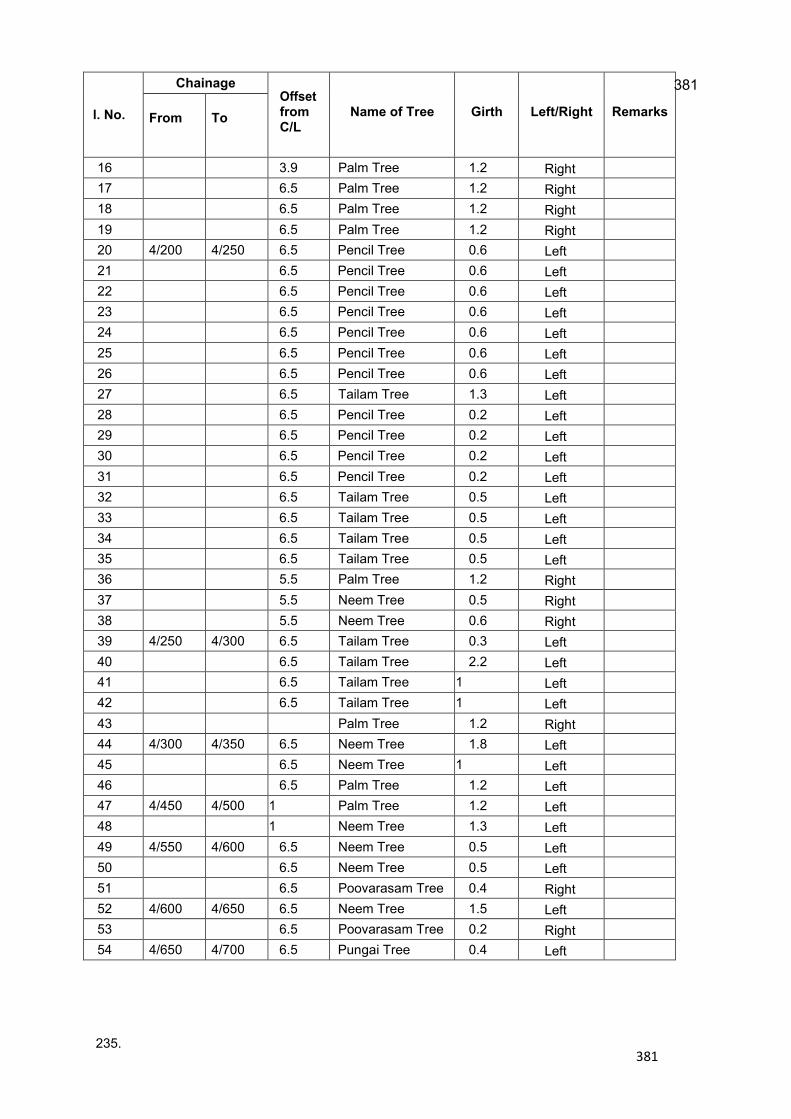
235.
381
381
l. No.
Chainage Offset from C/L
Name of Tree
Girth
Left/Right
Remarks
From
To
16 3.9 Palm Tree 1.2 Right
17 6.5 Palm Tree 1.2 Right
18 6.5 Palm Tree 1.2 Right
19 6.5 Palm Tree 1.2 Right
20 4/200 4/250 6.5 Pencil Tree 0.6 Left
21 6.5 Pencil Tree 0.6 Left
22 6.5 Pencil Tree 0.6 Left
23 6.5 Pencil Tree 0.6 Left
24 6.5 Pencil Tree 0.6 Left
25 6.5 Pencil Tree 0.6 Left
26 6.5 Pencil Tree 0.6 Left
27 6.5 Tailam Tree 1.3 Left
28 6.5 Pencil Tree 0.2 Left
29 6.5 Pencil Tree 0.2 Left
30 6.5 Pencil Tree 0.2 Left
31 6.5 Pencil Tree 0.2 Left
32 6.5 Tailam Tree 0.5 Left
33 6.5 Tailam Tree 0.5 Left
34 6.5 Tailam Tree 0.5 Left
35 6.5 Tailam Tree 0.5 Left
36 5.5 Palm Tree 1.2 Right
37 5.5 Neem Tree 0.5 Right
38 5.5 Neem Tree 0.6 Right
39 4/250 4/300 6.5 Tailam Tree 0.3 Left
40 6.5 Tailam Tree 2.2 Left
41 6.5 Tailam Tree 1 Left
42 6.5 Tailam Tree 1 Left
43 Palm Tree 1.2 Right
44 4/300 4/350 6.5 Neem Tree 1.8 Left
45 6.5 Neem Tree 1 Left
46 6.5 Palm Tree 1.2 Left
47 4/450 4/500 1 Palm Tree 1.2 Left
48 1 Neem Tree 1.3 Left
49 4/550 4/600 6.5 Neem Tree 0.5 Left
50 6.5 Neem Tree 0.5 Left
51 6.5 Poovarasam Tree 0.4 Right
52 4/600 4/650 6.5 Neem Tree 1.5 Left
53 6.5 Poovarasam Tree 0.2 Right
54 4/650 4/700 6.5 Pungai Tree 0.4 Left

382
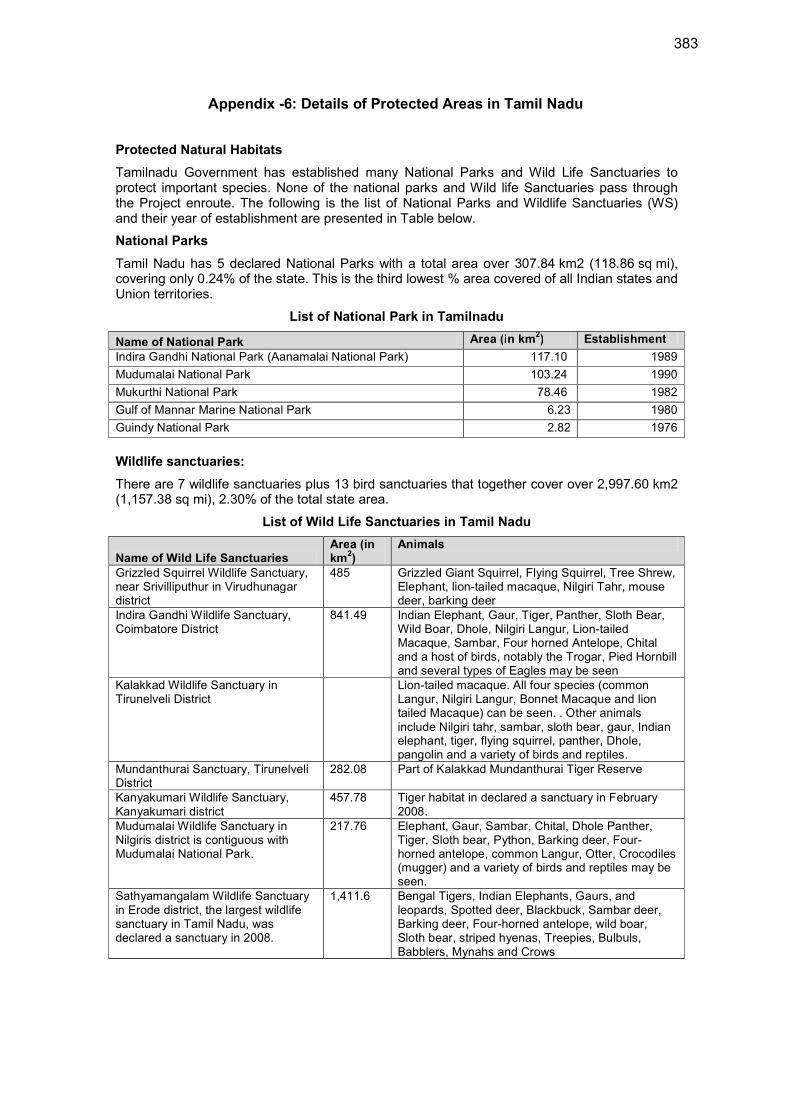
383
Appendix -6: Details of Protected Areas in Tamil Nadu
Protected Natural Habitats
Tamilnadu Government has established many National Parks and Wild Life Sanctuaries to protect important species. None of the national parks and Wild life Sanctuaries pass through the Project enroute. The following is the list of National Parks and Wildlife Sanctuaries (WS) and their year of establishment are presented in Table below.
National Parks
Tamil Nadu has 5 declared National Parks with a total area over 307.84 km2 (118.86 sq mi), covering only 0.24% of the state. This is the third lowest % area covered of all Indian states and Union territories.
List of National Park in Tamilnadu
Name of National Park Area (in km2) Establishment
Indira Gandhi National Park (Aanamalai National Park) 117.10 1989
Mudumalai National Park 103.24 1990
Mukurthi National Park 78.46 1982
Gulf of Mannar Marine National Park 6.23 1980
Guindy National Park 2.82 1976
Wildlife sanctuaries:
There are 7 wildlife sanctuaries plus 13 bird sanctuaries that together cover over 2,997.60 km2 (1,157.38 sq mi), 2.30% of the total state area.
List of Wild Life Sanctuaries in Tamil Nadu
Name of Wild Life Sanctuaries Area (in km
2)
Animals
Grizzled Squirrel Wildlife Sanctuary, near Srivilliputhur in Virudhunagar district
485 Grizzled Giant Squirrel, Flying Squirrel, Tree Shrew, Elephant, lion-tailed macaque, Nilgiri Tahr, mouse deer, barking deer
Indira Gandhi Wildlife Sanctuary, Coimbatore District
841.49 Indian Elephant, Gaur, Tiger, Panther, Sloth Bear, Wild Boar, Dhole, Nilgiri Langur, Lion-tailed Macaque, Sambar, Four horned Antelope, Chital and a host of birds, notably the Trogar, Pied Hornbill and several types of Eagles may be seen
Kalakkad Wildlife Sanctuary in Tirunelveli District
Lion-tailed macaque. All four species (common Langur, Nilgiri Langur, Bonnet Macaque and lion tailed Macaque) can be seen. . Other animals include Nilgiri tahr, sambar, sloth bear, gaur, Indian elephant, tiger, flying squirrel, panther, Dhole, pangolin and a variety of birds and reptiles.
Mundanthurai Sanctuary, Tirunelveli District
282.08 Part of Kalakkad Mundanthurai Tiger Reserve
Kanyakumari Wildlife Sanctuary, Kanyakumari district
457.78 Tiger habitat in declared a sanctuary in February 2008.
Mudumalai Wildlife Sanctuary in Nilgiris district is contiguous with Mudumalai National Park.
217.76 Elephant, Gaur, Sambar, Chital, Dhole Panther, Tiger, Sloth bear, Python, Barking deer, Four-horned antelope, common Langur, Otter, Crocodiles (mugger) and a variety of birds and reptiles may be seen.
Sathyamangalam Wildlife Sanctuary in Erode district, the largest wildlife sanctuary in Tamil Nadu, was declared a sanctuary in 2008.
1,411.6 Bengal Tigers, Indian Elephants, Gaurs, and leopards, Spotted deer, Blackbuck, Sambar deer, Barking deer, Four-horned antelope, wild boar, Sloth bear, striped hyenas, Treepies, Bulbuls, Babblers, Mynahs and Crows
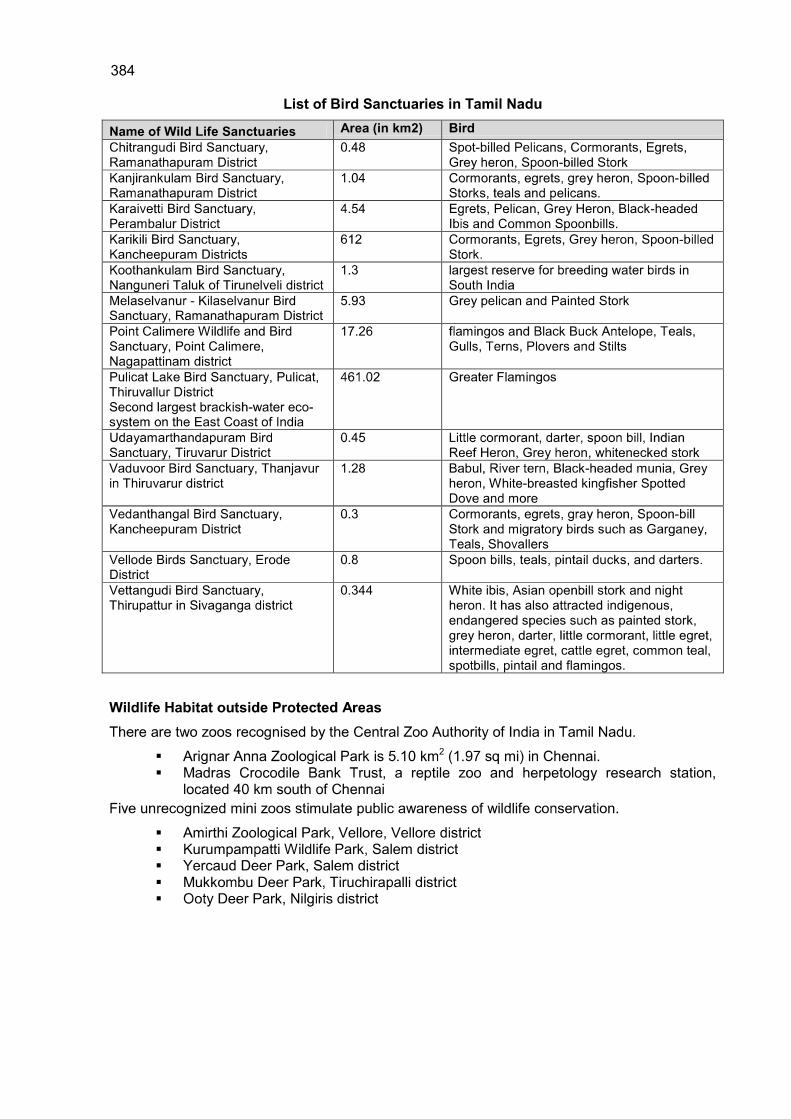
384

385
Appendix 7: Detailed Analysis of Air Modeling
A. Introduction
1. The major impact on the air quality during the operation stage will be due to plying of vehicles on the proposed corridor. The impact on air quality depends upon traffic volume, traffic fleet including fuel type and prevailing atmospheric conditions. An unstable atmospheric condition disperses pollutants more and results in to low pollutant concentrations while stable atmospheric conditions buildup the pollution level. To assess the likely impacts on the ambient air quality due to the proposed highway project, the prediction of the carbon monoxide (CO) and particulate matter (PM), Nitrogen Dioxide (NOx) and Sulphur Dioxide (SO2) concentrations have been carried out using line source dispersion modelling approach, based on Gaussian equation. CO is an indicator pollutant for vehicular pollution. So, prediction of CO concentration is representative of the impacts of air pollution due to traffic movement. The modeling for this project has been carried out using AERMOD-9, a steady-state plume model that incorporates air dispersion based on planetary boundary layer turbulence structure and scaling concepts, including treatment of both surface and elevated sources, and both simple and complex terrain, developed by the “The American Meteorological Society/Environmental Protection Agency Regulatory Model Improvement Committee (AERMIC)”. 2. It has been setup and run by using emission factors prevalent for Indian vehicles (ARAI, 2007) and hourly traffic volumes as predicted for the project. The study is conducted to predict 1-houly increment in CO and 24-houly increment in PM2.5, PM10, NOx and SO2 concentrations for the years 2020, 2025, 2030, 2035 and 2040.
B. Model descriptions
3. The AERMOD atmospheric dispersion modeling system is an integrated system that includes three modules: (a) A steady-state dispersion model designed for short-range (up to 50 kilometers) dispersion of air pollutant emissions from stationary industrial sources. (b) A meteorological data preprocessor (AERMET) that accepts surface meteorological data, upper air soundings, and optionally, data from on-site instrument towers. It then calculates atmospheric parameters needed by the dispersion model, such as atmospheric turbulence characteristics, mixing heights, friction velocity, Monin-Obukov length and surface heat flux. (c) A terrain preprocessor (AERMAP) whose main purpose is to provide a physical relationship between terrain features and the behavior of air pollution plumes. It generates location and height data for each receptor location. It also provides information that allows the dispersion model to simulate the effects of air flowing over hills or splitting to flow around hills. AERMOD also includes PRIME (Plume Rise Model Enhancements) [4] which is an algorithm for modeling the effects of downwash created by the pollution plume flowing over nearby buildings.
C. Source information
1. Traffic data
4. The fleet wise traffic volumes for the present study have been taken from the detailed feasibility report of the project. The annual average daily traffic (AADT) data is available for the proposed road through traffic survey. AERMOD model needs hourly average traffic volume. The total traffic hour volume is further categorized in to two-wheeler, four wheeler, Light
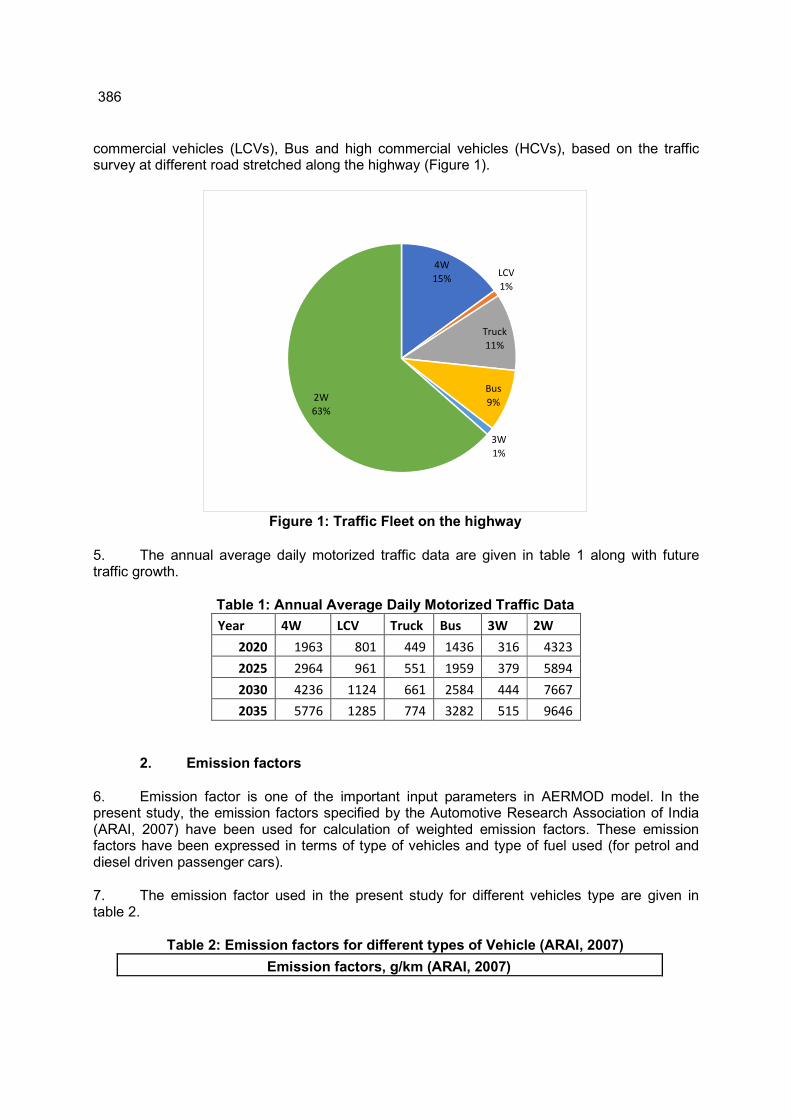
386
commercial vehicles (LCVs), Bus and high commercial vehicles (HCVs), based on the traffic survey at different road stretched along the highway (Figure 1).
Figure 1: Traffic Fleet on the highway
5. The annual average daily motorized traffic data are given in table 1 along with future traffic growth.
Table 1: Annual Average Daily Motorized Traffic Data
Year 4W LCV Truck Bus 3W 2W
2020 1963 801 449 1436 316 4323
2025 2964 961 551 1959 379 5894
2030 4236 1124 661 2584 444 7667
2035 5776 1285 774 3282 515 9646
2. Emission factors
6. Emission factor is one of the important input parameters in AERMOD model. In the present study, the emission factors specified by the Automotive Research Association of India (ARAI, 2007) have been used for calculation of weighted emission factors. These emission factors have been expressed in terms of type of vehicles and type of fuel used (for petrol and diesel driven passenger cars).
7. The emission factor used in the present study for different vehicles type are given in table 2.
Table 2: Emission factors for different types of Vehicle (ARAI, 2007)
Emission factors, g/km (ARAI, 2007)
4W
15%LCV
1%
Truck
11%
Bus
9%
3W
1%
2W
63%

387
2w 3w 4w lcv bus truck
CO 1.04 1.25 1.28 1.56 8.03 6
NOx 0.31 0.6 0.32 1.46 9.01 9.3
PM 0.02 0.22 0.04 0.28 0.55 1.24
SO2 0.01 0.01 0.03 0.06 0.13 0.13
3. Meteorological data
8. The meteorological parameters such as wind speed, wind direction, temperature, rainfall, cloud cover, pressure, and humidity were used in model. Meteorological parameters observed during environmental monitoring carried out in the month of December 2019 were used for the model and is given below table 3.
Table 3: Meteorological Parameters used for modelling
Hour Temperature (oC)
Humidity (%)
WD (o)
Wind Speed (kmph)
Pressure (Pa)
Precip. (mm)
Cl
1:00 28.6 84 315 0 29.82 0 0
2:00 27.6 86 45 1 29.82 0 0
3:00 26.8 81 315 4 29.87 0 0
4:00 26.7 92 0 5 29.87 0 0
5:00 24.3 94 0 7 29.87 0 0
6:00 26.4 96 0 6 29.84 0 0
7:00 27.6 92 315 2 29.84 0 0
8:00 28.7 86 45 2 29.84 0 0
9:00 32.4 73 315 3 27.78 0 0
10:00 33.6 70 45 4 27.78 0 0
11:00 33.4 77 315 2 27.78 0 0
12:00 35.6 76 315 5 29.76 0 0
13:00 34.8 71 315 1 29.76 0 0
14:00 35.5 69 0 6 29.76 0 0
15:00 32.4 72 0 7 29.83 0 0
16:00 36.5 65 0 1 29.83 0 0
17:00 32.5 62 0 6 29.83 0 0
18:00 30.5 78 315 7 29.83 0 0
19:00 31.5 88 315 6 29.83 0 0
20:00 34.2 75 315 5 29.83 0 0
21:00 32.2 62 315 5 29.8 0 0
22:00 31.8 58 315 6 29.8 0 0
23:00 30.4 51 315 3 29.8 0 0
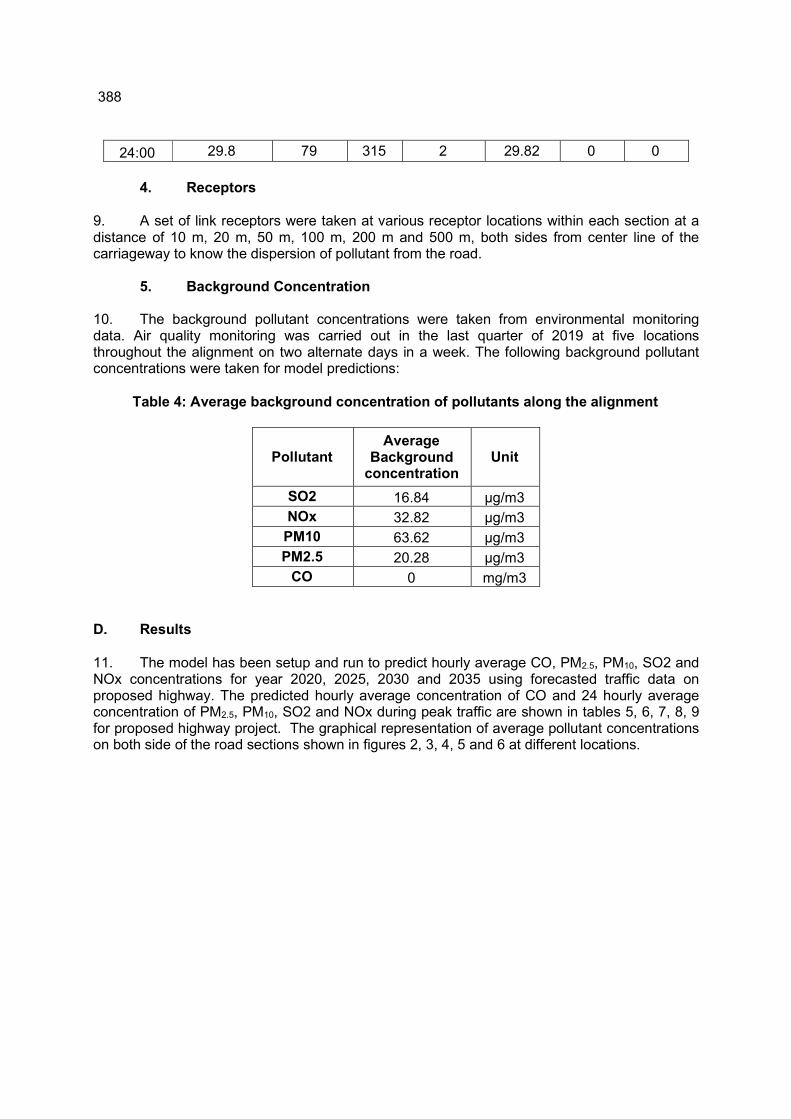
388
24:00 29.8 79 315 2 29.82 0 0
4. Receptors
9. A set of link receptors were taken at various receptor locations within each section at a distance of 10 m, 20 m, 50 m, 100 m, 200 m and 500 m, both sides from center line of the carriageway to know the dispersion of pollutant from the road.
5. Background Concentration
10. The background pollutant concentrations were taken from environmental monitoring data. Air quality monitoring was carried out in the last quarter of 2019 at five locations throughout the alignment on two alternate days in a week. The following background pollutant concentrations were taken for model predictions:
Table 4: Average background concentration of pollutants along the alignment
Pollutant Average
Background concentration
Unit
SO2 16.84 µg/m3
NOx 32.82 µg/m3
PM10 63.62 µg/m3
PM2.5 20.28 µg/m3
CO 0 mg/m3
D. Results
11. The model has been setup and run to predict hourly average CO, PM2.5, PM10, SO2 and NOx concentrations for year 2020, 2025, 2030 and 2035 using forecasted traffic data on proposed highway. The predicted hourly average concentration of CO and 24 hourly average concentration of PM2.5, PM10, SO2 and NOx during peak traffic are shown in tables 5, 6, 7, 8, 9 for proposed highway project. The graphical representation of average pollutant concentrations on both side of the road sections shown in figures 2, 3, 4, 5 and 6 at different locations.
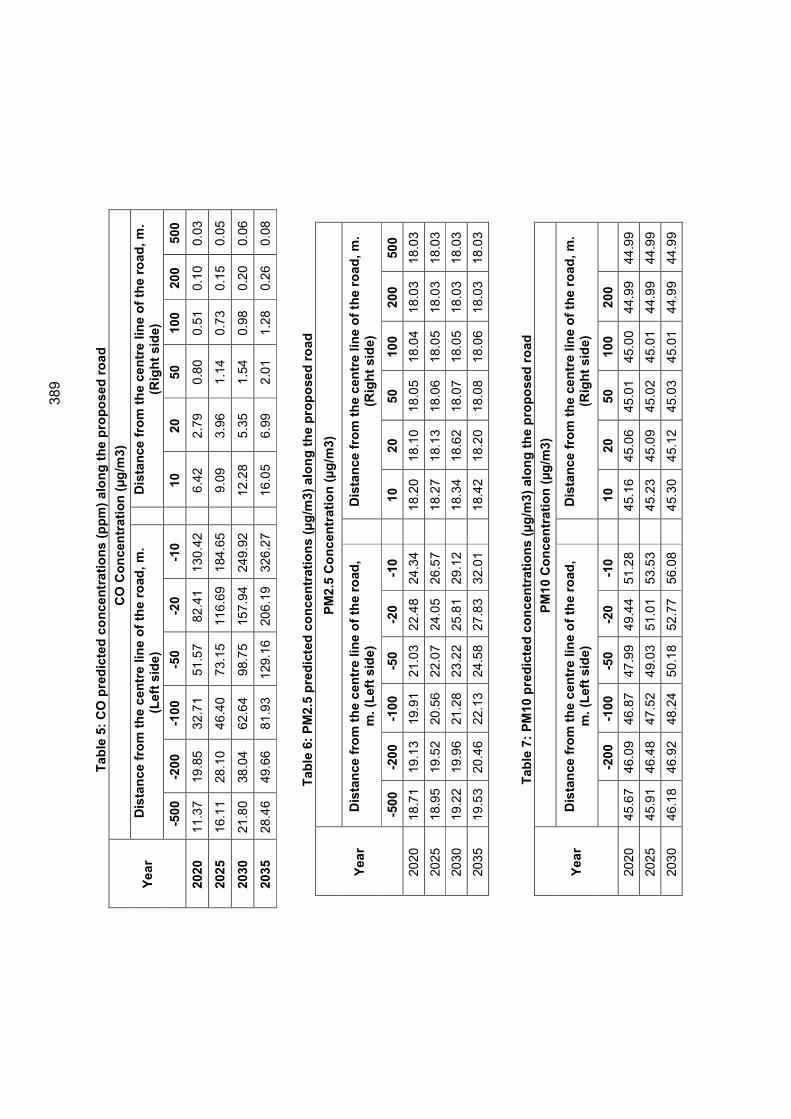
38
9
Ta
ble
5:
CO
pre
dic
ted
co
nc
en
tra
tio
ns
(p
pm
) a
lon
g t
he
pro
po
se
d r
oa
d
Ye
ar
CO
Co
nc
en
tra
tio
n (
µg
/m3
)
Dis
tan
ce
fro
m t
he
ce
ntr
e l
ine
of
the r
oad
, m
.
(Le
ft s
ide
)
Dis
tan
ce
fro
m t
he c
en
tre
lin
e o
f th
e r
oa
d,
m.
(Rig
ht
sid
e)
-50
0
-20
0
-10
0
-50
-2
0
-10
1
0
20
5
0
10
0
20
0
50
0
20
20
1
1.3
7
19
.85
3
2.7
1
51
.57
8
2.4
1
13
0.4
2
6
.42
2
.79
0
.80
0.5
1
0.1
0
0.0
3
20
25
1
6.1
1
28
.10
4
6.4
0
73
.15
11
6.6
9
18
4.6
5
9
.09
3
.96
1.1
4
0.7
3
0.1
5
0.0
5
20
30
2
1.8
0
38
.04
6
2.6
4
98
.75
15
7.9
4
24
9.9
2
1
2.2
8
5.3
5
1.5
4
0.9
8
0.2
0
0.0
6
20
35
2
8.4
6
49
.66
8
1.9
3
129
.16
20
6.1
9
32
6.2
7
1
6.0
5
6.9
9
2.0
1
1.2
8
0.2
6
0.0
8
Ta
ble
6:
PM
2.5
pre
dic
ted
co
nc
en
tra
tio
ns
(µ
g/m
3)
alo
ng
th
e p
rop
ose
d r
oa
d
Ye
ar
PM
2.5
Co
nc
en
tra
tio
n (
µg
/m3
)
Dis
tan
ce
fro
m t
he
ce
ntr
e l
ine
of
the r
oad
, m
. (L
eft
sid
e)
D
ista
nc
e f
rom
th
e c
en
tre
lin
e o
f th
e r
oa
d,
m.
(Rig
ht
sid
e)
-50
0
-20
0
-10
0
-50
-2
0
-10
10
2
0
50
1
00
2
00
50
0
20
20
1
8.7
1
19.1
3
19
.91
2
1.0
3
22
.48
2
4.3
4
1
8.2
0
18.1
0
18
.05
1
8.0
4
18
.03
1
8.0
3
20
25
1
8.9
5
19.5
2
20
.56
2
2.0
7
24
.05
2
6.5
7
1
8.2
7
18.1
3
18
.06
1
8.0
5
18
.03
1
8.0
3
20
30
1
9.2
2
19.9
6
21
.28
2
3.2
2
25
.81
2
9.1
2
1
8.3
4
18.6
2
18
.07
1
8.0
5
18
.03
1
8.0
3
20
35
1
9.5
3
20.4
6
22
.13
2
4.5
8
27
.83
3
2.0
1
1
8.4
2
18.2
0
18
.08
1
8.0
6
18
.03
1
8.0
3
Ta
ble
7:
PM
10
pre
dic
ted
co
nc
en
tra
tio
ns
(µ
g/m
3)
alo
ng
th
e p
rop
os
ed
ro
ad
Ye
ar
PM
10
Co
nc
en
tra
tio
n (
µg
/m3
)
Dis
tan
ce
fro
m t
he
ce
ntr
e l
ine
of
the r
oad
, m
. (L
eft
sid
e)
D
ista
nc
e f
rom
th
e c
en
tre
lin
e o
f th
e r
oa
d,
m.
(Rig
ht
sid
e)
-2
00
-1
00
-5
0
-20
-1
0
1
0
20
5
0
10
0
20
0
20
20
4
5.6
7
46.0
9
46
.87
4
7.9
9
49
.44
5
1.2
8
4
5.1
6
45.0
6
45
.01
4
5.0
0
44
.99
4
4.9
9
20
25
4
5.9
1
46.4
8
47
.52
4
9.0
3
51
.01
5
3.5
3
4
5.2
3
45.0
9
45
.02
4
5.0
1
44
.99
4
4.9
9
20
30
4
6.1
8
46.9
2
48
.24
5
0.1
8
52
.77
5
6.0
8
4
5.3
0
45.1
2
45
.03
4
5.0
1
44
.99
4
4.9
9
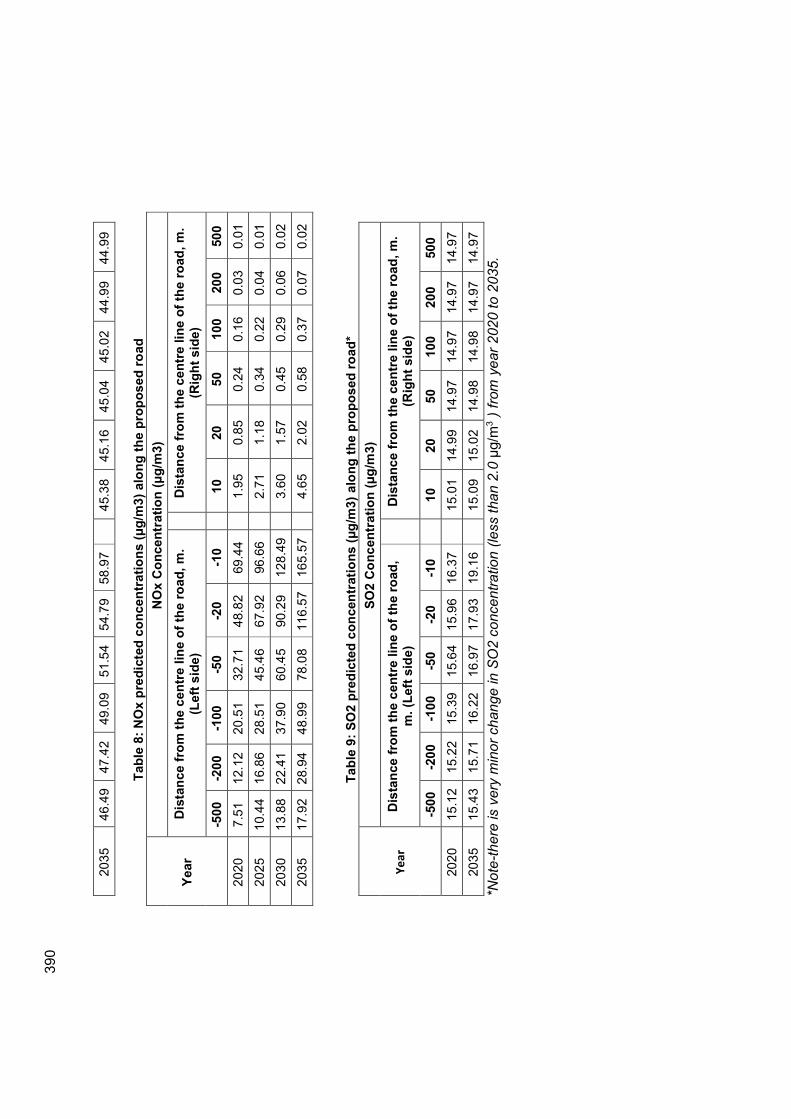
3
90
20
35
4
6.4
9
47.4
2
49
.09
5
1.5
4
54
.79
5
8.9
7
4
5.3
8
45.1
6
45
.04
4
5.0
2
44
.99
4
4.9
9
Ta
ble
8:
NO
x p
red
icte
d c
on
ce
ntr
ati
on
s (
µg
/m3
) a
lon
g t
he p
rop
os
ed
ro
ad
Ye
ar
NO
x C
on
ce
ntr
ati
on
(µ
g/m
3)
Dis
tan
ce
fro
m t
he
ce
ntr
e l
ine o
f th
e r
oa
d,
m.
(Le
ft s
ide
)
Dis
tan
ce
fro
m t
he
ce
ntr
e l
ine
of
the
ro
ad
, m
.
(Rig
ht
sid
e)
-50
0
-20
0
-100
-5
0
-20
-10
10
20
5
0
10
0
20
0
50
0
20
20
7
.51
1
2.1
2
20
.51
3
2.7
1
48.8
2
69
.44
1.9
5
0.8
5
0.2
4
0.1
6
0.0
3
0.0
1
20
25
1
0.4
4
16.8
6
28
.51
4
5.4
6
67.9
2
96
.66
2.7
1
1.1
8
0.3
4
0.2
2
0.0
4
0.0
1
20
30
1
3.8
8
22.4
1
37
.90
6
0.4
5
90.2
9
12
8.4
9
3
.60
1.5
7
0.4
5
0.2
9
0.0
6
0.0
2
20
35
1
7.9
2
28.9
4
48
.99
7
8.0
8
11
6.5
7
16
5.5
7
4
.65
2.0
2
0.5
8
0.3
7
0.0
7
0.0
2
Ta
ble
9:
SO
2 p
red
icte
d c
on
cen
trati
on
s (
µg
/m3
) a
lon
g t
he
pro
po
se
d r
oa
d*
Ye
ar
SO
2 C
on
ce
ntr
ati
on
(µ
g/m
3)
Dis
tan
ce
fro
m t
he
ce
ntr
e l
ine
of
the r
oad
, m
. (L
eft
sid
e)
D
ista
nc
e f
rom
th
e c
en
tre
lin
e o
f th
e r
oa
d,
m.
(Rig
ht
sid
e)
-50
0
-20
0
-10
0
-50
-2
0
-10
10
2
0
50
1
00
2
00
50
0
20
20
1
5.1
2
15.2
2
15
.39
1
5.6
4
15
.96
1
6.3
7
1
5.0
1
14.9
9
14
.97
1
4.9
7
14
.97
1
4.9
7
20
35
1
5.4
3
15.7
1
16
.22
1
6.9
7
17
.93
1
9.1
6
1
5.0
9
15.0
2
14
.98
1
4.9
8
14
.97
1
4.9
7
*No
te-t
he
re is v
ery
min
or
ch
an
ge in
SO
2 c
once
ntr
atio
n (
less t
ha
n 2
.0 µ
g/m
3 )
fro
m y
ear
202
0 to
20
35
.
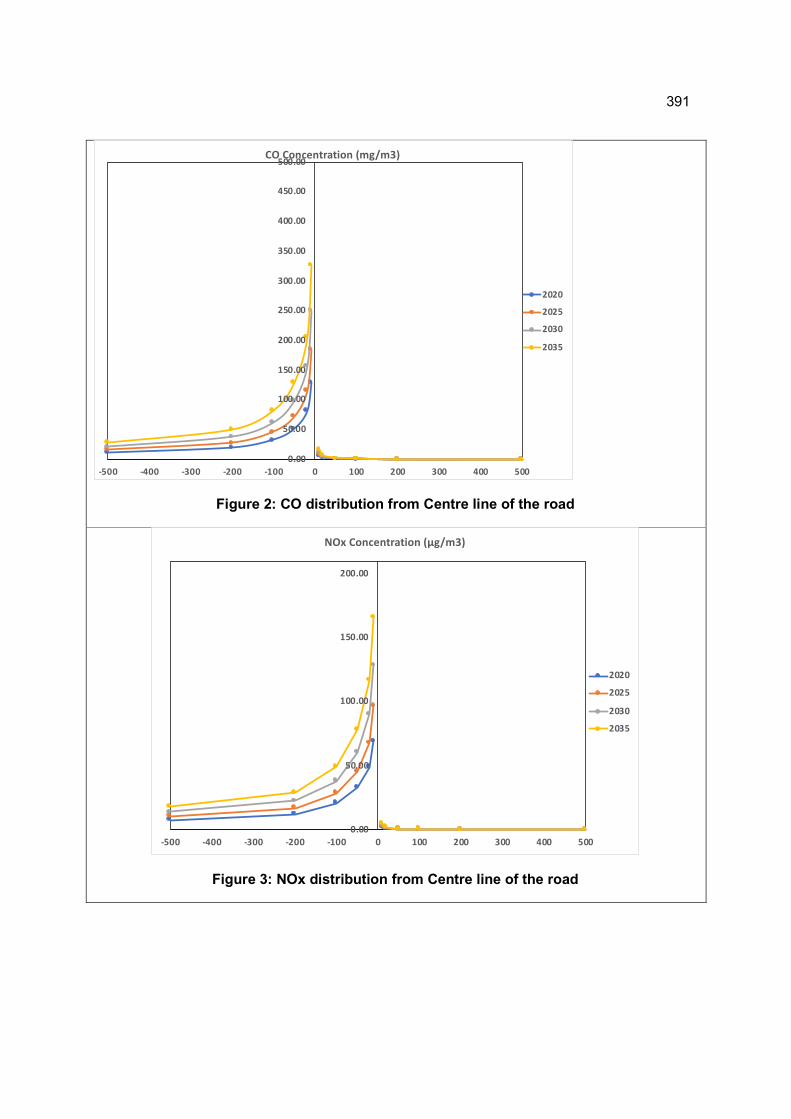
391
Figure 2: CO distribution from Centre line of the road
Figure 3: NOx distribution from Centre line of the road
0.00
50.00
100.00
150.00
200.00
250.00
300.00
350.00
400.00
450.00
500.00
-500 -400 -300 -200 -100 0 100 200 300 400 500
CO Concentration (mg/m3)
2020
2025
2030
2035
0.00
50.00
100.00
150.00
200.00
-500 -400 -300 -200 -100 0 100 200 300 400 500
NOx Concentration (µg/m3)
2020
2025
2030
2035
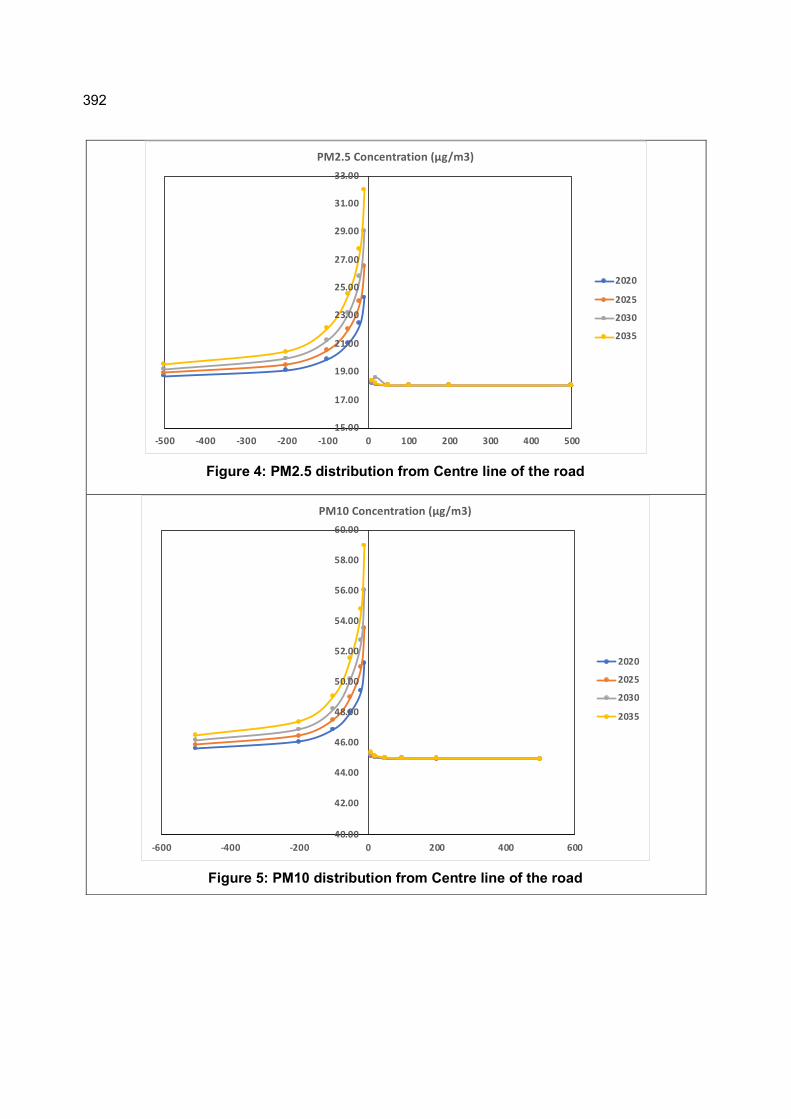
392
Figure 4: PM2.5 distribution from Centre line of the road
Figure 5: PM10 distribution from Centre line of the road
15.00
17.00
19.00
21.00
23.00
25.00
27.00
29.00
31.00
33.00
-500 -400 -300 -200 -100 0 100 200 300 400 500
PM2.5 Concentration (µg/m3)
2020
2025
2030
2035
40.00
42.00
44.00
46.00
48.00
50.00
52.00
54.00
56.00
58.00
60.00
-600 -400 -200 0 200 400 600
PM10 Concentration (µg/m3)
2020
2025
2030
2035
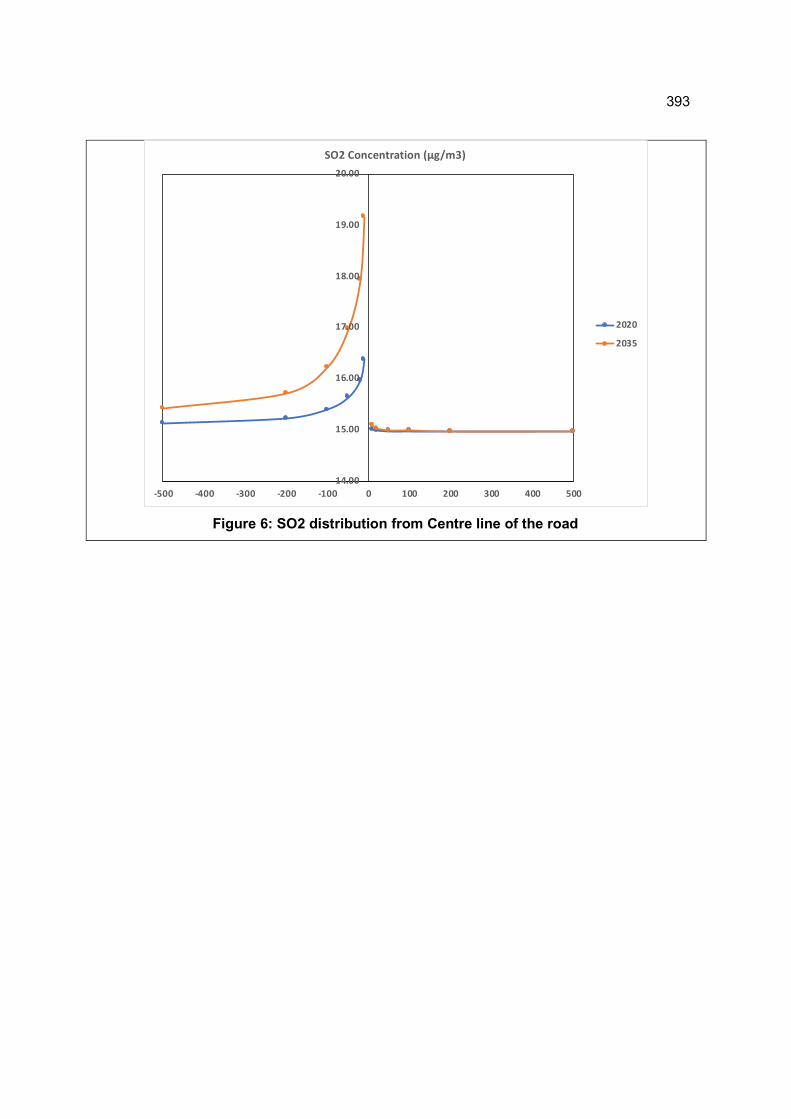
393
Figure 6: SO2 distribution from Centre line of the road
14.00
15.00
16.00
17.00
18.00
19.00
20.00
-500 -400 -300 -200 -100 0 100 200 300 400 500
SO2 Concentration (µg/m3)
2020
2035
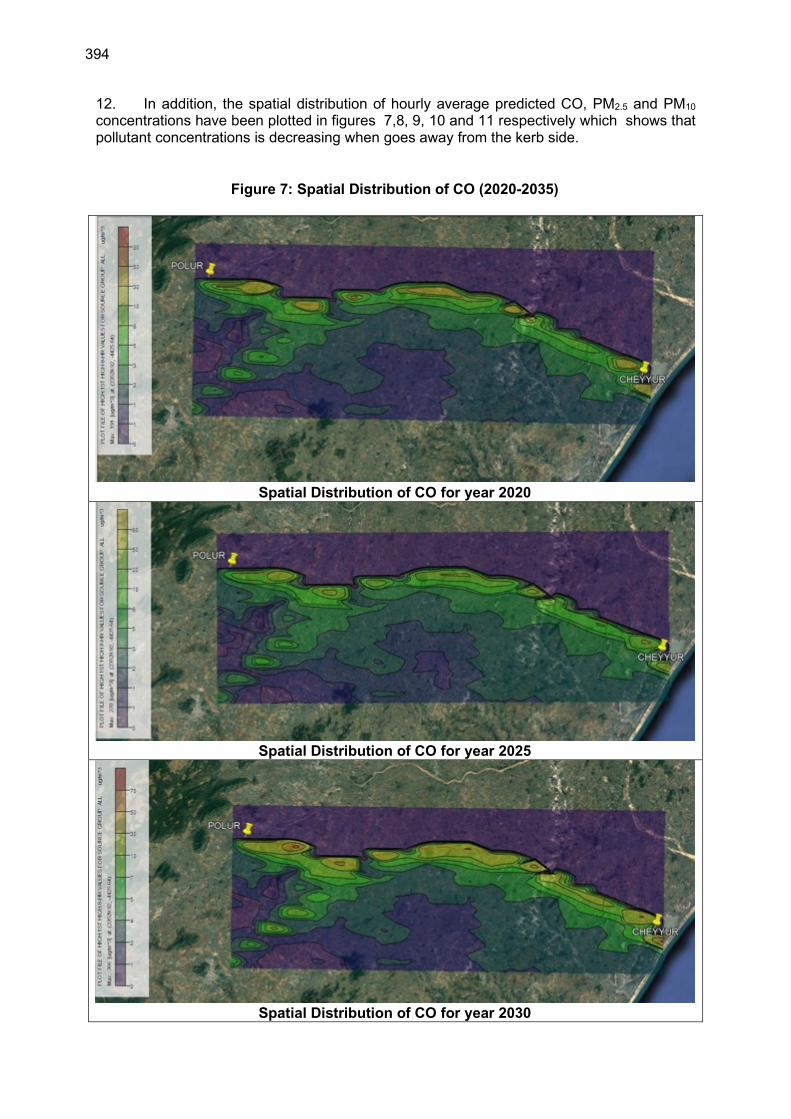
394
12. In addition, the spatial distribution of hourly average predicted CO, PM2.5 and PM10 concentrations have been plotted in figures 7,8, 9, 10 and 11 respectively which shows that pollutant concentrations is decreasing when goes away from the kerb side.
Figure 7: Spatial Distribution of CO (2020-2035)
Spatial Distribution of CO for year 2020
Spatial Distribution of CO for year 2025
Spatial Distribution of CO for year 2030

395
Spatial Distribution of CO for year 2035
Figure 8: Spatial Distribution of PM2.5 (2020-2035)
Spatial Distribution of PM2.5 for year 2020
Spatial Distribution of PM2.5 for year 2025
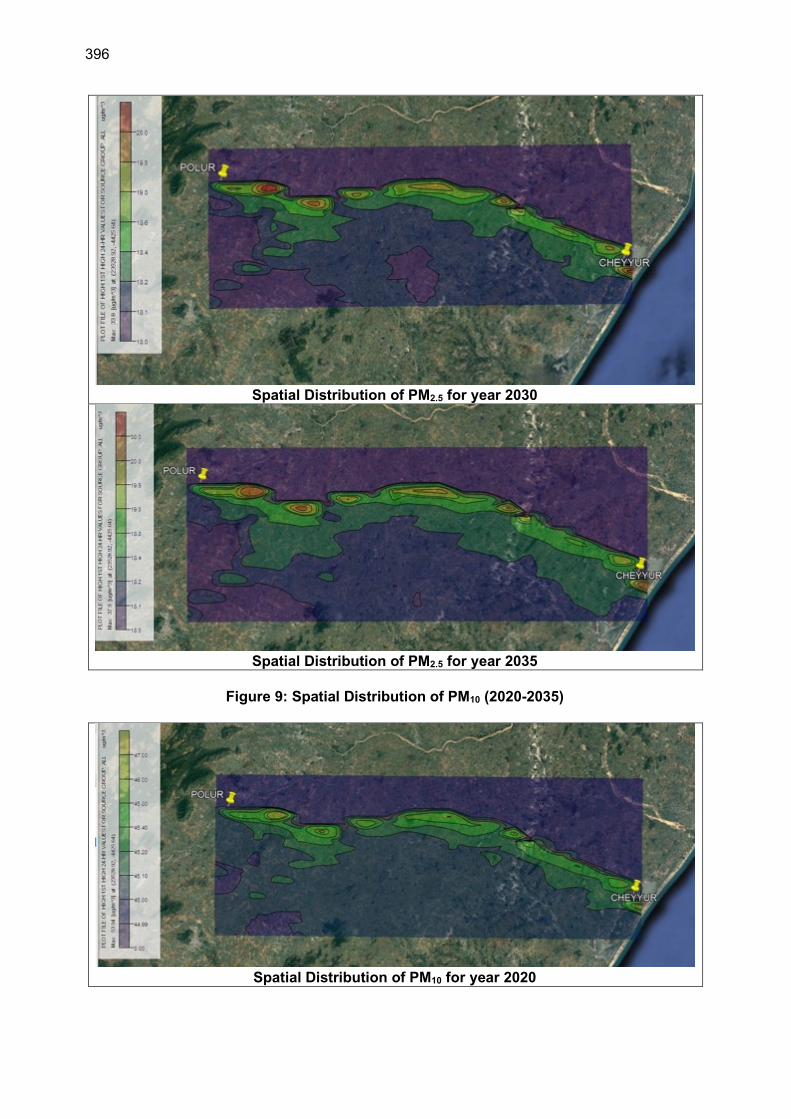
396
Spatial Distribution of PM2.5 for year 2030
Spatial Distribution of PM2.5 for year 2035
Figure 9: Spatial Distribution of PM10 (2020-2035)
Spatial Distribution of PM10 for year 2020
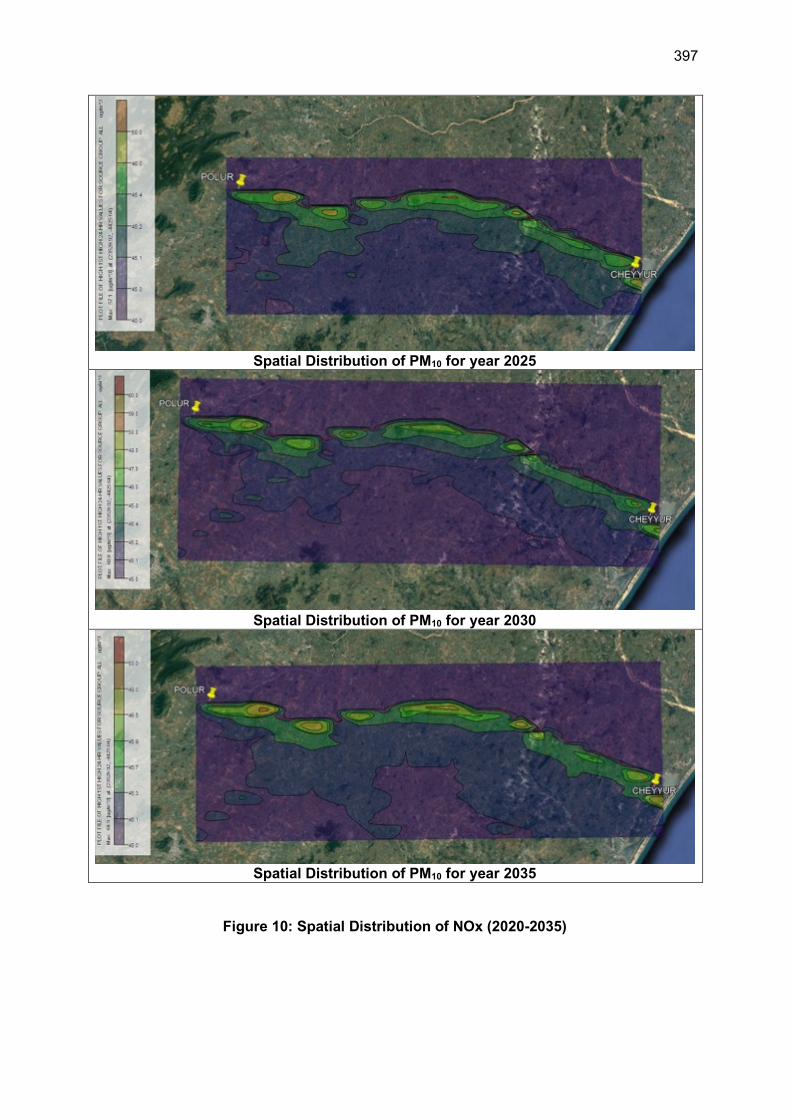
397
Spatial Distribution of PM10 for year 2025
Spatial Distribution of PM10 for year 2030
Spatial Distribution of PM10 for year 2035
Figure 10: Spatial Distribution of NOx (2020-2035)
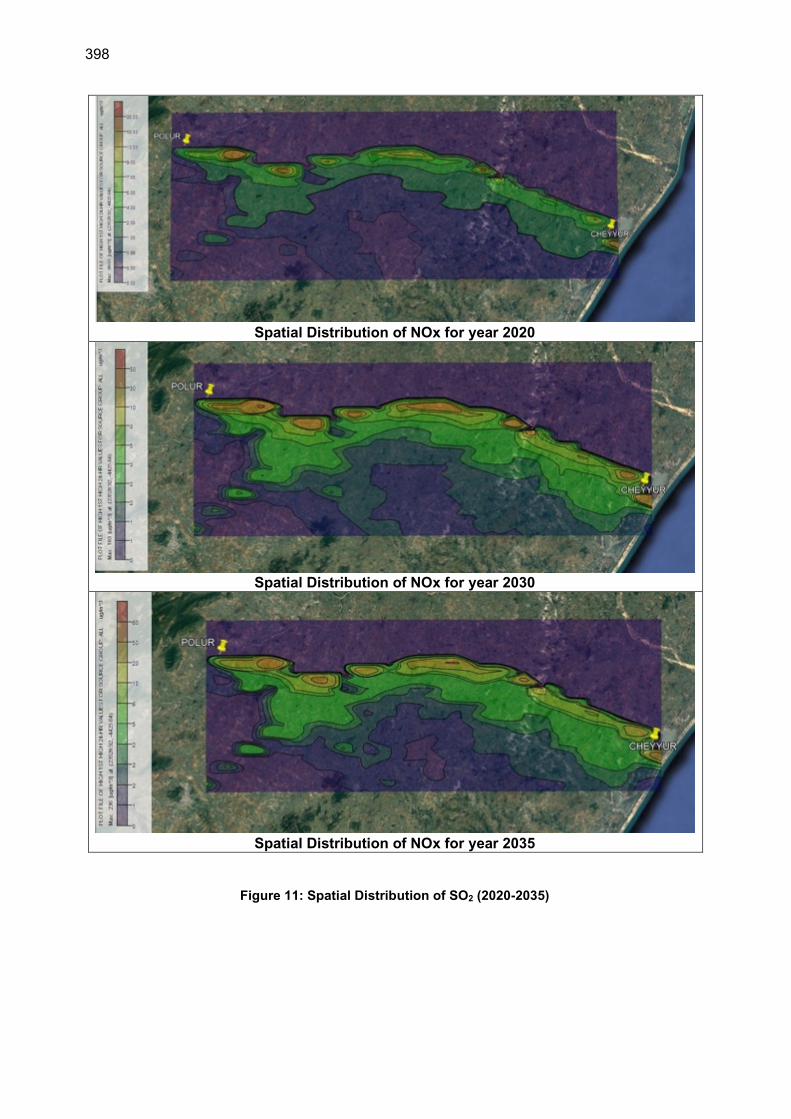
398
Spatial Distribution of NOx for year 2020
Spatial Distribution of NOx for year 2030
Spatial Distribution of NOx for year 2035
Figure 11: Spatial Distribution of SO2 (2020-2035)
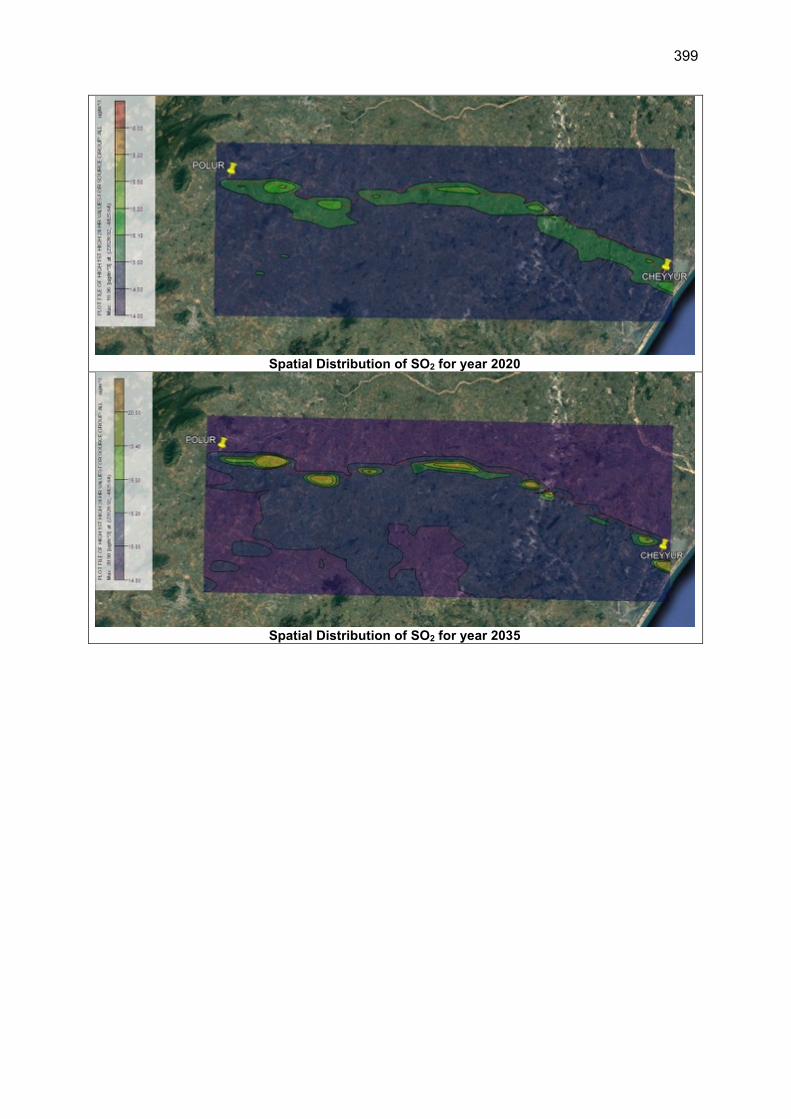
399
Spatial Distribution of SO2 for year 2020
Spatial Distribution of SO2 for year 2035
400
Appendix 8: Guidelines For Plant Management
A. Purpose
To ensure that statutory / regulatory requirements are complied with
To ensure that safeguard measures are taken to avoid / mitigate / minimize environmental impacts
B. Site selection criteria
1. Following criteria are to be met wherever possible for crusher and HMP:
500 m away from settlement, school, hospital on downwind directions
1 km from any archaeological site
1 km from ecologically sensitive areas i.e. forest, national park, sanctuary etc.
500 m from rivers, streams and lakes
500 m from ponds
200 m from State and National Highway boundary
away from agricultural land
preference to barren land
2. Concrete batching plant should be located at least 500 m from the settlement, preferably on leeward side, whenever possible. 3. The format for submission of details to the Engineer during finalisation of plant site is given as follows (Site identification for Plants). C. Statutory Requirements
Obtaining Consent-for-Establishment (CFE) under Air and Water Acts from the State Pollution Control Board (SPCB) before start of installation
Obtaining Consent-for-Operation (CFO) under Air and Water Acts from the State Pollution Control Board (SPCB) before start of commissioning and trial run
Complying with the terms and conditions laid down in the CFE and CFO, which generally include providing metallic road inside plant campus for movement of vehicles, plantation, periodic (monthly) pollution monitoring i.e. ambient air, noise and stack emission
The suspended particulate matter contribution value at a distance of 40 m from a controlled isolated as well as from a unit located in a cluster should be
less than 600 g/m3 or as shall be prescribed by SPCB.
Obtain certificates from manufacturer for Type Approval and Conformity of Production for Diesel Generator (DG) set/s.
For DG sets of capacity up to 1000 kVA, the noise level at 1 m from the enclosure surface shall not exceed 75 dB (A).
D. Pollution control measures
Dust control measures in stone crusher plant i.e. water sprinkling at primary crusher and secondary crusher, conveyor & return belts, covered conveyor system, chute at outfall of aggregates, cyclone separator, wind braking wall etc.
For HMP, ensure adequate stack height as stipulated in CFE, install emission control devices such as bag house filters, cyclone separators, water scrubbers etc., as attached with the plant by the manufacturer or stipulated in CFE.
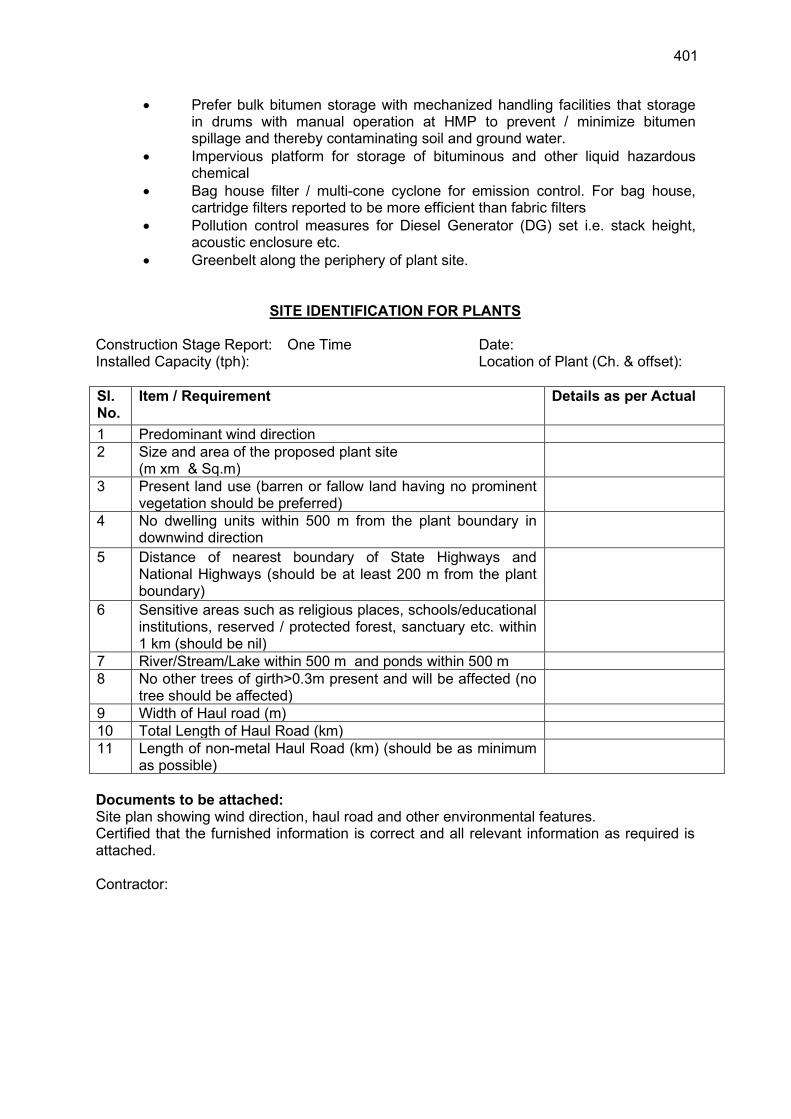
401
Prefer bulk bitumen storage with mechanized handling facilities that storage in drums with manual operation at HMP to prevent / minimize bitumen spillage and thereby contaminating soil and ground water.
Impervious platform for storage of bituminous and other liquid hazardous chemical
Bag house filter / multi-cone cyclone for emission control. For bag house, cartridge filters reported to be more efficient than fabric filters
Pollution control measures for Diesel Generator (DG) set i.e. stack height, acoustic enclosure etc.
Greenbelt along the periphery of plant site.
SITE IDENTIFICATION FOR PLANTS
Construction Stage Report: One Time Date: Installed Capacity (tph): Location of Plant (Ch. & offset):
Sl. No.
Item / Requirement Details as per Actual
1 Predominant wind direction
2 Size and area of the proposed plant site (m xm & Sq.m)
3 Present land use (barren or fallow land having no prominent vegetation should be preferred)
4 No dwelling units within 500 m from the plant boundary in downwind direction
5 Distance of nearest boundary of State Highways and National Highways (should be at least 200 m from the plant boundary)
6 Sensitive areas such as religious places, schools/educational institutions, reserved / protected forest, sanctuary etc. within 1 km (should be nil)
7 River/Stream/Lake within 500 m and ponds within 500 m
8 No other trees of girth>0.3m present and will be affected (no tree should be affected)
9 Width of Haul road (m)
10 Total Length of Haul Road (km)
11 Length of non-metal Haul Road (km) (should be as minimum as possible)
Documents to be attached: Site plan showing wind direction, haul road and other environmental features. Certified that the furnished information is correct and all relevant information as required is attached. Contractor:
402
Appendix 9: Guidelines for Camp Site Management
A. Purpose
1. Campsite of a contractor represents the single potentially most polluting location during implementation of any road project. Air pollution may be caused by emissions from Crushers, Hot-Mix, and Concrete Batching Plants. Water pollution may be caused by discharge of sediment, oil & grease, and organics laden run-off from these plants and their ancillary facilities as well as workshops, residential quarters for the labor. Land may be polluted due to indiscriminate disposal of domestic waste or (accidental) release of hazardous solids from storage areas. 2. While the installation and operation of Crushers and Hot-Mix Plants are regulated by the respective Pollution Control Boards, the other sources described above usually do not appear to be causes of significant concern. Items to be considered for labor camps are mentioned briefly in Clause 105.2 (as part of 105: Scope of Work) of the Ministry of Road Transport and Highways (MoRTH) publication: Specifications for Road and Bridge Works. Some specific requirements for labor accommodation and facilities are to be met by the Contractor in line with Building and Other Construction Workers (Regulation of Employment and Conditions of Service) Act, 1996. Currently, there is no one-point guidance regarding the environmental management aspects of the Contractor’s campsite. This guideline on Campsites is designed to fill this gap. B. Scope
3. This guideline covers the Contractors’ camp sites – whether used by in-house crew or by any sub-contractors’ crew. It covers siting, operation, maintenance, repair and dismantling procedures for facilities for labor employed on project (and ancillary) activities as well as equipment and vehicles. It does not include siting, operation, maintenance, repair and dismantling of major plants – Hot-mix Plant, Concrete Batching Plant, Crusher or Wet Mix Macadam Plant.
1. Siting, Establishing, Operation and Closure of Construction Camp
a. Potential Environmental Impacts
4. Construction camps require large areas for siting facilities like major plants, storage areas for material, residential accommodation for construction labor and supervisors, and offices. Removal of topsoil and vegetation from the land to be utilized for camps is the first direct impact of any such establishment. In addition, local drainage may be impaired if proper drainage is not effected by grading. Other impacts may include damage to ecologically important flora and fauna, if campsites are located close to such areas. Water pollution because of discharge of sediment, fuel and chemicals is also a possibility. Pollution of land due to indiscriminate disposal of construction wastes including scarified pavement, concrete and even substantial quantities of domestic wastes from residential areas can also be potentially disastrous, especially if the site is reverted to its original use after the project (mostly agriculture).
b. Mitigation Measures
2. Siting of Construction Camps 5. The following guidelines will assist the Contractor to avoid any environmental issues while siting construction camps:
403
Maintain a distance of at least 1 km from boundaries of designated Reserved Forests, Sanctuary or National Park area for locating any temporary or permanent camps.
Maintain 500m from river, stream and lake and from ponds
Maintain 200 m from the boundary of state and national highways
Locate facilities in areas not affected by flooding and clear of any natural or storm water courses.
Locate campsites in the (most prevalent) downwind direction of nearest village(s). The boundary of the campsite should be at least 500m from the nearest habitation so that the incoming labor does not stress the existing local civic facilities.
The ground should have gentle slope to allow free drainage of the site.
Recorded consultations should be held with residents of the nearest settlement and/or their representatives to understand and incorporate where possible, what they would like to see within their locality.
3. Establishment, Operation, and Closure of Camps
The facilities within the camp site should be laid out so that the separation distances suggested in other guidelines are maintained. A notional lay-out of the facilities except the major plants is included in this guideline.
Topsoil from the area of the plant shall be stored separately for the duration of the operation of the camp and protected from being washed away, unless agreed otherwise in writing with the owner. If stored, it will be returned on to its original location at the time of closure of the site.
The Contractor shall prepare, make widely available (especially to staff responsible for water and material management), and implement a Storm water Management Plan (SWMP) for (all) the site(s) following approval of the same by the Engineer. .
The Contractor shall prepare an Emergency and Spill Response Plan as per the requirements of Appendix 1 to Clause 501 of Specifications for Road and Bridge Works to cover the spillage of bitumen and/or chemicals like retarders, curing compounds, etc.
The Contractor shall prepare a Waste Management Plan describing the types and quantities that are likely to be generated from within the camp site, with the period and duration during the construction schedule; methods to be adopted to minimize these; methods of removal, treatment and (on-site or off-site) disposal for each type; as well as location of final disposal site, if any.
The Contractor shall provide safe ingress and egress for vehicles from the site and public roads and shall not impact existing through traffic.
Water tankers with sprayers must be available at the camp site at all times to prevent dust generation.
In case of stockpiles of stored material rising higher than wind-breaking perimeter fencing provided, sprinklers shall be available on site to prevent dusting from the piles during windy days.
On completion of works, the Contractor shall restore the site to the condition it was in before the establishment of the campsite, unless agreed otherwise in writing with the owner(s) of the site(s). If such a written agreement has been made, the Contractor shall hand over the site to the owner(s) in accordance with such an agreement.
Construction waste disposal should be disposed only at landfill facilities which are selected, designed, constructed and operated to ensure environmentally safe disposal, and these facilities have to be approved by the regulators.
404
4. Equipment and Vehicle-related issues
a. Potential Environmental Impacts 6. The maintenance and repair of equipment and vehicles in Contractor’s camp are activities that can have significant adverse impacts if not carried out properly. The concern mainly arises from discharge of wash water contaminated with oil and grease, whether from washing of vehicles or degreasing of equipment and vehicle parts. Vehicle washing, especially dirt from tires, also gives rise to sediment-laden run-off. No such discharges should be directly allowed into surface water bodies since they can be harmful to aquatic species.
b. Mitigation Measures
i. Vehicles
All vehicles used by the Contractor must have copies of currently valid Pollution Under Control Certificates displayed as per the requirement of the Motor Vehicles Department for the duration of the Contract.
All vehicles and equipment will be fitted with silencers and/or mufflers which will be serviced regularly to maintain them in good working condition and conforming to the standard of 75dB (A) at 1m from surface of enclosure.
ii. Workshop and Maintenance areas
These areas must have impervious flooring to prevent seepage of any leaked oil & grease into the ground. The area should be covered with a roof to prevent the entry of rainwater.
The flooring shall be sloped to from both directions to one corner where an oil-and-grease trap with sufficient capacity should be installed. All discharges from the workshop area must pass through the trap to remove the floating oil and grease before entering the drainage system of the site. The trap should be designed to provide a hydraulic residence time of about 20 minutes for the peak hourly discharge anticipated from the area (as per following figure).
Alternatively, degreasing can also be carried out using mechanical spray type degreaser, with complete recycle using an enclosure with nozzles and two sieves, coarse above and fine below, may be used as shown in the adjacent photograph. This arrangement will require some initial investment and running cost for the pump, but the payback period, in terms of the use of diesel, under Indian conditions, has been reported to be less than 1 year.
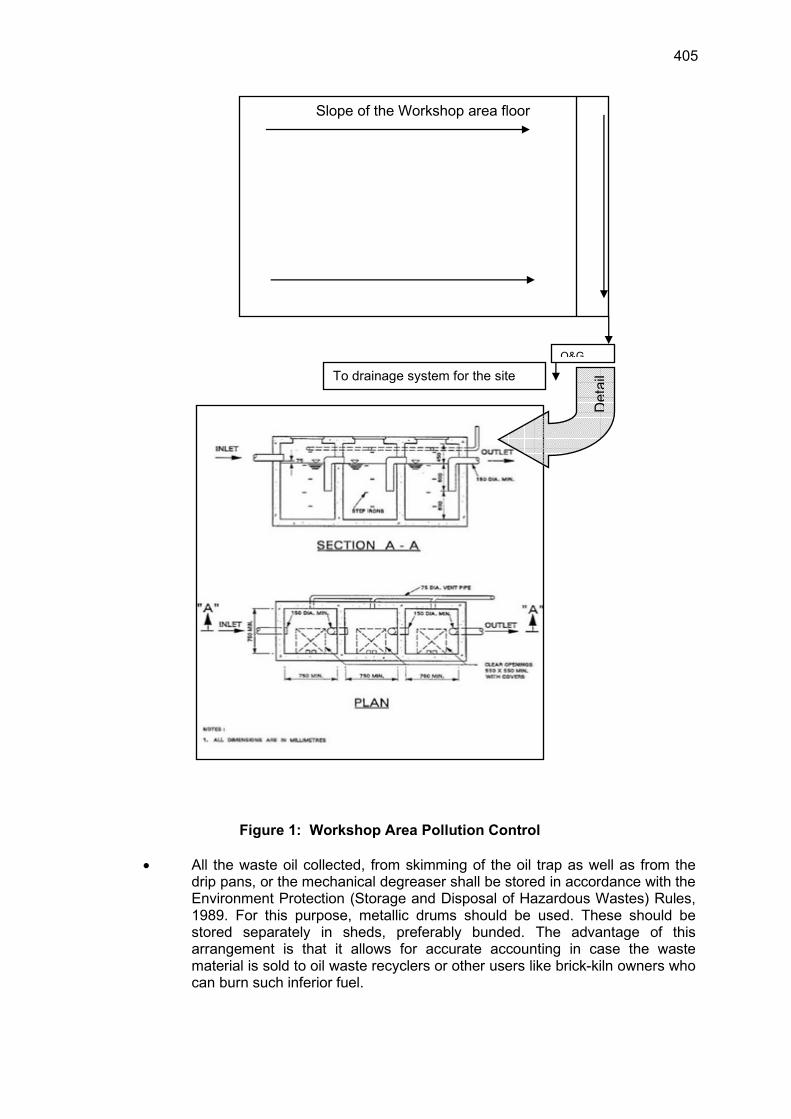
405
Figure 1: Workshop Area Pollution Control
All the waste oil collected, from skimming of the oil trap as well as from the drip pans, or the mechanical degreaser shall be stored in accordance with the Environment Protection (Storage and Disposal of Hazardous Wastes) Rules, 1989. For this purpose, metallic drums should be used. These should be stored separately in sheds, preferably bunded. The advantage of this arrangement is that it allows for accurate accounting in case the waste material is sold to oil waste recyclers or other users like brick-kiln owners who can burn such inferior fuel.
Slope of the Workshop area floor
O&G
Deta
ilTo drainage system for the site
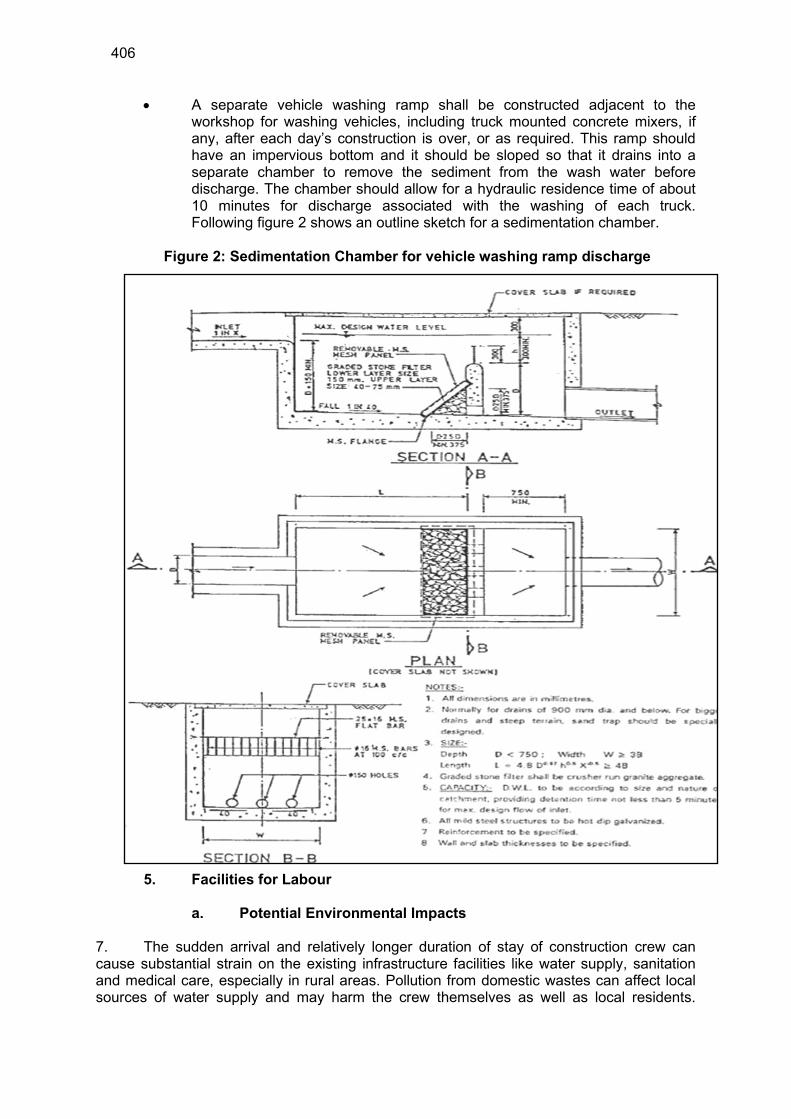
406
A separate vehicle washing ramp shall be constructed adjacent to the workshop for washing vehicles, including truck mounted concrete mixers, if any, after each day’s construction is over, or as required. This ramp should have an impervious bottom and it should be sloped so that it drains into a separate chamber to remove the sediment from the wash water before discharge. The chamber should allow for a hydraulic residence time of about 10 minutes for discharge associated with the washing of each truck. Following figure 2 shows an outline sketch for a sedimentation chamber.
Figure 2: Sedimentation Chamber for vehicle washing ramp discharge
5. Facilities for Labour
a. Potential Environmental Impacts
7. The sudden arrival and relatively longer duration of stay of construction crew can cause substantial strain on the existing infrastructure facilities like water supply, sanitation and medical care, especially in rural areas. Pollution from domestic wastes can affect local sources of water supply and may harm the crew themselves as well as local residents.
407
Improper sanitation and inadequate health care also potential bottlenecks that the Contractor can eliminate with relatively little effort.
b. Mitigation Measures
8. It should be emphasized that the Indian Law requires that the Contractor provide several facilities to for the workers as per Building and Other Construction Workers (Regulation of Employment and Conditions of Service) Act, 1996. Some of the provisions described herein are more stringent to act as benchmark for improved environmental performance of road projects:
The contractor shall provide free-of-charge temporary accommodation to all the labour employed for the project. The accommodation includes separate cooking place, bathing, washing and lavatory facilities. At least, one toilet will be provided for every 35 people and one urinal will be provided for every 20 persons. More toilets and/or urinals may have to be provided if the Engineer decides that these numbers are insufficient. In case female labourers are employed, separate toilet and urinals will be provided in locations clearly marked “Ladies Toilets” in a language understood by most labourers.
The contractor shall ensure the supply of wholesome water for all the labour, including those employed by any other agency working for the contractor. These locations will be marked “Drinking Water” in the language most commonly understood among the labour. In hot season, the contractor shall make efforts to ensure supply of cool water. No water point shall be located within 15 m of any washing place, urinal, or latrine.
The contractor shall ensure that adequate cooking fuel, preferably kerosene or LPG, is available on-site. The contractor will ensure that wood/ coal are not used as fuel on the site. Workers need to be made aware of this restriction. In cases where more than 250 labours are employed, canteen facility should be provided by the Contractor.
A crèche must be provided in each campsite where more than 50 female labourers are employed, whether directly or indirectly, for the project or its ancillary activities.
Contractor must provide adequate facilities for first-aid treatment at the campsite. A doctor / ambulance should be available on call for the duration of project implementation.
The contractor shall obtain the approval of the Engineer for these facilities within 30 days of mobilization.
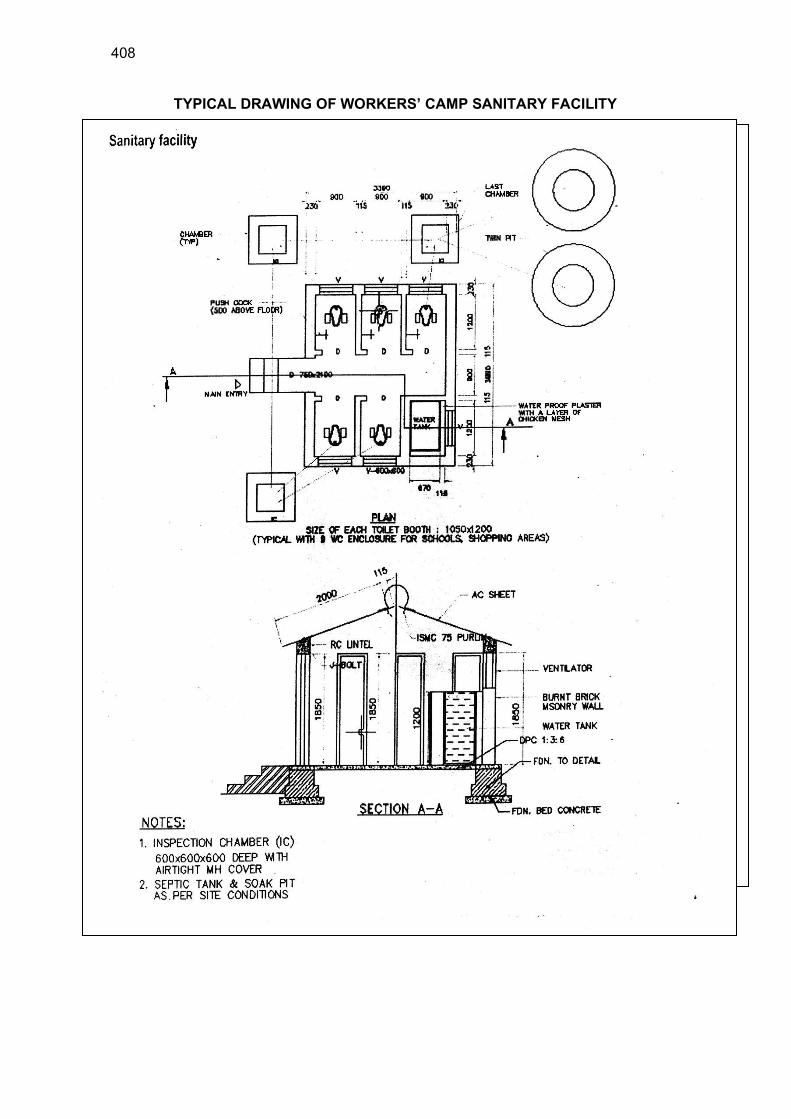
408
TYPICAL DRAWING OF WORKERS’ CAMP SANITARY FACILITY
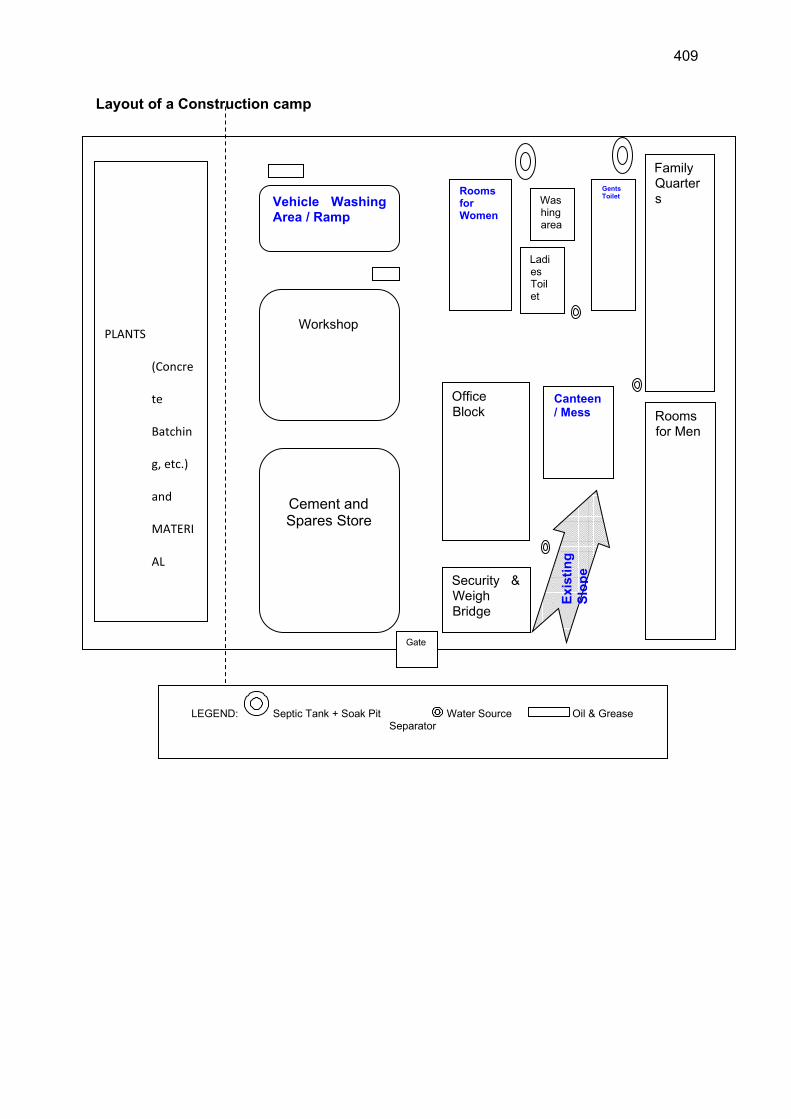
409
Layout of a Construction camp
Vehicle Washing Area / Ramp
Workshop
Cement and Spares Store
Security & Weigh Bridge
Office Block
Family Quarters
Rooms for Men
Rooms for Women
Ladies Toilet
Washing area
Gents Toilet
PLANTS
(Concre
te
Batchin
g, etc.)
and
MATERI
AL
Canteen / Mess
LEGEND: Septic Tank + Soak Pit Water Source Oil & Grease Separator
Gate
Exis
tin
g
Slo
pe
410
Appendix 10: Guidelines for Waste (Debris and Spoils) Disposal and Management
A Waste disposal and management plan will be prepared by the contractor before start of construction works and submitted to CKICP, PIU-ADB and the Construction Supervision Consultant for their review and approval. The management plan will follow the guidelines as given below:
(i) The debris disposal site should be identified which are preferably barren or low-lying areas away from settlements.
(ii) Contractor to prepare spoil disposal plan which identifies spoil disposal sites including volume of spoils that can be accommodated by each site, and agreed restoration measures (e.g. revegetation, compaction, provision of drainage, etc.) and timeline
(iii) Prior concurrence will be taken from concerned Government Authorities or land owner for selected disposal sites and restoration measures
(iv) Due care should be taken during site clearance and disposal of debris so that public/ private properties are not damaged or affected, no traffic are interrupted.
(v) All efforts should be made to use debris in road construction or any other public utilities to minimize spoils and debris
(vi) If immediate disposal is not possible, the debris and spoils should be stored at site ensuring that existing water bodies and drains within or adjacent to the site are kept safe and free and no blocking of drains occurs until ready to be transported to final spoils disposal site
(vii) All dust prone material should be transported in a covered truck.
(viii) All liquid waste like oils and paint waste should be stored at identified locations and preferably on a cemented floor. Provision of spill collection pit will be made in the floor to collect the spilled oil or paint. These should be sold off to authorized recyclers.
(ix) All domestic waste generated at construction camp preferably be composted in portable mechanized composter. The composted material will be used as manure. In case composting is not feasible, the material will either be disposed off though municipal waste disposal system or disposed of through land burial. The dump site must be covered up with at least six inch thick layer of soil.
(x) Only appropriately design and compliant landfills will be used for disposing waste
(xi) All efforts should be made that no chemical/ oily waste spill over to ground or water bodies.
(xii) All precautions should be followed for emergency preparedness and occupational health & safety during construction and handling wastes and spoils.
(xiii) Provision of fire extinguishers will be made at the storage area
(xiv) Adequate traffic control signals and barriers should be used in case traffic is to be diverted during debris disposal. All efforts should be made to ensure avoidance of traffic jam, which otherwise results in air pollution, noise pollution and inconveniences to the road users and adjacent communities.
(xv) Hazardous waste and chemicals should be stored in a dedicated storage area that has: 1) weather protection, 2) solid impermeable surface and drainage to treatment system, 3) security fence/lock, 4) primary and secondary containment with 110% volume for liquids.
(xvi) Domestic waste shall only be disposed of at the approved, appropriately designed, compliant waste management facility (landfill). Land burial of waste shall not be permitted.
Records: The following records will be maintained
Generation and disposal quantity with location of disposal
Recyclables waste generation and disposal

411
Domestic waste disposal locations details
Reporting:
The waste generation and disposal details will form part of quarterly report to CKICP, PIU-ADB
Responsibility:
Prime Responsibility: Contractor will be responsible for waste management and reporting
Supervisory Responsibility: Construction Supervision Consultant (CSC) will check the contractor’s adherence to the above guidelines
412
Appendix 11: Guidelines for Borrow Area Management
A. Purpose 1. Borrow areas are generally required to provide material for road construction sites, can have significant adverse environmental effects, especially on ecologically sensitive areas. Borrow areas can become environmental hotspots and can significantly affect the visual appearance of an area. Special mitigation and management measures are often required to avoid or minimise the environmental and social impacts of borrow areas.
B. Scope 2. These guidelines for borrow areas cover:
• statutory approvals • environmental and social impacts of borrow areas • selection of borrow areas • operation of borrow areas • rehabilitation of borrow areas
3. The guidelines seek to ensure that Contractors:
• comply with the regulatory requirements in force at the time • reasonably manage any impacts • reinstate and rehabilitate the land appropriately • consult with affected communities
C. Impacts
4. Some of the potential impacts of borrow areas are:
• trucks transporting materials to the site causing air pollution, and noise and vibrations
• ponds of stagnant water forming in excavated areas giving rise to the breeding of mosquitoes and the spreading of malaria and other mosquito-borne diseases
• natural beauty of the landscape being affected by excavations and the removal of vegetation
• natural drainage systems in the area being affected by excavations • agriculture land and productive soils being lost, especially in paddy field areas
5. Borrow areas are not generally specified in Contract documents but rather it is generally the responsibility of Contractors to identify borrow areas and obtain the necessary consent from land owner and approval from SC. 6. In IRC: 10 and Clause 305.2.2.2 of MoRTH Specification, exclusive guideline has been given for borrow areas located alongside the road and only some of the requirements have been indicated for borrow areas located outside the road land. Following guideline is proposed to supplement the existing stipulation in IRC:10 and Clause 305.2.2.2 of MoRTH Specification for Roads and Bridge Works:
D. Location • Identify areas having present land use as barren land, riverside land.
Otherwise, un-irrigated agriculture land or land without vegetation and tree cover;
• Prefer borrow areas on bed of irrigation water storage tank; • Prefer areas of highland with respect to surroundings;
413
• Avoid locating borrow area close to any road (maintain atleast 30 m distance from ROW and 10 m from toe of embankment, whichever is higher);
• Should be at least 1.5 km away from inhabited areas; • Maintain a distance of about 1.5km from ecologically sensitive area i.e.
Reserve Forest, Protected Forest, Sanctuary, wetland etc.; • Maintain a distance of about 1.5 km from school, hospital and any
archaeological sites; • Having adequate approach road with minimum length of earthen road; • Ensure that unsuitable soft rock is not prominent within the proposed depth of
excavation which will render rehabilitation difficult; • Depth of excavation should be decided based on natural ground level of the
land and the surroundings, and rehabilitation plan. In case higher depth of excavation is agreed with backfilling by unsuitable excavated soil (from roadway), then filling should be adequately compacted except topsoil which is to be spread on topmost layer (for at least 20cm thick).
E. Operation
• Controlled operation as per agreed / approved plan; • Preservation of topsoil at designated areas e.g. corners of the area etc.; • Maintain necessary buffer zone in all directions and go for vertical cut within
this area. Final cut slope should be maintained within the buffer zone; • Step-wise excavation if borrow area is located on inclined area having more
than 2% slope; • Restricting excavation up to 2m for each stages of operation if allowed depth
is more; • Avoid cutting of any tree of girth size > 30cm2. if any tree cutting is inevitable,
prior permission (written) from the competent authority should be taken and compensatory plantation has to be raised.
F. Rehabilitation
• Prior approval of Rehabilitation Plan considering terrain, land use and local need;
• Restricting operation as agreed by landowner and approved by the Engineer; • Rehabilitation within agreed timeframe and before taking over; • Integrate debris disposal and borrow area redevelopment.
G. Management Procedure
7. The important aspects of this procedure are:
• The first and foremost thing is to have tentative estimate of borrow material requirement chainage-wise. For this, Bill of Quantities(BOQ) quantity for earth work, which is given as total quantity for the entire package/milestone, has to be distributed chainage-wise. The requirement of borrow material chainage-wise then has to be estimated based on the suitability of roadway excavation material for reuse and BOQ.
• Contractor to site borrow areas fulfilling environmental requirements and obtaining one time approval of the Engineer both on quality as well as environmental consideration thereby integrating environmental safeguard measures into day-to-day activities;
• Contractor to submit environmental information in prescribed format for obtaining Engineer’s approval, as given in the following format (Borrow Area
2 Plant having girth size more than 30cm is considered as tree.
414
Identification). The format has been so designed that it stipulates the requirements as well as what is actual for each borrow areas and could be easily understood by any person, whoever in-charge of identifying borrow areas;
• Contractor to submit Borrow Area Layout Plan as attachment to the format showing the land use of the proposed and surrounding area along with the presence of other environmental features such as water bodies, forests, settlement, temple and any sensitive receptor i.e. health and educational institution, roads etc. within a radius of 1.5km area from the boundary of the borrow area;
• Contractor to prepare and submit Block Contour Map of each borrow area (especially which are located close to road and on undulating terrain) for deciding on operation and redevelopment plan;
• Contractor to prepare Operation Plan and submit as attachment to the format including cross sections on both directions (x,y) mentioning natural ground level, depth of topsoil (if any), total depth of excavation, cut side slope and bed slope;
• Contractor to prepare Rehabilitation/ Restoration and submit as attachment to the format include cross sections on both directions (x,y) mentioning natural ground level, excavated profile, finished profile after rehabilitation, volume of spoils that can be accommodated etc.;
• Contractor to maintain Borrow Material Register; • Periodic joint inspections of each borrow area until rehabilitation is complete
as agreed and approved. • The checklist for periodic inspection is given in this appendix.
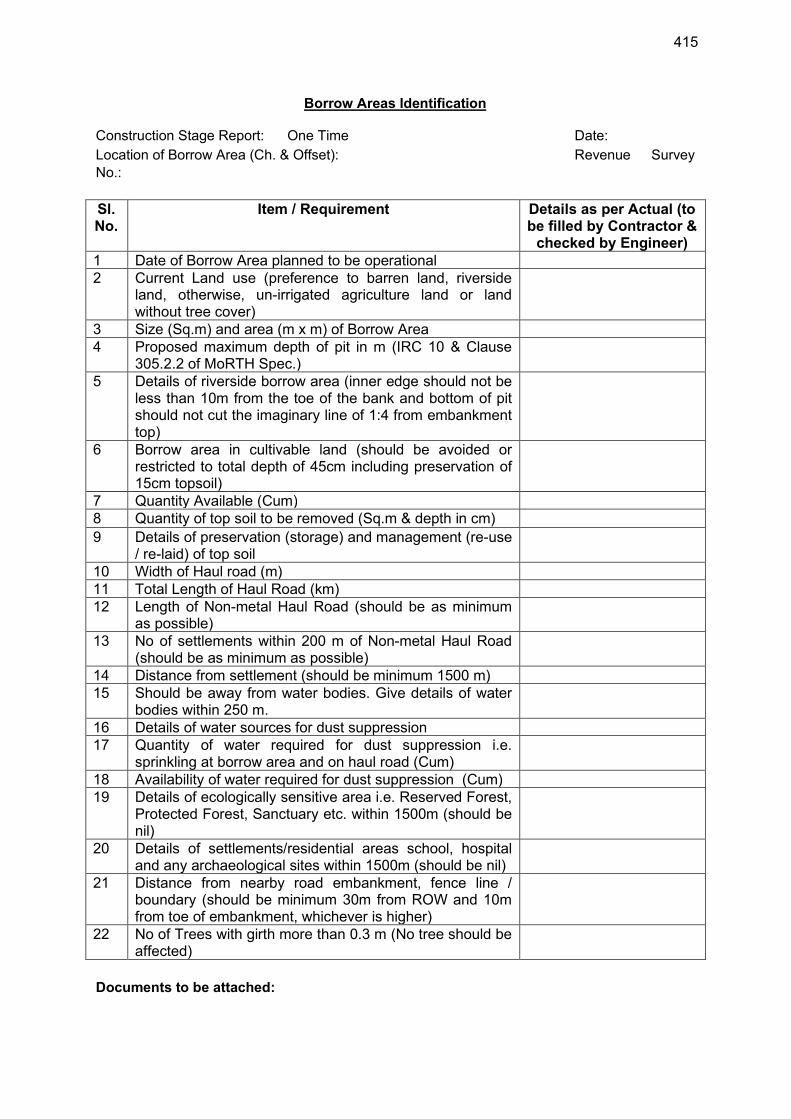
415
Borrow Areas Identification
Construction Stage Report: One Time Date:
Location of Borrow Area (Ch. & Offset): Revenue Survey
No.:
Sl. No.
Item / Requirement Details as per Actual (to be filled by Contractor &
checked by Engineer)
1 Date of Borrow Area planned to be operational
2 Current Land use (preference to barren land, riverside land, otherwise, un-irrigated agriculture land or land without tree cover)
3 Size (Sq.m) and area (m x m) of Borrow Area
4 Proposed maximum depth of pit in m (IRC 10 & Clause 305.2.2 of MoRTH Spec.)
5 Details of riverside borrow area (inner edge should not be less than 10m from the toe of the bank and bottom of pit should not cut the imaginary line of 1:4 from embankment top)
6 Borrow area in cultivable land (should be avoided or restricted to total depth of 45cm including preservation of 15cm topsoil)
7 Quantity Available (Cum)
8 Quantity of top soil to be removed (Sq.m & depth in cm)
9 Details of preservation (storage) and management (re-use / re-laid) of top soil
10 Width of Haul road (m)
11 Total Length of Haul Road (km)
12 Length of Non-metal Haul Road (should be as minimum as possible)
13 No of settlements within 200 m of Non-metal Haul Road (should be as minimum as possible)
14 Distance from settlement (should be minimum 1500 m)
15 Should be away from water bodies. Give details of water bodies within 250 m.
16 Details of water sources for dust suppression
17 Quantity of water required for dust suppression i.e. sprinkling at borrow area and on haul road (Cum)
18 Availability of water required for dust suppression (Cum)
19 Details of ecologically sensitive area i.e. Reserved Forest, Protected Forest, Sanctuary etc. within 1500m (should be nil)
20 Details of settlements/residential areas school, hospital and any archaeological sites within 1500m (should be nil)
21 Distance from nearby road embankment, fence line / boundary (should be minimum 30m from ROW and 10m from toe of embankment, whichever is higher)
22 No of Trees with girth more than 0.3 m (No tree should be affected)
Documents to be attached:
416
1) Site plan and layout plan of borrow area; 2) Proposed borrow area operation and redevelopment plan; 3) Written consent from competent authority for use of water for dust
suppression 4) Written consent of landowner on agreed operation and redevelopment plan
Certified that the furnished information is correct and all relevant information as required is attached Contractor’s Representative:
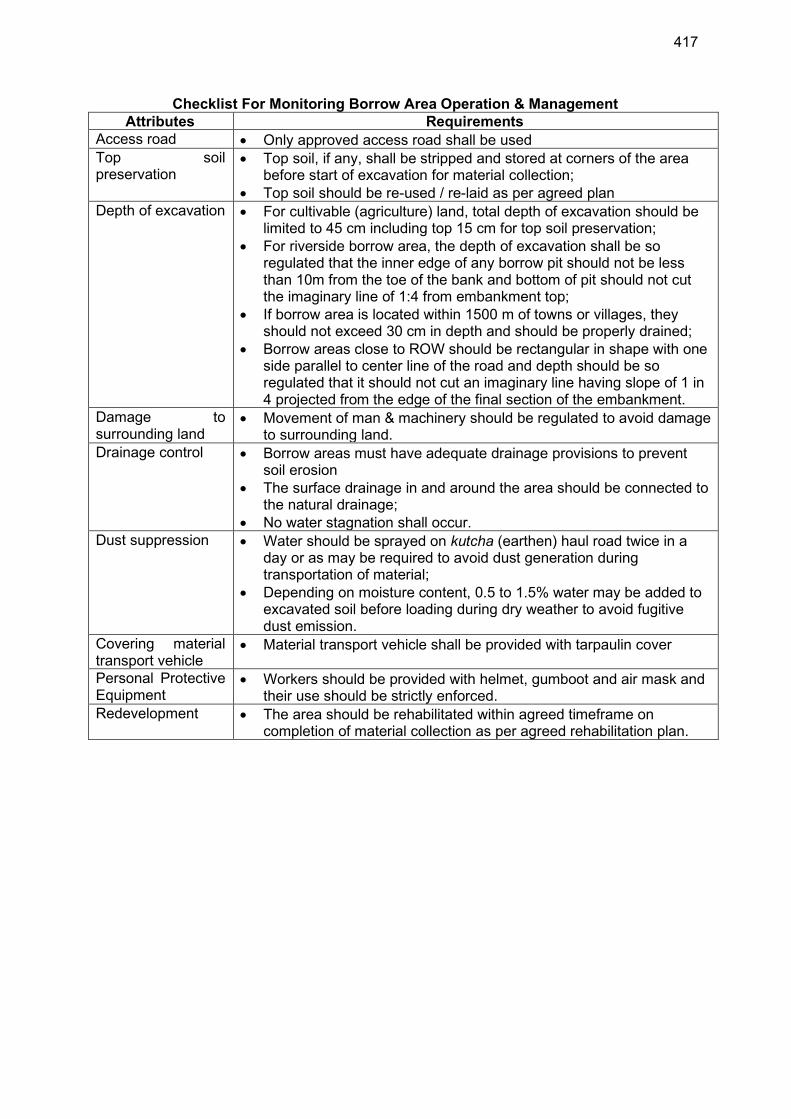
417
Checklist For Monitoring Borrow Area Operation & Management
Attributes Requirements
Access road Only approved access road shall be used
Top soil preservation
Top soil, if any, shall be stripped and stored at corners of the area before start of excavation for material collection;
Top soil should be re-used / re-laid as per agreed plan
Depth of excavation For cultivable (agriculture) land, total depth of excavation should be limited to 45 cm including top 15 cm for top soil preservation;
For riverside borrow area, the depth of excavation shall be so regulated that the inner edge of any borrow pit should not be less than 10m from the toe of the bank and bottom of pit should not cut the imaginary line of 1:4 from embankment top;
If borrow area is located within 1500 m of towns or villages, they should not exceed 30 cm in depth and should be properly drained;
Borrow areas close to ROW should be rectangular in shape with one side parallel to center line of the road and depth should be so regulated that it should not cut an imaginary line having slope of 1 in 4 projected from the edge of the final section of the embankment.
Damage to surrounding land
Movement of man & machinery should be regulated to avoid damage to surrounding land.
Drainage control Borrow areas must have adequate drainage provisions to prevent soil erosion
The surface drainage in and around the area should be connected to the natural drainage;
No water stagnation shall occur.
Dust suppression Water should be sprayed on kutcha (earthen) haul road twice in a day or as may be required to avoid dust generation during transportation of material;
Depending on moisture content, 0.5 to 1.5% water may be added to excavated soil before loading during dry weather to avoid fugitive dust emission.
Covering material transport vehicle
Material transport vehicle shall be provided with tarpaulin cover
Personal Protective Equipment
Workers should be provided with helmet, gumboot and air mask and their use should be strictly enforced.
Redevelopment The area should be rehabilitated within agreed timeframe on completion of material collection as per agreed rehabilitation plan.
418
Appendix 12: Guidelines for Quarry Area Management
A. Purpose
1. Quarries generally required to provide material for road construction sites, can have significant adverse environmental effects, especially on ecologically sensitive areas. Quarries can become environmental hotspots and can significantly affect the visual appearance of an area. Special mitigation and management measures are often required to avoid or minimise the environmental and social impacts of quarries.
B. Scope
2. These guidelines for quarries cover: • statutory approvals • environmental and social impacts of quarries • selection of quarries • operation of quarries • rehabilitation of quarries
3. The guidelines seek to ensure that Contractors3:
• comply with the regulatory requirements in force at the time • reasonably manage any impacts • reinstate and rehabilitate the land appropriately • consult with affected communities
C. Impacts
4. Some of the potential impacts of quarries are: • rock blasting causing air pollution, and noise and vibrations • trucks transporting materials to the site causing air pollution, and noise and
vibrations • ponds of stagnant water forming in excavated areas giving rise to the
breeding of mosquitoes and the spreading of malaria and other mosquito-borne diseases
• natural beauty of the landscape being affected by excavations and the removal of vegetation
• natural drainage systems in the area being affected by excavations
5. The procedure for identification and finalization of quarry site/s shall be as given below:
• Estimating the quantity of quarry material to be collected from each quarry area
• Only licensed quarry will be used • New quarry will be at least 1.5 km away from the settlement, forest and
other ecologically sensitive areas • Away from water body • Contractor shall identify alternative quarry sites along the whole corridor
based on required quantity and environmental consideration as given in the following prescribed format of Quarry source identification.
• Contractor shall submit to the Engineer the detailed information / documents as prescribed in the format;
3 The EMP stipulations will be applicable even if contract use existing licensed quarry. In case contractor use
the existing licensed quarry a copy of the quarry license and lease / sub-lease agreement should be submitted to the Project Proponent. Contractor shall submit a plan delineating how he shall comply with requirements stipulated in this plan and elsewhere in the EMP on quarrying activity.
419
• Engineer shall undertake site inspection of alternate quarry sites and convey to Contractor on accepting a particular quarry site on environmental consideration;
• Contractor shall then take apply and obtain Quarry Lease Deed / License from the Government of Tamil Nadu Department of Mines and Geology and Mining and provide copy of the same to the Engineer prior to operation;
• Contractor shall estimate water requirement for dust suppression at quarry sites during operation and for water spraying on kutcha (non-metal) haul road and ensure availability water by identifying sources and obtaining necessary permission;
• Contractor shall prepare quarry sites operation and redevelopment plan considering surrounding land uses, local needs and agreement with the landowner;
• Only licensed blaster i.e. short-firer certificate holder will be responsible for quarry blasting
• Permits for transportation, storage and use of explosive, as will be required, shall be obtained from the Controller of Explosive;
• Whenever so advised by the Engineer, controlled blasting e.g. using less charge, restricting depth and dia or drill holes, cut-off blasting etc., shall be undertaken.
• Quarry operation will be undertaken in stages with adequate benching
6. The procedure for environmentally sound operation and management of quarry sites is given below:
• Estimating the quantity of quarry material to be collected from each quarry area;
• Demarcating the entire quarry area by fencing and putting red-flag poles; • Providing adequate metallic access road; • Preserving topsoil from the quarry compound, if any, by stripping and
stacking aside separately at corners; • Carrying out blasting as per agreed operational plan complying with the
requirements of MoRTH Specification (Clause 302 & 303) and Ministry of Environment & Forests and Climate Change (MoEFCC) as given below;
• Maintaining a Quarry Material Collection Register on daily material collection for each of the quarry area, which shall be produced to Engineer’s representative as and when requested;
• Redeveloping the area within 2 months (or as will be agreed upon) of completion of quarry material collection;
D. Use of Explosive for Blasting 1. General
7. Blasting shall be carried out in a manner that completes the excavation to the lines indicated in drawings, with the least disturbance to adjacent material. It shall be done only with the written permission of the Engineer. All the statutory laws, regulations, rules, etc., pertaining to the acquisition, transport, storage, handling and use of explosives shall be strictly followed. 8. The Contractor may adopt any method or methods of blasting consistent with the safety and job requirements. Prior to starting any phase of the operation the Contractor shall provide information describing pertinent blasting procedures, dimension and notes. 9. The magazine for the storage of explosives shall be built as per national / international standards and located at the approved site. No unauthorized person shall be
420
admitted into the magazine which when not in use shall be kept securely locked. No matches or inflammable material shall be allowed in the magazine. The magazine shall have an effective lightning conductor. The following shall be displayed in the lobby of the magazine:
• A copy of the relevant rules regarding safe storage in English, Portuguese and in the language with which the workers concerned are familiar.
• A statement of up-to-date stock in the magazine. • A certificate showing the last date of testing of the lightning conductor. • A notice that smoking is strictly prohibited.
10. All explosives shall be stored in a secure manner in compliance with all laws and ordinances, and all such storage places shall be clearly marked. Where no local laws or ordinances apply, storage shall be provided to the satisfaction of the Engineer and in general not closer than 300 m from the road or from any building or camping area or place of human occupancy. In addition to these, the Contractor shall also observe the following instructions and any further additional instructions which may be given by the Engineer and shall be responsible for damage to property and any accident which may occur to workmen or the public on account of any operations connected with the storage, handling or use of explosives and blasting. The Engineer shall frequently check the Contractor’s compliance with these precautions.
2. Materials, Tools and Equipment
11. All the materials, tools and equipment used for blasting operations shall be of approved type. The Engineer may specify the type of explosives to be allowed in special cases. The fuse to be used in wet locations shall be sufficiently water-resistant as to be unaffected when immersed in water for 30 minutes. The rate of burning of the fuse shall be uniform and definitely known to permit such a length being cut as will permit sufficient time to the firer to reach safety before explosion takes place. Detonators shall be capable of giving effective blasting of the explosives. The blasting powder, explosives, detonators, fuses, etc., shall be fresh and not damaged due to dampness, moisture or any other cause. They shall be inspected before use and damaged articles shall be discarded totally and removed from the site immediately.
3. Personnel
12. The blasting operation shall remain in the charge of competent and experienced supervisor and workmen who are thoroughly acquainted with the details of handling explosives and blasting operations.
4. Blasting Operations
13. The blasting shall be carried out during fixed hours of the day preferably during the mid-day luncheon hour or at the close of the work as ordered in writing by the Engineer. The hours shall be made known to the people in the vicinity. All the charges shall be prepared by the man in charge only. 14. The Contractor shall notify each public utility company having structures in proximity to the site of the work of his intention to use explosives. Such notice shall be given sufficiently in advance to enable the companies to take such steps as they may deem necessary to protect their property from injury. In advance of any blasting work within 50 m of any railway track or structures, the Contractor shall notify the concerned Railway Authority of the location, date, time and approximate duration of such blasting operations.
421
15. Red danger flags shall be displayed prominently in all directions during the blasting operations. The flags shall be planted 200m and 500m from the blasting site in all directions for blasting at work site and quarry, respectively. People, except those who actually light the fuse, shall be prohibited from entering this area, and all persons including workmen shall be excluded from the flagged area at least 10 minutes before the firing, a warning siren being sounded for the purpose. 16. The charge holes shall be drilled to required depths and at suitable places. Blasting should be as light as possible consistent with thorough breakage of the material necessary for economic loading and hauling. Any method of blasting which leads to overshooting shall be discontinued. 17. When blasting is done with powder, the fuse cut to the required length shall be inserted into the hole and the powder dropped in. The powder shall be gently tamped with copper rods with rounded ends. The explosive powder shall then be covered with tamping material which shall be tamped lightly but firmly. 18. When blasting is done with dynamite and other high explosives, dynamite cartridges shall be prepared by inserting the square cut end of a fuse into the detonator and finishing it with nippers at the open end, the detonator gently pushed into the primer leaving 1/3rd of the copper tube exposed outside. The paper of the cartridge shall then be closed up and securely bound with wire or twine. The primer shall be housed into the explosive. Boreholes shall be such size that the cartridge can easily go down. The holes shall be cleared of all debris and explosive inserted. The space of about 200 mm above the charge shall then be gently filled with dry clay, pressed home and the rest of the tamping formed of any convenient material gently packed with a wooden rammer. 19. At a time, not more than 10 such charges will be prepared and fired. The man in charge shall blow a siren in a recognised manner for cautioning the people. All the people shall then be required to move to safe distances. The charges shall be lighted by the man-in-charge only. The man-in-charge shall count the number of explosions. He shall satisfy himself that all the charges have been exploded before allowing the workmen to go back to the blasting site.
5. Misfire
20. In case of misfire, the following procedure shall be observed:
Sufficient time shall be allowed to account for the delayed blast. The man-in-charge shall inspect all the charges and determine the missed charge.
If it is the blasting powder charge, it shall be completely flooded with water. A new hole shall be drilled at about 450 mm from the old hole and fired. This should blast the old charge. Should it not blast the old charge, the procedure shall be repeated till the old charge is blasted.
In case of charges of gelignite, dynamite, etc., the man-in-charge shall gently remove the tamping and the primer with the detonator. A fresh detonator and primer shall then be used to blast the charge. Alternatively, the hole may be cleared of 300 mm of tamping and the direction then ascertained by placing a stick in the hole. Another hole may then be drilled 150 mm away and parallel to it. This hole shall then be charged and fired when the misfired hole should explode at the same time. The man-in-charge shall at once report to the Contractor’s office and the Engineer all cases of misfire, the cause of the same and what steps were taken in connection therewith.
422
If a misfire has been found to be due to defective detonator or dynamite, the whole quantity in the box from which defective article was taken must be sent to the authority directed by the Engineer for inspection to ascertain whether all the remaining materials in the box are also defective.
6. Account
21. A careful and day to day account of the explosive shall be maintained by the Contractor in an approved register and manner which shall be open to inspection by the Engineer at all times. 22. During quarry operation, periodic joint inspection should be carried out by the Contractor and Engineer’s representatives. 23. A typical checklist for the same is given here.
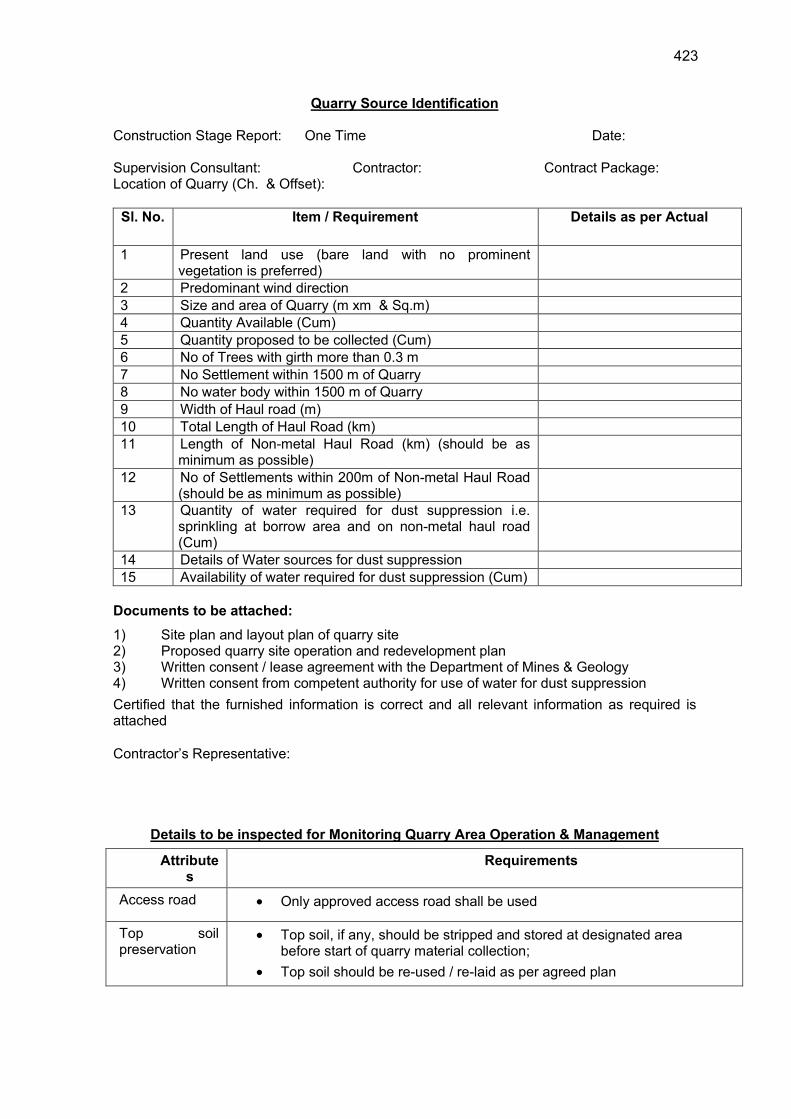
423
Quarry Source Identification Construction Stage Report: One Time Date: Supervision Consultant: Contractor: Contract Package: Location of Quarry (Ch. & Offset):
Sl. No. Item / Requirement Details as per Actual
1 Present land use (bare land with no prominent vegetation is preferred)
2 Predominant wind direction
3 Size and area of Quarry (m xm & Sq.m)
4 Quantity Available (Cum)
5 Quantity proposed to be collected (Cum)
6 No of Trees with girth more than 0.3 m
7 No Settlement within 1500 m of Quarry
8 No water body within 1500 m of Quarry
9 Width of Haul road (m)
10 Total Length of Haul Road (km)
11 Length of Non-metal Haul Road (km) (should be as minimum as possible)
12 No of Settlements within 200m of Non-metal Haul Road (should be as minimum as possible)
13 Quantity of water required for dust suppression i.e. sprinkling at borrow area and on non-metal haul road (Cum)
14 Details of Water sources for dust suppression
15 Availability of water required for dust suppression (Cum)
Documents to be attached:
1) Site plan and layout plan of quarry site 2) Proposed quarry site operation and redevelopment plan 3) Written consent / lease agreement with the Department of Mines & Geology 4) Written consent from competent authority for use of water for dust suppression
Certified that the furnished information is correct and all relevant information as required is attached
Contractor’s Representative:
Details to be inspected for Monitoring Quarry Area Operation & Management
Attributes
Requirements
Access road Only approved access road shall be used
Top soil preservation
Top soil, if any, should be stripped and stored at designated area before start of quarry material collection;
Top soil should be re-used / re-laid as per agreed plan
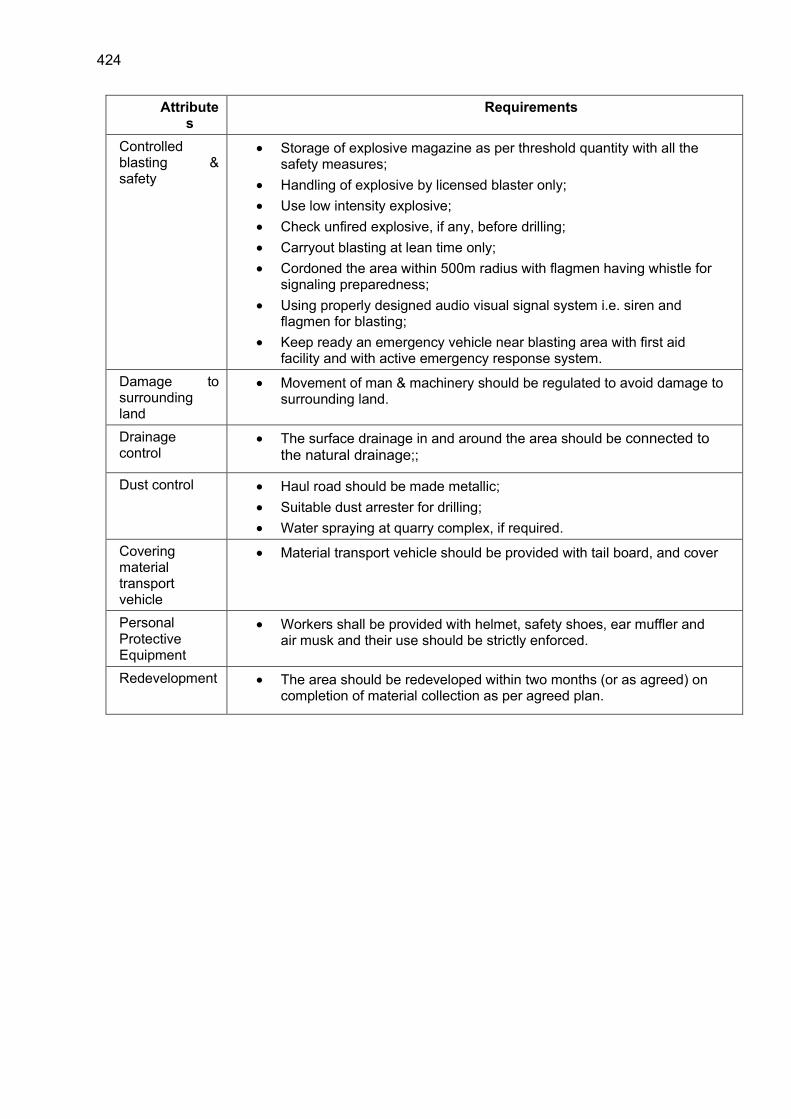
424
Attributes
Requirements
Controlled blasting & safety
Storage of explosive magazine as per threshold quantity with all the safety measures;
Handling of explosive by licensed blaster only;
Use low intensity explosive;
Check unfired explosive, if any, before drilling;
Carryout blasting at lean time only;
Cordoned the area within 500m radius with flagmen having whistle for signaling preparedness;
Using properly designed audio visual signal system i.e. siren and flagmen for blasting;
Keep ready an emergency vehicle near blasting area with first aid facility and with active emergency response system.
Damage to surrounding land
Movement of man & machinery should be regulated to avoid damage to surrounding land.
Drainage control
The surface drainage in and around the area should be connected to the natural drainage;;
Dust control Haul road should be made metallic;
Suitable dust arrester for drilling;
Water spraying at quarry complex, if required.
Covering material transport vehicle
Material transport vehicle should be provided with tail board, and cover
Personal Protective Equipment
Workers shall be provided with helmet, safety shoes, ear muffler and air musk and their use should be strictly enforced.
Redevelopment The area should be redeveloped within two months (or as agreed) on completion of material collection as per agreed plan.

425
Appendix 13: Noise Modeling Details
1. Federal Highway Administration's Traffic Noise Model (FHWA TNM) helps for highway traffic noise prediction and analysis. TNM computes highway traffic noise at nearby receivers. As sources of noise, it includes noise emission levels for the following vehicle types:
Automobiles: all vehicles with two axles and four tires -- primarily designed to carry nine or fewer people (passenger cars, vans) or cargo (vans, light trucks) -- generally with gross vehicle weight less than 4,500 kg (9,900 lb);
Medium trucks: all cargo vehicles with two axles and six tires -- generally with gross vehicle weight between 4,500 kg (9,900 lb) and 12,000 kg (26,400 lb);
Heavy trucks: all cargo vehicles with three or more axles -- generally with gross vehicle weight more than 12,000 kg (26,400 lb);
Buses: all vehicles designed to carry more than nine passengers; and
Motorcycles: all vehicles with two or three tires and an open-air driver / passenger compartment.
2. The procedure for prediction of noise levels involves the following steps: 1. Identification of various receivers 2. Determination of landuse and activities which may be affected by the noise
generated 3. Assemble input parameters 4. Application of the model
3. The description of the components to predict noise level are as follows: a. Receivers: TNM calculates the sound levels at the input receivers. In this
study two type of receivers selected to assess the impacts of moving traffic on surrounding noise level. One, discrete receptor and second, grid receptor.
b. Land uses: Land use along the road is obtained from the topographic drawings. This information provides the range of shielding and absorption factors to be applied at the various receivers.
c. Input Parameters: Traffic volume for the projected period is obtained from the traffic projections. The total number of vehicles passing per hour by type - light, medium and heavy along with their average speed is used for predictions.
d. Average Noise Level: All vehicles produce noise, which is taken as the base, and the cumulative noise at the receiver distance due to the whole traffic is estimated. The average noise level varies depending on the type of vehicle.
e. Application of Model: Equivalent noise levels due to traffic at the receivers are estimated using Federal Highway Noise model. Equivalent Sound Level (TEQ, denoted by the symbol, LAeqT): Ten times the base-10 logarithm of the square of the ratio of time-average, mean-square, instantaneous A-weighted sound pressure, during a stated time interval, T (where T=t2-t1), and the reference mean-square sound pressure of 20 : Pa, the threshold of human hearing, e.g., 1HEQ, denoted by the symbol, LAeq1H, represents the hourly equivalent sound level. LAeqT is related to LAE by the following equation :
LAeqT = LAE - 10*log10(t2-t1)
where LAE = Sound exposure level in dB
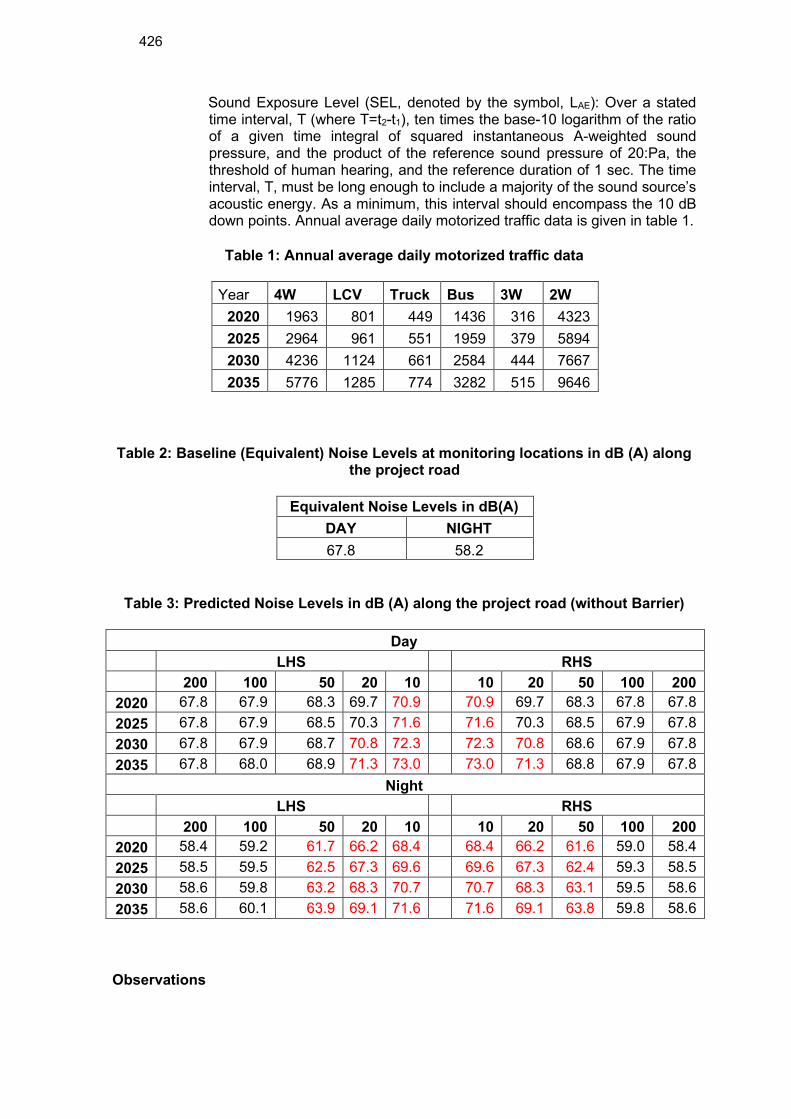
426
Sound Exposure Level (SEL, denoted by the symbol, LAE): Over a stated time interval, T (where T=t2-t1), ten times the base-10 logarithm of the ratio of a given time integral of squared instantaneous A-weighted sound pressure, and the product of the reference sound pressure of 20:Pa, the threshold of human hearing, and the reference duration of 1 sec. The time interval, T, must be long enough to include a majority of the sound source’s acoustic energy. As a minimum, this interval should encompass the 10 dB down points. Annual average daily motorized traffic data is given in table 1.
Table 1: Annual average daily motorized traffic data
Year 4W LCV Truck Bus 3W 2W
2020 1963 801 449 1436 316 4323
2025 2964 961 551 1959 379 5894
2030 4236 1124 661 2584 444 7667
2035 5776 1285 774 3282 515 9646
Table 2: Baseline (Equivalent) Noise Levels at monitoring locations in dB (A) along the project road
Equivalent Noise Levels in dB(A)
DAY NIGHT
67.8 58.2
Table 3: Predicted Noise Levels in dB (A) along the project road (without Barrier)
Day
LHS RHS
200 100 50 20 10 10 20 50 100 200
2020 67.8 67.9 68.3 69.7 70.9 70.9 69.7 68.3 67.8 67.8
2025 67.8 67.9 68.5 70.3 71.6 71.6 70.3 68.5 67.9 67.8
2030 67.8 67.9 68.7 70.8 72.3 72.3 70.8 68.6 67.9 67.8
2035 67.8 68.0 68.9 71.3 73.0 73.0 71.3 68.8 67.9 67.8
Night
LHS RHS
200 100 50 20 10 10 20 50 100 200
2020 58.4 59.2 61.7 66.2 68.4 68.4 66.2 61.6 59.0 58.4
2025 58.5 59.5 62.5 67.3 69.6 69.6 67.3 62.4 59.3 58.5
2030 58.6 59.8 63.2 68.3 70.7 70.7 68.3 63.1 59.5 58.6
2035 58.6 60.1 63.9 69.1 71.6 71.6 69.1 63.8 59.8 58.6
Observations
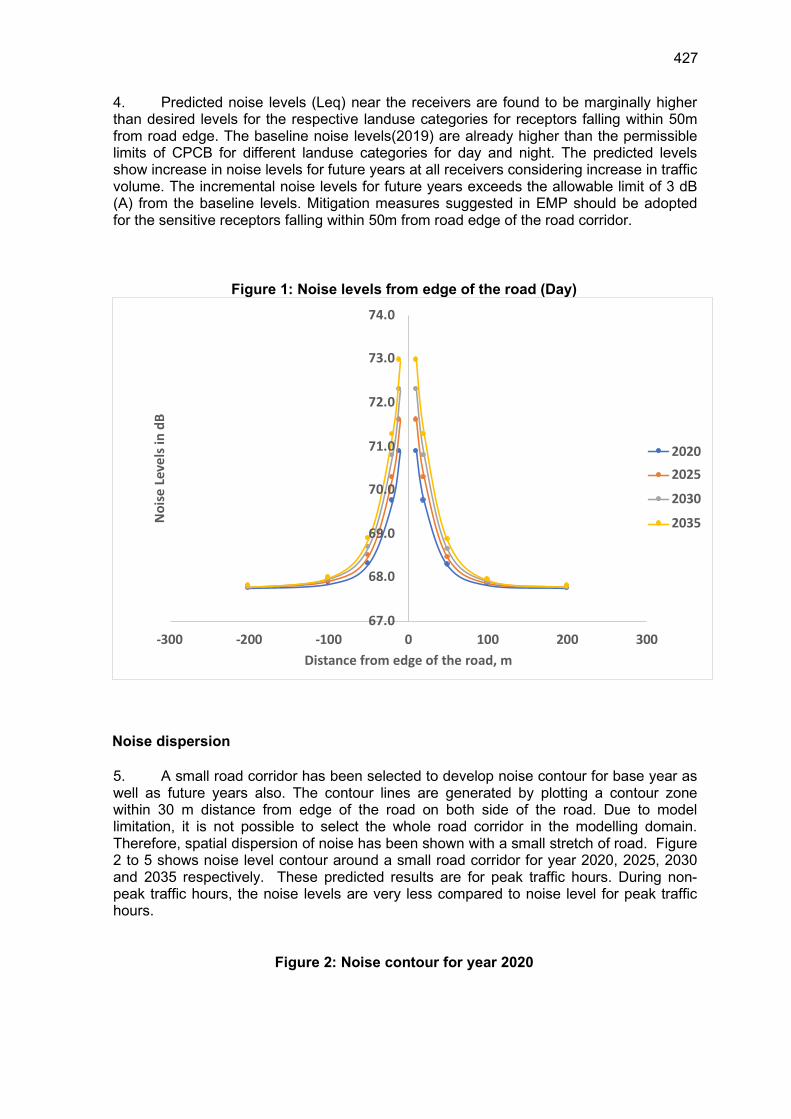
427
4. Predicted noise levels (Leq) near the receivers are found to be marginally higher than desired levels for the respective landuse categories for receptors falling within 50m from road edge. The baseline noise levels(2019) are already higher than the permissible limits of CPCB for different landuse categories for day and night. The predicted levels show increase in noise levels for future years at all receivers considering increase in traffic volume. The incremental noise levels for future years exceeds the allowable limit of 3 dB (A) from the baseline levels. Mitigation measures suggested in EMP should be adopted for the sensitive receptors falling within 50m from road edge of the road corridor.
Figure 1: Noise levels from edge of the road (Day)
Noise dispersion
5. A small road corridor has been selected to develop noise contour for base year as well as future years also. The contour lines are generated by plotting a contour zone within 30 m distance from edge of the road on both side of the road. Due to model limitation, it is not possible to select the whole road corridor in the modelling domain. Therefore, spatial dispersion of noise has been shown with a small stretch of road. Figure 2 to 5 shows noise level contour around a small road corridor for year 2020, 2025, 2030 and 2035 respectively. These predicted results are for peak traffic hours. During non-peak traffic hours, the noise levels are very less compared to noise level for peak traffic hours.
Figure 2: Noise contour for year 2020
67.0
68.0
69.0
70.0
71.0
72.0
73.0
74.0
-300 -200 -100 0 100 200 300
No
ise
Le
ve
ls i
n d
B
Distance from edge of the road, m
2020
2025
2030
2035

428
Figure 3: Noise contour for year 2025
Figure 4: Noise contour for year 2030
Figure 5: Noise contour for year 2035
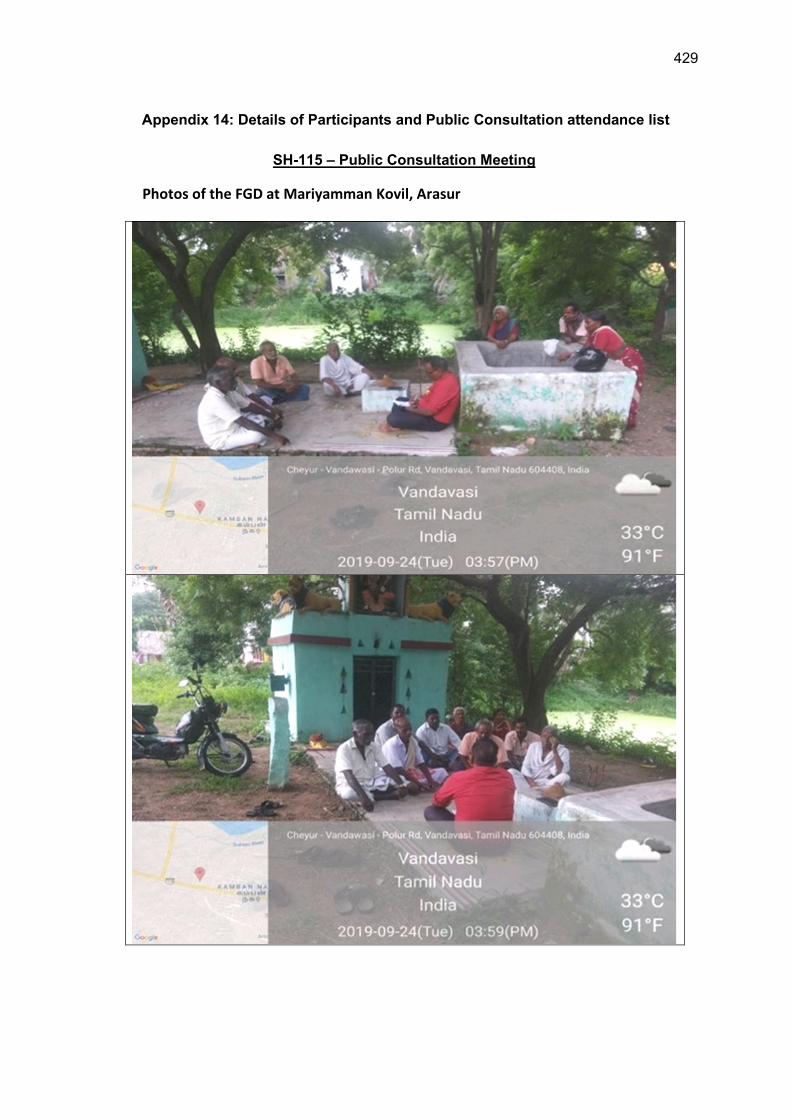
429
Appendix 14: Details of Participants and Public Consultation attendance list
SH-115 – Public Consultation Meeting
Photos of the FGD at Mariyamman Kovil, Arasur
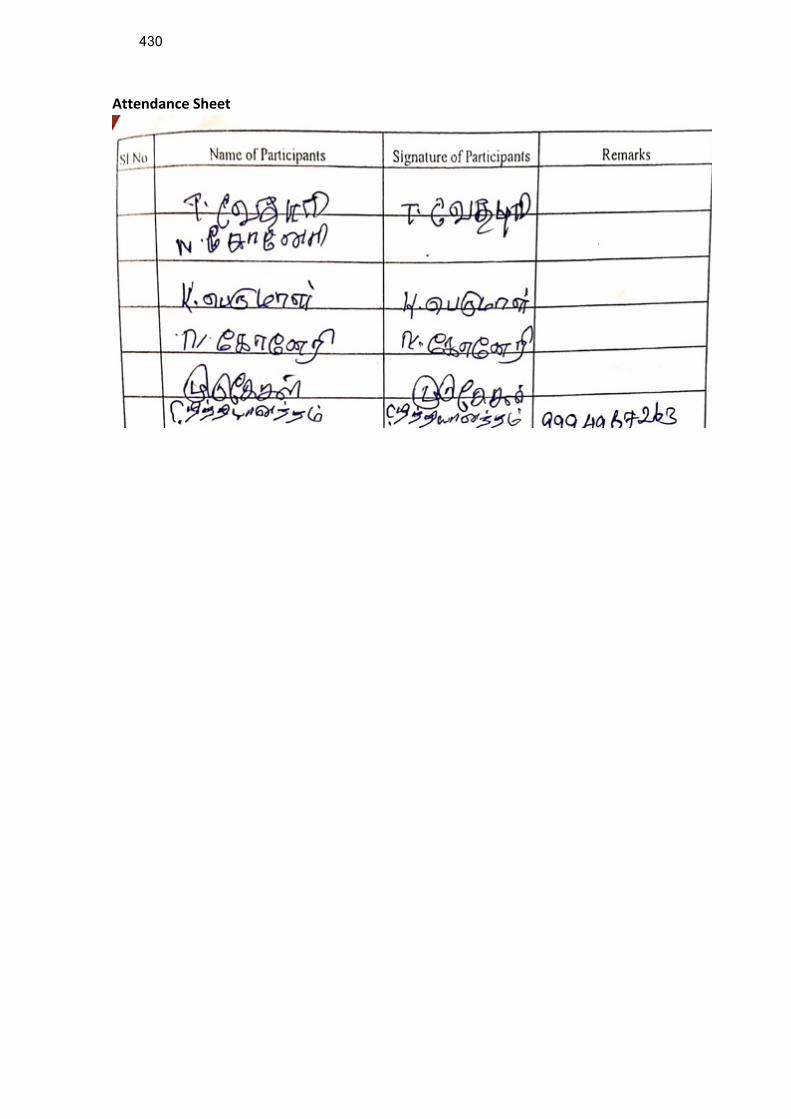
430
Attendance Sheet
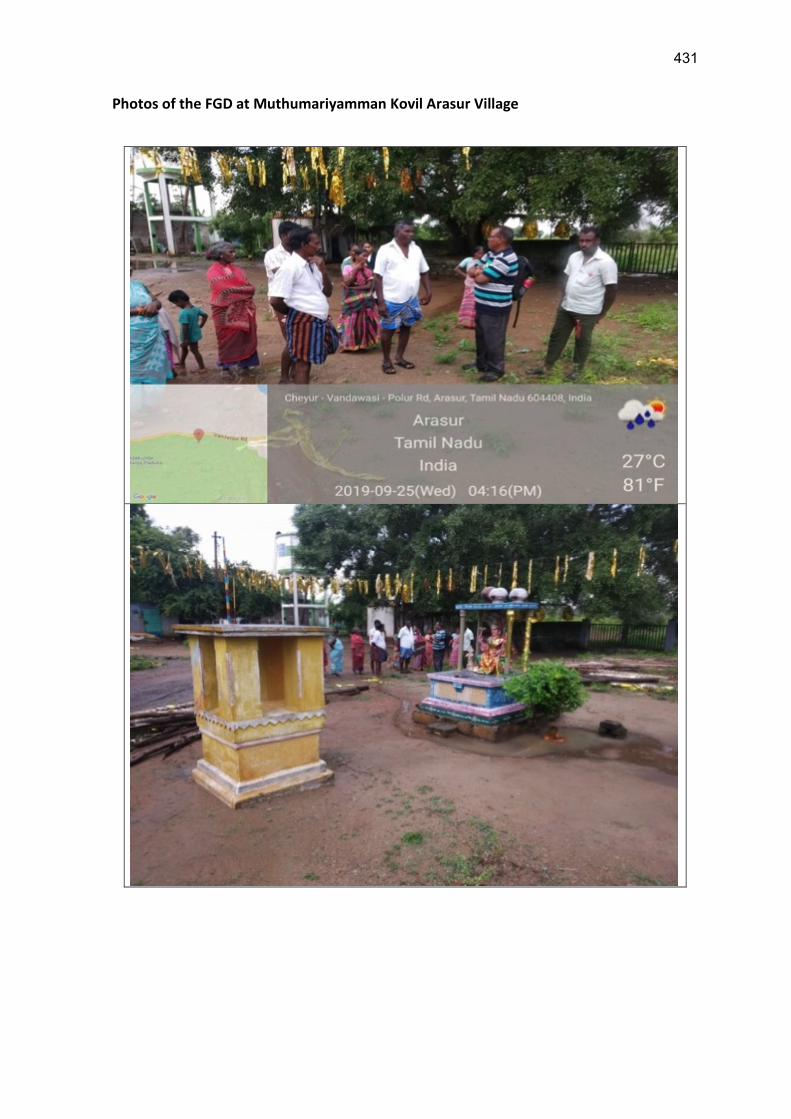
431
Photos of the FGD at Muthumariyamman Kovil Arasur Village
432
Attendance Sheet
Photos of the FGD:
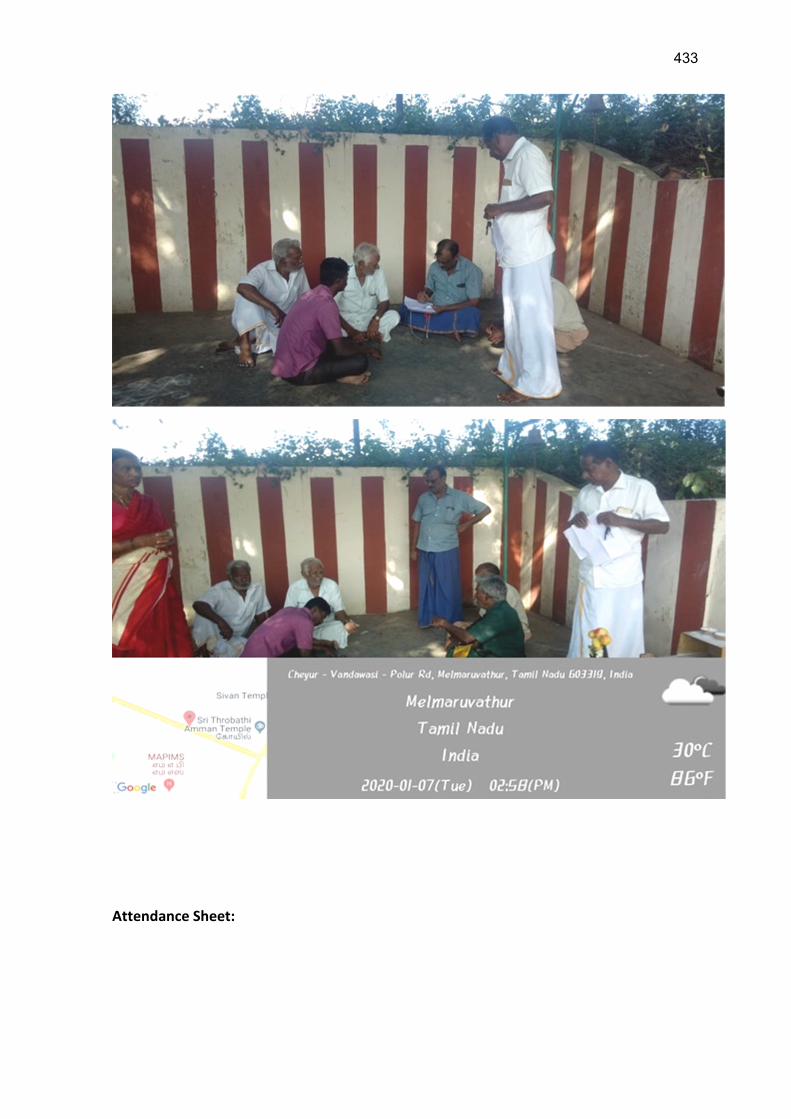
433
Attendance Sheet:
434
Photos of the FGD:

435
Attendance Sheet:
436
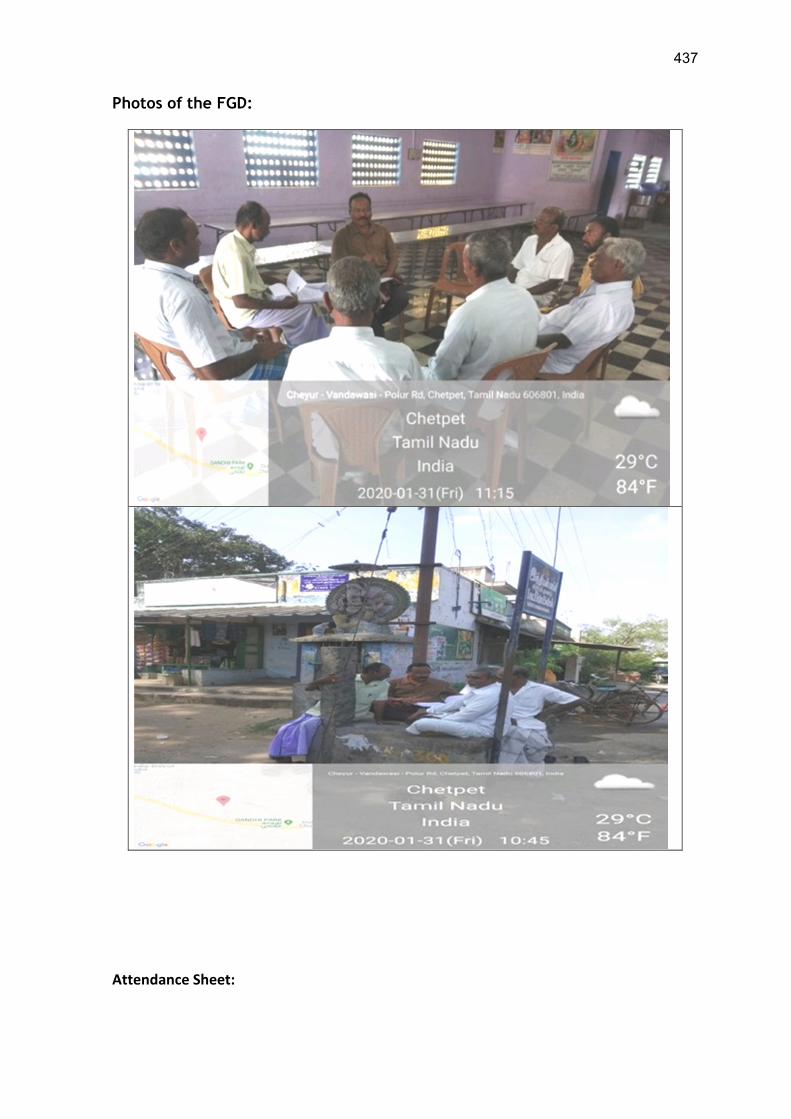
437
Photos of the FGD:
Attendance Sheet:
438
Photos of the FGD:
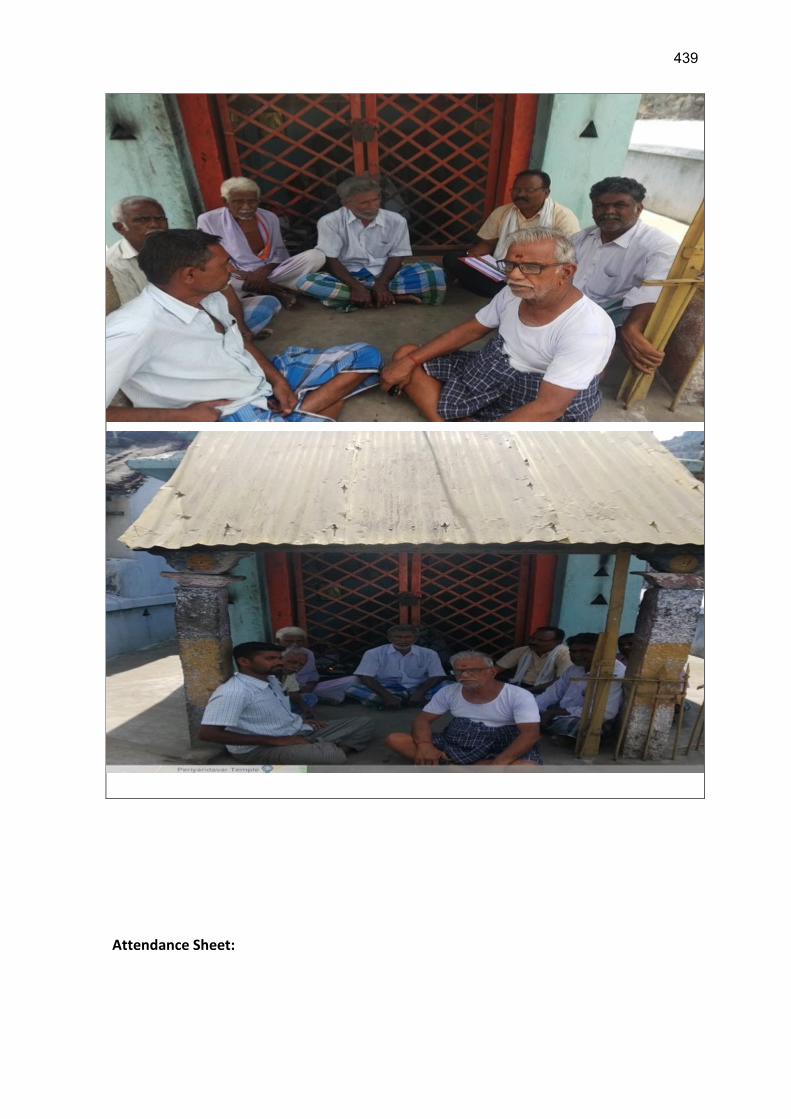
439
Attendance Sheet:
440

441
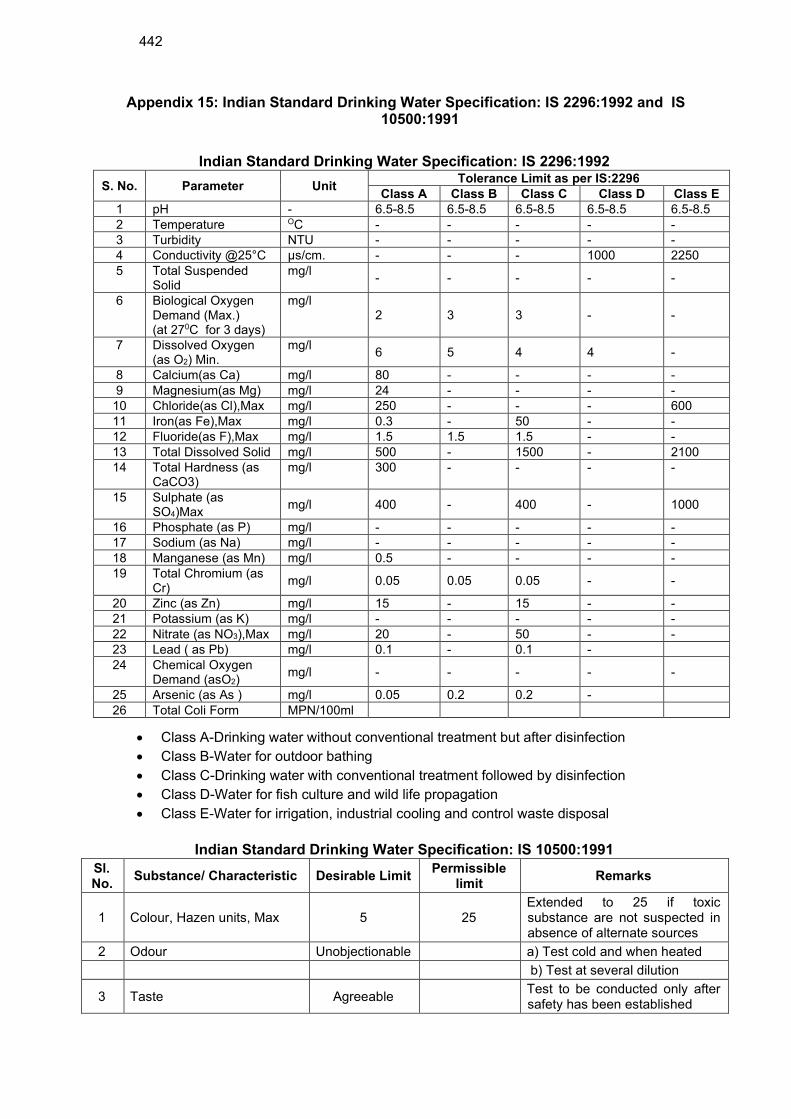
442
Appendix 15: Indian Standard Drinking Water Specification: IS 2296:1992 and IS 10500:1991
Indian Standard Drinking Water Specification: IS 2296:1992
S. No. Parameter Unit Tolerance Limit as per IS:2296
Class A Class B Class C Class D Class E
1 pH - 6.5-8.5 6.5-8.5 6.5-8.5 6.5-8.5 6.5-8.5
2 Temperature OC - - - - -
3 Turbidity NTU - - - - -
4 Conductivity @25°C µs/cm. - - - 1000 2250
5 Total Suspended Solid
mg/l - - - - -
6 Biological Oxygen Demand (Max.) (at 270C for 3 days)
mg/l 2 3 3 - -
7 Dissolved Oxygen (as O2) Min.
mg/l 6 5 4 4 -
8 Calcium(as Ca) mg/l 80 - - - -
9 Magnesium(as Mg) mg/l 24 - - - -
10 Chloride(as Cl),Max mg/l 250 - - - 600
11 Iron(as Fe),Max mg/l 0.3 - 50 - -
12 Fluoride(as F),Max mg/l 1.5 1.5 1.5 - -
13 Total Dissolved Solid mg/l 500 - 1500 - 2100
14 Total Hardness (as CaCO3)
mg/l 300 - - - -
15 Sulphate (as SO4)Max
mg/l 400 - 400 - 1000
16 Phosphate (as P) mg/l - - - - -
17 Sodium (as Na) mg/l - - - - -
18 Manganese (as Mn) mg/l 0.5 - - - -
19 Total Chromium (as Cr)
mg/l 0.05 0.05 0.05 - -
20 Zinc (as Zn) mg/l 15 - 15 - -
21 Potassium (as K) mg/l - - - - -
22 Nitrate (as NO3),Max mg/l 20 - 50 - -
23 Lead ( as Pb) mg/l 0.1 - 0.1 -
24 Chemical Oxygen Demand (asO2)
mg/l - - - - -
25 Arsenic (as As ) mg/l 0.05 0.2 0.2 -
26 Total Coli Form MPN/100ml
Class A-Drinking water without conventional treatment but after disinfection
Class B-Water for outdoor bathing
Class C-Drinking water with conventional treatment followed by disinfection
Class D-Water for fish culture and wild life propagation
Class E-Water for irrigation, industrial cooling and control waste disposal
Indian Standard Drinking Water Specification: IS 10500:1991
Sl. No.
Substance/ Characteristic Desirable Limit Permissible
limit Remarks
1 Colour, Hazen units, Max 5 25 Extended to 25 if toxic substance are not suspected in absence of alternate sources
2 Odour Unobjectionable a) Test cold and when heated
b) Test at several dilution
3 Taste Agreeable Test to be conducted only after safety has been established
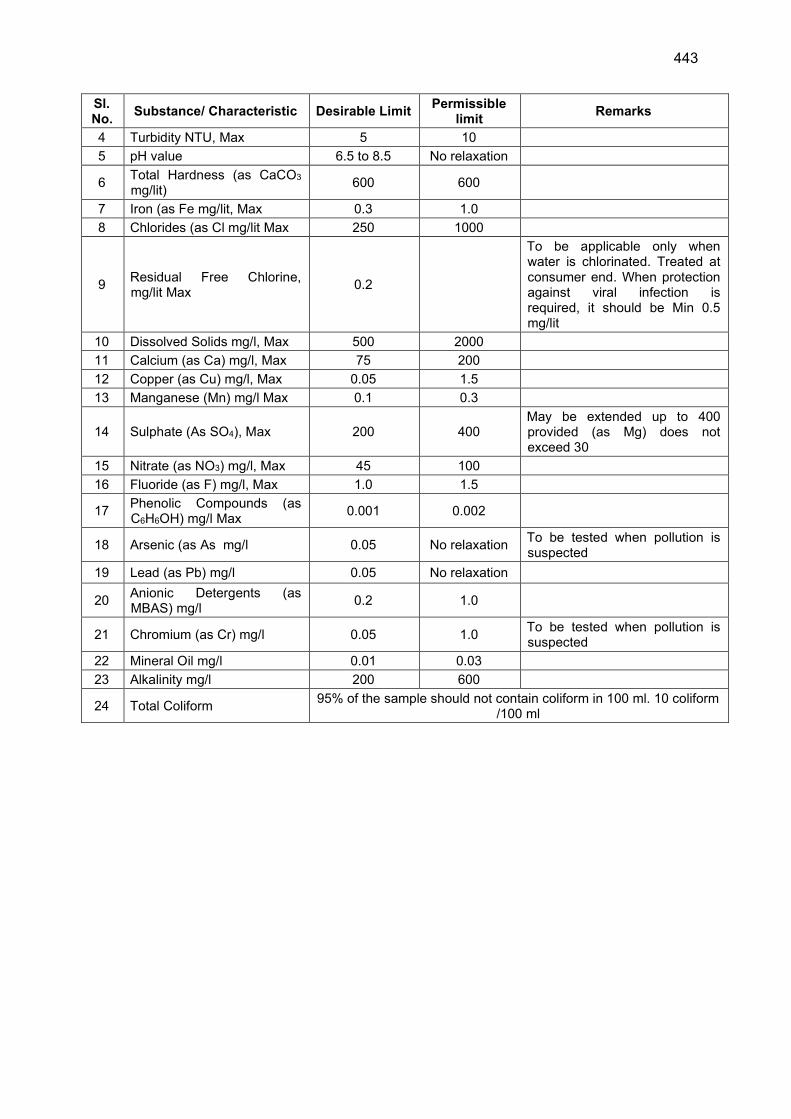
443
Sl. No.
Substance/ Characteristic Desirable Limit Permissible
limit Remarks
4 Turbidity NTU, Max 5 10
5 pH value 6.5 to 8.5 No relaxation
6 Total Hardness (as CaCO3 mg/lit)
600 600
7 Iron (as Fe mg/lit, Max 0.3 1.0
8 Chlorides (as Cl mg/lit Max 250 1000
9 Residual Free Chlorine, mg/lit Max
0.2
To be applicable only when water is chlorinated. Treated at consumer end. When protection against viral infection is required, it should be Min 0.5 mg/lit
10 Dissolved Solids mg/l, Max 500 2000
11 Calcium (as Ca) mg/l, Max 75 200
12 Copper (as Cu) mg/l, Max 0.05 1.5
13 Manganese (Mn) mg/l Max 0.1 0.3
14 Sulphate (As SO4), Max 200 400 May be extended up to 400 provided (as Mg) does not exceed 30
15 Nitrate (as NO3) mg/l, Max 45 100
16 Fluoride (as F) mg/l, Max 1.0 1.5
17 Phenolic Compounds (as C6H6OH) mg/l Max
0.001 0.002
18 Arsenic (as As mg/l 0.05 No relaxation To be tested when pollution is suspected
19 Lead (as Pb) mg/l 0.05 No relaxation
20 Anionic Detergents (as MBAS) mg/l
0.2 1.0
21 Chromium (as Cr) mg/l 0.05 1.0 To be tested when pollution is suspected
22 Mineral Oil mg/l 0.01 0.03
23 Alkalinity mg/l 200 600
24 Total Coliform 95% of the sample should not contain coliform in 100 ml. 10 coliform
/100 ml
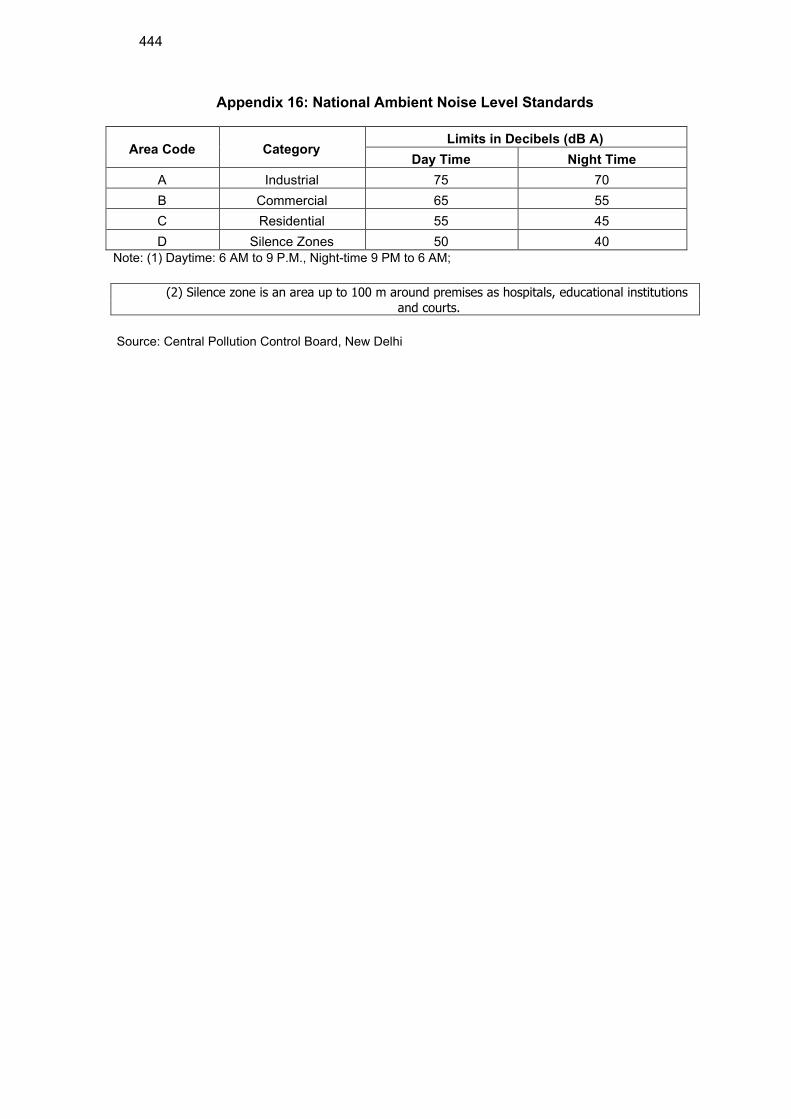
444
Appendix 16: National Ambient Noise Level Standards
Area Code Category Limits in Decibels (dB A)
Day Time Night Time
A Industrial 75 70
B Commercial 65 55
C Residential 55 45
D Silence Zones 50 40
Note: (1) Daytime: 6 AM to 9 P.M., Night-time 9 PM to 6 AM;
(2) Silence zone is an area up to 100 m around premises as hospitals, educational institutions
and courts.
Source: Central Pollution Control Board, New Delhi
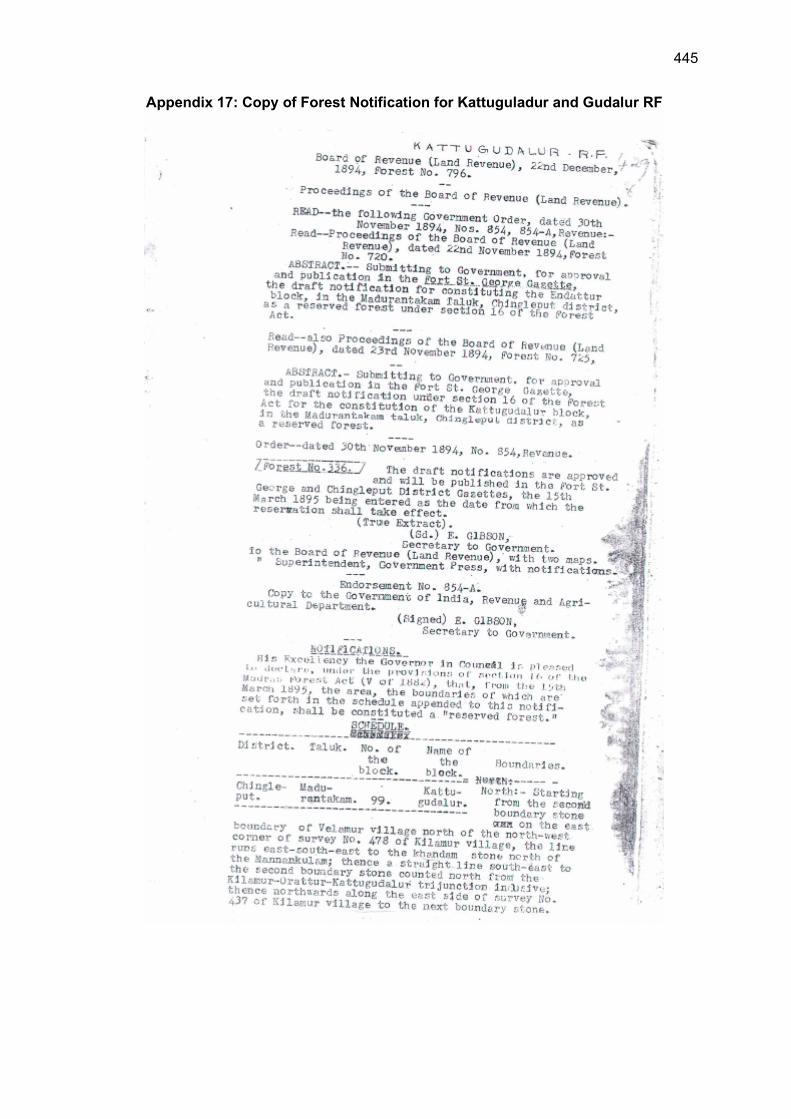
445
Appendix 17: Copy of Forest Notification for Kattuguladur and Gudalur RF
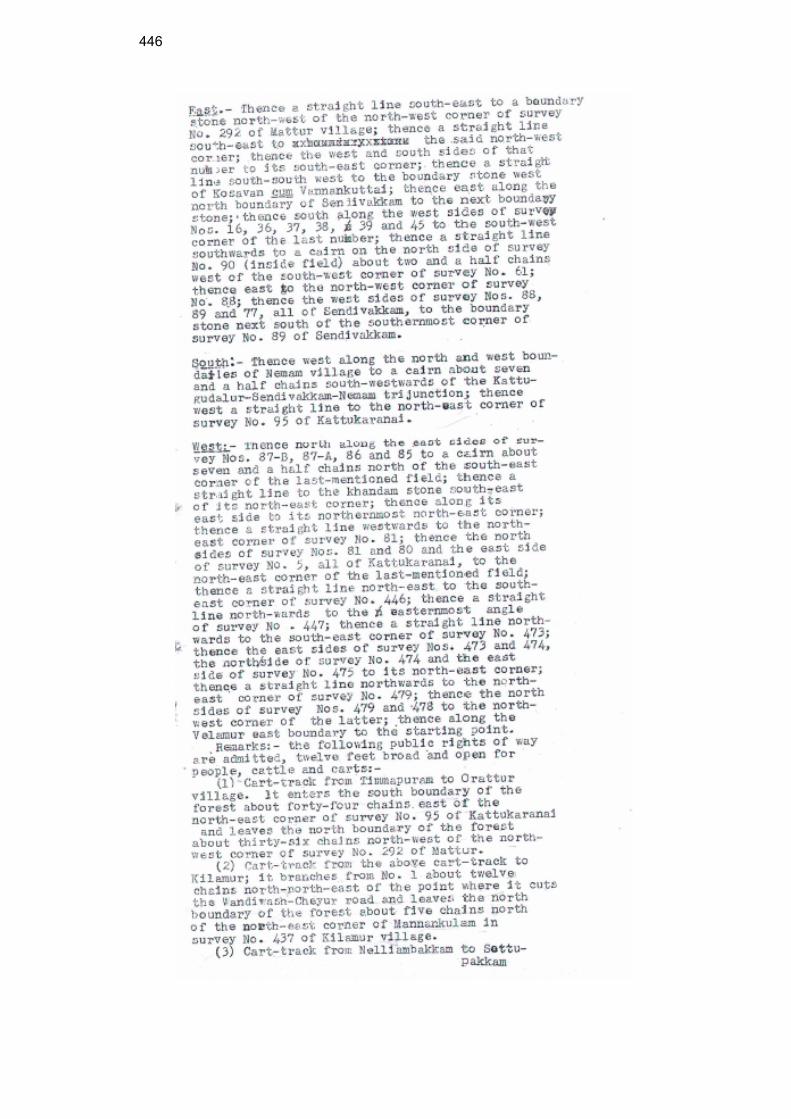
446
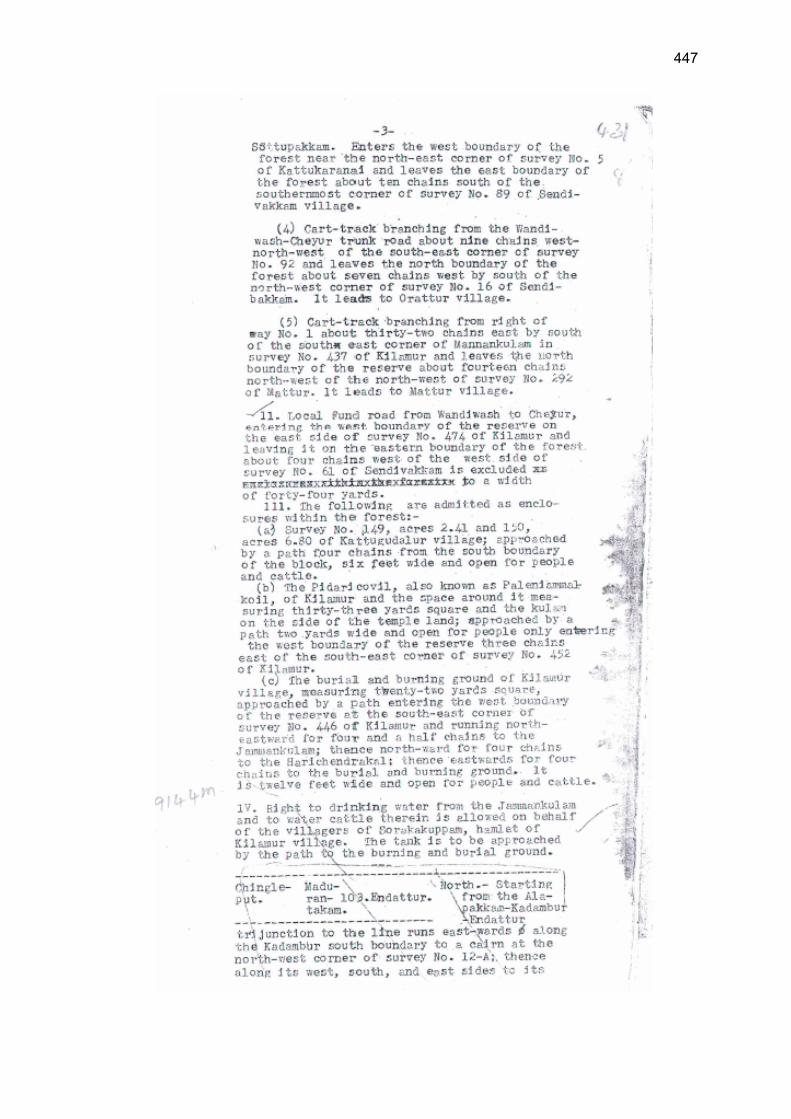
447
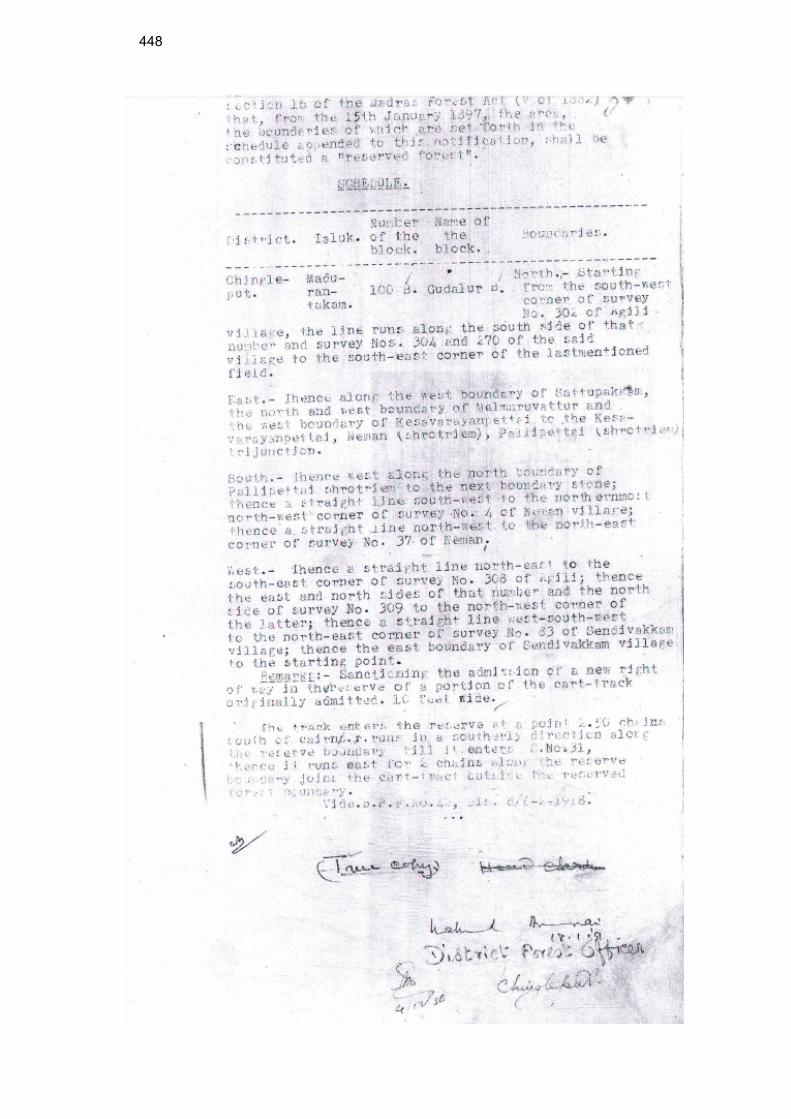
448