
Recommendations for Equitable Allocation of Trades in High ...

Information transmission around
block trades on the Spanish
stock exchange
M. A. Martıneza,*, M. Tapiab and J. Yzaguirrec
aDpto. de Fundamentos del Analisis Economico, Universidad del Paıs Vasco,Avda. Lehendakari Aguirre, 83, 48015 Bilbao, SpainbDpto. de Economıa de la Empresa, Universidad Carlos III de MadridcCalidad de Mercado, Sociedad de Bolsas
This study investigates the informational effects of large transactions,or Block Trades (BT), in the Spanish Stock Exchange (SSE). In theopen market period, this topic was not facilitated in the SSE as it was inother markets until 1998. The SSE thus provides a special environment foranalysing the information transmission of these specific transactions.
It is assumed that information can be better reflected by changesin true asset value, proxied by the midpoint of bid-ask best quotes.Therefore, we will look at changing true asset value orders instead oftrades.
Three different effects are studied around BTs: price, liquidity andinformation transmission. To capture them, three different endogenousvariables are considered: true asset returns, relative spreads and adverseselection spread component. With this approach, no clear effects of BTsare found. The main result of the study is that there seems to be an increasein information asymmetries when one looks at the adverse selection spreadcomponent in some of the different subsample classifications (buyer, sellerand sweeping BT), but there is no significant permanent effect on returns.This result could be related to insiders trading in the market. In sharpcontrast with adverse selection evidence, a temporary decrease in bid/askspread around BTs is also observed. These changes reflect temporaryliquidity effects related to other spread components (order processingcosts and inventory costs).
I. Introduction
Information transmission through order flow is an
important issue in financial research. The general
markets efficiency assumption is based on this
point. According to theoretical financial literature
on information, the value of private information
depreciates quickly (see, for example, Foster and
Viswanathan, 1990). Thus, informed investors prefer
large transactions (Block Trades, or BT henceforth)
in order to get into a valuable position as soon as
possible. Formal models of information disclosure
*Corresponding author. E-mail: [email protected]
Applied Financial Economics ISSN 0960–3107 print/ISSN 1466–4305 online # 2005 Taylor & Francis Ltd 173
http://www.tandf.co.uk/journalsDOI: 10.1080/0960310042000306952
Applied Financial Economics, 2005, 15, 173–186
Downloaded By: [University Carlos III of Madrid] At: 10:29 8 March 2010

through BTs can be found in Easley and O’Hara
(1987) and Seppi (1990).1 On the other hand, it isalso known that informed investors, in order to con-
ceal their superior private information, are interestedin camouflaging their desired trades into small or
medium size trades (Kyle, 1985). From the empirical
point of view, it is not clear whether these BTs maybe understood as strategic trading motivated by
information or whether they may be viewed only asa consequence of institutional investors’ balancing
their portfolios.Most of the empirical research into BTs focuses on
information transmission by looking at permanentand temporary effects of BTs on asset prices or
returns. The permanent part is interpreted as beinginformation motivated, whereas the temporary one
is associated with price pressure or liquidity costs.
Kraus and Stoll (1972), Scholes (1972), Holthausenet al. (1987, 1990), Aggarwal and Chen (1990),
Chan and Lakonishok (1993, 1995), LaPlante andMuscarella (1997) and Madhavan and Cheng (1997)
are interesting examples of this issue on the NYSE.Both effects (permanent and temporary) seem to be
present and the sign depends on the type of BT (buyeror seller). Similar analyses for order driven markets
can be found in Ball and Finn (1989), for the SidneyStock Exchange, and Riva (1996), for the Paris
Bourse.2
This approach must be differentiated from the onein the corporate governance literature, in which block
trades are related to publicly announced changes inthe ownership structure of firms.3 Some outstanding
references of this alternative literature are Barclayand Holderness (1991), Bethel et al. (1998) and
Bolton and Von Thadden (1998). Instead of analys-ing the public announcements of large purchases or
sells of assets, the present focus is in the anonymouslarge transactions crossed in the open market.
This study investigates the impact of BTs in the
Spanish Stock Exchange (SSE). The SSE offers aparticularly appropriate testing ground for examining
these issues. The reason is that in the open marketperiod, this type of transaction was not facilitated
as in other markets till 1998, so that BTs were dealt
like small trades.4 This market microstructure char-acteristic makes these transactions costly because
of the effort required to cross them. In this way,the SSE provides a special environment for analys-
ing the information transmission of these specific
transactions.In order to analyse whether these transactions
transmit information, a new approach is proposed.In sharp contrast with previous BT research, it is
assumed that information can be better reflected bychanges in true asset value, proxied by the midpoint
of bid-ask best quotes. By looking at these intrinsicvalue changes instead of price changes, the effects of
liquidity (noninformative) trades are avoided whichmodify asset prices without affecting their true
value (the so-called bid-ask bounce).5 At the same
time, this allows one to consider very informativebid-ask changes which do not result from a new
transaction (so that no new price is established),but which reflect worthy changes in the investor’s
preferences for assets. Therefore, the study willlook at changing true asset value orders instead of
trades.In relation to information effects, two variables are
looked at. As previous studies have done, the impactof BTs on true asset returns is analysed and a differ-
ent behaviour is expected depending on the type of
BT. Also, as pointed out in market microstructureliterature, changes in the adverse selection spread
component show how prices absorb information.6
Adverse selection can be understood as a measure
of information asymmetries. Thus, if a decrease inadverse selection component around BTs is observed,
one could conclude that BTs transmit informationdiminishing information asymmetries between agents.
This adverse selection component must be dif-ferentiated from liquidity in general. Therefore, the
behaviour of relative spreads around BTs will also be
analysed to detect changes in liquidity not related toinformation transmission. These changes would be
motivated by order processing costs and inventorycosts.
1 Easley and O’Hara (1987) show how BTs significantly increase the probability market participants attach to the existence ofprivate information. Seppi (1990) develops a model where, under not very restricted circumstances, information-based BTsare traded in a partial-pooling equilibrium.2Gemmill (1996), for the London Stock Exchange, has recently analysed the liquidity effects of BTs under different publica-tion rules. In related literature, Seppi (1992) and Daley et al. (1995) among others, investigate the extent to which block pricechanges around quarterly earnings announcements.3An anonymous referee is thanked for pointing this out.4 Examples of these special BT devices are the upstairs market in the NYSE (Hasbrouck et al., 1993) and the broader bid-askspread in the Paris Bourse (Riva, 1996).5 Seppi (1992) also points out that the conclusions obtained by looking at price changes may be affected by the poten-tial presence of a variety of price pressure effects.6 See O’Hara (1995).
174 M. A. Martınez et al.
Downloaded By: [University Carlos III of Madrid] At: 10:29 8 March 2010

This new approach is proposed, together with thespecial market microstructure that is analysed, makesthis study innovative in current literature on informa-tion transmission around BTs.
Evidence of information transmission is foundaround some types of BTs when one looks at theadverse selection spread component. However, con-trary to previous research, no significant permanenteffect on true asset returns is found. Changes inliquidity around BTs are also observed, but this effectis related to temporary spread components.
The remainder of the article is organized as fol-lows. Section II reviews briefly the microstructure ofthe SSE and, particularly, the block trading process.The data set and sampling rules are presented inSection III. Section IV discusses the methodologyused and results obtained in the analysis. Finally,Section V offers some concluding remarks.
II. Institutional Settings of theSpanish Stock Market
The electronic continuous market for equities in SSEis a purely order driven market. Through this system,142 companies are traded. The main characteristicis a single order book for every stock. Three mainperiods are found in the daily market:
1. Preopening period (from 09:00 h to 10:00 h): Inthis period, introduction, modification and can-cellation of limit orders are allowed. Dependingon supply and demand, the system calculates apreopening price in real time. At 10:00 h thesystem assigns shares to orders at prices betterthan or equal to the opening price.
2. Open market period (from 10:00 h to 17:00 h):During this period limit and market orders areintroduced. If a counterparty is found they areautomatically executed. If not, the order remainson the book until an incoming order fits it, orthe order is cancelled. In this period, prices
change in real time depending on the flow of
buy and sell orders.
3. Special operations period (from 17:00 h to
20:00 h): In this period it is possible to report
pre-agreed trades with an effective volume
bigger than 20% of the daily turnover.
In order to identify the information effects of
BTs clearly, the focus will be on the open market
period.7 In this way, other news is avoided that
could affect the opening asset price during the closed
periods.
As in other markets, an investor willing to buy
or sell a large number of shares looks for a counter-
party through brokerage houses establishing a pre-
agreement in shares and price. However, in order to
cross this preagreement in the open market in SSE,
investors suffer two handicaps. First, traders must
introduce a limit order to execute a BT, so it is
impossible to cross it outside the limit order book.
Second, in order to transact the BT, the limit order
must be at the best level of buy or sell prices. As a
result, it can be costly to trade large blocks of shares
in this period.
In this context, a BT trader can face two different
market situations: (i) When there is a level of prices
available between best buy and best sell (spread
bigger than tick size), traders quickly introduce
pre-agreed sell and buy limit orders inside the
spread and BT is transacted. (ii) When there is no
such available price and traders do not want to
wait, they sweep the necessary orders to open
the spread and get a price available inside it. This
sweeping activity is particularly necessary for stocks
that are so liquid that it is very difficult to find an
available price. Obviously, it imposes an additional
cost.
On crossing the two types of BTs, when one side
order has been introduced, there is always the
possibility that another limit order may arrive and
the pre-agreed BT cannot be completely crossed.8
We call this issue ‘interference risk’.
7During the period analysed, 11% of the total number of BTs was traded in the preopening period, and 15% in the specialoperations period. Regarding the effective volume, the percentages are 20% and 16%, respectively.8 Since 6 November 1998, a new device for reporting and trading BTs in the open market period has been operational. Thisfeature allows market members, as other European markets already do, to trade BTs outside the best bid-ask spread of thebook. In any case, this possibility is set according to a certain relationship with market prices. Specifically, there are currentlytwo ways to trade a block: (i) For stocks belonging to the IBEX-35 Index (the 35 most liquid stocks on the SSE), members canreport agreed blocks to the Exchange. As a result, interference risk has been eliminated. Minimum required amount of sharesfor trade is 5% of the daily turnover in the last quarter of the year and 100 million pesetas (0.59 million euros). In this context,the spread is the on line weighted average price of the six best levels of bid and ask. (ii) For all the stocks on the SSE, marketmembers can introduce orders bigger than 10% of the daily turnover in the last quarter with a deviation of 15% from lastclosing price and 250 million pesetas (1.5 million euros). Here there is no time and price priority rule and members can selectany order. Some modifications regarding the minimum required amount of shares and the price divergence were introducedon 1 June 2000.
Block trades on the Spanish stock exchange 175
Downloaded By: [University Carlos III of Madrid] At: 10:29 8 March 2010
III. Data
Data on all best bid and ask prices on the SSE in the
open market during the one-year period from May
1996 to April 1997 were collected. As indicated, only
quotes that change true asset value were selected
because they reflect information arrival appropri-
ately. The cause of these changes is the introduction
of a new limit order that improves one of the best
prices of the limit order book (bid or ask), the can-
cellation of the limit orders that are at these best
levels of prices or a transaction that clears one of
these best positions in the limit order book. The avail-
able information for each of these selected quotes
includes: time (stamped to the nearest second), date,
bid, ask, transaction price and number of shares
transacted since the previous selected quote.9 The
value of the SSE Index (IBEX-35) for each second
was also obtained from SSE.
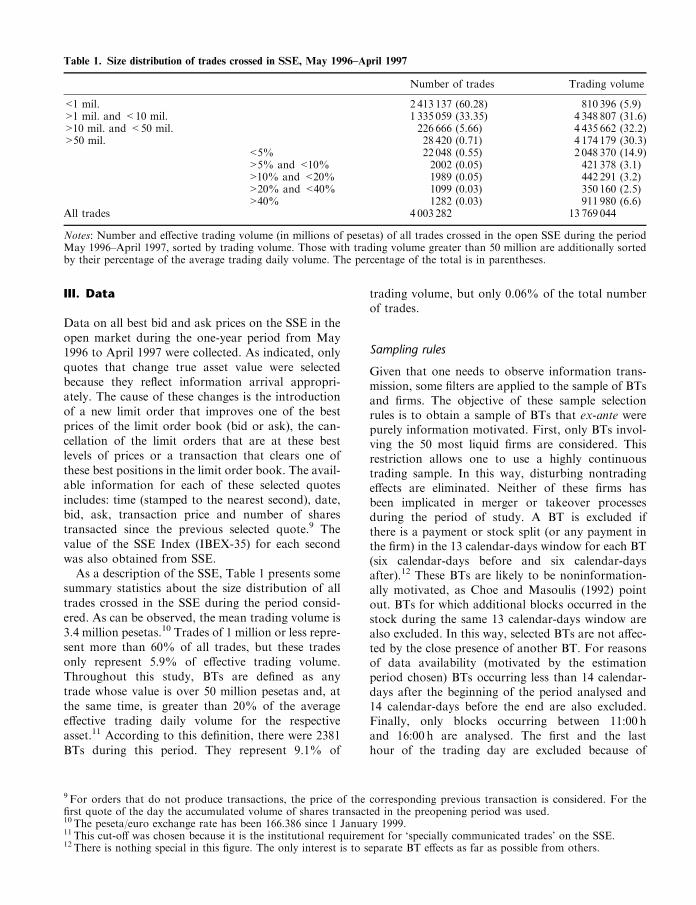
As a description of the SSE, Table 1 presents some
summary statistics about the size distribution of all
trades crossed in the SSE during the period consid-
ered. As can be observed, the mean trading volume is
3.4 million pesetas.10 Trades of 1 million or less repre-
sent more than 60% of all trades, but these trades
only represent 5.9% of effective trading volume.
Throughout this study, BTs are defined as any
trade whose value is over 50 million pesetas and, at
the same time, is greater than 20% of the average
effective trading daily volume for the respective
asset.11 According to this definition, there were 2381
BTs during this period. They represent 9.1% of
trading volume, but only 0.06% of the total numberof trades.
Sampling rules
Given that one needs to observe information trans-mission, some filters are applied to the sample of BTsand firms. The objective of these sample selectionrules is to obtain a sample of BTs that ex-ante werepurely information motivated. First, only BTs invol-ving the 50 most liquid firms are considered. Thisrestriction allows one to use a highly continuoustrading sample. In this way, disturbing nontradingeffects are eliminated. Neither of these firms hasbeen implicated in merger or takeover processesduring the period of study. A BT is excluded ifthere is a payment or stock split (or any payment inthe firm) in the 13 calendar-days window for each BT(six calendar-days before and six calendar-daysafter).12 These BTs are likely to be noninformation-ally motivated, as Choe and Masoulis (1992) pointout. BTs for which additional blocks occurred in thestock during the same 13 calendar-days window arealso excluded. In this way, selected BTs are not affec-ted by the close presence of another BT. For reasonsof data availability (motivated by the estimationperiod chosen) BTs occurring less than 14 calendar-days after the beginning of the period analysed and14 calendar-days before the end are also excluded.Finally, only blocks occurring between 11:00 hand 16:00 h are analysed. The first and the lasthour of the trading day are excluded because of
9 For orders that do not produce transactions, the price of the corresponding previous transaction is considered. For thefirst quote of the day the accumulated volume of shares transacted in the preopening period was used.10 The peseta/euro exchange rate has been 166.386 since 1 January 1999.11 This cut-off was chosen because it is the institutional requirement for ‘specially communicated trades’ on the SSE.12 There is nothing special in this figure. The only interest is to separate BT effects as far as possible from others.
Table 1. Size distribution of trades crossed in SSE, May 1996–April 1997
Number of trades Trading volume
<1 mil. 2 413 137 (60.28) 810 396 (5.9)>1 mil. and <10 mil. 1 335 059 (33.35) 4 348 807 (31.6)>10 mil. and <50 mil. 226 666 (5.66) 4 435 662 (32.2)>50 mil. 28 420 (0.71) 4 174 179 (30.3)
<5% 22 048 (0.55) 2 048 370 (14.9)>5% and <10% 2002 (0.05) 421 378 (3.1)>10% and <20% 1989 (0.05) 442 291 (3.2)>20% and <40% 1099 (0.03) 350 160 (2.5)>40% 1282 (0.03) 911 980 (6.6)
All trades 4 003 282 13 769 044
Notes: Number and effective trading volume (in millions of pesetas) of all trades crossed in the open SSE during the periodMay 1996–April 1997, sorted by trading volume. Those with trading volume greater than 50 million are additionally sortedby their percentage of the average trading daily volume. The percentage of the total is in parentheses.
176 M. A. Martınez et al.
Downloaded By: [University Carlos III of Madrid] At: 10:29 8 March 2010

the disturbing effects of opening and closing trades.
Many large transactions at opening cannot be con-
sidered as BTs: They are merely a large number of
individual transactions crossed together and printed
as one transaction. Likewise, transactions during the
last hour may incorporate end-of-the-day effects (see
Amihud and Mendelson, 1986 and Harris, 1986).
It must be said that some of the BTs selected
according to these criteria did not appear in the
original sample of quotes changing the asset true
value proxy. However, it was decided to include
them because their information effects could operate
with some delay or advance.13
After applying all these sampling rules, the number
of BTs finally considered is reduced to 195, in 41
firms. They represent 1.3% of the trading volume
during the whole of the period analysed. BT trading
volume ranges from 51 to 27 668 million pesetas and
the mean value is about 947 million pesetas.
The analyses will be performed individually for
each BT. The estimation period considered is a
29 calendar-days window for each BT (14 calendar-
days before and 14 calendar-days after BT).14 It is
clear, considering the differences between assets,
that the number of quotes in this fixed period is
very different from one asset to another. The range
goes from 235 quotes for the least liquid asset to 4460
for the most liquid, with 1487 being the average
number for all BTs in the sample.
Descriptive statistics
Unfortunately, the data set does not identify the
party initiating the large transaction. However, as
is clear from empirical literature on BTs, the
signs of the expected effects differ for buyer and
seller-initiated transactions. A buyer-initiated BT is
expected to produce a permanent increase in the
asset price, whereas the inverse effect is expected for
a seller-initiated BT. In order to sort BTs as buyer or
seller-initiated, the difference between the BT price
and the true value proxy at the previous trade are
calulated. If this difference is positive, the BT is
classified as buyer-initiated, whereas if it is negative
it is classified as seller-initiated. BTs whose price
equals the previous asset true value are classified
as indeterminate-initiated.15
The data set identifies most BTs according to an
inside the spread or sweeping classification, as referredto in Section 2. BTs not included in either of thesetypes are considered as not classified.16 Intuitively,
stronger effects are expected in sweeping BTs becauseof the additional cost they impose. BTs were also
sorted by whether or not they change the asset truevalue. As above, greater effects in BTs that change
the asset true value were expected. Additionally, BTsare classified in four groups according to their tradingvolume. Each group has about the same number of
BTs, with BB being the group with the biggest BTs,SS the group with the smallest, and BS and SB the
medium size group. A direct relationship betweeninformation transmission and BT size was expected.
Tables 2 and 3 illustrate some of the distinguishingfeatures of the BTs in the sample. Table 2 shows the
sample composition regarding the side initiating theBT, type and changes or not in asset true value.As can be observed in panel A, the sample distribu-
tion is very similar regarding the side initiating theBT, especially in the volume transacted. The number
of indeterminate-initiated BTs seems to be greaterthan the other types for small and medium BTs.
Panel B shows that the largest BTs by volume trans-acted are traded inside the spread, whereas the BTsnot classified seem to be the small ones. However, the
number of BTs in each group is very similar. Panel Cshows that the biggest BTs change the asset true
value. But this relationship is reversed for the othersize BTs.
Table 3 describes the day-of-the-week and hour-of-the-day distribution of the BT sample. The first valuein each cell is the percentage of the number of BTs
and the second is the corresponding trading volume.A clear seasonal pattern is found in the sample. First,
from the microstructure of the SSE, it is clear thatinvestors tend to use the less competitive hours of the
day to cross large transactions. It is seen in Table 3that the 13:00–14:00 h period is the time of the trad-
ing day when the biggest BTs are crossed. Differencesin days of the week are also observed. Surprisingly,on Friday (the day of the week when futures con-
tracts expire) no special derivatives effect is observed,
13 This possibility will be observed when traders choose not to introduce the BT order in the first level of book prices. If thereis enough time another order may arrive and when the BT is crossed a change in true asset value will not be observed.14 The estimation period must be long enough to provide precise estimates of parameters and short enough to keep the datamanageable. This period is considered as one that appropriately meets both requirements.15 This criterion has been used previously by Blume et al. (1989) and Hausman et al. (1992), among others. The ‘tick test’algorithm (which classifies a transaction by looking at the previous transaction’s price) proposed in Lee and Ready (1991),is a less information consuming, but also less accurate method (see Hausman et al., 1992).16 These are BTs whose limit orders were introduced in the book but not at the first level of prices, and which await execution.
Block trades on the Spanish stock exchange 177
Downloaded By: [University Carlos III of Madrid] At: 10:29 8 March 2010

whereas a large volume activity is seen during the firstpart of the week.
IV. Methodology and Results
There are certain features that characterize the dataset. First, quotes are sampled at irregularly spacedrandom intervals (whenever changes in true valueoccur), so observations are unlikely to be identicallydistributed, since some of them are very closelyspaced in time while others may be separated byhours. Second, asset prices are always quoted in
discrete units or ticks (discreteness). Among the
existing models of stock price discreteness, ordered
probit is the only specification that can easily capture
the impact of explanatory variables on price changes
while also accounting for price discreteness and
irregular transaction intervals.17 However, the use
of an ordered probit specification comes up against
a major problem with illiquid stocks. Tick move-
ments must be limited because of the necessary
degrees of freedom in the estimation procedure. So
this method is not useful for the sample.
Therefore, in order to diminish the discreteness
problem, returns will be used instead of prices.
17 A description of this estimation procedure can be found in Hausman et al. (1992).
Table 2. Size distribution of the BT sample
BB BS SB SS
N. ofBT (%) Vol. (%)
N. ofBT (%) Vol. (%)
N. ofBT (%) Vol. (%)
N. ofBT (%) Vol. (%)
Panel ABuyer-init. 0.35 0.32 0.26 0.32 0.21 0.34 0.22 0.33Seller-init. 0.39 0.45 0.25 0.33 0.29 0.39 0.16 0.34Indeterminate-init. 0.26 0.23 0.49 0.35 0.50 0.30 0.61 0.33
Panel BInside the spread 0.47 0.76 0.34 0.49 0.35 0.48 0.30 0.39Sweeping 0.31 0.20 0.33 0.43 0.32 0.40 0.31 0.53Not classified 0.22 0.04 0.33 0.08 0.33 0.13 0.39 0.08
Panel CChange in true asset value 0.67 0.65 0.47 0.35 0.51 0.35 0.52 0.37No change in true asset value 0.33 0.35 0.53 0.65 0.49 0.65 0.48 0.63
Note: Size distribution of the sample in number of BTs and trading volume (in percentage terms). Regarding trading volume,BTs are classified in four groups, including the biggest in BB and the smallest in SS. In panel A, BTs are classified according tothe side of the market initiating the BTs (buyer, seller or indeterminate initiated), in panel B they are classified according totype (inside the spread, sweeping or not classified) and in panel C according to whether they change the asset true value or not.
Table 3. Daily and hourly seasonality of the BT sample
Mon. (%) Tue. (%) Wed. (%) Thu. (%) Fri. (%) All days (%)
11:00–12:00 5.64 5.64 3.59 2.05 1.03 17.956.81 3.17 1.96 0.86 0.18 12.96
12:00–13:00 6.15 8.72 4.10 3.59 6.15 28.725.45 7.63 2.11 3.94 2.45 21.58
13:00–14:00 4.62 4.10 5.64 1.54 6.15 22.057.79 7.98 17.84 1.20 3.89 38.71
14:00–15:00 2.05 6.67 2.05 1.54 6.15 18.460.51 12.10 1.43 0.43 1.29 15.75
15:00–16:00 2.56 3.59 2.05 2.56 2.05 12.821.43 4.25 2.56 2.40 0.36 10.99
All periods 21.03 28.72 17.44 11.28 21.5421.99 35.13 25.91 8.82 8.16
Note: Day-of-the-week and hour-of-the-day distributions (in percentages terms) of the BT sample. The first value in each cellis the percentage of the number of blocks and the second one is the corresponding trading volume.
178 M. A. Martınez et al.
Downloaded By: [University Carlos III of Madrid] At: 10:29 8 March 2010

Furthermore, to solve the irregular random intervalsproblem, two alternative specifications will be used:the use of differences in time between consecutivequotes as an explanatory variable and the use of atime adjustment for the exogenous and endogenousvariables.
As mentioned in the introduction, one of the vari-ables that is focused on is changes in true asset value.The true value idea is taken from market microstruc-ture literature. Glosten and Milgrom (1985) advocatethe use of the midpoint of bid-ask prices as a proxyfor the true value. For asset j, the true value after thekth quote is denoted by mjk, and is obtained as:
mjk ¼Ajk þ Bjk
2ð1Þ
where Ajk and Bjk are the ask and bid prices of assetj on the kth quote, respectively. The point here isthat if large trades convey valuable information,agents revise their estimation of the true price andtheir subsequent orders will modify the book quotes.These modifications are considered informative(whether or not there is a new transaction), becausethey represent changes in the amount investors arewilling to pay or to receive for assets. Continuouslycompounded returns of relative change in the truevalue proxy are used as the information variable.This variable will be denoted by Rjk.
In addition to information transmission, BTs caninvolve temporary changes in liquidity. The idea isthat BTs can affect investors’ optimal portfolio orrelated variables and impose an inventory cost.These liquidity effects of BTs are analysed withregard to changes in relative spread. Many marketmicrostructure articles focus on relative spread tostudy liquidity effects around dividend or earningannouncements.18 The relative spread for asset j afterthe kth quote is denoted by Sjk, and is defined by:
Sjk ¼Ajk � Bjk
ðAjk þ BjkÞ=2ð2Þ
Additionally, it is considered that BTs can affectsome variables such as accumulated volume and dif-ferences in time between quotes. Some papers haveshown that it is important to control for some activityvariables when one wants to measure the informationflow. As Seppi (1992) indicates, when BTs arelooked at one should consider a proxy of activity.
One conclusion of market microstructure literatureis that market activity can be measured by tradingvolume. In this way, volume appears as one appro-priate variable reflecting information arrival.19 This isdenoted by VOLjk, the square root of accumulatednumber of shares traded on asset j between quotesk� 1 and k.20 This is denoted further as Diftjk, thesquare root of the time elapsed in seconds betweenquotes k� 1 and k on asset j.21 Engle and Lange(1997) show that this variable can signal changes inthe order flow regime. So one also looks at thesevariables, looking for changes in regime around BTs.
Preliminary evidence of BT effects on previousvariables is shown in Table 4. This table showspercentage changes in relative spread, differences intime and accumulated volume dividing each observa-tion by its average along the estimation period bycalculating the following statistic:
Kjk ¼Cjk
Cj
� 1
!100 ð3Þ
where C stands for S, Dift and VOL. For returns oneuses the statistic:
Kjk ¼ Rjk � Rj ð4Þ
The average of these statistics across all BTs iscalculated for 10 quotes just before and after them.The cross-sectional distribution of each averageis used to study the significant level of the event.We can observe different evidence in Table 4. First,relative spreads seem to decrease before and afterBTs. This indicates an increase in liquidity. This effectis especially important just after BTs. According tomarket microstructure theory, this reduction may becaused by a reduction in information asymmetries ortrading cost. No significant variation is observed inreturns around BTs, but there is a decrease in volumebefore BTs that could indicate that agents are waitingfor BTs to arrive. The only abnormal volume is thenext BT quote. This could be a sign of agents updat-ing their demands and portfolios. The positive andsignificant numbers found in time differences showthat time between quotes increases just beforeand after a BT. Again, this could be an indicationof investors waiting for trading and updatingtheir expectations. However, this evidence is contraryto insider trading behaviour, as shown in Engle and
18 Lee et al. (1993) and Rubio and Tapia (1996) are representative examples of this literature.19 Previous research (Lee et al. (1993) for the NYSE and Rubio and Tapia (1996) for the SSE) has found clear effects oftrade volume on relative spread. Therefore, volume will be considered as a control variable.20 The square root is used to avoid the outlier problem.21When a change of day occurs, the time from the market opening is used.
Block trades on the Spanish stock exchange 179
Downloaded By: [University Carlos III of Madrid] At: 10:29 8 March 2010

Lange (1997) and theoretical papers that indicate
that insiders would use noisy trading intervals to
camouflage their trades. So the preliminary evidence
around BTs shows different behaviour of relevant
variables such as spreads, volume and differences
in time.
However, the observed effects on the variables may
be due to variables affecting them other than BT
information transmission. In order to isolate the BT
effect, one needs to control the endogenous variables
considered for alternative influential variables around
BTs. The control variables used are well known in
financial literature.
As has been pointed out, volume appears to be one
appropriate control variable for information arrival.
Therefore, VOL is used as an independent variable in
the regression analysis. Three lags of this variable
are considered in order to allow for some delay in
its effects. In order to avoid the disturbing overnight
effect, one also considers an end-of-the-day dummy
variable.22 This variable, denoted by Dend, is taken
as 1 if the kth quote on asset j is the first quote of the
day and 0 otherwise. Market return is also taken into
account as an exogenous variable. The IBEX-35
Index is taken as the market index. The nearest in
seconds value is taken for each quote in the sample
period. Its return is denoted by RIBEX. Three lags of
this variable are also used in order to allow for some
delay in its effects. The aforementioned Dift is also
considered as a control variable.
Finally, to pick up effects around BTs, 21 dummy
variables are considered (a window of 10 quotes
before and after each BT) denoted by DBT�. Each
dummy is given a value of 1 for the quote occurring
� quotes after the BT, and 0 otherwise. The quote
corresponding to the BT itself is considered as the
reference quote, �¼ 0. So, after controlling by the
aforementioned variables, the coefficients of these
dummy variables will show us the effect of BTs on
the endogenous variables before and after they occur.
As pointed out in the introduction, three different
endogenous variables are considered: true asset
22 It has been well documented that overnight returns differ substantially from intraday returns (Amihud and Mendelson,1987 and Stoll and Whaley, 1990).
Table 4. Preliminary evidence of BT effects
Sjk Diftjk VOLjk Rjk � Rj
�10 2.77 16.69 �25.43* 0.41E-05�9 5.55 �10.11 �2.45 �1.33E-05�8 1.56 3.74 �24.02* �6.93E-05�7 �1.93 8.00 �26.50** �2.53E-05�6 0.63 9.03 �22.09* 2.90E-05�5 �7.28 58.39* 8.67 �4.65E-05�4 �4.31 28.65* �2.13 0.76E-05�3 �13.44* 101.36* 4.41 �3.78E-05�2 �5.11 74.35* 42.44** �0.67E-05�1 �25.45* 118.87* 35.92 �4.13E-050 �5.18 44.52* 5793.02* �3.66E-051 2.13 75.39* 316.71* 1.62E-052 �6.98 54.37* 20.57 �3.72E-053 �6.33 53.76* �14.70 1.17E-054 �5.88 58.32* �0.27 �4.51E-055 �9.77* 56.42* 4.92 0.04E-056 �10.71* 56.35* �12.53 �6.79E-057 �13.75* 28.21** �16.45 �3.28E-058 �11.41* 51.11* 3.71 �3.25E-059 �11.26* 53.99* 42.33** �6.29E-0510 �6.82 22.16 16.56 2.12E-05
Note: For the characteristics of relative spread, differences in time and accumulated volume, it is shown the percentagechanges, averaged across all BTs, according to the following statistic:
Kjk ¼Cjk
Cj
� 1
!100
where Cj is the average of each characteristic along the estimation period. For returns the statistic: Kjk ¼ Rjk � Rj is used.The asterisk indicates significance at 5% and double asterisk at 10%.
180 M. A. Martınez et al.
Downloaded By: [University Carlos III of Madrid] At: 10:29 8 March 2010

returns, relative spreads and adverse selection spreadcomponent. They capture price, liquidity and infor-mation transmission effects respectively. Because notwo firms have an identical timing of quotes, regres-sions cannot be estimated as a multivariate systemacross all BTs, so one time-series regression is runfor each BT. The coefficients are therefore averagedover all of them and over the different subsamplesconsidered. If BTs are relevant for these variables,significant coefficients will be observed for the appro-priate BT dummy variables. These are the relevantvariables in the analysis. The remaining variablesare included only to control for external effects.
Returns evidence
Next, the regression are shown for each BT usedto analyse the BT effects on true asset returns. Thetime-series regression for each BT j is:
Rk ¼ �þX�¼�3
�¼�1
��R� þX�¼�3
�¼0
��RIBEX� þX�¼�3
�¼0
��VOL�
þ �Diftþ ’Dend þX�¼10
�¼�10
��DBT� þ !k ð5Þ
where three lags of the endogenous variable are usedand DBT stands for the dummy variable employed topick up effects around BTs.23
The first column of Table 5 shows the results ofthe above regressions. Only the results for the totalsample of BTs are reported. First, one observesmean reversion in returns. This expected result is con-sistent with other results in related literature. Second,clock time measured by Dift is also significant. Othercontrol variables seem relevant and coefficient signsare as expected (RIBEX, VOL, Dend ). So the use ofthese variables to control seems to be justified.
Next, the closest BT dummy coefficients are shown.In general, they are not statistically significant. Thecontemporary coefficient is negative and significant.The most striking result is that in the differentsubsample classifications this coefficient does notchange its sign or is not statistically relevant.24 Thisis especially important in the buyer and seller classi-fication. This is not consistent with previous BT stu-dies or with intuition. In the total sample results, thisnegative effect of the contemporaneous BT dummy isalmost offset by the effect of two quotes later. In theend, it seems that there is no significant permanenteffect on returns. The reason for this result could bethe specific problems that traders face in the SSE in
crossing a BT. These problems could cause the BTprice not to be the real price. The idea is that inves-tors willing to buy (sell) a BT would pay (renounce)an additional fee that is not observed by marketparticipants. In this environment, BT prices mightnot be informative.
Alternatively in order to control for irregularinterval problem, time returns are also calculatedaccording to the expression:
TARk ¼ ð1þ RkÞ1=Diftk
h i� 1 ð6Þ
The analogous regressions now run for each BTare:
TARk ¼�þX�¼�3
�¼�1
��TAR� þX�¼�3
�¼0
l�TARIBEX�
þX�¼�3
�¼0
��TAVOL� þ ’Dend
þX�¼10
�¼�10
��DBT� þ !k ð7Þ
where TARIBEX is calculated in the same way asTAR, whereas TAVOL is VOL divided by Dift.
With this specification, the results are slightlydifferent. In general, the control variables are not rele-vant or their coefficients are lower than before, andBT dummies are not significant. Although one cannotconstruct a statistical test to evaluate the appropriate-ness of time adjustment, by looking at adjusted Rsquared one can conclude that, in general, adjustmentwith Dift as an exogenous variable is better than TARadjustment. This is why these results are not included.
Adverse selection evidence
To test the information transmission hypothesis, theadverse selection spread component is looked at. Theway in which we estimate this component is takenfrom Foster and Viswanathan (1993). These authorsmeasure adverse selection as the returns response tounexpected volume. Given their model, the followingtime series regressions are estimated for each BT:
VOLk ¼ �þX�¼�3
�¼�1
��R� þX�¼�3
�¼�1
��VOL� þ �Dift
þ ’Dend þ !k ð8Þ
Rk ¼ �þ �!k þX�¼10
�¼�10
��!kDBT� þ uk ð9Þ
23 The range of selected quotes for each regression goes from 235 to 4460. The study ran 195 regressions.24 The subsample results can be obtained from the authors by request.
Block trades on the Spanish stock exchange 181
Downloaded By: [University Carlos III of Madrid] At: 10:29 8 March 2010

Table 5. Aggregate results
R Adverse selection VOL S
CONS 1.56E-05 0.62E-05 13.49* 0.00*R(�1) �0.32* – – –R(�2) �0.07* – – –R(�3) �0.04* – – –RIBEX 0.40* – – –RIBEX(�1) 0.16* – – –RIBEX(�2) 0.10* – – –RIBEX(�3) 0.05* – – –VOL 0.13E-05* – – �2.41E-05*VOL(�1) 0.00E-05 – 0.02* 1.59E-05*VOL(�2) �0.02E-05 – 0.06* 0.42E-05*VOL(�3) �0.02E-05 – 0.04* 0.07E-05*S(�1) – – – 0.40*S(�2) – – – 0.22*S(�3) – – – 0.05*Dift �0.47E-05* – 1.36* �0.17E-05*Dend 52.49E-05* – 64.22* 0.00*� – 0.00E-05 – –�5 1.55E-05 �0.01E-05 �2.93 �4.41E-05�4 8.82E-05 0.38E-05 2.86 8.45E-05�3 �7.31E-05 �0.04E-05 �1.99 �24.0E-05�2 �17.42E-05 �0.03E-05 9.79* 26.2E-05�1 3.82E-05 0.51E-05 �8.01* �55.5E-05*0 �72.46E-05* �0.08E-05 348.24* �0.00*1 �11.36E-05 0.01E-05 4.38 �29.8E-052 58.36E-05* 5.64E-05 �26.57* �12.2E-053 �8.64E-05 0.75E-05 �19.45* 31.1E-05**4 19.33E-05 0.07E-05** �5.95* 18.7E-055 �13.33E-05 �0.02E-05 �2.43* �4.79E-05
Notes: For each BT in the sample, three time series regressions are run with three different specifications. In particular theregressions are:
Rk ¼ �þX�¼�3
�¼�1
��R� þX�¼�3
�¼0
��RIBEX� þX�¼�3
�¼0
��VOL�
þ �Diftþ ’Dend þX�¼10
�¼�10
��DBT� þ !k
Sk ¼ �þX�¼�3
�¼�1
��S� þX�¼�3
�¼0
��VOL� þ �Diftþ ’Dend
þX�¼10
�¼�10
��DBT� þ !k
VOLk ¼ �þX�¼�3
�¼�1
��VOL� þ �Diftþ ’Dend þX�¼10
�¼�10
��DBT� þ !k
where RIBEX is the return of IBEX-35, VOL is the square root of accumulated volume between quotes changing asset truevalue, Dift is the square root of time elapsed between quotes, Dend is a dummy variable for end-of-the-day effects and DBTstands for the dummy variable employed to pick up effects around BTs. To test the BT effects on the adverse selection spreadcomponent two time series regressions are run with two different specifications:
VOLk ¼ �þX�¼�3
�¼�1
��R� þX�¼�3
�¼�1
��VOL� þ �Diftþ ’Dend þ !k
Rk ¼ �þ �!k þX�¼10
�¼�10
��!kDBT� þ uk
The coefficients are averaged across all BTs. White (1980) standard errors are used.
182 M. A. Martınez et al.
Downloaded By: [University Carlos III of Madrid] At: 10:29 8 March 2010

The first equation estimates the unexpected volumefor each change in true return through residuals. Thesecond equation measures the reaction of returnsincluding as explanatory variables these residuals andBT dummies. In this context, coefficient � measuresmean adverse selection and coefficient � measuresabnormal adverse selection around BTs. Aggregateresults are included in the second column of Table 5.It can be observed that the adverse selection com-ponent, measured as the coefficient of residuals, isnot significant. The only significant coefficient is theone associated with four quotes after BT. These resultsare consistent with the Admati and Pfleiderer (1988)model where liquidity traders pool their trades.So insiders only act in these periods and not in the
middle of the day, when they would be detected.So, BTs are not as informative as expected.
Table 6 looks at different subsample classifications.The results are slightly different. The contemporaryBT dummy is significantly positive for buyer and sellerBTs but not for indeterminate BTs. This is consistentwith the sign of the initiator party. The same dummyis also significant and positive in sweeping BTs.This result is also consistent because of the additionalcost this type of BTs imposes. Finally, a significantpositive contemporary BT dummy is also found forno-changing-true-asset-value BTs. This coefficientmay be justified by the ignorance of investors aboutthe effects of this type of BT. These results are indica-tive of information transmission. There exists an
Table 6. Adverse selection evidence in subsample classifications
Buyer-init. Seller-init. Indeterminate-init. Inside the spread Sweeping Not classified
CONS �4.69E-06 9.02E-06 1.07E-05 1.15E-05 9.20E-07 1.52E-05� 4.16E-09 4.64E-09 1.19E-09 �1.31E-09 �3.10E-12 4.16E-08**�5 �8.85E-07 1.73E-07 1.14E-07 8.59E-07 2.92E-07 �7.55E-06**�4 5.27E-06 �2.14E-07 5.39E-06 3.73E-06 4.55E-06 �2.13E-07�3 7.32E-07 �1.95E-06* �8.77E-08 4.66E-07 �4.53E-07 �3.94E-06*�2 �8.34E-08 �1.35E-07 �4.20E-07 �1.55E-07 �1.18E-07 �1.61E-06�1 �1.87E-05 �5.33E-07 2.17E-05** 1.01E-05 �9.44E-06 7.47E-050 4.11E-06* 1.79E-06* �5.02E-06 �6.44E-06 2.65E-06* 3.99E-061 �1.66E-07 �9.73E-07 9.00E-07 1.27E-06 �5.80E-07 �9.08E-072 2.69E-06 5.76E-08 1.19E-04 1.42E-04 1.46E-06 1.76E-063 �9.93E-07 3.98E-07 1.65E-05 1.97E-05 �3.24E-08 �1.60E-064 5.92E-07 1.16E-06 5.44E-07 4.45E-07 7.41E-07 1.95E-065 3.49E-09 �6.53E-07 �6.29E-08 �8.57E-08 4.11E-09 �2.13E-06
BB BS SB SSChange intrue asset value
No change intrue asset value
CONS 3.18E-05* 6.66E-06 �2.70E-05* 1.27E-05 1.17E-05** �9.93E-07� 1.89E-09 �3.22E-09 1.12E-08 1.91E-09 5.17E-09 �1.02E-10�5 2.24E-07 �1.01E-06 2.92E-07 �2.37E-08 3.42E-08 �3.49E-07�4 4.15E-06 �2.78E-06 5.99E-06 8.04E-06 4.19E-06 3.37E-06�3 1.09E-07 �5.66E-07 �1.02E-06 �5.82E-08 �2.55E-07 �5.47E-07�2 �3.66E-07 �2.71E-07 �7.65E-07 3.73E-07 �2.02E-07 �3.24E-07�1 �1.14E-06** 5.61E-06 2.45E-05 �8.22E-06 1.06E-05 �2.25E-060 1.32E-06 9.50E-07 �7.30E-06 1.77E-06 �3.81E-06 3.21E-06*1 1.45E-08 2.78E-06* �9.08E-07 �1.46E-06 7.80E-07 �7.70E-072 �3.63E-07 4.11E-06 3.76E-06 2.17E-04 9.77E-05 1.82E-063 3.90E-07* 4.00E-07 �1.41E-06 3.06E-05 1.30E-05 3.07E-07**4 1.59E-07 �4.12E-08 7.95E-07 1.99E-06 4.36E-07 1.11E-065 1.72E-08 �1.28E-08 �8.28E-07 �1.29E-08 �3.62E-07 6.75E-10
Notes: For each BT in the sample, two time series regressions are run:
VOLk ¼ �þX�¼�3
�¼�1
��R� þX�¼�3
�¼�1
��VOL� þ �Diftþ ’Dend þ !k
Rk ¼ �þ �!k þX�¼10
�¼�10
��!kDBT� þ uk
where VOL is the square root of accumulated volume between quotes changing asset true value, Dift is the square root oftime elapsed between quotes, Dend is a dummy variable for end-of-the-day effects and DBT stands for the dummy variableemployed to pick up effects around BTs. The coefficients are averaged across all of them. White (1980) standard errorsare used.
Block trades on the Spanish stock exchange 183
Downloaded By: [University Carlos III of Madrid] At: 10:29 8 March 2010

increase in adverse selection spread component forthese subsamples. These results are consistent with thepresence of insiders trading with orders of these types.It seems that the knowledge of the BT initiator partyincreases information asymmetries among traders.Moreover, the implied greater cost of sweeping BTseems to be a signal of the quality of the informationtransmitted to the market. Additionally, informationasymmetries among traders increase with BTs that donot change the true asset value.
As a last test of information transmission, volumeis considered as an endogenous variable. Volume willmeasure abnormal activity around BTs. In this case,this would be a signal of insiders around BTs andinformation flow in the market.25 The regressionsfor each BT are:
VOLk ¼ �þX�¼�3
�¼�1
��VOL� þ �Diftþ ’Dend
þX�¼10
�¼�10
��DBT� þ !k ð10Þ
Results are in the third column of Table 5. Beforethe BT one sees an unclear pattern, with a negativecoefficient just before the BT but a positive one twoquotes before. However, after BTs there is a signifi-cant decrease in market activity that could be relatedto the presence of insiders. Those insiders could leadthe rest of market participants to decrease transactedvolume. This is associated with previous findings onadverse selection.
Liquidity evidence
For relative spread, Sk, the time-series regression runfor each BT is shown by the following expression:
Sk ¼ �þX�¼�3
�¼�1
��S� þX�¼�3
�¼0
��VOL� þ �Diftþ ’Dend
þX�¼10
�¼�10
��DBT� þ !k ð11Þ
The results are shown in the last column of Table 5.The lagged variables are positive and significant. Asexpected, an autorregresive process is observed inthis variable. Another important variable is volume.A negative contemporaneous coefficient and positivelagged ones are observed. A negative relationshiphas been documented in other research into theSSE (Rubio and Tapia, 1996). This evidence is also
consistent with Admati and Pfleiderer’s (1988) modeland, at the same time, is contrary to the results of Leeet al. (1993) for the US market.
The most important result related to liquidity is thenegative and significant BT dummy coefficients justbefore and contemporary with BT arrival. This isrelated to an increase in liquidity. The increase inliquidity before BT can be explained by the necessaryintroduction of pre-agreed BT limit orders for thesame amount of shares at the price available insidethe spread. After BTs there is a decrease in liquidity,so part of the effect is temporary. This result is relatedto a decrease in temporary spread components suchas inventory cost and operative cost. This is relevantbecause these coefficients have been obtained bytaking volume into account as a control variable.Looking at the SSE, this is a stronger result becauseprevious research did not find any effect on relativespread after controlling for volume.26
V. Concluding Remarks
To the best of knowledge, this study analyses for thefirst time the role of BTs in a market where this issueis not facilitated. This market microstructure charac-teristic gives us a special testing ground. Additionally,quotes are used that change true asset value insteadof prices.
Three different effects around BTs are studied:price, liquidity and information transmission. Tocapture them, three different endogenous variablesare considered: true asset returns, relative spreadsand adverse selection spread component. With thisapproach, there are no clear effects of BTs.
There is no significant permanent effect on returnsin the different subsample classification, which iscontrary to previous evidence and to our intuition.In related papers, other authors have obtained cleareffects of BTs on prices depending on BT type. Onesuspects that the reasons for these differences couldbe related to methodology and SSE market micro-structure. To discover the source of these differences,this methodology should be applied to other marketswith block trading facilities.
In addition to previous studies, adverse selection isanalysed as a measure of information asymmetriesand, as a consequence, of information transmission.It seems that there is an increase in information asym-metries when one look at adverse selection spread
25 See Admati and Pfleiderer (1988).26 Rubio and Tapia (1996) show that relative spreads do not change in the SSE around dividend announcements when theycontrol for activity variables such as volume and number of transactions.
184 M. A. Martınez et al.
Downloaded By: [University Carlos III of Madrid] At: 10:29 8 March 2010

component in the different subsample classifications(buyer, seller, sweeping and not-changing-true-asset-value BTs). This result could be related to insiderstrading in the market.
In sharp contrast with adverse selection evidence,one also observes a temporary increase in liquidityaround BTs. These changes reflect temporary liquid-ity effects related to other spread components (orderprocessing costs and inventory costs). This oppositeevidence could be explained by the fact that there areno special market participants such as specialists ordealers and as a result our market participants arenot required to absorb temporary order imbalances.
Acknowledgements
We are grateful to G. Rubio, I. Pena andJ. Marhuenda for helpful comments and to partici-pants at the XXIII Simposio de Analisis Economico,II Encuentro de Economıa Aplicada, II Workshopin Finance de Segovia, 1999 European FinancialManagement Association Annual Meeting, VEncontro Galego de Novos Investigadores de AnaliseEconomica and Seminars at Universidad de las IslasBaleares, Universidad de Alicante and UniversidadCarlos III. We would also like to acknowledgefinancial support from Direccion General Inter-ministerial Cientıfica y Tecnica (DGICYT), projectsPB94-1373 and PB97-0621. The contents of thispaper are the sole responsibility of the authors.
References
Admati, A. and Pfleiderer, P. (1988) A theory of intradaypatterns: volume and price variability, The Reviewof Financial Studies, 1, 3–40.
Aggarwal, R. and Chen, S. (1989) The adjustment of stockreturns to block trading information, QuarterlyJournal of Business and Economics, 29(1), 46–56.
Amihud, Y. and Mendelson, H. (1986) Asset pricing andthe bid-ask spread, Journal of Financial Economics,17(2), 223–49.
Amihud, Y. and Mendelson, H. (1987) Trading mechan-isms and stock returns: an empirical investigation,Journal of Finance, 42, 533–53.
Ball, R. and Finn, F. (1989) The effect of block transactionson share prices. Australian evidence, Journal ofBanking and Finance, 13, 397–419.
Barclay, M. and Holderness, C. (1991) Negotiated blocktrades and corporate control, Journal of Finance,46(3), 861–78.
Bethel, J., Porter, J. and Opler, T. (1998) Block sharespurchase and corporate performance, Journal ofFinance, 53(2), 605–34.
Blume, M., Mackinlay, C. and Terker, B. (1989) Orderimbalances and stock price movements on October19 and 20, 1987, Journal of Finance, 44, 827–48.
Bolton, P. and Von Thadden, E. (1998) Blocks, liquidityand corporate control, Journal of Finance, 53(1), 1–25.
Chan, L. and Lakonishok, J. (1993) Institutional trades andintraday stock price behavior, Journal of FinancialEconomics, 33, 173–99.
Chan, L. and Lakonishok, J. (1995) The behavior of stockprices around institutional trades, Journal of Finance,50, 1147–74.
Choe, H. and Masoulis, R. (1992) Measuring theimpact of dividend capture trading: a market micro-structure analysis, Working paper, VanderbiltUniversity.
Daley, L., Hughes, J. and Raiburn, J. (1995) The impactof earnings announcements on the permanentprice effects of block trades, Journal of AccountingResearch, 33(2), 317–34.
Easley, D. and O’Hara, M. (1987) Prices, trade size andinformation in security markets, Journal of FinancialEconomics, 19, 69–90.
Engle, R. and Lange, J. (1997) Measuring, forecasting andexplaining time varying liquidity in the stock market,Discussion paper 97-12, University of California,San Diego.
Foster, F. and Viswanathan, S. (1990) A theory of interdayvariations in volumes, variances and trading costs insecurities markets, The Review of Financial Studies, 3,593–624.
Foster, F. and Viswanathan, S. (1993) Variations in tradingvolume, return volatility, and trading cost: evidenceon recent price formation models, Journal of Finance,48, 187–211.
Gemmill, G. (1996) Transparency and liquidity: a studyof block trades on the London stock exchange underdifferent publication rules, Journal of Finance, 5,1765–90.
Glosten, L. and Milgrom, P. (1985) Bid, ask and transac-tion prices in a specialist market with heterogeneouslyinformed traders, Journal of Financial Economics,14, 71–100.
Harris, L. (1986) A transaction data study of weekly andintradaily patterns in stock returns, Journal ofFinancial Economics, 16(1), 99–117.
Hasbrouck, J., Sofianos, G. and Sosebee, D. (1993) NYSEsystems and trading procedure, NYSE Working Paper,93–101.
Hausman, J., Lo, A. and Mackinlay, C. (1992) An orderedprobit analysis of transaction stock prices, Journal ofFinancial Economics, 31, 319–79.
Holthausen, R., Leftwich, R. and Mayers, D. (1987) Theeffect of large block transactions on security prices,Journal of Financial Economics, 19, 237–67.
Holthausen, R., Leftwich, R. and Mayers, D. (1990) Largeblock transactions, the speed of response, and tempor-ary and permanent stock-price effects, Journal ofFinancial Economics, 26, 71–95.
Kraus, A. and Stoll, H. (1972) Price impacts of blocktrading on the New York Stock Exchange, TheJournal of Finance, 27, 569–88.
Kyle, A. (1985) Continuous auction and insider trading,Econometrica, 53, 1315–35.
LaPlante, M. and Muscarella, C. (1997) Do institutionsreceive comparable execution in the NYSE andNASDAQ markets? A transaction study of blocktrades, Journal of Financial Economics, 45(1), 97–134.
Lee, C., Mucklow, B. and Ready, M. (1993) Spreads,depths and the impact of earnings information: anintraday analysis, Review of Financial Studies, 6,345–74.
Block trades on the Spanish stock exchange 185
Downloaded By: [University Carlos III of Madrid] At: 10:29 8 March 2010
Lee, C. and Ready, M. (1991) Inferring trade direction fromintraday data, The Journal of Finance, 46(2), 733–47.
Madhavan, A. and Cheng, M. (1997) In search of liquidity:block trades in the upstairs and downstairs markets,Review of Financial Studies, 10(1), 175–203.
O’Hara, M. (1995) Market Microestructure Theory,Blackwee Publisher, MA.
Riva, F. (1996) Block trading on the Paris BourseCentral Market: an empirical study, Proceedings ofOrganization and Quality of Equity Markets, Paris.
Rubio, G. and Tapia, M. (1996) Adverse selection, volumeand transactions around dividend announcementsin a continuous auction markets, European FinancialManagement, 2(1), 39–67.
Scholes, M. (1972) The markets for securities: substitu-tion versus price pressure and the effects of infor-mation on share prices, Journal of Business, 45,179–211.
Seppi, D. (1990) Equilibrium block trading and asymmetricinformation, The Journal of Finance, 45(1), 73–94.
Seppi, D. (1992) Block trading and information revelationaround quarterly earnings announcements, The Reviewof Financial Studies, 5(2), 281–305.
Stoll, H. and Whaley, R. (1990) Stock market and vol-atility, Review of Financial Studies, 3, 37–71.
White, H. (1980) A heteroscedasticity-consistent covarianceestimator and a direct test for heteroscedasticity,Econometrica, 48, 817–39.
186 M. A. Martınez et al.
Downloaded By: [University Carlos III of Madrid] At: 10:29 8 March 2010
Copyright © 2022 FDOKUMEN