Influence of Some thiadiazole derivatives on corrosion inhibition of mild steel in formic and acetic...
16
Portugaliae Electrochimica Acta 25 (2007) 419-434 PORTUGALIAE ELECTROCHIMICA ACTA Influence of Some Thiadiazole Derivatives on Corrosion Inhibition of Mild Steel in Formic and Acetic Acid Media M.Z.A. Rafiquee, a S. Khan, a,* N. Saxena, a M.A. Quraishi b a Corrosion Research Laboratory, Department of Applied Chemisty, Faculty of Engineering and Technology, Aligarh Muslim University, Aligarh-202 002, India b Department of Applied Chemistry, Institute of Technology, Banaras Hindu University, Varanasi, India Received 30 th April 2007; accepted 17 th July 2007 Abstract 2-amino-1, 3, 4-thiadiazoles (AT), 2-amino-5-methyl-1, 3, 4-thiadiazoles (AMT), 2- amino-5-ethyl -1, 3, 4-thiadiazoles (AET) and 2-amino-5-propyl -1, 3, 4-thiadiazoles (APT) were synthesized. FT-IR and NMR studies were done in order to confirm the composition of the synthesized inhibitors. These compounds were evaluated as inhibitors for mild steel in 20% formic acid and 20% acetic acid by weight loss, potentiodynamic polarization and electrochemical impedance techniques. Scanning electron microscopic study (SEM) was also used to investigate the surface morphology of inhibited and uninhibited metal samples. The inhibition efficiency of these compounds was found to vary with the inhibitor concentration, immersion time, temperature and acid concentration. The adsorption of these compounds on the steel surface from both acids were found to obey Langmuir’s adsorption isotherm. These compounds are mixed type inhibitors in both acid solutions. Various thermodynamic parameters (E a , ΔG ads , ΔQ, ΔH, ΔS, t 1/2 ) have also been calculated to investigate the mechanism of corrosion inhibition. Electrochemical impedance study was used to investigate the mechanism of corrosion inhibition. Keywords: mild steel, potentiodynamic polarization, thiadiazoles, FT-IR spectroscopy, Langmuir adsorption isotherm, scanning electron microscopy. Introduction Corrosion studies on metals in organic acid solutions are scarce in comparison with similar studies in mineral acids [1-4]. The presence of reactive carboxyl group –COOH in organic acids makes them a basic building block for many compounds such as drugs, pharmaceuticals, plastics and fibers. * Corresponding author. E-mail address: [email protected]
-
Upload
independent -
Category
Documents
-
view
1 -
download
0
Transcript of Influence of Some thiadiazole derivatives on corrosion inhibition of mild steel in formic and acetic...
Portugaliae Electrochimica Acta 25 (2007) 419-434 PORTUGALIAE
ELECTROCHIMICA
ACTA
Influence of Some Thiadiazole Derivatives on Corrosion
Inhibition of Mild Steel in Formic and Acetic Acid Media
M.Z.A. Rafiquee,a S. Khan,
a,* N. Saxena,
a M.A. Quraishi
b
a Corrosion Research Laboratory, Department of Applied Chemisty, Faculty of Engineering and
Technology, Aligarh Muslim University, Aligarh-202 002, India b Department of Applied Chemistry, Institute of Technology, Banaras Hindu University,
Varanasi, India
Received 30th April 2007; accepted 17
th July 2007
Abstract 2-amino-1, 3, 4-thiadiazoles (AT), 2-amino-5-methyl-1, 3, 4-thiadiazoles (AMT), 2-
amino-5-ethyl -1, 3, 4-thiadiazoles (AET) and 2-amino-5-propyl -1, 3, 4-thiadiazoles
(APT) were synthesized. FT-IR and NMR studies were done in order to confirm the
composition of the synthesized inhibitors. These compounds were evaluated as
inhibitors for mild steel in 20% formic acid and 20% acetic acid by weight loss,
potentiodynamic polarization and electrochemical impedance techniques. Scanning
electron microscopic study (SEM) was also used to investigate the surface morphology
of inhibited and uninhibited metal samples. The inhibition efficiency of these
compounds was found to vary with the inhibitor concentration, immersion time,
temperature and acid concentration. The adsorption of these compounds on the steel
surface from both acids were found to obey Langmuir’s adsorption isotherm. These
compounds are mixed type inhibitors in both acid solutions. Various thermodynamic
parameters (Ea, ∆Gads, ∆Q, ∆H, ∆S, t1/2) have also been calculated to investigate the
mechanism of corrosion inhibition. Electrochemical impedance study was used to
investigate the mechanism of corrosion inhibition.
Keywords: mild steel, potentiodynamic polarization, thiadiazoles, FT-IR spectroscopy,
Langmuir adsorption isotherm, scanning electron microscopy.
Introduction
Corrosion studies on metals in organic acid solutions are scarce in comparison
with similar studies in mineral acids [1-4]. The presence of reactive carboxyl
group –COOH in organic acids makes them a basic building block for many
compounds such as drugs, pharmaceuticals, plastics and fibers.
* Corresponding author. E-mail address: [email protected]

M.Z.A. Rafiquee et al. / Portugaliae Electrochimica Acta 25 (2007) 419-434
420
Few corrosion studies of these acids [5-8] have been made. However, at high
temperatures, the acids can dissociate, forming more aggressive ions that can
cause faster corrosion than might otherwise be expected.
A variety of organic compounds containing heteroatoms such as O, N, S and
multiple bonds in their molecule are of particular interest as they give better
inhibition efficiency than those containing N or S alone [9-13], as lone pair of
electrons present on heteroatoms are the important structural features that
determine the adsorption of these molecules on the metal surface.
The corrosion inhibiting behaviour of thiadiazoles on mild steel was reported in
acidic media [14-17].
In the present investigation the influence of four thiadiazoles, namely, 2-amino-1,
3, 4-thiadiazoles (AT), 2-amino-5-methyl-1, 3, 4-thiadiazoles (AMT), 2-amino-
5-ethyl -1, 3, 4-thiadiazoles (AET) and 2-amino-5-propyl -1, 3, 4-thiadiazoles
(APT) on corrosion inhibition of mild steel in 20% formic acid and 20% acetic
acid with the minimum corrosion rate [18], were undertaken with a view to
establish their corrosion inhibition efficiencies along with the mechanism
involved on their adsorption phenomenon.
Experimental Material preparation
AR grade formic and acetic acid (MERCK) and doubled distilled water were used
for preparing test solutions of 20% formic acid and 20% acetic acid for all the
experiments. The inhibitors were synthesized following a procedure described
earlier [19] and compounds were characterized through their spectral data and
their purity was confirmed by thin layer chromatography (TLC), FT-IR and NMR
study. Name and structural formulas of the condensation products are given in
Table 1.
FT-IR spectroscopy
FT-IR spectroscopic study was used to investigate the purity of the compound
synthesized. The results are listed below:
1. 2-amino-1, 3, 4-thiadiazoles (AT) - IR (KBr): 3348 (NH2), 1647 (C=N), 1311
(C−N), 600 (C−S) cm-1.
2. 2-amino-5 -methyl-1, 3, 4-thiadiazoles (AMT) - IR (KBr): 3321 (NH2), 1645
(C=N), 1316 (C−N), 650 (C−S), 1284 (CH3−) cm-1.
3. 2-amino-5-ethyl-1, 3, 4-thiadiazoles (AET) - IR (KBr): 3220 (NH2), 1642
(C=N), 1316 (C−N), 653 (C−S), 1002 (CH3CH2−) cm-1.
4. 2-amino-5-propyl-1, 3, 4-thiadiazoles (APT) - IR (KBr): 3044 (NH2),
1653(C=N), 1285 (C−N), 657(C−S), 800 (CH3CH2CH2−) cm-1.
NMR spectroscopy
NMR spectral data (δCDCl3)
2-amino-5-propyl-1, 3, 4-thiadiazoles (APT) - 0.983 (3H, CH3), 2.008 (4H,
(CH2)2), 2.816 (2H, NH2)
M.Z.A. Rafiquee et al. / Portugaliae Electrochimica Acta 25 (2007) 419-434
421
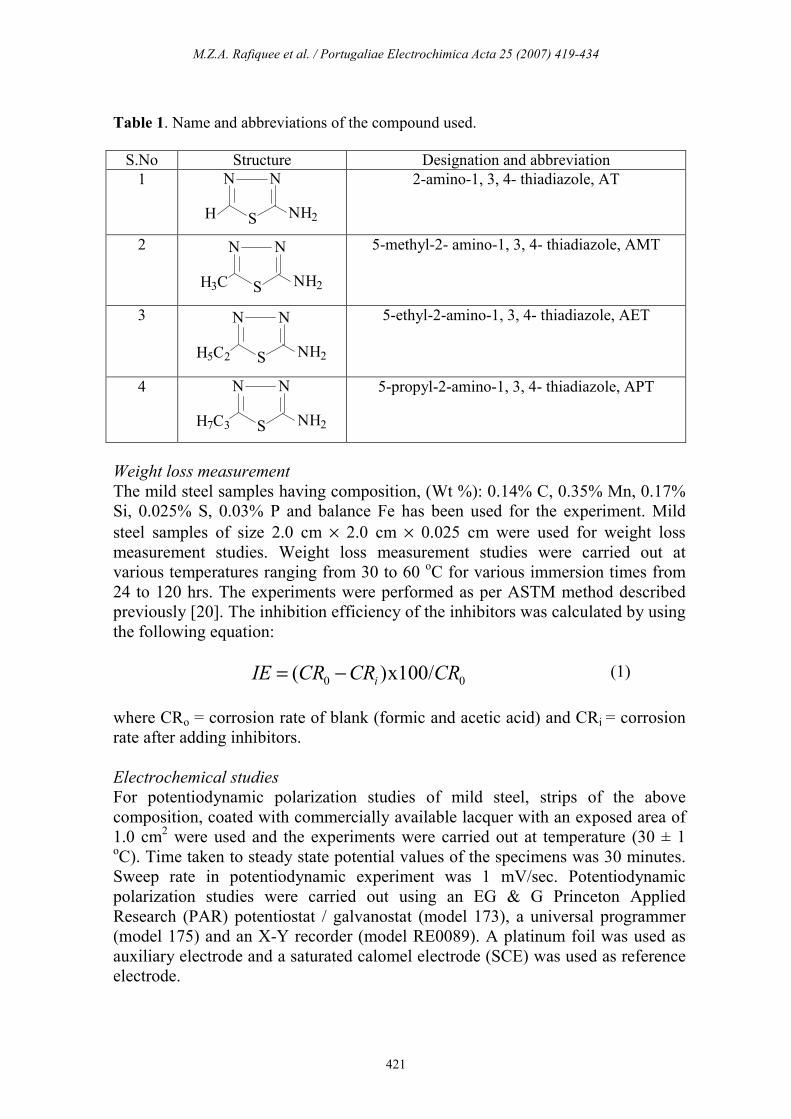
Table 1. Name and abbreviations of the compound used.
S.No Structure Designation and abbreviation
1 NN
SH NH2
2-amino-1, 3, 4- thiadiazole, AT
2 NN
SH3C NH2
5-methyl-2- amino-1, 3, 4- thiadiazole, AMT
3 NN
SH5C2 NH2
5-ethyl-2-amino-1, 3, 4- thiadiazole, AET
4 NN
SH7C3 NH2
5-propyl-2-amino-1, 3, 4- thiadiazole, APT
Weight loss measurement
The mild steel samples having composition, (Wt %): 0.14% C, 0.35% Mn, 0.17%
Si, 0.025% S, 0.03% P and balance Fe has been used for the experiment. Mild
steel samples of size 2.0 cm × 2.0 cm × 0.025 cm were used for weight loss
measurement studies. Weight loss measurement studies were carried out at
various temperatures ranging from 30 to 60 oC for various immersion times from
24 to 120 hrs. The experiments were performed as per ASTM method described
previously [20]. The inhibition efficiency of the inhibitors was calculated by using
the following equation:
0 0( )x100/iIE CR CR CR= − (1)
where CRo = corrosion rate of blank (formic and acetic acid) and CRi = corrosion
rate after adding inhibitors.
Electrochemical studies
For potentiodynamic polarization studies of mild steel, strips of the above
composition, coated with commercially available lacquer with an exposed area of
1.0 cm2 were used and the experiments were carried out at temperature (30 ± 1
oC). Time taken to steady state potential values of the specimens was 30 minutes.
Sweep rate in potentiodynamic experiment was 1 mV/sec. Potentiodynamic
polarization studies were carried out using an EG & G Princeton Applied
Research (PAR) potentiostat / galvanostat (model 173), a universal programmer
(model 175) and an X-Y recorder (model RE0089). A platinum foil was used as
auxiliary electrode and a saturated calomel electrode (SCE) was used as reference
electrode.

M.Z.A. Rafiquee et al. / Portugaliae Electrochimica Acta 25 (2007) 419-434
422
Electrochemical impedance studies
The electrical equivalent circuit for the system is shown in the figure below:
W
Rs
Cdl
Rt
RS = solution resistance, Rt = charge transfer resistance, W = Warburg
impedance, Cd1 = double layer capacitance.
The values of Rt and Cd1 were obtained using the Nyquist plot [21]. The %IE was
calculated using equation [22]:
100 x R/1
R/1 R/1 % IE
to
to −=
(2)
where Rt and Rto are the charge transfer resistance with and without inhibitor,
respectively.
The impedance diagrams are not perfect semicircles, and this difference has been
attributed to frequency dispersion [23]. All the measurements were carried out
using Zahner IM-6 electrochemical workstation at 30± 2 ºC, at a frequency range
of 5 Hz –100k Hz at Ecorr for mild steel in 20% formic acid at different inhibitor
concentration.
Scanning electron microscopy
Scanning electron microscope (SEM) model No 435 VP LEO, was used to study
the morphology of the corroded surface in the presence and absence of the
inhibitors. After weight loss studies at 30 ºC for 24 hours the specimens were
thoroughly washed with double distilled water before examination. The
photographs have been taken from that portion of specimen from where better
information was obtained. They were photographed at appropriate magnifications
(2500-3000 micron). To understand the morphology of the steel surface in
absence and presence of the inhibitors, the following cases have been examined:
i) polished mild steel specimen;
ii) mild steel specimen dipped in 20% formic acid;
iii) mild steel specimens dipped in 20% formic acid containing 500-ppm
concentrations of APT inhibitors.
M.Z.A. Rafiquee et al. / Portugaliae Electrochimica Acta 25 (2007) 419-434
423
Results and discussion
Weight loss measurements
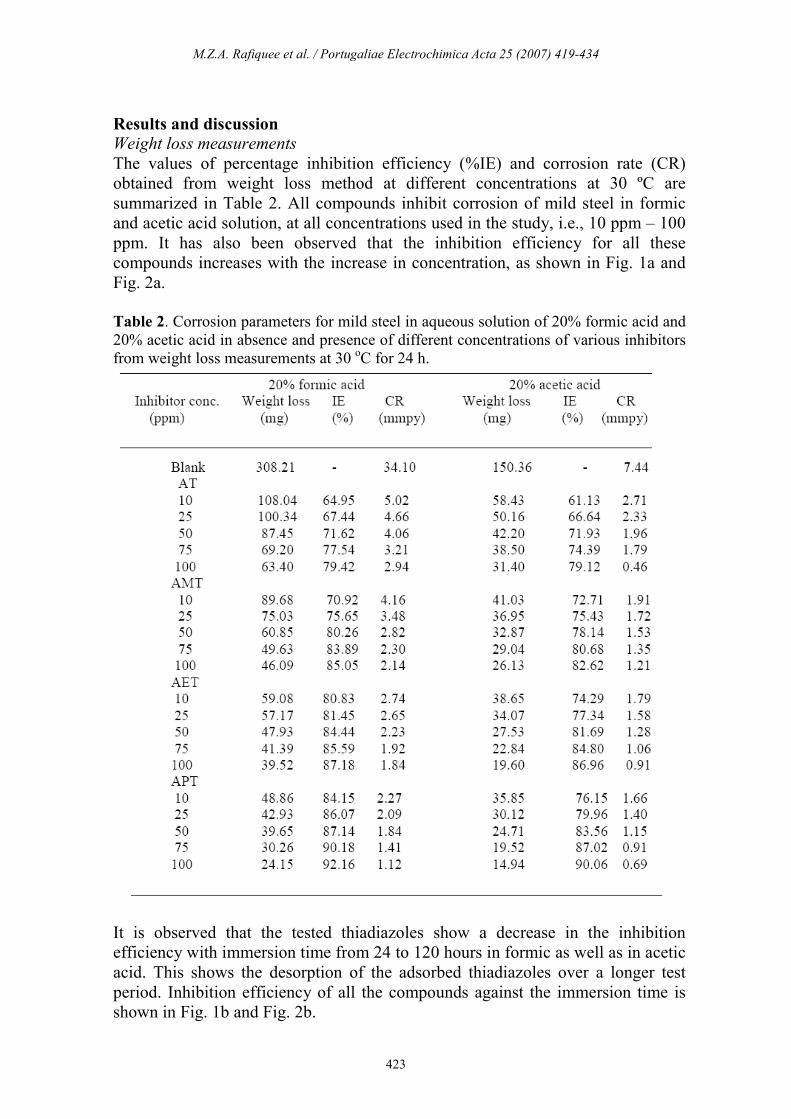
The values of percentage inhibition efficiency (%IE) and corrosion rate (CR)
obtained from weight loss method at different concentrations at 30 ºC are
summarized in Table 2. All compounds inhibit corrosion of mild steel in formic
and acetic acid solution, at all concentrations used in the study, i.e., 10 ppm – 100
ppm. It has also been observed that the inhibition efficiency for all these
compounds increases with the increase in concentration, as shown in Fig. 1a and
Fig. 2a.
Table 2. Corrosion parameters for mild steel in aqueous solution of 20% formic acid and
20% acetic acid in absence and presence of different concentrations of various inhibitors
from weight loss measurements at 30 oC for 24 h.
It is observed that the tested thiadiazoles show a decrease in the inhibition
efficiency with immersion time from 24 to 120 hours in formic as well as in acetic
acid. This shows the desorption of the adsorbed thiadiazoles over a longer test
period. Inhibition efficiency of all the compounds against the immersion time is
shown in Fig. 1b and Fig. 2b.

M.Z.A. Rafiquee et al. / Portugaliae Electrochimica Acta 25 (2007) 419-434
424
Figure 1.
Variation of the inhibition efficiency with (a) inhibitor concentration, (b)
immersion time, (c) solution temperature, (d) acid concentration in 20% formic acid (1:
AT; 2: AMT; 3: AET; 4: APT).
Figure 2. Variation of the inhibition efficiency with (a) inhibitor concentration, (b)
immersion time, (c) solution temperature, (d) acid concentration in 20% acetic acid (1:
AT; 2: AMT; 3: AET; 4: APT).

M.Z.A. Rafiquee et al. / Portugaliae Electrochimica Acta 25 (2007) 419-434
425
IE for compounds such as AT, AMT, AET and APT increases with temperature
from 30 ºC to 60 ºC (Fig. 1c and Fig. 2c), indicating that the inhibitive film
formed on the metal surface is protective up to 60 ºC. From Fig. 1d and Fig. 2d, it
is clear that change in acid concentration from 10% to 30% did not cause any
significant change in inhibition efficiency of all the compounds, thereby
suggesting that all the compounds are effective corrosion inhibitors in acid
solution at different concentrations.
The degree of surface coverage (θ) for different inhibitor concentrations in 20%
formic acid and 20% acetic acid at 30 oC over 24-hour immersion time was
evaluated from weight loss values. The data were tested graphically by fitting to
various isotherms. A plot of log (θ/1-θ) versus 1/T is shown in Fig. 3a and Fig.
4a. The plot gives the values of heat of adsorption (Q), which is determined from
the slope (-Q/2.303R). The values of heat of adsorption are presented in Table 3.
The values of heat of adsorption for the inhibitors in formic and acetic acid are
found to be less than (-40 kJ mol-1). This indicates that all the inhibitors are
adsorbed physically [24].
Figure 3.
(a) Adsorption isotherm plot for log (θ /1- θ) versus 1/T; (b) adsorption
isotherm plot for log (CR) versus 1/T; (c) adsorption isotherm plot for log (CR/T)
versus 1/T; and (d) half-life plot for log (weight loss) versus immersion time in 20%
formic acid (1: AT; 2: AMT; 3: AET; 4: APT; 5: Blank).

M.Z.A. Rafiquee et al. / Portugaliae Electrochimica Acta 25 (2007) 419-434
426
Figure 4.
(a) Adsorption isotherm plot for log (θ /1- θ) versus 1/T; (b) adsorption
isotherm plot for log (CR) versus 1/T; (c) adsorption isotherm plot for log (CR/T)
versus 1/T; and (d) half-life plot for log (weight loss) versus immersion time in 20%
acetic acid (1: AT; 2: AMT; 3: AET; 4: APT; 5: Blank).
Table 3. Thermodynamic activation parameters for mild steel in 20% formic acid and
20% acetic acid in absence and presence of inhibitors of 100-ppm concentration.
Inhibitor conc.
(ppm)
Ea
(KJ mol-1)
∆H
(KJ mol-1)
−∆S
(J mol-1K
-1)
−∆Gads
(KJ mol-1)
-Q
(KJmol-1)
20% formic acid 31.91 140.41 212.91 − − AT 19.15 25.52 229.18 32.78 19.15
AMT 12.76 19.15 233.98 34.08 12.76
AET 6.38 6.38 237.89 34.14 6.38
APT 3.19 28.72 242.59 37.08 10.21
20% acetic acid 30.84 102.12 214.83 − − AT 25.53 51.06 226.32 32.84 9.57
AMT 31.91 41.49 229.19 33.67 8.94
AET 38.29 31.91 234.93 34.59 2.68
APT 38.29 25.53 239.72 35.83 10.21
It has been reported earlier [25-27] that, in acid solution, the logarithm of the
corrosion rate is a linear function of 1/T (Arrhenius equation):
log (rate) = RT
Ea
303.2
0−+ A
(3)
M.Z.A. Rafiquee et al. / Portugaliae Electrochimica Acta 25 (2007) 419-434
427
where, Eoa is the apparent activation energy, R the general gas constant and A the
Arrhenius pre exponential factor. A plot of log (corrosion rate) versus 1/T gave
straight lines as shown in Fig. 3b and Fig. 4b. The values of activation energy
(Eo
a) obtained from the slope of the plot are given in Table III. An alternative
formula for the Arrhenius equation in the transition state is:
rate =
∆−
∆
RT
H
R
S
Nh
RT 00
expexp (4)
where, h is the Plank constant, N the Avogadro’s number, ∆So the entropy of
activation, and ∆Ho the enthalpy of activation. A plot of log (CR/T) versus 1/T
gave a straight line, (Fig. 3c and Fig. 4c) with a slope of (-∆Ho /2.303 R) and an
intercept of [(log (R / Nh) + (∆So/ 2.303 R)], from which the values of ∆S
o and
∆Ho were calculated and are listed in Table III. The data show that the
thermodynamic activation functions (Eoa) of the corrosion in mild steel in 20%
formic acid in the presence of the inhibitors are lower than those in the free acid
solution, indicating that all the inhibitors exhibit high inhibition efficiency at
elevated temperatures [28], while the (Eoa) values in the presence of inhibitors in
acetic acid are higher than those in the free acid solution, except for AT inhibitor,
indicating that the inhibitors exhibit high inhibition efficiency at lower
temperatures [28]. The values of ∆Ho (Table III) are in the order AT > AMT >
APT > AET in formic acid, while AT > AMT > AET > APT in acetic acid,
which is an indicative of the order of energy barrier at elevated temperature [28].
The values of activation ∆So
in the absence and presence of the inhibitors are
large and negative. This indicates that the activated complex in the rate
determining step represents an association rather than a dissociation step,
meaning that a decrease in disorderness takes place during the course of
transition from reactants to the activated complex [29]. The average values for
free energy of adsorption (∆Gads), calculated using the following equations [30]
are given in Table III.
∆Gads = - RT ln (55.5 K) (5)
and K is given by:
K = θ/C (1 - θ) (6)
where, θ is degree of coverage on the metal surface, C is the concentration of the
inhibitor in mol l-1, K is the equilibrium constant, R is a gas constant and T is the
temperature. It is found that the ∆Gads values for the studied compound at higher
temperature are less than -40 kJ mol-1, indicating that the thiadiazoles are
physically adsorbed on the metal surface [31].
The low and negative value of ∆Gads indicates the spontaneous adsorption of the
inhibitor on the surface of mild steel [32].

M.Z.A. Rafiquee et al. / Portugaliae Electrochimica Acta 25 (2007) 419-434
428
The plot of log (weight loss) versus immersion time, as shown in Fig. 3d and Fig.
4d, gave a straight line indicating that it follows first order reaction. The value of
the rate constant is calculated by using the first order rate law [33]
[ ][ ]A
Alog
t
2.303k o=
(7)
where [Ao] is the initial mass of the metal and [A] is the mass corresponding to
time t. The half-life (t1/2) values were calculated using the relationship [34]
t1/2 = 0.693/k (8)
The values of rate constants and half-life (t1/2) obtained from the above relations
are summarized in Table 4. Half-life values were found to be constant at different
immersion times. The order of effectiveness of the inhibitors were observed as
AET > APT > AMT > AT in 20% formic acid and APT > AET > AMT > AT in
20% acetic acid. The constant values of rate constant further confirmed that the
corrosion of mild steel in 20% formic acid and in 20% acetic acid in the presence
of different inhibitors follows first order kinetics.
Table 4. Half-life (h) values for the corrosion of mild steel at different immersion times
in 20% formic acid and 20% acetic acid in absence and presence of inhibitors of 100-
ppm concentration at 30 ºC.
Inhibitor concentration
(ppm)
k10-3 t1/2
20% formic acid
AT
AMT
AET
APT
20% acetic acid
AT
AMT
AET
APT
1.28±0.0608
2.49±0.0029
1.95±0.0024
1.59±0.0049
1.75±0.0035
7.57±0.0089
1.64±0.0019
1.34±0.0021
1.17±0.0015
0.71±0.0011
538.46
278.87
354.84
436.12
396.00
91.49
421.79
516.01
593.32
975.64
Application of the adsorption isotherm
The mechanism of corrosion inhibition may be explained on the basis of
adsorption behaviour of the inhibitors [35]. The degrees of surface coverage (θ)
for different inhibitor concentrations were evaluated from weight-loss data. Data
were tested graphically by fitting to various isotherms. A plot of log θ /(1- θ) vs.
log C shows a straight line (Fig. 5a and 5b) indicating that adsorption follows the
Langmuir isotherm

M.Z.A. Rafiquee et al. / Portugaliae Electrochimica Acta 25 (2007) 419-434
429
θ /(1- θ) = k C exp (- Gads/RT) (9)
where Gads is the free energy of adsorption and C is the inhibitor concentration.
Figure 5.
Langmuir’s adsorption isotherm plots for the adsorption of various inhibitors
on the surface of mild steel: a) 20% formic acid, b) 20% acetic acid (1: AT; 2: AMT; 3:
AET; 4: APT).
Polarization measurements
The cathodic and anodic polarization curves of mild steel in 20% formic and
20% acetic acid in the absence and presence of different inhibitors at 100-ppm
concentration and at 28 ± 2 ºC are shown in Fig. 6a and 6 b. Electrochemical
parameters such as corrosion current density (Icorr), corrosion potential (Ecorr) and
inhibition efficiency (IE) were calculated from Tafel plots and are given in Table
5. A maximum decrease in (Icorr) was observed for APT. It is also observed from
Table 5, that (Ecorr) values and Tafel slope constants ba and bc do not change
significantly in inhibited solution as compared to uninhibited solution. It is seen
from the results that thiadiazoles do not shift Ecorr values significantly, thereby
suggesting that they are mixed type inhibitors. This type of behaviour has been
observed for mild steel in acid solution containing 2-hydrazino-6-methyl-
benzothiazole [36].
Electrochemical impedance study
Impedance diagram obtained for mild steel in 20% formic acid is shown in Fig. 7
and the values of Rt, Cd1 and % IE are given in Table 6. Values of Rt increase with
increasing the inhibitor concentration and this in turn leads to an increase in the
I.E [37]. There is lowering of Cd1 values by the addition of 20% formic acid,
suggesting that the inhibition can be attributed to the surface adsorption of the
inhibitor on mild steel [38].

M.Z.A. Rafiquee et al. / Portugaliae Electrochimica Acta 25 (2007) 419-434
430
Table 5. Electrochemical polarization parameters for the corrosion of mild steel in 20%
formic acid and 20% acetic acid containing 100 ppm inhibitors at 30 oC.
Inhibitor conc.
(ppm)
Ecorr
(mV)
Icorr
(mA cm-2)
IE
(%)
ba
(mVdec-1)
bc
(mVdec-1)
20% formic acid -416 0.350 − 68 104
AT -420 0.068 80.57 62 120
AMT -418 0.054 84.57 60 104
AET -425 0.048 86.28 70 110
APT -408 0.026 92.57 56 102
20% acetic acid -404 0.240 − 60 100
AT -385 0.052 78.33 52 92
AMT -390 0.039 83.75 56 108
AET -412 0.034 85.83 54 102
APT -407 0.024 89.58 58 96
Figure 6. Potentiodynamic polarization curves for mild steel containing 100 ppm
concentrations of various thiadiazoles in: a) 20% formic acid, b) 20% acetic acid (1:
Blank; 2:AT; 3: AMT; 4: AET; 5: APT).

M.Z.A. Rafiquee et al. / Portugaliae Electrochimica Acta 25 (2007) 419-434
431
Figure 7.
Electrochemical impedance diagram (Nyquist plot) for mild steel in the
absence and presence of various concentrations of APT in 20% formic acid (1: Blank;
2:10 ppm; 3: 50 ppm; 4: 100 ppm).
Table 6. Electrochemical impedance parameters for the corrosion of mild steel in 20%
formic acid containing different concentrations of APT at 30 oC.
Scanning electron microscopy
SEM study (Fig. 8) shows that the inhibited metal surface is found to be
smoother than uninhibited metal surface, because the inhibitor gets adsorbed by
tightly binding on the metal surface, which shows less abrasion and corrosion on
mild steel surface as compared to uninhibited metal surface.
Figure 8. Scanning electron micrographs for: a) polished mild steel, b) mild steel in
20% formic acid, c) mild steel in 20% formic acid +100 ppm APT.

M.Z.A. Rafiquee et al. / Portugaliae Electrochimica Acta 25 (2007) 419-434
432
Mechanism of corrosion inhibition
The corrosion of mild steel in non-aqueous and aqueous solution may occur in
the following steps [39]:
Fe + HCOO -
[Fe (HCOO)]ads + e- (10)
[Fe (HCOO)] ads
[Fe (HCOO)]+ + e
- (11)
[Fe (HCOO)]+ + H
+ Fe
2+ + HCOOH (12)
The evolution of hydrogen occurs due to the following cathodic reaction:
Fe + HCOOH + e
-
Fe Hads + HCOO
- (13)
Fe Hads + Fe Hads H2 + Fe (14)
The adsorption of formate ions on the surface of iron is a prerequisite for the
anodic dissolution to occur, thus the rate of corrosion should depend on the
concentration of formate ion in the solution. The conductance of formic acid
solution gradually increases in concentration range from 5% - 20%. As a result,
the extent of adsorption of formate ion, as well as the rate of forward step (10),
increases and consequently the rate of corrosion also increases.
The thiadiazoles inhibit the corrosion by controlling both the anodic and cathodic
reactions. In acidic solutions these compounds exist as protonated species. These
protonated species adsorb on the cathodic sites of the mild steel and decrease the
evolution of hydrogen. The adsorption on anodic sites occurs through the π-
electrons of aromatic rings and lone pair of electrons of nitrogen and sulphur
atoms [35].
Among the compounds investigated, the order of IE is:
APT > AET > AMT > AT
(C3) (C2) (C1) (H)
The presence of the propyl group in APT increases the density of electrons on the
sulfur and nitrogen atoms caused by resonance effects, which facilitate stronger
adsorption of APT on the mild steel surface. This leads to higher IE of APT than
AET compared with AMT and AT. The IE decreases with decrease in the
number of carbon atoms as a consequence of the decrease in the electron density
on the nitrogen and sulfur atoms [40].
Conclusions (i) The thiadiazole derivatives showed good performance as corrosion
inhibitors in formic acid and acetic acid media.
(ii) Electrochemical study shows that the corrosion inhibition takes place by
adsorption of the inhibitor on mild steel surface.
M.Z.A. Rafiquee et al. / Portugaliae Electrochimica Acta 25 (2007) 419-434
433
(iii) All the compounds examined acted as mixed inhibitors in formic acid and
acetic acid solutions.
(iv) Scanning electron microscopy shows smoother surface of inhibited
metal samples than inhibited samples due to the formation of a film on
inhibited metal samples.
(v) All of the four thiadiazoles inhibited corrosion by adsorption mechanism
and the adsorption of these compounds from acid solution followed
Langmuir's adsorption isotherm.
Acknowledgement
We acknowledge the Chairman, Department of Applied Chemistry, A.M.U,
Aligarh, for providing the facilities needed in completing this work.
References
1. I.A. Sekine, A. Masuko and K. Senoo, Corros. Sci. 43 (1987) 553.
2. M.A. Quraishi and D. Jamal, Corrosion 56 (2000) 156.
3. V.B. Singh and R.N. Singh, Corros. Sci. 37 (1995) 1399.
4. I. Sekine, S. Hatakeyama and Y. Nakazawa, Corros. Sci. 27 (1987) 275.
5. E. Heitz, Corrosion of Metals in Organic Solvents, Plenum Press, New
York, NY (1974) 226.
6. I. Sekine, H. Ohkawa and T. Hank, Corros. Sci. 22 (1982) 1113.
7. I. Sekine and A. Chinda, Corrosion 40 (1984) 95.
8. M.M. Singh and A. Gupta. Mater. Chem. Phys. 46 (1996) 15.
9. S. Muralidhara, M.A. Quraishi and S.V.K. Iyer, Anti-Corros. Methods
Mater. 44 (1997) 100.
10. M.A. Quraishi, M.A.W. Khan and M. Ajmal, Anti-Corros. Methods Mater.
43 (1996) 5.
11. B. Hammouti, A. Aouniti, M. Taleb, M. Bright and S. Kertit, Corrosion 51
(1995) 411.
12. N. Al-Andis, E. Khamis, A. Al-Mayouf, and H. Aboul-Enein, Corros. Prev.
Cont. 42 (1995) 13.
13. Abd-El-Nabey, E. Khammis, M.Sh. Ramadan and A.E. Gindy, Corrosion
52 (1996) 671.
14. E.M. Azhar, B. Mernari, M. Traisnel, F. Bentiss, M. Legrenee, Corros. Sci.
43 (2001) 2229.
15. M. Bentiss, M. Traisnel and M. Lagrenee, J. Appl. Electrochem. 31 (2001)
41.
16. M. Lebrini, M. Lagrenee, H. Vezin, L. Gengembre and F. Bentiss, Corros.
Sci. 47 (2005) 485.
17. F. Bentiss, M. Lebrini, H. Vezin, and Lagrenee, Mater. Chem. Phys. 87
(2004) 18.
18. F.A. Ansari and D. Jamal, Mater. Chem. Phys. 77 (2002) 687.
19. M. Kidwai, P. Misra, K.R. Bhushan and B. Dave, Synth. Commun. 30 (2000)
3031.
M.Z.A. Rafiquee et al. / Portugaliae Electrochimica Acta 25 (2007) 419-434
434
20. ASTM, Standard Practice for Laboratory Immersion Corrosion Testing of
Metals, Annual Book of Standards, G 31-72, 3.02 (1990).
21. S.T. Hirozawa, Proc. 8th Eur. Symp. Corros. Inhi. Ann. Univ., Ferrara, Italy,
1 (1995) 25.
22. H. Ashassi-Sorkhabi, B. Shaabani, D. Seifzadeh, Electrochim. Acta 50
(2005) 3446.
23. K. Juttner, Electrochim. Acta 35 (1990) 1501.
24. L.J. Jha, Faculty of Science, Delhi University, Delhi, Ph.D. Thesis (Studies
of the adsorption of amide derivative during acid corrosion of pure iron and
its characterization) (1990) 111.
25. C.B. Breslin and W.M. Carrol, Corros. Sci. 34 (1993) 327.
26. M.G.A. Khedr and M.S. Lashien, Corros. Sci. 33 (1992) 137.
27. S.S.A. Rehim, H.H. Hassan, M.A. Amin, Mater. Chem. Phys. 70 (2001) 64.
28. I.N. Putilova, S.A. Balezin and Baranik, Metallic Corrosion Inhibitors
(Pergamon Press, New York), (1960) 31.
29. M.K. Gomma and M.H. Wahdan, Mater. Chem. Phys. 39 (1995) 209.
30. M. Schorr and J. Yahalom, Corros. Sci. 12 (1972) 867.
31. B.G. Ateya, B.E. Andouli and F.M. Nizami, Corros. Sci. 24 (1984) 509.
32. G.K. Gomma and M.H. Wahdan, Indian J. Chem. Technol. 2 (1995) 107.
33. K. Orubite-Okorosaye and N.C. Oforka, J. Appl. Sci. Environ. 8 (2004) 57.
34. P.W. Atkins, Chemisorbed and physisorbed species, a textbook of physical
chemistry (University press, Oxford), (1980) 936.
35. M.A. Quraishi, A.S. Mideen, M.A.W. Khan and M. Ajmal, Indian J. Chem.
Technol. 1 (1994) 329.
36. M. Ajmal, A.S. Mideen and M.A. Quraishi, Corros. Sci. 36 (1994) 79.
37. M. Houyi, S. Chen, B. Yin, S. Zhao, X. Liu, Corros. Sci. 45 (2003) 867.
38. N.C. Subramaniyam, S. Mayanna, Corros. Sci. 25 (1985) 163.
39. M.M. Singh and A. Gupta, Mater. Chem. Phys. 46 (1996) 15.
40. M.A. Quraishi and S. Khan, J. Appl. Electrochem. 36 (2006) 539.