Adsorptive Crystallization of Organic Substances in Silica ...
Upload
khangminh22Category
view
1download
0
HAL Id: hal-02176976https://hal.archives-ouvertes.fr/hal-02176976
Submitted on 22 Oct 2021
HAL is a multi-disciplinary open accessarchive for the deposit and dissemination of sci-entific research documents, whether they are pub-lished or not. The documents may come fromteaching and research institutions in France orabroad, or from public or private research centers.
L’archive ouverte pluridisciplinaire HAL, estdestinée au dépôt et à la diffusion de documentsscientifiques de niveau recherche, publiés ou non,émanant des établissements d’enseignement et derecherche français ou étrangers, des laboratoirespublics ou privés.
Distributed under a Creative Commons Attribution - NonCommercial| 4.0 InternationalLicense
Influence of proteins and humic-like substances fromsoluble microbial products on membrane bioreactor
fouling under normal and stress conditionsMaud Villain-Gambier, Isabelle Bourven, Gilles Guibaud, Benoît Marrot
To cite this version:Maud Villain-Gambier, Isabelle Bourven, Gilles Guibaud, Benoît Marrot. Influence of pro-teins and humic-like substances from soluble microbial products on membrane bioreactor foul-ing under normal and stress conditions. Process Biochemistry, Elsevier, 2019, 78, pp.140-147.�10.1016/j.procbio.2019.01.012�. �hal-02176976�
1
Influence of proteins and humic-like substances from soluble microbial
products on membrane bioreactor fouling under normal and stress
conditions
Maud VILLAIN-GAMBIER*a,b, Isabelle BOURVENc, Gilles GUIBAUDc, Benoît
MARROTa
aAix-Marseille Université, CNRS, M2P2 UMR 7340, 13545, Aix en Provence, France.
bLaboratoire de Reconnaissance et Procédés de Séparation Moléculaire (RePSeM), Université
de Strasbourg, Institut Pluridisciplinaire Hubert Curien (IPHC), UMR CNRS 7178, 25 rue
Becquerel, 67087 Strasbourg Cedex 2, France c Université de Limoges, GRESE EA 4330, 123 avenue Albert Thomas, 87060 Limoges, France.
*corresponding author: [email protected] ; phone number: + 33 368 85 27 48
© 2019 published by Elsevier. This manuscript is made available under the CC BY NC user licensehttps://creativecommons.org/licenses/by-nc/4.0/
Version of Record: https://www.sciencedirect.com/science/article/pii/S1359511318316441Manuscript_15c70bd8bdf5795dfab7d7b583cd58c9
2
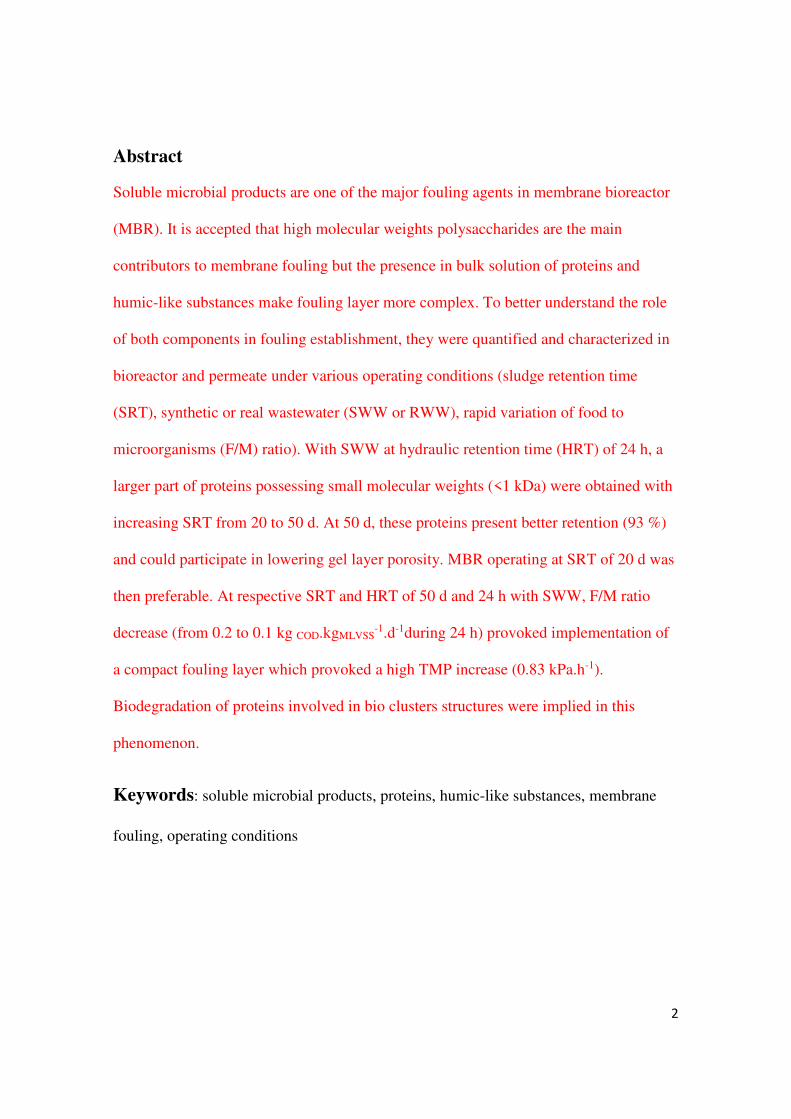
Abstract
Soluble microbial products are one of the major fouling agents in membrane bioreactor
(MBR). It is accepted that high molecular weights polysaccharides are the main
contributors to membrane fouling but the presence in bulk solution of proteins and
humic-like substances make fouling layer more complex. To better understand the role
of both components in fouling establishment, they were quantified and characterized in
bioreactor and permeate under various operating conditions (sludge retention time
(SRT), synthetic or real wastewater (SWW or RWW), rapid variation of food to
microorganisms (F/M) ratio). With SWW at hydraulic retention time (HRT) of 24 h, a
larger part of proteins possessing small molecular weights (<1 kDa) were obtained with
increasing SRT from 20 to 50 d. At 50 d, these proteins present better retention (93 %)
and could participate in lowering gel layer porosity. MBR operating at SRT of 20 d was
then preferable. At respective SRT and HRT of 50 d and 24 h with SWW, F/M ratio
decrease (from 0.2 to 0.1 kg COD.kgMLVSS-1.d-1during 24 h) provoked implementation of
a compact fouling layer which provoked a high TMP increase (0.83 kPa.h-1).
Biodegradation of proteins involved in bio clusters structures were implied in this
phenomenon.
Keywords: soluble microbial products, proteins, humic-like substances, membrane
fouling, operating conditions

3
1 Introduction
Membrane fouling remains the most challenging issue in MBR application [1]. In its
general conception, membrane fouling could be fractionated in different types as pore
clogging, gel layer, cake layer and changes of cake layer [2].Extra polymeric substances
(EPS) in their bound form or free in the bulk solution as soluble microbial products
(SMP) are considered as the main foulants of membrane used in MBR systems [3]. The
composition of fouling presents spatial and time related variations as a result of SMP
transfer from bulk solution to the membrane, the release of biopolymers by dead cells
and the biodegradation of SMP or biopolymers by live cells [4]. SMP compounds were
discovered to be the main contributor of membrane initial fouling (i.e. before the TMP
jump) whereas EPS were found to be the major foulant after the TMP jump [5].
Membrane fouling due to polymeric substances is mainly composed of polysaccharides,
proteins and humic-like substances. Since around ten years [3], it is well established that
polysaccharides possess high molecular weights (MW) (>100 kDa) and can be
considered as the main compound of biopolymers highly involved on membrane
fouling. In association with their high MW, the gelling properties of polysaccharides are
strongly implied in increasing fouling resistance. With relatively high SMP content, gel
layer could be more easily formed than cake layer and could provoke 100 times higher
specific filtration resistance (SFR) [2]. This gel layer was characterized with a high
porosity, where proteins could be embedded and its SFR increased with its thickness
[6]. Proteins and humic-like substances possess lower MWs but they are also involved
in membrane fouling, making it more complex. Because this mixed foulants system
could provoke a synergistic effect of membrane fouling [7], it is of practical interest to
4
better characterized proteins and humic-like substances to understand their role in
membrane fouling in order to control their propensity.
The aim of the present study was therefore to characterize proteins and humic-like
substances with the measurement of their concentrations in SMP from bulk solution,
permeate, their retention rate and their MWs under varying operating conditions to
know their impact in membrane fouling.
Operating conditions such as sludge retention time (SRT), hydraulic retention time
(HRT) and food to microorganisms ratio (F/M ratio) are known to influence SMP
production and composition. Many studies assessed the role of variable SRT in SMP
characteristics and membrane fouling [8-11]. Most of the literature reports that SMP
concentration decreased with increasing SRT [3] implying that MBR have to operate
above SRT of 15-20 d to control SMP concentration. However, in most of these studies,
one MBR system was used and SRT was progressively increased with a reduction of
sludge extraction. Thus MLSS concentration increased. As substrate composition and
species concentrations are let constant, F/M ratio progressively decreased with
increasing SRT. Therefore to clearly elucidate the role of SRT on SMP production and
consequences in membrane fouling, studies at constant F/M ratio have to be performed.
The optimum SRT of MBRs should be included in the range 20-50 d in order to
maintain high removal rates and limit membrane fouling [3]. With synthetic wastewater
(SWW), at constant F/M ratio of 0.2 kg COD.kgMLVSS-1.d-1, two campaigns were realized
at SRT of 20 or 50 d to assess impact of proteins and humic-like substances
characteristics variations on membrane fouling. In their review of 2017, Meng et al. [4]
mentioned that investigations have to be done to better understand changes of sludge
properties and membrane performance occurring after naturally happening events (i.e.
5
temperature shock, rainfall inflow, hazardous events). Wang and Zhang [12] have done
this type of study with activated sludge or pure culture in batch assays without
membrane. They tested starvation, salinity, heavy metals, low pH and high temperature
effects on SMP characteristics. Drews et al. [13] studied the role of various
temperatures and nitrification rate on SMP elimination and rejection. In these works,
there was no further insight into the specific modification produced on SMP
components characteristics and their role in fouling. In that context, F/M ratio rapid
changes (at 0.1 and 0.8 kg COD.kgMLVSS-1.d-1) were performed to simulate stressful
conditions. Impacts in proteins and humic-like substances characteristics and
modification in fouling establishment were assessed. With the same objectives, a last
campaign was realized where SWW was replaced by real wastewater (RWW). MBR
was working at SRT of 50 d at the same F/M ratio of 0.2 kg COD.kgMLVSS-1.d-1 in order to
compare obtained results with campaign realized with SWW and with the same
operating conditions. At lab scale membrane fouling of MBR process studies are
performed with SWW or RWW. This choice participates to the specification of
biological medium characteristics (sludge flocs, EPS and SMP composition,
concentrations and properties) [14] and could modify the conclusions obtained in term
of membrane fouling structure and composition. Therefore this study could partly fill up
the knowledge gap by performing two distinct experiments with substrate type as the
only variable.
2 Material and methods
2.1 MBR setup
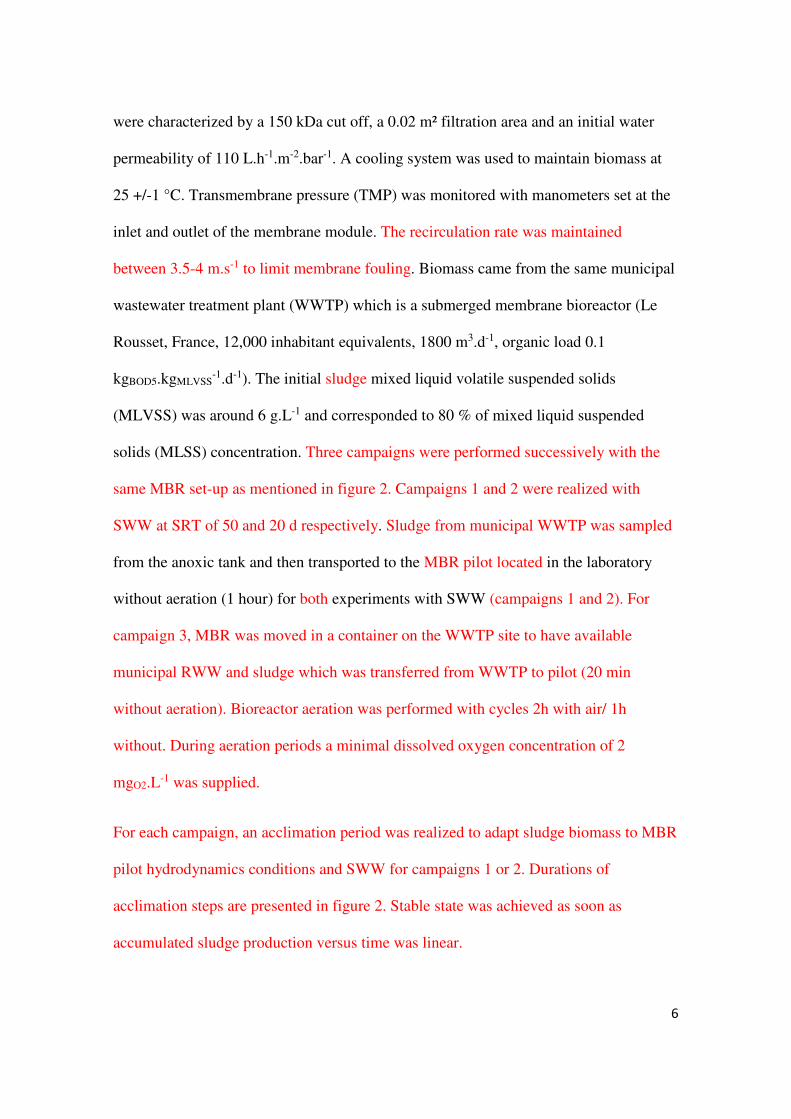
The 18 L external MBR (Polymem, France) was composed of a ceramic membrane
(ultrafiltration, Novasep-Orelis, France) made with ZrO2 – TiO2 (Figure 1). Membranes
6
were characterized by a 150 kDa cut off, a 0.02 m² filtration area and an initial water
permeability of 110 L.h-1.m-2.bar-1. A cooling system was used to maintain biomass at
25 +/-1 °C. Transmembrane pressure (TMP) was monitored with manometers set at the
inlet and outlet of the membrane module. The recirculation rate was maintained
between 3.5-4 m.s-1 to limit membrane fouling. Biomass came from the same municipal
wastewater treatment plant (WWTP) which is a submerged membrane bioreactor (Le
Rousset, France, 12,000 inhabitant equivalents, 1800 m3.d-1, organic load 0.1
kgBOD5.kgMLVSS-1.d-1). The initial sludge mixed liquid volatile suspended solids
(MLVSS) was around 6 g.L-1 and corresponded to 80 % of mixed liquid suspended
solids (MLSS) concentration. Three campaigns were performed successively with the
same MBR set-up as mentioned in figure 2. Campaigns 1 and 2 were realized with
SWW at SRT of 50 and 20 d respectively. Sludge from municipal WWTP was sampled
from the anoxic tank and then transported to the MBR pilot located in the laboratory
without aeration (1 hour) for both experiments with SWW (campaigns 1 and 2). For
campaign 3, MBR was moved in a container on the WWTP site to have available
municipal RWW and sludge which was transferred from WWTP to pilot (20 min
without aeration). Bioreactor aeration was performed with cycles 2h with air/ 1h
without. During aeration periods a minimal dissolved oxygen concentration of 2
mgO2.L-1 was supplied.
For each campaign, an acclimation period was realized to adapt sludge biomass to MBR
pilot hydrodynamics conditions and SWW for campaigns 1 or 2. Durations of
acclimation steps are presented in figure 2. Stable state was achieved as soon as
accumulated sludge production versus time was linear.
7
The main characteristics of MBR at stable state for the three campaigns are summarized
in table 1. Further explanations on MBR characteristics, acclimation procedure and
stable state determination are available in [15].
The constant flow rate mode was selected for MBR operations. As F/M ratios of
chemical oxygen demand (COD) and N-NH+4 influence SMP production, these F/M
ratios were maintained constant to allow comparison of SRT or substrate type influence
on SMP characteristics for the three campaigns. Nevertheless as COD and N-NH+4
concentrations were lower in RWW than in SWW, permeate flow of campaign 3 was
voluntary increased from 0.75 ± 0.02 (campaigns 1 and 2) to 1.64 ± 0.4 L.h-1 which
induced a HRT decrease from 24 to 9 h for campaign 3 realized with RWW. This HRT
variation was supposed to have no influence on SMP production as it was reported in
[16].
To fix the SRT (d) at the desired value, the volume of waste sludge per day (L.d-1)
named Vwaste was calculated with the following equation (Eq. (1)):
Vwaste=VR/SRT
With VR: volume of bioreactor (L).
MLSS and MLVSS measurements were regularly done with this daily wasted sludge. A
part of this wasted AS (30 mL) was centrifuged 15 min at 16,000 g to isolate MBR
supernatant from suspended solids. Removal rates of COD and N-NH+4 were calculated
with concentration measurements in MBR feed and permeate. Nitrates were analyzed in
bioreactor supernatant. COD, ammonium and nitrates measurements were done with
8
colorimetric methods. Reagent kits from Aqua Lytic and Merk (Germany) were used
respectively for COD and nitrates/ammonium concentrations determination.
2.2 Substrate nature: SWW or RWW
A balanced SWW (C/N/P ratio = 100/10/2) was prepared with mass ratios of 2.1
C6H12O6 (glucose), 1.0 (NH4)2SO4, 0.2 KH2PO4, 0.4 NaHCO3, 0.1 MgSO4 and 0.02
CaCl2. During campaigns 1 and 2 with SWW, pH was set at 7 with a pH controller
delivering NaHCO3. SWW was prepared in a clean tank every 2or 3 days. It was not
sterilized allowing then bacterial development and SMP production. Therefore main
components of SMP i.e. polysaccharides, proteins and humic-like substances were
quantified as explained in part 2.3. Results are presented in table 1.
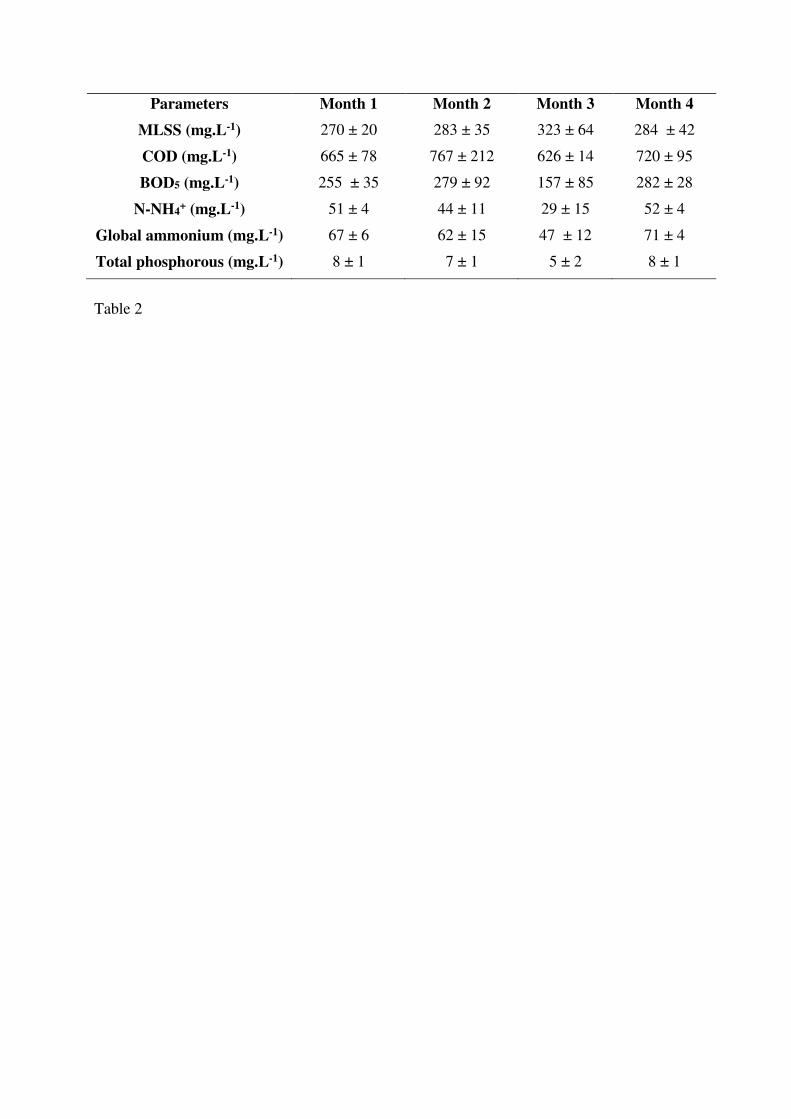
RWW was sampled after the different pre treatments in place on the WWTP of Le
Rousset. An additional 200 µm filtration was done before using it as feed for MBR pilot
to avoid pump system default due to possible residual particles presence in pretreated
RWW. Main characteristics of RWW are reported in table 2. RWW was stored in a tank
at room temperature. During campaign 3 pH regulation was not useful as bioreactor pH
was stable at 7.0 ± 0.1.
2.3 F/M ratio stress conditions
F/M ratio variations on MBR feed were performed. These stress conditions were only
applied at the end of campaign 1 (SWW, SRT of 50 d) (Figure 2). The stress I was a
F/M ratio decrease from 0.2 to 0.1 kg COD.kgMLVSS-1.d-1 during one day. The stress II was
a F/M ratio increase from 0.2 to 0.8 kg COD.kgMLVSS-1.d-1 during one day. For both F/M
ratio changes mass ratio of 2.1 C6H12O6 (glucose), 1.0 (NH4)2SO4, 0.2 KH2PO4, 0.4
9
NaHCO3, 0.1 MgSO4 and 0.02 CaCl2 was maintained. Between each F/M ratio
variation, ten days were assessed as necessary to get stability of MBR process back.
Steady state was assumed as sludge production and COD and ammonium removal rates
were stable.
2.4 SMP samples characteristics
At steady state of the three campaigns AS was sampled to extract SMP by
centrifugation (4000 g, 20 min, 4°C). The number of SMP sampling events per
campaign is accessible on figure 2. SMP content was also extracted from AS at the end
of both stress times (24 h after the beginning of F/M ratio modification).
Polysaccharides [17], protein and humic-like substances [18] were quantified with
colorimetric methods in substrate (Table 1), bioreactor supernatant and in permeate to
evaluate the fraction of SMP due to bacterial metabolism and the fraction retained by
the membrane after extraction by centrifugation (4000 g, 20 min, 4°C) ; glucose
(Sigma-Aldrich, 99.5 %), bovine serum albumin (Sigma-Aldrich, 98 %) and humic
acids (Sigma-Aldrich) were used respectively as a standard for polysaccharides,
proteins and humic-like substances contents. For each SMP sampling event analyses
were done in triplicate.
Three dimensional Excitation Emission Matrix (3D-EEM) spectra of both substrates,
typical MBR supernatant and permeates at stable state for the three campaigns and for
SMP sampled during stress times were measured to select a couple of common
Excitation/Emission wavelengths. 221/350 nm and 350/440 nm were respectively
chosen for protein and humic-likes substances fluorescence detection after size
exclusion chromatography (SEC) separation. Typical 3D-EEMs obtained are available
10
as supplementary material (Figure S1). Deeper explanations of 3D-EEM method are
contained in [19].
To assess apparent molecular weights (aMWs) distribution of protein and humic-like
content of SMP in the different conditions, separation was carried out with a Merck
Hitachi LA Chrom chromatograph equipped with a L7200 autosampler, a L7100
quaternary pump, a D7000 interface, fluorescence detector (L7485) and a diode array
UV detector (L7455). Separation was performed with a high molecular weight (HMW)
Amersham Biosciences column, the Agilent Bio SEC-300 Å column and low molecular
weight (LMW) Agilent Bio SEC 100 Å column having both high theoretical MW
resolution range of 5-1250 kDa and 0.1 to 100 kDa respectively. The total permeation
volumes of the HMW and LMW columns were estimated to 11.5 mL and 10.3 mL
respectively, using a sodium nitrate solution at 60 mg.mL-1. A solution containing 150
mM NaCl and 50 mM phosphate buffer (25 mM Na2HPO4 and 25 mM NaH2PO4), pH
7.0 ± 0.1 with constant flow rate of 1 mL.min-1 for both columns was used as mobile
phase. 100 µL of filtered samples (0.2 µm) were injected for each analysis.
2.5 Fouling resistance, permeability loss and TMP increase measurements
Removable, irremovable and irreversible parts of fouling were assessed after the stable
conditions (i.e. before stresses applications) for the three campaigns. The former can be
removed by hydraulic cleaning and main contributor is the cake layer establishment.
Irremovable fouling cannot be removed by simple hydraulic cleaning and requires
drastic chemical cleaning. Irreversible fouling cannot be removed. To dissociate the
different types of fouling, a succession of cleaning was applied. First distilled water
cleaning was performed to remove removable fouling. After chemical cleanings (with
11
NaOH 40 g L-1 followed by HNO3 concentrated at 68%) were done. Between each
cleaning step, the membrane permeability was measured. With the use of Eq. (2) below,
hydraulic resistances due to each fouling types can be calculated and contribution of
each fouling type can be obtained. Membrane hydraulic resistance was previously
measured and is equal to 3.3.1012 m-1.
� =1
� ∗ (�� + ��)
With Lp: membrane permeability (m3 m-2 s-1 Pa-1), Rf: fouling hydraulic resistance (m-
1), Rm: membrane hydraulic resistance (m-1), μ: dynamic viscosity of the permeate at 20
°C (Pa s). At stable state, for the three campaigns, relative permeability loss and TMP
increase were measured respectively as ratio between variation of relative permeability
or TMP on time. Both values were also calculated for each stress. Variations of relative
permeability and TMP corresponded to the difference between values measured just
before stress application and 24 h after.
3 Results and discussion
3.1 SMP composition
Campaigns 1 and 2 were realized at constant F/M ratio and SRT of 50 and 20 d
respectively. At stable state MLSS content of both reactors were comparable at 9.1 ±
1.2 g.L-1 for campaign 1 and 10.1 ± 0.8 g.L-1 for the second one (table 1). Both
bioreactors obtained efficient removals of COD and N-NH4+. Considering total SMP
content presented in figure 3, it was double at SRT of 50 d with 17 mg.gMLVSS-1. This is
in contradiction with most of the literature published in this field [8-10, 20]. These
opposed results came mainly from the way of operate MBR at different SRT. Typically,
researches performed on the influence of SRT on SMP production in MBR system
12
worked with a unique reactor and changed SRT progressively thanks to a decreasing
amount of biomass purged. As less extraction of sludge was required to reach longer
SRT, at constant nutrient content in the bioreactor feed, sludge concentration increased
and then lower F/M ratio is supplied to biomass which is able to consume part of SMP
content to counter substrate scarcity. Therefore SMP content observed in the previous
cited studies were lower at higher SRT. In the present study SRT of 20 and 50 d were
set in two different MBR working at the same F/M ratio and MLVSS concentration
(table 1). It offers the advantage of a complete dissociation of F/M ratio and SRT and
then SRT influence on SMP composition can be assessed. SMP content was higher at a
SRT of 50 d. In a previous study [15] performed in the same conditions, biomass
activities were compared at SRT of 20 and 50 d. Higher heterotrophic activity was
demonstrated at 50 d with a faster COD biodegradation than at 20 d. As heterotrophic
microorganisms present in AS are responsible for more than 92 % of total SMP content
[16], it seems likely that at longer SRT accumulation of SMP was observed.
The main component of SMP extracted from AS of MBR stabilized at 20 d was proteins
with 63 % of the total SMP content whereas it was polysaccharides at 50 d which
represented 44 % of the total SMP content. This higher content of polysaccharides
measured from SMP content at SRT of 50 d might be due to their low biodegradation
rate which could contribute to their accumulation in the bioreactor [21].
The total concentration of biopolymers from SWW was low (40 mg.L-1) (table 1) and
represents only around 25 % of the SMP concentration from RWW (155 mg.L-1).
Polymers from RWW were mainly composed of humic-like substances (65 %) whereas
SWW contained mainly proteins (63 %). As a part of RWW corresponds to rain water
in contact with soil, it explains its high humic-like substances content. The
13
polysaccharide concentration in SWW was voluntarily not shown. Indeed, as organic
carbon used to prepare SWW was glucose, the main part of polysaccharide
concentration observed came from this molecule. Polysaccharide content in SWW
linked to micro-organisms metabolism was assumed to be low compared to glucose
concentration. The main components of SMP extracted from biomass acclimated with
SWW at SRT of 50 d were polysaccharides at 44 % and proteins at 38 %. Protein
concentration was higher in SMP extracted from bioreactor supernatant than from
SWW at stable state. This result implies that bacterial metabolism was responsible for a
soluble protein production in the MBR. Campaign 3 was realized with RWW. At stable
state (SRT of 50 d) a MLSS concentration of 7.6 ± 0.9 g.L-1was maintained and good
removal rates of COD and N-NH4+ were reached (table 1). The total SMP concentration
observed in bioreactor fed with RWW decreased compared to the one measured in
RWW. In SMP extracted from AS supernatant acclimated with RWW, proteins as
humic-like substances concentrations decreased from 12 and 49 mg.L-1 respectively. As
F/M ratios, SRT and MLSS concentrations were approximately the same in campaigns
1 and 3, influence of substrate nature on SMP characteristics can be discussed. Total
concentrations of SMP extracted from biomasses fed with RWW or SWW were
equivalent around 15 mg.gMLVSS-1. Nevertheless the composition of both SMP extracts
were totally distinct. Polysaccharides were absent at stable state from SMP originating
from AS fed with RWW whereas it was present at 44 % for the AS coming from
campaign 1. Polysaccharides content of RWW was low but stable during all the
campaign 3 around 10 mg.L-1. During the first 20 days of campaign 3, polysaccharides
were detected in SMP of AS at value around 4 mg.gMLVSS-1 and in the permeate with
lower concentration (0.3 mg.gMLVSS-1). But for the next 50 days of campaign 3,
14
polysaccharides were not detected on SMP extracted from AS. It was assumed that
polysaccharides from RWW may tightly adsorb on sludge flocs.
SMP samples extracted from AS during stress periods I (F/M ratio decrease) and II
(F/M ratio increase) showed higher total amount of SMP of respectively 45 and 23
mg.gMLVSS-1 compared to SMP amount observed during steady state (17 mg.gMLVSS
-1).
This is in agreement with Sheng et al., [22] who mentioned that bacteria would excrete
more microbial products under unfavorable conditions. During the F/M ratio decrease a
drop of MLVSS concentration of 11 % was observed and removal rates of ammonium
and COD decreased respectively of 27 and 3 %. It is well accepted that SMP production
increase with biomass concentration. As MLVSS decreased during stress I, this
situation seems to have provoked a real stress on biomass. Furthermore, due to the high
shear rate in external MBR, cellular content of dead cell and cell membrane fragments
were released in the liquid medium explaining the higher content of SMP in the MBR
supernatant during this first stress. The stress II has induced an augmentation of protein
content in the bioreactor supernatant from 49 to 84 mg.L-1 whereas polysaccharides and
humic-like substances content remained steady. This result was in agreement with a
recent study realized with three sequencing batch reactors (SBR) working for 30 days
with a constant F/M ratio which was growing between each SBR from 0.2 to 0.5 kg
COD.kgMLVSS-1.d-1 [11]. With the highest F/M ratio tested, whereas polysaccharides
content remained low and stable below 5 mg.L-1, proteins concentration was comprised
between 17 and 32 mg.L-1. During this second stress, a 37 % increase of MLVSS
concentration was observed to reach 10.2 g.L-1. High removal rate of COD was
maintained with a small increase of 3% whereas N-NH4+elimination dropped of 48%.
Previous studies have already noticed the autotrophic biomass inhibition due to high

15
content of ammonium in the feed [23]. One of the main metabolic pathways of glucose
degradation is the glycolysis. Glucose biodegradation requires several enzymes to
produce the energy needed to maintain bacterial catabolism. Therefore an increase in
enzyme synthesis to biodegrade this excess of substrate could be a relevant explanation
of this large amount of proteins released. Lobos et al. [24] have also noticed an increase
of SMP protein content after an augmentation of F/M ratio.
3.2 SMP retention and aMWs distribution SMP main components retention rates are presented in table 3. Polysaccharides
retention rates were high at 87 and 100 % for campaign 1 and 2. These excellent
polysaccharides retention rates were due to their high MW (> 100 kDa) measured in
other studies [9,21]. Due to their low biodegradation rate [21] polysaccharides
concentration was higher in AS supernatant of MBR working at a SRT of 50 d
compared to values obtained at SRT of 20 d. But with the increase of SRT,
polysaccharides might be in a biodegraded state more advanced i.e. lower MW which
could explain a decrease of polysaccharides retention with SRT augmentation.
During campaigns 1 and 2 realized with SWW, protein content from SMP extracted
from AS exhibited higher retention rate during campaign 1 (93 %) than for campaign 2
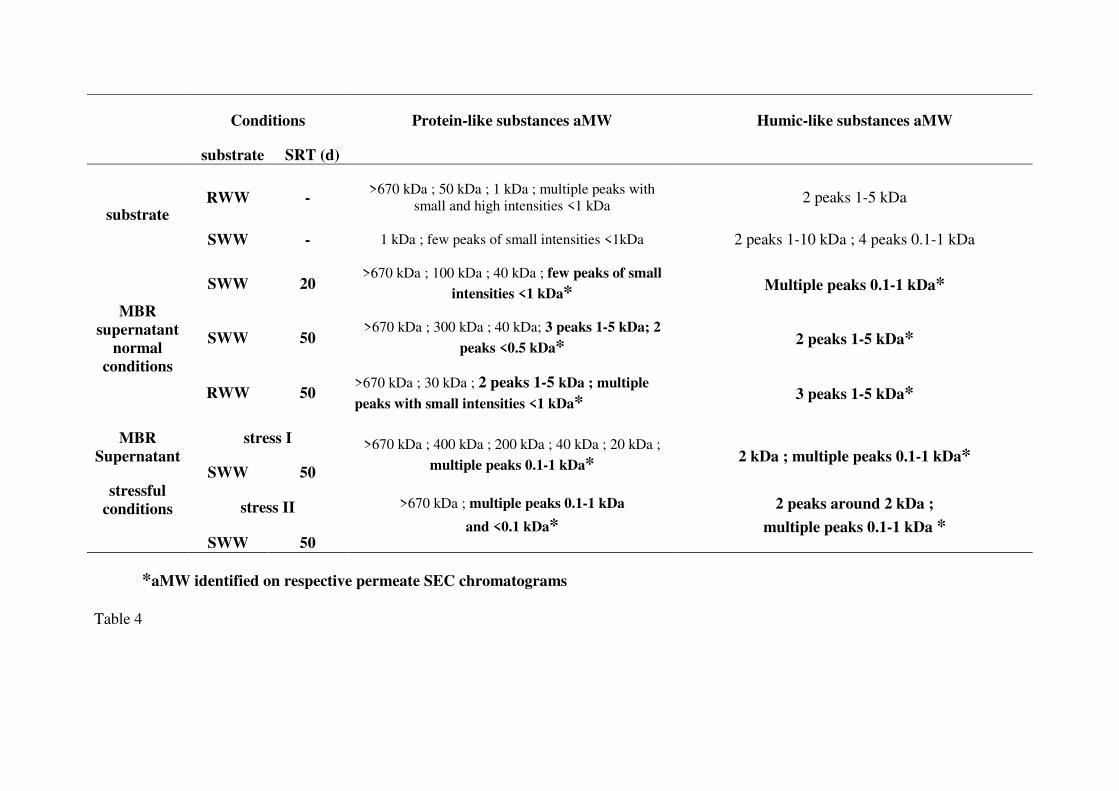
(69 %). aMWs of SMP protein content extracted from bioreactors of campaigns 1 and 2
are presented in table 4. aMWs of protein found in permeate were highlighted in bold
type in the same table. For both campaigns, SMP protein content extracted from
bioreactors exhibited aMWs ranging from aMWs higher than 670 kDa to under than 0.5
kDa. Proteins from SMP content of both bioreactors have shown larger aMWs (equal or
larger than 40 kDa) than the one observed for protein content of SWW. These protein
16
compounds were aggregated with the other organic foulants present in bioreactors and
are called biopolymer clusters. Main components of these biopolymers are
polysaccharides [4]. Sun et al. [25] pointed out that MBR is an enclosed system that
concentrates organic foulants in bulk solution causing aggregation of SMP to
biopolymers clusters causing cake deposition and severe membrane fouling. Literature
referenced such compounds and considers them as the most fouling fraction of SMP
[26-28].
aMW of protein-like substances at SRT of 20 d present less small molecules (<1 kDa)
than at 50 d. A part of compounds with high aMW (>670, 300 and 40 kDa) might be
biodegraded on smaller compounds as SRT increases. In their study of SMP
characteristics at various SRT in ceramic MBR, Shin and Kang [29] confirmed that
when SRT increases from 40 to 80 d, proportion of small molecules with aMW less
than 1 kDa is higher and the content of SMP of size between 30-100 kDa and superior
than 100 kDa decreases due to SMP bacterial degradation. Nevertheless higher protein
retention was observed during campaign 1. With their large MW and their gelling
properties, polysaccharides highly take part to membrane fouling with a gel layer
formation [21]. As polysaccharides content was higher in SMP from campaign 1 than 2
(figure 3), gel layer could be thicker. Chen et al. [6] proved that agar gel layer attached
to the membrane of their MBR system presented higher filtration resistance when agar
gel layer was thicker. Therefore, proteins with smaller aMWs of the campaign 1 could
be embedded in the gel layer and could participate to porosity reduction of this gel
layer.
Protein content of SMP from campaign 3 realized with RWW was poorly retained (13
% ). aMWs distribution of SMP proteins from campaign 3 presented similar sizes with
17
aMWs distribution of proteins from SMP of campaign 1 and 2. Biopolymer clusters
(aMW > 670 kDa), one fraction at 30kDa and numerous fractions with aMWs equal or
smaller than 5 kDa were visible. The low protein retention on campaign 3 indicates that
fractions with small sizes (<5 kDa) were predominant in the bioreactor.
A rapid analysis of aMWs of proteins from permeates of the three campaigns allows to
say that150 kDa membrane was able to retain proteins five times smaller than its cut
off. Permeates of all samples mentioned in normal conditions in table 4 were constituted
of protein-like substances with aMW less than 5 kDa. This result confirms the one
found by Jang et al. [30] who noted that 81 % of proteins and polysaccharides of MBR
permeate filtered with 0.4 µm membrane had aMW less than 1 kDa.
Substrate type seems to have no influence on aMWs distribution of humic-like
substances as size distribution was narrow between 1 and 5 kDa for both campaigns 1
and 3. Nevertheless, SRT could have an influence on humic-like substances size
repartition as only fractions with lower aMWs than 1 kDa were observed. At longer
SRT, a rearrangement with other organic molecules could explain the presence of
humic-like substances of higher aMWs.These compounds were poorly retained (lower
than 50 % for the three campaigns). Humic-like substances can contribute to membrane
fouling by adsorption phenomenon on/into membrane pores [31]. Johir et al. [27]
announced that after bio cluster, humic substances are the major membrane foulants.
Polysaccharides retention rates seem to be not influenced by stresses performed with
F/M ratio modifications as for both applied stresses retentions were equal or higher than
90 %.
18
Protein retention rate measured after the second stress was high (99 %) and in the same
range than the one obtained at stable state of the campaign 1. In that case, fractions with
aMWs of 300 and 40 kDa were absent from aMWs distribution of SMP proteins. Only 1
% of SMP proteins were found in permeate with aMWs lower than 1 kDa. This result
implies that SMP protein during stress II are mainly associated to the bio polymer
structures (>670 kDa). After the application of stress I, a decrease of SMP protein
retention rate was measured (84 %). New fractions with aMWs of 400, 200 and 20 kDa
appeared. According to Wang and Zhang [12] AS suffering from stressful conditions
are induced to produce more low MW components of SMP during the utilization of
substrate. As a biomass drop was obtained during that stressful conditions (11%), these
compounds could be part of biomass cell lysis. They could also be the biodegradation
products of SMP with higher aMWs.
Application of stresses I and II implied strong modifications of humic-like substances
retention rates. This retention was improved after stress I until 75 % whereas a higher
concentration of humic like substances was found in permeate after stress II provoking
their negative retention (-53 %). During second stress, protein and polysaccharide parts
of SMP are extremely well retained. Both components are implied on membrane fouling
and could have formed a fouling layer with high porosity due to their high aMWs. This
hypothesis could explain that humic-like substances during stress II were not retained.
A modification of aMWs distribution of humic-like substances was also visible and
could have contributed to the lower rejection rate observed. At stable state of campaign
1, humic-like substances present a bimodal repartition between 1 and 5 kDa. After stress
II a multiplication of fractions with low aMWs (<1 kDa) appeared.
19
After stress I, aMWs of humic-like substances were distributed in the same range than
after stress II but their rejection rate was improved. A modification of the fouling layer
structure may explain this variation. Proteins were less retained and fractions with
aMWs of 200 and 20 kDa appeared. Porosity of fouling layer may have been reduced
allowing better retention of humic-like substances.
3.3 Influence of SMP in membrane fouling
Relative permeability, TMP and permeate flux at 20 °C evolution with time for the three
campaigns are presented in figure 4. MBRs were operated at constant permeate flow
rate of 0.76 and 0.75 L.h-1 for campaigns 1 and 2 respectively and 1.64 L.h-1 for
campaign 3 (table 1). To maintain these permeate flow rates, TMP was progressively
increased during each campaign. Table 5 listed values of TMP increase and
permeability loss at stable state as membrane fouling resistance repartition (removable,
irremovable, irreversible percentages) for the three campaigns. For campaigns 1 and 2,
MBRs were operated without chemical cleaning during the entire experiment and TMP
jump was not reached. SMP are mainly involved in membrane fouling during initial
stage (i.e. before the TMP jump) [5]. During both campaigns MLSS concentrations
were relatively similar at 9.1 ± 1.2 (campaign 1) and 10.1 ± 0.8 (campaign 2) g.L-1. As
the only distinction between MBR bulk solutions of campaigns 1 and 2 was SMP
characteristics variations provoked by SRT change, differences observed in term of
fouling repartition, TMP increase and permeability loss could be attributed to these
SMP modifications. Permeability loss at stable state was the same for both campaigns,
but TMP increase was slightly faster during campaign 1 (0.046 kPa.h-1) than during
campaign 2 (0.015 kPa.h-1). A more pronounced mass transfer limitation corresponded
well with this higher TMP increase at a SRT of 50 d. A ticker fouling layer composed
20
of polysaccharides with embedded small proteins on the membrane surface and in pores
at SRT of 50 d could confirm this result. For both experiments, main part of fouling was
irremovable. The irremovable part of fouling was of 90 % for campaign 1 and 85 % for
campaign 2. Usually, the main part of fouling in MBR (80 %) is removable and could
be attributed to a cake layer formation [3]. Most of MBRs in literature operated with
organic membranes organized as hollow fibers or flat sheet membrane modules
submerged in bulk solution. This type of systems works under lower recirculation rates
than the ones applied with ceramic modules allowing fouling establishment mainly as a
cake layer [32-33]. The irremovable fouling is attributed to pore blocking. The slight
higher irremovable part of fouling observed at SRT of 50 d may be attributed to the
larger proportion of proteins with small aMWs (<1 kDa). For campaign 3 realized with
RWW, two rapid loss of relative permeability were visible around day 10 and 40. These
relative permeability drops corresponded with the TMP jump which was reached to
maintain constant permeate flux around 80 L.h-1.m-2 during acclimation phase. During
both TMP jump, severe fouling was noted and was mainly due to increase of MLSS
concentration higher than 10 g.L-1. At stable state permeate flux was maintained around
70 L.h-1.m-2 and TMP increase and permeability loss were low and in the same range
than values of campaign 2. The fouling was at 94 % irremovable. As no polysaccharides
were present in SMP of campaign 3, the cake layer contribution to membrane fouling
was low (4 %). The poorly retained humic-like substances and proteins of small sizes
mainly contributed to the membrane pore blocking. The stress I caused a drastic fouling
as TMP increase and permeability loss were around 20 times higher than during stable
state of campaign 1. The more compact fouling layer mentioned in part 3.2 could have
provoked higher mass transfer limitation in that case.
21
4 Conclusions
Proteins and humic-like substances content of SMP were characterized and their role in
membrane fouling layer was determined. With the increase of SRT from 20 to 50 d a
thicker layer of fouling occured. SRT of 20 d was preferable to limit membrane fouling
propensity. Filtration performances were severely affected by F/M ratio decrease and
the implementation of a compact fouling layer. Substrate choice for lab scale MBR
operation do not affect main sizes of proteins and humic-like substances but fouling
layers were specific depending on substrate used.
References
[1] M. Yang, D. Yu, M. Liu, L. Zheng, X. Zheng, Y. Wei, et al., Optimization of MBR
hydrodynamics for cake layer fouling control through CFD simulation and RSM design,
Biores. Technol. 227 (2017) 102–111.
[2] H. Hong, M. Zhang, Y. He, J. Chen, H. Lin, Fouling mechanisms of gel layer in a
submerged membrane bioreactor, Biores. Technol. 166 (2014) 295–302.
[3] F. Meng, S.R. Chae, A. Drews, M. Kraume, H.S. Shin, F. Yang, Recent advances in
membrane bioreactors (MBRs): Membrane fouling and membrane material, Water Res.
43 (2009) 1489-1512.
[4] F. Meng, S. Zhang, Y. Oh, Z. Zhou, H.S. Shin, S.R. Chae, Fouling in membrane
bioreactors: An updated review, Water Res. 114 (2017) 151-180.
[5] Z. Zhou, F. Meng, X. He, S.R. Chae, Y. An, X. Jia, Metaproteomic analysis of
biocake proteins to understand membrane fouling in a submerged membrane bioreactor,
Environ. Sci. Technol. 49 (2015) 1068-1077.
22
[6] J. Chen, M. Zhang, F. Li, L. Qian, H. Lin, L. Yang, et al., Membrane fouling in a
membrane bioreactor: High filtration resistance of gel layer and its underlying
mechanism, Water Res. 102 (2016) 82-89.
[7] C.Y.Y. Tang, T.H. Chong, A.G. Fane, Colloidal interactions and fouling of NF and
RO membranes: A review, Adv. Colloid Interface Sci. 164 (2011) 126-143.
[8] M. Esparza-Soto, S. Nunez-Hernandez, C. Fall C, Spectrometric characterization of
effluent organic matter of a sequencing batch reactor operated at three sludge retention
Times, Water Res. 4-5 (2011) 6555-6563.
[9] S. Rosenberger, C. Laabs, B. Lesjean, R. Gnissr, G. Amy, M. Jekel, et al., Impact of
colloidal and soluble organic material on membranes performances in membrane
bioreactors for municipal wastewater treatment, Water Res. 40 (2006) 710-720.
[10] S. Liang, C. Liu, L. Song, Soluble microbial products in membrane bioreactor
operation: Behaviors, characteristics, and fouling potential, Water Res. 41 (2007) 95-
101.
[11] E. Ferrer-Polonio, K. White, J.A. Mendoza-Roca, A. Bes-Piá, The role of the
operating parameters of SBR systems on the SMP production and on membrane fouling
reduction, J. Environ. Manag. 228 (2018) 205–212.
[12] Z.P. Wang, T. Zhang, Characterization of soluble microbial products (SMP) under
stressful conditions, Water Res. 44 (2010) 5499-5509.
[13] A. Drews, J. Mante, V. Iversen, M. Vocks, B. Lesjean, M. Kraume, Impact of
ambient conditions on SMP elimination and rejection in MBRs, Water Res. 41 (2007),
3850–3858.
[14] E. McAdam, S. Judd, E. Cartmell, B. Jefferson, Influence of substrate on
23
fouling in anoxic immersed membrane bioreactors, Water Res. 41 (2007) 3859–3867.
[15] M. Villain, B. Marrot, Influence of sludge retention time at constant food to
microorganisms ratio on membrane bioreactor performances under stable and unstable
state conditions, Biores. Technol. 128 (2013) 134–144.
[16] W.M. Xie, B.J. Ni, T. Seviour, G.P. Sheng, H.Q. Yu, Characterization of
autotrophic and heterotrophic soluble microbial product (SMP) fractions from activated
sludge, water res. 46 (2012) 6210-6217.
[17] M. Dubois, K.A. Gilles, J.K. Hamilton, P.A. Rebers, F. Smith, Colorimetric
method for determination of sugars and related substances, Anal. Chem. 28 (1956) 350–
356.
[18] B. Frolund, T. Griebe, P.H. Nielsen, Enzymatic activity in the activated-sludge floc
matrix, Appl. Microbiol. Biotechnol. 43 (1995) 755–761.
[19] M. Villain, I. Bourven, G. Guibaud, B. Marrot, Impact of synthetic or real urban
wastewater on membrane bioreactor (MBR) performances and membrane fouling under
stable conditions, Biores. Technol. 155 (2014) 235–244.
[20] W. Lee, S. Kang, H. Shin, Sludge characteristics and their contribution to
microfiltration in submerged membrane bioreactors, J. Membr. Sci. 216 (2003) 217-
227.
[21] F. Meng, Z. Zhou, B.J. Ni, X. Zheng, G. Huang, X. Jia, et al., Characterization of
the size-fractionated biomacromolecules: Tracking their role and fate in a membrane
bioreactor. Water Res. 45 (2011) 4661-4671.
[22] G.P. Sheng, H.Q. Yu, X.Y. Li, Extracellular polymeric substances (EPS) of
microbial aggregates in biological wastewater treatment systems: A review. Biotechnol.
Adv. 28 (2010) 882-894.
24
[23] J. Gagnaire, Couplage de procédés appliqués au traitement d’un effluent
decompostage. Thèse de doctorat, 2010, M2P2, Aix-Marseille.
[24] J. Lobos, C. Wisniewski, M. Heran, A. Grasmick, Effects of starvation conditions
on biomass behaviour for minimization of sludge production in membrane bioreactors,
Water Sci. Technol. 51 (2005) 35-44.
[25] F. Sun, X. Wang, X. Li, Change in the fouling propensity of sludge membrane
bioreactors in relation to the accumulation of biopolymer clusters, Biores. Technol. 102
(2011) 4718-4725.
[26] M. Yao, B. Ladewig, K. Zhang, Identification of the change of soluble microbial
products on membrane fouling in membrane bioreactor (MBR), Desalination. 278
(2011) 126–131.
[27] M.A.H. Johir, S. Vigneswaran, A. Sathasivan, J. Kandasamy, C.Y. Chang, Effect
of organic loading rate on organic matter and foulant characteristics in membrane bio-
reactor, Biores. Technol. 113 (2012) 154-160.
[28] Y.X. Shen, X. Kang, P. Liang, J.Y. Sun, S.J. Sai, X. Huang, Characterization of
soluble microbial products in10 large-scale membrane bioreactors for municipal
wastewater treatment in China,. J. Memb. Sci. 415-416 (2012) 336-345.
[29] H.S. Shin, S.T. Kang, Characteristics and fates of soluble microbial products in
ceramic membrane bioreactor at various sludge retention times, Water Res. 37 (2003)
121-127.
[30] N. Jang, X. Ren, G. Kim, C. Ahn, J. Cho, I.N. Kim, Characteristics of soluble
microbial products and extracellular polymeric substances in the membrane bioreactor
for water reuse, Desalination. 202 (2007) 90-98.
25
[31] L. Shen, Y. Zhou, B. Mahendran, D.M. Bagley, S.N. Liss. Membrane fouling in a
fermentative hydrogen producing membrane bioreactor at different organic loading
rates, J. Membr. Sci. 360 (2010) 226-233.
[32] Y. Liu, H. Liu, L. Cui, K. Zhang, K., The ratio of food-to microorganism
(F/M) on membrane fouling of anaerobic membrane bioreactors treating low-strength
wastewater, Desalination 297 (2012) 97-103.
[33] M. Zhang, W. Peng, J. Chen, Y. He, L. Ding, A. Wang, et al.,
A new insight into membrane fouling mechanism in submerged membrane bioreactor:
Osmotic pressure during cake layer filtration, water res. 47 (2013) 2777-2786.
26
Tables and figures legends Figure 1. Experimental set up of MBR
Figure 2. MBR campaigns characteristics and corresponding SMP sampling schedule
Figure 3. Influence of SRT (20 or 50 d), substrate type (SWW or RWW) and stress
period (stress I: F/M ratio decrease and stress II: F/M ratio increase) on SMP
composition in MBR bioreactor supernatant and permeate
Figure 4. Membrane relative permeability, TMP and permeate flux at 20°C for MBR
working with SWW at a SRT of 50 d (A and D), with SWW at SRT of 20 d (B and E)
and with RWW at SRT of 50 d (C and F)
Figure S1. 3D-EEM of (A) RWW, (B) MBR bioreactor supernatant (RWW ; SRT=50
d) (C) corresponding permeate, (D) SWW, (E) MBR bioreactor supernatant (SWW ;
SRT=50 d), (F) corresponding permeate, (G) SMP extracted during stress period I and
(H) II
Table 1. MBR operating conditions, substrates biochemical characteristics, COD and N-
NH4+ removal rates of lab scale MBR at stable state for the three campaigns
Table 2. RWW main characteristics
Table 3. Influence of SRT (20 or 50 d), substrate type (SWW or RWW) and stress
period (stress I: F/M ratio decrease and stress II: F/M ratio increase) on SMP retention
rate
Table 4. aMW determined for protein and humic-like substances content of substrates,
MBR supernatant and permeate in the different conditions tested
27
Table 5. TMP increase and permeability loss of MBR process in the different conditions
tested
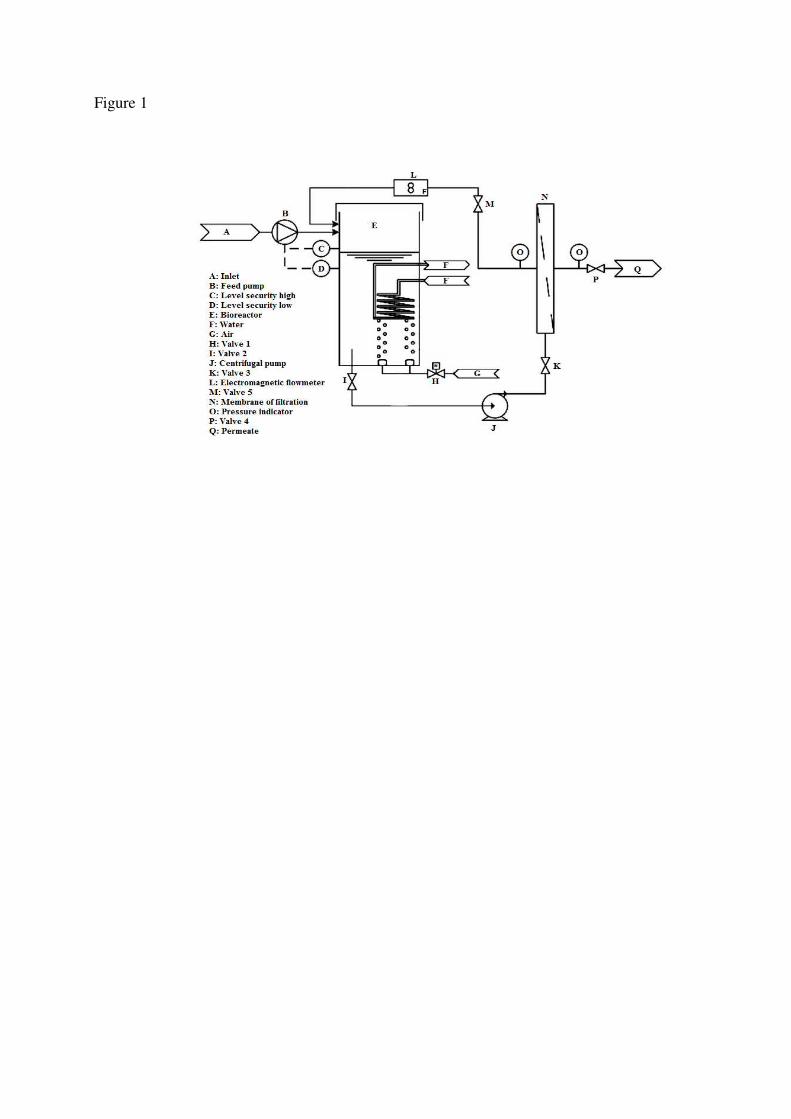
Figure 1
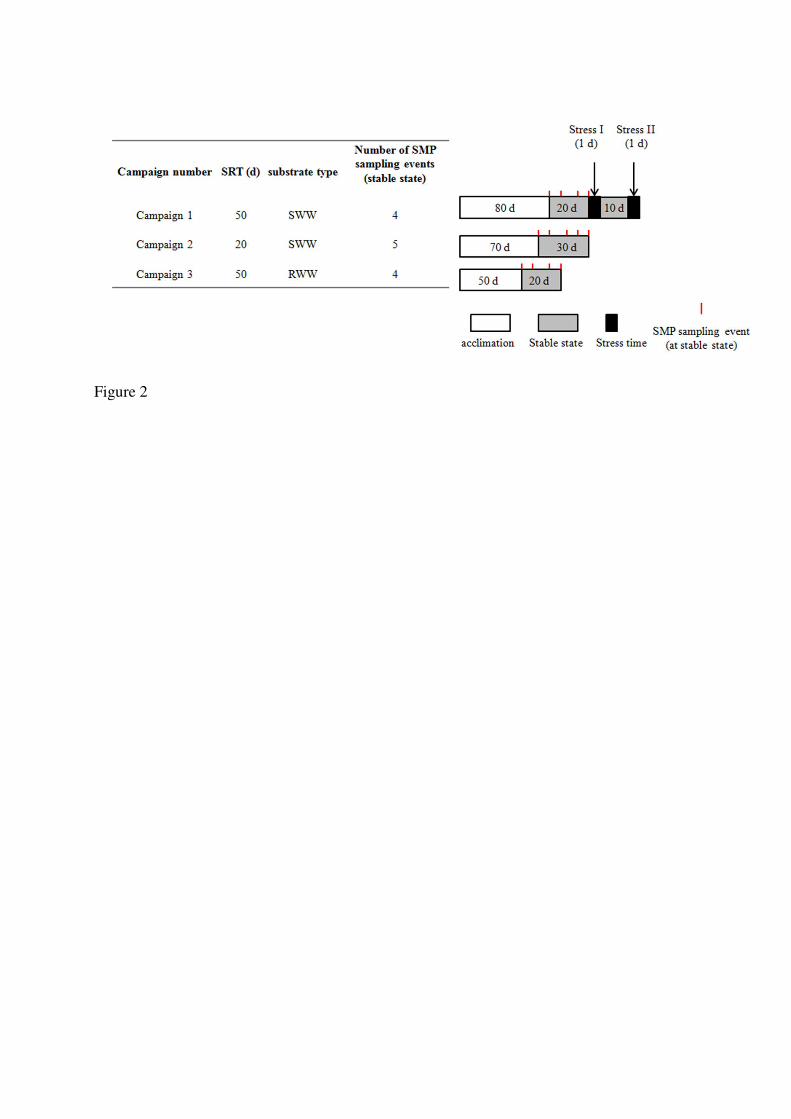
Figure 2

Figure 3

(A) (B) (C)
(D) (E) (F)
Figure 4
0
0.2
0.4
0.6
0.8
1
0 10 20 30 40 50 60 70 80 90 100
Lp/
Lp0
Time (d)
stable state
0
0.2
0.4
0.6
0.8
1
0 10 20 30 40 50 60 70 80 90 100
Lp/
Lp0
Time (d)
stable state
0
0.2
0.4
0.6
0.8
1
0 10 20 30 40 50 60 70
Lp/
Lp0
Time (d)
stable state
00.511.522.533.54
0
10
20
30
40
0 20 40 60 80 100
TM
P (bar)
J 20
°C (L
.h-1
.m-2
)
Time (d)
J 20°C TMP
00.511.522.533.54
0
10
20
30
40
0 20 40 60 80 100
TM
P (bar)J
20°C
(L.h
-1.m
-2)
Time (d)
J 20°C TMP
00.511.522.533.54
0.0
20.0
40.0
60.0
80.0
100.0
0 10 20 30 40 50 60 70
TM
P (bar)
J 20
°C (L
.h-1
.m-2
)
Time (d)
J 20°C TMP
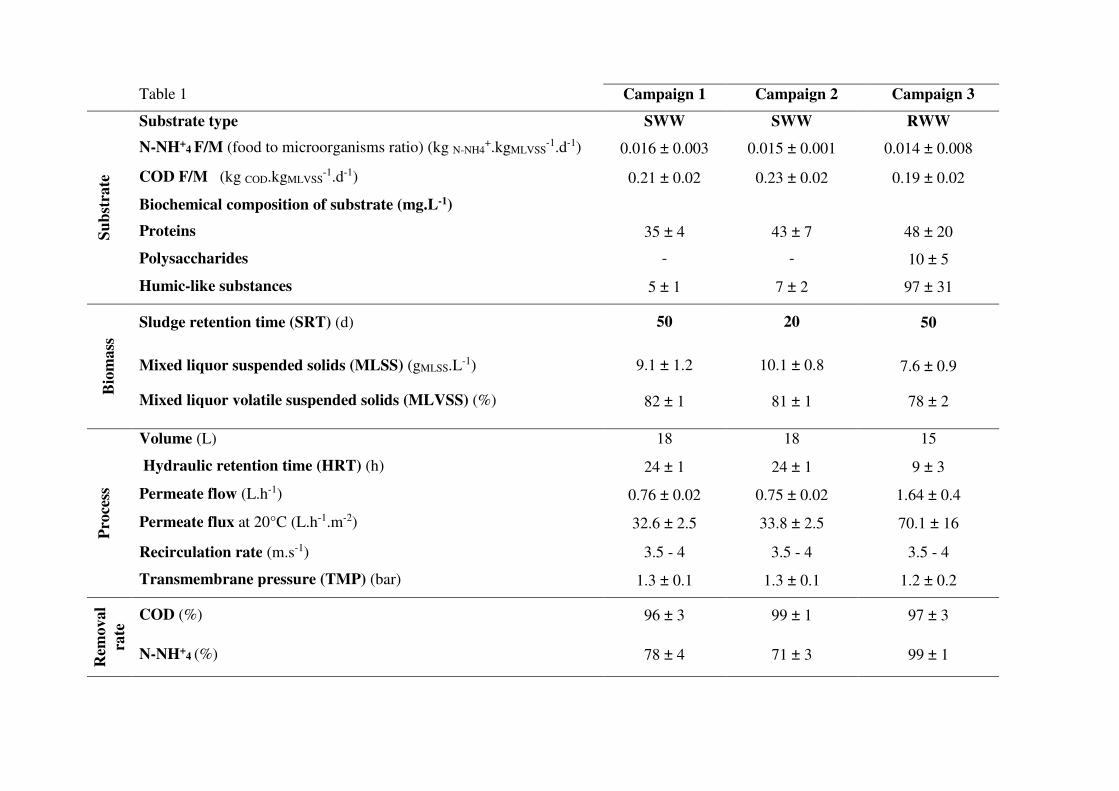
Table 1 Campaign 1 Campaign 2 Campaign 3 S
ub
stra
te
Substrate type SWW SWW RWW
N-NH+4 F/M (food to microorganisms ratio) (kg N-NH4
+.kgMLVSS-1.d-1) 0.016 ± 0.003 0.015 ± 0.001 0.014 ± 0.008
COD F/M (kg COD.kgMLVSS-1.d-1) 0.21 ± 0.02 0.23 ± 0.02 0.19 ± 0.02
Biochemical composition of substrate (mg.L-1)
Proteins 35 ± 4 43 ± 7 48 ± 20
Polysaccharides - - 10 ± 5
Humic-like substances 5 ± 1 7 ± 2 97 ± 31
Bio
mass
Sludge retention time (SRT) (d) 50 20 50
Mixed liquor suspended solids (MLSS) (gMLSS.L-1) 9.1 ± 1.2 10.1 ± 0.8 7.6 ± 0.9
Mixed liquor volatile suspended solids (MLVSS) (%) 82 ± 1 81 ± 1 78 ± 2
Pro
cess
Volume (L) 18 18 15
Hydraulic retention time (HRT) (h) 24 ± 1 24 ± 1 9 ± 3
Permeate flow (L.h-1) 0.76 ± 0.02 0.75 ± 0.02 1.64 ± 0.4
Permeate flux at 20°C (L.h-1.m-2) 32.6 ± 2.5 33.8 ± 2.5 70.1 ± 16
Recirculation rate (m.s-1) 3.5 - 4 3.5 - 4 3.5 - 4
Transmembrane pressure (TMP) (bar) 1.3 ± 0.1 1.3 ± 0.1 1.2 ± 0.2
Rem
oval
rate
COD (%) 96 ± 3 99 ± 1 97 ± 3
N-NH+4 (%) 78 ± 4 71 ± 3 99 ± 1
Parameters Month 1 Month 2 Month 3 Month 4
MLSS (mg.L-1) 270 ± 20 283 ± 35 323 ± 64 284 ± 42
COD (mg.L-1) 665 ± 78 767 ± 212 626 ± 14 720 ± 95
BOD5 (mg.L-1) 255 ± 35 279 ± 92 157 ± 85 282 ± 28
N-NH4+ (mg.L-1) 51 ± 4 44 ± 11 29 ± 15 52 ± 4
Global ammonium (mg.L-1) 67 ± 6 62 ± 15 47 ± 12 71 ± 4
Total phosphorous (mg.L-1) 8 ± 1 7 ± 1 5 ± 2 8 ± 1
Table 2

conditions
Substrate type
SRT (d)
SMP retention rate (%) Campaign
number Proteins Polysaccharides
Humic-like substances
Total
Stable state 1 SWW 50 93 ± 4 87 ± 2 41 ± 1 82 ± 2 2 SWW 20 69 ± 2 100 ± 5 44 ± 2 75 ± 3 3 RWW 50 13 ± 1 - 47 ± 3 32 ± 1
Stress I (F/M ratio decrease) 1 SWW 50 84 ± 5 92 ± 3 75 ± 4 85 ± 3 Stress II (F/M ratio increase) 1 SWW 50 99 ± 3 90 ± 5 -53 ± 4 75 ± 3
Table 3
Conditions Protein-like substances aMW
Humic-like substances aMW
substrate SRT (d)
substrate RWW -
>670 kDa ; 50 kDa ; 1 kDa ; multiple peaks with
small and high intensities <1 kDa 2 peaks 1-5 kDa
SWW - 1 kDa ; few peaks of small intensities <1kDa 2 peaks 1-10 kDa ; 4 peaks 0.1-1 kDa
MBR
supernatant
normal
conditions
SWW 20 >670 kDa ; 100 kDa ; 40 kDa ; few peaks of small
intensities <1 kDa* Multiple peaks 0.1-1 kDa*
SWW 50 >670 kDa ; 300 kDa ; 40 kDa; 3 peaks 1-5 kDa; 2
peaks <0.5 kDa* 2 peaks 1-5 kDa*
RWW 50 >670 kDa ; 30 kDa ; 2 peaks 1-5 kDa ; multiple
peaks with small intensities <1 kDa* 3 peaks 1-5 kDa*
MBR
Supernatant
stressful
conditions
stress I >670 kDa ; 400 kDa ; 200 kDa ; 40 kDa ; 20 kDa ;
multiple peaks 0.1-1 kDa* 2 kDa ; multiple peaks 0.1-1 kDa*
SWW 50
stress II >670 kDa ; multiple peaks 0.1-1 kDa
and <0.1 kDa*
2 peaks around 2 kDa ;
multiple peaks 0.1-1 kDa * SWW 50
*aMW identified on respective permeate SEC chromatograms
Table 4

Table 5
*not measured
Conditions TMP increase (kPa.h-1)
Relative permeability loss
(h-1)
Membrane fouling resistance (%)
Substrate SRT (d) removable irremovable irreversible
SWW 20 0.015 ± 0.013 0.003 ± 0.001 12 85 3
SWW 50 0.046 ± 0.021 0.004 ± 0.001 9 90 1
RWW 50 0.022 ± 0.020 0.001 ± 0.0007 4 94 2
stress I 0.83 ± 0.38 0.074 ± 0.003 -* -* -* SWW 50
stress II No variation 0.003 ± 0.001 -* -* -*
SWW 50

Substrate type SWW* SWW RWW*
SRT (d) 20 50 50
Biomass state Stable Stable Stable
Membrane fouling layer under various operating conditions
Bio clusters
SMP-proteins
SMP-polysaccharides
SMP-humic-like substances
* SWW and RWW : synthetic or real wastewater
SWW
50
24 h F/M ratio decrease (0.2 to 0.1 kgCOD.kgMLVSS
-1.h-1)
SWW
50
24 h F/M ratio increase (0.2 to 0.8 kgCOD.kgMLVSS
-1.h-1)
Thicker fouling layer
with increasing SRT
compact fouling layer
High potential of fouling
SRT, substrate, F/M ratio
influences
on fouling layer
Fouling layer with high porosity
fouling layer
specific to the
substrate used
Copyright © 2022 FDOKUMEN