Influence of Microenvironmental pH on Adriamycin Resistance1
7
1989;49:5638-5643. Cancer Res Oliver Alabaster, Tina Woods, Vilma Ortiz-Sanchez, et al. Influence of Microenvironmental pH on Adriamycin Resistance Updated version http://cancerres.aacrjournals.org/content/49/20/5638 Access the most recent version of this article at: E-mail alerts related to this article or journal. Sign up to receive free email-alerts Subscriptions Reprints and . [email protected] Department at To order reprints of this article or to subscribe to the journal, contact the AACR Publications Permissions . [email protected] Department at To request permission to re-use all or part of this article, contact the AACR Publications Research. on August 23, 2014. © 1989 American Association for Cancer cancerres.aacrjournals.org Downloaded from Research. on August 23, 2014. © 1989 American Association for Cancer cancerres.aacrjournals.org Downloaded from
Transcript of Influence of Microenvironmental pH on Adriamycin Resistance1
1989;49:5638-5643. Cancer Res Oliver Alabaster, Tina Woods, Vilma Ortiz-Sanchez, et al. Influence of Microenvironmental pH on Adriamycin Resistance
Updated version
http://cancerres.aacrjournals.org/content/49/20/5638
Access the most recent version of this article at:
E-mail alerts related to this article or journal.Sign up to receive free email-alerts
Subscriptions
Reprints and
To order reprints of this article or to subscribe to the journal, contact the AACR Publications
Permissions
To request permission to re-use all or part of this article, contact the AACR Publications
Research. on August 23, 2014. © 1989 American Association for Cancercancerres.aacrjournals.org Downloaded from
Research. on August 23, 2014. © 1989 American Association for Cancercancerres.aacrjournals.org Downloaded from
(CANCER RESEARCH 49, 5638-5643. October 15. I989|
Influence of Microenvironmental pH on Adriamycin Resistance1
Oliver Alabaster,2 Tina Woods, Vilma Ortiz-Sanchez, and Saleem Jahangeer
Division of Hematology and Oncology, George Washington University, Washington, DC 20037
ABSTRACT
Resistance to Adriamycin (ADR) is frequently dependent upon enhanced efflux associated with the expression of the IV!DR1-encoded P
membrane glycoprotein. Since enhanced expression of the MDR1 genein ADR-resistant cells may be the result of spontaneous genetic mutation
or amplification, it is presumed to be relatively stable and unalterable.Yet, reducing ADR efflux could increase sensitivity, and has been attempted using calcium channel blockers and other drugs. However, sincethe tumor cell microenvironment varies with respect to pH because ofdifferences in vascularization, oxygénation,and metabolite clearance, thepossibility exists that these factors could influence drug transport andthe critical biochemical pathways which determine cytotoxicity, even inresistant cells.
Using flow cytometric analysis of ADR fluorescence, the influx andefflux of IÃœMM ADR dissolved in MIS buffer (piI 6.5) and 4-(2-hydroxyethylene)-l-pipera/ineethanesulfonicacid buffer (pi I 7.5 and 8.5)
was measured in sensitive P388 and resistant P.388/R84 cells in vitro.Substantially enhanced uptake of ADR was detected at alkaline pi I inboth cell populations, while the proportion of ADR-positive cells and the
level of ADR uptake was decreased at lower pH. Acidification reducedADR efflux, whereas alkalinization increased efflux when the uptake pi Iwas 6.5 or 7.5. At uptake pH 8.5, the pH of the external buffer had littleeffect, even in resistant cells. In resistant cells in an alkaline microenvironment, ADR transport and retention were superior to that observed insensitive cells in an acidic microenvironment. No differences were observed in ADR transport when the transmembrane pH gradient wasequilibrated. These observations are especially relevant to the effect ofADR on tumor cell subpopulations that are acidic, and in which drugdiffusion is inefficient. Efforts to alkalinize tumor cells prior to ADRtherapy might reduce ADR resistance, even of genetic origin.
INTRODUCTION
Chemotherapeutic cytotoxicity depends upon many factorssuch as an adequate drug concentration in the tumor cellmicroenvironment, the cell cycle distribution, the rate of bidirectional drug transport across the cell membrane, relative ratesof drug activation and deactivation, and the subsequent inhibition of cell reproductive processes, with or without lethal metabolic paralysis. Yet, even when these factors appear to favordrug cytotoxicity a variable proportion of cells usually survivedrug treatment, particularly in solid tumors.
The most important reason for cell survival following cyto-toxic drug exposure is the presence or development of geneticvariants that are relatively drug resistant. Rapid mutation ofmalignant cells has been hypothesized to account for the development of resistant clones that finally emerge as predominantwhen sensitive cell subpopulations are eradicated during treatment (1). Apart from such spontaneous mutations, evidenceexists for the transfer of drug-resistant genes between cellswithin a cell population (2); a mechanism that would alsoenhance survival of cell subpopulations within a tumor subjected to chemotherapy. Another important genetic mechanism
Received 12/14/88; revised 6/29/89; accepted 7/13/89.The costs of publication of this article were defrayed in part by the payment
of page charges. This article must therefore be hereby marked advertisement inaccordance with 18 U.S.C. Section 1734 solely to indicate this fact.
1Supported in part by NIH Grant RO1-CA32756.2To whom requests for reprints should be addressed, at Division of Hematol-
ogy and Oncology, Suite 421, Ross Hall, George Washington University, Washington, DC 20037.
of drug resistance is the development of pleiotropic drug resistance following drug exposure (3, 4). At the cellular level, thisis characterized by the development of a wide range of crossresistance to anticancer drugs, usually of natural plant origin,that is induced by previous drug exposure. Activation of themultidrug-resistant gene (MDR1) is associated with the expression of a specific membrane glycoprotein of M, 170,000 (5, 6).The effect of this energy-dependent membrane pump protein isto enhance the efflux of intracellular drugs such as vincristineand ADR.' Further studies have demonstrated that as the gene
which encodes this protein is amplified, drug efflux is increased(7). The underlying mechanism by which this protein increasesdrug efflux has been elucidated in a number of studies that havedemonstrated binding of vinblastine and anthracyclines to thisP170 membrane glycoprotein (8, 9), and precipitation of thedrug-protein complex by a monoclonal antibody to the PI70glycoprotein (10). Although expression of the P170 membraneglycoprotein has been demonstrated in selected patients withovarian cancer (11), it is not yet known how frequently suchexpression occurs or is amplified in tumor cell populationsduring clinical chemotherapy.
Nevertheless, there is increasing interest in finding ways toreverse pleiotropic drug resistance by increasing drug uptakeand reducing drug efflux. Specifically, ADR resistance has beendiminished by the administration of verapamil, a calcium antagonist (12), and by certain drugs such as phenothiazines whichbind to calmodulin, the calcium regulatory protein (13-15).
In evaluating the effect of drugs on ADR transport, the flowcytometric technique (16-20) has the advantage of predominantly measuring the free ADR in individual cells. This technique not only permits the detection of cells which containmeasurable levels of ADR, but also the detection of cell sub-populations with different ADR levels (18, 19), and the detection of cells that do not contain free ADR.
In this study, we used flow cytometric analysis to measurethe influence of extracellular pH (and intracellular pH) on theuptake and efflux of ADR in sensitive P388 and resistant P388/R86 cells (18, 19). These studies indicate that the microenvi-ronmental pH influences the uptake of ADR, the proportion ofcells that contain ADR, the relative intracellular ADR concentration, and the rate of efflux of ADR: all factors that caninfluence the cytotoxic process. Furthermore, to contrast theeffects of intracellular and extracellular pH, the transmembranepH gradient was equilibrated to determine the effect of intracellular pH on ADR influx and efflux.
MATERIALS AND METHODS
The P388/R84 and P388 murine leukemia cell lines were maintainedas suspension cultures in RPMI 1640 medium supplemented with 10%fetal bovine serum, antibiotics (penicillin and streptomycin), and 5 n\\2-mercaptoethanoI. The cells were passaged every 2 to 3 days by dilutingone third of the suspension culture with fresh medium. For determination of ADR uptake and efflux, log phase cells were removed fromculture flasks, washed twice with ice-cold PBS, using centrifugation at1,000 rpm for 5 min at 4°C.Equal numbers of cells were resuspended
1The abbreviations used are: ADR. Adriamycin; PBS. phosphate bufferedsaline; MES. (2[/V-Morpholmo]Ethane Sulfonic Acid): HEPES, 4-(2-hydroxy-ethylene)-1 -piperazineethanesulfbnic acid.
5638
Research. on August 23, 2014. © 1989 American Association for Cancercancerres.aacrjournals.org Downloaded from
INFLUENCE OF MICROENVIRONMENTAL pH ON ADR RESISTANCE
in three flasks containing prepared buffers of pH 6.5, 7.5, and 8.5. ThepH 6.5 buffer was prepared by dissolving MES in RPMI so that thefinal buffer concentration was 25 mivi MES. The pH was adjusted byadding HC1. The pH 7.5 buffer was prepared by dissolving HEPES inRPMI so that the final concentration was 25 mM HEPES. The pH wasadjusted by the addition of NaOH. Finally, the pH 8.5 buffer was alsoprepared with HEPES in the same way as the pH 7.5 buffer, exceptthat NaOH was added until the pH was 8.5. ADR stock solution (1IHM;Adria Laboratories, Inc., Columbus, OH) was added to each bufferto obtain a final ADR concentration of 10 nM. The final osmolaritiesof the three buffers were 307, 310, and 327 mOsm/liter; respectively.
Triplicate flasks containing P388 and P388/R84 cells in each of thethree ADR-containing buffers were then transferred to a water bath at37°Cand the cells were allowed to incubate for varying time periods.
Trypan blue viability exceeded 90% in all experiments during theselected time periods, which also correlated with viability by light scatteranalysis (21). At predetermined time points, a small aliquot of cells wasremoved from each flask, washed twice in ice cold PBS, and resus-pended in a small volume of ice-cold PBS prior to immediate flowcytometric analysis, using a FACS IV (Becton Dickinson) equippedwith a 4-W argon laser at 488 nm. Using the well-established techniquefor measuring intracellular ADR by flow cytometry (16-20), cells werecounted and analyzed by amplified measurement of forward-angle lightscatter and simultaneous fluorescence, which distinguished cells thatwere fluorescence negative from those that were positive. Fluorescenceemission was only collected beyond 520 nm using an appropriate bandpass filter. At least 50,000 cells were measured during each sampleanalysis; and each sample was analyzed several times to ensure stabilityand reproducibility of the histograms. Data were collected on a PDP-11/34 computer (Digital Equipment Corporation) using NIH analyticalsoftware. Data analysis included measuring median ADR fluorescentintensity and counting the number of ADR-positive and -negative cells.Each complete experiment was repeated at least three times, but somevariations in the time intervals made exact data comparisons impossible. Note that before these experiments were performed, drug-free cellswere analyzed to determine the possible influence of autofluorescence.Any background fluorescence was then eliminated from the data analysis by establishing a fluorescence threshold for the presence of ADR,which in turn was correlated with an appropriate cell-light-scattersignal. In addition, FACS amplifier gain settings were standardized toensure fluorescence comparability between all samples.
Initial uptake experiments monitored ADR concentration in cellsafter incubation for 15, 45, 75, 105, and 135 min, respectively. Theeffect of drug concentration was evaluated at ADR concentrations of5, 10, and 50 ^M respectively (data not shown). Comparable pH effectson ADR uptake were evident at all ADR concentrations, but 10 juMwas arbitrarily selected for the complete range of experiments on influxand efflux described here.
The effect of pH 6.5, 7.5, and 8.5 (for 90 min at 37°C)on ADRuptake was then measured, and the cells were washed once in cold (4°C)matching drug-free buffers before being resuspended in warm (37°C)
drug-free buffers of pH 6.5, 7.5, and 8.5, respectively. ADR efflux wasthen measured in each cell population after 30 min and 90 min,respectively, using flow cytometric analysis of residual cell fluorescence.
RESULTS
Experiments with sensitive and resistant cells were alwaysdone concurrently so that differences between cell lines couldbe evaluated under standardized conditions. However, whenexperiments were repeated weeks or months apart, variationsin ADR uptake were sometimes detected that may have resultedfrom differences in cell growth phase at the time cells wereharvested for experiments. Typical examples of data are therefore presented.
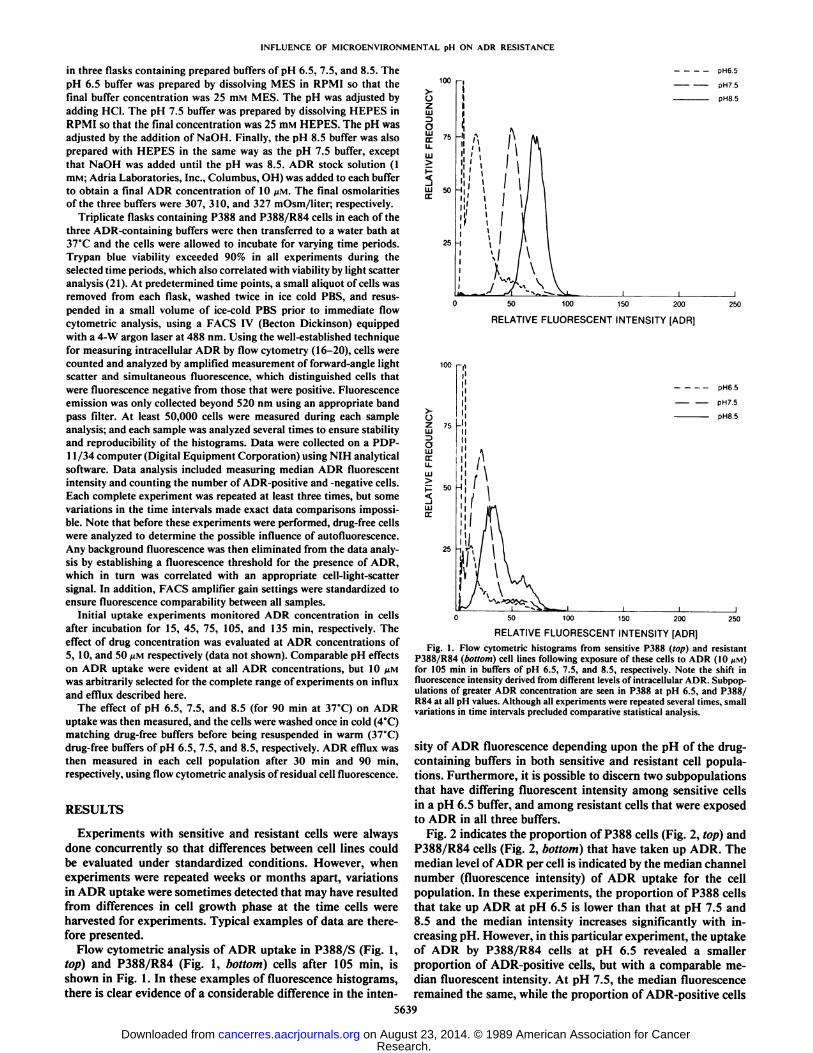
Flow cytometric analysis of ADR uptake in P388/S (Fig. 1,top) and P388/R84 (Fig. 1, bottom) cells after 105 min, isshown in Fig. 1. In these examples of fluorescence histograms,there is clear evidence of a considerable difference in the inten-
PH6.5
PH7.5
pHS.5
RELATIVE FLUORESCENT INTENSITY [ADR]
pH6.5
pH7.5
PH8.5
'00 150 200 250
RELATIVE FLUORESCENT INTENSITY [ADR]
Fig. 1. Flow cytometric histograms from sensitive P388 (top) and resistantP388/R84 (bottom) cell lines following exposure of these cells to ADR (10 MM)for 105 min in buffers of pH 6.5, 7.5, and 8.5, respectively. Note the shift influorescence intensity derived from different levels of intracellular ADR. Subpop-ulations of greater ADR concentration are seen in P388 at pH 6.5, and P388/R84 at all pH values. Although all experiments were repeated several times, smallvariations in time intervals precluded comparative statistical analysis.
sity of ADR fluorescence depending upon the pH of the drug-containing buffers in both sensitive and resistant cell populations. Furthermore, it is possible to discern two subpopulationsthat have differing fluorescent intensity among sensitive cellsin a pH 6.5 buffer, and among resistant cells that were exposedto ADR in all three buffers.
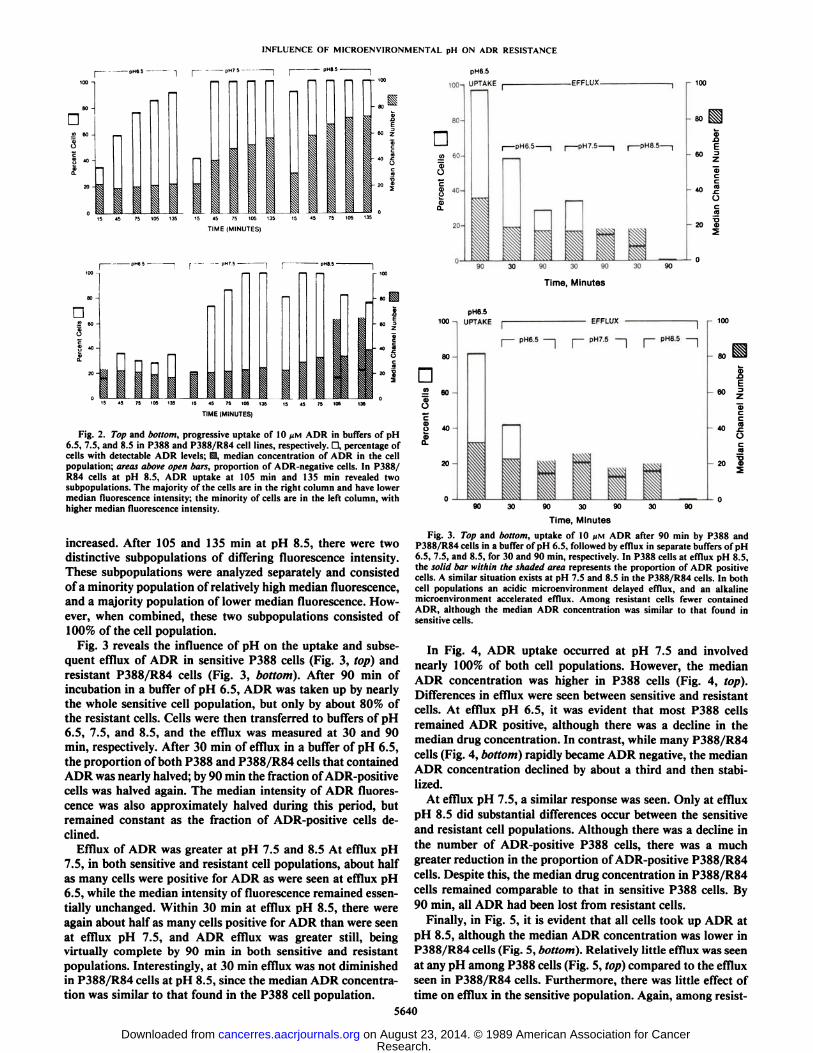
Fig. 2 indicates the proportion of P388 cells (Fig. 2, top) andP388/R84 cells (Fig. 2, bottom) that have taken up ADR. Themedian level of ADR per cell is indicated by the median channelnumber (fluorescence intensity) of ADR uptake for the cellpopulation. In these experiments, the proportion of P388 cellsthat take up ADR at pH 6.5 is lower than that at pH 7.5 and8.5 and the median intensity increases significantly with increasing pH. However, in this particular experiment, the uptakeof ADR by P388/R84 cells at pH 6.5 revealed a smallerproportion of ADR-positive cells, but with a comparable median fluorescent intensity. At pH 7.5, the median fluorescenceremained the same, while the proportion of ADR-positive cells
5639
Research. on August 23, 2014. © 1989 American Association for Cancercancerres.aacrjournals.org Downloaded from
INFLUENCE OF MICROENVIRONMENTAL pH ON ADR RESISTANCE
pHT.5 —¿�
100-BO
-n«
60-30
40-è20
-iI1—i1ï1111î••
•¿�•¿�,~1:\1-
100-
80-
60-
20
0
pH6.5
100-1 UPTAKE
TIME (MINUTES)
100-80
-n£
60-O"e.g
40-M
-il°
15 45ÌÌrs1051i~ÃŒ~ï—1~i-ï"•|—I1ÃZZZm'&Ã'Ã'Ã.':
.-:;|1-
100-»1s-60
lS'
3SMédianChanr135
15 45 75 t« 135 15 45 75 106 135
TIME (MINUTES)
Fig. 2. Top and bottom, progressive uptake of 10 /IM ADR in buffers of pH6.5, 7.5, and 8.5 in P388 and P388/R84 cell lines, respectively. D, percentage ofcells with detectable ADR levels; M, median concentration of ADR in the cellpopulation; areas above open bars, proportion of ADR-negative cells. In P388/R84 cells at pH 8.5, ADR uptake at 105 min and 135 min revealed twosubpopulations. The majority of the cells are in the right column and have lowermedian fluorescence intensity; the minority of cells are in the left column, withhigher median fluorescence intensity.
increased. After 105 and 135 min at pH 8.5, there were twodistinctive subpopulations of differing fluorescence intensity.These subpopulations were analyzed separately and consistedof a minority population of relatively high median fluorescence,and a majority population of lower median fluorescence. However, when combined, these two subpopulations consisted of100% of the cell population.
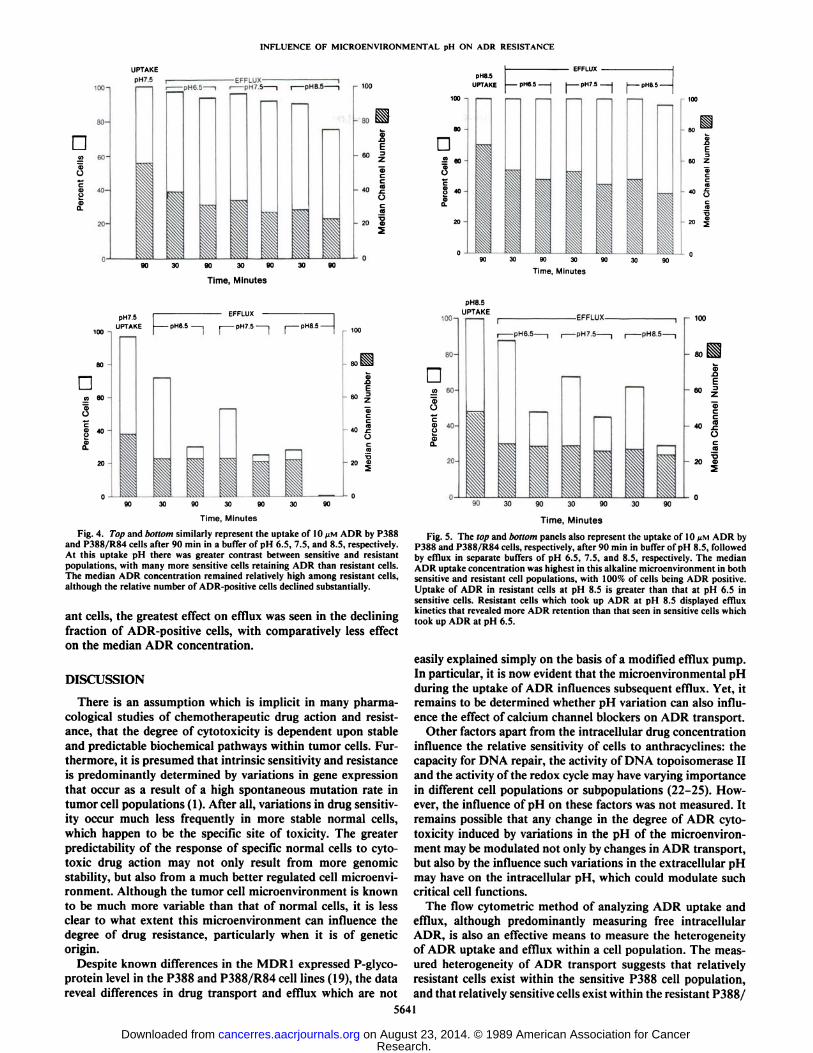
Fig. 3 reveals the influence of pH on the uptake and subsequent efflux of ADR in sensitive P388 cells (Fig. 3, top) andresistant P388/R84 cells (Fig. 3, bottom). After 90 min ofincubation in a buffer of pH 6.5, ADR was taken up by nearlythe whole sensitive cell population, but only by about 80% ofthe resistant cells. Cells were then transferred to buffers of pH6.5, 7.5, and 8.5, and the efflux was measured at 30 and 90min, respectively. After 30 min of efflux in a buffer of pH 6.5,the proportion of both P388 and P388/R84 cells that containedADR was nearly halved; by 90 min the fraction of ADR-positivecells was halved again. The median intensity of ADR fluorescence was also approximately halved during this period, butremained constant as the fraction of ADR-positive cells declined.
Efflux of ADR was greater at pH 7.5 and 8.5 At efflux pH7.5, in both sensitive and resistant cell populations, about halfas many cells were positive for ADR as were seen at efflux pH6.5, while the median intensity of fluorescence remained essentially unchanged. Within 30 min at efflux pH 8.5, there wereagain about half as many cells positive for ADR than were seenat efflux pH 7.5, and ADR efflux was greater still, beingvirtually complete by 90 min in both sensitive and resistantpopulations. Interestingly, at 30 min efflux was not diminishedin P388/R84 cells at pH 8.5, since the median ADR concentration was similar to that found in the P388 cell population.
Djn 60
U
I "°-9CL
20-
-EFFLUX-
-pH6.5- -pH7.5- -PH8.5-
90 30 90 30 90
Time, Minutes
pH6.5
90
90 30 90
Time, Minutes
Fig. 3. Top and bottom, uptake of 10 (¿MADR after 90 min by P388 andP388/R84 cells in a buffer of pH 6.5, followed by efflux in separate buffers of pH6.5, 7.5, and 8.5, for 30 and 90 min, respectively. In P388 cells at efflux pH 8.5,the solid bar within the shaded area represents the proportion of ADR positivecells. A similar situation exists at pH 7.5 and 8.5 in the P388/R84 cells. In bothcell populations an acidic microenvironment delayed efflux, and an alkalinemicroenvironment accelerated efflux. Among resistant cells fewer containedADR, although the median ADR concentration was similar to that found insensitive cells.
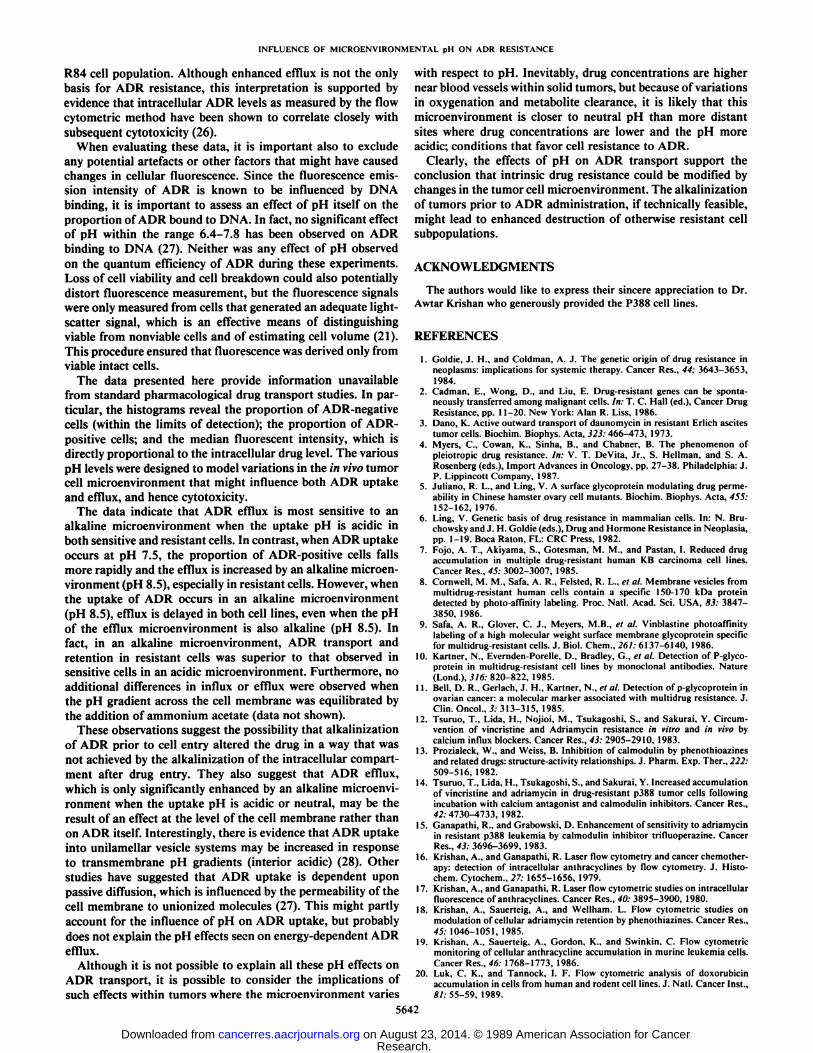
In Fig. 4, ADR uptake occurred at pH 7.5 and involvednearly 100% of both cell populations. However, the medianADR concentration was higher in P388 cells (Fig. 4, top).Differences in efflux were seen between sensitive and resistantcells. At efflux pH 6.5, it was evident that most P388 cellsremained ADR positive, although there was a decline in themedian drug concentration. In contrast, while many P388/R84cells (Fig. 4, bottom) rapidly became ADR negative, the medianADR concentration declined by about a third and then stabilized.
At efflux pH 7.5, a similar response was seen. Only at effluxpH 8.5 did substantial differences occur between the sensitiveand resistant cell populations. Although there was a decline inthe number of ADR-positive P388 cells, there was a muchgreater reduction in the proportion of ADR-positive P388/R84cells. Despite this, the median drug concentration in P388/R84cells remained comparable to that in sensitive P388 cells. By90 min, all ADR had been lost from resistant cells.
Finally, in Fig. 5, it is evident that all cells took up ADR atpH 8.5, although the median ADR concentration was lower inP388/R84 cells (Fig. 5, bottom). Relatively little efflux was seenat any pH among P388 cells (Fig. 5, top) compared to the effluxseen in P388/R84 cells. Furthermore, there was little effect oftime on efflux in the sensitive population. Again, among resist-
5640
Research. on August 23, 2014. © 1989 American Association for Cancercancerres.aacrjournals.org Downloaded from
INFLUENCE OF MICROENVIRONMENTAL pH ON ADR RESISTANCE
UPTAKEPH7.5 ,-
80-
nm 60-
g
» 40-
-pH6.5- -pH7.5 1 i PH8.5-
•¿�
I
- 20 aS
90 30 90 30 90 30 90
Time, Minutes
pH7.5UPTAKE pH6.5 -
EFFLUXPH7.5-
ao
nM 60
Siz
90 30 90 30
Time, Minutes
Fig. 4. Top and bottom similarly represent the uptake of 10 >JMADR by P388and P388/R84 cells after 90 min in a buffer of pH 6.5, 7.5, and 8.5, respectively.At this uptake pH there was greater contrast between sensitive and resistantpopulations, with many more sensitive cells retaining ADR than resistant cells.The median ADR concentration remained relatively high among resistant cells,although the relative number of ADR-positive cells declined substantially.
ant cells, the greatest effect on efflux was seen in the decliningfraction of ADR-positive cells, with comparatively less effecton the median ADR concentration.
DISCUSSION
There is an assumption which is implicit in many pharmacological studies of chemotherapeutic drug action and resistance, that the degree of cytotoxicity is dependent upon stableand predictable biochemical pathways within tumor cells. Furthermore, it is presumed that intrinsic sensitivity and resistanceis predominantly determined by variations in gene expressionthat occur as a result of a high spontaneous mutation rate intumor cell populations (1). After all, variations in drug sensitivity occur much less frequently in more stable normal cells,which happen to be the specific site of toxicity. The greaterpredictability of the response of specific normal cells to cyto-toxic drug action may not only result from more genomicstability, but also from a much better regulated cell microenvi-ronment. Although the tumor cell microenvironment is knownto be much more variable than that of normal cells, it is lessclear to what extent this microenvironment can influence thedegree of drug resistance, particularly when it is of geneticorigin.
Despite known differences in the MDR1 expressed P-glyco-protein level in the P388 and P388/R84 cell lines (19), the datareveal differences in drug transport and efflux which are not
PH8.5
UPTAKE
EFFLUX
PH6.5 1 I pH7.5 1 I pHS.5-
nè 60
O
l l i
i60 Z
90 30 90 30
Time, Minutes
PH8.5UPTAKE
nW 60-
QÜ
Å“ 40-
-PH6.5-
-EFFLUX-
-pH7.5 -pH8.5-
|Z
-40
Ãœcn
90 30 90 30 90 30 90
Time, Minutes
Fig. 5. The top and bottom panels also represent the uptake of 10 JJMADR byP388 and P388/R84 cells, respectively, after 90 min in buffer of pH 8.5, followedby efflux in separate buffers of pH 6.5, 7.5, and 8.5, respectively. The medianADR uptake concentration was highest in this alkaline microenvironment in bothsensitive and resistant cell populations, with 100% of cells being ADR positive.Uptake of ADR in resistant cells at pH 8.5 is greater than that at pH 6.5 insensitive cells. Resistant cells which took up ADR at pH 8.5 displayed effluxkinetics that revealed more ADR retention than that seen in sensitive cells whichtook up ADR at pH 6.5.
easily explained simply on the basis of a modified efflux pump.In particular, it is now evident that the microenvironmental pHduring the uptake of ADR influences subsequent efflux. Yet, itremains to be determined whether pH variation can also influence the effect of calcium channel blockers on ADR transport.
Other factors apart from the intracellular drug concentrationinfluence the relative sensitivity of cells to anthracyclines: thecapacity for DNA repair, the activity of DNA topoisomerase IIand the activity of the redox cycle may have varying importancein different cell populations or subpopulations (22-25). However, the influence of pH on these factors was not measured. Itremains possible that any change in the degree of ADR cytotoxicity induced by variations in the pH of the microenvironment may be modulated not only by changes in ADR transport,but also by the influence such variations in the extracellular pHmay have on the intracellular pH, which could modulate suchcritical cell functions.
The flow cytometric method of analyzing ADR uptake andefflux, although predominantly measuring free intracellularADR, is also an effective means to measure the heterogeneityof ADR uptake and efflux within a cell population. The measured heterogeneity of ADR transport suggests that relativelyresistant cells exist within the sensitive P388 cell population,and that relatively sensitive cells exist within the resistant P388/
5641
Research. on August 23, 2014. © 1989 American Association for Cancercancerres.aacrjournals.org Downloaded from
INFLUENCE OF MICROENVIRONMENTAL pH ON ADR RESISTANCE
R84 cell population. Although enhanced efflux is not the onlybasis for ADR resistance, this interpretation is supported byevidence that intracellular ADR levels as measured by the flowcytometric method have been shown to correlate closely withsubsequent cytotoxicity (26).
When evaluating these data, it is important also to excludeany potential artefacts or other factors that might have causedchanges in cellular fluorescence. Since the fluorescence emission intensity of ADR is known to be influenced by DNAbinding, it is important to assess an effect of pH itself on theproportion of ADR bound to DNA. In fact, no significant effectof pH within the range 6.4-7.8 has been observed on ADRbinding to DNA (27). Neither was any effect of pH observedon the quantum efficiency of ADR during these experiments.Loss of cell viability and cell breakdown could also potentiallydistort fluorescence measurement, but the fluorescence signalswere only measured from cells that generated an adequate light-scatter signal, which is an effective means of distinguishingviable from nonviable cells and of estimating cell volume (21).This procedure ensured that fluorescence was derived only fromviable intact cells.
The data presented here provide information unavailablefrom standard pharmacological drug transport studies. In particular, the histograms reveal the proportion of ADR-negativecells (within the limits of detection); the proportion of ADR-
positive cells; and the median fluorescent intensity, which isdirectly proportional to the intracellular drug level. The variouspH levels were designed to model variations in the in vivo tumorcell microenvironment that might influence both ADR uptakeand efflux, and hence cytotoxicity.
The data indicate that ADR efflux is most sensitive to analkaline microenvironment when the uptake pH is acidic inboth sensitive and resistant cells. In contrast, when ADR uptakeoccurs at pH 7.5, the proportion of ADR-positive cells fallsmore rapidly and the efflux is increased by an alkaline microenvironment (pH 8.5), especially in resistant cells. However, whenthe uptake of ADR occurs in an alkaline microenvironment(pH 8.5), efflux is delayed in both cell lines, even when the pHof the efflux microenvironment is also alkaline (pH 8.5). Infact, in an alkaline microenvironment, ADR transport andretention in resistant cells was superior to that observed insensitive cells in an acidic microenvironment. Furthermore, noadditional differences in influx or efflux were observed whenthe pH gradient across the cell membrane was equilibrated bythe addition of ammonium acetate (data not shown).
These observations suggest the possibility that alkalinizationof ADR prior to cell entry altered the drug in a way that wasnot achieved by the alkalinization of the intracellular compartment after drug entry. They also suggest that ADR efflux,which is only significantly enhanced by an alkaline microenvironment when the uptake pH is acidic or neutral, may be theresult of an effect at the level of the cell membrane rather thanon ADR itself. Interestingly, there is evidence that ADR uptakeinto unilamellar vesicle systems may be increased in responseto transmembrane pH gradients (interior acidic) (28). Otherstudies have suggested that ADR uptake is dependent uponpassive diffusion, which is influenced by the permeability of thecell membrane to unionized molecules (27). This might partlyaccount for the influence of pH on ADR uptake, but probablydoes not explain the pH effects seen on energy-dependent ADR
efflux.Although it is not possible to explain all these pH effects on
ADR transport, it is possible to consider the implications ofsuch effects within tumors where the microenvironment varies
with respect to pH. Inevitably, drug concentrations are highernear blood vessels within solid tumors, but because of variationsin oxygénationand metabolite clearance, it is likely that thismicroenvironment is closer to neutral pH than more distantsites where drug concentrations are lower and the pH moreacidic; conditions that favor cell resistance to ADR.
Clearly, the effects of pH on ADR transport support theconclusion that intrinsic drug resistance could be modified bychanges in the tumor cell microenvironment. The alkalinizationof tumors prior to ADR administration, if technically feasible,might lead to enhanced destruction of otherwise resistant cellsubpopulations.
ACKNOWLEDGMENTS
The authors would like to express their sincere appreciation to Dr.Awtar Krishna who generously provided the P388 cell lines.
REFERENCES
9.
10.
11.
12.
13.
14.
15.
16.
17.
18.
19.
20.
Goldie, J. H.. and Goldman. A. J. The genetic origin of drug resistance inneoplasms: implications for systemic therapy. Cancer Res., 44: 3643-3653,1984.Cadman, E., Wong. D., and Liu, E. Drug-resistant genes can be spontaneously transferred among malignant cells. In: T. C. Hall (ed.), Cancer DrugResistance, pp. 11-20. New York: Alan R. Liss, 1986.Daño,K. Active outward transport of daunomycin in resistant Erlich ascitestumor cells. Biochim. Biophys. Acta, 323: 466-473, 1973.Myers, C., Cowan, K., Sinha, B., and Chabner. B. The phenomenon ofpleiotropic drug resistance. In: V. T. DeVita. Jr.. S. Hellman, and S. A.Rosenberg (eds.). Import Advances in Oncology, pp. 27-38. Philadelphia: J.P. Lippincott Company. 1987.Juliano. R. L., and Ling, V. A surface glycoprotein modulating drug permeability in Chinese hamster ovary cell mutants. Biochim. Biophys. Acta, 455:152-162, 1976.Ling. V. Genetic basis of drug resistance in mammalian cells. In: N. Bru-chowsky and J. H. Goldie (eds.). Drug and Hormone Resistance in Neoplasia,pp. 1-19. Boca Raton, FL: CRC Press, 1982.Fojo, A. T., Akiyama, S., Gotesman, M. M., and Pastan, I. Reduced drugaccumulation in multiple drug-resistant human KB carcinoma cell lines.Cancer Res., 45: 3002-3007, 1985.Cornwell. M. M., Safa, A. R., Felsted, R. L., et al. Membrane vesicles frommultidrug-resistant human cells contain a specific 150-170 kDa proteindetected by photo-affinity labeling. Proc. Nati. Acad. Sci. USA, 83: 3847-3850, 1986.Safa, A. R., Glover, C. J., Meyers, M.B., et al. Vinblastine photoaffinitylabeling of a high molecular weight surface membrane glycoprotein specificfor multidrug-resistant cells. J. Biol. Chem., 261: 6137-6140. 1986.Kartner, N., Evernden-Porelle, D., Bradley. G., et al. Detection of P-glyco-protein in multidrug-resistant cell lines by monoclonal antibodies. Nature(Lond.), 316: 820-822, 1985.Bell. D. R., Gerlach, J. H., Kartner, N., et al. Detection of p-glycoprotein inovarian cancer: a molecular marker associated with multidrug resistance. J.Clin. Oncol., 3: 313-315, 1985.Tsuruo. T.. Lida. H., Nojioi, M., Tsukagoshi, S., and Sakurai, Y. Circumvention of vincristine and Adriamycin resistance in vitro and in vivo bycalcium influx blockers. Cancer Res., 43: 2905-2910, 1983.Prozialeck, W., and Weiss, B. Inhibition of calmodulin by phenothioazinesand related drugs: structure-activity relationships. J. Pharm. Exp. Ther., 222:509-516. 1982.Tsuruo, T.. Lida, H., Tsukagoshi. S.. and Sakurai, Y. Increased accumulationof vincristine and adriamycin in drug-resistant p388 tumor cells followingincubation with calcium antagonist and calmodulin inhibitors. Cancer Res.,42:4730-4733, 1982.Ganapathi, R., and Grabowski, D. Enhancement of sensitivity to adriamycinin resistant p388 leukemia by calmodulin inhibitor trifluoperazine. CancerRes., 43: 3696-3699, 1983.Krishan, A., and Ganapathi, R. Laser flow cytometry and cancer chemotherapy: detection of intracellular anthracyclines by flow cytometry. J. Histo-chem. Cytochem., 27: 1655-1656, 1979.Krishan, A., and Ganapathi, R. Laser flow cytometric studies on intracellularfluorescence of anthracyclines. Cancer Res.. 40: 3895-3900, 1980.Krishan, A., Sauerteig, A., and Wellham. L. Flow cytometric studies onmodulation of cellular adriamycin retention by phenothiazines. Cancer Res.,45: 1046-1051, 1985.Krishan, A.. Sauerteig. A., Gordon, K., and Swinkin, C. Flow cytometricmonitoring of cellular anthracycline accumulation in murine leukemia cells.Cancer Res.. 46: 1768-1773. 1986.Luk, C. K., and Tannock, I. F. Flow cytometric analysis of doxorubicinaccumulation in cells from human and rodent cell lines. J. Nati. Cancer Inst.,81: 55-59, 1989.
5642
Research. on August 23, 2014. © 1989 American Association for Cancercancerres.aacrjournals.org Downloaded from
INFLUENCE OF M1CROENVIRONMENTAL pH ON ADR RESISTANCE
21. Alabaster, O., Woo, W. B.. and Magrath. I. T. Separation of viable and in acquired and de novo multidrug resistance. Science (Wash. DC), 241: 694-nonviable human lymphoma cells influences flow cytometric analysis of DNA 697, 1988.content. In: Flow Cytometry IV, pp. 91-95. Universitetsforlaget, Norway, 25. Moscow, J. A., and Cowan, K. H. Multidrug resistance. J. Nati. Cancer Inst.,1980. SO: 14-20, 1988.
22. Batist. G.. Tulpule. A., and Sinha. B. K., el al. Overexpression of a novel 26. Durand. R. E., and Olive, P. L. Flow cytometry studies of intracellularMIInMIu glutathione transferase in multidrug resistant human breast cancer Adriamycin in single cells in vitro. Cancer Res., 41: 3489-3494. 1981.cells. J. Biol. Chem.. 261: 15544-15549. 1986. 27. Skovsgaard, T. Transport and binding of daunorubicin, Adriamycin. and
23. Deffie, A. M., Alam, T., and Seneviratine, C., et al. Multifactorial resistance rubidazone in Erlich Ascites Tumor Cells. Biochem. Pharmacol., 26: 215-to Adriamycin: relationship of DNA repair, glutathione transferase activity. 222, 1977.drug efflux, and P-glycoprotein in cloned cell lines of adriamycin-sensitive 28. Mayer, L. D., Bally, M. B.. and Cullis. P. R. Uptake of Adriamycin intoand resistant P388 leukemia. Cancer Res.. 48: 3595-3602. 1988. large unilamellas vesicles in response to a pH gradient. Biochim. Biophys.
24. Kramer. R. A.. Zakher.J.. and Kim, G. Role of the glutathionine redox cycle Acta. 857: 123-126, 1986.
5643
Research. on August 23, 2014. © 1989 American Association for Cancercancerres.aacrjournals.org Downloaded from