Quantify Protein Structure and Subfractions in Canola Seed ...
Upload
independentCategory
view
0download
0
This article appeared in a journal published by Elsevier. The attachedcopy is furnished to the author for internal non-commercial researchand education use, including for instruction at the authors institution
and sharing with colleagues.
Other uses, including reproduction and distribution, or selling orlicensing copies, or posting to personal, institutional or third party
websites are prohibited.
In most cases authors are permitted to post their version of thearticle (e.g. in Word or Tex form) to their personal website orinstitutional repository. Authors requiring further information
regarding Elsevier’s archiving and manuscript policies areencouraged to visit:
http://www.elsevier.com/copyright

Author's personal copy
Influence of chemical interesterification on thermal behavior, microstructure,polymorphism and crystallization properties of canola oil and fullyhydrogenated cottonseed oil blends
Ana Paula Badan Ribeiro a,*, Rodrigo Corrêa Basso a, Renato Grimaldi a, Luiz Antonio Gioielli b,Adenilson Oliveira dos Santos c, Lisandro Pavie Cardoso d, Lireny A. Guaraldo Gonçalves a
a Food Technology Department, Faculty of Food Engineering, University of Campinas – UNICAMP, C.P. 6091, 13083-970 Campinas, SP, Brazilb Department of Biochemical and Pharmaceutical Technology, Faculty of Pharmaceutical Sciences, University of São Paulo – USP, 05508-900 São Paulo, SP, Brazilc Social Sciences, Health and Technology Center, University of Maranhão – UFMA, 65900-410 Imperatriz, MA, Brazild Institute of Physics Gleb Wataghin, University of Campinas – UNICAMP, C.P. 6165, 13083-970 Campinas, SP, Brazil
a r t i c l e i n f o
Article history:Received 27 February 2009Accepted 22 May 2009
Keywords:Chemical interesterificationCanola oilFully hydrogenated cottonseed oilThermal behaviorMicrostructureCrystallization kineticsPolymorphism
a b s t r a c t
This work evaluated chemical interesterification of canola oil (CaO) and fully hydrogenated cottonseed oil(FHCSO) blends, with 20%, 25%, 30%, 35% and 40% (w/w) FHCSO content. Interesterification producedreduction of trisaturated and increase in monounsaturated and diunsaturated triacylglycerols contents,which caused important changes in temperatures and enthalpies associated with the crystallizationand melting thermograms. It was verified reduction in medium crystal diameter in all blends, in additioncrystal morphology modification. Crystallization kinetics revealed that crystal formation induction periodand maximum solid fat content were altered according to FHCSO content in original blends and as aresult of random rearrangement. Changes in Avrami constant (k) and exponent (n) indicated, respec-tively, that interesterification decreased crystallization rates and altered crystalline morphology. How-ever, X-ray diffraction analyses showed randomization did not change the original crystallinepolymorphism. The original and interesterified blends had significant predominance of b0 polymorph,which is interesting for several food applications.
� 2009 Elsevier Ltd. All rights reserved.
1. Introduction
Most natural oil and fat present limited application in their unal-tered forms, which is imposed by their particular composition infatty acids and triacylglycerols. Due to the increasing concern aboutthe nutritional impact of trans fatty acids on health, interesterifica-tion has become the main method for the preparation of plastic fatswith low trans isomer contents, or even with the absence of thesecompounds, given that it allows the modification of oil and fatbehaviors, rendering important contributions for the increase andoptimization of their use in food products (Haummann, 1994).
Particularly, the interesterification of fully hydrogenated vegeta-ble oil (hardfats) and liquid oil blends currently represents the mostversatile option for the production of low trans fats for severalindustrial purposes (Ribeiro, Moura, Grimaldi, & Gonçalves, 2007).Systems that are composed of raw materials with well varied com-positions provide good heterogeneity with regard to the triacylclyc-erol species and, consequently, can produce interesterified fats withsubstantially modified physical–chemical properties (Humphrey,
Moquin, & Narine, 2003). In view of its nutritional qualities, canolaoil (CaO) stands as interesting raw material for the making of fatfractions that are exempt of trans fatty acids. Fully hydrogenatedcottonseed oil (FHCSO) shows desirable properties for the produc-tion of interesterified fat bases, for it is characterized by its consid-erable palmitic acid content (20–25%), known as the promoter ofpolymorphic form b0, which contributes for the attainment of betterconsistency, plasticity and aeration characteristics (D’Souza, De-man, & Deman, 1992; Zeitoun, Neff, List, & Mounts, 1993).
The major structural component of plastic fats is their crystalnetwork. Crystal properties such as size, morphology, and poly-morphic form influence this structure, which, on its turn, affectstexture behavior, appearance, and functionality of fats (Rousseau,Marangoni, & Jeffrey, 1998). Crystallization process is the sponta-neous system ordering, which is characterized by total or partialmovement restriction caused by the chemical or physical bondsamong triacylglycerol molecules. Differences in crystal shapes re-sult in different molecular packing (Kawamura, 1979). A crystal,therefore, consist of molecules arranged in a fixed pattern knownas reticulate. Its high degree of molecular complexity permits thatthe same triacylglycerol group packs into many different andrelatively stable structures. Lipid composition and crystallization
0963-9969/$ - see front matter � 2009 Elsevier Ltd. All rights reserved.doi:10.1016/j.foodres.2009.05.016
* Corresponding author. Tel./fax: +55 19 32891186.E-mail address: [email protected] (A.P.B. Ribeiro).
Food Research International 42 (2009) 1153–1162
Contents lists available at ScienceDirect
Food Research International
journal homepage: www.elsevier .com/ locate / foodres

Author's personal copy
conditions influence the crystal habit – different polymorphicforms and crystal morphologies are possible. Crystals aggregateinto larger structures, creating a network that characterizes themicrostructural level of a given fat (Marangoni & Hartel, 1998).The characteristic polymorph type of a fat or fat base is dependenton the distribution of fatty acids in the triacylglycerol molecules,being the degree of randomization particularly important. Themicrostructure concept, on its turn, encompasses information onthe state, quantity, shape, size, spatial relation, and interactionamong all components of a crystal network and presents an enor-mous influence on the macroscopic properties of fats (Shi, Liang, &Hartel, 2005). Chemical interesterification alters the triacylglycerolcomposition, causing modifications in the crystal morphology offats and promoting changes of types and/or polymorph contentsof a natural fat (Marangoni, 2005). Hence, the chemical interesteri-fication process consist in an important means for the stabilizationof form b0, given that it can promote, according to the raw materialcomposition characteristics, the formation of triacylglycerols withmore varied network sizes. This results in a more disordered pack-ing of terminal methyl groups, which is associated to the formationof crystal lattices of lower density. Yet, interesterification promotessignificant alterations in the microstructure of fats, given that itmodifies the crystal lattice’s morphology and density. In general,the formation of smaller spherulites and/or the modification inthe crystal’s halo-nucleus ration take place, affecting the textureand functionality properties of interesterified bases (Rousseauet al., 1998; Tang, & Marangoni, 2006).
By monitoring the formation of crystalline solid material in keep-ing with time, it is possible to verify the nature of crystallization.Crystallization kinetics profoundly influences the final structure offats and is intrinsically related to their rheologic and plasticity prop-erties. The study of crystallization kinetics of interesterified fat basesbecomes, therefore, of significant importance so that their use maybe adjusted to industrial process limitations and the control overprocessing steps which include fat fraction recrystallization is im-proved, ensuring final product quality (Foubert, Dewettinck, Jans-sen, & Vanrolleghem, 2006; Wassel & Young, 2007). Additionally,when the triacylglycerol composition of a given oil or fat is subjectto change by interesterification, conjoined alterations in the thermalprofiles are visualized. The melting and crystallization thermogramsare very useful tools to verify the alterations caused by randomiza-tion, being the various thermal phenomena verified by the monitor-ing of changes in enthalpy and phase transitions of the varioustriacylglycerol blends (Che Man, Shamsi, Yusoff, & Jinap, 2003;Marikkar, Ghazali, Che Man, & Lai, 2003).
In recent years, several studies on crystallization process mod-ification as a result of interesterification have been carried out,originating many processing patents of oily bases to be used inmargarines and shortenings (Omar, Let, Seng, & Rashid, 2005).
The objective of this work was to evaluate the effect of chemicalinteresterification on the thermal behavior and crystallizationproperties of binary CaO:FHCSO blends, aiming at the study ofinteresterified bases for food product application. The modifica-tions resulting from randomization were evaluated by triacylglyc-erol composition, differential scanning calorimetry, crystallizationisotherms, polarized light microscopy, and X-ray diffraction.
2. Material and methods
2.1. Raw materials
Refined canola oil (CaO), acquired at the local market, and fullyhydrogenated cottonseed oil (FHCSO), kindly provided by a regio-nal industry, were used. The catalyst consisted of 99% sodiummethoxide powder (Sigma–Aldrich).
2.2. Blends
Blends were prepared in the proportions of 80:20, 75:25, 70:30,65:35, and 60:40 of CaO:FHCSO (w/w), melted at 100 �C andhomogenized during 10 min at this temperature for the completemelting of crystals, prior to each interesterification reaction.
2.3. Chemical interesterification
For reactions, a borosilicate-glass jacketed reactor (500 mL) wasused, with bottom outlet and emery-polished conical joints, coupledto: recirculating thermostatized bath (Lauda RE 212,�30 to +200 �C,±0.02 �C), agitation system (universal motor with electronic speedvariator up to 4000 rpm – Marconi, BR) with axial-flow agitationshaft, vacuum pump (vacuubrand model 30, diaphragm pump),and digital skewer type thermometer (�50 to +300 �C, ±1 �C – Inco-term). Samples (200 g) were dried in the reactor, under vacuum andagitation of 500 rpm, at 100 �C, for 20 min. The catalyst content usedwas equal to 0.4% and reaction was conducted under vacuum, at100 �C, with agitation of 500 rpm, during 20 min, according to opti-mization performed by Grimaldi, Gonçalves, and Ando (2005). Reac-tion was finalized through the addition of distilled water and 5%citric acid solution, and interesterified samples were carefullywashed with distilled water (80 �C), for the removal of soaps, andsubsequently dried under vacuum, at 110 �C, during 30 min.
2.4. Triacylclycerol composition
The triacylglycerol composition analysis was performed in capil-lary gas chromatograph CGC Agilent 6850 Series GC System. A cap-illary column DB-17HT Agilent Catalog: 122–1811 (50%-Phenyl-methylpolysiloxane, with 15 m in length � 0.25 mm in internaldiameter, and 0.15 lm film) was used. Conditions were the follow-ing: split injection, ratio of 1:100; column temperature: 250 �C, pro-grammed up to 350 �C at the ratio of 5 �C/min.; carrier gas: helium,flow of 1.0 mL/min.; injector temperature: 360 �C; detector temper-ature: 375 �C; volume injected: 1.0 lL; sample concentration:100 mg/5 mL of tetrahydrofuran. The analysis were carried out induplicate and the identification of triacylglycerol groups was per-formed through the comparison of retention times, according toAntoniosi Filho, Mendes, and Lanças’s (1995) procedures.
2.5. Thermal analysis
Thermal analysis of samples was performed by differentialscanning calorimetry (DSC), according to the method AOCS Cj 1–94 (AOCS, 2004). The equipment used was a thermal analyzerDSC 7 (Perkin–Elmer) coupled to a Thermal Analysis ControllerCooler TAC 7/DX. The data processing system used was the PyrisSeries Thermal Analysis System software. The analysis conditionswere: sample weight �10 mg; crystallization curves: 80 �C for10 min, 80 �C to �40 �C (10 �C/min), �40 �C for 30 min; meltingcurves: �40 �C to 80 �C (5 �C/min). The following parameters forresult assessment were used: onset crystallization and meltingtemperatures (Toc and Tof), peak crystallization and melting tem-peratures (Tpc and Tpf), crystallization and melting enthalpies(DHc and DHf), and final crystallization and melting temperatures(Tfinal cryst and Tfinal fus) (Biliaderis, 1983). The thermal analysis wascarried out only once for each sample.
2.6. Polarized light microscopy
Samples were melted at the temperature of 70 �C in a stove and,with the aid of a capillary tube, a sample drop was placed on a glassslide preheated at controlled temperature (70 �C) and covered witha cover glass. Glass slides were prepared in duplicates for each
1154 A.P.B. Ribeiro et al. / Food Research International 42 (2009) 1153–1162

Author's personal copy
sample. Samples were kept in the stove at the analysis temperature(25 �C) for 24 h. Crystal morphology was evaluated by means of thepolarized light microscope (Olympus, model BX 50) coupled to thedigital video camera (Media Cybernetics). Glass sliders were placedon a hot plate (Mettler Toledo, FP82 Microscope Hot Stage), kept atthe same crystallization temperature. Images were captured by theImage Pro-Plus version 4.5.1.22 (Media Cybernetics) software,using polarized light and amplified up to 40 times. For each glassslider, three visual fields were focused, of which only one was cho-sen to represent the observed crystals. The evaluation parametersselected for quantitative image analysis were the mean diameterof crystals and the range between the mean diameter variations(Gamboa & Gioielli, 2006). To obtain these parameters, 180 crystalswere measured for the original blends. For interesterified blends,the totality of crystals was considered in calculations.
2.7. Crystallization isotherms
Samples were melted (100 �C/15 min) and kept in high preci-sion dry bath (TCON 2000 – Duratech, USA) at 70 �C for completedestruction of its crystal history (Campos, 2005). The solid fat con-tent increase in keeping with crystallization time was monitoredby the Nuclear Magnetic Resonance Spectrometer (NMR) Brukerpc120 Minispec. Each sample tube was placed in the sample holderin the NMR equipment, with reading compartment stabilized at15 �C and 25 �C. The analyses were performed in duplicated foreach temperature. Data acquisition was automatic, with measuresbeing taken at every minute, during 60 min. Characterization ofcrystallization kinetics was performed in accordance with theinduction period (sSFC) – referent to the beginning of crystal forma-tion – and the maximum solid content (SFCmax). Induction time isgraphically attained and reflects the time needed for a stable nu-cleus of critical size to be formed in liquid phase (Himavan, Starov,& Stapley, 2006; Metin & Hartel, 2005). The original Avrami equa-tion, which consists in the most used model for the isothermalphase transformation kinetics description, was used for crystalliza-tion study at 25 �C (Narine, Humphrey, & Bouzidi, 2006; Toro-Vazquez, Dibildox-Alvarado, Charó-Alonso, Charó-Alonso, &Gómez-Aldapa, 2002):
CGSðtÞCGSð1Þ ¼ 1� e�ktn
where CGS(t) describes solid fat content (%) as time function,CGS(1) is the solid fat content limit when time tends to infinite, kis the Avrami constant (min�n), which takes into account both crys-tal nucleation and growth rate, and n is the Avrami exponent, whichindicates crystal growth mechanism (McGauley & Marangoni, 2002;Wright, Hartel, Narine, & Marangoni, 2000). The equation was line-arized and applied to the results attained during the first 20 min ofcrystallization in order to determine the k and n values.
2.8. X-ray diffraction
The samples fat crystals’ polymorphic form was determinedaccording to the method AOCS Cj 2-95 (AOCS, 2004). Analyses werecarried out in a diffractometer Philips (PW 1710), using Bragg–Bretano (h:2h) geometry with radiation of Cu-Ka (k = 1.54056 Å,tension of 40 kV and 30 mA). Measures were attained with 0.02�in 2h steps and acquisition time of 2 s, with scans of 5–40� (2hscale). The samples were melted in a microwave oven at approxi-mately 80 �C and stabilized at 20 �C for 7 days. Analyses were car-ried out at 20 �C. Polymorphic form identification was performedwith basis on the characteristic short spacings of crystals. Form apresents a single diffraction line at 4.15 Å. Form b0 is characterizedby two strong diffraction lines at 3.8 Å and 4.2 Å, whereas form b is
associated to a series of diffraction lines, with a prominent line at4.6 Å and lines of lesser intensity at 3.7 Å and 3.8 Å (AOCS, 2004;Rousseau & Marangoni, 2002). The crystal contents of types band b0, in the samples, were calculated from normalized areas bysum of peak areas. The areas were calculated by removing thebackground. The b form was calculated from the area of the shortspacings at 4.6 Å and the b0 was calculated from the areas of theshort spacings at 3.8 Å and 4.2 Å, using the equation:
%b ¼ ðAb � 100Þ=ðAb þ Ab0 Þ; %b0 ¼ ðAb0 � 100Þ=ðAb þ Ab0 Þ
where Ab and Ab0 were the peak areas of b and b0 polymorphs,respectively (Reshma, Saritha, Balachandran, & Arumughan, 2008;Yap, Deman, & Deman, 1989).
3. Results and discussion
3.1. Triacylclycerol composition
From a technological point of view, the triacylglycerol profile isthe key for the understanding of several physical properties of a gi-ven oil or fat (Buchgraber, Ulberth, Emons, & Anklan, 2004). Thechemical interesterification reactions result in complete fatty acidrandomization among all triacylglycerols present, according to thelaws of probability (Rousseau & Marangoni, 2002). Fig. 1 shows thetriacylglycerol compositions of blends before and after interesteri-fication, according to the triacylglycerol contents of types S3
(trisaturated), S2U (disaturated–monounsaturated), SU2 (monosat-urated–diunsaturated), and U3 (triunsaturated).
The addition of FHCSO to CaO promoted the increase of triacyl-glycerol S3 percentages and the concomitant decrease of other tri-acylglycerol classes. Original blends with 20% and 25% of hardfatpresented low contents of triacylglycerols S2U, which were not de-tected for the other blends. For the totality of blends, randomiza-tion caused a decrease in the contents of triacylglycerols of typesS3 and U3, with an increase in the percentages of the triacylglycerolclasses S2U and U2S, whose sum accounted for 58.82%, 60.49%,57.55%, 54.65% and 46.78% of the whole triacylglycerol composi-tion for the 80:20, 75:25, 70:30, 65:35 and 60:40 blends,respectively. For all blends, a significant predominance of triacyl-glycerols U3 was verified, before reaction. After random rearrange-ment, triacylglycerols U2S presented the highest concentrationamong the triacylglycerol classes. List, Mounts, Orthoefer, and Neff(1995) evaluated the interesterification of 80:20 CaO:FHCSO blend,with a view to producing margarines and shortenings. S3, S2U, SU2
and U3 contents before the reaction were 20.8%, 1.4%, 19.9% and57.6%, respectively. After randomization, the percentages of thesetriacylglycerol classes were, respectively, 4.1%, 11.9%, 46.0% and36.2%, very close to those found in this study.
Fig. 1. Triacylglycerol classes (TAG) (%) of CaO:FHCSO blends, before and afterinteresterification. I: interesterified blend. Triacylglycerols: S3 (trisaturated), S2U(disaturated–monounsaturated), SU2 (monosaturated-diunsaturated) and U3 (tri-unsaturated). Mean between sample injection duplicates.
A.P.B. Ribeiro et al. / Food Research International 42 (2009) 1153–1162 1155

Author's personal copy
According to Rodrigues, Gioielli, and Anton (2003), the proper-ties of fatty foods can be related to the triacylglycerol compositionof that fat which composes them. Triacylglycerols S2U, with melt-ing points between 27 �C and 42 �C, are mainly responsible for thestructure of products, whereas triacylglycerols U2S are importantwith regard to their sensorial and functionality properties at ambi-ent temperature. Hence, the increase of the S2U and U2S contents ofCaO:FHCSO blends, promoted by chemical interesterification, isassociated to the increase of technological functionality, thebetterment of sensorial characteristics, and, therefore, to a greaterpotential of these interesterified bases for food application (Wie-dermann, 1978).
3.2. Thermal behavior
Differential Scanning Calorimetry (DSC) is the most used ther-moanalytical technique for the study of oils and fats. The numerousthermal phenomena related to these raw materials are verified bymonitoring the enthalpy and phase transition changes of the vari-ous triacylglycerol blends (Che Man et al., 2003). Evaluation by DSCprovides direct measures on the energy involved in the meltingand crystallization processes of oils and fats. Oil crystallization re-sults in volume contraction, which is associated to an exothermiceffect. Fat melting, on the other hand, contributes for volumeexpansion, characterizing an endothermic effect. In general, oilsand fats may show an extremely complex thermal behavior, whichwill be highly dependent on the chemical composition and on theprotocol for the DSC experiment (Tan & Che Man, 2002). Table 1shows the parameters regarding the crystallization thermogramsfor the blends, before and after randomization.
The crystallization curve subdivision of a given oil or fat, in dif-ferent exothermic regions, corresponds to different types of triacyl-glycerols (Tan & Che Man, 2002). Original blends presented a singlepeak in the crystallization thermogram related to the FHCSO trisat-urated fraction, with high-melting-point triacylglycerols, mainlyrepresented by the species PStP, PStSt, and StStSt (Deman, Deman,& Blackman, 1989). The Toc, Tpc1 and Tfinal cryst values are functionsof the FHCSO concentration increase in the blends, proving that thecrystallization process was accelerated by the increase in the tria-cylglycerols S3 content of samples. The onset crystallization tem-perature (Toc) represents the beginning of the transition phase,that is, the temperature at which the first crystals are formed(Aronhime, 1988). The addition of hardfat to liquid oil producedblends with crystallization onset between 36.75 �C and 42.21 �C.
Peak crystallization temperature, on the other hand, refers tothe temperature at which the biggest proportion of lipid speciescrystallizes with maximum thermal effect (Campos, 2005). Origi-nal blends presented Tpc1 values between 31.04 �C and 37.13 �C.At the beginning of a blend’s crystallization process, the compo-nents coming from hardfats crystallize immediately. Therefore,the higher the hardfat concentration in the blends, the higher the
contents of high-melting-point components to be crystallized willbe. Consequently, the increase in the number of molecules withsimultaneous crystallization leads to a larger energy release bythe system (Campos, 2005; Humphrey & Narine, 2004). The crys-tallization enthalpy values of original blends were between33.59 J/g and 78.32 J/g.
Interesterification caused the appearance of a second peak in thecrystallization thermograms, which is characteristic of the expres-sive increase in the middle-melting-point triacylglycerols (S2Uand SU2) contents, as a result of the randomization process. Inter-esterified blends showed increasing Toc, Tpc1, Tpc2, and Tfinal cryst val-ues according to the gradual increase in the triacylglycerol S3
content (Fig. 1). There was onset (Toc) and final (Tfinal cryst) crystalli-zation temperature decrease, allowing interesterified blends tocrystallize at temperatures lower than those of their original blends(between 32.97 �C and 40.82 �C). Tpc2 presented values between0.15 �C and 10.63 �C, especially increasing as the function of the tri-acylglycerol S2U content in interesterified blends, which indicatesthat the crystallization intensity of this group of compounds di-rectly relates to its proportion in the blends.
According to Campos (2005), crystallization enthalpy value isstrongly related to the intermolecular arrangement of triacylglyc-erol species and, therefore, usually modified by randomization.DHc1 values decreased as a consequence of randomization, result-ing from the lower triacylglycerol S3 content in the blends whichsuffered random rearrangement. The enthalpy decrease valuesregarding the second peak verified in the thermograms (DHc2) pre-sented concordance with the triacylglycerol composition results,given that they showed a relation with the triacylglycerols S2Ucontents, a predominant class in the randomized blends.
Fig. 2 shows the differences between the Toc and Tpc1, (DTo–p)values for the original and interesterified blends. This parameteris proportional to crystal growth rate (Marangoni & Rousseau,1998). The DTo–p values of original blends are higher than thoseof interesterified blends. According to Rousseau and Marangoni(2002), this effect may be due to the randomization of saturatedfatty acids among all triacylglycerol species present, potentiallyleading to concomitant increase in nucleation and decrease in crys-talline growth rates. In terms of crystal packing, the random rear-rangement of fatty acids in the triacylglycerols would destroy anystructural complementarity among triacylglycerol molecules, dis-favoring crystal growth. Hence, the interesterification of CaO:FHC-SO blends results in a less kinetically and/or thermodynamicallyfavorable crystal growth (Rousseau & Marangoni, 2002).
Table 2 shows the parameters regarding the melting thermo-grams for the blends, before and after randomization. The meltingthermograms of original blends were characterized by two peakspertaining to the unsaturated fraction of CaO (Tpf1), with low-melt-ing-point triacylglycerols, and the trisaturated fraction corre-sponding to FHCSO (Tpf2), which were situated in the intervalsfrom �15.07 �C to �14.98 �C and from 54.27 �C to 58.22 �C, respec-
Table 1Onset crystallization temperature (Toc), peak crystallization temperature (Tpc), crystallization enthalpy (DHc), and final crystallization temperature (Tfinal cryst) of original andinteresterified blends. I: interesterified blend.
CaO:FHCSO Toc (�C) Tpc1 (�C) Tpc2 (�C) DHc1 (J/g) DHc2 (J/g) Tfinal cryst (�C)
80:20 36.75 31.04 – 33.59 – 13.6480:20-I 32.97 28.80 0.15 13.30 6.23 �9.9375:25 37.59 32.47 – 42.17 – 14.5575:25-I 33.62 31.27 3.30 18.30 6.83 �5.8670:30 38.45 33.97 – 52.94 – 15.5270:30-I 34.28 31.77 4.97 20.27 7.49 �3.9765:35 40.34 35.80 – 68.01 – 16.5565:35-I 37.41 33.97 6.63 22.45 8.20 �2.6960:40 42.21 37.13 – 78.32 – 18.4560:40-I 40.82 36.09 10.63 24.87 13.90 �1.82
1156 A.P.B. Ribeiro et al. / Food Research International 42 (2009) 1153–1162

Author's personal copy
tively. Onset melting temperature (Tof) presented small variation inkeeping with the FHCSO content of original blends, whereas theTpf1, Tpf2, and Tfinal cryst values increased according to FHCSO addi-tion in the blends, as a result of the percentage decrease of triacyl-glycerol species coming from CaO and the increment of high-melting-point triacylglycerols that are characteristic of FHCSO.This effect is also associated to the decrease and increase, respec-tively, of DHf1 and DHf2, upon the addition of FHCSO to CaO.According to Humphrey and Narine (2004), when hardfat contentof a given sample increases, high-melting-point components pro-portionally increase.
After randomization, an increase in the values of Tof and Tpf1was verified, which is related to the significant increase in the con-tents of middle-melting-point triacylglycerols (S2U and SU2). Yet,the DHf values significantly increased after reaction, indicatingan increase in the participation of these triacylglycerol species inthe interesterified blends. In parallel, interesterification promotedthe reduction of Tpf2, Tfinal fus, and DHf2 values as a result of the tri-acylglycerol S3 percentage decrease in the blends.
However, among original and interesterified blends, it was ob-served that the variations in peak melting temperatures werelow and not directly proportional to the triacylglycerol S3 increase.For the original blends, variation was between 0.08 �C and 1.4 �C,whereas for the interesterified blends a variation between 0.1 �Cand 3.7 �C was verified. Similar effect was verified by Humphreyand Narine (2004), who evaluated the melting thermograms of24 shortenings containing different fully hydrogenated oils, dilutedin soybean oil, in 5% increments. For the same hardfat type, themaximum peak temperature variation was small, not exceeding5 �C. According to the authors, the hardfat choice, and not its con-centration, is the determining factor for the attainment of blendswith differentiated melting properties.
3.3. Microstructure
According to Narine and Marangoni (2005), the microstructurallevel, or mesoscale, of a fat’s crystal network can be defined as the
group of structures with dimensions ranging from 0.5 lm to200 lm. The levels of a structure in a typical network are definedwhen the fat crystallizes from its completely melted state. Itsquantification is mainly attained through the visualization of itsgeometry. Polarized light microscopy (PLM) is the most used tech-nique for the visualization of fat microstructural network and ithas been applied with the intent of explaining the texture differ-ences of fat blends and showing morphological alterations in crys-tal growth (Gioielli, Simões, & Rodrigues, 2003).
Fig. 3 shows the crystal structure of CaO:FHCSO blends, beforeand after interesterification by slow crystallization at 25 �C. Crystalmean diameter values of blends and the range of crystalline distri-bution, before and after randomization, are shown in Table 3. Thehigh standard deviation values with relation to crystal mean diam-eter, that is, the high variation coefficients, are characteristic ofcrystallized fats when observed in PLM (Rousseau, Hill, & Marang-oni, 1996; Silva, Escobedo, & Gioielli, 2008).
Original blends presented crystals with mean diameters be-tween 79.95 lm and 92.77 lm, in the form of spherulites. Espe-cially in the 60:40 blend, spherulites were preponderantlyobserved in the form of agglomerates. Narine and Humphrey(2004) reported that the mean diameter of the spherulites ob-served for the CaO:FHCSO 75:25 blend, statically crystallized at20 �C, was approximately 100 lm, that is, close to that verified inthis study. According to Shi et al. (2005), the highest-melting-pointtriacylglycerol species of a blend dominates crystal morphology.FHCSO presents PStSt (�43%) and StStSt (�40%) as the predomi-nant triacylglycerols, with melting points equal to 61 �C and65 �C, respectively. The presence of large spherulites can be attrib-uted, therefore, to the significant triestearine content in the blends,which gives that undesirable sandy texture to fat (Deman et al.,1989; Rousseau et al., 1998). Concordantly with these observa-tions, crystal diameter decreased as CaO concentration increasedin the blends, although crystal morphology was not altered bythe dilution effect. Rousseau et al. (1998) also observed this behav-ior upon the liquid-oil proportion increase in palm oil/soybean oiland lard/canola oil blends. For original blends with FHCSO contentsbetween 20% and 35%, the minimum and maximum mean diame-ters of crystals were very similar. The minimum mean diametersshowed values from 61 lm to 68 lm, whereas the maximum meandiameters presented values between 96 lm and 109 lm. The60:40 original blend exhibits crystalline distribution characterizedby larger crystals, which mean diameters were from 73 lm to121 lm.
After randomization, complete modification of crystal morphol-ogy took place for the totality of blends. Disc-shaped crystals, withgranular distribution, were observed (Campos, 2005). Additionally,random rearrangement promoted significant crystal diameter de-crease for all blends. Notwithstanding, the mean diameter of crys-tals increased in keeping with the triacylglycerol S3 content inrandomized blends (as shown in Fig. 1), presenting dimensions be-
Table 2Melting onset temperature (Tof), melting peak temperatures (Tpf), melting enthalpies (DHf) and melting final temperature (Tfinal fus) of the original and interesterified blends. I:interesterified blend.
CaO:FHCSO Tof (�C) Tpf1 (�C) Tpf2 (�C) DHf1 (J/g) DHf2 (J/g) Tfinal (�C)
80:20 �19.00 �15.07 54.27 17.13 33.79 57.8780:20-I �18.72 �14.48 45.77 28.11 23.13 50.9475:25 �19.03 �14.82 55.52 15.70 44.54 58.7375:25-I �17.33 �12.40 47.76 29.80 39.50 53.0970:30 �19.09 �14.90 56.35 14.66 55.75 59.6070:30-I �16.21 �11.48 51.45 31.79 45.99 54.7065:35 �18.32 �14.65 57.76 9.22 65.07 61.1465:35-I �15.56 �12.32 51.35 33.91 53.83 53.8960:40 �18.57 �14.98 58.22 4.24 82.00 61.3160:40-I �14.97 �10.90 53.12 36.17 65.22 56.36
Fig. 2. Differences between onset (Toc) and peak (Tpc1) crystallization temperaturesof original and interesterified blends.
A.P.B. Ribeiro et al. / Food Research International 42 (2009) 1153–1162 1157

Author's personal copy
tween 6.13 lm and 15.60 lm. Interesterified blends with 20% and25% FHCSO contents showed similar crystalline distributions, withcrystals in range of 2–14 lm. For the 70:30, 65:35 and 60:40 inter-
esterified blends, the minimum mean diameter of crystals was alsoclose to 2 lm, but the maximum mean diameter of crystals wasconsiderably high, presenting values between 30 lm and 41 lm.
Fig. 3. Images of the crystallization of CaO:FHCSO blends, before and after chemical interesterification. A: 80:20, B: 80:20-I*, C: 75:25, D: 75:25-I, E: 70:30, F: 70:30-I, G:65:35, H: 65:35-I, I: 60:40, J: 60:40-I. The bar represents 200 lm. I�: interesterified blend.
Table 3Mean crystal diameter and minimum/maximum mean crystal diameter of CaO:FHCSO blends, before and after interesterification.
CaO:FHCSO Before interesterification After interesterification
Medium crystaldiameter (lm)
Range–medium crystaldiameter variations (lm)
Medium crystaldiameter (lm)
Range–medium crystaldiameter variations (lm)
80:20 79.95 ± 7.84 61.13–103.33 6.13 ± 2.81 2.21–13.4675:25 79.93 ± 7.36 62.28–100.01 7.92 ± 4.10 2.04–13.7170:30 80.85 ± 8.94 68.11–96.43 10.72 ± 5.86 2.52–30.2065:35 80.58 ± 9.63 65.63–109.24 11.80 ± 5.59 2.09–39.0660:40 92.77 ± 10.76 73.19–121.63 15.60 ± 7.04 2.19–41.19
1158 A.P.B. Ribeiro et al. / Food Research International 42 (2009) 1153–1162

Author's personal copy
According to Herrera, Falabella, Melgarejo, and Anón (1998), theapplication of fat in food products demands that the mean diame-ter of crystals be inferior to 30 lm in order to prevent that sandysensation in the mouth. For all blends evaluated, interesterificationwas effective at attaining fat bases which are compatible with foodapplication. Fig. 3 also shows that randomization promoted anexpressive increase in the number of crystals in the blends as well.The crystal dispersion of fats with a large number of small crystalscan provide desirable properties such as good spreadability. Be-sides, they are suitable for bakery products, because crystals ofsmall dimensions can enclose and stabilize air bubbles duringthe cream-formation stage, providing these products with a softand aerated texture (Kloek, Walstra, & van Vliet, 2000; Lee, Akoh,Himmesbach, & Lee, 2008).
According to Rousseau et al. (1998), alterations in the micro-structure of fats, caused by interesterification, result from modifi-cations in the morphology and density of the crystalline networkand affect the texture and functionality properties of interesterifiedbases. The triacylglycerol composition alteration caused by ran-domization modifies the relative strength of bonds among crystalelements in an aggregate (intraparticle) and among aggregates(interparticle), generating the formation of differentiated struc-tures (Shi et al., 2005). Moreover, the change in solid fat contentinherent to the interesterification process influences crystal net-work structuring. When solid content decreases, as verified in thisstudy, changes regarding the larger area and a greater molecularmobility for crystal formation take place (Himavan et al., 2006).
3.4. Crystallization kinetics
Crystallization kinetics deeply influences the final structure offats and is intrinsically related to their rheologic and plasticityproperties. The crystallization kinetics study of interesterified fatsis of significant importance so that fat can be adjusted to industrialprocess limitations and the control over processing steps which in-clude fat fraction recrystallization is improved, ensuring final prod-uct quality (Wassel & Young, 2007).
Fig. 4 shows crystallization isotherms attained at 15 �C and25 �C for original and interesterified blends. Crystallization of the80:20 interesterified blend, at 25 �C, did not occur, as a result ofits low solid fat content. Table 4 presents the induction period(sSFC) and maximum solid fat content (SFCmax) values for the origi-nal and interesterified blends. These parameters are to be consid-ered when outlining the application of interesterified fats. Insome specific industrial processes, fats must be completely crystal-lized until the end of the production line in order to ensure thatcrystal equilibrium is reached. Otherwise, the standardized pro-cessing times must be altered in accordance with the characteris-tics of the fat in use. This fact became particularly important asinteresterified fats started to replace partially hydrogenated fatsin most industrial applications (Herrera, Gatti, & Hartel, 1999).
The addition of FHCSO to CaO promoted proportional increasesin the SFCmax value. Original blends presented maximum SFCmax
between 19.77% and 39.31% at 15 �C and between 18.48% and37.81% at 25 �C. For all evaluated blends, the SFCmax values showedsmall decline with the increase of crystallization temperature.According to Rousseau et al. (1998), the increase of crystallizationtemperature promotes an effect related to formation of weaker fatcrystal networks, which reflect directly in the solid fat content. Theincrease of the temperature of isothermal crystallization was alsoassociated to decrease in sSFC for most original and interesterifiedblends. The 60:40 original blend, however, kept its induction per-iod characteristics. Additionally, the examination of Fig. 4 makesperceptible that at 25 �C all evaluated blends displayed longertimes to attain complete crystallization equilibrium when com-pared to blends crystallized at 15 �C.
Interesterification caused a SFCmax decrease of all blends, an ef-fect which is associated to the decrease of triacylglycerols S3 andsimultaneous increase in the percentages of triacylglycerols S2Uand SU2 (Rousseau & Marangoni, 2002). The reduction of SFCmax
caused by randomization corresponded to 66.10%, 63.48%, 37.48%and 38.24% for the 75:25, 70:30, 65:35 and 60:40 blends at25 �C, respectively. The sSFC of original blends was also modifiedby random rearrangement, especially in relation to the blends withsmaller percentages of FHCSO. Nevertheless, for blends with 35%and 40% of hardfat, this alteration was little significant. At 25 �C,original blends presented sSFC between 2 min and 4 min, whereasfor the interesterified blends, values between 4 min and 9 minwere observed.
The alteration in the induction or nucleation period of crystalli-zation primely results from the change in solid fat content that is
Fig. 4. Crystallization isotherms at 15 �C (a) and 25 �C (b) for original andinteresterified blends (I).
Table 4Induction period (sSFC), maximum solid fat content (SFCmax) for the CaO:FHCSOblends, at 15 and 25 �C, before and after interesterification. I: interesterified blend.
CaO:FHCSO 15 �C 25 �C
sSFC (min) SFCmax (%) sSFC (min) SFCmax (%)
80:20 3 19.77 ± 0.78 4 18.48 ± 2.5680:20-I 9 3.58 ± 0.76 – –75:25 2 24.87 ± 2.39 3 23.42 ± 1.3475:25-I 6 9.97 ± 0.66 9 7.94 ± 0.8570:30 2 29.29 ± 1.35 3 28.12 ± 2.5070:30-I 5 13.88 ± 2.91 6 10.27 ± 1.9665:35 2 34.22 ± 1.66 3 32.63 ± 1.5365:35-I 2 21.98 ± 1.17 4 20.40 ± 0.6160:40 2 39.31 ± 2.07 2 37.81 ± 1.9360:40-I 2 27.77 ± 2.44 4 23.35 ± 2.32
A.P.B. Ribeiro et al. / Food Research International 42 (2009) 1153–1162 1159

Author's personal copy
inherent to the interesterification process, which influences crystalnetwork formation and structuring (Himavan et al., 2006). More-over, the bigger the difference between crystallization temperatureand melting point of sample, the higher the supercooling degreeimposed on the system and, consequently, the smaller the sSFC val-ues will be. When supercooling degree is small, the incorporationof triacylglycerol molecules in the crystal structure occurs in themost suitable configuration and the stablest polymorph is formed,for there is enough time for the molecules to orient themselvesperfectly. At a high supercooling degree, however, the incorpora-tion of triacylglycerol molecules on the crystal surface is very fastand, therefore, imperfect, which can result in the formation ofmixed crystals and polymorphs that can persist indefinitely(McGauley & Marangoni, 2002; Metin & Hartel, 2005). Hence,although the percentage increase of middle-melting-point triacyl-glycerols (represented by species S2U and SU2, as shown in Fig. 1),caused by randomization, concurs for bigger sSFC values, intereste-rified blends with lower melting points are associated to greaterpolymorphic stability and homogeneity at the temperature of25 �C, which is of significant importance for food application (Mar-tini, Herrera, & Hartel, 2002; Wiedermann, 1978).
In the study of fats, the Avrami model describes an event inwhich there is an initial lag period, where crystallization occursslowly, and a subsequently rapid crystal mass increase. The Avramitheory considers that crystallization occurs both by nucleation andcrystal growth, and assumes that transformation conditions areisothermic, that nucleation occurs spatially and arbitrarily, andthat growth kinetics is linear, in which the new phase’s growthvelocity depends solely on temperature, and not on time. TheAvrami parameters provide information on the nature of the crys-tallization process. Constant k is the crystallization velocity con-stant and is mainly dependent on crystallization temperature.The Avrami exponent, n, is the combined function of time depen-dency, on the part of nucleation, and the number of dimensionsin which growth takes place. Nucleation can be instantaneous,with nuclei appearing all at once at the beginning of the process,or sporadic, with the number of nuclei linearly increasing withtime. Growth takes place in the form of needles, discs or spheru-lites, in one, two or three dimensions, respectively (McGauley &Marangoni, 2002; Wright et al., 2000). Fig. 5 shows the Avramiparameters (for crystallization at 25 �C) which indicate velocity(k) and crystallization form (n), before and after interesterification.
Avrami constant (k) gradually decreased with the increase inthe proportion of CaO for the original and interesterified blends,indicating that crystallization velocity was lower in keeping withthe dilution effect of FHCSO with liquid oil as well as the triacyl-glycerol U3 content increase and triacylglycerol S3 content de-crease. Interesterification promoted the crystallization rate dropof blends, which is related to the decrease in the percentages of
triacylglycerols S3, characterized by instantaneous crystallization(Marangoni, 2005). These results corroborate those previously dis-cussed, with relation to parameter DTo�p (Fig. 2), which evidencethat randomized blends show crystal growth thermodynamicallyless favorable than that of original blends.
n values equal to 3 correspond to spherulitic growth frominstantaneous nuclei or disc-shaped growth from sporadic nuclei,whereas n values equal to 2 denote needle-shaped growth fromsporadic nuclei or disc-shaped growth from instantaneous nuclei.Although n should correspond to an integer, fractional values areusually attained (Marangoni, 2005; McGauley & Marangoni, 2002).
As shown in Fig. 5, original blends showed n values very close to3. In parallel, the observation of the crystal structure of theseblends (Fig. 3) attest that crystals are shown as spherulites. Thus,it is concluded that the crystallization of the original blends ischaracterized by spherulitic growth from instantaneous nuclei.Interesterified blends showed n values very close to 2. Additionally,they were properly characterized by disc-shaped crystals, accord-ing to Fig. 3. Therefore, the conjoint result analysis leads to the con-clusion that randomized blends also present crystal growth frominstantaneous nuclei. In summary, results show that chemicalinteresterification only modified the crystal morphology ofCaO:FHCSO blends, but caused no alterations as to the nucleationmechanism.
3.5. Polymorphism
X-ray diffraction has been frequently used as a chemical inter-esterification evaluation technique, helping in the application out-lining of fat bases produced (Omar et al., 2005). A fundamentalaspect in fat processing techniques is the crystallization tendencyof fats. Generally, triacylglycerols first crystallize in polymorphicforms a and b0, although form b is the most stable. Transformationvelocity is dependent on the homogeneity degree of triacylglyce-rols. Fats with low variability of triacylglycerols rapidly transforminto the stable form b. Fats that consist in random distribution oftriacylglycerols can present the form b0 indefinitely (Sato, 2001).However, since fats are complex triacylglycerol blends, differentpolymorphic forms and liquid oil can simultaneously coexist atcertain temperature (Chong, Kamarudin, Lesieur, Marangoni,Bourgaux, & Ollivon, 2007).
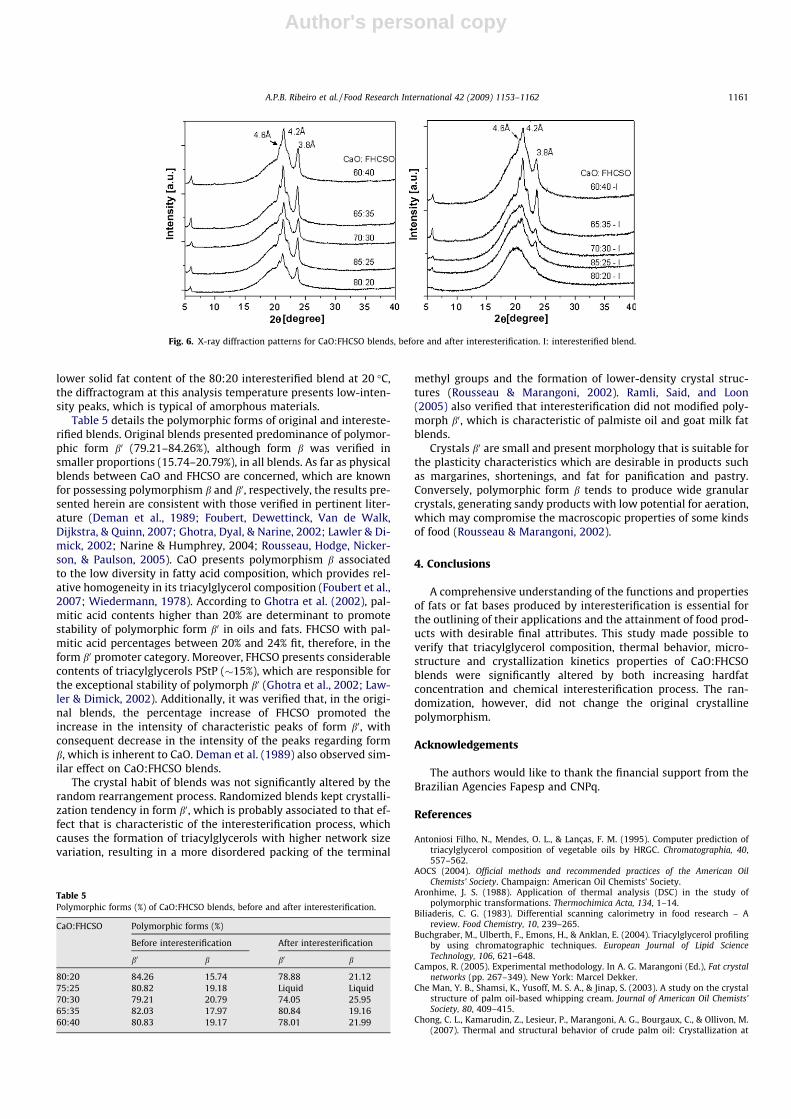
Diffractograms of blends, before and after chemical interesteri-fication, attained at 20 �C, are shown in Fig. 6. Diffraction patternsof natural or interesterified fats presented larger peaks than thoseof pure compounds, due to the presence of multiple triacylglyce-rols in the cellular units and the concomitant presence of liquidoil (Rousseau et al., 1998). For original and interesterified blends,peaks at 4.6 Å, and at 4.2 Å and 3.8 Å were verified, which is char-acteristic of polymorphic forms b and b0, respectively. Due to the
Fig. 5. Avrami constants (k) and exponents (n) of CaO:FHCSO blends, before and after interesterification, isothermally crystallized at 25 �C.
1160 A.P.B. Ribeiro et al. / Food Research International 42 (2009) 1153–1162
Author's personal copy
lower solid fat content of the 80:20 interesterified blend at 20 �C,the diffractogram at this analysis temperature presents low-inten-sity peaks, which is typical of amorphous materials.
Table 5 details the polymorphic forms of original and intereste-rified blends. Original blends presented predominance of polymor-phic form b0 (79.21–84.26%), although form b was verified insmaller proportions (15.74–20.79%), in all blends. As far as physicalblends between CaO and FHCSO are concerned, which are knownfor possessing polymorphism b and b0, respectively, the results pre-sented herein are consistent with those verified in pertinent liter-ature (Deman et al., 1989; Foubert, Dewettinck, Van de Walk,Dijkstra, & Quinn, 2007; Ghotra, Dyal, & Narine, 2002; Lawler & Di-mick, 2002; Narine & Humphrey, 2004; Rousseau, Hodge, Nicker-son, & Paulson, 2005). CaO presents polymorphism b associatedto the low diversity in fatty acid composition, which provides rel-ative homogeneity in its triacylglycerol composition (Foubert et al.,2007; Wiedermann, 1978). According to Ghotra et al. (2002), pal-mitic acid contents higher than 20% are determinant to promotestability of polymorphic form b0 in oils and fats. FHCSO with pal-mitic acid percentages between 20% and 24% fit, therefore, in theform b0 promoter category. Moreover, FHCSO presents considerablecontents of triacylglycerols PStP (�15%), which are responsible forthe exceptional stability of polymorph b0 (Ghotra et al., 2002; Law-ler & Dimick, 2002). Additionally, it was verified that, in the origi-nal blends, the percentage increase of FHCSO promoted theincrease in the intensity of characteristic peaks of form b0, withconsequent decrease in the intensity of the peaks regarding formb, which is inherent to CaO. Deman et al. (1989) also observed sim-ilar effect on CaO:FHCSO blends.
The crystal habit of blends was not significantly altered by therandom rearrangement process. Randomized blends kept crystalli-zation tendency in form b0, which is probably associated to that ef-fect that is characteristic of the interesterification process, whichcauses the formation of triacylglycerols with higher network sizevariation, resulting in a more disordered packing of the terminal
methyl groups and the formation of lower-density crystal struc-tures (Rousseau & Marangoni, 2002). Ramli, Said, and Loon(2005) also verified that interesterification did not modified poly-morph b0, which is characteristic of palmiste oil and goat milk fatblends.
Crystals b0 are small and present morphology that is suitable forthe plasticity characteristics which are desirable in products suchas margarines, shortenings, and fat for panification and pastry.Conversely, polymorphic form b tends to produce wide granularcrystals, generating sandy products with low potential for aeration,which may compromise the macroscopic properties of some kindsof food (Rousseau & Marangoni, 2002).
4. Conclusions
A comprehensive understanding of the functions and propertiesof fats or fat bases produced by interesterification is essential forthe outlining of their applications and the attainment of food prod-ucts with desirable final attributes. This study made possible toverify that triacylglycerol composition, thermal behavior, micro-structure and crystallization kinetics properties of CaO:FHCSOblends were significantly altered by both increasing hardfatconcentration and chemical interesterification process. The ran-domization, however, did not change the original crystallinepolymorphism.
Acknowledgements
The authors would like to thank the financial support from theBrazilian Agencies Fapesp and CNPq.
References
Antoniosi Filho, N., Mendes, O. L., & Lanças, F. M. (1995). Computer prediction oftriacylglycerol composition of vegetable oils by HRGC. Chromatographia, 40,557–562.
AOCS (2004). Official methods and recommended practices of the American OilChemists’ Society. Champaign: American Oil Chemists’ Society.
Aronhime, J. S. (1988). Application of thermal analysis (DSC) in the study ofpolymorphic transformations. Thermochimica Acta, 134, 1–14.
Biliaderis, C. G. (1983). Differential scanning calorimetry in food research – Areview. Food Chemistry, 10, 239–265.
Buchgraber, M., Ulberth, F., Emons, H., & Anklan, E. (2004). Triacylglycerol profilingby using chromatographic techniques. European Journal of Lipid ScienceTechnology, 106, 621–648.
Campos, R. (2005). Experimental methodology. In A. G. Marangoni (Ed.), Fat crystalnetworks (pp. 267–349). New York: Marcel Dekker.
Che Man, Y. B., Shamsi, K., Yusoff, M. S. A., & Jinap, S. (2003). A study on the crystalstructure of palm oil-based whipping cream. Journal of American Oil Chemists’Society, 80, 409–415.
Chong, C. L., Kamarudin, Z., Lesieur, P., Marangoni, A. G., Bourgaux, C., & Ollivon, M.(2007). Thermal and structural behavior of crude palm oil: Crystallization at
Table 5Polymorphic forms (%) of CaO:FHCSO blends, before and after interesterification.
CaO:FHCSO Polymorphic forms (%)
Before interesterification After interesterification
b0 b b0 b
80:20 84.26 15.74 78.88 21.1275:25 80.82 19.18 Liquid Liquid70:30 79.21 20.79 74.05 25.9565:35 82.03 17.97 80.84 19.1660:40 80.83 19.17 78.01 21.99
Fig. 6. X-ray diffraction patterns for CaO:FHCSO blends, before and after interesterification. I: interesterified blend.
A.P.B. Ribeiro et al. / Food Research International 42 (2009) 1153–1162 1161

Author's personal copy
very slow cooling rate. European Journal of Lipid Science and Technology, 109,410–421.
Deman, L., Deman, J. M., & Blackman, B. (1989). Polymorphic behavior of some fullyhydrogenated oils and their mixtures with liquid oil. Journal of American OilChemists’ Society, 66, 1777–1780.
D’Souza, V., Deman, J. M., & Deman, L. M. (1992). Chemical and physical propertiesof the solid fats in commercial soft margarines. Journal of American Oil Chemists’Society, 69, 1198–1205.
Foubert, I., Dewettinck, K., Janssen, G., & Vanrolleghem, P. A. (2006). Modelling two-step isothermal fat crystallization. Journal of Food Engineering, 75, 551–559.
Foubert, I., Dewettinck, K., Van de Walk, D., Dijkstra, A. J., & Quinn, P. J. (2007).Physical properties: Structural and physical characteristics. In F. D. Gunstone, J.L. Harwood, & A. J. Dijkstra (Eds.), The lipid handbook (pp. 471–508). Boca Raton:CRC Press.
Gamboa, O. W. D., & Gioielli, L. A. (2006). Comportamento de cristalização delipídios estruturados a partir de gorduras de palmiste e óleo de peixe. QuímicaNova, 29, 646–653.
Ghotra, B. S., Dyal, S. D., & Narine, S. S. (2002). Lipids shortenings: A review. FoodResearch International, 35, 1015–1048.
Gioielli, L. A., Simões, I. S., & Rodrigues, J. N. (2003). Crystal morphology andinteractions of binary and ternary mixtures of hydrogenated fats. Journal of FoodEngineering, 57, 347–355.
Grimaldi, R., Gonçalves, L. A. G., & Ando, M. Y. (2005). Otimização da reação deinteresterificação química de óleo de palma. Química Nova, 28, 633–636.
Haummann, B. F. (1994). Tools: Hydrogenation, interesterification. Inform, 5,668–678.
Herrera, M. L., Falabella, C., Melgarejo, M., & Anón, M. C. (1998). Isothermalcrystallization of hydrogenated sunflower oil: I – Nucleation. Journal ofAmerican Oil Chemists’ Society, 75, 1273–1280.
Herrera, M. L., Gatti, M. L., & Hartel, R. W. (1999). A kinetic analysis of crystallizationof a milk fat model system. Food Research International, 32, 289–298.
Himavan, C., Starov, V. M., & Stapley, A. G. F. (2006). Thermodynamic and kineticaspects of fat crystallization. Advances in Colloid and Interface Science, 122, 3–33.
Humphrey, K. L., Moquin, P. H. L., & Narine, S. S. (2003). Phase behavior of a binarylipid shortening system: From molecules to rheology. Journal of American OilChemists’ Society, 80, 1175–1182.
Humphrey, K. L., & Narine, S. S. (2004). A comparison of lipid shorteningfunctionality as a function of molecular ensemble and shear: Crystallizationand melting. Food Research International, 37, 11–27.
Kawamura, K. (1979). The DSC thermal analysis of crystallization behavior in palmoil. Journal of American Oil Chemists’ Society, 57, 48–52.
Kloek, W., Walstra, P., & van Vliet, T. (2000). Crystallization kinetics of fullyhydrogenated palm oil in sunflower oil mixtures. Journal of American OilChemists’ Society, 77, 389–398.
Lawler, P. J., & Dimick, P. S. (2002). Crystallization and polymorphism of fats. In C. C.Akoh & D. B. Min (Eds.), Food lipids: Chemistry, nutrition and biotechnology(pp. 275–300). Boca Raton: CRC Press.
Lee, J. H., Akoh, C. C., Himmesbach, D. S., & Lee, K. T. (2008). Preparation ofinteresterified plastic fats from fats and oils free of trans fatty acid. Journal ofAgricultural and Food Chemistry, 56, 4039–4046.
List, G. R., Mounts, T. L., Orthoefer, F., & Neff, W. E. (1995). Margarine and shorteningoils by interesterification of liquid and trisaturated triglycerides. Journal ofAmerican Oil Chemists’ Society, 72, 379–382.
Marangoni, A. G. (2005). Crystallization kinetics. In A. G. Marangoni (Ed.), Fat crystalnetworks (pp. 21–83). New York: Marcel Dekker.
Marangoni, A. G., & Hartel, R. W. (1998). Visualization and structural analysis of fatcrystal networks. Food Technology, 52, 46–51.
Marangoni, A. G., & Rousseau, D. (1998). The influence of chemical interesterificationon physicochemical properties of complex fat systems. 1. Melting andcrystallization. Journal of American Oil Chemists’ Society, 75, 1265–1271.
Marikkar, J. M. N., Ghazali, H. M., Che Man, Y. B., & Lai, O. M. (2003). Differentialscanning calorimetric analysis for determination of some animal fats asadulterants in palm olein. Journal of Food Lipids, 10, 63–79.
Martini, S., Herrera, M. L., & Hartel, R. W. (2002). Effect of cooling rate oncrystallization behavior of milk fat fraction/sunflower oil blends. Journal ofAmerican Oil Chemists’ Society, 79, 1055–1062.
McGauley, S. E., & Marangoni, A. G. (2002). Static crystallization behavior of cocoabutter and its relationship to network microstructure. In A. G. Marangoni & S. S.Narine (Eds.), Physical properties of lipids (pp. 85–123). Boca Raton: CRC Press.
Metin, S., & Hartel, R. W. (2005). Crystallization of fats and oils. In F. Shahidi (Ed.),Baileys industrial oil and fat products (pp. 45–76). New York: Wiley.
Narine, S. S., & Humphrey, K. L. (2004). A comparison of lipid shorteningfunctionality as a function of molecular ensemble and shear: Microstructure,polymorphism, solid fat content and texture. Food Research International, 37,28–38.
Narine, S. S., Humphrey, K. L., & Bouzidi, L. (2006). Modification of the Avrami modelfor application to the kinetics of the melt crystallization of lipids. Journal ofAmerican Oil Chemists’ Society, 83, 913–921.
Narine, S. S., & Marangoni, A. G. (2005). Microstructure. In A. G. Marangoni (Ed.), Fatcrystal networks (pp. 179–255). New York: Marcel Dekker.
Omar, Z., Let, C. C., Seng, C. C., & Rashid, N. A. (2005). Crystallization and rheologicalproperties of hydrogenated palm oil and palm oil blends in relation to crystalnetwork. European Journal of Lipid Science and Technology, 107, 634–640.
Ramli, N., Said, M., & Loon, N. T. (2005). Physicochemical characteristics of binarymixtures of hydrogenated palm kernel oil and goat fat milk. Journal of FoodLipids, 12, 243–260.
Reshma, M. V., Saritha, S. S., Balachandran, C., & Arumughan, C. (2008). Lipasecatalysed interesterification of palm stearin and rice bran oil blends forpreparation of zero trans shortening with bioactive phytochemicals. BioresourceTechnology, 99, 5011–5019.
Ribeiro, A. P. B., Moura, J. M. L. N., Grimaldi, R., & Gonçalves, L. A. G. (2007).Interesterificação química: Alternativa para obtenção de gorduras zero trans.Química Nova, 30, 1295–1301.
Rodrigues, J. N., Gioielli, L. A., & Anton, C. (2003). Propriedades físicas de lipídiosestruturados obtidos de misturas de gordura do leite e óleo de milho. Ciência eTecnologia de Alimentos, 23, 226–233.
Rousseau, D., Hill, A. R., & Marangoni, A. G. (1996). Restructuring butterfat throughblending and chemical interesterification. 2. Microestructure andpolymorphism. Journal of American Oil Chemists’ Society, 73, 973–981.
Rousseau, D., Hodge, S. M., Nickerson, M. T., & Paulson, A. T. (2005). Regulating theb0 ? b polymorphic transition in food fats. Journal of American Oil Chemists’Society, 82, 7–12.
Rousseau, D., & Marangoni, A. G. (2002). Chemical interesterification of food lipids:Theory and practice. In C. C. Akoh & D. B. Min (Eds.), Food lipids: Chemistry,nutrition and biotechnology (pp. 301–335). Boca Raton: CRC Press.
Rousseau, D., Marangoni, A. G., & Jeffrey, K. R. (1998). The influence of chemicalinteresterification on the physicochemical properties of complex fat systems. 2.Morphology and polymorphism. Journal of American Oil Chemists’ Society, 75,1833–1839.
Sato, K. (2001). Crystallization behavior of fats and lipids: A review. ChemicalEngineering Science, 56, 2255–2265.
Shi, Y., Liang, B., & Hartel, R. W. (2005). Crystal morphology, microstructure, andtextural properties of model lipid system. Journal of American Oil Chemists’Society, 82, 399–408.
Silva, R. C., Escobedo, J. P., & Gioielli, L. A. (2008). Comportamento de cristalização delipídios estruturados por interesterificação química de banha e óleo de soja.Química Nova, 31, 330–335.
Tan, C. P., & Che Man, Y. B. (2002). Differential scanning calorimetric analysis ofpalm, palm oil based products and coconut oil: Effects of scanning ratevariation. Food Chemistry, 76, 89–102.
Tang, D., & Marangoni, A. G. (2006). Microstructure and fractal analysis of fat crystalnetworks. Journal of American Oil Chemists’ Society, 83, 377–388.
Toro-Vazquez, J. F., Dibildox-Alvarado, E., Charó-Alonso, M., Charó-Alonso, V., &Gómez-Aldapa, C. A. (2002). The Avrami index and the fractal dimension invegetable oil crystallization. Journal of American Oil Chemists’ Society, 79,855–866.
Wassel, P., & Young, N. W. G. (2007). Food applications of trans fatty acidssubstitutes. International Journal of Food Science and Technology, 42, 503–517.
Wiedermann, L. H. (1978). Margarine and margarine oil, formulation and control.Journal of American Oil Chemists’ Society, 55, 823–829.
Wright, A. J., Hartel, R. W., Narine, S. S., & Marangoni, A. G. (2000). The effect ofminor components on milk fat crystallization. Journal of American Oil Chemists’Society, 77, 463–475.
Yap, P. H., Deman, J. M., & Deman, L. (1989). Polymorphism of palm oil and palm oilproducts. Journal of American Oil Chemists’ Society, 66, 693–697.
Zeitoun, M. A. M., Neff, W. E., List, G. R., & Mounts, T. L. (1993). Physical properties ofinteresterified fat blends. Journal of American Oil Chemists’ Society, 70, 467–471.
1162 A.P.B. Ribeiro et al. / Food Research International 42 (2009) 1153–1162
Copyright © 2022 FDOKUMEN