Inequality and executive compensation: Why Thomas Piketty is wrong?
39
Inequality and executive compensation: Why Thomas Piketty is wrong © Allaire, Firsirotu- 2014 1 Inequality and executive compensation: Why Thomas Piketty is wrong?* Professor Yvan Allaire, Ph.D. (MIT), FRSC Executive Chair Institute for Governance (IGOPP) Professor Mihaela Firsirotu, Ph.D. Professor of Strategy, ESG, UQAM with the collaboration of François Dauphin, Project Director, Institute for Governance (IGOPP) June 25, 2014 *The opinions expressed in this text are the authors' alone.
Transcript of Inequality and executive compensation: Why Thomas Piketty is wrong?

Inequality and executive compensation: Why Thomas Piketty is wrong
© Allaire, Firsirotu- 2014 1
Inequality and executive compensation:
Why Thomas Piketty is wrong?*
Professor Yvan Allaire, Ph.D. (MIT), FRSC
Executive Chair
Institute for Governance (IGOPP)
Professor Mihaela Firsirotu, Ph.D.
Professor of Strategy, ESG, UQAM
with the collaboration of
François Dauphin, Project Director, Institute for Governance (IGOPP)
June 25, 2014
Le 27 juin 2013
*The opinions expressed in this text are the authors' alone.
Inequality and executive compensation: Why Thomas Piketty is wrong
© Allaire, Firsirotu- 2014 2
In a position paper published in 2012, IGOPP asserted that the high levels of
compensation paid to corporate executives could potentially create issues of social
legitimacy for publicly listed corporations. If boards of directors are to fully discharge
their legal duty of acting in the long-term interest of the company, they must be
concerned by the impact of large, controversial compensation on the social legitimacy of
private business enterprises. ("Pay for Value", IGOPP, 2012)
Now, the topic of executive compensation has become a recurring media «scandal»
and a thorn for the board of directors of most corporations. Regardless of the
arguments that are put forward to explain and justify the considerable sums paid
to executives, the egregious disparity between the incomes in society and within
the business firms makes this issue, at best, a rallying cry for those who want a
fairer society and, at worst, a platform for demagogues.
True, disparities of income and wealth are inevitable in a meritocracy; true, the
benefits of a market economy are indissociable from a certain degree of inequality
in the sharing of the wealth, but this is not the issue.
The issue – the malaise – stems from the level of the inequalities and from the
source of the wealth. Beyond a certain threshold, every society becomes
uncomfortable with, and even hostile to, the fortune of a minority. This threshold
tends to vary considerably across countries and across societies. This hostility is
enhanced by the perception, the impression, that such wealth has not been
honestly earned, that it is not the result of an activity which benefits the whole
society.
This is why the fortune of entrepreneurs, innovators, and the creators of large
businesses arouses less hostility. The same is true of sports or film celebrities. On

Inequality and executive compensation: Why Thomas Piketty is wrong
© Allaire, Firsirotu- 2014 3
the other hand, the lavish compensation reaped by financial speculators, traders
and other financial magicians is viewed with great suspicion and animosity.
In fact, the financial crisis of 2008 revealed not only that the compensation of the
people responsible for this fiasco was one of the causes thereof, but also that these
people were paid enormous sums for activities of little social value. Despite its
short lifespan, the Occupy Wall Street movement did raise awareness of the wealth
of the privileged 1% of American society.
The issue had been framed; the passion was high for a while, but it then faded
away, until recently.
A group of economists, among whom the French economist Thomas Piketty,
produced a massive amount of data and statistics documenting the level and rise of
economic inequality over long periods of time and acros several countries.
Making use of this information, Piketty wrote a book, which became the darling of
the American, even global, left: Capital in the Twenty-First Century. The book
paints a vivid picture of rising inequalities and predicts the inevitable concentration
of wealth if States do not adopt radical measures.
In particular, Piketty and his colleagues point to the strong growth in inequalities in
"Anglo-Saxon" countries (especially the United States and Great Britain) due,
according to them, to enormous increases in "salary" paid to executives of
corporations listed on stock exchanges.
According to Mr. Piketty, this phenomenon stems from the fact that, given current
governance practices, executives essentially set their own "salary". As result of the
evolution in "social standards" since the Reagan and Thatcher era, American and

Inequality and executive compensation: Why Thomas Piketty is wrong
© Allaire, Firsirotu- 2014 4
British corporate executives get lavish compensation without facing opprobrium
and social push-back.
Are Piketty et al right, and, if so, can the same be said of Canada and Quebec?
Three forms of economic inequality
To understand the phenomenon of economic inequality, one must distinguish
between three forms of inequality:
1. Unequal distribution of income;
2. Unequal distribution of wealth (or patrimony);
3. Unequal intergenerational social mobility.

Inequality and executive compensation: Why Thomas Piketty is wrong
© Allaire, Firsirotu- 2014 5
Inequality of income
The calculation of income inequalities raises numerous definitional and
measurement problems, particularly when one wishes to make comparisons
between countries. (See the appendix to this text1).
Thus, a comparison of the gross income (i.e. before taxes and government
transfers) of families (Quebec, Canada) and households (United States) yields the
following result (Table 1).
On this basis, income distribution in the U.S. is somewhat more unequal than that
observed in Canada and Quebec.
1 On reading the multiple differences between the U.S. and Canadian compilations for recent years,
one easily understands the extent to which the undertaking by Piketty and his colleagues was
hazardous and subject to caution. The debate sparked by errors in the figures and questionable
assumptions that were identified by the Financial Times is hardly surprising, but does not ultimately
call into question the general conclusions of Piketty and his colleagues.

Inequality and executive compensation: Why Thomas Piketty is wrong
© Allaire, Firsirotu- 2014 6
TABLE 1
Income Distribution (Gross) per Population Quintile: Percentage of Total
Income Received by each 20% Group (2010)
_Source of Canadian data: Statistics Canada, CANSIM Table 202-0701
_Source of U.S. data: Congressional Budget Office, The Distribution of Household Income
and Federal Taxes, 2010. December 2013.
However, this distribution of gross (or market) income, which is often used to
assess inequalities, gives a misleading impression, as is shown in Table 2 for the
United States.
One notes in this table that the top quintile, before taxes and social transfers, has a
share of income 25 times higher than the lowest quintile (57.9/2.3) whereas, after
adjustments for taxes and social programs, this ratio falls to about 5:1 (47.2/9.3).
From this point forward, we will often use statistics for income after taxes and
transfers.

Inequality and executive compensation: Why Thomas Piketty is wrong
© Allaire, Firsirotu- 2014 7
TABLE 2
Share of Income, Transfers and Taxes per Income Quintile,
United States (2010)
_Source: Congressional Budget Office, “The Distribution of Household Income and Federal
Taxes”, 2010. December 2013.
How, therefore, do the United States, Canada and Quebec compare in terms of the
equalities of family and household incomes after taxes and transfers. Table 3 shows
that the inequality is relatively higher in the United States, but lessened by the
different manner of determining quintiles in the United States.2
One also notes that the income share of the first quintile, which was 52.3% in
Quebec according to Table 1, becomes 43% when taxes and social transfers are
taken into account.
2 This inequality would be even more reduced if one could correct for the fact that the quintiles in the American
distribution are determined on the basis of the distribution of income before taxes and transfers while the quintiles for the Canadian (and therefore Quebec) distribution are determined on the basis of the income after taxes and transfers.

Inequality and executive compensation: Why Thomas Piketty is wrong
© Allaire, Firsirotu- 2014 8
TABLE 3
Distribution of Income Share after Taxes and Transfers (2010)
_ Source of Canadian data: Statistics Canada, CANSIM Table 202-0703
_ Source of U.S. data: Congressional Budget Office: Congressional Budget Office, The
Distribution of Household Income and Federal Taxes, 2010. December 2013.
The relatively higher income share received by the fifth U.S. quintile is explained by
the fact that the state-subsidized medical services (Medicare - elderly persons;
Medicaid - people with low income) are accounted for as social transfers and added
to the income of U.S. households. Since the Canadian/Quebecois health-care
system is universal, the value of the medical services is not added to family
incomes.
Inequality and executive compensation: Why Thomas Piketty is wrong
© Allaire, Firsirotu- 2014 9
This table does certainly show an unequal distribution of net income, but the
difference is less dramatic than shown by other ways of assessing these
inequalities.
Top of the income pyramid
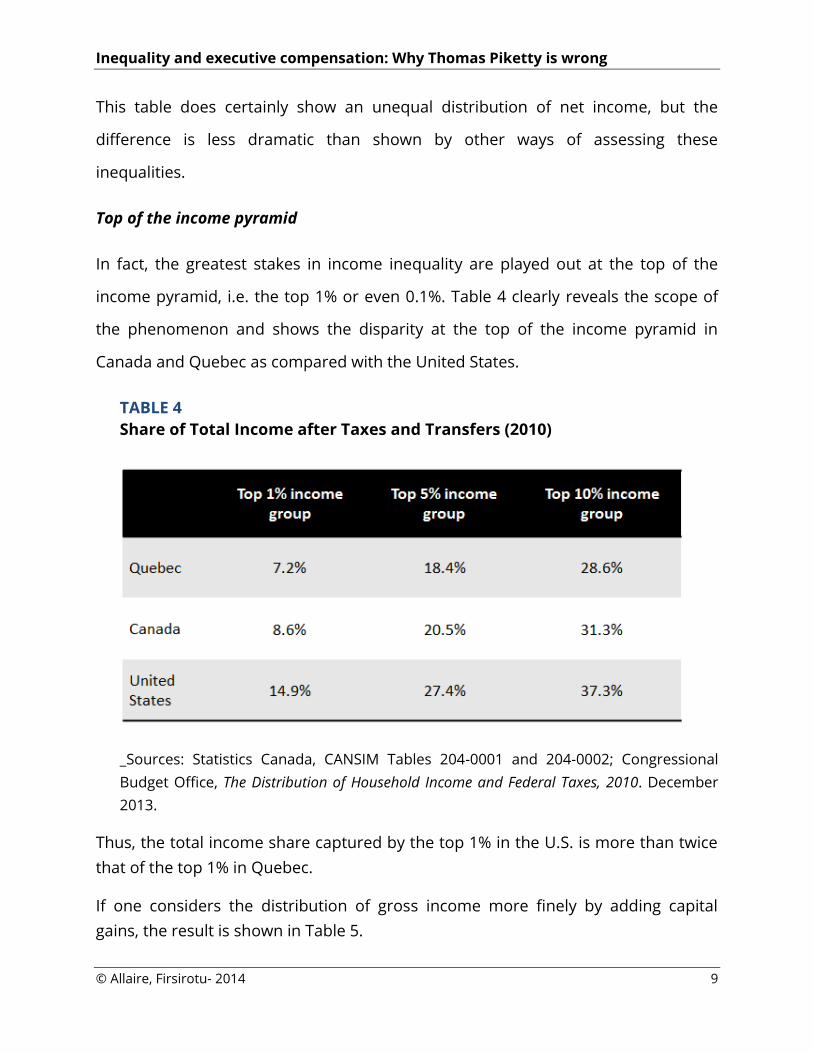
In fact, the greatest stakes in income inequality are played out at the top of the
income pyramid, i.e. the top 1% or even 0.1%. Table 4 clearly reveals the scope of
the phenomenon and shows the disparity at the top of the income pyramid in
Canada and Quebec as compared with the United States.
TABLE 4
Share of Total Income after Taxes and Transfers (2010)
_Sources: Statistics Canada, CANSIM Tables 204-0001 and 204-0002; Congressional
Budget Office, The Distribution of Household Income and Federal Taxes, 2010. December
2013.
Thus, the total income share captured by the top 1% in the U.S. is more than twice
that of the top 1% in Quebec.
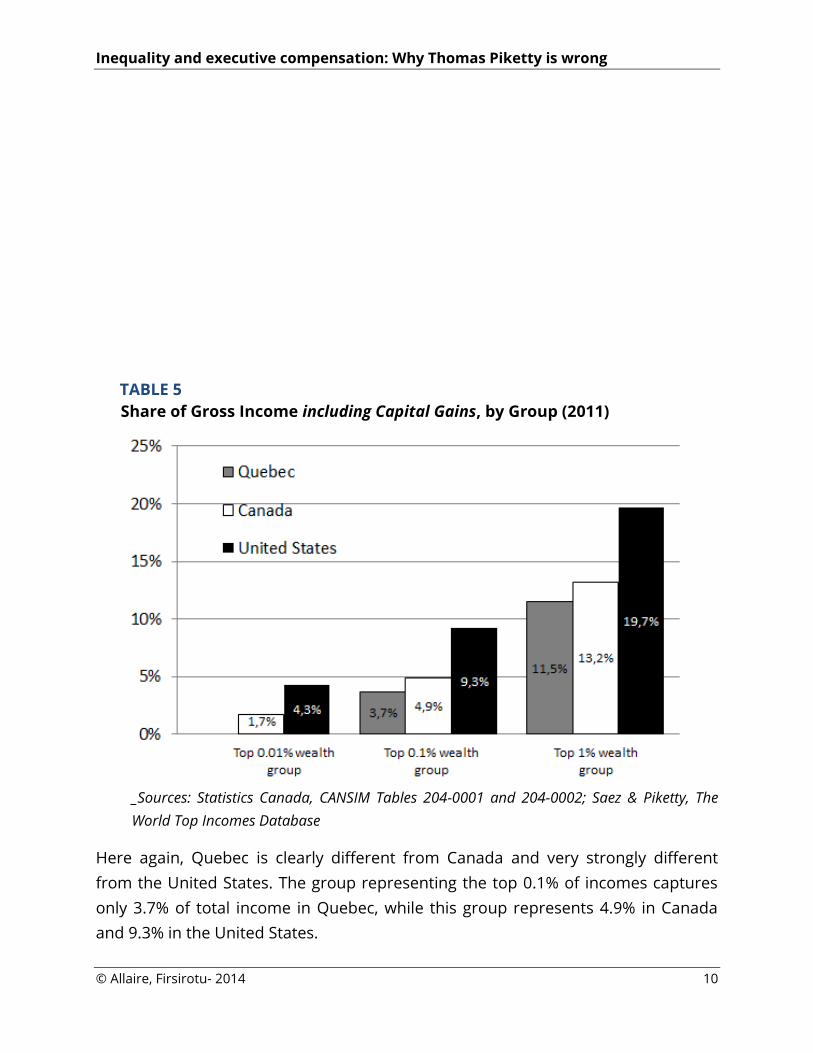
If one considers the distribution of gross income more finely by adding capital
gains, the result is shown in Table 5.
Inequality and executive compensation: Why Thomas Piketty is wrong
© Allaire, Firsirotu- 2014 10
TABLE 5
Share of Gross Income including Capital Gains, by Group (2011)
_Sources: Statistics Canada, CANSIM Tables 204-0001 and 204-0002; Saez & Piketty, The
World Top Incomes Database
Here again, Quebec is clearly different from Canada and very strongly different
from the United States. The group representing the top 0.1% of incomes captures
only 3.7% of total income in Quebec, while this group represents 4.9% in Canada
and 9.3% in the United States.
Inequality and executive compensation: Why Thomas Piketty is wrong
© Allaire, Firsirotu- 2014 11
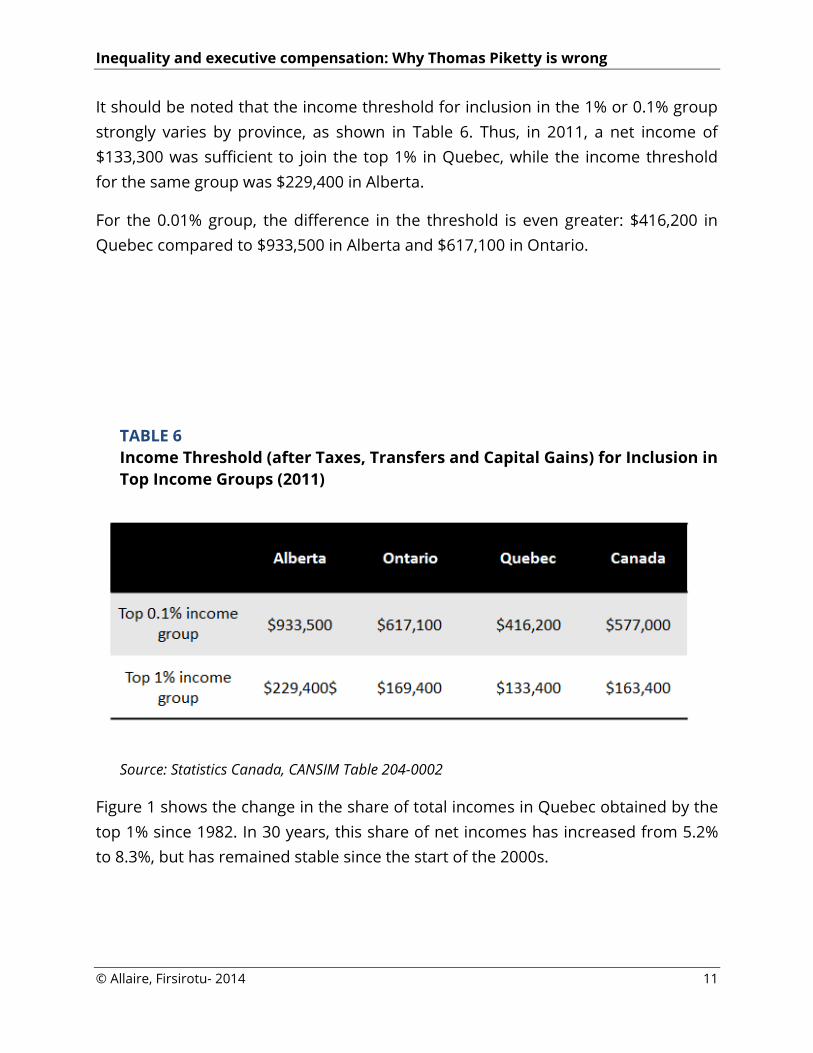
It should be noted that the income threshold for inclusion in the 1% or 0.1% group
strongly varies by province, as shown in Table 6. Thus, in 2011, a net income of
$133,300 was sufficient to join the top 1% in Quebec, while the income threshold
for the same group was $229,400 in Alberta.
For the 0.01% group, the difference in the threshold is even greater: $416,200 in
Quebec compared to $933,500 in Alberta and $617,100 in Ontario.
TABLE 6
Income Threshold (after Taxes, Transfers and Capital Gains) for Inclusion in
Top Income Groups (2011)
Source: Statistics Canada, CANSIM Table 204-0002
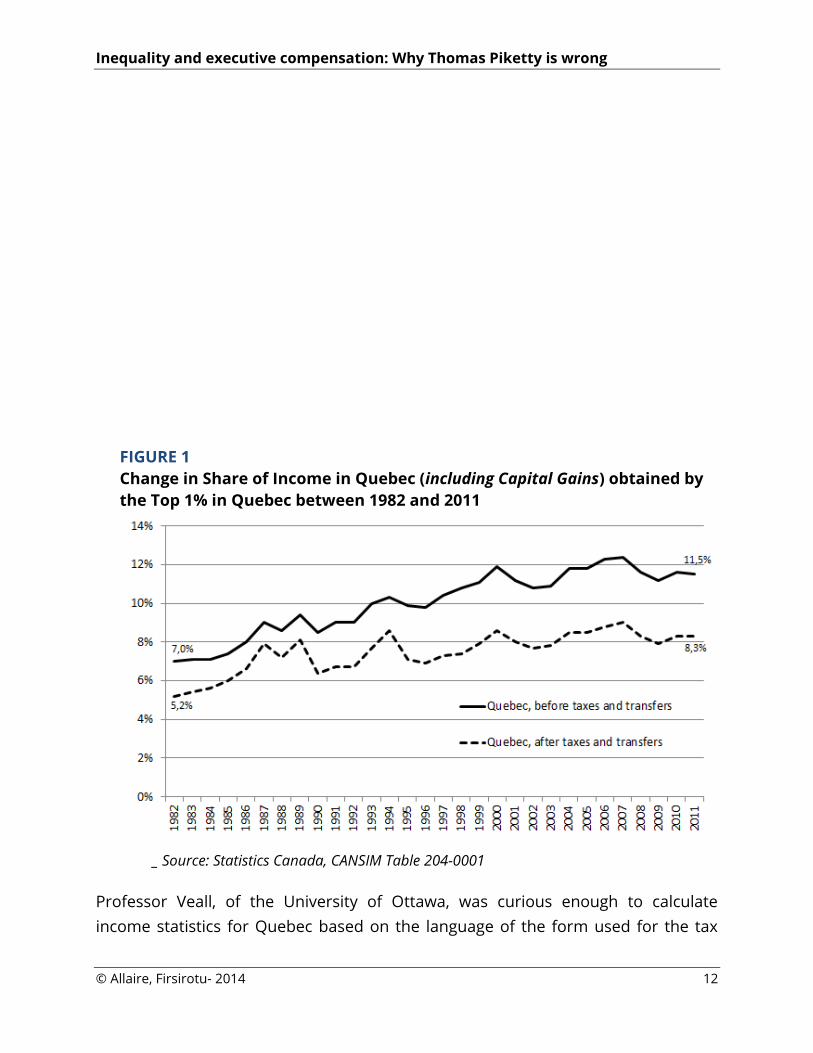
Figure 1 shows the change in the share of total incomes in Quebec obtained by the
top 1% since 1982. In 30 years, this share of net incomes has increased from 5.2%
to 8.3%, but has remained stable since the start of the 2000s.
Inequality and executive compensation: Why Thomas Piketty is wrong
© Allaire, Firsirotu- 2014 12
FIGURE 1
Change in Share of Income in Quebec (including Capital Gains) obtained by
the Top 1% in Quebec between 1982 and 2011
_ Source: Statistics Canada, CANSIM Table 204-0001
Professor Veall, of the University of Ottawa, was curious enough to calculate
income statistics for Quebec based on the language of the form used for the tax
Inequality and executive compensation: Why Thomas Piketty is wrong
© Allaire, Firsirotu- 2014 13
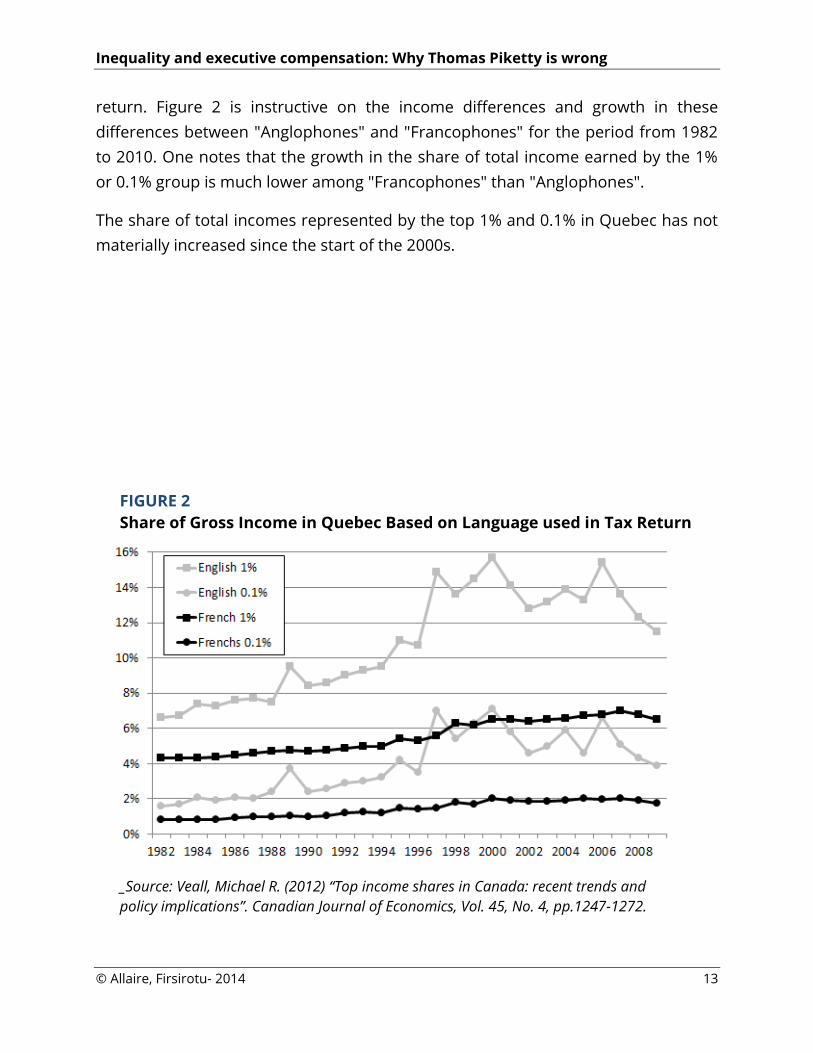
return. Figure 2 is instructive on the income differences and growth in these
differences between "Anglophones" and "Francophones" for the period from 1982
to 2010. One notes that the growth in the share of total income earned by the 1%
or 0.1% group is much lower among "Francophones" than "Anglophones".
The share of total incomes represented by the top 1% and 0.1% in Quebec has not
materially increased since the start of the 2000s.
FIGURE 2
Share of Gross Income in Quebec Based on Language used in Tax Return
_Source: Veall, Michael R. (2012) “Top income shares in Canada: recent trends and
policy implications”. Canadian Journal of Economics, Vol. 45, No. 4, pp.1247-1272.

Inequality and executive compensation: Why Thomas Piketty is wrong
© Allaire, Firsirotu- 2014 14
A correction in the U.S. data
Clearly, income inequalities in the U.S. seem to be large and growing. However, the
U.S. result is skewed by a very particular phenomenon: since the 1980s, many
owners of corporations (of a specific type known as S-corporations) have chosen to
report the corporation's net profits as personal income, thereby avoiding the
double taxation characteristic of ordinary corporations (taxes both on profits and
on dividends). Figure 3 below shows the scope of the phenomenon.
At the top of the pyramid (1.0%), "entrepreneurial income", which was negligible
until 1985, now represents close to 30% of the total share of income received by
this group.
FIGURE 3
Share of Total Income Received by Top 1% and Composition, United States,
1980-2011

Inequality and executive compensation: Why Thomas Piketty is wrong
© Allaire, Firsirotu- 2014 15
_Source: Piketty and Saez, The World Top Incomes Database
During another time period or under different tax rules, such as in Canada, for
example, this income and the taxes paid on it would be classed as "corporate
taxes".
In 2010, there were 2.6 million such corporations in the United States from all
sectors of industry with some 4.4 million shareholders, who reported net earnings
of $419 billion as income for tax purposes. Thus, the 31,000 S-corporations from
the "financial activities, securities, commodities, contracts and other financial
investments" sector reported average net earnings of more than $400,000.
Figure 3 also reveals the increase in and contribution of "salaries" in the
composition of the incomes of the top 1%.
The effect is even more noticeable if one refers to the very top of the income
pyramid, the top 0.01%, as shown in Table 7. Whereas "entrepreneurial income"
(essentially the famous S-corporations) only represented some 10% to 12% of the
Inequality and executive compensation: Why Thomas Piketty is wrong
© Allaire, Firsirotu- 2014 16
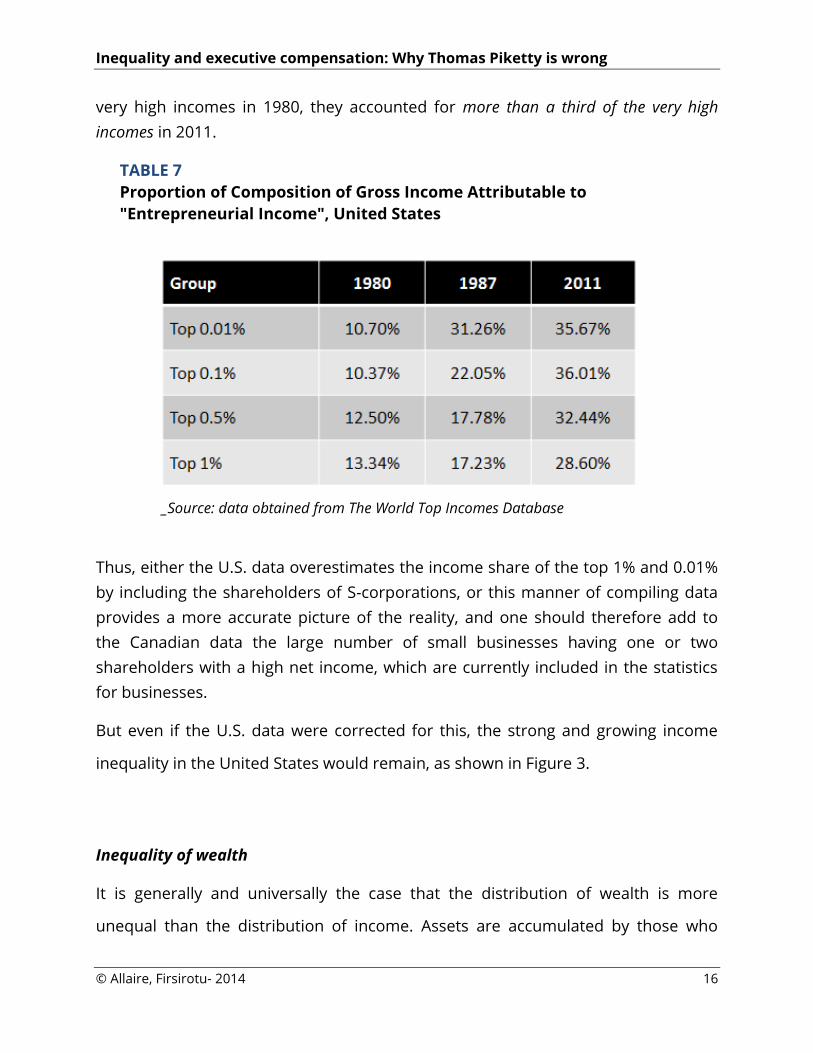
very high incomes in 1980, they accounted for more than a third of the very high
incomes in 2011.
TABLE 7
Proportion of Composition of Gross Income Attributable to
"Entrepreneurial Income", United States
_Source: data obtained from The World Top Incomes Database
Thus, either the U.S. data overestimates the income share of the top 1% and 0.01%
by including the shareholders of S-corporations, or this manner of compiling data
provides a more accurate picture of the reality, and one should therefore add to
the Canadian data the large number of small businesses having one or two
shareholders with a high net income, which are currently included in the statistics
for businesses.
But even if the U.S. data were corrected for this, the strong and growing income
inequality in the United States would remain, as shown in Figure 3.
Inequality of wealth
It is generally and universally the case that the distribution of wealth is more
unequal than the distribution of income. Assets are accumulated by those who

Inequality and executive compensation: Why Thomas Piketty is wrong
© Allaire, Firsirotu- 2014 17
have the means to add to them every year, and wealth also accumulates through
inheritances, the appreciation of financial assets, etc.
The unequal distribution of wealth (or assets), even more so than income
inequality, fans the flames of resentment and raises social fairness issues. It has
been shown that strong inequalities in wealth also lead to a reduction in social
mobility. (See Corak (2012), among others).
While the data on assets is of much lower quality than the data on income, it seems
clear that this inequality of wealth has grown nearly everywhere over the past 30
years, as shown by numerous research studies and publications. (See, in particular,
Alvaredo, Atkinson, Piketty and Saez, Journal of Economic Perspectives, Volume 27,
No. 3, 2013.)
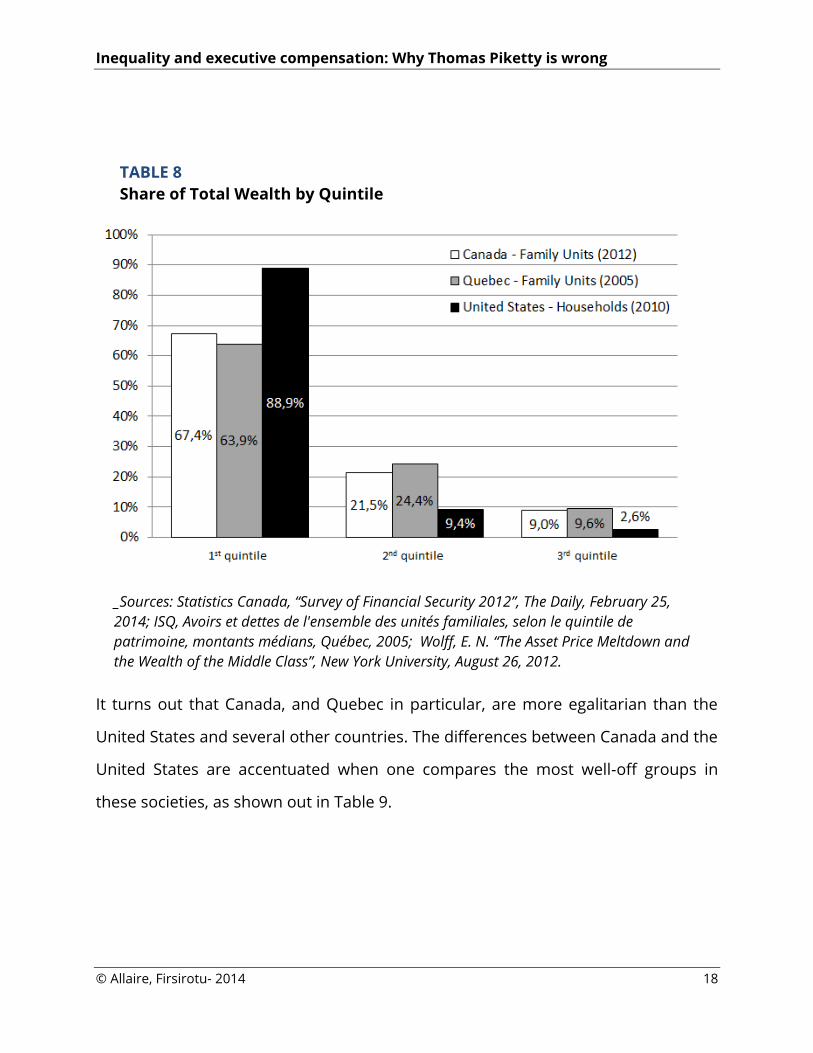
This development has resulted in historically high levels of inequality in wealth
distribution in the United States. Table 8 shows a comparison between the
situations in the U.S., Canada and Quebec.
Inequality and executive compensation: Why Thomas Piketty is wrong
© Allaire, Firsirotu- 2014 18
TABLE 8
Share of Total Wealth by Quintile
_Sources: Statistics Canada, “Survey of Financial Security 2012”, The Daily, February 25,
2014; ISQ, Avoirs et dettes de l'ensemble des unités familiales, selon le quintile de
patrimoine, montants médians, Québec, 2005; Wolff, E. N. “The Asset Price Meltdown and
the Wealth of the Middle Class”, New York University, August 26, 2012.
It turns out that Canada, and Quebec in particular, are more egalitarian than the
United States and several other countries. The differences between Canada and the
United States are accentuated when one compares the most well-off groups in
these societies, as shown out in Table 9.

Inequality and executive compensation: Why Thomas Piketty is wrong
© Allaire, Firsirotu- 2014 19
TABLE 9
Share of Total Wealth Held, by Group
_Source for Canada: Statistics Canada, Perspectives on labour and income,
Catalogue no. 75-001-XIE, December 2006, Vol. 7, No. 12; Wolff, E. N. “The Asset Price
Meltdown and the Wealth of the Middle Class”, New York University, August 26, 2012.
Those who believe that inequalities in income and wealth must be reduced and that
they are a socially explosive phenomenon at their current levels in the United
States must ensure they have a good understanding of the causes before
proposing public policies to address this issue.
Causes of observed inequalities
Piketty and his colleagues conclude that this inequality of income and wealth,
observed especially in the "Anglo-Saxon" countries (United States, United Kingdom,
Canada and Australia) is primarily the result of huge "salary" increases paid to
corporate executives of stock-exchange listed corporations.
Inequality and executive compensation: Why Thomas Piketty is wrong
© Allaire, Firsirotu- 2014 20
This "explanation" does not take into account the important phenomenon of S-
corporations (or "entrepreneurial income") that we described above.
And, in actual fact, the salaries and bonuses of U.S. corporate executives did not
substantially increase, in constant dollars, between the 1950s and 2000s! (Frydman
and Jenter, 2010)
Compensation linked to stock price
The staggering increases in the compensation of corporate executives of U.S. Stock-
exchange listed companies stems particularly from stock options and other forms
of compensation that are linked to the value of the corporate stock.
In a stock market that has been fueled on earnings per share for some 30 years,
stock- and stock option-based compensation has become appealing and nearly
irresistible to corporate boards in the United States for four reasons:
1. The proceeds of the exercise by corporate executives of these options and stocks
are taxed at the substantially lower rate applicable to capital gains (except in
Quebec); 2. Until 2004, corporations did not incur any accounting cost from this
type of compensation; after 2004, a relatively modest accounting charge was
imposed for the granting of options to corporate executives; 3. When the stock
options are actually exercised, the corporations, at least in the US, obtain a tax
credit equivalent to the difference between the exercise price and the market price
for the stock; the effect of this simple tax loophole is that hugely profitable
corporations, such as Microsoft, paid little or no tax on their profits in certain years
in which there was a massive exercise of options; 4. This form of compensation
caused executives to become ferociously focused on maximizing share value, to the
great pleasure of the investment funds that are now the majority shareholders of
U.S. companies.

Inequality and executive compensation: Why Thomas Piketty is wrong
© Allaire, Firsirotu- 2014 21
The arguments supporting this form of compensation, particularly in the United
States, seem irrefutable and difficult for a board member to dispute.
The granting of compensation to executives in the form of stocks and stock options
started on a small scale in the United States during the 1970s and grew, during the
1980s, to 26% of the total compensation granted by the 50 largest U.S.
corporations. During the 1990s, this percentage rose to 47% and then to 60%
during the period from 2000 to 2005. (Frydman and Jenter, 2010)
In 2010, compensation linked to the value of the stock represented 62% of the total
compensation of the CEOs of the 500 largest U.S. corporations and 55% for the
CEOs of the 60 largest Canadian corporations. (Allaire, IGOPP, 2012)
This type of compensation was practically non-existent in Europe until the 1990s
(except in the United Kingdom). Even in 2008, only 19% of the compensation of
European corporate executives was in the form of stock options and stock-related
incentives. (Conyon et al., 2010)
Thus, since this compensation in the form of options creates a direct link between
the compensation of U.S. corporate executives and the performance of the U.S.
stock markets, it is easy to understand how and why there has been a quantum
leap in this compensation, and in the unequal distribution of wealth, over the past
30 years.
Figure 4 shows that there was no correlation, before 1980, between the total
compensation of corporate executives and the stock markets. Then, beginning in
the 1980s, we observe that there is a nearly perfect correlation between the total
compensation of U.S. corporate executives and the stock markets.

Inequality and executive compensation: Why Thomas Piketty is wrong
© Allaire, Firsirotu- 2014 22
FIGURE 4
Total Compensation of the Three Highest Paid Executives of the 50 Largest
U.S. Firms Compared to the S&P Index
_ Source: Frydman and Saks, 2007
Given the performance of the U.S. stock markets over the past 30 years (the value of
stocks on the S&P 500 has increased tenfold during that time), and given that the term
of stock options is usually 10 years and that stocks and stock options are generally,
but not always, granted every year, the compensation and wealth of U.S. corporate
executives is such that most of them found themselves in the group of 1%, and
even 0.1%, of the richest persons during that 30-year period.
The "financialization" of the economy
The quantum leap in inequalities of wealth in the United States is also explained by
the particular evolution in the U.S. (and British) financial sector. The phenomenon
Inequality and executive compensation: Why Thomas Piketty is wrong
© Allaire, Firsirotu- 2014 23
of the financialization of the U.S. economy, which also seems to have escaped
Piketty and his colleagues, has exacerbated the unequal distribution of assets and
strongly contributed to the unprecedented level of concentration of wealth held by
the 1%, and especially 0.1%, of the richest Americans.
Thus, discreetly, and unnoticed by the general public, there has been a proliferation
over the past 30 years in the number of specialized firms, held by private interests,
engaging in financial, stock-market and speculative transactions of all kinds,
generating immense wealth for their partners and managers.
Hedge funds (which would be more appropriately called "speculative funds") are
included among these specialized, and largely invisible, firms that often have a
primary role, sometimes a supporting role, in most financial scandals. Managing
other people's money, they generally collect management fees of 2%, plus 20% of
the realized profits. When these hedge funds, numbering some 5,300 in the United
States, make a successful bet, they win the lottery.
Once per year, Alpha magazine compiles the data on the compensation earned by
the best 25 gamblers. According to this magazine, in 2013, these 25 individuals
collectively earned $21.15 billion, with compensation ranging from $300 million to
$3.5 billion. In other words, these 25 "managers" earned 3.5 times the total
compensation of the CEOs of the 500 largest corporations in the U.S. – the very same
CEOs who are so strongly criticized for the extravagance of their compensation. Of
course, hedge funds use ingenious organizational structures and other tax schemes
so that their income is subject to a very low tax rate.
Inequality of social mobility
Inequality and executive compensation: Why Thomas Piketty is wrong
© Allaire, Firsirotu- 2014 24
Inequality of social mobility – the fact that a child's economic fate is largely
dependent on his family's economic situation – is the cruelest of inequalities.
Inequality in the sharing of income and wealth appears as a transitory
phenomenon of less importance if the movement of people between classes of
income and wealth is large from one generation to the next.
However, as shown in Table 10 below, social mobility in the United States is rather
low, especially compared with Canadian social mobility.
Inequality and executive compensation: Why Thomas Piketty is wrong
© Allaire, Firsirotu- 2014 25
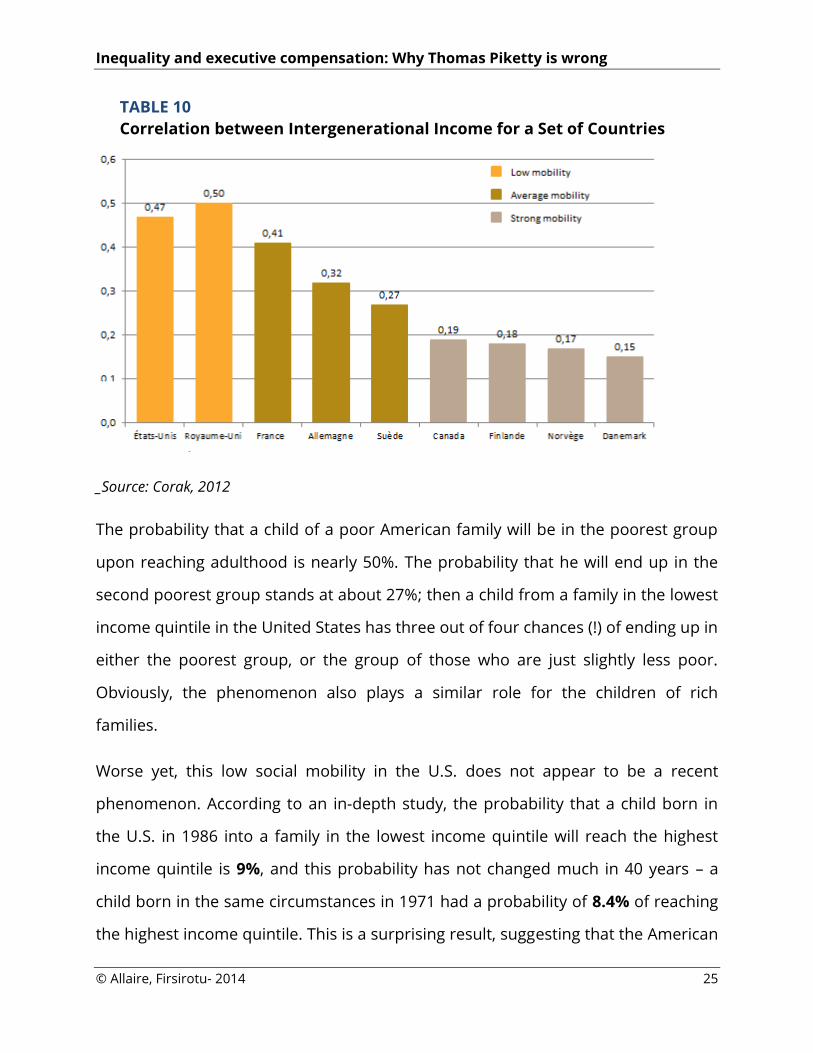
TABLE 10
Correlation between Intergenerational Income for a Set of Countries
_Source: Corak, 2012
The probability that a child of a poor American family will be in the poorest group
upon reaching adulthood is nearly 50%. The probability that he will end up in the
second poorest group stands at about 27%; then a child from a family in the lowest
income quintile in the United States has three out of four chances (!) of ending up in
either the poorest group, or the group of those who are just slightly less poor.
Obviously, the phenomenon also plays a similar role for the children of rich
families.
Worse yet, this low social mobility in the U.S. does not appear to be a recent
phenomenon. According to an in-depth study, the probability that a child born in
the U.S. in 1986 into a family in the lowest income quintile will reach the highest
income quintile is 9%, and this probability has not changed much in 40 years – a
child born in the same circumstances in 1971 had a probability of 8.4% of reaching
the highest income quintile. This is a surprising result, suggesting that the American

Inequality and executive compensation: Why Thomas Piketty is wrong
© Allaire, Firsirotu- 2014 26
dream that every citizen can become "rich and famous" seems to be more of an
American myth. (Chetty, Hendren, Kline, Saez and Turner, Working Paper 19844,
NBER, January 2014)
In this regard, the Crédit Suisse bank (Global Wealth Report, 2013) notes as follows:
"This […] suggests that ten generations or more have to lapse before the wealth of an
individual in North America [read the United States] is completely unrelated to the
wealth of their ancestors."
Social mobility and fairness
To the extent that the unequal distribution of wealth is perpetuated and passed on
from generation to generation, the stakes are high and could carry political risks as
the general population becomes aware of the mythical nature of the American
dream.
Table 10 clearly indicates how Canada [and Quebec] shows strong mobility from
one generation to the next, equivalent to that observed in some Scandinavian
countries.
It is also noteworthy, as Figure 5 illustrates, that a large percentage of the people in
the top 1% are replaced over a five-year period, in Quebec at least.For instance,
more than half of the persons who were in the top 1% group in 2011 were not in
this group in 2006.

Inequality and executive compensation: Why Thomas Piketty is wrong
© Allaire, Firsirotu- 2014 27
FIGURE 5
Persistence of High Income* in Quebec (1987-2011)
*Income after taxes and transfers, including capital gains
_Source: Statistics Canada, CANSIM Table 204-0002

Inequality and executive compensation: Why Thomas Piketty is wrong
© Allaire, Firsirotu- 2014 28
This precious result for Canada and Quebec may be attributed to our universal
health-care system and other social program, as well as the quality and accessibility
of our educational systems.
The OECD's studies conducted through the PISA program provide illuminating data
for assessing this phenomenon. This program consists of a triennial evaluation of
the mathematics, sciences and reading skills of 15-year-old students throughout
the world.
For example, in mathematics, of the 29 OECD member countries, Canada ranked 5th
and Quebec 2nd (just behind Korea). The United States ranked 20th.
But even more significant, as noted by the OECD specialists, Canada and Finland,
of all the OECD member countries, are the only counties to obtain a score that is
clearly above average for the performance of their students, and also an above-
average score for the fairness of their educational systems. The Canadian (and
Quebecois) educational systems are designed so that the parents' socio-economic
background has less influence on the quality of the schools and students'
performance.
This fairness and social mobility, which is largely a result of our educational system,
must be protected from the gradual erosion observed in a significant number of
countries over the past 20 years.
Inequality of wealth and social justice
In a notable work entitled A Theory of Justice, published in 1971, the American
philosopher, John Rawls, proposed two tests for determining the distribution of
wealth that would be compatible with a just society:

Inequality and executive compensation: Why Thomas Piketty is wrong
© Allaire, Firsirotu- 2014 29
1. Inequality in the division of wealth should not exceed the level for
which it can be shown that such inequality benefits the worst-off
members of society.
Rawls thereby acknowledged that absolute equality would not be in the interests of
the weakest members of society, because this would result in a decline in collective
wealth and, consequently, a general impoverishment and a shrinking of social
programs.
Economists endeavour to provide a partial response to this question of appropriate
and just level of inequality by examining the impact of various marginal rates of
income tax. Clearly, a high marginal rate reduces income inequalities between
citizens, but if the marginal rate is such that it leads, paradoxically, to a reduction in
the tax receipts of governments, then the State is compelled to reduce spending on
social programs to the detriment of the most disadvantaged members of society.
2. John Rawls also proposed the concept of the "veil of ignorance" to assess
what level of inequality a particular society would judge acceptable or
«optimal».
Let us suppose that the citizens were unaware of what their position would be in
the distribution of wealth since this position would be assigned to them at random.
What level of inequality would these citizens choose as desirable or optimal in such
circumstances? According to Rawls, such an (entirely conceptual) process would
reveal the true tolerance of the citizens as a whole for economic inequalities.
While such considerations are certainly interesting from an intellectual perspective,
they are difficult to apply in practice. However, recent American public opinion

Inequality and executive compensation: Why Thomas Piketty is wrong
© Allaire, Firsirotu- 2014 30
surveys give us an approximate response to this second question posed by Rawls,
as shown in Table 11.
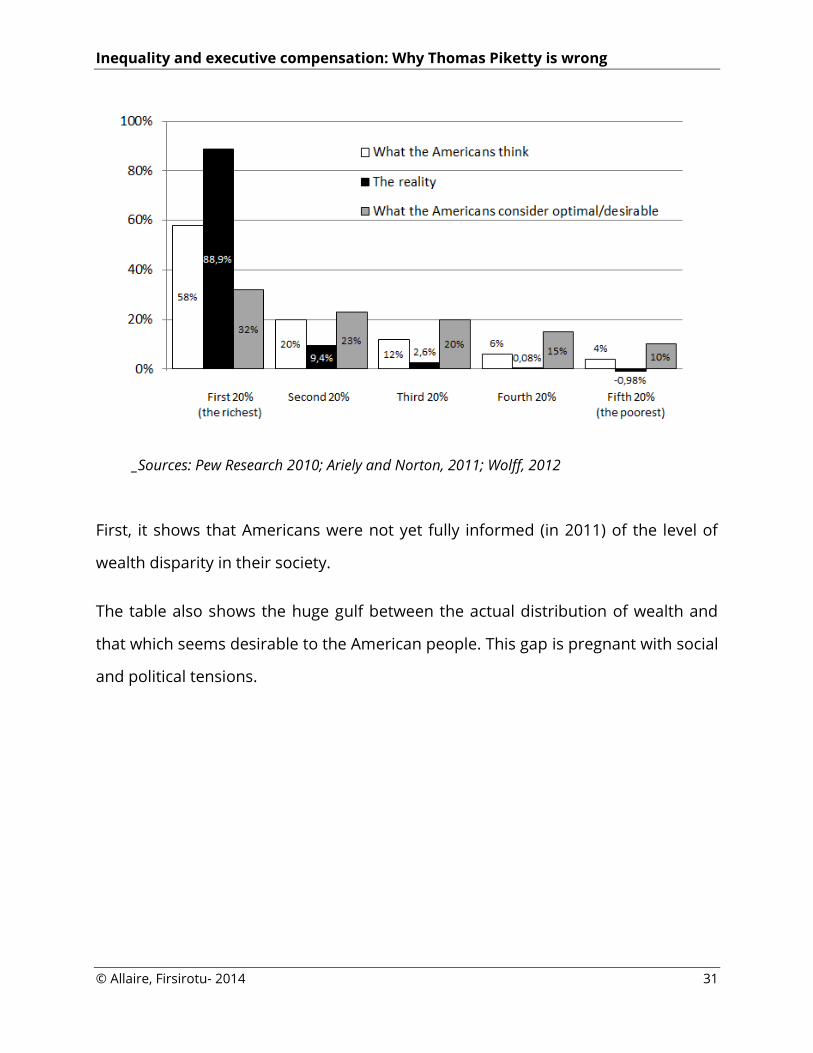
TABLE 11
Percentage of Total Wealth (or Assets) Held by each Quintile of the
Population
Inequality and executive compensation: Why Thomas Piketty is wrong
© Allaire, Firsirotu- 2014 31
_Sources: Pew Research 2010; Ariely and Norton, 2011; Wolff, 2012
First, it shows that Americans were not yet fully informed (in 2011) of the level of
wealth disparity in their society.
The table also shows the huge gulf between the actual distribution of wealth and
that which seems desirable to the American people. This gap is pregnant with social
and political tensions.

Inequality and executive compensation: Why Thomas Piketty is wrong
© Allaire, Firsirotu- 2014 32
Conclusion and proposals
A reasonable sharing of wealth and income is not just an issue of social justice; it is
a source of social peace as well as a driver of economic growth. Despite the sharp
increase in the compensation of Canadian corporate executives (see Allaire, Y.,
IGOPP, "Pay for Value", 2012), Canada and Quebec in particular are still lands of
moderate inequality of wealth and, in particular, of much greater social mobility
than the U.S. These constitute precious social assets about which we must not be
complacent.
In the United States, despite adjustments in the statistics that mitigate to some
extent the income inequalities first observed, inequalities in wealth are enormous
and still growing fast. There is no doubt that the massive increase in executive
compensation over the past 30 years, as well as the extensive financialization of the
American economy, have contributed to this socially harmful result. Finally, the
United States is suffering from low social mobility, which is aggravated by
inequalities of wealth and sustained by some of the U.S. social policies.
As American citizens become better informed about the large disparity in income
and wealth in their society as well as its perpetuation because of low social mobility,
these issues will generate social resentment and lead to a relative loss of legitimacy
for political leaders. These issues are now being addressed at the highest political
level in the United States, but the counteroffensive is vigorous and well financed.
Social and tax policies
The corrective measures proposed by Thomas Piketty are dramatic but politically
unrealistic: increase in the marginal tax rate to 80% and a global tax on capital.

Inequality and executive compensation: Why Thomas Piketty is wrong
© Allaire, Firsirotu- 2014 33
Indeed, most of the executive compensation in the form of options or stocks is
taxable at the rate applicable to capital gains (15% in the United States) and not at
the rate applicable to employment income. As well, the humongous income of
hedge fund managers and private equity fund managers, usually defined as
«carried interest» is thus shielded from the personal income tax rates. A significant
increase in the tax rate on capital gains (not proposed by Piketty) would have a
negative effect on investments and economic growth.
Piketty also proposes a global tax on capital. This proposal, which entails an
Orwellian process of disclosure and estimation of assets by all individuals, as well
as a transnational sharing of the information thereby collected, has only an
infinitesimal probability of being adopted.
Piketty and his colleagues therefore propose two measures, one based on a poor
understanding of the dynamics of executive compensation and of changes in the
financial industry, and the other on a program that is doomed from the start.
However, it is possible to take concrete and effective action to have a clear and
significant impact on economic inequality.
Here are ten policy proposals that are within the reach of governments or
corporate boards:
1. A quality educational system accessible to everyone without regard to family
income;
2. A change in the tax provisions to eliminate tax arrangements that favour
executive compensation schemes in the form of stock options and stocks of
the corporation. However, such a measure must be synchronized with the
relevant tax jurisdictions. Thus, Quebec would be ill advised, as is presently
the case, to go it alone in this area.

Inequality and executive compensation: Why Thomas Piketty is wrong
© Allaire, Firsirotu- 2014 34
3. The elimination of the U.S. tax benefit that gives businesses a tax credit for
the difference between the strike price of a stock option and the market
price at the time it is exercised by an executive. Canada, for example, does
not grant such tax credits.
4. The gradual elimination by corporate boards of stock options as a form of
compensation, as well as any other form linking compensation to the value
of the corporation's stock.
5. The limitation by the board of directors of the ratio between the CEO's
compensation and the firm's median compensation.
6. Implementation of compensation schemes which are sensitive to social
issues of income inequality within society. If corporate boards are incapable
of discharging this responsibility, governments will want to step in (which is
not desirable) by enacting rules and regulations, such as the prohibition of
compensation in the form of stock or stock options.
7. Governments should close the door on tax schemes that favour hedge funds
and other financial industry players. Thus, the tax subterfuge which allows
hedge funds, privatization funds and others to treat the compensation of
their owners as "carried interest" taxable at the capital gains rate, i.e. 15% in
the United States, should be disallowed.
8. Calibrate the tax on capital gains according to the holding period; any buy-
sell transaction within a year would be taxable at the rate applicable to
personal income; only investments held for three years or more would
benefit fully from the lower tax rate on capital gains.
9. Governments should issue directives to public pension funds under their
jurisdiction to the effect that they cannot hire fund "managers" who charge
more than 3% to 5% in management fees and incentives. The actual

Inequality and executive compensation: Why Thomas Piketty is wrong
© Allaire, Firsirotu- 2014 35
percentage would take into account the size of the fund and the level of
hurdle rate to be met before any incentive is paid to the manager. Boards of
large funds could also give serious consideration to this issue. It is curious
that the same investment funds which rightfully complain about the high
levels of compensation paid to executives of corporations in which they
invest have no qualms about giving management contracts to hedge funds
whose managers will collect unparalleled amounts for their performance.
10. As suggested by Leo Strine (2014), money managers should reflect in
their investment strategies the time horizons of their investors.
Fiscal and social measures of a very different nature than those proposed by
Thomas Piketty would go a long way towards reducing the economic disparities
observed in the United States and help maintain the favourable situation we
currently enjoy in Canada and Quebec.
DEFINITIONS OF TERMS USED
(according to Statistics Canada and the Congressional Budget Office)
Household (United States): A household consists of the people who share a
housing unit, regardless of their relationships.
Quintiles (in Canada): All the units of the population, whether individuals or
families, are ranked from lowest to highest by the value of their after-tax
income. Then the ranked population is divided into five groups of equal
numbers of units, called quintiles.
Quintiles (in the United States): groups are defined by ranking all people by
after-tax income and transfers, adjusted for household size—that is, divided
by the square root of the number of people in a household. Quintiles contain

Inequality and executive compensation: Why Thomas Piketty is wrong
© Allaire, Firsirotu- 2014 36
equal numbers of people. Households with negative income are excluded
from the lowest income category but are included in totals.
After-tax income: Total income minus income tax.
Income of individuals: income based on the information contained in federal
and provincial tax returns of tax filers. Generally speaking, market income is
comprised of earnings and income from investments, private pensions,
dividends, capital gains, support payments paid to a spouse, and other
taxable income.
Market income: sum of employment income (wages and salaries, or net
amount from self-employed work), investment income, retirement income
(private pension plan) and elements included in other income.
Total or pre-tax income: income from all sources including government
transfers before deduction of federal and provincial taxes.
Incomes used in calculating Canadian centiles: the definitions of income
used to determine centile groups in Canada and Quebec (0.01%, 0.1%, 1%,
etc.) are different are different from those used for the quintiles. The
concepts of income in the Longitudinal Administrative Databank (LAD) are
based on information contained in the federal and provincial forms.
Generally speaking, market income consists of income from earnings,
investments, pensions, support payments paid to a spouse, and other
taxable income. Total (or pre-tax) income is equal to the market income plus
government transfers and refundable tax credits. After-tax income is equal
to total income minus federal and provincial taxes.
Wealth: valuation of the net assets of a family unit (or a household in the
United States), i.e., the amount the family unit would have after selling all its
assets and paying off all its debts.
Transfers: transfers include cash payments and benefits received from social
insurance and other government assistance programs. In Canada, these
amounts include:
• old-age security pension and guaranteed income supplement,
allowance and allowance for the survivor;

Inequality and executive compensation: Why Thomas Piketty is wrong
© Allaire, Firsirotu- 2014 37
• Quebec Pension Plan or Canada Pension Plan benefits;
• employment insurance benefits;
• child benefits;
• other income from public sources.
In the United States, these amounts include:
Supplemental Nutrition Assistance Program
Medicaid
Medicare
Children’s Health Insurance Program
Social Security
Family units: Comprise economic families of two or more persons and single
persons. An economic family is a group of individuals sharing a common
dwelling unit who are related by blood, marriage (including common-law
relationships) or adoption.
REFERENCES
Allaire, Yvan. (2012) Payer pour la valeur ajoutée: Trancher le nœud gordien de
la rémunération des dirigeants. Prise de position: Institut sur la gouvernance
d’organisations privées et publiques, 70p.
Alvaredo, Facundo, Anthony B. Atkinson, Thomas Piketty & Emmanuel Saez.
(2013). “The Top 1 Percent in International and Historical Perspective”. The
Journal of Economic Perspectives, Vol. 27, No. 3, pp.3-20.
Inequality and executive compensation: Why Thomas Piketty is wrong
© Allaire, Firsirotu- 2014 38
Chetty, Raj, Nathaniel Hendren, Patrick Kline, Emmanuel Saez & Nicholas
Turner. (2014). Is the United States Still a Land of Opportunity? Recent Trends in
Intergenerational Mobility. NBER Working Paper No. 19844
Congressional Budget Office. (2013) The Distribution of Household Income and
Federal Taxes, 2010. December, 36p.
Conyon, Martin & Graham Sadler. (2010) “Shareholder Voting and Directors'
Remuneration Report Legislation: Say on Pay in the UK”. Corporate
Governance: An International Review, Vol. 18, No. 4, pp.296-312.
Corak, Miles. (2006) Do Poor Children Become Poor Adults? Lessons from a Cross
Country Comparison of Generational Earnings Mobility. IZA Discussion Paper
No. 1993, March, 67p.
CORAK, Miles (2012). « Inequality from Generation to Generation: The United
States in Comparison », dans Robert Rycroft (dir.), The Economics of Inequality,
Poverty, and Discrimination in the 21st Century, ABC-CLIO,
Frydman, Carola & Dirk Jenter. (2010) “CEO Compensation”. Annual Review of
Financial Economics, Vol. 2, pp. 75-102.
Frydman, Carola & Raven E. Saks. (2007) Executive Compensation: A New View
from a Long-Term Perspective, 1936-2005. FEDS Working Paper No. 2007-35;
AFA 2008 New Orleans Meetings Paper.
Kroll, Luisa. (2013) “Inside The 2013 Forbes 400: Facts And Figures On
America's Richest”. Forbes, Special Edition.
Morissette, René & Xuelin Zhang. (2006) “Revisiting wealth inequality”.
Perspectives on Labour and Income, Catalogue no. 75-001-XIE, Vol. 7, No. 12.
Norton, Michael I. & Dan Ariely. (2011) “Building a Better America – One
Wealth Quintile at a Time”. Perspectives on Psychological Science, Vol. 6, No. 1,
pp.9-12.
Piketty, Thomas. (2013) Le capital au 21e siècle. Éditions du Seuil, 976p.
Rawls, John. (1971) A Theory of Justice. The Belknap Press of Harvard
University Press, 607p.
Shorrocks, Anthony, Jim Davies & Rodrigo Lluberasis. (2013) Global Wealth
Report 2013. Credit Suisse Research Institute, 64p.
Statistics Canada. (2014) “Survey of Financial Security 2012”. The Daily,
February 25, Component of Catalogue no. 11-001-X.
Inequality and executive compensation: Why Thomas Piketty is wrong
© Allaire, Firsirotu- 2014 39
Veall, Michael R. (2012) “Top income shares in Canada: recent trends and
policy implications”. Canadian Journal of Economics, Vol. 45, No. 4, pp.1247-
1272.
Wolff, Edward N. (2012) The Asset Price Meltdown and the Wealth of the Middle
Class. New York University, August 26, 85p.