INDIVIDUAL AND CORPORATE INCOME TAX - Montana ...
42
54 revenue.mt.gov INDIVIDUAL AND CORPORATE INCOME TAX Overview of Individual Income Tax ..................................................... 55 Recent Legislative Changes to Individual Income Tax ....................... 57 Calculation of Individual Income Tax .................................................. 58 Income, Deductions, Credits, and Tax Liability ................................... 59 Taxation of Business Income .............................................................. 68 Pass-Through Entities ........................................................................ 72 Estates and Trusts .............................................................................. 82 Corporate Income Tax ........................................................................ 85
-
Upload
khangminh22 -
Category
Documents
-
view
1 -
download
0
Transcript of INDIVIDUAL AND CORPORATE INCOME TAX - Montana ...

54revenue.mt.gov
INDIVIDUAL AND CORPORATE INCOME TAX
Overview of Individual Income Tax ..................................................... 55Recent Legislative Changes to Individual Income Tax ....................... 57Calculation of Individual Income Tax .................................................. 58Income, Deductions, Credits, and Tax Liability ................................... 59Taxation of Business Income .............................................................. 68Pass-Through Entities ........................................................................ 72Estates and Trusts .............................................................................. 82Corporate Income Tax ........................................................................ 85

55revenue.mt.gov
Overview of Individual Income Tax
The individual income tax is the largest source of state tax revenue. All income tax revenue is allocated to the state general fund, accounting for 54 percent of general fund revenue for Fiscal Year 2018. Income tax revenue is collected primarily through withholding from wages and other periodic payments, quarterly estimated tax payments, and payments made when a return is filed.
The following tables show income tax revenue and return filings. Income tax revenue is closely related to the state economy. The large drop in revenue for Fiscal Year 2010 and in returns for 2009 is due to the national recession.
The Legislature enacted the income tax in 1933 and has made major changes infrequently. The latest change was enacted in 2003 (effective 2005), and it reduced the number of rates, lowered the top rate, capped the itemized deduction for federal taxes, and provided preferential treatment for capital gains income.
Most differences between the federal and Montana income tax structure reflect the legislative decisions to allow married couples to file separate in Montana when the file jointly for federal tax purposes, and to use Montana specific additions, subtractions and deductions in determining Montana taxable income.
Fiscal Year
TotalRevenue
FY 2008 $776,574,977FY 2009 $815,138,193FY 2010 $717,834,371FY 2011 $816,089,973FY 2012 $898,851,201FY 2013 $1,047,789,985FY 2014 $1,063,284,408FY 2015 $1,175,744,881FY 2016 $1,184,827,762FY 2017 $1,168,224,644FY 2018 $1,297,776,586
Individual Income Tax Collections
$0
$200
$400
$600
$800
$1,000
$1,200
$1,400M
illio
ns
Calendar Year Returns
Returns with Refund
Percent with Refund
Average Refund
2004 547,623 294,025 66% $4682005 554,224 297,993 66% $4912006 572,256 311,789 66% $4642007 591,874 345,972 71% $5062008 601,078 345,172 70% $5982009 587,425 337,714 70% $5452010 596,021 335,904 68% $5322011 604,758 341,057 68% $5382012 611,360 343,678 68% $5232013 626,655 348,137 67% $5322014 635,045 350,760 67% $5362015 647,329 357,902 67% $5462016 647,855 364,936 68% $5782017 657,720 366,734 67% $591
Timely Filed Current Year ReturnsIncome Tax Returns and Refunds

56revenue.mt.gov
Overview of Individual Income Tax
Federal law provides different rate tables for married couples who file joint and separate returns, and couples generally have lower federal tax if they file a joint return. Most states either require couples to make the same choice between joint and separate returns as they did for their federal taxes, have different rate tables for joint and separate returns, or have a single tax rate so that the choice does not matter. Montana is one of only five states that do not have at least one of these provisions. Because of this, most two-income married couples find their tax is lower if they file a joint federal return and separate Montana returns. This is because when they file separately, the spouses can apply the lower brackets of the tax table twice on their combined income, instead of only once when they file jointly.
Montana also is one of only six states that allows a deduction for federal income taxes. Montana and two other states have a cap on the deduction, while the deduction is uncapped in three states. Most states do not allow this deduction because not having it allows lower rates. To raise the same revenue, a state that allows the deduction must have higher rates to compensate for the smaller tax base. The 2003 Legislature partially offset the revenue reduction from lower rates by capping the deduction for federal taxes.
Before 1981, the Legislature occasionally adjusted rate tables and other tax parameters for the effects of inflation. The 1981 Legislature assigned this task to the department, and each year the department adjusts rate brackets, standard deductions, personal exemptions, and the partial exemption for pension income for inflation. This prevents increases in individual tax liabilities that are due simply to inflation: Without this inflation adjustment, a person whose income just kept up with inflation would pay higher effective tax rates over time as inflation moved them to higher rate brackets.

57revenue.mt.gov
Recent Legislative Changes to Individual Income Tax
The following bills passed by the 2015 Legislature affected the individual income tax:
House Bill 122 clarified that the wages of agricultural laborers are not subject to withholding.
House Bill 359 changed the schedule for inflation indexing of the rate table, personal exemption, standard deduction, and partial pension exemption. Beginning with 2016, the inflation indexing process began at the beginning of the tax year, rather than two-thirs of the way through the year, as was done before 2016.
House Bill 379 changed penalties and interest for late returns, late payments, or intentionally filing an inaccurate return to be more consistent with federal penalties and interest. It also reduced the time when the department may audit a return from five years to three years.
Senate Bill 175 expanded the credit for providing emergency lodging to victims of domestic violence. Previously, the credit was available for providing emergency lodging to an individual. This bill changed the wording to allow the credit for providing emergency lodging to a family.
Senate Bill 309 expanded the credit for allowing access across private land to isolated parcels of state land. It allowed the credit to be claimed for allowing access to national forest or U.S. Bureau of Land Management parcels.
Senate Bill 378 clarified the language exempting the military salaries of National Guard and Reserve members when they are called up for active duty or for homeland defense activity or a contingency operation.
Senate Bill 386 made changes to the circumstances where a pass-through entity is required to either file a composite return or make payments on behalf of its owners. It also reduced the maximum penalty for a pass-through entity failing to file a return.
Senate Bill 399 created a new type of tax-deferred savings account to be used to pay expenses of a family member with a disability. Deposits of up to $3,000 a year and earnings retained in the account would be exempt from state income tax.
Senate Bill 410 provides a tax credit for contributions to organizations that give scholarships to private school students or to a state account to fund grants to public schools for supplemental programs.
The following bills passed by the 2017 Legislature affected the individual income tax:
House Bill 42 changed the due date for partnership returns from the 15th day of the fourth month after then end of the tax year to the 15th day of the third month.
House Bill 63 changed the filing date for forms MW-3, RW-3 and related W-2 and 1099s from February 28th to January 31st.
House Bill 137 removed references to the Insure Montana tax credit from the state’s statutes. It also extended the Securities Restitution Assistance Fund end date to July 1, 2021.
House Bill 175 increased the deduction for contributions to medical savings accounts from $3,000 to $3,500 in Tax Year 2018 and $4,000 for 2019. The bill also requires the amount to be adjusted for inflation each tax year after 2019. The bill also limits contributions to the medical savings accounts to the deductible amount. Finally, the bill also changed medical savings accounts to allow the funds to be withdrawn for long-term care, long-term care insurance and family leave expenses.
House Bill 308 created a non-refundable tax credit of $750 per apprentice, and $1,500 per veteran apprenticeship, for employers who participate in a Department of Labor and Industry registered apprenticeship program. The credit becomes available to employers in Tax Year 2018.
58revenue.mt.gov
Calculation of Individual Income Tax
House Bill 391 created a state earned income tax credit that is equal to 3 percent of the federal earned income tax credit. The credit is fully refundable and is available starting Tax Year 2019.
House Bill 498 extended the termination date of the unlocking state lands credit from the end of Tax Year 2020 to the end of 2027.
House Bill 511 revises the Multistate Tax Compact to allow the market sourcing of sales when apportioning the Montana source income of some pass-through businesses.
House Bill 574 allows some individual income taxpayers to deduct wages, salaries, or business expenses from Montana income when the expenses cannot be deducted at the federal level, due to the taxpayer claiming a credit.
House Bill 597 created a deduction for taxpayers on their income taxes for donations made to the state’s public land access network grant program.
Senate Bill 10 repealed the income tax credit for residential property tax on a principal residence.
Senate Bill 138 extended the time a taxpayer can claim an income tax refund to one year after the overpayment or filing of the income tax return.
Senate Bill 252 expands the current waiver from having to file a composite return, or withholding tax, for certain second-tier pass-through entities to qualifying C Corporations and other entities.
Calculation of Individual Income TaxCalculation of Montana individual income tax begins with the taxpayer’s Federal Adjusted Gross Income. Several adjustments are made to determine Montana Adjusted Gross Income:
• Income taxed by the state but exempted by the federal government is added.• Income exempted by the state but taxed by the federal government is subtracted.• Deposits to Montana tax-advantaged savings accounts are subtracted.• Taxable withdrawals from Montana tax-advantaged savings accounts are added.• Net adjustments from filing a joint federal return and separate state returns are added.• Recoveries of costs deducted in previous years (primarily refunds of federal taxes previously
deducted) are added.
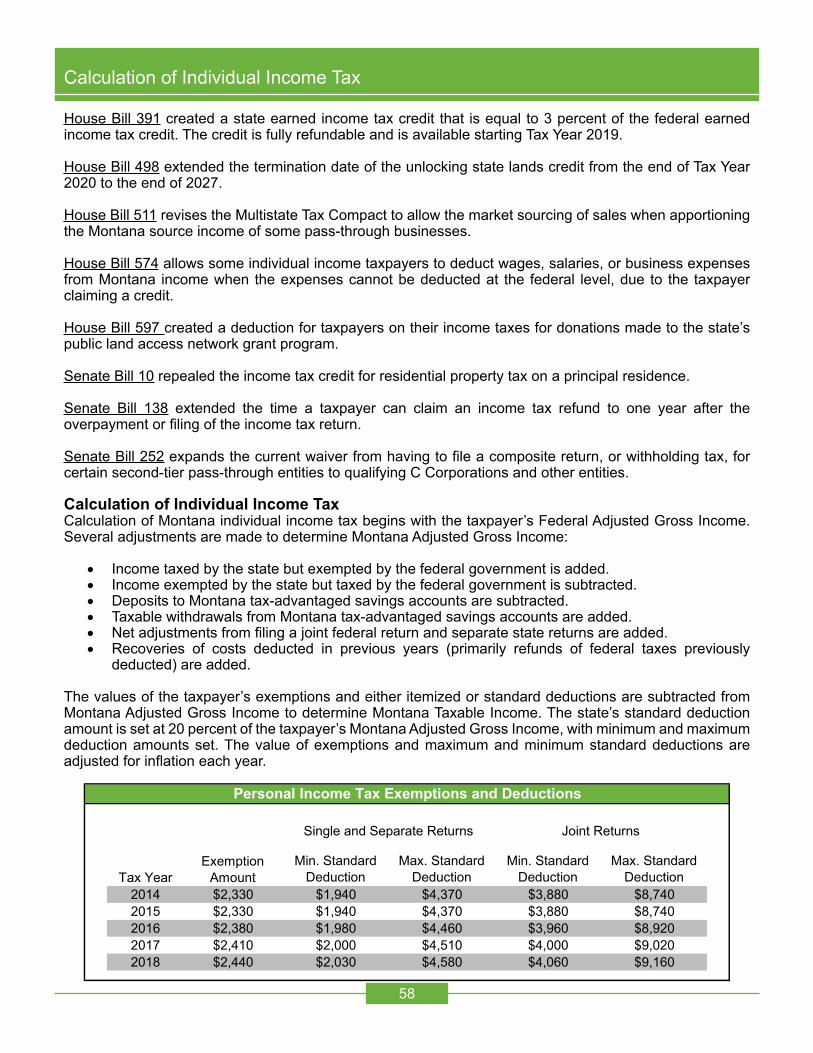
The values of the taxpayer’s exemptions and either itemized or standard deductions are subtracted from Montana Adjusted Gross Income to determine Montana Taxable Income. The state’s standard deduction amount is set at 20 percent of the taxpayer’s Montana Adjusted Gross Income, with minimum and maximum deduction amounts set. The value of exemptions and maximum and minimum standard deductions are adjusted for inflation each year.
Min. Standard Deduction
Max. Standard Deduction
Min. Standard Deduction
Max. Standard Deduction
2014 $2,330 $1,940 $4,370 $3,880 $8,7402015 $2,330 $1,940 $4,370 $3,880 $8,7402016 $2,380 $1,980 $4,460 $3,960 $8,9202017 $2,410 $2,000 $4,510 $4,000 $9,0202018 $2,440 $2,030 $4,580 $4,060 $9,160
Joint ReturnsSingle and Separate Returns
Exemption Amount
Personal Income Tax Exemptions and Deductions
Tax Year

59revenue.mt.gov
Income, Deductions, Credits, and Tax Liability
Tax liability is calculated from the rate table. The rate table shows tax rates to apply to taxable income, i.e. income after making all federal and state adjustments and subtracting exemptions and deductions. The rate table is adjusted for inflation each year. The following table shows the upper limit on taxable income subject to each rate.
Any credits the taxpayer may claim are subtracted from the tax liability to give the net tax. Non-refundable credits can partially or completely offset a taxpayer’s tax liability. Refundable credits can more than offset a taxpayer’s tax liability so that the taxpayer receives a payment from the state general fund rather than paying tax. Taxpayers with capital gains income are allowed a non-refundable credit equal to 2 percent of their capital gains. In effect, this credit reduces the taxes on capital gains to a maximum rate of 4.9 percent, compared to the maximum rate of 6.9 percent for other types of income. Other credits generally are a percentage of a certain type of qualifying expenditure the taxpayer has made.
The next six tables show information about individual line items on timely-filed full-year residents’ income tax returns for 2016 and 2017. For each line item, the table shows the count of the number of returns with a value on that line and the sum of those values. The total in each counts column is the number of returns with a number on at least one line. It is not the sum of the counts for individual lines.
Information in these tables is from unaudited returns as filed by taxpayers. It does not reflect changes or adjustments that taxpayers or the department may make after the extension filing deadline. It also does not include information from late-filed returns.
Tax Year 2014 2015 2016 2017 20181.0% $2,800 $2,800 $2,900 $2,900 $3,0002.0% $5,000 $5,000 $5,100 $5,200 $5,2003.0% $7,600 $7,600 $7,800 $7,900 $8,0004.0% $10,300 $10,300 $10,500 $10,600 $10,8005.0% $13,300 $13,300 $13,500 $13,600 $13,9006.0% $17,100 $17,100 $17,400 $17,600 $17,9006.9% Unlimited Unlimited Unlimited Unlimited Unlimited
Marginal Tax Rate Income Limits

60revenue.mt.gov
Income, Deductions, Credits, and Tax Liability
Montana Individual Income TaxIncome Reported on Full-Year Residents' Returns
2016 and 20172016 2017
Count Total Count TotalIncome ItemsWage and salary income 440,429 $16,791,932,650 444,434 $17,474,821,673Taxable interest income 184,220 $295,852,987 192,536 $297,882,239Ordinary dividend income 117,897 $690,231,697 120,354 $774,329,625Taxable refunds of state/local income taxes 103,029 $111,925,258 102,120 $109,337,852Alimony received 814 $16,123,328 773 $15,181,215Business income (Schedule C) 78,872 $862,601,508 80,309 $886,398,751Capital gains income 114,704 $1,616,569,882 120,423 $2,188,181,373Ordinary income gains 16,429 $80,014,927 16,491 $107,080,958IRA distributions - Taxable amount 57,554 $782,897,577 61,137 $870,507,097Pension and annuity income - Taxable amount 104,443 $2,215,680,872 106,410 $2,322,603,691Rent, royalty, partnership, etc. income 103,650 $2,650,879,193 103,393 $2,552,538,401Farm income 18,555 -$230,848,734 18,330 -$231,614,976Unemployment compensation 23,794 $94,926,088 22,084 $87,578,113Taxable social security benefits 89,908 $981,544,899 95,137 $1,072,023,315Other income 33,488 -$545,398,888 33,685 -$551,154,101
Total income 561,552 $26,414,933,244 569,228 $27,975,695,226
Federal Adjustments to IncomeEducator expenses 10,969 $2,563,221 10,646 $2,542,462Business expenses 766 $2,149,868 706 $1,962,930Health savings account deduction 12,408 $41,310,075 12,737 $43,149,496Moving expenses 2,925 $5,160,564 2,652 $4,753,851One-half self-employment tax 64,296 $88,099,153 64,881 $89,951,840Self-employed SEP, SIMPLE, and qual. plans 2,804 $50,148,146 2,805 $51,530,999Self-employed health insurance deduction 25,897 $145,127,725 24,739 $152,651,623Penalty on early withdrawal of savings 1,599 $280,108 1,628 $314,640Alimony paid 1,189 $18,942,254 1,174 $18,847,494IRA deduction 15,393 $66,073,642 15,302 $67,053,676Student loan interest deduction 49,805 $46,125,127 50,616 $46,843,507Tuition & fees deduction 5,330 $11,292,573 3,654 $7,716,922Domestic production activities deduction 8,039 $57,962,441 7,635 $57,849,388Federal write-ins 222 $1,571,465 263 $1,645,204
Total adjustments to income 148,923 $536,806,362 148,824 $546,814,032
Federal Adjusted Gross Income 561,634 $25,878,126,882 569,324 $27,428,881,194

61revenue.mt.gov
Income, Deductions, Credits, and Tax Liability
Montana Individual Income TaxAdditions Reported on Full-Year Residents' Returns
2016 and 20172016 2017
Count Total Count TotalMontana Additions to Federal Adjusted Gross IncomeInterest on other states' municipal bonds 19,349 $95,925,034 19,639 $89,749,187Dividends not included in FAGI 1,057 $633,479 931 $467,217Taxable federal refunds 79,838 $109,638,481 83,053 $116,256,063Recoveries of amounts deducted in earlier years 135 $382,825 212 $277,561Additions to federal taxable social security or railroad retirement 9,689 $16,592,639 9,893 $17,622,237Allocation of compensation to spouse 375 $6,824,402 350 $5,832,675Medical savings account nonqualified withdrawals 57 $93,482 73 $122,519First-time homebuyer's account nonqualified withdrawals 14 $27,839 * $11,317Farm and ranch risk management account taxable distributions * $3,500 * $0Dependent care assistance credit adjustment 34 $74,913 48 $96,664Smaller federal estate and trust taxable distributions 76 $177,318 69 $180,223Federal net operating loss carryover 5,121 $553,978,303 5,587 $585,869,318Federal taxes paid by your S. corporation 45 $202,147 59 $214,057Title plant depreciation * $0 * $1,413Other additions 2,539 $13,266,865 2,511 $14,102,800
Total Montana Additions 106,612 $797,821,227 110,424 $830,803,251* Not disclosed due to confidentiality concerns
Montana Individual Income TaxSubtractions Reported on Full-Year Residents' Returns
2016 and 20172016 2017
Count Total Count TotalMontana Subtractions from Federal Adjusted Gross IncomeFederal bonds exempt interest 19,244 $23,737,395 21,259 $25,990,828Exempt tribal income 6,336 $216,137,415 6,248 $254,049,703Exempt unemployment compensation 23,794 $94,926,088 22,084 $87,578,113Exempt worker's comp benefits 124 $699,707 155 $774,048Capital gains from small business investment companies 13 $24,738 * $1,449,364State tax refunds included in FAGI 103,014 $111,911,544 102,088 $109,313,706Recoveries of amounts deducted in earlier years 14 $102,822 16 $87,493Exempt active duty military salary 4,621 $174,056,632 4,735 $180,870,093Nonresident exempt military income 144 $5,389,119 111 $4,919,395Exempt life insurance premiums reimbursement (National Guard) 28 $15,633 28 $28,304Exempt pension income 47,308 $173,070,990 47,059 $173,734,004Elderly interest exclusion 75,163 $30,687,228 80,940 $33,284,834Exempt retirement disability income (under age 65) 37 $171,297 37 $170,951Exempt tip income 19,418 $71,768,259 20,945 $80,661,372Exempt income of child taxed to parent 135 $498,424 150 $351,252Exempt health insurance premiums taxed to employee 139 $563,180 165 $646,073Student loan repayments taxed to health care professional 435 $1,278,928 462 $1,315,847Medical care savings account exempt deposits 7,750 $19,419,283 7,817 $19,759,187First-time homebuyer exempt savings account deposits 256 $706,088 255 $691,899Family education savings account exempt deposits 4,744 $11,083,019 5,187 $12,361,878ABLE account exempt deposits 20 $42,190 42 $78,670Farm and ranch risk management accounts exempt deposits * $1,941 * $1,056Subtraction to federal taxable social security/Tier 1 railroad retirement 41,878 $187,960,115 43,058 $195,388,439Subtraction for federal taxable Tier II railroad retirement 3,062 $48,318,083 3,135 $50,097,081Subtraction for spouse filing joint return: passive loss carryover 44 $272,056 42 $388,522Subtraction for spouse filing joint return: capital loss adjustment 1,021 $2,205,698 1,146 $3,194,491Allocation of compensation to spouse 377 $6,849,766 351 $5,835,675Montana net operating loss carryover 3,538 $335,530,053 3,845 $364,609,11340% capital gain exclusion on pre-1987 installment sales 37 $166,133 14 $75,280Business expense of recycled material 118 $327,567 100 $279,218Sales of land to beginning farmers * $27,569 * $4,377Larger federal estate and trust taxable distributions 249 $751,486 300 $1,557,038Wage deduction reduced by federal targeted jobs credit 42 $234,434 59 $559,348Certain gains recognized by liquidating corporation * $188,516 * $17,361Other subtractions 4,000 $162,303,303 3,516 $178,548,038
Total Montana Subtractions 249,013 $1,681,426,699 252,470 $1,788,672,051* Not disclosed due to confidentiality concerns

62revenue.mt.gov
Income, Deductions, Credits, and Tax Liability
Montana Individual Income TaxDeductions Reported on Full-Year Residents' Returns
2016 and 20172016 2017
Count Total Count TotalDeductionsDeductible medical expenses 57,749 $293,717,332 62,282 $307,625,176Medical insurance premiums not deducted elsewhere 119,445 $445,884,104 120,710 $473,418,359Long-term care insurance premiums 13,309 $30,987,121 13,020 $30,898,836Federal Income Tax
Federal income tax withheld* 284,041 $2,079,268,149 292,337 $2,228,448,744Federal income tax estimated payments* 53,029 $891,748,134 53,215 $887,518,427Last year's federal income tax paid (e.g. with return)* 72,620 $795,786,733 69,141 $512,524,941Federal income tax from previous years* 4,518 $20,685,669 4,771 $23,267,963
Total federal income tax deduction 313,779 $1,325,330,899 321,141 $1,367,118,010State or local sales tax 450 $441,878 527 $669,560Local income taxes 417 $125,825 506 $213,412Real estate taxes 220,880 $491,661,308 225,604 $542,165,526Personal property taxes 176,536 $58,464,448 179,538 $61,716,979Other deductible taxes 17,666 $6,342,633 16,412 $6,262,752Home mortgage interest 166,068 $909,386,335 168,358 $932,109,767Qualified mortgage insurance premiums 24,647 $29,761,138 13,085 $15,411,102Investment interest 7,882 $28,383,859 7,761 $29,594,202Contributions by cash or check 170,477 $502,946,119 171,371 $490,356,062Contributions other than cash or check 82,231 $148,637,209 82,012 $118,484,126Carryover of contributions from previous years 3,228 $33,937,186 3,647 $42,384,106Child and dependent care expenses 591 $1,206,246 530 $1,093,360Casualty and theft losses 328 $6,744,568 286 $5,112,316Business Expenses
Unreimbursed employee business expenses* 61,627 $187,415,856 59,664 $188,650,789Other business expenses* 147,083 $174,174,795 149,261 $180,605,354
Total business expenses* 169,765 $361,590,651 171,946 $369,256,143Net deductible unreimbursed business expenses 59,851 $248,206,025 59,645 $250,808,301
Political contributions 11,123 $1,055,050 8,957 $838,756All other miscellaneous deductions not subject to 2% floor 2,054 $7,242,057 1,893 $5,298,965Gambling losses 1,614 $21,202,780 1,644 $24,498,818
Total itemized deductions 337,190 $4,591,664,120 345,356 $4,706,078,491Unallowed itemized deductions (due to income over threshold) 9,770 $63,170,821 10,619 $64,656,342Allowable itemized deductions 337,190 $4,528,493,299 345,356 $4,641,422,149Standard deductions 207,795 $846,396,140 206,961 $858,991,800
Total deductions 560,382 $5,374,889,439 568,087 $5,500,413,949* Items either are part of another line or include another line. They are not part of the total.

63revenue.mt.gov
Income, Deductions, Credits, and Tax Liability
Montana Individual Income TaxExemptions, Taxable Income, Tax, and Payments Reported on Full-Year Residents' Returns
2016 and 20172016 2017
Count Total Count TotalExemptions *Self Exemption 563,809 571,634Self 65 and Over Exemption 115,259 121,298Self Blind Exemption 1,039 1,085 Total Taxpayer Exemptions 563,809 680,098 571,634 694,017Spouse Exemption 86,057 84,011Spouse 65 and Over Exemption 25,194 25,167Spouse Blind Exemption 238 188 Total Spouse Exemptions 86,057 111,485 84,011 109,366Dependent Exemptions 131,402 238,573 132,077 239,621
Total Exemptions 563,801 1,030,156 571,634 1,043,004Value of Exemptions $2,451,771,280 $2,503,209,600
Taxable IncomeFederal Adjusted Gross Income 561,634 $25,878,126,882 569,324 $27,428,881,194
+Montana Additions 106,612 $797,821,227 110,424 $830,803,251-Montana Subtractions 249,013 $1,681,426,699 252,470 $1,788,672,051-Deductions 560,382 $5,374,889,439 568,087 $5,500,413,949-Value of Exemptions 563,801 $2,451,771,280 571,634 $2,503,209,600
Montana Taxable Income 472,832 $18,557,477,093 482,649 $19,887,757,453
Tax from Tax Table 472,274 $1,052,796,654 482,091 $1,136,604,107Capital Gains Credit 77,004 $33,576,490 89,684 $44,758,820Tax before Credits & Adjustments 468,251 $1,022,467,276 477,045 $1,095,451,716
Tax on Lump Sum Distributions 22 $2,552 26 $8,068Recapture of Credits Claimed Previously 11 $1,450 11 $4,625Total Tax $1,022,471,278 $1,095,464,409
PaymentsMontana income tax withheld from wages 449,699 $830,668,092 456,662 $878,731,702Tax withheld from mineral royalties 2,693 $1,458,271 2,661 $1,580,071Tax withheld by pass-through entities 448 $1,050,128 509 $1,077,590Estimated tax payments 52,296 $233,764,470 52,952 $246,969,777Extension payments 5,752 $30,761,768 5,914 $32,721,953
Total Payments $1,097,702,729 $1,161,081,093* Taxpayers claim exemptions for themselves and their spouses by checking boxes on the return. The counts for exemptions show the number of returns where the taxpayer claimed at least one exemption for themself, their spouse, or dependents. The totals column shows the number and type of exemptions claimed. For the taxpayer and spouse, the totals column shows the numbers of basic exemptions and extra exemptions for being 65 or over or blind. For dependent exemptions, the count is the number of returns claiming at least one dependent, and the total is the number of dependents claimed.

64revenue.mt.gov
Income, Deductions, Credits, and Tax Liability
Montana Individual Income TaxCredits Reported on Full-Year Residents' Returns
2016 and 20172016 2017
Count Total Count TotalCreditsNon-Refundable and No Carryover
Other states' income tax credit 14,202 $31,363,032 14,974 $33,636,066College contribution tax credit 3,597 $322,604 3,561 $369,846Qualified endowment tax credit 723 $2,708,754 823 $3,157,163Energy conservation tax credit 10,485 $4,138,900 9,888 $3,970,515Alternative fuel tax credit 17 $8,632 13 $6,194Insurance for uninsured Montanan's credit 49 $39,526 57 $51,629Elderly care tax credit 57 $82,771 59 $91,545Recycling tax credit 108 $329,343 111 $473,540Innovation Education Credit 47 $7,601 52 $8,420Student Scholarship Organization Credit 181 $30,474 171 $27,732Biodiesel blending/storage tank credit 0 $0 0 $0
Non-Refundable but with CarryoverContractor's gross receipts tax credit 650 $5,309,579 668 $5,335,391Geothermal systems tax credit 177 $195,186 107 $156,820Alternative energy systems credit 654 $372,227 634 $267,593Biomass alternative energy systems credit 510 $296,315 398 $184,145Alternative energy production tax credit * $1,843 * $33,788Dependent care assistance credit * $22,415 * $143,750Historic property preservation tax credit 22 $301,456 15 $183,891Infrastructure user fee credit 14 $646,145 21 $3,341,633Empowerment zone credit * $500 0 $0Research activities tax credit * $795 * $4,591Mineral exploration tax credit * $465 * $2,020Adoption credit 240 $222,618 233 $170,940
Total Non-Refundable Credits 30,221 $46,401,181 30,355 $51,617,212Refundable Credits
Elderly homeowner/renter tax creditClaimed with Income Tax Return 13,230 $6,510,107 13,679 $6,949,653Claimed without Income Tax Return 3,278 $1,426,062 2,883 $1,274,394
Emergency lodging credit * $2,030 21 $9,841Unlocking state lands credit * $1,973 * $1,973
Total Refundable Credits 13,244 $6,514,110 13,704 $6,961,467Total Credits 42,322 $52,915,291 42,986 $52,925,106
* Not disclosed due to confidentiality concerns

65revenue.mt.gov
Income, Deductions, Credits, and Tax Liability
Wages, Salaries, Tips55%
Interest and Dividend Income 3%
Gain or Loss on Asset Sales 7%
Retirement Income (Taxable Social Security, IRAs, Pensions, and Annuities) 13%
Business Income (NBI; Rents, Royalties, & Partnership: Farm;
Other) 21%
Breakdown of Income Sources - Tax Year 2017
Federal Taxes29%
Home Mortgage Interest and Other
Interest21%
Unreimbursed Business Expenses
5%
Medical Expenses and Health Insurance
Premiums17%
Property and Other Taxes13%
Contributions and Other15%
Breakdown of Itemized Deductions - Tax Year 2017

66revenue.mt.gov
Income, Deductions, Credits, and Tax Liability
The following tables show Montana adjusted gross income, deductions, taxable income and tax liability by decile group for full-year Montana residents. Each decile is 10 percent of the population of full year resident returns, sorted by adjusted gross income. Group 1 is the 10 percent with the lowest incomes, while group 10 is the 10 percent with the highest incomes. In these tables, married couples who file separate returns on the same form are counted as two returns, and their income and tax are counted separately. Non-residents and part-year residents are not included because their tax depends on the fraction of income that is apportioned to Montana, which varies widely for these individuals.
Decile Group Returns Income Range Returns Income Range
$ million % of total $ million % of total
1 56,380 less than $4,231 -$642.6 -3% 57,163 less than $4,450 -$669.4 -3%2 56,381 $4,231 to $10,228 $408.6 2% 57,163 $4,450 to $10,716 $434.3 2%3 56,381 $10,229 to $16,328 $747.2 3% 57,164 $10,717 to $17,015 $791.6 3%4 56,381 $16,329 to $22,847 $1,102.3 4% 57,163 $17,016 to $23,814 $1,166.0 4%5 56,381 $22,848 to $29,857 $1,481.2 6% 57,164 $23,815 to $31,086 $1,564.2 6%6 56,381 $29,858 to $38,141 $1,912.0 8% 57,163 $31,087 to $39,638 $2,017.4 8%7 56,381 $38,142 to $47,919 $2,415.4 10% 57,163 $39,639 to $49,741 $2,543.9 10%8 56,381 $47,920 to $61,124 $3,050.9 12% 57,164 $49,742 to $63,414 $3,209.0 12%9 56,381 $61,125 to $85,930 $4,041.7 16% 57,163 $63,415 to $89,445 $4,261.2 16%
10 56,381 more than $85,930 $10,477.7 42% 57,164 more than $89,445 $11,152.9 42%
All 563,809 $24,994.5 571,634 $26,471.0
Montana AdjustedGross Income
Montana AdjustedGross Income
Deciles of Montana Adjusted Gross IncomeFull-Year Residents
2016 and 20172016 2017
Decile Group
% Returns Itemize
% Returns Itemize
$ million average $ million average $ million average $ million average
1 34% $170.1 $8,752 $87.7 $2,374 36% $176.6 $8,581 $86.9 $2,3742 30% $114.0 $6,675 $90.9 $2,312 31% $117.2 $6,650 $92.6 $2,3423 38% $167.1 $7,729 $102.5 $2,949 38% $163.4 $7,479 $107.7 $3,0494 40% $187.2 $8,299 $133.7 $3,953 40% $192.2 $8,406 $140.4 $4,0935 46% $228.4 $8,880 $142.9 $4,660 46% $238.1 $9,124 $147.5 $4,7496 60% $317.8 $9,378 $117.1 $5,204 63% $341.0 $9,543 $114.4 $5,3407 79% $486.8 $10,881 $74.8 $6,427 80% $514.4 $11,195 $74.2 $6,6128 87% $632.7 $12,885 $51.7 $7,096 88% $656.4 $13,116 $50.6 $7,1089 92% $803.9 $15,496 $32.5 $7,217 92% $831.2 $15,748 $32.0 $7,306
10 97% $1,420.6 $26,021 $12.7 $7,101 97% $1,410.8 $25,480 $12.8 $7,117
All 60% $4,528.5 $11,994 $846.4 $3,792 61% $4,641.4 $12,041 $859.0 $3,857
Itemized Deductions Standard Deductions
Deductions by Decile GroupFull-Year Residents
2016 and 20172016 2017
Itemized Deductions Standard Deductions

67revenue.mt.gov
Income, Deductions, Credits, and Tax Liability
Decile Group Itemized DeductionsStandard
Deductions All Itemized DeductionsStandard
Deductions All
1 -37% -50% -40% -37% -45% -39%2 90% 32% 50% 85% 31% 48%3 58% 22% 36% 54% 22% 34%4 42% 20% 29% 41% 20% 29%5 34% 18% 25% 33% 17% 25%6 27% 16% 23% 27% 15% 23%7 25% 15% 23% 25% 15% 23%8 24% 13% 22% 23% 13% 22%9 22% 10% 21% 21% 10% 20%
10 14% 5% 14% 13% 5% 13%
All 22% 20% 22% 21% 20% 21%
Deductions as Percent of Montana Adjusted Gross IncomeFull-Year Residents
2016 and 20172016 2017
Decile Group
$ million Average % of Total $ million Average % of Total $ million Average % of Total $ million Average % of Total
1 $0.3 $6 0% $0.0 $0 0% $0.5 $8 0% $0.0 $0 0%2 $103.7 $1,839 1% $1.3 $23 0% $116.0 $2,029 1% $1.5 $26 0%3 $317.5 $5,631 2% $6.3 $111 1% $344.2 $6,021 2% $6.9 $121 1%4 $582.9 $10,338 3% $16.4 $291 2% $629.2 $11,007 3% $18.1 $317 2%5 $900.2 $15,967 5% $33.3 $591 3% $968.9 $16,950 5% $36.8 $644 3%6 $1,255.8 $22,273 7% $55.8 $989 5% $1,335.2 $23,358 7% $60.3 $1,054 6%7 $1,617.7 $28,692 9% $79.9 $1,418 8% $1,720.5 $30,098 9% $85.9 $1,503 8%8 $2,116.3 $37,535 11% $113.6 $2,015 11% $2,245.6 $39,284 11% $121.3 $2,122 11%9 $2,932.5 $52,012 16% $168.7 $2,993 17% $3,118.6 $54,556 16% $180.1 $3,151 16%
10 $8,730.6 $154,850 47% $547.1 $9,704 54% $9,409.1 $164,598 47% $584.4 $10,224 53%
All $18,557.5 $32,914 $1,022.5 $1,813 $19,887.8 $34,791 $1,095.5 $1,916
Taxable Income and TaxFull-Year Residents
2016 and 20172016 2017
Taxable Income Tax Liability Taxable Income Tax Liability
Decile GroupMontana Adjusted
Gross Income Tax Liability Tax / IncomeMontana Adjusted
Gross Income Tax Liability Tax / Income
$ million $ million % $ million $ million %
1 -$642.6 $0.0 0.0% -$669.4 $0.0 0.0%2 $408.6 $1.3 0.3% $434.3 $1.5 0.3%3 $747.2 $6.3 0.8% $791.6 $6.9 0.9%4 $1,102.3 $16.4 1.5% $1,166.0 $18.1 1.6%5 $1,481.2 $33.3 2.3% $1,564.2 $36.8 2.4%6 $1,912.0 $55.8 2.9% $2,017.4 $60.3 3.0%7 $2,415.4 $79.9 3.3% $2,543.9 $85.9 3.4%8 $3,050.9 $113.6 3.7% $3,209.0 $121.3 3.8%9 $4,041.7 $168.7 4.2% $4,261.2 $180.1 4.2%
10 $10,477.7 $547.1 5.2% $11,152.9 $584.4 5.2%
All $24,994.5 $1,022.5 4.1% $26,471.0 $1,095.5 4.1%
Tax as Percent of Adjusted Gross IncomeFull-Year Residents
2016 and 20172016 2017

68revenue.mt.gov
Taxation of Business Income
Business Structure and Taxation
A business’s legal ownership structure generally determines how income from the business is taxed. Business organization is a matter of state law, and a business operating in Montana may be organized under the provisions of the laws of Montana (generally Title 35, Montana Code Annotated) or of the laws of another state. States vary somewhat in the options for business organization they allow and in the details of particular business structures.
While tax considerations may affect a business’s choice of ownership structure, there are other factors that may have a larger influence. Different business structures give the owners different types of protection from or exposure to the business’s legal and financial liabilities. They have different mechanisms for decision making and control of the business’s operations. They have different arrangements for sharing of income, expenses, risks and rewards among the owners. And, they offer different levels of privacy or transparency of ownership. How a business is organized can also affect its ability to access capital markets. Most corporations and some types of partnerships can raise funds by issuing new shares, and existing shares can be bought and sold without requiring the other owners’ consent. With other business structures, buying and selling ownership interests or raising funds by bringing in new owners may require the other owners’ consent.
For taxation, the IRS code puts all businesses in one of three categories, and Montana law generally requires a business to be in the same category for state taxation as it is for federal taxation.
Informally organized sole proprietor businesses are not treated as an entity separate from the owner for income tax reporting purposes. The owner of a sole proprietor business must be an individual or a married couple. Some formally organized businesses with a single owner are not sole proprietor businesses and are treated as separate from the owner for income tax reporting purposes. These businesses are called disregarded entities and are subject to filing a Montana information return and income tax withholding paid on behalf of the owner. The disregarded entity’s income is still reported on the owner’s tax return and is taxed as part of the owner’s income. If the disregarded entity pays income tax on behalf of the owner, the owner can claim the payment as a refundable credit.
Partnerships, limited liability companies, and other unincorporated businesses with more than one owner generally are treated as pass-through entities. A corporation with no more than 100 shareholders, with a single class of stock, and with no shareholders that are another business entity or a nonresident alien, may elect to be treated as a pass-through entity. Such a corporation is known as an S Corporation, because its taxation is laid out in Subchapter S of Chapter 1 of the IRS code.
For a pass-through entity, there is no tax on income at the business entity level. The entity calculates its net income and each owner’s share of that net income. The owners must include that income (or loss) in the calculation of their taxable income. An owner’s income from a pass-through is a share of the business’s income, not the payments the owner receives from the business. If a pass-through entity retains part of its income to finance expansion or other investment, each owner is taxed on his or her share of the retained income, and the accounting value of each ownership interest is increased by the owner’s share of the retained income. If the pass-through pays out more than its annual net income, the excess is treated as a return of a portion of the owner’s investment. It is not taxed, and the accounting value of each ownership interest is reduced by the owner’s share of the excess distribution.
A pass-through entity is required to file an annual information return showing the calculation of its net income or loss and the distribution of that income or loss to owners. The owners are then responsible for reporting this income on their tax returns and including it in the calculation of their taxable income. If a pass-through entity has a nonresident or second-tier pass-through entity owner, then the pass-through must include the owner in a composite return, withhold income tax on behalf of the owner, or obtain a waiver of these requirements.

69revenue.mt.gov
Taxation of Business Income
A corporation that does not meet the requirements to be treated as a pass-through entity, or that does not choose pass-through treatment, is taxed on income at the business entity level. The corporation calculates its net income and is taxed on it at the corporate income tax rate. The corporation’s income is not directly attributed to the owners. A corporation’s owners include dividends they receive in the calculation of their taxable incomes. A corporation may pay dividends that are more or less than its net income. If it does, there is no adjustment to the accounting value of individual shares. This allows a corporation to retain profits for reinvestment without the shareholders being taxed on those profits.
The following table shows characteristics of businesses falling into each of the four business tax categories.
Business Structure, Tax Administration, and Compliance
Taxation of business income can be complicated when a business operates in more than one taxing jurisdiction and when one business entity is partly or completely owned by another. When a business operates in more than one taxing jurisdiction, it is necessary to decide how much of the business’s income is taxable by each jurisdiction. When one business entity owns another or two businesses have a common owner, it can be necessary to decide how much of the common income is due to each business. When affiliated businesses operate across multiple jurisdictions, the complications are compounded.
A general principle that most U.S. states and most countries follow is that business income should be taxable by the jurisdiction where the business activity that created the income took place and should not be taxable by other jurisdictions. This is often called the source principle of income taxation.1 When a business operates 1 The source principle of income taxation contrasts with the destination principle of consumption taxation. U.S. states and most countries follow the principle that taxes on consumptions, such as sales taxes, should be levied by the jurisdiction where the goods or services are used
Sole Proprietor Pass-Through Entity(S Corporation or Partnership) C Corporation Disregarded Entity
Legal Business Organization
Informal Partnership, Limited Liability Company (LLC), Corporation, Limited Partnership, etc.
Corporation Single Member LLC, etc.
May Be Owned By
One Individual or Married Couple
Individuals or Other Business Entities
Individuals or Other Business Entities
Individuals or Other Business Entities
Business Income and Owner's Income
The business net income is all attributed to the owner.
The business calculates its net income, and this income is attributed to the owners.
The business calculates its net income. Owners' income is dividends received.
The business net income is all attributed to the owner.
Distribution of Income to Owners
The business net income is the owners' income from the business.
Distributions to owners need not equal businesses' current net income.
Business pays dividends to shareholders. Dividends need not equal businesses' current net income.
Distribution to owner need not equal businesses' current net income.
Taxation Owner reports income from business as part of income subject to individual income tax
No tax at the entity level. Owners responsible for tax on income attributed to them.
Business net income subject to corporation income tax. Owners taxed on dividends.
Entity is ignored. Businesses' income is taxed as owner's income.
Reporting The business receipts and costs are reported on Schedule C of the owners' federal tax return (Schedule F for a farm), and net income is reported on Line 12 for Business Income or Loss (Line 18 for Farm Income or Loss) of the state return.
The business files federal and state information returns. Federal return shows receipts and costs and both show income, deductions, and credits passed through to owners. Owners report their share of net business income from the pass-through as business income (Schedule E and Line 17 of the tax return for individuals). If the business receives dividends, capital gains, or other passive income, owners report those separately on the appropriate return lines.
The business files federal and state corporate income tax returns and a federal information report, Form 1099-DIV, for each owner who received at least $10 of dividends. Owners report dividends received on their tax returns (Line 9 of state return for individuals).
Income is reported on owner's return.
Information return required if owner is a non-resident or another business.
Business Structure and Taxation

70revenue.mt.gov
Taxation of Business Income
in more than one taxing jurisdiction, each must decide how much of the business’s income has its source in that jurisdiction. For example, suppose a company harvests timber and mills it into lumber in Montana and sells the lumber in North Dakota. The company receives all its gross income in North Dakota, and pays most of its costs in Montana. Its net income, which is the basis of taxation in both Montana and North Dakota, is due to the combined operation in both states. Each state decides how much of the combined net income to tax through a process called apportionment. Each state uses a formula to determine an apportionment factor, the portion of the company’s business income2 to attribute to operations in the state. Montana uses the equally-weighted three-factor apportionment formula where the apportionment factor is the average of the proportions of a company’s property, payroll, and sales in a state. Other states use a range of formulas, with some placing more weight on one factor and less, or no, weight on the others.
If lumber production in Montana and lumber sales in North Dakota were separate, unrelated businesses, there would be no need for apportionment. The lumber production company’s net income would be the difference between its receipts from selling lumber wholesale and its costs of harvesting trees and milling lumber. This net income would be taxable by Montana. The lumber sales company’s net income would be the difference between its receipts from retail lumber sales and its costs of buying the lumber wholesale and operating its lumber yards. This net income would be taxable by North Dakota.
If the two companies are affiliates, such as two separate legal entities both owned by a third company, the situation is more complicated. Apportionment is still needed because wholesale lumber sales from the mill in Montana to the yards in North Dakota are not arms-length transactions. The transfer prices at which the lumber mill sells to the lumber yards are not determined in a market and do not necessarily reflect the lumber’s true value. From the point of view of the parent company, these transfer prices are irrelevant. The mill’s revenue from wholesale sales and the lumber yard’s expenses for wholesale purchases cancel each other out. The parent company’s net income is the difference between the revenue from retail lumber sales and the costs of timber harvesting, lumber milling, and lumber yard operations.
Transfer prices do matter to the states. If the lumber mill charges high prices to the lumber yards, its Montana profits will be higher and the lumber yards’ North Dakota profits will be lower. If the mill charges low prices, its Montana profits will be lower and the lumber yards’ North Dakota profits will be higher.
Montana law addresses this problem through combined reporting. Affiliated companies that are not engaged in completely separate businesses are required to file a single, combined return and to apportion the group’s income. The Montana timber harvesting and lumber milling company, the North Dakota lumber yard company, and their parent company would file a combined return and should pay the same Montana taxes as if they were a single company.
Another complication can arise when affiliated companies are pass-through entities and there is a tiered ownership structure, with a company that is actually conducting business being owned by a second-tier pass-through entity, which may be one of several owned by a third-tier pass-through entity, which may be a partnership owned by several fourth-tier pass-through entities, and so on. As income is passed through this chain to the individuals who are the ultimate owners, its original source may be ignored. For example, a person in New York or California who is a partner in a company that owns other companies may be unaware that part of their income from this partnership ultimately comes from business operations in Montana. In that case, they are likely to overlook their obligation to pay income tax in Montana.
Montana law tries to address this problem by requiring pass-through entities with out-of-state owners either to have the out-of-state owners agree to file Montana tax returns, to withhold Montana tax for the out-of-state owners, or to file a composite return and pay Montana tax on behalf of its owners.
rather than by jurisdictions where they are made or sold.2 Income that is not from a company’s normal line of business, such as income from sale of some of a company’s assets, generally is assigned to the state where the assets are located rather than being apportioned.

71revenue.mt.gov
Taxation of Business Income
Montana law requires individual corporations and affiliated groups to report world-wide income and apportion a share to Montana, with one exception. A group of affiliated companies may make what is called a water’s-edge election. When a group makes this election, it is only required to include affiliates in its combined report if the primary company owns at least half the stock and at least 20 percent of the affiliate’s payroll and property is in the United States, the affiliate is one of several types of companies defined in federal law that only engage in international trade, the affiliate has gains or losses from selling U.S. real estate, or the affiliate is incorporated in one of the countries listed as tax havens in section 15-31-322(1)(f), MCA. A corporate group that makes the water’s edge election is taxed at a rate of 7 percent rather than the normal rate of 6.75 percent.
Abusive tax shelters are arrangements where taxpayers mischaracterize either income or gains and losses in order to avoid taxes. While nothing about pass-through entities or tiered business ownership creates abusive tax shelters, individuals and corporations wanting to evade taxes have used the complexity that tiered ownership can create to try to hide or mischaracterize income.
Some abusive tax shelters involve pretending that monetary payments are a loan or that in-kind compensation is actually a business investment. Others involve creating transactions with offsetting paper gains and losses and then recognizing the losses for tax purposes while claiming that recognition of the gains can be indefinitely deferred. In others, the claim is made that the losses were incurred by a taxable entity while the gains belong to an entity that is not subject to taxes in the United States. Some types of abusive tax shelters make use of complicated, multi-tiered business structures either to try to hide the mischaracterization of income or to shuffle gains and losses between related entities and then claim that they are not related.
For example, one scheme involves creating a series of tiered business entities organized under the laws of several countries, with each passing its income to the next in line and the final entity paying the income to the owner but mischaracterizing it as a loan. The purpose of the tiered business structure in this case is just to make it too hard to track the money. In another scheme, the taxpayer sets up three business entities. Two entities engage in offsetting financial transactions, such as buying and selling offsetting futures contracts. The third is set up in another country. When the two contracts are closed out, one will have a gain and the other will have an equal loss. The taxpayer recognizes the loss and uses it to offset other income. The entity with the gain is sold, at a nominal price that does not reflect the value of the gain on its futures contracts, to the non-U.S. entity, and then the taxpayer claims that the gain is not subject to U.S. taxes.
U.S. courts have consistently ruled that these types of sham transactions with no economic purpose other than evading taxes should be ignored for U.S. tax purposes.

72revenue.mt.gov
Pass-Through Entities
Growth of Pass-Through Entities
Increasingly, in Montana and nationwide, business and investment activities are being conducted by “pass-through entities.” The graph below shows the number of returns filed with the IRS by C Corporations versus those filed by pass-through entities (partnerships and S Corporations) from 1980 through 2016 (the graphs and history in this section are from the Internal Revenue Service’s annual Data Book and other Statistics of Income Division reports).
Over time Congress has modified the rules governing pass-throughs, particularly S Corporations, making those business structures more attractive for business purposes. For example, the number of permitted shareholders has been expanded from the original 10 in 1958 to 35 in 1982, 75 in 1996, and 100 in 2004, where it remains today.
The graph on the next page shows growth over the same period, 1980–2016, of all types of business organizations, including non-farm sole proprietorships, S Corporations, partnerships, and farms filing Schedule F.
As can be seen from the graph, non-farm sole proprietorships are the most common type of business entity in the United States based upon the number of returns filed. The number of non-farm sole proprietorships has grown substantially – from 9 million in 1980 to just over 25.5 million in 2016.
0
1,000
2,000
3,000
4,000
5,000
6,000
Num
ber o
f Ret
uns F
iled
(In T
hous
ands
)
Number of U.S. C Corporation Returns Compared to S Corporation and Partnership Returns (Pass-through Entities), 1980 - 2016
C Corporations S Corporations Partnerships

73revenue.mt.gov
Pass-Through Entities
Sole proprietorships, just as the name suggests, are businesses with a single owner and are a familiar sight on many main streets in Montana. The Montana Department of Commerce in its publication, Economic and Demographic Analysis of Montana, December 2007, reported that over 60 percent of Montana businesses are sole proprietorships without any employees. The owner of a sole proprietorship will record his or her income on the state individual income tax form, Form 2 on line 12 as Business income (or loss), and will attach a copy of federal Schedule C (or C-EZ), which has been filed with the taxpayer’s federal tax return.
If the business owner has a farm or ranch operation that is operated as a sole proprietorship, the taxpayer reports his or her income on line 18 of the state individual income tax form (Farm income or (loss)), and attaches a copy of federal Schedule F, which has been filed with the taxpayer’s federal form. The number of farms filing under Schedule F is also shown on the graph. The total number of farms in the United States filing Schedule F went from 2.6 million in 1980 to 1.75 million in 2016. However, it should be noted that farms can also operate as partnerships or be incorporated as S or C Corporations.
During the same period, the number of C Corporation returns declined, going from 2.2 million corporations in 1980 to 1.63 million in 2013. One thing to note is that C Corporations in Montana seem to vary greatly in terms of size – there are large or very large businesses which engage in operations across many states and even countries, but there are also smaller firms that engage in agricultural operations, are main street businesses, or regional operations. Some of these corporations may have been incorporated before the S Corporation structure was available; others may have been incorporated as C Corporations in order to be better positioned to access capital markets, or for one or more of the advantages that C Corporation status provides.
-
5,000
10,000
15,000
20,000
25,000
30,000
Num
ber o
f Ret
uns F
iled
(In T
hous
ands
)
Number of Different Types of Business Returns, 1980-2016(IRS Statistics of Income)
C Corporations S Corporations PartnershipsNon-farm sole proprietorships Farms (Schedule F)

74revenue.mt.gov
Pass-Through Entities
The number of businesses that filed as S Corporations has also grown very rapidly during the same time. The IRS data shows the number went from 545,000 in 1980 to over 4.2 million in 2013, an annual average growth rate of 6.6 percent. Partnerships grew more slowly – increasing from 1.4 million in 1980 to 3.7 million in 2015.
Although not shown on the graph, less common types of pass-through entities also increased over the last three decades. These include real estate investment trusts (REITs) and regulated investment companies (RICs), better known as mutual funds, going from 1,691 returns in 1980 to 17,630 returns in 2012.
Ownership, Income, Deductions and Credits Reported on Montana Pass-Through Returns
Pass-through entities include partnerships; S Corporations; limited liability companies (LLCs); real estate investment trusts (REITS); regulated investment trusts (RITs), better known as mutual funds; and others. Partnerships are an old and familiar business entity, but S Corporations are less so. The S Corporation rules were enacted in 1958 and permit a corporation and its shareholders to elect to be taxed at one level.
The most common type of pass-through entity today is the limited liability company, or LLC. LLCs are actually a creation of the states since state law generally governs business structure. The first LLC statute was enacted in Wyoming in 1977 and now all states and the District of Columbia have LLC statutes. However, for federal tax purposes, federal law governs the tax treatment (states generally follow the federal treatment). For taxation purposes LLCs are generally treated as partnerships, although LLCs with two or more members can elect to be treated as S Corporations. Any single member LLC can elect to be treated as a sole proprietorship if the single member is an individual; if the single member is a corporation, then the LLC is treated as a branch by the IRS. The taxpayer’s state filing must be consistent with its federal filing, so if a business filed as an S Corporation at the federal level, it must file as an S Corporation at the state level.
A pass-through entity is not taxed itself. Instead, its income and expenses are reported on the tax returns of the owners. The owners can be corporations, individuals, other pass-through entities, or a mix of all of them. When pass-through entities are owned by other pass-through entities, a tiered business structure is created.
Tiered structures add complexity to tax administration because the taxpayer may be quite remote from the entity doing business in the state. Because pass-through entities can have a corporation, an individual, and/or another pass-through entity as a partner, owner or shareholder, they represent a challenge for tax administration. The diagram on the following page shows how complex a set of ownership, or partnership, relationships can become.
Businesses of all sizes can be C Corporations or pass-through
entities. Sole proprietor businesses generally are small. For 2013, the IRS reports that average receipts
were $4.6 million for C Corporations, $1.5 million for partnerships, and
$1.6 million for S Corporations, but only $56,000 for sole proprietor
businesses. Many sole-proprietor businesses are part-time or a
sideline for the owner. For 2017, 90% of taxpayers whose Montana
income tax returns showed income or loss from a sole-proprietor
business reported more income from other sources.

75revenue.mt.gov
Pass-Through Entities
Pass-through entities classified as S Corporations or partnerships with Montana source income are required to file an information return each year. If this entity has a partner, shareholder, member or other owner who is a non-resident individual, foreign C Corporation, or a pass-through entity with an owner, or shareholder, that is a non-resident individual or foreign C Corporation, the pass-through entity is also required to file with the state an agreement with the individual non-resident to timely file a Montana return, pay taxes and be subject to personal jurisdiction of the state with respect to the income from a pass-through. If this agreement is not met, the pass-through entity must in all subsequent tax years withhold the appropriate amount and remit the tax payment directly to the state (15-30-3313, MCA).
The pass-through information returns show the total amounts of various types of income, deductions, and credits allocated to the owners and the amount distributed to each owner. Pass-through entities operating in more than one state apportion part of their income to Montana using the same apportionment formula as C Corporations. Pass-through returns show the Montana source income allocated to each owner and indicate whether each owner is an individual or another business entity.
Owners of pass-through entities taxed as partnerships may be either individuals or business entities. Shares of S Corporations can only be owned by individuals, electing small business trusts or employee stock ownership plans. However, some types of pass-through entities that can be owned by other business entities can elect to be treated as S Corporations for tax purposes. The table to the right shows the number of owners associated with Montana’s pass-throughs broken down by individuals and business entities. Based upon information provided in each pass-through’s tax forms, this table also provides a breakdown of pass-throughs based on the residency status of the owner.
Tier 1 - LLC with $1,000 in Income to be
Distributed To Owners
Tier 4 - Individual Owners Receives $240 in Income from Tier 3 S Corporation
Tier 3 - S CorporationReceives $480 in Income
from Tier 2 Limited Partnership
Tier 3 - Individual Owners Receives $220 in Income
from Tier 2 Limited Partnership
Tier 2 - Limited Partnership Receives
$700 in Income from Tier 1 LLC
Tier 2 - Individual Owners Receives $200 in Income
from Tier 1 LLC
Tier 2 - Corporation Owner Receives $100 in Income from Tier 1 LLC
Tier 4 - Individual Owners Receives $240 in Income from Tier 3 S Corporation
Type of Owner Number %Resident Individuals 86,591 23%Nonresident Individuals 179,238 48%Montana Business Entities 5,880 2%Non-Montana Business Entities 100,575 27%
Total 372,284 100%
Shares of Pass-Through Owners by Residency Status

76revenue.mt.gov
Pass-Through Entities
In 2016, 372,284 owners were associated with the 61,627 pass-throughs filing information returns in Montana. Of the approximately 372,000 owners, 23 percent reported being residents of Montana. Non-resident individuals are the largest group of Montana’s pass-through owners, with 179,238 reported owners. Just under 5,900 Montana business entities were listed as owners of pass-throughs according to informational tax returns. More than 100,000 non-Montana business entities were owners of pass-throughs with Montana source income. Overall, individuals comprised 71 percent of the owners associated with Montana’s pass-throughs, which is a slight decrease from the 74 percent in 2014
The following table shows owner information from the same group of pass-through returns as in the previous table, but splits the ownership data into multi-state, as well as S Corporation and partnership, status.
Net income from a pass-through entity’s business operations is usually allocated to the owners as ordinary business income. Individual owners report this income on Schedule E of their federal tax returns and then report income from Schedule E on Line 17 of the Montana tax return. Income the pass-through entity receives from passive investments or the sale of assets is allocated to the owners as that type of income, and owners report it on the corresponding lines of their tax returns. For example, if a pass-through entity receives $1,000 of interest and allocates it equally to its 10 owners, who are Montana individuals, each owner should report the $100 of interest on Line 8a of their Form 2.
The next table shows the number of returns, types of income, Montana adjustments to income, and deductions that were reported on the pass-through informational returns in 2016.
Owners % Owners % Owners % Owners %Resident Individuals 34,396 91% 6,788 18% 36,780 68% 8,627 4%Nonresident Individuals 2,906 8% 25,766 70% 10,829 20% 139,737 57%Montana Business Entities 414 1% 323 1% 3,799 7% 1,344 1%Non-Montana Business Entities 109 0% 4,118 11% 2,979 5% 93,369 38%Total 37,825 100% 36,995 100% 54,387 100% 243,077 100%
PartnershipsMontana Multi-State
Montana Pass-Through Owners by Residency Status and Pass-Through Type
Type of Owner
S CorporationsMontana Multi-State
77revenue.mt.gov
Pass-Through Entities
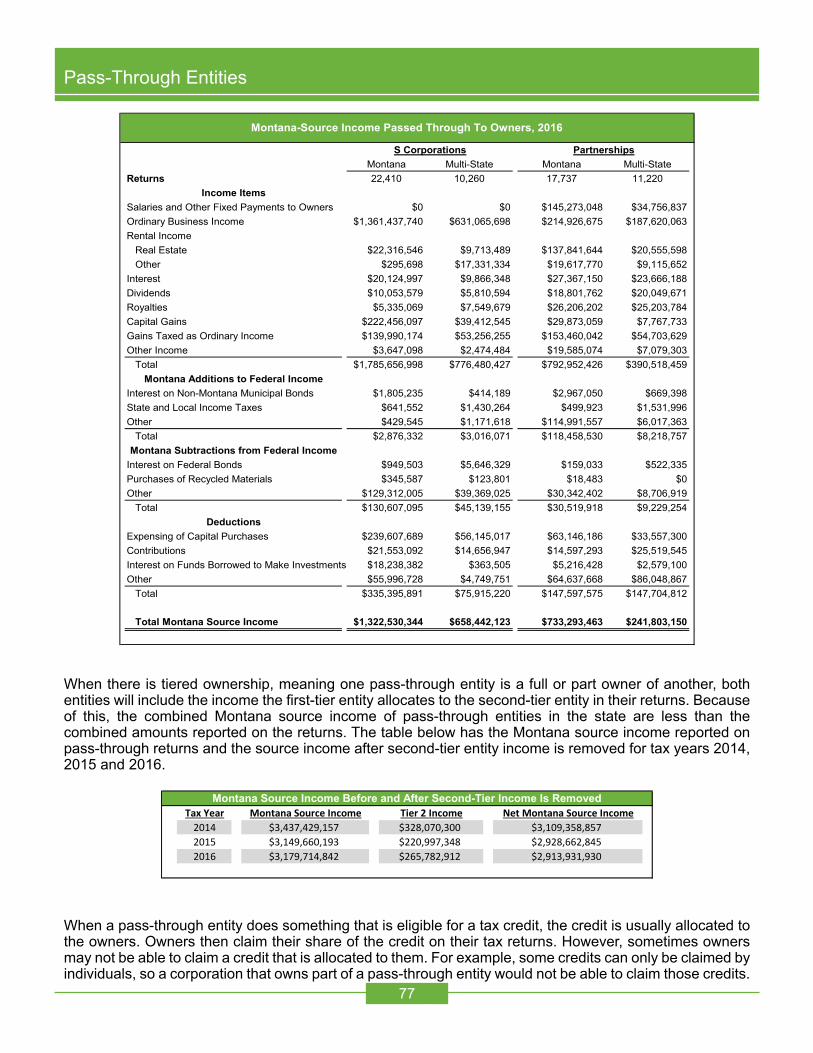
When there is tiered ownership, meaning one pass-through entity is a full or part owner of another, both entities will include the income the first-tier entity allocates to the second-tier entity in their returns. Because of this, the combined Montana source income of pass-through entities in the state are less than the combined amounts reported on the returns. The table below has the Montana source income reported on pass-through returns and the source income after second-tier entity income is removed for tax years 2014, 2015 and 2016.
When a pass-through entity does something that is eligible for a tax credit, the credit is usually allocated to the owners. Owners then claim their share of the credit on their tax returns. However, sometimes owners may not be able to claim a credit that is allocated to them. For example, some credits can only be claimed by individuals, so a corporation that owns part of a pass-through entity would not be able to claim those credits.
Montana Multi-State Montana Multi-StateReturns 22,410 10,260 17,737 11,220
Income ItemsSalaries and Other Fixed Payments to Owners $0 $0 $145,273,048 $34,756,837Ordinary Business Income $1,361,437,740 $631,065,698 $214,926,675 $187,620,063Rental Income
Real Estate $22,316,546 $9,713,489 $137,841,644 $20,555,598Other $295,698 $17,331,334 $19,617,770 $9,115,652
Interest $20,124,997 $9,866,348 $27,367,150 $23,666,188Dividends $10,053,579 $5,810,594 $18,801,762 $20,049,671Royalties $5,335,069 $7,549,679 $26,206,202 $25,203,784Capital Gains $222,456,097 $39,412,545 $29,873,059 $7,767,733Gains Taxed as Ordinary Income $139,990,174 $53,256,255 $153,460,042 $54,703,629Other Income $3,647,098 $2,474,484 $19,585,074 $7,079,303
Total $1,785,656,998 $776,480,427 $792,952,426 $390,518,459Montana Additions to Federal Income
Interest on Non-Montana Municipal Bonds $1,805,235 $414,189 $2,967,050 $669,398State and Local Income Taxes $641,552 $1,430,264 $499,923 $1,531,996Other $429,545 $1,171,618 $114,991,557 $6,017,363
Total $2,876,332 $3,016,071 $118,458,530 $8,218,757Montana Subtractions from Federal Income
Interest on Federal Bonds $949,503 $5,646,329 $159,033 $522,335Purchases of Recycled Materials $345,587 $123,801 $18,483 $0Other $129,312,005 $39,369,025 $30,342,402 $8,706,919
Total $130,607,095 $45,139,155 $30,519,918 $9,229,254Deductions
Expensing of Capital Purchases $239,607,689 $56,145,017 $63,146,186 $33,557,300Contributions $21,553,092 $14,656,947 $14,597,293 $25,519,545Interest on Funds Borrowed to Make Investments $18,238,382 $363,505 $5,216,428 $2,579,100Other $55,996,728 $4,749,751 $64,637,668 $86,048,867
Total $335,395,891 $75,915,220 $147,597,575 $147,704,812
Total Montana Source Income $1,322,530,344 $658,442,123 $733,293,463 $241,803,150
Montana-Source Income Passed Through To Owners, 2016
S Corporations Partnerships
Tax Year Montana Source Income Tier 2 Income Net Montana Source Income2014 $3,437,429,157 $328,070,300 $3,109,358,8572015 $3,149,660,193 $220,997,348 $2,928,662,8452016 $3,179,714,842 $265,782,912 $2,913,931,930
Montana Source Income Before and After Second-Tier Income Is Removed

78revenue.mt.gov
Pass-Through Entities
Some credits can only be used to reduce the current year’s tax liability, so owners with no taxable income in the current year would not be able to claim these credits. Because of this, the credits actually claimed on owners’ tax returns can be less than the credits reported on pass-through returns.
The next table shows credits reported on pass-through entity returns for 2016. Credits actually claimed by owners are included in the credits claimed against individual income tax and corporation income tax.
Credit Montana Multi-State Montana Multi-StateDependent Care Credit $0 $0 $0 $0College Contribution Credit $15,555 $4,121 $3,242 $609Insurance for Uninsured Montanans Credit $27,321 $1,590 $900 $0Credit for Investment in Recycling Equipment $294,589 $25,761 $0 $0Alternative Energy Production Credit $0 $23,734 $0 $0Contractor's Gross Receipts Credit $2,543,604 $1,927,912 $174,546 $139,092Alternative Fuel Credit $0 $0 $0 $0Infrastructure Users Fee Credit $0 $310,100 $35,547 $0Historic Building Preservation Credit $0 $0 $0 $0Mineral Exploration Credit $0 $0 $0 $0Empowerment Zone Credit $0 $0 $0 $0Biodiesel Blending Credit $0 $0 $0 $0Innovative Education Program Credit $0 $0 $0 $0Student Scholarship Organization Credit $0 $0 $0 $0Emergency Lodging Credit $0 $0 $1 $0Unlocking Public Lands Credit $0 $2,250 $685 $0
Total $2,881,069 $2,295,469 $214,921 $139,701
Tax Credits Passed Through To Owners, 2016
S Corporations Partnerships

79revenue.mt.gov
Pass-Through Entities
Pass-Through Distributions and Credits by Industry
When preparing an informational tax return, pass-through entities are expected to provide information on the type of industry work the pass-through is engaged in.1 The next table provides a list of the Montana source income that was distributed by Montana’s S Corporations in 2016, broken down by industry sector type. As can be seen from the tax return information, there is a significant amount of variation in the amount of income S Corporations provided to their respective owners at the industry level. S Corporations in the Trade, Transportation and Utilities sector generated the largest amount of combined Montana source income for their owners, distributing approximately $569 million in 2016. The Construction and Professional and Business Services S Corporations also provided a significant amount of income to their owners, passing through $338 million and $365 million in income respectively.
1 Industry data on income tax returns are self-reported and are subject to some reporting error.
Natural Resources & Mining
Construction ManufacturingTrade,
Transportation & Utilities
Information Financial Activities
Professional & Business
Services
Education & Health Services
Leisure & Hospitality
Other Services
Unknown / Public Admin
Returns 3,136 6,112 1,211 5,002 436 4,456 5,871 1,880 2,409 1,779 378 Income ItemsSalaries and Other Fixed Payments to Owners $0 $0 $0 $0 $0 $0 $0 $0 $0 $0 $0Ordinary Business Income $33,672 $423,174 $66,128 $575,184 $16,259 $158,950 $367,385 $165,061 $109,862 $75,408 $1,421Rental Income Real Estate $7,351 $106 $581 $5,227 $334 $15,619 -$163 $837 $1,870 $278 -$10 Other $794 $322 $582 $17,196 $30 -$1,381 -$357 $5 $314 $82 $39Interest $4,262 $2,390 $1,218 $6,603 $301 $10,983 $1,290 $751 $1,769 $409 $15Dividends $1,800 $830 $3,198 $2,286 $311 $6,328 $479 $73 $330 $220 $9Royalties $9,280 $305 $171 $212 $199 $1,849 $225 $2 $486 $156 $0Capital Gains $5,076 $3,070 $1,097 $33,575 $3,445 $191,232 $10,715 $7,097 $2,643 $3,881 $38Gains Taxed as Ordinary Income $72,557 $3,845 $21,057 $21,905 $180 $25,316 $23,863 $1,263 $22,573 $691 -$3Other Income -$158 $425 $1,696 $2,574 $0 $728 $391 $21 $401 $40 $3Total $134,633 $434,468 $95,729 $664,762 $21,058 $409,624 $403,828 $175,109 $140,250 $81,166 $1,512
Interest on Non-Montana Municipal Bonds $254.2 $144.2 $234.0 $98.0 $3.3 $563.9 $852.5 $0.3 $21.7 $47.1 $0.0State and Local Income Taxes $108.4 $613.4 $106.6 $408.3 $39.3 $94.0 $473.9 $20.6 $174.9 $32.5 $0.0Other $322.1 $355.7 $17.8 $205.2 $4.8 $440.0 $232.9 $0.0 $3.6 $19.1 $0.0
$684.7 $1,113.4 $358.4 $711.5 $47.4 $1,097.9 $1,559.3 $20.9 $200.2 $98.7 $0.0
Interest on Federal Bonds $28.4 $81.9 $119.8 $16.1 $0.1 $200.0 $6,147.4 $0.7 $0.8 $0.5 $0.0Purchases of Recycled Materials $6.9 $143.3 $217.2 $76.2 $0.0 $0.0 $0.0 $0.0 $25.7 $0.0 $0.0Other $3,708.3 $1,791.0 $154.0 $31,206.2 $134.2 $125,881.0 $3,042.5 $723.4 $2,024.0 $16.5 $0.0Total $3,743.6 $2,016.1 $491.1 $31,298.5 $134.4 $126,081.1 $9,189.8 $724.1 $2,050.5 $17.0 $0.0 DeductionsExpensing of Capital Purchases $52,924.7 $89,469.7 $13,353.5 $55,782.0 $2,015.2 $14,514.6 $25,595.9 $13,016.2 $17,646.3 $11,338.0 $96.7Contributions $2,245.9 $6,078.1 $4,764.6 $8,864.7 $288.0 $4,092.5 $4,583.9 $1,854.5 $2,255.2 $1,125.4 $57.3Interest on Funds Borrowed to Make Investments $516.4 $188.5 $1.4 $26.5 $0.1 $17,766.6 $58.7 $0.1 $5.7 $38.0 $0.0Other $4,870.3 $321.7 $92.7 $726.3 $27.8 $52,838.3 $571.0 $1,062.9 $162.5 $72.3 $0.6Total $60,557.3 $96,058.1 $18,212.2 $65,399.4 $2,331.1 $89,211.9 $30,809.5 $15,933.6 $20,069.8 $12,573.7 $154.6
Total Net Montana Source Income $71,017 $337,507 $77,384 $568,775 $18,639 $195,429 $365,388 $158,472 $118,330 $68,674 $1,357
Montana-Source Income Passed Through to Owners, 2016 (Thousands of Dollars)
S-Corporations
Montana Additions to Federal Income
Montana Subtractions from Federal Income

80revenue.mt.gov
Pass-Through Entities
As can be seen in the next table, the amount of pass-through income also varies significantly for Montana’s pass-through partnerships. In 2016, Financial Activity partnerships generated a little more than $440 million in income within Montana, which is more than double the income generated by any other pass-through industry sector. Unlike S Corporations, three partnership pass-through sectors reported negative pass-through income for their owners. In 2016, the Natural Resources, Manufacturing and Unclassified sectors reported $61.2 million in combined losses during the year.
Pass-Through Entities by Size - Number of OwnersPass-through entities vary greatly in size. Approximately 50 percent of Montana’s S Corporation pass-throughs reported a single owner and 68 percent of partnership pass-throughs with Montana source income had two or three owners. Overall, pass-throughs that operate in multiple states tend to have more owners than pass-throughs that only operate in Montana. Amoung S Corporations, fewer than 10 percent of pass-throughs that only operated in Montana in 2016 had more than eight reported owners, while more than 7 percent of multi-state S Corporations had at least nine owners. At the same time, 24 percent of Montana’s multi-state partnership pass-throughs had more than eight owners, which is approximately eight times larger than the proportion of Montana-only partnerships with at least nine reported owners.
Natural Resources & Mining
Construction ManufacturingTrade,
Transportation & Utilities
Information Financial Activities
Professional & Business
Services
Education & Health
Services
Leisure & Hospitality
Other Services
Unknown / Public Admin
Returns 3,974 1,360 514 1,889 296 15,862 2,068 455 1,430 654 455 Income ItemsSalaries and Other Fixed Payments to Owners $23,063 $17,105 $4,298 $21,600 $2,093 $18,103 $37,592 $41,309 $10,178 $4,419 $271
Ordinary Business Income -$79,963 $63,937 -$37,156 $26,629 $173,688 -$7,456 $104,385 $119,996 $28,112 $11,030 -$656Rental Income Real Estate $13,802 $520 $367 $7,716 $64 $146,915 -$16,161 $1,832 $2,155 $704 $484 Other $2,619 -$4 $85 -$329 $2,059 $23,692 $444 $42 $147 -$22 $0Interest $3,933 $417 $621 $2,519 $6,640 $32,568 $1,852 $1,555 $683 $185 $60Dividends $1,209 $114 $3,109 $895 $16 $28,650 $4,239 $176 $210 $225 $8Royalties $39,078 $304 $1,405 $93 $14 $9,096 $581 $157 $96 $563 $22Capital Gains $1,934 $1,782 -$2,526 -$12,239 $245 $52,804 -$678 $889 $588 -$4,659 -$500Gains Taxed as Ordinary Income $37,092 $5,154 $1,418 $7,557 $3,098 $132,850 $17,143 $2,745 $275 $656 $176
Other Income $14,886 $908 $11,995 $2,032 $62 $7,447 -$10,995 -$10 $277 $62 $0Total $57,652 $90,237 -$16,385 $56,474 $187,980 $444,668 $138,403 $168,691 $42,722 $13,165 -$135
Interest on Non-Montana Municipal Bonds $164 $37.4 $0.0 $0.4 $0.0 $3,218.2 $62.4 $0.2 $5.6 $147.9 $0.0
State and Local Income Taxes $65 $32.7 $130.1 $793.9 $179.2 $473.6 $108.3 $24.5 $221.5 $2.2 $0.6
Other $958 $10.2 $2.5 $25,507.6 $0.0 $89,555.6 $4,935.5 $0.3 $39.1 $0.0 $0.0$1,187.8 $80.2 $132.6 $26,301.9 $179.2 $93,247.4 $5,106.3 $25.0 $266.3 $150.0 $0.6
Interest on Federal Bonds $5 $0.7 $0.0 $1.3 $0.0 $628.5 $3.7 $28.5 $12.9 $0.6 $0.0Purchases of Recycled Materials $0 $12.1 $0.0 $0.0 $0.0 $0.0 $0.0 $0.0 $6.3 $0.0 $0.0
Other $4,956 $7,991.0 $30.0 -$3,302.0 $5,002.2 $18,345.5 $3,822.1 $154.2 $1,977.7 $72.8 $0.0Total $4,961 $8,003.8 $30.1 -$3,300.7 $5,002.2 $18,974.0 $3,825.9 $182.7 $1,997.0 $73.3 $0.0 DeductionsExpensing of Capital Purchases $48,824 $9,132.5 $3,430.1 $9,226.1 $289.5 $9,274.2 $3,780.0 $3,442.2 $7,533.1 $1,498.2 $273.7
Contributions $5,635 $1,107.9 $266.3 $885.1 $163.7 $29,135.9 $1,253.2 $525.3 $892.4 $244.6 $7.1Interest on Funds Borrowed to Make Investments $413 $9.1 $0.0 $283.1 $15.4 $6,550.5 $223.8 $0.0 $262.3 $30.9 $7.5
Other $37,265 $1,896.7 $2,553.6 $26,981.7 $7,721.7 $33,394.5 $31,105.8 $5,993.3 $2,700.7 $786.5 $287.4Total $92,137 $12,146.3 $6,250.0 $37,376.0 $8,190.3 $78,355.1 $36,362.7 $9,960.8 $11,388.4 $2,560.0 $575.7
Total Net Montana Source Income -$38,259 $70,167 -$22,533 $48,700 $174,967 $440,586 $103,321 $158,573 $29,602 $10,682 -$711
Montana-Source Income Passed Through to Owners, 2016 (Thousands of Dollars)
Partnerships
Montana Additions to Federal Income
Montana Subtractions from Federal Income
Number % Number % Number % Number %1 12,289 54.9% 3,967 40.0% 43 0.2% 65 0.6%
2 to 3 8,983 40.2% 3,826 38.5% 14,042 79.3% 5,476 50.2%4 to 8 977 4.4% 1,436 14.5% 3,123 17.6% 2,723 24.9%9 to 20 104 0.5% 475 4.8% 424 2.4% 1,026 9.4%Over 20 15 0.1% 224 2.3% 84 0.5% 1,626 14.9%
Pass-Through Entities - Number of OwnersS Corporations
Number of Reported Owners
Montana Multi-State MontanaPartnerships
Multi-State
81revenue.mt.gov
Pass-Through Entities
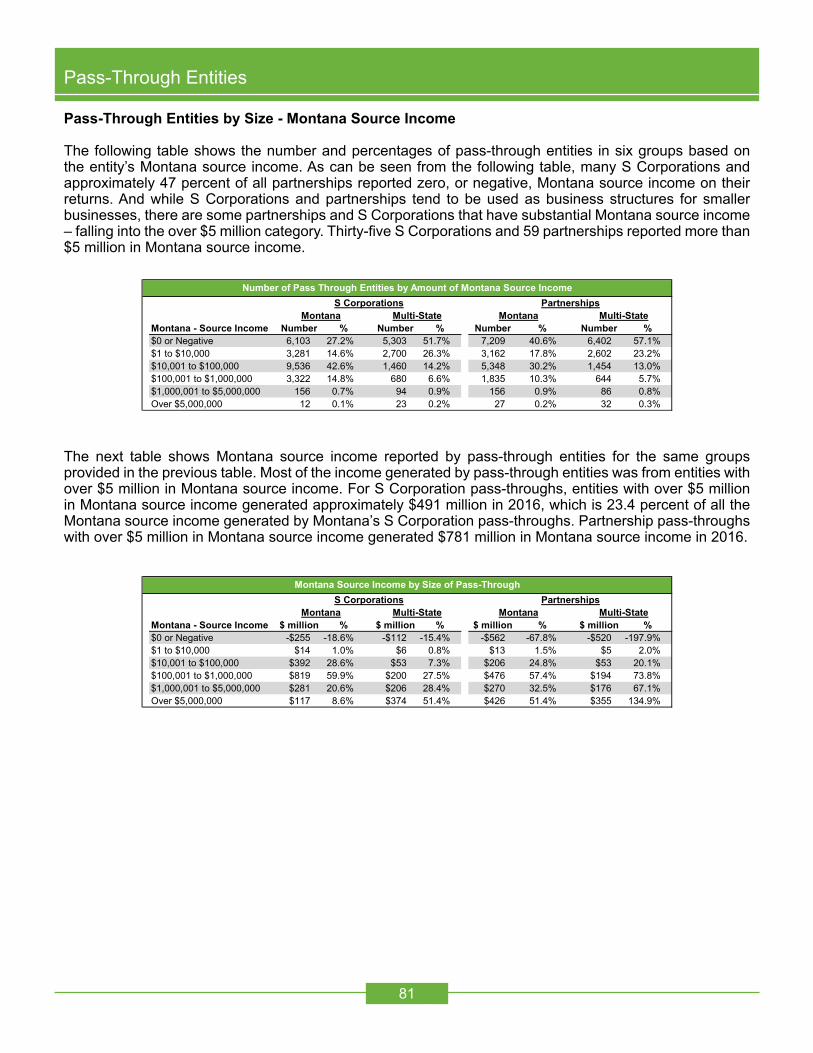
Pass-Through Entities by Size - Montana Source Income
The following table shows the number and percentages of pass-through entities in six groups based on the entity’s Montana source income. As can be seen from the following table, many S Corporations and approximately 47 percent of all partnerships reported zero, or negative, Montana source income on their returns. And while S Corporations and partnerships tend to be used as business structures for smaller businesses, there are some partnerships and S Corporations that have substantial Montana source income – falling into the over $5 million category. Thirty-five S Corporations and 59 partnerships reported more than $5 million in Montana source income.
The next table shows Montana source income reported by pass-through entities for the same groups provided in the previous table. Most of the income generated by pass-through entities was from entities with over $5 million in Montana source income. For S Corporation pass-throughs, entities with over $5 million in Montana source income generated approximately $491 million in 2016, which is 23.4 percent of all the Montana source income generated by Montana’s S Corporation pass-throughs. Partnership pass-throughs with over $5 million in Montana source income generated $781 million in Montana source income in 2016.
Montana - Source Income Number % Number % Number % Number %$0 or Negative 6,103 27.2% 5,303 51.7% 7,209 40.6% 6,402 57.1%$1 to $10,000 3,281 14.6% 2,700 26.3% 3,162 17.8% 2,602 23.2%$10,001 to $100,000 9,536 42.6% 1,460 14.2% 5,348 30.2% 1,454 13.0%$100,001 to $1,000,000 3,322 14.8% 680 6.6% 1,835 10.3% 644 5.7%$1,000,001 to $5,000,000 156 0.7% 94 0.9% 156 0.9% 86 0.8%Over $5,000,000 12 0.1% 23 0.2% 27 0.2% 32 0.3%
Number of Pass Through Entities by Amount of Montana Source IncomeS Corporations Partnerships
Montana Multi-State Montana Multi-State
Montana - Source Income $ million % $ million % $ million % $ million %$0 or Negative -$255 -18.6% -$112 -15.4% -$562 -67.8% -$520 -197.9%$1 to $10,000 $14 1.0% $6 0.8% $13 1.5% $5 2.0%$10,001 to $100,000 $392 28.6% $53 7.3% $206 24.8% $53 20.1%$100,001 to $1,000,000 $819 59.9% $200 27.5% $476 57.4% $194 73.8%$1,000,001 to $5,000,000 $281 20.6% $206 28.4% $270 32.5% $176 67.1%Over $5,000,000 $117 8.6% $374 51.4% $426 51.4% $355 134.9%
Montana Source Income by Size of Pass-ThroughS Corporations Partnerships
Montana Multi-State Montana Multi-State

82revenue.mt.gov
Estates and Trusts
Taxation of Estates and TrustsEstates and trusts are legal arrangements where one party holds assets on behalf of or for the benefit of one or more other parties. The details of these legal arrangements vary widely, because trusts can be set up to serve many purposes and because estates and trusts are created under state laws, which vary between states.
A trust generally is managed by one or more trustees. The estate of a decedent is managed by an executor. The manager of a bankruptcy estate is called a trustee or a debtor in possession depending on whether the estate is created under Chapter 7 or Chapter 11 of the bankruptcy code. Managers of trusts and estates are referred to as fiduciaries because of their fiduciary duty to act in the interest of another party rather than in their own interest.
When an estate or trust earns income, it may distribute part or all of the income to one or more beneficiaries or it may retain part or all of the income. Beneficiaries are taxed on income distributed to them, and the estate or trust is taxed on income it retains.
A trust may also distribute part of the principal to one or more beneficiaries. All estates and many trusts are created with the intention of ultimately distributing all their assets. Distributions from the principal of an estate or trust are not taxable.
Montana taxes the income of a trust or estate as if the trust or estate were an individual, with the exception that a trust or estate is allowed a deduction for income distributed to beneficiaries. Some trusts are created for the purpose of providing funds for charity, and estates and trusts are allowed a deduction for charitable contributions.
Estates and trusts may file on a tax year that is different from the calendar year. In this section, information is reported based on the calendar year when the estate or trust’s tax year started. Tax years numbered 2016 may have ended any time between December 31, 2016 and December 30, 2017. Returns are due by the 15th day of the fourth month after the end of the tax year, but taxpayers may receive a six-month filing extension. Thus, 2016 is the latest tax year for which all returns had been filed and processed by the time of publication.
Types of Estates and Trusts
The Montana return asks the fiduciary to indicate that the return is for one of 11 types of estate or trust. The following table shows the number of returns in each category for 2015 and 2016.
A simple trust is a trust where all income is to be distributed to the beneficiaries, no income is to be used for charitable purposes, none of the principal is to be distributed, and capital gains are to be allocated to the principal. A complex trust is a trust that does not qualify as a simple trust and does not fall into one of the other categories. A decedent’s estate is charged with distributing assets in accordance with the decedent’s will or state law and preserving assets until they are distributed.
A grantor trust is a trust where the person who created the trust retains control of or an ownership interest in the trust’s assets. For both federal and Montana taxes, a grantor trust is treated as a disregarded entity: Its income is treated as belonging to the grantor and its income and deduction line items should be reported on the grantor’s tax return.
2015 2016Simple Trust 2,586 2,569Complex Trust 4,663 4,731Decedent's Estate 1,485 1,526Grantor Trust 6,936 7,040Electing Small Business Trust 24 13Qualified Disability Trust 73 72Bankruptcy Estate (Chapter 7) 26 20Bankruptcy Estate (Chapter 11) 3 3Qualified Funeral Trust 2 3Pooled Income Fund 1 1Other 295 319
Total 16,094 16,297
Number of Estate and Trust Returns

83revenue.mt.gov
Estates and Trusts
An electing small business trust is a trust that holds shares in an S Corporation and for which the trustee has made an election to be taxed under a different section of federal law than generally applies to trusts. Montana taxes electing small business trust the same as other trusts.
A qualified disability trust is a trust whose beneficiaries are one or more disabled persons under the age of 65. A bankruptcy estate holds the assets of a bankrupt individual or business and is charged either with liquidating those assets to repay debts (Chapter 7) or with reorganizing the business (Chapter 11).
A qualified funeral trust is a type of grantor trust set up to pay the beneficiary’s funeral expenses. A pooled income fund is an arrangement where individuals or businesses donate assets to a charity with the provision that the donor is to receive part or all of the earnings from the assets for a fixed period or for life.
Income of Estates and Trusts
Montana law considers a trust to be a resident trust if the trust has sufficient connection to Montana, which includes having its primary place of administration in Montana, property located in Montana, and having beneficiaries located in Montana. A trust is classified as a part year resident trust if sufficient connection with the state has ceased during a year. A trust or estate that is created during a year has a short tax year but is considered either resident or non-resident.
All of a resident trust’s income is taxable by Montana, but a trust with income that has its source in another state may claim a credit against Montana tax for tax paid to another state. Montana source income of a non-resident trust is taxable by Montana. As with a non-resident individual, a non-resident trust calculates tax on all its income and then multiplies this calculated tax by the share of its income that has a Montana source.
The following table shows the different types of income reported by trusts and estates. It shows income of resident estates and trusts and non-resident and part-year resident estates and trusts separately. For non-resident and part-year resident estates and trusts, it shows the average nonresident / part-year resident ratio used in calculating their tax. This is the ratio of total Montana source income to total income from all sources.
ResidentNonresident
and Part-Year ResidentNonresident
and Part-Year
Interest $12.866 $161.809 $12.769 $199.730Dividends $48.591 $418.099 $49.324 $405.938
Sole Proprietor Business Income $2.250 -$34.384 $1.047 -$102.669Pass-Through Business, Rents, Royalties $52.489 -$16.245 $44.126 $522.881Gain or Loss on Asset Sales
Taxed as Capital Gains $78.114 $2,271.803 $50.130 $1,364.978
Taxed as Ordinary Income -$5.522 $113.482 -$1.774 $53.335Other $22.908 $37.243 $15.467 $38.132
Total $211.695 $2,951.807 $171.088 $2,482.326
Average Resident Ratio for Nonresident and Part-Year Resident Estates and Trusts 0.96% 0.81%
Type of Income
Income Reported on Estate and Trust Returns($ million)
2015 2016

84revenue.mt.gov
Deductions for Charitable Contributions and Distributions to Beneficiaries
Income earned by a trust or estate generally is put to one of four uses: It may be used to pay costs of the trust, it may be donated to charity, it may be distributed to a beneficiary, or it may be retained and added to the principal of the trust. In calculating taxable income, an estate or trust is allowed an itemized deduction for charitable contributions in the same way an individual is. Unlike an individual, an estate or trust is allowed a deduction for income distributed to a beneficiary. An estate or trust may also distribute part of the principal, but this is not deductible for the trust or taxable for the beneficiary. The following table shows deductions for charitable contributions and for distributions to beneficiaries.
Tax Paid by Estates and Trusts
Trusts and estates directly pay about $5 million in tax per year. The following table shows tax paid by type of trust or estate. Categories with few returns are combined to protect taxpayer confidentiality.
Entities with Deduction $ million
Entities with Deduction $ million
Charitable ConstributionsResident Estates and Trusts 246 $13.199 233 $9.772Nonresident and Part-Year 503 $158.226 538 $101.885
Distributions from IncomeResident Estates and Trusts 3,161 $110.465 3,219 $94.219Nonresident and Part-Year 965 $930.233 971 $790.656
Deductions for Charitable Contributions and Distributions to Beneficiaries2015 2016
Entity Type 2015 2016Bankruptcy Estates $0.002 $0.000Decedent Estates
Resident $0.252 $0.445Nonresident and Part-Year $0.018 $0.037
Electing Small Business TrustsResident $0.068 $0.000Nonresident and Part-Year $0.000 $0.000
Grantor Trusts $0.000 $0.000Simple Trusts
Resident $0.478 $0.303Nonresident and Part-Year $0.021 $0.084
Disability, Funeral, Pooled Income, and Other $0.005 $0.013Complex Trust Not in Another Category
Resident $1.814 $1.081Nonresident and Part-Year $0.518 $0.243
All Estates and Trusts $3.177 $2.206
Tax After Capital Gains Credit and Apportionment($ million)
Estates and Trusts

85revenue.mt.gov
Corporate Income Tax
Montana’s corporate income tax is a tax levied on C Corporations for the “privilege of carrying on business in this state for the tax year in which the income was earned” (15-31-101(3), MCA). A corporation includes:
an association, joint-stock company, common-law trust or business trust that does business in an organized capacity, all other corporations whether created, organized, or existing under and pursuant to the laws, agreements, or declarations of trust of any state, country or the United States, and any limited liability company, limited liability partnership, partnership or other entity that is treated as an association for federal income tax purposes and that is not a disregarded entity (15-31-101(1), MCA).
Every bank organized under the laws of the state of Montana, of any other state, or of the United States, and every savings and loan association organized under the laws of this state or of the United States is subject to the Montana corporate income tax (15-31-101(4), MCA).
The table below shows total corporate income tax collections for Fiscal Years 2008 through 2018 as recorded in the state accounting system. As a rule, corporate income tax collections in Montana follow the general national economy. Total collections in Fiscal Year 2008 (which started on July 1, 2007) were $155.9 million, increasing to $166.4 million in Fiscal Year 2009 and declining to $87.9 million in Fiscal Year 2010. Fiscal Year 2017 and Fiscal Year 2018 corporate tax revenues were $126.0 million and $167.1 million, respectively. Corporate income taxes are deposited in the state general fund.
The table on the following page provides a breakdown for the last seven years of revenues deposited in the general fund by how they are collected and also shows refunds.
As the table shows, estimated quarterly payments are by far the largest source of corporate income tax collections, followed by payments with returns.
Average estimated payments over the past seven years were $121.7 million. Average annual revenue for payments with returns over the same period was $32.3 million. The seven-year average of revenues from audits, penalties, and interest was $19.5 million. Refunds averaged about $24.4 million per year.
Over the past seven years, total corporate tax collections averaged about $149.1 million annually. However, there was wide variation in annual collections over that time period.
Fiscal Year
TotalRevenue
FY 2008 $155,890,705FY 2009 $166,352,453FY 2010 $87,906,411FY 2011 $119,045,890FY 2012 $127,774,092FY 2013 $177,500,421FY 2014 $147,550,091FY 2015 $172,731,561FY 2016 $118,386,603FY 2017 $125,991,635FY 2018 $167,099,816
Corporate Income Tax
$0$20$40$60$80
$100$120$140$160$180
Mill
ions

86revenue.mt.gov
Fiscal Year
Payments With Returns
Estimated Payments
Audits, Penalties, and
Interest RefundsTotal
Collections
FY 2012 $27,777,649 $110,864,886 $27,885,386 ($38,757,329) $127,770,592FY 2013 $35,894,922 $135,790,121 $16,811,485 ($10,999,107) $177,497,421FY 2014 $28,136,519 $130,352,294 $10,765,481 ($21,706,704) $147,547,591FY 2015 $31,109,657 $129,923,853 $28,775,440 ($17,972,938) $171,836,012FY 2016 $29,079,903 $108,541,034 $13,308,491 ($31,390,463) $119,538,965FY 2017 $31,668,677 $107,111,190 $12,318,708 ($25,851,754) $125,246,820FY 2018 $42,743,886 $129,097,865 $26,779,392 ($24,228,007) $174,393,137Average $32,344,459 $121,668,749 $19,520,626 ($24,415,186) $149,118,648
Corporate Income Tax Collections and Refunds - General Fund
Corporate Income Tax
Who pays Corporate Income Taxes?
Only C Corporations pay corporate income taxes. Corporations that elect to file as a subchapter S Corporation for federal tax purposes are also required to file as a subchapter S Corporation for Montana income tax purposes. Despite the filing requirement, subchapter S Corporations do not pay Montana corporate income taxes. Instead, the owners or shareholders of the S Corporation are subject to income tax on income flowed through the S Corporation to the owner or shareholder. Then the owner/shareholder reports any taxable income on their individual income tax form. S Corporations are discussed more in the section on pass-through entities.
Organizations exempt from the tax include corporations or associations organized and operated exclusively for religious, charitable, scientific, or educational purposes, and whose income does not benefit any stockholder or individual.
Other entities exempt from corporate income tax include labor, agricultural or horticultural organizations; civic organizations operated exclusively for the promotion of social welfare; clubs or corporations organized and operated exclusively for pleasure, recreation or other nonprofit purposes and who do not have income that benefits private stockholders or members; and similar nonprofit organizations.
Unrelated business taxable income, as defined by federal law, of exempt organizations that creates more than $100 of federal tax liability is taxable as corporate income in the same manner as other taxable corporate income.
To receive treatment as exempt from state corporation taxes, the corporation must prove it is in compliance with all statutory conditions (15-31-102, MCA and ARM 42.23.103). Research and development firms organized to engage in business for the first time in Montana do not have to pay the corporate income tax for the first five years of operation. To receive this tax treatment, the firm must apply to the Department of Revenue and be approved as meeting legal requirements (15-31-103, MCA).
Regular C Corporations 16,432S Corporations 32,670Total Corporations 49,102
C Corporations Paying Minimum Tax* 10,688C Corporations Paying More Than Minimum Tax 5,744Total C Corporations 16,432
Returns Filed for Tax Year 2016
* Includes corporations filing a tax return, but claiming zero or negative taxable income

87revenue.mt.gov
Distribution of Corporate Income Taxes
The following table shows the distribution by Montana tax liability of the 16,432 corporate returns with a Montana tax liability filed in calendar years 2017 and 2018 reporting on Tax Year 2016. Note that the revenues from the return data will not match the fiscal year revenues in earlier tables because fiscal year revenue is based upon payments, including estimated payments and payments with returns, recorded in the state accounting system.
Altogether the top 100 returns constituted about 69 percent of total tax liability for the entire group of taxpayers. The top 500 returns accounted for 89 percent of total Montana tax liability for the group. The other 15,932 returns accounted for only 11 percent of the total Montana tax liability.
Another way to look at the distribution of corporate income taxes is by economic sector. Starting with the 2009 tax returns, corporate taxpayers were asked to identify their primary industry just as identified on their federal tax forms. The following pie chart shows the distribution of corporate income taxes for the largest sectors.
The largest sector in terms of Tax Year 2016 tax liability was management of companies and enterprises. Corporations involved in the management of companies and enterprises that includes bank and other holding companies and corporate or regional headquarters paid about 35 percent of all the corporate income taxes.
Manufacturing was the second largest sector with 17 percent of all corporate income taxes in Tax Year 2016. The Census Bureau list of manufacturing activities includes food manufacturing including grain, oilseed, fruit and dairy processing; bakeries; beverages; sawmills, millwork, and paper manufacturing; petroleum and chemical manufacturing; cement and concrete; and other activities.
Corporations primarily involved in retail trade paid 15 percent of corporate income taxes; information paid 8 percent; and wholesale trade paid 6 percent.
Percent Cumulative Regular Corporation Tax of Total Percent of Total
Returns Number Liability Liability Liability
Top 100 returns 100 $87,765,316 69% 69% Second 100 returns 100 $12,029,931 9% 78% Third 100 returns 100 $6,425,096 5% 83% Fourth 100 returns 100 $4,226,805 3% 87% Fifth 100 returns 100 $2,944,682 2% 89% All other returns 15,932 $14,195,049 11% 100%
Total 16,432 $127,586,879 100% n/a
Tax Year 2016 Distribution of Montana Tax Liability
Corporate Income Tax

88revenue.mt.gov
Corporate Income Tax
When looking at the chart it is important to remember that only businesses organized as C Corporations pay corporate income taxes. Businesses can also be organized as partnerships, S Corporations, or sole proprietorships. These businesses are called pass-through entities because the income from the business is passed through to the owners or shareholders of these businesses, who then must report the income on their own tax returns. Businesses in certain industries, such as agriculture or legal services, may be more likely to be structured as a pass-through entity, rather than as a C Corporation.
Taxable Income and the Tax Rate
The starting point for calculating Montana corporate income tax is the corporation’s federal taxable income. To determine net income taxable by Montana, certain adjustments to federal taxable income must be made. For example, municipal bond interest is taxable and must be added to income. Also, Montana allows certain reductions to income, such as a portion of the cost of energy conservation investments made in a building used for the corporation’s business.
After the additions and reductions to federal taxable income required by Montana law, income is then apportioned to Montana to produce Montana taxable income.
If the corporation conducts business that is taxable only in Montana, then all of the net taxable income from that business is Montana taxable income. The tax is levied at a rate of 6.75 percent on net income earned in Montana.
Finance and Insurance
5%Information
8%
Management of Companies and
Enterprises35%
Manufacturing17%
Real Estate and Rental and Leasing
2%
Retail Trade15%
Transportation and Warehousing
3%
Wholesale Trade6%
Other (less than 2%)9%

89revenue.mt.gov
Multi-state corporations with net taxable income generated by doing business both inside and outside the state are required to apportion income to Montana based on an equally weighted, three-factor apportionment formula.
Receipts, property, and payroll comprise the three factors used in the apportionment formula. The payroll factor is the ratio of payroll paid in compensation attributable to the production of business income during the tax period in Montana to all payroll paid. Similarly, the property factor is based on the ratio of Montana property to all property and the receipts factor is based on the ratio of Montana receipts to all receipts. Once the three factors are calculated, they are averaged together to create the overall apportionment factor. That factor is applied against adjusted federal taxable income to produce the net income apportioned to Montana, or Montana taxable income.
The tax is normally levied at a rate of 6.75 percent on net income apportioned to Montana, with exceptions explained below.
Following is an example of how a multi-state corporation doing business in Montana would calculate its Montana source income assuming the following facts:
• The corporation has $1 million in payroll in Montana out of total payroll of $10 million dollars. • It has $2 million of property in Montana out of total property owned by the corporation of $125 million. • The corporation has receipts in Montana of $4 million out of total receipts for the firm of $100 million
during the tax year.
These facts result in an apportionment factor of 0.052 (see the calculations in the previous table).
If this corporation had total taxable income of $10,000,000, then its Montana taxable income is $520,000 ($10 million times 0.052 equals $520,000), and its state income tax is $35,100 before credits ($520,000 times 6.75 percent).
Relying on an apportionment formula simplifies the calculation of taxable income by state for the multistate taxpayer and for the state tax administrator, but there can still be issues. A simple example is that of a multistate taxpayer who over-apportions or shifts one or more of the factors - property, payroll or sales - to a state that does not tax corporate income. Apportioning too much in receipts or property or payroll to a non-income tax state reduces other states’ apportionment factors and so reduces the income taxable in those states.
Montana is a worldwide, combined unitary state. A business is unitary when the operations of that business within the state depend on or contribute to the operations of that business outside the state. However, in Montana corporations can elect to have primarily their United States income included in the apportionment process. Corporations taking this election, called a “water’s edge” election, pay the tax at a rate of 7 percent instead of 6.75 percent. For corporations electing to file as water’s edge corporations, there are some limits on exclusions under the water’s edge election (see 15-31-322 and 15-31-324, MCA).
Corporate Income Tax
Payroll In Montana
TotalPayroll
Payroll Factor
$1,000,000 ÷ $10,000,000 = 0.100
Property In Montana
Total Property
Property Factor
$2,000,000 ÷ $125,000,000 = 0.016
Receipts In Montana
Total Receipts
Receipts Factor
$4,000,000 ÷ $100,000,000 = 0.040
0.052
Example of Apportionment Factor Calculation for Multi-State Corporation
Apportionment Factor (Avg.)

90revenue.mt.gov
Corporate Income Tax
Multinational unitary corporations wishing to file under the water’s edge method are required to file a written election within the first 90 days of the tax period for which the election is to become effective. The Department of Revenue must approve the election before the corporation uses it and the election is binding for three consecutive taxable periods.
Corporations whose only activity in Montana consists of making sales, and who do not own or rent real estate or tangible personal property, and whose annual gross income from sales in Montana does not exceed $100,000, may elect to pay an alternative tax equal to 0.5 percent of gross sales.
There is a minimum tax of $50 for any corporation doing business in the state. The table on returns filed for Tax Year 2016 earlier in this section shows that for those returns filed in Tax Year 2016 by corporations, the minimum tax or less was paid on 10,688 returns or 65 percent. If the corporation has no property, sales, or payroll in the state during the tax period, it is exempt from the minimum tax.
All states with a corporate income tax allow corporations a carry forward of net operating losses (NOLs). These losses can be deducted against net taxable income in future years, although all states limit the number of years a corporation can carry forward losses. Some states, including Montana, allow carryback of net operating losses.
Beginning in Tax Year 2018, Montana NOLs of a corporation may be carried back for a period of 3 years and used to reduce prior years’ taxable income, and may be carried forward for up to 10 years to reduce taxable income in those future years. Loss carrybacks may not exceed $500,000 per tax period. Previously, losses could be carried back three years and forward seven years without any limitation on the carryback amount.
The table on the next page provides a comparison of Montana treatment of net operating loss deductions with that in other states.
In Montana, if a corporation has net operating losses, it can file an amended return and claim a refund of previously-paid taxes for any or all the prior three years, with the $500,000 carryback limitation per tax period beginning in Tax Year 2018.
For example, a hypothetical Montana corporation had net taxable income of $50,000 each year in years 1, 2, and 3. In year 4 it had losses of $160,000 and in year 5 it is back to profitability and has taxable income of $60,000. Based upon these assumptions, the corporation would have paid $3,375 in corporate income taxes ($50,000 times 0.0675) each year in years 1, 2, and 3. In year 4, it had net losses of $160,000 so it paid no corporate income tax (actually it would likely pay the $50 minimum tax unless it had credits). In year 4, the corporation could file amended returns for years 1, 2, and 3. On the amended returns, the taxpayer could claim $150,000 of year 4 losses against income earned in those prior years, and obtain refunds of taxes paid, or $10,125 (3 times $3,375). The remaining $10,000 of losses would be used as a deduction against year 5 income of $60,000, reducing taxable income from $60,000 to $50,000, and reducing the corporation’s tax liability by $675.
Twenty-nine states do not allow carryback of net operating losses, but do allow carryforward of losses, from five years up to 20 years. Fourteen states allow the same carryforward and carryback periods as federal tax law has historically allowed (two years back and 20 years forward). New York, Montana, and Utah allow corporations with net operating losses to carry back these losses against the three prior years of income.
As can be seen in the footnotes to the Net Operating Loss table on the following page, a number of states have restricted the amounts of losses that can be carried back and used to obtain refunds or carried forward in any one year. For example, like Montana, Utah provides a three year carryback of net operating losses, but has a limit of $1 million on carryback losses.

91revenue.mt.gov
Idaho allows losses to be carried back against income for up to two years, but limits carryback losses to $100,000. Idaho allows carry forward of losses for up to 20 years.
North Dakota allows carry forward of losses for up to 20 years, but does not allow carryback of losses.
Corporate Income Tax
5 years forward 10 years forward 12 years
forward15 years forward
20 years forward
ArizonaColorado
Arkansas Kansas Illinois Alabama ConnecticutRhode Island Michigan Minnesota District of Columbia
New Hampshire North Carolina FloridaVermont Oregon Indiana
Tennessee IowaKentucky
LouisianaMaine
MassachusettsNebraska
New JerseyNew MexicoNorth Dakota
OhioPennsylvania
South CarolinaWisconsin
Alaska
California DelawareGeorgiaHawaiiIdaho
MarylandMississippi
MissouriOklahoma
VirginiaWest Virginia
Montana Utah New York
Source: State Tax Handbook. 2017. CHS; Montana Department of Revenue. 2018.
States with Corporate Income TaxesAllowed Carryback and Carryforward Periods for Net Operating Losses
Allowed years of carryforward
Allowed years of
carryback
0 years back
2 years back
3 years back

92revenue.mt.gov
Corporate Income Tax
Credits
As with individual income tax, corporations with expenditures that qualify under state law can claim tax credits. Tax credits are applied against the corporation’s tax liability to reduce the amount the corporation owes.
For example, a corporation with Montana taxable income after deductions and additions of $3,000 has a tax liability of $202.50 ($3,000 times 6.75 percent). However if the corporation has expenditures that qualify under state law for a credit of $150, its tax liability is reduced to $52.50 from $202.50. For Tax Years 2015 and 2016, only three corporate income tax credits had enough claims to be able to disclose the number of businesses claiming the credit to the public; if the number of credits claimed on returns is less than 10, the information is confidential. These three credits can be seen in the following table.
Number of Credits
Total Credit Amounts
Number of Credits
Total Credit Amounts
Alternative Energy Production Credit 0 $0 0 $0Alternative Fuel Motor Vehicle Conversion Credit * $1,000 0 $0Biodiesel Blending and Storage Tax Credit 0 $0 0 $0Charitable Endowment Credit 15 $31,436 11 $25,130College Contribution Credit 28 $6,468 25 $4,898Contractor's Gross Receipts Credit 91 $644,922 88 $319,316Dependent Care Assistance Credit 0 $0 0 $0Empowerment Zone New Employees Tax Credit 0 $0 0 $0Geothermal Heating System Credit 0 $0 0 $0Health Insurance for Uninsured Montanans Credit * $5,750 * $350Historic Property Preservation Credit * $374,586 * $39,653Infrastructure Users Fee Credit * $1,676,702 * $706,524Mineral Exploration Credit * $25 * $25New/Expanded Industry Credit * $2,465 * $872Oilseed Crushing and Biodiesel Production Facility Credit 0 $0 0 $0Qualified Research Credit * $300 * $223Recycling Credit * $20,777 * $7,605Short-term Temporary Lodging Credit 0 $0 0 $0
Total Credits 156 $2,764,431 142 $1,104,596
Montana Corporation Tax Credits
Credit--- Tax Year 2015 --- --- Tax Year 2016 ---
Some of the above credits are claimed on returns that have not been audited yet. The amount of credit claimed may change once these returns are audited. In addition, some of the above numbers represent a carryback of some credits claimed on amended returns received during the fiscal year. Credits claimed on less than 10 returns are indicated by a *.

93revenue.mt.gov
Corporate Income Tax
Filing Requirements and Estimated Payments
Unlike individual income taxpayers who must file their federal and state returns based upon a calendar year, corporate taxpayers must file tax returns based upon their fiscal year. Corporate income taxpayers must use the same tax period for their state return as was used for the federal tax return (15-31-112, MCA).
As can be seen in the table in this section, about two-thirds of corporate taxpayers (69 percent) have a fiscal year/tax year that is based upon the calendar year. Tax returns for taxpayers using a calendar year as their fiscal year are due May 15 or November 15 under an automatic extension.
The next most-used fiscal year/tax year is the 12 months ending at the end of June; about 5 percent of corporate taxpayers filing in Montana used a fiscal year ending at the end of June. Tax returns for taxpayers using another period as their fiscal year are due the 15th day of the fifth month after close of the taxable year. So if a taxpayer’s fiscal year ends at the end of June, the tax return is due November 15 or May 15 under an automatic extension.
Automatic extensions are allowed for up to six months following the prescribed filing date.
For example, a taxpayer with a fiscal year/tax year that is also a calendar year can use the automatic extension moving the due date of their return from May 15 to November 15. So the Tax Year 2016 return for a taxpayer whose fiscal year is calendar year 2016 would be due May 15, 2017, but the taxpayer would have until November 15, 2017 to file under the automatic extension.
A taxpayer whose fiscal year/tax year ends June 30 can obtain an automatic six-month extension that moves the due date for its return from November 15 to May 15 of the following year. So the Tax Year 2016 return for a taxpayer whose fiscal year starts July 1 (in 2016) and goes through June 30 (of 2017) is due November 15, 2017 but the taxpayer would have until May 15, 2018, to file under automatic extension.Companies with a tax liability of $5,000 or more must make quarterly estimated payments. For a corporation operating with a calendar year as its fiscal year/tax year, the due dates for quarterly payments are April 15, June 15, September 15, and December 15. For a corporation using another 12-month period as its fiscal/tax year, the due dates for quarterly installments are the 15th day of the fourth month, the 15th day of the sixth month, the 15th day of the ninth month, and the 15th day of the 12th month (15-31-502, MCA).
Penalties and Interest
Corporations that do not pay taxes when due may be charged a late payment penalty of 1.2 percent per month on the unpaid tax, up to a maximum penalty of 12 percent of the tax due. Interest on unpaid tax accrues at a rate of 12 percent per year, or at 1 percent per month or fraction of a month on the unpaid tax.
Tax Year Number of Period Ending Taxpayers Percent
12/31/2016 11,269 69%1/31/2017 359 2%2/28/2017 248 2%3/31/2017 780 5%4/30/2017 212 1%5/31/2017 215 1%6/30/2017 848 5%7/31/2017 158 1%8/31/2017 205 1%9/30/2017 790 5%10/31/2017 834 5%11/30/2017 514 3%
Total 16,432 100%
Corporate Income TaxTax Year 2016

94revenue.mt.gov
Corporate Income Tax
Comparison of Corporate Tax Rate with Other States
Forty-four states and the District of Columbia have a tax on corporate income. The comparison table in this section uses data from the Federation of Tax Administrators (as of January 1, 2018) to show the maximum rates for states that have a corporate tax. These go from 12 percent down to 3 percent. A number of states have a graduated income tax which is indicated by an asterisk next to the state.
Of course, what is shown in the table is only the maximum rate for each state. The effective or average tax rate in different states can vary substantially, depending upon what the lower rates are and what income they apply to. Furthermore, state tax deductions, exemptions and credits, and other aspects of state taxation policy can substantially reduce the effective tax rate.
Nevada and Wyoming do not have corporate income taxes.
Texas does not have a corporate income tax, but imposes a franchise tax based on gross revenues.
Ohio has adopted a commercial activity tax which is a tax on gross receipts. Washington has a business and occupation tax which also is a tax on gross receipts.
Montana’s tax rate is 6.75 percent. Idaho’s tax rate is 7.4 percent and North Dakota’s top corporate income tax rate is 4.31 percent.
South Dakota does not have a general corporate income tax, but does have an excise tax on financial institutions which starts at 6 percent on net income of $400 million or less. The percentage tax declines in steps on net income over that amount.
As noted earlier, Wyoming does not have a corporate income tax, but does have a corporate franchise tax or license tax of two-tenths of on mill per dollar of assets, which applies to the sum of capital, property, and assets located in Wyoming (in addition to a general property tax), and also has a relatively broad-based sales tax.
Rank State Maximum Tax Rate1 Iowa* 12.00%2 Pennsylvania 9.99%3 Minnesota 9.80%4 Illinois 9.50%5 Alaska* 9.40%6 New Jersey 9.00%7 Maine * 8.93%8 California 8.84%9 Delaware 8.70%
10 Vermont * 8.50%11 District of Columbia 8.25%11 Maryland 8.25%12 New Hampshire 8.20%13 Louisiana * 8.00%13 Massachusetts 8.00%14 Wisconsin 7.90%15 Nebraska * 7.81%16 Oregon 7.60%17 Connecticut 7.50%18 Idaho 7.40%19 Rhode Island 7.00%20 Montana 6.75%21 New York 6.50%21 West Virginia 6.50%21 Alabama 6.50%21 Arkansas * 6.50%21 Tennessee 6.50%22 Hawaii * 6.40%23 Missouri 6.25%24 Georgia 6.00%24 Indiana 6.00%24 Kentucky * 6.00%24 Michigan 6.00%24 Oklahoma 6.00%24 Virginia 6.00%25 New Mexico* 5.90%26 Florida 5.50%27 Mississippi * 5.00%27 South Carolina 5.00%27 Utah 5.00%28 Arizona 4.90%29 Colorado 4.63%30 North Dakota* 4.31%31 Kansas 4.00%32 North Carolina 3.00%
* Graduated income taxAs of Jan. 1, 2018, Federation of Tax Administrators
Maximum Corporate Tax Rate By State

95revenue.mt.gov
Select History of Corporate Income (License) Tax
The corporate license tax was established in 1917. The tax rate was 1 percent and there was no minimum tax.
In 1933, the rate was raised to 2 percent with a minimum tax of $5. In 1937, the rate was raised to 3 percent; the minimum tax remained $5. Twenty years later in 1957, the rate was raised to 5 percent and the minimum tax changed to $10. The tax rate was changed several times in the years between 1960 and 1971 and the minimum tax was increased from $10 to $50.
In 1987, the water’s edge election, which includes a tax rate of 7 percent for corporations that elect to file as water’s edge companies, was added.
In 2013, the name of the corporate license tax was changed to corporate income tax.
Year Tax Rate Minimum Tax
Water's Edge
1987 6.75% $50 7%1971 6.75% $50 -1969 6.25% $50 -1965 5.25% $10 -1960 4.5% $10 -1957 5% $10 -1937 3% $5 -1933 2% $5 -1917 1% - -
Corporate Income TaxHistoric Tax Rates and Minimum Tax
Corporate Income Tax