inditex group company report - retail-apparel - Nova SBE
33
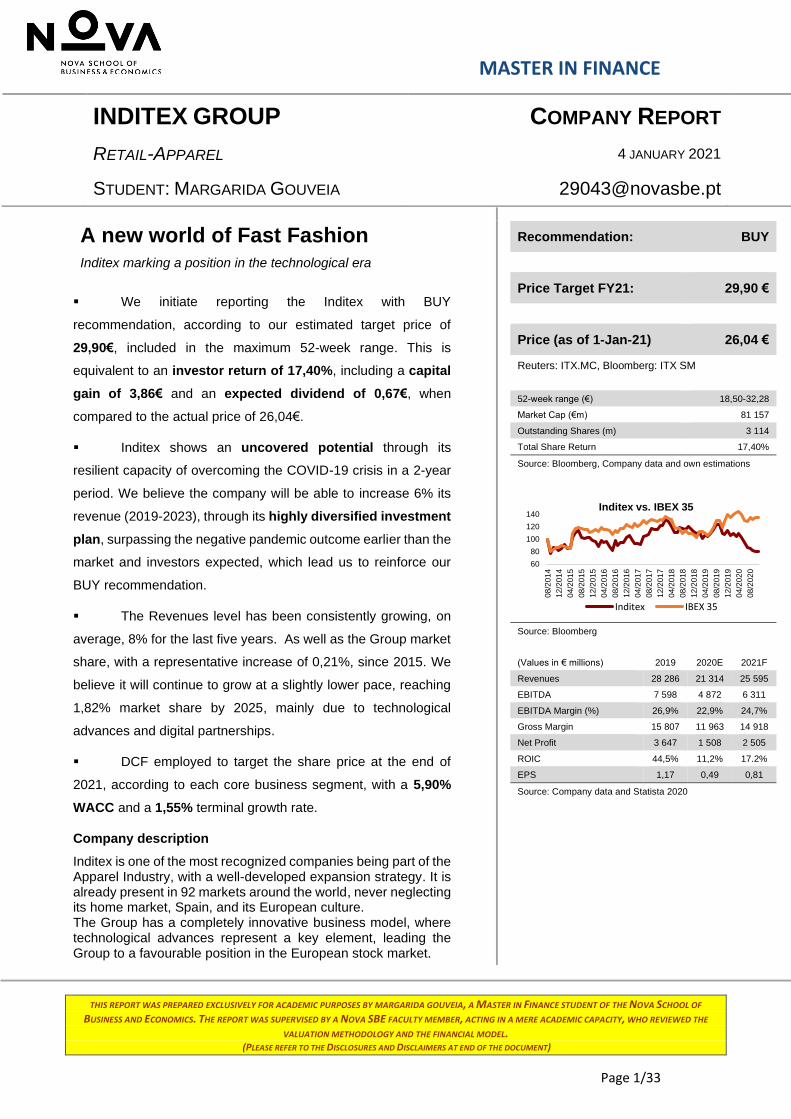
MASTER IN FINANCE THIS REPORT WAS PREPARED EXCLUSIVELY FOR ACADEMIC PURPOSES BY MARGARIDA GOUVEIA, A MASTER IN FINANCE STUDENT OF THE NOVA SCHOOL OF BUSINESS AND ECONOMICS. THE REPORT WAS SUPERVISED BY A NOVA SBE FACULTY MEMBER, ACTING IN A MERE ACADEMIC CAPACITY, WHO REVIEWED THE VALUATION METHODOLOGY AND THE FINANCIAL MODEL. (PLEASE REFER TO THE DISCLOSURES AND DISCLAIMERS AT END OF THE DOCUMENT) Page 1/33 ▪ We initiate reporting the Inditex with BUY recommendation, according to our estimated target price of 29,90€, included in the maximum 52-week range. This is equivalent to an investor return of 17,40%, including a capital gain of 3,86€ and an expected dividend of 0,67€, when compared to the actual price of 26,04€. ▪ Inditex shows an uncovered potential through its resilient capacity of overcoming the COVID-19 crisis in a 2-year period. We believe the company will be able to increase 6% its revenue (2019-2023), through its highly diversified investment plan, surpassing the negative pandemic outcome earlier than the market and investors expected, which lead us to reinforce our BUY recommendation. ▪ The Revenues level has been consistently growing, on average, 8% for the last five years. As well as the Group market share, with a representative increase of 0,21%, since 2015. We believe it will continue to grow at a slightly lower pace, reaching 1,82% market share by 2025, mainly due to technological advances and digital partnerships. ▪ DCF employed to target the share price at the end of 2021, according to each core business segment, with a 5,90% WACC and a 1,55% terminal growth rate. Company description Inditex is one of the most recognized companies being part of the Apparel Industry, with a well-developed expansion strategy. It is already present in 92 markets around the world, never neglecting its home market, Spain, and its European culture. The Group has a completely innovative business model, where technological advances represent a key element, leading the Group to a favourable position in the European stock market. INDITEX GROUP COMPANY REPORT RETAIL-APPAREL 4 JANUARY 2021 STUDENT: MARGARIDA GOUVEIA [email protected] A new world of Fast Fashion Inditex marking a position in the technological era Recommendation: BUY Price Target FY21: 29,90 € Price (as of 1-Jan-21) 26,04 € Reuters: ITX.MC, Bloomberg: ITX SM 52-week range (€) 18,50-32,28 Market Cap (€m) 81 157 Outstanding Shares (m) 3 114 Total Share Return 17,40% Source: Bloomberg, Company data and own estimations Source: Bloomberg (Values in € millions) 2019 2020E 2021F Revenues 28 286 21 314 25 595 EBITDA 7 598 4 872 6 311 EBITDA Margin (%) 26,9% 22,9% 24,7% Gross Margin 15 807 11 963 14 918 Net Profit 3 647 1 508 2 505 ROIC 44,5% 11,2% 17.2% EPS 1,17 0,49 0,81 Source: Company data and Statista 2020 60 80 100 120 140 08/2014 12/2014 04/2015 08/2015 12/2015 04/2016 08/2016 12/2016 04/2017 08/2017 12/2017 04/2018 08/2018 12/2018 04/2019 08/2019 12/2019 04/2020 08/2020 Inditex vs. IBEX 35 Inditex IBEX 35
-
Upload
khangminh22 -
Category
Documents
-
view
0 -
download
0
Transcript of inditex group company report - retail-apparel - Nova SBE
MASTER IN FINANCE
THIS REPORT WAS PREPARED EXCLUSIVELY FOR ACADEMIC PURPOSES BY MARGARIDA GOUVEIA, A MASTER IN FINANCE STUDENT OF THE NOVA SCHOOL OF
BUSINESS AND ECONOMICS. THE REPORT WAS SUPERVISED BY A NOVA SBE FACULTY MEMBER, ACTING IN A MERE ACADEMIC CAPACITY, WHO REVIEWED THE
VALUATION METHODOLOGY AND THE FINANCIAL MODEL. (PLEASE REFER TO THE DISCLOSURES AND DISCLAIMERS AT END OF THE DOCUMENT)
Page 1/33
▪ We initiate reporting the Inditex with BUY
recommendation, according to our estimated target price of
29,90€, included in the maximum 52-week range. This is
equivalent to an investor return of 17,40%, including a capital
gain of 3,86€ and an expected dividend of 0,67€, when
compared to the actual price of 26,04€.
▪ Inditex shows an uncovered potential through its
resilient capacity of overcoming the COVID-19 crisis in a 2-year
period. We believe the company will be able to increase 6% its
revenue (2019-2023), through its highly diversified investment
plan, surpassing the negative pandemic outcome earlier than the
market and investors expected, which lead us to reinforce our
BUY recommendation.
▪ The Revenues level has been consistently growing, on
average, 8% for the last five years. As well as the Group market
share, with a representative increase of 0,21%, since 2015. We
believe it will continue to grow at a slightly lower pace, reaching
1,82% market share by 2025, mainly due to technological
advances and digital partnerships.
▪ DCF employed to target the share price at the end of
2021, according to each core business segment, with a 5,90%
WACC and a 1,55% terminal growth rate.
Company description
Inditex is one of the most recognized companies being part of the Apparel Industry, with a well-developed expansion strategy. It is already present in 92 markets around the world, never neglecting its home market, Spain, and its European culture. The Group has a completely innovative business model, where technological advances represent a key element, leading the Group to a favourable position in the European stock market.
INDITEX GROUP COMPANY REPORT
RETAIL-APPAREL 4 JANUARY 2021
STUDENT: MARGARIDA GOUVEIA [email protected]
A new world of Fast Fashion
Inditex marking a position in the technological era
Recommendation: BUY
Price Target FY21: 29,90 €
Price (as of 1-Jan-21) 26,04 €
Reuters: ITX.MC, Bloomberg: ITX SM
52-week range (€) 18,50-32,28
Market Cap (€m) 81 157
Outstanding Shares (m) 3 114
Total Share Return 17,40%
Source: Bloomberg, Company data and own estimations
Source: Bloomberg
(Values in € millions) 2019 2020E 2021F
Revenues 28 286 21 314 25 595
EBITDA 7 598 4 872 6 311
EBITDA Margin (%) 26,9% 22,9% 24,7%
Gross Margin 15 807 11 963 14 918
Net Profit 3 647 1 508 2 505
ROIC 44,5% 11,2% 17.2%
EPS 1,17 0,49 0,81
Source: Company data and Statista 2020
60
80
100
120
140
08
/20
14
12
/20
14
04
/20
15
08
/20
15
12
/20
15
04
/20
16
08
/20
16
12
/20
16
04
/20
17
08
/20
17
12
/20
17
04
/20
18
08
/20
18
12
/20
18
04
/20
19
08
/20
19
12
/20
19
04
/20
20
08
/20
20
Inditex vs. IBEX 35
Inditex IBEX 35

INDITEX COMPANY REPORT
PAGE 2/33
Table of Contents
COMPANY OVERVIEW ........................................................................... 3
Indices .................................................................................................. 3 Shareholder Structure and Dividend Policy.................................... 4 Impact of Covid-19 ............................................................................. 5
THE SECTOR ........................................................................................... 6
Global economy .................................................................................. 6 Consumer Shifts ................................................................................. 7 ▪ Digitalisation .................................................................................. 7 ▪ Sustainability ................................................................................. 7 ▪ Innovation ...................................................................................... 7
COMPETITION ......................................................................................... 8
VALUE DRIVERS ..................................................................................... 9
SEGMENT ANALYSIS ............................................................................12
VALUATION ASSUMPTIONS .................................................................13
Revenues Forecast .......................................................................... 13 ▪ Spain ............................................................................................ 14 ▪ Europe (excluding Spain) .......................................................... 14 ▪ Americas ...................................................................................... 15 ▪ Asia and the rest of the world ................................................... 15 Costs .................................................................................................. 16 Depreciation & Amortisation ........................................................... 18 Capital Expenditures ........................................................................ 18 Net Working Capital ......................................................................... 19 Cost of Capital & Growth rate ......................................................... 20
VALUATION OUTCOME .........................................................................22
Discounted Cash-Flow Method ...................................................... 22 Multiples Valuation ........................................................................... 22
MAJOR RISKS ........................................................................................24
SENSITIVITY ANALYSIS ........................................................................25
FINAL RECOMMENDATION ...................................................................27
APPENDIX ..............................................................................................28
FINANCIAL STATEMENTS .....................................................................28
REPORT RECOMMENDATIONS ............................................................................ 31

INDITEX COMPANY REPORT
PAGE 3/33
Company Overview
Inditex is a global fashion retail group headquartered in Arteixo (A Coruña, Spain)
that designs, produces and commercializes fashion items, mainly apparel,
footwear and accessories. The company, initially denominated as Confecciones
GOA, was founded in 1963 by Amancio Ortega. In 1975, the founder opened the
first Zara store, and its success was followed by the successive launch of new
brands and international expansion. Ten years later, Inditex was founded to
incorporate all companies under one banner.
Nowadays, Inditex operates in 202 markets on five continents, selling products
through its over 7.300 stores across 96 markets and its online platform in an
integrated way. Revenues are segmented into four geographic areas: Spain,
Europe (excluding Spain), Americas and Asia and the rest of the world. As of the
first half of 2020, Europe accounted for the higher sales share (63,6%), 14,7%
coming from the Spanish market (Exhibit 1).
The company is made up of eight brands that serve distinct market segments. Zara
is the flagship brand of the Group and the one that generates the largest portion of
revenues (Exhibit 2). It aims to shrink the gap between customers’ needs and the
fashion industry’s offer at affordable prices. Still in the range of accessible brands
are Pull&Bear, Bershka and Stradivarius. On the other hand, Massimo Dutti
and Uterqüe are focused on high-end customers, producing high quality products.
Regarding Oysho, its product line includes lingerie, beachwear, home wear and
sport. Finally, Inditex also offers home furniture and decorative items under the
brand Zara Home, reaching a broad spectrum of consumers.
Today, Inditex is the world’s largest fashion group, with more than 176.000
employees from 172 different nationalities, who are responsible for the
anticipation of customers’ needs and consequent success of the Group’s strategy.
Indices
Inditex first went public during its Initial Public Offering in 2001. Currently, its shares
are listed on the four Spanish stock exchanges and the company integrates the
IBEX 35 Index and Euro STOXX 50 Index.
Inditex is the company with higher market capitalization of the IBEX 35 Index. By
observing the Exhibit 3, it is possible to note that the company’s stock price clearly
outperformed EURO Stoxx 50 from August 2017 until March 2020. In September
2019, analysts predicted that foreign exchange pressures were going to have a
Source: Company data
14,7%
48,9%
12,0%
24,4%
Exhibit 1: Revenues by geographic area in 1H2020
Spain
Europe (not Spain)
Americas
Asia and the rest of the world
Source: Company data
0,39% 6,10%
68,87%
6,25%
7,20%
8,61%2,59%
Exhibit 2: Revenues by brand in 1H2020 (in %)
Uterqüe
Massimo Dutti
Zara (Zara + Zara Home)
Stradivarius
Pull&Bear
Bershka
Oysho

INDITEX COMPANY REPORT
PAGE 4/33
negative impact on sales, and Inditex’s share prices fell as a consequence1. This
drop was accentuated by the Covid-19 crisis and the price reached a minimum of
21,19€ per share in October 2020.
Source: Bloomberg and own analysis
In addition, the Group is included in sustainability-based indices, reflecting the
strategy followed over the years to become more social and environmentally
friendly. In 2019, it obtained a score of 4,9 (out of 5) on FTSE4Good Index and a
score of 68 on Dow Jones Sustainability Index, 40 points higher than the industry
average, being considered as one of the most sustainable retail companies for the
nineteenth consecutive year by the latter Index.
Shareholder Structure and Dividend Policy
Inditex’s shareholder structure is dispersed (see Exhibit 4). The main shareholder
is Pontegadea Inversiones SL, that accounted for 50,01% of the shares by the end
of 2019. Institutional investors, who have the second highest stake, represented
33,87%. Additionally, Partler 2006 SL, Rosp Corunna Participaciones
Empresariales SL and Retail holds 9,28%, 5,05% and 1,71% of shares,
respectively. Lastly, Inditex owns 2.125.384 treasury shares that represents
0,068% of the share capital.
Since 2018, the ordinary dividend payout is 60% of the net profit generated in
the year. The dividend policy also includes the possibility of a bonus dividend.
Over the past few years, the dividend payout ratio has been growing, as well as
dividend per share (Exhibit 5). Despite the impact of the Covid-19 pandemic, the
Group plan to maintain its dividend policy (60% ordinary payout and bonus
dividends), which gives a positive sign to investors and indicates that, even facing
difficult times, the company is financial healthy.
1 https://www.retailgazette.co.uk/blog/2018/02/zaras-shares-fall-3-year-low-analysts-drop-full-year-estimates/
50
70
90
110
130
150
09/2
014
12/2
014
03/2
015
06/2
015
09/2
015
12/2
015
03/2
016
06/2
016
09/2
016
12/2
016
03/2
017
06/2
017
09/2
017
12/2
017
03/2
018
06/2
018
09/2
018
12/2
018
03/2
019
06/2
019
09/2
019
12/2
019
03/2
020
06/2
020
09/2
020
Exhibit 3: Relative Performance Inditex, IBEX35 and EURO Stoxx 50
Inditex IBEX 35 SX5E Index
50,01%33,87%
9,28%
5,05% 1,71%
0,07%
Exhibit 4: Inditex'sShareholding Structure 2019
Pontegadea Inversiones SL
Institutional
Partler 2006 SL
Rosp Corunna ParticipacionesEmpresariales SLRetail
Source: Company data

INDITEX COMPANY REPORT
PAGE 5/33
Exhibit 5: Inditex’s Historical Dividend Payout Ratio (2015-2019)
Impact of Covid-19
Until 2019, the Group grew steadily, having reached net sales of 28.2 billion euros
and net profits of 3.6 billion euros by the end of the year. This performance was
strongly impacted by the Covid-19 pandemic due to the temporary stores
closure. By end of April 2020, only 965 stores remained open in 27 countries, out
of a total of 7.469 (see Exhibit 6). At this time, the Group reported its first loss of
409M€. In the third quarter of 2020, Inditex registered a drop in net sales of 5.7bn€,
when compared to the same period of the previous year (Exhibit 7).
Inditex has been progressively recovering its performance, mainly due to the
strength of the business model and the online segment. However, it continues to
face a challenging and uncertain environment. One example is the new phase
of closures and restrictions established from 19 October in various markets. On
the other hand, it is not clear the impact that the pandemic will have on the
economy and, consequently, on consumers’ purchasing power. This makes it even
more difficult to predict sales for years to come. Nevertheless, based on forecasts
for the industry2, it is expected that the sector will recover the sales level of 2019
in 2022 and it will continue to grow in the following years, what will be discussed
in the Revenues Forecast Section.
2 Statista, 2020
2015 2016 2017 2018 2019
Dividend per share (in €) 0,52 0,60 0,68 0,75 0,88
Number of shares outstanding (in million) 3.113 3.114 3.113 3.114 3.114
Total dividends paid (in million €) 1.619 1.868 2.117 2.335 2.741
Net income available to shareholders 2.875 3.157 3.368 3.444 3.639
Dividend payout ratio 0,56 0,59 0,63 0,68 0,75
Source: Company data
-
10
20
30
2015 2016 2017 2018 2019 2020
Th
ousands
Exhibit 7: Revenue by quarter 2015-2020 (in million €)
1Q 2Q 3Q 4Q
Source: Company data and own calculations
Source: Company data
0
1
2
3
4
5
6
7
8
Jan
Jan
Fe
b
Mar
Ma
r
Ap
r
Ma
y
Ma
y
Jun
Jul
Jul
Th
ousands
Exhibit 6: Number of stores open (January-July 2020)

INDITEX COMPANY REPORT
PAGE 6/33
The Sector
The Apparel Industry is divided into three distinct segments as women, men, and
children’s apparel. Even though clothing is not a first order necessity good, it is a
key product to consumers, especially in the most advanced economies,
symbolizing the individual expression and social achievement.
At a worldwide level, the industry has been growing for the past five years,
achieving a market size of almost 1.6 trillion € in 2019, with an average CAGR of
3,58% from 2015 to 2019 (Exhibit 8). Regarding the future of the industry, Apparel
is expected to have a revenue decline of 19% (Exhibit 9). Nevertheless, it is
critical to highlight the exponentially higher forecasted CAGR for the period
between 2020 and 2025, of 5,50%.
Source: Statista, 2020
Fashion is facing major challenges, which are expected to shape the industry
growth for the upcoming years: Global economy and Consumer Shifts.
Global economy
Firstly, the macroeconomic context is challenging. The Covid-19 pandemic is
creating significant uncertainty, with a quantifiable impact on growth. Indicators of
recession will lead to consumers being increasingly cautions and, as a
consequence, a slowdown in the sector. As Exhibit 10 depicts, GDP will decrease
in 2020 as a result of the pressure that the global economy is facing, mainly due
to the lack of capacity of distinct markets to overcome the pandemic adversities
and the increase in public and private debt levels, exposing financial markets to
volatility. The impact will be more abrupt in the Group’s home market, Spain, where
it is predicted to achieve a negative value of 12,8%. Nevertheless, it is verified also
an enormous capacity to overcome the situation, in the following year. In addition,
it is also relevant to highlight the Asian smooth effect in the curve, leading to
assume a faster recovery from the crisis, comparing to the rest of the world, that is
-20%
-10%
0%
10%
20%
0
250
500
750
1 000
1 250
1 500
1 750
2 000
2017 2018 2019 2020F 2021F 2022F 2023F 2024F 2025F
Thousands
Exhibit 9: Expected Global Apparel Industry development, in terms of market size (million €) and growth
Source: IMF 2020, World Economic Outlook
-13%
-10%
-7%
-4%
-1%
2%
5%
8%
Exhibit 10: Real GDP Growth rate (%)
2019 2020F 2021F
Source: Statista, 2020 & Own calculations
5,50%
3,58%
2015-2019
2020-2025

INDITEX COMPANY REPORT
PAGE 7/33
expected to restore economically in 2022, with a forecasted real GDP growth of
4,2%.
Consumer Shifts
Secondly, the consumer behaviour has been impacting the way fashion companies
operate and their success on the market. The major opportunities for the industry
will come from three key pillars: digitalisation, sustainability, and innovation.
▪ Digitalisation
Over the years, consumers have made more purchases online, valuing the
convenience of not having to go to stores. This change in behaviour was largely
driven by the pandemic, given the closure of a large number of stores worldwide,
which resulted in an exponential increase in online sales. Fashion is the largest e-
commerce segment, and it is expected to grow 7,4% worldwide (CAGR 2020-
2025)3. Furthermore, the number of consumers who buys online worldwide is
expected continue to increase and reach 4.914 million in 2025, compared to 3.472
million in 20204 (Exhibit 11). Still regarding digitalisation, a study developed by
McKinsey5 states that fashion companies need to exploit social media platforms to
increase their sales. Social media is seen as a route to reach a large audience,
contributing to grab consumers’ attention and brand awareness.
▪ Sustainability
The fashion industry is extremely polluting and wasteful. It is responsible for 20%
to 35% of microplastic flows into the ocean and outweighs the carbon footprint of
shopping and international flights combined6. Consumers have been increasingly
aware of the environmental impacts of Apparel industry, putting players under
pressure. Thus, fashion companies will need to swap the way they operate to face
up the consumer demand for sustainable transformational changes, as well as
regulatory requirements.
▪ Innovation
The third major opportunity for the industry is innovation. Despite the increasing
importance of the digital segment, sales made in stores represents the higher stake
of total sales of fashion industry (80%7, approximately). Therefore, stores continue
to play an important role to customers, that are increasingly value the shopping
3 Statista, 2020 4 Statista, 2020 5 “The State of Fashion 2020 – Mckinsey & Company” 6 Chinasamy, Jasmine, “A monstrous disposable industry: Fast facts about fast fashion”, Unearthed, 12th September
2019 7 Statista, 2020
Source: Statista, 2020
2832 35 38 41 44 46 49
0
10
20
30
40
50
60
Hundre
ds
Exhibit 11: Number of users e-commerce worldwide (in
millions)

INDITEX COMPANY REPORT
PAGE 8/33
journey. To adapt to shift consumer behaviour, companies need to evolve, rethink
their store network, and focus on stores equipped with cutting edge tools. On the
other hand, stores will need to complement digital sales, creating an omnichannel
model. However, this will require a higher investment, which will keep a significant
number of companies away from this path. The ones capable of reduce the friction
in the customer experience will be a step ahead of their peers.
Competition
The Apparel Retail Industry is composed by a large number of small players, from
simple niches stores to entrepreneurial boutiques, exploiting opportunities side by
side with the world giants, like Inditex and H&M. As consequence, the market
assumes an extremely competitive and highly fragmented position, enhanced
through available market data, where the top 10 companies in the sector only
represent 10%8 of the global market share.
Inditex differentiates itself from its peers due to a business model that is strongly
customer oriented. Instead of allocating a high percentage of production to the next
season, the company allocates a small fraction and uses consumers’ feedback
and an efficient network to fill stores with new products. Through a close watch on
how the trends are evolving every day around the world, it creates new garments
and puts them into the market in a rapid manner. While most of the fashion
companies would take around six months to fill their stores with new products9,
Inditex takes only one or two weeks, what is one of the main competitive
advantages of the Group. This flexibility is possible by having 54% of the factories
close to the Group’s design facilities and 10 centralised logistic centres that
distribute stocks to online and physical warehouses all over the world with a
maximum delivery time of 48 hours (Exhibit 12).
In order to understand how the Group is positioned in the market, we analysed
Inditex’s competitors and compared to the Group historical performance. From
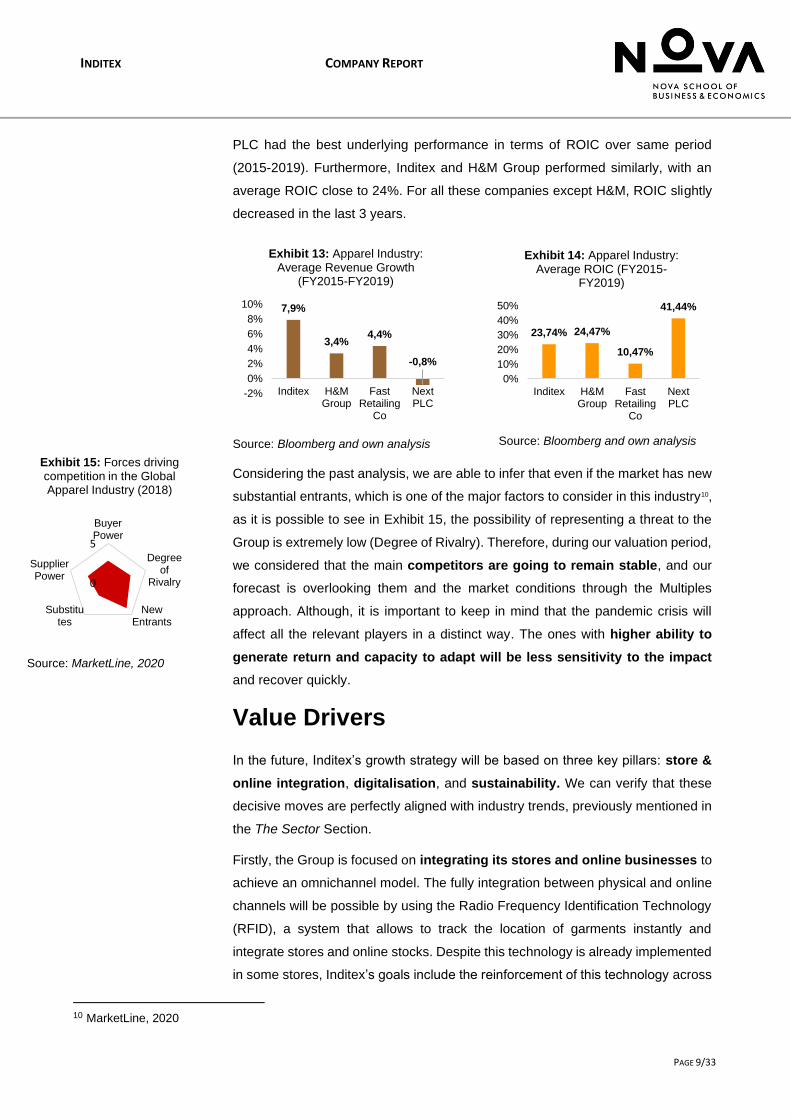
2015 through 2019, Inditex’s revenues increased 7,9% on average. Based on
Exhibit 13, the company has been outperforming its main competitors. The
difference is quite noticeable comparing Inditex with Next PLC, with a negative
average growth (-0,8%) and H&M Group (3,4%). Since these values might not be
directly comparable, the Return on Invested Capital (ROIC) was analysed to
better evaluate the differences in value across these companies. Considering the
Exhibit 14, it is possible to see that, despite having the lower revenue growth, Next
8 https://www.themds.com/companies/the-winner-takes-it-all-top-10-fashion-companies-hold-10-of-the-global-market.html 9 https://martinroll.com/resources/articles/strategy/the-secret-of-zaras-success-a-culture-of-customer-co-creation/
Source: Own analysis
Exhibit 12: Inditex centralised distribution model
INDITEX COMPANY REPORT
PAGE 9/33
PLC had the best underlying performance in terms of ROIC over same period
(2015-2019). Furthermore, Inditex and H&M Group performed similarly, with an
average ROIC close to 24%. For all these companies except H&M, ROIC slightly
decreased in the last 3 years.
Source: Bloomberg and own analysis
Considering the past analysis, we are able to infer that even if the market has new
substantial entrants, which is one of the major factors to consider in this industry10,
as it is possible to see in Exhibit 15, the possibility of representing a threat to the
Group is extremely low (Degree of Rivalry). Therefore, during our valuation period,
we considered that the main competitors are going to remain stable, and our
forecast is overlooking them and the market conditions through the Multiples
approach. Although, it is important to keep in mind that the pandemic crisis will
affect all the relevant players in a distinct way. The ones with higher ability to
generate return and capacity to adapt will be less sensitivity to the impact
and recover quickly.
Value Drivers
In the future, Inditex’s growth strategy will be based on three key pillars: store &
online integration, digitalisation, and sustainability. We can verify that these
decisive moves are perfectly aligned with industry trends, previously mentioned in
the The Sector Section.
Firstly, the Group is focused on integrating its stores and online businesses to
achieve an omnichannel model. The fully integration between physical and online
channels will be possible by using the Radio Frequency Identification Technology
(RFID), a system that allows to track the location of garments instantly and
integrate stores and online stocks. Despite this technology is already implemented
in some stores, Inditex’s goals include the reinforcement of this technology across
10 MarketLine, 2020
7,9%
3,4%4,4%
-0,8%
-2%
0%
2%
4%
6%
8%
10%
Inditex H&MGroup
FastRetailing
Co
NextPLC
Exhibit 13: Apparel Industry: Average Revenue Growth
(FY2015-FY2019)
Source: Bloomberg and own analysis
Source: MarketLine, 2020
0
5
BuyerPower
Degreeof
Rivalry
NewEntrants
Substitutes
SupplierPower
Exhibit 15: Forces driving competition in the Global Apparel Industry (2018)
23,74% 24,47%
10,47%
41,44%
0%
10%
20%
30%
40%
50%
Inditex H&MGroup
FastRetailing
Co
NextPLC
Exhibit 14: Apparel Industry: Average ROIC (FY2015-
FY2019)

INDITEX COMPANY REPORT
PAGE 10/33
all eight of its brands over the next two years. By the end of 2022, it is expected to
be fully implemented and operational. As it happened in the past, we believe that
this technology will contribute to a lower inventory on sales in the future, with a
consequent decrease in the average holding period (AHP).
In addition, the Group differentiates itself from the competition by understanding
that customers want to experience shopping, not just buy products. Therefore, to
strengthen its position in the market, the company intends to capitalize on the store
experience by focusing on high quality stores: all integrated, digital, and eco-
efficient. Inditex is committed to upgrade the integrated store platform by rolling
out new advanced technology solutions. Between 2020 and 2021, its plan also
includes the “absorption” of 1.000-1.200 small stores (500-600 annually),
especially of brands other than Zara, and the staff to be re-deployed to tasks such
as dispatching online purchases. Lastly, the Group has announced the opening of
450 new larger stores, that will be acting as distribution hubs for online sales. In
the future, stores area is expected to grow 2.5% per year (Exhibit 16). According
to the company, the total investment allocated to the integrated store platform plan
will be around 1.7 billion euros (900 million euros a year). These investments are
incorporated in the forecasts in “Property, Plant and Equipment”. Despite the
current challenging times, Inditex is highly committed to the store optimisation
program, having registered a provision at the end of the first quarter to accomplish
this strategic goal. These efforts lead us to believe that, by the end of 2022, all
stores will be upgraded and fully integrated, as planned by the Group.
The second pillar, digitalisation, relates to Inditex’s efforts to scaling up its online
sales and it is directly connected with the store optimization program, described
before. The company expects the online segment to constitute at least 25% of the
total sales by 2022 (Exhibit 17), compared to 14% in FY2019. We believe that
Inditex will reach this goal, since it is planning to invest a significant amount (1
billion euros between 2020 and 2022) to boost its online capabilities and leverage
the online network. Digital investments will include the development of “Inditex
Open Platform”, the Group’s proprietary digital operating system, over which all
of the integrated digital operations related to the e-commerce will run. This
investment was included in “Other intangible assets”. Investments also include
new online studios with 64.000 m2 for Zara in Arteixo, Spain.
On the other hand, our belief that e-commerce will keep on being the fastest
growing revenue channel is supported by the ongoing trend worldwide towards
online shopping, as described in The Sector Section. Moreover, Inditex has a
strong presence on social media, in platforms such as Instagram, Facebook,
Twitter and Weitao, having reached 178 million followers around the world by 2019
0%
1%
2%
3%
4%
5%
4000
4500
5000
5500
6000
2018
2019
2020F
2021F
2022F
2023F
2024F
2025F
Exhibit 16: Stores area growth - Historical and
forecast
Total area (000m2)
Growth
Source: Company data and own estimates
Source: Own estimates
14%
30%
28%
27%
26%
26%
26%
0% 100%
2017
2018
2019
2020F
2021F
2022F
2023F
2024F
2025F
Exhibit 17: Expected Online Sales development
Online Offline

INDITEX COMPANY REPORT
PAGE 11/33
(Exhibit 18). As described before, the social media is playing an increasingly
important role in the fashion industry. We believe that the Group’s position in these
platforms will continue to increase in the coming years, contributing positively to
an increase in revenues.
In what concerns the last pillar, sustainability, it is a key part of the strategy. The
Group coordinates its economic growth with environmental goals to move closer
to a circular economy. Seeking to reduce its environmental footprint, it is searching
for more sustainable processes and raw materials. The goal for 2025 is that
100% of cotton, polyester and linen used to produce its products will be recycled
or will come from sustainable sources. Taking into account that cotton is the most
common raw material used to produce Inditex’s products, we expect that a change
in its consumption will result in a change in the company’s costs, more specifically
in the cost of goods sold (COGS).
The production of sustainable cotton implies extra costs because the ecological
procedures are costly. A common practice consists of avoiding chemical products,
namely pesticides. While reducing the dependency of these produts, producers
have to hire more employees to perform activities such as cleanence and repair of
damages caused by pragues, which leads to an increase in production costs and,
consequently, to an increase of raw materials’ prices. On the other hand, these
materials can be hard to find and to produce, increasing even more the final
products’ prices. As a consequence, we believe that COGS as a percentage of
sales will continue to increase until 2025, following the same trend of the past. At
this point, we expect that 100% of raw materials will come from organic sources
(Exhibit 19), leading the company to achieve a steady-state in what regards to its
costs.
However, in terms of gross margin (Exhibit 20), we believe that this strategic point
will not have a huge impact despite the increase of costs because sustainable
clothes are sold at higher prices, reflecting their high quality, which will contribute
positively to the increase of the value of revenues expected for the coming years.
Some people are willing to pay more for products that are produced with less
negative impact.
There are other initiatives that reflect some of the efforts intended by the Group to
become a more sustainable business in the future and preserve the planet: have
used-clothing containers in all stores by the end of 2020; reduce the surplus at the
end of the fashion season, mainly due to the implementation of the RFID
technology, contributing to zero waste; eliminate single-use plastic from customer
interfaces and recycle all waste generated in its facilities by 2023.
55,0%
56,0%
57,0%
58,0%
59,0%
60,0%
0
5
10
15
20
25
2017
2018
2019
2020
2021F
2022F
2023F
2024F
2025F
Th
ousands
Exhibit 20: Inditex's Gross Margin Evolution
Gross Margin
Gross Margin (%)
Source: Company data and own analysis
Source: Company data
85 86
121 144
178
0
50
100
150
200
2015 2016 2017 2018 2019
Mill
ions
Exhibit 18: Followers of Inditex on Social Media
Platforms
105%
183%
581%
111%
0%
200%
400%
600%
2018 2019
Exhibit 19: Use of sustainable & recycled materials growth (2018-
2019)
Sustainable cottonRecycled polyesterSutainable linenSustainable viscose
Source: Company data

INDITEX COMPANY REPORT
PAGE 12/33
Segment Analysis
In connection with the industry and competition analysis, the geographic
segmentation unlocks the relevance of each region and the potential growing
opportunities the leading Apparel Corporations should pursue, in the short-term.
According to Exhibit 21, the Americas together with Asia and the rest of world
account for more than 72% of the industry. Having into account that Asia &
RoW includes Middle East and African markets. Furthermore, the Asia-Pacific
region conquers over 38%, representing the area with higher potential for future
development, mostly China and India.
Deeply analysing, the Asia-Pacific region shows a remarkable CAGR of 4,1%,
for the period between 2015 and 2019. In addition, the region has been less
affected by the pandemic, and thereby the fastest to recover. As result, it has been
a visible growth in the investment, around this area, where most of the international
apparel companies, like Inditex, have placed their manufacturing centres,
increasing their dependence on foreign developing markets.
America is the most affected area of the Apparel Industry, due to COVID-19 crisis,
reaching a decrease in their revenues of almost 22%. Nevertheless, as observable
in Exhibit 23, close to 2022 is expected to surpass the crisis and being in an
ascending position.
Looking at Europe in 2020, there is a more concentrated impact in the Apparel
value. The virus caused a 17,1% decrease in revenues, possible to overcome in
the beginning of 2022.
Nevertheless, it is possible to verify in Exhibit 22 that Inditex was always above the
industry CAGR, in all regions, except in Spain. At a worldwide level, the difference
represents almost 1,6%, leading us to conclude that the Group should recover its
sales value at a higher pace than the industry, in general.
CAGR Apparel (2015-2019)
CAGR Inditex (2015-2019)
Americas 3,44% 6,72%
Europe (not Spain) 2,93% 5,91%
Asia & RoW 4,11% 4,29%
Spain 3,26% 2,95%
World 3,58% 5,17%
Exhibit 22: Apparel Industry CAGR, for each segmented region (%)
Source: Statista, 2020 and own calculations
29,9%
26,0%
42,7%
1,4%
Exhibit 21: Geographic segmentation of the Global
Apparel market (2019)
Americas
Europe (not Spain)
Asia & RoW
Spain
Source: Statista, 2020
-25,8%-17,1%
-15,4%
-18,0%
21,8%16,2% 14,1% 15,9%
12,3% 9,4% 9,9% 9,4%9,1%
5,4% 8,2% 6,3%
Americas Europe Asia & RoW Spain
Exhibit 23: Projected Regional growth, for the Apparel Industry (2020-2023)
2020F 2021F 2022F 2023F
Source: Statista, 2020

INDITEX COMPANY REPORT
PAGE 13/33
Besides the region segregation relevance, there is an industry category
segmentation impacting Inditex attitude in the market, predominantly the target
category womenswear, conquering 51% share of the Apparel industry value,
while menswear only represents 33%, and childrenswear, 16%.
Valuation Assumptions
To determine the Inditex’s value, we will start by identifying of what drives the
company’s business. In this section, we will discuss and explain a set of inputs
fundamental to the DCF analysis.
Revenues Forecast
As previously mentioned in the Value Drivers Section, Inditex is planning to follow
a strategy based on the same growth drivers as the Apparel Industry. In this way,
we considered that by applying the industry growth11 in our projections for Inditex
revenue development up until 2025, we will incorporate the impact of these value
drivers (innovation, digitalisation, and sustainability) into the forecast.
On the other hand, it is possible to observe that Inditex has been growing
according to the industry trend in each of the segmented regions, however showing
some disparities. These disparities were counted as a marginal error, estimated
through an average of the prior four years, excluding 2020 from our considerations.
We considered it reasonable not to count with the year 2020 for the average
estimation, in the succeeding years, since this atypical pandemic period does not
reflect the usual marginal difference between the Group and the industry. Thus, in
order to project Revenues as accurately as possible, we consider the industry
forecasts for the upcoming years in each of the Group operating segments,
together with the percentage of growth discrepancy expected.
In this way, we consider that the usually positive marginal difference, in terms of
growth, between Inditex and the industry places the company in a favourable
position. In order to get a deeper understanding of what drives the company’s
performance, we analysed each one of the core business segments: Spain,
Europe (excluding Spain), Americas and Asia and the rest of the world (Asia &
RoW).
11 Statista, 2020

INDITEX COMPANY REPORT
PAGE 14/33
▪ Spain
Starting with the Group home market, Spain, has the highest market share, with
21% of the Apparel Industry sales in this area being captured by Inditex. Moreover,
this country is responsible for 17% of the Group’s total revenues by 2019, a
percentage that has been decreasing for the past four years (Exhibit 24), not as a
consequence of a reduction in sales, but rather due to the Inditex expansion plan,
where other regions are gaining more space. Although, the company’s strategy for
the future does not place Spain aside, with a considerable investment projecting a
studio for online productions, to be placed in the north of the country. Even though,
it is forecasted that this area, as all the others, will reach a negative peak in 2020,
reflected through a decrease of 1,6 billion euros in revenues, 16,3% below the
industry results, that already anticipated a negative outcome of 34,2%. This is a
result of Spain being one of the most affected countries in Europe. For Inditex,
Spain will be the region taking more time to fully recover from this situation.
At a revenue level, it will take approximately five to six years. Nevertheless, it is
predicted to continue generating revenues that will follow a positive trend (Exhibit
25), which lead us to believe that the Group will be able to maintain its competitive
advantage in this business segment, in the long-term, where almost half of the
European stores are located.
▪ Europe (excluding Spain)
Looking at Europe (excluding Spain), it is possible to understand that is one of
the main focus of the company, since in 2019 this area represented 48% of the
Inditex sales, enhancing the importance in the Group’s performance.
Therefore, the company has been trying to diversify the distribution of its stores
along this area, in order to have larger stores able to arrive to the most part of the
population. However, the region felt the pandemic impact, projected to be severe
in 2020, counting for a decrease in value of 17%. Industry’s projections states that
the recovery process will be quicker that in the Group home market, Spain. Still,
the Group reached results below the industry projections by 6,75%. For the future,
we expect Inditex to demonstrate an exponential growth above the industry
average of 3%, by approximately 5% in 2025. Thus, we expect that the area
growth will be 8%, corresponding to 18,6 billion euros in revenues, at this date
(Exhibit 26). Hence, the projections will be grounded on the propensity to maintain
this favourable growth trend, exceeding the apparel market, in the next five years,
mainly due the brand awareness and the consumer willingness to follow the
Group’s fashion trends.
Source: Company data
4,766
3 133
3 642
3 978
4 225
4 393
4 487
0
1 000
2 000
3 000
4 000
5 000
Exhibit 25: Revenues in Spain, from 2019 to 2025, in
million €
Source: Company data, Statista & Own analysis
13 682
10 422
12 674
14 485
15 885
17 253
18 603
0
4 000
8 000
12 000
16 000
20 000
Exhibit 26: Revenues in Europe (ex. Spain), from 2019 to 2025, in million €
Source: Company data, Statista & Own analysis

INDITEX COMPANY REPORT
PAGE 15/33
▪ Americas
Concerning Americas, we are estimating the sales to increase from 2020
onwards, as illustrated in Exhibit 27. By 2023, we expect the economic impact of
the virus to start to be surpassed. Even knowing that Inditex did not conquer a
considerable position in the American market, the Group is trying to gain market
share for the last five years, reaching almost 1% in 2019. In the long-term, this
position is expected to be enhanced, with a stable growth rate of 9%, almost
4,8% beyond the market expectations, in 2025. In an area where
competitiveness (in terms of variety) and cultural issues are huge obstacles to
consider when approaching the market, even considering the increment in the
number of stores, it might be extremely difficult for Inditex to achieve a dominant
position there.
▪ Asia and the rest of the world
Regarding Asia and the rest of the world, Inditex is far away from gaining a
significant position in the Asian market, having into account its dimension,
cultural dynamics, and intrinsic price competitiveness effects. Despite the
positive trend followed in the forecast, where the revenues are projected to
increase more than 2,7 billion euros by 2025 (see Exhibit 28), at a stable growth
rate of 6%, Inditex is expected to grow less 1,25% than the industry, estimated to
2023. On the other hand, this region is the one less affected by the Covid-19 crisis,
registering a loss of just 200 million euros, recovered in the following year. This
occurs mostly due to the capacity of the Asian market to manage and surpass the
crisis, more rapidly than in Europe.
Analysing at a worldwide level, the online integrated platform, the global advanced
radio frequency identification technology, the stock control system, and the
integration with the physical stores, will allow Inditex to recover from COVID-19
crisis in a two-years range. Despite a 0,12% decrease in market share for 2020, it
is expected a significantly quick recovery, exceeding the industry results in most
of the regions, together with a gradual improvement of the company’s performance
comparatively to the market. Afterwards, Inditex is forecasted to reach around
36,2 billion euros in revenues by 2025, with an annual growth around 7% and a
tendency to accomplish the steady state. In these projections, there are two
important notes to retain. Firstly, almost 23,1 billion euros (65%) occur in Europe
(Exhibit 29). Secondly, more than 9,4 billion euros are obtained through their online
platform, taking us to the last analysis relatively to the revenue’s generation, the
sales channel.
Source: Company data
17%48%
16%
19%65%
Exhibit 29: Sales by Geographic area, as
percentage of Inditex total sales
SpainEurope (not Spain)AmericasAsia & RoW
4 434
2 558
3 269
3 815
4 304
4 768
5 181
0
1 500
3 000
4 500
6 000
Exhibit 27: Revenues in Americas, from 2019 to
2025, in million €
Source: Company data, Statista & Own analysis
5 403
5 200
6 010
6 554
7 008
7 477
7 935
0
2 000
4 000
6 000
8 000
Exhibit 28: Revenues value in Asia & RoW, from 2019 to
2025, in million €
Source: Company data, Statista & Own analysis

INDITEX COMPANY REPORT
PAGE 16/33
Source: Statista 2020, Company data and own analysis
The channel customers choose or have the opportunity to use define a firm’s
development, if the corporation has an upgraded system ready to face this change,
as Inditex has. This allowed the Group to avoid an extremely difficult situation in
2020, when consumers do not have a possible alternative and end up buying more
than 30% of the items online. This historical propensity forced the company to have
their online platform and logistic system ready, to correspond to the consumer
needs, which was an advantage for Inditex considering the capital investments the
Group has been doing. Thus, we expect the online platform to represent 26%
of the total revenues by 2025, where this value reaches a stable point above the
company’s target of 25%.
Costs
Cost of Sales
The cost of sales includes mainly raw materials and consumables. These costs
vary with some factors, such as the price of goods and the volume of sales. Starting
with the price of goods, we analyzed the price of cotton, since it is the most
common raw material used to produce Inditex’s garments. As shown in Exhibit 31,
prices have been highly volatile over the years. However, COGS did not follow the
same pattern, as shown in Exhibit 32, making cotton prices bad inputs to forecast
this caption.
Despite the efforts made by Inditex to manage costs in a very strict way, the
average of the COGS as a percentage of sales increased in the past. Furthermore,
the company is committed to become more sustainable, which implies the use of
non-processed materials, such as organic cotton. This raw material is
approximately 20% to 30% more expensive than “ordinary” cotton, mainly because
-30%
-20%
-10%
0%
10%
20%
30%
-
6 000
12 000
18 000
24 000
30 000
36 000
2019 2020F 2021F 2022F 2023F 2024F 2025F
Exhibit 30: Inditex Expected Revenues from 2019 to 2025 by geographic area (in million €)
Total Spain Total Europe (not Spain)
Total Americas Total Asia & RoW
Growth rate
0
5
10
15
2015 2016 2017 2018 2019
Th
ousands
Exhibit 32: Cost of sales in million € (2015-2019)
Source: Company data
Source: Index Mundi, 2020
1,1
1,3
1,5
1,7
1,9
jan/1
5
ago/1
5
ma
r/16
out/16
ma
i/17
dez/1
7
jul/18
fev/1
9
set/
19
abr/
20
Exhibit 31: Cotton prices in U.S. cents per pound (2015-
2020)
INDITEX COMPANY REPORT
PAGE 17/33
the extra costs implied in its production and the relatively lower supply, as
discussed in the Value Drivers Section. Since Inditex is planning to continue to
increase the percentage of organic cotton until 2025, we expect that costs as a
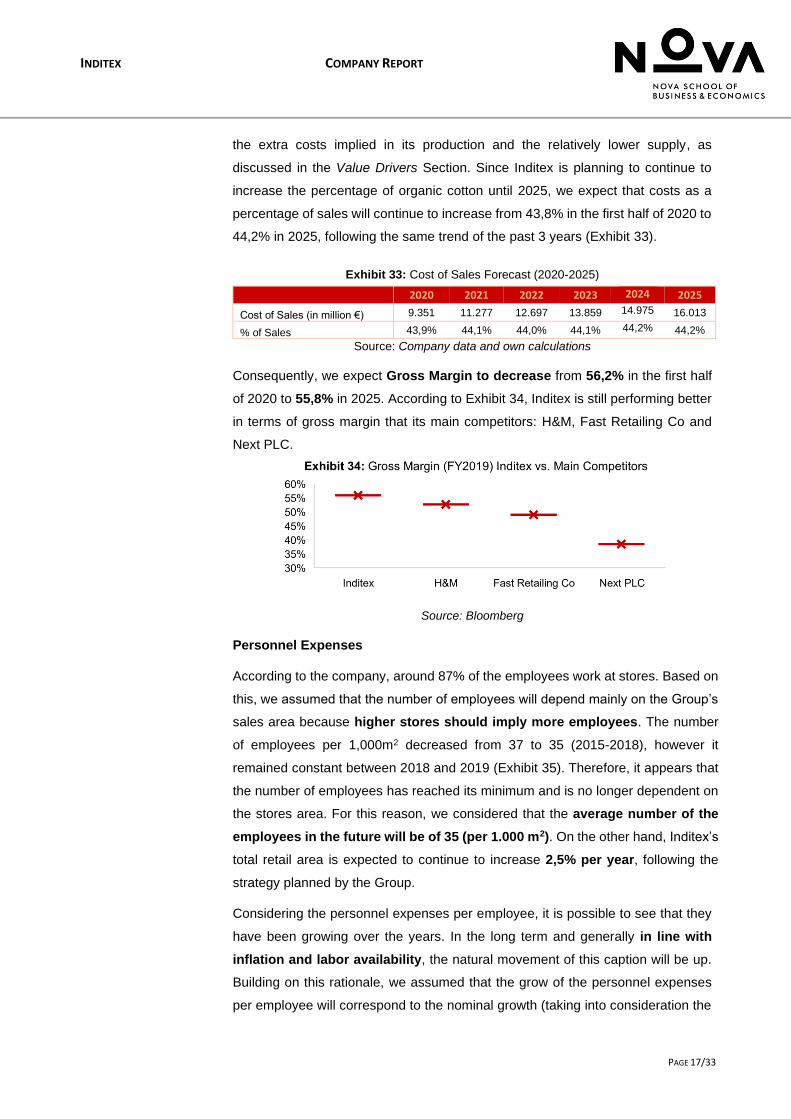
percentage of sales will continue to increase from 43,8% in the first half of 2020 to
44,2% in 2025, following the same trend of the past 3 years (Exhibit 33).
Exhibit 33: Cost of Sales Forecast (2020-2025)
Source: Company data and own calculations
Consequently, we expect Gross Margin to decrease from 56,2% in the first half
of 2020 to 55,8% in 2025. According to Exhibit 34, Inditex is still performing better
in terms of gross margin that its main competitors: H&M, Fast Retailing Co and
Next PLC.
Source: Bloomberg
Personnel Expenses
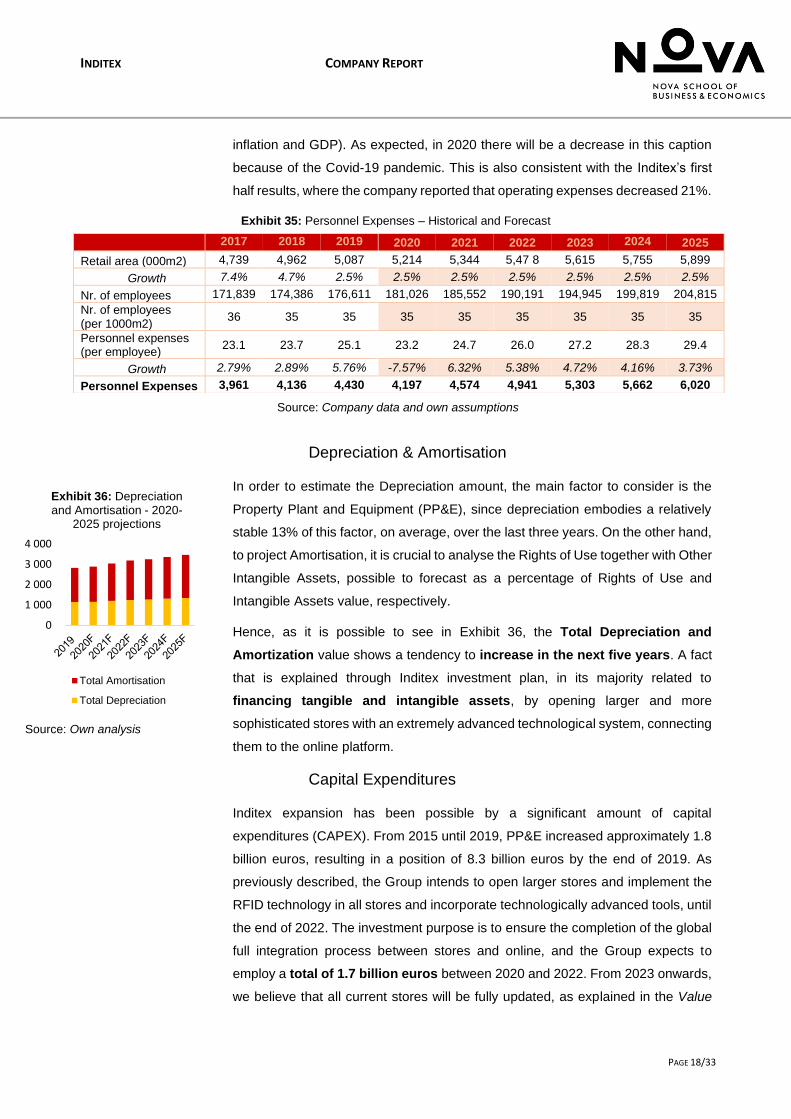
According to the company, around 87% of the employees work at stores. Based on
this, we assumed that the number of employees will depend mainly on the Group’s
sales area because higher stores should imply more employees. The number
of employees per 1,000m2 decreased from 37 to 35 (2015-2018), however it
remained constant between 2018 and 2019 (Exhibit 35). Therefore, it appears that
the number of employees has reached its minimum and is no longer dependent on
the stores area. For this reason, we considered that the average number of the
employees in the future will be of 35 (per 1.000 m2). On the other hand, Inditex’s
total retail area is expected to continue to increase 2,5% per year, following the
strategy planned by the Group.
Considering the personnel expenses per employee, it is possible to see that they
have been growing over the years. In the long term and generally in line with
inflation and labor availability, the natural movement of this caption will be up.
Building on this rationale, we assumed that the grow of the personnel expenses
per employee will correspond to the nominal growth (taking into consideration the
2020 2021 2022 2023 2024 2025
Cost of Sales (in million €) 9.351 11.277 12.697 13.859 14.975 16.013
% of Sales 43,9% 44,1% 44,0% 44,1% 44,2% 44,2%
INDITEX COMPANY REPORT
PAGE 18/33
inflation and GDP). As expected, in 2020 there will be a decrease in this caption
because of the Covid-19 pandemic. This is also consistent with the Inditex’s first
half results, where the company reported that operating expenses decreased 21%.
Exhibit 35: Personnel Expenses – Historical and Forecast
Depreciation & Amortisation
In order to estimate the Depreciation amount, the main factor to consider is the
Property Plant and Equipment (PP&E), since depreciation embodies a relatively
stable 13% of this factor, on average, over the last three years. On the other hand,
to project Amortisation, it is crucial to analyse the Rights of Use together with Other
Intangible Assets, possible to forecast as a percentage of Rights of Use and
Intangible Assets value, respectively.
Hence, as it is possible to see in Exhibit 36, the Total Depreciation and
Amortization value shows a tendency to increase in the next five years. A fact
that is explained through Inditex investment plan, in its majority related to
financing tangible and intangible assets, by opening larger and more
sophisticated stores with an extremely advanced technological system, connecting
them to the online platform.
Capital Expenditures
Inditex expansion has been possible by a significant amount of capital
expenditures (CAPEX). From 2015 until 2019, PP&E increased approximately 1.8
billion euros, resulting in a position of 8.3 billion euros by the end of 2019. As
previously described, the Group intends to open larger stores and implement the
RFID technology in all stores and incorporate technologically advanced tools, until
the end of 2022. The investment purpose is to ensure the completion of the global
full integration process between stores and online, and the Group expects to
employ a total of 1.7 billion euros between 2020 and 2022. From 2023 onwards,
we believe that all current stores will be fully updated, as explained in the Value
2017 2018 2019 2020 2021 2022 2023 2024 2025
Retail area (000m2) 4,739 4,962 5,087 5,214 5,344 5,47 8 5,615 5,755 5,899
Growth 7.4% 4.7% 2.5% 2.5% 2.5% 2.5% 2.5% 2.5% 2.5%
Nr. of employees 171,839 174,386 176,611 181,026 185,552 190,191 194,945 199,819 204,815
Nr. of employees (per 1000m2)
36 35 35 35 35 35 35 35 35
Personnel expenses (per employee)
23.1 23.7 25.1 23.2 24.7 26.0 27.2 28.3 29.4
Growth 2.79% 2.89% 5.76% -7.57% 6.32% 5.38% 4.72% 4.16% 3.73%
Personnel Expenses 3,961 4,136 4,430 4,197 4,574 4,941 5,303 5,662 6,020
Source: Company data and own assumptions
0
1 000
2 000
3 000
4 000
Exhibit 36: Depreciation and Amortisation - 2020-
2025 projections
Total Amortisation
Total Depreciation
Source: Own analysis

INDITEX COMPANY REPORT
PAGE 19/33
Drivers Section, and the amount invested in PP&E is meant to grow at the same
pace as the new stores’ area. According to Inditex’s projections, it is estimated a
gross space growth of 2,5% per year going forward. By the end of 2025, PP&E is
expected to reach 10,454 million euros (see Exhibit 37).
On the other hand, one of the Group’s key strategic pillars is digitalisation. It plans
to invest around 1 billion euros between 2020 and 2022 to develop the “Inditex
Open Platform”, where the digital transactions will take place. This amount was
incorporated into the forecasts as being an investment in Intangible Assets. For
the future, it is expected the online channel to continue to be responsible for an
increase in Inditex’s sales. Consequently, it is rational to continue to invest in this
segment, contributing to the increase in future cash flows. Thus, we estimate
intangible assets as a percentage of sales, considering the last 3 years. This
rationale was built on the fact that in the past, intangible assets represented a
relatively constant percentage of sales (2% per year). It seemed reasonable to
consider that this relation will be maintained in the future, however with higher
growth of 5% to keep up with the increasing trend of becoming even more digital.
Net Working Capital
An important determinant of value creation lies in the Group’s capacity to optimize
its working capital management. The changes in this input vary according to
Inventories, Trade and Other Receivables in addition to Payables, as well as
Income Tax Receivables and Payables, without disregarding Other Current
Assets, and Working Cash.
Over the past few years, the average holding period (AHP), determined as
inventories as a percentage of COGS, has been decreasing. Thus, the time
inventory stands in the warehouse has been lower, reflecting a sign of good
inventory management. More efficiency in manage the inventory level is in
accordance with Inditex’s investment in building a global stock integration system
and a single inventory position. As a matter of fact, when presenting the 1H2020
results, Pablo Isla stated that running the business with less inventory is an effort
that is being developed by the Group, leading us to consider that the AHP will
continue to decrease in the future at the same pace of the past. This measure
was used as an approximation to forecast inventory levels.
Regarding Trade and Other Receivables, in Exhibit 38 it is also possible to observe
coherence in the average collecting period (ACP) during the last three years.
Therefore, an estimation using an average of the ACP is a reasonable inference,
assuming the company will maintain its trade terms management conditions.
Source: Company data and own assumptions
88 8866 66 64 63 62
11 11 10 11 11 11 11
162 164 159 162 162 161 161
Exhibit 38: AHP, APP and ACP using the past 3 years
to forecast 2020-2023 period
Average Holding Period
Average Collecting Period
Average Payable Period
-40%
-20%
0%
20%
40%
60%
0
500
1000
1500
2000
Exhibit 37: CAPEX Forecast in million €
CAPEX Growth
Source: Own estimates

INDITEX COMPANY REPORT
PAGE 20/33
Looking at Trade and Other Payables, Inditex has been persistently increasing the
value, since 2017. While the average payable period had a small variation between
159 and 164 days. This means Inditex takes on average 162 days to fulfill their
accounts payable requirements.
With respect to Income Tax Receivable and Payables, it varies according to the
sales and cost of sales value, respectively, and consequently influence the core
taxes amount. These parameters vary according to the taxation of each country.
Not neglecting the Other Current Assets, which have been showing an increasing
trend, in the last five years, except for 2019, representing an average 0.5% of
revenues and just exhibiting a maximum of 0.2% variation. Considering the
working cash, it was assumed that represents 2% of the total revenues.
It is possible to observe that Inditex formulates a negative working capital value
in every financial year (Exhibit 39), meaning the Group receives money faster
than it pays to creditors. Not such a differentiation factor from the industry that also
follows this operation tactic to finance its current activity, since it receives from
customers at the moment they acquire the item, although hold the payments to
suppliers.
Source: Company data and own calculations
Cost of Capital & Growth rate
Inditex is a company with a low level of leverage, translated into a debt-to-value
ratio of 0,01. Therefore, it is almost a debt free company, that uses excess cash to
finance its activity and investments. Given the low amount of debt, the weighted
average cost of capital is very close to the cost of equity.
-923 -1 718 -1 871 -2 088
-2 309 -2 514
-817 -1 301
-1 638
-7 000
-2 000
3 000
2017 2018 2019 2020F 2021F 2022F 2023F 2024F 2025F
Exhibit 39: Operating Working Capital components: relevance and evolution along the years
Inventories Working Cash Trade and other receivables
Other current assets Income tax receivable Trade and other payables
Income tax payable

INDITEX COMPANY REPORT
PAGE 21/33
To determine the cost of equity, the Capital Asset Pricing Model (CAPM) was
applied. The current yield on the German’s 10-year Treasury Bond was considered
as the risk-free rate, thus resulting in a rate of -0,58%12. Regarding the Market
Risk Premium, it was considered to be 6,75%13, based on a recommendation from
KPMG. In order to determine the levered beta, we regressed Inditex’ stock returns
against market returns, using data from the last 5 years. The MSCI World in EUR
index, composed by a considerable number of industries and companies and
consequently, well-diversified, was chosen as a market proxy. In order to avoid
biases associated with shorter periods of time, monthly returns were considered
instead of weekly or daily returns. We arrived at a raw beta of 1,18. However, the
standard error of this regression is 0,19, meaning that the true beta may lie in the
interval between 0,81 and 1,55 (95% confidence interval)14. A widespread of the
confidence interval makes this method very imprecise and has a huge impact on
the company value, as we will discuss in the Sensitivity Analysis Section. In
addition, the regression’s R-squared is only 39,69%.
To improve the beta estimation and cross-check the result achieved, we analysed
6 industry peers: H&M, Fast Retailing Co, Next PLC, Hugo Boss, JD Sports
Fashion and American Eagle Outfitters, thus decreasing the effect of
idiosyncratic shocks. Unleveraging the betas of these similar companies in terms
of operating performance and capital structure led to an industry unlevered beta of
0,96. A beta of 0,96 implies that these securities’ prices tend to be slightly less
volatile than the overall market. By analysing the Apparel Industry’s fundamental
characteristics, it makes sense as the demand for fashion items is somehow linked
to the state of the economy. Taking as an example the current situation due to the
Covid-19 pandemic, there is much focus on purchasing essential items and fashion
becomes an after-thought for consumers with less purchasing power.
Nevertheless, this impact is felt mainly in the luxury segment. Since we are
primarily considering fast fashion players, this may explain a beta below one.
Lastly, the unlevered beta was re-levered by applying the Inditex’s market debt-to-
equity ratio of 0,01, yielding a levered beta of 0,96, as expected given the low
amount of debt. Based on the computed parameters, Inditex’s cost of equity is
5,94% and the weighted average cost of capital is 5,90% (Exhibit 40), both
parameters very close as previously stated.
12 As of 31 December 2020 13 Equity Market Risk Premium – Research Summary, 31 March 2020 14 True raw beta = Raw beta +/- 1.96 SE
Inputs
Target D/EV 0,01
Risk-free rate -0,58%
Tax rate 25%
MRP 6,75%
ΒU (industry) 0,96
ΒL 0,96
Cost of Equity 5,94%
Cost of Debt 0,05%
WACC 5,90%
Exhibit 40: Cost of Capital inputs
Source: Own assumptions and calculations

INDITEX COMPANY REPORT
PAGE 22/33
The perpetual growth rate is the rate at which we expect Inditex to grow throughout
the years, until perpetuity. Therefore, this rate was computed considering the
combination of the terminal ROIC of 26,51% with the terminal Reinvestment
Rate (RR) of 5,84%, forecasted as an average of the last three years, since it is
the period where the company starts presenting more stability and Inditex will not
be able to maintain its cash flows growing at the same rate for eternity. As result,
the rate at which the terminal value is expected to grow is approximately
1,55%. Given the relevance of this parameter, it will be challenged further through
a sensitivity analysis, discussed later in this analysis.
Valuation Outcome
Discounted Cash-Flow Method
The final firm value was determined through the DCF method, by discounting the
forecasted free cash flows at the WACC, which in the case of Inditex is close to
the cost of equity since the company presents almost no debt in its capital
structure. We assumed that Inditex will manage its capital structure to a target
level, which makes DCF the most suitable method to determine its value. As
depicts in Exhibit 41, for the forecasted period ending in 2025, the free cash flow
presents an upward trend, reflecting mainly the revenues increase, a strong
working capital management, and the investment in CAPEX. Another crucial
estimation is the terminal value, that reflects a steady-state performance. We
arrived at a terminal value of 4.439 million euros and an enterprise value of
93.989 million euros. Subtracting net debt and non-controlling interests, the
equity value amounted to 93.567 million euros. In what concerns shares
outstanding, we considered that its number will remain constant in the future
(3.114.38 million shares, not considering treasury shares). Finally, we arrived at
YE2021 target price of 29,90€ per share, what corresponds to a capital gain of
3,86€, given the current share price of 26,04€ per share. Furthermore, it is
expected the payment of a dividend of 0,67€ per share. This corresponds to a
total return of 17,40% and, consequently, our model discloses a BUY
recommendation.
Multiples Valuation
With the intention of better understand the Inditex’s fair value when compared to
its peers, we applied a Multiples valuation approach. Firstly, it was identified the
range of companies, within the industry, facing similar risks associated to
economic issues, positioned in identical market segments, and having a structured
expansion plan.
Source: Own assumptions and calculations
0
1000
2000
3000
4000
5000
Exhibit 41: Inditex's Expected Unlevered FCF

INDITEX COMPANY REPORT
PAGE 23/33
When deciding the most appropriate multiples to use, we start by a broader
analysis of Price to Earnings ratio (P/E), Price to Sales ratio (P/Sales), Enterprise
Value to Sales, EBIT and EBITDA. Considering that sales are a really volatile
parameter to ground our analysis on and both Inditex and its comparables have
a high investment level, EV/EBIT is more appropriate than EV/EBITDA. Since
EBITDA does not take into consideration the investments made by the company
may possibly lead to an overvalued estimation. EV/EBIT multiple discounts the
cash required for investments, turning out to be a better proxy of the cash available
to pay financial debt. As a result, we concluded that P/E and EV/EBIT are the most
reasonable multiples to follow our approach, combining the equity level with firm
structure, even though earnings value could be affected by one-time events.
Companies’ choice was elaborated keeping in mind Inditex’s strategic position
within the industry, as referred before, and three other criteria as the EBITDA
Margin, the Revenue growth, and the Debt-to-Equity (D/E). We attributed the
same weight deviation factor to each criteria (33%). These parameters allow us to
consider growth, profitability, and capital structure position of the other firms, when
compared to Inditex. The final rank was composed by a group of six firms that
presents the lowest deviation from Inditex’s situation. Nevertheless, the variation
range of both parameters is quite large and higher than the estimated final share
price, as visible in Exhibit 42, which is mostly due to the Inditex completely
differentiated business model and the current situation.
Deeply looking to the Inditex peers, it is imperative to recognize that Hennes &
Mauritz (H&M) is the most genuinely comparable company (Exhibit 44), with
only 10% EBITDA margin deviation, 2% D/E deviation, and a revenue growth
deviation near 0%. With a vast presence around the globe, both H&M and Inditex
are European firms, having a similar expansion plan and target audience, behind
its strategic operational situation. Followed by a Japanese growing company, Fast
Retailing Co, whose main strategy grounds on the intension to expand its already
large operational area, supported by continuous investment and the concept of
selling worthy products at low cost. After, Next PLC has a similar cultural origin
and variety of products, although does not have such a broader international
action. Hugo Boss distances itself from Inditex through its less global activity
network and the distinct strategic growth drivers, with a higher connection to brand
positioning. JD and American Eagle Outfitters have both, a different and more
specific target customer when compared to Inditex. These firms are located in a
more sportive fashion category, and even considering their widespread stores
locations, the brand development is fair behind.
P/E EV/EBIT
Inditex 26,00x 19,96x
H&M 22,76x 17,99x
Fast Retailing 91,07x 40,16x
Next PLC 15,23x 14,19x
Hugo Boss 14,57x 11,59x
JD 32,50x 23,50x
American E. Outfitters
14,11x 15,50x
Average 31.71x 20.49x
Share Price 15,01€ 17,72€
Exhibit 42: P/E and EV/EBIT multiples of Inditex and its
comparables
Source: Bloomberg and https://craft.co/inditex/competitors

INDITEX COMPANY REPORT
PAGE 24/33
In sum, it is reasonable to affirm that both, P/E and EV EBITDA, have presented a
highly diversified range of results. Following the Exhibit 43 and focusing our
analysis on the middle quartiles, share price is likely to vary from 11,59€ to 23,88€,
according to the P/E multiple, and to reach values between 15,33€ and 23,48€,
looking at the EV/EBIT multiple. This led us to conclude that, using the median, as
recommended, Inditex would achieve a share price of 15,01€ through the P/E, and
of 17,72€ in line with the EV/EBIT, which are values slightly below the minimum
ever reached by the Group. A fact that takes us to confirm a reality, where there
is the need to confirm the quality of the comparables representing the Apparel
industry and how properly can the peers estimate the firm’s future conditions
(Exhibit 44), as well as to analyse the time reference we are grounding our
estimations on. As a matter of fact, one period is not completely illustrative of the
future lucrativeness of the company and four out of the six comparables present
lower EV/EBIT and P/E multiples than the company, which may take us to
undervalue Inditex. Even more, considering the virus drastic temporarily effect on
multiples.
Major Risks
In this section, we will identify some risks that we consider to be underlying the
company’s business and that could jeopardize Inditex’s future performance.
Covid-19 pandemic: The pandemic has had a significant impact on sales, mainly
due to the closing of stores and restrictions on the number of customers. Our
revenue forecast is based on the assumption that the full recovery of the Covid-
19’s impact will happen in 2022 and will increase at a relatively high pace going
forward. However, if the depth and length of the pandemic were greater than
expected, this recovery could be delayed and, as a result, sales would be lower
than we anticipated for the coming years. The case where 2019 sales level is only
reached in 2023 will be further analysed in the Sensitivity Analysis Section.
Source: Bloomberg, Company data and own calculations
Inditex
H&M
Fast Retailing
Next PLC
Hugo Boss
JD
American Eagle
Outfitters0x
18x
36x
54x
72x
90x
0x 10x 20x 30x 40x
P/E
EV/EBIT
Exhibit 44: P/E and EV/EBIT multiples for Inditex and its comparables
10 15 20 25
P/E
EV/EBIT
Exhibit 43: Share Price variation for EV/BITDA and
P/E, in €

INDITEX COMPANY REPORT
PAGE 25/33
Delay of an effective Vaccine: In line with the last year and observing the
pandemic effect in each quarter of the year, it was possible to conclude that the
effect was softening along the time, since the companies are more prepared to
deal with the situation and the consumer is more opened and adapt to the
alternative consumption methods. Although, it is critical to account for the time it
can take for the vaccine to start making the difference and to be achieved
the group immunity, allowing the physical stores restrictions to be erased and
the population of each region to gain trust in a real recovery, incentivizing
consumption and, if still on time, avoiding an irreversible economic crisis.
Increased COGS: Inditex is focused on cost efficiencies, which requires great
control in terms of management of different lines of costs. Despite these efforts,
the ability to reduce costs not only depends on the company, but also on the market
conditions. We are already considering that COGS as a percentage of sales will
increase due to the higher prices of organic cotton, mostly related to production
costs. However, there are additional risks that can lead costs to increase even
more, as production disruption of certain raw materials due to extreme events,
such as weather events and diseases (e.g., Covid-19). This could lead to
significant pressure on Inditex’s activity if demand is lower, as well as reputational
risks related to brand perception. We will analyse the impact on the share price of
an increase in costs in the Sensitivity Analysis Section.
Sensitivity Analysis
Inditex, like other companies on the market, is facing an uncertain environment
and small changes in certain inputs can have a significant impact on the estimated
value. Given that, this section aims to test the company’s share price, when
faced with changes in some key drivers.
Firstly, we considered a sensitivity analysis of the share price, stressing the
terminal growth rate and the WACC. Concerning the first input, we assumed a
terminal growth rate of 1,55%. Since Inditex is a mature company, we do not
expect a high level of growth rate in the future. For instance, instead of 1,55%, it
seems reasonable to assume it to grow between 1,12% and 1,79% (minimum
and maximum growth of the last 3 years of the forecast period and the terminal
year). In what concerns the WACC, one of the most uncertain inputs is the beta,
which lead us to perform a more detailed evaluation to this factor (Exhibit 45).
With a more sensitive discussion of beta, through the industry data available, we
realized that, by including more comparables, the unlevered beta only decreases
by 0,01, and if we only have into account the closest truly comparable of Inditex
Source: Bloomberg & Own
estimates
4,82%
7,33%
9,84%
5,90%
5,46%
5,86%
0,00% 5,00% 10,00% 15,00%
0,81
1,18
1,55
0,97
0,90
0,96
Beta
s r
ange
Exhibit 45: WACC variation according to betas range
analysed

INDITEX COMPANY REPORT
PAGE 26/33
(H&M) the value drops by 0,05. This allows us to conclude that there is not an
impactful difference in using six or ten comparables, when estimating this input
value, knowing that the companies added to the projections present a higher
deviation to the Inditex Group position, in terms of Revenue, EBITDA margin and
capital structure (D/E). Then, due to the high instability and wideness of the
Inditex's raw beta confidence interval [0,81;1,55], we decided to select as basis
to perform our valuation the industry beta estimated using 6 more accurate
comparables, since it is the one closest to the average regression beta.
Afterwards, we performed a sensitivity analysis considering the lower bound and
the upper bound as the minimum and maximum betas, respectively, corresponding
to a WACC interval between 4,82% and 9,84%, as illustrated in Exhibit 45. As one
may see in Exhibit 46, Inditex’s share price is highly sensitive to changes in both
parameters, varying between 14,77€ per share and 42,75€ per share.
Exhibit 46: Inditex’s share price varying WACC and terminal growth rate
As mentioned before, it is fundamental to carry out a risk analysis to understand
the impact of the three scenarios described in the previous Major Risks Section.
Starting by performing a sensitivity analysis to the marginal growth difference
between Inditex and the Global Apparel industry, due to relevance of this
parameter in driving the revenues values. Then, considering a distinct scenario
than what we assumed in our recommendation path, the Group will follow the last
two complete years average of the discrepancy in value between its own growth
and the industry projections, from 2021 onwards, also not counting with the 2020
abnormal results. This case implies a return of just 6%, with a share price of
26,81€, instead of 29.90€ (Exhibit 47).
Additionally, analyzing the scenario where the 2019 sales level would only be
recovered in 2023 (instead of 2022), the share price would be 21,08€,
corresponding to a negative return of 17% compared to the current share price.
This analysis implies a relatively stable growth rate (between 6% and 8%) from
2020 onwards. Moreover, by varying the COGS as a percentage of sales by +2%
and -2%, it is possible to have a clear view of the impact that this input has on the
Terminal growth rate
1,12% 1,55% 1,77% 1,79%
WACC
4,82% 35,81€ 39,92€ 42,55€ 42,75€
5,46% 30,42€ 33,29€ 35,06€ 35,20€
5,86% 27,80€ 30,14€ 31,57€ 31,68€
5,90% 27,59€ 29,90€ 31,30€ 31,41€
7,33% 21,03€ 22,29€ 23,03€ 23,09€
9,84% 14,77€ 15,34€ 15,66€ 15,69€
Last complete years average of the marginal growth difference
comparative to the industry
Share price 26,81€/share
Investor Return 6%
Recommendation Hold
Sales recovery in 2023
Share price 21,08€/share
Investor Return -17%
Recommendation Sell
COGS -2%
Share price 35,16€/share
Investor Return 38%
Recommendation Buy
COGS +2%
Share price 25,17€/share
Investor Return -1%
Recommendation Sell
Exhibit 47: Risks: Sensitivity Analysis
Source: Own estimates
Source: Own calculations
INDITEX COMPANY REPORT
PAGE 27/33
company’s valuation. These two scenarios would result in a share price between
25,17€ and 35,16€, respectively, as illustrated in the Exhibit 47.
Lastly, evaluating the impact of incorporating in our analysis the delay in seeing
results of efficacy in a vaccine for COVID-19, by studying three dissimilar
scenarios, where the vaccine can take six, nine, or twelve months to show
efficiency and be able to create Group immunity (Exhibit 48). In each of the
scenarios, we believe the impact can be measured quarterly, according to the less
affected quarter of 2020 weight on the total loss in value, leading us to a 3% impact,
since even accounting with a delay in vaccine efficiency, the impact in 2021 will
never be as high as before. The first situation led us to a relatively positive
outcome, with an investor return of 6% and price of 27,17€ per share. The
second one illustrates a more negative scenario, leaving the investor with a
negative return of 5%. Finally, the most extreme view demonstrates how difficult
this situation can get, causing investors to achieve losses of 4,13€ per share,
already reflecting the expected dividends to be paid. In this way, we concluded that
Inditex will be mainly affected by a slower recovery in sales (second scenario), and
by a delay in an efficient outcome of the vaccine to stop the pandemic crisis by
more than 9 months, inclusive, what would change our recommendation from buy
to sell. Secondly, an increase of 2% in COGS as a percentage of sales, as well
as a change in the marginal growth difference of Inditex relative to the industry,
and the six months delay in the vaccine effectiveness would imply a hold
recommendation. The remaining scenarios would have no impact in our buy
recommendation.
Final Recommendation
In sum, we recommend Inditex to pay attention to the consequences a huge
delay in the vaccine effectiveness can bring to their physical stores sales, not
neglecting the continuous investment in the online platform and innovative
alternative solutions, in order to smooth the effect of a possible loss of almost 4
billion euros in revenue growth by 2025. Also, to be prudent with their
sustainability investments, since the costs of these materials could be truly
representative for the Group, as previously demonstrated, and with an increase of
more than 2% in the cost of raw materials, the company is able to lose almost 1
billion euros. Hence, we advise Inditex to be cautious and to make relevant and
beneficial partnerships in this area, not only with recognized brands in this field,
but also with credible producers. In a way of being transparent and publicizing the
beneficial path for humanity they are following, besides the crucial role in disrupting
the consumer trends and buying methods.
-20%
-15%
-10%
-5%
0%
5%
10%
€20 €22 €24 €26 €28
Exhibit 48: Investor Return and Share Price for 6, 9
and 12 months delay in the vaccine effectiviness
6 months
9 months
12 months
Source: Own calculations

INDITEX COMPANY REPORT
PAGE 28/33
Appendix
Financial Statements
Balance Sheet Forecast (€ millions) 2015 2016 2017 2018 2019 2020F 2021F 2022F 2023F 2024F 2025F
Invested Capital: Uses
Inventories 2.195 2.549 2.685 2.716 2.269 1.679 1.978 2.193 2.353 2.495 2.623
Working Cash 418 466 507 523 566 426 512 577 628 678 724
Trade and other receivables 669 861 778 820 780 637 758 837 927 996 1.061
Other current assets 139 141 160 162 78 108 120 120 146 153 161
Income tax receivable 89 107 110 108 174 58 99 132 146 166 183
Trade and other payables (4.514) (5.095) (4.906) (5.099) (5.443) (4.143) (4.977) (5.597) (6.130) (6.620) (7.073)
Income tax payable (77) (230) (151) (153) (142) (67) (107) (133) (158) (175) (191)
Operating Working Capital (1.081) (1.201) (817) (923) (1.718) (1.301) (1.638) (1.870) (2.087) (2,308) (2.513)
PP&E 6,597 7.283 7.644 8.339 8.355 8.855 9.164 9,428 9.710 9.945 10.187
Rights over leased assets 504 505 457 464 0 0 0 0 0 0 0
Rights of use 0 0 0 0 6.043 6.194 6.349 6.508 6.670 6.837 7.008
Other non-current assets 524 554 520 564 456 472 487 497 511 523 536
Financial investments 184 231 237 267 249 255 251 252 253 252 253
Other intangible assets 190 211 255 346 410 553 753 950 927 1.039 1.125
Other non-current liabilities (805) (920) (1.005) (1,072) (380) (382) (387) (399) (408) (418) (429)
Core Invested Capital (excluding Goodwill)
6.113 6.663 7,291 7.985 13.415 14.647 14.980 15.366 15.576 15.870 16.167
Goodwill 193 196 207 206 207 207 207 207 207 207 207
Core Invested Capital (including Goodwill)
6.306 6.859 7.498 8.191 13.622 14.854 15.187 15.573 15.783 16.077 16.374
Deferred tax assets 693 722 744 858 1.236 813 852 862 864 876 892
Investment property 21 21 21 20 21 21 21 21 21 21 21
Other financial assets 46 87 12 20 14 0 0 0 0 0 0
Provisions (145) (242) (259) (229) (217) (189) (216) (240) (269) (286) (306)
Deferred tax liabilities (285) (257) (268) (312) (370) (333) (344) (342) (347) (351) (353)
Other financial liabilities (69) (64) (105) (47) (40) 0 0 0 0 0 0
Non-Core Invested Capital 261 267 145 310 644 311 312 301 269 259 254
Total Invested Capital (excluding Goodwill)
6.374 6.930 7.436 8.295 14.059 14.958 15.292 15.667 15.845 16.130 16.421
Total Invested Capital (including Goodwill)
6.567 7.126 7.643 8.501 14.266 15.165 15.499 15.874 16.052 16.337 16.628
Invested Capital: Sources
Excess cash 3.808 3.650 4.424 4.343 4.214 4.263 4.443 4.644 4.769 4.829 4.863
Current financial investments 1.086 2.039 1.472 1.929 3.319 3.137 3.207 3.148 3.275 3.317 3.356
Financial debt (11) (63) (16) (89) (38) (12) (12) (12) (12) (12) (12)
Lease liabilities 0 0 0 0 (6.812) (6.999) (7.174) (7.360) (7.540) (7.729) (7.923)
Net Debt 4.884 5.625 5.879 6.182 683 388 464 420 492 406 283
Equity: Non-controlling interests (41) (38) (25) (30) (36) (36) (36) (36) (36) (36) (36)
Net Financial Assets 4.843 5.587 5.854 6.152 647 352 428 384 456 370 247
Equity: Parent 11.410 12.713 13.497 14.653 14.913 15.517 15.927 16.259 16.509 16.706 16.876

INDITEX COMPANY REPORT
PAGE 29/33
Income Statement Forecast (€ millions) 2015 2016 2017 2018 2019 2020F 2021F 2022F 2023F 2024F 2025F
Core Operations
Net Revenues 20.900 23.311 25.336 26.145 28.286 21.314 25.595 28.832 31.421 33.891 36.206
Cost of Sales (8.811) (10.032) (11.706) (11.329) (12.479) (9.351) (11.277) (12.697) (13.859) (14.975) (16.013)
Gross Margin 12.089 13.279 14.260 14.816 15.807 11.963 14.318 16.135 17.562 18.916 20.192
Operating Expenses (7.392) (8.176) (8.944) (9.329) (8.176) (7.069) (7.983) (8.755) (9.442) (10.111) (10.759)
Amortisation & Depreciation (1.022) (1.063) (963) (1.100) (2.826) (2.884) (3.039) (3.187) (3.246) (3.359) (3.462)
Results of companies accounted for using equity method
56 48 42 54 61 53 55 56 55 55 56
Core result before taxes 3.731 4.088 4.395 4.441 4.866 2.063 3.352 4.249 4.928 5.502 6.026
Taxes on Core Result (858) (920) (990) (983) (1.080) (459) (743) (943) (1.095) (1.221) (1.338)
NOPLAT 2.873 3.169 3.405 3.458 3.786 1.604 2.608 3.306 3.834 4.281 4.689
Non-Core Operations
Other losses and income, net 2 (20) (38) (30) (33) (22) (25) (26) (31) (32) (34)
Non-core result before taxes 2 (20) (38) (30) (33) (22) (25) (26) (31) (32) (34)
Taxes on Non-core result (1) 5 10 8 8 5 6 7 8 8 9
Total Comprehensive Income/ (loss), net of tax
(287) 57 (435) 40 36 0 0 0 0 0 0
Non-core result (286) 42 (464) 18 11 (16) (19) (20) (23) (24) (26)
Financing
Financial Results 10 10 (5) 17 (152) (107) (112) (120) (119) (123) (127)
Financing Result before taxes 10 10 (5) 17 (152) (107) (112) (120) (119) (123) (127)
Taxes on Financial Results (3) (3) 1 (4) 38 27 28 30 30 31 32
Non-controlling interest (8) (4) (5) (4) (8) 3 3 3 3 3 3
Financial Result (1) 4 (9) 9 (122) (77) (81) (87) (86) (90) (92)
Total Comprehensive Income: Equity holders of the Parent
2.587 3.214 2.933 3.484 3.675 1.511 2.508 3.199 3.725 4.167 4.570
Statement of Changes in Equity (€ millions) 2015 2016 2017 2018 2019 2020F 2021F 2022F 2023F 2024F 2025F
Capital 94 94 94 94 94 94 94 94 94 94 94
Share premium 20 20 20 20 20 20 20 20 20 20 20
Retained earnings 11.526 12.675 13.747 14.719 14.993 15.597 16.007 16.339 16.589 16.786 16.956
Other reserves 78 76 90 117 58 58 58 58 58 58 58
Reserves of companies accounted for using equity method
131 161 183 206 214 214 214 214 214 214 214
Treasury shares (73) (87) (77) (77) (60) (60) (60) (60) (60) (60) (60)
Translation differences (393) (240) (533) (420) (402) (402) (402) (402) (402) (402) (402)
Cash flows 28 15 (26) (6) (4) (4) (4) (4) (4) (4) (4)
TOTAL EQUITY 11.451 12.751 13.522 14.683 14.949 15.553 15.963 16.295 16.545 16.742 16.912
INDITEX COMPANY REPORT
PAGE 30/33
Consolidated Free Cash Flow (€ millions) 2016 2017 2018 2019 2020F 2021F 2022F 2023F 2024F 2025F 2026F
EBIT 4.088 4.395 4.441 4.866 2.063 3.352 4.249 4.928 5.502 6.026
Taxes (1.022) (1.099) (1.110) (1.217) (516) (838) (1.062) (1.232) (1.375) (1.507)
Tax Adjustments 103 109 127 136 57 95 119 138 154 169
NOPLAT 3.169 3.405 3.458 3.786 1.604 2.608 3.306 3.834 4.281 4.689 4.851
Depreciation & Amortisation 1.063 963 1.100 2.826 2.884 3.039 3.187 3.246 3.359 3.462
Gross Free Cash Flow 4.232 4.368 4.558 6.612 4.488 5.647 6.493 7.080 7.640 8.151
Changes in NWC 120 (384) 106 795 (417) 377 233 217 221 205
CAPEX (1.599) (1.201) (1.651) (1.161) (1.648) (1.507) (1.513) (1.554) (1.542) (1.583)
Changes in Intangible Assets (174) (130) (241) (7.324) (2.029) (2.196) (2.294) (2.114) (2.332) (2.378)
Changes in other long-term assets
38 113 (7) (566) (21) (5) 0 (5) (1) (3)
Operating Free Cash Flow 2.616 2.767 2.765 (1.644) 372 2.275 2.920 3.624 3.986 4.392
Non-Core Result 42 (464) 18 11 (16) (19) (20) (23) (24) (26)
Changes in Non-Core Invested Capital
(6) 122 (165) (334) 333 (1) 11 32 10 5
Non-Operating Free Cash Flow 36 (342) (148) (323) 317 (20) (8) 9 (14) (21)
Unlevered Free Cash Flow 2.652 2.425 2.617 (1.968) 689 2.255 2.911 3.633 3.972 4.371 4.439
INDITEX COMPANY REPORT
PAGE 31/33
Disclosures and Disclaimers
Report Recommendations
Buy Expected total return (including expected capital gains and expected dividend yield)
of more than 10% over a 12-month period.
Hold Expected total return (including expected capital gains and expected dividend yield)
between 0% and 10% over a 12-month period.
Sell Expected negative total return (including expected capital gains and expected
dividend yield) over a 12-month period.
This report was prepared by Margarida Gouveia, a Master in Finance student of Nova School of Business and
Economics (“Nova SBE”), within the context of the Field Lab – Equity Research.
This report is issued and published exclusively for academic purposes, namely for academic evaluation and
master graduation purposes, within the context of said Field Lab – Equity Research. It is not to be construed
as an offer or a solicitation of an offer to buy or sell any security or financial instrument.
This report was supervised by a Nova SBE faculty member, acting merely in an academic capacity, who revised
the valuation methodology and the financial model.
Given the exclusive academic purpose of the reports produced by Nova SBE students, it is Nova SBE
understanding that Nova SBE, the author, the present report and its publishing, are excluded from the persons
and activities requiring previous registration from local regulatory authorities. As such, Nova SBE, its faculty
and the author of this report have not sought or obtained registration with or certification as financial analyst by
any local regulator, in any jurisdiction. In Portugal, neither the author of this report nor his/her academic
supervisor is registered with or qualified under COMISSÃO DO MERCADO DE VALORES MOBILIÁRIOS (“CMVM”, the
Portuguese Securities Market Authority) as a financial analyst. No approval for publication or distribution of this
report was required and/or obtained from any local authority, given the exclusive academic nature of the report.
The additional disclaimers also apply:
USA: Pursuant to Section 202 (a) (11) of the Investment Advisers Act of 1940, neither Nova SBE nor the author
of this report are to be qualified as an investment adviser and, thus, registration with the Securities and
Exchange Commission (“SEC”, United States of America’s securities market authority) is not necessary.
Neither the author nor Nova SBE receive any compensation of any kind for the preparation of the reports.
INDITEX COMPANY REPORT
PAGE 32/33
Germany: Pursuant to §34c of the WpHG (Wertpapierhandelsgesetz, i.e., the German Securities Trading Act),
this entity is not required to register with or otherwise notify the Bundesanstalt für Finanzdienstleistungsaufsicht
(“BaFin”, the German Federal Financial Supervisory Authority). It should be noted that Nova SBE is a fully-
owned state university and there is no relation between the student’s equity reports and any fund raising
programme.
UK: Pursuant to section 22 of the Financial Services and Markets Act 2000 (the “FSMA”), for an activity to be
a regulated activity, it must be carried on “by way of business”. All regulated activities are subject to prior
authorization by the Financial Conduct Authority (“FCA”). However, this report serves an exclusively academic
purpose and, as such, was not prepared by way of business. The author - a Master’s student - is the sole and
exclusive responsible for the information, estimates and forecasts contained herein, and for the opinions
expressed, which exclusively reflect his/her own judgment at the date of the report. Nova SBE and its faculty
have no single and formal position in relation to the most appropriate valuation method, estimates or projections
used in the report and may not be held liable by the author’s choice of the latter.
The information contained in this report was compiled by students from public sources believed to be reliable,
but Nova SBE, its faculty, or the students make no representation that it is accurate or complete, and accept
no liability whatsoever for any direct or indirect loss resulting from the use of this report or of its content.
Students are free to choose the target companies of the reports. Therefore, Nova SBE may start covering
and/or suspend the coverage of any listed company, at any time, without prior notice. The students or Nova
SBE are not responsible for updating this report, and the opinions and recommendations expressed herein may
change without further notice.
The target company or security of this report may be simultaneously covered by more than one student.
Because each student is free to choose the valuation method, and make his/her own assumptions and
estimates, the resulting projections, price target and recommendations may differ widely, even when referring
to the same security. Moreover, changing market conditions and/or changing subjective opinions may lead to
significantly different valuation results. Other students’ opinions, estimates and recommendations, as well as
the advisor and other faculty members’ opinions may be inconsistent with the views expressed in this report.
Any recipient of this report should understand that statements regarding future prospects and performance are,
by nature, subjective, and may be fallible.
This report does not necessarily mention and/or analyze all possible risks arising from the investment in the
target company and/or security, namely the possible exchange rate risk resulting from the security being
denominated in a currency either than the investor’s currency, among many other risks.
The purpose of publishing this report is merely academic and it is not intended for distribution among private
investors. The information and opinions expressed in this report are not intended to be available to any person
other than Portuguese natural or legal persons or persons domiciled in Portugal. While preparing this report,
students did not have in consideration the specific investment objectives, financial situation or

INDITEX COMPANY REPORT
PAGE 33/33
particular needs of any specific person. Investors should seek financial advice regarding the appropriateness
of investing in any security, namely in the security covered by this report.
The author hereby certifies that the views expressed in this report accurately reflect his/her personal opinion
about the target company and its securities. He/ She has not received or been promised any direct or indirect
compensation for expressing the opinions or recommendation included in this report.
[If applicable, it shall be added: “While preparing the report, the author may have performed an internship
(remunerated or not) in Inditex Group. This Company may have or have had an interest in the covered company
or security” and/ or “A draft of the reports have been shown to the covered company’s officials (Investors
Relations Officer or other), mainly for the purpose of correcting inaccuracies, and later modified, prior to its
publication.”]
The content of each report has been shown or made public to restricted parties prior to its publication in Nova
SBE’s website or in Bloomberg Professional, for academic purposes such as its distribution among faculty
members for students’ academic evaluation.
Nova SBE is a state-owned university, mainly financed by state subsidies, students tuition fees and companies,
through donations, or indirectly by hiring educational programs, among other possibilities. Thus, Nova SBE
may have received compensation from the target company during the last 12 months, related to its fundraising
programs, or indirectly through the sale of educational, consulting or research services. Nevertheless, no
compensation eventually received by Nova SBE is in any way related to or dependent on the opinions
expressed in this report. The Nova School of Business and Economics does not deal for or otherwise offer any
investment or intermediation services to market counterparties, private or intermediate customers.
This report may not be reproduced, distributed or published, in whole or in part, without the explicit previous
consent of its author, unless when used by Nova SBE for academic purposes only. At any time, Nova SBE may
decide to suspend this report reproduction or distribution without further notice. Neither this document nor any
copy of it may be taken, transmitted or distributed, directly or indirectly, in any country either than Portugal or
to any resident outside this country. The dissemination of this document other than in Portugal or to Portuguese
citizens is therefore prohibited and unlawful.