
INDIA'S Q3FY19 REPORT CARD - Ashika Group
88
Market Overview Prominent Headlines February 2019 Q&A with CIO Mutual Fund Overview Stock Picks Monthly Insight Performance Valuation at a Glance Q3FY19 Result Analysis Sector Outlook - IT Economy Review Economy Chart Book Management Meet Note Technical View Market Diary Commodity Monthly Round Up World Economic Calendar IN SIGHT March 2019 INDIA’S Q3FY19 REPORT CARD Ashika Group received “BTVI Emerging Company of the Year” Award Mr. Chirag Jain received “BTVI Young Business Leader of the Year” Award Q&A with CIO Mr. Neelesh Surana - Chief Investment Officer - Mirae Asset Global Investments (India) Pvt. Ltd. ITC Ltd. | Tech Mahindra Ltd.
-
Upload
khangminh22 -
Category
Documents
-
view
3 -
download
0
Transcript of INDIA'S Q3FY19 REPORT CARD - Ashika Group

Market OverviewProminent Headlines February 2019Q&A with CIOMutual Fund Overview
Stock PicksMonthly Insight PerformanceValuation at a GlanceQ3FY19 Result Analysis
Sector Outlook - ITEconomy ReviewEconomy Chart BookManagement Meet Note
Technical ViewMarket DiaryCommodity Monthly Round UpWorld Economic Calendar
INSIGHTMarch 2019
INDIA’S Q3FY19 REPORT CARD
Ashika Group received “BTVI Emerging Company of the Year” Award
Mr. Chirag Jain
received “BTVI
Young Business
Leader of the Year”
Award Q&A with CIO
Mr. Neelesh Surana - Chief Investment Officer - Mirae Asset
Global Investments (India) Pvt. Ltd.
ITC Ltd. | Tech Mahindra Ltd.

INSIDE THIS ISSUE
Marketoverview1 45 Sector -
Information
Technology
6 Q&A with CIO- Neelesh Surana, Mirae Asset Global Investments (India) Private Limited
56 Economychart book
14 Stockpicks• ITC Ltd.• Tech Mahindra Ltd.
28 Valuationat a glance
76 Technicalview
80 Commoditymonthly round up
Economyreview 52
Mutualfund overview 8 Manage-
mentmeet note• Ajanta Pharma Ltd. 70
Monthlyinsight performance 20
Q3FY19Result Analysis 31
Marketdiary 79
Worldeconomic calendar 82
Prominent headlines February 2019 4PROMINENT
HEADLINES

1 March 2019INSIGHT
MarketOVERVIEW
Indian market has to deal with volatility in times ahead as uncertainty prevails with respect to geo political tensions and elections due in April to May. Geopolitical tensions could escalate as India carried out pre-dawn air strikes on terror camps across the Line of Control on 26th February.
2March 2019 INSIGHT
Foreign Secretary, Vijay Gokhale stated that India is firmly and resolutely committed to taking all
measures to fight the menace of terrorism. This excercise was non-military, pre-emptive action was targeted specifically to eliminate terror training camp. The move by India was widely expected given the ghastly attack on Indian soldiers in Jammu and Kashmir’s Pulwama and chances of follow on attacks. The strong statements by Prime Minister, Modi was essentially to send a stern message which promised for strong steps to counter terrorism. Even US President stated that the relation between Indian and Pakistan has stooped to new lows and that a strong answer by India was understandable. Nevertheless, the attacks were not orchestrated to hurt Pakistan but to counter terrorism. India has received support from international partners who have condemned the grievous attacks. Pakistan has rejected India’s claims but promised of a befitting reply for crossing the Line of Control and retaliated by entering Indian airspace on 27th February 2019. Thus, things could remain tense but not expected to turn into war as Pakistan PM signal to resolve issue through talks while India also wants to avoid further escalation of situation. Experts feel the impact of the geopolitical tensions to be modest unless things take an ugly turn. Geopolitical tensions across the border although affects investor sentiments but in reality, have a neutral impact on the earnings and thus could throw out immense opportunities to invest in good businesses in case pessimism hits the roof.
Going by the way markets have behaved, there is still confidence that Narendra Modi will get a second term as Prime Minister of India. The consensus view being that the NDA government will be able to form government with the help of regional parties, however, will not be able to gain majority on its own like that of 2014. Experts believe that the cash transfer move for farmers is a little late and the farmer dissent for the last two to three years will result in
loss of seats in Hindi heartland. The inherent strength of the market could also be on account of an anticipation of a stable government. A stable government is indeed desirable from investor point of view since it provides with the opportunity to carry on with the reforms which drives growth. However, what market is not pricing in at this point of time is a third front kind of government. In India’s history, a third front government has only resulted in re-election in short span of time as different regional parties fail to reach a consensus on account of divergent ideologies and agenda. Thus, clearly markets would be spooked once that is a reality. However, this is too early to predict anything on elections as the early poll results are also about to change as are the sentiments. Besides, a number of regional parties together contributing 100-150 seats have still kept their options opened and could be the swing factor joining the coalition which is in a better position to form government. Going by the past, NDA has the skills to allure coalitions to stick and that process has already started and expected to pick up. However, the final swing could be noticed post announcement of results. In case
two coalitions, UPA and NDA runs neck to neck, this clutch of regional parties will eventually decide the fate. Needless to mention, Uttar Pradesh will be the deciding factor, however the equation remains complex and challenges daunting for BJP to succeed since this time SP and BSP have formed a pre-poll alliance. There are caste divides between SP & BSP party cadres, and this could either work for or against, but nevertheless this could have a diminishing effect on BJP’s vote share in the state. Last time, BJP bagged 73 of 80 seats which is not expected to be repeated. A glimpse of arch rivals forming alliance and succeeding is an example of alliance between RJD and Janata Dal (United) in 2015 Bihar assembly elections which was a success. However, barring the uncertainties, what investors anticipate is a stable government and market has been discounting the same but uncertainties over the outcome have limited upside. Thus, post elections markets will probably find ground and stocks would play on their own based on individual fundamentals.
Good quality stocks with strong fundamentals are often bought when market corrects however not due to earnings concern. The present geopolitical crisis even though heightens will only cast its shadow for medium term and will pass on and thus it makes sense to look at the earnings perspective because that will drive the share prices. For the recently concluded earning season for quarter ended December, there were challenges presented in terms of tight liquidity, high raw material prices, currency volatility and slowdown in government spending (as election draws near) apart from global trade issues. However, weak INR provided support to export oriented sectors as well as Pharm and IT in particular while volumes in consumption space remained strong. Q3FY19 provided with a contrasting picture as the growth was driven by the Banking, financial services and insurance (BFSI) sector as against non-BFSI sector in earlier quarters. Earnings revival in the banking space led by corporate
Good quality stocks with strong fundamentals are often bought when market corrects however not due to earnings concern. The present geopolitical crisis even though heightens will only cast its shadow for medium term and will pass on and thus it makes sense to look at the earnings perspective because that will drive the share prices.
3 March 2019INSIGHT
banks drove BFSI performance and the trend is expected to continue. This is fourth consecutive quarter where Sensex companies (ex-banking) have recorded double digit bottomline growth, amid robust consumer sentiment and peaking commodity prices. Sensex companies (ex-banking) reported a stellar operational performance in Q3FY19 primarily driven by robust consumer demand domestically and uptick in commodity prices thereby benefitting the oil & gas as well as metals space. Net sales in Q3FY19 were up 22% YoY. This coupled with 165 bps improvement in EBITDA margin to 20.1% led to 13% growth in operating profit. Gross margins declined 270 bps YoY. partly compensated by operating leverage benefits like lower employee as well as other expenses. Subsequently Net Profit in Q3FY19 (Ex Tata Motors) was up 17.8% YoY. Going ahead, impact of low commodity prices including crude oil along with stabilisation of rupee may support growth. However, there are significant headwinds as well apart from the geo political and political tensions in the likes of global growth slowdown, domestic liquidity, shift in government spending from capex to rural. Global slowdown will impact companies in the IT and metal space as well as auto exports while
tight domestic liquidity condition will continue to impact NBFCs and shift in government spending will be boon for consumption companies but will slowdown industrials and cement companies in the short term. However, clarity will emerge only after general elections.
Recent economic indicators for Indian economy however suggest slackness in the economy which has also been highlighted by the RBI in its policy statement. Thus, the RBI in its latest policy lowered repo rates by 25 bps to give growth a chance. However, the key issue with the transmission of interest rates by banks still persists as incremental credit to deposit ratio of the banks is above 100% which suggests that unless deposit rates are lowered, the banks are unable to lower lending rates. Even if the deposit rates are lowered, it takes effect with a lag while the same on the lending rates is immediate which takes a toll on the margins, thus the banks and the RBI are not on the same page of passing on the rate cuts. Besides, the liquidity situation in India remains tight as currency in circulation is on a high. This has prompted RBI to conduct periodic open market operations (OMOs) however the systemic liquidity situation hasn’t improved
materially. Despite higher currency in circulation, the income velocity of money has lowered and is expected to stay low which again suggests slackness in economy. The recent set of data from automobile sales, business activity, online passenger traffic as well as exports suggest weakness. Consumption has been hurt as suggested in Q2FY19 GDP data as well and is not expected to have recovered. However, the inflationary pressures have remained subdued with the decline in food prices while the core inflation has been stubborn. The inflation estimates have actually been lower than RBI’s estimates as well and thus justifies the rate cut. However, going ahead, food prices would recover from low base besides the core inflation is expected to ease. Inflationary pressures could also be witnessed from higher fiscal deficit numbers which stands at 121.5% of the budgeted target for the period April to January. However, in an election year, this is understandable. Stability of Indian rupee is crucial and with the crude oil prices hovering ~USD65/barrel, current account deficit is not expected to breach dangerous levels. However, sustenance of foreign inflows is crucial which again depends on the global economic scenario and the view on global trade.
Paras BothraPresident - Equity ResearchEmail - [email protected]: 022 6611 1704 / 1786Mobile: 98203 97061
India needs fewer and mega banks which are strong because in
every sense, from bor-rowing rates to optimum utilisation, the economies of scale as far as banking sector is concerned are of great help - Arun Jaitley, Finance Minister
Inflation continues to come down on a global basis and provides the
cover for RBI to cut rates. However, in a period of fiscal expansion, cutting rates too aggressively will be adding fuel to the fire. That will lead to a higher price to be paid through inflation down the road. RBI better be very careful on this front - Krishna Memani, chief investment officer at Oppenheimer Funds
The major challenges for the future for the banking sector
remains ensuring inter-mediation by financial institutions is clean be it public sector banks, private sector or NBFC. How do we see that credit rating agencies also become far more accountable because their rating determines the flow of credit. It has impact on yields that’s another area - Rajiv Kumar, Financial Services Secretary
India and Russia are working to address and resolve trade
and investment issues to facilitate and increase private sector coopera-tion between the coun-tries - Suresh Prabhu, Commerce and Industry Minister
Indian equities are the best bet in the emerging market pack
at the moment, despite the nervousness ahead of the general elections and is bullish on technology and consumer-linked stocks in India - Mark Mobius, Founding Partner of Mobius Capital Partners
At the moment, we are not seeing strong inflows
into broad emerging markets although we have addressed the issue of large outflows which was the experience of 2018. I was saying earlier that coming into 2019, the EM positioning was over-weight India and what we are seeing is just a reallocation of the assets away from India towards markets like China, Brazil and Turkey where you are seeing stronger perfor-mance. What we might see is if EM continues to rise, you begin to see some inflows into broader EM funds, perhaps massive allocation by the global investors and then the FII net numbers might start to look a little bit better for India as it gets its share of the flow of capital into emerging markets - Adrian Mowat, EM - Equity Strategist
The risk is that the growing uncer-tainty about the
election outcome in India will lead to a slowdown in the inflows into domestic equity funds, which have been the main driver of the stock market since Modi was elected in May 2014. The latest data shows that such a decline is happening. This is clearly a growing risk in the short term, most particularly as many foreign investors will want to await the outcome of the pending elections - Christopher Wood, managing director and equity strategist at CLSA
Digital opportuni-ties and skills will pave the future of
the IT-BPM industry in India. Digitalisation ini-tiatives are at the core of business transformation and may be less impacted by somewhat lower growth in major econo-mies - Debjani Ghosh, President, Nasscom
Four clouds” or fac-tors undermining economic progress
– namely Brexit uncer-tainty, trade tensions and tariff escalations, global financial tightening and an accelerated slow-down in the Chinese economy. The risks posed by each cloud could create the “perfect economic storm”. We have big risks on the horizon and the clouds that we have signaled about [12 months ago] are getting darker by the day - Christine Lagarde, head of the International Monetary Fund
4March 2019 INSIGHT
PROMINENT HEADLINES FEBRUARY 2019

The country has climbed from seventh slot in
2017 to the third rank in 2018 in the world travel & tourism council’s power and performance index. the tourism sector alone has created nearly 14 million jobs across the country in the last four years alone - KJ Alphons, Union tourism minister
I think the (Indian economic) growth is still going to be higher
than China. We will probably see around 7 per cent, and that itself is a tremendous accomplish-ment. I know unemploy-ment is a real issue, and this is something that whoever comes to power in the next election, is going to have to address very forcefully. They will have to think how to make it work, and that means making it easier for foreign investors to come in - Mark Mobius, Founding Partner of Mobius Capital Partners
Historically, it has been seen that it (election) does
not have a long-standing impact on the markets. Most governments have been progressive and worked for development of the economy and as we go into the event, we think the construct of the Corporate India balance sheet will far outweigh the outcome of the elections - Kenneth Andrade, founder, Old Bridge Capital
The recent macro-economic tailwinds in India have been
especially compelling. Real GDP growth over the last two years has aver-aged 7%, the highest rate among the largest econ-omies in the world. This strong Indian economic performance is buoyed by a well-educated work-force and a pro-growth oriented government. Bold structural reforms, such as the implemen-tation of the GST, and the Insolvency and Bankruptcy Code, have improved governance standards and processes - Jonathan Gray, Presi-dent & COO Blackstone
Corporate debt is currently the leading bogeyman
among the international regulators. It is the thing that looks most likely, like sub-prime. Janet Yellen, the former chair of Fed-eral Reserve, spoke about it recently. The Bank of England released new data showing that it is double what we thought it was — $2.2 trillion, which also happens to be the same as the sub-prime debt - Kenneth Rogoff, professor of Economics at Harvard University
The recent trend of rolling out doles for the farm sector,
including the Union Budget’s basic income scheme, as a “disturbing trend” which will impact fiscal stability, growth and also Centre-state relations - Y V Reddy, former RBI Governor
No other large economy in the world is growing at over 7 per cent year after year, the fundamentals of our economy are sound. We are well set to become a 5 trillion-dollar economy in the near future. We are one of the most open countries for foreign direct investment today. More than 90 per cent of our sectors are now on automatic route for approval. As a result of this and the confidence in India, we have received FDI worth over USD 250 billion over the past four years - Narendra Modi, Prime Minister of India
India is its No.1 priority foreign investment destination and its companies are looking at becoming household names in the country with projects in oil refining, petrochemicals and fertilisers - Khalid Al-Falih, Saudi Oil Minister
5 March 2019INSIGHT
6March 2019 INSIGHT
Q: What is the mood amongst the investors given the geopolitical risks? How do you see the political landscape panning out and how should one position his portfolio considering so much of uncertainty?
A: Typically, investor behaviour swings like a pendulum from greed to fear and the other way. In the times of uncertainty, investors are generally fearful and are greedy during market buoyancy. History has shown us that the periods of uncertainty are generally the best times from investment perspective and building a portfolio. Point to point returns are
highest for the money invested at the peak of uncertainties.
Having said that, the best strategy for a retail investor is to do a periodic investment depending upon his cash flows which will average out / moderate out the impact mood swings of the investor.
So far as the political uncertainty is concerned, as per most experts and media reviews it seems the current NDA regime is expected to come back in power albeit with a lower mandate. Even if the outcome of election is otherwise, larger government policies and long term drivers of Indian
economy will be on a growth path, in our view.
From an Indian investor point of view, all the key risks (a) currency, (b) oil price and (c) interest rates had played out in 2018. 2019 has started on a much better macro backdrop. The Nifty valuations at 16.5x appear reasonable in the backdrop of FY18-20 earnings CAGR of 17%. We continue to stick to our bottom up stock picking strategy and see this as a good opportunity to invest in good quality names available at reasonable valuations.
Q: What’s your outlook on the markets in near-term considering that Budget sops and a rate cut by RBI which failed to lift the sentiments? Do you think there are further rate cuts in the offing?
A: While, the budget seems positive for the consumption sector and rate cuts is positive, normalization of liquidity situation for NBFCs, outcome of US-China trade talks and upcoming general elections, seem to be on top of the investor mind and could influence the markets in near term.
Interest rates are determined by various factors which include (1) inflation and its expectations, (2) fiscal deficit/government borrowings and (3) rate differential versus other economies. While the 2 (inflation and US Fed stance) of these 3 factors are favourable for interest rate cuts, government may struggle to meet its FY20 fiscal deficit which will act as a counter measure to rate cut.
Q: There are increasing chances of a global slowdown unless a truce is arrived at between US & China soon. How much it would impact the Indian markets and sentiments in case of a prolonged delay?
A: The outcome of the truce between US and China is un-determined at this stage. However, based on various news flow it seems the truce may get extended and the imposition of incremental duties may get delayed. Having said that, IMF has projected a slowdown of the global GDP growth rates for the coming year.
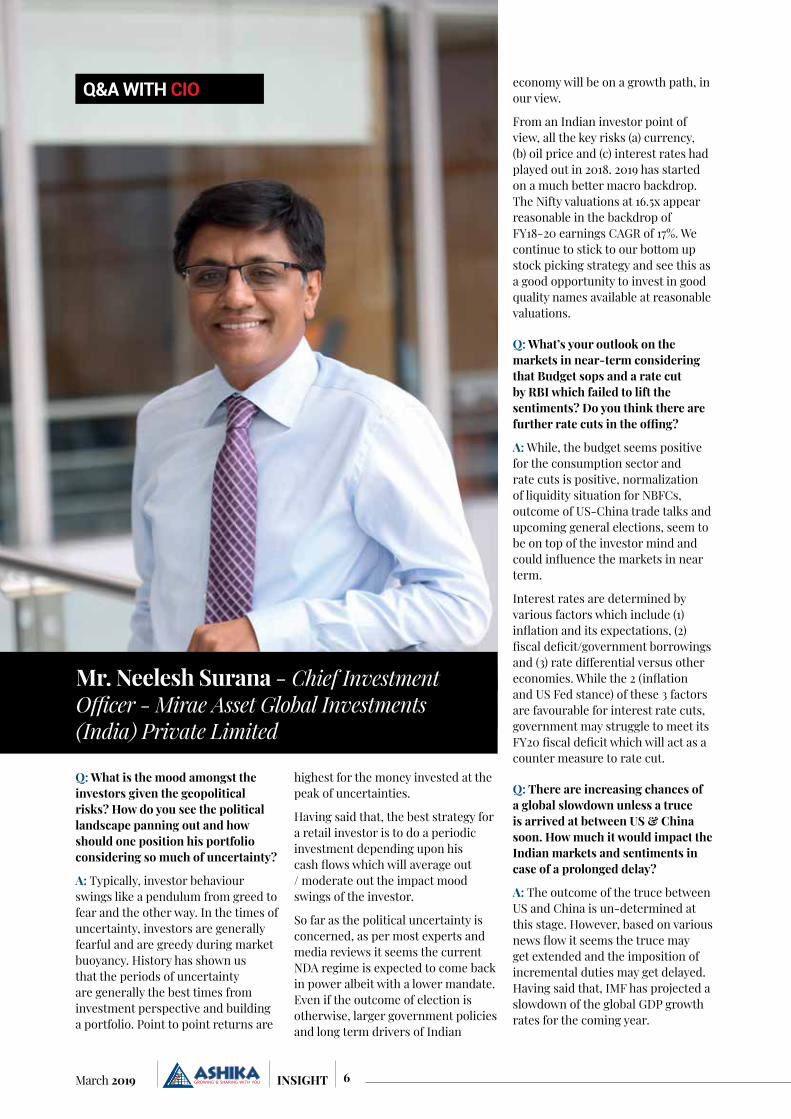
Mr. Neelesh Surana - Chief Investment Officer - Mirae Asset Global Investments (India) Private Limited
Q&A WITH CIO
7 March 2019INSIGHT
India’s EXIM trade (exports + imports) is ~30% of its GDP, hence, any meaningful slowdown or prolonged delayed growth will have some impact on the Indian economy. However, India being a largely a domestic oriented economy, any impact would be sector specific and even lesser from the investible universe point of view.
Q: How do see the rupee to play out given the outlook of crude oil prices?
A: The key influencers for rupee movement include crude price (through CAD), external fund flows and relative interest rates.
Given the long-term inflation differential between India and US, rupee is expected to depreciate 3-5% per annum to neutralize the interest rate differential between both the countries.
However, rupee does not depreciate secularly on a yearly basis, but it depreciates sharply by 15%-18% in a block of 4-5 years, as seen in its last 15 years history. Given, ~80% dependence of Indian economy on energy imports and consistent trade deficits, the same patterns should follow in the foreseeable future.
Q: How do you decode the December quarter corporate earnings and your expectations for FY20 & FY21?
A: The aggregate 3QFY19 Revenue/EBITDA/PAT (adjusted for one-off gains/impairments) growth for Nifty is at 23%/5%/10% YoY. At the sector level, Industrials, Healthcare, Financials (private corporate lenders) and Energy delivered earnings beat, while Materials, Utilities, and Autos (ex M&M) disappointed.
Corporate Banks showed a material sequential improvement in the slippage/asset quality trends. This coupled with return of credit growth augurs well for their earnings growth. This provides good visibility on the earnings outlook, as Corporate Banks were one of the key drivers for the earnings miss over the past few years.
As against higher single digit growth in FY19, FY20 consensus Nifty earnings are expected to grow at >25%. The earnings growth for FY20 over FY19 is meaningful and led by financials, Oil & Gas, IT and to some extent auto sector.
Q: Which are the sectors do you think would perform well in upcoming years? Also what is your take on consumer business given such high multiples?
A: The India corporate earnings are on a normalization path post the demonetization and GST disruptions. Over the next 3 years earnings momentum is expected to pick up led by (a) 12-15% nominal GDP growth, (b) NPA provisioning largely done, (c) likely pickup in private capex as industrial utilization nearing 78-80% in 2019/2020 and (d) national elections will be behind us.
We are currently positive on private banks, pharma and consumer sector from the medium-term perspective.
Consumer companies were significantly re-rated post 2008 global financial crisis because of their strong free cash generation capability, higher RoCE and stable growth. While the consumer businesses have rerated in the past, many of the richly valued stocks have corrected in the recent past. We keep evaluating such businesses and make our investment decisions based on appropriate entry points. At Mirae Asset, while building the portfolio, we follow bottom-up approach our stock selection philosophy is guided by growth at reasonable price (GARP).
Q: Do you think the crisis with the NBFCs is over or something bigger is in the offing?
A: The liquidity crisis which started with IL&FS issue while not fully resolved is on a normalization path. With the intervention by RBI and the government, we expect the normalization in the liquidity situation sooner than later.
For NBFC’s, while the funding costs on an average has increased, the NBFCs with strong parentage, good track record and balance sheet are still able to raise funds with relative ease.
Nevertheless, the near-term loan growth could be moderated for some NBFCs. On the margin front, NBFCs operating in niche segments, with ability to pass on the higher interest rates would be able to protect their spreads.
Q: Post correction, is it the right time to get in quality midcaps?
A: The valuation differential between midcaps and large caps have significantly corrected from its peak in December 2017 at a headline level.
The bottom up opportunities are clearly emerging in the midcap segment, however subject to valuation, we continue to be selective and invest in companies where earnings visibility is good and balance sheet/cash flow characteristics are not questionable.
Q: How do investors cope with corporate governance issues even in big names? Any sector specific risk you perceive or any underweight themes you want to highlight in current the market scenario?
A: Corporate governance is a very major issue across all geographies. While there are checks and balances like audit committee, auditors, rating agencies, regulators and whistle blower policies among others put in place in the system to counter the corporate governance issues, but they have not been 100% full proof. While the systematic improvement has taken care of this issue to a large extent over the time period and will only improve from here. In the interim, portfolio diversification is the only way for the investors to counter such issues.
On the sector specific issue, we have been underweight on sectors like public sector banks, infra space and telecom.
* View of Mr. Neelesh Surana (CIO - Mirae AMC) ably assisted by Mr. Harshad Borawake (Head – Research - Mirae Asset & Co-Manager of Mirae Asset India Equity Fund)

8March 2019 INSIGHT
Mutual Fund Overview MIRAE ASSET INDIA EQUITY FUND
Investment ObjectiveThe investment objective of the scheme is to generate long term capital appreciation by capitalizing on potential investment opportunities through predominantly invest-ing in equities, equity related securities. The Scheme does not guarantee or assure any returns. Suitable for investors who are seeking Multicap Investing.
Investment StrategyMirae Asset India Equity Fund is a multicap fund which follows the below strategy:
Investment approach is centered around participating in high quality business upto a reasonable price and holding the same over an extended period of time Has flexibility to invest across sectors, themes & market
caps. Aims to combine consistency of largecaps with
conviction ideas from midcaps. Focuses on companies with sustainable competitive
advantage- Stocks which have strong pricing power and are sector leaders.
Its strategy is based on fundamental bottom-up analysis and results in a well-diversified portfolio, with no sector, stock, theme, or style being disproportionate. Alpha generation is driven mainly by superior stock selection and not sector rotation. The fund’s process combines qualitative parameters and rigourous company analysis with quantitative parameters. The investment philosophy of the fund is built on three core principles: quality businesses with stable earnings, strong management, and attractive valuation.
Note: All data as on January 31, 2019; NAV as on February 22, 2019Source: Factsheet, Value Research
Important InformationNAV (G) (Rs.) 47.25NAV (D) (Rs.) 16.77Inception Date April 4, 2008Fund size (in Rs cr) 10,343.4Fund Manager Neelesh Surana, Harshad Borawake &
Gaurav MisraEntry load N.AExit Load 1% for redemption within 365 daysBenchmark NIFTY 200 TRIMin Investment Rs.5000Min SIP Investment Rs.1000
Key RatiosBeta 0.96Standard deviation (%) 14.42Sharpe Ratio 0.69Alpha 2.37R Squared 0.97Expense ratio (%) 2.05Portfolio Turnover ratio (%) 53.00Avg Market cap (Rs in cr) 129,741
Fund Features
Consistency of Performance**
Dual Strategy Of Core and Tactical allocation^Capitalize on Long & ShortTerm Opportunities
Risk mitigation to reduce volatility and improve liquidity
RiskMitigation
InvestmentProcess
ActiveManagement
(Core & Tactical)
PortfolioPsychographic
Benchmark
StockSelection
(Bottom-upApproach)
Flexibility to invest across sectors,themes, styles and market caps.
Focused on Good Businesses
9 March 2019INSIGHT
Month of Recom
Fund Name Benchmark NAV as on 22.02.2019
1 Year Return
(%)
3 Year Return (%)
5 Year Return
(%)
Nov-17 ICICI Prudential Multi Asset Fund Nifty 50 248.7 -4.0 14.7 13.3
Dec-17 SBI Bluechip Fund S&P BSE 100 35.8 -3.8 11.2 15.0
Jan-18 DSP BlackRock Tax Saver Fund Nifty 500 43.7 -4.2 15.1 17.2
Feb-18 IDFC Tax Advantage (ELSS) Fund S&P BSE 200 50.9 -11.5 15.0 15.8
Mar-18 Aditya Birla Sun Life Tax Relief 96 Fund S&P BSE 200 29.6 -3.3 14.8 18.8
Jul-18 Sundaram Equity Hybrid Fund CRISIL Hybrid 35+65 Aggressive 85.3 3.2 13.5 11.1
Aug-18 Franklin India Equity Saving Fund S&P BSE Small Cap 9.8 -- -- --
Sep-18 Sundaram Services Fund S&P BSE 200 10.3 -- -- --
Oct-18 Reliance Balanced Advantage Fund CRISIL Hybrid 35+65 Aggressive 86.6 1.9 14.9 14.0
Nov-18 Kotak Emerging Equity Scheme NIFTY Midcap 100 35.1 -10.3 14.6 22.4
Jan-19 Tata Hybrid Equity Fund CRISIL Hybrid 25+75 Aggressive 198.0 -3.04 8.62 13.61
Feb-19 Invesco India Contra Fund S&P BSE 500 44.2 -3.68 17.14 19.96
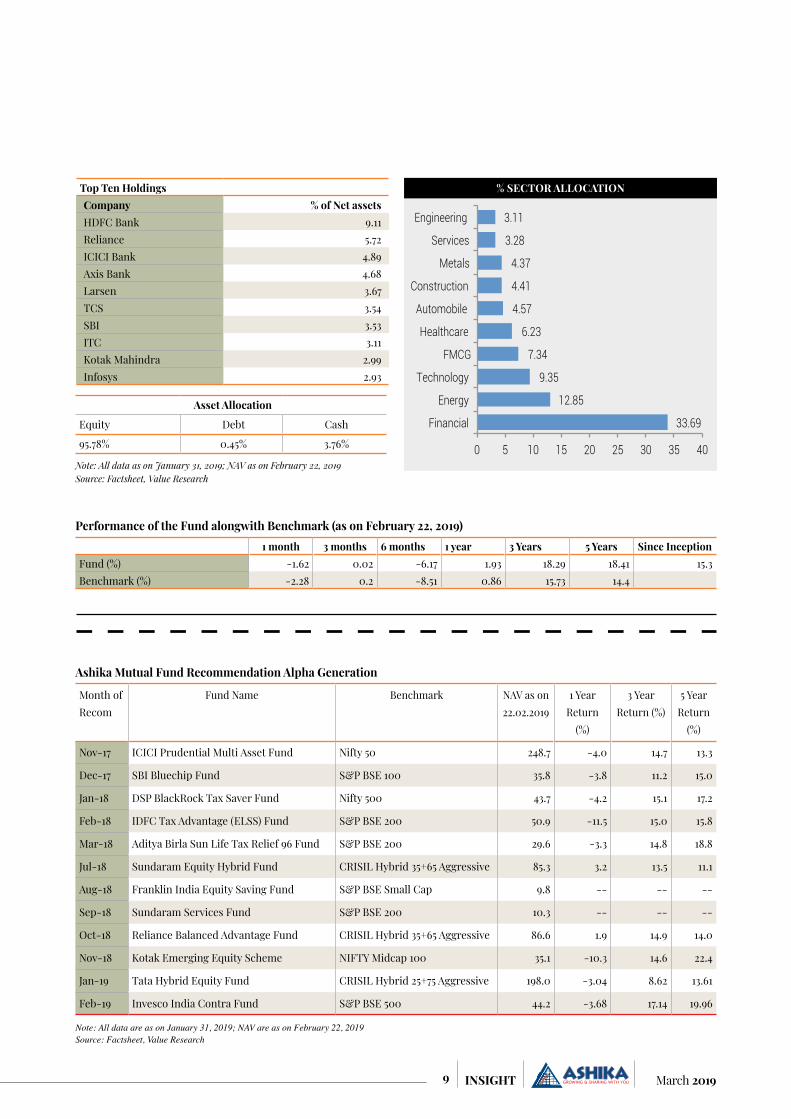
Ashika Mutual Fund Recommendation Alpha Generation
1 month 3 months 6 months 1 year 3 Years 5 Years Since InceptionFund (%) -1.62 0.02 -6.17 1.93 18.29 18.41 15.3Benchmark (%) -2.28 0.2 -8.51 0.86 15.73 14.4
Performance of the Fund alongwith Benchmark (as on February 22, 2019)
Asset Allocation
Equity Debt Cash
95.78% 0.45% 3.76%
33.69
12.85
9.35
7.34
6.23
4.57
4.41
4.37
3.28
3.11
0 5 10 15 20 25 30 35 40
Financial
Energy
Technology
FMCG
Healthcare
Automobile
Construction
Metals
Services
Engineering
% SECTOR ALLOCATION Top Ten HoldingsCompany % of Net assetsHDFC Bank 9.11Reliance 5.72ICICI Bank 4.89Axis Bank 4.68Larsen 3.67TCS 3.54SBI 3.53ITC 3.11Kotak Mahindra 2.99Infosys 2.93
Note: All data as on January 31, 2019; NAV as on February 22, 2019Source: Factsheet, Value Research
Note: All data are as on January 31, 2019; NAV are as on February 22, 2019Source: Factsheet, Value Research
10March 2019 INSIGHT
NAV AUM (Rs Cr)
3 M 6 M 1 Yr 3 Yr 5 Yr Since Inception
Return
Sharpe Ratio
Exp. Ratio
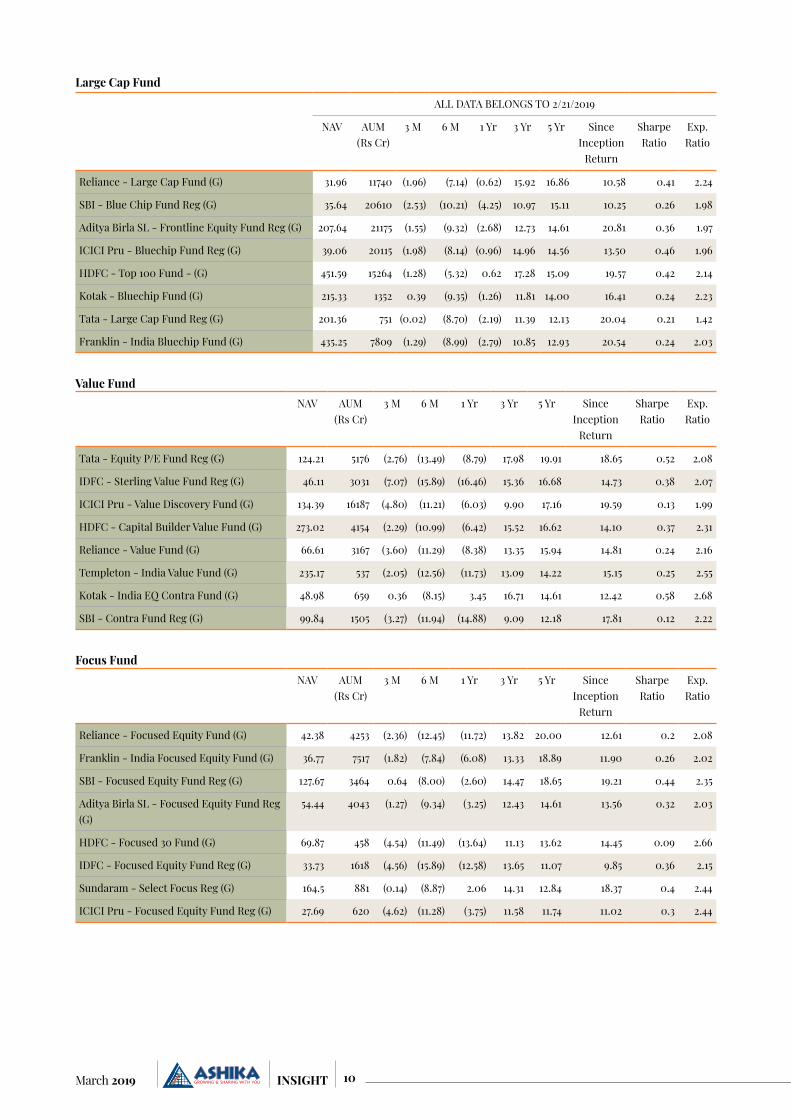
Reliance - Focused Equity Fund (G) 42.38 4253 (2.36) (12.45) (11.72) 13.82 20.00 12.61 0.2 2.08
Franklin - India Focused Equity Fund (G) 36.77 7517 (1.82) (7.84) (6.08) 13.33 18.89 11.90 0.26 2.02
SBI - Focused Equity Fund Reg (G) 127.67 3464 0.64 (8.00) (2.60) 14.47 18.65 19.21 0.44 2.35
Aditya Birla SL - Focused Equity Fund Reg (G)
54.44 4043 (1.27) (9.34) (3.25) 12.43 14.61 13.56 0.32 2.03
HDFC - Focused 30 Fund (G) 69.87 458 (4.54) (11.49) (13.64) 11.13 13.62 14.45 0.09 2.66
IDFC - Focused Equity Fund Reg (G) 33.73 1618 (4.56) (15.89) (12.58) 13.65 11.07 9.85 0.36 2.15
Sundaram - Select Focus Reg (G) 164.5 881 (0.14) (8.87) 2.06 14.31 12.84 18.37 0.4 2.44
ICICI Pru - Focused Equity Fund Reg (G) 27.69 620 (4.62) (11.28) (3.75) 11.58 11.74 11.02 0.3 2.44
Focus Fund
NAV AUM (Rs Cr)
3 M 6 M 1 Yr 3 Yr 5 Yr Since Inception
Return
Sharpe Ratio
Exp. Ratio
Tata - Equity P/E Fund Reg (G) 124.21 5176 (2.76) (13.49) (8.79) 17.98 19.91 18.65 0.52 2.08
IDFC - Sterling Value Fund Reg (G) 46.11 3031 (7.07) (15.89) (16.46) 15.36 16.68 14.73 0.38 2.07
ICICI Pru - Value Discovery Fund (G) 134.39 16187 (4.80) (11.21) (6.03) 9.90 17.16 19.59 0.13 1.99
HDFC - Capital Builder Value Fund (G) 273.02 4154 (2.29) (10.99) (6.42) 15.52 16.62 14.10 0.37 2.31
Reliance - Value Fund (G) 66.61 3167 (3.60) (11.29) (8.38) 13.35 15.94 14.81 0.24 2.16
Templeton - India Value Fund (G) 235.17 537 (2.05) (12.56) (11.73) 13.09 14.22 15.15 0.25 2.55
Kotak - India EQ Contra Fund (G) 48.98 659 0.36 (8.15) 3.45 16.71 14.61 12.42 0.58 2.68
SBI - Contra Fund Reg (G) 99.84 1505 (3.27) (11.94) (14.88) 9.09 12.18 17.81 0.12 2.22
Value Fund
ALL DATA BELONGS TO 2/21/2019
NAV AUM (Rs Cr)
3 M 6 M 1 Yr 3 Yr 5 Yr Since Inception
Return
Sharpe Ratio
Exp. Ratio
Reliance - Large Cap Fund (G) 31.96 11740 (1.96) (7.14) (0.62) 15.92 16.86 10.58 0.41 2.24
SBI - Blue Chip Fund Reg (G) 35.64 20610 (2.53) (10.21) (4.25) 10.97 15.11 10.25 0.26 1.98
Aditya Birla SL - Frontline Equity Fund Reg (G) 207.64 21175 (1.55) (9.32) (2.68) 12.73 14.61 20.81 0.36 1.97
ICICI Pru - Bluechip Fund Reg (G) 39.06 20115 (1.98) (8.14) (0.96) 14.96 14.56 13.50 0.46 1.96
HDFC - Top 100 Fund - (G) 451.59 15264 (1.28) (5.32) 0.62 17.28 15.09 19.57 0.42 2.14
Kotak - Bluechip Fund (G) 215.33 1352 0.39 (9.35) (1.26) 11.81 14.00 16.41 0.24 2.23
Tata - Large Cap Fund Reg (G) 201.36 751 (0.02) (8.70) (2.19) 11.39 12.13 20.04 0.21 1.42
Franklin - India Bluechip Fund (G) 435.25 7809 (1.29) (8.99) (2.79) 10.85 12.93 20.54 0.24 2.03
Large Cap Fund
11 March 2019INSIGHT
NAV AUM (Rs Cr)
3 M 6 M 1 Yr 3 Yr 5 Yr Since Inception
Return
Sharpe Ratio
Exp. Ratio
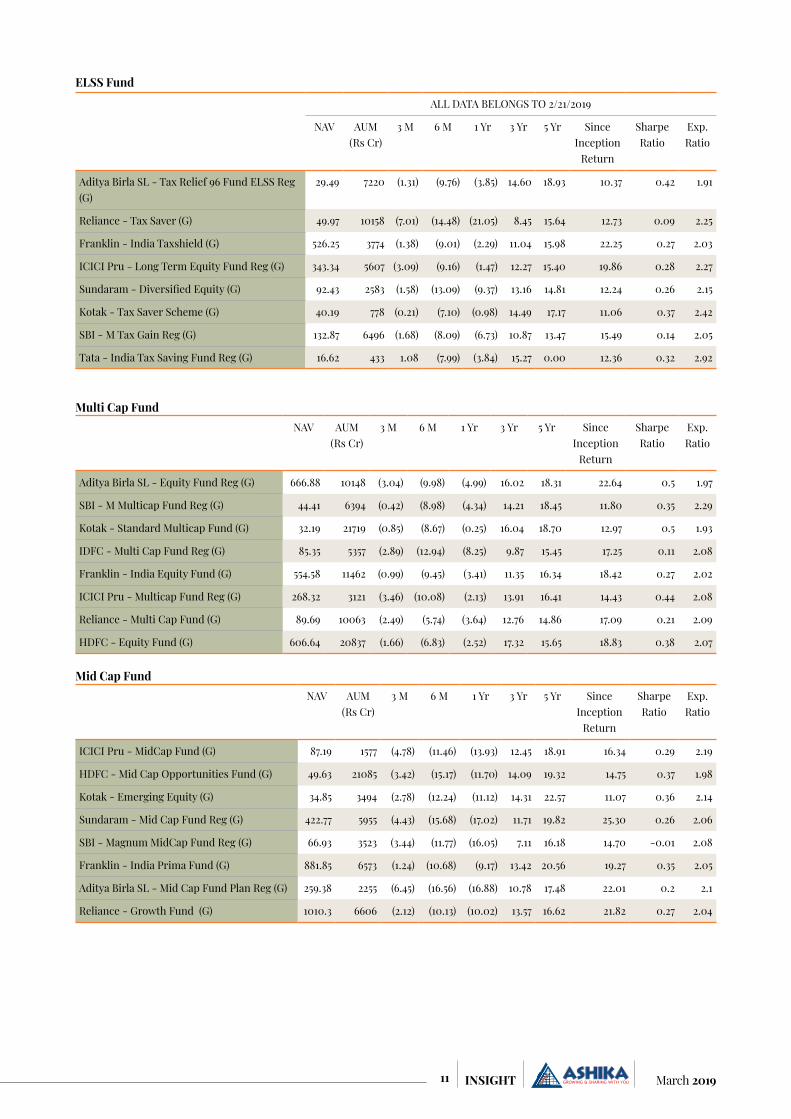
Aditya Birla SL - Equity Fund Reg (G) 666.88 10148 (3.04) (9.98) (4.99) 16.02 18.31 22.64 0.5 1.97
SBI - M Multicap Fund Reg (G) 44.41 6394 (0.42) (8.98) (4.34) 14.21 18.45 11.80 0.35 2.29
Kotak - Standard Multicap Fund (G) 32.19 21719 (0.85) (8.67) (0.25) 16.04 18.70 12.97 0.5 1.93
IDFC - Multi Cap Fund Reg (G) 85.35 5357 (2.89) (12.94) (8.25) 9.87 15.45 17.25 0.11 2.08
Franklin - India Equity Fund (G) 554.58 11462 (0.99) (9.45) (3.41) 11.35 16.34 18.42 0.27 2.02
ICICI Pru - Multicap Fund Reg (G) 268.32 3121 (3.46) (10.08) (2.13) 13.91 16.41 14.43 0.44 2.08
Reliance - Multi Cap Fund (G) 89.69 10063 (2.49) (5.74) (3.64) 12.76 14.86 17.09 0.21 2.09
HDFC - Equity Fund (G) 606.64 20837 (1.66) (6.83) (2.52) 17.32 15.65 18.83 0.38 2.07
Multi Cap Fund
NAV AUM (Rs Cr)
3 M 6 M 1 Yr 3 Yr 5 Yr Since Inception
Return
Sharpe Ratio
Exp. Ratio
ICICI Pru - MidCap Fund (G) 87.19 1577 (4.78) (11.46) (13.93) 12.45 18.91 16.34 0.29 2.19
HDFC - Mid Cap Opportunities Fund (G) 49.63 21085 (3.42) (15.17) (11.70) 14.09 19.32 14.75 0.37 1.98
Kotak - Emerging Equity (G) 34.85 3494 (2.78) (12.24) (11.12) 14.31 22.57 11.07 0.36 2.14
Sundaram - Mid Cap Fund Reg (G) 422.77 5955 (4.43) (15.68) (17.02) 11.71 19.82 25.30 0.26 2.06
SBI - Magnum MidCap Fund Reg (G) 66.93 3523 (3.44) (11.77) (16.05) 7.11 16.18 14.70 -0.01 2.08
Franklin - India Prima Fund (G) 881.85 6573 (1.24) (10.68) (9.17) 13.42 20.56 19.27 0.35 2.05
Aditya Birla SL - Mid Cap Fund Plan Reg (G) 259.38 2255 (6.45) (16.56) (16.88) 10.78 17.48 22.01 0.2 2.1
Reliance - Growth Fund (G) 1010.3 6606 (2.12) (10.13) (10.02) 13.57 16.62 21.82 0.27 2.04
Mid Cap Fund
ALL DATA BELONGS TO 2/21/2019
NAV AUM (Rs Cr)
3 M 6 M 1 Yr 3 Yr 5 Yr Since Inception
Return
Sharpe Ratio
Exp. Ratio
Aditya Birla SL - Tax Relief 96 Fund ELSS Reg (G)
29.49 7220 (1.31) (9.76) (3.85) 14.60 18.93 10.37 0.42 1.91
Reliance - Tax Saver (G) 49.97 10158 (7.01) (14.48) (21.05) 8.45 15.64 12.73 0.09 2.25
Franklin - India Taxshield (G) 526.25 3774 (1.38) (9.01) (2.29) 11.04 15.98 22.25 0.27 2.03
ICICI Pru - Long Term Equity Fund Reg (G) 343.34 5607 (3.09) (9.16) (1.47) 12.27 15.40 19.86 0.28 2.27
Sundaram - Diversified Equity (G) 92.43 2583 (1.58) (13.09) (9.37) 13.16 14.81 12.24 0.26 2.15
Kotak - Tax Saver Scheme (G) 40.19 778 (0.21) (7.10) (0.98) 14.49 17.17 11.06 0.37 2.42
SBI - M Tax Gain Reg (G) 132.87 6496 (1.68) (8.09) (6.73) 10.87 13.47 15.49 0.14 2.05
Tata - India Tax Saving Fund Reg (G) 16.62 433 1.08 (7.99) (3.84) 15.27 0.00 12.36 0.32 2.92
ELSS Fund
12March 2019 INSIGHT
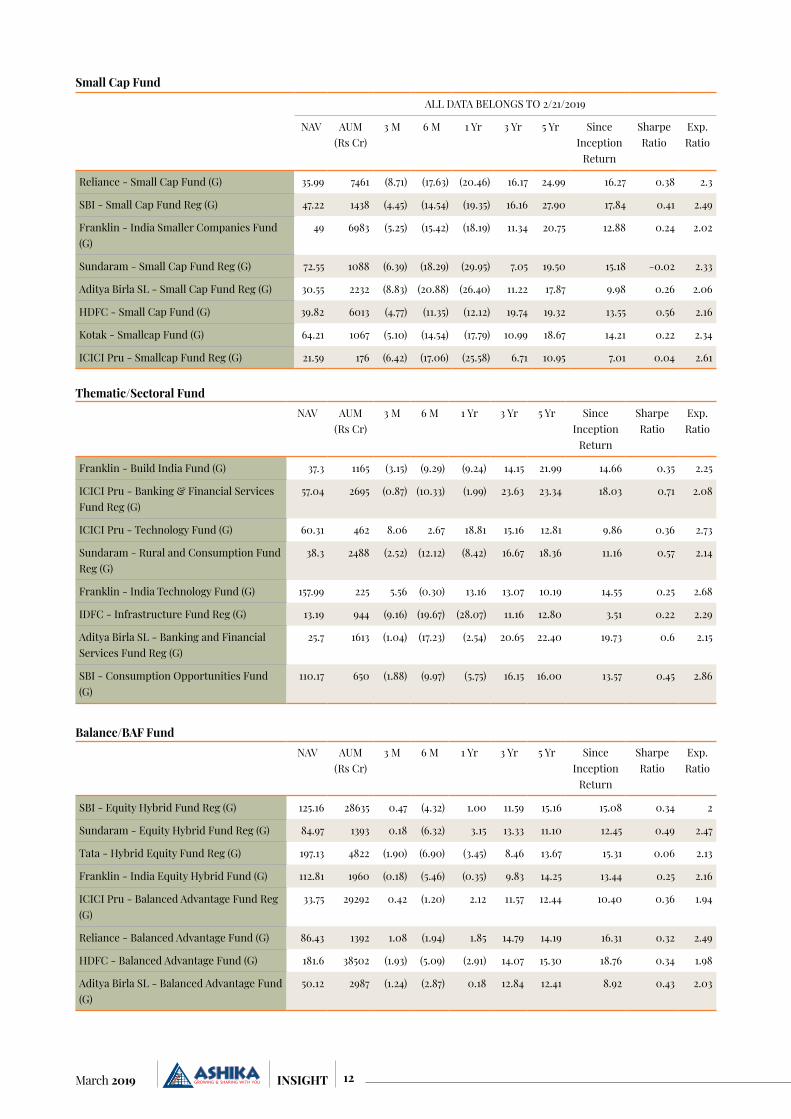
ALL DATA BELONGS TO 2/21/2019
NAV AUM (Rs Cr)
3 M 6 M 1 Yr 3 Yr 5 Yr Since Inception
Return
Sharpe Ratio
Exp. Ratio
Reliance - Small Cap Fund (G) 35.99 7461 (8.71) (17.63) (20.46) 16.17 24.99 16.27 0.38 2.3
SBI - Small Cap Fund Reg (G) 47.22 1438 (4.45) (14.54) (19.35) 16.16 27.90 17.84 0.41 2.49
Franklin - India Smaller Companies Fund (G)
49 6983 (5.25) (15.42) (18.19) 11.34 20.75 12.88 0.24 2.02
Sundaram - Small Cap Fund Reg (G) 72.55 1088 (6.39) (18.29) (29.95) 7.05 19.50 15.18 -0.02 2.33
Aditya Birla SL - Small Cap Fund Reg (G) 30.55 2232 (8.83) (20.88) (26.40) 11.22 17.87 9.98 0.26 2.06
HDFC - Small Cap Fund (G) 39.82 6013 (4.77) (11.35) (12.12) 19.74 19.32 13.55 0.56 2.16
Kotak - Smallcap Fund (G) 64.21 1067 (5.10) (14.54) (17.79) 10.99 18.67 14.21 0.22 2.34
ICICI Pru - Smallcap Fund Reg (G) 21.59 176 (6.42) (17.06) (25.58) 6.71 10.95 7.01 0.04 2.61
Small Cap Fund
NAV AUM (Rs Cr)
3 M 6 M 1 Yr 3 Yr 5 Yr Since Inception
Return
Sharpe Ratio
Exp. Ratio
Franklin - Build India Fund (G) 37.3 1165 (3.15) (9.29) (9.24) 14.15 21.99 14.66 0.35 2.25
ICICI Pru - Banking & Financial Services Fund Reg (G)
57.04 2695 (0.87) (10.33) (1.99) 23.63 23.34 18.03 0.71 2.08
ICICI Pru - Technology Fund (G) 60.31 462 8.06 2.67 18.81 15.16 12.81 9.86 0.36 2.73
Sundaram - Rural and Consumption Fund Reg (G)
38.3 2488 (2.52) (12.12) (8.42) 16.67 18.36 11.16 0.57 2.14
Franklin - India Technology Fund (G) 157.99 225 5.56 (0.30) 13.16 13.07 10.19 14.55 0.25 2.68
IDFC - Infrastructure Fund Reg (G) 13.19 944 (9.16) (19.67) (28.07) 11.16 12.80 3.51 0.22 2.29
Aditya Birla SL - Banking and Financial Services Fund Reg (G)
25.7 1613 (1.04) (17.23) (2.54) 20.65 22.40 19.73 0.6 2.15
SBI - Consumption Opportunities Fund (G)
110.17 650 (1.88) (9.97) (5.75) 16.15 16.00 13.57 0.45 2.86
Thematic/Sectoral Fund
NAV AUM (Rs Cr)
3 M 6 M 1 Yr 3 Yr 5 Yr Since Inception
Return
Sharpe Ratio
Exp. Ratio
SBI - Equity Hybrid Fund Reg (G) 125.16 28635 0.47 (4.32) 1.00 11.59 15.16 15.08 0.34 2
Sundaram - Equity Hybrid Fund Reg (G) 84.97 1393 0.18 (6.32) 3.15 13.33 11.10 12.45 0.49 2.47
Tata - Hybrid Equity Fund Reg (G) 197.13 4822 (1.90) (6.90) (3.45) 8.46 13.67 15.31 0.06 2.13
Franklin - India Equity Hybrid Fund (G) 112.81 1960 (0.18) (5.46) (0.35) 9.83 14.25 13.44 0.25 2.16
ICICI Pru - Balanced Advantage Fund Reg (G)
33.75 29292 0.42 (1.20) 2.12 11.57 12.44 10.40 0.36 1.94
Reliance - Balanced Advantage Fund (G) 86.43 1392 1.08 (1.94) 1.85 14.79 14.19 16.31 0.32 2.49
HDFC - Balanced Advantage Fund (G) 181.6 38502 (1.93) (5.09) (2.91) 14.07 15.30 18.76 0.34 1.98
Aditya Birla SL - Balanced Advantage Fund (G)
50.12 2987 (1.24) (2.87) 0.18 12.84 12.41 8.92 0.43 2.03
Balance/BAF Fund
13 March 2019INSIGHT
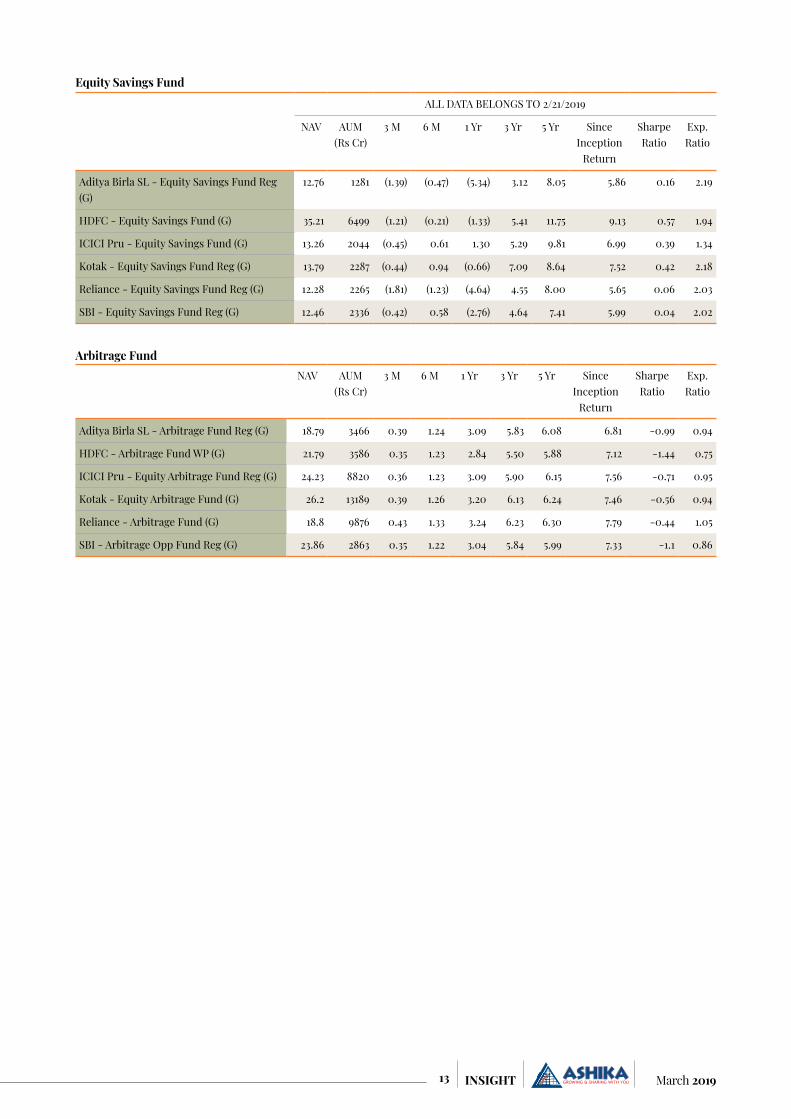
ALL DATA BELONGS TO 2/21/2019
NAV AUM (Rs Cr)
3 M 6 M 1 Yr 3 Yr 5 Yr Since Inception
Return
Sharpe Ratio
Exp. Ratio
Aditya Birla SL - Equity Savings Fund Reg (G)
12.76 1281 (1.39) (0.47) (5.34) 3.12 8.05 5.86 0.16 2.19
HDFC - Equity Savings Fund (G) 35.21 6499 (1.21) (0.21) (1.33) 5.41 11.75 9.13 0.57 1.94
ICICI Pru - Equity Savings Fund (G) 13.26 2044 (0.45) 0.61 1.30 5.29 9.81 6.99 0.39 1.34
Kotak - Equity Savings Fund Reg (G) 13.79 2287 (0.44) 0.94 (0.66) 7.09 8.64 7.52 0.42 2.18
Reliance - Equity Savings Fund Reg (G) 12.28 2265 (1.81) (1.23) (4.64) 4.55 8.00 5.65 0.06 2.03
SBI - Equity Savings Fund Reg (G) 12.46 2336 (0.42) 0.58 (2.76) 4.64 7.41 5.99 0.04 2.02
Equity Savings Fund
NAV AUM (Rs Cr)
3 M 6 M 1 Yr 3 Yr 5 Yr Since Inception
Return
Sharpe Ratio
Exp. Ratio
Aditya Birla SL - Arbitrage Fund Reg (G) 18.79 3466 0.39 1.24 3.09 5.83 6.08 6.81 -0.99 0.94
HDFC - Arbitrage Fund WP (G) 21.79 3586 0.35 1.23 2.84 5.50 5.88 7.12 -1.44 0.75
ICICI Pru - Equity Arbitrage Fund Reg (G) 24.23 8820 0.36 1.23 3.09 5.90 6.15 7.56 -0.71 0.95
Kotak - Equity Arbitrage Fund (G) 26.2 13189 0.39 1.26 3.20 6.13 6.24 7.46 -0.56 0.94
Reliance - Arbitrage Fund (G) 18.8 9876 0.43 1.33 3.24 6.23 6.30 7.79 -0.44 1.05
SBI - Arbitrage Opp Fund Reg (G) 23.86 2863 0.35 1.22 3.04 5.84 5.99 7.33 -1.1 0.86
Arbitrage Fund

14March 2019 INSIGHT
CMP: Rs 275 Rating: BUY Target: Rs 319
Investment RationaleCigarette Business, still the key revenue driverThe $11 billion cigarette market in India is dominated by 3 key players with ITC being the market leader and has been put under extremely stringent tobacco control regulations. Despite an extremely challenging
operating environment, the company consolidated its leadership position in the industry through innovative and varied consumer preferences. Some of the key recent initiatives include the launch of innovative variants viz., Classic’ Rich & Smooth (triple segment filter with superior filtration), Classic Verve low smell
(demi slim format), `Hollywood’ (triple segment filter) and `Flake’ Taste Pro (dual segment filter). The company’s cigarette segment witnessed volume growth of around 8% in Q3FY19 led by 64mm while the 69mm segment contributed 38-39% of cigarette sales volume and remaining ~20% was contributed by Long &
Company InformationBSE Code 500875NSE Code ITCBloomberg Code ITC INISIN INE154A01025Market Cap (Rs. Cr) 338,899.40Outstanding shares (Cr) 1,224.7052-wk Hi/Lo (Rs.) 322.7/251.3Avg. daily volume (1yr. on NSE) 11,244,750Face Value (Rs.) 1Book Value (Rs) 43.7
FII 17.1%
Others 44.9%
DII 38.1%
Shareholding pattern as of December 2018
STOCK PICKS
ITC Ltd.
15 March 2019INSIGHT
King size segments. Volume growth is back after stable pricing environment and recovered strongly from negative base (-5% in Q3FY18). Going ahead, stability in GST rates remains the key factor for sustenance of demand in the cigarette business. Cigarette EBIT margin in Q3FY19 was however impacted on account of higher cost of leaf tobacco crop and an increase in capsule cigarettes in the overall mix. Nevertheless, cigarette business remains as the highest contributor to revenues as well as operating profit (EBIT) with contribution of 42% and 84% respectively.
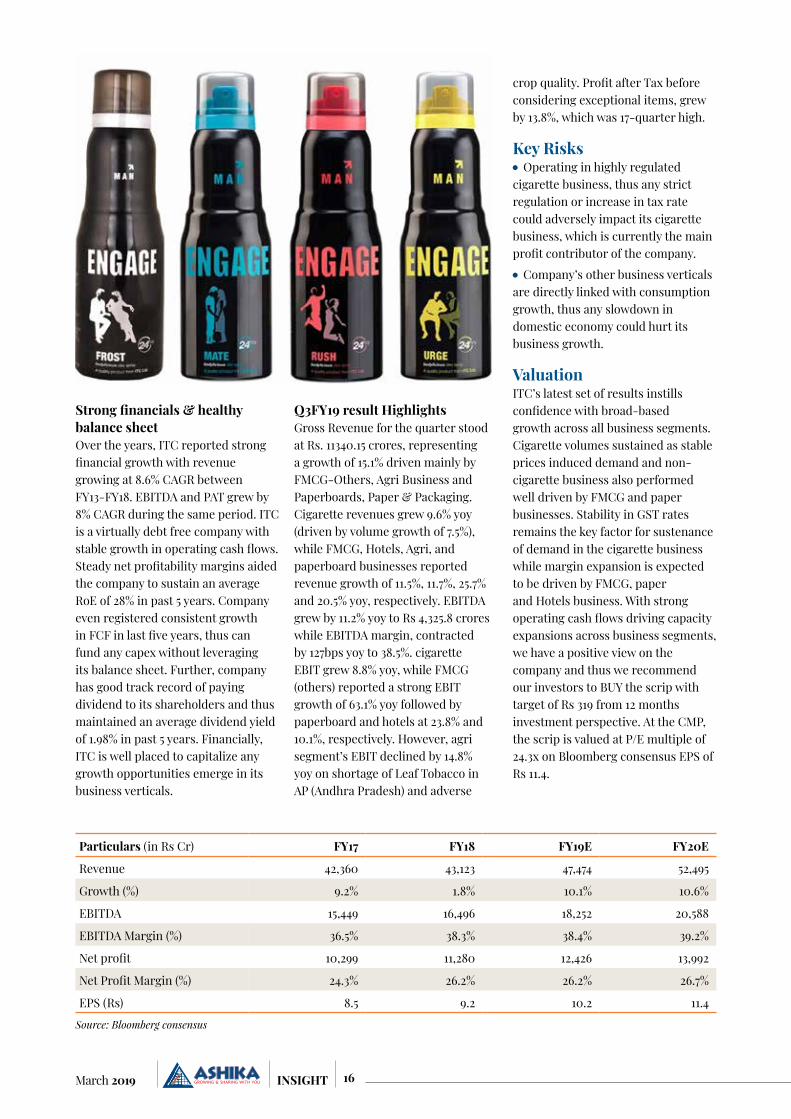
FMCG business-on strong growth trajectoryIn order to reduce its dependence on the highly taxed cigarette business and to diversify, it has steadily built a strong FMCG business franchisee which now contributes ~26% of revenues. The company expects that next leg of growth will come from this segment and has set an ambitious target to achieve Rs 1 lakh crore business in FMCG vertical by 2030. The FMCG business has been growing at a CAGR of 10% for the last five years. In a very short span of time ITC’s products have assumed market leadership – Aashirvaad is No. 1 in Branded Atta, Sunfeast is No. 1 in Premium Cream Biscuits, Bingo is No. 1 in the Bridges segment of Snack Foods. Other ITC brands are
also gaining significant consumer franchise. YiPPee being No. 2 in Noodles, Engage- No. 2 in Deodorants and Mangaldeep is No. 2 in Agarbattis and No. 1 in the Dhoop Segment. From being loss making at EBIT level as of FY13, FMCG business has slowly and gradually gained traction and presently contributes ~1.8% of consolidated EBIT. To make digital presence felt, ITC would start its own e-commerce operation for premium and niche products. The online store will complement its efforts to sell through online channel partners and marketplaces. ITC has also launched an e-store and an app for stationary products. The
company has continuously made investments in the FMCG business leveraging strong cashflows from cigarette business and intends to make fresh investment of Rs 1700 crore in West Bengal which would include a personal care products manufacturing line. The company will also expand its Dhulagarh facility and milk productivity improvement and procurement programme in the state. Hence with stabilizing trade channels and improving rural demand amid government effort to boost farm income, it can be expected that company’s non-cigarette business to deliver strong performance in coming years.
Other businesses to support margin expansionApart from cigarette and FMCG, the other significant mark for the company is in the Paperboards, Paper and Packaging and hotel businesses. In the paper business, ITC has emerged as a strong household name with ‘classmate’ brand (No. 1 in Notebooks) and packaging business is driven by FMCG, liquor and legal cigarette industry. In FY18, the business was hit due to GST implementation thus resulting in 2% decline in revenues, however it has turned around and posted growth of 9% in FY19 so far. It has a steady state contribution of ~6% to the consolidated EBIT and has continued this trend for last few years. Steady prices and benign input costs is expected to support margin expansion in paper & packaging business. Hotel business for ITC is a profitable one with revenue growth in the range of 5-6% annually for the last five years. Although, small, accounting for ~2-3% of consolidated revenue and EBIT contribution of ~1%, the hotel business is profitable with EBIT margins ~10% and has scope of expansion driven by improvement of around 4-5% in average room rate (ARR). Besides, higher occupancy levels (greater than 60%) will ensure steady run rate of revenues going ahead.
In order to reduce its dependence on the highly taxed cigarette business and to diversify, it has steadily built a strong FMCG business franchisee which now contributes ~26% of revenues.
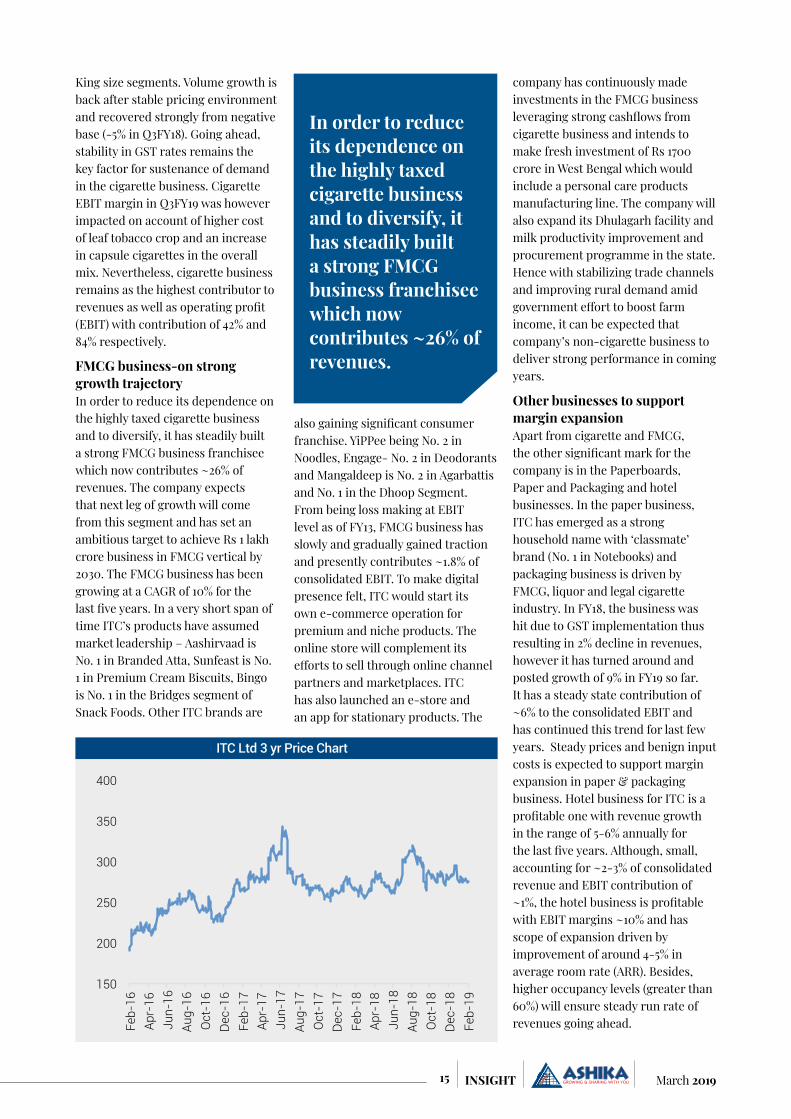
ITC Ltd 3 yr Price Chart
150
200
250
300
350
400
Feb-
16
Apr-
16
Jun-
16
Aug-
16
Oct
-16
Dec
-16
Feb-
17
Apr-
17
Jun-
17
Aug-
17
Oct
-17
Dec
-17
Feb-
18
Apr-
18
Jun-
18
Aug-
18
Oct
-18
Dec
-18
Feb-
19
16March 2019 INSIGHT
Strong financials & healthy balance sheetOver the years, ITC reported strong financial growth with revenue growing at 8.6% CAGR between FY13-FY18. EBITDA and PAT grew by 8% CAGR during the same period. ITC is a virtually debt free company with stable growth in operating cash flows. Steady net profitability margins aided the company to sustain an average RoE of 28% in past 5 years. Company even registered consistent growth in FCF in last five years, thus can fund any capex without leveraging its balance sheet. Further, company has good track record of paying dividend to its shareholders and thus maintained an average dividend yield of 1.98% in past 5 years. Financially, ITC is well placed to capitalize any growth opportunities emerge in its business verticals.
Q3FY19 result HighlightsGross Revenue for the quarter stood at Rs. 11340.15 crores, representing a growth of 15.1% driven mainly by FMCG-Others, Agri Business and Paperboards, Paper & Packaging. Cigarette revenues grew 9.6% yoy (driven by volume growth of 7.5%), while FMCG, Hotels, Agri, and paperboard businesses reported revenue growth of 11.5%, 11.7%, 25.7% and 20.5% yoy, respectively. EBITDA grew by 11.2% yoy to Rs 4,325.8 crores while EBITDA margin, contracted by 127bps yoy to 38.5%. cigarette EBIT grew 8.8% yoy, while FMCG (others) reported a strong EBIT growth of 63.1% yoy followed by paperboard and hotels at 23.8% and 10.1%, respectively. However, agri segment’s EBIT declined by 14.8% yoy on shortage of Leaf Tobacco in AP (Andhra Pradesh) and adverse
crop quality. Profit after Tax before considering exceptional items, grew by 13.8%, which was 17-quarter high.
Key Risks Operating in highly regulated
cigarette business, thus any strict regulation or increase in tax rate could adversely impact its cigarette business, which is currently the main profit contributor of the company.
Company’s other business verticals are directly linked with consumption growth, thus any slowdown in domestic economy could hurt its business growth.
ValuationITC’s latest set of results instills confidence with broad-based growth across all business segments. Cigarette volumes sustained as stable prices induced demand and non-cigarette business also performed well driven by FMCG and paper businesses. Stability in GST rates remains the key factor for sustenance of demand in the cigarette business while margin expansion is expected to be driven by FMCG, paper and Hotels business. With strong operating cash flows driving capacity expansions across business segments, we have a positive view on the company and thus we recommend our investors to BUY the scrip with target of Rs 319 from 12 months investment perspective. At the CMP, the scrip is valued at P/E multiple of 24.3x on Bloomberg consensus EPS of Rs 11.4.
Particulars (in Rs Cr) FY17 FY18 FY19E FY20E
Revenue 42,360 43,123 47,474 52,495
Growth (%) 9.2% 1.8% 10.1% 10.6%
EBITDA 15,449 16,496 18,252 20,588
EBITDA Margin (%) 36.5% 38.3% 38.4% 39.2%
Net profit 10,299 11,280 12,426 13,992
Net Profit Margin (%) 24.3% 26.2% 26.2% 26.7%
EPS (Rs) 8.5 9.2 10.2 11.4
Source: Bloomberg consensus

17 March 2019INSIGHT
STOCK PICKS
Tech Mahindra Ltd.CMP: Rs 825 Rating: BUY Target: Rs 960
Company InformationBSE Code 532755NSE Code TECHMBloomberg Code TECHM INISIN INE669C01036Market Cap (Rs. Cr) 81683Outstanding shares(Cr) 98.152-wk Hi/Lo (Rs.) 840.0 / 602.4Avg. daily volume (1yr. on NSE) 3,287,472Face Value(Rs.) 5.0Book Value 209.1
Investment RationaleTurnaround in Telecom verticalTelecom vertical which has been declining/flat for several quarters came back strong in last two quarters. Telecom which contributes 41% of revenue, grew 2.5% QoQ in USD in Q3FY19. Tech M’s Telecom vertical
has shown three consecutive years of tepid performance over FY15-FY18 led by ramp down in LCC (Acquired entity), Pricing pressure in Top client (AT&T), softness in Comviva and client specific weakness (KPN deal ramp down). Communication vertical organic USD revenues (ex-LCC) remained tepid for three consecutive
years (up 0.5% CAGR over FY15-FY18). It is expected that worst is behind for Communication vertical and recent large deal wins in 1HFY19 should render stability for this vertical performance. While Telecom pickup has already been visible in Q2FY19, it is expected that communication vertical will have a turnaround
Promoters 35.9%
DII 13.0%
FII 38.5%Others 12.6%
Share holding pattern as on December 2018

18March 2019 INSIGHT
performance going forward on the back of strong deal momentum, absence of revenue pruning at LCC and huge spends related to 5G roll out. The management highlighted that the telecom vertical would continue to grow in Q4FY19E, led by recent deal wins.
Better placed to capitalize on 5G opportunity5G is a large opportunity for which the company is well-positioned due to investments in network capability through LCC, investments in platforms and IP and investments in partnerships to develop an eco-system play, viz. Intel, Rakuten, stake in Altio Star, among others. This positions it well to capitalise on the 5G opportunity across networks and IT services. Deal wins were healthy with total consideration value (TCV) of $440 million includes US$240mn in the communications vertical and rest in the Enterprise segment. Taking into consideration strong deal wins in 9MFY19 (~US$1.2bn) accompanied by continued momentum in communication. Given its early investments, the communication deals have been spread across digital, network, software transformation and spending relating to the preparation for upcoming 5G transformation. Further, investment relating to 5G is expected to pick-up pace during H2FY20E on account of new capex
for strengthening of infrastructure and network, laying out of digital platform for customer management/ devices and automation to control the operating expenses. Going ahead, it is expected that 5G investments and modernization of existing systems by telecom operators, including pre-5G network transformation initiatives will be the key growth drivers in the Telecom Vertical.
Operating performance on an uptick TechM continues to deliver better operating margin performance for the last seven consecutive quarters, with an improvement of 650 bps in EBIT margins as compared to Q1FY18. Operating margins came in at a multi-quarter high at 19.3% (post 20.2% in Q3FY15) on the back of opti-misation of SG&A expenses (13.8% as % of revenue in Q3FY19) and benefit of increase in utilisation (rose 100 bps to 82%). The management said it would be comfortable in keeping SG&A as proportion of revenues in range of 14-14.5% though it may see quarterly volatility. The management also believes that there is scope for further improvement in margins, led by improvement business mix, increase in offshore revenue mix and improvement in profitability of portfolio companies to nearly dou-ble-digit levels. Further, incremental contribution from high margin digital segment (now 33% of revenues) and
healthy growth in the same (10% QoQ) along with healthy profitability in business process services would bode well for margins going ahead. Cost rationalisation in acquired companies could also give further boost to mar-gins. The management is confident of the improvement in EBIT margin to sustain, driven by operational efficiencies and improvement in profitability of acquired companies.
Strong client addition to sustain growthTech Mahindra’s strong clients addition across segments reduces dependency over particular clients and makes business structure more robust. This also helps maintain steady operating margins over longer period of time. Client addition during the recent quarters remained high which denotes rising demand for automation among different verticals. During Q3FY19 Tech Mahindra added 5 new clients taking total active clients counts to 935. During Q3FY19, Tech Mahindra have 416 clients in $1mn+bucket, 157 clients in $5mn+, 88 clients in $10mn+ and 20 clients in $20mn+ bucket. Total clients in the $50 mn+ clients bracket is 18.
First-ever share buybackTech Mahindra has approved its first-ever buy-back proposal worth Rs. 19.56 bn at a price of Rs. 950/share which is 9.2% of TechM’s net worth and ~29% of cash and investments as of Q3FY19-end. This makes TechM the last of the Top-5 IT majors to announce a buy-back and all having done so on more than one occasion. Importantly, this signals a shift in capital allocation policy, and such buy-backs could become a more regular feature for the company, going forward, as has been the case with each of the other four top-tier IT firms. At Rs. 950, TechM will buy back 20.585mn equity shares, which implies 2.1% of total shares outstand-ing. The company has fixed March 6, 2019 as the record date for the purpose of ascertaining shareholder eligibility to participate in the buy-back. Assuming buyback is successful and the entire Rs. 19.56 bn is utilised for the buy-back, after adjusting for lower other income, there will be a ~0.5% improvement in EPS. On the
Tech Mahindra Ltd. Price Chart
0 2,000 4,000 6,000 8,000 10,000 12,000 14,000 16,000 18,000
350 400 450 500 550 600 650 700 750 800 850
Feb-
16
May
-16
Aug-
16
Nov
-16
Feb-
17
May
-17
Aug-
17
Nov
-17
Feb-
18
May
-18
Aug-
18
Nov
-18
Feb-
19
Volume (000's) (RHS) TechM

19 March 2019INSIGHT
other hand, RoE should see improve-ment of >50 bps. It is believed that the buy-back will provides confidence on management’s view of underlying business strength, and will boost sentiment.
Steady quarterly performanceTech Mahindra reported Q3FY19 numbers above consensus estimates on all fronts. Rupee revenue came at Rs 8,944 crore, up by 3.6% QoQ. Dollar revenue came at USD 1,261 million, up by 3.5% QoQ while in Constant Currency terms revenue growth was up 4.3% QoQ. Revenue growth was led by BPO services with revenue growth of 13% QoQ at Rs 754.2 crore, while IT segment growth during the quarter was 3% QoQ at Rs 8,189.5 crore. Dig-ital revenues were up 10% QoQ and accounted to 33% of total revenues and remains the key growth driver. EBIT came at Rs 1,439 crore, up by 8.7% QoQ with EBIT margin at 16.10%, marginally improved by 76 bps QoQ. On EBIT front, IT services recorded a growth of 7% QoQ at Rs 1580 core, while BPO segment witnessed a de-growth of 2% QoQ at Rs 142.6 crore. Management cited that there was tax reversal benefit of 7.5% during the quarter. Net profitability came at Rs 1,203 crore, up by 13.0% QoQ led by better performance at operating level and lower tax rate. Total headcount at 121,842; up 3,451 QoQ. The Active Client count stood at 935 in Q3, up by 5 QoQ. Free cash flow of USD 160.3 million; cash conversion to PAT at 94%. Cash and Cash equivalent of USD 1,251.8 million as of Dec 31,2018.
Key Risk Delay in telecom spend can impact
company’s performance High exposure to Europe may
impact growth Adverse cross-currency
movements.
ValuationTech Mahindra has posted strong numbers in last few quarters with both revenue growth and margin expansion led by healthy deal wins. Going ahead it is expected that the company will post better perfor-mance in FY20 led by strong revival in
communication, continued deal wins and improvement in enterprise seg-ment. The communication segment (~41% of revenue) which was facing challenges for the past two years due to slow growth in LCC acquisition, tepid performance of Comviva and price cuts in its large account (AT&T), however with deal wins in last 2 quarters especially in area like Telco, OTT and media players will result in strong growth ahead. Further, given its diversified offerings in the telecom space, it is expected that TechM is well placed to capitalise the 5G opportunity across networks and IT services. Company has guided for healthy growth in telecom going ahead, aided by strong deal wins, healthy deal pipeline and 5G related opportunity. Moreover, the Company has consistently improved its margins since the last seven quarters led by multiple levers and aims for further margin expansion going forward led by changing business mix, increas-ing adoption of automation and improvement in portfolio companies’ margins. Going ahead, rising demand across geographies and across dif-ferent verticals helps Tech Mahindra to attain higher growth momentum. Along with robust business structure, healthy deal pipeline and revitaliza-tion of key business segment make Tech Mahindra a safer bet to invest in. Also, recent buyback announce-ments augur well for return ratios of the company. Thus, we recommend our investors to BUY the scrip with target of Rs. 960 from 12-18 months investment perspective. At the CMP, the scrip is valued at P/E multiple of 15.1x on Bloomberg consensus EPS of Rs. 55.
Particulars (in Rs Cr) FY18 FY19E FY20E FY21E
Net Sales 30772.9 34988.8 38627.6 42181.4
Growth (%) 5.6 13.7 10.4 9.2
EBITDA 4682.5 6437.9 7146.1 7803.6
EBITDA Margin (%) 15.2 18.4 18.5 18.5
Net profit 3786.1 4338.6 4867.1 5399.2
Net Profit Margin (%) 12.3 12.4 12.6 12.8
EPS (Rs) 43.0 44.2 49.6 55.0
Consensus Estimate: Bloomberg, Ashika Research
Tech Mahindra has posted strong numbers in last few quarters with both revenue growth and margin expansion led by healthy deal wins. Going ahead it is expected that the company will post better performance in FY20 led by strong revival in communication, continued deal wins and improvement in enterprise segment.

20March 2019 INSIGHT
Monthly Insight Recommendation Performance Sheet
21 March 2019INSIGHT
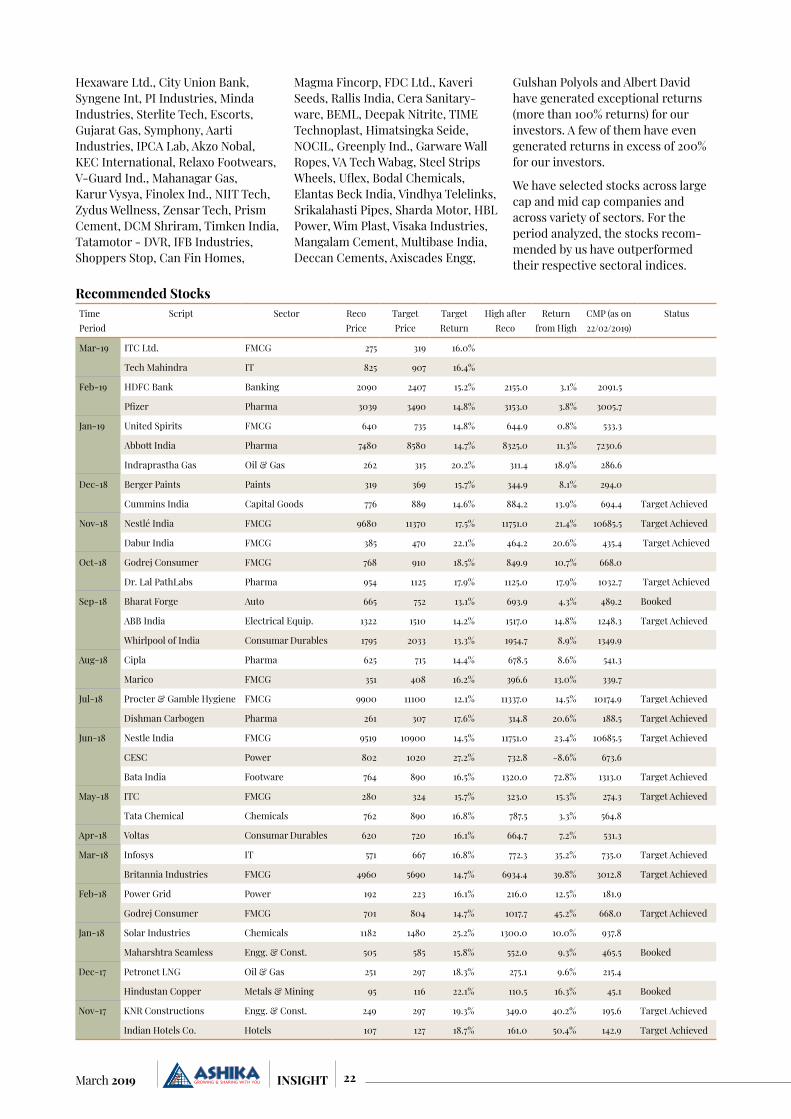
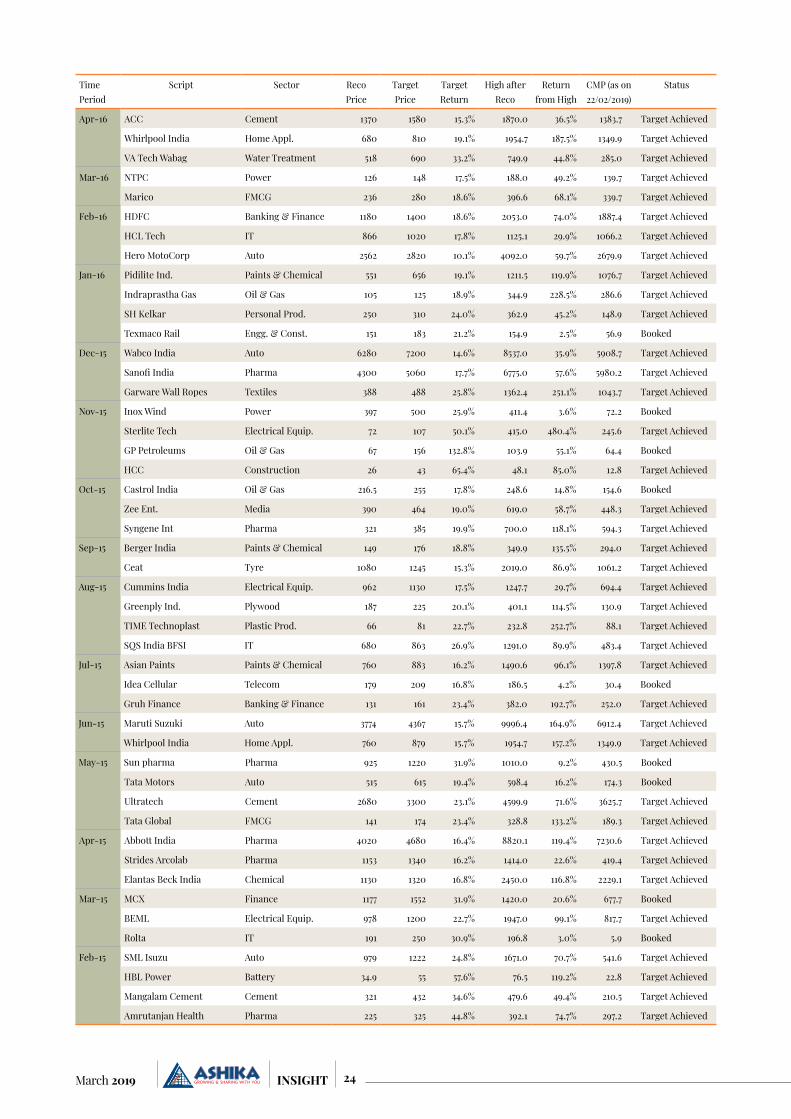
Our recommendation includes stocks across the sectors that are generating alpha return for our investors. For the last 10 years we have been consistent in generating superior return for our clients through our prestigious monthly insight recommendations. Since January 2012 we have recom-mended 271 stocks out of which 226 has achieved target. Success ratio stands at 84%. Out of these 135 stocks have given a return of more than 100%. During this period the Nifty has given a return of 127% from current
price and a return of 147% from its all time high.
Few of the stocks recommended by us have given stellar returns which are TCS Ltd, Maruti Suzuki, Kotak Mahindra Bank, L&T, Axis Bank, Indusind Bank, M & M, Ultratech Cement, Bajaj Finserv, Godrej Con-sumer, Godrej Consumer Prod, BPCL, Britannia, Britannia Industries, Tata Motors, Adani Ports, Hero MotoCorp, Dabur India, Tech M, Motherson Sumi, Shree Cement, Bharti InfraTel, Pidilite Ind., Zee Entertainment,
Lupin, Cadila Helthcare, HPCL, Dr. Reddy Lab, Ashok Leyland, Aurobindo Pharma, Havels India, Petronet LNG, MRF, UPL, Sun TV, L&T Finance, Divis Lab, Berger Paints, Berger India, Gruh Finance, Torrent Pharma, LIC Housing Fin, Emami, Exide Inds, Dewan Housing, Whirlpool India, Graphite India, Cummins India, Indraprastha Gas, Tata Global, SKS Microfinance, Glenmark Pharma, Indian Bank, Godrej Properties, Castrol India, Abbott India, Info Edge (India), AIA Engineering, MRPL,
Target Achieved 84%
Calls Open 6%
Exit / Booked 10%
Total Call: 271
Success Rate
Return Classification
More than 100% Return 50% - 135 stocks
50-25% Return 13% - 34 stocks
Less than 25% Return 20% - 55 stocks
100-50% Return 17% - 47 stocks
22March 2019 INSIGHT
TimePeriod
Script Sector RecoPrice
TargetPrice
TargetReturn
High afterReco
Returnfrom High
CMP (as on 22/02/2019)
Status
Mar-19 ITC Ltd. FMCG 275 319 16.0%
Tech Mahindra IT 825 907 16.4%
Feb-19 HDFC Bank Banking 2090 2407 15.2% 2155.0 3.1% 2091.5
Pfizer Pharma 3039 3490 14.8% 3153.0 3.8% 3005.7
Jan-19 United Spirits FMCG 640 735 14.8% 644.9 0.8% 533.3
Abbott India Pharma 7480 8580 14.7% 8325.0 11.3% 7230.6
Indraprastha Gas Oil & Gas 262 315 20.2% 311.4 18.9% 286.6
Dec-18 Berger Paints Paints 319 369 15.7% 344.9 8.1% 294.0
Cummins India Capital Goods 776 889 14.6% 884.2 13.9% 694.4 Target Achieved
Nov-18 Nestlé India FMCG 9680 11370 17.5% 11751.0 21.4% 10685.5 Target Achieved
Dabur India FMCG 385 470 22.1% 464.2 20.6% 435.4 Target Achieved
Oct-18 Godrej Consumer FMCG 768 910 18.5% 849.9 10.7% 668.0
Dr. Lal PathLabs Pharma 954 1125 17.9% 1125.0 17.9% 1032.7 Target Achieved
Sep-18 Bharat Forge Auto 665 752 13.1% 693.9 4.3% 489.2 Booked
ABB India Electrical Equip. 1322 1510 14.2% 1517.0 14.8% 1248.3 Target Achieved
Whirlpool of India Consumar Durables 1795 2033 13.3% 1954.7 8.9% 1349.9
Aug-18 Cipla Pharma 625 715 14.4% 678.5 8.6% 541.3
Marico FMCG 351 408 16.2% 396.6 13.0% 339.7
Jul-18 Procter & Gamble Hygiene FMCG 9900 11100 12.1% 11337.0 14.5% 10174.9 Target Achieved
Dishman Carbogen Pharma 261 307 17.6% 314.8 20.6% 188.5 Target Achieved
Jun-18 Nestle India FMCG 9519 10900 14.5% 11751.0 23.4% 10685.5 Target Achieved
CESC Power 802 1020 27.2% 732.8 -8.6% 673.6
Bata India Footware 764 890 16.5% 1320.0 72.8% 1313.0 Target Achieved
May-18 ITC FMCG 280 324 15.7% 323.0 15.3% 274.3 Target Achieved
Tata Chemical Chemicals 762 890 16.8% 787.5 3.3% 564.8
Apr-18 Voltas Consumar Durables 620 720 16.1% 664.7 7.2% 531.3
Mar-18 Infosys IT 571 667 16.8% 772.3 35.2% 735.0 Target Achieved
Britannia Industries FMCG 4960 5690 14.7% 6934.4 39.8% 3012.8 Target Achieved
Feb-18 Power Grid Power 192 223 16.1% 216.0 12.5% 181.9
Godrej Consumer FMCG 701 804 14.7% 1017.7 45.2% 668.0 Target Achieved
Jan-18 Solar Industries Chemicals 1182 1480 25.2% 1300.0 10.0% 937.8
Maharshtra Seamless Engg. & Const. 505 585 15.8% 552.0 9.3% 465.5 Booked
Dec-17 Petronet LNG Oil & Gas 251 297 18.3% 275.1 9.6% 215.4
Hindustan Copper Metals & Mining 95 116 22.1% 110.5 16.3% 45.1 Booked
Nov-17 KNR Constructions Engg. & Const. 249 297 19.3% 349.0 40.2% 195.6 Target Achieved
Indian Hotels Co. Hotels 107 127 18.7% 161.0 50.4% 142.9 Target Achieved
Recommended Stocks
Hexaware Ltd., City Union Bank, Syngene Int, PI Industries, Minda Industries, Sterlite Tech, Escorts, Gujarat Gas, Symphony, Aarti Industries, IPCA Lab, Akzo Nobal, KEC International, Relaxo Footwears, V-Guard Ind., Mahanagar Gas, Karur Vysya, Finolex Ind., NIIT Tech, Zydus Wellness, Zensar Tech, Prism Cement, DCM Shriram, Timken India, Tatamotor - DVR, IFB Industries, Shoppers Stop, Can Fin Homes,
Magma Fincorp, FDC Ltd., Kaveri Seeds, Rallis India, Cera Sanitary-ware, BEML, Deepak Nitrite, TIME Technoplast, Himatsingka Seide, NOCIL, Greenply Ind., Garware Wall Ropes, VA Tech Wabag, Steel Strips Wheels, Uflex, Bodal Chemicals, Elantas Beck India, Vindhya Telelinks, Srikalahasti Pipes, Sharda Motor, HBL Power, Wim Plast, Visaka Industries, Mangalam Cement, Multibase India, Deccan Cements, Axiscades Engg,
Gulshan Polyols and Albert David have generated exceptional returns (more than 100% returns) for our investors. A few of them have even generated returns in excess of 200% for our investors.
We have selected stocks across large cap and mid cap companies and across variety of sectors. For the period analyzed, the stocks recom-mended by us have outperformed their respective sectoral indices.

23 March 2019INSIGHT
TimePeriod
Script Sector RecoPrice
TargetPrice
TargetReturn
High afterReco
Returnfrom High
CMP (as on 22/02/2019)
Status
Oct-17 CDSL Banking & Finance 340 424 24.7% 396.9 16.7% 210.1 Booked
Karur Vysya Banking & Finance 125 145 15.8% 150.4 20.5% 67.1 Booked
Sep-17 Hindustan Unilever FMCG 1217 1379 13.3% 1869.5 53.6% 1768.6 Target Achieved
NMDC Metals & Mining 126 142 12.7% 162.7 29.1% 96.8 Target Achieved
Aug-17 Kaveri Seed Agricultural Prod. 683 790 15.7% 708.0 3.7% 402.9 Booked
Indraprastha Gas Oil & Gas 234 280 19.7% 344.9 47.4% 286.6 Target Achieved
Jul-17 Greaves Cotton Auto 159 193 21.4% 170.8 7.4% 119.0 Booked
Apollo Tyres Tyre 240 278 15.8% 307.3 28.0% 210.2 Target Achieved
Jun-17 Bosch Auto 23325 27442 17.7% 25240.0 8.2% 18120.8 Booked
Relaxo Footwears Footwear 458 571 24.7% 873.6 90.7% 731.3 Target Achieved
May-17 PNC Infratech Engg. & Const. 155 200 29.0% 228.3 47.3% 131.0 Target Achieved
PI Industries Chemical 866 1028 18.7% 1034.0 19.4% 905.2 Target Achieved
Apr-17 Akzo Nobel Paints & Chemical 1862 2135 14.7% 2089.0 12.2% 1727.9 Booked
Crompton Greaves Household Appl. 211 244 15.6% 295.0 39.8% 209.5 Target Achieved
Mar-17 Manappuram Finance Banking & Finance 95 120 26.3% 130.5 37.3% 112.9 Target Achieved
Deepak Nitrite Chemical 107 124 15.9% 305.0 185.0% 216.9 Target Achieved
Feb-17 Dewan Housing Banking & Finance 290 341 17.6% 691.5 138.4% 139.2 Target Achieved
CESC Power 750 860 14.7% 825.6 10.1% 673.6 Target Achieved
Jan-17 Persistent Systems IT 616 741 20.3% 915.0 48.5% 601.6 Target Achieved
Dec-16 Britannia Industries FMCG 3010 3522 17.0% 6934.4 130.4% 3012.8 Target Achieved
Berger Paints Paints & Chemical 240 280 16.7% 349.9 45.8% 294.0 Target Achieved
Dishman Pharma Pharma 243 300 23.5% 396.4 63.1% 188.5 Target Achieved
Nov-16 Max Financial Services Banking & Finance 550 650 18.2% 684.0 24.4% 404.5 Target Achieved
Natco Pharma Pharma 575 737 28.2% 1090.0 89.6% 587.2 Target Achieved
Minda Industries Auto 117 151 29.1% 459.0 292.3% 316.0 Target Achieved
Vindhya Telelinks Engg. & Const. 722 900 24.7% 2030.0 181.2% 1396.8 Target Achieved
Oct-16 Credit Analysis Banking & Finance 1314 1543 17.4% 1725.0 31.3% 959.0 Target Achieved
Nilkamal Plastic Prod. 1336 1700 27.2% 2275.0 70.3% 1247.5 Target Achieved
Sep-16 IDFC Bank Banking & Finance 55.4 70 26.4% 83.4 50.5% 45.6 Target Achieved
Mahanagar Gas Oil & Gas 641 748 16.7% 1377.5 114.9% 868.5 Target Achieved
Mercator Diversified 52 71 36.5% 55.3 6.3% 7.0 Booked
Kirloskar Ferrous Iron & Steel Prod. 86 113 31.4% 121.9 41.7% 89.9 Target Achieved
Aug-16 Indian Oil Corp. Oil & Gas 136 155 14.2% 231.5 70.5% 137.2 Target Achieved
LIC Housing Finance Banking & Finance 519 608 17.1% 794.0 53.0% 469.9 Target Achieved
Federal Bank Banking & Finance 65 78 20.0% 127.7 96.4% 79.5 Target Achieved
Unichem Lab Pharma 285 360 26.3% 382.0 34.0% 190.5 Target Achieved
Jul-16 Godrej Properties Construction 365 415 13.7% 920.0 152.1% 724.9 Target Achieved
Capital First Banking & Finance 40 47 16.7% 64.9 62.0% 45.6 Target Achieved
Aarti Industries Chemical 520 620 19.2% 1807.9 247.7% 1409.8 Target Achieved
Steel Strips Wheels Auto 456 578 26.8% 1473.8 223.2% 861.8 Target Achieved
Jun-16 Dabur India FMCG 290 335 15.5% 490.7 69.2% 435.4 Target Achieved
Godrej Consumer Prod FMCG 494 583 18.2% 1017.7 106.1% 668.0 Target Achieved
Glenmark Pharma Pharma 851 985 15.7% 994.0 16.8% 593.0 Target Achieved
Tata Power Co Power 73 85 16.4% 101.8 39.5% 67.1 Target Achieved
May-16 Mahindra & Mahindra Auto 665 775 16.5% 993.0 49.3% 646.6 Target Achieved
PI Industries Paints & Chemical 635 760 19.7% 1034.0 62.8% 905.2 Target Achieved
DCM Shriram Paints & Chemical 157 195 24.2% 628.0 300.0% 365.6 Target Achieved
24March 2019 INSIGHT
TimePeriod
Script Sector RecoPrice
TargetPrice
TargetReturn
High afterReco
Returnfrom High
CMP (as on 22/02/2019)
Status
Apr-16 ACC Cement 1370 1580 15.3% 1870.0 36.5% 1383.7 Target Achieved
Whirlpool India Home Appl. 680 810 19.1% 1954.7 187.5% 1349.9 Target Achieved
VA Tech Wabag Water Treatment 518 690 33.2% 749.9 44.8% 285.0 Target Achieved
Mar-16 NTPC Power 126 148 17.5% 188.0 49.2% 139.7 Target Achieved
Marico FMCG 236 280 18.6% 396.6 68.1% 339.7 Target Achieved
Feb-16 HDFC Banking & Finance 1180 1400 18.6% 2053.0 74.0% 1887.4 Target Achieved
HCL Tech IT 866 1020 17.8% 1125.1 29.9% 1066.2 Target Achieved
Hero MotoCorp Auto 2562 2820 10.1% 4092.0 59.7% 2679.9 Target Achieved
Jan-16 Pidilite Ind. Paints & Chemical 551 656 19.1% 1211.5 119.9% 1076.7 Target Achieved
Indraprastha Gas Oil & Gas 105 125 18.9% 344.9 228.5% 286.6 Target Achieved
SH Kelkar Personal Prod. 250 310 24.0% 362.9 45.2% 148.9 Target Achieved
Texmaco Rail Engg. & Const. 151 183 21.2% 154.9 2.5% 56.9 Booked
Dec-15 Wabco India Auto 6280 7200 14.6% 8537.0 35.9% 5908.7 Target Achieved
Sanofi India Pharma 4300 5060 17.7% 6775.0 57.6% 5980.2 Target Achieved
Garware Wall Ropes Textiles 388 488 25.8% 1362.4 251.1% 1043.7 Target Achieved
Nov-15 Inox Wind Power 397 500 25.9% 411.4 3.6% 72.2 Booked
Sterlite Tech Electrical Equip. 72 107 50.1% 415.0 480.4% 245.6 Target Achieved
GP Petroleums Oil & Gas 67 156 132.8% 103.9 55.1% 64.4 Booked
HCC Construction 26 43 65.4% 48.1 85.0% 12.8 Target Achieved
Oct-15 Castrol India Oil & Gas 216.5 255 17.8% 248.6 14.8% 154.6 Booked
Zee Ent. Media 390 464 19.0% 619.0 58.7% 448.3 Target Achieved
Syngene Int Pharma 321 385 19.9% 700.0 118.1% 594.3 Target Achieved
Sep-15 Berger India Paints & Chemical 149 176 18.8% 349.9 135.5% 294.0 Target Achieved
Ceat Tyre 1080 1245 15.3% 2019.0 86.9% 1061.2 Target Achieved
Aug-15 Cummins India Electrical Equip. 962 1130 17.5% 1247.7 29.7% 694.4 Target Achieved
Greenply Ind. Plywood 187 225 20.1% 401.1 114.5% 130.9 Target Achieved
TIME Technoplast Plastic Prod. 66 81 22.7% 232.8 252.7% 88.1 Target Achieved
SQS India BFSI IT 680 863 26.9% 1291.0 89.9% 483.4 Target Achieved
Jul-15 Asian Paints Paints & Chemical 760 883 16.2% 1490.6 96.1% 1397.8 Target Achieved
Idea Cellular Telecom 179 209 16.8% 186.5 4.2% 30.4 Booked
Gruh Finance Banking & Finance 131 161 23.4% 382.0 192.7% 252.0 Target Achieved
Jun-15 Maruti Suzuki Auto 3774 4367 15.7% 9996.4 164.9% 6912.4 Target Achieved
Whirlpool India Home Appl. 760 879 15.7% 1954.7 157.2% 1349.9 Target Achieved
May-15 Sun pharma Pharma 925 1220 31.9% 1010.0 9.2% 430.5 Booked
Tata Motors Auto 515 615 19.4% 598.4 16.2% 174.3 Booked
Ultratech Cement 2680 3300 23.1% 4599.9 71.6% 3625.7 Target Achieved
Tata Global FMCG 141 174 23.4% 328.8 133.2% 189.3 Target Achieved
Apr-15 Abbott India Pharma 4020 4680 16.4% 8820.1 119.4% 7230.6 Target Achieved
Strides Arcolab Pharma 1153 1340 16.2% 1414.0 22.6% 419.4 Target Achieved
Elantas Beck India Chemical 1130 1320 16.8% 2450.0 116.8% 2229.1 Target Achieved
Mar-15 MCX Finance 1177 1552 31.9% 1420.0 20.6% 677.7 Booked
BEML Electrical Equip. 978 1200 22.7% 1947.0 99.1% 817.7 Target Achieved
Rolta IT 191 250 30.9% 196.8 3.0% 5.9 Booked
Feb-15 SML Isuzu Auto 979 1222 24.8% 1671.0 70.7% 541.6 Target Achieved
HBL Power Battery 34.9 55 57.6% 76.5 119.2% 22.8 Target Achieved
Mangalam Cement Cement 321 432 34.6% 479.6 49.4% 210.5 Target Achieved
Amrutanjan Health Pharma 225 325 44.8% 392.1 74.7% 297.2 Target Achieved
25 March 2019INSIGHT
TimePeriod
Script Sector RecoPrice
TargetPrice
TargetReturn
High afterReco
Returnfrom High
CMP (as on 22/02/2019)
Status
Jan-15 Torrent Pharm Pharma 1096 1338 22.1% 1962.0 79.0% 1765.5 Target Achieved
Emami FMCG 392 462 18.0% 682.5 74.3% 399.7 Target Achieved
Dewan Housing Finance 199 240 20.9% 691.5 248.4% 139.2 Target Achieved
KPIT Tech IT 200 263 31.5% 314.5 57.3% 107.8 Booked
Dec-14 Bajaj Corp Personal Prod. 327 385 17.7% 525.0 60.6% 353.8 Target Achieved
Alstom India Electrical Equip. 586 725 23.7% 1044.7 78.3% 759.7 Target Achieved
Transport Corp Transportation 284 354 24.6% 375.9 32.4% 280.2 Target Achieved
Multibase India Rubber Prod. 164 300 82.9% 779.0 375.0% 379.5 Target Achieved
Albert David Pharma 256 363 41.8% 854.8 233.9% 391.0 Target Achieved
Nov-14 ONGC Oil & Gas 263 344 30.6% 412.5 56.6% 148.6 Booked
Cadila Helthcare Pharma 277 320 15.6% 2044.8 638.7% 315.2 Target Achieved
Karur Vysya Banks 103 140 35.9% 619.0 501.0% 67.1 Target Achieved
JK Lakshmi Cement Cement 348 396 13.8% 537.0 54.3% 313.1 Target Achieved
Diwali Pick
Ashok Leyland Auto 44 65 46.2% 167.5 276.8% 81.9 Target Achieved
Karur Vysya Banks 103 140 35.9% 619.0 501.0% 67.1 Target Achieved
SKS Microfinance Finance 317 412 30.0% 1234.8 289.5% 921.1 Target Achieved
NOCIL Chemical 43 60 38.4% 236.4 445.3% 126.0 Target Achieved
Oct-14 Kesoram Industries Diversified 117 176 50.4% 173.7 48.5% 61.6 Booked
Akzo Nobel Paints & Chemical 1240 1460 17.7% 2089.0 68.5% 1727.9 Target Achieved
IFB Industries Household Appl. 295 380 28.8% 1547.0 424.4% 826.0 Target Achieved
Munjal Auto Auto Parts 102 155 52.0% 152.7 49.7% 52.3 Booked
Sep-14 Tata Motors Auto 527 598 13.5% 612.4 16.2% 174.3 Target Achieved
Timken India Industrial Prod. 447 545 21.9% 1007.0 125.3% 558.8 Target Achieved
KEC International Electrical Equip. 102 130 27.5% 443.4 334.7% 238.3 Target Achieved
Indoco Remedies Pharma 256 327 27.7% 412.2 61.0% 174.1 Target Achieved
Ingersoll-Rand Industrial Prod. 649 785 21.0% 1124.4 73.3% 569.2 Target Achieved
Aug-14 Bodal Chemicals Chemical 60 94 56.7% 193.8 222.9% 97.8 Booked
Som Distilleries Breweries & Dist. 211 269 27.5% 322.8 53.0% 142.1 Booked
Sharda Motor Auto Parts 391 536 37.1% 3099.7 692.7% 1231.5 Target Achieved
Axiscades Engg IT 106 138 30.2% 396.2 273.8% 64.1 Target Achieved
Visaka Industries Cement Prod. 119 173 45.4% 838.6 604.7% 361.9 Target Achieved
Deccan Cements Cement 270 408 51.1% 1276.8 372.9% 349.9 Target Achieved
Gulshan Polyols Chemical 35.4 54.8 54.8% 114.0 221.9% 51.8 Target Achieved
Jul-14 Mahindra Lifespace Real Estate 560 710 26.8% 668.4 19.4% 372.8 Booked
V-Guard Ind. Industrial Prod. 593 746 25.8% 1198.0 102.0% 191.3 Target Achieved
Astra Microwaves Defence 142 186 31.0% 166.4 17.2% 78.8 Booked
Himatsingka Seide Textile 74 95 28.4% 443.8 499.7% 169.1 Target Achieved
Mangalam Cement Cement 221 285 29.0% 479.6 117.0% 210.5 Target Achieved
Jun-14 Coal India Coal 392 500 27.6% 447.1 14.1% 215.0 Target Achieved
Container Corporation Logistics 1180 1500 27.1% 1947.7 65.1% 475.7 Target Achieved
Balmer Lawrie Logistics 473 700 48.0% 682.0 44.2% 172.1 Target Achieved
Can Fin Homes Housing Finance 305 450 47.5% 3330.0 991.8% 269.9 Target Achieved
Srikalahasti Pipes Iron & Steel Prod. 46 70 52.2% 448.6 875.2% 178.6 Target Achieved
May-14 Bank of Baroda Banking 164.4 201.6 22.6% 228.9 39.2% 102.8 Target Achieved
AIA Engineering Industrial Prod. 606 726 19.8% 1880.0 210.2% 1701.4 Target Achieved
MOIL Ltd. Metals & Mining 255 341 33.7% 425.3 66.8% 143.4 Target Achieved
Wim Plast Plastic Prod. 310 400 29.0% 1249.5 303.1% 524.6 Target Achieved
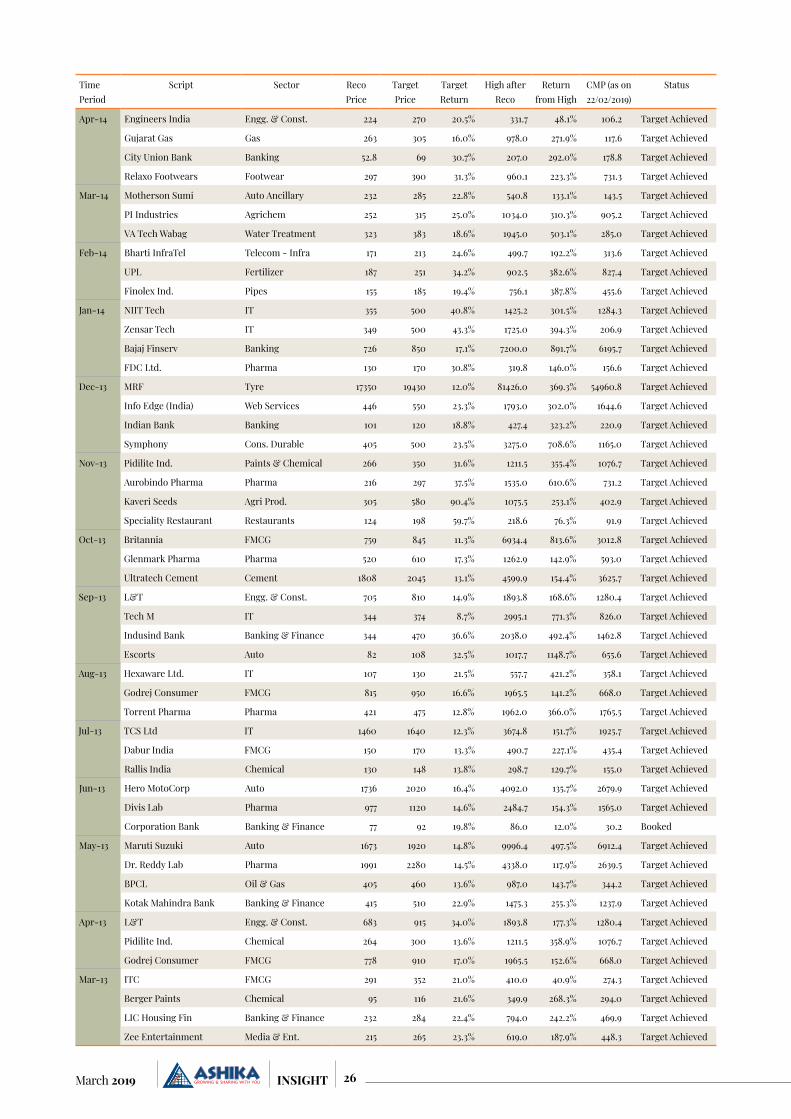
26March 2019 INSIGHT
TimePeriod
Script Sector RecoPrice
TargetPrice
TargetReturn
High afterReco
Returnfrom High
CMP (as on 22/02/2019)
Status
Apr-14 Engineers India Engg. & Const. 224 270 20.5% 331.7 48.1% 106.2 Target Achieved
Gujarat Gas Gas 263 305 16.0% 978.0 271.9% 117.6 Target Achieved
City Union Bank Banking 52.8 69 30.7% 207.0 292.0% 178.8 Target Achieved
Relaxo Footwears Footwear 297 390 31.3% 960.1 223.3% 731.3 Target Achieved
Mar-14 Motherson Sumi Auto Ancillary 232 285 22.8% 540.8 133.1% 143.5 Target Achieved
PI Industries Agrichem 252 315 25.0% 1034.0 310.3% 905.2 Target Achieved
VA Tech Wabag Water Treatment 323 383 18.6% 1945.0 503.1% 285.0 Target Achieved
Feb-14 Bharti InfraTel Telecom - Infra 171 213 24.6% 499.7 192.2% 313.6 Target Achieved
UPL Fertilizer 187 251 34.2% 902.5 382.6% 827.4 Target Achieved
Finolex Ind. Pipes 155 185 19.4% 756.1 387.8% 455.6 Target Achieved
Jan-14 NIIT Tech IT 355 500 40.8% 1425.2 301.5% 1284.3 Target Achieved
Zensar Tech IT 349 500 43.3% 1725.0 394.3% 206.9 Target Achieved
Bajaj Finserv Banking 726 850 17.1% 7200.0 891.7% 6195.7 Target Achieved
FDC Ltd. Pharma 130 170 30.8% 319.8 146.0% 156.6 Target Achieved
Dec-13 MRF Tyre 17350 19430 12.0% 81426.0 369.3% 54960.8 Target Achieved
Info Edge (India) Web Services 446 550 23.3% 1793.0 302.0% 1644.6 Target Achieved
Indian Bank Banking 101 120 18.8% 427.4 323.2% 220.9 Target Achieved
Symphony Cons. Durable 405 500 23.5% 3275.0 708.6% 1165.0 Target Achieved
Nov-13 Pidilite Ind. Paints & Chemical 266 350 31.6% 1211.5 355.4% 1076.7 Target Achieved
Aurobindo Pharma Pharma 216 297 37.5% 1535.0 610.6% 731.2 Target Achieved
Kaveri Seeds Agri Prod. 305 580 90.4% 1075.5 253.1% 402.9 Target Achieved
Speciality Restaurant Restaurants 124 198 59.7% 218.6 76.3% 91.9 Target Achieved
Oct-13 Britannia FMCG 759 845 11.3% 6934.4 813.6% 3012.8 Target Achieved
Glenmark Pharma Pharma 520 610 17.3% 1262.9 142.9% 593.0 Target Achieved
Ultratech Cement Cement 1808 2045 13.1% 4599.9 154.4% 3625.7 Target Achieved
Sep-13 L&T Engg. & Const. 705 810 14.9% 1893.8 168.6% 1280.4 Target Achieved
Tech M IT 344 374 8.7% 2995.1 771.3% 826.0 Target Achieved
Indusind Bank Banking & Finance 344 470 36.6% 2038.0 492.4% 1462.8 Target Achieved
Escorts Auto 82 108 32.5% 1017.7 1148.7% 655.6 Target Achieved
Aug-13 Hexaware Ltd. IT 107 130 21.5% 557.7 421.2% 358.1 Target Achieved
Godrej Consumer FMCG 815 950 16.6% 1965.5 141.2% 668.0 Target Achieved
Torrent Pharma Pharma 421 475 12.8% 1962.0 366.0% 1765.5 Target Achieved
Jul-13 TCS Ltd IT 1460 1640 12.3% 3674.8 151.7% 1925.7 Target Achieved
Dabur India FMCG 150 170 13.3% 490.7 227.1% 435.4 Target Achieved
Rallis India Chemical 130 148 13.8% 298.7 129.7% 155.0 Target Achieved
Jun-13 Hero MotoCorp Auto 1736 2020 16.4% 4092.0 135.7% 2679.9 Target Achieved
Divis Lab Pharma 977 1120 14.6% 2484.7 154.3% 1565.0 Target Achieved
Corporation Bank Banking & Finance 77 92 19.8% 86.0 12.0% 30.2 Booked
May-13 Maruti Suzuki Auto 1673 1920 14.8% 9996.4 497.5% 6912.4 Target Achieved
Dr. Reddy Lab Pharma 1991 2280 14.5% 4338.0 117.9% 2639.5 Target Achieved
BPCL Oil & Gas 405 460 13.6% 987.0 143.7% 344.2 Target Achieved
Kotak Mahindra Bank Banking & Finance 415 510 22.9% 1475.3 255.3% 1237.9 Target Achieved
Apr-13 L&T Engg. & Const. 683 915 34.0% 1893.8 177.3% 1280.4 Target Achieved
Pidilite Ind. Chemical 264 300 13.6% 1211.5 358.9% 1076.7 Target Achieved
Godrej Consumer FMCG 778 910 17.0% 1965.5 152.6% 668.0 Target Achieved
Mar-13 ITC FMCG 291 352 21.0% 410.0 40.9% 274.3 Target Achieved
Berger Paints Chemical 95 116 21.6% 349.9 268.3% 294.0 Target Achieved
LIC Housing Fin Banking & Finance 232 284 22.4% 794.0 242.2% 469.9 Target Achieved
Zee Entertainment Media & Ent. 215 265 23.3% 619.0 187.9% 448.3 Target Achieved

27 March 2019INSIGHT
TimePeriod
Script Sector RecoPrice
TargetPrice
TargetReturn
High afterReco
Returnfrom High
CMP (as on 22/02/2019)
Status
Feb-13 Axis Bank Banking & Finance 301 397.8 32.2% 734.5 144.0% 702.1 Target Achieved
Tata Motors Auto 298 379 27.2% 612.4 105.5% 174.3 Target Achieved
Petronet LNG Oil & Gas 152 200 31.6% 459.0 202.0% 215.4 Target Achieved
Jan-13 Adani Ports Others 135 180 33.3% 452.4 235.1% 354.3 Target Achieved
J & K Bank Banking & Finance 130 167 28.2% 195.5 50.0% 39.1 Target Achieved
Dec-12 Zee Entertainment Media & Ent 198 235 18.7% 619.0 212.6% 448.3 Target Achieved
Indusind Bank Banking & Finance 416 500 20.2% 2038.0 389.9% 1462.8 Target Achieved
Nov-12 IPCA Lab Pharma 450 545 21.1% 906.9 101.5% 792.9 Target Achieved
L&T Finance Banking & Finance 55 85 54.5% 213.9 288.8% 126.5 Target Achieved
Zydus Wellness FMCG 445 560 25.8% 1980.0 344.9% 1259.9 Target Achieved
Oct-12 Sun TV Media & Ent. 357 446 24.9% 1097.8 207.5% 585.9 Target Achieved
Allahabad Bank Banking & Finance 147 180 22.4% 191.1 30.0% 45.9 Target Achieved
Shoppers stop Others 393 465 18.3% 689.3 75.4% 490.0 Target Achieved
Sep-12 Dish TV Media & Ent. 68 92 35.3% 121.7 78.9% 37.4 Target Achieved
Havels India Cons. Durables 111 127.6 15.0% 754.3 579.5% 696.1 Target Achieved
Aug-12 Lupin Pharma 570 672 17.9% 2115.0 271.1% 777.7 Target Achieved
Bajaj Finserv Banking & Finance 730 877 20.1% 7200.0 886.3% 6195.7 Target Achieved
Jul-12 Uflex Others 112 145 29.5% 506.9 352.6% 208.7 Target Achieved
Cummins India Engg. & Const. 438 513 17.1% 1247.7 184.9% 694.4 Target Achieved
Exide Inds Others 135 165 22.2% 304.7 125.7% 213.6 Target Achieved
Engineers India Engg. & Const. 200 280 40.0% 305.0 52.5% 106.2 Target Achieved
Jun-12 Glenmark Pharma Pharma 350 410 17.1% 1262.9 260.8% 593.0 Target Achieved
Godrej Consumer FMCG 558 675 21.0% 1965.5 252.2% 668.0 Target Achieved
Cera Sanitaryware Cons. Durables 248 340 37.1% 3918.0 1479.8% 2207.7 Target Achieved
HPCL Oil & Gas 300 365 21.7% 991.0 230.3% 231.0 Target Achieved
May-12 Emami FMCG 457 535 17.1% 1365.0 198.7% 399.7 Target Achieved
Berger Paints Chemical 114 141 23.7% 349.9 206.9% 294.0 Target Achieved
Graphite India Others 92 110 19.6% 1127.0 1125.0% 416.3 Target Achieved
Rainbow papers Others 66 85 28.8% 94.4 43.0% 0.8 Target Achieved
Apr-12 Tatamotor - DVR Auto 158 200 26.6% 391.4 147.7% 89.2 Target Achieved
Pidilite Ind. Chemical 172 210 22.1% 1211.5 604.3% 1076.7 Target Achieved
Mar-12 Magma Fincorp Banking & Finance 70 ACCu 193.9 177.0% 98.3 Target Achieved
Torrent Power Power 222 290 30.6% 307.4 38.4% 232.7 Booked
Feb-12 Castrol India Oil & Gas 236 ACCU 544.0 130.5% 154.6 Target Achieved
Prism Cement Cement 48.75 ACCU 159.2 226.5% 71.4 Target Achieved
MRF Auto 9767 ACCU 81426.0 733.7% 54960.8 Target Achieved
Shoppers Stop Others 340 ACCU 689.3 102.7% 490.0 Target Achieved
Allahabad Bank Banking & Finance 200 ACCU 211.3 5.7% 45.9 Target Achieved
Zydus Wellness FMCG 382 ACCU 1980.0 418.3% 1259.9 Target Achieved
MRPL Oil & Gas 71 ACCU 146.7 106.6% 63.0 Target Achieved
Akzo Nobal Cons. Durables 857 ACCU 2089.0 143.8% 1727.9 Target Achieved
Maruti Suzuki Auto 1320 ACCU 9996.4 657.3% 6912.4 Target Achieved
M & M Auto 749 ACCU 1571.4 109.8% 646.6 Target Achieved
Feb-12 Tata Power Power 115 120 4.3% 117.6 2.2% 67.1 Target Achieved
Dr. Reddy Lab Pharma 1642 1795 9.3% 4338.0 164.2% 2639.5 Target Achieved
Jan-12 Shree Cement Cement 2100 ACCU 20538.0 878.0% 16146.0 Target Achieved
Dabur India FMCG 102 125 22.5% 490.7 381.0% 435.4 Target Achieved
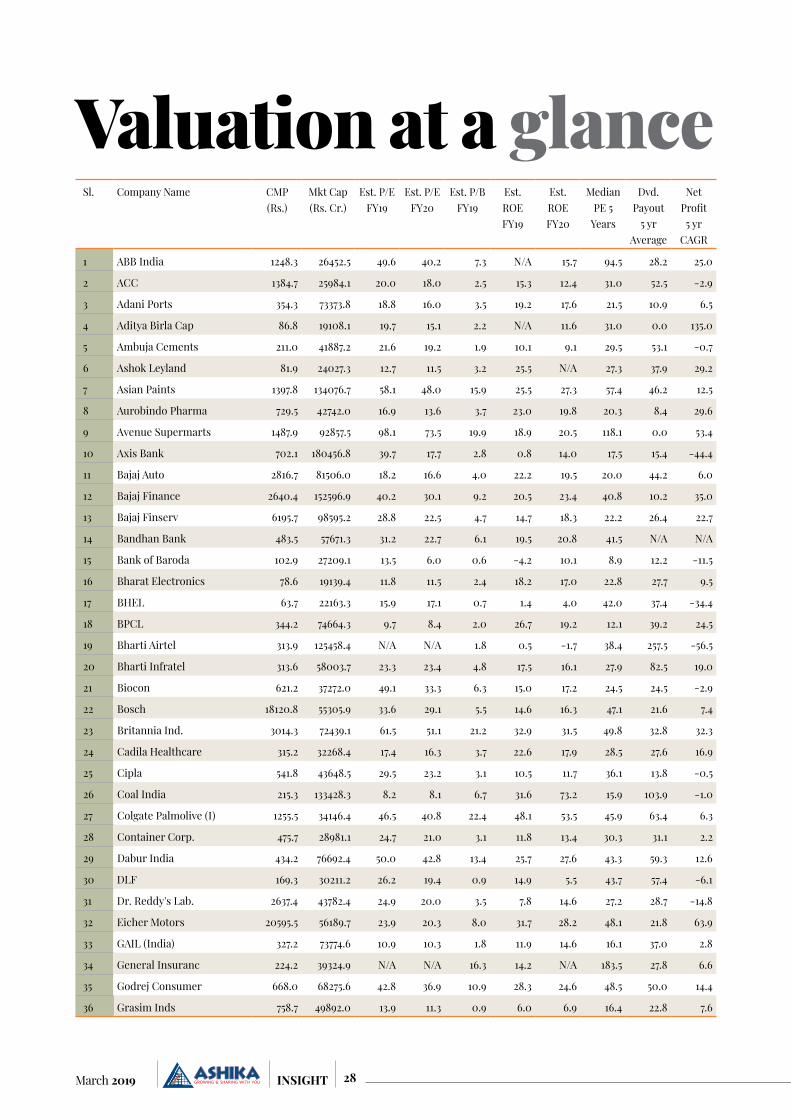
28March 2019 INSIGHT
Valuation at a glanceSl. Company Name CMP
(Rs.)Mkt Cap (Rs. Cr.)
Est. P/E FY19
Est. P/E FY20
Est. P/B FY19
Est. ROE FY19
Est. ROE FY20
Median PE 5
Years
Dvd. Payout
5 yr Average
Net Profit 5 yr
CAGR
1 ABB India 1248.3 26452.5 49.6 40.2 7.3 N/A 15.7 94.5 28.2 25.0
2 ACC 1384.7 25984.1 20.0 18.0 2.5 15.3 12.4 31.0 52.5 -2.9
3 Adani Ports 354.3 73373.8 18.8 16.0 3.5 19.2 17.6 21.5 10.9 6.5
4 Aditya Birla Cap 86.8 19108.1 19.7 15.1 2.2 N/A 11.6 31.0 0.0 135.0
5 Ambuja Cements 211.0 41887.2 21.6 19.2 1.9 10.1 9.1 29.5 53.1 -0.7
6 Ashok Leyland 81.9 24027.3 12.7 11.5 3.2 25.5 N/A 27.3 37.9 29.2
7 Asian Paints 1397.8 134076.7 58.1 48.0 15.9 25.5 27.3 57.4 46.2 12.5
8 Aurobindo Pharma 729.5 42742.0 16.9 13.6 3.7 23.0 19.8 20.3 8.4 29.6
9 Avenue Supermarts 1487.9 92857.5 98.1 73.5 19.9 18.9 20.5 118.1 0.0 53.4
10 Axis Bank 702.1 180456.8 39.7 17.7 2.8 0.8 14.0 17.5 15.4 -44.4
11 Bajaj Auto 2816.7 81506.0 18.2 16.6 4.0 22.2 19.5 20.0 44.2 6.0
12 Bajaj Finance 2640.4 152596.9 40.2 30.1 9.2 20.5 23.4 40.8 10.2 35.0
13 Bajaj Finserv 6195.7 98595.2 28.8 22.5 4.7 14.7 18.3 22.2 26.4 22.7
14 Bandhan Bank 483.5 57671.3 31.2 22.7 6.1 19.5 20.8 41.5 N/A N/A
15 Bank of Baroda 102.9 27209.1 13.5 6.0 0.6 -4.2 10.1 8.9 12.2 -11.5
16 Bharat Electronics 78.6 19139.4 11.8 11.5 2.4 18.2 17.0 22.8 27.7 9.5
17 BHEL 63.7 22163.3 15.9 17.1 0.7 1.4 4.0 42.0 37.4 -34.4
18 BPCL 344.2 74664.3 9.7 8.4 2.0 26.7 19.2 12.1 39.2 24.5
19 Bharti Airtel 313.9 125458.4 N/A N/A 1.8 0.5 -1.7 38.4 257.5 -56.5
20 Bharti Infratel 313.6 58003.7 23.3 23.4 4.8 17.5 16.1 27.9 82.5 19.0
21 Biocon 621.2 37272.0 49.1 33.3 6.3 15.0 17.2 24.5 24.5 -2.9
22 Bosch 18120.8 55305.9 33.6 29.1 5.5 14.6 16.3 47.1 21.6 7.4
23 Britannia Ind. 3014.3 72439.1 61.5 51.1 21.2 32.9 31.5 49.8 32.8 32.3
24 Cadila Healthcare 315.2 32268.4 17.4 16.3 3.7 22.6 17.9 28.5 27.6 16.9
25 Cipla 541.8 43648.5 29.5 23.2 3.1 10.5 11.7 36.1 13.8 -0.5
26 Coal India 215.3 133428.3 8.2 8.1 6.7 31.6 73.2 15.9 103.9 -1.0
27 Colgate Palmolive (I) 1255.5 34146.4 46.5 40.8 22.4 48.1 53.5 45.9 63.4 6.3
28 Container Corp. 475.7 28981.1 24.7 21.0 3.1 11.8 13.4 30.3 31.1 2.2
29 Dabur India 434.2 76692.4 50.0 42.8 13.4 25.7 27.6 43.3 59.3 12.6
30 DLF 169.3 30211.2 26.2 19.4 0.9 14.9 5.5 43.7 57.4 -6.1
31 Dr. Reddy's Lab. 2637.4 43782.4 24.9 20.0 3.5 7.8 14.6 27.2 28.7 -14.8
32 Eicher Motors 20595.5 56189.7 23.9 20.3 8.0 31.7 28.2 48.1 21.8 63.9
33 GAIL (India) 327.2 73774.6 10.9 10.3 1.8 11.9 14.6 16.1 37.0 2.8
34 General Insuranc 224.2 39324.9 N/A N/A 16.3 14.2 N/A 183.5 27.8 6.6
35 Godrej Consumer 668.0 68275.6 42.8 36.9 10.9 28.3 24.6 48.5 50.0 14.4
36 Grasim Inds 758.7 49892.0 13.9 11.3 0.9 6.0 6.9 16.4 22.8 7.6
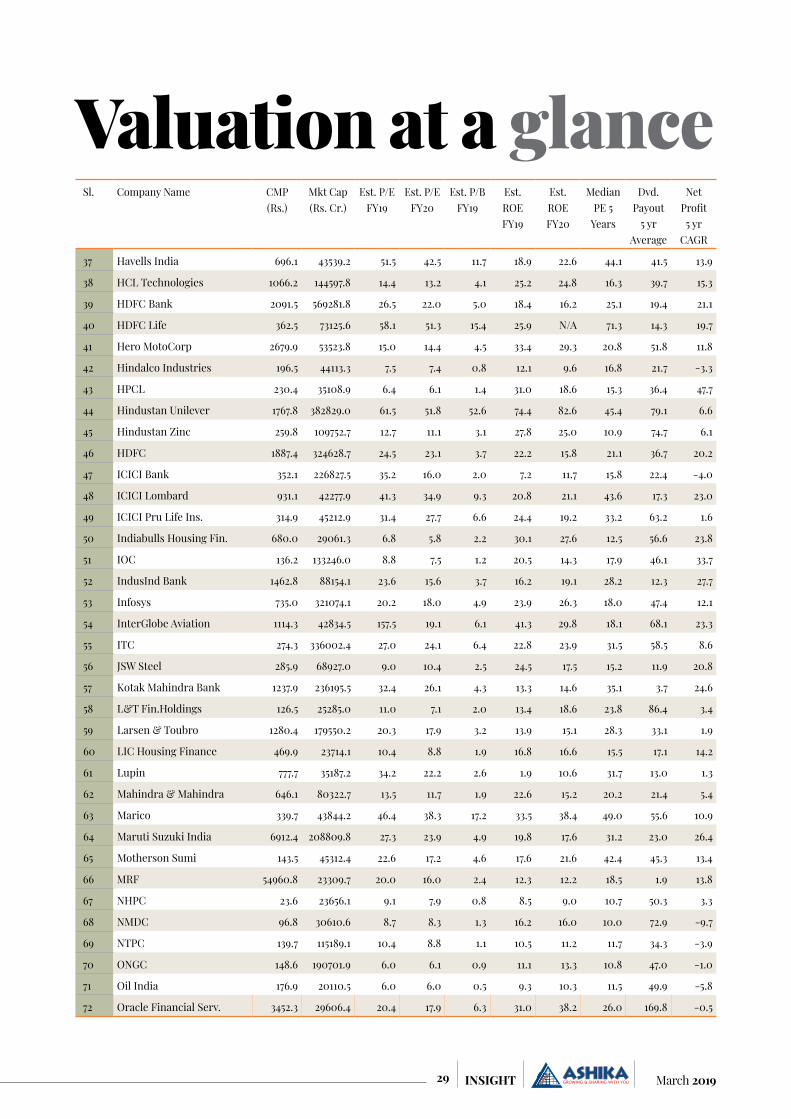
29 March 2019INSIGHT
Valuation at a glanceSl. Company Name CMP
(Rs.)Mkt Cap (Rs. Cr.)
Est. P/E FY19
Est. P/E FY20
Est. P/B FY19
Est. ROE FY19
Est. ROE FY20
Median PE 5
Years
Dvd. Payout
5 yr Average
Net Profit 5 yr
CAGR
37 Havells India 696.1 43539.2 51.5 42.5 11.7 18.9 22.6 44.1 41.5 13.9
38 HCL Technologies 1066.2 144597.8 14.4 13.2 4.1 25.2 24.8 16.3 39.7 15.3
39 HDFC Bank 2091.5 569281.8 26.5 22.0 5.0 18.4 16.2 25.1 19.4 21.1
40 HDFC Life 362.5 73125.6 58.1 51.3 15.4 25.9 N/A 71.3 14.3 19.7
41 Hero MotoCorp 2679.9 53523.8 15.0 14.4 4.5 33.4 29.3 20.8 51.8 11.8
42 Hindalco Industries 196.5 44113.3 7.5 7.4 0.8 12.1 9.6 16.8 21.7 -3.3
43 HPCL 230.4 35108.9 6.4 6.1 1.4 31.0 18.6 15.3 36.4 47.7
44 Hindustan Unilever 1767.8 382829.0 61.5 51.8 52.6 74.4 82.6 45.4 79.1 6.6
45 Hindustan Zinc 259.8 109752.7 12.7 11.1 3.1 27.8 25.0 10.9 74.7 6.1
46 HDFC 1887.4 324628.7 24.5 23.1 3.7 22.2 15.8 21.1 36.7 20.2
47 ICICI Bank 352.1 226827.5 35.2 16.0 2.0 7.2 11.7 15.8 22.4 -4.0
48 ICICI Lombard 931.1 42277.9 41.3 34.9 9.3 20.8 21.1 43.6 17.3 23.0
49 ICICI Pru Life Ins. 314.9 45212.9 31.4 27.7 6.6 24.4 19.2 33.2 63.2 1.6
50 Indiabulls Housing Fin. 680.0 29061.3 6.8 5.8 2.2 30.1 27.6 12.5 56.6 23.8
51 IOC 136.2 133246.0 8.8 7.5 1.2 20.5 14.3 17.9 46.1 33.7
52 IndusInd Bank 1462.8 88154.1 23.6 15.6 3.7 16.2 19.1 28.2 12.3 27.7
53 Infosys 735.0 321074.1 20.2 18.0 4.9 23.9 26.3 18.0 47.4 12.1
54 InterGlobe Aviation 1114.3 42834.5 157.5 19.1 6.1 41.3 29.8 18.1 68.1 23.3
55 ITC 274.3 336002.4 27.0 24.1 6.4 22.8 23.9 31.5 58.5 8.6
56 JSW Steel 285.9 68927.0 9.0 10.4 2.5 24.5 17.5 15.2 11.9 20.8
57 Kotak Mahindra Bank 1237.9 236195.5 32.4 26.1 4.3 13.3 14.6 35.1 3.7 24.6
58 L&T Fin.Holdings 126.5 25285.0 11.0 7.1 2.0 13.4 18.6 23.8 86.4 3.4
59 Larsen & Toubro 1280.4 179550.2 20.3 17.9 3.2 13.9 15.1 28.3 33.1 1.9
60 LIC Housing Finance 469.9 23714.1 10.4 8.8 1.9 16.8 16.6 15.5 17.1 14.2
61 Lupin 777.7 35187.2 34.2 22.2 2.6 1.9 10.6 31.7 13.0 1.3
62 Mahindra & Mahindra 646.1 80322.7 13.5 11.7 1.9 22.6 15.2 20.2 21.4 5.4
63 Marico 339.7 43844.2 46.4 38.3 17.2 33.5 38.4 49.0 55.6 10.9
64 Maruti Suzuki India 6912.4 208809.8 27.3 23.9 4.9 19.8 17.6 31.2 23.0 26.4
65 Motherson Sumi 143.5 45312.4 22.6 17.2 4.6 17.6 21.6 42.4 45.3 13.4
66 MRF 54960.8 23309.7 20.0 16.0 2.4 12.3 12.2 18.5 1.9 13.8
67 NHPC 23.6 23656.1 9.1 7.9 0.8 8.5 9.0 10.7 50.3 3.3
68 NMDC 96.8 30610.6 8.7 8.3 1.3 16.2 16.0 10.0 72.9 -9.7
69 NTPC 139.7 115189.1 10.4 8.8 1.1 10.5 11.2 11.7 34.3 -3.9
70 ONGC 148.6 190701.9 6.0 6.1 0.9 11.1 13.3 10.8 47.0 -1.0
71 Oil India 176.9 20110.5 6.0 6.0 0.5 9.3 10.3 11.5 49.9 -5.8
72 Oracle Financial Serv. 3452.3 29606.4 20.4 17.9 6.3 31.0 38.2 26.0 169.8 -0.5

30March 2019 INSIGHT
Sl. Company Name CMP (Rs.)
Mkt Cap (Rs. Cr.)
Est. P/E FY19
Est. P/E FY20
Est. P/B FY19
Est. ROE FY19
Est. ROE FY20
Median PE 5
Years
Dvd. Payout
5 yr Average
Net Profit 5 yr
CAGR
73 Petronet LNG 215.4 32310.0 13.3 11.8 3.3 23.5 22.6 19.2 22.6 12.6
74 Pidilite Industries 1076.0 54655.9 58.1 46.8 15.3 27.3 25.9 50.1 30.2 15.7
75 Piramal Enterprises 2308.1 43344.4 24.9 19.5 1.6 24.8 7.6 22.9 2.3 17.5
76 Power Grid Corp. 181.9 95162.6 10.0 9.3 1.7 15.7 16.3 14.3 27.0 14.2
77 P & G Hygiene 10199.0 33106.7 69.7 55.8 41.1 56.3 45.5 60.1 81.5 13.0
78 Reliance Industries 1232.4 781145.5 18.6 15.3 2.5 12.9 13.8 12.6 12.7 9.9
79 SBI Life Insuran 558.9 55885.0 54.8 39.1 8.6 19.0 18.0 59.7 15.7 13.1
80 Shree Cement 16146.0 56248.2 46.9 31.9 6.3 16.7 16.4 46.6 16.8 11.9
81 Shriram Transport Fin. 1073.8 24362.7 10.2 8.8 1.9 13.0 16.8 18.7 16.8 2.9
82 Siemens 991.8 35320.0 33.5 28.8 4.3 11.3 13.6 37.8 31.2 35.7
83 State Bank of India 270.8 241812.3 48.6 9.4 1.0 -2.8 11.3 13.1 16.1 -14.2
84 Steel Authority of India 49.3 20342.8 6.7 5.8 0.6 -0.8 7.9 11.6 14.2 -26.0
85 Sun Pharma 430.4 103264.5 26.1 20.2 2.7 5.8 11.8 42.9 -769.8 -0.9
86 Sun TV Network 1925.7 722578.0 23.1 20.8 8.5 36.2 36.3 22.7 51.8 9.8
87 TCS 174.6 54862.3 N/A 9.6 0.8 7.9 7.9 13.3 45.7 14.6
88 Tata Motors 502.3 56960.5 6.2 6.9 1.0 26.9 11.7 12.7 16.7 27.9
89 Tata Steel 826.0 81065.9 17.0 15.2 3.9 22.8 21.1 15.1 32.8 -3.8
90 Tech Mahindra 585.9 23089.4 15.8 14.6 4.9 26.0 26.8 21.4 28.5 43.7
91 New India Assurance 176.0 28996.6 N/A N/A 0.4 15.7 N/A 23.2 24.2 21.1
92 Titan Company 1041.6 92471.8 62.6 50.3 18.2 24.2 27.4 49.0 27.4 9.9
93 UltraTech Cement 3625.7 99575.3 41.5 31.5 3.8 8.8 9.7 39.5 11.6 -3.4
94 United Spirits 533.3 38748.0 50.0 40.4 16.0 30.1 25.2 242.0 0.0 11.9
95 UPL 827.4 42134.1 18.6 15.6 4.6 24.5 21.7 19.3 72.8 21.4
96 Vedanta 169.3 63062.2 8.8 6.3 1.0 16.7 14.9 10.2 63.2 126.9
97 Vodafone Idea 30.4 26512.2 N/A N/A N/A N/A -26.6 19.3 4.7 42.3
98 Wipro 378.8 171391.1 19.2 17.2 3.1 16.4 17.4 16.4 18.5 6.4
99 Yes Bank 222.0 51345.4 12.3 11.7 2.0 17.7 15.2 17.5 16.9 26.6
100 Zee Entertainment 448.6 43086.5 26.3 22.9 5.7 20.8 19.4 37.1 25.5 24.4
#N/A: Not Available
Source: Bloomberg Consensus as on February 22, 2019
Valuation at a glance

31 March 2019INSIGHT
India Inc. earnings have witnessed headwinds given the liquidity tightness, currency volatility, slowdown in government spending (with onset of elections) and global trade issues. The revenues of some companies saw decent growth with support provided in terms of volumes from the consumption space and weak INR aiding incremental revenues in certain sectors. However, the numbers reflect the theme of a recovering economy, key to generating jobs and raising incomes ahead of the general election scheduled in next few months. The overall earnings picture provides a contrasting situation wherein during the 4 previous quarters (Q3FY18 to Q2FY19), Non-BFSI was
providing the much needed earnings cheer when BFSI was a laggard in terms of earnings performance. However, during the current quarter Q3FY19, BFSI has shown remarkable improvement in financial performance, and Non-BFSI turned laggard. The Non-BFSI performance was clearly weighed down by OMCs on the back of steep oil prices. Given the current market scenario, the earnings reported by companies suggest a gradual recovery setting up; however, sustenance of the same would be a key monitorable, along with the demand scenario during the pre-election period. Evidence on private capex remains modest even though traction came from the strong execution of pending government
orders. Elections are seen as an opportunity for future government spending and the tendering of road projects. This is fourth consecutive quarter where Sensex companies (ex-banking) have recorded double digit bottomline growth, amid robust consumer sentiment and peaking commodity prices. Sensex companies (ex-banking) reported a stellar operational performance in Q3FY19 primarily driven by robust consumer demand domestically and uptick in commodity prices thereby benefitting the oil & gas as well as metals space. Net sales in Q3FY19 were up 22% YoY. This coupled with 165 bps improvement in EBITDA margin to 20.1% led to 13% growth in operating profit. Gross margins declined 270
Q3FY19 Result Analysis

32March 2019 INSIGHT
bps YoY. partly compensated by operating leverage benefits like lower employee as well as other expenses. Subsequently Net Profit in Q3FY19 (Ex Tata Motors) was up 17.8% YoY.
On the sectoral front, in the auto space, volumes were soft with overall auto sales volumes were up 6.8% YoY with healthy growth across all categories (except PV segment), especially CV space. In the banking space, major highlights were the sequential moderation in GNPA ratios, slippages, and credit growth for both private and PSU banks along with asset quality improvement continued with both absolute GNPA & NNPA declining QoQ. In the cement space, double digit volume growth trajectory continues with volume growth during the quarter was healthy at ~11% though some pricing pressure persists. In the
FMCG space, double digit volume growth trend continued depicting strong underlying rural demand, which is bound to further scale up given rural income enhancing measures being undertaken by the government. In IT space companies reported better than expected results, indicating an improving demand environment. Q3FY19 performance and management commentaries by IT companies indicate signs of improving demand environment and healthy deal pipelines. In the pharma space, companies demonstrated growth with equal contribution from domestic as well as foreign markets along with efficient cost control measures taken by the companies. In metals & mining space, ferrous metal reported a steady performance on the back of healthy domestic steel demand growth of 8.1%, while
non-ferrous companies reported subdued performance on the back of decline witnessed in the base metal prices in general.
In FY19 (April 2018 – January 2019) FIIs were net seller to the tune of Rs. 52,830 cr in the equity segment. For the month of January 2019, FIIs were net seller of Rs. 5,264 cr and during Q3FY19 they were net buyer of Rs. 3,320 cr while DIIs were the net buyers of Rs. 86,903 cr in FY19 (April 2018 – January 2019). For the month of January 2019, DIIs were net buyers of Rs. 2,147 cr and during Q3FY19 they were net buyers of Rs. 3,832 cr. India also remained a favoured destination for investment, FDI inflow is US$ 33.49 billion in 9MFY19 (Apr to Dec) against US$ 35.94 billion in 9MFY18 (Apr to Dec).
(In Rs. Cr.) Q3FY17 Q1FY17 Q1FY18 Q2FY18 Q3FY18 Q4FY18 Q1FY19 Q2FY19 Q3FY19
Net Sales 939609 1019584 951542 958632 987564 1091710 1049682 1110977 1130802
Growth (YoY) 11% 6% 5% 3% 5% 7% 10% 16% 15%
Growth (QoQ) 1% 9% -7% 1% 3% 11% -4% 6% 2%
Operating Expenses 782583 848840 795125 788303 810437 903752 865099 921269 936896
Growth (YoY) 11% 7% 7% 2% 4% 6% 9% 17% 16%
Growth (QoQ) 2% 8% -6% -1% 3% 12% -4% 6% 2%
% of Sales 83% 83% 84% 82% 82% 83% 82% 83% 83%
Operating Profit 157026 170744 156417 170329 177127 187957 184583 189707 193906
Growth (YoY) 9% 4% -2% 9% 13% 10% 18% 11% 9%
Growth (QoQ) 0% 9% -8% 9% 4% 6% -2% 3% 2%
OPM 17% 17% 16% 18% 18% 17% 18% 17% 17%
Depreciation 19243 24294 21494 21339 19906 25158 19089 25361 23901
Growth (YoY) 11% 13% 17% -8% 3% 4% -11% 19% 20%
Growth (QoQ) -17% 26% -12% -1% -7% 26% -24% 33% -6%
Interest 45208 48731 45611 47196 49137 51718 51239 53304 57429
Growth (YoY) 5% 2% 5% 5% 9% 6% 12% 13% 17%
Growth (QoQ) 0% 8% -6% 3% 4% 5% -1% 4% 8%
Other Income 35971 36433 36253 38068 37373 39402 40043 42677 43384
Growth (YoY) 6% -5% 1% 6% 4% 8% 10% 12% 16%
Growth (QoQ) 0% 1% 0% 5% -2% 5% 2% 7% 2%
Adj Profit 67956 70578 66270 73207 79712 61268 82307 75740 55811
Growth (YoY) 17% 27% 0% 1% 17% -13% 24% 3% -30%
Growth (QoQ) -6% 4% -6% 10% 9% -23% 34% -8% -26%
NPM 7% 7% 7% 8% 8% 6% 8% 7% 5%
Source: AceEquity, PL-Profit to Loss and LP=Loss to Profit
CNX 500 (Excluding Banks, NBFC & Oil Companies)

33 March 2019INSIGHT
Sectoral performance reviewAuto & Auto ancillary SectorThe Indian auto industry saw muted volume growth during Q3FY19. Volume growth in Q3FY19 was affected by weak market sentiment due to higher fuel prices and interest rates. Increase in motor insurance premiums further weakened demand and sentiment. The festive period, which largely fell in Q3 this year, failed to deliver as retail demand remained weak. According to Federation of Automobile Dealers Associations (FADA), retail sales were weak during this year’s festive period, with 14% YoY decline in PVs and 13% YoY decline in 2-Ws. Weak retail sales led to higher inventories and higher discounting to clear off inventories before start of the next model year. Overall domestic volumes for the quarter were at 61.6 lakh units, up 6.8% YoY vs. 9MFY19 growth of 9.6% YoY. PV segment volumes in Q3FY19
were down 0.8% YoY at 7.9 lakh units. The 2-W segment did relatively better, registering 8.5% YoY volume growth to 49.6 lakh units. CV segment grew 6.7% YoY to 2.4 lakh units. Overall auto sector exports grew 7.6% YoY to 11.1 lakh units
In the auto OEM space, TVS Motors reported strong set of numbers due to strong realization gain and margin due to improved product mix and operating leverage gains. In the PV segment, Maruti reported disappointing results, with steep 600 bps YoY decline in OPM to 9.8% due to negative operating leverage, coupled with adverse commodity/currency environment and higher promotional expenses. Tata Motors’ performance continued to be dented by persistent pain in its JLR operations. JLR wholesale volumes were down 11.0% YoY tracking the poor demand environment in China. The company reported after-tax loss of Rs. 270bn,
impacted by ~Rs. 278bn exceptional charge on account of write-down of product investments. In the 2W segment, Bajaj witnessed strong 25.8% YoY increase in volumes but due to continued aggressive pricing strategy, slower topline growth to 16.3% YoY resulting in drop in margins to 15.6%. Hero MotoCorp grew volumes by 5.2% YoY and registered 7.7% YoY rise in topline, with ASPs surprising positively. Margins, however, were impacted by other expenses and came in at 14.0%. In the ancillary space, tyre players witnessed a mixed volume trend, with Apollo Tyres and JK Tyre saw a moderation in volume growth on the back of a slowdown in OEM demand. With price hikes taken during the quarter getting reversed in Jan, margins will remain under pressure going ahead. All tyre companies disappointed on the margin front post gross margin contraction.
Company (Rs Cr) Net Sales
YoY %
QoQ %
OperatingProfit
YoY %
QoQ %
OPM %
Net Profit
YoY %
QoQ %
NPM %
Tata Motors Ltd. 76265 6% 7% 6041 -22% -3% 8% -26823 PL Loss -35%
Maruti Suzuki India Ltd. 18926 0% -12% 1931 -36% -44% 10% 1489 -17% -34% 8%
Motherson Sumi Systems Ltd.
16234 14% 9% 1294 10% 7% 8% 526 0% 12% 3%
Mahindra & Mahindra Ltd. 13070 13% 1% 1517 2% -5% 12% 1077 -11% -35% 8%
Hero MotoCorp Ltd. 7865 8% -13% 1105 -5% -20% 14% 769 -5% -21% 10%
Bajaj Auto Ltd. 7243 16% -8% 1155 -7% -14% 16% 1101 16% -4% 15%
Ashok Leyland Ltd. 6245 -11% -15% 649 -22% -20% 10% 381 -21% -17% 6%
TVS Motor Company Ltd. 4664 26% -7% 376 25% -12% 8% 178 16% -16% 4%
Apollo Tyres Ltd. 4655 16% 11% 527 6% 13% 11% 198 -19% 36% 4%
MRF Ltd. 4034 6% 3% 552 -22% -5% 14% 279 -18% 6% 7%
Bosch Ltd. 3096 1% -3% 423 -6% -29% 14% 335 19% -20% 11%
Exide Industries Ltd. 2497 10% -8% 313 11% -6% 13% 155 0% -42% 6%
Eicher Motors Ltd. 2328 3% -3% 680 -4% -7% 29% 491 7% 0% 21%
Amara Raja Batteries Ltd. 1695 9% -3% 253 5% 7% 15% 131 -3% 9% 8%
Bharat Forge Ltd. 1693 22% 1% 487 18% 12% 29% 310 36% 36% 18%
Cummins India Ltd. 1463 11% 1% 227 15% -10% 15% 187 9% -12% 13%
Balkrishna Industries Ltd. 1206 9% -9% 269 -7% -19% 22% 145 -24% -35% 12%
Total 173178 7% 0% 17796 -14% -13% 10% -19071 PL PL -11%
Source: AceEquity, PL-Profit to Loss and LP=Loss to Profit
Auto & Auto ancillary Companies
34March 2019 INSIGHT
Banking SectorFor Banks, the quarter Q3FY19 turned out to be a relatively better quarter, with banks seeing improved profitability, further revival in domestic credit growth, asset quality performance (with notably lower slippages, strong recoveries) and better treasury performance (aided by moderation in bond yields) helping recoup significant part of investment depreciation provisions made earlier.
Overall performance of Private Banks has seen improvement in Q3FY19, with a steep decline in net stressed loans (barring IL&FS, which weighed on asset quality/provisions for IndusInd Bank and YES Bank). Corporate focused private banks saw improved margin outlook and reported sequential NIM expansion as well. While the retail focused banks continued to report stable asset quality, coupled with strong growth performance, the corporate banks witnessed improvement in
asset quality performance with sequentially lower slippages. With a benefit of lower slippages and some MTM reversals, most private banks witnessed an improvement in their provision coverage ratios
(PCR). HDFC Bank maintained steady earnings growth, whereas Pre Provisional Operating Profit (PPoP) growth was ahead of earnings growth. Axis Bank, ICICI Bank, Kotak Mahindra Bank and RBL Bank all reported margin expansion, while HDFC Bank, IndusInd Bank and YES Bank delivered stable margins. However, the CASA ratio moderated for several private banks owing to sequentially weak SA deposit growth, and thus, an elevated credit-deposit ratio.
For Public Sector Banks, fall in bond yields of ~48 bps was a favorable development which resulted in healthy treasury gains and also helped them to get benefit of provision write-backs for MTM provisions made earlier. Net stressed loans moderated further, buoyed by healthy recoveries and a decline in fresh slippages. However, the downgrade of the ILFS account impacted the slippages trajectory for a few banks (Indian Bank, Canara
For Public Sector Banks, fall in bond yields of ~48 bps was a favorable development which resulted in healthy treasury gains and also helped them to get benefit of provision write-backs for MTM provisions made earlier.
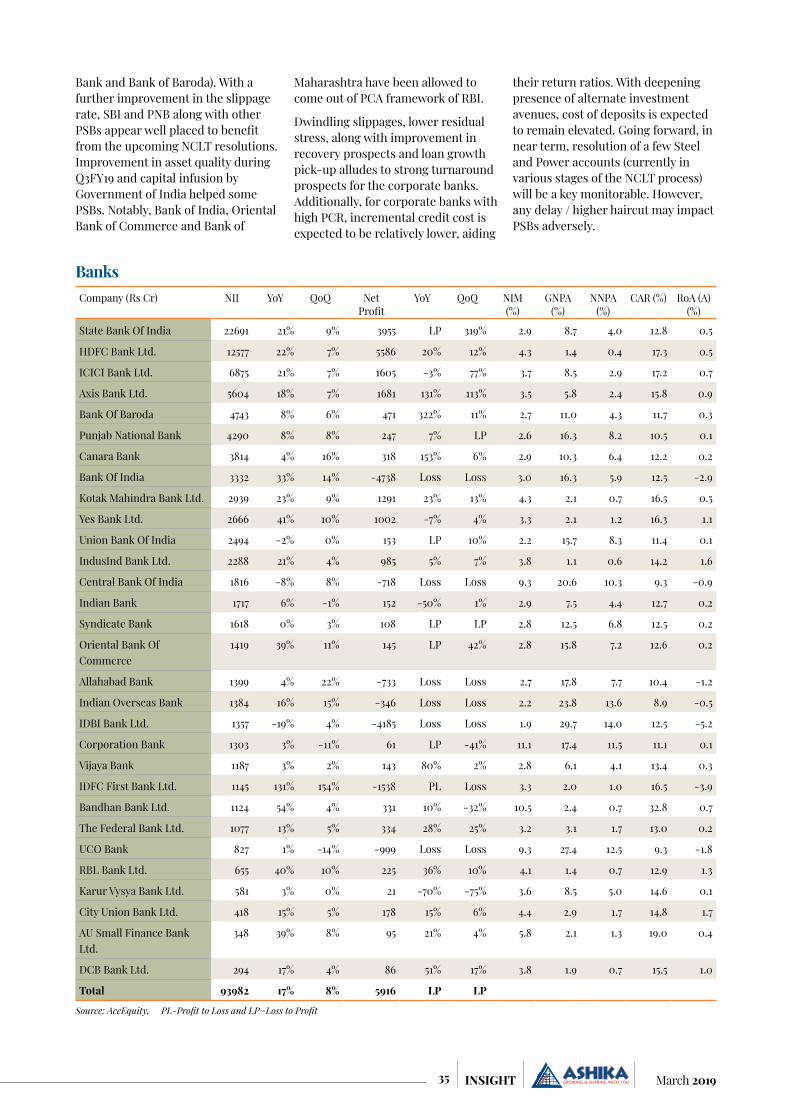
35 March 2019INSIGHT
Company (Rs Cr) NII YoY QoQ Net Profit
YoY QoQ NIM (%)
GNPA (%)
NNPA (%)
CAR (%) RoA (A) (%)
State Bank Of India 22691 21% 9% 3955 LP 319% 2.9 8.7 4.0 12.8 0.5
HDFC Bank Ltd. 12577 22% 7% 5586 20% 12% 4.3 1.4 0.4 17.3 0.5
ICICI Bank Ltd. 6875 21% 7% 1605 -3% 77% 3.7 8.5 2.9 17.2 0.7
Axis Bank Ltd. 5604 18% 7% 1681 131% 113% 3.5 5.8 2.4 15.8 0.9
Bank Of Baroda 4743 8% 6% 471 322% 11% 2.7 11.0 4.3 11.7 0.3
Punjab National Bank 4290 8% 8% 247 7% LP 2.6 16.3 8.2 10.5 0.1
Canara Bank 3814 4% 16% 318 153% 6% 2.9 10.3 6.4 12.2 0.2
Bank Of India 3332 33% 14% -4738 Loss Loss 3.0 16.3 5.9 12.5 -2.9
Kotak Mahindra Bank Ltd. 2939 23% 9% 1291 23% 13% 4.3 2.1 0.7 16.5 0.5
Yes Bank Ltd. 2666 41% 10% 1002 -7% 4% 3.3 2.1 1.2 16.3 1.1
Union Bank Of India 2494 -2% 0% 153 LP 10% 2.2 15.7 8.3 11.4 0.1
IndusInd Bank Ltd. 2288 21% 4% 985 5% 7% 3.8 1.1 0.6 14.2 1.6
Central Bank Of India 1816 -8% 8% -718 Loss Loss 9.3 20.6 10.3 9.3 -0.9
Indian Bank 1717 6% -1% 152 -50% 1% 2.9 7.5 4.4 12.7 0.2
Syndicate Bank 1618 0% 3% 108 LP LP 2.8 12.5 6.8 12.5 0.2
Oriental Bank Of Commerce
1419 39% 11% 145 LP 42% 2.8 15.8 7.2 12.6 0.2
Allahabad Bank 1399 4% 22% -733 Loss Loss 2.7 17.8 7.7 10.4 -1.2
Indian Overseas Bank 1384 16% 15% -346 Loss Loss 2.2 23.8 13.6 8.9 -0.5
IDBI Bank Ltd. 1357 -19% 4% -4185 Loss Loss 1.9 29.7 14.0 12.5 -5.2
Corporation Bank 1303 3% -11% 61 LP -41% 11.1 17.4 11.5 11.1 0.1
Vijaya Bank 1187 3% 2% 143 80% 2% 2.8 6.1 4.1 13.4 0.3
IDFC First Bank Ltd. 1145 131% 154% -1538 PL Loss 3.3 2.0 1.0 16.5 -3.9
Bandhan Bank Ltd. 1124 54% 4% 331 10% -32% 10.5 2.4 0.7 32.8 0.7
The Federal Bank Ltd. 1077 13% 5% 334 28% 25% 3.2 3.1 1.7 13.0 0.2
UCO Bank 827 1% -14% -999 Loss Loss 9.3 27.4 12.5 9.3 -1.8
RBL Bank Ltd. 655 40% 10% 225 36% 10% 4.1 1.4 0.7 12.9 1.3
Karur Vysya Bank Ltd. 581 3% 0% 21 -70% -75% 3.6 8.5 5.0 14.6 0.1
City Union Bank Ltd. 418 15% 5% 178 15% 6% 4.4 2.9 1.7 14.8 1.7
AU Small Finance Bank Ltd.
348 39% 8% 95 21% 4% 5.8 2.1 1.3 19.0 0.4
DCB Bank Ltd. 294 17% 4% 86 51% 17% 3.8 1.9 0.7 15.5 1.0
Total 93982 17% 8% 5916 LP LP
Source: AceEquity, PL-Profit to Loss and LP=Loss to Profit
Banks
Bank and Bank of Baroda). With a further improvement in the slippage rate, SBI and PNB along with other PSBs appear well placed to benefit from the upcoming NCLT resolutions. Improvement in asset quality during Q3FY19 and capital infusion by Government of India helped some PSBs. Notably, Bank of India, Oriental Bank of Commerce and Bank of
Maharashtra have been allowed to come out of PCA framework of RBI.
Dwindling slippages, lower residual stress, along with improvement in recovery prospects and loan growth pick-up alludes to strong turnaround prospects for the corporate banks. Additionally, for corporate banks with high PCR, incremental credit cost is expected to be relatively lower, aiding
their return ratios. With deepening presence of alternate investment avenues, cost of deposits is expected to remain elevated. Going forward, in near term, resolution of a few Steel and Power accounts (currently in various stages of the NCLT process) will be a key monitorable. However, any delay / higher haircut may impact PSBs adversely.
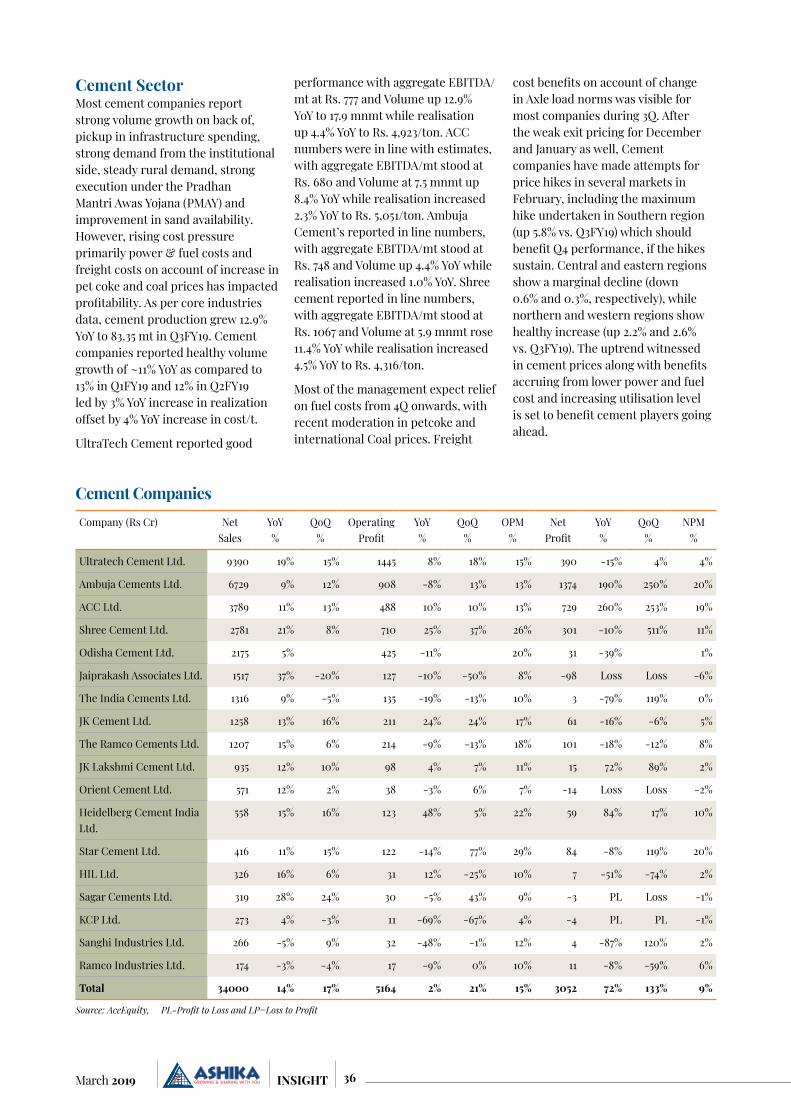
36March 2019 INSIGHT
Cement SectorMost cement companies report strong volume growth on back of, pickup in infrastructure spending, strong demand from the institutional side, steady rural demand, strong execution under the Pradhan Mantri Awas Yojana (PMAY) and improvement in sand availability. However, rising cost pressure primarily power & fuel costs and freight costs on account of increase in pet coke and coal prices has impacted profitability. As per core industries data, cement production grew 12.9% YoY to 83.35 mt in Q3FY19. Cement companies reported healthy volume growth of ~11% YoY as compared to 13% in Q1FY19 and 12% in Q2FY19 led by 3% YoY increase in realization offset by 4% YoY increase in cost/t.
UltraTech Cement reported good
performance with aggregate EBITDA/mt at Rs. 777 and Volume up 12.9% YoY to 17.9 mnmt while realisation up 4.4% YoY to Rs. 4,923/ton. ACC numbers were in line with estimates, with aggregate EBITDA/mt stood at Rs. 680 and Volume at 7.5 mnmt up 8.4% YoY while realisation increased 2.3% YoY to Rs. 5,051/ton. Ambuja Cement’s reported in line numbers, with aggregate EBITDA/mt stood at Rs. 748 and Volume up 4.4% YoY while realisation increased 1.0% YoY. Shree cement reported in line numbers, with aggregate EBITDA/mt stood at Rs. 1067 and Volume at 5.9 mnmt rose 11.4% YoY while realisation increased 4.5% YoY to Rs. 4,316/ton.
Most of the management expect relief on fuel costs from 4Q onwards, with recent moderation in petcoke and international Coal prices. Freight
cost benefits on account of change in Axle load norms was visible for most companies during 3Q. After the weak exit pricing for December and January as well, Cement companies have made attempts for price hikes in several markets in February, including the maximum hike undertaken in Southern region (up 5.8% vs. Q3FY19) which should benefit Q4 performance, if the hikes sustain. Central and eastern regions show a marginal decline (down 0.6% and 0.3%, respectively), while northern and western regions show healthy increase (up 2.2% and 2.6% vs. Q3FY19). The uptrend witnessed in cement prices along with benefits accruing from lower power and fuel cost and increasing utilisation level is set to benefit cement players going ahead.
Company (Rs Cr) Net Sales
YoY %
QoQ %
OperatingProfit
YoY %
QoQ %
OPM %
Net Profit
YoY %
QoQ %
NPM %
Ultratech Cement Ltd. 9390 19% 15% 1445 8% 18% 15% 390 -15% 4% 4%
Ambuja Cements Ltd. 6729 9% 12% 908 -8% 13% 13% 1374 190% 250% 20%
ACC Ltd. 3789 11% 13% 488 10% 10% 13% 729 260% 253% 19%
Shree Cement Ltd. 2781 21% 8% 710 25% 37% 26% 301 -10% 511% 11%
Odisha Cement Ltd. 2175 5% 425 -11% 20% 31 -39% 1%
Jaiprakash Associates Ltd. 1517 37% -20% 127 -10% -50% 8% -98 Loss Loss -6%
The India Cements Ltd. 1316 9% -5% 135 -19% -13% 10% 3 -79% 119% 0%
JK Cement Ltd. 1258 13% 16% 211 24% 24% 17% 61 -16% -6% 5%
The Ramco Cements Ltd. 1207 15% 6% 214 -9% -13% 18% 101 -18% -12% 8%
JK Lakshmi Cement Ltd. 935 12% 10% 98 4% 7% 11% 15 72% 89% 2%
Orient Cement Ltd. 571 12% 2% 38 -3% 6% 7% -14 Loss Loss -2%
Heidelberg Cement India Ltd.
558 15% 16% 123 48% 5% 22% 59 84% 17% 10%
Star Cement Ltd. 416 11% 15% 122 -14% 77% 29% 84 -8% 119% 20%
HIL Ltd. 326 16% 6% 31 12% -25% 10% 7 -51% -74% 2%
Sagar Cements Ltd. 319 28% 24% 30 -5% 43% 9% -3 PL Loss -1%
KCP Ltd. 273 4% -3% 11 -69% -67% 4% -4 PL PL -1%
Sanghi Industries Ltd. 266 -5% 9% 32 -48% -1% 12% 4 -87% 120% 2%
Ramco Industries Ltd. 174 -3% -4% 17 -9% 0% 10% 11 -8% -59% 6%
Total 34000 14% 17% 5164 2% 21% 15% 3052 72% 133% 9%
Source: AceEquity, PL-Profit to Loss and LP=Loss to Profit
Cement Companies
37 March 2019INSIGHT
FMCG SectorFMCG companies recorded robust growth in the September quarter primarily led by double digit volume growth witnessed in most of FMCG companies coupled with enhanced distribution network, improving rural demand and cost rationalisation measures. Rural sales have been growing stronger than urban sales on the back of increase in direct distribution network in rural areas, reducing dependency on wholesale network post GST implementation. This is the sixth consecutive quarter where rural growth has been higher than urban growth for most of the players. Most companies have declared that rural sales are growing stronger than urban sales as FMCG companies are focusing on increasing their direct distribution network in the rural areas and thereby, reduce their dependency on wholesale network post GST implementation. Even after witnessing a surge in rural revenues, their contribution to overall revenues is still way below their peak levels recorded in 2015. The trade channels, including wholesale and CSD, have largely stabilized, post disruption in the past few quarters on account of GST and is expected to pick up in FY19. Input costs remain a mixed bag including those of crude derivatives and agri commodities
unfavorable currency movements has affected the profitability of the international business and overall margins of the consumer goods companies. VAM has seen a sharp decline in prices by 14% YoY and 7.8% QoQ. Sugar prices remains flattish QoQ while down 2.2% YoY. Mentha has cooled down in Q4 from the higher levels of Q3FY19. It is down 6.2% QoQ but remains up 11.1% YoY. Barley prices remain firm; is up 31.6% YoY and 2% QoQ in Q4FY19. Palm oil prices continue to rise; it has increased 26.3% from the 3-year bottom in Nov’18. It is up 6.7% QoQ, however down 12.3% YoY in Q4FY19.
On the performance front in the large-cap space, HUL, ITC and Britannia maintained their steady performance with revenue growth at 11-15%, driven by volume growth of 7-10% in Q3FY2019. ITC’s cigarette business sales volume grew by ~7% during the quarter. Further, companies such as Dabur India and Marico registered double-digit revenue growth of ~12% and ~15%, respectively, in Q3FY2019. On the other hand, companies such as GCPL and Emami facing structural issues registered 1% and 3.5% volume growth, respectively, in the domestic business due to unfavourable weather conditions affecting the sales of winter products and household
insecticide products during the quarter.
Management of most of the FMCG companies is optimistic and hopeful about the demand recovery in rural India to accelerate, going ahead, led by Interim Budget 2019-2020 focused on boosting rural economy and in view of the upcoming 2019 central elections.
Hindustan Unilever management said demand outlook is positive and rural is growing 1.3x faster than Urban. Impact of rising crude and depreciating currency was off-set by improved product mix and operating leverage. The merger process with GSK and Integration of acquisition of Adityaa Milk Ice-cream is on track. Marico has maintained its Domestic volume growth guidance of 8-10% (5-7% in parachute, double digit in VAHO and double-digit constant currency growth internationally. Expect 15-20% decline in copra costs YoY next year and Target 18% plus EBITDA margins in FY20. Britannia Industries expect input cost inflation of 4-5% in FY20. Hopeful of volume growth to return back to double-digits. Innovations in dairy segment, new launches in core biscuits and adjacencies will lead to transformation. Emami maintained its Gross margins expectation in

38March 2019 INSIGHT
FMCG CompaniesCompany (Rs Cr) Net
SalesYoY %
QoQ %
OperatingProfit
YoY %
QoQ %
OPM %
Net Profit
YoY %
QoQ %
NPM %
ITC Ltd. 11340 15% 2% 4326 11% 3% 38% 3209 4% 9% 28%
Hindustan Unilever Ltd. 9357 12% 2% 2046 22% 1% 22% 1444 9% -5% 15%
United Spirits Ltd. 7764 9% 9% 348 28% -20% 4% 192 43% -26% 2%
United Breweries Ltd. 3188 22% -4% 248 62% -22% 8% 109 130% -33% 3%
Nestle India Ltd. 2879 11% -1% 551 3% -24% 19% 342 10% -23% 12%
Britannia Industries Ltd. 2827 11% -1% 452 13% -1% 16% 301 14% -1% 11%
Godrej Consumer Products Ltd.
2696 4% 2% 609 3% 25% 23% 423 -1% -27% 16%
Godrej Industries Ltd. 2473 18% -6% 58 25% -57% 2% -22 Loss PL -1%
Dabur India Ltd. 2199 12% 3% 445 10% -1% 20% 367 10% -3% 17%
Radico Khaitan Ltd. 2058 18% 8% 96 27% 4% 5% 52 49% 5% 3%
Tata Global Beverages Ltd.
1913 11% 9% 196 -17% 18% 10% 121 -35% -3% 6%
Marico Ltd. 1861 15% 1% 349 16% 19% 19% 252 13% 16% 14%
Godrej Agrovet Ltd. 1448 19% -8% 101 4% -28% 7% 45 -13% -53% 3%
Hatsun Agro Products Ltd.
1154 14% -3% 95 9% -23% 8% 19 24% -52% 2%
Glaxosmithkline Con-sumer Healthcare Ltd.
1117 7% -12% 239 15% -33% 21% 221 35% -20% 20%
Colgate-Palmolive (India) Ltd.
1092 6% -6% 314 11% -5% 29% 192 13% -2% 18%
Future Consumer Ltd. 991 26% -2% 27 64% 7% 3% 0 Loss PL 0%
KRBL Ltd. 936 19% -25% 203 13% -13% 22% 107 -13% -32% 11%
Jubilant FoodWorks Ltd. 929 17% 5% 171 25% 16% 18% 97 46% 24% 10%
Avanti Feeds Ltd. 835 18% 11% 110 -29% 52% 13% 85 -19% 57% 10%
Procter & Gamble Hygiene & Health Care Ltd.
818 16% 3% 191 -9% -9% 23% 124 -5% -14% 15%
Emami Ltd. 811 7% 29% 267 1% 41% 33% 138 -6% 67% 17%
Godfrey Phillips India Ltd.
681 13% 4% 116 27% -2% 17% 78 27% 11% 12%
Gillette India Ltd. 476 17% 4% 98 0% -8% 21% 54 -8% -17% 11%
Jyothy Laboratories Ltd. 434 1% 2% 72 4% -2% 17% 48 47% 7% 11%
Bajaj Consumer Care Ltd. 222 12% 8% 71 5% 17% 32% 60 9% 16% 27%
Zydus Wellness Ltd. 145 10% 5% 38 14% -2% 26% 40 10% -4% 28%
Bombay Burmah Trading Corporation Ltd.
54 10% -6% -5 Loss Loss -9% -12 Loss Loss -22%
Total 62700 13% 1% 11829 12% -1% 19% 8088 7% -4% 13%
Source: AceEquity, PL-Profit to Loss and LP=Loss to Profit
Q4FY19 while Kesh King’s recovery momentum appears strong. Dabur India expects consumption scenario should improve due to the budget. Rural sales to outpace Urban sales
by ~200bps in FY20. Price rise of 1.5-2% taken to neutralize input cost inflation. Management believes gross margins will recover in Q4FY19 on a standalone basis but subsidiary gross
margins could be under pressure. Godrej Consumer expects gross margins to improve going forward.
39 March 2019INSIGHT
Information Technology SectorDuring Q3FY19, the top five Indian IT companies delivered strong revenue growth despite weak seasonality, with acceleration in constant currency (CC) revenue growth on a QoQ/YoY basis. Tier-I IT companies reported another healthy quarter on deal signing front and digital growth. Revenues from digital segment witnessed growth of 35-40% on a YoY basis while deal signings also witnessed an improved trajectory in 9MFY19 over 9MFY18 (Infosys deal TCV grew 2x YoY in 9MFY19, HCL Tech bookings grew 40% YoY in 9M and TCS TCV grew 20% QoQ). On the revenue perspective, Tier-I IT companies reported CC revenue growth of 1.8-5.6% QoQ /7.0-13.0% YoY in Q3FY19, against 0.8-3.3% QoQ /3.0-11.2% YoY in Q3FY18. Growth was led by HCL Tech with revenue growth at 5.6% QoQ (CC) driven by infrastructure services, which grew 10.4% sequentially. It was followed
by Tech M (4.3%), Infosys (2.7%), Wipro (2.4%) and TCS (1.8%). Among midcaps, Persistent Systems, Mastek, LT Infotech and NIIT Tech reported healthy performance. On operating margin perspective, baring Wipro and Tech M, EBIT margin of remaining tier-I IT companies declined on a sequential basis during Q3FY19. Pressure on operating profitability during the quarter was attributed to higher subcontractor expenses (due to shortage of talents), incentives to control attritions, local hires and increased investments in enhancing
digital capabilities and transition of large deals. Wipro reported a stellar quarter as IT services EBIT services margins expanded 120 bps QoQ to 19.8% led by rupee depreciation and operational efficiencies. Among midcaps Persistent and NIIT Tech delivered strong margin performance.
Management commentary of most IT companies remained broadly positive on demand environment and indicated flat IT budget for CY19 despite potential macro uncertainties. Most IT companies highlighted strong deal inflows and healthy deal pipelines during the quarter. However, operating profitability is expected to be impacted going ahead owing to talent crunch at onsite locations, higher level of attrition rates and increasing local hires. Infosys increased its CC revenue guidance to 8.5-9% from 6-8 in constant currency terms suggesting a strong Q4 on the back of a positive surprise in Q3 while
Management commen-tary of most IT compa-nies remained broadly positive on demand environment and indi-cated flat IT budget for CY19 despite potential macro uncertainties.
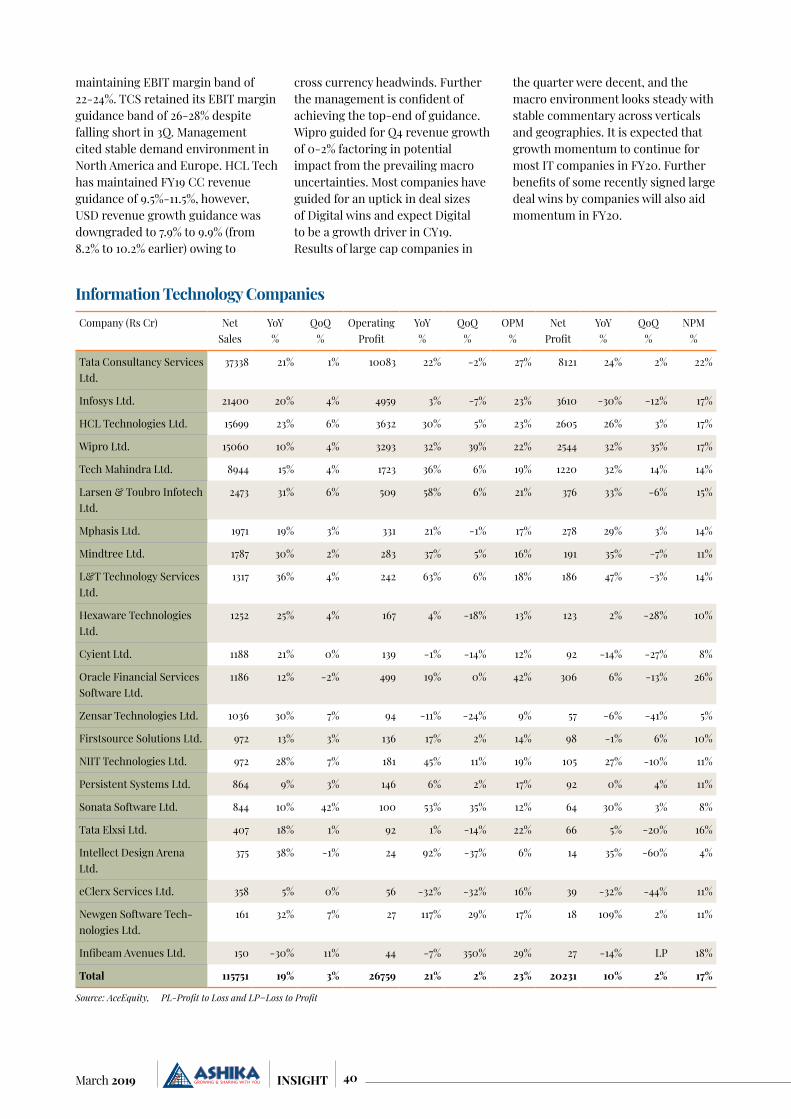
40March 2019 INSIGHT
Company (Rs Cr) Net Sales
YoY %
QoQ %
OperatingProfit
YoY %
QoQ %
OPM %
Net Profit
YoY %
QoQ %
NPM %
Tata Consultancy Services Ltd.
37338 21% 1% 10083 22% -2% 27% 8121 24% 2% 22%
Infosys Ltd. 21400 20% 4% 4959 3% -7% 23% 3610 -30% -12% 17%
HCL Technologies Ltd. 15699 23% 6% 3632 30% 5% 23% 2605 26% 3% 17%
Wipro Ltd. 15060 10% 4% 3293 32% 39% 22% 2544 32% 35% 17%
Tech Mahindra Ltd. 8944 15% 4% 1723 36% 6% 19% 1220 32% 14% 14%
Larsen & Toubro Infotech Ltd.
2473 31% 6% 509 58% 6% 21% 376 33% -6% 15%
Mphasis Ltd. 1971 19% 3% 331 21% -1% 17% 278 29% 3% 14%
Mindtree Ltd. 1787 30% 2% 283 37% 5% 16% 191 35% -7% 11%
L&T Technology Services Ltd.
1317 36% 4% 242 63% 6% 18% 186 47% -3% 14%
Hexaware Technologies Ltd.
1252 25% 4% 167 4% -18% 13% 123 2% -28% 10%
Cyient Ltd. 1188 21% 0% 139 -1% -14% 12% 92 -14% -27% 8%
Oracle Financial Services Software Ltd.
1186 12% -2% 499 19% 0% 42% 306 6% -13% 26%
Zensar Technologies Ltd. 1036 30% 7% 94 -11% -24% 9% 57 -6% -41% 5%
Firstsource Solutions Ltd. 972 13% 3% 136 17% 2% 14% 98 -1% 6% 10%
NIIT Technologies Ltd. 972 28% 7% 181 45% 11% 19% 105 27% -10% 11%
Persistent Systems Ltd. 864 9% 3% 146 6% 2% 17% 92 0% 4% 11%
Sonata Software Ltd. 844 10% 42% 100 53% 35% 12% 64 30% 3% 8%
Tata Elxsi Ltd. 407 18% 1% 92 1% -14% 22% 66 5% -20% 16%
Intellect Design Arena Ltd.
375 38% -1% 24 92% -37% 6% 14 35% -60% 4%
eClerx Services Ltd. 358 5% 0% 56 -32% -32% 16% 39 -32% -44% 11%
Newgen Software Tech-nologies Ltd.
161 32% 7% 27 117% 29% 17% 18 109% 2% 11%
Infibeam Avenues Ltd. 150 -30% 11% 44 -7% 350% 29% 27 -14% LP 18%
Total 115751 19% 3% 26759 21% 2% 23% 20231 10% 2% 17%
Source: AceEquity, PL-Profit to Loss and LP=Loss to Profit
Information Technology Companies
maintaining EBIT margin band of 22-24%. TCS retained its EBIT margin guidance band of 26-28% despite falling short in 3Q. Management cited stable demand environment in North America and Europe. HCL Tech has maintained FY19 CC revenue guidance of 9.5%-11.5%, however, USD revenue growth guidance was downgraded to 7.9% to 9.9% (from 8.2% to 10.2% earlier) owing to
cross currency headwinds. Further the management is confident of achieving the top-end of guidance. Wipro guided for Q4 revenue growth of 0-2% factoring in potential impact from the prevailing macro uncertainties. Most companies have guided for an uptick in deal sizes of Digital wins and expect Digital to be a growth driver in CY19. Results of large cap companies in
the quarter were decent, and the macro environment looks steady with stable commentary across verticals and geographies. It is expected that growth momentum to continue for most IT companies in FY20. Further benefits of some recently signed large deal wins by companies will also aid momentum in FY20.
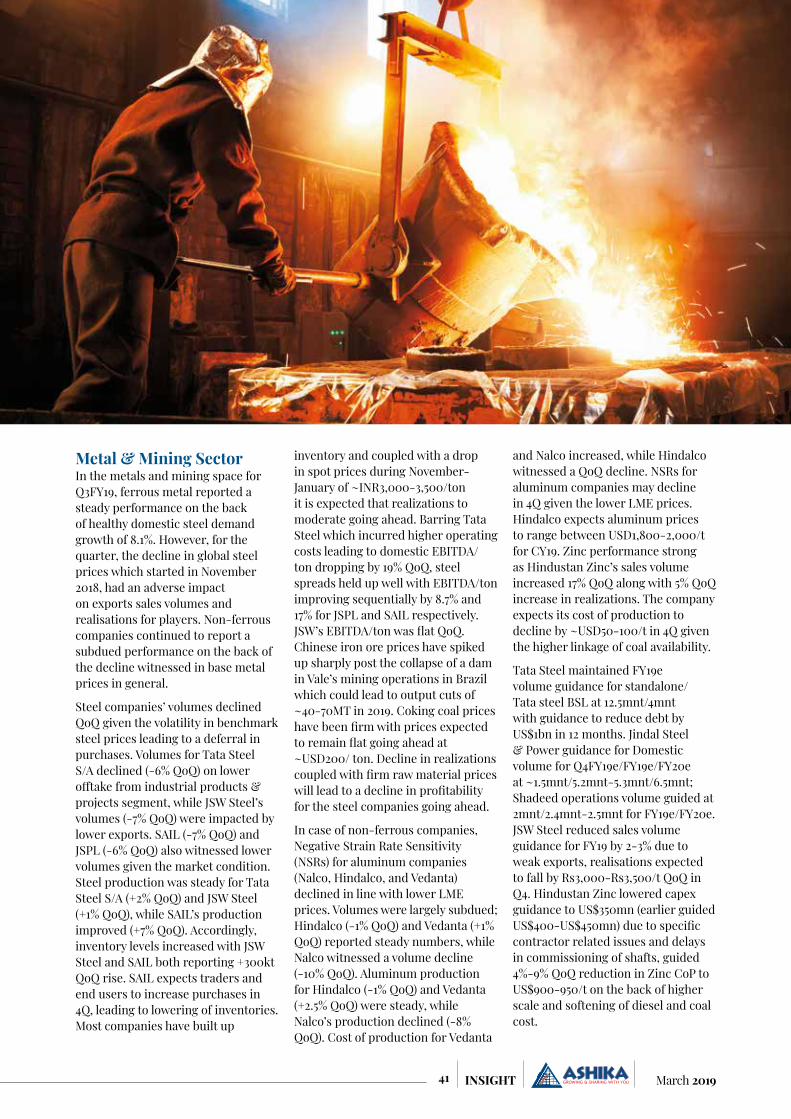
41 March 2019INSIGHT
Metal & Mining SectorIn the metals and mining space for Q3FY19, ferrous metal reported a steady performance on the back of healthy domestic steel demand growth of 8.1%. However, for the quarter, the decline in global steel prices which started in November 2018, had an adverse impact on exports sales volumes and realisations for players. Non-ferrous companies continued to report a subdued performance on the back of the decline witnessed in base metal prices in general.
Steel companies’ volumes declined QoQ given the volatility in benchmark steel prices leading to a deferral in purchases. Volumes for Tata Steel S/A declined (-6% QoQ) on lower offtake from industrial products & projects segment, while JSW Steel’s volumes (-7% QoQ) were impacted by lower exports. SAIL (-7% QoQ) and JSPL (-6% QoQ) also witnessed lower volumes given the market condition. Steel production was steady for Tata Steel S/A (+2% QoQ) and JSW Steel (+1% QoQ), while SAIL’s production improved (+7% QoQ). Accordingly, inventory levels increased with JSW Steel and SAIL both reporting +300kt QoQ rise. SAIL expects traders and end users to increase purchases in 4Q, leading to lowering of inventories. Most companies have built up
inventory and coupled with a drop in spot prices during November-January of ~INR3,000-3,500/ton it is expected that realizations to moderate going ahead. Barring Tata Steel which incurred higher operating costs leading to domestic EBITDA/ton dropping by 19% QoQ, steel spreads held up well with EBITDA/ton improving sequentially by 8.7% and 17% for JSPL and SAIL respectively. JSW’s EBITDA/ton was flat QoQ. Chinese iron ore prices have spiked up sharply post the collapse of a dam in Vale’s mining operations in Brazil which could lead to output cuts of ~40-70MT in 2019. Coking coal prices have been firm with prices expected to remain flat going ahead at ~USD200/ ton. Decline in realizations coupled with firm raw material prices will lead to a decline in profitability for the steel companies going ahead.
In case of non-ferrous companies, Negative Strain Rate Sensitivity (NSRs) for aluminum companies (Nalco, Hindalco, and Vedanta) declined in line with lower LME prices. Volumes were largely subdued; Hindalco (-1% QoQ) and Vedanta (+1% QoQ) reported steady numbers, while Nalco witnessed a volume decline (-10% QoQ). Aluminum production for Hindalco (-1% QoQ) and Vedanta (+2.5% QoQ) were steady, while Nalco’s production declined (-8% QoQ). Cost of production for Vedanta
and Nalco increased, while Hindalco witnessed a QoQ decline. NSRs for aluminum companies may decline in 4Q given the lower LME prices. Hindalco expects aluminum prices to range between USD1,800-2,000/t for CY19. Zinc performance strong as Hindustan Zinc’s sales volume increased 17% QoQ along with 5% QoQ increase in realizations. The company expects its cost of production to decline by ~USD50-100/t in 4Q given the higher linkage of coal availability.
Tata Steel maintained FY19e volume guidance for standalone/Tata steel BSL at 12.5mnt/4mnt with guidance to reduce debt by US$1bn in 12 months. Jindal Steel & Power guidance for Domestic volume for Q4FY19e/FY19e/FY20e at ~1.5mnt/5.2mnt-5.3mnt/6.5mnt; Shadeed operations volume guided at 2mnt/2.4mnt-2.5mnt for FY19e/FY20e. JSW Steel reduced sales volume guidance for FY19 by 2-3% due to weak exports, realisations expected to fall by Rs3,000-Rs3,500/t QoQ in Q4. Hindustan Zinc lowered capex guidance to US$350mn (earlier guided US$400-US$450mn) due to specific contractor related issues and delays in commissioning of shafts, guided 4%-9% QoQ reduction in Zinc CoP to US$900-950/t on the back of higher scale and softening of diesel and coal cost.
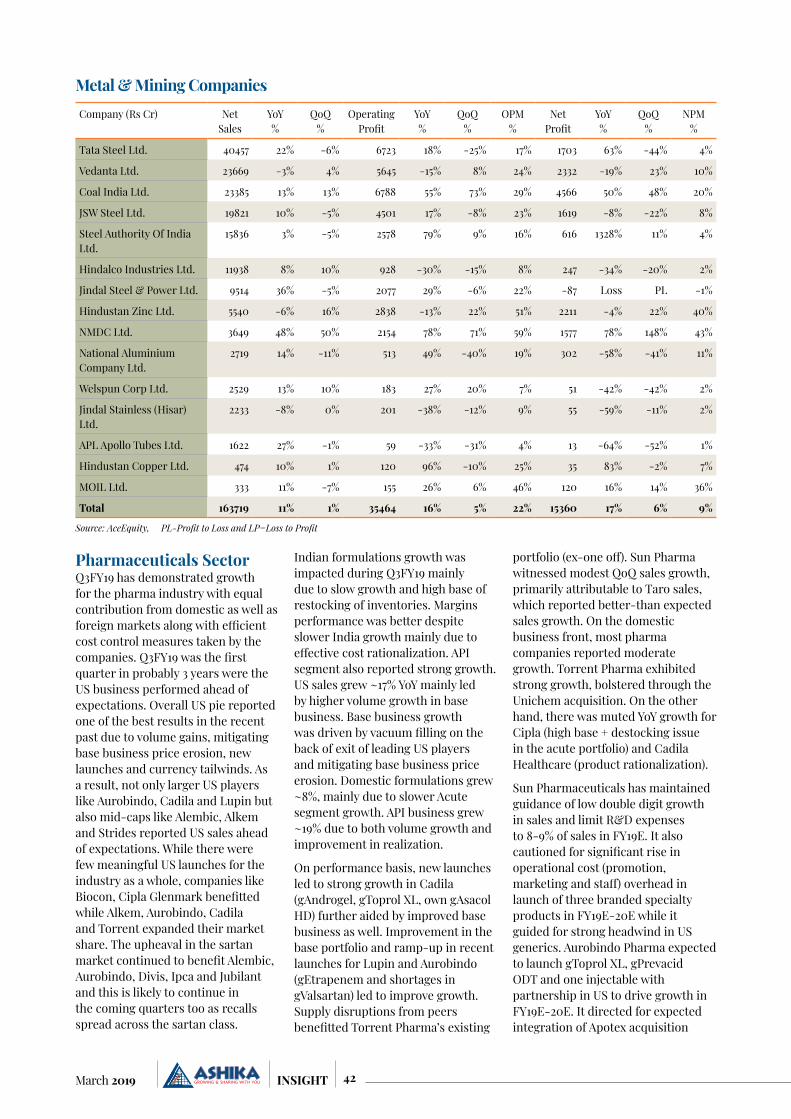
42March 2019 INSIGHT
Company (Rs Cr) Net Sales
YoY %
QoQ %
OperatingProfit
YoY %
QoQ %
OPM %
Net Profit
YoY %
QoQ %
NPM %
Tata Steel Ltd. 40457 22% -6% 6723 18% -25% 17% 1703 63% -44% 4%
Vedanta Ltd. 23669 -3% 4% 5645 -15% 8% 24% 2332 -19% 23% 10%
Coal India Ltd. 23385 13% 13% 6788 55% 73% 29% 4566 50% 48% 20%
JSW Steel Ltd. 19821 10% -5% 4501 17% -8% 23% 1619 -8% -22% 8%
Steel Authority Of India Ltd.
15836 3% -5% 2578 79% 9% 16% 616 1328% 11% 4%
Hindalco Industries Ltd. 11938 8% 10% 928 -30% -15% 8% 247 -34% -20% 2%
Jindal Steel & Power Ltd. 9514 36% -5% 2077 29% -6% 22% -87 Loss PL -1%
Hindustan Zinc Ltd. 5540 -6% 16% 2838 -13% 22% 51% 2211 -4% 22% 40%
NMDC Ltd. 3649 48% 50% 2154 78% 71% 59% 1577 78% 148% 43%
National Aluminium Company Ltd.
2719 14% -11% 513 49% -40% 19% 302 -58% -41% 11%
Welspun Corp Ltd. 2529 13% 10% 183 27% 20% 7% 51 -42% -42% 2%
Jindal Stainless (Hisar) Ltd.
2233 -8% 0% 201 -38% -12% 9% 55 -59% -11% 2%
APL Apollo Tubes Ltd. 1622 27% -1% 59 -33% -31% 4% 13 -64% -52% 1%
Hindustan Copper Ltd. 474 10% 1% 120 96% -10% 25% 35 83% -2% 7%
MOIL Ltd. 333 11% -7% 155 26% 6% 46% 120 16% 14% 36%
Total 163719 11% 1% 35464 16% 5% 22% 15360 17% 6% 9%
Source: AceEquity, PL-Profit to Loss and LP=Loss to Profit
Metal & Mining Companies
Pharmaceuticals SectorQ3FY19 has demonstrated growth for the pharma industry with equal contribution from domestic as well as foreign markets along with efficient cost control measures taken by the companies. Q3FY19 was the first quarter in probably 3 years were the US business performed ahead of expectations. Overall US pie reported one of the best results in the recent past due to volume gains, mitigating base business price erosion, new launches and currency tailwinds. As a result, not only larger US players like Aurobindo, Cadila and Lupin but also mid-caps like Alembic, Alkem and Strides reported US sales ahead of expectations. While there were few meaningful US launches for the industry as a whole, companies like Biocon, Cipla Glenmark benefitted while Alkem, Aurobindo, Cadila and Torrent expanded their market share. The upheaval in the sartan market continued to benefit Alembic, Aurobindo, Divis, Ipca and Jubilant and this is likely to continue in the coming quarters too as recalls spread across the sartan class.
Indian formulations growth was impacted during Q3FY19 mainly due to slow growth and high base of restocking of inventories. Margins performance was better despite slower India growth mainly due to effective cost rationalization. API segment also reported strong growth. US sales grew ~17% YoY mainly led by higher volume growth in base business. Base business growth was driven by vacuum filling on the back of exit of leading US players and mitigating base business price erosion. Domestic formulations grew ~8%, mainly due to slower Acute segment growth. API business grew ~19% due to both volume growth and improvement in realization.
On performance basis, new launches led to strong growth in Cadila (gAndrogel, gToprol XL, own gAsacol HD) further aided by improved base business as well. Improvement in the base portfolio and ramp-up in recent launches for Lupin and Aurobindo (gEtrapenem and shortages in gValsartan) led to improve growth. Supply disruptions from peers benefitted Torrent Pharma’s existing
portfolio (ex-one off). Sun Pharma witnessed modest QoQ sales growth, primarily attributable to Taro sales, which reported better-than expected sales growth. On the domestic business front, most pharma companies reported moderate growth. Torrent Pharma exhibited strong growth, bolstered through the Unichem acquisition. On the other hand, there was muted YoY growth for Cipla (high base + destocking issue in the acute portfolio) and Cadila Healthcare (product rationalization).
Sun Pharmaceuticals has maintained guidance of low double digit growth in sales and limit R&D expenses to 8‐9% of sales in FY19E. It also cautioned for significant rise in operational cost (promotion, marketing and staff) overhead in launch of three branded specialty products in FY19E-20E while it guided for strong headwind in US generics. Aurobindo Pharma expected to launch gToprol XL, gPrevacid ODT and one injectable with partnership in US to drive growth in FY19E-20E. It directed for expected integration of Apotex acquisition

43 March 2019INSIGHT
from Q4FY19E onwards. Cipla’s management maintains guidance of double digit growth across India & the US market; company is on track for 20 filings. Lupin guided seasonal sales of Tamiflu (PFOS) and India growth (15%) to drive sales in Q4FY19E. Dr Reddy’s Lab guided key US launches including gSuboxone,
gNuvaring, and gCopaxone to drive revenues and margin in FY20E-21E. Expects favourable outcome from the ongoing court case on gSuboxone as it continues injunction on its launch despite originator lost in summary judgment. Cadila has prioritized critical launches, which should support margins over the next few
quarters. Glenmark Pharma plans for partnership model before launching NDA product Ryaltis in Q1FY20E. and to commence Phase-III trial for Xolair by Q4FY19E. Also, it will explore opportunity to separate listing of its R&D comprising NCEs/NBEs in US.
Company (Rs Cr) Net Sales
YoY %
QoQ %
OperatingProfit
YoY %
QoQ %
OPM %
Net Profit
YoY %
QoQ %
NPM %
Sun Pharmaceutical Industries Ltd.
7657 16% 12% 2153 48% 41% 28% 1459 311% LP 19%
Aurobindo Pharma Ltd. 5175 21% 11% 1086 6% 10% 21% 710 19% 16% 14%
Lupin Ltd. 4378 12% 13% 753 9% 37% 17% -154 PL PL -4%
Cipla Ltd. 3906 2% -1% 708 -14% 1% 18% 323 -20% -12% 8%
Dr. Reddys Laboratories Ltd.
3786 5% 3% 805 2% 6% 21% 491 67% -3% 13%
Cadila Healthcare Ltd. 3516 11% 24% 840 -2% 22% 24% 513 -5% 25% 15%
Piramal Enterprises Ltd. 3489 22% 11% 2027 40% 23% 58% 536 22% 32% 15%
Glenmark Pharmaceuti-cals Ltd.
2510 16% -1% 435 35% -1% 17% 116 11% -72% 5%
Jubilant Life Sciences Ltd. 2353 15% 5% 493 18% 10% 21% 268 26% 28% 11%
Apollo Hospitals Enter-prise Ltd.
2169 17% 4% 268 21% 4% 12% 87 29% 10% 4%
Aster DM Healthcare Ltd. 2150 19% 17% 263 53% 110% 12% 117 -26% 698% 5%
Torrent Pharmaceuticals Ltd.
1948 36% 5% 561 56% 19% 29% 246 324% 37% 13%
Alkem Laboratories Ltd. 1925 11% 0% 312 -14% -14% 16% 205 14% -21% 11%
Biocon Ltd. 1541 46% 17% 381 72% 12% 25% 231 115% -39% 15%
Divis Laboratories Ltd. 1343 29% 5% 523 60% 2% 39% 379 69% -5% 28%
Fortis Healthcare Ltd. 1103 -2% -3% 38 -26% -41% 3% -197 Loss Loss -18%
Wockhardt Ltd. 1046 4% -7% -18 PL PL -2% -77 Loss Loss -7%
Alembic Pharmaceuticals Ltd.
1018 21% -10% 242 29% -20% 24% 171 30% -15% 17%
Abbott India Ltd. 948 8% -3% 146 -10% -24% 15% 117 1% -15% 12%
Ipca Laboratories Ltd. 948 10% -5% 232 43% 34% 24% 160 52% 34% 17%
Glaxosmithkline Pharma-ceuticals Ltd.
825 17% 1% 137 -3% -17% 17% 113 26% 12% 14%
Natco Pharma Ltd. 557 -1% 2% 208 -27% -5% 37% 159 -27% -12% 29%
Pfizer Ltd. 514 13% -1% 154 31% 19% 30% 132 51% 38% 26%
Ajanta Pharma Ltd. 485 -17% -11% 107 -46% -35% 22% 67 -55% -47% 14%
Syngene International Ltd.
467 20% 12% 140 26% 11% 30% 87 6% 11% 19%
Dr. Lal Pathlabs Ltd. 293 11% -8% 66 16% -24% 22% 46 27% -20% 16%
Eris Lifesciences Ltd. 248 20% -5% 94 15% -7% 38% 80 7% -6% 32%
Astrazeneca Pharma India Ltd.
215 67% 33% 41 LP 177% 19% 29 LP 219% 14%
Sun Pharma Advanced Research Company Ltd.
20 2% -68% -70 Loss Loss -354% -69 Loss Loss -347%
Total 56533 14% 6% 13125 19% 13% 23% 6347 29% 17% 11%Source: AceEquity, PL-Profit to Loss and LP=Loss to Profit
Pharma Companies

44March 2019 INSIGHT
Telecom SectorBucking the steep declining trend of the past several quarters, India wireless revenue for incumbents saw some stability during 3QFY19, led by ARPU improvement. This quarter marked the first quarter of full impact of minimum ARPU recharge plans rolled out by Vodafone Idea and Airtel. Consequently, the quarter witness subscriber base re-alignment amongst Vodafone Idea and Airtel as both the operators let go low ARPU/incoming customers. Q3FY19 witnessed re-alignment of customer base of Vodafone Idea and Airtel wherein Airtel lost 48 million (mn) subscribers (subs), majority were low ARPU/incoming customers. On account of this, subscriber base of the company is now at 284.2 mn subs while Vodafone Idea reported net
loss of 35.1 mn subs and the base is now at 387.2 mn. In terms of 4G subs additions, Jio remained in leadership position with 27.8 mn followed by Airtel and Vodafone Idea with 11.3 mn & 9.5 mn 4G subscriber additions during Q3FY19.
For Bharti, India wireless revenue was down 0.6% with ARPU of Rs. 104, up 2.9% QoQ (exit ARPU was at Rs. 118 on subscriber base decline). Non-wireless India revenues were sluggish on account of 7% QoQ revenue decline in Airtel business revenues. Africa business revenues was up 4.5% QoQ growth aided by Airtel money and strong data growth. Vodafone Idea’s combined entity revenues decline by 2.2% QoQ on account of loss of subscribers and marginal ARPU growth of 1.5% QoQ. In the
tower space, Infratel witnessed a net decline of 63 tenancies on a QoQ basis while rental revenues for the quarter were boosted by one-time exit charge. Tata Communication’s data segment performance was boosted by one-offs in Q3FY19 while voice business performance continued to be weak.
The management of telecom companies has guided that subscriber churn impact due to implementation of the minimum recharge plans for both Bharti and Vodafone Idea was not fully achieved in 3Q; the impact is expected to spillover in Q4FY19 and Q1FY20. Bharti will share its capex guidance next quarter, but indicated that it has peaked-out and plans to deleverage balance sheet through the Africa IPO.
Company (Rs Cr) Net Sales
YoY %
QoQ %
OperatingProfit
YoY %
QoQ %
OPM %
Net Profit
YoY %
QoQ %
NPM %
Bharti Airtel Ltd. 20519 1% 0% 6146 -18% 0% 30% 392 17% 357% 2%
Vodafone Idea Ltd. 11752 81% 54% 1137 -7% 146% 10% -5044 Loss Loss -43%
Tata Communications Ltd.
4269 3% 5% 843 31% 34% 20% 168 765% LP 4%
Bharti Infratel Ltd. 1733 2% 1% 822 3% 7% 47% 431 64% 19% 25%
Reliance Communica-tions Ltd.
1070 -6% 10% 146 -34% 43% 14% -236 Loss PL -22%
Mahanagar Telephone Nigam Ltd.
515 -11% 16% -330 Loss Loss -64% -832 Loss Loss -162%
Tata Teleservices (Maha-rashtra) Ltd.
305 -27% -5% 71 108% 63% 23% -409 Loss Loss -134%
Total 40163 15% 13% 8834 -13% 14% 22% -5531 Loss Loss -14%Source: AceEquity, PL-Profit to Loss and LP=Loss to Profit
Telecom Companies

45 March 2019INSIGHT
Information technologyDigital disruption in technological field has steadily changed the dynamics of Indian IT industry. Digital transformation involves using technologies to remake a process to become more efficient and effective.
Digitalization the new growth driver
SECTOR OUTLOOK

46March 2019 INSIGHT
Cloud computing, the Internet of Things, Big Data and Artificial Intelligence are now days notable topics which gain prominence in digital platform. In sync with the technological
disruption, Indian technological companies have grad-ually shifted their core focus to digital space and now digital technologies constitute over 20% of revenue for the Indian IT industry. On a year on year basis, digital revenue grew by 30% to touch USD 33 billion and becoming the new growth driver for Indian IT companies. In effort to enhance digital capabilities, the industry is investing in setting up centers of excellence and innovation hubs in key markets. As per NASSCOM, 80% of the incremental IT spending by global companies is expected to be on the digital technologies. Further, it has been estimated that by the year 2025, the share of traditional technologies is expected to reduce to 40% from 80%, while share of digital technologies is expected to rise to 60%. Moreover, a report from Ministry of Electronics and Information Technology, claim that India can create over USD 1 trillion of economic value from the digital economy in 2025, with half the opportunity originating in new digital ecosystems that can spring up in diverse sectors. Thus, Indian IT industry would be the key beneficiary of digital transformation happening globally.
Digital revenue shares steadily increasing for IT SectorAs per NASSCOM, the digital revenues for IT companies are growing at 30% in India, which is nearly 1.5x more than global digital growth rate. The projects in Digital are more skill intensive than people intensive and require companies to focus on re-skilling their workforce to address these opportunities. There is significant oppor-tunity for Indian service providers as digital technologies continue to be embedded in an ever-widening range of products and services. It has been estimated that digital market to reach USD 200-225 billion by 2020 and
USD 350-400 billion by 2025. However, headwinds like economic volatility, protectionism, competition, labour mobility and lack of talent would continue to pose a threat for the industry. Digital business, Blockchain, Internet of Things (IoT), AI/ML projects will be main drivers of growth going forward. As per CEO survey conducted by NASSCOM, digitization initiatives continue to grow at the same momentum. Digitization of businesses and enhanced customer experience emerged as the two top spending areas in the IT-BPM space for 2019, according to the survey. Domestically, government’s initiative to make a trillion-dollar digital economy also provided impetus to digitalization. Increasing access to internet in both urban as well as rural areas, ambitions e-governance projects, continued focus on skill development and growing digital transactions are some of the indicators of rapid growth of the India’s digital economy. Thus, it is expected that share of digital services in Indian IT exports to be doubled to ~30% by FY20, as the segment is growing at a healthy run rate of 30-35% per annum. The high growth rate will be supported by re-skilling of employees and increase merger & acquisitions by Indian IT companies, in order to enhance digital share in revenue.
Digital Opportunity
Source: Company Annual reports
Cloud
Analytics & BIG
Data
Mobility & Pervasive
Computing
Soci
al M
edia
Artifical Inteligence & Robotics
Indian IT-BPM exports (USD billion)
Source: NASSCOM & Media articles
117
125
13
7.2% Y-o-Y
9.2% Y-o-Y
7
FY17 FY18 FY19E
The IT exports in FY19 crossed $137 billion in revenues, higher than NASSCOM earlier estimate
Domestic IT Revenues (USD billion)
Source: NASSCOM & Media articles
38
4
7.9% Y-o-Y
7.9% Y-o-Y
1
44
FY17 FY18 FY19E
Domestic IT revenues during FY19 grew by 7.9% YoY at a slower pace
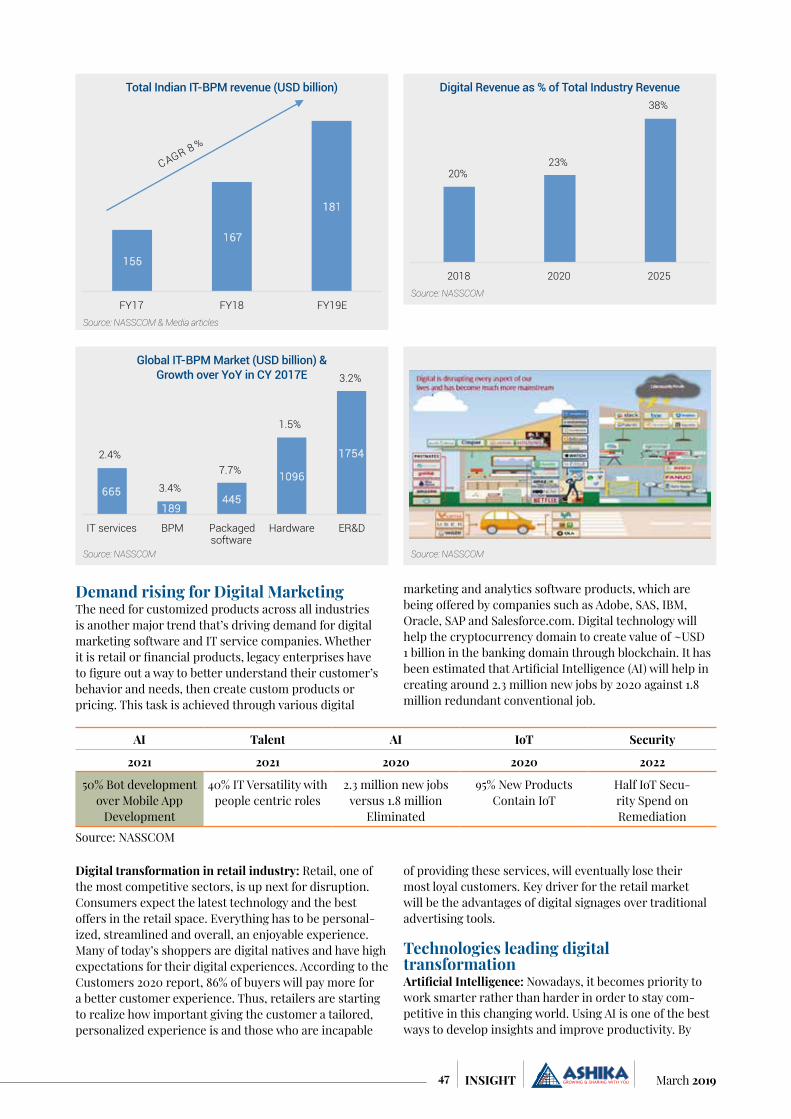
47 March 2019INSIGHT
Demand rising for Digital MarketingThe need for customized products across all industries is another major trend that’s driving demand for digital marketing software and IT service companies. Whether it is retail or financial products, legacy enterprises have to figure out a way to better understand their customer’s behavior and needs, then create custom products or pricing. This task is achieved through various digital
marketing and analytics software products, which are being offered by companies such as Adobe, SAS, IBM, Oracle, SAP and Salesforce.com. Digital technology will help the cryptocurrency domain to create value of ~USD 1 billion in the banking domain through blockchain. It has been estimated that Artificial Intelligence (AI) will help in creating around 2.3 million new jobs by 2020 against 1.8 million redundant conventional job.
Digital transformation in retail industry: Retail, one of the most competitive sectors, is up next for disruption. Consumers expect the latest technology and the best offers in the retail space. Everything has to be personal-ized, streamlined and overall, an enjoyable experience. Many of today’s shoppers are digital natives and have high expectations for their digital experiences. According to the Customers 2020 report, 86% of buyers will pay more for a better customer experience. Thus, retailers are starting to realize how important giving the customer a tailored, personalized experience is and those who are incapable
of providing these services, will eventually lose their most loyal customers. Key driver for the retail market will be the advantages of digital signages over traditional advertising tools.
Technologies leading digital transformationArtificial Intelligence: Nowadays, it becomes priority to work smarter rather than harder in order to stay com-petitive in this changing world. Using AI is one of the best ways to develop insights and improve productivity. By
Total Indian IT-BPM revenue (USD billion)
Source: NASSCOM & Media articles
155
167
181
FY17 FY18 FY19E
CAGR 8 %
Digital Revenue as % of Total Industry Revenue
Source: NASSCOM
20% 23%
38%
2018 2020 2025
Global IT-BPM Market (USD billion) & Growth over YoY in CY 2017E
Source: NASSCOM
665 189
445
1096
1754 2.4%
3.4%
7.7%
1.5%
3.2%
IT services BPM Packaged software
Hardware ER&D
Source: NASSCOM
AI Talent AI IoT Security
2021 2021 2020 2020 2022
50% Bot development over Mobile App
Development
40% IT Versatility with people centric roles
2.3 million new jobs versus 1.8 million
Eliminated
95% New Products Contain IoT
Half IoT Secu-rity Spend on Remediation
Source: NASSCOM
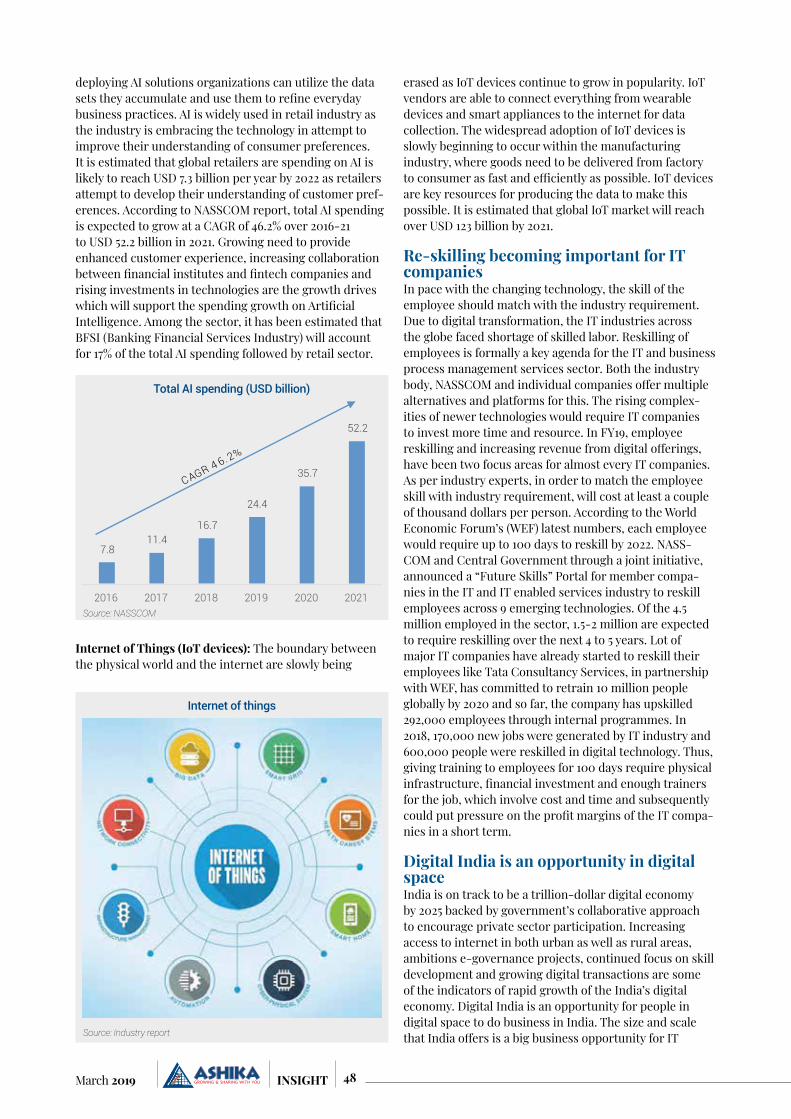
48March 2019 INSIGHT
deploying AI solutions organizations can utilize the data sets they accumulate and use them to refine everyday business practices. AI is widely used in retail industry as the industry is embracing the technology in attempt to improve their understanding of consumer preferences. It is estimated that global retailers are spending on AI is likely to reach USD 7.3 billion per year by 2022 as retailers attempt to develop their understanding of customer pref-erences. According to NASSCOM report, total AI spending is expected to grow at a CAGR of 46.2% over 2016-21 to USD 52.2 billion in 2021. Growing need to provide enhanced customer experience, increasing collaboration between financial institutes and fintech companies and rising investments in technologies are the growth drives which will support the spending growth on Artificial Intelligence. Among the sector, it has been estimated that BFSI (Banking Financial Services Industry) will account for 17% of the total AI spending followed by retail sector.
Internet of Things (IoT devices): The boundary between the physical world and the internet are slowly being
erased as IoT devices continue to grow in popularity. IoT vendors are able to connect everything from wearable devices and smart appliances to the internet for data collection. The widespread adoption of IoT devices is slowly beginning to occur within the manufacturing industry, where goods need to be delivered from factory to consumer as fast and efficiently as possible. IoT devices are key resources for producing the data to make this possible. It is estimated that global IoT market will reach over USD 123 billion by 2021.
Re-skilling becoming important for IT companiesIn pace with the changing technology, the skill of the employee should match with the industry requirement. Due to digital transformation, the IT industries across the globe faced shortage of skilled labor. Reskilling of employees is formally a key agenda for the IT and business process management services sector. Both the industry body, NASSCOM and individual companies offer multiple alternatives and platforms for this. The rising complex-ities of newer technologies would require IT companies to invest more time and resource. In FY19, employee reskilling and increasing revenue from digital offerings, have been two focus areas for almost every IT companies. As per industry experts, in order to match the employee skill with industry requirement, will cost at least a couple of thousand dollars per person. According to the World Economic Forum’s (WEF) latest numbers, each employee would require up to 100 days to reskill by 2022. NASS-COM and Central Government through a joint initiative, announced a “Future Skills” Portal for member compa-nies in the IT and IT enabled services industry to reskill employees across 9 emerging technologies. Of the 4.5 million employed in the sector, 1.5-2 million are expected to require reskilling over the next 4 to 5 years. Lot of major IT companies have already started to reskill their employees like Tata Consultancy Services, in partnership with WEF, has committed to retrain 10 million people globally by 2020 and so far, the company has upskilled 292,000 employees through internal programmes. In 2018, 170,000 new jobs were generated by IT industry and 600,000 people were reskilled in digital technology. Thus, giving training to employees for 100 days require physical infrastructure, financial investment and enough trainers for the job, which involve cost and time and subsequently could put pressure on the profit margins of the IT compa-nies in a short term.
Digital India is an opportunity in digital spaceIndia is on track to be a trillion-dollar digital economy by 2025 backed by government’s collaborative approach to encourage private sector participation. Increasing access to internet in both urban as well as rural areas, ambitions e-governance projects, continued focus on skill development and growing digital transactions are some of the indicators of rapid growth of the India’s digital economy. Digital India is an opportunity for people in digital space to do business in India. The size and scale that India offers is a big business opportunity for IT
Total AI spending (USD billion)
Source: NASSCOM
7.8 11.4
16.7
24.4
35.7
52.2
2016 2017 2018 2019 2020 2021
CAGR 4 6.2%
Internet of things
Source: Industry report

49 March 2019INSIGHT
companies. Currently, India’s digital economy generates about USD 200 billion of economic value (annually 8% of India’s GVA in FY18), largely from existing digital ecosys-tem comprising IT-BPM, digital communication services (including telecom), e-commerce, domestic electronics manufacturing, digital payments and direct subsidiary transfers. It is estimated that by 2025, India could create a digital economy of USD 800 billion to USD 1 trillion (nearly 18-23% of India’s nominal GDP). Current digital ecosystem could contribute up to USD 500 billion of economic value, but the potential could be huge if digital technologies are used to unlock productivity, savings and efficiency across more diverse sectors such as agriculture, education, energy, financial services, government services, health-care, logistics, manufacturing, trade and transportation. As per Ministry of Electronics and Information Technol-ogy, India’s e-commerce market grew to USD 35 billion, growing at 17% yoy in 2018, primarily led by rural India because of absence of shopping mall in these areas. Thus, the potential for five-fold increase in economic value from India’s digital transformation by 2025 would create a rapidly growing market for a host of digital services, platforms, applications, content and solutions. Govern-ment’s notable initiatives to push digitalization are Goods & Services Tax Network (GSTN), launching various digital skilling initiatives in aim to empower citizens with the knowhow of using IT and mobile services and transform-ing the country into cash-less economy. Other various government incentives such as referral bonus scheme to promote the use of BHIM, zero service tax on railway tickets booked online and launch of Aadhaar-based
mobile app are aimed at encouraging digital payments in the country.
100-130
215-265
5%
7.50%
Market size (USD billion) Share in GDP (%)
2016 2020
India’s Internet Economy
Source: NASSCOM
5% 6%
20%
FY2017 Q1 FY2018 FY2027
Digital transactions as % of GDP
Source: NASSCOM
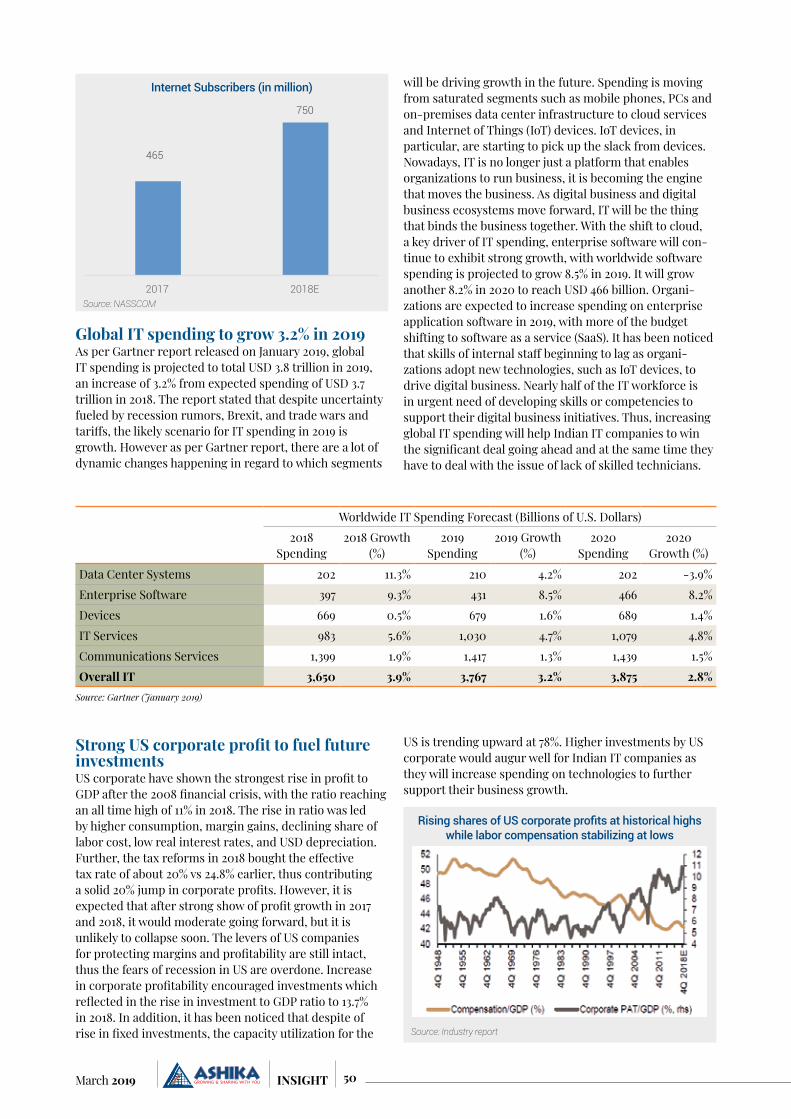
50March 2019 INSIGHT
Global IT spending to grow 3.2% in 2019As per Gartner report released on January 2019, global IT spending is projected to total USD 3.8 trillion in 2019, an increase of 3.2% from expected spending of USD 3.7 trillion in 2018. The report stated that despite uncertainty fueled by recession rumors, Brexit, and trade wars and tariffs, the likely scenario for IT spending in 2019 is growth. However as per Gartner report, there are a lot of dynamic changes happening in regard to which segments
will be driving growth in the future. Spending is moving from saturated segments such as mobile phones, PCs and on-premises data center infrastructure to cloud services and Internet of Things (IoT) devices. IoT devices, in particular, are starting to pick up the slack from devices. Nowadays, IT is no longer just a platform that enables organizations to run business, it is becoming the engine that moves the business. As digital business and digital business ecosystems move forward, IT will be the thing that binds the business together. With the shift to cloud, a key driver of IT spending, enterprise software will con-tinue to exhibit strong growth, with worldwide software spending is projected to grow 8.5% in 2019. It will grow another 8.2% in 2020 to reach USD 466 billion. Organi-zations are expected to increase spending on enterprise application software in 2019, with more of the budget shifting to software as a service (SaaS). It has been noticed that skills of internal staff beginning to lag as organi-zations adopt new technologies, such as IoT devices, to drive digital business. Nearly half of the IT workforce is in urgent need of developing skills or competencies to support their digital business initiatives. Thus, increasing global IT spending will help Indian IT companies to win the significant deal going ahead and at the same time they have to deal with the issue of lack of skilled technicians.
Strong US corporate profit to fuel future investmentsUS corporate have shown the strongest rise in profit to GDP after the 2008 financial crisis, with the ratio reaching an all time high of 11% in 2018. The rise in ratio was led by higher consumption, margin gains, declining share of labor cost, low real interest rates, and USD depreciation. Further, the tax reforms in 2018 bought the effective tax rate of about 20% vs 24.8% earlier, thus contributing a solid 20% jump in corporate profits. However, it is expected that after strong show of profit growth in 2017 and 2018, it would moderate going forward, but it is unlikely to collapse soon. The levers of US companies for protecting margins and profitability are still intact, thus the fears of recession in US are overdone. Increase in corporate profitability encouraged investments which reflected in the rise in investment to GDP ratio to 13.7% in 2018. In addition, it has been noticed that despite of rise in fixed investments, the capacity utilization for the
US is trending upward at 78%. Higher investments by US corporate would augur well for Indian IT companies as they will increase spending on technologies to further support their business growth.
465
750
2017 2018E
Internet Subscribers (in million)
Source: NASSCOM
Worldwide IT Spending Forecast (Billions of U.S. Dollars)2018
Spending2018 Growth
(%)2019
Spending2019 Growth
(%)2020
Spending2020
Growth (%)Data Center Systems 202 11.3% 210 4.2% 202 -3.9%Enterprise Software 397 9.3% 431 8.5% 466 8.2%Devices 669 0.5% 679 1.6% 689 1.4%IT Services 983 5.6% 1,030 4.7% 1,079 4.8%Communications Services 1,399 1.9% 1,417 1.3% 1,439 1.5%Overall IT 3,650 3.9% 3,767 3.2% 3,875 2.8%
Source: Gartner (January 2019)
Rising shares of US corporate profits at historical highs while labor compensation stabilizing at lows
Source: Industry report
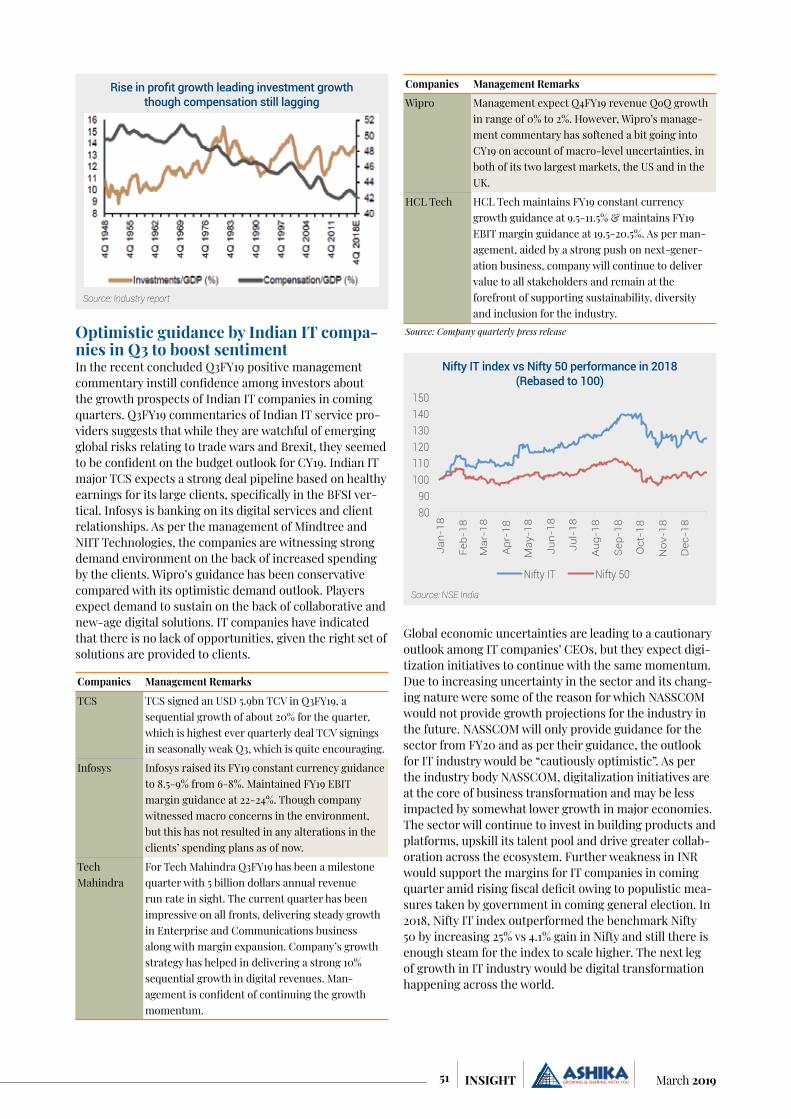
51 March 2019INSIGHT
Optimistic guidance by Indian IT compa-nies in Q3 to boost sentimentIn the recent concluded Q3FY19 positive management commentary instill confidence among investors about the growth prospects of Indian IT companies in coming quarters. Q3FY19 commentaries of Indian IT service pro-viders suggests that while they are watchful of emerging global risks relating to trade wars and Brexit, they seemed to be confident on the budget outlook for CY19. Indian IT major TCS expects a strong deal pipeline based on healthy earnings for its large clients, specifically in the BFSI ver-tical. Infosys is banking on its digital services and client relationships. As per the management of Mindtree and NIIT Technologies, the companies are witnessing strong demand environment on the back of increased spending by the clients. Wipro’s guidance has been conservative compared with its optimistic demand outlook. Players expect demand to sustain on the back of collaborative and new-age digital solutions. IT companies have indicated that there is no lack of opportunities, given the right set of solutions are provided to clients.
Companies Management Remarks
TCS TCS signed an USD 5.9bn TCV in Q3FY19, a sequential growth of about 20% for the quarter, which is highest ever quarterly deal TCV signings in seasonally weak Q3, which is quite encouraging.
Infosys Infosys raised its FY19 constant currency guidance to 8.5-9% from 6-8%. Maintained FY19 EBIT margin guidance at 22-24%. Though company witnessed macro concerns in the environment, but this has not resulted in any alterations in the clients’ spending plans as of now.
Tech Mahindra
For Tech Mahindra Q3FY19 has been a milestone quarter with 5 billion dollars annual revenue run rate in sight. The current quarter has been impressive on all fronts, delivering steady growth in Enterprise and Communications business along with margin expansion. Company’s growth strategy has helped in delivering a strong 10% sequential growth in digital revenues. Man-agement is confident of continuing the growth momentum.
Companies Management Remarks
Wipro Management expect Q4FY19 revenue QoQ growth in range of 0% to 2%. However, Wipro’s manage-ment commentary has softened a bit going into CY19 on account of macro-level uncertainties, in both of its two largest markets, the US and in the UK.
HCL Tech HCL Tech maintains FY19 constant currency growth guidance at 9.5-11.5% & maintains FY19 EBIT margin guidance at 19.5-20.5%. As per man-agement, aided by a strong push on next-gener-ation business, company will continue to deliver value to all stakeholders and remain at the forefront of supporting sustainability, diversity and inclusion for the industry.
Source: Company quarterly press release
Global economic uncertainties are leading to a cautionary outlook among IT companies’ CEOs, but they expect digi-tization initiatives to continue with the same momentum. Due to increasing uncertainty in the sector and its chang-ing nature were some of the reason for which NASSCOM would not provide growth projections for the industry in the future. NASSCOM will only provide guidance for the sector from FY20 and as per their guidance, the outlook for IT industry would be “cautiously optimistic”. As per the industry body NASSCOM, digitalization initiatives are at the core of business transformation and may be less impacted by somewhat lower growth in major economies. The sector will continue to invest in building products and platforms, upskill its talent pool and drive greater collab-oration across the ecosystem. Further weakness in INR would support the margins for IT companies in coming quarter amid rising fiscal deficit owing to populistic mea-sures taken by government in coming general election. In 2018, Nifty IT index outperformed the benchmark Nifty 50 by increasing 25% vs 4.1% gain in Nifty and still there is enough steam for the index to scale higher. The next leg of growth in IT industry would be digital transformation happening across the world.
Rise in profit growth leading investment growth though compensation still lagging
Source: Industry report
80 90
100 110 120 130 140 150
Jan-
18
Feb-
18
Mar
-18
Apr
-18
May
-18
Jun-
18
Jul-
18
Aug
-18
Sep
-18
Oct
-18
Nov
-18
Dec
-18
Nifty IT Nifty 50
Nifty IT index vs Nifty 50 performance in 2018 (Rebased to 100)
Source: NSE India

52March 2019 INSIGHT
The RBI has finally taken cognizance and surrendered to the concerns highlighted by the government with regards to the liquidity deficit in the system and as the clamour for lower interest rates to support growth.
In the last monetary policy, RBI has surprisingly lowered the interest rates by 25 bps and has thus prioritized growth over inflation as output gap has opened. The RBI minutes showed that serious
concerns with global growth slowdown adversely affecting the Indian economy, through the trade and investment channel was primarily the major reason for a rate cut
to spur growth. However, this is a calculated step con-sidering that the inflation has lowered significantly on the back of benign food inflation levels and there have been downward revisions in inflation projections during the year. RBI MPC minutes state that actual inflation outcome at 2.6% in Q3FY19 was marginally lower than the projection. On account of that, real interest rates in India
Economy review

53 March 2019INSIGHT
at present is not only one of the highest in recent years but also highest amongst other emerging economies. The only discomfort being that the core inflation levels have been sticky and is at 5.4% for January 2019, albeit CPI is at 2.05%, well below the target level of 4%. Experts believe that crude oil prices near USD85/barrel and depreciating rupee were clearly the reasons for high core inflation in mid-2018 and as crude stabilizes at USD65/barrel together with the rupee, core inflation levels are expected to ease with a lag. Besides, high GST rates particularly for services sector also accounted for the stickiness in core inflation. Selective cuts in GST rates by the government in the last few months is expected to result in decline in core inflation. However, there are upside risks to food inflation going ahead and thus, economists believe that the headline inflation will eventually converge gradually with the core inflation and towards the inflation target. The real interest rates in India currently at 4.2% is 280 bps higher than RBI’s comfort zone, states an article by Economic Times. Thus, experts believe the RBI to remain dovish for the time being however the opportunities could be limited as food inflation rises from here on and without any meaningful decline in core inflation, the headline inflation will move up, thus closing the gap of 280 bps.
RBI’s Survey of Professional Forecasters expects the headline inflation to slowly inch to 3.1% in Q4FY19 from ~2% now and then slowly inch towards 4.4% in Q3FY20.
Core inflation is expected to gradually decline from 5.6% in Q4FY19 to 5% in Q3FY20, thus clearly food inflation levels are expected to pick up from here on account of low base and improvement in rural incomes. It is important to remember that India is facing food deflation due to bumper crop production together with structural changes. With the various rural schemes brought about by government, rural income is expected to get a fillip in one year down the line. Inflation expectations of households, measured by the December 2018 round of the Reserve Bank’s survey, softened by 80 basis points for the three-month ahead horizon and by 130 basis points for the twelve-month ahead horizon over the last round, reflecting the continued decline in food and fuel prices. Producers’ assessment of inflation in input prices eased in Q3 as reported by manufacturing firms polled by the Reserve Bank’s industrial outlook survey. Thus, given the benign inflation expectations, the RBI monetary policy is expected to be dovish and on the other hand give growth a chance, which the government has been pitching for long.
The other significant area of concern for the government has been the systemic liquidity deficit which got aggra-vated during the IL&FS crisis. Government has time and again urged RBI to do more on this front and is one of the reasons which resulted in a tussle between government and the previous RBI governor. While in reality, the liquidity situation has been tight indeed, RBI has tried to ease the situation with periodic open market operations (OMOs) but failed to completely douse the fire and looks like RBI will continue with mammoth OMOs even in FY20. The RBI minutes highlighted that the primary reason has been the rise in currency in circulation which prompted RBI to inject liquidity through OMOs to the tune of Rs 500 billion each in December and January. For FY19 so far, the RBI has infused durable liquidity through OMOs to the tune of Rs 2.36 trillion, minutes of RBI monetary policy committee (MPC) notes. However, the MPC minutes also state that the situation improved in February with average daily liquidity position turning into surplus. However, this was only for a short phase as by the end of February, the liquidity situation again dipped in negative territory and close to Rs 1 trillion. The RBI is believed to have conducted OMOs to the tune of another Rs 125 billion as of 21st February by purchase of government securities.
Inflation
Source: RBI, Ashika Research
1
2
3
4
5
6
7
Jan-
15
Apr-
15
Jul-1
5
Oct
-15
Jan-
16
Apr-
16
Jul-1
6
Oct
-16
Jan-
17
Apr-
17
Jul-1
7
Oct
-17
Jan-
18
Apr-
18
Jul-1
8
Oct
-18
Jan-
19
Core Inflation (%) CPI Inflation (%)
Survey of Professional Forecasters-RBI
Source: RBI
3.1
3.5
4.0 4.4
5.6 5.2 5.2
5.0 Q
4FY1
9
Q1F
Y20
Q2F
Y20
Q3F
Y20
CPI Headline (%) Core inflation (%)
Real policy rate (%)
Source: RBI, Ashika Research
-1
0
1
2
3
4
5
6
Jan-
14
May
-14
Sep-
14
Jan-
15
May
-15
Sep-
15
Jan-
16
May
-16
Sep-
16
Jan-
17
May
-17
Sep-
17
Jan-
18
May
-18
Sep-
18
Jan-
19

54March 2019 INSIGHT
As can be seen from the graph, systemic liquidity under liquidity adjustment facility (LAF) has majorly been in the negative territory since December 2018 and occasionally moved into the surplus zone probably as and when RBI conducted OMOs, however for very brief periods and again moved into deficit.
According to experts, the systemic liquidity deficit is primarily on two counts – increase in currency in circu-lation and the RBI’s forex interventions. Indeed, there is a spike in cash in circulation and presently stands at Rs 21.06 trillion as of Feb 15, 2019 as against Rs 16-17 trillion range before demonetization. As % of GDP, currency in circulation stands near 12% of GDP, back to pre-demone-tization levels while the same plunged to near 6% during demonetization and was at 8.5% in March 2017. However, economists are of the view that this is not a major cause of concern as even in advanced nations, cash-to-GDP ratio is usually very strong like that of 7.9% in US and even higher at 10.6% in EU area.
According to an internal study by RBI, Indian households have shifted to savings deposits rather than fixed deposits in banks. Besides, households still prefer to hold cash for their transactional needs, suggesting a premium on
liquidity induced by the demonetization shock. Data shows that the share of savings deposits in the total deposits of households touched a new high of 41.7% in March 2018 against 36.9% in 2016. On the other hand, the share of fixed deposits fell to 52.5% in 2018 from 57.7% in 2016 in tandem. Surprisingly, the shift is despite the lower interest savings on savings deposits as opposed to fixed deposits. While it is understandable that demon-etization led to initial push to the high savings in FY17, the continuance of the same trend in FY18 is puzzling. The shift in savings trend is driven by the household sector which accounts for 60% of deposits with the Indian banking system in recent years. The share of the house-hold sector jumped to 63.2% of deposits with the Indian banking system in FY17 and stayed at the same level in FY18 too. This has resulted in a shift in composition of incremental deposits from term deposits accounting for 51% of the total in FY16 to 19% in FY17 while the savings portion jumped to 66% in FY17 from 42.8% in FY16. A shift towards savings as against term deposits is also likely on account of lower interest rates offered on term deposits driven by benign inflation levels. Thus, this partly explains the reason for high currency in circulation. However, the major component of the currency in circulation is currency with the public which has also been on a rising trend. According to economists, the other major reason for increase in currency in circulation is on account of a recovery in informal sector which was badly affected during demonetization.
Systemic Liquidity under LAF (Rs cr)
Source: CCIL India
-2,00,000
-1,50,000
-1,00,000
-50,000
0
50,000
1,00,000
1,50,000
03-D
ec-1
8
10-D
ec-1
8
17-D
ec-1
8
24-D
ec-1
8
31-D
ec-1
8
07-J
an-1
9
14-J
an-1
9
21-J
an-1
9
28-J
an-1
9
04-F
eb-1
9
11-F
eb-1
9
18-F
eb-1
9
Currency in circulation on the rise
Source: RBI, Ashika Research
5%
6%
7%
8%
9%
10%
11%
12%
0
5,000
10,000
15,000
20,000
Dec
-16
Feb-
17
Apr-
17
Jun-
17
Aug-
17
Oct
-17
Dec
-17
Feb-
18
Apr-
18
Jun-
18
Aug-
18
Oct
-18
Dec
-18
Feb-
19
Currency in circulation (Rs bn) % of GDP-RHS
Composition of incremental deposits (%)
Source: RBI
17.4 -2.2 1.5 1.7
13.3 6.4 14.8 11.2
21.0
30.1 27.0 30.3 19.6
42.8
66.2
47.0
61.6 72.0 71.5 68.0 67.1
50.8
19.1
41.8
FY11 FY12 FY13 FY14 FY15 FY16 FY17 FY18 Current Savings Term
Ownership of deposits - Institutional sectors (%)
Source: RBI
10.0 14.4 15.2 12.8 14.2 13.5 4.6
10.1 14.8 10.8 10.3 10.1 7.3
9.7 10.4
7.0 5.5 5.9
68.2 58.5
55.8 61.5 63.2 63.3
11.0 7.3 3.8 7.8 6.8 7.2
FY01 FY06 FY11 FY16 FY17 FY18
Govt. Non-Financial private corporate Financial Household Foreign
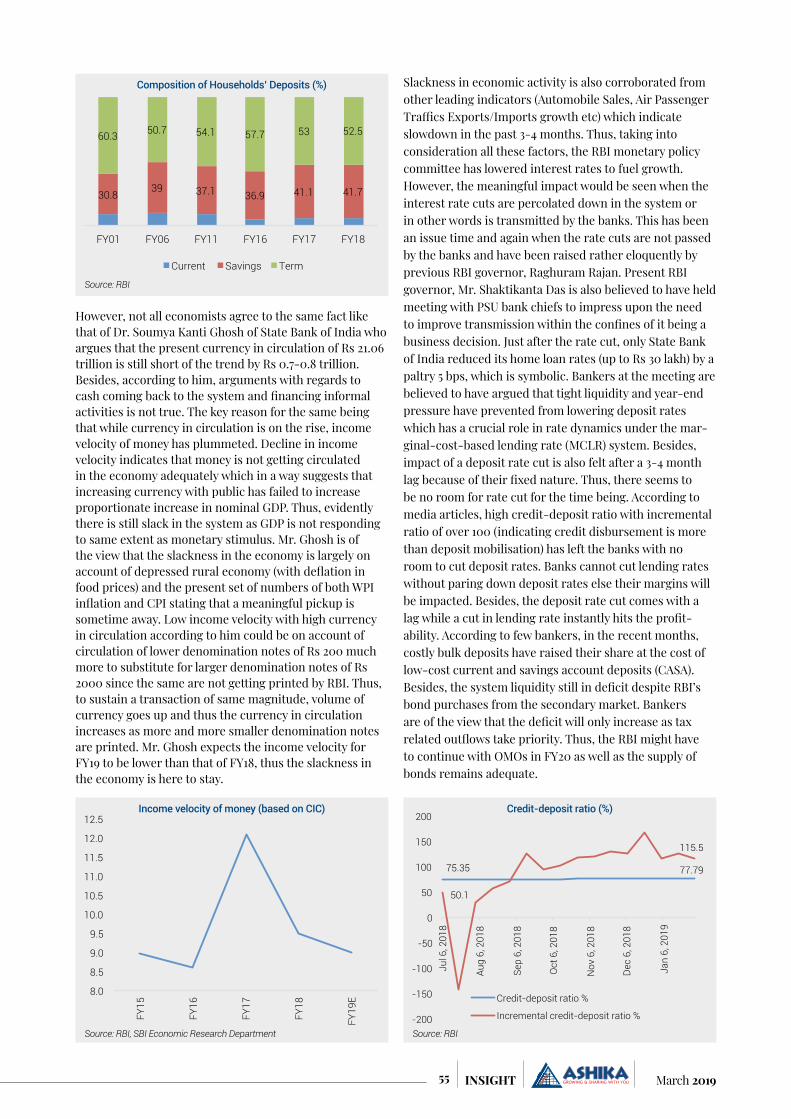
55 March 2019INSIGHT
However, not all economists agree to the same fact like that of Dr. Soumya Kanti Ghosh of State Bank of India who argues that the present currency in circulation of Rs 21.06 trillion is still short of the trend by Rs 0.7-0.8 trillion. Besides, according to him, arguments with regards to cash coming back to the system and financing informal activities is not true. The key reason for the same being that while currency in circulation is on the rise, income velocity of money has plummeted. Decline in income velocity indicates that money is not getting circulated in the economy adequately which in a way suggests that increasing currency with public has failed to increase proportionate increase in nominal GDP. Thus, evidently there is still slack in the system as GDP is not responding to same extent as monetary stimulus. Mr. Ghosh is of the view that the slackness in the economy is largely on account of depressed rural economy (with deflation in food prices) and the present set of numbers of both WPI inflation and CPI stating that a meaningful pickup is sometime away. Low income velocity with high currency in circulation according to him could be on account of circulation of lower denomination notes of Rs 200 much more to substitute for larger denomination notes of Rs 2000 since the same are not getting printed by RBI. Thus, to sustain a transaction of same magnitude, volume of currency goes up and thus the currency in circulation increases as more and more smaller denomination notes are printed. Mr. Ghosh expects the income velocity for FY19 to be lower than that of FY18, thus the slackness in the economy is here to stay.
Slackness in economic activity is also corroborated from other leading indicators (Automobile Sales, Air Passenger Traffics Exports/Imports growth etc) which indicate slowdown in the past 3-4 months. Thus, taking into consideration all these factors, the RBI monetary policy committee has lowered interest rates to fuel growth. However, the meaningful impact would be seen when the interest rate cuts are percolated down in the system or in other words is transmitted by the banks. This has been an issue time and again when the rate cuts are not passed by the banks and have been raised rather eloquently by previous RBI governor, Raghuram Rajan. Present RBI governor, Mr. Shaktikanta Das is also believed to have held meeting with PSU bank chiefs to impress upon the need to improve transmission within the confines of it being a business decision. Just after the rate cut, only State Bank of India reduced its home loan rates (up to Rs 30 lakh) by a paltry 5 bps, which is symbolic. Bankers at the meeting are believed to have argued that tight liquidity and year-end pressure have prevented from lowering deposit rates which has a crucial role in rate dynamics under the mar-ginal-cost-based lending rate (MCLR) system. Besides, impact of a deposit rate cut is also felt after a 3-4 month lag because of their fixed nature. Thus, there seems to be no room for rate cut for the time being. According to media articles, high credit-deposit ratio with incremental ratio of over 100 (indicating credit disbursement is more than deposit mobilisation) has left the banks with no room to cut deposit rates. Banks cannot cut lending rates without paring down deposit rates else their margins will be impacted. Besides, the deposit rate cut comes with a lag while a cut in lending rate instantly hits the profit-ability. According to few bankers, in the recent months, costly bulk deposits have raised their share at the cost of low-cost current and savings account deposits (CASA). Besides, the system liquidity still in deficit despite RBI’s bond purchases from the secondary market. Bankers are of the view that the deficit will only increase as tax related outflows take priority. Thus, the RBI might have to continue with OMOs in FY20 as well as the supply of bonds remains adequate.
Composition of Households’ Deposits (%)
Source: RBI
30.8 39 37.1 36.9 41.1 41.7
60.3 50.7 54.1 57.7 53 52.5
FY01 FY06 FY11 FY16 FY17 FY18
Current Savings Term
Income velocity of money (based on CIC)
Source: RBI, SBI Economic Research Department
8.0
8.5
9.0
9.5
10.0
10.5
11.0
11.5
12.0
12.5
FY15
FY16
FY17
FY18
FY19
E
Credit-deposit ratio (%)
Source: RBI
75.35 77.79
50.1
115.5
-200
-150
-100
-50
0
50
100
150
200
Jul 6
, 201
8
Aug
6, 2
018
Sep
6, 2
018
Oct
6, 2
018
Nov
6, 2
018
Dec
6, 2
018
Jan
6, 2
019
Credit-deposit ratio %
Incremental credit-deposit ratio %
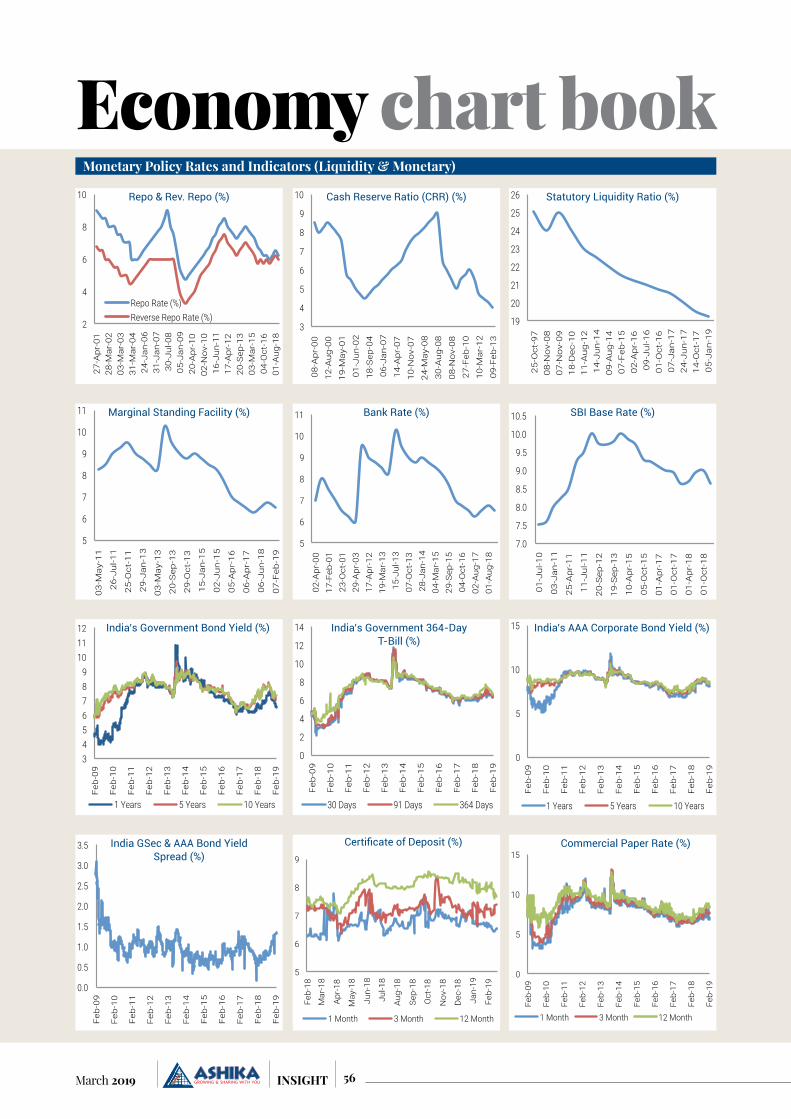
56March 2019 INSIGHT
Monetary Policy Rates and Indicators (Liquidity & Monetary)
Economy chart book
2
4
6
8
10
27-A
pr-0
1 28
-Mar
-02
03-M
ar-0
3 31
-Mar
-04
24-J
an-0
6 31
-Jan
-07
30-J
ul-0
8 05
-Jan
-09
20-A
pr-1
0 02
-Nov
-10
16-J
un-1
1 17
-Apr
-12
20-S
ep-1
3 03
-Mar
-15
04-O
ct-1
6 01
-Aug
-18
Repo Rate (%) Reverse Repo Rate (%)
Repo & Rev. Repo (%)
0
5
10
15
Feb
-09
Feb
-10
Feb
-11
Feb
-12
Feb
-13
Feb
-14
Feb
-15
Feb
-16
Feb
-17
Feb
-18
Feb
-19
1 Years 5 Years 10 Years
India’s AAA Corporate Bond Yield (%)
0.0
0.5
1.0
1.5
2.0
2.5
3.0
3.5
Feb
-09
Feb
-10
Feb
-11
Feb
-12
Feb
-13
Feb
-14
Feb
-15
Feb
-16
Feb
-17
Feb
-18
Feb
-19
India GSec & AAA Bond Yield Spread (%)
5
6
7
8
9
Feb-
18
Mar
-18
Apr
-18
May
-18
Jun-
18
Jul-1
8
Aug
-18
Sep-
18
Oct
-18
Nov
-18
Dec
-18
Jan-
19
Feb-
19
1 Month 3 Month 12 Month
Certificate of Deposit (%)
0
5
10
15
Feb-
09
Feb-
10
Feb-
11
Feb-
12
Feb-
13
Feb-
14
Feb-
15
Feb-
16
Feb-
17
Feb-
18
Feb-
19
1 Month 3 Month 12 Month
Commercial Paper Rate (%)
5
6
7
8
9
10
11
03
-May
-11
26
-Ju
l-11
25
-Oct
-11
29
-Jan
-13
03
-May
-13
20
-Sep
-13
29
-Oct
-13
15
-Jan
-15
02
-Ju
n-1
5
05
-Ap
r-1
6
06
-Ap
r-1
7
06
-Ju
n-1
8
07
-Feb
-19
Marginal Standing Facility (%)
3
4
5
6
7
8
9
10
08-A
pr-0
0
12-A
ug-0
0
19-M
ay-0
1
01-J
un-0
2
18-S
ep-0
4
06-J
an-0
7
14-A
pr-0
7
10-N
ov-0
7
24-M
ay-0
8
30-A
ug-0
8
08-N
ov-0
8
27-F
eb-1
0
10-M
ar-1
2
09-F
eb-1
3
Cash Reserve Ratio (CRR) (%)
5
6
7
8
9
10
11
02-A
pr-0
0 17
-Feb
-01
23-O
ct-0
1 29
-Apr
-03
17-A
pr-1
2 19
-Mar
-13
15-J
ul-1
3 07
-Oct
-13
28-J
an-1
4 04
-Mar
-15
29-S
ep-1
5 04
-Oct
-16
02-A
ug-1
7 01
-Aug
-18
Bank Rate (%)
19
20
21
22
23
24
25
26
25
-Oct
-97
0
8-N
ov-
08
0
7-N
ov-
09
1
8-D
ec-1
0
11
-Au
g-1
2
14
-Ju
n-1
4
09
-Au
g-1
4
07
-Feb
-15
0
2-A
pr-
16
0
9-J
ul-1
6
01
-Oct
-16
0
7-J
an-1
7
24
-Ju
n-1
7
14
-Oct
-17
0
5-J
an-1
9
Statutory Liquidity Ratio (%)
7.0
7.5
8.0
8.5
9.0
9.5
10.0
10.5
01-J
ul-1
0
03-J
an-1
1
25-A
pr-1
1
11-J
ul-1
1
20-S
ep-1
2
19-S
ep-1
3
10-A
pr-1
5
05-O
ct-1
5
01-A
pr-1
7
01-O
ct-1
7
01-A
pr-1
8
01-O
ct-1
8
SBI Base Rate (%)
3 4 5 6 7 8 9
10 11 12
Feb-
09
Feb-
10
Feb-
11
Feb-
12
Feb-
13
Feb-
14
Feb-
15
Feb-
16
Feb-
17
Feb-
18
Feb-
19
1 Years 5 Years 10 Years
India’s Government Bond Yield (%)
0
2
4
6
8
10
12
14
Feb
-09
Feb
-10
Feb
-11
Feb
-12
Feb
-13
Feb
-14
Feb
-15
Feb
-16
Feb
-17
Feb
-18
Feb
-19
30 Days 91 Days 364 Days
India’s Government 364-Day T-Bill (%)
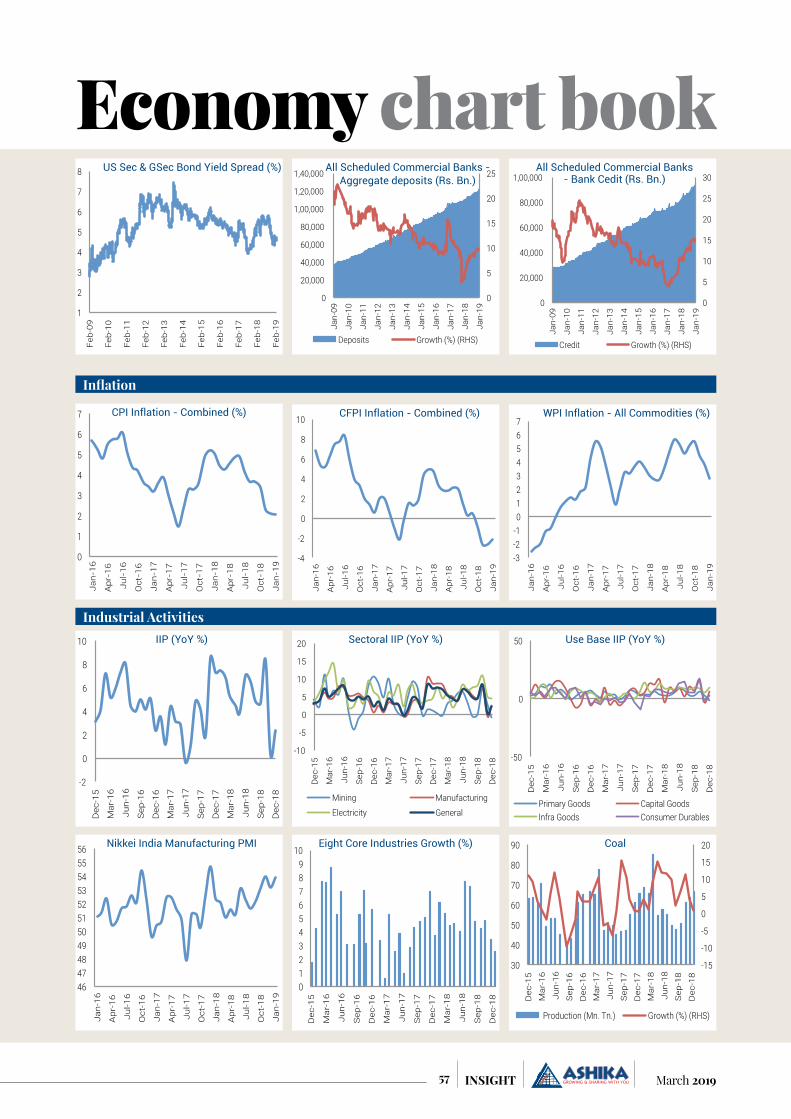
57 March 2019INSIGHT
Economy chart book
Inflation
Industrial Activities
1
2
3
4
5
6
7
8
Feb-
09
Feb-
10
Feb-
11
Feb-
12
Feb-
13
Feb-
14
Feb-
15
Feb-
16
Feb-
17
Feb-
18
Feb-
19
US Sec & GSec Bond Yield Spread (%)
0
5
10
15
20
25
0
20,000
40,000
60,000
80,000
1,00,000
1,20,000
1,40,000
Jan-
09
Jan-
10
Jan-
11
Jan-
12
Jan-
13
Jan-
14
Jan-
15
Jan-
16
Jan-
17
Jan-
18
Jan-
19
Deposits Growth (%) (RHS)
All Scheduled Commercial Banks - Aggregate deposits (Rs. Bn.)
0
5
10
15
20
25
30
0
20,000
40,000
60,000
80,000
1,00,000
Jan-
09
Jan-
10
Jan-
11
Jan-
12
Jan-
13
Jan-
14
Jan-
15
Jan-
16
Jan-
17
Jan-
18
Jan-
19
Credit Growth (%) (RHS)
All Scheduled Commercial Banks - Bank Cedit (Rs. Bn.)
0
1
2
3
4
5
6
7
Jan-
16
Apr
-16
Jul-
16
Oct
-16
Jan-
17
Apr
-17
Jul-
17
Oct
-17
Jan-
18
Apr
-18
Jul-
18
Oct
-18
Jan-
19
CPI Inflation - Combined (%)
-4
-2
0
2
4
6
8
10
Jan-
16
Apr
-16
Jul-1
6
Oct
-16
Jan-
17
Apr
-17
Jul-1
7
Oct
-17
Jan-
18
Apr
-18
Jul-1
8
Oct
-18
Jan-
19
CFPI Inflation - Combined (%)
-3 -2 -1 0 1 2 3 4 5 6 7
Jan-
16
Apr
-16
Jul-1
6
Oct
-16
Jan-
17
Apr
-17
Jul-1
7
Oct
-17
Jan-
18
Apr
-18
Jul-1
8
Oct
-18
Jan-
19
WPI Inflation - All Commodities (%)
-2
0
2
4
6
8
10
Dec
-15
Mar
-16
Jun-
16
Sep
-16
Dec
-16
Mar
-17
Jun-
17
Sep
-17
Dec
-17
Mar
-18
Jun-
18
Sep
-18
Dec
-18
IIP (YoY %)
46 47 48 49 50 51 52 53 54 55 56
Jan-
16
Apr
-16
Jul-1
6
Oct
-16
Jan-
17
Apr
-17
Jul-1
7
Oct
-17
Jan-
18
Apr
-18
Jul-1
8
Oct
-18
Jan-
19
Nikkei India Manufacturing PMI
-10
-5
0
5
10
15
20
Dec
-15
Mar
-16
Jun-
16
Sep-
16
Dec
-16
Mar
-17
Jun-
17
Sep-
17
Dec
-17
Mar
-18
Jun-
18
Sep-
18
Dec
-18
Mining Manufacturing
Electricity General
Sectoral IIP (YoY %)
0 1 2 3 4 5 6 7 8 9
10
Dec
-15
Mar
-16
Jun-
16
Sep
-16
Dec
-16
Mar
-17
Jun-
17
Sep
-17
Dec
-17
Mar
-18
Jun-
18
Sep
-18
Dec
-18
Eight Core Industries Growth (%)
-50
0
50
Dec
-15
Mar
-16
Jun-
16
Sep
-16
Dec
-16
Mar
-17
Jun-
17
Sep
-17
Dec
-17
Mar
-18
Jun-
18
Sep
-18
Dec
-18
Primary Goods Capital Goods Infra Goods Consumer Durables
Use Base IIP (YoY %)
-15
-10
-5
0
5
10
15
20
30
40
50
60
70
80
90
Dec
-15
Mar
-16
Jun-
16
Sep
-16
Dec
-16
Mar
-17
Jun-
17
Sep
-17
Dec
-17
Mar
-18
Jun-
18
Sep
-18
Dec
-18
Production (Mn. Tn.) Growth (%) (RHS)
Coal
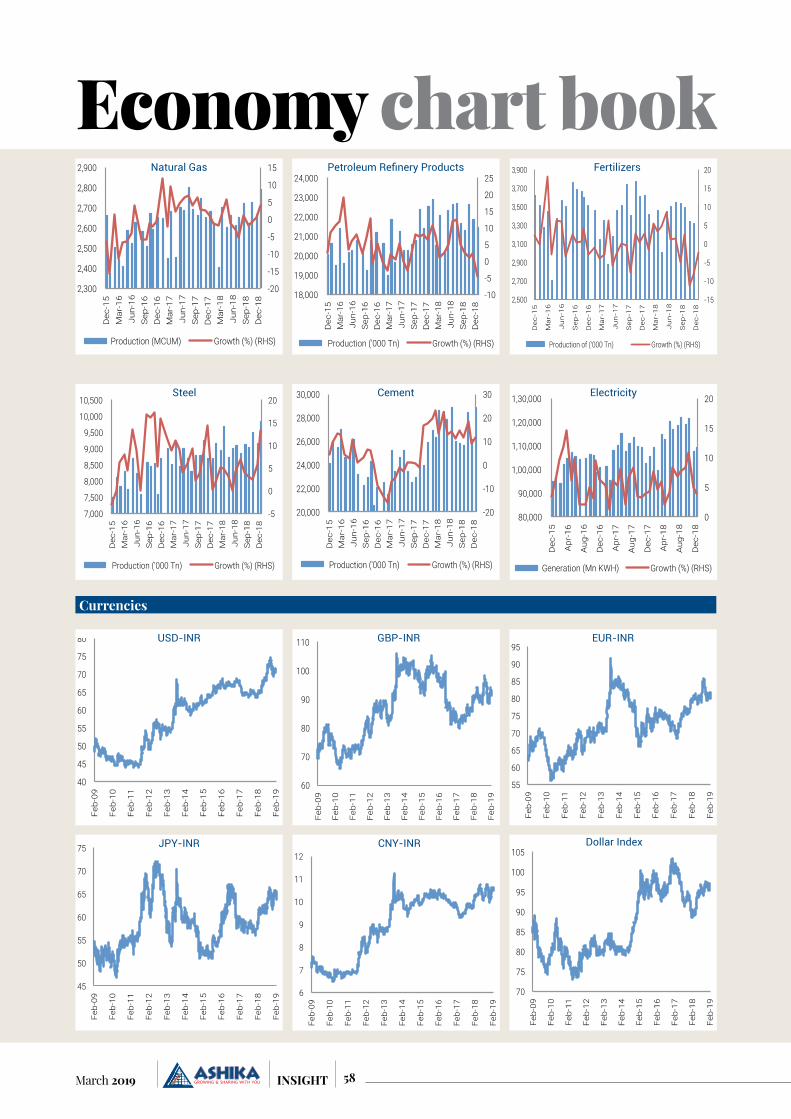
58March 2019 INSIGHT
Economy chart book
-20
-15
-10
-5
0
5
10
15
2,300
2,400
2,500
2,600
2,700
2,800
2,900
Dec
-15
Mar
-16
Jun-
16
Sep
-16
Dec
-16
Mar
-17
Jun-
17
Sep
-17
Dec
-17
Mar
-18
Jun-
18
Sep
-18
Dec
-18
Production (MCUM) Growth (%) (RHS)
Natural Gas
-20
-10
0
10
20
30
20,000
22,000
24,000
26,000
28,000
30,000
Dec
-15
Mar
-16
Jun-
16
Sep
-16
Dec
-16
Mar
-17
Jun-
17
Sep
-17
Dec
-17
Mar
-18
Jun-
18
Sep
-18
Dec
-18
Production ('000 Tn) Growth (%) (RHS)
Cement
-5
0
5
10
15
20
7,000
7,500
8,000
8,500
9,000
9,500
10,000
10,500
Dec
-15
Mar
-16
Jun-
16
Sep
-16
Dec
-16
Mar
-17
Jun-
17
Sep
-17
Dec
-17
Mar
-18
Jun-
18
Sep
-18
Dec
-18
Production ('000 Tn) Growth (%) (RHS)
Steel
-10
-5
0
5
10
15
20
25
18,000
19,000
20,000
21,000
22,000
23,000
24,000
Dec
-15
Mar
-16
Jun-
16
Sep
-16
Dec
-16
Mar
-17
Jun-
17
Sep
-17
Dec
-17
Mar
-18
Jun-
18
Sep
-18
Dec
-18
Production ('000 Tn) Growth (%) (RHS)
Petroleum Refinery Products
-15
-10
-5
0
5
10
15
20
2,500
2,700
2,900
3,100
3,300
3,500
3,700
3,900
Dec
-15
Ma
r-1
6
Ju
n-1
6
Sep
-16
Dec
-16
Ma
r-1
7
Ju
n-1
7
Sep
-17
Dec
-17
Ma
r-1
8
Ju
n-1
8
Sep
-18
Dec
-18
Production of ('000 Tn) Growth (%) (RHS)
Fertilizers
0
5
10
15
20
80,000
90,000
1,00,000
1,10,000
1,20,000
1,30,000
Dec
-15
Apr
-16
Aug
-16
Dec
-16
Apr
-17
Aug
-17
Dec
-17
Apr
-18
Aug
-18
Dec
-18
Generation (Mn KWH) Growth (%) (RHS)
Electricity
Currencies
55
60
65
70
75
80
85
90
95
Feb-
09
Feb-
10
Feb-
11
Feb-
12
Feb-
13
Feb-
14
Feb-
15
Feb-
16
Feb-
17
Feb-
18
Feb-
19
EUR-INR
45
50
55
60
65
70
75
Feb-
09
Feb-
10
Feb-
11
Feb-
12
Feb-
13
Feb-
14
Feb-
15
Feb-
16
Feb-
17
Feb-
18
Feb-
19
JPY-INR
6
7
8
9
10
11
12
Feb-
09
Feb-
10
Feb-
11
Feb-
12
Feb-
13
Feb-
14
Feb-
15
Feb-
16
Feb-
17
Feb-
18
Feb-
19
CNY-INR
70
75
80
85
90
95
100
105
Feb-
09
Feb-
10
Feb-
11
Feb-
12
Feb-
13
Feb-
14
Feb-
15
Feb-
16
Feb-
17
Feb-
18
Feb-
19
Dollar Index
40
45
50
55
60
65
70
75
80
Feb-
09
Feb-
10
Feb-
11
Feb-
12
Feb-
13
Feb-
14
Feb-
15
Feb-
16
Feb-
17
Feb-
18
Feb-
19
USD-INR
60
70
80
90
100
110
Feb-
09
Feb-
10
Feb-
11
Feb-
12
Feb-
13
Feb-
14
Feb-
15
Feb-
16
Feb-
17
Feb-
18
Feb-
19
GBP-INR

59 March 2019INSIGHT
Economy chart book
45
65
85
105
125
145
Feb
-10
Feb
-11
Feb
-12
Feb
-13
Feb
-14
Feb
-15
Feb
-16
Feb
-17
Feb
-18
Feb
-19
Australia Thermal Coal (USD/MT)
25
45
65
85
105
125
145
Feb-
09
Feb-
10
Feb-
11
Feb-
12
Feb-
13
Feb-
14
Feb-
15
Feb-
16
Feb-
17
Feb-
18
Feb-
19
Brent Crude (USD per Barrel)
1.5
2.5
3.5
4.5
5.5
6.5
Feb
-09
Feb
-10
Feb
-11
Feb
-12
Feb
-13
Feb
-14
Feb
-15
Feb
-16
Feb
-17
Feb
-18
Feb
-19
Natural Gas (USD/MMBtu)
Energy
Precious Metal
800
1000
1200
1400
1600
1800
2000
Feb-
09
Feb-
10
Feb-
11
Feb-
12
Feb-
13
Feb-
14
Feb-
15
Feb-
16
Feb-
17
Feb-
18
Feb-
19
Gold USD per Oz
13000
18000
23000
28000
33000
38000
Feb-
09
Feb-
10
Feb-
11
Feb-
12
Feb-
13
Feb-
14
Feb-
15
Feb-
16
Feb-
17
Feb-
18
Feb-
19
Gold Rs. per 10g
19000
29000
39000
49000
59000
69000
79000
Feb-
09
Feb-
10
Feb-
11
Feb-
12
Feb-
13
Feb-
14
Feb-
15
Feb-
16
Feb-
17
Feb-
18
Feb-
19
MCX Silver (Rs./Kg.)
-30
-20
-10
0
10
20
30
40
19
21
23
25
27
29
31
Jan-
14
Jun-
14
Nov
-14
Apr
-15
Sep
-15
Feb-
16
Jul-1
6
Dec
-16
May
-17
Oct
-17
Mar
-18
Aug
-18
Jan-
19
Amount (USD Bn) % Change (RHS)
India’s Export in $ terms
-40 -30 -20 -10 0 10 20 30 40 50 60
25
30
35
40
45
50
Jan-
14
Jun-
14
Nov
-14
Apr
-15
Sep
-15
Feb-
16
Jul-1
6
Dec
-16
May
-17
Oct
-17
Mar
-18
Aug
-18
Jan-
19
Amount (USD Bn) % Change (RHS)
India’s Import in $ terms
-20
-18
-16
-14
-12
-10
-8
-6
-4
Jan-
14
May
-14
Sep-
14
Jan-
15
May
-15
Sep-
15
Jan-
16
May
-16
Sep-
16
Jan-
17
May
-17
Sep-
17
Jan-
18
May
-18
Sep-
18
Jan-
19
India’s Trade Balance in $ terms (USD Bn.)
External Sector
240 260 280 300 320 340 360 380 400 420 440
Feb-
09
Feb-
10
Feb-
11
Feb-
12
Feb-
13
Feb-
14
Feb-
15
Feb-
16
Feb-
17
Feb-
18
Feb-
19
Foreign Exchange Reserve (USD Billion)
0
1,000
2,000
3,000
4,000
5,000
6,000
Dec
-13
May
-14
Oct
-14
Mar
-15
Aug
-15
Jan-
16
Jun-
16
Nov
-16
Apr
-17
Sep-
17
Feb-
18
Jul-1
8
Dec
-18
External Commercial Borrowings (USD Mn.)
15
17
19
21
23
25
120
220
320
420
520
620
20
05
2
00
6
20
07
2
00
8
20
09
2
01
0
20
11
2
01
2
20
13
2
01
4
20
15
2
01
6
20
17
2
01
8
Gross Total Debt (USD Bn.) % of GDP (RHS)
India’s External Debt

60March 2019 INSIGHT
Economy chart bookFund Flow – FII DII and MF
-15,000 -10,000
-5,000 0
5,000 10,000 15,000 20,000 25,000 30,000
Feb-
16
May
-16
Aug
-16
Nov
-16
Feb-
17
May
-17
Aug
-17
Nov
-17
Feb-
18
May
-18
Aug
-18
Nov
-18
Feb-
19
**20-Feb-2019
Mutual Fund Equity Investments (Rs. Cr.)
-40,000
-30,000
-20,000
-10,000
0
10,000
20,000
30,000
Feb-
18
Mar
-18
Apr
-18
May
-18
Jun-
18
Jul-
18
Aug
-18
Sep
-18
Oct
-18
Nov
-18
Dec
-18
Jan-
19
Feb-
19
FII Investments Equity DII Investments Equity
**20-Feb-2019
FII DII Equity Investments (Rs. Cr.)
30%
35%
40%
45%
50%
55%
3000
5000
7000
9000
11000
13000
Dec
-14
Jun-
15
Dec
-15
Jun-
16
Dec
-16
Jun-
17
Dec
-17
Jun-
18
Dec
-18
Equity AUM (Rs. Bn.) % of Total AUM
MF Equity AUM
3.0
4.0
5.0
6.0
7.0
8.0
9.0
Mar
-09
Mar
-10
Mar
-11
Mar
-12
Mar
-13
Mar
-14
Dec
-14
Jun-
15
Dec
-15
Jun-
16
Dec
-16
Jun-
17
Dec
-17
Jun-
18
Dec
-18
No. of MF accounts (In Crore)
-40,000 -30,000 -20,000 -10,000
0 10,000 20,000 30,000 40,000
Feb
-16
May
-16
Aug
-16
Nov
-16
Feb
-17
May
-17
Aug
-17
Nov
-17
Feb
-18
May
-18
Aug
-18
Nov
-18
Feb
-19
**20-Feb-2019
FII Investments (Rs. Cr.)
-30,000
-20,000
-10,000
0
10,000
20,000
30,000
Feb-
16
May
-16
Aug
-16
Nov
-16
Feb-
17
May
-17
Aug
-17
Nov
-17
Feb-
18
May
-18
Aug
-18
Nov
-18
Feb-
19
**20-Feb-2019
FII Debt Investments (Rs. Cr.)
-40,000
-30,000
-20,000
-10,000
0
10,000
20,000
30,000
Feb-
18
Mar
-18
Apr
-18
May
-18
Jun-
18
Jul-1
8 A
ug-1
8 S
ep-1
8 O
ct-1
8 N
ov-1
8 D
ec-1
8 Ja
n-19
Fe
b-19
FII Investments Equity MF Investments Equity **20-Feb-2019
FII MF Equity Investments (Rs. Cr.)
3500
4500
5500
6500
7500
8500
Jan-
17
Mar
-17
May
-17
Jul-1
7
Sep
-17
Nov
-17
Jan-
18
Mar
-18
May
-18
Jul-1
8
Sep
-18
Nov
-18
Jan-
19
SIP (Rs. Crore)
-20,000 -15,000 -10,000
-5,000 0
5,000 10,000 15,000 20,000 25,000 30,000
Feb-
16
May
-16
Aug
-16
Nov
-16
Feb-
17
May
-17
Aug
-17
Nov
-17
Feb-
18
May
-18
Aug
-18
Nov
-18
Feb-
19
**20-Feb-2019
DII Equity Investments (Rs. Cr.)
-20,000
0
20,000
40,000
60,000
80,000
1,00,000
Feb-
16
May
-16
Aug
-16
Nov
-16
Feb-
17
May
-17
Aug
-17
Nov
-17
Feb-
18
May
-18
Aug
-18
Nov
-18
Feb-
19
**20-Feb-2019
Mutual Fund Debt Investments (Rs. Cr.)
12
14
16
18
20
22
24
26
Jan-
16
Apr
-16
Jul-1
6
Oct
-16
Jan-
17
Apr
-17
Jul-1
7
Oct
-17
Jan-
18
Apr
-18
Jul-1
8
Oct
-18
Jan-
19
MF AUM (Rs. Trillion)
0
20
40
60
80
100
120
FY13
FY14
FY15
FY16
FY17
FY18
NSDL CDSL Mutual Fund
Demat a/c & Mutual Fund folios (In Mn)
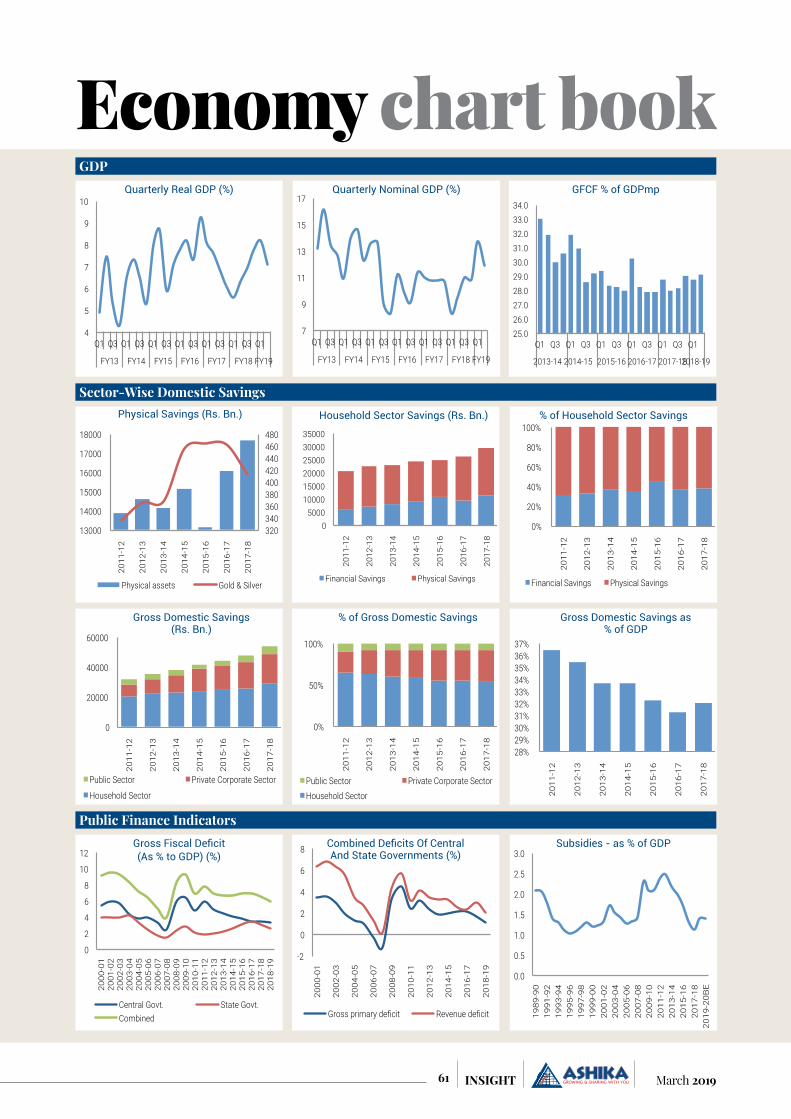
61 March 2019INSIGHT
Economy chart bookGDP
4
5
6
7
8
9
10
Q1 Q3 Q1 Q3 Q1 Q3 Q1 Q3 Q1 Q3 Q1 Q3 Q1
FY13 FY14 FY15 FY16 FY17 FY18 FY19
Quarterly Real GDP (%)
7
9
11
13
15
17
Q1 Q3 Q1 Q3 Q1 Q3 Q1 Q3 Q1 Q3 Q1 Q3 Q1
FY13 FY14 FY15 FY16 FY17 FY18 FY19
Quarterly Nominal GDP (%)
25.0 26.0 27.0 28.0 29.0 30.0 31.0 32.0 33.0 34.0
Q1 Q3 Q1 Q3 Q1 Q3 Q1 Q3 Q1 Q3 Q1
2013-14 2014-15 2015-16 2016-17 2017-18 2018-19
GFCF % of GDPmp
320 340 360 380 400 420 440 460 480
13000
14000
15000
16000
17000
18000
2011
-12
2012
-13
2013
-14
2014
-15
2015
-16
2016
-17
2017
-18
Physical assets Gold & Silver
Physical Savings (Rs. Bn.)
0 5000
10000 15000 20000 25000 30000 35000
2011
-12
2012
-13
2013
-14
2014
-15
2015
-16
2016
-17
2017
-18
Financial Savings Physical Savings
Household Sector Savings (Rs. Bn.)
0%
20%
40%
60%
80%
100%
2011
-12
2012
-13
2013
-14
2014
-15
2015
-16
2016
-17
2017
-18
Financial Savings Physical Savings
% of Household Sector Savings
0
20000
40000
60000
2011
-12
2012
-13
2013
-14
2014
-15
2015
-16
2016
-17
2017
-18
Public Sector Private Corporate Sector
Household Sector
Gross Domestic Savings (Rs. Bn.)
0%
50%
100%
2011
-12
2012
-13
2013
-14
2014
-15
2015
-16
2016
-17
2017
-18
Public Sector Private Corporate Sector Household Sector
% of Gross Domestic Savings
28% 29% 30% 31% 32% 33% 34% 35% 36% 37%
2011
-12
2012
-13
2013
-14
2014
-15
2015
-16
2016
-17
2017
-18
Gross Domestic Savings as % of GDP
Sector-Wise Domestic Savings
0
2
4
6
8
10
12
2000
-01
2001
-02
2002
-03
2003
-04
2004
-05
2005
-06
2006
-07
2007
-08
2008
-09
2009
-10
2010
-11
2011
-12
2012
-13
2013
-14
2014
-15
2015
-16
2016
-17
2017
-18
2018
-19
Central Govt. State Govt. Combined
Gross Fiscal Deficit (As % to GDP) (%)
-2
0
2
4
6
8
2000
-01
2002
-03
2004
-05
2006
-07
2008
-09
2010
-11
2012
-13
2014
-15
2016
-17
2018
-19
Gross primary deficit Revenue deficit
Combined Deficits Of Central And State Governments (%)
0.0
0.5
1.0
1.5
2.0
2.5
3.0
1989
-90
1991
-92
1993
-94
1995
-96
1997
-98
1999
-00
2001
-02
2003
-04
2005
-06
2007
-08
2009
-10
2011
-12
2013
-14
2015
-16
2017
-18
2019
-20B
E
Subsidies - as % of GDP
Public Finance Indicators
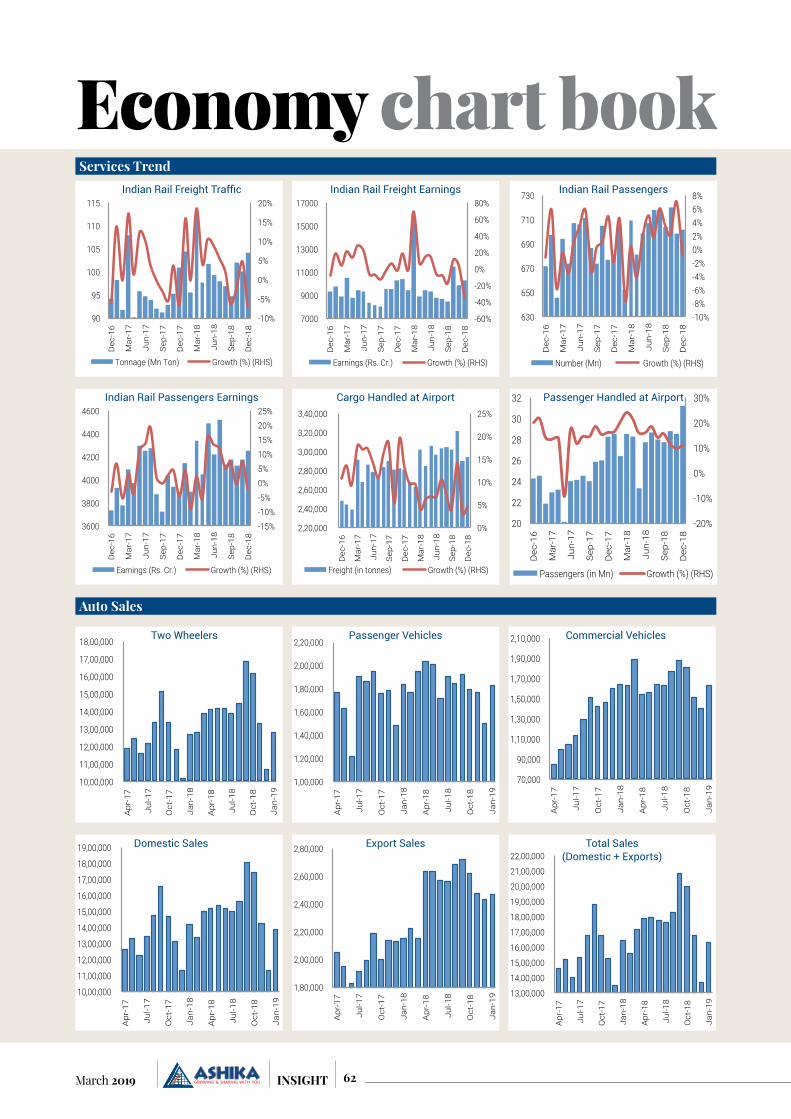
62March 2019 INSIGHT
Growth (%) (RHS)
-10% -8% -6% -4% -2% 0% 2% 4% 6% 8%
630
650
670
690
710
730
Dec
-16
Mar
-17
Jun-
17
Sep
-17
Dec
-17
Mar
-18
Jun-
18
Sep
-18
Dec
-18
Number (Mn)
Indian Rail Passengers
-20%
-10%
0%
10%
20%
30%
20
22
24
26
28
30
32
Dec
-16
Mar
-17
Jun-
17
Sep-
17
Dec
-17
Mar
-18
Jun-
18
Sep-
18
Dec
-18
Passengers (in Mn) Growth (%) (RHS)
Passenger Handled at Airport
13,00,000
14,00,000
15,00,000
16,00,000
17,00,000
18,00,000
19,00,000
20,00,000
21,00,000
22,00,000
Apr
-17
Jul-1
7
Oct
-17
Jan-
18
Apr
-18
Jul-1
8
Oct
-18
Jan-
19
Total Sales (Domestic + Exports)
10,00,000
11,00,000
12,00,000
13,00,000
14,00,000
15,00,000
16,00,000
17,00,000
18,00,000
19,00,000
Apr
-17
Jul-1
7
Oct
-17
Jan-
18
Apr
-18
Jul-1
8
Oct
-18
Jan-
19
Domestic Sales
-60%
-40%
-20%
0%
20%
40%
60%
80%
7000
9000
11000
13000
15000
17000
Dec
-16
Mar
-17
Jun-
17
Sep-
17
Dec
-17
Mar
-18
Jun-
18
Sep-
18
Dec
-18
Earnings (Rs. Cr.) Growth (%) (RHS)
Indian Rail Freight Earnings
0%
5%
10%
15%
20%
25%
2,20,000
2,40,000
2,60,000
2,80,000
3,00,000
3,20,000
3,40,000
Dec
-16
Mar
-17
Jun-
17
Sep-
17
Dec
-17
Mar
-18
Jun-
18
Sep-
18
Dec
-18
Freight (in tonnes) Growth (%) (RHS)
Cargo Handled at Airport
-10%
-5%
0%
5%
10%
15%
20%
90
95
100
105
110
115
Dec
-16
Mar
-17
Jun-
17
Sep-
17
Dec
-17
Mar
-18
Jun-
18
Sep-
18
Dec
-18
Tonnage (Mn Ton) Growth (%) (RHS)
Indian Rail Freight Traffic
-15% -10% -5% 0% 5% 10% 15% 20% 25%
3600
3800
4000
4200
4400
4600
Dec
-16
Mar
-17
Jun-
17
Sep-
17
Dec
-17
Mar
-18
Jun-
18
Sep-
18
Dec
-18
Earnings (Rs. Cr.) Growth (%) (RHS)
Indian Rail Passengers Earnings
Economy chart bookServices Trend
Auto Sales
1,80,000
2,00,000
2,20,000
2,40,000
2,60,000
2,80,000
Apr
-17
Jul-1
7
Oct
-17
Jan-
18
Apr
-18
Jul-1
8
Oct
-18
Jan-
19
Export Sales
10,00,000
11,00,000
12,00,000
13,00,000
14,00,000
15,00,000
16,00,000
17,00,000
18,00,000
Apr
-17
Jul-1
7
Oct
-17
Jan-
18
Apr
-18
Jul-1
8
Oct
-18
Jan-
19
Two Wheelers
1,00,000
1,20,000
1,40,000
1,60,000
1,80,000
2,00,000
2,20,000
Apr
-17
Jul-1
7
Oct
-17
Jan-
18
Apr
-18
Jul-1
8
Oct
-18
Jan-
19
Passenger Vehicles
70,000
90,000
1,10,000
1,30,000
1,50,000
1,70,000
1,90,000
2,10,000
Apr
-17
Jul-1
7
Oct
-17
Jan-
18
Apr
-18
Jul-1
8
Oct
-18
Jan-
19
Commercial Vehicles
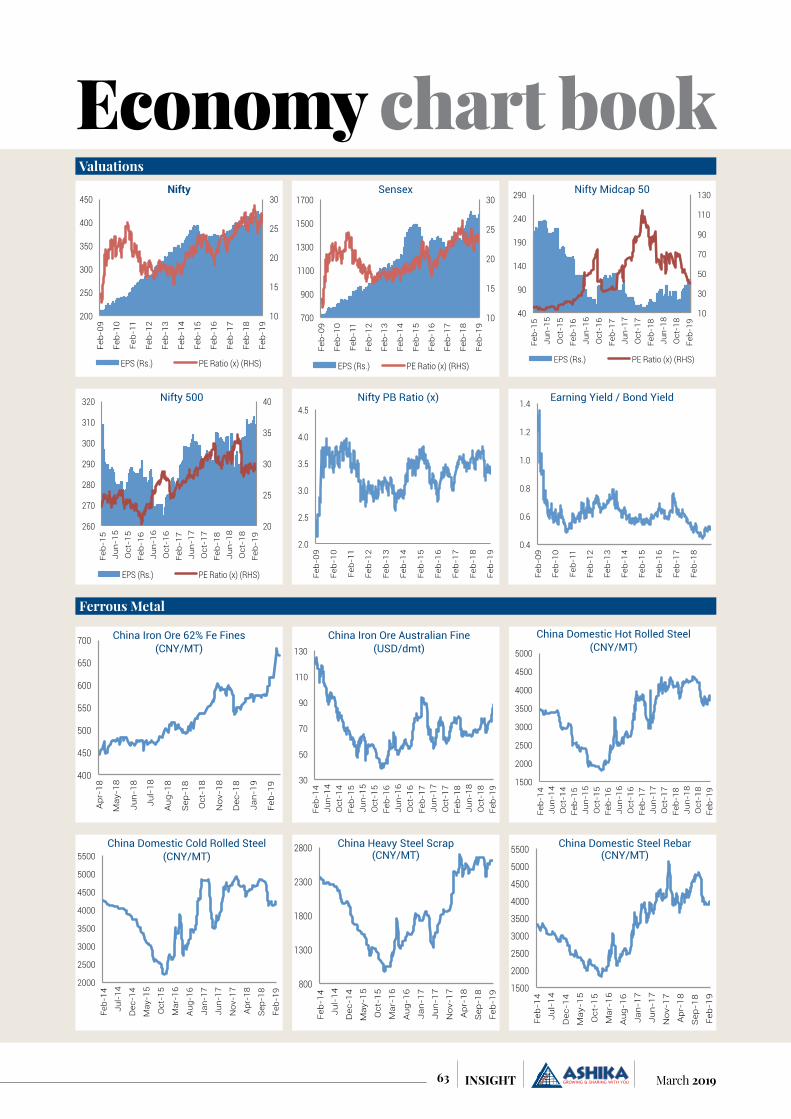
63 March 2019INSIGHT
Economy chart bookValuations
10
15
20
25
30
200
250
300
350
400
450
Feb-
09
Feb-
10
Feb-
11
Feb-
12
Feb-
13
Feb-
14
Feb-
15
Feb-
16
Feb-
17
Feb-
18
Feb-
19
EPS (Rs.) PE Ratio (x) (RHS)
Nifty
10
15
20
25
30
700
900
1100
1300
1500
1700
Feb-
09
Feb-
10
Feb-
11
Feb-
12
Feb-
13
Feb-
14
Feb-
15
Feb-
16
Feb-
17
Feb-
18
Feb-
19
EPS (Rs.) PE Ratio (x) (RHS)
Sensex
10
30
50
70
90
110
130
40
90
140
190
240
290
Feb-
15
Jun-
15
Oct
-15
Feb-
16
Jun-
16
Oct
-16
Feb-
17
Jun-
17
Oct
-17
Feb-
18
Jun-
18
Oct
-18
Feb-
19
EPS (Rs.) PE Ratio (x) (RHS)
Nifty Midcap 50
0.4
0.6
0.8
1.0
1.2
1.4
Feb-
09
Feb-
10
Feb-
11
Feb-
12
Feb-
13
Feb-
14
Feb-
15
Feb-
16
Feb-
17
Feb-
18
Earning Yield / Bond Yield
20
25
30
35
40
260
270
280
290
300
310
320
Feb-
15
Jun-
15
Oct
-15
Feb-
16
Jun-
16
Oct
-16
Feb-
17
Jun-
17
Oct
-17
Feb-
18
Jun-
18
Oct
-18
Feb-
19
EPS (Rs.) PE Ratio (x) (RHS)
Nifty 500
2.0
2.5
3.0
3.5
4.0
4.5
Feb-
09
Feb-
10
Feb-
11
Feb-
12
Feb-
13
Feb-
14
Feb-
15
Feb-
16
Feb-
17
Feb-
18
Feb-
19
Nifty PB Ratio (x)
400
450
500
550
600
650
700
Apr
-18
May
-18
Jun-
18
Jul-
18
Aug
-18
Sep
-18
Oct
-18
Nov
-18
Dec
-18
Jan-
19
Feb-
19
China Iron Ore 62% Fe Fines (CNY/MT)
30
50
70
90
110
130
Feb-
14
Jun-
14
Oct
-14
Feb-
15
Jun-
15
Oct
-15
Feb-
16
Jun-
16
Oct
-16
Feb-
17
Jun-
17
Oct
-17
Feb-
18
Jun-
18
Oct
-18
Feb-
19
China Iron Ore Australian Fine (USD/dmt)
1500
2000
2500
3000
3500
4000
4500
5000
Feb-
14
Jun-
14
Oct
-14
Feb-
15
Jun-
15
Oct
-15
Feb-
16
Jun-
16
Oct
-16
Feb-
17
Jun-
17
Oct
-17
Feb-
18
Jun-
18
Oct
-18
Feb-
19
China Domestic Hot Rolled Steel (CNY/MT)
2000
2500
3000
3500
4000
4500
5000
5500
Feb-
14
Jul-
14
Dec
-14
May
-15
Oct
-15
Mar
-16
Aug
-16
Jan-
17
Jun-
17
Nov
-17
Apr
-18
Sep-
18
Feb-
19
China Domestic Cold Rolled Steel (CNY/MT)
800
1300
1800
2300
2800
Feb-
14
Jul-
14
Dec
-14
May
-15
Oct
-15
Mar
-16
Aug
-16
Jan-
17
Jun-
17
Nov
-17
Apr
-18
Sep
-18
Feb-
19
China Heavy Steel Scrap (CNY/MT)
1500
2000
2500
3000
3500
4000
4500
5000
5500
Feb-
14
Jul-
14
Dec
-14
May
-15
Oct
-15
Mar
-16
Aug
-16
Jan-
17
Jun-
17
Nov
-17
Apr
-18
Sep
-18
Feb-
19
China Domestic Steel Rebar (CNY/MT)
Ferrous Metal
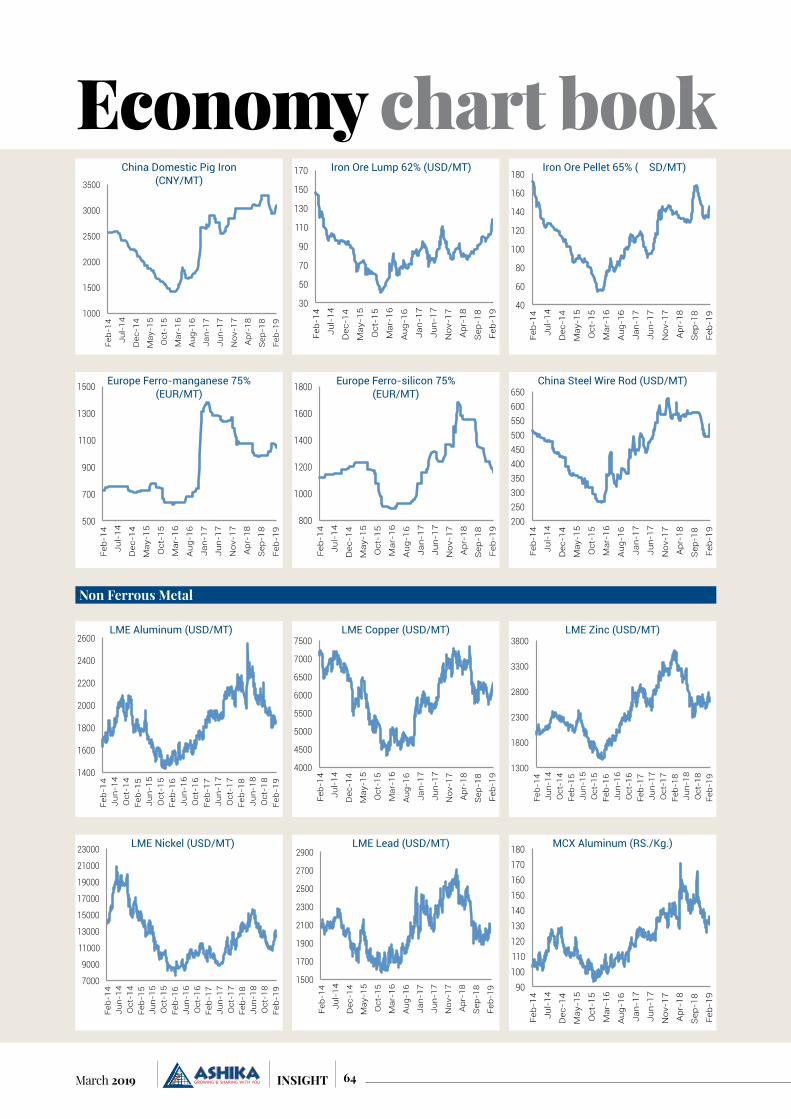
64March 2019 INSIGHT
500
700
900
1100
1300
1500
Feb-
14
Jul-
14
Dec
-14
May
-15
Oct
-15
Mar
-16
Aug
-16
Jan-
17
Jun-
17
Nov
-17
Apr
-18
Sep
-18
Feb-
19
Europe Ferro-manganese 75% (EUR/MT)
800
1000
1200
1400
1600
1800
Feb
-14
Jul-
14
Dec
-14
May
-15
Oct
-15
Mar
-16
Au
g-1
6
Jan
-17
Jun
-17
No
v-17
Ap
r-18
Sep
-18
Feb
-19
Europe Ferro-silicon 75% (EUR/MT)
200 250 300 350 400 450 500 550 600 650
Feb-
14
Jul-
14
Dec
-14
May
-15
Oct
-15
Mar
-16
Aug
-16
Jan-
17
Jun-
17
Nov
-17
Apr
-18
Sep
-18
Feb-
19
China Steel Wire Rod (USD/MT)
1400
1600
1800
2000
2200
2400
2600
Feb-
14
Jun-
14
Oct
-14
Feb-
15
Jun-
15
Oct
-15
Feb-
16
Jun-
16
Oct
-16
Feb-
17
Jun-
17
Oct
-17
Feb-
18
Jun-
18
Oct
-18
Feb-
19
LME Aluminum (USD/MT)
1000
1500
2000
2500
3000
3500
Feb-
14
Jul-
14
Dec
-14
May
-15
Oct
-15
Mar
-16
Aug
-16
Jan-
17
Jun-
17
Nov
-17
Apr
-18
Sep
-18
Feb-
19
China Domestic Pig Iron (CNY/MT)
30
50
70
90
110
130
150
170
Feb-
14
Jul-
14
Dec
-14
May
-15
Oct
-15
Mar
-16
Aug
-16
Jan-
17
Jun-
17
Nov
-17
Apr
-18
Sep
-18
Feb-
19
Iron Ore Lump 62% (USD/MT)
40
60
80
100
120
140
160
180
Feb-
14
Jul-
14
Dec
-14
May
-15
Oct
-15
Mar
-16
Aug
-16
Jan-
17
Jun-
17
Nov
-17
Apr
-18
Sep
-18
Feb-
19
Iron Ore Pellet 65% (USD/MT)
Economy chart book
Non Ferrous Metal
4000
4500
5000
5500
6000
6500
7000
7500
Feb-
14
Jul-
14
Dec
-14
May
-15
Oct
-15
Mar
-16
Aug
-16
Jan-
17
Jun-
17
Nov
-17
Apr
-18
Sep
-18
Feb-
19
LME Copper (USD/MT)
1300
1800
2300
2800
3300
3800
Feb-
14
Jun-
14
Oct
-14
Feb-
15
Jun-
15
Oct
-15
Feb-
16
Jun-
16
Oct
-16
Feb-
17
Jun-
17
Oct
-17
Feb-
18
Jun-
18
Oct
-18
Feb-
19
LME Zinc (USD/MT)
1500
1700
1900
2100
2300
2500
2700
2900
Feb-
14
Jul-
14
Dec
-14
May
-15
Oct
-15
Mar
-16
Aug
-16
Jan-
17
Jun-
17
Nov
-17
Apr
-18
Sep
-18
Feb-
19
LME Lead (USD/MT)
7000
9000
11000
13000
15000
17000
19000
21000
23000
Feb-
14
Jun-
14
Oct
-14
Feb-
15
Jun-
15
Oct
-15
Feb-
16
Jun-
16
Oct
-16
Feb-
17
Jun-
17
Oct
-17
Feb-
18
Jun-
18
Oct
-18
Feb-
19
LME Nickel (USD/MT)
90 100 110 120 130 140 150 160 170 180
Feb-
14
Jul-
14
Dec
-14
May
-15
Oct
-15
Mar
-16
Aug
-16
Jan-
17
Jun-
17
Nov
-17
Apr
-18
Sep
-18
Feb-
19
MCX Aluminum (RS./Kg.)

65 March 2019INSIGHT
Economy chart book
100
110
120
130
140
150
160
170
180
Feb-
14
Jul-
14
Dec
-14
May
-15
Oct
-15
Mar
-16
Aug
-16
Jan-
17
Jun-
17
Nov
-17
Apr
-18
Sep
-18
Feb-
19
MCX Lead (RS./Kg.)
50
100
150
200
250
300
350
Feb-
14
Jun-
14
Oct
-14
Feb-
15
Jun-
15
Oct
-15
Feb-
16
Jun-
16
Oct
-16
Feb-
17
Jun-
17
Oct
-17
Feb-
18
Jun-
18
Oct
-18
Feb-
19
Lithium (USD/MT)
20000
30000
40000
50000
60000
70000
80000
90000
100000
Feb-
14
Jul-
14
Dec
-14
May
-15
Oct
-15
Mar
-16
Aug
-16
Jan-
17
Jun-
17
Nov
-17
Apr
-18
Sep
-18
Feb-
19
LME Cobalt (USD/MT)
700
900
1100
1300
1500
1700
1900
2100
2300
Feb-
14
Jul-
14
Dec
-14
May
-15
Oct
-15
Mar
-16
Aug
-16
Jan-
17
Jun-
17
Nov
-17
Apr
-18
Sep
-18
Feb-
19
Mentha Oil (Rs./Kg.)
250
300
350
400
450
500
550
Feb-
14
Jul-
14
Dec
-14
May
-15
Oct
-15
Mar
-16
Aug
-16
Jan-
17
Jun-
17
Nov
-17
Apr
-18
Sep
-18
Feb-
19
MCX Copper (RS./Kg.)
90
110
130
150
170
190
210
230
250
Feb-
14
Jul-
14
Dec
-14
May
-15
Oct
-15
Mar
-16
Aug
-16
Jan-
17
Jun-
17
Nov
-17
Apr
-18
Sep
-18
Feb-
19
MCX Zinc (RS./Kg.)
500 600 700 800 900
1000 1100 1200 1300 1400
Feb-
14
Jun-
14
Oct
-14
Feb-
15
Jun-
15
Oct
-15
Feb-
16
Jun-
16
Oct
-16
Feb-
17
Jun-
17
Oct
-17
Feb-
18
Jun-
18
Oct
-18
Feb-
19
MCX Nickel (RS./Kg.)
4500
6500
8500
10500
12500
14500
Feb-
14
Jul-
14
Dec
-14
May
-15
Oct
-15
Mar
-16
Aug
-16
Jan-
17
Jun-
17
Nov
-17
Apr
-18
Sep-
18
Feb-
19
Copra at Cochin (Rs./quintal)
14000
16000
18000
20000
22000
24000
26000
Feb-
14
Jul-
14
Dec
-14
May
-15
Oct
-15
Mar
-16
Aug
-16
Jan-
17
Jun-
17
Nov
-17
Apr
-18
Sep
-18
Feb-
19
NCDEX Cotton (Rs./bale (500 lb))
500
600
700
800
900
1000
1100
1200
Feb-
14
Jul-
14
Dec
-14
May
-15
Oct
-15
Mar
-16
Aug
-16
Jan-
17
Jun-
17
Nov
-17
Apr
-18
Sep
-18
Feb-
19
Base Oil Price (USD/MT)
2000
2500
3000
3500
4000
4500
Feb-
14
Jul-
14
Dec
-14
May
-15
Oct
-15
Mar
-16
Aug
-16
Jan-
17
Jun-
17
Nov
-17
Apr
-18
Sep
-18
Feb-
19
Sugar M30 (Rs./quintal)
1500
2000
2500
3000
3500
Feb-
14
Jun-
14
Oct
-14
Feb-
15
Jun-
15
Oct
-15
Feb-
16
Jun-
16
Oct
-16
Feb-
17
Jun-
17
Oct
-17
Feb-
18
Jun-
18
Oct
-18
Feb-
19
Peninsular Malaysian Palm Oil (MYR/MT)
Agri Commodity
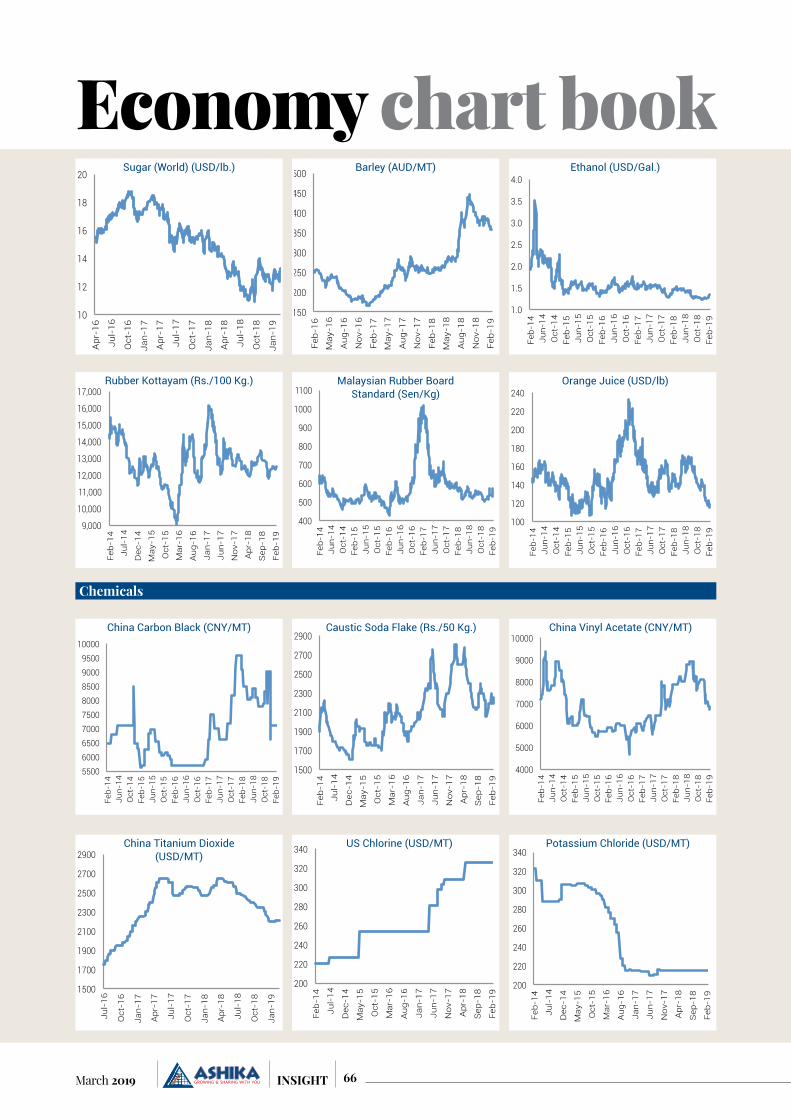
66March 2019 INSIGHT
9,000
10,000
11,000
12,000
13,000
14,000
15,000
16,000
17,000
Feb-
14
Jul-
14
Dec
-14
May
-15
Oct
-15
Mar
-16
Aug
-16
Jan-
17
Jun-
17
Nov
-17
Apr
-18
Sep
-18
Feb-
19
Rubber Kottayam (Rs./100 Kg.)
400
500
600
700
800
900
1000
1100
Feb-
14
Jun-
14
Oct
-14
Feb-
15
Jun-
15
Oct
-15
Feb-
16
Jun-
16
Oct
-16
Feb-
17
Jun-
17
Oct
-17
Feb-
18
Jun-
18
Oct
-18
Feb-
19
Malaysian Rubber Board Standard (Sen/Kg)
5500 6000 6500 7000 7500 8000 8500 9000 9500
10000
Feb-
14
Jun-
14
Oct
-14
Feb-
15
Jun-
15
Oct
-15
Feb-
16
Jun-
16
Oct
-16
Feb-
17
Jun-
17
Oct
-17
Feb-
18
Jun-
18
Oct
-18
Feb-
19
China Carbon Black (CNY/MT)
1500
1700
1900
2100
2300
2500
2700
2900
Feb-
14
Jul-
14
Dec
-14
May
-15
Oct
-15
Mar
-16
Aug
-16
Jan-
17
Jun-
17
Nov
-17
Apr
-18
Sep
-18
Feb-
19
Caustic Soda Flake (Rs./50 Kg.)
10
12
14
16
18
20
Apr
-16
Jul-
16
Oct
-16
Jan-
17
Apr
-17
Jul-
17
Oct
-17
Jan-
18
Apr
-18
Jul-
18
Oct
-18
Jan-
19
Sugar (World) (USD/lb.)
150
200
250
300
350
400
450
500
Feb-
16
May
-16
Aug
-16
Nov
-16
Feb-
17
May
-17
Aug
-17
Nov
-17
Feb-
18
May
-18
Aug
-18
Nov
-18
Feb-
19
Barley (AUD/MT)
1.0
1.5
2.0
2.5
3.0
3.5
4.0
Feb-
14
Jun-
14
Oct
-14
Feb-
15
Jun-
15
Oct
-15
Feb-
16
Jun-
16
Oct
-16
Feb-
17
Jun-
17
Oct
-17
Feb-
18
Jun-
18
Oct
-18
Feb-
19
Ethanol (USD/Gal.)
100
120
140
160
180
200
220
240
Feb-
14
Jun-
14
Oct
-14
Feb-
15
Jun-
15
Oct
-15
Feb-
16
Jun-
16
Oct
-16
Feb-
17
Jun-
17
Oct
-17
Feb-
18
Jun-
18
Oct
-18
Feb-
19
Orange Juice (USD/lb)
Economy chart book
Chemicals
4000
5000
6000
7000
8000
9000
10000
Feb-
14
Jun-
14
Oct
-14
Feb-
15
Jun-
15
Oct
-15
Feb-
16
Jun-
16
Oct
-16
Feb-
17
Jun-
17
Oct
-17
Feb-
18
Jun-
18
Oct
-18
Feb-
19
China Vinyl Acetate (CNY/MT)
1500
1700
1900
2100
2300
2500
2700
2900
Jul-
16
Oct
-16
Jan-
17
Apr
-17
Jul-
17
Oct
-17
Jan-
18
Apr
-18
Jul-
18
Oct
-18
Jan-
19
China Titanium Dioxide (USD/MT)
200
220
240
260
280
300
320
340
Feb-
14
Jul-
14
Dec
-14
May
-15
Oct
-15
Mar
-16
Aug
-16
Jan-
17
Jun-
17
Nov
-17
Apr
-18
Sep
-18
Feb-
19
US Chlorine (USD/MT)
200
220
240
260
280
300
320
340
Feb-
14
Jul-
14
Dec
-14
May
-15
Oct
-15
Mar
-16
Aug
-16
Jan-
17
Jun-
17
Nov
-17
Apr
-18
Sep
-18
Feb-
19
Potassium Chloride (USD/MT)

67 March 2019INSIGHT
5000 6000 7000 8000 9000
10000 11000 12000 13000 14000
Feb-
14
Jun-
14
Oct
-14
Feb-
15
Jun-
15
Oct
-15
Feb-
16
Jun-
16
Oct
-16
Feb-
17
Jun-
17
Oct
-17
Feb-
18
Jun-
18
Oct
-18
Feb-
19
China Phenol (CNY/MT)
1500 2000 2500 3000 3500 4000 4500 5000 5500 6000
Feb
-14
Jul-
14
Dec
-14
May
-15
Oct
-15
Mar
-16
Au
g-1
6
Jan
-17
Jun
-17
No
v-1
7
Ap
r-1
8
Sep
-18
Feb
-19
China Acetic Acid (CNY/MT)
1200
1300
1400
1500
1600
1700
1800
1900
Feb-
14
Jul-
14
Dec
-14
May
-15
Oct
-15
Mar
-16
Aug
-16
Jan-
17
Jun-
17
Nov
-17
Apr
-18
Sep
-18
Feb-
19
Vinyl Acetate Monomer (USD/MT)
Economy chart book
FY12 FY13 FY14 FY15 FY16 FY17 FY18 FY19(Till Date)External Sector (% YoY) Exports (USD Bn.) 309.8 306.6 318.6 316.5 266.4 280.1 309.0 271.5% YoY 20.9% -1.0% 3.9% -0.6% -15.9% 5.2% 10.3%Imports (USD Bn.) 499.5 502.2 466.2 461.5 396.4 392.6 469.0 428.6%YoY 30.3% 0.5% -7.2% -1.0% -14.1% -1.0% 19.5%Trade Deficit (USD Bn.) -189.8 -195.7 -147.6 -144.9 -130.1 -112.4 -160.0 -157.1Invisibles (USD Bn.) 111.6 107.5 115.3 118.1 107.9 98.0 111.3Current Account Deficit (USD Bn.) -78.2 -88.2 -32.3 -26.9 -22.2 -14.4 -48.7% to GDP -4.2% -4.8% -1.7% -1.3% -1.1% -0.6% -1.9%Capital Account (USD Bn.) 67.8 89.3 48.8 89.3 41.1 36.4 91.4% GDP 2.8% 3.0% 1.9% 3.8% 2.0% 2.2% 2.4%Forex Reserve (incl Gold) (USD Bn.) 294.4 292.0 304.2 341.6 360.2 370.0 424.5 398.1Months of imports 7.1 7.0 7.8 8.9 10.9 11.3 10.9 12.9External Debt (USD Bn.) 360.8 409.4 446.2 474.7 484.8 471.3 529.3Short Term Debt (USD Bn.) 78.2 96.7 91.7 85.5 83.5 88.1 102.2FDI Inflows (USD Bn.) 35.1 22.4 24.3 30.9 40.0 43.5 44.9 33.5ECB (USD Bn.) 35.4 32.0 33.2 28.4 24.4 22.0 28.9 24.0Exchange RateUSD/INR (Avg.) 51.2 60.1 54.4 62.6 66.3 67.1 64.5 69.9% Depreciation 17.5% -9.5% 15.1% 6.0% 1.1% -3.9% 8.4%Precious Metals Gold - Mumbai (Rs. per 10gms.) 25722 30164 29190 27415 26534 29665 29300 31047.0Gold - London (USD per troy oz.) 1645 1654 1327 1247 1147 1258 1285 1258.0Silver - Mumbai (Rs. per Kg.) 57316 57602 46637 40558 36318 42748 39072 38340.1Silver - NewYork (USD per troy oz.) 3546 3051 2145 1814 1526 1779 1687 15.4Crude OilYearly Avg. (USD per Barrel) 114.1 110.2 107.6 86.6 48.7 49.9 57.9 71.2Industry GrowthIIP 3.3% 3.3% 4.0% 3.3% 4.6% 3.7% 4.6%Mining -5.3% -0.1% -1.4% 4.3% 5.3% 2.9% 3.1%Manufacturing 4.8% 3.6% 3.8% 2.8% 4.4% 3.8% 4.7%Electricity 4.0% 6.1% 14.8% 5.7% 5.8% 5.1% 6.4%Primary Goods 0.5% 2.3% 3.8% 5.0% 4.9% 3.5% 4.1%Capital Goods 0.3% -3.7% -1.1% 3.0% 3.2% 2.7% 7.1%Consumer Durables 4.9% 5.6% 4.0% 3.4% 2.9% -1.1% 7.5%
Fiscal Year to 31 March

68March 2019 INSIGHT
FY12 FY13 FY14 FY15 FY16 FY17 FY18 FY19(Till Date)Core Sector GrowthEight Core Industries 3.8% 2.6% 4.9% 3.0% 4.8% 4.3% 4.8%Coal Production (Mn. Tn.) 552 569 575 621 651 672 689 506.0Coal Growth (%) 3.2% 1.0% 8.0% 4.8% 3.2% 2.6% 7.8%Crude Oil Production (Mn Tn) 38 38 38 37 37 36 36 25.9Crude Oil Growth (%) -0.6% -0.2% -0.9% -1.4% -2.5% -0.9% -3.7%Natural Gas Production (BCUM) 46 40 35 33 31 31 32 24.0Natural Gas Growth (%) -14.4% -12.9% -5.3% -4.7% -1.0% 2.9% -0.1%Petroleum Refinery Products Prodn (Mn Tn) 203 218 221 221 232 243 254 196.7Petroleum Refinery Products Growth (%) 7.2% 1.4% 0.2% 4.9% 4.9% 4.6% 4.1%Fertilizers Production of (Mn Tn) 39 37 38 39 41 41 41 30.7Fertilizers Growth (%) -3.3% 1.5% 1.3% 7.0% 0.2% 0.0% -1.4%Steel Production (Mn Tn) 76 82 88 92 91 101 106 82.3Steel Growth (%) 7.9% 7.3% 5.1% -1.3% 10.7% 5.6% 4.7%Cement Production (Mn Tn) 230 247 256 271 283 280 298 245.8Cement Growth (%) 7.5% 3.7% 5.9% 4.6% -1.2% 6.3% 13.9%Electricity Generation (Bn KWH) 877 912 967 1110 1174 1242 1308 1047.4Electricity Growth (%) 4.0% 6.1% 14.8% 5.7% 5.8% 5.3% 6.3%Railways TrafficFreight Traffic (Mn Tonne) 969.8 1009.7 1053.6 1097.6 1101.5 1106.6 1159.6 894.6Freight Traffic Revenue (Rs Bn) 696.7 858.7 934.7 1053.1 1090.0 1043.1 1170.3 853.3Airport TrafficTotal Freight (Mt in Mn) 2.3 2.2 2.3 2.5 2.7 3.0 3.4 2.7Total Passenger (in Mn) 162.3 159.4 168.9 190.1 224.0 265.0 308.8 252.2Automobile Sales (in mn)Passenger Vehicles 2.6 3.2 3.1 3.2 3.4 3.8 4.0Commercial Vehicles 0.8 0.9 0.7 0.7 0.8 0.8 1.0Three Wheelers 0.5 0.8 0.8 0.9 0.9 0.8 1.0Two Wheelers 13.4 15.8 16.9 18.4 18.9 19.9 23.0Grand Total 17.4 20.7 21.5 23.3 24.1 25.3 29.0FII Investments (Rs Bn)Equity 437.4 1400.3 797.1 1113.3 -141.7 557.0 256.3 -517.4Debt 499.9 283.3 -280.6 1661.3 -40.0 -72.9 1190.4 -499.4Total 937.3 1683.7 516.5 2774.6 -181.8 484.1 1446.8 -1017.9DII Investments (Rs Bn)Equity -37.9 -669.4 -540.7 -192.6 786.9 299.3 1146.0 928.2Monetary Indicators (% YoY)Money supply 14.6% 17.1% 13.2% 10.8% 10.1% 7.2% 9.6% 9.4%Inflation – WPI (Avg.) 9.0% 6.9% 5.2% 1.3% -3.6% 1.8% 2.9% 4.6%CPI (Avg.) 8.6% 10.2% 9.5% 6.0% 4.9% 4.5% 3.6% 3.6%10 Yr Gsec (%) 8.6% 8.0% 8.7% 7.8% 7.5% 6.7% 7.4% 7.7%364 day T-Bill (%) 8.4% 7.8% 8.7% 7.7% 7.1% 6.1% 6.5% 7.1%India AAA Corp 10 year (%) 9.5% 8.9% 9.6% 8.4% 8.4% 7.8% 8.2% 8.6%Bank Deposit (Rs. Bn.) 59091 67505 77056 85333 93273 107577 114260 121228Deposit growth (%) 13.5% 14.2% 14.1% 10.7% 9.3% 15.3% 6.2% 9.6%Bank Credit (Rs. Bn.) 46119 52605 59941 65364 72496 78415 86254 94299Bank credit growth (%) 17.0% 14.1% 13.9% 9.0% 10.9% 8.2% 10.0% 14.5%Domestic savings sectorwise (Rs Bn)Financial Savings 6426 7336 8321 8804 11108 9697 11290Physical Savings 14230 15017 14532 15587 13641 16532 18092Total Household Sector 20656 22353 22853 24391 24749 26229 29382Private Corporate Sector 8268 9940 12072 14571 16383 17701 19863Public Sector 2927 2988 2894 2990 3305 3767 4540Gross Domestic Savings 31851 35281 37819 41952 44437 47698 53786Net Domestic Savings 30268 33692 36082 40200 42823 46484 52160
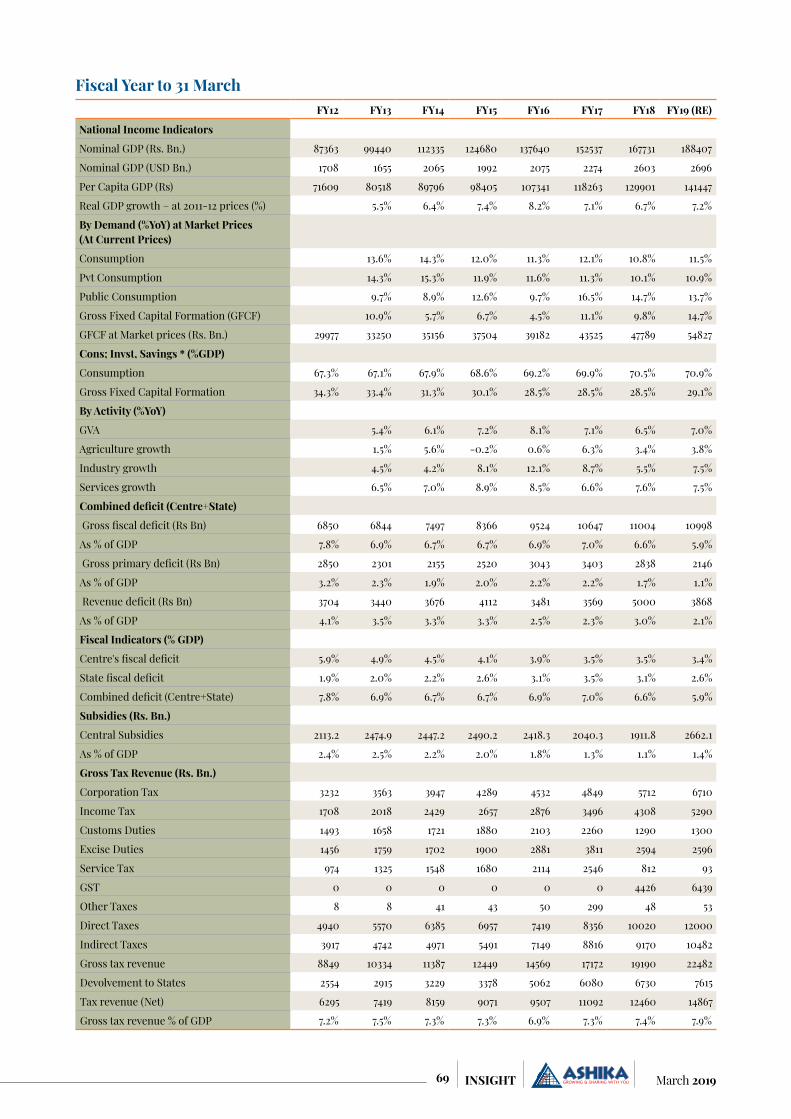
69 March 2019INSIGHT
FY12 FY13 FY14 FY15 FY16 FY17 FY18 FY19 (RE)
National Income Indicators
Nominal GDP (Rs. Bn.) 87363 99440 112335 124680 137640 152537 167731 188407
Nominal GDP (USD Bn.) 1708 1655 2065 1992 2075 2274 2603 2696
Per Capita GDP (Rs) 71609 80518 89796 98405 107341 118263 129901 141447
Real GDP growth – at 2011-12 prices (%) 5.5% 6.4% 7.4% 8.2% 7.1% 6.7% 7.2%
By Demand (%YoY) at Market Prices (At Current Prices)
Consumption 13.6% 14.3% 12.0% 11.3% 12.1% 10.8% 11.5%
Pvt Consumption 14.3% 15.3% 11.9% 11.6% 11.3% 10.1% 10.9%
Public Consumption 9.7% 8.9% 12.6% 9.7% 16.5% 14.7% 13.7%
Gross Fixed Capital Formation (GFCF) 10.9% 5.7% 6.7% 4.5% 11.1% 9.8% 14.7%
GFCF at Market prices (Rs. Bn.) 29977 33250 35156 37504 39182 43525 47789 54827
Cons; Invst, Savings * (%GDP)
Consumption 67.3% 67.1% 67.9% 68.6% 69.2% 69.9% 70.5% 70.9%
Gross Fixed Capital Formation 34.3% 33.4% 31.3% 30.1% 28.5% 28.5% 28.5% 29.1%
By Activity (%YoY)
GVA 5.4% 6.1% 7.2% 8.1% 7.1% 6.5% 7.0%
Agriculture growth 1.5% 5.6% -0.2% 0.6% 6.3% 3.4% 3.8%
Industry growth 4.5% 4.2% 8.1% 12.1% 8.7% 5.5% 7.5%
Services growth 6.5% 7.0% 8.9% 8.5% 6.6% 7.6% 7.5%
Combined deficit (Centre+State)
Gross fiscal deficit (Rs Bn) 6850 6844 7497 8366 9524 10647 11004 10998
As % of GDP 7.8% 6.9% 6.7% 6.7% 6.9% 7.0% 6.6% 5.9%
Gross primary deficit (Rs Bn) 2850 2301 2155 2520 3043 3403 2838 2146
As % of GDP 3.2% 2.3% 1.9% 2.0% 2.2% 2.2% 1.7% 1.1%
Revenue deficit (Rs Bn) 3704 3440 3676 4112 3481 3569 5000 3868
As % of GDP 4.1% 3.5% 3.3% 3.3% 2.5% 2.3% 3.0% 2.1%
Fiscal Indicators (% GDP)
Centre's fiscal deficit 5.9% 4.9% 4.5% 4.1% 3.9% 3.5% 3.5% 3.4%
State fiscal deficit 1.9% 2.0% 2.2% 2.6% 3.1% 3.5% 3.1% 2.6%
Combined deficit (Centre+State) 7.8% 6.9% 6.7% 6.7% 6.9% 7.0% 6.6% 5.9%
Subsidies (Rs. Bn.)
Central Subsidies 2113.2 2474.9 2447.2 2490.2 2418.3 2040.3 1911.8 2662.1
As % of GDP 2.4% 2.5% 2.2% 2.0% 1.8% 1.3% 1.1% 1.4%
Gross Tax Revenue (Rs. Bn.)
Corporation Tax 3232 3563 3947 4289 4532 4849 5712 6710
Income Tax 1708 2018 2429 2657 2876 3496 4308 5290
Customs Duties 1493 1658 1721 1880 2103 2260 1290 1300
Excise Duties 1456 1759 1702 1900 2881 3811 2594 2596
Service Tax 974 1325 1548 1680 2114 2546 812 93
GST 0 0 0 0 0 0 4426 6439
Other Taxes 8 8 41 43 50 299 48 53
Direct Taxes 4940 5570 6385 6957 7419 8356 10020 12000
Indirect Taxes 3917 4742 4971 5491 7149 8816 9170 10482
Gross tax revenue 8849 10334 11387 12449 14569 17172 19190 22482
Devolvement to States 2554 2915 3229 3378 5062 6080 6730 7615
Tax revenue (Net) 6295 7419 8159 9071 9507 11092 12460 14867
Gross tax revenue % of GDP 7.2% 7.5% 7.3% 7.3% 6.9% 7.3% 7.4% 7.9%
Fiscal Year to 31 March

70March 2019 INSIGHT
Ajanta Pharma Ltd.
MANAGEMENT MEET NOTE
Company Background Ajanta Pharma ltd (APL) is an Indian pharma company
mainly into exports as well as domestic formulations.
Company owns 5 manufacturing facilities including 4 in Aurangabad, Maharashtra and one in Mauritius. Of these
five facilities, only one in Aurangabad is an API facility, while rest all are formulation business.
Company’s Dahej facility is US FDA approved and tax exempted.
APL domestic business has core focus on 4 Therapeutic segments including Cardiology, Ophthalmology, Der-matology and Pain Management. In above 4 segments company has 15 divisions.
There are around 3000+ MRs in India and 800+ outside India working for the company and has 270+ products in its product basket
Sector Pharmaceuticals
Promoter Holding 70.47%
Shareholding Motilal Oswal Multicap 35 Fund, SBI Equity Hybrid Fund, UTI - Equity Fund, Matthews India Fund & Kotak Mahindra (International) Limited.
Company InformationBSE Code 532331NSE Code AJANTPHARMBloomberg Code AJP INISIN INE031B01049Market Cap (Rs. Cr) 8,821.2 Outstanding shares(Cr) 8.80 52-wk Hi/Lo (Rs.) 1457.7/895.8Avg. daily volume (1yr. on NSE) 377,380 Face Value(Rs.) 2Book Value (Rs) 259.2

71 March 2019INSIGHT
Globally, company caters to US, Africa (19 countries), West Asia (3 countries), Commonwealth of Independent states (4 countries), South East Asia (3 countries) and India.
Continue to focus on 4 Therapeutic Segments for India
Cardiology Growth continues exceeding industry average
Ophthalmology Maintaining 3rd position, growing faster than industry
Dermatology Growth becoming visible, expected to pick up in next few quarters
Pain Management Growth momentum picks up to above industry performance
Source: Company
IPM -RankingMar-05 Dec-17 Dec-18
Ophthal 28 2 3Derma 98 14 13Cardio 38 16 17Pain NA 42 41Ajanta 88 32 32
Source: Company
Industry update Last 2 years Indian pharma industry witnessed slow-
down because of demonetization, GST roll out, price control, Fixed dose combination (FDC), Ayushman Bharat, etc. Slowdown in overall industry impacted Ajanta Pharma’s business as well, thus the growth of APL receded from 12 to 14% to 7 to 8%.
During September 2018, Indian health ministry pro-hibited 328 fixed dose combinations (fdc), citing their ingredients had no therapeutic value and were risky for consumption. The ban on 328 drugs shaved off over Rs 1,500 crore from India’s Rs 1.18 lakh crore pharmaceutical industry. Such drugs, known as fixed dose combina-tions (FDCs), are cocktails of two or more therapeutic ingredients.
The government under Drug Pricing Control Order (DPCO) control on 1800+ drugs in last 3 years and all are implemented on old generation molecules.
65% of India business is 1st to market for better margins and market share.
Business Segments Branded generics, African Institutions and US gener-
ics are the three business segments of Ajanta Pharma. Branded generics account for 75% of total revenue and revenue comes from India, Asia & Africa. African Insti-tution business and US generic business account for 10% and 15% of total revenue respectively.
Out of total 75% of branded generic revenue, 35% is contributed by India and 40% by Asia & Africa.
Ajanta pharma has always focused on profitable growth hence the EBIDTA margins are best in the industry at 30%+.
Company transitioned from a OTC player pre-2005 to specialty Therapeutic area with higher EBITDA margin in the industry. Currently, company has no presence in OTC drug market and MR visit only to specialist and they are all prescribed drugs.
For company, profitability power is the key focus area rather than volume growth.
12% 14%
9% 6%
11%
26% 23%
16%
6%
14%
March-2015 March-2016 March-2017 March-2018 December-2018
Indian Pharmaceutical Market Ajanta Pharma
Pharma Industry growth (%)
Source: Company
11% 11% 9% 9%
14% 14% 16%
13%
20%
9%
Pharma Market Cardiology Ophthalmology Pain Mgt. Dermatology
Indian Pharmaceutical Market Ajanta Pharma
Therapeutic Segment Growth (%)
Source: Company
India Branded Generic IMS MAT Dec . 2018 Sales (%)
Source: Company
Pain Mgt., 6%
Cardiology, 41%
Opthalmology, 30%
Dermatology, 23%
Revenue Contribution
Source: Company
AfricaInstitution,
10%
USgeneric,
15%Brandedgenerics,
75%
India,35%
Asia & Africa,
40%
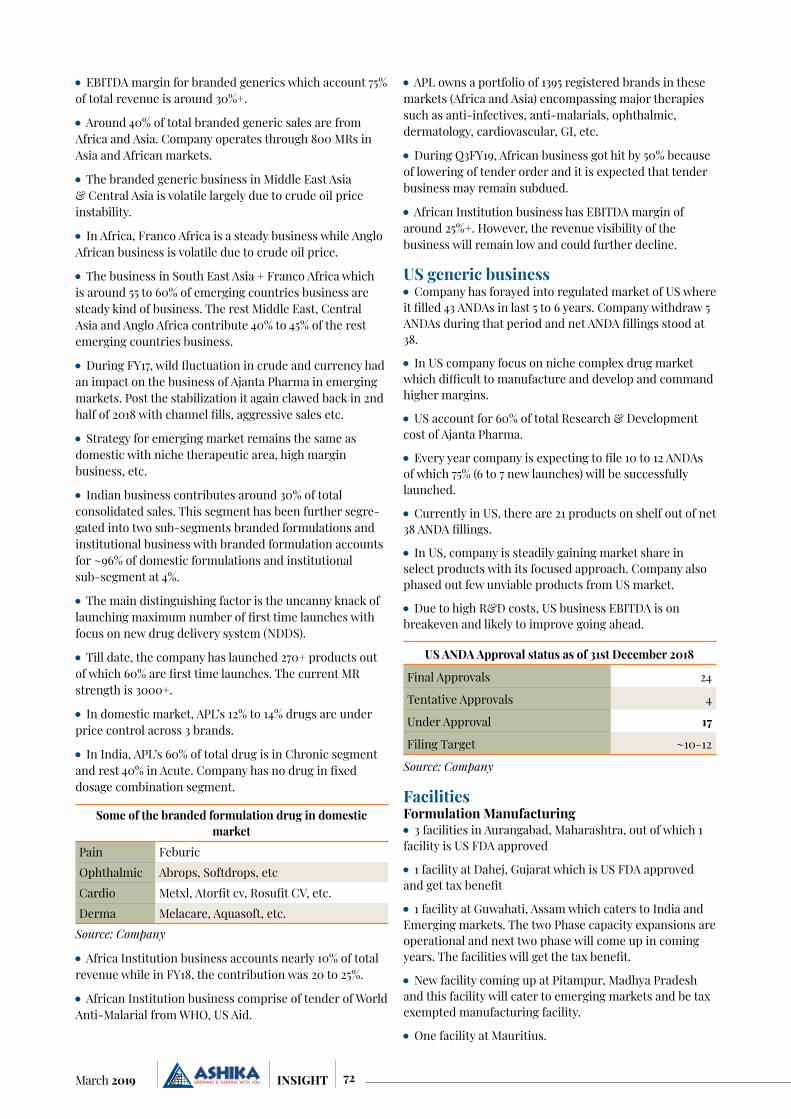
72March 2019 INSIGHT
EBITDA margin for branded generics which account 75% of total revenue is around 30%+.
Around 40% of total branded generic sales are from Africa and Asia. Company operates through 800 MRs in Asia and African markets.
The branded generic business in Middle East Asia & Central Asia is volatile largely due to crude oil price instability.
In Africa, Franco Africa is a steady business while Anglo African business is volatile due to crude oil price.
The business in South East Asia + Franco Africa which is around 55 to 60% of emerging countries business are steady kind of business. The rest Middle East, Central Asia and Anglo Africa contribute 40% to 45% of the rest emerging countries business.
During FY17, wild fluctuation in crude and currency had an impact on the business of Ajanta Pharma in emerging markets. Post the stabilization it again clawed back in 2nd half of 2018 with channel fills, aggressive sales etc.
Strategy for emerging market remains the same as domestic with niche therapeutic area, high margin business, etc.
Indian business contributes around 30% of total consolidated sales. This segment has been further segre-gated into two sub-segments branded formulations and institutional business with branded formulation accounts for ~96% of domestic formulations and institutional sub-segment at 4%.
The main distinguishing factor is the uncanny knack of launching maximum number of first time launches with focus on new drug delivery system (NDDS).
Till date, the company has launched 270+ products out of which 60% are first time launches. The current MR strength is 3000+.
In domestic market, APL’s 12% to 14% drugs are under price control across 3 brands.
In India, APL’s 60% of total drug is in Chronic segment and rest 40% in Acute. Company has no drug in fixed dosage combination segment.
Some of the branded formulation drug in domestic market
Pain FeburicOphthalmic Abrops, Softdrops, etcCardio Metxl, Atorfit cv, Rosufit CV, etc.Derma Melacare, Aquasoft, etc.
Source: Company
Africa Institution business accounts nearly 10% of total revenue while in FY18, the contribution was 20 to 25%.
African Institution business comprise of tender of World Anti-Malarial from WHO, US Aid.
APL owns a portfolio of 1395 registered brands in these markets (Africa and Asia) encompassing major therapies such as anti-infectives, anti-malarials, ophthalmic, dermatology, cardiovascular, GI, etc.
During Q3FY19, African business got hit by 50% because of lowering of tender order and it is expected that tender business may remain subdued.
African Institution business has EBITDA margin of around 25%+. However, the revenue visibility of the business will remain low and could further decline.
US generic business Company has forayed into regulated market of US where
it filled 43 ANDAs in last 5 to 6 years. Company withdraw 5 ANDAs during that period and net ANDA fillings stood at 38.
In US company focus on niche complex drug market which difficult to manufacture and develop and command higher margins.
US account for 60% of total Research & Development cost of Ajanta Pharma.
Every year company is expecting to file 10 to 12 ANDAs of which 75% (6 to 7 new launches) will be successfully launched.
Currently in US, there are 21 products on shelf out of net 38 ANDA fillings.
In US, company is steadily gaining market share in select products with its focused approach. Company also phased out few unviable products from US market.
Due to high R&D costs, US business EBITDA is on breakeven and likely to improve going ahead.
US ANDA Approval status as of 31st December 2018
Final Approvals 24
Tentative Approvals 4
Under Approval 17
Filing Target ~10-12
Source: Company
FacilitiesFormulation Manufacturing 3 facilities in Aurangabad, Maharashtra, out of which 1
facility is US FDA approved
1 facility at Dahej, Gujarat which is US FDA approved and get tax benefit
1 facility at Guwahati, Assam which caters to India and Emerging markets. The two Phase capacity expansions are operational and next two phase will come up in coming years. The facilities will get the tax benefit.
New facility coming up at Pitampur, Madhya Pradesh and this facility will cater to emerging markets and be tax exempted manufacturing facility.
One facility at Mauritius.

73 March 2019INSIGHT
API Manufacturing One facility at Waluj, Aurangabad, Maharashtra and use
for Captive consumption.
Dahej facility got operational & Guwahati two Phase are operational and optimum capacity utilization will see cost rationalization and hence better margins with these new facilities starts delivering going forward. At present operational cost is high inclusive of R&D as company outsourced ~45% of its business production, which after capacity expansion will be produced in-house, thereby saving substantial operating costs.
Research & Development ThrustDuring FY18, R&D costs account 9% of revenue, thus it signifies that company invest on research and develop-ment of complex drugs which command higher margins. For 9MFY19, company incurred R&D expense of Rs 140 crore up by 9% yoy.
Capex Management expects capex of around Rs 200 to Rs 250
crore per year in next 3 years.
In next year, company will incur a capex of Rs 150 crore towards Pitampur capacity expansion.
For expansion in Guwahati, Rs 200 crore is already spent and another Rs 200 crore would be spend in next 2 years.
Management expects annual maintenance capex of Rs 100 to Rs 125 core.
Management guidance The management has guided for 10-12% of sales growth
and EBITDA margins improvement of ~150 bps.
The management has guided for domestic growth of 10-12%.
The Emerging market business expected to grow at 9% to 10% with EBIDTA margin of 30%.
Branded generic segment is expected to grow 10 to 12% while the blended growth will be range of 10 to 12%
For African business, management expects revenue in the range between Rs 170 to 175 crore in FY19, while for FY20, the expectation is flat to decline of 7% to 10%.
Management expects US business to grow at a CAGR of 20 to 25% and margin to improve further.
Current capacity utilization at Dahej, Guwahati facilities is in the range of 18-20%. It is likely to improve to 45-50% in FY20.
The management expects tax rate to go down to 22% in next couple of years due to higher capacity utilization at Dahej and Guwahati and tax incentive for new plants.
Management expects net profitability to grow around 20%+ on the back of 4% tax benefit that company will get from new manufacturing plants.
Every year on an average India product rollout is 18 to 20 and Emerging market is 25 to 30. Every year 75 to 100 product fillings and 50 to 60 product launches.
Q4FY19 numbers will not be satisfactory because of previous years high base effect.
In latest development, Ajanta Pharma hired key person from Dr. Reddy laboratories for its US business.
Company approved Buyback of 7,69,230 fully paid up equity shares of Rs 2/- each (“Equity Shares”) of Ajanta Pharma Limited (“Company”) at a price of Rs 1,300/- per Equity Share for an aggregate consideration not exceeding Rs 100 crores through the tender offer process pursuant to Securities and Exchange Board of India (Buy Back of Securities) Regulations, 2018, as amended.
R&D spend % of revenue
Source: Company
50 70 106
153 186 4% 5%
6%
8% 9%
FY14 FY15 FY16 FY17 FY18
R&D spend (Rs crs)
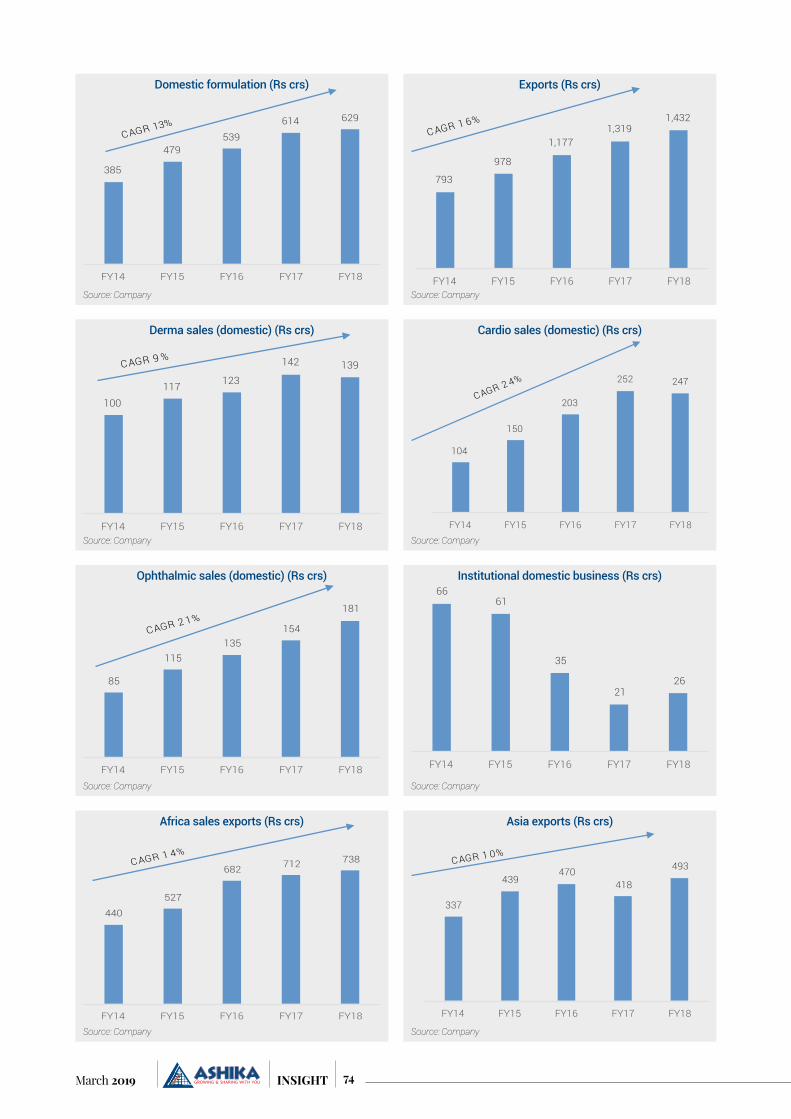
74March 2019 INSIGHT
Domestic formulation (Rs crs)
Source: Company
385
479 539
614 629
FY14 FY15 FY16 FY17 FY18
CAGR 13%
Derma sales (domestic) (Rs crs)
Source: Company
100 117 123
142 139
FY14 FY15 FY16 FY17 FY18
CAGR 9 %
Ophthalmic sales (domestic) (Rs crs)
Source: Company
85
115 135
154
181
FY14 FY15 FY16 FY17 FY18
CAGR 2 1%
Africa sales exports (Rs crs)
Source: Company
440
527
682 712 738
FY14 FY15 FY16 FY17 FY18
CAGR 1 4%
Cardio sales (domestic) (Rs crs)
Source: Company
104
150
203
252 247
FY14 FY15 FY16 FY17 FY18
CAGR 2 4%
Institutional domestic business (Rs crs)
Source: Company
66 61
35
21 26
FY14 FY15 FY16 FY17 FY18
Asia exports (Rs crs)
Source: Company
337
439 470
418
493
FY14 FY15 FY16 FY17 FY18
CAGR 1 0%
Exports (Rs crs)
Source: Company
793
978
1,177 1,319
1,432
FY14 FY15 FY16 FY17 FY18
CAGR 1 6%

75 March 2019INSIGHT
Financial 201803 201703 201603 201503 201403 201303
Inc / Exp Performance
Gross Sales 2,130.9 2,001.6 1,749.4 1,485.2 1,216.0 936.9
Total Income 2,149.9 2,007.1 1,755.1 1,490.4 1,222.1 936.4
Total Expenditure 1,467.4 1,296.4 1,146.9 968.3 839.6 706.4
PBIDT 682.6 710.7 608.2 522.0 382.5 230.1
PBT 622.6 648.2 558.9 456.0 329.9 176.8
PAT 468.6 506.8 415.6 309.9 233.9 112.1
Cash Profit 528.2 568.0 460.0 361.5 277.8 146.3
Sources of Funds
Equity Paid Up 17.6 17.6 17.6 17.6 17.6 11.7
Net Worth 2,041.3 1,567.6 1,190.8 840.6 592.6 392.8
Total Debt 1.8 1.3 80.5 72.4 130.5 124.6
Capital Employed 2,043.2 1,569.0 1,271.4 913.5 723.8 518.0
Application of Funds
Gross Block 1,417.2 894.9 715.7 549.9 492.0 438.5
Investments 190.0 181.6 76.8 59.5 63.5 8.5
Cash and Bank balance 93.1 70.0 43.4 136.8 60.4 46.2
Net Current Assets 877.6 603.9 503.4 383.8 244.6 146.7
Total Current Liabilities 346.1 246.7 259.9 249.6 275.4 222.3
Total Assets 2,426.0 1,823.3 1,479.4 1,146.4 949.4 718.2
Cash Flow
Cash Flow from Operations 285.4 609.3 326.1 279.4 212.4 234.3
Cash Flow from Investing activities (260.4) (383.1) (209.1) (158.4) (187.8) (103.7)
Cash Flow from Finance activities (0.2) (201.8) (117.3) (105.2) (20.1) (104.5)
Free Cash flow 269.1 593.9 335.7 177.1 68.9 93.7
Key Ratios
Debt to Equity(x) 0.0 0.0 0.1 0.1 0.2 0.3
Current Ratio(x) 3.5 3.4 2.9 2.5 1.9 1.7
ROCE(%) 34.5 45.7 51.6 56.4 54.5 38.6
RONW(%) 26.0 36.7 40.9 43.2 47.5 32.5
PBIDTM(%) 32.0 35.5 34.8 35.1 31.5 24.6
PATM(%) 22.0 25.3 23.8 20.9 19.2 12.0
Market Cues
Close Price (Unit Curr.) 1,405.8 1,760.3 1,410.5 1,225.5 400.6 171.6
Market Capitalization 12,371.0 15,490.6 12,412.4 10,777.8 3,520.9 1,506.8
Adjusted EPS 53.3 57.6 47.2 35.2 26.6 12.8
CEPS 60.0 64.6 52.3 41.1 31.6 16.7
Enterprise Value 12,279.8 15,422.0 12,449.5 10,713.5 3,591.0 1,585.2
Valuation Ratios
Adjusted PE (x) 26.4 30.6 29.9 34.8 15.1 13.4
PCE(x) 23.4 27.3 27.0 29.8 12.7 10.3
Price / Book Value(x) 6.1 9.9 10.4 12.8 5.9 3.8
Dividend Yield(%) - 0.7 0.6 0.5 1.0 1.0
EV/Net Sales(x) 5.8 7.8 7.2 7.3 3.0 1.7
EV/EBITDA(x) 18.0 21.7 20.5 20.5 9.4 6.9
M Cap / Sales 5.8 7.8 7.2 7.3 2.9 1.6
Financial snapshot (Rs in crores unless stated)
76March 2019 INSIGHT
Technical view Classical theory of Technical Analysis Another consecutive month of consolidation amidst the broader range of 10600-11000, such consolidation for a prolonged period gives a buying opportunity at meaning decline and profit booking or selling opportunity at key resistance levels until it provides a breakout or breakdown from the defined price range. Though at the beginning of the month Nifty seems to have provided the necessary breakout but was unable to maintain higher levels and with a bearish Evening Doji Star formation in daily chart began its corrective decline for 8 consecutive day in a row. The continuous slide halted near the lower range of the band at 10600. The rising trendline since November 2018 was breached but retreated, inability to sustain above the trendline would again be considered as reemerges of negative outlook for the Index. Hence the short-term trend in Nifty is weak and since the Index is at the close vicinity of lower trading range possibility remains high of a minor bounce, sustaining prices at higher level though remains uncertain. Nifty snapped the eight continuous day of decline amid short covering and eventually formed a double bottom formation in daily chart with a sizable bull candle hence the recent bottom of 10575-10585 need to be well respected. Key thing to highlight is that, the market breadth has improved for the past couple pf days,
supported by across the sector buying. A symmetrical triangle range bound action in Nifty for the last couple of months is also being observed hence can expect a short term bottom reversal in the next couple of trading session. However it need to be noted that Triangles are very volatile trading pattern and stoploss gets triggered, generally it creates very tough trading environments.
Modern approach in Technical AnalysisOn the oscillator front 14-period RSI has been lying on a key lower area of 40 levels in both the daily and weekly

77 March 2019INSIGHT
time frame. On the daily frame though the indicator is witnessing signs of reversal from its oversold region and historically in few occasions’ RSI has turned up from such low levels with prices witnessing a mirror reflection of the same. However, on the weekly time frame it seems there is still room for correction. Hence it can be concluded that RSI is entering in oversold zone which suggests that prices can witness a time consolidation before stretching higher. Weekly 13 period –DMI has turned up by holding dominance and weekly 13 period ADX is placed at 14-15 levels. Both these indicators are not showing encouraging signal for bulls for near term.
Moving average being the widely followed tool smoothen out the price fluctuations and since in the daily time frame prices are trapped between key averages in both short and medium term perspective, upside seems capped from the key averages of 20/50 and 200 SMA hence it seems that the short term trend in the market might have changed from neutral to negative in comparison to previous month. However, in the weekly time frame prices are still able to hold above the medium term averages of 100WMA at 10390-10400, breach of which can be extremely negative for the market and can drag the Index lower towards the March 2018 swing low of 9950-10000.
Elliot Wave theory As per Elliot Wave theory “wave i” started from 4531 and ended at 6229. The “wave ii” started from 6229 and ended at 5118, while “wave iii” started from 5118 and ended at 9119. The fall from 9119 to 6825 can be identified as “wave iv” down. Now presently Nifty is in “wave v” and still is in progress phase which could extend for another 3-4 Months. “wave v” further upfolded into 5 wave structure with its internals labeled as 1-2-3-4-5. Rise from 6825 to 8968 can be marked as “wave 1”, fall from 8968 to 7893 a corrective wave structure marked as “wave 2” while rise from 7893 to 11171 has been marked as “wave 3” and the fall from 11171 to 9951 as “wave 4”. Now the terminal “wave 5” is in progress and going by the equality princi-ple “wave 1” = “wave 2” principle, initial target for Nifty in short to medium term perspective stands around 12094 ((9951+(8968-6825)) which further coincides with 223.6% projected retracement of “wave iv” followed by 12275(238.2% projected retracement). “wave 5s” internals are in development in which “wave a & b has ended and “wave c, d & e” are pending. Overall the cycle degree “wave v” is still in progress which could head towards 11100 and 11400 or to new life high. On the contrary if the recent high if considered as an end of “wave v” and the decline since September 2018 if considered as Zig-Zag correction then the low of 10004 can be denoted as end of wave A followed by reactive Wave B which witness pullback towards 61.8% retracement (i.e. around 11090) and the final Wave C might again descend lower towards 9525 (Wave A = Wave C).
Retracement principleNifty has trading amidst the broader range of 10500-11000 for the past few consecutive months in a row and the recent corrective move has dragged the Index lower towards the 50% retracement of the entire rally since October 2018 (i.e. High: 11118; Low: 10004) at around 10500-10550. Nifty need to sustain above the said support level in order to maintain a possitive outlook in Nifty. The level of 10500-10550 has an added significance as it coincides with the long term trendline since March 2016 onward (adjoining lows of March2016, December 2016 of 6825, 7893 respectively). It would be unfair to say that there is a drastic change in price structure as the medium-term trend continues to remain positive and pullback from current level might face resistance around 11085-11100 (61.8% retracement considering High: 11751; Low:10004). Only silver lining being technical bounce emerged from 61.8% retracement of last up move (10334–11118) at 10633.
Inter-market analysisU.S Market:With a dramatic turn in Fed stance Chairman Jerome Powell turned Dovish where they wanted to raise rates gradually into 2020 said taking cognizance of the global slowdown they would be patient on future rate hikes and would be announcing plans to stop reducing the fed balance sheet size. US market has gained past month amid continued optimism that upcoming round of talks between the U.S. and Chinese officials will take the two nations closer toward achieving a trade deal in the foreseeable future and as US was able to avoid another partial government shutdown which boosted the market sentiments. On the technical front a ‘V’ Shaped recovery in the Index was seen with prices scaling past the down-ward sloping trendline since October 2018 onward and is now testing the 78.2% retracement of October 2018 sell-off. Dow appear to be heading towards overbought region as indicated by positive divergence in the RSI indicator denotes an extension of existing rally a bit further before symbolizing top. The area of 25400 would be the potential support area followed by 24950 being the second possible support area marked from downward sloping trendline and the 61.8% retracement taken from 26951-21712. If bulls fails to hold the above mentioned support zones, present momentum might be questioned.
Crude Oil Brent:Crude oil prices continued to remain upbeat note as U.S. sanctions against Venezuela and Iran and supply cuts led by the OPEC boosted the sentiments higher. Supply issues in Venezuela are also bolstering oil markets as the country suffers a political and economic crisis, OPEC and some non-affiliated suppliers including Russia are withholding supply in order to tighten the market and prop up prices, the producer group has agreed to cut crude output by a joint 1.2 million barrels per day (bpd). However prices
78March 2019 INSIGHT
continue to face some pressure on account of increasing supply from US and concerns of a weakening global demand. The US-China trade talks have instilled hope and if it materializes crude oil prices could easily extend its rally. On the technical front Brent crude oil prices since December 2018 stopped the decline and had been wit-nessing a reactive correction until last month. The outlook in the commodity seems to have changed after structur-ally it formed bullish “Inverse Head and Shoulder” and the bulls seems to have provided the necessary breakout from the neckline of the said pattern. The breakout seems genuine and legitimate and hence crude oil prices are expected to continue higher towards 50% retracement at $68 followed by 200dma at $71.
Indian Rupee: Rupee appreciated in last couple of days after better than expected IIP’s data was released. The narrowing down of interest rates in India and US creates a scenario of pulling out investments by FII’s and FPI’s, hence making a case of further depreciation in rupee. The slow and steady rise in crude oil prices also creates pressure on rupee. Means the Indian government will have to pump more dollars to meet its domestic demands for oil, which would lead to rising in CAD of the national economy which eventually would lead the rupee to further crash and make new lows in coming session. On the technical front the rally from Jan. 7 low of $69.185 ran out of steam at 100-day MA earlier this month and the repeated bull failure there was followed around $71.5. The average is again proving a tough nut to crack. close above the 100-day MA is needed to strengthen the bull grip. The ascending trendline since January 2018 with bullish divergence of MACD indicates that the currency might hold above the psychological $70 level mark, violation of the ascending trendline support around $69.5 would revive the bearish sentiment in the currency.
Positives: • Bullish Symmetrical Triangle formation.
• Bullish Double bottom formation.
• Oversold placement of Oscillators in daily time frame.
• Technical bounce emerged from 61.8% retracement of last up move (10334–11118) at 10633
• Lower band in Bollinger in Weekly chart exist at 10540
• India VIX continues to trade lower amidst the range of 14-18.
Negatives:• Short term trend seems negative as prices are below crucial averages of 20/50/200 dma
• Elliot wave principle projects corrective pattern Wave ‘c’ is in the making with downside target being 9525.
• Dow Jones heading towards overbought region
symbolizing top being near.
• Bullish ‘Inverse Head & Shoulder’ pattern in Brent Crude might glide prices towards $68-$71.
• USD INR likely to trade above the $70 mark due to ascending Triangle support.
To sum up, since the interim budget Nifty took support from the 38.2% retracement of the rally from October 2018 till January 2019 and witnessed a minor rally, breaking out from the congestion zone indicating of a pattern breakout and reinstated a bullish outlook in Nifty. Nifty managed to clear the psychological level of 11000. However index failed to maintain its momentum and the decent rally gradually fizzled out and resulted into a breakout failure from long consolidation phase. At the latter phase strong buying emerged from the 50% retracement of October 2018-February 2019 rally (10004-11118) at around 10550-10560. The sequence of eight continuous day of decline halted and eventually formed a double bottom formation in daily chart hence the recent bottom of 10575-10585 need to be well respected. However it seems that further confirmation in the form of price and time is required before labelling it as immediate bottom since as per trend analysis the present trend in the market still continues to remain neutral. Bias though might continue to remain positive as long as Nifty upholds lower band of consoli-dation (at 10500). The consistent positive development of market breadth signifies improving health of the market and a sustainable upmove may take the Index higher towards upper band of consolidation (at 11100) in next few trading session. On the oscillator front daily 14 period RSI has now entered the 40 level mark and as long as oscillator stays above the said level, Index seems well protected and no real threat exist for upside momentum in Nifty. Weekly 13 period ADX too is turning up indicating of a resumption of sharp trended move in Nifty on either side. Amidst such optimism it need to be remembered that there was a failed breakout attempt in Nifty which has a negative repercussion historically. The 200-dma is a crucial trend deciding level for Nifty currently placed at 10860. Nifty need to scale the the said average to maintain positive biasness. Hence to conclude with broader market par-ticipation for the past couple of days indicates that there might be some possibility of upside but expected upside might be short lived due to the presence of important resistance around 10950-11000 aiding towards higher base consolidation. Lower band of consolidation at 10500 can be defended as it happens to be the 50% retracement of the entire pullback from October 2018 till February 2019 high further coinciding with the long term upward sloping trend line drawn adjoining low of December 2016 at 7893 and October 2018 lows of 10005. Overall maintain neutral stance in the band of 10550 to 11100 and adopt sell on rise and buy on decline strategy until Nifty again provides a range breakout.

79 March 2019INSIGHT
Market diaryBEST PERFORMERS FOR THE MONTH (NIFTY 100)
Sl No.
Co. Name Cl. Price25.01.2019
Cl. Price25.02.2019
Cl. Price Var (%)
1 Zee Entertainment Enterprises Ltd.
318.4 446.2 40.1%
2 Sun TV Network Ltd. 505.9 587.1 16.1%3 Tech Mahindra Ltd. 729.1 832.3 14.2%4 Bandhan Bank Ltd. 424.5 480.4 13.2%5 UPL Ltd. 753.1 846.5 12.4%6 HCL Technologies Ltd. 969.4 1083.5 11.8%7 Tata Steel Ltd. 452.9 503.9 11.3%8 Avenue Supermarts
Ltd.1365.7 1503.0 10.1%
9 Wipro Ltd. 353.5 386.5 9.4%10 Bharti Infratel Ltd. 279.8 304.0 8.7%11 Bajaj Auto Ltd. 2626.4 2845.0 8.3%12 Cipla Ltd. 507.7 547.1 7.8%13 NMDC Ltd. 90.5 97.1 7.3%14 Titan Company Ltd. 978.0 1043.7 6.7%15 Maruti Suzuki India
Ltd.6513.4 6934.0 6.5%
16 DLF Ltd. 158.0 168.2 6.5%17 Motherson Sumi
Systems Ltd.150.8 160.5 6.4%
18 ICICI Prudential Life Insurance Company Ltd.
299.4 317.2 5.9%
19 Ultratech Cement Ltd. 3510.8 3710.1 5.7%20 ICICI Lombard
General Insurance Co Ltd
855.5 902.0 5.4%
Source: NSE
WORST PERFORMERS FOR THE MONTH (NIFTY 100)Sl No.
Co. Name Cl. Price25.01.2019
Cl. Price25.02.2019
Cl. Price Var (%)
1 Godrej Consumer Products Ltd.
780.3 660.1 -15.4%
2 MRF Ltd. 63921.0 55301.1 -13.5%3 Adani Ports and
Special Economic Zone Ltd.
373.9 325.5 -12.9%
4 Vedanta Ltd. 194.7 170.9 -12.2%5 Lupin Ltd. 865.1 776.0 -10.3%6 General Insurance
Corporation of India Ltd.
245.3 220.7 -10.0%
7 Aurobindo Pharma Ltd.
786.2 708.5 -9.9%
8 SBI Life Insurance Company Ltd.
619.6 560.0 -9.6%
9 Indiabulls Housing Finance Ltd.
744.5 678.8 -8.8%
10 Cadila Healthcare Ltd. 343.7 313.8 -8.7%11 Container Corporation
Of India Ltd.519.9 474.8 -8.7%
12 Marico Ltd. 369.9 341.0 -7.8%13 Vodafone Idea Ltd. 32.9 30.3 -7.8%14 Biocon Ltd. 664.7 616.7 -7.2%15 Bank Of Baroda 110.2 102.9 -6.7%16 NHPC Ltd. 25.0 23.4 -6.6%17 Bharat Petroleum
Corporation Ltd.357.5 335.8 -6.1%
18 L&T Finance Holdings Ltd.
134.7 126.5 -6.1%
19 Hindustan Petroleum Corporation Ltd.
241.8 227.4 -6.0%
20 Oracle Financial Services Software Ltd.
3708.0 3508.0 -5.4%
Indices Performance 25.01.2019 –25.02.2019Sector Indices - Monthly Return (%)
Source: BSE
-2.7% -2.6%
-2.1% -1.7%
-1.5% -1.2%
-0.9% -0.9% -0.6%
-0.1%
1.5% 1.6%
-3%
-3%
-2%
-2%
-1%
-1%
0%
1%
1%
2%
2%
Info
rmat
ion
Tech
nolo
gy
Met
al
Tele
com
Oil&
Gas
Hea
lthca
re
Pow
er
Capi
tal G
oods
FMCG
Auto
Cons
umer
Dur
able
s
Bank
Real
ty

80March 2019 INSIGHT
To meet surging demand, four U.S. copper projects are set to open by next year, the first to do so in decades, accord-ing to Reuters. For the time being the focus is on US China trade talk and President Trump’s comments on that. Any ground breaking truce between US and China will give a huge boost to the price.
Technical AnalysisAfter giving a decent weekly closing above $6400 at LME, copper after a long gap able to came out from trading range between $6400- $5700 range. And again taking the high of the breakout weekly high of $6484, market is providing clear signal for bulls to ride the upside trend. Weekly RSI is well above 60 level which is again
supporting the recent bullish arguments. Market is also above 34 weeks Simple Moving Average which generally act good with copper chart and can be taken as reliable indicator. Our advice is to go long in the metal with stop of $6285 which is just below the mid portion of last long bullish candle (Morubazu). $6800 and $7150 are the two preferred targets for the metal. $6900 is last significant swing high in the weekly chart which is another pivotal point for bulls and bears.
In MCX copper, the target may be fixed near 500, the rate of appreciation may curtail down because of the strength in INR against Dollar. We are recommending Long posi-tion in copper MCX and adventurous shorts are strictly prohibited in this bullish scenario.
Commodity monthly round-upCOPPER LME copper gained in closing open
outcry trading to $6,478 a ton in Mid February 2019, its highest since July 4’2018.
On-warrant LME copper inven-tories , those not earmarked for delivery, slumped by nearly half to
39,800 tonnes in one day, the lowest since August 2005.
These two points are painting a real rosy picture for the copper for 2019. Morgan Stanley, Citi and all banks are upgrading copper and predicting nice upmove for the metal. The investment banks projected a 14 percent upside
for copper in 2019, based on a widen-ing supply deficit and the likelihood of a resolution to the U.S.-China trade spat. Singapore-based DBS Bank also sees a copper shortage over the mid-term. Analysts expect supply to be in a deficit each year between now and at least 2022, when it could be at its widest since 2004.
“Life is 10% what happens to you and 90% how you react to it ” - Charles R. Swindoll
Copper price projected to rise on widening supply deficit
Source: Bloomberg/DBS Bank

81 March 2019INSIGHT
EUR/GBPThe UK is currently scheduled to divorce from the EU on March 29’2019. A vote was set to take place in the House of Commons on last week of February, on the Prime Minis-ter’s proposed Brexit deal. MPs previously voted against Mrs May’s planned deal at the time, doing nothing to quell the prospect of a no-deal Brexit. However, the Leader of the Conservative Party said she intends to delay the vote, in an announcement made on Twitter. The Prime Minister aims to rally support for her withdrawal agreement in coming weeks, with the postponed meaningful vote taking place by March 12. Mrs. May also confirmed she still thought it was “in our grasp” to leave the EU with a deal on March 29.So currently GBP is looking stronger than Euro if the deal reached. So its high time for May to defend
herself and also the BREXIT.
Technical AnalysisThe pair is stuck between the range of 0.92 at the upside and of 0.84 in the downside as per the weekly chart. So traders may take the opportunity to trade in the range. Weekly RSI is taking rest near 40 and short term Sto-chastic Oscillator is also giving some upside turn. But still we don’t have any reversal candle formation and also the base is in between 0.85 to 0.84. So our recommen-dation is to wait for a reversal formation in weekly chart between 0.85-0.84 region and then place for buy order for a minimum target of 0.90. Weekly 50 Simple Moving Average is also flat which is supporting the sideways view of the market.
Weekly Chart: LME Copper
Weekly Chart: EURO/GBP (Spot)
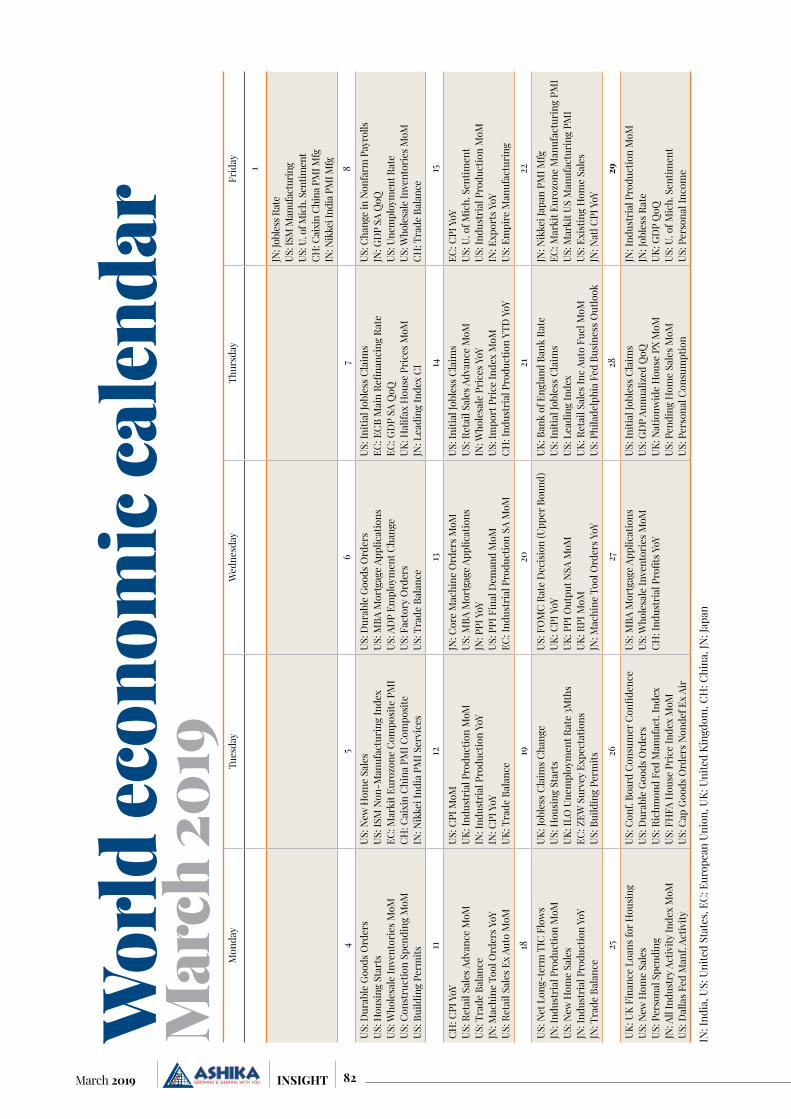
82March 2019 INSIGHT
Mon
day
Tues
day
Wed
nesd
ayTh
ursd
ayFr
iday 1
JN: J
oble
ss R
ate
US: I
SM M
anuf
actu
ring
US: U
. of M
ich.
Sen
timen
tCH
: Cai
xin
Chin
a PM
I Mfg
IN: N
ikke
i Ind
ia P
MI M
fg
45
67
8
US: D
urab
le G
oods
Ord
ers
US: H
ousi
ng S
tart
sUS
: Who
lesa
le In
vent
orie
s MoM
US: C
onst
ruct
ion
Spen
ding
MoM
US: B
uild
ing
Perm
its
US: N
ew H
ome
Sale
sUS
: ISM
Non
-Man
ufac
turi
ng In
dex
EC: M
arki
t Eur
ozon
e Co
mpo
site
PM
ICH
: Cai
xin
Chin
a PM
I Com
posi
teIN
: Nik
kei I
ndia
PM
I Ser
vice
s
US: D
urab
le G
oods
Ord
ers
US: M
BA M
ortg
age
Appl
icat
ions
US: A
DP
Empl
oym
ent C
hang
eUS
: Fac
tory
Ord
ers
US: T
rade
Bal
ance
US: I
nitia
l Job
less
Cla
ims
EC: E
CB M
ain
Refin
anci
ng R
ate
EC: G
DP
SA Q
oQUK
: Hal
ifax
Hou
se P
rice
s MoM
JN: L
eadi
ng In
dex
CI
US: C
hang
e in
Non
farm
Pay
rolls
JN: G
DP
SA Q
oQUS
: Une
mpl
oym
ent R
ate
US: W
hole
sale
Inve
ntor
ies M
oMCH
: Tra
de B
alan
ce
1112
1314
15
CH: C
PI Y
oYUS
: Ret
ail S
ales
Adv
ance
MoM
US: T
rade
Bal
ance
JN: M
achi
ne T
ool O
rder
s YoY
US: R
etai
l Sal
es E
x Au
to M
oM
US: C
PI M
oMUK
: Ind
ustr
ial P
rodu
ctio
n M
oMIN
: Ind
ustr
ial P
rodu
ctio
n Yo
YIN
: CPI
YoY
UK: T
rade
Bal
ance
JN: C
ore
Mac
hine
Ord
ers M
oMUS
: MBA
Mor
tgag
e Ap
plic
atio
nsJN
: PPI
YoY
US: P
PI F
inal
Dem
and
MoM
EC: I
ndus
tria
l Pro
duct
ion
SA M
oM
US: I
nitia
l Job
less
Cla
ims
US: R
etai
l Sal
es A
dvan
ce M
oMIN
: Who
lesa
le P
rice
s YoY
US: I
mpo
rt P
rice
Inde
x M
oMCH
: Ind
ustr
ial P
rodu
ctio
n YT
D Y
oY
EC: C
PI Y
oYUS
: U. o
f Mic
h. S
entim
ent
US: I
ndus
tria
l Pro
duct
ion
MoM
IN: E
xpor
ts Y
oYUS
: Em
pire
Man
ufac
turi
ng
1819
2021
22
US: N
et L
ong-
term
TIC
Flo
ws
JN: I
ndus
tria
l Pro
duct
ion
MoM
US: N
ew H
ome
Sale
sJN
: Ind
ustr
ial P
rodu
ctio
n Yo
YJN
: Tra
de B
alan
ce
UK: J
oble
ss C
laim
s Cha
nge
US: H
ousi
ng S
tart
sUK
: ILO
Une
mpl
oym
ent R
ate
3Mth
sEC
: ZEW
Sur
vey
Expe
ctat
ions
US: B
uild
ing
Perm
its
US: F
OM
C Ra
te D
ecis
ion
(Upp
er B
ound
)UK
: CPI
YoY
UK: P
PI O
utpu
t NSA
MoM
UK: R
PI M
oMJN
: Mac
hine
Too
l Ord
ers Y
oY
UK: B
ank
of E
ngla
nd B
ank
Rate
US: I
nitia
l Job
less
Cla
ims
US: L
eadi
ng In
dex
UK: R
etai
l Sal
es In
c Au
to F
uel M
oMUS
: Phi
lade
lphi
a Fe
d Bu
sine
ss O
utlo
ok
JN: N
ikke
i Jap
an P
MI M
fgEC
: Mar
kit E
uroz
one
Man
ufac
turi
ng P
MI
US: M
arki
t US
Man
ufac
turi
ng P
MI
US: E
xist
ing
Hom
e Sa
les
JN: N
atl C
PI Y
oY
2526
2728
29
UK: U
K Fi
nanc
e Lo
ans f
or H
ousi
ngUS
: New
Hom
e Sa
les
US: P
erso
nal S
pend
ing
JN: A
ll In
dust
ry A
ctiv
ity In
dex
MoM
US: D
alla
s Fed
Man
f. Ac
tivity
US: C
onf.
Boar
d Co
nsum
er C
onfid
ence
US: D
urab
le G
oods
Ord
ers
US: R
ichm
ond
Fed
Man
ufac
t. In
dex
US: F
HFA
Hou
se P
rice
Inde
x M
oMUS
: Cap
Goo
ds O
rder
s Non
def E
x Ai
r
US: M
BA M
ortg
age
Appl
icat
ions
US: W
hole
sale
Inve
ntor
ies M
oMCH
: Ind
ustr
ial P
rofit
s YoY
US: I
nitia
l Job
less
Cla
ims
US: G
DP
Annu
aliz
ed Q
oQUK
: Nat
ionw
ide
Hou
se P
X M
oMUS
: Pen
ding
Hom
e Sa
les M
oMUS
: Per
sona
l Con
sum
ptio
n
JN: I
ndus
tria
l Pro
duct
ion
MoM
JN: J
oble
ss R
ate
UK: G
DP
QoQ
US: U
. of M
ich.
Sen
timen
tUS
: Per
sona
l Inc
ome
IN: I
ndia
, US:
Uni
ted
Stat
es, E
C: E
urop
ean
Unio
n, U
K: U
nite
d Ki
ngdo
m, C
H: C
hina
, JN
: Jap
an
Wor
ld ec
onom
ic ca
lend
ar
Mar
ch 2
019

83 March 2019INSIGHT
Capital Markets Fund Raising Advisory
• Issue Management • IPO / FPO • Right Issue • Qualified Institutional Placement
• Open Offer • Takeover • Buyback • Delisting
• Overseaslisting
• Underwriting
• Private Equity• Venture / Growth Capital • Pipe
• Debt Syndication• Project Finance • Team Loan • Working Capital Loan • Acquisition Funding • Construction Finance
• M &A• Merger / Acquisition / Disposal• Management Buy-outs / Buy-ins• Leveraged Buy-outs • Joint Ventures • Strategic Partnership • Spin-Offs• Divestment
• Corporate restructuring• Capital Restructuring • Finance Restructuring
• Business Valuation• ESPO Valuation • Fairness Opinion
For Debt Fund raising / Mergers & Acquisition / Business OpportunityIf you have any queries or questions, please mail us at [email protected]
Services at Ashika Capital Limited
Mr. Stephen Joseph Harper is a Canadian economist, entrepreneur, who served as the 22nd prime minister of Canada for 10 years and presided over the G20 (hosted in Toronto), G7, NATO, etc.
Ashika Group hosted an event with 22nd Canadian Prime Minister Mr. Stephen Joseph Harper in Mumbai on January 12, 2019

84March 2019 INSIGHT
AWARDS
NSE Market Achievers Award 2018REGEIONAL RETAIL MEMBER OF THE YEAR 2018 -
EASTERN INDIA
Helping Clients Reach for Better Via SIP – National from Franklin Templeton Investments, 2018NSDL STAR PERFORMANCE AWARD 2018
NSE Market Achievers Award 2017REGEIONAL RETAIL MEMBER OF THE YEAR 2017 -
EASTERN INDIA
BTVI Emerging Company of the Year 2019
BTVI Young Business Leader of the Year 2019
85 March 2019INSIGHT
Ashika Stock Broking Ltd.Ashika Stock Broking Limited (“ASBL”) started its journey in the year 1994 and is presently offering a wide bouquet of services to its valued clients including broking services, depository services and distributorship of financial prod-ucts (Mutual funds, IPO & Bonds). It became a “Research Entity” under SEBI (Research Analyst) Regulations 2014 in the year of 2015 (Reg No. INH000000206).
ASBL is a wholly owned subsidiary of Ashika Global Securities (P) Ltd., a RBI registered non-deposit taking NBFC Company. ASHIKA GROUP (details enumerated on our website www.ashikagroup.com) is an integrated financial service provider inter alia engaged in the business of Investment Banking, Corporate Lending, Com-modity Broking, Debt Syndication & Other Advisory Services.
There were no significant and mate-rial disciplinary actions against ASBL taken by any regulatory authority during last three years except routine matters.
DISCLOSUREResearch reports are being prepared and distributed by ASBL in the sole capacity of being a Research Analyst under SEBI (Research Analyst) Regu-lations 2014. The following disclosures and disclaimer are an essential part of any Research Report so being distributed.
1) ASBL or its associates, its Research
Analysts (including their relatives) may have financial interest in the subject company(ies). And, the said financial interest is not limited to having an open stock market position in /acting as advisor to /having a loan transaction with the subject com-pany(ies) apart from registration as clients.
2) ASBL or its Research Analysts (including their relatives) do not have any actual / beneficial ownership of 1% or more of securities of the subject company(ies) at the end of the month immediately preceding the date of publication of the source research report or date of the concerned public appearance. However, ASBL’s associates may have actual / beneficial ownership of 1% or more of securities of the subject company(ies).
3) ASBL or its Research Analysts (including their relatives) do not have any other material conflict of interest at the time of publication of the source research report or date of the concerned public appearance. However, ASBL’s associates might have an actual / potential conflict of interest (other than ownership).
4) ASBL or its associates may have received compensation for investment banking, merchant banking, broker-age services and for other products and services from the subject compa-nies during the preceding 12 months. However, ASBL or its associates or its
Research analysts (forming part of Research Desk) have not received any compensation or other benefits from the subject companies or third parties in connection with the research report/ research recommendation. Moreover, Research Analysts have not received any compensation from the companies mentioned in the research report/ recommendation in the past twelve months.
5) The subject companies in the research report/ recommendation may be a client of or may have been a client of ASBL during the twelve months preceding the date of con-cerned public appearance for invest-ment banking/ merchant banking / brokerage services.
6) ASBL or their Research Analysts have not managed or co–managed public offering of securities for the subject company(ies) in the past twelve months. However, ASBL’s associates may have managed or co–managed public offering of securities for the subject company(ies) in the past twelve months.
7) Research Analysts have not served as an officer, director or employee of the companies mentioned in the report/ recommendation.
8) Neither ASBL nor its Research Analysts have been engaged in market making activity for the companies mentioned in the report / recommendation.
DISCLAIMERThe research recommendations and information are solely for the personal information of the authorized recipient and does not con-strue to be an offer document or any investment, legal or taxation advice or solicitation of any action based upon it. This report is not for public distribution or use by any person or entity, where such distribution, publication, availability or use would be contrary to law, regulation or subject to any registration or licensing requirement. We will not treat recipients as customer by virtue of their receiving this report. The report is based upon the information obtained from public sources that we consider reliable, but we do not guarantee its accuracy or completeness. ASBL shall not be in anyways responsible for any loss or damage that may arise to any such person from any inadvertent error in the information contained in this report. The recipients of this report should rely on their own investigations.
A
PR
OD
UCT
| in
fo@
tris
ysco
m.c
om
Registered OfficeTrinity226/1, A.J.C. Bose Road7th Floor, Kolkata-700020Phone:033-4010 2500Fax No:033-4010 2543
Corporate Office1008, Raheja Centre,214, Nariman Point, 10th FloorMumbai-400021Phone:022-6611 1700Fax No: 022-6611 1710
Group CompaniesAshika Credit Capital Ltd.
(RBI Registered NBFC)CIN No. L67120WB1994PLC062159
Ashika Global Securities Pvt. Ltd.(RBI Registered NBFC)
CIN No. U65929WB1995PTC069046
Ashika Capital Ltd.(SEBI Authorised Merchant Banker)CIN No. U30009WB2000PLC091674
Ashika Investment Managers Pvt Ltd.CIN number – U65929MH2017PTC297291
Ashika Stock Broking Ltd.(Member : NSE, BSE, MCX-SX, Depository participant of CDSL / NSDL, AMFI Mutual Fund Advisor, Research Analyst)CIN No. U65921WB1994PL217071
Ashika Commodities & Derivatives Pvt. Ltd.(Member : NCDEX, MCX & ICEX)CIN No. U51909WB2003PTC096985
Ashika Wealth Advisors Pvt Ltd.CIN number – U65999WB2018PTC227019
www.ashikagroup.com