INDIAN ECONOMIC DEVELOPMENT - Anujjindal.in
211
INDIAN ECONOMIC DEVELOPMENT TEXTBOOK FOR CLASS XI 2021-22
-
Upload
khangminh22 -
Category
Documents
-
view
1 -
download
0
Transcript of INDIAN ECONOMIC DEVELOPMENT - Anujjindal.in

INDIAN ECONOMIC DEVELOPMENT
TEXTBOOK FOR CLASS XI
2021-22
First EditionFebruary 2006 Phalguna 1927
ReprintedOctober 2006 Kartika 1928December 2007 Pausha 1929December 2008 Pausha 1930January 2010 Pausha 1931January 2011 Pausha 1932March 2012 Phalguna 1933January 2013 Pausha 1934January 2014 Pausha 1935December 2014 Pausha 1936February 2016 Magha 1937January 2017 Magha 1938January 2018 Magha 1939February 2019 Magha 1940December 2019 Pausha 1941February 2021 Phalguna 1942
PD 28T RSP
© National Council of EducationalResearch and Training, 2006
`̀̀̀̀ ??.00
Printed on 80 GSM paper withNCERT watermark
Published at the Publication Divisionby the Secretary, National Council ofEducational Research and Training,Sri Aurobindo Marg, New Delhi 110 016and printed at
ISBN 81-7450-551-2
ALL RIGHTS RESERVED
No part of this publication may be reproduced, stored in a retrievalsystem or transmitted, in any form or by any means, electronic,mechanical, photocopying, recording or otherwise without the priorpermission of the publisher.
This book is sold subject to the condition that it shall not, by way oftrade, be lent, re-sold, hired out or otherwise disposed of withoutthe publisher’s consent, in any form of binding or cover other thanthat in which it is published.
The correct price of this publication is the price printed on thispage, Any revised price indicated by a rubber stamp or by a stickeror by any other means is incorrect and should be unacceptable.
Publication Team
Head, Publication : Anup Kumar RajputDivision
Chief Editor : Shveta Uppal
Chief Production : Arun ChitkaraOfficer
Chief Business : Vipin DewanManager (Incharge)
Assistant Editor : Ram NiwasBharadwaj
Production Assistant : Prakash Veer Singh
Cover and IllustrationsSarita Verma Mathur
OFFICES OF THE PUBLICATIONDIVISION, NCERT
NCERT CampusSri Aurobindo MargNew Delhi 110 016 Phone : 011-26562708
108, 100 Feet RoadHosdakere Halli ExtensionBanashankari III StageBengaluru 560 085 Phone : 080-26725740
Navjivan Trust BuildingP.O.NavjivanAhmedabad 380 014 Phone : 079-27541446
CWC CampusOpp. Dhankal Bus StopPanihatiKolkata 700 114 Phone : 033-25530454
CWC ComplexMaligaonGuwahati 781 021 Phone : 0361-2674869
2021-22

FOREWORD
The National Curriculum Framework (NCF) 2005, recommends that
children’s life at school must be linked to their life outside the school.
This principle marks a departure from the legacy of bookish learning
which continues to shape our system and causes a gap between the
school, home and community. The syllabi and textbooks developed on
the basis of NCF signify an attempt to implement this basic idea. They
also attempt to discourage rote learning and the maintenance of sharp
boundaries between different subject areas. We hope these measures
will take us significantly further in the direction of a child-centred system
of education outlined in the National Policy on Education (1986).
The success of this effort depends on the steps that school principals
and teachers will take to encourage children to reflect on their own
learning and to pursue imaginative activities and questions. We must
recognise that, given space, time and freedom, children generate new
knowledge by engaging with the information passed on to them by adults.
Treating the prescribed textbook as the sole basis of examination is one
of the key reasons why other resources and sites of learning are ignored.
Inculcating creativity and initiative is possible if we perceive and treat
children as participants in learning, not as receivers of a fixed body of
knowledge.
These aims imply considerable change in school routines and mode
of functioning. Flexibility in the daily time-table is as necessary as rigour
in implementing the annual calendar so that the required number of
teaching days are actually devoted to teaching. The methods used for
teaching and evaluation will also determine how effective this textbook
proves for making children’s life at school a happy experience, rather
than a source of stress or boredom. Syllabus designers have tried to
address the problem of curricular burden by restructuring and
reorienting knowledge at different stages with greater consideration for
child psychology and the time available for teaching. The textbook
attempts to enhance this endeavour by giving higher priority and space
to opportunities for contemplation and wondering, discussion in small
groups, and activities requiring hands-on experience.
2021-22

The National Council of Educational Research and Training (NCERT)appreciates the hard work done by the textbook development committeeresponsible for this book. We wish to thank the Chairperson of theadvisory group in Social Sciences, Professor Hari Vasudevan and theChief Advisor for this book, Professor Tapas Majumdar for guiding thework of this committee. Several teachers contributed to the developmentof this textbook; we are grateful to their principals for making thispossible. We are indebted to the institutions and organisations whichhave generously permitted us to draw upon their resources, materialand personnel. We are especially grateful to the members of the NationalMonitoring Committee, appointed by the Department of Secondary andHigher Education, Ministry of Human Resource Development under theChairpersonship of Professor Mrinal Miri and Professor G.P. Deshpande,for their valuable time and contribution. As an organisation committedto systemic reform and continuous improvement in the quality of itsproducts, NCERT welcomes comments and suggestions which will enableus to undertake further revision and refinement.
Director
New Delhi National Council of Educational20 December 2005 Research and Training
iv
2021-22

TEXTBOOK DEVELOPMENT COMMITTEE
CHAIRPERSON, ADVISORY COMMITTEE FOR TEXTBOOKS IN SOCIAL SCIENCES
AT HIGHER SECONDARY LEVEL
Hari Vasudevan, Professor, Department of History, University of Calcutta,Kolkata
CHIEF ADVISOR
Tapas Majumdar, Emeritus Professor, Jawaharlal Nehru University, NewDelhi
MEMBERS
Bharat C. Thakur, PGT, Government Pratibha Vikas Vidyalaya, SurajmalVihar, Delhi
Gopinath Perumula, Lecturer, Tata Institute of Social Sciences, Mumbai
Jaya Singh, Lecturer, DESS, NCERT, New Delhi
Nishit Ranjan Das, PGT, New Alipore Multipurpose School, Behala, Kolkata
Naushad Ali Azad, Professor, Department of Economics, Jamia MilliaIslamia, New Delhi
Neeraja Rashmi, Reader, DESS, NCERT, New Delhi
Rama Gopal, Professor, Department of Economics, Annamalai University,Annamalai Nagar, Tamil Nadu
Pratima Kumari, Lecturer, DERPP, NCERT, New Delhi
Poonam Bakshi, Senior Lecturer, Department of Economics, PunjabUniversity, Chandigarh
R. Srinivasan, S.G. Lecturer, Department of Economics, Arignar AnnaGovernment Arts College, Villupuram, Tamil Nadu
Sabitha Patnaik, PGT, Demonstration School, Regional Institute ofEducation, Sachivalaya Marg, Bhubaneswar
Sharmista Banerjee, Headmistress, Bidya Bharti Girls High School, Kolkata
MEMBER–COORDINATOR
M.V. Srinivasan, Lecturer, DESS, NCERT, New Delhi
2021-22

ACKNOWLEDGEMENTS
Many friends and colleagues have helped in preparing this textbook. TheNational Council of Educational Research and Training acknowledgesM. Karpagam, Lecturer, Department of Economics, Meenakshi College,Chennai; J. John, Director, Centre for Education and Communication, NewDelhi; Pratyusa K. Mandal, Reader, DESS, NCERT, New Delhi; NandanaReddy, Director (Development), Concern for Working Children, Bangalore;V. Selvam, Research Scholar, Centre for Study of Regional Development andSatish Jain, Professor, Centre for Economic Studies and Planning,Jawaharlal Nehru University, New Delhi; Pooja Kapoor, Modern School,Barakhamba Road, New Delhi; Priya Vaidya, Sardar Patel Vidyalaya, LodhiEstate, New Delhi; and Nalini Padmanabhan, DTEA Senior SecondarySchool, Janakpuri, New Delhi for providing their feedback and inputs.
The Council expresses its gratitude to Jan Breman and Parthiv Shahfor using photographs from their book, Working in the mill no more, publishedby Oxford University Press, Delhi. Some stories were taken from the book,Everybody Loves a Good Drought, authored by P. Sainath and published byPenguin Books, New Delhi. A photo relating to farmers committing suicideshas been used from The Hindu. A few photographs and text materials onenvironmental issues have been used from the State of India’s Environment
1 and 2 published by the Centre for Science and Environment, New Delhi.The Council thanks the authors, copyright holders and publishers of thesereference materials. The Council also acknowledges the Press InformationBureau, Ministry of Information and Broadcasting, New Delhi; NationalRail Museum, New Delhi for allowing to use photographs available in theirphoto library. Some photographs were given by S. Thirumal Murugan,Principal, Adhiyaman Matriculation School, Uthangarai, Tamil Nadu; JohnSuresh Kumar, Synodical Board of Social Service; Sindhu Menon of Labour
File, New Delhi; R. C. Das of CIET, New Delhi; Renuka of National Instituteof Health and Family Welfare, New Delhi. The Council acknowledges theircontribution as well.
Special thanks are due to Savita Sinha, Professor and Head, Departmentof Education in Social Sciences and Humanities for her support.
The Council also gratefully acknowledges the contributions ofMamta and Arvind Sharma, DTP Operators; Neena Chandra, Copy Editor;Dillip Kumar Agasti, Proof Reader; and Dinesh Kumar, Incharge Computer
Station in shaping this book. The efforts of the Publication Department,NCERT are also duly acknowledged.
2021-22

HOW TO USE THIS BOOK
The main objective of this book, Indian Economic Development, is toexpose you to some of the key issues facing the Indian economy. Inthis process, as young adults, you are expected to be sensitised aboutthese issues, appreciate and learn to critically assess the role of thegovernment in various economic spheres. The book also providesopportunities for knowing what economic resources are and how theseresources are being utilised in different sectors. You are also exposedto numerical information relating to various aspects of Indian economyand India’s economic policies. You are expected to develop analyticalskills, interpret the economic events and visualise the economic futureof India. Nevertheless, conscious effort has been made not to burdenwith concepts and data.
With regard to various economic issues and trends, this bookattempts to bring out alternative views on every issue so that studentscan engage yourself in well-informed debates. On completion of thecourse, Indian Economic Development, you are expected to acquireskills to understand macroeconomic events which occur around them,and to critically evaluate and interpret the relevant information providedby the media.
This course comprises of many activities with each chapter. Youneed to carry out such activities under the guidance of their teachers.In fact, the role of the teacher in enriching the understanding of theIndian economy is greater in this course. The activities include
classroom discussions, collecting information fromgovernment documents such as Economic Survey, archivalmaterials, from newspapers, television, internet and otherssources. Learners should also be encouraged to read theoriginal works of scholars on various topics.
For all this to happen, the teachers have to initiate theprocess by taking some steps before starting the course. At the beginningof the academic year, you can collect clippings from newspapers andmagazines relating to different topics under the course — five yearplans and the role of NITI Aayog in planning; allocation of funds tovarious sectors like agriculture, industry, services and for specificcauses such as poverty and employment; key issues of rural
2021-22

development, environment, various infrastructure, health, educationand energy; and economic events in China and Pakistan. You maymaintain these clippings, and when the teacher starts teaching aparticular topic, you can cull out those news items, which you havecollected from the beginning of the course, and display/use them inthe classroom. It is necessary you to build this collection right fromthe beginning of the course so that the relevent information is at handas and when needed; this habit will also come in handy during laterstages of education.
The schools will have to buy a hard copy of the Economic Surveyfor the latest year. You will notice that information relating to the IndianEconomy is updated in the Economic Survey. It is necessary for thestudents to familiarise themselves with such reports and work onrelevant activities. The statistical tables available as Appendix in theEconomic Survey would be immensely helpful in understanding variousissues.
While discussing a particular issue, discussion of the numericalinformation about the issue is inevitable. For instance, when we talk ofgrowth rates — overall growth rates and growth of different sectors —though it may be necessary for you to have a rough idea about thetrends in growth rates, you may also be encouraged to learn theprocess involved in reaching the level of growth and factors contributingto the trend rather than mere reproduction of tabular data of growthrate.
You will notice numbered boxes in all chapters. These boxessupplement the information given in the text. Through these boxes, anattempt has been made to lend a humane touch and, thus, bring theissue under discussion closer to real life. However, these boxes, as also‘Work These Out’ activities, are not meant for examination/evaluationpurposes.
Besides the relatively conventional‘Exercises’, each chapter has ‘SuggestedAdditional Activities’ at the end and ‘Work This/These Out’ as part of the text; the more elaborate
activities of these can be treated as projects. You may explorebeyond the text while attempting these activities.
Understandably, Information Technology facilities may not beavailable in all the schools, however, it is important to take note thatvarious information relating to the Indian economy are available on theinternet. You need to learn to use the internet and access the websites
viii
2021-22

of various government departments to get the required information.For instance, the details relating to poverty are published by the NITIAayog. You need to know that the NITI Aayog of the Government of
India has a website in which various reports relating todifferent aspects of India, including poverty, are availablein the form of reports. Since it may not be always possibleto procure such reports in hard copy, students and
teachers may attempt to download such reports from websites anduse them in the classroom.
The reports such as Economic Surveys of the last 10 years areavailable on the website: http://www.indiabudget.gov.in. Manyorganisations change their website addresses. In case a website givenin this book is not accessible, kindly search those websites throughsearch engines such as Google (www.google.co.in).
For the first time, each chapter has been briefly summed up in the‘Recap’ to facilitate learning. Also, please take note that sources for alltables have not been given with the table as these tables were sourcedfrom various research material which have been covered under‘References’ for each chapter.
We wish to reiterate the fact that the prime objective of this courseon Indian economy is to introduce the basic macro issues of the Indianeconomy to the student community and to initiate a well-informeddebate on our economy. We also stress that collaborative learning is animportant aspect of this course, hence the involvement of students, aswell as, teachers in collecting information on the Indian economy fromother sources is necessary and such collected information should beused as important inputs for both teaching, as well as, learning aboutthe Indian economy.
You can send your queries and feedback relating to any part of this bookto the following address.
Programme Coordinator (Economics)Department of Education in Social SciencesNational Council of Educational Research and TrainingSri Aurobindo MargNew Delhi 110 016.Email: [email protected]
ix
2021-22

WE, THE PEOPLE OF INDIA,
[SOVEREIGN SOCIALIST SECULAR
DEMOCRATIC REPUBLIC]
JUSTICE,
LIBERTY
EQUALITY
FRATERNITY
IN OUR CONSTITUENT ASSEMBLY
HEREBY ADOPT, ENACT AND GIVE TO
OURSELVES THIS CONSTITUTION.
havingsolemnly resolved to constitute India into a
and to secureto all its citizens :
social, economic andpolitical;
of thought, expression, belief,faith and worship;
of status and of opportunityand to promote among them all;
assuring the dignity ofthe individual and the [unity andintegrity of the Nation];
this twenty-sixth day of November, 1949 do
1
2
1. Subs. by the Constitution (Forty-second Amendment) Act, 1976, Sec.2,for "Sovereign Democratic Republic" (w.e.f. 3.1.1977)
2. Subs. by the Constitution (Forty-second Amendment) Act, 1976, Sec.2,for "Unity of the Nation" (w.e.f. 3.1.1977)
THE CONSTITUTION OFINDIA
PREAMBLE
2021-22

CONTENTS
FOREWORD iii
UNIT I : DEVELOPMENT POLICIES AND EXPERIENCE (1947-1990) 1-35
CHAPTER 1: INDIAN ECONOMY ON THE EVE OF INDEPENDENCE 3
– LOW LEVEL OF ECONOMIC DEVELOPMENT UNDER THE COLONIAL RULE 4
– AGRICULTURAL SECTOR 5
– INDUSTRIAL SECTOR 7
– FOREIGN TRADE 8
– DEMOGRAPHIC CONDITION 9
– OCCUPATIONAL STRUCTURE 10
– INFRASTRUCTURE 11
CHAPTER 2 : INDIAN ECONOMY 1950-1990 16
– THE GOALS OF FIVE YEAR PLANS 19
– AGRICULTURE 22
– INDUSTRY AND TRADE 27
– TRADE POLICY: IMPORT SUBSTITUTION 30
UNIT II : ECONOMIC REFORMS SINCE 1991 36-56
CHAPTER 3 : LIBERALISATION, PRIVATISATION AND GLOBALISATION : AN APPRAISAL 38
– BACKGROUND 39
– LIBERALISATION 41
– PRIVATISATION 44
– GLOBALISATION 45
– INDIAN ECONOMY DURING REFORMS: AN ASSESSMENT 48
UNIT III: CURRENT CHALLENGES FACING THE INDIAN ECONOMY 57-178
CHAPTER 4 : POVERTY 59
– WHO ARE THE POOR? 60
– HOW ARE POOR PEOPLE IDENTIFIED? 63
– THE NUMBER OF POOR IN INDIA 65
2021-22

– WHAT CAUSES POVERTY? 68
– POLICIES AND PROGRAMMES TOWARDS POVERTY ALLEVIATION 72
– POVERTY ALLEVIATION PROGRAMMES — A CRITICAL ASSESSMENT 75
CHAPTER 5 : HUMAN CAPITAL FORMATION IN INDIA 82
– WHAT IS HUMAN CAPITAL? 84
– SOURCES OF HUMAN CAPITAL 84
– HUMAN CAPITAL AND HUMAN DEVELOPMENT 90
– STATE OF HUMAN CAPITAL FORMATION IN INDIA 91
– EDUCATION SECTOR IN INDIA 92
– FUTURE PROSPECTS 94
CHAPTER 6 : RURAL DEVELOPMENT 99
– WHAT IS RURAL DEVELOPMENT? 100
– CREDIT AND MARKETING IN RURAL AREAS 101
– AGRICULTURAL MARKET SYSTEM 104
– DIVERSIFICATION INTO PRODUCTIVE ACTIVITIES 106
– SUSTAINABLE DEVELOPMENT AND ORGANIC FARMING 110
CHAPTER 7 : EMPLOYMENT: GROWTH, INFORMALISATION AND OTHER ISSUES 116
– WORKERS AND EMPLOYMENT 118
– PARTICIPATION OF PEOPLE IN EMPLOYMENT 119
– SELF-EMPLOYED AND HIRED WORKERS 120
– EMPLOYMENT IN FIRMS, FACTORIES AND OFFICES 123
– GROWTH AND CHANGING STRUCTURE OF EMPLOYMENT 124
– INFORMALISATION OF INDIAN WORKFORCE 127
– UNEMPLOYMENT 130
– GOVERNMENT AND EMPLOYMENT GENERATION 132
CHAPTER 8 : INFRASTRUCTURE 139
– WHAT IS INFRASTRUCTURE? 140
– RELEVANCE OF INFRASTRUCTURE 141
– THE STATE OF INFRASTRUCTURE IN INDIA 141
– ENERGY 144
– HEALTH 150
xii
2021-22

CHAPTER 9 : ENVIRONMENT AND SUSTAINABLE DEVELOPMENT 162
– ENVIRONMENT — DEFINITION AND FUNCTIONS 163
– STATE OF INDIA’S ENVIRONMENT 167
– SUSTAINABLE DEVELOPMENT 171
– STRATEGIES FOR SUSTAINABLE DEVELOPMENT 172
UNIT IV : DEVELOPMENT EXPERIENCES OF INDIA : A COMPARISON 179-197
WITH NEIGHBOURS
CHAPTER 10 : COMPARATIVE DEVELOPMENT EXPERIENCES OF 181
INDIA AND ITS NEIGHBOURS
– DEVELOPMENTAL PATH — A SNAPSHOT VIEW 182
– DEMOGRAPHIC INDICATORS 185
– GROSS DOMESTIC PRODUCT AND SECTORS 186
– INDICATORS OF HUMAN DEVELOPMENT 189
– DEVELOPMENT STRATEGIES — AN APPRAISAL 190
GLOSSARY 198-206
xiii
2021-22

Constitution of India
Fundamental Duties
It shall be the duty of every citizen of India —
(a) to abide by the Constitution and respect its ideals and institutions, the
National Flag and the National Anthem;
(b) to cherish and follow the noble ideals which inspired our national struggle
for freedom;
(c) to uphold and protect the sovereignty, unity and integrity of India;
(d) to defend the country and render national service when called upon to
do so;
(e) to promote harmony and the spirit of common brotherhood amongst all
the people of India transcending religious, linguistic and regional or
sectional diversities; to renounce practices derogatory to the dignity of
women;
(f) to value and preserve the rich heritage of our composite culture;
(g) to protect and improve the natural environment including forests, lakes,
rivers, wildlife and to have compassion for living creatures;
(h) to develop the scientific temper, humanism and the spirit of inquiry and
reform;
(i) to safeguard public property and to abjure violence;
(j) to strive towards excellence in all spheres of individual and collective
activity so that the nation constantly rises to higher levels of endeavour
and achievement;
*(k) who is a parent or guardian, to provide opportunities for education to
his child or, as the case may be, ward between the age of six and
fourteen years.
Note: The Article 51A containing Fundamental Duties was inserted by the Constitution
(42nd Amendment) Act, 1976 (with effect from 3 January 1977).
*(k) was inserted by the Constitution (86th Amendment) Act, 2002 (with effect from
1 April 2010).
Part IV A (Article 51 A)
2021-22

DEVELOPMENT POLICIES AND EXPERIENCE
(1947-90)
UNIT
IIIUNIT
I
2021-22
The two chapters in this unit give us an overview
of the state of the Indian economy as it was at the
eve of independence till after four decades of
planned development, which was a path that India
chose. This meant that the Government of India
had to take a series of steps such as the
establishment of the Planning Commission and
announcement of five year plans. An overview of
the goals of five year plans and a critical appraisal
of the merits and limitations of planned development
has been covered in this unit.
2021-22

1
After studying this chapter, the learners will
• become familiar with the state of the Indian economy in 1947, the
year of India’s Independence
• understand the factors that led to the underdevelopment and
stagnation of the Indian economy.
INDIAN ECONOMY
ON THE
EVE OF INDEPENDENCE
2021-22

4 INDIAN ECONOMIC DEVELOPMENT
1.1 INTRODUCTION
The primary objective of this book,Indian Economic Development, is to
familiarise you with the basic featuresof the Indian economy, and itsdevelopment, as it is today, in the
aftermath of Independence. However, itis equally important to know somethingabout the country’s economic past even
as you learn about its present state andfuture prospects. So, let us first look atthe state of India’s economy prior to the
country’s independence and form anidea of the various considerations thatshaped India’s post-independence
development strategy.The structure of India’s present-
day economy is not just of current
making; it has its roots steeped inhistory, particularly in the period whenIndia was under British rule whichlasted for almost two centuries beforeIndia finally won its independence on15 August 1947. The sole purpose ofthe British colonial rule in India wasto reduce the country to being a rawmaterial supplier for Great Britain’s
own rapidly expanding modernindustrial base. An understanding ofthe exploitative nature of thisrelationship is essential for anyassessment of the kind and level ofdevelopment which the Indianeconomy has been able to attain overthe last six and half decades. 1.2
1.2 LOW LEVEL OF ECONOMIC
DEVELOPMENT UNDER THE
COLONIAL RULE
India had an independent economybefore the advent of the British rule.Though agriculture was the mainsource of livelihood for most people,yet, the country’s economy wascharacterised by various kinds ofmanufacturing activities. India wasparticularly well known for itshandicraft industries in the fields ofcotton and silk textiles, metal andprecious stone works etc. Theseproducts enjoyed a worldwide marketbased on the reputation of the finequality of material used and the highstandards of craftsmanship seen in allimports from India (See Box 1.1).
“India is the pivot of our Empire... If the Empire loses any other part of itsDominion we can survive, but if we lose India, the sun of our Empire will haveset.”
Victor Alexander Vruce, the Viceroy of British India in 1894
Box 1.1: Textile Industry in Bengal
Muslin is a type of cotton textile which had its origin in Bengal, particularly,places in and around Dhaka (spelled during the pre-independence period asDacca), now the capital city of Bangladesh. ‘Daccai Muslin’ had gained worldwidefame as an exquisite type of cotton textile. The finest variety of muslin wascalled malmal. Sometimes, foreign travellers also used to refer to it as malmal
shahi or malmal khas implying that it was worn by, or fit for, the royalty.
2021-22

5INDIAN ECONOMY ON THE EVE OF INDEPENDENCE
The economic policies pursued bythe colonial government in India wereconcerned more with the protectionand promotion of the economicinterests of their home country thanwith the development of the Indianeconomy. Such policies brought abouta fundamental change in the structureof the Indian economy — transformingthe country into supplier of rawmaterials and consumer of finishedindustrial products from Britain.
Obviously, the colonial govern-ment never made any sincereattempt to estimate India’s nationaland per capita income . Someindividual attempts which weremade to measure such incomesyielded conflicting and inconsistentresults. Among the notable estimators— Dadabhai Naoroji, William Digby,Findlay Shirras, V.K.R.V. Rao and
R.C. Desai — it was Rao, whose
estimates during the colonial periodwas considered very significant.
However, most studies did find that
the country’s growth of aggregate real
output during the first half of thetwentieth century was less than two
per cent coupled with a meagre half
per cent growth in per capita output
per year.
1.3 AGRICULTURAL SECTOR
India’s economy under the British
colonial rule remained fundamentally
agrarian — about 85 per centof the country’s population lived
mostly in villages and derived
livelihood directly or indirectly from
agriculture (See Box 1.2). However,despite being the occupation of such
a large population, the agricultural
Fig. 1.1 India’s agricultural stagnationunder the British colonial rule
Box 1.2: Agriculture DuringPre-British India
The French traveller, Bernier, describedseventeenth century Bengal in thefollowing way: “The knowledge I haveacquired of Bengal in two visits inclinesme to believe that it is richer than Egypt.It exports, in abundance, cottons andsilks, rice, sugar and butter. It producesamply — for its own consumption —wheat, vegetables, grains, fowls, ducksand geese. It has immense herds of pigsand flocks of sheep and goats. Fish ofevery kind it has in profusion. Fromrajmahal to the sea is an endlessnumber of canals, cut in bygone agesfrom the Ganges by immense labour fornavigation and irrigation.”
Ø Take note of the agricultural prosperity in our country in the seventeenth century. Contrast it
with agricultural stagnation around the time when the British left India, around 200 years later.
2021-22

6 INDIAN ECONOMIC DEVELOPMENT
sector continued to experience
stagnation and, not infrequently,unusual deterioration. Agricultural
pro-ductivity became low though, in
absolute terms, the sector experienced
some growth due to the expansion ofthe aggregate area under cultivation.
This stagnation in the agricultural
sector was caused mainly because of
the various systems of landsettlement that were introduced by
the colonial government. Particularly,
under the zamindari system which
was implemented in the then BengalPresidency comprising parts ofIndia’s present-day eastern states,the profit accruing out of theagriculture sector went to thezamindars instead of the cultivators.However, a considerable number ofzamindars, and not just the colonialgovernment, did nothing to improvethe condition of agriculture. The main
interest of the zamindars was only tocollect rent regardless of theeconomic condition of the cultivators;this caused immense misery andsocial tension among the latter. To avery great extent, the terms of therevenue settlement were alsoresponsible for the zamindars
adopting such an attitude; dates fordepositing specified sums of revenuewere f ixed, fai l ing which thezamindars were to lose their rights.Besides this, low levels of technology,lack of irrigation facilities andnegligible use of fertilisers, all addedup to aggravate the plight of thefarmers and contributed to thedismal level of agriculturalproductivity. There was, of course,some evidence of a relatively higheryield of cash crops in certainareas of the country due tocommercialisation of agriculture.
Work These Out
Ø Compare the map of British India with that of independent India and find
out the areas that became parts of Pakistan. Why were those parts so
important to India from the economic point of view? (Refer, to your
advantage, Dr Rajendra Prasad’s book, India Divided).
Ø What were the various forms of revenue settlement adopted by the British
in India? Where did they implement them and to what effect? How far do
you think those settlements have a bearing on the current agricultural
scenario in India? (In your attempt to find answers to these questions, you
may refer to Ramesh Chandra Dutt’s Economic History of India, which comes
in three volumes, and B.H. Baden-Powell’s The Land Systems of British
India, also in two volumes. For better comprehension of the subject, you
can also try and develop an illustrated agrarian map of British India either
by hand or with the help of your school computer. Remember, nothing
helps better than an illustrated map to understand the subject at hand).
2021-22

7INDIAN ECONOMY ON THE EVE OF INDEPENDENCE
But this could hardly help farmers inimproving their economic conditionas, instead of producing food crops,now they were producing cash cropswhich were to be ultimately used byBritish industries back home. Despitesome progress made in irrigation,India’s agriculture was starved ofinvestment in terracing, flood-control,drainage and desalinisation of soil.While a small section of farmerschanged their cropping pattern fromfood crops to commercial crops, a largesection of tenants, small farmers andsharecroppers neither had resourcesand technology nor had incentive toinvest in agriculure.
1.4 INDUSTRIAL SECTOR
As in the case of agriculture, so alsoin manufacturing, India could notdevelop a sound industrial base underthe colonial rule. Even as the country’sworld famous handicraft industriesdeclined, no corresponding modernindustrial base was allowed to comeup to take pride of place so longenjoyed by the former. The primary
motive of the colonial governmentbehind this policy of systematically de-
industrialising India was two-fold. The
intention was, first, to reduce India tothe status of a mere exporter of
important raw materials for the
upcoming modern industries inBritain and, second, to turn India into
a sprawling market for the finished
products of those industries so thattheir continued expansion could be
ensured to the maximum advantage of
their home country — Britain. In the
unfolding economic scenario, the
decline of the indigenous handicraftindustries created not only massive
unemployment in India but also a new
demand in the Indian consumermarket, which was now deprived of the
supply of locally made goods. This
demand was profitably met by theincreasing imports of cheap
manufactured goods from Britain.
During the second half of thenineteenth century, modern industry
began to take root in India but its
progress remained very slow.Initially, this development was
confined to the setting up of cotton
and jute textile mills. The cottontextile mills, mainly dominated by
Indians, were located in the western
parts of the country, namely,Maharashtra and Gujarat, while
the jute mills dominated by the
foreigners were mainly concentratedin Bengal. Subsequently, the iron
and steel industries began coming up
in the beginning of the twentiethcentury. The Tata Iron and Steel
Company (TISCO) was incorporated
in 1907. A few other industries in thefields of sugar, cement, paper etc.
came up after the Second World War.However, there was hardly any
capital goods industry to helppromote further industrialisation inIndia. Capital goods industry meansindustries which can produce machinetools which are, in turn, used forproducing articles for currentconsumption. The establishment of afew manufacturing units here and
2021-22

8 INDIAN ECONOMIC DEVELOPMENT
there was no substitute to the nearwholesale displacement of thecountry’s traditional handicraftindustries. Furthermore, the growthrate of the new industrial sector andits contribution to the Gross DomesticProduct (GDP) or Gross Value Addedremained very small. Anothersignificant drawback of the newindustrial sector was the very limitedarea of operation of the public sector.This sector remained confined only tothe railways, power generation,communications, ports and someother departmental undertakings.
1.5 FOREIGN TRADE
India has been an important tradingnation since ancient times. But therestrictive policies of commodityproduction, trade and tariff pursuedby the colonial government adverselyaffected the structure, composition andvolume of India’s foreign trade.
Consequently, India became an
exporter of primary products such as
raw silk, cotton, wool, sugar, indigo,
jute etc. and an importer of finished
consumer goods like cotton, silk and
woollen clothes and capital goods like
light machinery produced in the
factories of Britain. For all practical
purposes, Britain maintained a
monopoly control over India’s exports
and imports. As a result, more than
half of India’s foreign trade was
restricted to Britain while the rest was
allowed with a few other countries like
China, Ceylon (Sri Lanka) and Persia
(Iran). The opening of the Suez Canal
further intensified British control over
India’s foreign trade (see Box 1.3).
The most important characteristic
of India’s foreign trade throughout the
colonial period was the generation of
a large export surplus. But this
surplus came at a huge cost to the
country’s economy. Several essential
commodities—food grains, clothes,
Work These Out
ØPrepare a list showing where and when other modern industries of India
were first set up. Can you also find out what the basic requirements are forsetting up any modern industry? What, for example, might have been thereasons for the setting up of the Tata Iron and Steel Company at Jamshedpur,which is now in the state of Jharkhand?
ØHow many iron and steel factories are there in India at present? Are these
iron and steel factories among the best in the world or do you think thatthese factories need restructuring and upgradation? If yes, how can this bedone? There is an argument that industries which are not strategic in natureshould not continue to be in the public sector. What is your view?
ØOn a map of India, mark the cotton textiles, jute mills and textile mills that
existed at the time of independence.
2021-22

9INDIAN ECONOMY ON THE EVE OF INDEPENDENCE
kerosene etc. — were scarcely availablein the domestic market. Furthermore,this export surplus did not result inany flow of gold or silver into India.Rather, this was used to makepayments for the expenses incurred byan office set up by the colonialgovernment in Britain, expenses on war,again fought by the British
government, and the import of invisible
items, all of which led to the drain ofIndian wealth.
1.6 DEMOGRAPHIC CONDITION
Various details about the populationof British India were first collectedthrough a census in 1881. Thoughsuffering from certain limitations, itrevealed the unevenness in India’spopulation growth. Subsequently,
Fig.1.2 Suez Canal: Used as highway
between India and Britain
Box 1.3: Trade Through the SuezCanal
Suez Canal is an artificial waterwayrunning from north to south across theIsthmus of Suez in north-easternEgypt. It connects Port Said on theMediterranean Sea with the Gulf ofSuez, an arm of the Red Sea. The canalprovides a direct trade route for shipsoperating between European orAmerican ports and ports located inSouth Asia, East Africa and Oceania bydoing away with the need to sail aroundAfrica. Strategically and economically,it is one of the most importantwaterways in the world. Its opening in1869 reduced the cost of transportationand made access to the Indian marketeasier.
Not to scale
Work These Out
Ø Prepare a list of items that were exported from and imported into India during
the British rule.
Ø Collect information from the Economic Survey for various years published
by the Ministry of Finance, Government of India, on various items of exportfrom India and its imports. Compare these with imports and exports fromthe pre-independence era. Also find out the names of prominent ports whichnow handle the bulk of India’s foreign trade.
Not to scale
2021-22

10 INDIAN ECONOMIC DEVELOPMENT
every ten years such census operationswere carried out. Before 1921, Indiawas in the first stage of demographictransition. The second stage oftransition began after 1921. However,neither the total population of India northe rate of population growth at thisstage was very high.
The various social developmentindicators were also not quiteencouraging. The overall literacy levelwas less than 16 per cent. Out of this,the female literacy level was at anegligible low of about seven percent. Public health facilities wereeither unavailable to large chunks ofpopulation or, when available, werehighly inadequate. Consequently,water and air-borne diseases wererampant and took a huge toll onlife. No wonder, the overall mortalityrate was very high and in that,
particularly, the infant mortalityrate was quite alarming—about 218per thousand in contrast to thepresent infant mortality rate of 33 perthousand. Life expectancy was alsovery low—32 years in contrast to thepresent 69 years. In the absence ofreliable data, it is difficult to specify theextent of poverty at that time but thereis no doubt that extensive povertyprevailed in India during the colonialperiod which contributed to theworsening profile of India’s populationof the time.
1.7 OCCUPATIONAL STRUCTURE
During the colonial period, theoccupational structure of India, i.e.,distribution of working personsacross different industries andsectors, showed little sign of change.The agricultural sector accounted for
Fig. 1.3 A large section of India’s population did not have basic needs such as housing
2021-22

11INDIAN ECONOMY ON THE EVE OF INDEPENDENCE
the largest share of workforce, whichusually remained at a high of 70-75per cent while the manufacturing andthe services sectors accounted for only10 and 15-20 per cent respectively.Another striking aspect was thegrowing regional variation. Partsof the then Madras Presidency(comprising areas of the present-daystates of Tamil Nadu, AndhraPradesh, Kerala and Karnataka),Bombay and Bengal witnessed adecline in the dependence of theworkforce on the agricultural sectorwith a commensurate increase in themanufacturing and the servicessectors. However, there had been anincrease in the share of workforce inagriculture during the same time instates such as Orissa, Rajasthan andPunjab.
1.8 INFRASTRUCTURE
Under the colonial regime, basicinfrastructure such as railways,ports, water transport, posts and
telegraphs did develop. However, the
real motive behind this development
was not to provide basic amenities tothe people but to subserve various
colonial interests. Roads constructed
in India prior to the advent of theBritish rule were not fit for modern
transport. The roads that were built
primarily served the purposes ofmobilising the army within India and
drawing out raw materials from the
countryside to the nearest railwaystation or the port to send these to
far away England or other lucrative
foreign destinations. There alwaysremained an acute shortage of all-
weather roads to reach out to the
rural areas during the rainy season.Naturally, therefore, people mostly
living in these areas suffered
grievously during natural calamitiesand famines.
The British introduced the
railways in India in 1850 and it isconsidered as one of their most
important contributions. The
railways affected the structure of theIndian economy in two important
ways. On the one hand it enabled
people to undertake long distancetravel and thereby break
geographical and cultural barriers
while, on the other hand, it fosteredcommercialisation of Indian
agriculture which adversely affected
the self-sufficiency of the villageeconomies in India. The volume of
India’s exports undoubtedly
expanded but its benefits rarelyaccrued to the Indian people.The social benefits, which the
Work These Out
Ø Can you find out the
reasons behind frequentoccurrence of famines inIndia before independence?You may read from NobelLaureate Amartya Sen’sbook, Poverty and Famines.
ØPrepare a pie chart for
the occupational structurein India at the time ofindependence.
2021-22

12 INDIAN ECONOMIC DEVELOPMENT
Indian people gained owing to theintroduction of the railways, werethus outweighed by the country’shuge economic loss.
Along with the development ofroads and railways, the colonialdispensation also took measures fordeveloping the inland trade and sealanes. However, these measures werefar from satisfactory. The inlandwaterways, at times, also proveduneconomical as in the case of theCoast Canal on the Orissa coast.Though the canal was built at a huge
cost to the government exchequer, yet,it failed to compete with the railways,which soon traversed the regionrunning parallel to the canal, and hadto be ultimately abandoned. Theintroduction of the expensive systemof electric telegraph in India, similarly,served the purpose of maintaining lawand order. The postal services, on theother hand, despite serving a useful
public purpose, remained all through
Fig.1.5 Tata Airlines, a division of Tata and
Sons, was established in 1932
inaugurating the aviation sector in India
Fig. 1.4 First Railway Bridge linking Bombay with Thane, 1854
Work This Out
Ø There is a perception still
going around that inmany ways the Britishadministration in Indiawas quite beneficial. Thisperception needs aninformed debate. Howwould you look at thisperception? Argue thisout in your class — ‘Wasthe British Raj good forIndia’?
2021-22

13INDIAN ECONOMY ON THE EVE OF INDEPENDENCE
inadequate. You will learn more aboutthe present status of variousinfrastructure in Chapter 8.
1.9 CONCLUSION
By the time India won its independence,the impact of the two-century longBritish colonial rule was alreadyshowing on all aspects of the Indianeconomy. The agricultural sector wasalready saddled with surplus labourand extremely low productivity. Theindustrial sector was crying for
modernisation, diversification, capacity
building and increased public
investment. Foreign trade was oriented
to feed the Industrial Revolution in
Britain. Infrastructure facilities,
including the famed railway network,
needed upgradation, expansion and
public orientation. Prevalence of
rampant poverty and unemployment
required welfare orientation of public
economic policy. In a nutshell, the
social and economic challenges before
the country were enormous.
Recap
Ø An understanding of the economy before independence is necessary to
know and appreciate the level of development achieved during the post-independence period.
Ø Under the colonial dispensation, the economic policies of the government
were concerned more with the protection and promotion of Britisheconomic interests than with the need to develop the economic conditionof the colonised country and its people.
Ø The agricultural sector continued to experience stagnation and
deterioration despite the fact that the largest section of Indian populationdepended on it for sustenance.
Ø The rule of the British-India government led to the collapse of India’s
world famous handicraft industries without contributing, in anysignificant manner, to its replacement by a modern industrial base.
Ø Lack of adequate public health facilities, occurrence of frequent natural
calamities and famines pauperised the hapless Indian people andresulted in engendering high mortality rates.
Ø Some efforts were made by the colonial regime to improve infrastructure
facilities but these efforts were spiced with selfish motives. However, theindependent Indian government had to built on this base throughplanning.
2021-22

14 INDIAN ECONOMIC DEVELOPMENT
1. What was the focus of the economic policies pursued by the colonialgovernment in India? What were the impacts of these policies?
2. Name some notable economists who estimated India’s per capitaincome during the colonial period.
3. What were the main causes of India’s agricultural stagnation duringthe colonial period?
4. Name some modern industries which were in operation in our countryat the time of independence.
5. What was the two-fold motive behind the systematic de-industrialisation effected by the British in pre-independent India?
6. The traditional handicrafts industries were ruined under the Britishrule. Do you agree with this view? Give reasons in support of youranswer.
7. What objectives did the British intend to achieve through theirpolicies of infrastructure development in India?
8. Critically appraise some of the shortfalls of the industrial policypursued by the British colonial administration.
9. What do you understand by the drain of Indian wealth during thecolonial period?
10. Which is regarded as the defining year to mark the demographictransition from its first to the second decisive stage?
11. Give a quantitative appraisal of India’s demographic profile duringthe colonial period.
12. Highlight the salient features of India’s pre-independence occupationalstructure.
13. Underscore some of India’s most crucial economic challenges at thetime of independence.
14. When was India’s first official census operation undertaken?
15. Indicate the volume and direction of trade at the time ofindependence.
16. Were there any positive contributions made by the British in India?Discuss.
EXERCISES
2021-22

15INDIAN ECONOMY ON THE EVE OF INDEPENDENCE
SUGGESTED ADDITIONAL ACTIVITIES
REFERENCES
1. Prepare a list of goods and services that were available to people inpre-independence India in rural and urban areas. Compare it withthe consumption pattern of such goods and services by the peopletoday. Highlight the perceptible difference in the people’s standardof living.
2. Find pictures of towns/villages, in your vicinity, of the pre-independence period and compare these with their present scenario.What changes can you mark? Are such changes for better or forworse? Discuss.
3. Rally around your teacher and organise a group discussion on ‘Hasthe zamindari system really been abolished in India’? If theconsensus is negative, then what measures would you think shouldbe taken to banish it and why?
4. Identify the major occupations followed by the people of our countryat the time of independence. What major occupations do the peoplefollow today? In the light of reform policies, how would you visualisethe occupational scenario in India 15 years from now—say, 2035?
BADEN-POWELL, B.H. 1892. The Land Systems of British India, Vols I, II andIII. Oxford Clarendon Press, Oxford.
BUCHANAN, D.H. 1966. Development of Capitalist Enterprise in India. FrankCass and Co, London.
CHANDRA, BIPAN. 1993. ‘The Colonial Legacy’ in Bimal Jalan (Ed.), The IndianEconomy: Problems and Prospects. Penguin Books, New Delhi.
DUTT, R.C. 1963. Economic History of India, Vols I and II. Ministry ofInformation and Broadcasting, Government of India, New Delhi.
KUMAR, D. AND MEGHNAD DESAI (Eds.). 1983. Cambridge Economic History ofIndia. Cambridge University Press, Cambridge.
MILL, JAMES.1972. History of British India. Associated Publishing House,New Delhi.
PRASAD, RAJENDRA. 1946. India Divided. Hind Kitabs, Bombay.
SEN, AMARTYA. 1999. Poverty and Famines. Oxford University Press, New Delhi.
Government Reports
Economic Survey (for various years). Ministry of Finance, Government of India.
2021-22

After studying this chapter, the learners will
• come to know the goals of India’s five year plans
• know about the development policies in different sectors such asagriculture and industry from 1950-1990
• learn to think about the merits and limitations of a regulated economy.
2
INDIAN ECONOMY
1950–1990
2021-22

17INDIAN ECONOMY 1950-1990
2.1 INTRODUCTION
On 15 August 1947, India woke to anew dawn of freedom. Finally we weremasters of our own destiny aftersome two hundred years of Britishrule; the job of nation building wasnow in our own hands. The leadersof independent India had to decide,among other things, the type ofeconomic system most suitable forour nation, a system which wouldpromote the welfare of all rather thana few. There are different types ofeconomic systems (see Box 2.1) andamong them, socialism appealed toJawaharlal Nehru the most. However,he was not in favour of the kind ofsocialism established in the formerSoviet Union where all the means ofproduction, i.e. all the factories andfarms in the country, were owned bythe government. There was no privateproperty. It is not possible in ademocracy l ike India for thegovernment to change the ownershippattern of land and other propertiesof its citizens in the way that it wasdone in the former Soviet Union.
Nehru, and many other leaders andthinkers of the newly independentIndia, sought an alternative to theextreme versions of capitalism andsocialism. Basically sympathising withthe socialist outlook, they found the
answer in an economic system which,in their view, combined the bestfeatures of socialism without itsdrawbacks. In this view, India wouldbe a socialist society with a strongpublic sector but also with privateproperty and democracy; the governmentwould plan (see Box 2.2) for the
The central objective of Planning in India... is to initiate a process ofdevelopment which will raise the living standards and open out to the peoplenew opportunities for a richer and more varied life.
First Five Year Plan
Work These Out
Ø Prepare a chart on the
different types of economicsystems prevalent in theworld. List out the countriesas capitalist, socialist andmixed economy.
Ø Plan a class trip to an
agriculture farm. Divide theclass into seven groups witheach group to plan a specificgoal, for example, thepurpose of the visit, moneyexpenditure involved, timetaken, resources, peopleaccompanying the groupand who need to becontacted, possible placesof visit, possible questionsto be asked etc. Now, withthe help of your teacher,compile these specific goalsand compare with long-termgoals of successful visit toan agricultural farm.
2021-22

18 INDIAN ECONOMIC DEVELOPMENT
Box 2.1: Types of Economic Systems
Every society has to answer three questions
ØWhat goods and services should be produced in the country?
ØHow should the goods and services be produced? Should producers use
more human labour or more capital (machines) for producing things?
ØHow should the goods and services be distributed among people?
One answer to these questions is to depend on the market forces of
supply and demand. In a market economy, also called capitalism, only thoseconsumer goods will be produced that are in demand, i.e., goods that canbe sold profitably either in the domestic or in the foreign markets. If carsare in demand, cars will be produced and if bicycles are in demand, bicycleswill be produced. If labour is cheaper than capital, more labour-intensivemethods of production will be used and vice-versa. In a capitalist societythe goods produced are distributed among people not on the basis of whatpeople need but on the basis of Purchasing Power—the ability to buy goodsand services. That is, one has to have the money in the pocket to buy it. Lowcost housing for the poor is much needed but will not count as demand inthe market sense because the poor do not have the purchasing power toback the demand. As a result this commodity will not be produced andsupplied as per market forces. Such a society did not appeal to JawaharlalNehru, our first prime minister, for it meant that the great majority of peopleof the country would be left behind without the chance to improve theirquality of life.
A socialist society answers the three questions in a totally different
manner. In a socialist society the government decides what goods are to beproduced in accordance with the needs of society. It is assumed that thegovernment knows what is good for the people of the country and so thedesires of individual consumers are not given much importance. Thegovernment decides how goods are to be produced and how they should bedistributed. In principle, distribution under socialism is supposed to be basedon what people need and not on what they can afford to purchase. Unlikeunder capitalism, for example, a socialist nation provides free health careto all its citizens. Strictly, a socialist society has no private property sinceeverything is owned by the state. In Cuba and China, for example, most ofthe economic activities are governed by the socialistic principles.
Most economies are mixed economies, i.e. the government and the
market together answer the three questions of what to produce, how toproduce and how to distribute what is produced. In a mixed economy, themarket will provide whatever goods and services it can produce well, andthe government will provide essential goods and services which the marketfails to do.
2021-22

19INDIAN ECONOMY 1950-1990
economy with the private sector beingencouraged to be part of the plan effort.The ‘Industrial Policy Resolution’ of1948 and the Directive Principles ofthe Indian Constitution reflectedthis outlook. In 1950, the PlanningCommission was set up with thePrime Minister as its Chairperson. Theera of five year plans had begun.
2.2 THE GOALS OF FIVE YEAR PLANS
A plan should have some clearlyspecified goals. The goals of the fiveyear plans were: growth, modernisation,self-reliance and equity. This does notmean that all the plans have givenequal importance to all these goals.Due to limited resources, a choice hasto be made in each plan about which
of the goals is to be given primaryimportance. Nevertheless, the plannershave to ensure that, as far as possible,the policies of the plans do notcontradict these four goals. Let us nowlearn about the goals of planning insome detail.
Growth: It refers to increase in thecountry’s capacity to produce theoutput of goods and services withinthe country. It implies either alarger stock of productive capital,or a larger s ize of support ingserv i ces l ike t ranspor t andbanking, or an increase in theefficiency of productive capital andservices. A good indicator ofeconomic growth, in the language of
Box 2.2: What is a Plan?
A plan spells out how the resources of a nation should be put to use. It
should have some general goals as well as specific objectives which are tobe achieved within a specified period of time; in India plans were of fiveyears duration and were called five year plans (we borrowed this from theformer Soviet Union, the pioneer in national planning). Our plan documentsupto the year 2017 not only specify the objectives to be attained in the fiveyears of a plan but also what is to be achieved over a period of twenty years.This long-term plan is called ‘perspective plan’. The five year plans weresupposed to provide the basis for the perspective plan.
It will be unrealistic to expect all the goals of a plan to be given equal
importance in all the plans. In fact the goals may actually be in conflict. Forexample, the goal of introducing modern technology may be in conflict withthe goal of increasing employment if the technology reduces the need forlabour. The planners have to balance the goals, a very difficult job indeed.We find different goals being emphasised in different plans in India.
India’s five year plans did not spell out how much of each and every
good and service is to be produced. This is neither possible nor necessary(the former Soviet Union tried to do this and failed). It is enough if the planis specific about the sectors where it plays a commanding role, for instance,power generation and irrigation, while leaving the rest to the market.
2021-22

20 INDIAN ECONOMIC DEVELOPMENT
Box 2.3: Mahalanobis: the Architect of Indian Planning
Many distinguished thinkers contributed to the formulation of India’s five
year plans. Among them, the name of the statistician, Prasanta ChandraMahalanobis, stands out.
Planning, in the real sense of the term, began with the Second Five YearPlan. The Second Plan, a landmark contribution to development planningin general, laid down the basic ideas regardinggoals of Indian planning; this plan was basedon the ideas of Mahalanobis. In that sense, hecan be regarded as the architect of Indianplanning.
Mahalanobis was born in 1893 in Calcutta.He was educated at the Presidency College inCalcutta and at Cambridge University inEngland. His contributions to the subject ofstatistics brought him international fame. In1945 he was made a Fellow (member) ofBritain’s Royal Society, one of the mostprestigious organisations of scientists; only themost outstanding scientists are mademembers of this Society.
Mahalanobis established the IndianStatistical Institute (ISI) in Calcutta andstarted a journal, Sankhya, which still servesas a respected forum for statisticians todiscuss their ideas. Both, the ISI and Sankhya, are highly regarded bystatisticians and economists all over the world to this day.
During the second plan period, Mahalanobis invited manydistinguished economists from India and abroad to advise him on India’seconomic development. Some of these economists became Nobel Prize winnerslater, which shows that he could identify individuals with talent. Amongthe economists invited by Mahalanobis were those who were very critical ofthe socialist principles of the second plan. In other words, he was willing tolisten to what his critics had to say, the mark of a great scholar.
Many economists today reject the approach to planning formulated byMahalanobis but he will always be remembered for playing a vital role inputting India on the road to economic progress, and statisticians continueto profit from his contribution to statistical theory.
Source: Sukhamoy Chakravarty, ‘Mahalanobis, Prasanta Chandra’ in John
Eatwell et.al, (Eds.) The New Palgrave Dictionary: Economic
Development, W.W. Norton, New York and London.
2021-22

21INDIAN ECONOMY 1950-1990
economics, is steady increase in theGross Domestic Product (GDP). TheGDP is the market value of all thefinal goods and services produced inthe country during a year. You havestudied this concept in Class X aswell. You can think of the GDP as acake and growth is increase in thesize of the cake. If the cake is larger,more people can enjoy it. It isnecessary to produce more goodsand services if the people of India areto enjoy (in the words of the First FiveYear Plan) a more rich and varied life.
The GDP of a country is derivedfrom the different sectors of theeconomy, namely the agriculturalsector, the industrial sector and theservice sector. The contributionmade by each of these sectors makesup the structural composition ofthe economy. In some countries,growth in agriculture contributesmore to the GDP growth, while insome countries the growth in theservice sector contributes more toGDP growth (see Box 2.4).
Modernisation: To increase theproduction of goods and services
the producers have to adopt newtechnology. For example, a farmer canincrease the output on the farm byusing new seed varieties instead ofusing the old ones. Similarly, a factorycan increase output by using a newtype of machine. Adoption of newtechnology is called modernisation.
However, modernisation does notrefer only to the use of new technologybut also to changes in social outlooksuch as the recognition that womenshould have the same rights as men. Ina traditional society, women aresupposed to remain at home while menwork. A modern society makes use ofthe talents of women in the work place— in banks, factories, schools etc. —and such a society in most occassionsis also prosperous.
Self-reliance: A nation can promoteeconomic growth and modernisationby using its own resources or byusing resources imported from othernations. The first seven five year plansgave importance to self-reliancewhich means avoiding importsof those goods which could be
Box 2.4: The Service Sector
As a country develops, it undergoes ‘structural change’. In the case of India,the structural change is peculiar. Usually, with development, the share ofagriculture declines and the share of industry becomes dominant. At higherlevels of development, the service sector contributes more to the GDP than theother two sectors. In India, the share of agriculture in the GDP was more than50 per cent—as we would expect for a poor country. But by 1990 the share ofthe service sector was 40.59 per cent, more than that of agriculture or industry,like what we find in developed nations. This phenomenon of growing share ofthe service sector was accelerated in the post 1991 period (this marked theonset of globalisation in the country which will be discussed in chapter 3).
2021-22

22 INDIAN ECONOMIC DEVELOPMENT
produced in India itself. This policywas considered a necessity in orderto reduce our dependence on foreigncountries, especially for food. It isunderstandable that people whowere recently freed from foreigndomination should give importanceto self-reliance. Further, it was fearedthat dependence on imported foodsupplies, foreign technology andforeign capital may make India’ssovereignty vulnerable to foreigninterference in our policies.
Equity: Now growth, modernisationand self-reliance, by themselves, maynot improve the kind of life whichpeople are living. A country can havehigh growth, the most moderntechnology developed in the countryitself, and also have most of its peopleliving in poverty. It is important toensure that the benefits of economicprosperity reach the poor sections aswell instead of being enjoyed only bythe rich. So, in addition to growth,modernisation and self-reliance,equity is also important. Every Indianshould be able to meet his or her basic
needs such as food, a decent house,education and health care andinequality in the distribution of wealthshould be reduced.
Let us now see how the first sevenfive year plans, covering the period1950-1990, attempted to attain thesefour goals and the extent to whichthey succeeded in doing so, withreference to agriculture, industryand trade. You will study the policiesand developmental issues taken upafter 1991 in Chapter 3.
2.3 AGRICULTURE
You have learnt in Chapter 1 thatduring the colonial rule there wasneither growth nor equity in theagricultural sector. The policy makersof independent India had to addressthese issues which they did throughland reforms and promoting the useof ‘High Yielding Variety’ (HYV) seedswhich ushered in a revolution inIndian agriculture.
Land Reforms: At the time ofindependence, the land tenure systemwas characterised by intermediaries
Work These Out
Ø Discuss in your class the changes in technology used for
(a) Production of food grains(b) Packaging of products(c) Mass communication
Ø Find out and prepare a list of major items that India imported and exported
during 1990-91 and 2018-19. (For this, see P. 192 also).
(a) Observe the difference
(b) Do you see the impact of self-reliance? Discuss.
For getting these details you may refer to Economic Survey of the latest year.
2021-22

23INDIAN ECONOMY 1950-1990
(variously called zamindars, jagirdars
etc.) who merely collected rent from theactual tillers of the soil withoutcontributing towards improvementson the farm. The low productivity ofthe agricultural sector forced India toimport food from the United States ofAmerica (U.S.A.). Equity in agriculturecalled for land reforms which primarilyrefer to change in the ownership of
landholdings. Just a year afterindependence, steps were taken toabolish intermediaries and to make thetillers the owners of land. The ideabehind this move was that ownershipof land would give incentives (see Box2.5) to the tillers to invest in makingimprovements provided sufficientcapital was made available to them.
Land ceiling was another policy topromote equity in the agriculturalsector. This means fixing the maximumsize of land which could be owned byan individual. The purpose of landceiling was to reduce the concentrationof land ownership in a few hands.
The abolition of intermediariesmeant that some 200 lakh tenantscame into direct contact with thegovernment — they were thusfreed from being exploited by thezamindars. The ownership conferredon tenants gave them the incentive toincrease output and this contributedto growth in agriculture. However, thegoal of equity was not fully servedby abolition of intermediaries. Insome areas the former zamindars
Box 2.5: Ownership and Incentives
The policy of ‘land to the tiller’ is based on the idea that the cultivators willtake more interest — they will have more incentive — in increasing output ifthey are the owners of the land. This is because ownership of land enables thetiller to make profit from the increased output. Tenants do not have the incentiveto make improvements on land since it is the landowner who would benefitmore from higher output. The importance of ownership in providing incentivesis well illustrated by the carelessness with which farmers in the former SovietUnion used to pack fruits for sale. It was not uncommon to see farmers packingrotten fruits along with fresh fruits in the same box. Now, every farmer knowsthat the rotten fruits will spoil the fresh fruits if they are packed together. Thiswill be a loss to the farmer since the fruits cannot be sold. So why did theSoviet farmers do something which would so obviously result in loss for them?The answer lies in the incentives facing the farmers. Since farmers in theformer Soviet Union did not own any land, they neither enjoyed the profits norsuffered the losses. In the absence of ownership, there was no incentive onthe part of farmers to be efficient, which also explains the poor performance ofthe agricultural sector in the Soviet Union despite availability of vast areas ofhighly fertile land.
Source: Thomas Sowell, Basic Economics: A Citizen’s Guide to the Economy,
New York: Basic Books, 2004, Second Edition.
2021-22

24 INDIAN ECONOMIC DEVELOPMENT
continued to own large areas of landby making use of some loopholes inthe legislation; there were cases wheretenants were evicted and thelandowners claimed to be self-cultivators (the actual tillers), claimingownership of the land; and even whenthe tillers got ownership of land, thepoorest of the agricultural labourers(such as sharecroppers and landlesslabourers) did not benefit from landreforms.
The land ceiling legislation alsofaced hurdles. The big landlordschallenged the legislation in thecourts, delaying its implementation.They used this delay to register theirlands in the name of close relatives,thereby escaping from thelegislation. The legislation also hada lot o f loopholes which wereexploited by the big landholders toretain their land. Land reforms weresuccessful in Kerala and WestBengal because these states hadgovernments committed to the policyof land to the tiller. Unfortunatelyother states did not have the samelevel o f commitment and vastinequality in landholding continuesto this day.
The Green Revolution: Atindependence, about 75 per cent ofthe country’s population wasdependent on agriculture.Productivity in the agricultural sectorwas very low because of the use of oldtechnology and the absence ofrequired infrastructure for the vastmajority of farmers. India’sagriculture vitally depends on the
monsoon and if the monsoon fell shortthe farmers were in trouble unlessthey had access to irrigation facilitieswhich very few had. The stagnation inagriculture during the colonial rulewas permanently broken by the greenrevolution. This refers to the largeincrease in production of food grainsresulting from the use of high yieldingvariety (HYV) seeds especially forwheat and rice. The use of these seedsrequired the use of fertiliser andpesticide in the correct quantities aswell as regular supply of water; theapplication of these inputs in correctproportions is vital. The farmers whocould benefit from HYV seeds requiredreliable irrigation facilities as well asthe financial resources to purchasefertiliser and pesticide. As a result, inthe first phase of the green revolution(approximately mid 1960s upto mid1970s), the use of HYV seeds wasrestricted to the more affluent statessuch as Punjab, Andhra Pradesh andTamil Nadu. Further, the use of HYVseeds primarily benefited the wheat-growing regions only. In the secondphase of the green revolution(mid-1970s to mid-1980s), the HYVtechnology spread to a larger numberof states and benefited more varietyof crops. The spread of greenrevolution technology enabled Indiato achieve self-sufficiency in foodgrains; India no longer had to beat the mercy of America, or anyother nation, for meeting its foodrequirements.
Growth in agricultural output isimportant but it is not enough. If alarge proportion of this increase is
2021-22

25INDIAN ECONOMY 1950-1990
consumed by the farmers themselvesinstead of being sold in the market,the higher output will not make muchof a difference to the economy as awhole. If, on the other hand, asubstantial amount of agriculturalproduce is sold in the market by thefarmers, the higher output can makea difference to the economy. Theportion of agricultural produce whichis sold in the market by the farmersis called marketed surplus. A goodproportion of the rice and wheatproduced during the green revolutionperiod (available as marketedsurplus) was sold by the farmers inthe market. As a result, the price offood grains declined relative to otheritems of consumption. The low-income groups, who spend a large
percentage of their income on food,benefited from this decline in relativeprices. The green revolution enabledthe government to procure sufficientamount of food grains to build a stockwhich could be used in times of foodshortage.
While the nation had immenselybenefited from the green revolution, thetechnology involved was not free fromrisks. One such risk was the possibilitythat it would increase the disparitiesbetween small and big farmers—sinceonly the big farmers could afford therequired inputs, thereby reaping mostof the benefits of the green revolution.Moreover, the HYV crops were also moreprone to attack by pests and the smallfarmers who adopted this technologycould lose everything in a pest attack.
2021-22

26 INDIAN ECONOMIC DEVELOPMENT
Fortunately, these fears did notcome true because of the steps takenby the government. The governmentprovided loans at a low interest rateto small farmers and subsidisedfertilisers so that small farmers couldalso have access to the neededinputs. Since the small farmers couldobtain the required inputs, theoutput on small farms equalled theoutput on large farms in the courseof time. As a result, the greenrevolution benefited the small as wellas rich farmers. The risk of the smallfarmers being ruined when pestsattack their crops was considerablyreduced by the services rendered byresearch institutes established by thegovernment. You should note thatthe green revolution would havefavoured the rich farmers only if thestate did not play an extensive rolein ensuring that the small farmer alsogains from the new technology.
The Debate Over Subsidies: Theeconomic justification of subsidies inagriculture is, at present, a hotly
debated question. It is generallyagreed that it was necessary to usesubsidies to provide an incentive for
adoption of the new HYV technologyby farmers in general and smallfarmers in particular. Any new
technology will be looked upon asbeing risky by farmers. Subsidieswere, therefore, needed to encourage
farmers to test the new technology.Some economists believe that oncethe technology is found profitable
and is widely adopted, subsidies
should be phased out since theirpurpose has been served. Further,subsidies are meant to benefit the
farmers but a substantial amount offertiliser subsidy also benefits thefert i l iser industry; and among
farmers, the subsidy largely benefitsthe farmers in the more prosperousregions. Therefore, it is argued that
there is no case for continuing withfertiliser subsidies; it does not benefitthe target group and it is a huge
burden on the government’s finances(see also Box 2.6).
On the other hand, some believe
that the government should continuewith agricultural subsidies becausefarming in India continues to be a
risky business. Most farmers are verypoor and they will not be able toafford the required inputs without
subsidies. Eliminating subsidies willincrease the inequality between richand poor farmers and violate the goal
of equity. These experts argue that ifsubsidies are largely benefiting thefertiliser industry and big farmers,
the correct policy is not to abolish
subsidies but to take steps to ensurethat only the poor farmers enjoy the
benefits.
Thus, by the late 1960s, Indian
agricultural productivity had increasedsufficiently to enable the country to be
self-sufficient in food grains. This is an
achievement to be proud of. On the
negative side, some 65 per cent of thecountry’s population continued to be
employed in agriculture even as late as
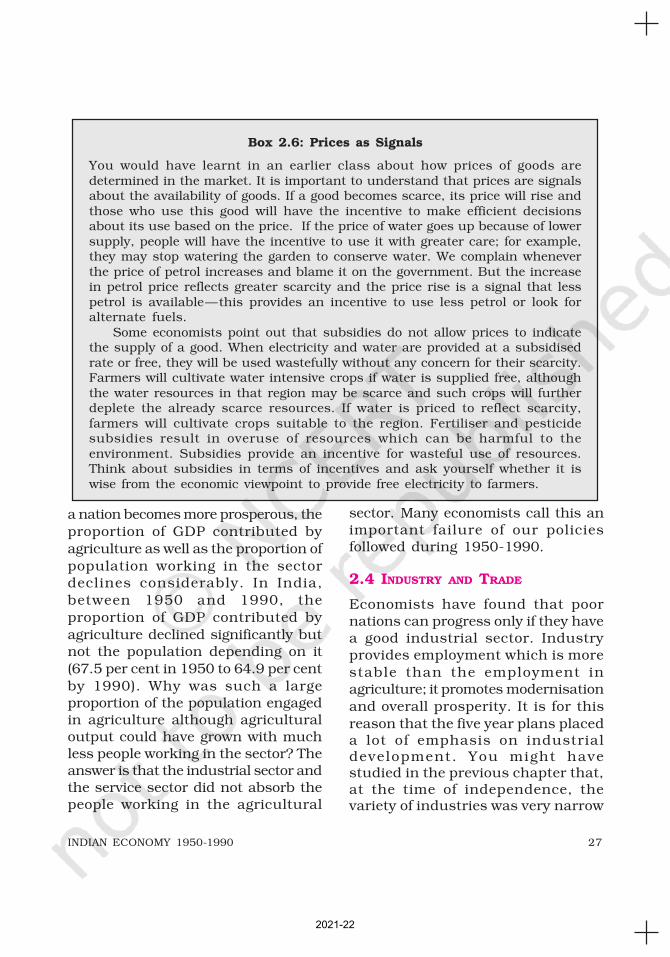
1990. Economists have found that as
2021-22
27INDIAN ECONOMY 1950-1990
a nation becomes more prosperous, the
proportion of GDP contributed by
agriculture as well as the proportion of
population working in the sectordeclines considerably. In India,
between 1950 and 1990, the
proportion of GDP contributed by
agriculture declined significantly butnot the population depending on it
(67.5 per cent in 1950 to 64.9 per cent
by 1990). Why was such a largeproportion of the population engagedin agriculture although agriculturaloutput could have grown with muchless people working in the sector? Theanswer is that the industrial sector andthe service sector did not absorb thepeople working in the agricultural
sector. Many economists call this animportant failure of our policiesfollowed during 1950-1990.
2.4 INDUSTRY AND TRADE
Economists have found that poornations can progress only if they havea good industrial sector. Industryprovides employment which is more
stable than the employment inagriculture; it promotes modernisation
and overall prosperity. It is for this
reason that the five year plans placeda lot of emphasis on industrialdevelopment. You might havestudied in the previous chapter that,at the time of independence, thevariety of industries was very narrow
Box 2.6: Prices as Signals
You would have learnt in an earlier class about how prices of goods aredetermined in the market. It is important to understand that prices are signalsabout the availability of goods. If a good becomes scarce, its price will rise andthose who use this good will have the incentive to make efficient decisionsabout its use based on the price. If the price of water goes up because of lowersupply, people will have the incentive to use it with greater care; for example,they may stop watering the garden to conserve water. We complain wheneverthe price of petrol increases and blame it on the government. But the increasein petrol price reflects greater scarcity and the price rise is a signal that lesspetrol is available—this provides an incentive to use less petrol or look foralternate fuels.
Some economists point out that subsidies do not allow prices to indicatethe supply of a good. When electricity and water are provided at a subsidisedrate or free, they will be used wastefully without any concern for their scarcity.Farmers will cultivate water intensive crops if water is supplied free, althoughthe water resources in that region may be scarce and such crops will furtherdeplete the already scarce resources. If water is priced to reflect scarcity,farmers will cultivate crops suitable to the region. Fertiliser and pesticidesubsidies result in overuse of resources which can be harmful to theenvironment. Subsidies provide an incentive for wasteful use of resources.Think about subsidies in terms of incentives and ask yourself whether it iswise from the economic viewpoint to provide free electricity to farmers.
2021-22

28 INDIAN ECONOMIC DEVELOPMENT
— largely confined to cotton textilesand jute. There were two well-managed iron and steel firms — onein Jamshedpur and the other inKolkata — but, obviously, we neededto expand the industrial base with avariety of industries if the economywas to grow.
Public and Private Sectors in IndianIndustrial Development: The bigquestion facing the policy makers was— what should be the role of thegovernment and the private sector inindustrial development? At the time ofindependence, Indian industrialists didnot have the capital to undertake
Work These Out
Ø A group of students may visit an agricultural farm, prepare a case study on
the method of farming used, that is, types of seeds, fertilisers, machines,means of irrigation, cost involved, marketable surplus and income earned.It will be beneficial if the changes in cultivation methods could be collectedfrom an elderly member of the farming family
(a) Discuss the findings in your class.
(b) The different groups can then prepare a chart showing variations incost of production, productivity, use of seeds, fertilisers, means ofirrigation, time taken, marketable surplus and income of the family.
Ø Collect newspaper cuttings related to the World Bank, International
Monetary Fund, World Trade Organisation (and meets of G7, G8, G10countries). Discuss the views shared by the developed and developingcountries on farm subsidies.
Ø Prepare pie charts on the occupational structure of the Indian economy
available in the following table. Discuss the possible reasons for the changein the shape of pies.
Sector 1950–51 1990–91
Agriculture 72.1 66.8Industry 10.7 12.7Services 17.2 20.5
ØStudy the arguments for and against agricultural subsidies. What is your
view on this issue?
ØSome economists argue that farmers in other countries, particularly
developed countries, are provided with high amount of subsidies and areencouraged to export their produce to other countries. Do you think ourfarmers will be able to compete with farmers from developed countries?Discuss.
2021-22

29INDIAN ECONOMY 1950-1990
investment in industrial venturesrequired for the development of Indianeconomy; nor was the market bigenough to encourage industrialists toundertake major projects even if theyhad the capital to do so. It is principallyfor these reasons that the erstwhilegovernments had to play an extensiverole in promoting the industrial sector.In addition, the decision to develop theIndian economy on socialist lines ledto the policy of the governmentcontrolling the commanding heights ofthe economy, as the Second Five Yearplan put it. This meant that thegovernment would have completecontrol of those industries that werevital for the economy. The policies of theprivate sector would have to becomplimentary to those of the publicsector, with the public sector leadingthe way.
Industrial Policy Resolution 1956(IPR 1956): In accordance with thegoal of the state controlling thecommanding heights of the economy,the Industrial Policy Resolution of1956 was adopted. This resolutionformed the basis of the Second FiveYear Plan, the plan which tried tobuild the basis for a socialist patternof society. This resolution classifiedindustries into three categories. Thefirst category comprised industrieswhich would be exclusively owned bythe government; the second categoryconsisted of industries in which theprivate sector could supplement theefforts of the public sector, with thegovernment taking the soleresponsibility for starting new units;the third category consisted of theremaining industries which were tobe in the private sector.
Although there was a category ofindustries left to the private sector,the sector was kept under statecontrol through a system of licenses.No new industry was allowed unlessa license was obtained from thegovernment. This policy was used forpromoting industry in backwardregions; it was easier to obtain alicense if the industrial unit wasestablished in an economicallybackward area. In addition, suchunits were given certain concessionssuch as tax benefits and electricityat a lower tariff. The purpose of thispolicy was to promote regionalequality.
Even an existing industry had toobtain a l icense for expandingoutput or for diversifying production(producing a new variety of goods).This was meant to ensure that thequantity of goods produced was notmore than what the economyrequired. L icense to expandproduction was given only if thegovernment was convinced that theeconomy required a larger quantityof goods.
Small-Scale Industry: In 1955, theVillage and Small-Scale IndustriesCommittee, also called the KarveCommittee, noted the possibility ofusing small-scale industries forpromoting rural development. A‘small-scale industry’ is defined withreference to the maximum invest-ment allowed on the assets of a unit.This limit has changed over a periodof time. In 1950 a small-scaleindustrial unit was one which invested
2021-22

30 INDIAN ECONOMIC DEVELOPMENT
a maximum of rupees five lakh; atpresent the maximum investmentallowed is rupees one crore.
It is believed that small-scaleindustries are more ‘labour intensive’i.e., they use more labour than thelarge-scale industries and, therefore,generate more employment. But theseindustries cannot compete with the bigindustrial firms; it is obvious thatdevelopment of small-scale industryrequires them to be shielded from thelarge firms. For this purpose, theproduction of a number of productswas reserved for the small-scaleindustry; the criterion of reservationbeing the ability of these units tomanufacture the goods. They were alsogiven concessions such as lower exciseduty and bank loans at lower interestrates.
2.5 TRADE POLICY: IMPORT SUBSTITUTION
The industrial policy that Indiaadopted was closely related to thetrade policy. In the first seven plans,trade was characterised by what iscommonly called an inward lookingtrade strategy . Technically, thisstrategy is called import substi-tution. This policy aimed at replacingor substituting imports with domesticproduction. For example, instead ofimporting vehicles made in a foreigncountry, industries would beencouraged to produce them in Indiaitself. In this policy the governmentprotected the domestic industriesfrom foreign competition. Protectionfrom imports took two forms: tariffsand quotas. Tariffs are a tax on
imported goods; they make importedgoods more expensive and discouragetheir use. Quotas specify the quantityof goods which can be imported. Theeffect of tariffs and quotas is that theyrestrict imports and, therefore, protectthe domestic firms from foreigncompetition.
The policy of protection was basedon the notion that industries ofdeveloping countries were not in aposition to compete against thegoods produced by more developedeconomies. It was assumed that if thedomestic industries were protectedthey would learn to compete in thecourse of time. Our planners alsofeared the possibility of foreignexchange being spent on import ofluxury goods if no restrictions wereplaced on imports. Nor was anyserious thought given to promoteexports until the mid-1980s.
Effect of Policies on IndustrialDevelopment: The achievements ofIndia’s industrial sector during thefirst seven plans are impressiveindeed. The proport ion of GDPcontr ibuted by the industr ia lsector increased in the period from13 per cent in 1950-51 to 24.6 per centin 1990-91. The rise in theindustry ’s share of GDP is animportant indicator of development.The six per cent annual growth rateof the industrial sector during theperiod is commendable. No longerwas Indian industry restricted largelyto cotton textiles and jute; in fact, theindustrial sector became welldiversified by 1990, largely due to
2021-22

31INDIAN ECONOMY 1950-1990
the public sector. The promotionof small-scale industries gaveopportunities to those people who didnot have the capital to start largefirms to get into business. Protectionfrom foreign competition enabled thedevelopment of indigenous industriesin the areas of electronics andautomobile sectors which otherwisecould not have developed.
In spite of the contribution madeby the public sector to the growth ofthe Indian economy, some economistsare critical of the performance ofmany public sector enterprises. Itwas proposed at the beginning of thischapter that initially public sector
was required in a big way. It is nowwidely held that state enterprisescontinued to produce certain goodsand services (often monopolisingthem) although this was no longerrequired. An example is the provisionof telecommunication service. Thisindustry continued to be reserved forthe Public Sector even after it wasrealised that private sector firms couldalso provide it. Due to the absence ofcompetition, even till the late 1990s,one had to wait for a long time toget a telephone connection.Another instance could be theestablishment of Modern Bread, abread-manufacturing firm, as if the
Work These Out
Ø Construct a pie chart for the following table on sectoral contribution to GDP
and discuss the difference in the contribution of the sectors in the light ofeffects of development during 1950-91.
Sector 1950-51 1990-91
Agriculture 59.0 34.9
Industry 13.0 24.6
Services 28.0 40.5
Ø Conduct a debate in your classroom on the usefulness of Public Sector
Undertakings (PSUs) by dividing the class into two groups. One group mayspeak in favour of PSUs and the other group against the motion (involve asmany students as possible and encourage them to give examples).
2021-22

32 INDIAN ECONOMIC DEVELOPMENT
private sector could not manufacturebread! In 2001 this firm was sold tothe private sector. The point is thatafter four decades of Planneddevelopment of Indian Economy nodistinction was made between (i)what the public sector alone can doand (ii) what the private sector canalso do. For example, even now onlythe public sector supplies nationaldefense. And even though the privatesector can manage hotels well, yet,the government also runs hotels. Thishas led some scholars to argue thatthe state should get out of areaswhich the private sector can manageand the government may concentrateits resources on important serviceswhich the private sector cannotprovide.
Many public sector firms incurredhuge losses but continued tofunction because it is difficult to closea government undertaking even if itis a drain on the nation’s limitedresources. This does not mean thatprivate firms are always profitable(indeed, quite a few of the publicsector firms were originally privatefirms which were on the verge ofclosure due to losses; they were thennationalised to protect the jobs of theworkers). However, a loss-makingprivate firm will not waste resourcesby being kept running despite thelosses.
The need to obtain a license to startan industry was misused byindustrial houses; a big industrialistwould get a license not for starting anew firm but to prevent competitorsfrom starting new firms. The excessive
regulation of what came to be calledthe permit license raj preventedcertain firms from becoming moreefficient. More time was spent byindustrialists in trying to obtain alicense or lobby with the concernedministries rather than on thinkingabout how to improve their products.
The protection from foreigncompetition was also being criticisedon the ground that it continued evenafter it proved to do more harm thangood. Due to restrictions on imports,the Indian consumers had topurchase whatever the Indianproducers produced. The producerswere aware that they had a captivemarket; so they had no incentive toimprove the quality of their goods.Why should they think of improvingquality when they could sell lowquality i tems at a high price?Competition from imports forces ourproducers to be more efficient.
A few economists also point outthat the public sector is not meantfor earning profits but to promote thewelfare of the nation. The publicsector firms, on this view, should beevaluated on the basis of the extentto which they contribute to the welfareof people and not on the profits theyearn. Regarding protection, someeconomists hold that we shouldprotect our producers from foreigncompetition as long as the richnations continue to do so. Owing toall these conflicts, economists calledfor a change in our policy. This,
alongwith other problems, led the
government to introduce a new
economic policy in 1991.
2021-22

33INDIAN ECONOMY 1950-1990
2.6 CONCLUSION
The progress of the Indian economy
during the first seven plans was
impressive indeed. Our industries
became far more diversified compared
to the situation at independence.
India became self- sufficient in food
production thanks to the green
revolution. Land reforms resulted in
abolition of the hated zamindari
system. In industrial sector, many
economists became dissatisfied withthe performance of many public sectorenterprises. Excessive governmentregulation prevented growth of
entrepreneurship. In the name of self-
reliance, Indian producers were
protected against foreign competition
and this did not give them the
incentive to improve the quality of
goods that they produced. Indian
policies were ‘inward oriented’ that
failed to develop a strong export
sector. The need for reform of
economic policy was widely felt in the
context of changing global economic
scenario, and the new economic policy
was initiated in 1991 to make
Indian economy more efficient. This is
the subject of the next chapter.
Recap
Ø After independence, India envisaged an economic system which combines
the best features of socialism and capitalism—this culminated in the mixedeconomy model.
Ø All the economic planning has been formulated through five year plans.
Ø Common goals of five year plans are growth, modernisation, self-sufficiency
and equity.
Ø The major policy initiatives in agriculture sector were land reforms and
green revolution. These initiatives helped India to become self-sufficient infood grains production.
Ø The proportion of people depending on agriculture did not decline as expected.
Ø Import substitution policy initiatives in the industrial sector raised its
contribution to GDP.
Ø One of the major drawbacks in the industrial sector was the inefficient
functioning of the public sector as it started incurring losses leading todrain on the nation’s limited resources.
2021-22

34 INDIAN ECONOMIC DEVELOPMENT
1. Define a plan.
2. Why did India opt for planning?
3. Why should plans have goals?
4. What are High Yielding Variety (HYV) seeds?
5. What is marketable surplus?
6. Explain the need and type of land reforms implemented in theagriculture sector.
7. What is Green Revolution? Why was it implemented and how didit benefit the farmers? Explain in brief.
8. Explain ‘growth with equity’ as a planning objective.
9. Does modernisation as a planning objective create contradictionin the light of employment generation? Explain.
10. Why was it necessary for a developing country like India to followself-reliance as a planning objective?
11. What is sectoral composition of an economy? Is it necessary thatthe service sector should contribute maximum to GDP of aneconomy? Comment.
12. Why was public sector given a leading role in industrialdevelopment during the planning period?
13. Explain the statement that green revolution enabled thegovernment to procure sufficient food grains to build its stocksthat could be used during times of shortage.
14. While subsidies encourage farmers to use new technology, they area huge burden on government finances. Discuss the usefulness ofsubsidies in the light of this fact.
15. Why, despite the implementation of green revolution, 65 per centof India’s population continued to be engaged in the agriculturesector till 1990?
16. Though public sector is very essential for industries, many publicsector undertakings incur huge losses and are a drain on theeconomy’s resources. Discuss the usefulness of public sectorundertakings in the light of this fact.
EXERCISES
2021-22

35INDIAN ECONOMY 1950-1990
17. Explain how import substitution can protect domestic industry.
18. Why and how was private sector regulated under the IPR 1956?
19. Match the following:
1. Prime Minister A. Seeds that give large proportion of output
2. Gross Domestic B. Quantity of goods that can be imported
Product
3. Quota C. Chairperson of the planning commission
4. Land Reforms D. The money value of all the final goodsand services produced within the economyin one year
5. HYV Seeds E. Improvements in the field of agricultureto increase its productivity
6. Subsidy F. The monetary assistance given bygovernment for productionact iv i t i es .
BHAGWATI, J. 1993. India in T ransition: Freeing the Economy. OxfordUniversity Press, Delhi.
DANDEKAR, V.M. 2004. Forty Years After Independence, in Bimal Jalan,(Ed.). The Indian Economy: Problems and Prospects. Penguin, Delhi.
JOSHI, VIJAY. and I.M.D. LITTLE. 1996. India’s Economic Reforms 1991-2001.
Oxford University Press, Delhi.
MOHAN, RAKESH. 2004. Industrial Policy and Controls, in Bimal Jalan(Ed.). The Indian Economy: Problems and Prospects. Penguin, Delhi.
RAO, C.H. HANUMANTHA. 2004. Agriculture: Policy and Performance, in BimalJalan, (Ed.). The Indian Economy: Problems and Prospects. Penguin,Delhi.
REFERENCES
2021-22

UNIT
II
ECONOMIC REFORMS
SINCE 1991
UNIT
IIIUNIT
II
2021-22

After forty years of planned development, India
has been able to achieve a strong industrial base
and became self-sufficient in the production of food
grains. Nevertheless, a major segment of the
population continues to depend on agriculture for
its livelihood. In 1991, a crisis in the balance of
payments led to the introduction of economic
reforms in the country. This unit is an appraisal of
the reform process and its implications for India.
2021-22

After studying this chapter, the learners will
• understand the background of the reform policies introduced in Indiain 1991
• understand the mechanism through which reform policies wereintroduced
• comprehend the process of globalisation and its implications for India
• be aware of the impact of the reform process in various sectors.
LIBERALISATION, PRIVATISATION
AND
GLOBALISATION: AN APPRAISAL
3
2021-22
39LIBERALISATION, PRIVATISATION AND GLOBALISATION: AN APPRAISAL
3.1 INTRODUCTION
You have studied in the previouschapter that, since independence,India followed the mixed economyframework by combining theadvantages of the capitalist economicsystem with those of the socialisteconomic system. Some scholars arguethat, over the years, this policy resultedin the establishment of a variety ofrules and laws, which were aimed atcontrolling and regulating theeconomy, ended up instead inhampering the process of growth anddevelopment. Others state that India,which started its developmental pathfrom near stagnation, has since beenable to achieve growth in savings,developed a diversified industrialsector which produces a variety ofgoods and has experienced sustainedexpansion of agricultural outputwhich has ensured food security.
In 1991, India met with aneconomic crisis relating to its externaldebt — the government was notable to make repayments on itsborrowings from abroad; foreignexchange reserves , which wegenerally maintain to import petroleumand other important items, droppedto levels that were not sufficient foreven a fortnight. The crisis wasfurther compounded by rising pricesof essential goods. All these led thegovernment to introduce a new set of
policy measures which changed thedirection of our developmentalstrategies. In this chapter, we willlook at the background of the crisis,measures that the government hasadopted and their impact on varioussectors of the economy.
3.2 BACKGROUND
The origin of the financial crisis canbe traced from the ineff ic ientmanagement of the Indian economyin the 1980s. We know that forimplementing various policies andits general administration, thegovernment generates funds fromvarious sources such as taxation,running of public sector enterprisesetc. When expenditure is more thanincome, the government borrows tofinance the deficit from banks andalso from people within the countryand from international financialinstitutions. When we import goodslike petroleum, we pay in dollarswhich we earn from our exports.
Development policies required thateven though the revenues werevery low, the government hadto overshoot its revenue to meetchallenges l ike unemployment,poverty and population explosion. Thecontinued spending on developmentprogrammes of the government did notgenerate additional revenue. Moreover,the government was not able to
There is a consensus in the world today that economic development is not alland the GDP is not necessarily a measure of progress of a society.
K.R. Narayanan, Former President of India
2021-22

40 INDIAN ECONOMIC DEVELOPMENT
generate sufficiently from internalsources such as taxation. When thegovernment was spending a largeshare of its income on areas which donot provide immediate returns such asthe social sector and defence, there wasa need to utilise the rest of its revenuein a highly efficient manner. Theincome from public sectorundertakings was also not very high tomeet the growing expenditure. Attimes, our foreign exchange ,borrowed from other countries andinternational financial institutions,was spent on meeting consumptionneeds. Neither was an attempt made toreduce such profligate spending norsufficient attention was given to boostexports to pay for the growing imports.
In the late 1980s, governmentexpenditure began to exceed itsrevenue by such large margins thatmeeting the expenditure throughborrowings became unsustainable.Prices of many essential goods rosesharply. Imports grew at a very highrate without matching growth ofexports. As pointed out earlier, foreignexchange reserves declined to a levelthat was not adequate to financeimports for more than two weeks.There was also not sufficient foreignexchange to pay the interest thatneeded to be paid to internationallenders. Also no country or internationalfunder was willing to lend to India.
India approached the InternationalBank for Reconstruction andDevelopment (IBRD), popularlyknown as World Bank and theInternational Monetary Fund (IMF),
and received $7 billion as loan tomanage the crisis. For availing theloan, these international agenciesexpected India to liberalise and openup the economy by removingrestrictions on the private sector,reduce the role of the government inmany areas and remove traderestrictions between India and othercountries.
India agreed to the conditionalitiesof World Bank and IMF andannounced the New Economic Policy(NEP). The NEP consisted of wideranging economic reforms. Thethrust of the policies was towardscreating a more competit iveenvironment in the economy andremoving the barriers to entry andgrowth of firms. This set of policiescan broadly be classified into twogroups: the stabilisation measuresand the structural reform measures.Stabilisation measures are short-term measures, intended to correctsome of the weaknesses that havedeveloped in the balance ofpayments and to bring inflationunder control. In simple words, thismeans that there was a need tomaintain sufficient foreign exchangereserves and keep the rising pricesunder control. On the other hand,structural reform policies are long-termmeasures, aimed at improving theefficiency of the economy and increasingits international competitiveness byremoving the rigidities in varioussegments of the Indian economy. Thegovernment initiated a variety ofpolicies which fall under three heads
2021-22

41LIBERALISATION, PRIVATISATION AND GLOBALISATION: AN APPRAISAL
viz., liberalisation, privatisation andglobalisation.
3.3 LIBERALISATION
As pointed out in the beginning,rules and laws which were aimed atregulating the economic activitiesbecame major hindrances in growthand development. Liberalisation wasintroduced to put an end to theserestrictions and open various sectorsof the economy. Though a fewliberal isation measures wereintroduced in 1980s in areas ofindustrial licensing, export-importpolicy, technology upgradation,fiscal policy and foreign investment,reform policies initiated in 1991 weremore comprehensive. Let us studysome important areas, such as theindustrial sector, financial sector, taxreforms, foreign exchange marketsand trade and investment sectorswhich received greater attention inand after 1991.
Deregulation of Industrial Sector: InIndia, regulatory mechanisms wereenforced in various ways (i) industriallicensing under which every entrepreneurhad to get permission from governmentofficials to start a firm, close a firmor decide the amount of goodsthat could be produced (ii) privatesector was not allowed in manyindustries (iii) some goods could beproduced only in small-scale industries,and (iv) controls on price fixation anddistribution of selected industrialproducts.
The reform policies introduced inand after 1991 removed many ofthese restrict ions. Industriallicensing was abolished for almost allbut product categories — alcohol,cigarettes, hazardous chemicals,industrial explosives, electronics,aerospace and drugs and pharma-ceuticals. The only industries whichare now reserved for the public sectorare a part of atomic energygeneration and some core activitiesin railway transport. Many goodsproduced by small-scale industrieshave now been dereserved. In mostindustries, the market has beenallowed to determine the prices.
Financial Sector Reforms:Financial sector includes financialinstitutions, such as commercialbanks, investment banks, stockexchange operations and foreignexchange market. The financialsector in India is regulated by theReserve Bank of India (RBI). You maybe aware that all banks and otherfinancial institutions in India areregulated through various norms andregulations of the RBI. The RBIdecides the amount of money thatthe banks can keep with themselves,fixes interest rates, nature of lendingto various sectors, etc. One of themajor aims of financial sector reformsis to reduce the role of RBI fromregulator to facilitator of financialsector. This means that the financialsector may be al lowed to takedecisions on many matters withoutconsulting the RBI.
2021-22

42 INDIAN ECONOMIC DEVELOPMENT
The reform policies led to theestablishment of private sector banks,Indian as well as foreign. Foreigninvestment limit in banks was raised toaround 74 per cent. Those banks whichfulfil certain conditions have been givenfreedom to set up new brancheswithout the approval of the RBI andrationalise their existing branchnetworks. Though banks have beengiven permission to generate resourcesfrom India and abroad, certainmanagerial aspects have been retainedwith the RBI to safeguard the interestsof the account-holders and the nation.Foreign Institutional Investors (FII),such as merchant bankers, mutualfunds and pension funds, are nowallowed to invest in Indian financialmarkets.
Tax Reforms: Tax reforms areconcerned with the reforms in thegovernment’s taxation and publicexpenditure policies, which arecollectively known as its fiscal policy.There are two types of taxes: direct andindirect. Direct taxes consist of taxeson incomes of individuals, as well as,profits of business enterprises. Since1991, there has been a continuousreduction in the taxes on individualincomes as it was felt that high rates ofincome tax were an important reasonfor tax evasion. It is now widelyaccepted that moderate rates of incometax encourage savings and voluntarydisclosure of income. The rate ofcorporation tax, which was very highearlier, has been gradually reduced.Efforts have also been made to reformthe indirect taxes, taxes levied oncommodities, in order to facilitate the
establishment of a common nationalmarket for goods and commodities.
In 2016, the Indian Parliamentpassed a law, Goods and Services TaxAct 2016, to simplify and introduce aunified indirect tax system in India.This law came into effect from July2017. This is expected to generateadditional revenue for the government,reduce tax evasion and create ‘onenation, one tax and one market’.Another component of reform in thisarea is simplification. In order toencourage better compliance on thepart of taxpayers, many procedureshave been simplified and the rates alsosubstantially lowered.
Foreign Exchange Reforms: The firstimportant reform in the external sectorwas made in the foreign exchangemarket. In 1991, as an immediatemeasure to resolve the balance ofpayments crisis, the rupee wasdevalued against foreign currencies.This led to an increase in the inflow offoreign exchange. It also set the tone tofree the determination of rupee valuein the foreign exchange market fromgovernment control. Now, more oftenthan not, markets determine exchangerates based on the demand and supplyof foreign exchange.
Trade and Investment PolicyReforms: Liberalisation of trade andinvestment regime was initiated toincrease international competitiveness ofindustrial production and also foreigninvestments and technology into theeconomy. The aim was also to promotethe efficiency of local industries andadoption of modern technologies.
2021-22

43LIBERALISATION, PRIVATISATION AND GLOBALISATION: AN APPRAISAL
Work These Out
Ø Give an example each of nationalised bank, private bank, private foreign
bank, FII and a mutual fund.
Ø Visit a bank in your locality with your parents. Observe and find out thefunctions it performs. Discuss the same with your classmates and preparea chart on it.
Ø Find out from your parents if they pay taxes. If yes, why do they do so andhow?
Ø Do you know that for a very long time countries used to keep silver and goldas reserves to make payments abroad? Find out in what form do we keepour foreign exchange reserves and find out from newspapers, magazinesand the Economic Survey how much foreign exchange reserves India hadduring the last year. Also find the foreign currency of the following countriesand its latest rupee exchange rate.
Country Currency Value of 1(one) unit of foreign
currency in Indian rupee
U.S.A.U.K.JapanChinaKoreaSingaporeGermany
In order to protect domesticindustries, India was following a regimeof quantitative restrictions onimports. This was encouraged throughtight control over imports and bykeeping the tariffs very high. Thesepolicies reduced efficiency andcompetitiveness which led to slowgrowth of the manufacturing sector.The trade policy reforms aimed at (i)dismantling of quantitative restrictionson imports and exports (ii) reduction
of tariff rates and (iii) removal oflicensing procedures for imports.Import licensing was abolished exceptin case of hazardous andenvironmentally sensitive industries.Quantitative restrictions on imports ofmanufactured consumer goods andagricultural products were also fullyremoved from April 2001. Exportduties have been removed to increasethe competitive position of Indian goodsin the international markets.
2021-22

44 INDIAN ECONOMIC DEVELOPMENT
3.4 PRIVATISATION
It implies shedding of the ownershipor management of a governmentowned enterprise . Governmentcompanies are converted into privatecompanies in two ways ( i) bywithdrawal of the government fromownership and management ofpublic sector companies and or (ii) byoutright sale of public sectorcompanies.
Privatisation of the public sectorenterprises by selling off part of theequity of PSEs to the public is knownas disinvestment. The purpose of thesale, according to the government,was mainly to improve financialdiscipline and facilitate modernisation.It was also envisaged that privatecapital and managerial capabilitiescould be effectively utilised toimprove the performance of the PSUs.
Box 3.1: Navratnas and Public Enterprise Policies
You must have read in your childhood about the famous Navratnas or NineJewels in the Imperial Court of King Vikramaditya who were eminent personsof excellence in the fields of art, literature and knowledge. In order to improveefficiency, infuse professionalism and enable them to compete more effectivelyin the liberalised global environment, the government identifies PSEs anddeclare them as maharatnas, navratnas and miniratnas. They were given greatermanagerial and operational autonomy, in taking various decisions to run thecompany efficiently and thus increase their profits. Greater operational,financial and managerial autonomy has also been granted to profit-makingenterprises referred to as miniratnas.
The Central Public Sector Enterprises are designated with different status.A few examples of public enterprises with their status are as follows:(i) Maharatnas – (a) Indian Oil Corporation Limited, and (b) Steel Authority ofIndia Limited, (ii) Navratnas – (a) Hindustan Aeronautics Limited,(b) Mahanagar Telephone Nigam Limited; and (iii) Miniratnas – (a) BharatSanchar Nigam Limited; (b) Airport Authority of India and (c) Indian RailwayCatering and Tourism Corporation Limited.
Many of these profitable PSEs were originally formed during the 1950sand 1960s when self-reliance was an important element of public policy. Theywere set up with the intention of providing infrastructure and direct employmentto the public so that quality end-product reaches the masses at a nominalcost and the companies themselves were made accountable to all stakeholders.
The granting of status resulted in better performance of these companies.Scholars allege that instead of facilitating public enterprises in their expansionand enabling them to become global players, the government partly privatisedthem through disinvesment. Of late, the government has decided to retainthem in the public sector and enable them to expand themselves in the globalmarkets and raise resources by themselves from financial markets.
2021-22

45LIBERALISATION, PRIVATISATION AND GLOBALISATION: AN APPRAISAL
The government envisaged thatprivatisation could provide strongimpetus to the inflow of FDI.
The government has also madeattempts to improve the efficiency ofPSUs by giving them autonomyin taking managerial decisions. Forinstance, some PSUs have beengranted special status as maharatnas,
navratnas and miniratnas (seeBox 3.1).
3.5 GLOBALISATION
Although globalisation is generallyunderstood to mean integration of theeconomy of the country with the worldeconomy, it is a complex phenomenon.It is an outcome of the set of variouspolicies that are aimed at transformingthe world towards greaterinterdependence and integration. Itinvolves creation of networks andactivities transcending economic, socialand geographical boundaries.Globalisation attempts to establish
links in such a way that the happeningsin India can be influenced by eventshappening miles away. It is turning theworld into one whole or creating aborderless world.
Outsourcing: This is one of theimportant outcomes of theglobalisation process. In outsourcing,a company hires regular service fromexternal sources, mostly from othercountries, which was previouslyprovided internally or from within thecountry (like legal advice, computerservice, advertisement, security —each provided by respectivedepartments of the company). As aform of economic activity, outsourcinghas intensified, in recent times,because of the growth of fast modesof communication, particularly thegrowth of Information Technology(IT). Many of the services such asvoice-based business processes(popularly known as BPO orcall centres), record keeping,
Work These Out
Ø Some scholars refer to disinvestment as the wave of privatisation spreading
all over the world to improve the performance of public sector enterpriseswhereas others call it as outright sale of public property to the vestedinterests. What do you think?
Ø Prepare a poster which contains 10-15 news clippings which you consideras important and relating to navaratnas from newspapers. Also collect thelogos and advertisements of these PSEs. Put these on the notice board anddiscuss them in the classroom.
Ø Do you think only loss making companies should be privatised? Why?
Ø Losses incurred by public sector enterprises are to be met out of the publicbudget. Do you agree with this statement? Discuss.
2021-22

46 INDIAN ECONOMIC DEVELOPMENT
accountancy, banking services, musicrecording, film editing, booktranscription, clinical advice or eventeaching are being outsourced bycompanies in developed countries toIndia. With the help of moderntelecommunication links including theInternet, the text, voice and visual datain respect of these services is digitisedand transmitted in real time overcontinents and national boundaries.Most multinational corporations, andeven small companies, are outsourcingtheir services to India where they can
be availed at a cheaper cost withreasonable degree of skill andaccuracy. The low wage rates andavailability of skilled manpower inIndia have made it a destination forglobal outsourcing in the post-reformperiod.
World Trade Organisation (WTO):The WTO was founded in 1995 asthe successor organisation to theGeneral Agreement on Trade andTariff (GATT). GATT was establishedin 1948 with 23 countries as the
Box 3.2: Global Footprint!
Owing to globalisation, you might find many Indian companies have expandedtheir wings to many other countries. For example, ONGC Videsh, a subsidiary ofthe Indian public sector enterprise, Oil and Natural Gas Corporation engaged inoil and gas exploration and production has projects in 16 countries. Tata Steel, aprivate company established in 1907, is one of the top ten global steel companiesin the world which have operations in 26 countries and sell its products in 50countries. It employs nearly 50,000 persons in other countries. HCL Technologies,one of the top five IT companies in India has offices in 31 countries and employsabout 15,000 persons abroad. Dr Reddy's Laboratories, initially was a smallcompany supplying pharmaceutical goods to big Indian companies, today hasmanufacturing plants and research centres across the world.
Source: www.rediff.com accessed on 14.10.2014.
global trade organisationto administer allmultilateral tradeagreements by providingequal opportunities toall countries in theinternational market fortrading purposes. WTO isexpected to establish arule-based trading regimein which nations cannotplace arbitrary restrictionson trade. In addition, itspurpose is also to enlargeFig. 3.1 Outsourcing: a new employment opportunity in big cities
2021-22

47LIBERALISATION, PRIVATISATION AND GLOBALISATION: AN APPRAISAL
production and trade of services, toensure optimum utilisation of worldresources and to protect theenvironment. The WTO agreementscover trade in goods as well as servicesto facilitate international trade(bilateral and multilateral) throughremoval of tariff as well as non-tariffbarriers and providing greater marketaccess to all member countries.
As an important member ofWTO, India has been in the forefrontof framing fair global rules,regulations and safeguards andadvocating the interests of thedeveloping world. India has kept itscommitments towards liberalisationof trade, made in the WTO, byremoving quantitative restrictions onimports and reducing tariff rates.
TABLE 3.1Growth of GDP and Major Sectors (in %)
Sector 1980-91 1992-2001 2002-07 2007-12 2012-13 2013-14 2014-15
Agriculture 3.6 3.3 2.3 3.2 1.5 4.2 – 0.2*Industry 7.1 6.5 9.4 7.4 3.6 5 7.0*Services 6.7 8.2 7.8 10 8.1 7.8 9.8*Total 5.6 6.4 7.8 8.2 5.6 6.6 7.4
Source: Economic Survey for various years, Ministry of Finance, Government of India.
Note: *Data pertaining to Gross Value Added (GVA). The GVA is estimated from GDP by addingsubsidies on production and subtracting indirect taxes.
Work These Out
Many scholars argue that globalisation is a threat as it reduces the role ofthe government in many sectors. Some counter argue that it is anopportunity as it opens up markets to compete in and capture. Debate inthe classroom.
Prepare a chart consisting of a list of five companies that have BPO servicesin India, along with their turnover.
Did you attend online classes or watched videos of your teachers or anyother teacher taking classes during the last year through television, mobilephone or computers due to Covid 19 Pandemic? Share your experiencesrelated to information technology.
Is employment in call centres sustainable? What kinds of skills should peopleworking in call centres acquire to get a regular income?
If the multinational companies outsource many services to countries likeIndia because of cheap manpower, what will happen to people living in thecountries where the companies are located? Discuss.
2021-22

48 INDIAN ECONOMIC DEVELOPMENT
Some scholars question theusefulness of India being a member ofthe WTO as a major volume ofinternational trade occurs among thedeveloped nations. They also say thatwhile developed countries filecomplaints over agricultural subsidiesgiven in their countries, developingcountries feel cheated as they are forcedto open their markets for developedcountries but are not allowed access tothe markets of developed countries.What do you think?
period, the growth of agriculture hasdeclined. While the industrial sectorreported fluctuation, the growth of theservice sector has gone up. Thisindicates that GDP growth is mainlydriven by growth in the service sector.During 2012-15, there has been asetback in the growth rates of differentsectors witnessed post–1991. Whileagriculture recorded a high growth rateduring 2013–14, this sector witnessednegative growth in the subsequentyear. While the service sectorcontinued to witness a high level ofgrowth — higher than the overall GDPgrowth in 2014–15, this sectorwitnessed the high growth rate of 9.8per cent. The industrial sectorwitnessed a steep decline during 2012–13, in the subsequent years it beganto show a continuous positive growth. The opening of the economy hasled to a rapid increase in foreign directinvestment and foreign exchangereserves. The foreign investment,which includes foreign directinvestment (FDI) and foreigninstitutional investment (FII), hasincreased from about US $100 millionin 1990-91 to US $ 30 billion in2017-18. There has been an increasein the foreign exchange reserves fromabout US $ 6 billion in 1990-91 toabout US $ 413 billion in 2018-19.India is one of the largest foreignexchange reserve holders in the world. Since 1991, India is seen as asuccessful exporter of auto parts,pharmaceutical goods engineeringgoods, IT software and textiles. Risingprices have also been kept undercontrol.
Fig. 3.2 IT industry is seen as a major contributorto India’s exports
3.6 INDIAN ECONOMY DURING
REFORMS: AN ASSESSMENT
The reform process has completedthree decades since its introduction.Let us now look at the performanceof the Indian economy during thisperiod. In economics, the growth ofan economy is measured by the GrossDomestic Product. Look at Table 3.1.The post–1991 India witnessed arapid growth in GDP on a continualbasis for two decades. The growthof GDP increased from 5.6 per centduring 1980–91 to 8.2 per centduring 2007–12. During the reform
2021-22

49LIBERALISATION, PRIVATISATION AND GLOBALISATION: AN APPRAISAL
Work These Out
In the previous chapter, you might have studied about subsidies in varioussectors, including agriculture. Some scholars argue that subsidy in agricultureshould be removed to make the sector internationally competitive. Do youagree? If so, how can it be done? Discuss in class.
Read the following passage and discuss in class.
Groundnut is a major oilseed crop in Andhra Pradesh. Mahadeva,who was a farmer in Anantpur district of Andhra Pradesh, used to spendRs. 10,000 for growing groundnut on his plot of half an acre. The costincluded expenditure on raw material (seeds, fertilisers, etc.), labour,bullock power and machinery used. On an average, Mahadeva used to gettwo quintals of groundnut, and each quintal was sold for Rs. 7,000.Mahadeva, thus, was spending Rs. 10,000 and getting an income of Rs.14,000. Anantpur district is a drought-prone area. As a result of economicreforms, the government did not undertake any major irrigation project.Recently, groundnut crop in Anantpur is facing problems due to cropdisease. Research and extension work has gone down due to lowergovernment expenditure. Mahadeva and his friends brought this matterrepeatedly to the notice of the government officials entrusted with thisresponsibility, but failed. Subsidy was reduced on material (seeds,fertilisers) which increased Mahadeva’s cost of cultivation. Moreover, thelocal markets were flooded with cheap imported edible oils, which was aresult of removal of restriction on imports. Mahadeva was not able to sellhis groundnut in the market as he was not getting the price to coverhis cost.
What could be done to farmers like Mahadeva from incurring losses?Discuss in the class.
On the other hand, the reformprocess has been widely criticisedfor not being able to address someof the basic problems facing oureconomy especially in areas ofemployment, agriculture, industry,infrastructure development and fiscalmanagement.
Growth and Employment: Thoughthe GDP growth rate has increased inthe reform period, scholars point outthat the reform-led growth has notgenerated sufficient employmentopportunities in the country. You willstudy the link between different aspectsof employment and growth in thenext unit.
2021-22

50 INDIAN ECONOMIC DEVELOPMENT
Reforms in Agriculture: Reformshave not been able to benefitagriculture, where the growth rate hasbeen decelerating.
Since 1991, public investment inagriculture sector especially ininfrastructure, which includesirrigation, power, roads, marketlinkages and research and extension(which played a crucial role in theGreen Revolution), has fallen. Further,the partial removal of fertiliser subsidyhas led to increase in the cost ofproduction, which has severelyaffected the small and marginalfarmers. This sector has beenexperiencing a number of policychanges such as reduction in importduties on agricultural products, lowminimum support price and lifting ofquantitative restrictions on the importsof agricultural products. These haveadversely affected Indian farmers asthey now have to face increasedinternational competition.
Moreover, because of export-oriented policy strategies in agriculture,there has been a shift from productionfor the domestic market towardsproduction for the export marketfocusing on cash crops in lieu ofproduction of food grains. This putspressure on prices of food grains.
Reforms in Industry: Industrialgrowth has also recorded a slowdown.This is because of decreasing demandof industrial products due tovarious reasons such as cheaperimports, inadequate investment in
infrastructure etc. In a globalisedworld, developing countries arecompelled to open up their economiesto greater flow of goods and capitalfrom developed countries andrendering their industries vulnerableto imported goods. Cheaper importshave, thus, replaced the demandfor domestic goods. Domesticmanufacturers are facing competitionfrom imports. The infrastructurefacilities, including power supply,have remained inadequate due to lackof investment. Globalisation is, thus,often seen as creating conditions forthe free movement of goods andservices from foreign countries thatadversely affect the local industriesand employment opportunities indeveloping countries.
Moreover, a developing countrylike India still does not have the accessto developed countries’ marketsbecause of high non-tariff barriers. Forexample, although all quotarestrictions on exports of textiles andclothing have been removed in India,USA has not removed their quotarestriction on import of textiles fromIndia and China.
Disinvestment: Every year, thegovernment fixes a target fordisinvestment of PSEs. For instance,in 1991-92, it was targeted to mobiliseRs 2500 crore through disinvestment.The government was able to mobilise` 3,040 crore more than the target.In 2017–18, the target was about`1,00,000 crore, and the achievementwas about ̀ 1,00,057 crore. Critics
2021-22

51LIBERALISATION, PRIVATISATION AND GLOBALISATION: AN APPRAISAL
point out that the assets of PSEs havebeen undervalued and sold to theprivate sector. This means that therehas been a substantial loss to thegovernment and the outright sale ofpublic assets! Moreover, the proceedsfrom disinvestment are used to offsetthe shortage of government revenuesrather than using it for thedevelopment of PSEs and buildingsocial infrastructure in the country.Do you think selling a part of theproperties of government companiesis the best way to improve theirefficiency?
Reforms and Fiscal Policies:Economic reforms have placed limitson the growth of public expenditure,especially in social sectors. The taxreductions in the reform period, aimedat yielding larger revenue and curb taxevasion, have not resulted in increasein tax revenue for the government. Also,
Box 3.3: Siricilla Tragedy!
Power sector reforms in many Indian states led to do away with the supply ofelectricity at subsidised rates and steep rise in power tariff. This has affectedworkers engaged in small industries. Powerloom textile industry in AndhraPradesh is an example. Since the wages of the powerloom workers are linkedto the production of cloth, power cut means cut in wages of weavers, whowere already suffering from hike in tariff. A few years ago, this led to a crisisin the livelihood of the weavers and 50 powerloom workers committed suicidein a small town called ‘Siricilla’ in Andhra Pradesh.
Do you think the power tariff should not be raised? What would be your suggestions to revive small industries affected by
reforms?
the reform policies, involving tariffreduction, have curtailed the scope forraising revenue through custom duties.In order to attract foreign investment,tax incentives are provided to foreigninvestors which further reduced thescope for raising tax revenues. This hasa negative impact on developmental andwelfare expenditures.
3.7 CONCLUSION
The process of globalisation throughliberalisation and privatisation policieshas produced positive, as well as,negative results both for India andother countries. Some scholars arguethat globalisation should be seen asan opportunity in terms of greateraccess to global markets, hightechnology and increased possibility oflarge industries of developingcountries to become importantplayers in the international arena.
2021-22

52 INDIAN ECONOMIC DEVELOPMENT
On the contrary, the critics arguethat globalisation is a strategy of thedeveloped countries to expand theirmarkets in other countries. Accordingto them, it has compromised thewelfare and identity of peoplebelonging to poor countries. It hasfurther been pointed out that market-driven globalisation has widened theeconomic disparities among nationsand people.
Viewed from the Indian context,some studies have stated that thecrisis that erupted in the early 1990swas basically an outcome of the deep-rooted inequalities in Indian societyand the economic reform policies
initiated as a response to the crisisby the government, with externallyadvised policy package, furtheraggravated the inequalities. Further,it has increased the income andquality of consumption of only high-income groups and the growth hasbeen concentrated only insome select areas in the services sectorsuch as telecommunication,information technology, finance,entertainment, travel and hospitalityservices, real estate and trade,rather than vital sectors such asagriculture and industry whichprovide livelihoods to millions ofpeople in the country.
Recap
The economy was facing problems of declining foreign exchange, growingimports without matching rise in exports and high inflation. India changedits economic policies in 1991 due to a financial crisis and pressure frominternational organisations like the World Bank and IMF.
In the domestic economy, major reforms were undertaken in the industrialand financial sectors. Major external sector reforms included foreignexchange deregulations and import liberalisation.
With a view to improving the performance of the public sector, there was aconsensus on reducing its role and opening it up to the private sector. Thiswas done through disinvestment and liberalisation measures.
Globalisation is the outcome of the policies of liberalisation and privatisation.It means an integration of the economy of the country with the world economy.
Outsourcing is an emerging as a major activity in industrial and servicesectors.
The objective of the WTO is to establish a rule based trade regime to ensureoptimum utilisation of world resources.
During the reforms, growth of agriculture and industry has gone down butthe service sector has registered growth.
Reforms have not benefited the agriculture sector. There has also been adecline in public investment in this sector.
Industrial sector growth has slowed down due to availability of cheaperimports and lower investment.
2021-22

53LIBERALISATION, PRIVATISATION AND GLOBALISATION: AN APPRAISAL
1. Why were reforms introduced in India?
2. Why is it necessary to became a member of WTO?
3. Why did RBI have to change its role from controller to facilitator offinancial sector in India?
4. How is RBI controlling the commercial banks?
5. What do you understand by devaluation of rupee?
6. Distinguish between the following
(i) Strategic and Minority sale(ii) Bilateral and Multi-lateral trade(iii) Tariff and Non-tariff barriers.
7. Why are tariffs imposed?
8. What is the meaning of quantitative restrictions?
9. Those public sector undertakings which are making profitsshould be privatised. Do you agree with this view? Why?
10. Do you think outsourcing is good for India? Why are developedcountries opposing it?
11. India has certain advantages which makes it a favourite outsourcingdestination. What are these advantages?
12. Do you think the navaratna policy of the government helps inimproving the performance of public sector undertakings in India?How?
13. What are the major factors responsible for the high growth of theservice sector?
14. Agriculture sector appears to be adversely affected by the reformprocess. Why?
15. Why has the industrial sector performed poorly in the reformperiod?
16. Discuss economic reforms in India in the light of social justiceand welfare.
EXERCISES
2021-22

54 INDIAN ECONOMIC DEVELOPMENT
1. The table given below shows the GDP growth rate at 2004-05prices. You have studied about the techniques of presentationof data in your Statistics for Economics course. Draw a timeseries line graph based on the data given in the table and inter-pret the same.
Year GDP Growth Rate (%)
2005-06 9.5
2006-07 9.6
2007-08 9.3
2008-09 6.7
2009-10 8.6
2010-11 8.9
2011-12 6.7
2012-13 5.4
2013-14 6.4
2014-15 7.4
2. Observe around you — you will find State Electricity Boards(SEBs), BSES and many public and private organisations sup-plying electricity in different states and union territories. There areprivate buses on roads alongside the goverment bus services andso on.
(i) What do you think about this dual system of the co-existenceof public and private sectors?
(ii) What are the merits and demerits of such a dual system?Discuss.
3. With the help of your parents and grandparents prepare a list ofmultinational companies that existed in India at the time ofindependence. Now put a (ü) mark against those which are stillgrowing and a (× ) against those which do not exist any more. Arethere any companies whose names have changed? Find out thenew names, the country of origin, nature of product, logo andprepare charts and display in your class.
SUGGESTED ADDITIONAL ACTIVITIES
2021-22

55LIBERALISATION, PRIVATISATION AND GLOBALISATION: AN APPRAISAL
4. Give appropriate examples for the following:
Nature of Product Name of a Foreign CompanyBiscuitsShoesComputersCarsTV and RefrigeratorsStationery
Now, find out if these companies which are mentioned above existed inIndia before 1991, or came after the New Economic Policy. For this, takethe help of your teacher, parents, grandparents and shopkeepers.
5. Collect a few relevant newspaper cuttings and from the interneton meetings organised by WTO. Discuss the issues debated inthese meetings, and find out how WTO facilitates world trade.
6. Was it necessary for India to introduce economic reforms at thebehest of World Bank and International Monetary Fund? Was thereno alternative for the government to solve the balance of pay-ments crisis? Discuss in the classroom.
Books
ACHARYA, S. 2003. India’s Economy: Some Issues and Answers. AcademicFoundation, New Delhi.
ALTERNATIVE SURVEY GROUP. 2005. Alternative Economic Survey, India 2004–05,Disequalising Growth. Daanish Books, Delhi.
AHLUWALIA, I.J. and I.M.D. LITTLE. 1998. India’s Economic Reforms andDevelopment. Oxford University Press, New Delhi.
BARDHAN, PRANAB. 1998. The Political Economy of Development in India.Oxford University Press, Delhi.
BHADURI, AMIT and DEEPAK NAYYAR. 1996. The Intelligent Person’s Guide toLiberalisation. Penguin, Delhi.
BHAGWATI, JAGDISH. 1992. India in Transition: Freeing the Economy. OxfordUniversity Press, Delhi.
REFERENCES
2021-22

56 INDIAN ECONOMIC DEVELOPMENT
BYRES, TERENCE J. 1997. The State, Development Planning andLiberalisation in India. Oxford University Press, Delhi.
CHADHA, G.K. 1994. Policy Perspectives in Indian Economic Development.Har-Anand, Delhi.
CHELLIAH, RAJA J. 1996. Towards Sustainable Growth: Essays in Fiscaland Financial Sector Reforms in India. Oxford University Press, NewDelhi.
DEBROY, B. and RAHUL MUKHERJI (Eds.). 2004. The Political Economy ofReforms. Bookwell Publication, New Delhi.
DREZE, JEAN and AMARTYA SEN. 1996. India: Economic Development andSocial Opportunity. Oxford University Press, New Delhi.
DUTT, RUDDAR AND K.P.M. SUNDARAM. 2005. Indian Economy. S. Chand andCompany, New Delhi.
GUHA, ASHOK (Ed.) 1990. Economic Liberalisation, Industrial Structureand Growth in India. Oxford University Press, New Delhi.
JALAN, BIMAL. 1993. India’s Economic Crisis: The Way Ahead. OxfordUniversity Press, New Delhi.
JALAN, BIMAL. 1996. India’s Economic Policy: Preparing for the TwentyFirst Century. Viking, Delhi.
JOSHI, VIJAY and I.M.D. LITTLE. 1996. India’s Economic Reforms 1991-2001.Oxford University Press, New Delhi,
KAPILA, Uma. 2020. Indian Economy: Performences and Policies. AcademicFoundation, New Delhi.
MAHAJAN, V.S. 1994. Indian Economy Towards 2000 A.D. Deep & Deep,Delhi.
PAREKH, KIRIT and RADHAKRISHNA, 2002, India Development Report 2001-02.Oxford University Press, New Delhi.
RAO, C.H. HANUMANTHA. and HANS LINNEMANN. 1996. Economic Reforms andPoverty Alleviation in India, Sage Publication, Delhi.
SACHS, JEFFREY D., ASHUTOSH VARSHNEY and NIRUPAM BAJPAI.1999. India inthe Era of Economic Reforms. Oxford University Press, New Delhi.
Government Reports and Websites
Economic Survey for various years. Ministry of Finance, Government ofIndia. Published by Oxford University Press, New Delhi.Tenth Five Year Plan 1997-2002. Vol. 1. Government of India, PlanningCommission, New Delhi.Appraisal Document of Twelfth Five Year Plan 2012-2017, NITI Aayog,Government of India.https://dipam.gov.inHandbook of Statistics on Indian Economy, Reserve Bank of India for variousyears, Mumbai.
2021-22

CURRENT CHALLENGES FACING THE
INDIAN ECONOMY
UNIT
IIIUNIT
III
2021-22

Some of the most challenging issues facing India
today are poverty, development of rural India and
building infrastructure. We are a billion-strong
country today and our human capital is the biggest
asset; it needs investment in health and education.
We also need to understand the concept of
employment and the need for creating more
employment in our country. We will also look at
the implications of development on our environment
and call for sustainable development. There is a
need to critically assess government initiatives in
tackling all these issues each of which has been
taken up separately in this unit.
2021-22

After studying this chapter, the learners will
• understand the various attributes of poverty
• comprehend the diverse dimensions relating to the concept of poverty
• critically appreciate the way poverty is estimated
• appreciate and be able to assess existing poverty alleviation programmes.
POVERTY
4
2021-22

60 INDIAN ECONOMIC DEVELOPMENT
4.1 INTRODUCTION
In previous chapters, you havestudied the economic policies thatIndia has taken in the last sevendecades and the outcome of thesepolicies with relation to the variousdevelopmental indicators. Providingminimum basic needs to the peopleand reduction of poverty have beenthe major aims of independent India.The pattern of development that thesuccessive five year plans envisagedlaid emphasis on the upliftment of thepoorest of the poor (Antyodaya),integrating the poor into themainstream and achieving aminimum standard of living for all.
While addressing the ConstituentAssembly in 1947, Jawaharlal Nehruhad said, “This achievement(Independence) is but a step, anopening of opportunity, to the greattriumphs and achievements thatawait us… the ending of poverty andignorance and disease and inequalityof opportunity”.
However, we need to know wherewe stand today. Poverty is not only achallenge for India, as more than one-fifth of the world’s poor live in Indiaalone; but also for the world, whereabout 300 million people are not ableto meet their basic needs.
Poverty has many faces, whichhave been changing from place toplace and across time, and has been
described in many ways. Most often,poverty is a situation that peoplewant to escape. So, poverty is a callto action — for the poor and thewealthy alike — a call to change theworld so that many more may haveenough to eat, adequate shelter,access to education and health,protection from violence, and a voicein what happens in theircommunities.
To know what helps to reducepoverty, what works and what doesnot, what changes over time, povertyhas to be defined, measured andstudied — and even experienced. Aspoverty has many dimensions, it hasto be looked at through a variety ofindicators — levels of income andconsumption, social indicators, andindicators of vulnerability to risksand of socio-political access.
4.2 WHO ARE THE POOR?
You would have noticed that in alllocalities and neighbourhoods, bothin rural and urban areas, there aresome of us who are poor and somewho are rich. Read the story of Anuand Sudha. Their lives are examplesof the two extremes (see Box 4.1).There are also people who belong tothe many stages in between.
Push-cart vendors, street cobblers,women who string flowers, rag pickers,vendors and beggars are some examples
No society can surely be flourishing and happy, of which the far greaterNo society can surely be flourishing and happy, of which the far greaterNo society can surely be flourishing and happy, of which the far greaterNo society can surely be flourishing and happy, of which the far greaterNo society can surely be flourishing and happy, of which the far greater
part of the members are poor and miserable.part of the members are poor and miserable.part of the members are poor and miserable.part of the members are poor and miserable.part of the members are poor and miserable.
Adam SmithAdam SmithAdam SmithAdam SmithAdam Smith
2021-22

61POVERTY
Box 4.1: Anu and Sudha
Anu and Sudha were both born on the same day. Anu’s mother and fatherwere construction labourers and Sudha’s father was a businessman and hermother a designer.
Anu’s mother worked by carrying head loads of bricks until she went intolabour. She then went behind the tool shed on the construction site anddelivered her baby alone. She fed her child and then wrapped her in an oldsari, made a cradle with a gunny sack, put little Anu in it and hung it from atree. She hurried back to work as she was afraid she would lose her job. Shehoped that Anu would sleep until evening.
Sudha was born in one of the best nursing homes in the city. She wasthoroughly checked by doctors, she was bathed and dressed in clean softclothes and placed in a crib next to her mother. Her mother fed her whenevershe was hungry, hugged and kissed her and sang her to sleep. Her familyand friends celebrated her arrival.
Anu and Sudha had very different childhoods. Anu learnt to look afterherself at a very early age. She knew what hunger and deprivation were. Shediscovered how to pick food from the dustbin, how to keep warm during thewinter, to find shelter in the monsoon and how to play with a piece of string,stones and twigs. Anu could not go to school as her parents were migrantworkers who kept moving from city to city in search of work.
Anu loved to dance. Whenever she heard music she would improvise. Shewas very beautiful and her movements were graceful and evocative. Her dreamwas to dance on a stage some day. Anu could have become a great dancerbut she had to begin work at the age of 12. She had to earn a living with hermother and father, building houses for the rich. Houses, she would never live in.
Sudha went to a very good play school where she learnt how to read,write and count. She went on excursions to the planetarium, museum andnational parks. She later went to a very good school. She loved painting andstarted getting private lessons from a famous artist. She later joined a designschool and became a well-known painter.
of poor and vulnerable groups inurban areas. The poor people possessfew assets and reside in kutcha
hutments with walls made of bakedmud and roofs made of grass, thatch,bamboo and wood. The poorest ofthem do not even have suchdwellings. In rural areas many ofthem are landless. Even if some ofthem possess land, it is only dry orwaste land. Many do not get to have
even two meals a day. Starvation andhunger are the key features of thepoorest households. The poor lackbasic literacy and skills and hencehave very l imited economicopportunities. Poor people also faceunstable employment.
Malnutrition is alarmingly highamong the poor. Ill health, disabilityor serious i l lness makes themphysically weak. They borrow from
2021-22

62 INDIAN ECONOMIC DEVELOPMENT
moneylenders, who chargehigh rates of interest thatlead them into chronicindebtedness. The poor arehighly vulnerable. They arenot able to negotiate theirlegal wages from employersand are exploited. Most poorhouseholds have no accessto electricity. Their primarycooking fuel is firewood andcow dung cake. A largesection of poor people donot even have access tosafe drinking water. Thereis evidence of extremegender inequality in theparticipation of gainfulemployment, education and indecision-making within the family.Poor women receive less care on theirway to motherhood. Their children areless likely to survive or be born healthy.
Economists identify the poor onthe basis of their occupation and
ownership of assets. They statethat the rural poor work mainlyas landless agricultural labourers,cult ivators with very smalllandholdings, or landless labourers,who are engaged in a variety ofnon-agricultural jobs and tenant
cultivators with smallland holdings. The urbanpoor are largely theoverflow of the rural poorwho had migrated tourban areas in search ofalternative employmentand livelihood, labourerswho do a variety of casualjobs and the self-emloyedwho sel l a variety ofthings on roadsides andare engaged in variousactivities.
Fig. 4.2 Many poor families live in kutcha houses
Fig. 4.1 Majority of agricultural labourers are poor
2021-22
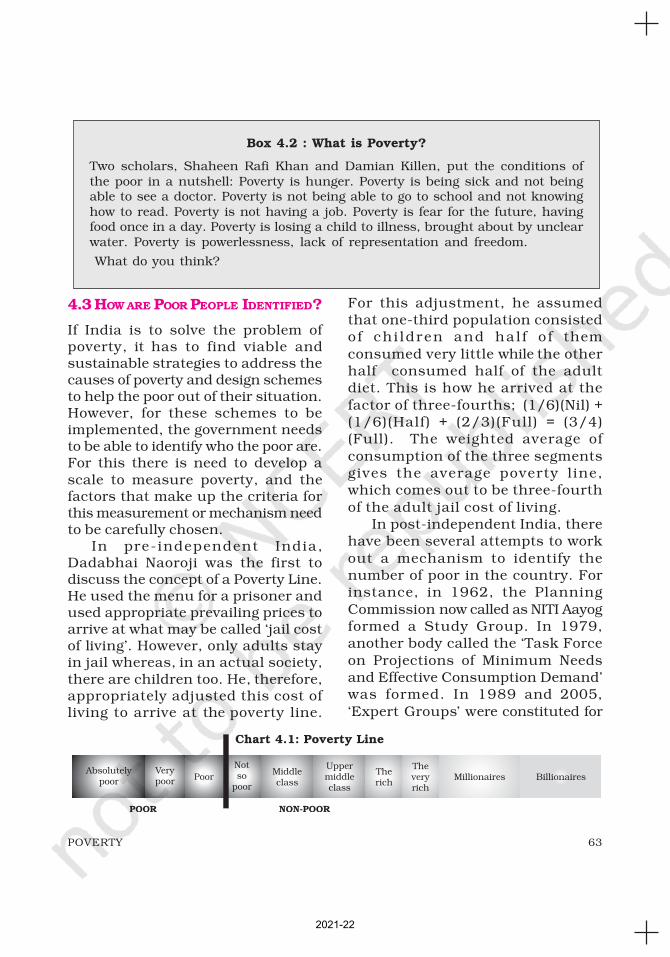
63POVERTY
4.3 HOW ARE POOR PEOPLE IDENTIFIED?
If India is to solve the problem ofpoverty, it has to find viable andsustainable strategies to address thecauses of poverty and design schemesto help the poor out of their situation.However, for these schemes to beimplemented, the government needsto be able to identify who the poor are.For this there is need to develop ascale to measure poverty, and thefactors that make up the criteria forthis measurement or mechanism needto be carefully chosen.
In pre-independent India,Dadabhai Naoroji was the first todiscuss the concept of a Poverty Line.He used the menu for a prisoner andused appropriate prevailing prices toarrive at what may be called ‘jail costof living’. However, only adults stayin jail whereas, in an actual society,there are children too. He, therefore,appropriately adjusted this cost ofliving to arrive at the poverty line.
For this adjustment, he assumedthat one-third population consistedof ch i ldren and hal f o f them
consumed very little while the otherhalf consumed half of the adultdiet. This is how he arrived at the
factor of three-fourths; (1/6)(Nil) +(1/6)(Half) + (2/3)(Full) = (3/4)(Full). The weighted average of
consumption of the three segmentsgives the average poverty l ine,which comes out to be three-fourth
of the adult jail cost of living.In post-independent India, there
have been several attempts to work
out a mechanism to identify thenumber of poor in the country. Forinstance, in 1962, the Planning
Commission now called as NITI Aayogformed a Study Group. In 1979,another body called the ‘Task Force
on Projections of Minimum Needsand Effective Consumption Demand’was formed. In 1989 and 2005,
‘Expert Groups’ were constituted for
Box 4.2 : What is Poverty?
Two scholars, Shaheen Rafi Khan and Damian Killen, put the conditions ofthe poor in a nutshell: Poverty is hunger. Poverty is being sick and not beingable to see a doctor. Poverty is not being able to go to school and not knowinghow to read. Poverty is not having a job. Poverty is fear for the future, havingfood once in a day. Poverty is losing a child to illness, brought about by unclearwater. Poverty is powerlessness, lack of representation and freedom.
What do you think?
Chart 4.1: Poverty Line
2021-22

64 INDIAN ECONOMIC DEVELOPMENT
the same purpose. Besides the
Planning Commission, many individual
economists have also attempted to
develop such a mechanism.
For the purpose of defining
poverty, we divide people into two
categories; the poor and the non-poor
and the poverty line separates the two.
However, there are many kinds of
poor; the absolutely poor, the very
poor and the poor. Similarly, there are
various kinds of non-poor; the middle
class, the upper middle class, the rich,
the very rich and the absolutely rich.
Think of this as a line or continuum
from the very poor to the absolutely
rich with the poverty line dividing the
poor from the non-poor.
Categorising Poverty: There are many
ways to categorise poverty. In one such
way people who are always poor and
those who are usually poor but who
may sometimes have a little more
money (example: casual workers) are
grouped together as the chronic poor.
Another group are the churning poor
who regularly move in and out of
poverty (example: small farmers
and seasonal workers) and the
occasionally poor who are rich most
of the time but may sometimes have a
patch of bad luck. They are called the
transient poor. And then, there are
those who are never poor and they are
the non-poor (Chart 4.2).
The Poverty Line: Now, let us
examine how to determine the
poverty line. There are many ways of
measuring poverty. One way is to
determine it by the monetary value
(per capita expenditure) of the
minimum calorie intake that was
estimated at 2,400 calories for a rural
person and 2,100 calories for a
person in the urban area. Based on
this, in 2011-12, the poverty line was
defined for rural areas as
consumption worth Rs 816 per
person a month and for urban areas
it was Rs 1,000.
Though the government uses
Monthly Per Capita Expenditure (MPCE)
as proxy for income of households to
identify the poor, do you think this
mechanism satisfactorily identifies the
poor households in our country?
Chart 4.2: The Chronic Poor, Transient Poor and Non-poor
2021-22

65POVERTY
Economists state that a major
problem with this mechanism is that it
groups all the poor together and does
not differentiate between the very poor
and the other poor (See chart 4.2). Also
this mechanism takes into account
expenditure on food and a few select
items as proxy for income, economists
question its basis. This mechanism is
helpful in identifying the poor as a
group to be taken care of by the
government, but it would be difficult to
identify who among the poor need help
the most.There are many factors, other than
income and assets, which are associated
with poverty; for instance, the
accessibility to basic education, health
care, drinking water and sanitation.
They need to be considered to develop
Poverty Line. The existing mechanism
for determining the Poverty Line also
does not take into consideration social
factors that trigger and perpetuate
poverty such as illiteracy, ill health,
lack of access to resources,
discrimination or lack of civil and
political freedoms. The aim of poverty
alleviation schemes should be to
improve human lives by expanding the
range of things that a person could be
and could do, such as to be healthy and
well-nourished, to be knowledgeable
and participate in the life of a
community. From this point of view,
development is about removing the
obstacles to the things that a person
can do in life, such as illiteracy, ill
health, lack of access to resources,
or lack of civil and political
freedoms.
Though the government claims that
higher rate of growth, increase in
agricultural production, providing
employment in rural areas and
economic reform packages introduced
in the 1990s have resulted in a decline
in poverty levels, economists raise
doubts about the government’s claim.
They point out that the way the data
are collected, items that are included
in the consumption basket,
methodology followed to estimate the
poverty line and the number of poor
are manipulated to arrive at the
reduced figures of the number of poor
in India.
Due to various limitations in the
official estimation of poverty, scholars
have attempted to find alternative
methods. For instance, Amartya Sen,
noted Nobel Laureate, has developed
an index known as Sen Index. There
are other tools such as Poverty Gap
Index and Squared Poverty Gap. You
will learn about these tools in higher
classes.
4.4 THE NUMBER OF POOR IN INDIA
When the number of poor is
estimated as the proportion of
people below the poverty line, it is
known as ‘Head Count Ratio’.
You might be interested in
knowing the total number of poor
persons residing in India. Where do
they reside and has their number or
proportion declined over the years or
2021-22

66 INDIAN ECONOMIC DEVELOPMENT
not? When such a comparative
analysis of poor people is made in terms
of ratios and percentages, we will have
an idea of different levels of poverty of
people and their distribution; between
states and over time.
The official data on poverty is now
made available to the public by the NITI
Aayog. It is estimated on the basis of
consumption expenditure data
collected by the National Sample
Survey Organisation (NSSO) now
called as National Statistical Office.
Chart 4.3 shows the number of poor
and their proportion to the population
in India for the years 1973-2012.
In 1973-74, more than 320 million
people were below the poverty line. In
2011-12, this number has come
down to about 270 million. In terms
Chart 4.3: Trends in Poverty in India, 1973–2012
Work These Out
Ø In Sections 4.2 and 4.3, you will notice that the poor are identified not only
with income and expenditure related indicators but also with many otheritems such as access to land, housing, education, health, sanitation. Alsoto be considered is discriminatory practices. Discuss how an alternativepoverty line could be constructed in such a way that it includes all theother indicators.
Ø On the basis of the given definition for poverty line, find out whether peoplewho work as domestic help, dhobies and newspaper vendors etc. in yourlocality/neighbourhood are above the poverty line or not.
2021-22

67POVERTY
of proportion, in 1973-74, about 55per cent of the total population wasbelow the poverty line. In 2011-12, ithas fallen to 22 per cent. In 1973-74,more than 80 per cent of the poorresided in rural areas and thissituation has not changed even in2011-12. This means that more thanthree-fourth of the poor in India stillreside in villages. Why do you think thisis the case?
In the 1990s, the absolutenumber of poor in rural areas haddeclined whereas the number of theirurban counterparts increasedmarginally. The poverty ratio declined
continuously for both urban andrural areas. From Chart 4.3, you willnotice that during 1973-2012, therehas been a decline in the number ofpoor and their proportion but thenature of decline in the twoparameters is not encouraging. Theratio is declining much slower thanthe absolute number of poor in thecountry. You will also notice thatthe gap between the absolutenumber of poor in rural and urbanareas got reduced whereas in thecase of ratio the gap has remainedthe same until 1993-94 and haswidened in 2011-12.
49
62
48
55
62
53
66
46
55 57
63
9
34
1721
3632 33
1511
29
20
0
10
20
30
40
50
60
70
An
dh
raPra
des
h
Bih
ar
Gu
jara
t
Kar
nat
aka
Mad
hya
Pra
des
h
Mah
aras
htr
a
Odis
ha
Raj
asth
an
Tam
il N
adu
Utt
ar P
rades
h
Wes
t B
enga
l
1973-742011-12
Chart 4.4: Population Below Poverty Line in Some Large States, 1973-2012 (%)
Note: For the year 1973, Uttar Pradesh includes the present Uttarakhand; MadhyaPradesh includes Chhattisgarh and Bihar includes Jharkhand.
2021-22

68 INDIAN ECONOMIC DEVELOPMENT
unequal distribution of wealth.Aggregate poverty is just the sum ofindividual poverty. Poverty is alsoexplained by general, economy-wideproblems, such as (i) low capitalformation (ii) lack of infrastructure(iii) lack of demand (iv) pressureof population (v) lack of social/welfare nets.
In Chapter 1 you have read aboutthe British rule in India. Although thefinal impact of the British rule onIndian living standards is still beingdebated, there is no doubt that therewas a substantial negative impact onthe Indian economy and standard ofliving of the people. There wassubstantial de-industrialisation inIndia under the British rule. Importsof manufactured cotton cloth fromLancashire in England displacedmuch local production, and Indiareverted to being an exporter of cottonyarn, not cloth.
As over 70 per cent of Indianswere engaged in agr i cu l turethroughout the British Raj period,the impact on that sector was moreimportant on living standards thananything else. Brit ish pol iciesinvolved sharply raising rural taxesthat enab led merchants andmoneylenders to become largelandowners. Under the British,India began to export food grainsand, as a result, as many as 26mill ion people died in faminesbetween 1875 and 1900.
Britain’s main goals from the Rajwere to provide a market for Britishexports, to have India service its
The state level trends in poverty areshown in Chart 4.4. The two lines inthe chart indicate the national povertylevel. The first line from below indicatespoverty level during 2011-12 and theother line indicates the same for theyear 1973-74. This means, theproportion of poor in India during1973-2012 has come down from 55 to22 per cent. The chart also reveals thatsix states - Tamil Nadu, Uttar Pradesh,Bihar, Madhya Pradesh, West Bengaland Orissa - contained a large sectionof poor in 1973-74. During 1973-2012, many Indian states reduced thepoverty levels to a considerable extent.Yet, the poverty levels in four states -Odisha, Madhya Pradesh, Bihar andUttar Pradesh are still far above thenational poverty level. You may noticeAndhra Pradesh, Rajasthan, WestBengal and Tamil Nadu reducedpoverty level much better than otherstates. How come they were able to domuch better than other states?
4.5 WHAT CAUSES POVERTY?
The causes of poverty lie in theinstitutional and social factors thatmark the life of the poor. The poorare deprived of quality education andunable to acquire skills whichfetch better incomes. Also access tohealth care is denied to the poor. Themain victims of caste, religious andother discriminatory practices are poor.These can be caused as a result of (i)social, economic and politicalinequality (ii) social exclusion (iii)unemployment (iv) indebtedness (v)
2021-22

69POVERTY
debt payments to Britain,and for India to providemanpower for the Britishimperial armies.
The British Rajimpoverished millions of peoplein India. Our natural resourceswere plundered, our industriesworked to produce goods at lowprices for the British and ourfood grains were exported.Many died due to famine andhunger. In 1857-58, anger atthe overthrow of many localleaders, extremely high taxesimposed on peasants, andother resentments boiled overin a revolt against British ruleby the sepoys, Indian troopscommanded by the British.
Even today agriculture is theprincipal means of livelihood andland is the primary asset of ruralpeople; ownership of land is animportant determinant of materialwell-being and those who own someland have a better chance to improvetheir living conditions.
Since independence, the governmenthas attempted to redistribute land andhas taken land from those who havelarge amounts to distribute it to thosewho do not have any land, but workon the land as wage labourers.However, this move was successfulonly to a limited extent as largesections of agricultural workers werenot able to farm the small holdingsthat they now possessed as they didnot have either money (assets) orskills to make the land productive
and the land holdings were too smallto be viable. Also most of the Indianstates failed to implement landredistribution policies.
A large section of the rural poorin India are the small farmers. Theland that they have is, in general, lessfertile and dependent onrains. Their survival depends onsubsistence crops and sometimes onlivestock. With the rapid growth ofpopulation and without alternativesources of employment, the per-headavailability of land for cultivation hassteadily declined leading tofragmentation of land holdings. Theincome from these small land holdingsis not sufficient to meet the family’sbasic requirements.
You must have heard aboutfarmers committing suicide due totheir inability to pay back the loansthat they have taken for cultivation
Fig. 4.4 Low quality self-employment sustains poverty
2021-22

70 INDIAN ECONOMIC DEVELOPMENT
and other domestic needs as theircrops have failed due to drought orother natural calamities (see Box 4.3).
Most members of ScheduledCastes and Scheduled Tribes are notable to participate in the emergingemployment opportunities in differentsectors of the urban and rural economyas they do not have the necessaryknowledge and skills to do so.
A large section of urban poor
in India are largely the overflowof the rural poor who migrate tourban areas in searchof employment and a livelihood.Industrialisation has not beenable to absorb all these people.The urban poor are eitherunemployed or intermittentlyemployed as casual labourers.Casual labourers are among themost vulnerable in society asthey have no job security, noassets, limited skills, sparseopportunities and no surplus tosustain them.
Poverty is, therefore, alsoclosely related to nature ofemployment. Unemployment or underemployment and the casual andintermittent nature of work in bothrural and urban areas that compelsindebtedness, in turn, reinforcespoverty. Indebtedness is one of thesignificant factors causing poverty.
A steep rise in the price of foodgrains and other essential goods, at
Fig. 4.5 Quality employment is still a dream for the poor
Work These Out
You may come across washermen and barbers in your neighbourhood. Sparea few moments and speak to a few of them. Collect details about what madethem to take up this activity, where they live with their family members,number of meals they are able to consume in a day, whether they possessany physical assets and why they could not take up a job. Discuss the detailsthat you have collected in the classroom.
List the activities of people in rural and urban areas separately. You mayalso list the activities of the non-poor. Compare the two and discuss in theclassroom why the poor are unable to take up such activities.
2021-22

71POVERTY
Box 4.3: Distress Among Cotton Farmers
Many small land owning farmers and farming households and weavers are descendinginto poverty due to globalisation related shock and lack of perceived income earningopportunities in relatively well performing states in India. Where households havebeen able to sell assets, or borrow, or generate income from alternative employmentopportunities, the impact of such shocks may be transient. However, if the householdhas no assets to sell or no access to credit, or isable to borrow only at exploitative rates of interestand gets into a severe debt trap, the shocks canhave long duration ramification in terms of pushinghouseholds below the poverty line. The worst formof this crisis is suicides. Since 2001, more than12,000 farmers committed suicides in India andmainly in states such as Maharashtra and AndhraPradesh.
India has the largest area under cottoncultivation in the world covering 125 lakh hectaresin 2017–18. The low yield of 476 kg per hectarepushes it into third position in production. Highproduction costs, low and unstable yields, declinein world prices, global glut in production due tosubsidies by the U.S.A. and other countries, andopening up of the domestic market due toglobalisation have increased the exposure offarmers and led to agrarian distress and suicidesespecially in the cotton belt of Andhra Pradeshand Maharashtra. The issue is not one of profitsand higher returns but that of the livelihood andsurvival of millions of small and marginal farmers who are dependent on agriculture.
Scholars cite several factors that have led farmers to commit suicides (i) theshift from traditional farming to the farming of high yielding commercial crops withoutadequate technical support combined with withdrawal of the state in the area ofagricultural extension services in providing counselling on farm technologies,problems faced, immediate remedial steps and lack of timely advice to farmers (ii)decline in public investment in agriculture in the last two decades (iii) low rates ofgermination of seeds provided by large global firms, spurious seeds and pesticides byprivate agents (iv) crop failure, pest attack and drought (v) debt at very high interestrate of 36 per cent to 120 per cent from private money lenders (vi) cheap importsleading to decline in pricing and profits (vii) lack of access to water for crops whichforced the farmers to borrow money at exorbitant rates of interest to sink borewellsthat failed.
Sources: Excerpted from A.K. Mehta and Sourabh Ghosh assisted by Ritu Elwadhi,“Globalisation, Loss of Livelihoods and Entry into Poverty,” AlternativeEconomic Survey, India 2004-2005, Alternative Survey Group, Daanish Books,Delhi 2005 and P. Sainath, The swelling ‘Register of Deaths’, The Hindu, 29December 2005. Shashi Arya, “over 40 per cent of farmer suicides in last 5years, yet it is not a poll issue” Times of India, 25 September 2019.
Shantabai, wife of Neelakanta
Sitaram Khoke who committedsuicide in Yavatma, Maharashtra
2021-22
72 INDIAN ECONOMIC DEVELOPMENT
a rate higher than the price of luxury
goods, further intensif ies thehardship and deprivation of lower
income groups. The unequal
distribution of income and assets has
also led to the persistence of povertyin India.
All this has created two distinct
groups in society: those who posses
the means of production and earngood incomes and those who have
only their labour to trade for survival.
Over the years, the gap between the
rich and the poor in India has widened.Poverty is a multi-dimensional
challenge for India that needs to be
addressed on a war footing.
4.6 POLICIES AND PROGRAMMES
TOWARDS POVERTY ALLEVIATION
The Indian Constitution and five
year plans state social justice as
the primary objective of thedevelopmental strategies of the
government. To quote the First Five
Year Plan (1951-56), “the urge to
bring economic and social changeunder present conditions comes from
the fact of poverty and inequalities in
income, wealth and opportunity”.
The Second Five Year Plan (1956-61)also pointed out that “the benefits of
economic development must accrue
more and more to the relatively less
privileged classes of society”. One canfind, in al l pol icy documents,emphasis being laid on povertyal leviation and that variousstrategies need to be adopted by thegovernment for the same.
The government’s approach topoverty reduction was of threedimensions. The first one is growth-oriented approach. It is based on theexpectation that the effects ofeconomic growth — rapid increase ingross domestic product and percapita income — would spread to allsections of society and will trickledown to the poor sections also. Thiswas the major focus of planningin the 1950s and early 1960s.It was felt that rapid industrialdevelopment and transformationof agriculture through greenrevolution in select regions wouldbenefit the underdeveloped regionsand the more backward sections ofthe community. You must have readin Chapters 2 and 3 that the overallgrowth and growth of agricultureand industry have not beenimpressive. Population growth hasresulted in a very low growth in percapita incomes. The gap betweenpoor and rich has actually widened.The Green Revolution exacerbated thedisparities regionally and betweenlarge and small farmers. There wasunwil l ingness and inabil i ty toredistribute land. Economists statethat the benefits of economic growthhave not trickled down to the poor.
While looking for alternatives tospecifically address the poor, policymakers started thinking thatincomes and employment for thepoor could be raised through thecreation of additional assets and bymeans of work generation. Thiscould be achieved through specific
2021-22

73POVERTY
poverty alleviation programmes.This second approach has beeninitiated from the Third Five YearPlan (1961-66) and progressivelyenlarged since then. One of the notedprogrammes initiated in the 1970swas Food for Work.
Most poverty alleviationprogrammes implemented prior to2015 were based on the perspectiveof the Five Year Plans. Expanding self-employment programmes and wageemployment programmes are beingconsidered as the major ways ofaddressing poverty. Example of self-employment programmes implementedis Prime Minister’s Rozgar Yojana(PMRY) and Swarna Jayanti ShahariRozgar Yojana (SJSRY). This kind ofprogramme aimed at creating self-
employment opportunities in urbanareas. The K hadi and VillageIndustries Commission wasimplementing it. Under thisprogramme, one could get financialassistance in the form of bank loansto set up small industries. Theeducated unemployed from low-income families in rural and urbanareas could get financial help to setup any kind of enterprise thatgenerates employment under PMRY.Some programmes aim at creatingemployment opportunities—both self-employment and wage employment—in urban areas.
Earlier, under self-employmentprogrammes, financial assistancewas given to families or individuals.Since the 1990s, this approach has
Fig. 4.6 Wage employment under ‘Food for Work’ programme
2021-22

74 INDIAN ECONOMIC DEVELOPMENT
been changed. Now those who wish tobenefit from these programmes areencouraged to form self-help groups.Initially they are encouraged to savesome money and lend amongthemselves as small loans. Later,through banks, the governmentprovides partial financial assistanceto SHGs which then decide whomthe loan is to be given to for self-employment activities. A similarprogramme has also been in place forurban poor. Find out the details of theprogramme implemented in your areaand discuss in the class.
The government has a variety ofprogrammes to generate wageemployment for the poor unskilledpeople living in rural areas. In August2005, the Parliament passed a new Actto provide guaranteed wageemployment to every rural householdwhose adult volunteer is to dounskilled manual work for a minimumof 100 days in a year. This is knownas Mahatma Gandhi National RuralEmployment Guarantee Act(MNREGA). Under this Act all thoseamong the poor who are ready to workat the minimum wage can report forwork in areas where this programmeis implemented. Nearly five crorehouseholds get employmentopportunities under this law.
The third approach to addressingpoverty is to provide minimum basicamenities to the people. India wasamong the pioneers in the world toenvisage that through publicexpenditure on social consumptionneeds — provision of food grains at
subsidised rates, education, health,water supply and sanitation—people’sliving standard could be improved.Programmes under this approach areexpected to supplement theconsumption of the poor, createemployment opportunities and bringabout improvements in health andeducation. One can trace this approachfrom the Fifth Five Year Plan, “even withexpanded employment opportunities,the poor will not be able to buy forthemselves all the essential goods andservices. They have to be supplementedup to at least certain minimumstandards by social consumption andinvestment in the form of essential foodgrains, education, health, nutrition,drinking water, housing,communications and electricity.” Threemajor programmes that aim atimproving the food and nutritionalstatus of the poor are PublicDistribution System, Poshan Abhiyanand Midday Meal Scheme. PradhanMantri Gram Sadak Yojana andValmiki Ambedkar Awas Yojana arealso attempts in developinginfrastructure and housing conditions.It may be essential to briefly state thatIndia has achieved satisfactoryprogress in many aspects.
The government also has a varietyof other social security programmesto help a few specific groups. NationalSocial Assistance Programme is onesuch programme initiated by thecentral government. Under thisprogramme, elderly people who do nothave anyone to take care of them aregiven pension to sustain themselves.
2021-22

75POVERTY
Poor women who are destitute andwidows are also covered under thisscheme. The government has alsointroduced a few schemes to providehealth insurance to poor people. From2014, a scheme called Pradhan MantriJan-Dhan Yojana is available in whichpeople in India are encouraged to openbank accounts. Besides promotingsavings habit, this scheme intends totransfer all the benefits of governmentschemes and subsidies to accountholders directly. Each bank accountholder is also entitled to Rs. 1- 2 lakhaccidental insurance cover.
4.7 POVERTY ALLEVIATION
PROGRAMMES — A CRITICAL
A S S E S S M E N T
Efforts at poverty alleviation have bornefruit in that for the first time sinceindependence, the percentage ofabsolute poor in some states is nowwell below the national average. Despitevarious strategies to alleviate poverty,hunger, malnourishment, illiteracy and
lack of basic amenities continue to bea common feature in many parts ofIndia. Though the policy towardspoverty alleviation has evolved in aprogressive manner, over the last sevendecades, it has not undergone anyradical transformation. You can findchange in nomenclature, integrationor mutations of programmes. However,none resulted in any radical changein the ownership of assets, process ofproduction and improvement of basicamenities to the needy. Scholars, whileassessing these programmes, statethree major areas of concern whichprevent their successfulimplementation. Due to unequaldistribution of land and other assets,the benefits from direct povertyalleviation programmes have beenappropriated by the non-poor.Compared to the magnitude ofpoverty, the amount of resourcesallocated for these programmes is notsufficient. Moreover, theseprogrammes depend mainly on
Work These Out
Discuss and then develop a list of three employment opportunities eachthat can arise in coastal areas, deserts, hilly tribal areas and othertribal areas under : (i) MNREGA and (ii) self-employment.
In your area or neighbourhood, you will find developmental works suchas laying of roads, construction of buildings in government hospitals,government schools etc. Visit such sites and prepare a two-three pagereport on the nature of work, how many people are getting employed,wages paid to the labourers etc.
2021-22

76 INDIAN ECONOMIC DEVELOPMENT
Box 4.4: Ramdas Korwa’s Road to Nowhere
Somehow, Ramdas Korwa of Rachketha village was not overjoyed to learn
that he was worth Rs l7.44 lakh to the government. Late in 1993, the
authorities decided to lay a three km road leading to Rachketha village in the
name of tribal development by allocating Rs 17.44 lakh towards the project.
Tribals constitute a 55 per cent majority in Surguja, one of India’s poorest
districts. And the Pahadi or Hill Korwas, who have been listed as a primitive
tribe by the government, fall in the bottom 5 per cent. Special efforts are
underway for their development which often involves large sums of money.
Just one centrally funded scheme, the Pahadi Korwa project, is worth Rs 42
crores over a five-year period.
There are around 15,000 Pahadi Korwas, the largest number of these in
Surguja. However, for political reasons, the main base of the project is in
Raigad district. There was just one small problem about building the Pahadi
Korwa Marg in Rachketha—the village is almost completely devoid of Pahadi
Korwas. Ramdas’s family is the only real exception.
‘It doesn’t matter if these don’t benefit the Pahadi Korwas in the least and
are completely useless. Out here, even if you put up a swimming pool and a
bungalow, you do it in the name of tribal development,’ says an NGO activist.
‘Nobody bothered to check whether there were really any Pahadi Korwas living
in Rachketha village’ and ‘there was already a kutcha road here,’ says
Ramavatar Korwa, son of Ramdas. ‘They just added lal mitti (red earth) to it.
Even today, after spending Rs 17.44 lakh, it is not a pucca road.’
Ramdas’s own demands are touchingly simple. ‘All I want is a little water,’
he says. ‘How can we have agriculture without water?’ When repeatedly
pressed, he adds: ‘Instead of spending Rs 17.44 lakh on that road, if they had
spent a few thousand on improving that damaged well on my land, wouldn’t
that have been better? Some improvement in the land is also necessary, but
let them start by giving us a little water.’
Ramdas’s problems were ignored. The government’s problem was ‘fulfilling
a target’. ‘If the money were simply put into bank fixed deposits, none of these
Pahadi Korwa families would ever have to work again. The interest alone would
make them very well off by Surguja’s standards’, says an official mockingly.
Nobody thought of asking Ramdas what he really needed, what his
problems were, or involving him in their solution. Instead, in his name, they
built a road he does not use, at a cost of Rs17.44 lakh. ‘Please do something
about my water problem, sir,’ says Ramdas Korwa as we set off across the
plain, journeying two km to reach his road to nowhere.
Source: Excerpted from P. Sainath, 1996, Everybody Loves a Good Drought:
Stories from India’s Poorest Districts, Penguin Books, New Delhi.
2021-22

77POVERTY
government and bank officials for theirimplementation. Since such officials areill motivated, inadequately trained,corruption prone and vulnerable topressure from a variety of local elites,the resources are inefficiently used andwasted. There is also non-participationof local level institutions in programmeimplementation.
Government policies have alsofailed to address a majority ofvulnerable people who are living on orjust above the poverty line. It alsoreveals that high growth alone is not
sufficient to reduce poverty. Withoutthe active participation of the poor,successful implementation of anyprogramme is not possible.
Poverty can effectively be eradicatedonly when the poor start contributingto growth by their active involvementin the growth process. This is possiblethrough a process of socialmobilisation, encouraging poor peopleto participate and get them empowered.This will also help create employmentopportunities which may lead toincrease in levels of income, skilldevelopment, health and literacy.Moreover, it is necessary to identifypoverty stricken areas and provideinfrastructure such as schools, roads,power, telecom, IT services, traininginstitutions etc.
4.8 CONCLUSION
We have travelled about seven and halfdecades since independence. Theobjective of all our policies had beenstated as promoting rapid andbalanced economic development withequality and social justice. Povertyalleviation has always been acceptedas one of India’s main challenges bythe policy makers, regardless of whichgovernment was in power. Theabsolute number of poor in the countryhas gone down and some states haveless proportion of poor than even thenational average. Yet, critics pointout that even though vast resourceshave been allocated and spent, weare still far from reaching the goal.
Fig. 4.7 Scrap collector: mismanagement ofemployment planning forces people totake up very low paying jobs
2021-22

78 INDIAN ECONOMIC DEVELOPMENT
There is improvement in terms of percapita income and average standardof living; some progress towardsmeeting the basic needs has beenmade. But when compared to theprogress made by many othercountries, our performance has notbeen impressive. Moreover, the fruitsof development have not reached all
sections of the population. Somesections of people, some sectors of theeconomy, some regions of the countrycan compete even with developedcountries in terms of social andeconomic development, yet, there aremany others who have not been ableto come out of the vicious circle ofpoverty.
Recap
Reducing poverty has been one of the major objectives of India’sdevelopmental strategies.
The per capita consumption expenditure level which meets the averageper capita daily requirement of 2,400 calories in rural areas and 2,100calories in urban areas, along with a minimum of non-food expenditure,is called poverty line or absolute poverty.
When the number of poor and their proportion is compared, we will havean idea of different levels of poverty of people and their distribution betweenstates and over time.
The number of poor in India and their proportion to total population hasdeclined substantially. For the first time in the 1990s, the absolutenumber of poor has declined.
Majority of poor are residing in rural areas and engage themselves incasual and unskilled jobs.
Income and expenditure oriented approaches do not take into accountmany other attributes of the poor people.
Over the years, the government has been following three approaches toreduce poverty in India: growth oriented development, specific povertyalleviation programmes and meeting the minimum needs of the poor.
Government initiatives are yet to transform the ownership of assets,processes of production and meet the basic amenities of the poor.
2021-22

79POVERTY
1. Why calorie - based norm is not adequate to identify the poor?
2. What is MNREGA?
3. Why are employment generation programmes important in povertyalleviation in India?
4. How can creation of income earning assets address the problemof poverty?
5. The three dimensional attack on poverty adopted by the govern-ment has not succeded in poverty alleviation in India. Comment.
6. What programmes has the government adopted to help theelderly people, poor and destitute women in India?
7. Is there any relationship between unemployment and poverty?Explain.
8. Suppose you are from a poor family and you wish to get help fromthe government to set up a petty shop. Under which scheme willyou apply for assistance and why?
9. Illustrate the difference between rural and urban poverty. Is itcorrect to say that poverty has shifted from rural to urban areas?Use the trends in poverty ratio to support your answer.
10. Suppose you are a resident of a village, suggest a few measuresto tackle the problem of poverty in your village.
11. If you live in an urban area, you may notice people live in slums, onthe roadsides, near railway stations and near bus stands. Suggest afew measures to improve their living conditions.
1. Collect data from 30 persons of your locality regarding their dailyconsumption of various commodities. Then rank the persons onthe basis of relatively better off and worse, to get the degree ofrelative poverty.
EXERCISES
SUGGESTED ADDITIONAL ACTIVITIES
2021-22

80 INDIAN ECONOMIC DEVELOPMENT
2. Collect information and fill in the following table with the amount ofmoney spent in terms of rupees by four low income families onvarious commodities. Analyse the research and find out whichfamily is relatively poor in comparison to the other families. Alsofind out who are absolutely poor if the poverty line is fixed at anexpenditure of Rs 500 per month per person.
Commodities Family A Family B Family C Family D
Wheat/RiceVegetable OilSugarElectricity/LightingGheeClothesHouse Rent
3. The following table shows the average monthly expenditure perperson on items of consumption in India and Delhi slums in termsof percentage. ‘Rice and wheat’ in rural areas at 25 per centmeans that for every 100 rupees spent, Rs 25 goes towards thepurchase of rice and wheat alone. Read the table further andanswer the questions that follow.
Items Rural Urban Delhi Slums
Rice and wheat 25.0 35.9 28.7Pulses and their products 5.7 6.1 9.9Milk and milk products 17.4 14.1 10.3Vegetables and fruits 15.1 12.7 19.6Meat, fish and eggs 6.3 5.3 13.1Sugar 3.3 3.8 4.0Salt and spices 10.8 10.8 8.1Other food items 16.5 11.3 6.4Total: All food 100 100 100Expenditure on food 62.9 72.2 72.8items as a % of all items
• Compare the percentage of expenditure on food items among
different groups and their priorities.
• Do you think households in slums are depending more on cereals
and pulses?
• On which item do people living in different areas spend the least?
Compare them.
• Do you think that slum dwellers have given more emphasis to
meat, fish and eggs?
2021-22

81POVERTY
Books and Articles
ABHIJIT VINAYAK BANARJEE, P. BARDHAN, R. SOMANATHAN AND T. N. SRINIVASAN. 2019.Poverty and Income distribution in India. Juggernaut, New Delhi.
DANDEKAR, V.M. and NILAK ANTHA RATH. 1971. Poverty in India, Indian Schoolof Political Economy, Pune.
DREZE, JEAN. AMARTYA SEN & AKTHAR HUSAIN (Eds.). 1995. The Political Economyof Hunger. Clarendon Press, Oxford.
ESTHER DUFLO AND A. V. BANARJEE. 2019. Good Economics for Hard Times: Answersto our biggest problems. Juggernaut, New Delhi.
MINHAS, B.S., L.R. JAIN and S.D. TENDULK AR. 1991. ‘Declining Incidence ofPoverty in the 1980s — Evidence versus Artefacts,’ Economic andPolitical Weekly, July 6-13.
NAOROJI, DADABHAI. 1996. Poverty and Un-British Rule in India, PublicationsDivision, Ministry of Information and Broadcasting, Government ofIndia, Second Edition, New Delhi.
SAINATH, P. 1996. Everybody Loves a Good Drought: Stories from India’sPoorest Districts. Penguin Books, New Delhi.
SEN, AMARTYA. 1999. Poverty and Famines: An Essay on Entitlement andDeprivation. Oxford University Press, New Delhi.
SUBRAMANIAM, S. (Ed.). 2001. India’s Development Experience: SelectedWritings of S. Guhan. Oxford University Press, New Delhi.
Government Reports
Report of the Expert Group of the Estimation of Proportion and Number ofPoor, Perspective Planning Division, Planning Commission Governmentof India, New Delhi, 1993.
Economic Survey (for various years). Ministry of Finance, Government of India.
Tenth Five Year Plan 2002-2007, Vol. II: Sectoral Policies and Programmes,Planning Commission, Government of India, New Delhi.
Twelfth Five Year Plan (2012-17), Vols. I, II and III. Sage Publications Pvt.Ltd., New Delhi (for Planning Commission, Government of India).
State of Indian Agriculture 2017, Ministry of Agriculture and Farmer’sWelfare, Government of India, New Delhi.
REFERENCES
2021-22

82 INDIAN ECONOMIC DEVELOPMENT
After studying this chapter, the learners will understand
• the concepts of Human Resource, Human Capital Formation and HumanDevelopment
• the links between investment in human capital, economic growth andhuman development
• the need for government spending on education and health
• the state of India’s educational attainment.
HUMAN CAPITAL
FORMATION IN INDIA
5
2021-22

83HUMAN CAPITAL FORMATION IN INDIA
5.1 INTRODUCTION
Think of one factor that has made agreat difference in the evolution ofmankind. Perhaps it is humancapacity to store and transmitknowledge which they have been doingthrough conversation, through songsand through elaborate lectures. Buthumans soon found out that we needa good deal of training and skill to dothings efficiently. We know that thelabour skill of an educated person ismore than that of an uneducatedperson and hence the former is able
to generate more income than the latterand his or her contribution to economicgrowth is, consequently, more.
Education is sought not only as itconfers higher earning capacity onpeople but also for its other highlyvalued benefits: it gives one a bettersocial standing and pride; it enablesone to make better choices in life; itprovides knowledge to understand thechanges taking place in society; it alsostimulates innovations. Moreover,the availability of educated labourforce facilitates adaptation of new
“... the wisdom of expending public and private funds on education is not to bemeasured by its direct fruits alone. It will be profitable as a mere investment,to give the masses of people much greater opportunities than they can generallyavail themselves of. For by this means many, who would have died unknown,are enabled to get the start needed for bringing out their latent abilities”.
Alfred Marshall
Fig. 5.1 Adequate education and training to farmers can raise productivity in farms
2021-22

84 INDIAN ECONOMIC DEVELOPMENT
technologies. Economists havestressed the need for expandingeducational opportunities in a nationas it accelerates the developmentprocess.
5.2 WHAT IS HUMAN CAPITAL?
Just as a country can turn physicalresources like land into physicalcapital like factories, similarly, it canalso turn human resources likenurses, farmers, teachers, studentsinto human capital like engineers anddoctors. Societies need sufficienthuman capital in the first place —inthe form of competent people who havethemselves been educated and trainedas professors and other professionals.In other words, we need good humancapital to produce other human capital(say, nurses, farmers, teachers,doctors, engineers...). This means thatwe need investment in human capitalto produce more human capital out ofhuman resources.
Let us understand a little more ofwhat human capital means by posingthe following questions :
(i) What are the sources of humancapital?
(ii) Is there any relation betweenhuman capital and economicgrowth of a country?
(iii) Is the formation of humancapital linked to people’s all-rounddevelopment or, as it is now called,human development?
(iv) What role can the governmentplay in human capital formationin India?
5.3 SOURCES OF HUMAN CAPITAL
Investment in education is consideredas one of the main sources of humancapital. There are several other sourcesas well. Investments in health, on- the-job training, migration and informationare the other sources of human capitalformation.
Why do your parents spendmoney on education? Spending on
education by individuals is similar tospending on capital goods bycompanies with the objective ofincreasing future profits over a periodof time. Likewise, individuals investin education with the objective ofincreasing their future income.
Like education, health is alsoconsidered as an important input forthe development of a nation as muchas it is important for the developmentof an individual.
Who can work better —a sickperson or a person with sound health?A sick labourer without access tomedical facilities is compelled toabstain from work and there is loss ofproductivity. Hence, expenditure onhealth is an important source ofhuman capital formation.
Work This Out Identify and collect the data
from three families fromdifferent strata (i) very poor(ii) middle class and (iii)af fluent. Study theexpenditure pattern of thefamilies on education ofmale and female children.
2021-22

85HUMAN CAPITAL FORMATION IN INDIA
The amount of moneyspent on preventivemedicine (vaccination),curative medicine(medical interventionduring illness), socialmedi-cine (spread ofhealth literacy) andprovision of clean
drinking water and good sanitationare the various forms of healthexpenditures. Health expendituredirectly increases the supply of healthylabour force and is, thus, a source of
human capitalformation.Firms spend ongiving on-the-job-training totheir workers.This may takedifferent forms:
one, the workers may be trained in thefirm itself under the supervision of askilled worker; two, the workers maybe sent for off-campus training. In boththese cases firms incur some expenses.Firms will, thus, insist that the workersshould work for a specific period oftime, after their on-the-job training,during which it can recover the benefitsof the enhanced productivity owing tothe training. Expenditure regarding on-the-job training is a source of humancapital formation as the return of suchexpenditure in the form of enhancedlabour productivity is more than thecost of it.
People migrate in search of jobsthat fetch them higher salaries thanwhat they may get in their native
places. Unemployment is the reasonfor the rural-urban migration in India.Technically qualified persons, likeengineers and doctors, migrate to othercountries because of higher salariesthat they may get in such countries.Migration in both these cases involvescost of transport, higher cost of livingin the migrated places and psychiccosts of living in a strange socio-cultural setup. The enhanced earningsin the new place outweigh the costs ofmigration; hence, expenditure onmigration is also a source of humancapital formation.
People spend to acquireinformation relating to the labourmarket and other markets likeeducation and health. For example,people want to know the level of salariesassociated with various types of jobs,whether the educational institutionsprovide the right type of employableskills and at what cost. This informationis necessary to make decisionsregarding investments in human capitalas well as for efficient utilisation of theacquired human capital stock.Expenditure incurred for acquiringinformation relating to the labourmarket and other markets is also asource of human capital formation.
2021-22
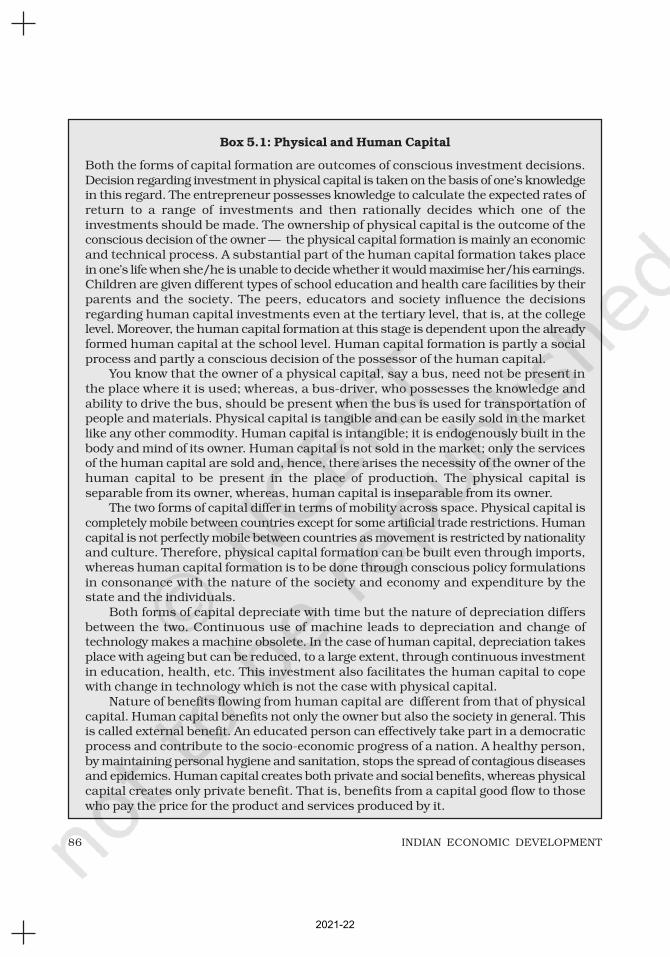
86 INDIAN ECONOMIC DEVELOPMENT
Box 5.1: Physical and Human Capital
Both the forms of capital formation are outcomes of conscious investment decisions.Decision regarding investment in physical capital is taken on the basis of one’s knowledgein this regard. The entrepreneur possesses knowledge to calculate the expected rates ofreturn to a range of investments and then rationally decides which one of theinvestments should be made. The ownership of physical capital is the outcome of theconscious decision of the owner — the physical capital formation is mainly an economicand technical process. A substantial part of the human capital formation takes placein one’s life when she/he is unable to decide whether it would maximise her/his earnings.Children are given different types of school education and health care facilities by theirparents and the society. The peers, educators and society influence the decisionsregarding human capital investments even at the tertiary level, that is, at the collegelevel. Moreover, the human capital formation at this stage is dependent upon the alreadyformed human capital at the school level. Human capital formation is partly a socialprocess and partly a conscious decision of the possessor of the human capital.
You know that the owner of a physical capital, say a bus, need not be present inthe place where it is used; whereas, a bus-driver, who possesses the knowledge andability to drive the bus, should be present when the bus is used for transportation ofpeople and materials. Physical capital is tangible and can be easily sold in the marketlike any other commodity. Human capital is intangible; it is endogenously built in thebody and mind of its owner. Human capital is not sold in the market; only the servicesof the human capital are sold and, hence, there arises the necessity of the owner of thehuman capital to be present in the place of production. The physical capital isseparable from its owner, whereas, human capital is inseparable from its owner.
The two forms of capital differ in terms of mobility across space. Physical capital iscompletely mobile between countries except for some artificial trade restrictions. Humancapital is not perfectly mobile between countries as movement is restricted by nationalityand culture. Therefore, physical capital formation can be built even through imports,whereas human capital formation is to be done through conscious policy formulationsin consonance with the nature of the society and economy and expenditure by thestate and the individuals.
Both forms of capital depreciate with time but the nature of depreciation differsbetween the two. Continuous use of machine leads to depreciation and change oftechnology makes a machine obsolete. In the case of human capital, depreciation takesplace with ageing but can be reduced, to a large extent, through continuous investmentin education, health, etc. This investment also facilitates the human capital to copewith change in technology which is not the case with physical capital.
Nature of benefits flowing from human capital are different from that of physicalcapital. Human capital benefits not only the owner but also the society in general. Thisis called external benefit. An educated person can effectively take part in a democraticprocess and contribute to the socio-economic progress of a nation. A healthy person,by maintaining personal hygiene and sanitation, stops the spread of contagious diseasesand epidemics. Human capital creates both private and social benefits, whereas physicalcapital creates only private benefit. That is, benefits from a capital good flow to thosewho pay the price for the product and services produced by it.
2021-22

87HUMAN CAPITAL FORMATION IN INDIA
The concept of physical capital isthe base for conceptualising humancapital. There are some similaritiesbetween the two forms of capital; thereare some striking dissimilarities aswell. See Box 5.1.
Human Capital and EconomicGrowth: Who contributes more tonational income — a worker in a factoryor a software professional? We knowthat the labour skill of an educatedperson is more than that of anuneducated person and that the formergenerates more income than the latter.Economic growth means the increasein real national income of a country;naturally, the contribution of theeducated person to economic growth ismore than that of an illiterate person. Ifa healthy person could provide
uninterrupted labour supply for alonger period of time, then health is alsoan important factor for economicgrowth. Thus, both education andhealth, along with many other factorslike on-the-job training, job marketinformation and migration, increase an
Fig. 5.2 Creating human capital: a school being run in make shift premises in Delhi
Look at Fig. 5.2and discuss.
(a) What are the advantages ofhaving proper ‘classroom’?
(b) Do you think the childrengoing to this schol arereceiving quality education?
(c) Why these schools do nothave buildings?
2021-22

88 INDIAN ECONOMIC DEVELOPMENT
individual’s income generating capacity. This enhanced productivity of
human beings or human capitalcontributes substantially not onlytowards increasing labourproductivity but also stimulatesinnovations and creates ability toabsorb new technologies. Educationprovides knowledge to understandchanges in society and scientificadvancements, thus, facilitateinventions and innovations. Similarly,the availability of educated labourforce facilitates adaptation to newtechnologies.
Empirical evidence to prove thatincrease in human capital causeseconomic growth is rather nebulous.This may be because of measurementproblems. For example, educationmeasured in terms of years ofschooling, teacher-pupil ratio andenrolment rates may not reflect thequality of education; health servicesmeasured in monetary terms, lifeexpectancy and mortality rates maynot reflect the true health status of thepeople in a country. Using theindicators mentioned above, ananalysis of improvement in educationand health sectors and growth in realper capita income in both developingand developed countries shows thatthere is convergence in the measuresof human capital but no sign ofconvergence of per capita real income.In other words, the human capitalgrowth in developing countries hasbeen faster but the growth of per capitareal income has not been that fast.There are reasons to believe that the
causality between human capital andeconomic growth flows in eitherdirections. That is, higher incomecauses building of high level of humancapital and vice versa, that is, high levelof human capital causes growth ofincome.
India recognised the importance ofhuman capital in economic growthlong ago. The Seventh Five Year Plansays, “Human resources development(read human capital) has necessarilyto be assigned a key role in anydevelopment strategy, particularly ina country with a large population.Trained and educated on sound lines,a large population can itself becomean asset in accelerating economicgrowth and in ensuring social changein desired directions.”
It is difficult to establish a relation ofcause and effect from the growth ofhuman capital (education and health)to economic growth but we can see in
Fig. 5.3 Scientific and technical manpower: a richingredient of human capital
2021-22

89HUMAN CAPITAL FORMATION IN INDIA
Table 5.1 that these sectors havegrown simultaneously. Growth in eachsector probably has reinforced thegrowth of every other sector.
The National Education Policy2020 states that the world isundergoing rapid changes in theknowledge landscape. With variousdramatic scientific and technologicaladvances, such as the rise of big data,machine learning, and artificialintelligence, many unskilled jobsworldwide may be taken over bymachines, while the need for a skilled
workforce, particularly involvingmathematics, computer science, anddata science, in conjunction withmultidisciplinary abilities across thesciences and social sciences, andhumanities, will be increasingly ingreater demand. With climate change,increasing pollution, and depletingnatural resources, there will be asizeable shift in how we meet theworld’s energy, water, food, andsanitation needs, again resulting in theneed for new skilled labour,particularly in biology, chemistry,
physics, agriculture, climatescience, and social science. Thegrowing emergence of epidemicsand pandemics will also call forcollaborative research in infectiousdisease management anddevelopment of vaccines and theresultant social issues heightensthe need for multidisciplinarylearning. There will be a growingdemand for humanities and art,as India moves towards becominga developed country as well as
TABLE 5.1
Select Indicators of Development in Education and Health Sectors
Particulars 1951 1981 1991 2001 2016-17
Real Per Capita Income (in Rs) 7,651 12,174 15,748 23,095 77,659
Crude Death 25.1 12.5 9.8 8.1 6.3Rate (Per 1,000 Population)
Infant Mortality Rate 146 110 80 63 33
Life Expectancy 37.2 54.1 59.7 63.9 67at Birth (in Years)
36.2 54.7 60.9 66.9 70
16.67 43.57 52.21 65.20 76
Female
Male
Literacy Rate (%)
Source: Economic Survey for various years, Ministry of Finance National Statistical Office & Ministryof Statistics and Programme Implementation; Government of India.
Fig. 5.4 Job on hand: transforming India into a knowledge economy
2021-22

90 INDIAN ECONOMIC DEVELOPMENT
among the three largest economies inthe world. This policy vision suggestshow human capital formation in Indiawill move its economy to a highergrowth trajectory based on knowledgelandscape.
5.4 HUMAN CAPITAL AND HUMAN
DEVELOPMENT
The two terms sound similar but thereis a clear distinction between them.Human capital considers educationand health as a means to increaselabour productivity. Humandevelopment is based on the idea thateducation and health are integral tohuman well-being because only whenpeople have the ability to read andwrite and the ability to lead a longand healthy life, theywill be able to make other choiceswhich they value. Human capitaltreats human beings as a means toan end; the end being the increasein productivity. In this view, anyinvestment in education and health isunproductive if it does not enhanceoutput of goods and services. In thehuman development perspective,
human beings are ends in themselves.Human welfare should be increasedthrough investments in education andhealth even if such investments do notresult in higher labour productivity.Therefore, basic education and basichealth are important in themselves,irrespective of their contribution tolabour productivity. In such a view,every individual has a right to get basiceducation and basic health care, thatis, every individual has a right to beliterate and lead a healthy life.
Box 5.2: India as a Knowledge Economy
The Indian software industry has been showing an impressive record over thepast two decades. Entrepreneurs, bureaucrats and politicians are now advancingviews about how India can transform itself into a knowledge-based economy byusing information technology (IT). There have been some instances of villagersusing e-mail which are cited as examples of such transformation. Likewise, e-governance is being projected as the way of the future. The value of IT dependsgreatly on the existing level of economic development. Do you think IT - basedservices in rural areas will lead to human development? Discuss.
Work This Out
If a construction worker,maid-servant, dhobi or apeon in school has absentedherself/himself for long dueto ill health, find out how ithas affected her/his
(i) job security
(ii) wage/salary
What could be the possiblereasons?
2021-22

91HUMAN CAPITAL FORMATION IN INDIA
5.5 STATE OF HUMAN CAPITAL
FORMATION IN INDIA
In this section we are going to analysehuman capital formation in India. Wehave already learnt that humancapital formation is the outcomeof investments in education, health,on-the-job training, migration andinformation. Of these education andhealth are very important sources ofhuman capital formation. We knowthat India is a federal country with aunion government, state governmentsand local governments (MunicipalCorporations, Municipalities andVillage Panchayats). The Constitutionof India mentions the functions tobe carried out by each level ofgovernment. Accordingly, expendi-tures on both education and health areto be carried out simultaneously by allthe three tiers of the government.Analysis of health sector is taken upin Chapter 8; hence, we will analyseonly the education sector here.
Do you know who takes care ofeducation and health in India? Before wetake up the analysis of the educationsector in India, we will look into the needfor government intervention in educationand health sectors. We do understandthat education and health care servicescreate both private and social benefits andthis is the reason for the existence of bothprivate and public institutions in theeducation and health service markets.Expenditures on education and healthmake substantial long-term impact andthey cannot be easily reversed; hence,government intervention is essential. Forinstance, once a child is admitted to a
school or health care centre where therequired services are not provided, beforethe decision is taken to shift the child toanother institution, substantial amountof damage would have been done.Moreover, individual consumers ofthese services do not have completeinformation about the quality of servicesand their costs. In this situation, theproviders of education and healthservices acquire monopoly power and areinvolved in exploitation. The role ofgovernment in this situation is to ensurethat the private providers of theseservices adhere to the standardsstipulated by the government and chargethe correct price.
In India, the ministries ofeducation at the union and state level,departments of education and variousorganisations like National Council ofEducational Research and Training(NCERT), University Grants Commission(UGC) and All India Council ofTechnical Education (AICTE) facilitateinstitutions which come under theeducation sector. Similarly, theministries of health at the union andstate level, departments of health andvarious organisations like NationalMedical Commission and IndianCouncil for Medical Research (ICMR)facilitate institutions which come underthe health sector.
In a developing country like India,with a large section of the populationliving below the poverty line, manypeople cannot afford to access basiceducation and health care facilities.Moreover, a substantial sectionof India’s population cannot afford
2021-22

92 INDIAN ECONOMIC DEVELOPMENT
to reach super specialty health careand higher education. Furthermore,when basic education and health careis considered as a right of the citizens,then it is essential that the governmentshould provide education and healthservices free of cost for the deservingcitizens and those from the sociallyoppressed classes. Both, the union andstate governments, have been steppingup expenditures in the educationsector over the years in order to fulfilthe objective of attaining cent per centliteracy and considerably increase theaverage educational attainment ofIndians.
the development of education inthe country. During 1952-2014,education expenditure as percentageof total government expenditureincreased from 7.92 to 15.7 and aspercentage of GDP increased from0.64 to 4.13. Throughout this periodthe increase in education expenditurehas not been uniform and there hasbeen irregular rise and fall. To this ifwe include the private expenditureincurred by individuals and byphilanthropic institutions, the totaleducation expenditure should bemuch higher.
Elementary education takes a majorshare of total education expenditureand the share of the higher/tertiaryeducation (institutions of higherlearning like colleges, polytechnics anduniversities) is the least. Though, on anaverage, the government spends less ontertiary education, ‘expenditure perstudent’ in tertiary education is higherthan that of elementary. This does notmean that financial resources should betransferred from tertiary education toelementary education. As we expandschool education, we need moreteachers who are trained in the highereducational institutions; therefore,expenditure on all levels of educationshould be increased.
In 2014-15, the per capita publicexpenditure on elementary educationdiffers considerably across states fromas high as Rs 34,651 in HimachalPradesh to as low as Rs 4088 in Bihar.This leads to differences in educationalopportunities and attainments acrossstates.
5.6 EDUCATION SECTOR IN INDIA
Growth in Government Expenditureon Education: Do you know howmuch the government spends oneducation? This expenditure by thegovernment is expressed in two ways(i) as a percentage of ‘total governmentexpenditure’ (ii) as a percentage ofGross Domestic Product (GDP).
The percentage of ‘educationexpenditure of total governmentexpenditure’ indicates the importanceof education in the scheme ofthings before the government. Thepercentage of ‘education expenditureof GDP’ expresses how much ofpeople’s income is being committed to
Work This Out
Ø Identify the objectives and
functions of NCERT, UGC,AICTE and ICMR.
2021-22

93HUMAN CAPITAL FORMATION IN INDIA
One can understand the inadequacyof the expenditure on education if wecompare it with the desired level ofeducation expenditure as recommendedby the various commissions. TheEducation Commission (1964–66) hadrecommended that at least 6 per cent ofGDP be spent on education so as tomake a noticeable rate of growth ineducational achievements. The TapasMajumdar Committee, appointed bythe Government of India in 1999,estimated an expenditure of around Rs
1.37 lakh crore over 10 years(1998-99 to 2006-07) tobring all Indian children inthe age group of 6-14 yearsunder the purview of schooleducation. Compared to thisdesired level of educationexpenditure of around 6 percent of GDP, the current levelof a little over 4 per cent hasbeen quite inadequate. Inprinciple, a goal of 6 per centneeds to be reached—this hasbeen accepted as a must for
the coming years. In 2009, theGovernment of India enacted the Rightof Children to Free and CompulsoryEducation Act to make free educationa fundamental right of all children inthe age group of 6-14 years.
Government of India has alsostarted levying a 2 per cent ‘educationcess’ on all Union taxes. The revenuesfrom education cess has beenearmarked for spending on elementaryeducation. In addition to this, thegovernment sanctions a large outlay forthe promotion of higher education and
Fig. 5.5 Investment in educational infrastructure is inevitable
Work These Out
Prepare case studies of dropouts at different levels of schooling, say
(i) Primary dropouts
(ii) Class VIII dropouts
(iii) Class X dropouts
Find out the causes and discuss in the class.
‘School dropouts are giving way to child labour’. Discuss how this is a lossto human capital.
2021-22

94 INDIAN ECONOMIC DEVELOPMENT
TABLE 5.2
Educational Attainment in India
Sl.No. Particulars 1990 2000 2011 2017-18
1. Adult Literacy Rate (per cent of people aged 15+)
1.1 Male 61.9 68.4 79 82
1.2 Female 37.9 45.4 59 66
2. Primary completion rate (per cent of relevant age group)
2.1 Male 78 85 92 932.2 Female 61 69 94 96
3. Youth literacy rate (per cent of people aged 15+ to 24)
3.1 Male 76.6 79.7 90 933.2 Female 54.2 64.8 82 90
new loan schemes for students topursue higher education.
Educational Achievements in India:
Generally, educational achievementsin a country are indicated in termsof adult literacy level, primaryeducation completion rate and youthliteracy rate. These statistics for thelast two decades are given above inTable 5.2.
5.7 FUTURE PROSPECTS
Education for All — Still a DistantDream: Though literacy rates for both— adults as well as youth — haveincreased, still the absolute number ofilliterates in India is as much as India’spopulation was at the time ofindependence. In 1950, when theConstitution of India was passed by theConstituent Assembly, it was noted inthe Directive Principles of the
Fig. 5.6 School dropouts give way to child labour: a loss to human capital
2021-22

95HUMAN CAPITAL FORMATION IN INDIA
Constitution that the governmentshould provide free and compulsoryeducation for all children up to the ageof 14 years within 10 years from thecommencement of the Constitution.Had we achieved this, we would havecent per cent literacy by now.
Gender Equity — Better than Before:The differences in literacy rates betweenmales and females are narrowingsignifying a positive development ingender equity; still the need to promoteeducation for women in India isimminent for various reasons such asimproving economic independence andsocial status of women and alsobecause women education makes afavourable impact on fertility rate andhealth care of women and children.Therefore, we cannot be complacentabout the upward movement in theliteracy rates and we have miles to goin achieving cent per cent adult literacy.
unemployment among educated youthis the highest. As per NSSO data, in theyear 2011-12, the rate ofunemployment among youth males whostudied graduation and above in ruralareas was 19 per cent. Their urbancounterparts had relatively less level ofunemployment at 16 per cent. The mostseverely affected ones were young ruralfemale graduates as nearly 30 per centof them are unemployed. In contrast tothis, only about 3-6 per cent of primarylevel educated youth in rural and urbanareas were unemployed. The situationis yet to improve as indicated by thePeriodic Labour Force Survey 2017-18.Therefore, the government shouldincrease allocation for higher educationand also improve the standard of highereducation institutions, so that studentsare imparted employable skills in suchinstitutions. When compared to lesseducated, a large proportion of educatedpersons are unemployed. Why?
5.8 CONCLUSION
The economic and social benefits ofhuman capital formation and humandevelopment are well known. The unionand state governments in India havebeen earmarking substantial financialoutlays for development of educationand health sectors. The spread ofeducation and health services acrossdifferent sectors of society should beensured so as to simultaneously attaineconomic growth and equity. India hasa rich stock of scientific and technicalmanpower in the world. The need of thehour is to better it qualitatively andprovide such conditions so that they areutilised in India.
Fig. 5.7 Higher Education: few takers
Higher Education — a Few Takers:The Indian education pyramid issteep, indicating lesser and lessernumber of people reaching the highereducation level. Moreover, the level of
2021-22

96 INDIAN ECONOMIC DEVELOPMENT
1. What are the two major sources of human capital in a country?
2. What are the indicators of educational achievement in a country?
3. Why do we observe regional differences in educational attainmentin India?
4. Bring out the differences between human capital and humandevelopment.
5. How is human development a broader term as compared to humancapital?
6. What factors contribute to human capital formation?
Recap
Ø Investments in education convert human beings into human capital; human
capital represents enhanced labour productivity, which is an acquired abilityand an outcome of deliberate investment decisions with an expectation thatit will increase future income sources.
Ø Investments in education, on-the-job training, health, migration and
information are the sources of human capital formation.
Ø The concept of physical capital is the base for conceptualising human capital.
There are some similarities as well as dissimilarities between the two formsof capital formation.
Ø Investment in human capital formation is considered as efficient and growth
enhancing.
Ø Human development is based on the idea that education and health are
integral to human well-being because only when people have the ability toread and write and the ability to lead a long and healthy life, will they beable to make other choices which they value.
Ø The percentage of expenditure on education of the total government
expenditure indicates the importance of education in the scheme of thingsfor the government.
EXERCISES
2021-22

97HUMAN CAPITAL FORMATION IN INDIA
7. How government organisations facilitate the functioning of schoolsand hospitals in India?
8. Education is considered to be an important input for the developmentof a nation. How?
9. Discuss the following as a source of human capital formation
(i) Health infrastructure
(ii) Expenditure on migration.
10. Establish the need for acquiring information relating to health andeducation expenditure for the effective utilisation of humanresources.
11. How does investment in human capital contribute to growth?
12. ‘There is a downward trend in inequality world-wide with a rise inthe average education levels’. Comment.
13. Examine the role of education in the economic development of anation.
14. Explain how investment in education stimulates economic growth.
15. Bring out the need for on-the-job-training for a person.
16. Trace the relationship between human capital and economic growth.
17. Discuss the need for promoting women’s education in India.
18. Argue in favour of the need for different forms of governmentintervention in education and health sectors.
19. What are the main problems of human capital formation in India?
20. In your view, is it essential for the government to regulate the feestructure in education and health care institutions? If so, why?
1. Identify how Human Development Index is calculated. What is theposition of India in the World Human Development Index?
2. Is India going to be a knowledge based economy in the near future?Discuss in the classroom.
3. Interpret the data given in Table 5.2.
4. As an educated person, what will be your contribution to the causeof education? (Example ‘Each one — teach one’).
SUGGESTED ADDITIONAL ACTIVITIES
2021-22

98 INDIAN ECONOMIC DEVELOPMENT
5. Enlist the various sources that provide information regardingeducation, health and labour.
6. Read the annual reports of Union Ministries of Education and Healthand Family welfare and make summaries. Read the chapter on socialsector in the Economic Survey. These can be downloaded from websitesof the respective Union Government Ministries.
Books
BECKER, GARY S. 1964. Human Capital. 2nd Edition, Columbia UniversityPress, New York.
FREEMAN, RICHARD. 1976. The Overeducated American. Academic Press,New York.
SIDDHARTHAN, N.S. AND K. NARAYANAN (Eds.). 2013. Human Capital and Development— The Indian Experience. Springer, New Delhi.
Government Reports
India Human Development Report 2011: Towards Social Inclusion, Plan-ning Commission, Government of India.
Educational Statistics At a glance, Ministry of Education, (for various years),Government of India.
Annual Reports, Ministry of Education, Government of India.
National Education Policy 2020, Ministry of Education, Govt. of India,New Delhi.
Websites
http://epathshala.nic.inwww.education.nic.inwww.cbse.nic.inwww.ugc.ac.inwww.aicte.ernet.inwww.ncert.nic.inwww.finmin.nic.inwww.mospi.nic.inhttp://nroer.gov.in
REFERENCES
2021-22

99RURAL DEVELOPMENT
After studying this chapter, the learners will
• understand rural development and the major issues associated with it
• appreciate how crucial the development of rural areas is for India’s overalldevelopment
• understand the critical role of credit and marketing systems in ruraldevelopment
• learn about the importance of diversification of productive activities tosustain livelihoods
• understand the significance of organic farming in sustainabledevelopment.
RURAL
DEVELOPMENT
6
2021-22
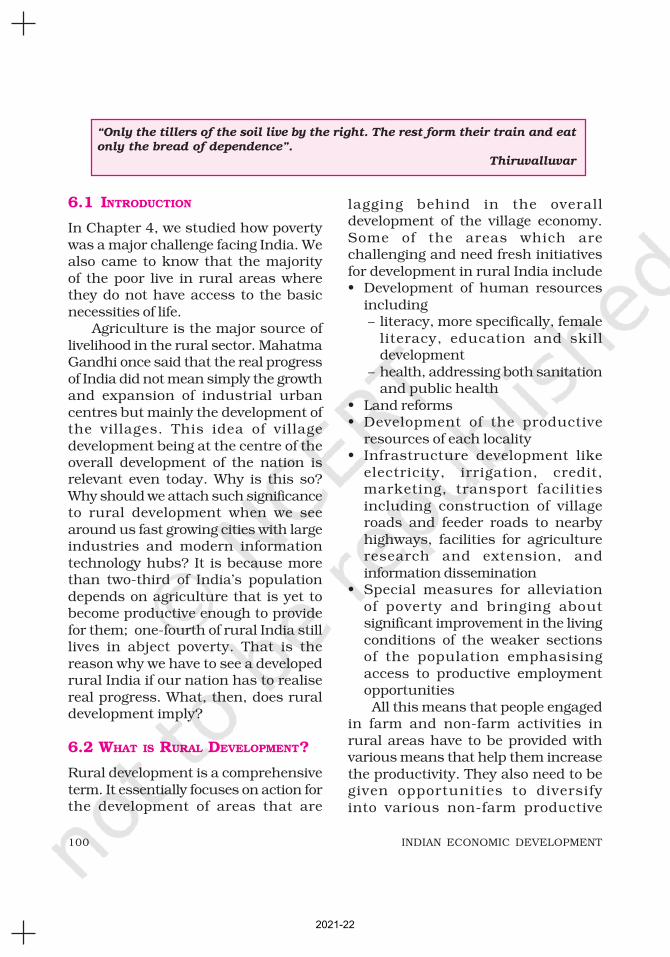
100 INDIAN ECONOMIC DEVELOPMENT
6.1 INTRODUCTION
In Chapter 4, we studied how povertywas a major challenge facing India. Wealso came to know that the majorityof the poor live in rural areas wherethey do not have access to the basicnecessities of life.
Agriculture is the major source oflivelihood in the rural sector. MahatmaGandhi once said that the real progressof India did not mean simply the growthand expansion of industrial urbancentres but mainly the development ofthe villages. This idea of villagedevelopment being at the centre of theoverall development of the nation isrelevant even today. Why is this so?Why should we attach such significanceto rural development when we seearound us fast growing cities with largeindustries and modern informationtechnology hubs? It is because morethan two-third of India’s populationdepends on agriculture that is yet tobecome productive enough to providefor them; one-fourth of rural India stilllives in abject poverty. That is thereason why we have to see a developedrural India if our nation has to realisereal progress. What, then, does ruraldevelopment imply?
6.2 WHAT IS RURAL DEVELOPMENT?
Rural development is a comprehensiveterm. It essentially focuses on action forthe development of areas that are
lagging behind in the overalldevelopment of the village economy.Some of the areas which arechallenging and need fresh initiativesfor development in rural India include• Development of human resources
including– literacy, more specifically, female
literacy, education and skilldevelopment
– health, addressing both sanitationand public health
• Land reforms• Development of the productive
resources of each locality• Infrastructure development like
electricity, irrigation, credit,marketing, transport facilitiesincluding construction of villageroads and feeder roads to nearbyhighways, facilities for agricultureresearch and extension, andinformation dissemination
• Special measures for alleviationof poverty and bringing aboutsignificant improvement in the livingconditions of the weaker sectionsof the population emphasisingaccess to productive employmentopportunitiesAll this means that people engaged
in farm and non-farm activities inrural areas have to be provided withvarious means that help them increasethe productivity. They also need to begiven opportunities to diversifyinto various non-farm productive
“Only the tillers of the soil live by the right. The rest form their train and eatonly the bread of dependence”.
Thiruvalluvar
2021-22

101RURAL DEVELOPMENT
activities such as food processing.Enabling them better and moreaffordable access to healthcare,sanitation facilities at workplaces andhomes and education for all would alsoneed to be given top priority for rapidrural development.
It was observed in an earlier chapterthat although the share of agriculturesector’s contribution to GDP was on adecline, the population dependent onthis sector did not show any significantchange. Further, after the initiation ofreforms, the growth rate of agriculturesector decelerated to about 3 per centper annum during the 1991-2012,which was lower than the earlier years.In recent years, this sector has becomevolatile. During 2014-15, the GVAgrowth rate of agriculture and its alliedsectors was less than one per cent.Scholars identify decline in publicinvestment since 1991 as the major
reason for this. They also argue thatinadequate infrastructure, lack ofalternate employment opportunities inthe industry or service sector,increasing casualisation of employmentetc., further impede rural development.The impact of this phenomenon can beseen from the growing distresswitnessed among farmers acrossdifferent parts of India. Against thisbackground, we will critically look atsome of the crucial aspects of ruralIndia like credit and marketingsystems, agricultural diversificationand the role of organic farming inpromoting sustainable development.
6.3 CREDIT AND MARKETING IN RURAL
AREAS
Credit: Growth of rural economydepends primarily on infusion ofcapital, from time to time, to realisehigher productivity in agriculture andnon-agriculture sectors. As the timegestation between crop sowing andrealisation of income after production isquite long, farmers borrow from varioussources to meet their initial investmenton seeds, fertilisers, implements andother family expenses of marriage,death, religious ceremonies etc.
At the time of independence,moneylenders and traders exploitedsmall and marginal farmers andlandless labourers by lending to themon high interest rates and bymanipulating the accounts to keepthem in a debt-trap. A major changeoccurred after 1969 when Indiaadopted social banking and multi-agency approach to adequately meetthe needs of rural credit. Later, the
Work These Out
On a monthly basis, go through thenewspapers of your region andidentify the problems raised bythem in relation to rural areas andthe solutions offered. You could alsovisit a nearby village and identifythe problems faced by people there.Discuss this in the classroom.
Prepare a list of recent schemesand their objectives from thegovernment website https://www.rural.nic.in. Collect the detailsof how anyone of these schemesimplemented in your resion/ruralneighbourhood areas. Discuss yourobservations in class.
2021-22

102 INDIAN ECONOMIC DEVELOPMENT
Box 6.1: The Poor Women’s Bank
‘Kudumbashree’ is a women-oriented community-based poverty reductionprogramme being implemented in Kerala. In 1995, a thrift and credit societywas started as a small savings bank for poor women with the objective toencourage savings. The thrift and credit society mobilised Rs 1 crore as thriftsavings. These societies have been acclaimed as the largest informal banks inAsia in terms of participation and savings mobilised.
Source: www.kudumbashree.org. Visit this website and explore various other initiativesundertaken by this organisation. Identify some factors which contributed totheir successes and discuss in the class.
National Bank for Agriculture andRural Development (NABARD) was setup in 1982 as an apex body tocoordinate the activities of allinstitutions involved in the ruralfinancing system. The GreenRevolution was a harbinger of majorchanges in the credit system as it led tothe diversification of the portfolio ofrural credit towards production-oriented lending.
The institutional structure of ruralbanking today consists of a set ofmulti-agency institutions, namely,commercial banks, regional ruralbanks (RRBs), cooperatives and landdevelopment banks. They are expectedto dispense adequate credit at cheaper
rates. Recently, Self-Help Groups(henceforth SHGs) have emerged to fillthe gap in the formal credit systembecause the formal credit deliverymechanism has not only proveninadequate but has also not been fullyintegrated into the overall rural socialand community development. Sincesome kind of collateral is required, vastproportion of poor rural householdswere automatically out of the creditnetwork. The SHGs promote thrift insmall proportions by a minimumcontribution from each member. Fromthe pooled money, credit is given to theneedy members to be repayable insmall instalments at reasonable interestrates. By May 2019, nearly 6 crore
Work These Out
In your locality/neighbourhood, you might notice self-help groups providingcredit. Attend few meetings of such self-help groups. Write a report on theprofile of a self-help group. The profile may include — when it was started,the number of members, amount of savings and type of credit they provideand how borrowers use the loan.
You might also find that those who take a loan for starting self-employmentactivities but use it for other purposes. Interact with few such borrowers.Identify the reasons for not starting self employment activities and discussin the classroom.
2021-22

103RURAL DEVELOPMENT
women in India have become memberin 54 lakh women SHGs. About ` 10-15,000 per SHG and another ̀ 2.5 lakhsper SHG as a Community InvestmentSupport Fund (CISF) are provided as partof renovating fund to take up selfemployement for income generation.Such credit provisions are generallyreferred to as micro-credit programmes.SHGs have helped in the empowermentof women. It is alleged that the borrowingsare mainly confined to consumptionpurposes. Why are borrowers notspending for productive purposes?
Rural Banking — a CriticalAppraisal: Rapid expansion of thebanking system had a positive effect onrural farm and non-farm output,income and employment, especiallyafter the green revolution — it helpedfarmers to avail services and creditfacilities and a variety of loans formeeting their prodution needs. Faminesbecame events of the past; we have nowachieved food security which is reflectedin the abundant buffer stocks of grains.
However, all is not well with ourbanking system.
With the possible exception of thecommercial banks, other formalinstitutions have failed to develop aculture of deposit mobilisation —lending to worthwhile borrowers andeffective loan recovery. Agriculture loandefault rates have been chronicallyhigh. Why farmers failed to pay backloans? It is alleged that farmers aredeliberately refusing to pay backloans. What could be the reasons?
Thus, the expansion and promotionof the rural banking sector has taken abackseat after reforms. To improve thesituation, In recent years, all the adultsare encouraged to open bank accountsas a part of a scheme known as Jan-Dhan Yojana. Those bank holders canget Rs. 1-2 lakh accidental insurancecoverage and overdraft facilities for Rs.10,000 and get their wages, old agepension and other social securitypayments of the government transferredto bank accounts. There is no need tokeep minimum bank balance. This has
Work These Out
In the last few years, you might have taken note — in your neighbourhood if youare living in rural areas or read in the newspapers or seen on TV — of farmerscommiting suicides. Many such farmers had borrowed money for farming and otherpurposes. It was found that when they were unable to pay back due to crop failure,insufficient income and employment opportunities, they took such steps. Collectinformation relating to such cases and discuss in the classroom.
Visit banks that cater to rural areas. They may be primary agricultural cooperativebanks, land development banks, regional rural banks or district cooperative banks.Collect details such as how many rural households borrowed from them, amountgenerally borrowed, kinds of collateral used, interest rates and dues.
If farmers who borrowed from cooperative banks could not pay back due to cropfailure and other reasons, their loans should be waived otherwise they may takedrastic decisions like committing suicides. Do you agree?
2021-22

104 INDIAN ECONOMIC DEVELOPMENT
led to more than 40 crore people openingbank accounts; indirectly it haspromoted thrift habit and efficientallocation of financial resourcesparticularly in rural areas. Banks alsocould mobile funds of more thanRs. 1,40,000 crores through theseaccounts.
6.4 AGRICULTURAL MARKET SYSTEM
Have you ever asked yourself how foodgrains, vegetables and fruits that weconsume daily come from differentparts of the country? The mechanismthrough which these goods reachdifferent places depends on the marketchannels. Agricultural marketing is aprocess that involves the assembling,storage, processing, transportation,packaging, grading and distributionof different agricultural commoditiesacross the country.
Prior to independence, farmers,while selling their produce to traders,suffered from faulty weighing andmanipulation of accounts. Farmers whodid not have the required information
on prices prevailing in markets wereoften forced to sell at low prices. Theyalso did not have proper storage facilitiesto keep back their produce for sellinglater at a better price. Do you know thateven today, more than 10 per cent ofgoods produced in farms are wasted dueto lack of storage? Therefore, governmentintervention became necessary toregulate the activities of the private traders.
Let us discuss four such measuresthat were initiated to improve themarketing aspect. The first step wasregulation of markets to create orderlyand transparent marketing conditions.By and large, this policy benefitedfarmers as well as consumers. However,there is still a need to develop about27,000 rural periodic markets asregulated market places to realise thefull potential of rural markets. Secondcomponent is provision of physicalinfrastructure facilities like roads,railways, warehouses, godowns, coldstorages and processing units. Thecurrent infrastructure facilities are quiteinadequate to meet the growing demandand need to be improved. Cooperative
Fig. 6.1 Regulated market yards benefit farmers as well as consumers
2021-22

105RURAL DEVELOPMENT
marketing, in realising fair prices forfarmers’ products, is the third aspect of
government initiative. The success of
milk cooperatives in transforming the
social and economic landscape of
Gujarat and some other parts of the
country is testimony to the role of
cooperatives. However cooperatives have
received a setback during the recent past
due to inadequate coverage of farmer
members, lack of appropriate link
between marketing and processing
cooperatives and inefficient financial
management. The fourth element is the
policy instruments like (i) assurance of
minimum support prices (MSP) for
agricultural products (ii) maintenance
of buffer stocks of wheat and rice
by Food Corporation of India and
(iii) distribution of food grains and sugar
through PDS. These instruments are
aimed at protecting the income of the
farmers and providing foodgrains at a
subsidised rate to the poor. However,
despite government intervention, private
trade (by moneylenders, rural political
elites, big merchants and rich farmers)
predominates agricultural markets. The
need for government intervention is
imminent particularly when a large
share of agricultural products, is
handled by the private sector.Agricultural marketing has come
a long way with the intervention of thegovernment in various forms. Somescholars argue that commercialisationof agriculture offers tremendous scopefor farmers to earn higher incomesprovided the government interventionis restricted. What do you think aboutthis view?
Emerging Alternate MarketingChannels: It has been realised that iffarmers directly sell their produce toconsumers, it increases their incomes.Some examples of these channels areApni Mandi (Punjab, Haryana andRajasthan); Hadaspar Mandi (Pune);Rythu Bazars (vegetable and fruitmarkets in Andhra Pradesh andTelangana) and Uzhavar Sandies
(farmers markets in Tamil Nadu).Further, several national andmultinational fast food chains areincreasingly entering into contracts/alliances with farmers to encourage
Work These Out
Ø Visit a nearby vegetable and fruit market. Observe and identify different
characteristics of the market. Identify the place of origin of at least tendifferent fruits and vegetables and distance travelled to reach the market.Further, look at the modes of transport and its implication on prices.
Ø Most small towns have regulated market yards. Farmers can go to these
markets and sell their produce. They can also store their goods in the yard.Visit one regulated market yard; collect the details of its functioning, kindof goods coming to the yard and how prices are fixed. Prepare a detailedreport and discuss in the class.
2021-22

106 INDIAN ECONOMIC DEVELOPMENT
them to cultivate farm products(vegetables, fruits, etc.) of the desiredquality by providing them with not onlyseeds and other inputs but also assuredprocurement of the produce at pre-decided prices. It is argued that sucharrangements will help in reducing theprice risks of farmers and would alsoexpand the markets for farm products.Do you think such arrangements raiseincomes of small farmers.
greater risk in depending exclusivelyon farming for l ivel ihood.Diversification towards new areas isnecessary not only to reduce the riskfrom agriculture sector but also toprovide productive sustainablelivelihood options to rural people.Much of the agricultural employmentactivities are concentrated in theKharif season. But during the Rabiseason, in areas where there areinadequate irrigation facilities, itbecomes difficult to find gainfulemployment. Therefore expansioninto other sectors is essential toprovide supplementary gainfulemployment and in realising higherlevels of income for rural people toovercome poverty and othertribulations. Hence, there is a need tofocus on allied activities, non-farmemployment and other emergingalternatives of livelihood, thoughthere are many other options availablefor providing sustainable livelihoodsin rural areas.
In 2020, Indian Parliament passedthree laws to reform agriculturemarketing system. While some sectionof farmers support these reforms, therest of the farmers oppose and theseActs are still being debated. Collectthe details of these laws, debate anddiscuss in the class.
6.5 DIVERSIFICATION INTO PRODUCTIVE
ACTIVITIES
Diversification includes two aspects -one relates to change in croppingpattern and the other relates to a shiftof workforce from agriculture to otherallied activities (livestock, poultry,fisheries etc.) and non-agriculturesector. The need for diversificationarises from the fact that there is Fig. 6.2 Jaggery making is an allied activity
of the farming sector
Work This Out
Visit one such alternative marketingsystem which farmers in yourlocality, or in the neighbourhoodrural areas, use. How are theydifferent from regulated marketyards? Should they be encouragedand supported by the government?Why and how? Discuss.
2021-22

107RURAL DEVELOPMENT
A s agriculture is alreadyovercrowded, a major proportion of theincreasing labour force needs to findalternate employment opportunities inother non-farm sectors. Non-farmeconomy has several segments in it;some possess dynamic linkages thatpermit healthy growth while others arein subsistence, low productivitypropositions. The dynamic sub-sectorsinclude agro-processing industries,food processing industries, leatherindustry, tourism, etc. Those sectorswhich have the potential but seriouslylack infrastructure and othersupport include traditionalhome-based industries likepottery, crafts, handlooms etc.Majority of rural women findemployment in agriculture whilemen generally look for non-farmemployment. In recent times,women have also begun lookingfor non-farm jobs (see Box 6.2).
Animal Husbandry: In India, thefarming community uses themixed crop-livestock farmingsystem —cattle, goats, fowl
are the widely held species. Livestockproduction provides increased stabilityin income, food security, transport, fueland nutrition for the family withoutdisrupting other food-producingactivities. Today, livestock sector aloneprovides alternate livelihood options toover 70 million small and marginalfarmers including landless labourers. Asignificant number of women also findemployment in the livestock sector.
Chart 6.1 shows the distribution oflivestock in India. Poultry accounts forthe largest share with 61 per cent
Box 6.2: Tamil Nadu Women in Agriculture (TANWA)
Tamil Nadu Women in Agriculture (TANWA) was a project initiated in the late 1980sin Tamil Nadu to train women in latest agricultural techniques and in organic farming.It encouraged women to actively participate in raising agricultural productivity andfamily income. At a Farm Women’s Group in Thiruchirapalli, run by Anthoniammal,trained women are successfully making and selling vermicompost and earning moneyfrom this venture. Many other Farm Women’s Groups are creating savings in theirgroup by functioning like mini banks through a micro-credit system. With theaccumulated savings, they promote small-scale household activities like mushroomcultivation, soap manufacture, doll making or other income-generating activities.There could be similar initiatives in your area or your neighborhood rural areas.Talk to organisation or women entrepreneurs and discuss the details in the class.
Chart 6.1: Distribution of Poultry andLivestock in India, 2019
2021-22

108 INDIAN ECONOMIC DEVELOPMENT
followed by others. Other animals whichinclude camels, asses, horses, poniesand mules are in the lowest rung. Indiahad about 303 million cattle, including110 million buffaloes in 2019.Performance of the Indian dairy sectorover the last three decades has beenquite impressive. Milk production inthe country has increased by about tentimes between 1951-2016. This canbe attributed mainly to the successfulimplementation of ‘Operation Flood’. Itis a system whereby all the farmers canpool their milk produced according todifferent grading (based on quality),processed and marketed to urbancentres through cooperatives. In thissystem the farmers are assured of a fairprice and income from the supply ofmilk to urban markets. As pointed outearlier Gujarat state is held as asuccess story in the efficientimplementation of milk cooperativeswhich has been emulated by manystates. Gujarat, Madhya Pradesh, UttarPradesh, Andhra Pradesh,Maharashtra, Punjab and Rajasthan,are major milk producing states. Meat,
eggs, wool and other by- products arealso emerging as important productivesectors for diversification.
Fisheries: The fishing communityregards the water body as ‘mother’ or‘provider’. The water bodies consistingof sea, oceans, rivers, lakes, naturalaquatic ponds, streams etc. are,therefore, an integral and life-givingsource for the fishing community. InIndia, after progressive increase inbudgetary allocations and introductionof new technologies in fisheries andaquaculture, the development offisheries has come a long way.Presently, fish production from inlandsources contributes about 65 per centto the total value of fish production andthe balance 35 per cent comes from themarine sector (sea and oceans). Todaytotal fish production accounts for0.9 per cent of the total GDP. In India,West Bengal, Andhra Pradesh, Kerala,Gujarat, Maharashtra and Tamil Naduare major fish producing states. A largeshare of fishworker families are poor.Rampant underemployment, low percapita earnings, absence of mobility oflabour to other sectors and a high rateof illiteracy and indebtedness are someof the major problems fishingcommunity face today. Even thoughwomen are not involved in activefishing, about 60 per cent of theworkforce in export marketing and 40per cent in internal marketing arewomen. There is a need to increasecredit facilities through cooperatives
Fig. 6.3 Sheep rearing — an important incomeaugmenting activity in rural areas
2021-22

109RURAL DEVELOPMENT
and SHGs for fisherwomen to meet the
working capital requirements for
marketing.
Horticulture: Blessed with a varyingclimate and soil conditions, India hasadopted growing of diverse horti-cultural crops such as fruits,vegetables, tuber crops, flowers,medicinal and aromatic plants, spicesand plantation crops. These crops playa vital role in providing foodand nutrition, besides addressingemployment concerns. Horticulturesector contributes nearly one-third ofthe value of agriculture output and sixper cent of Gross Domestic Product ofIndia. India has emerged as a worldleader in producing a variety of fruitslike mangoes, bananas, coconuts,cashew nuts and a number of spicesand is the second largest producer offruits and vegetables. Economiccondition of many farmers engaged inhorticulture has improved and it hasbecome a means of improving livelihoodfor many unprivileged classes. Flower
harvesting, nursery maintenance,hybrid seed production and tissueculture, propagation of fruits andflowers and food processing are highlyremunerative employment options forwomen in rural areas.
Though, in terms of numbers, ourlivestock population is quite impressivebut its productivity is quite low ascompared to other countries. It requiresimproved technology and promotion of
good breeds of animals toenhance productivity.Improved veterinary careand credit facilities tosmall and marginalfarmers and landlesslabourers would enhancesustainable livelihoodoptions throughlivestock production.Production of fisherieshas already increasedsubstantially.
However problemsrelated to over- fishing andFig. 6.4 Poultry has the largest share of total livestock in India
Fig. 6.5 Women in rural households take up bee-keeping as an entrepreneurial activity
2021-22

110 INDIAN ECONOMIC DEVELOPMENT
pollution need to be regulated andcontrolled. Welfare programmes for thefishing community have to be reorientedin a manner which can provide long-termgains and sustenance of livelihoods.Horticulture has emerged as a successfulsustainable livelihood option and needsto be encouraged significantly.Enhancing its role requires investmentin infrastructure like electricity, coldstorage systems, marketing linkages,small-scale processing units andtechnology improvement anddissemination.
Other Alternate Livelihood Options:The IT has revolutionised many sectorsin the Indian economy. There is broadconsensus that IT can play a criticalrole in achieving sustainabledevelopment and food security in thetwenty-first century. Governments canpredict areas of food insecurity andvulnerability using appropriateinformation and software tools so thataction can be taken to prevent orreduce the likelihood of an emergency.It also has a positive impact on theagriculture sector as it can disseminateinformation regarding emerging
technologies and its applications,
prices, weather and soil conditions for
growing different crops etc. Though IT
is, by itself, no catalyst of change but
it can act as a tool for releasing the
creative potential and knowledge
embedded in the society. It also has
potential of employment generation in
rural areas. Experiments with IT and
its application to rural development are
carried out in different parts of India.
6.6 SUSTAINABLE DEVELOPMENT AND
ORGANIC FARMING
In recent years, awareness of the
harmful effect of chemical-based
fertilisers and pesticides on our healthis on a rise. Conventional agriculture
relies heavily on chemical fertilisers
and toxic pesticides etc., which enter
the food supply, penetrate the watersources, harm the livestock, deplete the
soil and devastate natural eco-systems.
Efforts in evolving technologies which
are eco-friendly are essential forsustainable development and one
such technology which is eco-friendly
is organic farming. In short, organic
Box 6.3: Adoption of Village by Parliamentarians
In October, 2014, The Government of India introduced a new scheme calledSaansad Adarsh Gram Yojana (SAGY). Under this scheme, Members of India'sParliament need to identify and develop one village from their constituencies. Tobegin with, MPs can develop one village as a model village by 2016, and two moreby 2019, covering over 2,500 villages in India. According to the scheme, the villagecan have a population of 3,000-5,000 in the plains and 1,000-3,000 in the hillsand should not be MPs' own or their spouse's village. MPs are expected to facilitatea village development plan, motivate villagers to take up activities and builtinfrastructure in the areas of health, nutrition and education.
Source: www.pib.nic.in accessed on 24 October 2014.
2021-22

111RURAL DEVELOPMENT
agriculture is a whole system of
farming that restores, maintains and
enhances the ecological balance. Thereis an increasing demand for
organically grown food to enhance
food safety throughout the world (see
Box 6.4).
Benefits of Organic Farming: Organic
agriculture offers a means to substitute
costlier agricultural inputs (such as
HYV seeds, chemical fertilisers,pesticides etc.) with locally produced
organic inputs that are cheaper andthereby generate good returns oninvestment. Organic agriculture also
generates income through exports asthe demand for organically grown crops
is on a rise. Studies across countrieshave shown that organically grown food
has more nutritional value thanchemical farming thus providing uswith healthy foods. Since organic
farming requires more labour inputthan conventional farming, India willfind organic farming an attractive
proposition. Finally, the produce ispesticide-free and produced in anenvironmentally sustainable way (see
Box 6.5).
Popularising organic farming
requires awareness and willingness onthe part of farmers to adapt to new
technology. Inadequate infrastructure
and the problem of marketing the
products are major concerns which
Box 6.5: Organically Produced Cotton in Maharashtra
In 1995, when Kisan Mehta of Prakruti (an NGO) first suggested that cotton,the biggest user of chemical pesticides, could be grown organically, the thenDirector of the Central Institute for Cotton Research, Nagpur, famously remarked,“Do you want India to go naked?” At present, as many as 130 farmers havecommitted 1,200 hectares of land to grow cotton organically on the InternationalFederation of Organic Agriculture Movement’s standards. The produce waslater tested by the German Accredited Agency, AGRECO, and found to be ofhigh quality. Kisan Mehta feels that about 78 per cent of Indian farmers aremarginal farmers owning about less than 0.8 hectare but accounting for 20 percent of India’s cultivable land. For such farmers, organic agriculture is moreprofitable in terms of money and soil conservation in the long run. Visit a farmin your locality which uses organic manure and discuss the uses associatedwith the farming practices. Present the report in your class.
Source: Lyla Bavadam, A Green Alternative, Frontline, 29 July 2005.
Box 6.4: Organic FoodOrganic food is growing in popularity across the world. Many countries havearound 10 per cent of their food system under organic farming. There are manyretail chains and supermarkets which are accorded with green status to sellorganic food. Moreover, organic foods command higher price of around 10-100per cent than conventional ones.
2021-22

112 INDIAN ECONOMIC DEVELOPMENT
need to be addressed apart from an
appropriate agriculture policy topromote organic farming. It has been
observed that the yields from organic
farming are less than modern
agricultural farming in the initial years.Therefore, small and marginal farmers
may find it difficult to adapt to large-
scale production. Organic produce may
also have more blemishes and a shortershelf life than sprayed produce.
Moreover choice in production of
off-season crops is quite limited in
organic farming. Nevertheless, organicfarming helps in sustainable
development of agriculture and India
has a clear advantage in producing
organic products for both domestic andinternational markets. Do you think
food and non-food items cultivated
using organic farming methods will be
cheaper?
6.7 CONCLUSION
It is clear that until and unless some
spectacular changes occur, the rural
sector might continue to remainbackward. There is a greater need
today to make rural areas more
vibrant through diversification into
dairying, poultry, f isheries,vegetables and fruits and linking up
the rural production centres with the
urban and foreign (export) markets
to realise higher returns on theinvestments for the products.
Moreover, infrastructure elements
like credit and marketing, farmer-
friendly agricultural policies and aconstant appraisal and dialogue
between farmers’ groups and state
agricultural departments are
essential to realise the full potentialof the sector.
Today we cannot look at the
environment and rural development as
two distinct subjects. There is need toinvent or procure alternate sets of eco-
friendly technologies that lead to
sustainable development in different
Work These Out
Ø Make a list of five popular items that are organically produced in India.
Ø Visit a nearby super market, vegetable shop and/or a departmental shop.
Identify a few products. Prepare a chart comparing a few goods that areproduced organically and in the normal way on the basis of their prices,shelf life, quality and the kind of advertisement through which they arepopularised.
Ø Visit a horticultural farm in the nearby locality. Collect the details of
goods that they cultivate on the farm. They could have diversified theircropping patterns. Discuss with them the merits and demerits of thediversification.
2021-22

113RURAL DEVELOPMENT
circumstances. From these, each ruralcommunity can choose whatever willsuit its purpose. We need to learnfrom, and also try out when foundrelevant, practices from the availableset of ‘best practice’ illustrations
(which means success stories ofrural development experiments thathave already been carried out insimilar conditions in different partsof India), to speed up this processof ‘learning by doing’.
1. What do you mean by rural development? Bring out the key issues inrural development.
2. Discuss the importance of credit in rural development.
3. Explain the role of micro-credit in meeting credit requirements of thepoor.
4. Explain the steps taken by the government in developing ruralmarkets.
5. Why is agricultural diversification essential for sustainablelivelihoods?
Recap
Rural development is quite a comprehensive term but it essentially meansa plan of action for the development of rural areas which are laggingbehind in socio-economic development.
There is a need for improving the quantity and quality of infrastructurein rural areas such as banking, marketing, storage, transport andcommunications etc. to realise its true potential.
Diversification towards new areas such as livestock, fisheries and othernon-agricultural activities is necessary not only to reduce the risk fromagriculture sector but also to provide productive sustainable livelihoodoptions to our rural people.
The importance of organic farming as an environmentally sustainableproduction process is on a rise and needs to be promoted.
EXERCISES
2021-22

114 INDIAN ECONOMIC DEVELOPMENT
6. Critically evaluate the role of the rural banking system in the processof rural development in India.
7. What do you mean by agricultural marketing?
8. Mention some obstacles that hinder the mechanism of agriculturalmarketing.
9. What are the alternative channels available for agriculturalmarketing? Give some examples.
10. Distinguish between ‘Green Revolution’ and ‘Golden Revolution’.
11. Do you think various measures taken by the government to improveagricultural marketing are sufficient? Discuss.
12. Explain the role of non-farm employment in promoting ruraldiversification.
13. Bring out the importance of animal husbandry, fisheries andhorticulture as a source of diversification.
14. ‘Information technology plays a very significant role in achievingsustainable development and food security’ — comment.
15. What is organic farming and how does it promote sustainabledevelopment?
16. Identify the benefits and limitations of organic farming.
17. Enlist some problems faced by farmers during the initial years oforganic farming.
18. “Jan-Dhan-Yojna helps in the rural development.” Do you agree withthis statement? Explain.
ACHARYA, S.S. 2004. Agricultural Marketing, State of the Indian Farmer, aMillennium Study. Academic Foundation, New Delhi.
ALAGH, Y.K. 2004. State of the Indian Farmer, a Millennium Study — an Overview.Academic Foundation, New Delhi.
CHAWLA, N.K., M.P.G. KURUP and V. P. SHARMA. 2004. Animal Husbandry, State ofthe Indian Farmer, a Millennium Study. Academic Foundation, New Delhi.
DEHADRAI, P.V. and Y.S. YADAV. 2004. Fisheries Development, State of the IndianFarmer, a Millennium Study. Academic Foundation, New Delhi.
REFERENCES
2021-22

115RURAL DEVELOPMENT
JALAN, BIMAL. (Ed.). 1992. The Indian Economy: Problems and Perspectives.Penguin Publication, New Delhi.
NARAYANAN, S. 2005. Organic Farming in India. NABARD Occasional Paper No:38, Department of Agriculture and Rural Development, Mumbai.
SINGH, H.P., P.P. DUTTA and M. SUDHA. 2004. Horticulture Development, State ofthe Indian Farmer, a Millennium Study. Academic Foundation, New Delhi.
SINGH, SURJIT and VIDYA SAGAR. 2004. Agricultural Credit in India: State of theIndian Farmer, a Millennium Study. Academic Foundation, New Delhi.
SINHA, V.K. 1998. Challenges in Rural Development. Discovery PublishingHouse, New Delhi.
TODARO, MICHAEL P. 1987. Economic Development in the Third World. OrientLongman Ltd, Hyderabad.
TOPPO, E. 2004. Organic Vegetable Gardening: Grow Your Own Vegetables. Unitfor Labour Studies, Tata Institute of Social Sciences, Mumbai.
Government Reports
Successful Governance Initiatives and Best Practices: Experiences from IndianStates, Government of India in Coordination with Human ResourceDevelopment Centre and UNDP, Planning Commission, Delhi, 2002.
Annual Reports, Ministry of Rural Development, Government of India, NewDelhi.
Basic Animal Husbandry and Fisheries Statistics ( for various years), Ministryof Agriculture and Farmers’ Welfare, Government of India.
Websites
www.dahd.nic.in
www.saanjhi.gov.in
www.ruralindiaonline.org
2021-22

116 INDIAN ECONOMIC DEVELOPMENT
After studying this chapter, the learners will
• understand a few basic concepts relating to employment such aseconomic activity, worker, workforce and unemployment
• understand the nature of participation of men and women in variouseconomic activities in various sectors
• know the nature and extent of unemployment
• assess the initiatives taken by the government in generating employmentopportunities in various sectors and regions.
EMPLOYMENT : GROWTH,INFORMALISATION
AND OTHER ISSUES
7
2021-22

117EMPLOYMENT : GROWTH, INFORMALISATION AND OTHER ISSUES
7.1 INTRODUCTION
People do a variety of work. Somework on farms, in factories, banks,shops and many otherworkplaces; yet a few others workat home. Work at home includesnot only traditional work likeweaving, lace making or variety ofhandicrafts but also modern jobslike programming work in the ITindustry. Earlier factory workmeant working in factories locatedin cities whereas now technologyhas enabled people to producethose factory-based goods athome in villages. During Covid 19pandemic in 2020-21, millions ofworkers delivered their products andservices through work from home.
Why do people work? Work playsan important role in our lives asindividuals and as members of society.People work for ‘earning’ a living. Somepeople get, or have, money by inheritingit, not working for it. This does notcompletely satisfy anybody. Beingemployed in work gives us a sense ofself-worth and enables us to relateourselves meaningfully with others.Every working person is activelycontributing to national income andhence, the development of the countryby engaging in various economicactivities — that is the real meaning of‘earning’ a living. We do not work only
for ourselves; we also have a sense ofaccomplishment when we work to meetthe requirements of those who aredependent on us. Having recognisedthe importance of work, MahatmaGandhi insisted upon education andtraining through a variety of worksincluding craft.
Studying about working peoplegives us insights into the quality andnature of employment in a country andhelps in understanding and planningour human resources. It helps us toanalyse the contribution made bydifferent industries and sectors towardsnational income. It also helps us toaddress many social issues such asexploitation of marginalised sections ofthe society, child labour, etc.
What I object to, is the ‘craze’ for machinery, not machinery as such. Thecraze is for what they call labour-saving machinery. Men go on ‘saving labour’till thousands are without work and thrown on the open streets to die ofstarvation...
Mahatma Gandhi
Fig. 7.1 Multinational companies sell footballsmade in the houses of Jalandhar, Punjab
2021-22

118 INDIAN ECONOMIC DEVELOPMENT
7.2 WORKERS AND EMPLOYMENT
What is employment? Who is a worker?When a farmer works on fields, he orshe produces food grains and rawmaterials for industries. Cottonbecomes cloth in textile mills and inpowerlooms. Lorries transport goodsfrom one place to another. We knowthat the total money value of all suchfinal goods and services produced in acountry in a year is called its grossdomestic product for that year. Whenwe also consider what we pay for ourimports and get from our exports wefind that there is a net earning for thecountry which may be positive (if wehave exported more in value terms thanimported) or negative (if importsexceeded exports in value terms) or zero(if exports and imports were of the samevalue). When we add this earning (plusor minus) from foreign transactions,what we get is called the country’s grossnational product for that year.
Those activities which contribute tothe gross national product are calledeconomic activities. All those who areengaged in economic activities, inwhatever capacity — high or low, areworkers. Even if some of themtemporarily abstain from work due toillness, injury or other physicaldisability, bad weather, festivals, socialor religious functions, they are alsoworkers. Workers also include all thosewho help the main workers in theseactivities. We generally think of onlythose who are paid by an employer fortheir work as workers. This is not so.Those who are self-employed are alsoworkers.
The nature of employment in Indiais multifaceted. Some get employmentthroughout the year; some others getemployed for only a few months in ayear. Many workers do not get fairwages for their work. While estimatingthe number of workers, all those whoare engaged in economic activities areincluded as employed. You might beinterested in knowing the number ofpeople actively engaged in variouseconomic activities. During 2017-18,India had about a 471 million strongworkforce. Since majority of our peoplereside in rural areas, the proportion ofworkforce residing there is higher. The
Work This Out
In your house orneighbourhood, you mightcome across many womenwho, even though theyhave technical degreesand diplomas and also freetime to go to work, do notgo to work. Ask them thereasons for not going towork. List all of them anddiscuss in the classroomwhether they should go forwork and why, and alsoways by which they couldbe sent for work. Somesocial scientists argue thathousewives working athome without getting paidfor that work must also beregarded as contributing tothe gross national productand therefore, as engagedin an economic activity.Would you agree?
2021-22

119EMPLOYMENT : GROWTH, INFORMALISATION AND OTHER ISSUES
rural workers constitute about two-thirds of this 471 million. Men formthe majority of workforce in India.About 77 per cent of the workers aremen and the rest are women (men andwomen include child labourers inrespective sexes). Women workersaccount for one-fourth of the ruralworkforce whereas in urban areas,they are just one-fifth of theworkforce. Women carry out workslike cooking, fetching water andfuelwood and participate in farmlabour. They are not paid wages incash or in the form of grains; at timesthey are not paid at all. For thisreason, these women are notcategorised as workers. Economistsargue that these women should alsobe called workers. What do you think?
7.3 PARTICIPATION OF PEOPLE IN
EMPLOYMENT
Worker-population ratio is an indicatorwhich is used for analysing theemployment situation in the country.This ratio is useful in knowing theproportion of population that isactively contributing to the productionof goods and services of a country. Ifthe ratio is higher, it means that theengagement of people is greater; if theratio for a country is medium, or low,it means that a very high proportionof its population is not involveddirectly in economic activities.
You might have already studied,in lower classes, the meaning of theterm ‘population’. Population isdefined as the total number of peoplewho reside in a particular locality at
a particular point of time. If you wantto know the worker-population ratiofor India, divide the total number ofworkers in India by the population inIndia and multiply it by 100, you willget the worker-population ratio forIndia.
If you look at Table 7.1, it showsthe different levels of participation ofpeople in economic activities. Forevery 100 persons, about 35 (byrounding off 34.7) are workers inIndia. In urban areas, the proportionis about 34, whereas in rural India, theratio is about 35. Why is there such adifference? People in rural areas havelimited resources to earn a higherincome and participate more in theemployment market. Many do not goto schools, colleges and other traininginstitutions. Even if some go, theydiscontinue in the middle to join theworkforce; whereas, in urban areas, aconsiderable section is able to study invarious educational institutions. Urbanpeople have a variety of employmentopportunities. They look for theappropriate job to suit theirqualifications and skills. In rural areas,people cannot stay at home as theireconomic condition may not allow themto do so.
TABLE 7.1
Worker-Population Ratio in India,2017-2018
Sex Worker-Population Ratio
Total Rural Urban
Men 52.1 51.7 53.0
Women 16.5 17.5 14.2
Total 34.7 35.0 33.9
2021-22

120 INDIAN ECONOMIC DEVELOPMENT
Compared to females, more malesare found to be working. The differencein participation rates is very large inurban areas: for every 100 urbanfemales, only about 14 are engaged insome economic activities. In rural areas,for every 100 rural women about 18participate in the employment market.Why are women, in general, and urbanwomen, in particular, not working? Itis common to findthat where men areable to earn highincomes, familiesdiscourage femalemembers fromtaking up jobs.
Going back towhat has alreadybeen mentionedabove, manyhousehold activitiesdone by women arenot recognised asproductive work.This narrow defini-tion of work leads tonon-recognition of
women’s work and, therefore, to theunderestimation of the number ofwomen workers in the country. Thinkof the women actively engaged in manyactivities within the house and at familyfarms who are not paid for such work.As they certainly contribute to themaintenance of the household andfarms, do you think that their numbershould be added to the number ofwomen workers?
7.4 SELF-EMPLOYED AND HIRED
WORKERS
Does the worker-population ratio sayanything about workers’ status insociety or about the workingconditions? By knowing the statuswith which a worker is placed in anenterprise, it may be possible to knowone dimension — quality of employmentin a country. It also enables us to knowthe attachment a worker has with his
Fig. 7.2 Brick-making: a form of casual work
Work These Out
Ø Any study of employment
must start with a reviewof the worker-populationratios — why?
Ø In some communities, you
might have noticed thateven if the males do notearn a high income, they donot send women to work.Why?
2021-22

121EMPLOYMENT : GROWTH, INFORMALISATION AND OTHER ISSUES
or her job and the authority she or hehas over the enterprise and over otherco-workers.
Let us take three workers from theconstruction industry — a cement shopowner, a construction worker and a civilengineer of a construction company. Sincethe status of each one of them is differentfrom another, they arealso called differently.Workers who own andoperate an enterprise toearn their livelihood areknown as self-employed.Thus the cement shopowner is self-employed.About 52 per centworkforce in Indiabelongs to this category.The construction workersare known as casual wagelabourers; they accountfor about 25 per cent ofIndia’s workforce. Suchlabourers are casually
engaged in others’ farmsand, in return, get aremuneration for the workdone. Workers like the civilengineer working in theconstruction companyaccount for 23 per cent ofIndia’s workforce. When aworker is engaged bysomeone or an enterpriseand paid his or her wageson a regular basis, they areknown as regular salariedemployees (see table 2.3).
Look at Chart 7.1you will notice that self-employment is a major
source of livelihood for both men andwomen as this category accounts formore than 50 per cent of the workforce.Casual wage work is the second majorsource for both men and women,
a little more so for the latter (24-27per cent). When it comes to regular
Chart 7.2 : Distribution of Employment by Region
Urban Workers Rural Workers
Casual Wage Labourers Regular Salaried Employees
Self-employed
15%38%
47%
58% 29%
13%
Chart 7.1 : Distribution of Employmentby Gender
Male Workers Female Workers
Self-employed
Casual Wage Labourers
Regular Salaried Employees
21%
27%52%
24%
24% 52%
2021-22

122 INDIAN ECONOMIC DEVELOPMENT
employment and regular wage salariedjobs are greater. In the former, since
majority of those depending on farming
own plots of land and cultivate
independently, the share of self-employed is greater.
The nature of work in urban areas
is different. Obviously everyone cannot
run factories, shops and offices ofvarious types. Moreover enterprises in
urban areas require workers on a
regular basis.
salaried employment, both women andmen are found to be so engaged ingreater proportion. Men form 23 per
cent whereas women form 21 per cent.The gap between men and women isvery less.
When we compare the distributionof workforce in rural and urban areasin Chart 7.2 you will notice that the self-
employed and casual wage labourersare found more in rural areas than in
urban areas. In the latter, both self-
Work These Out
Ø We generally think that only those who are doing paid work regularly or
casually such as agricultural labourers, factory workers, those who workin banks and other offices as assistants and clerks are workers. From theabove discussion, you must have understood that those who are self-employed such as pavement vegetable vendors, professionals such aslawyers, doctors and engineers are also workers. Mark (a), (b) and (c)against self-employed, regular salaried employees and casual wagelabourers respectively:
1. Owner of a saloon
2. Worker in a rice mill who is paid on daily basis but employed regu-larly
3. Cashier in State Bank of India
4. Typist working in a state government office on a daily wage basis but
paid monthly
5. A handloom weaver
6. Loading worker in wholesale vegetable shop
7. Owner of a cool drinks shop which sells Pepsi, Coca Cola and Mirinda
8. Nurse in a private hospital who gets monthly salary and has beenworking regularly for the past 5 years.
Ø Economists point out that casual wage labourers are the most vulnerable
among the three categories. Could you locate who these workers are andwhere they are found and why?
Ø Can we say that the self-employed earn more than the casual wage labourers
or regular salaried employees? Identify a few other indicators of quality of
employment.
2021-22

123EMPLOYMENT : GROWTH, INFORMALISATION AND OTHER ISSUES
7.5 EMPLOYMENT IN
FIRMS, FACTORIES
AND OFFICES
In the course ofeconomic developmentof a country, labourflows from agricultureand other relatedactivities to industry andservices. In this process,workers migrate fromrural to urban areas.Eventually, at a muchlater stage, the industrial sector beginsto lose its share of total employmentas the service sector enters a period ofrapid expansion. This shift can beunderstood by looking at thedistribution of workers by industry.Generally, we divide all economicactivities into eight different industrialdivisions. They are (i) Agriculture (ii)M ining and Quarrying (iii)Manufacturing (iv) Electricity, Gas andWater Supply (v) Construction (vi)Trade (vii) Transport and Storage and
(viii) Services. For simplicity, all theworking persons engaged in thesedivisions can be clubbed into threemajor sectors viz., (a) primary sectorwhich includes (i) and (ii), (b) secondarysector which includes (iii), (iv) and (v)and (c) service sector which includesdivisions (vi), (vii) and (viii). Table 7.2shows the distribution of workingpersons in different industries duringthe year 2017-18.
Primary sector is the main sourceof employment for majority of workers
TABLE 7.2
Distribution of Workforce by Industry, 2017-2018
Industrial Category Place of Residence Sex Total
Rural Urban Men Female
Primary Sector 59.8 6.6 40.7 57.1 44.6
Secondary Sector 20.4 34.3 26.5 17.7 24.4
Tertiary/ Service Sector 19.8 59.1 32.8 25.2 31.0
Total 100.0 100.0 100.0 100.0 100.0
Fig. 7.3 Garment workers: upcoming factory employment for women
2021-22

124 INDIAN ECONOMIC DEVELOPMENT
in India. Secondary sector provides
employment to only about 24 per cent
of workforce. About 31 per cent of
workers are in the service sector. Table
7.2 also shows that about 60 per cent
of the workforce in rural India depends
on agriculture, forestry and fishing.
About 20 per cent of rural workers are
working in manufacturing industries,
construction and other industrial
activities. Service sector provides
employment to about 20 per cent of
rural workers. Agriculture is not a
major source of employment in urban
areas where people are mainly engaged
in the service sector. About 60 per cent
of urban workers are in the service
sector. The secondary sector gives
employment to about one-third of
urban workforce.
Though both men and women
workers are concentrated in the
primary sector, women workers’
concentration is very high there. About
57 per cent of the female workforce is
employed in the primary sector whereas
less than half of males work in that
sector. Men get opportunities in both
secondary and service sectors.
7.6 GROWTH AND CHANGING STRUCTURE
OF EMPLOYMENT
In Chapters 2 and 3, you might havestudied about the planning strategiesin detail. Here we will look at twodevelopmental indicators — growth ofemployment and GDP. Nearly seventyyears of planned development havebeen aimed at expansion of theeconomy through increase in nationaloutput and employment.
During the period 1950–2010,Gross Domestic Product (GDP) of Indiagrew positively and was higher thanthe employment growth. However,there was always fluctuation in thegrowth of GDP. During this period,employment grew at the rate of notmore than 2 per cent.
Chart 7.3 also points at anotherdisheartening development in the late1990s: employment growth starteddeclining and reached the level ofgrowth that India had in the earlystages of planning. During these years,we also find a widening gap betweenthe growth of GDP and employment.This means that in the Indian economy,without generating employment, wehave been able to produce more goods
Work This Out
Ø All newspapers have one section meant for job opportunities. Some also
devote an entire supplement in a day or every week like Opportunities inThe Hindu or Ascent in The Times of India. Many companies advertisevacancies for various positions. Cut those sections. Develop a table whichcontains four columns: whether the company is private or public, name ofthe post, number of posts, sector — primary, secondary or tertiary — andqualification required. Analyse the table in the classroom about jobsadvertised in the newspapers.
2021-22

125EMPLOYMENT : GROWTH, INFORMALISATION AND OTHER ISSUES
and services. Scholars refer to thisphenomenon as jobless growth.
So far we have seen howemployment has grown in comparisonto GDP. Now it is necessary to knowhow the growth pattern of employmentand GDP affected different sections ofworkforce. From this we will also beable to understand what types ofemployment are generated in ourcountry.
Let us look at two indicators thatwe have seen in the preceding sections— employment of people in variousindustries and their status. We knowthat India is an agrarian nation; amajor section of population lives inrural areas and is dependent onagriculture as their main livelihood.
Developmental strategies in manycountries, including India, have aimedat reducing the proportion of peopledepending on agriculture.
Distribution of workforce byindustrial sectors shows substantialshift from farm work to non-farm work(see Table 7.3). In 1972-73, about 74per cent of workforce was engaged inprimary sector and in 2011-12, thisproportion has declined to about50 per cent. Secondary and servicesectors are showing promising futurefor the Indian workforce. You maynotice that the shares of these sectorshave increased from 11 to 24 per centand 15 to 27 per cent, respectively.
The distribution of workforce indifferent status indicates that over the
Chart 7.3: Growth of Employment and Gross DomesticProduct, 1951–2012 (%)
Note: *This is the period for which comparable and authentic data are available.
2021-22

126 INDIAN ECONOMIC DEVELOPMENT
last five decades (1972-2018), peoplehave moved from self-employment andregular salaried employment to casualwage work. Yet self-employmentcontinues to be the major employmentprovider. Look at the last column oftable 7.3. How do you understand thestagnation of secondary sector andmoderate rise in self-employementduring 2011-18? Discuss in the class.Scholars call the process of moving
from self-employment and regularsalaried employment to casual wagework noticed during 1972-94 ascasualisation of workforce. Thismakes the workers highly vulnerable.How? Look at the case study ofAhmedabad in the preceding section.
In the mean time you also noticein 2017-18 a moderate rise in theshare of regular salaried employees.How do you explain this phenomenon?
Item 1972-73 1983 1993-94 2011-2012 2017-2018
SectorPrimary 74.3 68.6 64 48.9 44.6
Secondary 10.9 11.5 16 24.3 24.4
Services 14.8 16.9 20 26.8 31.0
Total 100.0 100.0 100.0 100.0 100.0
Status
Self-employed 61.4 57.3 54.6 52.0 52.2
Regular Salaried Employees 15.4 13.8 13.6 18.0 22.8
Casual Wage Labourers 23.2 28.9 31.8 30.0 25.0
Total 100.0 100.0 100.0 100.0 100.0
TABLE 7.3
Trends in Employment Pattern (Sector-wise and Status-wise), 1972-2018 (in %)
Work These Out
Do you know that maintaining employment growth at 2 per cent for a country likeIndia is not an easy thing? Why?
What will happen if there is no additional employment generated in the economyeven though we are able to produce goods and services in the economy? How couldjobless growth happen?
Economists say that if casualisation increases the earning of the people, suchphenomenon should be welcomed. Suppose a marginal farmer becomes a full-timeagricultural labourer, do you think he will be happy even if he earns more in hisdaily wage work? Or will a permanent and regular worker of the pharmaceuticalindustry be happy if he becomes a daily wage labourer, even if his or her overallearnings increase? Discuss in the classroom.
2021-22

127EMPLOYMENT : GROWTH, INFORMALISATION AND OTHER ISSUES
7.7 INFORMALISATION OF INDIAN
WORKFORCE
In the previous section we have foundthat the proportion of hired work jobs -working for others has been increasing.One of the objectives of developmentplanning in India, since India’sindependence, has been to providedecent livelihood to its people. It hasbeen envisaged that the industrialisationstrategy would bring surplus workersfrom agriculture to industry with betterstandard of living as in developedcountries. We have seen in the precedingsection, that even after 70 years ofplanned development, more than halfof the Indian workforce depends onfarming as the major source of livelihood.
Economists argue that, over theyears, the quality of employment hasbeen deteriorating. Even after working formore than 10-20 years, why do someworkers not get maternity benefit,provident fund, gratuity and pension?Why does a person working in theprivate sector get a lower salary ascompared to another person doing thesame work but in the public sector?
You may find that a small section ofIndian workforce is getting regularincome. The government, through its
labour laws, enable them to protect theirrights in various ways. This section of theworkforce forms trade unions, bargainswith employers for better wages and othersocial security measures. Who are they?To know this we classify workforce intotwo categories: workers in formal andinformal sectors, which are also referredto as organised and unorganisedsectors. All the public sectorestablishments and those privatesector establishments which employ10 hired workers or more are calledformal sector establishments and thosewho work in such establishments areformal sector workers. All otherenterprises and workers working in thoseenterprises form the informal sector.Thus, informal sector includes millionsof farmers, agricultural labourers,owners of small enterprises and peopleworking in those enterprises as also theself-employed who do not have anyhired workers. It also includes all non-farm casual wage labourers who workfor more than one employer such asconstruction workers and headloadworkers. You may note that this is oneof the ways of classifying workers.There could be other ways ofclassification as well. Discuss thepossible ways in the class.
Box 7.1: Formal Sector Employment
The information relating to employment in the formal sector is collected by the UnionMinistry of Labour through employment exchanges located in different parts of the country.Do you know who is the major employer in the formal sector in India? In 2012, out ofabout 30 million formal sector workers, about 18 million workers were employed by thepublic sector. Here also men form the majority, as women constitute only aboutone-sixth of the formal sector workforce. Economists point out that the reform processinitiated in the early 1990s resulted in a decline in the number of workers employed inthe formal sector. What do you think?
2021-22

128 INDIAN ECONOMIC DEVELOPMENT
Those who are working in theformal sector enjoy social securitybenefits. They earn more than thosein the informal sector. Developmentalplanning envisaged that as theeconomy grows, more and moreworkers would become formal sectorworkers and the proportion of workersengaged in the informal sector woulddwindle. But what has happened inIndia? Look at thefollowing chart whichgives the distribution ofworkforce in formaland informal sectors.
In Section 7.2, welearnt that in 2011-12there were about 473million workers inIndia. There wereabout 30 millionworkers in the formalsector. Can youestimate the percentage
of people employed in the formalsectors in the country? About only sixper cent (30/473×100)! Thus, the rest94 per cent are in the informal sector.In 2011-12, the year for which genderwise data on formal-informal sectoremployment is available (Chart 7.4).About 20 per cent of formal sector and30 per cent of informal sector workersare women.
Chart 7.4: Workers in Formal/ Informal Sector, 2011
Fig. 7.4 Road side vending: an increasing variety of informal sector employment
Num
ber
of
Work
ers
(in
mil
lion
)
350
300
250
200
150
100
50
0
246
310
133
Male Female
2021-22

129EMPLOYMENT : GROWTH, INFORMALISATION AND OTHER ISSUES
Box 7.2: Informalisation in Ahmedabad
Ahmedabad is a prosperous city with its wealth based on the produce of morethan 60 textile mills with a labour force of 1,50,000 workers employed in them.These workers had, over the course of the century, acquired a certain degreeof income security. They hadsecure jobs with a livingwage; they were covered bysocial security schemesprotecting their health andold age. They had a strongtrade union which not onlyrepresented them indisputes but also ranactivities for the welfare ofworkers and their families.In the early 1980s, textilemills all over the countrybegan to close down. In someplaces, such as Mumbai,the mills closed rapidly. InAhmedabad, the process ofclosure was long drawn outand spread over 10 years.Over this period, approximately over 80,000 permanent workers and over 50,000non-permanent workers lost their jobs and were driven to the informal sector.The city experienced an economic recession and public disturbances, especiallycommunal riots. A whole class of workers was thrown back from the middleclass into the informal sector, into poverty. There was widespread alcoholismand suicides, children were withdrawn from school and sent to work.
Source: Renana Jhabvala, Ratna M. Sudarshan and Jeemol Unni (Ed.) Informal
Economy at Centre Stage: New Structures of Employment, Sage
Publications, New Delhi, 2003, pp.265.
Since the late 1970s, manydeveloping countries, including India,started paying attention to enterprisesand workers in the informal sector asemployment in the formal sector is notgrowing. Workers and enterprises in theinformal sector do not get regular income;they do not have any protection or
regulation from the government. Workersare dismissed without any compensation.Technology used in the informal sectorenterprises is outdated; they also do notmaintain any accounts. Workers of thissector live in slums and are squatters.
Of late, owing to the efforts of the
International Labour Organisation (ILO),
Change in the balance of power in a house: anunemployed mill worker peeling garlic whereas his wifehas a new job of beedi rolling.
2021-22

130 INDIAN ECONOMIC DEVELOPMENT
the Indian government has initiated themodernisation of informal sector
enterprises and provision of social security
measures to informal sector
workers.
7.8 UNEMPLOYMENT
You might have seen peoplelooking for jobs innewspapers. Some look fora job through friendsand relatives. In manycities, you might findpeople standing in someselect areas looking forpeople to employ themfor that day’s work. Somego to factories and officesand give their bio-data
and ask whether there is any vacancyin their factory or office. Many inthe rural areas do not go out and
Work These Out
Tick (ü) mark against those which are in the informal sector
Ø Worker in a hotel which has seven hired workers and three family workers
Ø A private school teacher in a school which has 25 teachers
Ø A police constable
Ø Nurse in a government hospital
Ø Cycle-rickshaw puller
Ø The owner of a textile shop employing nine workers
Ø Driver of a bus company which has more than 10 buses with 20 drivers,
conductors and other workers
Ø Civil engineer working in a construction company which has 10 workers
Ø Computer operator in the state government office working on a temporary
basis
Ø A clerk in the electricity office.
Fig. 7.5 Unemployed mill workers waiting for casual jobs
2021-22

131EMPLOYMENT : GROWTH, INFORMALISATION AND OTHER ISSUES
ask for a job but stay home whenthere is no work. Some go toemployment exchanges and registerthemselves for vacancies notified throughemployment exchanges. The Nationalstatistical office (Previously it was knownas National Sample Survey Organisation)defines unemployment as a situation inwhich all those who, owing to lack ofwork, are not working but either seekwork through employment exchanges,intermediaries, friends or relatives or bymaking applications to prospectiveemployers or express their willingnessor availability for work under theprevailing condition of work andremunerations. There are a variety ofways by which an unemployed personis identified. Economists defineunemployed person as one who is notable to get employment of even one hourin half a day.
There are three sources of data onunemployment : Reports of Census ofIndia, National Statistical Office’sReports of Employment andUnemployment Situation, Annual
Reports of Periodic LabourForce Survey, andDirectorate General ofEmployment and Trainingdata of Registration withEmployment Exchanges.Though they providedif ferent estimates ofunemployment, they doprovide us with theattributes of theunemployed and thevariety of unemploymentprevailing in our country.
Do we have differenttypes of unemployment in oureconomy? The situation described in thefirst paragraph of this section is calledopen unemployment. Economists callunemployment prevailing in Indianfarms as disguised unemployment.What is disguised unemployment?Suppose a farmer has four acres of landand he actually needs only two workersand himself to carry out variousoperations on his farm in a year, but ifhe employs five workers and his familymembers such as his wife and children,this situation is known as disguisedunemployment. One study conductedin the late 1950s showed about one-third of agriculture workers in India asdisguisedly unemployed.
You may have noticed that manypeople migrate to an urban area, pickup a job and stay there for some time,but come back to their home villagesas soon as the rainy season begins.Why do they do so? This is becausework in agriculture is seasonal; thereare no employment opportunities in thevillage for all months in the year. When
Fig. 7.6 Sugar cane cutters: disguised unemployment is commonin farm works
2021-22

132 INDIAN ECONOMIC DEVELOPMENT
there is no work to do on farms, peoplego to urban areas and look for jobs.This kind of unemployment is knownas seasonal unemployment. This is alsoa common form of unemploymentprevailing in India.
Though we have witnessed slowgrowth of employment, have you seenpeople being unemployed over a verylong time? Scholars say that in India,people cannot remain completelyunemployed for very long because theirdesperate economic condition wouldnot allow them to be so. You will ratherfind them being forced to acceptjobs that nobody else would do,unpleasant or even dangerous jobs inunclean, or unhealthy surroundings.The Central and State governmentstake initiatives and generateemployment to facilitate a decent living
for low income familiesthrough various measures.These will be discussed in thefollowing section.
7.9 GOVERNMENT AND
EMPLOYMENT GENERATION
You may recall aboutthe Mahatma Gandhi NationalRural Employment GuaranteeAct 2005. It promises 100days of guaranteed wageemployment to all ruralhouseholds who volunteer to dounskilled manual work. Thescheme based on this Act isone of the many measures thegovernment has implemented
to generate employment for those whoare in need of jobs in rural areas.
Since Independence, the Unionand State governments have playedan important role in generatingemployment or creating opportunitiesfor employment generation. Theirefforts can be broadly categorised intotwo — direct and indirect. In the firstcategory, as you have seen in thepreceding section, the governmentemploys people in variousdepartments for administrativepurposes. It also runs industries,hotels and transport companies, andhence, provides employment directlyto workers. When the outputof goods and services fromgovernment enterprises increases, then
Fig. 7.7 Dam construction work is a direct way of employmentgeneration by the government
2021-22

133EMPLOYMENT : GROWTH, INFORMALISATION AND OTHER ISSUES
private enterprises which receive rawmaterials from government enterpriseswill also raise their output and henceincrease the number of employmentopportunities in the economy. Forexample, when a government ownedsteel company increases its output, itwill result in direct increase inemployment in that governmentcompany. Simultaneously, privatecompanies, which purchase steel fromit, will also increase their output andthus employment. This is the indirectgeneration of employmentopportunities by the governmentinitiatives in the economy.
In Chapter 4, you would havenoticed that many programmes thatthe governments implement, aimed atalleviating poverty, are throughemployment generation. They arealso known as employmentgeneration programmes. All theseprogrammes aim at providing notonly employment but also services inareas such as primary health,primary education, rural drinkingwater, nutrition, assistance for peopleto buy income and employmentgenerating assets, development ofcommunity assets by generatingwage employment, construction ofhouses and sanitation, assistance forconstructing houses, laying of ruralroads, development of wastelands/degraded lands.
7.10 CONCLUSION
There has been a change in thestructure of workforce in India. Newly
emerging jobs are found mostly in theservice sector. The expansion of theservice sector and the advent of hightechnology now frequently permit ahighly competitive existence for efficientsmall scale and often individualenterprises or specialist workers side byside with the multinationals.Outsourcing of work is becoming acommon practice. It means that abig firm finds it profitable to closedown some of its specialistdepartments (for example, legal orcomputer programming or customerservice sections) and hand over a largenumber of small piecemeal jobs to verysmall enterprises or specialistindividuals, sometimes situated even inother countries. The traditional notionof the modern factory or office, as aresult, has been altered in sucha manner that for many the homeis becoming the workplace. All ofthis change has not gone in favourof the individual worker. The natureof employment has become moreinformal with only limited availabilityof social security measures to theworkers.
In the last few decades, therehas been rapid growth in the grossdomestic product, but withoutsimultaneous increase in employmentopportunities. This has forced thegovernment to take up initiatives ingenerating employment opportunitiesparticularly in the rural areas.
2021-22

134 INDIAN ECONOMIC DEVELOPMENT
1. Who is a worker?
2. Define worker-population ratio.
3. Are the following workers — a beggar, a thief, a smuggler, a gambler?Why?
Recap
Ø All those persons who are engaged in various economic activities and
hence contribute to gross national product are workers.
Ø About two-fifth of the total population in the country is engaged in various
economic activities.
Ø Men particularly rural men, form the major section of workforce in India.
Ø Majority of workers in India are self-employed. Casual wage labourers
and regular salaried employees together account for less than half theproportion of India’s workforce.
Ø About three-fifth of India’s workforce depends on agriculture and other
allied activities as the major source of livelihood.
Ø In recent years, the growth of employment has decelerated.
Ø During post-reform period, India has been witness to employment
opportunities in the service sector. These new jobs are found mostly inthe informal sector and the nature of jobs is also mostly casual.
Ø Government is the major formal sector employer in the country.
Ø Disguised unemployment is a common form of unemployment in rural
India.
Ø There has been a change in the structure of the workforce in India.
Ø Through various schemes and policies, the government takes initiatives
to generate employment directly and indirectly.
EXERCISES
2021-22

135EMPLOYMENT : GROWTH, INFORMALISATION AND OTHER ISSUES
4. Find the odd man out (i) owner of a saloon (ii) a cobbler (iii) a cashierin Mother Dairy or Milk Cooperative Society of your area (iv) a tuitionmaster (v) transport operator (vi) construction worker.
5. The newly emerging jobs are found mostly in the sector(service/manufacturing).
6. An establishement with four hired workers is known as (formal/informal) sector establishment.
7. Raj is going to school. When he is not in school, you will find himworking in his farm. Can you consider him as a worker? Why?
8. Compared to urban women, more rural women are found working.Why?
9. Meena is a housewife. Besides taking care of household chores, sheworks in the cloth shop which is owned and operated by her husband.Can she be considered as a worker? Why?
10. Find the odd man out (i) rickshaw puller who works under a rick-shaw owner (ii) mason (iii) mechanic shop worker (iv) shoeshine boy.
11. The following table shows distribution of workforce in India for theyear 1972-73. Analyse it and give reasons for the nature of workforcedistribution. You will notice that the data is pertaining to the situationin India about 50 years ago!
Place of Residence Workforce (in millions)
Male Female Total
Rural 125 69 195
Urban 32 7 39
12. The following table shows the population and worker population ratiofor India in 1999-2000. Can you estimate the workforce (urban andtotal) for India?
Region Estimates of Worker Estimated
Population Population No. of Workers
(in crores) Ratio (in crores)
Rural 71.88 41.9 71.88 × 41.9 = 30.12
Urban 28.52 33.7 ?
Total 100.40 39.5 ?
100
2021-22

136 INDIAN ECONOMIC DEVELOPMENT
13. Why are regular salaried employees more in urban areas than inrural areas?
14. Why are less women found in regular salaried employment?
15. Analyse the recent trends in sectoral distribution of workforce in India.
16. Compared to the 1970s, there has hardly been any change in thedistribution of workforce across various industries. Comment.
17. Do you think that during 1950-2010 employment generated in thecountry is commensurate with the growth of GDP in India? How?
18. Is it necessary to generate employment in the formal sector ratherthan in the informal sector? Why?
19. Victor is able to get work only for two hours in a day. Rest of the day,he is looking for work. Is he unemployed? Why? What kind of jobscould persons like Victor be doing?
20. You are residing in a village. If you are asked to advice the villagepanchayat, what kinds of activities would you suggest for theimprovement of your village which would also generate employment.
21. Who is a casual wage labourer?
22. How will you know whether a worker is working in the informal sector?
1. Select a region, say a street or colony, and divide it into 3-4sub-regions. Conduct a survey by which you can collect the detailsof activity each person living there is engaged in. Derive theworker-population ratio for all the regions. Interpret the results fordifferences in worker-population ratio for the different sub-regions.
2. Suppose 3-4 groups of students are given different regions of a state.One region is mainly engaged in cultivation of paddy. In another region,coconut is the main plantation. The third region is a coastal regionwhere fishing is the main activity. The fourth region has a river nearbywith a lot of livestock rearing activities. Ask all the four groups todevelop a report on what kind of employment could be generated inthe four regions.
3. Visit the local library and ask for Employment News, a weekly publishedby the Government of India. Go through each issue for the last twomonths. There will be seven issues. Select 25 advertisements and
SUGGESTED ADDITIONAL ACTIVITIES
2021-22

137EMPLOYMENT : GROWTH, INFORMALISATION AND OTHER ISSUES
fill in the following table (expand the table as needed). Discuss the
nature of jobs in the classroom.
Items Advertisement 1 Advertisement 2
1. Name of Office2. Department/company3. Private/public/joint venture4. Name of the post5. Sector—primary/seconday/
service6. Number of posts/vacancies7. Qualification required
4. You might notice, in your locality, a variety of works being done bythe government, for example laying of roads, desilting of tanks,construction of school buildings, hospital and other governmentoffices, construction of check dams and houses for the poor etc.Prepare a critical assessment report on one such activity. The issuescovered could be the following (i) how the work was identified (ii)amount sanctioned (iii) contribution of local people, if any (iv) numberof persons involved — both men and women (v) wages paid (vi) is itreally required in that area and other critical comments on theimplementation of the scheme under which the work is being carriedout.
5. In recent years, you may have noticed that many voluntaryorganisations also take initiatives to generate employment in hillyand dry land regions. If you find such initiatives in your locality, visitand prepare a report.
CHADHA, G.K. and P.P. SAHU, 2002. ‘Post-reform Setbacks in Rural Employment:Issues that need further scrutiny.’ Economic and Political Weekly, May25, pp.1998-2026.
DESAI, S and M.B.DAS. 2004. ‘Is Employment Driving India’s Growth Surge’,Economic and Political Weekly, July 3, pp. 3045-3051.
GHOSE, AJIT K. 1999. ‘Current Issues of Employment Policy in India.’ Economic
and Political Weekly, September 4, pp. 2592-2608.
HIRWAY, INDIRA. 2002. ‘Employment and Unemployment Situation in 1990s:How Good are NSS Data.’ Economic and Political Weekly, May 25,pp. 2027-2036.
REFERENCES
2021-22
138 INDIAN ECONOMIC DEVELOPMENT
JACOB, PAUL. 1986. ‘Concept of ‘work’ and estimates of ‘workforce’ — Anappraisal of the treatment of activities relating to non-marketed output,’Sarvekshana, Vol.IX, No.4, April.
KULSHRESHTHA, A.C., GULAB SINGH, ALOK KAR and R.L. MISHRA. 2000. ‘Workforce inthe Indian National Accounts Statistics,’ The Journal of Income and
Wealth, Vol.22, No.2, July, pp. 3-39.
PRADHAN, B.K. and M.R.SALUJA. 1996. ‘Labour Statistics in India: A Review.’Margin, July- September, Vol.28, Number 4, pp. 319-347.
RATH, NILAKANTHA. 2001. ‘Data on Employment, Unemployment and Education:Where to go from here?’ Economic and Political Weekly, June 9,pp. 2081-2087.
SUNDARAM, K. 2001. ‘Employment-Unemployment Situation in the Nineties:Some Results from NSS 55th Round Survey’, Economic and Political
Weekly, March 17, pp. 931-940.
SUNDARAM, K. 2001. ‘Employment and Poverty in 1990s: Further Results fromNSS 55th Round Employment-Unemployment Survey, 1999-2000,’Economic and Political Weekly, August 11, pp. 3039-3049.
VISARIA, PRAVIN. 1996. ‘Structure of the Indian Workforce, 1961-1994,’ The
Indian Journal of Labour Economics, Vol.39, No.4, pp. 725-740.
Government Reports
Annual Reports, Ministry of Labour, Government of India, Delhi.
Census of India 2011, Primary Census Abstract, Registrar General of CensusOperations, Ministry of Home Affairs, Government of India, Delhi.
Economic Survey, Ministry of Finance, Government of India.
Reports on Employment and Unemployment Situation in India, Ministry ofStatistics and Planning, Government of India.
Annual Report of Periodic Labour Force Survey 2017-18, National StatisticalOffice, Ministry of Statistics and Programme Implementation, Governmentof India, New Delhi.
Websites
www.censusofindia.nic.inwww.mospi.nic.in
2021-22

After studying this chapter, the learners will
• understand the main challenges India faces in the areas of social andeconomic infrastructure
• know the role of infrastructure in economic development
• understand the role of energy as a critical component of infrastructure
• understand the problems and prospects of the energy and health sectors
• understand the health infrastructure of India.
INFRASTRUCTURE
8
2021-22

140 INDIAN ECONOMIC DEVELOPMENT
8.1 INTRODUCTION
Have you ever thought of why somestates in India are performing muchbetter than others in certain areas? Whydo Punjab, Haryana and HimachalPradesh prosper in agriculture andhorticulture? Why are Maharashtraand Gujarat industrially moreadvanced than others? How comeKerala, popularly known as ‘God’s owncountry’, has excelled in literacy, healthcare and sanitation and also attractstourists in such large numbers? Whydoes Karnataka’s informationtechnology industry attracts worldattention?
It is all because these states havebetter infrastructure in the areas theyexcel than other states of India. Somehave better irrigation facilities. Othershave better transportation facilities, orare located near ports which makes rawmaterials required for various
manufacturing industries easilyaccessible. Cities like Bengaluru inKarnataka attract many multinationalcompanies because they provideworld-class communication facilities.All these support structures, whichfacilitate development of a country,constitute its infrastructure. Howthen does infrastructure facilitatedevelopment?
8.2 WHAT IS INFRASTRUCTURE?
Infrastructure provides supportingservices in the main areas of industrialand agricultural production, domesticand foreign trade and commerce. Theseservices include roads, railways, ports,airports, dams, power stations, oil andgas pipelines, telecommunicationfacilities, the country’s educationalsystem including schools and colleges,health system including hospitals,sanitary system including clean
drinking water facili-ties and the monetarysystem includingbanks, insurance andother financial institu-tions. Some of thesefacilities have a directimpact on productionof goods and serviceswhile others giveindirect support bybuilding the socialsector of the economy.
“Many things we need can wait, the child cannot. To him, we cannot say,‘tomorrow’. His name is today.”
Gabrriella Mistral— Chilean poetSo is the Infrastructure.
Fig. 8.1 Roads are the missing link with growth
2021-22

141INFRASTRUCUTRE
Some divide infrastructure intotwo categories — economic and social.Infrastructure associated with energy,transportation and communicationare included in the former categorywhereas those related to education,health and housing are included inthe latter.
speedy and large-scaletransport of seeds,pesticides, fertilisersand the produce usingmodern roadways,railways and shippingfacilities. In recent times,agriculture also dependson insurance andbanking facilitiesbecause of its need tooperate on a very largescale.
Infrastructure contributes toeconomic development of a countryboth by increasing the productivity ofthe factors of production and improvingthe quality of life of its people.Inadequate infrastructure can havemultiple adverse effects on health.Improvements in water supply andsanitation have a large impact byreducing morbidity (meaningproneness to fall ill) from majorwaterborne diseases and reducing theseverity of disease when it occurs. Inaddition to the obvious linkage betweenwater and sanitation and health,the quality of transport andcommunication infrastructure canaffect access to health care. Air pollutionand safety hazards connected totransportation also affect morbidity,particularly in densely populated areas.
8.4 THE STATE OF INFRASTRUCTURE ININDIA
Traditionally, the government has beensolely responsible for developing the
8.3 RELEVANCE OF INFRASTRUCTURE
Infrastructure is the support system onwhich depends the efficient working ofa modern industrial economy. Modernagriculture also largely depends on it for
Fig. 8.2 Schools: an important infrastructure for a nation
Work This Out
In your locality or neighbourhoodyou might be using a variety ofinfrastructure. List all of those.Your locality may also berequiring a few more. List thoseseparately. Classify them usinga few criteria and discuss thedetails in the class.
2021-22
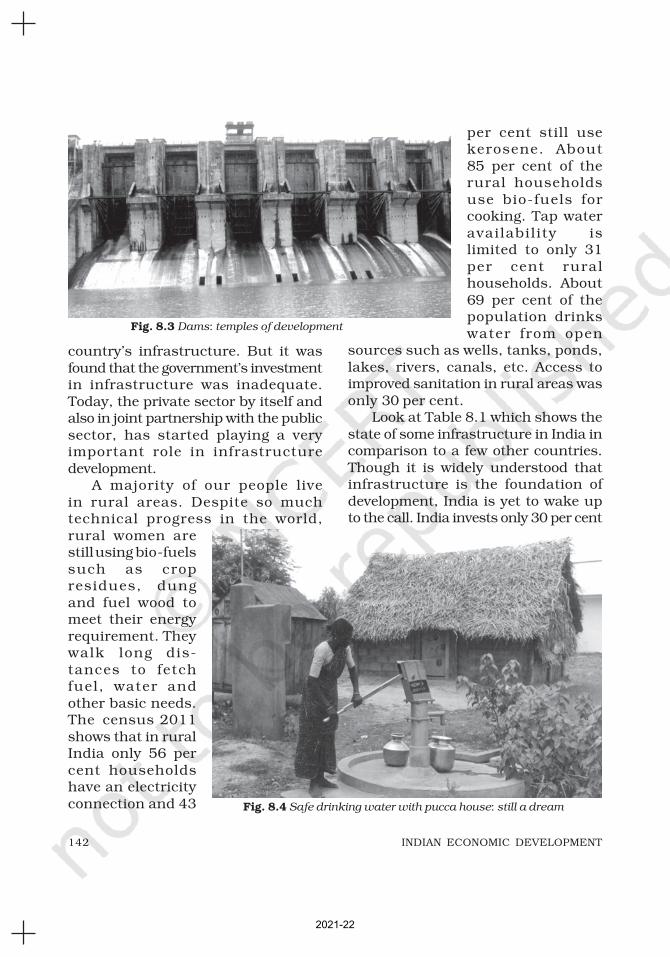
142 INDIAN ECONOMIC DEVELOPMENT
country’s infrastructure. But it wasfound that the government’s investmentin infrastructure was inadequate.Today, the private sector by itself andalso in joint partnership with the publicsector, has started playing a veryimportant role in infrastructuredevelopment.
A majority of our people livein rural areas. Despite so muchtechnical progress in the world,rural women arestill using bio-fuelssuch as cropresidues, dungand fuel wood tomeet their energyrequirement. Theywalk long dis-tances to fetchfuel, water andother basic needs.The census 2011shows that in ruralIndia only 56 percent householdshave an electricityconnection and 43
per cent still usekerosene. About85 per cent of therural householdsuse bio-fuels forcooking. Tap wateravailabil ity islimited to only 31per cent ruralhouseholds. About69 per cent of thepopulation drinkswater from open
sources such as wells, tanks, ponds,lakes, rivers, canals, etc. Access toimproved sanitation in rural areas wasonly 30 per cent.
Look at Table 8.1 which shows thestate of some infrastructure in India incomparison to a few other countries.Though it is widely understood thatinfrastructure is the foundation ofdevelopment, India is yet to wake upto the call. India invests only 30 per cent
Fig. 8.3 Dams: temples of development
Fig. 8.4 Safe drinking water with pucca house: still a dream
2021-22

143INFRASTRUCUTRE
of its GDP on infrastructure, which isfar below that of China and Indonesia.
Some economists have projectedthat India will become the third biggesteconomy in the world a few decadesfrom now. For that to happen, India will
have to boost its infrastructureinvestment. In any country, as theincome rises, the composition ofinfrastructure requirements changessignificantly. For low-income countries,basic infrastructure services, likeirrigation, transport and power, aremore important. As economies matureand most of their basic consumptiondemands are met, the share ofagriculture in the economy shrinks andmore service-related infrastructure isrequired. This is why, the share of powerand telecommunication infrastructureis greater in high-income countries.
Thus, development of infrastructureand economic development go hand inhand. Agriculture depends, to aconsiderable extent, on the adequateexpansion and development of irrigationfacilities. Industrial progress dependson the development of power andelectricity generation, transport andcommunications. Obviously, if properattention is not paid to the developmentof infrastructure, it is likely to act as a
TABLE 8.1
Some Infrastructure in India and other Countries, 2018
Country Investment* in Percentage of people using Mobile Consumption
Infrastructure safely managed Subscribers/100 of energy (ml.as a % GDP Drinking Sanitation People tonnes of
Water Sources Services oil equivalent)
China 44 96 72 115 3274Hong Kong 22 100 92 259 31
India 30 94 40 87 809
South Korea 31 98 100 130 301
Pakistan 16 35 64 73 85
Singapore 28 100 100 146 88
Indonesia 34 87 61 120 186
Sources: World Development Indicators 2019, World Bank website: www.worldbank.org.; BP Statistical Review of World Energy 2019, 69th Edition.
Note: (*) refers to Gross Capital Formation.
Work These Out
Ø While reading newspapers
you will come across termslike Bharat Nirman, SpecialPurpose Vehicle (SPV),Special Economic Zones(SEZ), Build OperateTransfer (BOT), PrivatePublic Partnership (PPP) etc.Make a scrapbook of newsitems containing theseterms. How are these termsrelated to infrastructure?
Ø Using the references at
the end of the chapter,co l l ec t the deta i ls o fother infrastructure.
2021-22

144 INDIAN ECONOMIC DEVELOPMENT
severe constraint oneconomic development. Inthis chapter the focuswill be on only two kinds ofinfrastructure —thoseassociated with energyand health.
8.5 ENERGY
Why do we need energy?In what forms is itavailable? Energy is acritical aspect of thedevelopment process of anation. It is, of course,essential for industries.Now it is used on a largescale in agriculture and related areaslike production and transportation offertilisers, pesticides and farmequipment. It is required in houses forcooking, household lighting andheating. Can you think of producing acommodity or service without usingenergy?
Sources of Energy: There arecommercial and non-commercialsources of energy. Commercialsources are coal, petroleum andelectricity as they are bought andsold. Non-commercial sources ofenergy are fuelwood, agriculturalwaste and dried dung. These are non-
commercial as they are notavailable in the market on alarge scale.
While commercialsources of energy aregenerally exhaustible (withthe exception of hydropower),non-commercial sources ortraditional are generallyrenewable. More than 60 percent of Indian householdsdepend on traditionalsources of energy formeeting their regularcooking and heating needs.
Fig. 8.6 Bullock carts still play a crucial role in ruraltransportation market
Fig. 8.5 Fuel wood is the major source of energy
2021-22
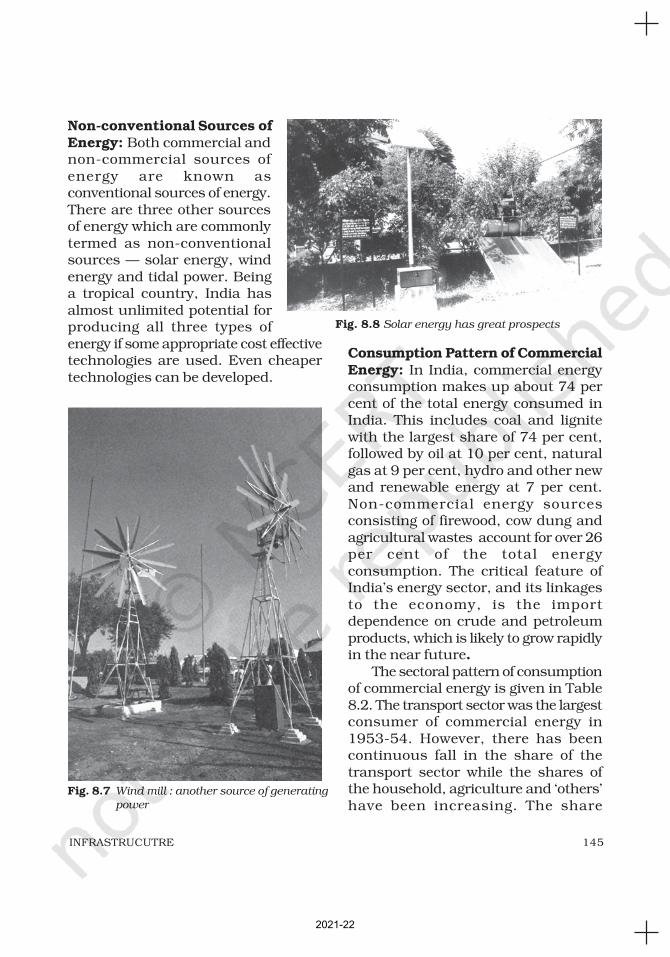
145INFRASTRUCUTRE
Non-conventional Sources ofEnergy: Both commercial andnon-commercial sources ofenergy are known asconventional sources of energy.There are three other sourcesof energy which are commonlytermed as non-conventionalsources — solar energy, windenergy and tidal power. Beinga tropical country, India hasalmost unlimited potential forproducing all three types ofenergy if some appropriate cost effectivetechnologies are used. Even cheapertechnologies can be developed.
Consumption Pattern of CommercialEnergy: In India, commercial energyconsumption makes up about 74 percent of the total energy consumed inIndia. This includes coal and lignitewith the largest share of 74 per cent,followed by oil at 10 per cent, naturalgas at 9 per cent, hydro and other newand renewable energy at 7 per cent.Non-commercial energy sourcesconsisting of firewood, cow dung andagricultural wastes account for over 26per cent of the total energyconsumption. The critical feature ofIndia’s energy sector, and its linkagesto the economy, is the importdependence on crude and petroleumproducts, which is likely to grow rapidlyin the near future.
The sectoral pattern of consumptionof commercial energy is given in Table8.2. The transport sector was the largestconsumer of commercial energy in1953-54. However, there has beencontinuous fall in the share of thetransport sector while the shares ofthe household, agriculture and ‘others’have been increasing. The share
Fig. 8.7 Wind mill : another source of generatingpower
Fig. 8.8 Solar energy has great prospects
2021-22

146 INDIAN ECONOMIC DEVELOPMENT
of oil and gas is the highest among allcommercial energy consumption. Withthe rapid rate of economic growth, therehas been a corresponding increase inthe use of energy.
Power/Electricity: The most visibleform of energy, which is often identifiedwith progress in modern civilisation, ispower, commonly called electricity. It isa critical component of infrastructurethat determines the economicdevelopment of a country. The growth
rate of demand for power is generallyhigher than the GDP growth rate.Studies point out that in order to have8 per cent GDP growth per annum,power supply needs to grow around 12per cent annually.
In India, in 2018, thermalsources accounted for 82 per centof the power generation capacity.Hydel power accounted for 8.5 per cent,while nuclear power accounted for only2.5 per cent. India’s energy policyencourages three energy sources — solar,
hydel, and wind — as theydo not rely on fossil fuel and,hence, avoid carbonemissions. Yet, this has notresulted in faster growth ofelectricity produced fromthese sources.
Atomic energy is animportant source of electricpower, it has economicadvantages. At present,nuclear energy accountsfor only 2.5 per cent of thetotal energy consumption,
Source: Ninth Five year Plan, Vol. II, Chapter 6, Planning Commission, Government of India, New Delhi
and Energy Statistics 2019, Central Statistical Office, Ministry of Statistics and ProgrammeImplementation, Government of India.
TABLE 8.2
Trends in Sectoral Share of Commercial Energy Consumption (in %)
Sector 1953-54 1970-71 1990-91 2017-18
Household 10 12 12 24
Agriculture 01 03 08 18
Industries 40 50 45 42
Transport 44 28 22 1
Others 5 07 13 15
Total 100 100 100 100
Chart 8.1: Different Sources of Electricity Generatedin India, 2016
Thermal
Hydro
Nuclear
New and RenewableEnergy82%
7%
8.5%
2.5%
2021-22

147INFRASTRUCUTRE
against a global average of 13 per cent.This is far too low. Hence, somescholars suggest to generate moreelectricity through atomic (nuclear)sources and yet a few others objectabout this, from the viewpoint ofenvironment and sustainabledevelopment. What do you think?
Some Challenges in the PowerSector: Electricity generated byvarious power stations is not consumedentirely by ultimate consumers; a partis consumed by power stationauxiliaries. Also, while transmittingpower, a portion is lost in transmission.What we get in our houses, offices andfactories is the net availability.
Some of the challenges that India’spower sector faces today are — (i) India’sinstalled capacity to generate electricityis not sufficient to feed the higheconomic growth. In order to meet thegrowing demand for electricity, India’scommercial energy supply needs togrow at about 7 per cent. At present,India is able to add only 20,000 MW ayear. Even the installed capacity isunder-utilised because plants are notrun properly (ii) State Electricity Boards(SEBs), which distribute electricity,incur losses exceed `20,000 crores.This is due to transmission anddistribution losses, wrong pricing ofelectricity and other inefficiencies. Somescholars also say that distribution ofelectricity to farmers is the main reason
Box 8.1: Making a Difference
Thane city is acquiring a brand new image — an environment-friendlymakeover. Large-scale use of solar energy, which was considered a somewhatfar-fetched concept, has brought in real benefits and results in cost and energysaving. It is being applied to heat water, power traffic lights and advertisinghoardings. And leading this unique experiment is the Thane MunicipalCorporation. It has made compulsory for all new buildings in the city to installsolar water heating system. (Appeared in the column, Making a Difference,Outlook, 01 August 2005).
ØCan you suggest such other ideas to use non-conventional energy in a better
way?
Work These Out
Ø Among other sources of
energy, you would have
noticed that a marginal share
of energy comes from nuclear
power. Why?
Ø Solar energy, wind power and
power produced from tides
are going to be the future
sources of energy. What are
their comparative merits
and demerits? Discuss in
the class.
2021-22

148 INDIAN ECONOMIC DEVELOPMENT
for the losses; electricity is also stolenin different areas which also adds to thewoes of SEBs (iii) private sector powergenerators are yet to play their role in amajor way; same is the case withforeign investors (iv) there is generalpublic unrest due to high power tariffs
Box 8.2: Power Distribution: The Case of Delhi
Since Independence, power management in the national capital has changed
hands four times. The Delhi State Electricity Board (DSEB) was set up in
1951. This was succeeded by the Delhi Electric Supply Undertaking (DESU)
in 1958. The Delhi Vidyut Board (DVB) came into existence as SEB in
February 1997. Now, the distribution of electricity vests with two leading
Private sector companies — Reliance Energy Limited (BSES Rajdhani Power
Limited and BSES Yamuna Power Limited) and Tata Power Limited (NDPL).
They supply electricity to approximately 46 lakh customers in Delhi. The
tariff structure and other regulatory issues are monitored by the Delhi
Electricity Regulatory Commission (DERC). Though it was expected that
there will be greater improvement in power distribution and the consumers
will benefit in a major way, experience shows unsatisfactory results.
Box 8.3: Saving Energy: Promoting the Case of Compact FluorescentLamps (CFL) and LED Bulbs
According to the Bureau of Energy Efficiency (BEE), CFLs consume 80 per cent
less power as compared to ordinary bulbs. As put by a CFL manufacturer,
Indo-Asian, replacement of one million 100-watt bulbs with 20 watt CFLs can
save 80 megawatt in power generation. This amounts to saving Rs 400 crore.
These days LED (Light Emitting Diode) lamps are promoted throughout the
country to save energy. The LED bulb uses one-tenth energy as an
incandescent bulb and half as much as a CFL to produce the same amount of
light. According to the Energy Efficiency Services Ltd, the UJALA scheme that
aims to replace incandescent bulbs with LEDs could save 5,905 MW in power
generation. This translates to an annual savings of Rs. 4,000 for an average
family due to efficiency gains and lower replacement costs.
and prolonged power cuts in differentparts of the country, and (v) thermalpower plants, which are the mainstay ofIndia’s power sector are facing shortageof raw material and coal supplies.
Thus, continued economicdevelopment and population growth
2021-22

149INFRASTRUCUTRE
are driving the demand for energy fasterthan what India is producing currently.More public investment, better researchand development efforts, exploration,technological innovation and use ofrenewable energy sources can ensureadditional supply of electricity. Insteadof investing in the power sector by
adding to the installed capacity, thegovernment has gone for privatisationof the power sector, and particularly,distribution (see Box 8.2), and allowedmuch higher prices for electricity thathave impacted certain sectors verybadly (see Box 3.3). Do you think it is aright policy? Why? Discuss in the class.
Work These Out
Ø What kind of energy do you use in your house? Find out from your parents
the amount they spend in a month on different types of energy.
Ø Who supplies power to your area and where is it generated? Can you think
of other cheaper alternative sources which could help in lighting your house
or cooking food or for travelling to far away places?
Ø Look at the following table. Do you think energy consumption is an effective
indicator of development?
Country GDP per capita Energy use (kg of(in US $) in oil equivalent per
2018 (ppp) capita) 2018
India 6,899 637
Indonesia 11,605 884
Egypt 11,013 828
U.K. 40,158 2777
Japan 294 3471
U.S.A. 58,681 6961
Source: World Development Indicators 2019, www.worldbank.org.
Ø Find out how power is distributed in your area/state. Also find out the total
electricity demand of your city, village or town and how it is being met.
Ø You might notice people using a variety of methods to save electricity and
other energy. For instance, while using the gas stove, some suggestions are
made by gas agencies for using the gas efficiently and economically. Discuss
them with your parents and the elderly, note down the points and discuss
them in class.
2021-22

150 INDIAN ECONOMIC DEVELOPMENT
8.6 HEALTH
Since 2020, due to Covid 19 Pandemicyou are aware of the need for keepingour hands washed, wearing masks andfollowing social distance. Health is notonly absence of disease but also theability to realise one’s potential. It is ayardstick of one’s well being. Health isthe holistic process related to the overallgrowth and development of the nation.Though the twentieth century has seena global transformation in humanhealth unmatched in history, it may bedifficult to define the health status ofa nation in terms of a single set ofmeasures. Generally, scholars assesspeople’s health by taking into accountindicators, like infant mortality andmaternal mortality rates, life expectancyand nutrition levels, along with theincidence of communicable and non-communicable diseases.
Development of health infra-structure ensures a country of healthy
manpower for the production of goodsand services. In recent times, scholarsargue that people are entitled to healthcare facilities. It is the responsibility ofthe government to ensure the right tohealthy living. Health infrastructureincludes hospitals, doctors, nurses andother para-medical professionals, beds,equipment required in hospitals and awell-developed pharmaceuticalindustry. It is also true that merepresence of health infrastructure is notsufficient to have healthy people. Thesame should be accessible to allpeople. Since, the initial stages ofplanned development, policy-makersenvisaged that no individual shouldfail to secure medical care, curativeand preventive, because of theinability to pay for it. But are we ableto achieve this vision? Before wediscuss various health infrastructure,let us discuss the status of healthin India.
Fig. 8.9 Health infrastructure is still lacking in large parts of the country
2021-22
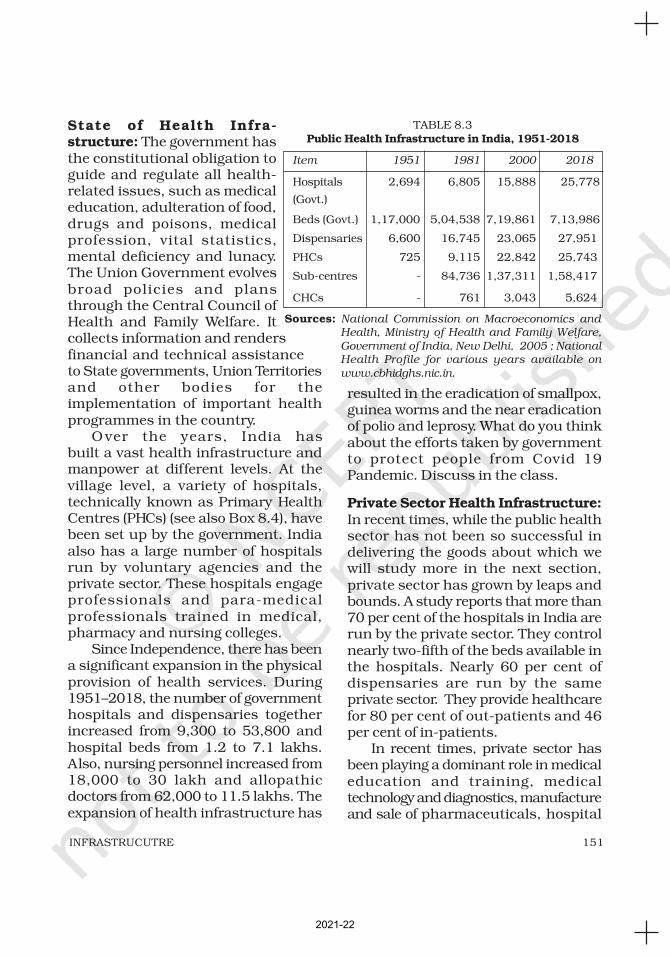
151INFRASTRUCUTRE
State of Health Infra-structure: The government hasthe constitutional obligation toguide and regulate all health-related issues, such as medicaleducation, adulteration of food,drugs and poisons, medicalprofession, vital statistics,mental deficiency and lunacy.The Union Government evolvesbroad policies and plansthrough the Central Council ofHealth and Family Welfare. Itcollects information and rendersfinancial and technical assistanceto State governments, Union Territoriesand other bodies for theimplementation of important healthprogrammes in the country.
Over the years, India hasbuilt a vast health infrastructure andmanpower at different levels. At thevillage level, a variety of hospitals,technically known as Primary HealthCentres (PHCs) (see also Box 8.4), havebeen set up by the government. Indiaalso has a large number of hospitalsrun by voluntary agencies and theprivate sector. These hospitals engageprofessionals and para-medicalprofessionals trained in medical,pharmacy and nursing colleges.
Since Independence, there has beena significant expansion in the physicalprovision of health services. During1951–2018, the number of governmenthospitals and dispensaries togetherincreased from 9,300 to 53,800 andhospital beds from 1.2 to 7.1 lakhs.Also, nursing personnel increased from18,000 to 30 lakh and allopathicdoctors from 62,000 to 11.5 lakhs. Theexpansion of health infrastructure has
resulted in the eradication of smallpox,guinea worms and the near eradicationof polio and leprosy. What do you thinkabout the efforts taken by governmentto protect people from Covid 19Pandemic. Discuss in the class.
Private Sector Health Infrastructure:In recent times, while the public healthsector has not been so successful indelivering the goods about which wewill study more in the next section,private sector has grown by leaps andbounds. A study reports that more than70 per cent of the hospitals in India arerun by the private sector. They controlnearly two-fifth of the beds available inthe hospitals. Nearly 60 per cent ofdispensaries are run by the sameprivate sector. They provide healthcarefor 80 per cent of out-patients and 46per cent of in-patients.
In recent times, private sector hasbeen playing a dominant role in medicaleducation and training, medicaltechnology and diagnostics, manufactureand sale of pharmaceuticals, hospital
TABLE 8.3Public Health Infrastructure in India, 1951-2018
Item 1951 1981 2000 2018
Hospitals 2,694 6,805 15,888 25,778
(Govt.)
Beds (Govt.) 1,17,000 5,04,538 7,19,861 7,13,986
Dispensaries 6,600 16,745 23,065 27,951
PHCs 725 9,115 22,842 25,743
Sub-centres - 84,736 1,37,311 1,58,417
CHCs - 761 3,043 5,624
Sources: National Commission on Macroeconomics andHealth, Ministry of Health and Family Welfare,Government of India, New Delhi, 2005 ; NationalHealth Profile for various years available onwww.cbhidghs.nic.in.
2021-22

152 INDIAN ECONOMIC DEVELOPMENT
Box 8.4: Health System in India
India’s health infrastructure and health care is made up of a three-tier system—primary, secondary and tertiary. Primary health care includes educationconcerning prevailing health problems and methods of identifying, preventingand controlling them; promotion of food supply and proper nutrition andadequate supply of water and basic sanitation; maternal and child healthcare; immunisation against major infectious diseases and injuries; promotionof mental health and provision of essential drugs.
Auxiliary Nursing Midwife(ANM) is the first person whoprovides primary healthcare inrural areas. In order to provideprimary health care, hospitalshave been set up in villages andsmall towns which are generallymanned by a single doctor, anurse and a limited quantity ofmedicines. They are known asPrimary Health Centres (PHC),Community Health Centres(CHC) and sub-centres. Whenthe condition of a patient is notmanaged by PHCs, they arereferred to secondary or tertiary hospitals. Hospitals which have better facilitiesfor surgery, X-ray, Electro Cardio Gram (ECG) are called secondary health
care institutions. They function both as primary healthcare provider and also provide better healthcare facilities.They are mostly located in district headquarters and inbig towns. All those hospitals which have advanced levelequipment and medicines and undertake all thecomplicated health problems, which could not bemanaged by primary and secondary hospitals, comeunder the tertiary sector.
The tertiary sector also includes many premierinstitutes which not only impart quality medicaleducation and conduct research but also providespecialised health care. Some of them are — All India
Institute of Medical Science, New Delhi; Post Graduate Institute, Chandigarh;Jawaharlal Institute of Postgraduate Medical Education and Research,Pondicherry; National Institute of Mental Health and Neuro Sciences, Bangaloreand All India Institute of Hygiene and Public Health, Kolkata.
Source: Report of the National Commission on Macroeconomics and Health, 2005.
Polio drops beinggiven to an infant
A health awareness meeting in progress
2021-22

153INFRASTRUCUTRE
Box 8.5: Medical Tourism — A great opportunity
You might have seen and heard on TV news or read in newspapers aboutforeigners flocking to India for surgeries, liver transplants, dental and evencosmetic care. Why? Because India’s health services combine the latest medicaltechnologies with qualified professionals and are cheaper for foreigners ascompared to costs of similar healthcare services in their own countries. In2016, as many as 2,01,000 foreigners visited India for medical treatment. Andthis figure is likely to increase by 15 per cent each year. Experts predict that by2020 India could earn more than 500 billion rupees a year through such ‘medicaltourism’.Sources : Ministry of Tourism, Government of India and www.grantthornton.in
construction and the provision ofmedical services. In 2001-02, therewere more than 13 lakh medicalenterprises employing 22 lakh people;more than 80 per cent of them weresingle person owned, and operated byone person occasionally employing ahired worker. Scholars point out thatthe private sector in India has grownindependently without any majorregulation; some private practitionersare not even registered doctors and areknown as quacks.
Box 8.6: Community and Non-profit Organisations in Healthcare
One of the important aspects of a good healthcare system is communityparticipation. It functions with the idea that the people can be trained andinvolved in primary healthcare system. This method is already being used insome parts of our country. SEWA in Ahmedabad and ACCORD in the Nilgiriscould be the examples of some such NGOs working in India. Trade unions havebuilt alternative healthcare services for their members and also to givelow-cost healthcare to people from nearby villages. The most well-known andpioneering initiative in this regard has been Shahid Hospital, built in 1983and sustained by the workers of CMSS (Chhattisgarh Mines Shramik Sangh)in Durg, Madhya Pradesh. A few attempts have also been made by ruralorganisations to build alternative healthcare initiatives. One example is inThane, Maharashtra, where in the context of a tribal people’s organisation,Kashtakari Sangathan, trains women health workers at the village level totreat simple illnesses at minimal cost.
Since the 1990s, owing toliberalisation measures, manynon-resident Indians and industrialand pharmaceutical companies have setup state-of-the-art super-specialtyhospitals to attract India’s rich andmedical tourists (see Box 8.5). Do youthink most people in India can getaccess to such super -specialtyhospitals? Why not? What could bedone so that every person in India couldaccess a decent quality healthcare?
2021-22

154 INDIAN ECONOMIC DEVELOPMENT
Indian Systems of Medicine (ISM):It includes six systems—Ayurveda,Yoga, Unani, Siddha, Naturopathyand Homeopathy (AYUSH). At present,there are 4,095 AYUSH hospitals and27,951 dispensaries and as many as8 lakh registered practitioners inIndia. But little has been done to setup a framework to standardiseeducation or to promote research.ISMs have huge potential and cansolve a large part of our healthcareproblems because they are effective,safe and inexpensive.
Indicators of Health and HealthInfrastructure—A Critical Appraisal:As pointed out earlier, the health statusof a country can be assessed throughindicators, such as infant mortality andmaternal mortality rates, life expectancyand nutrition levels, along with theincidence of communicable andnon-communicable diseases. Some ofthe health indicators, and India’sposition, are given in Table 8.4.
Scholars argue that there is greaterscope for the role of government in thehealth sector. For instance, the tableshows expenditure on health sector as3.7 per cent of the total GDP. This isabysmally low as compared to othercountries, both developed anddeveloping.
One study points out that Indiahas about one-fifth of the world’spopulation but it bears a frightening20 per cent of the global burden ofdiseases (GBD). GBD is an indicatorused by experts to gauge the numberof people dying prematurely due to aparticular disease, as well as, thenumber of years spent by them in astate of ‘disability’ owing to thedisease.
A 2017 study shows nearly two-thirds of GBD, now known as TotalBurden of Disease was caused by non-communicable diseases associatedwith heart, respiratory system – lungs,kidney, obesity and lifestyle. Diarrhoea,lower respiratory system and other
TABLE 8.4
Indicators of Health in India in comparison with other Countries, 2016-2018
Indicators India China USA Sri Lanka
Infant Mortality Rate/1,000 live births (2018) 30 7.4 5.6 6.4
Under-5 mortality /1,000 live-births (2016) 37 8.6 6.5 7.4
Birth by skilled attendants (% of total) (2016) 81 81 99 99
Infants immunised (DTP) (%) (2016) 89 89 94 99
Government health spending 3.7 5.7 17 3.9
as a % of GDP (%) (2016)
Out of pocket expenditure as a % of 65 36 11.1 50current health expenditure (2016)
Sources: World Development Indicators 2019, World Bank, Washington.
2021-22

155INFRASTRUCUTRE
common infectious diseases accountfor one-sixth of total deaths in India.Out of 4.1 million early deaths occuringglobally due to air pollution, 1.1 milliondeaths occur in India alone. Theproportion of deaths occurs due tocancer (8 per cent) injuries (11 per cent)also has been increasing over the lasttwo decades.
At present, less than 20 per cent ofthe population utilises public healthfacilities. One study has pointed out
that only 38 per cent of the PHCs havethe required number of doctors andonly 30 per cent of the PHCs havesufficient stock of medicines.
Urban-Rural and Poor-Rich Divide:Though 70 per cent of India’spopulation lives in rural areas, onlyone-fifth of its hospitals (includingprivate hospitals) are located in ruralareas. Rural India has only about halfthe number of dispensaries. Out of
Work These Out
Find out one or two government hospitals of different kinds. Invite nurses anddoctors to discuss the ways and means through which they managed Covid 19situation.
Visit a primary health centre located in your area or neighbourhood. Also, collectthe details of the number of private hospitals, medical laboratories, scan centres,medical shops and other such facilities in your locality.
Debate in the class on the topic — ‘Should we build an army of tais (midwives) totake care of the poor, who cannot afford the services of the thousands of medi-cal graduates who pass out of our medical colleges every year?’
A study estimates that medical costs alone push down 2.2 per cent of the popu-lation below the poverty line each year. How?
Visit a few hospitals in your locality. Find out the number of children receivingimmunisation from them. Ask the hospital staff about the number of childrenimmunised 5 years ago. Discuss the details in class.
Two students — Leena Talukdar (16) and Sushanta Mahanta (16) of Assam —have developed a herbal mosquito repellent ‘jag’ using a few locally availablemedicinal plants — paddy straw, husk and dried garbage. Their experimenthas been successful [Shodh Yatra (innovation), Yojana, September 2005]. If youknow anyone whose innovative methods improve the health status of people, orif you know someone who has a knowledge of medicinal plants and heals theailments of people, speak to them and bring them to the class or collectinformation about why and how they treat ailments. Share this with your class.You can also write to local newspapers or magazines.
Do you think Indian cities could be provided with world-class health infrastructureso that they will become attractive for medical tourists? Or should the governmentconcentrate on providing health infrastructure to people in rural areas? Whatshould be the priority of the government? Debate.
2021-22

156 INDIAN ECONOMIC DEVELOPMENT
about 7.13 lakh beds in governmenthospitals, roughly 30 per cent areavailable in rural areas. Thus, peopleliving in rural areas do not havesufficient medical infrastructure. Thishas led to differences in the health status
of people. As far as hospitals areconcerned, there are only 0.36 hospitalsfor every one lakh people in rural areas,
while urban areas have 3.6 hospitals forthe same number of people. The PHCslocated in rural areas do not even offer
X-ray or blood testing facilities, whichfor a city dweller, constitutes basichealthcare. States, like Bihar, Madhya
Pradesh, Rajasthan and Uttar Pradesh,are relatively lagging behind inhealthcare facilities. In rural areas, the
percentage of people who have no access
to proper healthcare facilities hasincreased over the last few years.
Villagers have no access to anyspecialised medical care, likepaediatrics, gynaecology, anaesthesiaand obstetrics. Even though 530recognised medical colleges produceabout 50,000 medical graduates everyyear, the shortage of doctors in ruralareas persists. While one-fifth of thesedoctor graduates leave the country forbetter monetary prospects, many othersopt for private hospitals, which are mostlylocated in urban areas. What could bethe reason for this trend? Interact withone or two doctors working in your areaand discuss in the class.
One study points out that thepoorest 20 per cent of Indians living inboth urban and rural areas spend 12
Fig. 8.10 Despite availing various healthcare measures, maternal health is a cause of concern
Work These Out
Ø The overall health status of the country has certainly improved through the years.
Life expectancy has gone up, infant mortality rate has come down. Smallpox has
been eradicated and the goal to eradicate leprosy and polio looks achievable. But
these statistics seem good only when you look at them in isolation. Compare these
with the rest of the world. You can get these details from the World Health Report
brought out by the World Health Organization What do you find?
Ø Observe your class for a month and find out why some students remain absent. If it
is due to health problems, then find out what kind of medical problems they had.
Collect the details of the problem, the nature of treatment they took and the amount
of money their parents spent on their treatment. Discuss the information in class.
2021-22

157INFRASTRUCUTRE
per cent of their income on healthcare,while the rich spend only 2 per cent.What happens when the poor fall sick?Many have to sell their land or evenpledge their children to afford treatment.Since government-run hospitals do notprovide sufficient facilities, the poor aredriven to private hospitals, which makethem indebted forever, else they opt todie. Recently, Indian governments havebeen taking various initiatives toimprove healthcare. Collect the detailsand review in the class.
Women’s Health: Women constituteabout half of the total population inIndia. They suffer many disadvantagesas compared to men in the areas ofeducation, participation in economicactivities and healthcare. Thedeterioration in the child sex ratioin the country from 927 in 2001 to919 in 2011 points to the growingincidence of female foeticide. Five percent of girls aged between 15-19 yearsare not only married but have alreadyborne children at least once. More than50 per cent of married women in theage group of 15–49 years have anaemiaand nutritional anaemia caused by irondeficiency, and this has not declinedsince 2005. The GBD Study 2017reports that premature deaths due toneonatal disorders tops in both theyears 2007 and 2017 and this has notdeclined since 2005.
Health is a vital public good and abasic human right. All citizens can getbetter health facilities if public healthservices are decentralised. Success inthe long-term battle against diseasesdepends on education and efficienthealth infrastructure. It is, therefore,critical to create awareness on health
and hygiene and provide efficientsystems. The role of telecom and ITsectors cannot be neglected in thisprocess. The effectiveness of healthcareprogrammes also rests on primaryhealthcare. The ultimate goal shouldbe to help people move towards abetter quality of life. There is a sharpdivide between urban and ruralhealthcare in India. If we continue toignore this deepening divide, we run therisk of destabilising the socio-economicfabric of our country. In order to providebasic healthcare to all, accessibility andaffordability need to be integrated inour basic health infrastructure.
8.7 CONCLUSION
Infrastructure, both economic andsocial, is essential for the developmentof a country. As a support system, itdirectly influences all economicactivities by increasing the productivityof the factors of production andimproving the quality of life. In the lastseven decades of Independence, Indiahas made considerable progress inbuilding infrastructure, nevertheless,its distribution is uneven. Many partsof rural India are yet to get good roads,telecommunication facilities, electricity,schools and hospitals. As India movestowards modernisation, the increase indemand for quality infrastrucutre,keeping in view their environmentalimpact, will have to be addressed. Thereform policies by providing variousconcessions and incentives, aim atattracting the private sector, in general,and foreign investors, in particular.While assessing the two infrastructure— energy and health, it is clear thatthere is scope for equal access to
infrastructure for all.
2021-22

158 INDIAN ECONOMIC DEVELOPMENT
Recap
Ø Infrastructure is a network of physical facilities and public services
and with this social infrastructure is equally important to support it.It is an important base for economic development of the country.
Ø Infrastructure needs to be upgraded from time to time to maintain
high economic growth rate. Better infrastructural facilities haveattracted more foreign investments and tourists to India recently.
Ø It is important to develop rural infrastructural facilities.
Ø Public and private partnership is required to bring in huge funds for
infrastructural development.
Ø Energy is very vital for rapid economic growth. There is a big gap between
consumer demand and supply of electricity in India.
ØNon-conventional sources of energy can be of great support to meet
shortage of energy.
Ø The power sector is facing a number of problems at generation,
transmission and distribution levels.
Ø Health is a yardstick of human well-being, physical as well as mental.
Ø There has been significant expansion in physical provision of health
services and improvements in health indicators since independence.
Ø Public health system and facilities are not sufficient for the bulk of the
population.
Ø There is a wide gap between rural-urban areas and between poor and
rich in utilising health care facilities.
Ø Women’s health across the country has become a matter of great
concern with reports of increasing cases of female foeticide andmortality.
Ø Regulated private sector health services can improve the situation and,
at the same time, NGOs and community participation are veryimportant in providing health care facilities and spreading healthawareness.
Ø Natural systems of medicine have to be explored and used to support
public health. There is a great scope of advancement of medical tourismin India.
2021-22

159INFRASTRUCUTRE
1. Explain the term ‘infrastructure’.
2. Explain the two categories into which infrastructure is divided. Howare both interdependent?
3. How do infrastructure facilities boost production?
4. Infrastructure contributes to the economic development of a country.Do you agree? Explain.
5. What is the state of rural infrastructure in India?
6. What is the significance of ‘energy’? Differentiate between commercialand non-commercial sources of energy.
7. What are the three basic sources of generating power?
8. What do you mean by transmission and distribution losses? How canthey be reduced?
9. What are the various non-commercial sources of energy?
10. Justify that energy crisis can be overcome with the use of renewablesources of energy.
11. How has the consumption pattern of energy changed over the years?
12. How are the rates of consumption of energy and economic growthconnected?
13. What problems are being faced by the power sector in India?
14. Discuss the reforms which have been initiated recently to meet theenergy crisis in India.
15. What are the main characteristics of health of the people of ourcountry?
16. What is a ‘total burden of disease’?
17. Discuss the main drawbacks of our health care system.
18. How has women’s health become a matter of great concern?
19. Describe the meaning of public health. Discuss the major public healthmeasures undertaken by the state in recent years to control diseases.
20. Differentiate the six systems of Indian medicine.
21. How can we increase the effectiveness of health care programmes?
EXERCISES
2021-22
160 INDIAN ECONOMIC DEVELOPMENT
1. Did you know that to bring a megawatt of electricity to your homes, 30-40million rupees are spent? Building a new power plant would cost millions.Isn’t this reason enough for you to begin conserving energy in your house?Electricity saved is money saved; in fact, it is worth much more thanelectricity generated. Every time your electricity bill reaches home, yourealise there is no need for so many lights and fans around you. All youhave to do is be slightly more alert and careful. And the best thing is, youcan start right away. Involve the rest of your family in this effort and seethe difference. Note down the monthly consumption of electricity in yourhouse. See the difference in the bill amount after you apply energy savingtactics.
2. Find out what infrastructure projects are in progress in your area. Then,
find out
(i) The budget allotted for the project.
(ii) The sources of its financing.
(iii) How much employment will it generate?
(iv) What will be the overall benefits after its completion?
(v) How long will it take to be completed?
(vi) Company/companies engaged in the project.
3. Visit any nearby thermal power station/hydro-power station/nuclearpower plant. Observe how these plants work.
4. The class can be divided into groups to make a survey of energy use intheir neighbourhood. The aim of the survey should be to find out whichparticular fuel is most used in the neighbourhood and the quantity inwhich it is used. Graphs can be made by the different groups and comparedto find out possible reason for preference of one particular fuel.
5. Study the life and work of Dr Homi Bhaba, the architect of modern India’s
energy establishments.
6. Hold a classroom discussion or debate on — ‘warring nations make for an
unhealthy world, so do warped attitudes and closed minds make for men-tal ill-health’.
Books
JALAN, BIMAL (Ed.). The Indian Economy — Problems and Prospects. Penguin Books,Delhi, 1993.
KALAM, A.P.J. ABDUL WITH Y.S. RAJAN. 2002. India 2020: A Vision for the New
Millennium. Penguin Books, Delhi.
SUGGESTED ADDITIONAL ACTIVITIES
REFERENCES
2021-22

161INFRASTRUCUTRE
PARIKH, KIRIT S. AND RADHAKRISHNA (Eds.). 2005. India Development Report
2004-05. Oxford University Press, Delhi.
Government Reports
Energy Statistics 2016, Ministry of Statistics and Programme Implementation,Government of India.
The World Health Report 2002. Reducing Risks, Promoting Healthy Life, WorldHealth Organisation, Geneva.
Report of the National Commission on Macroeconomics and Health, Ministry
of Health and Family Welfare, Government of India, New Delhi, 2005.
Tenth Five Year Plan, Vol.2, Planning Commission, Government of India,New Delhi.
The India Infrastructure Report: Policy Imperatives for Growth and Welfare
1996. Expert Group on the Commercialisaton of Infrastructure Projects.Vols.1, 2 and 3 Ministry of Finance. Government of India, New Delhi.
World Development Report 2004. The World Bank, Washington DC.
India Infrastructure Report 2004. Oxford University Press, New Delhi.
Economic Survey 2004-2005. Ministry of Finance, Government of India.
World Development Indicators, 2013, The World Bank, Washington.
World Health Statistics 2014, World Health Organisation, Geneva.
National Health Profile (NHP) of India for various years, Central Bureau ofHealth Intelligence, Goverment of India, New Delhi.
National Family Health Survey (NFHS-4) 2015-16, Ministry of Health andFamily Welfare, Govt. of India.
ICMR et al. 2017. India: Health of the Nation States: The India State Level
Disease Burden Initiative, Indian Coucil of Medical Research, Public HealthFoundation of India and, Institute for Health Metrics and Evaluation,
New Delhi.
Websites
On energy related issues:www.pcra.orgwww.bee-india.comwww.edugreen.teri.res.inhttp://powermin.nic.in
On health related issues:
http://www.aiims.eduhttp://www.whoindia.orghttp://mohfw.nic.inwww.apollohospitalsgroup.comwww.worldbank.orgwww.cbhidghs.nic.in
2021-22

162 INDIAN ECONOMIC DEVELOPMENT
After studying this chapter, the learners will
• understand the concept of environment
• analyse the causes and effects of ‘environmental degradation’ and ‘resource
depletion’
• understand the nature of environmental challenges facing India
• relate environmental issues to the larger context of sustainable
development.
ENVIRONMENT AND
SUSTAINABLE DEVELOPMENT
9
2021-22

163ENVIRONMENT AND SUSTAINABLE DEVELOPMENT
9.1 INTRODUCTION
In the earlier chapters we havediscussed the main economic issuesfaced by the Indian economy. Theeconomic development that we haveachieved so far has come at a very heavyprice —at the cost of environmentalquality. As we step into an era ofglobalisation that promises highereconomic growth, we have to bear inmind the adverse consequences of thepast developmental path on ourenvironment and consciously choose apath of sustainable development. Tounderstand the unsustainable path ofdevelopment that we have taken andthe challenges of sustainabledevelopment, we have to firstunderstand the significance andcontribution of environment toeconomic development. With this inmind, this chapter is divided into threesections. The first part deals with thefunctions and role of environment. Thesecond section discusses the state ofIndia’s environment and the thirdsection deals with steps and strategiesto achieve sustainable development.
9.2 ENVIRONMENT — DEFINITION AND
FUNCTIONS
Environment is defined as the totalplanetary inheritance and the totalityof all resources. It includes all the biotic
and abiotic factors that influence eachother. While all living elements —thebirds, animals and plants, forests,fisheries etc.—are biotic elements,abiotic elements include air, water, landetc. Rocks and sunlight are examplesof abiotic elements of the environment.A study of the environment then callsfor a study of the inter-relationshipbetween these biotic and abioticcomponents of the environment.
Functions of the Environment: Theenvironment performs four vitalfunctions (i) it supplies resources:resources here include both renewableand non-renewable resources.Renewable resources are those whichcan be used without the possibility ofthe resource becoming depleted orexhausted. That is, a continuoussupply of the resource remainsavailable. Examples of renewableresources are the trees in the forests andthe fishes in the ocean. Non-renewableresources, on the other hand, are thosewhich get exhausted with extractionand use, for example, fossil fuel (ii) itassimilates waste (iii) it sustains life byproviding genetic and bio diversity and(iv) it also provides aesthetic serviceslike scenery etc.
The environment is able to performthese functions without any interruptionas long as the demand on these
The environment, left to itself, can continue to support life for millions ofyears. The single most unstable and potentially disruptive element in thescheme is the human species. Human beings, with modern technology, havethe capacity to bring about, intentionally or unintentionally, far-reachingand irreversible changes in the enviornment.
Anonymous
2021-22

164 INDIAN ECONOMIC DEVELOPMENT
Work These Out
Ø Why has water become an economic commodity? Discuss.
Ø Fill in the following table with some common types of diseases and illnesses
that are caused due to air, water and noise pollution.
functions is within its carryingcapacity. This implies that the resourceextraction is not above the rate ofregeneration of the resource and thewastes generated are within theassimilating capacity of theenvironment. When this is not so, theenvironment fails to perform its thirdand vital function of life sustenance and
this results in anenvironmental crisis. Thisis the situation todayall over the world. Therising population of thedeveloping countries andthe affluent consumptionand production standardsof the developed world haveplaced a huge stress on theenvironment in terms of itsfirst two functions. Manyresources have becomeextinct and the wastesgenerated are beyond theabsorptive capacity of theenvironment. Absorptivecapacity means the abilityof the environment to
absorb degradation. The result — weare today at the threshold ofenvironmental crisis. The pastdevelopment has polluted and dried uprivers and other aquifers making wateran economic good. Besides, theintensive and extensive extraction ofboth renewable and non-renewableresources has exhausted some of these
Air Pollution Water Pollution Noise Pollution
Asthma Cholera
Fig. 9.1 Water bodies: small, snow-fed Himalayan streams are
the few fresh-water sources that remain unpolluted.
2021-22

165ENVIRONMENT AND SUSTAINABLE DEVELOPMENT
vital resources and we are compelledto spend huge amounts on technologyand research to explore new resources.Added to these are the health costs ofdegraded environmental quality —decline in air and water quality (seventyper cent of water in India is polluted)have resulted in increased incidence ofrespiratory and water-borne diseases.Hence the expenditure on health is alsorising. To make matters worse, globalenvironmental issues such as globalwarming and ozone depletion alsocontribute to increased financialcommitments for the government.
Box 9.1: Global Warming
Global warming is a gradual increase in the average temperature of the earth’slower atmosphere as a result of the increase in greenhouse gases since theIndustrial Revolution. Much of the recent observed and projected globalwarming is human-induced. It is caused by man-made increases in carbondioxide and other greenhouse gases through the burning of fossil fuels anddeforestation. Adding carbon dioxide, methane and such other gases (thathave the potential to absorb heat) to the atmosphere with no other changeswill make our planet’s surface warmer. The atmospheric concentrations ofcarbon dioxide and CH
4 have increased by 31 per cent and 149 per cent
respectively above pre-industrial levels since 1750. During the past century,the atmospheric temperature has risen by 1.1°F (0.6°C) and sea level hasrisen several inches. Some of the longer-term results of global warming aremelting of polar ice with a resulting rise in sea level and coastal flooding;disruption of drinking water supplies dependent on snow melts; extinction ofspecies as ecological niches disappear; more frequent tropical storms; and anincreased incidence of tropical diseases.
Among factors that may be contributing to global warming are the burningof coal and petroleum products (sources of carbon dioxide, methane, nitrousoxide, ozone); deforestation, which increases the amount of carbon dioxide inthe atmosphere; methane gas released in animal waste; and increased cattleproduction, which contributes to deforestation, methane production, and useof fossil fuels. A UN Conference on Climate Change, held in Kyoto, Japan, in1997, resulted in an international agreement to fight global warming whichcalled for reductions in emissions of greenhouse gases by industrialised nations.
Source: www.wikipedia.org
Thus, it is clear that the opportunitycosts of negative environmentalimpacts are high.
The biggest question that arises is:are environmental problems new to thiscentury? If so, why? The answer to thisquestion requires some elaboration. Inthe early days when civilisation justbegan, or before this phenomenalincrease in population, and beforecountries took to industrialisation, thedemand for environmental resourcesand services was much less than theirsupply. This meant that pollution waswithin the absorptive capacity of the
2021-22

166 INDIAN ECONOMIC DEVELOPMENT
Box 9.2: Ozone Depletion
Ozone depletion refers to the phenomenon of reductions in the amount of ozonein the stratosphere. The problem of ozone depletion is caused by high levelsof chlorine and bromine compounds in the stratosphere. The origins of thesecompounds are chlorofluorocarbons (CFC), used as cooling substances in air-conditioners and refrigerators, or as aerosol propellants, andbromofluorocarbons (halons), used in fire extinguishers. As a result of depletionof the ozone layer, more ultraviolet (UV) radiation comes to Earth and causesdamage to living organisms. UV radiation seems responsible for skin cancerin humans; it also lowers production of phytoplankton and thus affects otheraquatic organisms. It can also influence the growth of terrestrial plants. Areduction of approximately 5 per cent in the ozone layer was detected from1979 to 1990. Since the ozone layer prevents most harmful wavelengths ofultraviolet light from passing through the Earth’s atmosphere, observed andprojected decreases in ozone have generated worldwide concern. This led tothe adoption of the Montreal Protocol banning the use of chlorofluorocarbon(CFC) compounds, as well as other ozone depleting chemicals such as carbontetrachloride, trichloroethane (also known as methyl chloroform), and brominecompounds known as halons.
Source: www.ceu.hu
environment and the rate of resourceextraction was less than the rate ofregeneration of these resources. Henceenvironmental problems did not arise.
But with population explosion and withthe advent of industrial revolutionto meet the growing needs of theexpanding population, things
changed. The result was that thedemand for resources for bothproduction and consumptionwent beyond the rate ofregeneration of the resources; thepressure on the absorptivecapacity of the environmentincreased tremendously — thistrend continues even today. Thuswhat has happened is a reversalof supply-demand relationshipfor environmental quality — weare now faced with increaseddemand for environmentalresources and services but theirsupply is limited due to overuse
Fig. 9.2 Damodar Valley is one of India’s most
industrialised regions. Pollutants from the heavyindustries along the banks of the Damodar river
are converting it into an ecological disaster
2021-22

167ENVIRONMENT AND SUSTAINABLE DEVELOPMENT
and misuse. Hencethe environmentalissues of wastegeneration andpollution havebecome criticaltoday.
9.3 STATE OF INDIA’SENVIRONMENT
India has abundantnatural resources interms of rich qualityof soil, hundreds ofrivers and tributaries,lush green forests,plenty of mineraldeposits beneath the land surface, vaststretch of the Indian Ocean, ranges ofmountains, etc. The black soil of theDeccan Plateau is particularly suitablefor cultivation of cotton, leading toconcentration of textile industries in thisregion. The Indo-Gangetic plains —spread from the Arabian Sea to the Bayof Bengal — are one of the most fertile,intensively cultivated and denselypopulated regions in the world. India’sforests, though unevenly distributed,provide green cover for a majority of itspopulation and natural cover for itswildlife. Large deposits of iron-ore, coaland natural gas are found in thecountry. India accounts for nearly8 per cent of the world’s total iron-orereserves. Bauxite, copper, chromate,diamonds, gold, lead, lignite,manganese, zinc, uranium, etc. are alsoavailable in different parts of thecountry. However, the developmentalactivities in India have resulted in
pressure on its finite natural
resources, besides creating impacts on
human health and well-being. The
threat to India’s environment poses a
dichotomy—threat of poverty-induced
environmental degradation and, at the
same time, threat of pollution from
affluence and a rapidly growing
industrial sector. Air pollution,
water contamination, soil erosion,
deforestation and wildlife extinction
are some of the most pressing
environmental concerns of India. The
priority issues identified are (i) land
degradation (ii) biodiversity loss (iii) air
pollution with special reference to
vehicular pollution in urban cities (iv)
management of fresh water and (v) solid
waste management. Land in India
suffers from varying degrees and types
of degradation stemming mainly from
unstable use and inappropriate
management practices.
Fig. 9.3 Deforestation leads to land degradation, biodiversity loss andair pollution
2021-22

168 INDIAN ECONOMIC DEVELOPMENT
Box. 9.3: Chipko or Appiko — What’s in a Name?
You may be aware of the Chipko Movement, which aimed at protecting forestsin the Himalayas. In Karnataka, a similar movement took a different name,‘Appiko’, which means to hug. On 8 September 1983, when the felling of treeswas started in Salkani forest in Sirsidistrict, 160 men, women and childrenhugged the trees and forced thewoodcutters to leave. They kept vigil inthe forest over the next six weeks. Onlyafter the forest officials assured thevolunteers that the trees will be cutscientifically and in accordance with theworking plan of the district, did theyleave the trees.
When commercial felling bycontractors damaged a large number ofnatural forests, the idea of hugging thetrees gave the people hope andconfidence that they can protect theforests. On that particular incident, withthe felling discontinued, the people saved12,000 trees. Within months, thismovement spread to many adjoiningdistricts.
Indiscriminate felling of trees forfuelwood and for industrial use has led to many environmental problems.Twelve years after setting up of a paper mill in Uttar Kanara area, bamboohas been wiped out from that area. “Broad-leaved trees which protected thesoil from the direct onslaught of rain have been removed, the soil washedaway, and bare laterite soil left behind. Now nothing grows but a weed”, saysa farmer. Farmers also complain that rivers and rivulets dry up quicker, andthat rainfall is becoming erratic. Diseases and insects earlier unknown arenow attacking the crops.
Appiko volunteers want the contractors and forest officials to follow certainrules and restrictions. For instance, local people should be consulted whentrees are marked for felling and trees within 100 metres of a water sourceand on a slope of 30 degrees or above should not be felled.
Do you know that the government allocates forestlands to industries touse forest materials as industrial raw material? Even if a paper mill employs10,000 workers and a plywood factory employs 800 people but if they deprivethe daily needs of a million people, is it acceptable? What do you think?
Source: Excerpts from ‘State of India’s Environment 2: The Second Citizens’ Report 1984-85’,
Centre for Science and Environment, 1996, New Delhi.
2021-22

169ENVIRONMENT AND SUSTAINABLE DEVELOPMENT
Work These Out
Ø In order to enable the students to appreciate the contribution of environment
to economic development, the following game can be introduced. One studentmay name a product used by any enterprise and the other student maytrace out its roots to nature and earth.
trucks steel and rubbersteel iron mineral earthrubber trees forests earthbooks paper trees forest earthcloth cotton plant naturepetrol earthmachinery iron mineral earth
Ø A truck driver had to pay Rs 10,000 as challan as his truck was emitting
black soot. Why do you think he was penalised? Was it justified? Discuss.
Some of the factors responsiblefor land degradation are (i) lossof vegetation occuring due todeforestation (ii) unsustainable fuelwood and fodder extraction (iii) shiftingcultivation (iv) encroachment into forestlands (v) forest fires and over grazing(vi) non-adoption of adequate soilconservation measures (vii) impropercrop rotation (viii) indiscriminate use ofagro-chemicals such as fertilisers andpesticides (ix) improper planning andmanagement of irrigation systems(x) extraction of ground water in
the competing uses of land forforestry, agriculture, pastures, humansettlements and industries exert anenormous pressure on the country’sfinite land resources.
The per capita forest land in thecountry is only 0.06 hectare againstthe requirement of 0.47 hectare to meetbasic needs, resulting in an excessfelling of about 15 million cubic metreforests over the permissible limit.
Estimates of soil erosion show thatsoil is being eroded at a rate of 5.3billion tonnes a year for the entire
excess of the recharge capacity (xi)open access resource and (xii) povertyof the agriculture-dependent people.
India supports approximately 17per cent of the world’s human and 20per cent of livestock population on amere 2.5 per cent of the world’sgeographical area. The high densityof population and livestock and
country as a result of which thecountry loses 0.8 million tonnes ofnitrogen, 1.8 million tonnes ofphosphorus and 26.3 million tonnesof potassium every year. According tothe Government of India, the quantityof nutrients lost due to erosion eachyear ranges from 5.8 to 8.4 milliontonnes.
2021-22

170 INDIAN ECONOMIC DEVELOPMENT
Box 9.4 : Pollution Control Boards
In order to address two major environmental concerns in India, viz. water andair pollution, the government set up the Central Pollution Control Board (CPCB)in 1974. This was followed by states establishing their own state level boardsto address all the environmental concerns. They investigate, collect anddisseminate information relating to water, air and land pollution, lay downstandards for sewage/trade effluent and emissions. These boards providetechnical assistance to governments in promoting cleanliness of streams andwells by prevention, control and abatement of water pollution, and improvethe quality of air and to prevent, control or abate air pollution in the country.
These boards also carry out and sponsor investigation and researchrelating to problems of water and air pollution and for their prevention, controlor abatement. They organise, through mass media, a comprehensive massawareness programme for the same. The PCBs prepare manuals, codes andguidelines relating to treatment and disposal of sewage and trade effluents.
They assess the air quality through regulation of industries. In fact, stateboards, through their district level officials, periodically inspect every industryunder their jurisdiction to assess the adequacy of treatment measures providedto treat the effluent and gaseous emissions. It also provides background airquality data needed for industrial siting and town planning.
The pollution control boards collect, collate and disseminate technical andstatistical data relating to water pollution. They monitor the quality of waterin 125 rivers (including the tributaries), wells, lakes, creeks, ponds, tanks,drains and canals. Visit a nearby factory/irrigation department and collect the details of
measures that they adopt to control water and air pollution. You might be seeing advertisements in newspapers, radio and television
or billboards in your locality on awareness programmes relating to waterand air pollution. Collect a few news-clippings, pamphlets and otherinformation and discuss them in the classroom.
In India, air pollution is widespreadin urban areas where vehicles are themajor contributors and in a few otherareas which have a high concentrationof industries and thermal power plants.Vehicular emissions are of particularconcern since these are ground levelsources and, thus, have the maximumimpact on the general population. Thenumber of motor vehicles has increasedfrom about 3 lakh in 1951 to 30 croresin 2019. In 2016, personal transport
vehicles (two-wheeled vehicles and carsonly) constituted about 85 per cent ofthe total number of registered vehiclesthus contributing significantly to totalair pollution load.
India is one of the ten mostindustrialised nations of the world.But this status has brought withit unwanted and unanticipatedconsequences such as unplannedurbanisation, pollution and the risk ofaccidents. The CPCB (Central Pollution
2021-22
171ENVIRONMENT AND SUSTAINABLE DEVELOPMENT
Control Board) has identified seventeencategories of industries (largeand medium scale) as significantlypolluting (See Box 9.4).
allow all future generations to have a
potential average quality of life that isat least as high as that which is beingenjoyed by the current generation. The
concept of sustainable developmentwas emphasised by the United NationsConference on Environment and
Development (UNCED), which definedit as: ‘Development that meets the needof the present generation without
compromising the ability of the futuregeneration to meet their own needs’.
Read the definition again. You will
notice that the term ‘need’ and thephrase ‘future generations’ in thedefinition are the catch phrases. The
use of the concept ‘needs’ in thedefinition is linked to distribution ofresources. The seminal report—Our
Common Future—that gave the abovedefinition explained sustainabledevelopment as ‘meeting the basic
needs of all and extending to all theopportunity to satisfy their aspirationsfor a better life’. Meeting the needs of
all requires redistributing resourcesand is hence a moral issue.Edward Barbier defined sustainable
development as one which is directlyconcerned with increasing the materialstandard of living of the poor at
the grass root level — this can bequantitatively measured in terms ofincreased income, real income,
educational services, health care,sanitation, water supply etc. In morespecific terms, sustainable development
aims at decreasing the absolute povertyof the poor by providing lasting andsecure livelihoods that minimise
resource depletion, environmental
The above points highlight thechallenges to India’s environment. Thevarious measures adopted by theMinistry of Environment and thecentral and state pollution controlboards may not yield reward unlesswe consciously adopt a path ofsustainable development. The concernfor future generations alone can makedevelopment last forever. Developmentto enhance our current living styles,without concern for posterity, willdeplete resources and degradeenvironment at a pace that is bound toresult in both environmental andeconomic crisis.
9.4 SUSTAINABLE DEVELOPMENT
Environment and economy areinterdependent and need each other.Hence, development that ignores itsrepercussions on the environment willdestroy the environment that sustainslife forms. What is needed is sustainabledevelopment: development that will
Work This Out
Ø You can see a column on the
measure of air pollution inany national daily. Cut outthe news item a week beforeDiwali, on the day of Diwaliand two days after Diwali.Do you observe a significantdifference in the value?Discuss in your class.
2021-22

172 INDIAN ECONOMIC DEVELOPMENT
degradation, cultural disruption andsocial instability. Sustainabledevelopment is, in this sense, adevelopment that meets the basic needsof all, particularly the poor majority, foremployment, food, energy, water,housing, and ensures growth ofagriculture, manufacturing, power andservices to meet these needs.
The Brundtland Commissionemphasises on protecting the futuregeneration. This is in line with theargument of the environmentalists whoemphasise that we have a moralobligation to hand over the planet earthin good order to the future generation;that is, the present generation shouldbequeath a better environment to thefuture generation. At least we shouldleave to the next generation a stock of‘quality of life’ assets no less than whatwe have inherited.
The present generation canpromote development that enhancesthe natural and built environment inways that are compatible with(i) conservation of natural assets(ii) preservation of the regenerativecapacity of the world’s naturalecological system (iii) avoiding theimposition of added costs or risks onfuture generations.
According to Herman Daly, a leadingenvironmental economist, to achievesustainable development, the followingneeds to be done (i) limiting the humanpopulation to a level within the carryingcapacity of the environment. The carryingcapacity of the environment is likea‘plimsoll line’ of the ship which is its loadlimit mark. In the absence of the plimsollline for the economy, human scale grows
beyond the carrying capacity of the earthand deviates from sustainabledevelopment (ii) technological progressshould be input efficient and not inputconsuming (iii) renewable resourcesshould be extracted on a sustainable basis,that is, rate of extraction should not exceedrate of regeneration (iv) for non-renewableresources rate of depletion should notexceed the rate of creation of renewablesubstitutes and (v) inefficiencies arisingfrom pollution should be corrected. In2015, the UN formulated 17 SustainableDevelopment Goals (SDGs) intended to beachieved by the year 2030. Collect thedetails of those goals and discuss them inthe context of India.
9.5 STRATEGIES FOR SUSTAINABLE
DEVELOPMENT
Use of Non-conventional Sources ofEnergy: India, as you know, is hugelydependent on thermal and hydropower plants to meet its powerneeds. Both of these have adverseenvironmental impacts. Thermal powerplants emit large quantities of carbondioxide which is a green house gas. Italso produces fly ash which, if not usedproperly, can cause pollution of waterbodies, land and other components ofthe environment. Hydroelectric projectsinundate forests and interfere with thenatural flow of water in catchmentareas and the river basins. Wind powerand solar rays are good examples ofconventional. In recent years, someefforts are being taken to tap theseenergy resources. Collect the detailsof one such unit set up in your area ifany, and discuss in the class.
2021-22

173ENVIRONMENT AND SUSTAINABLE DEVELOPMENT
LPG, Gobar Gas in Rural Areas:Households in rural areas generally usewood, dung cake or other biomass asfuel. This practice has several adverseimplications like deforestation,reduction in green cover, wastage ofcattle dung and air pollution. To rectifythe situation, subsidised LPG is beingprovided. In addition, gobar gas plantsare being provided through easy loansand subsidy. As far as liquefiedpetroleum gas (LPG) is concerned, it isa clean fuel — it reduces householdpollution to a large extent. Also, energywastage is minimised. For the gobargas plant to function, cattle dung is fedto the plant and gas is produced whichis used as fuel while the slurry whichis left over is a very good organicfertiliser and soil conditioner.
CNG in Urban Areas: In Delhi, the useof Compressed Natural Gas (CNG) asfuel in public transport system hassignificantly lowered air pollution andthe air has become cleaner. In the last
few years many other Indian cities alsobegan to use CNG.
Wind Power: In areas where speed ofwind is usually high, wind mills canprovide electricity without any adverseimpact on the environment. Windturbines move with the wind andelectricity is generated. No doubt, theinitial cost is high. But the benefits aresuch that the high cost gets easilyabsorbed.
Work This Out In Delhi, buses and other public
transport vehicles uses CNG as fuelinstead of petrol or diesel; somevehicles use convertible engines;solar energy is being used to lightup the streets. What do you thinkabout these changes? Delhi alsoadopted odd/even scheme to restrictthe use of vehicles with registrationending with odd/even numbers onalternative days, for specific periodin a year. Organise a debate in classon the need for sustainabledevelopment practices in India.
Fig.9.4 Gobar Gas Plant uses cattle dung to produce energy
2021-22

174 INDIAN ECONOMIC DEVELOPMENT
Solar Power through PhotovoltaicCells: India is naturally endowed witha large quantity of solar energy in theform of sunlight. We use it in differentways. For example, we dry our clothes,grains, other agricultural products aswell as various items made for daily use.We also use sunlight to warm ourselvesin winter. Plants use solar energy toperform photosynthesis. Now, with thehelp of photovoltaic cells, solar energycan be converted into electricity. Thesecells use special kind of materials tocapture solar energy and then convertthe energy into electricity. Thistechnology is extremely useful for remoteareas and for places where supply ofpower through grid or power lines iseither not possible or proves very costly.This technique is also totally free frompollution. In recent years India is takingefforts to increase the power generationthrough solar. India is also leading anInternational body called InternationalSolar Alliance (ISA).
Mini-hydel Plants: In mountainousregions, streams can be found almosteverywhere. A large percentage of suchstreams are perennial. Mini-hydelplants use the energy of such streamsto move small turbines. The turbinesgenerate electricity which can be usedlocally. Such power plants are more orless environment-friendly as they do notchange the land use pattern in areaswhere they are located; they generateenough power to meet local demands.This means that they can also do awaywith the need for large scaletransmission towers and cables andavoid transmission loss.
Traditional Knowledge andPractices: Traditionally, Indian peoplehave been close to their environment.They have been more a component ofthe environment and not its controller.If we look back at our agriculturesystem, healthcare system, housing,transport etc., we find that all practiceshave been environment friendly. Onlyrecently have we drifted away from thetraditional systems and caused largescale damage to the environment andalso our rural heritage. Now, it is timeto go back. One apt example is inhealthcare. India is very muchprivileged to have about 15,000 speciesof plants which have medicinalproperties. About 8,000 of these are inregular use in various systems oftreatment including the folk tradition.With the sudden onslaught of thewestern system of treatment, weignored our traditional systems suchas Ayurveda, Unani, Tibetan and folksystems. These healthcare systems arein great demand again for treatingchronic health problems. Now a daysevery cosmetic produce — hair oil,toothpaste, body lotion, face cream andwhat not — is herbal in composition.Not only are these products environmentfriendly, they are relatively free from sideeffects and do not involve large-scaleindustrial and chemical processing.
Biocomposting: In our quest toincrease agricultural productionduring the last five decades or so, wealmost totally neglected the use ofcompost and completely switched overto chemical fertilisers. The result is thatlarge tracts of productive land have
2021-22

175ENVIRONMENT AND SUSTAINABLE DEVELOPMENT
been adversely affected, water bodiesincluding ground water system havesuffered due to chemical contaminationand demand for irrigation has beengoing up year after year.
Farmers, in large numbers all overthe country, have again started usingcompost made from organic wastes ofdifferent types. In certain parts of thecountry, cattle are maintained onlybecause they produce dung which isan important fertiliser and soilconditioner.
Earthworms can convert organicmatter into compost faster than thenormal composting process. Thisprocess is now being widely used.Indirectly, the civic authorities arebenefited too as they have to disposereduced quantity of waste.
Biopest Control: With the advent ofgreen revolution, the entire countryentered into a frenzy to use more andmore chemical pesticides for higheryield. Soon, the adverse impacts beganto show; food products werecontaminated, soil, water bodies andeven ground water were polluted withpesticides. Even milk, meat and fisheswere found to be contaminated.
To meet this challenge, efforts areon to bring in better methods of pestcontrol. One such step is the use ofpesticides based on plant products.Neem trees are proving to be quiteuseful. Several types of pest controllingchemicals have been isolated from neemand these are being used. Mixedcropping and growing different cropsin consecutive years on the same landhave also helped farmers.
In addition, awareness is spreadingabout various animals and birds whichhelp in controlling pests. For example,snakes are one of the prime group ofanimals which prey upon rats, mice andvarious other pests. Similarly, largevarieties of birds, for example, owls andpeacocks, prey upon vermin and pests.If these are allowed to dwell around theagricultural areas, they can clear largevarieties of pests including insects.Lizards are also important in thisregard. We need to know their value andsave them.
Sustainable development hasbecome a catch phrase today. It is‘indeed’ a paradigm shift indevelopment thinking. Though it hasbeen interpreted in a number of ways,adherence to this path ensures lastingdevelopment and non-declining welfarefor all.
9.6 CONCLUSION
Economic development, which aimed atincreasing the production of goods andservices to meet the needs of a risingpopulation, puts greater pressure onthe environment. In the initial stagesof development, the demand forenvironmental resources was less thanthat of supply. Now the world isfaced with increased demand forenvironmental resources but theirsupply is limited due to overuse andmisuse. Sustainable development aimsat promoting the kind of developmentthat minimises environmental problemsand meets the needs of the presentgeneration without compromising theability of the future generation to meettheir own needs.
2021-22

176 INDIAN ECONOMIC DEVELOPMENT
1. What is meant by environment?
2. What happens when the rate of resource extraction exceeds that oftheir regeneration?
3. Classify the following into renewable and non-renewable resources(i) trees (ii) fish (iii) petroleum (iv) coal (v) iron-ore (vi) water.
4. Two major environmental issues facing the world today are ____________and _____________.
5. How do the following factors contribute to the environmental crisisin India? What problem do they pose for the government?
(i) Rising population(ii) Air pollution
EXERCISES
Recap
Ø Environment performs four functions: supplies resources, assimilateswastes, sustains life by providing genetic and bio diversity and providesaesthetic services.
Ø Population explosion, affluent consumption and production have placeda huge stress on the environment.
Ø Developmental activities in India have put immense pressure on its finitenatural resources, besides creating impact on human health andwell-being.
Ø The threat to India’s environment is of two dimensions —threat of povertyinduced environmental degradation and the threat of pollution fromaffluence and a rapidly growing industrial sector.
Ø Though the government, through various measures, attempts to safeguardthe environment, it is also necessary to adopt a path of sustainabledevelopment.
Ø Sustainable development is development that meets the need of the presentgeneration without compromising the ability of the future generation tomeet their own needs.
Ø Promotion of natural resources, conservation, preserving regenerativecapacity of ecological system and avoiding the imposition of environmentalrisks on future generations would lead to sustainable development.
2021-22

177ENVIRONMENT AND SUSTAINABLE DEVELOPMENT
(iii) Water contamination(iv) Affluent consumption standards(v) Illiteracy
(vi) Industrialisation(vii) Urbanisation
(viii) Reduction of forest coverage(ix) Poaching, and(x) Global warming.
6. What are the functions of the environment?
7. Identify six factors contributing to land degradation in India.
8. Explain how the opportunity costs of negative environmental impactare high.
9. Outline the steps involved in attaining sustainable development in India.
10. India has abundant natural resources —substantiate the statement.
11. Is environmental crisis a recent phenomenon? If so, why?
12. Give two instances of
(a) Overuse of environmental resources(b) Misuse of environmental resources.
13. State any four pressing environmental concerns of India.
14. Correction for environmental damages involves opportunitycosts — explain.
15. Explain how the supply-demand reversal of environmental resourcesaccount for the current environmental crisis.
16. Highlight any two serious adverse environmental consequences ofdevelopment in India. India’s environmental problems pose a dichotomy— they are poverty induced and, at the same time, due to affluence inliving standards — is this true?
17. What is sustainable development?
18. Keeping in view your locality, describe any four strategies of sustainabledevelopment.
19. Explain the relevance of intergenerational equity in the definition ofsustainable development.
1. Suppose 70 lakh cars are added every year to the roads of metropolitans.Which type of resources do you think are undergoing depletion? Discuss.
2. Make a list of items that can be recycled.
SUGGESTED ADDITIONAL ACTIVITIES
2021-22

178 INDIAN ECONOMIC DEVELOPMENT
3. Prepare a chart on the causes and remedies of soil erosion in India.
4. How does population explosion contribute to the environmental crisis?Debate in the classroom.
5. The nation has to pay heavily for correcting environmental damages —discuss.
6. A paper factory is to be set up in your village. Arrange a role playconsisting of an activist, an industrialist and a group of villagers.
BOOKS
AGARWAL, ANIL and SUNITA NARAIN. 1996. Global Warming in an Unequal World.Centre for Science and Environment, Reprint Edition, New Delhi.
BHARUCHA, E. 2005. Textbook of Environmental Studies for UndergraduateCourses, Universities Press (India) Pvt Ltd.
CENTRE FOR SCIENCE AND ENVIRONMENT. 1996. State of India’s Environment1: The First Citizens’ Report 1982. Reprint Edition, New Delhi.
CENTRE FOR SCIENCE AND ENVIRONMENT. 1996. State of India’s Environment 2: The Second Citizens’ Report 1985, Reprint Edition, New Delhi.
KARPAGAM, M. 2001.Environmental Economics: A Textbook. Sterling Publishers,New Delhi.
RAJAGOPALAN, R. 2005. Environmental Studies: From Crisis to Cure. OxfordUniversity Press, New Delhi.
SCHUMACHER, E.F. Small is Beautiful. Abacus Publishers, New York.
Reports
State of India’s Environment (for various years), Centre for Science andEnvironment, New Delhi.
Journals
Scientific American, India, Special Issue, September 2005Down to Earth, Centre for Science and Environment, New Delhi.
Websites
http://envfor.nic.inhttp://cpcb.nic.inhttp://www.cseindia.org
REFERENCES
2021-22

DEVELOPMENT EXPERIENCES OF INDIA: A COMPARISON
WITH NEIGHBOURS
UNIT
IIIUNIT
IV
2021-22

In today’s globalised world, where geographical
boundaries are slowly becoming meaningless, it
is important for neighbouring countries in the
developing world to understand the development
strategies being pursued by their neighbours. This
is more so because they share the relatively limited
economic space in world markets. In this unit, we
will compare India’s developmental experiences
with two of its important and strategic neighbours
— Pakistan and China.
2021-22

After studying this chapter, the learners will
• figure out comparative trends in various economic and humandevelopment indicators of India and its neighbours, China and Pakistan
• assess the strategies that these countries have adopted to reach theirpresent state of development.
COMPARATIVE
DEVELOPMENT EXPERIENCES OF INDIA
AND ITS NEIGHBOURS
10
2021-22

182 INDIAN ECONOMIC DEVELOPMENT
10.1 INTRODUCTION
In the preceding units we studied thedevelopmental experience of India indetail. We also studied the kind ofpolicies India adopted, which hadvarying impacts in different sectors.Over the last two decades or so, theeconomic transformation that is takingplace in different countries across theworld, partly because of the processof globalisation, has both short aswell as long-term implications foreach country, including India. Nationshave been primarily trying to adoptvarious means which will strengthentheir own domestic economies. To thiseffect, they are forming regional andglobal economic groupings such asthe SAARC, European Union,ASEAN, G-8, G-20, BRICS etc. Inaddition, there is also an increasingeagerness on the parts of variousnations to try and understand thedevelopmental processes pursued bytheir neighbouring nations as itallows them to better comprehendtheir own strengths and weaknessesvis-à-vis their neighbours. In theunfolding process of globalisation,this is particularly consideredessential by developing countries asthey face competition not only fromdeveloped nations but also amongstthemselves in the relatively limitedeconomic space enjoyed by thedeveloping world. Besides, an
understanding of the other economiesin our neighbourhood is also requiredas all major common economicactivities in the region impinge onoverall human development in ashared environment.
In this chapter we will compare thedevelopmental strategies pursued byIndia and the largest two of itsneighbouring economies—Pakistanand China. It has to be rememberedthat despite being endowed with vastnatural resources, there is littlesimilarity between the political powersetup of India - the largest democracyof the world which is wedded to asecular and deeply liberal Constitutionfor more than half a century, and themilitarist political power structure ofPakistan or the command economyof China that has only recentlystarted moving towards a democraticsystem and more liberal economicrestructuring respectively.
10.2 DEVELOPMENTAL PATH—ASNAPSHOT VIEW
Do you know that India, Pakistan andChina have many similarities in theirdevelopmental strategies? All the threenations have started towards theirdevelopmental path at the same time.While India and Pakistan becameindependent nations in 1947, People’sRepublic of China was established in1949. In a speech at that time,
Geography has made us neighbours. History has made us friends. Economicshas made us partners, and necessity has made us allies. Those whom God hasso joined together, let no man put asunder.
John F. Kennedy
2021-22

183COMPARATIVE DEVELOPMENT EXPERIENCES OF INDIA AND ITS NEIGHBOURS
Jawaharlal Nehru had said, “Thesenew and revolutionary changes inChina and India, even though theydiffer in content, symbolise the newspirit of Asia and new vitality which isfinding expression in the countries inAsia.”
All three countries had startedplanning their development strategiesin similar ways. While Indiaannounced its first Five Year Plan for1951–56, Pakistan announced its firstfive year plan, now called the MediumTerm Development Plan, in 1956.China announced its First Five YearPlan in 1953. Since 2018, Pakistan isworking on the basis of 12th Five YearDevelopment Plan (2018–23), whereas,China is working on 14th Five YearPlan (2021–25). Until March 2017,India has been following Five YearPlan- based development model. Indiaand Pakistan adopted similarstrategies, such as creating a largepublic sector and raising publicexpenditure on social development.Till the 1980s, all the three countrieshad similar growth rates and per capitaincomes. Where do they stand todayin comparison to one another? Beforewe answer this question, let us tracethe historical path of developmentalpolicies in China and Pakistan. Afterstudying the last three units, wealready know what policies India hasbeen adopting since its Independence.
China: After the establishment ofPeople’s Republic of China under one-party rule, all critical sectors of theeconomy, enterprises and lands ownedand operated by individuals werebrought under government control.
The Great Leap Forward (GLF)campaign initiated in 1958 aimed atindustrialising the country on amassive scale. People were encouragedto set up industries in their backyards.In rural areas, communes werestarted. Under the Commune system,people collectively cultivated lands. In1958, there were 26,000 communescovering almost all the farmpopulation.
GLF campaign met with manyproblems. A severe drought causedhavoc in China killing about 30 millionpeople. When Russia had conflicts withChina, it withdrew its professionalswho had earlier been sent to China tohelp in the industrialisation process.In 1965, Mao introduced the GreatProletarian Cultural Revolution(1966–76) under which students andprofessionals were sent to work andlearn from the countryside.
The present day fast industrialgrowth in China can be traced back tothe reforms introduced in 1978. Chinaintroduced reforms in phases. In theinitial phase, reforms were initiated inagriculture, foreign trade andinvestment sectors. In agriculture, forinstance, commune lands were dividedinto small plots, which were allocated(for use not ownership) to individualhouseholds. They were allowed to keepall income from the land after payingstipulated taxes. In the later phase,reforms were initiated in the industrialsector. Private sector firms, in general,and township and village enterprises,i.e., those enterprises which wereowned and operated by local collectives,in particular, were allowed to produce
2021-22

184 INDIAN ECONOMIC DEVELOPMENT
goods. At this stage, enterprises ownedby government (known as State OwnedEnterprises—SOEs), which we, inIndia, call public sector enterprises,were made to face competition. Thereform process also involved dualpricing. This means fixing the prices intwo ways; farmers and industrial unitswere required to buy and sell fixedquantities of inputs and outputs on thebasis of prices fixed by the governmentand the rest were purchased and soldat market prices. Over the years, asproduction increased, the proportion ofgoods or inputs transacted in themarket also increased. In order toattract foreign investors, specialeconomic zones were set up.
Pakistan: While looking at variouseconomic policies that Pakistanadopted, you will notice manysimilarities with India. Pakistan alsofollows the mixed economy model with
co-existence of public and privatesectors. In the late 1950s and 1960s,Pakistan introduced a variety ofregulated policy framework (for importsubstitution-based industrialisation).The policy combined tariff protection formanufacturing of consumer goodstogether with direct import controls oncompeting imports. The introduction ofGreen Revolution led to mechanisationand increase in public investment ininfrastructure in select areas, whichfinally led to a rise in the production offoodgrains. This changed the agrarianstructure dramatically. In the 1970s,nationalisation of capital goodsindustries took place. Pakistan thenshifted its policy orientation in the late1970s and 1980s when the majorthrust areas were denationalisationand encouragement of private sector.During this period, Pakistan alsoreceived financial support from westernnations and remittances from
Fig. 10.1 Wagah Border is not only a tourist place but also used fortrade between India and Pakistan
2021-22

185COMPARATIVE DEVELOPMENT EXPERIENCES OF INDIA AND ITS NEIGHBOURS
continuously increasing outflow ofemigrants to the Middle-east. Thishelped the country in stimulatingeconomic growth. The then governmentalso offered incentives to the privatesector. All this created a conduciveclimate for new investments. In 1988,reforms were initiated in the country.
Having studied a brief outline ofthe developmental strategies of Chinaand Pakistan, let us now comparesome of the developmental indicatorsof India, China and Pakistan.
10.3 DEMOGRAPHIC INDICATORS
If we look at the global population, outof every six persons living in thisworld, one is an Indian and another aChinese. We shall compare somedemographic indicators of India,China and Pakistan. The populationof Pakistan is very small and accountsfor roughly about one-tenth of Chinaor India.
Though China is the largest nationand geographically occupies the largestarea among the three nations, itsdensity is the lowest. Table 10.1 shows
the population growth as being thehighest in Pakistan, followed by Indiaand China. Scholars point out the one-child norm introduced in China in thelate 1970s as the major reason for lowpopulation growth. They also state thatthis measure led to a decline in the sexratio, the proportion of females per1000 males. However, from the table,you will notice that the sex ratio is lowand biased against females in all threecountries. Scholars cite son preferenceprevailing in all these countries as thereason. In recent times, all threecountries are adopting variousmeasures to improve the situation. One-child norm and the resultant arrest inthe growth of population also have otherimplications. For instance, after a fewdecades, in China, there will be moreelderly people in proportion to youngpeople. This led China to allow couplesto have two children.
The fertility rate is also low inChina and very high in Pakistan.Urbanisation is high in China withIndia having 34 per cent of its peopleliving in urban areas.
TABLE 10.1
Select Demographic Indicators, 2017-18
Country Estimated Annual Density Sex Fertility Urbanisation
Population Growth of (per sq. km) Ratio Rate(in million) Population
India 1352 1.03 455 924 2.2 34
China 1393 0.46 148 949 1.7 59
Pakistan 212 2.05 275 943 3.6 37
Source: World Development Indicators 2019, www.worldbank.org
2021-22

186 INDIAN ECONOMIC DEVELOPMENT
10.4 GROSS DOMESTIC
PRODUCT AND
SECTORS
One of the much-talkedissues around the worldabout China is its growthof Gross DomesticProduct. China has thesecond largest GDP (PPP)of $22.5 trillion in theworld, whereas, India’sGDP (PPP) is $9.03trillion and Pakistan’sGDP is $ 0.94 trillion,roughly about 11 percent of India’s GDP.India’s GDP is about 41per cent of China’s GDP.
When many developed countrieswere finding it difficult to maintain agrowth rate of even 5 per cent, Chinawas able to maintain near double-digitgrowth during 1980s as can be seenfrom Table 10.2. Also, notice that in the1980s, Pakistan was ahead of India;China was having double-digit growthand India was at the bottom. In 2015–17,there has been a decline in Pakistan
Work These Out
Ø Does India follow any population stabilisation measures? If so, collect the
details and discuss in the classroom. You may refer to the latest EconomicSurvey, annual reports or website of the Ministry of Health and FamilyWelfare (http://mohfw.nic.in).
Ø Scholars find son preference as a common phenomenon in many developing
countries, including India, China and Pakistan. Do you find this phenomenonin your family or neighbourhood? Why do people practise discriminationbetween male and female children? What do you think about it? Discuss itin the classroom.
Fig. 10.2 Land use and agriculture in India, China and Pakistan
(Not to scale)
Source: Key Indicators for Asia and Pacific 2016,Asian Development Bank, Philippines; WorldDevelopment Indicators 2018
TABLE 10.2
Annual Growth of Gross DomesticProduct (%), 1980–2017
Country 1980–90 2015–2017
India 5.7 7.3
China 10.3 6.8
Pakistan 6.3 5.3
2021-22

187COMPARATIVE DEVELOPMENT EXPERIENCES OF INDIA AND ITS NEIGHBOURS
and China’s growth rates, whereas,India met with moderate increase ingrowth rates. Some scholars hold thereform processes introduced inPakistan and political instability overa long period as reasons behind thedeclining growth rate in Pakistan. Wewill study in a later section whichsector contributed to different growthrates in these countries.
First, look at how people engaged indifferent sectors contribute to the GrossDomestic Product now called as GrossValue Added. It was pointed out in theprevious section that China and
Pakistan have moreproportion ofurban population thanIndia. In China, due totopographic and climaticconditions, the areasuitable for cultivation isrelatively small — onlyabout 10 per cent of itstotal land area. The totalcultivable area in Chinaaccounts for 40 per centof the cultivable area inIndia. Until the 1980s,more than 80 per cent ofthe people in China weredependent on farmingas their sole sourceof livelihood. Sincethen, the governmentencouraged peopleto leave their fieldsand pursue otheractivities such ashandicrafts, commerceand transport. In 2018–
19, with 26 per cent of its workforceengaged in agriculture, its contributionto the GVA in China is 7 per cent (seeTable 10.3).
In both India and Pakistan, thecontribution of agriculture to GVA were16 and 24 per cent, respectively, butthe proportion of workforce that worksin this sector is more in India. InPakistan, about 41 per cent of peoplework in agriculture, whereas, in India,it is 43 per cent. Twenty four per centof Pakistan workforce is engaged inindustry but it produces 19 per centof GVA. In India, industry workforce
Fig. 10.3 Industry in India, China and Pakistan
(Not to scale)
2021-22

188 INDIAN ECONOMIC DEVELOPMENT
account for 25 per cent but producesgoods worth 30 per cent of GVA. InChina, industries contribute to GVA at41, and employ 28 per cent ofworkforce. In all the three countries,service sector contributes highest shareof GVA.
In the normal course ofdevelopment, countries first shift theiremployment and output fromagriculture to Industry and then toservices. This is what is happening inChina as can be seen from Table 10.3.The proportion of workforce engagedin industry in India and Pakistan werelow at 25 per cent and 24 per centrespectively. The contribution ofindustries to GVA is at 30 per cent inIndia and 19 per cent in Pakistan. Inthese countries, the shift is taking placedirectly to the service sector.
Thus, in all the three countries theservice sector is emerging as a majorplayer of development. It contributesmore to GVA and, at the same time,emerges as a prospective employer. Ifwe look at the proportion of workforcein the1980s, Pakistan was faster inshifting its workforce to service sectorthan India and China. In the 1980s,
India, China and Pakistan employed17, 12 and 27 per cent of its workforcein the service sector respectively. In2019, it has reached the level of 32,46 and 35 per cent, respectively.
In the last five decades, thegrowth of agriculture sector, whichemploys the largest proportion ofworkforce in all the three countries, hasdeclined. In the industrial sector, Chinahas maintained a near double-digitgrowth rate in 1980s but beganshowing decline in recent years,
TABLE 10.3
Sectoral Share of Employment and GVA (%) in 2018–2019
Sector Contribution to GVA Distribution of Workforce
India China Pakistan India China Pakistan
Agriculture 16 7 24 43 26 41
Industry 30 41 19 25 28 24
Services 54 52 57 32 46 35
Total 100 100 100 100 100 100
Source: Human Development Report 2019 ; Key Indicators of Asia and Pacific 2019.
Work These Out
Do you think it is necessaryfor India and Pakistan toconcentrate on the manu-facturing sector as Chinadoes? Why?
Scholars argue that theservice sector should not beconsidered as an engine ofgrowth whereas India andPakistan have raised theirshare of output mainly inthis sector only. What doyou think?
2021-22

189COMPARATIVE DEVELOPMENT EXPERIENCES OF INDIA AND ITS NEIGHBOURS
whereas, for India and Pakistan growthrate has declined. In case of servicesector, China was able to maintain itsrate of growth during 1980–1990,whilethere was a positive and increaringgrowth of India’s service sector output.Thus, China’s growth is contributedby the manufacturing and servicesectors and India’s growth by theservice sector. During this period,Pakistan has shown deceleration in allthree sectors.
10.5 INDICATORS OF HUMAN
DEVELOPMENT
You might have studied about theimportance of human developmentindicators in the lower classes and theposition of many developed anddeveloping countries. Let us look howIndia, China and Pakistan haveperformed in some of the selectindicators of human development.Look at Table 10.5.
TABLE 10.4
Trends in Output Growth in Different Sectors, 1980–2015
Country 1980–90 2014–18
Agriculture Industry Service Agriculture Industry Service
India 3.1 7.4 6.9 3.1 6.9 7.6
China 5.9 10.8 13.5 3.1 5.3 7.1
Pakistan 4 7.7 6.8 1.7 4.8 5.0
TABLE 10.5
Some Selected Indicators of Human Development, 2017-2019
Item India China Pakistan
Human Development Index (Value) 0.645 0.761 0.557
Rank (based on HDI) 130 87 154
Life Expectancy at Birth (years) 69.7 76.9 67.3
Mean years of Schooling (% aged 15 and above) 6.5 8.1 5.2
Gross National Income per capita (PPP US$) 6,681 16,057 5,005
Percentage of People living Below Poverty Line (National) 21.9* 1.7** 24.3*
Infant Mortality Rate (per 1000 live births) 29.9 7.4 57.2
Maternal Mortality Rate (per 1 lakh births) 133 29 140
Population using at least basic Sanitation (%) 60 75 60
Population using at least basic drinking 93 96 91Water Source (%)
Percentage of Undernourished Children 37.9 8.1 37.6
Note: * for the year 2011; for the years 2015.Sources: Human Development Report 2019 and 2020 and World Development Indicators(www.worldbank.org); Key indicators for Asia and the Pacific 2019, Asian Development Bank (ADB).
2021-22

190 INDIAN ECONOMIC DEVELOPMENT
Table 10.5 shows that China ismoving ahead of India and Pakistan.This is true for many indicators —income indicator such as GDP percapita, or proportion of populationbelow poverty line or health indicatorssuch as mortality rates, access tosanitation, literacy, life expectancy ormalnourishment. China and Pakistanare ahead of India in reducingproportion of people below the povertyline and also their performance insanitation. But India and Pakistanhave not been able to save women frommaternal mortality. In China, for onelakh births, only 29 women diewhereas in India and Pakistan, about133 and 140 women die respectively.Surprisingly all the three countriesreport providing improved drinkingwater sources for most of itspopulation. China has the smallestshare of poor among the threecountries. Find out for yourself howthese differences occur.
In dealing with or makingjudgements on such questions,however, we should also note a problemwhile using the human developmentindicators given above with conviction.This occurs because these are allextremely important indicators; butthese are not sufficient. Along withthese, we also need what may be called‘liberty indicators’. One such indicatorhas actually been added as a measureof ‘the extent of democraticparticipation in social and politicaldecision-making’ but it has not beengiven any extra weight. Some obvious‘liberty indicators’ like measures of ‘the
extent of Constitutional protectiongiven to rights of citizens’ or ‘the extentof constitutional protection ofthe Independence of the Judiciary andthe Rule of Law’ have not evenbeen introduced so far. Withoutincluding these (and perhaps somemore) and giving them overridingimportance in the list, the constructionof a human development index maybe said to be incomplete and itsusefulness limited.
10.6 DEVELOPMENT STRATEGIES — AN
APPRAISAL
It is common to find developmentalstrategies of a country as a model toothers for lessons and guidance fortheir own development. It is particularlyevident after the introduction of thereform process in different parts of theworld. In order to learn from economicperformance of our neighbouringcountries, it is necessary to have anunderstanding of the roots of theirsuccesses and failures. It is alsonecessary to distinguish between, andcontrast, the different phases of theirstrategies. Though countries gothrough their development phasesdifferently, let us take the initiation ofreforms as a point of reference. Weknow that reforms were initiated inChina in 1978, Pakistan in 1988 andIndia in 1991. Let us briefly assess theirachievements and failures in pre- andpost-reform periods.
Why did China introducestructural reforms in 1978? China didnot have any compulsion to introduce
2021-22

191COMPARATIVE DEVELOPMENT EXPERIENCES OF INDIA AND ITS NEIGHBOURS
reforms as dictated by the World Bankand International Monetary Fund toIndia and Pakistan. The newleadership at that time in China wasnot happy with the slow pace of growthand lack of modernisation in theChinese economy under the Maoistrule. They felt that Maoist vision ofeconomic development based ondecentralisation, self sufficiency andshunning of foreign technology, goodsand capital had failed. Despiteextensive land reforms, collectivisation,the Great Leap Forward and otherinitiatives, the per capita grain outputin 1978 was the same as it was in themid-1950s.
It was found that establishment ofinfrastructure in the areas ofeducation and health, land reforms,long existence of decentralisedplanning and existence of smallenterprises had helped positively inimproving the social and incomeindicators in the post reform period.Before the introduction of reforms,there had already been massiveextension of basic health services inrural areas. Through the communesystem, there was more equitabledistribution of food grains. Expertsalso point out that each reformmeasure was first implemented at asmaller level and then extended on amassive scale. The experimentationunder decentralised governmentenabled to assess the economic, socialand political costs of success or failure.For instance, when reforms were madein agriculture, as pointed out earlier
by handing over plots of land toindividuals for cultivation, it broughtprosperity to a vast number of poorpeople. It created conditions for thesubsequent phenomenal growth inrural industries and built up a strongsupport base for more reforms.Scholars quote many such exampleson how reform measures led to rapidgrowth in China.
Scholars argue that in Pakistanthe reform process led to worsening ofall the economic indicators. We haveseen in an earlier section thatcompared to 1980s, the growth rateof GDP and its sectoral constituentshave not yet improved.
Though the data on internationalpoverty line for Pakistan is quitehealthy, scholars using the officialdata of Pakistan indicate risingpoverty there. The proportion of poorin 1960s was more than 40 per centwhich declined to 25 per cent in 1980sand started rising again in the recentdecades. The reasons for the slow-down of growth and re-emergence ofpoverty in Pakistan’s economy, asscholars put it, are agricultural growthand food supply situation were basednot on an institutionalised process oftechnical change but on good harvest.When there was a good harvest, theeconomy was in good condition, whenit was not, the economic indicatorsshowed stagnation or negative trends.You will recall that India had to borrowfrom the IMF and World Bank toset right its balance of paymentscrisis; foreign exchange is an essentialcomponent for any country and it is
2021-22

192 INDIAN ECONOMIC DEVELOPMENT
Work These Out
While India has performed relatively well vis-à-vis other developing
countries (including its Asian neighbours) in terms of economic growth,
India is yet to show the world that there is considerable progress in terms
of human development indicators. Where India went wrong ? Why did we
not take care of our human resources? Discuss in the classroom.
There is a general perception going around in India that there is sudden
increase in dumping of Chinese goods into India which have implications
for manufacturing sector in India and also that we do not engage
ourselves in trading with our neighbouring nations. Look at the following
table, which shows exports from India to, and imports from, Pakistan
and China. From newspapers and websites and listening to news, collect
the details of goods and services transacted in trading with our
neighbours. In order to get detailed information relating to international
trade, you can log on to the website: http://dgft.gov.in.
Calculate exports as a % of imports for both the years and discuss the
probable reasons for the trend in the class.
Country Exports from India ( Rs in crore) Imports to India (Rs in crore)
2004-2005 2018-2019 Annual 2004-2005 2018-2019 AnnualRate of Rate of
Growth (%) Growth (%)
Pakistan 2,341 14,426 3.7 427 3476 5.1
China 25,232 1,17,289 2.6 31,892 4,92,079 10.3
2021-22

193COMPARATIVE DEVELOPMENT EXPERIENCES OF INDIA AND ITS NEIGHBOURS
important to know how it can beearned. If a country is able to build upits foreign exchange earnings bysustainable export of manufacturedgoods, it need not worry. In Pakistanmost foreign exchange earnings camefrom remittances from Pakistaniworkers in the Middle-east and theexports of highly volatile agriculturalproducts; there was also growingdependence on foreign loans on the onehand and increasing difficulty in payingback the loans on the other.
However, during the last few years,Pakistan has recovered its economicgrowth and has been sustaining. In2017-18, the Annual Plan 2019-20reports that, the GDP registered agrowth of 5.5 per cent, highest whencompared to the previous decade. Whileagriculture recorded growth rate farfrom satisfactory level, industrial andservice sectors grew at 4.9 and 6.2 percent respectively. Many macroeconomicindicators also began to show stableand positive trends.
10.7 CONCLUSION
What are we learning from thedevelopmental experiences of ourneighbours? India, China andPakistan have travelled seven decadesof developmental path with variedresults. Till the late 1970s, all of themwere maintaining the same level of lowdevelopment. The last three decadeshave taken these countries to different
levels. India, with democraticinstitutions, performed moderately,but a majority of its people still dependon agriculture. India has taken manyinitiatives to develop the infrastructureand improve the standard of living.Scholars are of the opinion thatpolitical instability, over-dependenceon remittances and foreign aid alongwith volatile performance ofagriculture sector are the reasons forthe slowdown of the Pakistaneconomy. Yet, last five years, manymacroeconomic indicators beganshowing positive and moderate growthrates reflecting the economic recovery.In China, the lack of political freedomand its implications for human rightsare major concerns; yet, in the last fourdecades, it used the ‘market systemwithout losing political commitment’and succeeded in raising the level ofgrowth alongwith alleviation of poverty.You will also notice that unlike Indiaand Pakistan, which are attempting toprivatise their public sectorenterprises, China has used themarket mechanism to ‘createadditional social and economicopportunities’. By retaining collectiveownership of land and allowingindividuals to cultivate lands, Chinahas ensured social security in ruralareas. Public intervention in providingsocial infrastructure even prior toreforms has brought about positiveresults in human developmentindicators in China.
2021-22

194 INDIAN ECONOMIC DEVELOPMENT
Recap
Ø With the unfolding of the globalisation process, developing countries
are keen to understand the developmental processes pursued by theirneighbours as they face competition from developed nations as alsoamongst themselves.
Ø India, Pakistan and China have similar physical endowments but
totally different political systems.
Ø All the three countries follow the similar planned pattern of
development. However, the structures established to implementdevelopmental policies are quite different.
Ø Till the early 1980s, the developmental indicators of all the three
countries, such as growth rates and sectoral contribution towardsnational income, were similar.
Ø Reforms were introduced in 1978 in China, in 1988 in Pakistan and in1991 in India.
Ø China introduced structural reforms on its own initiative while theywere forced upon India and Pakistan by international agencies.
Ø The impact of policy measures were different in these countries — for
instance, one-child norm has arrested the population growth in Chinawhereas in India and Pakistan, a major change is yet to take place.
Ø Even after seventy years of planned development, majority of theworkforce in all the countries depends on agriculture. The dependencyis greater in India.
Ø Though China has followed the classical development pattern of
gradual shift from agriculture to manufacturing and then to services,India and Pakistan’s shift has been directly from agriculture to servicesector.
Ø China’s industrial sector has maintained a high growth rate while it
is not so in both India and Pakistan. This led to rapid increase of theGDP per capita in China than in India and Pakistan.
Ø China is ahead of India and Pakistan on many human development
indicators. However these improvements were attributed not to thereform process but the strategies that China adopted in the pre-reformperiod.
Ø While assessing the developmental indicators, one also has to consider
the liberty indicators.
2021-22
195COMPARATIVE DEVELOPMENT EXPERIENCES OF INDIA AND ITS NEIGHBOURS
1. Why are regional and economic groupings formed?
2. What are the various means by which countries are trying tostrengthen their own domestic economies?
3. What similar developmental strategies have India and Pakistanfollowed for their respective developmental paths?
4. Explain the Great Leap Forward campaign of China as initiated in1958.
5. China’s rapid industrial growth can be traced back to its reforms in1978. Do you agree? Elucidate.
6. Describe the path of developmental initiatives taken by Pakistanfor its economic development.
7. What is the important implication of the ‘one child norm’ in China?
8. Mention the salient demographic indicators of China, Pakistan andIndia.
9. Compare and contrast India and China’s sectoral contributiontowards GVA/GDP. What does it indicate?
10. Mention the various indicators of human development.
11. Define the liberty indicator. Give some examples of liberty indicators.
12. Evaluate the various factors that led to the rapid growth in economicdevelopment in China.
13. Group the following features pertaining to the economies of India,China and Pakistan under three heads
• One-child norm
• Low fertility rate
• High degree of urbanisation
• Mixed economy
• Very high fertility rate
• Large population
• High density of population
• Growth due to manufacturing sector
• Growth due to service sector.
EXERCISES
2021-22

196 INDIAN ECONOMIC DEVELOPMENT
14. Give reasons for the slow growth and re-emergence of poverty inPakistan.
15. Compare and contrast the development of India, China and Pakistanwith respect to some salient human development indicators.
16. Comment on the growth rate trends witnessed in China and Indiain the last two decades.
17. Fill in the blanks
(a) First Five Year Plan of ________________ commenced in theyear 1956. (Pakistan/China)
(b) Maternal mortality rate is high in _____________. (China/Pakistan)
(c) Proportion of people below poverty line is more in __________.(India/Pakistan)
(d) Reforms in ______________ were introduced in 1978. (China/Pakistan)
1. Organise a class debate on the issue of free trade between Indiaand China and India and Pakistan.
2. You are aware that cheap Chinese goods are available in the market,for example, toys, electronic goods, clothes, batteries etc. Do youthink that these products are comparable in quality and price withtheir Indian counterparts? Do they create a threat to our domesticproducers? Discuss.
3. Do you think India can introduce the one-child norm like China toreduce population growth? Organise a debate on the policies thatIndia can follow to reduce population growth.
4. China’s growth is mainly contributed by the manufacturing sectorand India’s growth by the service sector —prepare a chart showingthe relevance of this statement with respect to the structuralchanges in the last decade in the respective countries.
5. How is China able to lead in all the Human Development Indicators?Discuss in the classroom. Use Human Development Report of thelatest year.
SUGGESTED ADDITIONAL ACTIVITIES
2021-22

197COMPARATIVE DEVELOPMENT EXPERIENCES OF INDIA AND ITS NEIGHBOURS
Books
DREZE, JEAN AND AMARTYA SEN. 1996. India: Economic Development and Social
Opportunity. Oxford University Press, New Delhi.
Articles
RAY, ALOK. 2002. ‘The Chinese Economic Miracle: Lessons to be Learnt.’Economic and Political Weekly, September 14, pp. 3835-3848.
ZAIDI, S. AKBAR. 1999. ‘Is Poverty now a Permanent Phenomenon in Pakistan?’Economic and Political Weekly, October 9, pp. 2943-2951.
Government Reports
Annual Plan 2016-17, Ministry of Planning, Development & Reform, Gov-ernment of Pakistan accessed from http://pc.gov.pk on 02 January 2017.
Economic Survey, Ministry of Finance, Government of India (for various years).
Human Development Report 2005, United Nations Development Programme,Oxford University Press, Oxford.
Labour Market Indicators, 3rd Edition, International Labour Organisation,Geneva.
Pakistan: National Human Development Report 2003, United NationsDevelopment Programme, Second Impression 2004.
World Development Report 2005, The World Bank, Oxford University Press,New York.
World Development Indicators for various years, World Bank Washington.
Human Development Report for various years, United Nations DevelopmentProgramme Geneva.
Key Indicators of Asia and Pacific 2016, Asian Development Bank, Philippines.
Websites
www.stats.gov.cnwww.statpak.gov.pkwww.un.orgwww.ilo.orgwww.planningcommission.nic.inwww.dgft.delhi.nic.in
REFERENCES
2021-22