Indian Dairy Industry - Present Status and Future Prospects.
57
1
-
Upload
uasbangalore -
Category
Documents
-
view
1 -
download
0
Transcript of Indian Dairy Industry - Present Status and Future Prospects.

1

SEMINAR-II
Vasanth Kumar, C.PALB – 3104
Sr. M.Sc. (Agril Economics)
Major advisorDr . D. Sreenivasa
MurthyPrincipal Scientist, IIHR, Bengaluru
DEPARTMENT OF AGRICULTURAL ECONOMICSUAS, GKVK, BENGALURU. 2

Flow of Seminar Global Overview of Dairy Industry
Overview of Indian Dairy Industry
Structure of Indian Dairy Industry
Dairy cooperatives at Glance
Trade performance of India's Dairy Industry
Indian Dairy Industry: Growth Drivers & Key Challenges
Future Prospects Conclusion
3

• World milk production - Increased > 50 % during last 3 decades• 482 million tones in 1982 to 780.3 million tonnes in 2013.
• Highest milk surplus countries: New Zealand, USA, Germany, France, Australia and Ireland.
• Highest milk deficits countries: China, Italy, Russian Federation, Mexico, Algeria and Indonesia.
• Number of households engaged : > 150 million households.
MILK – WORLD SCENARIO
• India (17%) 1
• U. S. 2
• China 3
• Pakistan 4
• Russia 5
• Germany 6
• Brazil 7
• France 8
• New Zealand 9
• U. K. 10
Table 1: Rank –
Production
Source: Authors representation based on FAO report and other various reports.
4

Fig 1: WORLD TOP MILK PRODUCING COUNTRIES
(in Million Tonnes)
Source: Authors representation based on FAO report and other various reports. .
5
India's milk production is equal to that of whole EU by 2021

(in Million Tonnes)
Source: Authors representation based on faostat.fao.org/.
2013-14
6Fig 2: WORLD-TOP MILK CONSUMING COUNTRIES

Global Consumption increasing faster than Population growth...
• Global consumption of protein increased from 3.7 to 5.4 lakh tonnes per day - CAGR of 2% .
• Global population increased from 5.4 to 7.0 billion - CAGR of 1% .
• Increasing proportions of this growth is from animal protein • Meat - 2.9 % • Dairy – 0.5 % increase • Vegetables, soy and fruit – 2% increase • Cereals - decreased 6.2%
Demand for animal proteins likely to continue to increase faster than other categories
Source: FAOSTAT, PwC Analysis 7
Fig 3 :

• Price volatility is likely to remain in the near future.
• Thin volumes of global milk trade .• Few players dominate global market.
Prices of dairy products remain high despite increased production due to increasing demand and higher cost of production.
Global dairy sector - Price trends
8
Fig 4 :

Cost of production(US $/ 100 Kg)
Country
> 20 ≤ 30 Argentina, Pakistan, Vietnam, Indonesia , Chile (Small farms), China (small farms).
> 30 ≤ 40 Estonia, Czech Republic, Brazil, Bangladesh, Thailand, Poland , India and New Zealand.
> 40 ≤50 Spain, Denmark, Ireland, UK, USA, Germany(large Farms) and Neither land(Large farms) and Israel.
> 50 ≤60 Austria, France, Sweden, China, Neither land Small farms) .
> 60 ≤ 120 Switzerland, Norway, Finland, Canada and Germany(small Farms)Source: IFCN Dairy Report 2011
Table 2: Cost of Production of Milk
9

Largest producer in the world (>17%)- 137.7 mt in 2013-14.
India’s share in livestock population in the world15% of the total livestock57.3 % of total buffaloes (105 million)and 14.7 % (200 million) of total cattle.
Share in India’s GDP3.6% (13.7 % agriculture)
secondary source of income for 70 million rural households engaged in dairying.
Growth rate of milk production : 3.5% Consumer demand rate : 5%. 4.38 million women members in dairy cooperatives across the country as on march 2014.
MILK – Indian Scenario
Source : Indiastat.com , NDDB and Ministry of Animal Husbandry.
10

Year
Fig 5: Trend in Milk production in IndiaSource : Author’s Representation based on FAO
and NDDB .11

Table 3: Trends in average annual growth rates of milk 1950-51 to 2010-11
Year Average annual milk growth rate
1950-51 to 1960-61 1.64
1960-61 to 1973-74 1.15
1973-74 to 1980-81 4.51
1980-81 to 1990-91 5.48
1990-91 to 2000-01 4.11
2000-01 to 2010-11 4.15
Source: Authors Compilation based on FPI report 2011
12

• Small and marginal farmers own 33 % of land and about 60 percent of female cattle and buffaloes.
• Some 75 % of rural households own, on average, two to four animals.
• Dairying is a part of the farming system, not a separate enterprise.
• Feed is mostly residual from crops, whereas cow dung is important for manure.
• Dairying provides a source of regular income, whereas income from agriculture is seasonal.
• About a one third of rural incomes are dependent upon dairying.
• Livestock is a security asset to be sold in times of crisis.
Characteristics of India’s dairy farming and its relevance to inclusive growth
13

SWOT Analysis of Indian Dairy Industry Strength
Largest milk producer in the world. A huge base of around 11 million farmers. Traditional emphasis on consumption.
Weakness Poor feeding practices. Poor access to institutional credit. Lack of cold storage facilities.
Opportunities
Elastic demand; economic growth will spur demand.
Increasing preference for branded dairy products.
Growing focus on health and nutrients in urban market.
Threat Nearly 80 per cent
of the Indian dairy industry is unorganized.
Removal of import duty has led to the threat of dumping.
14

State
Fig 6 : Top 10 Milk Producing states
2013-14
Source : Author’s Representation based on India stat and NDDB .
15
Milk Production in 000’ Tonnes
Top 7 Milk producing states contributes more than 65% of Milk production.

UP – 18%AP & Rajasthan –
9% each.Punjab & Gujarat –
8% each.MP & Maharashtra –
7%Karnataka 5 %
16Fig 7 : Top Milk production states in India

Table 4 : Average Yield of Milk (kg/day)
Indigenous cow
2.36
Exotic/ Crossbreed
7.02
Buffalo 4.80Goat 0.43
• Bovine population – about 115 million
• Indigenous cows - for 40% of milch population but only 24% production.
• Buffalo milk - 55% of production
• Average daily milk yield/ animal – 4.4 litres/animal .
• Wet animals – 69.3% (increased by about 12% over the last decade)
Source: DAHD, ICAR, PwC analysis
Milk yield by Animal type
40
14
46
24
21
55
0 20 40 60 80 100 120
Indigenous cow
Crossbred
Buffalo
m ilch populatonM ilk production
Percentage contribution 17
Fig 8 :

Fig 9: Trend of Per Capita Availability of Milk in India
Source : Author’s Representation based on NDDB and Ministry of animal husbandry.
130 126 112
128
176
217 233
273 281 290 296 302
0
50
100
150
200
250
300
350
1950-51 1960-61 1970-71 1980-81 1990-91 2000-01 2004-05 2009-10 2010-11 2011-12 2012-13 2013-14
Milk represents 17.5 % of global beverage consumption
gms/day
18
world average - 294 gms/day

Source: NSSO, MOSPI
Rural Urban
Fig 10: Milk Consumption in India
Litre per capita per annum
19

20
Table 5 : Share of Expenditure on Milk and Milk products in Total Monthly per Capita Consumer
Expenditure
Item
1987-88 1993-94 1999-2000 2004-05 2012-13
Rural Milk and Milk Products 8.6 9.3 10.1 10.6 11.3 Cereals and Pulses
30.1 27.6 24.1 20.37 18.9 Total Food 63.8 62.1 59.4 53.3 51.7 Total Non-food 36.2 37.9 40.6 46.7 48.3 Total Exp. 100.0 (158) 100.0 (286) 100.0 (436) 100.0 (579)
100.0 (836)
Urban Milk and Milk products 9.3 8.6 7.8 7.6 7.2 Cereals and Pulses 18.4 16.8 15.2 13.6 11.6 Total Food 55.9 53.9 48.1 42.0 39.3 Total Non-food 44.1 46.1 51.9 58.0 60.7 Total Exp. 100.0 (250) 100.0 (464) 100.0 (855)
100.0 (1104)
100.0 (1463)
Values in the parenthesis indicate expenditure in Rs per month.
Source : NSSO, Household Consumer Expenditure in India, Government of India, New Delhi, various reports.
(Per cent)

Fig 11: Structure of Indian Dairy Industry
Indian Milk Production(137.7 MT )
Unorganized Sector~110 MT (80%)
Organized Sector ~28 MT (20 %) [ Private Dairies-532,
Cooperatives-254 Government-46]
Retained or sold at
rural level~(41%)
Liquid Milk (13.5%)
Value added products (6.5%) Loose milk
sold in urban areas
~ (17%)
Value added products{most
ly traditional}
(22%)
Shifts from unorganized to the organized sector
Source – Authors representation based on Ministry of Agriculture, Economic Survey of India, Rabobank and Technopak analysis, NDDB annual report 2013-14.
21

22
Fig 12: Supply chain of Indian Dairy Industry

– Largest agricultural programme in the world using food aid for development.
– Transformed the face of India’s dairy industry through organising farmers into cooperatives.
Operation Flood
Source : Author’s Representation based on NDDB reports.23
Fig 13

• The bedrock of Operation Flood has been village milk producers’ cooperatives, which • procure milk • provide inputs and services, • making modern management and
technology available to members.
• Operation Flood’s objectives included:• Increase milk production (“a
flood of milk”)• Augment rural incomes• Reasonable prices for consumers• Programme Implementation
Operation Flood Strategy
24

1. Making India the largest producer of milk and milk products, and hence is also called the White Revolution of India.
2. Followed the Indian Green Revolution and helped alleviating poverty by offering gainful employment, and also providing access to better nutrition.
3. Operation Flood has helped dairy farmers direct their own development, placing control of the resources they create in their own hands.
4. Reducing seasonal and regional price variations and ensure and ensure fair market prices.
Achievements of Operation Flood
25

Indian dairy sector has evolved from rags to riches
-Per capita milk availability-132g/day -Milk rationing and scarcity -Dependent on import -High intermediation
White revolution
-Per capita milk availability-302 g/day -17% of global output -Net exporter -Increased share of producers share in consumer price
• Cooperative dairying
• countrywide milk grid – linking producers to consumers
• Cutting out middle men
• Strengthening production, procurement, infrastructure and technology transfer
1940’s
Made dairy farming India’s largest self-sustainable rural employment generator making the country #1 in milk production.
2013End
Resul
t
26
Dairy Cooperatives at a Glance
27

Cooperative Revolution in India
Dairy Cooperative Network
Includes 177 milk unions, operate over 346 districts covers 1,33,349 villages owned by around 13.9 million farmers
Milk production
Increased from 21.2 in 1968-69 to 137.7 million MT in 2013-14
Per capita availability increased from 112 gms/day in 1968-69 to 309 gms/day in 2013-14
Marketing in 2013-14 average daily cooperative milk marketing stood at 220.4 lakh litres with average annual growth rate of 6.1% compounded annually over 5 years.
Innovation Bulk vending- saving money and the environment.
Market travels to deficit areas carried by innovative rail and road milk tankers.
Automatic milk collection unit(AMCU) and Bulk milk cooler (BMC) at grass root level. Preserve quality and reduce post procurement losses.
28

Source: Authors representation based on NDDB report 2013-1429
Fig 14 : Dairy Cooperative Societies(in Numbers)
Fig 15 : Producer Members (in Million)

Source: Authors representation based on NDDB report 2013-1430
Fig 16: Milk Procurement (in million kilograms Per Day)
Fig 17 : Liquid Milk Marketing (in million litres Per Day)

THE SUCCESS STORYTHE SUCCESS STORY
31

AMUL INTRODUCTIONAMUL INTRODUCTION More than 60 products. Exported to more than 20
countries. Founded in 1946. “AMUL
Pattern” in co-operative sector.
National Dairy Development Board White Revolution
IRMA GCMMF - One brand
32

Members: 13 district cooperative milk producers' Union
No. of Producer Members: 2.79 million
No. of Village Societies: 13,328
Total Milk handling capacity:
11.22 million litres per day
Milk collection (Total - 2013-14):
3.42 billion litres
Milk collection (Daily Average 2013-14):
9.4 million litres
Milk Drying Capacity: 626 Mts. per day
Cattle feed manufacturing Capacity:
3500 Mts. per day 33
Table 6 : Table 6 : Snapshot of AMULSnapshot of AMUL

Specifically, AMUL has been able Specifically, AMUL has been able toto
• Produce an appropriate blend of the policy makers comprising of farmers and professionals with each group appreciating its role and limitations;
• Bring at the command of the rural milk producers the best of the technology and harness its benefits for the betterment of members;
• Provide a support system to the milk producers without disturbing their agro-economic systems;
• Plough back the profits, by prudent use of men, material and machines, in the rural sector for the common good and betterment of the member producers; and
• Despite growth in the scale of operations, it has remained with the smallest producer members.
34

Product Range Brand Name
Liquid Milk (nine varieties)Milk Powders (five varieties)ButterGhee (two varieties)Bread SpreadCheese (three varieties)Cocoa Products (two varieties)Sweets (three varieties)Ice Cream (several varieties)Condensed MilkEdible Oil (nine varieties)Mineral WaterFruit Drinks
Panel E: Number of BrandsLiquid Milk: AMUL, SAGARMilk Powders: Amulspray,AMUL, SAGAR, Amulspree,AmulyaCocoa Products: AMUL,NutramulEdible Oils: Dhara, LokdharaMineral Water: Jal DharaFruit Drinks: Safal
35

Trade performance of India's Dairy Industry
36
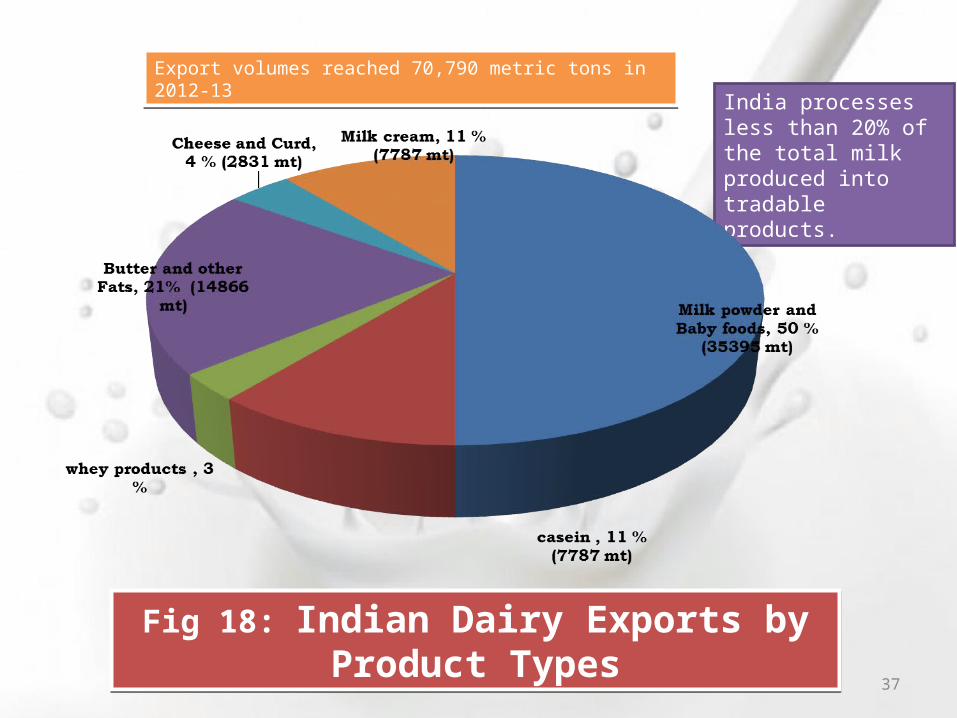
(Source: GTIS, Technopak analysis, 2013)
India processes less than 20% of the total milkproduced into tradable products.
Export volumes reached 70,790 metric tons in 2012-13
Fig 18: Indian Dairy Exports by Product Types 37

(in US $ Million)
Fig 19: India’s Dairy TradeSource: NDDB report 2013-14 38

MAJOR GOVERNMENT INITIATIVES IN DAIRY FARMING
39

Improve the entire dairy supply chain by providing financial aids and technical support.
Pattern of assistance is 100% grant in aid with a maximum allocation of Rs 300 lakhs /district.
A 70 % loan and 30% basis of funding is provided for over 20000 LPD milk processing capacity.
Milk chilling capacity of 18.49 lakh litres per day and processing capacity of 23.96 lakh litres per day have been created under this scheme.
Intensive Dairy Development Scheme
40

To generate self-employment and provide infrastructure to unorganized dairy sector for making improvement in quality and to help increasing the commercial viability of these activities.
Aims to promote ventures in the dairy sector.
Assistance is provided to bankable projects with 50% interest free loan component.
Dairy Venture Capital Fund Scheme
41

Aims to increase the milk production to about 180 million tones by 2021-22.
Enhancing milk production in major milk producing areas, and strengthening and expanding infrastructure for production process.
This plan also proposes to bring 65% of the surplus milk produced under the organized sector for procurement as against the present 30%.
National Dairy Plan
42

To promote clean milk production and creation of necessary infrastructure for it.
Pattern of funding is in the ratio of 75:25 for purchase and installation of bulk milk coolers at village level.
Achievement : About 30,468 farmers trained, 1368 no. of bulk milk coolers with total chilling capacity of 21.05 lakhs LPD were installed and 884 existing laboratories have strengthened.
Strengthening Infrastructure and Clean Milk Production Programme
43

Indian Dairy Industry: Growth Drivers & Key Challenges
44

Growth drivers of Indian dairy Industry
Population Growth
Economic Growth
Rapid Urbanization
Rising Income levels
Technical Innovation in milk Products processing.
Fast changing food habits and value added products.
45
Fig 20

Key Challenges of Indian dairy Industry
Small Holder Level
increasing pressure on land resources for cultivation.
Lack of good quality animal feed. Lack of animal health care
facilities. Low genetic potentiality of
animals. Lack of chilling capacities High production costs.Collection
Level
Milk base mainly consisting of small holders.
.Involvement of too many intermediaries.
Lack of infrastructure. Manipulation of quality of milk by
farmers.Processing Level
Seasonality of production and fluctuating supply.
.Absence of quality standards. Adulteration and foods safety. Lack of trained and skilled
workers. 46

Key Challenges of Indian dairy Industry
Storage and Logistics level
Lack of cold storage facilities. Gap in cold chain and transport
facilities.
Co-operative Level
Less number of member farmers. Lower participation in the
decision making process. Low prices of milk. Inefficient services. Insufficient infrastructure..
Marketing challenges
Majority of the market is still organized.
Acceptability of the customer base. Less penetration to the rural
market. Lack of transparent milk pricing
system..
47

Prospects of Indian Dairy industry
48

Increasing GDP Government welfare programmes like NREGA Increasing Urbanization Emphasis on Healthy Eating Shift : CEREALS
Increasing Demand of Milk & Dairy Products
Projected demand for milk :about 200 million tonnes by 2021-22
Milk production is increasing by 3 million tonnes annually Must henceforth increase by 6 million tonnes annually 49

•National Dairy Plan to double milk production •Increase in milk production by increasing productivity of our animals
scientific approach to feeding and breeding
•Increase of Organized sector’s share of marketable surplus
from 30 percent to 60 percent improve milk handling & product quality
•Encouragement of milk producer to produce more milk
Increasing income from sale of milk Value added product
……..to meet the growing demand
50

51
1. Increased milk production : Highest bovine population in the world. tremendous potential to further strengthen
India's position in the world dairy market. demand for livestock products will increase
substantially.
2. . Export Potential : Milk and milk products have emerged as the largest
agricultural commodity India has the potential to become one of the
leading players in milk and milk product crore in exports.
Largest exporter of skimmed milk 583 million dollar in 2012-13.
leading players are Amul, Nestle, Britannia and Mother Dairy.

3. Employment opportunities: Dairy sector is the major source of income for an estimated 27.6
million people. 65 to 70% are small, marginal and land-less farmers.
pro-poor sectors with any positive development
4. Nutrient supply
5. Low greenhouse gas potential of milkMilk production is more environment-friendly when compared to meat production.
per unit production mutton emits 11.9 times as much GHG as milk with the net GHG for mutton being 482.5 vs. 29.2 g for milk. (Pathak et al, 2012)
52

AMUL type cooperatives
•impressive trends in milk production .
•restrictive trade policy for milk products.
•milk production has grown at an exponential rate .
•Farmers receiving a favorable price for their milk and the milk production system.
•self-contained one, is now being transformed into a commercial proposition.
•Public private partnerships
53

Fig 21: world milk Yield
(Tonnes/head)
Source: Authors representation based on FAO report 54

Table 7:Key players in the Dairy industry in India
Key players Brand Turnover Rs crore (2012-
13)GCMMF Amul 8007Nestle India Nestle 1641Punjab state cooperative
Verka 1150
Hatsun Agro Anun, komatha 1141Britania industries limited
Britania 1083
Kwality Kwality walls 1054Heritage foods Heritage gold 900Modern dairy Modern dairy 445ADF food Ashoka 102Himalaya international
Himalaya fresh 6955

56
Conclusion:
Dairy has a lot of potential to improve rural incomes, nutrition and women empowerment, and hence is a very critical area for investment.
A well-developed industry will enable millions of farmers to capitalize on the emerging opportunities and make a significant impact on rural incomes. On the flip side, weak efforts towards dairy development also can have a significant but negative impact on the dairy industry.
The growth rate has been sluggish over the past few years.

“Eight hours for dairy, Eight hours for family and Eight hours for sleep”
- Dr. Verghese Kurien
57