Increased exposure to community-based education and ‘below the line’ social marketing results in...
10
Public Health Nutrition: 16(11), 1961–1970 doi:10.1017/S1368980013001614 Increased exposure to community-based education and ‘below the line’ social marketing results in increased fruit and vegetable consumption Colleen Glasson 1, *, Kathy Chapman 1 , Tamara Wilson 1 , Kristi Gander 1 , Clare Hughes 1 , Nayerra Hudson 1 and Erica James 2 1 Cancer Council NSW, PO Box 572, Kings Cross, Sydney, NSW 1340, Australia: 2 School of Medicine and Public Health, University of Newcastle, Newcastle, New South Wales, Australia Submitted 16 May 2012: Final revision received 10 April 2013: Accepted 8 May 2013: First published online 28 June 2013 Abstract Objective: To determine if localised programmes that are successful in engaging the community can add value to larger fruit and vegetable mass-media campaigns by evaluating the results of the Eat It To Beat It programme. Design: The Eat It To Beat It programme is a multi-strategy intervention that uses community-based education and ‘below the line’ social marketing to increase fruit and vegetable consumption in parents. This programme was evaluated by a controlled before-and-after study with repeat cross-sectional data collected via computer-assisted telephone interviews with 1403 parents before the intervention (2008) and 1401 following intervention delivery (2011). Setting: The intervention area was the Hunter region and the control area was the New England region of New South Wales, Australia. Subjects: Parents of primary school-aged children (Kindergarten to Year 6). Results: The programme achieved improvements in knowledge of recommended intakes for fruit and vegetables and some positive changes in knowledge of serving size for vegetables. Exposure to the programme resulted in a net increase of 0?5 servings of fruit and vegetables daily for those who recalled the programme compared with those who did not (P 5 0?004). Increased intake of fruit and vegetables was significantly associated with increasing exposure to programme strategies. Conclusions: The Eat It To Beat It programme demonstrates that an increase in consumption of fruit and vegetables can be achieved by programmes that build on the successes of larger mass-media and social-marketing campaigns. This suggests that funding for localised, community-based programmes should be increased. Keywords Fruit Vegetables Community intervention Controlled before-and-after study An adequate fruit and vegetable intake is protective against a number of chronic diseases including obesity, CHD and some cancers (1–4) and significant health gains can be made from even small increases in fruit and vegetable intakes (5,6) . As daily fruit and vegetable con- sumption of adults is below the recommended levels of two servings of fruit and five servings of vegetables in Australia (7,8) , more needs to be done to encourage an increase in consumption. Internationally, several media and social-marketing interventions have resulted in improvements in fruit and vegetable intakes (9–12) . In Australia, the Go for 2&5 R fruit and vegetable campaign was conducted in Western Australia from 2002 to 2005 (13) ; the campaign launched nationally in 2005 (14) , with New South Wales (NSW) launching its campaign in 2007 (15) . Evaluations demonstrate that these campaigns can increase awareness and knowledge of fruit and vegetable recommendations and increased consumption of fruit and vegetables in Australian adults (13,15–17) . Although many of these social-marketing campaigns have included different types and varying intensities of programme components such as accompanying websites, public relations events, publications and community or school-based activities, the main component of these programmes is usually a high-cost but short-lived media campaign with long off-air periods. Assessment of these campaigns shows that while short-term changes in consumption can be achieved in some cases, success is influenced by intensity of the message exposure, reach, timing and cost (12) and sustained effects are difficult to maintain after the media campaign ends (18) . *Corresponding author: Email [email protected] r Cancer Council NSW 2013
-
Upload
independent -
Category
Documents
-
view
4 -
download
0
Transcript of Increased exposure to community-based education and ‘below the line’ social marketing results in...

Public Health Nutrition: 16(11), 1961–1970 doi:10.1017/S1368980013001614
Increased exposure to community-based education and‘below the line’ social marketing results in increased fruitand vegetable consumption
Colleen Glasson1,*, Kathy Chapman1, Tamara Wilson1, Kristi Gander1,Clare Hughes1, Nayerra Hudson1 and Erica James2
1Cancer Council NSW, PO Box 572, Kings Cross, Sydney, NSW 1340, Australia: 2School of Medicine andPublic Health, University of Newcastle, Newcastle, New South Wales, Australia
Submitted 16 May 2012: Final revision received 10 April 2013: Accepted 8 May 2013: First published online 28 June 2013
Abstract
Objective: To determine if localised programmes that are successful in engagingthe community can add value to larger fruit and vegetable mass-media campaignsby evaluating the results of the Eat It To Beat It programme.Design: The Eat It To Beat It programme is a multi-strategy intervention that usescommunity-based education and ‘below the line’ social marketing to increasefruit and vegetable consumption in parents. This programme was evaluated by acontrolled before-and-after study with repeat cross-sectional data collected viacomputer-assisted telephone interviews with 1403 parents before the intervention(2008) and 1401 following intervention delivery (2011).Setting: The intervention area was the Hunter region and the control area was theNew England region of New South Wales, Australia.Subjects: Parents of primary school-aged children (Kindergarten to Year 6).Results: The programme achieved improvements in knowledge of recommendedintakes for fruit and vegetables and some positive changes in knowledgeof serving size for vegetables. Exposure to the programme resulted in a netincrease of 0?5 servings of fruit and vegetables daily for those who recalled theprogramme compared with those who did not (P 5 0?004). Increased intake offruit and vegetables was significantly associated with increasing exposure toprogramme strategies.Conclusions: The Eat It To Beat It programme demonstrates that an increasein consumption of fruit and vegetables can be achieved by programmes thatbuild on the successes of larger mass-media and social-marketing campaigns.This suggests that funding for localised, community-based programmes shouldbe increased.
KeywordsFruit
VegetablesCommunity intervention
Controlled before-and-after study
An adequate fruit and vegetable intake is protective
against a number of chronic diseases including obesity,
CHD and some cancers(1–4) and significant health gains
can be made from even small increases in fruit and
vegetable intakes(5,6). As daily fruit and vegetable con-
sumption of adults is below the recommended levels of
two servings of fruit and five servings of vegetables in
Australia(7,8), more needs to be done to encourage an
increase in consumption.
Internationally, several media and social-marketing
interventions have resulted in improvements in fruit and
vegetable intakes(9–12). In Australia, the Go for 2&5�R fruit
and vegetable campaign was conducted in Western
Australia from 2002 to 2005(13); the campaign launched
nationally in 2005(14), with New South Wales (NSW)
launching its campaign in 2007(15). Evaluations demonstrate
that these campaigns can increase awareness and
knowledge of fruit and vegetable recommendations
and increased consumption of fruit and vegetables in
Australian adults(13,15–17).
Although many of these social-marketing campaigns
have included different types and varying intensities of
programme components such as accompanying websites,
public relations events, publications and community
or school-based activities, the main component of these
programmes is usually a high-cost but short-lived media
campaign with long off-air periods. Assessment of
these campaigns shows that while short-term changes in
consumption can be achieved in some cases, success
is influenced by intensity of the message exposure,
reach, timing and cost(12) and sustained effects are
difficult to maintain after the media campaign ends(18).
*Corresponding author: Email [email protected] r Cancer Council NSW 2013

Therefore more needs to be done at a community level to
promote, prolong and extend the messages to achieve
additional, sustained behaviour change. Indeed, the
Australian Government in its National Preventative Health
Strategy recommends that social-marketing programmes
to change lifestyle behaviours should ‘Ensure mass media
is accompanied by funded local programmes and skills
development at the local level’(19).
Eat It To Beat It was a multi-strategy community-based
intervention conducted by Cancer Council NSW from
2008 to 2010 in the Hunter region of NSW. The Hunter
region is approximately 150 km north of Sydney and
includes the regional centre of Newcastle with a popu-
lation of approximately 540 000 and a number of smaller
outlying regional and rural communities. The programme
aimed to increase the consumption of fruit and vegetables
by parents of primary school-aged children by using
localised community-based education and ‘below the
line’ social marketing. For the purposes of the present
study ‘below the line’ social marketing is defined as
marketing via methods other than mass media(20) and
included information in school newsletters, cooking
demonstrations, activities at community events and
competitions. The strategies were designed to take a
community engagement approach and complement
existing mass-media campaigns.
The Eat It To Beat It programme supported the
media messages from the NSW Go for 2&5�R campaign.
This state-wide campaign included paid television, radio,
cinema and print media advertisements, publications
and web-based information, bus and supermarket
trolley advertising, and supermarket demonstrations(15).
Most of the activity for this programme took place in
the first half of 2007. The Eat It To Beat It programme
also complemented the Good for Kids. Good for Life
programme. This programme was conducted in the
Hunter and New England regions of NSW continuously
from 2007 to 2010 and used paid media to disseminate
healthy lifestyle messages along with other strategies
such as organisational change in local councils, schools,
child-care centres, community service organisations,
health services and sporting clubs to promote healthy
eating and physical activity to children aged up to
15 years(21). The Good for Kids. Good for Life media
campaign targeting vegetables was implemented in late
2009 and included television, radio and print media
advertisements(22).
There are very few studies that isolate the effects
of community-based education strategies and below the
line marketing from the mass-media component of fruit
and vegetable campaigns at a population level(18). The
present study uses the evaluation results of the Eat It To
Beat It programme to investigate whether localised pro-
grammes that are successful in engaging the community
can add value to larger fruit and vegetable mass-media
campaigns.
Methodology
The intervention
Theory for the intervention
Parents of primary school-aged children (rather than
children) were the focus of the Eat It To Beat It
programme. The programme was developed following
formative research to determine the motivators and
barriers to fruit and vegetable consumption in this target
group(23). These findings were integrated with a model
proposed by Van Duyn et al.(24) which used Social
Cognitive Theory(25), the PRECEDE-PROCEED model(26)
and the stage-of-change continuum(27,28) to conceptualise
the factors that influence healthy eating. Van Duyn
et al.’s model suggests that focusing on factors such as
knowledge, awareness, attitudes and perceived barriers
would result in an increase in fruit and vegetable
consumption(24).
Strategies
The programme strategies included: Fruit & Veg $ense, an
education programme facilitated by trained community
peer educators(29); the Fruit & Vegie Drive, a fruit and
vegetable fundraiser box; Fruit ‘n’ Veg Month, a campaign
for primary schools; shopping centre cooking/tasting
demonstrations; and a communication strategy utilising
free editorial in local print media generated through local
community engagement activities, community service
announcements and nutrition snippets for school news-
letters. The programme maximised its resources by using
volunteers to implement and administer some of the
strategies and by negotiating significant free media.
Study design
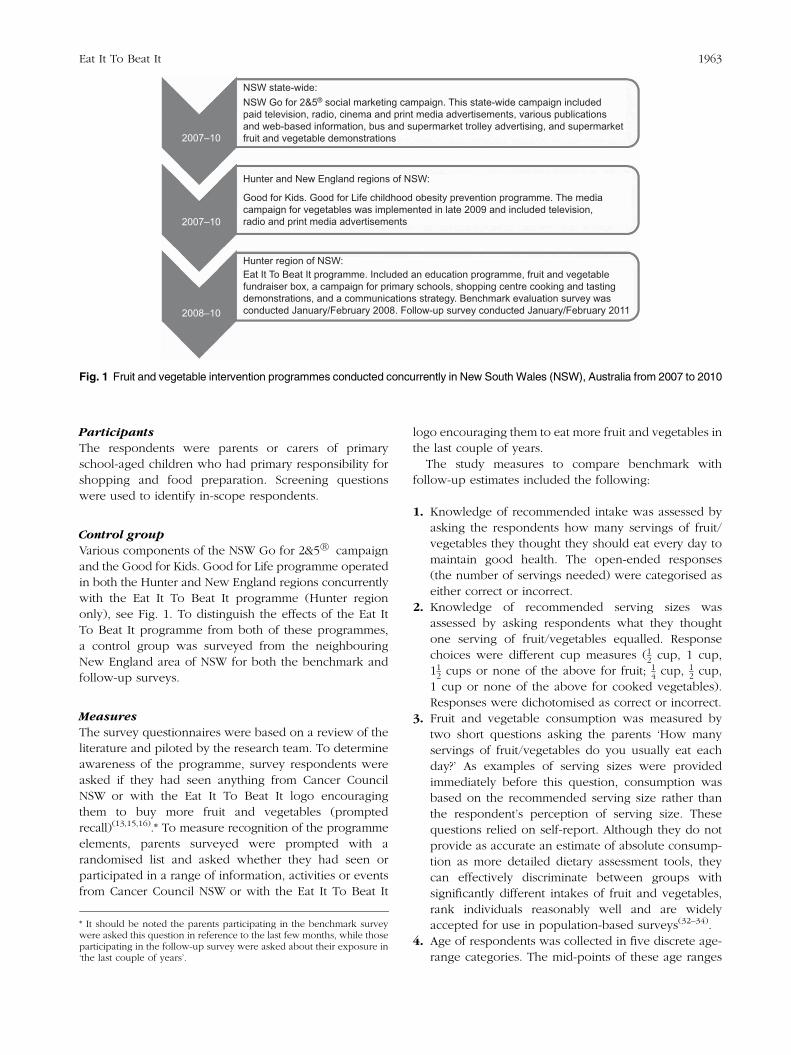
Figure 1 shows how the current study operated in
relation to other programmes during the same time frame.
As it was not feasible to evaluate the programme using
a randomised controlled trial for a number of methodo-
logical reasons(30,31), the programme was evaluated by
a controlled before-and-after study. The study was con-
ducted according to the guidelines laid down in the
Declaration of Helsinki and all procedures involving
human subjects were approved by the Cancer Council
NSW’s Ethics Committee in October 2007 (approval
number 226). Informed verbal consent was obtained from
all participants.
Data collection
Data for the present repeat cross-sectional study were
collected using computer-assisted telephone interviews
with sampling via random digit dialling. The benchmark
survey was conducted from 17 January to 27 February 2008,
with the follow-up survey conducted from 20 January
to 20 February 2011. The methodology for both waves
was identical.
1962 C Glasson et al.
Participants
The respondents were parents or carers of primary
school-aged children who had primary responsibility for
shopping and food preparation. Screening questions
were used to identify in-scope respondents.
Control group
Various components of the NSW Go for 2&5�R campaign
and the Good for Kids. Good for Life programme operated
in both the Hunter and New England regions concurrently
with the Eat It To Beat It programme (Hunter region
only), see Fig. 1. To distinguish the effects of the Eat It
To Beat It programme from both of these programmes,
a control group was surveyed from the neighbouring
New England area of NSW for both the benchmark and
follow-up surveys.
Measures
The survey questionnaires were based on a review of the
literature and piloted by the research team. To determine
awareness of the programme, survey respondents were
asked if they had seen anything from Cancer Council
NSW or with the Eat It To Beat It logo encouraging
them to buy more fruit and vegetables (prompted
recall)(13,15,16).* To measure recognition of the programme
elements, parents surveyed were prompted with a
randomised list and asked whether they had seen or
participated in a range of information, activities or events
from Cancer Council NSW or with the Eat It To Beat It
logo encouraging them to eat more fruit and vegetables in
the last couple of years.
The study measures to compare benchmark with
follow-up estimates included the following:
1. Knowledge of recommended intake was assessed by
asking the respondents how many servings of fruit/
vegetables they thought they should eat every day to
maintain good health. The open-ended responses
(the number of servings needed) were categorised as
either correct or incorrect.
2. Knowledge of recommended serving sizes was
assessed by asking respondents what they thought
one serving of fruit/vegetables equalled. Response
choices were different cup measures (12 cup, 1 cup,
112 cups or none of the above for fruit; 1
4 cup, 12 cup,
1 cup or none of the above for cooked vegetables).
Responses were dichotomised as correct or incorrect.
3. Fruit and vegetable consumption was measured by
two short questions asking the parents ‘How many
servings of fruit/vegetables do you usually eat each
day?’ As examples of serving sizes were provided
immediately before this question, consumption was
based on the recommended serving size rather than
the respondent’s perception of serving size. These
questions relied on self-report. Although they do not
provide as accurate an estimate of absolute consump-
tion as more detailed dietary assessment tools, they
can effectively discriminate between groups with
significantly different intakes of fruit and vegetables,
rank individuals reasonably well and are widely
accepted for use in population-based surveys(32–34).
4. Age of respondents was collected in five discrete age-
range categories. The mid-points of these age ranges
NSW state-wide:
2007–10
2007–10
2008–10
Hunter and New England regions of NSW:
Hunter region of NSW:Eat It To Beat It programme. Included an education programme, fruit and vegetablefundraiser box, a campaign for primary schools, shopping centre cooking and tastingdemonstrations, and a communications strategy. Benchmark evaluation survey wasconducted January/February 2008. Follow-up survey conducted January/February 2011
Good for Kids. Good for Life childhood obesity prevention programme. The mediacampaign for vegetables was implemented in late 2009 and included television,radio and print media advertisements
NSW Go for 2&5® social marketing campaign. This state-wide campaign includedpaid television, radio, cinema and print media advertisements, various publicationsand web-based information, bus and supermarket trolley advertising, and supermarketfruit and vegetable demonstrations
Fig. 1 Fruit and vegetable intervention programmes conducted concurrently in New South Wales (NSW), Australia from 2007 to 2010
* It should be noted the parents participating in the benchmark surveywere asked this question in reference to the last few months, while thoseparticipating in the follow-up survey were asked about their exposure in‘the last couple of years’.
Eat It To Beat It 1963

(in single years) have been used for the coding of the
continuous form of the variable in the Generalized
Linear Modelling (GLM) procedure.
5. Approximate household annual income was collected
in four discrete income categories. The mid-points of
these income ranges (in units of $AU 10 000) have
been used for the continuous form of the variable in
the GLM procedure.
6. Education was collected in nine individual categories
(primary school; year 10 or below; year 11; year 12;
certificate at level 1 or 2; certificate at level 3 or 4;
advanced diploma or diploma; bachelor or under-
graduate degree; postgraduate degree, diploma or
certificate). The mid-points of these categories (in
years of education) have been used for the coding of
the continuous form of the variable in the GLM
procedure. The initial categories were further cate-
gorised as Year 12 or less, trade or certificate (technical
education) and university undergraduate or postgraduate
qualifications.
7. Exposure to programme strategies was measured as
the total number of individual programme strategies
that a parent claimed to have seen or participated in
from the Eat It To Beat It programme. Participants
were prompted with a randomised list of programme
strategies. This variable was used as both a categorical
variable (categories: 0, 1–5, 6–10, 11–15, 16–20) and as
a continuous variable (coded using individual counts)
in the GLM procedure.
Sample size
A sample size of 700 in both groups allowed for detection
of differences of at least 7?6 % for a dichotomous variable,
or a difference of 15 % of a standard deviation for con-
tinuous variables, with 95 % significance and 80 % power.
A sample size of 150 per group allowed for the detection
of differences of 0?5 of a serving of fruit and vegetables
(1 serving of fruit 5 150 g and 1 serving of vegetables 5
75 g), assuming a standard deviation of 1?6 servings(35),
with 95 % significance and 80 % power.
Analysis
It was hypothesised that compared with the New England
control group, parents from the target group in the
Hunter region would report greater awareness of the
programme, greater recognition of programme strategies
and better knowledge of recommended intakes and
serving sizes for fruit and vegetables. Furthermore, it was
hypothesised that in the Hunter intervention area, there
would be a dose-related response whereby an increased
exposure to the number of different Eat It To Beat It
programme elements would correspond with higher fruit
and vegetable consumption.
Data were analysed using the statistical software
package IBM SPSS Statistics version 20?0 for Windows.
Continuous and categorical outcome variables were
compared by t tests and x2 tests, respectively. Parameter
estimates for factors affecting fruit and vegetable intake
(considered separately) were derived using GLM.
A Poisson log-linear-type model was used with the cate-
gorical variables age, education level, income, knowledge
of recommended fruit/vegetable intakes, knowledge of
fruit/vegetable serving size and exposure to programme
strategies. A separate model was derived using exposure
to programme strategies as a continuous variable to
examine the trend for this covariate. As log-transformed
outcomes are used in the analysis, effects are reported in
terms of proportionate changes in means rather than
mean differences. Results were considered statistically
significant at the P , 0?05 level.
Results
Response rate
The benchmark survey resulted in 1403 completed
interviews (695 surveys in the Hunter region, 708 in
New England; 82 % response rate). The follow-up survey
resulted in 1401 surveys (700 surveys in the Hunter
region, 701 in New England; 86 % response rate).
Demographics
Demographic characteristics of the sample are shown
in Table 1. There were no significant differences in
the demographic characteristics of the intervention and
control groups except for approximate annual household
income. The Hunter sample was skewed towards parti-
cipants with higher incomes (P , 0?0001) for both waves,
but not higher levels of education. The sample char-
acteristics fluctuated only slightly across both waves of
the project.
Awareness of programme strategies
Recall of the category ‘anything from the Cancer Council
NSW or with the Eat It To Beat It logo encouraging them
to buy more fruit and vegetables’ (prompted recall)
among parents in the Hunter region following the launch
of the programme increased from 13 % at benchmark to
28 % at follow-up (P , 0?0001). Similar increases were
also seen among parents in New England between
benchmark and follow-up (11 % at benchmark compared
with 23 % at follow-up, P , 0?0001); however, there was a
non-significant trend towards higher recall in the Hunter
region. Seventy per cent of parents in the Hunter region
reported seeing or participating in at least one strategy or
activity of the Eat It To Beat It programme in ‘the last
couple of years’. This result was significantly higher than
among control parents in New England (62 %, P 5 0?001).
Table 2 compares the study groups’ recognition of
elements of the Eat It To Beat It programme at follow-up.
1964 C Glasson et al.

Knowledge of recommended fruit and
vegetable intakes
At the end of the intervention period, the proportion of
Hunter parents who correctly stated that they should eat
two servings of fruit each day increased significantly
from 41 % to 46 % (P 5 0?041) and the proportion who
correctly stated they should eat five servings of vegetables
each day increased significantly from 32 % to 37 %
Table 1 Demographic characteristics of the sample: parents with children of primary school age with primary responsibility for shopping andfood preparation, Hunter and New England regions of New South Wales, Australia, 2008–2011
Benchmark survey (2008) Follow-up survey (2011)
Hunter New England Hunter New England(n 695) (n 708) (n 700) (n 701)
Characteristic % % % %
Respondent age#24 years 1?3 1?8 0?4 1?025–34 years 25?8 28?0 24?6 25?735–44 years 58?1 54?1 55?6 54?945–54 years 12?9 13?4 18?1 16?5$55 years 1?9 2?7 1?1 1?6
GenderMale 14?1 11?7 16?3 14?1Female 85?9 88?3 83?7 85?9
Employment statusFull-time 26?5 29?9 34?7 34?4Part-time/casual 37?0 36?2 35?3 35?9Home duties 29?2 28?0 22?9 22?1Unemployed 2?9 1?8 3?9 4?1Student 1?7 1?6 1?3 1?4Age pension 1?3 0?3 0?4 0?0Pension other than age pension 1?4 2?0 1?3 1?9
Highest level of educationYear 12 or less 26?8 24?3 19?1 22?8Trade or certificate (technical education) 48?6 50?4 45?9 45?1University undergraduate or postgraduate qualifications 24?4 25?0 34?4 31?7
Approximate annual household income before taxLess than $AU 40 000 25?0 31?8 17?5 24?1$AU 40 000–80 000 32?9 41?1 27?8 35?2More than $AU 80 000–less than $AU 120 000 42?1 27?1 32?3 23?9$AU 120 000 or over 0?0 0?0 22?4 16?8
*Denominator for each category may change due to missing values.
Table 2 Recognition of elements of the Eat It To Beat It programme at follow-up: parents with children of primaryschool age with primary responsibility for shopping and food preparation, Hunter and New England regions ofNew South Wales, Australia, 2011
Hunter New England(n 700) (n 701)
Programme element % % P value
Article in a school or other newsletter 44 36 0?004Television community service announcement 42 41 0?328Homework activity 29 23 0?031Information sheet 28 24 0?038Conversation with a friend or colleagues 27 28 0?577Recipe cards 24 19 0?070Fruit and vegetable boxes to raise money for the school/organisation 21 6 ,0?0001An article in the local newspaper 18 15 0?336Someone talking on local radio 17 16 0?932A vegetable recipe demonstration 14 8 ,0?0001Talk at a school assembly 13 11 0?508Talk at a Transition to Kindergarten session 13 11 0?253Competition promoting fruit and vegetables 11 7 0?037Show bag of information 10 6 0?002Fridge magnet 10 8 0?319Cook & Eat session held at a school 8 6 0?500Website 7 7 0?977An activity at a Cancer Council NSW event 6 9 0?153Competition about families eating fruit and vegetables in local newspaper 6 3 0?002A Fruit & Veg $ense session 4 4 0?927
Eat It To Beat It 1965

(P 5 0?046; Table 3). There were no corresponding
significant increases in the New England control group.
Knowledge of serving size
There were no significant changes in the proportion of
parents who could state the correct serving size for fruit in
either the Hunter intervention group or in the New England
control group (Table 3). There was a non-significant
increase in the proportion of Hunter parents who could
state the correct serving size for vegetables (34 % to 39 %,
P 5 0?073; Table 3).
Consumption of fruit and vegetables
For Hunter parents, the mean number of fruit and vege-
table servings consumed fell by 0?3 servings/d; from 5?0
at benchmark to 4?7 servings/d at follow-up (P 5 0?033).
Similar results were also seen among parents in New
England, where mean consumption fell from 5?1 to
4?9 servings/d (P 5 0?046). However, when only those
parents who claimed to recall the programme (prompted
recall) were considered, the mean number of servings of
fruit and vegetables among parents in the Hunter region
increased marginally, but not significantly, in comparison
to benchmark (from 5?0 to 5?1 servings/d; Table 4).
By contrast, the mean number of servings among parents
who did not recall the programme decreased significantly
(from 5?0 to 4?6 servings/d). This resulted in a net difference
of 0?5 servings/d (P 5 0?004). There were no corresponding
differences found in the control group.
Factors influencing fruit and vegetable
consumption
Table 5 shows that fruit intake was significantly associated
with higher levels of education and increasing exposure
to programme strategies. The fruit intake model with
the continuous level of education variable suggests
that every additional year of education results in a 5?8 %
increase in the mean number of fruit servings consumed
daily (Ptrend , 0?0001). The fruit intake model with the
continuous exposure to programme strategies variable
suggests that exposure to each additional programme
strategy results in a 2?0 % increase in the mean number of
fruit servings consumed daily (Ptrend 5 0?007). Parents
who had a correct knowledge of the recommended
intakes for fruit were less likely to have higher intakes of
fruit (P , 0?0001).
Vegetable intake was significantly associated with age,
higher levels of education and increasing levels of
exposure to programme strategies. The vegetable intake
model with the continuous level of age variable suggests
that each additional year of age results in a 0?5 % increase
in the mean number of vegetable servings consumed
daily (P 5 0?048). The vegetable intake model with the
continuous level of education variable suggests that every
additional year of education results in a 2?0 % increase in
Table 3 Knowledge of recommended intakes and serving sizes at benchmark and follow-up: parents with children of primary school agewith primary responsibility for shopping and food preparation, Hunter and New England regions of New South Wales, Australia, 2008–2011
Hunter New England
Benchmark Follow-up Benchmark Follow-up(n 695) (n 708) P value (n 700) (n 701) P value
FruitUnderstanding of fruit servings recommended each day
% Correct 41 46 0?041 42 45 0?419Understanding of fruit serving size
% Correct 54 55 0?818 55 58 0?308Vegetables
Understanding of vegetable servings recommended each day% Correct 32 37 0?046 28 32 0?199
Understanding of vegetable serving size% Correct 34 39 0?073 34 34 0?883
Table 4 Fruit and vegetable consumption at follow-up by exposure to the programme (prompted recall): parents with children ofprimary school age with primary responsibility for shopping and food preparation, Hunter and New England regions of New South Wales,Australia, 2011
Exposed Not exposed
Mean no. ofservings/d SD
Mean no. ofservings/d SD
Difference between exposedand not exposed groups 95 % CI Difference P
Hunter (n 199) (n 498)5?08 1?90 4?60 2?05 0?48 0?16, 0?82 0?004
New England (n 164) (n 534)5?04 2?00 4?81 2?09 0?23 20?13, 0?59 0?210
1966 C Glasson et al.

Table 5 Potential predictors of change to fruit and vegetable consumption: parents with children of primary school age with primary responsibility for shopping and food preparation, Hunterregion of New South Wales, Australia, 2011 (relative difference percentages and 95 % confidence intervals)
Fruit Vegetables
PredictorMean no. ofservings/d
% differencein means 95 % CI P
Mean no. ofservings/d
% differencein means 95 % CI P
Age#24 years 2?67 211?4 27?3, 661?3 0?091 2?00 229?2 264?2, 40?1 0?28825–34 years 1?62 85?3 24?5, 259?4 2?75 23?9 231?4, 34?535–44 years 1?78 95?2 1?1, 276?7 3?10 2?0 226?9, 42?245–54 years 1?89 106?1 6?1, 300?1 3?19 6?1 224?3, 48?8$55 years 1?00 Ref. 2?86 Ref.
Trend (per year increase) 0?2 20?6, 0?9 0?677 0?5 0?0, 1?0 0?048Income
Less than $AU 40 000 1?73 9?2 28?6, 30?4 0?799 2?88 0?3 210?7, 12?7 0?570$AU 40 000–80 000 1?76 4?5 210?4, 22?0 2?83 24?5 213?7, 5?6More than $AU 80 000–less than $AU 120 000 1?74 2?4 211?3, 18?1 3?18 1?5 27?4, 11?3$AU 120 000 or over 1?79 Ref. 3?12 Ref.
Trend (per $AU 10 000 increase) 20?7 22?1, 0?7 0?327 0?2 20?7, 1?12 0?648Highest education
Year 12 or less 1?53 226?4 235?7, 215?8 ,0?0001 2?73 212?6 219?9, 24?5 0?003Trade or certificate (technical education) 1?75 214?6 225?2, 22?5 2?84 212?6 219?9, 24?5University undergraduate or postgraduatequalifications
1?99 Ref. 3?45 Ref.
Trend (per year of education increase) 5?8 3?6, 8?1 ,0?0001 2?0 0?6, 3?5 0?005Knowledge of recommended intakes
Correct 1?52 223?7 231?4, 215?2 ,0?0001 3?79 42?5 33?1, 52?7 ,0?0001Incorrect 1?96 Ref. 2?56 Ref.
Knowledge of serving sizeCorrect 1?72 22?7 212?2, 7?8 0?598 3?34 7?4 0?1, 15?3 0?046Incorrect 1?80 Ref. 2?81 Ref.
Extent of exposure to programme strategies0 strategies 1?69 4?9 248?6, 114?1 0?025 2?89 236?7 256?0, 28?9 0?0201–5 strategies 1?68 7?9 52?9, 119?7 3?07 231?9 252?6, 22?26–10 strategies 2?09 32?0 235?5, 170?3 3?00 232?7 253?4, 22?811–15 strategies 1?75 11?8 247?6, 138?2 3?33 222?2 247?6, 15?616–20 strategies 1?50 Ref. 4?25 Ref.
Trend (per each additional strategy exposed to) 2?0 0?5, 3?4 0?007 1?1 0?2, 2?1 0?020
Ref., reference category.
Eat
ItTo
Beat
It1967

the mean number of vegetable servings consumed daily
(P 5 0?005). Similarly, the vegetable intake model with
the continuous exposure to programme strategies variable
suggests that exposure to each additional programme
strategy results in a 1?1% increase in the mean number of
vegetable servings consumed daily (P 5 0?020). Parents
who had a correct knowledge of the recommended
intakes (P , 0?0001) and serving sizes (P 5 0?046) for
vegetables were more likely to have higher intakes.
There were no significant associations for fruit or
vegetables based on income.
Discussion
The results of the present study show that the Eat It To Beat
It programme achieved improvements in fruit and vege-
table intake in those parents exposed to the programme.
Furthermore, the results demonstrate that increased intakes
of fruit and vegetables were significantly associated with
increasing exposure to programme strategies.
To achieve these results, the Eat It To Beat It programme
maximised the use of programme funding by using
volunteers to implement and administer some of the stra-
tegies and made optimal use of free media coverage that
resulted from programme activities. However, the low-
intensity nature of the programme means that the reach
and dose of programme strategies achieved were lower
than for a mass-media campaign. As a result, prompted
recall of the Eat It To Beat It programme was low at 28%
(an increase of 15% from benchmark) compared with
92% for the Western Australian Go for 2&5�R campaign
(no benchmark results reported)(13), 68% (up 22%) for the
NSW Go for 2&5�R campaign(15) and 83% (up 59%) for the
national campaign(16). Despite the low reach, parents in
the Hunter area were more likely to have recalled or
claimed to have participated in the main components
of the Eat It To Beat It programme than those in the
New England region.
Studies have shown that fruit and vegetable intake
is significantly associated with knowledge of recom-
mended intakes(36). There were significant improvements
in parents’ knowledge of both fruit (an increase of 5 % in
the proportion of parents who stated they should eat two
servings of fruit each day) and vegetable recommenda-
tions (an increase of 5 % in the proportion of parents
who stated they should eat five servings of vegetables
each day) as a result of the Eat It To Beat It programme.
These results compare favourably with no improvement
reported in the national Go for 2&5�R campaign survey
for fruit(16) and an increase of 8 %(16) for vegetables.
However, results from the GLM found that parents who
had a correct knowledge of the recommended intakes
for fruit were less likely to have higher intakes of fruit.
Correct knowledge of the recommended servings for fruit
is higher than for vegetables and therefore other factors
such as eating fruit for its taste may mean that the cor-
relation between correct knowledge of recommended
intake for fruit and intake of fruit may not be as strong as
it is for vegetables.
Increases in fruit and vegetable consumption as a result
of large mass-media campaigns are of the order of
0?4 servings/d for the national Go for 2&5�R campaign(16)
and 0?8 servings/d for the Western Australian Go for
2&5�R campaign(13). For the Eat It To Beat It programme,
there was a significant decrease in consumption of fruit and
vegetables in both the Hunter (decrease of 0?3 servings/d)
and New England areas (decrease of 0?2 servings/d) at
follow-up. However, this decrease in consumption must
be considered in the light of other factors occurring
during the intervention period. Perceived cost of fruit and
vegetables has previously been reported as the second
most important influence on food choice after taste(37).
Perceived cost was reported as the main barrier for both
fruit and vegetables at follow-up in the present study.
During the follow-up survey period there was a higher
than expected increase in the cost of fruit and vegetables
in the Hunter area due to significant flooding in agri-
cultural regions of eastern Australia during 2010–11. This
flooding was estimated to have reduced agricultural
production by at least $AU 500–600 million, with sig-
nificant impacts on the production of fruit and vegetables
immediately before the interview period(38). Furthermore,
a survey conducted by Cancer Council NSW found that
the cost of a basket of eight common fruit and vegetables
increased by more than 25 % in real terms (i.e. adjusted
for inflation) between December 2008 and January 2011
(Cancer Council NSW, unpublished results).
Despite this increase in the cost of fruit and vegetables,
the decrease in consumption among parents in the
Hunter region appears to be mitigated by exposure to the
Eat It To Beat It programme and resulted in a significant
difference of 0?5 servings of fruit and vegetables daily for
those who recalled the programme compared with those
who did not. Furthermore, there appears to be a dose-
related response so that every additional programme
strategy that a parent was exposed to resulted in an
increase in consumption by parents.
These results emphasise the importance of local
programmes that can engage the community on an
ongoing basis to support and sustain the effects of larger
mass-media campaigns. The funding available for health
organisations to implement these programmes is typically
meagre compared with funding available for large, mass-
media type campaigns. Therefore, adequate funding for
local programmes that deliver community-based educa-
tion and ‘below the line’ social marketing needs to be
provided to allow a greater reach and a higher dosage
of programme strategies. Given the lack of controlled
evaluations of smaller localised programmes, funding
provided should be sufficient to include a good-quality
evaluation component.
1968 C Glasson et al.

Limitations
There was confusion between the brand and activities of
the Eat It To Beat It programme and the two other major
fruit and vegetable initiatives operating at the same time,
leading to higher than expected levels of recall for the
programme and its activities in the control population.
Confusion between multiple programmes, activities and
messaging has been noted in other studies(16,39,40). In
addition, there was some unavoidable contamination
of the New England control area with some of the pro-
gramme strategies such as Fruit ‘n’ Veg month that
occurred across the state. Likewise, there may have been
some cross-over of regional boundaries with some of the
newspaper print articles about Eat It To Beat It activities.
The short questions used to determine fruit and vege-
table consumption do not give as accurate an estimate of
absolute intakes and this should be taken into account
when interpreting these results.
Both the intervention and control sample populations
were somewhat skewed towards tertiary-educated
respondents and the intervention sample was skewed
towards higher-income respondents for both waves. As a
result, extrapolating these results to the overall popula-
tion of parents of primary school-aged children should be
done with caution.
Conclusions
Despite a modest programme reach, the Eat It To Beat
It programme achieved improvements in knowledge
of recommended intakes and some positive changes in
knowledge of serving size for vegetables in its target
population. While this has not translated into overall
behaviour change across the population, exposure to the
Eat It To Beat It programme appears to have positively
influenced overall fruit and vegetable intake. The Eat It To
Beat It programme demonstrates that additional gains in the
modifiable, predisposing factors for consumption of fruit
and vegetables and, to a limited extent, changes in actual
consumption can be achieved by the implementation of
community-based strategies that build on the successes of
larger mass-media and social-marketing campaigns.
Furthermore, the results of the present study show
the more activities parents were exposed to that promote
and educate about fruit and vegetables, the greater the
resulting increases in consumption. This suggests that
funding for localised, community-based fruit and vegetable
programmes should be increased.
Acknowledgements
Sources of funding: The Australian Government Depart-
ment of Health and Ageing provided funding for project
costs but had no influence on the design, analysis or
reporting. Conflicts of interest: The authors have no
conflicts of interest to declare. Authors’ contributions:
C.G. developed the methodology and the questionnaire
and was responsible for data analysis and writing the
manuscript. K.C. provided advice on the methodology
and implementation of the research and assisted in
writing the manuscript. T.W., K.G. and N.H. coordinated
the implementation of the intervention and T.W., C.H.
and N.H. assisted in writing the manuscript. E.J. provided
advice on the methodology and assisted in writing
the manuscript. Acknowledgements: The authors thank
Christophe Lecathelinais for assistance with determining
sample size, Sam Egger for assistance with statistical
advice, the volunteers who assisted in the implementation
of the programme and the participants.
References
1. Begg S, Vos T, Barker B et al. (2007) The Burden of Diseaseand Injury in Australia 2003. Canberra: AIHW.
2. Lichtenstein AH, Appel LJ, Brands M et al. (2006) Dietand lifestyle recommendations revision 2006: a scientificstatement from the American Heart Association NutritionCommittee. Circulation 114, 82–96.
3. National Health and Medical Research Council (2013)Australian Dietary Guidelines. Canberra: NHMRC; availableat http://www.nhmrc.gov.au/_files_nhmrc/publications/attachments/n55_australian_dietary_guidelines_0.pdf
4. World Health Organization (2003) Diet, Nutrition and thePrevention of Chronic Disease. Report of a Joint WHO/FAOExpert Consultation. WHO Technical Report Series no. 916.Geneva: WHO.
5. Khaw K-T, Bingham S, Welch A et al. (2001) Relationbetween plasma ascorbic acid and mortality in men andwomen in EPIC-Norfolk prospective study: a prospectivepopulation study. Lancet 357, 657–663.
6. He FJ, Nowson CA, Lucas M et al. (2007) Increasedconsumption of fruit and vegetables is related to a reducedrisk of coronary heart disease: meta-analysis of cohortstudies. J Hum Hypertens 21, 717–728.
7. Australian Government Department of Health and Ageing(2008) Factsheet—Fruit and Vegetable Serves. http://www.health.gov.au/internet/healthyactive/publishing.nsf/Content/fact1 (accessed April 2012).
8. Centre for Epidemiology and Research (2010) 2009Summary Report on Adult Health from the New SouthWales Population Health Survey. http://www.health.nsw.gov.au/resources/publichealth/surveys/hsa_09summary.pdf(accessed April 2012).
9. Pomerleau J, Lock K, Knai C et al. (2005) Interventionsdesigned to increase adult fruit and vegetable intake can beeffective: a systematic review of the literature. J Nutr 135,2486–2495.
10. Snyder LB, Hamilton MA, Mitchell EW et al. (2004) A meta-analysis of the effect of mediated health communicationcampaigns on behavior change in the United States. J HealthCommun 9, Suppl. 1, 71–96.
11. Matson-Koffman DM, Brownstein JN, Neiner JA et al.(2005) A site-specific literature review of policy andenvironmental interventions that promote physical activityand nutrition for cardiovascular health: what works? Am JHealth Promot 19, 167–193.
12. Brownson RC, Haire-Joshu D & Luke DA (2006) Shapingthe context of health: a review of environmental and policyapproaches in the prevention of chronic diseases. AnnuRev Public Health 27, 341–370.
Eat It To Beat It 1969

13. Pollard CM, Miller MR, Daly AM et al. (2008) Increasing fruitand vegetable consumption: success of the Western AustralianGo for 2&5 campaign. Public Health Nutr 11, 314–320.
14. Australian Government Department of Health and Ageing(2008) Welcome to the Go for 2&5
TM
Website. http://www.health.gov.au/internet/healthyactive/publishing.nsf/content/2and5 (accessed April 2012).
15. NSW Health, Cancer Institute of NSW (2007) SummaryReport: Evaluation of the NSW Go for 2&5�R Fruit andVegetable Campaign. Sydney: NSW Health.
16. Elliott D & Walker D (2007) Evaluation of the National Gofor 2&5�R Campaign. Canberra: Australian GovernmentDepartment of Health and Ageing; available at http://www.health.gov.au/internet/healthyactive/publishing.nsf/Content/EAED0B3283A8A1E2CA257259007CFC2D/$File/2&5-eval-jan06.pdf
17. Queensland Health (2010) The Health of Queenslanders2010. Third Report of the Chief Health Officer Queensland.Brisbane: Queensland Health.
18. Wakefield MA, Loken B & Hornik RC (2010) Use of massmedia campaigns to change health behaviour. Lancet 376,1261–1271.
19. Moodie AR, Daube M, Carnell K et al. (2009) Australia: theHealthiest Country by 2020. National Preventative HealthStrategy – the Roadmap for Action. Canberra: AustralianGovernment, Preventative Health Taskforce; available athttp://www.preventativehealth.org.au
20. Carter SM (2003) Going below the line: creating transpor-table brands for Australia’s dark market. Tob Control 12,Suppl. 3, iii87–iii94.
21. Hunter New England Area Health Service (2009) Good forKids. Good for Life. About us. http://www.goodforkids.nsw.gov.au/About_Us (accessed April 2012).
22. Hunter New England Area Health Service (2009) Good ForKids. Good for Life. Vegies – Serve ’em up! Campaign.http://www.goodforkids.nsw.gov.au/Parents/Vegies_Serve_em_up (accessed April 2012).
23. Eureka Strategic Research (2007) Influencing Food Pur-chasing Decisions. Sydney: Cancer Council NSW.
24. Van Duyn MA, Kristal AR, Dodd K et al. (2001) Associationof awareness, intrapersonal and interpersonal factors, andstage of dietary change with fruit and vegetable consump-tion: a national survey. Am J Health Promot 16, 69–78.
25. Bandura A (1986) Social Foundations of Thought and Action:A Social Cognitive Theory. Englewood Cliffs, NJ: Prentice-Hall.
26. Green L & Kreuter M (1991) Health Promotion Planning:An Educational and Environmental Approach, 2nd ed.Mountain View, CA: Mayfield Publishing Company.
27. Prochaska JO & DiClemente CC (1983) Stages andprocesses of self-change of smoking: toward an integrativemodel of change. J Consult Clin Psychol 51, 390–395.
28. Ma J, Betts NM, Horacek T et al. (2003) Assessing stagesof change for fruit and vegetable intake in youngadults: a combination of traditional staging algorithmsand food-frequency questionnaires. Health Educ Res 18,224–236.
29. Glasson C, Chapman K, Gander K et al. (2012) The efficacyof a brief, peer-led nutrition education intervention inincreasing fruit and vegetable consumption: a wait-list,community-based randomised controlled trial. PublicHealth Nutr 15, 1318–1326.
30. Atienza AA & King AC (2002) Community-based healthintervention trials: an overview of methodological issues.Epidemiol Rev 24, 72–79.
31. Merzel C & D’Afflitti J (2003) Reconsidering community-based health promotion: promise, performance, andpotential. Am J Public Health 93, 557–574.
32. Coyne T, Ibiebele TI, McNaughton S et al. (2004)Evaluation of brief dietary questions to estimate vegetableand fruit consumption – using serum carotenoids andred-cell folate. Public Health Nutr 8, 298–308.
33. Greene GW, Fey-Yensan N, Padula C et al. (2004)Differences in psychosocial variables by stage of changefor fruits and vegetables in older adults. J Am Diet Assoc104, 1236–1243.
34. Marks GC (2001) Monitoring Food Habits in the AustralianPopulation Using Short Questions. Canberra: AustralianFood and Nutrition Monitoring Unit.
35. Glasson C, Chapman K & James E (2010) Fruit andvegetables should be targeted separately in health promo-tion programmes: differences in consumption levels,barriers, knowledge and stages of readiness for change.Public Health Nutr 14, 694–701.
36. Shaikh AR, Yaroch AL, Nebeling L et al. (2008) Psychosocialpredictors of fruit and vegetable consumption in adults areview of the literature. Am J Prev Med 34, 535–543.
37. Glanz K, Basil M, Maibach E et al. (1998) Why Americanseat what they do: taste, nutrition, cost, convenience, andweight control concerns as influences on food consump-tion. J Am Diet Assoc 98, 1118–1126.
38. Australian Bureau of Agricultural and Resource Economicsand Sciences (2011) The Impact of Recent Flood Events onCommodities. Canberra: Australian Bureau of Agriculturaland Resource Economics and Sciences.
39. Berry TR, Spence JC, Plotnikoff RC et al. (2009) A mixedmethods evaluation of televised health promotion adver-tisements targeted at older adults. Eval Program Plann 32,278–288.
40. Ashfield-Watt P, Welch A, Godward S et al. (2007) Effect ofa pilot community intervention on fruit and vegetableintakes: use of FACET (Five-a-day Community EvaluationTool). Public Health Nutr 10, 671–680.
1970 C Glasson et al.