Incentive Compensation in The Public Sector
31
I Incentive Compensation in The Public Sector: Evidenceand Potential DAVID LEWIN* NEIL JACOBY PROFESSOR OF MANAGEMENT, HUMAN RESOURCES AND ORGANIZATIONAL BEHAVIOR ANDERSON SCHOOL AT UCLA REVISED JULY 2002 PREPARED FOR INCLUSION IN A SYMPOSIUM ON "THE FUTURE OF LABOR RELATIONS IN THE PUBLIC SECTOR" JOURNAL OF LABOR RESEARCH ---~ @ 2002. Not for Citation, Quotation, Reproduction or Distribution Without Written Permission * Author's e-mail address: david.lewin(Q).anderson.ucla.edu
-
Upload
khangminh22 -
Category
Documents
-
view
6 -
download
0
Transcript of Incentive Compensation in The Public Sector

I
Incentive Compensation in The Public Sector:Evidence and Potential
DAVID LEWIN*NEIL JACOBY PROFESSOR OF MANAGEMENT, HUMAN
RESOURCES AND ORGANIZATIONAL BEHAVIORANDERSON SCHOOL AT UCLA
REVISED JULY 2002PREPARED FOR INCLUSION IN A SYMPOSIUM ON
"THE FUTURE OF LABOR RELATIONS IN THE PUBLIC SECTOR"JOURNAL OF LABOR RESEARCH---~ @ 2002. Not for Citation, Quotation, Reproduction
or Distribution Without Written Permission
* Author's e-mail address: david.lewin(Q).anderson.ucla.edu

INCENTIVE COMPENSAllON IN THE PUBLIC SECTOR:EVIDENCE AND POTENTIAL
I. Introduction
To what extent is incentive compensation practiced in the U.S. public sector and what are the future
prospects for its use? These are the focal questions herein. In Section II, a brief history of public sector
compensation practices is presented. Section III analyzes recent evidence about the uses of incentive
compensation in the public sector based on survey data from 17 state and 284 local governments. In
Section IV, perceptions of and preferences regarding incentive compensation in the public sector are
analyzed based on a second set of survey data drawn from samples of elected officials, managerial
personnel, employees, and residents of four state and 18 local governments. Section V examines the
prevailing wage rule that operates in these same governments, with emphasis on how implementation of
this rule affects incentive compensation. In Section VI, some predictions about the future of incentive
compensation in the public sector are offered. Section VII summarizes my main conclusions and
predictions.
II. Historical Summary
Early in the 20th century, public sector compensation practices were largely ad hoc and unsystematic. In
that period, political patronage primarily determined not only what public sector employees were paid but,
more fundamentally, also who got public sector jobs. Access to public sector employment depended less on
what you knew than whom you knew. In this employment "system," pay rates for individuals performing
the same work varied widely among individuals. And, similar to a portion of the private sector during this
[ period, payments, payoffs, or kickbacks from employees to supervisors, managers, and political bosses
were commonly made to secure and maintain jobs (Loverd and Pavlak, 1983).
This patronage system of public sector employment and pay was challenged and for the most part
supplanted between the two world wars by the "reform" movement. Civil service was at the heart of this
movement, with public sector jobs becoming formally analyzed, graded, and classified. New rules and
procedures were established for the specification and filling of jobs, recruitment became an open rather
than closed process, employment tests were administered to applicants, protections from arbitrary dismissal
1
_c"~- ."" ~-".,""',.."" ..

were put in place, and pay rates and rate ranges were established for civil service jobs. This new
employment and pay system was adopted by the federal government and large state and local governments,
and it eventually trickled down to small governments in cities, towns, and villages (Loverd and Pavlak,
1983).
To implement their new pay systems, governments increasingly looked to the private sector for
comparison or benchmark rates. During the 1950s and 1960s, such comparisons became formalized under
prevailing wage statutes and policies adopted by governments. Some governments, typically large ones,
instituted their own pay surveys, while other, typically smaller, governments relied on pay surveys
conducted by the U.s. Bureau of Labor Statistics, larger governments, and specialized organizations, such
as the International City Managers' Association (ICMA), to obtain market data for setting their pay rates
(Lewin, 1974a). Also during this period, and paralleling developments in the private sector, U.S.
governments adopted pension plans and, later, health-care plans for their employees so that pay, per se,
became a relatively smaller part of total compensation. Prevailing wage surveys, in turn, evolved into
prevailing total compensation surveys.
Whatever else may be said about prevailing wage theory as a basis for governmental pay-setting,
implementation of this theory was decided exclusively by governmental management; in other words, the
public sector pay-setting process was virtually exclusively management-determined (Dunlop, 1944). Yet,
the private sector pay data on which governments increasingly relied to set their pay rates included a
substantial portion of rates that had been determined through collective bargaining between unionized
employees and managers. Public sector employees became increasingly dissatisfied with a pay (and work)
system in which they had little or no voice, so they began to organize with a vengeance. Over the 20-year
span from 1960 to 1980, the U.S. public sector unionization rate grew from about 10 percent to about 33
percent and, by a few years later, surpassed the U.S. private sector unionization rate. This dramatic increase
in the unionization of government employees was substantially aided by public sector collective bargaining
statutes enacted by state legislatures. Thus, the pay-setting process in state and local government (as well as
the federal government) changed from largely management determined to partly collectively determined
and partly management determined (Lewin et al., 1988).
2
" ","".,." "*

Nevertheless, under both collective bargaining and management detennination public sector pay
practices continued to feature "payment for time" in the forms of wage, salaries, and fringe benefits. To this
point, the use of incentive compensation in government was as foreign as the reform movement had been
during the patronage era of government employment and pay. But several developments subsequently
spurred consideration and then selected use of incentive compensation in the U.S. public sector. One of
these developments was the slowdown in growth, followed by actual decline, of the public sector. During
the third quarter of the 20d1 century, state and local government was the fastest growing "industry" in the
U.S., with government employment and pay both rising rapidly. But the mid-1970s recession, the second
deepest recession of the 20d1 century, had especially pronounced effects on the public sector that, according
to many 0 bservers, faced a fiscal crisis. Consequently, government h iring freezes were widely adopted,
followed by layoffs (termed "reductions in force") and so-called concession bargaining in which unionized
public employees "gave back" some pay and benefits to their government employers (Lewin, 1982). A few
of these negotiations featured "productivity bargaining" in which certain unions, such as of sanitation
employees, agreed to work-crew size reductions coupled with incentive pay in the form ofbonuses for
achieving higher levels of sewage disposal, snow removal, street maintenance, and the like (Lewin, 1987).
A second development spurring greater use of incentive compensation in government was the taxpayer
revolt which, in states such as California and Massachusetts, took the form of new, permanent, lower
property-tax assessments which, in turn, reduced the budgets available to fund public services, especially
education. At the national level, this revolt led to reductions in individual and corporate income tax rates.
More fundamentally, during this time, the dominant view among the citizenry was that "smaller was better"
so far as government was concerned. For many, if not most, government employers, this political-economic
climate meant choosing between having a smaller better-paid work force or a larger poorer-paid work
force. I t a Iso meant searching for ways in which public employees' pay could become more i ncentive-
based, such as through performance bonuses for teachers tied to student achievement on standardized tests,
and for police personnel tied to reduced crime rates or increased arrest and clearance rates.
A third development, closely related to the second, spurring greater use of incentive compensation in
government was increasing domestic and global economic competition, stimulated in part by de-regulation.
If the third-quarter of the 20d1 century featured state and local government as the nation's fastest growing
3

-
indus1ry,it also featured a majority of private industries that were officially classified as oligopolies and
monopolies. By the end of the 1980s, however, a substantial majority of U.S. industries had become
competitive, with much of this competition stemming from abroad. It is no coincidence that, during this
period, the notion of the market-driven or customer-driven fmn came of age (Kotler, 1991). And, this idea
was extended to the public sector with the view that governments should be more citizen-customer driven.
For some governments, embracing this idea led to instituting or increasing user fees for certain services, for
others it resulted in the subcontracting or outsourcing of certain services, and for still others it meant
privatizing some services that had previously been "publicly" delivered. But, in addition, this new emphasis
on a more competitive, market-driven public sector led many governments to adopt new incentive
compensation initiatives, including department-wide bonuses based on achievement of measurable
performance objectives, gain-sharing, and productivity-sharing payments for some unionized employee
groups, and more individual performance-based pay for mid-level and senior public sector managers
(Gaebler and Osborne, 1992).
These developments continued into the 1990s and the impetus they gave to greater use of incentive
compensation in government was further reinforced by the economic recession that occurred early in that
decade. Whereas the m id-1970s recession h ad particularly strong negative effects on the government of
New York City, which bordered on bankruptcy and whose fInancial management and operations were
taken over by a new State-level Emergency Financial Control Board, the early 1990s' recession had
especially strong negative effects on local governments in California, most notably the County of Orange,
the second largest county government in the state, which did declare bankruptcy. One of that County's
post-bankruptcy initiatives was the adoption of a new management performance plan requiring all future
management pay increases to be based on achievement of individual performance objectives which, in turn,
were linked to larger departmental objectives (County of Orange, CA, 1998). At about the same time, the
City of Los Angeles, the nation's second largest municipal government, adopted a new management
performance assessment and compensation plan that substantially strengthened the link between pay and
performance for the director and assistant director of each of the City's 35 departments (City Of Los
Angeles, 1995).
41,
"- -, , ~"-,-,",",

This economic recession soon turned to recovery and was followed by exceptionally rapid economic
growth during the remainder of the 1990s. In this unusually favorable economic environment, the federal
government and almost all state and local governments ran budget surpluses, which might have served to
dampen further initiatives toward using incentive compensation in government. But two additional
developments appeared to strongly support such initiatives; one was the re-inventing government
movement, the other was the pay-for-performance movement. Advocates of government reinvention
envisioned smaller, leaner, more efficient governments whose leaders design new strategies for managing
their organizations and for rendering high performance in the delivery of pubic services (Risher, 1997;
Gaebler and Osborne, 1992). Incentive compensation is viewed by some of these advocates as a leading
tool for the re-invention of government (Risher et a1., 1997; Siegel, 1992; Meehan, 1991). Advocates of
pay-for-performance envisioned public sector compensation systems in which employees at all levels from
top executives to front-line personnel to operatives have significant portions of their pay tied to
organizational, unit, department, or individual performance (Wise, 1994; Newland et a1., 1991; Mitchell et
al., 1990). These advocates rely heavily on motivation and compensation theories, traditionally applied
more to the private than the public sector, in which tight links between rewards and performance lead to
more favorable employee attitudes toward work followed, in turn, by greater (or smarter) work effort and
enhanced job and organizational performance (Lawler, 2000; Gerhart et al., 1992; Vroom, 1964). Taken
together, these two doctrines provide a conceptual basis for governments to use incentive compensation to
motivate public employees -internal customers -to deliver high quality services to a discerning
citizenry -external customers -and perhaps also thereby to ward off pressures for the privatization of
public services.
Thus, several macro economic-political developments imply and certain conceptual frameworks
support expanded use of incentive compensation in the public sector, and selected recent examples from
large local governments illustrate such usage. Attention now turns to empirical evidence about incentive
compensation usage in the public sector more broadly.
5
~,."., """li, -","c ,..",..

f
1lI. Incentive Compensation Usage in State and Local Government
A recent study analyzed the breadth, depth, and determinants of incentive compensation usage in the public
sector (Lewin, 1992) based on a survey administered in late 1998 to 25 state governments and 400 local
governments that collectively had more than 6 million employees (excluding education employees). In the
survey, incentive compensation was defined to include (1) performance-based pay, (2) merit pay, (3)
productivity-sharing, (4) gain-sharing, (5) skill-based-pay, (6) pay-for-knowledge, (7) bonus pay, and (8)
other. Brief defmitions of each of these types of incentive compensation were provided in the survey. I
Respondents were asked to indicate which of these types 0 f incentive compensation were used by their
respective governments as well as for which major groups of employees-managerial, professional,
technical, clerical, operators, manual, and other service-they were used and in which
agencies/departments they were used2. Completed surveys providing fully usable data were received from
17 or 68 percent of the state governments and 284 or 71 percent of the local governments.
Regarding the breadth of incentive compensation usage, Table 1 shows that all but one of the state
governments and 242 or 85 percent of the local governments use incentive compensation. Performance-
based pay and merit pay and are the most prevalent types of incentive compensation in these governments,
followed by skill-based pay and gain-sharing, while bonus pay is least frequently used. Among major
employee/occupational groups, Table 1 shows that incentive compensation is most prevalent among
professional and technical employees and least prevalent among clerical and manual employees. There is
also considerable variation by agency/department in the use of incentive compensation (not shown in Table
1), with such compensation being most widely used in taxation, fInance (budget), welfare, health care,
sanitation, highways, and utilities (i.e., water and power), and least widely used in public works, motor
vehicles, general services, criminal justice (excluding police) and protective services (including police).
Concerning the duration of incentive compensation plans, a few of these state and local governments
adopted one or another incentive compensation plan in the mid-to-late 1970s, but the "typical" government
in this sample began to use incentive compensation in the early-to-mid 1990s. Also of note, unionized
employees in these governments tend to be covered by productivity-sharing and gain-sharing plans, while
non union employees are primarily covered by performance-based-pay and merit-pay plans.
6
---"""."",.."I..,,_-'L " ,"_.c""~-~.."J..,,,

l
In these governments, the type of incentive compensation plan used also varies widely by
employee/occupational group (Table 1). Performance-based-pay, merit pay, and pay-for-knowledge plans
are most likely for professional and technical employees; productivity-sharing and gain-sharing plans for
operatives; skill-based pay for technical employees and operatives and, to a lesser extent, professional and
other service employees; and bonus pay for managerial and technical employees. The overall incidence of
pay-for-knowledge and bonus plans in these governments, however, is far lower than the overall incidence
of pay-for-performance, merit pay, skill-based pay, productivity-sharing and gain-sharing plans. Stated
differently, an employee in any of these governments is far more likely -about five times as likely -to
be covered by a pay-for-performance or merit-pay plan than by a pay-for-knowledge or bonus plan.
To examine the determinants of incentive compensation usage in these governments, an incentive
compensation index was constructed from the survey data. The index incorporates (i.e., assigns points to)
the types of incentive compensation plans used by each government, employee coverage of the plans in
each government, and the agency/department coverage of the plans in each government. 3 This index was
regressed 0 nto several independent and control variables. The statistically significant findings from this
analysis (not shown here) were that larger and older governments, governments with relatively high retail
sales and income tax rates, governments with high ratios of white-collar to blue-collar employees and total
public expenditures to total economic activity, governments with prevailing wage policies, governments in
the Midwest and Southwest regions, and governments that recently used a compensation consultant were
most likely to use incentive compensation. Also, among local governments, those with a city manager form
of government were significantly more likely to use incentive compensation than governments with mayor,
mayor-council, council only, or other forms ofgovernment. By contrast, employee unionization and the
presence of a living wage statute/policy/ were not significantly associated with the use of incentive
compensation in state and local governments. These statistically insignificant findings are substantively
significant, however, in that they suggest that governments' use of incentive compensation is not affected
(i.e., constrained) by the unionization of their employees or by their adoption of living wage statutes or
policies.
Additional regression analyses (also not shown here) confirmed that incentive compensation is most
likely to be used for professional and technical employees, least likely to be used for clerical and manual
7
"0"

employees, of state and local governments. Managerial, operative, and other service employment were not
significantly associated with incentive compensation usage by these state and local governments. The
insignificant fmding for managerial employees is nevertheless notable because of the contrasting practice in
industry, where incentive compensation has its broadest (and deepest) coverage in management ranks
(Milkovich and Newman, 1999).
Turning from the breadth to the depth of incentive compensation usage in government, "What
proportion of total compensation paid to employees of state and local government is accounted for by
incentive compensation?" This is an important question, especially in light of the continuing debate over
the (relative) amount of incentive compensation that is required to motivate enhanced employee
performance, whether in the public or private sector (Ingraham, 1993; Milkovich and Newman, 1999). Data
to answer this question were provided by the survey, which asked respondents to state or estimate total
direct compensation (i.e~, excluding benefits) paid to employees of their respective state and local
governments during the most recent fiscal year, and then to state or estimate total incentive compensation
paid to these same employees during the most recent fiscal year. 4 Additional questions elicited similar data
for major employee/occupational groups and agencies/departments; the data are summarized in Table 2.
On the basis of these data, incentive compensation accounted for slightly more than six percent of base
compensation (i.e., salaries and wage) paid to employees of state and local government in 1998. Among
employee/occupational groups, incentive compensation as a proportion of base compensation was highest
for technical and professional employees and lowest for clerical and managerial employees. Among
agencies/departments, incentive compensation as a proportion of base compensation was highest in
taxation, finance, and utilities and lowest in criminal justice, public works, and motor vehicles. On balance,
then, the use of incentive compensation appears widespread, that is, broad, in state and local government.
but the amount of such compensation relative to base compensation is small, that is, not very deep, falling
well short of the depth that most experts believe is required to enhance employee and government
performance (Levine, 1997; Risher, 1999).
8
'~~"'.,"," "_c""_clcw,

l
N. Incentive Compensation Perceptions and Preferences
Having considered patterns of actual incentive compensation usage in government, consider next the
perceptions and preferences of key public sector "actors" regarding such compensation; the main groups of
actors include public officials, managers, employees, and citizens. Of particular interest are (1) differences
among these groups regarding perceived incentive compensation usage in government, (2) differences
benNeen actual and perceived use of incentive compensatio~ and (3) differences among these groups
regarding their preferences for incentive compensation usage. For this purpose, the aforementioned study
included surveys that were administered to samples of elected officials, managers, (non management)
employees, and residents of four state governments and 18 local governments (none of which were located
in the four states). Sample selection yielded 110 elected officials, 132 managers, 220 employees, and 440
residents to whom the survey was mailed. 5 This procedure, together with a follow-up mailing and
telephone calls to 20 percent of the total sample, resulted in an overall response rate of 62 percent,
composed of 57 percent of elected officials, 64 percent of managers, 59 percent of employees, and 65
percent of residents.
As summarized in Table 3, large majorities of elected officials and managers believe that incentive
compensation is used by their respective governments, compared to only 41 percent of employees and 26
percent of residents. When asked about the percentage of government employees covered by incentive
compensation, the responses ranged from a high of 75 percent among elected officials to a low of 15
percent among residents. W hen asked toe stirnate the percentage 0 f total direct employee compensation
represented by incentive compensation in their governments, the mean responses were 15 percent among
elected officials, nine percent among managers, six percent among employees, and three percent among
residents. Several of these inter-group differences were statistically significant.
Instructively, employees were more accurate t ban elected 0 fficials, managers, and residents in their
estimates of the ratio of incentive compensation to total direct compensation in these governments. Using
data from this study's fIrst survey, the mean ratio of incentive compensation to total direct compensation in
these governments was 6.80 in the most recent fiscal year, with a standard deviation of 1.65 percent and a
range from 3.50 to 8.10 percent. Thus, employees' mean estimate of six percent for this ratio was close to
the actual ratio, whereas elected officials and managers substantially over-estimated the actual ratio and
9
,"

residents substantially under-estimated the actual ratio of incentive compensation to total direct
compensation in their respective governments (Table 3).
Survey respondents were also asked about their preferences for using incentive compensation by
government. As shown in Table 3, 85 percent of officials, 78 percent of managers, 61 percent of
employees, and 72 percent of residents favored incentive compensation. Across the four surveyed groups,
the most common reason for favoring such use was "to improve government performance." Elected
officials in particular cited "increased agency accountability" in favoring the use of incentive compensation
by government, whereas managers most often cited "increased employee motivation," and residents cited
"better quality services" in this regard. Employees who favor greater use 0 f incentive compensation b y
their governments cited "increased compensation" as the main rationale for their position, while employees
who oppose greater use of incentive compensation by their governments cited "management favoritism,"
"pay inequity," and "measurement problems" as the main reasons for their position.
Concerning the types of public sector incentive compensation favored by survey respondents, overall
support was strongest for p ay- for-performance and skill-based p ay a rrangements a nd weakest for bonus
plans. Among the four surveyed groups, officials most strongly favored performance-based pay, managers
most strongly favored bonus pay, employees most strongly favored skill-based pay and pay-for-knowledge,
and residents most strongly favored productivity-sharing and gain-sharing type incentive compensation
plans (Table 3). In explaining their preferences, managers view bonus pay as recognition for achievement
of agency/department wide performance objectives and as a mechanism for bringing them "up (or closer) to
par" with their private sector counterparts. Notably, and by contrast, employees explained their aversion to
performance-based pay and merit-pay plans by questioning management's competence to establish
performance/merit criteria and to judge employee performance/merit. These employees regard skill-based
pay and pay-for-knowledge plans as relatively unambiguous and, because they are viewed as enhancing
their work-related competencies, prefer them to other incentive compensation plans.
As to their preferences regarding the amount of total direct compensation that should be represented by
incentive compensation in their governments, the mean response was 16 percent for the entire sample and
12 percent among officials, 20 percent among managers, 14 percent among employees, and 11 percent
among residents (Table 3). Thus, all of these groups favor a significantly larger ratio of incentive
10
--", ""g j.""c_""

--"ceo,"
compensation to total direct compensation than actually exists in these governments as a whole (i.e., 6.80
percent) or in the single government with the highest ratio (i.e., 8.10 percent). However, managers,
employees, and residents favor a larger ratio, while elected officials favor a lower ratio, of incentive
compensation to total direct compensation than they, respectively, believe presently exists in these
governments.
What factors influence the perceptions and preferences of elected officials, managers, employees ,and
residents about the use of incentive compensation by government? To answer this question, several
perceptual and preference-type dependent variables were regressed onto sets of independent and control
variables, and the four respondent groups were combined into one for most of the analyses (n = 563). The
quantitative findings (not shown here) confimled that elected officials and managers perceive incentive
compensation to be m ore widely used, c over a larger portion 0 f t he work force, and constitute a larger
proportion of total direct compensation in their respective governments than do employees and citizens of
these same governments. Among respondents as a whole, age and length of residence in the current
government jurisdiction are significantly associated with perceived high use of incentive compensation by
governments, and men are significantly more likely than women to perceive such high use. By contrast,
family income and voting in the most recent (state or local government) election are significantly
associated with perceived low use of incentive compensation by these governments. Furthermore,
respondents from smaller governments, governments with relatively low sales tax, income tax and public
employee unionization rates, and governments in the Southwest region are significantly more likely than
respondents from other jurisdictions to perceive incentive compensation as being highly used by their
governments. When limited to the sample of residents of these government jurisdictions, the analysis found
resident's occupation (ranked from low to high) to be significantly associated with perceived low use of
incentive compensation by government, whereas being unemployed or retired was significantly associated
with perceived high use of incentive compensation by government.
Concerning respondents' preferences about the compensation practices of their respective
governments, the regression findings indicate that employees have a significantly lower preference than
officials, managers, and residents for the use of incentive compensation. Among respondents as a whole,
age and length of residence in the current government jurisdiction are significantly associated with a
11
,,'~...,- ~.~ ,.

preference for low use of incentive compensation by government, whereas family income and voting in the
most recent election are significantly associated with a preference for high use of incentive compensation
by government. Furthermore, men are significantly more likely than women to prefer the use of incentive
compensation by their respective governments. Respondents from governments with relatively high sales
tax, income tax, and public employee unionization rates and those located in the Northeast region are
significantly more likely than respondents from other governments to prefer high use of incentive
compensation by government. Among the sample of residents, occupational ranking was found to be
significantly a ssociated with a preference for high use 0 f incentive compensation b y government, while
unemployed and retired residents preferred low use of incentive compensation by government.
Regarding the relative size of incentive compensation (or, depth of incentive compensation usage) in
their respective governments, residents prefer a significantly lower ratio of incentive compensation to total
direct compensation t ban do 0 fficials, managers, and employees. Younger, male, relatively high-income
respondents and those who have lived for a relatively short time in their current government jurisdiction
and voted in the most recent election have significantly stronger preferences than others for a high ratio of
incentive compensation to total direct compensation. Moreover, respondents from governments with
relatively high s ales tax, income tax, and public employee unionization rates have significantly stronger
preferences than respondents from other jurisdictions for a high ratio of incentive compensation to total
direct compensation. Among residents of these government jurisdictions, occupational ranking was found
to be significantly associated with a preference for a high ratio of incentive compensation to total direct
compensation, whereas being unemployed or retired was significantly associated with a preference for a
low ratio of incentive compensation to total direct compensation.
To summarize, analysis of data obtained from samples of elected officials, managers, employees, and
residents of four state and 18 local governments indicates that all of these groups have strong, though
varying, preferences for the use of incentive compensation by their respective governments. Additionally,
all four groups prefer that incentive compensation be a larger proportion of total direct compensation than
is actually the case in these governments -in other words, they prefer more pay at risk in public sector
compensation sy sterns. I t has a Iso been sh own that perceptions 0 fa nd preferences regarding t he use 0 f
incentive compensation by government are systematically related to certain demographic characteristics of
12
."" ,,"."_J.~."c""""""'-"-~,c'",,'c'".'" c,...

---
survey respondents as well as to particular economic and organizational characteristics of the governrnents
themselves.
V. The Prevailing Wage Rule and Incentive Compensation
Most U.S. governrnents have in place a prevailing wage statute, ordinance, or policy that requires public
sector pay rates to be set based on consideration of pay rates prevailing in industry (or, for some jobs,
elsewhere in governrnent). To implement this rule, some governrnents conduct their own pay surveys while
many others rely on pay surveys conducted by the U.S. Bureau of Labor Statistics and other organizations
(Siegel, 1992; Lewin, 1974a). A typical pay survey specifies and describes certain benchmark jobs and is
sent to a sample of private sector employers with a request that they provide compensation information
about such jobs. Traditionally, wage and salary information as well as certain fringe benefit information has
been elicited through these surveys. With the rising use of incentive compensation in the private sector, it is
important to know if public jurisdictions are sy stematically seeking incentive compensation information
from the private sector as part of their contemporary prevailing wage survey efforts. It is similarly
important to know how public jurisdictions use prevailing wage data, especially incentive compensation
data, in determining their own compensation practices and rates.
To analyze this issue, attention is again turned toward the aforementioned four state and 18 local
governrnents. All of the state governrnents and 15 of the 18 local governrnents have one or another type of
prevailing wage rule in place. To implement this rule, each of the state governrnents and nine of the local
governrnents conduct a regular (typically, annual) pay survey. Copies of the most recent pay survey
conducted by each of these governrnents were obtained and content analyzed for the information they
provided about private sector incentive compensation usage, plans and rates, as summarized in Table 4.
Private employers reported using incentive compensation for 79 percent of the 174 jobs that were
included in the 13 governrnent pay surveys analyzed in this study. The most frequently used types of
incentive compensation by these employers were merit pay (used by 77 percent of the private employers),
performance-based pay (62 percent), stock ownership (55 percent), skill-based pay (51 percent), and bonus
pay (44 percent), while the least frequently used types of incentive compensation were gain-sharing (16
percent) and productivity-sharing (11 percent). Stock-option plans, which are the fastest growing type of
13
"
incentive compensation in industry, were used by 24 percent of the private employers who responded to
these pay surveys. Concerning major job groups, private employers use incentive compensation most
frequently for management jobs (i.e., for 89 percent of the management jobs included in the pay surveys),
followed by technical (85 percent), professional (83 percent), and operative jobs (58 percent). The lowest
incidence of private employers' incentive compensation usage was for clerical jobs (37 percent).6
Among the private employers included in these government pay surveys, incentive compensation
comprises about 19 percent of total direct compensation for all jobs and approximately 27 percent for
management jobs, 15 percent for professional jobs, 18 percent for technical jobs, 12 percent for operative
jobs, and nine percent for clerical jobs (Table 4). Moreover, these percentages grew substantially during the
five-year period preceding these governments' most recent pay surveys. Thus, the pay surveys analyzed
herein indicate that private employers use some type of incentive compensation for large majorities of their
jobs and employees, and that the use of such compensation is growing in these fIrms. This suggests, in turn,
that under strict implementation of the prevailing wage rule governments should also be using and
increasing their use of incentive compensation for the bulk of their jobs and employees. Are they, in fact,
doing so?
One answer to this question is "yes," based on analysis of the compensation practices of the 13
governments included in this study that regularly conduct private sector pay surveys. As shown in Table 4,
these governments use incentive compensation to about the same extent that it is used by the private fIrms
against which these governments benchmark their own pay rates. Another answer to this question is "no,"
however, based on consideration of the types of incentive compensation practices existing in these 13
governments and the fIrms they survey. These governments make significantly more use of merit pay,
somewhat less use of performance-based pay, and considerably less use of bonus pay than the surveyed
firms. But the largest public-private sector differences in incentive compensation practices involve stock
ownership and stock option plans. While stock ownership plans are used by a majority of the private firms
and stock option plans are used by about one-quarter of the firms included in the pay surveys, these types
of incentive compensation plans are not used at all by the governments that conducted the surveys (or by
governments more broadly). Because stock ownership and especially stock option plans represent
increasingly important types of incentive compensation in the surveyed fIrms, there is a marked and
14
.'"

I
growing difference in the mix of incentive compensation plans as between these firms on the one hand, and
the governments that surveyed them on the other.
These inter-sectoral differences in incentive compensation mix lead to large differences between the 13
governments and the surveyed firms in t he ratio of incentive compensation to total direct compensation
(Table 4). In the fIrms, incentive compensation constituted about 19 percent of total direct compensation,
for all job groups in the late 1990s, whereas for the 13 governments incentive compensation constituted
about seven percent of total direct compensation. By job group the largest public-private sector differences
in the ratio of incentive compensation to total direct compensation are for management jobs (about 27
percent v. 6 percent) followed by technical (about 18 percent v. 8.5 percent) and professional (about 15
percent v. 7 percent) jobs, while the smallest difference is for clerical jobs (about 9 percent v. 5.5 percent).
Additional analysis of compensation practice and pay survey data from these governments found that
public-private sector differentials in the ratio of incentive compensation to total direct compensation
increased as a whole and for each major job/employee group during the late 1990s. Therefore, while these
13 governments use incentive compensation about as broadly in terms of job/employee coverage as the
private firms they survey for pay information, they use incentive compensation much less deeply than those
firms. This, in turn, indicates that these governments fall well short of (and are falling further behind in)
full implementation of their respective prevailing wage policies.
This conclusion is even stronger for governments that have prevailing wage policies in place but do not
conduct their own pay surveys. In this regard, incentive compensation use, mix, and relationship to total
direct compensation were examined for the nine local governments that have prevailing wage policies but
do not conduct pay surveys, and then compared with the nine local governments that have prevailing wage
policies and do conduct pay surveys. While the percentage of jobs/employees covered by incentive
compensation and the mix of incentive compensation plans do not differ significantly between these two
sets of governments, the overall ratio of incentive compensation to total direct compensation in the
governments with prevailing wage policies but without pay surveys is significantly lower, at about 4.5
percent, than in the governments with both prevailing wage policies and pay surveys, at about 7.0 percent.
Earlier in this paper the presence of a prevailing wage policy was reported to be significantly positively
associated with an index of incentive compensation usage by 301 state and local governments. Extending
15
'._"'i'"

I
that analysis using data from responses to a question that asked whether or not a state or local government
conducted its own pay survey, the estimated ratio of incentive compensation to total direct compensation in
each of these 301 governments was regressed on the presence of a prevailing wage policy and on
implementation of that policy by conducting a pay survey. The regression findings (not shown here)
indicate that governments with a prevailing wage policy but without a pay survey have a marginally
significantly higher ratio of incentive compensation to total direct compensation (1.0 percent, p = < .10)
than governments without both a prevailing wage policy and a pay survey. Governments with both a
prevailing wage policy and a pay survey, however, have a significantly higher ratio of incentive
compensation to total direct compensation (7.0 percent) than governments without both a prevailing wage
policy and a pay survey (1.4 percent,p = < .01) and governments with a prevailing wage policy but without
a pay survey (2.2 percent, p = < .05). Therefore, the gap between private and public employers with respect
to the ratio of incentive compensation to total direct compensation is likely to be greatest in those public
jurisdictions that do not attempt to link themselves, through prevailing wage policies and pay surveys, to
private sector labor markets in determining their compensation practices and rates. This gap is significantly
(though modestly) smaller in governments that follow prevailing wage policies and conduct pay surveys,
but insignificantly smaller in governments that follow prevailing wage policies but do not conduct pay
surveys.
VI. The Future of Public Sector Incentive Compensation
On balance, the story told herein is one of broad but not deep use of incentive compensation in the U.S.
public sector. Most jobs and employees in the governments studied here are covered by one or another type
of incentive compensation plan, but the amount of such compensation as a proportion of total direct
compensation is relatively small compared to private industry and also to the (relative) amount of
compensation that motivation and compensation theories suggest is required to bring about improved
individual and organizational performance. Looking ahead, it may be asked, "Will incentive compensation
become more deeply practiced by government, remain at about the same level and depth of usage, or
decline?" To answer this question requires prognostication about compensation developments in both the
public and private sectors.
16!
---" ,. ,,"m""'.WU

r
Among the factors that imply deeper future use of incentive compensation by government are the
preferences of citizen-residents as well as employees, managers, and elected officials. As shown earlier,
each of these groups clearly prefers more use of incentive compensation by government, especially a higher
ratio of incentive compensation to total direct compensation, than presently exists. It is one thing for
scholars, practitioners, and public sector experts to advocate greater use of pay-for-performance by
government, but quite another, more compelling, thing for citizens, managers, employees, and elected
officials to advocate the same. If representative democracy works effectively, the preferences of these
actors should influence future practice and thereby lead to deeper use of incentive compensation by
government.
More extensive adoption by governments of prevailing wage policies and more aggressive
implementation of such policies by governments that already have them in place should also lead to
broader and deeper use of incentive compensation in the public sector. The available evidence shows that
governments with prevailing wage policies are more likely to practice incentive compensation than
governments without such policies. Furthermore, governments that implement their prevailing wage
policies by conducting their own pay (compensation) surveys use incentive compensation more broadly and
deeply than governments that have prevailing wage policies but don't conduct their own pay surveys. In
this regard, the preference of elected officials for greater use of incentive compensation in the public sector
is likely to lead more governments to adopt prevailing wage policies, especially if coupled with similar
efforts by those who advocate government re-invention. And, additional pressure on governments with
prevailing wage policies to conduct their own pay surveys is most likely to emanate from unionized public
employees, thereby leading to deeper use of incentive compensation by government. This view is
consistent with the empirical fmding that public employee unionization is not negatively associated with -
does not serve as a barrier to -the use of incentive compensation by government.
As noted earlier, proponents of government re-invention typically contend that such re-invention will
result in smaller, less hierarchical, more efficient and responsive government. But the movement to re-
invent government may also be seen as a movement to preserve government and, in this regard, to limit the
extent to which public services are sub-contracted to industry or privatized altogether. From this
perspective, achieving the relatively limited goals of government re-invention will likely be aided by
17

i
greater use of incentive compensation in the public sector, especially for executives and managers. Such
incentives can include bonuses for department heads in municipal governments who manage their
operations particularly efficiently over a multi-year period, meaning that their operational expenditures do
not exceed or even fall below budgeted expenditures. In another example, citizen (external customer)
satisfaction with government services, as determined through surveys of random samples of residents of
local government jurisdictions, can serve as one criterion for determining bonus or performance-based
payments to local, s tate, and even federal government executives a nd managers. T he more fundamental
point, however, is that the government re-invention movement is likely to enhance rather than retard the
use of incentive compensation by government.
Just as the economic recession of the early 1990s spurred additional use of incentive compensation by
government, the economic recession of the early 2000s is likely to do the same. Through relatively mild by
historical standards, the current recession, like others before it, has already resulted in shrinking
governmental revenues and budgets, conversion in many governments of budget surpluses to budget
deficits, and public sector work force reductions. In order to preserve and deliver public services in such an
economic environment, and also to ward off further erosion of their resources, governments will likely go
further and deeper in their use of incentive compensation -perhaps in the same way that fIrms that
become overly mature make greater use of incentive compensation as a tool for renewing themselves
(Milkovich and Stevens, 2000).
In addition, the early 2000s recession has substantially shrunk the (current and future) value of stock
options, especially but not only in the high-technology sector. This development has and, even more, will
have the effect of reducing the ratio of incentive compensation to total direction compensation in industry.
It also makes employees at all levels more risk averse with respect to their compensation preferences, so in
the future they will prefer relatively more conventional, less risky, time-based pay (i.e., wage and salaries)
and perhaps less risky forms of variable pay (i.e., profit-sharing and bonuses). This shifting risk preference
is further and substantially strengthened by the rising incidence and growing recognition of malfeasance
and fraud in company financial reporting, as illustrated by the recent examples of Xerox, Waste
Management, Enron, Tyco, and WorldCom Such "cooking the books" led to artificially inflated stock
prices and unmerited financial gain, especially for executives and managers, from the exercise of stock
18
~ c~",",

--CO"',""""'","" I
options and sale of company stock. Therefore, stock options as a form of compensation are and will
increasingly be viewed as being far more risky than in the recent past, with the result that the extent of their
use in industry will decline. All of this suggests that public-private sector differences in the ratio of
incentive compensation to total direct compensation will also decline.
These prognostications would not be complete without some consideration of the potential effects of
global terrorism on governments' use of incentive compensation. The cataclysmic events of 9/11reminded
the nation and the world that the first function of government is to provide for the national defense,
meaning the safety and security of the populace. In the wake of9/11, the federal government assumed
responsibility for airport security (becoming the employer of formerly privately-employed security
personnel), and a new federal government, cabinet-level Department of Homeland Security is about to be
created. The most direct effect of the events of 9/11 on public sector compensation took the form of large
amounts of overtime pay to fIrefighters and police personnel of New York City (and certain other public
entities, such as the Port Authority of New York and New Jersey). Beyond this immediate effect, however,
major emphasis on government's role in providing safety/security is likely to lead to new incentive
compensation initiatives for those who actually provide public safety and security. Cash awards for
exceptional individual service, bonus pay for achieving departmental objectives, and special payments for
outstanding inter-departmental and inter-agency cooperation are but some of the forms of incentive
compensation that can be more widely and deeply used in this regard.
It may be argued that a focus on direct compensation, including incentive compensation, in the public
sector overlooks employment stability and fringe benefits in this sector, both of which are often claimed to
be significantly greater than in industry (Kellough and Selden, 1997; Risher et al., 1997). From this
perspective, consideration of incentive compensation and other direct compensation together with fringe
benefits and employee turnover/retention will show that, on balance, the private and public sectors are in
rough equilibrium in so far as their compensation/reward practices and labor market positioning are
concerned. Stated another way, the higher ratio of incentive compensation to total direct compensation in
industry than in government can be explained -and is offset -by the comparatively lower rates of
employment stability and fringe benefits in industry than in government. Following this reasoning, there is
19
, ,-- -

no rationale for increasing either the use of incentive compensation or the ratio of incentive compensation
to total direct compensation in government.
While it is true that continuity of employment is relatively greater in government than in industry, this
has been true for a long time, including when governments did not use incentive compensation. 7
Furthermore, there is now more volatility -less stability -in government employment than in prior eras.
As to fringe benefits, government employers do expend a larger portion of a payroll dollar on fringe
benefits than private employers (U.S. Department of Labor, 2000), but this was also the case when
governments did not use incentive compensation. What has changed most in recent years is the rapid
growth in the private sector of incentive compensation as a proportion of total direct compensation, which
contrasts sharply with the modest growth of such compensation in the public sector. In light of this
widening difference or gap, arguments about the superior employment stability and fringe benefits in
government compared to industry are unlikely to stem other, aforementioned pressures for expanded use of
incentive compensation in the public sector.
Still other factors, however, may indeed mitigate expanded future use of incentive compensation by
government. As noted earlier, many governments have in place prevailing wage policies that require public
sector pay to be set in consideration of private sector pay. While there are both market and equity rationale
to support a prevailing wage policy, governments have been shown systematically to implement this policy
by "overpaying" employees at the lower end of the skill/occupation distribution and "underpaying"
employees at the upper end of the skill/occupation distribution (Fogel and Lewin, 1974; Lewin, 1974b) so
that governments to some extent ignore private market pay data (even when they collect it) and adopt more
egalitarian pay structures than those in industry. Such egalitarianism is further reinforced by the widespread
use of minimum wage statutes by state and local governments, statutes that typically provide for higher
minimums than those required of private employers. Hence, equity considerations dominate market
considerations in public sector pay-setting, resulting in significantly less steep occupational pay structures
and much smaller executive-to-employee pay ratios than in the private sector. It is unlikely that these inter-
sectoral pay policy and practice differences will change in future. To the extent that new incentive
compensation initiatives threaten relatively egalitarian public sector pay structures, such initiatives are
likely to be curtailed or abandoned.
20
""""'..c"_J.c","-_:'

Further evidence of government's dominant concern for pay equity rests in the recent adoption by
numerous local governments of "living-wage" statutes and policies, which go beyond minimum wage laws
that apply only to governments' own employees. Fueled in part by rapid economic growth during much of
the 1990s and in part by perceived widening of economic inequality, elected officials in Los Angeles,
Philadelphia, Chicago, Santa Monica, Saint Louis, and other cities enacted living-wage statutes requiring
contractors, sub-contractors, and consultants to the local governments to pay (at least) the specified living
wage to their employees. Indeed, under these statutes, a written commitment to paying this wage is required
of contractors, sub-contractors, and consultants as a condition of their doing business and securing
contracts with a municipal government. Typically, these living wage statutes specify two pay rates, one
being lower if the employer provides fringe benefits to employees, the other being higher if the employer
does not provide fringe benefits. As an example, the City of Santa Monica's living wage statute calls for
contractors, sub-contractors, and consultants to pay their employees $10.50 per hour if fringe benefits are
provided, $13.25 per hour if fringe benefits are not provided (Los Angeles Times, 2000). In light of the
economic recession of the early 2000s, the further spread of governmental living wage statutes is
problematic. But existing statutes provide further evidence of government's dominant concern for equity
over market considerations in the area of compensation -whether public sector or private sector
compensation. Instructively, none of these governments' living wage statutes so much as mentions
incentive compensation for private employees, implying that such compensation is also of relatively minor
concern to these governments, per se.
On balance, and looking ahead to the next several years, I expect incentive compensation to become
somewhat more widely used by governments. This forecast gives substantial weight to the argument that,
for many of the services it provides, government is not or is no longer a monopolist, and there are various
private market alternatives or supplements to publicly provided services. This forecast is also based in part
on the evidence that elected officials, government managers, public employees, and citizens-residents of
government jurisdictions prefer deeper use of incentive compensation. But I do not envision greatly
deepened use of incentive compensation by governments, in large part because of governments' dominant
concern for equity in pay determination, as expressed in various statutes and policies. Ironically, though,
the gap between the public and private sectors in the proportion of total compensation accounted for by
21
" "...,

incentive compensation is likely to shrink in future, not because of new governmental incentive
compensation initiatives but, rather, because of shifting compensation risk preferences among private
employees that portend, in particular, sharply declining use of stock options as a form of compensation.
VII. Conclusions
During much of the 20th century, the U.S. public sector underwent a conversion from a patronage to a civil
service system of work and pay. Later in that century, a substantial proportion of public employees became
unionized, with the consequence that pay (and other terms and conditions of employment) became less
single-mindedly management determined and more collectively determined. Still later, fiscal crisis, the
government re-invention movement, and broadened economic competition spurred governments to shift
away from strict payment for time practices and adopt various incentive compensation initiatives based on
the principle of pay-for-performance. That this is not the only pay principle operative in governments,
however, is attested to by the existence of prevailing wage, minimum wage, and, most recently, living-
wage statutes in many if not most governments.
Empirical evidence from a recent study of 17 state and 284 local governments shows that they quite
broadly use incentive compensation, with 86 percent of the sample having one or more incentive
compensation plans in place. Performance-based pay and merit pay are most often used by these
governments, while productivity-sharing and gain-sharing pay are 1 east used. Professional and technical
employees of these governments are most likely to be covered by incentive compensation plans, clerical
and manual employees least likely to be covered. There is also substantial variation in incentive
compensation plan c overage by agencies/departments in these governments. Multivariate analysis found
several organizational characteristics, e.g., size and ratio of white-collar to blue-collar employees,
systematically related to variation in the use of incentive compensation. But while it is broadly used,
incentive compensation is not deeply used by these governments, as reflected in a mean ratio of incentive
compensation to total direct compensation of little more than six percent. This ratio also varied
considerably by employee group and agency/department.
Additional empirical evidence from a sub-sample of 4 state and 18 local governments shows that
employees are more knowledgeable than elected officials, managers, and citizens about the ratio of
22
..

incentive compensation to total direct compensation in government, which is estimated to be about seven
percent in these governments compared to 19 percent in the private sector. However, all four groups prefer
government to make greater use of incentive compensation than it does at present, primarily because such
compensation is perceived to improve governmental performance. Within this su b-sample, governments
with prevailing wage rules that conduct their own pay surveys have a significantly higher ratio of incentive
compensation to total direct compensation than governments with prevailing wage rules that don't conduct
pay surveys and than governments without prevailing wage rules.
Several factors presage increased use of incentive compensation by government. These include the
preferences of the key actors mentioned above as well as the government re-invention movement,
increasing economic competition, spells of economic recession, and even the 9/11 terrorist attacks. By
contrast, the ways in which governments have chosen to implement their prevailing wage rules together
with governments' minimum wage policies and newly adopted living-wage statutes imply that, in the future
as well as at present, governments will continue to value equity over market or efficiency considerations in
pay determination, thereby implying little in the way of new incentive compensation initiatives.
Nevertheless, the deeper use of incentive compensation by industry than government, as reflected in
comparative ratios of incentive compensation to total direct compensation, is likely to decline due to
private sector employee risk preferences shifting away from incentive compensation, especially stock-
based compensation. Consequently, in future, the public and private sectors are more likely to converge
rather than diverge with respect to both the breadth and depth of incentive compensation usage.
23

REFERENCES
City of Los Angeles. 1995. R~ort Qfthe Mavor's General Manal!er Performance Aooraisal Task Force.Los Angeles: City of Los Angeles, Department of Personnel.
County of Orange, California. 1998. The Manal!ement Performance Plan (MPP) in the County of Orange.Santa Ana, CA: County of Orange, Department of Human Resources.
Dunlop, J.T. 1944. Wal!e Determination Under Trade Unions. New York: Macmillan.
Flannery, T.P., Hofrichter, D.A. & Platten, P.E. 1996. Peoole. Performance & Pay. New York: Free Press.
Fogel, W. and Lewin, D. 1974. "Wage Determination in the Public Sector," Industrial and Labor RelationsReview, 27, 3: 410-431.
Gaebler, T. & D. Osborne. 1992. Reinventinl! Government: How the Entreoreneurial Soffit is Transformingthe Public Sector. Reading, MA: Addison-Wesley.
Gerhart, B., Milkovich, G. T. & Murray, B. 1992. "Pay, Performance, and Participation," in D. Lewin, O.S.Mitchell, and P .D. Sherer, Eds., Research Frontiers in Industrial Relations and Human Resources.Madison, WI: Industrial Relations Research Association, pp. 193-238.
Ingraham, P. W. 1993. "Of Pigs in Pokes and Policy Diffusion: Another Look at Pay-for-Performance,"Public Administration Review, 53,4: 348-356.
Kellough, J.E. & Selden, S.C. 1997. "Pay for Performance Systems in State Government,"Review of Public Personnel Administration. 17, 1: 5-21.
Kotler, P. 1991. Marketing Management. Englewood Cliffs, NJ. Prentice-Hall.
Lawler, E.E., III. 2000. Rewardinl! Excellence: Pav Stratel!ies for the New Economv. San Francisco:
Jossey-Bass.
Levine, H.Z. 1997. "New Strategies for Public Pay: Rethinking Government Compensation Programs,"Comoensation and Benefits Review, 29, 6: 75-
Lewin, D. 2002. "Incentive Compensation in the U.S. Public Sector: A Study of Usage, Perceptions andPreferences," Paper presented to the 54fu Annual Meeting, Industrial Relations Research Association,Atlanta, GA, January.
Lewin, D. 1982. "Public Sector Concession Bargaining: Lessons for the Private Sector," Proceedings of theThirty-Fifth Annual Meetinl! of the Industrial Relations Research Association. Madison, WI; IRRA,pp. 383-393.
Lewin, D. 1987. "Technological Change in the Public Sector: The Case of Sanitation Service,"pp. 281-309 inWorkers. Manal!ers. and Technological Change: Emerging Patterns of Labor Relations, in D. Cornfield, D. Ed.New York: Plenum,
Lewin, D. 1974a. "Aspects of Wage Determination in Local Government Employment," ~Administration Review, 34, 2: 149-155.
Lewin, D. 1974b. "The Prevailing Wage Principle and Public Wage Decisions," Public PersonnelManagement. 3. 6: 473-485.
Lewin, D., Feuille, P., Kochan, T.A. & Delaney, J.T. 1988. Public Sector Labor Relations: Analysis andReadings. Lexington, MA: Lexington.
24

...,
...',;I.~
C'.,c
...'"
Los Angeles Times. 2000. "Morning Briefing: Santa Monica Adopts Living Wage Law." Los Angeles:October 4.
Loverd, R. & Pavlak, T. 1983. "The Historical Development of the American Civil Service," in J. Rabin,et.al., Eds., Handbook on Public Personnel Administration and Labor Relations. New York; Dekker,pp. 245-287.
Meehan, R.H. 1991. "Strategic Total Compensation Planning in the Public Sector, CoillRensation andBenefits Managemenl7, 3: 10-17.
Milkovich, G.T. & Newman, J.M. 1999. CoillRensation. Burr Ridge, IL: Irwin/McGraw-Hill.
Milkovich, G.T. & Stevens, J. 2000. "From Pay to Rewards: 100 Years of Change," ACA Journal. 9,1:6-18.
Mitchell, D.J.B., Lewin, D. & Lawler, E.E., ill. 1990. "Alternative Pay Systems, Firm Performance, andProductivity," in A.S. Blinder, Ed., Pa.Yi!!g for ProductivitY: A Look at the Evidence. Washington,D.C., Brookings, pp. 15-88.
Newlin, J., Meng, J.G. & Jonathan, G. 1991. "The Public Sector Pays for Performance," Personnel Journal,70,10: 110-114.
Risher, H.W. 1999. "Are Public Employers Ready for a 'New Pay" Program?," Public PersonnelManagement, 28, 3: 323-343.
Risher, H.W. 1997. "The Search for a New Model for Salary Management: Is There Support for PrivateSector Practices? ," Public Personnel Management, 26, 4: 431-439.
Risher, H. W. 1994. "The Emerging Model for Salary Management in the Private Sector: Is it Relevant toGovernment? ," Public Personnel Managemenl 23, 4: 649-665.
Risher, H.W., Fay, C.H. & Associates. 1997. New Strategies for Public Pav: Rethinking GovernmentCoillRensation Programs. San Francisco, CA: Jossey-Bass.
Siegel, G.1992. Public E!!mlovee Comnensation and its Role in Public Sector Strategic Management. NewYork: Quorum.
U.S. Department of Labor, Bureau of Labor Statistics. 2000. Monthly Labor Review. 123,2: Table 6, p. 96.
Vroom, V. 1964. Work and Motivation. New York: Wiley.
Wise, L.R. 1994. "Factors Affecting the Size of Performance Awards Among Mid-Level Civil Servants inthe United States," Public Administration Ouarterlv, 18,3: 260-278.
25
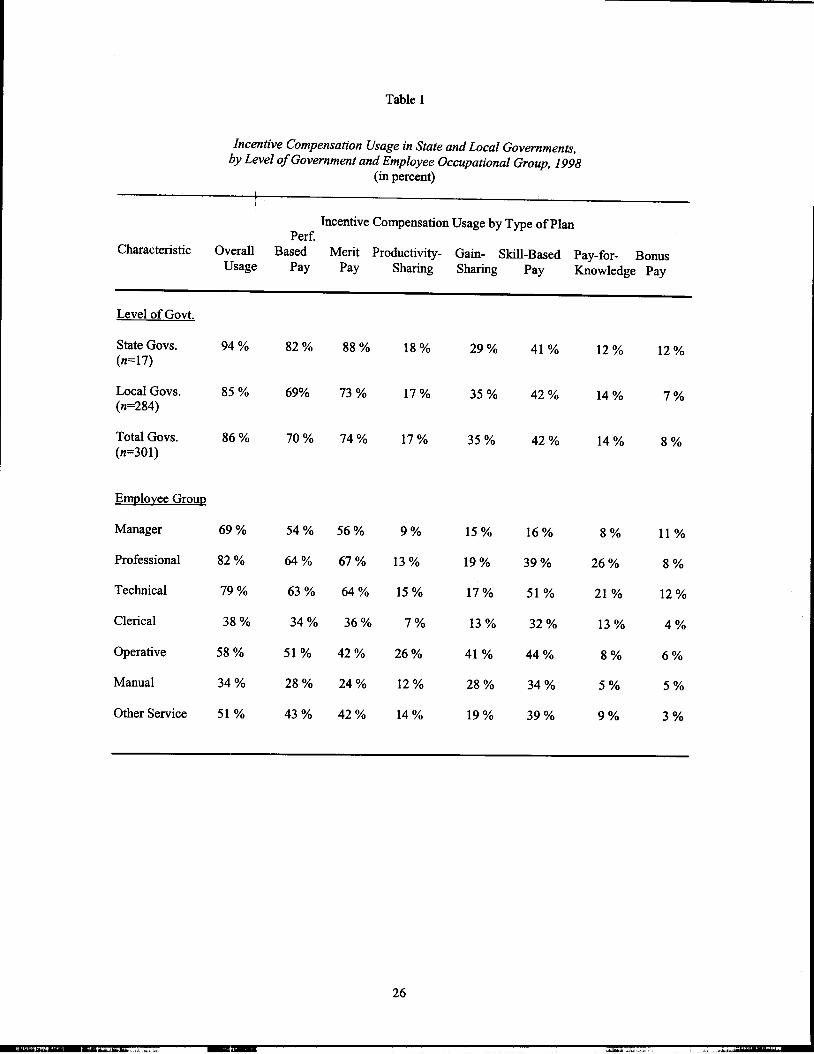
Table 1
Incentive Compensation Usage in State and Local Governments,by Level of Government and Employee Occupational Group, 1998
(in percent)
IIncentive Compensation Usage by Type of Plan
Perf.Characteristic Overall Based Merit Productivity- Gain- Skill-Based Pay-for- Bonus
Usage Pay Pay Sharing Sharing Pay Knowledge Pay
Level of Govt.
State Govs. 94% 82% 88% 18% 29% 41 % 12% 12%
(n=17)
Local Govs. 85 % 69% 73 % 17 % 35 % 42 % 14 % 7 %
(n=284)
Total Govs. 86% 70% 74% 17% 35% 42% 14% 8%
(n=301)
Emplovee Group
Manager 69% 54% 56% 9% 15% 16% 8% 11%
Professional 82 % 64 % 67 % 13 % 19 % 39 % 26 % 8 %
Technical 79 % 63 % 64 % 15 % 17 % 51 % 21 % 12 %
Clerical 38% 34 % 36 % 7 % 13 % 32 % 13 % 4 %
Operative 58% 51% 42% 26% 41% 44% 8% 6%
Manual 34 % 28 % 24 % 12 % 28 % 34 % 5 % 5 %
Other Service 51 % 43 % 42 % 14 % 19 % 39 % 9 % 3 %
26
"""""',1'.",," -""_c.""""

Table 2
Incentive Compensation As a Percent of Total Direct Compensation in State andLocal Governments, by Agency/Department and Employee Group, Fiscal 1998
E!!mlovee Group Agencv/De~artment
All Employee Groups 6.15 % All Agencies/Departments 6.15%
Professional 7.75 % Taxation 8.10%
Technical 7.60 % Finance 7.55%
Operative 6.45 % Utilities 7.45%
Other Service 5.65 % Sanitation 6.35%
Manual 4.80 %* Highways 6.10%
Managerial 4.40 %* Health Care 5.75%
Clerical 4.15 %* Welfare 5.45%
General Services 5.05%
Protective Services 4.85%
Motor Vehicles 4.15%
Public Works 3.85%
Criminal Justice 3.05%**
*(**) Significantly different from other employee groups atp = < .10 (.05).
27
,~ .

..-
Table 3
Perceptions of and Preferences About Incentive Compensation Usagein Four State and Eighteen Local Governments, by Respondent Group
Perceptions of:
Respondent Incentive Compo Used Percent of Employees Incentive Compo As PercentGroup by Own Government Covered by Incentive Compo of Total Direct Compo
(% responded "yes") (response mean %) (response mean %)---, .--, '---r ~._~ 'VI
All Groups 51 % 49 % 8 %(n = 563)
Elected Officials 71 % 75 % 15 %(n = 63)
Managers 66 % 64 % 9 %***(n = 84)
Employees(n = 130) 41 %* 44 %** 6 %***
Residents(n = 286) 26 %* 15 %** 3 %***
Preferences About:
Respondent Incentive Compo Use Type of Incentive Incentive Compo As PercentGroup by Own Government Compo Plan of Total Direct Compo
(% favoring) (plan with highest (response mean %)% favoring)
All Groups 74 % 71 % (skill-based pay) 16 %(n = 563) 69 % (gain-sharing)
Elected Officials 85 % 91 % (pay-for-performance) 12 %***(n = 63)
Managers 78 % 84 % (bonus pay) 20 %(n = 84)
Employees 61 %** 72 % (skill-based pay) 14 %***(n = 130) 64 % (pay-for-knowledge)
Residents 72 % 77 % (productivity-sharing) 11 %***(n = 286) 74 % (gain-sharing)
*(**,***) Significantly different from elected officials, managers and/or residents atp = < .10 (.05, .01).
28
---","""~ ".."' "

Table 4
Incentive Compensation Usage by Four State and Nine Local Governments and byPrivate Firms Surveyed by These Governments, by Job Group
Incentive Compensation Use Incentive Compensation as aJob Group by Percent of Jobs in Group Percent of Total Direct Compensation
S & L Governments Private Firms S & L Governments Private Firms
All Job Groups 73 % 79 % 6.8 %*** 19.2 %***(n of jobs = 174)
Management Jobs 81 % 89 % 6.0 %*** 27.3 %***(n = 24)
Professional Jobs 76 % 83 % 7.2%*** 17.9 %***(n = 48)
Technical Jobs 69 %** 85 %** 8.5 %*** 21.2 %***(n = 43)
Operative Jobs 46 %** 58 %** 6.2 %*** 11.9 %***(n = 36)
Clerical Jobs 44 % 37 % 5.5 %** 9.2 %**(n = 23)
..,. **(***) Significant public-private sector difference at p = < .05 (.01)
29
," -'",,"~~
~
,
NOTES
1 As examples, performance-based pay was defined as "pay changes based on achievement of individual
employee performance goals, such as those set through Management by Objectives (MBO)," and merit pay\ was defmed as "pay changes based on the results of a supervisor's appraisal of an employee's job
rerformance."The survey was sent to the head personnel officer of each of the four states governments and the chiefadministrative officer, head personnel officer or, in some cases, city manager of the 284 local governments.Of the 301 completed surveys, about 70 percent were signed by a head personnel officer, 20 percent by achief administrative officer and 10 percent by other officials or managers (e.g., city manager, head budgetofficer, and head financial officer).3 Values for this index ranged between 0 and 40, with a mean value of 17 and a standard deviation of 3.6.
Another version of the index includes the length of time, in years, that each incentive plan has been inplace. For this version, the incentive compensation index ranged between 0 and 50, the mean value was 20,and the standard deviation was 3.9. On average, incentive compensation plans in these governments hadbeen in place for 7.2 years. Two local governments had one or another type of incentive compensation planin place for more than 50 years.4 The survey did not ask respondents for data on or estimates of fringe benefits for employees, which aremore difficult to value than direct compensation. More to the point, fringe benefits are generally notconsidered a form of incentive compensation and benefit coverages typically do not vary byagency/department or employee group in state and local government (Risher et al., 1997).5 None of the residents were elected officials, managers, or employees of the four state or 18 localgovernments. That is, the resident sample is entirely separate from the three other groups and is regarded asrepresenting citizens 0 f t he respective government jurisdictions included in this portion 0 f t he study. Avariety of sources were used to identify and select the four sample populations, including state and localgovernment personnel listings, human resource/personnel directors, and zip code listings. Additionalinformation about sample selection for the four surveyed groups as well as design and administration of thesurveys is available from the author.6 Private employer use of incentive compensation for the manual and "other service" job categories wereexcluded from this analysis since so few of these types of jobs were included in the state and localgovernments' pay surveys. Together, managerial, professional, technical, operative, and clerical jobsaccounted for 92 percent of all jobs that were included in these surveys.7 For example, unemployment among "government workers," as reported by the U.S. Bureau of LaborStatistics, is typically much lower than among nonagricultural wage and salary workers in the U.S.economy, and this continues to be true even as overall unemployment has declined sharply in recent years.Thus, in 1997, 1998, and 1999 unemployment rates were 5.0,4.6, and 4.3 percent, respectively, amongnonagricultural wage and salary workers, compared with 2.6, 2.3 and 2.2 percent, respectively, amonggovernment workers (U.S. Department of Labor, 2000).
30
~