In vivo collective cell migration requires an LPAR2-dependent increase in tissue fluidity
15
JCB: Article The Rockefeller University Press $30.00 J. Cell Biol. Vol. 206 No. 1 113–127 www.jcb.org/cgi/doi/10.1083/jcb.201402093 JCB 113 S. Kuriyama and E. Theveneau contributed equally to this paper. Correspondence to Roberto Mayor: [email protected] E. Theveneau’s present address is Centre de Biologie du Developpement UMR5547, Centre National de la Recherche Scientifique, Université Paul Sabatier, Toulouse, France. Abbreviations used in this paper: ANOVA, analysis of variance; CCM, collec- tive cell migration; EMT, epithelial–mesenchymal transition; FDx, Fluorescein- dextran; FRET, Förster resonance energy transfer; LPA, lysophosphatidic acid; MO, morpholino oligonucleotide; NC, neural crest; PDMS, polydimethyl methyl- hydrogen siloxane; VinTS, vinculin-tension sensor. Introduction Epithelial–mesenchymal transition (EMT) is essential during embryo development and found in common pathologies such as organ fibrosis and in the initiation of metastasis for cancer progression. EMT is a process that converts an epithelium into individual mesenchymal cells. Cells lose their apico-basal polarity and cell–cell adhesion, and gain migratory and invasive proper- ties to become mesenchymal cells (Thiery et al., 2009; Hanahan and Weinberg, 2011; Lim and Thiery, 2012). However, not all EMTs go to completion, and cells can have various degrees of mesenchymal phenotypes. In particular, cell–cell adhesion can be partially conserved. Interestingly, the ability to retain sta- ble cell–cell contacts does not correlate with the capability of undergoing collective cell migration (CCM), a process during which a group of cells cooperate to migrate in a coordinated manner. Indeed, collective behavior can be found in cells that have been described as epithelial, mesenchymal, or as having an intermediate phenotype (Rørth, 2009; Friedl et al., 2012; Theveneau and Mayor, 2013). It is unclear what such interme- diate phenotypes represent and what advantage, if any, they would confer on cells compared with fully epithelial or mesen- chymal phenotypes. In particular, this raises the question of the role of cell–cell adhesion remodeling during EMT, especially when the cell population that activates an EMT program has to subsequently undergo CCM. Here we use the neural crest (NC) cell population to (1) ex- plore how cell–cell adhesion is regulated in a collectively migrat- ing cell population and to (2) assess the implication of maintaining or disrupting cell–cell adhesion during collective migration. NC cells are a highly migratory and multipotent embryonic cell population, whose invasive behavior has been likened to malignant invasion (Mayor and Theveneau, 2013; Powell et al., 2013). It has been well characterized that the initiation of NC C ollective cell migration (CCM) and epithelial– mesenchymal transition (EMT) are common to can- cer and morphogenesis, and are often consid- ered to be mutually exclusive in spite of the fact that many cancer and embryonic cells that have gone through EMT still cooperate to migrate collectively. Here we use neural crest (NC) cells to address the question of how cells that have down-regulated cell–cell adhesions can migrate col- lectively. NC cell dissociation relies on a qualitative and quantitative change of the cadherin repertoire. We found that the level of cell–cell adhesion is precisely regulated by internalization of N-cadherin downstream of lyso- phosphatidic acid (LPA) receptor 2. Rather than promot- ing the generation of single, fully mesenchymal cells, this reduction of membrane N-cadherin only triggers a partial mesenchymal phenotype. This intermediate phenotype is characterized by an increase in tissue fluidity akin to a solid-like–to–fluid-like transition. This change of plasticity allows cells to migrate under physical constraints without abolishing cell cooperation required for collectiveness. In vivo collective cell migration requires an LPAR2-dependent increase in tissue fluidity Sei Kuriyama, 1,2 Eric Theveneau, 1 Alexandre Benedetto, 3 Maddy Parsons, 4 Masamitsu Tanaka, 2 Guillaume Charras, 1,3 Alexandre Kabla, 5 and Roberto Mayor 1 1 Cell and Developmental Biology Department, University College London, London WC1E 6BT, England, UK 2 Department of Molecular Medicine and Biochemistry, Akita University Graduate School of Medicine and Faculty of Medicine, Akita City, Akita 010-8543, Japan 3 London Centre for Nanotechnology, University College London, London WC1H 0AH, England, UK 4 Randall Division of Cell and Molecular Biophysics, Kings College London, London SE11UL, England, UK 5 Engineering Department, Mechanics and Materials Division, Cambridge University, Cambridge CB2 1PZ, England, UK © 2014 Kuriyama et al. This article is distributed under the terms of an Attribution– Noncommercial–Share Alike–No Mirror Sites license for the first six months after the pub- lication date (see http://www.rupress.org/terms). After six months it is available under a Creative Commons License (Attribution–Noncommercial–Share Alike 3.0 Unported license, as described at http://creativecommons.org/licenses/by-nc-sa/3.0/). THE JOURNAL OF CELL BIOLOGY on March 31, 2016 jcb.rupress.org Downloaded from Published July 7, 2014 http://jcb.rupress.org/content/suppl/2014/07/07/jcb.201402093.DC3.html http://jcb.rupress.org/content/suppl/2014/07/07/jcb.201402093.DC2.html http://jcb.rupress.org/content/suppl/2014/07/03/jcb.201402093.DC1.html Supplemental Material can be found at:
-
Upload
independent -
Category
Documents
-
view
0 -
download
0
Transcript of In vivo collective cell migration requires an LPAR2-dependent increase in tissue fluidity
JCB: Article
The Rockefeller University Press $30.00J. Cell Biol. Vol. 206 No. 1 113–127www.jcb.org/cgi/doi/10.1083/jcb.201402093 JCB 113
S. Kuriyama and E. Theveneau contributed equally to this paper.Correspondence to Roberto Mayor: [email protected]. Theveneau’s present address is Centre de Biologie du Developpement UMR5547, Centre National de la Recherche Scientifique, Université Paul Sabatier, Toulouse, France.Abbreviations used in this paper: ANOVA, analysis of variance; CCM, collec-tive cell migration; EMT, epithelial–mesenchymal transition; FDx, Fluorescein-dextran; FRET, Förster resonance energy transfer; LPA, lysophosphatidic acid; MO, morpholino oligonucleotide; NC, neural crest; PDMS, polydimethyl methyl-hydrogen siloxane; VinTS, vinculin-tension sensor.
IntroductionEpithelial–mesenchymal transition (EMT) is essential during embryo development and found in common pathologies such as organ fibrosis and in the initiation of metastasis for cancer progression. EMT is a process that converts an epithelium into individual mesenchymal cells. Cells lose their apico-basal polarity and cell–cell adhesion, and gain migratory and invasive proper-ties to become mesenchymal cells (Thiery et al., 2009; Hanahan and Weinberg, 2011; Lim and Thiery, 2012). However, not all EMTs go to completion, and cells can have various degrees of mesenchymal phenotypes. In particular, cell–cell adhesion can be partially conserved. Interestingly, the ability to retain sta-ble cell–cell contacts does not correlate with the capability of undergoing collective cell migration (CCM), a process during which a group of cells cooperate to migrate in a coordinated
manner. Indeed, collective behavior can be found in cells that have been described as epithelial, mesenchymal, or as having an intermediate phenotype (Rørth, 2009; Friedl et al., 2012; Theveneau and Mayor, 2013). It is unclear what such interme-diate phenotypes represent and what advantage, if any, they would confer on cells compared with fully epithelial or mesen-chymal phenotypes. In particular, this raises the question of the role of cell–cell adhesion remodeling during EMT, especially when the cell population that activates an EMT program has to subsequently undergo CCM.
Here we use the neural crest (NC) cell population to (1) ex-plore how cell–cell adhesion is regulated in a collectively migrat-ing cell population and to (2) assess the implication of maintaining or disrupting cell–cell adhesion during collective migration.
NC cells are a highly migratory and multipotent embryonic cell population, whose invasive behavior has been likened to malignant invasion (Mayor and Theveneau, 2013; Powell et al., 2013). It has been well characterized that the initiation of NC
Collective cell migration (CCM) and epithelial– mesenchymal transition (EMT) are common to can-cer and morphogenesis, and are often consid-
ered to be mutually exclusive in spite of the fact that many cancer and embryonic cells that have gone through EMT still cooperate to migrate collectively. Here we use neural crest (NC) cells to address the question of how cells that have down-regulated cell–cell adhesions can migrate col-lectively. NC cell dissociation relies on a qualitative and quantitative change of the cadherin repertoire. We found
that the level of cell–cell adhesion is precisely regulated by internalization of N-cadherin downstream of lyso-phosphatidic acid (LPA) receptor 2. Rather than promot-ing the generation of single, fully mesenchymal cells, this reduction of membrane N-cadherin only triggers a partial mesenchymal phenotype. This intermediate phenotype is characterized by an increase in tissue fluidity akin to a solid-like–to–fluid-like transition. This change of plasticity allows cells to migrate under physical constraints without abolishing cell cooperation required for collectiveness.
In vivo collective cell migration requires an LPAR2-dependent increase in tissue fluidity
Sei Kuriyama,1,2 Eric Theveneau,1 Alexandre Benedetto,3 Maddy Parsons,4 Masamitsu Tanaka,2 Guillaume Charras,1,3 Alexandre Kabla,5 and Roberto Mayor1
1Cell and Developmental Biology Department, University College London, London WC1E 6BT, England, UK2Department of Molecular Medicine and Biochemistry, Akita University Graduate School of Medicine and Faculty of Medicine, Akita City, Akita 010-8543, Japan3London Centre for Nanotechnology, University College London, London WC1H 0AH, England, UK4Randall Division of Cell and Molecular Biophysics, Kings College London, London SE11UL, England, UK5Engineering Department, Mechanics and Materials Division, Cambridge University, Cambridge CB2 1PZ, England, UK
© 2014 Kuriyama et al. This article is distributed under the terms of an Attribution–Noncommercial–Share Alike–No Mirror Sites license for the first six months after the pub-lication date (see http://www.rupress.org/terms). After six months it is available under a Creative Commons License (Attribution–Noncommercial–Share Alike 3.0 Unported license, as described at http://creativecommons.org/licenses/by-nc-sa/3.0/).
TH
EJ
OU
RN
AL
OF
CE
LL
BIO
LO
GY
on March 31, 2016
jcb.rupress.orgD
ownloaded from
Published July 7, 2014
http://jcb.rupress.org/content/suppl/2014/07/07/jcb.201402093.DC3.html http://jcb.rupress.org/content/suppl/2014/07/07/jcb.201402093.DC2.html http://jcb.rupress.org/content/suppl/2014/07/03/jcb.201402093.DC1.html Supplemental Material can be found at:

JCB • VOLUME 206 • NUMBER 1 • 2014 114
Here we studied the specific role of LPA via LPAR2 during Xenopus NC cell development. Our results show that LPAR2 is essential for NC migration in vivo by controlling the internaliza-tion of N-cadherin. Importantly, LPAR2-induced cell–cell disso-ciation is critical only when cells are challenged into migrating through interstices in vivo or in vitro. Conversely, forcing cells to fully abolish cell–cell adhesion blocks migration in vivo but enhances dispersion in vitro. Thus down-regulation of cell–cell contacts has to be mild to endow the NC population with enough plasticity to invade its surroundings without abolishing cell coop-eration required for collectiveness. LPA has been widely studied as a regulator of guanine nucleotide exchange factors (GEFs) for RhoA (Moolenaar et al., 2004; Xiang et al., 2013) but LPA func-tion as a negative regulator of cell–cell adhesion by controlling N-cadherin endocytosis has never been shown before. Similarly, the role of cadherin endocytosis during EMT has been well charac-terized (Ogata et al., 2007), but its ability to control tissue plastic-ity necessary for in vivo CCM has not been previously revealed.
Our work offers novel insight on how cells can balance the need to migrate as individual cells, in an environment where physical constraints are present, with the need to maintain a cer-tain degree of cooperation via cell–cell adhesion. We anticipate that similar fine-tuning of cell–cell contact during collective mi-gration in vivo occurs in other systems such as carcinoma cells or gastrulating mesoderm.
migration during embryo development requires activation of an EMT program, which involves a qualitative and quantitative change of cell adhesion (Sauka-Spengler and Bronner-Fraser, 2008; Duband, 2010; Theveneau and Mayor, 2012). Migratory Xenopus laevis NC cells have been described as a pseudoepithe-lial cell population that progressively disassemble their cell–cell junctions (Alfandari et al., 2010). In this system, cells become fully migratory before complete cell–cell dissociation, which allows us to address specifically the role of cell–cell dissocia-tion during CCM in vivo.
Looking for candidate regulators of cell–cell adhesion, we found incipient data linking lysophosphatidic acid (LPA) signal-ing with changes in cadherin function during EMT in both can-cer and NC cells (Smicun et al., 2007; Groysman et al., 2008; Kam and Quaranta, 2009; Huang et al., 2012; Liu et al., 2012). The cellular activities controlled by LPA signaling are diverse, including proliferation, cell motility, chemotaxis, tumor inva-sion, gap-junction closure, tight junction opening, etc. (Mills and Moolenaar, 2003). This diversity of biological functions, as well as some apparent different cellular responses triggered by LPA, is likely related to the fact that LPA can bind any of six distinct receptors (Lin et al., 2010). In addition, some level of redundancy has been described in mammalian embryos (Contos et al., 2000a,b, 2002), making impossible to characterize the biological activity of each LPA receptor using knockout mice.
Figure 1. LPAR2 signaling is required for in vivo NC migration. (A) In situ hybridization for Foxd3 and LPAR2. (B) In situ hybrid-ization for Twist and LPAR2. Asterisks indicate eyes. (C) Control Morpholino coinjected with membrane-mCherry into animal caps expressing 5UTR-LPAR2GFP. (D) LPAR2 Morpholino coinjected with membrane-mCherry into animal caps expressing 5UTR-LPAR2GFP. Note the absence of LPAR2-GFP fluorescence in the cell injected with LPAR2MO. (E) Frontal view of embryos injected with Control MO (CMO) or LPAR2MO, Foxd3 in situ hybridization. Asterisks, eyes; Inj., injected side; red lines, normal migration in control side. (F) LPAR2MO-injected embryos have NC migration defects (41 em-bryos were analyzed). Student’s t test (two-tailed): ***, P < 0.005; errors bars indicate SD. (G) Grafting procedure. (H) Graft of control (left) or LPAR2MO (middle) or LPAR1MO cells (right) labeled with FDx (green) into host embryos. (I) Graft of control NC cells labeled with rhodamine-dextran (RDx, red) into LPAR2MO host (FDx, green). Bars: (A, B, E, H, and I) 0.5 mm; (C and D) 100 µm.
on March 31, 2016
jcb.rupress.orgD
ownloaded from
Published July 7, 2014
115LPA triggers N-cadherin endocytosis in neural crest • Kuriyama et al.
external source of stromal cell derived factor-1 (SDF1), a well-known NC chemoattractant (Belmadani et al., 2005, 2009; Olesnicky Killian et al., 2009; Kasemeier-Kulesa et al., 2010; Theveneau et al., 2010, 2013; Fig. 3, C and D). Both control and LPAR2MO-injected cells were able to respond to SDF1 and mi-grate toward the source with similar efficiency (Fig. 3 E and Video 1). These results show that blocking LPA signaling does not block NC cell motility or their ability to respond to chemotac-tic cues. Our data also show that in 2D culture assays, LPAR2-depleted NC cells are able to migrate normally. This is in striking contrast to the situation in the 3D environment of the living embryo, in which NC migration requires LPAR2. One possible explanation for this discrepancy may lie in the physical nature of the embryo: in vivo, NC cells encounter physical barriers (i.e., the eye, otic vesicle, epibranchial placodes) and chemical inhibitors (i.e., class 3 semaphorins, Eph/ephrins) that restrict migration into specific territories. Such constraints do not exist in an open 2D culture.
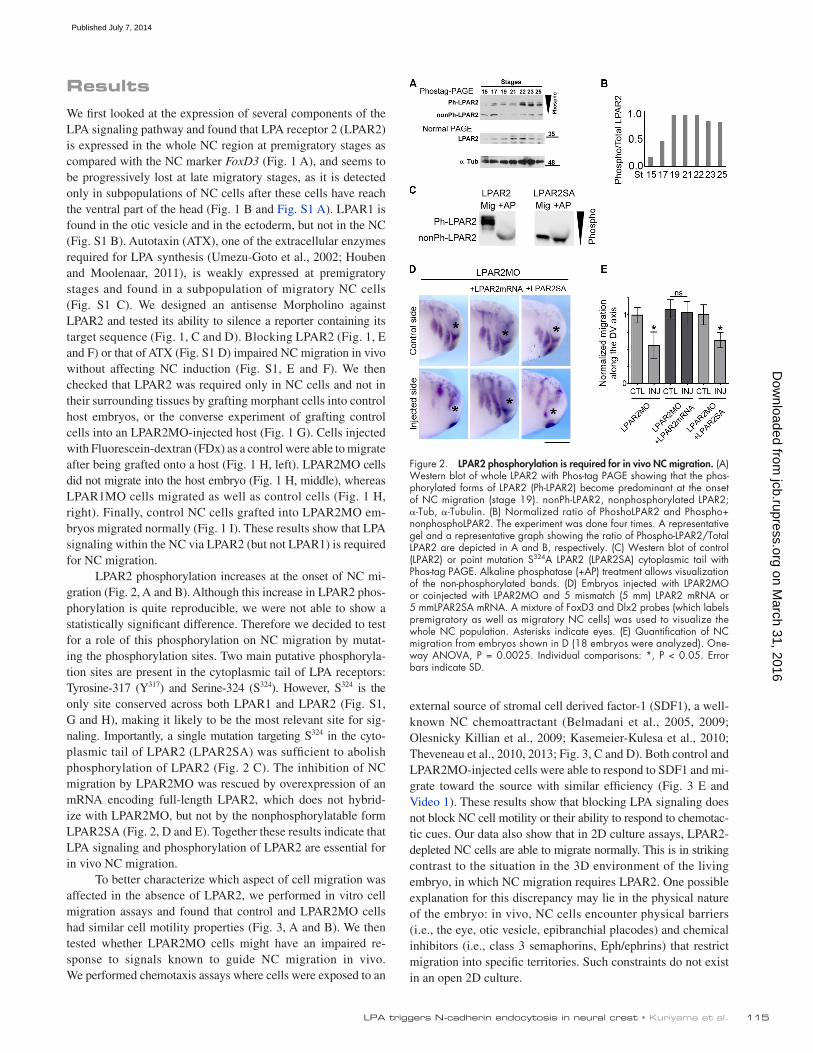
ResultsWe first looked at the expression of several components of the LPA signaling pathway and found that LPA receptor 2 (LPAR2) is expressed in the whole NC region at premigratory stages as compared with the NC marker FoxD3 (Fig. 1 A), and seems to be progressively lost at late migratory stages, as it is detected only in subpopulations of NC cells after these cells have reach the ventral part of the head (Fig. 1 B and Fig. S1 A). LPAR1 is found in the otic vesicle and in the ectoderm, but not in the NC (Fig. S1 B). Autotaxin (ATX), one of the extracellular enzymes required for LPA synthesis (Umezu-Goto et al., 2002; Houben and Moolenaar, 2011), is weakly expressed at premigratory stages and found in a subpopulation of migratory NC cells (Fig. S1 C). We designed an antisense Morpholino against LPAR2 and tested its ability to silence a reporter containing its target sequence (Fig. 1, C and D). Blocking LPAR2 (Fig. 1, E and F) or that of ATX (Fig. S1 D) impaired NC migration in vivo without affecting NC induction (Fig. S1, E and F). We then checked that LPAR2 was required only in NC cells and not in their surrounding tissues by grafting morphant cells into control host embryos, or the converse experiment of grafting control cells into an LPAR2MO-injected host (Fig. 1 G). Cells injected with Fluorescein-dextran (FDx) as a control were able to migrate after being grafted onto a host (Fig. 1 H, left). LPAR2MO cells did not migrate into the host embryo (Fig. 1 H, middle), whereas LPAR1MO cells migrated as well as control cells (Fig. 1 H, right). Finally, control NC cells grafted into LPAR2MO em-bryos migrated normally (Fig. 1 I). These results show that LPA signaling within the NC via LPAR2 (but not LPAR1) is required for NC migration.
LPAR2 phosphorylation increases at the onset of NC mi-gration (Fig. 2, A and B). Although this increase in LPAR2 phos-phorylation is quite reproducible, we were not able to show a statistically significant difference. Therefore we decided to test for a role of this phosphorylation on NC migration by mutat-ing the phosphorylation sites. Two main putative phosphoryla-tion sites are present in the cytoplasmic tail of LPA receptors: Tyrosine-317 (Y317) and Serine-324 (S324). However, S324 is the only site conserved across both LPAR1 and LPAR2 (Fig. S1, G and H), making it likely to be the most relevant site for sig-naling. Importantly, a single mutation targeting S324 in the cyto-plasmic tail of LPAR2 (LPAR2SA) was sufficient to abolish phosphorylation of LPAR2 (Fig. 2 C). The inhibition of NC migration by LPAR2MO was rescued by overexpression of an mRNA encoding full-length LPAR2, which does not hybrid-ize with LPAR2MO, but not by the nonphosphorylatable form LPAR2SA (Fig. 2, D and E). Together these results indicate that LPA signaling and phosphorylation of LPAR2 are essential for in vivo NC migration.
To better characterize which aspect of cell migration was affected in the absence of LPAR2, we performed in vitro cell migration assays and found that control and LPAR2MO cells had similar cell motility properties (Fig. 3, A and B). We then tested whether LPAR2MO cells might have an impaired re-sponse to signals known to guide NC migration in vivo. We performed chemotaxis assays where cells were exposed to an
Figure 2. LPAR2 phosphorylation is required for in vivo NC migration. (A) Western blot of whole LPAR2 with Phos-tag PAGE showing that the phos-phorylated forms of LPAR2 (Ph-LPAR2) become predominant at the onset of NC migration (stage 19). nonPh-LPAR2, nonphosphorylated LPAR2; -Tub, -Tubulin. (B) Normalized ratio of PhoshoLPAR2 and Phospho+ nonphosphoLPAR2. The experiment was done four times. A representative gel and a representative graph showing the ratio of Phospho-LPAR2/Total LPAR2 are depicted in A and B, respectively. (C) Western blot of control (LPAR2) or point mutation S324A LPAR2 (LPAR2SA) cytoplasmic tail with Phos-tag PAGE. Alkaline phosphatase (+AP) treatment allows visualization of the non-phosphorylated bands. (D) Embryos injected with LPAR2MO or coinjected with LPAR2MO and 5 mismatch (5 mm) LPAR2 mRNA or 5 mmLPAR2SA mRNA. A mixture of FoxD3 and Dlx2 probes (which labels premigratory as well as migratory NC cells) was used to visualize the whole NC population. Asterisks indicate eyes. (E) Quantification of NC migration from embryos shown in D (18 embryos were analyzed). One-way ANOVA, P = 0.0025. Individual comparisons: *, P < 0.05. Error bars indicate SD.
on March 31, 2016
jcb.rupress.orgD
ownloaded from
Published July 7, 2014

JCB • VOLUME 206 • NUMBER 1 • 2014 116
of a container is a characteristic of fluids, whereas solids have a structural rigidity making them resistant to such changes of shape. Hence, cell populations behave as solid-like when ex-posed to structures that are smaller than their correlation length whereas they behave as fluids in spaces that are bigger than their correlation length.
We found that, in control groups, movement of cells lo-cated anywhere within the group showed little correlation with neighbors, with a correlation length on the order of 25 µm, roughly corresponding to one and a half cell diameters (Fig. 4 G, left) in accordance with our observation that control NC cells were able to reorganize to pass through tunnels of 25 µm. In contrast, LPAR2MO cells displayed a solid-like behavior even over distances between 150 and 200 µm, roughly six to eight cell diameters (Fig. 4 G, right). This result means that LPAR2MO cells may need an infinite amount of time to reorganize in order to take on a shape smaller than 150 µm. This can explain why LPAR2MO cells were only able to partially enter tunnels of 150 µm but not smaller ones. These dynamics measurements were also seen to be constant over time (Fig. 4, H and I). This result indicated that LPAR2MO cells, despite being fully motile and responding accurately to chemotactic cues, tend to behave as a solid at the scale of hundreds of microns, making them unable to rearrange to invade narrow spaces. By comparison, control cells emerge as a fluid-like material at the scale of only a few tens of microns and as such are able to reorganize to pass through interstices. Thus, the acquisition of a fluid-like behavior allows CCM into interstices, whereas inhibition of this phase transition by blocking LPAR2 makes cell clusters too solid to pass.
Such an increase in the solid-like behavior observed in LPAR2MO cells could be caused by a decrease in cell motility or an increase in the cohesion of the tissue. Because cell motility of single or clustered cells was not affected by LPAR2 depletion (Fig. 3, A and B), we hypothesized that the observed phenotype might be caused by increased cell–cell adhesion slowing down cell rearrangements within the group. To determine whether cells lacking LPAR2 displayed stronger cell–cell adhesions, we performed a 2D culture dispersal experiment using control and LPAR2MO-injected cells (Fig. S3). Under these conditions,
To test the idea that LPAR2 is required for cells to migrate into physical constraints, we developed a chemotaxis assay in which cells are forced to navigate through tunnels. The dimen-sions of these tunnels corresponded to the size of the NC streams observed in vivo (Fig. S2). NC cells were cultured on microfluidic chips containing tunnels of various widths corresponding to one nucleus diameter (10 µm), one cell diameter (25 µm), two cell diameters (50 µm), and six cell diameters (150 µm). All tunnels were one nuclei diameter in height (10 µm), thereby dictating that cells within a multilayered explant must rearrange them-selves to squeeze into the tunnel (Fig. S2). We found that cells in control explants were capable of invading all channel widths (Fig. 4, A, C, and E), which indicates that substantial cell rear-rangements had taken place. In contrast, LPAR2MO-injected cells consistently stalled at the entrance or in the first half of the tunnels (Fig. 4, B, D, and E; and Video 2), which suggests that LPAR2MO cells had a low plasticity and were deficient in their ability to exchange positions with their neighbors.
To test the idea that a lack of LPAR2 impairs the ability of cells to exchange neighbors, we quantified the relative motion of cells within a group in control and LPAR2MO conditions. We cultured cells for 1–3 h on a 2D substrate and character-ized the degree of alignment of velocity vectors by calculating the correlation function of the cell velocity field (see Materials and methods). Alignment of velocity vectors is expressed as a function of the relative position of the cells averaged over time (Fig. 4, F and G) or as a function of radial distance between cells and time (Fig. 4, H and I). Velocity vectors are perfectly aligned where this function is 1, and randomly aligned where the function is 0. In other words, cells move in the same direc-tion where this function is 1, whereas their movements are not correlated where this function is 0. In vitro and in silico studies (Kabla, 2012; Ladoux and Nicolas, 2012; Doxzen et al., 2013) have shown that a population appears solid-like at scales smaller than the correlation length, but free to reshape at larger scales. Therefore, the characteristic length at which this function de-cays (the distance between two cells at which coordination is lost) qualitatively defines the response of the cell population to confinement. The ability to flow in order to take on the shape
Figure 3. Inhibition of LPAR2 does not affect cell motility or chemotaxis. (A and B) Cell tracking analysis on cell clusters (A; n = 2,261 cells from four independent experiments; Student’s two-tailed t test: P = 0.25) and single cells (B; n = 1,299 cells from three independent experiments; Student’s two-tailed t test: P = 0.75). (C and D) Chemotaxis assay with controls (C) and LPAR2MO cells (D). Time projection of cell tracks color-coded according to their Chemo-taxis index (from blue [0.1] to red [0.9]). (E) Chemotaxis index from experiments shown in C and D (mean chemotactic index of 22 explants from three independent experiments; Student’s two-tailed t test: P = 0.1837).
on March 31, 2016
jcb.rupress.orgD
ownloaded from
Published July 7, 2014

117LPA triggers N-cadherin endocytosis in neural crest • Kuriyama et al.
by performing immunostaining for N-cadherin in control and LPAR2MO cells (Fig. 5 A; quantification shown in Fig. 5 B). LPAR2-deficient cells showed stronger N-cadherin staining at the cell–cell junction (Fig. 5 D), as well as at the free membrane of the edge cells, than control cells (Fig. 5 C). A similar increase in other components of the cell–cell junction complex, such as p120-catenin (Fig. 5 G) and -catenin, was also observed in vitro (Fig. 5 H) and in vivo (Fig. 5 I). However, there were no changes in the mRNA (Fig. 5 E) or total protein levels (Fig. 5 F) of these molecules, which suggests a more subtle regulation at the level of spatial distribution of the cell–cell adhesion complexes. To determine whether these effects were caused by altered traf-fic of adhesion components, we assessed N-cadherin endocyto-sis using pulse-chase analysis of N-cadherin fused to a HaloTag (Urh and Rosenberg, 2012) on the extracellular domain. Cells were coinjected with mRNAs encoding HaloTag–N-cadherin
control NC cells are known to progressively spread in a radial fashion with cells at the border of the group, eventually break-ing away as single cells within 5 h (DeSimone et al., 2005). This dispersion is a direct consequence of the loss of cell–cell adhe-sion and can be quantified by measuring the area between the near-est neighbors using Delaunay triangulation (Carmona-Fontaine et al., 2011; Barriga et al., 2013). Control cells were able to efficiently disperse, whereas LPAR2MO cells remained as a group (Fig. S3 and Video 3). Altogether, our results show that LPAR2MO cells are as migratory and as responsive to external guidance cues as control cells but fail to dissociate and thus represent a partial EMT phenotype where motility is intact but cell–cell dissociation does not occur.
We next investigated the molecular effectors of LPA signaling that could explain the observed phenotype. We first looked for potential changes in cell–cell junction composition
Figure 4. LPAR2 signaling is required for solid-like–to–fluid-like transition during NC EMT. (A–D) Invasion assay with microfluidic tunnels. Bars, 50 µm. (E) Quantification of invasion assay (19 10-µm explants from seven independent experiments; Student’s two-tailed t test: P = 0.279; 31 25-µm explants from nine independent experiments; Student’s two-tailed t test: P = 0.006; 22 50-µm explants from seven independent experiments; Student’s two-tailed t test: P = 0.0018; 29 150-µm explants from eight independent experiments; Student’s two-tailed t test: P < 0.001). (F–I) Spatial correlation kymographs. Projection of all time points (F) or temporal maps (H) where each line corresponds to a mean of three consecutive time points. Hot colors indicate a high level of correlation between two compared velocity vectors. (G) Comparison of correlation kymographs projections between control (left) and LPAR2MO (right). (I) Comparison of correlation kymographs over time between control (top) and LPAR2MO (bottom) cells. The broken line in the control data indicates at which distance between cells correlation is lost. That represents the threshold of solid-like–to–liquid-like behavior transition.
on March 31, 2016
jcb.rupress.orgD
ownloaded from
Published July 7, 2014

JCB • VOLUME 206 • NUMBER 1 • 2014 118
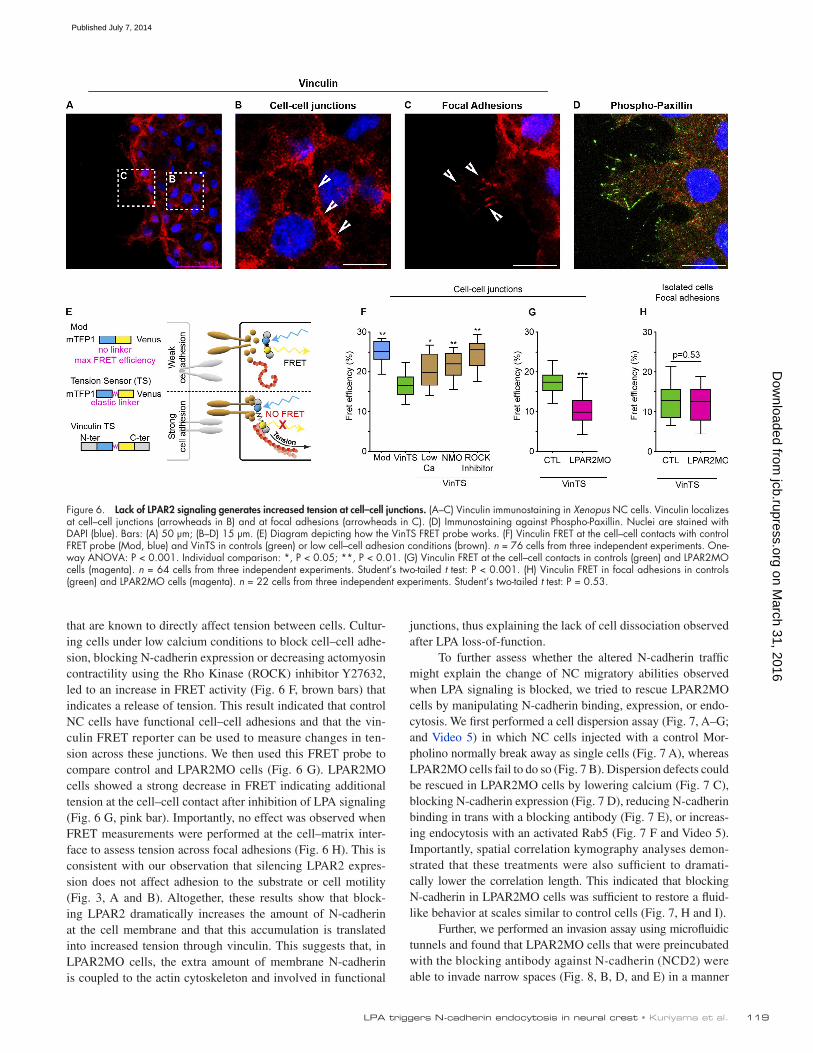
Förster resonance energy transfer (FRET) reporter containing two fluorophores separated by an elastic linker (Fig. 6 E). Vin-culin is known to experience tension when involved in a cell–cell adhesion complex (Miyake et al., 2006; Yonemura et al., 2010; Sumida et al., 2011; Taguchi et al., 2011; Ishiyama et al., 2013). When this reporter is under tension the two fluoro-phores are pulled apart, abolishing FRET (Grashoff et al., 2010). We first checked that endogenous vinculin localizes at the cell–cell junction in NC cells (Fig. 6, A and B) and is also found in focal adhesions (Fig. 6 C) as compared with another focal adhesion component (Fig. 6 D). Although the VinTS reporter has been extensively used by one of us before (Grashoff et al., 2010), we performed several controls to validate the use of the VinTS in our system. First, we compared FRET of the VinTS measured at the cell–cell contacts to the FRET Module alone (Mod). The Mod construct only contains the two fluorophores in direct ap-position without the elastic linker and acts as a control of maxi-mum FRET efficiency. VinTS showed significantly reduced FRET (Fig. 6 F, green bar) compared with Mod (Fig. 6 F, blue bar). Second, we analyzed FRET after using several treatments
and membrane-mCherry, and incubated for a short time with the HaloTag ligand (green), which cannot penetrate the cell mem-brane. The excess ligand was then washed and cells were moni-tored. In control cells, most of the HaloTag–N-cadherin was seen in intracellular vesicles (Fig. 5, J, M, and N; and Video 4), whereas LPAR2MO cells had a strong accumulation of N-cadherin in the cell membrane and a reduced number of N-cadherin–positive vesicles within the cell (Fig. 5, K, M, and N; and Video 4). Importantly, expressing an activated form of Rab5, a well-known promoter of endocytosis, was sufficient to rescue the effect of LPAR2MO on N-cadherin internalization (Fig. 5, L, M, and N; and Video 4). These results indicate that LPA signaling is re-quired for N-cadherin endocytosis during NC EMT.
Higher levels of N-cadherin at the cell membrane do not systematically translate into stronger cell–cell adhesion. Cad-herins need to be coupled to the actin cytoskeleton to mediate strong adhesive forces. Such coupling places components of the cell adhesion complex under tension. Therefore, to assess if the increased N-cadherin levels lead to increased tension at the cell membrane, we used a vinculin-tension sensor (VinTS)
Figure 5. LPAR2 signaling controls N-cadherin internalization. (A) N-cadherin immunostaining in controls and LPAR2MO cells. Bar, 10 µm. (B) Mean nor-malized fluorescence intensity along the cell–cell contact area is plotted for controls (green curve) and LPAR2MO cells (magenta curve). Error bars indicate SEM. (C) Maximum fluorescence levels at the free edge (78 cells from 13 independent experiments; Student’s two-tailed t test: P < 0.001; error bars indi-cate SD). (D) Maximum fluorescence levels at the cell–cell junctions (48 contacts from 13 independent experiments; Student’s two-tailed t test: P < 0.001; error bars indicate SD) are shown for controls (green dots) and LPAR2MO (magenta dots). (E) RT-PCR for Sox 9 (NC marker), -catenin, and N-cadherin from embryos at premigratory (stage 19) and migratory (stage 24) NC injected with control MO (CMO) or LPAR2MO. (F) Western blot for N-cadherin and tubulin from dissected NC and eye tissue of the embryos injected with CMO or LPAR2MO. (G) Localization of p120-GFP expressed in controls and LPAR2MO cells. (H and I) Immunostaining for endogenous -catenin in controls and LPAR2MO cells performed in vitro (H) or whole mount staining of dissected cranial tissues (I). Boxed regions are enlarged on the right. (J–L) Pulse-chase assay with NC cells injected with N-cadherin HaloTag (green) and membrane-mCherry (magenta) in controls (J), LPAR2MO cells (K), or cells coinjected with LPAR2MO and activated Rab5 (L). Boxed regions are enlarged in the “zoom” column. (M) Normalized fluorescence intensity levels for N-cadherin at the cell membrane in controls (green), LPAR2MO cells (magenta), and LPAR2MO-CA-Rab5 cells (cyan). n = 73 cells from three independent experiments. One-way ANOVA: P < 0.0001. Individual comparisons: **, P < 0.01; ***, P < 0.001. Error bars indicate SD. (N) Normalized number of intracellular vesicles per cells in controls (green), LPAR2MO cells (magenta), and LPAR2MO-CA-Rab5 cells (cyan). n = 291 cells from three independent experiments. One-way ANOVA: P < 0.0001. Individual comparisons: **, P < 0.01; ***, P < 0.001. Error bars indicate SD. Bars: (G–I) 50 µm; (G and H, high magnification) 10 µm; (J–K) 20 µm.
on March 31, 2016
jcb.rupress.orgD
ownloaded from
Published July 7, 2014
119LPA triggers N-cadherin endocytosis in neural crest • Kuriyama et al.
junctions, thus explaining the lack of cell dissociation observed after LPA loss-of-function.
To further assess whether the altered N-cadherin traffic might explain the change of NC migratory abilities observed when LPA signaling is blocked, we tried to rescue LPAR2MO cells by manipulating N-cadherin binding, expression, or endo-cytosis. We first performed a cell dispersion assay (Fig. 7, A–G; and Video 5) in which NC cells injected with a control Mor-pholino normally break away as single cells (Fig. 7 A), whereas LPAR2MO cells fail to do so (Fig. 7 B). Dispersion defects could be rescued in LPAR2MO cells by lowering calcium (Fig. 7 C), blocking N-cadherin expression (Fig. 7 D), reducing N-cadherin binding in trans with a blocking antibody (Fig. 7 E), or increas-ing endocytosis with an activated Rab5 (Fig. 7 F and Video 5). Importantly, spatial correlation kymography analyses demon-strated that these treatments were also sufficient to dramati-cally lower the correlation length. This indicated that blocking N-cadherin in LPAR2MO cells was sufficient to restore a fluid-like behavior at scales similar to control cells (Fig. 7, H and I).
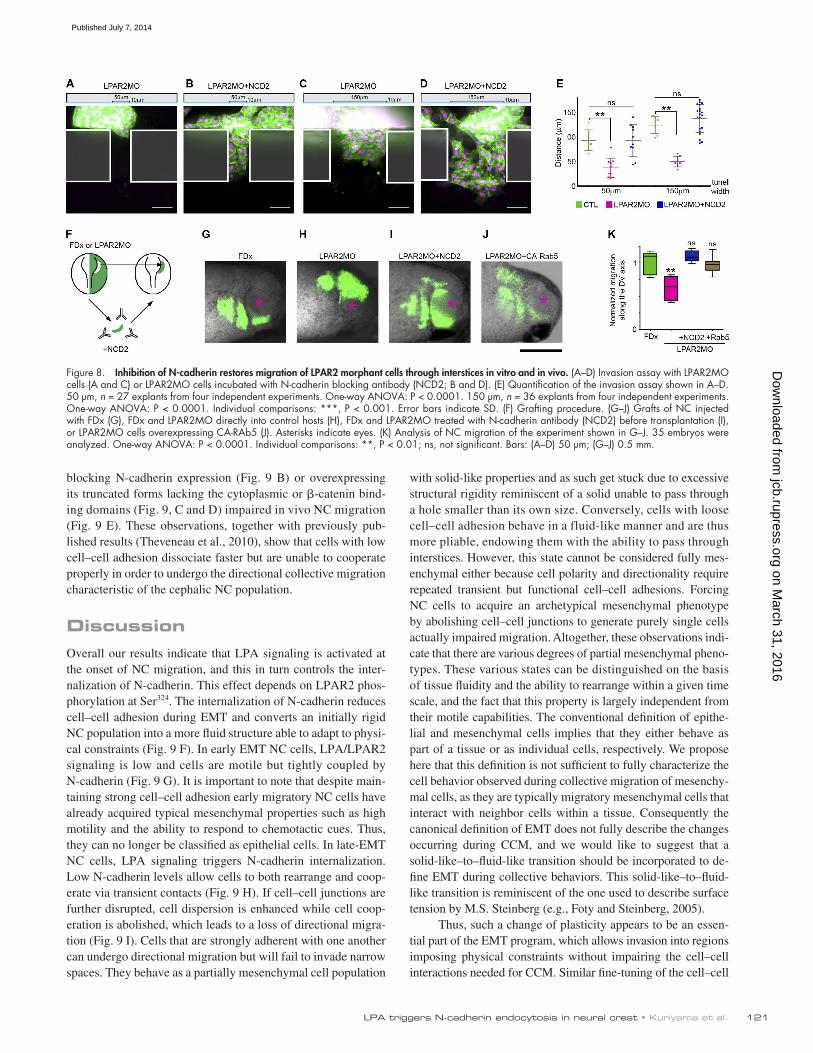
Further, we performed an invasion assay using microfluidic tunnels and found that LPAR2MO cells that were preincubated with the blocking antibody against N-cadherin (NCD2) were able to invade narrow spaces (Fig. 8, B, D, and E) in a manner
that are known to directly affect tension between cells. Cultur-ing cells under low calcium conditions to block cell–cell adhe-sion, blocking N-cadherin expression or decreasing actomyosin contractility using the Rho Kinase (ROCK) inhibitor Y27632, led to an increase in FRET activity (Fig. 6 F, brown bars) that indicates a release of tension. This result indicated that control NC cells have functional cell–cell adhesions and that the vin-culin FRET reporter can be used to measure changes in ten-sion across these junctions. We then used this FRET probe to compare control and LPAR2MO cells (Fig. 6 G). LPAR2MO cells showed a strong decrease in FRET indicating additional tension at the cell–cell contact after inhibition of LPA signaling (Fig. 6 G, pink bar). Importantly, no effect was observed when FRET measurements were performed at the cell–matrix inter-face to assess tension across focal adhesions (Fig. 6 H). This is consistent with our observation that silencing LPAR2 expres-sion does not affect adhesion to the substrate or cell motility (Fig. 3, A and B). Altogether, these results show that block-ing LPAR2 dramatically increases the amount of N-cadherin at the cell membrane and that this accumulation is translated into increased tension through vinculin. This suggests that, in LPAR2MO cells, the extra amount of membrane N-cadherin is coupled to the actin cytoskeleton and involved in functional
Figure 6. Lack of LPAR2 signaling generates increased tension at cell–cell junctions. (A–C) Vinculin immunostaining in Xenopus NC cells. Vinculin localizes at cell–cell junctions (arrowheads in B) and at focal adhesions (arrowheads in C). (D) Immunostaining against Phospho-Paxillin. Nuclei are stained with DAPI (blue). Bars: (A) 50 µm; (B–D) 15 µm. (E) Diagram depicting how the VinTS FRET probe works. (F) Vinculin FRET at the cell–cell contacts with control FRET probe (Mod, blue) and VinTS in controls (green) or low cell–cell adhesion conditions (brown). n = 76 cells from three independent experiments. One-way ANOVA: P < 0.001. Individual comparison: *, P < 0.05; **, P < 0.01. (G) Vinculin FRET at the cell–cell contacts in controls (green) and LPAR2MO cells (magenta). n = 64 cells from three independent experiments. Student’s two-tailed t test: P < 0.001. (H) Vinculin FRET in focal adhesions in controls (green) and LPAR2MO cells (magenta). n = 22 cells from three independent experiments. Student’s two-tailed t test: P = 0.53.
on March 31, 2016
jcb.rupress.orgD
ownloaded from
Published July 7, 2014

JCB • VOLUME 206 • NUMBER 1 • 2014 120
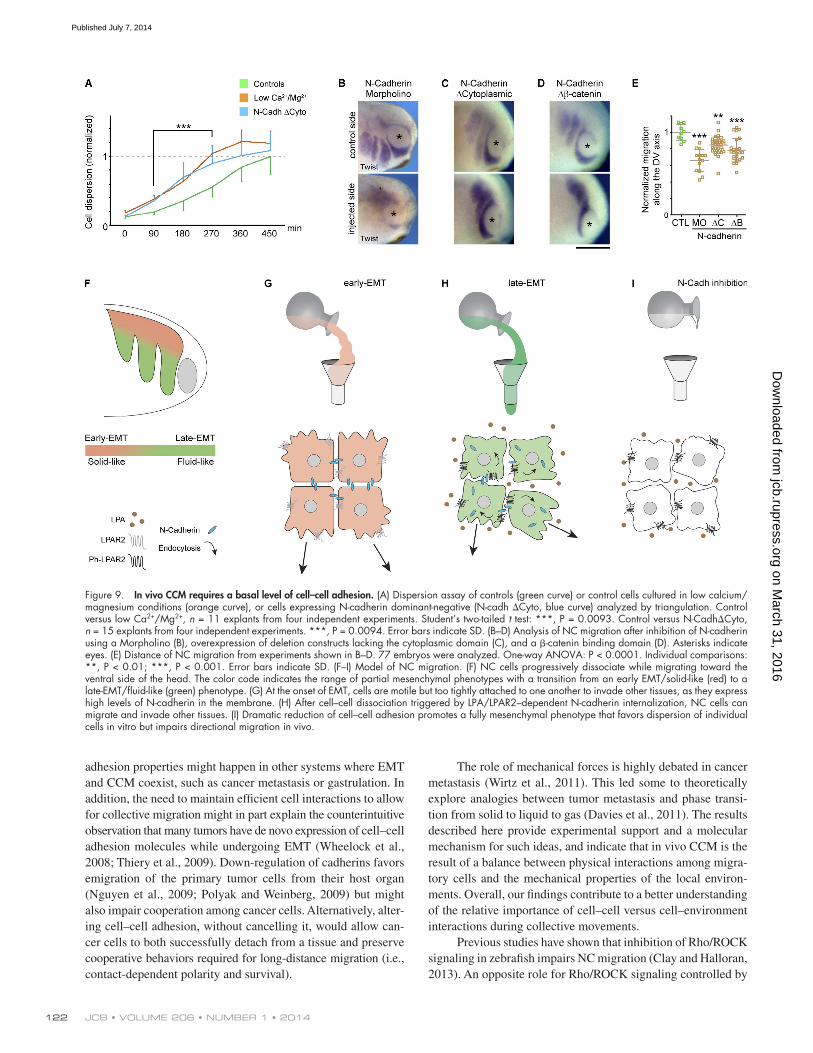
We have previously shown that cell–cell interactions are required for in vivo CCM of NC cells (Carmona-Fontaine et al., 2008; Theveneau et al., 2010; Carmona-Fontaine et al., 2011). Cell contacts polarize cells, rendering them able to sense chemo-tactic cues in a process coined collective chemotaxis (Theveneau et al., 2010). Therefore, lowering cell–cell adhesion even fur-ther than in control cells should favor cell dispersion over CCM by abolishing cell cooperation and thus inhibit NC migration in vivo but not in vitro. To test this idea, we analyzed the effect of reducing cell–cell adhesion in a 2D in vitro dispersion assay (Fig. 9 A) and found that NC cells cultured under low calcium/magnesium conditions (orange curve) or injected with a dominant-negative form of N-cadherin (blue curve) dissociate faster than control cells (green curve). Then we performed a similar ex-periment in vivo by reducing cell–cell adhesion by specifically blocking N-cadherin expression or using deletion constructs that are known to act as dominant-negatives (Fig. 9, B–E). Indeed,
similar to that seen in control cells (Fig. 8, A, B, and E; and Video 6). Finally, we tested the ability of a mild inhibition of N-cadherin or increased endocytosis to rescue migration of LPAR2MO cells in vivo. We first grafted LPAR2MO NC cells directly into control hosts or first incubated them with the blocking antibody against N-cadherin (NCD2) before transplantation (Fig. 8 F). LPAR2MO cells were unable to migrate after being grafted into hosts (Fig. 8, H and K), whereas LPAR2MO cells treated with NCD2 (Fig. 8, I and K) migrated as efficiently as control cells (Fig. 8, G and K). Simi-larly, coinjection of LPAR2MO with an mRNA encoding constitutively active Rab5 was sufficient to restore in vivo NC migration (Fig. 8, J and K). These results show that inhi-bition of N-cadherin or activation of N-cadherin endocytosis in LPAR2-deficient cells is sufficient to restore the plasticity required for NC migration under physical constraints in vitro and in vivo.
Figure 7. Inhibition of cell–cell adhesion rescues LPAR2 loss of function. (A–F) Cell dispersion assay in controls (A), LPAR2MO cells (B), or LPAR2MO cells in low calcium/magnesium conditions (C), coinjected with N-Cadherin MO (D), incubated with N-Cadherin blocking antibody (E), or coinjected with activated Rab5 (F). (G) Dispersion analysis using Delaunay triangulation from experiments shown in A. n = 103 explants from 12 independent experiments. One-way ANOVA: P < 0.0001. Individual comparison: ***, P < 0.001; ns, not significant. (H) Spatial correlation analysis. The broken line represents the solid-to-fluid transition. (I) Quantification of the spatial correlation analysis; the plot shows distances at which the alignment of velocity vectors falls below 0.5 for each experimental condition. n = 17 explants from three independent experiments. One-way ANOVA: P < 0.0001. Individual comparisons: ***, P < 0.01.
on March 31, 2016
jcb.rupress.orgD
ownloaded from
Published July 7, 2014
121LPA triggers N-cadherin endocytosis in neural crest • Kuriyama et al.
with solid-like properties and as such get stuck due to excessive structural rigidity reminiscent of a solid unable to pass through a hole smaller than its own size. Conversely, cells with loose cell–cell adhesion behave in a fluid-like manner and are thus more pliable, endowing them with the ability to pass through interstices. However, this state cannot be considered fully mes-enchymal either because cell polarity and directionality require repeated transient but functional cell–cell adhesions. Forcing NC cells to acquire an archetypical mesenchymal phenotype by abolishing cell–cell junctions to generate purely single cells actually impaired migration. Altogether, these observations indi-cate that there are various degrees of partial mesenchymal pheno-types. These various states can be distinguished on the basis of tissue fluidity and the ability to rearrange within a given time scale, and the fact that this property is largely independent from their motile capabilities. The conventional definition of epithe-lial and mesenchymal cells implies that they either behave as part of a tissue or as individual cells, respectively. We propose here that this definition is not sufficient to fully characterize the cell behavior observed during collective migration of mesenchy-mal cells, as they are typically migratory mesenchymal cells that interact with neighbor cells within a tissue. Consequently the canonical definition of EMT does not fully describe the changes occurring during CCM, and we would like to suggest that a solid-like–to–fluid-like transition should be incorporated to de-fine EMT during collective behaviors. This solid-like–to–fluid-like transition is reminiscent of the one used to describe surface tension by M.S. Steinberg (e.g., Foty and Steinberg, 2005).
Thus, such a change of plasticity appears to be an essen-tial part of the EMT program, which allows invasion into regions imposing physical constraints without impairing the cell–cell interactions needed for CCM. Similar fine-tuning of the cell–cell
blocking N-cadherin expression (Fig. 9 B) or overexpressing its truncated forms lacking the cytoplasmic or -catenin bind-ing domains (Fig. 9, C and D) impaired in vivo NC migration (Fig. 9 E). These observations, together with previously pub-lished results (Theveneau et al., 2010), show that cells with low cell–cell adhesion dissociate faster but are unable to cooperate properly in order to undergo the directional collective migration characteristic of the cephalic NC population.
DiscussionOverall our results indicate that LPA signaling is activated at the onset of NC migration, and this in turn controls the inter-nalization of N-cadherin. This effect depends on LPAR2 phos-phorylation at Ser324. The internalization of N-cadherin reduces cell–cell adhesion during EMT and converts an initially rigid NC population into a more fluid structure able to adapt to physi-cal constraints (Fig. 9 F). In early EMT NC cells, LPA/LPAR2 signaling is low and cells are motile but tightly coupled by N-cadherin (Fig. 9 G). It is important to note that despite main-taining strong cell–cell adhesion early migratory NC cells have already acquired typical mesenchymal properties such as high motility and the ability to respond to chemotactic cues. Thus, they can no longer be classified as epithelial cells. In late-EMT NC cells, LPA signaling triggers N-cadherin internalization. Low N-cadherin levels allow cells to both rearrange and coop-erate via transient contacts (Fig. 9 H). If cell–cell junctions are further disrupted, cell dispersion is enhanced while cell coop-eration is abolished, which leads to a loss of directional migra-tion (Fig. 9 I). Cells that are strongly adherent with one another can undergo directional migration but will fail to invade narrow spaces. They behave as a partially mesenchymal cell population
Figure 8. Inhibition of N-cadherin restores migration of LPAR2 morphant cells through interstices in vitro and in vivo. (A–D) Invasion assay with LPAR2MO cells (A and C) or LPAR2MO cells incubated with N-cadherin blocking antibody (NCD2; B and D). (E) Quantification of the invasion assay shown in A–D. 50 µm, n = 27 explants from four independent experiments. One-way ANOVA: P < 0.0001. 150 µm, n = 36 explants from four independent experiments. One-way ANOVA: P < 0.0001. Individual comparisons: ***, P < 0.001. Error bars indicate SD. (F) Grafting procedure. (G–J) Grafts of NC injected with FDx (G), FDx and LPAR2MO directly into control hosts (H), FDx and LPAR2MO treated with N-cadherin antibody (NCD2) before transplantation (I), or LPAR2MO cells overexpressing CA-RAb5 (J). Asterisks indicate eyes. (K) Analysis of NC migration of the experiment shown in G–J. 35 embryos were analyzed. One-way ANOVA: P < 0.0001. Individual comparisons: **, P < 0.01; ns, not significant. Bars: (A–D) 50 µm; (G–J) 0.5 mm.
on March 31, 2016
jcb.rupress.orgD
ownloaded from
Published July 7, 2014
JCB • VOLUME 206 • NUMBER 1 • 2014 122
The role of mechanical forces is highly debated in cancer metastasis (Wirtz et al., 2011). This led some to theoretically explore analogies between tumor metastasis and phase transi-tion from solid to liquid to gas (Davies et al., 2011). The results described here provide experimental support and a molecular mechanism for such ideas, and indicate that in vivo CCM is the result of a balance between physical interactions among migra-tory cells and the mechanical properties of the local environ-ments. Overall, our findings contribute to a better understanding of the relative importance of cell–cell versus cell–environment interactions during collective movements.
Previous studies have shown that inhibition of Rho/ROCK signaling in zebrafish impairs NC migration (Clay and Halloran, 2013). An opposite role for Rho/ROCK signaling controlled by
adhesion properties might happen in other systems where EMT and CCM coexist, such as cancer metastasis or gastrulation. In addition, the need to maintain efficient cell interactions to allow for collective migration might in part explain the counterintuitive observation that many tumors have de novo expression of cell–cell adhesion molecules while undergoing EMT (Wheelock et al., 2008; Thiery et al., 2009). Down-regulation of cadherins favors emigration of the primary tumor cells from their host organ (Nguyen et al., 2009; Polyak and Weinberg, 2009) but might also impair cooperation among cancer cells. Alternatively, alter-ing cell–cell adhesion, without cancelling it, would allow can-cer cells to both successfully detach from a tissue and preserve cooperative behaviors required for long-distance migration (i.e., contact-dependent polarity and survival).
Figure 9. In vivo CCM requires a basal level of cell–cell adhesion. (A) Dispersion assay of controls (green curve) or control cells cultured in low calcium/magnesium conditions (orange curve), or cells expressing N-cadherin dominant-negative (N-cadh Cyto, blue curve) analyzed by triangulation. Control versus low Ca2+/Mg2+, n = 11 explants from four independent experiments. Student’s two-tailed t test: ***, P = 0.0093. Control versus N-CadhCyto, n = 15 explants from four independent experiments. ***, P = 0.0094. Error bars indicate SD. (B–D) Analysis of NC migration after inhibition of N-cadherin using a Morpholino (B), overexpression of deletion constructs lacking the cytoplasmic domain (C), and a -catenin binding domain (D). Asterisks indicate eyes. (E) Distance of NC migration from experiments shown in B–D. 77 embryos were analyzed. One-way ANOVA: P < 0.0001. Individual comparisons: **, P < 0.01; ***, P < 0.001. Error bars indicate SD. (F–I) Model of NC migration. (F) NC cells progressively dissociate while migrating toward the ventral side of the head. The color code indicates the range of partial mesenchymal phenotypes with a transition from an early EMT/solid-like (red) to a late-EMT/fluid-like (green) phenotype. (G) At the onset of EMT, cells are motile but too tightly attached to one another to invade other tissues, as they express high levels of N-cadherin in the membrane. (H) After cell–cell dissociation triggered by LPA/LPAR2–dependent N-cadherin internalization, NC cells can migrate and invade other tissues. (I) Dramatic reduction of cell–cell adhesion promotes a fully mesenchymal phenotype that favors dispersion of individual cells in vitro but impairs directional migration in vivo.
on March 31, 2016
jcb.rupress.orgD
ownloaded from
Published July 7, 2014

123LPA triggers N-cadherin endocytosis in neural crest • Kuriyama et al.
Reagents and solutionsThe following reagents and solutions were used. Agarose (BP1356-100; Thermo Fischer Scientific), BSA (A4503; Sigma-Aldrich), fibronectin (F1141; Sigma-Aldrich), FDx (D1821; Sigma-Aldrich), gelatin (G1890; Sigma-Aldrich), methylcellulose (M0387-100; Sigma-Aldrich), Mowiol 40-88 (81386; Fluka), penicillin-streptomycin (P4458; Sigma-Aldrich), Rhoda-mine-dextran (D1824; Sigma-Aldrich), sucrose and (27480.294; VWR). Danilchick’s medium 1×: 53 mM NaCl, 5 mM NA2CO3, 4.5 mM potas-sium gluconate, 32 mM sodium gluconate, 1 mM MgSO4-7H20, 1 mM CaCl2, and 0.1% BSA. MEMFA: 1 mM MOPS, 2 mM EGTA, 1 mM MgSO4, and 3.7% formaldehyde. Normal amphibian medium (NAM): 110 mM NaCl, 2 mM KCl, 1 mM Ca(CO3)2, 1 mM MgSO4, 0.1 mM EDTA, 1 mM NaHCO3, and 2 mM sodium phosphate. NTMT: 0.1 M NaCl, 0.1 M TrisHCl, pH 9.5, 50 mM MgCl2, and Tween 0.1%. PBS 1×: 137 mM NaCl, 2.7 mM KCl, 10 mM Na2HPO4, 1.8 mM KH2PO4, 1 mM CaCl2-2H2O, and 0.5 mM MgCl2-6H2O.
Microfabrication of microfluidic tunnelsTwo-layer chips were designed using the AutoCAD 2009 software (Auto-desk). High-resolution soda-lime masks for the microchannel layer, and emulsion masks for the chamber layers were obtained from JD Photo-Tools. 3-inch silicon wafers were ordered from Virginia Semiconductor Inc. Molds were processed in two steps in the cleanroom facility of the London Centre for Nanotechnology. AZ5214E resist (MicroChemicals GmbH) was spun at 5,000 rpm and processed as a negative resist using standard procedures to create the mask for the microchannel layer. The patterned wafer was then etched for 10 or 20 µm using a deep reactive ion etcher (Surface Technology Systems ICP DRIE; SPTS Technologies), plasma cleaned in a TePla plasma cleaner (PVA TePla) and further cleaned with fluoric acid. A second 150-µm-thick SU-8-2100 photoresist (MicroChem Corp.) layer was then deposited and processed using standard microfab-rication techniques (García and Henry, 2006) to generate the mold for the explant culture chamber and the chemoattractant channel. The mold was finally cleaned once more in the TePla plasma cleaner. It was then plasma activated (using a Plasma Clean 4; Ilmvac), plunged in 1% tri-decafluoro-1,1,2,2-tetrahydrooctyl-1-dimethylchlorosilane (13F; MCC) in toluene for 30 min, washed, dried, and baked at 55°C for 15 min. Polydimethyl methylhydrogen siloxane (PDMS) casts were prepared by mixing 1:10 parts of curing agent to base Sylgard 184 elastomer (Dow Corning Corp.). The PDMS mix was degassed and poured onto the 13F-coated patterned wafer and cured at 55°C overnight. Then, input/output were created using a biopsy punch and the culture chamber was opened by cutting out a square of PDMS with a surgical scalpel. PDMS casts were further exposed to plasma for 30 s and irreversibly bonded to 35-mm- diameter glass-bottom dishes (WillCo; Intracell). Finally, the assembled chips were baked for 15 min at 75°C.
Spatial correlation analysisThis method allows us to assess the degree of alignment between cells within a group and to express this alignment as a function of distance. Nuclei are tracked over time and their displacement between two con-secutive time points give a series of velocity vectors that can then be sys-tematically compared with one another. For statistical comparisons, one has to choose a threshold of alignment. Then, the mean distance between cells at which this mean alignment is reached is used to compare experi-mental conditions. We chose the distance at which the mean alignment of velocity vectors across the population is 0.5 to compare experimental conditions. Further detail of the strategy to obtain velocity vectors is pro-vided hereafter.
To quantify the spatial correlations of cell displacements, the veloc-ity fields are first calculated using an optical flow method on images of stained nuclei (cells were injected with mRNA for nuclear-mCherry). Dis-placements are quantified from pairs of images 5 min apart, at a resolu-tion of 2.05 µm/pixel. The spatial correlation function of the velocity field is then calculated at each time step using the methodology developed by Kabla (2012). The 2D correlation function g(r) is introduced to character-ize the mean degree of coordination between a cell moving at the origin moving along the x axis, and another cell located at a position r with re-spect to the first. This enables one to distinguish correlations along the direction of motion and correlations in the transverse direction. Quantitatively, the correlation function at any instant is calculated from:
g rv r v r R r r r
v rδ
δ( ) =
( ) ⋅ + ( )( )2
,
LPA has been proposed in chick NC. Groysman et al. (2008) showed that adding LPA to trunk NC cultures activated RhoA/B and blocked cell emigration. It is not known which LPA recep-tors are present in trunk NC cells in chicks, and the phenotype induced by adding LPA in the culture medium is likely to be the result of the activation of multiple signaling cascades. Here we specifically blocked LPAR2 and showed an impairment in cell–cell dissociation. We do not know the effect that activation or inhibition of other LPA receptors could have on NC migra-tion in our system.
Genetic studies with LPA receptor–null mice have sug-gested some degree of redundancy, as LPAR2-null mice have no obvious phenotype, but the LPAR1/LPAR2 double-null mice have a higher lethality than LPAR1-null mice (Contos et al., 2000a, 2002). It is common to find this degree of redundancy between signaling pathways in mice and not in other animal models like Xenopus, which allowed using this animal model to discover this novel function for LPAR2. Previous studies in Xenopus embryos have shown that LPAR2 is involved in wound healing by controlling the actin cytoskeleton (Tao et al., 2007). Whether the actin cytoskeleton is modulated by LPAR2 signal-ing in our cells remains to be investigated. Interestingly, our findings on the role of ATX and subsequent LPA signaling via LPAR2 are consistent with the biological activity reported in cancer models (Houben and Moolenaar, 2011), and suggest that Xenopus NC cells could be an adequate model to study cell be-haviors important for cancer metastasis.
Materials and methodsPCR primersFor LPAR2 mutations. Forward primer: 5-TGAATTCATGAAcCAaTGtTT cTAcAATGAGAGTATTAAGTTC-3. Mutations are represented by lower- case italicized letters. For the Ser324 point mutation of LPAR2, pCS2+/ 5 mm LPAR2 whole plasmid was amplified using the following primers. S324>A forward (Fw), 5-ACTAATACAGAGAGGAGAGTCTTGGCT-GAC-3; S324>A reverse (Rv), 5-TGCCTTAAGGGAAGCCGGTGAG-TATTTGG-3. For making 5 UTR-LPAR2-GFP shown in Fig. S4, 5 UTR-LPAR2 ORF cDNA was amplified by 5 UTR-LPAR2 forward, 5-TCGAATTC-GACAGGCGGAGGC-TGAGCTGTA-3; and AgeI-LPAR2 reverse primer, 5-CGACCGGTGCAAGACTGCATTCTCTCATTG-3.
For HaloTag–N-cadherin. N-cad Fw, 5-CAGCATCGATGTGCCGG-AAAGAGCCCTTCC-3; Rv, 5-AGTCTAGATTCAGTCGTCGCTCCCTC-CGTAC-3. First, the restriction sites for HaloTag fusion protein were introduced into XN-cadherin by PCR with the following sets of primers. N-cadSPFw, 5-CGTTTATGCAAGACAGGATTTCTTGAGGATG-3; N-cadSPRv, 5-AGTTCCCCCGAGTGCTTCAACTGGTCCCT-3; HaloTagFw, 5-AGTAT-GGCAGAAATCGGTACTGGCTT-3; HaloTagRv, 5-CGTGGTTGGCTCGCC-GGAAATCTC-3. Then the pro-domain of N-cadherin was removed by another PCR, N-cadEC1Fw: 5-AATCACGCGTGATTGGGTTATTCCACCAAT-3.
For semiquantitative RT-PCR. XN-cadh-U, 5-CCCTTTATCTTTGAACT-TCCTTA-3; XN-cadh-D, 5-TTATCTCTGACATCATCTTCTGG-3; X-Cat-U, 5-CTATCCAGTTGATGGACTTCCTG-3; X-Cat-D, 5-TCTGACCAAATAAA-GGACCAGAA-3.
RNAs were extracted from whole embryos (2–3 embryos) or 20 pieces of dissected cranial NC cells using RNeasy Protect Mini kit (QIAGEN). The cDNA was reverse-transcribed by SuperScript II Reverse transcription (Life Technologies). For semiquantitative PCR, PCR cycles were decided by pilot experiment using the whole embryos’ cDNA. The program for amplifica-tion was 96°C for 1 min, 96°C for 15 s, 55°C for 30 s, and 72°C for 45 s × cycles as follows: Sox9 (29 cycles), X-Cat (27 cycles), N-cadh (27 cycles), ornithine decarboxylase 1 (ODC; 23 cycles). Primers for RT-PCR for Ep-Ker, ODC, and muscle actin were described in Xenbase (Bowes et al., 2008), and Sox9 (Monsoro-Burq et al., 2003), Snail2 (Aybar et al., 2003), and FoxD3 (Sasai et al., 2001) have been described previously.
on March 31, 2016
jcb.rupress.orgD
ownloaded from
Published July 7, 2014

JCB • VOLUME 206 • NUMBER 1 • 2014 124
In situ hybridizationEmbryos were fixed overnight at 4°C in MEMFA before being dehydrated by several baths in pure methanol. Embryos were then rehydrated by solu-tions of decreasing methanol concentration, washed in PBS, and bleached in a peroxide solution to remove skin pigments. After bleaching a short postfixation in formaldehyde 3.7% was performed. Embryos were then in-cubated overnight at 65°C in formamide-based hybridization buffer con-taining a digoxigenin-labeled antisense probe against the gene of interest. Probes are washed in Formamide-based washing solutions, then washed in PBS 0.1% Tween, incubated in a serum-based blocking solution, and left overnight at 4°C in blocking solution containing the anti-digoxigenin antibody coupled with alkaline phosphatase. Staining was achieved by incubating embryos in a pH 9.5 solution containing NBT and BCIP in equal proportions.
ImmunostainingCells were cultured on fibronectin-coated dishes, left to migrate for a few hours, fixed in 4% PFA for 30 min, blocked in a serum-based solution, incubated for 2 h with a primary antibody, quickly washed in PBS, and incubated 1 h with a secondary antibody mixed with DAPI or phalloidin if necessary. Primary antibodies: rat anti–N-cadherin (MNCD2; Develop-mental Studies Hybridoma Bank), rabbit anti–-catenin (ab6302; Abcam), and mouse anti-vinculin (V9131; Sigma-Aldrich). Secondary antibodies were all Alexa Fluor–coupled immunoglobulins from Invitrogen (Alexa Fluor 488 or 555).
NC cell cultureXenopus cranial NC cells were dissected as described in DeSimone et al. (2005). In brief, at around stage 18 the pigmented epidermal layer is re-moved, then NC cells are gently taken out by microdissection. When needed, cell dissociation was performed by putting the NC explants in Ca2+/Mg2+-free medium for a few minutes before transferring them to nor-mal culture medium. All cell cultures were performed on Fibronectin-coated Petri dishes.
cDNAs and expression constructscDNA clones were obtained from the I.M.A.G.E. consortium. Xenopus au-totaxin, I.M.A.G.E. 5570505; Xl-LPAR2 (EDG4), I.M.A.G.E. 6864256. Xenopus LPAR1 cDNA was a gift from J. Chun (The Scripps Research Insti-tute, San Diego, CA). Specificity of LPAR2 MO was tested with a mutant LPAR2 including five mismatches in MO target sequences, and different LPAR2 mutants were also created by PCR (sequence given in the Gene knockdown section). For HaloTag–N-cadherin, Xenopus N-cadherin ORF was amplified by primers shown in the PCR primers section, and subcloned into pCSf107mT vector. HaloTag cDNA was inserted between N-cadherin prodomain and EC1.
Pulse-chase assay (HaloTag in situ labeling)At the eight-cell stage, HaloTag N-cadherin mRNA (500 pg/embryo) and membrane-mCherry mRNA (300 pg/embryo) were injected, and the em-bryos were cultured until stage 19. HaloTag-N-cadherin–expressing NC explants were dissected and preincubated for 30 min at room temperature with Alexa Fluor 488–nonpermeable HaloTag ligand solution in 1× Marc’s modified Ringer (MMR; 1:1,000, Promega; Los and Wood, 2007), and the excess ligands were washed. Then labeled NC cells were cultured on fibronectin-coated coverslips (Tissue Tek II; Nalgene), and time-lapse imagining was performed (LSM 510 Meta; Carl Zeiss) immediately after cell attachment. The lens used for this imaging was a Plan-Apochromat 63×/1.4 oil objective. The temperature was 23°C. The imaging medium was Immersol 518F (Carl Zeiss). Images were obtained and analyzed with LSM 510 version 3.2 microscope operation software and Zeiss Image Browser (both from Carl Zeiss).
Phostag PAGE and Western blottingPhos-tag PAGE and Western blotting were performed as described previ-ously (Kinoshita et al., 2006; Kuriyama and Mayor, 2009; Tanaka et al., 2012). The protein samples for phosphorylation analyses were prepared from Xenopus tissues lysed in PLC buffer with 0.5 mM sodium orthovana-date as a phosphorylation inhibitor. Phos-tag gel contains 50 µM phos-tag chemical compound in 12.5% acrylamide gel (SuperSep Phos-tag; Wako Chemicals USA). After electrophoresis, Phos-tag PAGE gels were rinsed in Tris-glycine blotting buffer containing 10 mM EDTA for 10 min three times, and twice without EDTA. For the control of protein dephosphorylation of LPAR2 cytoplasmic domain, we performed alkaline phosphatase treatment of protein lysates for 2 h at 50 C°. Antibodies for WB were as follows:
where R(r) is the transformation rotating the velocity vector v(r) along the horizontal x axis. The normalization of the function ensures that g = 1 where cells’ velocities are fully aligned, and 0 where orientations are random.
Spatial maps were obtained by averaging over all time steps be-tween 0 and 75 min. Time-resolved maps were obtained by calculating, at each time point, the radial mean of g(r) over 200 min (3 h, 20 min). The distance at which such function decays can be interpreted as the correla-tion length of the cell population.
Statistical analysisComparison of percentages was performed using contingency tables as described previously (Taillard et al., 2008). Two datasets were considered significantly different (null hypothesis rejected) if T > 3.841 (*, = 0.05), T > 6.635 (**, = 0.01), or T > 10.83 (***, = 0.001). Normality of datasets was tested using the Kolmogorov-Smirnov’s test, d’Agostino and Pearson’s test, and Shapiro-Wilk’s test using Prism 4 (GraphPad Software). A dataset was considered normal if found as normal by all three tests. Da-tasets following a normal distribution were compared with a Student’s t test (two-tailed, unequal variances) in Excel (Microsoft) or a one-way analysis of variance (ANOVA) with a Dunnett’s multiple comparisons post-test in Prism 4. Datasets that did not follow a normal distribution were compared using a Mann Whitney’s test or a nonparametric ANOVA (Kruskal-Wallis with Dunn’s multiple comparisons post-test) using Prism 4. Cross-comparisons were performed only if the overall P-value of the ANOVA was <0.05. Scatter plots show individual values for each individual experiment in each condi-tion, and error bars show the mean and the standard deviation. Box and whiskers plot: the box extends from the 25th to the 75th percentile; the whiskers show the extent of the whole dataset. The median is plotted as a line inside the box.
Delaunay triangulationIn brief, individual nuclei were first automatically detected using the Parti-cle Analysis tool in ImageJ. Then, xy positions of all nuclei were used to build triangles between the nearest neighbors with the Delaunay Triangula-tion plug-in. Areas of individual triangles are extracted. An average trian-gle area is calculated for each explant and the values were then normal-ized according to the mean of the control batch of each experiment. It is important to note that triangle area distribution is exponential. Thus, to per-form statistical analysis, the datasets are converted into logarithms of areas that follow a normal distribution. Paired and multiple statistical compari-sons were made as described in the Statistical analysis section.
Cell trackingCell tracking was performed with the Manual Tracking plug-in in ImageJ or with spot tracking function in Imaris (Bitplane). In all cases nuclear staining was used to follow individual cells over time. Directionality, velocity, and chemotaxis index (also known as the forward motion index) were extracted using the Chemotaxis Tool plugin in ImageJ or calculated from data gener-ated by the Imaris tracking tool.
NC graftsThe appropriate morpholino oligo and FDx or rhodamine-dextran (RDx; 1 µg/µl, mol wt 1,000; Molecular Probes) were injected into two-cell-stage embryos. Embryos at stage 18 were immobilized in a Petri dish filled with plasticine. The pigmented ectoderm layer located above the NC region was carefully removed using an eyebrow knife. NC cells can be mechani-cally detached from their surrounding tissues by applying gentle pressure on the side of the neural fold, passing the eyebrow knife from lateral to me-dial a few times. To perform the graft, a given NC explant has to first be taken from a donor embryo, then a similar procedure is immediately done on the host embryo. The NC explant coming from the donor is then placed into the wound of the host and kept in place by placing a square glass cov-erslip on top for 15 min. The coverslip is then removed and embryos are left to heal. Further details on grafting procedures can be found elsewhere (DeSimone et al., 2005; Theveneau et al., 2013).
Gene knockdownGene knockdown of Autotaxin, LPAR1, LPAR2, and N-cadherin (Nandadasa et al., 2009) was done by injection of morpholino oligonucleotides (MOs; Gene Tools, LLC). Morpholinos sequences were as follows XlAutotaxin, 5-CTGAATCCGTTTTTCATTGCCATAG-3; XlLPAR1, 5-ACTCTGAAAGA-GAAGCCATTTTAGC-3; and XlLPAR2, 5-ATAAAAGCACTGATTCATCTT-GAGT-3. ATX morpholino was provided by L. Dale (University College London, London, England, UK).
on March 31, 2016
jcb.rupress.orgD
ownloaded from
Published July 7, 2014

125LPA triggers N-cadherin endocytosis in neural crest • Kuriyama et al.
length analysis. E. Theveneau and R. Mayor organized the figures and supple-mentary information. E. Theveneau, R. Mayor, S. Kuriyama, and A. Kabla wrote the manuscript. All authors commented on the manuscript.
Submitted: 18 February 2014Accepted: 2 June 2014
ReferencesAlfandari, D., H. Cousin, and M. Marsden. 2010. Mechanism of Xenopus cranial
neural crest cell migration. Cell Adhes. Migr. 4:553–560. http://dx.doi .org/10.4161/cam.4.4.12202
Aybar, M.J., M.A. Nieto, and R. Mayor. 2003. Snail precedes slug in the genetic cascade required for the specification and migration of the Xenopus neural crest. Development. 130:483–494. http://dx.doi.org/10.1242/dev.00238
Barriga, E.H., P.H. Maxwell, A.E. Reyes, and R. Mayor. 2013. The hypoxia factor Hif-1 controls neural crest chemotaxis and epithelial to mes-enchymal transition. J. Cell Biol. 201:759–776. http://dx.doi.org/10 .1083/jcb.201212100
Belmadani, A., P.B. Tran, D. Ren, S. Assimacopoulos, E.A. Grove, and R.J. Miller. 2005. The chemokine stromal cell-derived factor-1 regulates the migration of sensory neuron progenitors. J. Neurosci. 25:3995–4003. http://dx.doi.org/10.1523/JNEUROSCI.4631-04.2005
Belmadani, A., H. Jung, D. Ren, and R.J. Miller. 2009. The chemokine SDF-1/ CXCL12 regulates the migration of melanocyte progenitors in mouse hair follicles. Differentiation. 77:395–411. http://dx.doi.org/10.1016/j .diff.2008.10.015
Bowes, J.B., K.A. Snyder, E. Segerdell, R. Gibb, C. Jarabek, E. Noumen, N. Pollet, and P.D. Vize. 2008. Xenbase: a Xenopus biology and genom-ics resource. Nucleic Acids Res. 36:D761–D767. http://dx.doi.org/10 .1093/nar/gkm826
Carmona-Fontaine, C., H.K. Matthews, S. Kuriyama, M. Moreno, G.A. Dunn, M. Parsons, C.D. Stern, and R. Mayor. 2008. Contact inhibition of lo-comotion in vivo controls neural crest directional migration. Nature. 456:957–961. http://dx.doi.org/10.1038/nature07441
Carmona-Fontaine, C., E. Theveneau, A. Tzekou, M. Tada, M. Woods, K.M. Page, M. Parsons, J.D. Lambris, and R. Mayor. 2011. Complement frag-ment C3a controls mutual cell attraction during collective cell migration. Dev. Cell. 21:1026–1037. http://dx.doi.org/10.1016/j.devcel.2011.10.012
Clay, M.R., and M.C. Halloran. 2013. Rho activation is apically restricted by Arhgap1 in neural crest cells and drives epithelial-to-mesenchymal transi-tion. Development. 140:3198–3209. http://dx.doi.org/10.1242/dev.095448
Contos, J.J., N. Fukushima, J.A. Weiner, D. Kaushal, and J. Chun. 2000a. Requirement for the lpA1 lysophosphatidic acid receptor gene in normal suckling behavior. Proc. Natl. Acad. Sci. USA. 97:13384–13389. http://dx.doi.org/10.1073/pnas.97.24.13384
Contos, J.J., I. Ishii, and J. Chun. 2000b. Lysophosphatidic acid receptors. Mol. Pharmacol. 58:1188–1196.
Contos, J.J., I. Ishii, N. Fukushima, M.A. Kingsbury, X. Ye, S. Kawamura, J.H. Brown, and J. Chun. 2002. Characterization of lpa(2) (Edg4) and lpa(1)/lpa(2) (Edg2/Edg4) lysophosphatidic acid receptor knock-out mice: signaling deficits without obvious phenotypic abnormal-ity attributable to lpa(2). Mol. Cell. Biol. 22:6921–6929. http://dx.doi .org/10.1128/MCB.22.19.6921-6929.2002
Davies, P.C., L. Demetrius, and J.A. Tuszynski. 2011. Cancer as a dynamical phase transition. Theor. Biol. Med. Model. 8:30. http://dx.doi.org/10 .1186/1742-4682-8-30
DeSimone, D.W., L. Davidson, M. Marsden, and D. Alfandari. 2005. The Xenopus embryo as a model system for studies of cell migration. Methods Mol. Biol. 294:235–245.
Doxzen, K., S.R. Vedula, M.C. Leong, H. Hirata, N.S. Gov, A.J. Kabla, B. Ladoux, and C.T. Lim. 2013. Guidance of collective cell migration by substrate geometry. Integr Biol (Camb). 5:1026–1035. http://dx.doi .org/10.1039/c3ib40054a
Duband, J.L. 2010. Diversity in the molecular and cellular strategies of epithe-lium-to-mesenchyme transitions: Insights from the neural crest. Cell Adhes. Migr. 4:458–482. http://dx.doi.org/10.4161/cam.4.3.12501
Foty, R.A., and M.S. Steinberg. 2005. The differential adhesion hypothesis: a direct evaluation. Dev. Biol. 278:255–263. http://dx.doi.org/10.1016/ j.ydbio.2004.11.012
Friedl, P., J. Locker, E. Sahai, and J.E. Segall. 2012. Classifying collective cancer cell invasion. Nat. Cell Biol. 14:777–783. http://dx.doi.org/ 10.1038/ncb2548
García, C.D., and C.S. Henry. 2006. Micro-molding for poly(dimethylsiloxane) microchips. Methods Mol. Biol. 339:27–36.
monoclonal anti-Myc antibody (1:2,000 dilution, 9E10; Santa Cruz Biotech-nology, Inc.), polyclonal rabbit anti-LPAR2 antibody (1: 375, HPA019616; ATLAS Antibodies), monoclonal anti–N-cadherin antiserum (1:200, MNCD2; Developmental Studies Hybridoma Bank), and monoclonal anti–-tubulin antibody (1:5,000, B-5-1-2; Sigma-Aldrich).
VinTS FRETSamples for analysis of FRET by acceptor photobleaching were imaged using a laser scanning confocal microscope (LSM 510 Meta) and a 25× NA 1.4 Ph2 or 63× Plan Apochromat NA 1.4 Ph3 oil objective lens as specified. The CFP and YFP channels were excited using the 440-nm diode laser and the 514-nm argon lines, respectively. The two emission chan-nels were split using a 545-nm dichroic mirror, which was followed by a 475–525-nm bandpass filter for CFP and a 530-nm longpass filter for YFP (Chroma Technology Corp). Pinholes were opened to give a depth of focus of 2 mm for each channel. Scanning was performed on a sequential line-by-line basis for each channel. The gain for each channel was set to 75% of dynamic range (12-bit, 4,096 gray levels) and offset such that backgrounds were zero. Time-lapse mode was used to collect one pre-bleach image for each channel followed by bleaching with a minimum of 50 iterations of the 514-nm argon laser line at maximum power (to bleach YFP). A second postbleach image was then collected for each channel. Control nonbleached areas were acquired for all samples in the same field of view as bleached cells to confirm specificity of FRET detection. Pre- and post-bleach CFP and YFP images were then imported into ImageJ for processing (AccpbFRET plugin; Roszik et al., 2008). Within this, all pixels were reregistered (using the Fast Hartley Transform algorithm) to correct for any shifts in the xy plane; bleed-through between donor and acceptor channels and efficiency of acceptor photobleaching were all accounted for in the analysis.
Invasion assay in microfluidic tunnelsThe closed compartment of the microchip was loaded with a solution of SDF-l (0.25 µg/ml), and NC explants were labeled with nuclear-mCherry and membrane-GFP, or nuclear and membrane-mCherry were seeded in front of each tunnel. The chip was sealed and imaged on an upright micro-scope (i80; Nikon) with a 20× lens.
Online supplemental materialFig. S1 shows that LPAR2 and Autotaxin are required for NC migration. Fig. S2 details the use of a microfluidic chamber to test 2D migration under physical constraints. Fig. S3 provides the results of Delaunay triangula-tion analyses of a cell dispersion assay. Video 1 shows how control and LPAR2MO-injected NC cells respond to Sdf-1 chemoattraction. Video 2 shows how NC cells migrate through various sizes of microfluidic tun-nels. Video 3 shows a dispersion assay with controls and LPAR2MO cells. Video 4 monitors N-cadherin internalization using HaloTag pulse labeling. Video 5 shows that the impaired LPAR2MO cell dispersion is rescued by modification of cell–cell adhesions. Video 6 shows that functional block-ing antibody of N-cadherin rescues LPAR2MO phenotype in microfluidic tunnel. Online supplemental material is available at http://www.jcb.org/ cgi/content/full/jcb.201402093/DC1.
We thank J. Leslie, A. Yap, and J.P. Thiery for comments on the manuscript. We thank Elena Scarpa for providing data that contributed to Fig. 5 J.
This study was supported by grants from the Medical Research Council (MR/J000655/1) and the Biotechnology and Biological Sciences Research Council to R. Mayor; by The Ministry of Education, Culture, Sports, Science and Technology (MEXT) Grants-in-Aid for Scientific Research (KAKENHI; 25111702), Japan Society for the Promotion of Science (JSPS) KAKENHI (24700962), the Uehara memorial foundation, and the Asahi Glass foundation to S. Kuriyama; and JSPS KAKENHI (25290042) to M. Tanaka. E. Theveneau was supported by the Wellcome Trust Value in People Award. M. Parsons was supported by a Royal Society University Research fellowship. G. Charras was supported by a Royal Society University Research Fellowship. A. Benedetto was supported by a Biotechnology and Biological Sciences Research Council grant (BB/F019769/1) to G. Charras.
The authors declare no competing financial interests.
Author contributions: S. Kuriyama and E. Theveneau performed the experi-ments. S. Kuriyama, E. Theveneau, and R. Mayor designed the experiments. S. Kuriyama, E. Theveneau, and R. Mayor analyzed and interpreted most of the data. A. Benedetto, E. Theveneau, and G. Charras designed the mi-crofluidic chips. A. Benedetto performed the microfluidic chip fabrication. M. Parsons and E. Theveneau performed the FRET experiments. M. Tanaka and S. Kuriyama designed the fusion proteins. A. Kabla performed the correlation
on March 31, 2016
jcb.rupress.orgD
ownloaded from
Published July 7, 2014

JCB • VOLUME 206 • NUMBER 1 • 2014 126
Ogata, S., J. Morokuma, T. Hayata, G. Kolle, C. Niehrs, N. Ueno, and K.W. Cho. 2007. TGF- signaling-mediated morphogenesis: modulation of cell adhesion via cadherin endocytosis. Genes Dev. 21:1817–1831. http://dx .doi.org/10.1101/gad.1541807
Olesnicky Killian, E.C., D.A. Birkholz, and K.B. Artinger. 2009. A role for chemokine signaling in neural crest cell migration and craniofacial development. Dev. Biol. 333:161–172. http://dx.doi.org/10.1016/ j.ydbio.2009.06.031
Polyak, K., and R.A. Weinberg. 2009. Transitions between epithelial and mes-enchymal states: acquisition of malignant and stem cell traits. Nat. Rev. Cancer. 9:265–273. http://dx.doi.org/10.1038/nrc2620
Powell, D.R., A.J. Blasky, S.G. Britt, and K.B. Artinger. 2013. Riding the crest of the wave: parallels between the neural crest and cancer in epithelial-to-mesenchymal transition and migration. Wiley Interdiscip Rev Syst Biol Med. 5:511–522. http://dx.doi.org/10.1002/wsbm.1224
Rørth, P. 2009. Collective cell migration. Annu. Rev. Cell Dev. Biol. 25:407–429. http://dx.doi.org/10.1146/annurev.cellbio.042308.113231
Roszik, J., J. Szöllosi, and G. Vereb. 2008. AccPbFRET: an ImageJ plugin for semi-automatic, fully corrected analysis of acceptor photobleaching FRET images. BMC Bioinformatics. 9:346. http://dx.doi.org/10.1186/ 1471-2105-9-346
Sasai, N., K. Mizuseki, and Y. Sasai. 2001. Requirement of FoxD3-class signaling for neural crest determination in Xenopus. Development. 128: 2525–2536.
Sauka-Spengler, T., and M. Bronner-Fraser. 2008. A gene regulatory network orchestrates neural crest formation. Nat. Rev. Mol. Cell Biol. 9:557–568. http://dx.doi.org/10.1038/nrm2428
Smicun, Y., O. Gil, K. Devine, and D.A. Fishman. 2007. S1P and LPA have an attachment-dependent regulatory effect on invasion of epithelial ovarian cancer cells. Gynecol. Oncol. 107:298–309. http://dx.doi.org/10.1016/ j.ygyno.2007.06.024
Sumida, G.M., T.M. Tomita, W. Shih, and S. Yamada. 2011. Myosin II activ-ity dependent and independent vinculin recruitment to the sites of E-cadherin-mediated cell-cell adhesion. BMC Cell Biol. 12:48. http://dx.doi.org/10.1186/1471-2121-12-48
Taguchi, K., T. Ishiuchi, and M. Takeichi. 2011. Mechanosensitive EPLIN-dependent remodeling of adherens junctions regulates epithelial reshaping. J. Cell Biol. 194:643–656. http://dx.doi.org/10.1083/jcb .201104124
Taillard, E.D., P. Waelti, and J. Zuber. 2008. Few statistical tests for propor-tions comparison. Eur. J. Oper. Res. 185:1336–1350. http://dx.doi.org/ 10.1016/j.ejor.2006.03.070
Tanaka, M., S. Kuriyama, and N. Aiba. 2012. Nm23-H1 regulates contact inhibi-tion of locomotion, which is affected by ephrin-B1. J. Cell Sci. 125:4343–4353. http://dx.doi.org/10.1242/jcs.104083
Tao, Q., S. Nandadasa, P.D. McCrea, J. Heasman, and C. Wylie. 2007. G-protein-coupled signals control cortical actin assembly by controlling cadherin expression in the early Xenopus embryo. Development. 134:2651–2661. http://dx.doi.org/10.1242/dev.002824
Theveneau, E., and R. Mayor. 2012. Neural crest delamination and migration: from epithelium-to-mesenchyme transition to collective cell migration. Dev. Biol. 366:34–54. http://dx.doi.org/10.1016/j.ydbio.2011.12.041
Theveneau, E., and R. Mayor. 2013. Collective cell migration of epithelial and mesenchymal cells. Cell. Mol. Life Sci. 70:3481–3492. http://dx.doi.org/ 10.1007/s00018-012-1251-7
Theveneau, E., L. Marchant, S. Kuriyama, M. Gull, B. Moepps, M. Parsons, and R. Mayor. 2010. Collective chemotaxis requires contact-dependent cell polarity. Dev. Cell. 19:39–53. http://dx.doi.org/10.1016/j.devcel .2010.06.012
Theveneau, E., B. Steventon, E. Scarpa, S. Garcia, X. Trepat, A. Streit, and R. Mayor. 2013. Chase-and-run between adjacent cell populations promotes directional collective migration. Nat. Cell Biol. 15:763–772. http://dx.doi .org/10.1038/ncb2772
Thiery, J.P., H. Acloque, R.Y. Huang, and M.A. Nieto. 2009. Epithelial-mesenchymal transitions in development and disease. Cell. 139:871–890. http://dx.doi .org/10.1016/j.cell.2009.11.007
Umezu-Goto, M., Y. Kishi, A. Taira, K. Hama, N. Dohmae, K. Takio, T. Yamori, G.B. Mills, K. Inoue, J. Aoki, and H. Arai. 2002. Autotaxin has lyso-phospholipase D activity leading to tumor cell growth and motility by ly-sophosphatidic acid production. J. Cell Biol. 158:227–233. http://dx.doi .org/10.1083/jcb.200204026
Urh, M., and M. Rosenberg. 2012. HaloTag, a Platform Technology for Protein Analysis. Curr. Chem. Genomics. 6:72–78. http://dx.doi.org/10 .2174/1875397301206010072
Wheelock, M.J., Y. Shintani, M. Maeda, Y. Fukumoto, and K.R. Johnson. 2008. Cadherin switching. J. Cell Sci. 121:727–735. http://dx.doi.org/ 10.1242/jcs.000455
Grashoff, C., B.D. Hoffman, M.D. Brenner, R. Zhou, M. Parsons, M.T. Yang, M.A. McLean, S.G. Sligar, C.S. Chen, T. Ha, and M.A. Schwartz. 2010. Measuring mechanical tension across vinculin reveals regulation of focal adhesion dynamics. Nature. 466:263–266. http://dx.doi.org/10 .1038/nature09198
Groysman, M., I. Shoval, and C. Kalcheim. 2008. A negative modulatory role for rho and rho-associated kinase signaling in delamination of neural crest cells. Neural Dev. 3:27. http://dx.doi.org/10.1186/1749-8104-3-27
Hanahan, D., and R.A. Weinberg. 2011. Hallmarks of cancer: the next genera-tion. Cell. 144:646–674. http://dx.doi.org/10.1016/j.cell.2011.02.013
Houben, A.J., and W.H. Moolenaar. 2011. Autotaxin and LPA receptor signal-ing in cancer. Cancer Metastasis Rev. 30:557–565. http://dx.doi.org/ 10.1007/s10555-011-9319-7
Huang, R.Y., C.C. Wen, C.K. Liao, S.H. Wang, L.Y. Chou, and J.C. Wu. 2012. Lysophosphatidic acid modulates the association of PTP1B with N-cadherin/catenin complex in SKOV3 ovarian cancer cells. Cell Biol. Int. 36:833–841. http://dx.doi.org/10.1042/CBI20110687
Ishiyama, N., N. Tanaka, K. Abe, Y.J. Yang, Y.M. Abbas, M. Umitsu, B. Nagar, S.A. Bueler, J.L. Rubinstein, M. Takeichi, and M. Ikura. 2013. An autoin-hibited structure of -catenin and its implications for vinculin recruitment to adherens junctions. J. Biol. Chem. 288:15913–15925. http://dx.doi .org/10.1074/jbc.M113.453928
Kabla, A.J. 2012. Collective cell migration: leadership, invasion and segregation. J. R. Soc. Interface. 9:3268–3278. http://dx.doi.org/10.1098/rsif.2012.0448
Kam, Y., and V. Quaranta. 2009. Cadherin-bound -catenin feeds into the Wnt pathway upon adherens junctions dissociation: evidence for an inter-section between -catenin pools. PLoS ONE. 4:e4580. http://dx.doi .org/10.1371/journal.pone.0004580
Kasemeier-Kulesa, J.C., R. McLennan, M.H. Romine, P.M. Kulesa, and F. Lefcort. 2010. CXCR4 controls ventral migration of sympathetic pre-cursor cells. J. Neurosci. 30:13078–13088. http://dx.doi.org/10.1523/ JNEUROSCI.0892-10.2010
Kinoshita, E., E. Kinoshita-Kikuta, K. Takiyama, and T. Koike. 2006. Phosphate-binding tag, a new tool to visualize phosphorylated pro-teins. Mol. Cell. Proteomics. 5:749–757. http://dx.doi.org/10.1074/mcp .T500024-MCP200
Kuriyama, S., and R. Mayor. 2009. A role for Syndecan-4 in neural induction involving ERK- and PKC-dependent pathways. Development. 136:575–584. http://dx.doi.org/10.1242/dev.027334
Ladoux, B., and A. Nicolas. 2012. Physically based principles of cell adhesion mechanosensitivity in tissues. Rep. Prog. Phys. 75:116601. http://dx.doi .org/10.1088/0034-4885/75/11/116601
Lim, J., and J.P. Thiery. 2012. Epithelial-mesenchymal transitions: insights from development. Development. 139:3471–3486. http://dx.doi.org/10 .1242/dev.071209
Lin, M.E., D.R. Herr, and J. Chun. 2010. Lysophosphatidic acid (LPA) receptors: signaling properties and disease relevance. Prostaglandins Other Lipid Mediat. 91:130–138. http://dx.doi.org/10.1016/j.prostaglandins.2009.02.002
Liu, Y., R. Burkhalter, J. Symowicz, K. Chaffin, S. Ellerbroek, and M.S. Stack. 2012. Lysophosphatidic Acid disrupts junctional integrity and epithelial cohesion in ovarian cancer cells. J. Oncol. 2012:501492. http://dx.doi .org/10.1155/2012/501492
Los, G.V., and K. Wood. 2007. The HaloTag: a novel technology for cell imaging and protein analysis. Methods Mol. Biol. 356:195–208.
Mayor, R., and E. Theveneau. 2013. The neural crest. Development. 140:2247–2251. http://dx.doi.org/10.1242/dev.091751
Mills, G.B., and W.H. Moolenaar. 2003. The emerging role of lysophospha-tidic acid in cancer. Nat. Rev. Cancer. 3:582–591. http://dx.doi.org/10 .1038/nrc1143
Miyake, Y., N. Inoue, K. Nishimura, N. Kinoshita, H. Hosoya, and S. Yonemura. 2006. Actomyosin tension is required for correct recruitment of adher-ens junction components and zonula occludens formation. Exp. Cell Res. 312:1637–1650. http://dx.doi.org/10.1016/j.yexcr.2006.01.031
Monsoro-Burq, A.H., R.B. Fletcher, and R.M. Harland. 2003. Neural crest in-duction by paraxial mesoderm in Xenopus embryos requires FGF signals. Development. 130:3111–3124. http://dx.doi.org/10.1242/dev.00531
Moolenaar, W.H., L.A. van Meeteren, and B.N. Giepmans. 2004. The ins and outs of lysophosphatidic acid signaling. Bioessays. 26:870–881. http://dx.doi.org/10.1002/bies.20081
Nandadasa, S., Q. Tao, N.R. Menon, J. Heasman, and C. Wylie. 2009. N- and E-cadherins in Xenopus are specifically required in the neural and non-neural ectoderm, respectively, for F-actin assembly and morphogenetic movements. Development. 136:1327–1338. http://dx.doi.org/10.1242/ dev.031203
Nguyen, D.X., P.D. Bos, and J. Massagué. 2009. Metastasis: from dissemina-tion to organ-specific colonization. Nat. Rev. Cancer. 9:274–284. http://dx.doi.org/10.1038/nrc2622
on March 31, 2016
jcb.rupress.orgD
ownloaded from
Published July 7, 2014
127LPA triggers N-cadherin endocytosis in neural crest • Kuriyama et al.
Wirtz, D., K. Konstantopoulos, and P.C. Searson. 2011. The physics of cancer: the role of physical interactions and mechanical forces in metastasis. Nat. Rev. Cancer. 11:512–522. http://dx.doi.org/10.1038/nrc3080
Xiang, S.Y., S.S. Dusaban, and J.H. Brown. 2013. Lysophospholipid receptor activation of RhoA and lipid signaling pathways. Biochim. Biophys. Acta. 1831:213–222. http://dx.doi.org/10.1016/j.bbalip.2012.09.004
Yonemura, S., Y. Wada, T. Watanabe, A. Nagafuchi, and M. Shibata. 2010. α-Catenin as a tension transducer that induces adherens junction develop-ment. Nat. Cell Biol. 12:533–542. http://dx.doi.org/10.1038/ncb2055
on March 31, 2016
jcb.rupress.orgD
ownloaded from
Published July 7, 2014