In Vitro Medicinal Properties of Novel Compounds from Croton ...
154
In Vitro Medicinal Properties of Novel Compounds from Croton steenkampianus By Adeboye Mutiu Adelekan Submitted in partial fulfillment of the requirements for the degree of DOCTOR OF PHILOSOPHIAE: PLANT SCIENCE Department of Plant Science Faculty of Natural and Agricultural Sciences University of Pretoria Promoter: Prof JJM Meyer 2009 © University of Pretoria
-
Upload
khangminh22 -
Category
Documents
-
view
0 -
download
0
Transcript of In Vitro Medicinal Properties of Novel Compounds from Croton ...

In Vitro Medicinal Properties of Novel Compounds from Croton
steenkampianus
By Adeboye Mutiu Adelekan
Submitted in partial fulfillment of the requirements for the degree of
DOCTOR OF PHILOSOPHIAE: PLANT SCIENCE
Department of Plant Science
Faculty of Natural and Agricultural Sciences
University of Pretoria
Promoter: Prof JJM Meyer
2009
©© UUnniivveerrssiittyy ooff PPrreettoorriiaa

I declare that the thesis/dissertation, which I hereby submit for the degree PHD
Plant Science at the University of Pretoria, is my own work and has not
previously been submitted by me for a degree at this or any other tertiary
institution.
SIGNATURE:
Date: 26/01/2009

iii
ACKNOWLEDGEMENTS
Glory be to God almighty for His grace and mercy over me throughout the
study.
I also wish to thank the following people for the role they have played in the
course of the research:
Prof JJM Meyer for the assistance, guidance and support given to me.
Prof AI Louw for his contribution.
The National Research Foundation and University of Pretoria for their
financial support.
Dr Ahmed Hussein for his help in the isolation and identification of the
compounds and for arranging antiplasmodial bioassay.
Dr Adrian Basson for help with the cytotoxicity testing.
Dr Benedict Bapela for assistance with the TB assay.
Dr Emmanuel Tshikalange for help with anti-HIV assay.
Prof P Smith (University of Cape Town), Bruce Tshilamulele and Luis David
(Smithsonian Tropical Research Institute, Panama) for help with the malaria
bioassays.
Eric Palmer, Department of Chemistry, University of Pretoria for the
assistance with the NMR.
Prof Peet van Roogen for assistance with x-ray crystallography.
My wife Tsholofelo D Adelekan for her support and encouragement.
All my friends and well-wishers.

i
SUMMARY
In Vitro Medicinal Properties of Novel Compounds from Croton
steenkampianus
by
Adeboye Mutiu Adelekan
Promoter: Prof JJM Meyer
Department of Plant Science
Doctor of Philosophiae
The effect of infectious diseases on the population in the developing countries
is of utmost concern. Malaria, tuberculosis (TB) and human immunodeficiency
virus (HIV) are the three major infectious disease threats. They account for
approximately half of the mortality caused by infectious diseases, which is
almost half of the mortality in the developing countries. With no vaccine likely
in the foreseeable future, drugs remain the best means of controlling
infectious diseases. In the industrialized nations at the present time, some
50% of all prescribed drugs are derived or synthesized from natural products
(animals, marine species, plants and micro-organisms). It has been estimated
that plants are the most important source of medicine for more than 80% of
the world’s population. As previous work on the leaves of Croton
steenkampianus gave promising results and revealed that it still contained
bioactive compounds that could be isolated, it was chosen for further work.
The bioassay guided fractionation of the ethanol crude extract using silica and
Sephadex column chromatography resulted in the isolation of six compounds:
three flavoniods (quercetin, tamarixetin and eriodictyol), one new indane (1)
(2,6-dimethyl-1-oxo-4 indanecarboxylic acid) and two new diterpenes
(steenkrotin A (2) and steenkrotin B (3)) with novel skeletons. The structure of
the compounds was determined using NMR, IR, UV, MS and X-ray
crystallography.

ii
Ethanol crude extract, quercetin, steenkrotin A, steenkrotin B and the indane
were tested against four strains of Plasmodium falciparum (D6, D10, Dd2 and
W2). Quercetin showed good antiplasmodial activity against the D10 and Dd2
strains. The antiplasmodial activity of steenkrotin A and crude extract were
moderate. The antimalarial activity of steenkrotin A in particular is promising,
as it showed more activity against resistant strains. The indane, and
steekrotin B were not active against the strains of P. falciparum used (IC50 >
10 µg/m). The IC50 of the compounds improved when they were combined
with chloroquine. However, the IC50 of chloroquine was still the lowest. The
compounds showed moderate bioactivity against Bacillus cereus and
Escherichia coli. The three new compounds (1, 2 and 3) tested against
Mycobacterium (H37Rv) were not active (IC50 > 10 µg/ml). The indane (1)
showed anti-HIV activity at 50 µg/ml against reverse transcriptase. The
antioxidant activity of the compounds tested ranged from weak to excellent
(>280.00 µg/ml for compound 1 and 2 to 0.05 µg/ml for quercetin).
The cytotoxicity of the compounds and extract were determined against Vero
cells lines. Their IC50 values ranged from 34.0 to 305.9 µg/ml, which is higher
and better than that of chloroquine. The IC50 values obtained are: chloroquine
(25.0), quercetin (33.6), steenkrotin A (35.0), ethanol extract (45.0),
tamarixetin (53.8), indane (248.2) and steenkrotin B (305.9).

iv
CONTENTS
Summary……………………………………………………………………………….i Acknowledgements…………………………………………………………………..iii List of figures…………………………………………………………………………vii List of tables…………………………………………………………………………..xi List of abbreviations…………………………………………………………………xii
Chapter 1: Introduction
1.1 Medicinal plants…………………………………………………………….. 3
1.2 Traditional medicine………………………………………………………... 4
1.2.1 African traditional medicine……………………………………… 5
1.2.2 American traditional medicine (North, Central and South)…... 6
1.2.2.1 North America…………………………………………... 6
1.2.2.2 Central and South America…………………………… 7
1.2.3 Australian and Southeast Asian medicine………………….….. 7
1.2.4 Ayurvedic medicine (Indian traditional medicine)……………... 8
1.2.5 Chinese traditional medicine……………………………………. 9
1.2.6 European medicine……………………………………..………... 10
1.2.7 Classical Arabic and North African traditional medicine……… 12
1.3 Drug discovery from medicinal plants……………………………………. 15
1.4 Synthesis and role of plant secondary metabolites……………………... 18
1.4.1 Terpenes………………………………………………………...... 19
1.4.1.1 Monoterpenes………………………………..…………. 20
1.4.1.2 Sesquiterpenes…………………………………………. 20
1.4.1.3 Diterpenes………………………………………………. 21
1.4.1.4 Triterpenes………………………………...……..…….. 21
1.4.2 Phenolic compounds…………………………………………….. 21
1.4.2.1 Flavonoids………………………………………………. 22
1.4.3 Nitrogen containing compounds…………………...………....... 23
1.4.3.1 Alkaloids…………………………...………………..…... 24
1.4.3.2 Cyanogenic glycosides………………………………… 25
1.5 Infectious diseases…………………………………………………………. 25
1.5.1 Malaria…………………………………………………………………….. 26
1.5.2 Human immunodeficiency virus………………………………………… 28

v
1.5.3 Tuberculosis………………………………………………………………. 30
1.6 Antioxidant activity ...………………………………………………………. 31
1.7 Croton steenkampianus……………………………………………………. 32
1.8 Objectives…………………………………………………………………… 33
1.9 Scope of the thesis…………………………………………………………. 33
1.10 Hypothesis……………….……………………………………………...…. 34
1.11 References…………………………………………………………..…….. 35
Chapter 2: Bioassay guided fractionation of the crude extract from
Croton steenkampianus
2.1 Introduction………………………………………………………………….. 43
2.2 Materials and Methods…………………………………………………….. 43
2.2.1 Collection of plant materials…………………………………….. 43
2.2.2 Methods…………………………………………………………… 44
2.2.2.1 Preparation of the crude extract…………...…………. 44
2.2.2.2 Bacterial culturing and antibacterial testing…………. 44
2.2.2.3 Isolation and identification of compounds…………… 45
2.2.2.4 Structure elucidation…………………………………… 46
2.3 Results and Discussion………………………………...………….………. 48
2.4 References……………………………………………………………..…… 75
Chapter 3: Antiplasmodial bioactivity of crude extract and isolated
compounds
3.1 Introduction…………………………………………………………………..
79
3.2 Methods…………………….……………………………………………….. 80
3.2.1 Culture medium and washed human erythrocytes……………. 80
3.2.2 In vitro culturing of malaria parasites…………………………… 80
3.2.3 Giemsa stained thin blood smear preparations..………........... 81
3.2.4 In vitro synchronisation of malaria parasites………..…………. 81
3.2.5 Preparation of microculture plates…………………….………... 82
3.2.6 Determination of antiplasmodial activity with the Malstat
method……………………………………………………………………
82

vi
Chapter 4: Antibacterial and antioxidant activity of isolated compounds
Chapter 5: Anti-HIV activity of the isolated compounds
3.2.7 Determination of antiplasmodial activity with the
microfluorimetric method………………………………………………..
83
3.2.7.1 Fluorimetric susceptibility test……...…………………. 83
3.2.7.2 Synergistic activity…………………………….............. 84
3.3 Results and Discussion……………..……………………………….......... 85
3.4 References…...…………………………………………………….……….. 87
4.1 Introduction…………………………………………………………………
91
4.2 Materials and Methods…………………………………………………… 92
4.2.1 Qualitative determination of antibacterial activity……..…………….. 92
4.2.2 Quantitative determination of antibacterial activity……...………….. 92
4.2.3 Antimycobacterial testing……………………….....…………… 93
4.2.4 Antioxidant activity……………………………………………… 94
4.2.4.1 Qualitative assay……….....…….……………. 94
4.2.4.2 Quantitative assay………………….………… 94
4.3 Results and Discussion…………………………………………………... 95
4.4 References…...……………………………………………………………. 100
5.1 Introduction……………………………………………………………….... 104
5.1.1 HIV in South Africa……………………………………………… 105
5.1.2 Anti-HIV compounds……………………………………………. 106
5.1.3 Reverse transcriptase (RT)……………………………...…….. 107
5.1.4 Replication of HIV……………………………………...……….. 107
5.2 Materials and Method……………………………………...……………... 110
5.2.1 Materials……………………………………………..…………... 110
5.2.2 Method…………...……………………………………..……….. 110
5.3 Results.…………………………….………..…………………….……….. 111
5.4 Discussion………………………….……………………………………… 111
5.5 References…...……………………………………………………………. 113

vii
Chapter 6: Cytotoxicity of the isolated compounds
Chapter 7: General discussion and conclusion
Appendix
6.1 Introduction………………………………………………………………....
117
6.2 Materials and Method……………………………………………...……... 118
6.2.1 Plant materials……………………………………...…………… 118
6.2.2 Preparation of extract and isolation of the compounds…..…. 118
6.2.3 Cell culture…………………………………………..……...….... 118
6.2.4 Toxicity screening (XTT viability assay)…..……..……..…….. 119
6.3 Results and Discussion……….………..…………………….…………... 120
6.4 References…...……………………………………………………….…… 124
7.1 Introduction……………………………………………………………..….. 127
7.2 Bioassay guided fractionation of the ethanol crude extract and
isolated compounds…………………………………………………………....
127
7.3 Biological evaluation of the isolated compounds ...………...…………. 128
7.4 References…...……………….……………………………………..….…. 130
Appendix 1 Paper published from thesis……………………………………. 132

viii
LIST OF FIGURES
Chapter 1
Figure 1.1 The structure of artemisinin and arteether…………………………... 16
Figure 1.2 Schematic representation of a typical medicinal plant drug
discovery process and development………………………………………………
17
Figure 1.3 Main pathways leading to secondary metabolites …. .……………. 19
Figure 1.4 Monoterpenes commonly found in essential oils…………………… 20
Figure 1.5 The pathways of secondary metabolites derived from precursors
in the shikimate pathway……………………………………………………………
22
Figure 1.6 Basic structures of some flavonoids…………………………………. 23
Figure 1.7 Structures of some alkaloids………………. ………………………… 24
Figure 1.8 Global malaria distribution…………………………………………….. 27
Figure 1.9 Distribution of malaria in Africa……………………………………….. 27
Figure 1.10 Croton steenkampianus leaves...…………………………………… 33
Chapter 2 Figure 2.1 Schematic representation of the bioassay guided isolation of
active compounds from C. steenkampianus ……...……….. …………………..
47
Figure 2.2 Typical results obtained from the pooled fractions from the silica
column tested for antibacterial activity………..…………………………………..
48
Figure 2.3 TLC plates showing antibacterial activity of pure compounds…….. 49
Figure 2.4 Structures of isolated compounds……………………………………. 50
Figure 2.5 1H-NMR spectrum of tamarixetin……………………………………... 52
Figure 2.6 1H-NMR spectrum of quercetin………………………………………. 53
Figure 2.7 13C-NMR spectrum of quercetin………………………………….…... 53
Figure 2.8 1H-NMR spectrum of eriodictyol……………………………………… 54
Figure 2.9 1H-NMR spectrum of indane………………………………………….. 55
Figure 2.10 13C-NMR spectrum of indane……………………………………….. 55
Figure 2.11 COSY spectrum of indane…………………………………………… 56
Figure 2.12 HMQC spectrum of indane………………………………………….. 56
ix
Figure 2.13 HMBC spectrum of indane………………………………………….. 57
Figure 2.14 NOESY spectrum of indane……………………………………….... 57
Figure 2.15 HMBC correlation of partial structure………………………………. 58
Figure 2.16 1H-NMR spectrum of steenkrotin A……………………………….... 62
Figure 2.17 13C-NMR spectrum of steenkrotin A……………………………….. 63
Figure 2.18 COSY spectrum of steenkrotin A…………………………………… 63
Figure 2.19 NEOSY spectrum of steenkrotin A………………………………..... 64
Figure 2.20 DEPT 135 spectrum of steenkrotin A………………………………. 64
Figure 2.21 MS data of spectrum of steenkrotin A……………………………… 65
Figure 2.22 X-ray structure of steenkrotin A……………………………………... 65
Figure 2.23 1H-NMR spectrum of steenkrotin B…………………………………. 68
Figure 2.24 13C-NMR spectrum of steenkrotin B……………………………….. 69
Figure 2.25 DEPT 135 spectrum of steenkrotin B………………………………. 69
Figure 2.26 COSY spectrum of steenkrotin B…………………………………… 70
Figure 2.27 HMQC spectrum of steenkrotin B…………………………………... 70
Figure 2.28 HMBC spectrum of steenkrotin B…………………………………… 71
Figure 2.29 1H-NMR spectrum of steenkrotin B acetate……………………….. 71
Figure 2.30 13C-NMR spectrum of steenkrotin B acetate………………………. 72
Figure 2.31 COSY spectrum of steenkrotin B acetate…………………………. 72
Figure 2.32 HSQC spectrum of steenkrotin B acetate…………………………. 73
Figure 2.33 HMBC spectrum of steenkrotin B acetate…………………..……... 73
Figure 2.34 NEOSY spectrum of steenkrotin B acetate………………………... 74
Chapter 4
Figure 4.1 Bioautogram of the indane in lanes 1-7……………………………. 95
Figure 4.2 Qualitative antioxidant assay………………………………………... 97
Figure 4.3 Quantitative antioxidant assay………………………………………. 97
Figure 4.4 Antioxidant activities of the crude extract and compounds…….… 99

x
Chapter 5
Chapter 6
Figure 5.1 Human immunodeficiency virus…………………………………….. 105
Figure 5.2 The HIV replication cycle……………………………………………. 108
Figure 5.3 The immature and mature forms of the HIV……....………….…… 109
Figure 6.1 The reduction of yellow tetrazolium salt MTT to purple formazan. 118
Figure 6.2 Sample plate design…………………………………………………. 119
Figure 6.3 Activity of the isolated compounds on the growth of Vero cells
in µg/ml ………………………………………………………………………….…
121

xi
LISTS OF TABLES
Table1.1 Botanical drugs used in traditional medicine which led to useful
modern drugs…………………………………………………………………...
14
Table 2.1 NMR spectroscopic data for compound 1.................................. 51
Table 2.2 NMR spectroscopic data for compounds 2-4………………….. 60
Table 2.3 Significant NOE data of compounds 2-4………………………… 61
Table 3.1 Antiplasmodial activity of compounds and extract……………... 85
Table 4.1 MIC of compounds against B. cereus and E. coli……………… 96
Table 4.2 Quantitative antioxidant activities of the ethanol crude extract
and the isolated compounds………………………………………………….
97
Table 6.1 Cytotoxicity of the crude ethanol extract and compounds
isolated from C. steenkampianus on Vero cells…………………………….
120

xii
LIST OF ABBREVIATIONS
13C-NMR: Carbon nuclear magnetic resonance
1H-NMR: Proton nuclear magnetic resonance
AIDS: Acquired immune deficiency syndrome
APAD: 3-Acetylpyrimidine adenine dinucleotide
COSY: Correlated spectroscopy
DEPT: Distortionless enhancement by polarization transfer
DHFR: Dihydrofolate reductase
DHODase: Dihydroorotate dehydrogenase
DHPS: Dihydropteroate synthase
DMSO: Dimethylsufoxide
DPP: Dimethylallyl pyrophosphate
EDTA: Ethylenediaminotetra-acetic acid
FPIX: Ferriprotoporphyrin IX
HEPES: N-2-hydroxyethylpiperazine-N-2-ethane sulfonic acid
HIV: Human immunodeficiency virus
HMBC: Heteronuclear multiple bond correlation
HMQC: Heteronuclear multiple quantum correlation
HSQC: Heteronuclear singlequantum coherence
IPP: Isopentenyl pyrophosphate
IR: Infrared
LD50: 50% Lethal dose
MS: Mass spectroscopy
MTCT: Mother-to-child transmission
MTT: 3-[4, 5-Dimethylthiazol-2-yl]-2, 5-diphenyltetrazolium bromide
NBT: Nitroblue tetrazolium
NMR: Nuclear magnetic resonance
NOESY: Nuclear overhauser effect spectroscopy
NSP: National strategic plan
PBS: Phosphate buffer saline
PEP: Post-exposure prophylaxis
PF: Potentiating factor

xiii
SP: Sulphadoxine-pyrimethamine
STD: Sexual transmitted disease
STI: Sexual transmitted infection
TLC: Thin layer chromatography
TMS: Tetramethylsilane
TRIS: N-tris (hydroxymethyl) aminomethane
UNAIDS: Joint United Nations programme on HIV/AIDS
UNGASS: United Nations general assembly session on HIV/AIDS
UNICEF: United Nations children’s fund
USAID: United States agency for international development
UV: Ultraviolet
WHO: World health organization

1
CHAPTER 1 INTRODUCTION 1.1 Medicinal plants…………………………………………………………….. 3
1.2 Traditional medicine………………………………………………………… 4
1.2.1 African traditional medicine……………………………………… 5
1.2.2 American traditional medicine (North, Central and South)…... 6
1.2.2.1 North America…………………………………………... 6
1.2.2.2 Central and South America……………………………. 7
1.2.3 Australian and Southeast Asian medicine………………….….. 7
1.2.4 Ayurvedic medicine (Indian traditional medicine)……………... 8
1.2.5 Chinese traditional medicine…………………………………….. 9
1.2.6 European medicine……………………………………..………... 10
1.2.7 Classical Arabic and North African traditional medicine……… 12
1.3 Drug discovery from medicinal plants…………………………………….. 15
1.4 Synthesis and role of plant secondary metabolites……………………... 18
1.4.1 Terpenes………………………………………………………...... 19
1.4.1.1 Monoterpenes………………………………..…………. 20
1.4.1.2 Sesquiterpenes…………………………………………. 20
1.4.1.3 Diterpenes………………………………………………. 21
1.4.1.4 Triterpenes………………………………………..…….. 21
1.4.2 Phenolic compounds……………………………………………... 21
1.4.2.1 Flavonoids………………………………………………. 22
1.4.3 Nitrogen containing compounds…………………...…………… 23
1.4.3.1 Alkaloids…………………………...………………..…... 24
1.4.3.2 Cyanogenic glycosides………………………………… 25
1.5 Infectious diseases…………………………………………………………. 25
1.5.1 Malaria……………………………………………………………………... 26
1.5.2 Human immunodeficiency virus………………………………………… 28
1.5.3 Tuberculosis………………………………………………………………. 30
1.6 Antioxidant activity………………………………………………………….. 31
1.7 Croton steenkampianus……………………………………………………. 32
1.8 Objectives……………………………………………………………………. 33
1.9 Scope of the thesis…………………………………………………………. 33

2
1.10 Hypothesis………………………………………………………………..... 34
1.11 References…………………………………………………………..…….. 35

3
CHAPTER 1 INTRODUCTION
1.1 Medicinal plants
Throughout the ages, humans have relied on nature for their basic needs, for
the production of food, shelter, clothing, transportation, fertilizers, flavours and
fragrances, and medicines (Cragg and Newman, 2005). Plants have formed
the basis of sophisticated traditional medicine systems that have been in
existence for thousands of years and continue to provide mankind with new
remedies. Although some of the therapeutic properties attributed to plants
have proven to be erroneous, medicinal plant therapy is based on the
empirical findings of hundreds and probably thousands of years of use. The
first records, written on clay tablets in cuneiform, are from Mesopotamia and
date from about 2 600 BC (Heinrich et al., 2004). Among the substances that
were used are oils of Cedrus species (cedar) and Cupressus sempervirens
(cypress), Glycyrrhiza glabra (licorice), Commiphora species (myrrh) and
Papaver somniferum (poppy juice), all of which are still in use today for the
treatment of ailments ranging from coughs and colds to parasitic infections
and inflammation. In ancient Egypt, bishop’s weed (Ammi majus) was
reported to be used to treat vitiligo, a skin condition characterized by a loss of
pigmentation (Staniszewska, et al., 2003; Beissert and Schwarz, 2002). More
recently, a drug (β-methoxypsoralen) has been produced from this plant to
treat psoriasis and other skin disorders, as well as T-cell lymphoma (Beissert
and Schwarz, 2002).
The interest in nature as a source of potential chemotherapeutic agents
continues. Natural products and their derivatives represent more than 50% of
all the drugs in clinical use in the world today. Higher plants contribute no less
than 25% of the total (Farnsworth et al., 1985; Cragg and Newman, 2005). In
the last 40 years, many potent drugs have been derived from flowering plants;
including for example Dioscorea species (diosgenin), from which all
anovulatory contraceptive agents have been derived; reserpine and other anti-
hypertensive and tranquilizing alkaloids from Rauwolfia species; pilocarpine to
treat glaucoma and ‘dry mouth’, derived from a group of South American trees

4
(Pilocarpus spp.) in the Citrus family; two powerful anti-cancer agents from the
Rosy Periwinkle (Catharanthus roseus); laxative agents from Cassia sp. and a
cardiotonic agent to treat heart failure from Digitalis species (Newman et al.,
2000).
Approximately half (125 000) of the world’s flowering plant species are found
in the tropical forests. Tropical rain forests continue to support a vast reservoir
of potential drug species. They continue to provide natural product chemists
with invaluable compounds as starting points for the development of new
drugs. The potential for finding more compounds is enormous as to date only
about 1% of tropical species have been studied for their pharmaceutical
potential (Cragg and Newman, 2005). This proportion is even lower for
species confined to the tropical rain forests. To date about 50 drugs have
come from tropical plants. The probable undiscovered pharmaceuticals for
modern medicine has often been cited as one of the most important reasons
for protecting tropical forests. Therefore the high annual extinction rate is a
matter for concern.
Although discovered through serendipitous laboratory observation, three of
the major sources of anti-cancer drugs on the market or completing clinical
trials are derived from North American plants used medicinally by native
Americans: the papaw (Asimina spp); the western yew tree (Taxus brevifolia),
effective against ovarian cancer and the mayapple (Podophyllum peltatum)
used to combat leukaemia, lymphoma lung and testicular cancer (Gurib-
Fakim, 2006).
1.2 Traditional medicine
Plants have been utilized as medicines for thousands of years (Samuelsson,
2004). These medicines initially took the form of crude drugs such as
tinctures, teas, poultices, powders, and other herbal formulations (Balick and
Cox, 1997; Samuelsson, 2004). The specific plants to be used and the
methods of application for particular ailments were passed down through oral
tradition. Eventually information regarding medicinal plants was recorded in
herbal phamacopoeias (Balunas, 2005).

5
Modern allopathic medicine has its roots in ancient medicine, and it is likely
that many important new remedies will be discovered and commercialized in
the future, as it has been till now, by following the leads provided by traditional
knowledge and experiences. While European traditions are particularly well
known and have had a strong influence on modern western pharmacognosy,
almost all societies have well-established herbal traditions, some of which
have hardly been studied at all. The study of these traditions will not only
provide an insight into how the field has developed but it is also a fascinating
example of our ability to develop a diversity of cultural practices.
In some countries, the use of medicinal plants is often associated with
witchcraft and superstition, because people do not have the scientific insight
to explain and predict the curative action of plants. One example of such an
irrational concept is the Doctrine of Signatures, elements of which are found in
many of the healing cultures of the world (Boehme, 1982). It is based on the
assumption that the appearance of plants may give clues to their medicinal
properties—it is interpreted as God’s signature on the plant. Red juice and
sap, for example, is associated with blood and menstrual ailments; yellow
flowers with bile and jaundice; the human shape of certain roots with the
female form of fertility and so on. Sometimes this concept however, worked:
Chelidonium majus, contains yellow flowers and a yellow alkaloid containing
latex, and has been used successfully to treat jaundice (Gurib-Fakim, 2006).
1.2.1 African traditional medicine
African traditional medicine is ancient and perhaps the most diverse of all
medicinal systems. Africa is considered to be the cradle of humankind, with a
rich biological and cultural diversity and marked regional differences in healing
practices. Unfortunately, even today the systems of medicines are poorly
recorded. The documentation of medicinal uses of African plants is becoming
increasingly urgent because of the rapid loss of the natural habitats of these
plants due to human activities. The African continent is reported to have one
of the highest rates of deforestation in the world. This loss is all the greater
because the continent has a high rate of endemism, with Madagascar topping
the list at 82% (Green and Sussman, 1990).

6
African traditional medicine in its varied forms is holistic, involving both the
body and the mind. The healer typically diagnoses and treats the
psychological basis of an illness before prescribing medicines to treat the
symptoms. Well known African medicinal plants include Acacia senegal (gum
arabic), Agathosma betulina (buchu), Aloe ferox (Cape aloes), Aloe vera
(north African origin), Artemisia afra (African wormwood), Aspalanthus linearis
(rooibos tea), Boswellia sacra (frankincense), Catha edulis (khat),
Commiphora myrrha (myrrh), Harpagophytum procumbens (devil’s claw),
Hibiscus sabdariffa (hibiscus, roselle), Hypoxis hemerocallidea (African
potato), Prunus africana (African cherry). Madagascar has contributed
Catharanthus roseus (rosy periwinkle) and has the potential of contributing
more in view of the diversity of the flora and fauna (Newman et al., 2000;
Neuwinger, 2000).
1.2.2 American traditional medicine (North, Central and South)
1.2.2.1 North America
In the USA, just like in many other cultures, the indigenous healer or Shaman
treated illnesses by addressing both the physical and spiritual dimension of
diseases. These Shamanistic ceremonies involve chanting, dancing and other
rituals aimed at expelling evil forces so that the patient or the community as a
whole can be healed (Fabricant and Farnsworth, 2001). Early settlers learnt
from native practices and they eventually adopted many of the herbal
remedies, which later formed the basis of the early United States
Pharmacopoeia. Among the well known medicinal plants of the United States
are Echinacea (Echinacea purpurea) and Goldenseal (Hydrastis canadensis).
During most of the 20th century, herbs or botanicals have been regarded with
skepticism and the practice of herbal medicine went into decline. Plants were
viewed mainly as a potential source of pure chemical compounds for the
development of medicine. In recent years, herbs and botanicals have become
very popular in the USA and Canada but they are still considered as
nutritional supplements rather than medicines in their own rights (Pieroni et
al., 2000; Heinrich et al., 2004; Gurib-Fakim, 2006).

7
1.2.2.2 Central and South America Just like Africa, Central and South American countries have rich and diverse
healing cultures, which are poorly known and have not been properly
recorded. They will no doubt be a source of new herbal remedies in the years
to come. South and Central America have made enormous contributions to
agriculture and a large number of food crops such as maize, potatoes,
tomatoes, pumpkins, cassava, peanuts and sweet potato originate from there.
Traditional American Indian medicinal herbs are used extensively but the
influence of Spanish, European, East Asian and African medical systems is
obvious. Notable examples of medicinal plants are: Cinchona pubescens
(peruvian bark), Erythroxylum coca (coca), Ilex paraguariensis (maté),
Myroxylon balsamum (tolu balsam), Paullinia cupana (guarana), Peumus
boldus (boldo), Psidium guajava (guava), Spilanthes acmella (Brazilian cress),
Tabebuia impetiginosa (lapacho) and Uncaria tomentosa (cat’s claw)
(Fabricant and Farnsworth, 2001; Gurib-Fakim, 2006).
1.2.3 Australian and Southeast Asian medicine
This region has witnessed a resurgence of interest in traditional medicine and
many countries now promote research into medicinal plants as a potential
source of new remedies. The Aborigines had a complex healing system but
much of the traditional knowledge in Australia was lost before it could be
systematically recorded. In contrast, many healing practices such as those of
Malaysia, Thailand, Vietnam, New Zealand, Borneo, and the Polynesian
Islands remain intact and are being recorded and developed. A strong
Chinese influence is being observed in most countries. Among the well-known
medicinal products originating from this region are Croton tiglium (purging
croton), Duboisia hopwoodii (pituri), Eucalyptus globulus (bluegum),
Melaleuca alternifolia (tea tree), Myristica fragrans (nutmeg and Mace), Piper
methysticum (kava kava), Strychnos nux-vomica (strychnine), Styrax benzoin
(benzoin) and Syzygium aromaticum (cloves) (Maher, 1999; Kapoor, 1990;
Newman, 2000; Gurib-Fakim, 2006).

8
1.2.4 Ayurvedic medicine (Indian traditional medicine)
Ayurveda is perhaps, the most ancient of all medicinal traditions. It is probably
older than traditional Chinese medicine and is considered to be the origin of
systemized medicine. It is actually a practical and holistic set of guidelines to
maintain balance and harmony in the system. Dioscorides (who influenced
Hippocrates) is thought to have taken many of his ideas from India. Ancient
Hindu writings on medicine contain no references to foreign medicines
whereas Greek and Middle Eastern texts refer to concepts and drugs of Indian
origin (Magner, 1992; Chopra, 2000).
Ayurveda is derived from the Indian words ‘Ayar’ (life) and ‘veda’ (knowledge
or science) and hence means the science of life. Following the system would
help ensure a long life, which is considered to be the instrument for achieving
righteousness (dharma), wealth (artha) and happiness (sukha).
In India, knowledge and wisdom have been passed on from one generation to
the next through songs and poems, which scholars and physicians had to
learn and recite by heart. The Veda is an ancient text in four parts (Rig Veda,
Sama Veda, Yajur Veda and Atharva Veda), the earliest of which date back to
2 000 years BC. The principles of Ayurvedic medicine and the medicinal uses
of plants are contained in thousands of poetic hymns in the Rig Veda. The first
school to teach Ayurvedic medicine was at the University of Banaras in 500
BC where the great Samhita (or encyclopedia of medicine) was written.
Another great enclyclopedia was written 700 years later, and these two
together form the basis of the Ayurveda (Chopra, 2000).
Ayurveda is similar to Galenical medicine in that it is based on body humours
(dosas) and the inner life force (prana) that is believed to maintain digestion
and mental activity. The living and the non-living environment, including
humans, are considered to be elements: earth (prithvi), water (jada), fire
(tejac), air (vaju) and space (akasa). For an understanding of these traditions,
the concept of impurity and cleansing is also essential. Illness is the
consequence of imbalance between the various elements and it is the goal of
the treatment to restore this balance (Magner, 1992).

9
Famous Ayurvedic medicinal plants include Azadirachta indica (neem),
Centella asiatica (gotu kola), Cinnamomum camphora (camphor), Elettaria
cardamomum (ela or cardamomum), Rauwolfia serpentina (Indian snake
root), Santalum album (sandalwood), Terminalia species (myrobolan) and
Withania somnifera (aswargandha) (Kapoor, 1990; Magner, 1992; Padua de,
1999; Gurib-Fakim, 2006).
1.2.5 Chinese traditional medicine
The civilizations of China and India were flourishing when only modestly
sophisticated cultures were developing in Europe. Expectedly writings on
medicinal plants and the aesthetics of vegetation were numerous. This
ancient system of medicine, believed to be more than 5 000 years old, is
based on two separate theories about the natural laws that govern good
health and longevity, namely yin and yang, and the five elements (wu xing)
(Kapoor, 1990; Patwardhan, 2005).
The legendary emperor Shen Nung discussed medicinal herbs in his works—
which were probably written 2 500 years B.P. (Before Present) and not the
traditional date of 3 500 B.P. The Traditional Chinese medicine was
systematized and written between 100 and 200 BC (Before Christ). The most
complete reference to Chinese herbal prescription is the Modern Day
Encyclopedia of Chinese materia medica published in 1977. It lists nearly 6
000 medicines out of which 4 800 are of plant origin (Magner, 1992).
Treatment is based on symptoms and on a pattern of imbalances, often
detected by taking the pulse or observing the patient’s tongue. Warming or hot
herbs, such as ginger and cinnamon, are used to treat ailments associated
with cold symptoms such as cold hands, abdominal pains and indigestion
(Kapoor, 1990; Padua de, 1999).
In common with Western and African traditional medicines, Chinese herbs are
usually given in fixed mixtures or formulas of up to 20 herbs, carefully
prepared according to traditional recipes. There are hundreds such recipes
being used alongside with Western medicines. As in other healing cultures,

10
traditional recipes are used preferentially against chronic illnesses while acute
or serious illnesses are cured by Western medicines.
The spread of traditional Chinese medicine to most continents has
undoubtedly contributed to the current popularity of herbal medicines
throughout the world. Examples of famous Chinese medicinal plants are
Angelica polymorpha var. sinensis (dang gui), Artemisia annua (qing hao),
Ephedra sinica (ma huang), Paeonia lactiflora (bai shao yao), Panax ginseng
(ren shen) and Rheum palmatum (da huang) (Magner, 1992; Padua de, 1999;
Gurib-Fakim, 2006).
1.2.6 European medicine
In the ancient Western world, the Greeks contributed significantly to the
rational development of the use of herbal drugs. However, the European
healing system is said to have originated with Hippocrates (460–377 BC) and
Aristotle (384–322 BC), whose own ideas were rooted in ancient beliefs from
India and Egypt. The philosopher and natural scientist, Theophratus (~300
BC), in his History of Plants, dealt with the medicinal qualities of herbs, and
noted the ability to change their characteristics through cultivation.
Dioscorides, a Greek physician (100 AD), during his travels with Roman
armies, recorded the collection, storage and the use of medicinal herbs and
Galen (130–200 AD) who practiced and taught pharmacy and medicine in
Rome, published no less than 30 books on these subjects, and is well known
for his complex prescriptions and formulas used in compounding drugs,
sometimes containing dozens of ingredients (“galenicals”) (Weiher et al.,
1999).
Greek and Roman medicine was based on the belief that the world is
composed of four elements—earth, wind, fire and water. Each of these has its
corresponding humours, linked to the four vital fluids in the body. The four
humours—blood, phlegm, black bile and yellow bile, influence both health and
temperament (respectively sanguine, phlegmatic, melancholic and choleric).
In order to restore balance, drastic measures such as blood letting (reducing
excess blood) and purging (to remove excess black bile) was used. The four

11
humours were also associated with cold, heat, dampness and dryness and
each of these had a corresponding range of cold, hot, damp or dry herbs that
were supposedly able to restore imbalances. European tradition also had
many regional influences that influenced local folk practices and traditions
(Weiher et al., 1999).
One of the most powerful influences was the famous book De Materia Medica,
written by the Greek physician Dioscorides in the first century AD. It is
generally accepted to be the first European herbal and was the standard
reference in Europe for more than 1 000 years, providing the base for most of
the later herbals. As early as AD 800, medicinal plants were cultivated
according to a standardized layout in monasteries in Central Europe. One of
the famous healers of this era was Hildegard of Bingen (1098–1179). In later
years a Swiss alchemist known as Paracelsus (1493–1541) emphasized the
importance of the correct dosage for medical treatments (Gurib-Fakim, 2006).
Herbal medicine was part of everyday life in many countries in Europe and to
this day has remained a popular method of treating ailments but is often
considered to be supportive rather than curative. To date in several European
countries, the use of herbal tea is still very popular. In addition to these,
‘natural products’ taken in their crude form (unprocessed) as teas or
decoctions, more sophisticated phytomedicines (standardized and formulated
extracts of plants, often subject to rigorous testing in humans) remain a
popular alternative to medicinal products derived from pure synthetic
chemicals (Vicker and Zollman, 1999).
A large number of traditional herbal remedies in Europe have become widely
known as a result of commercialization and a number of active compounds
have been isolated from medicinal plants and are used today as single
chemical entities (Pieroni, 2000).

12
1.2.7 Classical Arabic and North African traditional medicine
The oldest written information in the Arabic traditions comes from the
Sumerians and Akkadians of Mesopotamia, thus originating from the same
areas as the archeological records of Shanidar IV (Heinrich et al., 2004). The
earliest documented record, which presumably relates to medicinal plants,
dates from 60 000 before the common era (BCE) found in the grave of the
Neanderthal man from Shanidar IV, an archeological site in Iraq. Pollen of
several species of plants, presumably used as medicines, was discovered
among which are: Centaurea solstitialis (Asteraceae), Ephedra altissima
(Ephedraceae), Althea sp. (Malvaceae) amongst others. Although this may
not be a finding with direct bearing on the culture of Shanidar, these species
or closely related ones from the same genus, are still important today in the
phytotherapy of Iraq and also known from other cultural traditions. These
species may well have been typical for the Neanderthal people and may also
be part of a tradition for which Shaidar IV represents the first available record
(Cragg and Newman, 2005).
The Middle East is known as the cradle of civilisation and many plants
cultivated nowadays were domesticated in this region. The Babylonians,
Assyrians and Sumerians recorded herbal remedies in cuneiform writing on
numerous clay tablets. Of special interest is the Code of Hammurabi (ca. 1
700 BC), a comprehensive set of civil laws carved in stone and commissioned
by the King of Babylon and which lists several medicinal herbs (Spiegel and
Springer, 1997).
Similar documents have survived several millennia in Egypt. The Egyptians
documented their knowledge (including medical and pharmaceutical) in wall
paintings of tombs dating from the Old Kingdom and on papyrus which is
made from Cyperus aquaticus. The most important of these writings is the
Ebers Papyrus, which originates from around 1 500 BC and is reported to
contain ancient medicinal knowledge from before 3 000 BC (Oubré et al,
1997). This famous 20 m papyrus scroll reputedly found in a tomb is inscribed
in Egyptian hieroglyphics and named after Prof. Ebers Georges at Thebes in
1872. It was deposited at the University of Leipzig 1873 and two years later G.

13
Ebers published a facsimile edition (Ghalioungui, 1987). The Ebers Papyrus is
a medical handbook covering all sorts of illnesses and includes empirical as
well as symbolic forms of treatment. The diagnostic precision documented in
this text is impressive. During the Dark and Middle Ages (5–12th Centuries,
AD), the monasteries in countries such as England, Ireland, and Germany
were responsible for preserving the remains of Western knowledge. But it was
the Arabs who were responsible for the preservation of much of the Greco-
Roman expertise, and for expanding it to include the use of their own
resources, together with the Chinese and Indian herbs, till then unknown to
the Greco-Roman world. The Arabs were the first to establish privately owned
drug stores in the 8th century. The Persian pharmacist, physician, philosopher
and poet, Avicenna, contributed much to the sciences of pharmacy and
medicine throughout works such as Canon medicinae, regarded as the “final
codification of all Greco-Roman medicine”. Canon medicinae included
elements of other cultures healing system and forms the basis for a distinct
Islamic healing system known today as Unani-Tibb (Sheehan and Hussain,
2002).
Among the famous medicinal plants of the Middle East and Egypt are: Allium
cepa (onion), Astracantha gummifera (tragacanth), Carthamus tinctorius
(safflower), Carum carvi (caraway), Ferula assafoetida (asofoetida), Lawsonia
inermis (henna), Papaver somniferum (opium poppy), Peganum harmala
(syrian rue), Prunus dulcis (almond), Punica granatum (pomegranate), Rosa x
damascena (damask rose), Ricinus communis (castor oil plant), Salvadora
persica (toothbrush tree), Senna alexandrina (senna), Sesamum indicum
(sesame), Trachyspermum ammi (ajowan), Trigonella foenum-graecum
(fenugreek) and Vitis vinifera (grape) (Padua de, 1999; Neuwinger, 2000;
Gurib-Fakim, 2006). A list of some botanical drugs used in traditional
medicine, which have led to useful modern drugs are shown in Table 1.1.
However, it should be noted that concern has been raised on the toxicity of
Kava pyrones and that their anxiolytics have been positively reviewed
(Schulze et al., 2003).

14
Table 1.1: Botanical drugs used in traditional medicine which led to useful modern drugs (Gurib-Fakim 2006).
Botanical names English
names Indigenous use Origin Uses in biomedicine Biologically active compounds
Adhatoda vasica –
Antispasmodic,
antiseptic,
insecticide, fish
poison
India, Sri Lanka Antispasmodic, oxytocic,
cough suppressant
Vasicin (lead molecule for Bromhexin and
Ambroxol)
Catharanthus roseus Periwinkle Diabetes, fever Madagascar Cancer chemotherapy Vincristine, Vinblastine
Condrodendron tomentosum – Arrow poison Brazil, Peru Muscular relaxation D-Tubocurarine
Gingko biloba Gingko Asthma, anthelmintic
(fruit) Eastern China
Dementia,
cerebral
deficiencies
Ginkgolides
Harpagophytum procumbens Devil’s claw Fever, inflammatory
conditions Southern Africa Pain, rheumatism
Harpagoside, Caffeic acid
Piper methysticum Kava Ritual stimulant, tonic Polynesia Anxiolytic, mild stimulant Kava pyrones
Podophyllum peltatum May apple Laxative, skin infections North America Cancer
chemotherapy, warts
Podophyllotoxin and lignans
Prunus africana African plum Laxative, ‘Old man’s
disease’ Tropical Africa Prostate hyperplasia
Sitosterol

15
1.3 Drug discovery from medicinal plants Drug discovery from medicinal plants has evolved to include numerous fields
of inquiry and various methods of analysis. The process typically begins with a
botanist, ethnobotanist, ethnopharmacologist, or plant ecologist who collects
and identifies the plant(s) of interest. Collection may involve species with
known biological activity for which active compound(s) have not been isolated
(i.e traditionally used herbal remedies) or may involve taxa collected randomly
for a large screening program. It is necessary to respect the intellectual
property rights of a given country where plant(s) of interest are collected
(Baker et al., 1995). Phytochemists (natural product chemists) prepare
extracts from the plant material, subject these extracts to biological screening
in pharmacologically relevant assays, and commence the process of isolation
and characterization of the active compound(s) through bioassay-guided
fractionation. Molecular biology has become essential to medicinal plant drug
discovery through the determination and implementation of appropriate
screening assays directed towards physiologically relevant molecular targets.
Pharmacognosy encapsulates all of these fields into a distinct interdisciplinary
science.
Numerous methods used to acquire compounds for drug discovery include:
isolation from plants and other natural sources; synthetic chemistry;
combinatorial chemistry, and molecular modeling (Ley and Baxendale, 2002;
Geysen et al., 2003; Lombardino and Lowe, 2004). Despite the recent interest
in molecular modelling, combinatorial chemistry, and other synthetic chemistry
techniques by pharmaceutical companies and funding organizations, the
natural products, and particularly that of medicinal plants, remain an important
source of new drugs, drug leads, and chemical entities (Newman et al., 2000;
Newman et al., 2003; Butler, 2004). In both 2001 and 2002, approximately
one quarter of the best-selling drugs worldwide were natural products or were
derived from natural products (Butler, 2004). An example is Arteether (Fig.
1.1), a potent antimalaria drug. It is derived from artemisinin, a sesquiterpene
lactone isolated from Artemisia annua (Asteraceae), a plant used in traditional
Chinese medicine (TCM) (van Agtmael et al., 1999; Graul, 2001).

16
O
OO
O
O
O
OO
O
OCH2CH3
Artemisinin Arteether
Figure 1.1: The structure of artemisinin and arteether. Despite evident successes of drug discovery from medicinal plants, future
endeavors face many challenges. Pharmacognosists, phytochemists, and
other natural product scientists will need to continuously improve the quality
and quantity of compounds that enter the drug development phase to keep
pace with other drug discovery efforts (Butler, 2004). The process of drug
discovery has been estimated to take an average of 10 years upwards
(Reichert, 2003) and cost more than 800 million US dollars (Dickson and
Gagnon, 2004). Much of this time and money is spent on the numerous leads
that are discarded during the drug discovery process. It has been estimated
that only one in 5000 lead compounds will successfully advance through
clinical trials and be approved for use. Lead identification is only the first step
in a lengthy drug development process (Fig. 1.2). There is also lead
optimization (involving medicinal and combinatorial chemistry), development
(including toxicology, pharmacology, pharmacokinetics, ADME [absorption,
distribution, metabolism, and excretion], and drug delivery), and clinical trials
which all take a considerable length of time.

17
Figure 1.2: Schematic representation of a typical medicinal plant drug
discovery process and development (Balunas and Kinghorn, 2005).
Drug discovery from medicinal plants has traditionally been lengthier and
more complicated than other drug discovery methods. Therefore, many
pharmaceutical companies have eliminated or scaled down their natural
product research (Butler, 2004; Koehn and Carter, 2005).
Recently, there has been a rekindling of interest in ‘rediscovering natural
products’. As stated by one authority “We would not have the top-selling drug
class today, the statins; the whole field of angiotensin antagonists and
angiotensin-converting enzyme inhibitors; the whole area of
immunosuppressives, nor most of the anticancer and antibacterial drugs.
Imagine all of these drugs not being available to physicians or patients today”.
It is clear that nature has played and will continue to play, a vital role in the
drug discovery process (Cragg and Newmann, 2005).

18
1.4 Synthesis and role of plant secondary metabolites
In plants, as a result of metabolic processes, many different kinds and types
of organic compounds or metabolites are produced. These metabolites are
grouped into primary and secondary metabolites. The primary metabolites like
chlorophyll, amino acids, nucleotides, simple carbohydrates or membrane
lipids, play recognised roles in photosynthesis, respiration, solute transport,
translocation, nutrient assimilation and differentiation. The secondary
metabolites also differ from primary metabolites in having a restricted
distribution in the plant kingdom. That is, particular secondary metabolites are
often found in only one plant species or a taxonomically related group of
species, whereas the basic primary metabolites are found throughout the
plant kingdom (Taiz and Zeiger, 2006). During the past few decades,
experimental and circumstantial evidence has made it clear that many
secondary metabolites do indeed have functions that are vital for the fitness of
a plant producing them. The main roles are:
• Defence against herbivores (insects, vertebrates)
• Defence against fungi and bacteria
• Defence against viruses
• Defence against other plants competing for light, water and nutrients
• Signal compounds to attract pollinating and seed dispersing animals
• Signals for communication between plants and symbiotic micro-
organisms (e.g. N-fixing Rhizobia or mycorrhizal fungi)
• Protection against UV-light or other physical stress (Wink, 1999)
They have also provided an invaluable resource that has been used to find
new drug molecules (Gurib-Fakim, 2006).
Plant secondary metabolites can be grouped into three chemically distinct
classes: terpenes, phenolics and nitrogen containing compounds. Figure 1.3
shows, in simplified form, the pathways involved in the biosynthesis of
secondary metabolites and their interconnection with primary metabolites.

19
1.4.1 Terpenes
Terpenes, terpenoids or isoprenoids are dimmers, trimers or polymers of
isoprene units, which are usually jointed in a head to tail fashion. In plants the
H3C C CH
CH3
CH3
Isoprene unit
activated form of the isoprene unit (isopentenyl pyrophosphate) which is the
building-block of each type of terpenoid is synthesised either by the mevalonic
acid pathway (e.g. sesquiterpenoids) or the methylerythritolphosphate
pathway (e.g. mono- and diterpenoids) (Taiz and Zeiger, 2006) (Fig 1.3).
Isoprene units usually condense to form linear chain or ring compounds
commonly containing carbon atom numbers of 10 (the monoterpenoids), 15
(the sesquiterpenoids, 20 (the diterpenoids), or 30 (the triterpenoids).
Terpenoids with 25 carbons are rarely found.
Figure 1.3: Main pathways leading to secondary metabolites (Taiz and
Zeiger, 2006).

20
1.4.1.1 Monoterpenes
Monoterpenes are commonly found in essential oils. Iridoids and pyrethrins
are included in this group. Examples of monoterpenes (Fig. 1.4) commonly
found in essential oils are shown below (Taiz and Zeiger, 2006):
OH
OH
OH
O
α- Pinene β-Pinene Linalool Menthol Borneol 1,8-cineol Figure 1.4: Monoterpenes commonly found in essential oils. They are widely used as insecticides and their pharmacological properties
range from analgesic to anti-inflammatory.
1.4.1.2 Sesquiterpenes
Sesquiterpenes are also constituents of essential oils of many plants, e.g.
bisabolol, humulene and caryophyllene. Sesquiterpene lactones are well
known as bitter principles and occur in families like the Asteraceae.
These compounds possess a broad range of activities due to the α-
methylene-γ-lactone moiety and epoxides. Their pharmacological activities
are antibacterial, antifungal, anthelmintic, antimalarial and molluscicidal. An
example is santonin, which is used as anthelmintic and antimalarial (Gurib-
Fakim, 2006).
O
O
CH3
CH3
O
CH3
α- Santonin

21
1.4.1.3 Diterpenes
Diterpenes are present in animals and plants and have some therapeutic
applications, for example, the famous taxol and its derivatives are anticancer
drugs. Other examples are forskolin, which has antihypertensive activity;
zoapatanol is an abortifacient while stevoside is a sweetening agent (Gurib-
Fakim, 2006).
1.4.1.4 Triterpenes
Triterpenes are C30 compounds arising from the cyclization of squalene. They
are comprised of a variety of structurally diverse compounds, which include
steroids. Tetracyclic terpenes and steroids have similar structures but have
different biosynthetic pathways (Taiz and Zeiger, 2006).
Steroids contain a ring system of three six-membered and one five-membered
ring. Because of the profound biological activities encountered, many natural
steroids together with a considerable number of synthetic and semi-synthetic
steroidal compounds, are employed in medicine (e.g. steroidal saponins,
cardioactive glycosides, corticosteroid hormones and mammalian sex
hormones). The pharmaceutical applications of triterpenes and steroids are
considerable (Gurib-Fakim, 2006).
1.4.2 Phenolic compounds
All phenolic compounds have an aromatic ring that contains various attached
substituent groups such as hydroxyl, and methoxy (-O-CH3) groups, and often
other non-aromatic ring structures.
OH
They range from simple structures with one aromatic ring to complex
polymers such as tannins and lignins. Phenolics differ from lipids in being
more soluble in water and less soluble in non-polar organic solvents. Some
phenolics, however, are rather soluble in ether, especially when the pH is low
enough to prevent ionization of any carboxyl and hydroxyl group present.
22
These properties greatly aid separation of phenolics from one another and
from other compounds (Taiz and Zeiger, 2006). Other classes of phenolic
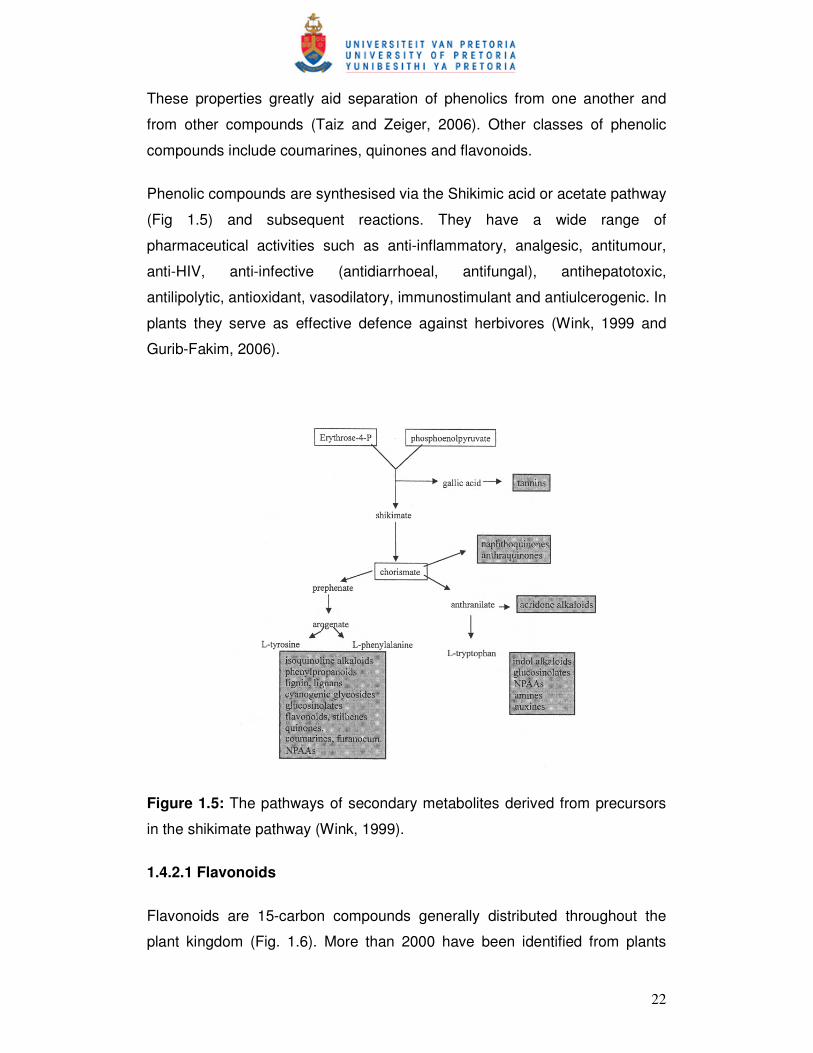
compounds include coumarines, quinones and flavonoids.
Phenolic compounds are synthesised via the Shikimic acid or acetate pathway
(Fig 1.5) and subsequent reactions. They have a wide range of
pharmaceutical activities such as anti-inflammatory, analgesic, antitumour,
anti-HIV, anti-infective (antidiarrhoeal, antifungal), antihepatotoxic,
antilipolytic, antioxidant, vasodilatory, immunostimulant and antiulcerogenic. In
plants they serve as effective defence against herbivores (Wink, 1999 and
Gurib-Fakim, 2006).
Figure 1.5: The pathways of secondary metabolites derived from precursors
in the shikimate pathway (Wink, 1999).
1.4.2.1 Flavonoids
Flavonoids are 15-carbon compounds generally distributed throughout the
plant kingdom (Fig. 1.6). More than 2000 have been identified from plants

23
(Taiz and Zeiger, 2006). They are responsible for the colour of flowers, fruits
and sometimes leaves. Some may contribute to the colour by acting as a co-
pigment. The name ‘flavonoid’ refers to the Latin word ‘flavus’ meaning yellow.
OH
O
O
O
H
OH
H
O
O
H
Chalcones Dihydroflavonols Flavonones
O
O
O
O
OH
O
O
Flavones Flavonols Isoflavonoids
Figure 1.6: Basic structures of some flavonoids.
Flavonoids protect the plant from UV-damaging effects and play a role in
pollination by attracting animals with their colours (Gurib-Fakim, 2006). The
basic structure of flavonoids is 2-phenyl chromane or an Ar–C3–Ar skeleton.
Biosynthetically they are derived from a combination of the Shikimic acid and
the acetate pathways. Small differences in basic substitution patterns give rise
to several sub-groups. In the plant, flavonoids can either occur as aglycones
or as O- or C-glycosides (Gurib-Fakim, 2006). Recently, flavonoids have
attracted interest due to the discovery of their pharmacological activities.
1.4.3 Nitrogen containing compounds
A large variety of plant secondary metabolites have nitrogen in their
structures. Included in this category are such well-known antiherbivore
compounds such as alkaloids and cyanogenic glycosides, which are of
considerable interest because of their toxicity to humans and their medicinal

24
properties. Most nitrogenous secondary metabolites are biosynthesised from
common amino acids (Taiz and Zeiger, 2006).
1.4.3.1 Alkaloids
The term ‘alkaloid’ has been defined as a cyclic organic compound containing
nitrogen in a negative oxidation state, which has limited distribution in living
organisms (Taiz and Zeiger, 2006). Based on their structures, alkaloids are
divided into several subgroups: non-heterocyclic alkaloids and heterocyclic
alkaloids, which are again divided into 12 major groups according to their
basic ring structure. Mescaline is an example of a non-heterocyclic or pseudo-
alkaloid, tetrandrine is an example of a bisbenzylisoquinoline alkaloid while
solasodine is a triterpene alkaloid (GuribFakim, 2006) (Fig. 1.7).
H3CO
H3CO
H3CO
NH2
O
N
HH
H
H
H
HO
H
Mescaline Solasodine
NN
OOCH3
OCH3H3CO
O
H3CCH3
H
OCH3
Tetrandrine
Figure 1.7: Structures of some alkaloids.

25
Free alkaloids are soluble in organic solvents and react with acids to form
water-soluble salts. There are exceptions like berberine, which is a quartenary
ammonium alkaloid. Most alkaloids are solids except for nicotine, which is a
liquid.
Alkaloids, usually have a marked physiological action on humans or animals,
and are sometimes believed to be waste products and a nitrogen source.
They are thought to play an important role in plant protection, germination and
plant growth stimulation.
Alkaloids are pharmaceutically significant, e.g. morphine as a narcotic
analgesic, codeine in the treatment of coughs and pain, colchicines in the
treatment of gout, quinine as an antimalarial, quinidine as an antiarrythmic
and L-hyoscyamine (in the form of its racemic mixture known as atropine) as
antispasmodic and for pupil dilation (Gurib-Fakim, 2006).
1.4.3.2 Cyanogenic glycosides
Perhaps the most obvious defence-related secondary metabolites are the
cyanogenic glucosides (Bennett and Wallsgrove, 1994). They are not in
themselves toxic but are readily broken down to give off volatile poisons when
the plant is crushed. Cyanogenic glycosides release the well-known
respiratory poisonous gas, hydrogen cyanide (Taiz and Zeiger, 2006).
1.5 Infectious diseases
Despite the tremendous progress in medicine, infectious diseases caused by
bacteria, fungi, viruses and parasites continue to pose a threatening challenge
to public health (Cos et al., 2006). The burden of these diseases is felt the
most in developing countries due to poverty, unavailability of medicines and
the emergence of widespread resistance of pathogens to the available drugs
(Okeke et al., 2005). The World Health Organisation in 2002 has also reported
that infectious and parasitic diseases account for 26.2% of the global cause of
death, the vast majority of which occurred in the developing countries (WHO,
2003).

26
Every year, more than half of the deaths associated with infectious diseases
continue to be attributed to three illnesses: HIV/AIDS, tuberculosis and
malaria. These diseases are present in epidemic proportion, profoundly
affecting and serving as major obstacles to the economic growth and
development in many of the poorest countries in the world (Mandell et al.,
2005). Urgent solutions are required if the poorest regions in the world is to
develop.
1.5.1 Malaria
Malaria is a protozoal disease caused by parasitic protozoa of the genus
Plasmodium. It is transmitted to humans by the female Anopheles mosquito.
There are over three hundred species of Anopheles mosquito, however, only
about sixty are able to transmit the malaria parasite. Malaria commonly affects
the populations of tropical and subtropical areas world wide, as well as
increasing number of travellers to and from these areas. The following four
species of Plasmodium cause the disease in its various forms: P. falciparum,
P. vivax, P. ovale and P. malariae. P. falciparum is the most widespread and
dangerous of the four as it can lead to the fatal cerebral malaria, which often
results in death (Hyde, 2002). Today some 500 million people in Africa, India,
South East Asia and South America are exposed to endemic malaria and it is
estimated to cause 2.5 million deaths annually, one million of which are
children. Although malaria is found in over 100 countries (Fig. 1.8 and 1.9),
the major burden of the disease is carried by the nations of Africa, where over
90% of all falciparum malaria deaths are recorded, and where the high levels
of morbidity and transmission place considerable strain on public health
services and economic infrastructure (Hyde, 2002). In the absence of effective
vaccines, management of the disease has depended largely upon
chemotherapy and chemoprophylaxis. Of the various antimalaria drugs
available, the aminoquinoline, chloroquine was for several decades the agent
of choice, as it was safe, effective and cheap. Parasite resistance to this drug
was first observed in Thailand in 1957 and then on the border of Colombia
and Venezuela in 1959. By the late 1970s it had spread to East Africa and by
the mid-1980s had become a major problem in several areas in Africa
(Wernsdorfer and Payne, 1991).

27
Although the increasing prevalence of drug resistant P. falciparum has
hindered the ability to control/treat the disease, it has at the same time
intensified attempts to develop novel antimalaria drugs and agents to prolong
Figure 1.8: Global malaria distribution (WHO global atlas, 2005).
Figure 1.9: Distribution of malaria in Africa (WHO global atlas, 2005).
the clinical usefulness of the few currently available drugs (Singh and Puri,
2000). An increasing number of countries have been compelled to adopt a
different class of drug, the antifolates, as the first line of alternatives to

28
chloroquine. The most widely used combination of this type consist of
pyrimethamine (PYR) and sulfadoxine (SDX), known as fansider or SP, which
is cheap and, until recently, was effective against the chloroquine-resistant
parasites found in Africa. However, resistance to this formulation, long
established in parts of south-east Asia and South America (Wernsdorfer,
1994), now threatens to leave Africa with no affordable treatment. Further
combinations of antifolates with newer drugs such as the artemisinin
derivatives, or the development of alternative combinations, may be the only
way to limit the pace of the parasitic resistance to chemotherapy. For
example, the antifolate prodrug, proguanil, has now been formulated together
with a new type inhibitor, atovaquone, to yield malarone, recently licensed for
clinical use (Hyde, 2002).
Developing countries, were malaria is epidemic, still depend on traditional
medicine for the treatment of the disease. However, little scientific data are
available to assess the efficacy of these herbal remedies. On the other hand,
it is accepted that the recognition and validation of traditional medicinal
practices could lead to new plant derived drugs, e.g. artemisinin from
Artemisia annua, a Chinese traditional medicine plant (Ridley, 2002).
Therefore it is important that medicinal plants which have a folklore reputation
for antimalarial properties are investigated, in order to establish their efficacy
and to determine their potential as a source of new antimalarial drugs (Tran
et.al., 2003). South Africa is an ideal place to search for a new drug because
of its remarkable biodiversity and rich cultural traditions of plant uses.
1.5.2 Human immunodeficiency virus (HIV)
The Joint United Nations Programme on HIV/AIDS (UNAIDS) and the World
Health Organisation (WHO), reported the number of people living with HIV at
the end of 2006 to be 39.5 million globally. Of the people infected worldwide,
64% reside in sub-Saharan Africa, 77% of which are women. The severity of
the epidemic has been associated with poverty, low status of women and
other socio-economic factors (Nicoll and Gill, 1999; NSP, 2000).

29
A number of documents have described the seriousness of HIV/AIDS in the
Southern Africa region with particular emphasis on Southern Africa being the
most affected (UNAIDS, 2000). The prevalent rate for South Africa is
estimated to be 12.5%, which is one of the highest national prevalent rates in
the world (James et al., 2006). Women are more hit by the epidemic of
HIV/AIDS. Of the 5.54 million people living with HIV in South Africa in 2005,
18.8% are adults aged 15-49 years of which women account for
approximately 55%. The infection is more pronounced in the age group 20-24
years and 25-29 where the HIV prevalence rates are 23.9% for women to 6%
for men and 33.3% for women and 12.2% for men respectively (NSP, 2007).
HIV was around 3% among children aged 2-14 year and nearly 4% for people
in their sixties (Dinkelman et al., 2007).
The United Nations General Assembly Session on HIV/AIDS (UNGASS) has
identified young people of the age group 15-24 years as the target group for
reducing new cases of HIV infection and set a global target of reducing
incidence of HIV in this group by 20% by 2015. Young people represent the
main focus for altering the course of this epidemic. UNAIDS data on the
experience of several countries including South Africa, confirm that positive
behavioural change is more likely in this group than in older ages (NSP,
2007).
The increase in pregnancy and HIV infection in young school leaving people
has been linked with unemployment. The inability to secure a job plus
pressure from family members to make financial contributions for the
maintenance of their homes, predispose them to sex work as a way to make
ends meet (Dinkelman et al., 2007).
Children under the age of 18 comprise 40% of the population of South Africa.
In 2004, it was reported that 13% of them have lost either mother or father,
half of which was due to AIDS. Children from deeply impoverished
households were worst affected by the impact of AIDS (UNAIDS, 2004).
Children are exposed to HIV through sexual abuse, blood transfusion and

30
mother to child transmission (MTCT) which occurs mostly during birth and/or
breastfeeding (Nicoll and Gill, 1999).
The immediate determinant of the spread of HIV relates to behaviours such as
unprotected sexual intercourse, multiple sexual partnerships, and some
biological factors such as sexually transmitted infections, the fundamental
drivers of this epidemic in South Africa are deep rooted in the problem of
poverty, underdevelopment, and low status of women, including gender-based
violence in society (Dinkelman et al., 2007).
Many countries in Africa and Asia have taken urgent steps to curb the
epidemic with varying degrees of success. In South Africa, despite the effort
invested, the HIV infection rate has increased significantly over the last 5
years (NSP, 2000). The country has the largest number of people enrolled on
antiretroviral therapy in the world. There are still many more people in need of
this and other related interventions to reduce the morbidity and mortality of
HIV/AIDS. In particular, more eligible adults than children have accessed
these services. There is need to develop more innovative strategies to
improve access for children in schools (primary and secondary) (NSP, 2007).
At the moment there is no cure for HIV. Single drug therapy is no longer
effective due the resistance developed by the virus. Combinational therapy is
now the method of choice in treatments (Spencer, 2005). The adverse side
effects of the available drugs or combination of drugs and non-compliance of
patients on treatment did not help the situation (Spencer, 2005). There is a
urgent need to develop drugs with less side effects for the treatment and a
cure for the disease. The only effective way to combat HIV infection at the
moment is in prevention-advocacy and the practice of abstinence, and safe
sexual practice (Nicoll and Gill, 1999).
1.5.3 Tuberculosis
The bacterium (Mycobacterium tuberculosis) causing tuberculosis first
emerged as a major disease threat more than 15 000 years ago. Today about
2 billion people are infected. However, not all these individuals will become ill
or develop active tuberculosis (Mandell et al., 2005). HIV infection is the

31
strongest risk factor for progression to active disease: 46% of people in the
developing world with HIV are co-infected with tuberculosis (Nicoll and Gill,
1999; Anthony and Fauci, 2005). About 4 million people have active
tuberculosis at any time resulting in about 2 million deaths each year. Most of
the deaths occur in the developing countries predominantly in Africa and Asia
(Anthony and Fauci, 2005). The fatalities of this disease are worsened by the
development of resistance to the available antituberculosis drugs (Mandell et
al., 2005).
1.6 Antioxidant activity
Free radical decomposition results in a large number of human diseases, such
as heart disease, cataracts, cognitive dysfunction, aging and cancer
(Brahmachari and Gorai, 2006). These damages or diseases are caused by
free radicals called reactive oxygen species (ROS). Examples of ROS include
superoxide anions, singlet oxygens, hydroxyl radicals, lipid peroxyl radicals
and peroxynitrite radicals (Erkoç et al., 2003).
The human body has evolved with antioxidant systems to protect it against
free radicals. These systems include some antioxidants produced in the body
(endogenous), obtained from the diet (exogenous) and repair antioxidant
(proteases, lipase, transferases, and DNA repair enzymes). The ones
produced in the body are enzymatic defences, such as Se-glutathione
peroxidase, catalase, and superoxide dismutase, which metabolize
superoxide, hydrogen peroxide and lipid peroxides, thus preventing most of
the formation of the toxic hydroxyl radicals. Exogenous antioxidants consist of
non-enzymatic defenses, such as glutathione, histidine-peptides, the iron-
binding proteins transferring and ferritin, dihydrolipoic acid etc (Erkoç et al.,
2003; Brahmachari and Gorai, 2006). Owing to the incomplete efficiency of
our endogenous defence systems and the existence of some
physiopathological situations (cigarette smoking, air pollutants, UV radiation,
high polyunsaturated fatty acid diet, inflammation, ischemia/reperfusion, etc)
in which ROS are produce in excess and at the wrong time and place, dietary
antioxidants are needed for diminishing the cumulative effects of oxidative

32
damage over the life span. The antioxidants derived from diet are vitamins C,
E and A, and carotenoids. Other antioxidants of value to health derived from
plants include phenols, phenolic acids, flavonoids, tannins and lignans (Pietta,
2000).
Antioxidant activity of a drug candidate adds to its medicinal value. In this
chapter the antioxidant activity of the compounds isolated has been
investigated using both qualitative and quantitative assays.
1.7 Croton steenkampianus
Several species of the genus Croton (Euphorbiaceae) showed excellent
results when crude extracts were tested for antiplasmodial activity previously.
Of the species tested, the leaves of C. steenkampianus Gestner, had the best
activity and was therefore selected for isolation of the active principles in this
study (Prozesky, 2004). Before 2004, little or nothing was known regarding
the chemical composition and medicinal use of C. steenkampianus other than
that known for the family in general. However, flavonoids and terpenes that
showed promising antiplasmodial activities had been isolated from its leaves
(Prozesky, 2004). Therefore it was decided to attempt the isolation of more
active principles from this species.
Generally, species in the family Euphorbiaceae have a variety of uses and
commercial products include rubber (Hevea), tung oil (Aleurites), castor oil
(Ricinus), and cassava (Manhot) and many are used as ornamentals
(Leistner, 2000). Medicinally, despite reports that many species are
poisonous, they are used for ailments such as malaria, hepatic and kidney
disorders, obesity, hypertension, fever, dysentery, convulsions, snakebite,
chest pains, gastrointestinal disturbances, sterility, eye and respiratory
complaints (Pooley, 1993; Ngadjui et al., 2002; Suarez et al., 2006).
Chemically, the genus contains very diverse compounds including alkaloids,
flavonoids and triterpenes. Many structurally diverse diterpenes have also
been isolated from the genus (Prozesky, 2004).
C. steenkampianus is a shrub to small tree (1.5-4 m) (Fig. 1.10), found on the
margins of sand forests and thickets in the eastern parts of South Africa and

33
further north into Africa. The main stem is much branched from the base, with
smoothish grey bark. The leaves are large, heart shaped, grey to olive-green
above, white beneath, with a pointed tip (Pooley, 1993; Prozesky, 2004).
Figure 1.10 Croton steenkampianus leaves.
1.8 Objectives
The objectives of this study were:
� Isolation of biologically active compound(s) from C. steenkampianus
� In vitro testing of pure compound(s) for antibacterial activity, antiplasmodial
activity, anti-HIV activity and antioxidant activity
� In vitro testing of the antiplasmodial activity of isolated compound(s) with
and without chloroquine
� Cytotoxicity testing of isolated compound(s)
1.9 Scope of the thesis
The isolation and identification of three flavonoids, two new diterpenes (with a
newly described skeleton) and one new indane is described in chapter two.
The isolation was performed using bioassay-guided fractionation (antibacterial
activity). The bio-activities (antiplasmodial, antibacterial and antioxidant, anti-
HIV and cytotoxicity of the isolated compounds are described in chapters 3, 4,

34
5 and 6 respectively. Chapter 7 consists of a general discussion and
conclusion.
1.10 Hypothesis
The determination of biological activities and isolation of compounds from C.
steenkampianus was performed for the first time by Prozesky (2004). This
species not being well studied plus the interesting results reported previously
led to the conclusion that it contains more active principles and was
reselected for further studies. The hypothesis of this study is therefore that C.
steenkampianus contains compounds with valuable bioactivity.

35
1.11 References
Anthony, S. and Fauci, M.D. 2005. Emerging and reemerging infectious diseases:
the perpetual challenge. Acad. Med. 80(12):1079-1085.
Baker, J.T., Borris, R.P., Carté, B., Cordell, G.A., Soejarto, D.D., Cragg, G.M.,
Gupta, M.P., Iwu, M.M., Madulid, D.R. and Tyler, V.E. 1995. Natural products drug
discovery and development: new perspective on international collaboration. J. Nat.
Prod. 58 (9):1325-1357.
Balick, M.J. and Cox, P.A. 1997. Plants, people and culture: the science of
ethnobotany. Scientific American Library, New York, NY.
Balunas, M. J. and Kinghorn, D.A. 2005. Drug discovery from medicinal plants.
Review article. Life Sci. 78 (5):431-441.
Beissert, S. and Schwarz, T. 2002. Role of immunomodulation in diseases
responsive to phototherapy. Methods 28 (1):138-144.
Boehme, J. 1982. Signature of all things. James Clarke & Co: Cambridge.
Brahmachari, G. and Gorai, D. 2006. Progress in the research on naturally
occurring flavones and flavonols: An overview. Curr. Org. Chem. 10:873-898.
Butler, M.S. 2004. The role of natural product chemistry in the drug discovery. J.
Nat. Prod. 67 (12):2141-2153.
Chopra, A. 2000. Ayurvedic medicine and arthritis. Rheum. Disease Clin. N. AM. 26
(1):133-144.
Cos, P., Vlietinck, A.J., Berghe, D.V. and Maes, L. 2006. Anti-infective potential of
natural products: How to develop a stronger invitro ‘proof-of-concept. J.
Ethnopharmacol. 106(3):290-302.

36
Cragg, G.M. and Newman, D.J. 2004. A tale of two tumor targets: topoisomerase 1
and tubulin. The Wall and Wani contribution to cancer chemotherapy. J. Nat. Prod.
67 (2):232-244.
Cragg, G.M. and Newman, D.J. 2005. Biodiversity: A continuing source of novel
drug leads. Pure Appl. Chem. 77 (1):7-24.
Dickson, M. and Gagnon, J.P. 2004. Key factor in the rising cost of new drug
discovery and development. Nat. Rev. Drug Discovery 3 (5):417-429.
Dinkelman, T., Lam, D. and Leibbrandt, M. 2007. Household and community
income, economic shock and risky sexual behavior of young adults: evidence from
the Cape area panel study 2002 and 2005. AIDS. 21 Suppl 7:S49-S56.
Erkoç, Ş., Erkoç, F. and Keskin, N. 2003. Theoretical investigation of quercetin and
its radical isomers. J. Mol. Struct. 631:141-146.
Fabricant, D.S. and Farnsworth, N.R. 2001. The value of plants used in traditional
medicine for drug discovery. Environ. Health Perspect. 109:69-75.
Farnsworth, N., Akerele, A.O., Bingel, A.S., Soejarto, D.D., Guo, Z., 1985. Bull.
WHO 63:965-981.
Geysen, H.M., Schoenen, F., Wagner, D., Wagner, R. 2003. Combinatorial
compound libraries for drug discovery: an ongoing challenge. Nat. Rev. Drug
Discovery 2 (3):222-230.
Ghalioungui, P. 1987. The Ebers papyrus. A new English translation, commentaries
and glossaries. Cairo: Academy of Scientific Research and Technology p.182-192.
Graul, A.I. 2000. The year’s new drugs. Drug News Perspect. 14 (1):12-31.

37
Green, G.M. and Sussman, R.W. 1990. Deforestation history of the eastern rain
forest of Madagascar from satellite image. Science 248 (4952):212-215.
Gurib-Fakim, A. 2006. Medicinal plants: Tradition of yesterday and drugs of
tomorrow. Review article. Mol. Aspects Med. 27 (1):1-93.
Heinrich, M., Barnes, J., Gibbons, S., Williamson, E.M. 2004. Fundamentals of
Pharmacognosy and Phytotherapy. Churchill Livingstone, Elsevier Science Ltd.,
UK.
HIV/AIDS/STD strategic plan for South Africa (NSP) 2000-2005. Viewed 10 Jan
2008. http://www.info.gov.za/otherdocs/aidsplan2000.pdf.
HIV/AIDS/STD strategic plan for South Africa (NSP) 2007-2011. Viewed 10 Jan
2008. http://www.doh.gov.za/docs/misc/stratplan-f.html.
Hyde, J.E. 2002. Mechanisms of resistance of Plasmodium falciparum to anti-
malaria drugs. Microbes infect. 4:165-174.
James, S., Reddy, P., Ruiter, R.A.C., McCauley, A. and van den Borne, B.
2006.The impact of an HIV and AIDS life skills program on secondary school
students in KwaZulu-Natal, South Africa. AIDS Educ. Prev. 18(4):281-294.
Joint United Nations Programme on HIV/AIDS (UNAIDS). 2000. Report on the
global HIV and AIDS epidemic. Geneva.
Kapoor, L.D.1990. CRC Handbook of Ayurvedic medicinal plants. CRC Press, Boca
Raton, USA.
Koehn, F.E. and Carter, G.T. 2005. The evolving role of natural products in drug
discovery. Nat. Rev. Drug Discovery 4 (3):206-220.

38
Leistner, O.A. (ed.). 2000. Seed plants of Southern Africa: families and genera.
Strelitzia 10.p.34. National Botanical Institute, Pretoria.
Ley, S.V. and Baxendale, I.R. 2002. New tool and concepts for modern organic
synthesis. Nat. Rev. Drug Discovery 1 (8):573-586.
Lombardino, J.G. and Lowe III, J.A. 2004. The role of medicinal chemist in drug
discovery- then and now. Nat. Rev. Drug Discovery 3 (10):853-862.
Magner, L. N. 1992. A history of medicine. Marcel Dekker Inc: New York.
Maher, P. 1999. A review of ‘traditional’ Aboriginal health beliefs. Aust. J. Rural
Health 7:229-236.
Mandell, G.L., Bennett, J.E. and Dolin, R. 2005. Principles and practice of infectious
diseases. 6th edn. Ostroff, S.M., McDade, J.E., LeDuc, J.W. and Hughes, J.M. In:
Emerging and re-emerging infectious disease threats. Ch. 13. pp. 173-192.
Philadelphia, Pennsylvania: Churchill Livingstone.
Neuwinger, H.D. 2000. African traditional medicine. MedPharm Scientific
Publishers, Stuttgart, Germany.
Newman, D. J., Cragg, G.M. and Snader, K.M. 2000. The influence of natural
products upon drug discovery, Nat. Prod. Rep. 17 (3):215-234.
Newman, D.J., Cragg, G.M. and Snader, K.M. 2003. Natural products as sources of
new drugs over the period 1981-2002. J. Nat. Prod. 66 (7):1022-1037.
Ngadjui, B.T., Abegaz, B.M., Keumedjio, F., Folefoc, G.N., & Kapche G.W.F. 2002.
Diterpenoid from the stem bark of Croton zambesicus. Phytochemistry 60:345-349.

39
Nicoll, A. and Gill, O.N. 1999. The global impact of HIV infection and disease.
Commun. Dis. Public Health 2(2):85-100.
Okeke, I.N., Laxmaninarayan, R., Bhutta, Z.A., Duse, A.G., Jenkns, P., O’Brien,
T.F., Pablos-Mendez, A. and Klugman, K.P. 2005. Antimicrobial resistance in
developing countries. Part 1: recent tends and current status. Lancet Infect. Dis.
5:481-493.
Oubré, A.Y., Carlson, T.J., King, S.R. and Reaven, G.M. 1997. From plant to
patient: an ethnomedical approach to the identification of new drugs for the
treatment of NIDDM. Diabetologia 40:614-617.
Padua de, L.S., Bunyapraphatsara, N and Lemmens, R.H.M.J. 1999. Plant
resources of South-East Asia, No 12(1). Medicinal and Poisonous Plant 1.
Backhuys Publishers, Leiden, The Netherlands.
Patwardhan, B., Warude, D., Pushpangadan, P. and Bhatt, N. 2005. Ayurveda and
traditional Chinese medicine: A comparative overview. e.C.A.M. 2 (4):465-473.
Pieroni, A. 2000. Medicinal plants and food medicines in the folk traditions of the
Lucca Province, Italy. J. Ethnopharmacol. 70:235-273.
Pietta, P. 2000. Flavonoids as Antioxidants. J. Nat. Prod. 63:1035-1042.
Pooley, E. 1993. The complete field guide to trees of Natal, Zululand & Transkei.
P.222. Natal Foral Publications Trust, Durban.
Prozesky, E.A. 2004. Antiplasmodial and chloroquine resistance reversal properties
of a new diterpene from Croton steenkampianus. PhD thesis. University of Pretoria,
South Africa.
Reichert, J.M. 2003. Trends in development and approval times for new
therapeutics in the United States. Nat. Rev. Drug Discovery 2 (9):695-702.

40
Ridley, R.G. 2002. Medical need scientific opportunity and the drive for antimalarial
drugs. Nature 415:686-693.
Samuelsson, G. 2004. Drugs of natural origin: a textbook of pharmacognosy, 5th
Swedish Pharmaceutical Press, Stockholm.
Schulze, J., Raasch, W. and Siegers, C.P. 2003. Toxicity of Kava pyrones, drugs
safety and precautions-a case study. Phytomedicine 10 Suppl 4: 68-73.
Sheehan, H.E. and Hussain, S.J. 2002. Unani-Tibb: History, theory and
contemporary practice in South Asia. Ann. Amer. Acad. Polit. Soc. Sci. 583(1):122-
135.
Singh, N. and Puri, S.K. 2000. Interaction between chloroquine and diverse
pharmacological agents in chloroquine resistant Plasmodium yoelii nigeriensis.
Acta Trop. 77:185-193.
Spencer, D.C. 2005. The clinical practice of HIV medicine: A practical guide to the
care of the HIV infected. Ch. 2. pp.17. Johannesburg, South Africa: Goldstream
Book.
Spiegel, A.D. and Springer, CR. 1997. Babylonian medicine, managed care and
codex hummurabi, circa 1700 B.C. J. Community Health 22 (1):69-87.
Staniszewska, I., Królicka, A., Maliński, E., Łojkowska, E. and Szafranek, J. 2003.
Elicitation of secondary metabolites in in vitro cultures of Ammi majus L. Enzymes
Microb. Technol. 33: 565-568.
Suarez, A. I., Blanco, Z., Compagnone, R.S., Salazar-Bookaman, M.M., Zapata V.,
Alvarado C. 2006. Anti-inflammatory activity of Croton cuneatus aqueous extract. J.
Ethnopharmacol. 105: 99-101.

41
Taiz, L. & Zeiger, E. 2006. Plant physiology, 4th edn. Ch. 13. pp. 315-344. Sinauer
Associates, Inc., Publishers, Massachusetts.
Tran, Q.L., Tezuke Y., Ueda J., Nguyen N.T., Maruyama Y., Begum K., Kim H.,
Wataya Y., Tran Q.K. & Kadota S. 2003. In vitro antiplasmodial activity of anti-
malarial medicinal plants used in Vietnamese traditional medicine. J.
Ethnopharmacol. 86:249-252.
UNAIDS, UNICEF and USAID. Children on the brink. 2004, Geneva.
Van Agtmael, M.A., Eggelte, T.A. and van Boxtel, C.J. 1999. Artemisinin drugs in
the treatment of malaria: from medicinal herb to registered medication. Trends
Pharmacol. Sci. 20 (5):199-205.
Vicker, A. and Zollman, C. ABC of complementary medicine: herbal medicine.
B.M.J. 319 (7222):1422.
Weiher, E., van der Werf, A., Thompson, K., Roderick, M., Garnier, E. and
Ericksson, O. 1999. Challenging Theophrastus: A common core list of plant traits for
functional ecology. J. Veg. Sci. 10 (5): 609-620.
Wernsdorfer, M.H. and Payne, D. 1991. The dynamics of drug resistance in
Plasmodium falciparum. Pharmacol. Therap. 50: 95-121.
Wernsdorfer, W.H. 1994. Epidemiology of drug resistance in malaria. Acta Trop. 56:
143-156.
Wink, M. 1999. Biochemistry of plant secondary metabolism. Annual plant reviews,
volume 2. Ch. 1. p. 1-16. Sheffield Academic Press.
World Health Organisation (WHO) global atlas. Viewed 24 April, 2005.
http://www.liv.ac.za.uk/geography/researh_projects/epidemics/MAL_geography.htm.
World Health Organisation. 2003. World health report. Geneva.

42

42
CHAPTER 2
BIOASSAY GUIDED FRACTIONATION OF THE CRUDE EXTRACT FROM
CROTON STEENKAMPIANUS
2.1 Introduction………………………………………………………………….. 43
2.2 Materials and Methods……………………………………………………... 43
2.2.1 Collection of plant materials……………………………………... 43
2.2.2 Methods……………………………………………………………. 44
2.2.2.1 Preparation of the crude extract…………...…………. 44
2.2.2.2 Bacterial culturing and antibacterial testing…………. 44
2.2.2.3 Isolation and identification of compounds…………… 45
2.2.2.4 Structure elucidation…………………………………… 46
2.3 Results and Discussion………………………………...………….………. 48
2.4 References……………………………………………………………..……. 75

43
CHAPTER 2
BIOASSAY GUIDED FRACTIONATION OF THE CRUDE EXTRACT FROM
CROTON STEENKAMPIANUS
2.1 Introduction Plants from the Euphorbiaceae family are well known for their medicinal
properties and are used to treat many diseases around the world (Suarez et
al., 2003). This family has about 300 genera and 5 000 species of trees,
shrubs and herbs. The genus Croton has about 750 species of trees, shrubs
and herbs distributed in tropical and subtropical regions and is rich in
constituents with biological activity (Suarez et al., 2003). This genus is being
used to treat malaria, hepatic and kidney disorders, obesity, hypertension,
wounds, inflammation, tumors, diabetes, diarrhoeas, rheumatism, gastric
ulcers and pain. A number of biologically active compounds (terpenes,
flavonoids and alkaloids) have been isolated from it (Silva et al., 2005; Suarez
et al., 2003; Suarez et al., 2006; Ngadjui et al., 2002).
Before 2004, C. steenkampianus had no history of medicinal usage or any
record of the isolation of an active compound. However, it has since been
reported that the crude extracts from the leaves showed antiplasmodial
activity and contained several interesting compounds such as a diterpene with
a new exoskeleton, one triterpene and two flavonoids (Prozesky 2004).
Antibacterial activity was used to guide the isolation of compounds from
fractions because it is simpler and quicker to perform. This method is
supported by the fact that most compounds showing antibacterial activity also
show antiplasmodial activity (Boonphong et al., 2007; Zdzislawa, 2007).
2.2 Materials and Methods 2.2.1 Collection of plant materials
Leaves of C. steenkampianus Gerstner were collected in April 2003, at
Thembe Elephant Park in northern KwaZulu-Natal, South Africa, and a
voucher specimen (registry number 92520) is preserved at the HGWJ
Schweickerdt Herbarium (PRU) at the University of Pretoria.

44
2.2.2 Methods 2.2.2.1 Preparation of the crude extract The leaves were allowed to dry for two weeks at room temperature. The dried
leaves (2 kg) were then crushed to a powder and extracted with ethanol at
room temperature for 3 days. The resulting mixture was then filtered under
vacuum and the residue generated was extracted further with ethanol. The
combined filtrate was evaporated under reduced pressure at 37°C to yield an
80 g total extract.
2.2.2.2 Bacterial culturing and antibacterial testing
Bacillus cereus and Escherichia coli were obtained from the Department of
Microbiology and Plant Pathology, University of Pretoria. These bacteria were
maintained on nutrient agar slant and were recovered for testing by culturing
them in a nutrient broth. A sterile loop was used to transfer some bacterial
colonies to the nutrient broth (50 ml) in conical flasks under sterile conditions
(in a laminar flow cabinet). The opening of the flask was then plugged with
cotton wool, covered with aluminium foil, placed on a shaker and incubated for
24 hours at 37°C. After 24 hours, the bacterial culture was centrifuged at 3
000 rpm for 20 minutes. The supernatant was discarded and the sedimented
bacteria resuspended in fresh nutrient broth (Lund and Lyon, 1975).
The isolation of the possible antiplasmodial active fraction and compound was
guided by antibacterial testing using direct bioautography on TLC plates. This
is because the bioassay is simpler and quicker to perform than an
antiplasmodial bioassay and most compounds showing antibacterial activity
also show antiplasmodial activity (Boonphong, 2007; Zdzislawa, 2007). The
extract or fraction (~5 µl) was applied to silica gel 60 plates (Merck),
developed in 3-10% methanol in chloroform and observed under ultraviolet
light (254 and 366 nm). The developed TLC plate was then left to dry
overnight (for the solvent to evaporate completely). It was then sprayed with
bacterial suspension until it appeared translucent and incubated at 25°C for
24 hours in humid conditions. The plates were then sprayed with an aqueous
solution of 2.0 mg/ml p-iodonitrotetrazolium violet (Sigma) and reincubated at

45
25°C for 3 hours. Any inhibition of bacterial growth could be clearly seen as
white spots on a red background (Begue and Kline, 1972; Eloff, 1998).
2.2.2.3 Isolation and identification of compounds The total ethanol extract (80 g) was applied (Fig. 2.1) to a flash silica gel
column (10 x 50 cm). The column was developed with a solvent gradient of
hexane : ethyl acetate, in order of increasing polarity (100:0 to 0:100) and the
fractions were collected. Similar fractions were pooled together according to
the TLC profile to yield 4 fractions, which was then tested for antibacterial
activity. Fractions 2 and 4 showed antibacterial activity.
Fraction 2 (10 g) was applied to a flash silica gel column (3.0 x 50 cm) and
eluted with solvent gradient of hexane : ethyl acetate mixture (95:5 to 90:10).
Similar fractions obtained were pooled together resulting in six main fractions
(2.1-2.6) while 2.4 to 2.6 showed antibacterial activity.
Fraction 2.5 (2.4 g) was applied to a flash silica gel column (2.5 x 30 cm), and
eluted with a solvent gradient of hexane : ethyl acetate in a 95:5 to 90:10.
Sub-fraction 2.5.13 that showed antibacterial activity was purified further with
a Sephadex LH-20 column, using methanol as eluent to yield the pure
compound 1 (100 mg).
Fraction 2.6 (2.4 g) was further purified on a silica column. A solvent mixture
of hexane : ethyl acetate was applied to the column in a 1:19 to 1:1 ratio. Sub-
fraction 2.6.4 was further purified with a Sephadex LH-20 column with
methanol as eluent to yield compound 1 (48 mg) and eriodictyol (5 mg).
Fraction 2.4, upon standing overnight, gave a crystalline compound which was
washed with hexane : ethyl acetate (1:1) to give compound 2 (150 mg). The
remaining part of fraction 2.4 was further purified with a flash silica gel column
(2.5 x 30 cm) which was developed with a solvent system of hexane : ethyl
acetate in ratio 7:3 (100 ml fractions collected), to yield more of the pure
compound 2 (100 mg).

46
Fraction 4 (5 g) was applied to a flash silica gel column (3.0 x 50 cm) and
developed with a solvent gradient of hexane : ethyl acetate in a 95:5 to
90:10. Sub-fraction 4.2 that showed antibacterial was further purified with a
Sephadex LH-20 column, which was developed with solvent mixture
methanol : chloroform mixture (1:9) to yield tamarixetin (5 mg) and quercetin
(10 mg) respectively. Fraction 4.2.1 showed antibacterial activity and was
purified further on a silica gel column (2.5 x 30 cm) and eluted with a solvent
mixture of methanol : chloroform (1:19). The resulting sub-fraction 4.2.1.4
which still indicated antibacterial activity was then purified further with a
Sephadex LH-20 column and eluted with water : ethanol mixture (1:19) to
yield the pure compound 3 (50 mg).
2.2.2.4 Structure elucidation
The isolated compounds were identified by their proton-nuclear magnetic
resonance (1H-NMR), carbon-nuclear magnetic (13C-NMR), two dimensional
NMR, mass spectroscopy (MS), infra red (IR), UV spectra and X-ray
crystallography (Fig. 2.5-2.8) (section 2.3). The nuclear magnetic resonance
(NMR) data were obtained at 300 MHz on a Bruker ARX 300 NMR
spectrometer using CDCl3 as solvent with tetramethylsilane (TMS) as internal
standard.

47
Ethanol Extract 2 kg
Silica column (25 fractions & 4 pooled fractions)
Fraction 2 (10 g) Fraction 4 (5g)
Silica column Silica column
Fraction 4.2 (833mg)
Fraction 2.4 (3.3 g)
Fraction 2.5 (2.4 mg)
Fraction 2.6 (2.4 mg)
Sephadex column
Compound 2 (150 mg)
Silica column Silica column Tamarixetin (5 mg)
Quercetin (10 mg)
Fraction 4.2.1(345mg)
Silica column Fraction 2.5.13 (94mg) Fraction 2.6.4
(689mg)
Compound 2 (100 mg)
Sephadex column Silica column
Sephadex column
Compound 1 (148 mg)
Compound 3 (50 mg)
Sephadex column
Fraction 4.2.1.4 (10mg)
Eriodictyol (5 mg)
Figure 2.1: Schematic representation of the bioassay guided isolation of active compounds from C. steenkampianus. Only fractions with antibacterial activity are shown.

48
2.3 Results and Discussion Fractions with antibacterial activity have been reported to show antiplasmodial
activity (Prozesky, 2004; Boonphong et al., 2007; Zdzislawa, 2007).
Therefore, antibacterial-guided fractionation was used to monitor and direct
the isolation of compounds with possible antiplasmodial activity from the crude
ethanol extracts of the leaves of C. steenkampianus. Pooled fractions from the
columns were then collected and tested against Bacillus cereus. A typical
result of this method is shown in Fig. 2.2 and 2.3. This method has led to the
isolation of six compounds: two diterpenes with new skeletons, three
flavonoids and one indane (Fig. 2.4). Compounds showed moderate to good
antibacterial activity. The antibacterial activity observed in fractions (Fig. 2.2b)
is more pronounced than those of pure compounds (Fig. 2.3). This could be
due to other compounds not isolated having synergistic effects in the
fractions.
(a) (b)
Figure 2.2: Typical results obtained from the pooled fractions from the silica
column tested for antibacterial activity. Both TLC plates were developed with
chloroform : methanol (9:1). The white zones on TLC plate (b) indicate
antibacterial activity.

49
(1a) (1b)
Purified fraction of the indane.
(2a) (2b)
Purified fraction of quercetin.
(3a) (3b)
Purified fraction of tamarixetin.
Figure 2.3: TLC plates showing antibacterial activity of pure compounds. The
TLC for the purified fractions were developed in solvent mixture: hexane :
ethyl acetate (1:1) for indane, chloroform : methanol (9:1) for quercetin and
tamarixetin. a) sprayed with vanillin reagent. b) the white zone indicates
antibacterial activity.

50
HO
HHO
O
O
HH
HO
O
O
HO
OH
HH
O
O
AcO
O
OOAc
O
O
OAc
O
COOH
H
1
3
78
9
13 14
15
1617
18
19
205
11
1
1
39
11
12
108
4
6
2 3
4
1
8
10
9
1
8
10
9
13
10
5 6
13
Figure 2.4: Structures of isolated compounds.
2,6-Dimethyl-1-oxo-4-indanecarboxylic acid (1) was isolated as a
amorphous white solid, it showed in UV (MeOH) spectra absorptions at λmax
215, 248, 310 nm, the IR (KBr) showed absorption peaks at max 3400-2300,
2924, 1709, 1580, 1459, 1423, 1250, 1182, 1133, 927, 836, 693 cm-1. Low-
resolution mass spectrometry and combustion analysis indicated a
molecular formula C12H12O3 for 1 and its NMR spectroscopic data (Table
2.1) were in agreement with a structure of 2,6-dimethyl-1-oxo-4-
indanecarboxylic acid. In particular, the HMBC (Fig. 2.13) correlations
observed for 1 (C-1 with H-2, H2-3, H-7, and Me-10; C-12 with H-5 and H-7;
C-9 with H-2, H2-3, H-5 and H-7; C-11 with H-5, and C-12 with H-5 and H-7)
established a 1-indanone skeleton and a 2,6-dimethyl-4-carboxyl
substitution pattern for this new substance. Since 1 was devoid of optical

51
rotation between 589 and 365 nm, it was evident that the isolated
compound is a racemic mixture of the two enantiomers at the C-2
asymmetric center, which can be easily racemized through the enolic form
of the 1-indanone.
Table 2.1: NMR spectroscopic data [400 (1H) and 100 (13C) MHz, CDCl3] for
compound 1.a
Position δC, mult. δH (J in Hz) HMBCb
1 209.1, qC - -
2 42.0, CH 2.72, ddq (7.9, 7.0, 3.7) 1, 3, 8, 9, 10
3 36.1, CH2 3.77, dd (18.6, 7.9) 1, 2, 4, 8, 9, 10
3.02, dd (18.6, 3.7) 1, 2, 4, 8, 9, 10
4 127.1, qC - -
5 138.0, CH 8.18, d (2.0) 4, 6, 7, 9, 11, 12
6 138.1, qC - -
7 129.4, CH 7.79, d (2.0) 1, 5, 6, 8, 9, 12
8 137.9, qC - -
9 153.1, qC - -
10 16.2, CH3 1.31, d (7.0) 1, 2, 3
11 171.3, qC 8.60, brc d
12 20.9, CH3 2.45, s 5, 6, 7
aThese assignments were also in agreement with the COSY and HSQC
spectra. bHMBC correlations, optimized for 8 Hz, are from proton(s) stated to
the indicated carbon. cCarboxylic proton. dNot observed (Fig. 2.9-2.14).

52
Figure 2.5: 1H-NMR spectrum of tamarixetin.

53
Figure 2.6: 1H-NMR spectrum of quercetin.
Figure 2.7: 13C-NMR spectrum of quercetin.

54
Figure 2.8: 1H-NMR spectrum of eriodictyol.

55
Figure 2.9: 1H-NMR spectrum of indane.
Figure 2.10: 13C-NMR spectrum of indane.

56
Figure 2.11: COSY spectrum of indane.
Figure 2.12: HMQC spectrum of indane.

57
Figure 2.13: HMBC spectrum of indane.
Figure 2.14: NOESY spectrum of indane.
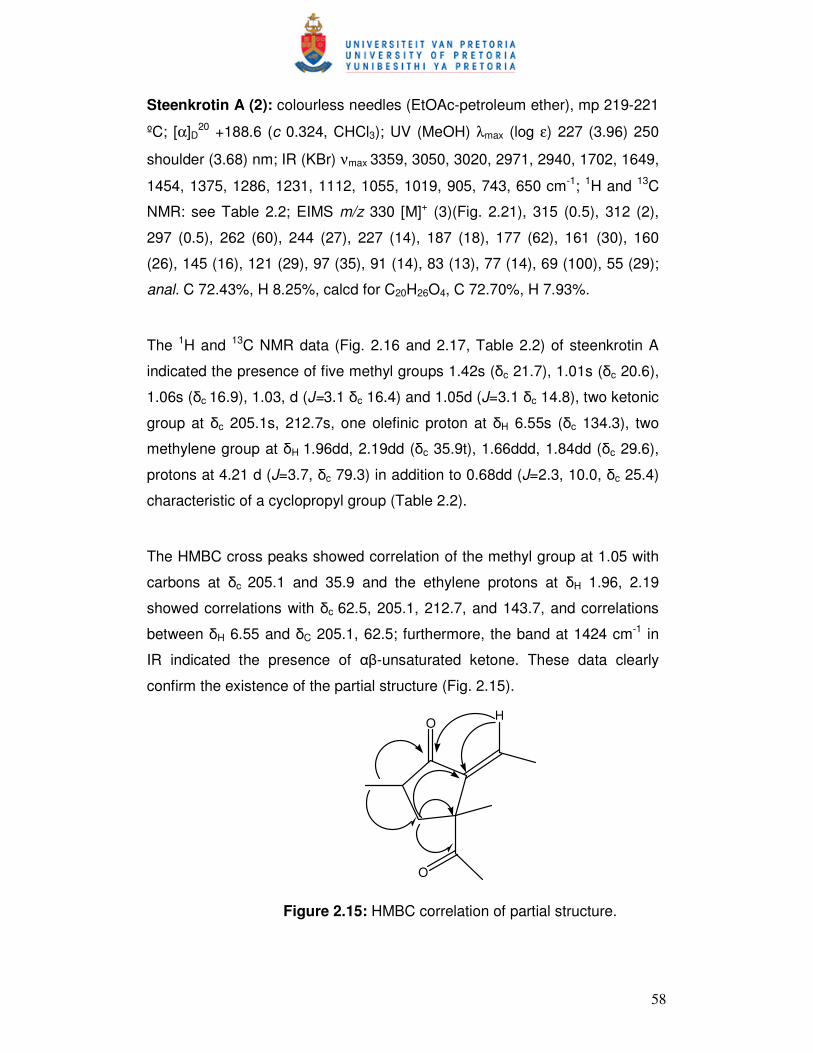
58
Steenkrotin A (2): colourless needles (EtOAc-petroleum ether), mp 219-221
ºC; [α]D20 +188.6 (c 0.324, CHCl3); UV (MeOH) λmax (log ε) 227 (3.96) 250
shoulder (3.68) nm; IR (KBr) νmax 3359, 3050, 3020, 2971, 2940, 1702, 1649,
1454, 1375, 1286, 1231, 1112, 1055, 1019, 905, 743, 650 cm-1; 1H and 13C
NMR: see Table 2.2; EIMS m/z 330 [M]+ (3)(Fig. 2.21), 315 (0.5), 312 (2),
297 (0.5), 262 (60), 244 (27), 227 (14), 187 (18), 177 (62), 161 (30), 160
(26), 145 (16), 121 (29), 97 (35), 91 (14), 83 (13), 77 (14), 69 (100), 55 (29);
anal. C 72.43%, H 8.25%, calcd for C20H26O4, C 72.70%, H 7.93%.
The 1H and 13C NMR data (Fig. 2.16 and 2.17, Table 2.2) of steenkrotin A
indicated the presence of five methyl groups 1.42s (δc 21.7), 1.01s (δc 20.6),
1.06s (δc 16.9), 1.03, d (J=3.1 δc 16.4) and 1.05d (J=3.1 δc 14.8), two ketonic
group at δc 205.1s, 212.7s, one olefinic proton at δH 6.55s (δc 134.3), two
methylene group at δH 1.96dd, 2.19dd (δc 35.9t), 1.66ddd, 1.84dd (δc 29.6),
protons at 4.21 d (J=3.7, δc 79.3) in addition to 0.68dd (J=2.3, 10.0, δc 25.4)
characteristic of a cyclopropyl group (Table 2.2).
The HMBC cross peaks showed correlation of the methyl group at 1.05 with
carbons at δc 205.1 and 35.9 and the ethylene protons at δH 1.96, 2.19
showed correlations with δc 62.5, 205.1, 212.7, and 143.7, and correlations
between δH 6.55 and δC 205.1, 62.5; furthermore, the band at 1424 cm-1 in
IR indicated the presence of αβ-unsaturated ketone. These data clearly
confirm the existence of the partial structure (Fig. 2.15).
O
H
O
Figure 2.15: HMBC correlation of partial structure.

59
The other structural parts were confirmed from the other HMBC correlations
as follows: the methyl group at 1.03 showed correlations with carbons at δc
62.5, 212.7, 29.6 in addition to the correlations δH 0.68/ δc 74.7, 39.8, 20.6,
21.7; δH 6.55/ δc 134.9, 75.1, 63.3, 21.7. All the foregoing information in
addition to the other data of HMBC, DEPT 135, COSY 45, and HMQC (Fig.
2.18 and 2.20) confirm the plane structure of 2.
The NOESY correlations of the compound (Fig. 2.19) showed correlations
between methyl-20, H-8, H-6, H-5, H-11, H-3 (δH 2.19) with H-12 (δH 1.66);
H-13/H-12, and finally between H-3 (δH 1.96)/H-2. These data indicate that
the groups; methyl-20, H-8, H-6, H-5, H-11, H-3 (δH 2.19) and H-12 (δH 1.66)
are on one side and the groups H-13, H-12, H-3 (δH 1.96) and H-2 are on the
other side.
Finally the structure of steenkrotin A (2, C20H26O4) was confirmed from X-ray
diffraction studies. Figure 2.22 is a perspective view of the molecule of 2
showing its relative configuration. Moreover, the 1D and 2D NMR
spectroscopic data of 2 (Tables 2.2 and 2.3) were in complete agreement
with the proposed structure.
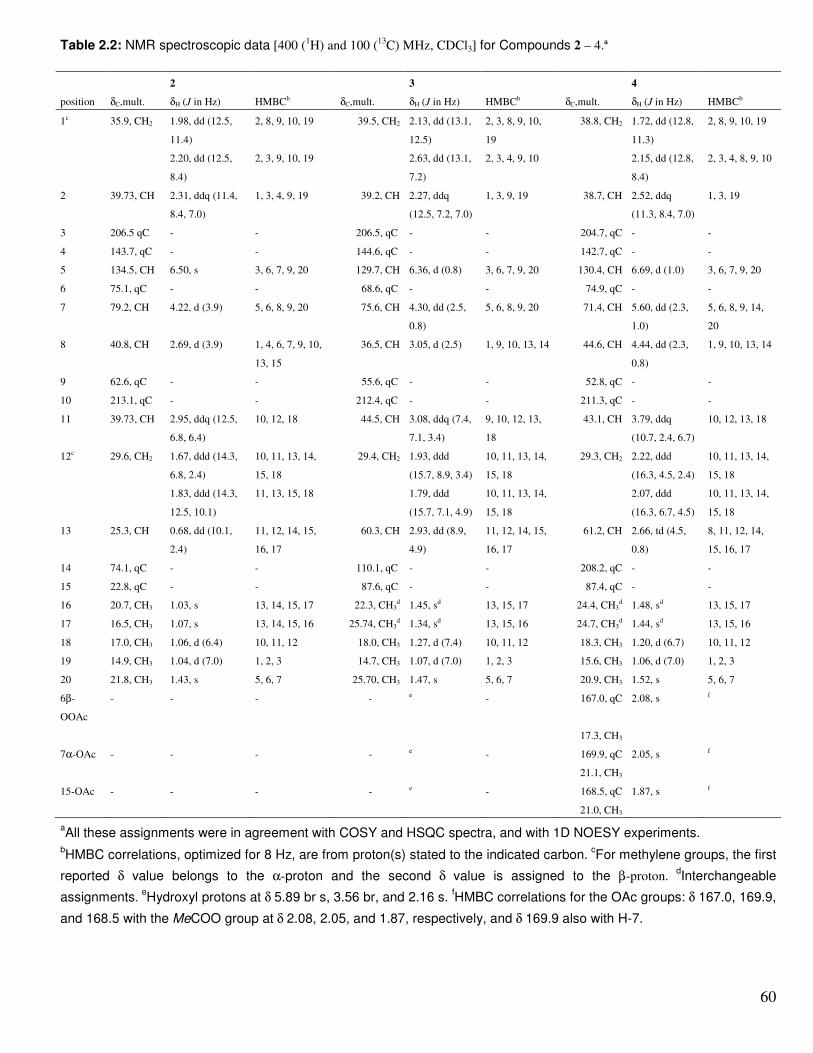
60
Table 2.2: NMR spectroscopic data [400 (1H) and 100 (
13C) MHz, CDCl3] for Compounds 2 – 4.ª
2 3 4
position δC,mult. δH (J in Hz) HMBCb δC,mult. δH (J in Hz) HMBC
b δC,mult. δH (J in Hz) HMBC
b
1c 35.9, CH2 1.98, dd (12.5,
11.4)
2, 8, 9, 10, 19 39.5, CH2 2.13, dd (13.1,
12.5)
2, 3, 8, 9, 10,
19
38.8, CH2 1.72, dd (12.8,
11.3)
2, 8, 9, 10, 19
2.20, dd (12.5,
8.4)
2, 3, 9, 10, 19 2.63, dd (13.1,
7.2)
2, 3, 4, 9, 10 2.15, dd (12.8,
8.4)
2, 3, 4, 8, 9, 10
2 39.73, CH 2.31, ddq (11.4,
8.4, 7.0)
1, 3, 4, 9, 19 39.2, CH 2.27, ddq
(12.5, 7.2, 7.0)
1, 3, 9, 19 38.7, CH 2.52, ddq
(11.3, 8.4, 7.0)
1, 3, 19
3 206.5 qC - - 206.5, qC - - 204.7, qC - -
4 143.7, qC - - 144.6, qC - - 142.7, qC - -
5 134.5, CH 6.50, s 3, 6, 7, 9, 20 129.7, CH 6.36, d (0.8) 3, 6, 7, 9, 20 130.4, CH 6.69, d (1.0) 3, 6, 7, 9, 20
6 75.1, qC - - 68.6, qC - - 74.9, qC - -
7 79.2, CH 4.22, d (3.9) 5, 6, 8, 9, 20 75.6, CH 4.30, dd (2.5,
0.8)
5, 6, 8, 9, 20 71.4, CH 5.60, dd (2.3,
1.0)
5, 6, 8, 9, 14,
20
8 40.8, CH 2.69, d (3.9) 1, 4, 6, 7, 9, 10,
13, 15
36.5, CH 3.05, d (2.5) 1, 9, 10, 13, 14 44.6, CH 4.44, dd (2.3,
0.8)
1, 9, 10, 13, 14
9 62.6, qC - - 55.6, qC - - 52.8, qC - -
10 213.1, qC - - 212.4, qC - - 211.3, qC - -
11 39.73, CH 2.95, ddq (12.5,
6.8, 6.4)
10, 12, 18 44.5, CH 3.08, ddq (7.4,
7.1, 3.4)
9, 10, 12, 13,
18
43.1, CH 3.79, ddq
(10.7, 2.4, 6.7)
10, 12, 13, 18
12c 29.6, CH2 1.67, ddd (14.3,
6.8, 2.4)
10, 11, 13, 14,
15, 18
29.4, CH2 1.93, ddd
(15.7, 8.9, 3.4)
10, 11, 13, 14,
15, 18
29.3, CH2 2.22, ddd
(16.3, 4.5, 2.4)
10, 11, 13, 14,
15, 18
1.83, ddd (14.3,
12.5, 10.1)
11, 13, 15, 18 1.79, ddd
(15.7, 7.1, 4.9)
10, 11, 13, 14,
15, 18
2.07, ddd
(16.3, 6.7, 4.5)
10, 11, 13, 14,
15, 18
13 25.3, CH 0.68, dd (10.1,
2.4)
11, 12, 14, 15,
16, 17
60.3, CH 2.93, dd (8.9,
4.9)
11, 12, 14, 15,
16, 17
61.2, CH 2.66, td (4.5,
0.8)
8, 11, 12, 14,
15, 16, 17
14 74.1, qC - - 110.1, qC - - 208.2, qC - -
15 22.8, qC - - 87.6, qC - - 87.4, qC - -
16 20.7, CH3 1.03, s 13, 14, 15, 17 22.3, CH3
d 1.45, s
d 13, 15, 17 24.4, CH3
d 1.48, s
d 13, 15, 17
17 16.5, CH3 1.07, s 13, 14, 15, 16 25.74, CH3
d 1.34, s
d 13, 15, 16 24.7, CH3
d 1.44, s
d 13, 15, 16
18 17.0, CH3 1.06, d (6.4) 10, 11, 12 18.0, CH3 1.27, d (7.4) 10, 11, 12 18.3, CH3 1.20, d (6.7) 10, 11, 12
19 14.9, CH3 1.04, d (7.0) 1, 2, 3 14.7, CH3 1.07, d (7.0) 1, 2, 3 15.6, CH3 1.06, d (7.0) 1, 2, 3
20 21.8, CH3 1.43, s 5, 6, 7 25.70, CH3 1.47, s 5, 6, 7 20.9, CH3 1.52, s 5, 6, 7
6β-
OOAc
- - - - e
- 167.0, qC 2.08, s f
17.3, CH3
7α-OAc - - - - e
- 169.9, qC 2.05, s f
21.1, CH3
15-OAc - - - - e
- 168.5, qC 1.87, s f
21.0, CH3
aAll these assignments were in agreement with COSY and HSQC spectra, and with 1D NOESY experiments.
bHMBC correlations, optimized for 8 Hz, are from proton(s) stated to the indicated carbon.
cFor methylene groups, the first
reported δ value belongs to the α-proton and the second δ value is assigned to the β-proton. dInterchangeable
assignments. eHydroxyl protons at δ 5.89 br s, 3.56 br, and 2.16 s.
fHMBC correlations for the OAc groups: δ 167.0, 169.9,
and 168.5 with the MeCOO group at δ 2.08, 2.05, and 1.87, respectively, and δ 169.9 also with H-7.

61
Table 2.3: Significant NOE Data for Compounds 2 – 4.
Compound Irradiated proton (s)
(δ)
Observed NOEs
2 H-1α (1.98) H-1β,a H-8α,
b Me-19
b
H-5 (6.50) Me-20b
H-7β (4.22) H-8α,b Me-16 + Me-17,
c Me-20
b
H-8α (2.69) H-1α,c H-1β,
c H-7β,
b H-11α,
a, Me-17
b
H-11α (2.95) H-1β,b H-8α,
a H-12α,
b H-12β,
c Me-18
a
H-13β (0.68) H-12α,c H-12β,
a Me-16
b
Me-20 (1.43) H-5,c H-7β,
b Me-16
c
3 H-1β (2.63) H-1α,a H-2β,
a Me-18
b
H-5 (6.36) Me-20b
H-7β (4.30) H-8α,b Me-20
b
H-13β (2.93) H-12α,c H-12β,
b Me-18
c
Me-18 (1.27) H-1β,c H-11α,
c H-13β,
c H-12α + H-12βc
Me-19 (1.07) H-1α,b H-1β,
c, H-2βb
4 H-1α (1.72) H-1β,a H-2β,
b Me-19
b
H-2β (2.52) H-1α,c H-1β,
b Me-19
b
H-5 (6.69) Me-20a
H-7β (5.60) H-8α,a Me-20
a
H-8α (4.44) H-5,c H-7β,
a H-11α,
a H-12α,
b Me-16 + Me-17,
b 15-
OAcc
H-11α (3.79) H-8α,a H-12α,
b H-12β,
c Me-18,
b 15-OAc
c
H-13β (2.66) H-12α + H-12β,a Me-16 + Me-17,
a Me-18
b
Me-18 (1.20) H-11α,c H-13β,
c H-12α + H-12βb
Me-19 (1.06) H-1α,b H-1β,
c H-2β,
b 7α-OAc
c
aStrong NOE enhancement (>4%). bMedium NOE enhancement (1.5 - 4%). cWeak
NOE enhancement (0.5 – 1.5%).

62
X-Ray Structure Determination of 2. The crystallographic data set was collected at 20
°C on a Siemens P4 diffractometer fitted with a Bruker 1K CCD detector and SMART
control software using graphite-monochromated, Mo-Kα radiation by means of a
combination of phi and omega scans. Data reduction was performed using SAINT+ and
the intensities were corrected for absorption using SADABS. The structures were solved
by direct methods using SHELXTS and refined by full-matrix least squares using
SHELXTL and SHELXL-97. All hydrogen atoms for the structure of 2 were located
experimentally. In the refinement, the hydrogen atoms were refined without any
positional constrains. Isotropic displacement parameters for the non-methyl hydrogen
atoms were calculated as 1.2 × Ueq of the atom to which they were attached, and the
corresponding value for methyl hydrogen atoms was 1.5 × Ueq of the carbon atom to
which they were attached. All non-hydrogen atoms were refined with anisotropic
displacement parameters. Drawings of the structure (Fig. 2.22) were produced using
Ortep-3 for Windows (Farruggia, 1997), Mercury and POV-Ray for Windows.
Figure 2.16: 1H-NMR spectrum of steenkrotin A.

63
Figure 2.17: 13C-NMR spectrum of steenkrotin A.
Figure 2.18: COSY spectrum of steenkrotin A.

64
Figure 2.19: NEOSY spectrum of steenkrotin A. Figure 2.20: Dept 135 spectrum of steenkrotin A.

65
Figure 2.21: MS data of steenkrotin A.
Figure 2.22: X-ray structure of steenkrotin A.

66
Steenkrotin B (3): colourless fine needles (MeOH), mp 130-132 ºC (decomp.); [α]D20
+24.4 (c 0.119, CHCl3); UV (MeOH) λmax (log ε) 233 (3.98) nm; IR (KBr) νmax 3435,
2976, 2932, 1731, 1691, 1676, 1457, 1372, 1194, 1078, 901 cm-1; 1H and 13C NMR:
see Table 2.2; (ESI)MS positive mode m/z 403 [M+Na]+, 783 [2M+Na]+; (ESI)MS
negative mode m/z 379 [M-H]-; EIMS m/z 380 [M]+ (0.3), 362 (1), 348 (1), 338 (25),
305 (19), 264 (27), 245 (21), 219 (27), 203 (38), 187 (45), 177 (56), 161 (55), 152 (39),
141 (43), 121 (40), 95 (31), 91 (41), 85 (41), 83 (45), 71 (57), 69 (54), 55 (100); anal. C
63.31%, H 7.36%, calcd for C20H28O7, C 63.14%, H 7.42%. Steenkrotin B (3,
C20H28O7) showed 1H, 13C, COSY, HSQC, and HMBC NMR spectra (Fig. 2.23-2.28)
very similar to those of 2 (Table 2.2). The observed differences were consistent with
the presence in 3 of a hydroxyisopropyl group [δH 1.45 and 1.34 (Me-16 and Me-17);
δC 22.3 and 25.7 (C-16 and C-17), and 87.6, qC, C-15] [δH 1.45 and 1.34 (Me-16 and
Me-17); δC 22.3 and 25.7 (C-16 and C-17), and 87.6, qC, C-15] and a hemiacetal
carbon (δ 110.1, qC, C-14) instead of the pentasubstituted cyclopropane of 2. This
structural difference was also supported by the HMBC spectra, because 2 showed
correlations through three bonds between C-15 and H-8, and between C-14 and Me-
16 and Me-17, that were not observed for 3 (Table 2.2). Three of the seven oxygen
atoms of 3 were involved in two ketones [δ 206.5 (C-3) and 212.4 (C-10)] and in a
secondary hydroxyl group [δH 4.30; δC 75.6, CH (C-7)] like in 2, and two other oxygens
must be placed at C-14 and C-15 as one of the hemiacetal oxygens and as a tertiary
hydroxyl group, respectively (see above). The remaining two oxygens of 3 must be
part of an endoperoxide moiety between C-6 (δ 68.6, qC) and the hemiacetalic C-14
carbon. The presence of this endoperoxide was also in agreement with molecular
formula requirements (7 unsaturations) and with the observed loss of O2 (ion at m/z
348) from the molecular ion (m/z 380) in the EI mass spectrum of 3 (Perales, 1983).
Treatment of 3 with acetic anhydride-pyridine yielded the triacetyl derivative 4
(C26H34O10), the IR spectrum of which was devoid of hydroxyl absorptions. In the 13C
NMR spectrum of 4, the methyl carbon of one of the acetates (δC 167.0, qC and 17.3,
CH3; δH 2.08) appeared unusually shifted ((δC 17.3) indicating the presence of a
peroxyacetate function (Olah et al.,1976; Baj and Chrobok, 2000), which is also in
agreement with molecular formula requirements. Thus, apart from the esterification of
the hydroxyl groups at C-7 and C-15, the acetylation of 3 caused the hydrolysis of the
14-hemiacetal and subsequent acetylation of the resulting 6-hydroperoxide, as was

67
also evidenced by the appearance of an additional ketone at C-14 ((δC 208.2, HMBC
correlated with H-7, H-8, H2-12, and H-13, Table 2.2) in the 13C NMR spectrum of 4.
The relative stereochemistry of 3 and 4 must be identical to that of 2 for the following
reasons: NOE experiments (Table 2.3) established that H-8 and H-11 are in a cis
spatial relationship in 2 and 4, because a strong NOE enhancement was observed in
H-11 when H-8 was irradiated and vice versa. Consequently, Me-18 must be trans (β-
oriented) with respect to H-8. Moreover, the NOE observed between H-13 and Me-18
in the 1D NOESY spectra of 2 – 4 was in agreement with a β-orientation of H-13. In the
case of 2, a cis arrangement between H-8α and the 1-methylene protons was
supported by weak NOE enhancements, but no NOEs between these protons were
observed for 3 and 4. However, the similar 1H NMR chemical shifts and the almost
identical coupling constant values for H2-1, H-2, and Me-19 in 2 – 4 (Table 2.2),
together with the absence of NOE between Me-18 and Me-19, support an α-orientation
for the 1-methylene and Me-19 groups in 3 and 4, as it was established for 2 by an X-
ray analysis. In addition, one of the H2-1 protons of 3 (δ2.63) showed NOE with the
close Me-18 group, and this proton must be the β-oriented one, which in turn displayed
a strong NOE with H-2 and no NOE with Me-19, thus establishing an α-orientation for
Me-19. This conclusion was also supported by the 1D NOESY behavior of 4, that
showed a weak NOE in H-2 (+1%) and a medium NOE in Me-19 (+3.4%) when H-1α
(δ 1.72) was irradiated. For structural requirements, the α-orientation of H-8 in 2 forces
to a 6β,14β closure of its cyclic ether, and 3 must also have the same stereochemistry
for its endoperoxide, because steenkrotin B (3) also has its H-8 proton α-oriented (see
above). Consequently, the 6-peroxyacetate of 4 must be β-oriented.
The cyclohexene ring of 3 and 4 adopts an envelope conformation with the flap at C-7,
like in 2 (Fig. 2.4), and H-7β and 7α-OH (or 7α-OAc in 4) are equatorial and axial
substituents, respectively, thus explaining the similar J7β,8αvalues (Table 2.2) and the
NOE behaviour of these compounds (Table 2.3). NOE experiments also allowed the
assignment of the Me-16 and Me-17 groups in 2, as it is shown in the formula and
Table 2.2. Irradiation at δ 1.43 (Me-20) caused NOE enhancement only in one of the
two C-15 methyls (δ 1.03, Me-16), whereas the signal of the other one (δ 1.07, Me-17)
was enhanced when H-8α was irradiated. The assignment of the configuration for both

68
12-methylene protons in 2 – 4 (Table 2.2) was also supported by NOE results (Table
2.3).
To the best of our knowledge, diterpenoids 2 and 3 possess new carbon skeleta that
may be derived from the tigliane (5) and daphnane (6) types, respectively, by an
8(9→10) abeo rearrangement. It is of interest that diterpenes belonging to 5 and 6
carbon frameworks have repeatedly been found in several Croton species and in other
Euphorbiaceae genera (Connolly and Hill, 1991).
Transformation of Steenkrotin B (3) into Compound 4. Treatment of 3 (15.0 mg)
with Ac2O-pyridine (1:1, 4.0 ml) for 24 h at room temperature, followed with
evaporation of the volatiles at 50 ºC under reduced pressure, yielded a residue which
was chromatographed on a silica gel column using 10% ethyl acetate in hexane to give
4 (8 mg, 53.0 % yield): amorphous white solid; [α]D (Farruggia, 1997) –99.3 (c 0.293,
CHCl3); IR (KBr) νmax 2929, 1745, 1736, 1706, 1694, 1457, 1369, 1225, 1102, 1076,
1039, 945, 922, 849 cm-1; 1H and 13C NMR: see Table 2.2; (ESI) MS positive mode m/z
529 [M+Na]+, 1035 [2M+Na]+; anal. C 61.83%, H 6.80%, calcd for C26H34O10, C
61.65%, H 6.77% (Fig. 2.29-2.34).
Figure 2.23: 1H-NMR spectrum of steenkrotin B.

69
Figure 2.24: 13C-NMR spectrum of steenkrotin B.
Figure 2.25: Dept spectrum of steenkrotin B.

70
Figure 2.26: COSY spectrum of steenkrotin B.
Figure 2.27: HMQC spectrum of steenkrotin B.

71
Figure 2.28: HMBC spectrum of steenkrotin B.
Figure 2.29: 1H-NMR spectrum of steenkrotin B acetate.

72
Figure 2.30: 13C-NMR spectrum of steenkrotin B acetate.
Figure 2.31: COSY spectrum of steenkrotin B acetate.

73
Figure 2.32: HSQC spectrum of steenkrotin B acetate.
Figure 2.33: HMBC spectrum of steenkrotin B acetate.

74
Figure 2.34: NEOSY spectrum of steenkrotin B acetate.

75
2.4 References:
Baj, S. and Chrobok, A. 2000. Alkylation of peroxyacids as a new method of
peroxyester synthesis. J. Chem. Soc., Perkin Trans. 1:2575-2576.
Boonphong, S., Puangsombat, P., Baramee, A., Mahidol, C., Ruchirawat, S.
and Kittakoop, P. 2007. Bioactive compounds from Bauhinia purpurea
possessing antimalaral, antimycobacterial, antifungal, anti-inflammatory, and
cytotoxic activities. J. Nat. Prod. 70:795-801.
Clarkson, C., Maharaj, V.J., Crouch, N.R., Grace, O.M., Pillay, P., Matsabisa,
M.G., Bhagwandin, N., Smith P.J., Folb. P.I. 2004. In vitro antplasmodial
activity of medicinal plants native to or naturalised in South Africa. J.
Ethnopharmacol. 92 :177-191.
Eloff, J.N., 1998. A sensitive and quick micro-plate method to determine the
minimal inhibitory concentration of plant extract for bacteria. Planta Med. 64
(8):711-713.
Farruggia; L.J. 1997. ORTEP-3 for Windows - a version of ORTEP-III with a
Graphical User Interface (GUI). J. Appl. Crystallogr. 30:565.
Lund, B.M. and Lyon, G.D. 1975. Detection of inhibitors of Erwina carotovora
and E. herbicola on thin layer chromatograms. J. Chromatogr. 110:193-196.
Mercury (Version 1.4.2). 2007. Cambridge Crystallographic Data Centre.
URL: http://www.ccdc.cam.ac.uk.
Ngadjui, B.T., Abegaz, B.M., Keumedjio, F., Folefoe, G.N. and Kapche,
G.W.F (2002). Diterpenoids from the stem bark of Croton zambesicus.
Phytochem. 60 (4):345-349.

76
Noedl, H., Wongsrichanalai C. and Wernsdorfer, W.H. 2003. Malaria drug-
sensitivity testing: new assays, new perspectives. Trends Parasitol. 19
(4):175-181.
Olah, G. A.; Parker, D. G.; Yoneda, N. and Pelizza, F. 1976.
Oxyfunctionalization of hydrocarbons. 1. Protolytic cleavage-rearrangement
of tertiary alkyl hydroperoxides with magic acid. J. Am. Chem. Soc.
98:2245-2250.
Perales, A.; Martínez-Ripoll, M.; Fayos, J.; Savona, G.; Bruno, M. and
Rodríguez, B. 1983. Sesquiterpenoid constituents of Meriandra
benghalensis (Labiatae). X-ray structure analysis. J. Org. Chem. 48:5318-
5321.
POV-Ray for Windows. (Version 3.6). 2004. Persistence of Vision Raytracer
Pty. Ltd., Victoria, Australia. URL: http://www.povray.org.
Prozesky, E.A. 2004. Antiplasmodial and chloroquine resistance reversal
properties of a new diterpene from Croton steenkampianus. PhD thesis.
University of Pretoria, South Africa.
SHELXS-97 and SHELXL-97. Sheldrick, G.M. 1997. University of Gottingen,
Germany.
Silver, R.M., Oliveira, F.A., Cunha K.M.A., Maia, J.L., Maciel, M.A.M., Pinto
A.C., Nascimento N.R.F., Santos F.A. & Rao V.S.N. (2005). Cardiovascular
effects of trans-dehydrocrotonin, a diterpene from Croton cajucara in rats.
Vascul. Pharmacol. 43(1):11-18.

77
SMART(Version 5.054), SAINT (Version 6.45), SADABS (Version 2.10) and
SHELXTS / SHELXTL (Version 6.12). 2001. Bruker AXS Inc., Madison,
Wisconsin, USA. 6.45.
Stoltz, A.C. 1992. Biochemical and immunochemical investigation of some
South African strains of the human malaria parasite, Plasmodium falciparum.
MSc thesis, University of Pretoria, Pretoria, South Africa.
Suarez, A.I., Blanco Z., Compagnone R.S., Salazar-Bookaman M.M., Zapata
V., Alvarado C. (2006). Anti-inflammatory activity of Croton cuneatus
aqueous extract. J. Ethnopharmacol. 105:99-101.
Suarez, A.I., Compagnone R.S., Salazar-Bookaman M.M., Tillett S.,
Monache F.D., Giulio C.D. and Bruges G. 2003. Antinociceptive and anti-
inflammatory effects of Croton malambo bark aqueous extract. J.
Ethnopharmacol. 88 (1):11-14.
Trager, M. and Jensen, J.B. 1976. Human malaria parasite in continuous
culture. Science 193:674.
Willcox, M.L. and Bodeker, G. 2004. Traditional herbal medicines for malaria.
B.M.J. 329:1156-1159.
Zdzislawa, N. 2007. A review of anti-infective and anti-inflammatory
chalcones. Eur. J. Med. Chem. 42(2):125-137.

78

78
CHAPTER 3 ANTIPLASMODIAL BIOACTIVITY OF CRUDE EXTRACT AND ISOLATED COMPOUNDS
3.1 Introduction…………………………………………………………………..
79
3.2 Methods…………………….……………………………………………….. 80
3.2.1 Culture medium and washed human erythrocytes……………. 80
3.2.2 In vitro culturing of malaria parasites…………………………… 80
3.2.3 Giemsa stained thin blood smear preparations..………........... 81
3.2.4 In vitro synchronisation of malaria parasites………..…………. 81
3.2.5 Preparation of microculture plates…………………….………... 82
3.2.6 Determination of antiplasmodial activity with the Malstat
method……………………………………………………………………
82
3.2.7 Determination of antiplasmodial activity with the
microfluorimetric method………………………………………………..
83
3.2.7.1 Fluorimetric susceptibility test……...…………………. 83
3.2.7.2 Synergistic activity…………………………….............. 84
3.3 Results and Discussion……………..……………………………….......... 85
3.4 References…...…………………………………………………….……….. 87

79
CHAPTER 3 ANTIPLASMODIAL BIOACTIVITY OF CRUDE EXTRACT AND ISOLATED COMPOUNDS 3.1 Introduction Among many and different maladies that afflict mankind, malaria appears to
be making a strong comeback (Van der Westhuyzen; Parkinson, 2005).
Cases of malaria are on the increase in the world, more especially, in the
tropical and sub-tropical regions. The World Health Organization estimates
that 300-500 million new cases of malaria are reported annually, causing the
death of about 2.5 million people (Hyde, 2002; Van der Westhuyzen;
Parkinson, 2005). The increasing prevalence and distribution of malaria has
been attributed to a number of factors, one of them being the emergence and
spread of drug resistant parasites. The search for new methods to combat the
disease has become imperative as commonly available cheap drugs are no
longer effective for treatment. Efforts are now being directed towards the
discovery and development of new chemically diverse antimalarial agents
(Clarkson et al., 2004). The success of artemisinin and its derivatives has
encouraged and supported the continued investigation of plant resources for
novel antimalaria drugs (Willcox, 2004).
Before 1976 drug sensitivity testing was done only in vivo, making the
procedure very expensive and difficult. Since the development of in vitro
assays, drug sensitivity testing has become easier, faster and more efficient
(Noedl et al., 2003). Although in vitro antiplasmodial testing is a lot easier than
in vivo methods, bio-guided isolation of antiplasmodial compounds using in
vitro methods remains a long and difficult process. The antibacterial screening
test (direct bioautography) is the easiest and might be successful in isolating
antiplasmodial compounds (Prozesky, 2004; Boonphong, 2007; Zdzislawa,
2007).

80
3.2 Methods 3.2.1 Culture medium and washed human erythrocytes The wash medium was made up of 10.4 g RPMI 1640 (containing L-
glutamine), 5.94 g HEPES, 4.0 g D-glucose, 44 mg hypoxanthine, 5%
NaHCO3 and 4 mg of gentamycin dissolved in 900 ml deionised sterile water.
The culture medium was prepared by supplementing the wash medium with
5% Albumex II.
Erythrocytes for maintenance of the parasite cultures were obtained from the
whole blood of a O+ blood group donor, and then centrifuged in a Hermle Z
320 bench centrifuge at 500 g for 5 minutes. The plasma and buffy coat was
removed. The erythrocytes were then re-suspended in wash medium and
centrifuged at 500 g for 5 minutes. The supernatant was removed and the
procedure was repeated three times. The washed erythrocytes were then
stored in 10 ml wash medium at 4°C for up to 2 weeks (Trager and Jensen,
1976; Stoltz, 1992; Hoppe, 1993).
3.2.2 In vitro culturing of malaria parasites Two chloroquine sensitive (D6 and D10) and two chloroquine resistant (Dd2
and W2) strains of Plasmodium falciparum was used in the bioassay (Stoltz,
1992). For continuous in vitro culturing a slightly modified version of the
Trager and Jansen method was employed (Trager and Jensen, 1976; Hoppe,
1993).
The frozen malaria-isolates (~5% parasitemia) in cryotubes stored in liquid
nitrogen, was quickly thawed in a water bath at 37°C. The content of the
croytube (~1 ml) was transferred under sterile conditions to a 10 ml centrifuge
tube and 0.2 ml sterile 12% NaCl was slowly added to the thawed culture. It
was then mixed well for (10-20) seconds after which a sterile 1.6% NaCl
solution was slowly added and mixed for (10-20) seconds. The solution was
centrifuged at 2 500 g for 5 min and the supernatant was removed. The
parasite was then re-suspended in a 75 ml culture flask (Sterilin) containing

81
10 ml culture medium and supplemented with fresh uninfected human
erythrocytes from the O+ blood group.
The hematocrit in the parasite culture was adjusted and maintained at 5% by
adding washed erythrocytes to the culture medium. The culture flask was then
filled with a special gas mixture made up of 5% oxygen, 5% carbon dioxide
and 90% nitrogen before being incubated in a Forma incubator at 37C. Daily
the parasite culture was checked, with the thin blood smear (reported in
section 3.2.3). The culture medium was changed, flask filled with the gas
mixture from above and returned to the incubator. The hematocrit of the
cultured parasites was continually maintained at 5% by adding fresh cells at
least every 2-3 days.
3.2.3 Giemsa stained thin blood smear preparation A smear of parasitic culture was made by placing a drop of about 12 µl
parasitic culture at one end of a slide and by using a second slide at an angle,
the drop was evenly spread along the first slide and then allowed to dry.
Methanol (analytical grade) was used to fixate the blood smear by allowing it
to stand for 1 minute, after which the methanol was removed by decanting.
The DNA intercalator Giemsa (Sigma) was used to stain the parasitic DNA
(Wright, 1984). The Giemsa stain was formulated in glycerol and methanol as
indicated by the supplier. A phosphate buffer, containing 9.5 g/l sodium
dihydrogen phosphate at a pH of between 6.8 and 7.2 was used to dilute the
Giemsa solution. Two drops of Giemsa solution were added for every 1 ml of
phosphate buffer. The slide was covered with this solution for 5 minutes,
rinsed in water and then allowed to dry in the open air. A drop of microscope
oil immersion was placed on the slide and it was evaluated using a 100x oil
objective of a Nikon phase contrast microscope.
3.2.4 In vitro synchronisation of malaria parasites The method described by Vernes et al. (1984) and modified by Hoppe (1993)
was used for the in vitro synchronization of malaria parasites.
Synchronisations were performed on malaria cultures consisting of 80% ring-
phase parasites. The cultures were transferred from the culture flask to a 50

82
ml centrifuge tube, centrifuged at 500 g for 5 minutes and the supernatant
removed. The pellet volume was about 0.5 ml when 10 ml of a parasitic
culture (5% hematocrit) was centrifuged. Then 4 ml of a 15% D-sorbitol
solution was added to every 0.5 ml of parasite pellet. After careful mixing, by
inversion, the solution was incubated at 37°C for 5 minutes, where after, 8 ml
of a 0.1% D-glucose solution was added per 0.5 ml of parasite pellet, followed
by mixing by tube inversion. The parasite solution was again incubated at
37°C for 5 minutes, centrifuged at 500 g for 5 minutes and the supernatant
containing lysate erythrocytes, was removed. The pellet ring-phase infected
and uninfected erythrocytes were re-suspended in 10 ml of the culture
medium and returned to the culture flasks. The hematocrite was adjusted to
about 5% by adding washed erythrocytes, filled with the special gas mixture
described in 3.2.2 and returned to the incubator. This procedure was repeated
until the cultures consisted of about 95% ring-phase parasites.
3.2.5 Preparation of microculture plates Microculture plates were prepared in the same way for all the antiplasmodial
bioassays. Final concentrations of the extracts were made by appropriate
dilutions of stock solutions with the culture medium. 20 µl extract/compound in
duplicate and at different concentrations were added to the flat-bottom wells
of a 96-wells microculture plate, as well as 80 µl of a 5% hematocrit of 0.5-
1.0% parasitized cells (95-100% rings) in supplemented RPMI 1640 medium.
Microcultures were incubated for 48 hours in a modular incubator chamber at
37°C in a gas mixture of 5% oxygen, 5% carbon dioxide and 90% nitrogen for
the assessment of antiplasmodial activity. After 24 hours, 50µl of the medium
from each well was removed and replaced by 10 µl of the extract/compound
and 40 µl of the fresh culture medium (Makler et al., 1995).
3.2.6 Determination of antiplasmodial activity with the Malstat method The method used was a slightly modified version of the lactate
dehydrogenase assay (Makler et al., 1995). The experiment was done in
duplicate at 1% parasitemia and 5% hematocrite as described in section 3.2.5
After 48 hours, the 96-well microculture plate was prepared by adding 100 µl

83
Malstat reagent (133 ml Triton X-100, 1.33 g lactate, 0.44 g Tris buffer and 44
mg 3-actylpyrimidine adenine dinucleotide (APAD) made up to 200 ml) to
each well together with 25 µl developing dye solution (160 mg nitroblue
tetrazolium (NBT) and 8 mg phenazine ethosulphate (PES) to 100 ml Millipore
water) and 10 µl from the incubated plate. The plate was then incubated for
20 min in the dark and read with an ELISA plate reader at 620 nm.
3.2.7 Determination of antiplasmodial activity with the microfluorimetric
method
The method used was based on the detection of parasitic DNA by the
intercalation of PicoGreen (Corbett et al., 2004). Synchronized ring form
cultures (2% hematocrit and 1% parasitemia) were used to determine the
activity of pure compounds in 96-well microculture culture plates. The cultures
of P. falciparium were grown and synchronized as described in section 3.2.2
and 3.2.4. The microculture plates were prepared as described in section
3.2.5. Compounds were dissolved in DMSO and tested in duplicate at the final
concentration of 10.0, 2.0 and 0.4 µg/ml and re-evaluated at higher or lower
concentration when necessary. The final dilution in the wells contains less
than 0.1% DMSO, which had no measurable effect on the parasite survival in
this system. The negative control was 0.1% DMSO in RPMI 1640 culture
media which represent 100% parasitic viability. The positive control consisted
of chloroquine at concentrations of 100.0, 10.0, and 1.0 nM that provided a
measure of susceptibility of the parasite to known antimalarial drugs (Corbett
et al., 2004).
3.2.7.1 Fluorimetric susceptibility test After 48 hours, 150 µl of the culture described in 3.2.7 was transferred to a
new 96 well microculture flat bottom plate. Fifty micro-litres of the
fluorochrome mixture, which consisted of PicoGreen (Molecular Probes, Inc.,
EUGENE, OR), 10 mM Tris-HCl, 1 mM EDTA, pH 7.5 (TE buffer), and a 2%
Triton X-100 dilution with double distilled DNAse-free water, was then added
to liberate and label the parasitic DNA. The plates were then incubated for 5-
30 minutes in the dark. The fluorescence signal, measured as relative

84
fluorescence units (RFU) was quantitated with a fluorescence microplate
reader (FLX 800; Bio-Tek Instruments, Inc., Winooski, VT) at 485/20 nm
excitations and 528/20 nm emissions. Simultaneously, the RFU from the
samples (compounds, negative and positive control) were obtained, stored,
and analysed (Corbett et al., 2004).
The data analyses were performed with a programmed calculus sheet on
Microsoft (Redmond, WA) Excel 2000 that processes the relative
fluorescence units exported through the KC junior software from the
microplate fluorimeter. The calculus sheet consists of 1) a formula that
calculates the mean of the two replicates per sample condition, 2) the
subtraction of the respective colour background of each dilution of the plant
extract, 3) the conversion of the mean RFU value to a percentage of the
response, taking as 100% the mean of the negative control, and 4) the
conversion of the percentage to the 50% inhibitory concentration (IC50) by log
regression. To adjust for the potential contribution of the haemoglobin
pigments from the erythrocytes and the possible fluorescence from the
intrinsic pigments present in some plant extracts, control wells were used that
consisted of non-infected erythrocytes alone, samples of the diluted drugs or
extracts with non-infected erythrocytes.
3.2.7.2 Synergistic activity The chloroquine reversal effect of compounds with chloroquine was
determined by measuring the activity of each of the compounds alone and in
combination with chloroquine. Two strains of P. falciparum were used, a
sensitive strain (D6) and resistant strain (W2). They were cultured and
synchronised as described in sections 3.2.2 and 3.2.4. The In vitro
antiplasmodial test was done with the microfluorimetric method described in
section 3.2.7. The compounds at concentrations of 10.0, 2.0 and 0.4 µg/ml
were combined with chloroquine at concentrations of 100.0, 10.0 and 1.0 nM
respectively.

85
3.3 Results and Discussion The antiplasmodial activity of the compounds isolated are shown in Table 3.1.
Two of the flavonoids (tamarixetin and eriodictyol) isolated were not tested
because they were obtained in insufficient quantities. Quercetin showed a
very good antiplasmodial activity against D6 (0.34 µg/ml) and Dd2 (0.73
µg/ml). Antimalarial activity of quercetin was also reported by Bylka et al.
(2004), Tona et al., (2004) and Prozesky (2004). The activity shown by
steenkrotin A is moderate and promising. This is because it is more active
against resistant strains (3.00 and 3.10 µg/ml for W2 and Dd2 respectively)
than the sensitive strain D10 (5.20 µg/ml). It did not show any activity against
D6 at the concentration in which it was tested. This compound was first
isolated and described as an antiplasmodial agent by Prozesky (2004).
Table 3.1: Antiplasmodial activity of compounds and extract.
ND = not done
Q = chloroquine
Extract/Compounds
IC50 (µg/ml)
Sensitive strains Resistant strains
D6 D10 W2 Dd2
Ethanol extract ND 8.60 ND 5.80
Eriodictyol ND ND ND ND
Indane >10.00 >10.00 >10.00 >10.00
Quercetin >10.00 0.34 >10.00 0.73
Steenkrotin A >10.00 5.20 3.00 3.10
Steenkrotin B >10.00 >10.00 >10.00 >10.00
Steenkrotin B acetate ND >10.00 ND >10.00
Tamarixetin ND ND ND ND
Chloroquine (Q) 0.01 0.01 0.03 0.07
Indane + Q >10.00 ND 2.00 ND
Quercetin + Q 8.00 ND 3.00 ND
Steenkrotin A + Q 12.00 ND 2.00 ND
Steenkrotin B + Q 3.00 ND 3.00 ND

86
Steenkrotin B, steenkrotin B acetate and the indane were not active
(compounds with IC50<10 µg/ml is said to be active) against the strains of P.
falciparum at the concentrations at which they were tested. Steenkrotin B and
its acetate were expected to be active because they contain an endoperoxide
which has been linked to antiplasmodial activity of artemisinin, a potent
antimalarial agent (van der Westhuyzen; Parkinson, 2005). The inactivity of
these two compounds against P. falciparum seem to indicate that there are
severe structural constraints involved in them that prevent either the access of
the radicals to the membranes of the parasite, or are involved in some mode
of deactivation of the material itself. Studies on structural modifications of
these compounds are needed to determine the activity of the endoperoxide in
them. Furthermore, there is no report on the antimalarial activity of an indane
in literature.
When the indane, steenkrotin A and steenkrotin B were spiked with
chloroquine and tested against D6 and W2, the IC50 of the compounds
improved a little bit. However, Prozesky (2004) reported synergistic activity of
steenkrotin A (called crotrene A) with chloroquine on P. falciparum (RB1). He
also reported a similar observation that the compound is more potent against
a resistant strain than a sensitive one.

87
3.4 References
Boonphong, S., Puangsombat, P., Baramee, A., Mahidol, C., Ruchirawat, S.
and Kittakoop, P. 2007. Bioactive compounds from Bauhinia purpurea
possessing antimalaral, antimycobacterial, antifungal, anti-inflammatory, and
cytotoxic activities. J. Nat. Prod. 70:795-801.
Bylka, W., Matlawska, I. and Pilewski, N.A. 2004. Natural flavonoids as
antimicrobial agent. J.A.N.A. 7:24-31.
Clarkson, C., Maharaj, V.J., Crouch, N.R., Grace, O.M., Pillay, P., Matsabisa,
M.G., Bhagwandin, N., Smith P.J. and Folb. P.I. 2004. In vitro antplasmodial
activity of medicinal plants native to or naturalised in South Africa. J.
Ethnopharmacol. 92 :177-191.
Hoppe, H.C. 1993. Identification and characterization of selected merozoite-
stage antigens is South Africa isolates of Plasmodium falciparum. PhD thesis,
University of Pretoria, South Africa.
Kalauni, S.K., Awale, S., Tezuka,Y., Banskota, A.H., Linn,T.Z., Asih, P.B.S.,
Syafruddin, D. and Kadota, S. 2006. Antimalarial Activity of Cassane- and
Norcassane-Type Diterpenes from Caesalpinia crista and Their Structure–
Activity Relationship. Biol. Pharm. Bull. 29(5):1050-1052.
Makler, M.T., Ries, J.M., Williams, J.A., Bancroft, J.E., Piper, R.C., Gibbins,
B.L. and Hinrichs, D.J. 1995. Parasite lactate dehydrogenase as an assay for
Plasmodium falciparum drug sensitivity. Am. J. Trop. Med. Hyg. 48:739-741.
Noedl, H., Wongsrichanalai, C. and Wernsdorfer, W.H. 2003. Malaria
drug-sensitivity testing: new assays, new perspectives. Trends Parasitol. 19
(4):175-181.

88
Oduola, A.M.J., Sowunmi, A., Milhous, W.K., Brewer, T.G., Kyle, D.E.,
Gerena, L., Rossan R.N., Salako L.A. and Schuster B.G. 1998. In vitro and in
vivo reversal of chloroquine resistance in Plasmodium falciparum with
promethazine. Am. J. Trop. Med. Hyg., 58(5):625-629.
Prozesky, E.A. 2004. Antiplasmodial and chloroquine resistance reversal
properties of a new diterpene from Croton steenkampianus. PhD thesis.
University of Pretoria, South Africa.
Quashie, N.B., De Koning, H.P. and Ranford-Cartwright, L.C. 2006. An
improved and highly sensitive microfluorimetric method for assessing
susceptibility of Plasmodium falciparum to antimalarial drugs in vitro. Malar. J.
95(5):1-6.
Stoltz, A.C. 1992. Biochemical and immunochemical investigation of some
South African strains of the human malaria parasite, Plasmodium falciparum.
MSc thesis, University of Pretoria, Pretoria, South Africa.
Tona, L., Cimanga R.K., Mesia, K., Musuamba, C.T., De Bruyne, T., Apers,
S., Hernans, N., Van Miert, S., Pieters, L., Totté, J. and Vlietinck, A.J. 2004.
In vitro antiplasmodial activity of extracts and fractions from seven medicinal
plants used in the Democratic Republic of Congo. J. Ethnopharmacol.
93(1):27-32.
Trager, M. and Jensen, J.B. 1976. Human malaria parasite in continuous
culture. Science 193: 674.
Van der Westhuyzen, C.W. and Parkinson, C.J. 2005. Synthesis of a
structurally constrained endoperoxide having antimalarial activity from α-
santonin. S. Afr. J. Chem. 58:41-45.
Willcox, M.L. and Bodeker, G. 2004. Traditional herbal medicines for malaria.
B.M.J. 329:1156-1159.

89
Yeh, S., Smith, P. J. and Chibale, K. 2006. Dual-acting diamine antiplasmodial
and chloroquine resistance modulating agents. Biochem. Pharmacol.
72(2):156-165.
Zdzislawa, N. 2007. A review of anti-infective and anti-inflammatory
chalcones. Eur. J. Med. Chem. 42(2):125-137.

90
CHAPTER 4 ANTIBACTERIAL AND ANTIOXIDANT ACTIVITY OF ISOLATED
COMPOUNDS
4.1 Introduction…………………………………………………………………
91
4.2 Materials and Methods…………………………………………………… 92
4.2.1 Qualitative determination of antibacterial activity……..…………….. 92
4.2.2 Quantitative determination of antibacterial activity……...………….. 92
4.2.3 Antimycobacterial testing……………………….....…………… 93
4.2.4 Antioxidant activity……………………………………………… 94
4.2.4.1 Qualitative assay……….....…….……………. 94
4.2.4.2 Quantitative assay………………….………… 94
4.3 Results and Discussion…………………………………………………… 95
4.4 References…...……………………………………………………………. 100

91
CHAPTER 4 Antibacterial and Antioxidant Activity of Isolated Compounds 4.1 Introduction Bacterial diseases continue to present a major threat to human health.
Tuberculosis, for instance, rank among the world’s leading causes of death.
Streptococcus, another bacterium, continues to be a frequent cause of life
threatening infections during the first two months of life. Food-borne and
water-borne bacteria such as Samonella and Campylobacter are responsible
for a recent troubling increase in diarrhoea related diseases. Meanwhile,
during the last decade, scientists have discovered many new organisms and
new strains of many familiar bacteria, such as Escherichia coli. Emerging
bacterial diseases present a clear challenge to biomedical researchers
(NIAID, 2007; Mandell et al., 2005). Suffering caused by these pathogens is
worsened by their development of resistance to antibiotics.
The complexity of this challenge is becoming even clearer as researchers
begin to appreciate the many unsuspecting mechanisms that bacteria have for
causing trouble to human beings. For example, gene transfer among different
strains of bacteria, and even between different species of bacteria, is now
understood to be a common means whereby these organisms acquire
resistance to antibiotics. Basic research has also discovered that some
bacteria may play a major role in certain chronic diseases not formerly
associated with bacterial infection. The bacterium Helicobacter pylori, for
example, have been found to cause stomach ulcers and may contribute to
stomach cancer; Guillain Barré syndrome has been associated with prior
diarrhoea related diseases caused by Campylobacter jejuni (NIAID, 2007;
Mandell et al., 2005).
In addition, the frequency of serious nosocomial bacterial and fungal
infections is rising due to the use of newer and more powerful antimicrobial
agents. As additional new antimicrobial agents are being found, micro-
organisms become more resistant to existing chemotherapies. Thus, there is
continuous need to develop novel antimicrobial compounds that would be
effective against these and other pathogens (Zgoda and Porter, 2001).

92
4.2 Materials and Methods 4.2.1 Qualitative determination of antibacterial activity The direct bioautography method described by Begue and Kline (1972) was
used. TLC plates were spotted with compounds or fractions and developed in
a solvent system: 3-10% methanol in chloroform. The developed plates were
allowed to dry overnight under a stream of air to remove residual solvent,
which might inhibit bacterial growth. The two cultured bacteria (Escherichia
coli and Bacillus cereus) were then sprayed on the TLC plates (i.e. E. coli on
one plate and B. cereus on another) and incubated at 37°C in humid
conditions. After incubation, plates were sprayed with 2 mg/ml solution of p-
iodonitrotetrazolium violet [INT] (Sigma) (Section 2.2.2.2). Clear zones on the
chromatograms indicated inhibition of growth after incubation (Fig. 4.1).
4.2.2 Quantitative determination of antibacterial activity Round bottom sterile 96-well microplates (0.5 ml volume, Fisher Scientific)
were used to determine minimal inhibitory concentration (MIC) of the
compounds isolated (Eloff, 1998). The stock solution of positive control
(streptomycin) and the compounds were dissolved in 5% dimethylsulfoxide
(DMSO) (Sigma) so that the concentration of DMSO in the microwells was
less than 1% (Langfield et al., 2004). The stock solution was kept on ice until
used. The concentrations of compounds in the micro-wells ranged from 1.56
to 200.00 µg/ml. The control and compounds were tested in duplicate.
A multipipettor was used to dispense 100 µl of nutrient broth (Merck
Chemicals) into all the wells on the microplate. Hundred micro-litres of control
were dispensed into each of the first two wells in role A. The same amount of
solution containing each of the compounds was introduced into the
subsequent two wells on the row. Using a multipipettor set at 100 µl, the
control and compounds in the wells were mixed by sucking up and down 6-8
times without splashing. Serial dilutions of the compounds and the control in
row A were made by withdrawing 100 µl of the mixture from the wells and
transferring these to wells in row B. Similarly, 100 µl of solution in wells on row
B were transferred to row C after mixing them for 6-8 times. This procedure

93
was repeated down the columns to row H. 100 µl of the solutions were
withdrawn and discarded from the wells in the last row (H).
One hundred microlitres of cultured bacteria (Section 2.2.2.2) were dispensed
into all the wells except the ones in the last two rows (G and H) which were for
sterility control and incubated overnight at 37°C. To indicate bacterial growth
40 µl of p-INT solution (0.20 mg/ml) was then added to each well and the
plates incubated for an additional ½ hour to 1 hour.
4.2.3 Antimycobacterial testing The radiometric BACTEC method was used to determine the
antimycobacterial activity of the isolated compounds on the H37Rv (reference,
drug susceptible) strain of Mycobacterium tuberculosis (Lall and Meyer, 2001;
Lall et al., 2003). The H37Rv strain was obtained from the American Type
Collection (Rockville, MD, USA). The principle of the method is based on the
metabolism of the 14C-labelled substrate (palmitic acid) present in the
BACTEC 12B broth (7H12 medium) by viable bacteria to produce 14C-labelled
carbon dioxide. The amount of 14CO2 detected which is reflected by the rate
and amount of growth occurring in the sealed vial, is expressed in terms of the
growth index (GI) (Mativandlela et al., 2005).
A homogenized culture (0.1 ml) of the strain of M. tuberculosis (H37Rv),
yielding 1 x 10⁴ – 1 x 10⁵ colony forming U/ml (CFU per ml), were inoculated in
the vials containing the compound, as well as in the control vial. Two
compound free vials were used as controls: one vial was inoculated in the
same way as the vials containing the compound, and the other was inoculated
with a 1:100 dilution of the inoculum (1:100 control), to produce an initial
concentration representing 1% of the bacteria population (1 x 10² – 1 x 10³
CFU per ml) found in the vials containing the compound. The minimal
inhibitory concentration (MIC) was defined as the lowest concentration of the
compound that inhibited more than 99% of the bacterial population.
Inoculated bottles were incubated at 38ºC and each bottle was assayed
everyday at about the same time until the cumulative results were
interpretable. The difference in the GI values of the last 2 days is designated

94
as ∆GI. The reading of the vials containing the compound was compared with
the control vial, containing a 1:100 dilution of the inoculum. Readings were
taken until the control vials containing a 100 times lower dilution of the
inoculum, than the vial with the compound, reached a GI of 30 or more. If the
∆GI value of the vial containing the compound was less than the control the
population was reported to be susceptible to the compound. All compounds
(steenkrotin A, steenkrotin B and the indane) were tested in triplicate (Lall and
Meyer, 2001).
4.2.4. Antioxidant testing The antioxidant activity was assessed by measurement of the scavenging
ability of the isolated compounds on the free radical 2, 2’-diphenyl-1-
picryldrazyl (DPPH) (C18H12N5O6). The radical DPPH is reduced to the
corresponding colourless hydrazine upon reaction with hydrogen donors
(Pandey et al. 2005). Both qualitative and quantitative assays were
performed. DPPH was obtained from Fluka Chemie AG, Bucks. Ascorbia acid
(Sigma) was used as the control. DPPH (4 mg) was dissolved in MeOH (50
ml) to obtain a concentration of 80 µg/ml.
4.2.4.1 Qualitative assay The compounds tested were applied on a TLC plate and sprayed with DPPH
solution using an atomiser. It was allowed to develop for 30 min. The colour
changes (purple on white) were then noted (Kumarasamy et al., 2002) (Fig.
4.2).
4.2.4.2 Quantitative assay The ethanol extract and compounds were dissolved in MeOH to obtain a
concentration 3 mg/ml and 1 mg/ml respectively. Serial dilution of the extract,
compounds and control were made on a 96-welled plate. The extract was
diluted to obtain final concentrations of 1 000.0, 500.0, 250.0, 125.0, 62.5,
31.3, 15.6 and 7.8 µg/ml. The compounds (except quercetin), ethanol extract
and control (ascorbic acid) (Table 4.2) were diluted to obtain final
concentrations of 500.0, 250.0, 125.0, 62.5, 31.3, 15.6, 7.8 and 3.9 µg/ml. The
quercetin was tested at a final concentration of 0.05 µg/ml. The diluted

95
solutions (100 µl) were mixed with DPPH (100 µl) and allowed to stand for half
an hour to allow for any reaction to occur. A negative control (blank) was also
included in the assay. The wells for the negative control contain solvent,
MeOH (100 µl) and DPPH (100 µl) (Kumarasamy et al., 2002) (Fig.4.3).
The program (KC Junior) was used to read the plate on an ELISA plate reader
at 550 nm. The experiment was done in triplicate and the absorption was
noted for each concentration. The percentage decrease of the absorbance
was calculated by the formula: I = [(AB-AA)/AB] x 100, where I = % inhibition,
AB = absorbance of the blank sample (t = 0), AA = absorbance of the test
sample at the end of the reaction (t = 30 min). The IC50 was extrapolated from
the standard curve of the percentage inhibition against concentration (Paixão
et al., 2007).
4.3 Results and Discussion All compounds tested with bioautography on TLC plates (Fig. 4.1) showed
interesting activity against Gram-negative bacteria (E. coli) and Gram-positive
bacteria (B. cereus). Therefore, the MIC of the compounds on these
pathogens was determined with a serial dilution microplate assay (Table 4.1).
1 2 3 4 5 6 7
Figure 4.1: Bioautogram of the indane in lanes 1-7. A TLC plate was
developed and sprayed with B. cereus, incubated overnight then sprayed with
INT. Growth inhibition is indicated by the lighter zones on the lanes.

96
Table 4.1: MIC of compounds against B. cereus and E. coli.
Compound MIC (µg/ml)
E. coli
MIC (µg/ml)
B. cereus
Eriodictyol 100.0 100.0
Quercetin 50.0 50.0
Steenkrotin A 50.0 50.0
Steenkrotin B 50.0 50.0
The indane 100.0 50.0
Streptomycin 10.0 10.0
The MIC of the compounds on both pathogens was promising against Gram
negative and positive bacteria. The observed activity of quercetin corresponds
to the findings of Bylka et al. (2004). The possibility of synergistic activity of
the compounds need further investigation, this is because the bioautography
of the fractions indicated more intense inhibition of the bacteria than that
obtained for pure compounds (Fig. 2.2b and 2.3).
In literature, derivatives of the indane and diterpenes have been reported to
be active against M. tuberculosis (Turan-Zitouni et al., 2008; Berrue et al.,
2007; Dettrakul et al., 2003). However, the IC50 for the three compounds:
steenkrotin A, the indane (2,6-dimethyl-1-oxo-4-indanecarboxylic acid) and
steenkrotin B tested for antimycobacterial activity was greater than 10 µg/ml
(highest concentration in well) while that of the control RMP was 0.12 µg/ml.
Since the compounds tested did not show activity at highest concentration,
they are classified as inactive against M. tuberculosis. Although the activity of
RMP used as positive control against M. tuberculosis (H37Rv) was much
higher than those for the novel compounds tested, it would be interesting to
study the synergistic effect, if any, when these compounds are tested in
combination with established antitubercular drugs.
The crude extract and all the isolated compounds tested showed DPPH
radical scavenging activity (Fig. 4.2, 4.3 and 4.4).

97
Figure 4:2 Qualitative antioxidant assay. All compounds tested showed
antioxidant activity. The indane in lane 1, steenkrotin A in lane 2, tamarixetin
in lane 3, quercetin in lane 4 and steenkrotin B in lane 5.
1 2 3 4 5 6 7 9 10 11 12 13
Figure 4.3 Quantitative antioxidant assay. Lane 1-3: ascorbic acid, lane 4-6:
crude extract, lane 7-10: steenkrotin B and lane 11-12: negative control
(blank).
Quercetin was the most active of all the substances tested (Table 4.2). This
can be attributed to the presence of the phenolic group in its molecule
(Kumarasamy et al., 2002). From the IC50 values, it can be seen that the
Table 4.2 Quantitative antioxidant activities of the ethanol crude extract and
the isolated compounds.
Substance IC50 (µg/ml) Ascorbic equivalents Ethanol crude extract 76.01 0.04 Indane > 280.00 > 0.01
Quercetin 0.05 66.00
Steenkrotin A > 280.00 > 0.01
Steenkrotin B 274.00 0.01
Ascorbic acid 3.30 1.00

98
increasing order of activity was quercetin > ascorbic acid > crude extract >
steenkrotin B > steenkrotin A and indane. It was established that the DPPH
scavenging activity of quercetin was 66 times more than that of ascorbic acid,
1 535 times more than that of the crude extract, 5 500 times more than
steenkrotin B and over 5 500 times more active than that of steenkrotin A and
indane. The moderate antioxidant activity of the ethanol extract was probably
due to its rich phenolic compounds content (Narasimhan et al. 2005).

99
Ascorbic acid
0
20
40
60
80
100
1.9 3.9 7.8 15.3 31.3 62.5 125 250
Concentration (µg/ml)
% I
nh
ibit
ion
Quercetin
020406080
100
0.000
01
0.00005
0.0005
0
0.005
00
0.05000
0.5000
0
5.000
00
50.0
0000
Concentration (ng/ml)
%In
hib
itio
n
Figure 4.4 Antioxidant activities of the crude extract and compounds.
Crude extract
0
20
40
60
80
100
7.8 15.6 31.3 62.5 125 250 500 1000
Concentration (µg/ml)
%In
hib
itio
n

100
4.4 References
Berrue, F., Thomas, O.P., Laville, R., Prado, S., Golebiowski, J., Fernandez,
R. and Amade, P. 2007. The marine sponge Plakortis zyggompha: a source
of original bioactive polyketides. Tetrahedron 63(10):2328-2334.
Begue, M.J. and Kline, R.M., 1972. The use of tetrazolium salts
bioautographic procedures. J. Chrom. 64:182-184.
Dettrakul, S., Kittakoop, P., Isaka, M., Nopichai, S., Suyarnsestakorn, C.,
Tanticharoen, M. and Thebtaranonth, Y. 2003. Antimycobacterial pimarane
diterpenes from the Fungus Diaporthe sp. Bioorg. Med. Chem. Lett.
13(7):1253-1255.
Eloff, J.N., 1998. A sensitive and quick micro-plate method to determine the
minimal inhibitory concentration of plant extract for bacteria. Planta Med. 64
(8):711-713.
Greenwood, D., Slack, R.C.B. and Peutherer, J.F., 1997. A guide to microbial
infections: Pathogenesis, immunity, laboratory diagnosis and control. Medical
Microbiology, 15th edn. Ch. 3. p. 25-35. Churchill Livingstone.
Kumarasamy, Y., Fergusson, M.E., Nahar, L. and Satyajit, S.D. 2002.
Bioactivity of Moschamindole from Centaurea moschata. Pharm. Biol.
40(4):307-310.
Lall, N. and Meyer, J.J.M. 2001. Inhibition of drug-sensitive and drug-resistant
strains of Mycobacterium tuberculosis by diospyrin, isolated from Euclea
natalensis, J. Ethnopharmacol. 78:213-219.
Lall, N., Das Sarma, M., Hazra, B. and Meyer, J.J.M. 2003. Antimycobacterial
activity of diospyrin derivatives and a structural analogue of diospyrin against
Mycobacterium tuberculosis in vitro. J. Antimicrob. Chemother. 51:435-438.

101
Langfield, R.D., Scarano, F.J., Heitzman, M.E., Kondo, M., Hammond, G.B.
and Neto, C.C. 2004. Use of a modified microplate bioassay method to
investigate antibacterial activity in the Peruvian medicinal plant Peperomia
galioides. J. Ethnopharmacol. 94:279-281.
Luczaj, W. and Skrzydlewska, E. 2005. Antioxidant properties of black tea.
Prev. Med. 40:910-918.
Mandell, G.L., Bennett, J.E. and Dolin, R. 2005. Principles and practice of
infectious diseases. 6th edn. Ostroff, S.M., McDade, J.E., LeDuc, J.W. and
Hughes, J.M. In: Emerging and re-emerging infectious disease threats. Ch.
13. pp.173-192. Philadelphia, Pennsylvania: Churchill Livingstone.
Mativandlela, S.P.N., Lall, N. and Meyer, J.J.M. 2005. Antibacterial, antifungal
and antitubercular activity of the roots of Pelargonium reniforme (CURT) and
Pelargonium sidoides (DC) (Geraniaceae) root extracts. S. Afr. J. Bot.
72(3):349-352.
Middlebrook, G., Reggiards, Z. and Tigertt, W.D. 1977. Automable radiometric
detection of growth of Mycobacterium tuberculosis in selective media. Am.
Rev. Respir. Dis. 115:1067-1069.
Narasimhan, S., Govindarajan, R., Vijayakumar, M. and Mehrotra, S. 2005.
Free radical scavenging potential of Chlorophytum tuberosum Baker. J.
Ethnoharmacol. 104: 423-425.
National Institute of Allergy and Infectious Diseases (NIAID). Microbes in
sickness and in health. Viewed 20 October 2007, http//www.niaid.nih.gov/.
Paixão, N., Perestrelo, R., Marques, J.C. and Cāmara, J.S. 2007.
Relationship between antioxidant capacity and total phenolic content of red,
rosé and white wines. Article in press: www.sciencedirect.com.

102
Pandey, M. M., Govindarajan, R., Rawat, A.K. and Pushpangadan, P. 2005.
Free radical scanvenging potential of Saussarea costus. Acta Pharm. 55:297-
304.
Turan-Zitouni, G., Ozdemir, A., Kaplanikli, Z.A., Benkli, K., Chevallet, P. and
Akalin, G. 2008. Synthesis and antituberculosis activity of new
thiazolylhydrazone derivatives. Eur. J. Med. Chem. 43(5):981-985.
Zgoda, J.R. and Porter, J.R. 2001. A convenient microdilution method for
screening natural products against bacteria and fungi. Pharm. Biol. 39(3):221-
225.

103
CHAPTER 5 ANTI-HIV ACTIVITY OF THE ISOLATED COMPOUNDS
5.1 Introduction………………………………………………………………… 104
5.1.1 HIV in South Africa……………………………………………… 105
5.1.2 Anti-HIV compounds……………………………………………. 106
5.1.3 Reverse transcriptase (RT)……………………………...…….. 107
5.1.4 Replication of HIV……………………………………...……….. 107
5.2 Materials and Method……………………………………...……………... 110
5.2.1 Materials……………………………………………..………….. 110
5.2.2 Method…………...……………………………………..……..… 110
5.3 Results.…………………………….………..…………………….……….. 111
5.4 Discussion………………………….……………………………………… 111
5.5 References…...……………………………………………………………. 113

104
CHAPTER 5 ANTI-HIV ACTIVITY OF THE ISOLATED COMPOUNDS
5.1 Introduction Globally, millions of people are infected and are still being infected with the
human immunodeficiency virus (HIV) (Fig 5.1), the pathogen that causes
Acquired Immunodeficiency Syndrome (AIDS) (Gurib-Fakim, 2006). AIDS is a
collection of symptoms and infections in humans resulting from the specific
damage to the immune system by the virus. The late stage of the condition
leaves individuals prone to opportunistic infections and tumors (Marx, 1982).
HIV uses cells of the immune system (macrophages and helper T cells) as
sites for reproduction. Multiple copies of the viral genetic material (RNA) are
made and packaged into new viral particles ready for dispersal into a new
viral host. More and more cells of the immune system are killed or damaged
with each round of infection, while millions of viral particles may be produced
each day. Despite the production of antibodies and helper T cells that fight the
disease, eventually the virus prevails and the infections and cancer
associated with AIDS begins to appear (Gurib-Fakim, 2006). Although
treatments for AIDS and HIV exist to slow the virus’s progression, there is no
known cure. HIV is transmitted through direct contact of a mucous membrane
or the bloodstream with a bodily fluid containing HIV, such as blood, semen,
vaginal fluid, pre-seminal fluid and breast milk. This transmission can come in
the form of anal, vaginal or oral sex, blood transfusions, contaminated
needles, exchange between mother and baby during pregnancy, childbirth or
breast feeding, or other exposure to bodily fluids (Mandell et al., 2005).

105
Figure 5.1: Human immunodeficiency virus (NIAID, 1998).
Most researchers believe that HIV originated in sub-Saharan Africa during the
twentieth century (Gao et al.,1999); it is now a pandemic with an estimated
38.6 million people living with the disease worldwide. As of January 2006, the
joint United Nations Programme on HIV/AIDS (UNAIDS) and the World Health
Organisation (WHO) estimated that AIDS has killed more than 25 million
people since it was first recognised on June 5, 1981, making it one of the
most destructive epidemics in recorded history. In 2005 alone, AIDS claimed
an estimated 2.4-3.3 million lives, of which more than 570,000 were children.
A third of these deaths are occurring in sub-Saharan Africa, retarding
economic growth and destroying human life (UNAIDS, 2006).
5.1.1 HIV in South Africa A number of documents have described the seriousness of HIV/AIDS in the
southern Africa region with particular emphasis on South Africa being the
most affected (UNAIDS, 2000). The prevalent rate for South Africa is
estimated to be 12.5%, which is one of the highest national prevalent rates in
the world (James et al., 2006). Women are the worst hit by the epidemic of
HIV/AIDS. Of the 5.54 million people living with HIV in South Africa in 2005,
18.8% are adults aged 15-49 of which women account for approximately 55%.
The infection is more pronounced in the age group 20-24 and 25-29 years
where the HIV prevalence rates are 23.9% for women, 6% for men and 33.3%
for women, 12.2% for men respectively (NSP, 2007). HIV was around 3%
among children aged 2-14 year and nearly 4% for people in their sixties
(Dinkelman et al., 2005).

106
Children under the age of 18 years comprise 40% of the population of South
Africa. In 2004, it was reported that 13% of them have lost either mother or
father, half of which was due to AIDS. Children from deeply impoverished
household were worst affected by the impact of AIDS (UNAIDS, 2004).
The severe effect of HIV/AIDS has led to a dramatic increase in the probability
of death in South Africa’s adult population. The latest forecast from the
Actuarial Society of South Africa showed the likelihood of death before 60th
birthday among men jumping from 36% in 1990 to 61% in 2008, whereas the
likelihood of death among women increases from 21% in 1990 to 53% in 2008
(Collins and Leibbrandt, 2007).
5.1.2 Anti-HIV compounds Currently, there is no cure for HIV/AIDS. Antiretroviral treatments reduce both
the mortality and the morbidity of HIV infection, but routine access to
antiretroviral medication is not available in all countries. Antiretroviral therapy
(ART) consists of four major treatment modalities, nucleoside reverse
transcriptase inhibitors (NRTIs), non-nucleoside reverse transcriptase
inhibitors (NNRTIs), protease inhibitors (PIs), and fusion or entry inhibitors
(Grinspoon, 2005). The HIV/AIDS stigma is more severe than that associated
with other life-threatening conditions and extends beyond the disease itself to
providers and even volunteers involved with the care of people living with HIV
(UNAIDS, 2006).
New anti-HIV compounds from natural sources are reported almost daily,
some essentially unproven and others with distinct promise based on in vitro
research. Some of these compounds are at different stages in clinical trials
while further studies on others have stopped because they are found not to be
suitable for use as drugs (Gurib-Fakim, 2006). The search for molecules from
natural resources with anti-HIV activity or the ability to treat AIDS related
infections needs to be intensified and accelerated so that the possibility of
developing a drug will soon be realised.

107
5.1.3 Reverse transcriptase (RT) Reverse transcriptase is a DNA polymerase that will either use an RNA or
DNA strand as a primer. It is responsible for the production of a double
stranded DNA copy of the single stranded RNA genome that is contained in
the HIV virus particle. RT from HIV-1 is of tremendous medical interest as it is
the target enzyme for the best known anti-AIDS drug, AZT, which acts by
causing chain termination of the polymerase reaction. Knowledge of its
detailed three dimensional structures will greatly assist the development of
new anti-AIDS drugs (Arnold et al., 1995).
5.1.4 Replication of HIV Infection typically begins when an HIV particle, which contains two copies of
the HIV RNA, encounters a cell with a surface molecule called cluster
designation 4 (CD4). Cells with this molecule are known as CD4 positive
(CD4+) cells. One or more of the virus’s glycoprotein (gp120) molecules binds
tightly to the CD4 molecule(s) on the cell’s surface (Fig. 5.2). The membrane
of the virus and the cell fuse, a process that probably involves the envelope
protein of the HIV (NIAID, 1998).
Although CD4+ T cells appear to be the HIV’s main target, other immune
system cells with CD4 molecules on their surfaces are infected as well.
Among these are the long-lived cells called monocytes and macrophages,
which apparently can harbour large quantities of the virus without being killed,
thus acting as reservoirs of HIV. CD4+ T cells also serve as important
reservoirs of HIV: a small proportion of these cells harbour HIV in a stable,
inactive form. Normal immune processes may activate these cells, resulting in
the production of new virions (NIAID, 1998).
In the cytoplasm of the cell, HIV reverse transcriptase converts viral RNA into
DNA, the nucleic acid form in which the cell carries its genes. Seven of the 11
antiviral drugs approved in the United States for the treatment of people with
HIV infection namely zidovudine (AZT), zalcitabine (ddC), didanosine (ddI),
stavudine (d4T), lamivudine (3TC), neviraine (NVP) and delavirdine (DLV),
work by interfering with this stage of the viral life cycle.

108
Figure 5.2: The HIV replication cycle (NIAID, 1998).
The newly made HIV DNA moves to the cell’s nucleus, where it is spliced into
the host’s DNA with the help of HIV integrase. Once incorporated into the
cell’s genes, HIV DNA is called a “provirus.” Integrase is an important target
for the development of new drugs. For a “provirus” to produce new viruses,
RNA copies must be made that can be read by the host cell’s protein making
machinery. These copies are called messenger RNA (mRNA). Production of
mRNA is called transcription, a process that involves the host cell’s own
enzymes. Transcription requires the presence of transcription factors, the
most important of which is NF kappa B (NF-KB). Proteins, cytokines, that are
involved in the normal regulation of the immune response also may regulate
transcription. Molecules such as necrosis factor (TNF)-alpha and interleukin
(IL)-6 that are secreted in elevated levels by the cells of HIV-infected people

109
may help to activate HIV “proviruses”. Early efforts at stopping HIV replication
focused on these chemicals. Other infections, by organism such as
Mycobacterium tuberculosis, also may enhance transcription (NIAID, 1998;
Hopkins, 1999).
After HIV mRNA is processed in the nucleus, it is transported into the
cytoplasm. HIV proteins are critical to this process: for example, a protein
encoded by HIV’s rev gene allows HIV structural proteins encoding mRNA to
be transferred from the nucleus to the cytoplasm. Without the rev protein,
structural proteins are not made. In the cytoplasm, the virus co-opts the cell’s
protein-making machinery including structures called ribosomes to make long
chains of viral proteins and enzymes, using HIV mRNA as a template. This
process is called translation result in immature viral particles which at this
stage are not yet infectious. The long chains of proteins and enzymes that
make up the immature viral core are now cleaved into smaller pieces by a
viral enzyme called protease. This step results in infectious mature viral
particles. Drugs called protease inhibitors (saquinavir, ritonavir, indinavir and
nelfinavir) interfere with this step of the viral life cycle (NIAID, 1998).
Figure 5.3: The immature and mature forms of the HIV (NIAID, 1998).

110
Several reports have linked human immunodeficiency virus (HIV) infection
and prolong usage of highly active antiretroviral therapy (HAART) with
increased risk of cardiovascular disease (CVD), premature atherosclerosis
and development of metabolic syndrome (dyslipidemia, insulin resistance, fat
redistribution and hypertension) (Maggi et al., 2007; Friis-Møller et al., 2003).
The relative risk rate of myocardial infarction is said to increase by 26% per
year of HAART exposure (Grinspoon, 2005).
The fact that currently there is no cure in sight and that available treatment
predisposes patients to risky side effects, is reason enough for desperate and
radical search for new remedy with curative or preventive properties. Hence,
the compounds isolated were assessed for anti-HIV activities.
5.2 Materials and Methods 5.2.1 Materials The preparation of the crude extract and the isolation of compounds were as
described in Chapter 2. The reverse transcriptase assay kit was purchased
from Roche Applied Science, the dimethylsufoxide (DMSO) from Sigma-
Aldrich and the sterile 96-well microplates from Fishers Scientific.
5.2.2 Method The anti-HIV activity of the compounds isolated was determined with the
reverse transcriptase colorimetric assay. The protocol outlined in the kit was
followed. The pure compounds were tested in triplicate at 50 µg/ml final
concentration. Sterile 96-well microplates were used for the experiment. One
positive controls and one negative control were included in each assay. The
well for the positive control contained Doxirubicin at 100 µg/ml with 3.3%
DMSO, 20 µl of the 83.33 ng/ml enzyme, 20 µl lysis buffer and 20 µl reaction
mixture. The negative control was made of 40 µl lysis buffer with 20 µl
reaction mixture without the enzyme. All other wells contained 20 µl of the
83.33 ng/ml enzyme, 50 µg/ml of the compounds with 3.3 % DMSO and 20 µl
reaction mixture. The plate was then incubated at 37°C for an hour after which
it was washed five times with 250 µl washing buffer per well per washing

111
cycle. Two hundred micro-litres antibody solution was added to each well and
the plate was incubated at 37°C for an hour. The plate was washed again five
times with 250 µl washing buffer per well per washing cycle. After 200 µl of
the ABT substrate solution was added to each well, the plate was incubated
for 10 minutes before being measured at 412 nm wavelength in an ELISA
plate reader.
5.3 Results Steenkrotin A, steenkrotin B, the indane and quercetin were each tested
against reverse transcriptase in vitro. Indane showed 6% activity against the
enzyme at 50 µg/ml. Eriodictyol and tamarixetin was not tested because the
quantities isolated were very small. Quercetin, steenkrotin A and steenkrotin B
were not active at the concentration (50 µg/ml) at which they were tested.
5.4 Discussion Many natural products have been found to be inhibitors of HIV-1 RT. These
compounds belong to diverse structural classes which include coumarins,
flavonoids, tannins, alkaloids, lignans, terpenes and quinines (Mahidol et al.,
2002). For this reason the possible anti-HIV activity of the isolated compounds
was explored. Mahidol et al. (2002) reported anti-HIV activity of quercetin-3-
O-α-L-rhamnoside. The fact that quercetin had no anti-HIV activity can only be
attributed to structural change (absence of glycosidic side chain attached to
the molecule). The two diterpenes (steenkrotin A and steenkrotin B) also did
not show anti-HIV activity at 50 µg/ml concentration. This can also be linked
to differences in molecular structure of the compounds as a furanoid labdane
diterpene was reported to exhibit antiviral activity (Kittakoop et al., 2001). Of
the compounds tested only the indane showed weak activity of inhibiting
reverse transcriptase. Its observed cytotoxicity was very low (chapter 6).
However, the mechanism of action leading to the observed activities is not
clear at the moment. It could be due to the acidic property of the compound
(presence of the carboxylic acid side chain in the molecule).
Furthermore, in order to fully explore the possible anti-HIV activity of the
compounds isolated, they may have to be tested at higher concentrations and

112
different assays methods may have to be used. Possible derivatives of the
compound could be made and tested for anti-HIV activity.

113
5.5 References
Arnold, E., Ding, J., Hughes, S.H. and Hostomsky, Z. 1995. Excellent review
of latest work on DNA polymerase. Curr. Opin. Struct. Biol. 5:27-38. Viewed
10 October, 2007. http://www.biochem.ucl.ac.uk/bsm/xtal/teach/repl/rt.html.
Collins, D.L. and Leibbrandt, M. 2007. The financial impact of HIV/AIDS
onpoor households in South Africa. AIDS. 21 (Suppl 7):S75-S81.
Dinkelman, T., Lam, D. and Leibbrandt, M. 2007. Household and community
income, economic shock and risky sexual behavior of young adults: evidence
from the Cape area panel study 2002 and 2005. AIDS. 21 (Suppl 7):S49-S56.
Friis-Møller, N., Weber, R., Reiss, P., Thiébaut, R., Kirk, O., Monforte, A.D.,
Pradier, C., Morfeldt, L., Mateu, S., Law, M., El-Sadr, W., De Wit, S., Sabin,
C.A. and Phillips, A.N. 2003 Cardiovascular disease risk factors in HIV
patients- association with antiretroviral therapy. Result from the DAD study.
AIDS. 17:1179-1193.
Gao, F., Bailes, E., Robertson, D.L., Chen, Y., Rodenburg, C.M., Michael,
S.F., Cummins, L.B., Arthur, L.O., Peeter, M., Shaw, G.M., Sharp, P.M. and
Hahn, B.H. 1999. “Origin of HIV-1 in the Chimpanzee Pan troglodytes”.
Nature. 397:436-41.
Grinspoon, S.K. 2005. Metabolc syndrome and cardiovascular disease in
patients with human immunodeficiency virus. Am. J. Med. 118 Suppl 2:S23-8.
Gurib-Fakim, A. 2006. Medicinal plants: Tradition of yesterday and drugs of
tomorrow. Review article. Mol. Aspects Med. 27(1):1-93.
HIV/AIDS. Wrong diagnosis. Viewed 15 October 2007,
http://www.wrongdiagnosis.com.

114
HIV/AIDS/STD strategic plan for South Africa (NSP) 2007-2011. Viewed 20
January 2008, http://www.doh.gov.za/docs/misc/stratplan-f.html.
Hopkins 1999. Life cycle of HIV infection. Viewed 25 April 2007,
http://hopkins-aids.edu/hiv_lifecycle/hivcycle_txt.html.
James, S., Reddy, P., Ruiter, R.A.C., McCauley, A. and van den Borne, B.
2006. The impact of an HIV and AIDS life skills program on secondary school
students in KwaZulu-Natal, South Africa. AIDS Educ. Prev. 18(4):281-294.
Joint United Nations Programme on HIV/AIDS (UNAIDS). 2000. Report on the
global HIV and AIDS epidemic. Geneva, Switzerland: Author.
Kittakoop, P., Wanasith, S., Watts, P., Kramyu, J., Tanticharoen, M. and
Thebtaranonth, Y. 2001. Potent antiviral potanogetonyde and potamogetonol,
new furanoid labdane diterpenes from Potamogeton malaianus. J. Nat. Prod.
64:385-388.
Maggi, P., Perilli, F., Lillo, A., Carito, V., Epifani, G., Bellacosa, C., Pastore, G.
and Regina, G. 2007. An ultrasound-based comparative study on carotide
plaques in HIV-positive patients vs. atherosclerotic and arteritis patients:
atherosclerotic or inflammatory lesion? Coron. Artery Dis. 18:23-9.
Mahidol, C., Prawat, H., Prachyawarakorn, V. and Ruchirawat, S. 2002.
Investigation of some bioactive Thai medicinal plants. Phytochem. Rev.
1:287-297.
Marx, J.L. 1982. “New disease baffles medical community”. Science 217
(4560): 618-621.
National Institute of Allergy and Infectious Diseases (NIAID) fact sheet 1998.
How HIV causes AIDS. Viewed 20 April 2007,
http://www.albany.edu/sph/AIDS/howhiv.html.

115
Spencer, D.C. 2005. The clinical practice of HIV medicine: a practical guide to
the care of the HIV infected. Goldstream Book: Johannesburg.
UNAIDS, UNICEF, USAID. Children on the brink. 2004, Geneva.
UNAIDS. 2006. “Overview of the global AIDS epidemic”, 2006 report on the
global AIDS epidemic.

116
CHAPTER 6 CYTOTOXICITY OF THE ISOLATED COMPOUNDS
6.1 Introduction…………………………………………………………………
117
6.2 Materials and Method……………………………………………...……... 118
6.2.1 Plant materials……………………………………...…………… 118
6.2.2 Preparation of extract and isolation of the compounds…..…. 118
6.2.3 Cell culture…………………………………………..……...…… 118
6.2.4 Toxicity screening (XTT viability assay)…..……..……..…….. 119
6.3 Results and Discussion……….………..…………………….………….. 120
6.4 References…...……………………………………………………….…… 124

117
CHAPTER 6 CYTOTOXICITY OF ISOLATED COMPOUNDS 6.1 Introduction Drug development is a very expensive and time consuming process and only
1 in 5 000 drug candidates that enter pre-clinical testing makes it through the
development process (Kraljevic et al., 2004). One-third of these failures are
due to unacceptable toxicity levels. An in vitro cytotoxicity assay is a rapid and
cost effective tool to identify likely failures before a compound is entered into
the costly development process and also helps to choose the optimal
candidate.
Cytotoxicity can be measured by the following assays: MTT (3-(4,5-
dimethylthiazol-2-yl)-2,5-diphenyltetrazolium bromide, a tetrazole); XTT
(sodium 3-[1(phenylaminocarbonyl)-3,4-tetrazolium]-bis (4-methoxy-6-nitro)
benzene sulfonic acid hydrate); Trypan blue (TB); Sulforhodamine B (SRB);
WST and the clonogenic assay (Mosmann, 1983; Wilson, 2000).
XTT and MTT assays operate on the same principle. They are standard
colorimetric assays (that is assays which measure changes in colour) used for
measuring cellular proliferation (cell growth). The principle of the MTT or XTT
assays are based on the cleavage of the yellow tetrazolium salts MTT or XTT
to purple or orange formazan (Figure 6.1), respectively in the mitochondria of
living cells. A solubilization solution (usually either dimethyl sufoxide or a
solution of the detergent sodium dodecyl sulphate in dilute hydrochloric acid)
is added to dissolve the insoluble formazan product into a coloured solution.
The absorbance of this coloured solution can be quantified by measuring at a
wavelength of 400 nm using a spectrophotometer (ELISA reader) (Mosmann,
1983; Wilson, 2000).
This cleavage takes place only when mitochondria reductase enzymes are
active, and therefore conversion is directly related to the number of viable
(living) cells. When the amount of formazan produced by the cells treated with
an agent is compared with the amount of formazan produced by the untreated
control cells, the effectiveness of the agent in causing death of cells can be
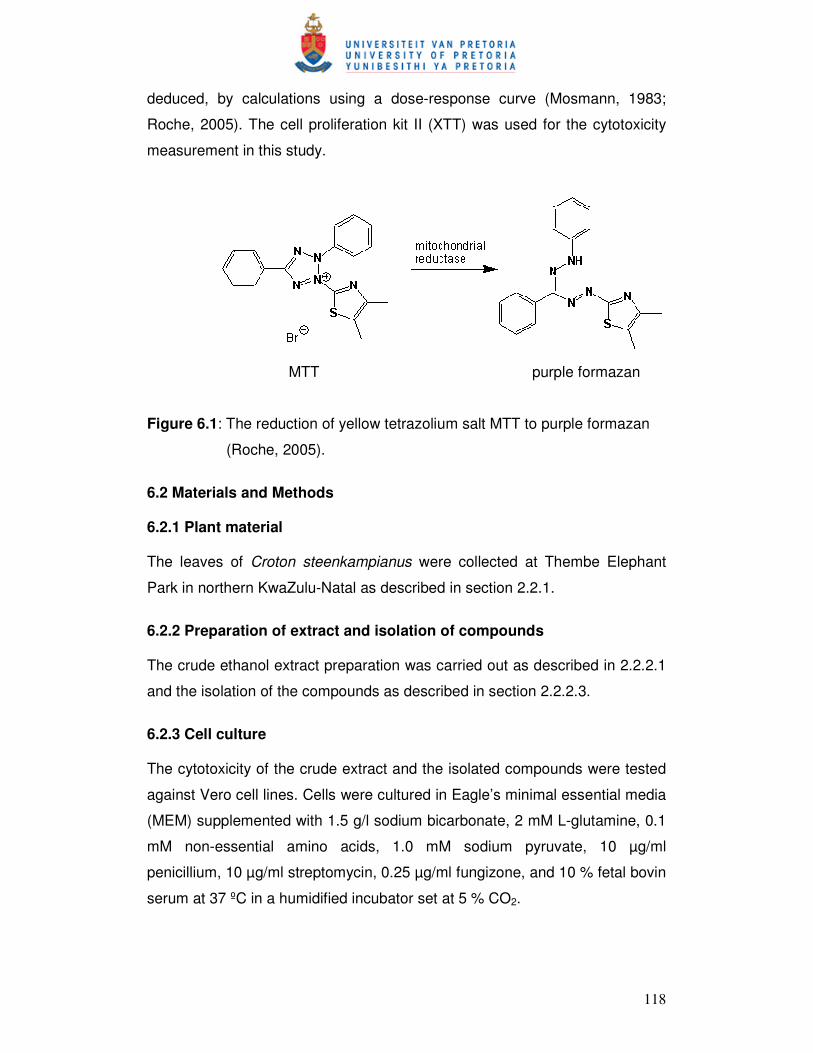
118
deduced, by calculations using a dose-response curve (Mosmann, 1983;
Roche, 2005). The cell proliferation kit II (XTT) was used for the cytotoxicity
measurement in this study.
MTT purple formazan
Figure 6.1: The reduction of yellow tetrazolium salt MTT to purple formazan
(Roche, 2005).
6.2 Materials and Methods 6.2.1 Plant material The leaves of Croton steenkampianus were collected at Thembe Elephant
Park in northern KwaZulu-Natal as described in section 2.2.1.
6.2.2 Preparation of extract and isolation of compounds The crude ethanol extract preparation was carried out as described in 2.2.2.1
and the isolation of the compounds as described in section 2.2.2.3.
6.2.3 Cell culture The cytotoxicity of the crude extract and the isolated compounds were tested
against Vero cell lines. Cells were cultured in Eagle’s minimal essential media
(MEM) supplemented with 1.5 g/l sodium bicarbonate, 2 mM L-glutamine, 0.1
mM non-essential amino acids, 1.0 mM sodium pyruvate, 10 µg/ml
penicillium, 10 µg/ml streptomycin, 0.25 µg/ml fungizone, and 10 % fetal bovin
serum at 37 ºC in a humidified incubator set at 5 % CO2.

119
6.2.4 Toxicity screening (XTT viability assay) The XTT colourimetric assay was used to measure the cytotoxicity of the
crude extract and the isolated compounds (Roche, 2005). On day one of the
experiment, the outer wells of the 96- well plate (Figure 6.2) were filled with
200 µl of incomplete medium while the inner wells were filled with cell
suspension. The plate was then incubated overnight at 37 ºC in a humidified
incubator set at 5 % CO2. The 100 µl of the crude extract/pure compound was
dispensed into the cell-containing wells of the sample plate in triplicate. The
final concentrations of the crude extract in the wells were 0.39, 0.78, 1.56,
3.13, 6.25, 12.50, 25.00, 50.00, 100.00, 200.00 µg/ml. The final
concentrations of the pure compounds in the wells were 0.39, 0.78, 1.56,
3.13, 6.25, 12.50, 25.00, 50.00, 100.00 µg/ml. Control wells received a final
concentration of 1 % DMSO in complete medium. Doxorubicin and
zelaralenone were used as positive controls. The plate was then incubated for
3 days.
Figure 6.2: Sample plate design. Reference plates (without cells), containing 100 µl of medium and 100 µl of
diluted extract/compound, were also prepared in triplicate. These plates were
also incubated at 37 ºC in a humidified incubator set at 5 % CO2 for 3 days.
On the 4th day, 50 µl of sodium 3-[1(phenylaminocarbonyl)-3,4-tetrazolium]-bis
medium
medium control
DMSO control
sample one
sample two
CONCENTRATION
CONCENTRATION
LOW
LOW HIGH
HIGH
Sample

120
(4-methoxy-6-nitro) benzene sulfonic acid hydrate (XTT) reagent was added
to the wells and incubated for 1.4 hours. The colour changes were measured
at 450 nm (690 nm reference wavelength). The program (KC Junior) used to
read the plates automatically subtracted the values at 690 nm from the
corresponding ones at 450 nm. Reference plate values were then subtracted
from their corresponding sample values. Cell viabilities were assessed by
comparing the sample values to the control values.
6.3 Results and Discussion The results obtained for the cytotoxicity of the crude extract and pure
compounds showed that they have little or no toxicity (Table 6.1 and Fig. 6.3).
Table 6.1: Cytotoxicity of the crude ethanol extract and compounds isolated
from C. steenkampianus on Vero cells.
Plant extract/compound ID50 µg/ml
Ethanol extract 45.0
Eriodictyol Nt
Indane 248.2
Quercetin 33.6
Steenkrotin A 35.3
Steenkrotin B 305.9
Steenkrotin B acetate Nt
Tamarixetin 53.8
Chloroquine 25.0
Nt = not done
All the isolated compounds as well as the extract had lower toxicity than
chloroquine. The indane and steenkrotin B showed the lowest toxicity in this in
vitro assay.

121
Steenkrotin A
0.00020.00040.00060.00080.000
100.000120.000
1.5
63
3.1
25
6.2
50
12.5
00
25.0
00
50.0
00
100.0
00
200.0
00
Concentration
Perc
en
t co
ntr
ol
Steenkrotin B
0.000
50.000
100.000
150.000
3.1
25
6.2
50
12.5
00
25.0
00
50.0
00
100.0
00
200.0
00
400.0
00
Concentration
Perc
en
t co
ntr
ol
Indan
0.00020.00040.00060.00080.000
100.000120.000
3.1
25
6.2
50
12.5
00
25.0
00
50.0
00
100.0
00
200.0
00
400.0
00
Concentration
Perc
en
t co
ntr
ol
Tamarixetin
0.00020.00040.00060.00080.000
100.000120.000
0.7
81
1.5
63
3.1
25
6.2
50
12.5
00
25.0
00
50.0
00
100.0
00
Concentration
Perc
en
t co
ntr
ol
Quercetin
-20.0000.000
20.00040.00060.00080.000
100.000120.000
0.7
81
1.5
63
3.1
25
6.2
50
12.5
00
25.0
00
50.0
00
100.0
00
Concentration
Perc
en
t co
ntr
ol
Figure 6.3: Activity of the isolated compounds on the growth of Vero cells in µg/ml.

122
Quercetin is the most toxic when its ID50 is compared to those of the crude
extract and compounds isolated. However, It showed the highest
antiplasmodial activity (0.34 and 0.73 µg/ml) at concentrations where its
toxicity on Vero cells cause between 0% and 10% inhibition. Its therapeutic
index for antimalarial activity is 46.0 to 98.8, which are not as high as the
proposed index for a good remedy (Prozesky, 2004). However, it is being
used as an important drug agent with very broad biological activities (Terao et
al., 1994; Hollman et al., 1995).
Steenkrotin A showed no toxicity on the Vero cells at concentration of 1.5 to
6.3 µg/ml. This finding is very interesting and promising in that at this range it
showed antiplasmodial activity (3.0 to 5.2 µg/ml) with corresponding
therapeutic index of 7.0 to 11.8. Just as in the case of quercetin, its low
therapeutic index based on this in vitro study may not mean that it will not be
suitable for in vivo use. Nevertheless, Its suitability as a drug candidate
requires further investigation in vivo.
Steenkrotin B did not show toxicity on Vero cells at concentration of 3.1 to 200
µg/ml. It is the least toxic of compounds isolated. However, its percentage
inhibition increases from 0 to 80% at 400 µg/ml. Its antibacterial activities
were at the concentrations where Vero cells’ growth was not inhibited. Again,
its therapeutic index (6.1) is very low compared to what is expected of a good
drug. However, its very low toxicity properties might make it a promising
therapeutic agent.
The indane did not inhibit the growth of Vero cells at concentrations between
3.1 and 25 µg/ml while between 50 and 200 µg/ml, the growth of cells
dropped from 90 to 75%. The concentrations (50 to 100 µg/ml) where it has
shown biological activities (anti-HIV and antibacterial) correspond to
concentrations where Vero cells’ growth was inhibited. Further evaluation
needs to be performed to establish whether the observed biological activities
are due to toxicity of the compound at these concentrations.

123
The crude extract showed lower toxicity (45.0 µg/ml) compared to the known
drugs (chloroquine and quercetin). Its rich diverse component compounds
which include flavonoids and terpenes known for their medicinal properties as
well as its relatively low toxicity makes it a good candidate to be considered as
medicine just like other species of the genus Croton being used traditionally
for treatment of ailments (Pooley, 1993; Ngadjui et al., 2002; Suarez et al.,
2006).
In conclusion, in vivo studies are needed to determine and establish the
overall potential (safety, efficacy, suitability etc) of the crude extract and
compounds as potential drug agents.

124
6.4 References Al-fatimi, M., Friedrich, U. and Jenett-siems, K. 2005. Cytotoxicity of plants in
traditional medicine in Yemen. Fitoterapia 76:355-358.
Barile, F.A., Dierickx, P.J. and Kristen, U. 1994. In vitro cytotoxicity testing for
prediction of acute human toxicity. Cell Biol. Toxicol. 10(3):155-162.
Hollman, P.C., de Vries, J.H., van Leeuwen, S.D., Mengelers, M.J., Katan,
M.B. 1995. Absorption of dietary quercetin glycosides and quercetin in healthy
ileostomy volunteers. Am. J. Clin. Nutr. 62(6):1276-82.
Kraljevic, S., Stambrook, P.J. and Pavelic, K. 2004. Accelerating drug
discovery. EMBO Rep. 5(9):837–842. doi: 10.1038/sj.embor.7400236.
Lall, N. and Meyer, J.J.M. 2000. Antibacterial activity of water and acetone
extracts of the roots of Euclea natalensis. J. Ethnopharmacol. 72: 313-316.
Mosmann, T. 1983. Rapid colourimetric assay for cellular growth and survival:
application to proliferation and cytotoxicity assay. J. Immunol. Meth. 65:55-63.
Ngadjui, B.T., Abegaz, B.M., Keumedjio, F., Folefoc, G.N., & Kapche G.W.F.
2002. Diterpenoid from the stem bark of Croton zambesicus. Phytochem. 60:
345-349.
Pooley, E. 1993. The complete field guide to trees of Natal, Zululand &
Transkei. P.222. Natal Foral Publications Trust.
Prozesky, E.A. 2004. Antiplasmodial and chloroquine resistance reversal
properties of a new diterpene from Croton steenkampianus. PhD thesis.
Roche 2005. Cell proliferation kit II (XTT). Viewed 28 October 2007,
http://www.roche-applied-science.com/pack-insert/14650a.pdf.

125
Suarez, A. I., Blanco, Z., Compagnone, R.S., Salazar-Bookaman, M.M.,
Zapata V., Alvarado C. 2006. Anti-inflammatory activity of Croton cuneatus
aqueous extract. J. Ethnopharmacol. 105: 99-101.
Terao, J. Piskula, M. Yao, Q. 1994. Protective effect of epicatechin,
epicatechin gallate, and quercetin on lipid peroxidation in phospholipid
bilayers. Arch. Biochem. Biophys. 308(1):278-84.
Wilson, A.P. 2000. Cytotoxicity and viability assay in animal cell culture: a
practical approach, 3rd ed. Oxford University Press, Oxford.

126

126
CHAPTER 7 GENERAL DISCUSSION AND CONCLUSION
7.1 Introduction……………………………………………………………..…………
127
7.2 Bioassay guided fractionation of the ethanol crude extract and isolated
compounds………………………………………………………...…………………..
127
7.3 Biological evaluation of the isolated compounds...………………..….……… 128
7.4 References…...……………….……………………………………..…………… 130

127
CHAPTER 7 General discussion and conclusion 7.1 Introduction New and re-emerging infectious diseases for which no effective therapy is
available and the development of resistance of many pathogens to currently
used drugs are of utmost concern. In the developing countries, malaria,
tuberculosis (TB) and human immunodeficiency virus (HIV) are the three
major infectious diseases. They account for approximately half of the mortality
caused by infectious diseases, which is almost half of the mortality in the
developing countries (Mahidol et al., 2002). Malaria has been responsible for
much of human suffering and misery. Every year there are more than 300
million cases of malaria in the world and malaria kills more than one million
people. Over the last ten years, the malaria situation has been worsening in
many areas of the world. The need to find new antimalarials is pressing, due
to the resistance of the human malarial parasite, Plasmodium falciparum to
the presently available common antimalarial drugs. Treatment has thus
become both less effective and much more expensive. The problem is further
aggravated by the resistance of the vector anopheline mosquitoes to the most
effective and least toxic insecticides, which had been used to kill them.
The potential of natural products as therapeutic agents in the treatment of
malaria is enormous and the research work in this area has been the subject
of some recent reviews.
7.2 Bioassay guided fractionation of the ethanol crude extract and
isolated compounds
The crude extract of the leaves of C. steenkampianus was prepared in
ethanol. The isolation of the compounds was guided with antibacterial and
antimalarial bioassays. The correlation between the active antibacterial and
active antimalarial fractions reported by Prozesky, 2004, Boonphong, 2007
and Zdzislawa, 2007 was verified. The compounds were isolated with silica
and Sephadex chromatography. Six compounds were isolated: an indane,

128
steenkrotin A, steenkrotin B, quercetin, tamarixetin and eriodictyol. These
compounds were identified with NMR, LCMS, IR and X-ray crystallography.
7.3 Biological evaluation of the compounds Quercetin showed the highest antiplasmodial activity among the compounds
isolated. Its activity was the best against D10 and Dd2 strains of the parasite.
It also displayed moderate antibacterial activity and best antioxidant activity. It
showed no anti-HIV activity. Quercetin is an established medicine of value
with increasing application in health care. Its biological activities (antibacterial
and antioxidant) reported in this work were as documented in the literature
(Kumarasamy et al., 2002; Brahmachari and Gorai, 2006). Of the compounds
isolated, quercetin showed the highest toxicity value but less toxicity than that
of chloroquine.
The antiplasmodial activity shown by steenkrotin A is very interesting and
promising. Even though its activity is less than that of quercetin against the
parasite, it is more active against resistant strains than sensitive ones. The
potential of steenkrotin A as an antiplasmodial agent needs further studies
and development. Several derivatives of the compound needs to be
synthesised and tested for improved activity. Steenkrotin A showed moderate
antibacterial activity and weak antioxidant activity. No activity was observed
against reverse transcriptase. Its toxicity value is similar to that of quercetin.
Steenkrotin B did not show antiplasmodial activity on the strains of P.
falciparum used. However, it showed moderate antibacterial activity and
moderate antioxidant activity, and no anti-HIV activity at the concentration in
which it was tested. The activity of steenkrotin A and steenkrotin B on bacteria
is promising and indicated antibiotic activity against Gram negative and
positive bacteria. The antiplasmodial activity of steenkrotin B needs to be
researched further because of the presence of an endoperoxide in its
molecule. The high activity of artemisinin against malarial parasites has been
linked to the endoperoxide in its structure. In order to optimise the possible
antimalarial activity of steenkrotin B, many derivatives need to be made and
tested for activity. The fact that artemisinin is active against P. falciparum

129
while steenkrotin B is not, may mean that even though both contain
endoperoxides they are in different chemical environments. Steenkrotin B
showed the best overall toxicity value, being the lowest of all the compounds
isolated. However, more studies are required to identify other biological
properties of this compound.
The indane did not show antiplasmodial activity at the concentrations in which
it was tested. However, it showed moderate antibacterial activity, slight anti-
HIV activity and weak antioxidant activity. The indane showed the second best
toxicity value in this study. It had low cytotoxicity but moderate antibacterial
and weak anti-HIV activity.
The biological study of the activities of tamarixetin and eriodictyol were not
done because their quantities isolated were very small. However, their
antioxidant, antimalarial and antibacterial activities are well documented
(Prozesky, 2004; Mahidol et al., 2002; Newman et al., 2003). The toxicity
(ID50) of tamarixetin was 53.8, which is relatively low.
Only three compounds (indane, steenkrotin A and steenkrotin B) were tested
against Mycobacterium tuberculosis. None of them show antimycobacterial
activity at the concentration at which they were tested.
The crude ethanol extract showed moderate antimalarial, antioxidant and
antibacterial activity. These bioactivities can be linked to the compounds
(flavonoids, diterpenes, triterpenes etc) of the extract. Without doubt C.
steenkampinus like other species of Croton (Pooley, 1993) possesses
medicinal properties. Its low cytotoxicity unlike others species (Mahidol et al.,
2002) makes it worthy of further studies in vivo.

130
7.4 References Boonphong, S., Puangsombat, P., Baramee, A., Mahidol, C., Ruchirawat, S.
and Kittakoop, P. 2007. Bioactive compounds from Bauhinia purpurea
possessing antimalaral, antimycobacterial, antifungal, anti-inflammatory, and
cytotoxic activities. J. Nat. Prod. 70:795-801.
Brahmachari, G. and Gorai, D. 2006. Progress in the research on naturally
occurring flavones and flavonols: An overview. Curr. Org. Chem. 10:873-898.
Kumarasamy, Y., Fergusson, M.E., Nahar, L. and Satyajit, S.D. 2002.
Bioactivity of Moschamindole from Centaurea moschata. Pharm. Biol.
40(4):307-310.
Mahidol, C., Prawat, H., Prachyawarakon, V. and Ruchirawat, S. 2002.
Investigation of some bioactive Thai medicinal plants. Phytochem. Rev. 1:287-
297.
Newman, D.J., Cragg, G.M. and Snader, K.M. 2003. Natural products as
sources of new drugs over the period 1981-2002. J. Nat. Prod. 66 (7):1022-
1037.
Pooley, E. 1993. The complete field guide to trees of Natal, Zululand &
Transkei. P.222. Natal Foral Publications Trust, Durban.
Prozesky, E.A. 2004. Antiplasmodial and chloroquine resistance reversal
properties of a new diterpene from Croton steenkampianus. PhD thesis.
University of Pretoria, South Africa.
van der Westhuyzena, C.W and Parkinson, C.J. 2005. Synthesis of a
Structurally Constrained Endoperoxide having Antimalarial Activity from
Santonin. S. Afr. J. Chem. 58:41–45. Viewed 20 January 2008,
<http://journals.sabinet.co.za/sajchem/>.

131
Zdzislawa, N. 2007. A review of anti-infective and anti-inflammatory
chalcones. Eur. J. Med. Chem. 42(2):125-137.

132
APPENDIX 1: PAPER PUBLISHED FROM THESIS

Bioactive Diterpenes and Other Constituents of Croton steenkampianus
Adeboye M. Adelekan,† Erwin A. Prozesky,† Ahmed A. Hussein,*,†,‡ Luis D. Urena,§ Petrus H. van Rooyen,⊥ David C. Liles,⊥
J. J. Marion Meyer,† and Benjamın Rodrıguez0
Department of Plant Science, UniVersity of Pretoria, Pretoria, 0002, South Africa, Smithsonian Tropical Research Institute, Ancon Panama,Republic of Panama, Department of Chemistry, UniVersity of Pretoria, Pretoria, 0002, South Africa, Chemistry of Medicinal PlantsDepartment, National Research Centre, Dokki, Cairo, Egypt, and Instituto de Quımica Organica, Consejo Superior de InVestigacionesCientıficas (CSIC), Juan de la CierVa 3, E-28006 Madrid, Spain
ReceiVed June 6, 2008
A new indanone derivative (1) and two new diterpenoids (2 and 3), together with three known flavonoids, have beenisolated from an ethanol extract of the leaves of Croton steenkampianus. The structure of 2 was solved by single-crystalX-ray diffraction analysis, whereas those of 1 and 3 were established mainly by 1D and 2D NMR spectroscopic methods.The isolated compounds were tested for their antiplasmodial activity and cytotoxicity. Antiplasmodial assays againstchloroquine-susceptible strains (D10 and D6) and the chloroquine-resistant strains (Dd2 and W2) of Plasmodiumfalciparum showed that compound 2 gave moderate activities at 9.1-15.8 µM, while none of the compounds werecytotoxic against Vero cells.
Croton steenkampianus Gerstner (Euphorbiaceae), commonlyknown as “Marsh Fever-berry” and “Tonga Croton”, is a shrub ortree endemic to restricted areas of central Africa and eastern partsof southern Africa.1 Various medicinal uses of the genus Crotonare reported in countries all over the world, and many species areused to treat bleeding, bleeding gums, chest complaints, coughs,fever, indigestion, malaria, and rheumatism.1 Chemically, the genuscontains very diverse compound types including alkaloids, fla-vonoids, and terpenoids.2,3 However, no phytochemical reports haveappeared for the species C. steenkampianus. Medicinally, the vaporfrom the fresh leaves is used to relieve aches.1 In this paper, wedescribe the isolation of six compounds, namely, three knownflavonoids, quercetin (5), taxmarixetin, and eriodictyol,4–6 a newindane derivative (1), and two new diterpenoids (2 and 3), from anethanol extract of leaves of C. steenkampianus. The structures of1-3 were elucidated mainly by 1D and 2D NMR spectroscopicmeans and, in the case of 2, by single-crystal X-ray diffractionanalysis. In addition, we also report on antiplasmodial activity andcytotoxicity of the isolated compounds.
Repeated chromatographic processes on the EtOH extract of thedried leaves of C. steenkampianus allowed the isolation of threeflavonoids (quercetin (5), taxmarixetin, and eriodictyol) togetherwith the indane derivative 1 and the diterpenoids 2 and 3(steenkrotins A and B, respectively). The flavonoids were identifiedby comparison of their data with published values.4–6
Low-resolution mass spectrometry and combustion analysisindicated a molecular formula of C12H12O3 for 1, and its NMRspectroscopic data were in agreement with the structure of 2,6-dimethyl-1-oxo-4-indanecarboxylic acid (1). In particular, theHMBC correlations observed for 1 (C-1 with H-2, H2-3, H-7, andMe-10; C-12 with H-5 and H-7; C-9 with H-2, H2-3, H-5, and H-7;C-11 with H-5; and C-12 with H-5 and H-7) established a1-indanone skeleton and a 2,6-dimethyl-4-carboxyl substitutionpattern for this new substance. Since 1 did not show any opticalrotation between 589 and 365 nm, it was evident that it is a racemicmixture of the two enantiomers at the C-2 asymmetric center, whichcan be easily racemized through the enolic form of the 1-indanone.
The structure of steenkrotin A (2, C20H26O4) was established fromX-ray diffraction studies. Figure 1 is a perspective view of themolecule of 2 showing its relative configuration. Moreover, the 1Dand 2D NMR spectroscopic data of 2 (Table 1 and Tables S1 andS2, Supporting Information) were in complete agreement with theproposed structure.
Steenkrotin B (3, C20H28O7) showed 1H and 13C NMR spectravery similar to those of 2 (Table 1). The observed differences wereconsistent with the presence in 3 of a hydroxyisopropyl group [δH
1.45 and 1.34 (Me-16 and Me-17); δC 22.3 and 25.7 (C-16 andC-17), and 87.6, qC, C-15] and a hemiacetal carbon (δ 110.1, qC,C-14) instead of the pentasubstituted cyclopropane of 2. Thisstructural difference was also supported by the HMBC spectra(Table S1, Supporting Information), because 2 showed correlationsthrough three bonds between C-15 and H-8 and between C-14 andMe-16 and Me-17 that were not observed for 3. Three of the sevenoxygen atoms of 3 were involved in two ketones [δ 206.5 (C-3)and 212.4 (C-10)] and in a secondary hydroxyl group [δH 4.30;δµC 75.6, CH (C-7)], as in 2, and two other oxygens must be placedat C-14 and C-15 as one of the hemiacetal oxygens and as a tertiaryhydroxyl group, respectively (see above). The remaining twooxygens of 3 must be part of an endoperoxide moiety between C-6(δ 68.6, qC) and the hemiacetalic C-14 carbon. The presence ofthis endoperoxide was also in agreement with molecular formula
* To whom corresspondence should be addressed. Tel: (202) 33371564.Fax: (202) 33370931. E-mail: [email protected].
† Department of Plant Science, University of Pretoria.‡ Chemistry of Medicinal Plants Department, NRC, Cairo.⊥ Department of Chemistry, University of Pretoria.§ Smithsonian Tropical Research Institute.0 Instituto de Quımica Organica (CSIC).
Figure 1. ORTEP diagram for compound 2.
J. Nat. Prod. XXXX, xxx, 000 A
10.1021/np800333r CCC: $40.75 XXXX American Chemical Society and American Society of PharmacognosyPublished on Web 10/15/2008
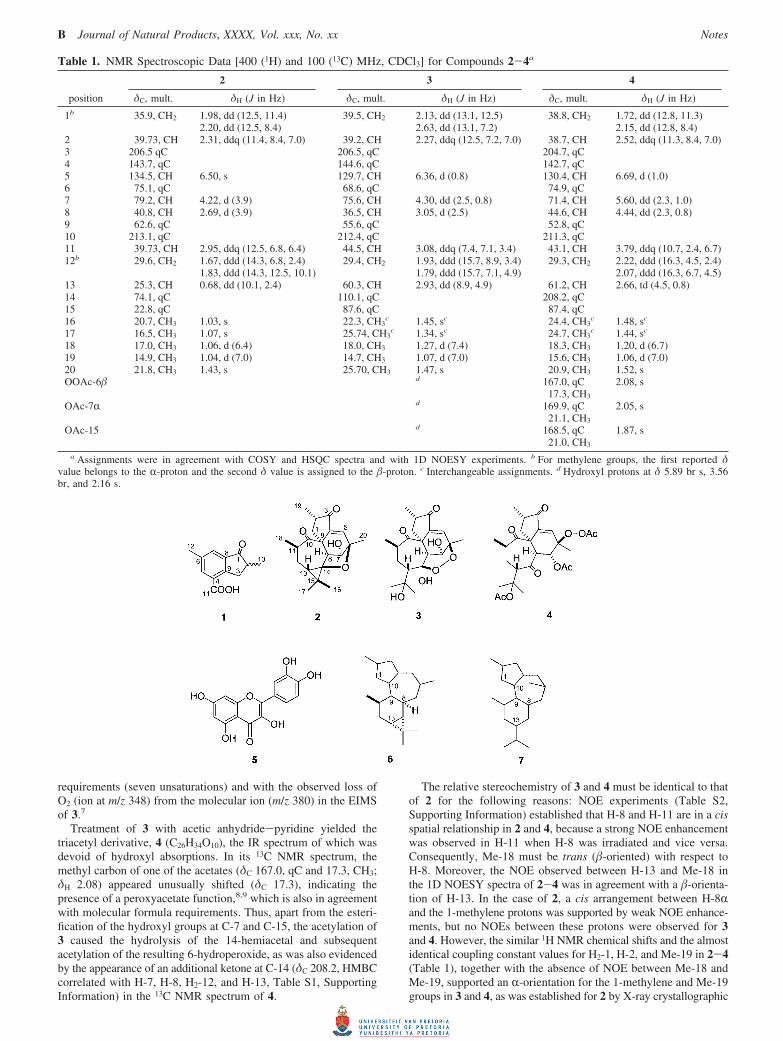
requirements (seven unsaturations) and with the observed loss ofO2 (ion at m/z 348) from the molecular ion (m/z 380) in the EIMSof 3.7
Treatment of 3 with acetic anhydride-pyridine yielded thetriacetyl derivative, 4 (C26H34O10), the IR spectrum of which wasdevoid of hydroxyl absorptions. In its 13C NMR spectrum, themethyl carbon of one of the acetates (δC 167.0, qC and 17.3, CH3;δH 2.08) appeared unusually shifted (δC 17.3), indicating thepresence of a peroxyacetate function,8,9 which is also in agreementwith molecular formula requirements. Thus, apart from the esteri-fication of the hydroxyl groups at C-7 and C-15, the acetylation of3 caused the hydrolysis of the 14-hemiacetal and subsequentacetylation of the resulting 6-hydroperoxide, as was also evidencedby the appearance of an additional ketone at C-14 (δC 208.2, HMBCcorrelated with H-7, H-8, H2-12, and H-13, Table S1, SupportingInformation) in the 13C NMR spectrum of 4.
The relative stereochemistry of 3 and 4 must be identical to thatof 2 for the following reasons: NOE experiments (Table S2,Supporting Information) established that H-8 and H-11 are in a cisspatial relationship in 2 and 4, because a strong NOE enhancementwas observed in H-11 when H-8 was irradiated and vice versa.Consequently, Me-18 must be trans (�-oriented) with respect toH-8. Moreover, the NOE observed between H-13 and Me-18 inthe 1D NOESY spectra of 2-4 was in agreement with a �-orienta-tion of H-13. In the case of 2, a cis arrangement between H-8Rand the 1-methylene protons was supported by weak NOE enhance-ments, but no NOEs between these protons were observed for 3and 4. However, the similar 1H NMR chemical shifts and the almostidentical coupling constant values for H2-1, H-2, and Me-19 in 2-4(Table 1), together with the absence of NOE between Me-18 andMe-19, supported an R-orientation for the 1-methylene and Me-19groups in 3 and 4, as was established for 2 by X-ray crystallographic
Table 1. NMR Spectroscopic Data [400 (1H) and 100 (13C) MHz, CDCl3] for Compounds 2-4a
2 3 4
position δC, mult. δH (J in Hz) δC, mult. δH (J in Hz) δC, mult. δH (J in Hz)
1b 35.9, CH2 1.98, dd (12.5, 11.4) 39.5, CH2 2.13, dd (13.1, 12.5) 38.8, CH2 1.72, dd (12.8, 11.3)2.20, dd (12.5, 8.4) 2.63, dd (13.1, 7.2) 2.15, dd (12.8, 8.4)
2 39.73, CH 2.31, ddq (11.4, 8.4, 7.0) 39.2, CH 2.27, ddq (12.5, 7.2, 7.0) 38.7, CH 2.52, ddq (11.3, 8.4, 7.0)3 206.5 qC 206.5, qC 204.7, qC4 143.7, qC 144.6, qC 142.7, qC5 134.5, CH 6.50, s 129.7, CH 6.36, d (0.8) 130.4, CH 6.69, d (1.0)6 75.1, qC 68.6, qC 74.9, qC7 79.2, CH 4.22, d (3.9) 75.6, CH 4.30, dd (2.5, 0.8) 71.4, CH 5.60, dd (2.3, 1.0)8 40.8, CH 2.69, d (3.9) 36.5, CH 3.05, d (2.5) 44.6, CH 4.44, dd (2.3, 0.8)9 62.6, qC 55.6, qC 52.8, qC10 213.1, qC 212.4, qC 211.3, qC11 39.73, CH 2.95, ddq (12.5, 6.8, 6.4) 44.5, CH 3.08, ddq (7.4, 7.1, 3.4) 43.1, CH 3.79, ddq (10.7, 2.4, 6.7)12b 29.6, CH2 1.67, ddd (14.3, 6.8, 2.4) 29.4, CH2 1.93, ddd (15.7, 8.9, 3.4) 29.3, CH2 2.22, ddd (16.3, 4.5, 2.4)
1.83, ddd (14.3, 12.5, 10.1) 1.79, ddd (15.7, 7.1, 4.9) 2.07, ddd (16.3, 6.7, 4.5)13 25.3, CH 0.68, dd (10.1, 2.4) 60.3, CH 2.93, dd (8.9, 4.9) 61.2, CH 2.66, td (4.5, 0.8)14 74.1, qC 110.1, qC 208.2, qC15 22.8, qC 87.6, qC 87.4, qC16 20.7, CH3 1.03, s 22.3, CH3
c 1.45, sc 24.4, CH3c 1.48, sc
17 16.5, CH3 1.07, s 25.74, CH3c 1.34, sc 24.7, CH3
c 1.44, sc
18 17.0, CH3 1.06, d (6.4) 18.0, CH3 1.27, d (7.4) 18.3, CH3 1.20, d (6.7)19 14.9, CH3 1.04, d (7.0) 14.7, CH3 1.07, d (7.0) 15.6, CH3 1.06, d (7.0)20 21.8, CH3 1.43, s 25.70, CH3 1.47, s 20.9, CH3 1.52, sOOAc-6� d 167.0, qC 2.08, s
17.3, CH3
OAc-7R d 169.9, qC 2.05, s21.1, CH3
OAc-15 d 168.5, qC 1.87, s21.0, CH3
a Assignments were in agreement with COSY and HSQC spectra and with 1D NOESY experiments. b For methylene groups, the first reported δvalue belongs to the R-proton and the second δ value is assigned to the �-proton. c Interchangeable assignments. d Hydroxyl protons at δ 5.89 br s, 3.56br, and 2.16 s.
B Journal of Natural Products, XXXX, Vol. xxx, No. xx Notes

analysis. In addition, one of the H2-1 protons of 3 (δ 2.63) showeda NOE with the proximal Me-18 group, and this proton must bethe �-oriented one, which in turn displayed a strong NOE withH-2 and no NOE with Me-19, thus establishing an R-orientationfor Me-19. This conclusion was also supported by the 1D NOESYbehavior of 4, which showed a weak NOE in H-2 (+1%) and amedium NOE in Me-19 (+3.4%) when H-1R (δ 1.72) wasirradiated. For structural requirements, the R-orientation of H-8 in2 requires a 6�, 14� closure of its cyclic ether, and 3 must alsohave the same stereochemistry for its endoperoxide, becausesteenkrotin B (3) also has its H-8 proton R-oriented (see above).Consequently, the 6-peroxyacetate of 4 must be �-oriented.10
The cyclohexene ring of 3 and 4 adopts an envelope conforma-tion with the flap at C-7, like in 2 (Figure 1), and H-7� and OH-7R (or OAc-7R in 4) are equatorial and axial substituents,respectively, thus explaining the similar J7�,8R values (Table 1) andthe NOE behavior of these compounds (Table S2, SupportingInformation).
NOE experiments also allowed the assignment of the Me-16 andMe-17 groups in 2, as it is shown in the formula and Table S2(Supporting Information). Irradiation at δ 1.43 (Me-20) caused NOEenhancement only in one of the two C-15 methyls (δ 1.03, Me-16), whereas the signal of the other one (δ 1.07, Me-17) wasenhanced when H-8R was irradiated. The assignment of theconfiguration for both methylene protons at C-12 in 2-4 (Table 1)was also supported by NOE results (Table S2, Supporting Informa-tion).
To the best of our knowledge, diterpenoids 2 and 3 possess newcarbon skeletons that may be derived from the tigliane (6) anddaphnane (7) types, respectively, by an 8(9f10)-abeo rearrange-ment.11 It is of interest that diterpenes belonging to 6 and 7 carbonframeworks have repeatedly been found in several Croton speciesand in other Euphorbiaceae genera.12
Antiplasmodial testing (Table 2) showed that the ethanolic extractof C. steenkampianus demonstrated an IC50 activity against thechloroquine-susceptible strain D10 (8.6 µg/mL) and the chloroquine-resistant strain Dd2 (5.8 µg/mL) of Plasmodium falciparum.Activity was more pronounced against the resistant strain. Com-pound 2 displayed antiplasmodial activities of 15.8 (D10), 9.1 (W2),and 9.4 (Dd2) µM. Quercetin (5) was active against the D10 andDd2 strains. The cytotoxicity values for the isolated compoundson Vero cells using MTT assays were all >30 µM, showing thatthe substances tested (Table 2) are not potent cytotoxic agents.
Experimental Section
General Experimental Procedures. Melting points were determinedon a Kofler block and are uncorrected. Optical rotations were measuredon a Perkin-Elmer 241 MC polarimeter. UV spectra were recorded ona Perkin-Elmer Lambda 2 UV/vis spectrophotometer. IR spectra wereobtained on a Perkin-Elmer Spectrum One spectrophotometer. 1H and
13C NMR spectra were recorded in CDCl3 solution on a Varian INOVA400 spectrometer at 400 and 100 MHz, respectively. Chemical shiftsare reported relative to the residual CHCl3 (δ 7.25) for protons and tothe solvent (δCDCl3 77.00) for carbons. All the assignments for protonsand carbons were in agreement with 2D COSY, gHSQC, gHMBC, and1D NOESY spectra. Mass spectra were registered in the positive EImode on a Hewlett-Packard 5973 instrument (70 eV) and in the positiveor negative ESI mode on a Hewlett-Packard Series 1100 MSDspectrometer. Elemental analyses were conducted on a Leco CHNS-932 apparatus. Merck Si gel (70-230 and 230-400 mesh, for gravityflow and flash chromatography, respectively) was used for columnchromatography. Merck 5554 Kieselgel 60 F254 sheets were used forTLC analysis. Petroleum ether (bp 50-70 °C) was used for columnchromatography.
Plant Material. Leaves of Croton steenkampianus were collectedin April 2003, at Tember Elephant Park in northern KwaZulu-Natal,South Africa, and voucher specimens (registry number 92520) areidentified and preserved at the H.G.W.J. Schweickerdt Herbarium (PRU)at the University of Pretoria.
Extraction and Isolation. The dried leaves (2 kg) were extractedwith ethanol (0.2 kg leaves/L solvent) for 3 days at room temperature.The extract was filtered and concentrated with a rotary evaporator at40 °C. The extraction procedures were repeated twice. The total extract(80.0 g) was applied to a flash silica gel column, developed with asolvent gradient of hexane-ethyl acetate mixtures of increasing polarity.Similar fractions were combined together, to yield four main fractions,A1-A4. Fraction A2 (10 g) was applied to a silica gel columndeveloped with hexane- ethyl acetate (95:5) to yield pure compounds1 (148 mg) and 2 (250 mg) and eriodictyol (5 mg). Fraction A4 (3.0mg) was applied to a silica gel column developed with a solvent gradientof hexane-ethyl acetate (90:10). Subfraction 2 (350 mg) was furtherchromatographed over Sephadex LH-20, using ethanol as eluent, togive quercetin (5, 10 mg), tamarixetin (5 mg), and compound 3 (50mg).
2,6-Dimethyl-1-oxo-4-indanecarboxylic acid (1): amorphous, whitesolid; [R]D
20 0, [R]57820 0, [R]546
20 0, [R]43620 0, [R]365
20 0 (c 0.26, CHCl3);UV (MeOH) λmax (log ε) 215 (5.56), 248 (4.02), 310 (3.66) nm; IR(KBr) νmax 3400-2300, 2924, 1709, 1580, 1459, 1423, 1250, 1182,1133, 927, 836, 693 cm-1; 1H NMR (400 MHz, CDCl3) δ 1.31, (3H,d, J ) 7.0 Hz, H-10), 2.45, (3H, s, H-12), 2.72, (1H, ddq, J ) 7.9, 7.0,3.7 Hz, H-2), 3.02, () (H, dd, J ) 18.6, 3.7 Hz, H2-3), 3.77 (1H, dd J) 18.6, 7.9 Hz, H1-3), 7.79 (1H, d, J ) 2.0 Hz, H-7), 8.18 (1H, d J )2.0 Hz, H-5), 8.60 (1H, br, H-11); 13C NMR (100 MHz, CDCl3) δ16.2 (CH3, C-10), 20.9 (CH3, C-12), 36.1 (CH2, C-3), 42.0 (CH, C-2),127.1 (qC, C-4), 129.4 (CH, C-7), 137.9 (qC, C-8), 138.0 (CH, C-5),138.1 (qC, C-6), 153.1 (qC, C-9), 171.3 (qC, C-11), 209.1 (qC, C-1);EIMS m/z 204 [M]+ (100), 189 (86), 176 (21), 161 (44), 159 (19), 148(44), 131 (26), 115 (37), 91 (21), 77 (18), 63 (13), 51 (14); anal. C70.67%, H 5.81%, calcd for C12H12O3, C 70.58%, H 5.92%.
Steenkrotin A (2): colorless needles (EtOAc-petroleum ether), mp219-221 °C; [R]D
20 +188.6 (c 0.32, CHCl3); UV (MeOH) λmax
(log ε) 227 (3.96) 250 shoulder (3.68) nm; IR (KBr) νmax 3359, 3050,3020, 2971, 2940, 1702, 1649, 1454, 1375, 1286, 1231, 1112, 1055,1019, 905, 743, 650 cm-1; 1H and 13C NMR, see Table 1; EIMS m/z330 [M]+ (3), 315 (0.5), 312 (2), 297 (0.5), 262 (60), 244 (27), 227(14), 187 (18), 177 (62), 161 (30), 160 (26), 145 (16), 121 (29), 97(35), 91 (14), 83 (13), 77 (14), 69 (100), 55 (29); anal. C 72.43%, H8.25%, calcd for C20H26O4, C 72.70%, H 7.93%.
X-ray Structure Determination of 2.13 The crystallographic dataset was collected at 20 °C on a Siemens P4 diffractometer fitted witha Bruker 1K CCD detector and SMART control software14 usinggraphite-monochromated Mo KR radiation by means of a combinationof phi and omega scans. Data reduction was performed usingSAINT+,18 and the intensities were corrected for absorption us-ing SADABS.18 The structure was solved by direct methods usingSHELXTS14 and refined by full-matrix least-squares using SHELXTL14
and SHELXL-97.15 All hydrogen atoms for the structure of 2 werelocated experimentally. In the refinement, the hydrogen atoms wererefined without any positional constraints. Isotropic displacementparameters for the non-methyl hydrogen atoms were calculated as 1.2× Ueq of the atom to which they were attached, and the correspondingvalue for methyl hydrogen atoms was 1.5 × Ueq of the carbon atom towhich they were attached. All non-hydrogen atoms were refined withanisotropic displacement parameters. Drawings of the structure were
Table 2. Antiplasmodial Activities and Cytotoxicity (µM) ofIsolates against Chloroquine-Susceptible Strains (D10 and D6)and the Chloroquine-Resistant Strains (Dd2 and W2) ofPlasmodium falciparum
antiplasmodial activity (IC50)
sample D6 W2 D10 Dd2 cytotoxicity (IC50)
ethanol extracta ntb ntb 8.60 5.80 45.01 >49.0 >49.0 >49.0 >49.0 1216.72 >30.0 9.40 107.03 >26.3 9.1 15.8 >26.30 805.0quercetin (5) ntb >26.3 >26.3 110.0tamarixetin ntb 2.40 170.3eriodictyol ntb ntb 1.10 ntb ntb
chloroquinec ntb ntb ntb
0.03 0.06 0.02 0.14 48.5a Activity recorded in µg/mL. b nt ) not tested. c Positive control
substance.
Notes Journal of Natural Products, XXXX, Vol. xxx, No. xx C

produced using ORTEP-3 for Windows,16 Mercury,17 and POV-Rayfor Windows.18
Steenkrotin B (3): colorless fine needles (MeOH), mp 130-132°C (dec); [R]D
20 +24.4 (c 0.12, CHCl3); UV (MeOH) λmax (log ε) 233(3.98) nm; IR (KBr) νmax 3435, 2976, 2932, 1731, 1691, 1676, 1457,1372, 1194, 1078, 901 cm-1; 1H and 13C NMR, see Table 1; positivemode ESIMS m/z 403 [M + Na]+, 783 [2M + Na]+; negative modeESIMS m/z 379 [M - H]-; EIMS m/z 380 [M]+ (0.3), 362 (1), 348(1), 338 (25), 305 (19), 264 (27), 245 (21), 219 (27), 203 (38), 187(45), 177 (56), 161 (55), 152 (39), 141 (43), 121 (40), 95 (31), 91(41), 85 (41), 83 (45), 71 (57), 69 (54), 55 (100); anal. C 63.31%, H7.36%, calcd for C20H28O7, C 63.14%, H 7.42%.
Acetylation of Steenkrotin B (3). Treatment of 3 (15.0 mg) withAc2O-pyridine (1:1, 4.0 mL) for 24 h at room temperature, followedwith evaporation of the volatiles at 50 °C under reduced pressure,yielded a residue, which was chromatographed on a silica gel columnusing 10% ethyl acetate in hexane to give 4 (8 mg, 53.0% yield):amorphous, white solid; [R]D
20 -99.3 (c 0.29, CHCl3); IR (KBr) νmax
2929, 1745, 1736, 1706, 1694, 1457, 1369, 1225, 1102, 1076, 1039,945, 922, 849 cm-1; 1H and 13C NMR, see Table 1; positive modeESIMS m/z 529 [M + Na]+, 1035 [2M + Na]+; anal. C 61.83%, H6.80%, calcd for C26H34O10, C 61.65%, H 6.77%.
Antiplasmodial Bioassay. The antiplasmodial activity against strainsof Plasmodium falciparum (Table 2) was determined as previouslydescribed.19–21
Cytotoxicity. The cytotoxicity was determined as previously de-scribed.22
Acknowledgment. The National Research Foundation and theUniversity of Pretoria are thanked for their financial contribution. Thiswork was supported in part by funds from the Spanish “ComisionInterministerial de Ciencia y Tecnologıa” (CICYT), grant no. CTQ2006-15279-C03-02. Thanks are due to Mr. B. Tshilamulele and Dr. A.Basson from the Department of Plant Science, University of Pretoria,and Mr. E. Palmer, Department of Chemistry, University of Pretoria,for their assistance.
Supporting Information Available: Tables of 2D NMR data for1-4 and crystallographic data of 2. This information is available freeof charge via the Internet at http://pubs.acs.org.
References and Notes
(1) Pooley, E. The Complete Field Guide to Trees of Natal, Zululand andTranskei; Natal Flora Publication Trust: Durban, 1993; p 222.
(2) Gupta, M.; Mazumder, U. K.; Vamsi, M. L. M.; Sivakumar, T.;Kandar, C. C. J. Ethnopharmacol. 2004, 90, 21–25.
(3) Cai, Y.; Evans, F. J.; Roberts, M. F.; Phillipson, J. D.; Zenk, M. H.;Gleba, Y. Y. Phytochemistry 1991, 30, 2033–2040.
(4) Zhu, C.; Peng, W.; Li, Y.; Han, X.; Yu, B. Carbohydr. Res. 2006,341, 1047–1051.
(5) Wang, M.; Li, J.; Ho, G. S.; Peng, X.; Ho, C. T. J. Food Lipids 1998,5, 313–321.
(6) Owen, R. W.; Haubner, R.; Hull, W. E.; Erben, G.; Spiegelhalder,B.; Bartsch, H.; Haber, B. Food Chem. Toxicol. 2003, 41, 1727–1738.
(7) Perales, A.; Martınez-Ripoll, M.; Fayos, J.; Savona, G.; Bruno, M.;Rodrıguez, B. J. Org. Chem. 1983, 48, 5318–5321.
(8) Olah, G. A.; Parker, D. G.; Yoneda, N.; Pelizza, F. J. Am. Chem.Soc. 1976, 98, 2245–2250.
(9) Baj, S.; Chrobok, A. J. Chem. Soc., Perkin Trans. 1 2000, 2575–2576.
(10) It was not possible to confirm the relative configuration of 3 by X-raycrystallographic analysis because the crystals of this diterpenoid werenot suitable for that purpose, and its derivative 4 is an amorphoussolid. Attempts at obtaining suitable crystals of 3 and to crystallize 4were unsuccessful.
(11) The numbering system used for compounds 2-4 is based on that ofthe tigliane skeleton (6),12 except for the C-9 and C-10 carbons, whichare interchanged for uniformity of the carbon sequence.
(12) Connolly, J. D.; Hill, R. A. Dictionary of Terpenoids; Chapman &Hall: London, 1991; Vol. 2, pp 1033-1038.
(13) Crystallographic data (excluding structure factors) for the structuresreported in this paper have been deposited with the CambridgeCrystallographic Data Centre as supplementary crystallographic data(CCDC-698281) for 2 and can be obtained free of charge viawww.ccdc.cam.ac.uk/conts/retrieving.html (or from the CambridgeCrystallographic Data Centre, 12 Union Road, Cambridge CB21EZ,UK; fax: (+44) 1223-336-033; or [email protected]).
(14) SMART (Version 5.054), SAINT (Version 6.45), SADABS (Version2.10), and SHELXTS/SHELXTL (Version 6.12); Bruker AXS Inc.:Madison, WI, 2001.
(15) Sheldrick, G. M. SHELXS-97 and SHELXL-97; University of Gottin-gen: Germany, 1997.
(16) Farruggia, L. J. J. Appl. Crystallogr. 1997, 30, 565.(17) Mercury (Version 1.4.2); Cambridge Crystallographic Data Centre,
http://www.ccdc.cam.ac.uk.(18) POV-Ray for Windows (Version 3.6); Persistence of Vision Raytracer
Pty. Ltd.: Victoria, Australia, http://www.povray.org, 2004.(19) Trager, W.; Jensen, J. B. Science 1976, 193, 673–675.(20) Makler, M. T.; Ries, J. M.; Williams, J. A.; Bancroft, J. E.; Piper,
R. C.; Gibbins, B. L.; Hinrichs, D. J. Am. J. Trop. Med. Hyg. 1995,48, 739–741.
(21) Clarkson, C.; Campbell, W. E.; Smith, P. Planta Med. 2003, 8, 720–724.
(22) Mossman, T. J. Immunol. Methods 1983, 65, 55–63.
NP800333R
D Journal of Natural Products, XXXX, Vol. xxx, No. xx Notes