
IN D PH DUPL HASE LEX S E STA STAIN ABILI NLES ITY SS ...
233
Dire Coor Supe UNI DIPA SCUO INGEG IN D ettore della rdinatore d ervisore: Pr IVERSI ARTIME OLA DI D GNERIA CH PH DUPL Scuola: Ch d’indirizzo: rof.ssa Irene Se ITA’ DE NTO DI DOTTORA IN HIMICA, D HASE LEX S h.mo Prof. P : Prof. Enric e Calliari ede Amminist EGLI S INGEG ATO DI R NDUSTRI DEI MATER CICLO XX E STA STAIN Paolo Colom co Savio trativa STUDI NERIA I ICERCA IALE RIALI E DE XVI ABILI NLES mbo D DI PAD INDUST IN INGEG ELLA PROD ITY SS STE Dottorando: DOVA TRIALE GNERIA DUZIONE EELS : Marco Bre S eda
-
Upload
khangminh22 -
Category
Documents
-
view
4 -
download
0
Transcript of IN D PH DUPL HASE LEX S E STA STAIN ABILI NLES ITY SS ...

Dire
Coor
Supe
UNI
DIPA
SCUO
INGEG
IN D
ettore della
rdinatore d
ervisore: Pr
IVERSI
ARTIME
OLA DI D
GNERIA CH
PH
DUPL
Scuola: Ch
d’indirizzo:
rof.ssa Irene
Se
ITA’ DE
NTO DI
DOTTORA
INHIMICA, D
HASE
LEX S
h.mo Prof. P
: Prof. Enric
e Calliari
ede Amminist
EGLI S
INGEG
ATO DI R
NDUSTRIDEI MATER
CICLO XX
E STA
STAIN
Paolo Colom
co Savio
trativa
STUDI
NERIA I
ICERCA
IALE RIALI E DE
XVI
ABILI
NLES
mbo
D
DI PAD
INDUST
IN INGEG
ELLA PROD
ITY
SS STE
Dottorando:
DOVA
TRIALE
GNERIA
DUZIONE
EELS
: Marco Bre
S
eda


Eadem mutata resurgo


i
SUMMARY
This thesis summarizes the work performed during the research activities developed in the
three-years course of scientific training for the attainment of the Doctor of Philosophy
degree. The research was mainly focused on the study of the physical metallurgy of
Duplex stainless steels, a particular class of stainless steels having a biphasic austeno-
ferritic microstructure, with the aim to characterize their microstructural stability as a
consequence of heat treatments and cold plastic deformation.
The choice of the research topic was dictated by the increasing use of these steels for
industrial applications, being able to provide high-strength features and elevated
performances against corrosive attacks, making them particularly suitable and competitive
in aggressive environments, also as structural materials. However, there are limitations to
the use of Duplex steels, owing to the occurrence of microstructural modifications, either
during high-temperature exposures or as a result of cold working, which can compromise
their interesting features.
The thesis is organized into three main parts; the first chapter is focused on properties,
problems and applications of Duplex stainless steels, providing a general introduction
about these materials and in which particular emphasis was given to those metallurgical
variables that affect the production process and the microstructural stability. In Chapter 2
and 3, the research activities concerning the effects of heat treatments (Chapter 2) and cold
rolling (Chapter 3) the on the Duplex properties are presented and discussed. It was
considered appropriate to report a brief summary of literature at the beginning of the
second chapter, aimed to provide the reader with the “state of art” on the effects of thermal
cycles on Duplex steels properties, whereas the remaining sections of the chapter are a
constitutive part of the research activities. In addition, the experimental part discussed in
Chapters 2 and 3 has been integrated with a section devoted to the study of Duplex
application at an industrial scale (Appendix A), aimed to the employment of these
materials in marine environment. Finally, Appendix B reports the results concerning

ii
archaeometallurgical studies, which has contributed to the scientific training of the
candidate, even if it was not related to the main research topic.
Experiments and training courses were mainly carried out in facilities and laboratories
pertaining to the Industrial Engineering Department (DII ) of the University of Padua – and
particularly those belonging to the DII “metallurgy group” – under the supervision of Prof.
Irene Calliari and Prof . Emilio Ramous. However, certain specific activities have required
the involvement of other structures external to the University of Padua; among these, the
neutron diffraction measurements were carried out in the INES diffractometer, located at
the ISIS facility in the Rutherford Appleton Laboratory (Didcot, UK), in collaboration with
Dr. Antonella Scherillo and Dr. Francesco Grazzi (CNR of Florence), while the magnetic
measurements were performed in the laboratories of the University of Budapest (BME), in
collaboration with Prof. István Mészáros. Moreover, the EBSD analysis on the deformed
materials were executed by Dr. Paola Bassani (CNR of Lecco), while the mechanical
impact tests were carried out in collaboration with Dr. Cinzia Menapace (University of
Trento), in the university laboratories, and with Eng. Marco Pizzo (Unilab Laboratori
Industriali srl), in the Exova CTR srl laboratories.
The results of the studies pertaining to the research period and reported in this thesis
have contributed to enhance the knowledge about Duplex stainless steels, in relation to the
effects that microstructural modifications can induce on the materials properties, and were
of appropriate scientific relevance to allowing their presentation in international
conferences and their publication in scientific journals.
iii
INTRODUZIONE
La presente tesi riassume il lavoro eseguito durante l’attività di ricerca svolta nel corso del
triennio di formazione scientifica per il conseguimento del titolo di Dottore di Ricerca.
L’obiettivo principale è stato lo studio della metallurgia fisica degli acciai inossidabili
Duplex, una particolare categoria di acciai inossidabili a struttura bifasica austeno-ferritica,
con lo scopo di caratterizzarne la stabilità microstrutturale a seguito di trattamenti termici e
deformazione plastica a freddo.
La scelta del tema di ricerca è stata dettata dal sempre più crescente utilizzo di questi
acciai in ambito industriale, grazie alle loro elevate caratteristiche meccaniche e di
resistenza agli attacchi corrosivi che li rendono particolarmente adatti e competitivi per
applicazioni in ambienti aggressivi, anche come materiali ad uso strutturale. Tuttavia,
esistono delle limitazioni all’impiego degli acciai Duplex, dovute a trasformazioni
microstrutturali che possono insorgere durante l’esposizione del materiale a temperature
elevate o che possono verificarsi a seguito di deformazioni a freddo, compromettendone le
interessanti caratteristiche.
La tesi è suddivisa in tre parti principali. Nel primo capitolo è riportata un’introduzione
generale sugli acciai Duplex, focalizzata sulle loro proprietà, problematiche e applicazioni,
in cui è stata data particolare enfasi alle variabili metallurgiche che ne influenzano il
processo produttivo e la stabilità microstrutturale. Nei Capitoli 2 e 3, invece, sono
presentate e discusse le attività oggetto di ricerca riguardanti lo studio degli effetti dei
trattamenti termici (Capitolo 2) e della laminazione a freddo (Capitolo 3) sulle
caratteristiche dei Duplex. Si è ritenuto opportuno esporre all’inizio del secondo capitolo
un breve riassunto di lavori presenti in letteratura, con lo scopo di fornire al lettore lo
“stato dell’arte” in merito alle conoscenze sugli effetti dei cicli termici sulle proprietà dei
Duplex, mentre le restanti sezioni del capitolo sono parte costitutiva dell’attività di ricerca
svolta dal candidato. Inoltre, la parte sperimentale discussa nei Capitoli 2 e 3 è stata
integrata con una sezione dedicata allo studio dei Duplex in ambito industriale (Appendice
A) e riguardante le applicazioni di questi materiali in ambiente marino. Infine, in
Appendice B si riportano i risultati ottenuti da uno studio archeometrico di carattere

iv
metallurgico, sviluppato nel corso del periodo di Dottorato e che ha contribuito alla
formazione scientifica del candidato, seppure il tema in oggetto non sia strettamente
correlato all’attività di ricerca principale.
Le attività di ricerca, sperimentali e di formazione, sono state principalmente svolte
presso i locali e i laboratori del Dipartimento di Ingegneria Industriale (DII) dell’Università
degli Studi di Padova, ed in particolare in quelli pertinenti al gruppo di metallurgia del DII,
sotto la supervisione della Prof.ssa Irene Calliari e del Prof. Emilio Ramous. Tuttavia,
alcune attività hanno richiesto il coinvolgimento di altre strutture esterne all’Università di
Padova. Nella fattispecie, le misurazioni di diffrazione di neutroni sono state effettuate
nella stazione diffrattometrica INES, situata presso la struttura ISIS nel Rutherford
Appleton Laboratory (Didcot, UK) in collaborazione con la Dott.ssa Antonella Scherillo ed
il Dott. Francesco Grazzi del CNR di Firenze, mentre le misure magnetiche sono state
condotte presso i laboratori dell’Università di Budapest (BME), in collaborazione con il
Prof. István Mészáros. Le analisi EBSD sui materiali deformati sono invece state realizzate
dalla Dott.ssa Paola Bassani del CNR di Lecco, mentre le prove meccaniche di tenacità ad
impatto sono state effettuate in collaborazione con la Dott.ssa Cinzia Menapace
dell’Università di Trento, presso i laboratori universitari, e con l’Ing. Marco Pizzo (Unilab
Laboratori Industriali srl), presso i laboratori Exova CTR srl.
I risultati riportati nella presente tesi hanno contribuito ad ampliare la conoscenza degli
effetti delle modificazioni microstrutturali sulle caratteristiche e proprietà degli acciai
Duplex e, pertanto, presentano una rilevanza scientifica tale da averne permesso la
presentazione in convegni internazionali e la pubblicazione in riviste scientifiche di settore.

v
CONTENTS
DUPLEX STAINLESS STEELS.............................................1
1.1. INTRODUCTION....................... .............................................1
1.2. PHYSICAL METALLURGY .... .............................................5 1.2.1. Effects of alloying elements............ ....................................7 1.2.2. Solidification..................................................... .................12 1.2.3. Solution-annealing treatment (solubilisation)... .................14 1.2.3.1. Elements partitioning................................... .................17 1.2.4. Solid-state phase transformations..................... .................18 1.2.4.1. Ferrite stability............................................ .................18 1.2.4.2. Austenite stability........................................ .................22 1.2.4.3. Secondary phases........................................ .................24 1.2.4.4. Effects of secondary phases on DSS properties........ ........32
1.3. MECHANICAL PROPERTIES............................. .................34 1.3.1. Tensile characteristics....................................... .................36 1.3.2. Impact toughness.............................................. .................38
1.4. CORROSION RESISTANCE.................................................39 1.4.1. Pitting corrosion................................................ .................39 1.4.2. Crevice corrosion.............................................. .................41 1.4.3. Stress Corrosion Cracking (SCC).............................. ....... 42 1.4.4. Resistance to acids and caustics.........................................42
1.5. APPLICATIONS................................................... .................43
ISOTHERMAL HEAT TREATMENTS................... ....... 49
2.1. INTRODUCTION.................................................. .................49
2.2. EFFECTS ON MICROSTRUCTURE................... .................53
vi
2.2.1. As-received materials.........................................................54 2.2.1.1. State of Art: secondary phases in DSS............ .................54 2.2.1.2. Nitrides in DSS.................................................... .......59 2.2.1.3. New Lean DSS: LDX 2101 and LDX 2404............. .......64 2.2.2. Cold rolled materials......................................... .................73 2.2.2.1. SAF 2205 and SAF 2507 cold rolled
and heat treated.................................................... ........74
2.3. EFFECTS ON IMPACT RESISTANCE............... .................80 2.3.1. Impact toughness.............................................. .................81 2.3.1.1. Impact toughness of isothermally treated
2205 and Zeron®100................................... .................81 2.3.2. Transition Temperature......................................................95 2.3.2.1. Ductile-to-Brittle Transition
in a Zeron®100 SDSS.................................. .................96
EFFECTS OF COLD ROLLING........................ ...............111
2.4. INTRODUCTION.................................................. ...............111
2.5. EFFECTS ON MICROSTRUCTURES AND PROPERTIES............................................... ...............116
2.5.1. Microstructures................................................. ...............116 2.5.2. Hardness...........................................................................121 2.5.3. Textures and x-rays diffraction......................... ...............123 2.5.4. Pitting corrosion resistance............................... ...............127 2.5.5. Magnetic properties..........................................................134
2.6. STRAIN-INDUCED MARTENSITE IN DSS...... ...............136 2.6.1. Characterization of a cold rolled SAF 2101..... ...............137 2.6.2. Effects of cold rolling in SAF 2205 DSS......... ...............144
vii
APPENDIX A
Industrial applications of Duplex Stainless Steels.......... ...............167 APPENDIX B
Archaeometallurgy.... ....................................................................189 APPENDIX C
List of publications......................................................... ...............217

viii

1
CHAPTER 1
DUPLEX STAINLESS STEELS
1.1. INTRODUCTION
Duplex Stainless Steels (DSS) represent a particular category of stainless steels,
characterized by a biphasic (namely Duplex) microstructure, composed by ferrite and
austenite. The presence of almost equal volume fractions of the two phases allow for the
achievement of a very favourable combination of mechanical and corrosion resistance
properties, making DSS suitable for particular applications. Due to their properties, these
steels play a role of great interest and, moreover, the relatively limited cost further makes
DSS highly competitive against the standard ferritics and austenitics grades [1-5].
These steels are known since the thirties but, owing to the provided interesting features
together with the costs saving, their development was of great industrial and commercial
relevance especially in the last forty years. The remarkable growth in nickel cost,
associated with an increasing demand by the petrochemical industry, have eased the
improvement of DSS, in order to obtain materials of limited cost, employable in aggressive
environments also as structural materials. Moreover, the introduction of steels
manufacturing production systems such as VOD (Vacuum Oxygen Decarburization) and
AOD (Argon Oxygen Decarburization) have permitted the attainment of decreased carbon
contents and reduced presences of inclusions together with a more strict control of the
nitrogen amount in alloys, making the DSS manufacturing ever more reliable [5].
DSS are high-alloyed steels (Table 1.1) and their composition must be carefully
balanced in order to obtain a microstructure of approximately 50% austenite and 50%
ferrite. They mainly contain chromium (20–29%), nickel (1–7%), molybdenum (4%
maximum) and nitrogen (up to 0.4%), while the carbon content is maintained around
0.03% or below. The most common grade is the SAF 2205, with 22%-Cr and 5%-Ni, but

2
in the last years increasing efforts were made to develop other alternative grades, either of
lower cost or higher performances. Recently, DSS with lower Ni and Mo contents – the so-
called Lean grades – were produced, owing to the increased cost of these elements, for
which a further addition of Mn and N is needed to balance the microstructure [6].
Conversely, the achievement of a highly superior corrosion resistance, particularly against
pitting and stress corrosion, and a further mechanical strengthening was accomplished by
the design of other new categories – the so-called Super- and Hyper-DSS (SDSS and
HDSS, respectively) – containing W, Cu and higher amounts of Cr, Mo and N; for these
latter grades, the increased cost is justified by the attainment of extraordinary properties.
Table 1.1 – Chemical compositions of common Duplex Stainless Steels [wt.%].
Grade UNS EN C Cr Ni Mo N Mn Cu W
Lean
2101 S32101 1.4162 0.04 21.0–22.0 1.4–1.7 0.1–0.8 0.20–0.25 4–6 0.1–0.8 -
- S32202 1.4062 0.03 21.5–24.0 1.0–2.8 0.45 0.18–0.26 2.00 - -
2304 S32304 1.4362 0.03 21.5–24.5 3.0–5.5 0.1–0.6 0.05–0.20 2.50 0.1–0.6 -
Standard
2205 S31803 1.4462 0.03 21.0–23.0 4.5–6.5 2.5–3.5 0.08–0.20 2.00 - -
2205 S32205 1.4462 0.03 22.0–23.0 4.5–6.5 3.0–3.5 0.14–0.20 2.00 - -
Super
2507 S32750 1.4410 0.03 24.0–26.0 6.0–8.0 3.0–5.0 0.24–0.32 1.20 0.5 -
- S32760 1.4501 0.03 24.0–26.0 6.0–8.0 3.0–4.0 0.20–0.30 1.00 0.5–1.0 0.5–1
- S32906 - 0.03 28.0–30.0 5.8–7.5 1.5–2.6 0.30–0.40 1–1.5 0.8 -
Hyper
- S32707 - 0.03 26.0–29.0 5.5–9.5 4.0–5.0 0.30–0.50 1.50 1.0 -
- S33207 - 0.03 29.0–33.0 6.0–9.0 3.0–5.0 0.40–0.60 1.50 1.0 -
In several applications DSS are preferred against other stainless steels, especially when
the risk of stress corrosion limits the use of austenitics and when generalized corrosion
restricts the use of ferritics. As the others stainless steels, DSS can be classified according
to their resistance to pitting corrosion, assessed by the PREN index (Pitting Resistance
Equivalent Number), a parameter which is intimately related to the composition of the steel
3
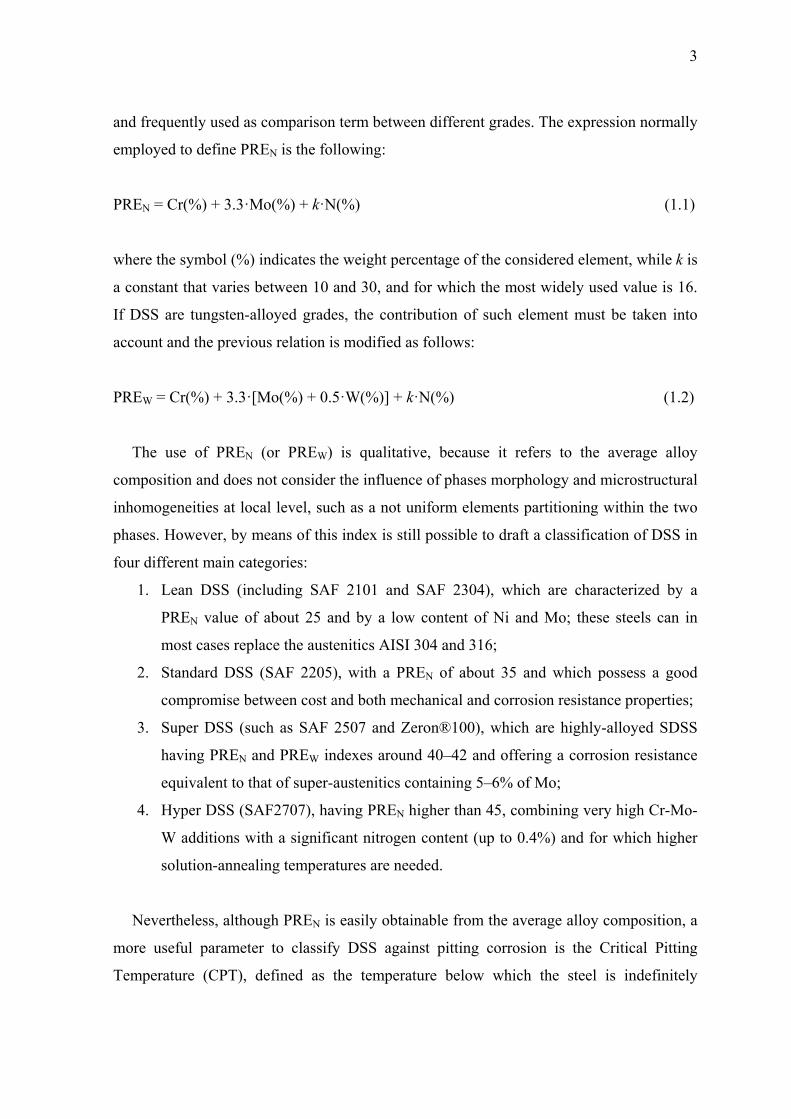
and frequently used as comparison term between different grades. The expression normally
employed to define PREN is the following:
PREN = Cr(%) + 3.3·Mo(%) + k·N(%) (1.1)
where the symbol (%) indicates the weight percentage of the considered element, while k is
a constant that varies between 10 and 30, and for which the most widely used value is 16.
If DSS are tungsten-alloyed grades, the contribution of such element must be taken into
account and the previous relation is modified as follows:
PREW = Cr(%) + 3.3·[Mo(%) + 0.5·W(%)] + k·N(%) (1.2)
The use of PREN (or PREW) is qualitative, because it refers to the average alloy
composition and does not consider the influence of phases morphology and microstructural
inhomogeneities at local level, such as a not uniform elements partitioning within the two
phases. However, by means of this index is still possible to draft a classification of DSS in
four different main categories:
1. Lean DSS (including SAF 2101 and SAF 2304), which are characterized by a
PREN value of about 25 and by a low content of Ni and Mo; these steels can in
most cases replace the austenitics AISI 304 and 316;
2. Standard DSS (SAF 2205), with a PREN of about 35 and which possess a good
compromise between cost and both mechanical and corrosion resistance properties;
3. Super DSS (such as SAF 2507 and Zeron®100), which are highly-alloyed SDSS
having PREN and PREW indexes around 40–42 and offering a corrosion resistance
equivalent to that of super-austenitics containing 5–6% of Mo;
4. Hyper DSS (SAF2707), having PREN higher than 45, combining very high Cr-Mo-
W additions with a significant nitrogen content (up to 0.4%) and for which higher
solution-annealing temperatures are needed.
Nevertheless, although PREN is easily obtainable from the average alloy composition, a
more useful parameter to classify DSS against pitting corrosion is the Critical Pitting
Temperature (CPT), defined as the temperature below which the steel is indefinitely

4
resistant to localized attacks and which is intimately related to the real microstructural
conditions of the steel. Similarly, the Critical Crevice Temperature (CCT) can be defined
as a ranking index against crevice corrosion but, due to the dependence of such localized
attack on the particular geometry of the interested components, the difficulty to achieve
reproducible practice tests restrains it use.
After the forming operations, all DSS are necessarily solution-annealed and water
quenched, in order to obtain the characteristic biphasic microstructure. The treatment
temperature is strongly dependent on steels composition and on the previous thermo-
mechanical process at which the steels were subjected, and is performed in the temperature
range where the two phases coexist in approximately comparable volume fractions.
Besides the interesting properties provided by the biphasic microstructure, DSS can be
efficiently employed only within a limited temperature range (-50–250°C), since at lower
temperatures the material exhibit a not negligible drop in toughness, whereas precipitation
of secondary phases can occur at higher temperatures [1]. The sub-zero toughness
reduction is due to the presence of the BCC ferrite, which exhibits cleavage as the
temperature is lowered, and also the precipitation of undesired phases is caused by the
ferritic phase, which is thermodynamically unstable at high temperatures and may
decompose. In fact, the high alloying elements content eases decomposition reactions in
ferrite, making DSS particularly prone to phases precipitation after (relatively) prolonged
exposures at high temperature. In practice, the onset of these phases is due to inefficient
cooling or improper heat treatments during the manufacturing process, but can also be
encountered during the product lifecycle, for example after incorrect welding operation.
Secondary phases may precipitate in a wide temperature range (250–1000°C) and those
of greater interest are formed above 600°C, because the decomposition kinetics are
enhanced by the high temperature and their formation rate is greater (the precipitation can
occur after few minutes in the higher-alloyed DSS grades). The presence of these
secondary phases (intermetallic compounds, nitrides, carbides) affect the excellent
characteristics of DSS, promoting localized corrosion and markedly reducing their impact
toughness, also for very low volume fractions. In fact, the most relevant phases possess Cr
and Mo contents which are higher than in ferrite from which are formed, causing a
depletion in such elements and promoting the risk of localized corrosion; moreover, since
these phases are structural discontinuities, they act as preferential sites for cracks
nucle
purp
bipha
the m
In
aspec
again
whol
1.2.
The
ferrit
favou
them
DSS
therm
room
matte
the m
relate
to th
subje
eation. For t
ose, the so
asic micros
manufacturin
n the presen
cts concern
nst corrosio
le Ph.D. res
Fi
PHYSI
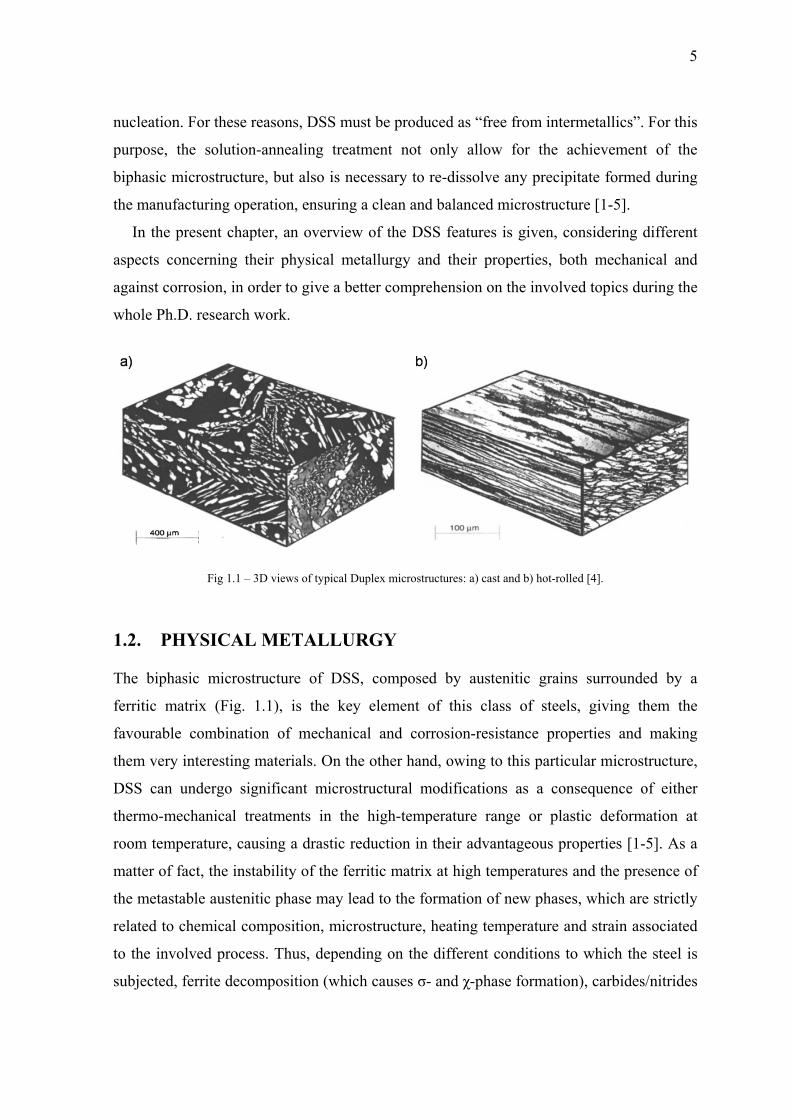
biphasic m
tic matrix
urable com
m very intere
can under
mo-mechani
m temperatu
er of fact, th
metastable a
ed to chemi
he involved
ected, ferrite
these reason
olution-anne
tructure, bu
ng operatio
nt chapter, a
ning their p
n, in order t
search work
ig 1.1 – 3D view
ICAL ME
microstructu
(Fig. 1.1),
mbination of
esting mater
rgo signific
ical treatme
ure, causing
he instabilit
austenitic ph
ical compos
process. Th
e decompos
ns, DSS mu
ealing treat
ut also is ne
n, ensuring
an overview
physical me
to give a be
k.
ws of typical D
ETALLUR
ure of DSS
is the key
f mechanic
rials. On th
cant micros
ents in the
a drastic re
ty of the fer
hase may le
sition, micr
hus, depend
sition (whic
ust be produ
tment not
ecessary to
a clean and
w of the DS
etallurgy an
etter compre
Duplex microstru
RGY
S, compose
y element o
cal and cor
he other han
structural m
e high-temp
eduction in
rritic matrix
ead to the fo
rostructure,
ding on the
ch causes σ-
uced as “free
only allow
re-dissolve
d balanced m
SS features
nd their pro
ehension on
uctures: a) cast
d by auste
of this clas
rrosion-resis
nd, owing to
modification
perature ran
their advan
x at high tem
ormation of
heating tem
different c
- and χ-phas
e from inter
w for the a
any precip
microstructu
is given, co
operties, bo
n the involve
and b) hot-roll
enitic grain
ss of steels
stance prop
o this particu
ns as a con
nge or plas
ntageous pr
mperatures
f new phase
mperature an
onditions to
se formation
rmetallics”.
achievement
itate formed
ure [1-5].
onsidering d
oth mechan
ed topics du
led [4].
s surrounde
s, giving th
perties and
ular micros
nsequence o
stic deform
operties [1-
and the pre
s, which are
nd strain as
o which the
n), carbides
5
For this
t of the
d during
different
nical and
uring the
ed by a
hem the
making
tructure,
of either
mation at
-5]. As a
esence of
e strictly
ssociated
e steel is
s/nitrides
6
precipit
austenit
solidific
depends
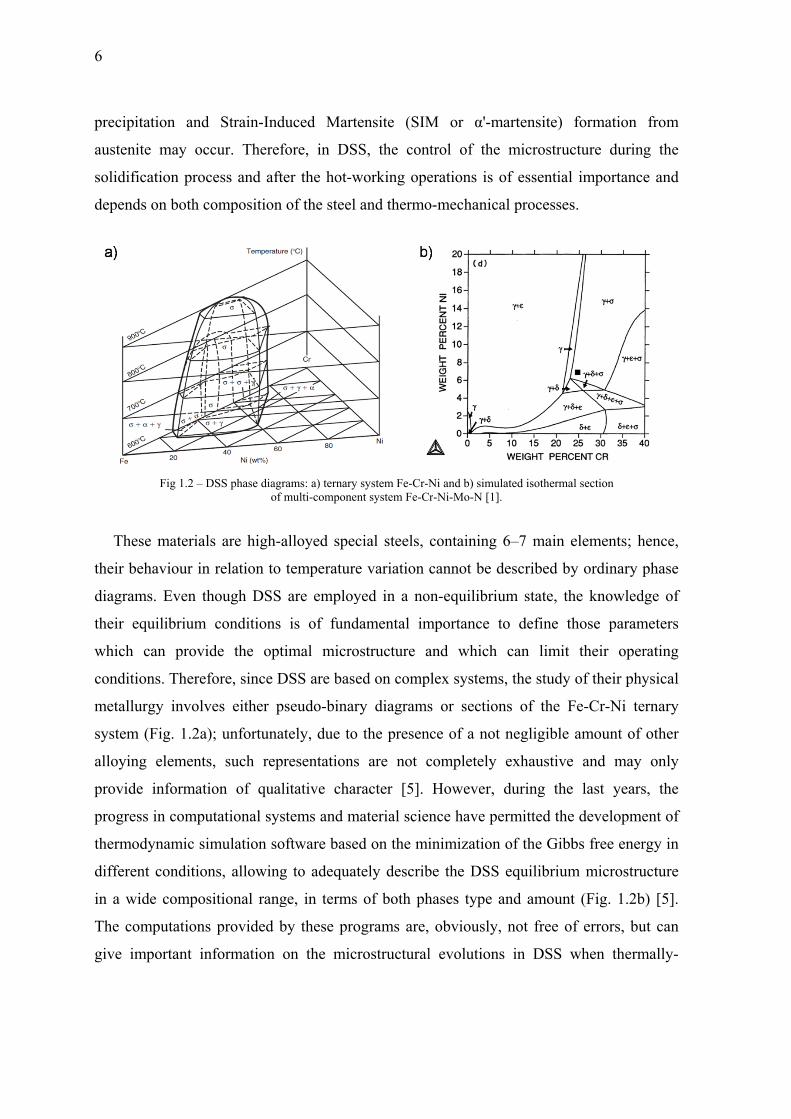
Thes
their be
diagram
their eq
which
conditio
metallur
system
alloying
provide
progres
thermod
differen
in a wid
The com
give im
tation and
te may occ
cation proce
s on both co
Fig 1.2 – D
se materials
ehaviour in
ms. Even th
quilibrium
can provid
ons. Therefo
rgy involve
(Fig. 1.2a);
g elements,
informatio
s in comput
dynamic sim
nt condition
de composi
mputations
mportant inf
Strain-Indu
cur. Therefo
ess and afte
omposition
SS phase diagraof m
s are high-a
relation to
ough DSS
conditions
de the opti
ore, since D
es either ps
; unfortunat
, such repr
on of quali
tational syst
mulation sof
ns, allowing
itional rang
provided b
formation o
uced Mart
fore, in DS
er the hot-w
of the steel
ams: a) ternary multi-componen
alloyed spec
temperature
are employ
is of fund
imal micro
DSS are base
seudo-binar
tely, due to
resentations
itative char
tems and m
ftware base
g to adequat
ge, in terms
by these pro
on the micr
ensite (SIM
S, the con
working ope
and thermo
system Fe-Cr-N
nt system Fe-C
cial steels,
e variation
yed in a no
damental im
ostructure a
ed on comp
ry diagrams
the presen
s are not c
racter [5].
material scien
ed on the mi
tely describ
of both ph
ograms are,
rostructural
M or α'-m
ntrol of the
erations is o
o-mechanica
Ni and b) simulr-Ni-Mo-N [1].
containing
cannot be d
on-equilibriu
mportance t
and which
plex systems
s or section
nce of a not
completely
However,
nce have pe
inimization
be the DSS
hases type a
obviously,
l evolutions
martensite)
microstruc
of essential
al processes
lated isotherma.
6–7 main e
described by
um state, th
to define th
can limit
s, the study
ns of the F
negligible
exhaustive
during the
ermitted the
of the Gibb
equilibrium
and amount
, not free o
s in DSS w
formation
cture durin
l importanc
s.
al section
elements; h
y ordinary p
he knowled
hose param
their oper
of their phy
Fe-Cr-Ni te
amount of
e and may
e last years
e developme
bs free ener
m microstru
t (Fig. 1.2b
f errors, bu
when therm
from
g the
e and
hence,
phase
dge of
meters
rating
ysical
ernary
other
only
s, the
ent of
rgy in
ucture
b) [5].
ut can
mally-
7
treated; moreover, these computations are also often employed in design for the
development of new grades.
Nevertheless, while the high-temperature precipitations were widely studied during the
past years, only little attention was paid to the possibility of a strain-induced martensitic
transformation in this class of steel. Therefore, it is of fundamental importance to define
those parameters which affect the formation of dangerous phases arising from either
diffusive or diffusionless processes, in order to avoid their occurrence during the
manufacturing operations and during the lifecycle of the final products. Among the
previously mentioned phase transformations, the products of ferrite decomposition and the
high-temperature precipitations are, in general, of greater interest. Thus, the present
paragraph firstly deals with the understanding of both the effect of the alloying elements
and the physical metallurgy of DSS in relation to the exposition of the materials at high
temperatures, while a description of the strain-induced phase transformation is given in
Paragraph 1.2.4.4, even though it must be underlined that the room temperature behaviours
are ever conditioned by the high-temperature processes.
1.2.1. Effects of alloying elements
DSS are high-alloyed steels containing considerable amounts of several elements. As a
premise, it is necessary to underline that the study of the influences of individual elements
in alloys becomes increasingly complicated as the number of such elements increases,
although the preliminary study of the individual influence assumes relevance in order to
supervise and orient the obtainable properties from the applicative point of view.
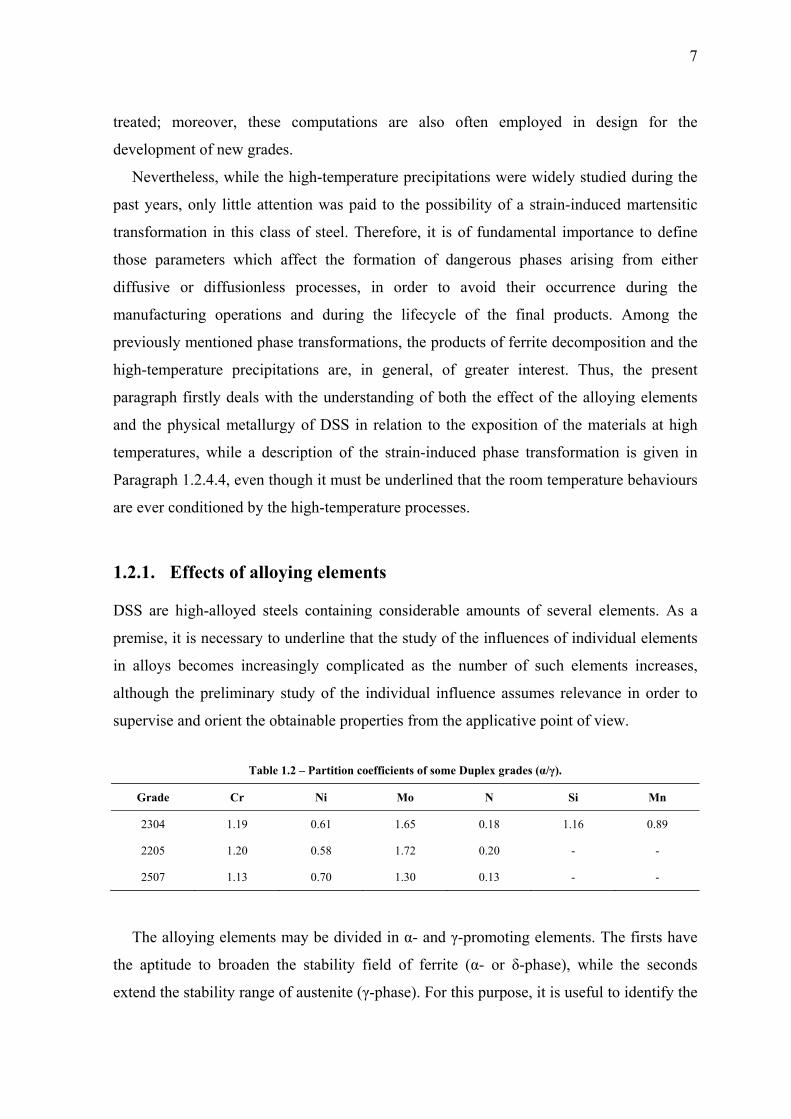
Table 1.2 – Partition coefficients of some Duplex grades (α/γ).
Grade Cr Ni Mo N Si Mn
2304 1.19 0.61 1.65 0.18 1.16 0.89
2205 1.20 0.58 1.72 0.20 - -
2507 1.13 0.70 1.30 0.13 - -
The alloying elements may be divided in α- and γ-promoting elements. The firsts have
the aptitude to broaden the stability field of ferrite (α- or δ-phase), while the seconds
extend the stability range of austenite (γ-phase). For this purpose, it is useful to identify the

8
so-called partition coefficients, defined as the ratio between the amounts of the element
solubilised in each phase, intimately relate to the bulk composition of the alloy. Since
partitioning is a diffusive process, these ratios strictly depend on the particular cooling
conditions at which the alloy is subjected. Slow cooling rates can correctly redistribute the
elements between the two phases on the basis of their thermodynamic characteristics,
whereas high rates tend to inhibit such process, making the composition of austenite and
ferrite more homogeneous and giving rise to partition coefficients close to the unit. In
Table 1.2 the partition coefficients of some DSS grades are reported, while the partitioning
process is further discussed in Paragraph 1.2.3.
Fig 1.3 – Schaeffler diagram.
As already reported, DSS are characterized by a typical biphasic microstructure
consisting of ferrite and austenite, usually present in almost equal volume fraction, which
is achieved by an adequate balancing of the alloying elements. However, the adjustment of
the microstructure is complicate, because not only depends on the alloy composition.
The identification of the obtainable stainless steels microstructure can be made by
means of the Schaeffler diagram (Fig. 1.3), originally developed for the evaluation of
welded microstructures resulting from non-equilibrium rapid cooling. This diagram is
based on the relation between the elements and their specific attitude to stabilize the BCC-
or the FCC-iron lattice structures (α- or γ-promoting elements). Therefore, the obtainable
steels microstructures are plotted as a function of chromium-equivalent (Creq) and nickel-

9
equivalent (Nieq) parameters, which are commonly calculated using the following
expressions:
Creq = Cr(%) + 1.5·Si(%) + Mo(%) + 0.5·Nb(%) + 2·Ti(%) + 5·V(%) + 3·Al(%) (1.3)
Nieq = Ni(%) + 30·C(%) + 0.87·Mn(%) + a·[N(%) - 0.045] (1.4)
An increased content of alloying elements will suppress the martensitic transformation
which may occur during quenching, resulting in an austenitic (high Nieq) or ferritic (high
Creq) structure. If the austenite-stabilizing elements are present in an adequately content,
the austeno-ferritic (Duplex) microstructure is formed.
Chromium
Chromium is a strong α-promoting element, and therefore stabilize ferrite; it is also the
main alloying element and, as a matter of fact, a minimum of 10.5% of Cr is required to
make the steels “stainless”. The main advantage of adding chromium is indeed to improve
the resistance to localised corrosion (pitting, crevice), owing to the formation of the
protective passive Cr-rich oxy-hydroxide layer. Even though Cr increases the nitrogen
solubility in ferrite, there is a limit in the amount that can be added to the steel, as the
beneficial effect of higher contents is negated by enhancing the precipitation of detrimental
intermetallic phases, such as the σ-phase [4].
Molybdenum
Molybdenum has a similar effect on ferrite stability owing to its α-promoting character and
also increases the nitrogen solubility in the ferritic phase. As for Cr, its beneficial influence
concerns the extension of the passive potential range and the reduction of the corrosion
current density in the active range, enhancing pitting and crevice corrosion resistance in
chloride solutions. The corrosion resistance was also found to be improved by suppressing
the active sites via formation of an oxy-hydroxide or molybdate ion. In high temperature
seawater, the addition of at least 3% of Mo is recommended to prevent crevice corrosion,
while an upper limit of about 4% Mo has been quoted, due to the tendency of enhancing σ-
phase formation in the hot-working temperature range. This element not only increases the
10
rate of intermetallic precipitation, but also extends the stability range to higher
temperatures [4].
Nickel
In order to maintain about 40–60% ferrite, the steel composition must be balanced with
austenite stabilisers; for this reason, the level of nickel addition depends on the Cr content.
Excessive Ni contents cause an increase in austenite level that can be well above 50%,
resulting in a Cr and Mo enrichment of the remaining ferrite, and therefore enhancing the
intermetallic phases formation. Ni retards the σ-phase precipitation, but too higher contents
accelerate the α’ formation in the range 300–600°C, another embrittling phase. Ni does not
have some direct effect on corrosion properties and its main role is to control phase
balance and element partitioning [4].
Nitrogen
Nitrogen is a strong γ-promoting elements and has a multiple effect by increasing pitting
resistance, austenite content and steel strength. The influence on pitting is similar to that of
Cr and Mo, moving the passivation potential toward the noble direction and thus increasing
the passive potential range. This effect is enhanced in the presence of Mo and it has been
suggested that Mo and N have a synergistic influence on pitting characteristics. Nitrogen
preferentially dissolves into austenite due to the increased solubility in that phase and also
concentrates at the metal-passive film interface. Nitrogen has also been noted to increase
the crevice corrosion resistance due to the altering of the crevice solution chemistry or by
segregating to the surface, which is in keeping with the mechanism for enhanced pitting
resistance. Another important property of N is the ability to stabilise DSS against the
intermetallic phases precipitation by retarding the precipitation kinetics, since it reduces Cr
partitioning [4].
The increasing in nitrogen level can reduce the risk of nitride formation; this may
appear contradictory, but is due to an increase in austenite content and thus to a reduction
in the distance between austenite islands. The addition of C and N strengthens both ferrite
and austenite by interstitial solid solution but, as carbon is undesirable due to the risk of
sensitisation, the addition of nitrogen is preferred [4]. Nitrogen also reduces the stacking
fault energy of austenite and increases its work-hardening rate.

11
Manganese
Manganese is an austenite stabiliser but has little effect on DSS phase balance, especially
at the normally encountered levels. Nevertheless, it increases N solubility but seems that
can increase temperature range and formation rate of σ-phase. Its additions is useful
against abrasion and wear resistance and also the tensile properties are improved without
loss of ductility. However, Mn additions in excess of 3–6%, for nitrogen levels of 0.1–
0.25%, significantly decrease the critical pitting temperature (CPT), probably due to the
increased likelihood of MnS inclusions which can act as initiation sites for pits and to the
destabilization of the passive layer [4].
Copper
Copper additions to high alloyed austenitic stainless steel are recognised to reduce the
corrosion rate in non-oxidising environments, such as sulphuric acid. In general, the
addition of Cu to DSS is limited to about 2%, since higher levels reduce hot ductility and
can lead to precipitation hardening. Under high velocity conditions, where cavitation
erosion in H2S-contaminated seawater prevail, Cu appears to be beneficial, due to the
formation of a Cu-rich layer on the surface during active dissolution. Further, copper has
been found to improve machinability in low oxygen and sulphur materials and can lead to
hardening after exposure to the 300–600°C temperature range, apparently due to the
precipitation of tiny Cu-rich precipitates. These precipitates do not significantly reduce
corrosion resistance or toughness and have been exploited for improving abrasion-
corrosion resistance in DSS pump castings [4].
Tungsten
Tungsten additions of up to 2% improve pitting resistance, by extending the passive
potential range and reducing the passivation current. Similarly, W increases crevice
corrosion resistance in heated chloride solutions, due to its adsorption into the passive layer
without modification of the oxide state. However, in acid chloride solutions W appears to
pass from the substrate into the passive film by interaction with water to form insoluble
WO3, increasing the oxides stability and bonding to the substrate.
Tungsten is known to promote intermetallic formation in the 600–1000°C temperature
range and it is believed to be thermodynamically, but not kinetically, equivalent to

12
molybdenum with respect to σ-phase formation. However, levels between 1–3% have been
shown to restrict the formation of σ-phase at the grain boundaries and, on the contrary,
precipitation occurs at intragranular sites [4].
Silicon
Silicon is beneficial for concentrated nitric acid service and also enhances the high
temperature oxidation resistance. Nevertheless, since Si is generally considered to enhance
σ-phase formation, it is generally preferred to limit its addition to 1% [4].
Carbon, sulphur and phosphorus
The carbon content of most wrought duplex stainless steels is limited to 0.02–0.03%,
primarily to suppress the precipitation of Cr-rich carbides, which can act as initiation sites
for pitting corrosion and intergranular attack. Similarly, S and P contents are controlled,
although not eliminated, as the presence of some sulphur is important for weld bead
penetration [4].
1.2.2. Solidification
The solidification of high-alloyed stainless steels can proceed in different ways, primarily
as a function of the specific chemical composition of the alloy (Fig. 1.4a). If the percentage
of the α-promoting elements is high, the material will solidify at the Cr-rich side of the
eutectic field in Fig. 1.4b, the solidification is completely ferritic and austenite arises after
further cooling as product of a diffusion-controlled solid-state reaction. The second
possibility route is the so-called flip-flop solidification, which occur in the eutectic valley
at very low cooling rates and with an increased amount of γ-promoting elements. In this
case, after a primary crystallization of the α-phase, the equilibrium is shifted toward the
three-phase valley, due to the melt depletion of α-promoting elements, therefore promoting
the γ-crystals nucleation [7-9].
In general, due to the great amount of ferrite-stabilizing elements, DSS solidify as fully
ferritic and δ-ferrite is formed as first solidification product, with a liquidus temperature of
about 1400–1500°C and which varies in relation to the chemical composition of the steel,
while the austenitic phase (γ) forms afterwards through a partial solid-state phase
transformation process. The so-obtained ferrite/austenite Duplex structure is stable only

withi
are p
of th
Gene
conte
more
A
throu
repla
eutec
comp
interm
χ-pha
passi
these
(Fig.
trans
Th
stabl
to ro
enco
in a definite
proper for a
he Duplex st
erally, in DS
ents reduce
e rapid gene
Fig 1.4 –
As cooling c
ugh a first
acement of
ctoidic dec
pounds, nitr
metallic σ-p
ase. The fo
ing through
e phases are
1.5) and,
sformed at th
he solidific
le only with
om tempera
untered and
e temperatu
given grad
tructure bei
SS, the Creq
e this ratio,
esis of the γ
Phase diagram
continues, f
(high-temp
δ-ferrite, si
composition
rides and ca
phase, whic
rmation of
h the critica
e not structu
, in isothe
he equilibri
ation proce
hin a high-r
ature. Below
d, if the tim
ure range, in
de and vary
ing influenc
q/Nieq ratio
allowing t
-phase durin
s: a) pseudobin
for tempera
perature) cr
nce at those
n. These n
arbides, amo
ch is often a
such phase
al range at a
ural anomal
ermal cond
ium [5].
ss proceeds
remperature
w 600°C an
me at which
n which ph
with tempe
ced more by
is maintaine
the austenit
ng cooling
nary system for
ature lower
ritical rang
e temperatu
new formin
ong which t
accompanie
es is strongl
a proper co
ies but belo
ditions, grad
s with the g
s range, an
nother (low-
the alloy re
hase ratio an
erature, with
y nitrogen c
ed between
te formation
[9].
DSS [9] and b)
r than 1000
e in which
ures the pha
ng phases
the most im
ed by anothe
ly time-dep
ooling rate.
ong to the D
dually repl
gradual disap
d α-ferrite i
-temperatur
emains in te
nd the respe
h the high te
content, tha
2.25 and 3
n at higher
) ternary system
0°C the sol
h other pha
ase is unstab
are princi
mportant (an
er intermeta
pendent and
Despite th
DSS equilibr
lace ferrite
ppearing of
is formed a
re) critical te
emperature
ective comp
emperature
an by Cr or
.5; higher N
temperatur
m Fe-Cr-Ni [7].
lidifying all
ases are fo
ble and sen
ipally inter
nd dangerou
allic compo
d can be avo
eir harmful
rium micros
e, which is
f austenite,
around 700°
emperature
is sufficien
13
positions
stability
Mo [4].
Ni and N
re and a
loy pass
ormed in
nsitive to
rmetallic
us) is the
ound, the
oided by
l effects,
structure
s totally
which is
°C down
range is
ntly long,

14
the formation of other secondary phases and the spinoidal decomposition of ferrite can also
occur. However, due to the low temperature, the kinetics involved to allow ferrite
decomposition are rather slow and thus the formation of such secondary phases can be
easily avoided.
Fig 1.5 – Binary Fe-Cr phase diagram.
As a consequence of this complex solidification process, DSS require a particular and
careful solution-annealing treatment, in order to guarantee a balanced microstructure and
avoid the secondary phases formation, due to the severe detrimental effects on DSS
properties (Paragraph 1.2.4.4 and Chapter 2).
1.2.3. Solution-annealing treatment (solubilisation)
This treatment is mandatory in all DSS, because it allows for the formation of a balanced
austeno-ferritic microstructure free from intermetallics, and it consists in a solution-
annealing treatment at a proper temperature for a certain soaking time, followed by water-
quenching. The solubilisation temperature, always above 1040°C, is primarily related to
the particular grade – and therefore to the alloy composition – and is chosen within the
ferrite/austenite stability field, in order to achieve an equal volume fraction of the phases.
The soaking time must instead take into account the previous manufacturing process and
should be adequately long both to guarantee an adequate elements partitioning and to re-
dissolve the secondary phases, if presents. Finally, the water quenching must be as rapid as

15
possible, in order to avoid the precipitation of undesirable phases. Hence, through this
treatment, the high-temperature microstructure is frozen at room temperature and the final
DSS microstructure is then composed by a ferritic matrix in which the austenitic grains are
dispersed (Fig. 1.1). As a result, the two phases have different compositions, due to the
different solid solubility potential of alloying elements in BCC and FCC lattices –
especially for interstitial atoms – and which are also related to solubilisation temperature
and cooling rate [10].
It must be notice that the so-obtained ferritic phase is the high-temperature δ-ferrite and
is sometimes improperly called α-phase, which is instead the low-temperature ferrite. Both
ferrites have the same BCC crystal structure but their composition and stability range are
different; the real α-ferrite forms during the complete solidification of the alloy at about
700°C in DSS and, since the composition is different and suffer from the disappearing of
the γ phase during the solidification process, must be considered different from the δ-
phase. However, the ferritic phase obtained from solubilisation is often called α-ferrite, but
is only a denomination.
The annealing conditions (solubilisation temperature and soaking time) affect both
miscrostructure and elements partitioning inside the phases, and depend on the previous
thermo-mechanical processes. If the DSS are annealed at a temperature near the ferrite
solvus, the phase balance will be high in ferrite while, reducing the temperature, a
progressive amount of austenite is expected (Fig. 1.6a). In equilibrium conditions, the α-
and γ-promoting elements are correctly distributed inside the phases, with Cr-Mo-W
concentrated in ferrite and Ni-C-N-Mn in austenite, and, with falling temperature, the
equilibrium compositions of both phases are continually changing, according to the ferrite
solvus line composition [9]. At the same time, diffusion is slowing with decreasing
temperature and if the soaking time is too short the elements will not correctly partition
inside the two phases (Fig. 1.6b). Furthermore, hot working speeds diffusion, so that a
lower effective quenching temperature is more easily obtained for wrought DSS than for
casts and welds [9]. Practically, the annealing temperature must be as lower as possible and
should be chosen in order to re-dissolve any precipitates and to achieve the desired Duplex
microstructure – and this also minimizes the amount of nitrogen remaining in the ferritic
phase. Nevertheless, although the 50/50 ferrite/austenite phase ratio is the ideal value for a

16
Duplex
between
The
this is q
large or
Moreov
rates mu
cooling
intragra
insuffic
Thus
tempera
implicat
while th
tempera
owing t
can cau
effect o
(Paragra
microstruct
n 40/60 and
Fig 1.6 –
ideal struct
quite difficu
r during w
ver, if the s
ust be prop
s, chromium
anular nitrid
ient time fo
s, after sol
ature from
tions on the
he allotrop
ature, in a
to the FCC
use other typ
of thermal c
aph 1.2.4.2)
ture, in real
d 60/40.
– a) variation inof el
ture of DSS
ult to achiev
elding oper
steel is an h
perly chosen
m nitrides
des are lik
or nitrogen t
lubilisation,
a high-te
e phases sta
pic nature o
Duplex m
iron structu
pes of solid
cycles but w
).
lity the pha
n ferrite contentlements partitio
S is of cours
ve, particula
rations, wh
high-alloyed
n because, w
behave in
kely to for
to escape fro
, both ferr
emperature
ability, owin
of iron allo
icrostructur
ure which p
-state phase
which are di
se fractions
t with temperatuoning coefficien
se purely fe
arly when t
hen the coo
d grade, the
while σ-pha
an opposit
rm when th
om ferrite [
rite and au
equilibrium
ng to the pe
ow the exi
re austenite
pertains to
e transforma
iffusionless
s cover a sli
ure and b) tempnts (K = α/γ) [4]
erritic-auste
the dimensi
oling rates
e situation
ase tends to
te way; in
he cooling
11].
ustenite are
m conditio
eculiar char
stence of t
e is instead
higher temp
ation, which
, possessing
ightly wider
perature depend].
enitic. Howe
ons of the f
cannot be
is aggravat
o be a prob
particular,
is so rap
e forced to
on and thi
acter of eac
the BCC δ
d in metast
perature. T
h are no mo
g a strain-in
r range, wh
dence
ever, in pra
final produc
fully contro
ted. The co
lem during
non-equilib
id that the
o exist at
is has diff
ch phase. In
δ-ferrite at
table condi
his metasta
ore related t
nduced char
hich is
actice,
ct are
olled.
ooling
slow
brium
ere is
room
ferent
n fact,
room
tions,
ability
to the
racter
1.2.3
The
solub
Ferri
Parag
amon
neve
enric
highl
more
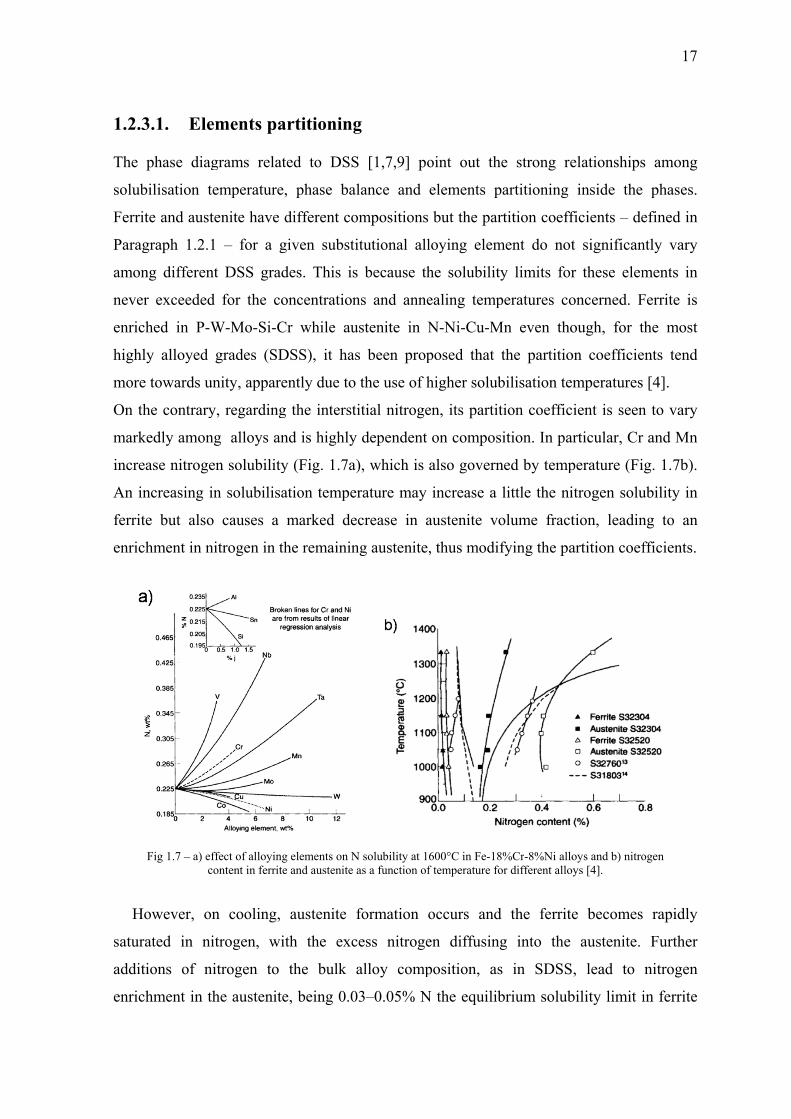
On th
mark
incre
An in
ferrit
enric
H
satur
addit
enric
3.1. Ele
phase diag
bilisation te
ite and auste
graph 1.2.1
ng different
r exceeded
ched in P-W
ly alloyed
e towards un
he contrary
kedly among
ease nitroge
ncreasing in
te but also
chment in ni
Fig 1.7 – a) efco
However, on
rated in ni
tions of ni
chment in th
ments pa
grams relat
emperature,
enite have d
1 – for a g
t DSS grad
d for the co
W-Mo-Si-C
grades (SD
nity, appare
y, regarding
g alloys an
en solubility
n solubilisa
causes a
itrogen in th
ffect of alloyingontent in ferrite
n cooling,
trogen, wit
itrogen to
he austenite
artitioning
ted to DSS
, phase bal
different co
given substi
des. This is
oncentration
Cr while au
DSS), it has
ently due to
g the intersti
nd is highly
y (Fig. 1.7a)
ation temper
marked de
he remainin
g elements on Ne and austenite a
austenite f
th the exc
the bulk a
e, being 0.0
g
S [1,7,9] po
lance and
ompositions
itutional all
s because th
ns and anne
ustenite in N
s been prop
the use of h
itial nitroge
dependent
), which is
rature may
crease in a
ng austenite,
N solubility at 1as a function of
formation o
cess nitroge
alloy comp
3–0.05% N
oint out th
elements p
but the par
loying elem
he solubility
ealing temp
N-Ni-Cu-M
posed that
higher solub
en, its partit
on compos
also govern
increase a
austenite vo
, thus modif
600°C in Fe-18f temperature fo
occurs and
en diffusing
position, as
N the equilib
he strong re
partitioning
rtition coeff
ment do not
y limits for
peratures co
Mn even tho
the partitio
bilisation te
tion coeffic
sition. In pa
ned by temp
little the ni
olume fract
fying the pa
8%Cr-8%Ni alloor different allo
d the ferrite
g into the
s in SDSS
brium solub
elationships
inside the
ficients – de
t significan
r these elem
oncerned. F
ough, for t
on coefficie
emperatures
cient is seen
articular, Cr
perature (Fi
itrogen solu
tion, leadin
artition coef
oys and b) nitrooys [4].
e becomes
austenite.
, lead to
bility limit i
17
s among
phases.
efined in
ntly vary
ments in
Ferrite is
the most
ents tend
[4].
n to vary
and Mn
g. 1.7b).
ubility in
ng to an
fficients.
ogen
rapidly
Further
nitrogen
in ferrite
18
at room temperature. Nitrogen addition has a significant influence on pitting corrosion
resistance, especially in austenite, which is the weakest phase against pitting, balancing the
preferential partitioning of Cr and Mo in ferrite and leading to a similar pitting resistance
of the two phases [4].
1.2.4. Solid-state phase transformations
Numerous microstructural changes can occur in DSS during isothermal or continuous
cooling heat treatments and most of them are concerned with ferrite, which is unstable at
high temperatures. However, as reported at the beginning of this paragraph, the metastable
condition of austenite can cause other types of phase transformation, which do not involve
thermal activation, but which are related to the plastic response to the FCC phase during
cold working. Hence, if the interesting properties of DSS are precisely achieved from the
simultaneous presence of the two phases, in the other hand their favourable features are
mined by the instability of the phases in different temperature ranges.
The difference between the two phases is primarily site in their different crystal
structure: austenite is characterized by a FCC lattice while ferrite is a BCC phase. This
implies different responses to plastic deformation and different behaviours when diffusion
mechanisms are involved. Both phases form interstitial and substitutional solid solutions
with the alloying elements but ferrite favours diffusion processes at high temperature
owing to the BCC crystal structure. On the other hand, FCC austenite is more deformable
and posseses a low stacking fault energy, which can ease lattice rearrangements and
diffusionless phase transformations.
1.2.4.1. Ferrite stability
Austenite from ferrite is only the first solid-state phase transformation which occur in DSS
during solidification, whereas other secondary phases are formed by decreasing/increasing
temperature within a wide temperature range. Ferrite is unstable at high temperatures and
the precipitation mechanisms related to such phases formation are also enhanced by the
diffusion rates of the involved elements, which are approximately 100 times faster in
ferrite than in austenite, due to the less compact lattice of the BCC structure. Moreover, as
already mentioned, ferrite is enriched in Cr and Mo, which are known to promote the

form
temp
Isoth
The p
the c
diffe
of th
treatm
Temp
whic
curve
trans
1
mation of in
perature, inc
hermal heat
precipitatio
concerned
rent grades
he Time-Tem
ment follo
perature-Pr
ch the preci
es, three
sformations
1. 300–600
because
forming
character
domains
processe
ntermetallic
creasing the
Fig 1.8 – S
t treatments
on of these p
temperature
to seconda
mperature T
owed by w
ecipitation
ipitation can
main tem
can be defi
0°C. This “l
at this tem
phases ca
rized by the
s with sligh
es have bee
c phases, a
e probability
Secondary phason p
s
phases, can
e range (Fi
ary phases f
Transformat
water quen
(TTP) diag
n occur in
mperature r
ined, and ca
low-temper
mperature th
an cause se
e spinoidal
ht different
en found to
nd their so
y of precipit
ses in DSS and precipitation kin
n be subdivi
ig. 1.8). Th
formation is
tion (TTT)
nching. Th
grams and a
terms of pr
ranges con
an considere
ature” rang
he ferrite tra
evere embr
decomposi
lattice para
o occur in
olubility in
tation during
influence of allnetics [9].
ided in two
he investig
s usually ca
diagrams, p
hese diagra
are aimed t
recipitation
ncerning th
ed valid for
ge is the so-
ansformatio
itteling eff
ition of ferr
ameters. Fu
this range
n ferrite fal
g heat treatm
loying elements
main categ
gation of th
arried out by
produced af
ams are o
to define th
kinetics. T
he ferrite
all the DSS
-called “475
on is (relativ
fects. This
rite in Cr-ric
urthermore,
and, amon
lls with de
ments. [4].
s
gories, in re
he susceptib
y the determ
fter isotherm
ften called
he critical ra
Thus, from
solid-state
S grades [1-
5°C embritt
vely) faster
range is p
ch α’ and F
other prec
ng these, t
19
ecreasing
lation to
bility of
mination
mal heat
d Time-
anges in
the TTP
e phase
5]:
tlement”,
r and the
primarily
Fe-rich α
cipitation
the most
20
important is certainly relative to the precipitation the G-phase, containing high
levels of Ni, Mo and Si.
2. 600–1050°C. This “high-temperature” range is characterized by the formation of
several secondary phases, whose precipitation kinetics and incubation times are
strongly affected by the chemical composition. These phases, discussed in detail in
Paragraph 1.2.4.3, are identified as σ-phase, χ-phase, Cr2N nitrides, carbides (M7C3,
M23C6), π-phase, ε-phase, secondary austenite (γ2) and R-phase, and mainly
originates from the eutectoidic decomposition of ferrite. Their precipitation occurs
in significantly shorter times respect to the low-temperature range and is enhanced
in the high-alloyed grades. Each alloying element has a characteristic effects of
phases formation (Paragraph 1.2.1) and the composition must be balanced also in
terms of elements inter-mechanisms. These phases can cause a strong decreasing in
both mechanical and corrosion resistance properties, as discussed in Paragraph
1.2.4.4 and in Chapter 2.
3. Above about 1050°C: for normal cooling rates DSS solidify as fully ferritic and,
during cooling, part of this ferrite transformed into austenite. This transformation is
naturally reversible and, therefore, an increasing in temperature results in a greater
volume fraction of ferrite, also causing a reduction in the partition of substitutional
elements between the phases[4].
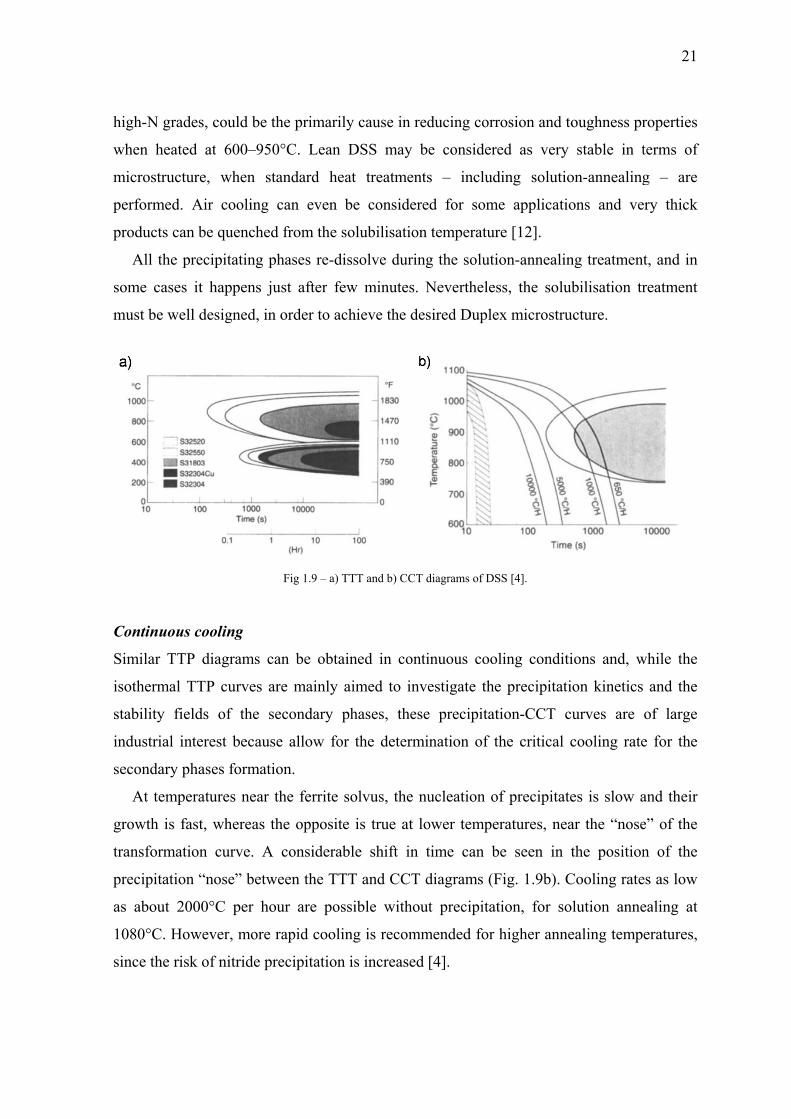
Both in high- and low-temperature ranges (1) and (2), can be identified a temperature at
which the precipitation kinetics are favoured and where ferrite decomposition occurs faster
(hereinafter called “nose”). As reported, in range (1) the decomposition is promoted at
about 475°C and this temperature is almost the same for all DSS, while in range (2) the
“nose” is strongly composition-dependent and therefore varies among DSS grades (Fig.
1.9a) [4,7]. As expected, SDSS grades show the greatest propensity for intermetallic
precipitation, due to their higher contents of Cr, Mo and W, and especial care is required
during the manufacturing operations. However, it should be emphasised that the
precipitation kinetics in these high-alloyed DSS are, at worst, equivalent to the super-
austenitic or super-ferritic stainless steels [4].
For the low-alloyed DSS (i.e. Lean DSS or Mo-free grades), intermetallics precipitation
need much more holding time (several 10 hours) and nitrides precipitations, particularly in
high-
when
micro
perfo
produ
A
some
must
Cont
Simi
isoth
stabi
indus
secon
A
grow
trans
preci
as ab
1080
since
-N grades, c
n heated at
ostructure,
ormed. Air
ucts can be
All the precip
e cases it h
t be well de
tinuous coo
lar TTP di
hermal TTP
ility fields
strial intere
ndary phase
At temperatu
wth is fast, w
sformation
ipitation “no
bout 2000°
0°C. Howev
e the risk of
could be the
t 600–950°
when stan
cooling ca
quenched f
pitating pha
happens jus
signed, in o
F
oling
agrams can
curves are
of the sec
est because
es formation
ures near th
whereas the
curve. A c
ose” betwee
C per hour
ver, more ra
f nitride prec
e primarily
C. Lean D
ndard heat
an even be
from the sol
ases re-diss
st after few
order to achi
Fig 1.9 – a) TTT
n be obtain
e mainly aim
condary ph
allow for t
n.
he ferrite so
e opposite i
considerable
en the TTT
r are possib
apid cooling
cipitation is
cause in red
DSS may be
treatments
e considere
lubilisation
solve during
w minutes. N
ieve the des
T and b) CCT d
ed in conti
med to inve
hases, these
the determi
lvus, the nu
is true at lo
e shift in t
and CCT d
ble without
g is recomm
s increased
ducing corro
e considere
s – includ
d for some
temperatur
g the solutio
Nevertheles
sired Duplex
diagrams of DS
inuous cool
estigate the
e precipitati
nation of th
ucleation of
ower temper
time can be
diagrams (F
t precipitat
mended for h
[4].
osion and to
ed as very
ding solutio
e applicatio
e [12].
on-annealin
ss, the solub
x microstru
S [4].
ling conditi
e precipitati
ion-CCT cu
he critical c
f precipitate
ratures, nea
e seen in t
Fig. 1.9b). C
ion, for so
higher anne
oughness pr
stable in t
on-annealing
ons and ve
ng treatment
bilisation tr
ucture.
ions and, w
on kinetics
urves are
cooling rate
es is slow a
ar the “nose
the position
Cooling rate
lution anne
ealing temp
21
roperties
terms of
g – are
ery thick
t, and in
reatment
while the
and the
of large
e for the
and their
e” of the
n of the
es as low
ealing at
eratures,

22
1.2.4.2. Austenite stability
Austenite is the paramagnetic FCC allotropic form of iron and its existence competes to
high temperature; thus, at room temperature, austenite is in a metastable condition and the
occurrence of proper deformation mechanisms could generate lattice rearrangements
involving stress- or strain-induced phase transformations. Austenite is (partially) stabilized
by adding a suitable amount of γ-promoting elements in DSS compositions, and this
stabilization is further effective by increasing the content of such elements. However,
being DSS biphasic, the composition must be well-balanced and limited values of the
Creq/Nieq ratio must be maintained, in order to achieve the Duplex microstructure and to
avoid harmful precipitations. As previously mentioned, if austenite is not well stabilized,
its metastable conditions at room temperature could give rise to a difusionless solid-state
phase transformation during plastic deformation, leading to the appearance of the so-called
Strain-Induced Martensite (SIM or α’-martensite).
The stability of the austenitic phase depends on the amount of the solubilised alloying
elements, and the involved deformation mechanisms can be associated to its Staking Fault
Energy (SFE), which is related to the phase chemical composition at a fixed temperature
[13]. SFE is an important parameter in the definition of the plastic behaviour of a phase,
owing to its relationship to the dislocation configuration; high-SFE materials, exhibiting
more cross-slip, form cellular dislocation structures while low-SFE materials usually form
planar array of dislocations in which the absence of significant cross-slip promotes work-
hardening [14]. The tendency to SIM formation increases with the decreasing of the SFE
value [15] and is primarily related to plastic strain rather than to the acting stress [16]. As a
matter of fact, in Lean and Standard DSS grades, austenite is differently alloyed respect to
austenite in austenitic stainless steels, since the amount of the strong γ-promoting Ni is
lower – and thus requiring higher amounts of N and the presence of Mn. This leads to
lower SFE values of austenite in DSS and therefore to a more or less metastable condition
of the phase at room temperature, depending on the considered grade.
Strain-Induced Martensite
The strain-induced martensitic transformation is generally observed in metastable
austenitic stainless steels, where austenite evolves toward the thermodynamically more
stable α’-martensite as a consequence of the cold plastic deformation. The process is
23
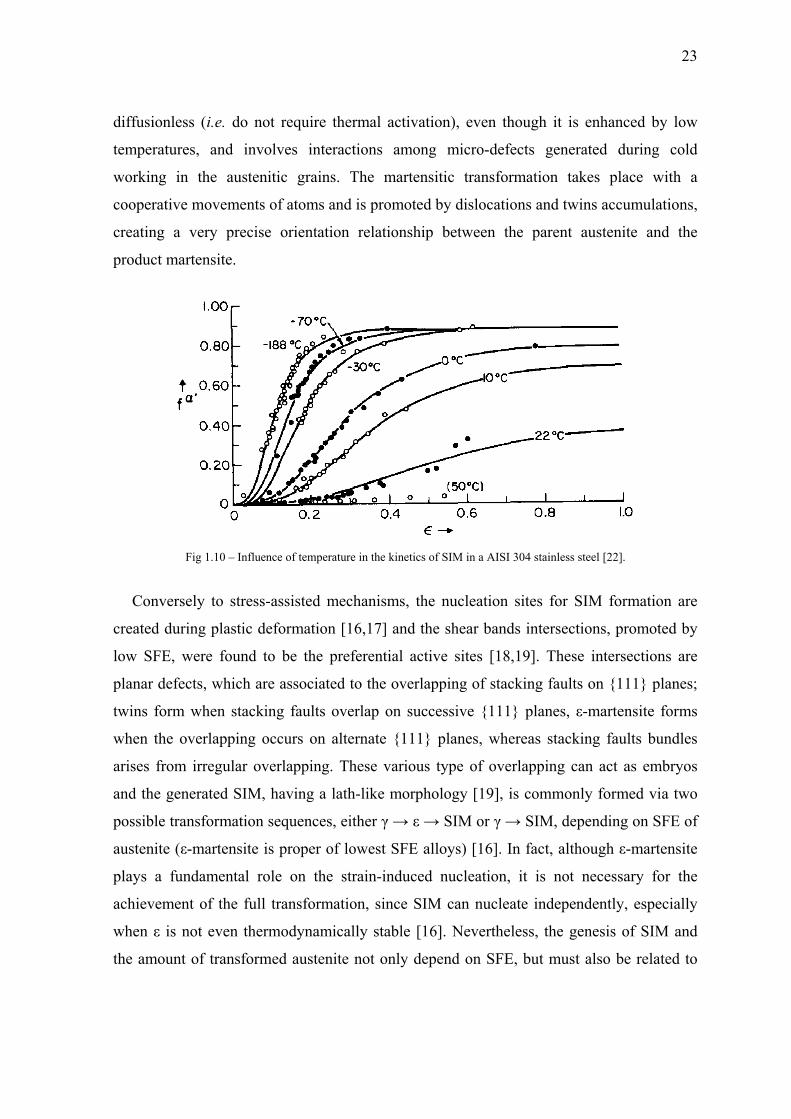
diffusionless (i.e. do not require thermal activation), even though it is enhanced by low
temperatures, and involves interactions among micro-defects generated during cold
working in the austenitic grains. The martensitic transformation takes place with a
cooperative movements of atoms and is promoted by dislocations and twins accumulations,
creating a very precise orientation relationship between the parent austenite and the
product martensite.
Fig 1.10 – Influence of temperature in the kinetics of SIM in a AISI 304 stainless steel [22].
Conversely to stress-assisted mechanisms, the nucleation sites for SIM formation are
created during plastic deformation [16,17] and the shear bands intersections, promoted by
low SFE, were found to be the preferential active sites [18,19]. These intersections are
planar defects, which are associated to the overlapping of stacking faults on 111 planes;
twins form when stacking faults overlap on successive 111 planes, ε-martensite forms
when the overlapping occurs on alternate 111 planes, whereas stacking faults bundles
arises from irregular overlapping. These various type of overlapping can act as embryos
and the generated SIM, having a lath-like morphology [19], is commonly formed via two
possible transformation sequences, either γ → ε → SIM or γ → SIM, depending on SFE of
austenite (ε-martensite is proper of lowest SFE alloys) [16]. In fact, although ε-martensite
plays a fundamental role on the strain-induced nucleation, it is not necessary for the
achievement of the full transformation, since SIM can nucleate independently, especially
when ε is not even thermodynamically stable [16]. Nevertheless, the genesis of SIM and
the amount of transformed austenite not only depend on SFE, but must also be related to
24
other parameters, such as strain rate, temperature and stress-type, which can modify the
phase response to the plastic deformation (Fig. 1.10) [16-26].
SIM may enhance the work hardening rate of the steel, influencing the uniform
elongation – which is good for formability – and the mechanical strength is also increased.
However, it can cause delayed cracking in deep drawn components [27] and can affect the
pitting corrosion resistance, due the presence of residual stresses caused by the γ → SIM
volume change and owing to the increasing in the number of active anodic sites in the
surface [28-30]. SIM is a BCC ferromagnetic phase, having nearly the same lattice
parameter to that of ferrite (a ≈ 0.287 nm [23]), while ε-martensite is paramagnetic (as
austenite) and possesses a HCP crystal structure. Hence, SIM identification in austenitic
stainless steels by x-rays diffraction techniques is very easy to achieve, owing to the solely
presence of the FCC-austenite; on the contrary, the concurrent presence of ferrite and
austenite renders this method unhelpful in DSS. Nevertheless, due to the magnetic
behaviour of SIM, a change in magnetic properties of DSS occurs after its formation,
allowing its detection throughout magnetic measurements, even though these methods
require an appreciable volume fraction of martensite.
The Strain-Induced Martensite was extensively studied in metastable austenitc stainless
steels – especially in types AISI 304L and 316L [13-26] – in which it occurs at relatively
low strains in a wide range of temperatures, but a few attention was paid on such
possibility in DSS [31-33]. In Chapter 3, the effects of cold rolling in DSS are presented
and the onset of SIM formation is discussed, pointing out that the Duplex microstructure
can play a not negligible role on such transformation, modifying the mechanisms of
deformation and the kinetics of SIM formation owing to its biphasic character.
1.2.4.3. Secondary phases
As previously reported, DSS may undergo a series of significant phase transformation,
especially at high temperatures. In Paragraph 1.2.4.1 the precipitation of secondary phases
was generally described, attributing the genesis of such phases to the instability of the
ferritic matrix and to the chemical composition of the steel, and a subdivision of the critical
temperature range (300–1000°C) was presented.
25
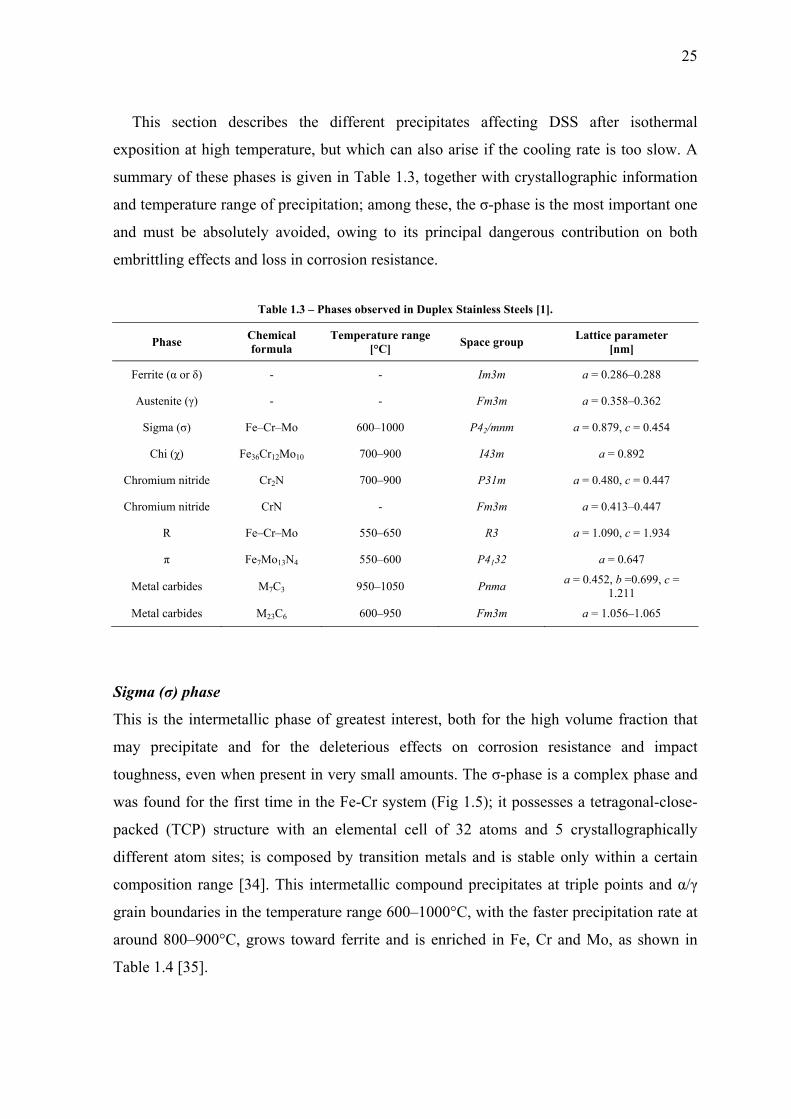
This section describes the different precipitates affecting DSS after isothermal
exposition at high temperature, but which can also arise if the cooling rate is too slow. A
summary of these phases is given in Table 1.3, together with crystallographic information
and temperature range of precipitation; among these, the σ-phase is the most important one
and must be absolutely avoided, owing to its principal dangerous contribution on both
embrittling effects and loss in corrosion resistance.
Table 1.3 – Phases observed in Duplex Stainless Steels [1].
Phase Chemical formula
Temperature range [°C] Space group Lattice parameter
[nm]
Ferrite (α or δ) - - Im3m a = 0.286–0.288
Austenite (γ) - - Fm3m a = 0.358–0.362
Sigma (σ) Fe–Cr–Mo 600–1000 P42/mnm a = 0.879, c = 0.454
Chi (χ) Fe36Cr12Mo10 700–900 I43m a = 0.892
Chromium nitride Cr2N 700–900 P31m a = 0.480, c = 0.447
Chromium nitride CrN - Fm3m a = 0.413–0.447
R Fe–Cr–Mo 550–650 R3 a = 1.090, c = 1.934
π Fe7Mo13N4 550–600 P4132 a = 0.647
Metal carbides M7C3 950–1050 Pnma a = 0.452, b =0.699, c = 1.211
Metal carbides M23C6 600–950 Fm3m a = 1.056–1.065
Sigma (σ) phase
This is the intermetallic phase of greatest interest, both for the high volume fraction that
may precipitate and for the deleterious effects on corrosion resistance and impact
toughness, even when present in very small amounts. The σ-phase is a complex phase and
was found for the first time in the Fe-Cr system (Fig 1.5); it possesses a tetragonal-close-
packed (TCP) structure with an elemental cell of 32 atoms and 5 crystallographically
different atom sites; is composed by transition metals and is stable only within a certain
composition range [34]. This intermetallic compound precipitates at triple points and α/γ
grain boundaries in the temperature range 600–1000°C, with the faster precipitation rate at
around 800–900°C, grows toward ferrite and is enriched in Fe, Cr and Mo, as shown in
Table 1.4 [35].

26
In DSS, this phase is not the consequence of errors in the manufactoring cycle, but
pertains to the equilibrium structure of (almost) all DSS. The σ-phase forms by ferrite
decomposition, according to the sequence σ → ferrite + austenite, even though in many
cases the precipitation sequence is more complex and involves the formation of other
compounds, such as χ-phase, nitrides, etc. This decomposition is very similar to an
eutectoid decomposition and the forming austenite is indicated as “tertiary” (γ3) – even if it
is often improperly called γ2. The ferrite transformation follows this mechanism because
the growing of σ causes a depletion in Cr and Mo of the surrounding ferrite and a
concurrent enrichment in Ni, leading to the formation of austenite from ferrite; at the same
time, the formation of this austenite causes an enrichment in Cr and Mo of the adjacent
ferrite, which becomes a suitable nucleation site for σ and so on. The result is the
occurrence of alternate areas of austenite and σ-phase. This mechanism also justifies the
preferential formation of σ at the α/γ grain boundaries and at the triple points, instead of
inside the ferritic grains [5].
Table 1.4 – Compositional ranges of the σ-phase [wt.%].
Cr Ni Mo W
29–34 3–5 3–9 0–7
The formation of σ is mainly favoured by Cr and Mo – but also by W and Si – which
enlarge its stability field and enhance both the precipitation rate and its volume fraction,
and can occur in very few minutes in the higher-alloyed DSS grades. A high solubilisation
temperature tends to increase the volume fraction of ferrite and will suppress σ
precipitation, owing to a greater dilution of the ferrite-stabilizing elements, but the cooling
rate is also a vital factor. However, whereas sigma is avoided by cooling from higher
temperatures, the conditions for chromium nitrides will instead become more favourable
[1].
The σ -phase is a hard and brittle phase; its unit cell does not possess easy-slip planes,
therefore causing significant embrittling effects, which are enhanced by the coalescence of
the particles. The disadvantages induced by σ also derive from its composition, because its
formation causes a depletion in Cr of the surrounding ferritic matrix, whose composition
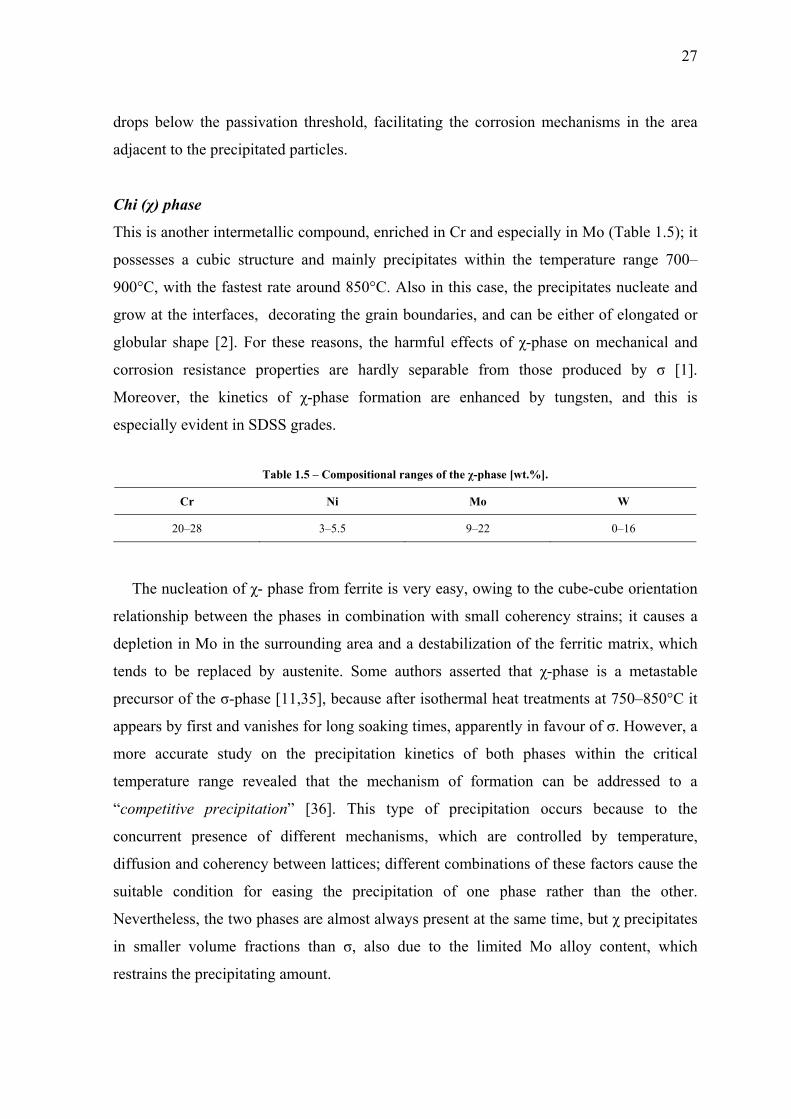
27
drops below the passivation threshold, facilitating the corrosion mechanisms in the area
adjacent to the precipitated particles.
Chi (χ) phase
This is another intermetallic compound, enriched in Cr and especially in Mo (Table 1.5); it
possesses a cubic structure and mainly precipitates within the temperature range 700–
900°C, with the fastest rate around 850°C. Also in this case, the precipitates nucleate and
grow at the interfaces, decorating the grain boundaries, and can be either of elongated or
globular shape [2]. For these reasons, the harmful effects of χ-phase on mechanical and
corrosion resistance properties are hardly separable from those produced by σ [1].
Moreover, the kinetics of χ-phase formation are enhanced by tungsten, and this is
especially evident in SDSS grades.
Table 1.5 – Compositional ranges of the χ-phase [wt.%].
Cr Ni Mo W
20–28 3–5.5 9–22 0–16
The nucleation of χ- phase from ferrite is very easy, owing to the cube-cube orientation
relationship between the phases in combination with small coherency strains; it causes a
depletion in Mo in the surrounding area and a destabilization of the ferritic matrix, which
tends to be replaced by austenite. Some authors asserted that χ-phase is a metastable
precursor of the σ-phase [11,35], because after isothermal heat treatments at 750–850°C it
appears by first and vanishes for long soaking times, apparently in favour of σ. However, a
more accurate study on the precipitation kinetics of both phases within the critical
temperature range revealed that the mechanism of formation can be addressed to a
“competitive precipitation” [36]. This type of precipitation occurs because to the
concurrent presence of different mechanisms, which are controlled by temperature,
diffusion and coherency between lattices; different combinations of these factors cause the
suitable condition for easing the precipitation of one phase rather than the other.
Nevertheless, the two phases are almost always present at the same time, but χ precipitates
in smaller volume fractions than σ, also due to the limited Mo alloy content, which
restrains the precipitating amount.

28
Chromium nitrides (Cr2N and CrN )
The nitrogen levels generally present in DSS are well above the solubility limit in ferrite
for temperatures around 1000°C but, on the contrary, are below of that in austenite (Fig.
1.11). This difference in solubility has important implications on the precipitation of
nitrides. Nitrides precipitation causes a local depletion of chromium, making the steel more
susceptible to localized corrosion and the presence of such microstructural discontinuities
also increases the number of preferential sites for the cracks initiation, compromising the
resistance characteristics of the steel. In DSS, the predominating chromium nitride is the
Cr2N type, with a hexagonal structure, while CrN nitrides with a cubic structure has been
less frequently observed, taking apart in the heat affected zone of the weldments in a SAF
2205 [37].
Fig 1.11 – Nitrogen solubility in ferrite and austenite [9].
The formation of Cr2N can occur by two distinct ways, in relation to the thermal process
at which the DSS are subjected. They can precipitate either intragranularly, as a result of a
too quick cooling from the solution-annealing temperatures (1050–1100°C), or
intergranularly, during isothermal heat treatments at lower temperatures. The intragranular
nitrides is formed because, at the solubilisation temperatures, the nitrogen solubility in
ferrite reaches comparables values to that in austenite and a quick cooling to low
temperatures, where the solubility in ferrite decreases, causes an incomplete diffusion and
redistribution of nitrogen into austenite, resulting in a ferrite nitrogen-supersaturated solid
solution. The consequence is the precipitation of nitrides with elongated shape inside the
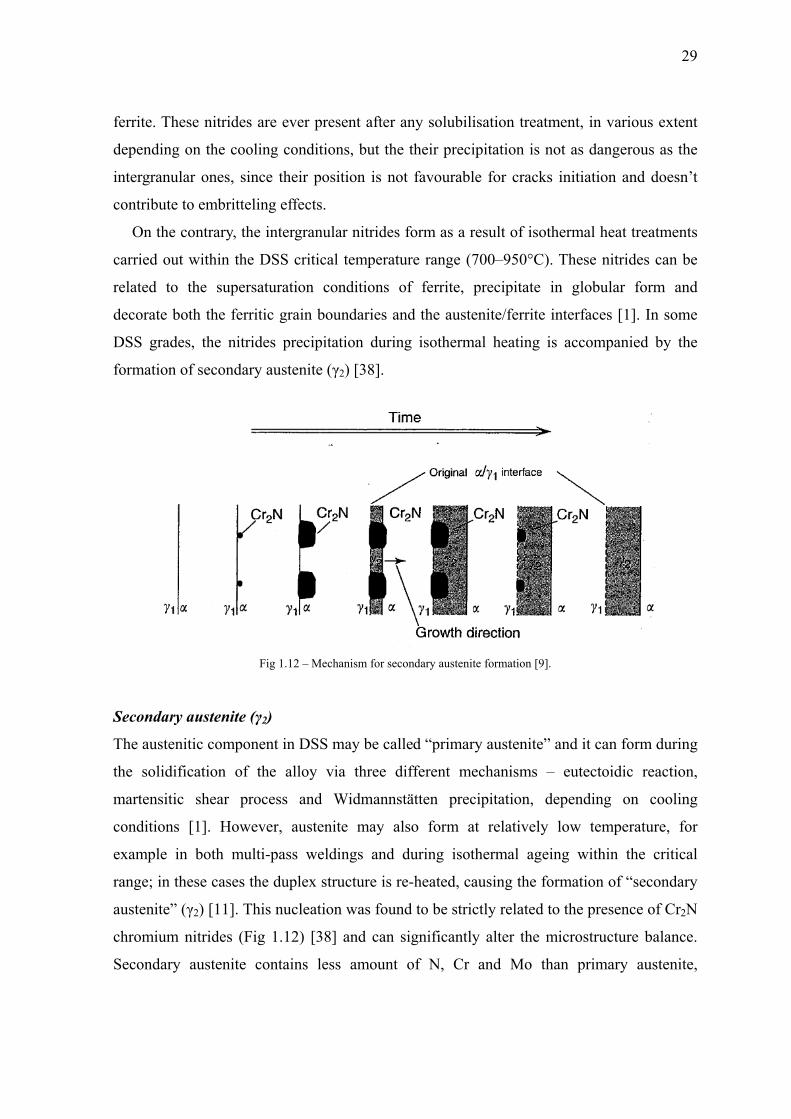
29
ferrite. These nitrides are ever present after any solubilisation treatment, in various extent
depending on the cooling conditions, but the their precipitation is not as dangerous as the
intergranular ones, since their position is not favourable for cracks initiation and doesn’t
contribute to embritteling effects.
On the contrary, the intergranular nitrides form as a result of isothermal heat treatments
carried out within the DSS critical temperature range (700–950°C). These nitrides can be
related to the supersaturation conditions of ferrite, precipitate in globular form and
decorate both the ferritic grain boundaries and the austenite/ferrite interfaces [1]. In some
DSS grades, the nitrides precipitation during isothermal heating is accompanied by the
formation of secondary austenite (γ2) [38].
Fig 1.12 – Mechanism for secondary austenite formation [9].
Secondary austenite (γ2)
The austenitic component in DSS may be called “primary austenite” and it can form during
the solidification of the alloy via three different mechanisms – eutectoidic reaction,
martensitic shear process and Widmannstätten precipitation, depending on cooling
conditions [1]. However, austenite may also form at relatively low temperature, for
example in both multi-pass weldings and during isothermal ageing within the critical
range; in these cases the duplex structure is re-heated, causing the formation of “secondary
austenite” (γ2) [11]. This nucleation was found to be strictly related to the presence of Cr2N
chromium nitrides (Fig 1.12) [38] and can significantly alter the microstructure balance.
Secondary austenite contains less amount of N, Cr and Mo than primary austenite,

30
increases the toughness of the material but it is deleterious for the corrosion resistance,
particularly against pitting.
The formation of secondary austenite can be addressed to two different mechanisms.
The first concerns the increasing of the primary austenite grains, while the second takes
into account the nucleation within the ferrite grains and is associated to the pre-existing
precipitation of chromium nitrides. Considering the latter mechanism, the intergranular
position of the precipitated Cr2N nitrides causes a local depletion of Cr and Mo which,
during the heating, allows for the nucleation of γ2 at the grain boundaries and its
subsequent growth [38]. Its appearance is much more frequent in multiple-pass weldings,
due to the re-heating of the welding zone, and a more accurate description between
secondary austenite and intra- and intergranular chromium nitrides can be found in [38].
Carbides (M23C6 and M7C3)
Carbides are interstitial phases composed by a transition metal and carbon. Their
precipitation occur at high temperatures when a too high carbon content (generally
>0.03%) is present in the bulk composition and make the material susceptible to
intergranular corrosion. Among these, chromium carbides are the more harmful ones
because they cause a depletion in Cr of the matrix.
In DSS, the M23C6 and M7C3 are the most frequently observed carbides [1], which
precipitate at α/γ and α/α interfaces. The Cr23C6 carbides, having a HCP crystal structure,
are the first precipitating ones, due to the high mobility of carbon in ferrite at high
temperatures and their formation increases the risk of intergranular corrosion. However,
the low carbon content in DSS makes difficult the carbides precipitation and the nitrides
formation is favoured.
Spinoidal decomposition (α’)
This precipitation occurs by spinoidal decomposition of ferrite in the temperature range
300–600°C, leading to the formation of two Cr-rich (α’) and Fe-rich (α) phases, which
cause a decrease in toughness and a hardness increase. Since this decomposition occurs
more rapidly at 475°C, it is also known as “475°C embrittlement” and also causes a
decrease in corrosion resistance, particularly against pitting [39].
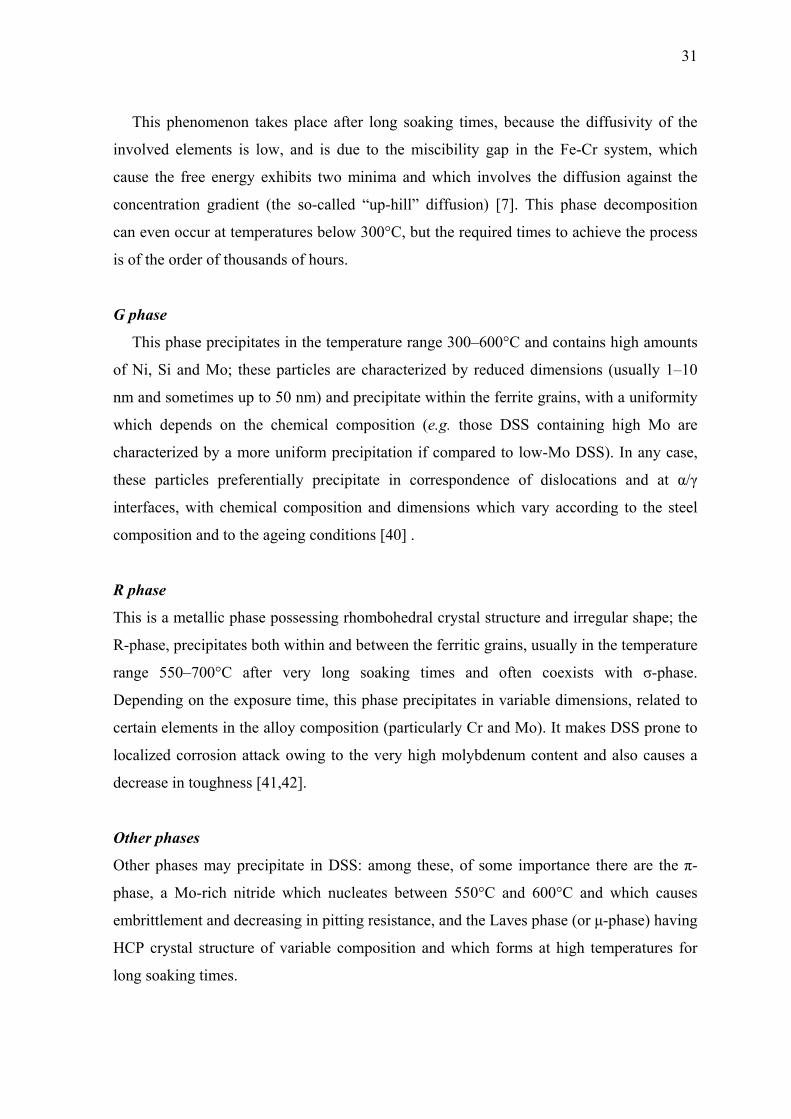
31
This phenomenon takes place after long soaking times, because the diffusivity of the
involved elements is low, and is due to the miscibility gap in the Fe-Cr system, which
cause the free energy exhibits two minima and which involves the diffusion against the
concentration gradient (the so-called “up-hill” diffusion) [7]. This phase decomposition
can even occur at temperatures below 300°C, but the required times to achieve the process
is of the order of thousands of hours.
G phase
This phase precipitates in the temperature range 300–600°C and contains high amounts
of Ni, Si and Mo; these particles are characterized by reduced dimensions (usually 1–10
nm and sometimes up to 50 nm) and precipitate within the ferrite grains, with a uniformity
which depends on the chemical composition (e.g. those DSS containing high Mo are
characterized by a more uniform precipitation if compared to low-Mo DSS). In any case,
these particles preferentially precipitate in correspondence of dislocations and at α/γ
interfaces, with chemical composition and dimensions which vary according to the steel
composition and to the ageing conditions [40] .
R phase
This is a metallic phase possessing rhombohedral crystal structure and irregular shape; the
R-phase, precipitates both within and between the ferritic grains, usually in the temperature
range 550–700°C after very long soaking times and often coexists with σ-phase.
Depending on the exposure time, this phase precipitates in variable dimensions, related to
certain elements in the alloy composition (particularly Cr and Mo). It makes DSS prone to
localized corrosion attack owing to the very high molybdenum content and also causes a
decrease in toughness [41,42].
Other phases
Other phases may precipitate in DSS: among these, of some importance there are the π-
phase, a Mo-rich nitride which nucleates between 550°C and 600°C and which causes
embrittlement and decreasing in pitting resistance, and the Laves phase (or μ-phase) having
HCP crystal structure of variable composition and which forms at high temperatures for
long soaking times.
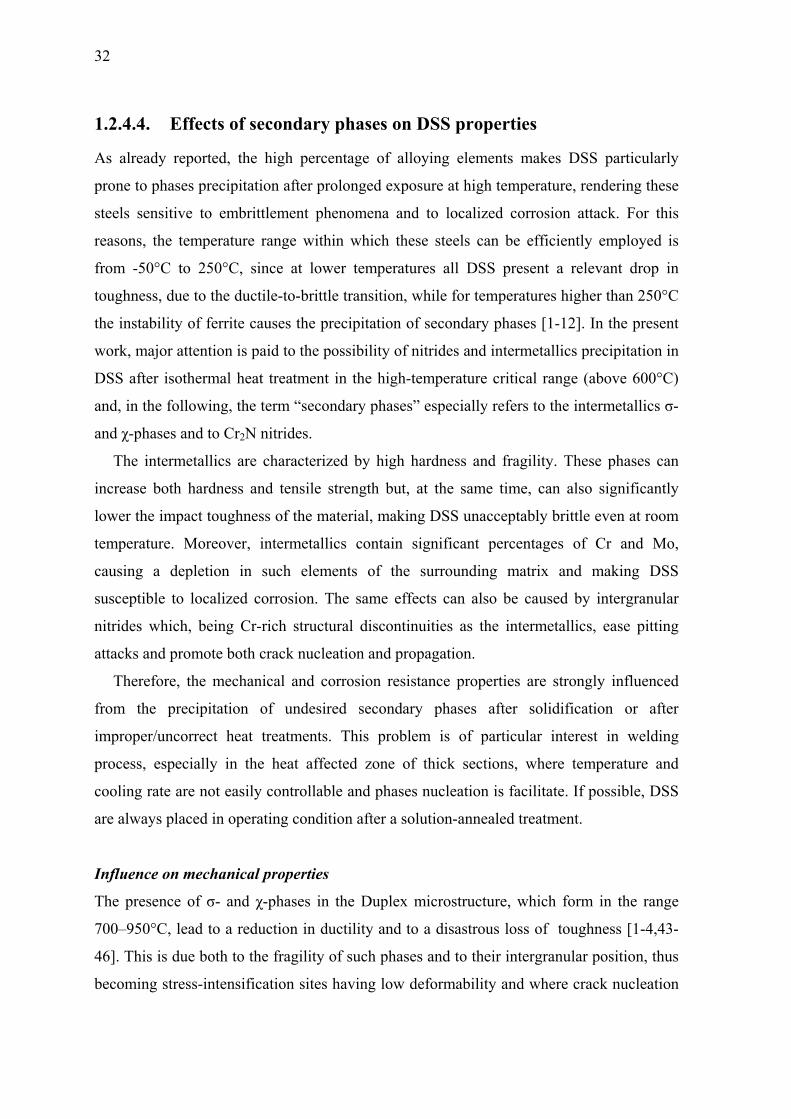
32
1.2.4.4. Effects of secondary phases on DSS properties
As already reported, the high percentage of alloying elements makes DSS particularly
prone to phases precipitation after prolonged exposure at high temperature, rendering these
steels sensitive to embrittlement phenomena and to localized corrosion attack. For this
reasons, the temperature range within which these steels can be efficiently employed is
from -50°C to 250°C, since at lower temperatures all DSS present a relevant drop in
toughness, due to the ductile-to-brittle transition, while for temperatures higher than 250°C
the instability of ferrite causes the precipitation of secondary phases [1-12]. In the present
work, major attention is paid to the possibility of nitrides and intermetallics precipitation in
DSS after isothermal heat treatment in the high-temperature critical range (above 600°C)
and, in the following, the term “secondary phases” especially refers to the intermetallics σ-
and χ-phases and to Cr2N nitrides.
The intermetallics are characterized by high hardness and fragility. These phases can
increase both hardness and tensile strength but, at the same time, can also significantly
lower the impact toughness of the material, making DSS unacceptably brittle even at room
temperature. Moreover, intermetallics contain significant percentages of Cr and Mo,
causing a depletion in such elements of the surrounding matrix and making DSS
susceptible to localized corrosion. The same effects can also be caused by intergranular
nitrides which, being Cr-rich structural discontinuities as the intermetallics, ease pitting
attacks and promote both crack nucleation and propagation.
Therefore, the mechanical and corrosion resistance properties are strongly influenced
from the precipitation of undesired secondary phases after solidification or after
improper/uncorrect heat treatments. This problem is of particular interest in welding
process, especially in the heat affected zone of thick sections, where temperature and
cooling rate are not easily controllable and phases nucleation is facilitate. If possible, DSS
are always placed in operating condition after a solution-annealed treatment.
Influence on mechanical properties
The presence of σ- and χ-phases in the Duplex microstructure, which form in the range
700–950°C, lead to a reduction in ductility and to a disastrous loss of toughness [1-4,43-
46]. This is due both to the fragility of such phases and to their intergranular position, thus
becoming stress-intensification sites having low deformability and where crack nucleation

33
is promoted. Experimental results showed that the above-mentioned detrimental loss of
toughness is evident at all temperatures (Fig. 1.13) and only the 1% volume fraction of
intermetallics is sufficient to reduce the room temperature impact toughness to a third of
the value in the solution-annealed material [44-46].
Fig 1.13 – Influence of σ-phase precipitation on DSS impact toughness [34].
Furthermore, distribution and morphology of the precipitates affect the impact response
and it was evidenced that the lower the precipitation temperature, the more brittle the
behaviour [46]. This primarily depends on the morphology of the sigma phase, and even
little deformations cause transcrystalline, finely structured brittle fractures of σ-phase
particles, due to its TCP structure. In the more net-like morphology precipitated at lower
temperatures, cracks are enabled to run through σ-phase particles over long distances and
the narrow fields of surrounding ferrite are forced to cleave, whereas in the bigger and
more bulk σ-phase at higher precipitation temperatures, the bigger portion of ferrite and
austenite enhances the surrounding ferrite to a more ductile failure mode [46]. This
phenomenon is particularly important in the SDSS grades, in which the precipitation is the
most rapid and therefore special care is required throughout the thermo-mechanical
process, including correct solution-annealing temperature, component thickness and
quenching rate [4].
Conversely, the influence of intermetallics on tensile strength has a different character.
Tensile and yield strengths generally grow with the amount of precipitated intermetallic
phases and a influence of morphology can also be recognized. The increase in strength can
mainly attributed to strength of the intermetallic particles in combination with their cross-
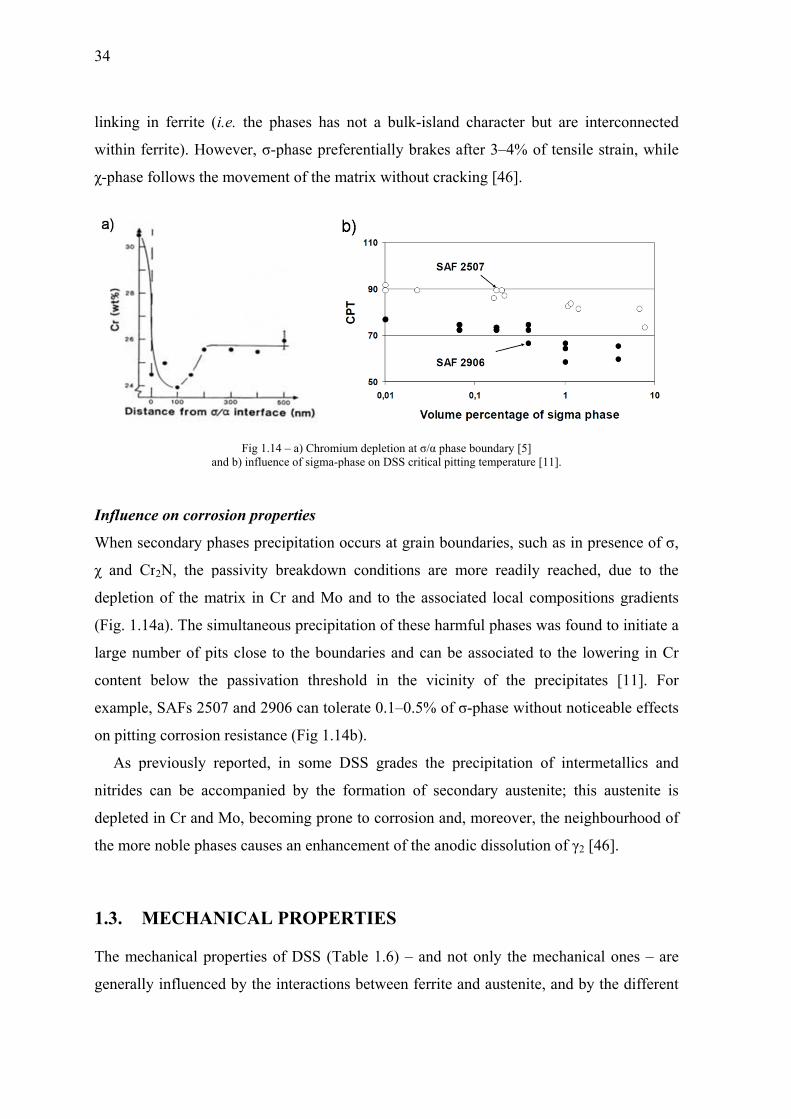
34
linking
within f
χ-phase
Influen
When s
χ and C
depletio
(Fig. 1.
large nu
content
example
on pittin
As p
nitrides
depleted
the mor
1.3. M
The me
generall
in ferrite (
ferrite). How
follows the
a
nce on corro
econdary p
Cr2N, the p
on of the m
14a). The si
umber of pi
below the
e, SAFs 250
ng corrosion
previously r
can be ac
d in Cr and
re noble pha
MECHAN
echanical pr
ly influence
(i.e. the pha
wever, σ-ph
e movement
Fig 1.14 –and b) influence
osion prope
hases precip
passivity br
matrix in Cr
imultaneous
its close to
e passivatio
07 and 2906
n resistance
reported, in
ccompanied
Mo, becom
ases causes
NICAL P
roperties of
ed by the in
ases has no
hase prefere
t of the mat
– a) Chromiume of sigma-phas
erties
pitation occ
reakdown c
and Mo an
s precipitati
the bounda
on threshol
6 can tolera
e (Fig 1.14b
n some DS
by the for
ming prone t
an enhance
PROPERT
f DSS (Tabl
nteractions b
ot a bulk-is
entially bra
trix without
m depletion at σ/se on DSS critic
curs at grain
conditions a
nd to the as
ion of these
aries and ca
ld in the v
ate 0.1–0.5%
).
SS grades t
rmation of
to corrosion
ment of the
TIES
le 1.6) – an
between fer
sland chara
akes after 3–
cracking [4
/α phase boundacal pitting temp
n boundarie
are more r
ssociated lo
e harmful ph
an be assoc
vicinity of
% of σ-phas
the precipit
secondary
n and, more
e anodic diss
nd not only
rrite and au
acter but are
–4% of tens
46].
ary [5] perature [11].
es, such as i
readily reac
ocal compo
hases was fo
ciated to the
the precip
se without n
tation of in
austenite;
eover, the n
solution of
y the mecha
stenite, and
e interconn
sile strain, w
in presence
ched, due t
ositions grad
found to init
e lowering
pitates [11]
noticeable e
ntermetallics
this austen
neighbourho
γ2 [46].
anical ones
d by the diff
nected
while
of σ,
to the
dients
tiate a
in Cr
. For
ffects
s and
nite is
ood of
– are
ferent
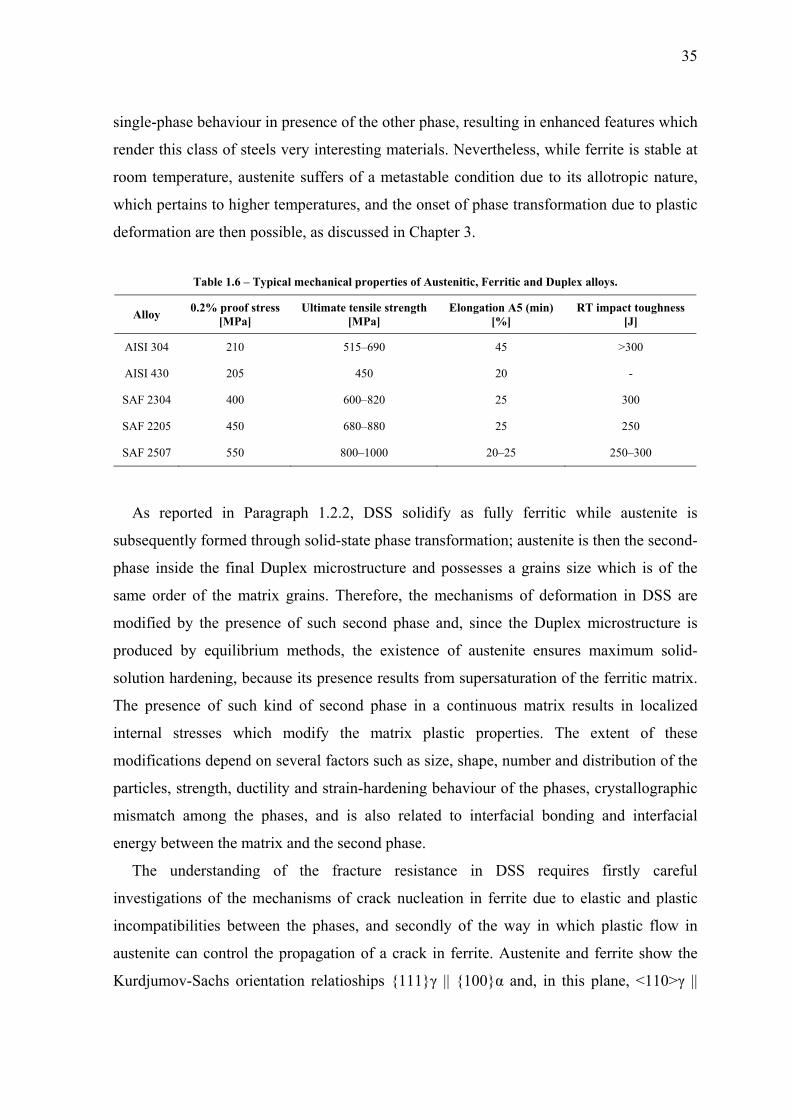
35
single-phase behaviour in presence of the other phase, resulting in enhanced features which
render this class of steels very interesting materials. Nevertheless, while ferrite is stable at
room temperature, austenite suffers of a metastable condition due to its allotropic nature,
which pertains to higher temperatures, and the onset of phase transformation due to plastic
deformation are then possible, as discussed in Chapter 3.
Table 1.6 – Typical mechanical properties of Austenitic, Ferritic and Duplex alloys.
Alloy 0.2% proof stress [MPa]
Ultimate tensile strength [MPa]
Elongation A5 (min) [%]
RT impact toughness [J]
AISI 304 210 515–690 45 >300
AISI 430 205 450 20 -
SAF 2304 400 600–820 25 300
SAF 2205 450 680–880 25 250
SAF 2507 550 800–1000 20–25 250–300
As reported in Paragraph 1.2.2, DSS solidify as fully ferritic while austenite is
subsequently formed through solid-state phase transformation; austenite is then the second-
phase inside the final Duplex microstructure and possesses a grains size which is of the
same order of the matrix grains. Therefore, the mechanisms of deformation in DSS are
modified by the presence of such second phase and, since the Duplex microstructure is
produced by equilibrium methods, the existence of austenite ensures maximum solid-
solution hardening, because its presence results from supersaturation of the ferritic matrix.
The presence of such kind of second phase in a continuous matrix results in localized
internal stresses which modify the matrix plastic properties. The extent of these
modifications depend on several factors such as size, shape, number and distribution of the
particles, strength, ductility and strain-hardening behaviour of the phases, crystallographic
mismatch among the phases, and is also related to interfacial bonding and interfacial
energy between the matrix and the second phase.
The understanding of the fracture resistance in DSS requires firstly careful
investigations of the mechanisms of crack nucleation in ferrite due to elastic and plastic
incompatibilities between the phases, and secondly of the way in which plastic flow in
austenite can control the propagation of a crack in ferrite. Austenite and ferrite show the
Kurdjumov-Sachs orientation relatioships 111γ || 100α and, in this plane, <110>γ ||
36
<111>α, resulting in either one common slip system or two nearly-common slip systems.
Hence, the interface is a complex semicoherent interface. It has been shown that, during
compression tests in cast DSS alloys, deformation takes place homogeneously in both
phases and the slip traces were found to be continuous from one phase to the other. In
austenite plastic deformation is quite homogeneous in the whole phase, even if slip has a
rather plane character, while deformation in ferrite starts from the interfaces and seems to
be correlated to deformation started in austenite [47].
The tensile properties of DSS are influenced by plate thickness, becoming increasingly
anisotropic with thickness reduction. The anisotropy, and concomitant strengthening, are
due to refinement of the structure, with the ferrite/austenite structure being elongated
parallel to the principal strain axis (banded-like or pancake grains displacement), but there
is no fibre-strengthening effect due to plastic deformation, since the phases have similar
hardness values. In a previous work [4], a marked and unusual texture was reported to
developed in the two phases, with a major orientation of the type (100)[011] to (211)[011]
for ferrite and (110)[223] for austenite, whereas more recent studies have pointed out that
in SAF 2205 cold-rolled sheets the developed texture are (100)[001] in ferrite and
110<112> in austenite [48]; however, a more detailed description on textures
development in DSS is reported in Chapter 3. In any case, a strong anisotropy in DSS
mechanical properties is expected as a consequence of the plastic deformation, owing to
the formation of a heavily-banded microstructure, especially in the cold rolled conditions.
Finally, a very interesting property of these steels is the so-called superplasticity, which
enable DSS to be considerably plastically deform under moderate stress at appropriate
temperatures, making possible the achievement of very complex shapes.
1.3.1. Tensile characteristics
Austenite and ferrite have similar Young's modules, but the yield stress is smaller in the
former phase than for the latter [47]. This difference, coupled with a different deformation
hardening rate of the individual phases, causes a different load sharing between the phases
and therefore strong inter-phase reactions result in the formation of microstresses that
maintain their equilibrium among subsets of grains of different orientations [11]. These
residual microstresses have a great effect on DSS yielding and, consequently, affect

37
deformation and fracture behaviour. However, the resulting yield strength of DSS is
usually two or three times greater than in AISI 304 and the high elastic limit, combined
with their good ductility, allow for a weight reduction of structures, leading to consequent
savings in raw materials and manufacturing costs [49].
The strength in DSS is essentially controlled by ferrite and strongly depends on grain
size; the fine microstructure usually achieved in Duplex allow for the attainment of a
considerable contribution to the strength, as described by the well known Hall-Petch
relation [1]. Besides that, the mechanical properties of DSS can be also related to the
beneficial synergistic effect given by the two-phase structure and to the contribution of
both substitutional and interstitial solid solutions which are formed with the alloying
elements. Hence, the high mechanical resistance of DSS is the result of a combination of
several simultaneous mechanisms [4]:
- interstitial solid solution hardening (C, N);
- substitutional solid solution hardening (Cr, Mo, Ni, etc.);
- strengthening by grain refinement;
- presence of the biphasic microstructure;
- strengthening due to ferrite, since, for a similar composition, this phase is harder
than the austenitic structure;
- strain induced by differential contraction of the two phases on cooling from
annealing temperatures.
About the first strengthening mechanism, a raising in N content preferentially
strengthens austenite by interstitial solid solution hardening, till it becomes stronger than
ferrite. Indeed, for low nitrogen contents (<0.1%) austenite has the lower yield strength,
while at higher levels (>0.2%) ferrite becomes the weaker phase; this explains why
macroscopic hardening is most pronounced for small nitrogen additions, becoming less
marked beyond a certain level (i.e. 0.12% for 2205), where only a moderate hardening
occurs [4].
The variation in mechanical strength for DSS alloys with temperature is essentially
controlled by ferrite. Strengthening is accentuated at low temperatures, with some
significant drops over the temperature range 20–300°C; an increase in wall thickness may
be necessary when operating at 100°C, as compared to 20°C [4].

38
The work hardening rate in DSS is similar to other types of stainless steel. Only 304-
304L grades show higher work-hardening rate, owing to the Strain-Induced Martensite
transformation, a phenomenon which may also occur in low-alloyed DSS and which was
also found to be possible in the medium-alloyed grades, such as the 2205 [31-33] (Chapter
3). The capacity to work-harden up to tensile strengths of 1200 MPa or above is exploited
in the manufacture of wirelines and surgical.
Further, the addition of Cu enables considerable hardening to be obtained, without
excessive loss of ductility, provided that the heat treatment has been optimised; therefore it
is not surprising that the use of copper is particularly appreciated for applications requiring
both abrasion and corrosion resistance [4].
1.3.2. Impact toughness
Despite their high strength, DSS exhibit good ductility and toughness which, however, are
lower than austenitic steels. These materials retain a good toughness even to low
temperatures (e.g. -40°C) and, if compared to carbon and ferritic steels, the ductile-to-
brittle transition is more gradual. The low temperature toughness behaviour of DSS is, in
fact, between that of ferritics and austenitics, due to the combined effect of the two phases,
and can be ascribed to the presence of austenite, which retards the cleavage fracture of
ferrite [1]. High impact energies can be achieved in SDSS (e.g. over 100 J, at -100°C [50])
in solution-annealed and unwelded conditions. As it happens in all materials, a marked
scatter in the toughness values should be expected during the transition, owing to alloy
composition and thermomechanical history, which in turn affect microstructure and
texture. Moreover, the impact strength can be improved by reducing the oxygen content,
and by controlling the aluminium leve1, to avoid the formation of AlN [4].
Cold working reduces the room temperature impact strength in DSS and increases the
ductile to brittle transition temperature. The textures developed during cold rolling in the
two phases alter the impact response in DSS, leading to higher value in transverse than in
longitudinal direction relative to the banded structure [1]. The combination of cold
working and ageing in the range 300–400°C causes a great drop in impact toughness at
room temperature and the ductile to brittle transition can be raised above ambient
temperature [4].

39
1.4. CORROSION RESISTANCE
The corrosion properties of stainless steels are generally defined by the ability to passivate
and to remain in the passive state in the service environment. However, there are
fundamental differences in alloy design of Duplex and austenitic grades, which leads to
significant variations in their corrosion behaviour, especially in environments where
general corrosion is taking place. On the other hand, austenitic and DSS alloys with
equivalent PREN often exhibit similar critical pitting and crevice corrosion temperatures in
chloride media [4].
DSS exhibit a high level of corrosion resistance in most environments where the
austenitic stainless steels are normally employed; the high Cr content, which is beneficial
in oxidizing acids, coupled with Mo and N, give DSS a superior resistance in mildly-
reducing acid environments and the relatively high amount of these three elements also
provides very good resistance to chloride induced pitting and crevice corrosion. Ferrite is,
however, susceptible to hydrogen embrittlement which causes a decreasing in resistance in
environments or applications where H may be charged into the metal. As a matter of fact,
if compared to standard austenitics grades, DSS possess a greater resistance to localized
corrosion attacks, such as stress corrosion cracking (SCC), crevice and pitting corrosion,
and also have a better resistance against generalized corrosion than ferritics. Therefore, the
realization of these steels is related to the possibility to obtain materials of limited cost,
employable in such environments where the risk of stress corrosion does not allow the use
of austenitics and where the generalized corrosion restricts the use of ferritics [4].
1.4.1. Pitting corrosion
In chlorinated solutions, the pitting phenomenon occurs when the intervention of Cl- ions
cause the destruction of the passive film, as their specific action results in the reduction of
the stability field of the passive potential and in increasing the corrosion current. The role
of chloride ions in pitting initiation is related to a local destabilization of the passive film,
together with an effect which counteract the formation of a new protective layer. Cr-Mo-N-
W are the main beneficial elements against pitting attacks and a qualitative quantification
of DSS resistance is given by the PREN index, obtained by Relations (1.1) and (1.2).

40
However, it is necessary to consider that pitting resistance of ferrite and austenite is
different, due to the partitioning of the alloying elements between the phases, and
especially if the heat treatment is not optimised. In fact, an alloy with a high nominal PREN
may produce a lower pitting resistance than expected if one of the phases is depleted in one
of the characterizing elements compared to the other phase (i.e. it has a lower localised
PREN value). In particular, the effect of different partitioning on corrosion resistance
assumes relevance in relation to weldments. In DSS, austenite is the weakest phase
towards pitting resistance, owing to its lower PREN (or PREW) index, and the only manner
to increase its resistance is to increase the nitrogen content, which is not even possible. For
this purpose, a greater volume fraction of ferrite can increase the austenite resistance by
allowing the solubilisation of a greater amount of Cr , Mo and N inside the γ-phase, at
expenses of mechanical resistance.
In general, the pitting resistance is significantly influenced by metallurgical parameters
such as composition, inclusions or second phases, heat treatments, size of grains and cold
working, which are not taken into account in the PREN ranking. However, for a given
chlorinated environment, each stainless steel can be characterized with a temperature
below which pitting does not occur, even after indefinitely long times. This temperature is
defined as the Critical Pitting Temperatures (CPT) and represents a parameter of highly
interest, because it takes into account the influence of both the microstructure and the
elements distribution inside the phases and, therefore, the real conditions of the steel.
Indeed, a steel with a high nominal PREN value can be characterized by a low CPT value,
if one of the phases is depleted of Cr, Mo, W or N – i.e. whether the local value of the
PREN is, for any reason, low. The CPT is usually determined in discreetly chlorinated
solutions, but its value was found to be independent of both chlorides concentration, in the
range 0.01–5 M, and pH, in the range of 1–7 [51,52]. On the contrary, the surface
roughness of the material can affect the measured CPT value [53], which decreases as the
roughness increased.
In general, the Duplex CPT are comparable to that of austenitics (Fig. 1.15a) and those
of SDSS are slightly superior to that of 6%Mo super-austenitics. SAF 2205 can be used at
very high temperatures, while in chlorinated seawater only superduplex or superaustenitic
steels can be successfully applied. SAF 2205 is also resistant to pitting up to about 80°C in
1.5% NaCI (0.90% CI-) solution, while superduplex grades are immune up to the boiling
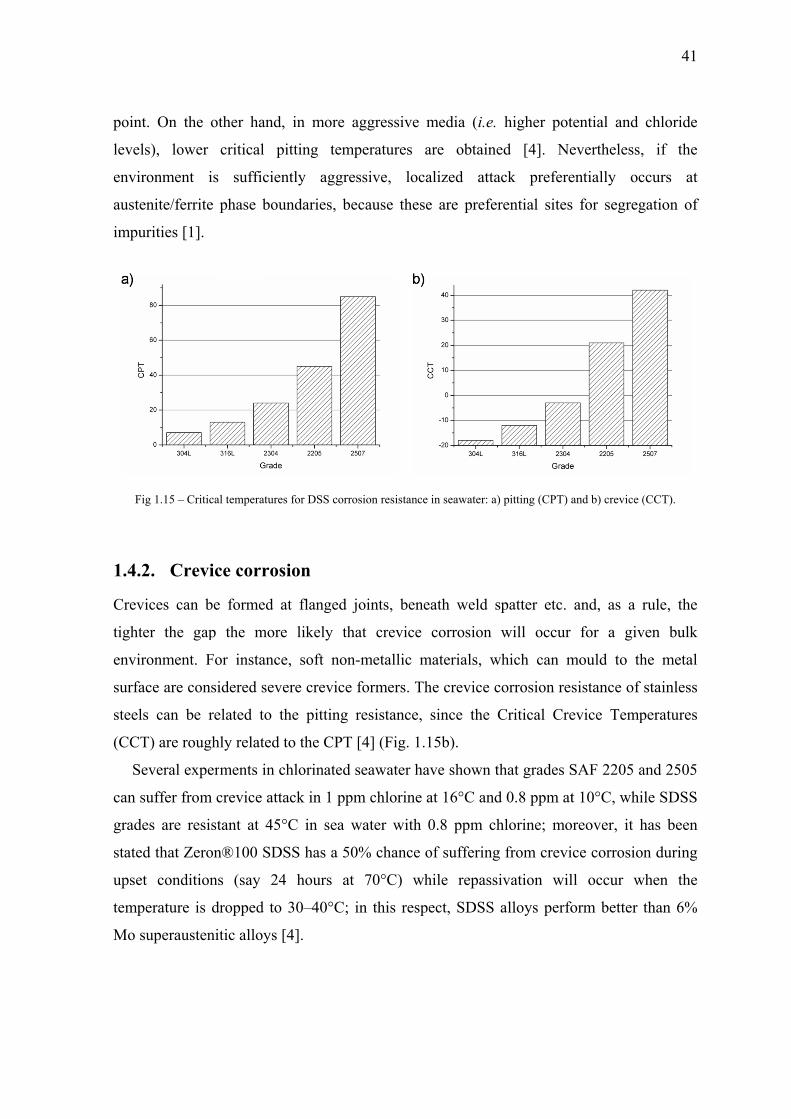
point
level
envir
auste
impu
Fi
1.4.2
Crev
tight
envir
surfa
steel
(CCT
Se
can s
grade
state
upset
temp
Mo s
t. On the o
ls), lower
ronment is
enite/ferrite
urities [1].
ig 1.15 – Critic
2. Crevi
vices can be
er the gap
ronment. F
ace are cons
s can be re
T) are rough
everal exper
suffer from
es are resis
d that Zeron
t condition
perature is d
superausten
other hand,
critical pi
s sufficien
phase bou
al temperatures
ce corros
e formed a
p the more
or instance
sidered seve
elated to th
hly related t
rments in ch
crevice atta
stant at 45°
n®100 SDS
ns (say 24
dropped to
nitic alloys [
in more a
itting temp
ntly aggres
undaries, be
s for DSS corro
ion
at flanged j
e likely tha
e, soft non-
ere crevice f
he pitting r
to the CPT
hlorinated s
ack in 1 ppm
°C in sea w
SS has a 50
4 hours at
30–40°C; i
[4].
aggressive m
peratures a
ssive, loca
cause these
sion resistance
oints, bene
at crevice
-metallic m
formers. Th
resistance,
[4] (Fig. 1.1
seawater ha
m chlorine a
water with 0
0% chance o
70°C) wh
in this respe
media (i.e.
are obtaine
alized atta
e are prefer
in seawater: a)
eath weld s
corrosion
materials, w
he crevice c
since the C
15b).
ave shown th
at 16°C and
0.8 ppm ch
of suffering
hile repassi
ect, SDSS
higher pot
ed [4]. Ne
ack prefere
rential sites
pitting (CPT) a
patter etc.
will occur
which can m
corrosion res
Critical Cre
hat grades S
d 0.8 ppm at
hlorine; mo
from crevi
ivation wil
alloys perfo
tential and
evertheless,
entially oc
s for segreg
and b) crevice (
and, as a r
for a giv
mould to th
sistance of
evice Temp
SAF 2205 a
t 10°C, whi
oreover, it h
ce corrosion
ll occur w
orm better t
41
chloride
if the
ccurs at
gation of
(CCT).
rule, the
ven bulk
he metal
stainless
peratures
and 2505
le SDSS
has been
n during
when the
than 6%

42
1.4.3. Stress Corrosion Cracking (SCC)
If compared to austenitic grades with similar pitting and crevice corrosion resistance, DSS
exhibit significantly better Stress Corrosion Cracking (SCC) resistance, owing to the
presence of ferrite, which is immune to this type of failure [54]. However, they are
susceptible to this type of corrosion under certain conditions, such as at high temperatures,
in chloride environments or when the circumstances favour hydrogen-induced cracking
(e.g. boiling 42%-Mg, pressurized aqueous chloride systems and drop evaporation at high
temperatures) and, moreover, they are sensitive to Sulphide-induced Stress Corrosion
Cracking (SSCC).
In chloride environments, cracking can preferentially occur in ferrite or through both
phases; this may seem surprising as the resistance of ferritic stainless steels is normally
considered high, while the susceptibility of austenitic grades is renowned, due to the higher
Ni contents. However, the ferrite in a DSS contains at least 3% of Ni, in comparison to
common nickel-free ferritic grades, and this makes the ferrite phase in DSS susceptible to
SCC [4].
The resistance of DSS to stress corrosion cracking in the presence of H2S and chloride
is reduced, if compared to similar environments where only chloride is present, owing to
the effect of hydrogen sulphide, which may be evolved in oil wells or polluted waters due
to bacterial activity. Reduced sulphur species are known to catalyse the anodic dissolution
of Fe and Ni, and therefore can be assumed to control the kinetics of localised corrosion.
The presence of H2S in a solution will remove oxygen to form elemental sulphur and
water; the removal of oxygen restricts the cathodic reaction to hydrogen evolution or, to a
lesser extent, reduction of sulphur to a sulphide; thus, the surface of the steel becomes
enriched in atomic hydrogen, which enhances hydrogen diffusion into the steel, leading to
the possibility of hydrogen-induced cracking [4].
1.4.4. Resistance to acids and caustics
Duplex 2205 and 2507 outperform many high-Ni austenitics steels in sulphuric acid
solutions containing up to about 15% acid, and they are better than types 316 or 317
through at least 40% acid. DSS do not have sufficient Ni to resist the strong reducing
conditions of mild-concentration sulphuric acid solutions or hydrochloric acid. At wet/dry

43
interfaces in reducing environments, where acid concentrates, corrosion – especially of
ferrite – may be activated and proceeds rapidly. The resistance to oxidizing conditions
makes DSS good candidates for nitric and strong-organic acid services.
In sulphuric acid, the beneficial effect of copper, as an active alloying element in
reducing acids, leads to the improved performance of alloys 2505 and Zeron®100 –
containing between 0.5% and 2% of Cu – if compared to 2507 without copper. In
hydrochloric acid, grade 2205 offers similar resistance to 316L at low temperatures,
although the resistance is better at higher temperatures, while SDSS show improved
resistance and are similar to austenitic alloys; the best performance in HCI is observed in
Zeron®100, with Cu and W additions, which has been shown to be acceptable in a number
of applications previously thought unsuitable for stainless steels. However, under highly
oxidising conditions, like concentrated nitric acid, DSS exhibit dramatically different
behaviours because Mo has a strong negative effect, while Cr is beneficial. For this reason,
a limit of 2%Mo has been recommended.
DSS, and in particular SDSS, have shown remarkably good passivation properties in
pure and contaminated organic acids; modern Duplex are resistant in acetic acid whereas
the austenitic grade 304L corrodes at high temperatures and may also crack at high
concentrations; in formic acid – the most aggressive of the organic acids – most stainless
steels and titanium corrode heavily at intermediate concentrations and high temperatures,
but SDSS were found to be resistant almost to the boiling point [4].
The high Cr content and the presence of ferrite provide good performances of DSS also
in caustics environments. In presence of sodium hydroxide, as in pulp and paper industry,
DSS have shown much lower corrosion rates at moderate temperatures than standard
austenitic grades in white liquors, and their beneficial is more marked in synthetic white
liquors, where chlorides are present [4].
1.5. APPLICATIONS
DSS were firstly introduced onto the market as alternatives to the standard austenitic
grades AISI 304 and 316 in aggressive environments, especially owing to the improved
corrosion resistance and to cost-savings due to the lower Ni amount. Enhanced corrosion
performances, in combination with toughness, mechanical strength and good weldability,

44
render these steels very suitable for several applications in chlorides-containing media
[12].
Nowadays, DSS gained a considerable interest in the great welded constructions and as
container ships for highly-aggressive chemicals products; however, their use in
construction of large welded bridges is limited due to the fact that there is not a
considerable amount of experimental data on DSS fatigue resistance, comparable to that
existing for conventional carbon steels [49]. Hence, due to their favourable combinations
of properties, DSS can be successfully employed in different aggressive environments:
- Chemical, petrochemical and nuclear plants
- Oil and gas offshore applications (piping, flowlines, bolting, etc.)
- Pulp and paper industries
- Desalination plants
- Buildings and bridges
- Power generation (seawater cooling below 300°C)
- Mining/extraction
- Food manufacture
- Implantation material in human bodies (biocompatibility for high PREN)
Chemical and petrochemical
Among the various DSS grades, SAF 2205 is preferred against the 300-series austenitic
stainless steels, owing to its higher corrosion and stress-corrosion resistance in many
environments, together with considerable higher tensile properties and only a moderate
increase in price. SAF 2304 has been used for clean duties, replacing austenitic grades in
hot aqueous chloride media; today, this grade is selected for exchanger tubing in natural
gas preheaters, where low grade steam is used for heating purposes. For applications where
higher chloride contents are present, e.g. brackish water and hot coastal conditions, both
tubing and tubesheets are made in SAF 2205. This grade has also been used for reactors,
heat exchangers and storage tanks in the production of detergent.
For many years, cast J93370 DSS has found applications in phosphoric (and sulphuric)
acid production, where chlorides and fluorides are present combined with erosion and wear
conditions, such as in pumps, agitator blades and shafts. More recently, this grade has been

45
employed for stud bolts in ammonia injectors; valve internals in urea recycle lines and
pumps and valves in sulphuric and nitric acid duties [4].
Oil&Gas offshore applications
The use of DSS for offshore applications predominantly started in the early days of the
North Sea developments. The corrosive conditions which were encountered in this region
negated the use of carbon steels and led to the selection of stainless steels. DSS have been
successfully supplied for down hole equipment and wellheads, flow lines, umbilical,
process piping, vessels and mechanical components, such as pump parts, compressors and
valves. In particular, due to their high strength and good corrosion resistance, they have
become ever more employed in high pressure systems, topside equipment, pipework, and
blast walls, which lead to a reduction in the topside weight in offshore facilities. Presently,
DSS are used with thicknesses up to 100 mm and with design temperatures down to -50°C
and, generally, they can provide many years of trouble-free service [4].
Several extended papers issued from Oil&Gas companies underline the very
satisfactory behaviour of 22- and 25-Cr DSS which have been experienced in a large set of
applications (i.e. top side, subsea pipings, manifolds, umbilical, wells applications, fire
systems). Some failures have been observed but most of them are related to unintended
service conditions, including poor design, high local stresses, overloaded conditions,
unexpected microstructure defects (σ-phase), local saturated brine solutions
(evaporation/condensation phenomenon’s associated with high temperature), and some
Hydrogen-Induced Stress Cracking (HISC) cases [12].
Other experiences underline the possible benefits of the uses of lean DSS in structural
applications for platforms; pipe racks, pipe supports, architectural walls, insulation
claddings, cable trays could be typical applications where carbon steel is replaced by lean
DSS, with a typical cost savings of 20–40%. Nevertheless, special care should be made in
material selection, taking in to account the in service conditions since, among Lean DSS, a
wide range of chemistries are proposed (PREN from 23 to 28) [12].
Pulp and paper
One of the first applications involved grade S31500 (3RE60) for suction rolls. In this steel,
the combination of high-Cr and low-Ni contents seemed to be beneficial against attack in
46
such media and, similarly, SDSS clad plates of SAF 2507 have been successfully used for
chip prestreaming vessels in continuous digesters. Generally, DSS find many applications
in this industry sector, including chemical pulping, bleaching, chemi-thermomechanical
pulping (CTMP), pulp storage tanks, paper machines, recovery and steam plants [4].
Desalination and severe chloride containing environments
Some companies have completely shifted from austenitic to duplex grades. SAF 2205 is
the cost-saver material, bringing weight reductions and low maintenance costs due to the
excellent corrosion resistance properties; more recently SAF 2304 has been introduced for
the less severe conditions. Conversely, for the most severe conditions the classical SDSS
are to be considered and the newly Hyper DSS grades seem to offer improved properties
[12]. Thus, DSS evaporators can be built with thinner plates, requiring less material and
less welding.
Building and construction/bridges
Due to their cost advantages when considering weight savings aspects and maintenance
cost savings (21-23% Cr providing more corrosion resistance than 304 grades), Lean DSS
are more and more considered for structural applications; reinforced Duplex bars are now
specified for corrosion free bridge even in marine environments [12].
Experimental works have confirmed that duplex grades can be used in the most critical
cases for design and construction; the cost calculation for solid Duplex bridges, compared
to carbon steel, resulted in an increase of 20% of the erection and building costs (including
the welds), whereas savings are expected from lower maintenance costs. Furthermore,
more recent investigations confirm the advantages of DSS in fire conditions; higher
temperature can be considered without damages as well as more safety margins [12].
REFERENCES
[1] J. O. Nilsson. Mater Sci Tech Ser 8 (1992) 685. [2] J. Charles. Proc. Conf. Duplex Stainless Steels ’91. Les Ulis, France (1991) 185. [3] J. Charles. Proc. Conf. Duplex Stainless Steel '94. Glasgow, Scotland (1994) 41.
47
[4] R. N. Gunn. Duplex Stainless Steels: Microstructure, Properties and Applications. Abington Publishing, Cambridge, England (1997).
[5] E. Ramous. La Metallurgia Italiana 4 (2004) 37. [6] I. Calliari, M. Dabalà, E. Ramous and G. Staffellini. Mater Sci Forum 604–605 (2009) 419. [7] M. Knyazeva and M. Pohl. Metallogr Microstruct Anal 2 (2013) 113. [8] J. Charles. La Metallurgia Italiana 2 (1995) 83. [9] J. C. Lippold and D. J. Kotecki. Welding Metallurgy and Weldability of Stainless Steels. John Wiley
& Sons, Hoboken, New Jersey (2005). [10] G. Melotti, R. Bertelli, M. Zanesco, I. Calliari, E. Ramous. La Metallurgia Italiana 4 (2005) 39. [11] J. O. Nilsson, G. Chai. Proc. Conf. Duplex 2007 International Conference & Expo. Grado, Italy
(2007). [12] J. Charles. A review after DSS ‘07 held in Grado (2007). [13] R. E. Schramm and R. P. Reed. Metall Trans A 6A (1975) 1345. [14] R. E. Schramm and R. P. Reed. Metall Trans A 7A (1976) 359. [15] P. Seetharaman and J. Krishnan. J Mater Sci 16 (1981) 523. [16] G. B. Olson and M. Cohen.. J Less-Common Met 28 (1972) 107. [17] S. S. Hecker, M. G. Stout, K. P. Staudhammer and J. L. Smith. Metall Trans A 13A (1982) 619. [18] R. Lagenborg. Acta Metall 12 (1964) 823. [19] P. L. Mangonon and G. Thomas. Metall Trans 1 (1970) 1577. [20] F. Lecroisey and A. Pineau. Metall Trans 3 (1972) 387. [21] K. Spencer, M. Véron, K. Yu-Zhang and J. D. Embury. Mater Sci Tech 25 (2009) 7. [22] G. B. Olson and M. Cohen. Metall Trans A 6A (1975) 791. [23] P. Haušild, V. Davydov, J. Drahokoupil, M. Landa, P. Pilvin. Mater and Design 31 (2010) 1821. [24] A. Das, S. Sivaprasad, M. Ghosh, P. C. Chakraborti, S. Tarafder. Mat Sci Eng A 486 (2008) 283. [25] J. Talonen, H. Hänninen. Acta Mater 55 (2007) 6108. [26] A. Hedayati, A. Najafizadeh, A. kermanpur, F. Forouzan. J Mat Proc Tech 210 (2010) 1017. [27] K. H. Lo, C. H Shek, J. K. L. Lai. Mat Sci Eng R 65 (2009) 39. [28] G. F. Vander Voort. Metallography: Priciples and Practice. ASM International (2007). [29] A. Randak and F. W. Trautes. Werkstoffe und Korrosion 21 (1970) 97. [30] K. Elaylperumal, P. K. De, J. Balachandra. Corrosion 28 (1972) 269. [31] W. Reick, M. Pohl and A. F. Padilha. Steel Res 67 (1996) 253–256. [32] S. S. M. Tavares, M. R. da Silva, J. M. Pardal, H. F. G. Abreu, A. M. Gomes. J Mater Process Tech
180 (2006) 318. [33] P. Bassani, M. Breda, K. Brunelli, I. Mészáros, F. Passaretti, M. Zanellato and I. Calliari. Microsc
Microanal 19 (2013) 988. [34] M. Pohl, O. Storz, T. Glogowski. Mater Charact 58 (2007) 65–71. [35] L. Karlsson, L. Bengtsson, U. Rolander, S. Pak. Proc. Conf. Application stainless steels ’92.
Stockholm, Sweden (1992) 335. [36] I. Calliari, M. Breda, M. Pellizari and E. Ramous. The χ-phase in duplex stainless steels (in press). [37] S. Hertzman, W. Roberts and M. Lindenmo, Proc. conf. Duplex Stainless steels. The Hague, The
Nederlands (1986) 257. [38] A. J. Ramirez, J. C. Lippold and S. D. Brandi. Metall Mater Trans A 34A (2003) 1575. [39] S. S. M. Tavares, R. F. de Noronha, M. R. da Silva, J. M. Neto, S. Pairis. Material Research 4 (2001)
237. [40] M. Guttmann. Proc. Conf. Duplex Stainless Steels ’91. Beaune, France (1991) 79. [41] B. Joeffson, J. O. Nilsson, A. Wilson. Proc. Conf. Duplex Stainless Steels ’91. Beaune, France (1991)
67. [42] L. Karlsson, L. Ryen, S. Pak. Welding Research Supplement 74 (1995) 28.

48
[43] J. O. Nilsson, A. Wilson. Mater Sci Tech 9 (1993) 545. [44] I. Calliari, M. Zanesco, E. Ramous. J Mater Sci 41 (2006) 7643. [45] I. Calliari, M. Breda, E, Ramous, K. Brunelli, M. Pizzo, C. Menapace. J Mater Eng Perform 21
(2012) 2117. [46] M. Pohl, O. Storz, T. Glogowski. Int J Mater Res 99 (2008) 1163. [47] B. Verhaeghe, F. Louchet, B. Doisneau-Cottignies, Y, Bréchet. Philos Mag 76 (1997) 1079. [48] W. B. Hutchinson, K. Ushioda and G. Runnsjö. Mater Sci Tech Ser 1 (1985) 728. [49] S. Bernhardsson. Proc. Conf. Duplex Stainless Steels ’91. Beaune, France (1991) 185. [50] M. Breda, I. Calliari, E. Ramous, M. Pizzo, L. Corain, G. Straffelini. Mater Sci Eng A 585 (2013) 57. [51] R. Qvarfort. Corros Sci 29 (1989) 987. [52] N. J. Laycock, M. H. Moayed, R. C. Newman. J Electrochem Soc 145 (1998) 2622. [53] M. H. Moayed, N. J. Laycock, R. C. Newman. Corrosion Science 45 (2003) 1203. [54] H. Bhadeshia and R. Honeycombe. Steels: Microstructures and Properties. Butterworth-Heinemann,
Oxford, England (2006).

49
CHAPTER 2
ISOTHERMAL HEAT TREATMENTS
2.1. INTRODUCTION
In the present chapter, the effects of isothermal heat treatments (or ageing treatments) on
DSS microstructures and impact properties are discussed. As reported in Chapter 1, owing
to the instability of the ferritic matrix at high temperatures, DSS are sensitive to secondary
phases precipitations, which can cause not negligible implications, especially during the
manufacturing process and in welding operations, due to the detrimental effects on
properties of the new generated phases.
The chapter deals with the solid-state phase transformations pertaining to the DSS high-
temperature critical range, where the diffusion kinetics are enhanced and where the
precipitation may occur for very short soaking times, as happens in SDSS. The
intermetallics σ- and χ-phases and chromium nitrides are the phases of major interest,
causing local Cr-depletions in the matrix, compromising the resistance to localized attack
and highly worsening the impact toughness of the materials.
The intermetallics are known to be generated by the eutectoidic decomposition of
ferrite, where the metastable α-phase is replaced by a more stable mixture of phases
following the reaction α → σ(χ) + γ2. However, the formation of intermetallics seems to
interest only the higher-alloyed grades, rather than low-alloyed Lean DSS, which are
instead mainly subjected to nitrides formation. The main difference between high- and
low-alloyed grades is the different elements amount in and, in particular, the molybdenum
content, as will be discussed in the following sections. DSS are biphasic steels at room
temperature but, owing to the allotropic nature of iron, if the temperature is raised above
700°C, and especially within the high-temperature critical range, ferrite does no more
belong to the equilibrium microstructure. This causes its decomposition, and the high

50
content of alloying elements further affect its stability, leading to the formation of
secondary phases. The eutectoidic reaction involves the formation of phases with different
composition to the parent matrix and long-range diffusion mechanisms are required, both
of substitutional and interstitial elements [1].
The precipitation phenomenon in DSS involves diffusion mechanisms and takes place
in solid-state conditions. Therefore, besides the obvious effect of temperature on
promoting atoms mobility, the kinetics of reactions are also conditioned by the particular
microstructure of the steel. A large number of grain boundaries and defects inside the
matrix may enhance secondary phases formation, because, under certain circumstances,
diffusion may preferentially occur along such high-diffusivity paths, rather than through
the lattice, thus becoming the dominant diffusion mechanism [1]. Secondary phases is
known to preferentially nucleate at triple points and grain boundaries, within a temperature
range where grain boundaries diffusion is preferred (i.e. below 0.75–0.8·TM, being TM the
equilibrium melting temperature), and their growth proceed toward the unstable ferrite,
subtracting elements to the matrix and causing its decomposition. Comparing DSS having
the same nominal chemical composition but different microstructures, a different responses
to phases precipitation can be achieved. For example, if the number of triple points is
increased due to recrystallization processes occurred during solubilisation, or if a greater
number of dislocations is present, the precipitation kinetics can be substantially altered and
phases formation can be enhanced. These facts underline the importance of the thermo-
mechanical history of the steels on the precipitation behaviour, which cannot be neglected,
even though a comparison among different DSS grades overcomes these microstructural
effects, being the precipitation mainly influenced by the alloying grade.
Although the effects of secondary phases on DSS properties are clearly related to the
microstructural damage after ageing, in this chapter the topics are presented separately.
First of all, a description of the precipitation kinetics within the critical temperature range
is presented. This can give an understanding on the entity of such damage induced by the
secondary phases precipitation at a microstructural level in terms of volume fraction of
such phases, which varies among different DSS grades, and is of fundamental importance
in order to design reliable manufacturing processes and to know the limits of these steels.
Then, the effects on mechanical properties, and in particular on impact toughness, are
discussed, with the aim to fully characterize the DSS behaviour after phases precipitation.

51
This separation in two sections can provide a better description of the overall implications
due to secondary phases in DSS, pointing out different important aspects.
Ageing treatments
All the isothermal heat treatments were carried out by introducing the samples inside a
muffle furnace set at the soaking temperature, allowing the heating of the material from
room temperature. The various ageing temperatures were chosen on the basis of previous
works reported in literature and, in the case of new materials, either considering critical
temperatures ranges in similar DSS or after the analysis of the equilibrium phase diagrams.
Each set of treatments, followed by water quenching, has involved different annealing
times, in order to fully characterize the precipitation kinetics in the steels under
examination.
This procedure was designed for the determination of the precipitation kinetics inside
the critical temperature range, or the range itself, in the investigted DSS. This is also
suitable for a reproduction of industrial applications, allowing the simulation of such
conditions at which the material may be subjected, as the heat-affected zone during
welding operations.
Table 2.1 – Chemical composition of the investigated Duplex Stainless Steels.
Grade C Si Mn Cr Ni Mo Cu W P S N
SAF 2101 0.028 0.69 3.82 21.72 1.13 0.10 0.34 - 0.028 0.0025 0.16
LDX 2101 0.025 0.65 5.13 21.57 1.56 0.28 0.30 - 0.019 0.0010 0.23
SAF 2304 0.030 0.56 1.43 23.17 4.29 0.18 0.16 - 0.027 0.0010 0.13
LDX 2404 0.022 0.33 2.83 24.41 3.34 1.54 0.42 - 0.021 0.0004 0.25
SAF 2205 0.030 0.56 1.46 22.75 5.04 3.19 - - 0.025 0.0020 0.16
SAF 2507 0.015 0.24 0.83 24.80 6.89 3.83 0.23 - 0.023 0.0010 0.27
SAF 2510 0.020 0.44 0.37 25.30 9.90 4.00 - - 0.018 0.0010 0.275
Zeron®100 0.014 0.25 0.88 25.23 6.89 3.67 0.72 0.62 0.023 0.0010 0.28
Materials
The investigated DSS are reported in Tables 2.1 and 2.2, together with their relative
chemical composition, product type and PREN index. All the materials were treated in the

52
as-received conditions; this means that, after the forming operations, they were all
subjected to a solubilisation treatment at the proper temperature and subsequently water
quenched.
The materials were of different shape (rods, bars, plates, billets or sheets), hence with
different starting microstructures, which can in some extent alter the precipitation
behaviour at the early stages of precipitation, as explained in the following sections. Thus,
the presented results may not to be consider as absolute, but can give in any case a
significant overview of the precipitation phenomenon which affect DSS and permit to
underline the different existing behaviours among different DSS grades.
Table 2.2 – Product type and PREN indexes of the investigated Duplex Stainless Steels.
Grade Product type Size PREN (PREW) index
SAF 2101 bar 10x40 mm (cross-section) 25
LDX 2101 sheet 3 mm (thickness) 26
SAF 2304 billet 60x60 mm (cross-section) 26
LDX 2404 sheet 2 mm (thickness) 33.5
SAF 2205 bar 10x30 mm (cross-section) 36
SAF 2507 plate 15x1250 mm (cross-section) 42
SAF 2510 rod 45 mm (diameter) 43
Zeron®100 plate 14.5x1350 mm (cross-section) 43
Investigation methods
The microstructures were investigated by means of classical metallographic techniques.
Optical Microscopy (OM) by using a Leica DMRE was only performed on the as-received
samples after chemical etching (Beraha’s reagent), whereas a Leica Cambridge Stereoscan
440 Scanning Electron Microscopy (SEM), coupled with Energy Dispersive Spectrometry
(EDS) for the composition analysis, was employed to investigate the microstructural
features of the treated samples. The OM and SEM micrographs were used to estimate the
volumetric fraction of the phases, by means of an image-analysis software.
The use of SEM does not require any samples etching, because the observations in
backscattered-electron mode (BSE) at 29 kV permit to distinguish the phases according to
their different average atomic number. Austenite appears brighter than ferrite, while the
53
secondary phases (such as σ and χ) are more brilliant due to the higher content of Cr and
Mo, and therefore to the higher average atomic number; nitrides and carbides can instead
be observed as small black particles, whose shape and location depend on the process from
which are generated.
Some samples were also examinated by X-Ray Diffraction (XRD), using a Siemens
D500 diffractometer (CrKα radiation, step 0.05° and 3 sec of acquisition time) in the
angular range 2θ = 55–145°, in order to unambiguously identify the present phases.
The equilibrium phase diagrams were obtained by thermodynamic simulations, using the
Thermo-Calc software [2] based on the CALPHAD method [3] and employing the
thermodynamic database TCFe6.
The study of DSS mechanical properties was focused on the determination of impact
toughness. For these tests, different Charpy pendulums were employed on V-notched
specimens, having available energies of 300–450 J, as reported in the specific sections. The
fracture surfaces were investigated by means of SEM, in secondary-electron mode (SE) at
15 kV, and by using a Stereo Microscope, in order to investigate the fracture surfaces at
macro- and microstructural levels.
2.2. EFFECTS ON MICROSTRUCTURE
The main effect of the DSS exposure at high temperature is the decomposition of the
ferritic matrix, which can occur in a wide temperature range. In the present thesis, only the
high-temperature decomposition of ferrite is considered, which occurs in the temperature
range 600–1000°C and in different extent depending on the examined grade. In this range,
the decomposition may lead to the formation of the secondary (intermetallic) χ- and σ-
phases, via eutectoidic reaction, and also to the precipitation of chromium nitrides.
As previously reported, the microstructural conditions can strongly affect the steel
behaviour during the ageing treatments. In this paragraph the effect of different
microstructures is (partially) taken into account by separately considering the materials in
the as-received and cold-worked conditions. These cases are obviously completely
different, because cold working introduces an increased number of defects inside the
microstructures, altering the diffusion kinetics at high temperatures and, therefore, the
precipitation behaviours, which is a diffusive phenomenon.
54
However, the as-received microstructures in the investigated DSS cannot be considered
as equals, in terms of precipitation behaviour. As a matter of fact, the manufacturing
operations are not the same for all the final products and, if it were, it is possible that were
not performed in the same extent in all materials. Moreover, if different products are taken
into account, the solution-annealing treatments, aimed to restore the microstructures after
the forming operations, are not even accomplished at the same manner, and the particular
conditions at which are carried out cause the onset of different microstructures. Therefore,
besides the compositions of different DSS grades, microstructure can play a fundamental
role on the precipitation kinetics, since ferrite decomposition preferentially occur at grain
boundaries and interfaces, which are intimately connected to microstructure achieved
during the manufacturing process.
2.2.1. As-received materials
The materials presented in this section are final products coming from different
manufacturing cycles and thus of various forms and with different microstructures. As
previously pointed out, different microstructures may lead to peculiar responses to the
ageing treatments, but a comparison between different DSS grades can be made in any
case, because the composition effect overcomes the microstructural effect in terms of
precipitation kinetics.
In the first section of this paragraph, an overview on the effects of heat treatments on
DSS microstructures is presented and a brief review of literature papers is reported. These
works mainly belong to the various activities performed in the researcher’s department on
as-received (or as-delivered) materials, but were not performed by the researcher.
However, it was thought be useful to give a comprehension of the “state of art” on what is
known about phases precipitations in DSS. All the others sub-sections of this paragraph are
instead an integral part of the Ph.D. research work and describe the results obtained from
isothermal heat treatments in various DSS grades.
2.2.1.1. State of Art: secondary phases in DSS
In this paragraph a brief review of previous works is presented, concerning the effect of
isothermal heat treatments on microstructures in various DSS grades. The following results
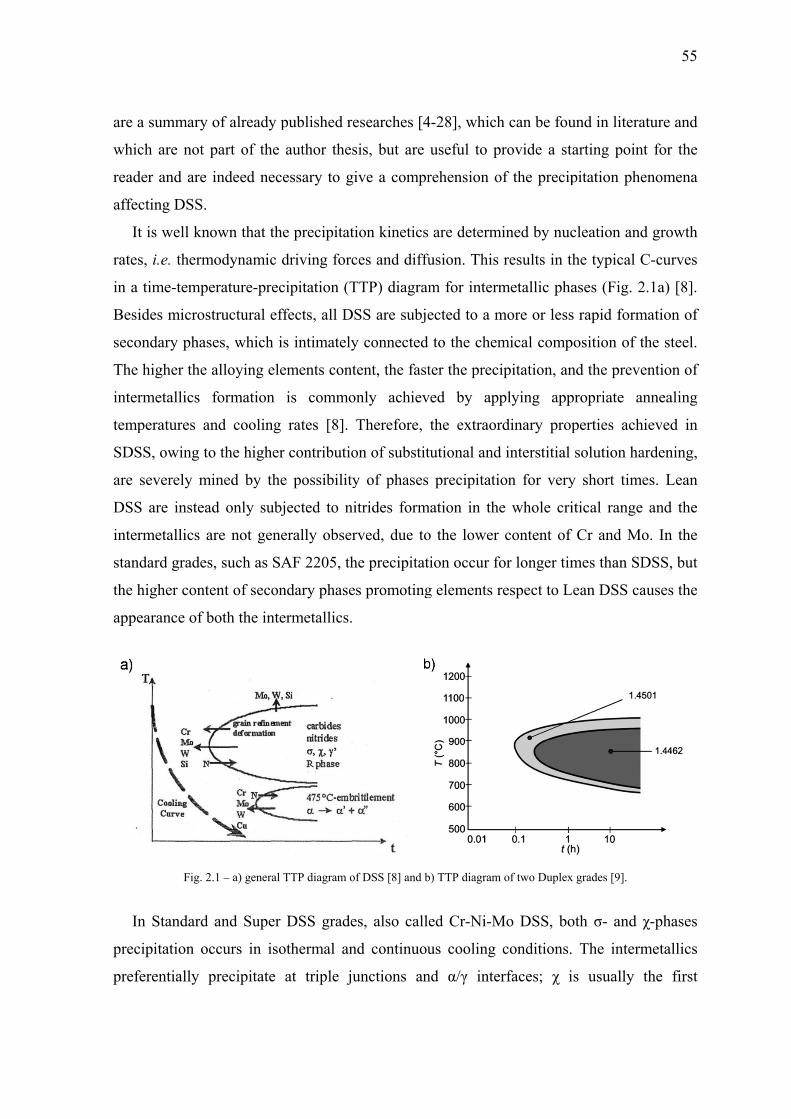
are a
whic
reade
affec
It
rates
in a t
Besid
secon
The h
interm
temp
SDS
are s
DSS
interm
stand
the h
appe
In
preci
prefe
a summary o
ch are not p
er and are i
cting DSS.
is well kno
, i.e. thermo
time-tempe
des microst
ndary phase
higher the a
metallics f
peratures an
S, owing to
severely mi
are instead
metallics ar
dard grades,
higher conte
arance of b
Fig. 2.
n Standard
ipitation oc
erentially p
of already p
part of the a
indeed nece
own that the
odynamic d
erature-preci
tructural eff
es, which is
alloying ele
formation
nd cooling
o the higher
ined by the
d only subj
re not gene
, such as SA
ent of secon
oth the inte
1 – a) general T
and Super
ccurs in iso
precipitate a
published re
author thes
essary to gi
e precipitati
driving forc
ipitation (T
fects, all DS
s intimately
ements conte
is common
rates [8]. T
contributio
e possibility
ected to nit
erally observ
AF 2205, th
ndary phases
rmetallics.
TTP diagram of
DSS grade
thermal and
at triple ju
esearches [4
is, but are
ive a compr
ion kinetics
ces and diffu
TTP) diagram
SS are subje
y connected
ent, the fast
nly achiev
Therefore,
on of substit
y of phases
trides form
ved, due to
he precipitat
s promoting
f DSS [8] and b
s, also calle
d continuou
unctions an
4-28], which
useful to p
rehension o
are determ
usion. This
m for interm
ected to a m
to the chem
ter the preci
ved by app
the extraor
tutional and
precipitatio
mation in the
o the lower
tion occur fo
g elements r
b) TTP diagram
ed Cr-Ni-M
us cooling
nd α/γ inte
h can be fou
provide a st
of the precip
mined by nuc
results in th
metallic pha
more or less
mical comp
ipitation, an
plying app
rdinary prop
d interstitial
on for very
e whole cri
content of
or longer tim
respect to L
m of two Duplex
Mo DSS, bo
conditions.
rfaces; χ i
und in litera
arting point
pitation phe
cleation and
he typical C
ases (Fig. 2
s rapid form
position of t
nd the preve
propriate an
perties ach
solution ha
y short time
itical range
f Cr and Mo
mes than SD
Lean DSS ca
x grades [9].
oth σ- and χ
The interm
is usually t
55
ature and
t for the
enomena
d growth
C-curves
2.1a) [8].
mation of
the steel.
ention of
nnealing
ieved in
ardening,
es. Lean
and the
o. In the
DSS, but
auses the
χ-phases
metallics
the first
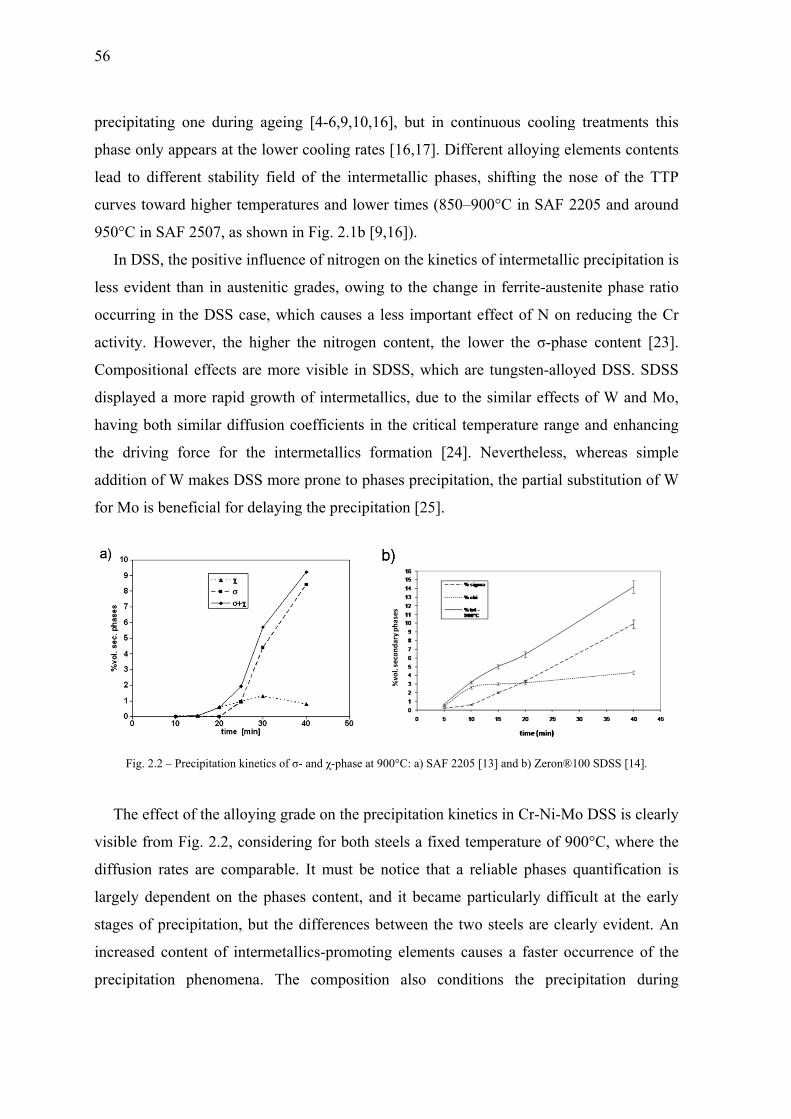
56
precipit
phase o
lead to
curves t
950°C i
In D
less evi
occurrin
activity
Compos
displaye
having
the driv
addition
for Mo
Fig.
The e
visible f
diffusio
largely
stages o
increase
precipit
tating one d
nly appears
different st
toward high
in SAF 2507
SS, the posi
dent than in
ng in the D
. However,
sitional effe
ed a more r
both simila
ving force
n of W mak
is beneficia
. 2.2 – Precipita
effect of the
from Fig. 2
on rates are
dependent
of precipitat
ed content
tation phen
during agei
s at the low
tability fiel
her tempera
7, as shown
itive influen
n austenitic
DSS case, w
, the higher
ects are mo
rapid growt
ar diffusion
for the in
kes DSS mo
al for delayi
ation kinetics of
e alloying g
2.2, conside
comparabl
on the pha
tion, but th
of intermet
nomena. Th
ing [4-6,9,1
er cooling r
ld of the in
atures and lo
n in Fig. 2.1b
nce of nitrog
c grades, ow
which causes
r the nitrog
ore visible i
th of interm
coefficient
ntermetallics
ore prone to
ng the prec
f σ- and χ-phase
grade on the
ering for bot
le. It must
ases content
he difference
tallics-prom
he compos
10,16], but
rates [16,17
ntermetallic
ower times
b [9,16]).
gen on the k
wing to the
s a less imp
gen content
in SDSS, w
metallics, du
ts in the cri
s formation
phases pre
ipitation [25
e at 900°C: a) S
e precipitatio
th steels a f
be notice t
t, and it bec
es between
moting elem
sition also
in continuo
7]. Different
phases, sh
(850–900°
kinetics of i
change in
portant effe
t, the lower
which are tu
ue to the sim
tical tempe
n [24]. Nev
cipitation, t
5].
SAF 2205 [13]
on kinetics
fixed tempe
that a reliab
came partic
the two ste
ments causes
conditions
ous cooling
t alloying el
hifting the n
C in SAF 2
intermetalli
ferrite-auste
ect of N on
r the σ-pha
ungsten-allo
milar effect
erature rang
vertheless,
the partial s
and b) Zeron®
in Cr-Ni-M
erature of 9
ble phases
cularly diffi
eels are cle
s a faster o
s the prec
g treatments
lements con
nose of the
2205 and ar
c precipitat
enite phase
reducing th
ase content
oyed DSS. S
ts of W and
e and enhan
whereas si
substitution
100 SDSS [14]
Mo DSS is cl
900°C, wher
quantificati
icult at the
early eviden
ccurrence o
cipitation d
s this
ntents
TTP
round
tion is
e ratio
he Cr
[23].
SDSS
d Mo,
ncing
imple
of W
.
learly
re the
ion is
early
nt. An
of the
during

57
continuous cooling treatments, causing an increasing of the critical cooling rate for
secondary phases formation from 0.35°C/s in SAF 2205 to 0.8–0.9°C/s in SAF 2507
[16,17].
The precipitation kinetics in DSS were extensively studied and the reported
observations, also in the same grade, were not free of discrepancies, as pointed out by
different authors in the SAF 2205 aged at 850°C [8,9,13]. However, the stability field of χ-
phase, and the relative nose of the TTP diagram, is at slightly lower temperatures than σ
[12,19] and its presence is strongly affected by compositional effects. Moreover, in
previous works, χ-phase was erroneously stated to be a metastable precursor of the more
thermodynamically stable σ-phase, whereas recent studies have pointed out that its
presence can be addressed to a competitive precipitation phenomenon between the two
intermetallics [7], as reported in Chapter 1. In equilibrium conditions, the χ-phase seems to
disappear in favour of σ, which tends to substitute ferrite and, after ageing, the ferrite-
austenite 50/50 microstructure tends to be replaced by a sigma/austenite microstructure, for
which the relative volume fraction is found to be assessed in a proportion of 75/25 for the
SAF 2205, as shown in Fig. 2.3.
Fig. 2.3 – Evolution of α, γ and σ-phase volume fractions at 850°C
in a 2205 DSS [8].
According to the precipitation temperature, the morphology of the σ-phase changes
(Fig. 2.4). At the lowest precipitation temperatures (750°C), a coral-like structure of σ-
phase can be found. The amount of single σ nuclei at the beginning of the precipitation is
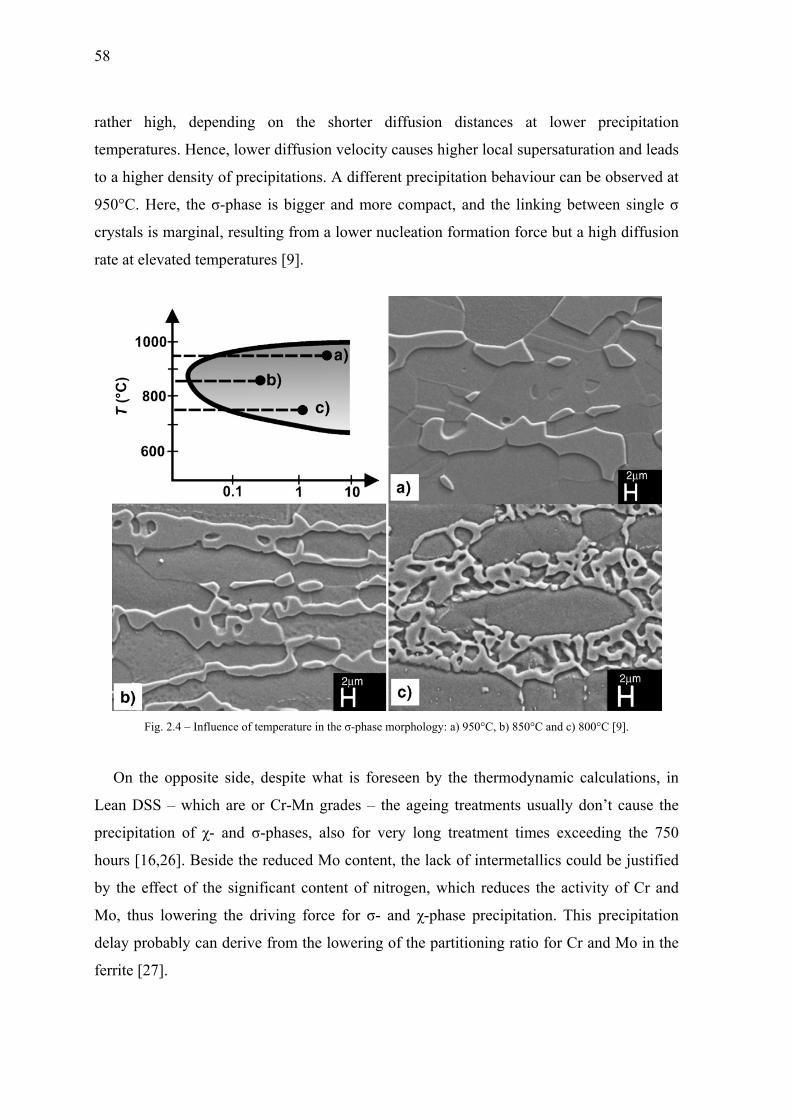
58
rather high, depending on the shorter diffusion distances at lower precipitation
temperatures. Hence, lower diffusion velocity causes higher local supersaturation and leads
to a higher density of precipitations. A different precipitation behaviour can be observed at
950°C. Here, the σ-phase is bigger and more compact, and the linking between single σ
crystals is marginal, resulting from a lower nucleation formation force but a high diffusion
rate at elevated temperatures [9].
Fig. 2.4 – Influence of temperature in the σ-phase morphology: a) 950°C, b) 850°C and c) 800°C [9].
On the opposite side, despite what is foreseen by the thermodynamic calculations, in
Lean DSS – which are or Cr-Mn grades – the ageing treatments usually don’t cause the
precipitation of χ- and σ-phases, also for very long treatment times exceeding the 750
hours [16,26]. Beside the reduced Mo content, the lack of intermetallics could be justified
by the effect of the significant content of nitrogen, which reduces the activity of Cr and
Mo, thus lowering the driving force for σ- and χ-phase precipitation. This precipitation
delay probably can derive from the lowering of the partitioning ratio for Cr and Mo in the
ferrite [27].
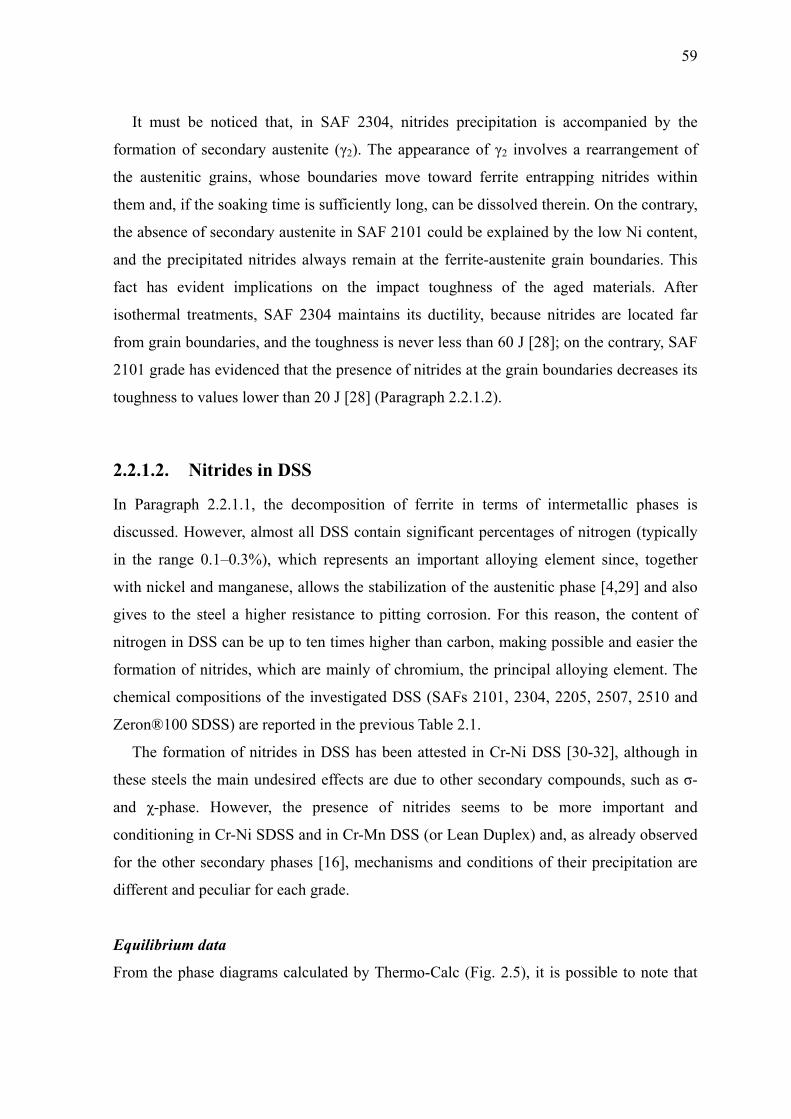
59
It must be noticed that, in SAF 2304, nitrides precipitation is accompanied by the
formation of secondary austenite (γ2). The appearance of γ2 involves a rearrangement of
the austenitic grains, whose boundaries move toward ferrite entrapping nitrides within
them and, if the soaking time is sufficiently long, can be dissolved therein. On the contrary,
the absence of secondary austenite in SAF 2101 could be explained by the low Ni content,
and the precipitated nitrides always remain at the ferrite-austenite grain boundaries. This
fact has evident implications on the impact toughness of the aged materials. After
isothermal treatments, SAF 2304 maintains its ductility, because nitrides are located far
from grain boundaries, and the toughness is never less than 60 J [28]; on the contrary, SAF
2101 grade has evidenced that the presence of nitrides at the grain boundaries decreases its
toughness to values lower than 20 J [28] (Paragraph 2.2.1.2).
2.2.1.2. Nitrides in DSS
In Paragraph 2.2.1.1, the decomposition of ferrite in terms of intermetallic phases is
discussed. However, almost all DSS contain significant percentages of nitrogen (typically
in the range 0.1–0.3%), which represents an important alloying element since, together
with nickel and manganese, allows the stabilization of the austenitic phase [4,29] and also
gives to the steel a higher resistance to pitting corrosion. For this reason, the content of
nitrogen in DSS can be up to ten times higher than carbon, making possible and easier the
formation of nitrides, which are mainly of chromium, the principal alloying element. The
chemical compositions of the investigated DSS (SAFs 2101, 2304, 2205, 2507, 2510 and
Zeron®100 SDSS) are reported in the previous Table 2.1.
The formation of nitrides in DSS has been attested in Cr-Ni DSS [30-32], although in
these steels the main undesired effects are due to other secondary compounds, such as σ-
and χ-phase. However, the presence of nitrides seems to be more important and
conditioning in Cr-Ni SDSS and in Cr-Mn DSS (or Lean Duplex) and, as already observed
for the other secondary phases [16], mechanisms and conditions of their precipitation are
different and peculiar for each grade.
Equilibrium data
From the phase diagrams calculated by Thermo-Calc (Fig. 2.5), it is possible to note that

60
nitrides
equilibr
alloy ni
minimu
alloyed
ferrite
Consequ
solubili
Cr-Mn g
In these
promoti
reductio
The 2
characte
ferrite a
limit), a
(Cr2N),
accurate
ageing
times sm
750°C t
are equili
rium for tem
itrogen con
um of about
Cr-Ni grad
nitrogen is
uently, in t
sation temp
grades: SA
e steels, the
ing Mn in r
on in χ- and
2101 DSS,
erized by ni
and austenit
appeared to
but the pr
e distinction
times short
mall nitride
the precipita
ibrium pha
mperatures
ncentration a
1.5–2% of
des. As exp
s present a
the non-equ
perature, the
Fig. 2.5 – Cal
AF 2101 and
e balanced m
replacement
d σ-phase pr
isothermall
itrides preci
te. The prec
o be enrich
resence of
n by SEM-
ter than 40
es began to
ation occurr
ases in all
below 950–
and on the
f the volume
pected, nitr
at lower c
uilibrium m
e ferrite is g
culated phase d
d SAF 2304
microstructu
t of Ni, whi
recipitation.
ly heat treat
ipitation, lo
cipitates, an
hed in chrom
chromium
-BSE inves
minutes, th
o appear at
red after on
DSS and
–1000°C. T
overall com
e fraction in
rogen is m
concentratio
microstructur
enerally sup
diagrams: a) SA
4
ure is obtai
ile the low
ted in the te
ocated at the
nalyzed by
mium and
carbides (M
stigation is n
he precipita
the ferritic
nly 20 minut
are forese
The amount
mposition o
n 2205 DSS
ainly disso
ons, mainly
re obtained
persaturated
AF 2101 and b)
ined by add
content of
emperature r
e ferritic gra
means of E
were ident
M23C6) can
not guarant
ation has n
grain boun
tes and nitri
een at the
t of nitrides
of the steel,
S to about 4–
lved in aus
y at elevat
by rapid c
d in nitrogen
SAF 2205.
ding high co
Mo allows
range 600–
ain boundar
EDS (close
tified as ch
nnot be exc
teed. At 600
not occurred
ndaries. On
ides continu
thermodyn
s depends o
, ranging fr
–5% in the
stenite, whi
ted tempera
cooling from
n.
ontents of t
for a signif
–950°C, was
ries and bet
to the resol
hromium nit
cluded, sinc
0–650°C an
d, but for lo
n the contra
ued to be pr
namic
on the
rom a
high-
ile in
ature.
m the
the γ-
ficant
s only
tween
lution
trides
ce an
nd for
onger
ary, at
resent
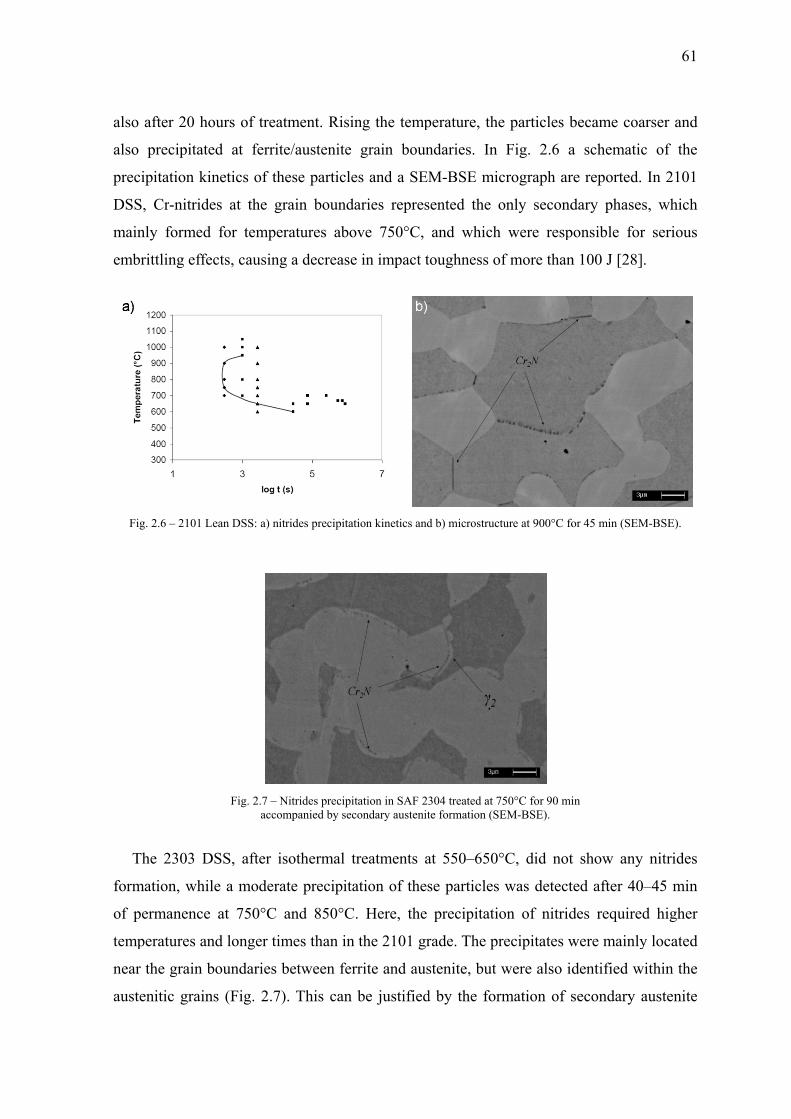
also
also
preci
DSS
main
embr
Fig
Th
form
of pe
temp
near
auste
after 20 ho
precipitate
ipitation kin
, Cr-nitride
nly formed
rittling effec
g. 2.6 – 2101 Le
he 2303 DS
mation, while
ermanence
peratures an
the grain b
enitic grains
ours of treat
ed at ferrite
netics of the
es at the gr
for temper
cts, causing
ean DSS: a) nitr
Fig. 2.7 – Naccom
SS, after is
e a modera
at 750°C a
nd longer tim
oundaries b
s (Fig. 2.7)
tment. Risin
e/austenite
ese particle
rain bounda
ratures abov
g a decrease
rides precipitati
Nitrides precipitmpanied by seco
sothermal tr
ate precipita
and 850°C.
mes than in
between ferr
. This can b
ng the temp
grain boun
s and a SEM
aries repres
ve 750°C,
in impact t
ion kinetics and
tation in SAF 23ondary austenit
reatments a
ation of thes
. Here, the
the 2101 gr
rite and aus
be justified
perature, the
ndaries. In
M-BSE mic
sented the o
and which
toughness o
d b) microstruct
304 treated at 7te formation (SE
at 550–650°
se particles
precipitatio
rade. The pr
stenite, but
d by the for
e particles b
Fig. 2.6 a
crograph ar
only second
h were resp
f more than
ture at 900°C fo
750°C for 90 miEM-BSE).
°C, did not
was detect
on of nitrid
recipitates w
were also id
rmation of s
became coa
a schematic
re reported.
dary phases
ponsible for
n 100 J [28]
or 45 min (SEM
in
t show any
ted after 40–
des required
were mainly
dentified w
secondary a
61
arser and
c of the
In 2101
s, which
r serious
.
M-BSE).
nitrides
–45 min
d higher
y located
within the
austenite
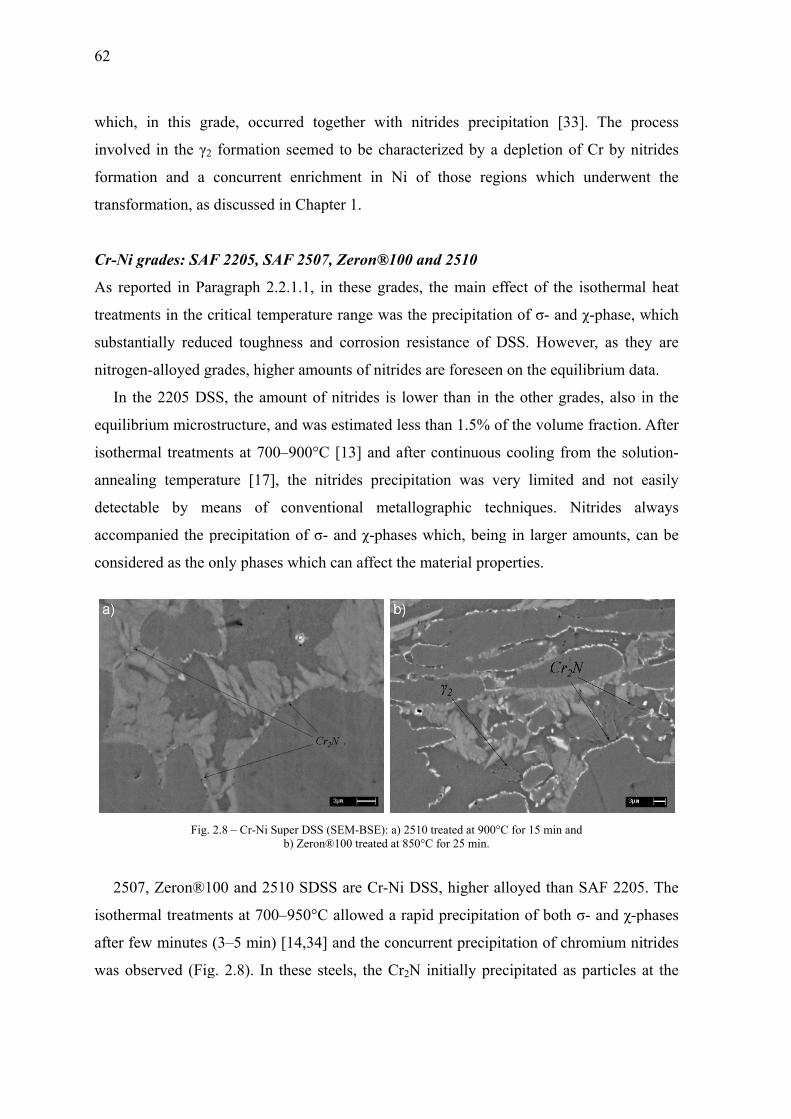
62
which,
involved
formatio
transfor
Cr-Ni g
As repo
treatmen
substant
nitrogen
In th
equilibr
isotherm
annealin
detectab
accomp
conside
2507
isotherm
after few
was obs
in this gra
d in the γ2
on and a c
rmation, as d
grades: SAF
orted in Par
nts in the c
tially reduc
n-alloyed gr
he 2205 DS
rium micros
mal treatme
ng tempera
ble by me
panied the p
red as the o
Fig. 2
7, Zeron®10
mal treatme
w minutes (
served (Fig
ade, occurr
formation
concurrent
discussed in
F 2205, SAF
ragraph 2.2
ritical temp
ced toughne
rades, highe
SS, the amo
structure, an
ents at 700–
ature [17],
eans of c
precipitation
only phases
2.8 – Cr-Ni Supb
00 and 251
nts at 700–
(3–5 min) [
g. 2.8). In th
red togethe
seemed to
enrichment
n Chapter 1
F 2507, Zer
.1.1, in the
perature ran
ess and cor
er amounts o
ount of nitri
nd was estim
–900°C [13]
the nitrides
conventiona
n of σ- and
which can a
per DSS (SEM-b) Zeron®100 t
0 SDSS are
–950°C allow
14,34] and
hese steels,
er with nitr
be characte
t in Ni of
.
ron®100 an
ese grades, t
nge was the
rrosion resi
of nitrides a
ides is lowe
mated less t
] and after
s precipitat
al metallog
χ-phases w
affect the m
-BSE): a) 2510 treated at 850°C
e Cr-Ni DS
wed a rapid
the concurr
the Cr2N i
rides precip
erized by a
f those reg
nd 2510
the main ef
precipitatio
istance of D
are foreseen
er than in th
than 1.5% o
continuous
tion was v
graphic tec
which, being
material prop
treated at 900°C for 25 min.
S, higher a
d precipitati
rent precipi
initially pre
pitation [33
depletion o
ions which
ffect of the
on of σ- and
DSS. Howe
n on the equ
he other gr
of the volum
cooling fro
ery limited
chniques. N
g in larger
perties.
C for 15 min an
alloyed than
ion of both
itation of ch
ecipitated as
3]. The pr
of Cr by nit
h underwen
e isothermal
d χ-phase, w
ever, as the
uilibrium da
ades, also i
me fraction.
om the solu
d and not e
Nitrides al
amounts, c
nd
n SAF 2205
σ- and χ-p
hromium nit
s particles a
rocess
trides
nt the
l heat
which
ey are
ata.
in the
After
ution-
easily
lways
an be
5. The
phases
trides
at the
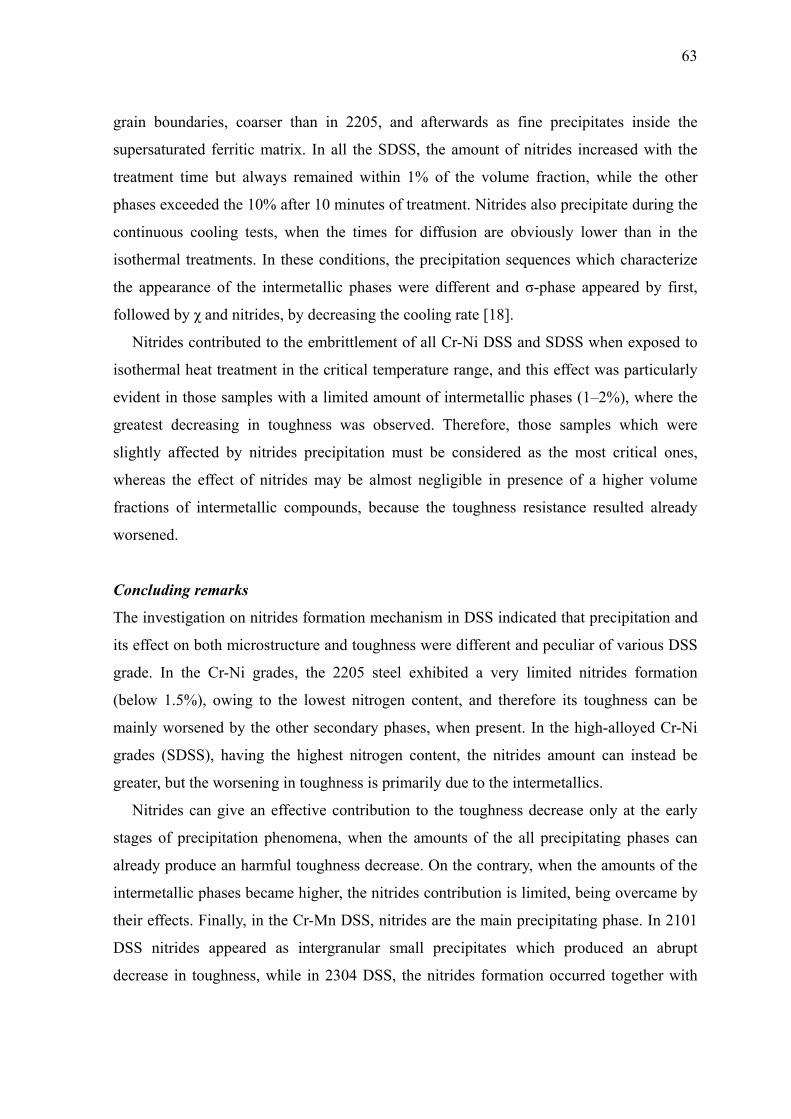
63
grain boundaries, coarser than in 2205, and afterwards as fine precipitates inside the
supersaturated ferritic matrix. In all the SDSS, the amount of nitrides increased with the
treatment time but always remained within 1% of the volume fraction, while the other
phases exceeded the 10% after 10 minutes of treatment. Nitrides also precipitate during the
continuous cooling tests, when the times for diffusion are obviously lower than in the
isothermal treatments. In these conditions, the precipitation sequences which characterize
the appearance of the intermetallic phases were different and σ-phase appeared by first,
followed by χ and nitrides, by decreasing the cooling rate [18].
Nitrides contributed to the embrittlement of all Cr-Ni DSS and SDSS when exposed to
isothermal heat treatment in the critical temperature range, and this effect was particularly
evident in those samples with a limited amount of intermetallic phases (1–2%), where the
greatest decreasing in toughness was observed. Therefore, those samples which were
slightly affected by nitrides precipitation must be considered as the most critical ones,
whereas the effect of nitrides may be almost negligible in presence of a higher volume
fractions of intermetallic compounds, because the toughness resistance resulted already
worsened.
Concluding remarks
The investigation on nitrides formation mechanism in DSS indicated that precipitation and
its effect on both microstructure and toughness were different and peculiar of various DSS
grade. In the Cr-Ni grades, the 2205 steel exhibited a very limited nitrides formation
(below 1.5%), owing to the lowest nitrogen content, and therefore its toughness can be
mainly worsened by the other secondary phases, when present. In the high-alloyed Cr-Ni
grades (SDSS), having the highest nitrogen content, the nitrides amount can instead be
greater, but the worsening in toughness is primarily due to the intermetallics.
Nitrides can give an effective contribution to the toughness decrease only at the early
stages of precipitation phenomena, when the amounts of the all precipitating phases can
already produce an harmful toughness decrease. On the contrary, when the amounts of the
intermetallic phases became higher, the nitrides contribution is limited, being overcame by
their effects. Finally, in the Cr-Mn DSS, nitrides are the main precipitating phase. In 2101
DSS nitrides appeared as intergranular small precipitates which produced an abrupt
decrease in toughness, while in 2304 DSS, the nitrides formation occurred together with

64
the formation of significant amounts of secondary austenite. In this latter case, nitrides
remained embedded within the enlarged austenitic grains and this different location
reduced their harmful effects on toughness which was instead weakly reduced.
2.2.1.3. New Lean DSS: LDX 2101 and LDX 2404
Previous studies have shown that the precipitation of the two intermetallic compounds χ-
and σ-phase only interests the high-alloyed DSS grades, due to the higher content of
alloying elements, while the low-alloyed Lean DSS seemed only interested by the
formation of nitrides [16]. In this paragraph, the microstructural modifications resulting
from isothermal treatments in two Lean DSS steels is discussed, with the aim to examine
their microstructural stability for a relatively short soaking times and in conditions close to
equilibrium.
Table 2.3 – Chemical composition of the Lean Duplex Stainless Steels.
Grade C Si Mn Cr Ni Mo Cu P S N PREN
LDX 2101 0.025 0.65 5.13 21.57 1.56 0.28 0.30 0.019 0.0010 0.23 26
LDX 2404 0.022 0.33 2.83 24.41 3.34 1.54 0.42 0.021 0.0004 0.25 33.5
The investigated Lean Duplex steels were two new-developed grades (LDX 2101 and
LDX 2404), whose composition is reported in Table 2.3 together with the corresponding
PREN index. As can be seen, the composition of LDX 2101 is not so far from that of SAF
2101, whereas LDX 2404 differs from the steels of the same category for a higher amount
of molybdenum.
The two Lean DSS were in the form of sheet, obtained from cold rolling with a
maximum thickness reduction of 50%, solubilised at the proper temperature and
subsequently water quenched. The materials were then subjected to the same isothermal
heat treatments, at different temperatures within the whole DSS critical temperature range
(600–1000°C) and for various soaking times (from 10 minutes to 100 hours), in order to
compare the obtained results in terms of atomic mobility and diffusion mechanisms, which
are strongly temperature-dependent.

Micr
The m
expe
with
anne
nearl
form
rollin
inves
on th
abou
Th
diagr
equil
certa
wher
time-
Th
phas
highe
that p
fores
rostructures
microstruct
cted, exhib
a partial r
aling treatm
ly the same
ming process
ng process
stigation, es
he OM micr
ut 52% ferrit
Fig. 2.9
he ageing
rams obtain
librium mic
ain phases m
re the name
-temperatur
he analysis
e at equilib
er temperat
promote its
seen, as it
s and equili
tures of the
bited the cla
recrystalliza
ment. In th
e chemical
s cannot be
can conditi
specially in
rographs con
te and 48%
9 – Microstruct
temperatur
ned by ther
crostructure
may be favo
es of the tw
re combinat
of the phas
rium in bot
tures in 240
formation
instead hap
ibrium pha
steels in the
assical grain
ation of the
his regard,
compositio
e neglected
ion in some
n the first st
nfirmed tha
austenite.
tures of the as-r
res were ch
rmodynamic
and therefo
oured. The
wo DSS (2
tions.
se diagrams
th the steels
04, probably
(in particul
ppens for th
se diagram
e as-receive
n fragmenta
e austenitic
comparing
on – the ro
d, and the g
e extent the
tages of pre
at the phases
received sample
hosen after
c simulation
fore on thos
performed
101 and 24
s shown in F
s, with a sta
y due to the
lar Cr and M
he highly a
s
ed condition
ation due to
c grains du
nominally
ole of micr
grain fragm
e precipitati
ecipitation. T
s of both ste
es (OM): a) LD
r the analy
ns, which c
se temperatu
treatments
404) are pla
Fig. 2.10, h
ability field
e higher co
Mo). On the
alloyed DS
ns are shown
o the previo
ue to the su
y equal DS
rostructure
mentation in
on kinetics
The image-
eels were w
DX 2101 and b)
ysis of the
can provide
ures at whic
are summa
aced in cor
highlighted
slightly mo
ontent of the
e contrary, t
S [6-LEAN
n in Fig. 2.9
ous rolling
ubsequent s
S grades –
achieved a
nduced by
in the stee
-analysis pe
well balanced
LDX 2404.
equilibrium
e indication
ch the form
arized in Ta
rrespondenc
the predicti
ore enlarged
e alloying e
the χ-phase
N], and this
65
9 and, as
process,
solution-
– having
after the
the cold
els under
erformed
d, with a
m phase
s on the
mation of
able 2.4,
ce of the
ion of σ-
d toward
elements
was not
s can be
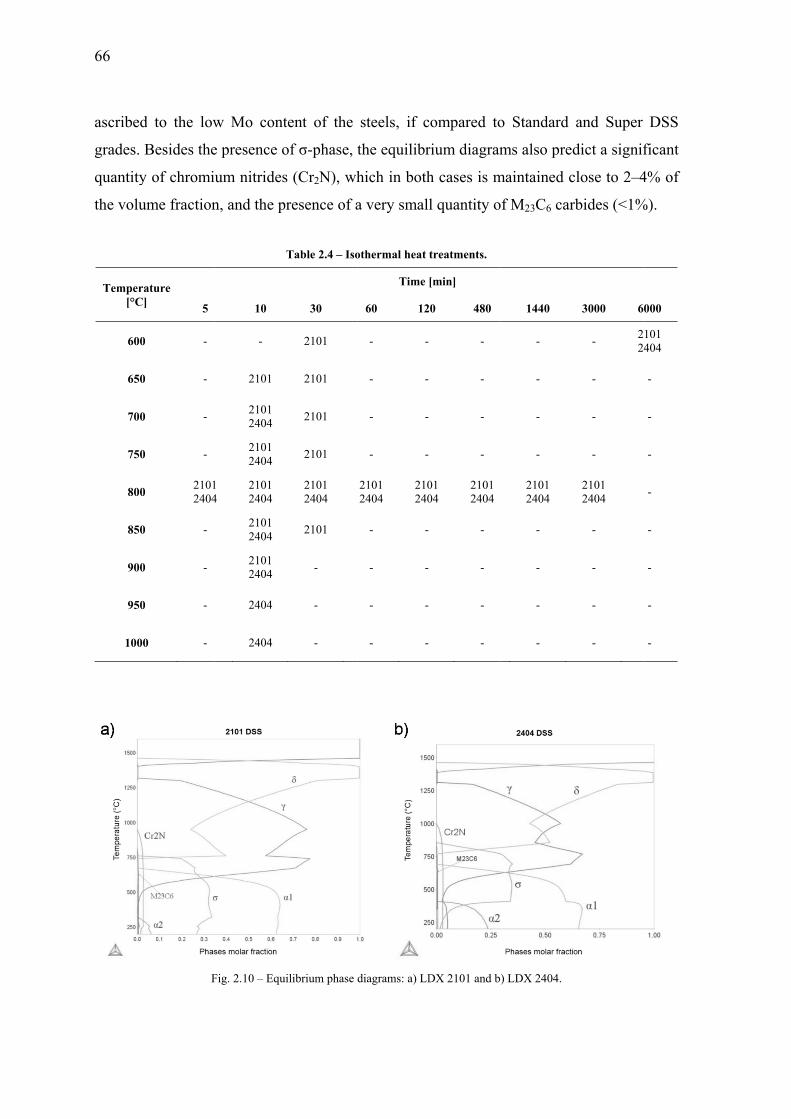
66
ascribed
grades.
quantity
the volu
Temper[°C
600
650
700
750
800
850
900
950
100
d to the low
Besides the
y of chromi
ume fraction
rature ] 5
0 -
0 -
0 -
0 -
0 21012404
0 -
0 -
0 -
0 -
F
w Mo cont
e presence o
um nitrides
n, and the p
10
-
2101
2101 2404
2101 2404
1 4
2101 2404
2101 2404
2101 2404
2404
2404
Fig. 2.10 – Equi
tent of the
of σ-phase, t
s (Cr2N), wh
resence of a
Table 2.4 – Iso
30
2101
2101
2101
2101
2101 2404
2101
-
-
-
ilibrium phase
steels, if c
the equilibr
hich in both
a very small
othermal heat
Time
60 12
- -
- -
- -
- -
2101 2404
210240
- -
- -
- -
- -
diagrams: a) LD
compared to
rium diagram
h cases is m
l quantity o
treatments.
[min]
20 480
-
-
-
-
01 04
2101 2404
-
-
-
-
DX 2101 and b
o Standard
ms also pre
maintained c
of M23C6 car
1440
-
-
-
-
2101 2404
-
-
-
-
) LDX 2404.
and Super
dict a signif
close to 2–4
rbides (<1%
3000 6
- 22
-
-
-
2101 2404
-
-
-
-
DSS
ficant
4% of
%).
000
101 404
-
-
-
-
-
-
-
-

In
(appr
the d
equil
equil
falls
600°
As p
both
detec
2101
Th
struc
spect
signi
C
recei
peak
the s
allow
n both diagr
roximately
diffusion pr
librium con
librium con
in the σ-ph
°C isotherm
previously r
steels. Ho
cted, prefer
1 than in 240
Fig. 2.
hese partic
cture), but t
tra acquired
ificant enric
omparing th
ived conditi
k, the Cr2N
solely prese
wed to attrib
rams, at 60
30% of the
rocesses, th
nditions is v
ndition may
ase stability
mal heat trea
reported, at
owever, afte
rentially arr
04 (Fig. 2.1
.11 – Microstru
cles were
their size w
d on such
chment in C
he diffractio
ions (Fig. 2
principal p
ence of the
bute it to thi
00°C, it is p
e volume fr
his temperat
very long. A
be reached
y field, in 2
atments
600°C the
er a 100 h
ranged at fe
1).
uctures after isoa) LDX
identified b
was below t
particles in
Cr was detec
on spectra o
2.12), it is
peak (2θ ≈ 6
main peak
is class of n
possible to
raction) but
ture is very
At 800°C, d
d in shorter
101 it falls o
calculation
hours treatm
erritic grain
othermal treatmeX 2101 and b) L
by XRD a
the EDS de
ncluded the
cted.
obtained on
possible to
65.4°). The
k, whose int
nitrides.
notice app
t, if one co
y low and t
diffusion is
time but, w
outside of th
ns provide t
ment, only
n boundarie
ents at 600°C foLDX 2404.
as Cr2N ch
etection lim
e signal fro
the treated
o notice, jus
low volum
tensity was
preciable qu
nsiders the
the required
faster and
while for 24
hat range.
the presenc
small dark
es and in g
for 100 hours (S
hromium n
mit. Howeve
om the surr
materials w
st before th
me fraction
s very low
uantities of
kinetics go
d time to re
the thermod
404 this tem
e of the σ-p
k precipitat
greater quan
SEM-BSE):
nitrides (he
er, even if t
rounding m
with those in
he γ(111) a
of nitrides
but whose
67
σ-phase
overning
each the
dynamic
mperature
phase in
tes were
ntities in
exagonal
the EDS
matrix, a
n the as-
ustenitic
justified
position
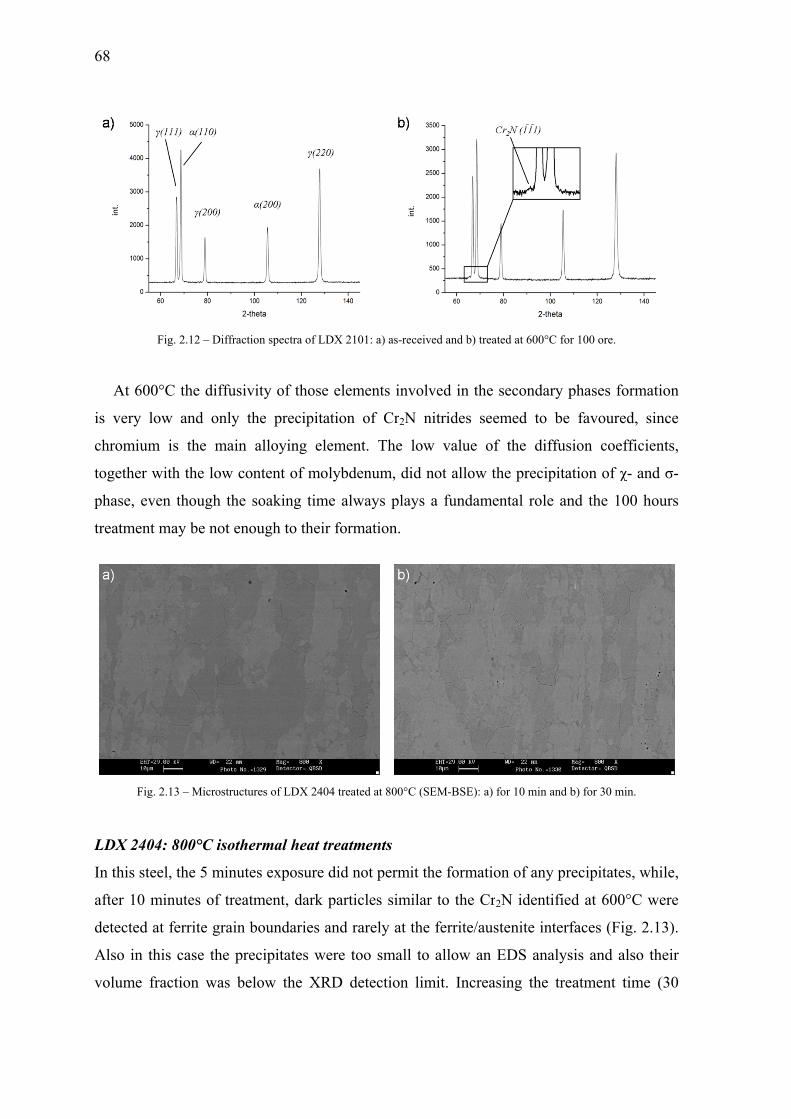
68
At 60
is very
chromiu
together
phase, e
treatmen
F
LDX 24
In this s
after 10
detected
Also in
volume
Fig. 2.12 – D
00°C the di
low and o
um is the
r with the lo
even though
nt may be n
Fig. 2.13 – Micr
404: 800°C
steel, the 5 m
0 minutes o
d at ferrite g
this case t
fraction w
Diffraction spec
iffusivity of
only the pr
main alloy
ow content
h the soakin
not enough t
rostructures of L
isothermal
minutes exp
f treatment,
grain bound
he precipita
was below t
ctra of LDX 21
f those elem
recipitation
ying elemen
of molybde
ng time alw
to their form
LDX 2404 treat
l heat treatm
posure did n
, dark parti
daries and r
ates were to
the XRD d
01: a) as-receiv
ments involv
of Cr2N n
nt. The low
enum, did n
ways plays
mation.
ted at 800°C (S
ments
not permit th
cles similar
rarely at the
oo small to
detection lim
ved and b) treat
ved in the s
nitrides seem
w value of
not allow th
a fundamen
EM-BSE): a) fo
he formatio
r to the Cr2
e ferrite/aust
allow an E
mit. Increas
ed at 600°C for
secondary p
med to be
the diffus
he precipitat
ntal role an
for 10 min and b
on of any pre
2N identified
tenite interf
EDS analys
sing the tre
r 100 ore.
phases form
favoured,
ion coeffic
tion of χ- a
nd the 100 h
b) for 30 min.
ecipitates, w
d at 600°C
faces (Fig. 2
sis and also
atment tim
mation
since
cients,
and σ-
hours
while,
were
2.13).
their
e (30

min)
notic
XRD
N
Conv
new
signi
comp
1). A
signi
In
the a
2.14)
alloy
, any subst
ceably incre
D.
Tabl
Cr
30
Nevertheless
versely to w
phase was
ificantly en
position wa
After 2 hou
ificantly ext
F
ncreasing th
almost total
), highlighti
yed DSS. A
tantial grow
eased (Fig. 2
e 2.5 – Chemic
M
, the steel’s
what happen
s observed.
nriched in C
as within th
urs treatmen
tent to enab
Fig. 2.14 – Micr
he soaking ti
l decompos
ing that suc
Again, the E
wth in parti
2.13), rema
cal composition
Mo
3
s behaviour
ns to other
The EDS
Cr and Mo
e provided
nt (Fig. 2.14
ble its detect
rostructural evo
ime, a progr
sition of fer
ch transform
EDS analysi
icles size w
ining howe
n of σ-phase in
Ni
2
r as a result
Lean DSS
analysis c
o if compa
ranges for
4), the volu
tion by XRD
olution of LDX
ressive incr
rrite was re
mation occu
is and the X
was not obs
ver not iden
n LDX 2404 (1
t of longer
, after 1 ho
confirmed i
ared to ferr
this interme
ume fraction
D analysis.
2404 treated at
rease in σ-ph
eached afte
urred very sl
XRD spectr
served, whe
ntifiable by
hour at 800°C
Mn
3.5
treatment t
our of perm
it to be σ-
rite and au
etallic comp
n of σ incr
t 800°C (SEM-B
hase amoun
er 50 hours
lowly if com
rum (Fig. 2
ereas their
y means of E
C) [wt.%].
Fe
bal
times was d
manence at
-phase (Tab
ustenite and
pound (see
reased, but
BSE).
nt was obser
s of treatme
mpared to t
.15) confirm
69
quantity
EDS and
l
different.
800°C a
ble 2.5),
d whose
Chapter
not in a
rved and
ent (Fig.
the high-
med that
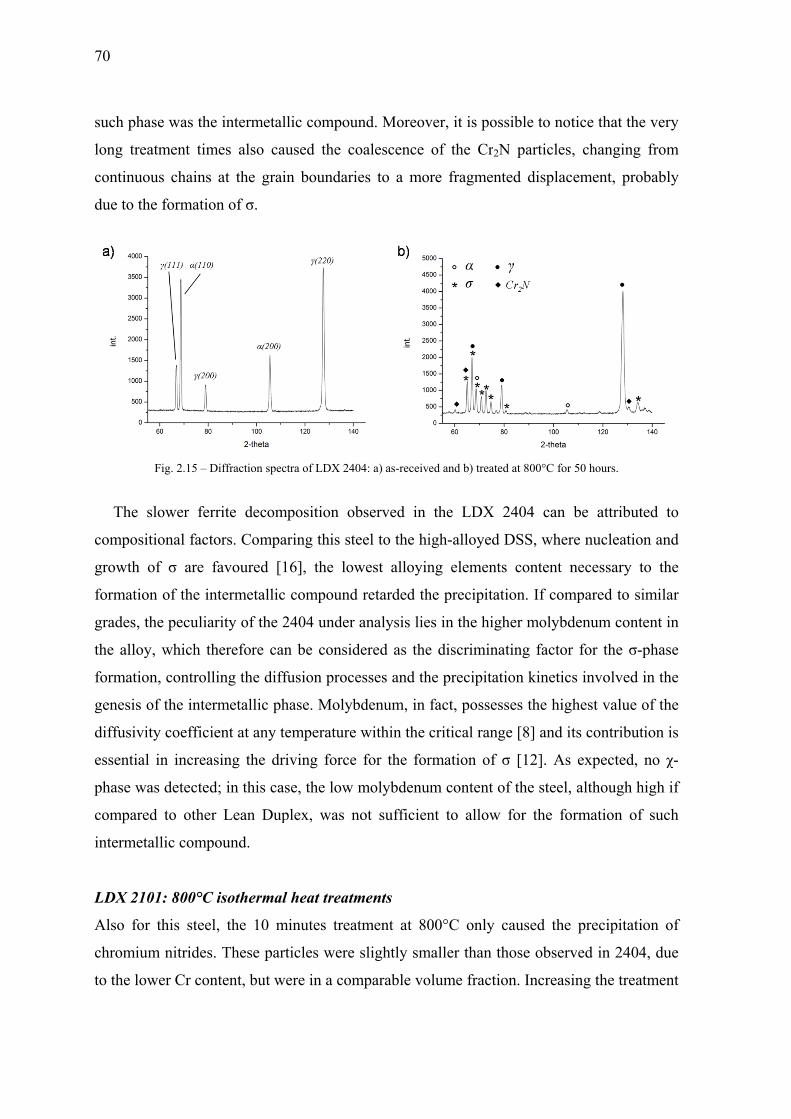
70
such ph
long tre
continuo
due to th
The
compos
growth
formatio
grades,
the allo
formatio
genesis
diffusiv
essentia
phase w
compare
interme
LDX 21
Also fo
chromiu
to the lo
hase was the
eatment tim
ous chains
he formatio
Fig. 2.15 – D
slower fer
sitional facto
of σ are f
on of the in
the peculiar
oy, which th
on, controll
of the inter
vity coefficie
al in increas
was detected
ed to other
tallic comp
101: 800°C
or this steel
um nitrides.
ower Cr con
e intermetal
mes also cau
at the grai
on of σ.
Diffraction spec
rrite decom
ors. Compa
favoured [1
ntermetallic
rity of the 2
herefore can
ling the diff
rmetallic ph
ent at any te
sing the dri
d; in this cas
r Lean Dup
ound.
isothermal
l, the 10 m
. These part
ntent, but w
lic compou
used the co
in boundari
ctra of LDX 240
mposition ob
aring this ste
16], the low
compound
2404 under
n be consid
fusion proce
hase. Molyb
emperature
iving force
se, the low
plex, was n
l heat treatm
minutes treat
ticles were
ere in a com
und. Moreov
oalescence
es to a mo
04: a) as-receiv
bserved in
eel to the hi
west alloyin
d retarded th
analysis lie
dered as the
esses and th
bdenum, in
within the
for the for
molybdenu
not sufficien
ments
tment at 80
slightly sm
mparable vo
ver, it is pos
of the Cr2N
ore fragmen
ed and b) treate
the LDX
igh-alloyed
ng element
he precipitat
es in the hig
e discrimina
he precipitat
fact, posses
critical rang
rmation of
um content o
nt to allow
00°C only
maller than t
olume fracti
ssible to not
N particles
nted displac
ed at 800°C for
2404 can
DSS, wher
ts content n
tion. If com
gher molybd
ating factor
tion kinetic
sses the hig
ge [8] and it
σ [12]. As
of the steel,
for the fo
caused the
those observ
on. Increasi
tice that the
, changing
cement, prob
50 hours.
be attribut
re nucleation
necessary t
mpared to si
denum conte
r for the σ-p
s involved i
hest value o
ts contribut
expected,
although h
ormation of
precipitatio
ved in 2404
ing the treat
e very
from
bably
ed to
n and
to the
imilar
ent in
phase
in the
of the
tion is
no χ-
high if
f such
on of
4, due
tment
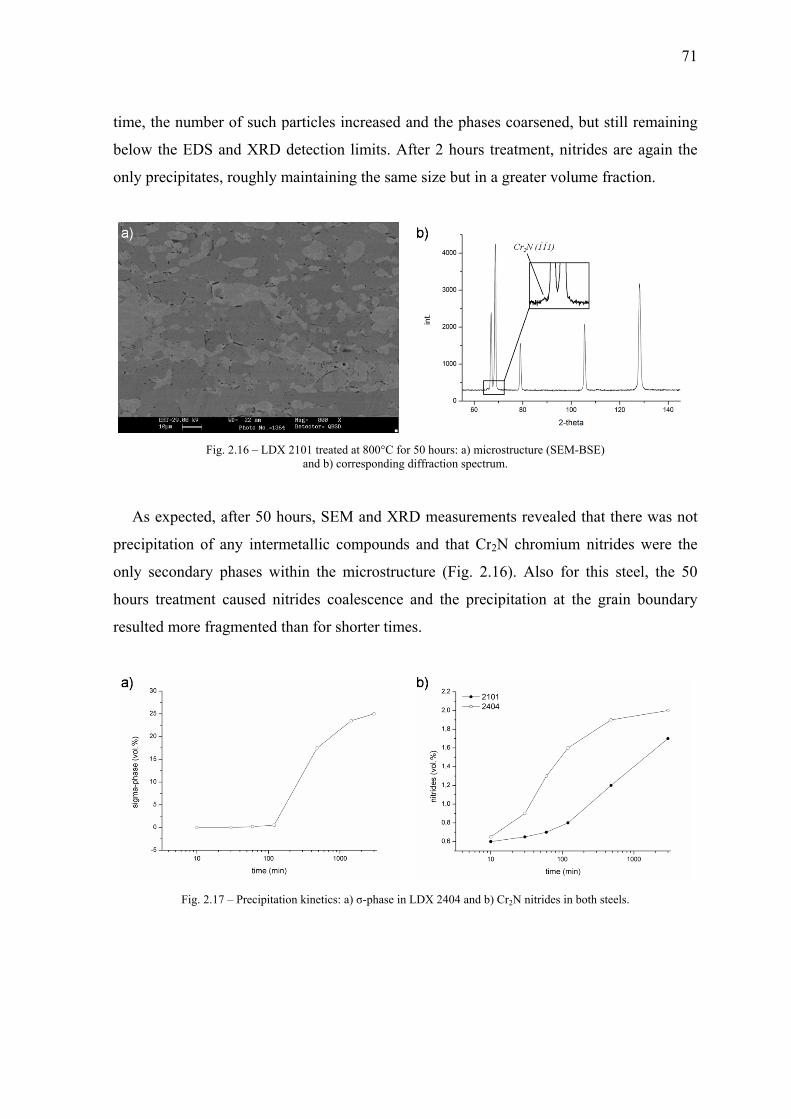
time,
below
only
A
preci
only
hour
resul
, the numbe
w the EDS
precipitates
Fi
As expected,
ipitation of
secondary
s treatment
lted more fr
Fig. 2.1
er of such p
and XRD
s, roughly m
ig. 2.16 – LDX
, after 50 ho
f any interm
phases wit
t caused nit
ragmented th
17 – Precipitatio
particles inc
detection li
maintaining
2101 treated atand b) corre
ours, SEM
metallic com
thin the mi
trides coale
han for shor
on kinetics: a) σ
creased and
imits. After
the same si
t 800°C for 50 hesponding diffr
and XRD m
mpounds an
icrostructur
escence and
rter times.
σ-phase in LDX
the phases
r 2 hours tre
ize but in a
hours: a) microaction spectrum
measuremen
nd that Cr2N
e (Fig. 2.16
d the precip
X 2404 and b) C
coarsened,
eatment, ni
greater volu
ostructure (SEMm.
nts revealed
N chromium
6). Also fo
pitation at t
Cr2N nitrides in
, but still re
trides are a
ume fractio
M-BSE)
d that there
m nitrides w
or this steel
the grain b
n both steels.
71
emaining
again the
n.
was not
were the
l, the 50
boundary
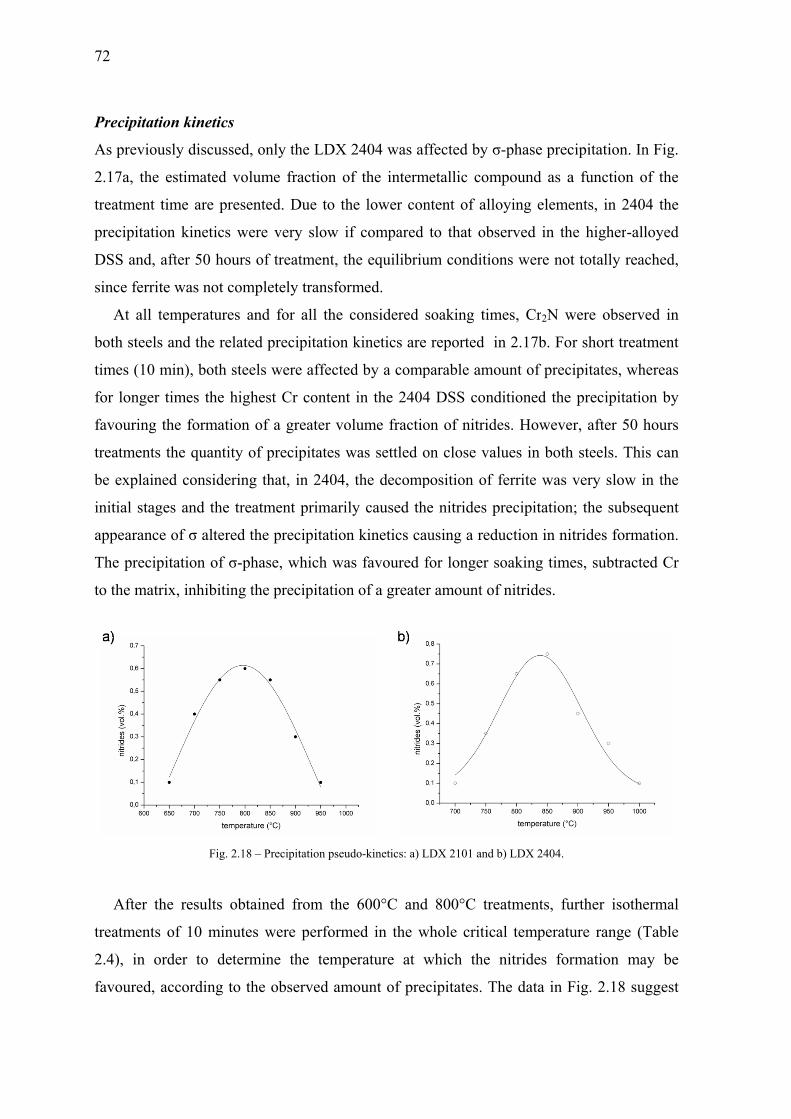
72
Precipit
As prev
2.17a, t
treatmen
precipit
DSS an
since fe
At a
both ste
times (1
for long
favourin
treatmen
be expla
initial s
appeara
The pre
to the m
After
treatmen
2.4), in
favoure
tation kinet
viously discu
the estimate
nt time are
tation kineti
nd, after 50
errite was no
ll temperatu
eels and the
10 min), bot
ger times th
ng the form
nts the quan
ained consi
tages and t
ance of σ alt
ecipitation o
matrix, inhib
F
r the result
nts of 10 m
n order to
d, accordin
tics
ussed, only
ed volume
presented.
ics were ve
hours of tre
ot complete
ures and fo
related pre
th steels we
he highest C
mation of a
ntity of pre
idering that
he treatmen
tered the pr
of σ-phase,
biting the pr
Fig. 2.18 – Preci
ts obtained
minutes wer
determine
ng to the ob
the LDX 2
fraction of
Due to the
ery slow if
eatment, the
ly transform
or all the co
ecipitation k
ere affected
Cr content i
greater volu
ecipitates w
t, in 2404, t
nt primarily
recipitation
which was
recipitation
ipitation pseudo
from the 6
re performe
the temper
bserved amo
2404 was af
the interm
e lower con
compared
e equilibriu
med.
onsidered s
kinetics are
d by a comp
in the 2404
ume fractio
as settled o
the decomp
y caused the
kinetics cau
favoured f
of a greater
o-kinetics: a) L
600°C and
ed in the w
rature at w
ount of prec
ffected by σ
etallic com
ntent of allo
to that obs
um condition
soaking tim
reported in
parable amo
4 DSS cond
on of nitride
on close val
position of f
e nitrides pr
using a redu
for longer so
r amount of
DX 2101 and b
800°C tre
whole critica
which the n
cipitates. Th
-phase prec
mpound as a
oying eleme
erved in th
ns were not
mes, Cr2N w
n 2.17b. Fo
ount of prec
ditioned the
es. Howeve
ues in both
ferrite was
recipitation
uction in nit
oaking time
f nitrides.
b) LDX 2404.
atments, fu
al temperatu
nitrides for
he data in F
cipitation. In
a function o
ents, in 240
he higher-al
t totally rea
were observ
r short treat
ipitates, wh
precipitatio
er, after 50 h
h steels. Thi
very slow i
n; the subse
trides forma
es, subtracte
urther isothe
ure range (T
rmation ma
Fig. 2.18 su
n Fig.
of the
04 the
loyed
ached,
ved in
tment
hereas
on by
hours
is can
in the
quent
ation.
ed Cr
ermal
Table
ay be
uggest
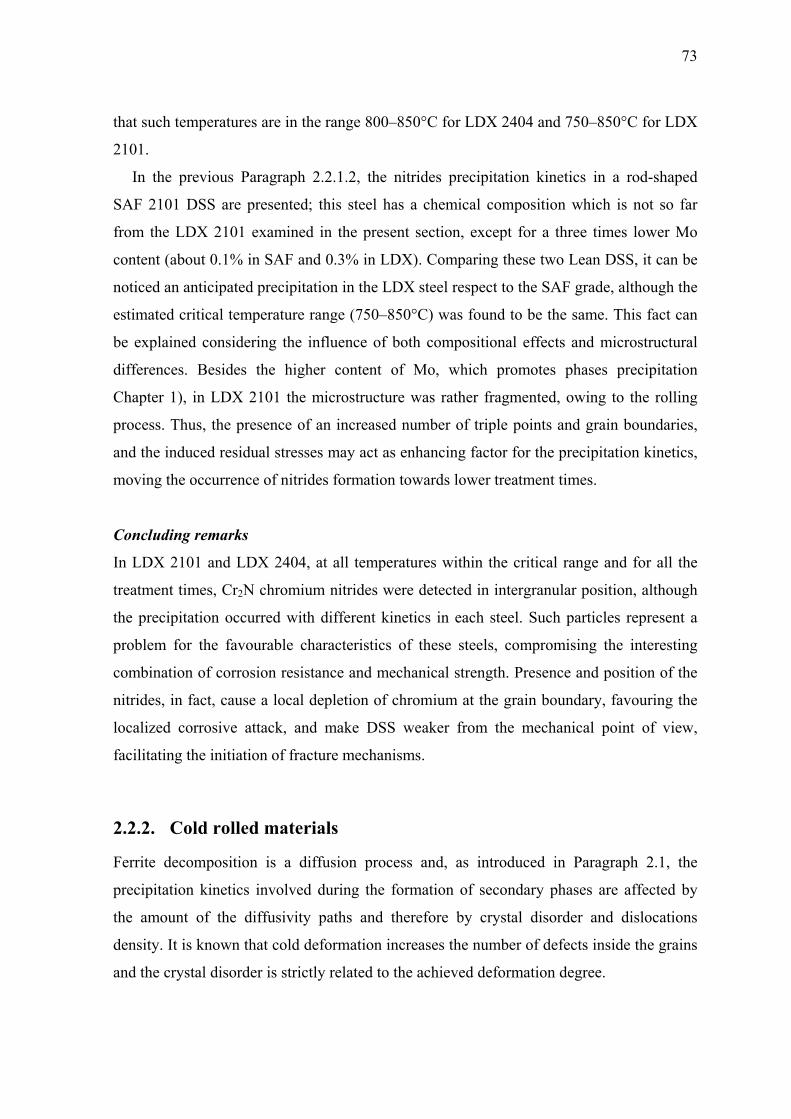
73
that such temperatures are in the range 800–850°C for LDX 2404 and 750–850°C for LDX
2101.
In the previous Paragraph 2.2.1.2, the nitrides precipitation kinetics in a rod-shaped
SAF 2101 DSS are presented; this steel has a chemical composition which is not so far
from the LDX 2101 examined in the present section, except for a three times lower Mo
content (about 0.1% in SAF and 0.3% in LDX). Comparing these two Lean DSS, it can be
noticed an anticipated precipitation in the LDX steel respect to the SAF grade, although the
estimated critical temperature range (750–850°C) was found to be the same. This fact can
be explained considering the influence of both compositional effects and microstructural
differences. Besides the higher content of Mo, which promotes phases precipitation
Chapter 1), in LDX 2101 the microstructure was rather fragmented, owing to the rolling
process. Thus, the presence of an increased number of triple points and grain boundaries,
and the induced residual stresses may act as enhancing factor for the precipitation kinetics,
moving the occurrence of nitrides formation towards lower treatment times.
Concluding remarks
In LDX 2101 and LDX 2404, at all temperatures within the critical range and for all the
treatment times, Cr2N chromium nitrides were detected in intergranular position, although
the precipitation occurred with different kinetics in each steel. Such particles represent a
problem for the favourable characteristics of these steels, compromising the interesting
combination of corrosion resistance and mechanical strength. Presence and position of the
nitrides, in fact, cause a local depletion of chromium at the grain boundary, favouring the
localized corrosive attack, and make DSS weaker from the mechanical point of view,
facilitating the initiation of fracture mechanisms.
2.2.2. Cold rolled materials
Ferrite decomposition is a diffusion process and, as introduced in Paragraph 2.1, the
precipitation kinetics involved during the formation of secondary phases are affected by
the amount of the diffusivity paths and therefore by crystal disorder and dislocations
density. It is known that cold deformation increases the number of defects inside the grains
and the crystal disorder is strictly related to the achieved deformation degree.

74
The sheets manufacturing processes, as recently introduced for the fabrication of water
tanks and heat exchange panels [35], can induce several microstructural modifications
which affect the formability properties. The influences of manufacturing processes on the
tensile properties of DSS sheet, and especially elongation at room temperature, have been
studied by few researchers, but it was evidenced that the elongation is related to the hot-
rolling texture, as well as to the annealing temperature after both hot- and cold-rolling [35].
On the contrary, there are no data on mechanisms and kinetics of phases precipitation in
the cold rolled samples after heat treatments.
In the present paragraph, the effect of cold rolling on phases precipitation in two DSS is
presented. Even though the examined steels have different TTP curves, the heat treatment
were performed at the same temperature, in order to compare the results in terms of atomic
mobility and diffusion mechanisms, which are strongly temperature-dependent. The
solution annealing temperature, the relative elements concentration and their partitioning
contribute to regulate both the activation energy for the precipitation and the flux of atoms
through the different phases. Thus, supposing that the mechanisms which regulate the
diffusion processes are almost the same, treatments at same temperatures will similarly
condition the precipitation.
2.2.2.1. SAF 2205 and SAF 2507 cold rolled and heat treated
In this section, the SAFs 2205 and 2507 DSS presented in Paragraph 2.1 – and whose
chemical compositions are reported in Table 2.6 – were examined. The steels were cold
rolled at various deformation degrees, from 5% to 85% thickness reduction, in the same
direction of the previous hot working, then isothermically heat treated in a muffle furnace
at 900°C for 10 and 30 minutes and finally water quenched. For a comparison, the as-
received materials were treated at the same conditions.
Table 2.6 – Chemical composition of the investigated DSS.
Grade C Si Mn Cr Ni Mo Cu P S N
SAF 2205 0.030 0.56 1.46 22.75 5.04 3.19 - 0.025 0.0020 0.16
SAF 2507 0.015 0.24 0.83 24.80 6.89 3.83 0.23 0.023 0.0010 0.27
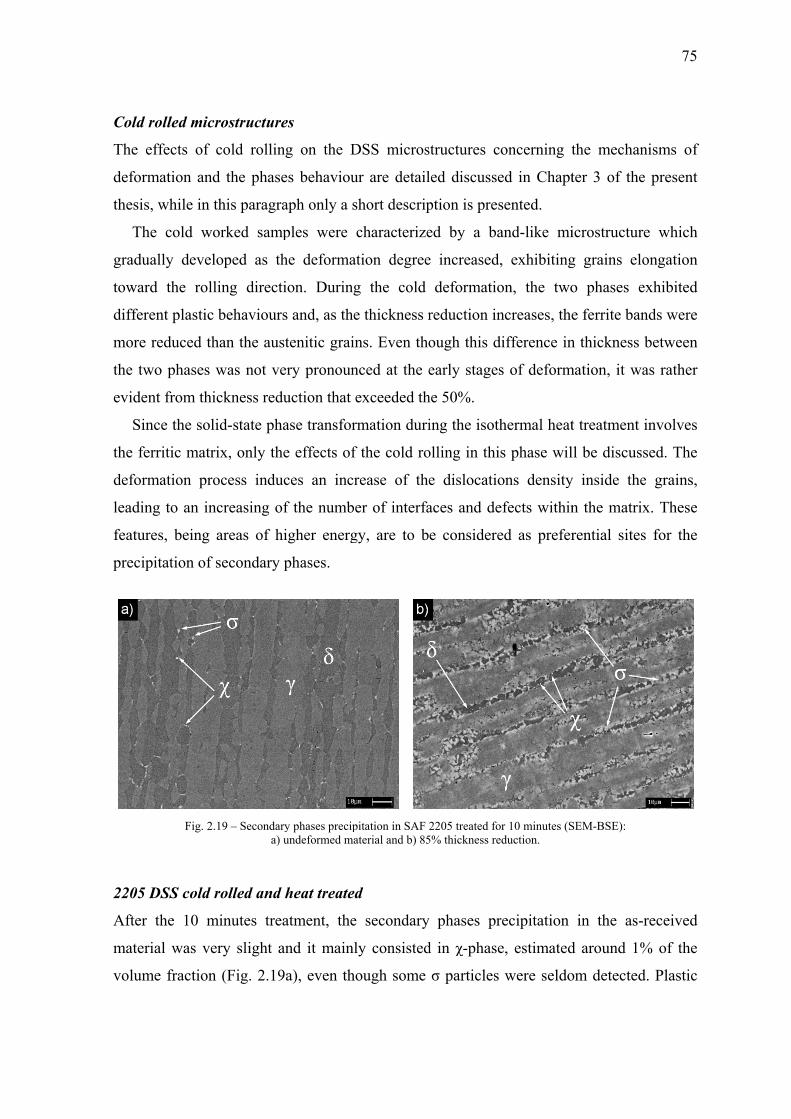
Cold
The
defor
thesi
Th
gradu
towa
diffe
more
the tw
evide
Si
the f
defor
leadi
featu
preci
2205
After
mate
volum
d rolled mic
effects of
rmation and
is, while in t
he cold wo
ually devel
ard the roll
rent plastic
e reduced th
wo phases
ent from thi
ince the sol
ferritic matr
rmation pro
ing to an in
ures, being
ipitation of
Fig. 2.
5 DSS cold r
r the 10 m
erial was ve
me fraction
rostructure
cold rolling
d the phase
this paragra
orked samp
loped as th
ling directi
behaviours
han the aust
was not ve
ickness redu
id-state pha
rix, only the
ocess induc
ncreasing of
areas of hi
secondary p
.19 – Secondarya) u
rolled and h
minutes trea
ery slight an
n (Fig. 2.19a
es
g on the D
es behaviou
aph only a s
ples were c
he deformat
ion. During
s and, as the
tenitic grain
ery pronoun
uction that e
ase transform
e effects of
ces an incr
f the numbe
igher energ
phases.
y phases precipundeformed ma
heat treated
atment, the
nd it mainl
a), even tho
DSS micros
ur are detail
hort descrip
characterize
tion degree
g the cold
e thickness r
ns. Even tho
nced at the e
exceeded th
mation duri
the cold ro
rease of the
er of interfa
gy, are to b
pitation in SAF aterial and b) 85
d
secondary
ly consisted
ough some
structures c
led discusse
ption is pres
ed by a ba
e increased,
deformatio
reduction in
ough this d
early stages
he 50%.
ing the isoth
olling in thi
e dislocatio
aces and de
e considere
2205 treated fo5% thickness re
y phases pr
d in χ-phase
σ particles
oncerning t
ed in Chapt
sented.
and-like mi
, exhibiting
on, the two
ncreases, the
difference in
s of deform
hermal heat
s phase wil
ons density
efects within
ed as prefer
or 10 minutes (Seduction.
recipitation
e, estimated
were seldo
the mechan
ter 3 of the
icrostructur
g grains elo
o phases e
e ferrite ban
n thickness
mation, it wa
t treatment
ll be discuss
y inside the
n the matrix
rential sites
SEM-BSE):
in the as-
d around 1%
om detected
75
nisms of
e present
e which
ongation
exhibited
nds were
between
as rather
involves
sed. The
e grains,
x. These
s for the
received
% of the
d. Plastic
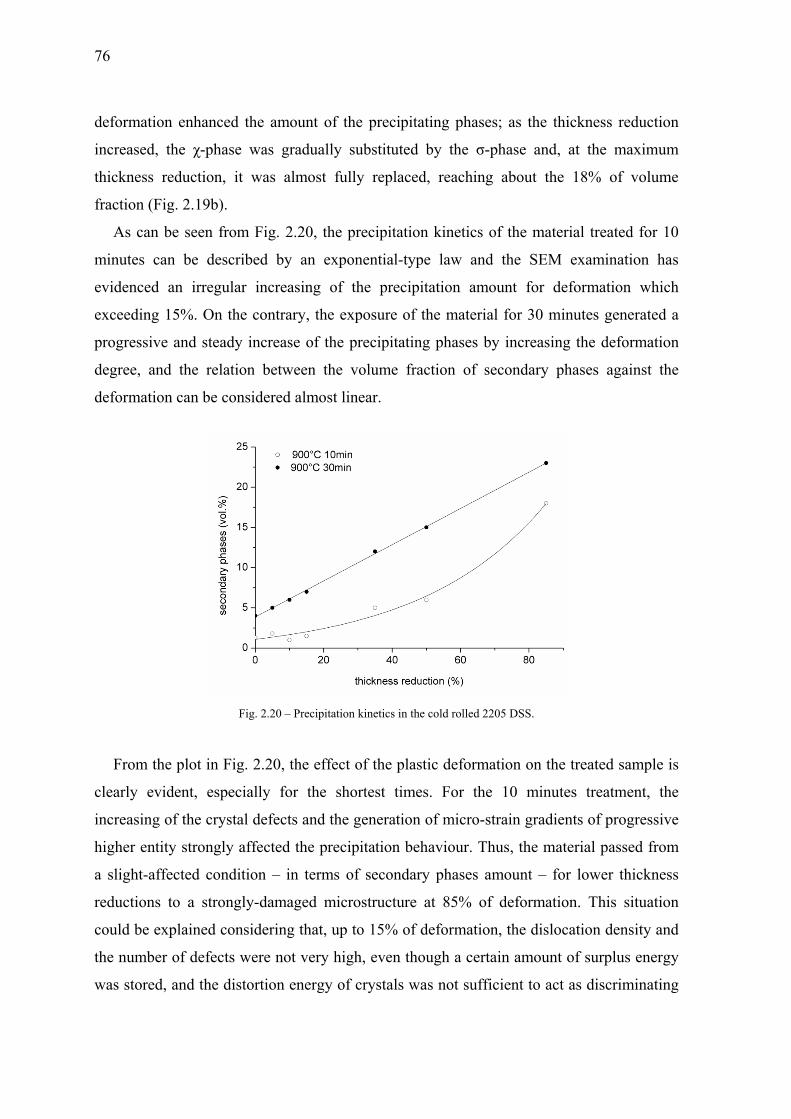
76
deformation enhanced the amount of the precipitating phases; as the thickness reduction
increased, the χ-phase was gradually substituted by the σ-phase and, at the maximum
thickness reduction, it was almost fully replaced, reaching about the 18% of volume
fraction (Fig. 2.19b).
As can be seen from Fig. 2.20, the precipitation kinetics of the material treated for 10
minutes can be described by an exponential-type law and the SEM examination has
evidenced an irregular increasing of the precipitation amount for deformation which
exceeding 15%. On the contrary, the exposure of the material for 30 minutes generated a
progressive and steady increase of the precipitating phases by increasing the deformation
degree, and the relation between the volume fraction of secondary phases against the
deformation can be considered almost linear.
Fig. 2.20 – Precipitation kinetics in the cold rolled 2205 DSS.
From the plot in Fig. 2.20, the effect of the plastic deformation on the treated sample is
clearly evident, especially for the shortest times. For the 10 minutes treatment, the
increasing of the crystal defects and the generation of micro-strain gradients of progressive
higher entity strongly affected the precipitation behaviour. Thus, the material passed from
a slight-affected condition – in terms of secondary phases amount – for lower thickness
reductions to a strongly-damaged microstructure at 85% of deformation. This situation
could be explained considering that, up to 15% of deformation, the dislocation density and
the number of defects were not very high, even though a certain amount of surplus energy
was stored, and the distortion energy of crystals was not sufficient to act as discriminating

facto
disto
preci
In
preci
defor
regul
fact,
thus
or in order
ortional ene
ipitation.
n the sample
ipitation en
rmations ov
lar because
the precipit
a greater tim
Fig. 2.21
Fig. 2.22
to reduce t
ergy stored
es treated f
ntity, but w
ver 15%. In
e the exposu
tation proce
me at the tre
1 – Secondary pa) u
2 – Secondary pa) u
the time fo
inside the
for 30 minu
without the
n this case
ure time at
ess is a diff
eatment tem
phases precipitaundeformed ma
phases precipitaundeformed ma
or the precip
e grains w
utes the defo
e strong dr
the increas
the soakin
fusive transf
mperature pr
ation in the 2205aterial and b) 50
ation in the SAFaterial and b) 65
pitation. On
as enough
ormation al
rop observ
ing of the p
ng temperatu
formation a
romoted the
5 grade treated 0% thickness re
F 2507 treated 5% thickness re
n the contr
to signific
so caused a
ved in the
precipitates
ure was hig
and is strong
e entire diffu
for 30 minuteseduction.
for 10 minutes eduction.
rary, over 3
cantly prom
an increasin
previous c
s amount w
gher (Fig. 2
gly time-dep
fusion proce
(SEM-BSE):
(SEM-BSE):
77
35%, the
mote the
ng of the
case for
was more
2.21). In
pendant,
ess.
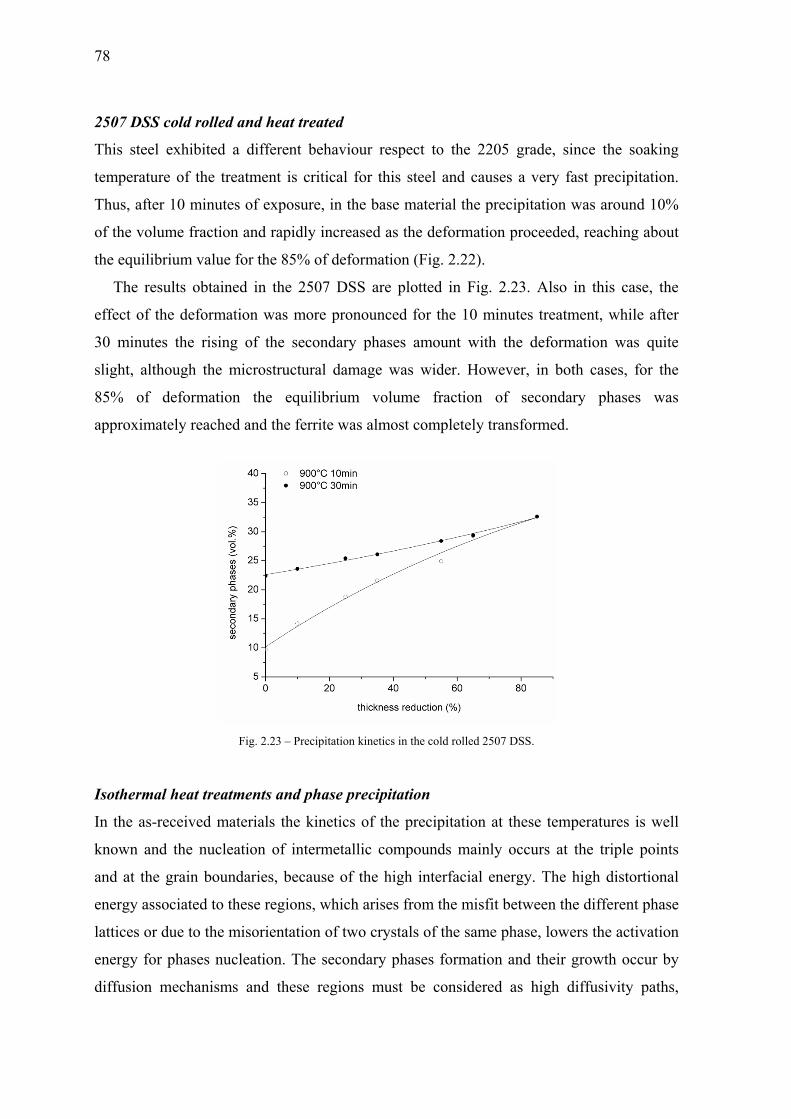
78
2507 DSS cold rolled and heat treated
This steel exhibited a different behaviour respect to the 2205 grade, since the soaking
temperature of the treatment is critical for this steel and causes a very fast precipitation.
Thus, after 10 minutes of exposure, in the base material the precipitation was around 10%
of the volume fraction and rapidly increased as the deformation proceeded, reaching about
the equilibrium value for the 85% of deformation (Fig. 2.22).
The results obtained in the 2507 DSS are plotted in Fig. 2.23. Also in this case, the
effect of the deformation was more pronounced for the 10 minutes treatment, while after
30 minutes the rising of the secondary phases amount with the deformation was quite
slight, although the microstructural damage was wider. However, in both cases, for the
85% of deformation the equilibrium volume fraction of secondary phases was
approximately reached and the ferrite was almost completely transformed.
Fig. 2.23 – Precipitation kinetics in the cold rolled 2507 DSS.
Isothermal heat treatments and phase precipitation
In the as-received materials the kinetics of the precipitation at these temperatures is well
known and the nucleation of intermetallic compounds mainly occurs at the triple points
and at the grain boundaries, because of the high interfacial energy. The high distortional
energy associated to these regions, which arises from the misfit between the different phase
lattices or due to the misorientation of two crystals of the same phase, lowers the activation
energy for phases nucleation. The secondary phases formation and their growth occur by
diffusion mechanisms and these regions must be considered as high diffusivity paths,
79
where the initiation of the process and the phases growth are facilitated. In the deformed
DSS, cold rolling modified the grains shape, implying an increase of the distortion at the
interfaces and making these regions more reactive.
Thus, plastic deformation rendered the interfaces more prone to the nucleation of new
phases by giving to the whole structure a surplus of internal energy, which promots the
entire process (nucleation and growth). After cold rolling, the χ-phase formation was
particularly favoured, due to the low misfit between the crystal structures of such phase
and ferrite, especially in correspondence of the dislocations, since both phases are BCC.
Moreover, the treatments were carried out below the theoretical limit value of 0.75–
0.8·TM, causing a predominant diffusion along grain boundaries and dislocations respect
the diffusion through the crystal lattice [1].
The precipitation sequences in the deformed samples were not different from that
observed in the as-received materials. The χ-phase appears always by first and was
followed by the σ-phase, but the precipitation occurred not only at the interfaces but also
inside the ferritic grains, due to the presence of dislocations agglomerates, and the kinetics
of the phenomenon were modified. In the deformed samples, the nucleation sites were
much more than in the as-received material, reducing the time for the precipitation
depending on the degree of deformation degree.
Concluding remarks
Cold working modified the microstructure by increasing the crystals disorder. As expected,
the number of defects and interfaces were higher than in the as-received materials and the
grains were increasingly fragmented as the thickness reduction proceeded. This gave to the
entire microstructure a surplus of internal energy, in terms of distortional energy of the
interfaces and strain gradients at the local level, making the ferritic phase more prone to
phase transformation. Grain boundaries and dislocations must be considered as high
diffusivity paths and thus an increasing of them and of their interfacial energy promoted
the diffusional processes as the secondary phase precipitation.
Plastic deformation at room temperature significantly enhanced the precipitation
kinetics, leading to a substantial damage even for short soaking time at the critical
temperature. Thus, after any degrees of cold deformation a further solution-annealing
treatment is recommended, in order to allow for the relaxation of the microstructure and

80
the reduction of the internal defects. The solubilisation after cold deformation must be
well designed, taking into account the composition of the steel, the size of the product and
the deformation degree. The temperature and the time also must be well chosen, in order to
guarantee approximately the 50/50 phase ratio and the greatest reduction of internal defects
and stresses. Moreover, the soaking time must avoid an excessive grains polygonalization
during annealing because it causes the generation of a major number of triple points, which
are preferential precipitation sites.
2.3. EFFECTS ON IMPACT RESISTANCE
Secondary phases are hard structural discontinuities inside the Duplex microstructure and,
since preferentially precipitate at the interfaces, can give rise to serious embritteling effect.
The enhanced mechanical properties of DSS are achieved from the biphasic microstructure
and, as observed in SDSS, an increased amount of alloying elements allow for a further
mechanical strengthening by solid solution hardening (Chapter 1). However, increasing the
alloying content will render the material more prone to phases precipitation, implying a
very careful control of the microstructure after forming and welding operations, in order to
avoid precipitation phenomena. The results presented in this paragraph concern to the
impact toughness of DSS, and the effects of secondary phases precipitation on the impact
response are discussed.
DSS retain considerable impact toughness values even at low temperatures (i.e. -40°C)
and the ductile-to-brittle transition (DBT) is more gradual than in carbon steels or ferritic
stainless steels. On the contrary, ductility and impact toughness are in general lower than
those of austenitic grades (Chapter 1). In fact, whereas the tensile properties of DSS are
essentially governed by the BCC ferritic matrix, the good toughness could be ascribed to
the presence of the FCC austenite, which easily accomodates plastic deformation, retarding
the cleavage fracture of ferrite [4,36].
The materials toughness can be evaluated by means of Charpy-V impact instrument, in
which a standard specimen is impacted using a striker mounted on a pendulum; the
absorbed energy during the impact gives the impact toughness (KV) of the material. The
samples have a V-shaped blunt notch to initiate the crack and, therefore, toughness can be
consider as a measure of the difficulty to the crack initiation as well as to the crack
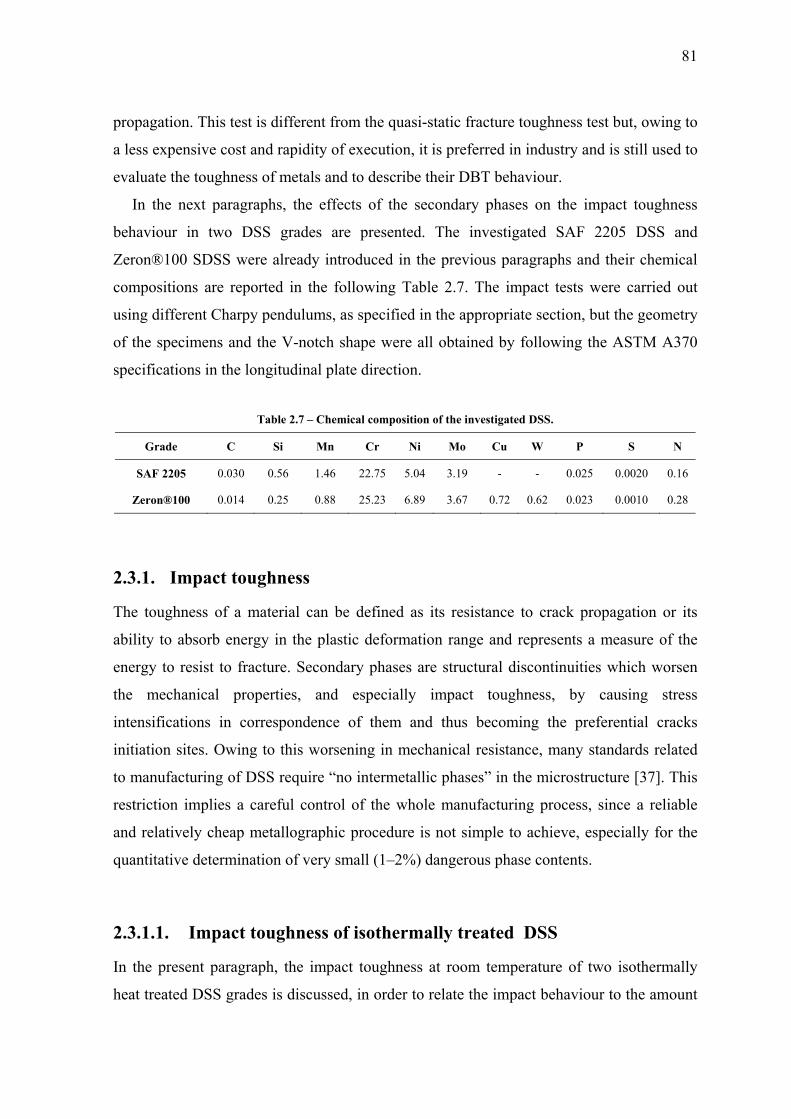
81
propagation. This test is different from the quasi-static fracture toughness test but, owing to
a less expensive cost and rapidity of execution, it is preferred in industry and is still used to
evaluate the toughness of metals and to describe their DBT behaviour.
In the next paragraphs, the effects of the secondary phases on the impact toughness
behaviour in two DSS grades are presented. The investigated SAF 2205 DSS and
Zeron®100 SDSS were already introduced in the previous paragraphs and their chemical
compositions are reported in the following Table 2.7. The impact tests were carried out
using different Charpy pendulums, as specified in the appropriate section, but the geometry
of the specimens and the V-notch shape were all obtained by following the ASTM A370
specifications in the longitudinal plate direction.
Table 2.7 – Chemical composition of the investigated DSS.
Grade C Si Mn Cr Ni Mo Cu W P S N
SAF 2205 0.030 0.56 1.46 22.75 5.04 3.19 - - 0.025 0.0020 0.16
Zeron®100 0.014 0.25 0.88 25.23 6.89 3.67 0.72 0.62 0.023 0.0010 0.28
2.3.1. Impact toughness
The toughness of a material can be defined as its resistance to crack propagation or its
ability to absorb energy in the plastic deformation range and represents a measure of the
energy to resist to fracture. Secondary phases are structural discontinuities which worsen
the mechanical properties, and especially impact toughness, by causing stress
intensifications in correspondence of them and thus becoming the preferential cracks
initiation sites. Owing to this worsening in mechanical resistance, many standards related
to manufacturing of DSS require “no intermetallic phases” in the microstructure [37]. This
restriction implies a careful control of the whole manufacturing process, since a reliable
and relatively cheap metallographic procedure is not simple to achieve, especially for the
quantitative determination of very small (1–2%) dangerous phase contents.
2.3.1.1. Impact toughness of isothermally treated DSS
In the present paragraph, the impact toughness at room temperature of two isothermally
heat treated DSS grades is discussed, in order to relate the impact behaviour to the amount
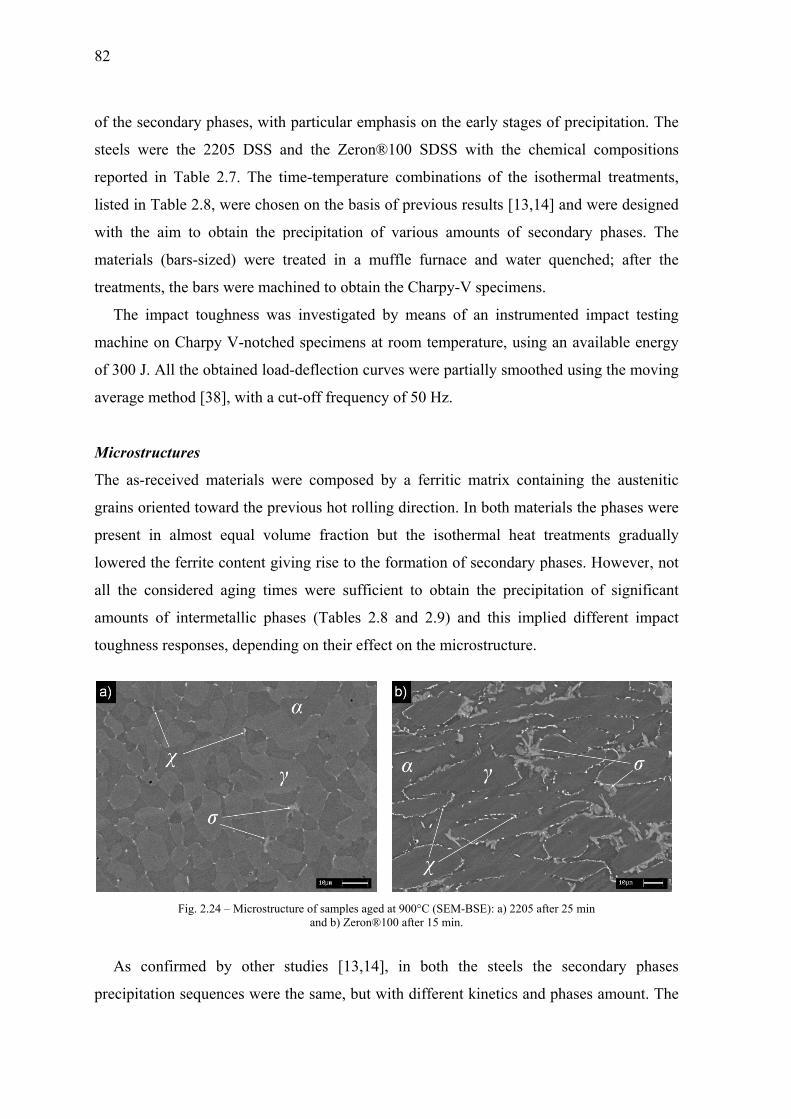
82
of the s
steels w
reported
listed in
with th
material
treatmen
The
machine
of 300 J
average
Microst
The as-
grains o
present
lowered
all the
amounts
toughne
As c
precipit
econdary ph
were the 22
d in Table
n Table 2.8,
e aim to o
ls (bars-siz
nts, the bars
impact tou
e on Charpy
J. All the ob
e method [38
tructures
-received m
oriented tow
in almost
d the ferrite
considered
s of interm
ess response
Fig. 2.2
confirmed
tation seque
hases, with
205 DSS a
2.7. The ti
were chose
obtain the p
zed) were t
s were mach
ughness was
y V-notche
btained load
8], with a cu
materials we
ward the pre
equal volu
content giv
aging time
metallic pha
es, dependin
24 – Microstruct
by other s
ences were t
particular e
and the Zer
ime-tempera
en on the ba
precipitation
treated in a
hined to obt
s investigat
ed specimen
d-deflection
ut-off frequ
ere compos
evious hot ro
ume fractio
ving rise to
es were suf
ases (Tables
ng on their e
ture of samplesand b) Zer
studies [13
the same, b
emphasis o
ron®100 SD
ature comb
asis of prev
n of variou
a muffle fu
tain the Cha
ted by mea
ns at room t
n curves wer
uency of 50
sed by a fe
olling direc
on but the
the formati
fficient to
s 2.8 and 2
effect on th
s aged at 900°Cron®100 after 1
3,14], in bo
but with diff
n the early
DSS with
binations of
vious results
us amounts
urnace and
arpy-V spec
ans of an in
temperature
re partially
Hz.
erritic matri
ction. In bot
isothermal
ion of secon
obtain the
2.9) and thi
e microstru
(SEM-BSE): a15 min.
oth the ste
ferent kinet
stages of p
the chemic
f the isothe
s [13,14] an
of second
water quen
cimens.
nstrumented
e, using an
smoothed u
ix containin
th materials
heat treat
ndary phase
precipitatio
is implied
ucture.
a) 2205 after 25
eels the se
ics and pha
recipitation
cal compos
rmal treatm
nd were des
dary phases
nched; afte
d impact te
available en
using the mo
ng the aust
the phases
tments grad
es. Howeve
on of signif
different im
5 min
econdary p
ases amount
n. The
itions
ments,
igned
. The
er the
esting
nergy
oving
enitic
were
dually
er, not
ficant
mpact
phases
t. The

83
χ-phase was the first precipitating one, in correspondence of triple points and grain
boundaries and, by increasing the treatment time, its formation was followed by the
occurrence of the σ-phase, which grown toward ferrite (Fig. 2.24). The σ particles were
coarser than the χ ones and also grown faster, progressively embedding the χ precipitates.
As can be seen from Fig. 2.24, the precipitation kinetics was faster in the Zeron®100 DSS
owing to its higher alloying element content.
Table 2.8 – Treatments, toughness and precipitates amount for 2205 DSS.
Ageing temperature [°C]
Ageing time [min]
Absorbed energy [J]
Secondary phases [%]
780
20 242.5 not present
25 231.5 not present
30 173 < 0.1
40 141 < 0.1
850
10 229 not present
15 219 not present
20 125 <0.1
25 87.5 <0.1
30 83.5 0.5
40 28.5 2.5
900
10 222 < 0.1
15 181 < 0.1
20 97 0.6
25 37.5 1.9
30 15.5 5.7
40 14 9.2
The microstructural damage not only depends on the ageing time, but must also be
related to local microstructural conditions, because composition differences at a local level
may lead to unevenly distributions of the new generated phases and to slight difference in
chemical composition of such particles. In agreement with the precipitation kinetics
[13,14], which are strictly related to the steel’s grade, the treatment times influence the
intermetallic content and also the size of the precipitating particles. Therefore, the observed
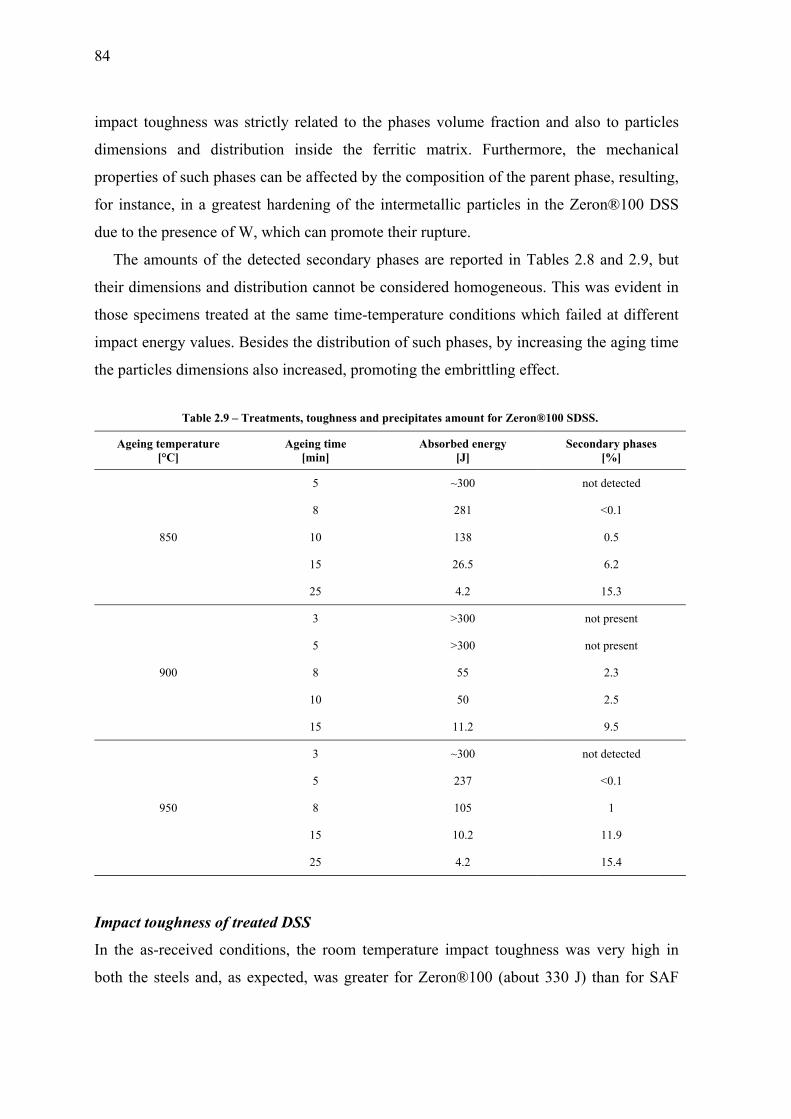
84
impact toughness was strictly related to the phases volume fraction and also to particles
dimensions and distribution inside the ferritic matrix. Furthermore, the mechanical
properties of such phases can be affected by the composition of the parent phase, resulting,
for instance, in a greatest hardening of the intermetallic particles in the Zeron®100 DSS
due to the presence of W, which can promote their rupture.
The amounts of the detected secondary phases are reported in Tables 2.8 and 2.9, but
their dimensions and distribution cannot be considered homogeneous. This was evident in
those specimens treated at the same time-temperature conditions which failed at different
impact energy values. Besides the distribution of such phases, by increasing the aging time
the particles dimensions also increased, promoting the embrittling effect.
Table 2.9 – Treatments, toughness and precipitates amount for Zeron®100 SDSS.
Ageing temperature [°C]
Ageing time [min]
Absorbed energy [J]
Secondary phases [%]
850
5 ~300 not detected
8 281 <0.1
10 138 0.5
15 26.5 6.2
25 4.2 15.3
900
3 >300 not present
5 >300 not present
8 55 2.3
10 50 2.5
15 11.2 9.5
950
3 ~300 not detected
5 237 <0.1
8 105 1
15 10.2 11.9
25 4.2 15.4
Impact toughness of treated DSS
In the as-received conditions, the room temperature impact toughness was very high in
both the steels and, as expected, was greater for Zeron®100 (about 330 J) than for SAF
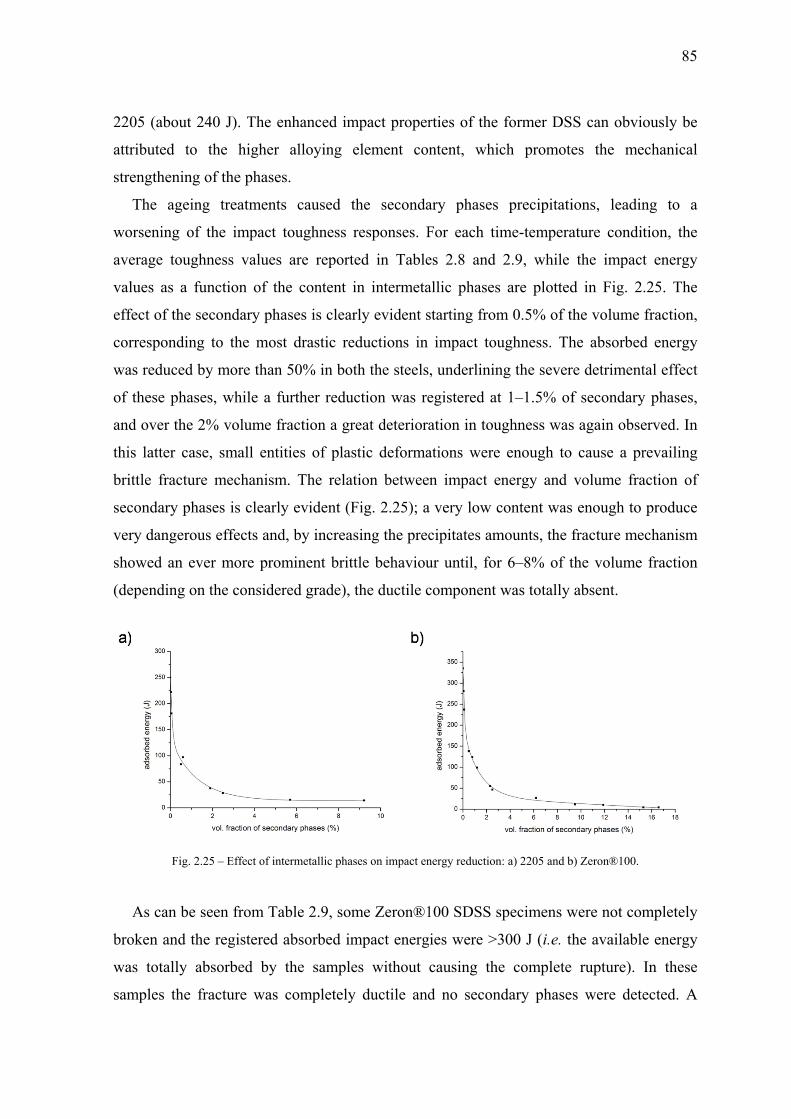
2205
attrib
stren
Th
wors
avera
value
effec
corre
was r
of th
and o
this l
brittl
secon
very
show
(depe
A
brok
was
samp
5 (about 240
buted to th
ngthening of
he ageing
sening of th
age toughn
es as a fun
ct of the sec
esponding t
reduced by
hese phases,
over the 2%
latter case,
le fracture m
ndary phase
dangerous
wed an ever
ending on th
Fig. 2.25
As can be see
en and the
totally abs
ples the fra
0 J). The en
he higher
f the phases
treatments
he impact t
ess values
nction of th
condary pha
to the most
more than
, while a fu
% volume fr
small entit
mechanism
es is clearly
effects and
r more prom
he consider
– Effect of inte
en from Tab
registered a
sorbed by t
acture was c
nhanced im
alloying e
s.
s caused th
toughness r
are reporte
e content in
ases is clear
t drastic red
50% in both
urther reduc
raction a gre
ties of plast
m. The relat
y evident (F
, by increas
minent britt
red grade), t
ermetallic phas
ble 2.9, som
absorbed im
the sample
completely
mpact proper
element con
he seconda
responses. F
ed in Table
n intermeta
ly evident s
ductions in
h the steels
ction was re
eat deteriora
tic deforma
ion betwee
Fig. 2.25); a
sing the prec
tle behaviou
the ductile c
es on impact en
me Zeron®1
mpact energ
s without
ductile and
rties of the
ntent, whic
ary phases
For each tim
es 2.8 and
allic phases
starting from
impact tou
, underlinin
egistered at
ation in tou
ations were
n impact e
a very low c
cipitates am
ur until, for
component w
nergy reduction
100 SDSS s
gies were >3
causing the
d no secon
former DS
ch promote
precipitati
me-tempera
2.9, while
are plotted
m 0.5% of t
ughness. Th
ng the sever
t 1–1.5% of
ughness was
enough to
energy and
content was
mounts, the f
r 6–8% of t
was totally
n: a) 2205 and b
specimens w
300 J (i.e. th
e complete
ndary phase
S can obvio
es the me
ions, leadin
ature condit
the impact
d in Fig. 2
the volume
he absorbed
re detriment
f secondary
s again obse
cause a pr
volume fra
s enough to
fracture me
the volume
absent.
b) Zeron®100.
were not com
he available
rupture).
s were dete
85
ously be
echanical
ng to a
tion, the
t energy
.25. The
fraction,
d energy
tal effect
y phases,
erved. In
revailing
action of
produce
echanism
fraction
mpletely
e energy
In these
ected. A

86
completely ductile behaviour was also observed in some 2205 DSS specimens aged for the
shortest times. In both cases the heat treatments were not sufficient to allow the
precipitation of secondary phases.
Fig. 2.26 – Load curves of 2205 DSS specimens: a) impact energy >150 J (780°C for 20 min), b) impact
energy 50-150 J (900°C for 20 min) and c) impact energy <50 J (900°C for 40 min).
The obtained results were suitable to define a subdivision of the energy plots reported in
Fig. 2.25 on the basis of the content in intermetallic phases and the corresponding impact
behaviour. The first region comprehends those specimens with an intermetallic amounts
lower than 0.5%, while to the third one pertain those samples in which the secondary
phases overcomes the 1–2%; the second region is a transient one which lies at intermediate
values between the first and the third and whose boundaries depend on the considered
grade. Each region is characterized by the similarity of the load curves obtained from the
impact test, while different shapes of these curves correspond to different fracture
behaviours (Figs. 2.26 and 2.27). It is important to note that the boundaries between the
three regions are not well defined and the materials exhibited a transition from the
completely ductile to completely brittle fracture mechanism.

87
In the materials pertaining to the first region, with an intermetallics content <0.5%, the
dynamic yieldings were about 15 kN for 2205 DSS and 20 kN for Zeron®100 SDSS, while
the absorbed energies were >100 J and >150 J, respectively (Figs. 2.26a and 2.27a). After
the yielding, the applied loads increased, owing to the strain-hardening, the fractures
nucleated in relation to the maximum loads and the following decreasing can be associated
to stable crack propagations, due to the ductile mechanism. A small amounts of secondary
phases, identified as mainly χ particles, was detected. In this region, an increasing of the
intermetallics content caused a progressively change in the curve slope after the maximum
load and a reduction of the fracture propagation time.
Fig. 2.27 – Load curves of Zeron®100 SDSS specimens: a) impact energy >150 J (850°C for 8 min),
b) impact energy 50-150 J (950°C for 8 min), c) impact energy <50 J (900°C for 8 min) and d) impact energy <50 J (900°C for 15 min).
The second region includes the samples with an intermetallics amount of 0.5–1% for
2205 DSS and 0.5–2% for Zeron®100 SDSS, and for which the absorbed energies were in
the range 50–150 J. In these specimens the fractures were not completely ductile and the
brittle component started to manifest itself. The dynamic yieldings remained almost
unchanged for both the steels (Figs. 2.26b and 2.27b) but, after an initial stable crack
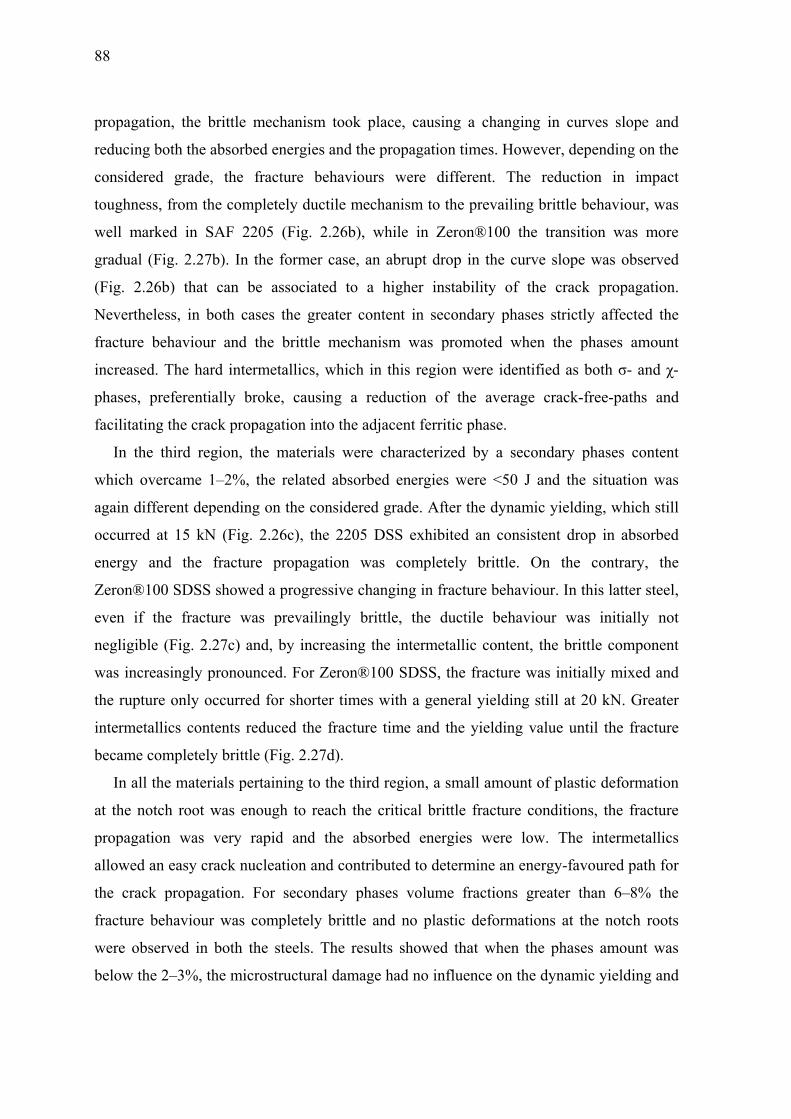
88
propagation, the brittle mechanism took place, causing a changing in curves slope and
reducing both the absorbed energies and the propagation times. However, depending on the
considered grade, the fracture behaviours were different. The reduction in impact
toughness, from the completely ductile mechanism to the prevailing brittle behaviour, was
well marked in SAF 2205 (Fig. 2.26b), while in Zeron®100 the transition was more
gradual (Fig. 2.27b). In the former case, an abrupt drop in the curve slope was observed
(Fig. 2.26b) that can be associated to a higher instability of the crack propagation.
Nevertheless, in both cases the greater content in secondary phases strictly affected the
fracture behaviour and the brittle mechanism was promoted when the phases amount
increased. The hard intermetallics, which in this region were identified as both σ- and χ-
phases, preferentially broke, causing a reduction of the average crack-free-paths and
facilitating the crack propagation into the adjacent ferritic phase.
In the third region, the materials were characterized by a secondary phases content
which overcame 1–2%, the related absorbed energies were <50 J and the situation was
again different depending on the considered grade. After the dynamic yielding, which still
occurred at 15 kN (Fig. 2.26c), the 2205 DSS exhibited an consistent drop in absorbed
energy and the fracture propagation was completely brittle. On the contrary, the
Zeron®100 SDSS showed a progressive changing in fracture behaviour. In this latter steel,
even if the fracture was prevailingly brittle, the ductile behaviour was initially not
negligible (Fig. 2.27c) and, by increasing the intermetallic content, the brittle component
was increasingly pronounced. For Zeron®100 SDSS, the fracture was initially mixed and
the rupture only occurred for shorter times with a general yielding still at 20 kN. Greater
intermetallics contents reduced the fracture time and the yielding value until the fracture
became completely brittle (Fig. 2.27d).
In all the materials pertaining to the third region, a small amount of plastic deformation
at the notch root was enough to reach the critical brittle fracture conditions, the fracture
propagation was very rapid and the absorbed energies were low. The intermetallics
allowed an easy crack nucleation and contributed to determine an energy-favoured path for
the crack propagation. For secondary phases volume fractions greater than 6–8% the
fracture behaviour was completely brittle and no plastic deformations at the notch roots
were observed in both the steels. The results showed that when the phases amount was
below the 2–3%, the microstructural damage had no influence on the dynamic yielding and

on th
follo
Frac
Defo
an ex
revea
In
defor
2.28)
prom
he overall
wing strain
ctography
ormation an
xamination
al the distin
Fig. 2.2
Fig. 2.2
n the first re
rmation and
). In both th
mote the bri
yielding b
n-hardening
d fracture b
of both frac
nguishing fe
28 – Samples faa) 2205 (h
29 – Samples fa
egion the ma
d the fractu
he steels, th
ttle fracture
ehaviour, e
contributio
behaviour w
cture morph
eatures.
ailed in the firsthigh magnificat
failed in the firsta) 2
aterials faile
ure morphol
he low volu
e and the in
even though
n was smal
were strongl
hology and
t region (ductiletion) and b) Zer
t region. Grain
2205 and b) Zer
ed in a comp
logy showe
ume fraction
ntermetallic
h it occurr
ler.
y influence
microstruct
e behaviour). Frron®100 (low m
shearing near thon®100.
pletely duct
d the chara
n of second
cs acted as n
red for sho
ed by the sec
ture close to
racture surfacesmagnification).
he notch root (S
tile manner
acteristic dim
dary phases
nucleation s
orter times
condary ph
o the notch
s (SEM-SE):
SEM-BSE):
after a larg
mpled surfa
was not en
sites for the
89
and the
ases and
root can
ge plastic
ace (Fig.
nough to
e ductile
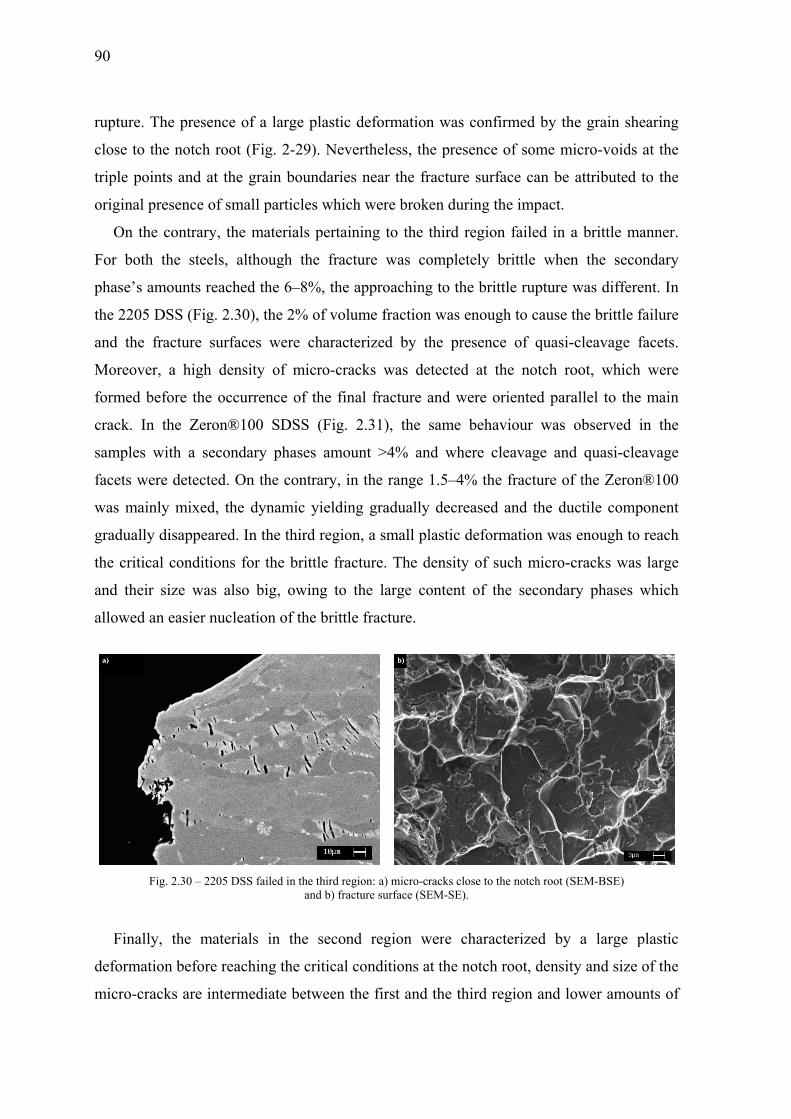
90
rupture.
close to
triple po
original
On th
For bot
phase’s
the 2205
and the
Moreov
formed
crack. I
samples
facets w
was ma
graduall
the criti
and the
allowed
Final
deforma
micro-c
. The presen
o the notch
oints and at
l presence o
he contrary
th the steel
amounts re
5 DSS (Fig
e fracture s
ver, a high
before the
In the Zero
s with a se
were detecte
ainly mixed
ly disappea
ical conditio
eir size was
d an easier n
Fig. 2.30 – 22
lly, the ma
ation before
cracks are in
nce of a lar
root (Fig. 2
t the grain
of small part
y, the mater
ls, although
eached the 6
. 2.30), the
surfaces we
density of
occurrence
on®100 SD
econdary ph
ed. On the c
d, the dynam
ared. In the t
ons for the
s also big,
nucleation o
205 DSS failed
aterials in
e reaching th
ntermediate
rge plastic d
2-29). Neve
boundaries
ticles which
rials pertain
h the fractu
6–8%, the a
2% of volu
ere characte
f micro-crac
e of the fina
DSS (Fig. 2
hases amou
contrary, in
mic yielding
third region
brittle frac
owing to t
of the brittle
in the third regiand b) fract
the second
he critical c
e between th
deformation
ertheless, th
near the fr
h were brok
ning to the t
ure was co
approaching
ume fraction
erized by th
cks was de
al fracture a
2.31), the
unt >4% an
n the range
g gradually
n, a small pl
cture. The d
the large co
e fracture.
ion: a) micro-crture surface (SE
d region w
conditions a
he first and
n was confi
he presence
racture surfa
en during th
third region
ompletely b
g to the brit
n was enoug
he presence
etected at th
and were or
same behav
nd where cl
1.5–4% the
y decreased
lastic deform
density of su
ontent of th
racks close to thEM-SE).
were charac
at the notch
the third re
irmed by th
of some m
face can be
he impact.
n failed in a
brittle when
ttle rupture
gh to cause t
e of quasi-
he notch ro
riented para
viour was
leavage and
e fracture of
and the du
mation was
uch micro-c
he secondar
he notch root (S
cterized by
root, densit
egion and lo
he grain she
micro-voids a
attributed t
a brittle ma
n the secon
was differe
the brittle fa
-cleavage fa
oot, which
allel to the
observed i
d quasi-clea
f the Zeron®
uctile comp
enough to
cracks was
ry phases w
SEM-BSE)
a large p
ty and size o
ower amoun
earing
at the
to the
anner.
ndary
ent. In
failure
facets.
were
main
n the
avage
®100
onent
reach
large
which
plastic
of the
nts of

embr
of th
an i
defor
mixe
fractu
phas
Regr
As p
of a
the S
interm
avera
Th
consi
each
consi
durin
is th
depe
diffe
ritteling sec
he material c
ncreasingly
rmation as
ed and the m
ure, shifting
es amount.
Fig. 2.31 –
ression ana
previously re
certain amo
SEM micro
metallics a
age value of
he investiga
idering the
temperatu
idered as th
ng the impa
e distributio
nding on th
rent toughn
condary pha
changed wh
y pronounc
the interme
morphology
g toward th
Zeron®100 SDclose to th
lysis: iso-to
eported, alm
ount of seco
graphs, but
amounts in
f secondary
ation on DS
experimen
ure-time co
he two main
act is the res
on of preci
he position o
ness respons
ases were d
hen conside
ced brittle
etallic amo
y exhibited
he first or t
DSS failed in thhe notch root (S
oughness su
most any tim
ondary pha
t which can
the previo
y phases.
SS impact t
nt as a facto
ombination.
n factors, w
sponse varia
ipitates insi
on the treat
ses were ob
detected. Th
ering the up
fracture m
unt increas
the charact
the second
he third region (EM-BSE) and b
urfaces
me-tempera
ases, quantif
nnot be con
ous Tables
oughness w
orial plan in
. Temperat
while the m
able. A not
ide the sam
ed bar from
bserved. Mo
his is a trans
pper and the
mechanism
sed. For bot
teristic featu
depending
(prevailing fragb) fracture surf
ature combin
fied through
nsidered uni
2.8 and 2.
was also suit
n which 3 r
tures and
measured en
negligible –
mples, which
m which the
oreover, ano
sient region
e lower ener
and an ev
th the steel
ures of both
on the pre
gile behaviour): face (SEM-SE).
nation caus
h image-ana
iform withi
9 are, in f
table for a r
replicates w
times of
nergy absorb
– and not co
h was not h
impact sam
other not-co
n and the be
rgy limits,
ver smaller
ls, the fract
h brittle and
cipitated se
a) micro-crack.
sed the prec
alysis proce
n the samp
fact, referre
regression a
were carried
treatment
bed by the
ontrollable
homogenou
mple was m
ontrollable
91
ehaviour
showing
r plastic
ture was
d ductile
econdary
ks
cipitation
edure on
ples. The
ed to an
analysis,
d out for
can be
material
– factor
us. Thus,
machined,
factor is
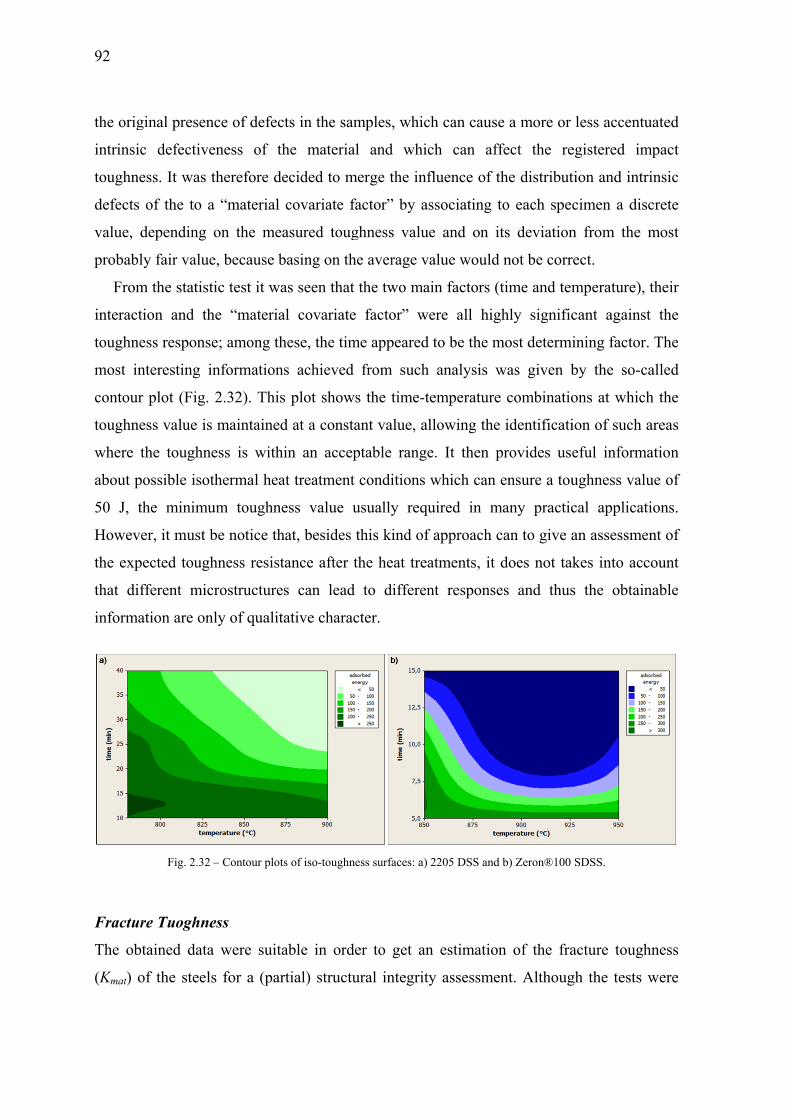
92
the orig
intrinsic
toughne
defects
value, d
probabl
From
interacti
toughne
most in
contour
toughne
where t
about po
50 J, th
Howeve
the expe
that dif
informa
Fractur
The obt
(Kmat) o
ginal presenc
c defective
ess. It was t
of the to a
depending o
y fair value
m the statisti
ion and th
ess response
nteresting in
r plot (Fig.
ess value is
the toughne
ossible isoth
he minimu
er, it must b
ected tough
fferent micr
ation are onl
Fig. 2.32 –
re Tuoghne
tained data
of the steels
ce of defect
eness of th
therefore de
a “material c
on the mea
e, because b
ic test it wa
he “material
e; among th
nformations
2.32). This
maintained
ess is withi
hermal heat
um toughne
be notice tha
hness resista
rostructures
ly of qualita
– Contour plots
ess
were suita
s for a (part
ts in the sam
he material
ecided to m
covariate fa
asured toug
asing on the
as seen that
l covariate
hese, the tim
s achieved
plot shows
d at a consta
in an accep
t treatment
ess value u
at, besides t
ance after t
s can lead
ative charac
s of iso-toughne
able in orde
tial) structu
mples, whic
l and whic
erge the inf
actor” by as
ghness valu
e average v
the two ma
factor” w
me appeared
from such
s the time-t
ant value, al
ptable range
conditions
usually requ
this kind of
the heat trea
to differen
cter.
ess surfaces: a)
er to get an
ural integrity
ch can cause
ch can aff
fluence of th
ssociating t
e and on it
alue would
ain factors (t
ere all hig
to be the m
analysis w
temperature
llowing the
e. It then p
which can
uired in m
f approach c
atments, it
nt response
2205 DSS and
n estimation
y assessmen
e a more or
fect the re
he distribut
to each spe
ts deviation
not be corr
time and tem
ghly signific
most determ
was given b
e combinatio
identificati
provides us
ensure a tou
many practic
can to give a
does not ta
es and thus
b) Zeron®100
n of the fra
nt. Althoug
less accent
egistered im
tion and intr
cimen a dis
n from the
rect.
mperature),
cant agains
ining factor
by the so-c
ons at whic
ion of such
eful inform
ughness val
cal applica
an assessme
akes into ac
s the obtai
SDSS.
acture tough
gh the tests
tuated
mpact
rinsic
screte
most
, their
st the
r. The
called
ch the
areas
mation
lue of
ations.
ent of
count
inable
hness
were
93
not carried out with a direct dependence from the temperature (i.e. the tests were all
performed at room temperature after the aging treatments), the material showed a ductile-
to-brittle transition that is somehow possible to relate to the transition obtained by
decreasing the testing temperature. In fact, even though the shape of the curves was not
similar to the transition temperature trend – which is sigmoidal – the material exhibited a
gradual decreasing of the impact toughness due to the increasing content of secondary
phases that can be associated to the decreasing in ductility when the temperature is
lowered. Thus, it is possible to relate the steel behaviour to the so called Master Curve
Approach where the secondary phases, randomly distributed inside the microstructure, can
be associated to low toughness regions as in the “weakest links” hypothesis [39].
For the ductile regime (first region) the correlation between the Charpy data (KV) and the
fracture toughness is given by [40], resulting in a conservative prediction.
𝐾 = (0.54) ∙ 𝐾𝑉 + 55 (2.1)
Although the previous equation is recommended when the Charpy energy is greater
than 60 J, it is however not usable for the transition regime (second region) in the two DSS
– for which the transition occurred in the range 160–50 J – because to the presence of the
brittle mechanism that begins to manifest itself in an increasing extent. Furthermore, the so
called Master Curve Equation, suitable for the transition regime, is not even usable due to
the fact that a real transition temperature does not exist in the performed experimentation
(the method needs the definition of the Charpy 27 J temperature) and the equation should
be rearranged for the specific case.
Finally, for the brittle regime (third region) the correlation could be given by [40]:
𝐾 = 12 ∙ √𝐾𝑉 (2.2)
𝐾 = (𝐾 − 20) ∙ 25𝐵 + 20 (2.3)
where the estimated fracture toughness of the material, Kmat25, must be corrected for the
appropriate thickness B.

94
A note must be done on the Charpy 27 J critical impact toughness value: this value is
relevant to material testing standards, which frequently require a minimum Charpy impact
energy of 27 J. In [4] the TTT diagram for a SAF 2507 SDSS showing the curve
corresponding to the 27 J impact toughness are reported. In the investigated SAF 2205 and
Zeron®100, a full analysis on the effect of the isothermal treatments on the impact
toughness in the whole temperature range 700–1000°C has not been done, but is it possible
to say something about the time-temperature combinations which allowed a significant
secondary phases amount and which leaded to an impact toughness value of about 27 J.
From the impact test results, it can be seen that for Zeron®100 SDSS the critical value of
secondary phases is reached after aging the material at 850°C for 15 minutes, while for the
others two temperatures it is only possible to say that the critical value is reached after 10–
15 minutes at 900°C and after 8–15 minutes at 950°C. Similar conclusions can be derived
for the 2205 DSS, in which the critical value of secondary phases was reached after ageing
the material at 850°C for 40 minutes and at 900°C for 25–30 minutes. The higher content
of alloying elements in Zeron®100 makes the steel more prone to secondary phases
precipitation, lowering the treatment times for which the critical values are reached.
Concluding remarks
Small amounts of secondary phases were enough to severely compromise the toughness of
the materials, which instead was very high in the as-received conditions. The impact
testing results showed that for about 0.5% of intermetallic phases the impact toughness was
reduced by over 50% in both the steels and for contents <0.5% the main effect was a
reduction of the absorbed energy by facilitating the ductile fracture. Up to 1–1.5% of
volume fraction the fracture was mixed and for greater amounts the fracture was mainly
brittle. For greater volume fractions of intermetallics the impact toughness was further
reduced and small entities of plastic deformations were enough to cause a prevailing brittle
fracture mechanism until, for 6÷8% of volume fraction, the ductile component was totally
absent.
The plastic deformation caused the secondary phases breakage with the formation of a
high density of micro-cracks, inducing an easy nucleation and a fast propagation of the
final fracture crack. Both σ- and χ-phase was found to be responsible for the embritteling
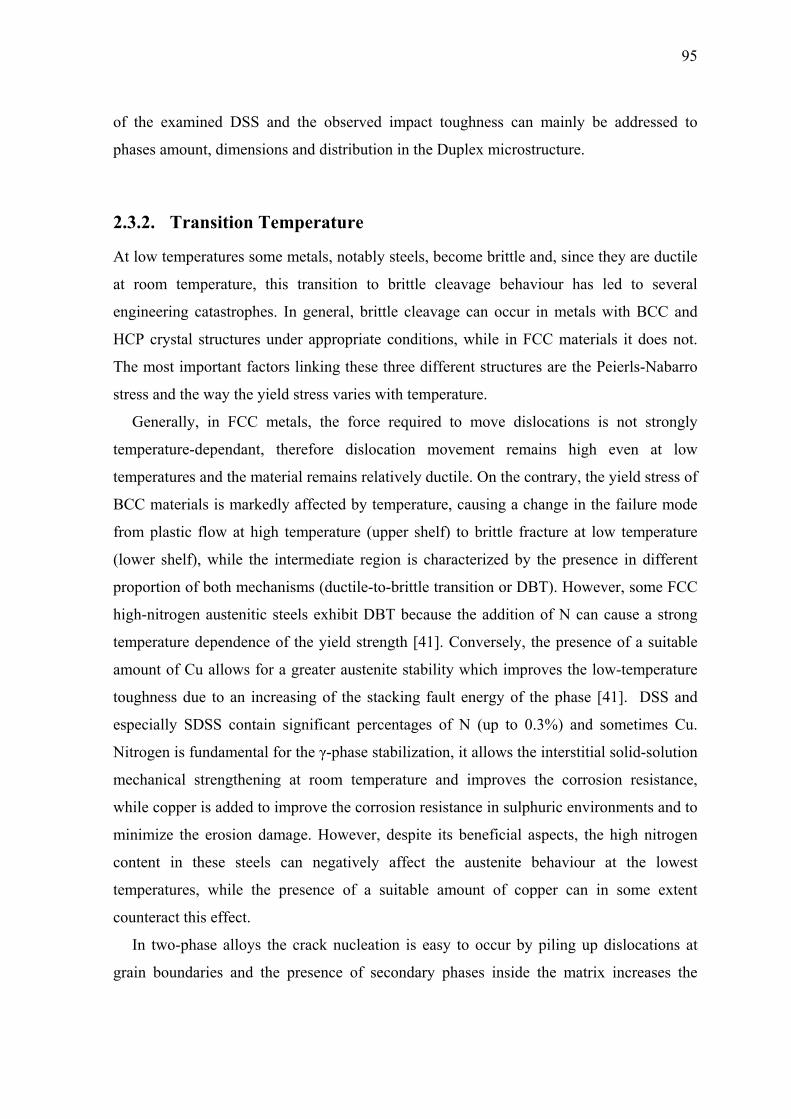
95
of the examined DSS and the observed impact toughness can mainly be addressed to
phases amount, dimensions and distribution in the Duplex microstructure.
2.3.2. Transition Temperature
At low temperatures some metals, notably steels, become brittle and, since they are ductile
at room temperature, this transition to brittle cleavage behaviour has led to several
engineering catastrophes. In general, brittle cleavage can occur in metals with BCC and
HCP crystal structures under appropriate conditions, while in FCC materials it does not.
The most important factors linking these three different structures are the Peierls-Nabarro
stress and the way the yield stress varies with temperature.
Generally, in FCC metals, the force required to move dislocations is not strongly
temperature-dependant, therefore dislocation movement remains high even at low
temperatures and the material remains relatively ductile. On the contrary, the yield stress of
BCC materials is markedly affected by temperature, causing a change in the failure mode
from plastic flow at high temperature (upper shelf) to brittle fracture at low temperature
(lower shelf), while the intermediate region is characterized by the presence in different
proportion of both mechanisms (ductile-to-brittle transition or DBT). However, some FCC
high-nitrogen austenitic steels exhibit DBT because the addition of N can cause a strong
temperature dependence of the yield strength [41]. Conversely, the presence of a suitable
amount of Cu allows for a greater austenite stability which improves the low-temperature
toughness due to an increasing of the stacking fault energy of the phase [41]. DSS and
especially SDSS contain significant percentages of N (up to 0.3%) and sometimes Cu.
Nitrogen is fundamental for the γ-phase stabilization, it allows the interstitial solid-solution
mechanical strengthening at room temperature and improves the corrosion resistance,
while copper is added to improve the corrosion resistance in sulphuric environments and to
minimize the erosion damage. However, despite its beneficial aspects, the high nitrogen
content in these steels can negatively affect the austenite behaviour at the lowest
temperatures, while the presence of a suitable amount of copper can in some extent
counteract this effect.
In two-phase alloys the crack nucleation is easy to occur by piling up dislocations at
grain boundaries and the presence of secondary phases inside the matrix increases the
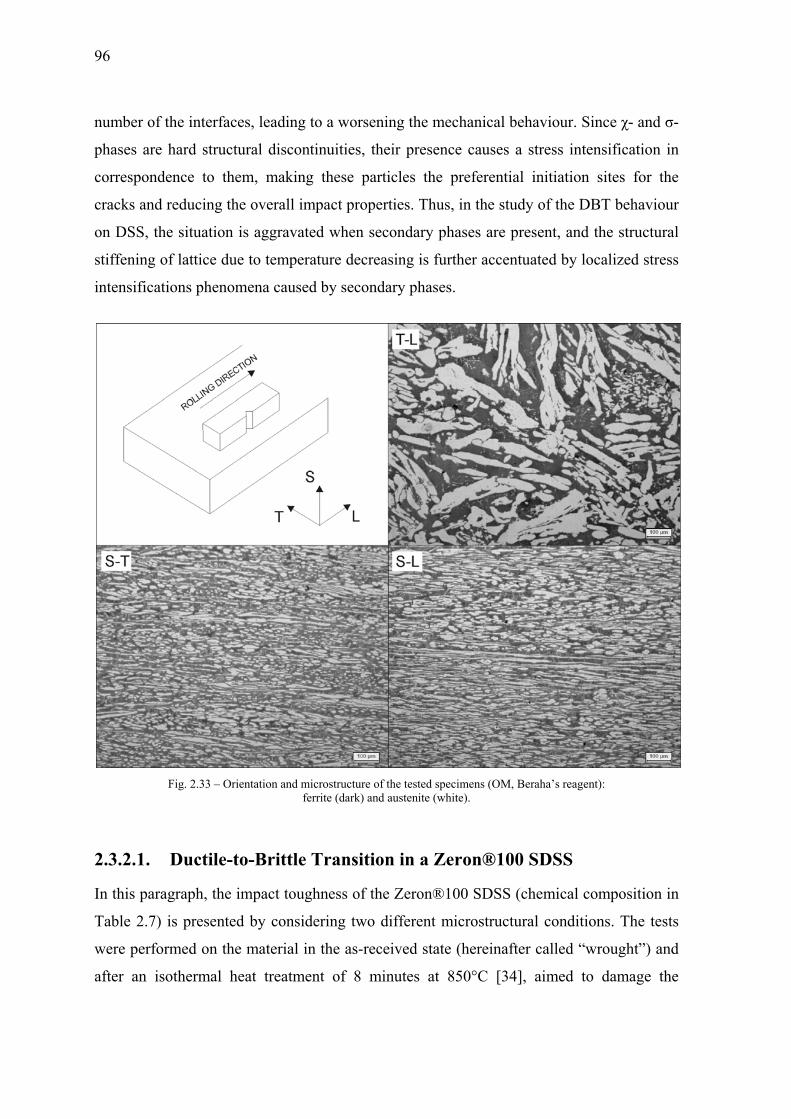
96
number of the interfaces, leading to a worsening the mechanical behaviour. Since χ- and σ-
phases are hard structural discontinuities, their presence causes a stress intensification in
correspondence to them, making these particles the preferential initiation sites for the
cracks and reducing the overall impact properties. Thus, in the study of the DBT behaviour
on DSS, the situation is aggravated when secondary phases are present, and the structural
stiffening of lattice due to temperature decreasing is further accentuated by localized stress
intensifications phenomena caused by secondary phases.
Fig. 2.33 – Orientation and microstructure of the tested specimens (OM, Beraha’s reagent):
ferrite (dark) and austenite (white).
2.3.2.1. Ductile-to-Brittle Transition in a Zeron®100 SDSS
In this paragraph, the impact toughness of the Zeron®100 SDSS (chemical composition in
Table 2.7) is presented by considering two different microstructural conditions. The tests
were performed on the material in the as-received state (hereinafter called “wrought”) and
after an isothermal heat treatment of 8 minutes at 850°C [34], aimed to damage the

micro
0.5%
stron
impa
Th
(Fig.
furth
of th
pend
More
meas
accor
the p
Micr
The
48%
expe
treatm
secon
ostructure b
%). From w
ngly affecte
act toughnes
he impact e
2.33), initi
her test at -1
he transition
dulum, with
eover, for
suring the w
rding to AS
plastic defor
rostructure
as-received
austenite
rimental tem
ment caused
ndary phase
by allowing
what was rep
ed the tough
ss by over 5
energy was
ially in a te
120°C only
n. The imp
h an availa
all the tes
width of the
STM A370 s
rmation of t
Fig. 2
d material w
and 52% f
mperature w
d the eutect
es. As expe
g the precip
ported in P
hness prope
50% at room
s evaluated
emperature
on the wro
pact tests w
able energy
sted specim
specimens
standards, i
he samples
2.34 – Microstrferrite (α
was compose
ferrite) and
was within t
toidic decom
ected, the pr
pitation of a
Paragraph 1
erties of the
m temperatu
on the T-L
range from
ought mater
were carried
y of 450
mens the la
opposite to
n order to a
.
ructure of the agα), austenite (γ)
ed by almo
d no second
the critical t
mposition o
recipitation
a slight amo
1.2.4.4, this
e material,
ure.
L direction
m -100°C to
rial, in orde
d out by m
J, accordin
ateral expan
o the V-notc
achieve a fu
ged sample (SE) and χ-phase.
st equal vol
dary phase
temperature
of the ferritic
in the treat
ount of inte
s amount of
leading to
of the wro
o 20°C and
r to obtain
means of an
ng to AST
nsion was
ch before an
urther param
EM-BSE):
lumes of ph
es were det
e range and
c matrix, w
ted sample w
ermetallic p
f secondary
a decreasin
ought mater
then follow
a better des
n automatic
TM E23 st
also evalua
nd after the
meter to char
hase fractio
tected. The
the isotherm
with the form
was very sl
97
hases (<
y phases
ng of the
rial plate
wed by a
scription
c impact
tandards.
ated, by
tests, in
racterize
n (about
e chosen
mal heat
mation of
light and

98
the soaking time mainly allowed for the formation of χ-phase. As can be seen in Fig. 2.34,
the secondary phases were mainly χ particles located at the grain boundaries, even though
some σ islands were also observed. The χ particles sizes were in the order of few
micrometers or less, while the rare σ particles were little coarser, and the evaluated total
amount was estimated to be lesser than 0.5%, even though in these conditions an accurate
quantification is not simple.
Ductile-to-Brittle Transition
The presence of both BCC ferrite and FCC austenite imply that the resulting transition
curve for the tested steel may appear as a combination of the two different behaviours
pertaining to the single-phase materials and the characteristic “S-shaped” curve was
expected to be quite smoothed. Due to the discrete character of the test, a mathematical
model is required to describe the material behaviour and the obtained data were then fitted
by using the hyperbolic tangent function (tanh) [42]:
𝑌 = 𝐴 + 𝐵 ∙ 𝑡𝑎𝑛ℎ (𝑇 − 𝑇 )𝐶 (2.4)
where Y is the KV energy, T is the test temperature and A, B, T0 and C are adjustable
parameters estimated by regression procedure. T0 is a location parameter which provides
the inflection point of the curve and, in the present work, it was considered to be the
transition temperature (Ttrans), A+B corresponds to the upper shelf energy (USE) and A-B
to the lower shelf energy (LSE).
Table 2.10 – Results of tanh fitting and extrapolated data.
Condition A B C T0 (TTRANS) USE χ2 R2 T27J
wrought 180.75 153.55 53.36 -73.23 334.30 1.20 0.99 -158
aged 143.27 113.03 44.36 -49.82 256.30 2.58 0.97 -120
Note: TTRANS from regression analysis [42] and T27J from extrapolation [40].
The average impact test values and the tanh fittings are plotted in Fig. 2.35, while the
results of the regression analyses are reported in Table 2.10 and will be discussed later. It
is evident that the two materials did not reach the completely brittle fracture conditions in
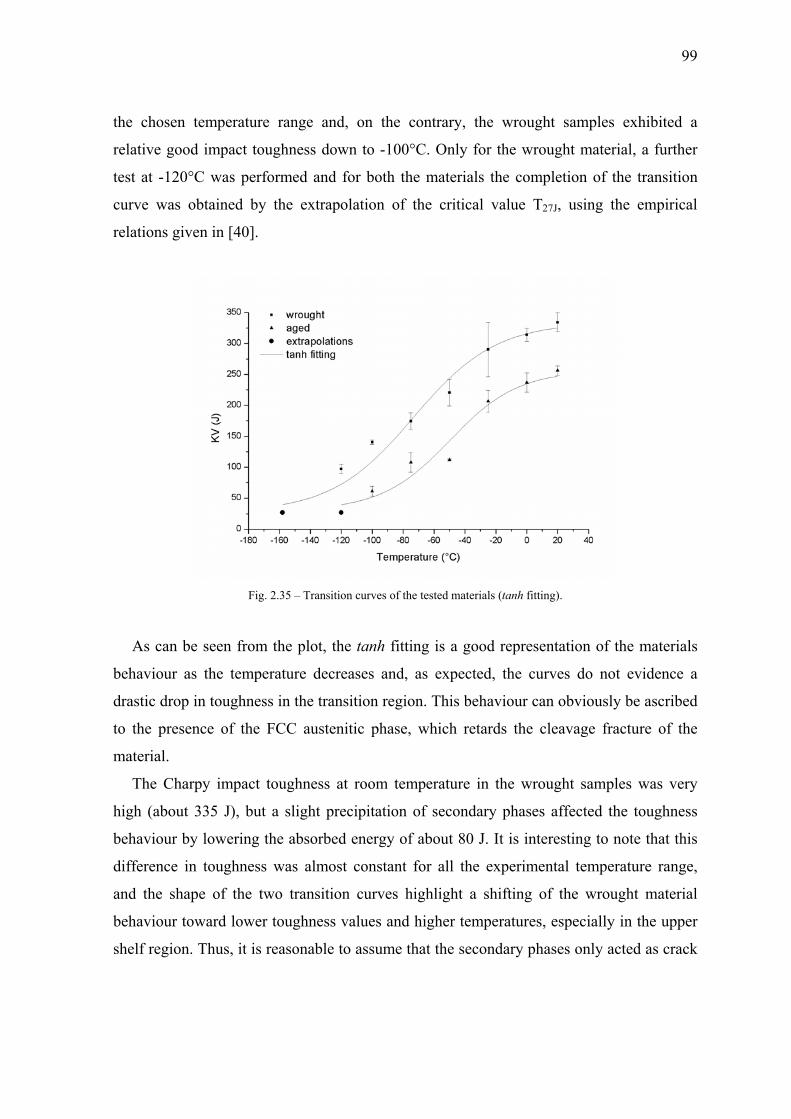
99
the chosen temperature range and, on the contrary, the wrought samples exhibited a
relative good impact toughness down to -100°C. Only for the wrought material, a further
test at -120°C was performed and for both the materials the completion of the transition
curve was obtained by the extrapolation of the critical value T27J, using the empirical
relations given in [40].
Fig. 2.35 – Transition curves of the tested materials (tanh fitting).
As can be seen from the plot, the tanh fitting is a good representation of the materials
behaviour as the temperature decreases and, as expected, the curves do not evidence a
drastic drop in toughness in the transition region. This behaviour can obviously be ascribed
to the presence of the FCC austenitic phase, which retards the cleavage fracture of the
material.
The Charpy impact toughness at room temperature in the wrought samples was very
high (about 335 J), but a slight precipitation of secondary phases affected the toughness
behaviour by lowering the absorbed energy of about 80 J. It is interesting to note that this
difference in toughness was almost constant for all the experimental temperature range,
and the shape of the two transition curves highlight a shifting of the wrought material
behaviour toward lower toughness values and higher temperatures, especially in the upper
shelf region. Thus, it is reasonable to assume that the secondary phases only acted as crack

100
initiatio
matrix a
The
pressure
coeffici
[44], the
impact
transitio
severe t
by the a
2507 SD
which c
tungsten
Fig
on sites, wh
and remaine
tanh fitting
e vessel su
ents on DS
e Zeron®10
toughness
on temperat
temperature
addition of
DSS [45], p
can be prob
n in solid so
g. 2.36 – Fractu
hile the pla
ed similar in
g is widely
ubjected to
SS are avai
00 SDSS ex
reduction
ture was sub
e conditions
a major con
points out a
bably ascrib
olution.
ure surfaces at 2
astic deform
n both the e
used to de
neutron irr
lable in lite
xhibited a b
in the tran
bstantially
s, underlinin
ntent of allo
again a bett
bed to a g
20°C (SEM-SE
mation beha
examined m
escribe the
radiation, b
erature. Ho
better overal
nsition regio
lower and t
ng the enha
oying eleme
ter response
reater cont
): a) wrought m
aviour was
materials, as
DBT of st
but no data
owever, if c
ll toughness
on was mo
the brittle fr
anced prope
ents. Moreo
e in the con
ent of copp
material, b) aged
determined
reported in
teels, espec
a concerning
compared to
s response a
ore gradual
fracture took
erties of thi
over, a com
nsidered tem
per and to
d material and c
d by the Du
[43].
ially for nu
g the regre
o the 2205
and the obs
l. The estim
k place for
is steel ach
mparison wit
mperature r
the presen
c) detail of (b).
uplex
uclear
ession
DSS
erved
mated
more
hieved
th the
range,
nce of

Frac
At ro
fractu
typic
the d
lowe
the c
surfa
attrib
quasi
cases
2.37)
due
prese
the sp
Th
featu
with
it wa
defin
is rea
mate
cture Behav
oom tempe
ure surfaces
cal dimpled
ductile mec
ered the abs
cracks free-p
ace – the i
buted to pre
i-cleavage m
s the plasti
), even thou
to the seco
ence of the
pecimens st
Fig. 2.37
he macrosc
ures of the f
a microstru
as possible
ne the tempe
asonable to
erial and at
viour
erature, the
s had the ty
d surface (F
chanism wa
orbed energ
paths. As c
intermetallic
e-existing c
micro-facet
ic deformat
ugh in the a
ondary pha
intermetalli
till retained
7 – SEM-SE im
opic analys
fractures ass
uctural inve
to assign t
erature rang
o assume tha
around 0°
wrought m
ypical fibrou
Fig. 2.36a).
as the prev
gy, enhanci
can be seen
c sites are
avities, and
ts in their v
tion in corr
aged materia
ase particles
ics in the ag
d an apprecia
mages of the not
sis of the fra
sociated to
estigation an
the boundar
ge associate
at the trans
C for the a
material fai
us character
In the aged
vailing one
ing the britt
from Fig.
clearly vi
d are consid
vicinity (see
respondence
al the micro
s which ac
ged material
able toughn
tch root at 20°C
acture surfac
temperature
nd consideri
ries to the b
ed to the tra
ition began
aged one, w
led in a co
r and the fra
d material,
e, the prese
tle cleavage
2.36b – tak
sible, altho
dered respon
e detail in F
e of the no
ovoids coale
cted as pref
l clearly low
ness.
C: a) wrought m
ces (Fig. 2.3
e decreasing
ing the obta
both shelve
ansition regi
n between 0
when signif
ompletely d
acture morp
although at
ence of the
e and allowi
ken from th
ough some
nsible for th
Fig. 2.36c)
otch root w
escence was
ferential nu
wered the ab
material and b) a
38) revealed
g. By coupl
ained impac
es (upper an
ion. From th
0°C and -25
ficantly ext
ductile man
phology sho
t room tem
e secondary
ing the redu
he centre of
of them c
he formatio
. However,
was very hi
s more pron
ucleation si
bsorbed ene
aged material.
d the disting
ling the obs
ct toughness
nd lower) a
he available
5°C for the
tended mac
101
nner, the
owed the
mperature
y phases
uction of
f fracture
could be
on of the
, in both
gh (Fig.
nounced,
tes. The
ergy, but
guishing
servation
s values,
and thus
e data, it
wrought
rocracks

102
appeare
Seconda
tempera
the fract
In th
transitio
value, t
nearby
deforma
material
fracture
2.40a) a
due to th
Fig
ed on the fra
ary phases
ature and by
ture was pre
he wrought
on beginnin
the brittle
and in cor
ation at the
l the impac
e surface we
and the mic
he presence
g. 2.39 – Wroug
acture surfa
s affected
y promoting
evailing duc
Fig. 2.38 –
material, t
ng) was main
fracture sta
rrespondenc
e notch roo
ct toughnes
ere more ex
crovoid coal
e of the inter
ght material fail
ace and whe
the steels
g the initiat
ctile and the
Fractures of wr
the fracture
nly ductile b
arted to ma
ce of the m
ot was stil
s at 0°C w
xtended than
lescence at
rmetallics.
ed at -25°C (SE
en the surfa
behaviour
tion of the b
e plastic def
rought (up) and
e behaviour
but, despite
anifest itsel
macrocracks
ll observed
was also hig
n in the wro
the notch r
EM-SE): a) clea
ace started to
r by incre
brittle ruptu
formation w
d aged (down) m
r at -25°C
e to the high
lf and clea
s (Fig. 2.39
(Fig. 2.39
gh, but the
ought one at
root was mo
avage nearby a
o be substan
easing the
ure, even if
was still very
materials.
(i.e. after t
h recorded im
avage facets
9a), even if
9b). Likewi
quasi-cleav
t the same t
ore pronoun
macrocrack an
ntially dam
transition
also in this
y high.
the hypothe
mpact tough
s appeared
f a large p
ise, in the
vage areas i
emperature
nced (Fig. 2
d b) notch root.
maged.
start
s case
esized
hness
both
plastic
aged
in the
(Fig.
2.40b)
.

F
Lo
mate
Fig.
prop
rollin
whos
mode
has
fractu
In
notch
(Fig.
ig. 2.40 – Aged
owering the
erials and th
2.38. The
agation wh
ng plane, a
se number i
e, dependin
occurred b
ure mode.
n the wroug
h root and p
2.41). The
d material failed
e temperatu
he delamina
presence o
ich occurre
along the m
increased a
ng on the te
by decohesi
F
ght material
passing from
e same beh
d at 0°C (SEM-
ure, a mixed
ation phenom
of these sp
ed at the fer
most elonga
s the tempe
esting tempe
ion of the
Fig. 2.41 – Cleaat -100
, at -75°C t
m -100°C t
aviour at th
-SE): a) cleavag
d ductile/br
menon start
plits (or wa
rrite/austeni
ated grains
erature decr
erature, wh
crystallogr
avage in the wro0°C (SEM-SE):
the firsts cle
to -120°C th
he notch ro
ge in the lower p
rittle fractur
ted to mani
alls) is ass
ite interface
[46]. Betw
reased, the m
hile in corre
raphic plan
ought material notch root.
eavage mic
he extension
oot was obs
part of the surfa
re mode wa
ifest itself, c
sociated to
es in a direc
ween two n
material wa
espondence
nes, with a
failed
cro-facets w
n of these a
served in th
ace and b) notc
as observed
clearly visib
an unstabl
ction parall
neighbourin
as failed in
of them th
completely
were observe
areas was e
he aged mat
103
h root.
d in both
ble from
le crack
el to the
ng walls,
a mixed
e failure
y brittle
ed at the
enhanced
terial by

104
passing
and ther
Durin
pronoun
compon
high in
material
As a
transitio
the aged
in both
several
tempera
Extrapo
In the e
conditio
behavio
recorded
frequen
useful f
possible
from -75°C
refore of the
ng the trans
nced in the
nent was sti
n both mate
l, allowing
Fig. 2.42 –
a result of t
on a temper
d one. How
materials,
ductile area
atures.
olations and
xperimenta
on for the
our was not
d. The defi
ntly require
for the diff
e to estimat
C to -100°C
e shelves –
sition, cleav
whole frac
ill observed
erials, but
an easier m
– Fracture surfa
the investig
rature lower
wever, even
the comple
as was inste
d Regressio
al temperatu
so-called C
t observed,
inition of th
a minimum
ferent indus
te it from C
C, highlighti
toward high
vage facets
cture surfac
d. The plas
the presenc
microvoid fo
aces at -100°C (
gation, it is
r than -120°
though a s
etely brittle
ead observed
on Analysis
ure range, no
Charpy 27
even thou
he T27J valu
m Charpy im
strial applic
Charpy value
ing again th
her tempera
with river p
e (Fig. 2.42
stic deforma
ce of the s
rmation.
SEM-SE): a) w
reasonable
°C for the w
significant t
e mechanism
d in the frac
one of the t
J Tempera
ugh a progr
ue is relevan
mpact energ
cations. If t
es at other t
he shifting o
atures.
patterns and
2), even tho
ation at the
secondary
wrought materia
to assume
wrought mat
oughness re
m is not ev
cture surfac
tested mater
ture (T27J)
ressive drop
nt to materi
gy of 27 J a
the T27J is
temperature
of the transi
d tongues w
ough an app
e notch roo
phases wor
al and b) aged m
as lower b
terial and ne
eduction ha
vident in no
ce, even at th
rials has rea
and the co
p in impact
ial testing s
and its deter
not directly
e by means
ition behavi
were increas
preciable du
ot remained
rsened the
material.
boundary fo
earby -100°
as been obs
one of them
he lowest te
ached the cr
ompletely b
t toughness
standards, w
rmination c
y observed,
of the emp
iour –
singly
uctile
d very
aged
or the
°C for
erved
m and
esting
ritical
brittle
s was
which
an be
, it is
pirical
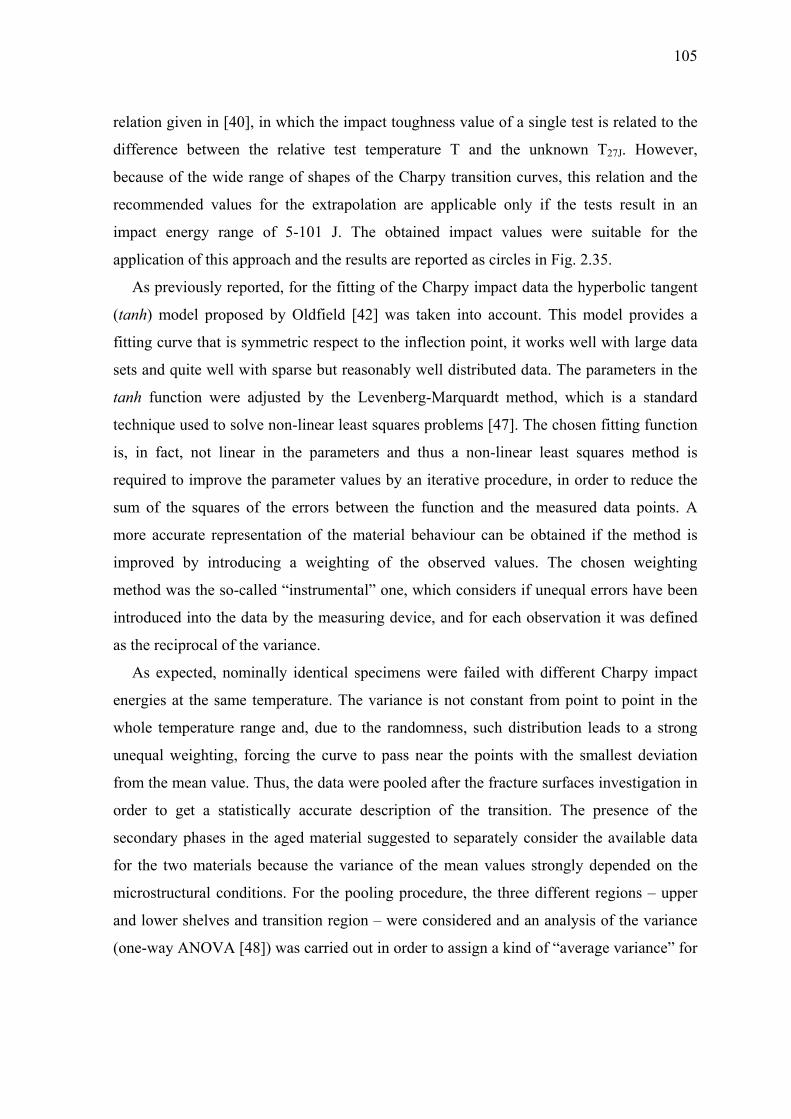
105
relation given in [40], in which the impact toughness value of a single test is related to the
difference between the relative test temperature T and the unknown T27J. However,
because of the wide range of shapes of the Charpy transition curves, this relation and the
recommended values for the extrapolation are applicable only if the tests result in an
impact energy range of 5-101 J. The obtained impact values were suitable for the
application of this approach and the results are reported as circles in Fig. 2.35.
As previously reported, for the fitting of the Charpy impact data the hyperbolic tangent
(tanh) model proposed by Oldfield [42] was taken into account. This model provides a
fitting curve that is symmetric respect to the inflection point, it works well with large data
sets and quite well with sparse but reasonably well distributed data. The parameters in the
tanh function were adjusted by the Levenberg-Marquardt method, which is a standard
technique used to solve non-linear least squares problems [47]. The chosen fitting function
is, in fact, not linear in the parameters and thus a non-linear least squares method is
required to improve the parameter values by an iterative procedure, in order to reduce the
sum of the squares of the errors between the function and the measured data points. A
more accurate representation of the material behaviour can be obtained if the method is
improved by introducing a weighting of the observed values. The chosen weighting
method was the so-called “instrumental” one, which considers if unequal errors have been
introduced into the data by the measuring device, and for each observation it was defined
as the reciprocal of the variance.
As expected, nominally identical specimens were failed with different Charpy impact
energies at the same temperature. The variance is not constant from point to point in the
whole temperature range and, due to the randomness, such distribution leads to a strong
unequal weighting, forcing the curve to pass near the points with the smallest deviation
from the mean value. Thus, the data were pooled after the fracture surfaces investigation in
order to get a statistically accurate description of the transition. The presence of the
secondary phases in the aged material suggested to separately consider the available data
for the two materials because the variance of the mean values strongly depended on the
microstructural conditions. For the pooling procedure, the three different regions – upper
and lower shelves and transition region – were considered and an analysis of the variance
(one-way ANOVA [48]) was carried out in order to assign a kind of “average variance” for
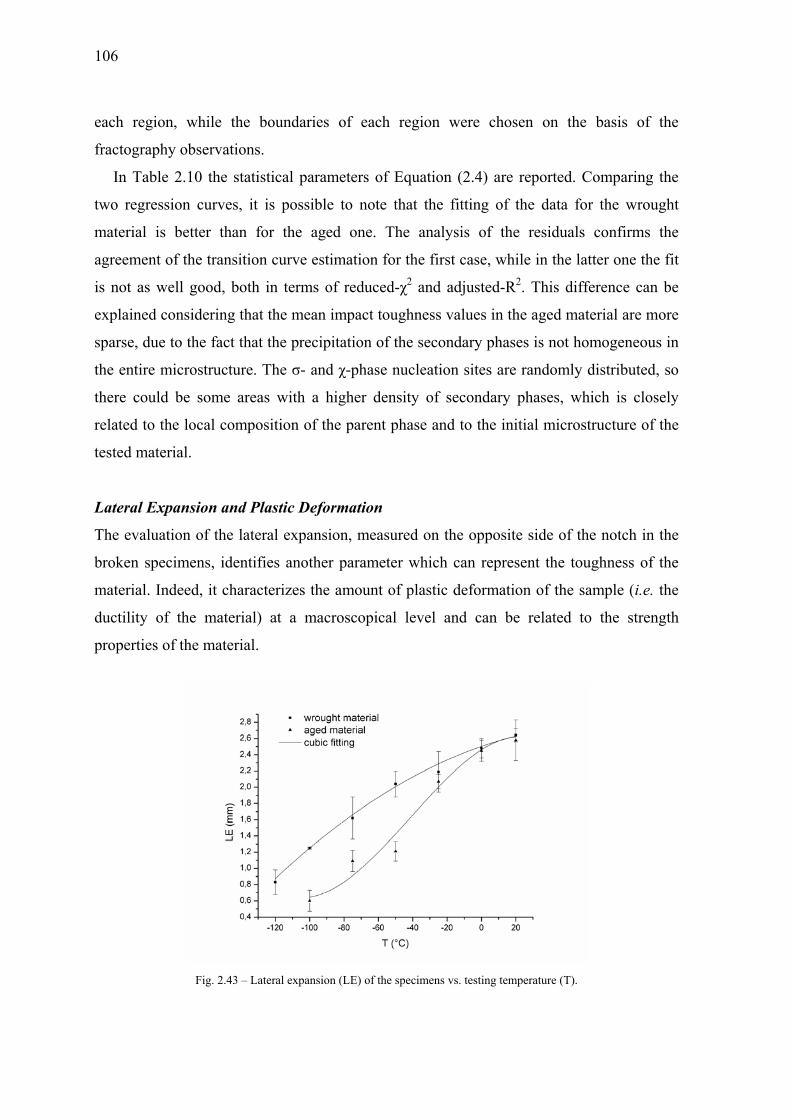
106
each region, while the boundaries of each region were chosen on the basis of the
fractography observations.
In Table 2.10 the statistical parameters of Equation (2.4) are reported. Comparing the
two regression curves, it is possible to note that the fitting of the data for the wrought
material is better than for the aged one. The analysis of the residuals confirms the
agreement of the transition curve estimation for the first case, while in the latter one the fit
is not as well good, both in terms of reduced-χ2 and adjusted-R2. This difference can be
explained considering that the mean impact toughness values in the aged material are more
sparse, due to the fact that the precipitation of the secondary phases is not homogeneous in
the entire microstructure. The σ- and χ-phase nucleation sites are randomly distributed, so
there could be some areas with a higher density of secondary phases, which is closely
related to the local composition of the parent phase and to the initial microstructure of the
tested material.
Lateral Expansion and Plastic Deformation
The evaluation of the lateral expansion, measured on the opposite side of the notch in the
broken specimens, identifies another parameter which can represent the toughness of the
material. Indeed, it characterizes the amount of plastic deformation of the sample (i.e. the
ductility of the material) at a macroscopical level and can be related to the strength
properties of the material.
Fig. 2.43 – Lateral expansion (LE) of the specimens vs. testing temperature (T).
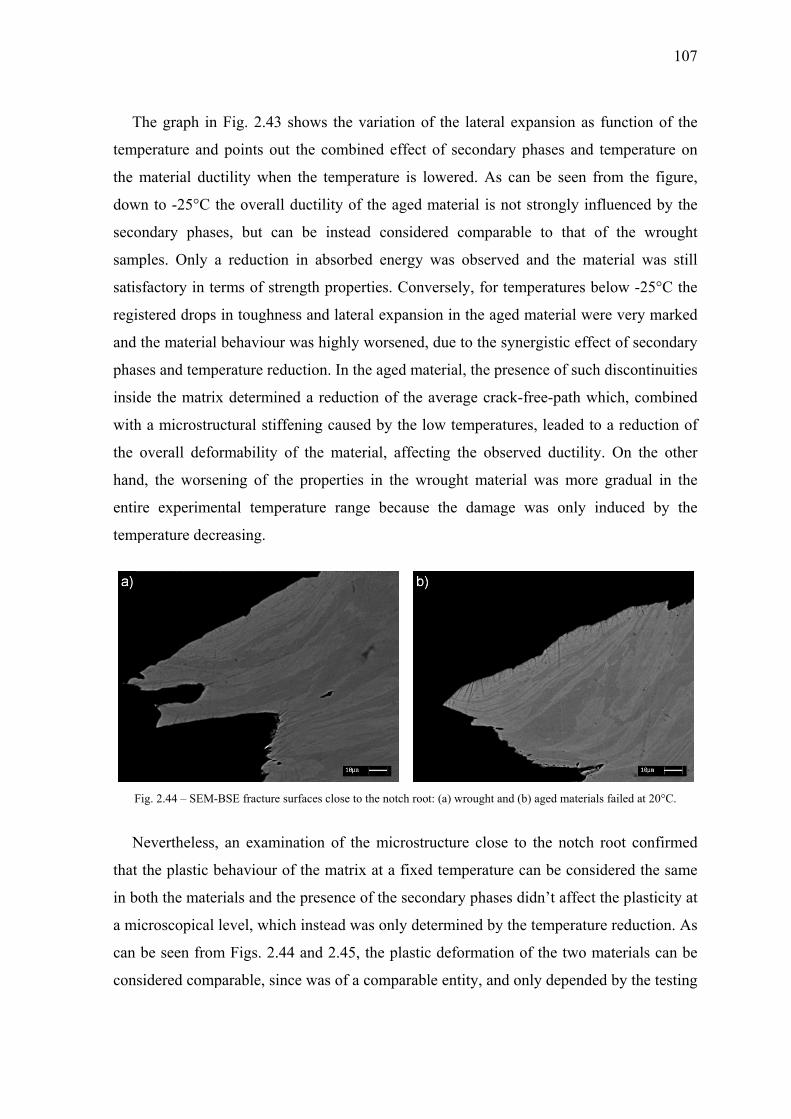
Th
temp
the m
down
secon
samp
satisf
regis
and t
phas
insid
with
the o
hand
entir
temp
Fi
N
that t
in bo
a mic
can b
consi
he graph in
perature and
material duc
n to -25°C
ndary phas
ples. Only
factory in te
stered drops
the material
es and temp
de the matri
a microstru
overall defo
d, the worse
e experime
perature dec
ig. 2.44 – SEM-
Nevertheless
the plastic b
oth the mate
croscopical
be seen from
idered comp
n Fig. 2.43
d points out
ctility when
the overall
ses, but can
a reduction
erms of stre
s in toughne
l behaviour
perature red
ix determin
uctural stiff
ormability o
ening of th
ental tempe
creasing.
-BSE fracture s
, an examin
behaviour o
erials and th
level, whic
m Figs. 2.4
parable, sin
shows the
t the combi
n the tempe
ductility of
n be instea
n in absorb
ength prope
ess and later
was highly
duction. In th
ed a reduct
fening cause
of the mate
he propertie
erature rang
surfaces close to
nation of th
of the matri
he presence
ch instead w
44 and 2.45,
nce was of a
variation o
ined effect
erature is lo
f the aged m
ad consider
ed energy
erties. Conv
ral expansio
y worsened,
he aged ma
tion of the a
ed by the lo
erial, affect
s in the wr
ge because
o the notch root
he microstr
ix at a fixed
of the seco
was only det
, the plastic
a comparabl
f the latera
of seconda
owered. As
material is
red compar
was observ
versely, for
on in the ag
due to the
aterial, the p
average cra
ow tempera
ting the obs
rought mate
the dama
t: (a) wrought a
ructure clos
d temperatu
ndary phase
termined by
c deformatio
le entity, an
l expansion
ary phases a
s can be see
not strongly
rable to th
ved and the
temperatur
ged materia
synergistic
presence of s
ack-free-pat
atures, leade
served duct
erial was m
ge was on
and (b) aged ma
e to the no
ure can be c
es didn’t af
y the temper
on of the tw
nd only depe
n as functio
and temper
en from the
y influence
hat of the
e material w
res below -2
al were very
effect of se
such discon
th which, co
ed to a redu
tility. On th
more gradua
nly induced
aterials failed at
otch root co
considered t
ffect the pla
rature reduc
wo material
ended by th
107
on of the
rature on
e figure,
d by the
wrought
was still
25°C the
y marked
econdary
ntinuities
ombined
uction of
he other
al in the
d by the
t 20°C.
onfirmed
the same
sticity at
ction. As
s can be
he testing
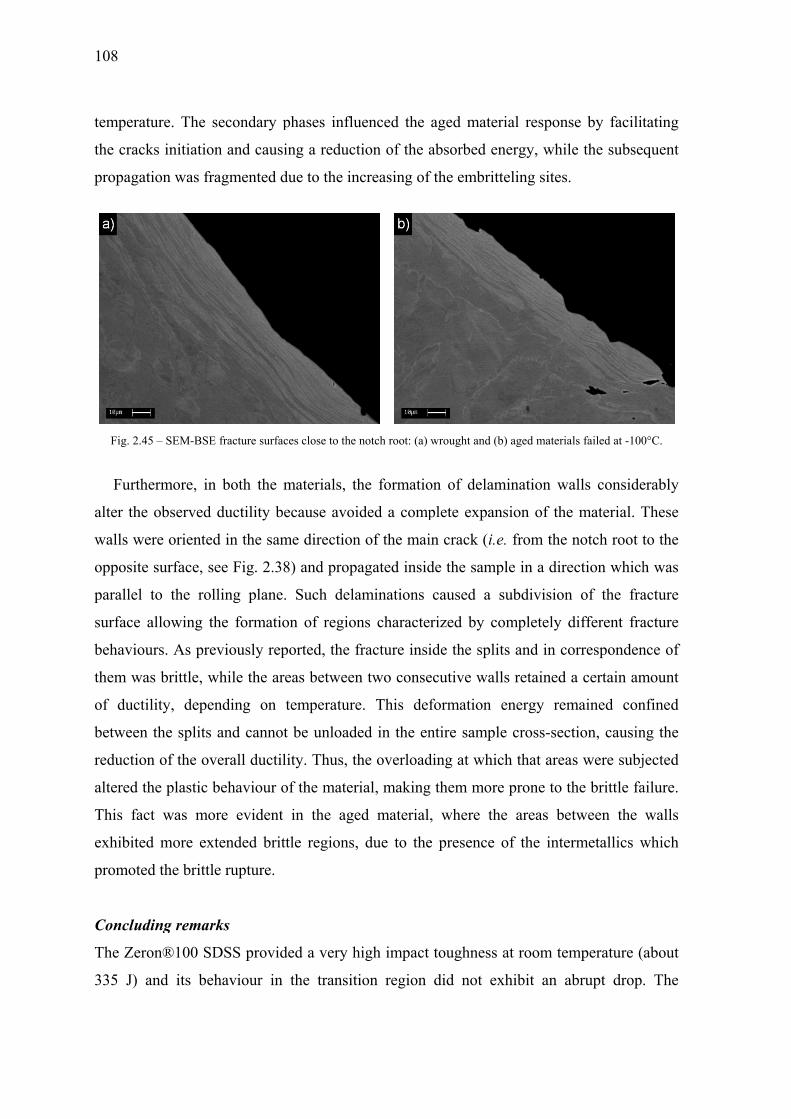
108
tempera
the crac
propaga
Fig. 2.4
Furth
alter the
walls w
opposite
parallel
surface
behavio
them w
of duct
between
reductio
altered t
This fa
exhibite
promote
Conclud
The Zer
335 J)
ature. The s
cks initiation
ation was fr
45 – SEM-BSE
hermore, in
e observed
were oriented
e surface, s
to the rol
allowing th
ours. As pre
as brittle, w
tility, depen
n the splits
on of the ov
the plastic b
act was mo
ed more ext
ed the brittl
ding remar
ron®100 SD
and its beh
secondary p
n and causi
agmented d
E fracture surfac
n both the m
ductility be
d in the sam
ee Fig. 2.38
lling plane.
he formatio
eviously rep
while the are
nding on t
and cannot
verall ductil
behaviour o
ore evident
tended britt
e rupture.
rks
DSS provid
haviour in
phases influ
ing a reduct
due to the in
ces close to the
materials, th
ecause avoi
me direction
8) and prop
Such dela
on of region
ported, the f
eas between
temperature
t be unload
lity. Thus, th
of the mater
in the age
tle regions,
ded a very h
the transit
uenced the
tion of the a
ncreasing of
notch root: (a)
he formatio
ided a comp
n of the mai
agated insid
aminations
ns characte
fracture insi
n two conse
e. This def
ed in the en
he overload
rial, making
ed material
, due to the
high impact
ion region
aged mater
absorbed en
f the embritt
wrought and (b
on of delam
plete expan
in crack (i.e
de the samp
caused a s
erized by co
ide the split
ecutive wall
formation
ntire sampl
ding at whic
g them more
, where th
e presence
toughness
did not ex
rial respons
nergy, whil
teling sites.
b) aged materia
mination wa
nsion of the
e. from the n
ple in a dire
subdivision
ompletely d
ts and in co
ls retained a
energy rem
e cross-sect
ch that area
e prone to th
e areas bet
of the inter
at room tem
xhibit an ab
se by facilit
e the subse
als failed at -100
alls conside
e material. T
notch root t
ection which
n of the fra
different fra
orresponden
a certain am
mained con
tion, causin
s were subj
he brittle fa
tween the
rmetallics w
mperature (
brupt drop.
tating
quent
0°C.
erably
These
to the
h was
acture
acture
nce of
mount
nfined
ng the
jected
ailure.
walls
which
about
. The
109
material in the wrought conditions consistently passed the Charpy test specification of 40 J
minimum and 0,38 mm lateral expansion at -120°C [49] and, as a matter of fact, it showed
more than twice of these values. The mechanical properties of this steel are improved if
compared to the widely employed 2205 DSS and the similar grade 2507 DSS, the impact
toughness behaviour was always better in the whole transition region and the transition
temperature is considerably higher.
Nevertheless, a slight secondary phases precipitation (<0.5%) lowered the impact
energy of about 80 J at room temperature and this difference in impact toughness can be
consider almost constant within the whole transition region. The ductility of the aged
material fell considerably for temperatures below -20°C, highlighting that the presence of
the intermetallic phases acts as preferential cracks nucleation site and reduces the average
crack-free-path, lowering the overall ductility, while the matrix plastic behaviour can be
considered comparable to the wrought material and is strictly related to the reduction of
temperature.
Any toughness requirement must be valid where intermetallic precipitates are present
[50], thus, for this reason, the material in the aged conditions in not suitable for the normal
applications and cannot be consider reliable for exercises in temperature ranges below
zero.
REFERENCES
[1] D. A. Porter, K. E. Easterling and M. Y. Sherif. Phase transformations in metals and alloys. CRC Press, Taylor&Francis Group, USA (2009).
[2] B. Sundman, B. Jansson and J. O. Anderson. CALPHAD 9 (1985). [3] L. Kaufman and H Bernstein. Computer calculation of phase diagrams. Man. Labs. Inc. Cambridge,
Mass/Academic Press, New York (1970). [4] J. O. Nilsson. Mater Sci Tech Ser 8 (1992) 685. [5] J. O. Nilsson, G. Chai. Proc. Conf. Duplex 2007 International Conference & Expo. Grado, Italy
(2007). [6] J. O. Nilsson, P. Kangas, T. Karlsson and A. Wilson. Metall Mater Trans A 31A (2000) 35. [7] I. Calliari, M. Breda, M. Pellizzari and E. Ramous. The χ-phase in duplex stainless steels (in press). [8] L. Duprez, B. C. De Cooman and N. Akdut. Steel Res 72 (2001) 311. [9] M. Pohl, O. Storz, T. Glogowski. Mater Charact 58 (2007) 65. [10] M. Pohl, O. Storz, T. Glogowski. Int J Mater Res 99 (2008) 1163. [11] J. Charles. La Metallurgia Italiana 2 (1995) 83.
110
[12] S. Wessman, R. Petterson and S. Hertzman. Steel Res Int 81 (2010) 337. [13] I. Calliari, M. Zanesco, E. Ramous. J Mater Sci 41 (2006) 7643. [14] I. Calliari, M. Pellizzari, E. Ramous. Mat Sci Tech Ser 27 (2011) 928. [15] I. Calliari, K. Brunelli, M. Zanellato, E. Ramous, R. Bertelli. J Mater Sci 44 (2009) 3764. [16] I. Calliari, M. Pellizzari, M. Zanellato, E. Ramous. J Mater Sci 46 (2011) 6916. [17] I. Calliari, M. Zanesco, E. Ramous and P. Bassani. J Mater Eng Perform 16 (2007) 109. [18] I. Calliari, P. Bassani, K. Brunelli, M. Breda and E. Ramous. J Mater Eng Perform 22 (2013) 3860. [19] D. M. Escriba, E, Materna-Morris, R. L. Plaut and A. F. Padilha. Mater Sci Forum 636–637 (2010)
478. [20] S. B. Kim, K. W. Paik, Y. G. Kim. Mat Sci Eng A A247 (1998) 67. [21] Z. L. Jiang, X. Y. Chen, H. Huang, X. Y. Liu. Mat Sci Eng A A363 (2003) 263. [22] T. H. K. L. Weng, J. R. Yang. Mat Sci Eng A A338 (2002) 259. [23] C. S. Huang, C. C. Shih. Mat Sci Eng A A402 (2005) 66. [24] S. Hertzman, R. Petterson, K. Frisk, T. Jerwin. Proc. Conf. Duplex 2000 6th World Conference &
Expo. Venice, Italy (2000). [25] K. T. Kim, Y. H. Lee and Y. D. Lee. Proc. Conf. Duplex Stainless Steels ‘97 International Conference
& Expo. Maastricht. The Nederlands (1997). [26] I. Calliari, K. Brunelli, M. Zanellato, E. Ramous, R. Bertelli. J Mater Sci 44 (2009) 3764. [27] J. Li, Z. Ma, X. Xiao, J. Zhao, L. Jiang. Mater Design 32 (2011) 2199. [28] I. Calliari, M. Dabalà, E. Ramous, G. Straffelini. Mater Sci Forum 604-605 (2009) 419. [29] A. Weisbrodt-Reisch, M. Brummer, B. Hadler, B. Wolbank, E.A. Werner. Mat Sci Eng A A416
(2006) 1. [30] N. Sathirachinda, R. Pettersson, S. Wessman, J. Pan. J Corr. Sci 52 (2010) 179. [31] Z. Weia, J. Laizhua, H. Jinchenga, S. Hongmeia. Mat Charact 60 (2009) 50. [32] B. Deng, Y.M. Jiang, J. Gao, J. Li. J Alloy Compd 493 (2010) 461. [33] P. Johansson, M. Liljas. Avesta Polarit Corros Manag Appl Eng 24 (2001) 24. [34] I. Calliari, M. Breda, E. Ramous, K. Brunelli, M. Pizzo and C. Menapace. J Mater Eng Perform 21
(2012) 2117. [35] J. Hamada and N. Ono. Mater Trans 51 (2010) 635. [36] R. N. Gunn. Duplex Stainless Steels: Microstructure, Properties and Applications. Abington
Publishing, Cambridge, England (1997). [37] R. B. Johansen, B. H. Leinum, S. Karlsen, H. A. Trandem, G. Valdø, A. O. Tjernæs and T. Helgesen,
Proc. Conf. Duplex 2000 6th World Conference & Expo. Venice, Italy (2000) 405. [38] G. Straffelini. Metall Mater Trans A 31A (2000) 1443. [39] K. Wallin. Innovative approaches to irradiation damages and fracture analysis (1989) 170. [40] A. C. Bannister. Structural Integrity Assessment Procedures for European Industry (SINTAP). British
Steel plc. (1997). [41] B. Hwang. Mater Sci Forum 654-656 (2010) 158. [42] W. Oldfield, ASTM Standardisation News 3 (1975) 24. [43] I. Calliari, G. Straffelini and E. Ramous. Mater Sci Tech Ser 26 (2010) 81. [44] H. Sieurin and R. Sandström. Eng Fract Mech 73 (2006) 377. [45] G. Chai. Struct Dur Hlth 3 (2007) 191. [46] E. Erauzkin and A.M. Irisarri. Fatigue Fract Eng M 15 (1992) 129–137. [47] D. W. Marquardt. J Soc Ind Appl Math 11 (1963) 431–441. [48] D. C. Montgomery. Design and Analysis of Experiments. Wiley&Sons, USA (2008). [49] R. Francis, G. Byrne, G. R. Warburton. Proc. Conf. Stainless Steel World ‘99. SSW99-007 (1999)
613. [50] C. S. Wiesner. Proc. Conf. Stainless Steel World ’97. D97-107 (1997) 979–990.
111
CHAPTER 3
EFFECTS OF COLD ROLLING
3.1. INTRODUCTION
This chapter deals with the effect of cold rolling in DSS, a particular cold working process
associated to plain-strain conditions (i.e. where two direction are mainly interested by
deformation), in which the resulting strain can be considered approximately homogeneous
in the deformation plane [1]. In technological terms, “cold” means that the operations are
carried out at or below room temperature; in metallurgical terms, a metal is said to be
“cold-worked” when it is deformed at temperatures and strain rates resulting in a negligible
contribution of diffusional processes to the strain, conventionally when a metal is
deformed at temperatures below 0.3·TM, being TM the absolute melting temperature.
Changing the shape is the primary aim of cold working; hence, deformations imparted
during such processes tend to be large. This process alters the mechanical properties of the
materials, and these changes correspond in variation of structure and textures which
accompany the plastic deformation [1].
Low temperatures plastic deformation of a polycrystalline metal essentially consists of
grains deformation, being negligible the contribution of either grain boundary migration or
sliding. Since DSS are biphasic materials, diffuse strain heterogeneities (i.e. different strain
states inside the same subdivided grain and influences exercised by neighbouring grains on
each other) can arise from the concomitant deformation of grains of a different strength
(austenite and ferrite) and from the tendency to change into a specific strain state that
partially accommodates the imposed macroscopic strain state. A specific feature of the
deformed state in heavily strained metals is the increasing "structural damage", i.e. such
structural events which cause degradation of the mechanical properties and eventually lead
to ductile fracture (void formation, void coalescence leading to cracks, etc.) [1], intimately
related to the crystal disorder induced at the microstructural level.

112
Heavily cold worked metals are subdivided by grain boundaries and dislocations
boundaries, which are arranged in lamellar or subgrain structures and whose frequency and
distribution determine the properties of the deformed metal, including flow stress, textures,
recrystallization behaviour and formability. These boundaries originate not only from pre-
existing boundaries in the undeformed metal, but also from dislocation boundaries which
form during the deformation process, dividing the grains into sub-regions that are smaller
than the original grain size [2]. Many metals develop a cellular substructure – also after
moderate strains – which can gradually evolve in a subgrained structure as the deformation
becomes more pronounced, and the dislocation density is the fundamental average
parameter of these cold worked substructure [1].
DSS possess a two-phases microstructure, composed by austenitic grains dispersed
within a ferritic matrix, and the phases behaviours during plastic deformation depend on
the mechanisms associated to the crystallographic relationships between the phases
(Chapter 1). The phases behaviour during cold working is conditioned by the interphase
distance, which for austenite is the grain size itself. When this distance is thinner than the
free-slip distance, a cell substructure develops, whereas dislocations mainly form
transverse walls connecting the interfaces when the interphase distance is of the same order
– or less – than the free-slip distance [1]. In DSS, the grain sizes of the phases are of the
same order of magnitude and austenite is confined by the surrounding ferritic matrix;
hence, the deformation mechanisms and the developed substructure suffers from the
restraints that the phases impose to each other, as discussed in the present chapter.
Moreover, cold plastic deformation can cause a martensitic transformation in austenite,
especially if the phase is not well stabilized (Chapter 1). This kind of solid-state induced
process give rise to the so-called Strain-Induced – or α’ – Martensite (hereinafter called
SIM), extensively observed in metastable austenitic stainless steels [3-17].
The aim of this chapter is to study the effects of cold rolling in various DSS grades, not
only in terms of strain-induced phase transformation, but also considering the involved
deformation mechanisms and discussing the associated changes in properties.
Cold rolling
The materials were subjected to cold rolling at different deformation degrees, from 3% to
85% of thickness reduction, by using a manual reversing mill. The various reduction
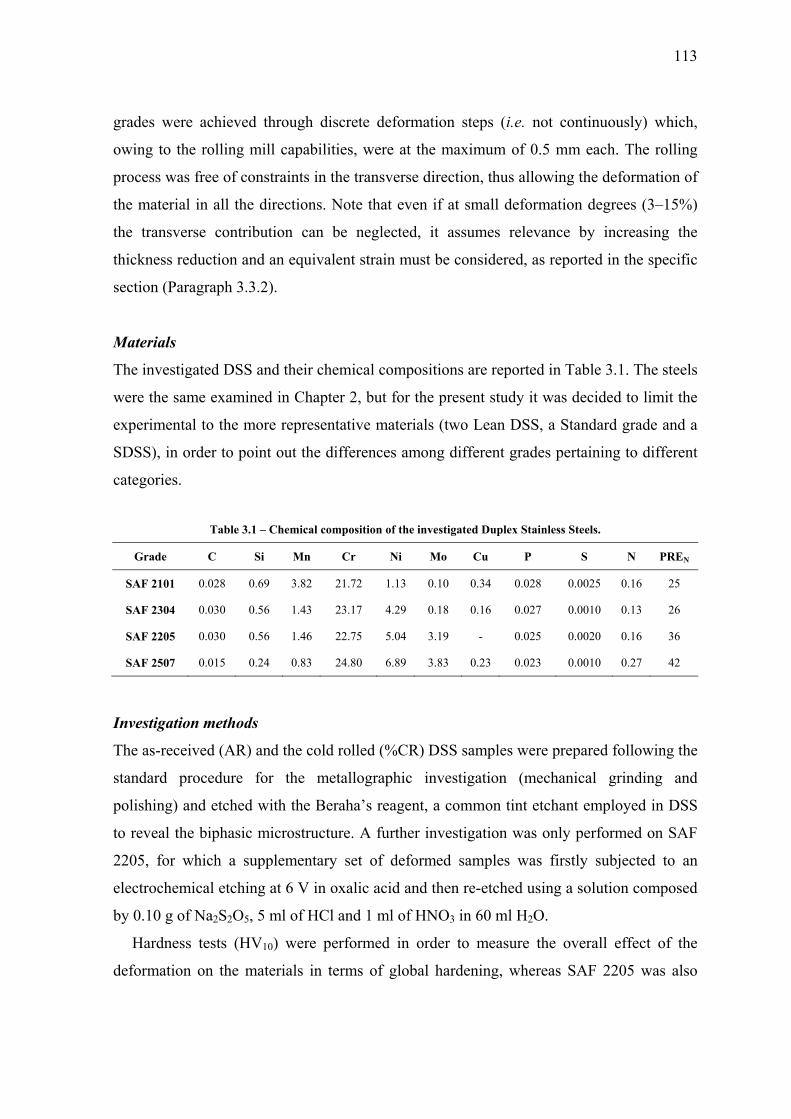
113
grades were achieved through discrete deformation steps (i.e. not continuously) which,
owing to the rolling mill capabilities, were at the maximum of 0.5 mm each. The rolling
process was free of constraints in the transverse direction, thus allowing the deformation of
the material in all the directions. Note that even if at small deformation degrees (3–15%)
the transverse contribution can be neglected, it assumes relevance by increasing the
thickness reduction and an equivalent strain must be considered, as reported in the specific
section (Paragraph 3.3.2).
Materials
The investigated DSS and their chemical compositions are reported in Table 3.1. The steels
were the same examined in Chapter 2, but for the present study it was decided to limit the
experimental to the more representative materials (two Lean DSS, a Standard grade and a
SDSS), in order to point out the differences among different grades pertaining to different
categories.
Table 3.1 – Chemical composition of the investigated Duplex Stainless Steels.
Grade C Si Mn Cr Ni Mo Cu P S N PREN
SAF 2101 0.028 0.69 3.82 21.72 1.13 0.10 0.34 0.028 0.0025 0.16 25
SAF 2304 0.030 0.56 1.43 23.17 4.29 0.18 0.16 0.027 0.0010 0.13 26
SAF 2205 0.030 0.56 1.46 22.75 5.04 3.19 - 0.025 0.0020 0.16 36
SAF 2507 0.015 0.24 0.83 24.80 6.89 3.83 0.23 0.023 0.0010 0.27 42
Investigation methods
The as-received (AR) and the cold rolled (%CR) DSS samples were prepared following the
standard procedure for the metallographic investigation (mechanical grinding and
polishing) and etched with the Beraha’s reagent, a common tint etchant employed in DSS
to reveal the biphasic microstructure. A further investigation was only performed on SAF
2205, for which a supplementary set of deformed samples was firstly subjected to an
electrochemical etching at 6 V in oxalic acid and then re-etched using a solution composed
by 0.10 g of Na2S2O5, 5 ml of HCl and 1 ml of HNO3 in 60 ml H2O.
Hardness tests (HV10) were performed in order to measure the overall effect of the
deformation on the materials in terms of global hardening, whereas SAF 2205 was also
114
subjected to micro-hardness tests (HV0.025), with the aim to follow the work-hardening
evolution of the phases during to the plastic deformation.
The etched microstructures of the samples were observed using a Leica Cambridge
Stereoscan 440 Scanning Electron Microscope (SEM), operating in backscattered-electron
mode (BSE) at 29 kV. A Leica DMRE Optical Microscope (OM) was employed to
investigate the AR materials after the Beraha’s etching, and both SEM-BSE and OM
micrographies were edited on an image-analysis software for an estimation of the
volumetric percentage of the phases.
Electron Back-Scattering Diffraction (EBSD) analyses were only performed on SAF
2101 subjected to 10%, 50% and 80% thickness reduction, after metallographic
preparation. In this material, the rolling direction plane of the sheets was considered.
Observations were performed using a LEO 1430 SEM at 20 kV, equipped with an
IncaCrystal 300 system and coupled with a 1330x1024 CCD camera. EBSD maps were
measured on a square grid and the step size (2.5–0.125 μm) was selected according to the
magnification of the scan field.
In SAF 2205, a deeper investigation on the effects of cold working was performed using
a Jeol JEM 200CX Transmission Electron Microscope (TEM), operating at 160 kV. The
thin foils samples were firstly mechanically thinned and polished, and then
electrochemically polished on a Struers TecnoPol at –20°C and 35 V, employing a solution
composed by 5% percloric acid, 25% glicerol and 75% ethanol.
All the samples were analyzed by X-Ray Diffraction (XRD) on a Siemens D500
diffractometer, using CrKα radiation (λ = 2.2909 Å) in the angular range 2θ = 60–140°
(step size of 0.05° and 3 seconds of counting time for each step), in order to investigate the
phases displacement in the solution-annealed and cold worked conditions. The same
instrument was employed to achieve the patterns for the SFE calculations in SAF 2205,
limiting the analysis to the angular range 2θ = 60–85° (step size of 0.025° and 6 seconds of
counting time for each step). All the XRD measurements for both phases displacement and
SFE calculations were performed on the rolling plane, with the samples oriented toward
the rolling direction (RD). Moreover, a slightly deeper description of textures development
in SAF 2205 has also involved measurements on the orthogonal plane (ND) to the rolling
one, whereas a more detailed study on texture formation will be given in a further
publication.

115
Since SIM is a ferromagnetic phase while austenite is not, magnetic measurements
allow to identify and quantify the martensite amount in the %CR samples, if present. The
saturation polarization is linearly proportional to the amount of ferromagnetic phase in
alloys [18,19] and the quantification can be achieved by a direct comparison with the
saturation polarization obtained by the magnetic tests on the as-received materials. For the
present work, specials AC and DC magnetometers was developed and applied for testing
the bulk samples. The AC device consists in a close circuit composed by a “U” shaped Fe-
Si iron yoke, with a driving coil connected to a function generator and a power amplifier,
capable to measure different values by applying a maximal effective field of 2458 A/m.
The DC Stäblein-Steinitz magnetic equipment is a close circuit designed to reach higher
coercivity and magnetization field than the AC magnetonmeter, consisting in two E-shaped
soft iron yokes placed opposite one another and with an air-gap between each of the three
pairs of transverse limbs. These techniques are both based on the reaching the magnetic
saturation from hysteresis loop and the adopted measuring set-up are especially suitable for
testing structural steel and medium hard magnetic samples.
Anodic potentiodynamic polarization tests were conducted for testing the corrosion
behaviour of as-received and deformed DSS, using an AMEL 568 potentiostat and
immerging the samples in a pH7 electrolyte solution composed by 35 g/l of NaCl in
deionized water (artificial sea water). All tests were performed at room temperature using
as reference a calomel electrode (SCE) and platinum as counter-electrode. For all tests, a
scanning rate of 0.8 mV/s was applied.
For the determination of the Critical Pitting Temperatures (CPT) of the materials, the
ASTM G150 standard was followed, using a potentiostat/galvanostat AMEL 7060. The
system included two cells containing the same aqueous solution (1 Molar of NaCl) and
electrically connected by means of a salt bridge. In the first cell, maintained at room
temperature, the reference electrode (calomel) was immerged, while the second, a
thermostated bath, included the counter-electrode (platinum) and the sample. The ASTM
standard states the evaluation of the CPT by maintaining a constant potential of 700 mV
and increasing the temperature of the thermostated cell at the rate of 1°C/min. The CPT is
then defined as that temperature at which a current of 100 μA/cm2 is absorbed by the
sample.

116
The cold rolled SAFs 2205 and 2101 DSS were also analyzed by means of the Neutron
Time-of-Flight Diffraction (ToF-ND) technique, in the Italian Neutron Experimental
Station (INES) located at the pulsed neutron source ISIS (Didcot, UK). The INES
diffractometer is equipped with 9 banks of 3He detectors, covering an angular range of
2θ=11–170° and lying on a circle of 1 m radius from the diffraction centre [20]. Each bank
provides a diffraction pattern which resolution depends on the angular position of the bank
itself, according to the derivative of the Time-of-Flight equation, thus leading to a higher
resolution in the backscattering one (i.e. bank-1). For the measurements, the samples were
mounted on aluminium tape, which has a small scattering length such that allowed
avoiding undesired reflections from the support device, and were oriented in order to
achieve the diffraction patterns pertaining to the rolling direction.
The ToF-ND spectra were refined using the Rietveld method on the GSAS software
[21], which allowed to provide accurate information on lattice parameters variation, phases
fractions, texture indexes and microstrains evolution during the deformation process. In all
the Rietveld analyses, the peak profile function number 4 [22] was taken into account for a
proper estimation of the phases microstrain, and both the overall and the phase-related
parameters were refined.
3.2. EFFECTS ON MICROSTRUCTURES AND PROPERTIES
Cold rolling modifies the microstructure by refining and orienting the grains as the
thickness reduction increases, causing the formation of a heavily banded microstructure at
high degrees of deformation and making DSS strongly anisotropic. The microstructural
damage induced by cold working assumes ever more relevance as the deformation
proceeds; grains shapes macroscopically change and an increased number of defects is
introduced within the crystal lattices, leading to the formation of sub-structures. Therefore,
also owing to the possible occurrence of the strain-induced martensitic transformation, a
variation of DSS properties is expected.
3.2.1. Microstructures
The OM and SEM micrographies obtained on the AR samples revealed that the solution-
annealed microstructures were intermetallics-free and by image-analysis it was possible to

evalu
well
SAF
phas
mech
cond
A
A
shap
proce
uate the rela
balanced, w
2101, for
e ratio in
hanisms dur
ditions.
T
Ferrite (α)
Austenite (γ)
Fig. 3.1
As can be se
e of the co
ess (hot ro
ated phases
with a cont
which it w
this latter
ring cold w
Table 3.2 – Au
21
7
2
1 – As-received
een from Fi
onstituent p
lling and s
s fractions,
tent of both
was estimate
r steel can
working and
ustenite and fer
101
76
24
d microstructure
g. 3.1, the v
phases are
solubilisatio
reported in
h phases clo
ed a ferrite
n alter in
d can affect
rrite volume fr
2304
47
53
es of the investi
various AR
closely rel
on), leading
Table 3.2.
ose to the 5
e content of
some exte
t the observ
ractions from i
gated DSS (SE
R microstruc
lated to the
g to possibl
The AR m
50/50 optim
f about 76%
ent the inv
ved propert
image analysis
2205
45.5
54.5
EM-BSE, Berah
ctures were
e previous
le different
microstructur
mal value, e
%. The unb
volved defo
ties, also in
[%].
250
45
55
ha’s etching).
e different. S
thermo-me
t responses
117
res were
except in
balanced
ormation
n the AR
07
Size and
echanical
to cold

118
rolling,
identify
obtained
quite si
microstr
small a
rolling p
Conv
austenit
process
2205, a
process
recrysta
not evid
SAFs 22
especially
y different
d through d
milar and c
ructure is n
ustenitic is
process emp
versely, SA
tic grains w
, evidencin
austenitic gr
parameter
allization in
dent as well
205 and 230
Fig. 3.2 – D
in the ear
types of st
different ma
coarser resp
not well evi
lands can b
ployed to ac
AFs 2101 a
were heavily
ng the panc
rains were
rs (such a
austenite d
and its mic
04.
DSS microstructu
rly stages o
tarting micr
anufacturin
pect to the
ident. An in
be notice in
chieve the f
and 2205 w
y elongated
ake grain d
highly poly
s thickness
during solub
crostructure
ures after 85%
of deformat
rostructures
g processes
other two
ncreased gr
n SAF 250
final shape o
were both
d toward the
displacemen
ygonalized,
s reduction
bilisation. In
e can be add
of thickness red
tion. From
s. In SAFs
s, the shape
grades, and
rain fragmen
07, mostly
of this steel
from simil
e direction
nt of the D
owing to a
n and anne
n SAF 2101
dressed to an
duction (SEM-B
Fig. 3.1, i
2304 and
es of austen
d the classi
ntation and
owing to th
.
lar final pr
of the prev
DSS microst
a particular
ealing time
1 such polyg
n intermedia
BSE, Beraha’s
it is possib
2507, alth
nitic grains
cal banded
d the presen
he strong c
roducts, and
vious hot ro
tructure. In
r combinati
e) which
gonalization
ate type bet
etching).
ble to
hough
were
DSS
nce of
cross-
d the
olling
SAF
on of
eased
n was
tween
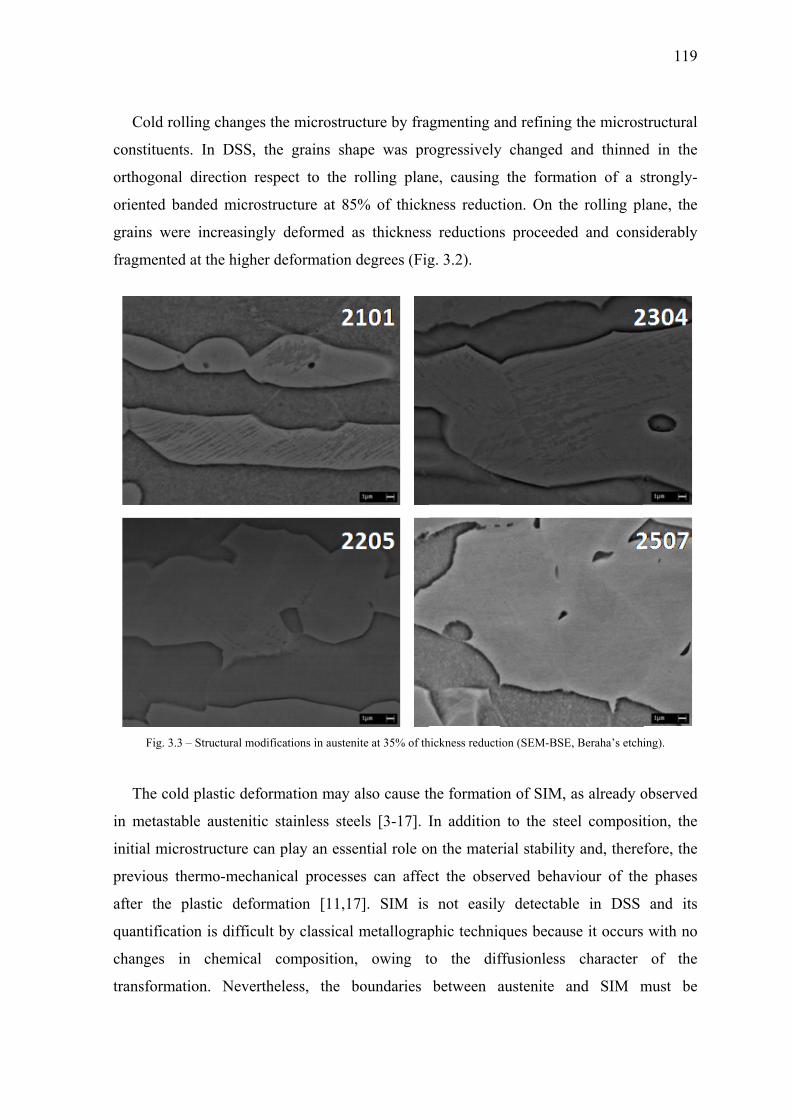
C
const
ortho
orien
grain
fragm
Th
in m
initia
previ
after
quan
chan
trans
old rolling
tituents. In
ogonal dire
nted banded
ns were inc
mented at th
Fig. 3.3 – Stru
he cold plas
metastable au
al microstru
ious thermo
the plasti
ntification is
nges in ch
sformation.
changes the
n DSS, the
ction respe
d microstruc
creasingly d
he higher de
uctural modifica
stic deform
ustenitic st
ucture can p
o-mechanic
ic deformat
s difficult b
hemical co
Neverthel
e microstruc
grains sha
ect to the r
cture at 85
deformed a
eformation d
ations in austeni
ation may a
ainless stee
play an esse
cal processe
tion [11,17
by classical
omposition,
ess, the b
cture by fra
ape was pr
rolling plan
% of thickn
as thickness
degrees (Fig
ite at 35% of th
also cause t
els [3-17]. I
ential role o
es can affec
7]. SIM is
metallograp
owing t
boundaries
agmenting a
ogressively
ne, causing
ness reduct
s reductions
g. 3.2).
hickness reducti
he formatio
In addition
n the mater
ct the obse
not easily
phic techniq
to the dif
between a
and refining
y changed a
the format
tion. On the
s proceeded
ion (SEM-BSE,
on of SIM, a
n to the stee
rial stability
erved behav
y detectabl
ques becaus
ffusionless
austenite a
the micros
and thinned
tion of a s
e rolling pl
d and cons
, Beraha’s etchi
as already o
el composit
y and, there
viour of the
le in DSS
se it occurs
character
and SIM m
119
tructural
d in the
strongly-
lane, the
siderably
ing).
observed
tion, the
fore, the
e phases
and its
with no
of the
must be
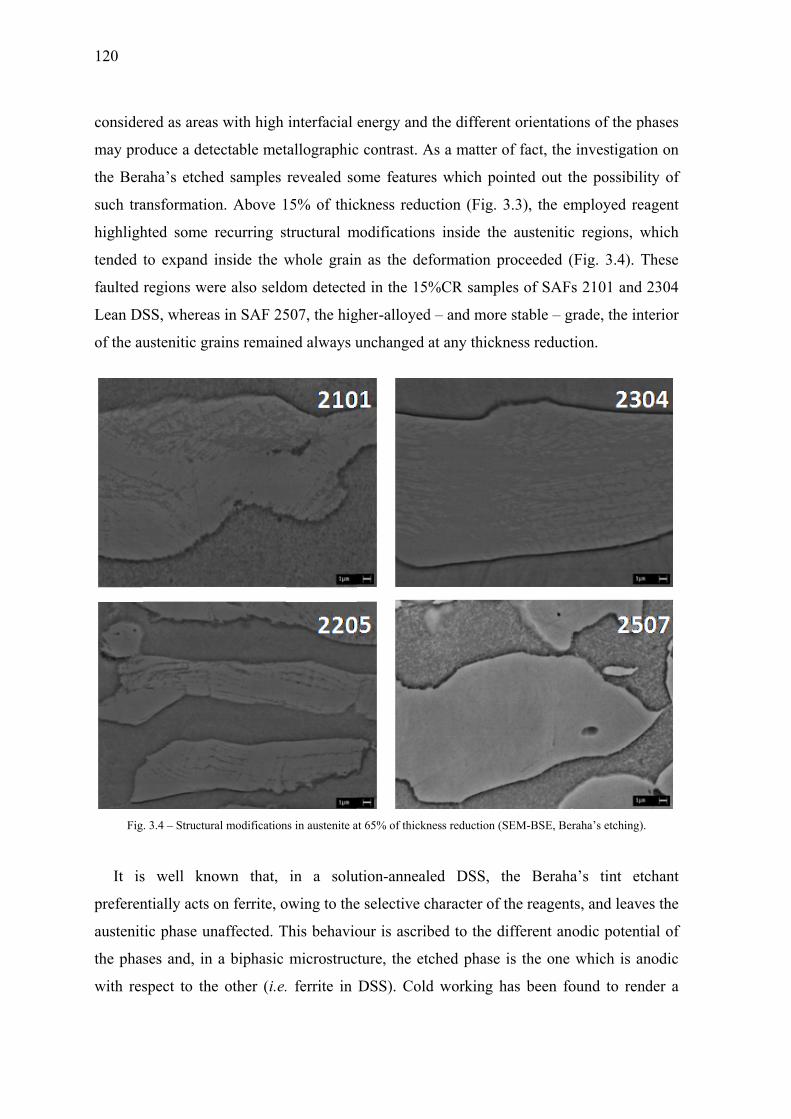
120
conside
may pro
the Ber
such tra
highligh
tended
faulted
Lean DS
of the au
Fig
It is
preferen
austenit
the pha
with res
red as areas
oduce a dete
aha’s etche
ansformatio
hted some
to expand i
regions wer
SS, wherea
ustenitic gra
. 3.4 – Structur
s well kno
ntially acts o
tic phase un
ses and, in
spect to the
s with high
ectable met
ed samples
on. Above 1
recurring s
inside the w
re also seld
s in SAF 25
ains remain
al modification
own that,
on ferrite, o
naffected. T
a biphasic
e other (i.e.
interfacial
tallographic
revealed so
15% of thic
tructural m
whole grain
dom detecte
507, the hig
ned always u
ns in austenite a
in a solu
owing to the
This behavio
microstruc
. ferrite in
energy and
c contrast. A
ome feature
ckness redu
modification
n as the def
d in the 15%
gher-alloyed
unchanged a
at 65% of thickn
ution-anneal
e selective c
our is ascrib
ture, the etc
DSS). Cold
the differen
As a matter
es which po
ction (Fig.
s inside the
formation p
%CR samp
d – and more
at any thick
ness reduction (
led DSS,
character of
bed to the d
ched phase
d working h
nt orientatio
of fact, the
ointed out t
3.3), the em
e austenitic
proceeded (
ples of SAFs
e stable – g
kness reduct
(SEM-BSE, Ber
the Beraha
f the reagent
different an
is the one
has been fo
ons of the p
investigatio
the possibili
mployed re
c regions, w
(Fig. 3.4). T
s 2101 and
grade, the in
tion.
raha’s etching)
a’s tint et
ts, and leave
odic potent
which is an
ound to ren
phases
on on
ity of
eagent
which
These
2304
nterior
.
tchant
es the
tial of
nodic
nder a

121
deformed area more anodic, owing to the increasing of the active anodic sites on the
surface [23] and, therefore, leading to different corrosion behaviours inside the same phase
as a consequence of the plastic deformation. Hence, after cold rolling, the faulted regions
detected inside the γ-grains clearly gained a more anodic potential respect to the
surrounding austenite but, unfortunately, cannot be strictly related to SIM laths because,
between them, there could be some austenitic regions which did not transform into
martensite but which gained a different anodic potential with respect to other parts of the
same grain. These features have been already observed in a 2101 DSS [24] (Paragraph
3.3.1) where the martensitic transformation was investigated by means of EBSD and, also
in this case, a direct attribution to SIM formation was not possible.
The presence of the faulted region in Lean DSS at very low thickness reductions (15%)
can be addressed to a more proneness to SIM formation of austenite in such materials or, at
least, to a increased plasticity of these materials. Indeed, in Lean DSS, austenite is less
stable than in the other grades, due to the lack of γ-stabilizing elements, and therefore the
martensitic transformation can more readily occur. On the contrary, the absence of
structural modifications in SAF 2507 highlights the great stability of this material if
compared to the other grades.
3.2.2. Hardness
The same increasing trend in Vickers Hardness (HV) was observed in all DSS. The work-
hardening of the biphasic steels is modified respect to the characteristic single-phase
behaviour, and the presence of austenite gave rise to a macro-hardness increment which is
conditioned by the high strain-hardening rate of the FCC austenitic phase in the first stages
of deformation (Fig. 3.5). At low thickness reductions, up to 15% of deformation, a rapid
increase in hardness was observed in all DSS, due to the strain-hardening, whereas the
subsequent cold working leaded to an almost linear rising in HV. In Lean DSS, the greater
relative hardness increment was observed, owing to the minor amount of alloying elements
in these grades which caused less important effects due to solid solution strengthening
mechanisms, making the phases more prone to deformation. This was particularly evident
in SAF 2304, in which the compositional effect, combined to a coarser structure of the
steel, eased the highest strain-hardening, especially in austenite.
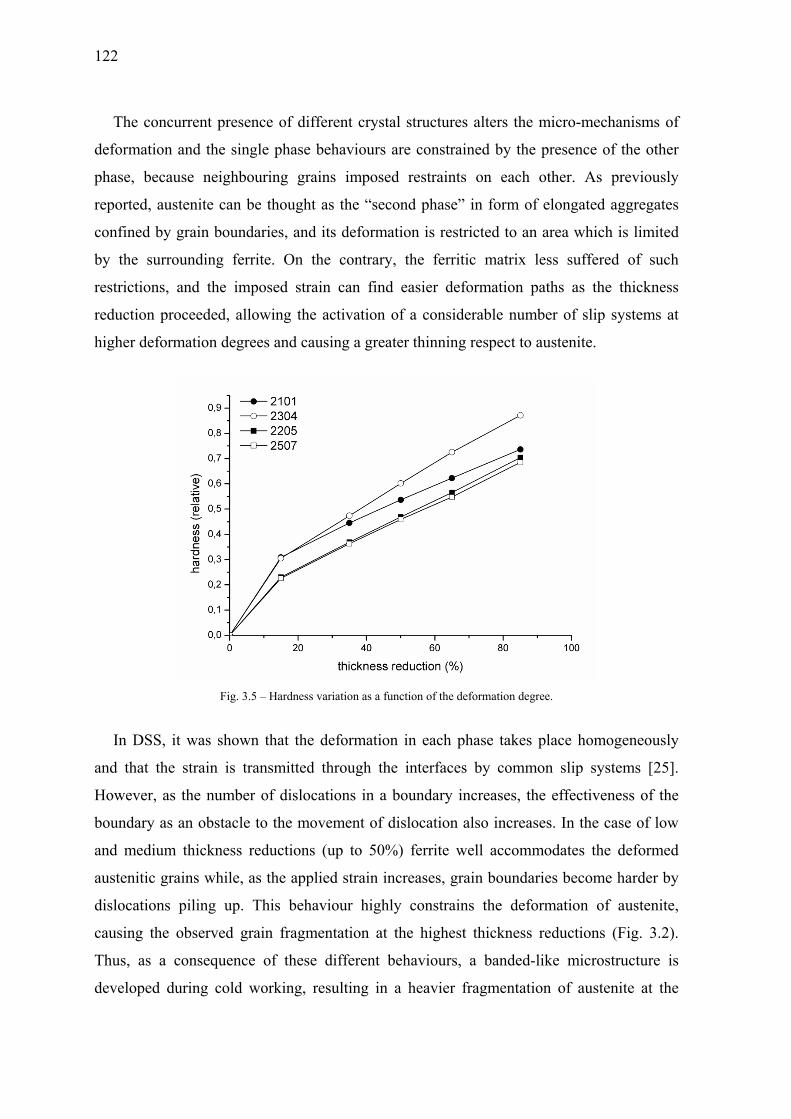
122
The concurrent presence of different crystal structures alters the micro-mechanisms of
deformation and the single phase behaviours are constrained by the presence of the other
phase, because neighbouring grains imposed restraints on each other. As previously
reported, austenite can be thought as the “second phase” in form of elongated aggregates
confined by grain boundaries, and its deformation is restricted to an area which is limited
by the surrounding ferrite. On the contrary, the ferritic matrix less suffered of such
restrictions, and the imposed strain can find easier deformation paths as the thickness
reduction proceeded, allowing the activation of a considerable number of slip systems at
higher deformation degrees and causing a greater thinning respect to austenite.
Fig. 3.5 – Hardness variation as a function of the deformation degree.
In DSS, it was shown that the deformation in each phase takes place homogeneously
and that the strain is transmitted through the interfaces by common slip systems [25].
However, as the number of dislocations in a boundary increases, the effectiveness of the
boundary as an obstacle to the movement of dislocation also increases. In the case of low
and medium thickness reductions (up to 50%) ferrite well accommodates the deformed
austenitic grains while, as the applied strain increases, grain boundaries become harder by
dislocations piling up. This behaviour highly constrains the deformation of austenite,
causing the observed grain fragmentation at the highest thickness reductions (Fig. 3.2).
Thus, as a consequence of these different behaviours, a banded-like microstructure is
developed during cold working, resulting in a heavier fragmentation of austenite at the
123
highest thickness reductions and in a concentration of deformation in ferrite, which is
instead more thinned in the orthogonal direction to the rolling plane.
The above described mechanisms must be considered valid in well-balanced DSS,
having an almost equal volume fractions of the phases, where austenite readily strain-
hardens at the early stages of deformation, causing a greater thinning of the ferritic bands
at the higher deformation degrees. In SAF 2101, containing a not negligible surplus of
ferritic phase, this phenomenon does not occur and, even if the ferritic bands are in any
case reduced, cold working mainly affects the austenitic phase, which is more refined and
fragmented. In this steel, the gross presence of the hard ferritic matrix overcaome the
strain-hardening effect occurring in austenite, thus causing the observed different
deformation behaviour at a microstructural level.
3.2.3. Textures and x-rays diffraction
In this paragraph, XRD measurements on AR and %CR samples were employed to
investigate the grains reorientation as a consequence of the plastic deformation. However,
the phases displacement described here is only of qualitative character, and a full
description of grains rearrangement after cold rolling requires deeper investigations. A
slightly detailed description of texture development in SAF 2205 is given in Paragraph
3.3.2, and the observed behaviour may be in some extent considered valid for the other
grades when heavy deformations are involved, even though different starting
microstructures can alter the intermediate reorientation phenomena and the development of
the final textures.
The formation of texture in DSS and single-phase stainless steels is reported in several
literature works [26-32], where phases orientations after hot-deformation, annealing and
cold-working are extensively discussed. In these studies, the investigated DSS can be
compared to SAFs 2205 and 2507 analyzed in theis thesis, but the presented results are not
free of discrepancies. Nevertheless, it emerges that the hot rolling manufacturing process
causes the formation of Cubic textures in both DSS phases and, in addition, typical FCC
deformation textures – mainly the Brass-type component – are developed in austenite.
The Brass component is typical in hot-rolled materials having low SFE, such as
austenite in DSS, and for which the conditions for extensive dislocations cross-slip are

124
difficult to reach. Conversely, the development of the Copper-type texture in austenite
seems to be not possible in DSS, owing to its low SFE value and therefore to the
impossibility to achieve sufficient reductions at room temperature [33], even though it was
observed in a hot-rolled high-alloyed DSS [30]. On the other hand, the development of
FCC cubic textures can be associated to the dynamic recrystallization process occurring
during high-temperature deformations, especially during the roughing stage, where the
higher thermal regimes do not inhibit its formation. Finally, for what concerns ferrite, the
observed major component is the Rotated Cubic 001<110>, caused by dynamic recovery
during hot rolling, especially after the finishing operations.
The solubilisation of DSS, which follows the forming operations, is performed at
temperature higher than 1050°C, and the required soaking times are enough to allow the
formation of annealing textures, more or less pronounced in relation to the entity of
previous hot-working. Annealing textures can be substantially different from deformation
textures – and are generally more pronounced – and are known to be affected by several
factors, such as rolling reduction, chemical composition, grain size, annealing temperature
and time, heating rate and many others. In DSS, austenite was found to develop a dominant
Cubic texture, whereas ferrite exhibits a dominant Rotated Cubic with a weak Cubic
component [27]. It is however possible that other types of textures may take place during
annealing as a consequence of the previous hot-working. After rolling, owing to the BCC
structure, ferrite can develop Cubic and Goss-type components, whereas the presence of a
not negligible Goss-type component in austenite can be either formed during rolling and
retained in the annealing stage, or directly formed during solubilisation, as it is a typical
recrystallization texture occurring in FCC materials. However, it must be taken into
account that a description with ideal components is always inadequate, and this is
especially valid for alloys. Rather, textures (deformation and annealing) can be better
described as a spread of orientations, among which certain are better developed and more
pronounced than others. Moreover, the thermo-mechanical history of the material and the
hot-working process parameters are responsible for the particular texture developed in the
annealing stage, since are part of the variables affecting grains displacements.
For what was previously reported, XRD patterns are characteristic of the manufacturing
process and the phases orientations in the AR state can substantially affect the behaviour
during cold working. In the present study, XRD measurements were only performed in the
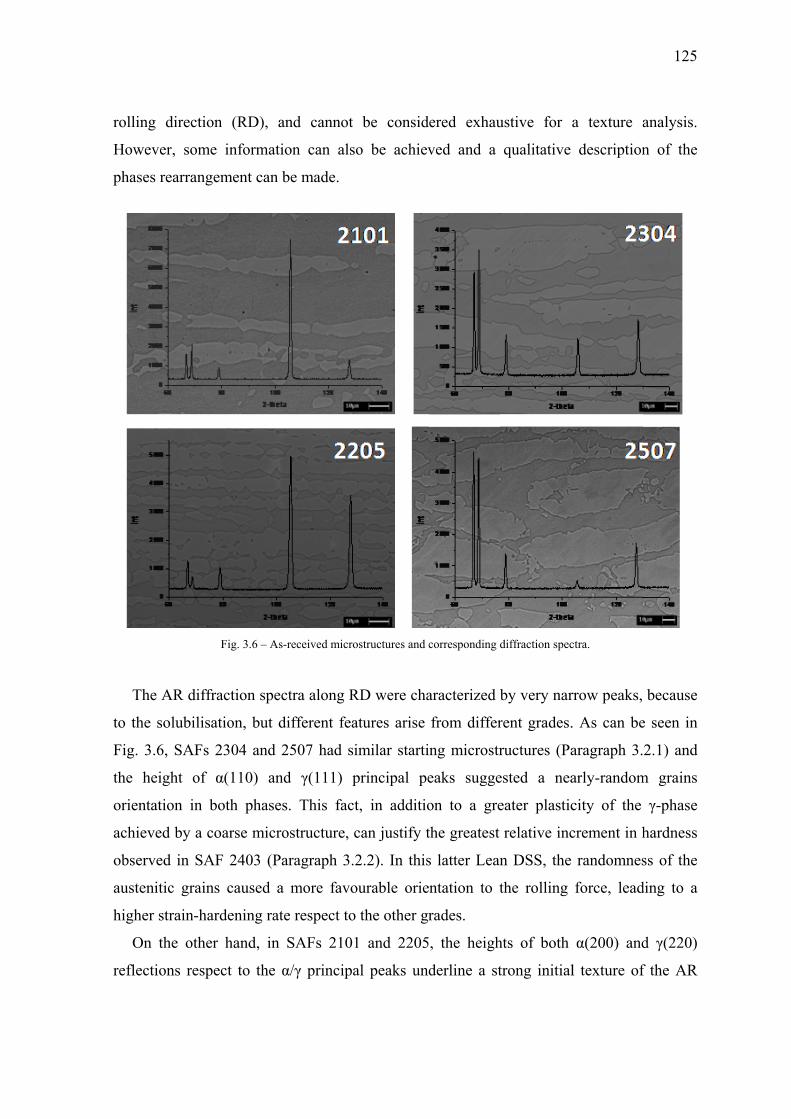
rollin
How
phas
Th
to th
Fig.
the h
orien
achie
obser
auste
highe
O
refle
ng direction
wever, some
es rearrange
he AR diffr
he solubilisa
3.6, SAFs
height of
ntation in b
eved by a co
rved in SA
enitic grain
er strain-har
On the other
ctions respe
n (RD), an
e informatio
ement can b
Fig. 3.6 – As-
raction spec
ation, but d
2304 and 2
α(110) and
both phases
oarse micro
AF 2403 (Pa
s caused a
rdening rate
r hand, in
ect to the α
nd cannot
on can also
be made.
-received micro
ctra along R
different fea
2507 had si
d γ(111) p
s. This fact
ostructure, c
aragraph 3.2
more favo
e respect to
SAFs 2101
α/γ principa
be consid
o be achiev
ostructures and c
RD were cha
atures arise
imilar starti
principal pe
t, in additio
can justify t
2.2). In this
ourable orie
the other gr
1 and 2205
al peaks und
ered exhau
ved and a
corresponding d
aracterized b
from differ
ng microstr
eaks sugge
on to a gre
the greatest
s latter Lean
ntation to t
rades.
, the heigh
derline a st
ustive for
qualitative
diffraction spec
by very nar
rent grades.
ructures (Pa
ested a nea
eater plastic
relative inc
n DSS, the
the rolling
hts of both
trong initial
a texture a
description
ctra.
rrow peaks,
. As can be
aragraph 3.
arly-random
city of the
crement in h
randomnes
force, lead
α(200) and
l texture of
125
analysis.
n of the
because
e seen in
2.1) and
m grains
γ-phase
hardness
ss of the
ding to a
d γ(220)
f the AR

126
material
the pres
rolling
cubic te
underlin
textures
found to
Goss-ty
textures
Cold
redistrib
cold de
mainly
ferrite. F
ls (Fig. 3.6)
sence of a st
and recryst
extures. In
ned its unb
s in the FC
o be mainly
ype and 1
s pertaining
Fig.
d deformati
bution proc
formed DS
causes the
From these
). In these s
trong cubic
tallization p
SAF 2101,
balanced mi
C phase. O
y composed
00<001>
to the hot r
. 3.7 – Diffracti
ion caused
ess strongly
S [26-32] p
developme
works also
steels, the h
orientation
processes, s
the height
icrostructure
On the contr
by a combi
Cube comp
rolling proce
ion spectra of A
d a rearran
y depended
point out th
ent of the
o emerges th
huge signal f
n in the AR-
ince both a
ts of the γ-p
e and cann
rary, in SA
ination of r
ponents –
ess, as expl
AR, 50%CR and
ngement of
d on the init
hat cold rol
001<110>
hat austenit
from α(200
ferrite, achi
are responsi
peaks, if co
not fully rev
AF 2205, th
ecrystalliza
and other
ained in the
d 85%CR mater
f the grain
tial microst
ling up to 9
> Rotated C
te is interest
0) planes in
ieved after t
ible for the
ompared to
veal the pr
e AR-auste
ation texture
r remnants
e next Parag
rials (3D view)
ns, and su
tructure. Pre
90% of thic
Cubic textur
ted by an a
the RD rev
the previous
developme
those of fe
resence of i
enite texture
es – 110<
of deform
graph 3.3.2.
).
uch orientat
evious work
ckness redu
re compone
lloy-type te
vealed
s hot-
ent of
errite,
initial
e was
<100>
mation
tions-
ks on
uction
ent in
exture

127
development since the early stages of deformation and, at the higher deformation degrees,
the 110<112> Brass-type texture is accompanied by a spread in orientations; moreover,
austenite was found to be also characterized by the presence of a more pronounced
110<100> Goss component than in single-phase austenitic stainless steels.
Concerning the present work, after intermediate reorientations, in correspondence of the
highest thickness reduction both phases in all DSS tended to displace toward what
appeared to be the main rolling textures directions, and the huge peak broadening revealed
a heavy grains refinement as a consequence of the cold-working (Fig. 3.7). In the 85%CR
samples, the strong α(200) reflections in RD underlined that ferrite mainly displaced
toward a cubic orientation (BCC rolling texture), whereas in the 85%CR-austenite the
strong presence of both γ(111) and γ(220) suggested the presence of typical FCC rolling
texture. This is not so evident in SAF 2101, owing to the scarce presence of γ-phase in the
starting microstructure and also to the possible formation of SIM. However, in all DSS, a
full description of deformation textures requires deeper investigations.
XRD measurements are also widely employed to detect SIM in austenitic stainless
steels, since it appearance can be easily revealed. However, if the martensitic
transformation occurs, SIM and ferrite peaks will be superimposed, making a pattern
analysis difficult to be performed. In the cases under study, the strong initial texture in
SAFs 2101 and 2205 and the heavy phases orientations acquired at high deformations
make the XRD direct-comparison procedure not reliable, since is based on a random grain
distribution, and also hindered the full-pattern refinements performed by the Rietveld
method. Nevertheless, the presence of the γ(220) peaks at the higher thickness reduction in
all the investigated DSS underlined that if the martensitic phase was formed, it did not
replac the whole austenitic phase. Moreover, no HCP ε-martensite was detected; its
absence could be ascribed to either the possibility of a direct γ → SIM transformation
through dislocations reaction [34] or a too low amount of the metastable hexagonal phase.
3.2.4. Pitting corrosion resistance
Several studies have highlighted the unclear role of cold working on the resistance to
localized corrosion of stainless steels [35-37], but the occurrence of residual stress and the
formation of SIM can substantially affect their pitting resistance, because the number of

128
the active anodic sites in the surface are increased [23,37,38]. Thickness, composition and
uniformity of the passive layer are modified in different extent by plastic deformation
[39,40] and the increasing in dislocation density favours the film dissolution, due to the
presence of lower binding energy regions, if compared to a perfect crystal [41]. However,
cold plastic deformation induces distortions within the microstructure, creating sub-
structures inside the grains (dislocations networks, twins, deformation bands), thus
increasing the crystalline disorder and the number of interfaces. This may affect the
formation of a less effective passive film on the surface and, moreover, the presence of
distorted interfaces and defects must be considered as high energy sites which may provide
further trigger points for the localized corrosive attack [42,43].
In this section, the pitting resistance of the four selected DSS grades in as-received
conditions and after cold rolling is discussed, with the aim to highlight the effects of cold
plastic deformation on the corrosion behaviour. The investigated steels were the SAFs
2101, 2304, 2205 and 2507 reported in Table 3.1. All the steels, in solution-annealing and
water-quenched conditions, were cold rolled at various degrees of deformation, from 15%
to 85%. Since surface roughness can affect the measured CPT value [44] and with the aim
to correctly compare the results on different materials, the surfaces of the tested samples
were prepared in the same manner, with a finishing as uniform as possible.
Table 3.3 – Results from potentiodynamic tests.
2101 2304 2205 2507
TQ 50% 85% TQ 50% 85% TQ 50% 85% TQ 50% 85%
Ecor [mV] -230 -140 -175 -245 -200 -235 -180 -130 -230 -130 -200 -160
Icor [A/cm2]
2.8 E-08
2.4 E-08
8.5 E-08
3.8 E-08
2.3 E-08
3.3 E-08
1.1 E-08
1.5 E-08
2.1 E-08
1.0 E-08
1.5 E-08
2.5 E-08
Ebreak [mV] 140 80 50 505 550 450 1170 1180 1160 1170 1150 1175
Note: test performed in pH7 solution (35 g/l of NaCl in deionized water – artificial seawater)
Potentiodynamic tests at room temperature
The main data obtained from the potentiodynamic tests performed at pH7 in aqueous
solution are summarized in Table 3.3, where Icorr was obtained by Tafel extrapolation from
the free corrosion potential. As expected, a comparison between the as-received samples of

diffe
seaw
3.3).
for a
whic
grade
A
beha
of SA
rent grade r
water, signif
Although t
ll steels, the
ch character
es, for whic
A compariso
aviour of the
AF 2304 in
revealed th
ficantly high
the absorbe
e corrosion
rizes the pa
ch the break
Fig.
Fig. 3.9 – An
n between t
e latter DSS
n marine en
e excellent
her than the
d current de
potential in
assive beha
kdown poten
3.8 – Anodic p
odic polarizatioa) SA
the two SAF
S respect to
nvironment
behaviours
e SAF 2304
ensity in pa
ncreased wit
aviour was
ntial was alm
polarization curv
on curves of AR
AF 2205 and b)
F 2101 and
the former,
is clearly
s of SAF 22
4 and 2101
assive condi
th PREN ind
considerab
most ten tim
ves of the AR m
R, 50%CR and SAF 2304.
2304 Lean
and the be
visible from
205 and 250
Lean DSS
ition were r
dex, and the
bly wider fo
mes higher t
materials.
85%CR materi
n DSS revea
st response
m the curve
07 DSS in
(Fig. 3.8 an
roughly com
e range of p
or the high
than in SAF
als:
aled a highe
to pitting c
es in Fig. 3
129
artificial
nd Table
mparable
otentials
h-alloyed
F 2101.
r overall
corrosion
3.8. Free

130
corrosion potentials and currents were similar for the two steels but the SAF 2304
exhibited a greater stability in passive conditions, with a wider passive range and a
breakdown potential three times higher than SAF 2101. Although in SAF 2304 the highest
content of Cr and Mo resulted in a negligible increase in terms of PREN, the presence of
higher amounts of such elements provided this steel an enhanced resistance to pitting
corrosion, owing to the beneficial effect of both elements on the stability of the passive
film. Furthermore, the higher content of Mn in SAF 2101, added to stabilize the austenitic
phase, may be responsible for a further destabilization of the passive film at potential next
to breakdown.
Fig. 3.10 – Anodic polarization curves of SAF 210, as-received and deformed.
Cold working did not substantially alter the pitting resistance in SAF 2304, 2205 and
2507. The tests on the deformed materials didn’t reveal significant variations and the
curves didn’t exhibit specific variation trends by increasing the deformation. In these DSS
both the free corrosion and breakdown potentials in the deformed state were very close to
each other (Fig. 3.9), even though in SAF 2304 a decreasing in transpassivity potential at
the highest deformation degree was observed. Nevertheless, the curves remained almost
unchanged even after cold working and the oxide film appeared to be stable in any case. In
SAF 2205 and 2507 the best responses as a consequence of deformation were registered. In
these materials, the curves are virtually superimposed (see Fig. 3.9a for SAF 2205, while
SAF 2507 exhibited a similar behaviour), underlining the very high stability in aggressive
environments even after heavy plastic deformation.
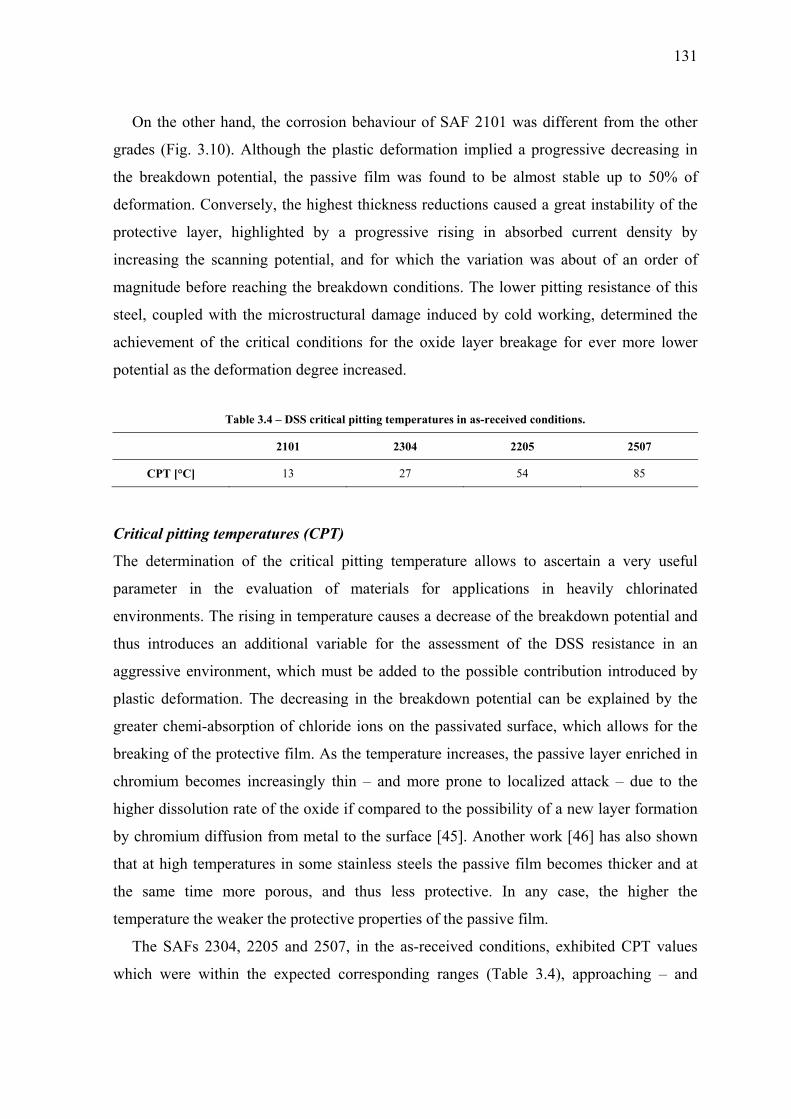
131
On the other hand, the corrosion behaviour of SAF 2101 was different from the other
grades (Fig. 3.10). Although the plastic deformation implied a progressive decreasing in
the breakdown potential, the passive film was found to be almost stable up to 50% of
deformation. Conversely, the highest thickness reductions caused a great instability of the
protective layer, highlighted by a progressive rising in absorbed current density by
increasing the scanning potential, and for which the variation was about of an order of
magnitude before reaching the breakdown conditions. The lower pitting resistance of this
steel, coupled with the microstructural damage induced by cold working, determined the
achievement of the critical conditions for the oxide layer breakage for ever more lower
potential as the deformation degree increased.
Table 3.4 – DSS critical pitting temperatures in as-received conditions.
2101 2304 2205 2507
CPT [°C] 13 27 54 85
Critical pitting temperatures (CPT)
The determination of the critical pitting temperature allows to ascertain a very useful
parameter in the evaluation of materials for applications in heavily chlorinated
environments. The rising in temperature causes a decrease of the breakdown potential and
thus introduces an additional variable for the assessment of the DSS resistance in an
aggressive environment, which must be added to the possible contribution introduced by
plastic deformation. The decreasing in the breakdown potential can be explained by the
greater chemi-absorption of chloride ions on the passivated surface, which allows for the
breaking of the protective film. As the temperature increases, the passive layer enriched in
chromium becomes increasingly thin – and more prone to localized attack – due to the
higher dissolution rate of the oxide if compared to the possibility of a new layer formation
by chromium diffusion from metal to the surface [45]. Another work [46] has also shown
that at high temperatures in some stainless steels the passive film becomes thicker and at
the same time more porous, and thus less protective. In any case, the higher the
temperature the weaker the protective properties of the passive film.
The SAFs 2304, 2205 and 2507, in the as-received conditions, exhibited CPT values
which were within the expected corresponding ranges (Table 3.4), approaching – and

132
sometimes overcoming – the upper limits. The same statement was instead not valid in
SAF 2101, for which the measured CPT was very close to the lowest limit established for
its category. In this latter steel, although an increase of ferrite content may lead to an
improved performance of the austenitic phase, the content of such elements which
characterize the stability of the passive layer (Cr and Mo) is lower than in other grades.
Moreover, as previously explained, the presence of a too high amount of manganese can
contribute to the worsening of its pitting resistance, destabilizing the protective layer.
Fig. 3.11 – Critical Pitting Temperatures (CPT) as a function of the deformation degree.
Generally, the microstructural changes induced by cold working affect in some extent
the corrosion behaviour of stainless steels. Composition and thickness of the passive layer
are altered by the presence of residual stresses and crystalline disorder [39-42], and also
the possible presence of SIM can further worsen the steel resistance in aggressive
environments. As can be seen from Fig. 3.11, in SAF 2507 there wasn’t any change in
critical temperature at any thickness reduction, while in SAF 2205 only a decreasing of 4%
at the highest deformation degree was registered. The corrosion resistance and
microstructural stability of these two steels was very high, owing to the increased content
of alloying elements which ensured an adequate stability of the passive layer (Cr, Mo and
N) and the stabilization of the austenitic phase (Ni, N). However, the causes of the slight
reduction in CPT observed in SAF 2205 (lower alloyed than 2507) could be addressed not
only to the disorder induced by plastic deformation, but also to the formation of the
martensitic phase, as reported in previous studies [47] and discussed in Paragraph 3.3.2.
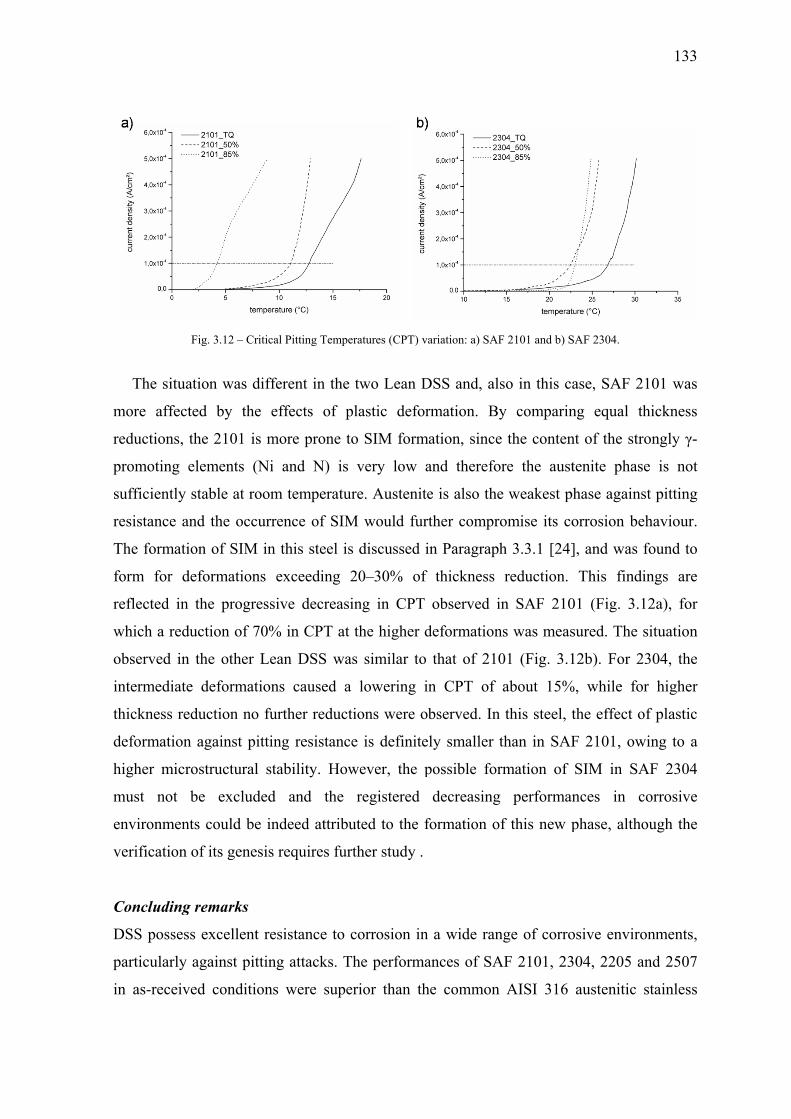
Th
more
reduc
prom
suffic
resist
The
form
refle
whic
obser
interm
thick
defor
highe
must
envir
verif
Conc
DSS
parti
in as
Fig. 3
he situation
e affected
ctions, the 2
moting elem
ciently stab
tance and t
formation o
m for defor
cted in the
ch a reductio
rved in the
mediate de
kness reduct
rmation aga
er microstru
t not be
ronments co
fication of it
cluding rem
possess ex
cularly aga
s-received c
3.12 – Critical P
n was differ
by the eff
2101 is mo
ments (Ni a
ble at room
the occurren
of SIM in th
rmations ex
progressiv
on of 70%
other Lean
eformations
tion no furt
ainst pitting
uctural stab
excluded
ould be ind
ts genesis re
marks
xcellent resi
inst pitting
conditions w
Pitting Temper
rent in the t
fects of pl
ore prone to
and N) is v
temperature
nce of SIM
his steel is
xceeding 2
ve decreasin
in CPT at t
n DSS was
caused a
ther reductio
g resistance
bility. How
and the r
deed attribut
equires furth
istance to c
attacks. Th
were super
atures (CPT) va
two Lean D
lastic defor
o SIM forma
very low a
e. Austenite
M would furt
discussed i
0–30% of
ng in CPT
the higher d
similar to
lowering in
ons were ob
is definitel
wever, the p
registered
ted to the f
her study .
orrosion in
he performa
rior than th
ariation: a) SAF
DSS and, als
rmation. By
ation, since
and therefo
e is also the
ther compro
n Paragraph
thickness
observed i
deformation
that of 210
n CPT of
bserved. In
ly smaller t
possible for
decreasing
formation o
a wide ran
ances of SA
he common
F 2101 and b) S
so in this c
y comparin
e the conten
ore the aust
e weakest p
omise its co
h 3.3.1 [24]
reduction.
n SAF 210
ns was meas
01 (Fig. 3.1
about 15%
this steel, t
than in SAF
rmation of
performan
f this new p
nge of corro
AF 2101, 23
AISI 316
SAF 2304.
ase, SAF 2
ng equal th
nt of the str
tenite phas
phase agains
orrosion be
], and was
This findi
01 (Fig. 3.1
sured. The s
12b). For 2
%, while fo
the effect o
F 2101, ow
SIM in SA
nces in c
phase, altho
osive enviro
304, 2205 a
austenitic
133
101 was
hickness
rongly γ-
e is not
st pitting
ehaviour.
found to
ings are
12a), for
situation
304, the
r higher
of plastic
wing to a
AF 2304
corrosive
ough the
onments,
and 2507
stainless
134
steel in artificial seawater (pH7). The excellent behaviour of the two higher-alloyed SAF
2205 and 2507, both as-received and cold-worked, makes these steels more suitable for
applications in heavily chlorinated respect to Lean DSS, where the higher cost is justified
by the extraordinary pitting resistance.
On the contrary, the performances of SAF 2101 were significantly lower than the other
grades, making the steel not particularly suitable for applications in marine environment,
especially if subjected to cold deformation. In 2101, the presence of high manganese
contents and the SIM formation after cold working caused a great destabilization of the
passive layer and global deterioration of the corrosion resistance characteristics. The
characteristics in SAF 2304 were instead intermediate between SAF 2101 and the higher-
alloyed grades, having breakdown potential close to that of 2101 but with a passive layer
more stable – even after plastic deformations – owing to its higher content of alloy
elements such as chromium and molybdenum.
The CPT determination underlined the findings revealed by the potentiodynamic tests.
SAF 2507, as expected, possessed the highest CPT value in the as-received conditions
(85°C) and exhibited the greatest microstructural stability even after heavy cold
deformation, owing to its higher content of alloying elements. In SAF 2205 only a slight
decrease in CPT at the highest deformation degree was registered, caused by the onset of
little amount of SIM (Paragraph 3.3.2) and by the increasing in active anodic sites which
promoted the localized attack. In Lean DSS, plastic deformation caused a decreasing in
CPT but, while in SAF 2304 this reduction was mild (15%) and there were no further
reductions over 50% of deformation, in SAF 2101 a marked reduction in CPT was
observed, reaching the 25% of the initial value at the highest deformation degree. In both
cases, the deterioration of the corrosion behaviour can be attributed not only to
compositional factors and to the disorder induced by plastic deformation, but also to the
formation of SIM, which was attested in SAF 2101 (Paragraph 3.3.1) and which requires
further investigations in SAF 2304.
3.2.5. Magnetic properties
As DSS contain about 50% of ferrite, they exhibit a certain degree of magnetism, which
however is not sufficient to avoid mechanical clamping during machining [48]. As

135
reported, cold working can cause the formation of the ferromagnetic SIM from austenite,
therefore increasing the amount of magnetic phase. The austenitic regions which undergo
martensitic transformation act as small ferromagnets and are magnetized when an external
magnetic field is applied, influencing the magnetic properties of the material. This change
in magnetic properties as a consequence of plastic deformation can be detected by means
of the AC and DC magnetometers presented in Paragraph 3.1.
All the AR and %CR DSS were firstly demagnetized and then subjected to magnetic
tests, but they were not all tested using the same technique. SAFs 2304 and 2205 were only
examined by means of AC measurements, owing to a scarce availability of material in the
deformed state; in these steels, both the well-balanced microstructure and the discrete
magnetic level of ferrite have permitted to obtain representative magnetic hysteresis loops,
since both materials have reached the saturation level. On the contrary, the AC method
wasn’t able to saturate the SAFs 2101 and 2507, owing to the higher ferrite content in the
former steel and to the high magnetic level of ferrite in the latter; thus, in these cases, the
DC magnetometer was employed. Unfortunately, the results provided by AC and DC
measurements are of different type and the obtained saturation values reported in Table 3.5
are not directly comparable. Nevertheless, in both cases, if the SIM transformation took
place in the deformed DSS, an increasing of the saturation magnetic field (Bmax) is
expected.
Table 3.5 – DSS saturation magnetic field in as-received conditions.
2101 2304 2205 2507
Bmax [T] 0.75** 0.63* 0.55* 0.59**
(*) AC magnetization (**) DC magnetization
As can be seen from Fig. 3.13, in SAFs 2101 and 2304 a strong increase of Bmax was
observed by increasing the deformation degree; in SAF 2205, only a little variation toward
higher Bmax values was registered at the highest thickness reduction, whereas in SAF 2507
the saturation field remained almost unchanged. These findings reveal that cold rolling
caused a strong increase of the magnetic phase amount in Lean DSS, which can be
ascribed to the SIM formation. Is it known that the saturation magnetic field is linearly
proportional to the amount of ferromagnetic phase [18,19], allowing a determination of the
SIM amount. Unfortunately, a quantification of the strain-induced phase is not even

136
possible, because these measurements need the knowledge of the total amount of
transformed austenite at the higher deformation degree, in order to set the limits of the
calibration curve, thus only qualitative considerations can be made.
Fig. 3.11 – Saturation magnetic field (Bmax) as a function of the deformation degree.
SIM also formed in SAF 2205 and, from the magnetic results, it seems that it only
occurred at the highest thickness reduction, in significantly lower extents respect to Lean
DSS. In this case, the steel is more stable than Lean DSS and a reduced SIM amount was
expected. However, as described in the next Paragraph 3.3.2, deeper analysis revealed that
in SAF 2205 the SIM transformation took place after 15% of thickness reduction and this
discrepancy with the magnetic results can be ascribed to the very low amount of SIM
formed during low and intermediate deformation stages, making not possible its
observation by means of AC test, owing to its detection limits. Conversely, SAF 2507 was
found to be highly stable, and the saturation magnetic field only exhibited some
fluctuations arising from local microstructural inhomogeneities.
3.3. STRAIN-INDUCED MARTENSITE IN DSS
As already reported, DSS are characterized by a high content of alloying element and can
undergo significant microstructural modifications as a consequence of either thermo-
mechanical treatments or plastic deformation (Chapter 1). In the previous sections of this
chapter, the possibility of a strain-induced martensitic transformation in the steel under
137
study was hypothesized. Various experimental evidences was presented and all the
performed measurements point toward such direction. In this section, the onset of SIM in
DSS after plastic deformation is discussed, by analyzing two cold rolled DSS grades (SAF
2101 and SAF 2205).
In Chapter 1, SIM formation is described as a diffusionless process, which occurs in
metastable austenitic stainless steels as a consequence of cold working [3-17]; throughout
this process, austenite evolves toward the thermodynamically more stable SIM, owing to
the shear bands intersection mechanisms. Austenite stability depends on the microstructure
developed after the processes to which the steel was subjected, and on the Staking Fault
Energy (SFE) of the phases, related to the steel chemical composition at a fixed
temperature [3]. The SIM formation, whose tendency increases with the decrease of the
SFE value [5], is frequently associated to the appearance of an intermediate phase, the ε-
martensite, whose formation is not necessary for the SIM process, especially in low SFE
materials [6]. This transformation has been already suggested in a cold rolled SAF 2205
[47], although the austenite in that DSS was found to be less metastable than in the
austenitic grades, and a further analysis of the SIM phenomenon in discussed in the present
section.
3.3.1. Characterization of a cold rolled SAF 2101
SAF 2101 is one of the lower-alloyed DSS grade in which the amount of both
substitutional and interstitial elements is rather low if compared to other grades; therefore,
the stability of austenite is expected to be lower than other DSS, and also lower than
austenitic stainless steels. The chemical composition of the investigated steel is reported in
Table 3.6. This steel was subjected to cold rolling from 10% to 80% of thickness reduction
and the as-received (AR) and cold rolled (%CR) samples were subjected to a deep
characterization, in order to understand if the SIM transformation can also occur in this
class of steels.
Table 3.6 – Chemical composition of the investigated SAF 2101 DSS.
C Si Mn Cr Ni Mo Cu P S N
SAF 2101 0.028 0.69 3.82 21.72 1.13 0.10 0.34 0.028 0.0025 0.16
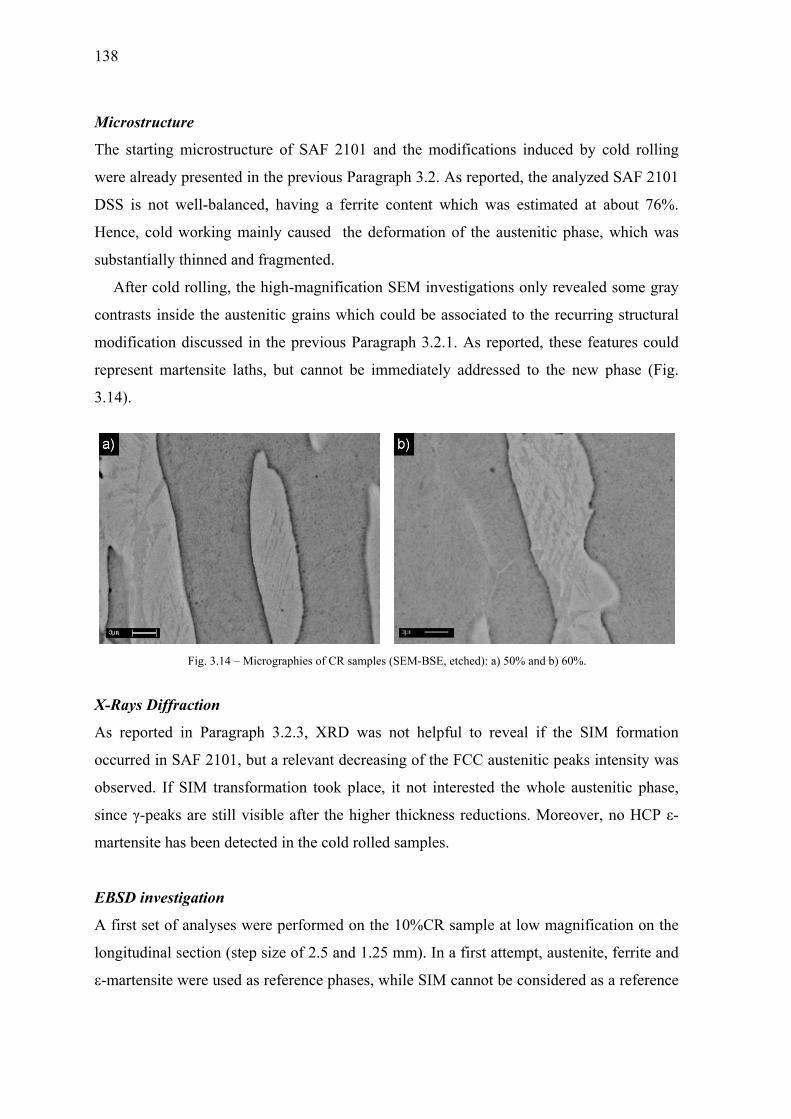
138
Microst
The sta
were alr
DSS is
Hence,
substant
After
contrast
modific
represen
3.14).
X-Rays
As repo
occurred
observe
since γ-
martens
EBSD i
A first s
longitud
ε-marten
tructure
arting micro
ready prese
not well-b
cold worki
tially thinne
r cold rollin
ts inside the
cation discu
nt martensi
Fig. 3
Diffraction
orted in Pa
d in SAF 2
ed. If SIM t
-peaks are s
site has been
investigatio
set of analy
dinal section
nsite were u
ostructure o
nted in the
balanced, ha
ing mainly
ed and fragm
ng, the high
e austenitic
ussed in the
te laths, bu
3.14 – Microgra
n
aragraph 3.2
101, but a r
transformat
still visible
n detected i
on
yses were pe
n (step size
used as refe
of SAF 210
previous Pa
aving a fer
caused the
mented.
h-magnifica
grains whi
previous P
ut cannot b
aphies of CR sa
2.3, XRD w
relevant dec
tion took pl
after the hi
n the cold r
erformed on
of 2.5 and
erence phase
01 and the m
aragraph 3.2
rrite content
e deformati
ation SEM i
ich could b
Paragraph 3
e immediat
mples (SEM-B
was not he
creasing of
lace, it not
igher thickn
rolled sampl
n the 10%C
1.25 mm).
es, while SI
modificatio
2. As report
t which wa
ion of the a
investigation
e associated
.2.1. As rep
tely address
SE, etched): a)
elpful to re
the FCC au
interested
ness reducti
les.
CR sample a
In a first at
IM cannot b
ons induced
ted, the ana
as estimated
austenitic ph
ns only rev
d to the rec
ported, thes
sed to the
50% and b) 60
eveal if the
ustenitic pea
the whole a
ions. Moreo
at low mag
ttempt, aust
be considere
d by cold ro
alyzed SAF
d at about
hase, which
vealed some
curring struc
se features
new phase
0%.
e SIM form
aks intensity
austenitic p
over, no HC
gnification o
tenite, ferrit
ed as a refe
olling
2101
76%.
h was
e gray
ctural
could
(Fig.
mation
y was
phase,
CP ε-
on the
te and
erence
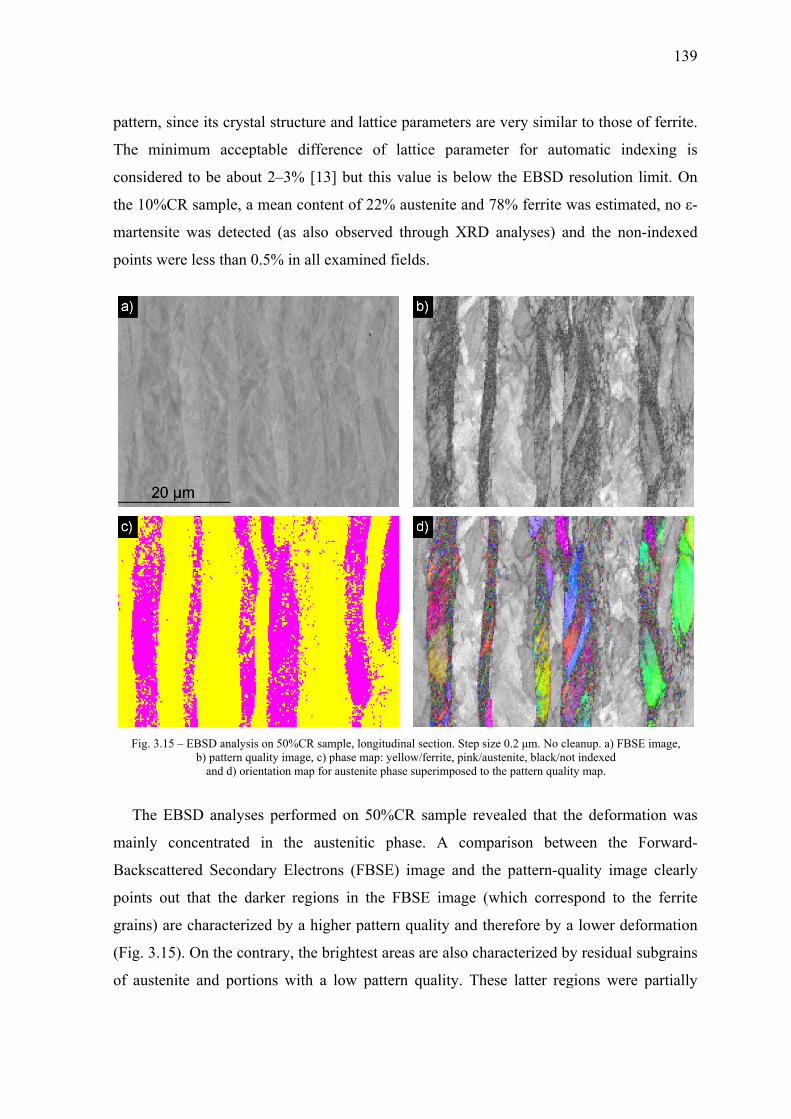
patte
The
consi
the 1
mart
point
Fig
Th
main
Back
point
grain
(Fig.
of au
ern, since its
minimum
idered to be
10%CR sam
ensite was
ts were less
g. 3.15 – EBSDb) p
an
he EBSD a
nly concent
kscattered S
ts out that
ns) are char
3.15). On t
ustenite and
s crystal str
acceptable
e about 2–3
mple, a mean
detected (a
s than 0.5%
D analysis on 50pattern quality imnd d) orientation
analyses per
trated in t
Secondary E
the darker
racterized by
the contrary
d portions w
ructure and
e difference
3% [13] bu
n content of
as also obs
in all exam
0%CR sample, mage, c) phase n map for auste
rformed on
the austeni
Electrons (F
regions in
y a higher p
y, the bright
with a low
lattice para
e of lattice
ut this value
f 22% auste
erved throu
mined fields.
longitudinal secmap: yellow/fe
enite phase supe
n 50%CR sa
itic phase.
FBSE) ima
n the FBSE
pattern qual
test areas ar
pattern qu
meters are v
e paramete
e is below t
enite and 78
ugh XRD a
ction. Step sizeerrite, pink/austerimposed to th
ample reve
A compa
age and the
E image (wh
lity and the
re also chara
uality. Thes
very similar
er for auto
the EBSD r
8% ferrite w
analyses) an
0.2 μm. No cletenite, black/nothe pattern qualit
aled that th
arison betw
e pattern-qu
hich corres
erefore by a
acterized by
e latter reg
r to those o
omatic inde
resolution li
was estimate
nd the non-
eanup. a) FBSEt indexed ty map.
he deformat
ween the F
uality image
spond to th
a lower defo
y residual su
gions were
139
of ferrite.
exing is
imit. On
ed, no ε-
-indexed
E image,
tion was
Forward-
e clearly
he ferrite
ormation
ubgrains
partially
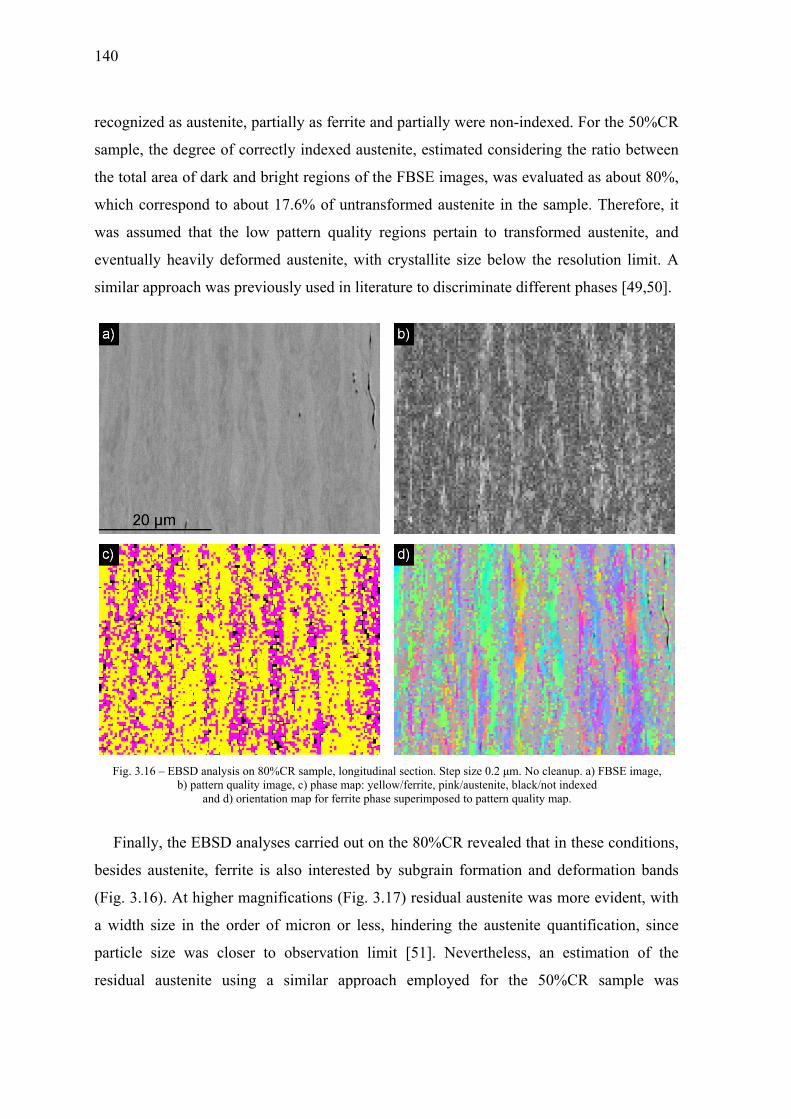
140
recogniz
sample,
the total
which c
was ass
eventua
similar
Fig. 3.
Final
besides
(Fig. 3.
a width
particle
residual
zed as auste
the degree
l area of da
correspond
sumed that
ally heavily
approach w
16 – EBSD anab) patter
and
lly, the EBS
austenite,
16). At high
h size in the
size was
l austenite
enite, partia
e of correctl
ark and brig
to about 17
the low pa
deformed
was previous
alysis on 80%Crn quality imagd d) orientation
SD analyses
ferrite is al
her magnifi
e order of m
closer to o
using a s
ally as ferrit
ly indexed a
ght regions o
7.6% of unt
attern quali
austenite, w
sly used in l
CR sample, longge, c) phase mapn map for ferrite
s carried ou
lso intereste
ications (Fig
micron or l
observation
similar app
te and partia
austenite, e
of the FBSE
transformed
ity regions
with crystal
literature to
gitudinal sectionp: yellow/ferritee phase superim
ut on the 80%
ed by subgr
g. 3.17) res
less, hinder
n limit [51]
proach emp
ally were no
stimated co
E images, w
d austenite
pertain to
llite size be
discriminat
n. Step size 0.2 e, pink/austenit
mposed to patter
%CR revea
rain format
idual austen
ring the aus
]. Neverthe
ployed for
on-indexed.
onsidering th
was evaluate
in the samp
transforme
elow the res
te different
μm. No cleanue, black/not indrn quality map.
aled that in t
tion and de
nite was mo
stenite quan
eless, an es
the 50%C
. For the 50
he ratio bet
ed as about
ple. Therefo
ed austenite
solution lim
phases [49
up. a) FBSE imadexed
these condi
eformation b
ore evident,
ntification,
stimation o
CR sample
0%CR
tween
80%,
ore, it
e, and
mit. A
,50].
age,
tions,
bands
, with
since
of the
was

perfo
this c
detec
Neve
2101
Fig
Mag
It is w
ferro
ferro
polar
Th
doub
exter
ormed; a va
case the err
cted, causin
ertheless, fr
1 DSS transf
g. 3.17 – EBSD b) orientation
gnetic measu
well known
omagnetic p
omagnetic S
rization obta
he first ma
ble-yoke m
rnal field a
lue of abou
ror is of the
ng a strong
rom such m
formed to S
analysis on 80%n map for auste
pink/austeni
urements
n that the sa
phase in al
SIM in the
ained by the
agnetization
magnetomete
applied was
ut 2% of the
order of 1%
g decreasin
measurement
SIM.
%CR sample, lenite phase supeite, black/not in
aturation po
loys [18,19
e CR sam
e magnetic
n curves an
er on the
s about 22
volumetric
%, since in
ng in accu
ts, it is pos
ongitudinal secerimposed to pandexed and d) o
olarization is
9], allowing
mples by a
tests.
nd the satur
completely
50 A/cm,
c fraction ca
many cases
uracy of th
sible to ass
ction. Step size attern quality morientation map
s linearly pr
g for a qua
direct com
ration hyste
y demagnet
which was
an be estima
s very few
e performe
sert that alm
0.12 μm. No clmap, c) phase ma
for ferrite phas
roportional
antification
mparison w
eresis loops
tized sampl
s absolutely
ated, even th
pixels per g
ed evaluatio
most all aus
leanup. a) FBSEap: yellow/ferrise.
with the am
n of the am
with the sa
s were mea
les; the m
y sufficient
141
hough in
grain are
on [52].
stenite in
E image, ite,
mount of
mount of
aturation
asured a
maximum
for the

142
magneti
values g
material
SIM can
𝜇 𝑀
where:
sample,
ferrite a
T and 0
The
together
same at
leads to
highest
Equatio
Hardne
The res
measure
ic saturation
gradually in
l to 0.94 T
n be calcula
= 𝑅 𝜇Ms
sample, M
δ-ferrite an
and SIM. Th
.92 T respe
Fig. 3.18 – a) F
saturation
r in Fig. 3.
t the lower
o a stronger
value of 0.
on (3.1) at ea
ess test
ults of Vick
ements are p
n of the sam
ncreased wi
in the 80%
ated from th
𝑀 + 𝑅Ms
δ and Msm
nd SIM resp
he determin
ctively.
First magnetizaand t
polarizatio
.18b. The s
thickness r
r and gradu
.94 T at 80
ach thickne
kers hardne
plotted toge
mples. As ca
ith the plas
CR sample
he following
𝜇 𝑀artensite are t
pectively. R
ned saturatio
ation curves on the quantified a
on values a
saturation p
eduction, u
ual increase
0% of thickn
ss reduction
ess test HV
ether in Fig
an be seen in
tic deforma
, as a result
g eqiation:
𝑀the saturati
Rdelta and Rm
on polarizat
AR and CR sam
amount of marte
and the qu
polarization
up to 30%. A
e in magnet
ness reduct
n is reported
10 and the a
g. 3.19. At lo
n Fig. 3.18a
ation, passin
t of the SIM
on magneti
martensite are i
tion values
mples and b satensite vs. strain
uantified am
(blue poin
A further in
tic saturatio
tion. The es
d in Fig. 3.1
amount of S
ow strain ra
a, the satura
ng from 0.7
M formation
ization valu
instead the
of ferrite a
uration polarizan).
mount of S
nts) seems t
ncrease in c
on field, wh
stimated am
18b as red p
SIM estima
ates, up to 2
ation polariz
752 T in th
n. The amou
ues of the t
relative rati
and SIM are
ation values
SIM are pl
to be almos
cold deform
hich reache
mount of SIM
points.
ated by mag
20% of thick
zation
he AR
unt of
(3.1)
tested
ios of
e 0.95
lotted
st the
mation
es the
M by
gnetic
kness

reduc
whic
in th
incre
harde
to an
auste
that
the S
Conc
This
phas
incre
take
and i
In
on th
densi
defor
ction, the h
ch affects th
e increase o
eases quite
ening proce
n increased
enite. Comp
exceeding t
SIM formati
cluding rem
investigati
e was trans
eased as the
place; in 5
in 80%CR s
n this steel,
he strain-ha
ity inside
rmation the
ardness inc
he overall h
of hardness
linearly w
ess can be a
number of
paring the ha
the 20%, th
ion.
Fig. 3.19 – Vic
marks
on has poin
sformed into
e deformatio
0%CR only
samples alm
up to 20%
ardening of
the grains
e hardness i
reases rapid
hardening be
was observ
with the am
associated w
f shear band
ardness resu
he energy a
ckers hardness v
nted out th
o the so-cal
on proceede
y about 20%
most all the a
of thickness
f the mater
and there
ncreased sl
dly due to th
ehaviour, w
ved. Above
mount of S
with a subst
d intersectio
ults to the tr
ssociated to
vs. estimated am
hat, during
lled Strain-I
ed. In 20%
% of the in
austenite w
s reduction
rial, leading
efore to an
ightly, beca
he high stra
while for fur
20% of thi
SIM. In the
tantial incre
on, mainly o
rend of SIM
o deformati
mount of strain-
cold rolling
Induced Ma
CR sample
nitial austen
as transform
the deform
g to a rapi
n increase
ause the ene
ain-hardenin
rther deform
ickness redu
e low defo
ease of dislo
owing to th
M formation
on process
-induced marten
g, in SAF 2
artensite (SI
es the transf
nite underwe
med.
mation energ
id increase
in hardnes
ergy was th
ng rate of a
mations a re
uction, the h
ormation ra
ocation den
he high plas
n, it can be s
is mostly s
nsite.
2101 the a
IM), whose
formation st
ent SIM fo
gy was main
of the dis
ss. Above
hought to be
143
austenite,
eduction
hardness
ange the
nsity and
sticity of
supposed
spent for
ustenitic
e amount
tarted to
rmation;
nly spent
slocation
20% of
e mostly

144
employed for the SIM formation, whose amount seemed to be linearly related to the
thickness reduction, and only in a minor part for a further strain-hardening of the material.
Magnetic and EBSD measurements are in agreement each other, highlighting the formation
of SIM in this DSS grade.
However, it must be notice that EBSD was of discrete character and has only involved
the investigation of 10%CR, 50%CR and 80%CR samples, thus without any information
on the first stages of the SIM formation. Moreover, as reported in Paragraph 3.2.5, the
sensibility of the magnetic measurement does not allow to detect magnetic variations
inside the samples when the phase content is very low (<10%). Thus, it is highly probable
that SIM transformation can also occur at lower deformation degrees than 20% of
thickness reduction, but more sensible techniques are required in. For this purpose, SAF
2101 (as-received and cold rolled) was subjected to Neutron Time-of-Flight Diffraction,
but the data are still under analysis, in order to fully describe such transformation.
3.3.2. Effects of cold rolling in SAF 2205 DSS
From the results presented in the previous Paragraph 3.3.1, is evident that the SIM
transformation could reasonably take place in SAF 2101 DSS as a consequence of cold
rolling, even though there were no direct observations of the new phase and only the
magnetic consequences of such transformation were detected. In the present section, the
effects of cold rolling on another DSS grade, the SAF 2205, were investigated using deeper
investigation techniques, such as Neutron Diffraction (ToF-ND) and Transmismsion
Electron Microscopy (TEM), in order to unambiguously characterize the onset of such
transformation.
In SAF 2205, since the amount of the γ-promoting elements is low, the austenitic phase
is in any case lower-alloyed respect to that of austenitic stainless steel, but its stability can
be conditioned by the biphasic microstructure. As a matter of fact, a comparison with a
metastable AISI 304L austenitic steel – for which the SIM transformation have been
extensively studied [3-17] – is presented, in terms of austenite stability and Stacking Fault
Energy (SFE) associated to the FCC phase.
Nevertheless, the steel under examination in this paragraph differs from the SAF 2101
previously presented and, since SAF 2205 is characterized by a greater amount of γ-

145
promoting elements (see composition in Table 3.7), the austenite stability is higher. Thus,
if the SIM transformation takes place, a lower extent of SIM is expected. Moreover, as
previously reported, the DSS microstructure, owing to its biphasic character, can play a not
negligible role in such phase transformation, modifying the mechanisms of deformation
and the kinetics of SIM formation.
Table 3.7 – Chemical compositions of SAF 2205 and AISI 304L [wt.%].
C Si Mn Cr Ni Mo P S N
SAF 2205 0.030 0.56 0.89 22.75 5.04 3.19 0.025 0.002 0.18
AISI 304L 0.033 0.53 1.59 18.11 7.96 0.64 0.026 0.002 0.07
Preliminary considerations
As reported in Paragraph 3.1, the SAF 2205 DSS was cold rolled at room temperature in a
not continuously manner, involving thickness reductions in the range 3–85% and using a
manual reversing mill free of constraints in the transverse direction. This latter fact implies
that the transverse contribution at medium-high thickness reductions cannot be neglected
and an equivalent strain must be considered. As pointed out by Hecker et al. [7], a change
in deformation mode from mono- to bi-axial has certain influence on the martensitic
transformation, delaying the kinetics at the first steps of deformation and causing an
increase of the SIM content at medium-high strains. Hence, the effective strain criterion
considered in the present work was that of von Mises, given by the following relation:
𝜀 = √ (𝜀 − 𝜀 ) + (𝜀 − 𝜀 ) + (𝜀 − 𝜀 ) (3.2)
This criterion typically provides a better correlation between plastic flow and stress
state [7] and gives a better description of the effective strain developed during the rolling
process. Table 3.8 relates the various thickness reductions to the effective strains at which
the samples were subjected.
Table 3.8 – Correlation between thickness reduction and effective strain.
thickness reduction 3% 5% 15% 35% 50% 65% 85%
von Mises effective strain (εVM) 0.032 0.054 0.170 0.451 0.726 1.099 1.987

146
The stacking fault probability of the austenitic phase was estimated considering the
Warren-Averbach approach [53], founded on γ(111) and γ(200) peaks displacement after
plastic deformation. The DSS samples were deformed to 3% of thickness reduction in
order to produce a suitable number of stacking faults [54] and resulting in a detectable
shifting of the diffraction lines positions. The calculations were performed comparing the
annealed (AR) and the 3% cold worked (3%CR) spectra, using the following expression
[3]:
𝛥2𝜃 = (2𝜃 − 2𝜃 ) % − (2𝜃 − 2𝜃 )
= − 45√3𝜋 𝑡𝑎𝑛 𝜃 + 12 𝑡𝑎𝑛 𝜃 𝛼 (3.3)
The SFE of austenite was determined using the formula developed by Schramm and
Reed [3] and which was already employed for the analysis of several austenitic stainless
steels:
𝛾 = 𝐾 𝜔 𝐺( ) 𝑎 𝐴 . 𝜋 √3 ⟨𝜀 ⟩𝛼 (3.4)
In expression (3.3) the 2θs are given in degrees and were achieved by a Gaussian fit of
the diffraction peaks, while α denotes the stacking fault probability, which increases with
the density of the generated stacking faults. In equation (3.4), K111 ω0 is a proportionality
constant found to be 6.6 [55], a0 is the austenite lattice parameter, G(111) is the share
modulus for the γ(111) planes – assumed 7.39·1010 N/mm2 for the 2205 DSS [56] –, A is
the Zener anisotropy 2C44/(C11 – C12) – calculated considering the Cij given in [57] – and
<ε2>111 is the mean square strain, estimated from the XRD peak broadening after the cold
deformation. For a verification of the SFE results, the same calculations were performed
on an AISI 304L austenitic stainless steel (composition in Table 3.7), as-received and 3%
cold rolled, whose SFE is extensively reported in literature (~17–20 mJ/m2 [3,58-62]),
assuming a shear modulus G(111) = 6.5·1010 N/mm2 and a Zener anisotropy A = 3.43 from a
previous work [3].
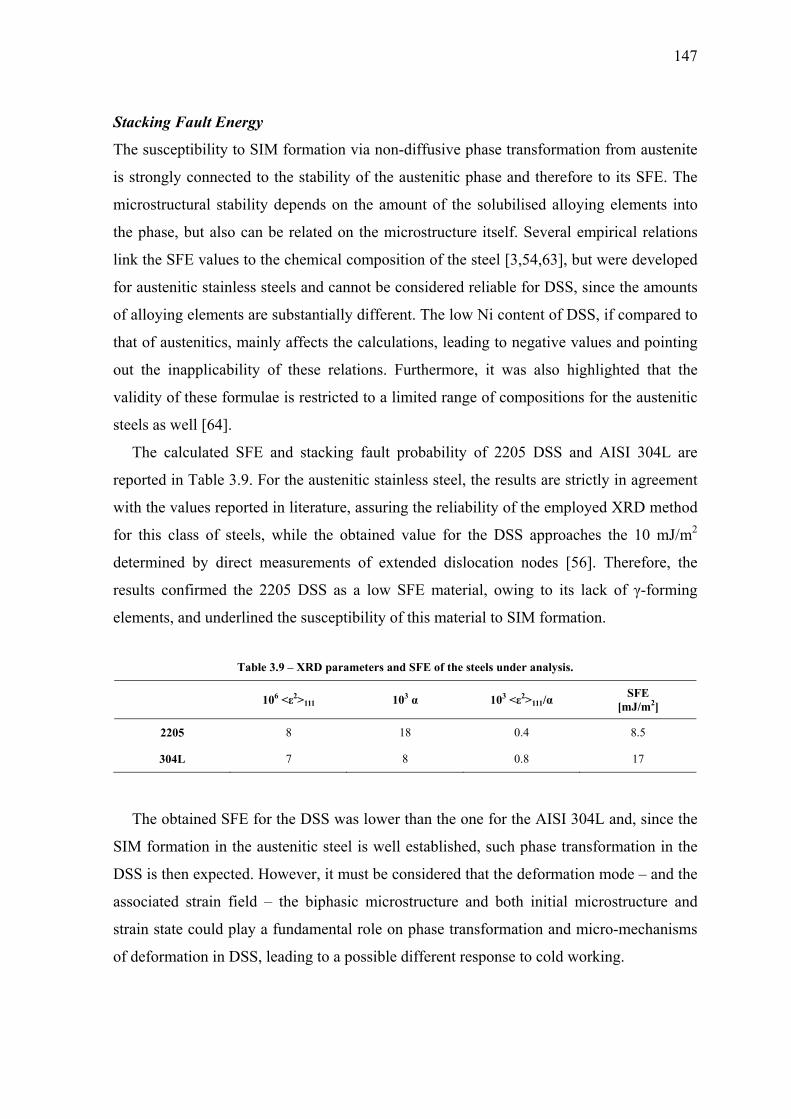
147
Stacking Fault Energy
The susceptibility to SIM formation via non-diffusive phase transformation from austenite
is strongly connected to the stability of the austenitic phase and therefore to its SFE. The
microstructural stability depends on the amount of the solubilised alloying elements into
the phase, but also can be related on the microstructure itself. Several empirical relations
link the SFE values to the chemical composition of the steel [3,54,63], but were developed
for austenitic stainless steels and cannot be considered reliable for DSS, since the amounts
of alloying elements are substantially different. The low Ni content of DSS, if compared to
that of austenitics, mainly affects the calculations, leading to negative values and pointing
out the inapplicability of these relations. Furthermore, it was also highlighted that the
validity of these formulae is restricted to a limited range of compositions for the austenitic
steels as well [64].
The calculated SFE and stacking fault probability of 2205 DSS and AISI 304L are
reported in Table 3.9. For the austenitic stainless steel, the results are strictly in agreement
with the values reported in literature, assuring the reliability of the employed XRD method
for this class of steels, while the obtained value for the DSS approaches the 10 mJ/m2
determined by direct measurements of extended dislocation nodes [56]. Therefore, the
results confirmed the 2205 DSS as a low SFE material, owing to its lack of γ-forming
elements, and underlined the susceptibility of this material to SIM formation.
Table 3.9 – XRD parameters and SFE of the steels under analysis.
106 <ε2>111 103 α 103 <ε2>111/α SFE [mJ/m2]
2205 8 18 0.4 8.5
304L 7 8 0.8 17
The obtained SFE for the DSS was lower than the one for the AISI 304L and, since the
SIM formation in the austenitic steel is well established, such phase transformation in the
DSS is then expected. However, it must be considered that the deformation mode – and the
associated strain field – the biphasic microstructure and both initial microstructure and
strain state could play a fundamental role on phase transformation and micro-mechanisms
of deformation in DSS, leading to a possible different response to cold working.

148
Microst
The effe
3.2.1, in
investig
6V in ox
of HCl
revealed
As p
microstr
3.10), w
toward t
T
Ferrite
Austeni
As e
ferrite s
stages o
tructure
ects of cold
n which the
gation, a fur
xalic acid a
and 1 ml
d by the Ber
Fig. 3.20 – A
previously
ructure, com
with the au
the directio
Table 3.10 – Vo
phase(v
OM
e (α) 45.5
ite (γ) 54.5
xpected, in
slightly hard
occurred du
d working on
e observed f
rther set of s
and then re-e
of HNO3 i
raha’s etcha
AR microstruct
reported, th
mposed by
ustenitic gra
on of the pre
olume fraction
e fraction vol.%)
HToF
43.2
56.8
the solutio
der than au
uring the sol
n DSS micr
features per
samples wa
etched usin
in 60 ml H
ant.
ture of SAF 220
he as-recei
y almost eq
ains (γ) disp
evious hot-r
ns, hardness an
HV0.025 cell
375 2
345 3
on-annealed
ustenite (Tab
lution-annea
rostructures
rtains to Be
as firstly sub
g a solution
H2O, to hig
05 (SEM-BSE)
ived SAF 2
qual volum
persed insid
rolling proce
nd refined para
To
dimension a [A]
2.87906
3.60637
material th
ble 3.10), o
aling treatm
are reporte
eraha’s etch
bjected to an
n composed
ghlight othe
): a) Beraha’s et
2205 DSS
e fractions
de a ferritic
ess (Fig. 3.2
ameters of the
oF Rietveld par
crystallites size [A]
2425
4106
he phases ha
owing to rec
ment. The su
ed in the pre
ed samples
n electroche
d by 0.10 g o
er features
tchig and b) oxa
exhibited
of the two
c matrix (α
20).
phases in the A
rameters (bank
microstraiS400
0.991
0.177
ave differen
covery and
ubsequent c
evious Parag
. For the pr
emical etchi
of Na2S2O5,
respect to
alic acid.
a well-bala
o phases (T
α) and elon
AR samples.
k 1)
in texture iJ
9.48
1.39
nt hardness,
recrystalliz
cold deform
graph
resent
ing at
, 5 ml
those
anced
Table
ngated
index
2
3
, with
zation
mation
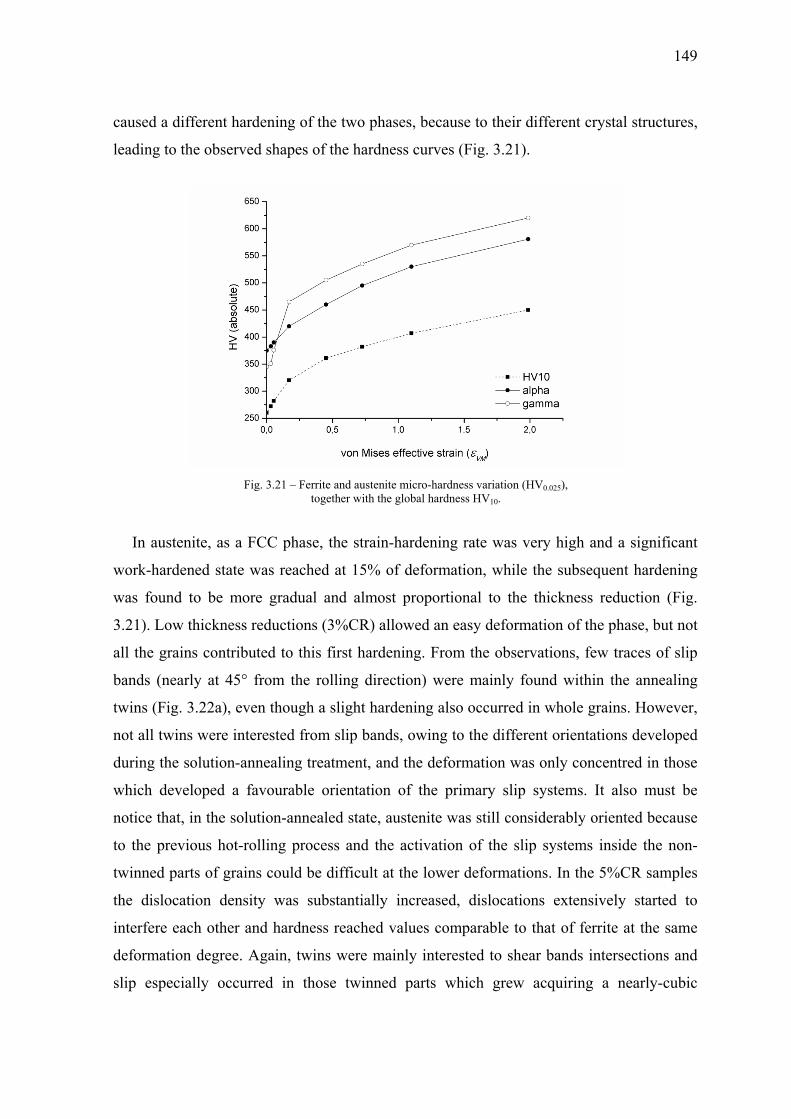
149
caused a different hardening of the two phases, because to their different crystal structures,
leading to the observed shapes of the hardness curves (Fig. 3.21).
Fig. 3.21 – Ferrite and austenite micro-hardness variation (HV0.025),
together with the global hardness HV10.
In austenite, as a FCC phase, the strain-hardening rate was very high and a significant
work-hardened state was reached at 15% of deformation, while the subsequent hardening
was found to be more gradual and almost proportional to the thickness reduction (Fig.
3.21). Low thickness reductions (3%CR) allowed an easy deformation of the phase, but not
all the grains contributed to this first hardening. From the observations, few traces of slip
bands (nearly at 45° from the rolling direction) were mainly found within the annealing
twins (Fig. 3.22a), even though a slight hardening also occurred in whole grains. However,
not all twins were interested from slip bands, owing to the different orientations developed
during the solution-annealing treatment, and the deformation was only concentred in those
which developed a favourable orientation of the primary slip systems. It also must be
notice that, in the solution-annealed state, austenite was still considerably oriented because
to the previous hot-rolling process and the activation of the slip systems inside the non-
twinned parts of grains could be difficult at the lower deformations. In the 5%CR samples
the dislocation density was substantially increased, dislocations extensively started to
interfere each other and hardness reached values comparable to that of ferrite at the same
deformation degree. Again, twins were mainly interested to shear bands intersections and
slip especially occurred in those twinned parts which grew acquiring a nearly-cubic
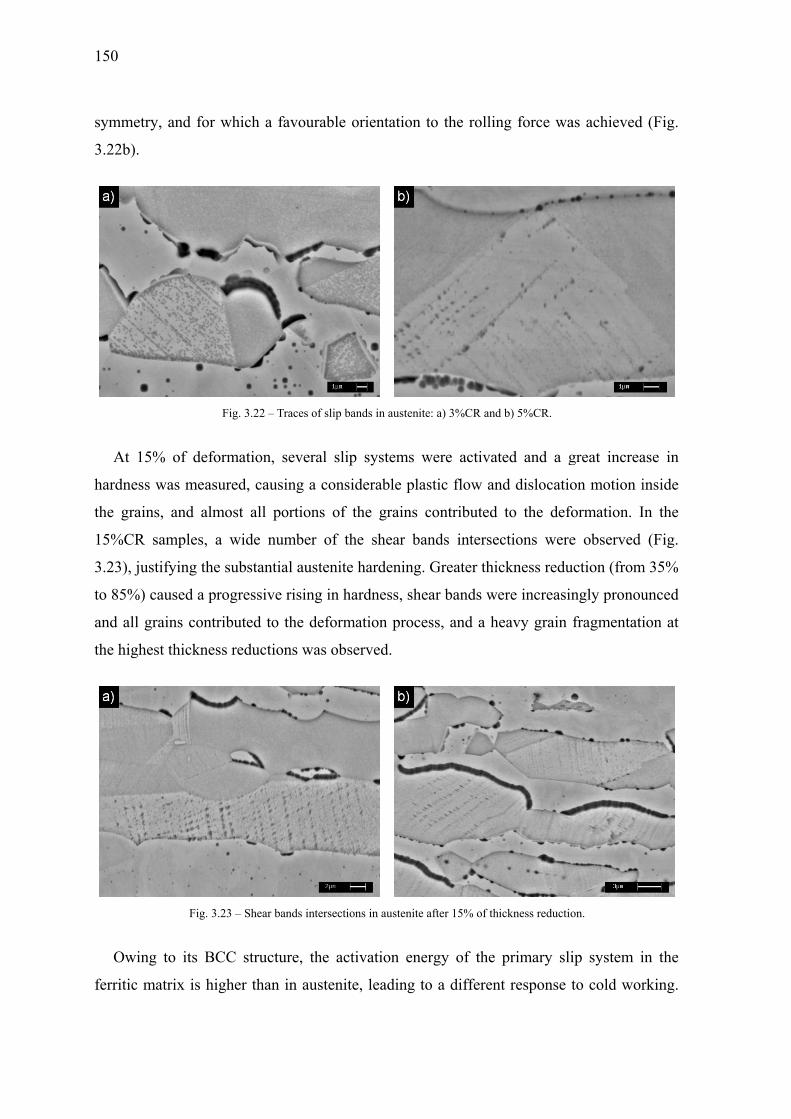
150
symmet
3.22b).
At 1
hardnes
the grai
15%CR
3.23), ju
to 85%)
and all
the high
Owin
ferritic
try, and for
5% of defo
ss was meas
ins, and alm
R samples,
ustifying the
) caused a p
grains cont
hest thickne
Fig. 3
ng to its B
matrix is hi
r which a fa
Fig. 3.22 – Tr
formation, s
sured, causi
most all po
a wide num
e substantia
progressive
tributed to t
ess reduction
3.23 – Shear ban
CC structu
igher than i
avourable o
races of slip ban
several slip
ing a consid
ortions of th
mber of the
al austenite
rising in ha
the deforma
ns was obse
nds intersection
ure, the acti
in austenite
orientation t
nds in austenite
systems w
derable plas
he grains c
e shear ban
hardening.
ardness, shea
ation proces
erved.
ns in austenite a
ivation ener
e, leading to
to the rollin
e: a) 3%CR and
were activat
stic flow an
contributed
nds intersec
Greater thic
ar bands we
ss, and a he
after 15% of thi
rgy of the
o a differen
ng force wa
d b) 5%CR.
ted and a g
nd dislocatio
to the defo
ctions were
ckness redu
ere increasin
eavy grain
ickness reductio
primary sli
nt response t
as achieved
great increa
on motion i
formation. I
e observed
uction (from
ngly pronou
fragmentati
on.
ip system i
to cold wor
(Fig.
ase in
inside
In the
(Fig.
m 35%
unced
ion at
in the
rking.

The
(Fig.
rollin
auste
85%
allow
X-Ra
The
proce
subse
respe
quan
revea
In
chara
α(20
textu
plane
had
direc
observed in
3.21) and h
ng plane, f
enite, a grea
CR sample
wed a greate
ays Diffract
diffraction
ess and the
equent cold
ect to the
ntitative tex
aled and a q
n the SAF 2
acterized by
0) and γ(22
ure in the m
es in the RD
a 100 C
ctions and w
ncrement in
hardening w
ferrite was
ater thinnin
es, due to th
er deformati
tion
patterns de
e phases or
d working. T
rolling pla
xture analys
qualitative d
Fig. 3.24 –
2205 DSS
y very narro
20) reflectio
material (Fig
D correlate
Cubic orient
which can be
n HV was in
was found to
elongated
ng of the gra
he activatio
ion of the g
epend on th
rientations
The XRD m
ne (RD an
sis. Howev
description o
Diffraction patta) rolling plan
under stud
ow peaks, b
ons respect
g. 3.24). Fo
ed to the sp
tation, almo
e respective
ndeed nearl
o be almost
toward th
ains in the
on of a con
grains.
he microstru
can substa
measuremen
nd ND) and
ver, the pre
of the phase
terns of SAF 22
ne (RD) and b) n
dy, the spec
because to
to the α/γ p
or the AR m
ectrum obta
ost equally
ely ascribed
ly regular in
linear with
he rolling d
orthogonal
nsiderable n
ucture achie
antially affe
nts were per
d cannot b
esence of p
es rearrange
205 (AR, 50%Cnormal plane (N
ctrum of th
the solubili
principal pe
material, the
ained in ND
y spread tow
d to the prev
n the whole
h the thickne
direction bu
direction w
number of
eved during
ects the be
rformed in
be consider
preferred o
ement can b
CR and 85%CRND).
e AR mate
isation, and
eaks underli
e strong hu
D, revealed
ward both
vious hot-ro
e deformatio
ess reductio
ut, if comp
was observe
slip system
g the manuf
haviour du
only two di
red comple
orientations
be made.
R):
erial along
d the height
ined a stron
uge from the
d that ferrite
<110> and
olling proces
151
on range
on. In the
pared to
ed in the
ms which
facturing
uring the
irections
te for a
can be
RD was
t of both
ng initial
e α(200)
e mainly
d <100>
ss and to
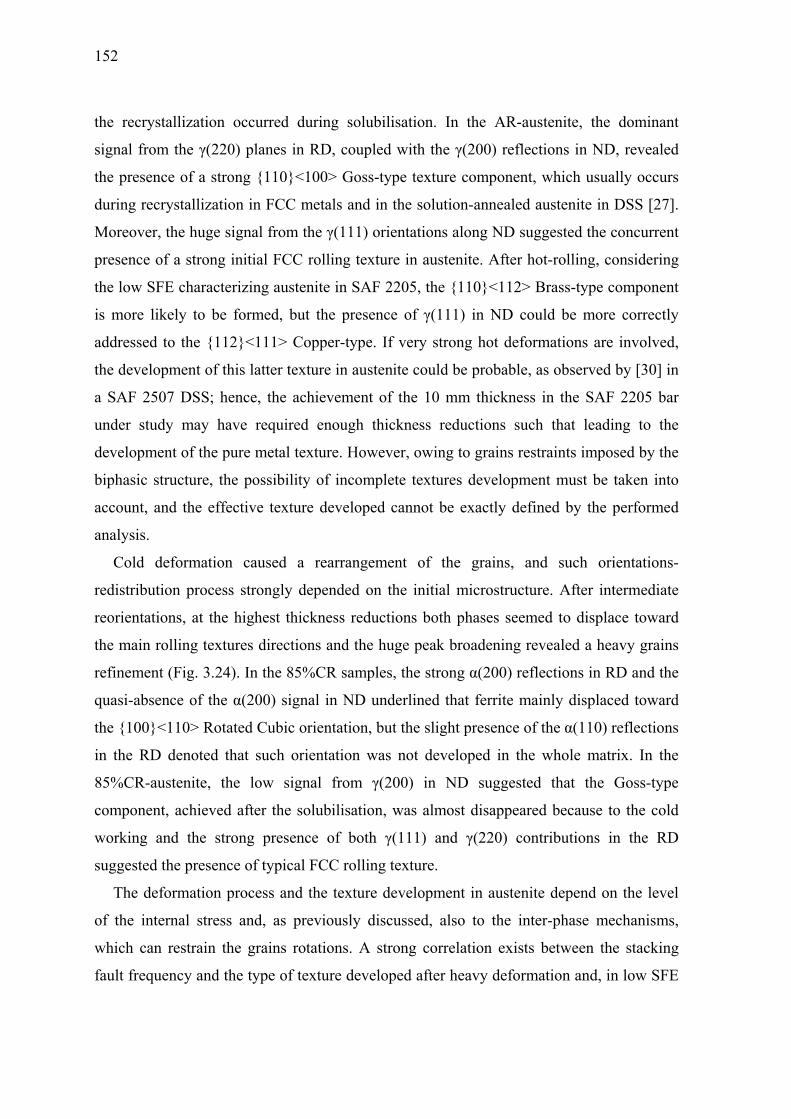
152
the recrystallization occurred during solubilisation. In the AR-austenite, the dominant
signal from the γ(220) planes in RD, coupled with the γ(200) reflections in ND, revealed
the presence of a strong 110<100> Goss-type texture component, which usually occurs
during recrystallization in FCC metals and in the solution-annealed austenite in DSS [27].
Moreover, the huge signal from the γ(111) orientations along ND suggested the concurrent
presence of a strong initial FCC rolling texture in austenite. After hot-rolling, considering
the low SFE characterizing austenite in SAF 2205, the 110<112> Brass-type component
is more likely to be formed, but the presence of γ(111) in ND could be more correctly
addressed to the 112<111> Copper-type. If very strong hot deformations are involved,
the development of this latter texture in austenite could be probable, as observed by [30] in
a SAF 2507 DSS; hence, the achievement of the 10 mm thickness in the SAF 2205 bar
under study may have required enough thickness reductions such that leading to the
development of the pure metal texture. However, owing to grains restraints imposed by the
biphasic structure, the possibility of incomplete textures development must be taken into
account, and the effective texture developed cannot be exactly defined by the performed
analysis.
Cold deformation caused a rearrangement of the grains, and such orientations-
redistribution process strongly depended on the initial microstructure. After intermediate
reorientations, at the highest thickness reductions both phases seemed to displace toward
the main rolling textures directions and the huge peak broadening revealed a heavy grains
refinement (Fig. 3.24). In the 85%CR samples, the strong α(200) reflections in RD and the
quasi-absence of the α(200) signal in ND underlined that ferrite mainly displaced toward
the 100<110> Rotated Cubic orientation, but the slight presence of the α(110) reflections
in the RD denoted that such orientation was not developed in the whole matrix. In the
85%CR-austenite, the low signal from γ(200) in ND suggested that the Goss-type
component, achieved after the solubilisation, was almost disappeared because to the cold
working and the strong presence of both γ(111) and γ(220) contributions in the RD
suggested the presence of typical FCC rolling texture.
The deformation process and the texture development in austenite depend on the level
of the internal stress and, as previously discussed, also to the inter-phase mechanisms,
which can restrain the grains rotations. A strong correlation exists between the stacking
fault frequency and the type of texture developed after heavy deformation and, in low SFE

153
materials, the stresses imposed by rolling and the presence of low amounts of cross-slip
preferentially lead to the development of a Brass-type texture [33,65,66]. The Brass-type
becomes increasingly effective as the deformation proceed, while a spread in orientations –
and eventually the Copper-type texture – are dominant when extensively cross-slip occurs
[33]. For low SFE materials – as the 2205 DSS – the Copper-type texture is difficult to
achieve after cold deformation at room temperature, because it is not possible to get
sufficient reduction for its development, and thus the Brass-type is generally the dominant
one [33]. In the 85%CR-austenite, the absence of the γ(200) reflections in RD revealed that
any type of cubic orientation were lost after the cold working and the low amount of the
γ(111) in ND suggested that no – or very few – Copper component was formed. Thus, the
strong contribution of both γ(111) and γ(220) planes in RD can be addressed to a Brass-
type texture, already observed in different DSS grades [26,27] and in austenitic stainless
steels [67], probably accompanied by incomplete grains rotations owing to the biphasic
microstructure.
As previously pointed out, the assurance of these hypotheses requires a careful
investigation, but it can be assured that both the inter-phases mechanisms of deformation
and the band-like structure strongly influence the phases rearrangement, leading to
restrained lattice rotations and thus to the possible occurrence of incomplete textures
developments. Austenite, being the “second phase”, is more prone to such restrictions,
owing to the presence of the ferritic matrix, and the development of harder boundaries
could avoid the complete grains reorientation.
The use of XRD is helpful to reveal SIM in fully austenitic stainless steels but, due to
the presence of ferrite and also to the similarity of its lattice parameter to that of SIM [13],
in DSS this kind of analysis cannot clearly reveal if the transformation took place. If such
transformation occurred, SIM and ferrite peaks will be superimposed, making a pattern
analysis difficult to be performed. The strong solution-annealed and cold-rolled textures in
SAF 2205 hindered the full-pattern refinements performed by the Rietveld method, making
a phases quantification not estimable and making XRD unhelpful for a SIM investigation.
Moreover, it must be considered that XRD, being a surface technique, could be influenced
by the strain-hardening occurred on samples after the grinding/polishing procedures,
leading to a misrepresentation of the results.
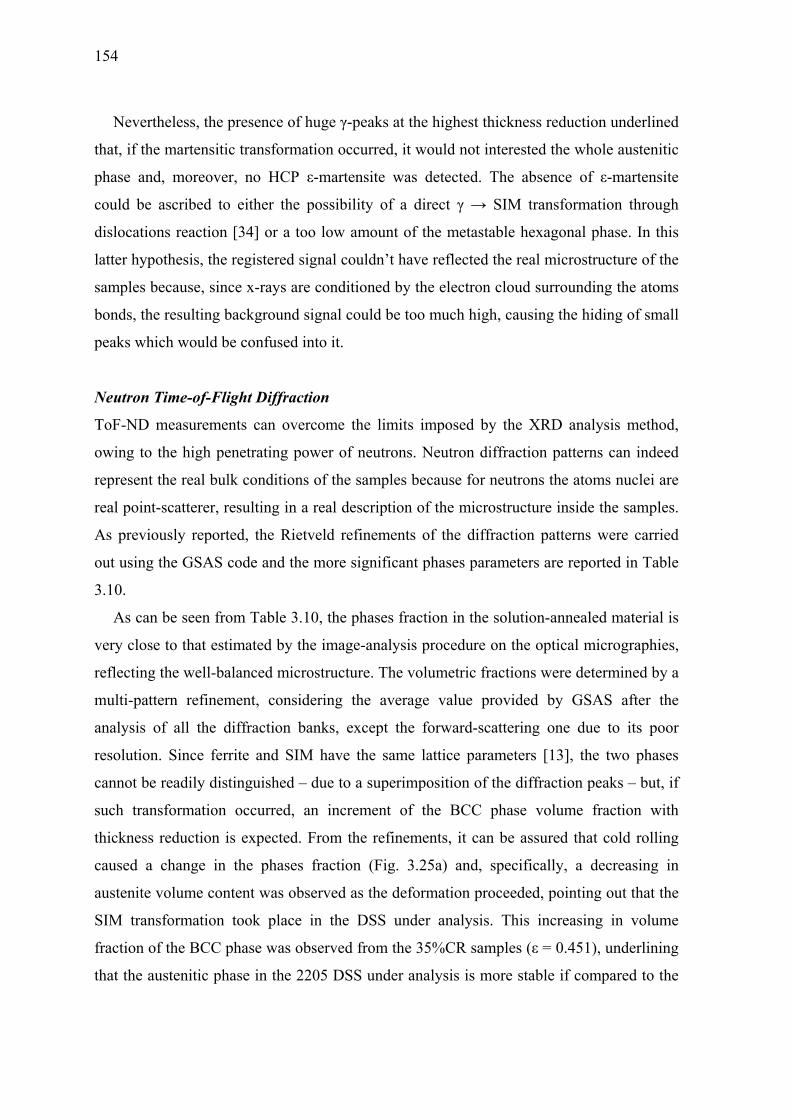
154
Nevertheless, the presence of huge γ-peaks at the highest thickness reduction underlined
that, if the martensitic transformation occurred, it would not interested the whole austenitic
phase and, moreover, no HCP ε-martensite was detected. The absence of ε-martensite
could be ascribed to either the possibility of a direct γ → SIM transformation through
dislocations reaction [34] or a too low amount of the metastable hexagonal phase. In this
latter hypothesis, the registered signal couldn’t have reflected the real microstructure of the
samples because, since x-rays are conditioned by the electron cloud surrounding the atoms
bonds, the resulting background signal could be too much high, causing the hiding of small
peaks which would be confused into it.
Neutron Time-of-Flight Diffraction
ToF-ND measurements can overcome the limits imposed by the XRD analysis method,
owing to the high penetrating power of neutrons. Neutron diffraction patterns can indeed
represent the real bulk conditions of the samples because for neutrons the atoms nuclei are
real point-scatterer, resulting in a real description of the microstructure inside the samples.
As previously reported, the Rietveld refinements of the diffraction patterns were carried
out using the GSAS code and the more significant phases parameters are reported in Table
3.10.
As can be seen from Table 3.10, the phases fraction in the solution-annealed material is
very close to that estimated by the image-analysis procedure on the optical micrographies,
reflecting the well-balanced microstructure. The volumetric fractions were determined by a
multi-pattern refinement, considering the average value provided by GSAS after the
analysis of all the diffraction banks, except the forward-scattering one due to its poor
resolution. Since ferrite and SIM have the same lattice parameters [13], the two phases
cannot be readily distinguished – due to a superimposition of the diffraction peaks – but, if
such transformation occurred, an increment of the BCC phase volume fraction with
thickness reduction is expected. From the refinements, it can be assured that cold rolling
caused a change in the phases fraction (Fig. 3.25a) and, specifically, a decreasing in
austenite volume content was observed as the deformation proceeded, pointing out that the
SIM transformation took place in the DSS under analysis. This increasing in volume
fraction of the BCC phase was observed from the 35%CR samples (ε = 0.451), underlining
that the austenitic phase in the 2205 DSS under analysis is more stable if compared to the
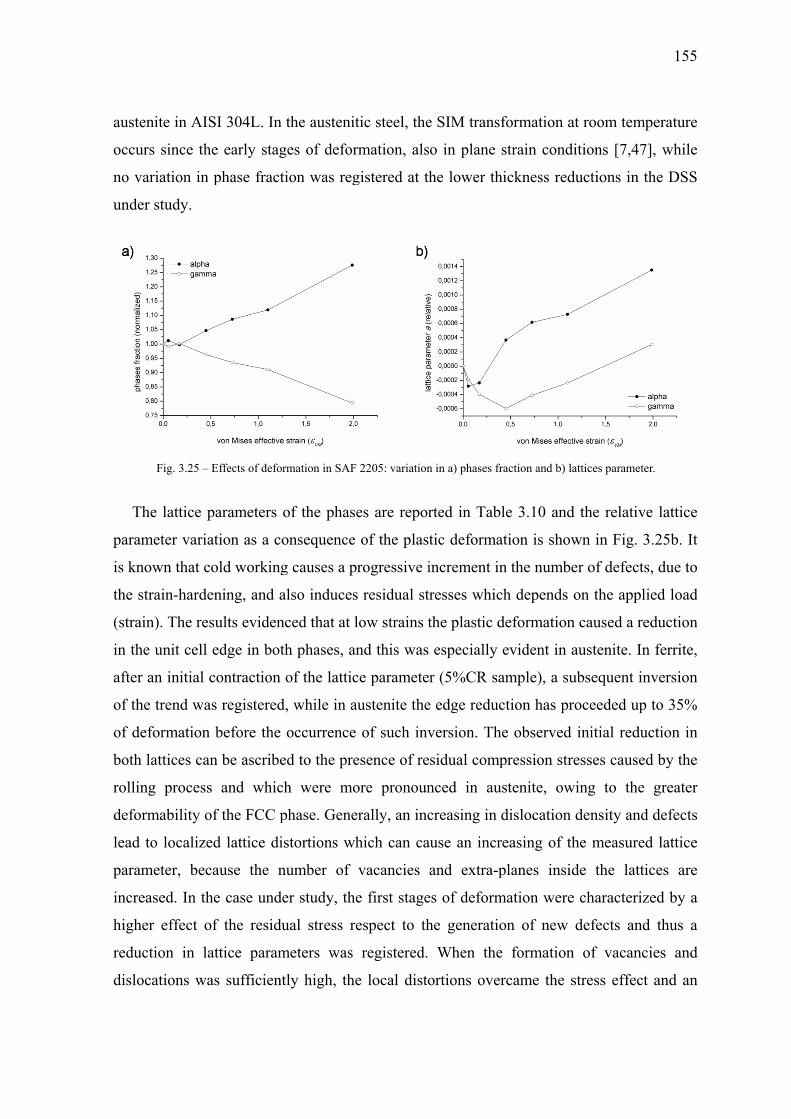
auste
occu
no va
unde
Th
param
is kn
the s
(strai
in th
after
of th
of de
both
rollin
defor
lead
param
incre
highe
reduc
dislo
enite in AIS
urs since the
ariation in p
er study.
Fig. 3.25 – E
he lattice p
meter variat
nown that co
strain-harden
in). The res
e unit cell e
an initial c
he trend was
eformation
lattices can
ng process
rmability of
to localized
meter, beca
eased. In the
er effect of
ction in lat
ocations wa
SI 304L. In
e early stag
phase fracti
Effects of defor
arameters o
tion as a co
old working
ning, and a
ults evidenc
edge in both
contraction o
s registered,
before the
n be ascribe
and which
f the FCC p
d lattice dis
ause the n
e case unde
f the residu
ttice param
s sufficient
the austenit
ges of defor
ion was reg
rmation in SAF
of the phase
onsequence
g causes a pr
also induces
ced that at l
h phases, an
of the lattic
, while in au
occurrence
ed to the pre
h were mo
phase. Gene
stortions wh
umber of
er study, the
ual stress re
meters was
tly high, the
tic steel, the
rmation, als
gistered at th
2205: variation
es are repor
of the plas
rogressive i
s residual st
low strains t
nd this was
ce paramete
ustenite the
of such inv
esence of re
ore pronoun
rally, an inc
hich can ca
vacancies
e first stage
espect to th
registered.
e local disto
e SIM trans
o in plane
he lower th
n in a) phases fr
rted in Tab
tic deforma
increment in
tresses whic
the plastic d
especially
r (5%CR sa
e edge reduc
version. Th
esidual comp
nced in au
creasing in
ause an incr
and extra-p
es of deform
he generatio
When the
ortions ove
formation a
strain cond
hickness red
raction and b) l
le 3.10 and
ation is show
n the numbe
ch depends
deformation
evident in a
ample), a su
ction has pr
he observed
pression str
ustenite, ow
dislocation
reasing of th
planes insid
mation were
on of new
e formation
rcame the s
at room tem
ditions [7,47
ductions in
attices paramet
d the relativ
wn in Fig. 3
er of defect
on the appl
n caused a re
austenite. In
ubsequent in
roceeded up
initial redu
resses cause
wing to the
density and
he measure
de the latt
e characteriz
defects and
n of vacanc
stress effec
155
mperature
7], while
the DSS
ter.
ve lattice
3.25b. It
ts, due to
lied load
eduction
n ferrite,
nversion
p to 35%
uction in
ed by the
e greater
d defects
ed lattice
tices are
zed by a
d thus a
cies and
t and an

156
inversion of the decreasing trends was observed. The generation of a great amount of
defects caused the expected increasing in the relative lattice parameter variation, which
occurred in different extent in the two phases due to their different plastic behaviour.
As suggested by the broadening of the x-rays diffraction peaks, the cold deformation
caused a heavy grains refinement. The crystallites size of the phases can also be estimated
from the broadening of the neutron peaks and must be intended as the average size of the
phase volume which is free of defects (such as dislocations and stacking faults). The
average crystallites size for both phases in the AR samples are reported in Table 3.10 and,
from a comparison with the observed microstructure, the obtained values were smaller than
expected. This is due to an instrumental upper limit on the correctly detectable size, which
is in the order of 100 nm [20], whereas smaller values can be reliably determined. Hence,
in the solubilised samples, the reported average sizes must be only considered from a
qualitative point of view, being the real value bigger than the refined one; conversely, the
refined sizes as a result of the plastic deformation are the effectively achieved ones. Thus,
the solution-annealed grains, although of the same order of magnitude, were coarser in
austenite than in ferrite, owing to the greater recrystallization grade achieved by the FCC
phase during solubilisation, as also confirmed by the SEM observations. In Fig. 3.26a the
crystallite sizes evolution is shown as a function of the applied equivalent strain, and both
phases globally exhibited similar trends as the thickness reduction increased. Low
deformations (5%) caused the strongest reduction in defect-free areas, which was more
evident in austenite, underlining the greater increase in dislocation density occurring in the
FCC phase at low strains and justifying the measured increment in hardness. Further
thickness reductions caused a progressive reduction of the crystallite size in both phases,
reaching a plateau after 35% of deformation, with the defects density more concentrated in
austenite (smaller grain size). The global trend is in agreement with several results reported
in literature [1,68], even though both phases reached constant size values which are shifted
toward very low levels of strain respect to other materials, and were also interested by a
heavier grain fragmentation. This strong and readily grain fragmentation can be addressed
to compositional factors and also to the biphasic microstructure. As a matter of fact, the
increased amount of substitutional alloying elements lowers the SFE of the phases, leading
to a more effective resistance to dislocation motion and inhibiting extensive dislocations
cross-slip; thus, the formation of dislocation boundaries and the achievement of smaller
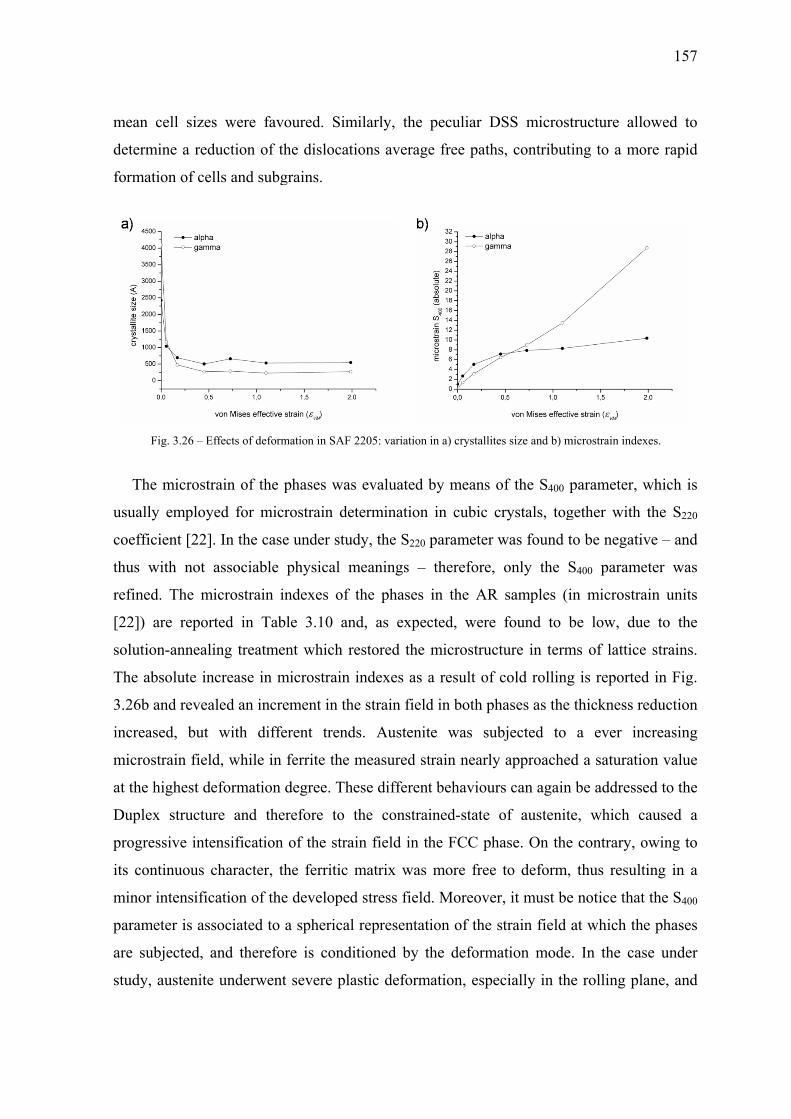
mean
deter
form
Th
usual
coeff
thus
refin
[22])
solut
The
3.26b
incre
micro
at the
Dupl
progr
its co
mino
param
are s
study
n cell sizes
rmine a red
mation of cel
Fig. 3.26 – Ef
he microstr
lly employe
ficient [22].
with not a
ned. The mi
) are report
tion-anneali
absolute in
b and revea
eased, but
ostrain field
e highest de
lex structur
ressive inte
ontinuous c
or intensific
meter is ass
subjected, a
y, austenite
s were favo
duction of th
lls and subg
ffects of deform
rain of the p
ed for micr
. In the case
associable
icrostrain in
ted in Tab
ing treatmen
crease in m
aled an incre
with diffe
d, while in
eformation d
re and ther
ensification
character, th
ation of the
sociated to a
and therefor
underwent
oured. Sim
he dislocati
grains.
mation in SAF 2
phases was
rostrain det
e under stud
physical m
ndexes of t
le 3.10 and
nt which re
microstrain i
ement in the
erent trends
ferrite the m
degree. The
refore to t
of the strai
he ferritic m
e developed
a spherical
re is condit
t severe pla
milarly, the
ons average
2205: variation
evaluated b
termination
dy, the S220
meanings –
the phases
d, as expec
estored the
indexes as a
e strain field
s. Austenit
measured st
ese different
the constrai
in field in th
matrix was
d stress field
representat
tioned by t
stic deform
peculiar D
e free paths
in a) crystallite
by means o
in cubic c
parameter w
therefore,
in the AR
cted, were
microstruct
a result of c
d in both ph
te was sub
train nearly
t behaviour
ined-state o
he FCC pha
more free
d. Moreover
tion of the s
the deforma
mation, espec
SS microst
s, contributi
es size and b) m
of the S400 p
crystals, tog
was found t
only the S
samples (i
found to b
ture in term
cold rolling
hases as the
bjected to
approached
s can again
of austenite
ase. On the
to deform,
r, it must be
strain field a
ation mode
cially in the
tructure allo
ing to a mo
microstrain index
parameter, w
gether with
to be negativ
S400 parame
in microstra
be low, du
ms of lattice
g is reported
thickness re
a ever in
d a saturatio
be addresse
e, which c
e contrary, o
thus result
e notice that
at which th
. In the cas
e rolling pl
157
owed to
ore rapid
xes.
which is
the S220
ve – and
eter was
ain units
e to the
e strains.
d in Fig.
eduction
ncreasing
on value
ed to the
caused a
owing to
ting in a
t the S400
e phases
se under
ane, and
158
the measured relative increment of the longitudinal stress field was substantially higher
than in ferrite, which instead was more reduced in the orthogonal direction (greater
thinning). These different deformation states changed the phases strain fields, which were
no longer spherical, forcing the values of the S400 parameter to assume different values for
the phases. Austenite was more deformed in the rolling plane than ferrite thickened in the
orthogonal direction, leading to the observed difference in the estimated microstrain
parameters.
Fig. 3.27 – Texture indexes variation as a function of the effective strain.
Refinements also provided an estimation of the texture index J, defined as the ratio
between the total volume of grains divided by the volume of the non-oriented grains [22].
This type of analysis was performed only on the first diffraction bank (bank-1), taking into
account the spherical-harmonic approach [22], and thus without any information on which
would be the specifics preferred orientations assumed by the phases, but was useful to
evidence the orientation and re-orientation processes developed during rolling. The texture
indexes in the AR samples are reported in Table 3.10, while their evolution during the cold
working is shown in Fig. 3.27. As can be seen, in the solution-annealed conditions ferrite
was still strongly oriented, as also revealed by XRD, while the texture in austenite was
maintained within typical values for the medium-textured materials. Clearly, the recovery
and recrystallization stages in the phases took place at different time during the
solubilisation and the measured texture indexes in the AR sample were affected by these
different responses. Comparing Figs. 3.24a and 3.27, the reorientation of ferrite is clearly
evident. Cold working caused a rearrangement of the grains and, starting from a (double)
cubic texture in the AR conditions, ferrite passed through intermediate rotations, reaching a

159
heavily rolling-oriented state at 85% of thickness reduction. The situation is different in
austenite, since recrystallization and rolling textures are different and are not both cubic.
The texture index always increased during the whole deformation process due to the
rolling texture development and to the concurrent disappearance of the Goss-type
component. However, a change in the curve slope in Fig. 3.27 can be noticed after the 50%
of deformation, which can be ascribed either to a saturation of the texture development,
due to the restraints imposed by the biphasic structure, or to the incomplete reorientation of
grains, as discussed in the previous XRD section.
TEM investigation
Neutron diffraction revealed the possibility of the martensitic transformation in SAF 2205,
but the estimated volume fractions were rather low, also after the maximum thickness
reduction (see next section); thus, only the 85%CR samples were subjected to
electrochemical preparation for TEM observations. Unfortunately, performing an
investigation on heavy cold rolled samples may be difficult, since the presence of a
substantially increased number of defects may interfere with the observation, making the
detection of the new phase more complicated. However, considering the low SIM amounts
developed throughout the entire deformation process, the probability of finding a polished
area containing martensite was higher in 85%CR samples than for the others.
Plastic deformation is known to cause the formation of substructures. Dislocations
arranges into high-density tangles as the deformation proceeds and grains are progressively
subdivided into cells, resulting in the development of a structure composed by cell blocks.
Each block is subdivided in defect-free cells by Incidental Dislocations Boundaries (IDBs)
and is separated from the neighbouring one by walls originated by the fusion of
microbands, called Geometrically Necessary Boundaries (GNBs). Increasing the
deformation, this blocks-structure is maintained and tends to assume a lamellar
configuration throughout blocks rotations; very high deformations lead to ever finer
microstructures with blocks separations in the order of few thousand of nanometers, but it
is not clear if a saturation limit is reached. In low-SFE materials, the features generated by
cold-working may be very complex, owing to the simultaneous presence of dislocation
substructures, microtwins and, frequently, large proportion of shear bands; moreover, if the
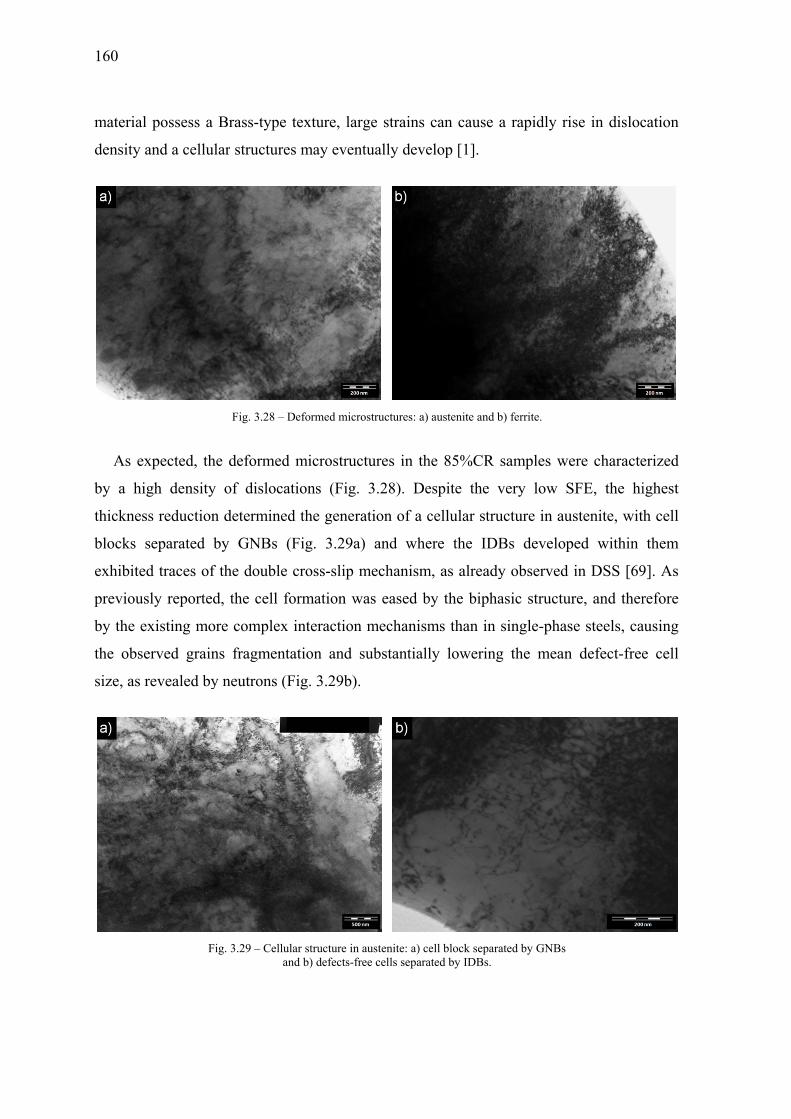
160
material
density
As e
by a hi
thicknes
blocks
exhibite
previou
by the e
the obs
size, as
l possess a
and a cellul
expected, th
igh density
ss reduction
separated b
ed traces of
usly reported
existing mo
erved grain
revealed by
F
Brass-type
lar structure
Fig. 3.28 –
he deformed
y of disloca
n determine
by GNBs
f the double
d, the cell f
ore complex
ns fragment
y neutrons (
ig. 3.29 – Cellua
e texture, lar
es may even
Deformed micr
d microstruc
ations (Fig.
ed the gener
(Fig. 3.29a
e cross-slip
formation w
x interaction
tation and
(Fig. 3.29b)
ular structure inand b) defects-f
rge strains
ntually deve
rostructures: a)
ctures in th
. 3.28). De
ration of a c
a) and whe
mechanism
was eased b
n mechanism
substantiall
.
n austenite: a) cefree cells separa
can cause a
elop [1].
austenite and b
he 85%CR
espite the v
cellular stru
ere the IDB
m, as already
by the bipha
ms than in
ly lowering
ell block separaated by IDBs.
a rapidly ri
b) ferrite.
samples we
very low S
ucture in au
Bs develop
y observed
asic structur
single-phas
g the mean
ated by GNBs
se in disloc
ere characte
SFE, the hi
ustenite, with
ped within
in DSS [69
re, and ther
se steels, ca
n defect-free
cation
erized
ighest
h cell
them
9]. As
refore
ausing
e cell

B
aime
refin
induc
samp
micro
regio
dislo
to th
How
BCC
Strai
The m
value
auste
data
room
volum
appli
micro
Bera
esides the e
ed to revea
nements. As
ced marten
ple hindered
ostructural
ons having
ocations agg
he increased
wever, the pe
C-structure w
in-Induced
martensitic
e of austen
enitic stainl
was below
m temperatu
me fraction
ied equiva
ographies.
aha’s etched
effects of de
al the prese
s a matter o
nsite, even t
d an imme
features. A
a deep da
glomerates,
d deformati
ertaining di
within the F
Fig. 3.30 –
Martensite
transforma
nite, it occ
ess steels. T
14% at the
ure of DSS-
n of SIM obt
alent strain
As pointed
d samples
eformation o
ence of SIM
of fact, the
though the
diate detec
As can be s
ark contras
but withou
ion degree,
ffraction pa
FCC austeni
Strain-Inducedand b) corr
e quantifica
ation took p
curred in a
The estimat
e highest de
-austenite, i
tained from
n, together
d out in the
suggested
on microstru
M within a
observatio
significant
tion of SIM
seen from F
st inside th
ut assuming
as also ob
attern clearl
itic grains (F
d Martensite in aresponding diff
ation
place in the
a significan
ted volume
eformation d
if compared
m ToF-ND re
r with the
e previous P
the presen
ucture, the
austenite, a
ons confirm
t microstruc
M, being ab
Fig. 3.30a,
he austeniti
g the charac
bserved by
ly revealed
Fig. 3.30b).
austenite: a) trafraction pattern
SAF 2205
ntly lower
fraction of
degree, und
d to the aus
efinements
e estimate
Paragraph 3
nce of SIM
TEM invest
as suggeste
med the pres
ctural disor
ble to be c
SIM can b
ic grains a
cteristic lath
[11] for a
the presenc
ansformed regio.
DSS and, d
extent resp
f SIM from
derlining the
stenitic steel
is reported
d quantity
3.2.1, the in
M, and the
tigation wa
ed by the T
sence of th
rder in the
onfused wi
be revealed
and surroun
h-like shape
fairly grow
ce of the ma
on
despite the l
pect to me
neutron dif
e greater sta
ls. In Fig. 3
as a functio
y from th
nvestigation
estimated
161
s mainly
ToF-ND
e strain-
85%CR
ith other
such as
nded by
e, owing
wn SIM.
artensitic
low SFE
etastable
ffraction
ability at
3.31, the
on of the
he SEM
n on the
volume
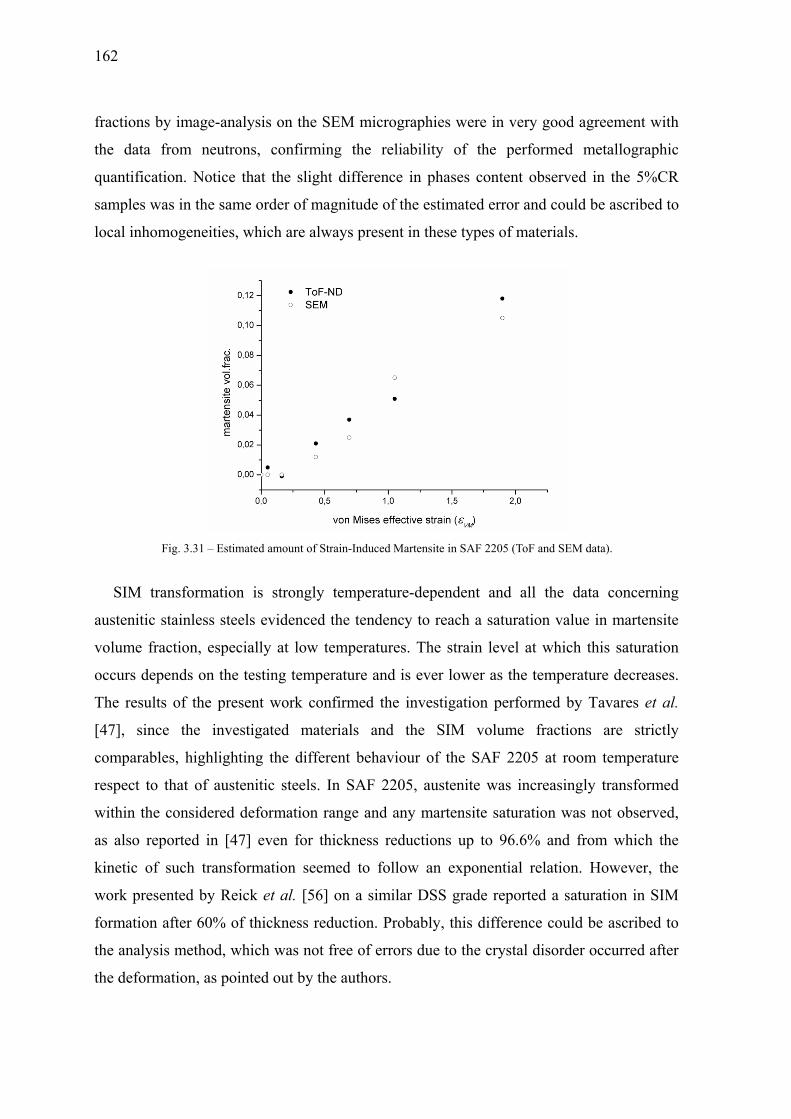
162
fractions by image-analysis on the SEM micrographies were in very good agreement with
the data from neutrons, confirming the reliability of the performed metallographic
quantification. Notice that the slight difference in phases content observed in the 5%CR
samples was in the same order of magnitude of the estimated error and could be ascribed to
local inhomogeneities, which are always present in these types of materials.
Fig. 3.31 – Estimated amount of Strain-Induced Martensite in SAF 2205 (ToF and SEM data).
SIM transformation is strongly temperature-dependent and all the data concerning
austenitic stainless steels evidenced the tendency to reach a saturation value in martensite
volume fraction, especially at low temperatures. The strain level at which this saturation
occurs depends on the testing temperature and is ever lower as the temperature decreases.
The results of the present work confirmed the investigation performed by Tavares et al.
[47], since the investigated materials and the SIM volume fractions are strictly
comparables, highlighting the different behaviour of the SAF 2205 at room temperature
respect to that of austenitic steels. In SAF 2205, austenite was increasingly transformed
within the considered deformation range and any martensite saturation was not observed,
as also reported in [47] even for thickness reductions up to 96.6% and from which the
kinetic of such transformation seemed to follow an exponential relation. However, the
work presented by Reick et al. [56] on a similar DSS grade reported a saturation in SIM
formation after 60% of thickness reduction. Probably, this difference could be ascribed to
the analysis method, which was not free of errors due to the crystal disorder occurred after
the deformation, as pointed out by the authors.

A
and C
stain
𝑓
In
strain
relate
prob
found
overa
-188–
is em
the m
N
consi
a rel
achie
a sig
param
An attempt w
Cohen [12]
nless steels:
= 1 − expn this equat
n εVM by th
ed to the p
ability that
d to be 4.5
all agreeme
–50°C [12]
mphasized a
martensite v
Fig. a)
Nevertheless
idering the
liable descr
eved by neu
gmoidal sha
meters assu
was made to
], which is
p −𝛽[ 1 −tion, the vo
he two temp
path of sh
an intersec
5 for austen
ent between
. In austenit
at the lower
volume fract
3.32 – SIM tran) Neutron ToF d
, since in
results pres
iption of th
utrons (Fig.
ape, resultin
ume values
o fit the obt
currently e
𝑒𝑥𝑝( – 𝛼 𝜀olume fracti
perature-dep
hear bands
ction will fo
nitic stainle
n the model
tic steels th
strains as t
tion at the h
nsformation kindata (present w
the steel
sented in [4
he SIM kin
3.32a), the
ng in a poor
comparabl
tained data
employed to
) ] ion of SIM
pendent par
formation,
orm a SIM e
ess steels a
and the exp
is fitting cu
the tempera
higher defor
netics. Applicat
work) and b) add
under stu
47], it can b
netics in DS
e value n =
r fitting in
le to that o
by using th
o model the
M (f SIM) is r
rameters α
while the
embryo. Th
and was det
perimental r
urve is gener
ture decrea
rmation deg
tion of the Olsoding the results
udy the sa
e supposed
SS. As a m
4.5 forced t
terms of R
of austeniti
he equation
e kinetics o
related to t
and β. The
latter is p
he value of
termined co
result in the
rally sigmo
ses, underli
grees.
n&Cohen modin Tavares et al
aturation w
that the mo
matter of fac
the regressi
R2 (0.95) an
cs at the h
proposed b
of SIM in a
the effective
e former con
proportiona
the exponen
onsidering
e temperatu
idal and its
ining a satu
el [12] to: l. [47].
wasn’t reach
odel cannot
ct, using the
ion curve to
d causing t
higher temp
163
by Olson
ustenitic
(3.5)
e plastic
nstant is
al to the
nt n was
the best
ure range
S-shape
ration in
hed and
t provide
e results
o acquire
the other
peratures

164
(about 50°C in [12]). On the contrary, letting the exponent free to vary caused a collapse of
the regression curve into a nearly-exponential type (Fig. 3.32a), without any meaningful
values of the regression parameters. Another attempt was made by adding to the results of
the present investigation the martensite amounts estimated by [47] (Fig. 3.32b); however, it
is evident that the trend of SIM formation is better described by an exponential law, rather
than a sigmoidal curve. In fact, trying to fit the entire dataset with the proposed model
always caused a collapse of the regression curve into an exponential-type, pointing out the
inapplicability of such regression analysis to DSS. Thus, in order to describe the kinetics of
SIM formation in this class of steels, a deeper analysis must be carried out, considering
various DSS grades and taking into account both the effect of temperature and the possible
contribution of different microstructures.
Concluding remarks
The results presented in this section has evidenced the occurrence of the strain-induced
martensitic transformation in SAF 2205 DSS. SIM was found to form in the low-alloyed
DSS grades, such as SAF 2101 [24], and its appearance in SAF 2205 was not completely
unexpected. The presence of a low amount of γ-promoting elements, although greater than
in SAF 2101, makes austenite in any case unstable at room temperature, and therefore
more prone to undergo this diffusionless process after cold plastic deformation.
However, the present investigation underlined the greater stability of DSS-austenite in
SAF 2205 at room temperature if compared to austenitic stainless steels, as also evidenced
by Tavares et al. [47], and the amount of SIM was estimated below 14% of the volume
fraction at the highest thickness reduction. Moreover, the transformation kinetics were
different. In SAF 2205, the estimated amount of SIM was ever increasing in the whole
deformation range and any saturation in martensite amount wasn’t reached, as also
reported by [47] for further thickness reductions. Thus, the model proposed by Olson and
Cohen [12] to describe the SIM transformation kinetics is not applicable in DSS and a
deeper study is required, considering different DSS grades and taking into account other
variables such as temperature and microstructure.
Nevertheless, the presence of SIM in SAF 2205 did not affect its extraordinary
combination of properties. The mechanical stiffening induced by cold working will
probably lead to a reduction in impact toughness in the transverse direction respect to the
165
rolling plane, but the corrosion properties did not suffer of the martensitic transformation.
As reported in Paragraph 3.2.4, cold working – and therefore the presence of SIM – did not
substantially alter the corrosion behaviour of SAF 2205, and especially its resistance
against localized pitting attacks. As a matter of fact, a slight reduction in Critical Pitting
Temperature was found to occur only after 85% of deformation, whereas the pitting
resistance at room temperature was not influenced by cold deformation.
REFERENCES
[1] J. Gil Sevillano. Prog Mater Sci 25 (1981) 69. [2] D. A. Hughes and N. Hansen. Acta Mater 45 (1997) 3871. [3] R. E. Schramm and R. P. Reed. Metall Trans A 6A (1975) 1345. [4] R. E. Schramm and R. P. Reed. Metall Trans A 7A (1976) 359. [5] P. Seetharaman and J. Krishnan. J Mater Sci 16 (1981) 523. [6] G. B. Olson and M. Cohen. J Less-Common Met 28 (1972) 107. [7] S. S. Hecker, M. G. Stout, K. P. Staudhammer and J. L. Smith. Metall Trans A 13A (1982) 619. [8] R. Lagenborg. Acta Metall 12 (1964) 823. [9] P. L. Mangonon and G. Thomas. Metall Trans 1 (1970) 1577. [10] F. Lecroisey and A. Pineau. Metall Trans 3 (1972) 387. [11] K. Spencer, M. Véron, K. Yu-Zhang and J. D. Embury. Mater Sci Tech Ser 25 (2009) 7. [12] G. B. Olson and M. Cohen. Metall Trans A 6A (1975) 791–795. [13] P. Haušild, V. Davydov, J. Drahokoupil, M. Landa, P. Pilvin. Mater Design 31 (2010) 1821. [14] A. Das, S. Sivaprasad, M. Ghosh, P. C. Chakraborti, S. Tarafder. Mat Sci Eng A 486 (2008) 283. [15] J. Talonen, H. Hänninen. Acta Mater 55 (2007) 6108. [16] A. Hedayati, A. Najafizadeh, A. Kermanpur, F. Forouzan. J Mater Process Tech 210 (2010) 1017. [17] J. M. Diani and D. M. Parks. J Mech Phys Solids 46 (1998) 1613. [18] F. Fiorillo. Measurements and characterization of magnetic materials. Elsevier Publishing Company,
Amsterdam, The Nederlands (2004). [19] I. Mészáros and P. J. Szabo. NDTE Int 38 (2005) 517. [20] S. Imberti, W. Kockelmann, M. Celli, F. Grazzi, M. Zoppi, A. Botti, A. Sodo, M. Leo Imperiale, M.
de Vries-Melein, D. Visser and H. Postma. Meas Sci Technol 19 (2008). [21] A. C. Larson and R. B. Von Dreele. General Structure Analysis System (GSAS). Los Alamos National
Laboratory Report LAUR (1994) 86. [22] A. C. Larson and R. B. Von Dreele. GSAS Manual (2004). [23] G. F. Vander Voort. Metallography: Priciples and Practice. ASM International (2007). [24] P. Bassani, M. Breda, K. Brunelli, I. Mészáros, F. Passaretti, M. Zanellato and I. Calliari. Microsc
Microanal 19 (2013) 988–995. [25] B. Verhaeghe, F. Louchet, B. Doisneau-Cottignies, Y, Bréchet. Phil Mag 76 (1997) 1079. [26] J. A. Jimenez, M. Carsi, O. A. Ruano. J Mater Sci 35 (2000) 907. [27] J. Ryś, M. Witkowska. Arch Metall 55 (2010) 733. [28] J. Keichel, J. Foct and G. Gottstein. ISIJ Int 43 (2003) 1781.

166
[29] J. Keichel, J. Foct and G. Gottstein. ISIJ Int 43 (2003) 1787. [30] J. Hamada and N. Ono. Mater Trans 51 (2010) 635. [31] C. H. Shek, G. J. Shen, J. K. L. Lai and B. J. Duggan. Mater Sci Forum 157–162 (1994) 853. [32] L. Duprez, B. C. De Cooman and N. Akdut. Steel Res 73 (2002) 531. [33] I. L. Dillamore and W. T. Roberts. Acta Metall 12 (1964) 281. [34] I. Altenberger, B. Scholtes, U. Martin, H. Oettel. Mat Sci Eng A A264 (1999) 1. [35] Z. Szaklarska-Smialowska. Corrosion 27 (1971) 223. [36] D. C. Cook. Metall Trans A 18A (1987) 201. [37] A. Randak, F. W. Trautes. Werkstoffe und Korrosion 21 (1970) 97. [38] K. Elayaperumal, P. K. De, J. Balachandra. Corrosion 28 (1972) 269. [39] S. V. Phadins, A. K. Satpati, K. P. Muthe, J. C. Vyas, R. I. Sudaresan. Corr Sci 45 (2003) 2467. [40] F. Navai. J Mater Sci 30 (1995) 1166. [41] N. D. Greene, G. A. Saltzman. Corrosion 20 (1964) 294. [42] A. Barbacci, G. Cerisola, P. L. Cabot. J Electrochem Soc 149 (2002) B534. [43] P. K. Chiu, S. H. Wang, J. R. Yang, K. L. Weng, J. Fang. Mater Chem Phys 98 (2006) 103. [44] N. J. Laycock, M. H. Moayed, R. C. Newman. J Electrochem Soc 145 (1998) 2622. [45] R. Qvarfort. Corr Sci 40 (1998) 215. [46] J. H. Wang, C. C. Siu, Z. Szaklarska-Smialowska. Corrosion 44 (1988) 732. [47] S. S. M. Tavares, M. R. da Silva, J. M. Pardal, H. F. G. Abreu, A. M. Gomes. J Mater Process Tech
180 (2006) 318. [48] R. N. Gunn. Duplex Stainless Steels: Microstructure, Properties and Applications. Abington
Publishing, Cambridge, England (1997). [49] A. Wilson and G. Spanos. Mater Charact 46 (2001) 407. [50] R. Petrov, L. Kestens, A. Wasilikowka and Y. Houbert. Mat Sci Eng A A447 (2007) 285. [51] V. Randle. Mater Charact 60 (2009) 913. [52] F. Humpreys. Scripta Mater 51 (2004) 771. [53] B. E. Warren. Prog Met Phys (1959) 147. [54] C. G. Rhodes and A. W. Thompson. Metall Trans A 8A (1977) 1901. [55] R. P. Reed and R. E. Schramm. J Appl Phys 45 (1974) 4705. [56] W. Reick, M. Pohl and A. F. Padilha. Steel Res 67 (1996) 253. [57] N. Jia, Y. D. Wang and R. Lin Peng. J Phys-Condens Mat 20 (2008) 1. [58] J. Talonen, H. Hänninen. Acta Mater 55 (2007) 6108. [59] M. J. Whelan, P. B. Hirsh, R. W. Horne and W. Bollmann. Proc Roy Soc A 240 (1957) 524. [60] L. E. Murr. Thin Solid Films 4 (1969) 389. [61] J. F. A. Borges, A. F. Padilha and K. Imakuma. Rev Brasilera de Fisica Aplicada e Instrumentaçao 1
(1986) 335. [62] H. J. Kestenbach. Metalurgia 32 (1976) 181. 63] F. B. Pickering, Proc. Conf. Stainless Steels ’84. The Institute of Metals, London (1984) 12. [64] K. H. Lo, C. H. Shek, J. K. L. Lai. Mat Sci Eng R 65 (2009) 39. [65] H. Hu, S. R. Cline and R. S. Goodman. J Appl Phys 32 (1961) 1392. [66] R. E. Smallman and K. H. Westmacott. Phil Mag 2 (1957) 669. [67] D. Raabe. Acta Mater 45 (1997) 1137. [68] G. A. Malygin. Phys Solid State 48 (2006) 693. [69] U. Messerschmidt, M. Bartsch. Mater Chem Phys 81 (2003) 518.

167
APPENDIX A
Industrial applications of Duplex Stainless Steels
Duplex Stainless Steels (DSS) are very interesting materials and their employment in
aggressive environments is presently of increasing interest. The beneficial properties and
limits of these steels are presented throughout the present thesis, discussing the various
difference arising from different composition and after both isothermal heat treatments and
cold working. But what about their real industrial applications? Some of them are listed in
Chapter 1, covering a wide range of possibilities where the choice of DSS in particular
environment is preferred. As evidenced in this thesis, these steels must be handled with
extreme care, in terms of specific use, especially if thermal cycles are involved and also if
cold plastic deformation is needed to acquire peculiar shapes or sizes. As a matter of fact,
the production of big pipes requires manufacturing welding operations on steel plates or
sheets, and frequently the materials must be cold worked to reach the final product
dimensions. Thus, the effective employment of DSS must be accurately chosen,
considering all the possible situations which can alter their microstructure, in order to
avoid undesired effects.
In this appendix, two examples of DSS employment in seawater applications are
discussed, concerning their usage for pipelines production in off-shore platforms and for
armouring wires in subsea cables.
A.1 Characterization of UNS S32760 welded joints for Off- Shore
applications
The UNS 32760 is a Super Duplex Stainless Steel (SDSS), also known as Zeron®100,
which can be thought as an improved version of the SAF 2507, containing W and a greater
amount of Cu to enhance the corrosion resistance. This grade is a high-alloyed DSS,
reaching very high values of mechanical properties combined to excellent resistance to
168
stress corrosion cracking (SCC) and intergranular corrosion in marine environments.
Hence, in Off-Shore engineering, its use permits to design components having smaller
thicknesses – and therefore lighter – without compromising the corrosion resistance and
avoiding the use of expensive anti-corrosion coatings.
From the welding point of view, SDSS must be managed as austenitic stainless steels
but using dedicated devices, in order to limit the occurrence of corrosion caused by the
formation of undesired structures. As reported in Chapters 1 and 2, DSS – and especially
SDSS – are very sensitive to secondary phases precipitation (σ- and χ-phases, nitrides) if
subjected to improper thermal cycles in the temperature range 850–950°C, even for very
short times. The formation of the two intermetallic phases χ and σ is essentially due to the
instability of ferrite at high temperatures, whereas the formation of nitrides is associated to
the low solubility of nitrogen in ferrite at room temperature and to specific heating/cooling
conditions at which the steel is subject. These phases must be avoided, since they severely
worsen the good performances of these steels by lowering their toughness and making
them more prone to corrosive attack [1].
In this first part of this section, the development of a welding procedure for joining a
UNS S32760 SDSS (commercially F55) is described. The particularity of the examined
case consists in the requested combination of mechanical and microstructural features of
the weldment, at the limits for a reproducible welding procedure, suitable to be used as
manufacturing process compatible to production requirements. Therefore, it was necessary
to carefully design the welding procedure, choosing the best process parameters in order to
achieve the required results.
The whole process was monitored and controlled throughout the quality management
system of special welding process in De Pretto Industrie company, according to the ISO
3834-2 standards.
Welded joint requirements
The F55 SDSS is systematically and industrially welded around the world, including Italy.
In the past 5 years, the requests coming from various contractual specifications for the
realization of welds have became much more restrictive, especially for those parts intended
for Off-Shore applications. Increasingly restrictive ranges of impact toughness values at
low temperature and ferrite content, and the required corrosion resistance have caused not
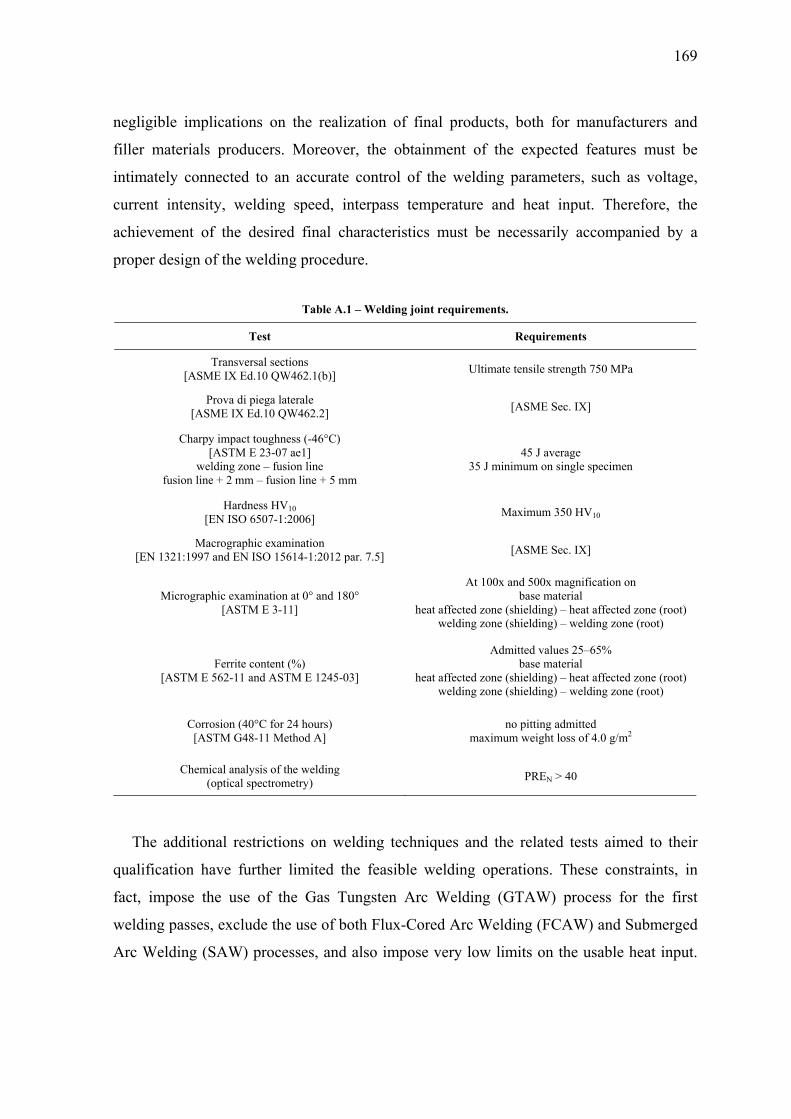
169
negligible implications on the realization of final products, both for manufacturers and
filler materials producers. Moreover, the obtainment of the expected features must be
intimately connected to an accurate control of the welding parameters, such as voltage,
current intensity, welding speed, interpass temperature and heat input. Therefore, the
achievement of the desired final characteristics must be necessarily accompanied by a
proper design of the welding procedure.
Table A.1 – Welding joint requirements.
Test Requirements
Transversal sections [ASME IX Ed.10 QW462.1(b)] Ultimate tensile strength 750 MPa
Prova di piega laterale [ASME IX Ed.10 QW462.2] [ASME Sec. IX]
Charpy impact toughness (-46°C) [ASTM E 23-07 ae1]
welding zone – fusion line fusion line + 2 mm – fusion line + 5 mm
45 J average 35 J minimum on single specimen
Hardness HV10 [EN ISO 6507-1:2006] Maximum 350 HV10
Macrographic examination [EN 1321:1997 and EN ISO 15614-1:2012 par. 7.5] [ASME Sec. IX]
Micrographic examination at 0° and 180° [ASTM E 3-11]
At 100x and 500x magnification on base material
heat affected zone (shielding) – heat affected zone (root) welding zone (shielding) – welding zone (root)
Ferrite content (%) [ASTM E 562-11 and ASTM E 1245-03]
Admitted values 25–65% base material
heat affected zone (shielding) – heat affected zone (root) welding zone (shielding) – welding zone (root)
Corrosion (40°C for 24 hours) [ASTM G48-11 Method A]
no pitting admitted maximum weight loss of 4.0 g/m2
Chemical analysis of the welding (optical spectrometry) PREN > 40
The additional restrictions on welding techniques and the related tests aimed to their
qualification have further limited the feasible welding operations. These constraints, in
fact, impose the use of the Gas Tungsten Arc Welding (GTAW) process for the first
welding passes, exclude the use of both Flux-Cored Arc Welding (FCAW) and Submerged
Arc Welding (SAW) processes, and also impose very low limits on the usable heat input.

170
Moreover, the mandatory use of specific shielding gases and the additional technological
restrictions have further limited the welding procedure design.
For the qualification of the procedure, the welded joint must comply with the
combination of mechanical and microstructural features reported in Table A.1, depending
on the demands of the design code (ASME BPVC). All joints must be subjected to non-
destructive tests (Table A.2), according to ASME standard and to additional requests from
customer and end user.
Table A.2 – Non destructive tests.
Test Extent
Visual examination 100%
Penetrating-liquids examination 100%
Radiologic examination 100%
Ultrasonic examination 100%
As-received material
The UNS S32760 base material employed in the bead welding execution for the process
qualification has been provided by the customer in form of sheet, which will be
longitudinally welded to obtain the metal pipes (ASME SA928). The chemical
composition and mechanical properties of the material (evaluated at room temperature,
except where otherwise noted) are listed in Tables A.3 and A.4, respectively.
Table A.3 – UNS S32760 chemical composition [wt.%].
C Mn Si P S Cr Ni Mo N Cu W PREN
0.02 0.642 0.359 0.0211 0.0007 25.173 6.886 3.585 0.2292 0.54 0.6414 40.67
Table A.4 – UNS S32760 mechanical properties.
Rp0.2 [N/mm2]
Rm [N/mm2] A% KV -46 °C
[J] Ferrite (%) Hardness (HV10)
695 863 31.5 118 (average) 44.87 max 302
ASME. IX Ed.10 QW-150 ASTM A 370-11a ASTM E 562-11 ASTM E 384-11
transverse to the welding welding zone and
heat affected zone
minimum from welding zone and
heat affected zone
maximum from base material,
welding zone and heat affected
zone
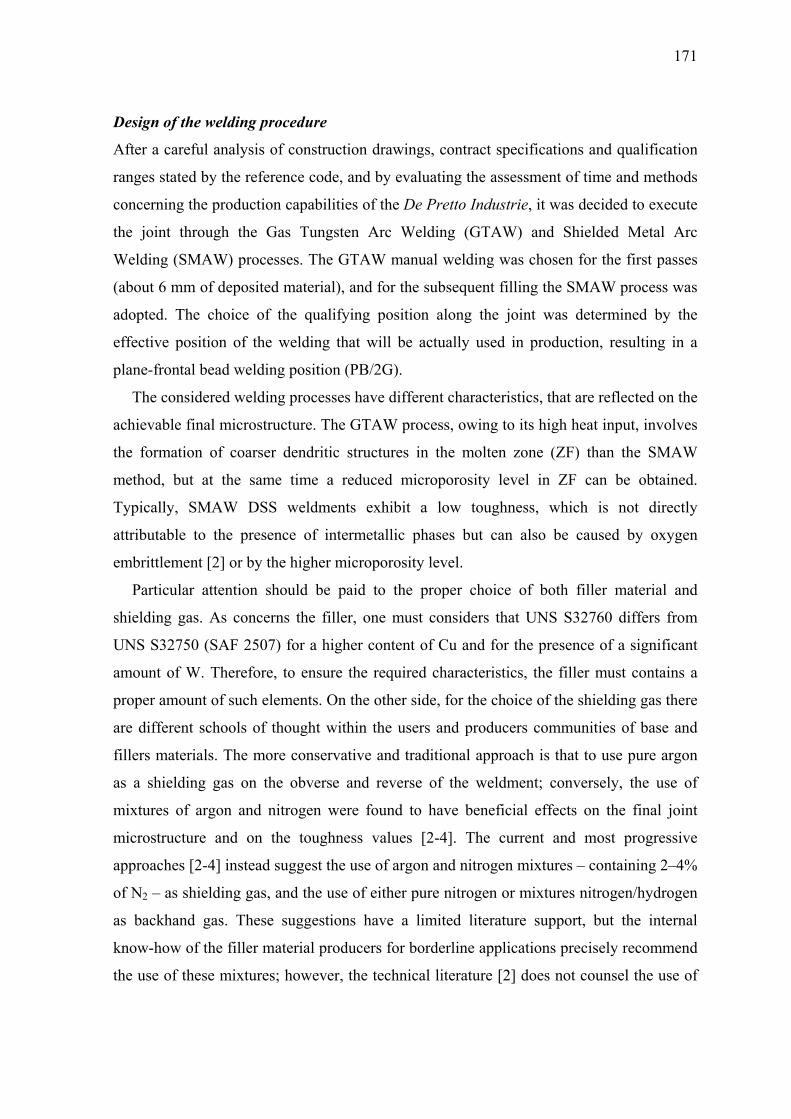
171
Design of the welding procedure
After a careful analysis of construction drawings, contract specifications and qualification
ranges stated by the reference code, and by evaluating the assessment of time and methods
concerning the production capabilities of the De Pretto Industrie, it was decided to execute
the joint through the Gas Tungsten Arc Welding (GTAW) and Shielded Metal Arc
Welding (SMAW) processes. The GTAW manual welding was chosen for the first passes
(about 6 mm of deposited material), and for the subsequent filling the SMAW process was
adopted. The choice of the qualifying position along the joint was determined by the
effective position of the welding that will be actually used in production, resulting in a
plane-frontal bead welding position (PB/2G).
The considered welding processes have different characteristics, that are reflected on the
achievable final microstructure. The GTAW process, owing to its high heat input, involves
the formation of coarser dendritic structures in the molten zone (ZF) than the SMAW
method, but at the same time a reduced microporosity level in ZF can be obtained.
Typically, SMAW DSS weldments exhibit a low toughness, which is not directly
attributable to the presence of intermetallic phases but can also be caused by oxygen
embrittlement [2] or by the higher microporosity level.
Particular attention should be paid to the proper choice of both filler material and
shielding gas. As concerns the filler, one must considers that UNS S32760 differs from
UNS S32750 (SAF 2507) for a higher content of Cu and for the presence of a significant
amount of W. Therefore, to ensure the required characteristics, the filler must contains a
proper amount of such elements. On the other side, for the choice of the shielding gas there
are different schools of thought within the users and producers communities of base and
fillers materials. The more conservative and traditional approach is that to use pure argon
as a shielding gas on the obverse and reverse of the weldment; conversely, the use of
mixtures of argon and nitrogen were found to have beneficial effects on the final joint
microstructure and on the toughness values [2-4]. The current and most progressive
approaches [2-4] instead suggest the use of argon and nitrogen mixtures – containing 2–4%
of N2 – as shielding gas, and the use of either pure nitrogen or mixtures nitrogen/hydrogen
as backhand gas. These suggestions have a limited literature support, but the internal
know-how of the filler material producers for borderline applications precisely recommend
the use of these mixtures; however, the technical literature [2] does not counsel the use of

172
H2 as shielding gas, owing to the possibility of hydrogen embrittlement and hydrogen
cracking in ferritic structures. Finally, ternary and quaternary mixtures can be used for the
DSS weldings, but they are suitable for automatic and concentrated-energy welding
processes; the employment of these particular shielding mixtures allows to guarantee a
correct execution of the weldment, limiting the formation of inclusions and ensuring a
correct phase balance, a critical point for DSS.
As previously mentioned, the UNS S32760 SDSS is characterized by the precipitation
of secondary phases, which may form even for very short exposure times; hence, the
welding operations performed on this DSS grade always involve the precipitation of a
certain percentage of such phases. Therefore, the welding procedure must be designed to
limit the formation of detrimental compounds, mainly acting on heat input and thermal
gradients during cooling, and taking into account solutions that are compatible with timing
and costs..
The DSS weldments, as for austenitic stainless steels, do not require any preheating, but
the weld edges must be carefully cleaned. Regarding the interpass temperatures, an
analysis of literature and specifications [2,5] has highlighted the preference for the lowest
possible value, consistent with needs and traditional industrial costs. This is because the
realization of dedicated forced-cooling equipments for the areas close to the joint are not
industrially feasible, considering the number of different types of joints which can be
realized. In DSS, a maximum interpass temperature of 150°C is generally accepted,
although it may sometimes not be enough; on the other hand, the maximum heat input is
generally set between 1.5 and 1.8 kJ/mm, and must be carefully controlled throughout the
entire welding procedure, particularly during the first (root) pass.
Execution of the welding procedure
A first qualification procedure (first bead) has involved the adoption of a welding
procedure identical to that used for standard DSS grades (as SAF 2205), whose main
process parameters are listed in Table A.5. However, the execution of the first bead has led
to unsatisfactory results in terms of mechanical properties and microstructural requests.
Therefore, the procedure was re-designed by changing the process parameters, as reported
in Table A.5, and using the “hot-pass” technique.

173
Table A.5 – Process parameters for the qualification procedures.
Parameter Value
First qualification procedure Second qualification procedure
Process type (firsts passes) GTAW
Process type (filling) SMAW
Joint type Head-head on pipe – V-joint
Dimensions Øext 324 mm, thickness 12 mm
Welding position 2G/Frontal
Filler material ER 2594 + E 2595-15
Interpass temperature 150°C 100°C
Shielding gas Argon + N2
Backhand gas Argon + N2 N2 + N2
Maximum heat input (first pass) 1.8 KJ/mm 1.7 KJ/mm
In both qualifications, the welding parameters were continuously monitored and
recorded, paying particular attention to electrical variables and feed rate; the oxygen
content was also constantly monitored in the reverse shielding gas chamber (O2 < 0.05%).
Table A.6 – Results on the qualification beads.
Test Values
First qualification procedure (bead 29090A)
Second qualification procedure (bead 29316)
Tensile test (transversal to the welding) - minimum 833 MPa
Lateral bending 2 satisfactory 2 failed 4 satisfactory
Charpy impact toughness (a) Welding zone – (b) Fusion line
(c) Fusion line + 2 mm (d) Fusion line + 5 mm
(a) average 84J – minimum 63J (b) average 39J – minimum 33J
(a) average 59J – minimum 51J (b) average 84J – minimum 76J
(c) average 128J – minimum 110J (d) average 162J – minimum 156J
Hardness HV10 - maximum 326 HV10
Macrographic examination satisfactory satisfactory
Ferrite content (%) - 47–62
Corrosion Pitting and weight loss (8.0 g/m2) no pitting and no weight loss
Chemical analysis of the welding PREN = 41.1 PREN = 41.0

174
Mechan
All the
acceptab
accordin
the first
the cont
second
requirem
Microst
Overall
In both
structur
achieve
σ-phase
compou
heat trea
heat-aff
the obs
presenc
zone (F
nical tests of
non-destru
bility criter
ng to the co
t qualificati
trary, as a r
qualificatio
ments (Tabl
tructural ch
l microstruc
h the qualif
re and the
d after the m
e is clearly
und is condi
atments, an
fected (HAZ
ervations o
e of any in
ig. A.3).
of the qualif
uctive tests
ria reported
ontractual re
on bead (29
result of the
on bead (2
le A.6).
haracterizat
cture
fication bea
biphasic m
melt cooling
evident in
itioned by m
nd the tempe
Z) zones fal
of ZF and H
ntermetallic
Fig. A.
fication bea
s for both
in Table A
equirements
9090A) wer
e redesigne
9316) were
tion
ads, the opt
microstructu
g. In the fir
correspond
many factor
eratures whi
ll within the
HAZ in the
phases, bot
.1 – Welding zo
ads
beads wer
A.2 and all t
s, the result
re classified
ed welding p
e found to
tical microg
ure exhibite
st bead (Fig
dence of the
rs such as c
ich are norm
e critical ra
e second qu
th in the co
one in bead 290
re performe
the results w
ts of the me
d as “not sa
procedure,
be in com
graphies re
ed the class
g A.1), the p
e α/γ interfa
chemical co
mally reache
ange for its
ualification
overage area
090° (OM, NaO
ed in accor
were satisfa
echanical tes
atisfactory”
the mechan
mpliance wi
evealed the
sical dendr
presence of
faces. The f
omposition,
ed in both w
formation.
bead has n
a (Fig. A.2)
OH).
rdance with
actory. How
sts perform
(Table A.6
nical tests o
ith the cust
typical we
ritic morpho
the interme
formation o
temperatur
welding (ZF
On the con
not reveale
) and in the
h the
wever,
ed on
6). On
on the
tomer
elding
ology
etallic
of this
re and
F) and
ntrary,
ed the
e root

GTA
The
same
both
signi
vicin
preci
of th
obser
cooli
critic
input
Fig. A.2 – Wel
Fig. A.3 – W
W welding
first passes
e GTAW w
porosity
ificant amo
nity of the
ipitates in Z
he weld. Af
rved, maint
ing rate affe
cality of the
t that distin
lding joint (shie
Welding joint (r
area
s of the two
welding pro
and inclusi
ount of seco
centreline
ZF occurs fr
fter the sub
taining the c
ecting this a
e GTAW pr
nguishes th
elding) in bead
root) in bead 29
o qualificat
cedure, diff
ion conten
ondary pha
of the wel
rom the firs
bsequent pa
central posi
area. The ce
rocess on w
his method,
29316 (OM, N
9316 (OM, NaO
ion beads 2
fferentiated
nts were al
ases, such a
ld (Fig. A.4
st pass at th
sses, an inc
ition and ex
entral locati
welding this
the centre
NaOH): a) weldi
OH): a) welding
29090A and
in the para
lmost comp
as σ- and χ
4). In this
he bead root
creased con
xtending up
ion of the pr
type of ste
eline positio
ing zone and b)
g zone and b) he
d 29316 we
ameters abo
parable. In
χ-phases, w
bead, the
t, about 1 m
ntent of sec
to the last p
recipitation
el; in additi
on was fou
heat affected z
eat affected zon
ere obtained
ove mention
n bead 290
was observe
formation o
mm from the
condary pha
pass, due to
n sites highli
ion to the h
und to be t
175
zone.
ne.
d by the
ned, and
090A, a
d in the
of small
e bottom
ases was
o the low
ights the
high heat
the most

176
favoure
long for
S
0.9
The
A.7. On
allowed
phase. D
complet
29090A
the micr
0.5% of
about 5
possible
unequiv
to its hig
must be
S32760
element
d precipitat
r the format
F
Tabl
Si
92
average com
n the contr
d a better yi
Despite the
tely avoided
A. Neverthe
rostructure
f volume fr
50% at room
e to carry o
vocal presen
gher averag
e considered
SDSS, in w
ts which ren
tion area, s
tion of inter
Fig. A.4 – Bead
le A.7 – Chem
Mo
6.00
mposition o
rary, in bea
ield in obta
e use of su
d (Fig. A.5)
less, the da
must not be
ractions of
m temperat
out a compo
nce of σ-ph
ge atomic nu
d highly crit
which the p
nder the mat
since the tim
rmetallic ph
d 29090A: σ- e χ
mical compos
Cr
26.87
of the σ-pha
ad 29316, t
aining a “cl
uitable proc
), even if it o
angerousnes
e neglected
such phase
ture. Due t
osition anal
hase, which
umber. The
tical for the
precipitation
terial more
me in the c
hases.
χ-phases in the
sition of σ-pha
M
0
ase detected
he use of a
lean” micro
cedures, the
occurred in
ss of very l
d; in fact, as
es is enough
to the smal
lysis, but th
appears bri
se findings
ese steels, an
n kinetics ar
prone to int
critical temp
GTAW weldin
ase in bead 2
Mn
0.64
d in bead 2
an appropri
ostructure, l
e intermeta
significant
low second
evidenced
h to cause a
ll size of t
he microgra
ighter than
again revea
nd especiall
re favoured
termetallic
perature ran
ng centreline.
9090A [wt.%
Fe
58.24
29090A is r
iate protect
imiting the
allics precip
ly lower ex
dary phases
by previou
a reduction
the precipit
aphies in Fi
austenite an
aled that the
ly for the hi
by the high
formation [
nge was en
%].
Ni
7.33
eported in T
tion gas mi
formation
pitation wa
xtent than in
amounts w
us studies [6
in toughne
tates, it wa
ig. A.5 show
nd ferrite, o
e GTAW pr
igh-alloyed
h content of
[7].
nough
Table
ixture
of σ-
as not
n bead
within
6], the
ess of
as not
w the
owing
rocess
UNS
f such

In
inter
interg
as sm
cooli
therm
not h
prese
expo
parti
therm
n both the b
ested by th
granular po
mall blacks
ing rate in
mal regime
high enough
ence of suc
osure, but th
cles were o
mal cycles (
Fig. A
Fig. A.5
eads, the ba
he precipitat
osition (Fig.
particles a
these areas
which cann
h for interm
ch phases i
hat nitrides
observed in
(Fig. A.6b).
A.6 – Chromiu
– Bead 29316:
ase material
tion of Cr2N
. A.6a). The
at the ferriti
s, and henc
not be consi
metallics for
in the vicin
were alread
a bead zone
um nitrides in th
: σ-phase in the
l next to the
N chromium
ese particle
ic grain bou
ce to a prol
ider negligi
rmation. Ho
nity of the
dy present
e sufficientl
he base material
e GTAW weldin
e HAZ of th
m nitrides
es, which ar
undaries, ca
longed expo
ible for nitr
owever, it c
HAZ was
in the base
ly far from
l: a) heat affecte
ng centreline.
he GTAW p
of globular
re visible in
an be attrib
osure of the
rides format
cannot to b
not due to
e material, s
ZF and not
ed zone and b)
process, was
r form, obs
n the micro
buted to a t
e material
tion, but wh
be excluded
o high temp
since some
t affected by
bead end.
177
s instead
erved in
graphies
too slow
within a
hich was
that the
peratures
of these
y critical
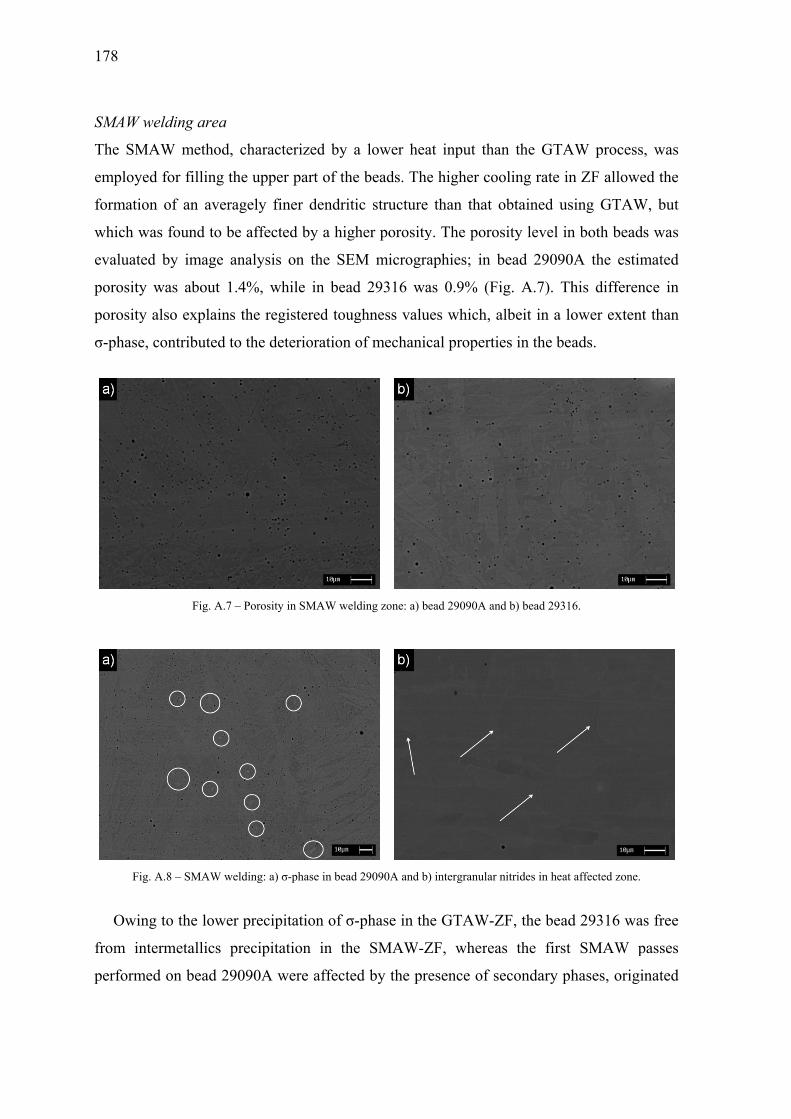
178
SMAW
The SM
employe
formatio
which w
evaluate
porosity
porosity
σ-phase
Fig
Owin
from in
perform
welding are
MAW metho
ed for fillin
on of an av
was found to
ed by imag
y was abou
y also expla
e, contribute
Fig. A
g. A.8 – SMAW
ng to the lo
ntermetallic
med on bead
ea
od, charact
ng the upper
veragely fin
o be affecte
ge analysis
ut 1.4%, wh
ains the reg
ed to the det
A.7 – Porosity
W welding: a) σ
wer precipi
cs precipitat
d 29090A w
erized by a
r part of the
ner dendriti
ed by a high
on the SEM
hile in bead
istered toug
terioration o
in SMAW weld
σ-phase in bead
itation of σ-
tion in the
were affected
a lower hea
e beads. The
ic structure
her porosity
M microgra
d 29316 wa
ghness valu
of mechanic
ding zone: a) be
29090A and b)
-phase in th
e SMAW-Z
d by the pre
at input tha
e higher coo
than that o
y. The poros
aphies; in b
as 0.9% (Fi
ues which, a
cal propertie
ead 29090A an
) intergranular n
he GTAW-Z
ZF, wherea
esence of se
an the GTA
oling rate in
obtained us
sity level in
bead 29090
ig. A.7). Th
albeit in a lo
es in the bea
d b) bead 2931
nitrides in heat
ZF, the bead
as the first
econdary ph
AW process
n ZF allowe
sing GTAW
n both bead
0A the estim
his differen
ower extent
ads.
6.
affected zone.
d 29316 wa
SMAW p
hases, origi
, was
ed the
W, but
s was
mated
nce in
t than
s free
passes
inated
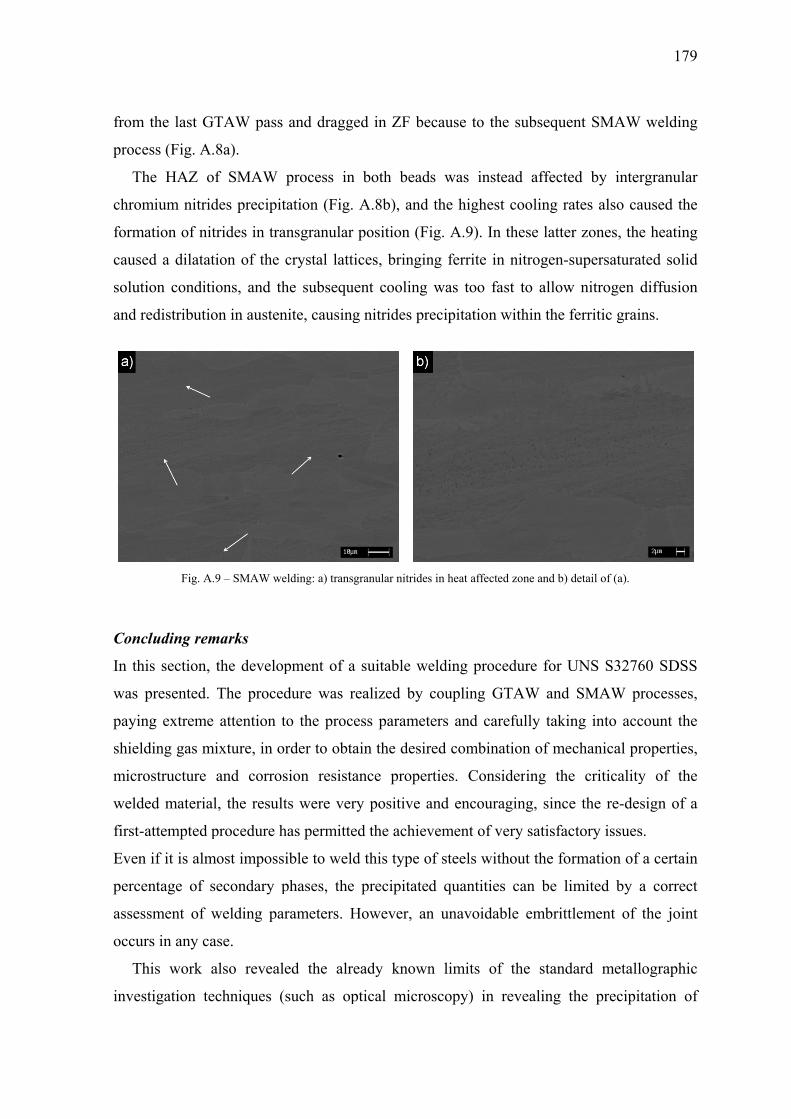
from
proce
Th
chrom
form
cause
solut
and r
Conc
In th
was
payin
shiel
micro
weld
first-
Even
perce
asses
occu
Th
inves
m the last GT
ess (Fig. A.
he HAZ o
mium nitrid
mation of nit
ed a dilatat
tion conditi
redistributio
Fig. A.
cluding rem
his section,
presented.
ng extreme
lding gas m
ostructure
ded material
-attempted p
n if it is alm
entage of s
ssment of w
urs in any ca
his work a
stigation te
TAW pass
8a).
f SMAW
des precipit
trides in tra
tion of the c
ions, and th
on in austen
9 – SMAW we
marks
the develop
The proced
attention t
ixture, in or
and corros
l, the result
procedure h
most impossi
secondary p
welding par
ase.
also reveale
echniques (s
and dragge
process in
tation (Fig.
ansgranular
crystal latti
he subseque
nite, causing
elding: a) transg
pment of a
dure was re
o the proce
rder to obta
sion resista
ts were very
has permitte
ible to weld
phases, the
rameters. H
ed the alre
such as op
ed in ZF be
both bead
A.8b), and
position (F
ces, bringin
ent cooling
g nitrides pr
granular nitrides
suitable we
ealized by
ess paramet
ain the desir
ance proper
y positive a
d the achiev
d this type o
precipitate
However, an
eady known
ptical micro
ecause to th
ds was inst
the highest
ig. A.9). In
ng ferrite in
was too fa
recipitation
s in heat affecte
elding proc
coupling G
ters and car
red combina
rties. Cons
and encoura
vement of v
of steels wit
d quantities
n unavoidab
n limits of
oscopy) in
he subseque
tead affecte
t cooling ra
n these latter
n nitrogen-s
ast to allow
within the f
ed zone and b) d
cedure for U
GTAW and
refully takin
ation of me
idering the
aging, since
very satisfac
thout the for
s can be li
ble embritt
f the stand
revealing t
ent SMAW
ed by inter
ates also ca
r zones, the
supersaturat
w nitrogen d
ferritic grain
detail of (a).
UNS S3276
SMAW pr
ng into acc
chanical pr
e criticality
e the re-des
ctory issues
rmation of a
imited by a
lement of t
dard metallo
the precipit
179
welding
rgranular
used the
e heating
ted solid
diffusion
ns.
60 SDSS
rocesses,
ount the
operties,
y of the
sign of a
.
a certain
a correct
the joint
ographic
tation of

180
secondary phases. It is rather common that a microstructure stated as “clean” in reality it is
not, since the real microstructural conditions can be only observed through high
magnification investigation (SEM rather than OM). However, the use of advanced
techniques is not even possible and is also somewhat expensive, making difficult a reliable
microstructural characterization of the welded joints.
A.2 Characterization of SAF 2205 armouring wires
Historically, submarine (or subsea) power cables were introduced to link shore-based
power grids across bays, estuaries, rivers, straits, etc. and, at the present day, the number of
these cables being installed world-wide is rapidly increasing. In fact, subsea cables are now
employed to carry power between countries and to offshore installations (oil/gas platforms
and ocean science observatories), to transfer power from offshore renewable energy
schemes to shore (wind, wave and tidal systems), and to transfer power from energy
sources to consumers, thus interconnecting different regional electrical transmission
networks to allow global trading of energy, also in remote areas. Advances in subsea
cables technology, the fast rate of return on investments compared to power stations
construction, and the ability to import power from hydroelectric or wind generating
systems have combined to make the installation of submarine cable links attractive [8].
Subsea cables (Fig. A.10) can mainly subdivided in two categories, HVAC and HVDC
cables. The former are aimed to transfer Alternating Current, transmitted down each of
three conductors, whereas in the latter the Direct Current is transmitted down a primary
conductor and requires a return path provided via another conductor or via seawater using
an anode/cathode. Both single- and three-core subsea cables are normally produced and the
progresses in subsea technology has recently advanced to allow the manufacture of cables
for bulk power transmission in continuous length up to 100 km. These cables are designed
to satisfy specific mechanical and corrosion-resistance requirements and, with growing
reliance on offshore-based renewable energy schemes, many countries now classifies
submarine power cables as critical infrastructure [8].
The installation of subsea cables present many challenges in the fields of mechanical
and marine engineering. Cables, in fact, must withstand the significant mechanical forces
that are generated during installation, due to their own weight and the action of tidal
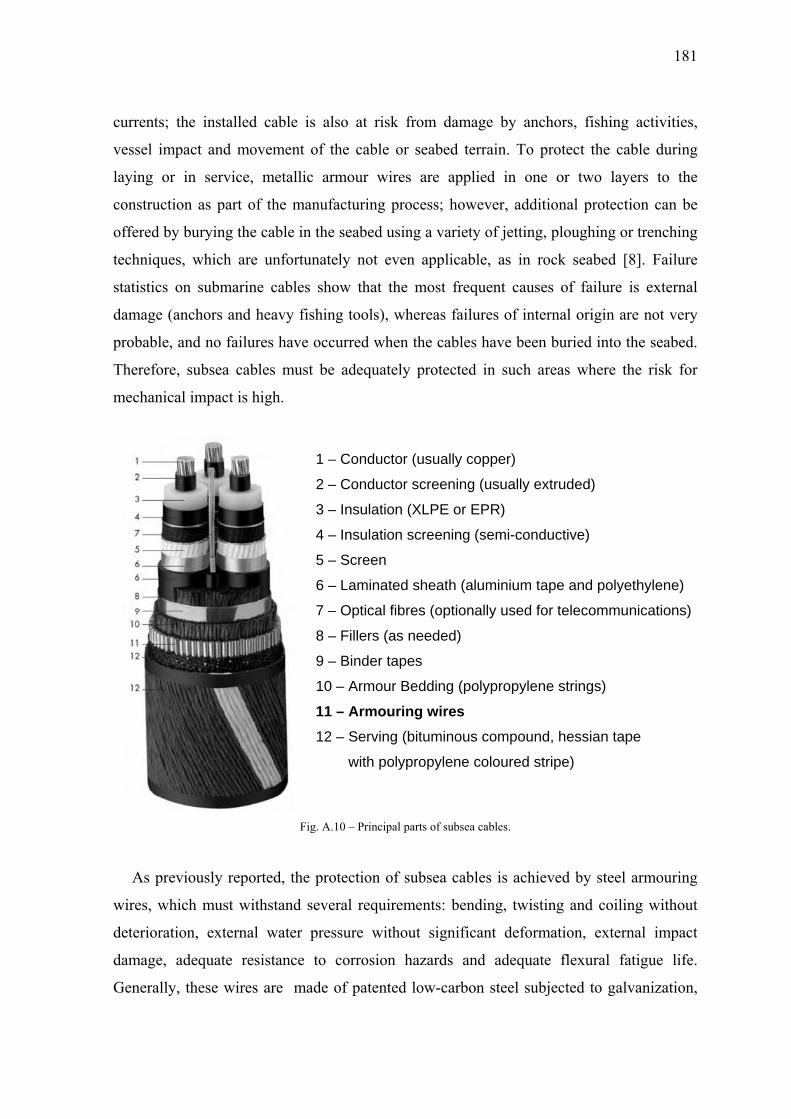
181
currents; the installed cable is also at risk from damage by anchors, fishing activities,
vessel impact and movement of the cable or seabed terrain. To protect the cable during
laying or in service, metallic armour wires are applied in one or two layers to the
construction as part of the manufacturing process; however, additional protection can be
offered by burying the cable in the seabed using a variety of jetting, ploughing or trenching
techniques, which are unfortunately not even applicable, as in rock seabed [8]. Failure
statistics on submarine cables show that the most frequent causes of failure is external
damage (anchors and heavy fishing tools), whereas failures of internal origin are not very
probable, and no failures have occurred when the cables have been buried into the seabed.
Therefore, subsea cables must be adequately protected in such areas where the risk for
mechanical impact is high.
1 – Conductor (usually copper)
2 – Conductor screening (usually extruded)
3 – Insulation (XLPE or EPR)
4 – Insulation screening (semi-conductive)
5 – Screen
6 – Laminated sheath (aluminium tape and polyethylene)
7 – Optical fibres (optionally used for telecommunications)
8 – Fillers (as needed)
9 – Binder tapes
10 – Armour Bedding (polypropylene strings)
11 – Armouring wires 12 – Serving (bituminous compound, hessian tape
with polypropylene coloured stripe)
Fig. A.10 – Principal parts of subsea cables.
As previously reported, the protection of subsea cables is achieved by steel armouring
wires, which must withstand several requirements: bending, twisting and coiling without
deterioration, external water pressure without significant deformation, external impact
damage, adequate resistance to corrosion hazards and adequate flexural fatigue life.
Generally, these wires are made of patented low-carbon steel subjected to galvanization,

182
in order to achieve high mechanical properties and an adequate resistance to corrosion
attacks. However, in the last years, the improved combination of mechanical and
corrosion-resistance features have shifted the choice toward the more interesting stainless
steels, both austenitic and duplex grades. As a matter of fact, these stainless steels have
high mechanical properties, also in sub-zero conditions, and possess a low permeability,
allowing the reduction of energy losses by the cable’s magnetic field and consequently
significantly increasing its efficiency, without needing to interfere with the cable design.
Moreover, the enhanced resistance to crevice and pitting corrosion, makes these grades
very suitable in subsea applications. In some cases, stainless steels are galvanized in order
to offer excellent corrosion performances because, when the zinc layer gets damaged, the
surrounding zinc will sacrifice itself serving as a sacrificial anode and protecting the
underlying stainless steel.
Duplex armouring wires
The interesting combination of properties in aggressive environments makes DSS
particularly suitable for submarine applications, where the high initial cost is justified by
the extraordinary performances throughout the product lifecycle. In the present section, a
characterization of SAF 2205 DSS armouring wires is presented, both in terms of
mechanical and corrosion-resistance properties, aimed to prove the performances of
differently produced wires, originated by different manufacturing processes, in order to
determine an achievable cost-saving by reducing the number of forming operations.
As previously reported, armouring wires must possess high mechanical properties to
satisfy the required strength and must be suitable against corrosion; moreover the electrical
resistivity must be as higher as possible, because the induced current in the armour can be
high, up to the same values as in the conductor, thus leading to considerable ohmic losses.
Hence, the choose of SAF 2205 DSS seem to be favourable, owing to its corrosion
properties, but the achievement of sufficient strength and electrical resistivity requires
plastic deformations at room temperatures.
The manufacturing cycle of DSS armouring wires is composed by subsequent wire-
drawing and annealing steps, in order to determine the proper combination of properties.
For the purpose of this section, products deriving from two similar production cycles were
investigated. The processes are reported in Fig. A.11 (denoted with the numbers 2 and 3,

wher
by st
H); i
mm)
1 and
Th
a fun
of th
mech
form
hardn
trans
are a
work
summ
each
most
It
strain
resist
seaw
prop
reas 1 is a p
tarting from
in process 2
. Note that
d 2).
he wire pro
nction of th
he following
hanical prop
mation of a
ness and m
sverse direc
aimed to re
kable by par
mation of t
manufactu
t critical one
must be no
n-hardened,
tivity, but
water, since
erties is o
pre-forming
m 6 mm diam
2, the final d
all the anne
operties wer
e cold plast
g solubilisa
perties. In
banded fer
mechanical
tion is redu
estore the m
rtially (or t
the measure
uring step is
e, because i
oticed that w
, in order
at the same
are aimed f
obtained by
process), b
meter wires
diameter is
ealing treatm
Fig. A.11
re tested aft
tic deforma
ations. It is
wire-drawi
rrite/austeni
strength ar
uced. On the
microstructu
totally) rege
ed mechani
s reported.
it involves t
wires have
to achieve
e time they
for applicati
y properly
oth involvin
s (B) and re
achieved a
ments are, i
– Wire produc
er each step
ation induce
well know
ng, DSS ar
ite structure
re increased
e other hand
ures in term
enerating th
ical, physic
As expecte
he maximum
to satisfy a
sufficient
y must pos
ion in marin
y designing
ng wire-dra
eaching the
after an inter
in fact, solu
tion processes.
p, in order t
ed by wire-d
wn that cold
re highly s
e and maki
d, whereas
d, the subse
ms of plastic
he starting c
al and corr
ed, process
m cold redu
combinatio
mechanica
sess an ade
ne environm
g the anne
awing and a
final diame
rmediate ste
ubilisations
to understan
drawing an
d-working
train-harden
ing them st
the impac
equent solut
c strains, m
characteristi
rosion prop
3 (B-G-H
uction in wi
on of prope
l strengthen
equate corr
ments. The c
ealing trea
nnealing op
eter of 3 mm
ep (D, diam
at 1050°C (
nd their var
nd as a cons
causes a ch
ned, leadin
trongly anis
ct toughnes
tion-anneali
making DSS
ics. In Tabl
perties perta
sequence)
ire diameter
erties. They
ning and e
rosion resis
combination
atments aft
183
perations
m (F and
meter 4.5
(Chapter
iation as
sequence
hange in
ng to the
sotropic;
s in the
ing steps
S further
le A.8, a
aining to
was the
r (50%).
must be
electrical
stance in
n of such
ter each
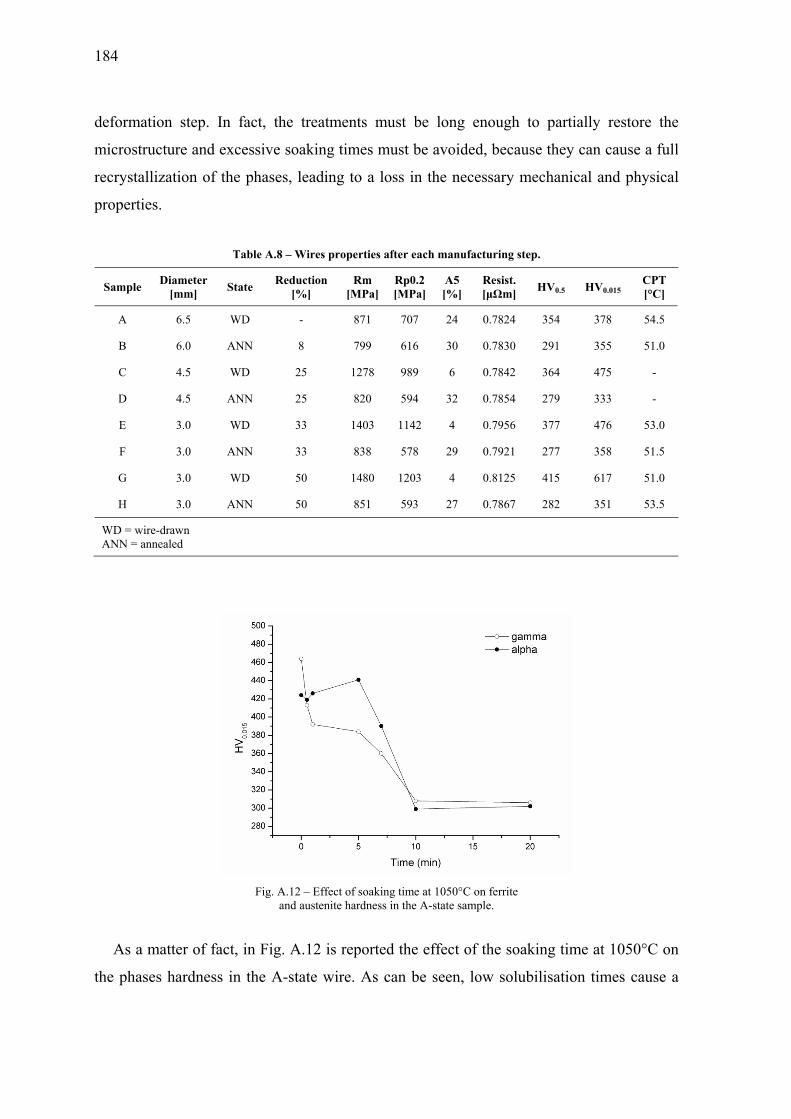
184
deformation step. In fact, the treatments must be long enough to partially restore the
microstructure and excessive soaking times must be avoided, because they can cause a full
recrystallization of the phases, leading to a loss in the necessary mechanical and physical
properties.
Table A.8 – Wires properties after each manufacturing step.
Sample Diameter [mm] State Reduction
[%] Rm
[MPa] Rp0.2 [MPa]
A5 [%]
Resist. [μΩm] HV0.5 HV0.015
CPT [°C]
A 6.5 WD - 871 707 24 0.7824 354 378 54.5
B 6.0 ANN 8 799 616 30 0.7830 291 355 51.0
C 4.5 WD 25 1278 989 6 0.7842 364 475 -
D 4.5 ANN 25 820 594 32 0.7854 279 333 -
E 3.0 WD 33 1403 1142 4 0.7956 377 476 53.0
F 3.0 ANN 33 838 578 29 0.7921 277 358 51.5
G 3.0 WD 50 1480 1203 4 0.8125 415 617 51.0
H 3.0 ANN 50 851 593 27 0.7867 282 351 53.5
WD = wire-drawn ANN = annealed
Fig. A.12 – Effect of soaking time at 1050°C on ferrite
and austenite hardness in the A-state sample.
As a matter of fact, in Fig. A.12 is reported the effect of the soaking time at 1050°C on
the phases hardness in the A-state wire. As can be seen, low solubilisation times cause a

ready
proce
value
the e
previ
of di
the m
time
Micr
The
were
disto
cause
polyg
mech
state
Th
longi
the h
with
y recrystalli
esses. How
es, thus get
effect of so
ious deform
ifferent enti
microstructu
must be pro
rostructures
microstruct
e increasing
ortion in the
ed a partia
gonalization
hanical and
s (deformed
Fig. A.1
he HV0.015
itudinal sec
hardness val
the deform
izzation of a
wever, after
ting ineffec
olubilisation
mation degre
ity. This en
ure. Therefo
operly chos
s and prope
tures of the
gly fragmen
e 50% defor
al recrystal
n (Fig. A.1
d electrical p
d/annealed)
13 – Wire micro
micro-hard
ction and, a
lues decreas
mation mode
austenite (γ)
10 minute
ctive the str
n on restori
ee, since dif
nergy is rele
fore, owing
sen, also con
erties
e wire-draw
nted as the
rmed sampl
llization of
3b). As co
properties s
and are clo
ostructures: a) 5
dness tests
as expected,
sed from th
e at which w
), whereas f
es treatment
rain-hardeni
ing the mic
fferent redu
eased durin
to these h
nsidering th
wn samples
e diameter
le (Fig. A.1
f the auste
onfirmed by
significantly
osely related
50% deformed s
on both ph
, the profile
he wire surfa
wires were su
ferrite (α) is
t, the phase
ing achieve
crostructure
uctions in di
ng annealing
high-tempera
he previous
depended o
reduction i
13a); the su
enitic grain
y the result
y vary cons
d to the mic
sample (G-state
hases were
es showed a
face towards
ubjected.
s mainly int
es reach co
ed by cold-w
is strongly
iameter cau
g, leading t
ature pheno
deformation
on the defor
increased, w
ubsequent an
ns, underlin
ts presented
sidering the
rostructure
e) and b) anneal
e performed
a similar tre
s the wire c
terested by r
omparable h
working. M
y dependen
use a energy
o the restor
omena, the
n step.
rmation deg
with the m
nnealing tre
ned by bou
d in Table
e two differ
of each sam
led (H-state).
d on a diam
end. In all s
centre, in ag
185
recovery
hardness
Moreover,
nt on the
y storage
ration of
soaking
gree and
maximum
eatments
undaries
A.8, the
rent wire
mple.
metrical-
samples,
greement
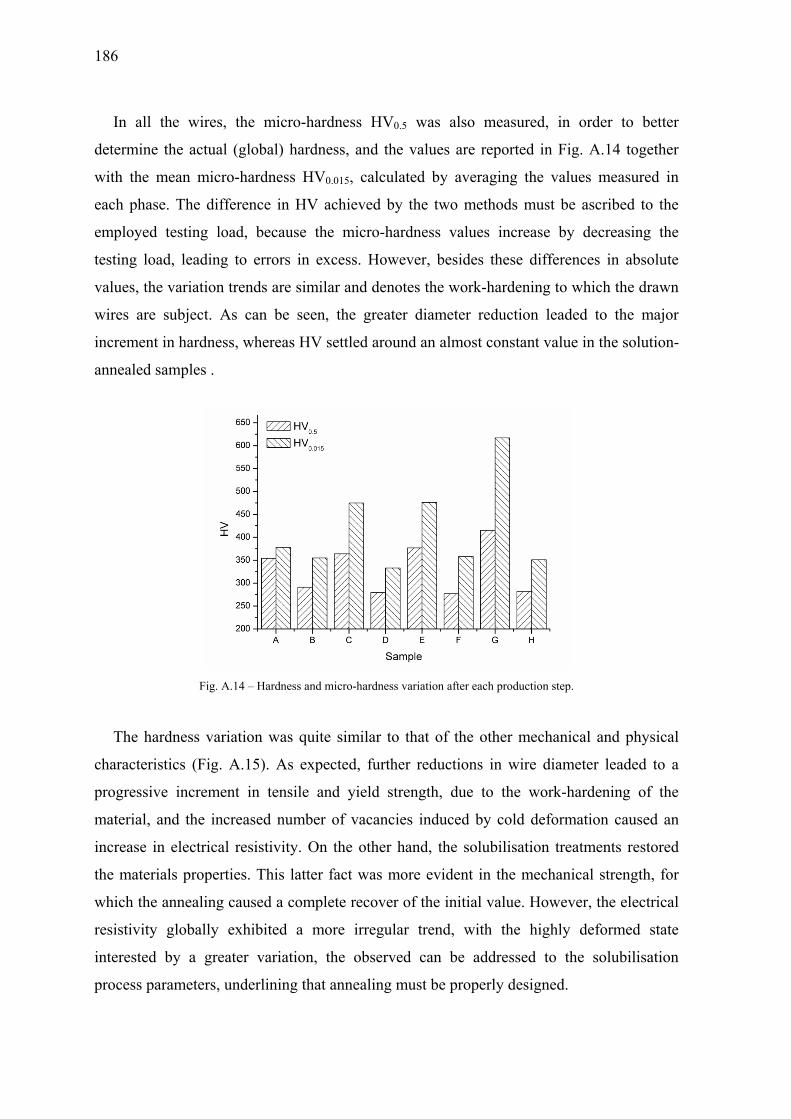
186
In all the wires, the micro-hardness HV0.5 was also measured, in order to better
determine the actual (global) hardness, and the values are reported in Fig. A.14 together
with the mean micro-hardness HV0.015, calculated by averaging the values measured in
each phase. The difference in HV achieved by the two methods must be ascribed to the
employed testing load, because the micro-hardness values increase by decreasing the
testing load, leading to errors in excess. However, besides these differences in absolute
values, the variation trends are similar and denotes the work-hardening to which the drawn
wires are subject. As can be seen, the greater diameter reduction leaded to the major
increment in hardness, whereas HV settled around an almost constant value in the solution-
annealed samples .
Fig. A.14 – Hardness and micro-hardness variation after each production step.
The hardness variation was quite similar to that of the other mechanical and physical
characteristics (Fig. A.15). As expected, further reductions in wire diameter leaded to a
progressive increment in tensile and yield strength, due to the work-hardening of the
material, and the increased number of vacancies induced by cold deformation caused an
increase in electrical resistivity. On the other hand, the solubilisation treatments restored
the materials properties. This latter fact was more evident in the mechanical strength, for
which the annealing caused a complete recover of the initial value. However, the electrical
resistivity globally exhibited a more irregular trend, with the highly deformed state
interested by a greater variation, the observed can be addressed to the solubilisation
process parameters, underlining that annealing must be properly designed.
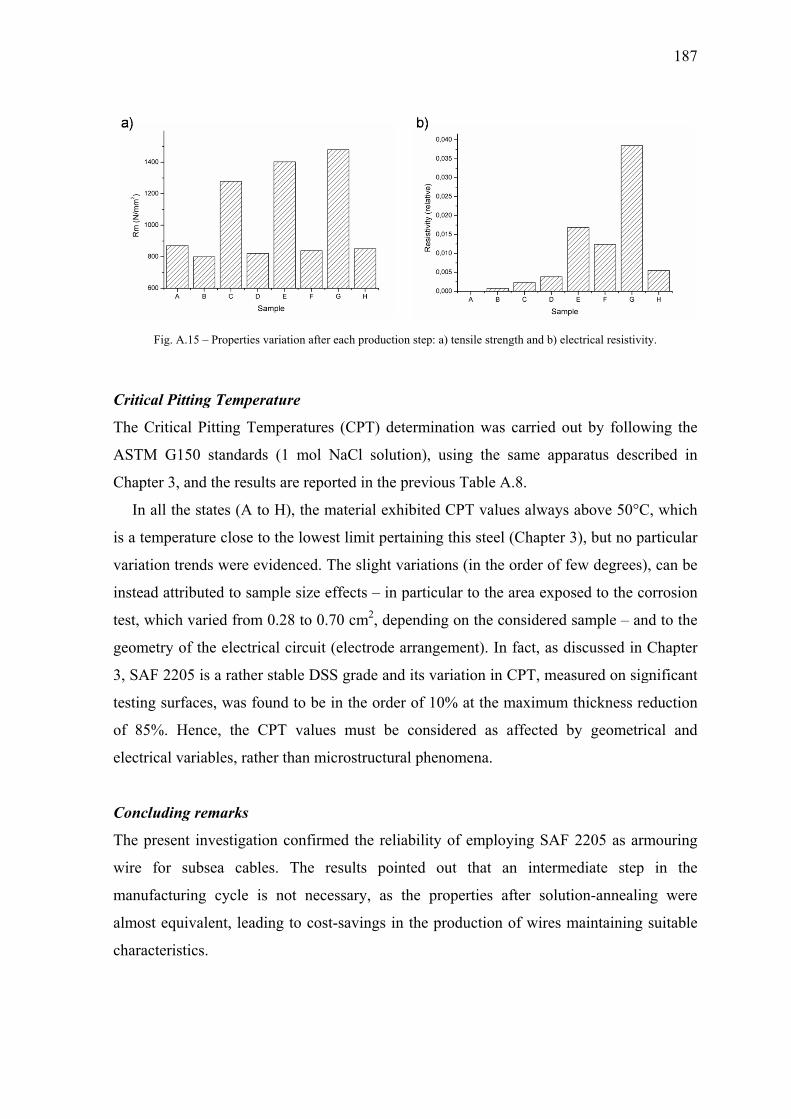
Criti
The
AST
Chap
In
is a t
varia
inste
test,
geom
3, SA
testin
of 8
elect
Conc
The
wire
manu
almo
chara
Fig. A.15 – P
ical Pitting
Critical Pit
M G150 st
pter 3, and t
n all the stat
temperature
ation trends
ead attribute
which varie
metry of the
AF 2205 is
ng surfaces,
5%. Hence
trical variab
cluding rem
present inv
for subse
ufacturing
ost equivale
acteristics.
Properties varia
Temperatu
tting Tempe
tandards (1
the results a
tes (A to H
e close to th
were evide
ed to sample
ed from 0.2
e electrical c
a rather stab
, was found
e, the CPT
bles, rather t
marks
vestigation c
ea cables.
cycle is no
ent, leading
ation after each
ure
eratures (CP
1 mol NaC
are reported
), the mater
he lowest lim
enced. The s
e size effect
28 to 0.70 cm
circuit (elec
ble DSS gra
d to be in th
T values mu
than microst
confirmed t
The result
ot necessar
to cost-sav
production step
PT) determ
Cl solution),
in the prev
rial exhibite
mit pertainin
slight variat
ts – in parti
m2, dependi
ctrode arran
ade and its
he order of
ust be con
tructural ph
the reliabili
ts pointed
ry, as the
vings in the
p: a) tensile stre
mination was
, using the
ious Table A
ed CPT valu
ng this stee
tions (in the
icular to the
ing on the c
ngement). In
variation in
10% at the
nsidered as
henomena.
ty of emplo
out that
properties
production
ength and b) ele
s carried ou
same appa
A.8.
ues always
l (Chapter 3
e order of fe
e area expos
considered
n fact, as di
n CPT, meas
maximum
affected b
oying SAF
an interme
after soluti
n of wires m
ectrical resistivi
ut by follow
aratus desc
above 50°C
3), but no p
ew degrees)
sed to the c
sample – an
iscussed in
sured on sig
thickness re
by geometri
2205 as ar
ediate step
ion-annealin
maintaining
187
ity.
wing the
cribed in
C, which
particular
), can be
corrosion
nd to the
Chapter
gnificant
eduction
ical and
rmouring
p in the
ng were
suitable

188
Moreover, the results also suggested the possibility to employ SAF 2205 in the as-
deformed state (very high mechanical strength an electrical resistivity without any loss in
corrosion performances), even if in this case a full characterization is required, including
magnetic tests and impact toughness and fatigue properties determination.
REFERENCES
[1] J. O. Nilsson. Mater Sci Tech Ser 8 (1992) 685-700. [2] TMR Stainless. Linee guida pratiche per la lavorazione di acciai inossidabili austeno-ferritici.
International Molybdenum Association (2011). [3] M. Frodigh. High alloyed duplex stainless steels – Aspects on welding and fabrication. Giornate
nazionali di saldatura 7 (2013). [4] C. O. Pettersson, P. Stenvall, Z. Zhou. High alloyed duplex & austenitic stainless steels – Aspects on
welding and fabrication. Eurojoint 5 & Giornate nazionali di saldatura 5 (2009). [5] IIS. Saldatura per fusione – Vol.2. Istituto Italiano della Saldatura (1996). [6] I. Calliari, M. Breda, E, Ramous, K. Brunelli, M. Pizzo, C. Menapace. J Mater Eng Perform 21
(2012) 2117. [7] I. Calliari, M. Pellizzari, E. Ramous. Mat Sci Tech Ser 27 (2011) 928. [8] J. R. Attwood. Cable design for subsea power links. IEEE Power Engineering Review (2000) 13.

189
APPENDIX B
Archaeometalurgy
It is rather diffuse that, during his Ph.D. period, the student is involved in other projects,
which are not intimately connected to the aim of his final research, but which belong to
further activities performed in his department. Despite the various works performed on
thesis of different topics, this appendix deals with an important side-project accomplished
throughout the three years of Ph.D. – and which is still under development – regarding the
archaeometallurgical study of papal coins converted into medals. One can think that there
aren’t any connections between this topic and the research project, and in part it is true
(steels and silver-copper coin alloys are not metallurgically and industrially equivalent),
but the involved archaeo-investigations are still of metallurgical character and may provide
the author a wider vision of the metallurgical world, in a different form respect to the steels
metallurgy, but useful to improve his knowledge and background.
The research presented in this appendix is aimed to systematically study more than 500
coins, minted in a time ranging from 17th to 19th century and subsequently transformed
into devotional medals, in order to (possibly) date the period of such conversion. The
investigated medals are composed by a wide variety of coins and pegs, and a stylistic
classification is needed to subdivide the entire collection in smaller groups with similar
aesthetics features. However, this qualitative classification from macroscopical
observations cannot be considered exhaustive to achieve reliable information about the
conversion period and deeper analyses are required. On the other hand, the analysis of the
composition of the brazing alloys can give a better knowledge on the technical skills of the
silversmiths who performed the joint, and the amount of the employed alloying elements
can be used as discriminating factors for the medallions dating. Particularly, the crucial
factor for a possible dating of the coin-to-medal conversion is the presence of zinc in the
brazing alloy. In fact, referring to the literature on the use of metallic zinc in Europe (see
references in Table B.5), from the composition of the brazing drop it might be possible to

190
establish a sort of history regarding the analyzed alloys, allowing a dating in respect such
conversions into medals.
The transformation of the coins into pendants has involved the joining with proper pegs
by means of a brazing procedure. Obviously, the more reliable investigation method is that
to directly observe the brazing drop by cutting the coin in two halves. Unfortunately, the
medals cannot be damaged and the employment of destructive techniques such as cutting
must be avoided, because they cause a loss in the intrinsic value of the artefacts. The
particularity of this study consists in the analysis of the various brazing drops compositions
in the lowest-destructive possible way, but at the same time suitable to achieve reliable
results. For this purpose, a thin layer of metal was firstly removed by micro-milling from
each brazing drop, allowing the appearance of the brazing alloy, free from oxides and dirty
layers. These areas were then analyzed by a Scanning Electron Microscope (SEM) coupled
with an Energy Dispersive Spectroscope (EDS), in order to characterize the brazing alloy
from a compositional point of view.
However, this approach needs a validation, because the brazing drop is the result of a
strong non-equilibrium solidification process and, therefore, the sampling points on the
drop are not all equivalent in terms of alloy composition. Position and depth of the
sampling point can affect the obtainable results and a reference sample must be firstly
analyzed. Hence, it was of paramount importance the preliminary metallographic study
performed on a sample called “expendable”, in order to determine the brazing alloy
composition and understand in detail the physical metallurgy of the brazing, in terms of
resulting microstructures and elements partitioning. The investigations on the expendable
medal has evidenced that the brazing drop is composed by a Ag-Cu alloy, charged with
other minor elements such as Zn and Pb, and also the semi-destructive analyses on other
medals revealed the presence of such elements, in different extent depending on the
considered case. Moreover, once the composition of the brazing alloy is known, a cross-
linking with the stylistic classification is required in order to determine possible
connections and to attribute the conversion works to different sets of artisans. However,
the stylistic features are still under classification and the related results are not yet
available. From this latter point of view, the research was also extended to the analysis on
pegs of similar brand, in order to achieve another correlation parameter regarding similar
characteristics.
191
B.1 Metallurgical study of a XIX century Scudo converted into medal
In this first section, the results from the preliminary study on the medallion called
“expendable” are presented. This first study was of fundamental importance in order to
determine the brazing alloy composition and the solidification microstructures, since
different cooling conditions lead to different microstructures inside the same brazing drop,
affecting the partitioning of the alloying elements. Therefore, the obtained results were
employed to assess the reliability of the employed semi-destructive method on the analyses
of the 500 coins.
Moreover, from this preliminary destructive study, it was possible to achieve
information on the coin microstructure, allowing a better understanding on the production
cycle of the coin itself in the XIX century.
Introduction
In Numismatics, coins provides a lot of information about the social, economical and
technological history of the people and territories trends which created them. Numismatics
study of the mid 17th to 21st century generally focuses on the research of production
methods, use of money and the social context in which the coin was minted. In this regard,
metallography is very helpful, as it can be used to link the internal structure of metals and
alloys with production processes and to the chemical-physical-mechanical properties.
In the XVIII century, the manufacturing process used in the Papal States to produce coins
consisted of several processing stages. First, silver plates of uniform thickness were
prepared by rolling mills. Second, blanks were obtained by means of metal punches. Third,
the blanks were heated and chemically bleached, in order to obtain a bright surface.
Finally, the blanks were coined by a screw press (striking).
Later, after a period of circulation, the coins were recycled as an adornment. This
demonetization was recognizable by the presence of a little hole through the coin or the
addition of a peg to allow its use as pendant. The sacred subject represented on obverse
and reverse side of the Papal silver Scudo and its axes transformed the coin into a
devotional or a decorative object. A pendant obtained in such way not only had an
ideological or religious value, but also emphasized the economic power and the social
prestige of those who exhibited it.

192
In th
from the
contains
preferre
account
[1]. On
informa
alteratio
The c
of coins
analysis
work, w
fabricat
project
physica
used to
Fig
The coi
The inv
using a
Concern
sitting o
arms in
his section, t
e 19th centu
s a brazing
ed non-destr
t because th
n the other
ation, especi
on layers, pa
coin under
s from 17th
s is currentl
was necessa
tion and its
discussed i
al analysis. T
confirm the
g. B.1 – Examinw
in
vestigated sa
a Ag-Cu al
ning the sac
on clouds w
n oval fram
the attention
ury, shown
g drop, pre
ructive anal
he results c
r hand, in
ially for ana
atinas..) and
study is par
h to 19th cen
ly being un
ary for to un
subsequent
n this appe
The results
e reliability
ned medallion: with keys and t
ample was
lloy contain
cred represe
with keys an
me between
n is focused
in Fig. B.1,
esumably a
lysis, such a
can be misr
most case
alysis of art
d when they
rt of a wide
ntury and fo
ndertaken. T
nderstand th
t conversion
ndix and ai
obtained fr
and the val
a) photo of revtemple) sides of
a silver Sc
ning 91.7%
entations, in
nd the temp
n two branc
d on the me
, modified b
dded to ho
as X-Ray F
representativ
es XRF rep
t objects wit
y cannot be
r private co
or which a
The section
he manufact
n into a me
imed at sup
from the ana
lidation of o
verse (Papal Shif the Pius VII S
udo, minted
% silver and
n the obver
ple, while o
ches of lau
etallographi
by a Ag-sur
old a peg.
luorescence
ve due to t
presents th
thout surfac
damaged [2
ollection of
classificatio
ing of the c
turing proce
edal. This in
pporting num
alyses discu
other non-de
ield) and obversScudo and b) sam
d by Pope P
d having a
rse of the c
on the rever
urel and sur
ic analysis o
rface enrichm
The applic
e (XRF), wa
the limited
e only wa
ce alteration
2].
similar pen
on based on
coin, as car
esses involv
nvestigation
mismatic cl
ussed in thi
estructive an
se (Madonna sempling area.
Pius VII in
a title toler
oin the Chu
rse side the
rmounted b
of a silver m
ment. The m
cation of w
as not taken
depth resol
ay to get u
ns (corrosio
ndants, comp
n non-destru
rried out fo
ved in the c
n is part of
lassification
s section w
nalyses.
eated on clouds
n 1816, offi
rance of ±0
urch is dep
ere is the co
by the tiara
medal
medal
widely
n into
lution
useful
n and
posed
uctive
or this
coin’s
a the
n with
will be
cially
0.3%.
icted,
oat of
a and

cross
Tom
Th
of a s
are d
micro
the d
on th
Th
(Ag-
can b
by th
distin
grain
caref
betw
sed keys (F
mmaso Merc
he SEM-ED
silver-copp
different, w
ograph and
differences b
he surface, e
Ag
Cu
Fig. B
he schemat
enriched) e
be seen, its
he presence
nguished by
ns, more or
ful observa
ween the fi
Fig. B.1).
andetti, me
DS analyses
er alloy. As
with a grea
the schema
between the
especially w
Table B
g
u
.2 – Cross-sect
tic presented
extends to a
microstruct
e of a single
y the prese
less etched
ation of the
rst two lay
The mono
dalist and e
s performed
s can be see
ater content
atic represen
e surface an
within the fir
B.1 – Surface a
ion of the coin
d in Fig. B
about 20-25
ture is not w
e layer of w
nce of the
d in relation
e micrograp
yers. This
ogram TM
engraver of t
d on the cro
en from Tab
t of Ag in
ntation in F
nd the bulk
rst layers.
and bulk comp
surface
96.8
3.2
surface: a) OM
B.2b highlig
µm in dep
well-define
white (Ag-ri
biphasic (α
n to the spec
ph in Fig.
intermedia
stands for
the Papal St
oss section
ble B.1, the
n the area a
Fig. B.2 prov
structure, u
osition of the c
M, etched and b)
hts the diff
th and is co
d. The inter
ich) grains.
α-β) structu
cific copper
B.2a allow
ate layer w
r the initial
tates.
revealed th
bulk and su
approaching
vided a bett
underlining
coin (wt.%).
) schematic repr
ferent layers
omposed by
rmediate lay
The core (
ure in form
r content of
ws to identi
was generat
ls of the e
hat the coin
urface comp
g the surfa
ter understa
a silver enr
bulk
92.8
7.2
resentation.
s. The exte
y about 97%
yer is chara
bulk) of the
of mainly
f each. Mor
ify a transi
ted by the
193
engraver
consists
positions
ace. The
anding of
richment
ernal one
% Ag; as
acterized
e coin is
twinned
reover, a
ent area
natural
194
solidification of the blank during the fabrication process [3], and certainly has suffered
from an additional copper depletion caused by the combined action of electrochemical and
wearing processes that may have reduced the content of the less noble metal in the alloy.
The bulk microstructure of the coin, as revealed after chemical etching by chromic acid
(H2CrO4), can be interpreted considering a process of thermo-mechanical nature [4]. It is
known that size, shape and configuration of grains are related to the production process;
from the micrographies of the internal layer, it is possible to assert that the blank was
mechanically deformed and hammered into sheet, probably by a rolling mill. However, the
dendritic structure due to the solidification of the plates is completely absent, excluding a
solely cold rolling manufacturing process. Plastic deformation is in any case confirmed by
the small size of the grains, appearing in a polygonal shape, and the presence of twins
suggests two hypothesis. The slabs, in fact, can be either annealed after the cold rolling or
directly obtained from a hot deformation process, since in both cases it is possible to obtain
the observed microstructure owing to static or dynamic recristallization stages,
respectively.
The obtainment of the starting slabs for the coins production has necessarily involved
the melting of the alloy and the casting in suitable forms. Thus, the observed
microstructure, modified by the subsequent thermo-mechanical processes, preserves
somehow memory of what was obtained during the plates solidification. A deeper analysis
of the coin structure in Fig. B.3 allows to hypothesize a different origin of the grains on the
basis of the different entities of the chemical etching; chromic acid selectively acts on the
copper-based phases (Cu-rich, coloured in red), leaving the silver-based phases unaffected
(Ag-rich, white) and etching in different extent those phases containing a suitable amount
of copper (intermediate colouring). From these considerations, it is possible to assume that
the Ag-rich and the slightly attacked grains are those deriving from the silver-based
solidification dendrites, having low coppers content or concentrations close to solid
solution saturation limit. On the contrary, the red-coloured grains can be attributed to the
Cu-rich secondary dendrites, separated from the melt during the solidification process.
Finally, the grains having intermediate colorations probably derived from the eutectic
structure, which surrounded primary and secondary dendrites as a result of non-equilibrium
solidification conditions. These distinctions allows to suppose which was the
microstructural evolution occurred during the manufacturing process of the plates, even if

the h
phas
M
grain
twinn
Stack
prefe
Neve
copp
comp
prim
numb
the fo
the o
cente
lowe
favou
interm
Fr
out i
rigor
high-temper
es.
Moreover, it
ns arising fr
ned areas in
king Fault
erentially r
ertheless, in
per content
position. In
mary dendrite
ber of lattic
formation of
observation
ered cubic
er the SFE o
ur a nearly
mediate com
rom the obs
in the mint
rous checks
rature diffus
Fig
t is interest
rom the seco
nside them
Energy (
rearranging
n some (rar
is very low
n these latte
es could be
ce vacancie
f twins char
s, this phen
metals (suc
of the solven
y-pure silv
mposition.
served findi
t workshop
at the begi
sion may in
. B.3 – Bulk mi
ting to note
ondary soli
are compos
SFE), silve
within th
re) grains d
w, it is poss
er cases, the
influenced
es, eased a
racterized b
nomenon is
ch as Ag a
nt. The pres
ver twinnin
ings, it is po
s. Assumin
inning and a
nfluence the
icrostructure of
e that the t
dification d
sed by almo
er caused
he phases,
deriving fro
sible to obs
e low conte
by the silve
copper redi
y an interm
s in contra
and Cu), wh
sence of cop
ng which, i
ossible to hy
ng that the
at the end o
elements d
f the coin (OM,
twinning pr
dendrites (en
ost pure silv
the forma
both in C
om primary
serve twins
ent of copp
er matrix w
istribution i
mediate copp
st with wh
here the so
pper in the
in the case
ypothesize t
goodness o
of the produ
distribution
etched).
rocess main
nriched in c
ver. In fact,
ation of an
Cu-rich an
y dendrites,
s of interme
er in solid
which, proba
in solid sol
per-silver co
hat generally
olute conten
Ag-rich pha
e under st
the differen
of the alloy
uction chain
within the d
nly intereste
copper) and
, owing to i
nnealing tw
nd eutectic
, and in w
ediate copp
solution wi
ably owing t
lution, thus
omposition.
y happens
nt can subs
ases, in fact
tudy, is ins
nt operation
y was subj
n, it is plaus
195
different
ed those
d that the
its lower
wins by
grains.
hich the
per-silver
ithin the
to a high
causing
Despite
in face-
stantially
t, should
stead of
s carried
ected to
sible that

196
the blanks were obtained from the plates by punching after the rolling operations. In the
following step, the dowel was heated and minted.
The thermo-mechanical processes and environment alter the surface state of metals,
especially in absence of protective atmospheres, and the alloy composition may play a
fundamental role on the achievable features; in the case under study, the first surface layer
of the investigated coin (Fig. B.2) can be attributed to a combination of random and
intentional processes. A recent experimental study by Beck et al. [3] has shown that, for
Ag-Cu alloys containing more than 72% of Ag, the surface enrichment may directly derive
from the solidification process. Such alloys undergo phase separation during cooling,
leading to the formation of a Ag-rich layer in the outer side of the sample. This layer is
characterized by a thickness that varies between 20 and 80 microns whereas, at greater
depths, the grains of Ag-rich phase are surrounded by an eutectic matrix. Despite the high
silver content in the alloys studied by Beck, it was also noticed that the surface did not
appear shiny and bright, owing to the occurrence of oxidative phenomena within the first
surface layers, in the order of a few micrometers. Therefore, for this unsightly surface
effect, is reasonable to assume that mints intentionally proceeded to a further surface
treatment.
The enrichment in silver of the coin surface (silvering), detailed described by Cope [5]
and subsequently studied by La Niece [6], provides that the blanks were firstly heated in
order to cause the oxidation of the copper in the surface and, in a second stage, washed
using a weak acid (probably vinegar, acid derived from citrus fruit, sulfuric acid, etc.) to
remove the oxide. This treatment make the surface porous and depleted in copper, while
the final strike of the coinage was intended to consolidate the Ag-rich phase, giving a
surface appearance as if it were of high quality silver. Hence, the first and second layers
described above can be respectively addressed to the silver enrichment procedure and to
the Ag-rich layer derived from the phenomenon described by Beck.
Therefore, it was possible to suppose the processes involved in the coin manufacturing,
according to the production technologies developed in the 18th century and still employed
in the 19th. The plates were brought to the proper thickness by alternating rolling and
annealing processes, the blanks were obtained by means of a punching machine and the
coins, subjected to silvering, were finally minted by a press [7]. Moreover, the edge of the
coin is characterized by a circumferential knurling and by the incision of the Latin word

PAX
blank
the k
The
The
this h
alloy
in the
C
can
Refe
study
betw
alloy
X (peace), ev
ks were pla
knurling des
brazing dro
coin under
has permitt
y's average c
e solidificat
wt%
at%
onsidering
be determi
rring to the
y as a “pur
ween 750°C
ying elemen
videncing t
aced betwee
sign and the
op
study was
ted to choos
composition
tion microst
A
75
66
the previou
ined that th
e Ag-Cu-Zn
e-ternary” a
and 800°C
nt will furthe
Fig. B.4 – aan
the existenc
en two steel
e legend [7,8
devoid of t
se the samp
n is reported
tructure is d
Table B.2 – Br
Ag
5,5
6,1
usly reporte
he melting
ternary dia
alloy – i.e.
(see the sh
er lowers th
a) composition d b) microstruc
ce of a furth
l rods, one
8].
the peg but
pling area in
d in Table B
discussed la
razing alloy av
Cu
17,9
23,4
d composit
points are
agram [9,10
without Pb
aded triang
his temperat
of the brazing
cture of the braz
her step prio
fixed and o
the brazing
n order to a
B.2, while t
ater in this s
erage composi
ions of the
e about 890
], if one con
b – its melt
le in Fig. B
ture.
if considered aszing drop (SEM
or to the co
one sliding,
g drop was
analyse the
the partition
ection.
ition.
Zn
4,4
6,3
coin and th
0°C and 93
nsiders the
ting point c
B.4) and the
s “pure-ternary”M-BSE).
oinage in w
in order to
still clearly
brazing its
ning of the e
Pb
2,2
1,0
he enriched
30°C, resp
brazing allo
can be estim
presence o
”
197
which the
o imprint
y visible;
self. The
elements
b
2
0
layer, it
ectively.
oy under
mated as
f lead as

198
The brazing solidification is a non-equilibrium process, and thus its distinguishing
features can be revealed from a microstructural analysis. Due to the different solidification
conditions at which the liquid metal is subjected, from a microstructural point of view, the
overall microstructure can be divided in two main regions as seen in Figs. B.4b and B.5: a
sideward eutectic region and a central prevailing-dendritic area.
Fig. B.5 – Schematic representation of the brazing.
The eutectic region is mainly composed of a fine eutectic structure that embeds some
coarser zones in which, during solidification, the conditions for the formation of the
primary dendrites are mainly not reached. The parts of the brazing in contact with the
ambient air and with the coin's surface appear fine-structured due to a greater undercooling
and therefore to a higher solidification rate, while the liquid metal located between them
solidifies a little more slowly, resulting in the formation of a coarser eutectic structure that
sometimes involves the growth of the primary (Ag-rich) α-dendrites with a globular shape.
In the central region, the cooling rates are still high, but slower than the eutectic areas, and
the melt is trapped inside the solidified sideward regions. Such conditions are more shifted
towards the equilibrium and allow for the formation of a structure composed by primary
(Ag-rich) α-phase in the form of dendrites inside an eutectic matrix. In addition to the
dendritic growth of the Ag-rich phase, in this area the separation of the secondary (Cu-
rich) β-dendrites also occurs.
It is possible to note that the dendritic zone is not completely surrounded by the eutectic
structure, but instead extends up to the top of the brazing, corresponding to the contact
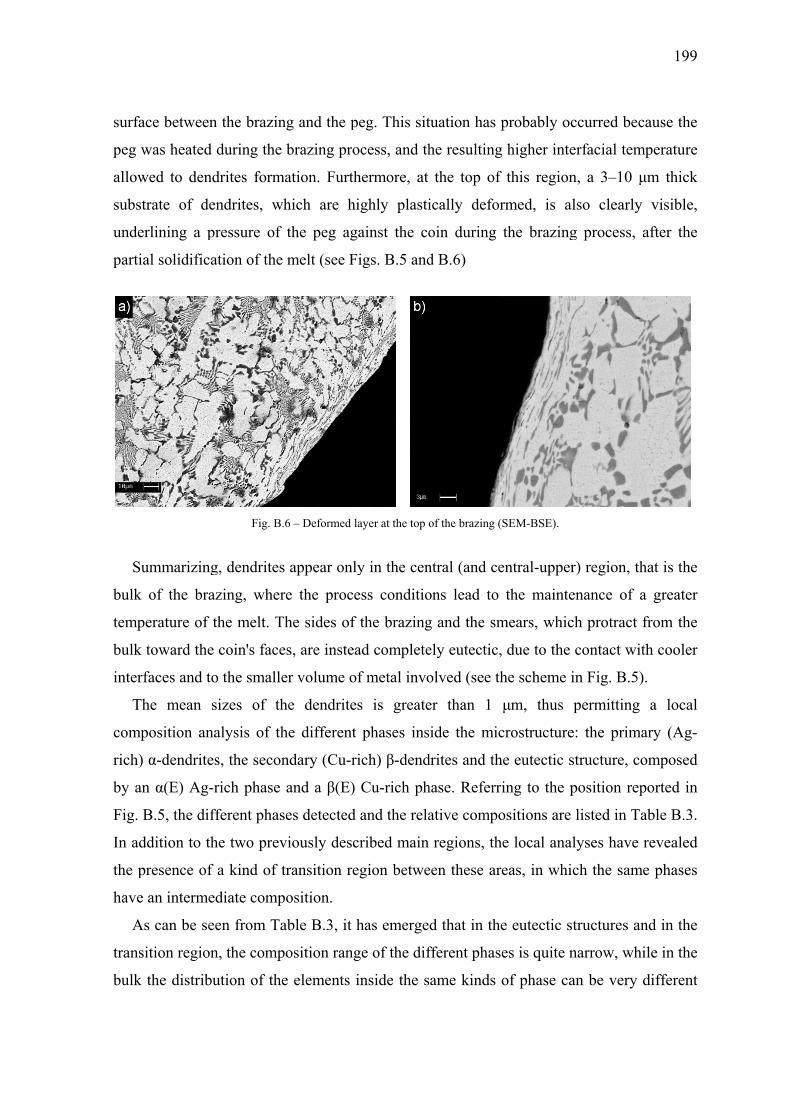
surfa
peg w
allow
subst
unde
parti
Su
bulk
temp
bulk
inter
Th
comp
rich)
by an
Fig. B
In ad
the p
have
A
trans
bulk
ace between
was heated
wed to dend
trate of de
erlining a p
al solidifica
ummarizing
of the bra
perature of t
toward the
faces and to
he mean s
position ana
α-dendrite
n α(E) Ag-r
B.5, the dif
ddition to th
presence of
an interme
As can be se
sition region
the distribu
n the brazin
during the
drites forma
endrites, wh
pressure of
ation of the
Fig. B.6
g, dendrites
azing, where
the melt. Th
coin's face
o the smalle
sizes of th
alysis of th
s, the secon
rich phase
fferent phase
he two prev
a kind of tr
ediate comp
en from Ta
n, the compo
ution of the
g and the p
brazing pro
ation. Furth
hich are hi
the peg ag
melt (see F
6 – Deformed l
appear only
e the proce
he sides of
s, are instea
er volume o
he dendrite
he different
ndary (Cu-ri
and a β(E)
es detected
viously desc
ransition re
osition.
able B.3, it h
osition rang
e elements i
peg. This sit
ocess, and th
hermore, at
ighly plasti
ainst the co
igs. B.5 and
ayer at the top o
y in the cen
ess conditio
the brazing
ad complete
f metal invo
s is greate
phases ins
ich) β-dend
Cu-rich ph
and the rela
cribed main
egion betwe
has emerge
ge of the dif
inside the s
tuation has
he resulting
the top of
ically defor
oin during
d B.6)
of the brazing (
ntral (and ce
ons lead to
g and the sm
ely eutectic,
olved (see th
er than 1
side the mic
drites and th
hase. Referr
ative compo
regions, th
een these ar
d that in th
fferent phas
same kinds
probably oc
g higher inte
f this region
rmed, is al
the brazing
(SEM-BSE).
entral-upper
the mainte
mears, whic
, due to the
he scheme i
μm, thus
crostructure
he eutectic s
ring to the p
ositions are
he local ana
reas, in whi
e eutectic s
ses is quite n
of phase ca
ccurred bec
erfacial tem
n, a 3–10 μ
lso clearly
g process, a
r) region, th
enance of a
ch protract f
contact wit
in Fig. B.5)
permitting
e: the prima
structure, co
position rep
listed in Ta
lyses have
ch the same
structures an
narrow, whi
an be very d
199
cause the
mperature
μm thick
visible,
after the
hat is the
a greater
from the
th cooler
.
a local
ary (Ag-
omposed
ported in
able B.3.
revealed
e phases
nd in the
ile in the
different
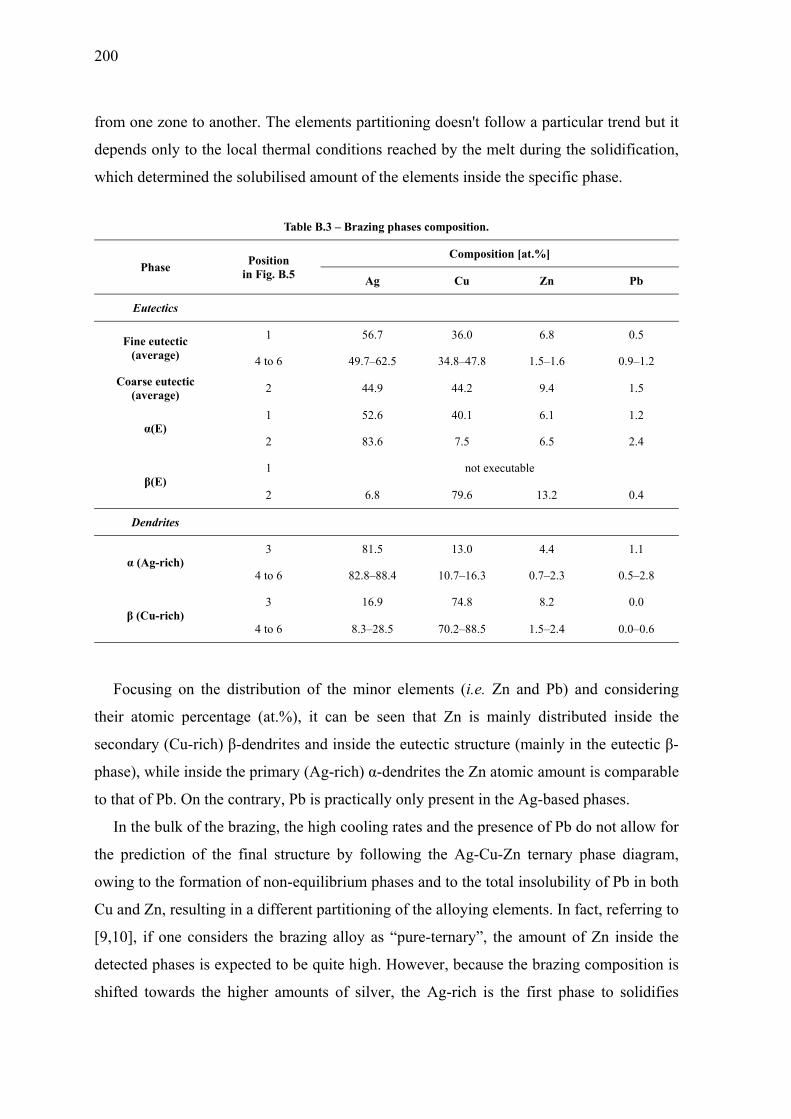
200
from one zone to another. The elements partitioning doesn't follow a particular trend but it
depends only to the local thermal conditions reached by the melt during the solidification,
which determined the solubilised amount of the elements inside the specific phase.
Table B.3 – Brazing phases composition.
Phase Position in Fig. B.5
Composition [at.%]
Ag Cu Zn Pb
Eutectics
Fine eutectic (average)
1 56.7 36.0 6.8 0.5
4 to 6 49.7–62.5 34.8–47.8 1.5–1.6 0.9–1.2
Coarse eutectic (average) 2 44.9 44.2 9.4 1.5
α(E) 1 52.6 40.1 6.1 1.2
2 83.6 7.5 6.5 2.4
β(E) 1 not executable
2 6.8 79.6 13.2 0.4
Dendrites
α (Ag-rich) 3 81.5 13.0 4.4 1.1
4 to 6 82.8–88.4 10.7–16.3 0.7–2.3 0.5–2.8
β (Cu-rich) 3 16.9 74.8 8.2 0.0
4 to 6 8.3–28.5 70.2–88.5 1.5–2.4 0.0–0.6
Focusing on the distribution of the minor elements (i.e. Zn and Pb) and considering
their atomic percentage (at.%), it can be seen that Zn is mainly distributed inside the
secondary (Cu-rich) β-dendrites and inside the eutectic structure (mainly in the eutectic β-
phase), while inside the primary (Ag-rich) α-dendrites the Zn atomic amount is comparable
to that of Pb. On the contrary, Pb is practically only present in the Ag-based phases.
In the bulk of the brazing, the high cooling rates and the presence of Pb do not allow for
the prediction of the final structure by following the Ag-Cu-Zn ternary phase diagram,
owing to the formation of non-equilibrium phases and to the total insolubility of Pb in both
Cu and Zn, resulting in a different partitioning of the alloying elements. In fact, referring to
[9,10], if one considers the brazing alloy as “pure-ternary”, the amount of Zn inside the
detected phases is expected to be quite high. However, because the brazing composition is
shifted towards the higher amounts of silver, the Ag-rich is the first phase to solidifies

201
inside the bulk, with a very high Ag content (about 90 wt.%). This allows for the solubility
of Cu and Pb to increase, and therefore partial rejection of Zn, due to its complete
insolubility in Pb. Despite to the high solubility of Zn in Ag, the concurrent presence of Pb
causes the rejection of Zn from within the α-dendrites and thus the resulting primary (Ag-
rich) α-dendrites are almost free of Zn. Solidification then proceeds with the formation of
the secondary (Cu-rich) β-dendrites, containing also Ag and enriched in Zn, due to the
great affinity between Cu and Zn. In these dendrites, Pb is nearly or totally absent, because
it is rejected by both Cu and Zn, in which it is completely insoluble. Finally, the
interdendritic melt undergoes eutectic solidification, by forming a Cu-rich phase that
rejects Pb toward the liquid, and the Ag-rich phase, enriched in Pb and containing the
remaining Zn. In the whole central region all of the Pb is completely solutionized by the
present phases and no pure Pb segregations was detected.
Fig. B.7 – Coexistence of different forms of eutectic (SEM-BSE).
The sides and the smears, as previously reported, solidify as completely eutectic,
because they are subjected to a greater undercooling, and the phases analyzed exhibit an
average composition more or less comparable to the eutectic in the bulk, except for the Zn
content which is substantially higher. The eutectic which is formed in this region is either
lamellar or globular (Fig. B.7), whose shape depends on the different diffusion kinetics
involved in the solidification process, which are affected by the local thermal conditions
reached at the solid/liquid interface. In these regions, the Pb is mostly segregated due to the
higher cooling rates and therefore to the absence of the primary (Ag-rich) α-dendrites
which preferentially dissolve this element. Thus, as can be seen from Fig. B.8, the

202
exceedi
matrix,
In th
of the
compos
evolutio
pertains
Conclud
The inv
technolo
the man
was aid
blanks o
blanks
pressure
The
confirm
reflects
after th
reveals
compos
layer is
ng pure Pb
due to the h
he transition
alloying e
sition betwe
on of the co
s to the bulk
ding remar
vestigations
ogy produc
nufacture of
ded by rolli
of the requi
were then
e of two hea
investigatio
mation of les
the mean
e removal
that the am
sition, while
too thick,
b solidifies
high atomic
n region, the
elements in
een the prev
oarse eutecti
k of the braz
Fig. B.8 – Lea
rks
performed
ction started
f a blank to
ing mills, i
ired size an
chemically
avy iron scr
on of the
ss invasive
composition
of a thin la
mounts of A
e the presen
or if the sam
in areas th
c number.
e establishe
nside the s
viously des
ic structure
zing.
ad segregation i
on the expe
d from XVI
o the impres
in order to
nd thickness
blanched,
rews.
elemental p
analyses on
n of the br
ayer of me
Ag and Cu
nce of elem
mpling poin
hat appear a
ed thermal r
olidifying
cribed regi
that is mov
inside the eutec
endable coin
III century
ssion of the
produce u
s could be c
subjected t
partitioning
n other sim
razing alloy
tal from th
u not deviat
ments such
nt is located
as big brigh
regime lead
phases, res
ons. This r
ving toward
ctic structure (S
n are in acc
[7], which
e design. Th
uniformly th
cut by mean
to creasing
g in the br
milar sample
y. In fact, a
he sideward
te substanti
Zn and Pb
d near the c
ht spots ins
ds to a diffe
sulting in
egion can b
d the compo
SEM-BSE).
ordance wit
provides m
he preparati
hick strips
ns of metal
g and finally
razing drop
es, since the
an EDS ana
d regions (s
ially from t
is ensured.
contact surf
side the eu
erent partitio
an interme
be thought
osition rang
th the innov
many stages
ion of the b
from whic
l punches. T
y coined b
p will allow
e obtainable
alysis perfo
sides or sm
the real av
. If the rem
face betwee
utectic
oning
ediate
as an
e that
vative
from
blanks
h the
These
by the
w for
e data
ormed
mears),
verage
moved
en the

203
brazing and the peg, the EDS analysis reflects the bulk composition of the brazing and thus
the presence of Zn could be underestimated.
B.2 Compositional study of brazing alloys on XVII–XIX century coins
converted into medals
In this section, the results obtained from the systematic study of the brazing drops on more
than 500 coins converted into medals are presented. For editorial reasons, the compositions
of the brazing alloys are not reported in the present thesis and, as previously mentioned,
the data are still under analysis because the stylistic classification is not yet complete.
However, the compositional results suggested some hypothesis which are discussed in the
present section.
The samples belong to a wide private collection of medallions of similar aspect,
consisting in coins ranging from 17th to 19th century and subsequently transformed into
devotional medals by brazing pegs of different stylistic character. The investigated medals
were subdivided into the three following categories.
- Papal coins, numbered in sequence.
- Not-Papal medals, signed with the letter C.
- Papal medals, signed with the letter M.
All the medals were obtained from coins out of circulation by means of brazing, a
joining technique which consists in connecting metal pieces using another metal alloy of
(mainly) different nature, called filler, without melting the portions to be assembled. The
brazing alloy, whose melting temperature should be less than that of the base metals, is
interposed between the parts to be bonded; at this temperature the molten brazing alloy
wets the metal parts, allowing their joining after cooling.
This study deals with the determination of the brazing drops chemical compositions by
SEM-EDS analyses in the least-destructive possible way, in order to date the period of the
conversion into medals. As reported in the introduction, the discriminating factor for such
dating may be the presence of zinc as brazing alloying element and its relative amount,
since the employment of its metallic form by artisans for the realization of brazing alloys
and artefacts can be addressed to recent times. Hence, the present section is mainly focused
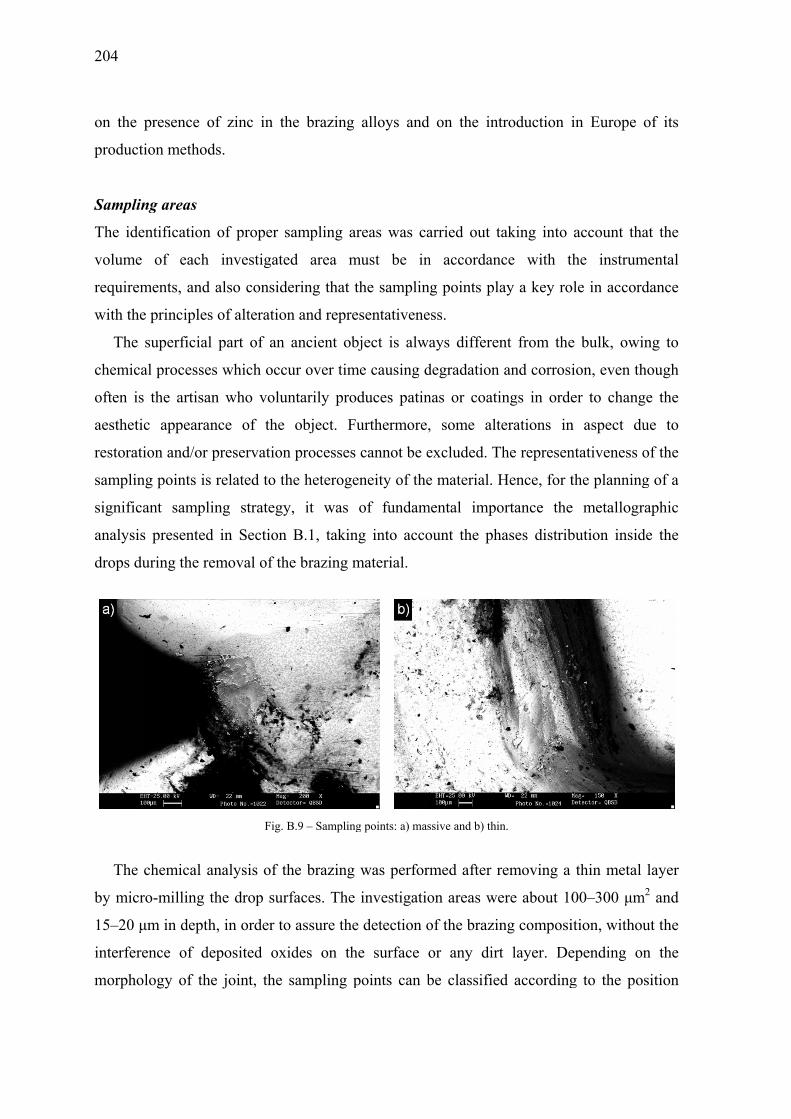
204
on the
product
Samplin
The ide
volume
requirem
with the
The
chemica
often is
aestheti
restorati
samplin
significa
analysis
drops du
The
by micr
15–20 μ
interfere
morpho
presence o
tion method
ng areas
entification
of each
ments, and
e principles
superficial
al processes
s the artisan
c appearan
ion and/or p
ng points is
ant samplin
s presented
uring the re
chemical an
ro-milling th
μm in depth
ence of de
ology of the
f zinc in th
ds.
of proper s
investigate
also consid
of alteratio
part of an
s which occ
n who volu
nce of the
preservation
related to th
ng strategy
in Section
emoval of th
Fig.
nalysis of t
he drop sur
h, in order to
eposited ox
e joint, the
he brazing
sampling ar
ed area m
dering that t
on and repre
ancient ob
cur over tim
untarily prod
object. Fu
n processes
he heteroge
y, it was
n B.1, takin
he brazing m
B.9 – Sampling
the brazing
rfaces. The
o assure the
xides on th
sampling p
alloys and
reas was ca
must be in
the samplin
esentativene
bject is alw
me causing d
duces patin
urthermore,
cannot be e
eneity of the
of fundam
ng into acco
material.
g points: a) mas
was perfor
investigatio
e detection o
he surface o
points can b
d on the int
arried out t
n accordan
ng points pla
ess.
ays differen
degradation
nas or coati
, some alt
excluded. T
e material. H
mental impo
ount the ph
ssive and b) thin
rmed after r
on areas we
of the brazin
or any dirt
be classified
troduction i
taking into
nce with th
ay a key ro
nt from the
and corrosi
ings in orde
terations in
The represen
Hence, for t
ortance the
hases distrib
n.
removing a
ere about 10
ng composi
t layer. De
d according
in Europe
account tha
he instrum
ole in accord
e bulk, owi
ion, even th
er to chang
n aspect du
ntativeness o
the planning
e metallogr
bution insid
thin metal
00–300 μm
ition, withou
epending on
g to the po
of its
at the
mental
dance
ng to
hough
ge the
ue to
of the
g of a
raphic
de the
layer
m2 and
ut the
n the
sition
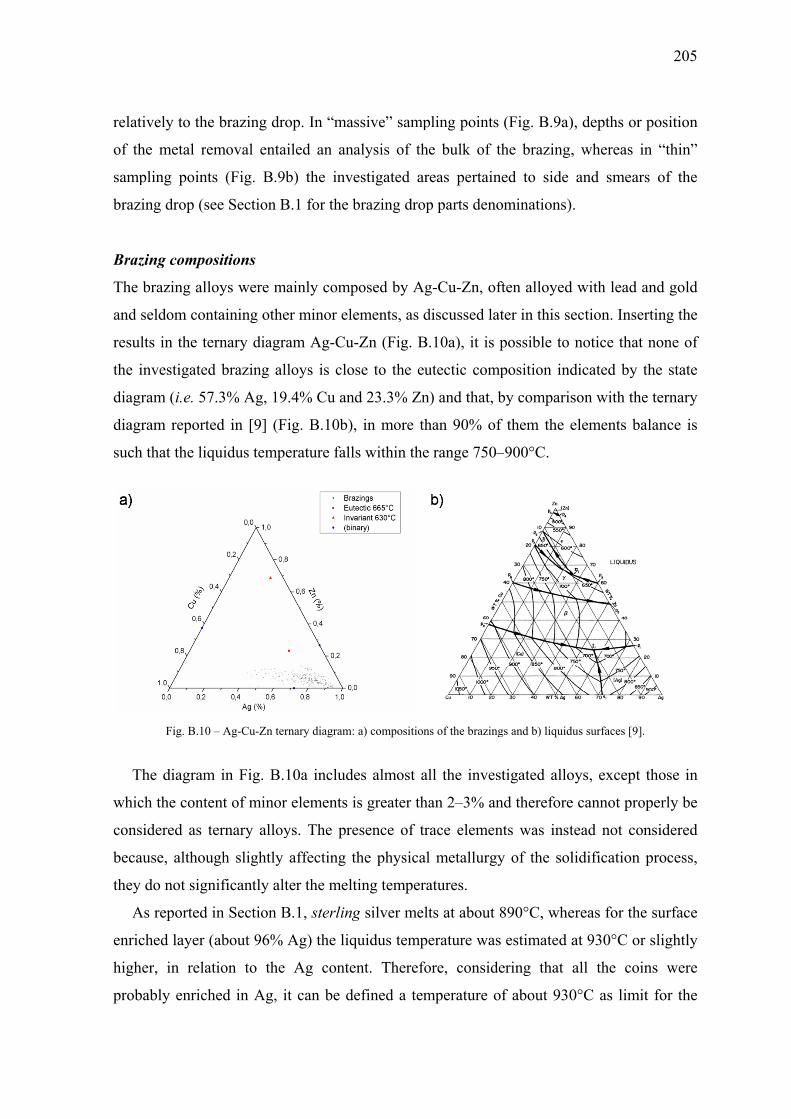
relati
of th
samp
brazi
Braz
The b
and s
resul
the i
diagr
diagr
such
Th
whic
consi
becau
they
A
enric
highe
prob
ively to the
he metal rem
pling points
ing drop (se
zing compos
brazing allo
seldom cont
lts in the ter
nvestigated
ram (i.e. 57
ram reporte
that the liq
Fig. B.10 –
he diagram
ch the conte
idered as te
use, althoug
do not sign
As reported i
ched layer (
er, in relat
ably enrich
brazing dro
moval enta
s (Fig. B.9b
ee Section B
sitions
oys were m
taining othe
rnary diagr
d brazing al
.3% Ag, 19
ed in [9] (F
quidus tempe
– Ag-Cu-Zn ter
m in Fig. B.
nt of minor
ernary alloy
gh slightly
nificantly alt
in Section B
about 96%
tion to the
hed in Ag, i
op. In “mas
ailed an ana
b) the inve
B.1 for the b
mainly comp
er minor ele
am Ag-Cu-
lloys is clos
9.4% Cu and
Fig. B.10b),
erature falls
rnary diagram:
10a include
r elements is
ys. The pre
affecting th
ter the melt
B.1, sterling
Ag) the liqu
Ag conten
it can be de
ssive” samp
alysis of the
estigated ar
brazing drop
posed by Ag
ements, as d
-Zn (Fig. B
se to the eu
d 23.3% Zn
in more th
s within the
a) composition
es almost al
s greater tha
esence of tr
he physical
ing tempera
g silver melt
uidus tempe
nt. Therefo
efined a tem
pling points
e bulk of t
reas pertain
p parts deno
g-Cu-Zn, of
discussed lat
.10a), it is p
utectic comp
n) and that, b
han 90% of
range 750–
ns of the brazing
ll the inves
an 2–3% an
race elemen
l metallurgy
atures.
ts at about 8
erature was
ore, conside
mperature o
(Fig. B.9a)
the brazing,
ned to side
ominations)
ften alloyed
ter in this se
possible to
position ind
by comparis
f them the e
–900°C.
gs and b) liquid
stigated allo
nd therefore
nts was inst
y of the sol
890°C, whe
s estimated a
ering that
of about 930
), depths or
, whereas i
and smear
.
d with lead a
ection. Inse
notice that
dicated by t
son with the
elements ba
dus surfaces [9].
oys, except
e cannot pro
tead not co
lidification
ereas for the
at 930°C or
all the coi
0°C as limi
205
position
in “thin”
rs of the
and gold
erting the
none of
the state
e ternary
alance is
.
those in
operly be
nsidered
process,
e surface
r slightly
ns were
t for the
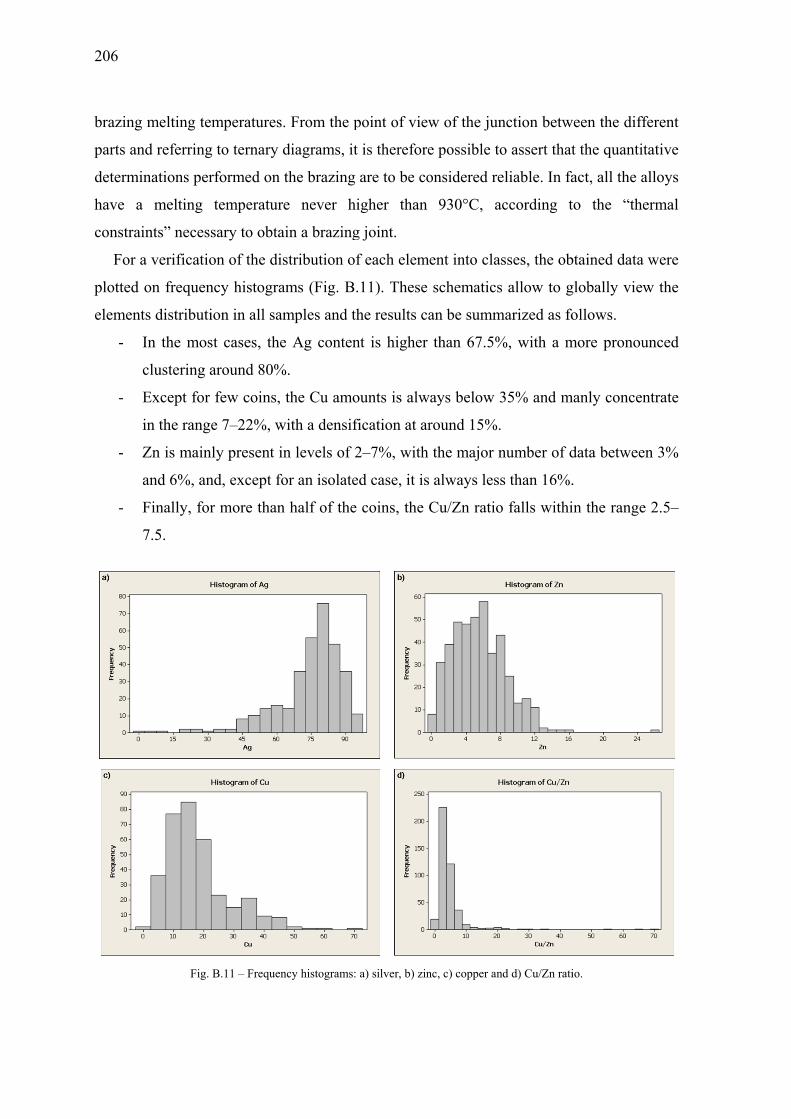
206
brazing
parts an
determi
have a
constrai
For a
plotted
element
- I
c
- E
i
- Z
a
- F
7
melting tem
nd referring
nations perf
melting t
ints” necess
a verificatio
on frequenc
ts distributio
In the most
clustering a
Except for
in the range
Zn is mainl
and 6%, and
Finally, for
7.5.
Fig. B
mperatures.
to ternary d
formed on t
temperature
sary to obtai
on of the dis
cy histogram
on in all sam
t cases, the
around 80%
few coins, t
e 7–22%, w
ly present in
d, except fo
r more than
B.11 – Frequen
From the p
diagrams, it
the brazing
e never hi
in a brazing
stribution of
ms (Fig. B.
mples and th
e Ag conten
%.
the Cu amo
with a densif
n levels of 2
or an isolate
half of the
ncy histograms:
point of view
t is therefore
are to be co
igher than
g joint.
f each elem
.11). These
he results ca
nt is higher
ounts is alw
fication at ar
2–7%, with
ed case, it is
coins, the
a) silver, b) zin
w of the jun
e possible to
onsidered re
930°C, a
ment into cla
schematics
an be summ
than 67.5%
ways below 3
round 15%.
the major n
always less
Cu/Zn ratio
nc, c) copper an
nction betw
o assert that
eliable. In fa
according t
sses, the ob
s allow to g
marized as fo
%, with a m
35% and m
.
number of d
s than 16%.
o falls withi
nd d) Cu/Zn rati
ween the diff
t the quantit
act, all the a
to the “the
btained data
globally view
ollows.
more pronou
manly concen
data betwee
.
in the range
io.
ferent
tative
alloys
ermal
a were
w the
unced
ntrate
en 3%
e 2.5–
207
Content of zinc
The analyses pointed out that zinc is always present in all the investigated brazing drops
and, as can be seen from the frequency histograms, its amount in the alloys is always less
than 16%. The phenomenon of zinc segregation and its distribution within the different
phases in the brazing microstructure is discussed in Section B.1 and, as above mentioned,
it is possible to assert that the obtained results are more or less representative of the bulk
brazing composition, in relation to the specific sampling area. If the investigated area
pertains to a “massive” sampling point (Fig. B.9a), the detected Zn amount is an
underestimation of the bulk zinc content, whereas if the metal is removed from a thinner
area (Fig. B.9b), the Zn amount corresponds to that of the bulk composition.
Moreover, it must be considered that the high volatility of zinc can cause a reduction of
its amount in those parts of the brazing drop which are in contact with the environment.
This depletion in zinc, especially in correspondence of brazing sides and smears, can lead
to an underestimation of the true zinc content whenever the removed metal layer was not
of appropriate thickness, i.e. when the oxide layers were not totally removed. This fact is
confirmed by a comparison between the analyses performed before and after the micro-
milling operations, and from which the detected zinc content was found to be increased by
at least 5 percentage points after the material removal (Table B.4).
Table B.4 – Brazing compositions after and before micro-milling [wt.%].
Coin number Brazing state Ag Cu Zn
187
as-received 87.5 6.6 5.9
oxides (as-received) AgO-CuO-ZnO 86.4 7.1 6.5
milled 69.9 19.4 10.7
217
as-received 92.5 6.9 0.6
oxides (as-received) AgO-CuO-ZnO 91.8 7.5 0.7
milled 77.1 16.9 5.9
243
as-received 91.8 7.5 1.7
oxides (as-received) AgO-CuO-ZnO 91.1 7.1 1.8
milled 74.1 17.5 8.4
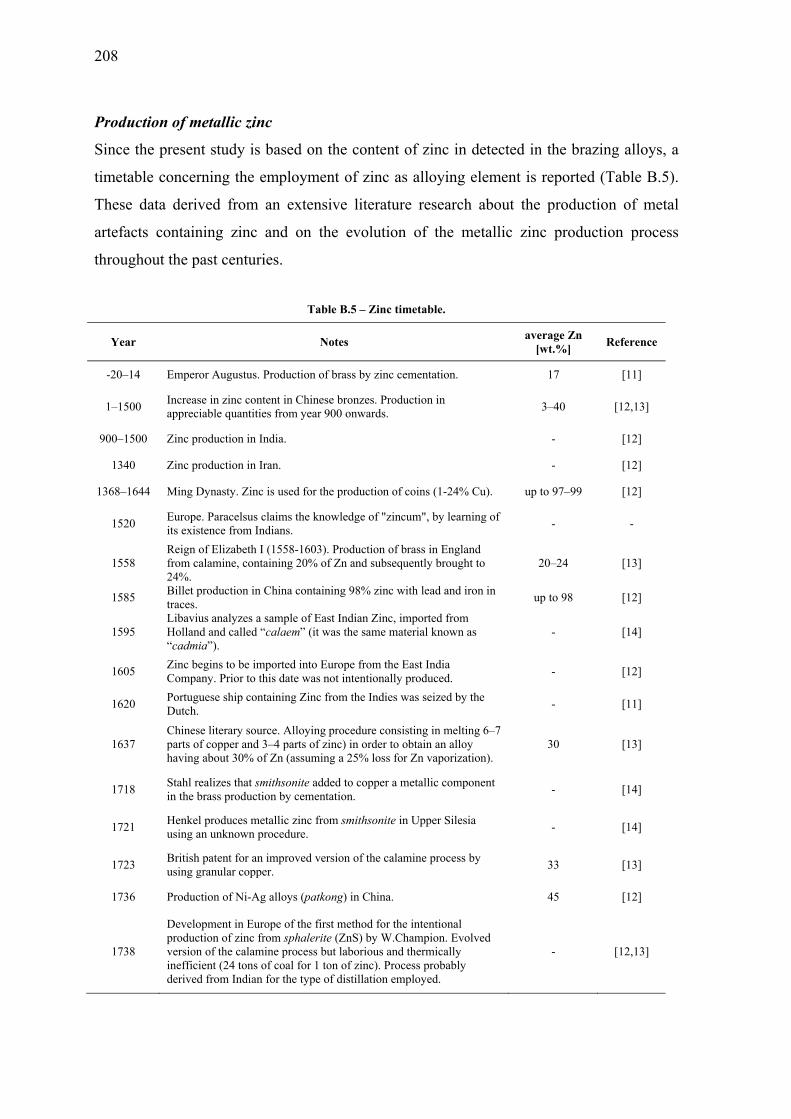
208
Production of metallic zinc
Since the present study is based on the content of zinc in detected in the brazing alloys, a
timetable concerning the employment of zinc as alloying element is reported (Table B.5).
These data derived from an extensive literature research about the production of metal
artefacts containing zinc and on the evolution of the metallic zinc production process
throughout the past centuries.
Table B.5 – Zinc timetable.
Year Notes average Zn [wt.%] Reference
-20–14 Emperor Augustus. Production of brass by zinc cementation. 17 [11]
1–1500 Increase in zinc content in Chinese bronzes. Production in appreciable quantities from year 900 onwards. 3–40 [12,13]
900–1500 Zinc production in India. - [12]
1340 Zinc production in Iran. - [12]
1368–1644 Ming Dynasty. Zinc is used for the production of coins (1-24% Cu). up to 97–99 [12]
1520 Europe. Paracelsus claims the knowledge of "zincum", by learning of its existence from Indians. - -
1558 Reign of Elizabeth I (1558-1603). Production of brass in England from calamine, containing 20% of Zn and subsequently brought to 24%.
20–24 [13]
1585 Billet production in China containing 98% zinc with lead and iron in traces. up to 98 [12]
1595 Libavius analyzes a sample of East Indian Zinc, imported from Holland and called “calaem” (it was the same material known as “cadmia”).
- [14]
1605 Zinc begins to be imported into Europe from the East India Company. Prior to this date was not intentionally produced. - [12]
1620 Portuguese ship containing Zinc from the Indies was seized by the Dutch. - [11]
1637 Chinese literary source. Alloying procedure consisting in melting 6–7 parts of copper and 3–4 parts of zinc) in order to obtain an alloy having about 30% of Zn (assuming a 25% loss for Zn vaporization).
30 [13]
1718 Stahl realizes that smithsonite added to copper a metallic component in the brass production by cementation. - [14]
1721 Henkel produces metallic zinc from smithsonite in Upper Silesia using an unknown procedure. - [14]
1723 British patent for an improved version of the calamine process by using granular copper. 33 [13]
1736 Production of Ni-Ag alloys (patkong) in China. 45 [12]
1738
Development in Europe of the first method for the intentional production of zinc from sphalerite (ZnS) by W.Champion. Evolved version of the calamine process but laborious and thermically inefficient (24 tons of coal for 1 ton of zinc). Process probably derived from Indian for the type of distillation employed.
- [12,13]
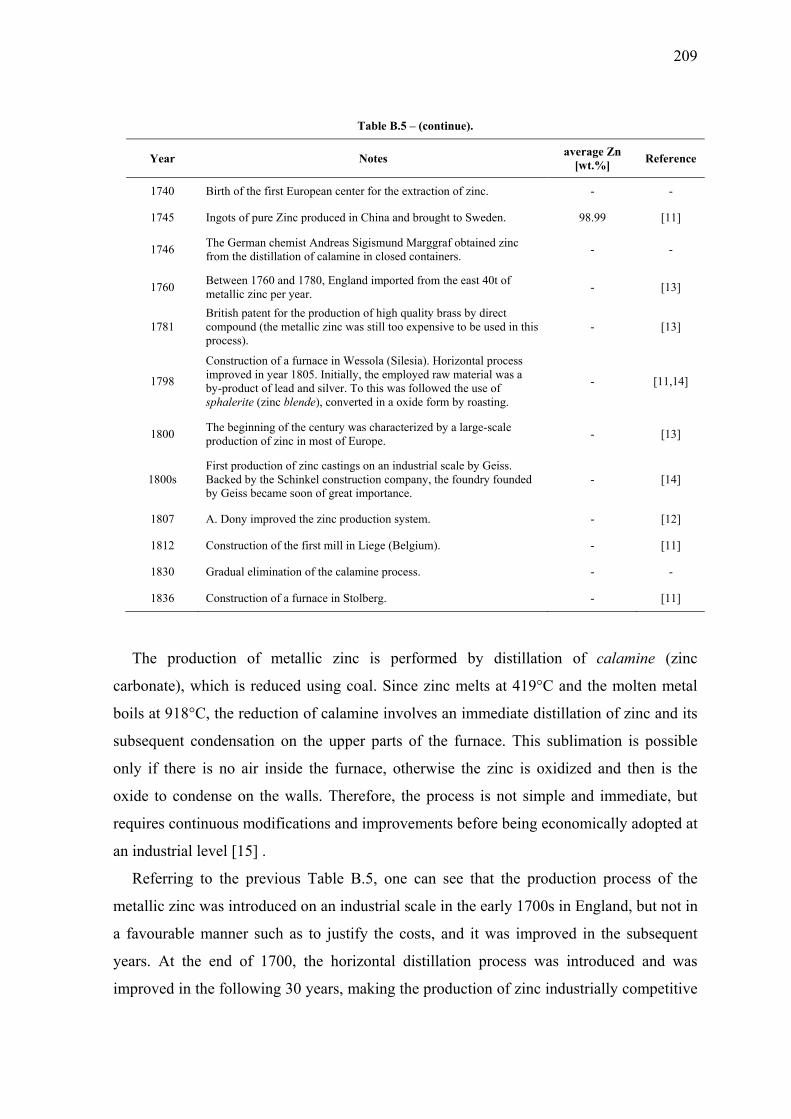
209
Table B.5 – (continue).
Year Notes average Zn [wt.%] Reference
1740 Birth of the first European center for the extraction of zinc. - -
1745 Ingots of pure Zinc produced in China and brought to Sweden. 98.99 [11]
1746 The German chemist Andreas Sigismund Marggraf obtained zinc from the distillation of calamine in closed containers. - -
1760 Between 1760 and 1780, England imported from the east 40t of metallic zinc per year. - [13]
1781 British patent for the production of high quality brass by direct compound (the metallic zinc was still too expensive to be used in this process).
- [13]
1798 Construction of a furnace in Wessola (Silesia). Horizontal process improved in year 1805. Initially, the employed raw material was a by-product of lead and silver. To this was followed the use of sphalerite (zinc blende), converted in a oxide form by roasting.
- [11,14]
1800 The beginning of the century was characterized by a large-scale production of zinc in most of Europe. - [13]
1800s First production of zinc castings on an industrial scale by Geiss. Backed by the Schinkel construction company, the foundry founded by Geiss became soon of great importance.
- [14]
1807 A. Dony improved the zinc production system. - [12]
1812 Construction of the first mill in Liege (Belgium). - [11]
1830 Gradual elimination of the calamine process. - -
1836 Construction of a furnace in Stolberg. - [11]
The production of metallic zinc is performed by distillation of calamine (zinc
carbonate), which is reduced using coal. Since zinc melts at 419°C and the molten metal
boils at 918°C, the reduction of calamine involves an immediate distillation of zinc and its
subsequent condensation on the upper parts of the furnace. This sublimation is possible
only if there is no air inside the furnace, otherwise the zinc is oxidized and then is the
oxide to condense on the walls. Therefore, the process is not simple and immediate, but
requires continuous modifications and improvements before being economically adopted at
an industrial level [15] .
Referring to the previous Table B.5, one can see that the production process of the
metallic zinc was introduced on an industrial scale in the early 1700s in England, but not in
a favourable manner such as to justify the costs, and it was improved in the subsequent
years. At the end of 1700, the horizontal distillation process was introduced and was
improved in the following 30 years, making the production of zinc industrially competitive
210
and only after 1810. In fact, although the metal was widely known and imported from
China by some European nations, the spread of the metallic zinc in Europe on a large scale
can be dated to a period subsequent to 1810, since in the previous years the manufacturing
process was probably still too expensive and not industrially competitive. However, is not
to be excluded that the process could be developed for artisanal productions, using the new
metal as alloying element for brazing pastes and sold at high cost.
Following its introduction in Europe in the early 1600s, zinc was employed as metallic
element in brazing alloys, although not accessible to most people. As a matter of fact, in
the late 17st century the word braze acquired the meaning of “welding using a copper-zinc
alloy” [16] and around the middle of the 18th century there were several attempts in France
to use it in place of tin in order to protect iron objects.
Volatility of zinc
Zinc is a transition metal of group 12 and, such as cadmium and mercury, is characterized
by a low melting point and a low boiling temperature, due to the bonds weakness in the 4s
orbital. Hence, the volatility of this element is not negligible, even at room temperature.
This is confirmed by the analyses before and after the metal removal from the brazing
drop, revealing a zinc content in the first layers substantially lower than the real one.
An accurate thermodynamic analysis on the volatility of this element can be made by
considering that the partial pressure of solid and liquid zinc at the melting point is low
(2·10-4 atm at 419°C). However, this value is high enough to ensure that complete
evaporation or sublimation can be effectively reached at temperatures close to the melting
point and at a relatively modest degree of vacuum. The vapor pressure of liquid zinc
increases rapidly with temperature, reaching the value of 1 atm at 907°C, the zinc boiling
point [11] and the theoretical evaporation rate can be predicted from the kinetic theory of
gases (Langmuir equation). Therefore, knowing parameters such as process temperature,
crucibles size and heating time, it is possible to obtain an estimation of the zinc loss rate
for vaporization.
Re-melting of brasses
For the production of the brazing alloys, one hypothesis could take into account the re-
melting of brasses, in order to balance the composition. Regardless a deeper analysis
211
considering the thermodynamic theory, it is possible to notice that the melting temperature
of the most common brasses is always higher than 920°C, i.e. the zinc boiling temperature,
causing a high loss of the metal in the re-melting process, since vaporization already starts
at 420°C, the zinc melting temperature.
However, the obtainment of the brazing alloys by brasses re-melting seems to be not
realistic. In fact, considering a range of brasses Cu-Zn of variable composition (from 70–
85% Cu and 30–15% Zn) and assuming a zinc loss for vaporization of about 25%, the
resulting Ag-Cu-Zn alloys, having a percentage of silver within the range of interest (i.e.
65–85%), should possess a Cu/Zn ratio between 9 and 22, which is satisfied only by 20
alloys on over 520 analyzed. Therefore, these results lead to reasonably exclude the
possibility of a systematic re-melting of brass artefacts in order to produce the investigated
brazing alloys, although this type of practice is not to be completely excluded, since if it
happened in a small part there are no ways to know it.
Presence of other elements
Several alloys contain important percentages of other elements and, therefore, are no more
to be consider as pure ternary Ag-Cu-Zn alloys. However, some considerations on the
origin of these elements must be done since, in some cases, they may have been
intentionally added by the artisans to fulfill technical or aesthetic requirements, while in
other cases they must be interpreted as impurities. Concerning this latter case, it must be
considered that impurities are always present in ancient objects, as the manufacturing
techniques did not allow to achieve a narrow control of the composition. Hence, the
presence of high quantities of impurities deriving from the refining methods of silver and
copper is rather expected, and may be originated from processing waste placed in the
crucible during the alloying; in some alloys, the impurities level reaches the 10–15%.
Lead
This was the most diffuse element; in most cases it was present in traces or percentages
around 2.5–4%, although in some specimens amounts between 5% and 14% were detected.
Small percentages of Pb can be related to the process employed for the silver separation
from the argentiferous lead galena (Pb,Ag)S [17], because the silver obtained by
cupellation process would be characterized by a residual lead between around 0.05–2.5%
212
[18]. On the contrary, massive percentages denote a voluntary addition, justified by the fact
that this element allows a lowering of the melting temperature.
Moreover, it should be pointed out that identification and quantification of lead is not
trivial, since the principal peak corresponding to the PbM characteristic radiation overlaps
with one the Ag L-shell, and an overestimation of the element is not to be excluded.
Gold
This element was found only in brazing of golden coins and its presence may be dictated
by a voluntary addition, in order to maintain a certain continuity of colour.
Mercury
Although it is known that mercury is found in nature as impregnation of different rocks,
generally in small quantities, the presence of 3–5% in some alloys can be associated to the
process of silver extraction by amalgamation. In this ancient process, gold and silver
minerals (suitably shredded) are mixed with mercury, originating an amalgam; the precious
metals are then extracted by heating the amalgam, which sublimated mercury. This
method, in use since 1550, was abandoned in the late 1800 and early 1900 and is now
rarely used because of its high cost, low yield and the high toxicity of mercury.
Arsenic
This element, in form of sulphide – realgar (As4S4) and orpiment (As2S3) – can be
generally found in nature as associated with other metals sulphides, and appeared as an
alloys constituent since ancient times. Arsenic was normally used in ancient brazings, even
if the year of issue of the coin in which the As was detected suggests a voluntary addition
and would lead to a date of the brazing in periods subsequent to 1800. Most likely, the low
arsenic percentages can be addressed to the extraction of either silver from proustite
(Ag3AsS3) or copper from enargite (Cu3AsS4).
Nickel
This element was detected in one case, and its high amount (11.5%) leads to exclude a
modern brazing alloy, in which Ni is generally maintained less than 5% if present in the
alloy with copper. Given the low percentage of silver detected in the alloy (10.5%), it is

213
reasonable to think that Ni was employed to save the precious metal, without sacrificing
the colour continuity; nickel, in fact, has the property of almost completely whiten the
copper, obtaining a metallic gray colour.
Iron
In one sample, Fe was detected in association with Ni; such coexistence could be explained
with the use by the silversmith minerals containing both Fe and Ni , such as bravoite
(Fe,Ni)S2, a gray-silvery variety of pyrite.
In the other samples where iron was detected, its presence can be related to the extraction
of copper from chalcopyrite (CuFeS2) or from bornite (Cu5FeS4) which, together with
chalcocite (Cu2S), are the most important among the many copper ores [19].
Aluminium
The presence in traces of this element may be due to the leaching process (solid-liquid
extraction) for the silver separation, consisting in treating the milled minerals (only native
metal or silver chloride) with sodium cyanide and recovering the metallic silver by
reduction with metallic zinc or aluminium. A similar process, replacing the amalgam
method, was introduced in 1800 by using sodium thiosulfate instead of cyanide, but it was
soon abandoned.
Other elements
The presence of elements such as Magnesium and Silicon is not directly correlated to the
extractive metallurgy of the principal elements employed in the brazing alloy realization
and can be explained by the custom of re-melt objects, in order to meet the needs of
material in absence of a strict control of the obtained alloy. Moreover, the use of silica-
based fluxes during the alloy preparation is not to be excluded.
Conclusions
The coins were divided into the three main categories previously introduced (Coins/C/M)
but, despite the differences in chemical composition, no evidences of any peculiarities
characterizing a particular subdivision in macro-class were revealed.

214
Regarding the compositions, the results did not reveal any correlation in the investigated
alloys and also a chronological order based on the year of the coins mint did not give
useful information about any grouping of similar alloys. The analyses evidenced that the
brazing period cannot be traced only by the elemental composition of the alloys because
artisans often used to re-melt objects, without any effective control on the brazing alloy.
Hence, a further grouping based on aesthetical features of the pegs is necessary – and is
still under development – probably allowing the identification of different groups of
artisans. Moreover, to extend these results, it may be also necessary to know what were the
most common brazing alloys used in the past, how were prepared (metals and minerals
most frequently used, melting methods, temperatures reached in the crucibles, etc.) and the
brazing methods; unfortunately, such information are not easily available, since belonged
to the artisans know-how.
Considering the emerged results and the previously reported timetable, the detected zinc
suggests that such element has been intentionally introduced in the brazing alloys. Its
volatility excludes the possibility of brass artefacts re-melting, also because these objects
were considered to be of a certain value and therefore not suitable for metal scraps usage.
Moreover, the detected amounts revealed that the accidental addition of zinc, associated to
ores at which the element is naturally bonded (lead, silver, iron and copper ores), is not a
reliable hypothesis. Thus, if the zinc was voluntary added, the brazing alloys should
definitely dated post 1810, year when the zinc production process was advantageously
introduced in Europe; in fact, in the previous years, the metal was too expensive for a large
scale production of brazed medallions and its manufacturing process was still not suitable
for a spread in an industrial scale.
REFERENCES
[1] I. Calliari, M. Magrini, A. Zambon, P. Guerriero, R. Martini. X-Ray Spectrom 28 (1999) 86. [2] N. Civici, S. Gjongecaj, F. Stamati, T. Dilo, E. Pavlidou, E. Polychroniadis. Nucl Instrum Meth B 258
(2007) 414. [3] L. Beck, S. Bosonnet, S. Reveillon, D. Eliot and F. Pilon: Nucl Instrum Meth B 226 (2004) 153. [4] D. A. Scott.. Metallography and Microstructure of Ancient and historic Metals. The Getty
Conservation Institute (1999).
215
[5] L. H. Cope. Methods of Chemical and Metallurgical Investigation of Ancient Coinage. E. T. Hall, RNS Special Publication (1972).
[6] S. La Niece and P. Craddock. Metal Plating and Platination. Butterworth-Heinemann Ltd, London, (1993).
[7] C. Crisafulli. Uomini e Tecnologie monetarie: la visita di Du Bois alla Zecca di Venezia, in A. Saccocci (Eds) Inspecto nummo. Esedra, Padova, Italy (2001).
[8] A. Finetti. Numismatica e tecnologia. La nuova Italia Scientifica, Roma, Italy (1987). [9] Y. A. Chang, D. Goldberg and J. P. Neumann. J Phys Chem Ref Data 6 (1977) 669. [10] Materials Science International Team (MSIT®). Numerical Data and Functional Relationship in
Science and Technology, Group IV: Physical Chemistry, Vol. 11: Ternary Alloy Systems, Subvol. C: Non-Ferrous Metal Systems, Part 3: Selected Soldering and Brazing Systems. G. Effenberg and S. Ilyenko, The Landolt-Börnstein series, Springer (2007).
[11] C. H. Mathewson. Zinc: the science and technology of the metal, its alloys and compounds. Hafner Publishing Company (1970).
[12] R. F. Tylecote. A history of metallurgy. Maney Publishing, London, England (2002). [13] A. M. Pollard and C. Heron. Archaeological Chemistry. The Royal Society of Chemistry, Cambridge,
England (1996). [14] F. Habashi. Handbook of extractive metallurgy. Wiley-VCH, Heidelberg, Germany (1997). [15] R. J. Forbes. Metallurgy in antiquity: a notebook for archaeologists and technologists. Leiden, Brill
(1950). [16] D. M. Jacobson and G. Humpston. Principles of Brazing. ASM International (2005). [17] G. Artioli. Scientific Methods and Cultural Heritage: An Introduction to the Application of Materials
Science to Archaeometry and Conservation Science. Oxford University Press, USA (2010). [18] C. Giardino. I metalli nel mondo antico: introduzione all’archeometallurgia. Laterza, Roma, Italy
(1998). [19] C. Klein. Mineralogia. Zanichelli, Bologna, Italy (2004).

216
217
APPENDIX C
List of publications
Published papers
BREDA M, Calliari I, Ramous E, Pizzo M, Corain L, Straffelini G (2013). Ductile-to-
brittle transition in a Zeron®100 SDSS in wrought and aged conditions. Materials Science
and Engineering A – Structural Materials: Properties, microstructure and processing, vol.
585, pp. 57–65.
Calliari I, Bassani P, Brunelli K, BREDA M, Ramous E (2013). Effect of Continuous
Cooling on Secondary Phase Precipitation in the Super Duplex Stainless Steel ZERON-
100. Journal of Materials Engineering and Performance, vol. 22, issue 12, pp. 3860–3866.
Bassani P, BREDA M, Brunelli K, Mészáros I, Passaretti F, Zanellato M, Calliari I (2013).
Characterization of a Cold-Rolled 2101 Lean Duplex Stainless Steel. Microscopy and
Microanalysis, vol. 19, pp. 988–995, ISSN.
Calliari I, BREDA M, Ramous E, Brunelli K, Pizzo M, Menapace C (2012). Impact
Toughness of an Isothermally Treated Zeron®100 SDSS. Journal of Materials Engineering
and Performance, vol. 21, issue 10, pp. 2117–2123.
Miranda Pérez A F, Calliari I, Ramous E, BREDA M (2012). Trattamenti di ricottura
dell'acciaio inossidabile duplex 2205 dopo deformazione plastica. La Metallurgia Italiana,
vol. 5 (2012), p. 13–17.
218
BREDA M, Canovaro C, Miranda Pérez A F and Calliari I (2012). From Coin to Medal: a
Metallurgical Study of the Brazing Drop on a 19th Century Scudo. Journal of Metals,
Minerals and Materials Society, vol. 64, pp. 1350–1355.
Canovaro C, BREDA M, Miranda Pérez AF, Vajna E, Calliari I (2013). Da moneta a
medaglia: caratterizzazione metallografica di uno scudo romano del XIX secolo. La
Metallurgia Italiana, vol. 10 (2013), pp.41–47.
Conference Proceedings
BREDA M, Calliari I, Frigo M, Pellizzari M, Ramous E (2013). Precipitazione di fasi
secondarie in acciai Lean Duplex a seguito di trattamenti isotermici. In: 24° Convegno
Nazionale Trattamenti Termici. Associazione Italiana Metallurgia, Piacenza (IT), October
2013.
BREDA M, Pezzato L, Pizzo M, Mészáros I, Calliari I (2013). Effects of Cold Deformation
in Duplex Stainless Steels. In: EUROMAT 2013. Federation of European Materials
Societies, Seville (ES), September 2013.
Calliari I, BREDA M, Straffelini G, Miranda Perez A F, Reyes Valdes F A (2013). Impact
toughness of isothermally treated Duplex Stainless Steels. In: XXII International Materials
Research Congress. Materials Research Society, Cancun (MEX), August 2013.
BREDA M, Pezzato L, Pizzo M, Calliari I (2013). Effetto della deformazione plastica a
freddo sulla resistenza al pitting negli acciai inossidabili Duplex. In: Giornate Nazionali
sulla Corrosione e Protezione – X Edizione. Associazione Italiana di Metallurgia, Neaples
(IT), July 2013.
Calliari I, BREDA M, Ramous E, Straffelini G, Magrini M (2013). Effect of isothermal
heat treatments on Duplex Stainless Steels impact toughness. In: XXII Convegno
Nazionale IGF. Italian Group of Fracture, Rome (IT), July 2013.

219
BREDA M, Pizzo M, Baldan M, Ramous E and Calliari I (2012). Transizione duttile-
fragile in un acciaio inossidabile Super Duplex Zeron®100 in condizioni di fornitura e a
seguito di trattamento isotermico. In: 34° Convegno Nazionale AIM. Associazione Italiana
di Metallurgia, Trento (IT), November 2012.
Ramous E, BREDA M, Miranda Pérez A F, Cardenas J C, Bertelli R (2012). Gli azoturi
negli acciai inossidabili Duplex. In: 34° Convegno Nazionale AIM, Associazione Italiana
di Metallurgia, Trento (IT), November 2012.
Canovaro C, BREDA M, Miranda Pérez A F, Vajna E and Calliari I (2012). Da moneta a
medaglia: caratterizzazione metallografica di uno scudo romano del XIX secolo. In: 34°
Convegno Nazionale AIM, Associazione Italiana di Metallurgia, Trento (IT), November
2012.
Calliari I, BREDA M, Miranda Pérez A F, Ramous E, Bertelli R (2012). Phase
Transformation induced by Heat Treatment in Cold Rolled Duplex Stainless Steels. In:
International Conference & Exhibition on Analysis & Testing of Metallurgical Processes
& Materials. The Chinese Society for Metals, Beijing (RC), October 2012.
Carrasco-González L A, García-Vázquez F, Perez-Medina G Y, Calliari I, BREDA M
(2012). Analysis of Discontinuities Generated by GTAW Process in the Manufactoring of
Hospital Furniture of AISI 304 Stainless Steel. In: 34th International Congress of
Metallurgy and Materials.
Poster presentations
Bassani P., BREDA M, Brunelli K, Mészáros I, Zanellato M and Calliari I (2012).
Characterization of a Cold Rolled 2101 Lean Duplex Stainless Steel. In: EMAS 2012
Electron Probe Microanalysis of Materials Today - Practical Aspects.
220
Submitted papers
Basoni J, Calliari I, BREDA M, Toldo F, Meneghini R. Caratterizzazione meccanica e
microstrutturale di giunti saldati in UNS S32760 per applicazioni Off-Shore. Rivista
Italiana della Saldatura (Accepted, pub. on January-February 2014).
Calliari I, BREDA M, Miranda Pérez A F, Pellizzari M, Ramous E. The Nitrides in Duplex
Stainless Steels. Journal of Materials Science and Technology (Submitted).
BREDA M, Calliari I, Frigo M, Pellizzari M, Ramous E. Secondary phases precipitation in
Low-Ni Duplex Stainless Steels sheets. Journal of Metals, Minerals and Materials Society
(Submitted).

221
AKNOWLEDGMENTS
First of all, I would like to thank my parents for giving me all the necessary to follow my
objectives, Caterina for supporting me every day in all my decisions and lifetime, and my
brother for being always at my side.
A sincere grateful goes to Prof. Irene Calliari and Prof. Emilio Ramous for trust in me and
in my skills and for the great given opportunities in contributing to their research projects;
I am very pleased to have worked with you.
My thoughts also go to all the persons who I found during my Ph.D. training course,
especially my mentor Katya and my lovely colleagues Argelia, Luca, Rodrigo and Silvia,
and all the people of the DII metallurgy group, Max, Giulia, Prof. Dabalà and Prof.
Magrini for their contribution to my research.
Finally, a special thanks goes to my friend Eng. Marco Pizzo (we are on the way!) for
sharing with me its knowledge and for all the collaborations, and to all my friends in
Guizza for the daily things.
I’ve been very lucky to have met you all.