Improving cost estimation in construction projects
10
Full Terms & Conditions of access and use can be found at https://www.tandfonline.com/action/journalInformation?journalCode=tjcm20 International Journal of Construction Management ISSN: (Print) (Online) Journal homepage: https://www.tandfonline.com/loi/tjcm20 Improving cost estimation in construction projects Mohamed Sayed , Mohamed Abdel-Hamid & Karim El-Dash To cite this article: Mohamed Sayed , Mohamed Abdel-Hamid & Karim El-Dash (2020): Improving cost estimation in construction projects, International Journal of Construction Management, DOI: 10.1080/15623599.2020.1853657 To link to this article: https://doi.org/10.1080/15623599.2020.1853657 Published online: 04 Dec 2020. Submit your article to this journal View related articles View Crossmark data
-
Upload
khangminh22 -
Category
Documents
-
view
4 -
download
0
Transcript of Improving cost estimation in construction projects

Full Terms & Conditions of access and use can be found athttps://www.tandfonline.com/action/journalInformation?journalCode=tjcm20
International Journal of Construction Management
ISSN: (Print) (Online) Journal homepage: https://www.tandfonline.com/loi/tjcm20
Improving cost estimation in construction projects
Mohamed Sayed , Mohamed Abdel-Hamid & Karim El-Dash
To cite this article: Mohamed Sayed , Mohamed Abdel-Hamid & Karim El-Dash (2020): Improvingcost estimation in construction projects, International Journal of Construction Management, DOI:10.1080/15623599.2020.1853657
To link to this article: https://doi.org/10.1080/15623599.2020.1853657
Published online: 04 Dec 2020.
Submit your article to this journal
View related articles
View Crossmark data

Improving cost estimation in construction projects
Mohamed Sayed, Mohamed Abdel-Hamid and Karim El-Dash
Civil Engineering Department, Faculty of Engineering at Shobra, Benha University, Egypt
ABSTRACTThe accurate cost estimate is one of the success keys to construction projects. The influence of inaccuratecost estimation on construction projects is critical. There is no consensus among researchers about themost important factors influencing the cost estimate accuracy. The study’s objective is to get an accuratecost estimate because the precise cost estimate keeps all parties focused on delivering the project withinthe budget. This objective is achieved by collecting the influential factors from the literature review andcreating a powerful arithmetical model of cost estimation. Twenty-nine factors were collected by review-ing many researches. A questionnaire was prepared and then was examined by fourteen project manag-ers. Pareto technique was conducted to get the foremost influential factors. Based on the Paretotechnique, the 29 factors were reduced to nine. Then, a powerful arithmetical model was created in thisstudy to get an accurate cost estimate. Finally, fourteen finished projects were selected to be case stud-ies. The cost variance percentages were between 1% and 15% for each case study. By using the model,the estimated contract value of each case study was recalculated and, the cost variance percentageswere between 0.5% and 0.8% for each case study.
KEYWORDSCost estimation;questionnaire;Pareto technique
Introduction
The construction industry is essential within any state’s eco-nomic development (Avinash et al. 2018). In Dec 2019, the con-struction industry represented about 8% of Egypt’s total grossdomestic product. The construction projects are unique becausethey are priced before being constructed (Arif et al. 2015). Thecost estimation process predicts the value of implementing activ-ities to accomplish the construction project’s set objectives withina specific period (Hatamleh et al. 2018). Cost estimation is ameaningful process in the construction industry’s success becausethe cost estimation process is the one sure-fire way to ensure theprojects stay on-budget (Alumbugu et al. 2014).
This study’s main concept is to improve the cost estimation pro-cess in construction projects because this process helps the ownersto make the right decisions towards financing their projects.
The main problem is the influence of inaccurate cost estima-tion on construction projects because the erroneous estimatewould lead to project failure in terms of time, cost (Hatamleh etal. 2018). The overestimated cost results in an extreme tenderprice by the contractor, making the tender unacceptable to theclient (Enshassi et al. 2013). On the other hand, the underesti-mated cost leads to a situation where a contractor incurs lossesand exposes the owner to several problems depending on thecontract type (Avinash et al. 2018).
There are many gaps in the cost estimation process, such asthere is no consensus among researchers about the most import-ant factors influencing the cost estimate accuracy. Also, there isno exact model to get an accurate cost estimate in the construc-tion projects.
The main objective and the importance of this study is to getan accurate cost estimate because the precise cost estimate playsa vital role in the construction project’s success.
Some researchers have clarified the importance of the costestimate accuracy. Qinghua (2019) stated that the precise costestimate helps the decision-makers to finance the projects.Agyekum (2018) said that the accurate cost estimate depends onadequate cost information. The cost estimate could also beimproved if the client identifies the project scope accuratelyfrom the beginning. Hatamleh et al. (2018) explained that thecost estimate is essential to the construction project’s success andshould be considered from the beginning of the project. Enshassiet al. (2013) clarified that the construction project’s successdepends on the cost estimate’s accuracy. According to Matelet al. (2019), accurate cost estimates allow the project managerto control costs effectively. Avinash et al. (2018) stated that aprecise cost estimate has a crucial influence on the contractor’sprofit. Akintoye (2000) mentioned that the cost estimate’s accur-acy might significantly affect the contractor’s ability to competesuccessfully with other contractors. Also, the cost estimate’saccuracy should be based on the detailed project information.
This study discusses the most influential factors affecting thecost estimation process and provides a powerful arithmeticalmodel to calculate the total project’s accurate cost estimate.
Research methodology
The study’s objective is to get an accurate cost estimate, and themain problem is the influence of inaccurate cost estimation onconstruction projects. Hence, this section presents the researchmethodology employed in the clarification and execution ofthis study.
Many previous researches were reviewed to collect costestimation methodologies and collect twenty-nine factors thataffect the cost estimation process’s accuracy. The questionnairetechnique was selected to gather opinions about the foremost
CONTACT Mohamed Sayed [email protected]� 2020 Informa UK Limited, trading as Taylor & Francis Group
INTERNATIONAL JOURNAL OF CONSTRUCTION MANAGEMENThttps://doi.org/10.1080/15623599.2020.1853657

important cost estimation factors from twenty-nine factors. Thequestionnaire form’s contents were based on the previous litera-ture review and consisted of twenty-nine factors investigated byresearchers. Then, the questionnaire was sent to 280 participants,and the total respondents are about 265. The respondents are civilengineers who consist of consultant and contractor engineers.
The Pareto technique is used to analyse all the collected data,allows seeing which 20% of factors cause 80% of the problemsand where efforts should be focused to get the most significantimprovement. This technique shows the foremost influential fac-tors, which are reduced from twenty-nine to nine. The first threefactors are the market’s state, the estimating team’s experiencelevel, and site conditions.
The study provides a powerful arithmetical model, which iscreated to estimate the construction project cost. This model isdeveloped by merging the nine factors inside the model andselecting all techniques and procedures to get an accuratecost estimate.
Fourteen finished construction projects were selected to becase studies to validate the nine factors’ importance and themodel’s effectiveness. These case studies had cost variancebetween the estimated cost and final actual contract value. Thereis a significant relationship between the nine factors and the costvariance reasons for each case study. That’s clarified the import-ance of the nine factors, and the cost estimator must considerthe nine factors while conducting the cost estimation process.On the other hand, the cost variance percentages were between1% and 15% for each case study, but after using the arithmeticalmodel, the case studies’ cost variance percentages are between0.5% and 0.8%. That’s clarified the model’s effectiveness. Hence,the cost estimators should use the study’s model to get the mostaccurate cost estimate for the construction projects.
The study’s results are the nine factors deduced from thePareto technique and the powerful arithmetical model. That’s toget an accurate cost estimate.
The research methodology was chosen with the previoussequence to show how the study’s objective is achieved and toprovide more clarification for the reader. All the previous pointswill be discussed in detail in the following sections.
Literature review
This study is needed to get an accurate cost estimate for con-struction projects. Previous studies and several researches havebeen done to discuss the cost estimate’s precision and the influ-ential factors that affect the cost estimate’s accuracy in the con-struction projects. Azman et al. (2013) presented research toenhance the cost estimate accuracy in Malaysia, selected eighty-three projects as case studies and then, deduced that site condi-tions and cost data are essential factors in preparing accurateestimates. Mahamid (2015) determined forty-one factors affectthe accuracy of cost estimation for construction projects in theWest Bank in Palestine. He deduced that the estimating team’sexperience level is an essential factor in improving constructionprojects’ cost estimate. Odusami and Onukwube (2008) discussedthe factors that influenced the cost estimation process and identi-fied the most influential factors. These factors are the estimatingteam’s experience level and market condition. Hatamleh et al.(2018) mentioned that the equipment’s cost change affects thecost estimate’s accuracy in the construction projects. Qinghua(2019) stated that the estimator must consider the site conditionsbecause they cost overcharge, which might be missed while con-ducting the cost estimation process. Avinash et al. (2018)
clarified that the cost information’s accuracy and reliability playan essential role in increasing the cost estimate precision.
On the other hand, cost estimating methodologies will be dis-cussed in detail to get the best methodology. That’s to use it inthe arithmetical model. The list of factors that affect the costestimation process will also be discussed in detail in the follow-ing sections.
Cost estimating methodologies
There are two cost estimating methodologies; conceptual anddetailed. As the project definition level increases, the estimat-ing method will progress from conceptual methods todetailed methods.
Early-stage cost estimation plays a vital role in backing up theowners’ decision making (Zhi et al. 2014). When the project isfeasible, the owner proceeds by engagement of design firm todescribe the project’s unique requirements and quality of con-struction. The design team will prepare an approximate estimateof the project at this stage (Akintoye 2000). This type of estima-tion is known as a conceptual estimation. After the owner hasinvited contractors to bid, the contractors make their detailedbid estimate. The contractor should present the lowest and themost accurate estimate because he aims to gain the project. Thecontractor should use the detailed cost estimation methodologybecause it is the most precise methodology to get a precise costestimate. The detailed estimation aims to establish the real costof executing the project (Phuwadol 2010). Detailed cost estimat-ing consists of the following seven steps:
� Separating the project into individual work items.� Determining labor, equipment, and material that are
required to execute all work items.� Defining the production rate.� Determining the cost of labor, equipment, and material.� Calculating the total cost for each work item by summing
all work item costs.� Determining taxes, overhead cost, and profit complete
the estimate.� Reviewing by the estimator is also required to determine if
the assembly’s price seems reasonable for the amount ofwork that has to be completed (Phuwadol 2010).
The estimators should depend on the detailed cost estimationmethodology to get an accurate cost estimate, and also, thismethodology is used in the study’s model.
List of factors
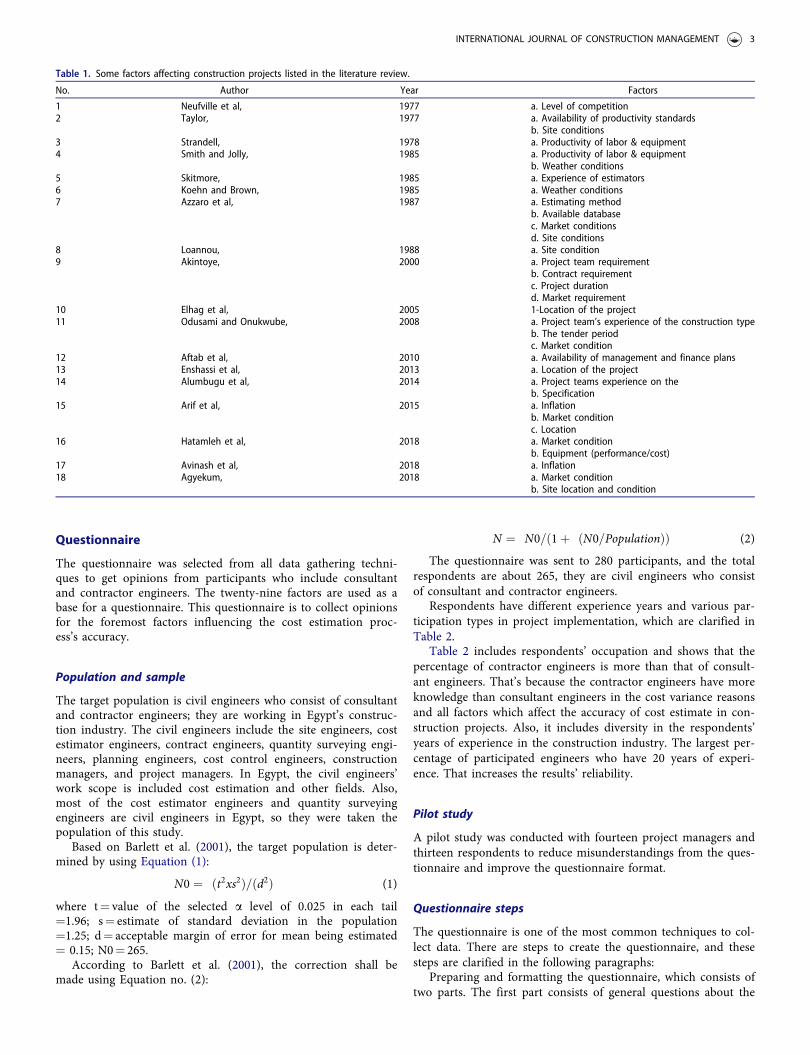
Many studies were performed on the factors influencing theaccuracy of construction projects cost estimate. The researchersused different procedures to define the most influential factorson the cost estimate’s accuracy. Table 1 shows some factorswhich were mentioned in previous literature.
Table 1 includes some factors affecting the cost estimate’saccuracy, the researcher names, and the published research year.
Based on that, twenty-nine factors are collected in Table 3and are divided into three groups. The groups are project char-acteristics, financial issues, and estimation process. That will beclarified in the questionnaire section.
2 M. SAYED ET AL.
Questionnaire
The questionnaire was selected from all data gathering techni-ques to get opinions from participants who include consultantand contractor engineers. The twenty-nine factors are used as abase for a questionnaire. This questionnaire is to collect opinionsfor the foremost factors influencing the cost estimation proc-ess’s accuracy.
Population and sample
The target population is civil engineers who consist of consultantand contractor engineers; they are working in Egypt’s construc-tion industry. The civil engineers include the site engineers, costestimator engineers, contract engineers, quantity surveying engi-neers, planning engineers, cost control engineers, constructionmanagers, and project managers. In Egypt, the civil engineers’work scope is included cost estimation and other fields. Also,most of the cost estimator engineers and quantity surveyingengineers are civil engineers in Egypt, so they were taken thepopulation of this study.
Based on Barlett et al. (2001), the target population is deter-mined by using Equation (1):
N0 ¼ ðt2xs2Þ=ðd2Þ (1)
where t¼ value of the selected a level of 0.025 in each tail¼1.96; s¼ estimate of standard deviation in the population¼1.25; d¼ acceptable margin of error for mean being estimated¼ 0.15; N0¼ 265.
According to Barlett et al. (2001), the correction shall bemade using Equation no. (2):
N ¼ N0=ð1þ ðN0=PopulationÞÞ (2)
The questionnaire was sent to 280 participants, and the totalrespondents are about 265, they are civil engineers who consistof consultant and contractor engineers.
Respondents have different experience years and various par-ticipation types in project implementation, which are clarified inTable 2.
Table 2 includes respondents’ occupation and shows that thepercentage of contractor engineers is more than that of consult-ant engineers. That’s because the contractor engineers have moreknowledge than consultant engineers in the cost variance reasonsand all factors which affect the accuracy of cost estimate in con-struction projects. Also, it includes diversity in the respondents’years of experience in the construction industry. The largest per-centage of participated engineers who have 20 years of experi-ence. That increases the results’ reliability.
Pilot study
A pilot study was conducted with fourteen project managers andthirteen respondents to reduce misunderstandings from the ques-tionnaire and improve the questionnaire format.
Questionnaire steps
The questionnaire is one of the most common techniques to col-lect data. There are steps to create the questionnaire, and thesesteps are clarified in the following paragraphs:
Preparing and formatting the questionnaire, which consists oftwo parts. The first part consists of general questions about the
Table 1. Some factors affecting construction projects listed in the literature review.
No. Author Year Factors
1 Neufville et al, 1977 a. Level of competition2 Taylor, 1977 a. Availability of productivity standards
b. Site conditions3 Strandell, 1978 a. Productivity of labor & equipment4 Smith and Jolly, 1985 a. Productivity of labor & equipment
b. Weather conditions5 Skitmore, 1985 a. Experience of estimators6 Koehn and Brown, 1985 a. Weather conditions7 Azzaro et al, 1987 a. Estimating method
b. Available databasec. Market conditionsd. Site conditions
8 Loannou, 1988 a. Site condition9 Akintoye, 2000 a. Project team requirement
b. Contract requirementc. Project durationd. Market requirement
10 Elhag et al, 2005 1-Location of the project11 Odusami and Onukwube, 2008 a. Project team’s experience of the construction type
b. The tender periodc. Market condition
12 Aftab et al, 2010 a. Availability of management and finance plans13 Enshassi et al, 2013 a. Location of the project14 Alumbugu et al, 2014 a. Project teams experience on the
b. Specification15 Arif et al, 2015 a. Inflation
b. Market conditionc. Location
16 Hatamleh et al, 2018 a. Market conditionb. Equipment (performance/cost)
17 Avinash et al, 2018 a. Inflation18 Agyekum, 2018 a. Market condition
b. Site location and condition
INTERNATIONAL JOURNAL OF CONSTRUCTION MANAGEMENT 3
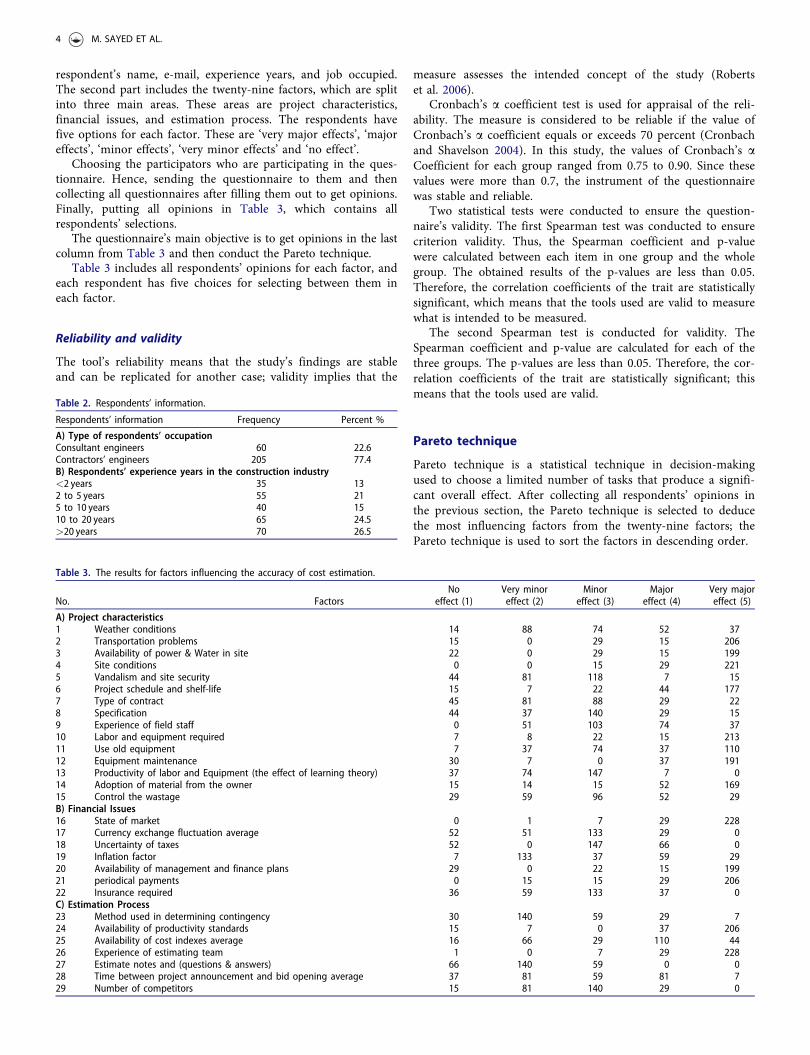
respondent’s name, e-mail, experience years, and job occupied.The second part includes the twenty-nine factors, which are splitinto three main areas. These areas are project characteristics,financial issues, and estimation process. The respondents havefive options for each factor. These are ‘very major effects’, ‘majoreffects’, ‘minor effects’, ‘very minor effects’ and ‘no effect’.
Choosing the participators who are participating in the ques-tionnaire. Hence, sending the questionnaire to them and thencollecting all questionnaires after filling them out to get opinions.Finally, putting all opinions in Table 3, which contains allrespondents’ selections.
The questionnaire’s main objective is to get opinions in the lastcolumn from Table 3 and then conduct the Pareto technique.
Table 3 includes all respondents’ opinions for each factor, andeach respondent has five choices for selecting between them ineach factor.
Reliability and validity
The tool’s reliability means that the study’s findings are stableand can be replicated for another case; validity implies that the
measure assesses the intended concept of the study (Robertset al. 2006).
Cronbach’s a coefficient test is used for appraisal of the reli-ability. The measure is considered to be reliable if the value ofCronbach’s a coefficient equals or exceeds 70 percent (Cronbachand Shavelson 2004). In this study, the values of Cronbach’s aCoefficient for each group ranged from 0.75 to 0.90. Since thesevalues were more than 0.7, the instrument of the questionnairewas stable and reliable.
Two statistical tests were conducted to ensure the question-naire’s validity. The first Spearman test was conducted to ensurecriterion validity. Thus, the Spearman coefficient and p-valuewere calculated between each item in one group and the wholegroup. The obtained results of the p-values are less than 0.05.Therefore, the correlation coefficients of the trait are statisticallysignificant, which means that the tools used are valid to measurewhat is intended to be measured.
The second Spearman test is conducted for validity. TheSpearman coefficient and p-value are calculated for each of thethree groups. The p-values are less than 0.05. Therefore, the cor-relation coefficients of the trait are statistically significant; thismeans that the tools used are valid.
Pareto technique
Pareto technique is a statistical technique in decision-makingused to choose a limited number of tasks that produce a signifi-cant overall effect. After collecting all respondents’ opinions inthe previous section, the Pareto technique is selected to deducethe most influencing factors from the twenty-nine factors; thePareto technique is used to sort the factors in descending order.
Table 3. The results for factors influencing the accuracy of cost estimation.
No. FactorsNo
effect (1)Very minoreffect (2)
Minoreffect (3)
Majoreffect (4)
Very majoreffect (5)
A) Project characteristics1 Weather conditions 14 88 74 52 372 Transportation problems 15 0 29 15 2063 Availability of power & Water in site 22 0 29 15 1994 Site conditions 0 0 15 29 2215 Vandalism and site security 44 81 118 7 156 Project schedule and shelf-life 15 7 22 44 1777 Type of contract 45 81 88 29 228 Specification 44 37 140 29 159 Experience of field staff 0 51 103 74 3710 Labor and equipment required 7 8 22 15 21311 Use old equipment 7 37 74 37 11012 Equipment maintenance 30 7 0 37 19113 Productivity of labor and Equipment (the effect of learning theory) 37 74 147 7 014 Adoption of material from the owner 15 14 15 52 16915 Control the wastage 29 59 96 52 29B) Financial Issues16 State of market 0 1 7 29 22817 Currency exchange fluctuation average 52 51 133 29 018 Uncertainty of taxes 52 0 147 66 019 Inflation factor 7 133 37 59 2920 Availability of management and finance plans 29 0 22 15 19921 periodical payments 0 15 15 29 20622 Insurance required 36 59 133 37 0C) Estimation Process23 Method used in determining contingency 30 140 59 29 724 Availability of productivity standards 15 7 0 37 20625 Availability of cost indexes average 16 66 29 110 4426 Experience of estimating team 1 0 7 29 22827 Estimate notes and (questions & answers) 66 140 59 0 028 Time between project announcement and bid opening average 37 81 59 81 729 Number of competitors 15 81 140 29 0
Table 2. Respondents’ information.
Respondents’ information Frequency Percent %
A) Type of respondents’ occupationConsultant engineers 60 22.6Contractors’ engineers 205 77.4B) Respondents’ experience years in the construction industry<2 years 35 132 to 5 years 55 215 to 10 years 40 1510 to 20 years 65 24.5>20 years 70 26.5
4 M. SAYED ET AL.

Pareto calculations
The last column in Table 3 is rearranged in descending orderand then put in Table 4, then calculates the cumulative fre-quency for each factor and then gets the percentage of cumula-tive frequency by dividing each the cumulative frequency valueby the total.
Table 4 shows the cumulative calculation for each factor andthe cumulative percentage by dividing each the cumulative num-ber by the total (2,797) for each factor.
Pareto chart
The value of the Pareto Principle is that it reminds us to focuson 20% of the issues that matter. Identify, and focus on thosethings first, but don’t entirely ignore the remaining 80%.
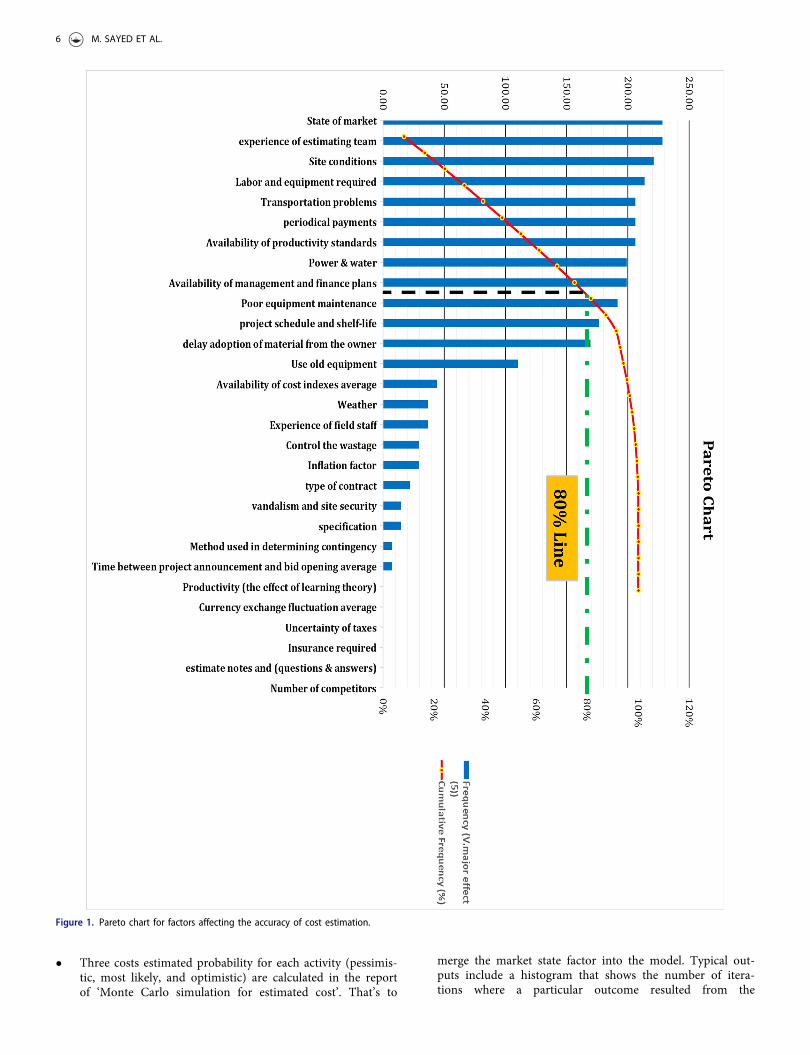
Results from the Pareto technique
As a result of the Pareto technique in Figure 1, the authorsdeduce issues: the first nine factors in Figure 1. Not taking thenine factors into account during the cost estimation processleads to inaccuracy of this process’s results and causing a vari-ance between the estimated cost and the project’s final cost.Then, the impact of these factors will be verified through areview of case studies.
Figure 1 shows the most significant factors, which are the firstnine factors in the chart. The foremost influential factors are: themarket’s state, the estimating team’s experience level, site condi-tions, labor and equipment required, transportation problems,periodical payments, availability of productivity standards, avail-ability of power & water in site, and availability of managementand finance plans.
Analytical model
An analytical model is provided in this study. This model’s mainobjective is to get an accurate cost estimate and reduce the vari-ance between the estimated cost and final cost in the construc-tion projects. This model consists of inputs and outputs. Allinputs consist of three parts that will be clarified in the inputssection. This model introduces many reports, which are themodel’s outputs. Reports are the sheets that present informationin an organized format for the users. The content of thesereports will be clarified in the outputs section. There are someconstraints in this model, such as the project type is the con-struction project, and the measured quantities of all items in theproject must be specific and precise.
On the other hand, this model is developed by merging thenine factors inside it and also, selecting all techniques and proce-dures are led to the most accurate cost estimation. That’s clari-fied in the following points:
Table 4. Pareto technique.
No. Factors Frequency (Very major effect (5)) Cumulative Frequency Cumulative Frequency (%)
1 State of market 228 228 8%2 Experience of estimating
Team228 456 16%
3 Site conditions 221 677 24%4 Labor and equipment
Required213 891 32%
5 Transportation problems 206 1,097 39%6 periodical payments 206 1,303 47%7 Availability of productivity standards 206 1,509 54%8 Availability of power &
water in site199 1,708 61%
9 Availability of managementand finance plans
199 1,907 68%
10 Equipment maintenance 191 2,098 75%11 Project schedule and
shelf-life177 2,275 81%
12 Adoption of material fromthe owner
169 2,444 87%
13 Use old equipment 110 2,554 91%14 Availability of cost indexes average 44 2,598 93%15 Weather 37 2,635 94%16 Experience of field staff 37 2,672 96%17 Control the wastage 29 2,702 97%18 Inflation factor 29 2,731 98%19 Type of contract 22 2,753 98%20 vandalism and site security 15 2,768 99%21 Specification 15 2,783 99%22 Method used in determining contingency 7 2,790 100%23 Time between project announcement and
bid opening average7 2,797 100%
24 Productivity (the effect of learning theory) 0 2,797 100%25 Currency exchange
fluctuation average0 2,797 100%
26 Uncertainty of taxes 0 2,797 100%27 Insurance required 0 2,797 100%28 Estimate notes and
(questions & answers)0 2,797 100%
29 Number of competitors 0 2,797 100%Total 2,797
INTERNATIONAL JOURNAL OF CONSTRUCTION MANAGEMENT 5
� Three costs estimated probability for each activity (pessimis-tic, most likely, and optimistic) are calculated in the reportof ‘Monte Carlo simulation for estimated cost’. That’s to
merge the market state factor into the model. Typical out-puts include a histogram that shows the number of itera-tions where a particular outcome resulted from the
Figure 1. Pareto chart for factors affecting the accuracy of cost estimation.
6 M. SAYED ET AL.

simulation or a cumulative probability distribution (S-curve)that shows the probability of achieving any specific productor less.
� In the wages & salaries calculation sheet, transportation costis calculated as a part of the indirect cost.
� In a detailed calculation sheet for mobilization cost, all siterequirements are calculated.
� The model includes productivity standards, which is aninput in this model.
� This model contains a monthly allocating cost estimate toknow what financial value should be provided each monthto complete the project. This model also includes the esti-mated cash flow and net cash flow for the project that pro-vides more effective management and financial plans.
Based on the previous, the merging of the nine factors intothe arithmetical model and using Mont Carlo simulation techni-ques help decrease the cost variance between the estimated costand final project cost. The next two sections clarify the inputsand the outputs of this model.
Inputs
Inputs consist of three parts. The first part is the measuredquantities of the work items identified by the tender documenta-tion’s drawings and specifications. All quantities required are putin identified cells in the model. The second part is the unit priceof the needed materials, supplies, and equipment. All unit priceis placed in identified cells in the model. The third part is themonthly wages and salaries for all workers and engineers. Allthese are put in identified cells in the model. After putting allinputs, all calculations will be conducted automatically.
Outputs
The outputs of the model consist of many reports, which are:
� ‘Bar chart & allocated for estimated cost report’. Using thisreport, the user can get a monthly estimated cost for allactivities this month.
� ‘Cost estimation & weight% for all item report’. Using thisreport, the user can get more details in the direct cost sec-tion, indirect cost section, and mark-up section. Also, theuser can get the percentage for each item in the project.
� ‘Aggregate demand plan for the material report’. Using thisreport, the user can know monthly quantities and monthlyestimated costs for every project’s material.
� ‘Detailed cost estimation for mobilization, excavation, andbackfilling works report’; ‘detailed direct cost estimation forconcrete works report’; ‘detailed direct cost estimation forfinishing & MEP works report’; and ‘detailed indirect costestimation report’. These reports produced all detailed esti-mated costs and expected working hours for each item andall projects. These reports help in making control during theproject life cycle and decreasing cost variance.
� ‘Estimated cash flow & net cash flow report’. From thisreport, the user can know monthly and cumulative esti-mated cash flow. That will help the user to determinefinance plans for the project.
� ‘Equipment ownership cost report’. This report’s outputs aresalvage value after the end of the default age of equipment,book value every year, and total depreciation cost.
� ‘Break-even point report’. This report for comparisonbetween owned & rental equipment. (3) Results from thePareto technique.
The model’s accuracy and effectiveness will be validated byrecalculation of the cost estimate for each case study, and thatwill be discussed in the following section.
Case studies
This section aims to validate the importance of the nine factorsand the model’s effectiveness. This study needs finished con-struction projects as case studies that have cost variance betweenthe estimated cost and the actual contract values. So, moresearching was led to select compatible case studies. Fourteenprojects were chosen to be consistent with this study. These proj-ects’ characteristics were different in terms of duration, type ofcontract, original cost estimation technique, and the actual cost.By communicating with the project managers and the construc-tion companies that carried out the projects, the lessons learnedregisters from these projects were collected to get the cost vari-ance reasons for each case study. These projects were finishedwithout any change in scope or any change order related to theproject cost. These cases are shown in Table 5.
Table 5 contains fourteen case studies, estimated contractvalue, actual contract value, cost variance value, cost variancepercentage, type of project contract, and original cost estimations
Table 5. All information for case studies.
No. Project Name
Estimatedcontract
value (EGP)
Actualcontract
value (EGP)
Costvariance
value (EGP) CV%Type ofcontract
Type oforiginal costestimationapproaches
1 Bank of Housing and Development Branch of Burj Al Arab 63,000,000 64,247,400 1,247,400 2% Fixed price Bottom-UP2 Villa Ghazal 23,277,997 23,776,146 498,149 2% Fixed price Parametric3 Beltone Financial New Head Office Smart Village 88,999,332 89,889,326 889,994 1% Fixed price Bottom-UP4 Al Bustan Mall 224,759,440 237,235,384 12,475,944 6% Unit price Analogous5 Core & Shell Offices - Smart Village 38,034,000 41,076,720 3,042,720 8% Unit price Analogous6 Local Popular Council in Luxor 4,500,000 4,734,000 234,000 5% Fixed price Bottom-UP7 Al-Rehab Building 57,788,945 60,747,739 2,958,794 5% Fixed Price Analogous8 Bloom Bank Head Quarter 121,530,978 136,053,930 14,522,952 12% Unit price Parametric9 Madkour quotas primary School in Dakahlyah 1,824,409 2,098,070 273,661 15% Fixed price Parametric10 Odeer Al Hadydy secondary industrial school in Dakahlyah 5,409,552 6,172,840 763,288 14% Unit price Parametric11 Rayah building Smart Village 49,000,000 53,998,000 4,998,000 10% Unit price Analogous12 EFG Hermes New Headquarter - Smart Village 190,687,009 193,547,314 2,860,305 1% Fixed price Bottom-UP13 Piraeus Bank Egypt, Smart Village 190,212,739 198,019,228 7,806,489 4% Fixed price Bottom-UP14 Ekhnatoon School-New Cairo 65,700,000 70,824,600 5,124,600 8% Fixed price Analogous
INTERNATIONAL JOURNAL OF CONSTRUCTION MANAGEMENT 7

approach for every case study. This table’s information was col-lected from communication with project managers and lessonslearned registers for every project.
The cost variance is the difference between the actual projectcontract value and the estimated project cost. Also, the cost vari-ance percentage (% CV) is considered an indicator of the costestimating accuracy. The cost variance reasons show in Table 6for each case study. All cost variance reasons were collected toclarify all inaccurate cost estimates reasons.
Table 6 contains the cost variance reasons for each case study.This table’s information is collected from communication withproject managers, from the lesson learned registers, and issuelogs for every project.
There is a significant similarity between these cost variancereasons, which were mentioned in Table 6, and the previouslymentioned nine factors that were deduced from the Pareto chart.That’s clarified the nine factors’ importance. Based on that, thecost estimator must consider the nine factors while conductingcost estimation calculations.
On the other hand, that’s important to validate the arithmet-ical model’s accuracy and effectiveness. Without using the model,case studies’ cost variance percentages were between 1% and15%. The estimated contract value for each case study is recalcu-lated by using the model. The bill of quantity for each case studyis the input in the mathematical model, and the new estimatedcontract value of each case study is the output. Hence, all case
studies’ cost variance percentage is between 0.5% and 0.8% afterusing the model. All these values are in Table 7.
Table 7 contains fourteen case studies, estimated contractvalue without using the model, estimated contract value withusing the model, cost variance percentage without using themodel, and cost variance percentage with using the model.
Results of case studies
There is a significant similarity between the cost variance reasons,which were mentioned in Table 6 for each case study, and thenine factors deduced from the Pareto chart. That’s clarifiedthe nine factors’ importance. The cost estimator must consider thenine factors while conducting cost estimation calculations. If thenine factors are considered, the cost variance reasons will decrease.
On the other hand, after using the model in all case studies,the cost variance percentage decreased, as showed in Table 7.That proves the model’s accuracy and effectiveness. Hence, theestimators should use the study’s model.
Summary and conclusions
Estimating the cost of construction projects is highly complexand challenging for construction companies. This study’s sum-mary and conclusions are shown in the following paragraphs:
Table 6. Cost variance reasons after reviewing case studies.
No. Project name Cost variance reasons
1 Bank of Housing and Development Branch of Burj Al Arab a. Equipment maintenance costs weren’t estimated correctly.b. Labor transportation cost wasn’t estimated by the accurate value
2 Villa Ghazal a. Power and water cost on site weren’t taken into consideration.3 Beltone Financial New Head Office Smart Village a. Bad site conditions weren’t taken into consideration such as (bad road
to the site and no services around the site).4 Al Bustan Mall a. Unstable site condition during the project life cycle which wasn’t taken
into consideration during the estimation process.5 Core & Shell Offices - Smart Village a. Using the incorrect production rate in the estimation process.6 Local Popular Council in Luxor a. More mistakes from the cost estimation team during the calculation.7 Al-Rehab Building a. Difference between estimated periodic payment and actual periodic payment.8 Bloom Bank Head Quarter a. Bad site management.9 Madkour quotas primary School in Dakahlyah a. Bad comparison between rented equipment and owned equipment.10 Odeer Al Hadydy secondary industrial school in Dakahlyah a. The mistake in calculation labor number.11 Rayah building Smart Village a. Labor transportation cost wasn’t estimated by the accurate value12 EFG Hermes New Headquarter - Smart Village a. Increasing equipment number from equipment number in the estimated calculation.13 Piraeus Bank Egypt, Smart Village a. Unstable site condition during the project life cycle which wasn’t taken
into consideration during the estimation process.14 Ekhnatoon School-New Cairo a. Equipment maintenance costs weren’t estimated correctly.
b. Using the incorrect production rate in the estimation process.
Table 7. Cost variance percentage without using the model and with using model.
No. Project name
Estimated contractvalue without usingthe model (EGP)
Estimated contractvalue with usingthe model (EGP)
Actualcontract
value (EGP)
CV% withoutusing themodel
CV% withusing themodel
1 Bank of Housing and Development Branch of Burj Al Arab 63,000,000 63,917,320 64,247,400 2% 0.5%2 Villa Ghazal 23,277,997 23,610,046 23,776,146 2% 0.7%3 Belt one Financial New Head Office Smart Village 88,999,332 89,410,116 89,889,326 1% 0.5%4 Al Bustan Mall 224,759,440 236,035,124 237,235,384 6% 0.5%5 Core & Shell Offices - Smart Village 38,034,000 40,816,020 41,076,720 8% 0.6%6 Local Popular Council in Luxor 4,500,000 4,703,000 4,734,000 5% 0.7%7 Al-Rehab Building 57,788,945 60,317,111 60,747,739 5% 0.7%8 Bloom Bank Head Quarter 121,530,978 135,153,580 136,053,930 12% 0.7%9 Madkour quotas primary School in Dakahlyah 1,824,409 2,081,285 2,098,070 15% 0.8%10 Odeer Al Hadydy secondary industrial school in Dakahlyah 5,409,552 6,127,161 6,172,840 14% 0.7%11 Rayah building Smart Village 49,000,000 53,706,411 53,998,000 10% 0.5%12 EFG Hermes New Headquarter - Smart Village 190,687,009 192,018,290 193,547,314 1% 0.8%13 Piraeus Bank Egypt, Smart Village 190,212,739 196,831,113 198,019,228 4% 0.6%14 Ekhnatoon School-New Cairo 65,700,000 70,328,828 70,824,600 8% 0.7%
8 M. SAYED ET AL.

Twenty-nine factors were collected from the previousresearches. The questionnaire technique was selected to collectopinions from participants who consisted of consultant and con-tractor engineers. The questionnaire was distributed to a sampleof 280 participants. The objective of this questionnaire is to getparticipants’ opinions on twenty-nine factors.
Using the Pareto technique, the findings indicate that ninefactors should be considered during the cost estimation process.The first three factors from the nine factors are the market’sstate, the estimating team’s experience level, and site conditions.
A powerful arithmetical model is presented in this study toget an accurate cost estimate. Fourteen projects were selected ascase studies to validate the nine factors’ importance and themodel’s effectiveness. The cost variance reasons between the esti-mated cost and final cost were obtained by reviewing all lessonlearned registers for each case study. There is considerable con-vergence between the first nine factors in the Pareto chart andthe cost variance reasons in all case studies. If the nine factorsare considered, the cost variance reasons will decrease. All casestudies’ cost variance percentage was 1% and 15%, but afterusing the model, these percentages changed between 0.5% and0.8% for each case study. Hence, the cost estimator should usethis model to increase the cost estimation accuracy.
The implications are that the study is not limited to construc-tion projects only but may be generalized to other types of proj-ects, the findings of this study supply useful information forfuture studies associated with the construction industry.
Finally, the study’s results are the nine factors and the power-ful arithmetical model. That’s to get an accurate cost estimate.The nine factors are: the market’s state, the estimating team’sexperience level, site conditions, labor and equipment required,transportation problems, periodical payments, availability ofproductivity standards, availability of power & water in site, andavailability of management and finance plans. On the otherhand, the arithmetical model was verified from its effectivenessby recalculating the cost estimate for each case study. The costvariance percentage after using the model was between 0.5%and 0.8%.
Hence, the cost estimator must consider the nine factors anduse the arithmetical model while conducting the constructionprojects’ cost estimation process. By implementing the study’sresults, all the previously mentioned gaps in the cost estimationprocess will be addressed.
Disclosure statement
No potential conflict of interest was reported by the authors.
References
Aftab H, Ismail A, Mohd A, Ade A. 2010. Factors affecting construction costin mara large construction project: perspective of project managementconsultant. Int J Sustain Constr Eng Technol. 1(2):42–54.
Agyekum G. 2018. The degree of accuracy and factors that influence theuncertainty of SME cost estimates. Int J Constr Manage. 19(5):2–12.
Akintoye A. 2000. Analysis of factors influencing project cost estimatingpractice. J Constr Manage Econ. 18(1):77–89.
Alumbugu P, Ola-Awo W, Saidu I, Abdullahi M, Abdulazeez A. 2014.Assessment of the factors affecting accuracy of pre-tender cost estimate inKaduna state, Nigeria. IOSRJ Environ Sci Toxicol Food Technol. 8(5):19–27.
Arif F, Lodi S, Azhar N. 2015. Factors influencing accuracy of constructionproject cost estimates in Pakistan: perception and reality. Int J ConstrManage. 15(1):59–61.
Avinash RY, Swamy RM. 2018. Factors affecting cost and inflation of a pro-ject. Int Res J Eng Technol. 5(2):1713.
Azman M, Abdul-Samad Z, Ismail S. 2013. The accuracy of preliminary costestimates in public works department (PWD) of Peninsular Malaysia. IntJ Project Manage. 31(7):994–1005.
Azzaro D, Hubbard J, Robertson D. 1987. Contractors’ estimating procedures –an overview. London (UK): Royal Institution of Chartered Surveyors; p. 2–12.
Barlett J, Kotrlik J, Higgins C. 2001. Organizational research: determiningappropriate sample size in survey research. J Inf Technol Learn Perform.19(1):43–50.
Cronbach L, Shavelson R. 2004. My current thoughts on coefficient alphaand successor procedures. J Educ Psychol Meas. 64(3):391–418.
Elhag TMS, Boussabaine A, Ballal TMA. 2005. Critical determinants of con-struction tendering costs: quantity surveyors’ standpoint. Int J ProjectManage. 23(7):538–545.
Enshassi A, Mohamed S, Abdel-Hadi M. 2013. Factors affecting the accuracyof pre-tender cost estimates in the Gaza strip. J Constr Dev Countries.24(1):2–17.
Hatamleh MT, Hiyassat M, Sweis GJ, Sweis RJ. 2018. Factors affecting theaccuracy of cost estimate: case of Jordan. Eng Constr Architect Manage.25(1):113–653.
Koehn E, Brown G. 1985. Climatic effects on construction. J Constr EngManage. 111(2):129–137.
Loannou P. 1988. Geologic exploration and risk reduction in under-groundconstruction. J Constr Eng Manage. 114(4):532–547.
Mahamid I. 2015. Factors affecting cost estimate accuracy: evidence fromPalestinian construction projects. Int J Manage Sci Eng Manage. 10(2):117–125.
Matel E, Vahdatikhaki F, Hosseinyalamdary S, Evers T, Voordijk H. 2019.An artificial neural network approach for cost estimation of engineeringservices. Int J Constr Manage. 37(5):1–14.
Neufville R, Hani E, Lesage Y. 1977. Bidding models effects of bidders’ riskaversion. J Constr Div. 103(1):57–65.
Odusami K, Onukwube H. 2008. Factors affecting the accuracy of a pre ten-der cost estimate in Nigeria. J Cost Eng. 50(9):32–35.
Phuwadol S. 2010. A visual approach to construction cost estimating. Thesis(M.Sc.). Marquette University; p. 2–55.
Qinghua J. 2019. Estimation of construction project building cost by back-propagation neural network. J Eng Des Technol. 18(3):601–604.
Roberts P, Priest H, Traynor M. 2006. Reliability and validity in research.Nurs Standard. 20(36):41–45.
Skitmore R. 1985. The influence of professional expertise in constructionprice forecasts. Salford, UK: University of Salford, British CatalogingLibrary Publishing; p. 12
Smith G, Jolly P. 1985. Estimating for building and civil engineering worksEngland: Butterworth’s. 10.
Strandell M. 1978. Productivity in the construction industry. AACE Bull.20(2):18.
Taylor T. 1977. How certain area you about the uncertainty of your esti-mates. AACE Bull. 12(2):30–31.
Zhi R, Han S, Hyun C, Kim J. 2014. Improving accuracy of early stage costestimation by revising categorical variables in a case-based reasoningmodel. J Constr Eng Manage. 140(7):04014025.
INTERNATIONAL JOURNAL OF CONSTRUCTION MANAGEMENT 9