Improvement of Tourists Satisfaction According to Their Non ...
18
applied sciences Article Improvement of Tourists Satisfaction According to Their Non-Verbal Preferences Using Computational Intelligence Claudia C. Tusell-Rey 1 , Ricardo Tejeida-Padilla 1 , Oscar Camacho-Nieto 2 , Yenny Villuendas-Rey 2 and Cornelio Yáñez-Márquez 3, * Citation: Tusell-Rey, C.C.; Tejeida-Padilla, R.; Camacho-Nieto, O.; Villuendas-Rey, Y.; Yáñez-Márquez, C. Improvement of Tourists Satisfaction According to Their Non-Verbal Preferences Using Computational Intelligence. Appl. Sci. 2021, 11, 2491. https://doi.org/ 10.3390/app11062491 Academic Editor: Enrico Vezzetti Received: 13 February 2021 Accepted: 3 March 2021 Published: 11 March 2021 Publisher’s Note: MDPI stays neutral with regard to jurisdictional claims in published maps and institutional affil- iations. Copyright: © 2021 by the authors. Licensee MDPI, Basel, Switzerland. This article is an open access article distributed under the terms and conditions of the Creative Commons Attribution (CC BY) license (https:// creativecommons.org/licenses/by/ 4.0/). 1 Escuela Superior de Turismo del Instituto Politécnico Nacional, Miguel Bernard 39, Residencial La Escalera, GAM, CDMX 07630, Mexico; [email protected] (C.C.T.-R.); [email protected] (R.T.-P.) 2 Centro de Innovación y Desarrollo Tecnológico en Cómputo del Instituto Politécnico Nacional, Juan de Dios Bátiz s/n, GAM, CDMX 07700, Mexico; [email protected] (O.C.-N.); [email protected] (Y.V.-R.) 3 Centro de Investigación en Computación del Instituto Politécnico Nacional, Juan de Dios Bátiz s/n, GAM, CDMX 07700, Mexico * Correspondence: [email protected]; Tel.: +52-572-9600 (ext. 56584) Abstract: In the tourism industry it is common that the information obtained from customers can be varied, dispersed, and with high volumes of data. In this context, the automatic analysis of information has been proposed through electronic customer relationship management, which refers to marketing activities, tools and techniques, delivered with the use of electronic channels for the specific purpose of locating, building and improving long- term relationships with customers, to enhance their individual potential. In this paper, we refer to the analysis of information in three aspects: customer satisfaction, the study of customer behavior and the forecast of tourist demand. Specifically, we have created a novel dataset comprising the non-verbal preference assessment of tourists who are clients of the Sol Cayo Guillermo hotel belonging to the Melia hotel chain, in Jardines del Rey, Cuba. Then, by applying Computational Intelligence algorithms to this dataset, we achieve segment customers according to their non-verbal preferences, in order to increase their satisfaction, and therefore the client profitability. In order to achieve a good performance in the realization of this task, we have proposed two modifications of the Naïve Associative Classifier, whose results are compared with the most relevant computational algorithms of the state of the art. The experimentally obtained values of balanced accuracy and averaged F1 measure show that, by clearly improving the results of the state-of-the-art algorithms, our proposal is adequate to successfully use electronic customer relationship management in the tourist services provided by hotel chains. Keywords: computational intelligence; electronic customer relationship management; tourism 1. Introduction Customer Relationship Management (CRM) is defined as all marketing activities di- rected towards the establishment, development, and maintenance of satisfactory relational exchanges with customers [1]. Moreover, Grönroos defines it as “identifying and establish- ing, maintaining and improving and, when necessary, also terminating relationships with customers and other interested parties, for profit, so that the objectives of all parties are met, and let this be done through mutual exchange and the fulfillment of promises” [2]. On the other hand, CRM has also been defined as “a business strategy that includes a combination of people, processes and technologies through all points of contact with cus- tomers, including marketing, sales, and customer service” [3]. With regard to tourism companies, it is a fact that this type of business increasingly makes use of CRM in activities aimed at attracting new customers to the different services offered in hotel facilities and in tourist sites around the world. Tourism entrepreneurs continually invest resources to offer clients innovations in services. In this context, CRM plays a fundamental role, because the use of cutting-edge technologies that are associated with CRM makes it possible to Appl. Sci. 2021, 11, 2491. https://doi.org/10.3390/app11062491 https://www.mdpi.com/journal/applsci
-
Upload
khangminh22 -
Category
Documents
-
view
0 -
download
0
Transcript of Improvement of Tourists Satisfaction According to Their Non ...

applied sciences
Article
Improvement of Tourists Satisfaction According to TheirNon-Verbal Preferences Using Computational Intelligence
Claudia C. Tusell-Rey 1, Ricardo Tejeida-Padilla 1 , Oscar Camacho-Nieto 2 , Yenny Villuendas-Rey 2
and Cornelio Yáñez-Márquez 3,*
Citation: Tusell-Rey, C.C.;
Tejeida-Padilla, R.; Camacho-Nieto,
O.; Villuendas-Rey, Y.;
Yáñez-Márquez, C. Improvement of
Tourists Satisfaction According to
Their Non-Verbal Preferences Using
Computational Intelligence. Appl. Sci.
2021, 11, 2491. https://doi.org/
10.3390/app11062491
Academic Editor: Enrico Vezzetti
Received: 13 February 2021
Accepted: 3 March 2021
Published: 11 March 2021
Publisher’s Note: MDPI stays neutral
with regard to jurisdictional claims in
published maps and institutional affil-
iations.
Copyright: © 2021 by the authors.
Licensee MDPI, Basel, Switzerland.
This article is an open access article
distributed under the terms and
conditions of the Creative Commons
Attribution (CC BY) license (https://
creativecommons.org/licenses/by/
4.0/).
1 Escuela Superior de Turismo del Instituto Politécnico Nacional, Miguel Bernard 39, Residencial La Escalera,GAM, CDMX 07630, Mexico; [email protected] (C.C.T.-R.); [email protected] (R.T.-P.)
2 Centro de Innovación y Desarrollo Tecnológico en Cómputo del Instituto Politécnico Nacional, Juan de DiosBátiz s/n, GAM, CDMX 07700, Mexico; [email protected] (O.C.-N.); [email protected] (Y.V.-R.)
3 Centro de Investigación en Computación del Instituto Politécnico Nacional, Juan de Dios Bátiz s/n, GAM,CDMX 07700, Mexico
* Correspondence: [email protected]; Tel.: +52-572-9600 (ext. 56584)
Abstract: In the tourism industry it is common that the information obtained from customers canbe varied, dispersed, and with high volumes of data. In this context, the automatic analysis ofinformation has been proposed through electronic customer relationship management, which refersto marketing activities, tools and techniques, delivered with the use of electronic channels for thespecific purpose of locating, building and improving long- term relationships with customers, toenhance their individual potential. In this paper, we refer to the analysis of information in threeaspects: customer satisfaction, the study of customer behavior and the forecast of tourist demand.Specifically, we have created a novel dataset comprising the non-verbal preference assessment oftourists who are clients of the Sol Cayo Guillermo hotel belonging to the Melia hotel chain, in Jardinesdel Rey, Cuba. Then, by applying Computational Intelligence algorithms to this dataset, we achievesegment customers according to their non-verbal preferences, in order to increase their satisfaction,and therefore the client profitability. In order to achieve a good performance in the realization ofthis task, we have proposed two modifications of the Naïve Associative Classifier, whose results arecompared with the most relevant computational algorithms of the state of the art. The experimentallyobtained values of balanced accuracy and averaged F1 measure show that, by clearly improvingthe results of the state-of-the-art algorithms, our proposal is adequate to successfully use electroniccustomer relationship management in the tourist services provided by hotel chains.
Keywords: computational intelligence; electronic customer relationship management; tourism
1. Introduction
Customer Relationship Management (CRM) is defined as all marketing activities di-rected towards the establishment, development, and maintenance of satisfactory relationalexchanges with customers [1]. Moreover, Grönroos defines it as “identifying and establish-ing, maintaining and improving and, when necessary, also terminating relationships withcustomers and other interested parties, for profit, so that the objectives of all parties aremet, and let this be done through mutual exchange and the fulfillment of promises” [2].On the other hand, CRM has also been defined as “a business strategy that includes acombination of people, processes and technologies through all points of contact with cus-tomers, including marketing, sales, and customer service” [3]. With regard to tourismcompanies, it is a fact that this type of business increasingly makes use of CRM in activitiesaimed at attracting new customers to the different services offered in hotel facilities and intourist sites around the world. Tourism entrepreneurs continually invest resources to offerclients innovations in services. In this context, CRM plays a fundamental role, becausethe use of cutting-edge technologies that are associated with CRM makes it possible to
Appl. Sci. 2021, 11, 2491. https://doi.org/10.3390/app11062491 https://www.mdpi.com/journal/applsci

Appl. Sci. 2021, 11, 2491 2 of 18
improve the quality of tourist services in the eyes of customers [4]. More recently, CRM isdefined as “the approach that involves the process of identifying, attracting, developingand maintaining successful relationships with clients to increase the retention of profitableclients”. In the field of tourism, the CRM allows the integration and participation ofclients and tourist communities. Both businessmen and tourist clients are aware of thepractical implications of CRM in the field of tourist facilities and services [5]. The mainimplication of this study for tourism is that it allows the client’s profitability to be increased,understanding this as the client not only continuing to use the services of that institution,but also positively promoting said institution. This is achieved through a differentiatedcommunicative attention that allows improving the perception of the services provided tothe client.
With the emergence of new information and communication technologies, CRMhas evolved in the digital age, giving way to eCRM (electronic CRM), where marketingactivities have at least one virtual component. eCRM refers to marketing activities, toolsand techniques, delivered with the use of electronic channels for the specific purpose oflocating, building and improving long-term relationships with customers, to enhance theirindividual potential [6]. An eCRM allows capturing or building a record of each individual,study it in terms of needs or past behavior, prioritize with respect to value or potential sale,facilitate two-way communication electronically and in other ways, and most importantly,personalized so that even among the thousands or millions an individual can feel specialand satisfy their needs [3].
eCRM includes enterprise-level global data storage and analysis, customization, andintegration of multi-channel communication subsystems. This allows companies to trackand manage the profitability of customers, their behavior, and achieve their satisfaction ata reasonable [7].
However, although eCRM is closely linked to information and communication tech-nologies, it cannot be seen solely as a computational application. Rather, eCRM shouldbe viewed as a combination of hardware, software, human resources, processes, applica-tions, and management commitments, seeking to attract and keep valuable customers, andimproving marketing effectiveness through creating and delivering maximum value forcustomers [7].
According to the above, there are great advantages of applying eCRM in the tourismindustry. This is precisely and expressly the motivation for our proposal. We are motivatedto take advantage of the application of eCRM in hotel facilities, in order to try to achievethe creation of facilities and benefits that promote the participation of tourist clients in com-panies dedicated to tourism. Specifically, in this paper we use Computational Intelligencealgorithms to segment customers according to their non-verbal preferences, in order toincrease their satisfaction, and therefore the client profitability. Our research is focused onhotel facilities, for the Melia company in Jardines del Rey, Cuba.
The contribution of this paper are (a) the obtention of a novel dataset, comprisingthe non-verbal preference assessment of clients, through a customized questionnaire, (b) asegmentation of the clients according to their non-verbal preferences, by using clusteringalgorithms, (c) the experimental determination of the classification techniques suitable forclassifying new clients, according to their non-verbal preferences, and (d) two modificationsof the Naïve Associative Classifier [8] to improve its performance.
The paper is organized as follows: Section 2 reviews some related works aboutusing computational intelligence techniques for eCRM, while Section 3 explains the datacollection procedure for assessment of the non-verbal preferences of the clients. Section 4details the segmentation of the clients, by using clustering algorithms, Section 5 shows theexperimental analysis of the suitability of supervised classification techniques for clientclassification according to their non-verbal preferences, and Section 6 offers the conclusionsand future works.

Appl. Sci. 2021, 11, 2491 3 of 18
2. Related Works
The information obtained from customers can be varied, dispersed, and with highvolumes of data. In this research, we refer to the analysis of information in three aspectswithin the eCRM: customer satisfaction, the study of customer behavior and the forecast oftourist demand.
Automatic sentiment analysis of the reviews the clients post online is a hot topic [9–11].Usually, such reviews are labelled as positive, negative, or neutral. Several countries implementsuch eCRM, by automatic classification of the reviews: China [12], the Sultanate of Oman [9],Serbia [13], Spain [14,15] and Japan [16], among others. Reviews are also used for several purposes,such as better understand of tourist attractions [17] and facilitation of service improvement.
Another use of computational intelligent algorithms in eCRM is to forecast the tourismdemand [18–21], while other researchers use it for the classification of tourist scenarios [22,23].
On the other hand, information from social networks has also been used to identifytourist attractions [24] and user behavior [25]. Based on this knowledge, the study of thebehavior of a user acquires, in contemporary research, a privileged position to proposeappropriate marketing strategies to promote a site [24,26].
With a different goal, Pantano and Dennis aim to understand the extent to whicha large luxury department store affects the attractiveness of the place, using Harrods(London, UK) as a case study [27]. The results showed that the Harrods building is centralin most of the analyzed images, representing the main point photographed in a radius of1 km, and the exterior of the building is added as an attribute of department stores anddemonstrates the role of large warehouses in the attractiveness of a place. The study alsooffers helpful suggestions for marketing managers to develop more personalized retailstrategies [27].
Currently, the real-life impact of areas such as artificial intelligence, soft comput-ing, computational intelligence, and neural networks, with special emphasis on deeplearning, is undeniable [28–33]. Recently, computational intelligence techniques are beingused to determine the tourists’ attitudes towards technology [34], to develop intelligentfacilities [35–37], to search for hot destinations [38,39], to analyze the impact of smartdestinations in tourism [40–42], and for customer segmentation [43].
However, none of the above-mentioned research deals with the non-verbal aspectsof the communication with the clients. There are numerous theoretical and empiricalpublications on this topic in the field of Psychology and also in the field of Marketing, forexample [44,45]. However, the literature on the analysis of non-verbal communication ofclients is rare. An interesting example is the work of Puccinelli et al. [46] where the authorsexperimented with groups of students.
3. Research Methodology
This research focuses on the Sol Cayo Guillermo hotel belonging to the Melia hotelchain, in Jardines del Rey, Cuba. This hotel is considered as a sample of the research; it is arepresentative sample of the population of four-star hotels in Cuba, because in all thesehotels there are similar difficulties in terms of the communicative relationship with theclients, given that the professional and academic training, as well as the training of allpersonnel working in tourism in Cuba is homogeneous, and does not include non-verbalcommunication elements.
The objective of the research is to classify the arriving clients according to their non-verbalcommunication preferences in order to increase satisfaction and give them better service. Toclassify the type of clients it is necessary to establish types of clients and have labeled data.For this purpose, the clients will be grouped according to their non-verbal preferences, forwhich a questionnaire was developed that allows the capture of data of interest.
The research methodology is illustrated in four steps in the schematic diagram of theFigure 1: (i) application of the questionnaire to hotel clients to determine their non-verbalpreferences; (ii) the application of data clustering algorithms to obtain groups of clients;(iii) the application of supervised classification algorithms, trained with the clients’ non-
Appl. Sci. 2021, 11, 2491 4 of 18
verbal preferences, and (iv) the determination of the type of client of the new customers,also by supervised classification.
Appl. Sci. 2021, 11, x 4 of 19
The research methodology is illustrated in four steps in the schematic diagram of the Figure 1: (i) application of the questionnaire to hotel clients to determine their non-verbal preferences; (ii) the application of data clustering algorithms to obtain groups of clients; (iii) the application of supervised classification algorithms, trained with the clients’ non-verbal preferences, and (iv) the determination of the type of client of the new customers, also by supervised classification.
Figure 1. Schematic diagram of the research methodology.
Summarizing, we applied a questionnaire to hotel clients, with such information we determine their non-verbal preferences; then we applied clustering algorithms to group the clients according to their non-verbal preferences and set the group number as class labels. Subsequently, we train a supervised classifier. One a new guest arrives to the hotel, we propose him/her to fill the questionnaire, and we use the obtained non-verbal prefer-ences for supervised classification. Finally, we obtain the type of client of the arrived guest, and give that information to the staff, in order to provide a personalized attention to the guest, according to their non-verbal preferences, favoring the client satisfaction.
Data Collection The Sol Cayo Guillermo hotel has 268 rooms of three types: double, double sea view
and superior sea view. In high season (November to February), hotel occupancy is practi-cally at 100% of its capacity, while in low season (March–October), occupancy ranges be-tween 40–60%. The data used were obtained from customer surveys, in December 2019.
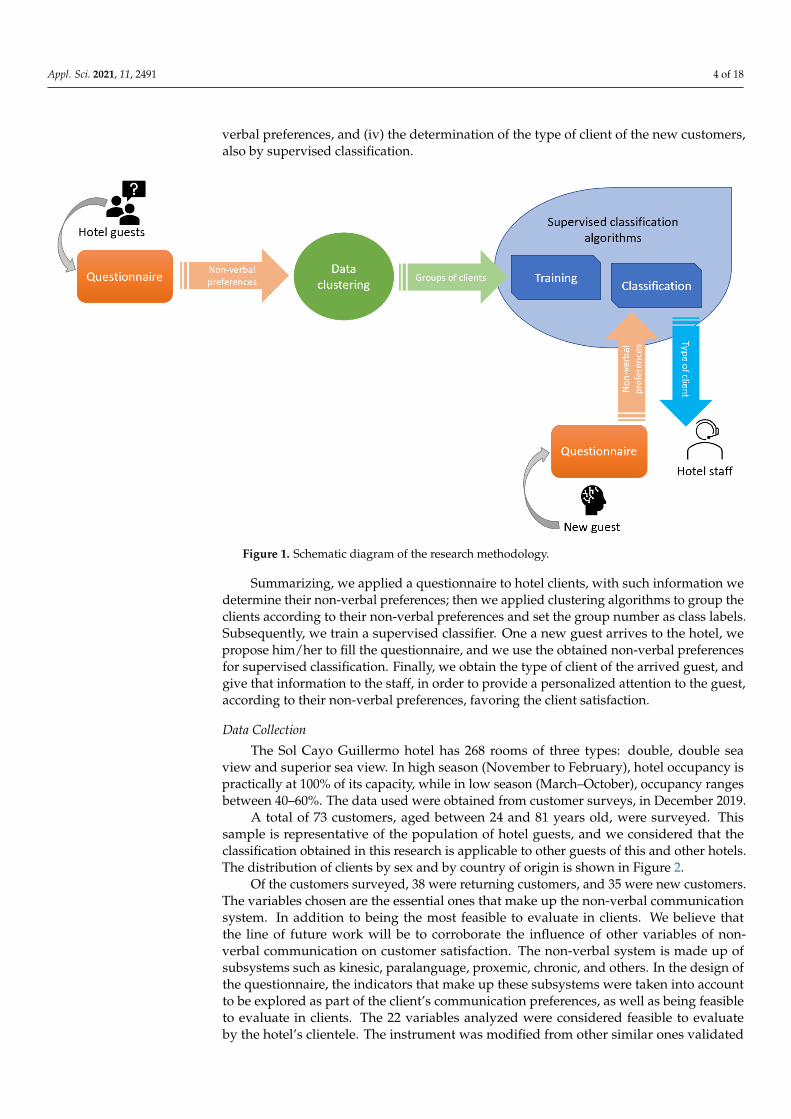
A total of 73 customers, aged between 24 and 81 years old, were surveyed. This sam-ple is representative of the population of hotel guests, and we considered that the classi-fication obtained in this research is applicable to other guests of this and other hotels. The distribution of clients by sex and by country of origin is shown in Figure 2.
Figure 1. Schematic diagram of the research methodology.
Summarizing, we applied a questionnaire to hotel clients, with such information wedetermine their non-verbal preferences; then we applied clustering algorithms to group theclients according to their non-verbal preferences and set the group number as class labels.Subsequently, we train a supervised classifier. One a new guest arrives to the hotel, wepropose him/her to fill the questionnaire, and we use the obtained non-verbal preferencesfor supervised classification. Finally, we obtain the type of client of the arrived guest, andgive that information to the staff, in order to provide a personalized attention to the guest,according to their non-verbal preferences, favoring the client satisfaction.
Data Collection
The Sol Cayo Guillermo hotel has 268 rooms of three types: double, double seaview and superior sea view. In high season (November to February), hotel occupancy ispractically at 100% of its capacity, while in low season (March–October), occupancy rangesbetween 40–60%. The data used were obtained from customer surveys, in December 2019.
A total of 73 customers, aged between 24 and 81 years old, were surveyed. Thissample is representative of the population of hotel guests, and we considered that theclassification obtained in this research is applicable to other guests of this and other hotels.The distribution of clients by sex and by country of origin is shown in Figure 2.
Of the customers surveyed, 38 were returning customers, and 35 were new customers.The variables chosen are the essential ones that make up the non-verbal communicationsystem. In addition to being the most feasible to evaluate in clients. We believe thatthe line of future work will be to corroborate the influence of other variables of non-verbal communication on customer satisfaction. The non-verbal system is made up ofsubsystems such as kinesic, paralanguage, proxemic, chronic, and others. In the design ofthe questionnaire, the indicators that make up these subsystems were taken into accountto be explored as part of the client’s communication preferences, as well as being feasibleto evaluate in clients. The 22 variables analyzed were considered feasible to evaluateby the hotel’s clientele. The instrument was modified from other similar ones validated
Appl. Sci. 2021, 11, 2491 5 of 18
by Rey-Benguría [47] to establish communicative preferences in teachers. The form ofmeasurement of these questionnaires was maintained.
Appl. Sci. 2021, 11, x 5 of 19
(a) (b)
Figure 2. Distribution of clients responding the survey: (a) By sex; (b) By country.
Of the customers surveyed, 38 were returning customers, and 35 were new custom-ers. The variables chosen are the essential ones that make up the non-verbal communica-tion system. In addition to being the most feasible to evaluate in clients. We believe that the line of future work will be to corroborate the influence of other variables of non-verbal communication on customer satisfaction. The non-verbal system is made up of subsys-tems such as kinesic, paralanguage, proxemic, chronic, and others. In the design of the questionnaire, the indicators that make up these subsystems were taken into account to be explored as part of the client’s communication preferences, as well as being feasible to evaluate in clients. The 22 variables analyzed were considered feasible to evaluate by the hotel’s clientele. The instrument was modified from other similar ones validated by Rey-Benguría [47] to establish communicative preferences in teachers. The form of measure-ment of these questionnaires was maintained.
The variables that were considered, coming from the survey carried out, and that were used to characterize each client are shown in Table 1.
Table 1. Variables from the questionnaire, used to assess the non-verbal preference of the clients.
Number Name Description Admissible Values 1 Sex Sex of the client Male, Female, ? 1 2 Age Age of the client 0–100, ? 3 Country Country of the client United Nations admitted countries, ? 4 Returning If the client is returning Yes, No, ? 5 GImg1 Handshake Indifferent, likes, dislikes, ? 6 GImg2 Hug Indifferent, likes, dislikes, ? 7 GImg3 Kiss Indifferent, likes, dislikes, ? 8 PImg1 Consent posture Indifferent, likes, dislikes, ? 9 PImg2 Interest posture Indifferent, likes, dislikes, ?
10 PImg3 Neutral posture Indifferent, likes, dislikes, ? 11 PImg4 Reflexive posture Indifferent, likes, dislikes, ? 12 PImg5 Negative posture Indifferent, likes, dislikes, ? 13 Tense-relaxed Observed emotional clime. 1–10, ? (1 is too tense, 10 is too relaxed) 14 Authoritative -anarchic Observed emotional clime 1–10, ? (1 is too authoritative, 10 is too anarchic) 15 Hostile-friendly Observed emotional clime 1–10, ? (1 is too hostile, 10 is too friendly) 16 TAudio1 Authoritative Indifferent, likes, dislikes, ? 17 TAudio2 Sarcastic Indifferent, likes, dislikes, ? 18 TAudio3 Friendly Indifferent, likes, dislikes, ? 19 QAudio1 Spitting Indifferent, likes, dislikes, ? 20 QAudio2 Hum Indifferent, likes, dislikes, ?
Male48%
Female52%
0
5
10
15
20
25
Germ
any
Arge
ntin
aBr
asil
Cana
daCh
ileCo
lom
bia
Cuba
Scot
land
Spai
nHu
ngar
yEn
glan
dIta
lyM
exico
Pola
ndRu
ssia
Urug
uay
Figure 2. Distribution of clients responding the survey: (a) By sex; (b) By country.
The variables that were considered, coming from the survey carried out, and that wereused to characterize each client are shown in Table 1.
Table 1. Variables from the questionnaire, used to assess the non-verbal preference of the clients.
Number Name Description Admissible Values
1 Sex Sex of the client Male, Female, ? 1
2 Age Age of the client 0–100, ?3 Country Country of the client United Nations admitted countries, ?4 Returning If the client is returning Yes, No, ?5 GImg1 Handshake Indifferent, likes, dislikes, ?6 GImg2 Hug Indifferent, likes, dislikes, ?7 GImg3 Kiss Indifferent, likes, dislikes, ?8 PImg1 Consent posture Indifferent, likes, dislikes, ?9 PImg2 Interest posture Indifferent, likes, dislikes, ?10 PImg3 Neutral posture Indifferent, likes, dislikes, ?11 PImg4 Reflexive posture Indifferent, likes, dislikes, ?12 PImg5 Negative posture Indifferent, likes, dislikes, ?13 Tense-relaxed Observed emotional clime. 1–10, ? (1 is too tense, 10 is too relaxed)14 Authoritative -anarchic Observed emotional clime 1–10, ? (1 is too authoritative, 10 is too anarchic)15 Hostile-friendly Observed emotional clime 1–10, ? (1 is too hostile, 10 is too friendly)16 TAudio1 Authoritative Indifferent, likes, dislikes, ?17 TAudio2 Sarcastic Indifferent, likes, dislikes, ?18 TAudio3 Friendly Indifferent, likes, dislikes, ?19 QAudio1 Spitting Indifferent, likes, dislikes, ?20 QAudio2 Hum Indifferent, likes, dislikes, ?21 QAudio3 Sigh Indifferent, likes, dislikes, ?
22 Proxemic Physical distance preferred for the client A, B, C, D, ? (A. intimate: 15–45 cm; B. personal:46–122 cm; C. social: 123–360 cm; D. public: >360 cm)
1 ? states for missing values for all attributes.
The survey considered several non-verbal preferences. To do so, six non-verbalcategories were surveyed: gesture, posture, emotional atmosphere, tone, quasi lexiconexpressions, and proxemic. To do so, several images, audios and videos were presentedto the clients, to determine their preferences. Non-verbal behavior can modify, contradict,substitute, complete, accentuate, and regulate verbal signs [48]. We are based on theimportance of non-verbal communication in interpersonal relationships. Paying attentionto all these types of non-verbal communication is successful in influencing customerperception and satisfaction. The goal of the hotel facility is customer satisfaction. Customersduring their trip may find themselves subject to unexpected situations that require theattention of the quality department. The staff must then give specialized attention throughnon-verbal communication, which favors communicative interactions and the perceptionof the client. These variables are part of the non-verbal communication system. The quality
Appl. Sci. 2021, 11, 2491 6 of 18
and customer service department, which receives customer complaints and concerns, doesnot have the alternative of improving hotel infrastructure and services provided. The use ofnon-verbal communication is chosen to mediate the perception of the client and influencetheir satisfaction.
In addition to the preferences, we also survey some general information about theclients (sex, age, country and repetend). The results obtained from the application of thedescribed instrument have allowed us to design and create a new dataset, which containsvaluable information related to clients of tourism companies. The resulting dataset obtainedfrom the questionnaires, will be donated to the University of California (UCI) MachineLearning Repository, to be publicly available. Another viable alternative would be toobserve the non-verbal behavior of clients. The obvious advantage that our proposalpresents is that the use of the questionnaire allows better data collection and processing.The questionnaire is voluntary, and the client is free to express his preferences instead ofassuming them through observation. In this way, investigator bias is avoided, which iswhy the voluntary response is believed to be more objective.
After surveying the clients, we proceeded to the automatic formation of client groups,with the purpose of determining what types of non-verbal communication elements eachof the client groups prefer in their treatment.
4. Client Segmentation by Clustering
For the segmentation of the customers, it was considered that the data obtained aredescribed by numerical variables (for example, age) and categorical variables (for example,sex), and that they also have missing information (not all clients answered all the questions).Due to these elements, three clustering algorithms were applied, which are designed forhandling mixed and incomplete data, such as those obtained from clients.
The number of algorithms for mixed and incomplete data clustering is much smallerthan their counterparts for numeric data. Among mixed and incomplete data clustering,there are a few with good behavior in practice, by finding a small number of clusters (lessthan 20). Previous research [49,50] state that KMSF is very good for clustering, followed byk-Prototypes and AGKA.
(a) The k-Prototypes algorithm [51]. Parameters: Number of clusters: k.(b) The k-means with similarity functions (KMSF) algorithm [52]. Parameters: Number
of clusters: k, Similarity function: 1/HEOM.(c) The genetic k-means clustering algorithm (AGKA) algorithm [53]. Parameters: Num-
ber of clusters: k, Population number np = 25, crossover probability cp = 1.0, mutationprobability mp = 0.05, number of iterations: it = 100.
In the specialized literature, a large number of algorithms can be found to performthe clustering task. However, the vast majority of these algorithms only support patternswith numeric values in their features. In our research, the use of clustering algorithmsis required to carry out customer segmentation. However, the patterns that describe thetourist clients in our dataset have a uniqueness the data obtained from the questionnaireare described by numerical variables (for example, age) and categorical variables (forexam-ple, sex), and that they also have missing information (not all clients answered allthe questions). By considering these severe data constraints, the availability of clusteringalgorithms is dramatically reduced. There are VERY SCARCE clustering algorithms thatsupport incomplete patterns with mixed traits, like the ones we discussed in our research.For these reasons, these three clustering algorithms were selected, which are one of the fewthat are designed for handling mixed and incomplete data, such as those obtained fromclients. The advantages of adopting these three algorithms are clear: they allow handlingmixed and incomplete data, such as those obtained from clients: this has a positive effecton the results, as shown in the tables and in the discussion section.
For the application of these algorithms, the EEUC (Experimenter Environment forUnsupervised Classification) software was used, which allows the application and eval-uation of data grouping algorithms [54]. The use of the EEUC software platform in our
Appl. Sci. 2021, 11, 2491 7 of 18
research is very relevant. The advantages of using EEUC are clear: this software platformis efficient, friendly, and allows the application and evaluation of data grouping algorithms,among which are the three algorithms selected for the segmentation of tourist clients.Consequently, the segmentation results are reliable and efficiently obtained.
The number of groups to be obtained was defined from two to 10 groups. Subsequently,the groups obtained were evaluated to determine their quality. For this, the Dunn index wasused, which is widely recommended to assess the quality of the clusters [55]. Clusteringis a task of the unsupervised learning paradigm. The measures to measure the quality ofthe clusters thrown by the clustering algorithms fall broadly into three classes: internalvalidation is based on calculating properties of the resulting clusters; relative validationis based on comparisons of partitions generated by the same algorithm with differentparameters or different subsets of the data; and external validation compares the partitiongenerated by the clustering algorithm and a given partition of the data. In our research weare interested in calculating the internal properties of groups of tourist clients attendingto a specific criterion of non-verbal communication. The internal indices to use in ourproposal are appropriate because their aim is to identify sets of clusters that are compact,with a small variance between members of the cluster, and well separated, where the meansof different clusters are sufficiently far apart, as compared to the within cluster variance.Three are the most important options in this area: the Dunn index, the Silhouette indexand the Davies—Bouldin index. For a given assignment of clusters, a higher Dunn indexindicates better clustering, and its advantages are clear over the other feasible alternativeswhen the number of clusters is small. This feature of our dataset gave us the opportunity tochoose the Dunn index to assess the quality of the clusters. In the experiments carried outin reference [55] of our manuscript, the authors found that the Dunn index attains betterrank correlation and therefore is widely recommended. This guarantees us that the clustersof tourist clients are of high quality, which has a positive impact on the results.
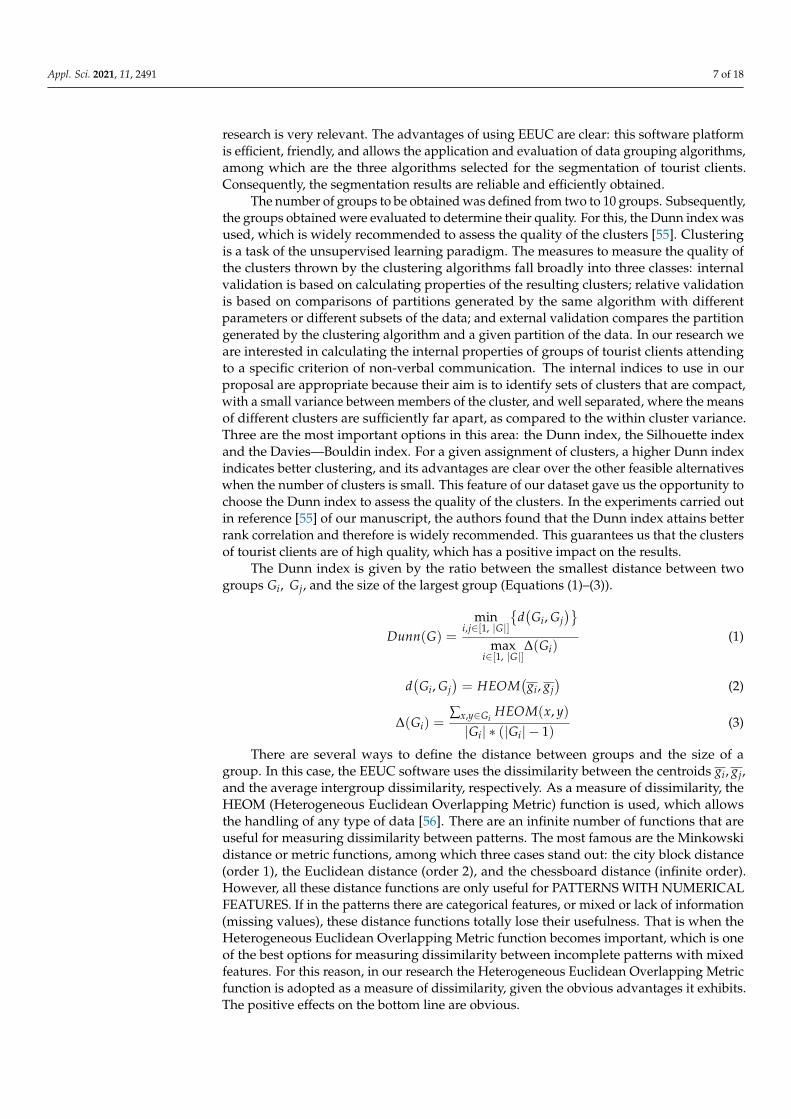
The Dunn index is given by the ratio between the smallest distance between twogroups Gi, Gj, and the size of the largest group (Equations (1)–(3)).
Dunn(G) =
mini,j∈[1, |G|]
d(Gi, Gj
)max
i∈[1, |G|]∆(Gi)
(1)
d(Gi, Gj
)= HEOM
(gi, gj
)(2)
∆(Gi) =∑x,y∈Gi
HEOM(x, y)|Gi| ∗ (|Gi| − 1)
(3)
There are several ways to define the distance between groups and the size of agroup. In this case, the EEUC software uses the dissimilarity between the centroids gi, gj,and the average intergroup dissimilarity, respectively. As a measure of dissimilarity, theHEOM (Heterogeneous Euclidean Overlapping Metric) function is used, which allowsthe handling of any type of data [56]. There are an infinite number of functions that areuseful for measuring dissimilarity between patterns. The most famous are the Minkowskidistance or metric functions, among which three cases stand out: the city block distance(order 1), the Euclidean distance (order 2), and the chessboard distance (infinite order).However, all these distance functions are only useful for PATTERNS WITH NUMERICALFEATURES. If in the patterns there are categorical features, or mixed or lack of information(missing values), these distance functions totally lose their usefulness. That is when theHeterogeneous Euclidean Overlapping Metric function becomes important, which is oneof the best options for measuring dissimilarity between incomplete patterns with mixedfeatures. For this reason, in our research the Heterogeneous Euclidean Overlapping Metricfunction is adopted as a measure of dissimilarity, given the obvious advantages it exhibits.The positive effects on the bottom line are obvious.
Appl. Sci. 2021, 11, 2491 8 of 18
The HEOM function is shown in Equations (4)–(7).
HEOM(x, y) =√
∑Ai∈A
di(xi, yi)2 (4)
di(xi, yi) =
1 if missingoverlap(xi, yi) if nominalrn_di f f (xi, yi) is numeric
(5)
overlap(xi, yi) =
0 if xi = yi
1 otherwise(6)
rndi f f (xi ,yi)=
|xi − yi|maxi −mini
(7)
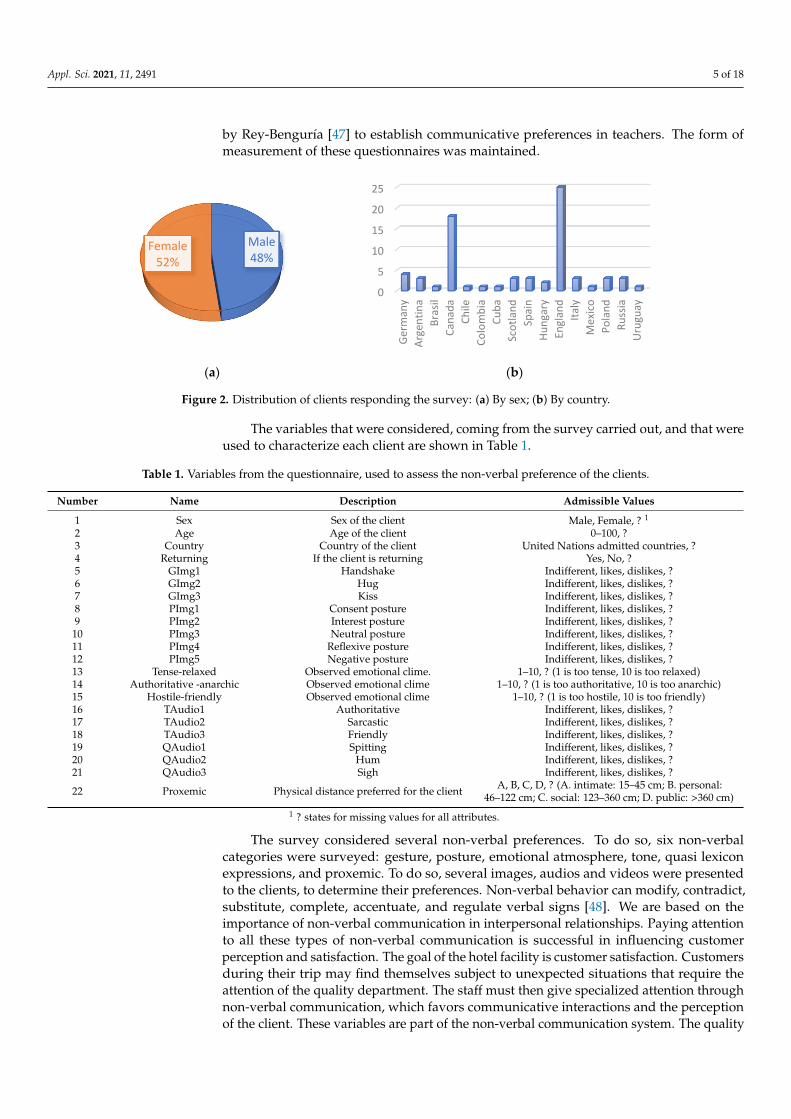
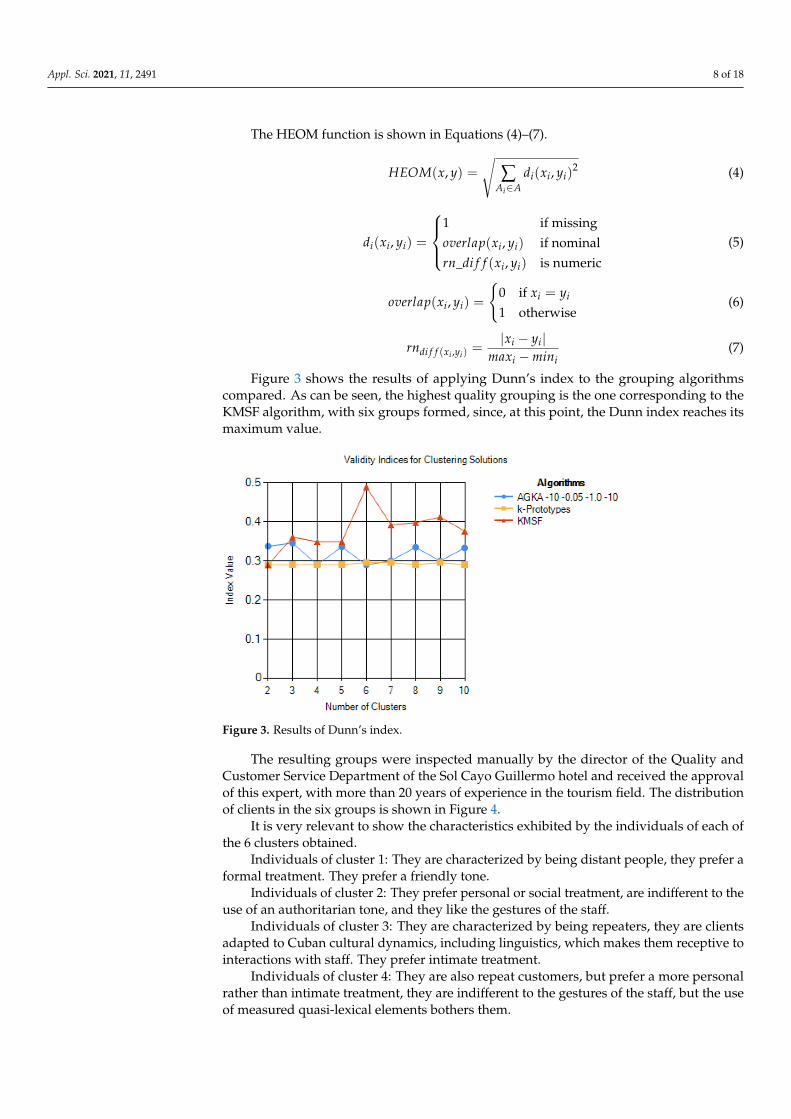
Figure 3 shows the results of applying Dunn’s index to the grouping algorithmscompared. As can be seen, the highest quality grouping is the one corresponding to theKMSF algorithm, with six groups formed, since, at this point, the Dunn index reaches itsmaximum value.
Appl. Sci. 2021, 11, x 9 of 19
Figure 3. Results of Dunn’s index.
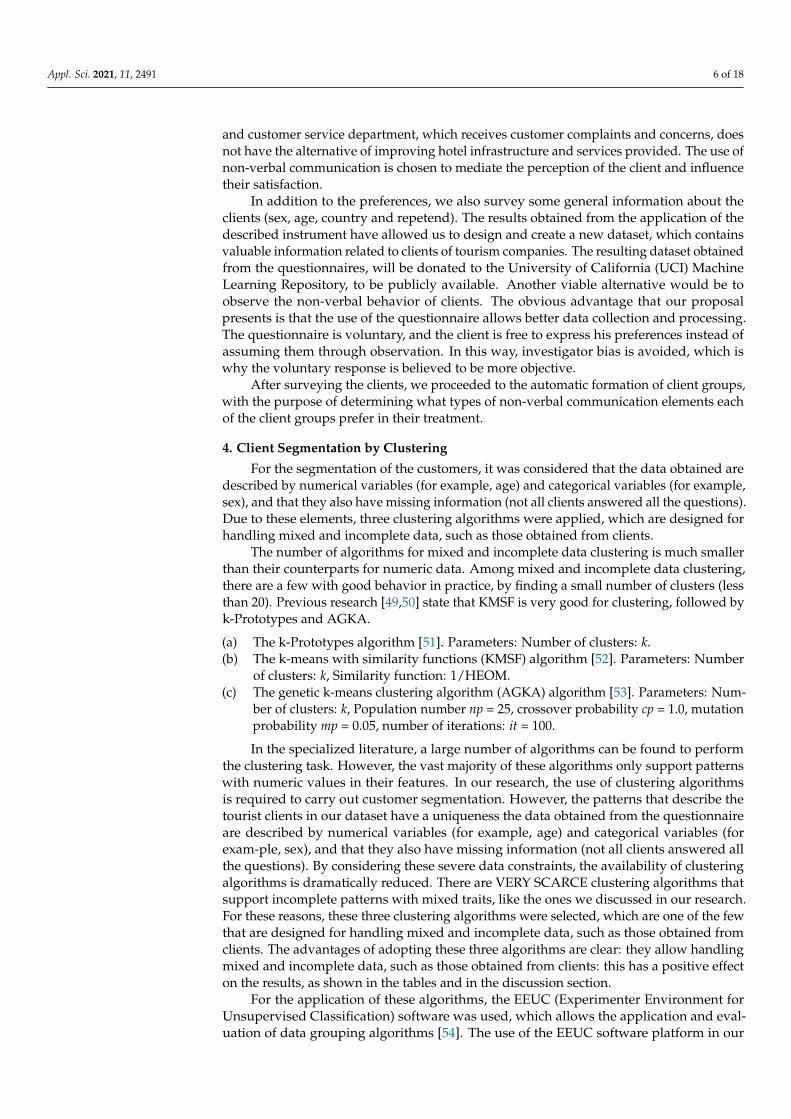
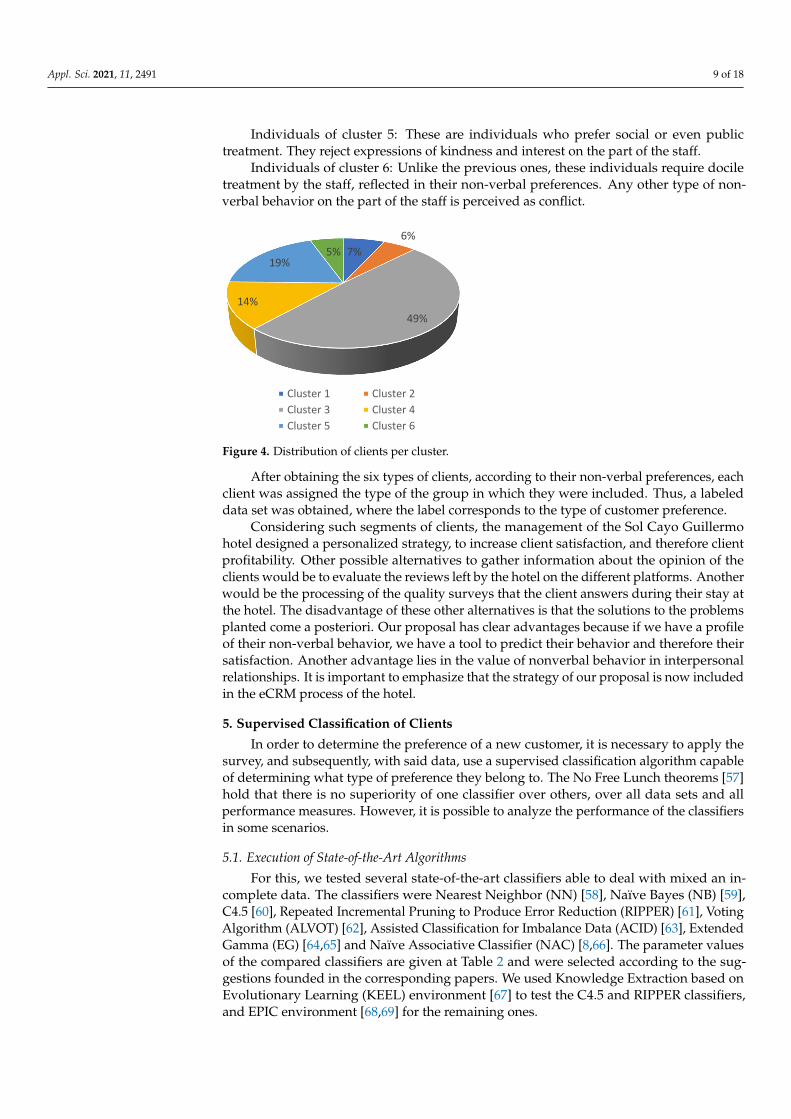
The resulting groups were inspected manually by the director of the Quality and Customer Service Department of the Sol Cayo Guillermo hotel and received the approval of this expert, with more than 20 years of experience in the tourism field. The distribution of clients in the six groups is shown in Figure 4.
Figure 4. Distribution of clients per cluster.
It is very relevant to show the characteristics exhibited by the individuals of each of the 6 clusters obtained.
Individuals of cluster 1: They are characterized by being distant people, they prefer a formal treatment. They prefer a friendly tone.
Individuals of cluster 2: They prefer personal or social treatment, are indifferent to the use of an authoritarian tone, and they like the gestures of the staff.
Individuals of cluster 3: They are characterized by being repeaters, they are clients adapted to Cuban cultural dynamics, including linguistics, which makes them receptive to interactions with staff. They prefer intimate treatment.
Individuals of cluster 4: They are also repeat customers, but prefer a more personal rather than intimate treatment, they are indifferent to the gestures of the staff, but the use of measured quasi-lexical elements bothers them.
Individuals of cluster 5: These are individuals who prefer social or even public treat-ment. They reject expressions of kindness and interest on the part of the staff.
7%6%
49%14%
19%5%
Cluster 1 Cluster 2Cluster 3 Cluster 4Cluster 5 Cluster 6
Figure 3. Results of Dunn’s index.
The resulting groups were inspected manually by the director of the Quality andCustomer Service Department of the Sol Cayo Guillermo hotel and received the approvalof this expert, with more than 20 years of experience in the tourism field. The distributionof clients in the six groups is shown in Figure 4.
It is very relevant to show the characteristics exhibited by the individuals of each ofthe 6 clusters obtained.
Individuals of cluster 1: They are characterized by being distant people, they prefer aformal treatment. They prefer a friendly tone.
Individuals of cluster 2: They prefer personal or social treatment, are indifferent to theuse of an authoritarian tone, and they like the gestures of the staff.
Individuals of cluster 3: They are characterized by being repeaters, they are clientsadapted to Cuban cultural dynamics, including linguistics, which makes them receptive tointeractions with staff. They prefer intimate treatment.
Individuals of cluster 4: They are also repeat customers, but prefer a more personalrather than intimate treatment, they are indifferent to the gestures of the staff, but the useof measured quasi-lexical elements bothers them.
Appl. Sci. 2021, 11, 2491 9 of 18
Individuals of cluster 5: These are individuals who prefer social or even publictreatment. They reject expressions of kindness and interest on the part of the staff.
Individuals of cluster 6: Unlike the previous ones, these individuals require dociletreatment by the staff, reflected in their non-verbal preferences. Any other type of non-verbal behavior on the part of the staff is perceived as conflict.
Appl. Sci. 2021, 11, x 9 of 19
Figure 3. Results of Dunn’s index.
The resulting groups were inspected manually by the director of the Quality and Customer Service Department of the Sol Cayo Guillermo hotel and received the approval of this expert, with more than 20 years of experience in the tourism field. The distribution of clients in the six groups is shown in Figure 4.
Figure 4. Distribution of clients per cluster.
It is very relevant to show the characteristics exhibited by the individuals of each of the 6 clusters obtained.
Individuals of cluster 1: They are characterized by being distant people, they prefer a formal treatment. They prefer a friendly tone.
Individuals of cluster 2: They prefer personal or social treatment, are indifferent to the use of an authoritarian tone, and they like the gestures of the staff.
Individuals of cluster 3: They are characterized by being repeaters, they are clients adapted to Cuban cultural dynamics, including linguistics, which makes them receptive to interactions with staff. They prefer intimate treatment.
Individuals of cluster 4: They are also repeat customers, but prefer a more personal rather than intimate treatment, they are indifferent to the gestures of the staff, but the use of measured quasi-lexical elements bothers them.
Individuals of cluster 5: These are individuals who prefer social or even public treat-ment. They reject expressions of kindness and interest on the part of the staff.
7%6%
49%14%
19%5%
Cluster 1 Cluster 2Cluster 3 Cluster 4Cluster 5 Cluster 6
Figure 4. Distribution of clients per cluster.
After obtaining the six types of clients, according to their non-verbal preferences, eachclient was assigned the type of the group in which they were included. Thus, a labeleddata set was obtained, where the label corresponds to the type of customer preference.
Considering such segments of clients, the management of the Sol Cayo Guillermohotel designed a personalized strategy, to increase client satisfaction, and therefore clientprofitability. Other possible alternatives to gather information about the opinion of theclients would be to evaluate the reviews left by the hotel on the different platforms. Anotherwould be the processing of the quality surveys that the client answers during their stay atthe hotel. The disadvantage of these other alternatives is that the solutions to the problemsplanted come a posteriori. Our proposal has clear advantages because if we have a profileof their non-verbal behavior, we have a tool to predict their behavior and therefore theirsatisfaction. Another advantage lies in the value of nonverbal behavior in interpersonalrelationships. It is important to emphasize that the strategy of our proposal is now includedin the eCRM process of the hotel.
5. Supervised Classification of Clients
In order to determine the preference of a new customer, it is necessary to apply thesurvey, and subsequently, with said data, use a supervised classification algorithm capableof determining what type of preference they belong to. The No Free Lunch theorems [57]hold that there is no superiority of one classifier over others, over all data sets and allperformance measures. However, it is possible to analyze the performance of the classifiersin some scenarios.
5.1. Execution of State-of-the-Art Algorithms
For this, we tested several state-of-the-art classifiers able to deal with mixed an in-complete data. The classifiers were Nearest Neighbor (NN) [58], Naïve Bayes (NB) [59],C4.5 [60], Repeated Incremental Pruning to Produce Error Reduction (RIPPER) [61], VotingAlgorithm (ALVOT) [62], Assisted Classification for Imbalance Data (ACID) [63], ExtendedGamma (EG) [64,65] and Naïve Associative Classifier (NAC) [8,66]. The parameter valuesof the compared classifiers are given at Table 2 and were selected according to the sug-gestions founded in the corresponding papers. We used Knowledge Extraction based onEvolutionary Learning (KEEL) environment [67] to test the C4.5 and RIPPER classifiers,and EPIC environment [68,69] for the remaining ones.
Appl. Sci. 2021, 11, 2491 10 of 18
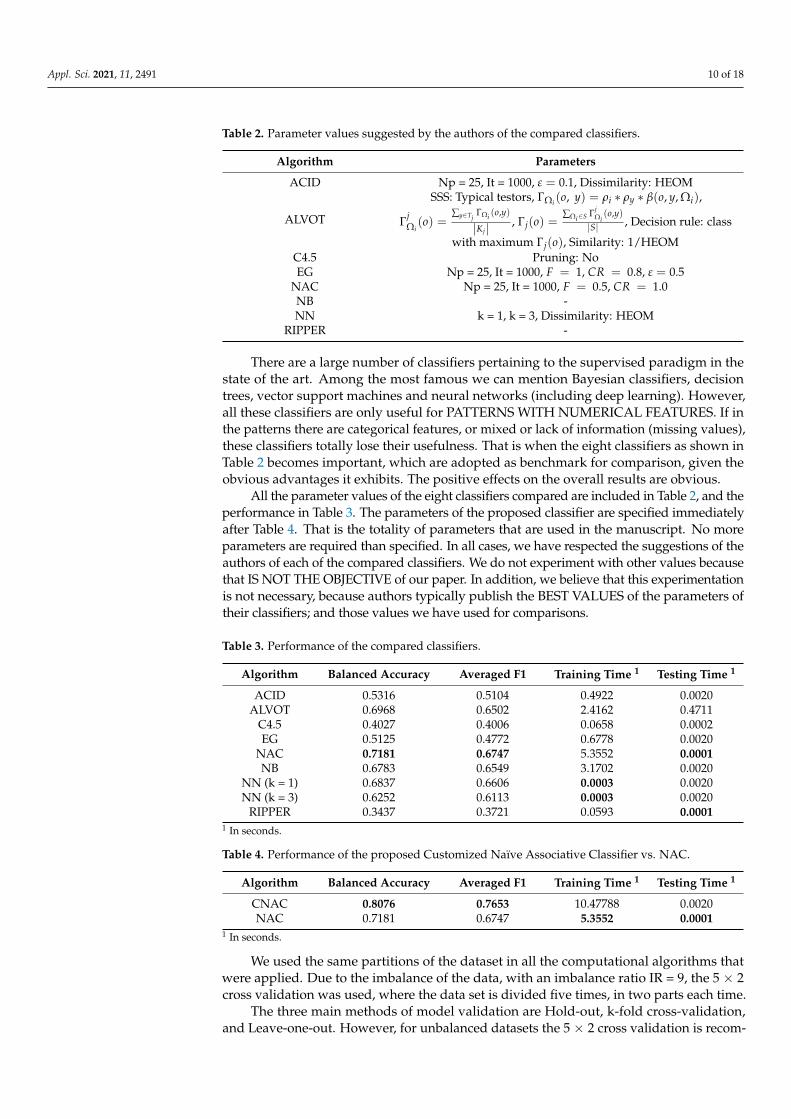
Table 2. Parameter values suggested by the authors of the compared classifiers.
Algorithm Parameters
ACID Np = 25, It = 1000, ε = 0.1, Dissimilarity: HEOM
ALVOT
SSS: Typical testors, ΓΩi (o, y) = ρi ∗ ρy ∗ β(o, y, Ωi),
ΓjΩi(o) =
∑y∈TjΓΩi (o,y)
|Kj| , Γj(o) =∑Ωi∈S Γj
Ωi(o,y)
|S| , Decision rule: class
with maximum Γj(o), Similarity: 1/HEOMC4.5 Pruning: NoEG Np = 25, It = 1000, F = 1, CR = 0.8, ε = 0.5
NAC Np = 25, It = 1000, F = 0.5, CR = 1.0NB -NN k = 1, k = 3, Dissimilarity: HEOM
RIPPER -
There are a large number of classifiers pertaining to the supervised paradigm in thestate of the art. Among the most famous we can mention Bayesian classifiers, decisiontrees, vector support machines and neural networks (including deep learning). However,all these classifiers are only useful for PATTERNS WITH NUMERICAL FEATURES. If inthe patterns there are categorical features, or mixed or lack of information (missing values),these classifiers totally lose their usefulness. That is when the eight classifiers as shown inTable 2 becomes important, which are adopted as benchmark for comparison, given theobvious advantages it exhibits. The positive effects on the overall results are obvious.
All the parameter values of the eight classifiers compared are included in Table 2, and theperformance in Table 3. The parameters of the proposed classifier are specified immediatelyafter Table 4. That is the totality of parameters that are used in the manuscript. No moreparameters are required than specified. In all cases, we have respected the suggestions of theauthors of each of the compared classifiers. We do not experiment with other values becausethat IS NOT THE OBJECTIVE of our paper. In addition, we believe that this experimentationis not necessary, because authors typically publish the BEST VALUES of the parameters oftheir classifiers; and those values we have used for comparisons.
Table 3. Performance of the compared classifiers.
Algorithm Balanced Accuracy Averaged F1 Training Time 1 Testing Time 1
ACID 0.5316 0.5104 0.4922 0.0020ALVOT 0.6968 0.6502 2.4162 0.4711
C4.5 0.4027 0.4006 0.0658 0.0002EG 0.5125 0.4772 0.6778 0.0020
NAC 0.7181 0.6747 5.3552 0.0001NB 0.6783 0.6549 3.1702 0.0020
NN (k = 1) 0.6837 0.6606 0.0003 0.0020NN (k = 3) 0.6252 0.6113 0.0003 0.0020
RIPPER 0.3437 0.3721 0.0593 0.00011 In seconds.
Table 4. Performance of the proposed Customized Naïve Associative Classifier vs. NAC.
Algorithm Balanced Accuracy Averaged F1 Training Time 1 Testing Time 1
CNAC 0.8076 0.7653 10.47788 0.0020NAC 0.7181 0.6747 5.3552 0.0001
1 In seconds.
We used the same partitions of the dataset in all the computational algorithms thatwere applied. Due to the imbalance of the data, with an imbalance ratio IR = 9, the 5 × 2cross validation was used, where the data set is divided five times, in two parts each time.
The three main methods of model validation are Hold-out, k-fold cross-validation,and Leave-one-out. However, for unbalanced datasets the 5 × 2 cross validation is recom-
Appl. Sci. 2021, 11, 2491 11 of 18
mended. This is the reason why it is adopted in this study, given the obvious advantages itexhibits. The positive effects on the overall results are obvious.
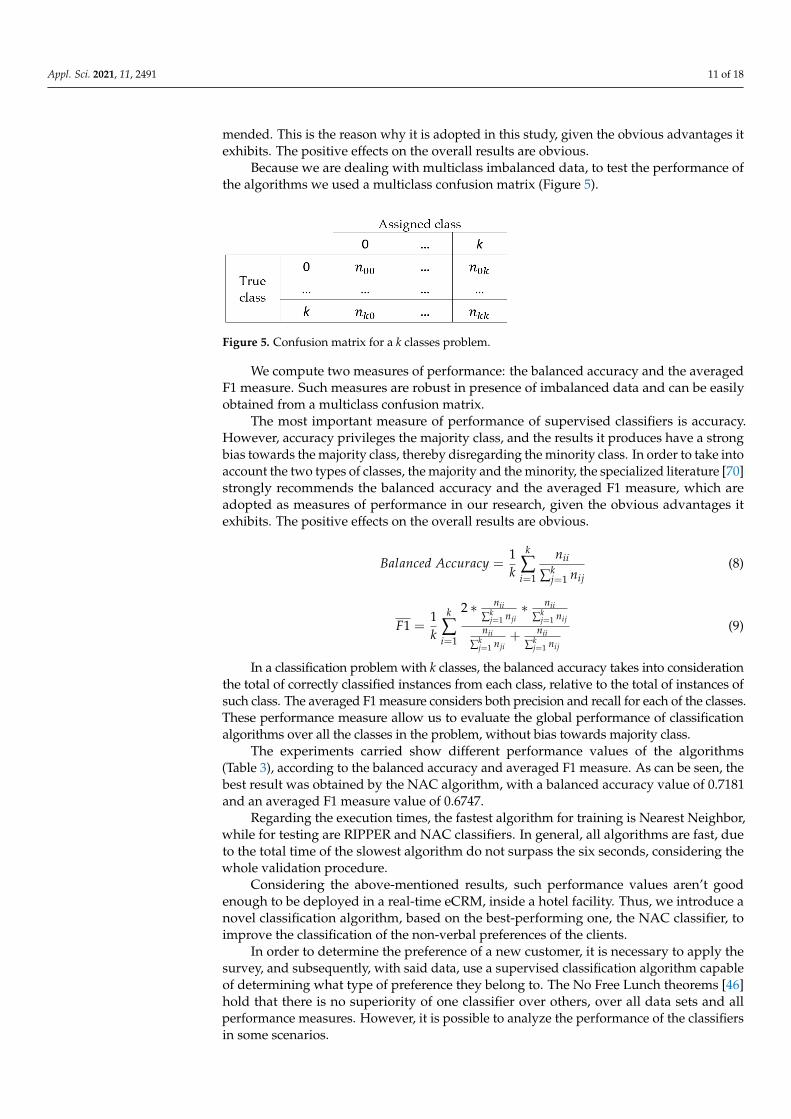
Because we are dealing with multiclass imbalanced data, to test the performance ofthe algorithms we used a multiclass confusion matrix (Figure 5).
Appl. Sci. 2021, 11, x 11 of 19
There are a large number of classifiers pertaining to the supervised paradigm in the state of the art. Among the most famous we can mention Bayesian classifiers, decision trees, vector support machines and neural networks (including deep learning). However, all these classifiers are only useful for PATTERNS WITH NUMERICAL FEATURES. If in the patterns there are categorical features, or mixed or lack of information (missing val-ues), these classifiers totally lose their usefulness. That is when the eight classifiers as shown in Table 2 becomes important, which are adopted as benchmark for comparison, given the obvious advantages it exhibits. The positive effects on the overall results are obvious.
All the parameter values of the eight classifiers compared are included in Table 2, and the performance in Table 3. The parameters of the proposed classifier are specified immediately after Table 4. That is the totality of parameters that are used in the manu-script. No more parameters are required than specified. In all cases, we have respected the suggestions of the authors of each of the compared classifiers. We do not experiment with other values because that IS NOT THE OBJECTIVE of our paper. In addition, we believe that this experimentation is not necessary, because authors typically publish the BEST VALUES of the parameters of their classifiers; and those values we have used for compar-isons.
We used the same partitions of the dataset in all the computational algorithms that were applied. Due to the imbalance of the data, with an imbalance ratio IR = 9, the 5 × 2 cross validation was used, where the data set is divided five times, in two parts each time.
The three main methods of model validation are Hold-out, k-fold cross-validation, and Leave-one-out. However, for unbalanced datasets the 5 × 2 cross validation is recom-mended. This is the reason why it is adopted in this study, given the obvious advantages it exhibits. The positive effects on the overall results are obvious.
Because we are dealing with multiclass imbalanced data, to test the performance of the algorithms we used a multiclass confusion matrix (Figure 5).
Figure 5. Confusion matrix for a k classes problem.
We compute two measures of performance: the balanced accuracy and the averaged F1 measure. Such measures are robust in presence of imbalanced data and can be easily obtained from a multiclass confusion matrix.
The most important measure of performance of supervised classifiers is accuracy. However, accuracy privileges the majority class, and the results it produces have a strong bias towards the majority class, thereby disregarding the minority class. In order to take into account the two types of classes, the majority and the minority, the specialized liter-ature [70] strongly recommends the balanced accuracy and the averaged F1 measure, which are adopted as measures of performance in our research, given the obvious ad-vantages it exhibits. The positive effects on the overall results are obvious.
𝐵𝑎𝑙𝑎𝑛𝑐𝑒𝑑 𝐴𝑐𝑐𝑢𝑟𝑎𝑐𝑦 = 1𝑘 𝑛∑ 𝑛 (8)
Figure 5. Confusion matrix for a k classes problem.
We compute two measures of performance: the balanced accuracy and the averagedF1 measure. Such measures are robust in presence of imbalanced data and can be easilyobtained from a multiclass confusion matrix.
The most important measure of performance of supervised classifiers is accuracy.However, accuracy privileges the majority class, and the results it produces have a strongbias towards the majority class, thereby disregarding the minority class. In order to take intoaccount the two types of classes, the majority and the minority, the specialized literature [70]strongly recommends the balanced accuracy and the averaged F1 measure, which areadopted as measures of performance in our research, given the obvious advantages itexhibits. The positive effects on the overall results are obvious.
Balanced Accuracy =1k
k
∑i=1
nii
∑kj=1 nij
(8)
F1 =1k
k
∑i=1
2 ∗ nii∑k
j=1 nji∗ nii
∑kj=1 nij
nii∑k
j=1 nji+ nii
∑kj=1 nij
(9)
In a classification problem with k classes, the balanced accuracy takes into considerationthe total of correctly classified instances from each class, relative to the total of instances ofsuch class. The averaged F1 measure considers both precision and recall for each of the classes.These performance measure allow us to evaluate the global performance of classificationalgorithms over all the classes in the problem, without bias towards majority class.
The experiments carried show different performance values of the algorithms(Table 3), according to the balanced accuracy and averaged F1 measure. As can be seen, thebest result was obtained by the NAC algorithm, with a balanced accuracy value of 0.7181and an averaged F1 measure value of 0.6747.
Regarding the execution times, the fastest algorithm for training is Nearest Neighbor,while for testing are RIPPER and NAC classifiers. In general, all algorithms are fast, dueto the total time of the slowest algorithm do not surpass the six seconds, considering thewhole validation procedure.
Considering the above-mentioned results, such performance values aren’t goodenough to be deployed in a real-time eCRM, inside a hotel facility. Thus, we introduce anovel classification algorithm, based on the best-performing one, the NAC classifier, toimprove the classification of the non-verbal preferences of the clients.
In order to determine the preference of a new customer, it is necessary to apply thesurvey, and subsequently, with said data, use a supervised classification algorithm capableof determining what type of preference they belong to. The No Free Lunch theorems [46]hold that there is no superiority of one classifier over others, over all data sets and allperformance measures. However, it is possible to analyze the performance of the classifiersin some scenarios.

Appl. Sci. 2021, 11, 2491 12 of 18
5.2. Customized Naïve Associative Classifier (CNAC)
NAC classifier has a predefined similarity function, based on the Mixed and Incom-plete Data Similarity Operator (MIDSO). It also has the possibility of using feature weights,and to compute them by means of metaheuristic algorithms [55]. In addition, in its func-tioning NAC considers the overall similarity of the instance to classify with respect everyclass of instances, which makes it suitable for dealing with imbalanced data [7].
The first modification to NAC is to substitute the MIDSO operator by a customizedfeature similarity operator Customized Mixed and Incomplete Data Similarity Operator(CMIDSO). We consider that if we replace MIDSO with a customized similarity operator,able to use feature weights, and to compare the differences between feature values, wecan extend the NAC algorithm to a Customized Naïve Associative Classifier (CNAC).By that, we preserve the nature of NAC, but we make it more flexible and useful forspecific problems.
Other feasible alternatives are: (a) design a novel classifier for mixed and incompletedata, based on other paradigms, and (b) using data preprocessing techniques with theobjective of enhancing the results. However, (a) is complex, and (b) will require havingmore data than the ones we have.
The main advantage of adopting this operator is that it is based on features comparisoncriteria, which makes it suitable for designed customized similarity functions. This is ageneralization of the MIDSO operator and allows the users to define whatever similaritythey want, for any specific problem.
This affects the results in a positive way, due to the experiments made show a signifi-cant increase in the performance of the classifier, by using the proposed CMIDSO operator.In our opinion, the increase in the performance is due to the use of a similarity functionwhich takes into consideration the problem specifications, as well as the way the featurevalues are compared.
Let x and y be two instances, described by a set of features A = A1, · · · , Am. Ifan attribute is missing, its value is denoted by ”?”. Each instance belongs to a uniqueclass from a set of classes K =
K1, · · · , Kp
. and the set of attributes A may have an
associated set of attribute weights W = w1, · · · , wm. The total similarity st with respect
to the instance o to be classified, is computed as st(o, y) =m∑
i=1wi ∗ CMIDSO(o, y, Ai). As
using CMIDSO function as an algorithm parameter, we can customize the classifier, bymaintaining the NAC advantages.
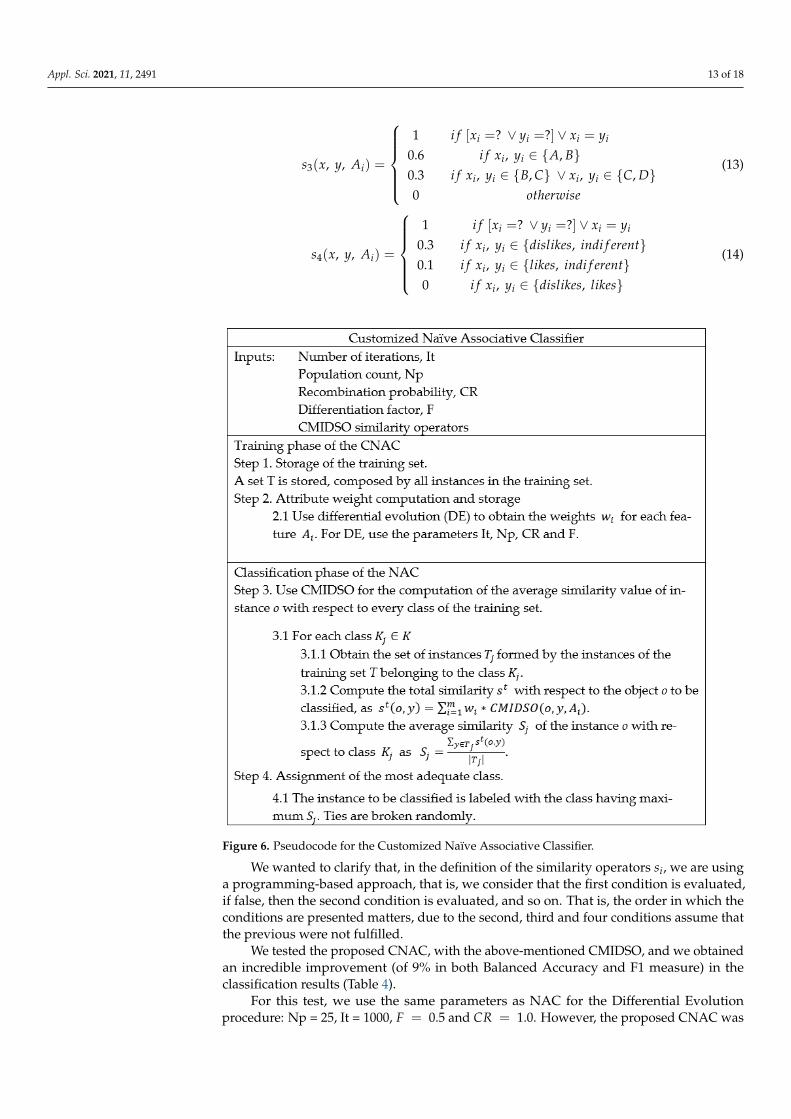
The pseudocode of the proposed Customized Naïve Associative Classifier is shown inFigure 6.
To solve the problem of classifying the non-verbal preferences of the clients, weintroduce a novel operator, suitable for comparing the non-verbal preferences of the clients.The proposed CMIDSO is then defined as follows, by considering the features defined forthe clients’ preferences (Table 1):
CMIDSO(x, y, Ai) =
s1(x, y, Ai)
s2(x, y, Ai)
i f i ∈ 1, 3, 4i f i ∈ 2, 13, 14, 15
s3(x, y, Ai)
s4(x, y, Ai)
i f i = 22otherwise
(10)
s1(x, y, Ai) =
0 i f xi 6= yi
1 otherwise(11)
s2(x, y, Ai) =
|xi−yi |maxi−mini
i f xi 6=? ∧ yi 6=?
1 i f xi =? ∨ yi =?(12)
Appl. Sci. 2021, 11, 2491 13 of 18
s3(x, y, Ai) =
1
0.6i f [xi =? ∨ yi =?] ∨ xi = yi
i f xi, yi ∈ A, B0.30
i f xi, yi ∈ B, C ∨ xi, yi ∈ C, Dotherwise
(13)
s4(x, y, Ai) =
1
0.3i f [xi =? ∨ yi =?] ∨ xi = yi
i f xi, yi ∈ dislikes, indi f erent0.10
i f xi, yi ∈ likes, indi f erenti f xi, yi ∈ dislikes, likes
(14)Appl. Sci. 2021, 11, x 14 of 19
Figure 6. Pseudocode for the Customized Naïve Associative Classifier.
To solve the problem of classifying the non-verbal preferences of the clients, we in-troduce a novel operator, suitable for comparing the non-verbal preferences of the clients. The proposed CMIDSO is then defined as follows, by considering the features defined for the clients’ preferences (Table 1):
𝐶𝑀𝐼𝐷𝑆𝑂(𝑥, 𝑦, 𝐴 ) = ⎩⎨⎧𝑠 (𝑥, 𝑦, 𝐴 )𝑠 (𝑥, 𝑦, 𝐴 ) 𝑖𝑓 𝑖 ∈ 1,3,4𝑖𝑓 𝑖 ∈ 2,13,14,15𝑠 (𝑥, 𝑦, 𝐴 )𝑠 (𝑥, 𝑦, 𝐴 ) 𝑖𝑓 𝑖 = 22𝑜𝑡ℎ𝑒𝑟𝑤𝑖𝑠𝑒 (10)
𝑠 (𝑥, 𝑦, 𝐴 ) = 0 𝑖𝑓 𝑥 ≠ 𝑦1 𝑜𝑡ℎ𝑒𝑟𝑤𝑖𝑠𝑒 (11)
𝑠 (𝑥, 𝑦, 𝐴 ) = |𝑥 − 𝑦 |𝑚𝑎𝑥 − 𝑚𝑖𝑛 𝑖𝑓 𝑥 ≠? ∧ 𝑦 ≠?1 𝑖𝑓 𝑥 =? ∨ 𝑦 =? (12)
𝑠 (𝑥, 𝑦, 𝐴 ) = 10.6 𝑖𝑓 [𝑥 =? ∨ 𝑦 =? ] ∨ 𝑥 = 𝑦 𝑖𝑓 𝑥 , 𝑦 ∈ 𝐴, 𝐵 0.30 𝑖𝑓 𝑥 , 𝑦 ∈ 𝐵, 𝐶 ∨ 𝑥 , 𝑦 ∈ 𝐶, 𝐷𝑜𝑡ℎ𝑒𝑟𝑤𝑖𝑠𝑒 (13)
Figure 6. Pseudocode for the Customized Naïve Associative Classifier.
We wanted to clarify that, in the definition of the similarity operators si, we are usinga programming-based approach, that is, we consider that the first condition is evaluated,if false, then the second condition is evaluated, and so on. That is, the order in which theconditions are presented matters, due to the second, third and four conditions assume thatthe previous were not fulfilled.
We tested the proposed CNAC, with the above-mentioned CMIDSO, and we obtainedan incredible improvement (of 9% in both Balanced Accuracy and F1 measure) in theclassification results (Table 4).
For this test, we use the same parameters as NAC for the Differential Evolutionprocedure: Np = 25, It = 1000, F = 0.5 and CR = 1.0. However, the proposed CNAC was

Appl. Sci. 2021, 11, 2491 14 of 18
slower than NAC. This is due to, in our opinion, the change in the similarity operator, dueto MIDSO is faster than the proposed CMIDSO.
The computational complexity of NAC and CNAC algorithms includes its storagecomplexity and its training and classification complexity. The storing computational com-plexity of NAC is bounded by O(n ∗m) + O(3m) where n is the number of instances andm is the number of features, due to NAC stores the training set as well as the minimum,maximum and standard deviation values of each feature. For CNAC, the storage com-plexity is bounded by O(n ∗m) because it only stores the training set. Regarding storage,CNAC is less complex, although by little.
The training complexity of the NAC is given by the computation of the standarddeviations of features bounded by O(n ∗m) and the use of Differential Evolution (DE) toobtain feature weights. Using DE has a complexity bounded by O(it ∗ np ∗ fNAC), where itis the number of evaluations, np is the population number and SNAC is the complexity ofcomputing the fitness function (classifier performance of NAC over a portion of the testingset). Thus, the training complexity of NAC is bounded by O(n ∗m) + O(it ∗ np ∗ fNAC).
The training complexity of CNAC is also given by the use of Differential Evolutionto obtain feature weights. That is, it is bounded by O(it ∗ np ∗ fCNAC), where fCNAC isthe complexity of computing the fitness function (classifier performance of CNAC over aportion of the testing set).
Regarding training complexity, there are two differences between NAC and CNAC:(a) the computing of standard deviations in NAC and (b) the similarity function used inthe classifier, which affects the value of the fitness function. For the case of study, having asmall number of instances, we can disregard the difference (a), and due to we are using thesame values of it and np, we consider the difference of NAC and CNAC with respect toexecution time is given by the use of a different similarity function.
The classification complexity of NAC is given by the similarity comparison of theunclassified instance with respect to the instances in the training set. The similarity compu-tation complexity using the MIDSO operator is given by O(m ∗ 1) = O(m) due to it onlycompares the feature values in a predefined way. Thus, the classification complexity of theNAC is bounded by O(n ∗m).
The classification complexity of CNAC is also given by the similarity comparison ofthe unclassified instance with respect to the instances in the training set. This complexity isgiven by O(n ∗ s) where s is the complexity of computing the similarity between instances.The complexity of CMIDSO operator is bounded by O(c ∗m), where c is the complexityof computing the feature similarity criterion. Thus, the total classification complexity ofCNAC is bounded by O(n ∗m ∗ c).
According to classification, CNAC is more complex than NAC, due to the use of acustomized similarity, which adds complexity to the classifier.
Nevertheless, expending only ten seconds once to train the model is good enough forusing it in a real environment, inside the electronic Customer Relationship Managementsystem implemented in the hotel.
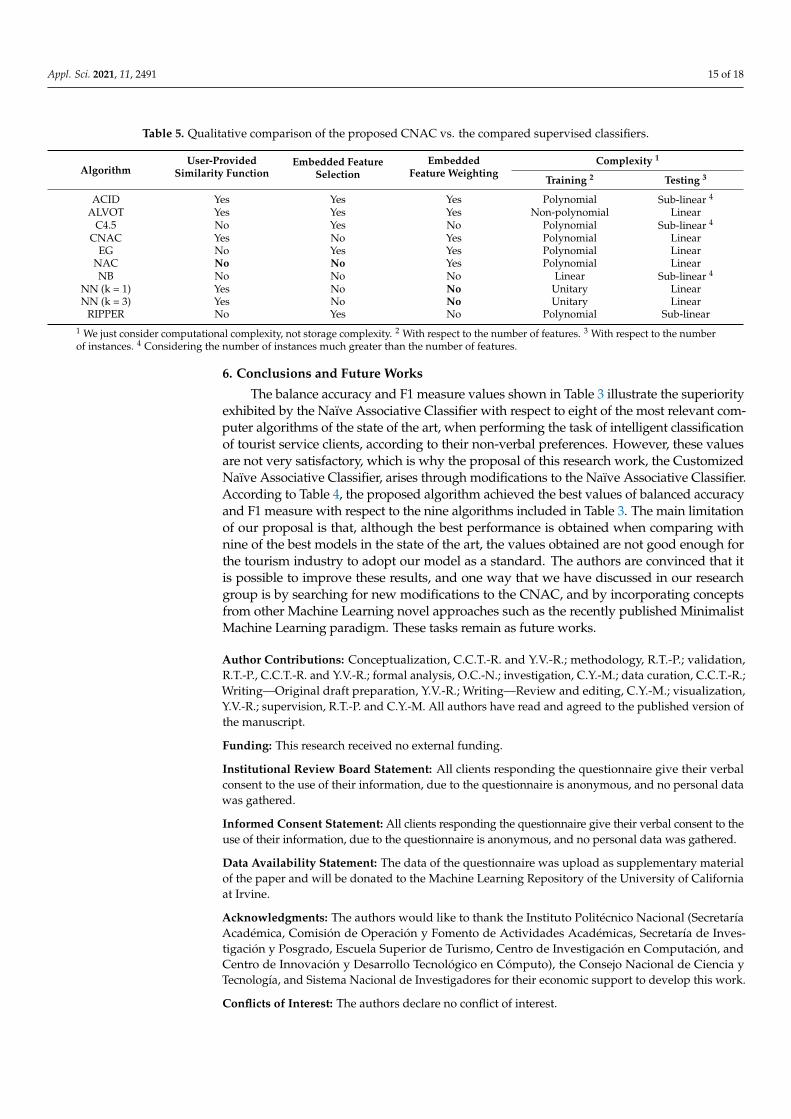
Apart from the quantitative comparison, a qualitative comparison between our pro-posed CNAC and the other compared supervised classifiers is provided in Table 5. Dueto all compared classifiers deal with mixed and incomplete data, and have some kind oftransparency in their decisions, we include other aspects in the qualitative comparison.The included aspects are the possibility of using a user-defined similarity function, theinclusion of embedded procedures for feature selection and feature weighing, and thecomputational complexity of training and testing phases of the algorithms. As shown, theproposed CNAC is different from the other compared classifiers, due to none of them hasthe same qualitative characteristics of CNAC.
Appl. Sci. 2021, 11, 2491 15 of 18
Table 5. Qualitative comparison of the proposed CNAC vs. the compared supervised classifiers.
AlgorithmUser-Provided
Similarity FunctionEmbedded Feature
SelectionEmbedded
Feature WeightingComplexity 1
Training 2 Testing 3
ACID Yes Yes Yes Polynomial Sub-linear 4
ALVOT Yes Yes Yes Non-polynomial LinearC4.5 No Yes No Polynomial Sub-linear 4
CNAC Yes No Yes Polynomial LinearEG No Yes Yes Polynomial Linear
NAC No No Yes Polynomial LinearNB No No No Linear Sub-linear 4
NN (k = 1) Yes No No Unitary LinearNN (k = 3) Yes No No Unitary Linear
RIPPER No Yes No Polynomial Sub-linear1 We just consider computational complexity, not storage complexity. 2 With respect to the number of features. 3 With respect to the numberof instances. 4 Considering the number of instances much greater than the number of features.
6. Conclusions and Future Works
The balance accuracy and F1 measure values shown in Table 3 illustrate the superiorityexhibited by the Naïve Associative Classifier with respect to eight of the most relevant com-puter algorithms of the state of the art, when performing the task of intelligent classificationof tourist service clients, according to their non-verbal preferences. However, these valuesare not very satisfactory, which is why the proposal of this research work, the CustomizedNaïve Associative Classifier, arises through modifications to the Naïve Associative Classifier.According to Table 4, the proposed algorithm achieved the best values of balanced accuracyand F1 measure with respect to the nine algorithms included in Table 3. The main limitationof our proposal is that, although the best performance is obtained when comparing withnine of the best models in the state of the art, the values obtained are not good enough forthe tourism industry to adopt our model as a standard. The authors are convinced that itis possible to improve these results, and one way that we have discussed in our researchgroup is by searching for new modifications to the CNAC, and by incorporating conceptsfrom other Machine Learning novel approaches such as the recently published MinimalistMachine Learning paradigm. These tasks remain as future works.
Author Contributions: Conceptualization, C.C.T.-R. and Y.V.-R.; methodology, R.T.-P.; validation,R.T.-P., C.C.T.-R. and Y.V.-R.; formal analysis, O.C.-N.; investigation, C.Y.-M.; data curation, C.C.T.-R.;Writing—Original draft preparation, Y.V.-R.; Writing—Review and editing, C.Y.-M.; visualization,Y.V.-R.; supervision, R.T.-P. and C.Y.-M. All authors have read and agreed to the published version ofthe manuscript.
Funding: This research received no external funding.
Institutional Review Board Statement: All clients responding the questionnaire give their verbalconsent to the use of their information, due to the questionnaire is anonymous, and no personal datawas gathered.
Informed Consent Statement: All clients responding the questionnaire give their verbal consent to theuse of their information, due to the questionnaire is anonymous, and no personal data was gathered.
Data Availability Statement: The data of the questionnaire was upload as supplementary materialof the paper and will be donated to the Machine Learning Repository of the University of Californiaat Irvine.
Acknowledgments: The authors would like to thank the Instituto Politécnico Nacional (SecretaríaAcadémica, Comisión de Operación y Fomento de Actividades Académicas, Secretaría de Inves-tigación y Posgrado, Escuela Superior de Turismo, Centro de Investigación en Computación, andCentro de Innovación y Desarrollo Tecnológico en Cómputo), the Consejo Nacional de Ciencia yTecnología, and Sistema Nacional de Investigadores for their economic support to develop this work.
Conflicts of Interest: The authors declare no conflict of interest.

Appl. Sci. 2021, 11, 2491 16 of 18
References1. Morgan, R.M.; Hunt, S.D. The commitment-trust theory of relationship marketing. J. Mark. 1994, 58, 20–38. [CrossRef]2. Grönroos, C. Relationship marketing: Strategic and tactical implications. Manag. Decis. 1996, 34, 5–14. [CrossRef]3. Wang, Y.; Fesenmaier, D.R. Towards understanding members’ general participation in and active contribution to an online travel
community. Tour. Manag. 2004, 25, 709–722. [CrossRef]4. Goel, V.; Singh, A.; Shrivastava, S. CRM: A winning approach for tourism sector. Int. J. Eng. Manag. Res. Ijemr 2015, 5, 321–325.5. Sigala, M. eCRM 2.0 applications and trends: The use and perceptions of Greek tourism firms of social networks and intelligence.
Comput. Hum. Behav. 2011, 27, 655–661. [CrossRef]6. Lee-Kelley, L.; Gilbert, D.; Mannicom, R. How e-CRM can enhance customer loyalty. Mark. Intell. Plan. 2003, 21, 239–248. [CrossRef]7. Mastorakis, G.; Trihas, N.; Perakakis, E.; Kopanakis, I. E-CRM in tourism exploiting emerging information and communication
technologies. Anatolia 2015, 26, 32–44. [CrossRef]8. Villuendas-Rey, Y.; Rey-Benguría, C.F.; Ferreira-Santiago, Á.; Camacho-Nieto, O.; Yáñez-Márquez, C. The naïve associative
classifier (NAC): A novel, simple, transparent, and accurate classification model evaluated on financial data. Neurocomputing2017, 265, 105–115. [CrossRef]
9. Ramanathan, V.; Meyyappan, T. Twitter text mining for sentiment analysis on people’s feedback about Oman tourism. InProceedings of the 2019 4th MEC International Conference on Big Data and Smart City (ICBDSC), Muscat, Oman, 15–16 January2019; pp. 1–5.
10. Afzaal, M.; Usman, M.; Fong, A. Tourism mobile app with aspect-based sentiment classification framework for tourist reviews.IEEE Trans. Consum. Electron. 2019, 65, 233–242. [CrossRef]
11. Alaei, A.R.; Becken, S.; Stantic, B. Sentiment analysis in tourism: Capitalizing on big data. J. Travel Res. 2019, 58, 175–191. [CrossRef]12. Fu, Y.; Hao, J.-X.; Li, X.; Hsu, C.H. Predictive accuracy of sentiment analytics for tourism: A metalearning perspective on Chinese
travel news. J. Travel Res. 2019, 58, 666–679. [CrossRef]13. Grljevic, O.; Bošnjak, Z.; Bošnjak, S. Contemporary data analysis techniques for online reputation management in hospitality and
tourism. Facta Univ. Ser. Econ. Organ. 2019, 16, 59–73. [CrossRef]14. García, A.; Gaines, S.; Linaza, M.T. A lexicon based sentiment analysis retrieval system for tourism domain. eRev. Tour. Res. 2012,
10, 35–38.15. González-Rodríguez, M.R.; Martínez-Torres, R.; Toral, S. Post-visit and pre-visit tourist destination image through eWOM
sentiment analysis and perceived helpfulness. Int. J. Contemp. Hosp. Manag. 2016, 28, 2609–2627. [CrossRef]16. Zeng, C.; Nakatoh, T.; Hirokawa, S.; Eguchi, M. Text mining of tourism preference in a multilingual site. IEEJ Trans. Electr.
Electron. Eng. 2019, 14, 590–596. [CrossRef]17. Yu, C.; Zhu, X.; Feng, B.; Cai, L.; An, L. Sentiment analysis of Japanese tourism online reviews. J. Data Inf. Sci. 2019, 4, 89–113. [CrossRef]18. Law, R.; Li, G.; Fong, D.K.C.; Han, X. Tourism demand forecasting: A deep learning approach. Ann. Tour. Res. 2019, 75, 410–423. [CrossRef]19. Sun, S.; Wei, Y.; Tsui, K.-L.; Wang, S. Forecasting tourist arrivals with machine learning and internet search index. Tour. Manag.
2019, 70, 1–10. [CrossRef]20. Zhang, F.; Jiang, Q.; Wang, Z. Forecasting mode of sports tourism demand based on support vector machine. In Proceedings of
the 5th International Conference on Frontiers of Educational Technologies, Beijing, China, 1–3 June 2019; pp. 154–158.21. Zhang, X.; Wang, B. Design of estimation algorithm of island intelligent tourist volume based on data mining. J. Coast. Res. 2020,
95, 985–990. [CrossRef]22. Qi, T.; Xu, Y.; Ling, H. Tourism scene classification based on multi-stage transfer learning model. Neural Comput. Appl. 2019, 31,
4341–4352. [CrossRef]23. Saito, N.; Ogawa, T.; Asamizu, S.; Haseyama, M. Classification of tourism categories based on heterogeneous features considering
existence of reliable results. In Proceedings of the International Workshop on Advanced Image Technology (IWAIT), Singapore,6–9 January 2019; p. 1104905.
24. Giglio, S.; Bertacchini, F.; Bilotta, E.; Pantano, P. Using social media to identify tourism attractiveness in six Italian cities. Tour.Manag. 2019, 72, 306–312. [CrossRef]
25. Zhang, K.; Chen, Y.; Li, C. Discovering the tourists’ behaviors and perceptions in a tourism destination by analyzing photos’visual content with a computer deep learning model: The case of Beijing. Tour. Manag. 2019, 75, 595–608. [CrossRef]
26. Giglio, S.; Bertacchini, F.; Bilotta, E.; Pantano, P. Machine learning and points of interest: Typical tourist Italian cities. Curr. IssuesTour. 2019. [CrossRef]
27. Pantano, E.; Dennis, C. Store buildings as tourist attractions: Mining retail meaning of store building pictures through a machinelearning approach. J. Retail. Consum. Serv. 2019, 51, 304–310. [CrossRef]
28. Banan, A.; Nasiri, A.; Taheri-Garavand, A. Deep learning-based appearance features extraction for automated carp speciesidentification. Aquac. Eng. 2020, 89, 102053. [CrossRef]
29. Fan, Y.; Xu, K.; Wu, H.; Zheng, Y.; Tao, B. Spatiotemporal modeling for nonlinear distributed thermal processes based on KLdecomposition, MLP and LSTM network. IEEE Access 2020, 8, 25111–25121. [CrossRef]
30. Shamshirband, S.; Rabczuk, T.; Chau, K.W. A survey of deep learning techniques: Application in wind and solar energy resources.IEEE Access 2019, 7, 164650–164666. [CrossRef]
31. Estebsari, A.; Rajabi, R. Single residential load forecasting using deep learning and image encoding techniques. Electronics 2020, 9,68. [CrossRef]

Appl. Sci. 2021, 11, 2491 17 of 18
32. Fu, M.; Fan, T.; Ding, Z.A.; Salih, S.Q.; Al-Ansari, N.; Yaseen, Z.M. Deep learning data-intelligence model based on adjustedforecasting window scale: Application in daily streamflow simulation. IEEE Access 2020, 8, 32632–32651. [CrossRef]
33. Faizollahzadeh Ardabili, S.; Najafi, B.; Shamshirband, S.; Minaei Bidgoli, B.; Deo, R.C.; Chau, K.W. Computational intelligenceapproach for modeling hydrogen production: A review. Eng. Appl. Comput. Fluid Mech. 2018, 12, 438–458. [CrossRef]
34. Chi, O.H.; Gursoy, D.; Chi, C.G. Tourists’ attitudes toward the use of artificially intelligent (AI) devices in tourism service delivery:Moderating role of service value seeking. J. Travel Res. 2020. [CrossRef]
35. Leung, R. Hospitality technology progress towards intelligent buildings: A perspective article. Tour. Rev. 2020, 76, 69–73. [CrossRef]36. Wei, C.; Wang, Q.; Liu, C. Research on construction of a cloud platform for tourism information intelligent service based on
blockchain technology. Wirel. Commun. Mob. Comput. 2020, 2020. [CrossRef]37. Yang, L.; Henthorne, T.L.; George, B. Artificial intelligence and robotics technology in the hospitality industry: Current applica-
tions and future trends. In Digital Transformation in Business and Society; Springer: Cham, Switzerland, 2020; pp. 211–228.38. Li, D.; Deng, L.; Cai, Z. Statistical analysis of tourist flow in tourist spots based on big data platform and DA-HKRVM algorithms.
Pers. Ubiquitous Comput. 2020, 24, 87–101. [CrossRef]39. Zhang, J.; Dong, L. Image monitoring and management of hot tourism destination based on data mining technology in big data
environment. Microprocess. Microsyst. 2020, 80, 103515. [CrossRef]40. Sigalat-Signes, E.; Calvo-Palomares, R.; Roig-Merino, B.; García-Adán, I. Transition towards a tourist innovation model: The
smart tourism destination: Reality or territorial marketing? J. Innov. Knowl. 2020, 5, 96–104. [CrossRef]41. Wahyono, I.D.; Asfani, K.; Mohamad, M.M.; Aripriharta, A.; Wibawa, A.P.; Wibisono, W. New smart map for tourism using
artificial intelligence. In Proceedings of the 2020 10th Electrical Power, Electronics, Communications, Controls and InformaticsSeminar (EECCIS), Malang, Indonesia, 26–28 August 2020; pp. 213–216.
42. Ortega, J.L.C.; Malcolm, C.D. Touristic stakeholders’ perceptions about the smart tourism destination concept in Puerto Vallarta,Jalisco, Mexico. Sustainability 2020, 12, 1741. [CrossRef]
43. Sari, I.U.; Sergi, D.; Ozkan, B. Customer segmentation using RFM analysis: Real case application on a fuel company. In Applicationof Big Data and Business Analytics; Emerald Publishing Limited: Bingley, UK, 2020.
44. Gabbott, M.; Hogg, G. The role of non-verbal communication in service encounters: A conceptual framework. J. Mark. Manag.2001, 17, 5–26. [CrossRef]
45. Gabbott, M.; Hogg, G. An empirical investigation of the impact of non-verbal communication on service evaluation. Eur. J. Mark.2000, 34, 384–398. [CrossRef]
46. Puccinelli, N.M.; Andrzejewski, S.A.; Markos, E.; Noga, T.; Motyka, S. The value of knowing what customers really want: Theimpact of salesperson ability to read non-verbal cues of affect on service quality. J. Mark. Manag. 2013, 29, 356–373. [CrossRef]
47. Rey-Benguría, C.F. Pedagogical Model for the Formation of the Non-Verbal Subsystem of the Communicative Competence ofPreschool Teachers (in Spanish, Modelo Pedagógico Para la Formación del Subsistema no Verbal de la Competencia Comunicativade los Docentes de la Educación Preescolar). Ph.D. Thesis, Center for studies and research for educational development,Universidad de Ciencias Pedagógicas “José Martí”, Camagüey, Cuba, 2006.
48. Phutela, D. The importance of non-verbal communication. IUP J. Soft Ski. 2015, 9, 43–49.49. Barroso-Cubas, E. Experimental Evaluation of Restricted Clustering Algorithms for Mixed and Incomplete Data (Evaluación
Experimental de Algoritmos de Agrupamiento Restringidos para Datos Mezclados e Incompletos, in Spanish). Bachelor’s Thesis,Department of Computer Sciences, University of Ciego de Ávila, Ciego de Ávila, Cuba, 2012.
50. González-Patiño, D. Bioinspired Classification Model and Its Application to Medical Diagnosis. Ph.D. Thesis, Centro deInvestigación en Computación, Instituto Politécnico Nacional, Mexico City, Mexico, 2020.
51. Huang, Z. Extensions to the k-means algorithm for clustering large data sets with categorical values. Data Min. Knowl. Discov.1998, 2, 283–304. [CrossRef]
52. García-Serrano, J.R.; Martínez-Trinidad, J.F. Extension to c-means algorithm for the use of similarity functions. In Proceedings ofthe European Conference on Principles of Data Mining and Knowledge Discovery, Prague, Czech Republic, 15–18 September1999; pp. 354–359.
53. Roy, D.K.; Sharma, L.K. Genetic k-means clustering algorithm for mixed numeric and categorical data sets. Int. J. Artif. Intell.Appl. 2010, 1, 23–28.
54. Cabrera-Venegas, J.F.; Villuendas-Rey, Y.; Chávez-Castilla, Y. Integrated experimenter environment for unsupervised classification.In Proceedings of the UCIENCIA, La Habana, Cuba, 10–12 April 2014; pp. 18–28.
55. Brun, M.; Sima, C.; Hua, J.; Lowey, J.; Carroll, B.; Suh, E.; Dougherty, E.R. Model-based evaluation of clustering validationmeasures. Pattern Recognit. 2007, 40, 807–824. [CrossRef]
56. Wilson, D.R.; Martinez, T.R. Improved heterogeneous distance functions. J. Artif. Intell. Res. 1997, 6, 1–34. [CrossRef]57. Wolpert, D.H.; Macready, W.G. No free lunch theorems for optimization. IEEE Trans. Evol. Comput. 1997, 1, 67–82. [CrossRef]58. Cover, T.; Hart, P. Nearest neighbor pattern classification. IEEE Trans. Inf. Theory 1967, 13, 21–27. [CrossRef]59. John, G.H.; Langley, P. Estimating continuous distributions in Bayesian classifiers. In Proceedings of the Eleventh Conference on
Uncertainty in Artificial Intelligence, Montreal, QU, Canada, 18–20 August 1995; pp. 338–345.60. Quinlan, J.R. C4. 5: Programs for Machine Learning; Morgan Kaufman: Burlington, MA, USA, 1993.61. Cohen, W.W. Fast effective rule induction. In Machine Learning Proceedings; Elsevier: Amsterdam, The Netherlands, 1995; pp.
115–123.
Appl. Sci. 2021, 11, 2491 18 of 18
62. Ruiz-Shulcloper, J. Pattern recognition with mixed and incomplete data. Pattern Recognit. Image Anal. 2008, 18, 563–576. [CrossRef]63. Villuendas-Rey, Y.; Alanis-Tamez, M.D.; Rey-Benguría, C.; Yáñez-Márquez, C.; Nieto, O.C. Medical diagnosis of chronic diseases
based on a novel computational intelligence algorithm. J. UCS 2018, 24, 775–796.64. Sonia, O.-Á.; Yenny, V.-R.; Cornelio, Y.-M.; Itzamá, L.-Y.; Oscar, C.-N. Determining electoral preferences in Mexican voters by
computational intelligence algorithms. IEEE Lat. Am. Trans. 2020, 18, 704–713. [CrossRef]65. Villuendas-Rey, Y.; Yáñez-Márquez, C.; Anton-Vargas, J.A.; López-Yáñez, I. An extension of the gamma associative classifier for
dealing with hybrid data. IEEE Access 2019, 7, 64198–64205. [CrossRef]66. Serrano-Silva, Y.O.; Villuendas-Rey, Y.; Yáñez-Márquez, C. Automatic feature weighting for improving financial decision support
systems. Decis. Support Syst. 2018, 107, 78–87. [CrossRef]67. Triguero, I.; González, S.; Moyano, J.M.; García López, S.; Alcalá Fernández, J.; Luengo Martín, J.; Fernández Hilario, A.;
Jesús Díaz, M.J.d.; Sánchez, L.; Herrera Triguero, F. KEEL 3.0: An open source software for multi-stage analysis in data mining.Int. J. Comput. Intell. Syst. 2017, 10, 1238–1249. [CrossRef]
68. Hernández-Castaño, J.A.; Villuendas-Rey, Y.; Camacho-Nieto, O.; Yáñez-Márquez, C. Experimental platform for intelligentcomputing (EPIC). Computación y Sistemas 2018, 22, 245–253. [CrossRef]
69. Hernández-Castaño, J.A.; Villuendas-Rey, Y.; Camacho-Nieto, O.; Rey-Benguría, C.F. A New experimentation module for theEPIC Software. Res. Comput. Sci. 2018, 147, 243–252. [CrossRef]
70. Sokolova, M.; Japkowicz, N.; Szpakowicz, S. Beyond accuracy, F-score and ROC: A family of discriminant measures forperformance evaluation. In Proceedings of the Australasian joint conference on artificial intelligence, Hobart, Australia, 4–8December 2006; pp. 1015–1021.