Improvement of a two-stage fermentation process for docosahexaenoic acid production by...
8
Improvement of a two-stage fermentation process for docosahexaenoic acid production by Aurantiochytrium limacinum SR21 applying statistical experimental designs and data analysis Silvina Mariana Rosa a,b , Marcelo Abel Soria c , Carlos Guillermo Vélez b , Miguel Angel Galvagno a,d, * a Instituto de Investigaciones Biotecnológicas, IIB-CONICET, Universidad Nacional de San Martín, Av. Colectora General Paz 5445, (1650) Buenos Aires, Argentina b Departamento de Biodiversidad y Biología Experimental, Facultad de Ciencias Exactas y Naturales, Universidad de Buenos Aires, Ciudad Universitaria, (1428) Buenos Aires, Argentina c Cátedra de Microbiología Agrícola, Facultad de Agronomía, Universidad de Buenos Aires, Av. San Martín 4453, (1417) Buenos Aires, Argentina d Departamento de Ingeniería Química, Facultad de Ingeniería, Universidad de Buenos Aires, Pabellón de Industrias, Ciudad Universitaria, (1428) Buenos Aires, Argentina article info Article history: Received 4 February 2008 Received in revised form 20 February 2009 Accepted 24 October 2009 Available online 16 December 2009 Keywords: Docosahexaenoic acid Aurantiochytrium Two-stage fermentation Statistical designs Artificial neural networks abstract Statistical screening experimental designs were applied to identify the significant culture variables for biomass production of Aurantiochytrium limacinum SR21 and their optimal levels were found using a combination of Artificial Neural Networks, genetic algorithms and graphical analysis. The biomass value obtained (40.3 g cell dry weight l 1 ) employing the selected culture conditions agreed with that predicted by the model. Subsequently, two significant culture conditions for docosahexaenoic acid (DHA) produc- tion were determined, finding that an inoculum of 10% (v/v), obtained from the previous (statistically optimized) stage, should be used in a DHA production medium having a molar C:N ratio of 55:1, to reach a production of 7.8 g DHA l 1 d 1 . The production step was thereafter scaled in a 3.5 l bioreactor, and DHA productivity of 3.7 g l 1 d 1 was obtained. This two-stage strategy: statistically optimized inoculum pro- duction (fist step) and a DHA production step, is presented for the first time to optimize a bioprocess con- ducive to the obtention of microbial DHA. Ó 2009 Elsevier Ltd. All rights reserved. 1. Introduction Docosahexaenoic acid (22:6n3) (DHA) is a long-chain polyun- saturated fatty acid (PUFA) that belongs to the omega-3 group. In recent years, DHA has attracted much attention because of its health related aspects (Ratledge, 2004; Sijtsma and de Swaaf, 2004), including its importance for proper development of the brain and eye in infants (Lauritzen et al., 2001) and for inhibiting risk factors involved in cardiovascular diseases in adults (Nordoy et al., 2001). As the typical ‘‘Western” diet provides low levels of omega-3 PUFAs, the market for these fatty acids has expanded last years and their usage as dietary supplements is recommended by many milestone advisories nowadays (Ward and Singh, 2005). The traditional main sources of omega-3 fatty acids have been fatty fish, but they have some disadvantages such as variable quality, contamination by environmental pollution, unpleasant smell and taste and expensive purification (Gunstone, 2001). In this context, exploration of alternative sources, like microbial oils (single cell oils, SCO) is currently being developed (Ratledge, 2004) because they have interesting advantages: possibility to obtain oils with high and specific PUFAs content, with higher oxidative stability, production from sustainable raw materials, lower purification costs, the absence of environmental man-made pollutants (Sijtsma and de Swaaf, 2004) and a more constant product quality is possible. Among the oleaginous microorganisms, thraustochytrids – common marine microheterotrophs – can be cultured to produce high biomass, containing substantial amounts of lipids rich in PUFAs (Lewis et al., 1999). The high DHA yields obtained with the thraustochytrid Schizochytrium resulted in a production of low-cost oil that is used as a nutraceutical in the food and feed market (Ward and Singh, 2005). The improvement of the bioprocess and the reductions of its cost are crucial for the expansion of the SCO market. Several factors influence the yield, productivity and total amounts of PUFAs produced. Since interactions between those process factors are expected, the application of experimental design strategies appears as an appropriate strategy for optimization (Thiry and Cingolani, 2002). Methods for experimental design can be broadly divided in two categories (Montgomery, 1991). The first one includes all those designs used for process screening, that is, the exploration of a potentially large number of input variables to dis- cover those that are statistically significant and estimate their magnitude; fractional factorial (FFr) and Plackett–Burman (PB) designs are examples of these methods (Standbury et al., 1986). 0960-8524/$ - see front matter Ó 2009 Elsevier Ltd. All rights reserved. doi:10.1016/j.biortech.2009.11.056 * Corresponding author. Address: Instituto de Investigaciones Biotecnológicas, IIB-CONICET, Universidad Nacional de San Martín, Av. Colectora General Paz 5445, (1650) Buenos Aires, Argentina. Tel.: +54 11 4576 3300x222; fax: +54 11 4576 3341. E-mail address: [email protected] (M.A. Galvagno). Bioresource Technology 101 (2010) 2367–2374 Contents lists available at ScienceDirect Bioresource Technology journal homepage: www.elsevier.com/locate/biortech
-
Upload
independent -
Category
Documents
-
view
0 -
download
0
Transcript of Improvement of a two-stage fermentation process for docosahexaenoic acid production by...

Bioresource Technology 101 (2010) 2367–2374
Contents lists available at ScienceDirect
Bioresource Technology
journal homepage: www.elsevier .com/locate /bior tech
Improvement of a two-stage fermentation process for docosahexaenoic acidproduction by Aurantiochytrium limacinum SR21 applying statisticalexperimental designs and data analysis
Silvina Mariana Rosa a,b, Marcelo Abel Soria c, Carlos Guillermo Vélez b, Miguel Angel Galvagno a,d,*
a Instituto de Investigaciones Biotecnológicas, IIB-CONICET, Universidad Nacional de San Martín, Av. Colectora General Paz 5445, (1650) Buenos Aires, Argentinab Departamento de Biodiversidad y Biología Experimental, Facultad de Ciencias Exactas y Naturales, Universidad de Buenos Aires, Ciudad Universitaria, (1428) Buenos Aires, Argentinac Cátedra de Microbiología Agrícola, Facultad de Agronomía, Universidad de Buenos Aires, Av. San Martín 4453, (1417) Buenos Aires, Argentinad Departamento de Ingeniería Química, Facultad de Ingeniería, Universidad de Buenos Aires, Pabellón de Industrias, Ciudad Universitaria, (1428) Buenos Aires, Argentina
a r t i c l e i n f o a b s t r a c t
Article history:Received 4 February 2008Received in revised form 20 February 2009Accepted 24 October 2009Available online 16 December 2009
Keywords:Docosahexaenoic acidAurantiochytriumTwo-stage fermentationStatistical designsArtificial neural networks
0960-8524/$ - see front matter � 2009 Elsevier Ltd. Adoi:10.1016/j.biortech.2009.11.056
* Corresponding author. Address: Instituto de InvIIB-CONICET, Universidad Nacional de San Martín, Av(1650) Buenos Aires, Argentina. Tel.: +54 11 4576 33341.
E-mail address: [email protected] (M.A. Galvagn
Statistical screening experimental designs were applied to identify the significant culture variables forbiomass production of Aurantiochytrium limacinum SR21 and their optimal levels were found using acombination of Artificial Neural Networks, genetic algorithms and graphical analysis. The biomass valueobtained (40.3 g cell dry weight l�1) employing the selected culture conditions agreed with that predictedby the model. Subsequently, two significant culture conditions for docosahexaenoic acid (DHA) produc-tion were determined, finding that an inoculum of 10% (v/v), obtained from the previous (statisticallyoptimized) stage, should be used in a DHA production medium having a molar C:N ratio of 55:1, to reacha production of 7.8 g DHA l�1 d�1. The production step was thereafter scaled in a 3.5 l bioreactor, and DHAproductivity of 3.7 g l�1 d�1 was obtained. This two-stage strategy: statistically optimized inoculum pro-duction (fist step) and a DHA production step, is presented for the first time to optimize a bioprocess con-ducive to the obtention of microbial DHA.
� 2009 Elsevier Ltd. All rights reserved.
1. Introduction they have interesting advantages: possibility to obtain oils with
Docosahexaenoic acid (22:6n�3) (DHA) is a long-chain polyun-saturated fatty acid (PUFA) that belongs to the omega-3 group. Inrecent years, DHA has attracted much attention because of itshealth related aspects (Ratledge, 2004; Sijtsma and de Swaaf,2004), including its importance for proper development of thebrain and eye in infants (Lauritzen et al., 2001) and for inhibitingrisk factors involved in cardiovascular diseases in adults (Nordoyet al., 2001). As the typical ‘‘Western” diet provides low levels ofomega-3 PUFAs, the market for these fatty acids has expanded lastyears and their usage as dietary supplements is recommended bymany milestone advisories nowadays (Ward and Singh, 2005).The traditional main sources of omega-3 fatty acids have been fattyfish, but they have some disadvantages such as variable quality,contamination by environmental pollution, unpleasant smell andtaste and expensive purification (Gunstone, 2001). In this context,exploration of alternative sources, like microbial oils (single celloils, SCO) is currently being developed (Ratledge, 2004) because
ll rights reserved.
estigaciones Biotecnológicas,. Colectora General Paz 5445,300x222; fax: +54 11 4576
o).
high and specific PUFAs content, with higher oxidative stability,production from sustainable raw materials, lower purificationcosts, the absence of environmental man-made pollutants (Sijtsmaand de Swaaf, 2004) and a more constant product quality ispossible. Among the oleaginous microorganisms, thraustochytrids– common marine microheterotrophs – can be cultured to producehigh biomass, containing substantial amounts of lipids rich inPUFAs (Lewis et al., 1999). The high DHA yields obtained withthe thraustochytrid Schizochytrium resulted in a production oflow-cost oil that is used as a nutraceutical in the food and feedmarket (Ward and Singh, 2005).
The improvement of the bioprocess and the reductions of itscost are crucial for the expansion of the SCO market. Several factorsinfluence the yield, productivity and total amounts of PUFAsproduced. Since interactions between those process factors areexpected, the application of experimental design strategiesappears as an appropriate strategy for optimization (Thiry andCingolani, 2002). Methods for experimental design can be broadlydivided in two categories (Montgomery, 1991). The first oneincludes all those designs used for process screening, that is, theexploration of a potentially large number of input variables to dis-cover those that are statistically significant and estimate theirmagnitude; fractional factorial (FFr) and Plackett–Burman (PB)designs are examples of these methods (Standbury et al., 1986).
2368 S.M. Rosa et al. / Bioresource Technology 101 (2010) 2367–2374
Methods in the second category aim to optimize a process given areduced number of variables. A typical scenario is the use of Box-Behnken or Central Composite designs and response surface anal-ysis on linear or quadratic models. Additionally to traditional sta-tistical experimental designs, other screening strategies can beemployed, such as artificial neural networks (ANNs) (Kennedyand Krouse, 1999; Mutihac and Mutihac, 2008), which are modelsthat mimic the learning ability of the brain. They are trained withsets of inputs and outputs and ‘‘learn” how to reproduce an outputfrom the input. The main advantage of ANNs is that they can modelnon-linear situations without any previous knowledge of the sys-tem dynamics (Soria et al., 2004). The drawback of ANNs is thatthey are ‘‘black-box” models, that is, the inspection of its parame-ters does not yield an understanding of the influence of the inputvariables on the output. For this reason, the standard techniquesof differentiation applied to parametric models to find maxima orminima do not apply for ANNs optimization. Instead, a numberof search methods were developed, among them, the family of ge-netic algorithms (GA) are the most frequently used. The name ofthis method relates to the way it proceeds. First, the output valuesare calculated using the ANN model for a number of ‘‘individuals”,each containing a chromosome with as many ‘‘genes” as input vari-ables and initial random values assigned to them. Those individu-als with the highest or lowest output values, depending whetherthe objective is finding a maximum or minimum respectively arekept for the next generation and new individuals are created bycrossing over the successful chromosomes and by randomlymutating individuals from the previous generation. The processis repeated for a given number of generation or until the popula-tion reaches a maximum (or minimum). The combination of ANNand GA for process optimization has been successfully applied inbiotechnology and industrial chemistry (Mutihac and Mutihac,2008; Desai et al., 2008).
In order to achieve lipid accumulation in a microorganism, itneeds to be grown in a medium with excess of carbon substrateand a limiting amount of other nutrients, usually nitrogen, (Ratl-edge, 2004). However, different nutritional conditions are morelikely to be required for growth; for example, concentration of Nsource is a determining factor for cell division. In this context,the aim of the present study was to optimize DHA production bya two-stage (growth and production) fermentation with Aurantio-chytrium (=Schizochytrium) (Yokoyama and Honda, 2007) limaci-num SR21. First, statistical experimental designs and ANNs wereused to define the optimal growth medium (first stage), and thendifferent conditions for lipid accumulation in production media(second stage) were studied. The optimal conditions obtained forthe production bioprocess in flask cultures were scaled up in a3.5 l bioreactor.
2. Methods
2.1. Microorganism and maintenance
Aurantiochytrium limacinum SR21 used in this study wasprovided by the Institute of Fermentation of Osaka (Japan, strainnumber IFO 32693). The microorganism was maintained in at�70 �C in medium containing glycerol 10% v/v. Working cultureswere carried out in GPY medium (% w/v: 2.0, glucose; 1.0, peptone;0.5, yeast extract – YE; 1.75, artificial sea salt; 1.5, agar; pH 5.5) at28 �C in an orbital shaker at 250 rpm.
2.2. Statistical experimental designs, data analysis and ANN
Plackett–Burman and fractional factorial designs were appliedto screen culture variables that significantly effected biomass accu-
mulation. These screening designs were set up for three or fourfactors (see Section 3) with two coded levels (�1 and +1) (Mont-gomery, 1991) covering different ranges, as indicated in Table 3,to evaluate their linear effect on dry cell weight (DCW). Three cen-tre points were run for each experiment. The results were fittedwith a first-order model, estimating the coefficient (slope) for eachfactor and its level of significance.
2.2.1. Clustering of experiments and group validationA two-step procedure was used to determine whether the runs
from the screening experiments could be pooled for optimization.In the first step individual runs from the five screening experi-ments (Table 3) were clustered using the K-means algorithmaccording to the values of the significant factors, i.e., inoculum size,glucose and corn steep liquor concentration (Hartigan and Wong,1979). The K-means algorithm distributes samples, runs in ourcase, among a given number of clusters. If that number, n, is notknow a priori, several values of n are evaluated and the cumulativewithin-group sums of squares penalized by n are calculated foreach. That n with the lowest penalized sum of squares is selected.Due to the partial overlap of sample spaces most or all the groupsresulting from the K-means algorithm, should contain runs fromdifferent experiments. Table 4 shows it was the case, four out offive experiments had their runs allocated in at least three clusters,a five out of six clusters had runs from at least two experiments.The second step of the analysis was to determine whether therewas a significant difference of mean DCW values across clustersobtained by K-means. This assertion is a direct consequence ofclustering, because it was done on the significant factors. However,the expected differences in DCW could be blurred if the uncon-trolled variability among screening experiment was large. To testthis point we performed a one-factor analysis of variance of runsusing the cluster membership as the classifier and the DCW valuesas the dependent variable.
2.2.2. Model building and analysisFor the optimization stage, the dataset consisting of the pooled
runs of five screening experiments were split into two subsets,one for model fitting or training and the other for validation.Three different models were fitted to the training dataset: linearwith interactions, quadratic with interactions and ANN. Themodels were used to make predictions on the validation subsetand for comparison of their performance, the squared root ofthe mean sum of squares of the errors (mse) was calculated foreach model:
mse ¼ffiffiffiffiffiffiffiffiffiffiffiffiffiffiffiffiffiffiffiffiffiffiffiffiffiffiffiffiffiffiffiffiffiffiffiffiffiffiffiffiffiffiffiffiffiffiffiffiffiffiffiffiffiffiffiffiffiffiffiffiffiffiffiffiffiffiffi1n
Xn
iðobservedi � expectediÞ
2
r
The statistical and numerical analyses of data were performedwith R (R Development Core Team, 2007).
ANN design, training and predictions were performed as de-scribed by Soria et al. (2004) using the Neural Network Toolbox in-cluded in MATLAB ver. 6.0 (The MathWorks, Natick, MA, USA). Thearchitecture of the ANN consisted of a feed-forward network withthree layers: one input layer with three inputs (inoculum size andcorn steep liquor-CSL- and glucose concentrations), one hiddenlayer with four neurons and one output layer that rendered thepredicted DCW value. The transfer function of the neurons in thehidden layer was the hyperbolic tangent sigmoid transfer function(tansig) and the neuron in the output layer had a linear transferfunction. The Bayesian regularization back-propagation (trainbr)method was used for training (Foresse and Hagan, 1997; MacKay,1992). This training method searches the number of neurons inthe hidden layer that produce good predictions while avoidingoverfitting.
S.M. Rosa et al. / Bioresource Technology 101 (2010) 2367–2374 2369
A genetic algorithm was applied to find a combination ofglucose, CSL concentrations and inoculum size that yielded amaximum of biomass production. The Genetic Algorithm and Di-rect Search Toolbox of MATLAB was used with the followingparameters: population type, double vector; population size, 40individuals; elite count (number of fit individuals that survive tothe next generation), 10; cross-over fraction (fraction of the 30remaining individuals that are generated by recombination),0.95; scale value for the variance of the first generation, 0.8. Otherparameters were left to their default values. The possible valuesthat could take the individuals of the first generation were re-stricted to glucose 8–12 g l�1, CSL 11–13% v/v and inoculum size5.0–6.0 � 106 cells ml�1. These parameter and initial values wereselected to thoroughly search a region that an initial exploratoryanalysis showed to contain a maximum. The fitness function wasthe trained ANN with a constraint to prevent it for searching con-centrations of CSL higher than 13% and inoculum sizes higher that6.0 � 106 cells ml�1, because any maximum found beyond thoselimits would not be realizable in practice.
2.3. Culture conditions
Statistical experimental designs were carried out with five-daycultures grown in media with different nutrient concentration(see Table 3). To investigate the effect of C:N ratio on biomassand lipid production, cultures were grown in production basalmedium PBM (% w/v): 10.0, glucose; 0.4, KH2PO4; 0.1, YE; 1.75artificial sea salt; variable concentrations of ammonium acetateranging from 0.17% to 2.15% (see results); pH 5.5. For optimizationof DHA production by a two-stage fermentation, cells were firstlyincubated in the optimized growth medium, centrifuged at7000 rpm for 15 min and washed with 1.75% artificial sea waterthree times, transferred to the same volume of PBM-derivedmedia with different C:N ratios and incubated during three daysat 28 �C in an orbital shaker at 250 rpm. In all cases, cultures werecarried out in 100 ml Erlenmeyer flasks containing 20 ml of cul-ture medium.
Fermentor experiments were performed in a 5.6-l BioFlo 110bioreactor (New Brunswick Scientific, Edison, NJ, USA). The fer-mentor was equipped with controllers for pH, temperature, agita-tion and dissolve oxygen concentration (DOC). Batch cultures werecarried out in 3.5 l of production medium (composition based onresults of previous shaken flask experiments). Temperature wasmaintained at 28 �C and the agitation speed automatically varied(from 300 to 500 rpm) at a fixed air flow rate of 1.71 vvm to main-tain the DOC at 20% air saturation. To control foam formation, 30 llantifoam l�1 (Antifoam289, Sigma, Saint Louis, MO, USA) wasadded at the beginning of the run. Samples (15 ml) for off-linedetermination of biomass and glucose, lipids and DHA concentra-tion were withdrawn every 8 h until the end of the fermentation(96 h).
2.4. Analytical determinations
For biomass production estimations as dry cell weight (DCW),samples were washed with distilled water and dried at 90 �C for1 day. Total lipids were extracted and determined gravimetricallyfrom washed cells as described by Kates (1998). Samples for DHAmeasurement were prepared as described by Yokochi et al.(1998), and subjected to gas chromatography/flame ionizationdetector (GC/FID) (HP 5890; Hewlett–Packard Co., Palo Alto, CA,USA) on a SB five capillary column (Supelco; Bellefonte, Pennsylva-nia, USA) with temperature programming (180–225 �C at5 �C min�1). Residual glucose was estimated with a commercialenzymatic kit based on the glucose oxidase–peroxidase method(Wiener Lab., Argentina), residual ammonia by the indophenol
method (Scheiner, 1975) and proteins concentration according toLowry et al. (1951).
3. Results
3.1. Screening designs
The concentration of carbon and nitrogen source and theirinteraction are crucial for A. limacinum SR21 growth and DHA pro-duction, and their effect are not expected to be the same on bothparameters. As previous reports found optimal conditions forDHA production in a one-stage process (Yaguchi et al., 1997; Yoko-chi et al., 1998), we investigated in more detail the significant vari-ables on A. limacinum SR21 growth as a first step to optimize DHAproduction by a two-stage process.
To assess the relative importance of nutrient concentration,environmental conditions and their interaction on A. limacinumSR21 growth, the effect of glucose (C source), CSL (N source), pHand salinity were firstly evaluated modulating the variablesaccording to a FFr. Since values of cell number and DCW werenot coincident along the experiment, the later was chosen asgrowth parameter because it is more significant from a biotechno-logical point of view. Table 1 shows one of the FFr used, the codedand the actual levels of the independent variables and the responseattained, DCW, which widely varied from 4.1 to 38.5 g l�1 depend-ing on the conditions tested. Regression coefficients for codifiedvariables and their interactions are shown in Table 2. Only the con-centration of glucose and CSL and their interaction had significanteffect on biomass production (P < 0.05). Positive coefficients forthis variables means that the highest levels of biomass are pro-duced with high concentration of glucose and CSL in the culturemedium.
As other factors could affect the production of biomass too, likethe inoculum size or the addition of phosphate or vitamins to theculture medium, it seemed worthwhile to include their study dur-ing the screening stage. Several ‘‘small” screening experimental de-signs (PB and FFr) were carried out in order to test the effect ofdifferent ranges of nutrients (C, N and P sources and vitamins),environmental conditions (pH and salinity) and inoculum size onA. limacinum SR21 growth (Table 3). Our results revealed that un-der the conditions assayed, artificial sea salt (0.35–3.5%) and pH(4–7) did not significantly affect biomass production, so they weremaintained at 1.75% concentration and 5.5, respectively in the fol-lowing experiments. Within the range of tested concentrations forYE (0.1–0.8%) and KH2PO4 (0.1–1%), as supplements of vitamins orphosphate, respectively, no significant differences were observedby including these variables, so they were not investigated further.On the other hand, concentration of glucose and CSL, covering 0.5–13.5% and 0.5–15% ranges, respectively, in the different experi-ments performed, had both a positive significant effect on biomassproduction, except for glucose in FFr2 that showed a negative ef-fect, possibly caused by a hyperosmotic effect. Positive significanceof glucose-CSL interaction suggested an effect of the C:N ratio onbiomass accumulation. Inoculum size was maintained at approxi-mately 106 cells ml�1 in all experiments, except in FFr2, in whichit varied between 103 and 106 cells ml�1 and presented a signifi-cant and positive effect.
3.2. Data analysis for process optimization
When the screening stage of a process development consists ofone or two screening designs, the recommended course of actionfor the optimization stage is to apply other types of experiments,like central composite and Box-Behnken designs. In our case, wehad performed five experiments in which the range of at least

Table 1Fractional factorial screening design (FFr1) and response (DCW) for biomass production by A. limacinum SR21.
Trial Factor level* DCW
Glucose (X1) pH (X2) CSL (X3) Artificial sea salt (X4)
1 +1 9.0 +1 7.0 �1 1.1 �1 0.35 6.302 +1 9.0 +1 7.0 +1 11.0 �1 3.50 38.363 �1 2.0 +1 7.0 �1 1.1 �1 0.35 5.344 0 5.5 0 5.7 0 6.0 0 1.92 21.665 �1 2.0 +1 7.0 +1 11.0 �1 0.35 6.406 +1 9.0 +1 7.0 +1 11.0 +1 3.50 38.567 �1 2.0 �1 4.5 +1 11.0 +1 3.50 9.208 +1 9.0 �1 4.5 +1 11.0 �1 0.35 32.409 +1 9.0 �1 4.5 �1 1.1 �1 0.35 5.1610 �1 2.0 +1 7.0 +1 11.0 +1 3.50 8.2811 �1 2.0 �1 4.5 �1 1.1 �1 0.35 5.0412 �1 2.0 �1 4.5 �1 1.1 +1 3.50 4.1413 +1 9.0 �1 4.5 +1 11.0 +1 3.50 32.2814 0 5.5 0 5.7 0 6.0 0 1.92 20.7015 +1 9.0 �1 4.5 �1 1.1 +1 3.50 8.9416 �1 2.0 �1 4.5 +1 11.0 �1 0.35 6.1217 �1 2.0 +1 7.0 �1 1.1 +1 3.50 4.1818 0 5.5 0 5.7 0 6.0 0 1.92 21.4419 +1 9.0 +1 7.0 �1 1.1 +1 3.50 9.10
For each factor, numbers in the first column are the coded values.* Glucose and artificial sea salt in% (w/v), CSL in% (v/v) and DCW in g l�1. About 3.5% artificial sea salt is equivalent to the mean sea salt concentration.
Table 2Analysis of a Fractional Factorial screening design (FFr1) for biomass production(DCW) by A. limacinum SR21.
Term Regression coefficient Standard error P-value
Intercept 14.926 1.588 0.00255**
X1 7.650 1.730 0.02149*
X2 0.827 1.730 0.66518X3 7.712 1.730 0.02102*
X4 0.597 1.730 0.75266X1: X2 0.865 1.730 0.65151X1: X3 6.300 1.730 0.03572*
X2: X3 0.622 1.730 0.74287X1: X4 0.235 1.730 0.90057X2: X4 �0.132 1.730 0.94378X3: X4 0.032 1.730 0.98619X1: X2:X3 0.745 1.730 0.69586X1: X2:X4 0.050 1.730 0.97876X1: X3:X4 �0.845 1.730 0.65878X2: X3:X4 0.022 1.730 0.99044X1: X2:X3:X4 0.140 1.730 0.94061
Codified values for: X1, glucose; X2, pH; X3, CSL; X4, artificial sea salt; ‘‘:” meansinteraction among factors.Residual standard error: 6.921 on three degrees of freedom.Multiple R-squared: 0.9472; adjusted R-squared: 0.6834.* Significance code: P < 0.05.** Significance code: P < 0.005.
Table 3Experiments to screen the effect of different variables on biomass production by A. limaci
Experiment code Significant factors
Glucose CSL
Range (%) Slope Range (%) Slope
PB1 0.5–3.5 3.181*** 0.5–2.0 �0.028PB2 2–9 1.128* 0.5–5.0 0.07**
PB3 2–10 10.201* 3–14 7.451*
FFr1 2–9 7.650* 1–11 7.712*
FFr2 6.5–13.5 �2.778* 2.5–15.0** 4.941**
Screening experiments with Plackett–Burman (PB) or factorial fractional (FFr) designs wvariation are shown for tested factors, and fixed values otherwise.* Significance code: P < 0.05.** Significance code: P < 0.005.*** Significance code: P < 0.0005.
2370 S.M. Rosa et al. / Bioresource Technology 101 (2010) 2367–2374
one-factor overlapped to some extent with the range of the samefactor in another experiment. As a consequence, we alreadycounted with a relatively large number of data points coveringthe experimental space that could be pooled together to fit to amodel and search for optimal points. However, the variationsamong experiments and the fact that the overlapping of samplingspaces was only partial could preclude the pooling of the data. Totest this point a two-step procedure was carried out that combineda K-means clustering with an analysis of variance (for details, seeSection 2). The analysis showed that runs from different screeningexperiments with similar values of inoculum size, glucose and CSLconcentrations could be grouped into a single cluster and that thedifferences in DCW among clusters were statistically different(P < 10�6), indicating that we could safely pool the runs from thescreening designs into a single dataset for process optimization(Table 4).
To find the actual optimal values of inoculum size, concentra-tion of glucose and concentration of CSL, we split the dataset intoa training subset and a validation subset to fit linear and quadraticregression and ANN models on the former subset and made predic-tions on the latter (see Section 2). The mse values for the linear,quadratic and ANN were 5.8, 4.2 and 2.6, respectively. In conse-quence, the trained ANN model was used to simulate the biomassproduced by 5172 combinations of glucose and CSL concentrationsand inoculum sizes. An exploratory analysis showed that biomass
num SR21.
Other assayed non-significant factors
Log (inoculum)
Log (cells ml�1) Slope
6.2 – Artificial sea salt (0.35–3.15%), YE (0.1–0.8%)5.9 – Artificial sea salt (0.70–3.50%), pH (4–7)6.3 – Artificial sea salt (0.70–3.50%)6.3 – Artificial sea salt (0.35–3.50%), pH (4.5–7.0)3.0–6.0 3.247* KH2PO4 (0.1–1.0%)
ere run to test the effect of several variables on biomass accumulation. Ranges of
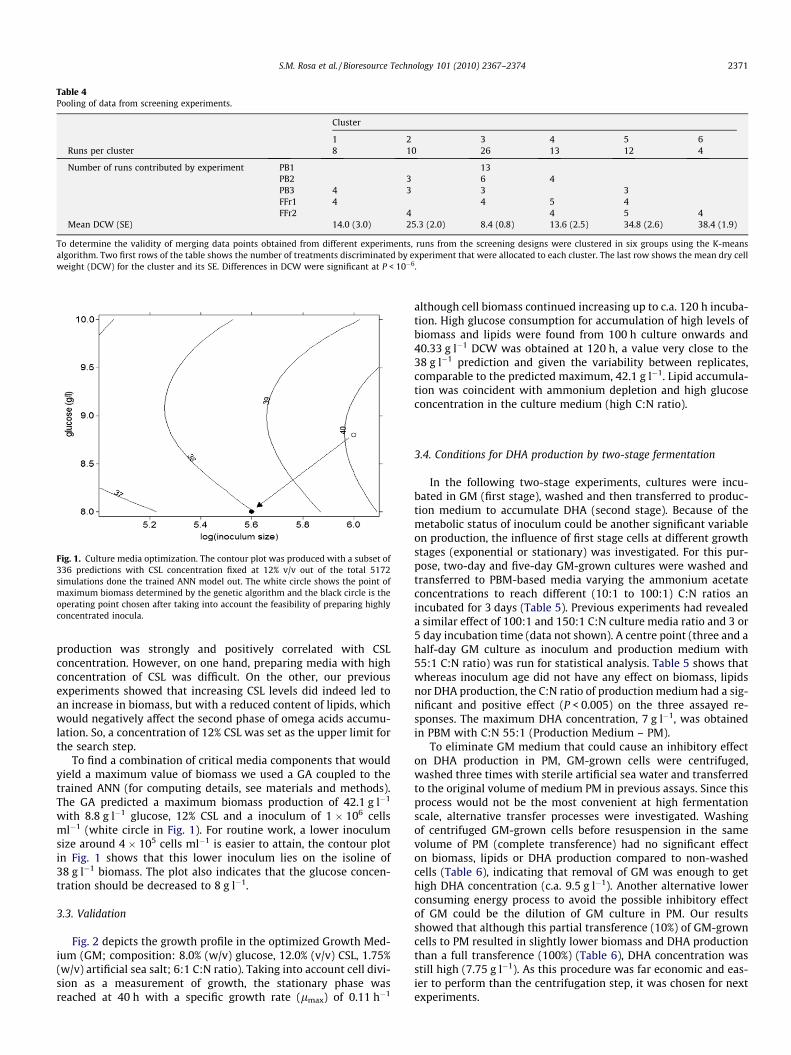
Table 4Pooling of data from screening experiments.
Cluster
1 2 3 4 5 6Runs per cluster 8 10 26 13 12 4
Number of runs contributed by experiment PB1 13PB2 3 6 4PB3 4 3 3 3FFr1 4 4 5 4FFr2 4 4 5 4
Mean DCW (SE) 14.0 (3.0) 25.3 (2.0) 8.4 (0.8) 13.6 (2.5) 34.8 (2.6) 38.4 (1.9)
To determine the validity of merging data points obtained from different experiments, runs from the screening designs were clustered in six groups using the K-meansalgorithm. Two first rows of the table shows the number of treatments discriminated by experiment that were allocated to each cluster. The last row shows the mean dry cellweight (DCW) for the cluster and its SE. Differences in DCW were significant at P < 10�6.
Fig. 1. Culture media optimization. The contour plot was produced with a subset of336 predictions with CSL concentration fixed at 12% v/v out of the total 5172simulations done the trained ANN model out. The white circle shows the point ofmaximum biomass determined by the genetic algorithm and the black circle is theoperating point chosen after taking into account the feasibility of preparing highlyconcentrated inocula.
S.M. Rosa et al. / Bioresource Technology 101 (2010) 2367–2374 2371
production was strongly and positively correlated with CSLconcentration. However, on one hand, preparing media with highconcentration of CSL was difficult. On the other, our previousexperiments showed that increasing CSL levels did indeed led toan increase in biomass, but with a reduced content of lipids, whichwould negatively affect the second phase of omega acids accumu-lation. So, a concentration of 12% CSL was set as the upper limit forthe search step.
To find a combination of critical media components that wouldyield a maximum value of biomass we used a GA coupled to thetrained ANN (for computing details, see materials and methods).The GA predicted a maximum biomass production of 42.1 g l�1
with 8.8 g l�1 glucose, 12% CSL and a inoculum of 1 � 106 cellsml�1 (white circle in Fig. 1). For routine work, a lower inoculumsize around 4 � 105 cells ml�1 is easier to attain, the contour plotin Fig. 1 shows that this lower inoculum lies on the isoline of38 g l�1 biomass. The plot also indicates that the glucose concen-tration should be decreased to 8 g l�1.
3.3. Validation
Fig. 2 depicts the growth profile in the optimized Growth Med-ium (GM; composition: 8.0% (w/v) glucose, 12.0% (v/v) CSL, 1.75%(w/v) artificial sea salt; 6:1 C:N ratio). Taking into account cell divi-sion as a measurement of growth, the stationary phase wasreached at 40 h with a specific growth rate (lmax) of 0.11 h�1
although cell biomass continued increasing up to c.a. 120 h incuba-tion. High glucose consumption for accumulation of high levels ofbiomass and lipids were found from 100 h culture onwards and40.33 g l�1 DCW was obtained at 120 h, a value very close to the38 g l�1 prediction and given the variability between replicates,comparable to the predicted maximum, 42.1 g l�1. Lipid accumula-tion was coincident with ammonium depletion and high glucoseconcentration in the culture medium (high C:N ratio).
3.4. Conditions for DHA production by two-stage fermentation
In the following two-stage experiments, cultures were incu-bated in GM (first stage), washed and then transferred to produc-tion medium to accumulate DHA (second stage). Because of themetabolic status of inoculum could be another significant variableon production, the influence of first stage cells at different growthstages (exponential or stationary) was investigated. For this pur-pose, two-day and five-day GM-grown cultures were washed andtransferred to PBM-based media varying the ammonium acetateconcentrations to reach different (10:1 to 100:1) C:N ratios anincubated for 3 days (Table 5). Previous experiments had revealeda similar effect of 100:1 and 150:1 C:N culture media ratio and 3 or5 day incubation time (data not shown). A centre point (three and ahalf-day GM culture as inoculum and production medium with55:1 C:N ratio) was run for statistical analysis. Table 5 shows thatwhereas inoculum age did not have any effect on biomass, lipidsnor DHA production, the C:N ratio of production medium had a sig-nificant and positive effect (P < 0.005) on the three assayed re-sponses. The maximum DHA concentration, 7 g l�1, was obtainedin PBM with C:N 55:1 (Production Medium – PM).
To eliminate GM medium that could cause an inhibitory effecton DHA production in PM, GM-grown cells were centrifuged,washed three times with sterile artificial sea water and transferredto the original volume of medium PM in previous assays. Since thisprocess would not be the most convenient at high fermentationscale, alternative transfer processes were investigated. Washingof centrifuged GM-grown cells before resuspension in the samevolume of PM (complete transference) had no significant effecton biomass, lipids or DHA production compared to non-washedcells (Table 6), indicating that removal of GM was enough to gethigh DHA concentration (c.a. 9.5 g l�1). Another alternative lowerconsuming energy process to avoid the possible inhibitory effectof GM could be the dilution of GM culture in PM. Our resultsshowed that although this partial transference (10%) of GM-growncells to PM resulted in slightly lower biomass and DHA productionthan a full transference (100%) (Table 6), DHA concentration wasstill high (7.75 g l�1). As this procedure was far economic and eas-ier to perform than the centrifugation step, it was chosen for nextexperiments.
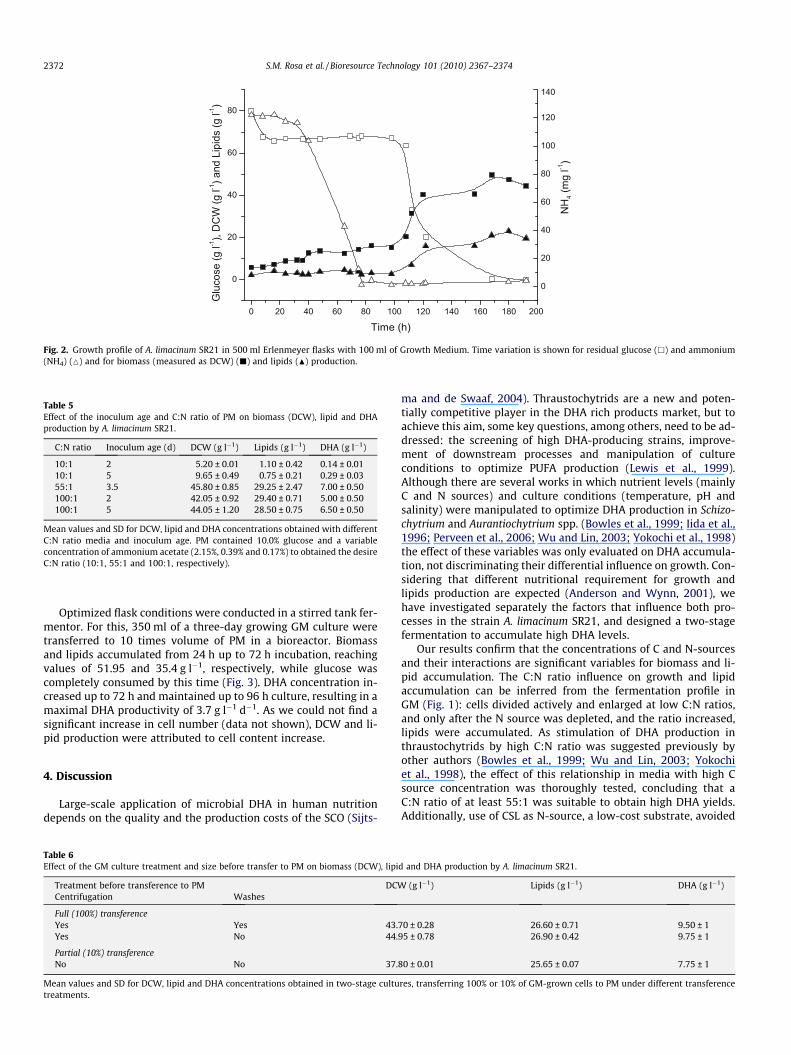
Fig. 2. Growth profile of A. limacinum SR21 in 500 ml Erlenmeyer flasks with 100 ml of Growth Medium. Time variation is shown for residual glucose (h) and ammonium(NH4) (M) and for biomass (measured as DCW) (j) and lipids (N) production.
Table 5Effect of the inoculum age and C:N ratio of PM on biomass (DCW), lipid and DHAproduction by A. limacinum SR21.
C:N ratio Inoculum age (d) DCW (g l�1) Lipids (g l�1) DHA (g l�1)
10:1 2 5.20 ± 0.01 1.10 ± 0.42 0.14 ± 0.0110:1 5 9.65 ± 0.49 0.75 ± 0.21 0.29 ± 0.0355:1 3.5 45.80 ± 0.85 29.25 ± 2.47 7.00 ± 0.50100:1 2 42.05 ± 0.92 29.40 ± 0.71 5.00 ± 0.50100:1 5 44.05 ± 1.20 28.50 ± 0.75 6.50 ± 0.50
Mean values and SD for DCW, lipid and DHA concentrations obtained with differentC:N ratio media and inoculum age. PM contained 10.0% glucose and a variableconcentration of ammonium acetate (2.15%, 0.39% and 0.17%) to obtained the desireC:N ratio (10:1, 55:1 and 100:1, respectively).
2372 S.M. Rosa et al. / Bioresource Technology 101 (2010) 2367–2374
Optimized flask conditions were conducted in a stirred tank fer-mentor. For this, 350 ml of a three-day growing GM culture weretransferred to 10 times volume of PM in a bioreactor. Biomassand lipids accumulated from 24 h up to 72 h incubation, reachingvalues of 51.95 and 35.4 g l�1, respectively, while glucose wascompletely consumed by this time (Fig. 3). DHA concentration in-creased up to 72 h and maintained up to 96 h culture, resulting in amaximal DHA productivity of 3.7 g l�1 d�1. As we could not find asignificant increase in cell number (data not shown), DCW and li-pid production were attributed to cell content increase.
4. Discussion
Large-scale application of microbial DHA in human nutritiondepends on the quality and the production costs of the SCO (Sijts-
Table 6Effect of the GM culture treatment and size before transfer to PM on biomass (DCW), lipi
Treatment before transference to PM DCWCentrifugation Washes
Full (100%) transferenceYes Yes 43.Yes No 44.
Partial (10%) transferenceNo No 37.
Mean values and SD for DCW, lipid and DHA concentrations obtained in two-stage cultutreatments.
ma and de Swaaf, 2004). Thraustochytrids are a new and poten-tially competitive player in the DHA rich products market, but toachieve this aim, some key questions, among others, need to be ad-dressed: the screening of high DHA-producing strains, improve-ment of downstream processes and manipulation of cultureconditions to optimize PUFA production (Lewis et al., 1999).Although there are several works in which nutrient levels (mainlyC and N sources) and culture conditions (temperature, pH andsalinity) were manipulated to optimize DHA production in Schizo-chytrium and Aurantiochytrium spp. (Bowles et al., 1999; Iida et al.,1996; Perveen et al., 2006; Wu and Lin, 2003; Yokochi et al., 1998)the effect of these variables was only evaluated on DHA accumula-tion, not discriminating their differential influence on growth. Con-sidering that different nutritional requirement for growth andlipids production are expected (Anderson and Wynn, 2001), wehave investigated separately the factors that influence both pro-cesses in the strain A. limacinum SR21, and designed a two-stagefermentation to accumulate high DHA levels.
Our results confirm that the concentrations of C and N-sourcesand their interactions are significant variables for biomass and li-pid accumulation. The C:N ratio influence on growth and lipidaccumulation can be inferred from the fermentation profile inGM (Fig. 1): cells divided actively and enlarged at low C:N ratios,and only after the N source was depleted, and the ratio increased,lipids were accumulated. As stimulation of DHA production inthraustochytrids by high C:N ratio was suggested previously byother authors (Bowles et al., 1999; Wu and Lin, 2003; Yokochiet al., 1998), the effect of this relationship in media with high Csource concentration was thoroughly tested, concluding that aC:N ratio of at least 55:1 was suitable to obtain high DHA yields.Additionally, use of CSL as N-source, a low-cost substrate, avoided
d and DHA production by A. limacinum SR21.
(g l�1) Lipids (g l�1) DHA (g l�1)
70 ± 0.28 26.60 ± 0.71 9.50 ± 195 ± 0.78 26.90 ± 0.42 9.75 ± 1
80 ± 0.01 25.65 ± 0.07 7.75 ± 1
res, transferring 100% or 10% of GM-grown cells to PM under different transference
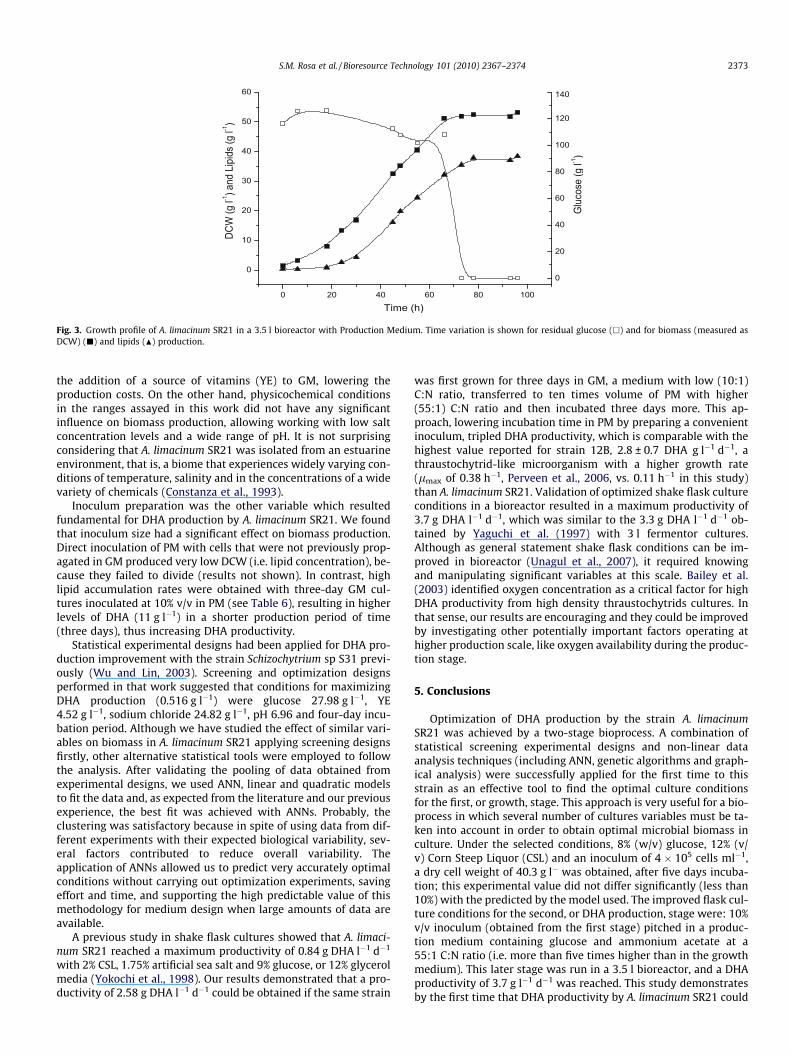
Fig. 3. Growth profile of A. limacinum SR21 in a 3.5 l bioreactor with Production Medium. Time variation is shown for residual glucose (h) and for biomass (measured asDCW) (j) and lipids (N) production.
S.M. Rosa et al. / Bioresource Technology 101 (2010) 2367–2374 2373
the addition of a source of vitamins (YE) to GM, lowering theproduction costs. On the other hand, physicochemical conditionsin the ranges assayed in this work did not have any significantinfluence on biomass production, allowing working with low saltconcentration levels and a wide range of pH. It is not surprisingconsidering that A. limacinum SR21 was isolated from an estuarineenvironment, that is, a biome that experiences widely varying con-ditions of temperature, salinity and in the concentrations of a widevariety of chemicals (Constanza et al., 1993).
Inoculum preparation was the other variable which resultedfundamental for DHA production by A. limacinum SR21. We foundthat inoculum size had a significant effect on biomass production.Direct inoculation of PM with cells that were not previously prop-agated in GM produced very low DCW (i.e. lipid concentration), be-cause they failed to divide (results not shown). In contrast, highlipid accumulation rates were obtained with three-day GM cul-tures inoculated at 10% v/v in PM (see Table 6), resulting in higherlevels of DHA (11 g l�1) in a shorter production period of time(three days), thus increasing DHA productivity.
Statistical experimental designs had been applied for DHA pro-duction improvement with the strain Schizochytrium sp S31 previ-ously (Wu and Lin, 2003). Screening and optimization designsperformed in that work suggested that conditions for maximizingDHA production (0.516 g l�1) were glucose 27.98 g l�1, YE4.52 g l�1, sodium chloride 24.82 g l�1, pH 6.96 and four-day incu-bation period. Although we have studied the effect of similar vari-ables on biomass in A. limacinum SR21 applying screening designsfirstly, other alternative statistical tools were employed to followthe analysis. After validating the pooling of data obtained fromexperimental designs, we used ANN, linear and quadratic modelsto fit the data and, as expected from the literature and our previousexperience, the best fit was achieved with ANNs. Probably, theclustering was satisfactory because in spite of using data from dif-ferent experiments with their expected biological variability, sev-eral factors contributed to reduce overall variability. Theapplication of ANNs allowed us to predict very accurately optimalconditions without carrying out optimization experiments, savingeffort and time, and supporting the high predictable value of thismethodology for medium design when large amounts of data areavailable.
A previous study in shake flask cultures showed that A. limaci-num SR21 reached a maximum productivity of 0.84 g DHA l�1 d�1
with 2% CSL, 1.75% artificial sea salt and 9% glucose, or 12% glycerolmedia (Yokochi et al., 1998). Our results demonstrated that a pro-ductivity of 2.58 g DHA l�1 d�1 could be obtained if the same strain
was first grown for three days in GM, a medium with low (10:1)C:N ratio, transferred to ten times volume of PM with higher(55:1) C:N ratio and then incubated three days more. This ap-proach, lowering incubation time in PM by preparing a convenientinoculum, tripled DHA productivity, which is comparable with thehighest value reported for strain 12B, 2.8 ± 0.7 DHA g l�1 d�1, athraustochytrid-like microorganism with a higher growth rate(lmax of 0.38 h�1, Perveen et al., 2006, vs. 0.11 h�1 in this study)than A. limacinum SR21. Validation of optimized shake flask cultureconditions in a bioreactor resulted in a maximum productivity of3.7 g DHA l�1 d�1, which was similar to the 3.3 g DHA l�1 d�1 ob-tained by Yaguchi et al. (1997) with 3 l fermentor cultures.Although as general statement shake flask conditions can be im-proved in bioreactor (Unagul et al., 2007), it required knowingand manipulating significant variables at this scale. Bailey et al.(2003) identified oxygen concentration as a critical factor for highDHA productivity from high density thraustochytrids cultures. Inthat sense, our results are encouraging and they could be improvedby investigating other potentially important factors operating athigher production scale, like oxygen availability during the produc-tion stage.
5. Conclusions
Optimization of DHA production by the strain A. limacinumSR21 was achieved by a two-stage bioprocess. A combination ofstatistical screening experimental designs and non-linear dataanalysis techniques (including ANN, genetic algorithms and graph-ical analysis) were successfully applied for the first time to thisstrain as an effective tool to find the optimal culture conditionsfor the first, or growth, stage. This approach is very useful for a bio-process in which several number of cultures variables must be ta-ken into account in order to obtain optimal microbial biomass inculture. Under the selected conditions, 8% (w/v) glucose, 12% (v/v) Corn Steep Liquor (CSL) and an inoculum of 4 � 105 cells ml�1,a dry cell weight of 40.3 g l� was obtained, after five days incuba-tion; this experimental value did not differ significantly (less than10%) with the predicted by the model used. The improved flask cul-ture conditions for the second, or DHA production, stage were: 10%v/v inoculum (obtained from the first stage) pitched in a produc-tion medium containing glucose and ammonium acetate at a55:1 C:N ratio (i.e. more than five times higher than in the growthmedium). This later stage was run in a 3.5 l bioreactor, and a DHAproductivity of 3.7 g l�1 d�1 was reached. This study demonstratesby the first time that DHA productivity by A. limacinum SR21 could
2374 S.M. Rosa et al. / Bioresource Technology 101 (2010) 2367–2374
be improved by a two-stage bioprocess, i.e. firstly statistically opti-mizing the production of cell biomass by the combination of twomethods, and then using thE biomass obtained as inoculum forPUFAs production. At this second stage, inoculation conditions(concentration and pre-treatment of inoculum culture) and C:Nratio in the medium resulted to be the most significant variablesstudied for DHA production in thraustochytrids.
Acknowledgements
We are grateful to Lic. Ruben O. Fernandez (CONEA-Argentina)for helping us with DHA samples preparation and measurementby GC/FID, and to Dr. Pablo I. Nikel for collaborating in biorreactorassays. SMR is graduate fellow of CONICET and MAG is a CONICETresearcher.
References
Anderson, A., Wynn, J., 2001. Microbial polyhydroxyalkanoates, polysaccharidesand lipids. In: Ratledge, C., Kristiansen, B. (Eds.), Basic Biotechnology.Cambridge University Press, Cambridge, pp. 325–348.
Bailey, R.B., DiMasi, D., Hansen, J.M., Mirrasoul, P.J., Ruecker, C.M., Veeder, G.T.,Kaneko, T., Barclay, W.R., 2003. In: ‘‘United States Patent”. 6607900, USA.
Bowles, R.D., Hunt, A.E., Bremer, G.B., Duchars, M.G., Eaton, R.A., 1999. Long chainn�3 polyunsaturated fatty acid production by members of the marine protistangroup the thraustochytrids: screening of isolates and optimisation ofdocosahexaenoic acid production. J. Biotechnol. 70, 193–202.
Constanza, R., Kemp, M., Boynton, W., 1993. Predictability, scale and biodiversity incoastal and estuarine ecosystems: implication for management. Ambio 22, 88–96.
Desai, K.M., Survase, S.A., Saudagar, P.S., Lele, S.S., Singhal, R.S., 2008. Comparison ofartificial neural network (ANN) and response surface methodology (RSM) infermentation media optimization: case study of fermentative production ofscleroglucan. Biochem. Eng. J. 41, 266–273.
Foresse, D.F., Hagan, M.T., 1997. Gauss-Newton approximation for Bayesianlearning. In: 1997 Proc. Int. Joint Conf. Neural Networks, pp. 1930–1935.
Gunstone, F.D., 2001. Basic oleochemicals, oleochemical products and newindustrial oils. In: Gunstone, F.D., Hamilton, R.J. (Eds.), OleochemicalManufacture and Application. Sheffield Academic Press, Sheffield, pp. 1–22.
Hartigan, J.A., Wong, M.A., 1979. A K-means clustering algorithm. Appl. Stat. 28,100–108.
Iida, I., Nakahara, T., Yocochi, T., Kamisaka, Y., Yagi, H., Yamaoka, M., Suzuki, O.,1996. Improvement of docosahexaenoic acid production in a culture ofThraustochytrium aureum by medium optimization. J. Ferment. Bioeng. 81,76–78.
Kates, M., 1998. Techniques of lipidology. Isolation, analysis and identification oflipids. In: Burdon, R.H., van Knippenberg, P.H. (Eds.), Laboratory techniques inbiochemistry and molecular biology. Elsevier, Amsterdam, pp. 100–111.
Kennedy, M., Krouse, D., 1999. Strategies for improving fermentation mediumperformance. a review. J. Ind. Microbiol. Biotechnol. 23, 456–475.
Lauritzen, L., Hansen, H.S., Jorgensen, M.H., Michaelsen, K.F., 2001. The essentialityof long chain n�3 fatty acids in relation to development and function of thebrain and retina. Prog. Lipid Res. 40, 1–94.
Lewis, T.E., Nichols, P.D., McMeekin, T.A., 1999. The biotechnological potential ofthraustochytrids. Mar. Biotechnol. 1, 580–587.
Lowry, O.H., Rosbrough, N.J., Farr, A.L., Randall, R.J., 1951. Protein measurementwith the Folin phenol reagent. J. Biol. Chem. 193, 265–275.
MacKay, D., 1992. Bayesian Interpolation. Neural Comput. 4, 415–447.Montgomery, D.C., 1991. Design and analysis of experiments. John Wiley, New York.Mutihac, L., Mutihac, R., 2008. Mining in chemometrics. Anal. Chim. Acta 612, 1–18.Nordoy, A., Marchioli, R., Arnesen, H., Videbaek, J., 2001. n�3 polyunsaturated fatty
acids and cardiovascular diseases. Lipids 36, 127–129.Perveen, Z., Ando, H., Ueno, A., Ito, Y., Yamamoto, Y., Yamada, Y., Takagi, T., Kaneko,
T., Kogame, K., Okuyama, H., 2006. Isolation and characterization of a novelthraustochytrid-like microorganism that efficiently produces docosahexaenoicacid. Biotechnol. Lett. 28, 197–202.
Ratledge, C., 2004. Fatty acid biosynthesis in microorganisms being used for singlecell oil production. Biochimie 86, 807–815.
Scheiner, D., 1975. Determination of ammonia and kjeldhal nitrogen by indophenolmethod. Water Res. 10, 31–36.
Sijtsma, L., de Swaaf, M.E., 2004. Biotechnological production and applications ofthe omega-3 polyunsaturated fatty acid docosahexaenoic acid. Appl. Microbiol.Biotechnol. 64, 146–153.
Soria, A.M., Gonzalez Funes, J.L., Garcia, A.F., 2004. A simulation study comparingthe impact of experimental error on the performance of experimental designsand artificial neural networks used for process screening. J. Ind. Microbiol.Biotechnol. 31, 469–474.
Standbury, P.F., Whitaker, A., Hall, S.J., 1986. Media for industrial fermentations. In:Standbury, P.F., Whitaker, A., Hall, S.J. (Eds.), Principles of Fermentationtechnology. Pergamon, Oxford, pp. 93–122.
The MathWorks, Inc., 2004. Genetic Algorithm and Direct Search Toolbox User’sGuide.
Thiry, M., Cingolani, D., 2002. Optimizing scale-up fermentation processes. TrendsBiotechnol. 20, 103–105.
Unagul, P., Assantachai, C., Phadungruengluij, S., Suphantharika, M., Tanticharoen,M., Verduyn, C., 2007. Coconut water as a medium additive for the production ofdocosahexaenoic acid (C22:6 n3) by Schizochytrium mangrovei Sk-02. Biores.Technol. 98, 281–287.
Ward, O.P., Singh, A., 2005. Omega-3/6 fatty acids: alternative sources ofproduction. Process Biochem. 40, 3627–3652.
Wu, S.-T., Lin, L.-P., 2003. Application of response surface methodology to optimizedocosahexaenoic acid production by Schizochytrium sp. S31.. J. Food Biochem.27, 127–139.
Yaguchi, T., Tanaka, S., Yocochi, T., Nakahara, T., Higashihara, T., 1997. Production ofhigh yields of docosahexaenoic acid by Schizochytrium sp. strain SR21. J. Am. OilChem. Soc 74, 1431–1434.
Yokochi, T., Honda, D., Higasshihara, T., Nakahara, T., 1998. Optimization ofdocosahexaenoic acid production by Schizochytrium limacinum SR21. Appl.Microbiol. Biotechnol. 49, 72–77.
Yokoyama, R., Honda, D., 2007. Taxonomic rearrangement of the genusSchizochytrium sensu latu based on morphology, chemotaxonomiccharacteristics, and 18S rRNA gene phylogeny (Thraustochytriaceae,Labyrinthulomycetes): emendation for Schizochytrium and erection ofAurantiochytrium and Oblongichytrium gen. Mycoscience 48, 199–211.